0001104659-13-025425.txt : 20130328 0001104659-13-025425.hdr.sgml : 20130328 20130328165045 ACCESSION NUMBER: 0001104659-13-025425 CONFORMED SUBMISSION TYPE: 40-F PUBLIC DOCUMENT COUNT: 28 CONFORMED PERIOD OF REPORT: 20121231 FILED AS OF DATE: 20130328 DATE AS OF CHANGE: 20130328 FILER: COMPANY DATA: COMPANY CONFORMED NAME: HudBay Minerals Inc. CENTRAL INDEX KEY: 0001322422 STANDARD INDUSTRIAL CLASSIFICATION: METAL MINING [1000] IRS NUMBER: 980485558 FISCAL YEAR END: 1231 FILING VALUES: FORM TYPE: 40-F SEC ACT: 1934 Act SEC FILE NUMBER: 001-34244 FILM NUMBER: 13724637 BUSINESS ADDRESS: STREET 1: 201 PORTAGE AVENUE, SUITE 1906 CITY: WINNEPEG STATE: A2 ZIP: R3B 3L3 BUSINESS PHONE: (204) 949-4261 MAIL ADDRESS: STREET 1: 201 PORTAGE AVENUE, SUITE 1906 CITY: WINNEPEG STATE: A2 ZIP: R3B 3L3 40-F 1 a13-8934_140f.htm 40-F


UNITED STATES

SECURITIES AND EXCHANGE COMMISSION

Washington, D.C. 20549


FORM 40-F


[Check one]


o           REGISTRATION STATEMENT PURSUANT TO SECTION 12 OF THE SECURITIES EXCHANGE ACT OF 1934


OR


x         ANNUAL REPORT PURSUANT TO SECTION 13(a) OR 15(d) OF THE SECURITIES EXCHANGE ACT OF 1934


For the fiscal year ended December 31, 2012              Commission File Number   001-34244


HUDBAY MINERALS INC.

(Exact name of Registrant as specified in its charter)


N/A

(Translation of Registrant’s name into English (if applicable))


Canada

(Province or other jurisdiction of incorporation or organization)


1000

(Primary Standard Industrial Classification Code Number (if applicable))


98-0485558

(I.R.S. Employer Identification Number (if applicable))


25 York Street

Suite 800

Toronto, Ontario

M5J 2V5, Canada

416 362-8181

(Address and telephone number of Registrant’s principal executive offices)


Andrew W. Bongiorno

Bevan, Mosca, Giuditta & Zarillo, P.C.

200 Madison Avenue, Suite 510

New York, N.Y. 10016

908 385-4289

(Name, address (including zip code) and telephone number (including area code)

of agent for service in the United States)


Securities registered or to be registered pursuant to Section 12(b) of the Act.


Title of each class


Name of each exchange on which registered

Common Shares, no par value


The New York Stock Exchange


Securities registered or to be registered pursuant to Section 12(g) of the Act.


N/A

(Title of Class)


Securities for which there is a reporting obligation pursuant to Section 15(d) of the Act.


9.500% Senior Notes due 2020

(Title of Class)


For annual reports, indicate by check mark the information filed with this form:


x  Annual Information Form


x  Audited Annual Financial Statements


Indicate the number of outstanding shares of each of the issuer’s classes of capital or common stock as of the close of the period covered by the annual report: As at December 31, 2012, 171,984,487 common shares outstanding.


Indicate by check mark whether the registrant by filing the information contained in this form is also thereby furnishing the information to the U.S. Securities and Exchange Commission (the “Commission”) pursuant to Rule 12g3-2(b) under the Securities Exchange Act of 1934 (the “Exchange Act”). If “Yes” is marked, indicate the file number assigned to the registrant in connection with such rule.


Yes  o


No  x


Indicate by check mark whether the registrant: (1) has filed all reports required to be filed by Section 13(d) or 15(d) of the Exchange Act during the preceding 12 months (or for such shorter period that the registrant was required to file such reports); and (2) has been subject to such filing requirements in the past 90 days.


Yes  x


No  o


Indicate by check mark whether the registrant has submitted electronically and posted on its corporate Web site, if any, every Interactive Data File required to be submitted and posted pursuant to Rule 405 of Regulation S-T (§232.405 of this chapter) during the preceding 12 months (or for such shorter period that the Registrant was required to submit and post such files).


Yes  o


No  o


EXPLANATORY NOTE


HudBay Minerals Inc. (the “Registrant”) is a Canadian issuer eligible to file its annual report (“Annual Report”) pursuant to Section 13(a) of the Exchange Act, on Form 40-F pursuant to the multi-jurisdictional disclosure system under the Exchange Act. The Registrant is a “foreign private issuer” as defined in Rule 405 under the Securities Act of 1933, as amended, and Rule 3b-4 under the Exchange Act. The equity securities of the Registrant are accordingly exempt from Sections 14(a), 14(b), 14(c), 14(f) and 16 of the Exchange Act pursuant to Rule 3a12-3 under the Exchange Act.


The Registrant is permitted, under the multi-jurisdictional disclosure system adopted by the United States and Canada, to prepare this Annual Report on Form 40-F in accordance with Canadian disclosure requirements, which are different from those of the United States.


This Annual Report contains references to both United States dollars and Canadian dollars. All dollar amounts referenced, unless otherwise indicated, are expressed in Canadian dollars, and United States dollars are referred to as “United States dollars” or “US$”.


DOCUMENTS INCORPORATED BY REFERENCE


The Registrant’s Annual Information Form (“AIF”) for the fiscal year ended December 31, 2012 is incorporated herein by reference as Exhibit 99.1.


The audited consolidated financial statements (the “Audited Annual Financial Statements”) of the Registrant for the years ended December 31, 2012 and 2011, including the reports of the auditors with respect thereto, are incorporated herein by reference as Exhibit 99.2. The Audited Annual Financial Statements have been prepared using accounting policies consistent with International Financial Reporting Standards (“IFRS”) as issued by the International Accounting Standards Board.


The Registrant’s MD&A for the year ended December 31, 2012 is incorporated herein by reference as Exhibit 99.3.


The Registrant’s Disclosure Pursuant to Section 1503(a) of the Dodd-Frank Wall Street Reform and Consumer Protection Act is incorporated herein by reference as Exhibit 99.4.


The Registrant’s amended Code of Business Conduct and Ethics is incorporated herein by reference as Exhibit 99.5.


DISCLOSURE CONTROLS AND PROCEDURES


As of the end of the period covered by this Annual Report for the Registrant’s fiscal year ended December 31, 2012, an evaluation of the effectiveness of the Registrant’s “disclosure controls and procedures” (as such term is defined in Rules 13a-15(e) and 15d-15(e) of the Exchange Act) was carried out by the Registrant’s management with the participation and supervision of the principal executive officer and principal financial officer. Based upon that evaluation, the Registrant’s principal executive officer and principal financial officer have concluded that as of the end of that fiscal year, the Registrant’s disclosure controls and procedures are effective to ensure that information required to be disclosed by the Registrant in reports that it files or submits under the Exchange Act is (i) recorded, processed, summarized and reported within the time periods specified in Commission rules and forms and (ii) accumulated and communicated to the Registrant’s management, including its principal executive officer and principal financial officer, to allow timely decisions regarding required disclosure.


INTERNAL CONTROL OVER FINANCIAL REPORTING


The disclosure provided under “Internal control over financial reporting (“ICFR”)” on page 56 of Exhibit 99.3, Management’s Discussion & Analysis for the Year Ended December 31, 2012, is incorporated by reference herein.


During the first quarter of 2012, the Registrant’s Corporate office began using a new enterprise resource planning (“ERP”) information system that it previously implemented at its Manitoba business unit during the second quarter of 2011. The implementation of the new ERP system followed the Registrant’s project plans, which included a number of typical project controls, such as the testing of data conversion and system reports, user training and user acceptance testing, in order to ensure internal controls were in


2


place during and after the implementation. The Registrant did not make any other changes to its “internal control over financial reporting” (as such term is defined in Rules 13a-15(f) and 15d-15(f) of the Exchange Act) during the year ended December 31, 2012 that materially affected, or are reasonably likely to materially affect, its internal control over financial reporting.


All internal control systems, no matter how well designed, have inherent limitations. As a result, even systems determined to be effective may not prevent or detect misstatements on a timely basis, as systems can provide only reasonable assurance that the objectives of the control system are met. In addition, projections of any evaluation of the effectiveness of internal control over financial reporting to future periods are subject to the risk that controls may become inadequate because of changes in conditions, or that the degree of compliance with the policies or procedures may change.


ATTESTATION REPORT OF THE REGISTERED PUBLIC ACCOUNTING FIRM


The two reports of Deloitte LLP (“Deloitte”) titled “Report of Independent Registered Chartered Accountants” immediately preceeding the Registrant’s audited consolidated financial statements attached as Exhibit 99.2, Audited Annual Financial Statements for the years ended December 31, 2012 and 2011, are incorporated herein by reference.


BLACKOUT PERIODS


There were no “blackout periods”, as defined under Rule 100(b) of Regulation BTR, requiring notice pursuant to Rule 104 of Regulation BTR during the fiscal year ended December 31, 2012.


AUDIT COMMITTEE IDENTIFICATION AND FINANCIAL EXPERT


As at December 31, 2012, the Registrant’s audit committee consisted of J. Bruce Barraclough, Alan J. Lenczner and John. L. Knowles.  Mr. Barraclough, the Registrant’s esteemed Chair of the audit committee, passed away in March 2013. Following Mr. Barraclough’s passing, on the recommendation of the corporate governance and nominating committee, the Registrant’s board of directors appointed Alan R. Hibben as the Interim Chair of the audit committee. The Registrant’s corporate governance and nominating committee has commenced a search to find a permanent Chair for the audit committee. The Registrant’s board of directors has determined that each of Messrs. Hibben, Lenczner and Knowles is an “audit committee financial expert” within the meaning of the Commission’s rules.  Each of Messrs. Hibben, Lenczner and Knowles is also “independent” under the criteria of Rule 10A-3 of the Exchange Act as required by the New York Stock Exchange (the “NYSE”).  The Commission has indicated that the designation of Messrs. Hibben, Lenczner and Knowles as audit committee financial experts does not make any of them an “expert” for any purpose or impose any duties, obligations or liability on Messrs. Hibben, Lenczner and Knowles that are greater than those imposed on members of the audit committee and board of directors who do not carry this designation. The audit committee’s charter sets out its responsibilities and duties, qualifications for membership, procedures for committee appointment and reporting to the Registrant’s board of directors.  A copy of the current charter is attached to the AIF as Schedule C and is available on the Registrant’s website at www.hudbayminerals.com/English/About-Us/Governance/default.aspx.


CODE OF ETHICS


The Registrant has adopted a Code of Business Conduct and Ethics (the “Code of Ethics”) that applies to its principal executive officer, principal financial officer, principal accounting officer or controller and persons performing similar functions. A copy of the Code of Ethics is available on the Registrant’s website at www.hudbayminerals.com/English/About-Us/Governance/default.aspx. The Registrant undertakes to provide to any person, without charge, upon request, a copy of the Code of Ethics.  Requests for copies of the Code of Ethics should be made by contacting the Registrant’s Vice President, Legal and Corporate Secretary at 416 362-8181.  No waivers of the Registrant’s Code of Ethics were granted to any principal officer of the Registrant or any person performing similar functions during the fiscal year ended December 31, 2012.


During the fiscal year ended December 31, 2012, the Registrant conducted a review of its Code of Ethics to consider whether any amendments were advisable or required.  The following is a summary of the material amendments that were made to the Registrant’s Code of Ethics following that review and during


3


the fiscal year ended December 31, 2012.  All further amendments to the Code of Ethics, and all waivers of the Code of Ethics with respect to any of the officers covered by it, will be posted on the Registrant’s website at www.hudbayminerals.com/English/About-Us/Governance/default.aspx. The following description is qualified in its entirety by reference to the Registrant’s amended Code of Ethics, which is attached hereto as Exhibit 99.5 and incorporated herein by reference.


Use of Company Property


The Registrant added a provision to its Code of Ethics which provides that any theft or fraud by an employee of company assets will result in immediate termination of the responsible employee and could also result in the Registrant seeking criminal prosecution or civil charges against such employee.


PRINCIPAL ACCOUNTANT FEES AND SERVICES


The information provided under the heading “Audit Committee Disclosure” on pages 36 through 38 of the AIF attached hereto as Exhibit 99.1 is incorporated by reference herein. All audit services, audit-related services, tax services, and other services provided for the fiscal year ended December 31, 2012 were preapproved by the audit committee in accordance with the Registrant’s preapproval policy as described under the subheading “Policy Regarding Non-Audit Services Rendered by Auditors” on pages 37 through 38 of the AIF attached hereto as Exhibit 99.1.


Audit Fees


The aggregate fees billed by Deloitte, the Registrant’s independent auditor, for the fiscal years ended December 31, 2011 and December 31, 2012, respectively, for auditing annual financial statements and reviewing the interim financial statements, as well as services normally provided by Deloitte in connection with the Registrant’s statutory and regulatory filings for such fiscal years were $1,245,553 and $1,066,374, respectively.


Audit-Related Fees


The aggregate fees billed by Deloitte for the fiscal years ended December 31, 2011 and December 31, 2012, respectively, for audit-related fees, which are fees for assurance and services related to Deloitte’s role, including attest services not required by statute or regulation and other audit related services, for such fiscal years were $476,640 and $372,076, respectively.


Tax Fees


There were no tax fees billed by Deloitte for the fiscal years ended December 31, 2011 and December 31, 2012.


All Other Fees


There were no fees billed by Deloitte for the fiscal years ended December 31, 2011 and December 31, 2012, except as described above.


OFF-BALANCE SHEET ARRANGEMENTS


The Registrant has no off-balance sheet arrangements that have or are reasonably likely to have a current or future effect on the Registrant’s financial condition, changes in financial condition, revenues or expenses, results of operation, liquidity, capital expenditures or capital resources that is material to investors.


TABULAR DISCLOSURE OF CONTRACTUAL OBLIGATIONS


The disclosure provided under “Contractual Obligations and Commitments” on page 38 of Exhibit 99.3, Management’s Discussion & Analysis for the Year Ended December 31, 2012, is incorporated by reference herein.


COMPARISON WITH NEW YORK STOCK EXCHANGE GOVERNANCE RULES


The NYSE requires that each listed company meet certain corporate governance standards.  These standards supplement the corporate governance reforms adopted by the United State Securities and Exchange Commission pursuant to the Sarbanes-Oxley Act of 2002.


4


Under the NYSE’s Listed Company Manual, a “foreign private issuer”, such as the Registrant, is not required to comply with most of the NYSE corporate governance standards.  However, foreign private issuers are required to disclose any significant ways in which their corporate governance practices differ from those followed by U.S. companies under the NYSE corporate governance standards.


The Registrant is subject to the listing standards of the Toronto Stock Exchange (the “TSX”) and the corporate governance rules of Canadian Securities Administrators.  These listing standards and corporate governance rules are substantially similar to the NYSE listing standards.  The Registrant complies with these TSX listing standards and Canadian corporate governance rules.


The following are the significant ways in which the Registrant’s governance practices differ from those followed by domestic companies under the NYSE corporate governance standards:


Director Independence


The Registrant determines independence of its directors under the policies of the Canadian Securities Administrators.  For a director to be considered independent under the policies of the Canadian Securities Administrators, he or she must have no direct or indirect material relationship with us, being a relationship that could, in the view of the board of directors reasonably be expected to interfere with the exercise of his or her independent judgment, and must not be in any relationship deemed to be not independent pursuant to such policies.  To assist in determining the independence of directors for purposes that include compliance with applicable legal and regulatory requirements and policies, the board of directors has adopted certain categorical standards, which are part of our Corporate Governance Guidelines.  The Registrant’s board of directors also determines whether each member of the Registrant’s audit committee is independent pursuant to National Instrument 52-110 Audit Committees and Rule 10A-3 of the Exchange Act.  The Registrant’s board of directors has not adopted the director independence standards contained in Section 303A.02 of the NYSE’s Listed Company Manual.


Approval of Equity Compensation Plans


Section 303A.08 of the NYSE’s Listed Company Manual requires shareholder approval of all equity compensation plans and material revisions to such plans.  The definition of “equity compensation plans” covers plans that provide for the delivery of both newly issued and treasury securities, as well as plans that rely on securities re-acquired in the open market by the issuing company for the purpose of redistribution to employers and directors. The TSX rules provide that the creation of any equity compensation plans that provide for new issuances of securities is subject to shareholder approval.  Any amendments to such plans are subject to shareholder approval unless the specific equity compensation plan contains detailed provisions, approved by the shareholders, that specify those amendments requiring shareholder approval and those amendments which can be made without shareholder approval.  The Registrant follows the TSX rules with respect to the requirements for shareholder approval of equity compensation plans and revisions to such plans.


Shareholder Approval Requirement


In lieu of Section 312 of the NYSE’s Listed Company Manual, the Registrant will follow the TSX rules for shareholder approval of new issuances of its common shares.  Following the TSX rules, shareholder approval is required for certain issuances of shares that (i) materially affect control of the Registrant or (ii) provide consideration to insiders in aggregate of 10% or greater of the market capitalization of the listed issuer and have not been negotiated at arm’s length.  Shareholder approval is also required, pursuant to the TSX rules, in the case of private placements (x) for an aggregate number of listed securities issuable greater than 25% of the number of securities of the listed issuer which are outstanding, on a non-diluted basis, prior to the date of closing of the transaction if the price per security is less than the market price or (y) that during any six month period are to insiders for listed securities or options, rights or other entitlements to listed securities greater than 10% of the number of securities of the listed issuer which are outstanding, on a non-diluted basis, prior to the date of the closing of the first private placement to an insider during the six month period.


5


MINE SAFETY DISCLOSURE


Pursuant to Section 1503(a) of the Dodd-Frank Wall Street Reform and Consumer Protection Act, issuers that are operators, or that have a subsidiary that is an operator, of a coal or other mine are required to disclose in their periodic reports filed with the Commission information regarding specified health and safety violations, orders and citations, related assessments and legal actions, and mining-related fatalities. For information regarding the Registrant’s mine safety disclosures, see “Disclosure Pursuant to Section 1503(a) of the Dodd-Frank Wall Street Reform and Consumer Protection Act” filed as Exhibit 99.4 to this Annual Report on Form 40-F.


UNDERTAKING


The Registrant undertakes to make available, in person or by telephone, representatives to respond to inquiries made by the Commission staff, and to furnish promptly, when requested to do so by the Commission staff, information relating to: the securities registered pursuant to Form 40-F; the securities in relation to which the obligation to file an annual report on Form 40-F arises; or transactions in said securities.


CONSENT TO SERVICE OF PROCESS


The Registrant has previously filed with the Commission a written consent to service of process and power of attorney on Form F-X. Any change to the name or address of the Registrant’s agent for service shall be communicated promptly to the Commission by amendment to the Form F-X referencing the file number of the Registrant.


*              *              *


6


SIGNATURES


Pursuant to the requirements of the Exchange Act, the Registrant certifies that it meets all of the requirements for filing on Form 40-F and has duly caused this Annual Report to be signed on its behalf by the undersigned, thereto duly authorized.


HUDBAY MINERALS INC.


By:

/s/ Patrick Donnelly


Name:

Patrick Donnelly


Title:

Vice President, Legal and Corporate Secretary


Date:

March 28, 2013


7


EXHIBIT INDEX


Exhibit  Description and Date of Document


Annual Information; Management’s Discussion and Analysis; Mine Safety Disclosure


99.1                        Annual Information Form for the Year Ended December 31, 2012


99.2                        Audited Annual Financial Statements for the Years Ended December 31, 2012 and 2011


99.3                        Management’s Discussion & Analysis for the Year Ended December 31, 2012


99.4                        Disclosure Pursuant to Section 1503(a) of the Dodd-Frank Wall Street Reform and Consumer Protection Act


99.5                        Amended Code of Business Conduct and Ethics


Certifications


99.6                        Certification of Chief Executive Officer pursuant to Section 302 of the Sarbanes-Oxley Act of 2002


99.7                        Certification of Chief Financial Officer pursuant to Section 302 of the Sarbanes-Oxley Act of 2002


99.8                        Certification of Chief Executive Officer pursuant to Section 906 of the Sarbanes-Oxley Act of 2002


99.9                        Certification of Chief Financial Officer pursuant to Section 906 of the Sarbanes-Oxley Act of 2002


Consents


99.10                 Consent of Cashel Meagher, P.Geo., dated March 28, 2013


99.11                 Consent of Robert Carter, P.Eng., dated March 28, 2013


99.12                 Consent of Deloitte LLP, March 28, 2013


8


EX-99.1 2 a13-8934_1ex99d1.htm EX-99.1

Exhibit 99.1


HUDBAY MINERALS INC.


ANNUAL INFORMATION FORM


FOR THE


YEAR ENDED DECEMBER 31, 2012


March 27, 2013


TABLE OF CONTENTS


FORWARD-LOOKING INFORMATION

1

NOTE TO UNITED STATES INVESTORS

2

CURRENCY AND EXCHANGE RATES

2

OTHER IMPORTANT INFORMATION

3

CORPORATE STRUCTURE

3

Incorporation and Registered Office

3

Intercorporate Relationships

4

DEVELOPMENT OF OUR BUSINESS

4

Strategy

4

Three Year History

4

DESCRIPTION OF OUR BUSINESS

7

General

7

Material Mineral Projects

8

Other Assets

14

Other Information

16

CORPORATE SOCIAL RESPONSIBILITY

18

RISK FACTORS

19

DESCRIPTION OF CAPITAL STRUCTURE

28

Common Shares

28

Preference Shares

29

Senior Unsecured Notes

29

Credit Ratings

30

DIVIDENDS

31

MARKET FOR SECURITIES

31

Price Range and Trading Volume

31

Prior Sales

32

DIRECTORS AND OFFICERS

32

Board of Directors

32

Executive Officers

34

Corporate Cease Trade Orders, Bankruptcies, Penalties and Sanctions

35

Conflicts of Interest

36

AUDIT COMMITTEE DISCLOSURE

36

LEGAL PROCEEDINGS AND REGULATORY ACTIONS

38

INTEREST OF MANAGEMENT AND OTHERS IN MATERIAL TRANSACTIONS

40

TRANSFER AGENT AND REGISTRAR

40

MATERIAL CONTRACTS

40

QUALIFIED PERSONS

40

INTERESTS OF EXPERTS

40

ADDITIONAL INFORMATION

41

SCHEDULE A GLOSSARY OF MINING TERMS

A1

SCHEDULE B MATERIAL MINERAL PROJECTS

B1

SCHEDULE C AUDIT COMMITTEE CHARTER

C1


FORWARD-LOOKING INFORMATION


This annual information form (“AIF”) contains “forward-looking statements” and “forward-looking information” (collectively, “forward-looking information”) within the meaning of applicable Canadian and United States securities legislation. All information contained in this AIF, other than statements of current and historical fact, is forward-looking information. Forward-looking information includes information that relates to, among other things, our objectives, strategies, and intentions and future financial and operating performance and prospects. Often, but not always, forward-looking information can be identified by the use of words such as “plans”, “expects”, “budget”, “guidance”, “scheduled”, “estimates”, “forecasts”, “strategy”, “target”, “intends”, “objective”, “goal”, “understands”, “anticipates” and “believes” (and variations of these or similar words) and statements that certain actions, events or results “may”, “could”, “would”, “should”, “might” “occur” or “be achieved” or “will be taken” (and variations of these or similar expressions). All of the forward-looking information in this AIF is qualified by this cautionary statement.


Forward-looking information in this AIF includes, but is not limited to, continued production at our 777 and Lalor mines, continued processing at our Flin Flon concentrator, Snow Lake concentrator and Flin Flon zinc plant, our ability to develop our Lalor, Constancia and Reed projects and the anticipated scope and cost of, and development plans for, these projects, anticipated timing of our projects and events that may affect our projects, our expectation that we will receive the remaining US$250 million deposit under the precious metals stream transaction with Silver Wheaton Corp., the anticipated effect of external factors on revenue, such as commodity prices, anticipated exploration and development expenditures and activities and the possible success of such activities, estimation of mineral reserves and resources, mine life projections, timing and amount of estimated future production, reclamation costs, economic outlook, government regulation of mining operations, and business and acquisition strategies.


Forward-looking information is not, and cannot be, a guarantee of future results or events. Forward-looking information is based on, among other things, opinions, assumptions, estimates and analyses that, while considered reasonable by us at the date the forward-looking information is provided, inherently are subject to significant risks, uncertainties, contingencies and other factors that may cause actual results and events to be materially different from those expressed or implied by the forward-looking information. The material factors or assumptions that we identified and were applied by us in drawing conclusions or making forecasts or projections set out in the forward looking information include, but are not limited to:


·                                          the success of mining, processing, exploration and development activities;

·                                          the accuracy of geological, mining and metallurgical estimates;

·                                          the costs of production;

·                                          the supply and demand for metals we produce;

·                                          the volatility of commodity prices;

·                                          the volatility in foreign exchange rates;

·                                          the supply and availability of concentrate for our processing facilities;

·                                          the supply and availability of reagents for our concentrators;

·                                          the availability of third party processing facilities for our concentrate;

·                                          the supply and availability of all forms of energy and fuels at reasonable prices;

·                                          the availability of transportation services at reasonable prices;

·                                          no significant unanticipated operational or technical difficulties;

·                                          the availability of financing for our exploration and development projects and activities;

·                                          the ability to complete project targets on time and on budget and other events that may affect our ability to develop our projects;

·                                          the timing and receipt of various regulatory and governmental approvals;

·                                          the availability of personnel for our exploration, development and operational projects and ongoing employee relations;

·                                          maintaining good relations with the communities in which we operate, including the communities surrounding our Constancia project;

·                                          no significant unanticipated challenges with stakeholders at our various projects;

·                                          no significant unanticipated events relating to regulatory, environmental, health and safety matters;

·                                          no contests over title to our properties, including as a result of rights or claimed rights of aboriginal peoples;


·                                          the timing and possible outcome of pending litigation and no significant unanticipated litigation;

·                                          certain tax matters, including, but not limited to current tax laws and regulations; and

·                                          no significant and continuing adverse changes in general economic conditions or conditions in the financial markets.


The risks, uncertainties, contingencies and other factors that may cause actual results to differ materially from those expressed or implied by the forward-looking information may include, but are not limited to, risks generally associated with the mining industry, such as economic factors (including future commodity prices, currency fluctuations and energy prices), uncertainties related to the development and operation of our projects, depletion of our reserves, risks related to political or social unrest or change and those in respect of aboriginal and community relations and title claims, operational risks and hazards, including unanticipated environmental, industrial and geological events and developments and the inability to insure against all risks, failure of plant, equipment, processes, transportation and other infrastructure to operate as anticipated, compliance with government and environmental regulations, including permitting requirements and anti-bribery legislation, dependence on key personnel and employee relations, volatile financial markets that may affect our ability to obtain financing on acceptable terms, uncertainties related to the geology, continuity, grade and estimates of mineral reserves and resources and the potential for variations in grade and recovery rates, uncertain costs of reclamation activities, our ability to comply with our pension and other post-retirement obligations, our ability to abide by the covenants in our debt instruments, as well as the risks discussed under the heading “Risk Factors” in this AIF.


Should one or more risk, uncertainty, contingency or other factor materialize or should any factor or assumption prove incorrect, actual results could vary materially from those expressed or implied in the forward-looking information. Accordingly, you should not place undue reliance on forward-looking information. We do not assume any obligation to update or revise any forward-looking information after the date of this AIF or to explain any material difference between subsequent actual events and any forward-looking information, except as required by applicable law.


NOTE TO UNITED STATES INVESTORS


Information concerning our mineral properties has been prepared in accordance with the requirements of Canadian securities laws, which differ in material respects from the requirements of the U.S. Securities and Exchange Commission (“SEC”) Industry Guide 7. Under SEC Industry Guide 7, mineralization may not be classified as a “reserve” unless the determination has been made that the mineralization could be economically and legally produced or extracted at the time of the reserve determination, and the SEC does not recognize the reporting of mineral deposits which do not meet the SEC Industry Guide 7 definition of “Reserve”. In accordance with National Instrument 43-101 - Standards of Disclosure for Mineral Projects (“NI 43-101”) of the Canadian Securities Administrators, the terms “mineral reserve”, “proven mineral reserve”, “probable mineral reserve”, “mineral resource”, “measured mineral resource”, “indicated mineral resource” and “inferred mineral resource” are defined in the Canadian Institute of Mining, Metallurgy and Petroleum (“CIM”) Definition Standards for Mineral Resources and Mineral Reserves adopted by the CIM Council on December 11, 2005. While the terms “mineral resource”, “measured mineral resource”, “indicated mineral resource” and “inferred mineral resource” are recognized and required by NI 43-101, the SEC does not recognize them. You are cautioned that, except for that portion of mineral resources classified as mineral reserves, mineral resources do not have demonstrated economic value. Inferred mineral resources have a high degree of uncertainty as to their existence and as to whether they can be economically or legally mined. It cannot be assumed that all or any part of an inferred mineral resource will ever be upgraded to a higher category. Therefore, you are cautioned not to assume that all or any part of an inferred mineral resource exists, that it can be economically or legally mined, or that it will ever be upgraded to a higher category. Likewise, you are cautioned not to assume that all or any part of measured or indicated mineral resources will ever be upgraded into mineral reserves. For more information on the technical terms as they are used under NI 43-101, please see Schedule A “Glossary of Mining Terms”.


CURRENCY AND EXCHANGE RATES


This AIF contains references to both United States dollars and Canadian dollars. All dollar amounts referenced, unless otherwise indicated, are expressed in Canadian dollars, and United States dollars are


2


referred to as “United States dollars” or “US$”.  For Canadian dollars to United States dollars, the average exchange rate for 2012 and the closing exchange rate at December 31, 2012, as reported by the Bank of Canada, were one Canadian dollar per 1.000 and 1.005 United States dollars, respectively. On March 26, 2013 the Bank of Canada noon rate of exchange was C$1.00 = US$0.984.


OTHER IMPORTANT INFORMATION


Certain scientific and technical terms and abbreviations used in this AIF are defined in the “Glossary of Mining Terms” attached as Schedule A.


Unless the context suggests otherwise, references to “we”, “us”, “our” and similar terms, as well as references to “Hudbay” and “Company”, refer to HudBay Minerals Inc. and its direct and indirect subsidiaries.


CORPORATE STRUCTURE


Incorporation and Registered Office


We were formed by the amalgamation of Pan American Resources Inc. and Marvas Developments Ltd. on January 16, 1996, pursuant to the Business Corporations Act (Ontario) and changed our name to Pan American Resources Inc. On March 12, 2002, we acquired ONTZINC Corporation, a private Ontario corporation, through a reverse takeover and changed our name to ONTZINC Corporation. On December 21, 2004, we acquired Hudson Bay Mining and Smelting Co., Limited (“HBMS”) and changed our name to HudBay Minerals Inc. In connection with the acquisition of HBMS, on December 21, 2004, we amended our articles to consolidate our common shares on a 30 to 1 basis. On October 25, 2005, we were continued under the Canada Business Corporations Act (“CBCA”).  On August 15, 2011, we completed a vertical short-form amalgamation under the CBCA with our subsidiary, HMI Nickel Inc.


Our registered office is located at 2200-201 Portage Avenue, Winnipeg, Manitoba R3B 3L3 and our principal executive office is located at 25 York Street, Suite 800, Toronto, Ontario M5J 2V5.


Our common shares are listed on the Toronto Stock Exchange (“TSX”), New York Stock Exchange (“NYSE”) and Bolsa de Valores de Lima under the symbol “HBM”.


3


Intercorporate Relationships


The following chart shows our principal subsidiaries, their jurisdiction of incorporation and the percentage of voting securities we beneficially own or over which we have control or direction.
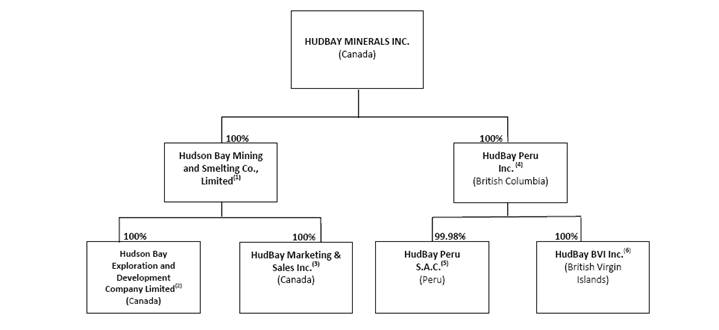


Notes:


(1)            HBMS owns our 777 and Lalor mines and our 70% owned Reed copper project and is a guarantor of our 9.50% senior unsecured notes.

(2)            Hudson Bay Exploration and Development Company Limited (“HBED”) holds our key exploration properties in Canada, acts as agent for HBMS and is a guarantor of our 9.50% senior unsecured notes.

(3)            HudBay Marketing & Sales Inc. markets and sells our copper concentrate and zinc metal produced in Manitoba and is a guarantor of our 9.50% senior unsecured notes.

(4)            HudBay Peru Inc. owns 99.98% of HudBay Peru S.A.C. (“Hudbay Peru”). The remaining 0.02% is owned by 6502873 Canada Inc., our wholly owned subsidiary.

(5)            Hudbay Peru owns the Constancia project.

(6)            HudBay (BVI) Inc. (“Hudbay BVI”) was incorporated for the sole purpose of entering into and fulfilling our obligations under the silver stream agreement in respect of the Constancia project.


DEVELOPMENT OF OUR BUSINESS


Strategy


Our strategy is to (i) optimize the value of our producing assets on an ongoing basis through increasing efficiency and safety and (ii) grow through the exploration, acquisition and development of, volcanogenic massive sulphide (“VMS”) and porphyry deposits with exploration upside in mining friendly jurisdictions in North and South America. As described below, we have been able to execute this strategy over the past three years by, among other things, acquiring the Constancia project, advancing our Lalor and Constancia projects to the construction stage of development, obtaining financing to facilitate the construction of our development projects, disposing of our interest in the Fenix project and other non-core assets and investing in junior exploration companies that have projects with the potential for development.


Three Year History


Issuance of 9.50% Senior Unsecured Notes


On September 13, 2012, we issued US$500 million aggregate principal amount of 9.50% senior unsecured notes due October 1, 2020. The notes were priced at 100% of their face value, and yielded proceeds of US$484 million net of directly attributable transaction costs. As the proceeds will be used to fund the development of our Constancia project, interest costs will be capitalized to project assets during the construction period of this project. The notes are fully and unconditionally guaranteed, jointly and severally, on


4


a senior unsecured basis, by substantially all of our existing and future subsidiaries other than our subsidiaries associated with the Constancia project. For additional information, refer below to the heading “Description of Capital Structure — Senior Unsecured Notes”.


Precious Metals Stream Transaction


On August 8, 2012, we entered into a precious metals stream transaction with Silver Wheaton Corp. (“Silver Wheaton”) pursuant to a precious metals purchase agreement (the “777 Stream Agreement”) among Silver Wheaton, Hudbay and HBMS and a silver purchase agreement (the “Constancia Stream Agreement” and, together with the 777 Stream Agreement, the “Stream Agreements”) among Silver Wheaton (Caymans) Ltd. (“SW Caymans”), Hudbay and Hudbay BVI.


Pursuant to the Stream Agreements, we have agreed to receive aggregate upfront deposit payments of US$750 million against delivery of (i) 100% of payable gold and silver from our 777 mine until the later of December 31, 2016 and satisfaction of a completion test at Constancia, and thereafter 50% of payable gold and 100% of payable silver for the remainder of the 777 mine life, and (ii) 100% of payable silver from the Constancia project. The stream transaction does not include gold production from Constancia, precious metals production from our Lalor project or our land package in Peru outside of the Constancia and Pampacancha deposits or any other metals or minerals, including copper or zinc, from any of our properties.


At closing, we received an upfront deposit payment of US$500 million and will receive a further US$250 million in deposit payments in two equal installments once US$500 million and US$1.0 billion, respectively, in capital expenditures have been incurred at our Constancia project.


In addition to the upfront payments, for gold and silver delivered in accordance with the Stream Agreements, we will receive cash payments equal to the lesser of (i) the market price and (ii) US$400 per ounce (for gold) and US$5.90 per ounce (for silver), subject to 1% annual escalation after three years. For additional information, refer to the complete copies of the Stream Agreements that have been filed on SEDAR and EDGAR and our Material Change Report dated August 14, 2012, also filed on SEDAR and EDGAR.


Construction of Constancia Project


On August 8, 2012, our board of directors approved a US$1.5 billion investment to fund the development and construction of our Constancia project in Peru. The Constancia development schedule contemplates nine quarters of construction, with initial production in late 2014 and full production commencing in the second quarter of 2015.


We acquired the Constancia project through our acquisition of all of the outstanding shares of Norsemont Mining Inc. (“Norsemont”) pursuant to a support agreement dated January 9, 2011 and an offer dated January 24, 2011 (as extended by a notice of extension dated March 1, 2011, the “Offer”). Pursuant to the Offer, and subsequent compulsory acquisition, we issued 22,475,704 Hudbay common shares and paid an aggregate of $130 million in cash to former Norsemont shareholders. For additional information, refer below to the heading “Description of our Business — Material Mineral Projects — Constancia Project”.


Closure of Trout Lake and Chisel North Mines


Our Trout Lake and Chisel North mines in northern Manitoba closed, as scheduled, at the end of the second and third quarters of 2012, respectively.


Reed Copper Project


On December 19, 2011, our board of directors approved the construction of the Reed copper project.  The capital construction budget for the Reed copper project is $72 million. The Reed copper project is currently under construction and is expected to commence production in late 2013.  Pursuant to our agreement with VMS Ventures Inc. (“VMS Ventures”), we have a 70% interest and VMS Ventures has a 30% interest in the project.  For additional information, refer below to the heading “Description of Our Business — Other Assets — Joint Ventures — Reed Copper Project”.


5


Dispositions of Fenix Project and Zochem


On September 9, 2011, we completed the sale of our interest in the Fenix ferro nickel project in Guatemala to the Solway Group (“Solway”) for cash consideration of US$140 million. In the fourth quarter of 2012, we received an additional $1 million from Solway to settle contingent consideration amounts that would have otherwise been receivable upon the satisfaction of certain conditions during the course of Solway’s development of the Fenix project and agreed with Solway to amend the terms of the indemnity to release us from all obligations except in respect of certain litigation matters. For additional information regarding these litigation matters, refer below to the heading “Legal Proceedings and Regulatory Actions”. We acquired the Fenix project in August 2008, through our acquisition of all of the issued and outstanding common shares of Skye Resources Inc.


On November 1, 2011, we sold our interest in Zochem Inc. to a third party for cash consideration of US$15 million. Zochem Inc. owns and operates a zinc oxide production facility in Brampton, Ontario.


Lalor Project


On August 4, 2010, our board of directors made a commitment to the development of our 100% owned Lalor project near Snow Lake, Manitoba by authorizing a $560 million investment to put the project into full production. Following our 2011 optimization study, our board of directors approved an incremental capital expenditure investment of $144 million to fund a new 4,500 tonne per day concentrator at Lalor instead of refurbishing the existing Snow Lake concentrator. Following the completion of basic engineering in the first quarter of 2013, estimated capital expenditures on the concentrator were increased by approximately $90 million for total estimated Lalor capital costs of $794 million. Scope changes and improved estimation from completion of basic engineering account for the $90 million increase. The scope changes include an increase in the grinding capacity by 20% to 5,400 tonnes per day to better match the potential production shaft capacity.


The new concentrator design also incorporates a longer construction schedule with concentrator start-up anticipated in late 2015. However, first ore production from the ventilation shaft commenced in August 2012 and first ore production from the main production shaft is still projected to be on schedule in late 2014, at which time it will be processed at our Snow Lake and Flin Flon mills and a portion stockpiled for the new concentrator upon its commissioning. Full production, use of the new concentrator and an increase to the capacity of the existing tailings facility are contingent upon receipt of required permits, which we believe to be forthcoming. For additional information, refer below to the heading “Description of our Business — Material Mineral Projects — Lalor Project”.


Investment in Augusta Resource Corporation


On August 27, 2010 we acquired 10,905,590 units of Augusta Resource Corporation (“Augusta”) at a subscription price of $2.75 per unit and an aggregate acquisition cost of approximately $30 million. Each unit consisted of one Augusta common share and one half of a common share purchase warrant. On March 18, 2011, we exercised all of our Augusta warrants at an exercise price of $3.90 per share. As at March 27, 2013, we owned approximately 15% of Augusta’s issued and outstanding common shares. Augusta’s primary asset is the Rosemont copper project in Arizona. The investment in Augusta is consistent with our strategy of investing in junior companies with near-development mineral projects.


777 North Expansion


On August 4, 2010, we announced a $20 million expansion to our 777 mine. The 777 North expansion involved driving a 2,500 metre ramp from surface to the 440 metre level below surface to access mineral resources in the north and east zones that are connected to the underground workings of our 777 mine. The expansion is expected to increase 777’s production capacity by approximately 8% and to provide an underground exploration platform to enable the evaluation of additional exploration opportunities near the 777 mine. For additional information, refer below to the heading “Description of our Business — Material Mineral Projects — 777 Mine”.


6


CEO Appointment


David Garofalo joined us as our President and Chief Executive Officer (“CEO”) on July 12, 2010. Mr. Garofalo was previously Senior Vice President, Finance and Chief Financial Officer and a director at Agnico-Eagle Mines Limited, where he had been employed since 1998. Between 1990 and 1998, Mr. Garofalo served as Treasurer and in various finance roles with another international mining company.


Closure of Copper Smelter and Refinery


On June 11, 2010, we closed our copper smelter in Flin Flon, which had been in operation for over 80 years. We closed our White Pine copper refinery soon thereafter and sold it in the second quarter of 2011.


DESCRIPTION OF OUR BUSINESS


General


We are an integrated mining company producing copper concentrate (containing copper, gold and silver) and zinc metal. With assets in North and South America, we are focused on the discovery, production and marketing of base and precious metals.


We have three material mineral projects, all of which are 100% owned:


1.              777, an underground mine in Flin Flon, Manitoba, which has been producing since 2004;


2.              Lalor, a zinc, gold and copper project currently under construction near Snow Lake, Manitoba, which commenced initial ore production from the ventilation shaft in August 2012 and is expected to begin production from the main shaft in late 2014; and


3.              Constancia, a copper project in Peru, which is expected to commence initial production in late 2014 and begin full production in the second quarter of 2015.


We also own a 70% interest in the Reed copper project near Snow Lake, Manitoba, which is currently under construction and expected to commence production in late 2013, exploration properties in North and South America and minority equity investments in several junior exploration companies as part of our strategy to build a pipeline of projects with the potential for development.


In addition, we own and operate a portfolio of processing facilities in northern Manitoba which includes our primary Flin Flon ore concentrator that produces zinc and copper concentrates, our Snow Lake concentrator that produces zinc and copper concentrates and our Flin Flon zinc plant that produces high-grade zinc metal.


7


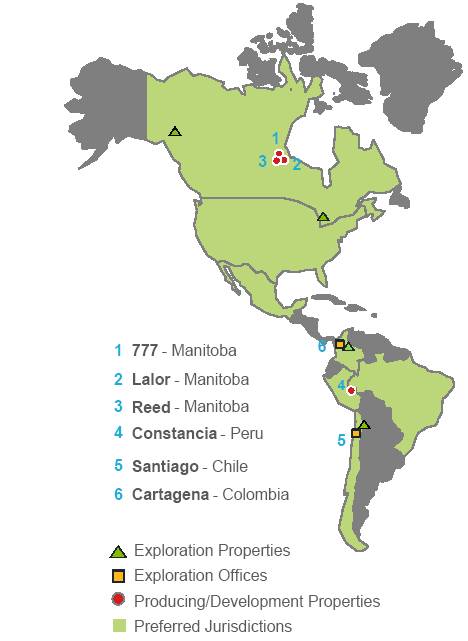
The following map shows where our material mineral projects and certain of our other assets are located.


Material Mineral Projects


777 Mine


Our 100% owned 777 mine is an underground copper, zinc, gold and silver mine located within the Flin Flon Greenstone Belt, immediately adjacent to our principal concentrator and zinc pressure leach plant in Flin Flon, Manitoba. Development of the 777 mine commenced in 1999 and commercial production began in 2004. The anticipated mine life is until 2020.


On August 4, 2010, we announced a $20 million expansion to our 777 mine. The 777 North expansion involved driving a 2,500 metre ramp from surface to the 440 metre level below surface to access mineral resources in the north and east zones that are connected to the underground workings of our 777 mine. The expansion is expected to increase 777’s production capacity by approximately 8% and to provide an underground exploration platform to enable the evaluation of additional exploration opportunities near the 777 mine. In 2012, approximately 30,000 tonnes of ore were produced from the 777 North ramp and full production from the 777 North expansion zones began in early 2013.


8


Ore produced at the 777 mine is transported to our Flin Flon concentrator for processing into copper and zinc concentrate. Copper concentrate is sold to third party purchasers and zinc concentrate is sent to our Flin Flon zinc plant where it is further processed into special high grade zinc before being sold to third party purchasers. For additional information, refer below to the headings “Description of our Business — Other Information — Processing Facilities” and “Description of our Business — Other Information — Products and Marketing”.


We have entered into a precious metals stream transaction with Silver Wheaton pursuant to which we received a US$455 million upfront deposit payment for a portion of the precious metals stream at our 777 mine (refer above to the heading “Development of our Business — Three Year History — Precious Metals Stream Transaction).


On November 6, 2012, we filed a NI 43-101 technical report titled “Technical Report, 777 mine, Flin Flon, Manitoba, Canada”, dated effective October 15, 2012 (the “777 Technical Report”), a copy of which is available under our profile on SEDAR at www.sedar.com and on EDGAR at www.sec.gov. For additional details on our 777 mine, including certain scientific and technical information from the 777 Technical Report, refer to Schedule B of this AIF.


Production


The following table sets forth our production forecast for the 777 Mine for 2013 (including the 777 North expansion), and actual production for the years ended December 31, 2012, 2011 and 2010.


December 31


Units


2013E


2012


2011


2010


Ore mined


tonnes


1,620,000


1,529,103


1,491,722


1,488,014


Copper grade in ore


%


2.18


2.32


3.18


2.86


Zinc grade in ore


%


4.41


4.16


3.71


4.01


Gold grade in ore


grams/tonne


1.94


2.18


2.37


2.09


Silver grade in ore


grams/tonne


30.89


25.77


26.78


25.89


Operating costs are expected to be similar to costs experienced in the past several years, as a result of ongoing productivity efforts. As in past years, costs in the first and fourth quarters are expected to be higher due to additional heating and other seasonal costs.


Mineral Reserves and Resources


We are in the process of having our estimates of the mineral reserves and resources at the 777 mine reviewed by Roscoe Postle Associates Inc., an independent expert. Commencing this year with the 777 mine, we intend to have our estimates of mineral reserves and resources at each of our material mineral projects reviewed by an independent expert once every three years.


9


The following tables set forth our estimates of the mineral reserves and resources at the 777 mine.


In-Mine Mineral Reserves — January 1, 2013(1)(2)(3)


Tonnes


Cu (%)


Zn (%)


Au (g/t)


Ag (g/t)


777 Mine


Proven


4,959,000


2.37


4.05


1.95


27.31


Probable


6,448,000


1.48


4.40


1.79


28.49


Total Mineral Reserve


11,407,000


1.87


4.25


1.86


27.98


Notes:

(1)            This table shows the estimated reserves at our 777 mine, including the 777 North expansion, in Manitoba.

(2)            The zinc price used for mineral reserve estimation was US$1.01 per pound (includes premium), the copper price was US$2.75 per pound, the gold price was US$1,250.00 per ounce and the silver price was US$25.00 per ounce using an exchange of 1.05 C$/US$.

(3)            For additional details relating to the estimates of mineral reserves and resources at our 777 mine, including data verification and quality assurance / quality control processes, refer to Schedule B and our technical report titled “Technical Report, 777 mine, Flin Flon, Manitoba, Canada” dated effective October 15, 2012, a copy of which is available on SEDAR at www.sedar.com and EDGAR at www.sec.gov.


In-Mine Inferred Mineral Resources — September 30, 2012(1)(2)(3)


Tonnes


Cu (%)


Zn (%)


Au (g/t)


Ag (g/t)


777 Mine


782,000


1.06


4.43


1.75


31.15


Notes:

(1)         This table shows our estimated inferred mineral resources at our 777 mine, including the 777 North expansion, in Manitoba.  Mineral resources that are not mineral reserves do not have demonstrated economic viability. The above mineral resources are exclusive of mineral reserves.

(2)         The zinc price used for mineral reserve estimation was US$1.01 per pound (includes premium), the copper price was US$2.75 per pound, the gold price was US$1,250.00 per ounce and the silver price was US$25.00 per ounce using an exchange of 1.05 C$/US$.

(3)         For additional details relating to the estimates of mineral reserves and resources at our 777 mine, including data verification and quality assurance / quality control processes, refer to Schedule B and our technical report titled “Technical Report, 777 mine, Flin Flon, Manitoba, Canada” dated effective October 15, 2012, a copy of which is available on SEDAR at www.sedar.com and EDGAR at www.sec.gov.


Lalor Project


On August 4, 2010, our board of directors made a commitment to the development of our 100% owned Lalor project near Snow Lake, Manitoba by authorizing a $560 million investment to put the project into full production. Following our 2011 optimization study, our board of directors approved an incremental capital expenditure investment of $144 million to fund a new 4,500 tonne per day concentrator at Lalor instead of refurbishing the existing Snow Lake concentrator. Following the completion of basic engineering in the first quarter of 2013, estimated capital expenditures on the concentrator were increased by approximately $90 million for total estimated Lalor capital costs of $794 million. Scope changes and improved estimation from completion of basic engineering account for the $90 million increase. The scope changes include an increase in the grinding capacity by 20% to 5,400 tonnes per day to better match the potential production shaft capacity.


The new concentrator design also incorporates a longer construction schedule with concentrator start-up anticipated in late 2015. However, first ore production from the ventilation shaft commenced in August 2012 and first ore production from the main production shaft is still projected to be on schedule in late 2014, at which time it will be processed at our Snow Lake and Flin Flon mills and a portion stockpiled for the new concentrator upon its commissioning.


The main production shaft has been sunk to approximately 596 metres as at March 15, 2013 and is 61% complete. Shaft sinking is expected to be completed in late 2013. Full production, use of the new


10


concentrator and an increase to the capacity of the tailings facility are contingent upon receipt of required permits, which we believe to be forthcoming.


As of February 28, 2013, we have invested approximately $332 million of the revised $794 million capital construction budget for the Lalor project and have entered into an additional $87 million in commitments for the project. Capital expenditures at Lalor in 2013 are expected to total approximately $144 million.


We expect to submit the Environment Act Licence application for the new concentrator to the provincial government in the first half of 2013. The new design will incorporate a larger grinding circuit being fed from the surface stockpile. We will hoist uncrushed ore up the Lalor shaft to be crushed on surface and then conveyed to the surface stockpile. The stockpile will feed a SAG mill and ball mill combination that has design capacity at 5,400 tonnes per day.


In January and March of 2013, members of the Mathias Colomb Cree Nation (“MCCN”) staged two separate blockades that impeded access to our Lalor site for part of a business day. After the two blockades, we successfully applied to the Manitoba Court of Queen’s Bench for an interlocutory injunction to prevent any further blockades at our Manitoba operations. We felt we had a responsibility to seek this injunction as any actions that prohibit access to our sites and operations present an unsustainable safety risk to our employees, contractors and others. Notwithstanding the court process, we remain committed to continued consultation and cooperation with the MCCN to share environmental information and discuss employment, business and training opportunities. We also support the proposal for a provincial Mining Table in Manitoba that will draw together First Nations, government, and the mining industry with the objective of addressing concerns raised by First Nations.


On March 30, 2012, we filed a NI 43-101 technical report titled “Pre-Feasibility Study Technical Report, on the Lalor Deposit, Snow Lake, Manitoba, Canada”, dated March 29, 2012 (the “Lalor Technical Report”), a copy of which is available under our profile on SEDAR at www.sedar.com and on EDGAR at www.sec.gov. For additional details on our Lalor project, including certain scientific and technical information from the Lalor Technical Report, refer to Schedule B of this AIF.


Production


The following table sets forth our production forecast from the ventilation shaft for 2013, and actual production from the ventilation shaft for the year ended December 31, 2012. Production from the 985 metre production shaft is anticipated to commence in late 2014.


December 31


Units


2013E


2012(1)


Ore mined


tonnes


418,000


72,293


Copper grade in ore 


%


0.54


0.63


Zinc grade in ore 


%


9.89


11.83


Gold grade in ore


grams/tonne


1.23


1.67


Silver grade in ore


grams/tonne


17.70


19.29


Notes:

(1)   Represents production via the ventilation shaft which commenced in August 2012.


11


Mineral Reserves and Resources


Lalor Mineral Reserves — January 1, 2013(1)(2)


Tonnes


Cu (%)


Zn (%)


Au (g/t)


Ag (g/t)


Lalor — Base Metal


Proven


57,000


0.48


12.40


0.63


15.52


Probable


13,147,000


0.67


8.15


1.59


23.62


Lalor — Gold Zone


Proven


Probable


1,866,000


0.37


0.37


3.96


21.41


Total Mineral Reserve


15,070,000


0.64


7.20


1.88


23.32


Notes:

(2)            The zinc price used for mineral reserve estimation was US$1.01 per pound (includes premium), the copper price was US$2.75 per pound, the gold price was US$1,250.00 per ounce and the silver price was US$25.00 per ounce using an exchange of 1.05 C$/US$.

(3)            For additional details relating to the estimates of mineral reserves at our Lalor project, including data verification and quality assurance / quality control processes, refer to Schedule B and our technical report titled “Pre-Feasibility Study Technical Report, on the Lalor Deposit, Snow Lake, Manitoba, Canada” dated effective March 29, 2012, a copy of which is available on SEDAR at www.sedar.com and EDGAR at www.sec.gov.


Lalor Inferred Mineral Resources — September 30, 2012(1)(2)(3)


Tonnes


Cu (%)


Zn (%)


Au (g/t)


Ag (g/t)


Lalor — Base Metal


Inferred


3,191,000


0.62


8.83


1.24


23.07


Lalor — Gold Zone


Inferred


7,338,000


0.41


0.32


4.63


31.32


Lalor — Copper Gold Zone


Inferred


1,461,000


4.16


0.31


6.81


20.34


Total Inferred Mineral Resource


11,990,000


0.92


2.58


3.99


27.79


Notes:

(1)         Mineral resources that are not mineral reserves do not have demonstrated economic viability. The above mineral resources are exclusive of mineral reserves.

(2)        The zinc price used for mineral reserve estimation was US$1.01 per pound (includes premium), the copper price was US$2.75 per pound, the gold price was US$1,250.00 per ounce and the silver price was US$25.00 per ounce using an exchange of 1.05 C$/US$.

(3)         For additional details relating to the estimates of mineral reserves at our Lalor project, including data verification and quality assurance / quality control processes, refer to Schedule B and our technical report titled “Pre-Feasibility Study Technical Report, on the Lalor Deposit, Snow Lake, Manitoba, Canada” dated effective March 29, 2012, a copy of which is available on SEDAR at www.sedar.com and EDGAR at www.sec.gov.


Constancia Project


Constancia is our 100% owned copper project in Peru, which we acquired through our acquisition of Norsemont in 2011. It is located in the Province of Chumbivilcas in southern Peru and consists of the Constancia and Pampacancha deposits.


On August 8, 2012, our board of directors approved a US$1.5 billion investment to fund the development and construction of our Constancia project. The Constancia development schedule contemplates nine quarters of construction, with initial production in late 2014 and full production commencing in the second quarter of 2015.


Of our US$1.5 billion capital construction budget, we have invested approximately US$409 million in the project to February 28, 2013 and have entered into an additional US$586 million in commitments as at


12


that date.  Capital expenditures at Constancia are expected to total approximately $961 million in 2013. The project’s forecasted final costs remain on budget.


The project site has sustained a higher than normal amount of rainfall in the past several months, which has negatively impacted the tailings management facility’s scheduled progress. The resulting impact to the schedule will be better understood after actual productivity can be monitored beginning in April with the onset of the annual dry season. We believe that the impact on project schedule will be recoverable and our targets for initial production and full production remain unchanged.


Permitting and regulatory efforts remain on schedule with the approval and receipt of the mining permit in December 2012. This approval followed in the normal course the beneficiation concession that was awarded in June of 2012. The next major permit is the operating permit, which we expect to receive in the normal course upon commissioning of the mine which is scheduled for early 2015. We have also received approval for the early refund of value-added tax on purchases with retroactive effect to December 2012.


We have entered into a precious metals stream transaction with SW Caymans pursuant to which we will receive US$295 million in upfront deposit payments (of which US$45 million has been received to date) for 100% of the payable silver at Constancia (refer above to the heading “Development of our Business — Three Year History — Precious Metals Stream Transaction).


On November 6, 2012, we filed a technical report titled “National Instrument 43-101, Technical Report, Constancia Project, Province of Chumbivilcas, Department of Cusco, Peru”, dated October 15, 2012 (the “Constancia Technical Report”), a copy of which is available under our profile on SEDAR at www.sedar.com and on EDGAR at www.sec.gov. For additional details on our Constancia project, including certain scientific and technical information from the Constancia Technical Report, refer to Schedule B of this AIF.


Mineral Reserves and Resources


The following table sets forth our estimates of the mineral reserves at the Constancia project as at August 8, 2012.(1)(2)


Constancia Mineral Reserves


Category


M
(tonnes)


Cu
(%)


Mo
(g/t)


Ag
(g/t)


Au
(g/t)


Cu Eq (3)
(%)


Proven


349


0.37


100


3.29


0.043


0.49


Probable


54


0.24


60


2.98


0.035


0.33


Total


403


0.35


96


3.25


0.042


0.47


Pampacancha Mineral Reserves


Proven


10


0.54


170


4.20


0.318


0.87


Probable


37


0.46


140


4.56


0.276


0.76


Total


47


0.48


149


4.49


0.285


0.78


Notes:

(1)                     The above mineral reserves are based on a Peruvian Sole:US Dollar exchange rate of $2.85:1 and the following long term metals prices: Cu US$2.75/lb; Ag US$23.00/oz; Au US$1,150.00/oz; and Mo US$14.00/lb.

(2)                     For additional details relating to the estimates of mineral reserves and resources at the Constancia project, including data verification and quality assurance/quality control processes, refer to Schedule B of this AIF and our technical report titled “National Instrument 43-101, Technical Report, Constancia Project, Province of Chumbivilcas, Department of Cusco, Peru” dated effective October 15, 2012, a copy of which is available on SEDAR and EDGAR.

(3)                     Not accounting for recovery.


13


The following table sets forth our estimates of the mineral resources at the Constancia project as at August 8, 2012.(1)(2)


Constancia Mineral Resources(3)


Category


M
(tonnes)


Cu
(%)


Mo
(g/t)


Ag
(g/t)


Au
(g/t)


Cu Eq (5)
(%)


Measured


119


0.23


62


2.3


0.038


0.31


Indicated


344


0.20


58


2.0


0.034


0.27


Total — Measured + Indicated


463


0.21


59


2.0


0.035


0.28


Inferred


219


0.19


49


1.8


0.032


0.25


Pampacancha Mineral Resources(4)


Inferred


4


0.41


103


6.2


0.207


0.67


Notes:

(1)         The above mineral resources are exclusive of mineral reserves.

(2)         For additional details relating to the estimates of mineral reserves and resources at the Constancia project, including data verification and quality assurance/quality control processes, refer to our technical report titled “National Instrument 43-101, Technical Report, Constancia Project, Province of Chumbivilcas, Department of Cusco, Peru” dated effective October 15, 2012, a copy of which is available on SEDAR and EDGAR.

(3)         The Constancia mineral resources are reported at a 0.12% copper cut-off and are based on the following assumptions: a copper price of US$2.88/lb, a molybdenum price of US$14.00/lb, copper recovery of 89%, molybdenum recovery of 60%, processing cost of US$ 5.50/t and mining cost of US$ 1.30/t.

(4)         The Pampacancha mineral resources are reported at a 0.20% copper cut-off and are based on a Peruvian Sole:US Dollar exchange rate of $2.85:1 and the following long term metals prices: Cu US$2.75/lb; Ag US$23.00/oz; Au US$1,150.00/oz; and Mo US$14.00/lb.

(5)         Not accounting for recovery.


Other Assets


Reed Copper Project


On July 5, 2010 we entered into a joint venture agreement with VMS Ventures respecting the Reed copper project, a copper-rich development property near Snow Lake, Manitoba. We have a 70% interest in the Reed copper project and VMS Ventures has a 30% interest. We have agreed to provide full financing for VMS Ventures’ proportionate share of the costs to develop the property, which will be repayable solely from VMS Ventures’ share of cash flow generated by the project. We have also entered into a second joint venture agreement with VMS Ventures in respect of our 70% interest in four exploration properties adjacent to the Reed property.


The Reed copper project is currently under construction and is expected to commence production in late 2013, with full production of approximately 1,300 tonnes of ore per day expected by the first quarter of 2014.  Of our $72 million capital construction budget, we have invested approximately $30 million on the project to February 28, 2013, and have entered into an additional $18 million in commitments for the project.  Capital expenditures at Reed are expected to total approximately $44 million in 2013.


After completing the first portal development round in October 2012, the underground ramp had advanced approximately 293 metres as at March 15, 2013. In December 2012, we submitted to the provincial government the Environment Act Licence application for Reed which, upon receipt, will allow for the commencement of full production.


14


Our estimates of mineral reserves and resources for the Reed copper project are set out below.


Reed Copper Project Probable Mineral Reserves — March 30, 2012(1)


Tonnes


Cu
(%)


Zn
(%)


Au
(g/t)


Ag
(g/t)


2,157,000


3.83


0.59


0.48


6.02


Notes:

(1)                     The copper price used for the mineral reserves estimation was US$2.95 per pound, the gold price was US$1,269.09 per ounce and the silver price was US$24.78 per ounce using an exchange rate of 1.034 C$/US$.


Reed Copper Project Inferred Mineral Resources — March 15, 2011(1)


Tonnes


Cu
(%)


Zn
(%)


Au
(g/t)


Ag
(g/t)


170,000


4.26


0.52


0.38


4.55


Notes:

(1)                                 Mineral resources that are not mineral reserves do not have demonstrated economic viability. The above mineral resources are exclusive of reserves and were estimated using the same metals prices as were used for the estimate of mineral reserves at the Reed copper project.


Exploration Properties


Our exploration properties are key to our strategy of pursuing organic growth. Over the past 86 years, we and our predecessors have brought into production 26 ore bodies on our lands. For 2013, our board of directors has approved total exploration expenditures of approximately $40 million, more than half of which is intended to be used for brownfield opportunities near our existing deposits in northern Canada and Peru.


We hold a land position of approximately 380,000 hectares in Manitoba and Saskatchewan, primarily in the highly prolific Flin Flon Greenstone Belt. Since much of this property is within 100 kilometres of our two ore concentrators in the region, and given that we have available capacity at our processing facilities from time to time, we are in a good position to economically exploit mineral deposits that a mining company without such proximate facilities may not be able to develop profitably due to higher costs of transportation and treatment charges. This, along with our 22,000 hectare land package in Peru, aligns well with our focus in 2013 on brownfield opportunities.


In addition, we intend to continue to explore greenfield opportunities in North and South America, including Chile and Colombia. In Colombia, we have signed several option agreements and plan to begin drilling on these properties in 2013, and in Chile we are looking for similar opportunities.


Our other exploration properties include our 51% interest in the Back Forty project in Michigan’s Upper Peninsula and our wholly owned Tom and Jason properties in the Yukon, both of which contain mineral resources. We are presently working with our joint venture partner, Aquila Resources Inc., to consider strategic alternatives for the Back Forty project and we continue to evaluate the Tom and Jason properties.


Processing Facilities


Concentrators


Our primary ore concentrator is located in Flin Flon, Manitoba. The concentrator, which is directly adjacent to our metallurgical zinc plant, produces zinc and copper concentrates from ore mined at our 777 mine. Its capacity is approximately 2.18 million tonnes of ore per year, and in 2012 approximately 1.87 million tonnes of ore were milled (which includes ore mined at our Trout Lake mine, which closed in June 2012, as scheduled). The concentrator can handle ore from more than one mine separately, and blending is done at the grinding stage. As a result, ore mined from our Lalor and Reed projects may be transported to the Flin Flon concentrator for processing. The Flin Flon concentrator facility includes a paste backfill plant and


15


associated infrastructure such as maintenance shops and laboratories. In 2010 we completed a copper concentrate filtration plant and other facilities to allow for the overseas shipping of the copper concentrate we produce. Tailings from the concentrator are pumped to the Flin Flon tailings impoundment immediately adjacent to the concentrator.


Our concentrator in Snow Lake, Manitoba was re-started in late 2009 and a new copper recovery circuit was installed in the third quarter of 2012 to facilitate processing of early Lalor ore. The concentrator currently processes ore from Lalor (and, prior to our Chisel North mine’s planned closure in September 2012, it also processed ore from Chisel North) and produces zinc and copper concentrates. The zinc concentrate is shipped by truck for further processing at our zinc plant in Flin Flon. The concentrator, which has crushing, grinding, flotation, thickening, filtering and drying capabilities, has a design capacity of approximately 1.1 million tonnes of ore per year. Tailings generated by the Snow Lake concentrator are deposited in our Anderson Lake tailings facility, which we believe mitigates environmental impacts, as the tailings are deposited in a subaqueous manner, minimizing the potential for generation of acid rock drainage.


Zinc Plant


Our zinc plant located in Flin Flon, Manitoba produces special high-grade zinc metal in three cast shapes from zinc concentrate. Our plant is one of three primary zinc producers in North America. We produced 100,697 tonnes of cast zinc in 2012. The capacity of the zinc plant is approximately 115,000 tonnes of cast zinc per year. Included in the zinc plant are an oxygen plant, a concentrate handling, storage and regrinding facility, a zinc pressure leach plant, a solution purification plant, a modern electro-winning cell house, a casting plant and a zinc storage area with the ability to load trucks or rail cars. The zinc plant has a dedicated leach residue disposal facility. The bulk of the waste material is gypsum, iron and elemental sulphur. Wastewater is treated and recycled through the zinc plant.


Both domestic concentrate produced from our mines and concentrate purchased from third parties are processed at the zinc plant. Purchased concentrate accounted for approximately 31% of zinc metal produced at our zinc plant in 2012, although no new purchases of third party concentrate are anticipated in 2013. Domestic zinc concentrate production together with stockpiles of approximately 18,300 tonnes of concentrate are expected to support capacity utilization of approximately 88% in 2013. Upon the completion of the Lalor project, domestic zinc concentrate production is expected to more than fully utilize the available capacity of the zinc plant.


Strategic Investments


As at December 31, 2012, we held minority equity positions in 15 junior exploration companies, representing investments with a fair market value of approximately $71 million, as part of our strategy to populate a pipeline of projects with the potential for development following the construction of Lalor and Constancia. Our early stage opportunity pipeline consists of projects in Canada, the United States, Chile, Peru and Colombia and includes our investment in Augusta. We are continuing to evaluate new projects and potential investments to add to our portfolio and will seek to dispose of investments when the underlying projects are no longer consistent with our strategy.


Cash and Cash Equivalents


Our cash and cash equivalents as of December 31, 2012 were $1,337 million, and are held in low risk liquid investments and deposit accounts pursuant to our investment policy.


Other Information


Products and Marketing


Our principal products are copper concentrate and zinc. In 2012, we produced 164,017 tonnes of copper concentrate and 100,697 tonnes of cast zinc. In 2012 copper concentrate sales represented approximately 68% (2011 70%) and zinc metal sales represented approximately 31% (2011 18%) of our total gross consolidated revenue, respectively.


16


In 2012, we sold approximately 73% of our copper concentrate production to third party purchasers in North America and Europe on benchmark terms and in 2013 we expect to sell approximately the same percentage. We sell the remainder of our copper concentrate production pursuant to shorter-term contracts as opportunities arise.


We sell gold and silver produced from our 777 mine that is contained in our copper concentrate to Silver Wheaton pursuant to the terms of the 777 Stream Agreement. For additional information, refer to “Three Year History”.


We ship cast zinc metal produced at our Flin Flon zinc plant to third party customers in North America by rail and truck. Following the sale of our Zochem Inc. subsidiary in November 2011, we agreed to sell approximately 20% of our zinc production to Zochem Inc. for one year at market terms, and we continue to do so at present.


Commodity Markets


Over the course of 2012, prices for our key metals traded within a relatively narrow range when compared to the previous four years. However, average prices in 2012 generally were higher than average prices in 2011. For additional information refer to our market analysis of copper, zinc, gold and silver prices during this period on pages 21 and 22 of our management’s discussion and analysis for the year ended December 31, 2012, a copy of which has been filed on SEDAR at www.sedar.com and EDGAR at www.sec.gov.


Specialized Skill and Knowledge


The success of our operations depends in part on our ability to attract and retain geologists, engineers, metallurgists and other personnel in the geographic areas in which we operate with specialized skill and knowledge about the mining industry. For additional information, refer below to the heading “Risk Factors — Human Resources”.


Competitive Conditions


The mining industry is intensely competitive and we compete with many companies in the search for and the acquisition of attractive mineral properties. In addition, we also compete for the technical expertise to find, develop, and operate such properties, the labour to operate the properties, and the capital for the purpose of funding such properties. For additional information, refer below to the heading “Risk Factors — Competition”.


Economic Dependence


We do not have any contracts upon which our business is substantially dependent, as our principal products, copper concentrate and zinc, are widely traded commodities and we may enter into contracts for the sale of such products with a variety of potential purchasers.


Environmental Protection


Our activities are subject to environmental laws and regulations. Environmental laws and regulations are evolving in a manner that will require stricter standards and enforcement, increased fines and penalties for non-compliance, more stringent environmental assessments of proposed projects and a heightened degree of responsibility for companies and their officers, directors and employees. For additional information, refer below to the heading “Risk Factors — Governmental and Environmental Regulation”.


Our goal is to continually improve our environmental performance. We have established an environmental management program directed at environmental protection and compliance to achieve our goal and address these regulatory changes. For additional information, refer below to the heading “Corporate Social Responsibility”.


17


Employees


As at December 31, 2012, we had 65 employees at our Toronto head office, 55 employees at Hudbay Peru’s office in Lima, Peru and 76 employees at the Constancia site and elsewhere in Peru. In addition, we had 39 employees elsewhere in North and South America.


Our HBMS subsidiary had approximately 1,275 employees as at December 31, 2012, of whom approximately 964 were unionized. In 1998, we entered into a labour stability agreement in respect of our existing Flin Flon/Snow Lake collective bargaining agreements, whereby we agreed with the unions that any collective agreement expiring prior to July 1, 2012 would be settled by way of binding arbitration in the event that the parties could not otherwise agree to a negotiated contract settlement. This agreement is intended to ensure that there will be no strike or lockout through December 2014. In 2012, we negotiated new collective bargaining agreements with all our unionized employees, thereby avoiding the need to settle such agreements by way of binding arbitration.


HBMS maintains a profit sharing plan pursuant to which 10% of its after-tax profit (excluding provisions or recoveries for deferred income and mining tax) for any given year is distributed among eligible employees in the Flin Flon/Snow Lake operations, with the exception of executive officers and key management personnel.


Continuous Improvement


In early 2012, we began the process of formalizing our approach to continuous improvement in order to enhance our overall performance and contain costs. We refer to this approach as Continuous Improvement and Process Optimization or CIPO.  The key objectives of our CIPO program are to:


·                  establish a standard process to manage continuous improvement activities;

·                  establish targets and accountabilities related to continuous improvement projects;

·                  maintain our competitive edge, reduce our costs and enhance our growth potential; and

·                  enhance our company culture by incorporating continuous improvement into the normal course of business.


CIPO is not a project with a start and end date, but rather it is a structure that defines how projects are managed. Under the CIPO governance structure, Project Champions have been identified in each of the functional areas of our company. Their activities are overseen by a CIPO Steering Committee whose main focus is to ensure that CIPO projects are aligned with our overall strategy and objectives. The governance structure provides a formal means by which any employee can submit a continuous improvement idea and receive feedback as to its status. Typically, employees who suggest projects are involved in the implementation. As well, CIPO governance is structured to ensure that all ideas are captured, evaluated consistently, and prioritized — with the goal of maintaining a high value project pipeline and a sustainable program.


Since inception of the formal CIPO program, we have completed approximately 30 projects, which are expected, and in some cases have begun, to deliver financial as well as health and safety benefits. We currently have approximately 60 active CIPO projects underway as well as a robust pipeline of new ideas for the next generation of projects.


CORPORATE SOCIAL RESPONSIBILITY


At Hudbay, we commit to our stakeholders to work to create benefits and opportunities that contribute to their economic and social sustainability, and to protect our natural environment. As described below, we have adopted a number of voluntary codes and other external instruments that we consider particularly relevant to our business, including ISO 14001, OHSAS 18001 and our Human Rights Policy.


18


Health, Safety and Environmental Policies


Among our core values are protecting the health and welfare of our employees and contractors and reducing the impact of our operations on the environment. All of our producing operations have management systems certified to Occupational Health and Safety Assessment Series 18001 and Environmental Management System Standard ISO 14001. In addition, the production and supply of our cast zinc products are registered to the ISO 9001 quality standard.


We believe that ongoing improvements in the safety of our workplace assists in maintaining healthy labour relations and that our ability to minimize lost-time injuries and environmental regulatory violations is a significant factor in maintaining and realizing opportunities to improve overall operational efficiency. Our safety management systems include the Positive Attitude Safety System (“PASS”), which is in use at our Manitoba operations. The PASS system is based on facilitated discussions at all levels of the organization to increase each person’s involvement in recognizing and managing workplace risks. In 2012, our lost time accident frequency per 200,000 hours worked was 0.3, the same frequency as for 2011. We remain committed to continuously improving the safety of our workplace.


We have established an environmental management program directed at environmental protection and compliance. The program consists of an environmental policy, codes of practice, regular audits, the integration of environmental procedures with operating procedures, employee training and emergency prevention and response procedures.  We have a dedicated team which is charged with managing our environmental activities and our compliance with all applicable environmental standards and regulations. We did not have any material environmental non-compliances in 2012.


Human Rights Policy


In May 2011, we adopted a formal Human Rights Policy. The policy is intended to capture and clearly state our commitments to human rights. Key aspects include our commitment to:


·                  Ethical business practices — further articulated in our Code of Business Conduct and Ethics;

·                  Labour practices and labour relations — including fair labour practices at our workplaces and a commitment to the health and safety of our employees;

·                  Community participation — including community consultation, contributing to long-term and sustainable opportunities for communities, respecting communities’ legal rights, and participating in a common effort to promote respect for human rights as they relate to our business; and

·                  Security measures that respect human rights — including our adoption of the Voluntary Principles on Security and Human Rights, and the United Nations Code of Conduct for Law Enforcement Officials.


Sustainability Reporting


We publish an annual corporate social responsibility report that further presents and discusses our environmental, health and safety performance. This report is prepared pursuant to the Global Reporting Initiative G3 guidelines, which is the world’s most widely used sustainability framework. We also subscribe to the Mining Association of Canada’s “Toward Sustainable Mining” initiative, which was designed to help mining companies evaluate the quality, comprehensiveness and robustness of their management systems under key performance elements, including tailings management, energy use and emissions, external outreach and crisis management planning. Our 2011 Corporate Social Responsibility Report is available on our website at www.hudbayminerals.com and our 2012 report is expected to be released in the second quarter of 2013.


RISK FACTORS


An investment in our securities is speculative and involves significant risks that should be carefully considered by investors and prospective investors. In addition to the risk factors described elsewhere in this AIF, the risk factors that impact us and our business include, but are not limited to, those set out below. Any


19


one or more of these risks could have a material adverse effect on our business, results of operations, financial condition and the value of our securities.


Metals Prices and Foreign Exchange


Our profit or loss and financial condition depend upon the market prices of metals, which are cyclical and which can fluctuate widely with demand for our metals. Demand is affected by numerous factors beyond our control, including the overall state of the economy, general level of industrial production, interest rates, rate of inflation, foreign exchange rates and investment demand for commodities. Such external economic factors are in turn influenced by changes in international investment patterns, monetary systems and political developments. Prices are also affected by the overall supply of the metals we produce, which can be affected by the start-up of major new mines, production disruptions and closures of existing mines.


Future price declines may, depending on hedging practices, materially reduce our profitability and could cause us to reduce output at our operations (including, possibly, closing one or more of our mines or plants), all of which could reduce our cash flow from operations.


In addition, since our core operations are located in Canada, our costs are incurred primarily in Canadian dollars. However, our revenue is tied to market prices for copper, zinc and other metals we produce, which are typically denominated in United States dollars. If the Canadian dollar appreciates in value against the United States dollar, our results of operations and financial condition could be materially adversely affected. Also, once our Constancia project reaches production, a substantial part of our operating costs will be incurred in Peruvian new soles, and future appreciation of the new sole relative to the United States dollar could adversely impact our future profitability. Although we may use hedging strategies to limit exposure to currency fluctuations, there can be no assurance that such hedging strategies will be successful or that they will mitigate the risk of such fluctuations.


Development of Key Projects


Our ability to develop our key mineral projects, including our Lalor and Constancia projects, is subject to many risks and uncertainties, including: our ability to upgrade estimates of mineral resources into mineral reserves; completion of feasibility studies; the ability to secure adequate financing to fund such projects; obtaining and maintaining various permits and approvals from governmental authorities; construction risk; securing required surface and other land rights; finding or generating suitable sources of power and water; developing and maintaining good relationships with communities, local government and other stakeholders and interested parties; political and social risk; and confirming the availability and suitability of appropriate local area infrastructure including, in respect of Constancia, the availability of access to a port for overseas shipment of concentrate.


We have negotiated life-of-mine community agreements with two communities directly affected by the Constancia project to secure required land rights for the project and efforts to relocate 36 families pursuant to one of the community agreements are underway. However, any inability to enforce these agreements, successfully relocate such families or maintain good relations with these and other nearby communities and other stakeholders could impair our ability to successfully develop or operate the project. At Lalor, we require permits under Manitoba’s The Environment Act and The Mines and Minerals Act in order to reach full production, expand the tailings facility and operate the concentrator that is planned at the site. While we believe that such permits will be forthcoming, it is possible that one or more of such permits may be delayed or not granted, which could prevent us from developing the Lalor project.


In addition, significant amounts of capital will be required to bring each of the Lalor and Constancia projects to production. Our capital and operating costs for such projects may be affected by a variety of factors, including project scope changes, local currency appreciation and general cost escalation common to mining projects globally. While we believe that we have sufficient liquidity to satisfy spending requirements to complete our key capital projects and meet our debt service obligations (including obligations under the Notes), to the extent that capital costs are higher than currently forecast, metals prices decline materially from current levels or we have other unanticipated demands on our liquidity, we may need to raise additional financing to complete our capital projects or seek other sources of liquidity such as additional streaming


20


transactions, dispositions of our investments in junior mining companies or reductions in or suspensions of our semi-annual dividend. Given current economic circumstances and other factors, there can be no certainty that sufficient financing or other transactions will be available on acceptable terms. If such financing or transactions are not available, we may not be able to fund the development of one or both of the Constancia and Lalor projects.


The capital expenditures and timeline needed to develop a new mine are considerable and the economics of and ability to complete a project can be affected by many factors, including: inability to complete construction and related infrastructure in a timely manner; changes in the legal and regulatory environment; general cost escalation; currency fluctuations; industrial disputes; availability of parts, machinery or operators; delays in the delivery of major process plant equipment; inability to obtain, renew or maintain the necessary permits, licenses or approvals; unforeseen natural events; and political, social and other factors. Factors such as changes to technical specifications, failure to enter into agreements with contractors or suppliers in a timely manner, including contracts in respect of Constancia project infrastructure, and shortages of capital, may also delay the completion of construction or commencement of production or require the expenditure of additional funds. Many major mining projects constructed in the last several years, or under construction currently, have experienced cost overruns that substantially exceeded the capital cost estimated during the basic engineering phase of those projects, sometimes by as much as 50% or more. There can be no assurance that our development projects will be able to be developed successfully or economically or that they will not be subject to the other risks described in this section.


Depletion of Reserves


Subject to any future expansion or other development, production from existing operations at our mines will typically decline over the life of the mine. As a result, our ability to maintain our current production or increase our annual production of base and precious metals and generate revenues therefrom will depend significantly upon our ability to discover or acquire and to successfully bring new mines into production and to expand mineral reserves at existing mines. Exploration and development of mineral properties involves significant financial risk. Very few properties that are explored are later developed into operating mines. Whether a mineral deposit will be commercially viable depends on a number of factors, including: the particular attributes of the deposit, such as size, grade and proximity to infrastructure; metal prices, which are highly cyclical; political and social stability; and government regulation, including regulations relating to prices, taxes, royalties, land tenure, land use, importing and exporting of minerals and environmental protection. Even if we identify and acquire an economically viable ore body, several years may elapse from the initial stages of development. We may incur significant expenses to locate and establish mineral reserves, to develop metallurgical processes and to construct mining and processing facilities. As a result, we cannot provide assurance that our exploration or development efforts will result in any new commercial mining operations or yield new mineral reserves to replace or expand current mineral reserves.


Political and Social Risks


The implementation of new, or the modification of existing, laws and regulations affecting our operations and other mineral properties could have a material adverse impact on us and our projects. Such laws or events could involve the expropriation of property, implementation of exchange controls and price controls, increases in production royalties and income and mining taxes, refusal to grant or renew required permits, licenses, leases or other approvals or requiring unfavourable amendments to or revoking current permits and licenses, and enacting environmental or other laws that would make contemplated operations uneconomic or impractical. The risk exists that further government limitations, restrictions or requirements, not presently foreseen, will be implemented. In addition, changes in policy that alter laws regulating the mining industry could have a material adverse effect on us.


There can be no assurance that industries which are deemed to be of national or strategic importance in countries in which we have operations or assets will not be nationalized. There also can be no assurance that our assets in these countries will not be subject to nationalization, requisition or confiscation, whether legitimate or not, by a government authority or other body.


21


In situations where we have acquired mineral rights, we may not be able to secure required surface rights. In addition, in situations where we possess surface rights, our land may be illegally occupied. Any inability to secure required surface rights or take possession of areas for which we hold surface rights could render us unable to carry out planned exploration, development and mining activities.


Notwithstanding the expressed intention of the current national government in Peru to support mining as a driver for the continued growth and future development of the country, other mining projects—like the Conga project in northern Peru and projects in the Cusco region in southern Peru—have been the target of initiatives that have delayed and disrupted project development and operations. Such initiatives, as well as political or social unrest or instability, could adversely affect our ability to develop and operate the Constancia project. Such adverse effects could result from positions or actions that may be taken by the national government or at the regional, community or local levels including encroaching on our land, challenging the boundaries of such land or our rights to possess and operate on such land, protesting against our project (including the environmental or social impacts of our project), impeding project activities through roadblocks or other public manifestations and attacking project assets or personnel. During the last several years, certain mining projects in Peru have been the target of political and community protests. By way of example, in late 2011, construction activities at the Conga project in northern Peru were suspended at the request of the central government following increasing protests by anti-mining activists led by the regional president. While there have been some initiatives in respect of the Constancia project, including an attempt to restrict access by workers, those initiatives have been limited and have not significantly disrupted the project’s development. There is the risk that more significant opposition may be mounted that may affect our ability to develop and operate the Constancia project.


Aboriginal Rights and Title


Governments in many jurisdictions, including Canada, must consult with aboriginal peoples with respect to grants of mineral rights and the issuance of or amendment to project authorizations. Consultation regarding rights or claimed rights of aboriginal people may require accommodations, including undertakings with respect to employment and other matters. This may affect our ability to acquire within a reasonable time frame, or on acceptable terms, effective mineral titles and permits in these jurisdictions, and may affect the timetable and costs of development of mineral properties in these jurisdictions. In addition, even in situations in which the government has satisfied its duty to consult with affected aboriginal peoples and we have complied with our related obligations, if any, such aboriginal peoples may occupy the mineral properties in question, block access to such properties or engage in other activities that impair our ability to develop our mineral properties and continue to conduct our operations. Claimed rights of aboriginal peoples, including the MCCN, may affect our ability to develop our Lalor and Reed projects and other mineral properties or may materially delay the development of such properties. For example, in January and March of 2013, members of the MCCN staged two separate blockades that impeded access to our Lalor site for part of a business day. After the two blockades, we successfully applied to the Manitoba Court of Queen’s Bench for an interlocutory injunction to prevent any further blockades at our Manitoba operations.


Community Relations


Our relationships and reputation, particularly with the communities in which we operate, are critical to the future success of our existing operations and the construction and development of our projects, including the Constancia project in Peru and the Lalor project in Manitoba. There is an increasing level of public concern relating to the perceived effect of mining activities on the environment and on communities impacted by those activities. Publicity adverse to us, our operations, or extractive industries generally, including as a result of anti-mining protests in Peru or in Canada, could have an adverse effect on us and may impact our reputation and relationship with the communities in which we operate, including the communities surrounding the Constancia project and the First Nations communities surrounding the Lalor and Reed projects, and other stakeholders. For example, while we have entered into life-of-mine agreements with two local communities directly affected by the Constancia project, there can be no assurance that disputes will not arise with other communities in the area or with the communities with whom we have reached the life-of-mine agreements. There is a risk that relations with local communities may be strained by real or perceived detrimental effects associated with our activities or those of other mining companies and that those strains may impact our ability to enforce these agreements or obtain necessary


22


permits and approvals to develop and operate the Constancia project. While we are committed to operating in accordance with applicable laws and in a socially responsible manner, there can be no assurance that our efforts, in this respect, will mitigate this potential risk.


Mining and Processing


Mining operations, including exploration, development and production of mineral deposits, generally involve a high degree of risk and are subject to conditions and events beyond our control. Our operations are subject to all of the hazards and risks normally encountered in the mining industry including: adverse environmental conditions; industrial and environmental accidents; metallurgical and other processing problems; unusual or unexpected rock formations; ground or slope failures; structural cave-ins or slides; flooding or fires; seismic activity; rock bursts; equipment failures; and periodic interruptions due to weather conditions. These risks could result in significant damage, including destruction of mines, equipment and other operations, resulting in partial or complete shutdowns, personal injury or death, environmental or other damage to our properties or the properties of others, delays in mining, monetary losses and potential legal liability. In addition, although we conduct extensive maintenance and incur significant costs to maintain and upgrade our fixed and mobile equipment and infrastructure, failures may occur that cause injuries or production loss.


Failure to achieve production, cost or life-of-mine estimates could have an adverse impact on our future cash flows, profitability, results of operations and financial condition. Our actual production, costs and the productive life of a mine may vary from estimates for a variety of reasons, including actual ore mined varying from estimates of grade, tonnage, dilution and metallurgical and other characteristics, short-term operating factors relating to the mineral reserves, such as the need for sequential development of ore bodies and the processing of new or different ore grades, revisions to mine plans, risks and hazards relating to mining and availability of and cost of labour and materials.


Production of zinc concentrate from our mines has not been sufficient to operate our zinc plant at full capacity, which has had an impact on our profitability. Any inability to provide adequate feed to our processing facilities could adversely impact our profitability or impair the viability of our processing facilities.


Governmental and Environmental Regulation


Our activities are subject to various laws and regulations governing prospecting, development, production, taxes, labour standards, occupational health, mine safety, toxic substances, protection of the environment and other matters. Environmental regulation is evolving in a manner that will require stricter standards and enforcement, increased fines and penalties for non-compliance, and more stringent environmental assessments of proposed projects. There can be no assurance that existing or future environmental regulation will not materially adversely affect our business, financial condition and results of operations. There is contamination on properties that we own or owned or for which we have or have had care, management or control and, in some cases on neighbouring properties, that may result in a requirement to remediate, which could involve material costs. We could be held responsible for investigative-cleanup cost relating to presently unknown contamination on our properties. We may also acquire properties with environmental risks. Any investigative and remediation costs for known or unknown contamination, or for future releases of hazardous or toxic substances at our properties or related to our activities, could be material.


Although we believe that our activities are currently carried out in material compliance with applicable laws and regulations, no assurance can be given that new laws and regulations will not be enacted or that existing laws and regulations will not be amended or applied in a manner that could have a material adverse effect on our business, financial condition and results of operations. Any failure to comply with such laws and regulations may result in enforcement actions, including orders issued by regulatory or judicial authorities causing operations to cease or be curtailed, and may include corrective measures requiring capital expenditures, installation of additional equipment, or remedial actions. We may be required to compensate those suffering loss or damage relating to mining activities, and we may have civil or criminal fines or penalties imposed for violations of applicable laws or regulations.


23


Government Approvals and Permits


Government approvals and permits are currently required in connection with all of our operations, and further approvals and permits will be required in the future, including in respect of our key development projects. The success of our efforts to obtain and maintain permits is contingent upon many variables outside of our control. Obtaining and complying with governmental permits may increase costs and cause delays. There can be no assurance that all necessary permits will be obtained and, if obtained, that the costs involved will not exceed our estimates or that we will be able to maintain such permits. To the extent such approvals are required and not obtained or maintained, our operations may be curtailed or we may be prohibited from proceeding with planned exploration, development, or operation of mineral properties.


Human Resources


The success of our operations and development projects depend in part on our ability to attract and retain geologists, engineers, metallurgists and other personnel with specialized skill and knowledge about the mining industry in the geographic areas in which we operate. Our development plans for our Lalor project in Snow Lake, Manitoba and our Constancia project in southern Peru, in particular, depend in part on our ability to attract new skilled personnel to work for us in these geographic areas.


We also are dependent on a number of key management and operating personnel, and our success will depend in large part on the efforts of these individuals and our ability to retain them. We do not have any key person insurance on any of these individuals.


There can be no assurance that our business will not suffer from a work stoppage at any location where we operate and there can be no assurance that we will be able to successfully negotiate new collective agreements with our employees at our Flin Flon and Snow Lake operations before the existing agreements expire in December 2014. From time to time we may temporarily suspend or close certain of our operations and we may incur significant labour and severance costs as a result of a suspension or closure. Further, temporary suspensions and closures may adversely affect our future access to skilled labour, as employees who are laid off may seek employment elsewhere.


Energy Prices and Availability


Our mining operations and facilities are intensive users of electricity and carbon based fuels. Energy prices can be affected by numerous factors beyond our control, including global and regional supply and demand, political and economic conditions, and applicable regulatory regimes. The prices of various sources of energy we rely on may increase significantly from current levels and any such significant increase could have an adverse effect on our profitability.


Access to Capital


There is no assurance that sufficient funding or financing will be available to us on acceptable terms, or at all, for further exploration or development of our properties or to fulfill our outstanding obligations. Global financial conditions have been subject to increased volatility and turmoil in recent years. This may affect our ability to obtain equity or debt financing on acceptable terms, or at all, in the future. Failure to obtain such additional funding or financing could result in the delay or indefinite postponement of the exploration and development of our properties, including Lalor and Constancia.


Senior Unsecured Notes


Our ability to make scheduled payments on or refinance our debt obligations, including the Notes, depends on our financial condition and operating performance, which are subject to prevailing economic and competitive conditions and to certain financial, business, legislative, regulatory and other factors beyond our control. We may be unable to maintain a level of cash flows from operating activities sufficient to permit us to pay the principal, premium, if any, and interest on our indebtedness, including the Notes.


24


If our cash flows and capital resources are insufficient to fund our debt service obligations, we could face substantial liquidity problems and could be forced to reduce or delay investments and capital expenditures or to dispose of material assets or operations, seek additional debt or equity capital or restructure or refinance our indebtedness, including the Notes. We may not be able to effect any such alternative measures on commercially reasonable terms or at all and, even if successful, those alternatives may not allow us to meet our scheduled debt service obligations. The indenture governing the Notes restricts our ability to dispose of assets and use the proceeds from those dispositions and may also restrict our ability to raise debt or equity capital to be used to repay other indebtedness when it becomes due. We may not be able to consummate those dispositions or to obtain proceeds in an amount sufficient to meet any debt service obligations then due.


If we cannot make scheduled payments on our debt, we will be in default and holders of the Notes could declare all outstanding principal and interest to be due and payable, causing a cross-acceleration or cross-default under certain of our other debt agreements, if any, and our other creditors could foreclose against the collateral securing our obligations and we could be forced into bankruptcy or liquidation.


In addition, the indenture governing the Notes contains a number of restrictive covenants that impose significant operating and financial restrictions on us and may limit our ability to engage in acts that may be in our long-term best interest, including restrictions on our ability to:


·                  incur additional indebtedness;

·                  pay dividends or make other distributions or repurchase or redeem capital stock;

·                  prepay, redeem or repurchase certain debt;

·                  make loans and investments;

·                  sell assets;

·                  incur liens;

·                  enter into transactions with affiliates;

·                  alter the businesses we conduct;

·                  enter into agreements restricting our subsidiaries’ ability to pay dividends; and

·                  consolidate, amalgamate, merge or sell all or substantially all of our assets.


A breach of the covenants under the Note indenture or our other debt instruments from time to time could result in an event of default under the applicable indebtedness. Such a default may allow the creditors to accelerate the related debt and may result in the acceleration of any other debt to which a cross-acceleration or cross-default provision applies. In the event the holders of our Notes or our lenders accelerate the repayment of our borrowings, we and our subsidiaries may not have sufficient assets to repay that indebtedness. These restrictions may affect our ability to grow in accordance with our strategy. As a result of these restrictions, we may be:


·                  limited in how we conduct our business;

·                  unable to raise additional debt or equity financing to operate during general economic or business downturns; or

·                  unable to compete effectively or to take advantage of new business opportunities.


Transportation and Infrastructure


At our mines in northern Manitoba and Saskatchewan, we are dependent upon a single railway and certain short-line rail networks to transport purchased concentrate to our Flin Flon metallurgical complex and to transport products from the Flin Flon metallurgical complex for further processing or to our customers. In late 2010 and early 2011, we had difficulty securing sufficient rail cars to ship our copper concentrate production and excess inventory. In addition, the Constancia project will require transportation improvements and access, which will require the cooperation of local government and other third parties, including the port authority. We may have similar dependencies at future mining and processing operations. Inability to secure reliable and cost-effective transportation and other infrastructure, or disruption of these services due to weather-related problems, strikes, lock-outs or other events could have a material adverse effect on our operations. If transportation for our products is or becomes unavailable, our ability to market our products


25


could suffer. In addition, increases in our transportation costs, relative to those of our competitors, could make our operations less competitive and could adversely affect our profitability.


Title to Mineral Properties


Although we believe we have taken reasonable measures to ensure valid title to our properties, there can be no assurance that title to any of our properties will not be challenged or impaired. Third parties may have valid claims underlying portions of our interests, including prior unregistered liens, agreements, transfers or claims, and aboriginal land claims, and title may be affected by, among other things, undetected defects or unforeseen changes to the boundaries of our properties by governmental authorities.


Competition


The mining industry is intensely competitive and we compete with many companies possessing greater financial and technical resources than us. Since mines have a limited life, we must compete with others who seek mineral reserves for attractive, high quality mining assets. In addition, we also compete for the technical expertise to find, develop, and operate such properties, the labour to operate the properties and the capital for the purpose of funding such properties. Existing or future competition in the mining industry could materially adversely affect our prospects for mineral exploration and success in the future.


Mineral Resource and Reserve Estimates


There are numerous uncertainties inherent in estimating mineral reserves and mineral resources and the future cash flows that might be derived from their production. Estimates of mineral reserves and mineral resources, and future cash flows necessarily depend upon a number of variable factors and assumptions, including, among other things, ability to achieve anticipated tonnages and grade, geological and mining conditions that may not be fully identified by available exploration data or that may differ from experience in current operations, historical production from the area compared with production from other producing areas, the assumed effects of regulation by governmental agencies and assumptions concerning metal prices, exchange rates, interest rates, inflation, operating costs, development and maintenance costs, reclamation costs, and the availability and cost of labour, equipment, raw materials and other services required to mine and refine the ore. In addition, there can be no assurance that mineral recoveries in small scale laboratory tests will be duplicated in larger scale tests under on-site conditions or during production. For these reasons, estimates of our mineral reserves and mineral resources in our public disclosure, and any estimates of future cash flows may vary substantially from our actual results.


Reclamation and Mine Closure Costs


The ultimate timing of, and costs for, future removal and site restoration could differ from current estimates. Our estimates for this future liability are subject to change based on amendments to applicable laws and legislation, the nature of ongoing operations and technological innovations.


In addition, regulatory authorities in various jurisdictions require us to post financial assurances to secure, in whole or in part, future reclamation and restoration obligations in such jurisdictions. Changes to the amounts required, as well as the nature of the collateral to be provided, could significantly increase our costs, making the maintenance and development of existing and new mines less economically feasible, and any capital resources we utilize for this purpose will reduce the resources available for our other operations and commitments. Although we accrue for future closure costs, we do not necessarily reserve cash in respect of these obligations or otherwise fund these obligations in advance. As a result, we will have significant cash costs when we are required to close and restore mine sites.


Post-Retirement Obligations


We have assets in defined benefit pension plans which arise through employer contributions and returns on investments made by the plans. The returns on investments are subject to fluctuations depending upon market conditions and we are responsible for funding any shortfall of pension assets compared to our pension obligations under these plans. Our liabilities under defined benefit pension plans are estimated based


26


on actuarial and other assumptions. These assumptions may prove to be incorrect and may change over time and the effect of these changes can be material. We also have substantial commitments for post-retirement health and other benefits for which no specific funding arrangements are in place.


Anti-Bribery Legislation


We are subject to the U.S. Foreign Corrupt Practices Act (“FCPA”), which prohibits corporations and individuals from paying, offering to pay, or authorizing the payment of anything of value to any foreign government official, government staff member, political party, or political candidate in an attempt to obtain or retain business or to otherwise influence a person working in an official capacity. The FCPA also requires public companies to make and keep books and records that accurately and fairly reflect their transactions and to devise and maintain an adequate system of internal accounting controls. We are also subject to Canada’s Corruption of Foreign Public Officials Act (“CFPOA”), which prohibits corporations and individuals from giving or offering to give a benefit of any kind to a foreign public official, or any other person for the benefit of the foreign public official, where the ultimate purpose is to obtain or retain a business advantage.


Our international activities, including our Constancia project and exploration activities elsewhere in South America, create the risk of unauthorized payments or offers of payments by our employees, consultants or agents. While we have implemented safeguards to prevent these practices, our existing safeguards and any future improvements to such safeguards may not be completely effective, and our employees, consultants or agents may engage in conduct for which we might be held responsible. Any failure to comply with the FCPA, the CFPOA and applicable laws and regulations in foreign jurisdictions could result in substantial penalties or restrictions on our ability to conduct business in certain foreign jurisdictions, which may have a material adverse impact on us and our share price.


Credit Risk


We mitigate credit risk relating to customers of our copper, zinc and precious metals by carrying out credit evaluations on our customers, making a significant portion of sales on a cash basis and maintaining insurance on trade receivables. If customers default on the credit extended to them and our loss is not covered by insurance, results of operations could be materially adversely affected. Further, we may enter into offsetting derivative contracts for which we do not obtain collateral or other security. In the event of non-performance by counterparties in connection with such derivative contracts, we are further exposed to credit risk.


Insurance


Our insurance will not cover all the potential risks associated with our operations. In addition, although certain risks are insurable, we may be unable to maintain insurance to cover these risks at economically feasible premiums. Insurance against risks such as environmental pollution or other hazards as a result of exploration and production is not generally available to us on acceptable terms. Losses from uninsured events may cause us to incur significant costs.


Dividend Payments


The Notes impose certain restrictions on our ability to make restricted payments, including common dividends. Our ability to make subsequent dividend payments at current levels will be subject to our ability to generate sufficient shareholders’ equity or to maintain a ratio of consolidated debt to EBITDA of 2.5 to 1 or less. It is doubtful that we will be able to comply with these covenants before our new mines achieve commercial production and generate additional cash flow and earnings; however, we are exploring alternatives that may provide us an opportunity to maintain dividends similar to those recently declared. At all times, the declaration of dividends is subject to the Board of Directors’ discretion.


Market Price of Common Shares


Our share price may be significantly affected by short-term changes in commodity prices or in our financial condition or results of operations. Other factors unrelated to our performance that may have an effect


27


on the price of our common shares include a lessening in trading volume and general market interest in our securities and the size of our public float. As a result of any of these factors, the market price of our common shares, at any given point in time, may not accurately reflect our long-term value. Securities class action litigation has been brought against companies following periods of volatility in the market price of their securities and issuers listed on U.S. stock exchanges (as we are), in particular, have been subject to increasing shareholder litigation. We may in the future be the target of similar litigation.


“Passive foreign investment company” under the U.S. Internal Revenue Code


We do not believe we are a “passive foreign investment company” under Section 1297(a) of the U.S. Internal Revenue Code (“PFIC”) for the current taxable year. If we derive 75% or more of our gross income from certain types of ‘‘passive’’ income (such as rents, royalties, interest, dividends, and other similar types of income), or if the quarterly average value during a taxable year of our ‘‘passive assets’’ (generally, assets that generate passive income) is 50% or more of the average value of all assets held by us, then the PFIC rules may apply to U.S. taxpayers that hold our common shares (regardless of the extent of their ownership interest in us). Several ‘‘look-through’’ rules apply in determining PFIC status, including that a 25% or more owned subsidiary corporation’s income and assets will be deemed those of its parent for purposes of the PFIC rules. Thus, a sufficiently active subsidiary may allow a parent corporation to avoid PFIC status, depending on the circumstances. Whether we are considered a PFIC for a specific taxable year is a factual determination that must be made annually at the end of that taxable year. As a result, our status in the current and future years will depend on the composition our gross income, our assets and activities in those years and our market capitalization as determined on the end of each calendar quarter, and there can be no assurance that we will or will not be considered a PFIC for any taxable year.


If we are classified as a PFIC during any portion of a U.S. taxpayer’s holding period for our common shares, as determined for U.S. federal income tax purposes, such taxpayer would be subject to adverse U.S. federal income tax consequences under the PFIC rules.  In such case (except as discussed below), any excess distribution (generally a distribution in excess of 125% of the average distribution over a three-year period or shorter holding period for our common shares) and realized gain on the sale, exchange or other disposition of our common shares will be treated as ordinary income and generally will be subject to tax as if (a) the excess distribution or gain had been realized ratably over the U.S. taxpayer’s holding period, (b) the amount deemed realized in each year had been subject to tax in each such year at the highest marginal rate for such year (other than income allocated to the current period or any taxable period before we became a PFIC, which would generally be subject to tax at the U.S. taxpayer’s regular ordinary income rate for the current year and would not be subject to the interest charge discussed in (c) below), and (c) the interest charge generally applicable to underpayments of tax had been imposed on the taxes deemed to have been payable in those years. Where a company that is a PFIC meets certain reporting requirements, a U.S. taxpayer may be able to mitigate certain adverse PFIC consequences described above by making a “qualified electing fund” (“QEF”) election to be taxed currently on its proportionate share of the PFIC’s ordinary income and net capital gains.  If we determine that we are a PFIC for any taxable year, we will determine at that time whether we will comply with the necessary accounting and record keeping requirements that would allow a U.S. taxpayer to make a QEF election with respect to us.  We have no obligation to determine whether we are a PFIC and may not make any such determination.


DESCRIPTION OF CAPITAL STRUCTURE


Common Shares


We are authorized to issue an unlimited number of common shares, of which there were 172,028,376 common shares issued and outstanding as of March 26, 2013.


Holders of common shares are entitled to receive notice of any meetings of our shareholders, to attend and to cast one vote per common share at all such meetings. Holders of common shares do not have cumulative voting rights with respect to the election of directors and, accordingly, holders of a majority of the common shares entitled to vote in any election of directors may elect all directors standing for election. Holders of common shares are entitled to receive, on a pro-rata basis, such dividends, if any, as and when declared by our board of directors at its discretion from funds legally available therefor. Upon our liquidation,


28


dissolution or winding up, holders of common shares are entitled to receive, on a pro-rata basis, our net assets after payment of debts and other liabilities, in each case, subject to the rights, privileges, restrictions and conditions attaching to any other series or class of shares ranking senior in priority to or on a pro-rata basis with the holders of common shares with respect to dividends or liquidation. The common shares do not carry any pre-emptive, subscription, redemption or conversion rights, nor do they contain any sinking or purchase fund provisions.


Preference Shares


We are authorized to issue an unlimited number of preference shares, none of which were issued and outstanding as of the date of this AIF.


Preference shares may from time to time be issued and the directors may fix the designation, rights, privileges, restrictions and conditions attaching to any series of preference shares.  Preference shares shall be entitled to preference over the common shares and over any other of our shares ranking junior to the preference shares with respect to the payment of dividends and the distribution of assets or return of capital in the event of our liquidation, dissolution or winding up or any other return of capital or distribution of our assets among our shareholders for the purpose of winding up our affairs.  Preference shares may be convertible into common shares at such rate and upon such basis as the directors in their discretion may determine. No holder of preference shares will be entitled to receive notice of, attend, be represented at or vote at any annual or special meeting, unless the meeting is convened to consider our winding up, amalgamation or the sale of all or substantially all of our assets, in which case each holder of preference shares will be entitled to one vote in respect of each preference share held. Holders of preference shares will not be entitled to vote or have rights of dissent in respect of any resolution to, among other things, amend our articles to increase or decrease the maximum number of authorized preference shares, increase or decrease the maximum number of any class of shares having rights or privileges equal or superior to the preference shares, exchange, reclassify or cancel preference shares, or create a new class of shares equal to or superior to the preference shares.


Senior Unsecured Notes


On September 13, 2012, we issued US$500 million aggregate principal amount of 9.50% senior unsecured notes (the “Notes”) due October 1, 2020 pursuant to a private placement offering.  Interest is payable on the Notes semi-annually on April 1 and October 1 of each year, beginning on April 1, 2013. The Notes were priced at 100% of their face value, and yielded proceeds of US$484 million net of directly attributable transaction costs. Approximately 99.5% of the Notes were subsequently exchanged for an equal aggregate principal amount of substantially identical new notes registered under the United States Securities Act of 1933, as amended (such new notes are also referred to herein as the “Notes”).


The Notes are fully and unconditionally guaranteed, jointly and severally, on a senior unsecured basis, by substantially all of our existing and future subsidiaries other than our subsidiaries associated with the Constancia project. The Notes also contain certain customary covenants and restrictions for a financing instrument of this type. Although there are no maintenance covenants with respect to our financial performance, there are transaction-based restrictive covenants that limit our ability to incur additional indebtedness in certain circumstances. In addition, our ability to make restricted payments, including dividend payments, is subject to our compliance with certain covenants which require either the generation of sufficient net earnings or, in the case of semi-annual dividend payments in an amount not exceeding US$20 million, the maintenance of a ratio of consolidated debt to earnings before interest, tax, depreciation and amortization of 2.50 to 1.00 or less.


At any time prior to October 1, 2016, we may redeem the Notes, in whole but not in part, at a redemption price equal to 100.000% of the aggregate principal amount of the Notes plus an amount equal to the greater of (i) 1% of the principal amount of the Notes to be redeemed and (ii) the excess, if any, of (a) the present value as of the date of redemption of the October 1, 2016 redemption price of the Notes (as described below) plus required interest payments through October 1, 2016 over (b) the then outstanding principal amount of such Notes, plus, in either case, accrued and unpaid interest.


29


On or after October 1, 2016, we may redeem the Notes, at our option in whole or in part, at the redemption prices (expressed as percentages of the principal amount of the Notes to be redeemed) set forth below, plus accrued and unpaid interest, if redeemed during the twelve-month period beginning on October 1 of each of the years indicated below:


Year 


Percentage


2016


104.750

%

2017


102.375

%

2018 and thereafter


100.000

%


In addition, we may redeem up to 35% of the Notes prior to October 1, 2015 with the net cash proceeds from certain equity offerings at a redemption price equal to 109.500% of the aggregate principal amount thereof, plus accrued and unpaid interest.


Credit Ratings


The following table sets out the credit ratings we received from Standard and Poor’s Ratings Services (“S&P”) and Moody’s Investors Services (“Moody’s”) on September 6, 2012 in connection with the offering of the Notes.


Credit Rating Organization


S&P


Moody’s

Corporate Credit Rating


B


B2

9.50% Senior Unsecured Notes


B3


B3


S&P has assigned its ‘B’ issue-level rating, and ‘3’ recovery rating, to the Notes and has maintained its ‘B’ long-term corporate credit rating on us, with a stable outlook. S&P’s credit ratings are on a rating scale that ranges from AAA (highest quality) to D (lowest quality). The ratings from ‘AA’ to ‘CCC’ may be modified by the addition of a plus (+) or minus (-) sign to show relative standing within the major rating categories. According to S&P’s rating system, an obligor rated ‘B’ currently has the capacity to meet its financial commitments, but adverse business, financial, or economic conditions will likely impair the obligor’s capacity or willingness to meet its financial commitments. A ‘B’ rating is the sixth highest of ten categories in S&P’s rating system.


S&P’s issue credit ratings are based, in varying degrees, on its analysis of the following considerations: (i) likelihood of payment; (ii) nature of and provisions of the obligation; and (iii) protection afforded by, and relative position of, the obligation in the event of bankruptcy. S&P’s recovery ratings focus solely on expected recovery in the event of a payment default of a specific issue, and utilize a numerical scale that runs from 1+ to 6. The recovery rating is not linked to, or limited by, the issuer credit rating or any other rating, and provides a specific opinion about the expected recovery. A ‘3’ recovery rating indicates S&P’s expectations of meaningful (50%-70%) recovery in the event of default.


S&P’s issuer credit rating is a forward-looking opinion about an obligor’s overall creditworthiness in order to pay its financial obligations. This opinion focuses on the obligor’s capacity and willingness to meet its financial commitments as they come due. It does not apply to any specific financial obligation.


Moody’s has assigned us a ‘B2’ corporate family rating, a ‘B2’ probability of default rating and a SGL-3 speculative grade liquidity rating; it has assigned the Notes a ‘B3’ rating. Moody’s ratings outlook is stable.


Moody’s credit ratings are on a rating scale that ranges from Aaa (highest quality) to C (lowest quality). Moody’s appends numerical modifiers 1, 2, and 3 to each generic rating classification from Aa through Caa. The modifier 1 indicates that the obligation ranks in the higher end of its generic rating category; the modifier 2 indicates a mid-range ranking; and the modifier 3 indicates a ranking in the lower end of that


30


generic rating category. Moody’s speculative grade liquidity ratings are on a rating scale that ranges from SGL-1 (best liquidity) to SGL-4 (weakest liquidity).


According to Moody’s credit rating system, obligations rated ‘B’ are considered speculative and are subject to high credit risk. A ‘B’ rating is the sixth highest of nine categories in Moody’s rating system.


According to Moody’s speculative grade liquidity rating system, an issuer with an ‘SGL-3’ rating possesses adequate liquidity and is expected to rely on external sources of committed financing.


Moody’s corporate family ratings are long-term ratings that reflect the likelihood of a default on a corporate family’s contractually promised payments and the expected financial loss suffered in the event of default. A corporate family rating is assigned to a corporate family as if it had and a single class of debt and a single consolidated legal entity structure. A probability of default rating is a corporate family-level opinion of the relative likelihood that any entity within a corporate family will default on one or more of its long-term debt obligations.


Moody’s long-term ratings are assigned to issuers or obligations with an original maturity of one year or more and reflect both on the likelihood of a default on contractually promised payments and the expected financial loss suffered in the event of default.


Moody’s speculative grade liquidity ratings are opinions of an issuer’s relative ability to generate cash from internal resources and the availability of external sources of committed financing, in relation to its cash obligations over the coming 12 months.


The credit ratings and stability ratings we received from S&P and Moody’s are not a recommendation to buy, sell or hold our securities and may be subject to revision or withdrawal at any time by either such credit rating organization. S&P and Moody’s each charged us a fee in respect of the credit ratings service they provided.


DIVIDENDS


We paid an inaugural semi-annual dividend of $0.10 per common share on September 30, 2010 and have continued to pay a semi-annual dividend of $0.10 per common share in March and September of each year. On February 20, 2013, our board of directors approved the payment of a dividend of $0.10 per common share payable on March 28, 2013 to shareholders of record on March 18, 2013.


The Notes impose certain restrictions on our ability to make restricted payments, including common dividends. Our ability to make subsequent dividend payments at current levels will be subject to our ability to generate sufficient shareholders’ equity or to maintain a ratio of consolidated debt to EBITDA of 2.5 to 1 or less. It is doubtful that we will be able to comply with these covenants before our new mines achieve commercial production and generate additional cash flow and earnings; however, we are exploring alternatives that may provide us an opportunity to maintain dividends similar to those recently declared. At all times, the declaration of dividends is subject to the Board of Directors’ discretion.


MARKET FOR SECURITIES


Price Range and Trading Volume


Our common shares are listed on the TSX and the NYSE under the symbol “HBM”. The volume of trading and the high and low trading price of our common shares on the TSX and NYSE during the periods indicated are set forth in the following table.


31


Trading of Common
Shares on TSX


Trading of Common
Shares on NYSE


Period


High


Low


Volume


High


Low


Volume


($)


($)


(common
shares)


(US$)


(US$)


(common
shares)


2012


January


12.34


10.02


11,451,708


12.32


9.77


574,857


February


12.47


11.61


7,476,237


12.48


11.60


503,501


March


12.43


10.75


18,577,154


12.54


10.75


1,095,364


April


11.18


10.14


13,452,387


11.29


10.21


429,385


May


10.65


7.53


13,847,056


10.83


7.31


989,494


June


8.28


7.36


10,337,507


8.15


7.11


563,697


July


8.76


7.51


17,948,198


8.64


7.41


421,975


August


9.56


8.07


8,289,373


9.63


8.09


806,581


September


10.34


8.34


12,664,336


10.66


8.44


1,102,987


October


9.78


8.97


11,782,509


10.00


9.08


449,790


November


10.03


8.86


7,505,748


10.10


8.77


342,140


December


10.91


9.53


16,359,535


11.07


9.61


750,858


On March 26, 2013, the closing prices of our common shares on the TSX and NYSE were $9.65 and US$9.49 per share, respectively.


Prior Sales


On September 13, 2012 we issued US$500 million aggregate principal amount of the Notes pursuant to a private placement offering.  A description of the Notes can be found under the heading “Description of Capital Structure” in this Annual Information Form.


DIRECTORS AND OFFICERS


Board of

Directors(1)


Roque Benavides
Lima, Peru


Director since: June 14, 2012


Committee memberships:

·       Technical Committee


Mr. Benavides has been Compañía de Minas Buenaventura’s Chairman and CEO since 2011 and, prior to that, served as the company’s Chief Financial Officer for more than 15 years.


David Garofalo

Richmond Hill, Ontario, Canada


Director since: August 4, 2010


Mr. Garofalo has been Hudbay’s President and Chief Executive Officer since July 2010. Previously, he served as Senior Vice President, Finance and Chief Financial Officer and a director with Agnico-Eagle Mines Limited.


Tom A. Goodman

Denare Beach, Saskatchewan, Canada


Director since: June 14, 2012


Committee memberships:

·       EHSS Committee (Chair)

·       Technical Committee


Mr. Goodman worked for Hudbay for over 34 years in a wide variety of operational, technical and management positions, including his last two years as Senior Vice President and Chief Operating Officer. He retired as an executive officer effective June 1, 2012.


32


Board of

Directors(1)


Alan R. Hibben
Toronto, Ontario, Canada


Director since: March 23, 2009


Committee memberships:

·       Audit Committee (Interim Chair)

·       EHSS Committee

·       Compensation Committee


Mr. Hibben has held several senior positions with RBC Capital Markets, including his current role as Managing Director, which he assumed on his return to RBC in March 2011. He was head of strategy and development at RBC Financial Group from January 2005 to June 2007 and a principal with Shakerhill Partners Ltd. from July 2007 to January 2009. From January 2009 to February 2011 he was a partner with Blair Franklin Capital Partners Inc., a financial advisory firm.   


W. Warren Holmes
Stratford, Ontario, Canada


Director since: March 23, 2009


Committee memberships:

·       Compensation Committee (Chair)

·       EHSS Committee

·       Technical Committee


From November 2009 to July 2010, Mr. Holmes served as our Executive Vice Chairman and from January 2010 to July 2010 served as our Interim Chief Executive Officer. He is a corporate director, including roles as Lead Director of Foraco International SA and Executive Vice Chairman of Atlanta Gold Inc.


John. L. Knowles
Winnipeg, Manitoba, Canada


Director since: March 23, 2009


Committee memberships:

·       Audit Committee

·       Corporate Governance and Nominating Committee


Mr. Knowles is President and CEO of Wildcat Exploration Ltd, a mining exploration company, and is also a corporate director.


Alan J. Lenczner
Toronto, Ontario,

Canada


Director since: March 23, 2009


Committee memberships:

·       Audit Committee

·       Corporate Governance and Nominating Committee


Mr. Lenczner has been a commercial litigator for over 40 years. He is Founding Partner and now Counsel at Lenczner Slaght Royce Smith Griffin LLP, a litigation-focused law firm. He is also a Commissioner of the Ontario Securities Commission.


Kenneth G. Stowe

Oakville, Ontario, Canada


Director since: June 24, 2010


Committee memberships:

·       Technical Committee (Chair)

·       EHSS Committee

·       Compensation Committee


Mr. Stowe was Chief Executive Officer of Northgate Minerals Corporation from 2001 until his retirement in 2011. He is currently a corporate director.


G. Wesley Voorheis
Toronto, Ontario, Canada


Director since: March 23, 2009


Committee memberships:

·       Corporate Governance and Nominating Committee (Chair)


Mr. Voorheis is Chairman of Hudbay. He is also Managing Director of VC & Co. Incorporated and a Partner of Voorheis & Co. LLP, which act as strategic advisors to institutional and other shareholders, including private equity and hedge funds..


Notes:

(1)                                 On Thursday, March 14, 2013, our esteemed board member J. Bruce Barraclough passed away. He was a member of our board of directors since April 2009 and was also the Chair of the Audit Committee in addition to serving on two other committees.


The term of office for each director of the Company will expire upon the completion of the next annual meeting of shareholders of the Company. Our executive officers as at the date of this AIF are listed below.


33


Executive Officers


David Garofalo

Richmond Hill, Ontario, Canada


Position with Hudbay: President and Chief Executive Officer


For biographical information for Mr. Garofalo, refer above to the heading “Board of Directors”.


David S. Bryson

Toronto, Ontario, Canada


Position with Hudbay: Senior Vice President and Chief Financial Officer


Mr. Bryson has been with Hudbay since August 2008. Prior to being appointed to his current role in February 2009, he was Vice President, Finance and Chief Financial Officer. Mr. Bryson held senior finance positions with Skye Resources Inc. from March 2007 to August 2008 and prior to that worked for Terasen Inc., a Vancouver-based energy infrastructure firm, in various roles for 16 years.


Ken Gillis

Toronto, Ontario, Canada


Position with Hudbay: Senior Vice President, Corporate Development


Mr. Gillis joined Hudbay in August 2010, prior to which he served as Executive Director of Macquarie Canada’s North American Mining Investment Banking practice.  Mr. Gillis has a 20 year history of corporate development and related activities in mining, both with mining companies and financial and investment firms.


Alan T.C. Hair

Toronto, Ontario, Canada


Position with Hudbay: Senior Vice President and Chief Operating Officer


Mr. Hair has been with Hudbay and its affiliates since 1996 and has held a number of senior operational and business development positions. Prior to being appointed to his current role in June 2012, he was Senior Vice President, Business Development and Technical Services. From October 2008 to August 2010 he was Senior Vice President, Development and from December 2004 to October 2008 he was Vice President, Metallurgy and Safety, Health and Environment. Before joining Hudbay, Mr. Hair worked in European base metals and African platinum group operations.


David Clarry

Toronto, Ontario, Canada


Position with Hudbay: Vice President, Corporate Social Responsibility


Mr. Clarry joined Hudbay in February 2011.  From June 2009 to January 2011 he worked through his own firm, Innotain Inc., providing consulting services to the mining and energy industries. Prior to that he spent 18 years with Hatch Ltd., an international engineering and consulting firm, ultimately as Director — Climate Change Initiatives.


Patrick Donnelly

Oakville, Ontario, Canada


Position with Hudbay: Vice President, Legal and Corporate Secretary


Mr. Donnelly joined Hudbay in 2008 and was appointed to his current role in December 2011. Prior to joining Hudbay, he practiced corporate and securities law at Osler, Hoskin & Harcourt LLP from 2002 to 2007. He also spent over a year in the legal department of TDL Group Corp.


Brad W. Lantz

Flin Flon, Manitoba, Canada


Position with Hudbay: Vice President, Manitoba Business Unit


Mr. Lantz has been Vice President, Manitoba Business Unit since September, 2011. From 2007 to September 2011 he was Vice President, Mining and from 2003 to July 2007 he was Mine Manager of the 777 mine. He has also held positions of progressively greater responsibility, at our Ruttan, Trout Lake and Callinan mines.


Cashel Meagher

Lima, Peru


Position with Hudbay: Vice President, South America Business Unit


Mr. Meagher joined Hudbay in 2008 and was appointed to his current role in September 2011. Prior to joining Hudbay, Mr. Meagher held management positions with Vale Inco in exploration, technical services, business analysis and mine operations.


34


Executive Officers


Patrick Merrin

Toronto, Ontario, Canada


Position with Hudbay:  Vice President, Business Development and Technical Services


Mr. Merrin rejoined Hudbay in July 2012 as Vice President, Business Development and Technical Services. Over the past five years, he gained experience in a variety of mining and metals environments, including as Chief Operating Officer of Adex Mining from September 2011 to July 2012, owner of PJM Consulting, a consulting firm for the mining industry, from December 2010 to September 2011, and Managing Director of Lucas Milhaupt Europe from July 2007 to July 2010.


Hernán Soza

Toronto, Ontario, Canada


Position with Hudbay:  Vice President, Exploration


Mr. Soza joined Hudbay in early 2011 as Director, South American Exploration and was appointed to his current role in September 2011. He brings more than forty years of mining and mineral exploration experience across South and Central America, most recently as an independent geologist, providing consulting services to clients in the mining industry.


John Vincic

Toronto, Ontario, Canada


Position with Hudbay:  Vice President, Investor Relations and Corporate Communications


Mr. Vincic joined Hudbay in August 2009. Between 2004 and August 2009 he was an executive vice president at Barnes McInerney Inc., an investor relations and communications firm based in Toronto.


As of March 26, 2013, our directors and executive officers, as a group, beneficially owned, directly or indirectly, or exercised control or direction over 320,431 common shares, representing less than 1% of the total number of common shares outstanding.


Corporate Cease Trade Orders, Bankruptcies, Penalties and Sanctions


Mr. Holmes was a director of Campbell Resources Inc. (“Campbell”) from 2006 to 2008. Mr. Holmes joined Campbell as a director while it was already under the protection of the Companies’ Creditors Arrangement Act (Canada) (the “CCAA”).  Mr. Holmes resigned from the board of directors of Campbell in November 2008.  On January 28, 2009, Campbell once again obtained creditor protection under the CCAA.  On December 10, 2009, a receiver was appointed over Campbell’s assets with power to solicit offers for the sale of the assets.


From September 2003 until June 24, 2004, Mr. Voorheis was a director of Atlas Cold Storage Holdings Inc. (“Atlas”), the entity through which Atlas Cold Storage Income Trust (“Atlas Income Trust”) carried on its business.  As a result of Atlas Income Trust not having filed its 2003 third quarter financial statements by the required deadline, the OSC issued a cease trade order relating to any trading in securities of Atlas Income Trust against the trustees of Atlas Income Trust, certain members of the board of directors of Atlas and certain other then-current and former officers of Atlas.  The cease trade order remained in effect until May 11, 2004, following the remediation of the filing default, and related to conduct that occurred before Mr. Voorheis became a director.


Mr. Voorheis was a director of Hollinger Inc. (“Hollinger”) from May 2006 to June 2008 and its Chief Executive Officer from April 2007 to June 2008. Mr. Voorheis agreed to join the Hollinger board at the request of a shareholder to deal with certain management misconduct. On August 1, 2007, Hollinger obtained an initial court order granting it creditor protection under the CCAA and made a concurrent application for a companion order under Chapter 15 of the United States Bankruptcy Code. On May 14, 2008, Hollinger announced that it had reached an agreement with its two principal creditors addressing the various principal matters in dispute among those parties and that, upon Court approval of that agreement, Mr. Voorheis would resign as an officer and director of Hollinger. The Court formally approved that agreement on May 26, 2008, and Mr. Voorheis resigned as a director and officer of Hollinger effective June 17, 2008.


35


Hollinger was the subject of several cease trade orders issued between 2004 and 2008, due to its failure to file financial statements on a timely basis, and Mr. Voorheis became subject to certain such orders as a result of his appointment as Chief Executive Officer. On August 5, 2008, the OSC issued a permanent cease trade order against Hollinger which remains in effect. Hollinger has stated that the cease trade order was issued as a result of its determination, in the interests of reducing its costs for the benefit of its stakeholders, not to prepare and file annual audited financial statements and other annual disclosure documents in respect of Hollinger’s financial year ended March 31, 2008.


Mr. Voorheis was a director of Sun Times Media Group, Inc. (“Sun Times”), a subsidiary of Hollinger, from August 2007 to June 2008. Mr. Voorheis agreed to join the Sun Times board at the request of a Hollinger shareholder to deal with certain management misconduct. On March 31, 2009, Sun Times and its domestic subsidiaries filed voluntary petitions under Chapter 11 of the United States Bankruptcy Code.


Mr. Voorheis was appointed as a director of Coventree Inc. (“Coventree”) in April 2008. On December 7, 2009, the OSC commenced proceedings against Coventree and certain of its officers in connection to events which occurred prior to Mr. Voorheis’ involvement with Coventree. The proceedings related to whether Coventree complied with its disclosure obligations in its prospectus relating to the initial public offering of its shares, and its timely disclosure obligations in 2007 prior to the market for certain asset-backed commercial paper freezing up on August 13, 2007 (collectively “Coventree Proceedings”). On November 8, 2011, the OSC issued orders in connection with the Coventree Proceedings which included (i) an order that Coventree pay an administrative penalty of $1,000,000; and (ii) an order that until its winding up is completed, trading in any securities by Coventree cease and that any Ontario securities law exemptions not apply to Coventree, provided that such order will not prevent the winding up of Coventree or trades in securities reasonably related to that winding up. Coventree appealed the OSC order at the Ontario Divisional Court in late 2012 but the Divisional Court dismissed the appeal.


On June 30, 2010, the shareholders of Coventree approved a special resolution authorizing the winding up of Coventree and the distribution of its remaining assets, if any, to shareholders pursuant to the plan of liquidation and distribution. On February 15, 2012, the liquidation plan commenced, a liquidator was appointed for the purposes of winding up Coventree’s affairs, Mr. Voorheis resigned as a director, and Mr. Voorheis became an inspector of the company’s liquidation on that date.


Conflicts of Interest


To the best of our knowledge, there are no known existing or potential conflicts of interest among or between us, our subsidiaries, our directors, officers or other members of management, as a result of their outside business interests, except that certain of our directors, officers, and other members of management serve as directors, officers, promoters and members of management of other entities and it is possible that a conflict may arise between their duties as a director, officer or member of management of Hudbay and their duties as a director, officer, promoter or member of management of such other entities.


Our directors and officers are aware of the existence of laws governing accountability of directors and officers for corporate opportunity and requiring disclosures by directors of conflicts of interest and we will rely upon such laws in respect of any directors’ and officers’ conflicts of interest or in respect of any breaches of duty by any of our directors or officers. All such conflicts are required to be disclosed by such directors or officers in accordance with the CBCA, and such individuals are expected to govern themselves in respect thereof to the best of their ability in accordance with the obligations imposed upon them by law. In addition, our Code of Business Conduct and Ethics requires our directors and officers to act with honesty and integrity and to avoid any relationship or activity that might create, or appear to create, a conflict between their personal interests and our interests.


AUDIT COMMITTEE DISCLOSURE


The Audit Committee is responsible for monitoring our systems and procedures for financial reporting and internal control, reviewing certain public disclosure documents and monitoring the performance and independence of our external auditors. The Audit Committee is also responsible for reviewing our annual audited consolidated financial statements, unaudited consolidated quarterly financial statements and


36


management’s discussion and analysis of results of operations and financial condition for annual and interim periods prior to their approval by the full board of directors.  There was no instance in 2012 where our board of directors declined to adopt a recommendation of the Audit Committee.


The Audit Committee’s charter sets out its responsibilities and duties, qualifications for membership, procedures for committee appointment and reporting to our board of directors. A copy of the current charter is attached hereto as Schedule C.


Composition


As at December 31, 2012, the Audit Committee consisted of Messrs. Barraclough, Lenczner and Knowles. Mr. Barraclough, our esteemed Chair of the Audit Committee, passed away in March 2013. Following Mr. Barraclough’s passing, on the recommendation of the Corporate Governance and Nominating Committee, our board of directors appointed Alan R. Hibben as the Interim Chair of the Audit Committee.


Mr. Hibben was previously a member of the Audit Committee. He resigned from the Audit Committee in March 2011 after assuming a position as Managing Director of RBC Capital Markets (“RBC”) because RBC was providing financial advisory services to us at the time and he no longer qualified as independent under National Instrument 52-110 - Audit Committees (“NI 52-110”). RBC is not presently providing advisory services to us and our board of directors has concluded that Mr. Hibben is independent within the meaning of NI 52-110. The Corporate Governance and Nominating Committee has commenced a search to find a permanent Chair for our Audit Committee.


Relevant Education and Experience


Each member of the Audit Committee is independent and financially literate within the meaning of NI 52-110.  Set out below is a description of the education and experience of each Audit Committee member that is relevant to the performance of his responsibilities as an Audit Committee member.


Alan R. Hibben has held several senior positions with RBC Capital Markets, including his current role as Managing Director, which he assumed on his return to RBC in March 2011. He was a principal with Shakerhill Partners Ltd. from July 2007 to January 2009, and from January 2009 to February 2011 he was a partner with Blair Franklin Capital Partners Inc., a financial advisory firm. Mr. Hibben received his Bachelor of Commerce Degree from the University of Toronto and is qualified as a Canadian Chartered Accountant. He also holds the CFA designation and is a certified director of the Institute of Corporate Directors (ICD.D).


Alan J. Lenczner has been a commercial litigator for over 40 years.  During that time he has represented accounting firms with respect to accounting and auditing issues both in the Superior Court and before the Institute of Chartered Accountants of Ontario.


John L. Knowles has over 25 years of experience in senior roles with Canadian and international resource companies.  He previously served as Executive Vice President and Chief Financial Officer of Aur Resources Inc. and was Vice President and Chief Financial Officer of HBMS from 1996 to April 2005 and, following its acquisition by Hudbay, he was Vice President and Chief Financial Officer of Hudbay until April 2005. He is a Chartered Accountant and holds a Bachelor of Commerce degree from Queen’s University.


Policy Regarding Non-Audit Services Rendered by Auditors


We have adopted a policy requiring Audit Committee pre-approval of non-audit services. Specifically, the policy requires that proposals seeking approval by the Audit Committee for routine and recurring non-audit services describe the terms and conditions and fees for the services and include a statement by the independent auditor and Chief Financial Officer that the provision of those services could not be reasonably expected to compromise or impair the auditor’s independence. The Audit Committee may pre-approve non-audit services without the requirement to submit a specific proposal, provided that any such pre-approval on a general basis shall be applicable for twelve months. The Chair of the Audit Committee has been delegated authority to pre-approve, on behalf of the Audit Committee, the provision of specific non-audit services by the independent auditor where (a) it would be impractical for the services to be provided by another firm; or (b)


37


the estimated fees associated with such services are not expected to exceed $50,000. Any approvals granted under this delegated authority are to be presented to the Audit Committee at its next scheduled meeting.


Remuneration of Auditor


The following table presents, by category, the fees accrued by Deloitte LLP as external auditor of, and for other services provided to, the Company for the fiscal years ended December 31, 2012 and 2011.


2012


2011


Category of Fees


Audit fees


$

1,066,374


$

1,245,553


Audit-related fees


$

372,076


$

476,640


Tax fees


All other fees


Total


$

1,438,450


$

1,722,193


“Audit fees” include fees for auditing annual financial statements and reviewing the interim financial statements, as well as services normally provided by the auditor in connection with our statutory and regulatory filings. “Audit-related fees” are fees for assurance and related services that are reasonably related to the performance of the audit or review of our financial statements and are not reported under “Audit fees”, including accounting advisory work, audit work related to our pension, benefit and profit sharing plans, audit work related to our NPI Agreement with Callinan (as described below) and work related to acquisitions and offerings. “Tax fees” are fees for services related to tax compliance, tax advice, and tax planning. “All other fees” are fees for services other than those described in the foregoing categories. Management presents regular updates to the Audit Committee of the services rendered by the auditors as part of the Audit Committee’s oversight regarding external auditor independence and pre-approved service authorizations.


LEGAL PROCEEDINGS AND REGULATORY ACTIONS


In 1995 HBMS was named as a co-defendant in two actions before the Saskatchewan Court of Queen’s Bench challenging various wrongful actions committed in connection with the use and operation of the Whitesand Dam and the Island Falls Hydroelectric station (collectively, the “Hydro Projects”) in Saskatchewan. The plaintiffs have claimed for an aggregate of $1 billion in compensatory damages and in excess of $100 million in punitive damages. One of Hudbay’s former subsidiaries constructed and operated the dam until it was transferred to Saskatchewan Power Corporation (“SaskPower”) in 1981. The plaintiffs in both actions claim that the lands on which the hydroelectric facilities were built are subject to aboriginal rights. As this matter has not been progressed since 1995, any potential liabilities are not reasonably determinable. The principal parties to this litigation are:


1.                                      In the Court of Queen’s Bench for Saskatchewan, Action No. 489 dated February 9, 1995


·                  Plaintiffs: Cornelius Ballantyne of Deschambault Lake, and Eileen Ballantyne Linklater of The Peter Ballantyne Indian Reserve #184, and Richard Highway of The Peter Ballantyne Indian Reserve #184, representing the inheritors and followers and members of the Peter Ballantyne Band and tribes of Indians who are traditional uses of land and water.


·                  Defendants: SaskPower, HBMS and Churchill River Power Company Limited (“CRP”).


2.                                      In the Court of Queen’s Bench for Saskatchewan, Action No. 505 dated February 10, 1995


·                  Plaintiffs: Gordon Bear of the Wapaskokimow Reserve, and Catherine Wapaskokimow Ballantyne, Emil Bear and Gary Morin of Sandy Bay, representing themselves and the inheritors and followers of the Chief Cornelius White Bear Band and tribes of Indians who are traditional users of land and water.


38


·                  Defendants: SaskPower, HBMS and CRP.


SaskPower has been named as a defendant in two other actions, one filed in Manitoba’s Court of Queen’s Bench in 1992 and one filed in Saskatchewan’s Court of Queen’s Bench in 2004. The plaintiffs in the Saskatchewan action are the Peter Ballantyne Cree Nation and its members (“PBCN”). Both actions claim damages alleged as a result of the operation and use of the Hydro Projects. HBMS has been named as a third party in the Saskatchewan action, but has not been named as a party in the Manitoba action. SaskPower has also added CRP, formerly a wholly-owned subsidiary of HBMS, which was dissolved, as a third party in the Saskatchewan action. SaskPower revived CRP for the purpose of taking action for alleged breaches by CRP of its obligation under a certain Purchase and Sale Agreement made in 1981. HBMS has filed a Statement of Defence to the Third Party Claim and served same on counsel for the other parties. The parties will be proceeding with a motion to have certain issues decided by the Saskatchewan Court of Queen’s Bench prior to a trial. The Statement of Claim does not specify the amount of damages being claimed but during the course of mediation sessions, legal counsel for the plaintiffs have indicated that the claim being advanced on behalf of PBCN is in the range of $100,000,000. SaskPower is seeking contribution and/or indemnity as well as a separate damage claim from CRP and HBMS but has not specified the amount claimed in the Third Party Claim or during the mediation sessions. Given the number of parties and the early stages of the proceedings, the resolution of the claim against CRP and HBMS is not reasonably determinable.


In March 2007, a statement of claim was issued in Manitoba’s Court of Queen’s Bench by Callinan Mines Limited (“Callinan”) against HBMS (“Manitoba Action”) seeking declaratory relief, an accounting and an undisclosed amount of damages relating to an alleged breach of a Net Profits Interest and Royalty Agreement (“NPI Agreement”) between HBMS and Callinan dated January 1, 1988. HBMS has filed a statement of defence denying liability to Callinan. Callinan has appointed an auditor to conduct an independent audit of the books and records of HBMS and the audited financial statements delivered pursuant to the NPI Agreement and the independent audit is underway. HBMS and Callinan entered into a Standstill Agreement not to take any further steps in connection with the Manitoba Action without giving at least thirty days written notice. The likelihood of success and potential liability of this claim are not reasonably determinable as the independent audit process has not been completed.


Hudbay is subject to three claims in the Ontario Superior Court in connection with its previous ownership of the Fenix project in Guatemala through its subsidiary at the time, Compañía Guatemalteca de Níquel S.A. (“CGN”).


The first action was served in September 2010. The plaintiff, Angelica Choc, asserts a claim of negligence against Hudbay and wrongful death, among other claims, against CGN in connection with the death of her husband Adolfo Ich Chaman on September 27, 2009. The plaintiff claims that the head of CGN security shot and killed Mr. Chaman during a confrontation between members of local communities who were unlawfully occupying CGN property and CGN personnel. The aggregate amount of the claim is $12 million.


In the second action, served in March 2011, eleven plaintiffs claim that they were victims of sexual assault committed by CGN security and members of the Guatemalan police and army during court ordered and state implemented evictions in January 2007 (before the project was acquired by Hudbay). These claims are asserted against Hudbay and its subsidiary at the time HMI Nickel Inc. The aggregate amount of the claims is $55 million.


The plaintiff in the third action, German Chub Choc, claims that he was shot and permanently injured by the head of CGN security during the same events that gave rise to the claim brought by Ms. Choc. This action was served in October 2011. The aggregate amount of the claim is $12 million.


We believe that all the claims with respect to the Fenix project are without merit. In March 2013, we argued motions to dismiss the three actions against Hudbay on the bases that the claims pleaded do not give rise to a reasonable cause of action. The court’s determination in respect of the motions is pending.


Except as noted above, we are not aware of any litigation outstanding, threatened or pending against us as of the date hereof that would reasonably be expected to be material to our financial condition or results of operations.


39


Regulatory Actions


We have not: (a) received any penalties or sanctions imposed against us by a court relating to securities legislation or by a securities regulatory authority during the financial year; (b) received any other penalties or sanctions imposed by a court or regulatory body that would likely be considered important to a reasonable investor in making an investment decision; and (c) entered any settlement agreements with a court relating to securities legislation or with a securities regulatory authority during the financial year.


INTEREST OF MANAGEMENT AND OTHERS IN MATERIAL TRANSACTIONS


Since January 1, 2010, none of our directors, executive officers or 10% shareholders and no associate or affiliate of the foregoing persons has or has had any material interest, direct or indirect, in any transaction that has materially affected or is reasonably expected to materially affect us.


TRANSFER AGENT AND REGISTRAR


The transfer agent and registrar for our common shares is Equity Financial Trust Company at its principal office in Toronto, Ontario.


MATERIAL CONTRACTS


Except for those contracts entered into in the ordinary course of our business, the following are the material contracts we entered into (i) within the last financial year or (ii) between January 1, 2002 and the beginning of the last financial year, which are still in effect:


1.                                      the Precious Metals Purchase Agreement dated August 8, 2012 with Silver Wheaton, whereby we agreed to sell a portion of the precious metals production from our 777 mine to Silver Wheaton. For additional details, refer above to the heading “Development of our Business — Three Year History — Precious Metals Stream Transaction”;


2.                                      the Silver Purchase Agreement dated August 8, 2012 with SW Caymans, whereby we agreed to sell 100% of the silver production from our Constancia project to SW Caymans. For additional details, refer above to the heading “Development of our Business — Three Year History — Precious Metals Stream Transaction”;


3.                                      the Indenture dated September 13, 2012 with U.S. Bank National Association, as trustee, governing the Notes. For additional details, refer above to the heading “Development of our Business — Three Year History — Issuance of 9.50% Senior Unsecured Notes”; and


4.                                      the Credit Facility with the lender’s party thereto from time to time and The Bank of Nova Scotia, as administrative agent, dated as of November 3, 2010, as amended, providing for a four year US$300 million revolving credit facility.


QUALIFIED PERSONS


The scientific and technical information contained in this AIF related to the Constancia project has been prepared by or under the supervision of Cashel Meagher, P.Geo., our Vice President, South America Business Unit. The scientific and technical information related to all other sites and projects contained in this AIF has been prepared by or under the supervision of Robert Carter, P.Eng., our Director, Technical Services.  Messrs. Meagher and Carter are Qualified Persons for the purposes of NI 43-101.


INTERESTS OF EXPERTS


Cashel Meagher, P.Geo. and Robert Carter, P.Eng. are experts who have prepared certain technical and scientific reports for us. As at the date hereof, to our knowledge, the aforementioned persons beneficially own, directly or indirectly, less than 1% of our outstanding securities and have no other direct or indirect interest in our company or any of its associates or affiliates.


40


Deloitte LLP are the auditors of Hudbay and are independent within the meaning of the Rules of Professional Conduct of the Institute of Chartered Accountants of Ontario and the Public Company Accounting Oversight Board (United States).


ADDITIONAL INFORMATION


Additional information, including directors’ and officers’ remuneration and indebtedness, principal holders of our securities and securities authorized for issuance under equity compensation plans, as applicable, is contained in our management information circular dated May 14, 2012. Additional financial information is provided in our financial statements and management’s discussion and analysis for the fiscal year ended December 31, 2012.


Additional information relating to the Company may be found on SEDAR at www.sedar.com and in the United States on EDGAR at www.sec.gov.


41


SCHEDULE A

GLOSSARY OF MINING TERMS


The following is a glossary of certain mining terms used in this annual information form.


mineral reserves


That part of a measured or indicated mineral resource which could be economically mined, demonstrated by at least a preliminary feasibility study that includes adequate information on mining, processing, metallurgical, economic and other relevant factors that demonstrate, at the time of reporting, that economic extraction can be justified. A mineral reserve includes diluting materials and allowances for losses that may occur when the material is mined. Mineral reserves are those parts of mineral resources which, after the application of all mining factors, result in an estimated tonnage and grade which, in the opinion of the qualified person(s) making the estimates, is the basis of an economically viable project after taking account of all relevant processing, metallurgical, economic, marketing, legal, environment, socio-economic and government factors. Mineral reserves are inclusive of diluting material that will be mined in conjunction with the mineral reserves and delivered to the treatment plant or equivalent facility. The term “mineral reserve” need not necessarily signify that extraction facilities are in place or operative or that all governmental approvals have been received. It does signify that there are reasonable expectations of such approvals. Mineral reserves are subdivided into proven mineral reserves and probable mineral reserves. Mineral reserves fall under the following categories:


proven mineral reserves


That part of a measured mineral resource that is the economically mineable part of a measured mineral resource, demonstrated by at least a preliminary feasibility study that includes adequate information on mining, processing, metallurgical, economic, and other relevant factors that demonstrate, at the time of reporting, that economic extraction is justified.


probable mineral reserves


That part of an indicated and in some circumstances a measured mineral resource that is economically mineable demonstrated by at least a preliminary feasibility study that includes adequate information on mining, processing, metallurgical, economic, and other relevant factors that demonstrate, at the time of reporting, that economic extraction can be justified.


mineral resources


A concentration or occurrence of natural, solid, inorganic or fossilized organic material in or on the Earth’s crust in such form and quantity and of such a grade or quality that it has reasonable prospects for economic extraction. The location, quantity, grade, geological characteristics and continuity of a mineral resource are known, estimated or interpreted from specific geological evidence and knowledge. Mineral resources fall under the following categories:


measured mineral resource


That part of a mineral resource for which quantity, grade or quality, densities, shape and physical characteristics are so well established that they can be estimated with confidence sufficient to allow the appropriate application of technical and economic parameters to support production planning and evaluation of the economic viability of the deposit. The estimate is based on detailed and reliable exploration, sampling and testing information gathered through appropriate techniques from locations such as outcrops, trenches, pits, workings and drill holes that are spaced closely enough to confirm both geological and grade continuity.


indicated mineral resource


That part of a mineral resource for which quantity, densities, shape and physical characteristics can be estimated with a level of confidence sufficient to allow the appropriate application of technical and economic parameters and to support mine planning and evaluation of the economic viability of the deposit. The estimate is based on detailed and reliable exploration and testing information gathered through appropriate techniques from locations such as outcrops, trenches, pits, workings and drill holes that are spaced closely enough for geological and grade continuity to be reasonably assumed.


inferred mineral resource


That part of a mineral resource for which quantity and grade or quality can be estimated on the basis of geological evidence and limited sampling and reasonably assumed, but not verified, geological and grade continuity. The estimate is based on limited information and sampling gathered through appropriate techniques from locations such as outcrops, trenches, pits, workings and drill holes.


SCHEDULE B
MATERIAL MINERAL PROJECTS


777 Mine


Project Description and Location


The 777 mine is an underground copper and zinc mine with significant precious metals credits located in Flin Flon, Manitoba.


We own a 100% interest in the properties that comprise the 777 mine through mineral leases, Order in Council (“OIC”) leases and mineral claims in Manitoba and Saskatchewan. The properties cover approximately 3,800 hectares, including approximately 500 hectares in Manitoba and approximately 3,300 hectares in Saskatchewan. Annual lease rental payments are $16,730 and $6,722 to the Manitoba and Saskatchewan governments, respectively, and the annual work expenditure requirement for the Saskatchewan properties is $257,025.  Individual leases have different expiry dates that range from 2013 to 2031. Our surface rights and permits are sufficient for purposes of our current mining operations.


Liabilities associated with the 777 mine are addressed by the closure plans that have been submitted to regulators in both Saskatchewan and Manitoba and financial assurance has been provided to cover the demolition and remediation activities outlined in such closure plans. The closure and remediation liability in respect of the property is estimated at $1,222,121 in January 1, 2010 dollars. In addition, closure plans have been submitted and are backed with financial assurance for the associated Flin Flon Metallurgical Plant (FFMC) and Flin Flon Tailings Impoundment System (FFTIS) utilized by the 777 mine.


Mineral production from the 777 mine property is subject to a 6 2/3% net profit interest and a $0.25 per short ton royalty pursuant to our agreement with Consolidated Callinan Flin Flon Mines Limited (“Callinan”).


Precious metals production from the 777 mine is subject to our agreement with Silver Wheaton, as described in this AIF. Pursuant to the 777 Stream Agreement, we received an aggregate upfront deposit payment of US$455 million against delivery of 100% of payable gold and silver from our 777 mine until the later of December 31, 2016 and satisfaction of a completion test at Constancia, and thereafter 50% of payable gold and 100% of payable silver for the remainder of the 777 mine life. In addition to the upfront payment, for gold and silver delivered in accordance with the 777 Stream Agreement, we will receive cash payments equal to the lesser of (i) the market price and (ii) US$400 per ounce (for gold) and US$5.90 per ounce (for silver), subject to 1% annual escalation after three years. For additional information, refer to “Three Year History”.


Accessibility, Climate, Local Resources, Infrastructure and Physiography


The 777 mine is located in Flin Flon, Manitoba, which has a population of approximately 6,000 people, and is accessible by paved highway. Flin Flon is the site of our principal concentrator and zinc plant and has well developed access to rail and air transportation. Personnel requirements for our 777 mine and processing facilities are largely drawn from the immediate area.


Electrical power is supplied from the Manitoba Hydro and Saskatchewan Power Corporation power grids, which are fed by three hydroelectric generating stations. No issues are foreseen for securing additional electrical power in the future if required.


Water for mining activities is supplied from a reservoir located adjacent to the 777 mine site and is sufficient for operations.


Tailings from milling are sent to the Paste Backfill Plant located at the lower level of the mill building. Mixed paste backfill is pumped to one of two lined boreholes adjacent to the mill, where paste is gravity fed to 1,082 metre level for distribution to mined out stopes. Tailings not used in paste production


are pumped to the Flin Flon Tailings Impoundment System (“FFTIS”). The FFTIS is located in Saskatchewan approximately 500m to the west of our Flin Flon Metallurgical Complex.


The 777 mine site is 311 metres above sea level. The geographical area has cool summers and very cold winters with a mean annual temperature of 0.6° C. Operating costs in the first and fourth quarters are typically higher due to additional heating and other seasonal costs. The predominant vegetation is closed stands of black spruce and jack pine with a shrub layer of ericaceous shrubs and ground cover of mosses and lichens.


History


Under the ownership of Minorco, S.A. in the mid-1990s, a strategic review of the company’s northern Manitoba and Saskatchewan operations depicted declining reserves, lower ore grades, rising costs and a poor safety record. At that time, it was concluded that a less than a 10-year mine life was possible and closure of operations before 2005 was planned.


In connection with the closure plan, it was decided to continue exploration efforts until 1998, the latest time an ore body could be developed for production prior to the planned closure. In 1993, based on the drilling program, the 777 deposit was first indicated by an underground exploration hole that intersected the mineralization at a depth of 1,000 metres.  In 1995, a drilling program delineated the ore body and by 1997, this ore body was defined.  In 1999, development of the 777 mine was commenced as part of the “777 Project” and commercial production from the mine commenced in January 2004.  By this time, Minorco S.A. had merged with Anglo American Corporation of South Africa to form Anglo American plc (“Anglo American”). In December 2004, we acquired HBMS and the 777 mine from Anglo American.


HBMS took a working option on the 777 property in 1967 from Callinan. In 1988, HBMS acquired Callinan’s remaining interest in the property and in return granted Callinan the net profit interest and royalty described above.


The 777 discovery was deemed a geological success as the first hole, 4Q-64, was drilled down to 1,682 metres in 1993 to test the down trend extents of the Callinan deposit. This hole, drilled on the west of Ross Lake, intercepted two zones of VMS style mineralization. With the confirmation of mineralization down trend, this hole was followed up with further drilling from underground at the 840 metre level track drift of the Callinan Mine. The deposit was later named after the discovery hole, CX-777, which intercepted several zones of massive mineralization, the largest of which was 22.52m in core length grading 5.358g/t gold, 55.994g/t silver, 2.89% copper, and 7.40% zinc.


Geological Setting


The 777 deposit lies in the western portion of the Paleoproterozoic Flin Flon Greenstone Belt. The Greenstone Belt is interpreted to be comprised of a variety of distinct 1.92 to 1.87Ga tectonostratigraphic assemblages including juvenile arc, back-arc, ocean floor and ocean island, and evolved volcanic arc assemblages that were amalgamated to form an accretionary collage prior to the emplacement of voluminous intermediate to granitoid plutons and generally subsequent deformation.  The volcanic assemblages consist of mafic to felsic volcanic rocks with intercalated volcanogenic sedimentary rocks. The younger plutons and coeval successor arc volcanics, volcaniclastic, and sedimentary successor basin rocks include the older, largely marine turbidites of the Burntwood Group and the terrestrial metasedimentary sequences of the Missi Group (which includes the Flin Flon formation).


The Flin Flon formation is subdivided into three mappable members containing units of heterolithic and monolithic breccias, rhyolite flows and domes, and massive and pillowed basalt flows and


B2


flow-top breccias. It is comprised of the Millrock member, which contains the 777 and Callinan mineralization, and the footwall to it with the Blue Lagoon and Club members.


A complex succession of felsic and basalt-dominated heterolithic volcaniclastic rocks host the Flin Flon Main, Callinan and 777 volcanogenic massive sulphide (VMS) deposits within the Greenstone Belt. The north-trending, VMS-hosting, 30 to 700 metre thick volcanic/volcaniclastic succession is recognized for at least 5 kilometres along strike and has an average dip of 60°E. The volcaniclastic rocks have been interpreted to occupy a volcano-tectonic depression within a basaltic footwall succession.


Exploration


Drilling


The 777 deposit was first discovered in 1993 and was defined with significant drilling between 1995 and 1997. Diamond drilling is the only drilling type carried out for the purposes of exploration, ore zone definition and sampling of our 777 mine.  Drilling is done by drilling contractors under the supervision of our geologists. The modern 777 drilling program began in the early 2000’s and, as at September 30, 2012, a total of 1,829 holes and 256,625 metres had been drilled. All holes, except a geotechnical shaft pilot hole, were drilled from underground by a contractor using AW-34, AQTK, BQ and NQ core sizes. Drill hole spacing along the 777 deposit is generally 30 to 50 metres. Core recovery is near 100% for all holes. Drilling was categorized as definition, exploration, or geotechnical. Geotechnical drilling was completed in areas of planned underground infrastructure to ensure competency.


Standard procedure is that the core is initially logged for lithology then descriptively for grain size, foliation, minor units, alteration minerals and intensity, faults, RQD, joints and contacts.  Sample intervals are determined by both lithology and a visual estimate of the sulphide mineralization. As a general rule, sample intervals are approximately one metre, though the length varies depending on lithology or type of mineralization. It is likely that in no cases were samples taken from intervals less than 10 centimetres in length. However, as many of the assays are historic in nature, several were split when they overlapped lithological boundaries in the resource block model and resulted in sample intervals having lengths as low as one centimetre.


Surveying


We routinely conduct time-domain borehole electromagnetic surveys with three dimensional probes on drill holes. These probes used are induction coil probes which measure the secondary magnetic field induced by the primary field created by a loop. These electronic methods can generally detect off hole targets up to 150 metres or more from the hole depending on the size and conductivity of the target.  The sample quality can be affected by active mine workings and the proximity of the geophysical apparatus to a large ore body, such as 777, which can leave an imprint of the mine itself on the data.


After the initial aggressive exploration program that defined the 777 deposit, few holes had downhole geophysical surveys. The first modern exploration drill hole at the 777 mine, T7X-001, was pulsed in late 2004. Following that hole, little exploration work was conducted between 2005 and 2008 with only 56 holes being drilled during that four year period. Since 2009, exploration efforts have increased with the downhole geophysical surveying of approximately 30 holes, 20 of these using one of the underground footwall loops.  These were concentrated on deep footwall drilling, around the West Zone, and in the hanging wall.  Among these 30 holes, eight were surveyed in the hanging wall using a surface loop. All high priority targets have been followed up with drilling as well as most of the lesser category targets. The few lesser category targets remaining are planned to be drill tested in 2012.


B3


Between May and September 2007 a seismic survey was conducted in the Flin Flon area as part of a joint initiative, labeled TGI. The initiative was funded by Natural Resources Canada, Saskatchewan Industry and Resources, as well as Manitoba Industry, Economic Development and Mines, with active participation from us. This joint Federal-Provincial effort was led by the Geological Survey of Canada as part of a five year program that was aimed at sustaining reserves of base metals in established mining communities across Canada by supporting exploration for new deposits in the vicinity.


During this time period a total of 75 kilometres of high resolution 2D seismic profiles as well as a 3D survey covering approximately 10 square kilometres was completed. Results were hampered by the significant challenges posed by the complex crystalline geology of the area, proximity to an active town, active mining operations, and the highly variable terrain.


The survey resulted in a greater understanding of the area geology. Also, the discovery of Zone 33 at the 777 Mine was attributed to this survey as it showed a seismic reflector in the footwall, which was later followed up with drilling and downhole pulsing. Previous downhole geophysical surveys had noted this anomaly, but it was previously discounted as a shadow effect from the 777 Mine. The first drill hole (T7X-060) intercept in the zone encountered 9.55 metres in core length of 6.402 g/t gold, 99.25 g/t silver, 0.89% copper, and 15.59% zinc.


Mineralization


The 777 and Callinan deposits occur within an east-facing sequence of volcanic rocks documented as tholeiitic and basalt-dominated, and dated around 1888 Ma. The rocks immediately hosting the mineralization, however, consist of quartz-phyric (QP) and quartzfeldspar-phyric (QFP) rhyolite flows and quartz-±feldspar crystal-lithic volcaniclastic rocks of rhyolitic composition.


The 777 deposit can be divided into two main southeast plunging trends, the North Limb and the South Limb, as well as the West Zone. All three zones lie within the same stratigraphic sequence with the same lithofacies as described above. The West Zone lies in the footwall in what is interpreted to be a lower thrust slice and both limbs have the same stratigraphic sequence. On average the lenses strike at 010° and dip to the east at 45°. All zones have a relatively shallow plunge trending at -35° towards 140°. Horizontal widths throughout the deposit range from 2.5 metres to 70 metres in thickness, and can be thicker when two or more zones overlap.


There are a total of nine distinct sulphide lenses contained within the 777 deposit. Each of the zones is distinguished based on grade and mineralization type as well as their spatial location. The 777 deposit encompasses an area approximately 1,300m downplunge by 550 metres across and varying in depth from approximately 870 to 1,600 metres below surface. Lenses in general are fairly continuous with the exception of scattered diorite intrusions.


The Callinan deposit is subdivided into two rhyolite horizons termed the East-QP and the West-QP. The East-QP is host to the lenses of the North Zone (northern portion), and the East Zone (southeast portion), and is on the same horizon as the 777 mineralization. The West-QP hosts the South Zone (southwest portion) and its associated lenses. Each of these zones is further subdivided into a number of mineralized lenses. The subdivision of Zones into lenses was based on the spatial distribution of the mineralization. The South Zone lenses generally strikes to the north and dips at 50° to the east with a plunge trending at -50° towards 135°. The North and East Zones generally strike at 020° with a 50° dip to the east with a shallow plunge trending at -30° towards 145°.


There are a total of 20 sulphide lenses contained within the three broad zones of the Callinan deposit. The Callinan mineralization is a distal deposit that has a matrix supported breccia with variable amounts of wallrock fragments in a fine to medium grained sulphide matrix. The wallrock fragments are


B4


intensely altered with chlorite, talc and sericite with some degree of pyritization and carbonation. These lenses contain variable amounts of pyrite, sphalerite, chalcopyrite and minor pyrrhotite.


Mineralization is generally medium to coarse grained disseminated to solid sulphides consisting of pyrite, chalcopyrite, sphalerite, pyrrhotite, and magnetite. The principle gangue minerals are chlorite and quartz. Alteration minerals include biotite, epidote and actinolite.


Sampling and Analysis


Sampling Methods


The majority of sample intervals from definition and exploration drilling were whole rock sampled with the core placed in a plastic bag with its unique sample identification tag. Typically when exploration drilling in new areas, all samples are either split or cut in half with a diamond saw.


The bagged samples were placed in either a burlap bag or a plastic pail with a submittal sheet that was prepared by the geologist or technician. Samples were delivered to the Flin Flon assay laboratory, located in the Flin Flon Metallurgical Complex, which is owned and operated by us. Samples are checked by laboratory personnel to ensure that they match the submittal sheet.


The samples were analyzed for the following elements: gold, silver, copper, zinc, lead, iron, arsenic and nickel. Base metal and silver assaying was completed by aqua regia digestion and read by a simultaneous ICP unit. The gold analysis was completed on each sample by AAS after fire assay lead collection. Gold values greater than 10g/t were reassayed using a gravimetric finish. All analytical balances are certified annually by a third party. Check weights are used daily to verify calibration of balances. All metal standards used to make the calibration standards for the AAS and ICP are certified and traceable. Each is received with a certificate of analysis. The Flin Flon assay laboratory was recently certified, in December 2011, to the ISO 9001 quality management system to help ensure it meets our needs as well as those of other stakeholders


A total of 112,732 samples from 3,396 drill holes were submitted to the Flin Flon assay laboratory for analysis as of the date of the most recent technical report. The average length for these sample intervals was 1.62 metres.


Bulk density measurements were taken on 2,982 of the mineralized samples selected for assaying as of the date of the most recent technical report. The measurement methodology consisted of first weighing the core sample in air, then, the sample was suspended in a tub filled with water by a chain on the underside of the scale in such a way that it did not touch the sides of the water-filled tub and the weight of the submerged sample was recorded.


Quality Assurance and Quality Control


As part of our Quality Assurance and Quality Control (QAQC) measures, a portion of the pulp duplicates has been sent to Acme Analytical Laboratories Ltd. (“Acme”) in Vancouver, British Columbia for comparison and verification purposes since early 2006. Our QAQC measures also involve the use of blank materials, reference standards, internal duplicates, and repeats.


During the drilling programs at 777 a total of four different types of blanks were inserted into the sample stream between early 2000 and September 2011. Blanks were inserted at a rate of 1 for every 20 assays until the fall of 2003, when this was reduced to 1 for every 50 assays as a means of cost reduction. Since our assay laboratory runs batches of 50-60 samples at a time this should place at least one blank in every batch.


B5


The use of reference standards has become increasingly systematic and they are now e increasingly systematic inserted into the sample stream at every 20th assay interval.


Duplicates are used as a check to verify the repeatability of the assay data. Duplicates are run at our laboratory at a frequency of one in twenty samples, and also at Acme as an independent check. Samples were selected by Acme at a minimum frequency of one sample per every five internal duplicates, which equates to at least one sample per every 100 samples.


Repeats, typically referred to as ‘blinds’, are run on a monthly basis on one sample out of every four or five duplicates that were analyzed during that month. The results are considered an internal independent check on our assay laboratory results.


Data Verification


Examination and mapping of the underground drifting visually confirmed the geology and VMS style of mineralization. As well, the examination of drill core for several holes has also confirmed the mineralization and geology and compared well to underground mapping with drill logs and assays.


A visit was conducted to the 777 core logging and storage area, exploration core storage facility, and our assay facility and each was deemed to be secure and in reasonable condition. In addition, the qualified person responsible for this section of the technical report has had several discussions with current and former geologists as well as other personnel that have worked at the deposit to verify various details of the mining, infrastructure, geology, drilling and sampling.


Full verification of the data was not able to be completed as a small portion of the data, from the Callinan portion of the deposit is considered historic in nature.


Security of Samples


For security purposes, all sample preparation, splitting, handling, and storage was in the control of our personnel at all times in accordance with then applicable chain of custody policies which were consistent with industry standards at the time. We implemented a documented full chain of custody procedure in August 2011. This involves the creation of a submittal sheet with all batches of drill core sent for assay by the geologist daily. The sheet is signed both by the geologist, to verify the samples were stored securely, and by the laboratory personnel, to verify it was in their control from the time it left the core shack and is consistent with the current industry standards.


Mineral Resource and Mineral Reserve Estimates


Mineral Resources


Mineral resources were separated into the 777 and Callinan portions of the deposit for purposes of calculating the estimate. This was done for mining and planning purposes as the Callinan lenses represent the upper, and more historic, portion of the mineralization and the 777 zones represent the lower more recently drilled and identified mineralization. The interpreted lenses of the 777 zones and certain Callinan lenses were built by digitizing polylines around the mineralization. Polylines were then linked with tag strings and triangulated in order to create three dimensional wireframe solids. The remainder of the mineralization was interpreted by digitizing polylines in a 2D plane around mineralized intercepts. The average strike and dip of the zone was estimated and utilized to calculate the horizontal width of the mineralization for both the 2D Gridded Seam Model and the polygonal interpretations.


B6


The mineral resource estimate, effective as of a September 30, 2012 cut-off date for diamond drilling, was completed using MineSight 6.5 software in mine coordinates, and for the Callinan lenses, the current version of MineSight at the time of estimation. The block model was constrained by interpreted 3D wireframes of the mineralization. Gold, silver, copper, zinc, iron, specific gravity and in some cases dilution variables and horizontal width were estimated into blocks using either ordinary kriging or relative co-ordinate kriging for most lenses. Lens intersections were generally selected based on a copper grade of greater than 1% copper or 2.5% zinc, or a combination thereof. Intersections were modelled as low as 0.3m to provide additional information for statistical and mining information.


A zinc or copper equivalency was not used in the determination of the resource.


Mineral Reserves


Mining, processing and economic parameters were applied to the block model to form the basis of the reserve estimate with an effective date of January 1, 2013. The measured resources were used to estimate the proven mineral reserves and the indicated resources were used to estimate the probable mineral reserves. For mining purposes, there are eight active mining areas in the mine to allow for a blended product with the end goal to send a blended grade to the mill. Mining methods were established for each mining area and a net smelter return (NSR) was calculated to determine the economic viability. NSR payable was calculated for each mining area comprised of blocks from the block model assuming metallurgical recoveries and long term metals prices. To determine the economic viability and NSR revenue of each mining block, onsite operating costs, capital development and offsite costs were estimated and applied against copper and zinc concentrate produced for each mining block. The final step of the reserving process involved developing an annualized life-of-mine production plan and supporting cash flow analysis to determine the 777 mine and 777 North expansion mineral reserves.


Reconciliation of Reserves and Resources


A year over year reconciliation of our estimated reserves and resources at the 777 mine is set out below.


777 Mine


Mineral Reserve Reconciliation (Proven & Probable)


tonnes


A                          2012 Mineral Reserve


11,838,000


B                          2012 Production (from Reserves)


1,400,000


C                          (A - B)


10,438,000


D                          Geology1 Gain/(Loss)


483,000


E                           Mine Planning2 Gain/(Loss)


(231,000

)


F                            Economics3 Gain/(Loss)


167,000


G                          (D + E + F)


419,000


H                         2013 Mineral Reserve (C + G)


10,857,000


1Geology - diamond drilling, interpretation, estimation (interpolation parameters)


2Mine Planning - dilution, recovery, resultant change in non-recoverable


3Economics - mine operating and capital, commodity price and CDN$/US$ exchange, concentrating, TC/RC, freight


B7


777 Mine


Mineral Resource Reconciliation (Inferred)


tonnes


I                              2012 Mineral Resource


1,065,000


J                              2013 Mineral Resource


698,000


K                         (J - I)


(367,000

)


Mining Operations


The 777 mine is a multi-lens orebody with shaft access down to the 1508 metre level. The mine consists of an internal ramp that provides access to each mining level. Mobile tired diesel equipment is utilized. Load haul dumps units vary from 6.1m3 to 7.6m3. Trucks are 40 to 50 ton units feeding an ore pass system or direct to rock-breakers which feed an underground crusher and ore is skipped to surface via the shaft.


Long-hole open stope is the mining method used at the 777 mine. Primary stopes are mined and filled with paste backfill, while secondary stopes are mined and filled with unconsolidated loose waste rock. Long-hole stopes are mined at 15 metre to 17 metre vertical sill to sill intervals. Stope strike lengths are generally 16 metres with widths of 2 to 100 metres, with an average of approximately 20 metres. The ore is undercut at the top and bottom of the block, providing access for drilling and mucking. Drilling is done by top hammer long-hole drills with holes varying in length between 10 metres and 20 metres long and a hole diameter of 3 inches. Mucking is accomplished by remote control load-haul-dumps (“LHDs”) and then loaded to haul trucks.


Retreat long-hole open stope and cut and fill are the mining methods planned for the 777 North expansion. Long-hole stopes will be mined using a similar method as at 777 mine.


Ore at 777 mine is loaded by LHDs to underground haul trucks, which dump to a series of ore passes that feed three chutes on 1412 metre level. Haul trucks are loaded from the chutes and haul the ore on the 1412 metre level haulage drift directly to the ore grizzly / rock-breaker at 1412 metres to properly size the muck. The ore is temporarily stored in a 1,725 tonne coarse ore bin that feeds the crusher. From the crusher it is conveyed to a 1,600 tonne fine ore bin, where it is conveyed to a loading pocket at the 1508 metre level and placed into two 15 tonne skips and hoisted to surface. The ore on surface is hauled by 53 to 63 tonne haulage trucks directly to the Flin Flon concentrator or is dumped on a stockpile close to the concentrator.


Ore from 777 North expansion is loaded onto haul trucks by LHDs and transported up the ramp to surface. The ore is dumped on the ground prior to being sent through a surface crusher operated by a contractor. The ore is then loaded and transported for processing at the Flin Flon concentrator or stockpiled nearby.


Our Flin Flon concentrator processes 777 ore into copper and zinc concentrates. Copper concentrate is sold to third party purchasers and zinc concentrate is sent to our Flin Flon zinc plant where it is further processed into special high grade zinc before being sold to third party purchasers. See “Description of our Business — Other Assets — Processing Facilities” and “Description of our Business — Other Information — Products and Marketing”.


Current production rates are expected to be approximately 4,000 tonnes per day for the 777 mine and 330 tonnes per day at the 777 North expansion based on 363 days of production per year. This yields an expected mine life through to 2020 for the 777 mine, while 777 North expansion is expected to end production in 2017. Production from 777 is subject to federal and provincial income taxes, as well as


B8


the Manitoba mining tax. The combined federal and provincial tax rates are assumed to be approximately 27% for the life of the mine.


The 777 mine has been in commercial production since 2004 and the original project capital has already been paid back and ongoing capital is defined as sustaining capital.


Exploration and Development


2011 marked the first year that a concentrated effort on exploration drilling was conducted from underground at the 777 mine. Much of the drilling to that date had been focused on converting resources to reserves. In excess of 86,000 metres of underground exploration drilling has been drilled at the 777 mine targeting additional resources in the hanging wall, footwall, along strike and in upgrading inferred resources. Significant knowledge was gained on the stratigraphy and current interpretations to the north of the deposit were proven to be accurate, and will be the focus of the 2013 exploration programs which is budgeted to exceed 28,000 metres of exploration drilling.


Lalor Project


Project Description and Location


Lalor is a zinc, gold and copper project currently under construction near the town of Snow Lake in the province of Manitoba. Lalor is located approximately 210 kilometres by road east of Flin Flon, Manitoba of which 197 kilometres is paved highway.


We own a 100% interest in the property through nine mineral leases that total approximately 913 hectares with annual rental payments payable to the Manitoba government of $10,825. The mineral leases terminate in April and September of 2023 and March of 2033. There are no royalties payable other than those potentially payable to the province. Surface rights are held under general permits with total annual rental payments of $1,212 and are sufficient for purposes of our development plans.


The Lalor project was envisaged to utilize, to the greatest extent possible, existing infrastructure in the Snow Lake area from previous mining activities and currently operating facilities. As such, liabilities associated with each operational area, have been addressed by the closure plans previously submitted to the regulators, and financial assurance has been provided to cover total closure and remediation costs. The project plan contemplated by the Advanced Exploration Project (AEP), which was approved by regulators, includes a closure plan for demolition and remediation of the AEP site. Financial assurance was also provided to cover costs detailed in the approved AEP closure plan.


As the Lalor project is in close proximity to our current operations in the Snow Lake area, it is possible for it to utilize existing facilities and infrastructure that have already been licensed and permitted. These licences and permits are tied to the recently closed Chisel North mine, Chisel Water Treatment Plant (WTP), Anderson Tailings Impoundment Area (TIA), and the Snow Lake concentrator.


Accessibility, Climate, Local Resources, Infrastructure and Physiography


The current project infrastructure includes a four kilometre main access road that was constructed in 2010 from provincial road 395 and provides access from the Chisel North mine site to the Lalor site. This access road includes a corridor with freshwater/discharge pipelines and a main hydro line. Access to the site is off of paved provincial highway 392 which runs between Snow Lake and Flin Flon.


The Snow Lake area has a typical mid-continental climate, with short summers and long, cold winters. Climate generally has only a minor effect on local exploration and mining activities.  The project


B9


area is approximately 300 metres above sea level, consisting of ridged to hummocky sloping rocks with depressional lowlands, and has gentle relief that rarely exceeds 10 metres. The area of Lalor and surrounding water bodies (Snow, File, Woosey, Anderson and Wekusko lakes) are located in the Churchill River Upland Ecoregion in the Wekusko Ecodistrict. The dominant soils are well to excessively drained dystic brunisols that have developed on shallow, sandy and stony veneers of water-worked glacial till overlying bedrock. Significant areas consist of peat-filled depressions with very poorly drained typic and terric fibrisolic and mesisolic organic soils overlying loamy to clayey glaciolacustrine sediments.


Tailings production associated with the Lalor project will be impounded in the currently permitted Anderson TIA. Waste rock from the underground development permitted under the Lalor AEP and Lalor mine is deposited into and stored in the Chisel Open Pit mine. Mine discharge water from the Lalor mine is treated in the Chisel WTP along with water from the Chisel Open Pit.


We operate a mine water pump station at the north end of Chisel Lake approximately eight kilometres from Lalor. In addition, we commissioned a 2,000 US gpm water treatment plant in the spring of 2008 at Chisel Lake, approximately seven kilometres by road from Lalor.


Power for the site construction is currently being transmitted at 25 kV using the current Chisel North mine substation via an eight kilometre long overhead transmission line.


Process water required for the construction phase of the project is estimated to be 45 to 50 m3/hr.  The process water will be drawn through existing pump stations located at Chisel Lake. Each pump station has a capacity of supplying 68 m3/hr.


Work on the project components of shaft sinking and site construction is currently being done by specialized contractors and there is a 198 person temporary construction camp in the town of Snow Lake to accommodate the Lalor project construction crew.


Personnel requirements for the Lalor project will largely be drawn from the immediate area where there is a history of operating mines. We believe there are sufficient skilled operating, maintenance and technical personnel available to bring Lalor to its planned full production. The Lalor mine in full operation will require approximately 300 employees and the new concentrator will require approximately 74 employees.


History


The Lalor deposit is situated in the Chisel Basin. Exploration in the Chisel Basin has been active since 1955. The Chisel Basin area has hosted three producing mines, namely, Chisel Lake, Chisel Open Pit and Chisel North. All three mines have very similar lithological and mineralogical features.


A Crone Geophysics survey in 2003 indicated a highly conductive shallow-dipping anomaly at a vertical depth of 800 metres. In early 2007, drill hole DUB168 was drilled almost vertically to test the anomaly and intersected a band of conductive mineralization between 781.74 metres and 826.87 metres (45.13 metres). Assay results include 0.30% Cu and 7.62% Zn over the 45.13 metres, including 0.19% Cu and 17.26% Zn over 16.45 metres.


Geological Setting


The Lalor property lies in the eastern (Snow Lake) portion of the Paleoproterozoic Flin Flon Greenstone Belt and is overlain by a thin veneer of Pleistocene glacial/fluvial sediments. Located within the Trans-Hudson Orogen, the Flin Flon Greenstone Belt consists of a variety of distinct 1.92 to 1.87 Ga tectonostratigraphic assemblages including juvenile arc, back-arc, ocean-floor and ocean-island and


B10


evolved volcanic arc assemblages that were amalgamated to form an accretionary collage (named the Amisk Collage) prior to the emplacement of voluminous intermediate to granitoid plutons and generally subsequent deformation. The volcanic assemblages consist of mafic to felsic volcanic rocks with intercalated volcanogenic sedimentary rocks. The younger plutons and coeval successor arc volcanics, volcaniclastic, and sedimentary successor basin rocks include the older, largely marine turbidites of the Burntwood Group and the terrestrial metasedimentary sequences of the Missi Group.


The Snow Lake arc assemblage that hosts the producing and past-producing mines in the Snow Lake area is a 20 kilometres wide by 6 kilometres thick section that records a temporal evolution in geodynamic setting from ‘primitive arc’ (Anderson sequence to the south) to ‘mature arc’ (Chisel Basin sequence) to ‘arc-rift’ (Snow Creek sequence to the northeast). The ‘mature arc’ Chisel Basin sequence that hosts the zinc rich Chisel, Ghost, Chisel North, and Lalor deposits typically contains thin and discontinuous volcaniclastic deposits and intermediate to felsic flow-dome complexes.


The Lalor deposit is similar to other massive sulphide bodies in the Chisel Basin sequence (Chisel Lake, Ghost Lake and Chisel North), and lies along the same stratigraphic horizon as the Chisel Lake and Chisel North deposits. It is interpreted that the top of the zone is near a decollement contact with the overturned hanging wall rocks.


Exploration and Drilling


Exploration in the Lalor deposit area is conducted by us. Time-domain borehole electromagnetic surveys with three dimensional probes are routinely conducted on drill holes. The survey results identify any off-hole conductors that have been missed and indicate direction to the target as well as the dimensions and the attitude of the conductor. The survey also may detect any possible conductors which lie past the end of the hole allowing the geologist to know whether or not the hole should be deepened.


Diamond drilling is the only type of drilling carried out at Lalor. Definition drilling is ongoing for purposes of mine planning and exploration drilling near the deposit has been deferred until we have underground access, which is expected in late 2014.


As of September 30, 2012, 121 parent and 101 wedge holes, amounting to 198,399 metres of drilling, was completed from surface, and a further 58 holes for 9,403 metres of definition drilling was completed from underground.


All diamond drilling completed from surface or underground retrieved whole core sizes of BQ and NQ. Wedge offsets and associated directional drilling were completed on parent holes, resulting in time and cost savings over drilling a new hole from surface. Wedging and directional drilling were used at Lalor to acquire metallurgical samples and delineate the ore body. For delineation purposes, wedge offsets are oriented towards specific targets selected by the geologists along a path calculated by the directional drilling technicians. In metallurgical sampling, wedge offsets are not oriented and the wedge is set just above the zone that is to be sampled such that the core sample collected is generally within 10 to 20 metres of the parent hole intersection.


Core recovery at Lalor is near 100% on all holes and all the diamond drilling at Lalor was conducted by Major Drilling Inc.


Mineralization


Lalor is interpreted as a VMS deposit that precipitated at or near the seafloor in association with contemporaneous volcanism, forming a stratabound accumulation of sulphide minerals. VMS deposits typically form during periods of rifting along volcanic arcs, fore arcs, and in extensional back arc basins.


B11


Rifting causes extension and thinning of the crust, providing the high heat source required to generate and sustain a high-temperature hydrothermal system.


The location of VMS deposits is often controlled by synvolcanic faults and fissures, which permit a focused discharge of hydrothermal fluids. A typical deposit will include the massive mineralization located proximal to the active hydrothermal vent, footwall stockwork mineralization, and distal products, which are typically thin but extensive. Footwall, and less commonly, hanging wall semi-conformable alteration zones are produced by high temperature water-rock interactions.


The depositional environment for the mineralization at Lalor is similar to that of present and past producing base metal deposits in felsic to mafic volcanic and volcaniclastic rocks in the Snow Lake mining camp. The deposit appears to have an extensive associated hydrothermal alteration pipe.


The Lalor VMS deposit is flat lying, with zinc mineralization beginning at approximately 570 metres from surface and extending to a depth of approximately 1,160 metres. The mineralization trends about 270° to 310° azimuth and dips between 15° and 30° to the north. It has a lateral extent of about 900 metres in the north-south direction and 700 metres in the east-west direction.


Sulphide mineralization is pyrite, sphalerite and chalcopyrite. In the near solid (semi-massive) to solid (massive) sulphide sections, pyrite occurs as fine to coarse grained crystals ranging one to six millimetres and averaging two to three millimetres in size. Sphalerite occurs interstitial to the pyrite. A crude bedding or lamination is locally discernable between these two sulphide minerals. Near solid coarse grained sphalerite zones occur locally as bands or boudins that strongly suggest that remobilization took place during metamorphism. Disseminated blebs and stringers of pyrrhotite and chalcopyrite occur locally within the massive sulphides, adjacent to and generally in the footwall of the massive sulphides.


Notable gold and silver rich zones have also been intersected in the footwall of the zinc rich base metal mineral resources on the property. The precious metal mineralization begins at approximately 750 metres from surface and extends to a depth of approximately 1,480 metres. Their general shape is similar to the base metals. However, the current interpretation suggests the deeper copper-gold lens tends to have a much more linear trend to the north than the rest of the zones.


Gold and silver enriched zones occur near the margins of the sulphide lenses and in local silicified footwall alterations. These silicified areas often correlate with disseminated to stringer chalcopyrite and galena, whether together or independent of each other. This footwall gold mineralization is typical of VMS footwall feeder zones with copper-rich disseminated and vein style mineralization overlain by massive zinc-rich zones.


Six distinct stacked zinc rich mineralized zones, five stacked lens groups of gold mineralization of low sulphide either in contact with or entirely separate to the zinc rich base metal resources and one copper gold zone of mineralization were interpreted. The interpreted gold zones are generally co-paralleled and/or separate to the zinc rich base metal mineral resource zones. However, gold and potential gold zones locally merge, overlap and cut through zinc rich base metal resources.


The gold zones remain open down plunge to the north and northeast.


Sampling and Analysis


Bagged samples are delivered to our Flin Flon assay laboratory and after preparation the pulp samples are delivered to Acme for analysis. A total of 63,904 samples from 108 parent holes and 96 wedges were submitted for assay and analysis. Base metals and silver assaying is completed by aqua


B12


regia digestion and read by a simultaneous ICP unit. Gold analysis conducted by Acme is completed on ICP after fire assay lead collection. Samples greater than 10 g/t are re-assayed using a gravimetric finish.  Assaying integrity is monitored internally with a quality control program which includes the use of assay sample standards, blanks, duplicates and repeats. In addition, within each group of 20 core samples, one sample is check assayed at a different laboratory.


Security of Samples


The measures taken to ensure the validity and integrity of samples taken at our Lalor project are substantially the same as those taken at our 777 mine, as described above.


Mineral Resource Estimates


The mineral resource estimate, effective as of a September 30, 2012 cut-off date for diamond drilling, for the zinc rich base metal, gold and copper-gold zones was completed using MineSight 6.5 block modeling software in UTM NAD83 coordinates.


The zinc rich base metal mineralized zones were constrained by interpreted 3D wireframes in the block model. Gold, silver, copper, zinc, lead, and iron grades and specific gravity were estimated into blocks using Ordinary Kriging (OK) interpolation. Zone intersections were selected based on a minimum 4% Zinc Equivalency formula (ZNEQ) over a two metre core length. The ZNEQ was calculated from metal price and metal recovery assumptions, with economic contributions from gold, silver, copper and zinc. Each block was assigned a ZNEQ.


The gold and copper-gold mineralized zones were constrained by interpreted 3D wireframes in the block model. A 1.0 g/t gold cut-off over a two metre core length was used to determine the zone outlines for continuity purposes to build the 3D wireframes. Gold, silver, copper, zinc, lead, and iron grades and specific gravity were estimated into blocks using OK interpolation.


In order to avoid any disproportionate influence of random, anomalously high grade assays on the estimated average metal grade, histograms, cumulative frequency log probability charts, cutting curves, and decile analysis charts were created to examine the assay grade distribution and assess the need for grade capping.


The zinc rich, gold and copper gold mineral resources are classified on the basis of the model blocks to the nearest composite, minimum number of composites, and minimum number of drill holes.


Mineral Reserve Estimates


Mining, processing and economic parameters were applied to the block model to form the basis of the reserve estimate with an effective date of January 1, 2013. The measured resources were used to estimate the proven mineral reserves and the indicated resources were used to estimate the probable mineral reserves. Mining methods were established for each mining area and an NSR was calculated to determine the economic viability. NSR payable was calculated for each mining area comprised of blocks from the block model assuming metallurgical recoveries and long term metals prices. To determine the economic viability and NSR revenue of each mining block, onsite operating costs, capital development and offsite costs were estimated and applied against copper bulk and zinc concentrate produced for each mining block. The final step of the reserving process involved developing an annualized life of mine production plan and supporting cash flow analysis to determine the Lalor mineral reserves..


B13


Reconciliation of Reserves and Resources


A year over year reconciliation of our reserves and resources at the Lalor project is set out below.


Lalor


Mineral Reserve Reconciliation (Proven & Probable)


tonnes


A                          2012 Mineral Reserve


14,432,000


B                          2012 Production (from Reserves)


59,000


C                          (A - B)


14,373,000


D                          Geology1 Gain/(Loss)


583,000


E                           Mine Planning2 Gain/(Loss)


(433,000

)


F                            Economics3 Gain/(Loss)


547,000


G                          (D + E + F)


697,000


H                         2013 Mineral Reserve (C + G)


15,071,000


1Geology - diamond drilling, interpretation, estimation (interpolation parameters), category upgrading


2Mine Planning - dilution, recovery, resultant change in non-recoverable, not included in mine plan


3Economics - mine operating and capital, commodity price and CDN$/US$ exchange, concentrating, TC/RC, freight


Lalor


Mineral Resource Reconciliation (Inferred)


tonnes


I                              2012 Mineral Resource


12,615,000


J                              2013 Mineral Resource


11,990,000


K                         (J - I)


(625,000

)


Mining Operations


Mine Planning


The economic analysis in the most recent technical report for the Lalor project was based on underground mining of 14.4 million tonnes of probable reserves and excludes the inferred resources. It contemplated a mine life of 15 years and an expected payback of project capital, based only on such probable reserves and the capital cost estimate at the time, in 2023.


The revised capital cost estimate for the project is based on our plan to develop the entire Lalor deposit. We are currently working on a revised mine plan to determine whether there are opportunities to optimize our expected ore production rate of 4,500 tonnes per day to better match the potential production shaft and concentrator grinding capacities.


Lalor reserves will be accessed from footwall access drifts off the main ramp. Mining is primarily by post pillar cut and fill and longhole methods with a combination of paste and unconsolidated waste backfill. The underground ore handling system will be done by truck to an ore pass with rock breaker and grizzly dump, hoisted to surface via a 6.7 metre diameter shaft and conveyed to the neighbouring surface crushing plant, then conveyed to the surface stockpile. The stockpile will feed a SAG mill and ball mill


B14


combination that has design capacity at 5,400 tonnes per day. The recovery process will be normal floatation producing a copper bulk concentrate and a zinc concentrate. The remaining tails will either provide feed to the paste plant or be sent to the Anderson Lake tailings impoundment area. Concentrates will be shipped to Flin Flon where the zinc concentrates are processed at our zinc plant and copper bulk concentrate will be loaded onto rail cars and sent to third party smelters. The Lalor shaft is based on the 777 shaft design and is designed to a planned vertical depth of 985 metres.


First production from the production shaft is still projected to be on schedule for late 2014. Prior to completion of the new concentrator in late 2015, production from the production shaft will be processed at the Snow Lake and Flin Flon mills and a portion stockpiled for the new concentrator upon its commissioning.


Permitting and Environmental


In April 2010, we received an AEP for the Lalor project from the Manitoba government which allows us to upgrade the existing exploration road, construct an exploration shaft and related facilities, develop an underground exploration platform, and extract up to a 10,000 tonne sample via the main production shaft from the gold and copper-gold zones for metallurgical testing. Current production via the ventilation shaft is permitted pursuant to the licence for the Chisel North mine.


Before the Lalor project can move into full mine production an Environment Act Licence (EAL) must be received. The EAL for the Lalor mine was submitted in May 2012. The Sewage Treatment Plant also requires an EAL approval and was included in the Lalor mine application. In addition, an EAL is also required for the new Lalor concentrator, the application for which is expected to be submitted in 2013. The application for the Chisel Substation EAL was submitted in February 2012 and the licence was granted in May 2012. Improvements to the Anderson TIA will commence after providing notice of major alteration of its existing licence to the regulatory authorities and the alteration is approved.


A closure plan and financial assurance is currently in place for the Lalor AEP and will be updated for the Lalor mine as a requirement of the EAL. Closure plans and financial assurance for demolition and remediation will be developed as part of other EALs for the changes to the overall impact that the Lalor project will have on our operations in the Snow Lake area.


Exploration and Development


During the fourth quarter of 2012, we hoisted 58,000 tonnes of ore from the ventilation shaft at Lalor. Between August and December 2012 we hoisted 72,300 tonnes of ore and 79,830 tonnes of waste using the ventilation shaft. Underground project development has continued to advance and our primary focus is to reach the 910 metre shaft station and continue to ramp to the 955 metre level. We expect shaft sinking to be completed in late 2013. Upon completion of sinking, the installation of the steel sets and guides as well as the headframe changeover will begin.


We are in the process of completing the final engineering work for the load out facilities located at the 955 metre level, as well as completing the main pumping installations. We are preparing for construction of the main intake fan systems and the main substation during 2013.


Constancia Project


Property Description and Location


We currently hold a 100% interest in the Constancia project in southern Peru. The Constancia project includes the Constancia and Pampacancha deposits and is located approximately 600 kilometres


B15


southeast of Lima at elevations of 4000 to 4500 metres above sea level. Geographic coordinates at the centre of the property are longitude 71° 47’ west and latitude 14° 27’ south.


We acquired the Constancia project in March 2011 through our acquisition of all of the outstanding shares of Norsemont. We own a 100% interest in the 36 mining concessions (covering an area of 22,516 hectares) that comprise the Constancia project, all of which are duly registered in the name of our wholly-owned subsidiary, HudBay Peru S.A.C.; HudBay Peru S.A.C. also has the required surface rights to develop the Constancia project. Most of the known mineralization is located in the claims Katanga J, Katanga O, Katanga K, and Peta 7, though small mineralized outcrops are common throughout the area. All the mining concessions are currently in good standing. The annual concession fee payments of US$3.00 per hectare are due on June 30 each year.


Most permits required for construction, including the ESIA and principal beneficiation concession, are now in place. The key permit required for operation is the mine permit. The mine permit was fully approved in December 2012 and we expect to receive other required permits in the ordinary course.


The Constancia project is subject to the following taxes, royalties and other agreements concerning mineral production:


Peruvian Tax Regime


The Constancia project is subject to the Peruvian tax regime, which includes the mining tax, mining royalty, 8% labour participation, corporate tax and IGV/VAT. The Special Mining Tax (SMT) and the Mining Royalty (MR) are recently introduced taxes (late-2011) for companies in the mineral extractive industries. Both the SMT and the MR are applicable to mining operating income based on a sliding scale with progressive marginal rates. The effective tax rate is calculated according to the operating profit margin of the company. Based on Constancia’s expected life-of-mine operating profit margin, the effective SMT and MR tax rates are projected to be 2.86% and 2.61% of operating income over the life of the project. The MR is subject to a minimum of 1% of sales during a given month.


Silver Stream Agreement


Silver production from our Constancia project is subject to our agreement with Silver Wheaton, as described in this AIF. Pursuant to the Constancia Stream Agreement, we have agreed to receive aggregate upfront deposit payments of US$295 million against delivery of 100% of payable silver from our Constancia project. At closing, we received an upfront deposit payment of US$45 million and will receive a further US$250 million in deposit payments in two equal installments once US$500 million and US$1.0 billion, respectively, in capital expenditures have been incurred at our Constancia project.


In addition to the upfront payments, for silver delivered in accordance with the Constancia Stream Agreement, we will receive cash payments equal to the lesser of (i) the market price and (ii) US$5.90 per ounce (for silver), subject to 1% annual escalation after three years. For additional information, refer to “Three Year History”.


Legacy NSR


We will be required to pay a net smelter return royalty (NSR) of 0.5% to a maximum of US$10.0 million to the previous owners of the property.


B16


Accessibility, Climate, Local Resources, Infrastructure and Physiography


The Constancia project is accessible from Lima by flying to either Arequipa or Cusco and then proceeding by paved and gravel highway to the project site, which in each case takes approximately seven hours. The closest town is Yauri (population 23,000), which is approximately 80 kilometres by road from the project site. The road to Yauri (in the general vicinity of Xstrata’s Tintaya and Antapaccay mines) is expected to be upgraded in time to meet the construction and life-of-mine transportation requirements of the project. Copper concentrate is expected to be transported via Yauri to the Matarani port, which is approximately 460 kilometres by road from the project site.


The climate of the region is typical of the Peruvian altiplano in which the seasons are divided into the wet season between October and March with slightly higher temperatures and a dry season during April to September with colder temperatures. Temperatures can dip below -10° Celsius and rise to 20° Celsius. The sun can be very strong with high ultraviolet readings being common during the mid-day period. There is a climate monitoring station installed at the project site.


Elevations on the property range from 4,000 to 4,500 metres above sea level with moderate relief and grass-covered altiplano terrain. Slopes are typically covered with grasses at lower elevations. At higher elevations, talus cover is common with very little vegetation. The grasslands are used as pasture for animals and at lower elevations for some limited subsistence agriculture. Water resources are readily available from a number of year-round streams near the project site.


The Constancia project’s maximum demand for electricity is estimated to be 96 MW with an average load of 85 to 90 MW in the first 5 years. It is expected that sufficient electricity will be available at the new 220 kV Tintaya substation (planned to be in operation in mid-2013) located about 70 kilometres from the mine site and we have executed a contract for integrated services to bring power from this substation to the Constancia project.


Other project infrastructure includes the tailings management facility, waste rock facility and water management systems.


We have entered into life-of-mine agreements with the neighbouring communities of Chilloroya and Uchuccarco. These agreements provide us the surface rights required for project construction and operations and specify our commitments to these local communities over the course of mine construction and operations. In particular, the community agreements contemplate cash payments for the land access rights, as well as funds for facilitation of development projects and investment for local enterprises. The agreements also outline ongoing annual investments in community development including medical, educational and agricultural services.


The nearby communities can provide unskilled labourers, but access to skilled mining talent must be obtained through training or enlisting personnel from outside the area.


History


The original Constancia property, consisting of 13 concessions, was obtained by Norsemont pursuant to an option agreement with Rio Tinto Mining and Exploration Ltd. (“Rio Tinto”). Norsemont acquired an initial 51% interest in the property from Rio Tinto in November 2007 by making cash payments totalling US$5.0 million, completing work expenditures of US$7.8 million and issuing 1,250,000 common shares to Rio Tinto. Pursuant to the option agreement, in March, 2008 Norsemont paid Rio Tinto US$8.0 million in order to acquire the remaining 19% interest in Constancia held by Rio Tinto. Norsemont acquired the remaining 30% interest in the project from Mitsui Mining and Smelting Company Limited Sucursal Del Peru (“Mitsui”) pursuant to an agreement whereby Mitsui transferred its 30% interest in the


B17


Constancia property to Norsemont with no further obligation to Mitsui or the underlying owners of the property, for total consideration of US$9.8 million. Twenty-three additional concessions were obtained by Norsemont in 2007 and 2008.


The San Jose prospect (which forms part of the Constancia deposit) was explored by Mitsui during the 1980s. Exploration consisted of detailed mapping, soil sampling, rock chip sampling, and ground magnetic and induced polarization surveys with several drill campaigns. Drilling was mainly focused on the western and southern sides of the prospect. Mitsui completed 24 drill holes (4,200 metres) and Minera Katanga completed 24 shallow close-spaced drill holes at San Jose (1,200 metres).


In 1995, reconnaissance prospecting by Rio Tinto identified evidence for porphyry style mineralization exposed over an area 1.4 x 0.7 kilometres, open in several directions, with some copper enrichment below a widespread leach cap developed in both porphyry and skarn.


In May 2003, Rio Tinto revisited the area and the presence of a leached cap and the potential for a significant copper porphyry deposit were confirmed. Negotiations with Mitsui, Minera Livitaca and Minera Katanga resulted in agreements being signed on October 31, 2003 with the underlying owners. Rio Tinto renamed the prospect “Constancia”.


The Rio Tinto exploration activities consisted of geological mapping, soil, and rock chip sampling, and surface geophysics (magnetics and induced polarization). Rio Tinto completed 24 diamond drill holes for a total of 7,500 metres.


Geological Setting


The Constancia deposit is a porphyry copper-molybdenum system which includes copper-bearing skarn mineralisation. This type of mineralisation is common in the Yauri-Andahuaylas metallogenic belt where several porphyry Cu-Mo-Au prospects have been described but not exploited. Multiple phases of monzonite and monzonite porphyry have intruded a sequence of sandstones, mudstones and micritic limestone of Cretaceous age. Structural deformation has played a significant role in preparing and localising the hydrothermal alteration and copper-molybdenum-silver-gold mineralisation, including skarn formation.


The Pampacancha deposit is a porphyry related skarn system, with copper-bearing skarn mineralization. This type of mineralisation is common in the Yauri-Andahuaylas metallogenic belt where several skarn deposits have been developed, including Corocohuayco in the Tintaya District and Las Bambas.


Exploration and Drilling


Exploration is ongoing in the Constancia project area and is focused on the following:


Surface mapping and sampling


From 2007 to 2011, 11,444 hectares were mapped in the Constancia project area at several scales, including 1:1,000, 1:2,000 and 1:5,000. Of this, 8,905 hectares were mapped on our mining concessions, which represents 39% of our mining rights in the area. Additionally, 2,595 rock samples and 41 stream sediments samples were collected during this period.


B18


Geophysical data


An in-house interpretation of the geophysical data along with interpretation of available surface mapping and rock and stream sediment geochemistry helped identify several targets within the project area. The most important ones are the anomalies associated with the Pampacancha deposit, the chargeability-magnetic anomalies observed in the Chilloroya South prospect and the chargeability anomalies located in Uchuccarco, at 3.8 kilometres northeast of the Constancia porphyry.


In addition, a Titan-24 DC-IP-MT survey was completed in July 2011 to the south of the Constancia deposit.


Exploration targets and drilling


Several targets have been identified in the Constancia project area, including the Pampacancha and Chilloroya South prospects, both of which were drilled as part of the 2012 exploration program.


The Pampacancha prospect is located approximately 3 kilometres southeast of the Constancia porphyry. The prospect was identified in May 2008 after a stream sediment survey revealed a 27 square-kilometre, Au-Ag-Cu anomalous area, which was subsequently corroborated by mapping and rock sampling conducted on the area. Exploratory drilling at Pampacancha started in August 2008 and is ongoing at the main Pampacancha deposit and Pampacancha West (a group of geophysical anomalies located approximately 500 metres west of the main deposit) (totalling 36,246 metres as at December 31, 2012). Drilling has been carried out at the “main body”, “magnetic halo” and “limestone replacement” target areas. The Pampacancha feasibility study is underway and further characterization of geotechnical and hydrogeological information will be incorporated in the study.


The Chilloroya South area is located 5 kilometres south of the Constancia porphyry. Evidence of porphyry-related Cu-Au-Mo mineralisation and Cu-Au and Au-only bearing skarns occur in an area of about 3.5 kilometres by 3.5 kilometres coincident with several composite chargeability and magnetic anomalies at depth. Five primary targets were identified and preliminarily drill-tested from June 2010 to January 2011 (totalling 12,028.55 metres distributed in 35 holes). In July 2011, a Titan-24 DC-IP-MT survey was completed for mapping the resistivity and chargeability of the subsurface to significant depths, assisting geological interpretations and identified target at depth. Chilloroya South drilling in 2012 yielded interesting results with the presence of some gold mineralization. Geological modeling for future exploration considerations is ongoing. The geophysical anomaly immediately west of the Constancia pit was not fully tested. Two drill holes failed to pierce a significant fault structure to properly test the geophysical anomaly. Near the fault some porphyry mineralization was encountered and further review is required. The opportunity remains to pierce through the faulted structure utilising a larger and more powerful drill.


As of December 31, 2012, a total of 212,362 metres (845 holes) had been drilled at the Constancia project (this includes 7,484.15 metres drilled by Rio Tinto prior to 2005), in six drilling programs (infill, condemnation, metallurgical, geotechnical, hydrogeological and exploration). Drilling has been comprised of both diamond drilling (core recovery) and reverse circulation (chip recovery), with diamond drilling representing 90% of the total metreage.


Mineralization


The Constancia porphyry copper-molybdenum system, including skarn, exhibits five distinct deposit types of mineralization:


B19


1.              Hypogene fracture-controlled and disseminated chalcopyrite mineralization in the monzonite (volumetrically small);

2.              Hypogene chalcopyrite (rare bornite) mineralization in the skarns (significant);

3.              Supergene digenite-covellite-chalcocite (rare native copper) in the monzonite (significant);

4.              Mixed secondary sulphides/chalcopyrite in the monzonite (significant); and

5.              Oxide copper mineralization (volumetrically small).


Molybdenite, plus gold and silver, occur within all the above deposit types.


Two areas of porphyry-style mineralisation are known within the project area, Constancia and San José. At Constancia, mineralisation is deeper than that observed at San José which occurs at surface. The mineralized zone extends about 1,200 metres in the north-south direction and 800 metres in the east-west direction.


The Pampacancha deposit is located approximately 3 kilometres southeast of the Constancia porphyry. The stratigraphy unit in the area is the massive, gray micritic limestone of Upper Cretaceous Ferrobamba Formation; this unit in contact with the dioritic porphyry generate a magnetite skarn, hosts economic mineralization of Cu-Au-Mo.


The intrusive rocks are Oligocene age unmineralized basement diorite. Diorite porphyry is recognized as the source for skarn mineralisation, which in turn is cut by mineralized monzonite intrusions which provide minor local increases in Cu-Au mineralisation. Skarn Cu-Au mineralisation is best developed at the upper and lower margins of the limestone body. Prograde magnetite-chalcopyrite-pyrite skarn grades are marginally well mineralized garnet and pyroxene skarn which are locally overprinted by epidote-bearing retrograde skarn.


Epithermal mineralisation of the low sulphidation quartz-sulphide Au + Cu style, accounts for common supergene enriched Au anomalies, and along with other features such as hydrothermal alteration and veins typical of near porphyry settings.


Sampling and Analysis and Security of Samples


The sample preparation, analysis, security procedures and data verification processes used in the exploration campaigns on the Constancia project prior to our acquisition were reviewed through the documentation available in previously filed technical reports and we have been determined that the sampling methodology, analyses, security measures and data verification processes were adequate for the compilation of data at Constancia and Pampacancha and such processes continue to be used by us.


Constancia


At Constancia, a total of 1,247 bulk density measurements were taken by ALS Chemex from 145 drill holes using the paraffin wax coat method. Samples for density measurement in each major rock unit were extracted at approximately 50 metre intervals. Sample preparation and assaying used for the resource estimate in Norsemont’s 2009 Definitive Feasibility Study was done by ALS Chemex. In July 2008, the primary lab was changed to SGS del Peru (“SGS”) in Lima. Samples were prepared and analyzed using standard procedures, including Fire Assay (for gold) and Inductively Coupled Plasma — Atomic Emission Spectroscopy and Atomic Absorption Spectrophotometry (for other elements). All samples with copper values above 0.2% were analyzed by a Sequential Copper Method (although sequential copper data was not available for Rio Tinto’s exploration campaign).


B20


All lithological, alteration, geotechnical and mineralization data was logged on paper logs that were later entered in spreadsheets from where they were imported into the database. It was noted that the data entry spreadsheets had a number of built-in logical checks to improve the validity of the database. As was mentioned in Norsemont’s 2009 Definitive Feasibility Study, the geological and sample data was verified by a senior geologist before importing into a database.


Assay data was delivered in digital form by the main laboratory. Checks for inconsistent values were made by the senior geologist before data was uploaded.


We checked collar positions visually on plans for correctness in the data entry. Down-hole surveys were checked by examining coarse changes in the variables. Check runs were at regular intervals to check consistency of the drilling data.


Discrepancies were not identified between the log data and assay certificates and the drill hole database of text files used for the mineral resource estimate.


The quality control protocol during Norsemont’s Constancia exploration campaigns from 2006 to 2010 included the insertion of the following control samples in the sample batches:


·                  Twin samples (Core) or field duplicates (RC): one in 20 samples.


·                  Certified Reference Materials (CRMs): one in 20 samples; four CRMs are inserted in alternate order.


·                  Blanks: one in 20 samples.


The twin samples, field duplicates, coarse blanks and CRMs were inserted on the drill site prior to submission to the laboratory and Acme acted as secondary laboratory for the 2006 and part of the 2007 campaigns to check samples.


Pampacancha


A total of 56 bulk density measurements were taken from actual core at the Pampacancha deposit. The density measurements were conducted by ALS Chemex and are representative of the different rock and mineralization domains recognized to date.


All samples were sent to SGS for preparation and assaying. The SGS laboratory conforms to ISO/IEC 17025 and ISO 9002 standards and all samples were analyzed through Inductively Coupled Plasma — Atomic Emission Spectrometry  after multi-acid digestion and gold was determined by fire assay with Atomic Absorption Spectroscopy.


During the drilling, blanks were inserted into the sample stream as per geologist instruction at approximate intervals of every 30 samples. Standard references were prepared with material obtained from the Pampacancha deposit by us and were analyzed and certified by Acme labs. As part of the Pampacancha drilling, duplicates were obtained by splitting half core samples, obtaining two quarter core sub-samples, one quarter representing the original sample and the other quarter representing the duplicate sample.


We submitted a total of 15,932 samples from 110 drill holes to SGS’s laboratory for analysis. In addition to these samples, 471 blanks, 336 reference standards and 486 duplicates were submitted.


·                  Blanks: During the drilling, blanks were inserted into the sample stream as per geologist instruction at approximate intervals of every 30 samples.


B21


·                  Reference Standards: The reference standards certified by Acme labs were assayed by SGS. Of the 336 copper standards submitted for assaying, 124 of the assays fell outside the lower standard deviation indicating possible sub-estimation of copper content.


·                  Duplicates: The geologist routinely inserted duplicate core samples to check the homogeneity of the mineralization and sampling precision; duplicates were inserted approximately every 30 samples.


An internal validation of the drill hole database against the original drill logs and assay certificate information was carried out by us. The validation included 100% of the assay values from the Pampacancha drilling. No significant discrepancies existed within the database and it is believed to be accurate and suitable for mineral resource estimation.


Mineral Resource and Mineral Reserve Estimates


Mineral Resources


Constancia


The Constancia mineral resource estimate was completed by AMEC, effective August 23, 2011, and was subsequently reviewed and approved by us (under the supervision of Cashel Meagher, P. Geo., our Vice President, South America Business Unit and a qualified person under NI 43-101). The mineral resource estimate updated a previous estimate done by GRD Minproc as part of Norsemont’s 2009 Definitive Feasibility Study, used updated modelling methods and parameters and was completed using MineSight software in PSAD56 UTM 19S coordinates.


Resource estimation for Constancia was based on integrated geological and assay interpretations of information recorded from diamond core logging and assaying and is comprised of following key steps: Exploratory Data Analysis, Modelling (Composites, variography and Interpolation) and Validations. A total of 161,110 metres (554 holes) had been drilled at the time of the resource estimate.


The Constancia geological model is comprised of six lithology domains and five mineralization type zones. The mineralization type zones are: leached, oxide, supergene, mixed and hypogene material. The mineralization type model is based on logged codes, which have been checked against the sequential leach copper assay values.


Statistical analyses were performed by lithology type and mineralization type zone and were used to develop estimation domains.


In terms of resources categorization, the drill hole spacing analysis results indicate that a drilling spacing of 50 metres by 50 metres could be used to classify material as measured resources and drilling spacing of 80 metres by 80 metres could be used to classify material as Indicated resources.


After detailed review, we determined that AMEC’s mineral resource estimate for the Constancia deposit was accurate and that the resource model would be used in future engineering studies.


Pampacancha


The Pampacancha mineral resource estimate was developed by our Geology Team under the direction of Robert Carter, P. Eng. Director, Technical Services. The estimate was completed using GEMS® software in PSAD56 UTM 19S coordinates and has been approved by Cashel Meagher, P. Geo., Vice President, South America Business Unit, a qualified person under NI 43-101.


B22


The Pampacancha deposit was first drilled by Norsemont in 2008 and continued to be drilled by us after we acquired Norsemont in 2011. A total of 110 holes (30,863 metres) were used in the resource calculation with 14 of those being derived from reverse circulation drilling and the remaining 96 from HQ diameter diamond drilling. All holes were drilled from surface by Geotec. Core recovery was near 100% for all holes.


The drilling results were used to enable the preparation of a 3D geological interpretation and estimation of mineral resources. The database for the drill hole data utilised was maintained in Access spreadsheets and was validated by us in order to identify possible errors and compatibility to the assay certificates. We determined that the skarn mineralisation hosts the majority of the copper and the resource estimation was completed only for the skarn.


The mineral resource was estimated by ordinary kriging interpolation. In contrast to the Constancia resource estimate, in the Pampacancha resource estimate, a pit optimization shell was not considered and the main parameter for resource categorization was a copper cut-off of 0.2%.


Mineral Reserves


The mineral reserve estimates for the Constancia project are based on block models, as described in the Constancia Technical Report. Mining, processing, and economics parameters have been used to develop the mineral reserve estimate for the project. The mineral reserves’ economics are also described in detail in the Constancia Technical Report.


The mineral reserves estimates for the Constancia and Pampacancha deposits were prepared by Audra Walsh (President, CEO at A2Z Mining Inc); and approved by us (under the supervision of Cashel Meagher, P. Geo., our Vice President South America Business Unit and a qualified person under NI 43-101).


The Block Models used for the mineral reserve estimates have, as a base, the original mineral resource estimate described above; they take the original resource model for Constancia and re-block its Selective Mining Unit (SMU) from 10x10x15 metres to 20x20x15 metres and re-block the Pampacancha resource model SMU from 10x10x5 metres to 20x20x10 metres.


The regularized models which were created to simulate the actual mining practice by regularizing the SMU block sizes were considered a diluted model (the resulting dilution applied is approximately 2% in the Constancia deposit and 7.5% in the Pampacancha deposit) and no internal nor external dilution was added to the block models during the Mineral Reserve Estimation.


The Qualified Person, Cashel Meagher, concluded that smoothing within the block model provided sufficient dilution and accounted for potential mine losses.


Mine design and reserve estimation for the Constancia and Pampacancha pits used the Net Smelter Return (NSR) block models, which consist of the NSR values calculation for each block in the block models, taking into account the Cu, Mo, Ag, and Au grades, mill recoveries, contained metal in concentrate, deductions and payable metal values, metal prices, freight costs, smelting and refining charges and royalty charges. All of these parameters were applied to the block model (re-blocked resource models) to form the basis of the reserve estimate.


Proven and probable reserves have continued to grow at Constancia and Pampacancha to 450 million tonnes at a copper equivalent grade of 0.49%. The mine plan is such that the process plant is expected to operate to the capacity of the grinding circuit throughout the life of the mine. The plant is


B23


expected to process 29 Mt /a (84,500 t/d at 94% availability) of ore. Concentrate production rates average 328,000 t/a over the life of the mine.


The economics of the mineral reserves were confirmed by the financial model described in the Constancia Technical Report. The financial model confirmed a 14.5% internal rate of return, based on the following metals prices: a copper price of US$2.75/lb, gold price of US$1,150/oz, silver price of US$23.00 /oz and molybdenum price of US$14.00/lb. Metallurgical recoveries were determined and used for each of the metallurgical domains determined for the deposit.


Reconciliation of Reserves and Resources


A year over year reconciliation of our reserves and resources at the Constancia project is set out below.


Constancia


Mineral Reserve Reconciliation (Proven & Probable)


tonnes


A                          2011 Mineral Reserve


372,000,000


B                          2011 Production (from Reserves)


C                          (A - B)


372,000,000


D                          Geology1 Gain/(Loss)


3,000,000


E                           Mine Planning2 Gain/(Loss)


5,000,000


F                            Economics3 Gain/(Loss)


23,189,000


G                          (D + E + F)


31,189,000


H                         2012 Mineral Reserve (C + G)


403,189,000


Constancia


Mineral Resource Reconciliation


tonnes


I                              2011 Mineral Resource (Inferred)


20,963,000


J                              Geology1 Gain/(Loss)


402,000,000


K                         Economics3 Gain/(Loss)


280,000,000


L                           (J + K)


682,000,000


M                       Measured & Indicated Mineral Resource Gain/(Loss)


463,000,000


N                          Inferred Mineral Resource Gain/(Loss)


198,037,000


O                          2012 Measured & Indicated Mineral Resource


463,000,000


P                            2012 Inferred Mineral Resource


219,000,000


1Geology - diamond drilling, interpretation, estimation (interpolation parameters)


2Mine Planning - dilution, recovery, resultant change in non-recoverable


3Economics - mine operating and capital, commodity price and CDN$/US$ exchange, concentrating, TC/RC, freight


B24


Pampacancha


Mineral Reserve Reconciliation (Proven & Probable)


tonnes


A         2011 Mineral Reserve


B         2011 Production (from Reserves)


C         (A - B)


D         Geology1 Gain/(Loss)


E         Mine Planning2 Gain/(Loss)


46,720,000


F         Economics3 Gain/(Loss)


G         (D + E + F)


46,720,000


H        2012 Mineral Reserve (C + G)


46,720,000


Pampacancha


Mineral Resource Reconciliation


tonnes


I          2011 Mineral Resource (Measured and Indicated)


51,207,000


J          2012 Mineral Resource (Measured and Indicated)


K        2011 Mineral Resource (Inferred)


L         2012 Mineral Resource (Inferred)


4,474,000


M        (J - I) Measured and Indicated Gain (Loss)


(51,207,000

)

N         (L-K) Inferred Gain (Loss)


4,474,000


1Geology - diamond drilling, interpretation, estimation (interpolation parameters)


2Mine Planning - dilution, recovery, resultant change in non-recoverable


3Economics - mine operating and capital, commodity price and CDN$/US$ exchange, concentrating, TC/RC, freight


Mining Operations


Annual contained copper metal in concentrate is expected to average approximately 118,000 tonnes during the first five full years of production (2015- 2019) and 77,000 tonnes in subsequent years. Operating cash costs, net of by-product credits, are expected to average US$0.66/lb of copper for the first five years of production, and US$1.11/lb thereafter. Project payback on an after-tax basis is expected to occur in late-2018, which is the fourth year of commercial production.


The Constancia project is a traditional open pit shovel/truck operation with two deposits, Constancia and Pampacancha. The project consists of open pit mining and flotation of sulphide minerals to produce commercial grade concentrates of copper and molybdenum. Silver and a small quantity of payable gold will report to the copper concentrate. The Pampacancha deposit exhibits higher grades of copper and gold and is scheduled to enter into production during 2016.


The Constancia ultimate pit will measure approximately 1.7 kilometres east to west, 1.5 kilometres north to south, and have a maximum depth of approximately 600 metres. The Pampacancha ultimate pit will measure approximately 0.6 kilometres east to west, 1 kilometre north to south, and have a maximum depth of approximately 300 metres. There will be one primary waste rock facility, which is located to the south of the Constancia pit and is intended to be used for both deposits. The processing


B25


facility will be located approximately 1 kilometre west of the Constancia pit, while the tailings management facility (TMF) will be located approximately 3.5 kilometres southwest of the Constancia pit.


Total project mine life (not including construction) is estimated to be 17 years, including 9 months of pre-stripping and 8 months of ramp up. Feed stockpiled during the pre-stripping period will be processed during the first year of plant production. The priority plant feed will consist of high grade material and medium grade material. The low grade material will be fed as needed and will otherwise be sent to the waste rock facility.


The processing plant is designed to process 76,000 tpd of ore (25.33 Mtpa at 91.3% plant availability) from the Constancia and San José ore bodies. In early 2012, Ausenco reviewed the processing plant and ancillary equipment design, resulting in the potential capacity moving from the originally designed throughput of 76,000 tpd at 91.3% availability to 85,000 tpd at 94% availability. This increased capacity is expected to require very little additional capital.


Annual concentrate production rates are expected to ramp up from 350,000 tpa in Year 1 year to a peak of 450,000 tpa in Year 3. Production then drops to around 300,000 tpa until Year 10, after which it falls to 200,000 tpa and below until mine closure in Year 15.


The primary crusher, belt conveyors, thickeners, tanks, pebble crushers, flotation cells, mills and various other types of equipment will be located outdoors without buildings or enclosures. To facilitate the appropriate level of operation and maintenance, molybdenum concentrate bagging plant, copper concentrate filters and concentrate storage will be housed in clad structural steel buildings.


The processing plant has been laid out in accordance with established good engineering practice for traditional grinding and flotation plants. The major objective is to make the best possible use of the natural ground contours to minimise pumping requirements by using gravity flows and also to reduce the height of steel structures.


Development


Site activity to date includes the completion of 3,500 beds in the construction camp. The tailings management facility, haul roads and water diversion infrastructure are under construction. We expect to complete the access roads for heavy haulage in the second quarter of 2013, and the tailings management and waste rock facilities in the third quarter of 2013.


In addition, we have executed a contract for the construction of the 70 kilometre power transmission line from the Tintaya substation, we are finalizing negotiations on power purchase agreements and the principal port operator has provided further assurances that the concentrate shipments will be accommodated, and we are considering the short term and long term solutions to best serve the project’s needs.


In accordance with the agreements we have entered into with local communities, relocation of affected families is underway and the construction of new housing is in progress. We have delivered new homes to 13 families, and the remaining 23 families are scheduled to be relocated in 2013.


Structural steel delivery is scheduled to commence in May 2013 and the major steel erection for the plant site is expected to commence in June 2013. We have secured major long lead items including flotation cells, pumps, regrind mills, SAG mills and crushers. The primary crusher mechanical installation is anticipated in the fourth quarter of 2013. We have also secured the mine fleet with 18 haul trucks scheduled for delivery between June 2013 and August 2014. Tire procurement is underway with a number of tires purchased and contracts arranged to meet fleet requirements. We expect the arrival of


B26


the three hydraulic shovels in August 2013, September 2013 and January 2014, respectively, and to begin pre-stripping activities late in 2013.


Civil earth works for the process plant area are 70% complete and remain on schedule. The principal foundations for the ball and SAG mills are poured and complete and forms are being erected for the reclaim tunnels and crusher foundation.


Notwithstanding the expressed intention of the current national government in Peru to support mining, other mining projects—like the Conga project in northern Peru and projects in the Cusco region in southern Peru—have been the target of initiatives that have delayed and disrupted project development and operations. We are unable to predict positions or actions that may be taken by the national government or at the regional, community or local levels that may affect the development of Constancia.


Exploration


Exploration is ongoing at the Constancia project with three diamond drills. One drill is focused on Pampacancha infill drilling, while the two others are concentrated on Pampacancha West. The objective of this drilling campaign is to expand the current resource outside the known reserve pit shell. Expansion of the known reserves at Pampacancha will provide us with an opportunity to further optimize the mine plan with enhanced grades in the early years of production. The infill drilling is also expected to provide information for mine optimization opportunities.


B27


SCHEDULE C
AUDIT COMMITTEE CHARTER


PURPOSE


The Audit Committee is appointed by the Board of Directors to assist the Board of Directors in its oversight and evaluation of:


·                  the quality and integrity of the financial statements of the Company,


·                  the compliance by the Company with legal and regulatory requirements in respect of financial disclosure,


·                  the qualification, independence and performance of the Company’s independent auditor,


·                  the assessment, monitoring and management of the strategic, operational, reporting and compliance risks of the Company’s business (the “Risks”), and


·                  The performance of the Company’s Chief Financial Officer.


In addition, the Audit Committee provides an avenue for communication between the independent auditor, the Company’s Chief Financial Officer and other financial senior management, other employees and the Board of Directors concerning accounting, auditing and Risk management matters.


The Audit Committee is directly responsible for the recommendation of the appointment and retention (and termination) and for the compensation and the oversight of the work of the independent auditor (including oversight of the resolution of any disagreements between senior management and the independent auditor regarding financial reporting) for the purpose of preparing audit reports or performing other audit, review or attest services for the Company.


The Audit Committee is not responsible for:


·                  planning or conducting audits,


·                  certifying or determining the completeness or accuracy of the Company’s financial statements or that those financial statements are in accordance with generally accepted accounting principles.


Each member of the Audit Committee shall be entitled to rely in good faith upon:


·                  financial statements of the Company represented to him or her by senior management of the Company or in a written report of the independent auditor to present fairly the financial position of the Company in accordance with generally accepted accounting principles; and


·                  any report of a lawyer, accountant, engineer, appraiser or other person whose profession lends credibility to a statement made by any such person.


The fundamental responsibility for the Company’s financial statements and disclosure rests with senior management.


REPORTS


The Audit Committee shall report to the Board of Directors on a regular basis and, in any event, before the public disclosure by the Company of its quarterly and annual financial results. The reports of the Audit Committee shall include any issues of which the Audit Committee is aware with respect to the quality or integrity of the Company’s financial statements, its compliance with legal or regulatory requirements, the performance and independence of the Company’s independent auditor and changes in Risks.


The Audit Committee also shall prepare, as required by applicable law, any audit committee report required for inclusion in the Company’s publicly filed documents.


COMPOSITION


The members of the Audit Committee shall be three or more individuals who are appointed (and may be replaced) by the Board of Directors on the recommendation of the Company’s Corporate Governance and Nominating Committee. The appointment of members of the Audit Committee shall take place annually at the first meeting of the Board of Directors after a meeting of shareholders at which directors are elected, provided that if the appointment of members of the Audit Committee is not so made, the directors who are then serving as members of the Audit Committee shall continue as members of the Audit Committee until their successors are appointed.  The Board of Directors may appoint a member to fill a vacancy that occurs in the Audit Committee between annual elections of directors.  Any member of the Audit Committee may be removed from the Audit Committee by a resolution of the Board of Directors.  Unless the Chair is elected by the Board of Directors, the members of the Audit Committee may designate a Chair by majority vote of the members of the Audit Committee.


Each of the members of the Audit Committee shall meet the Company’s Categorical Standards for Determining Independence of Directors and shall be financially literate (or acquire that familiarity within a reasonable period after appointment) in accordance with applicable legislation and stock exchange requirements.  No member of the Audit Committee shall:


·                  accept (directly or indirectly) any consulting, advisory or other compensatory fee from the Company or any of its subsidiaries1  (other than remuneration for acting in his or her capacity as a director or committee member) or be an “affiliated person”2 of the Company or any of its subsidiaries, or


·                  concurrently serve on the audit committee of more than three other public companies without the prior approval of the Audit Committee, the Corporate Governance and Nominating Committee and the Board of Directors and their determination that such simultaneous service would not impair the ability of the member to effectively serve on the Audit Committee (which determination shall be disclosed in the Company’s annual management information circular).


A majority of the members of the Audit committee shall be “resident Canadians”, as contemplated by the Canada Business Corporations Act.


RESPONSIBILITIES


Independent Auditor


The Audit Committee shall:


·                  Recommend the appointment and the compensation of, and, if appropriate, the termination of the independent auditor, subject to such Board of Directors and shareholder approval as is required under applicable legislation and stock exchange requirements.


·                  Obtain confirmation from the independent auditor that it ultimately is accountable, and will report directly, to the Audit Committee and the Board of Directors.


1  A company is a subsidiary of another company if it is controlled, directly or indirectly, by that other company (through one or more intermediaries or otherwise).


2  An “affiliate” of a person is a person that, directly or indirectly, through one or more intermediaries, controls, or is controlled by, or is under common control with the first person.


C2


·                  Oversee the work of the independent auditor, including the resolution of any disagreements between senior management and the independent auditor regarding financial reporting.


·                  Pre-approve all audit and non-audit services (including any internal control-related services) provided by the independent auditor (subject to any restrictions on such non-audit services imposed by applicable legislation, regulatory requirements and policies of the Canadian Securities Administrators).


·                  Adopt such policies and procedures as it determines appropriate for the pre-approval of the retention of the independent auditor by the Company and any of its subsidiaries for any audit or non-audit services, including procedures for the delegation of authority to provide such approval to one or more members of the Audit Committee.


·                  Provide notice to the independent auditor of every meeting of the Audit Committee.


·                  Approve all engagements for accounting advice prepared to be provided by an accounting firm other than independent auditor.


·                  Review quarterly reports from senior management on tax advisory services provided by accounting firms other than the independent auditor.


·                  Review expense reports of the Chairman and the Chief Executive Officer.


The Audit Process, Financial Statements and Related Disclosure


The Audit Committee shall:


·                  Meet with senior management and/or the independent auditor to review and discuss,


·                                          the planning and staffing of the audit by the independent auditor,


·                                          before public disclosure, the Company’s annual audited financial statements and quarterly financial statements, the Company’s accompanying  disclosure of Management’s Discussion and Analysis and earnings press releases and make recommendations to the Board of Directors as to their approval and dissemination of those statements and disclosure,


·                                          financial information and earnings guidance provided to analysts and rating agencies: this review need not be done on a case by case basis but may be done generally (consisting of a discussion of the types of information disclosed and the types of presentations made) and need not take place in advance of the disclosure,


·                                          any significant financial reporting issues and judgments made in connection with the preparation of the Company’s financial statements, including any significant changes in the selection or application of accounting principles, any major issues regarding auditing principles and practices, and the adequacy of internal controls that could significantly affect the Company’s financial statements,


·                                          all critical accounting policies and practices used,


·                                          all alternative treatments of financial information within GAAP that have been discussed with senior management, ramifications of the use of such alternative disclosures and treatments, and the treatment preferred by the independent auditor,


·                                          the use of “pro forma” or “adjusted” non-GAAP information,


C3


·                                          the effect of new regulatory and accounting pronouncements,


·                                          the effect of any material off-balance sheet structures, transactions, arrangements and obligations (contingent or otherwise) on the Company’s financial statements,


·                                          any disclosures concerning any weaknesses or any deficiencies in the design or operation of internal controls or disclosure controls made to the Audit Committee in connection with certification of forms by the Chief Executive Officer and/or the Chief Financial Officer for filing with applicable securities regulators, and


·                                          the adequacy of the Company’s internal accounting controls and management information systems and its financial, auditing and accounting organizations and personnel (including any fraud involving an individual with a significant role in internal controls or management information systems) and any special steps adopted in light of any material control deficiencies.


·                  Review disclosure of financial information extracted or derived from the Company’s financial statements.


·                  Review with the independent auditor,


·                                          the quality, as well as the acceptability of the accounting principles that have been applied,


·                                          any problems or difficulties the independent auditor may have encountered during the provision of its audit services, including any restrictions on the scope of activities or access to requested information and any significant disagreements with senior management, any management letter provided by the independent auditor or other material communication (including any schedules of unadjusted differences) to senior management and the Company’s response to that letter or communication, and


·                                          any changes to the Company’s significant auditing and accounting principles and practices suggested by the independent auditor or other members of senior management.


Risks


The Audit Committee shall:


·                  Recommend to the Board of Directors for approval a policy that sets out the Risks philosophy of the Company and the expectations and accountabilities for identifying, assessing, monitoring and managing Risks (the “ERM Policy”) that is developed and is to be implemented by senior management.


·                  Meet with senior management to review and discuss senior management’s timely identification of the most significant Risks, including those Risks related to or arising from the Corporation’s weaknesses, threats to the Corporation’s business and the assumptions underlying the Corporation’s strategic plan (“Principal Risks”).


·                  Approve a formalized, disciplined and integrated enterprise risk management process (the “ERM Process”) that is developed by senior management and, as appropriate, the Environmental Health and Safety Committee, to monitor, manage and report Principal Risks.


·                  Recommend to the Board of Directors for approval policies (and changes thereto) setting out the framework within which each identified Principal Risks of the Corporation shall be managed.


C4


·                  At least semi-annually, obtain from senior management and, as appropriate, the Environmental Health and Safety Committee, a report specifying the management of the Principal Risks of the Corporation including compliance with the ERM Policy and other policies of the Corporation for the management of Principal Risks.


·                  Review with senior management the Company’s tolerance for financial Risk and senior management’s assessment of the significant financial Risks facing the Company.


·                  Discuss with senior management, at least annually, the guidelines and policies utilized by senior management with respect to financial Risk assessment and management, and the major financial Risk exposures and the procedures to monitor and control such exposures in order to assist the Audit Committee to assess the completeness, adequacy and appropriateness of financial Risk disclosure in Management’s Discussion and Analysis and in the financial statements.


·                  Review policies and compliance therewith that require significant actual or potential liabilities, contingent or otherwise, to be reported to the Board of Directors in a timely fashion.


·                  Review the adequacy of insurance coverages maintained by the Company.


·                  Acting jointly with the Compensation Committee, discharge the Board’s oversight function in respect of the administration of the pension and other retirement plans of the Company and its affiliates.


Compliance


The Audit Committee shall:


·                  Obtain reports from senior management that the Company’s subsidiary/foreign affiliated entities are in conformity with applicable legal requirements and the Company’s Code of Business Conduct and Ethics including disclosures of insider and affiliated party transactions and environmental protection laws and regulations.


·                  Review with senior management and the independent auditor any correspondence with regulators or governmental agencies and any employee complaints or published reports, which raise material issues regarding the Company’s financial statements or accounting policies.


·                  Review senior management’s written representations to the independent auditor.


·                  Advise the Board of Directors with respect to the Company’s policies and procedures regarding compliance with applicable laws and regulations and with the Company’s Code of Business Conduct and Ethics.


·                  Review with the Company’s General Counsel legal matters that may have a material impact on the financial statements, the Company’s compliance policies and any material reports or inquiries received from regulators or governmental agencies.


·                  Establish procedures for,


·                                          the receipt, retention and treatment of complaints regarding accounting, internal accounting controls or auditing matters, and


·                                          the confidential, anonymous submission by employees of the Company with concerns regarding any accounting or auditing matters.


C5


Delegation


To avoid any confusion, the Audit Committee responsibilities identified above are the sole responsibility of the Audit Committee and may not be allocated by the Board of Directors to a different committee without revisions to this Charter.


INDEPENDENT ADVICE


In discharging its mandate, the Audit Committee shall have the authority to retain (and authorize the payment by the Company of) and receive advice from special legal, accounting or other advisors as the Audit Committee determines to be necessary to permit it to carry out its duties.


C6


EX-99.2 3 a13-8934_1ex99d2.htm EX-99.2

Exhibit 99.2


Consolidated Financial Statements

(In Canadian dollars)


HUDBAY MINERALS INC.


Years ended December 31, 2012 and 2011


Deloitte LLP


Brookfield Place


181 Bay Street


Suite 1400


Toronto, ON M5J 2V1


Canada


Tel: 416-601-6150


Fax: 416-601-6610


www.deloitte.ca


Report of Independent Registered Chartered Accountants


To the Shareholders and Board of Directors of HudBay Minerals Inc.


We have audited the internal control over financial reporting of HudBay Minerals Inc. and subsidiaries (the “Company”) as of December 31, 2012, based on the criteria established in Internal Control—Integrated Framework issued by the Committee of Sponsoring Organizations of the Treadway Commission. The Company’s management is responsible for maintaining effective internal control over financial reporting and for its assessment of the effectiveness of internal control over financial reporting, included in the accompanying Management’s Report on Internal Control over Financial Reporting. Our responsibility is to express an opinion on the Company’s internal control over financial reporting based on our audit.


We conducted our audit in accordance with the standards of the Public Company Accounting Oversight Board (United States). Those standards require that we plan and perform the audit to obtain reasonable assurance about whether effective internal control over financial reporting was maintained in all material respects. Our audit included obtaining an understanding of internal control over financial reporting, assessing the risk that a material weakness exists, testing and evaluating the design and operating effectiveness of internal control based on the assessed risk, and performing such other procedures as we considered necessary in the circumstances. We believe that our audit provides a reasonable basis for our opinion.


A company’s internal control over financial reporting is a process designed by, or under the supervision of, the company’s principal executive and principal financial officers, or persons performing similar functions, and effected by the company’s board of directors, management, and other personnel to provide reasonable assurance regarding the reliability of financial reporting and the preparation of financial statements for external purposes in accordance with generally accepted accounting principles. A company’s internal control over financial reporting includes those policies and procedures that (1) pertain to the maintenance of records that, in reasonable detail, accurately and fairly reflect the transactions and dispositions of the assets of the company; (2) provide reasonable assurance that transactions are recorded as necessary to permit preparation of financial statements in accordance with International Financial Reporting Standards, and that receipts and expenditures of the company are being made only in accordance with authorizations of management and directors of the company; and (3) provide reasonable assurance regarding prevention or timely detection of unauthorized acquisition, use, or disposition of the company’s assets that could have a material effect on the financial statements.


Membre de / Member of Deloitte Touche Tohmatsu


Because of the inherent limitations of internal control over financial reporting, including the possibility of collusion or improper management override of controls, material misstatements due to error or fraud may not be prevented or detected on a timely basis. Also, projections of any evaluation of the effectiveness of the internal control over financial reporting to future periods are subject to the risk that the controls may become inadequate because of changes in conditions, or that the degree of compliance with the policies or procedures may deteriorate.


In our opinion, the Company maintained, in all material respects, effective internal control over financial reporting as of December 31, 2012, based on the criteria established in Internal Control — Integrated Framework issued by the Committee of Sponsoring Organizations of the Treadway Commission.


We have also audited, in accordance with Canadian generally accepted auditing standards and the standards of the Public Company Accounting Oversight Board (United States), the consolidated financial statements as of and for the year ended December 31, 2012 of the Company and our report dated February 20, 2013 expressed an unqualified opinion on those financial statements.


Independent Registered Chartered Accountants
Licensed Public Accountants


February 20, 2013
Toronto, Canada


Deloitte LLP


Brookfield Place


181 Bay Street


Suite 1400


Toronto, ON M5J 2V1


Canada


Tel: 416-601-6150


Fax: 416-601-6610


www.deloitte.ca


Report of Independent Registered Chartered Accountants


To the Shareholders and Board of Directors of HudBay Minerals Inc.


We have audited the accompanying consolidated financial statements of HudBay Minerals Inc. and subsidiaries (the “Company”), which comprise the consolidated balance sheets as at December 31, 2012 and December 31, 2011, and the consolidated income statements, statements of comprehensive income (loss), statements of changes in equity and statements of cash flows for the years ended December 31, 2012 and December 31, 2011, and a summary of significant accounting policies and other explanatory information.


Management’s Responsibility for the Consolidated Financial Statements


Management is responsible for the preparation and fair presentation of these consolidated financial statements in accordance with International Financial Reporting Standards as issued by the International Accounting Standards Board, and for such internal control as management determines is necessary to enable the preparation of consolidated financial statements that are free from material misstatement, whether due to fraud or error.


Auditor’s Responsibility


Our responsibility is to express an opinion on these consolidated financial statements based on our audits. We conducted our audits in accordance with Canadian generally accepted auditing standards and the standards of the Public Company Accounting Oversight Board (United States). Those standards require that we comply with ethical requirements and plan and perform the audit to obtain reasonable assurance about whether the consolidated financial statements are free from material misstatement.


An audit involves performing procedures to obtain audit evidence about the amounts and disclosures in the consolidated financial statements. The procedures selected depend on the auditor’s judgment, including the assessment of the risks of material misstatement of the consolidated financial statements, whether due to fraud or error. In making those risk assessments, the auditor considers internal control relevant to the entity’s preparation and fair presentation of the consolidated financial statements in order to design audit procedures that are appropriate in the circumstances. An audit also includes evaluating the appropriateness of accounting policies used and the reasonableness of accounting estimates made by management, as well as evaluating the overall presentation of the consolidated financial statements.


We believe that the audit evidence we have obtained in our audits is sufficient and appropriate to provide a basis for our audit opinion.


Membre de / Member of Deloitte Touche Tohmatsu


Opinion


In our opinion, the consolidated financial statements present fairly, in all material respects, the financial position of the Company as at December 31, 2012 and December 31, 2011 and their financial performance and cash flows for the years ended December 31, 2012 and December 31, 2011 in accordance with International Financial Reporting Standards as issued by the International Accounting Standards Board.


Other Matter


We have also audited, in accordance with the standards of the Public Company Accounting Oversight Board (United States), the Company’s internal control over financial reporting as of December 31, 2012, based on the criteria established in Internal Control—Integrated Framework issued by the Committee of Sponsoring Organizations of the Treadway Commission and our report dated February 20, 2013 expressed an unqualified opinion on the Company’s internal control over financial reporting.


Independent Registered Chartered Accountants

Licensed Public Accountants


February 20, 2013
Toronto, Canada


HUDBAY MINERALS INC.

Consolidated Balance Sheets

(in thousands of Canadian dollars)


Dec. 31,


Dec. 31,


Note


2012


2011


Assets


Current assets


Cash and cash equivalents


8


$

1,337,088


$

899,077


Trade and other receivables


9


52,876


40,309


Inventories


10


58,409


77,150


Prepaid expenses and other current assets


23,970


13,964


Other financial assets


11


2,442


3,112


Taxes receivable


23i


52,952


4,352


1,527,737


1,037,964


Prepaid expenses


1,232


1,227


Receivables


9


43,149


5,212


Inventories


10


5,852


5,721


Other financial assets


11


73,135


102,193


Intangible assets


12


12,893


11,872


Property, plant and equipment


13


1,728,050


1,203,045


Goodwill


14


66,763


68,246


Pension


21


15,838


6,184


Deferred tax assets


23b


13,175


13,340


$

3,487,824


$

2,455,004


Liabilities


Current liabilities


Trade and other payables


15


$

206,489


$

163,187


Taxes payable


23i


5,098


17,413


Other liabilities


16


12,613


7,947


Other financial liabilities


17


18,363


1,159


Deferred revenue


19


70,911


313,474


189,706


Other financial liabilities


17


23,128


Long-term debt


18


479,540


Deferred revenue


19


391,367


Provisions


20


159,030


147,304


Pension obligations


21


13,488


12,737


Other employee benefits


22


108,422


100,236


Deferred tax liabilities


23b


240,907


189,663


1,729,356


639,646


Equity


Share capital


24b


1,020,458


1,020,126


Reserves


53,280


55,097


Retained earnings


685,041


737,940


Equity attributable to owners of the Company


1,758,779


1,813,163


Non-controlling interests


28


(311

)

2,195


1,758,468


1,815,358


$

3,487,824


$

2,455,004


Commitments and contingencies (note 31)


On behalf of the Board of Directors:


“J. Bruce Barraclough, FCPA, FCA”

Director

“John L. Knowles”

Director


1


HUDBAY MINERALS INC.

Consolidated Statements of Cash Flows

(in thousands of Canadian dollars)


Year ended


December 31


Note


2012


2011


Cash generated from (used in) operating activities:


Loss for the year


$

(21,170

)

$

(163,588

)

Loss from discontinued operations


(238,784

)

(Loss) profit from continuing operations


(21,170

)

75,196


Tax expense


23a


73,319


133,829


Items not affecting cash:


Depreciation and amortization


7b


76,604


104,601


Share-based payment expense


7c


5,769


3,037


Net finance income


7f


8,641


(2,165

)

Change in fair value of derivatives


(724

)

4,298


Change in deferred revenue related to stream


(29,322

)


Change in taxes receivable/payable, net


44,277


12,514


Items reclassified from other comprehensive income


27


(2,050

)

(2,212

)

Impairment and mark-to-market losses


7f


43,769


13,426


Loss (gain) on disposition


907


(2,453

)

Other


5,600


4,388


Operating cash flows of discontinued operations


(2,126

)

Taxes paid


(62,663

)

(90,179

)

Operating cash flows before stream deposit and change in non-cash working capital


142,957


252,154


Precious metals stream deposit


19


491,600


Change in non-cash working capital


33


(90,705

)

3,277


543,852


255,431


Cash generated from (used in) investing activities:


Interest received


5,728


8,468


Proceeds on disposition of assets


154,709


Acquisition of property, plant and equipment


(508,467

)

(241,617

)

Acquisition of intangible assets


(2,004

)

(5,692

)

Acquisition of investments


(3,802

)

(44,488

)

Acquisition of subsidiary, net of cash acquired


(94,855

)

Release of restricted cash


2,713


Sale of short-term investments


20,115


Acquisition of non-controlling interests


(11,476

)

Investing cash flows of discontinued operations


(7,163

)

Peruvian sales tax paid on capital expenditures


(37,108

)

(5,212

)


(545,653

)

(224,498

)

Cash generated from (used in) financing activities:


Long-term debt borrowing net of transaction costs


18


471,796


Share issue costs


(237

)

Proceeds from exercise of stock options


227


145


Financing costs


(8,676

)

(2,059

)

Dividends paid


24


(34,392

)

(34,346

)


428,955


(36,497

)


Effect of movement in exchange rates on cash and cash equivalents


10,857


2,948


Net increase (decrease) in cash and cash equivalents


438,011


(2,616

)

Cash and cash equivalents, beginning of year


899,077


901,693


Cash and cash equivalents, end of year


$

1,337,088


$

899,077


For supplemental information, see note 33.


2


HUDBAY MINERALS INC.

Consolidated Income Statements

(in thousands of Canadian dollars, except share and per share amounts)


Year ended


December 31


Note


2012


2011


Revenue


7a


$

702,550


$

890,817


Cost of sales


Mine operating costs


429,155


476,621


Depreciation and amortization


7b


75,801


103,915


Impairment losses


7g


6,839


504,956


587,375


Gross profit


197,594


303,442


Selling and administrative expenses


39,516


38,737


Exploration and evaluation


43,572


46,923


Other operating income


7e


(2,316

)

(3,374

)

Other operating expenses


7e


11,332


9,305


Results from operating activities


105,490


211,851


Finance income


7f


(6,217

)

(8,770

)

Finance expenses


7f


14,858


6,605


Other finance losses


7f


44,700


4,991


Net finance expense


53,341


2,826


Profit before tax


52,149


209,025


Tax expense


23a


73,319


133,829


(Loss) profit from continuing operations


(21,170

)

75,196


Loss from discontinued operations (net of taxes)


6


(238,784

)


Loss for the year


$

(21,170

)

$

(163,588

)


Attributable to:


Owners of the Company


$

(18,507

)

$

(153,895

)

Non-controlling interests


28


(2,663

)

(9,693

)


Loss for the year


$

(21,170

)

$

(163,588

)


Earnings (loss) per share - basic and diluted:


26


(Loss) profit from continuing operations


$

(0.11

)

$

0.48


Loss from discontinued operations


(1.40

)

Loss for the year


$

(0.11

)

$

(0.92

)


Weighted average number of common shares outstanding (note 26):


Basic


171,960,783


167,863,427


Diluted


171,960,783


167,863,427


3


HUDBAY MINERALS INC.

Consolidated Statements of Comprehensive Income (Loss)

(in thousands of Canadian dollars)


Year ended


December 31


2012


2011


Loss for the year


$

(21,170

)

$

(163,588

)


Other comprehensive (loss) income (note 27):


Recognized directly in equity:


Net exchange loss on translation of foreign operations


(10,886

)

15,793


Effective portion of change in fair value of cash flow hedges


(442

)

6,279


Change in fair value of available-for-sale financial investments


(29,852

)

(49,117

)

Tax effect


145


5,266


(41,035

)

(21,779

)

Transferred to income statements:


Disposal of foreign operations


20,416


Change in fair value of cash flow hedges


(2,050

)

(992

)

Change in fair value of available-for-sale financial assets


40,181


5,367


Sale of investments


8


Tax effect


529


(485

)


38,668


24,306


Other comprehensive (loss) income, net of tax, for the year


(2,367

)

2,527


Total comprehensive loss for the year


$

(23,537

)

$

(161,061

)


Attributable to:


Owners of the Company


(20,770

)

(151,472

)

Non-controlling interests


(2,767

)

(9,589

)


Total comprehensive loss for the year


$

(23,537

)

$

(161,061

)


4


HUDBAY MINERALS INC.

Consolidated Statements of Changes in Equity

(in thousands of Canadian dollars)


Attributable to owners of the Company


Share capital
(note 24)


Other
capital
reserves


Foreign
currency
translation
reserve


Available-
for-sale
reserve


Hedging
reserve


Retained
earnings


Total


Non-controlling
interests
(note 28)


Total equity


Balance, January 1, 2011


$

642,161


$

23,855


$

(14,744

)

$

43,565


$

(1,904

)

$

931,464


$

1,624,397


$

9,422


$

1,633,819


Loss


(153,895

)

(153,895

)

(9,693

)

(163,588

)

Other comprehensive income (loss) (note 27)


36,105


(37,404

)

3,722


2,423


104


2,527


Total comprehensive income (loss)


36,105


(37,404

)

3,722


(153,895

)

(151,472

)

(9,589

)

(161,061

)

Contributions by and distributions to owners


Shares issued on acquisition


345,119


345,119


345,119


Share issue costs


(239

)


(239

)


(239

)

Share-based payment expense (note 7c)


1,965


1,965


1,965


Stock options exercised


216


(63

)


153


153


Dividends (note 24b)


(34,346

)

(34,346

)


(34,346

)

Total contributions by and distributions to owners


345,096


1,902


(34,346

)

312,652


312,652


Change in ownership interests in subsidiaries that do not result in a loss of control


32,869


(5,283

)

27,586


2,362


29,948


Balance, December 31, 2011


$

1,020,126


$

25,757


$

21,361


$

6,161


$

1,818


$

737,940


$

1,813,163


$

2,195


$

1,815,358


5


HUDBAY MINERALS INC.

Consolidated Statements of Changes in Equity

(in thousands of Canadian dollars)


Attributable to owners of the Company


Share capital
(note 24)


Other
capital
reserves


Foreign 
currency 
translation 
reserve


Available-
for-sale 
reserve


Hedging 
reserve


Retained
earnings


Total


Non-controlling 
interests
(note 28)


Total equity


Balance, January 1, 2012


$

1,020,126


$

25,757


$

21,361


$

6,161


$

1,818


$

737,940


$

1,813,163


$

2,195


$

1,815,358


Loss


(18,507

)

(18,507

)

(2,663

)

(21,170

)

Other comprehensive (loss) income (note 27)


(10,782

)

10,337


(1,818

)


(2,263

)

(104

)

(2,367

)

Total comprehensive (loss) income


(10,782

)

10,337


(1,818

)

(18,507

)

(20,770

)

(2,767

)

(23,537

)


Contributions by and distributions to owners


Share-based payment expense (note 7c)


552


552


552


Stock options exercised


332


(106

)


226


226


Dividends (note 24b)


(34,392

)

(34,392

)


(34,392

)


Total contributions by and distributions to owners


332


446


(34,392

)

(33,614

)


(33,614

)

Acquisition of non-controlling interests


261


261


Balance, December 31, 2012


$

1,020,458


$

26,203


$

10,579


$

16,498


$


$

685,041


$

1,758,779


$

(311

)

$

1,758,468


6


HUDBAY MINERALS INC.

Notes to Consolidated Financial Statements

(in thousands of Canadian dollars, except where otherwise noted)

Years ended December 31, 2012 and 2011


1.                   Reporting entity


HudBay Minerals Inc. (“HMI” or the “Company”) was amalgamated under the Canada Business Corporations Act on August 15, 2011. The address of the Company’s principal executive office is 25 York Street, Suite 800, Toronto, Ontario. The consolidated financial statements of the Company for the year ended December 31, 2012 represent the financial position and the financial performance of the Company and its subsidiaries (together referred to as the “Group” or “Hudbay” and individually as “Group entities”).


Significant subsidiaries include Hudson Bay Mining and Smelting Co., Limited (“HBMS”), Hudson Bay Exploration and Development Company Limited (“HBED”), HudBay Marketing & Sales Inc. (“HMS”), HudBay Peru Inc. (“Peru Inc.”), HudBay Peru S.A.C. (“Hudbay Peru”) and HudBay (BVI) Inc.


Hudbay is an integrated mining company with shares listed under the symbol “HBM” on the Toronto, Bolsa de Valores de Lima and New York stock exchanges. With assets in North and South America, Hudbay produces copper concentrate (containing copper, gold and silver) and zinc metal and is focused on the discovery, production and marketing of base and precious metals. Through its subsidiaries, Hudbay owns copper/zinc/gold mines, ore concentrators and a zinc production facility in northern Manitoba and Saskatchewan and a copper mine under construction in Peru. The Group also has investments in a number of exploration companies. Hudbay’s mission is to create sustainable value through increased commodity exposure on a per share basis for its shareholders.


2.      Basis of preparation


(a)     Statement of compliance:


These consolidated financial statements have been prepared in accordance with International Financial Reporting Standards (“IFRS”) as issued by the International Accounting Standards Board (“IASB”) effective for the year ended December 31, 2012.


The Board of Directors approved these consolidated financial statements on February 20, 2013.


(b)     Functional and presentation currency:


The Group’s consolidated financial statements are presented in Canadian dollars, which is the Company’s functional currency. All values are rounded to the nearest thousand ($000) except where otherwise indicated.


7


HUDBAY MINERALS INC.

Notes to Consolidated Financial Statements

(in thousands of Canadian dollars, except where otherwise noted)

Years ended December 31, 2012 and 2011


(c)     Basis of measurement:


The consolidated financial statements have been prepared on the historical cost basis except for the following material items in the balance sheet:

·        Derivatives, embedded derivatives, other financial instruments at fair value through profit or loss (“FVTPL”) and available-for-sale financial assets are measured at fair value.

·        Liabilities for cash-settled share-based payment arrangements are measured at fair value.

·        A defined benefit asset is recognized as the net total of the plan assets, unrecognized past service costs and unrecognized actuarial losses, less unrecognized actuarial gains and the present value of the defined benefit obligation.


(d)     Use of judgement:


The preparation of the consolidated financial statements in conformity with IFRS requires the Group to make judgements, apart from those involving estimations, in applying accounting policies that affect reported amounts of assets and liabilities and disclosure of contingent assets and liabilities at the date of the consolidated financial statements, as well as reported amounts of revenue and expenses during the reporting period.


Judgements that affect multiple areas of the financial statements:

·         Estimating mineral reserves and resources

·         Acquisition method accounting (notes 3a)

·         Determination of functional currency (note 3b)

·         Taxes (notes 3o and 23)


Asset-based judgements (these judgements also affect other areas of the financial statements):

·       In-process inventory quantities and inventory cost allocations (note 3f)

·       Property, plant and equipment

·        Cost allocations for mine development (note 3j)

·        Mining properties expenditures capitalized (note 3i(ii))

·        Determining when exploration and evaluation assets should be transferred to capital works in progress within property, plant and equipment (notes 3h)

·        Componentization (note 3i)

·        Assessment of impairment, including determination of cash-generating units and assessing for indications of impairment (notes 3j and 6)

·        Recoverability of exploration and evaluation assets, including determination of cash-generating units and assessing for indications of impairment (notes 3h and 3j)

·       Determining whether assets meet criteria for classification as held for sale (note 3k)

·       Measurement and classification of Peruvian sales taxes paid on capital expenditures (note 9)


Liability-based judgement (these judgements also affect other areas of the financial statements):

·       Determining the accounting classification of the precious metals stream deposit (note 19)

·       Contingent liabilities (note 31)


8


HUDBAY MINERALS INC.

Notes to Consolidated Financial Statements

(in thousands of Canadian dollars, except where otherwise noted)

Years ended December 31, 2012 and 2011


(e)     Use of estimates:


The preparation of the consolidated financial statements in conformity with IFRS requires the Group to make estimates and assumptions that affect the application of accounting policies, reported amounts of assets and liabilities and disclosure of contingent assets and liabilities at the date of the consolidated financial statements, as well as reported amounts of revenue and expenses during the reporting period. Actual results may differ from these estimates.


The Group reviews these estimates and underlying assumptions on an ongoing basis, based on experience and other factors, including expectations of future events that the Group believe to be reasonable under the circumstances. Revisions to accounting estimates are recognized prospectively in the period in which the estimates are revised and in any future periods affected.


Significant areas where the Group applies estimates include:


Estimates that affect multiple areas of the financial statements:

·       Estimating mineral reserves and resources

·       Determination of the fair value of a business combination (note 3a)

·       Estimates of fair value of financial instruments (notes 3c, 3n and 30)

·       Taxes (notes 3o and 23)


Asset-based estimates (these estimates also affect other areas of the financial statements):

·       In-process inventory quantities, inventory cost allocations and inventory valuation (note 3f)

·       Property, plant and equipment

·        Units-of-production depreciation (note 3i)

·        Plant and equipment estimated useful lives and residual values (note 3i)

·        Finite life intangible assets (note 3g)

·       Assessment of impairment, including the determination of recoverable amount (notes 3j and 6)


Liability-based estimates (these estimates also affect other areas of the financial statements):

·       Pensions and other employee benefits (notes 3(l), 21 and 22)

·       Decommissioning, restoration and similar liabilities (notes 3m and 20)

·       Contingent liabilities (note 31)

·       Capital commitments (note 31)

·       Determination of deferred revenue per unit related to the precious metals stream transaction and determination of current portion of deferred revenue (note 19)


Estimates that relate mainly to the income statement:

·       Assaying used to determine revenue (note 3c)


9


HUDBAY MINERALS INC.

Notes to Consolidated Financial Statements

(in thousands of Canadian dollars, except where otherwise noted)

Years ended December 31, 2012 and 2011


There are numerous uncertainties inherent in estimating mineral reserves and resources, including many factors beyond the Group’s control. Ore reserves and resources are estimated based on information compiled by appropriately qualified persons relating to the geological data on the size, depth and shape of the ore body. Complex geological judgements are required to interpret this data. Changes in management’s assumptions, including economic assumptions such as metal prices and market conditions, could have a material effect on the Group’s financial position and results of operation. Changes in the reserve or resource estimates may affect:


·       The carrying value of exploration and evaluation assets, capital works in progress, mining properties and plant and equipment;

·       Depreciation expense for assets depreciated either on a unit-of-production basis or on a straight-line basis where useful lives are restricted by the life of the related mine or plan;

·       The calculation of deferred revenue per unit related to the stream transaction

·       The provision for decommissioning, restoration and similar liabilities; and

·       The carrying value of deferred tax assets.


The Group estimates mineral reserves and resources to determine future recoverable mine production based on assessment of geological, engineering and metallurgical analyses, estimates of future production costs, capital costs and restoration costs, as well as long-term commodity prices and foreign exchange rates.


(f)     Correction of immaterial error:


The Group identified an immaterial error in note 7d to the December 31, 2011 consolidated financial statements. The amount disclosed as equity-settled stock options, cash-settled deferred share units, and cash-settled restricted share units of $2,033, $(134), and $2,307, respectively, should have been $1,965, $(753), and $1,825, respectively. In addition, the Group has also included an additional line item titled employee share purchase plan in the amount of $994 for the comparative year ended December 31, 2011. The Group has corrected the error in the comparative amounts in note 7d Employee benefits expense to the current consolidated annual financial statements. The results of operations and the financial position of the Group remained unchanged.


3.      Significant accounting policies


The accounting policies set out below have been applied consistently to all periods presented in these consolidated financial statements. These accounting policies set out below have been applied consistently by all Group entities.


(a)     Basis of consolidation:


Intercompany balances and transactions are eliminated upon consolidation. When a Group entity transacts with an associate or jointly controlled entity of the Group, unrealized profits and losses are eliminated to the extent of the Group’s interest in the relevant associate or joint venture. The accounting policies of Group entities are changed when necessary to align them with the policies adopted by the Company.


10


HUDBAY MINERALS INC.

Notes to Consolidated Financial Statements

(in thousands of Canadian dollars, except where otherwise noted)

Years ended December 31, 2012 and 2011


Subsidiaries


A subsidiary is an entity controlled by the Group. The financial statements of subsidiaries are included in the consolidated financial statements from the date that control commences until the date that control ceases.


Non-controlling interests


Non-controlling interests in subsidiaries are identified separately from the Group’s equity in the subsidiaries. The interests of non-controlling shareholders may be initially measured either at fair value or at the non-controlling interests’ proportionate share of the fair value of the acquiree’s identifiable net assets. The choice of measurement basis is made on an acquisition-by-acquisition basis. Subsequent to acquisition, the carrying amount of non-controlling interests is the amount of those interests at initial recognition plus the non-controlling interests’ share of subsequent changes in equity. Total comprehensive income is attributed to non-controlling interests even if this results in the non-controlling interests having a deficit balance.


Business combinations and goodwill


When the Group makes an acquisition, it first determines whether the assets acquired and liabilities assumed constitute a business, in which case the acquisition requires accounting as a business combination. Management applies judgement in determining whether the acquiree is capable of being conducted and managed for the purpose of providing a return, considering the inputs of the acquiree and processes applied to those inputs that have the ability to create outputs.


The Group applies the acquisition method of accounting to business combinations, whereby the goodwill is measured at the acquisition date as the fair value of the consideration transferred including the recognized amount of any non-controlling interests in the acquiree, less the net recognized amount (fair value) of assets acquired and liabilities and contingent liabilities assumed (identifiable net assets) on the basis of fair value at the date of acquisition. When the excess is negative, a bargain purchase gain is recognized immediately in the income statement. The assessment of fair values on acquisition includes those mineral reserves and resources that are able to be reliably measured. In determining these fair values, management must also apply judgement in areas including future cash flows, metal prices, exchange rates and appropriate discount rates. Changes in such estimates and assumptions could result in significant differences in the amount of goodwill recognized.


The consideration transferred is the aggregate of the fair values at the date of acquisition of the sum of the assets transferred, the liabilities incurred or assumed, and the equity instruments issued by the acquirer in exchange for control of the acquiree. Acquisition-related costs are recognized in the income statement as incurred, unless they relate to issue of debt or equity securities.


Where applicable, the consideration transferred includes any asset or liability resulting from a contingent consideration arrangement and measured at its acquisition date fair value. Subsequent changes in such fair values are adjusted against the cost of acquisition where they qualify as measurement period adjustments. All other subsequent changes in the fair value of contingent consideration classified as an asset or liability are accounted for in accordance with relevant IFRS. Changes in the fair value of contingent consideration classified as equity are not recognized.


11


HUDBAY MINERALS INC.

Notes to Consolidated Financial Statements

(in thousands of Canadian dollars, except where otherwise noted)

Years ended December 31, 2012 and 2011


Where a business combination is achieved in stages, the Group’s previously held interests in the acquired entity are remeasured to fair value at the acquisition date, which is the date the Group attains control, and any resulting gain or loss is recognized in the income statement. Amounts previously recognized in other comprehensive income related to interests in the acquiree prior to the acquisition date are reclassified to the income statement, where such treatment would be appropriate if that interest were disposed of.


After initial recognition, goodwill is measured at cost less any accumulated impairment losses. For the purpose of impairment testing, goodwill acquired in a business combination is, from the acquisition date, allocated to each of the Group’s cash-generating units that are expected to benefit from the synergies of the combination, irrespective of whether other assets or liabilities of the acquiree are assigned to those units. Goodwill is allocated to the lowest level at which it is monitored for internal management purposes and is not larger than an operating segment before aggregation. Where goodwill forms part of a cash-generating unit and part of the operation within that unit is disposed of, the goodwill associated with the disposed operation is included in the determination of any gain or loss on disposal. An impairment loss in respect of goodwill is not reversed.


Goodwill is not amortized and is tested for impairment annually and whenever there is an indication of impairment for intangible assets with indefinite useful lives. If any such indication exists, the recoverable amount of the asset is estimated in order to determine the extent of the impairment, if any. The recoverable amount is determined as the higher of fair value less direct costs to sell and the asset’s value in use.


Fair value for mineral interests and related goodwill is generally determined as the present value of the estimated future cash flows expected to arise from the continued use of the asset, including any expansion prospects, and its eventual disposal, using assumptions that an independent market participant may take into account.


Value in use is determined as the present value of the estimated future cash flows expected to arise from the continued use of the asset in its present form and its eventual disposal. Value in use is determined by applying assumptions specific to the Group’s continued use and cannot take into account future development.


The weighted average cost of capital of the Group or comparable market participants is used as a starting point for determining the discount rates, with appropriate adjustments for the risk profile of the countries in which the individual cash-generating units operate and the specific risks related to the development of the project.


Where the asset does not generate cash flows that are independent of other assets, the Group estimates the recoverable amount of the cash-generating unit to which the asset belongs. If the carrying amount of an asset or cash-generating unit exceeds its recoverable amount, the carrying amount of the asset or cash-generating unit is reduced to its recoverable amount. An impairment loss is recognized as an expense in the consolidated income statement.


12


HUDBAY MINERALS INC.

Notes to Consolidated Financial Statements

(in thousands of Canadian dollars, except where otherwise noted)

Years ended December 31, 2012 and 2011


(b)     Translation of foreign currencies:


Management determines the functional currency of each Group entity as the currency of the primary economic environment in which the entity operates.


Foreign currency transactions


Transactions in foreign currencies are translated to the respective functional currencies of Group entities at exchange rates in effect at the transaction dates.


At the end of each reporting period, monetary assets and liabilities denominated in foreign currencies are translated to the functional currency using the closing exchange rate. Non-monetary assets and liabilities measured at fair value are translated using the exchange rates at the date when fair value was determined. Non-monetary assets and liabilities measured at historical cost in a foreign currency are translated using exchange rates that were in effect at the transaction dates. The same translations are applied when an entity prepares its financial statements from books and records maintained in a currency other than its functional currency, except revenues and expenses may be translated at monthly average exchange rates that approximate those in effect at the transaction dates.


Foreign currency gains and losses arising on translation are recognized in the income statement, except for differences arising on translation of available-for-sale equity instruments, a financial liability designated as a hedge of a net investment in a foreign operation, or qualifying cash flow hedges, which are recognized in other comprehensive income.


Foreign operations


For the purpose of the consolidated financial statements, assets and liabilities of Group entities that have functional currencies other than the Canadian dollar are translated to Canadian dollars at the reporting date using the closing exchange rate. Revenue and expenses are translated at monthly average exchange rates that approximate those in effect at the transaction dates. Differences arising from these foreign currency translations are recognized in other comprehensive income and presented within equity in the foreign currency translation reserve. When a foreign operation is disposed, the relevant exchange differences accumulated in the foreign currency translation reserve are transferred to the income statement as part of the profit or loss on disposal. On the partial disposal of a subsidiary that includes a foreign operation, the relevant proportion of such amount is reattributed to non-controlling interests. On disposal of a partial investment in an associate or joint venture that includes a foreign operation while retaining significant influence or joint control, the relevant proportion is reclassified to profit and loss.


Net investment in a foreign operation


Foreign currency gains and losses arising on translation of a monetary item receivable from or payable to a foreign operation for which settlement is neither planned nor likely to occur in the foreseeable future are considered to form part of a net investment in the foreign operation. Such gains and losses are recognized in other comprehensive income and presented within equity in the foreign currency translation reserve.


13


HUDBAY MINERALS INC.

Notes to Consolidated Financial Statements

(in thousands of Canadian dollars, except where otherwise noted)

Years ended December 31, 2012 and 2011


(c)     Revenue recognition:


Revenue from the sale of goods is measured at the fair value of the consideration received or receivable, net of treatment and refining charges and pre-production revenue.


Sales revenue is recognized when the significant risks and rewards of ownership have been transferred to the buyer, the Group has insignificant continuing management involvement with the goods, the amount of revenue can be measured reliably, recovery of the consideration is probable and the associated costs and possible return of goods can be estimated reliably. Transfers of risks and rewards vary depending on individual contract terms; this frequently occurs at the time when title passes to the customer. For medium and long-term contracts, revenue recognition criteria are assessed for individual sales within the contracts. Revenues from the sale of by-products are included within revenue.


Sales of concentrate and certain other products are “provisionally priced”. For these contracts, sales prices are subject to final adjustment at the end of a future period after shipment, based on quoted market prices during the quotational period specified in the contract. Revenue is recognized when the above criteria are met, using weight and assay results and forward market prices to estimate the fair value of the total consideration receivable. Such a provisional sale contains an embedded derivative that must be separated from the host contract. At each reporting date, provisionally priced metal sales are marked to market, with adjustments (both gains and losses) recorded in revenue in the income statement and in trade and other receivables on the balance sheet.


The Group recognizes deferred revenue in the event it receives payments from customers before a sale meets criteria for revenue recognition.


Interest revenue is recognized in finance income as it accrues, using the effective interest method.


Dividend revenue from investments is recognized when the shareholder’s right to receive payment has been established provided that it is probable that the economic benefits will flow to the Group and the amount of revenue can be measured reliably.


(d)     Cost of sales:


Cost of sales consists of those costs previously included in the measurement of inventory sold during the period, as well as certain costs not included in the measurement of inventory, such as the cost of warehousing and distribution to customers, provisional pricing adjustments related to purchased concentrates, and profit sharing, royalty payments, share-based payments and other indirect expenses related to producing operations.


14


HUDBAY MINERALS INC.

Notes to Consolidated Financial Statements

(in thousands of Canadian dollars, except where otherwise noted)

Years ended December 31, 2012 and 2011


(e)     Cash and cash equivalents:


Cash and cash equivalents include cash, demand deposits and short-term, highly liquid investments that are readily convertible to known amounts of cash and are subject to an insignificant risk of changes in value. Cash equivalents normally have maturities of three months or less at the date of acquisition. Interest earned is included in finance income on the income statement and in investing activities on the statement of cash flows.


Amounts that are restricted from being used for at least twelve months after the reporting date are classified as non-current assets and presented in restricted cash on the balance sheet. Changes in restricted cash balances are classified as investing activities on the cash flow statement.


(f)     Inventories:


Inventories consist of in-process inventory (concentrates and metals), metal products and supplies. Concentrates, metals and all other saleable products are valued at the lower of cost and estimated net realizable value. Net realizable value represents the estimated selling price for inventories less all estimated costs of completion and costs necessary to make the sale. Where the net realizable value is less than cost, the difference is charged to the income statement as an impairment charge in cost of sales.


Cost of production of concentrate inventory is determined on a weighted average cost basis and the cost of production of finished metal inventory is determined using the first in first out basis. The cost of production includes direct costs associated with conversion of production inventory: material, labour, contractor expenses, purchased concentrates, and an attributable portion of production overheads and depreciation of all property, plant and equipment involved with the mining and production process. Hudbay measures in-process inventories based on assays of material received at metallurgical plants and estimates of recoveries in the production processes. Due to significant uncertainty associated with volume and metal content, costs are not allocated to routine operating levels of stockpiled ore. Estimates and judgement are required to assess the nature of any significant changes to levels of ore stockpiles and determining whether allocation of costs is required.


Supplies are valued at the lower of average cost and net realizable value. A regular review is undertaken to determine the extent of any provision for obsolescence.


(g)     Intangible assets:


Computer software is measured at cost less accumulated amortization and accumulated impairment losses. Cost includes all directly attributable costs necessary to create, produce and prepare the asset to be capable of operating it in the manner intended by management.


15


HUDBAY MINERALS INC.

Notes to Consolidated Financial Statements

(in thousands of Canadian dollars, except where otherwise noted)

Years ended December 31, 2012 and 2011


Amortization methods, useful lives, and residual values if any, are reviewed at each year end and adjusted prospectively. When an intangible asset is disposed of, or when no further economic benefits are expected, the asset is derecognized, and any resulting gain or loss is recorded in the income statement.


Currently, the Group’s intangible assets relate primarily to an enterprise resource planning (“ERP”) information system. Amortization commenced in April 2011 upon implementation of the ERP system and is calculated on a straight-line basis over its estimated useful life. The expected useful life of the ERP system is 10 years from initial implementation.


(h)     Exploration and evaluation expenditures:


Exploration and evaluation activity begins when the Group obtains legal rights to explore a specific area and involves the search for mineral reserves, the determination of technical feasibility, and the assessment of commercial viability of an identified resource. Expenditures incurred in the exploration and evaluation phase include the cost of acquiring interests in mineral rights, licenses and properties and the costs of the Group’s exploration activities, such as researching and analyzing existing exploration data, gathering data through geological studies, exploratory drilling, trenching, sampling, and certain feasibility studies.


The Group expenses the cost of its exploration and evaluation activities and capitalizes the cost of acquiring interests in mineral rights, licenses and properties in business combinations, asset acquisitions or option agreements. Amounts capitalized are recognized as exploration and evaluation assets and presented in property, plant and equipment. Exploration and evaluation assets acquired as a result of an asset acquisition or option agreement are initially recognized at cost, and those acquired in a business combination are recognized at fair value on the acquisition date. They are subsequently carried at cost less accumulated impairment. No depreciation is charged during the exploration and evaluation phase. The Group expenses the cost of subsequent exploration and evaluation activity related to acquired exploration and evaluation assets. Cash flows associated with acquiring exploration and evaluation assets are classified as investing activities in the statement of cash flows; those associated with exploration and evaluation expenses are classified as operating activities.


Judgement is required in determining whether the respective costs are eligible for capitalization where applicable, and whether they are likely to be recoverable, which may be based on assumptions about future events and circumstances. Estimates and assumptions made may change if new information becomes available.


The Group monitors exploration and evaluation assets for factors that may indicate their carrying amounts are not recoverable. If such indicators are identified, the Group tests the exploration and evaluation assets or their cash-generating units, as applicable, for impairment. The Group also tests impairment when assets reach the end of the exploration and evaluation phase.


Exploration and evaluation assets are transferred to capital works in progress within property, plant and equipment once the Group has completed a preliminary feasibility study, some of the resources have been converted to reserves, and management determines it is probable the property will be developed into a mine. At that time, the property is considered to enter the development phase, and subsequent evaluation costs are capitalized.


16


HUDBAY MINERALS INC.

Notes to Consolidated Financial Statements

(in thousands of Canadian dollars, except where otherwise noted)

Years ended December 31, 2012 and 2011


(i)                 Property, plant and equipment:


The Group measures items of property, plant and equipment at cost less accumulated depreciation and any accumulated impairment losses.


The initial cost of an item of property, plant and equipment includes its purchase price or construction costs, including import duties and non-refundable purchase taxes, any costs directly attributable to bringing the asset into operation, and for qualifying assets, borrowing costs. The initial cost of property, plant and equipment also includes the initial estimate of the cost of dismantling and removing the item and restoring the site on which it is located, the obligation for which the Group incurs either when the item is acquired or as a consequence of having used the item during a particular period for purposes other than to produce inventories during that period.


Capitalization of costs ceases once an asset is in the location and condition necessary for it to be capable of operating in the manner intended by management. At this time, depreciation commences. For a new mine, this occurs upon commencement of commercial production. Any revenue earned in the process of preparing an asset to be capable of operating in the manner intended by management is included in the cost of the constructed asset. Any other incidental revenue earned prior to commencement of commercial production is recognized in the income statement.


Carrying amounts of property, plant and equipment, including assets under finance lease, are depreciated to their estimated residual value over the estimated useful lives of the assets or the estimated life of the related mine or plant, if shorter. Where components of an asset have different useful lives, depreciation is calculated on each separate component. Components may be physical or non-physical, including the cost of regular major inspections and overhauls required in order to continue operating an item of property, plant and equipment.


Certain items of property, plant and equipment are depreciated on a unit-of-production basis. The unit-of-production method is based on proven and probable tonnes of ore reserves. There are numerous uncertainties inherent in estimating ore reserves, and assumptions that were valid at the reporting date may change when new information becomes available. The actual volume of ore extracted and any changes in these assumptions could affect prospective depreciation rates and carrying values.


The carrying amount of an item of property, plant and equipment is derecognized on disposal or when no future economic benefits are expected from its use or disposal. Upon derecognition of an item of property, plant and equipment, the difference between its carrying value and net sales proceeds, if any, is presented as a gain or loss in other operating income or expense in the income statement.


17


HUDBAY MINERALS INC.

Notes to Consolidated Financial Statements

(in thousands of Canadian dollars, except where otherwise noted)

Years ended December 31, 2012 and 2011


(i)     Capital works in progress:


Capital works in progress consist of items of property, plant and equipment in the course of construction or mineral properties in the course of development, including those transferred upon completion of the exploration and evaluation phase. On completion of construction or development, costs are transferred to plant and equipment and/or mining properties as appropriate.


Capital works in progress are not depreciated.


(ii)    Mining properties:


Mining properties consist of costs transferred from capital works in progress when a mining property reaches commercial production, costs of subsequent mine and exploration development, and acquired mining properties in the production stage.


Mining properties include costs directly attributable to bringing a mineral asset into the state where it is capable of operating in the manner intended by management and includes such costs as the cost of shafts, ramps, track haulage drifts, ancillary drifts, sumps, electrical substations, refuge stations, ventilation raises, permanent manways, and ore and waste pass raises. The determination of development costs to be capitalized during the production stage of a mine operation requires the use of judgement and estimates such as estimates of tonnes of waste to be removed over the life of the mining area and economically recoverable reserves extracted as a result.


A mining property is considered to be capable of operating in a manner intended by management when it commences commercial production. Upon commencement of commercial production, a mining property is depreciated on a unit-of-production method. Unit-of-production depreciation rates are determined based on the related proven and probable mineral reserves and associated future development costs.


Subsequent mine development costs are capitalized to the extent they are incurred in order to access reserves mineable over more than one year. Ongoing maintenance and development expenditures are expensed as incurred and included in cost of sales in profit or loss. These include ore stope access drifts, footwall and hangingwall drifts in stopes, drawpoints, drill drifts, sublevels, slots, drill raises, stope manway access raises and definition diamond drilling.


(iii) Plant and equipment:


Plant and equipment consists of buildings and fixtures, surface and underground fixed and mobile equipment and assets under finance lease.


Plant and equipment are depreciated on either unit-of-production or straight-line basis based on factors including the production life of assets and mineable reserves. In general, mining assets are depreciated using a unit-of-production method; equipment is depreciated using the straight-line method, based on the shorter of its useful life and that of the related mine or facility; and plants are depreciated using the straight-line method, with useful lives limited by those of related mining assets.


18


HUDBAY MINERALS INC.

Notes to Consolidated Financial Statements

(in thousands of Canadian dollars, except where otherwise noted)

Years ended December 31, 2012 and 2011


(iv)  Commercial production:


Commercial production is the level of activities intended by management for a mine, or a mine and mill complex, to be capable of operating in the manner intended by management. The Group considers a range of factors when determining the level of activity that represents commercial production for a particular project, including a pre-determined percentage of design capacity for the mine and mill; achievement of continuous production, ramp-ups, or other output; or specific factors such as recoveries, grades, or inventory build-ups. In a phased mining approach, management may consider achievement of specific milestones at each phase of completion. Management assesses the operation’s ability to sustain production over a period of approximately one to three months, depending on the complexity related to the stability of continuous operation. Commercial production is considered to have commenced, and depreciation expense is recognized, at the beginning of the month after criteria have been met.


(v)   Capitalized borrowing costs:


The Group capitalizes borrowing costs that are directly attributable to the acquisition, construction or production of qualifying assets, which are assets that necessarily take a substantial period of time to get ready for their intended use or sale. Capitalization of borrowing costs ceases once the qualifying assets commence commercial production or are otherwise ready for their intended use or sale.


Where funds are borrowed specifically to finance a project, the amount capitalized represents the actual borrowing costs incurred. Where the funds used to finance a project form part of general borrowings, the amount capitalized is calculated using a weighted average of interest rates applicable to relevant general borrowings of the Group during the period, to a maximum of actual borrowing costs incurred. Investment income earned by temporarily investing specific borrowings pending their expenditure on qualifying assets is deducted from the borrowing costs eligible for capitalization. Capitalization of interest is suspended during extended periods in which active development is interrupted.


All other borrowing costs are recognized in the income statement in the period in which they are incurred.


(vi)  Depreciation rates of major categories of assets:


·

Capital works in progress


· not depreciated


·

Mining properties


· unit-of-production


·

Mining assets


· unit-of-production


·

Other plant assets


· straight line over 1 to 10 years


·

Equipment


· straight-line over 1 to 10 years


The Group reviews its depreciation methods, remaining useful lives and residual values at least annually and accounts for changes in estimates prospectively.


19


HUDBAY MINERALS INC.

Notes to Consolidated Financial Statements

(in thousands of Canadian dollars, except where otherwise noted)

Years ended December 31, 2012 and 2011


(j)      Impairment of non-financial assets:


At the end of each reporting period, the Group reviews the carrying amounts of property, plant and equipment, exploration and evaluation assets and computer software to determine whether there is any indication of impairment. If any such indication exists, the Group estimates the recoverable amount of the asset in order to determine the extent of the impairment loss, if any. The Group generally assesses impairment at the level of cash-generating units, which are the smallest identifiable groups of assets that generate cash inflows that are largely independent of cash inflows from other assets.


The Group’s cash-generating units consist of Manitoba, Peru, Balmat and exploration and evaluation assets.


The Group allocates exploration and evaluation assets to cash-generating units based on their operating segment, geographic location and management’s intended use for the property. Exploration and evaluation assets are allocated to cash-generating units separate from those containing producing or development-phase assets, except where exploration and evaluation assets have the potential to significantly affect the future production of producing or development-phase assets.


Goodwill is tested for impairment annually on September 30th and whenever there is an indication that the asset may be impaired.


Where an indicator of impairment exists, a formal estimate of the recoverable amount of the asset or cash-generating unit is made. The recoverable amount is the higher of the fair value less costs to sell and value in use:


·       Fair value less costs to sell is the amount obtainable from the sale of the asset or cash-generating unit in an arm’s length transaction between knowledgeable, willing parties, less costs of disposal. Fair value for mineral assets is often determined as the present value of the estimated future cash flows expected to arise from the continued use of the asset, including any expansion prospects, and its eventual disposal, using assumptions that an independent market participant may take into account. These cash flows are discounted by an appropriate discount rate that reflects current market assessments of the time value of money and the risks specific to the asset to arrive at a net present value of the asset.


·       Value in use is determined as the present value of the estimated future cash flows expected to arise from the continued use of the asset or cash-generating unit in its present form and its eventual disposal, discounted using a pre-tax rate that reflects current market assessments of the time value of money and risks specific to the asset for which estimates of future cash flows have not been adjusted. Value in use calculations apply assumptions specific to the Group’s continued use and cannot take into account future development. These assumptions are different to those used in calculating fair value, and consequently the value in use calculation is likely to give a different result to a fair value calculation.


20


HUDBAY MINERALS INC.

Notes to Consolidated Financial Statements

(in thousands of Canadian dollars, except where otherwise noted)

Years ended December 31, 2012 and 2011


The Group estimates future cash flows based on estimated future recoverable mine production, expected sales prices (considering current and historical commodity prices, price trends and related factors), production levels and cash costs of production, all based on detailed engineering life-of-mine plans. Future recoverable mine production is determined from reserves and resources after taking into account estimated dilution and recoveries during mining, and estimated losses during ore processing and treatment. Estimates of recoverable production from measured, indicated and inferred mineral resources are considered economically mineable and are based on management’s confidence in converting such resources to proven and probable reserves. Gains from the expected disposal of assets are not included in estimated future cash flows. Assumptions underlying future cash flow estimates are subject to risks and uncertainties. Changes in estimates may affect the expected recoverability of the Group’s investments in mining properties.


If the carrying amount of an asset or cash-generating unit exceeds its recoverable amount, the carrying amount is reduced to the recoverable amount, and an impairment loss is recognized in the income statement in the expense category consistent with the function of the impaired asset or cash-generating unit. The Group presents impairment losses related to operating assets in cost of sales. Impairment losses recognized in respect of a cash-generating unit are allocated first to reduce the carrying amount of any goodwill allocated to the cash-generating unit and then to reduce the carrying amounts of other assets in the cash-generating unit on a pro rata basis.


The Group assesses previously recognized impairment losses each reporting date for any indications that the losses have decreased or no longer exist. Such an impairment loss is reversed, in full or in part, if there has been a change in the estimates used to determine the recoverable amount. An impairment loss is reversed only to the extent that the asset’s carrying amount does not exceed the carrying amount that would have been determined, net of depreciation or amortization, if no impairment loss had been recognized for the asset in prior years. Such reversals of impairment losses are recognized in the income statement. An impairment loss recognized in relation to goodwill is not reversed for subsequent increases in the recoverable amount.


(k)              Assets held for sale and discontinued operations:


Assets held for sale


The Group classifies non-current assets, or disposal groups consisting of assets and liabilities, as held for sale when it expects to recover their carrying amounts primarily through sale rather than through continuing use. To meet criteria to be held for sale, the sale must be highly probable, and the assets or disposal groups must be available for immediate sale in their present condition. The Group must be committed to a plan to sell the assets or disposal group, and the sale should be expected to qualify for recognition as a completed sale within one year from the date of classification.


21


HUDBAY MINERALS INC.

Notes to Consolidated Financial Statements

(in thousands of Canadian dollars, except where otherwise noted)

Years ended December 31, 2012 and 2011


The Group measures assets or disposal groups at the lower of their carrying amount and fair value less costs to sell. Any impairment loss on a disposal group first is allocated to goodwill, and then to remaining assets and liabilities on pro rata basis, except that no loss is allocated to inventories, financial assets, deferred tax assets, employee benefit assets or investment property. Impairment losses on initial classification as held for sale and subsequent gains and losses on remeasurement are recognized in profit or loss; however, gains are not recognized in excess of any cumulative impairment loss. Upon classifying assets or disposal groups as held for sale, the Group presents the assets separately as a single amount and the liabilities separately as a single amount on the balance sheet. When an asset no longer meets the criteria for classification as an asset held for sale, the Group records the asset at the lower of its recoverable amount and the carrying amount before the asset was classified as held for sale.


Discontinued operations


A discontinued operation is a component of the Group’s business that represents a separate major line of business or geographical area of operations that has been disposed of or classified as held for sale. The operations and cash flows can be clearly distinguished from the rest of the Group, both operationally and for financial reporting purposes. When the Group classifies an operation as a discontinued operation, it re-presents the comparative income statement as if the operation had been discontinued from the start of the comparative year. In doing this, the Group excludes the results of the discontinued operations and any gain or loss from disposal from the income statement subtotal of profit or loss from continuing operations and presents them on a separate line as profit or loss (net of tax) from the discontinued operation.


(l)      Pension and other employee benefits:


The Group has non-contributory and contributory defined benefit programs for the majority of its Canadian employees. The defined benefit pension benefits are based on years of service and final average salary for the salaried plans and are based on a flat dollar amount combined with years of service for the hourly plans. The Group provides non-pension health and other post-employment benefits to certain active employees and pensioners (post-employment benefits) and also provides disability income, health benefits and other post-employment benefits to hourly and salaried disabled employees (other long-term employee benefits).


The Group accrues its obligations under the defined benefit plans as the employees render the services necessary to earn the pension and post-employment benefits. The actuarial determination of the accrued benefit obligations for pensions and post-employment benefits uses the projected benefit method prorated on service (which incorporates management’s best estimate of future salary levels, other cost escalation, retirement ages of employees and other actuarial factors). For other long-term employee benefits, the Group recognizes the full cost of the benefit obligation at the time the employee becomes disabled. Actuarial advice is provided by external consultants.


22


HUDBAY MINERALS INC.

Notes to Consolidated Financial Statements

(in thousands of Canadian dollars, except where otherwise noted)

Years ended December 31, 2012 and 2011


For the funded defined benefit plans, the Group recognizes the deficit or excess of the fair value of plan assets over the present value of the defined benefit obligation as a liability or an asset in the balance sheet, taking into account any unrecognized past service cost and any unrecognized actuarial gains and losses. However, the Group recognizes an excess of assets only to the extent that it represents a future economic benefit which is available in the form of refunds from the plan or reductions in future contributions to the plan. When these criteria are not met, it is not recognized but is disclosed in the notes. Impacts of minimum funding requirements in relation to past service are considered when determining the balance sheet position.


Actuarial gains (losses) on plan assets arise from the difference between the actual return on plan assets for a period and the expected return on plan assets for that period. For the purpose of calculating the expected return on plan assets, those assets are valued at fair value. Actuarial gains (losses) on the accrued benefit obligation arise from differences between actual and expected experience and from changes in the actuarial assumptions used to determine the accrued benefit obligation. Cumulative actuarial gains (losses) in excess of 10% of the greater of the accrued benefit obligation and the fair value of plan assets (in respect of pension and post-employment benefits) are amortized over the average remaining service period of active members expected to receive benefits under the plan. The average remaining service period of the active employees covered by the pension plans is 8.93 years. The average remaining service period of the active employees covered by the other retirement benefits plan is 12.0 years. Annual gains and losses in respect of other long-term post-employment benefits are recognized immediately through the income statement in the year they occur.


For the defined benefit plans, the benefit cost charged to the income statement consists of current service cost, interest cost, expected return on plan assets, effects of early retirements, curtailments or settlements, amortization of actuarial gains and losses in excess of the corridor and past service cost. The past service cost for the enhancement of pension benefits is accounted for when such benefits vest or become a constructive obligation.


Actuarial determinations used in estimating obligations relating to these plans incorporate assumptions using management’s best estimates of factors including plan performance, salary escalation, retirement dates of employees and drug cost escalation rates. Due to the complexity of the valuation, the underlying assumptions and its long-term nature, a defined benefit obligation is highly sensitive to changes in these assumptions. All assumptions are reviewed at each reporting date. In determining the appropriate discount rate, management considers the interest rates on corporate bonds in the respective currency with at least an AA rating, with extrapolated maturities corresponding to the expected duration of the defined benefit obligation. The mortality rate is based on publicly available mortality tables for the specific country. Future salary increases and pension increases are based on expected future inflation rates for the respective country.


The Group also has defined contribution plans providing pension benefits for certain of its salaried employees and certain of its US employees utilizing 401K plans. The Group recognizes the cost of the defined contribution plans based on the contributions required to be made during each period.


23


HUDBAY MINERALS INC.

Notes to Consolidated Financial Statements

(in thousands of Canadian dollars, except where otherwise noted)

Years ended December 31, 2012 and 2011


Termination benefits are recognized as an expense when the Group is committed demonstrably, without realistic possibility of withdrawal, to a formal detailed plan to either terminate employment before the normal retirement date, or to provide termination benefits as a result of an offer made to encourage voluntary redundancy. Termination benefits for voluntary redundancies are recognized as an expense if the Group has made an offer of voluntary redundancy, it is probable that the offer will be accepted, and the number of acceptances can be estimated reliably. Benefits that are payable more than one year after the reporting period are discounted to their present value.


(m)   Provisions:


Provisions are recognized when the Group has a present obligation (legal or constructive) as a result of a past event, it is probable than an outflow of resources will be required to settle the obligation, and a reliable estimate can be made. The provisions are recorded as management’s best estimate of the amount required to settle an obligation.


Provisions are stated at their present value. The present value is determined by discounting the expected future cash flows at a pre-tax rate that reflects current market assessments of the time value of money and the risks specific to the liability.


Decommissioning, restoration and similar liabilities


Provisions are recorded for legal and constructive obligations associated with the future costs of rehabilitating the Group’s current and previous operating and development sites. Such costs are associated with decommissioning and restoration activities such as dismantling and removing structures, rehabilitating mines and tailings, and reclamation and re-vegetation of affected areas.


The present value of estimated costs is recorded in the period in which the asset is installed or the environment is disturbed and a reasonable estimate of future costs and discount rates can be made. The provision is discounted using a risk-free rate, and estimates of future cash flows are adjusted to reflect risk.


Subsequent to the initial measurement, the obligation is adjusted to reflect the passage of time and changes in the estimated future cash flows underlying the obligation. The increase in the provision due to the passage of time is recognized as finance expense, whereas increases and decreases due to changes in the estimated future cash flows are capitalized and depreciated over the life of the related asset. Actual costs incurred upon settlement of the site restoration obligation are charged against the provision to the extent the provision was established for those costs. Upon settlement of the liability, a gain or loss may be recorded. For closed sites, changes to estimated costs are recognized immediately in the income statement within other operating expenses.


24


HUDBAY MINERALS INC.

Notes to Consolidated Financial Statements

(in thousands of Canadian dollars, except where otherwise noted)

Years ended December 31, 2012 and 2011


The Group assesses the reasonableness of its estimates and assumptions each year and when conditions change. The estimates are revised accordingly. Judgement is required to determine the scope of future decommissioning and restoration activities, as well as such estimates and assumptions including discount rates, expected timing of decommissioning and restoration costs, inflationary factors and market risks. Changes in cost estimates, which may arise from changes in technology and pricing of the individual components of the cost, result in offsetting changes to the asset and liability and corresponding changes to the associated depreciation and finance costs. In view of the uncertainties concerning these future obligations, the ultimate timing and cost of reclamation and mine closure may differ materially from these estimates.


If the change in estimate results in a significant increase in the decommissioning liability and therefore an addition to the carrying value of the asset, the Group considers whether this is an indication of impairment of the asset as a whole and, if so, tests for impairment in accordance with IAS 36, Impairment of Assets. If, for mature mines, the revised mine assets net of decommissioning and restoration liabilities exceeds the recoverable value, that portion of the increase is charged directly to expense.


In view of the uncertainties concerning environmental remediation, the ultimate cost of decommissioning and restoration liabilities could differ materially from the estimated amounts provided. The estimate of the total liability is subject to change based on amendments to laws and regulations and as new information concerning the Group’s operations becomes available. Future changes, if any, to the estimated total liability as a result of amended requirements, laws, regulations and operating assumptions, as well as discount rates, may be significant and would be recognized prospectively as a change in accounting estimate, when applicable. Environmental laws and regulations are continually evolving in all regions in which the Group operates. The Group is not able to determine the impact, if any, of environmental laws and regulations that may be enacted in the future on its results of operations or financial position due to the uncertainty surrounding the ultimate form that such future laws and regulations may take.


Onerous contracts


A contract is considered to be onerous when the unavoidable costs of meeting obligations under the contract exceed the economic benefits expected to be received under it. The Group records a provision for any onerous contracts at the lesser of costs to comply with a contract and costs to terminate it.


Restructuring provisions


A provision for restructuring is recognized when management, with appropriate authority within the Group, has approved a detailed and formal restructuring plan, and the restructuring has either commenced or has been announced publicly. Future operating costs are not provided for.


25


HUDBAY MINERALS INC.

Notes to Consolidated Financial Statements

(in thousands of Canadian dollars, except where otherwise noted)

Years ended December 31, 2012 and 2011


(n)              Financial Instruments:


Financial assets, financial liabilities, and non-financial derivative contracts are initially recognized at fair value plus, in the case of a financial asset or financial liability not at fair value through profit or loss, directly attributable transaction costs. Measurement in subsequent periods depends on the financial instrument’s classification. The Group uses trade date accounting for regular way purchases or sales of financial assets. The Group determines the classification of its financial instruments and non-financial derivatives at initial recognition.


Financial assets and liabilities are offset and the net amount presented in the balance sheet when, and only when, the Group has a legal right to offset the amounts and intends either to settle on a net basis or to realize the asset and settle the liability simultaneously.


(i)      Non-derivative financial instruments — classification:


Loans and receivables


Loans and receivables are non-derivative financial assets with fixed or determinable payments that are not quoted in an active market, other than those classified or designated as fair value through profit or loss (“FVTPL”) or available-for-sale. Subsequent to initial recognition, loans and receivables are measured at amortized cost using the effective interest method, less any impairment losses. Gains and losses are recorded in the income statement when the loans and receivables are derecognized or impaired, and through the amortization process.


Held-to-maturity investments


Non-derivative financial assets with fixed or determinable payments and fixed maturity are classified as held-to-maturity when the Group has the positive intention and ability to hold to maturity, other than financial assets that meet the definition of loans and receivables or that are designated as FVTPL or available-for-sale. Subsequent to initial recognition, financial assets classified as held-to-maturity are held at amortized cost using the effective interest method, less any impairment losses. The Group does not currently have any financial assets classified as held-to-maturity.


Available-for-sale financial assets


Available-for-sale financial assets are non-derivative financial assets that are designated as available-for-sale or are not classified as loans and receivables, held-to-maturity, or fair value through profit or loss. Subsequent to initial recognition, available-for-sale financial assets are measured at fair value. Gains and losses are recorded in other comprehensive income (“OCI”) and presented in equity within the available-for-sale reserve, with the exception of impairment losses and foreign currency differences on monetary available-for-sale financial assets, which are immediately recognized in the income statement. When available-for-sale assets are derecognized or determined to be impaired, the cumulative gain or loss previously recognized in the available-for-sale reserve is transferred to the income statement. The Group has classified investments in shares of Canadian metals and mining companies as available-for-sale assets.


26


HUDBAY MINERALS INC.

Notes to Consolidated Financial Statements

(in thousands of Canadian dollars, except where otherwise noted)

Years ended December 31, 2012 and 2011


Financial assets and financial liabilities at fair value through profit or loss


Financial assets and financial liabilities at FVTPL consist of those classified as held-for-trading and those designated as FVTPL on initial recognition. Financial instruments are classified as held-for-trading if they are acquired for the purpose of selling or repurchasing in the near term or if they are derivatives that are not designated in effective hedging relationships. Upon initial recognition, transaction costs are recognized in the income statement as incurred. Financial assets and financial liabilities at FVTPL are measured at fair value, and changes in fair value are recognized in other finance gains and losses except gains and losses on the non-hedge financial derivatives related to customer sales contracts are presented in revenue. The Group’s FVTPL category currently contains only derivatives and embedded derivatives. During the years ended December 31, 2012 and December 31, 2011, the Group’s financial assets and liabilities at FVTPL consisted of derivatives, embedded derivatives and investments in warrants classified as held-for-trading; the Group did not have any financial assets or liabilities designated as FVTPL on initial recognition.


Financial liabilities at amortized cost


Subsequent to initial recognition, the Group measures financial liabilities, other than those at FVTPL and those that are derivatives in designated hedging relationships, at amortized cost using the effective interest method. Gains and losses on derecognition are recognized in other finance gains and losses.


(ii)              Derivatives:


Derivatives are initially recognized at fair value when the Group becomes a party to the derivative contract and are subsequently re-measured to fair value at the end of each reporting period. The resulting gain or loss is recognized in the income statement immediately unless the derivative is designated and effective as a hedging instrument. Derivatives with positive fair value are recognized as assets; derivatives with negative fair value are recognized as liabilities.


Contracts to buy or sell non-financial items that meet the definition of a derivative but were entered into and are held in accordance with the Group’s expected purchase, sale or usage requirements are not recognized as derivatives. Such contracts are recorded as non-derivative purchases and sales.


(iii)           Embedded derivatives:


The Group considers whether a contract contains an embedded derivative when it becomes a party to the contract. Derivatives embedded in other financial instruments or other host contracts are treated as separate derivatives when their risks and characteristics are not closely related to those of the host contracts and the host contracts are not measured at FVTPL.


27


HUDBAY MINERALS INC.

Notes to Consolidated Financial Statements

(in thousands of Canadian dollars, except where otherwise noted)

Years ended December 31, 2012 and 2011


(iv)          Hedge accounting:


The Group may use derivatives and non-derivative financial instruments to manage exposures to interest, currency, credit and other market risks. Where hedge accounting can be applied, a hedging relationship is designated as a fair value hedge, a cash flow hedge or a hedge of a net investment in a foreign operation. The purpose of hedge accounting is to ensure that gains, losses, revenues and expenses from effective hedging relationships are recorded in the income statement in the same period.


At the inception of a hedge, the Group formally documents the hedging relationship and the risk management objective and strategy for undertaking the hedge. Such hedges are expected to be highly effective in achieving offsetting changes in fair value or cash flows. The Group tests effectiveness each period.


During the years ended December 31, 2012 and December 31, 2011, the Group had only cash flow hedging relationships. Cash flow hedges are hedges of the exposure to variability in cash flows that is attributable to a particular risk associated with a recognized asset or liability or a highly probable forecast transaction that could affect profit or loss.


In a cash flow hedging relationship, the effective portion of changes in the fair value of the hedging derivative is recognized in other comprehensive income and presented in the hedging reserve in equity. The gain or loss relating to the ineffective portion is recognized immediately in the income statement and is included in other finance gains and losses. Amounts previously recognized in other comprehensive income are reclassified to the income statement in the same periods as the hedged cash flows affect profit or loss and are presented on the same line of the income statement as the recognized hedged item. When the hedged item is a non-financial asset or liability, the amounts previously recognized in other comprehensive income are reclassified to the carrying amount of the non-financial asset or liability.


Hedge accounting is discontinued prospectively if the hedging instrument is sold, terminated or exercised, if the hedge no longer meets criteria for hedge accounting, or if the Group revokes the hedge designation. In these cases, any gain or loss accumulated in equity (in the hedging reserve) remains in equity until the forecast transaction occurs, at which time it is reclassified to the income statement. If the forecast transaction is no longer expected to occur, any gain or loss accumulated in equity is reclassified immediately from equity to the income statement.


(v)             Fair values of financial instruments:


The fair value of a financial instrument is the amount for which an asset could be exchanged, or a liability settled, between knowledgeable, willing parties in an arm’s-length transaction.


Fair values of financial instruments traded in active markets are determined based on quoted market prices, where available. Bid prices are used for assets held or liabilities to be issued; asking prices are used for assets to be acquired or liabilities held.


28


HUDBAY MINERALS INC.

Notes to Consolidated Financial Statements

(in thousands of Canadian dollars, except where otherwise noted)

Years ended December 31, 2012 and 2011


For financial instruments not traded in an active market, fair values are determined based on appropriate valuation techniques. Such techniques may include discounted cash flow analysis, using recent arm’s-length market transactions, reference to the current fair value of another instrument that is substantially the same, and other valuation models.


The Group applies a hierarchy to classify valuation methods used to measure financial instruments carried at fair value. Levels 1 to 3 are defined based on the degree to which fair value inputs are observable and have a significant effect on the recorded fair value, as follows:


·                       Level 1: Quoted prices (unadjusted) in active markets for identical assets or liabilities;

·                       Level 2: Valuation techniques use significant observable inputs, either directly (i.e., as prices) or indirectly (i.e., derived from prices), or valuations are based on quoted prices for similar instruments; and

·                       Level 3: Valuation techniques use significant inputs that are not based on observable market data (unobservable inputs).


An analysis of fair values of financial instruments is provided in note 30.


(vi)          Impairment of financial instruments:


Each reporting date, the Group assesses financial assets not carried at FVTPL to determine whether there is objective evidence of impairment. A financial asset or group of financial assets is impaired if objective evidence indicates that one or more events occurred after initial recognition of the asset that negatively affected the estimated future cash flows of the financial asset or group of financial assets.


Objective evidence that financial assets are impaired can include significant financial difficulty of the issuer or debtor, default or delinquency in interest or principal payments, restructuring of an amount due to the Group on terms that the Group would not consider otherwise, indications that a debtor or issuer will enter bankruptcy, or the disappearance of an active market for a security. For an investment in an equity security, a significant or prolonged decline in the fair value of the security below its cost is also objective evidence of impairment.


Impairment of financial assets carried at amortized cost:


The Group considers evidence of impairment for loans and receivables and any held-to-maturity investments at both a specific asset and collective level. First, the Group specifically assesses financial assets that are individually significant and groups of financial assets that are not individually significant. If evidence of impairment is not identified in the specific assessment, the Group then groups assets based on similar credit risk characteristics (excluding any assets that were specifically determined to be impaired) and collectively assesses them for impairment. Objective evidence of impairment for a portfolio of receivables could include the Group’s past experience of collecting payments, an increase in the number of delayed payments in the portfolio past the average credit period, as well as observable changes in national or local economic conditions that correlate with default on receivables.


29


HUDBAY MINERALS INC.

Notes to Consolidated Financial Statements

(in thousands of Canadian dollars, except where otherwise noted)

Years ended December 31, 2012 and 2011


If there is objective evidence that an impairment loss has been incurred, the Group measures the amount of the loss as the difference between the asset’s carrying amount and the present value of estimated future cash flows (excluding future expected credit losses that have not yet been incurred), discounted at the financial asset’s original effective interest rate.


In recording the impairment loss, the Group recognizes impairment loss in the income statement and reduces the carrying amount of the financial asset using an allowance account, unless the Group is satisfied that no recovery of the amount owing is possible; at that point amounts are considered unrecoverable and are written off against the financial asset directly.


If, in a subsequent year, the amount of the estimated impairment loss decreases as a result of an event occurring after the impairment was recognized, the Group reverses all or a portion of the previously recognized impairment loss by adjusting the asset carrying value or the allowance account and recognizing the reversal in the income statement in other finance gains and losses.


Impairment of available-for-sale financial assets:


Impairment losses on available-for-sale investments are recognized by transferring the cumulative loss that has been recognized in other comprehensive income (and presented in the available-for-sale reserve in equity) to the income statement. The amount of the impairment loss is the difference between the investment’s acquisition costs, net of any principal repayments and amortization, and its current fair value, less any impairment loss previously recognized in the income statement.


Impairment losses recognized in the income statement related to available-for-sale equity investments are not subsequently reversed. Any subsequent increases in fair value of the equity investments are recognized in other comprehensive income. However, impairment losses recognized related to available-for-sale debt instruments are subsequently reversed, in whole or in part, if the fair value of the debt instrument increases as a result of an event occurring after the impairment loss was recognized, and the amount of the reversal is recognized in the income statement in other finance gains and losses.


The Group presents impairment losses and reversals of impairment losses recognized in the income statement in other finance gains and losses.


(vii)       Derecognition of financial instruments:


The Group derecognizes financial assets when the contractual rights to the cash flows from the assets expire, or when the Group transfers the rights to receive the contractual cash flows on the financial assets in a transaction in which substantially all the risks and rewards of ownership of the financial asset are transferred. Any interest in transferred financial assets that is created or retained by the Group is recognized as a separate asset or liability. The Group derecognizes financial liabilities when its contractual obligations are discharged or cancelled or expire.


30


HUDBAY MINERALS INC.

Notes to Consolidated Financial Statements

(in thousands of Canadian dollars, except where otherwise noted)

Years ended December 31, 2012 and 2011


(o)              Taxation:


Current Tax


Current income tax assets and liabilities for the current and prior periods are measured at the amount expected to be recovered from or paid to the taxation authorities. The tax rates and tax laws used to compute the amount are those that are enacted or substantively enacted by the balance sheet date.


Hudbay is subject to income taxes in numerous jurisdictions. Significant judgement is required in determining the worldwide provision for income taxes due to the complexity of legislation. There are many transactions and calculations for which the ultimate tax determination is uncertain during the ordinary course of business. The Group recognizes liabilities for anticipated tax issues based on estimates of whether additional taxes will be due. Where the final tax outcome of these matters is different from the amounts that were initially recorded, such differences will affect the income tax and deferred tax provisions in the period in which such determination is made.


Additionally, future changes in tax laws in the jurisdictions in which the Group operates could limit the ability of the Group to obtain tax deductions in future periods.


Deferred Tax


Deferred tax is recognized using the balance sheet method in respect of temporary differences at the balance sheet date between the tax basis of assets and liabilities, and their carrying amounts for financial reporting purposes.


Deferred income tax liabilities are recognized for all taxable temporary differences, except:


·                      where the deferred income tax liability arises from the initial recognition of goodwill, or the initial recognition of an asset or liability in a transaction that is not a business combination and, at the time of the transaction, affects neither the accounting profit nor taxable profit or loss; and


·                      in respect of taxable temporary differences associated with investments in subsidiaries, associates and interests in joint ventures, where the timing of the reversal of the temporary differences can be controlled and it is probable that the temporary differences will not reverse in the foreseeable future.


31


HUDBAY MINERALS INC.

Notes to Consolidated Financial Statements

(in thousands of Canadian dollars, except where otherwise noted)

Years ended December 31, 2012 and 2011


Deferred income tax assets are recognized for all deductible temporary differences, carry-forward of unused tax assets and unused tax losses, to the extent that it is probable that taxable profit will be available against which the deductible temporary differences, and the carry-forward of unused tax assets and unused tax losses can be utilized, except:


·                      where the deferred income tax asset relating to the deductible temporary difference arises from the initial recognition of an asset or liability in a transaction that is not a business combination and, at the time of the transaction, affects neither the accounting profit nor taxable profit or loss; and


·                      in respect of deductible temporary differences associated with investments in subsidiaries, associates and interests in joint ventures, deferred tax assets are recognized only to the extent that it is probable that the temporary differences will reverse in the foreseeable future and taxable profit will be available against which the temporary differences can be utilized.


To the extent that it is probable that taxable profit will be available to offset the deductible temporary differences, the Group recognizes the deferred tax asset regarding the temporary difference on decommissioning, restoration and similar liabilities and recognizes the corresponding deferred tax liability regarding the temporary difference on the related assets.


The carrying amount of deferred income tax assets is reviewed at each balance sheet date and reduced to the extent that it is no longer probable that sufficient taxable profit will be available to allow all or part of the deferred income tax asset to be utilized. Unrecognized deferred income tax assets are reassessed at each balance sheet date and are recognized to the extent that it has become probable that future taxable profit will be available to allow the deferred tax asset to be recovered.


Judgement is required in determining whether deferred tax assets are recognized on the balance sheet. Deferred tax assets, including those arising from unutilized tax losses, require management to assess the likelihood of taxable profit in future periods in order to utilize recognized deferred tax assets. Estimates of future taxable income are based on forecast cash flows from operations and the application of existing tax laws in each jurisdiction. To the extent that future cash flows and taxable income differ significantly from estimates, the ability to realize the net deferred tax assets recorded at the balance sheet date could be affected.


Deferred tax is measured on an undiscounted basis at the tax rates that are expected to apply in the periods in which the asset is realized or the liability is settled, based on tax rates and tax laws enacted or substantively enacted at the balance sheet date.


Deferred income tax assets and deferred income tax liabilities are offset if a legally enforceable right exists to set off current tax assets against current tax liabilities and the deferred income taxes relate to the same taxable entity and the same taxation authority.


Current and deferred taxes relating to items recognized outside profit or loss (whether in other comprehensive income or directly in equity) are recognized outside profit or loss and not in the income statement. Mining taxes and royalties are treated and disclosed as current and deferred taxes if they have the characteristics of an income tax.


32


HUDBAY MINERALS INC.

Notes to Consolidated Financial Statements

(in thousands of Canadian dollars, except where otherwise noted)

Years ended December 31, 2012 and 2011


(p)              Share capital and reserves:


Transaction costs


Transaction costs directly attributable to equity transactions are recognized as a deduction from equity.


Other capital reserve


The other capital reserve is used for equity-settled share-based payments and includes amounts for stock options granted and not exercised.


Foreign currency translation reserve


The foreign currency translation reserve is used to record exchange differences arising from the translation of the financial statements of foreign operations. Translation gains and losses remain in the reserve until disposal of all or a portion of the foreign operation.


Hedging reserve


The hedging reserve contains the effective portion of the cumulative change in the fair value of cash flow hedging derivative instruments related to hedged transactions that have not yet occurred.


Available-for-sale reserve


The available-for-sale reserve contains the cumulative change in the fair value of available-for-sale investments with the exception of impairment losses and foreign currency differences on monetary available-for-sale assets. Gains and losses are reclassified to the income statement when the available-for-sale investments are impaired or derecognized.


(q)              Share-based payments:


Hudbay offers a Deferred Share Unit (“DSU”) plan for non-employee members of the Board of Directors and a Restricted Share Unit (“RSU”) plan and stock option plan for employees. These plans are included in provisions on the balance sheet and further described in note 25.


Cash-settled transactions, consisting of DSUs and RSUs, are initially measured at fair value and recognized as an obligation at the grant date. The liabilities are remeasured to fair value at each reporting date up to and including the settlement date, with changes in fair value recognized in the income statement. The Group values the liabilities based on the change in the Company’s share price. Additional DSUs and RSUs are credited to reflect dividends paid on Hudbay common shares over the vesting period. DSU and RSU liabilities are included in provisions on the balance sheet, and changes in the fair value of the liabilities are recorded in the income statement. The current portion of the liability reflects those grants that have vested or that are expected to vest within twelve months.


33


HUDBAY MINERALS INC.

Notes to Consolidated Financial Statements

(in thousands of Canadian dollars, except where otherwise noted)

Years ended December 31, 2012 and 2011


DSUs vest on the grant date and are redeemable when a participant is no longer a member of the Board of Directors. Issue and redemption prices of DSUs are based on the average closing price of the Company’s common shares for the five trading days prior to issuance or redemption.


RSUs vest on or before December 31st of the third calendar year after the grant date. Hudbay settles RSUs on the vest date with a cash payment based on the closing price of the Company’s common shares shortly prior to the vest date. Except in specified circumstances, RSUs terminate when an employee ceases to be employed by the Group. Valuations of RSUs reflect estimated forfeitures.


Equity-settled transactions with employees relate to stock options and are measured by reference to the fair value at the earlier of the grant date and the date that the employees unconditionally became entitled to the awards. Fair value is determined using a Black-Scholes option pricing model, which relies on estimates of the future risk-free interest rate, future dividend payments, future share price volatility and the expected average life of the options. The Group believes this model adequately captures the substantive features of the option awards and is appropriate to calculate their fair values. The fair value determined at the grant date is recognized over the vesting period in accordance with vesting terms and conditions, with a corresponding increase to other capital reserves. The amount recognized as an expense is adjusted to reflect the number of awards for which the related service and non-market vesting conditions are expected to be met.


(r)               Earnings per share:


The Company presents basic and diluted earnings (loss) per share (“EPS”) data for its common shares. Basic EPS is calculated by dividing the profit or loss attributable to common shareholders of the Company by the weighted average number of common shares outstanding during the period. Diluted EPS is determined by adjusting the profit or loss attributable to common shareholders and the weighted average number of common shares outstanding for the effects of all dilutive potential common shares, which currently consist of stock options granted to employees.


When calculating earnings per share for periods where the Group has a loss, Hudbay’s calculation of diluted earnings per share excludes any incremental shares from the assumed conversion of stock options as they would be anti-dilutive.


(s)                Leases:


Finance leases, under which substantially all the risks and rewards incidental to ownership of the leased item are transferred to the Group, are capitalized as assets at the inception of the lease at the lower of fair value or the present value of the minimum lease payments. Lease payments are apportioned between finance charges and the reduction of the liability so as to achieve a constant periodic rate of interest on the remaining balance of the liability. Finance charges are reflected in the income statement as finance costs. The Group currently does not have any finance leases.


Under operating lease arrangements, the risks and rewards incidental to ownership are not transferred to the Group. Operating lease payments are recognized as an expense in the income statement on a straight-line basis over the lease term.


34


HUDBAY MINERALS INC.

Notes to Consolidated Financial Statements

(in thousands of Canadian dollars, except where otherwise noted)

Years ended December 31, 2012 and 2011


(t)                 Segment reporting:


An operating segment is a component of the Group that engages in business activities from which it may earn revenues and incur expenses and for which discrete financial information is available. The Group’s chief executive officer regularly reviews the operating results of each operating segment to make decisions about resources to be allocated to the segment and assess its performance. In determining operating segments, the Group considers location and decision-making authorities. Refer to note 34.


(u)              Comparatives:


Where necessary, the comparative information has been changed to agree to the current year presentation. In such a case, the nature of the reclassification; the amount of each item that is reclassified; and, the reason for the reclassification, is disclosed.


4.                   New standards


New standards and interpretations adopted in the year


As required by the IASB, effective January 1, 2012 the Group adopted the following amendments to IFRS:


Amendments to IAS 12 Deferred Tax: Recovery of Underlying Assets


This amendment introduces an exception to the current measurement principles of deferred tax assets and liabilities arising from investment property measured using the fair value model in accordance with IAS 40 Investment Property. The exception also applies to investment properties acquired in a business combination accounted for in accordance with IFRS 3, Business Combinations assuming the acquirer subsequently measures these assets applying the fair value model. The Group’s adoption of these amendments had no material effect on its consolidated financial statements.


Amendments to IFRS 7 Disclosures Transfers of Financial Assets


This amendment requires disclosure of information that enables users of financial statements to understand the relationship between transferred financial assets that are not derecognized in their entirety and the associated liabilities and to evaluate the nature of, and risks associated with, the entity’s continuing involvement in derecognized financial assets. The Group’s adoption of this amendment had no material effect on its consolidated financial statements.


New standards and interpretations not yet adopted


IFRS 9 Financial Instruments


IFRS 9 Financial Instruments (“IFRS 9 (2009)”) replaces the guidance in IAS 39 Financial Instruments: Recognition and Measurement, on the classification and measurement of financial assets. IFRS 9 (2009) retains but simplifies the mixed measurement model and establishes two primary measurement categories for financial assets: amortized cost and fair value. The basis of classification depends on an entity’s business model and the contractual cash flow of the financial asset. Gains and losses on remeasurement of financial assets measured at fair value will be recognized in profit or loss, except that for an investment in an equity instrument which is not held-for-trading, IFRS 9 (2009) provides, on initial recognition, an irrevocable election to present all fair value changes from the investment in OCI. The election is available on an individual share-by-share basis. Amounts presented in OCI will not be reclassified to profit or loss at a later date. The new standard also requires use of a single impairment method, replacing the multiple impairment methods in IAS 39, and amends some of the requirements of IFRS 7 Financial Instruments: Disclosures.


IFRS 9 (2010) added guidance to IFRS 9 (2009) on the classification and measurement of financial liabilities, and this guidance is consistent with the guidance in IAS 39, except for changes related to financial liabilities measured at fair value under the fair value option and derivative liabilities that are linked to and must be settled by delivery of an unquoted equity instrument.


IFRS 9 (2010) supersedes IFRS 9 (2009) and is effective for annual periods beginning on or after January 1, 2015, with early adoption permitted. For annual periods beginning before January 1, 2015, either IFRS 9 (2009) or IFRS 9 (2010) may be applied.


The Group intends to adopt IFRS 9 (2010) in its financial statements for the annual period beginning on January 1, 2015. The Group has not yet determined the effect of adoption of IFRS 9 (2010) on its consolidated financial statements.


35


HUDBAY MINERALS INC.

Notes to Consolidated Financial Statements

(in thousands of Canadian dollars, except where otherwise noted)

Years ended December 31, 2012 and 2011


IFRS 10 Consolidated Financial Statements


In May 2011, the IASB issued IFRS 10 Consolidated Financial Statements, which replaces the guidance in IAS 27 Consolidated and Separate Financial Statements and SIC-12 Consolidation - Special Purpose Entities. IAS 27 (2011) Separate Financial Statements, carries forward the existing accounting requirements for separate financial statements. IFRS 10 provides a single model to be applied in the control analysis for all investees, including entities that currently are special purpose entities within the scope of SIC-12, stating that an investor controls an investee when it is exposed, or has rights, to variable returns from its involvement with the investee and has the ability to affect those returns through its power over the investee. In addition, IFRS 10 carries forward the consolidation procedures substantially unmodified from IAS 27 (2008). The Group intends to adopt IFRS 10 in its financial statements for the annual period beginning on January 1, 2013. The Group does not expect the adoption of IFRS 10 to have a material effect on its consolidated financial statements based on its current facts and circumstances.


IFRS 11 Joint Arrangements


In May 2011, the IASB issued IFRS 11 Joint Arrangements, which replaces the guidance in IAS 31 Interests in Joint Ventures. IFRS 11 classifies joint arrangements as either joint operations or joint ventures based on an entity’s rights and obligations. A joint operator will recognize its share of the assets, liabilities, revenue and expenses of the joint operation. A joint venturer will recognize an investment and account for that investment using the equity method. Under existing IFRS, entities have the choice to proportionately consolidate or apply the equity method to interests in jointly controlled entities. The Group intends to adopt IFRS 11 in its financial statements for the annual period beginning on January 1, 2013. The Group does not expect the adoption of IFRS 11 to have a material effect on its consolidated financial statements based on its current facts and circumstances.


IFRS 12 Disclosure of Interests in Other Entities


In May 2011, the IASB issued IFRS 12 Disclosure of Interests in Other Entities, which contains disclosure requirements for entities that have interests in subsidiaries, joint arrangements (i.e., joint operations or joint ventures), associates and/or unconsolidated structured entities. The required disclosures aim to enable users to evaluate the nature of, and the risks associated with, an entity’s interest in other entities, and the effects of those interests on the entity’s financial position, financial performance and cash flows. The Group intends to adopt IFRS 12 in its financial statements for the annual period beginning on January 1, 2013. The Group will provide additional disclosures as required and does not otherwise expect the adoption of IFRS 12 to have a material effect on its consolidated financial statements.


Amendments to IFRS 10, IFRS 11 and IFRS 12: Transition guidance


This amendment clarifies certain transitional guidance on the application of IFRS 10, IFRS 11 and IFRS 12 for the first time. The amendments are effective at the same effective date as IFRS 10, IFRS 11 and IFRS 12, therefore, the Group intends to adopt the amendments in its financial statements for the annual period beginning on January 1, 2013.


36


HUDBAY MINERALS INC.

Notes to Consolidated Financial Statements

(in thousands of Canadian dollars, except where otherwise noted)

Years ended December 31, 2012 and 2011


IFRS 13 Fair Value Measurement


In May 2011, the IASB published IFRS 13 Fair Value Measurement, which replaces the fair value measurement guidance contained in individual IFRS with a single source of fair value measurement guidance. It defines fair value as the price that would be received to sell an asset or paid to transfer a liability in an orderly transaction between market participants at the measurement date (i.e., an exit price). The standard establishes a framework for measuring fair value and sets out disclosure requirements for fair value measurements. The Group intends to adopt IFRS 13 in financial statements for the annual period beginning on January 1, 2013. The disclosure requirements of IFRS 13 need not be applied in comparative information for periods before initial application. The Group has not yet determined the effect of adoption of IFRS 13 on its consolidated financial statements.


Amendments to IAS 28 Investments in Associates and Joint Ventures


In May 2011, the IASB issued Amendments to IAS 28 Investments in Associates and Joint Ventures, which carries forward the requirements of IAS 28 (2008), with limited amendments related to associates and joint ventures held for sale, as well as to changes in interests held in associates and joint ventures when an entity retains an interest in the investment. The Group intends to adopt IAS 28 in its financial statements for the annual period beginning on January 1, 2013. The Group does not expect the amendments to have a material effect on its consolidated financial statements based on the current facts and circumstances.


Amendments to IAS 1 Presentation of Financial Statements: Presentation of Items of Other Comprehensive Income


In June 2011, the IASB issued amendments to IAS 1 Presentation of Financial Statements: Presentation of Items of Other Comprehensive Income. The amendments require separate presentation of the items of OCI that may be reclassified to profit or loss in the future from those that will never be reclassified to profit or loss. The Group intends to adopt IAS 1 in its financial statements for the annual period beginning on January 1, 2013. The Group has not yet determined the effect of adoption of the amendments on its consolidated financial statements.


Amendments to IAS 19 Employee Benefits


In June 2011, the IASB issued an amended version of IAS 19 Employee Benefits to revise certain aspects of the accounting for pension plans and other benefits. The amendments eliminate the corridor method of accounting for defined benefit plans and require immediate recognition of actuarial gains and losses in OCI; eliminate use of an expected rate of return on plan assets and require use of the discount rate to determine the interest on the plan asset component of the net interest cost; and set out additional disclosure requirements. The Group intends to adopt IAS 19 in its financial statements for the annual period beginning on January 1, 2013. The Group has not yet determined the effect of adoption of the amendments on its consolidated financial statements.


37


HUDBAY MINERALS INC.

Notes to Consolidated Financial Statements

(in thousands of Canadian dollars, except where otherwise noted)

Years ended December 31, 2012 and 2011


IAS 32 Offsetting Financial Assets and Liabilities


In October 2009, the IASB issued an amendment to IAS 32 Offsetting Financial Assets and Liabilities, which clarifies certain aspects of offsetting and net and gross settlement. The Group intends to adopt the amendments to IAS 32 in its financial statements for the annual period beginning on January 1, 2014. The Group has not yet determined the effect of adoption of the amendment to IAS 32 on its consolidated financial statements.


IFRS 7 Financial Instruments: Disclosures,


In October 2010, the IASB issued an amendment to IFRS 7 Financial Instruments: Disclosures, which contains new disclosure requirements related to offsetting of financial assets and liabilities. The Group intends to adopt the amendments to IFRS 7 in its financial statements for the annual period beginning on January 1, 2013. The Group will provide additional disclosures as required and does not otherwise expect the adoption of IFRS 7 to have a material effect on its consolidated financial statements.


IFRIC 20, Stripping Costs in the Production Phase of a Surface Mine


In October 2011, the IASB issued IFRIC 20 Stripping Costs in the Production Phase of a Surface Mine, which provides guidance on the accounting for waste removal costs that are incurred in surface mining activity during the production phase of a mine when two benefits accrue to the entity from the stripping activity: useable ore that can be used to produce inventory and improved access to further quantities of material that will be mined in future periods. The Group intends to adopt IFRIC 20 in its financial statements for the annual period beginning on January 1, 2013. IFRIC 20 does not currently impact the consolidated financial statements as the Group does not have any surface mines in the production phase.


5.                   Acquisition of Hudbay Peru


On March 1, 2011, the Group obtained control of Hudbay Peru, a Canadian mineral exploration and development company focused on its wholly-owned Constancia copper project in southern Peru. Hudbay obtained control of Hudbay Peru by acquiring 90.5% of the share capital and voting interests in the company. As a result, the Group’s equity interest in Hudbay Peru increased from 1.2% to 91.7%. On July 5, 2011, Hudbay acquired the remaining common shares and as at December 31, 2012 and December 31, 2011 wholly owned Hudbay Peru. Acquiring control of Hudbay Peru allows the Group an opportunity to develop the Constancia project and significantly increase Hudbay’s future copper production.


Consideration transferred


The following summarizes the acquisition date fair value of the major classes of consideration transferred:


Cash consideration


$

118,525


Equity instruments (20,372,986 common shares)


345,119


Total consideration transferred


463,644


Less: cash acquired


(23,670

)


Total consideration transferred, net of cash acquired


$

439,974


The fair value of the common shares issued was based on Hudbay’s listed share price of $16.94 at the March 1, 2011 acquisition date.


The Group incurred acquisition related costs of $5,778 mainly relating to external legal and advisory fees and due diligence costs. These costs have been included in selling and administrative expenses in the Group’s consolidated income statement. In addition, the Group incurred share issue costs of $239 and presented them as a deduction from share capital. For cash flow purposes, the Group paid $94,855 upon acquisition of Hudbay Peru representing $118,525 of cash paid, net of $23,670 cash received.


Identifiable assets acquired and liabilities assumed


The Group completed the purchase price allocation in 2011, resulting in recognized amounts of identifiable assets acquired and liabilities assumed as follows:


Fair value


Cash and cash equivalents


$

23,670


Short-term investments


20,052


Receivables and prepaid expenses


19,447


Mineral properties


520,768


Other property, plant and equipment


561


Deferred tax assets


750


Trade and other payables


(13,827

)

Provisions - decommissioning and restoration liabilities


(978

)

Deferred tax liabilities


(129,586

)


Total net identifiable assets


$

440,857


Acquired receivables were valued at $19,248. Based on the valuation performed at the acquisition date, management expected all contractual cash flows to be collectible. Receivables related primarily to the timing of receipt of proceeds by Hudbay Peru from exercises of stock options and warrants. Subsequent to the acquisition date, all receivables relating to the exercises of stock options and warrants were collected. Upon finalization of the purchase price allocation, the deferred tax liabilities were adjusted from $128,211 to $129,586. There was also an insignificant adjustment to other property, plant and equipment. These adjustments resulted in a corresponding change to the goodwill balance.


Goodwill


The Group recognized goodwill as at December 31, 2011 as a result of the acquisition as follows:


Total consideration transferred


$

463,644


Fair value of previous 1.2% interest in the acquiree


6,043


Non-controlling interests of 8.3% measured based on the proportionate share of identifiable net assets


36,591


Less: value of net identifiable asset acquired


(440,857

)

Goodwill upon acquisition March 1, 2011


65,421


Effects of movement in exchange rate


2,825


Goodwill balance as at December 31, 2011


$

68,246


The goodwill balance arose from the requirement to record deferred income tax liabilities measured at the tax effect of the difference between the fair values of the assets acquired and liabilities assumed and their tax bases. None of the goodwill recognized is expected to be deductible for income tax purposes.


As at December 31, 2012, the goodwill decreased to $66,763 as a result of effects of movement in exchange rate (note 14).


6.                   Discontinued operations


On September 9, 2011, Hudbay sold its interest in the Fenix ferro-nickel project in Guatemala to the Solway Group. Hudbay acquired the Fenix project in August 2008, through an acquisition of all of the issued and outstanding common shares of HMI Nickel Inc. (formerly Skye Resources Inc.). Pursuant to the terms of the agreement with the Solway Group, Hudbay received US$140 million in cash at closing. The Group has settled the original $30 million deferred payment obligation for a cash payment of $1 million, which has been recorded in other income in the consolidated income statements. The Group has presented the results of the Fenix project as discontinued operations for the comparative period.


38


HUDBAY MINERALS INC.

Notes to Consolidated Financial Statements

(in thousands of Canadian dollars, except where otherwise noted)

Years ended December 31, 2012 and 2011


The following summarizes results from discontinued operations for the year ended December 31, 2011:


Expenses


$

(3,636

)

Tax (loss) benefit


68


(3,568

)


Loss on remeasurement to fair value less costs to sell:


- Impairment loss


(212,739

)

- Additional loss on disposal


(2,061

)

Foreign exchange losses transferred from the foreign currency reserve (note 27)


(20,416

)


(235,216

)


Loss from discontinued operations


$

(238,784

)


7.                   Revenue and expenses


(a)              Revenue


The Group’s revenue by significant product types:


Year ended


December 31


2012


2011


Copper


$

343,691


$

480,978


Zinc


222,570


170,091


Gold


131,770


149,321


Silver


20,979


26,349


Zinc oxide


75,698


Other


6,364


23,788


725,374


926,225


Less: treatment and refining charges


(22,709

)

(35,408

)

Less: pre-production revenue


(115

)


$

702,550


$

890,817


A portion of the Group’s revenue from sales of zinc is hedged and designated as cash flow hedges. For the year ended December 31, 2012, revenues from zinc sales include gains of $2,050 (year ended December 31, 2011 - $992) from the hedging reserve (notes 27 and 30b).


Pre-production revenue relates to revenue earned from production at our Lalor project in Manitoba. As revenues are being earned prior to the declaration of commercial production, the pre-production revenue is being credited against capital costs rather than revenue.


39


HUDBAY MINERALS INC.

Notes to Consolidated Financial Statements

(in thousands of Canadian dollars, except where otherwise noted)

Years ended December 31, 2012 and 2011


(b)              Depreciation and amortization


Depreciation of property, plant and equipment and amortization of intangible assets are reflected in the income statements as follows:


Year ended


December 31


2012


2011


Total depreciation and amortization presented in:


Cost of sales


$

75,801


$

103,915


Selling and administrative expenses


803


686


$

76,604


$

104,601


(c)               Share-based payment expense


Total


Equity-settled


Cash-settled


share-based


Stock


RSUs


DSUs


payment


Options


(note 25)


(note 25)


expense


Year ended December 31, 2012


Share-based payment expense presented in:


Cost of sales


$


$

1,377


$


$

1,377


Selling and administrative expenses


552


2,308


1,125


3,985


Other operating expenses


334


334


Exploration and evaluation


73


73


$

552


$

4,092


$

1,125


$

5,769


Year ended December 31, 2011


Share-based payment expense presented in:


Cost of sales


$

38


$

463


$


$

501


Selling and administrative expenses


1,927


1,344


(753

)

2,518


Other operating expenses


6


6


Exploration and evaluation


12


12


$

1,965


$

1,825


$

(753

)

$

3,037


40


HUDBAY MINERALS INC.

Notes to Consolidated Financial Statements

(in thousands of Canadian dollars, except where otherwise noted)

Years ended December 31, 2012 and 2011


(d)              Employee benefits expense


Year ended


December 31


2012


2011


Current employee benefits


130,889


125,036


Profit-sharing plan expense


16,888


19,934


Share-based payments (notes 7c, 25) 1


Equity settled stock options


552


1,965


Cash-settled restricted share units


4,092


1,825


Cash-settled deferred share units


1,125


(753

)

Employee share purchase plan1


1,248


994


Post-employment pension benefits


Defined benefit plans


23,215


9,008


Defined contribution plans


924


775


Other post-retirement employee benefits


11,938


10,795


Termination benefits


1,286


2,071


Restructuring


1,799


193,956


171,650


1 See note 2f for correction of immaterial error note with respect to prior year employee benefit expense balances.


This table presents employee benefit expense recognized in the Group’s income statement, including amounts transferred from inventory upon sale of goods.


Manitoba has a profit sharing plan whereby 10% of Manitoba’s after tax profit (excluding provisions or recoveries for deferred income tax and deferred mining tax) for any given fiscal year will be distributed to all eligible employees in the Flin Flon/Snow Lake operations, with the exception of executive officers and key management personnel.


The Group has an employee share purchase plan for executives and other eligible employees where participants may contribute between 1% and 10% of their pre-tax base salary to acquire Hudbay shares. The Group makes a matching contribution of 75% of the participant’s contribution.


See note 21 for a description of the Group’s pension plans and note 22 for the Group’s other employee benefit plans.


41


HUDBAY MINERALS INC.

Notes to Consolidated Financial Statements

(in thousands of Canadian dollars, except where otherwise noted)

Years ended December 31, 2012 and 2011


(e)     Other operating income and expenses


Year ended


December 31


2012


2011


Other operating income


Gain on sale of property, plant and equipment


$

(122

)

$

(2,453

)

Other


(2,194

)

(921

)


(2,316

)

(3,374

)

Other operating expense


Cost of non-producing properties


$

10,966


$

9,275


Other


366


30


$

11,332


$

9,305


In June 2011, the Group disposed of its shares in the White Pine Copper Refinery for proceeds of $2,906 and recognized a gain on sale of $1,999.


Other operating income includes the $1,000 settlement payment received from Solway Group in relation to the sale of Fenix (note 6).


42


HUDBAY MINERALS INC.

Notes to Consolidated Financial Statements

(in thousands of Canadian dollars, except where otherwise noted)

Years ended December 31, 2012 and 2011


(f)     Finance income and expenses


Year ended


December 31


2012


2011


Finance income


Interest income


$

(6,217

)

$

(8,742

)

Other finance income


(28

)


(6,217

)

(8,770

)

Finance expense


Interest expense on long-term debt (note 18)


14,205


Unwinding of accretion on financial liabilities at amortized cost (note 17)


2,323


Unwinding of discounts on provisions (note 20)


3,036


3,322


Other finance expense


11,822


3,283


31,386


6,605


Less: interest capitalized (note 13)


(16,528

)


14,858


6,605


Other finance (gains) losses


Net foreign exchange losses (gains)


937


(832

)

Gain on ineffective cash flow hedges


(14

)

(884

)

Change in fair value of financial assets and liabilities at FVTPL:


Prepayment option embedded derivative (note 18)


(1,880

)


Investments classified as held-for-trading


2,900


2,221


Remeasurement to fair value of existing interest in Hudbay Peru upon acquisition of control:


Recognized in the income statements


(881

)

Reclassified from equity (note 27)


(1,220

)

Net gain reclassified from equity on disposal of available-for-sale investments (note 27)


8


Net loss from impairment of non-trade receivable


2,568


Reclassified from equity on impairment of available-for-sale investments (notes 11 and 27)


40,181


6,587


44,700


4,991


Net finance expense


$

53,341


$

2,826


Other finance expense for the year ended December 31, 2012 related mainly to amounts associated with efforts to arrange financing for development projects. Interest expense is capitalized to the Constancia project related to the other financial liabilities at amortized cost and long-term debt (notes 17, 18).


43


HUDBAY MINERALS INC.

Notes to Consolidated Financial Statements

(in thousands of Canadian dollars, except where otherwise noted)

Years ended December 31, 2012 and 2011


(g)     Impairment losses


On November 1, 2011, Hudbay sold Zochem Inc., its zinc oxide production facility in Ontario for proceeds of US$15,078. The Group recognized a total impairment loss of $6,839 related to Zochem, consisting of a loss of $5,878 recognized upon classification as held for sale based on the excess of carrying value over fair value less costs to sell and an additional loss of $961 recognized on disposal. On the income statement, the impairment loss is presented within cost of sales. Zochem was included within the Manitoba operating segment.


8.      Cash and cash equivalents


Dec. 31, 2012


Dec. 31, 2011


Cash on hand and demand deposits


$

1,292,414


$

899,077


Short-term money market instruments with maturities of three months or less at acquisition date


44,674


$

1,337,088


$

899,077


9.      Trade and other receivables


Dec. 31, 2012


Dec. 31, 2011


Current


Trade receivables


$

42,062


$

27,405


Embedded derivatives - provisional pricing


(937

)

(1,407

)

Statutory receivables


10,309


8,325


Other receivables


1,442


6,063


52,876


40,386


Less: allowance for bad debts


(77

)


52,876


40,309


Non-current


Statutory receivables - Peruvian sales tax


43,149


5,212


Total


$

96,025


$

45,521


The non-current receivable consists of refundable sales taxes in Peru that the Group has paid on capital expenditures for its Constancia project. The Group expects to receive refunds once the project reaches commercial production, as the accumulated sales tax pool is refundable up to 18% of the revenue earned each month. Significant judgements are required on measurement and classification of Peruvian sales taxes paid on capital expenditures (note 2d).


44


HUDBAY MINERALS INC.

Notes to Consolidated Financial Statements

(in thousands of Canadian dollars, except where otherwise noted)

Years ended December 31, 2012 and 2011


10.    Inventories


Dec. 31, 2012


Dec. 31, 2011


Current


Work in progress


$

6,141


$

4,362


Finished goods


38,750


58,730


Materials and supplies


13,518


14,058


58,409


77,150


Non-current


Materials and supplies


5,852


5,721


Total


$

64,261


$

82,871


During the year ended December 31, 2012, the Group recognized an expense of $16,805 in cost of sales related to write-downs of the carrying value of zinc inventories to net realizable value (December 31, 2011 - $5,420). For zinc inventories sold during 2012, the related amount transferred from inventory to cost of sales was $22,225 less than it would have been had write-downs not been previously recognized. As a result, for the year ended December 31, 2012, the net impact on cost of sales, related to zinc inventory write-downs, was a decrease of $5,420.


During the year ended December 31, 2012, the Group recognized an expense of $2,857 in cost of sales and $400 in other operating expense related to write-downs of the carrying value of materials and supplies.


In addition, the cost of inventories recognized as an expense and included in cost of sales amounted to $362,365 for the year ended December 31, 2012 (year ended December 31, 2011 - $385,940).


11.    Other financial assets


Dec. 31, 2012


Dec. 31, 2011


Current


Derivative assets


$

2,442


$

3,112


Non-current


Available-for-sale investments


71,260


98,279


Investments at fair value through profit or loss


220


2,090


Derivative assets


132


Restricted cash


1,655


1,692


73,135


102,193


$

75,577


$

105,305


45


HUDBAY MINERALS INC.

Notes to Consolidated Financial Statements

(in thousands of Canadian dollars, except where otherwise noted)

Years ended December 31, 2012 and 2011


Derivative assets


Derivative assets consist of cash flow hedges and non-hedge derivatives. See note 30b for further descriptions of the Group’s cash flow hedges, which expired in July 2012, and non-hedge derivatives.


Available-for-sale investments


Available for sale investments consist of investments in Canadian metals and mining companies, most of which are publicly traded.


During the year ended December 31, 2012, the Group recognized impairment losses on investments in listed shares and transferred pre-tax losses of $40,181 from the available-for-sale reserve within equity to the income statement (note 27) (2011 - $6,587).


The following table summarizes the change in available-for-sale investments:


Dec. 31, 2012


Dec. 31, 2011


Balance, beginning of year


$

98,279


$

104,990


Additions


4,049


47,570


Decrease from remeasurement to fair value (note 27)


(29,852

)

(49,117

)

Reclassification upon acquisition of control of Hudbay Peru


(5,164

)

Disposals


(1,216

)


Balance, end of year


$

71,260


$

98,279


Refer to note 3n(i) for a description of the Group’s accounting policy for available-for-sale investments.


Credit facility, letters of credit and restricted cash


On November 3, 2010, Hudbay arranged a US$300 million revolving credit facility with a syndicate of lenders. The facility has an initial term of four years, is secured by a pledge of assets of the Company, and is unconditionally guaranteed by Hudbay’s non-Peruvian material subsidiaries. Upon closing, restricted cash on deposit to support letters of credit was reclassified to cash and cash equivalents. As at December 31, 2012, the Group had outstanding letters of credit in the amount of $64,524 (December 31, 2011 - $61,954).


46


HUDBAY MINERALS INC.

Notes to Consolidated Financial Statements

(in thousands of Canadian dollars, except where otherwise noted)

Years ended December 31, 2012 and 2011


12.    Intangible assets - computer software


Dec. 31, 2012


Dec. 31, 2011


Cost


Balance, beginning of year


$

12,679


$

7,095


Additions


2,333


5,584


Balance, end of year


15,012


12,679


Accumulated amortization


Balance, beginning of year


807


12


Amortization for the year


1,312


795


Balance, end of year


2,119


807


Net book value


$

12,893


$

11,872


47


HUDBAY MINERALS INC.

Notes to Consolidated Financial Statements

(in thousands of Canadian dollars, except where otherwise noted)

Years ended December 31, 2012 and 2011


13.    Property, plant and equipment


Exploration and


Capital


evaluation


works in


Mining


Plant and


Dec. 31, 2012


assets


progress


properties


equipment


Total


Cost


Cost, beginning of year


$

36,994


$

786,844


$

378,335


$

576,898


$

1,779,071


Additions


2,304


563,621


18,594


495


585,014


Decommissioning and restoration


3,217


4,982


8,199


Interest capitalized (note 7f)


16,528


16,528


Depreciation capitalized


441


420


861


Transfers and other movements


(3,743

)

(37,636

)


41,379


Disposals


(125

)


(8,337

)

(8,462

)

Effects of movement in exchange rates


(166

)

(14,055

)


(14,221

)

Other


(270

)

(312

)

1,881


(907

)

392


Balance, end of year


35,119


1,318,523


399,230


614,510


2,367,382


Accumulated depreciation


Balance, beginning of year


312


308,235


267,479


576,026


Depreciation for the year


25,113


44,969


70,082


Disposals


(7,438

)

(7,438

)

Other


(312

)

974


662


Balance, end of year


334,322


305,010


639,332


Net book value


$

35,119


$

1,318,523


$

64,908


$

309,500


$

1,728,050


48


HUDBAY MINERALS INC.

Notes to Consolidated Financial Statements

(in thousands of Canadian dollars, except where otherwise noted)

Years ended December 31, 2012 and 2011


Exploration and


Capital


evaluation


works in


Mining


Plant and


Dec. 31, 2011


assets


progress


properties


equipment


Total


Cost


Cost, beginning of year


$

33,041


$

366,931


$

358,202


$

589,336


$

1,347,510


Additions


3,487


236,210


19,713


4,980


264,390


Acquisition of subsidiary (note 5)


526,015


526,015


Decommissioning and restoration


1,279


29,329


30,608


Depreciation capitalized


109


420


529


Transfers and other movements


(30,524

)


30,524


Disposals (note 6)


(333,160

)


(77,271

)

(410,431

)

Effects of movement in exchange rates


466


19,984


20,450


Balance, end of year


36,994


786,844


378,335


576,898


1,779,071


Accumulated depreciation


Balance, beginning of year


263,809


266,143


529,952


Depreciation for the year


109


44,426


45,031


89,566


Disposals


(43,695

)

(43,695

)

Other


203


203


Balance, end of year


312


308,235


267,479


576,026


Net book value


$

36,994


$

786,532


$

70,100


$

309,419


$

1,203,045


As at March 31, 2012, the Group determined that the Reed copper project reached the end of the exploration and evaluation phase. At that time, the Group had completed a pre-feasibility study, some of the resources had been converted to reserves, and management had determined it was probable the project would be developed into a mine. Effective April 1, 2012, the carrying value of exploration and evaluation assets related to the Reed project was reclassified to capital works in progress, and the Group is capitalizing subsequent costs to develop the project.


Refer to note 3i for a description of depreciation methods used by the Group, note 3i(vi) for depreciation rates of major classes of assets and note 6 for discussion with respect to the disposition of Fenix. Depreciation of property, plant and equipment and intangible assets related to producing properties is initially recognized in inventory and is then transferred to the cost of sales in the income statements as sales occur. Refer to note 7b for amounts recognized in the income statement.


As described in note 3j, at the end of each reporting period, the Group reviews the carrying amounts of its property, plant and equipment, exploration and evaluation assets and computer software (note 12) to determine whether there is any indication of impairment. One of the factors management considers in making this assessment is whether the carrying amounts of the Group’s net assets exceeds its market capitalization, in which case management applies judgement to determine the reason for the difference. Based on Hudbay’s listed share price of $10.02 at December 31, 2012, the carrying amount of the Group’s net assets exceeded its market capitalization by approximately $35,000 (2011 - $70,000). Management determined that this decline reflected a temporary correction in the market and was not a reflection of issues in any one of the Group’s cash-generating units. Management concluded this decline was not an indicator of impairment as at December 31, 2012.


49


HUDBAY MINERALS INC.

Notes to Consolidated Financial Statements

(in thousands of Canadian dollars, except where otherwise noted)

Years ended December 31, 2012 and 2011


Subsequent to December 31, 2012, Hudbay’s share price increased such that its market capitalization exceeded the carrying value of its assets.


14.    Goodwill


The goodwill of $66,763 arose on the Group’s 2011 acquisition of Hudbay Peru. As at September 30, 2012, the Group conducted its annual goodwill impairment test on the South America business unit to which goodwill has been assigned. The recoverable amount (fair value less cost to sell) of the cash-generating unit exceeded its carrying value, and the Group concluded the goodwill was not impaired.


The cash-generating unit’s fair value less cost to sell was determined using a discounted cash flow methodology. The South America business unit’s financial model was used to forecast real cash flows over a 20 year period. A 9%, real discount rate was used to present value projected cash flows and was determined using market rates and a Weighted Average Cost of Capital approach. A key assumption employed in the cash flow projection model was long-term copper prices of US$3 per pound. Hudbay believes this price is consistent with copper prices implied by recent precedent merger and acquisition transactions as well as long term incentive copper prices as forecast by independent third party participants.


There have been no significant events since the Group conducted the test and therefore the conclusion remains the same as at December 31, 2012. The changes in goodwill reflect movement in the foreign exchange rate during the year.


15.    Trade and other payables


Dec. 31, 2012


Dec. 31, 2011


Trade payables


$

68,190


$

94,557


Accruals and payables


129,560


62,893


Exploration and evaluation payables


967


1,258


Embedded derivatives - provisional pricing


(41

)

35


Statutory payables


7,813


4,444


$

206,489


$

163,187


16.    Other liabilities


Dec. 31, 2012


Dec. 31, 2011


Current portion of


Provisions (note 20)


$

9,100


$

4,434


Other employee benefits (note 22)


3,513


3,513


$

12,613


$

7,947


50


HUDBAY MINERALS INC.

Notes to Consolidated Financial Statements

(in thousands of Canadian dollars, except where otherwise noted)

Years ended December 31, 2012 and 2011


17.    Other financial liabilities


Dec. 31, 2012


Dec. 31, 2011


Current


Derivative liabilities


$

75


$

1,159


Other financial liabilities at amortized cost


18,288


18,363


1,159


Non-current


Other financial liabilities at amortized cost


23,128


$

41,491


$

1,159


In March 2012, Hudbay entered into two agreements with communities near the Constancia project in Peru pursuant to which Hudbay acquired rights to extract minerals over the useful life of the Constancia project, defined to be a minimum of fifteen years. The Group recognized a liability and a corresponding asset, which has been presented in capital works in progress within property, plant and equipment, together with capitalized costs of the Constancia project.


In June 2012, Hudbay entered into an additional agreement with one of the communities near the Constancia project, which allows the Group to carry out exploration and evaluation activities in the area for a minimum period of three years. The Group recognized the related liability and a corresponding exploration and evaluation expense.


These liabilities were recorded at fair value upon initial recognition, which the Group determined using a discounted cash flow analysis based on expected cash flows and a credit-adjusted discount rate. In making this determination, the Group applied estimates in determining the appropriate discount rate, as well as the timing and amount of future cash flows under the agreements. Subsequent to initial recognition, the Group measures such liabilities at amortized cost using the effective interest method.


During the year ended December 31, 2012, the Group capitalized $2,323 to property, plant and equipment related to the unwinding of accretion on financial liabilities at amortized cost (note 7f).


51


HUDBAY MINERALS INC.

Notes to Consolidated Financial Statements

(in thousands of Canadian dollars, except where otherwise noted)

Years ended December 31, 2012 and 2011


18.    Long-term debt


Balance, January 1, 2012


$


Principal, net of transaction costs


474,684


Fair value of embedded derivative (prepayment option)


(4,768

)

Effects of changes in foreign exchange


9,299


Cumulative accretion of transaction costs


325


Balance, December 31, 2012


$

479,540


On September 13 2012, Hudbay issued US$500,000 aggregate principal amount of 9.50% senior unsecured notes (the “Notes”) due October 1, 2020 pursuant to a private placement offering.


The Notes were priced at 100% of their face value, yielding proceeds of US$484,000 ($474,684) net of directly attributable transaction costs of $16,054. The Notes have been classified as financial liabilities at amortized cost and accounted for initially at fair value net of transaction costs and subsequently at amortized cost using the effective interest rate method. Interest is payable on the Notes semi-annually on April 1 and October 1 of each year, beginning on April 1, 2013. As the proceeds of the offering will be used to fund the development of the Constancia project, interest costs are capitalized to project assets during the development phase of this project. During the year ended December 31, 2012, the Group capitalized $14,205 (note 7f).


The Notes are fully and unconditionally guaranteed, jointly and severally, on a senior unsecured basis, by Hudbay’s existing and future subsidiaries, other than certain excluded subsidiaries which include subsidiaries that own the Constancia project. The Notes also contain certain customary covenants and restrictions for a financing instrument of this type. Although there are no maintenance covenants with respect to the Group’s financial performance, there are transaction-based restrictive covenants that limit the Group’s ability to incur additional indebtedness in certain circumstances. In addition, the Group’s ability to make restricted payments, including dividend payments, is subject to the compliance with certain covenants which require either the generation of sufficient net earnings or equity issuance or, in the case of semi-annual dividend payments in an amount not exceeding US$20 million, the maintenance of a ratio of consolidated debt to earnings before income tax and depreciation and amortization of 2.50 to 1.00 or less.


At any time prior to October 1, 2016, Hudbay may redeem the Notes, in whole but not in part, at a redemption price equal to 100.0% of the aggregate principal amount of the Notes plus an amount equal to the greater of (i) 1% of the principal amount of the Notes to be redeemed and (ii) the excess, if any, of (a) the present value as of the date of redemption of the October 1, 2016 redemption price of the Notes (as described below) plus required interest payments through October 1, 2016 over (b) the then outstanding principal amount of such Notes, plus, in either case, accrued and unpaid interest.


52


HUDBAY MINERALS INC.

Notes to Consolidated Financial Statements

(in thousands of Canadian dollars, except where otherwise noted)

Years ended December 31, 2012 and 2011


On or after October 1, 2016, Hudbay may redeem the Notes, at its option in whole or in part, at the redemption prices (expressed as percentages of the principal amount of the Notes to be redeemed) set forth below, plus accrued and unpaid interest, if redeemed during the twelve-month period beginning on October 1 of each of the years indicated below:


Year


Percentage


2016


104.750

%

2017


102.375

%

2018 and thereafter


100.000

%


In addition, Hudbay may redeem up to 35% of the Notes prior to October 1, 2015 with the net cash proceeds from certain equity offerings at a redemption price equal to 109.500% of the aggregate principal amount thereof, plus accrued and unpaid interest.


The prepayment options on the Notes represent embedded derivatives which are bifurcated from the host contract. The prepayment options are measured at fair value, with changes in the fair value being recognized as unrealized gains in other finance gains and losses (note 7f). The initial fair value at inception was $2,888 and as at December 31, 2012, the increase in the fair value of the embedded derivative was $1,880 (note 30c).


On January 18, 2013, the Group commenced an offer to exchange all of the outstanding Notes for an equal aggregate principal amount of substantially identical new Notes registered under the United States Security Act of 1933, as amended.


19.    Deferred revenue


On August 8, 2012, the Group entered into a precious metals stream transaction with Silver Wheaton Corp. (“Silver Wheaton”) whereby the Group will receive aggregate deposit payments of US$750,000 against delivery of 100% of payable gold and silver from Hudbay’s 777 mine until the later of the end of 2016 and satisfaction of a completion test at the Constancia project, and delivery of 50% of payable gold and 100% of payable silver for the remainder of the 777 mine life. The stream transaction also includes delivery of 100% of payable silver from the Constancia project.


In addition to the deposit payments, as gold and silver is delivered to Silver Wheaton, the Group will receive cash payments equal to the lesser of (i) the market price and (ii) US$400 per ounce (for gold) and US$5.90 per ounce (for silver), subject to 1% annual escalation after three years.


The Group received an upfront payment of US$500,000 ($491,600) in September 2012 and will receive the remaining US$250,000 in two equal installments once the Constancia project incurs capital expenditures of US$500,000 and US$1,000,000, respectively.


The Group recorded the upfront deposit received as deferred revenue and will recognize amounts in revenue as gold and silver are delivered to Silver Wheaton. The Group determines the amortization of deferred revenue to the income statement on a per unit basis using the estimated total number of gold and silver ounces expected to be delivered to Silver Wheaton over the life of the 777 and Constancia mines. The Group estimates the current portion of deferred revenue based on deliveries anticipated over the next twelve months.


53


HUDBAY MINERALS INC.

Notes to Consolidated Financial Statements

(in thousands of Canadian dollars, except where otherwise noted)

Years ended December 31, 2012 and 2011


The following table summarizes changes in deferred revenue:


Balance, January 1, 2012


$


Upfront deposit received


491,600


Recognition of revenue


(29,322

)

Balance, December 31, 2012


462,278


Reflected in the balance sheets as follows:


Current


70,911


Non-current


391,367


Balance, December 31, 2012


462,278


54


HUDBAY MINERALS INC.

Notes to Consolidated Financial Statements

(in thousands of Canadian dollars, except where otherwise noted)

Years ended December 31, 2012 and 2011


20.    Provisions


Dec. 31, 2012


Decommissioning,
restoration
and similar
liabilities


Deferred
share units
(Note 25)


Restricted
share units

(Note 25)


Other


Total


Balance, beginning of year


$

146,082


$

2,415


$

2,746


$

495


$

151,738


Additional provisions made


4,249


1,086


3,755


1,687


10,777


Amounts used


(1,072

)


(97

)

(2,008

)

(3,177

)

Unused amounts reversed


(427

)


(427

)

Unwinding of discount (note 7f)


3,036


3,036


Effect of change in discount rate


5,842


5,842


Effect of foreign exchange


(35

)


(35

)

Effect of change in share price


39


(81

)


(42

)

Effect of change in estimated forfeiture rate


418


418


Balance, end of year


$

157,675


$

3,540


$

6,741


$

174


$

168,130


Reflected in the balance sheets as follows:


Current (note 16)


$

1,839


$

3,540


$

3,547


$

174


$

9,100


Non-current


155,836


3,194


159,030


$

157,675


$

3,540


$

6,741


$

174


$

168,130


Dec. 31, 2011


Decommissioning,
restoration
and similar
liabilities


Deferred
share units
(Note 25)


Restricted
share units

(Note 25)


Other


Total


Balance, beginning of year


$

117,003


$

3,166


$

1,641


$

2,475


$

124,285


Additional provisions made


1,971


874


3,984


6,829


Acquisitions


978


978


Amounts used


(1,524

)


(905

)

(1,980

)

(4,409

)

Unused amounts reversed


(277

)


(277

)

Disposal of subsidiary


(8,242

)


(8,242

)

Unwinding of discount


3,438


3,438


Effect of change in discount rate


32,806


32,806


Effect of foreign exchange


(71

)


(71

)

Effect of change in share price


(1,625

)

(1,974

)


(3,599

)

Balance, end of year


$

146,082


$

2,415


$

2,746


$

495


$

151,738


Reflected in the balance sheet as follows


Current (note 16)


$

1,524


$

2,415


$


$

495


$

4,434


Non-current


144,558


2,746


147,304


$

146,082


$

2,415


$

2,746


$

495


$

151,738


55


HUDBAY MINERALS INC.

Notes to Consolidated Financial Statements

(in thousands of Canadian dollars, except where otherwise noted)

Years ended December 31, 2012 and 2011


Decommissioning, restoration and similar liabilities are remeasured at each reporting date to reflect changes in discount rates, which can significantly affect the liabilities.


Decommissioning, restoration and similar liabilities


The Group’s decommissioning, restoration and similar liabilities relate to the rehabilitation and closure of currently operating mines and metallurgical plants, development-phase properties and closed properties. The amount of the provision has been recorded based on estimates and assumptions that management believes are reasonable; however, actual decommissioning and restoration costs may differ from expectations.


During the year ended December 31, 2012 additional provisions recognized as a result of increased estimated cash flows related mainly to Hudbay Peru’s Constancia project, which is in the development stage. During the year ended December 31, 2011, the Group recognized a provision of $978 upon acquisition of Hudbay Peru and de-recognized provisions of $6,606 upon disposition of the Fenix project and $1,636 upon disposition of the White Pine Copper Refinery. Additional provisions made during 2011 related mainly to the Lalor project, which is in the development stage.


The Group’s decommissioning and restoration liabilities relate mainly to its Manitoba operations. Management anticipates that significant decommissioning and restoration activities will take place near the time closure of the mining and processing facilities, anticipated to occur from 2012 to 2021 for Flin Flon operations and up to 2031 for Snow Lake operations (including the Lalor mine). However, these provisions also reflect estimated post-closure cash flows that extend to 2100 for ongoing monitoring and water treatment requirements. The Balmat site is currently closed; management anticipates that future cash flows related to its decommissioning and restorations liabilities will extend to 2042. Management anticipates decommissioning and restoration activities for the Constancia project will occur from 2030 to 2035.


These estimates have been discounted to their present value at rates ranging from 0.1% to 2.9% per annum (2011 - 0.9% to 2.9%), using pre-tax risk-free interest rates that reflect the estimated maturity of each specific liability.


21.    Pension obligations


The Group maintains non-contributory and contributory defined benefit pension plans for certain of its employees.


The Group uses a December 31 measurement date for all of its plans. For the Group’s significant plans, the most recent actuarial valuations filed for funding purposes were performed during 2012 using data as at December 31, 2011. For these plans, the next actuarial valuation required for funding purposes will be performed during 2013 as at December 31, 2012.


The average remaining service period of the active employees covered by the pension plans was 8.93 years as at December 31, 2012.


56


HUDBAY MINERALS INC.

Notes to Consolidated Financial Statements

(in thousands of Canadian dollars, except where otherwise noted)

Years ended December 31, 2012 and 2011


2012


2011


Obligations and funded status:


Changes in pension obligation:


Obligation, beginning of year


$

310,927


$

299,920


Current service cost


9,022


8,243


Interest cost


17,239


16,471


Employee contributions


106


153


Plan amendments


13,841


Actuarial loss


64,843


9,072


Benefits paid (funded plans)


(22,219

)

(18,893

)

Benefits paid (unfunded plans)


(556

)

(371

)

Plan settlements - disposal of Zochem


(3,668

)

Obligation, end of year


$

393,203


$

310,927


Change in pension plan assets:


Fair value of plan assets, beginning of year


$

264,241


$

259,743


Expected return on plan assets


15,622


16,284


Actuarial gains (losses)


2,780


(8,540

)

Employer contributions


31,514


19,570


Employee contributions


106


153


Benefits paid (funded plans)


(22,219

)

(18,893

)

Plan settlements - disposal of Zochem


(4,076

)

Fair value of plan assets, end of year


$

292,044


$

264,241


The actual return on plan assets during 2012 was $18,402 (2011 - $7,744).


57


HUDBAY MINERALS INC.

Notes to Consolidated Financial Statements

(in thousands of Canadian dollars, except where otherwise noted)

Years ended December 31, 2012 and 2011


Dec. 31, 2012


Dec. 31, 2011


Reconciliation of assets and liabilities recognized in the balance sheet:


Funded pension obligations


$

(377,508

)

$

(297,565

)

Fair value of plan assets


292,044


264,241


Unfunded pension obligations


(15,695

)

(13,362

)

Unrecognized past service cost of non- vested benefits


3,000


Unrecognized net actuarial loss


100,509


40,133


Net assets (liabilities)


2,350


(6,553

)


The Group has changed certain comparative information, as described below, to agree to the current year presentation as the Group is required to separate the assets and liabilities:


Pension asset - non-current


15,838


6,184


Pension liability - non-current


(13,488

)

(12,737

)

Total pension asset (liability)


$

2,350


$

(6,553

)


Dec. 31, 2012


Dec. 31, 2011


History of experience gains and losses:


Difference between expected and actual return on assets


(1.0

)%

3.0

%

Experience loss on plan liabilities


(2.0

)%

(3.0

)%


Year ended


December 31


2012


2011


Pension expense recognized:


Current service cost


$

9,022


$

8,243


Interest cost


17,239


16,471


Expected return on plan assets


(15,622

)

(16,284

)

Amortization of actuarial loss


1,687


2


Early retirements, curtailments and settlements


948


Past service cost of benefits


10,841


Effect of asset limitation and minimum funding requirement


(30

)

Defined benefit pension expense


$

23,167


$

9,350


Defined contribution pension expense


$

764


$

662


58


HUDBAY MINERALS INC.

Notes to Consolidated Financial Statements

(in thousands of Canadian dollars, except where otherwise noted)

Years ended December 31, 2012 and 2011


Pension amounts recognized include those directly related to production of inventory; such amounts are recognized initially as costs of inventory and are expensed in the income statement within cost of sales upon sale of the inventory. Refer to note 7d for a summary of pension expense recognized in the income statement.


Past service costs related to new collective bargaining agreements during the year ended December 31, 2012.


Expected employer contributions to the pension plans for the fiscal year ending December 31, 2013 is $32,195.


2012


2011


To determine the net benefit expense for the year:


Discount rate - defined benefit


5.25

%

5.50

%

Expected return on plan assets


5.75

%

6.25

%

Rate of compensation increase1


2.00

%

2.50

%


To determine the accrued benefit obligations at the end of the year


Discount rate - defined benefit


4.36

%

5.25

%

Rate of compensation increase1


3.00

%

2.00

%


1plus merit and promotional scale based on member’s age


The Group’s pension cost is significantly affected by the discount rate used to measure obligations, the level of plan assets available to fund those obligations and the expected long term rate of return on plan assets.


The Group reviews the assumptions used to measure pension costs (including the discount rate) on an annual basis. Economic and market conditions at the measurement date affect these assumptions from year to year.


In determining the discount rate, the Group considers the duration of the pension plan liabilities.


In determining the expected future rate of return on pension assets, the Group considers the types of investment classes in which the plan assets are invested and the expected compound returns on those investment classes.


59


HUDBAY MINERALS INC.

Notes to Consolidated Financial Statements

(in thousands of Canadian dollars, except where otherwise noted)

Years ended December 31, 2012 and 2011


Plan assets


The pension plan asset allocations, by asset category, are as follows:


2013


2012


Weighted


Weighted


average


Target


average


Target


Equity securities


47.7

%

50.0

%

46.9

%

50.0

%

Debt securities


52.3

%

50.0

%

53.1

%

50.0

%


100.0

%

100.0

%

100.0

%

100.0

%


The pension plans do not invest directly in either securities or property/real estate of the Group.


The Group’s primary quantitative investment objectives are maximization of the long-term real rate of return, subject to an acceptable degree of investment risk, and preservation of principal. Risk tolerance is established through consideration of several factors, including past performance, current market conditions and the funded status of the plan.


With the exception of fixed income investments, the plan assets are actively managed by investment managers, with the goal of attaining returns that potentially outperform passively managed investments. Within appropriate limits, the actual composition of the invested funds may vary from the prescribed investment mix.


Mortality tables and life expectancies


The mortality assumptions reflect best practice and have been chosen with regard to the latest available published tables.


Life expectancy at age 65
for a male member
currently aged 65
(in years)


Life expectancy at age 65
for a female member
currently aged 65
(in years)


2012


2011


2012


2011


UP94 with generational improvements


19.7


19.7


22.1


22.1


60


HUDBAY MINERALS INC.

Notes to Consolidated Financial Statements

(in thousands of Canadian dollars, except where otherwise noted)

Years ended December 31, 2012 and 2011


22.    Other employee benefits


The Group sponsors both other long-term employee benefit plans and non-pension post-employment benefits plans and uses a December 31 measurement date. The obligations for these benefits consist mainly of end of service indemnities, which do not have the character of pensions. Information about the Group’s post-employment and other long-term employee benefits is as follows:


2012


2011


Obligations and funded status:


Change in other employee benefits obligation:


Obligation, beginning of year


$

121,425


$

108,045


Current service cost


3,477


3,726


Interest cost


6,466


6,138


Actuarial loss


11,978


5,977


Benefits paid


(2,552

)

(2,461

)

Obligation, end of year


$

140,794


$

121,425


Change in plan assets:


Fair value of plan assets, beginning of year


$


$


Employer contributions


2,552


2,461


Benefits paid


(2,552

)

(2,461

)

Fair value of plan assets, end of year


$


$


Dec. 31, 2012


Dec. 31, 2011


Reconciliation of assets and liabilities recognized in the balance sheet:


Unfunded benefit obligation


$

(140,794

)

$

(121,425

)

Unrecognized net actuarial loss


32,129


20,870


(108,665

)

(100,555

)

Vacation accrual and other - non-current


(3,270

)

(3,194

)

Net liability


$

(111,935

)

$

(103,749

)


Reflected in the balance sheet as follows:


Other employee benefits liability - current (note 16)


(3,513

)

(3,513

)

Other employee benefits liability - non-current


(108,422

)

(100,236

)


$

(111,935

)

$

(103,749

)


61


HUDBAY MINERALS INC.

Notes to Consolidated Financial Statements

(in thousands of Canadian dollars, except where otherwise noted)

Years ended December 31, 2012 and 2011


Dec. 31, 2012


Dec. 31, 2011


History of experience gains and losses:


Experience adjustment on plan liabilities


$

4,353


$

(669

)

Change of assumptions on plan liabilities


7,625


6,646


$

11,978


$

5,977


Year ended


December 31


2012


2011


Benefit expense recognized in the income statement:


Current service cost


$

3,477


$

3,726


Interest cost


6,466


6,138


Actuarial loss recognized in year


719


376


Other employee benefits expense


$

10,662


$

10,240


Other employee benefit amounts recognized include those directly related to production of inventory; such amounts are recognized initially as costs of inventory and are expensed in the income statement within cost of sales upon sale of the inventory. Refer to note 7d for a summary of other post-retirement employee benefit expense recognized in the income statement.


Additional information:


The weighted average assumptions used in the determination of other employee benefits expense and obligations were as follows:


2012


2011


To determine the net benefit expense for the year:


Discount rate


5.40

%

5.75

%

Initial weighted average health care trend rate


7.85

%

8.01

%

Ultimate weighted average health care trend rate


4.50

%

4.50

%


To determine the benefit obligations at the end of the year:


Discount rate


4.46

%

5.40

%

Initial weighted average health care trend rate


7.14

%

7.85

%

Ultimate weighted average health care trend rate


4.00

%

4.50

%


62


HUDBAY MINERALS INC.

Notes to Consolidated Financial Statements

(in thousands of Canadian dollars, except where otherwise noted)

Years ended December 31, 2012 and 2011


If the health care cost trend rate was increased or decreased by one percentage point, the accumulated post-employment benefit obligation and the aggregate service and interest cost would have increased (decreased) as follows:


2012


2011


Effect of health care cost trend rate increase by one percentage point:


Accumulated post-employment benefit obligation


$

27,451


$

25,260


Aggregate of service and interest cost


2,403


2,082


Effect of health care cost trend rate decrease by one percentage point:


Accumulated post-employment benefit obligation


$

(21,550

)

$

(19,842

)

Aggregate of service and interest cost


(1,836

)

(1,606

)


The Group’s post-employment and other long-term employee benefit cost is materially affected by the discount rate and health care cost trend rates used to measure obligations.


The Group reviews the assumptions used to measure post-employment and other long-term employee benefit costs (including the discount rate) on an annual basis.


In determining the discount rate, the Group considers the duration of the other retirement benefit plan liabilities.


63


HUDBAY MINERALS INC.

Notes to Consolidated Financial Statements

(in thousands of Canadian dollars, except where otherwise noted)

Years ended December 31, 2012 and 2011


23.    Income and mining taxes


(a)     Tax expense:


Year ended


December 31


2012


2011


Tax expense applicable to:


Current:


Income taxes


$

1,539


$

47,688


Mining taxes


33,059


29,977


Adjustments in respect of prior years - income taxes (note 23i)


(16,212

)


18,386


77,665


Deferred:


Income taxes - origination and reversal of temporary differences


26,857


22,840


Canadian mining taxes - origination and reversal of temporary differences


4,593


15,994


Adjustments in respect of prior years


18,695


Benefit arising from previously unrecognized tax losses, or temporary differences


(1,679

)

Peruvian mining tax - origination and reversal of temporary difference


4,788


19,009


54,933


56,164


Tax expense


$

73,319


$

133,829


64


HUDBAY MINERALS INC.

Notes to Consolidated Financial Statements

(in thousands of Canadian dollars, except where otherwise noted)

Years ended December 31, 2012 and 2011


(b)     Deferred tax assets and liabilities as represented on the balance sheets:


Dec. 31, 2012


Dec. 31, 2011


Deferred income tax asset


$

13,175


$

12,277


Deferred mining tax asset - Canada


1,063


13,175


13,340


Deferred income tax liability


(213,917

)

(170,381

)

Deferred mining tax liability - Canada


(3,530

)


Deferred mining tax liability - Peru


(23,460

)

(19,282

)


(240,907

)

(189,663

)

Net deferred tax liability balance, end of year


$

(227,732

)

$

(176,323

)


(c)     Changes in deferred tax assets and liabilities:


Dec. 31, 2012


Dec. 31, 2011


Net deferred tax (liability) asset balance, beginning of year


$

(176,323

)

$

8,104


Deferred tax expense


(54,933

)

(56,164

)

OCI transactions - available-for-sale investments (note 27)


6,346


Purchase price adjustment


(128,836

)

Foreign currency translation on Hudbay Peru deferred tax liability


3,524


(5,773

)


Net deferred tax liability balance, end of year


$

(227,732

)

$

(176,323

)


65


HUDBAY MINERALS INC.

Notes to Consolidated Financial Statements

(in thousands of Canadian dollars, except where otherwise noted)

Years ended December 31, 2012 and 2011


(d)     Reconciliation to statutory tax rate:


As a result of its mining operations, the Group is subject to both income and mining taxes. Generally, most expenditures incurred are deductible in computing income tax, whereas mining tax legislation, although based on a measure of profitability from carrying on mining operations, is more restrictive in respect of the deductions permitted in computing income subject to mining tax. These restrictions include costs unrelated to mining operations as well as deductions for financing expenses, such as interest and royalties. In addition, income unrelated to carrying on mining operations is not subject to mining tax.


A reconciliation between tax expense and the product of accounting profit multiplied by the Group’s statutory income tax rate for the years ended December 31, 2012 and 2011 is as follows:


Year ended


December 31


2012


2011


Statutory tax rate


27.28

%

28.49

%

Tax expense from continuing operations at statutory rate


$

14,226


$

59,551


Effect of:


Non controlling interest


726


2,762


Resource allowance and deductions related to resource taxes


(8,899

)

(14,213

)

Adjusted income taxes


6,053


48,100


Mining taxes


41,777


64,981


47,830


113,081


Temporary income tax differences not recognized


25,046


14,269


Permanent differences related to:


- capital items


4,551


1,360


- share-based payment expense


146


554


Other income tax permanent differences


2,414


3,091


Impact related to tax rates


(14

)

1,092


Benefit related to tax settlement and tax return amendment


(944

)


Foreign exchange on non-monetary items


(5,710

)

382


Tax expense


$

73,319


$

133,829


The average statutory income tax rate is the average of the standard income tax rates applicable in the jurisdictions in which the Group operates, weighted by the profit (loss) before tax of the subsidiaries included in the consolidated accounts.


The change in the average statutory income tax rate is primarily due to a decline in the Canadian federal income tax rate in 2012.


66


HUDBAY MINERALS INC.

Notes to Consolidated Financial Statements

(in thousands of Canadian dollars, except where otherwise noted)

Years ended December 31, 2012 and 2011


(e)               Income tax effect of temporary differences - recognized:


The tax effects of temporary differences that give rise to significant portions of the deferred tax assets or deferred tax liabilities at December 31, 2012 and 2011 are as follows:


Balance sheet


Income Statement


Dec. 31,
2012


Dec. 31,
2011


2012


2011


Deferred income tax asset (liability) / expense (recovery)


Property, plant and equipment


$

(1,903

)

$

2,033


$

3,936


$

600


Pension obligation


118


91


(27

)

(66

)

Other employee benefits


1,709


1,020


(689

)

164


Non-capital losses


9,044


7,112


(1,932

)

106


Share issue and debt costs


4,059


261


(3,798

)

973


Capital losses


Other


148


1,760


4,525


4,116


Deferred income tax asset


13,175


12,277


2,015


5,893


Deferred income tax liability (asset) / expense (recovery)


Property, plant and equipment


226,064


182,578


43,486


22,109


Pension obligation


765


(1,604

)

2,369


3,201


Other employee benefits


(9,708

)

(10,175

)

467


(9,034

)

Share issue and debt costs


21


38


(17

)

1,290


Other


(3,225

)

(456

)

(2,768

)

(619

)

Deferred income tax liability


213,917


170,381


43,537


16,947


Deferred income tax asset (liability) / expense (recovery)


$

(200,742

)

$

(158,104

)

$

45,552


$

22,840


The above reconciling items are disclosed at the tax rates that apply in the jurisdiction where they have arisen.


67


HUDBAY MINERALS INC.

Notes to Consolidated Financial Statements

(in thousands of Canadian dollars, except where otherwise noted)

Years ended December 31, 2012 and 2011


(f)                Income tax temporary differences - not recognized:


The Group has not recognized a deferred tax asset in respect of the following deductible income tax temporary differences:


Dec. 31, 2012


Dec. 31, 2011


Property, plant and equipment


$

94,418


$

50,600


Capital losses


43,192


46,742


Other employee benefits


75,582


63,234


Asset retirement obligations


152,240


143,731


Non-capital losses


82,322


68,389


Other


23,803


11,079


Temporary differences not recognized


$

471,557


$

383,775


The deductible temporary differences excluding non-capital losses do not expire under current tax legislation.


The Canadian non-capital losses were incurred between 2005 and 2012 and expire between 2013 and 2031. The Group incurred United States net operating losses between 2004 and 2012 which have a 20 year carry forward period. Peruvian net operating losses were incurred from 2010 to 2012 and expire between 2014 and 2016.


(g)  Mining tax effect of temporary differences:


The tax effects of temporary differences that give rise to significant portions of the deferred mining tax assets and liabilities at December 31, 2012 and December 31, 2011 are as follows:


Canada


Dec. 31, 2012


Dec. 31, 2011


Deferred mining tax (liabilities) assets:


Property, plant and equipment


$

(3,530

)

$

1,063


Peru


Dec. 31, 2012


Dec. 31, 2011


Deferred mining tax liabilities:


Property, plant and equipment


$

(23,460

)

$

(19,282

)


The Group did not have any unrecognized deferred tax assets at December 31, 2011 and December 31, 2012.


68


HUDBAY MINERALS INC.

Notes to Consolidated Financial Statements

(in thousands of Canadian dollars, except where otherwise noted)

Years ended December 31, 2012 and 2011


(h)              Unrecognized taxable temporary differences associated with investments:


The temporary differences associated with investments in subsidiaries, associates and joint ventures, for which a deferred tax liability has not been recognized, aggregate to $329.1 million (2011 - $291.6 million).


The Group has not recognized a deferred tax liability at December 31, 2012 or December 31, 2011 for taxes that would be payable. The Company is able to control the timing of reversal of the temporary difference and it is probable that the temporary difference will not reverse in the foreseeable future.


(i)                 Taxes receivable/payable:


The timing of payments results in significant variances in period-to-period comparisons of the tax receivable and tax payable balances. In addition, as a result of the positive tax ruling in the second quarter of 2012 from the Canada Revenue Agency with respect to the “New Mine” status for the Lalor project for income tax purposes, the Group recognized an increase in taxes receivable due to income tax credits (“ITCs”) recorded of $14,415 and a reduction of prior year taxes owing of $18,196 as a result of accelerated depreciation of prior year tax pools.


(j)                 Other disclosure:


The tax rules and regulations applicable to mining companies are highly complex and subject to interpretation. The Group may be subject in the future to a review of its historic income and other tax filings and, in connection with such reviews, disputes can arise with the taxing authorities over the interpretation or application of certain tax rules and regulations in respect of the Group’s business. These reviews may alter the timing or amount of taxable income or deductions. The amount ultimately reassessed upon resolution of issues raised may differ from the amount accrued.


69


HUDBAY MINERALS INC.

Notes to Consolidated Financial Statements

(in thousands of Canadian dollars, except where otherwise noted)

Years ended December 31, 2012 and 2011


24.            Share capital


(a)              Preference shares:


Authorized:                      Unlimited preference shares without par value


(b)              Common shares:


Authorized:                      Unlimited common shares without par value


Issued and fully paid:


Year ended


Year ended


Dec. 31, 2012


Dec. 31, 2011


Common


Common


shares


Amount


shares


Amount


Balance, beginning of year


171,937,665


$

1,020,126


149,431,339


$

642,161


Exercise of stock options


46,822


332


30,622


216


Share issue costs, net of tax


(239

)

Issued - acquisition of Hudbay Peru (note 5)


20,372,986


345,119


Issued - acquisition of non-controlling interest (note 5)


2,102,718


32,869


Balance, end of year


171,984,487


$

1,020,458


171,937,665


$

1,020,126


During the year, the Company declared semi-annual dividends of $0.10 per share. The Company paid $17,195 and $17,197 on March 30, 2012 and September 28, 2012 to shareholders of record as of March 20, 2012 and September 14, 2012, respectively.


In 2011, the Company paid $17,152 and $17,194 on March 31, 2011 and September 30, 2011 to shareholders of record as of March 31, 2011 and September 15, 2011, respectively.


The Company declared a semi-annual dividend of $0.10 per share on February 20, 2013. The dividend will be paid on March 28, 2013 to shareholders of record as of March 18, 2013 and is expected to total $17,197.


25.            Share-based payments


(a)              Cash-settled share-based payments:


The Group has two cash-settled share-based payment plans, as described below.


70


HUDBAY MINERALS INC.

Notes to Consolidated Financial Statements

(in thousands of Canadian dollars, except where otherwise noted)

Years ended December 31, 2012 and 2011


Deferred share units (DSU)


At December 31, 2012, the carrying amount and the intrinsic value of the outstanding liability related to the DSU plan was $3,540 (December 31, 2011 - $2,415) (note 20). The following table outlines information related to DSUs granted, expenses recognized and payments made during the year.


Year ended


Dec. 31, 2012


Dec. 31, 2011


Granted during the year:


Number of units


115,158


61,835


Weighted average price ($/unit)


$

9.43


$

14.11


(Gain) expenses recognized during the year1 (note 7c)


$

1,125


$

(753

)


1 This expense relates to the grant of DSUs, as well as mark-to-market adjustments, and is presented within selling and administrative expenses on the income statement.


Restricted share units (RSU)


At December 31, 2012, the carrying amount of the outstanding liability related to the RSU plan was $6,741 (December 31, 2011 - $2,746) (note 20). No RSUs were vested at December 31, 2012 and December 31, 2011. RSUs are settled on the vest date and therefore the intrinsic value at December 31, 2012 and December 31, 2011 of vested RSUs was nil. The following table outlines information related to RSUs granted, expenses recognized and payments made in the year


Year ended


Dec. 31, 2012


Dec. 31, 2011


Granted during the year:


Number of units


660,781


323,116


Weighted average price ($/unit)


$

11.54


$

15.79


Expenses recognized during the year1 (note 7c)


$

4,092


$

1,825


Payments made during the year


$

97


$

905


1 This net expense reflects recognition of RSU expense over the service period, as well as mark-to-market adjustments, and is presented mainly within cost of sales and selling and administrative expenses.


71


HUDBAY MINERALS INC.

Notes to Consolidated Financial Statements

(in thousands of Canadian dollars, except where otherwise noted)

Years ended December 31, 2012 and 2011


(b)     Equity-settled share-based payment - stock options:


The Group’s stock option plan was approved in June 2005 and amended in May 2008 (the “Plan”).


Under the amended Plan, the Group may grant to employees, officers, directors or consultants of the Group or its affiliates options to purchase up to a maximum of 13 million common shares of the Group. The maximum number of common shares issuable to insiders pursuant to the Plan is limited to 10% of the then issued and outstanding common shares of the Group. The maximum number of common shares issuable to each non employee directors under the Plan shall not exceed the lesser of $100,000 in value per year and 1% in number of the then issued and outstanding common shares of the Group per year. Options granted under the amended Plan have a maximum term of five years and become exercisable as follows: the first 33 1/3% are exercisable after one year, the next 33 1/3% are exercisable after two years, and the last 33 1/3% are exercisable after three years. Except in specified circumstances, options are not assignable and terminate upon, or within a specified time following, the optionee ceasing to be employed by or associated with the Group. The Plan further provides that the price at which common shares may be issued under the Plan cannot be less than the market price of the common shares on the last trading date before the relevant options are approved by the Board.


Prior to the May 2008 amendment, the Plan approved in June 2005 allowed the Group to grant options up to 10% (to a maximum of 8 million issued outstanding options) of the issued and outstanding common shares of the Group to employees, officers, and directors of the Group for a maximum term of ten years. Of the common shares covered by the stock option plan, the first 33 1/3% were exercisable immediately, the next 33 1/3% were exercisable after one year, and the last 33 1/3% were exercisable after two years.


No options were granted during the years ended December 31, 2012 and December 31, 2011.


The Group estimates expected life of options and expected volatility based on historical data, which may differ from actual outcomes.


Year ended


Year ended


Dec. 31, 2012


Dec. 31, 2011


Number


Weighted


Number


Weighted


of shares


average


of shares


average


subject


exercise


subject


exercise


to option


price


to option


price


Balance, beginning of year


3,898,705


$

14.24


4,368,784


$

14.50


Exercised


(46,822

)

4.84


(30,622

)

5.00


Forfeited


(121,668

)

17.02


(290,007

)

17.27


Expired


(45,750

)

20.75


(149,450

)

17.95


Balance, end of year


3,684,465


$

14.18


3,898,705


$

14.24


For stock options exercised during the year, the weighted average share price at the exercise date was $9.63 (2011 - $14.83)


72


HUDBAY MINERALS INC.

Notes to Consolidated Financial Statements

(in thousands of Canadian dollars, except where otherwise noted)

Years ended December 31, 2012 and 2011


The following table summarizes the options outstanding:


Dec. 31, 2012


Weighted-


average


Weighted-


Weighted-


Number of


remaining


average


Number of


average


Range of


options


contractual life


exercise


options


exercise


exercise prices


outstanding


(years)


price


exercisable


price


$

2.59

-

10.20


894,831


2.6


$

6.89


894,831


$

6.89


10.21

-

14.02


1,007,000


1.4


12.01


1,007,000


12.01


14.03

-

16.55


696,699


5.2


15.86


696,699


15.86


16.56

-

20.78


905,935


4.2


20.76


905,935


20.76


20.79

-

23.74


180,000


4.7


23.01


180,000


23.01


$

2.59

-

23.74


3,684,465


3.3


$

14.18


3,684,465


$

14.18


Dec. 31, 2011


Weighted-


average


Weighted-


Weighted-


Number of


remaining


average


Number of


average


Range of


options


contractual life


exercise


options


exercise


exercise prices


outstanding


(years)


price


exercisable


price


$

2.59

-

10.20


981,653


3.6


$

6.91


904,988


$

6.82


10.21

-

14.02


1,007,000


2.4


12.01


707,000


11.95


14.03

-

16.55


700,033


6.2


15.86


700,033


15.86


16.56

-

21.28


1,030,019


4.9


20.76


1,030,019


20.76


21.29

-

23.74


180,000


5.7


23.01


180,000


23.01


$

2.59

-

23.74


3,898,705


4.2


$

14.24


3,522,040


$

14.55


73


HUDBAY MINERALS INC.

Notes to Consolidated Financial Statements

(in thousands of Canadian dollars, except where otherwise noted)

Years ended December 31, 2012 and 2011


26.    Earnings per share data


Year ended


December 31


2012


2011


Weighted average common shares outstanding


171,960,783


167,863,427


Plus net incremental shares from assumed conversions:


- Stock options


274,747


498,930


Diluted weighted average common shares outstanding


172,235,530


168,362,357


The determination of the diluted weighted-average number of common shares excludes 1,922,556 shares related to stock options that were anti-dilutive for the year ended December 31, 2012 (year ended December 31, 2011 - 8,756 shares).


For periods where Hudbay records a loss, the Group calculates diluted loss per share using the basic weighted average number of shares, as if the diluted weighted average number of share was used; the result would be a reduction in the loss, which would be anti-dilutive. Consequently, for the year ended December 31, 2012, the Group calculated diluted loss per share using 171,960,783 common shares. For the year ended December 31, 2011, the Group calculated diluted loss per share using 167,863,427 common shares, except for profit from continuing operations per share.


Year ended


December 31


2012


2011


Profit (loss) from continuing operations attributable to:


Owners of the Company


$

(18,507

)

$

81,375


Non-controlling interests


(2,663

)

(6,179

)


$

(21,170

)

$

75,196


Loss from discontinued operations attributable to:


Owners of the Company


$


$

(235,270

)

Non-controlling interests


(3,514

)


$


$

(238,784

)


74


HUDBAY MINERALS INC.

Notes to Consolidated Financial Statements

(in thousands of Canadian dollars, except where otherwise noted)

Years ended December 31, 2012 and 2011


27.    Other comprehensive income (loss) (“OCI”)


Year ended
Dec. 31, 2012


Year ended
Dec. 31, 2011


Pre-tax


Tax


Net of
tax


Pre-tax


Tax


Net of
tax


Foreign currency translation


Net foreign exchange gain (loss) on translation of foreign operations


$

(10,886

)

$


$

(10,886

)

$

15,793


$


$

15,793


Transfer to income statement on disposal of foreign operations


20,416


20,416


(10,886

)


(10,886

)

36,209


36,209


Available-for-sale


Change in fair value of available-for-sale investments


(29,852

)


(29,852

)

(49,117

)

7,036


(42,081

)

Transfer to income statement on impairment of investments (note 7f)


40,181


40,181


6,587


(842

)

5,745


Transfer to income statements on sale of investments (note 7f)


8


8


Transfer to income statement on acquisition of subsidiary (note 7f)


(1,220

)

152


(1,068

)


10,337


10,337


(43,750

)

6,346


(37,404

)


Cash flow hedges


Effective portion of change in fair value of cash flow hedges


(442

)

145


(297

)

6,279


(1,770

)

4,509


Transfer to income statements as hedged transactions occurred (note 7a)


(2,050

)

529


(1,521

)

(992

)

205


(787

)


(2,492

)

674


(1,818

)

5,287


(1,565

)

3,722


Total OCI (loss)


$

(3,041

)

$

674


$

(2,367

)

$

(2,254

)

$

4,781


$

2,527


Gains and losses transferred from equity into profit or loss during the year are included in the following line items in the income statements:


2012


2011


Revenue (note 7a)


$

2,050


$

992


Other finance (gains) losses (note 7f)


(40,189

)

(5,367

)

Discontinued operations


(20,416

)

Tax expense


(529

)

485


$

(38,668

)

$

(24,306

)


75


HUDBAY MINERALS INC.

Notes to Consolidated Financial Statements

(in thousands of Canadian dollars, except where otherwise noted)

Years ended December 31, 2012 and 2011


28.    Non-controlling interests


Prior to the disposition of the Fenix project on September 9, 2011, the Group owned 98.2% of Compañía Guatemalteca de Níquel (“CGN”). As a result of the disposition, the Group is no longer required to account for the related non-controlling interest.


Hudbay owns 51% of the Back Forty project in accordance with a subscription, option and joint venture agreement with Aquila Resources Inc. (“Aquila”). Hudbay has control over the Back Forty project and accordingly consolidates the Back Forty project in its consolidated financial statements as a subsidiary. Hudbay suspended its exploration and evaluation activities at the Back Forty project effective July 3, 2012.


In accordance with a joint venture agreement with VMS Ventures Inc. (“VMS”), Hudbay owns 70% of the Reed copper project and the two claims immediately to the south. Hudbay has control over the project and accordingly consolidates the Reed copper project in its consolidated financial statements. The Reed copper project entered the development phase effective April 1, 2012. On October 22, 2012, Hudbay entered into a second joint venture agreement with VMS in respect of four exploration properties it had optioned in the area surrounding the Reed project.


The Group acquired 90.5% of Hudbay Peru on March 1, 2011 and increased its ownership throughout 2011, resulting in a 100% ownership interest as at September 30, 2011(note 5).


Reed


Back Forty


Project &


CGN


Project


Exploration


Hudbay Peru


Total


Balance, January 1, 2011


$

1,129


$

8,030


$

263


$


$

9,422


Share of assets acquired


9,446


9,446


Acquisition of non-controlling interest


(9,469

)

(9,469

)

Share of OCI


104


104


Share of net (loss) profit


(3,514

)

(5,041

)

(1,161

)

23


(9,693

)

Disposition of subsidiary


2,385


2,385


Balance, December 31, 2011


3,093


(898

)


2,195


Acquisition of non-controlling interest


261


261


Share of OCI


(104

)


(104

)

Share of net loss


(2,224

)

(439

)


(2,663

)

Balance, December 31, 2012


$


$

765


$

(1,076

)

$


$

(311

)


76


HUDBAY MINERALS INC.

Notes to Consolidated Financial Statements

(in thousands of Canadian dollars, except where otherwise noted)

Years ended December 31, 2012 and 2011


29.    Capital management


The Group’s definition of capital includes total equity and long-term debt. The Group’s long-term debt balance as at December 31, 2012 was $479,540 (December 31, 2011 - nil).


The Group’s objectives when managing capital are to maintain a strong capital base in order to:


·             Advance the Group’s corporate strategies to create long-term value for its stakeholders; and

·             Sustain the Group’s operations and growth throughout metals and materials cycles.


Hudbay monitors its capital and capital structure on an ongoing basis to ensure they are sufficient to achieve the Group’s short-term and long-term strategic objectives in a capital intensive industry. The Group faces several risks, including lengthy development lead times, rising capital costs and project delays caused by factors that are beyond its control such as the availability of resources and obtaining permits. The Group continually assesses the adequacy of its capital structure to ensure its objectives are met. Hudbay monitors its cash and cash equivalents, which were $1,337,088 as at December 31, 2012 (2011 - $899,077). The Group invests its cash and cash equivalents primarily in Canadian bankers’ acceptances, deposits at major Canadian banks, or treasury bills issued by the federal or provincial governments. In addition to the requirement to maintain sufficient cash balances to fund continuing operations, the Group must maintain sufficient cash to fund the interest expense on the long-term debt entered into in September 2012 (note 18). As part of the Group’s capital management activities, the Group monitors interest coverage ratios and leverage ratios.


77


HUDBAY MINERALS INC.

Notes to Consolidated Financial Statements

(in thousands of Canadian dollars, except where otherwise noted)

Years ended December 31, 2012 and 2011


30.    Financial instruments


(a)     Fair value and carrying value of financial instruments:


The following presents the fair value and carrying value of the Group’s financial instruments and non-financial derivatives:


Dec. 31, 2012


Dec. 31, 2011


Fair Value


Carrying
value


Fair Value


Carrying
value


Financial assets


Loans and receivables


Cash and cash equivalents 1


$

1,337,088


$

1,337,088


$

899,077


$

899,077


Restricted cash1


1,655


1,655


1,692


1,692


Trade and other receivables1 2


43,504


43,504


33,391


33,391


Fair value through profit or loss


Trade and other receivables - embedded derivatives3


(937

)

(937

)

(1,407

)

(1,407

)

Non-hedge derivative assets3


2,442


2,442


36


36


Investments at FVTPL4


220


220


2,090


2,090


Designated in cash flow hedges


Hedging derivative assets3


3,076


3,076


Available-for-sale


Available-for-sale investments4


71,260


71,260


98,279


98,279


1,455,232


1,455,232


1,036,234


1,036,234


Financial liabilities


Financial liabilities at amortized cost


Trade and other payables1 2 


198,717


198,717


158,708


158,708


Other financial liabilities5


39,838


41,416


Long-term debt6


528,541


484,365


Fair value through profit or loss


Trade and other payables - embedded derivatives3


(41

)

(41

)

35


35


Prepayment option embedded derivative7


(4,825

)

(4,825

)


Non-hedge derivative liabilities3


75


75


1,159


1,159


762,305


719,707


159,902


159,902


Net financial assets


$

692,927


$

735,525


$

876,332


$

876,332


1         Cash and cash equivalents, restricted cash, trade and other receivables and trade and other payables are recorded at carrying value, which approximates fair value due to their short-term nature and generally negligible credit losses.

2         Excludes embedded provisional pricing derivatives, as well as tax and other statutory amounts.

3         Derivatives and embedded provisional pricing derivatives are carried at their fair value, which is determined based on internal valuation models that reflect observable forward market commodity prices, currency exchange rates, and discount factors based on market US dollar interest rates adjusted for credit risk.

4         Available-for-sale investments are carried at their fair value, which is determined using quoted market bid prices in active markets for listed shares and determined using valuation models for shares of private companies. Investments at FVTPL consist of warrants to purchase listed shares, which are carried at fair value as determined using a Black-Scholes model.

5         These financial liabilities relate to agreements with communities near the Constancia project in Peru (note 17). Fair values have been determined using a discounted cash flow analysis based on expected cash flows and a credit adjusted discount rate.

6         Fair value of the long-term debt (note 18) has been determined using the quoted market price at the period end.


78


HUDBAY MINERALS INC.

Notes to Consolidated Financial Statements

(in thousands of Canadian dollars, except where otherwise noted)

Years ended December 31, 2012 and 2011


7         Fair value of the prepayment option embedded derivative related to the long-term debt (note 18) has been determined using a binomial tree/lattice approach based on the Hull-White single factor interest rate term structure model.


Fair value hierarchy


The table below provides an analysis by valuation method of financial instruments that are measured at fair value subsequent to recognition. Levels 1 to 3 are defined based on the degree to which fair value inputs are observable and have a significant effect on the recorded fair value, as follows:


·                       Level 1:            Quoted prices in active markets for identical assets or liabilities;

·                       Level 2:            Valuation techniques use significant observable inputs, either directly or indirectly, or valuations are based on quoted prices for similar instruments; and

·                       Level 3:            Valuation techniques use significant inputs that are not based on observable market data.


December 31, 2012


Level 1


Level 2


Level 3


Total


Financial assets measured at fair value


Financial assets at FVTPL:


Embedded derivatives


$


$

(937

)

$


$

(937

)

Non-hedge derivatives


2,442


2,442


Investments at FVTPL


220


220


Available-for-sale investments


69,260


2,000


71,260


69,260


1,725


2,000


72,985


Financial liabilities measured at fair value


Financial liabilities at FVTPL:


Embedded derivatives


(41

)


(41

)

Non-hedge derivatives


75


75


Prepayment option embedded derivative


(4,825

)


(4,825

)


$


$

(4,791

)

$


$

(4,791

)


December 31, 2011


Level 1


Level 2


Level 3


Total


Financial assets measured at fair value


Financial assets at FVTPL:


Embedded derivatives


$


$

(1,407

)

$


$

(1,407

)

Non-hedge derivatives


36


36


Investments at FVTPL


2,090


2,090


Hedging derivatives


3,076


3,076


Available for sale investments


94,279


4,000


98,279


94,279


3,795


4,000


102,074


Financial liabilities measured at fair value


Financial liabilities at FVTPL:


Embedded derivatives


35


35


Non-hedge derivatives


1,159


1,159


$


$

1,194


$


$

1,194


There were no transfers between levels during the year. During the year ended December 31, 2012, the Group impaired one of its level 3 investments by $2,000. There was no movement in the remaining level 3 investment.


79


HUDBAY MINERALS INC.

Notes to Consolidated Financial Statements

(in thousands of Canadian dollars, except where otherwise noted)

Years ended December 31, 2012 and 2011


(b)     Derivatives and hedging:


Non-hedge derivative zinc contracts


Hudbay enters into fixed price sales contracts with zinc customers and, to ensure that the Group continues to receive a floating or unhedged realized zinc price, enters into forward zinc purchase contracts that effectively offset the fixed price sales contracts. The fixed price sales contracts with customers are not recognized as derivatives, as they are executory contracts entered into and held for the purpose of the Group’s expected sale requirements. However, the zinc forward purchase contracts are recorded as derivatives. Gains and losses on these contracts are recorded in revenues, and cash flows are classified in operating activities.


At December 31, 2012, the Group held contracts for forward zinc purchases of 11,340 tonnes (December 31, 2011 - 8,011 tonnes) that related to forward customer sales of zinc. Prices ranged from US$1,807 to US$2,094 per tonne (December 31, 2011 - US$1,757 to US$2,209), and settlement dates extended out up to January 2014.


Non-hedge derivative gold and silver contracts


From time to time, the Group enters into gold and silver forward sales contracts to hedge the commodity price risk associated with the future settlement of provisionally priced deliveries. Hudbay is generally obligated to deliver gold and silver to Silver Wheaton prior to the determination of final settlement prices. These forward sales contracts are entered into at the time Hudbay delivers gold and silver to Silver Wheaton, and are intended to mitigate the risk of subsequent adverse gold and silver price changes. Gains and losses resulting from the settlement of these derivatives are recorded directly to revenue, as the forward sales contracts do not achieve hedge accounting, and the associated cash flows are classified in operating activities. The Group had no material gold and silver forward sales contracts outstanding as at December 31, 2012.


Cash flow hedging derivatives


In 2009, the Group entered into a foreign exchange swap contract to hedge foreign exchange risk for future receipts of US dollars and commodity swap contracts to hedge prices for a portion of future sales of zinc. The risk management objective for these hedging relationships was to mitigate the impact on the Group of fluctuating zinc prices and exchange rates. Cash flow hedge accounting was applied to the hedging relationships. Gains and losses reclassified from the cash flow hedge reserve to revenue are presented in note 27. These contracts expired in July 2012. No further amounts remain in the Group’s hedging reserve.


(c)     Embedded derivatives


Provisional pricing embedded derivatives


The Group records embedded derivatives related to provisional pricing in concentrate purchase, concentrate sale and certain other sale contracts. Under the terms of these contracts, prices are subject to final adjustment at the end of a future period after title transfers based on quoted market prices during the quotational period specified in the contract. The period between provisional pricing and final pricing is typically up to three months.


Provisional pricing embedded derivatives are presented in trade and other receivables when they relate to sales contracts and in trade and other payables when they relate to purchase contracts. At each reporting date, provisionally priced metals are marked to market based on the forward market


80


HUDBAY MINERALS INC.

Notes to Consolidated Financial Statements

(in thousands of Canadian dollars, except where otherwise noted)

Years ended December 31, 2012 and 2011


price for the quotational period stipulated in the contract, with changes in fair value recognized in revenues for sales contracts and in cost of sales for purchase concentrate contracts. Cash flows related to provisional pricing embedded derivatives are classified in operating activities.


At December 31, 2012, the Group’s net position consisted of contracts awaiting final pricing for sales of 9,840 tonnes of copper (year ended December 31, 2011 - 7,854 tonnes) and purchases of 2,099 tonnes of zinc (year ended December 31, 2011 - 4,664 tonnes). There were no provisionally priced sales of gold and silver as at December 31, 2012 as 100% of the gold and silver were sold to Silver Wheaton without a provisional price component (note 19) (year ended December 31, 2011 - 13,147 ounces of gold and 136,828 ounces of silver).


As at December 31, 2012, the Group’s provisionally priced copper sales subject to final settlement were recorded at average prices of US$3.59/lb (2011 - US$3.53/lb). In 2011 gold and silver sales subject to final settlement were recorded at average prices of US$1,604/oz and US$28.55/oz, respectively.


Prepayment option embedded derivative


The prepayment options on the Notes represent embedded derivatives which are bifurcated from the host contract. The prepayment options are measured at fair value, with changes in the fair value being recognized as unrealized gains in finance income and expense (note 7f). The increase in the fair value of the embedded derivative to December 31, 2012 was $1,880.


(d)     Financial risk management


The Group’s financial risk management activities are governed by Board-approved policies addressing risk identification, hedging authorization procedures and limits and reporting. Hudbay’s policy objective, when hedging activities are undertaken, is to reduce the volatility of future profit and cash flow within the strategic and economic goals of the Group. The Group from time to time employs derivative financial instruments, including forward and option contracts, to manage risk originating from exposures to commodity price risk, foreign exchange risk and interest rate risk. Significant derivative transactions are approved by the Board of Directors, and hedge accounting is applied when certain criteria have been met. The Group does not use derivative financial instruments for trading or speculative purposes.


The following is a discussion of the Group’s risk exposures.


(i)     Market risk


Market risk is the risk that changes in market prices, including foreign exchange rates, commodity prices and interest rates, will cause fluctuations in the fair value or future cash flows of a financial instrument.


81


HUDBAY MINERALS INC.

Notes to Consolidated Financial Statements

(in thousands of Canadian dollars, except where otherwise noted)

Years ended December 31, 2012 and 2011


Foreign currency risk


The Group’s primary exposure to foreign currency risk arises from:


·                       Translation of US dollar denominated revenues and expenses and, to a lesser extent, Peruvian nuevo soles expenses into Canadian dollars. Substantially all of the Group’s revenues are denominated in US dollars, while less than half of its expenses are denominated in US dollars. As a result, appreciation of the Canadian dollar relative to the US dollar will reduce the Group’s profit.


·                       Translation of US dollar and Peruvian nuevo soles denominated operating accounts, consisting mainly of certain cash and cash equivalents, trade and other receivables, trade and other payables and derivatives, as well as long-term debt and other financial liabilities. Cash balances may be held in US dollars and nuevo soles in anticipation of capital expenditures denominated in either currency. Appreciation of the Canadian dollar relative to the US dollar or nuevo sol will reduce the net asset value of these balances once they have been translated to Canadian dollars, resulting in foreign currency translation losses on foreign currency denominated assets and gains on foreign currency denominated liabilities.


The Group’s exposure to foreign currency risk was as follows based on notional financial instruments amounts stated in Canadian equivalent dollars:


Dec. 31, 2012


Dec. 31, 2011


USD


PEN


USD


PEN


Cash and cash equivalents


$

1,111,620


$

2,100


$

129,465


$

3,323


Trade and other receivables


40,033


15


16,848


330


Derivative assets


4,825


1,511


Trade and other payables


(58,546

)

(24,371

)

(18,571

)

(15,446

)

Other financial liabilities


(41,416

)


Long-term debt


(484,365

)


$

613,567


$

(63,672

)

$

129,253


$

(11,793

)


The Group’s foreign currency cash flow hedges are described in note 30b.


The following sensitivity analysis for foreign currency risk relates solely to financial instruments and non financial derivatives that were outstanding as at the year-end date; each sensitivity calculation assumes all other variables are held constant. This analysis does not reflect the overall effect that changes in market variables would have on the Group’s results of operations.


82


HUDBAY MINERALS INC.

Notes to Consolidated Financial Statements

(in thousands of Canadian dollars, except where otherwise noted)

Years ended December 31, 2012 and 2011


December 31, 2012


A change
of:


Would have changed 2012
after-tax profit by:


Would have changed 2012
after-tax OCI by:


Foreign currency risk


USD/CAD exchange rate1


+$0.10


$

55.6 million


$

2.8 million


USD/CAD exchange rate1


-$0.10


(55.6) million


(2.8) million


PEN/CAD exchange rate2


+$0.25


6.4 million


PEN/CAD exchange rate2


-$0.25


(6.4) million


December 31, 2011


A change
of:


Would have changed 2011
after-tax profit by:
(millions)


Would have changed 2011
after-tax OCI by:
(millions)


Foreign currency risk


USD/CAD exchange rate1


+$0.10


$

8.2 million


$

(0.6) million


USD/CAD exchange rate1


-$0.10


(8.2) million


0.8 million


PEN/CAD exchange rate2


+$0.25


0.4 million


PEN/CAD exchange rate2


-$0.25


(0.5) million


1 Effect on profit due to translation of balances denominated in US dollars; effect on OCI due to foreign currency cash flow hedging derivatives.


2 Effect on profit due to translation of balances denominated in Peruvian nuevo sol. Given that the functional currency of Hudbay Peru is the US dollar, this analysis assumes that the change is in the PEN/USD exchange rate with a constant USD/CAD exchange rate.


Commodity price risk


Hudbay is exposed to market risk from prices for the commodities the Group produces and sells, such as copper, zinc, gold and silver. From time to time, the Group maintains price protection programs and conducts commodity price risk management through the use of derivative contracts.


The following sensitivity analysis for commodity price risk relates solely to financial instruments and non financial derivatives that were outstanding as at the year-end date; each sensitivity calculation assumes all other variables are held constant. This analysis does not reflect the overall effect that changes in market variables would have on the Group’s results of operations.


83


HUDBAY MINERALS INC.

Notes to Consolidated Financial Statements

(in thousands of Canadian dollars, except where otherwise noted)

Years ended December 31, 2012 and 2011


December 31, 2012


Change of:


Would have changed 2012
after-tax profit by:


Would have changed 2012
after-tax OCI by:


Commodity price risk


Copper prices (US$/lb)3


+$0.30


$

3.3 million


Copper prices (US$/lb)3


-$0.30


(3.3) million


Zinc prices (US$/lb)4


+$0.10


1.6 million


Zinc prices (US$/lb)4


-$0.10


(1.6) million


December 31, 2011


Change
of:


Would have changed 2011
after-tax profit by:


Would have changed 2011
after-tax OCI by:


Commodity price risk


Copper prices (US$/lb)3


+$0.30


$

2.6 million


Copper prices (US$/lb)3


-$0.30


(2.6) million


Zinc prices (US$/lb)4


+$0.10


1.3 million


(1.2) million


Zinc prices (US$/lb)4


-$0.10


(1.3) million


1.2 million


3Effect on profit due to embedded provisional pricing derivatives (note 30c).


4Effect on profit due to embedded provisional pricing derivatives (note 30c) and non-hedge zinc derivatives (note 30b); effect on OCI due to zinc swap cash flow hedging derivatives (note 30b).


Share price risk


Hudbay is exposed to market risk from share prices for the Group’s investments in listed Canadian metals and mining companies. These investments are made to foster strategic relationships, in connection with joint venture agreements and for investment purposes. Management monitors the value of these investments for the purposes of determining whether to add to or reduce the Group’s positions.


The following sensitivity analysis for share price risk relates solely to financial instruments and non financial derivatives that were outstanding as at the year-end date; each sensitivity calculation assumes all other variables are held constant. This analysis does not reflect the overall effect that changes in market variables would have on the Group’s results of operations.


December 31, 2012


Change of:
%


Would have changed 2012
after-tax profit by:


Would have changed 2012
after-tax OCI by:


Share price risk


Share prices5


+25

%

$

1.4 million


$

16.4 million


Share prices5


-25

%

(3.2) million


(14.6) million


December 31, 2011


Change of:
%


Would have changed 2011
after-tax profit by:


Would have changed 2011
after-tax OCI by:


Share price risk


Share prices5


+25

%


$

21.5 million


Share prices5


-25

%


(24.6) million


5 Effect on OCI due to mark-to-market and effect on profit due to impairment on available-for-sale investments in listed shares (note 11).


84


HUDBAY MINERALS INC.

Notes to Consolidated Financial Statements

(in thousands of Canadian dollars, except where otherwise noted)

Years ended December 31, 2012 and 2011


Interest rate risk


The Group is exposed to cash flow interest rate risk on its cash and cash equivalents and fair value interest rate risk on its embedded derivative associated with its Notes. There is no impact on the long-term debt as it is fixed rate debt carried at amortized cost using the effective interest rate method.


The following sensitivity analysis for interest rate risk relates solely to the prepayment option embedded derivative in the long-term debt outstanding as at the year-end date; each sensitivity calculation assumes all other variables are held constant. This analysis does not reflect the overall effect that changes in market variables would have on the Group’s results of operations.


December 31, 2012


Change of:


Would have changed 2012
after-tax profit by:


Would have changed 2012
after-tax OCI by:


Interest rate risk


Interest rates


+2.00

%

$

(3.9) million


Interest rates


-0.25

%

$

0.4 million


At December 31, 2012, the effect of interest rate changes on the Group’s cash equivalents would not have resulted in a significant after tax impact on profit. At December 31, 2011, the Group did not have any cash equivalents, therefore there would have been no impact on the Group’s net earnings as a result of an increase or decrease in interest rates.


Refer to notes 3e and 8 for information about the Group’s cash and cash equivalents.


(ii)           Credit risk:


Credit risk is the risk of financial loss to the Group if a customer or counterparty to a financial instrument fails to meet its obligations. The Group’s maximum exposure to credit risk at the reporting date is represented by the carrying amount, net of any impairment losses recognized, of financial assets and non financial derivative assets recorded on the balance sheet. Refer to note 30a.


Substantially all of the Group’s cash and cash equivalents are represented by deposits with major Schedule 1 Canadian banks. Deposits and other investments with Schedule 1 Canadian banks represented 93.7% of total cash and cash equivalents as at December 31, 2012 (2011 - 100.0%). The Group’s investment policy requires it to comply with a list of approved investments, concentration and maturity limits, as well as credit quality. The Group has not invested in asset backed commercial paper. Credit concentrations in the Group’s short term investments are monitored on an ongoing basis.


Transactions involving derivatives are with counterparties the Group believes to be creditworthy.


Management has a credit policy in place that requires the Group to obtain credit insurance from an investment grade credit insurance provider to mitigate exposure to credit risk in its receivables. At December 31, 2012, approximately 81% of the Group’s trade receivables were insured, with a credit insurance deductible of 10%. The deductible and any additional exposure to credit risk is monitored and approved on an ongoing basis.


85


HUDBAY MINERALS INC.

Notes to Consolidated Financial Statements

(in thousands of Canadian dollars, except where otherwise noted)

Years ended December 31, 2012 and 2011


Four customers accounted for approximately 60% of total trade receivables as at December 31, 2012 (2011 - three customers accounted for approximately 27%). Credit risk for these customers is assessed as medium to low risk.


As at December 31, 2012, approximately 1% of the Group’s trade receivable was aged more than 30 days (2011 - approximately 1%).


(iii)        Liquidity risk:


Liquidity risk is the risk that the Group will not be able to meet its obligations associated with financial liabilities. Hudbay’s objective is to maintain sufficient liquid resources to meet operational and investing requirements.


The following summarizes the contractual undiscounted cash flows of the Group’s non-derivative and derivative financial liabilities, including any interest payments, by remaining contractual maturity. The table includes all instruments held at the reporting date for which payments had been contractually agreed at the reporting date. The undiscounted amounts shown are gross amounts, unless the liabilities will be settled net. Amounts in foreign currency are translated at the closing rate at the reporting date. When a counterparty has a choice of when an amount is paid, the liability is allocated to the earliest possible time period.


Dec. 31, 2012


Carrying
amount


Contractual
cash flows


12 months or
less


1-2
years


2-5
years


Maturing
in over 5
years


Assets used to manage liquidity risk


Cash and cash equivalents


$

1,337,088


$

1,337,088


$

1,337,088


$


$


$


Non-derivative financial liabilities


Trade and other payables, including embedded derivatives


(198,676

)

(198,676

)

(198,676

)


Other financial liabilities


(41,416

)

(50,704

)

(22,050

)

(3,654

)

(6,049

)

(18,951

)

Long-term debt, including prepayment option embedded derivative


(479,540

)

(877,713

)

(49,459

)

(47,258

)

(141,773

)

(639,223

)


(719,632

)

(1,127,093

)

(270,185

)

(50,912

)

(147,822

)

(658,174

)

Derivative financial liabilities


Non-hedge zinc derivative contracts (note 17)


(75

)

(75

)

(75

)


(75

)

(75

)

(75

)


86


HUDBAY MINERALS INC.

Notes to Consolidated Financial Statements

(in thousands of Canadian dollars, except where otherwise noted)

Years ended December 31, 2012 and 2011


Dec. 31, 2011


Carrying
amount


Contractual
cash flows


12 months
or less


1-2
years


2-5
years


Maturing in
over 5
years


Assets used to manage liquidity risk


Cash and cash equivalents


899,077


899,077


899,077


Non-derivative financial liabilities


Trade and other payables, including embedded derivatives


(158,743

)

(158,743

)

(158,743

)


740,334


740,334


740,334


Derivative financial liabilities


Non-hedge zinc derivative contracts (note 17)


(1,159

)

(1,159

)

(1,159

)


Cash flow hedging derivatives


- zinc


2,638


2,638


2,638


- foreign currency swaps


607


607


607


2,086


2,086


2,086


31. Commitments and contingencies


(a)              Operating lease commitments


The Group has entered into various lease commitments for facilities and equipment. The leases expire in periods ranging from one to ten years. There are no restrictions placed on the Group by entering into these leases. Future minimum lease payments under non-cancelable operating leases recognized in operating expenses at December 31, 2012 are:


2012


2011


Within one year


$

3,199


$

2,457


After one year but not more than five years


10,556


9,848


More than five years


8,163


8,479


$

21,918


$

20,784


Payments recognized in operating expenses:


2012


2011


Minimum lease payments


$

1,731


$

1,901


Sub-lease payments received


(431

)

(109

)


$

1,300


$

1,792


Future minimum sub-lease payments expected to be received on non-cancelable leases are $1,401.


(b)              Capital commitments


As at December 31, 2012, the Group had outstanding capital commitments of approximately $768,103 primarily related to its Constancia, Lalor and Reed projects, of which approximately $208,912 cannot be terminated by the Group (December 31, 2011 - approximately $126,150 of which $62,833 cannot be terminated).


87


HUDBAY MINERALS INC.

Notes to Consolidated Financial Statements

(in thousands of Canadian dollars, except where otherwise noted)

Years ended December 31, 2012 and 2011


(c)               Contingent liabilities


Contingent liabilities


The Group is involved in various claims and litigation arising in the ordinary course and conduct of business. As the outcomes are uncertain, no amounts have been recorded in these consolidated financial statements. By their nature, contingencies will be resolved only when one or more future events occur or fail to occur. The assessment of contingencies inherently involves the exercise of significant judgement and estimates of the outcome of future events.


The significant claims and litigation matters are as follows:


(a)             Statements of claim were filed against Saskatchewan Power Corporation (“SaskPower”), HBMS and Churchill River Power Company Limited (“CRP”) on February 10, 1995, seeking an aggregate of $1 billion in compensatory damages and in excess of $100 million in punitive damages. These claims were filed in connection with the use and operation of the Whitesand Dam and the Island Falls Hydro Electric Station in Saskatchewan, which were transferred by CRP, formerly a wholly-owned subsidiary of HBMS, to SaskPower in 1981. As this matter has not been progressed since 1995, any potential liabilities are not reasonably determinable.


(b)             On December 20, 2004, a Statement of Claim was filed by the Peter Ballantyne Cree Nation against SaskPower, the Government of Canada and the Province of Saskatchewan. The action claims damages alleged as a result of the operation and use of the Whitesand Dam and Island Falls Hydro-Electric Station. HBMS and CRP have both been named as third parties in the action by SaskPower. It has come to Hudbay’s attention that CRP, a former subsidiary of HBMS that was dissolved, has been revived by SaskPower for the purpose of taking legal action against CRP for alleged breaches by CRP of its obligations under a certain Purchase and Sale Agreement made in 1981. Given the number of parties and the early stages of the proceedings, the resolution of the claims against CRP and HBMS is not reasonably determinable.


(c)              On March 2, 2007, a Statement of Claim was issued in the Manitoba Court of Queen’s Bench by Callinan Mines Limited against HBMS seeking declaratory relief, an accounting and an undisclosed amount of damages in connection with a Net Profits Interest and Royalty Agreement between HBMS and Callinan Mines Limited dated January 1, 1988. HBMS is defending the claims and the likelihood of success and potential liability are not reasonably determinable as the independent audit process has not been completed.


Contingent assets


There were no significant contingent assets at December 31, 2012 or December 31, 2011.


88


HUDBAY MINERALS INC.

Notes to Consolidated Financial Statements

(in thousands of Canadian dollars, except where otherwise noted)

Years ended December 31, 2012 and 2011


32.            Related parties


(a)              Group companies


The financial statements include the financial statements of the Company and the following significant subsidiaries:


Entity’s


Beneficial ownership
of ultimate
controlling party
(HudBay Minerals
Inc.)


Name


Jurisdiction


Business


Parent


2012


2011


Hudson Bay Mining and Smelting Co. Limited


Canada


Zinc and copper production


HMI


100

%

100

%

Hudson Bay Exploration and Development Company Limited


Canada


Exploration


HBMS


100

%

100

%

HudBay Marketing & Sales Inc.


Canada


Marketing and sales


HBMS


100

%

100

%

HudBay Peru Inc.


British Columbia


Holding company


HMI


100

%

100

%

HudBay Peru S.A.C.


Peru


Exploration and development


Peru Inc.


100

%

100

%

HudBay (BVI) Inc.


British Virgin Islands


Precious metals sales


Peru Inc.


100

%


Transactions between the Company and its subsidiaries, which are related parties of the Company, have been eliminated on consolidation and are not disclosed in this note.


(b)              Compensation of key management personnel


The Group’s key management includes members of the Board of Directors, Hudbay’s Chief Executive Officer, the Group’s senior vice presidents and vice presidents.


Total compensation to key management personnel was as follows:


2012


2011


Short-term employee benefits1


$

8,056


$

7,391


Post-employment benefits


716


761


Termination benefits


2,310


Share-based payments


4,669


3,331


$

13,441


$

13,793


1 Such as salaries and social security contributions, paid annual leave and paid sick leave, profit-sharing and bonuses (if payable within twelve months of the end of the period) and non-monetary benefits (such as medical care, housing, cars and free or subsidized goods or services) for current employees.


89


HUDBAY MINERALS INC.

Notes to Consolidated Financial Statements

(in thousands of Canadian dollars, except where otherwise noted)

Years ended December 31, 2012 and 2011


33.            Supplementary cash flow information


(a)              Change in non-cash working capital:


December 31


2012


2011


Change in:


Trade and other receivables


$

(13,940

)

$

28,315


Inventories


12,858


17,993


Prepaid expenses and other current assets


(615

)

(3,679

)

Trade and other payables


(28,805

)

(22,389

)

Change in taxes receivable/payable


(37,178

)

(12,514

)

Taxes - ITC


(23,025

)

(4,449

)


$

(90,705

)

$

3,277


(b)              Non-cash transactions:


During the year ended December 31, 2012, the Group entered into the following non-cash investing and financing activities which are not reflected in the statements of cash flows:


·                      The Group recognized property, plant and equipment of $66,466 and recognized financial liabilities of $71,601 related to agreements with communities near the Constancia project relating to the acquisition of rights to extract minerals and the ability to explore the land. During the year, The Group made payments of $32,508, which are included in acquisition of property, plant and equipment in the statements of cash flows. The Group capitalized interest of $2,323 related to this agreement.


·                      Remeasurements of the Group’s decommissioning and restoration liabilities as at December 31, 2012, led to increases in related property, plant and equipment assets of $8,199 mainly as a result of discount rate changes. For the year ended December 31, 2011, such remeasurements led to increases in property, plant and equipment assets of $30,875.


·                      Property, plant and equipment included $107,604 of additions which were not yet paid for as at December 31, 2012 (December 31, 2011 - $23,964). These purchases will be reflected in the statements of cash flows in the periods payments are made.


90


HUDBAY MINERALS INC.

Notes to Consolidated Financial Statements

(in thousands of Canadian dollars, except where otherwise noted)

Years ended December 31, 2012 and 2011


(c)               Cash flows arising from the exploration for and evaluation of mineral properties:


2012


2011


Operating activities:


Exploration and evaluation expenses


(43,572

)

$

(46,923

)

Change in exploration and evaluation receivables1


(2,696

)

Change in exploration and evaluation payables


(290

)

35


(43,862

)

$

(49,584

)

Investing activities:


Exploration and evaluation asset additions


340


$

3,577


340


$

3,577


1 Relates to exploration expenditures expected to be reimbursed by a third party.


34.            Segmented information


The Group is an integrated metals producer. When making decisions on expansions, opening or closing mines, as well as day to day operations, management evaluates the profitability of the overall operation of the Group. The Group’s main mining operations are located in Manitoba and Saskatchewan and are included in the Manitoba segment. The Manitoba segment generates the Group’s revenues as it sells copper concentrate (containing copper, gold and silver), gold, silver, zinc and other metals. The South America segment consists of the Group’s Constancia project in Peru, which Hudbay acquired on March 1, 2011 in addition to exploration activities in Chile and Colombia. The “Other” segment includes operating segments that are not individually significant, as they do not meet the quantitative thresholds, and include the Balmat segment which consists of a zinc mine and concentrator and the Michigan segment which includes the Back Forty property and other exploration properties. The Michigan segment suspended exploration and evaluation activities in July 2012. The Group previously disclosed HMI Nickel Inc. as a segment; however, upon selling the Fenix project in September 2011 (note 6), Hudbay reclassified these activities to loss from discontinued operations. Corporate activities are not considered a segment and are included as a reconciliation to total consolidated results. Accounting policies for each reported segment are the same. Segment profit or loss represents the profit earned by each segment without allocation of corporate costs. This is the measure reported to the chief operating decision-maker for the purposes of resource allocation and the assessment of segment performance. Total assets and liabilities do not reflect intercompany balances, which have been eliminated on consolidation. Prior year comparatives have been reclassified to reflect updates to the Group’s segments.


91


HUDBAY MINERALS INC.

Notes to Consolidated Financial Statements

(in thousands of Canadian dollars, except where otherwise noted)

Years ended December 31, 2012 and 2011


Year ended December 31, 2012


Manitoba


South
America


Other


Corporate
activities and
unallocated
costs


Total


Revenue from external customers


$

702,550


$


$


$


$

702,550


Cost of sales


- mine operating costs


429,155


429,155


- depreciation and amortization


75,801


75,801


Gross profit


197,594


197,594


Selling and administrative expenses


1,474


38,042


39,516


Exploration and evaluation


15,335


19,942


6,935


1,360


43,572


Other operating income


(929

)

(31

)

(8

)

(1,348

)

(2,316

)

Other operating expenses


2,884


4,682


3,357


409


11,332


Results from operating activities


$

178,830


$

(24,593

)

$

(10,284

)

$

(38,463

)

$

105,490


Finance income


(6,217

)

Finance expenses


14,858


Other finance losses


44,700


Profit before tax


52,149


Tax expense


73,319


Loss from continuing operations


(21,170

)

Loss from discontinued operations


Loss for the year


$

(21,170

)


December 31, 2012


Manitoba


South
America


Other


Corporate
activities and
unallocated
costs


Total


Total assets


$

1,521,291


$

1,188,064


$

23,997


$

754,472


$

3,487,824


Total liabilities


877,832


318,872


21,057


511,595


1,729,356


Property, plant and equipment


726,826


974,733


21,039


5,452


1,728,050


Year ended December 31, 2012


Additions to property, plant and equipment1:


$

216,409


$

290,094


$

1,664


$

300


$

508,467


Additions to other non-current assets (intangibles)


2,004


2,004


1 Additions to property, plant and equipment represent cash additions only. For non-cash additions, see note 33b.


92


HUDBAY MINERALS INC.

Notes to Consolidated Financial Statements

(in thousands of Canadian dollars, except where otherwise noted)

Years ended December 31, 2012 and 2011


Year ended December 31, 2011


Manitoba


South
America


Other


Corporate
activities and
unallocated
costs


Total


Revenue from external customers


$

890,817


$


$


$


$

890,817


Cost of sales


- mine operating costs


476,621


476,621


- depreciation and amortization


103,915


103,915


- impairment


6,839


6,839


Gross profit


303,442


303,442


Selling and administrative expenses


2,300


36,437


38,737


Exploration and evaluation


25,699


7,865


12,335


1,024


46,923


Other operating income


(3,170

)


(204

)

(3,374

)

Other operating expenses


2,675


83


5,893


654


9,305


$

275,938


$

(7,948

)

$

(18,228

)

$

(37,911

)

$

211,851


Finance income


(8,770

)

Finance expenses


6,605


Other finance losses


4,991


Profit before tax


209,025


Tax expense


133,829


Profit from continuing operations


75,196


Loss from discontinued operations


(238,784

)

Loss for the year


$

(163,588

)


December 31, 2011


Total assets1


$

1,017,330


$

675,744


$

23,040


$

738,890


$

2,455,004


Total liabilities1


442,843


164,549


21,344


10,910


639,646


Property, plant and equipment1


588,775


588,532


19,773


5,965


1,203,045


Year ended December 31, 2011


Additions to property, plant and equipment2:


- continuing operations


$

199,580


$

33,837


$

3,577


$

4,623


$

241,617


- discontinued operations


7,163


7,163


Additions to other non-current assets (intangibles)


5,692


5,692


1 Other includes amounts related to discontinued operations.

2 Additions to property, plant and equipment represent cash additions only. For non-cash additions, see note 33b.


During the year ended December 31, 2012, two customers accounted for approximately 31% and 13%, respectively of total revenue during the year. During the year ended December 31, 2011 four customers accounted for approximately 21%, 17%, 15% and 11% respectively of total revenue during the year. Revenues from these customers have been presented in the Manitoba operating segment.


93


EX-99.3 4 a13-8934_1ex99d3.htm EX-99.3

Exhibit 99.3


HUDBAY MINERALS INC.


Management’s Discussion and Analysis of

Results of Operations and Financial Condition


For the Year Ended

December 31, 2012


February 20, 2013


GRAPHIC


TABLE OF CONTENTS


Page

Notes to Reader

1

Our Business

4

Summary

5

Key Financial and Production Results

6

Strategy

7

Development and Exploration Update

8

Operations Review

14

Environment, Health and Safety

14

Mines

15

Processing facilities

17

Metallurgical Facilities

19

Outlook

20

Commodity Markets

20

Sensitivity Analysis

22

Financial Review

23

Liquidity and Capital Resources

33

Financial Risk Management

39

Trend Analysis and Quarterly Review

40

Critical Accounting Estimates

43

Accounting Changes

49

Risk Factors

49

Non-IFRS Financial Performance Measures

53

Disclosure Controls and Procedures and Internal Control Over Financial Reporting

55


NOTES TO READER


This Management’s Discussion and Analysis (“MD&A”) dated February 20, 2013 is intended to supplement and complement HudBay Minerals Inc.’s audited consolidated financial statements and related notes for the year ended December 31, 2012 (the “consolidated financial statements”). The consolidated financial statements have been prepared using accounting policies consistent with International Financial Reporting Standards (“IFRS”) as issued by the International Accounting Standards Board.


Additional information regarding HudBay Minerals Inc., including the risks related to our business and those that are reasonably likely to affect our financial statements in the future, is contained in our continuous disclosure materials, including our most recent Annual Information Form (“AIF”), audited consolidated financial statements, and Management Information Circular, available on SEDAR at www.sedar.com and on EDGAR at www.sec.gov.


All amounts are in Canadian dollars unless otherwise noted.


References to “Hudbay”, the “Company”, “we”, “us”, “our” or similar terms refer to HudBay Minerals Inc. and its direct and indirect subsidiaries. “Hudbay Peru” refers to HudBay Peru Inc., our wholly-owned subsidiary. “WPCR” refers to the White Pine Copper Refinery Inc., which was sold during the second quarter of 2011. “Zochem” refers to Zochem Inc., which was sold during the fourth quarter of 2011.


GRAPHIC


Forward-Looking Information


This MD&A contains “forward-looking statements” and “forward-looking information” (collectively, “forward-looking information”) within the meaning of applicable Canadian and United States securities legislation. All information contained in this MD&A, other than statements of current and historical fact, is forward-looking information. Forward-looking information includes information that relates to, among other things, our objectives, strategies, and intentions and future financial and operating performance and prospects. Often, but not always, forward-looking information can be identified by the use of words such as “plans”, “expects”, “budget”, “guidance”, “scheduled”, “estimates”, “forecasts”, “strategy”, “target”, “intends”, “objective”, “goal”, “understands”, “anticipates” and “believes” (and variations of these or similar words) and statements that certain actions, events or results “may”, “could”, “would”, “should”, “might” “occur” or “be achieved” or “will be taken” (and variations of these or similar expressions). All of the forward-looking information in this MD&A is qualified by this cautionary statement.


Forward-looking information includes, but is not limited to, continued production at our 777 and Lalor mines, continued processing at our Flin Flon concentrator, Snow Lake concentrator and Flin Flon zinc plant, our ability to develop our Lalor, Constancia and Reed projects and the anticipated scope of, cost of and development plans for, these projects, anticipated timing of our projects and events that may affect our projects, our expectation that we will receive the remaining US$250 million deposit payment under the precious metals stream transaction with Silver Wheaton Corp., the anticipated effect of external factors on revenue, such as commodity prices, anticipated exploration and development expenditures and activities and the possible success of such activities, estimation of mineral reserves and resources, mine life projections, timing and amount of estimated future production, reclamation costs, economic outlook, government regulation of mining operations, and business and acquisition strategies.


Forward-looking information is not, and cannot be, a guarantee of future results or events. Forward-looking information is based on, among other things, opinions, assumptions, estimates and analyses that, while considered reasonable by us at the date the forward-looking information is provided, inherently are subject to significant risks, uncertainties, contingencies and other factors that may cause actual results and events to be materially different from those expressed or implied by the forward-looking information. The material factors or assumptions that we identified and were applied by us in drawing conclusions or making forecasts or projections set out in the forward looking information include, but are not limited to:


·             the success of mining, processing, exploration and development activities;

·             the accuracy of geological, mining and metallurgical estimates;

·             the costs of production;

·             the supply and demand for metals we produce;

·             the volatility of commodity prices;

·             the volatility in foreign exchange rates;

·             the supply and availability of concentrate for our processing facilities;

·             the supply and availability of reagents for our concentrators;

·             the availability of third party processing facilities for our concentrate;

·             the supply and availability of all forms of energy and fuels at reasonable prices;

·             the availability of transportation services at reasonable prices;

·             no significant unanticipated operational or technical difficulties;

·             the availability of financing for our exploration and development projects and activities;

·             the ability to complete project targets on time and on budget and other events that may affect our ability to develop our projects;

·             the timing and receipt of various regulatory and governmental approvals;

·             the availability of personnel for our exploration, development and operational projects and ongoing employee relations;

·             maintaining good relations with the communities in which we operate, including the communities surrounding our Constancia project and First Nations communities surrounding our Lalor and Reed projects;


2


GRAPHIC


·             no significant unanticipated challenges with stakeholders at our various projects;

·             no significant unanticipated events relating to regulatory, environmental, health and safety matters;

·             no contests over title to our properties, including as a result of rights or claimed rights of aboriginal peoples;

·             the timing and possible outcome of pending litigation and no significant unanticipated litigation;

·             certain tax matters, including, but not limited to current tax laws and regulations; and

·             no significant and continuing adverse changes in general economic conditions or conditions in the financial markets.


The risks, uncertainties, contingencies and other factors that may cause actual results to differ materially from those expressed or implied by the forward-looking information may include, but are not limited to, risks generally associated with the mining industry, such as economic factors (including future commodity prices, currency fluctuations and energy prices), uncertainties related to the development and operation of our projects, depletion of our reserves, risks related to political or social unrest or change and those in respect of aboriginal and community relations and title claims, operational risks and hazards, including unanticipated environmental, industrial and geological events and developments and the inability to insure against all risks, failure of plant, equipment, processes, transportation and other infrastructure to operate as anticipated, compliance with government and environmental regulations, including permitting requirements and anti-bribery legislation, dependence on key personnel and employee relations, volatile financial markets that may affect our ability to obtain financing on acceptable terms, uncertainties related to the geology, continuity, grade and estimates of mineral reserves and resources and the potential for variations in grade and recovery rates, uncertain costs of reclamation activities, our ability to comply with our pension and other post-retirement obligations, our ability to abide by the covenants in our debt instruments, as well as the risks discussed under the heading “Risk Factors” in this MD&A and the risks discussed under the heading “Risk Factors” in our most recent Annual Information Form and Form 40-F.


Should one or more risk, uncertainty, contingency or other factor materialize or should any factor or assumption prove incorrect, actual results could vary materially from those expressed or implied in the forward-looking information. Accordingly, you should not place undue reliance on forward-looking information. We do not assume any obligation to update or revise any forward-looking information after the date of this MD&A or to explain any material difference between subsequent actual events and any forward-looking information, except as required by applicable law.


3


GRAPHIC


Note to United States Investors


This MD&A has been prepared in accordance with the requirements of the securities laws in effect in Canada, which differ from the requirements of United States securities laws applicable to U.S. companies.


Information concerning our mineral properties has been prepared in accordance with the requirements of Canadian securities laws, which differ in material respects from the requirements of the Securities and Exchange Commission (the “SEC”) set forth in Industry Guide 7. Under the SEC’s Industry Guide 7, mineralization may not be classified as a “reserve” unless the determination has been made that the mineralization could be economically and legally produced or extracted at the time of the reserve determination, and the SEC does not recognize the reporting of mineral deposits which do not meet the SEC Industry Guide 7 definition of “Reserve”. In accordance with National Instrument 43-101 - Standards of Disclosure for Mineral Projects (“NI 43-101”) of the Canadian Securities Administrators, the terms “mineral reserve”, “proven mineral reserve”, “probable mineral reserve”, “mineral resource”, “measured mineral resource”, “indicated mineral resource” and “inferred mineral resource” are defined in the Canadian Institute of Mining, Metallurgy and Petroleum (the “CIM”) Definition Standards for Mineral Resources and Mineral Reserves adopted by the CIM Council on December 11, 2005. While the terms “mineral resource”, “measured mineral resource”, “indicated mineral resource” and “inferred mineral resource” are recognized and required by NI 43-101, the SEC does not recognize them. You are cautioned that, except for that portion of mineral resources classified as mineral reserves, mineral resources do not have demonstrated economic value. Inferred mineral resources have a high degree of uncertainty as to their existence and as to whether they can be economically or legally mined. It cannot be assumed that all or any part of an inferred mineral resource will ever be upgraded to a higher category. Therefore, you are cautioned not to assume that all or any part of an inferred mineral resource exists, that it can be economically or legally mined, or that it will ever be upgraded to a higher category. Likewise, you are cautioned not to assume that all or any part of measured or indicated mineral resources will ever be upgraded into mineral reserves. You are urged to consider closely the disclosure on the mining industry technical terms in Schedule A “Glossary of Mining Terms” of our AIF for the fiscal year ended December 31, 2011, available on SEDAR at www.sedar.com and incorporated by reference as Exhibit 99.1 in our Form 40-F filed on EDGAR on April 2, 2012 (File No. 001-34244).


Presentation of Non-IFRS Financial Performance Measures


We use operating cash flow per share and cash cost per pound of copper sold as non-IFRS financial performance measures in our MD&A. For a detailed description of each of the non-IFRS financial performance measures used in this MD&A, please see the discussion under “Non-IFRS Financial Performance Measures” beginning on page 54 of our MD&A.


Qualified Person


The technical and scientific information in this MD&A related to the Constancia project has been approved by Cashel Meagher, P. Geo, our Vice President, South America Business Unit. The technical and scientific information related to all other sites and projects contained in this MD&A has been approved by Robert Carter, P. Eng, our Director, Technical Services. Messrs. Meagher and Carter are qualified persons pursuant to NI 43-101.


OUR BUSINESS


We are an integrated mining company producing copper concentrate (containing copper, gold and silver) and zinc metal. With assets in North and South America, we are focused on the discovery, production and marketing of base and precious metals. Through our subsidiaries, we own copper/zinc/gold mines, ore concentrators and a zinc production facility in northern Manitoba and Saskatchewan and a copper project in Peru. We also have equity investments in a number of junior exploration companies. Our mission is to create sustainable value through increased commodity exposure on a per share basis for our shareholders. We are governed by the Canada Business Corporations Act and our shares are listed under the symbol “HBM” on the Toronto Stock Exchange, the New York Stock Exchange and Bolsa de Valores de Lima.


4


GRAPHIC


SUMMARY


·             Production of all metals in concentrate and overall unit operating costs met full year 2012 guidance.


·             Fourth quarter operating cash flow before stream deposit and change in non-cash working capital decreased to $6.0 million, mainly due to lower realized metals prices, the impact of the precious metal stream transaction on cash proceeds received for gold and silver sold in the quarter and unusually high sales volumes in the comparable 2011 period.


·             Profit and earnings per share in the fourth quarter of 2012 of $7.4 million and $0.04, respectively.


·             Development of three new mines proceeding well with first full quarter of ore production from the ventilation shaft at Lalor, full scale civil works underway at Constancia and ramp development advancing well at Reed.


·             Lalor project estimated capital expenditures increased by $90 million to $794 million as scope changes, including a 20% increase in grinding capacity to 5,400 tonnes per day, as well as improved estimation from completion of basic engineering are incorporated.


·             Drilling at Constancia’s higher grade Pampacancha satellite deposit continued to expand the known deposit raising the possibility of further grade enhancements early in the mine life.


·             Semi-annual dividend of $0.10 per share declared.


In the fourth quarter of 2012, we recorded a profit and earnings per share of $7.4 million and $0.04, respectively, compared to a profit and earnings per share of $34.3 million and $0.21, respectively, in the fourth quarter of 2011.


The fourth quarter of 2012 profit was affected by, among other things, the following items:


Pre-tax
gain (loss)

($ millions)


After-tax
gain (loss)

($ millions)


Per Share
($/share)


Impairments and mark-to-market adjustments related to junior mining investments


(4.1

)

(4.1

)

(0.02

)


Gain on mark-to-market of embedded derivative related to long term debt


1.9


1.9


0.01


Impact on deferred tax expense of translation of Peruvian tax basis


2.7


0.02


Impact on deferred taxes of change in discount rates on decommissioning and restoration liabilities


1.1


0.01


Foreign exchange gain


9.1


8.5


0.05


Loss as a result of provisional pricing adjustments


(3.5

)

(2.2

)

(0.01

)


Loss on forward zinc purchase contracts related to fixed price customer sales


(0.6

)

(0.4

)


5


GRAPHIC


Key Financial and Production Results


Financial Condition ($000s)


Dec. 312012


Dec. 31, 2011


Cash and cash equivalents


1,337,088


899,077


Working capital


1,214,263


848,258


Total assets


3,487,824


2,455,004


Equity1 


1,758,779


1,813,163


Financial Performance


Three Months Ended


Year Ended


($000s except per share and cash cost amounts) 


Dec. 31
2012


Dec. 31
2011


Dec. 31,
2012


Dec. 31,
2011


Revenue


180,994


254,314


702,550


890,817


Profit before tax


23,335


69,813


52,149


209,025


Profit (loss) from continuing operations


7,438


34,286


(21,170

)

75,196


Basic and diluted earnings (loss) per share1


0.04


0.21


(0.11

)

(0.92

)

Profit (loss) for the period


7,438


34,286


(21,170

)

(163,588

)

Operating cash flow before stream deposit and change in non-cash working capital


6,002


82,208


142,957


252,154


Operating cash flow per share 2


0.03


0.48


0.83


1.50


Cash cost per pound of copper sold 2


$

2.05


$

0.54


$

1.07


$

0.45


Production (contained metal in concentrate)3


Copper

(tonnes)


8,162


13,834


39,587


54,324


Zinc

(tonnes)


18,370


21,534


80,865


75,780


Gold

(troy oz.)


20,909


27,059


86,553


94,610


Silver

(troy oz.)


198,407


245,216


823,970


875,817


Metal Sold


Contained metal in concentrate4


Copper

(tonnes)


10,683


18,336


43,464


57,361


Gold

(troy oz.)


27,102


31,407


84,835


93,652


Silver

(troy oz.)


292,409


247,576


768,804


764,773


Refined zinc

(tonnes)


30,387


26,989


103,437


100,935


1 Attributable to owners of the Company.

2     Operating cash flow per share and cash cost per pound of copper sold are non-IFRS financial performance measures with no standardized definition under IFRS. For further information and a detailed reconciliation, please see page 53 of this MD&A.

3     Metal reported in concentrate is prior to refining losses or deductions associated with smelter contract terms.

4     Amounts in 2011 also include minimal amounts of copper cathode and anode, which were sold during the first quarter only.


6


GRAPHIC


STRATEGY


We believe that the greatest opportunities for shareholder value creation in the mining industry are in the discovery of new mineral deposits and the development of new facilities to profitably extract ore from those deposits. We also believe that our long history of mining in northern Manitoba and our highly experienced workforce provide us with a competitive advantage relative to other mining companies of similar scale.


To capitalize on these opportunities, our mission is to create sustainable value through increased commodity exposure on a per share basis, in high quality, long life deposits with exploration potential in mining friendly jurisdictions.


We intend to grow Hudbay through exploration and development of properties we already control, such as our Lalor and Reed projects in northern Manitoba, as well as through the acquisition of exploration and development properties, such as our Constancia project in Peru. We also intend to optimize the value of our producing assets through efficient and safe operations.


In order to ensure that any acquisitions we undertake create sustainable shareholder value, we have established a number of criteria for evaluating mineral property acquisition opportunities, which include the following:


·             Potential acquisitions should be located in jurisdictions that are supportive of mining activity and have acceptable levels of political risk. Given our current scale and geographic footprint, our current geographic focus is on investment grade countries in the Americas;

·             We believe we have particular expertise in the exploration and development of volcanogenic massive sulphide and porphyry mineral deposits. While these types of deposits typically contain copper, zinc and precious metals in varying quantities, we are not targeting any one type of metal; rather, we focus on properties where we see the greatest opportunities for risk-adjusted returns based on our expectations for future metals prices;

·             Any properties that we acquire must have excellent exploration potential. We believe that the markets for mining assets are sophisticated and fully value delineated resources and reserves, especially at properties that are already in production, which makes it difficult to acquire properties for substantially less than their fair value. However, markets may undervalue the exploration potential of prospective properties, providing us with an opportunity to create value through exploration on acquired properties;

·             We believe that large, transformational mergers or acquisitions are risky and potentially value-destructive in the mining industry, so we typically focus on earlier stage projects, except where exceptional opportunities present themselves;

·             Before we make an acquisition, we develop a clear understanding of how we can add value to the acquired property. We intend to add value through the application of technical, exploration and development expertise, the provision of needed financial capacity and other opportunities; and

·             Acquisitions should be accretive to Hudbay on a per share basis. Given that our strategic focus includes the acquisition of non-producing assets at various stages of development, when evaluating accretion we will consider measures such as net asset value per share and the contained value of reserves and resources per share.


7


GRAPHIC


Our key strategic objectives for 2013 and early 2014 are to:


·             Advance the Lalor project toward first ore from the main production shaft in late 2014, including achieving commercial production from the initial workings, advancing construction on the production shaft, finalizing engineering and commencing construction on the new Lalor concentrator, and acquiring necessary permits on a timely basis;

·             Advance the Constancia project, including ongoing construction of the heavy civil earthworks and processing facilities, completion of community relocations in accordance with existing agreements, finalizing arrangements for power supply and port handling and progressing technical and permitting work on the Pampacancha deposit;

·             Advance the Reed project, including completion of the underground ramp, acquiring necessary permits and commencing production in the fourth quarter of 2013;

·             Continue our exploration program in the Flin Flon Greenstone Belt, Peru, Chile and Colombia and continue to partner with junior mining companies to access promising exploration opportunities; and

·             Continue to evaluate acquisition opportunities that meet our criteria described above.


DEVELOPMENT AND EXPLORATION UPDATE


Construction Progress at Constancia


On August 8, 2012, our Board of Directors approved a US$1.5 billion investment in our 100% owned Constancia copper project in Peru. The Constancia development schedule contemplates nine quarters of construction, with initial production in late 2014 and full production commencing in the second quarter of 2015.


We have invested approximately US$351 million of our US$1.5 billion capital construction budget on the project to January 31, 2013 and have entered into an additional US$631 million in commitments for the project. We expect to incur capital expenditures of approximately $961 million on Constancia for 2013. The project site has sustained a higher than normal amount of rainfall, which has slowed project progress to date. We believe that the impact on project schedule is recoverable and the targets for initial production and full production remain unchanged. The project’s forecasted final costs remain on budget.


Site activity to date includes the completion of 3,500 beds in the construction camp. The tailings management facility, haul roads and water diversion infrastructure are under construction. We expect to complete the access roads for heavy haulage in the second quarter of 2013, and the waste rock facilities in the third quarter of 2013.


The Pampacancha feasibility study is underway, and we will incorporate further characterization of geotechnical and hydrogeological information in the study.


Structural steel delivery is scheduled to commence in May 2013 and the major steel erection for plant site is expected to commence in June 2013. We have secured major long lead items including flotation cells, pumps, regrind mills, SAG mills and crushers and expect to begin receiving these items in March 2013. The primary crusher mechanical installation is anticipated in the fourth quarter of 2013. We have also secured the mine fleet with 18 haul trucks scheduled for delivery from March 2013 through August 2014. Tire procurement is underway with a number of tires purchased and contracts arranged to meet fleet requirements. We expect the arrival of the three hydraulic shovels in June, July and December 2013, respectively and to begin pre-stripping activities late in 2013.


8


GRAPHIC


In addition, we have executed a contract for the construction of the 70 kilometre power transmission line from the Tintaya substation. We are finalizing negotiations on the power purchase agreements with long term pricing expected to be consistent with our original expectations. The principal port operator has provided further assurances that the concentrate shipments will be accommodated, and we are considering the short term and long term solutions to best serve the project’s needs.


In accordance with the agreements we have entered into with local communities, relocation of affected families is underway and the construction of new housing is in progress. We have delivered new homes to 13 families, and the remaining 23 families are scheduled to be relocated in 2013.


Permitting and regulatory efforts remain on schedule with the approval and receipt of the mining permit in December 2012. This approval followed in the normal course the beneficiation concession that was awarded in June 2012. The next major permit is the operating permit which we expect to receive in the normal course upon commissioning of the mine which is scheduled for early 2015. We have also received approval for the early refund of value-added tax on purchases with retroactive effect to December 2012.


The project is on schedule, which currently contemplates that the remaining capital spending on the project will occur over the 2013 - 2014 period as follows:


(in US$ millions)


2013


961


2014


262


Total estimated future capital spending


1,223


Total spent in 2012


323


Total


1,546


Lalor


We have invested approximately $326 million of the revised $794 million capital construction budget for our wholly owned Lalor project near Snow Lake, Manitoba to January 31, 2013 and have entered into an additional $93 million in commitments for the project.


The mine portion of the project remains on time and on budget. Basic engineering of the new Lalor concentrator is complete. Capital expenditures are expected to be approximately $90 million higher than the original budget of $263 million for the concentrator portion of the now $794 million project. Scope changes and improved estimation from completion of basic engineering account for the increase. The scope changes include an increase in the grinding capacity by 20% to 5,400 tonnes per day to better match the potential production shaft capacity. The mine plan, as previously disclosed, contemplates an ore production rate of 4,500 tonnes per day, at full production, however, the main production shaft is designed for 6,000 tonnes per day. The new concentrator design also incorporates a longer construction schedule with concentrator startup in late 2015. However, first ore production from the main production shaft is still projected to be on schedule in late 2014, at which time it will be processed at the Snow Lake and Flin Flon mills and a portion stockpiled for the new concentrator upon its commissioning.


9


GRAPHIC


Including the additional concentrator capital spending noted above, the remaining capital spending on the project is expected to occur over the 2013 - 2015 period as follows:


(in $ millions)


2013


144


2014


191


2015


138


Total estimated future capital spending


473


Total spent in 2010/2011


206


Total spent in 2012


115


Total1


794


1 The total project budget does not reflect investment tax credits associated with new mine status for income tax purposes, which will be netted against capitalized assets.


During the fourth quarter of 2012, we hoisted 58,000 tonnes of ore from the ventilation shaft at Lalor. Between August and December 2012, we hoisted 72,300 tonnes of ore and 79,830 tonnes of waste using the ventilation shaft. Underground project development has continued to advance and our primary focus is to reach the 910 metre shaft station and continue to ramp to the 955 metre level. The main production shaft is now sunk to approximately 525 metres and is 53% complete. We expect shaft sinking to be completed in late 2013. Upon completion of sinking, the installation of the steel sets and guides as well as the headframe changeover will begin.


We are in the process of completing the final engineering work for the load-out facilities located at the 955 metre level, as well as completing the main pumping installations. We are preparing for construction of the main intake fan systems and the main substation during 2013.


We expect to submit the Environmental Act Licence application for the new concentrator to the Manitoba government in the first half of 2013. The new design will incorporate a larger grinding circuit being fed from the surface stockpile. We will hoist uncrushed ore up the Lalor shaft to be crushed on surface and then conveyed to the surface stockpile. The stockpile will feed a SAG mill and ball mill combination that has design capacity of 5,400 tonnes per day.


The recovery process will be normal floatation producing a copper bulk concentrate and a zinc concentrate. The remaining tails will either provide feed to the paste plant or be sent to the existing tailings impoundment area.


Given the nature of the Lalor project, we expect to refer to three phases of the Lalor project when determining commercial production for accounting purposes. The first phase of the project is expected to include the main ventilation shaft and associated surface and underground workings that will contribute to the production of ore between 2012 and 2014. We expect to achieve commercial production for accounting purposes for the first phase in the second quarter of 2013. The second phase of the project is expected to include the main production shaft, and the third phase of the project involves the new Lalor concentrator. We are processing the Lalor ore at the nearby Snow Lake concentrator until we complete the production shaft and new concentrator.


10


GRAPHIC


Reed Copper Project Development Progressing on Schedule


During the fourth quarter, our focus for our 70% owned Reed copper project near Flin Flon, Manitoba was underground ramp development and completion of surface construction. Of our $72 million capital construction budget, we have invested approximately $26 million on the project to January 31, 2013 and have entered into an additional $20.5 million in commitments for the project. Capital expenditures at Reed are expected to total approximately $44 million in 2013.


After completing the first portal development round in October 2012, the underground ramp had advanced approximately 174 metres as of January 31, 2013. In December 2012, we submitted to the provincial government the Environmental Act Licence application for Reed which, upon receipt, will allow for the commencement of full production.


The project is on schedule, which currently contemplates that the remaining capital spending on the project will occur over the 2013 - 2014 period as follows:


(in $ millions)


2013


44


2014


4


Total estimated future capital spending


48


Total spent in 2012


24


Total


72


We expect initial production at the Reed copper project by the fourth quarter of 2013 and full production of approximately 1,300 tonnes of ore per day by the first quarter of 2014.


11


GRAPHIC


Exploration Update


Year Ended


Year Ended


($ millions)1


Dec. 312012
Actual


Dec 31, 2011
Actual


2012
Guidance


2013
Guidance


Manitoba


15


37


31


20


South America


20


9


13


18


Other North America


9


13


10


2


Total exploration expenditures


44


59


54


40


Capitalized spending


(12

)

(5

)

(5

)

Total exploration expense


44


47


49


35


1Amounts are net of investment tax credits where applicable.


For 2013 we have a budget for exploration expenditures of $40 million, more than half of which is focused on brownfield opportunities near our existing deposits. Our total exploration budget contemplates approximately 55,000 metres of drilling in the Flin Flon Greenstone Belt, 10,000 metres in Peru and 10,000 metres on greenfield projects in North and South America, including Chile and Colombia. Within the Flin Flon Greenstone Belt, we intend to explore near our active and historical mining areas. The variance between actual 2012 exploration expenditures and our 2012 guidance was due primarily to a positive variance in investment tax credits of $4 million (due to Lalor new mine status) in addition to a reduction of generative exploration in favour of brownfields targets.


Constancia Exploration Update


In Peru, exploration is ongoing at the Constancia project with three diamond drills. One drill is focused on Pampacancha infill drilling, while the two others are concentrated on Pampacancha West.


Our objective for the first quarter of 2013 is to drill Pampacancha West, which includes a group of geophysical anomalies located approximately 500 metres west of the main Pampacancha deposit. New drilling has yielded positive results including drill hole PO-12-142, which intersected 14.8 metres at 0.85% copper equivalent grade (at a depth from 11.2 metres to 26 metres) and almost 28 metres at 0.51% copper equivalent grade (at a depth from 91.4 metres to 119.75 metres). These intersections indicate that magnetite skarn mineralization exists in this western area and exploration of this area will continue to be a priority to understand if a meaningful resource can be delineated.


In addition, we anticipate recent drilling will have a positive impact on the grade and tonnage at the main Pampacancha deposit for consideration in the new Pampacancha feasibility study. This resource will provide us with an opportunity to continue to optimize the mine plan with potential to extend higher grades in the mine plan beyond the first five years of production. Among recent drilling results, infill drill hole PO-12-134 in the southern portion of the resource extended mineralization at depth of 108.10 metres at a 2.62% copper equivalent grade (at a depth from 88 metres to 196.1 metres). Drill hole PO-12-129 intersected almost 65 metres at 1.17% copper equivalent grade (at a depth from 23 metres to 88 metres) at the western margin of the Pampacancha resource, which remains open to the west. A total of 16,593 metres were drilled during 2012 and we plan on drilling 3,000 metres in the first quarter of 2013 targeting extensions to the northwest and west of the Pampacancha resource and the Pampacancha West mineralization.


Chilloroya South drilling in 2012 yielded interesting results with the presence of some gold mineralization. Geological modeling for future exploration considerations is ongoing. The geophysical anomaly immediately west of the Constancia pit was not fully tested. Two drill holes failed to pierce a significant fault structure to properly test the geophysical anomaly. Near the fault some porphyry mineralization was encountered and further review is required. The opportunity remains to pierce through the faulted structure utilising a larger and more powerful drill.


12


GRAPHIC


Highlights from the drill program are as follows:


Area


Hole


Length (m)


From (m)


To (m)


Cu
(%)


Mo (%)


Ag (g/t)


Au
(g/t)


Cu Eq 1
(%)


Pampacancha main body


PO-12-117


58.00


0.00


58.00


0.55


0.05


12.14


0.26


1.15


16.50


181.25


197.75


0.96


0.01


17.10


0.27


1.41


PO-12-119


10.00


215.80


225.80


0.40


<.01


7.54


0.38


0.76


20.00


266.40


286.40


0.74


<.01


8.35


0.41


1.13


PO-12-121


No significant mineralization


PO-12-122


16.00


2.00


18.00


0.25


<.01


1.76


0.15


0.38


39.00


34.00


73.00


0.36


0.01


6.33


0.35


0.74


15.50


81.50


97.00


0.32


0.05


1.01


0.13


0.66


34.55


146.15


180.70


0.74


<.01


12.66


0.24


1.07


52.00


189.00


241.00


0.49


<.01


6.51


0.16


0.70


8.25


250.75


259.00


0.52


0.06


7.00


0.34


1.13


PO-12-123


28.05


12.75


40.80


0.66


0.05


4.88


0.21


1.10


9.35


95.60


104.95


1.03


0.01


11.59


0.26


1.41


13.20


257.00


270.20


0.71


<.01


8.14


0.27


1.03


7.30


278.50


285.80


0.32


<.01


2.42


0.08


0.43


PO-12-124


No significant mineralization


PO-12-125


No significant mineralization


PO-12-126


No significant mineralization


PO-12-127


No significant mineralization


PO-12-128


Results pending


PO-12-129


65.00


23.00


88.00


0.80


0.01


2.46


0.38


1.17


PO-12-130


15.95


90.25


106.20


1.19


<.01


4.41


0.73


1.77


PO-12-131


No significant mineralization


PO-12-132


9.35


106.70


116.05


0.26


<.01


1.70


0.18


0.41


35.00


126.50


161.50


1.73


0.05


7.26


0.76


2.60


PO-12-133


Results pending


PO-12-134


108.10


88.00


196.10


1.76


0.08


7.73


0.50


2.62


PO-12-135


27.90


49.70


77.60


0.31


<.01


1.54


0.21


0.51


39.00


85.00


124.00


0.36


<.01


1.62


0.14


0.50


19.00


131.00


150.00


1.23


<.01


20.27


0.27


1.67


28.75


201.25


230.00


1.30


<.01


12.75


0.35


1.72


PO-12-136


Results pending


PO-12-137


21.40


59.60


81.00


0.35


0.05


1.70


0.08


0.67


PO-12-138


Results pending


PO-12-139


22.15


78.00


100.15


0.27


0.05


11.52


1.76


1.82


18.85


169.25


188.10


1.08


<.01


17.36


0.31


1.53


17.75


284.15


301.90


1.32


<.01


14.90


1.34


2.41


PO-12-140


16.00


31.00


47.00


0.22


0.02


1.52


0.09


0.40


9.00


131.00


140.00


0.33


<.01


6.06


0.13


0.51


17.50


248.50


266.00


0.59


<.01


8.32


0.71


1.21


Pampacancha west (Magnetic Halo)


PO-12-141


No significant mineralization


PO-12-142


14.80


11.20


26.00


0.29


<.01


17.43


0.47


0.85


28.35


91.40


119.75


0.31


<.01


8.14


0.14


0.51


South Chilloroya (Cut-off grade 0.2 g/t Au)


SO-12-027


12.00


30.00


42.00


0.00


0.62


0.28


0.20


18.00


80.00


98.00


0.09


4.46


0.38


0.40


SO-12-030


9.60


60.40


70.00


0.09


4.79


0.28


0.34


SO-12-031


11.00


97.00


108.00


0.08


3.86


0.52


0.47


1 Calculated using commodity prices of US$1,250/oz Au, US$25.00/oz Ag, US$2.75/lb Cu and US$14.00/lb Mo. Copper cut-off reported as 0.2%. Composited intersections are reported as core length and do not represent true width.


Hole


East


North


Elevation


Azimuth


Dip


Total Depth


PO-12-117


204680


8397598


4317.5


90


-85


368.85


PO-12-119


204649


8397335


4305


85


-75


310.3


PO-12-122


204602


8397548


4306.2


270


-80


293.25


PO-12-123


204599


8397650


4294.8


0


-80


319.2


PO-12-129


204576


8397011


4198.2


270


-85


110.85


PO-12-130


204576


8397095


4232.5


270


-85


152.8


PO-12-132


204628


8397103


4242


90


-85


203.5


PO-12-134


204681


8397103


4240


120


-85


229.7


PO-12-135


204781


8397301


4253


270


-80


275


PO-12-137


204576


8397593


4290.5


310


-75


169.8


PO-12-139


204577


8397496


4303.8


20


-65


382.9


PO-12-140


204577


8397599


4290.2


110


-80


321.8


PO-12-142


203648


8397828


4302


270


-75


223.9


CO-12-297


201021


8399961


4252.2


270


-80


382.9


SO-12-027


202603


8396005


4109.5


0


-75


187.6


SO-12-030


202886


8396381


4116.2


210


-80


528.4


SO-12-031


202987


8396244


4136


250


-80


309.5


Note: Collar coordinates, National Grid UTM coordinates based on the Provisional South America 1956 (PSAD56) datum 19S.


The processes that were used to verify the exploration data for Constancia contained in this MD&A and the quality assurance and quality control measures that were applied during the execution of the work being reported on are the same as those described in the technical report titled “National Instrument 43-101, Technical Report, Constancia Project, Province of Chumbivilcas, Department of Cusco, Peru” dated effective October 15, 2012, a copy of which is available on SEDAR and EDGAR.


13


GRAPHIC


OPERATIONS REVIEW


Environment, Health and Safety


The Environment


There were no significant environmental non-compliances during the year.


All producing operations have management systems certified to both OHSAS 18001 for occupational health and safety and ISO 14001 for the environment. In addition, the production and supply of Manitoba’s cast zinc products are registered to the ISO 9001 quality standard.


Health and Safety


For the three months ended December 31, 2012, we have recorded a lost time accident frequency (including contractors) of 0.2 per 200,000 hours worked compared to 0.6 for the same period in 2011. For the full years ended December 31, 2012 and December 31, 2011, we recorded a lost time accident frequency of 0.3.


Sustainability and Corporate Social Responsibility Reporting


We publish an annual sustainability report that further presents and discusses our environmental, health and safety performance. The 2011 report is available on our website at www.hudbayminerals.com. We expect to release the 2012 report in the spring of 2013.


14


GRAPHIC


Mines


Three Months Ended


Year Ended


Guidance


Dec. 31


Dec. 31


Dec. 31


Dec. 31


2012


2011


2012


2011


2012


2013


777


Ore


tonnes


403,281


382,329


1,529,103


1,491,722


1,553,000


1,620,000


Copper


%


2.04


3.17


2.32


3.18


2.30


2.18


Zinc


%


3.69


4.04


4.16


3.71


4.30


4.41


Gold


g/tonne


2.24


2.60


2.18


2.37


1.90


1.94


Silver


g/tonne


24.09


30.01


25.77


26.78


28.00


30.89


Trout Lake


Ore


tonnes


129,792


247,868


509,998


230,000


Copper


%


1.68


2.03


2.01


1.80


Zinc


%


3.92


3.65


3.53


2.30


Gold


g/tonne


2.13


2.23


1.37


1.50


Silver


g/tonne


16.62


13.64


13.47


7.10


Chisel North Zinc Ore


Ore


tonnes


48,090


135,808


196,406


108,000


Zinc


%


9.29


8.78


8.18


7.10


Chisel North Copper Ore


Ore


tonnes


16,973


50,970


68,056


57,000


Copper 


%


1.52


1.61


1.50


1.60


Zinc


%


2.26


2.50


2.30


0.90


Gold


g/tonne


2.33


2.44


2.23


2.10


Silver


g/tonne


22.78


24.39


22.22


20.60


Lalor


Ore


tonnes


57,926


72,293


86,000


418,000


Copper


%


0.54


0.63


0.40


0.54


Zinc


%


12.09


11.83


10.10


9.89


Gold


g/tonne


1.44


1.67


1.10


1.23


Silver


g/tonne


17.33


19.29


16.90


17.70


Total Mines


Ore


tonnes


461,207


577,184


2,036,042


2,266,182


2,034,000


Copper


%


1.85


2.54


2.06


2.60


2.14


Zinc 


%


4.74


4.40


4.64


4.02


4.37


Gold


g/tonne


2.14


2.32


2.07


1.99


1.82


Silver


g/tonne


23.24


26.25


24.70


23.93


24.79


Three Months Ended


Year Ended


Guidance


Dec. 31


Dec. 31


Dec. 31


Dec. 31


C$/tonne


Unit Operating Costs


2012


2011


2012


2011


2012


2013


Mines


777


$/tonne


49.31


41.02


42.83


37.44


38-42


38-42


Trout Lake


$/tonne


85.37


56.15


89.03


60-74


Chisel North


$/tonne


92.97


92.36


87.15


93-114


Total Mines


$/tonne


49.31


56.85


49.22


54.85


45-52


15


GRAPHIC


777 Mine


Ore production at our 777 mine for the fourth quarter of 2012 was 5% higher compared to the same period in 2011 due to changes in the timing of maintenance. Copper, zinc, gold and silver grades in the fourth quarter of 2012 were lower compared with the grades in the fourth quarter of 2011 by 36%, 9%, 14% and 20%, respectively, due to the sequencing of stopes. Operating costs per tonne of ore in the fourth quarter of 2012 were 20% higher, compared to the same period in 2011, primarily due to the timing of maintenance spending on mobile equipment and increased contractor costs.


Ore production for the full 2012 year increased 3% compared to 2011 due to additional production of 30,430 tonnes from the 777 North ramp. Full year 2012 ore production was slightly lower than guidance mainly due to the discovery of additional resources, which necessitated changes to the mining sequence from the North ramp. The copper, gold and silver grades recovered for the full year were lower by 27%, 8% and 4%, respectively, compared to 2011, while zinc grades were higher by 12% due to sequencing of stopes. Full year grades were in line with guidance. Full year operating costs were 14% higher, compared to the same period in 2011, primarily due to scheduled annual increases in labour costs, additional ground support requirements in the first half of 2012 and higher mobile equipment maintenance.


Trout Lake Mine


We closed our Trout Lake mine on June 29, 2012 after more than 30 years of operation, and there was no activity in the second half of the year. Ore production at Trout Lake for the full 2012 year decreased by 51% compared to 2011 due to mine closure. In addition, copper, zinc, gold and silver grades were 1%, 3%, 63% and 1% higher, respectively, for the full year in 2012, compared to 2011. The production and grades of all metals were higher than guidance due to optimal ground support and focus on individual stopes to ensure all material was removed. Operating costs per tonne of ore mined were 37% lower for the full 2012 year compared to 2011 and lower than guidance, as development costs were lower, less ground control work was required, fewer consumables were used and fixed cost labour resources were transitioned to the 777 North ramp and 777 mine.


Chisel North Mine


Production at our Chisel North mine ended on September 30, 2012. Ore production at Chisel North for the full 2012 year was 29% lower, compared to 2011 due to mine closure. Ore production was higher than guidance due to successful pillar recoveries and favaourable ground conditions. The full year 2012 zinc ore grades were 7% higher than 2011 and higher than guidance due to excellent recoveries from the pillars mined in 2012. Operating costs per tonne of ore mined for the year ended 2012 were 6% higher for the full 2012 year than 2011 as development costs are no longer being capitalized. The operating costs per tonne at Chisel North were within the range provided in our guidance.


Lalor Mine


Production in 2012 at our Lalor mine was below guidance as a result of delays experienced with the ore handling system and internal waste issues. Grades of all metals were higher than guidance as a result of higher realized grades in the areas mined than initially estimated based on surface drilling. Lalor mining costs are recorded to the Lalor project during the pre-production phase. We expect the first phase of the Lalor project to reach commercial production in the second quarter of 2013.


16


GRAPHIC


Processing Facilities


Three Months 
Ended


Year Ended


Guidance


Dec. 31


Dec. 31


Dec. 31


Dec. 31


2012


2011


2012


2011


2012


2013


Flin Flon Concentrator


Ore


tonnes


414,489


521,661


1,872,211


2,036,693


1,840,000


1,719,000


Copper


%


2.06


2.83


2.27


2.84


Zinc


%


3.74


3.95


4.06


3.59


Gold


g/tonne


2.23


2.48


2.20


2.09


Silver


g/tonne


24.45


26.79


24.16


23.28


Copper concentrate


tonnes


31,819


58,638


162,701


222,932


Concentrate grade


% Cu


24.88


23.59


24.18


24.37


Zinc concentrate


tonnes


25,453


33,901


123,326


119,220


Concentrate grade


% Zn


51.73


51.06


51.66


51.29


Copper recovery


%


92.7


93.8


92.7


94.0


93


92


Zinc recovery


%


84.9


83.9


83.8


83.5


85


85


Gold recovery


%


65.9


64.6


64.4


68.5


70


69


Silver recovery


%


55.9


54.6


55.6


57.5


Snow Lake Concentrator


Ore


tonnes


59,787


47,613


199,636


194,786


190,000


369,000


Copper


%


0.60


0.33


Zinc


%


9.23


9.18


8.91


7.79


Gold


g/tonne


1.33


0.84


Silver


g/tonne


15.31


29.38


Copper concentrate


tonnes


1,316


1,316


Concentrate grade


% Cu


18.54


18.55


Zinc concentrate


tonnes


10,179


8,168


33,275


28,560


Concentrate grade


% Zn


51.12


51.74


51.56


51.25


Copper recovery


%


68.5


37.3


82


Zinc recovery


%


94.3


96.7


96.4


96.4


95


95


Gold recovery


%


46.5


22.1


65


Silver recovery


%


55.1


8.6


Three Months 
Ended


Year Ended


Guidance


Dec. 31


Dec. 31


Dec. 31


Dec. 31


C$/tonne


Unit Operating Costs


2012


2011


2012


2011


2012


2013


Concentrators


Flin Flon


$/tonne


14.32


12.82


13.39


12.90


12-15


12-16


Snow Lake


$/tonne


42.97


30.43


38.11


27.68


32-37


25-30


17


GRAPHIC


Three Months
Ended


Year Ended


Guidance


Dec. 31


Dec. 31


Dec. 31


Dec. 31


2012


2011


2012


2011


2012


2013


Manitoba contained metal in concentrate


Copper


tonnes


8,162


13,834


39,587


54,324


35,000-40,000


33,000-38,000


Zinc


tonnes


18,370


21,534


80,865


75,780


70,000-85,000


85,000-100,000


Gold


troy oz.


20,909


27,059


86,553


94,610


Silver


troy oz.


198,407


245,216


823,970


875,817


Precious metals1


troy oz.


24,137


31,430


101,044


113,534


85,000-105,000


85,000-105,000


1                    Precious metals include gold and silver production. For precious metals production, silver is converted to gold using the average gold and silver realized sales prices during the period. For precious metals guidance, silver is converted to gold at a ratio of 50:1.


Flin Flon Concentrator


For the fourth quarter of 2012, ore processed decreased 21% compared to the same period in 2011 as a result of the Trout Lake and Chisel North mine closures. Compared to the fourth quarter of 2011, copper concentrate and zinc concentrate production decreased by 46% and 25%, respectively, as a result of the mine closures and lower copper ore grades. Recoveries of copper and zinc to concentrate in the fourth quarter of 2012 remained fairly consistent compared to the same period in 2011. Recoveries of gold and silver in the fourth quarter of 2012 were 2% higher compared to the same period in 2011 as reagent supply constraints eased. Operating cost per tonne of ore processed in the fourth quarter of 2012 increased by 12% compared to the same period in 2011, largely due to reduced ore throughput.


For the year ended December 31, 2012, ore processed was 8% lower than 2011 due to the Chisel North and Trout Lake closures, but above guidance due to the processing of ore stockpiles. Full year 2012 copper concentrate was 27% lower than 2011 as a result of mine closures and mine sequencing producing lower copper head grades. Zinc concentrate was 3% higher in 2012 than 2011 as a result of strong performance at the Trout Lake mine prior to closure. Recoveries of copper and zinc to concentrate in 2012 remained fairly consistent compared to 2011. Recoveries of gold and silver were 6% and 3% lower, respectively, compared to 2011 as a result of supply constraints on collection reagents which have since been addressed. Operating costs per tonne of ore processed for the full year 2012 were 4% higher than in 2011, primarily related to reduced ore throughput.


Snow Lake Concentrator


During the fourth quarter of 2012, the concentrator treated 26% more tonnes of ore than in the fourth quarter of 2011 as a result of increased availability of ore resulting from Lalor production as well as Chisel North stockpiles. Zinc recovery in the fourth quarter of 2012 was 2% lower than the same period in 2011 as a result of testing and optimization of the new copper circuit. Operating costs for the fourth quarter increased 41% from the same period in 2011 due to transitional work to process Lalor ore and additional manpower and training costs to prepare for increased concentrator throughput in 2013.


Ore processed in 2012 was 2% higher than in 2011, as well as higher than guidance, mainly as a result of better than anticipated production at Chisel North. Zinc recovery to concentrate for the full 2012 year remained fairly consistent with 2011 and in line with our guidance. Unit operating costs of ore processed in 2012 were 38% higher than in 2011 and were slightly higher than guidance due primarily to transitional costs associated with the new copper recovery circuit and preparation for higher throughput rates in 2013.


18


GRAPHIC


Metallurgical Facilities


Three Months Ended


Year Ended


Guidance


Dec. 31


Dec. 31


Dec. 31


Dec. 31


Zinc Production


2012


2011


2012


2011


2012


2013


Zinc Concentrate Treated


Domestic


tonnes


42,033


44,289


144,586


157,738


164,000


199,000


Purchased


tonnes


16,700


16,414


56,172


62,323


56,000


2,600


Total


tonnes


58,733


60,703


200,758


220,061


220,000


201,600


Refined Metal Produced


Domestic


tonnes


19,214


21,383


69,476


75,814


Purchased


tonnes


10,725


8,526


31,221


31,890


Total


tonnes


29,939


29,909


100,697


107,704


113,000


101,000


Three Months Ended


Year Ended


Guidance


Dec. 31


Dec. 31


Dec. 31


Dec. 31


C$/tonne


Unit Operating Costs


2012


2011


2012


2011


2012


2013


Zinc Plant


$/lb. Zn


0.33


0.33


0.36


0.34


0.32-0.37


0.33-0.39


Zinc Plant


Production of cast zinc in the fourth quarter of 2012 remained fairly consistent with the same period in 2011, as purchased concentrate was more readily available compared to earlier in 2012. Operating costs per pound of zinc metal produced during the fourth quarter of 2012 remained consistent compared to the same period in 2011.


In 2012, production was 7% lower than in 2011 and lower than 2012 guidance as a result of limited purchased concentrate availability in the first half of 2012. Production was lower than guidance as a result of available concentrate to treat. Full year 2012 operating costs per pound of zinc metal produced were 6% higher than in 2011 for the same reason. Increased zinc concentrate production from Lalor ore is expected to support 2013 production at levels consistent with 2012 without the need for new third party concentrate purchases.


Metal Sold


Three Months Ended


Year Ended


Dec. 31


Dec. 31


Dec. 31


Dec. 31


2012


2011


2012


20111


Contained metal in concentrate


Copper


tonnes


10,683


18,336


43,464


57,361


Gold


troy oz.


27,102


31,407


84,835


93,652


Silver


troy oz.


292,409


247,576


768,804


764,773


Refined zinc


tonnes


30,387


26,989


103,437


100,935


1     Amounts in 2011 also include minimal amounts of copper cathode and anode which were sold during the first quarter only.


19


GRAPHIC


OUTLOOK


The outlook and financial targets only relate to fiscal 2013. This outlook includes forward-looking information about our operations and financial expectations based on our expectations and outlook as of February 20, 2013. This outlook, including expected results and targets, is subject to various risks, uncertainties and assumptions, which may impact future performance and our achievement of the results and targets discussed in this outlook. For additional information on forward-looking information, refer to “Forward- Looking Information” on page 2 of this MD&A.


We may update our outlook depending on changes in metals prices and other factors.


In addition to this section, refer below to the “Operations Review” and “Financial Review” sections for additional details on our outlook for 2013. For information on our sensitivity to metals prices and foreign exchange rates, refer below to the “Commodity Markets” and “Sensitivity Analysis” sections of this MD&A.


Material Assumptions


Our 2013 operational and financial performance will be influenced by a number of factors. At the macro-level, the general performance of the North American and global economies will influence the demand for our products. The realized prices we achieve in the commodity markets significantly affect our performance. Our general expectations regarding metals prices and foreign exchange rates are included below in the “Commodity Markets” and “Sensitivity Analysis” sections of this MD&A.


2013 Domestic Mine and Mill Production (Contained Metal in Concentrate)


Full year 2012 production of all metals met our published 2012 guidance, representing the sixth consecutive year that we have met our production targets. We expect contained copper production in concentrate in 2013 to decrease slightly compared to 2012 because of the closures of the Trout Lake and Chisel North mines in 2012 following the end of their mine lives. Contained zinc production in concentrate in 2013 is expected to increase over 2012 levels, due to the full year of production expected from the main ventilation shaft at Lalor. We expect precious metals production to remain essentially unchanged from 2012.


COMMODITY MARKETS


In addition to our production, financial performance is directly affected by a number of factors including metals prices, foreign exchange rates, and input costs, including energy prices. Over the course of 2012, prices for our key metals traded within a relatively narrow range when compared to the previous four years. However, average prices in 2012 generally were higher than average prices in 2011.


We have developed the following market analysis from various information sources including analyst and industry experts.


Copper


In 2012, the London Metal Exchange (“LME”) copper price averaged US$3.61 per pound (“/lb”), with prices ranging between US$3.29/lb and US$3.93/lb. Copper concentrate and refined metal markets generally moved from a deficit in recent years to balance or a small surplus in 2012, mainly due to a slowdown in Chinese growth and weak economic activity in Europe. However, these factors were counterbalanced by central bank initiatives to provide additional monetary easing together with signs of a rebound in the Chinese economy in late 2012.


20


GRAPHIC


Higher copper demand forecast for 2013 arising from China and recovering western economies is expected to be met by significant growth in copper mine supply, assuming projects currently in construction are completed on time. Copper market surpluses may become more pronounced over the next several years if demand growth remains weak, but supply-side disruptions and the cancellation or deferral of a number of large projects in 2012 should mitigate this longer term.


Zinc


In 2012, the LME zinc price averaged US$0.88/lb, with prices ranging from US$0.80/lb to US$0.99/lb. Zinc demand growth was relatively modest in 2012, consistent with slower Chinese economic growth, although reduced utilization rates at Chinese smelters transferred a refined market surplus in 2011 into a concentrate market surplus in 2012, with an expected 2012 refined market deficit acting to limit growth in refined metal stocks, which remain at historically high levels.


High zinc inventory levels remain a risk to near-term prices, but the market is expected to see a significant reduction in mine production capacity starting in 2015-2016 as major zinc mines reach the end of their reserve lives. This should provide a positive medium term outlook for zinc prices.


Precious Metals


Gold and silver prices averaged US$1,669 per ounce and $31.17 per ounce during 2012, respectively. Prices continued to be supported by concerns about the risk of rising inflation as a result of the aggressive monetary response to macroeconomic weakness from the world’s major central banks.


Foreign Exchange


As revenues from our principal products are substantially denominated in US dollars and the majority of our operating costs are denominated in Canadian dollars, we are affected by fluctuations in the Canadian/US dollar exchange rate. In general, a stronger Canadian dollar causes our revenue, and therefore profit, to decrease when we convert our US dollar receipts into Canadian dollars. In addition, a stronger Canadian dollar may result in foreign exchange losses due to depreciation in the value of US dollar denominated cash balances.


The Canadian dollar traded in a relatively narrow range between $1.04 and $0.97 per US dollar through 2012, with an average rate of $1.00 per US dollar. As in previous years, during 2012 the Canadian/US dollar exchange rate was closely correlated with prices of commodities such as crude oil and base metals, which are important parts of Canada’s resource based economy.


As we develop our Constancia project in Peru, the exchange rate between the US dollar and the Peruvian nuevo sol (“PEN”) will become increasingly important with capital and operating costs denominated in soles. During 2012, the PEN continued a pattern of steady appreciation relative to the US dollar as a result of strong investment inflow into Peru, with the exchange rate strengthening from PEN2.70 per US dollar at the start of 2012 to PEN2.55 per US dollar at the end of 2012, with an average rate of PEN2.64 during 2012.


21


GRAPHIC


SENSITIVITY ANALYSIS


Profit Sensitivity


The following table displays the estimated impact of changes in metals prices and exchange rates on our 2013 net profit, assuming that our operational performance is consistent with our guidance for 2013.


Change of 10%, as
represented by:
1 2 


Would change
2013 profit by 1
 (C$ million)


Would change
 2013 profit
per share by 3
(C$/share)


Copper 1

lb.


US$

0.35


18.3


0.11


Zinc 1

lb.


US$

0.09


15.0


0.09


Gold 1

troy oz.


US$

172.50


(1.8

)

(0.01

)

Silver 1

troy oz.


US$

3.20


(0.5

)


Exchange Rates 2

C$/US$


C$

0.10

4

42.0


0.24


1 Based on exchange rate of US$1 to C$1.

2 Based on metals prices of US$3.50/lb copper, US$0.90/lb zinc, US$1,725.00/oz gold and US$32.00/oz silver.

3 Based on weighted average number of common shares outstanding of 172.0 million.

4 Representing a movement from C$1/US$ to C$1.1/US$.


22


GRAPHIC


FINANCIAL REVIEW


Financial Results


In the fourth quarter of 2012, profit was $7.4 million compared to a profit of $34.3 million for the fourth quarter of 2011. For the full year 2012, we recorded a loss of $21.2 million compared to a loss of $163.6 million in 2011.


Significant variances affecting our results, compared to the same periods in 2011, are as follows:


Three Months Ended


Year Ended


(in $ millions)


Dec. 312012


Dec. 312012


Increase (decrease) in components of profit or loss:


Revenues


(73.3

)

(188.2

)

Cost of sales


Mine operating costs


16.0


47.5


Depreciation and amortization


4.6


28.2


Impairment losses


1.0


6.8


Selling and administrative expenses


(2.7

)

(0.8

)

Exploration and evaluation


(0.6

)

3.4


Other operating income


1.1


(1.1

)

Other operating expenses


(2.1

)

(2.0

)

Finance income


(1.5

)

(2.6

)

Finance expenses


(0.8

)

(8.3

)

Other finance losses


11.8


(39.7

)

Tax


19.6


60.5


Decrease in loss from continuing operations compared to the same period in 2011


(26.9

)

(96.3

)


Decrease in loss from discontinued operations


238.8


(Decrease) in profit for the period and decrease in loss for the year


(26.9

)

142.5


The profit in the fourth quarter of 2012 decreased by $26.9 million compared to the same period in 2011 as a result of lower revenues, primarily due to lower copper and gold volumes, partially offset by lower cost of sales. For additional details on revenue and cost of sales variances see below.


The 2012 loss decreased by $142.5 million, compared to the same period in 2011, primarily as a result of the loss from discontinued operations of $238.8 million recorded in 2011. The gross profit was lower in 2012 compared to 2011 as a result of lower revenues partially offset by lower cost of sales. In addition to the lower profit margin, there was an increase in other finance losses of $39.7 million mainly related to impairment losses on available-for-sale investments and foreign exchange losses.


23


GRAPHIC


Revenue decreased in the fourth quarter of 2012


Total revenue for the fourth quarter of 2012 was $181.0 million; $73.3 million lower than the same period in 2011. This decrease was primarily due to lower sales volumes compared to the fourth quarter of 2011, when we drew down on unusually high copper concentrate inventory. Lower gold prices in the fourth quarter of 2012 reflect in part, the effect of the precious metals stream agreement.


For the full year 2012 revenue was $702.6 million, $188.2 million lower than in 2011, mainly as a result of lower sales volumes, primarily due to the reason described above, and lower metals prices. The following table provides further details of this variance:


(in $ millions)


Three Months Ended
Dec. 31
2012


Year Ended
Dec. 31
2012


Metals prices1 


Lower copper prices


(1.3

)

(31.9

)

Higher (lower) zinc prices


0.9


(18.4

)

Lower gold prices


(9.6

)

(5.3

)


Sales volumes


Lower copper sales volumes


(57.3

)

(109.9

)

Higher zinc sales volumes


7.1


5.3


Lower gold sales volumes


(7.1

)

(13.7

)

Higher silver sales volumes


1.0


1.0


Other


(Unfavourable) favourable movement in foreign exchange rates


(8.1

)

8.4


Derivative mark-to-market


(1.7

)

7.1


Sales in 2011 of copper bearing material recovered from copper smelter and WPCR after closure


(16.9

)

Other volume and pricing differences, including loss of premiums on zinc oxide sales after sale of Zochem in November 2011


(1.8

)

(26.6

)

Effect of lower treatment and refining charges


4.6


12.7


Decrease in revenue in 2012 compared to 2011


(73.3

)

(188.2

)


1 See discussion below for further information regarding metals prices.


24


GRAPHIC


Our revenue by significant product type is summarized below:


Three Months Ended


Year Ended


Dec. 31


Dec. 31


Dec. 31


Dec. 31


(in $ millions)


2012


2011


2012


2011


Copper


80.1


143.2


343.7


481.0


Zinc


62.7


52.9


222.6


170.1


Gold


36.1


53.1


131.8


149.3


Silver


6.3


7.5


21.0


26.3


Zinc Oxide1


6.8


75.7


Other


1.5


1.1


6.3


23.8


Gross revenue


186.7


264.6


725.4


926.2


Less: treatment and refining charges


(5.6

)

(10.3

)

(22.7

)

(35.4

)

Less: pre-production revenue


(0.1

)


(0.1

)


Revenue


181.0


254.3


702.6


890.8


1 As a result of our sale of Zochem during the fourth quarter of 2011, we did not have zinc oxide sales in 2012.


25


GRAPHIC


Our realized prices for the fourth quarter and year end of 2012 and 2011 are summarized below:


Realized prices1 for
quarter ended


Realized prices1 for year
ended


LME Q4


Dec. 31


Dec. 31


LME YTD


Dec. 31


Dec. 31


20122


2012


2011


2012 2


2012


2011


Prices in US$


Copper


US$/lb.


3.59


3.42


3.46


3.61


3.59


3.85


Zinc3


US$/lb.


0.89


0.95


0.94


0.88


0.96


1.05


Gold4


US$/troy oz.


1,719


1,341


1,652


1,669


1,548


1,612


Silver4


US$/troy oz.


32.64


21.96


29.45


31.15


27.33


34.83


Prices in C$


Copper


C$/lb.


3.56


3.40


3.54


3.60


3.59


3.80


Zinc3


C$/lb.


0.88


0.94


0.96


0.88


0.99


1.03


Gold4


C$/troy oz.


1,704


1,331


1,690


1,668


1,553


1,594


Silver4


C$/troy oz.


32.36


21.66


30.11


31.11


27.32


34.45


Exchange rate


US$1 to C$


0.99


1.02


1.00


0.99


1         Realized prices exclude refining and treatment charges and are on the sale of finished metal or metal in concentrate. Realized prices for copper in 2011 reflect an average of prices realized for copper cathode and spent anode sales and sales of contained copper in concentrate. Realized prices for gold and silver in 2011 reflect an average of prices realized for precious metals slimes and spent anode sales and sales of contained gold and silver in concentrate.

2         LME average for copper, zinc and gold prices. London Spot US equivalent for silver prices.

3         Zinc revenues include unrealized gains and losses related to forward zinc purchase contracts that are not included in the above realized prices. For the quarter, the unrealized components of these derivatives resulted in a gain of US$0.009/lb. for zinc.

4         Since August 1, 2012, sales of gold and silver from our 777 mine have been subject to our precious metals stream agreement with Silver Wheaton, pursuant to which we recognize deferred revenue for precious metals deliveries and also receive cash payments of US$400/oz for gold deliveries and US$5.90/oz for silver deliveries. Previously, we sold gold and silver from our 777 mine as contained metal within our copper concentrate. Realized gold and silver prices in the fourth quarter of 2012 include deferred revenue of $893.09/oz and $14.70/oz, respectively.


The price, quantity and mix of metals sold, along with movements in the Canadian dollar, affect our revenue, operating cash flow and profit. Revenue from metals sales can vary from quarter to quarter due to production levels, shipping volumes, and transfer of risk and title with customers.


Since August 1, 2012 sales of gold and silver from our 777 mine have been subject to our precious metals stream agreement with Silver Wheaton, pursuant to which we do not provisionally price gold and silver sales to Silver Wheaton.


26


GRAPHIC


Outlook (Refer to the Forward-Looking Information section on page 2 of this MD&A)


Revenues will continue to be affected by the volume of domestic contained metal production, purchased zinc concentrates and the market prices of copper, zinc, gold and silver, together with fluctuation of the US dollar exchange rate compared to the Canadian dollar. Although we expect higher domestic zinc concentrate production to offset lower domestic copper concentrate production, lower purchased zinc concentrate volumes are likely to result in lower revenues in 2013 compared to 2012, barring a significant change in metals prices. Some of our domestic production in 2013 is also expected to relate to production from Lalor, 777 North and Reed prior to commencement of commercial production, the receipts from which will be credited against capital costs rather than revenues.


Cost of sales decreased in the fourth quarter of 2012


Three Months Ended


Year Ended


Dec. 31


Dec. 31


Dec. 31


Dec. 31


($000s)


2012


2011


2012


2011


Detailed cost of sales


Mines


777


19,884


15,685


65,489


55,844


Trout Lake


11,080


13,918


45,403


Chisel North


6,049


17,251


23,047


Concentrators


Flin Flon


5,933


6,689


25,075


26,270


Snow Lake


2,570


1,449


7,609


5,391


Metallurgical plants


Zinc plant


21,475


21,893


79,383


81,381


Zochem


957


15,199


Other


Services and site administration


21,500


13,680


77,614


54,923


Purchased concentrate (before inventory changes)


8,037


10,955


51,597


52,818


Manitoba employee profit sharing


3,225


6,265


16,888


19,934


Net profits interest


4,018


7,266


17,867


23,733


Distribution


10,429


17,514


40,662


51,817


Other


572


2,135


3,353


3,995


Changes in domestic inventory


23,512


13,210


17,869


11,446


Depreciation and amortization


20,656


25,291


75,801


103,915


Adjustments related to zinc inventory write-downs


(2,290

)

69


(5,420

)

5,420


Asset impairment


961


6,839


Cost of sales, per financial statements


139,521


161,148


504,956


587,375


27


GRAPHIC


Total cost of sales for the fourth quarter of 2012 was $139.5 million, reflecting a decrease of $21.6 million from the fourth quarter of 2011, mainly due to reduced copper concentrate sales volumes. Costs decreased by $17.1 million as a result of our Trout Lake and Chisel North mines closing in the second and third quarters of 2012. Depreciation and amortization expenses in the fourth quarter of 2012 were $4.6 million lower than the same period in 2011 as a result of lower sales volumes and lower amortization costs primarily for Trout Lake and Chisel North. Distribution costs were lower by $7.1 million in the fourth quarter of 2012 as a result of reduced copper concentrate sales volumes compared to the same period in 2011. This was partially offset by an increase in change in domestic inventory of $10.3 million as a result of the draw down of inventory balances in the quarter as well as an increase of $7.8 million in service and site administration costs, which relates to higher pension costs associated with the new collective bargaining agreements as well as a write-down of supplies and materials inventory to net realizable value.


The cost of sales for the 2012 year was $505.0 million, reflecting a decrease of $82.4 million from the same period in 2011. This was mainly a result of a decrease in costs of $37.3 million at our Trout Lake and Chisel North mines in 2012, as well as the sale of Zochem in 2011, which reduced our costs by $15.2 million. In addition we recognized lower depreciation and amortization expense in the period as operations at our Trout Lake and Chisel North mines were extended past their original planned closure dates, reducing per tonne amortization. We also recorded a lower distribution cost in the year as a result of reduced copper concentrate sales. This was partially offset by a $22.7 million increase in service and administration costs, including approximately $10.8 million of past service pension costs associated with new collective agreements.


For details on unit operating costs refer to the respective tables in the Operations Review section beginning on page 15 of this MD&A.


For the fourth quarter of 2012, other significant variances in expenses, compared to the same period in 2011, include the following:


·            Selling and administrative expenses increased by $2.7 million compared to the same period in 2011. The increase was primarily due to increased administrative expenses and increased expenses for share units resulting from a higher share price and a greater number of outstanding units compared to the same period in 2011, partially offset by a reduction in share-based payment expense in 2012 resulting from fewer unvested stock options and lower stock option expense.


·            Other operating income increased by $1.1 million, compared to the same period in 2011, mainly as a result of $1 million received from the Solway Group to settle contingent consideration amounts that would have otherwise been receivable upon the satisfaction of certain conditions during the course of Solway’s development of the Fenix project.


·            Other operating expenses increased by $2.1 million to $3.0 million mainly as a result of an increase in expenses in our South America business unit and increased costs of our non producing mines, including a write down on our Trout Lake materials and supplies inventory.


·            Finance income decreased by $1.5 million to $1.2 million during the fourth quarter of 2012, due to lower interest income being earned.


28


GRAPHIC


·            Other finance gains/losses went from a loss of $4.9 million in the fourth quarter of 2011 to a gain of $6.9 million in the fourth quarter of 2012, primarily as a result of:


·             a gain of $1.9 million as a result of the fair value adjustment of the embedded derivative related to the unsecured notes;

·             foreign exchange gain of $9.1 million compared to foreign exchange loss of $3.4 million in the fourth quarter of 2011 as a result of a weaker Canadian dollar against the US dollar in the fourth quarter of 2012 and its impact on a higher US dollar denominated cash balance in 2012 than in 2011; and

·             the foregoing gains were partially offset by impairment and mark-to-market losses on investments of $4.1 million in the fourth quarter of 2012, compared to $1.5 million in the fourth quarter of 2011.


For the full year 2012, other significant variances in expenses from operations, compared to 2011, include the following:


·            Exploration and evaluation expenses decreased by $3.4 million to $43.6 million for the full year in 2012 primarily as a result of lower exploration spending in Manitoba and additional investment tax credits recognized as a result of the “New Mine” status for income tax purposes received in the second quarter of 2012 for the Lalor project. In addition, lower costs were incurred at our Back Forty project in Michigan following our decision to suspend development activities at the project and pursue strategic alternatives. This reduction in exploration expenses was partially offset by higher exploration activities in our South America business unit.


·             Other operating income decreased by $1.1 million mainly as a result of a gain recognized on our sale of WPCR during the second quarter of 2011, partially offset by $1.0 million received from the Solway Group to settle contingent consideration amounts that would have otherwise been receivable upon the satisfaction of certain conditions during the course of Solway’s development of the Fenix project.


·             Other operating expenses increased by $2.0 million to $11.3 million mainly as a result of higher general operating costs in our South America business unit and higher decommissioning and restoration expenses at our non producing mines. This was partially offset by a decrease in our non-producing mine costs in 2012.


·             Finance income decreased by $2.6 million to $6.2 million, mainly due to lower interest rates on cash and cash equivalents.


·             Finance expenses increased by $8.3 million which related mainly to financing fees associated with efforts to arrange financing for the Constancia project.


·             Other finance losses increased by $39.7 million mainly as a result of:


·             impairment losses of $40.2 million recognized on available-for-sale investments in junior mining companies primarily due to poor market conditions, compared to impairment losses of $6.6 million in 2011;

·             mark-to-market losses of $2.9 million on our portfolio of warrants to purchase shares in junior mining companies, compared to mark-to-market losses of $2.2 million in 2011 along with a $2.1 million gain on the acquisition of Hudbay Peru;

·             recognition of an impairment on non-trade receivables of $2.6 million;

·             a gain of $1.9 million as a result of the fair value adjustment of the embedded derivative related to the unsecured notes; and


29


GRAPHIC


·             foreign exchange losses of $0.9 million compared to a gain of $0.8 million in 2011.


Outlook (Refer to the “Forward-Looking Information” section on page 2 of this MD&A)


While unit operating costs at our 777 mine, Flin Flon concentrator and zinc plant are not expected to change materially in 2013 compared to 2012, we expect overall cost of sales to decline in line with reduced purchased zinc concentrate levels.


Tax Expense


Full year 2012 tax expense decreased by $60.5 million compared to the same period in 2011.


Three Months Ended


Year Ended


Dec. 31


Dec. 31


Dec. 31


Dec. 31


($000s)


2012


2011


2012


2011


Non-cash - income tax expense 1


2,862


7,282


45,552


21,161


Non-cash - mining tax expense 1


455


3,253


9,381


35,003


Total non-cash tax expense


3,317


10,535


54,933


56,164


Estimated current taxes payable - income tax


1,368


11,782


(14,673

)

47,688


Estimated current taxes payable - mining tax


11,212


13,210


33,059


29,977


Total estimated current taxes payable


12,580


24,992


18,386


77,665


Tax expense


15,897


35,527


73,319


133,829


1  Non-cash tax expenses represent our draw-down/increase of non-cash deferred income and mining tax assets/liabilities.


30


GRAPHIC


Income Tax Expense


Our effective income tax rate on profit before tax for full year 2012 was approximately 59.2% (full year 2011 - 32.9%). Applying the statutory income tax rate of 27.3% to our profit before taxes of $52.1 million would have resulted in a tax expense of approximately $14.2 million; however we recorded an income tax expense of $30.9 million (full year 2011 - $68.8 million). The significant items causing our effective income tax rate to be different than the 27.3% statutory income tax rate include:


·             Certain of our foreign operations realized losses of $22.0 million (full year 2011 - $7.5 million), the tax benefit of which has not been recognized since it was determined that it is not probable that we will realize the benefit of these losses. This results in an increase in deferred tax expense for the year.

·             An impairment loss of $40.2 million was recognized related to impairments on available for sale investments in junior mining companies primarily due to poor market conditions. As these write-downs are capital in nature, one-half of the write-down will never be deductible for tax purposes. This results in an expense for which there is no associated tax benefit. The remaining one-half of the write-down creates a deductible temporary difference which will become a capital loss once realized. Since this capital loss can only be used to shelter future capital gains, the associated tax benefit has not been recognized. These items result in an increase to overall tax expense.

·             We did not record the tax benefit of certain additional temporary differences related to obligations associated with mine closure realized in 2012 since it is not considered probable that the tax benefit of these temporary differences will be realized. Total temporary differences not recognized in 2012 were $14.6 million (full year 2011 - $35.0 million) resulting in an increase to tax expense.

·             A reduction to the deferred tax expense of $5.7 million due to the fact that Peruvian non-monetary assets are recognized at historical cost while the tax base of the assets change as exchange rates fluctuate which gives rise to a temporary difference.

·             Increases to our decommissioning and restoration liabilities resulting from a significant decrease in discount rates required us to record a corresponding non cash increase to property, plant and equipment. We recognized a deferred tax expense of $1.4 million (full year 2011 - $8.1 million) related to the increase in the property, plant and equipment; however, we did not recognize a deferred tax recovery related to the increase in the decommissioning and restoration liabilities because we determined it is not probable that we will realize the benefit of the recovery.


31


GRAPHIC


Mining Tax Expense


Applying the Manitoba statutory income tax rate of 17.0% to our profit before taxes for the full year of $52.1 million would have resulted in a tax expense of approximately $8.9 million; however, we recorded a mining tax expense of $42.4 million (full year 2011 - $65.0 million). For the full year, our effective rate for mining taxes was approximately 81.4% (full year 2011 - 31.1%). Effective mining tax rates can vary significantly based on the composition of our earnings and the expected amount of mining taxable profits. Corporate costs and other costs not related to mining operations are not deductible in computing mining profits. A brief description on how mining taxes are calculated in our various business units is discussed below.


Manitoba


The Province of Manitoba imposes mining tax on profit related to the sale of mineral products mined in the Province of Manitoba (mining taxable profit) at the following rates:


·             10% of total mining taxable profit if mining profit is $50 million or less;

·             15% of total mining taxable profit if mining profits are between $55 million and $100 million; and

·             17% of total mining taxable profit if mining profits exceed $105 million.


We have accumulated mining tax pools over the years and recorded the related benefits as future mining tax assets. We estimate that the tax rate that will be applicable when temporary differences reverse will be 17.0%.


Peru


In 2011, the Peruvian government enacted a new mining tax (the “Special Mining Tax”) that is imposed on the mining sector in parallel with the existing royalty regime, which in turn was amended in order to be applied on companies’ operating mining income, rather than sales (the “Modified Royalty”). Both the Special Mining Tax and the Modified Royalty are applied on operating mining income based on a sliding scale, with progressive rates ranging from 2.0% to 8.4% and 1.0% to 12.0%, respectively. Based on financial forecasts, we have recorded a deferred tax liability as at December 31, 2012 at the tax rate we expect to apply when temporary differences reverse.


32


GRAPHIC


LIQUIDITY AND CAPITAL RESOURCES


Precious Metals Stream Transaction with Silver Wheaton


On September 28, 2012 we closed a precious metals stream transaction with Silver Wheaton and received an upfront deposit payment of US$500 million. We will receive a further US$250 million in deposit payments in two equal installments once US$500 million and US$1 billion, respectively, in capital expenditures have been incurred at our Constancia project. The US$750 million of deposit payments are in respect of (i) 100% of payable gold and silver from our 777 mine until the later of December 31, 2016 and satisfaction of a completion test at Constancia, and thereafter 50% of payable gold and 100% of payable silver, and (ii) 100% of payable silver from the Constancia project. In addition to the deposit payments, for gold and silver delivered, we will receive cash payments equal to the lesser of (i) the market price and (ii) US$400 per ounce (for gold) and US$5.90 per ounce (for silver), subject to 1% annual escalation after three years.


The precious metals stream transaction does not include gold production at Constancia, precious metals production from our Lalor project or our land package in Peru outside of the Constancia and Pampacancha deposits or any other metals or minerals, including copper or zinc, from any of our properties.


For further information on the precious metals stream transaction, refer to note 19 of our December 31, 2012 annual consolidated financial statements.


9.50% Senior Unsecured Notes


On September 13, 2012, we issued US$500 million aggregate principal amount of 9.50% senior unsecured notes (the “Notes”) due October 1, 2020. The Notes were priced at 100 percent of their face value, and yielded proceeds of US$484 million net of directly attributable transaction costs. The Notes have been classified as long-term debt and accounted for initially at fair value and subsequently at amortized cost using the effective interest rate method. Interest is payable on the Notes semi-annually on April 1 and October 1 of each year, beginning on April 1, 2013. As the proceeds will be used to fund the development of Constancia, interest costs will be capitalized to project assets during the construction period of this project. The Notes are fully and unconditionally guaranteed, jointly and severally, on a senior unsecured basis, by substantially all of our existing and future subsidiaries other than our subsidiaries associated with the Constancia project.


The Notes contain certain customary covenants and restrictions for a financing instrument of this type. Although there are no maintenance covenants with respect to our financial performance, there are transaction-based restrictive covenants that limit our ability to incur additional indebtedness in certain circumstances. These restrictions could limit our ability to obtain future debt financing, grow in accordance with our strategy or secure the needed working capital to withstand future downturns in the economy or metals prices. In addition, our ability to make restricted payments, including dividend payments, is subject to our compliance with certain covenants which require either the generation of sufficient profit or equity issuances or, in the case of semi-annual dividend payments in an amount not exceeding US$20 million, the maintenance of a ratio of consolidated debt to earnings before interest, tax, depreciation and amortization (“EBITDA”) of 2.50 to 1.00 or less.  It is doubtful whether these criteria will be met at the time that the September 2013 dividend would be declared in the ordinary course, but we are considering alternatives to enable maintenance of the dividend at current levels. Given these restrictions, it is uncertain whether we will be able to maintain our semi annual dividend at its current level until our new mines achieve commercial production and generate additional cash flow and earnings.


33


GRAPHIC


On January 18, 2013, we commenced an offer to exchange all of the outstanding Notes for an equal aggregate principal amount of substantially identical new Notes registered under the United States Security Act of 1933, as amended.


For further information on the terms of the Notes, refer to note 18 of our December 31, 2012 annual consolidated financial statements.


Senior Secured Revolving Credit Facility


As a result of completing the precious metals stream transaction with Silver Wheaton, we entered into an amendment to our US$300 million credit facility with a syndicate of lenders. The amendment provides the lenders with security over our assets in Manitoba and Saskatchewan and eliminates the requirement to provide guarantees from our Peruvian business. The credit facility, which matures on November 3, 2014, contains customary covenants for a facility of this type, including the requirement to maintain a ratio of consolidated debt to EBITDA of 3.0 to 1.0 or less on a trailing 12 month basis, and the maintenance of minimum liquidity of 120% of remaining capital spending on the Lalor project.


As at December 31, 2012, we were in compliance with our covenants under the facility. Also as at December 31, 2012, we had $64.5 million in outstanding letters of credit collateralized by cash and cash equivalents that would have been classified as restricted cash in the absence of the credit facility. We intend to work with the lenders under the facility in the first half of 2013 to extend the maturity date of the facility beyond November 2014 and to implement other revisions to better accommodate our growth plans.


Financial Condition


Financial Condition as at December 31, 2012 compared to December 31, 2011


Cash and cash equivalents increased by $438.0 million from December 31, 2011 to $1,337.1 million as at December 31, 2012. This increase was mainly driven by receiving net proceeds of $475.0 million for the issuance of the Notes and an initial payment of $491.6 million related to the US$750 million precious metals stream transaction. This was partially offset by $510.5 million in capital expenditures primarily relating to our Lalor and Constancia projects, $62.7 million of cash taxes paid and $34.4 million of dividend payments, offset by operating cash flow. We hold the majority of our cash and cash equivalents in low-risk, liquid investments with major Canadian financial institutions.


Working capital increased by $366.0 million to $1,214.3 million from December 31, 2011 to December 31, 2012. In addition to the higher cash and cash equivalents position:


·             Inventory decreased by $18.7 million mainly due to the sales of inventory;

·             Taxes receivable, net of taxes payable, increased by $60.9 million as a result of timing of payments and as a result of the “New Mine” status granted for Lalor for income tax purposes which resulted in the recognition of additional ITCs in the tax receivable balance and reduced taxes owing from prior years as a result of accelerated depreciation of prior year tax pools.

·             Trade and other payables increased by $43.3 million primarily as a result of our development activities at Constancia and Lalor;

·             The current portion of other financial liabilities increased by $17.2 million primarily as a result of the Peru community agreements described below; and

·             Current portion of deferred revenue increased by $70.9 million in relation to the precious metals stream transaction.


34


GRAPHIC


In March 2012, we entered into two agreements with communities near the Constancia project in Peru pursuant to which we acquired rights to extract minerals over the useful life of the Constancia project, defined to be a minimum of 15 years. We recognized a liability and a corresponding asset, which have been presented in capital works in progress within property, plant and equipment, together with capitalized costs of the Constancia project. In June 2012, we entered into an additional agreement with one of the communities near the Constancia project, pursuant to which we acquired rights to carry out exploration and evaluation activities in the area for a minimum period of three years. We recognized the liability and a corresponding exploration and evaluation expense.


Cash Flows


The following table summarizes our cash flows for the three months and years ended December 31, 2012 and December 31, 2011.


Three Months Ended


Year Ended


Dec. 31


Dec. 31


Dec. 31


Dec. 31


($000s)


2012


2011


2012


2011


Profit (loss) for the period


7,438


34,286


(21,170

)

(163,588

)

Loss from discontinued operations


(238,784

)

Profit (loss) from continuing operations


7,438


34,286


(21,170

)

75,196


Tax expense


15,897


35,527


73,319


133,829


Items not affecting cash


(17,159

)

14,197


153,471


135,434


Operating cash flows of discontinued operations


(2,126

)

Taxes paid


(174

)

(1,802

)

(62,663

)

(90,179

)

Operating cash flows before stream deposit and change in non-cash working capital


6,002


82,208


142,957


252,154


Precious metals stream deposit


491,600


Change in non-cash working capital


16,999


18,280


(90,705

)

3,277


Cash generated by operating activities


23,001


100,488


543,852


255,431


Cash used in investing activities


(196,889

)

(70,348

)

(545,653

)

(224,498

)

Cash (used in) generated by financing activities


(1,785

)

(2,059

)

428,955


(36,497

)

Effect of movement in exchange rates on cash and cash equivalents


13,780


(93

)

10,857


2,948


(Decrease) increase in cash and cash equivalents


(161,893

)

27,988


438,011


(2,616

)


35


GRAPHIC


Cash Flow from Operating Activities


Operating cash flow before stream deposit and change in non-cash working capital was $6.0 million for the fourth quarter of 2012, a $76.2 million decrease compared with the same period in 2011 mainly as a result of the lower sales volumes and reduced gold and silver receipts as a result of the stream transaction.


For the full year 2012, operating cash flows before stream deposit and change in non-cash working capital were $143.0 million, reflecting a decrease of $109.2 million compared to 2011, mainly as a result of lower realized prices, lower sales volumes and reduced gold and silver receipts as a result of the stream transaction. Partially offsetting this decrease was a current tax recovery of $18.2 million to reflect the reduction of prior year taxes owing as a result of accelerated depreciation of prior year tax pools related to the New Mine status ruling at our Lalor mine in the second quarter of 2012.


Cash Flow from Investing and Financing Activities


During the fourth quarter of 2012, our investing and financing activities used cash of $198.7 million, driven primarily by capital expenditures of $180.7 million related mainly to our development stage projects and Peruvian sales tax payments of $18.6 million.


For the full year 2012, we used $116.7 million in investing and financing activities primarily driven by capital expenditures of $510.5 million, dividend payments of $34.4 million, and Peruvian sales tax payments of $37.1 million. This was significantly offset by the $471.8 million proceeds from the issuance of the Notes. In December 2012 the government of Peru accepted our application for early recovery of sales tax payable with respect to Constancia project capital expenditures.


Capital Expenditures


The following summarizes cash additions1 to capital assets for the periods indicated:


Three Months Ended


Year Ended


Dec. 31


Dec. 31


Dec. 31


Dec. 31


(in $ millions)


2012


2011


2012


2011


Plant and Equipment


8.8


15.7


38.1


40.4


Capital Development


2.0


4.2


13.9


17.1


Capitalized Exploration


1.9


2.1


4.7


14.3


Capitalized Fenix Project


7.2


Capitalized Lalor Project


24.6


43.2


118.3


156.8


Capitalized 777 North Expansion


1.6


6.9


Back Forty Project


1.2


Capitalized Reed Project


7.6


23.5


Capitalized Peru


174.5


18.7


395.8


43.6


221.0


83.9


602.4


279.4


Less: capital accruals for the period


(40.3

)

0.8


(91.9

)

(24.9

)

Total


180.7


84.7


510.5


254.5


1     Excludes non-cash additions such as changes resulting from estimates relating to decommissioning and restoration liabilities and capitalized depreciation.


Our capital expenditures for the three months ended December 31, 2012 were $180.7 million, an increase of $96.0 million compared to the same period in 2011. The increase is primarily due to increased


36


GRAPHIC


expenditures at our Constancia and Reed projects, partially offset by lower capitalized costs at our Lalor project due to timing.


Our capital expenditures for the year ended December 31, 2012 were $256.0 million higher than in 2011, primarily due to increased capitalized expenditures at our Constancia project. In addition capitalized expenditures increased as a result of our Reed project, partially offset by decreased capitalized expenditures at our Lalor project, reduced sustaining capital expenditures and the sale of our Fenix project in the third quarter of 2011. During the year ended December 31, 2012, we recorded $16.1 million in investment tax credits which were primarily netted against Lalor and Reed capitalized project expenditures.


Of the $91.9 million full year capital accruals, $41.4 million related to the Peru Community agreements that will be paid over the life of the Constancia mine.


Three Months Ended


Year Ended


Dec. 31


Dec. 31


Dec. 31


Dec. 31


(in $ millions)


2012


2011


2012


2011


777 Mine


5.1


6.4


25.9


22.6


Trout Lake Mine


0.1


1.2


0.1


Chisel North Mine


0.3


0.8


Lalor Operations Mine


0.1


0.1


Flin Flon and Snow Lake Concentrators


0.6


0.8


3.8


1.2


Flin Flon and Snow Lake Other


5.6


9.4


15.8


23.6


Zinc Plant


1.1


3.4


8.9


6.7


Other


0.2


1.0


5.2


Sustaining capital expenditures


12.7


20.4


56.7


60.2


Lalor Project


24.6


43.2


118.3


156.8


Fenix Project


7.2


Capitalized Peru


174.5


18.7


395.8


43.6


777 North Expansion


1.6


1.6


6.9


8.0


Back Forty Project


1.2


3.6


Reed Project


7.6


23.5


Growth capital expenditures


208.3


63.5


545.7


219.2


Less: capital accruals for the period


(40.3

)

0.8


(91.9

)

(24.9

)

Total


180.7


84.7


510.5


254.5


37


GRAPHIC


Contractual Obligations and Commitments


The following table summarizes, as at December 31, 2012, certain of our contractual obligations for the periods specified:


Less than


1 - 3


4-5


After


Payment Schedule


Total


1 Year


Years


Years


5 Years


($000s)


Long-term debt obligations


877,713


49,459


94,516


94,516


639,222


Operating lease obligations


21,918


3,199


6,150


4,406


8,163


Purchase obligations - capital commitments


768,213


621,815


146,398


Purchase obligation - other commitments1


518,459


7,427


257,175


253,857


Pension and other employee future benefits obligations


108,665


3,513


7,969


9,764


87,419


Decommissioning and restoration obligations2 


159,781


1,847


5,076


13,787


139,071


Total


2,454,749


687,260


517,284


376,330


873,875


1     Primarily made up of a long term agreement with a Peruvian mining contractor to provide mining services for the first 3 years of Constancia operation.

2     Before inflation


In addition to the contractual obligations included in the above payment schedule, we also have the following commitments:


·             A profit-sharing plan with most Manitoba employees;


·             Silver Wheaton precious metals stream agreement;


·             A royalty agreement and net profit interest agreement related to the 777 mine; and


·             Collective Bargaining Agreements in place with unionized Flin Flon/Snow Lake workforce that prohibit strikes and lockouts and provide for binding arbitration until the end of 2014.


Liquidity


As at December 31, 2012, we have $1,852 million in remaining estimated capital spending associated with the Constancia, Lalor and Reed projects (including accrued costs of $107.6 million) and we have total available liquidity of $1,822.5 million, comprised of our cash and cash equivalents, US$250 million in deposits to be received from Silver Wheaton and availability under our credit facility of $235.5 million net of outstanding letters of credit. These amounts do not include anticipated cash flow from operations. While we believe that we have sufficient liquidity to satisfy spending requirements to complete our key capital projects and meet our debt service obligations (including obligations under the Notes), to the extent that capital costs are higher than currently forecast, metals prices decline materially from current levels or we have other unanticipated demands on our liquidity, we may need to raise additional financing to complete our capital projects or seek other sources of liquidity such as additional streaming transactions, dispositions of our investments in junior mining companies or reductions in or suspensions of our semi-annual dividend.


38


GRAPHIC


In the course of development and operation of the Constancia project, under Peruvian law Hudbay Peru is required to provide security with respect to its decommissioning and restoration obligations. The amount of the security increases evenly over the remaining estimated mine life, with the first annual deposit of approximately US$19.9 million made in January 2013 by the provision of a letter of credit.


Outstanding Share Data


As of February 19, 2013, there were 172,014,487 common shares of Hudbay issued and outstanding. In addition, options for a maximum aggregate of 3,654,465 common shares were outstanding.


FINANCIAL RISK MANAGEMENT


From time to time we maintain price protection programs and conduct commodity price risk management to reduce risk through the use of financial instruments.


Base Metals Price Strategic Risk Management


Our strategic objective is to provide our investors with exposure to base metals prices, unless a reason exists to implement a hedging arrangement. We may hedge base metals prices from time to time to ensure we will have sufficient cash flow to meet our growth objectives, or to maximize debt capacity (and correspondingly minimize equity dilution) to the extent that third party financing may be needed to fund growth initiatives. However, we will generally prefer to raise financing for attractive growth opportunities through equity issuance if the only alternative is to engage in a substantial amount of strategic metals price hedging. We may also hedge base metals prices to manage the risk of putting higher cost operations into production or the risk associated with provisional pricing terms in concentrate purchase and sales agreements.


In October 2009, we implemented a price protection program for the restart of our Chisel North mine. We entered into zinc commodity swap contracts with an average volume of approximately 2.0 million pounds of zinc per month for the period May 2010 through July 2012, at an average price of approximately $1.01 per pound. This volume represented approximately 50% of the anticipated production from Chisel North. Hedge accounting was applied to these transactions.


To provide a service to customers who purchase zinc from our plants and require known future prices, we enter into fixed price sales contracts. To ensure that we continue to receive a floating or unhedged realized zinc price, we enter into forward zinc purchase contracts that effectively offset the fixed price sales contracts with our customers.


From time to time, we enter into gold and silver forward sales contracts to hedge the commodity price risk associated with the future settlement of provisionally priced deliveries. We are generally obligated to deliver gold and silver to Silver Wheaton prior to the determination of final settlement prices. These forward sales contracts are entered into at the time we deliver gold and silver to Silver Wheaton, and are intended to mitigate the risk of subsequent adverse gold and silver price changes. Gains and losses resulting from the settlement of these derivatives are recorded directly to revenue, as the forward sales contracts do not achieve hedge accounting, and the associated cash flows are classified in operating activities.


Our swap agreements are with counterparties we believe to be creditworthy and do not require us to provide collateral.


39


GRAPHIC


Interest Rate and Foreign Exchange Risk Management


To the extent that we incur indebtedness at variable interest rates to fund our growth objectives, we may enter into interest rate hedging arrangements to manage our exposure to short-term interest rates. We typically do not enter into hedging of our exposure to the Canadian dollar - US dollar exchange rate, as the historic correlation between the foreign exchange rate and commodity prices has generally served to mitigate our risk exposure to commodity prices.


In October 2009, we also entered into foreign exchange forwards to hedge anticipated US dollar revenues in connection with the price protection program for the Chisel North mine described above. We agreed to sell US dollars and purchase C$1.45 million per month for the same period as the zinc swap contracts described above, at an average rate of approximately C$1.07 per US dollar. We applied hedge accounting to these transactions, which expired in July 2012.


To the extent that we make commitments to capital expenditures denominated in foreign currencies, we may enter into foreign exchange forwards or acquire foreign currency outright, which may result in foreign exchange gains or losses in our income statement. At December 31, 2012, approximately C$1,112 million of our cash and cash equivalents was held in US dollars, and approximately C$2.1 million of our cash and cash equivalents was held in Peruvian soles.


TREND ANALYSIS AND QUARTERLY REVIEW


The following table sets forth selected consolidated financial information for each of our eight most recently completed quarters.


2012


2011


Q4


Q3


Q2


Q1


Q4


Q3


Q2


Q1


($000s)


Revenue


180,994


144,659


189,858


187,038


254,314


212,335


246,823


177,345


Profit (loss) before tax


23,335


4,960


(726

)

24,579


69,813


37,474


67,368


34,371


Profit (loss) from continuing operations


7,438


(6,138

)

(30,441

)

7,970


34,283


(16,052

)

41,092


15,870


Loss from discontinued operations


(25,031

)

(212,970

)

(783

)

Profit (loss)


7,438


(6,138

)

(30,441

)

7,970


34,283


(41,083

)

(171,878

)

15,087


Earnings (loss) per share:


Basic


0.04


(0.03

)

(0.17

)

0.05


0.21


(0.23

)

(0.97

)

0.11


Diluted


0.04


(0.03

)

(0.17

)

0.05


0.21


(0.23

)

(0.97

)

0.11


Operating cash flow per share1


0.03


0.12


0.38


0.25


0.48


0.37


0.36


0.27


1 Operating cash flow per share is a non-IFRS financial performance measure with no standardized definition under IFRS. For further information and a detailed reconciliation, please see page 54 of this MD&A.


40


GRAPHIC


In the first and fourth quarters of 2011 and 2012 we recorded a profit compared to losses in the second and third quarters of 2011 and 2012. The profit in the fourth quarter of 2012 was mainly a result of finance gains related to foreign exchange gains as well as a lower tax expense as a result of lower gross margin. The loss in the third quarter of 2012 was mainly a result of a significant foreign exchange loss and lower gross profit. The loss in the second quarter of 2012 was mainly due to a $31.0 million impairment on our available-for-sale investments in junior mining companies. The loss in the third quarter of 2011 was mainly a result of higher deferred tax expense of $26.9 million arising from changes in Peruvian mining tax rates and an increase in the present value of decommissioning and restoration obligations as well as a loss of $22.5 million on disposal of the Fenix project. The loss in the second quarter of 2011 was due to a $212.7 million impairment on the Fenix project which was sold in the third quarter of 2011.


Sales in the last three quarters of 2011 benefited from the drawdown of copper concentrate inventory that had accumulated in late 2010 and early 2011 due to a shortage of available railcars that was subsequently resolved. Revenues in 2011 also benefited from higher copper and zinc prices. Our revenue in 2012 has decreased as a result of volume and price reductions.


Operating cash flow per share was lower in the fourth quarter of 2012 compared to previous quarters, due mainly to reduced gold and silver cash receipts as a result of the stream transaction. The second quarter operating cash flow per share benefited from a current tax recovery of $18.2 million to reflect the reduction of prior year taxes owing as a result of accelerated depreciation of prior year tax pools related to the “New Mine” status ruling at our Lalor mine. Results in 2011 reflected strong metals prices in the first half and the drawdown of excess copper concentrate inventory in the second half.


The following table sets forth selected consolidated financial information for each of the three most recently completed years:


2012


2011


2010


($000s)


Revenue


702,550


890,817


781,032


Profit before tax


52,149


209,025


108,669


Profit from continuing operations


(21,170

)

75,196


40,415


Loss from discontinued operations


(238,784

)

(19,398

)

(Loss) profit


(21,170

)

(163,588

)

21,017


Earnings per share:


Continuing operations - basic and diluted


(0.11

)

0.48


0.29


Discontinued operations - basic and diluted


(1.40

)

(0.13

)

(Loss) earnings per share


(0.11

)

(0.92

)

0.16


Total assets


3,487,824


2,455,004


2,083,544


Operating cash flow before stream deposit and change in non-cash working capital 1


142,957


252,154


137,094


Total long-term financial liabilities 2


502,668


Dividends declared per share


0.20

3

0.20


0.10


1     Operating cash flow before stream deposit and change in non-cash working capital is a non-IFRS financial performance measure with no standardized definition under IFRS. For further information and a detailed reconciliation, please see page 54 of this MD&A.


2     Total long-term financial liabilities include non-current portions of long-term debt, other financial liabilities and obligations under capital leases.


3     Dividend declared during March and September of 2012.


41


GRAPHIC


Revenues increased from 2010 to 2011, primarily as a result of an upward trend in prevailing market prices for copper, zinc, gold, and silver since the market lows experienced during the recession of 2008. In addition, 2011 revenues benefited from increased sales volumes as excess copper concentrate inventories were sold. 2012 revenues declined as a result of lower sales volumes and prices.


Profit from continuing operations increased from 2010 to 2011 as a result of the increased revenue. In addition, our 2010 profit was affected by expenditures relating to the Lalor project, as it was in the exploration and evaluation phase; however, effective January 1, 2011, Lalor was considered a development phase project and therefore, the Lalor project costs were capitalized. In 2012 we recorded a loss as a result of decreased gross margin and impairments on our available-for-sale investments in junior mining companies which arose primarily as a result of poor equity market conditions during the year.


Losses from discontinued operations includes activities related to the Fenix project, which was sold during the third quarter of 2011. For 2011, the loss from discontinued operations includes an impairment loss of $212.7 million on the carrying value of Fenix, as well as a further loss of $22.5 million transferred from the foreign currency translation reserve within equity to the income statement upon disposal of the Fenix project.


Total assets increased significantly from 2010 to 2012 primarily due to investments in and financing raised for our development stage projects, Constancia, Lalor and Reed.


42


GRAPHIC


CRITICAL ACCOUNTING ESTIMATES


The preparation of the consolidated financial statements in conformity with IFRS requires us to make judgements, estimates and assumptions that affect the application of accounting policies, reported amounts of assets and liabilities, disclosure of contingent assets and liabilities at the date of the consolidated financial statements, and reported amounts of revenue and expenses during the reporting period. Actual results may differ from these estimates.


We review these estimates and underlying assumptions on an ongoing basis based on our experience and other factors, including expectations of future events that we believe to be reasonable under the circumstances. Revisions to accounting estimates are recognized in the period in which the estimates are revised and in any future periods affected.


Significant areas where we apply judgements include:


·  Judgements that affect multiple areas of the financial statements:

·        Estimating mineral reserves and resources;

·        Acquisition method accounting;

·        Determination of functional currency; and

·        Taxes.


·  Asset-based judgements (these judgements also affect other areas of the financial statements):

·        In process inventory quantities and inventory cost allocations;

·        Property, plant and equipment:

·             Cost allocations for mine development;

·             Mining properties expenditures capitalized;

·             Determining when exploration and evaluation assets should be transferred to capital works in progress within property, plant and equipment;

·             Componentization;

·             Assessment of impairment, including determination of cash-generating units and assessing for indications of impairment;

·             Recoverability of exploration and evaluation assets, including determination of cash-generating units and assessing for indications of impairment; and

·             Determining whether assets meet criteria for classification as held for sale


·  Judgements that relate mainly to liabilities (these judgements also affect other areas of the financial statements):

·             Determining the accounting classification of the precious metals stream deposit.


Significant areas where we apply estimates include:


·  Estimates that affect multiple areas of the financial statements:

·        Estimating mineral reserves and resources;

·        Acquisition method accounting;

·        Estimates of fair value of financial instruments; and

·        Taxes.


·  Asset-based estimates (these estimates also affect other areas of the financial statements):

·             In process inventory quantities, inventory cost allocations and inventory valuation

·             Property, plant and equipment;

·    Units of production depreciation;

·    Plant and equipment estimated useful lives and residual values;

·    Finite life intangible assets; and

·             Assessment of impairment, including determination of recoverable amount.


43


GRAPHIC


·  Estimates that relate mainly to liabilities (these estimates also affect other areas of the financial statements):

·             Pensions and other employee benefits;

·             Decommissioning, restoration and similar liabilities;

·             Contingent liabilities;

·             Capital commitments; and

·             Determination of deferred revenue per unit related to the precious metals stream transaction and determination of current portion of deferred revenue.


· Estimates that relate mainly to the income statement:

·                  Assaying used to determine revenue.


Mineral reserves and resources


We estimate mineral reserves and resources to determine future recoverable mine production based on assessment of geological, engineering and metallurgical analyses, estimates of future production costs, capital costs and reclamation costs, as well as long term commodity prices and foreign exchange rates.


There are numerous uncertainties inherent in estimating mineral reserves and resources, including many factors beyond our control. We base our estimates on information compiled by appropriately qualified persons relating to the geological data on the size, depth and shape of the ore body, and interpreting this data requires complex geological judgements. Changes in our assumptions, including economic assumptions such as metals prices and market conditions, could have a material effect on our financial position and results of operation.


Changes in our mineral reserve or resource estimates may affect:


·             the carrying value of exploration and evaluation assets, capital works in progress, mining properties and plant and equipment;


·             depreciation expense for assets depreciated either on a unit-of-production basis or on a straight line basis where useful lives are restricted by the life of the related mine or plan;


·             the provision for decommissioning, restoration and similar liabilities; and


·             the carrying value of deferred tax assets.


Acquisition method accounting


When we make an acquisition, we first determine whether the assets acquired and liabilities assumed constitute a business, in which case the acquisition requires accounting as a business combination. We apply judgement in determining whether the acquiree is capable of being conducted and managed for the purpose of providing a return, considering the inputs of the acquiree and processes applied to those inputs that have the ability to create outputs.


44


GRAPHIC


When we enter into a business combination, we apply the acquisition method of accounting. In doing this, we estimate the fair values of the assets we have acquired and the liabilities and contingent liabilities we have assumed as at the acquisition date. Determining such fair values frequently also requires us to estimate related mineral reserves and resources that can be reliably measured. In determining these fair values, we must also apply judgement in areas including future cash flows, metals prices, exchange rates and appropriate discount rates. We use the fair values when we recognize the assets and liabilities on the balance sheet, including goodwill. In certain circumstances, we may also have to make estimates or apply judgement to measure contingent consideration. We measure goodwill at the acquisition date as the fair value of the consideration transferred including the recognized amount of any non-controlling interests in the acquiree, less the net recognized amount (generally fair value) of assets acquired and liabilities and contingent liabilities assumed (identifiable net assets) on the basis of fair value at the date of acquisition. Changes in estimates and assumptions could result in significant differences in the amount of goodwill recognized.


Estimates of fair value of financial instruments


We record various financial assets, financial liabilities and derivatives at fair value. If quoted market prices are available, we use them for our fair value estimates, using bid prices for financial assets and asking prices for financial liabilities. If quoted market prices are not available, we use internal valuation models with observable forward market commodity prices, currency exchange rates and discount factors based on appropriate market interest rates, adjusted for credit risk. When we invest in warrants to acquire shares of other companies, we estimate their fair values using a Black-Scholes model. When we invest in shares of private companies, we estimate their fair value using valuation models or techniques such as discounted cash flow analysis, consideration of recent arm’s-length market transactions or reference to the current fair value of another instrument that is substantially the same. Valuation models can produce a fair value that may not reflect future fair value.


We separate and record at fair value embedded derivatives related to provisional pricing in concentrate purchase, concentrate sale, and certain other sale contracts. For these contracts, sales prices are subject to final adjustment at the end of a future period after shipment, based on quoted market prices during the quotational period specified in the contract. At each reporting date, we mark-to-market provisionally priced metals based on the forward market price for the quotational period stipulated in the contract with changes in fair value recognized in revenues for sales contracts and in cost of sales for purchase concentrate contracts.


Each reporting date, we exercise judgement as we assess financial assets not carried at fair value through profit or loss to determine whether there is objective evidence of impairment, For our available-for-sale investments in equity securities, this includes assessing whether there has been a significant or prolonged decline in the fair value of the security below its cost. Where we have previously recognized impairment of financial assets other than available-for-sale equity investments, we also apply judgement each reporting date to assess whether it is appropriate to reverse previous impairment based on improved conditions.


45


GRAPHIC


Taxes


We use the asset and liability method of tax allocation for accounting for income taxes. Deferred income and mining tax assets and liabilities are determined based on differences between the financial reporting and tax bases of assets and liabilities. Deferred tax assets and liabilities are measured using substantively enacted tax rates expected to be in effect in the years that differences reverse. These determinations rely on management’s estimate of when temporary differences will reverse, as well as management’s interpretation of tax legislation. Deferred tax assets are recognized to the extent that it is probable that the deferred tax assets will be realized. We evaluate the carrying value of deferred tax assets on a quarterly basis and adjusts the amount that is probable to be realized as necessary. Factors used to assess the likelihood of realization include forecasts of future taxable income and available tax planning strategies that could be implemented to realize deferred tax assets.


In process inventory quantities and inventory cost allocations


We determine the cost of production of concentrate inventory on a weighted average cost basis and the cost of production of finished metal inventory using the first in first out basis. The cost of production includes direct costs associated with conversion of production inventory: material, labour, contractor expenses, purchased concentrates, and an attributable portion of production overheads and depreciation of all property, plant and equipment involved with the mining and production process. We measure in-process inventories based on assays of material received at metallurgical plants and estimates of recoveries in the production processes. Due to significant uncertainty associated with volume and metal content, costs are not allocated to routine operating levels of stockpiled ore. Estimates and judgement are required to assess the nature of any significant changes to levels of ore stockpiles and determining whether allocation of costs is required.


We estimate the realizable value of in process inventories at reporting dates and carry inventories at the lower of cost and estimated net realizable value. Where the net realizable value is less than the accumulated costs that have been allocated to that inventory, we recognize an impairment charge as part of current period operating costs to reduce the carrying value of the inventory. If conditions improve subsequently, we determine whether it is appropriate to reverse impairment losses previously recorded.


Property, plant and equipment and exploration and evaluation


The carrying amounts of property, plant and equipment and exploration and evaluation assets on our balance sheet are significant and reflect multiple estimates and applications of judgement.


We exercise judgement in determining whether the costs related to exploration and evaluation are eligible for capitalization and whether they are likely to be recoverable by future exploration, which may be based on assumptions about future events and circumstances. We use judgement and estimates when we determine whether exploration and evaluation assets should be transferred to capital works in progress within property, plant and equipment. In accordance with our accounting policy, the end of the exploration and evaluation phase occurs when we have completed a preliminary feasibility study, some of the resources have been converted to reserves, and we determine it is probable the property will be developed into a mine.


For mines in the production stage, we apply judgement to determine development costs to be capitalized based on the extent they are incurred in order to access reserves mineable over more than one year. In doing this, we use estimates such as estimates of tonnes of waste to be removed over the life of the mining area and economically recoverable reserves extracted as a result.


46


GRAPHIC


For depreciable property, plant and equipment assets, we make estimates to determine depreciation. For assets depreciated using the straight-line method, we estimate residual value and useful lives of the assets or components. Where the estimated life of the related mine or plant is shorter, we use that in our depreciation calculations. For assets depreciated on a unit-of-production basis, we use estimated associated future development costs and estimated proven and probable tonnes of mineral reserves, as described above. There are numerous uncertainties inherent in estimating mineral reserves, and assumptions that were valid at the reporting date may change when new information becomes available. The actual volume of ore extracted and any changes in these assumptions could affect prospective depreciation rates and carrying values.


Assessment of impairment and recoverability of exploration and evaluation assets


At the end of each reporting period, we apply judgement when we review the carrying amounts of property, plant and equipment, exploration and evaluation assets and computer software to determine whether there is any indication of impairment. If any such indication exists, we estimate the recoverable amount of the asset in order to determine the extent of the impairment loss, if any.


The recoverable amount is the higher of the fair value less costs to sell and value in use. In our business, fair value less costs to sell is usually higher than value in use because IFRS restricts value in use calculations from considering future development. Judgement is required to determine fair value less costs to sell. For mineral assets, fair value is often determined as the present value of the estimated future cash flows expected to arise from the continued use of the asset, including any expansion prospects, and its eventual disposal, using assumptions that an independent market participant may take into account. These cash flows are discounted by an appropriate discount rate that reflects current market assessments of the time value of money and the risks specific to the asset to arrive at a net present value of the asset. During the year ended December 31, 2011, we recognized impairment losses on our Fenix and Zochem operations prior to selling them. In both situations, we determined the amount of impairment based on fair value less costs to sell, which we estimated based on indicative offers received.


Pensions and other employee benefits


Our post retirement obligations relate mainly to ongoing health care benefit plans. We estimate obligations related to our pension and other employee benefits plans using actuarial determinations that incorporate assumptions using our best estimates of factors including plan performance, salary escalation, retirement dates of employees and drug cost escalation rates. Due to the complexity of the valuation, the underlying assumptions and its long term nature, a defined benefit obligation is highly sensitive to changes in these assumptions. We review all assumptions at each reporting date. In determining the appropriate discount rate, we consider the interest rates on corporate bonds in the respective currency with at least an AA rating, with extrapolated maturities corresponding to the expected duration of the defined benefit obligation. We use a mortality rate based on publicly available mortality tables for the specific country, and we base future salary increases and pension increases on expected future inflation rates for the respective country.


47


GRAPHIC


Decommissioning, restoration and similar liabilities


Decommissioning, restoration and similar liabilities are estimated based on environmental plans, in compliance with current environmental and regulatory requirements. We estimate costs associated with decommissioning and restoration activities such as dismantling and removing structures, rehabilitating mines and tailings, and reclamation and re-vegetation of affected areas. When we provide for such future costs, we also record a corresponding decommissioning asset, except for closed sites where we recognize changes in estimated costs immediately in the income statement. We record the present value of estimated costs in the period in which the asset is installed or the environment is disturbed and a reasonable estimate of future costs and discount rates can be made. We adjust estimates of future cash flows to reflect risk, and then we discount the provision using a risk free rate. In subsequent periods, we re-measure the liabilities to reflect changes in the discount rate. We accrue the unwinding of discounts on provisions over the life of each associated operating mine or plant (or, for non-operating sites, over the period until we estimate rehabilitation will be complete), such that at the end of that period the provision is equal to the balance estimated to be paid at that date. We depreciate the decommissioning asset over the life of the related asset. judgement is required to determine assumptions including discount rates, expected timing of decommissioning and restoration costs, inflationary factors and market risks. Changes in cost estimates, which may arise from changes in technology and pricing of the individual components of the cost, result in offsetting changes to the asset and liability and corresponding changes to the associated depreciation and finance costs.


In view of the uncertainties concerning these future obligations, the ultimate timing and cost of reclamation and mine closure may differ materially from these estimates. The estimate of the total liability is subject to change based on amendments to laws and regulations and as new information concerning our operations becomes available. Future changes, if any, to the estimated total liability as a result of amended requirements, laws, regulations and operating assumptions, as well as discount rates, may be significant and would be recognized prospectively as a change in accounting estimate, when applicable. Environmental laws and regulations are continually evolving in all regions in which we operate. We are not able to determine the impact, if any, of environmental laws and regulations that may be enacted in the future on our results of operations or financial position due to the uncertainty surrounding the ultimate form that such future laws and regulations may take.


Contingent liabilities


We are involved in various claims and litigation arising in the ordinary course and conduct of our business. By their nature, contingencies will be resolved only when one or more future events occur or fail to occur. The assessment of contingencies inherently involves the exercise of significant judgement and estimates of the outcome of future events.


Assaying used to determine revenue


We measure revenue from the sale of goods at the fair value of the consideration received or receivable, net of treatment and refining charges. In determining the amount of revenue to recognize on copper concentrate sales, we use assays to estimate the metal contained in the concentrate. When we issue provisional invoices, we may use our own estimated assays to calculate the metal content and measure provisional revenue; for final invoices, we reach agreement with the customer on assays reflecting metal content.


48


GRAPHIC


RISK FACTORS


Set out below are certain of the risk factors applicable to our business and operations. Reference should be made to our Annual Information Form and Form 40-F for further risk factors applicable to our business and operations.


Development of Key Projects


Our ability to develop our key mineral projects, including the Lalor and Constancia projects, is subject to many risks and uncertainties, including: our ability to upgrade mineral resources and conceptual estimates of tonnage and grade of mineral deposits into mineral reserves; completion of feasibility studies; the ability to secure adequate financing to fund such projects; obtaining and maintaining various permits and approvals from governmental authorities; construction risk; securing required surface and other land rights; finding or generating suitable sources of power and water; developing and maintaining good relationships with communities, local government and other stakeholders and interested parties; political and social risk; and confirming the availability and suitability of appropriate local area infrastructure including, in respect of Constancia, the availability of access to the port.


We have negotiated life of mine community agreements with two communities directly affected by the Constancia project to secure required land rights for the project and efforts to relocate 36 families pursuant to one of the community agreements are underway. However, any inability to enforce these agreements, successfully relocate such families or maintain good relations with these and other nearby communities and other stakeholders could impair our ability to successfully develop or operate the project. At Lalor, we require permits under Manitoba’s The Environment Act and The Mines and Minerals Act in order to reach full production, expand the tailings facility and operate the concentrator that is planned at the site. While we believe that such permits are forthcoming, it is possible that one or more of such permits may be delayed or not granted, which could prevent us from developing the Lalor project.


In addition, significant amounts of capital will be required to bring each of the Lalor and Constancia projects to production. Our capital and operating costs for such projects may be affected by a variety of factors, including project scope changes, local currency appreciation and general cost escalation common to mining projects globally. While we believe that we have sufficient liquidity to satisfy spending requirements to complete our key capital projects and meet our debt service obligations (including obligations under the Notes), to the extent that capital costs are higher than currently forecast, metals prices decline materially from current levels or we have other unanticipated demands on our liquidity, we may need to raise additional financing to complete our capital projects or seek other sources of liquidity such as additional streaming transactions, dispositions of our investments in junior mining companies or reductions in or suspensions of our semi-annual dividend. Given current economic circumstances and other factors, there can be no certainty that sufficient financing or other transactions will be available on acceptable terms. If such financing or transactions are not available, we may not be able to fund the development of one or both of the Constancia and Lalor projects from our existing cash resources and future cash flows.


49


GRAPHIC


The capital expenditures and timeline needed to develop a new mine are considerable and the economics of and ability to complete a project can be affected by many factors, including: inability to complete construction and related infrastructure in a timely manner; changes in the legal and regulatory environment; general cost escalation; currency fluctuations; industrial disputes; availability of parts, machinery or operators; delays in the delivery of major process plant equipment; inability to obtain, renew or maintain the necessary permits, licenses or approvals; unforeseen natural events; and political, social and other factors. Factors such as changes to technical specifications, failure to enter into agreements with contractors or suppliers in a timely manner, including contracts in respect of Constancia project infrastructure, and shortages of capital, may also delay the completion of construction or commencement of production or require the expenditure of additional funds. Many major mining projects constructed in the last several years, or under construction currently, have experienced cost overruns that substantially exceeded the capital cost estimated during the basic engineering phase of those projects, sometimes by as much as 50% or more. There can be no assurance that our development projects will be able to be developed successfully or economically or that they will not be subject to the other risks described in this section.


Political and Social Risks


The implementation of new, or the modification of existing, laws and regulations affecting our operations and other mineral properties could have a material adverse impact on us and our projects. Such laws or events could involve the expropriation of property, implementation of exchange controls and price controls, increases in production royalties and income and mining taxes, refusal to grant or renew required permits, licenses, leases or other approvals or requiring unfavorable amendments to or revoking current permits and licenses, and enacting environmental or other laws that would make contemplated operations uneconomic or impractical. The risk exists that further government limitations, restrictions or requirements, not presently foreseen, will be implemented.


In addition, changes in policy that alter laws regulating the mining industry could have a material adverse effect on us. There can be no assurance that industries which are deemed to be of national or strategic importance in countries in which we have operations or assets will not be nationalized. There also can be no assurance that our assets in these countries will not be subject to nationalization, requisition or confiscation, whether legitimate or not, by a government authority or other body.


In situations where we have acquired mineral rights, we may not be able to secure required surface rights. In addition, in situations where we possess surface rights, our land may be illegally occupied. Any inability to secure required surface rights or take possession of areas for which we hold surface rights could render us unable to carry out planned exploration, development and mining activities.


50


GRAPHIC


Notwithstanding the expressed intention of the current national government in Peru to support mining as a driver for the continued growth and future development of the country, other mining projects—like the Conga project in northern Peru and projects in the Cusco region in southern Peru—have been the target of initiatives that have delayed and disrupted project development and operations. Such initiatives, as well as political or social unrest or instability, could adversely affect our ability to develop and operate the Constancia project. Such adverse effects could result from positions or actions that may be taken by the  national  government  or  at  the regional, community  or  local  levels  including  encroaching  on  our land,  challenging the  boundaries  of such  land  or our  right to  possess  and  operate  on  such  land,  protesting  against  our  project  (including  the environmental  or  social  impacts  of our project),  impeding  project  activities  through  roadblocks  or  other  public manifestations and  attacking  project  assets  or  personnel. During the last several  years,  certain mining  projects in Peru  have  been  the  target  of  political  and  community  protests.  By  way  of  example,  in  late  2011,  construction activities at the Conga project in northern Peru were suspended at the request of the central government following increasing protests by anti-mining activists led by the regional president. While there have been some initiatives in respect  of the Constancia  project, including  an  attempt to restrict  access  by  workers, those initiatives  have  been limited  and  have  not  significantly  disrupted  the project’s  development.  There is the risk that more significant opposition may be mounted that may affect our ability to develop and operate the Constancia project.


51


GRAPHIC


Community Relations


Our relationships and reputation, generally and particularly with the communities in which we operate and other stakeholders, are critical  to  the  future  success  of  our  existing  operations  and  the  construction  and development of our projects, including the Constancia project in Peru and the Lalor project in Manitoba. There is an increasing level of public concern relating  to  the  perceived  effect  of mining  activities  on  the  environment  and  on  communities  impacted  by  those activities. Publicity adverse to us, our operations, or extractive industries generally, including as a result of anti-mining protests in Peru or in Canada, could have an adverse effect on us and may impact our reputation and relationship with the communities in which we operate, including the communities surrounding the Constancia project and the First Nations communities surrounding the Lalor and Reed projects, and other stakeholders.  For  example,  while  we have  entered  into  life  of mine  agreements  with  two  local  communities directly  affected  by  the  Constancia  project,  there  can  be  no  assurance  that  disputes  will  not  arise  with  other communities in the area or with the communities with whom we have reached the life of mine agreements. There is the risk that relations with local communities may be strained by real or perceived detrimental effects associated with our activities  or  those  of  other  mining  companies  and  that  those  strains  may  impact  our  ability  to  enforce  these agreements or obtain necessary permits and approvals to develop and operate the Constancia project. While we are committed to operating in a socially responsible manner, there can be no assurance that our efforts, in this respect, will mitigate this potential risk.


Aboriginal Rights and Title


Governments in many jurisdictions, including Canada, must consult with aboriginal peoples with respect to grants of mineral rights and the issuance of or amendment to project authorizations. Consultation regarding rights or claimed rights of aboriginal people may require accommodations, including undertakings with respect to employment and other matters. This may affect our ability to acquire within a reasonable time frame, or on acceptable terms effective mineral titles and permits in these jurisdictions, and may affect the timetable and costs of development of mineral properties in these jurisdictions. In addition, even in situations in which the government has satisfied its duty to consult with affected aboriginal peoples and we have complied with our related obligations, if any, such aboriginal peoples may illegally occupy the mineral properties in question or engage in illegal activities that impair our ability to development such properties.  Aboriginal rights or title claims or such illegal activities also could affect our existing operations, in addition to our development projects and future acquisitions. These legal requirements, among other things, may affect our ability to develop our Lalor and Reed projects and other mineral properties or may materially delay the development of such properties.


Dividend Payments


The Notes impose certain restrictions on our ability to make restricted payments, including common dividends. Our ability to make subsequent dividend payments at current levels will be subject to our ability to generate sufficient shareholders’ equity or to maintain a ratio of consolidated debt to EBITDA of 2.5 to 1 or less. It is doubtful whether we will be able to comply with these covenants before our new mines achieve commercial production and generate additional cash flow and earnings, but we are considering alternatives to enable maintenance of the dividend at current levels. In addition, even during times when we are in compliance with these covenants, the declaration of any dividend will be subject to the Board of Directors’ discretion.


52


GRAPHIC


NON-IFRS FINANCIAL PERFORMANCE MEASURES


Operating cash flow per share and cash costs per pound of copper sold are included in this MD&A because we believe that, in the case of operating cash flow per share, it helps investors to evaluate changes in cash flow while taking into account changes in shares outstanding, and in the case of by-product cash costs, they help investors assess our overall costs of metal production and compare those costs to those of other base metal producers. These measures do not have a meaning prescribed by IFRS and are therefore unlikely to be comparable to similar measures presented by other issuers. These measures should not be considered in isolation or as a substitute for measures prepared in accordance with IFRS and are not necessarily indicative of operating profit or cash flow from operations as determined under IFRS. Other companies may calculate these measures differently.


Operating cash flow per share


The following table presents our calculation of operating cash flow per share for the three months and year ended December 31, 2012 and December 31, 2011.


Three Months Ended


Year Ended


Dec. 31


Dec. 31


Dec. 31


Dec. 31


($000s except share and per share
amounts)


2012


2011


2012


2011


Operating cash flow before stream deposit and change in non-cash working capital


6,002


82,208


142,957


252,154


Weighted average shares outstanding


171,975,800


171,905,912


171,960,783


167,863,427


Operating cash flow per share


$

0.03


$

0.48


$

0.83


$

1.50


Cash cost per pound of copper sold


Cash cost per pound of copper sold (“cash cost”) is a non-IFRS measure (see “Non IFRS Financial Performance Measures” above) that management uses as a key performance indicator to assess the performance of our operations. Our calculation takes a by-product costing approach, under which we designate copper as our primary metal of production and from which we subtract the net revenues realized from the sale of other metals mined with copper. As there is significant variation in calculation methodologies in practice, our cash cost may not be directly comparable with the cash cost of other companies.


Cost to copper concentrate includes all direct mining, milling, and concentrating costs incurred in the production of copper concentrate at our mines and mills in addition to general and administrative expenses directly related to those operations. Downstream costs include freight, distribution, and treatment charges related to copper concentrate plus copper refining costs. Net by-product credits include revenue from the sale of zinc, gold, silver, and other by-products less the production costs of zinc and refining costs associated with gold and silver. Realization of deferred revenue under the precious metals stream agreement with Silver Wheaton is not included in net by-product credits.


53


GRAPHIC


Three Months Ended


Year Ended


Dec. 31


Dec. 31


Dec. 31


Dec. 31


2012


2011


2012


2011


Cash cost per unit sold
$/lb


Mining, milling, concentrating


1.96


1.37


1.58


1.28


On-site administration and general expenses


0.38


0.19


0.29


0.19


Cost to copper concentrate


2.34


1.56


1.87


1.47


Treatment and refining


0.16


0.19


0.16


0.20


Freight and distribution


0.36


0.29


0.29


0.28


Other


0.02


0.01


0.02


Downstream costs


0.52


0.50


0.46


0.50


Net by-product credits


(0.81

)

(1.52

)

(1.26

)

(1.52

)

Cash cost per pound of copper sold


2.05


0.54


1.07


0.45


Reconciliation to Income Statement
($000’s)


Cost of sales - mine operating costs


118,865


134,896


429,155


476,621


Treatment and refining charges


5,529


10,166


22,709


35,408


By-product revenues


(106,586

)

(121,307

)

(381,683

)

(445,247

)

Less: change in deferred revenue


29,322


29,322


47,130


23,755


99,503


66,782


Less: indirect costs(1)


Share based payment


505


254


1,377


501


Adjustments related to zinc inventory write-downs (reversals)


(2,290

)

69


(5,420

)

5,420


Demolition and rehabilitation


555


1,550


684


3,329


Subtotal - cash costs


48,360


21,882


102,862


57,532


Copper sales (000s lbs)


23,553


40,425


95,821


126,461


Cash cost per pound of copper sold
($/lb)


2.05


0.54


1.07


0.45


1 Indirect costs in cost of sales - mine operating costs


54


GRAPHIC


Cash cost for the fourth quarter of 2012 was $2.05/lb, compared to $0.54/lb for the same period in 2011.  The increase is due primarily to the commencement of deliveries of gold and silver to Silver Wheaton under the stream agreement as the non-cash portion of these sales is excluded from by-product credits and the total sales price is relatively lower than the fourth quarter of 2011. The impact of the stream agreement reduced net by-product credits by approximately $1.82/lb during the quarter.


Cost to copper concentrate increased and costs of zinc metal sales decreased (resulting in a corresponding increase in net by-product credits) as a result of an update to our inventory costing process effective October 1, 2012. This change was necessitated by the accounting requirements related to both stream sales of 777 mine gold and silver, and pre-production revenue at our new Lalor and future Reed mines. Prior to the fourth quarter of 2012, costs to produce copper and zinc concentrate were allocated based on the refined value of contained metal. Commencing in the current quarter, and going forward, costs to concentrate will be allocated between copper and zinc concentrate based on the value of contained metal net of expected treatment and refining charges. Overhead costs will also be reallocated to better reflect activity levels. As a result of this change, relatively higher costs are assigned to copper concentrate and relatively lower costs are assigned to finished zinc as compared to prior quarters. These changes do not significantly affect overall cash costs.


Cash cost for the full year 2012 was $1.07/lb, compared to $0.45/lb for the full year 2011. Mining, milling and concentrating costs per pound of copper sold were lower in the first three quarters of 2012, compared to the same period in 2011, as a result of lower mine costs at our Chisel North and Trout Lake mines. At our Trout Lake mine, development costs were lower, we needed less ground control work and used fewer consumables. At our Chisel North mine, the mining method used to extract ore was lower cost as compared to 2011. Net by product credits decreased in the fourth quarter due to the stream agreement, increasing the average cash cost for the year.


Disclosure Controls and Procedures and Internal Control Over Financial Reporting


Disclosure controls and procedures


Management is responsible for establishing and maintaining adequate disclosure controls and procedures.


As of December 31, 2012, we have evaluated the effectiveness of the design and operation of our disclosure controls and procedures in accordance with requirements of National Instrument 52-109 of the Canadian Securities Commission (“NI 52-109”) and the Sarbanes Oxley Act of 2002 (as adopted by the U.S. Securities and Exchange Commission). Our Chief Executive Officer (“CEO”) and Chief Financial Officer (“CFO”) supervised and participated in this evaluation.


Based on management’s evaluation, our CEO and CFO concluded that our disclosure controls and procedures were effective to ensure that information required to be disclosed by us in reports we file or submit is recorded, processed, summarized and reported within the time periods specified in securities legislation and is accumulated and communicated to our management, including our CEO and CFO, to allow timely decisions regarding required disclosure.


Our annual management report on internal control over financial reporting will be included in our Annual Report on Form 40-F and Annual Information Form to be filed with the Canadian provincial regulatory authorities and the SEC.


55


GRAPHIC


Internal control over financial reporting (“ICFR”)


Management is responsible for establishing and maintaining adequate ICFR.


Under the supervision and with the participation of our management, including our CEO and CFO, we evaluated the effectiveness of our ICFR based upon the framework issued by the Committee of Sponsoring Organizations of the Treadway Commission. Based on management’s evaluation, our CEO and CFO concluded that our ICFR were effective as of December 31, 2012.


Our annual management report on internal control over financial reporting will be included in our Annual Report on Form 40-F and Annual Information Form to be filed with the Canadian provincial regulatory authorities and the SEC.


Deloitte LLP, our Independent Registered Chartered Accountants, have audited our consolidated financial statements for the year ended December 31, 2012 for purposes of providing reasonable assurances regarding the reliability of financial reporting and the preparation of financial statements.


Changes in ICFR


During the first quarter of 2012, our Corporate office began using a new enterprise resource planning (“ERP”) information system that we previously implemented at our Manitoba business unit during the second quarter of 2011. The implementation of the new ERP system followed our project plans, which included a number of typical project controls, such as the testing of data conversion and system reports, user training and user acceptance testing, in order to ensure internal controls were in place during and after the implementation. We did not make any other changes to ICFR during the year ended December 31, 2012 that materially affected, or are reasonably likely to materially affect, our ICFR.


Inherent limitations of controls and procedures


All internal control systems, no matter how well designed, have inherent limitations. As a result, even systems determined to be effective may not prevent or detect misstatements on a timely basis, as systems can provide only reasonable assurance that the objectives of the control system are met. In addition, projections of any evaluation of the effectiveness of ICFR to future periods are subject to the risk that controls may become inadequate because of changes in conditions, or that the degree of compliance with the policies or procedures may change.


56


EX-99.4 5 a13-8934_1ex99d4.htm EX-99.4

Exhibit 99.4


Disclosure Pursuant to Section 1503(a) of the Dodd-Frank Wall Street Reform and Consumer Protection Act


HudBay Minerals Inc. (“Hudbay” or the “Registrant”) is committed to the health and safety of its employees and to providing an incident free workplace.


Hudbay’s U.S. mining operations are subject to Federal Mine Safety and Health Administration (the “MSHA”) regulation under the U.S. Federal Mine Safety and Health Act of 1977 (the “FMSH Act”). The MSHA inspects Hudbay’s mines on a regular basis and issues various citations and orders when it believes a violation has occurred under the FMSH Act. Whenever the MSHA issues a citation or order, it also generally proposes a civil penalty, or fine, related to the alleged violation.


Pursuant to Section 1503(a) of the Dodd-Frank Wall Street Reform and Consumer Protection Act (the “Dodd-Frank Act”), issuers that are operators, or that have a subsidiary that is an operator, of a coal or other mine are required to disclose in their periodic reports filed with the Commission information regarding specified health and safety violations, orders and citations, related assessments and legal actions, and mining-related fatalities. During the fiscal year ended December 31, 2012, the Registrant’s Balmat Mine No. 4 and Mill received a total of seventeen citations and orders from the MHSA alleging certain violations specified by the Dodd-Frank Act resulting in proposed MHSA assessments totaling US$1,700 in the aggregate.


In addition, as required by the reporting requirements regarding mine safety included in section 1503(a)(2) of the Dodd-Frank Act, for the year ended December 31, 2012, none of the mines operated by Hudbay received written notice from the MSHA of (a) a pattern of violations of mandatory health or safety standards that are of such nature as could have significantly and substantially contributed to the cause and effect of mine health or safety hazards under section 104(e) of the FMSH Act or (b) the potential to have such a pattern.


The information in the table below reflects citations and orders that the MSHA issued to Hudbay during the year ended December 31, 2012, as reflected in Hudbay’s records. The data in Hudbay’s system may not match or reconcile with the data that the MSHA maintains on its public website. In evaluating this information, consideration should also be given to factors such as: (i) the number of citations and orders may vary depending on the size and operation of the mine, (ii) the number of citations issued may vary from inspector to inspector and mine to mine, and (iii) citations and orders may be contested and appealed, and in that process, may be reduced in severity and amount, and may be dismissed.


Mine ID
Number


Mine or
Operating Name


Section
104(a)
Significant
and
Substantial
Citations


Section
104(b)
Orders


Section
104(d)
Citations
and

Orders


Section
110(b)(2)
Violations


Section
107(a)
Orders


Proposed
MSHA
Assessments


Fatalities


Pending
Legal
Action


30-01185


Balmat Mine No. 4 & Mill


1


US$1,700


EX-99.5 6 a13-8934_1ex99d5.htm EX-99.5

Exhibit 99.5


HUDBAY MINERALS INC.
(the “Company”)


CODE OF BUSINESS CONDUCT AND ETHICS


INTRODUCTION


This Code of Business Conduct and Ethics (“Code”) sets out basic principles to guide all directors, officers and employees of the Company or any of its subsidiaries or affiliates1 (collectively, the “HB Group”) and all other persons acting on behalf of the HB Group (collectively, with the directors, officers and employees of the HB Group, “HB Personnel”) in the ethical conduct of business.  All HB Personnel must conduct themselves accordingly and seek to avoid even the appearance of improper behavior. If a law conflicts with a policy in this Code, HB Personnel must comply with the law.


HB Personnel who violate the standards in this Code will be subject to disciplinary action, which could include the termination of their employment or other relationship with the HB Group.  If you are in a situation that you believe may violate or lead to a violation of this Code, follow the guidelines described below under “Compliance Procedures”.


PURPOSE


The purpose of the Code is to:


·                  Promote honest and ethical conduct of all HB Personnel and promote the HB Group’s longstanding culture of honesty and accountability;


·                  Promote avoidance of conflicts of interest between personal interests of HB Personnel and professional interests of the HB Group, and provide guidance in the ethical handling of actual or apparent conflicts of interest;


·                  Promote full, fair, accurate, timely and understandable disclosure in the HB Group’s documents submitted to or filed with securities regulators, and in its other public communications;


·                  Ensure compliance with applicable laws, rules and regulations;


·                  Promote the prompt internal reporting to an appropriate person of violations of this Code, including, through the use of the HB Group’s confidential ‘whistleblower’ service.


1              A company is a subsidiary of another company if it is controlled, directly or indirectly, by that other company (through one or more intermediaries or otherwise).  A company is an affiliate of another company if either one of them is the subsidiary of the other company or if both are subsidiaries of the same company or if each of them is controlled by the same person or company.


As in effect May 2012


LEGAL COMPLIANCE


Compliance with Laws, Rules and Regulations (including Insider Trading Laws and Timely Disclosure)


HB Personnel are expected to comply in good faith at all times with all applicable laws, rules and regulations and behave in an ethical manner.


HB Personnel are required to comply with the Company’s Timely Disclosure, Confidentiality and Insider Trading Policy and all other policies and procedures applicable to them that are adopted by the Company from time to time.


HB Personnel must cooperate fully with Company officers in the preparation of documents to be filed with the securities regulatory authorities and all other publicly disclosed materials to ensure those persons are aware in a timely manner of all information that is required to be disclosed. HB Personnel should also cooperate fully with the independent auditors in their audits and in assisting in the preparation of financial disclosure.


THIRD PARTY RELATIONSHIPS


Conflict of Interest


HB Personnel are required to act with honesty and integrity and to avoid any relationship or activity that might create, or appear to create, a conflict between their personal interests and the interests of the HB Group.


“Conflicts of interest” arise where an individual’s private interests interfere in any way with the interests of the HB Group.  A conflict of interest can arise when HB Personnel take actions or have interests that may interfere with the performance of their work for the HB Group objectively, giving priority to the HB Group’s professional interests over their personal interests, or interests of a third party. HB Personnel shall perform the responsibilities of their positions on the basis of what is in the best interests of the HB Group, free from the influence of personal considerations and third party relationships.


Conflicts of interest may not always be clear-cut.  If you have a question, you should consult with your supervisor, department head, or the Head of the Legal group.  Any HB Personnel who become aware of a conflict or potential conflict should bring it to the attention of their supervisor, department head or Head of the Legal group and consult the procedures described below under “Compliance Procedures”.


Gifts, Entertainment and Hospitality


Business gifts and entertainment are customary courtesies designed to build goodwill and constructive relationships among business partners.  However, a problem may arise when these courtesies compromise, or appear to compromise, the HB Group’s ability to make fair and objective business decisions or to gain an unfair advantage.


HB Personnel or their immediate families shall not use their position with the HB Group to solicit any cash, gifts or free services from any HB Group customer, supplier or contractor for


2


their or their immediate family’s or friend’s personal benefit. Gifts or entertainment from others should not be accepted if they could be reasonably considered to be extravagant for the employee, officer or director who receives it, or otherwise improperly influence the HB Group’s business relationship with or create an obligation to a customer, supplier or contractor.


Similarly, no HB Personnel should ever offer, give or provide any gift, entertainment or hospitality unless it is not a cash gift, is consistent with customary business practices, is not excessive in value, cannot be construed as a bribe or payoff, and does not violate any applicable laws.  Strict rules apply when the HB Group does business with governmental agencies and officials, as discussed in more detail below.


In general, nominal gifts such as pens, caps, shirts and mugs are acceptable.   Invitations to social, cultural or sporting events may be accepted if the cost is reasonable and your attendance serves a customary business purpose such as networking.  More extravagant or costly invitations should only be accepted in consultation with your manager, and when in doubt, the Company’s Legal Department.


Payments to Government Personnel


All HB Personnel must comply with all laws prohibiting improper payments to government officials, including the Corruption of Foreign Public Officials Act (Canada) (the “CFPOA”) and the Foreign Corrupt Practices Act (US) (the “FCPA”).  These Acts prohibit, among other things, offering, promising or giving (or authorizing any of those activities) anything of value, directly or indirectly, to a foreign government official, official of a political party or political candidate, or to any official of any public international organization to influence any of their acts or decisions or to obtain or retain business or secure any other improper advantage.


Similarly, other governments have laws regarding business gifts that may be accepted by government personnel.  The promise, offer or delivery to an official or employee of various governments of a gift, favour or other gratuity in violation of these laws would not only violate Company policy but could also be a criminal offense.  It is important for HB Personnel to consult with the Company’s Legal Department whenever they believe they may be embarking on conduct that may raise potential issues under applicable anti-corruption laws.


Penalties for violations of the FCPA are severe and may include fines against an individual of up to US$250,000 for each violation and fines against the Company of up to US$2 million.  The financial consequences of an FCPA violation can escalate significantly through ‘disgorgement of profits’ and other penalty enhancers.


In the event that payments are made to third parties on behalf of governmental entities for legitimate purposes, HB Personnel should closely monitor such payments for fair valuation of the payments compared to the goods or services being provided to reduce the risk of kickbacks from the third-party suppliers to the applicable governmental personnel.  HB Personnel should ensure that any such payments are properly recorded in the applicable business entity’s books and records, including documentation of the specific deliverables received.  HB Personnel may not make or authorize cash or cash equivalent (e.g., check) reimbursements or payments of any kind to individual government officials without prior written authorization from the Company’s Legal Department.


3


There are narrow exceptions to the provisions of the FCPA.  Because the legality of payments to government officials in particular situations is hard to determine, HB Personnel must consult with the Company’s Legal Department before making any such payments to avoid potential liability or even the appearance of impropriety.


Government Relations; Influencing Testimony


HB Personnel may participate in the political process as private citizens. HB Personnel may not work on behalf of a candidate’s campaign while at work or use the HB Group’s facilities for that purpose.  It is important to separate personal political activity from the HB Group’s interests, in order to comply with applicable laws relating to lobbying or attempting to influence government officials.


In addition, HB Personnel are strictly prohibited from attempting to influence any person’s testimony in any manner whatsoever in courts of justice or any administrative tribunals or other government bodies.


Directorship


HB Personnel shall not act as directors or officers of any other corporate entity or organization, public or private, without the prior written approval of the Chief Executive Officer. Directorships or officerships with such entities will not be authorized if they are considered to be contrary to the interest of the HB Group. HB Personnel may, however, act as directors or officers of charitable organizations whose purposes do not conflict with the HB Group’s interests, and such directorship/officership will not otherwise interfere with the due performance of the their work.


INFORMATION AND RECORDS


Confidential and Proprietary Information and Trade Secrets


HB Personnel may be exposed to certain information that is considered confidential by the HB Group or entrusted to the HB Group by persons with whom the HB Group does business. HB Personnel shall not disclose  such confidential information to persons outside the HB Group, including family members, and should share it only with other HB Personnel who have a “need to know” unless the disclosure is specifically authorized by the Chief Executive Officer or Head of the Legal group.


Financial Reporting and Records


The HB Group requires honest and accurate recording and reporting of information to make responsible business decisions.  The HB Group’s accounting records are relied upon to produce reports for our management, directors, shareholders, governmental agencies and persons with whom the HB Group does business.  All of the HB Group’s financial statements and the books, records and accounts on which they are based must appropriately reflect the HB Group’s activities and conform to applicable legal and accounting requirements and to the HB Group’s system of internal controls.  Unrecorded or “off the books” funds or assets should not be maintained unless required by applicable law or regulation.


4


The U.S. FCPA’s accounting and internal-controls (“books-and-records”) provisions, which require accurate and transparent accounting records and internal accounting controls sufficient to prevent improper payments, apply to the Company and to other companies in which the Company may be considered to have a controlling interest.  These accounting, transparency, and internal-controls requirements are viewed by FCPA enforcers as bases for strict liability for any improper payment regardless of whether any knowledge of impropriety can be established regarding the Company.


Accordingly, companies within the HB Group must implement internal accounting controls based upon sound accounting principles and maintain and provide to the Company, upon request, accurate documentation regarding all transactions.


All HB Personnel have a responsibility, within the scope of their positions, to ensure that the HB Group’s accounting records do not contain any false or intentionally misleading entries.  The HB Group does not permit intentional misclassification of transactions as to accounts, departments or accounting records.  All transactions must be supported by accurate documentation in reasonable detail and recorded in the proper accounts and in the proper accounting period.


Business records and communications often become public through legal or regulatory proceedings or the media.  HB Personnel should avoid exaggeration, derogatory remarks, guesswork or inappropriate characterizations that can be misunderstood.  This requirement applies equally to communications of all kinds, including internal and external e-mail, informal notes, internal memos, and formal reports.


Record Retention


The HB Group maintains all records in accordance with laws, rules and regulations regarding retention of business records. The HB Group prohibits the unauthorized destruction of or tampering with any records, whether written or in electronic form, where the HB Group is required by laws, rules or regulations to maintain such records or where it has reason to know of a threatened or pending government investigation or litigation relating to such records.


COMPANY ASSETS


Use of Company Property


All HB Personnel should endeavor to protect the HB Group’s assets and ensure their efficient use.  The HB Group’s assets (such as funds, products or proprietary information) may be used only for legitimate business purposes. Theft, carelessness, and waste have a direct impact on the HB Group’s profitability.  Any suspected incident of fraud or theft should be reported immediately to your department head or the head of the Legal group for investigation. Any employee theft or fraud will result in immediate termination of the responsible employee. In such circumstances, management reserves the right to seek criminal prosecution or pursue civil charges where appropriate based on the nature of the offending behaviour.


Information Technology


The HB Group’s information technology systems, including computers, e-mail, intranet and internet access, telephones and voice mail are the property of the HB Group and are to be used


5


primarily for business purposes in compliance with the Company’s Information Technology Policy.


Electronic documents and messages (including voice-mail, e-mail and SMS) sent, received, created or modified by HB Personnel are considered HB Group property and HB Personnel should recognize that they are not “personal” or “private”.  Unless prohibited by law, the Company reserves the right to access and disclose (both internally and externally) electronic documents and messages, as well as, to specify, configure and restrict its electronic systems as necessary for its business purposes.  HB Personnel should use good judgment and not access, send messages or store any information that they would not want to be seen or heard by others.


WORKPLACE


A Nondiscriminatory  and Harrassment-Free Workplace


The HB Group fosters a work environment in which all individuals are treated with respect and dignity. The HB Group is an equal opportunity employer and does not discriminate against HB Personnel or potential employees, officers or directors on the basis of race, color, religion, sex, national origin, age, sexual orientation or disability or any other category protected by applicable laws The HB Group is committed to actions and policies to assure fair employment and will not tolerate discrimination by HB Personnel.


The HB Group will not tolerate harassment of HB Personnel, customers or suppliers in any form.


Sexual Harassment


Sexual harassment is illegal and all HB Personnel are prohibited from engaging in any form of sexually harassing behavior. Sexual harassment means unwelcome sexual conduct, either visual, verbal or physical, and may include, but is not limited to, unwanted sexual advances; unwanted touching and suggestive touching, language of a sexual nature, telling sexual jokes, innuendoes, suggestions, suggestive looks and displaying sexually suggestive visual materials.


Substance Abuse


The HB Group is committed to maintaining a safe and healthy work environment free of substance abuse. HB Personnel are expected to perform their responsibilities in a professional manner and, to the degree that job performance or judgment may be hindered, be free from the effects of drugs and/or alcohol.


Workplace Violence


The workplace must be free from violent behavior. Threatening, intimidating or aggressive behavior, as well as bullying, subjecting to ridicule or other similar behavior toward fellow employees or others in the workplace will not be tolerated.


Employment of Family Members


Employment of more than one family member at an HB Group office or other premises is permissible but the direct supervision of one family member by another is not permitted unless


6


otherwise authorized by the Chair of the Audit Committee. Except for summer and co-op students, indirect supervision of a family member by another is also discouraged and requires the prior approval of the Chair of the Audit Committee. If allowed, any personnel actions affecting that employee must also be reviewed and endorsed by the Chair of the Audit Committee.


Health and Safety


The HB Group is committed to providing a healthy and safe workplace in compliance with applicable laws. HB Personnel must be aware of the safety issues and policies that affect their job, other HB Personnel and the community in general.


WAIVERS OF THE CODE


Any waiver of this Code for directors or members of senior management (Vice President and above) may be made only by the Board of Directors (or a committee of the Board of Directors to whom that authority has been delegated) and will be disclosed promptly2 if required by law or stock exchange regulation, including the filing of a material change report describing the date of waiver, the parties involved, the reasons of the Board of Directors for approving the waiver or not sanctioning the respective departure and any measures taken by the Board of Directors to address the situation.  Waivers for other HB Personnel may be provided by the Chief Executive Officer.


REPORTING ANY ILLEGAL OR UNETHICAL BEHAVIOR


HB Personnel are encouraged to talk to their supervisors, department head or other appropriate personnel about observed illegal or unethical behavior and about the best course of action in a particular situation.  It is the policy of the HB Group not to allow retaliation for reports of misconduct by others made in good faith.  It is, at the same time, unacceptable to file a report knowing that it is false.  All HB Personnel are expected to cooperate in internal investigations of misconduct.


Procedures for the confidential and anonymous reporting of complaints concerning accounting, internal accounting control and auditing matters are provided in the Company’s Whistleblower Policy.


COMPLIANCE PROCEDURES


HB Personnel must endeavour to ensure prompt and consistent action against violations of this Code.  As situations that arise may not be clear cut the following steps provide an approach a new situations that may raise issues associated :


2  The Canadian Securities Administrators consider that conduct of directors or executive officers that constitutes a material departure from the Code, whether or not sanctioned by the Board of Directors, will likely constitute a “material change” (which would require the Company to issue a press release forthwith and to file a material change report within ten days of the change).


7


·                                          Make sure you have all the facts.  In order to reach the right solutions, we must be as fully informed as possible.


·                                          Ask yourself: What specifically am I being asked to do and does it seem unethical or improper?  Use your judgment and common sense - if something seems unethical or improper, it probably is.


·                                          Discuss the problem with your supervisor, department head or Head of the Legal group.


·                                          You may report ethical violations in confidence and without fear of retaliation.  If your situation requires that your identity be kept secret, your anonymity will be protected.  The HB Group does not permit retaliation of any kind against employees for good faith reports of ethical violations.


·                                          Always ask first, act later:  If you are unsure of what to do in any situation, seek guidance before you act.


APPLICABLE LAW


The provisions of this Code of Business Conduct and Ethics will be modified, as and to the extent necessary, to comply with applicable laws, regulations or policies imposed by the various jurisdictions in which the HB Group and HB Personnel operate.


8


EX-99.6 7 a13-8934_1ex99d6.htm EX-99.6

Exhibit 99.6


Certification by the Chief Executive Officer Pursuant to

Section 302 of the Sarbanes-Oxley Act of 2002


I, David Garofalo, certify that:


1)             I have reviewed this annual report on Form 40-F of HudBay Minerals Inc.;


2)             Based on my knowledge, this report does not contain any untrue statement of a material fact or omit to state a material fact necessary to make the statements made, in light of the circumstances under which such statements were made, not misleading with respect to the period covered by this report;


3)             Based on my knowledge, the financial statements, and other financial information included in this report, fairly present in all material respects the financial condition, results of operations and cash flows of the issuer as of, and for, the periods presented in this report;


4)             The issuer’s other certifying officer and I are responsible for establishing and maintaining disclosure controls and procedures (as defined in Exchange Act Rules 13a-15(e) and 15d-15(e)) and internal control over financial reporting (as defined in Exchange  Act Rules 13a-15(f) and 15d-15(f)) for the issuer and have:


(a)         Designed such disclosure controls and procedures, or caused such disclosure controls and procedures to be designed under our supervision, to ensure that material information relating to the issuer, including its consolidated subsidiaries, is made known to us by others within those entities, particularly during the period in which this report is being prepared;


(b)         Designed such internal control over financial reporting, or caused such internal control over financial reporting to be designed under our supervision, to provide reasonable assurance regarding the reliability of financial reporting and the preparation of financial statements for external purposes in accordance with generally accepted accounting principles;


(c)          Evaluated the effectiveness of the issuer’s disclosure controls and procedures and presented in this report our conclusions about the effectiveness of the disclosure controls and procedures, as of the end of the period covered by this report based on such evaluation; and


(d)         Disclosed in this report any change in the issuer’s internal control over financial reporting that occurred during the period covered by the annual report that has materially affected, or is reasonably likely to materially affect, the issuer’s internal control over financial reporting; and


5)             The issuer’s other certifying officer and I have disclosed, based on our most recent evaluation of internal control over financial reporting, to the issuer’s auditors and the audit committee of the issuer’s board of directors (or persons performing the equivalent functions):


(a)         All significant deficiencies and material weaknesses in the design or operation of internal control over financial reporting which are reasonably likely to adversely affect the issuer’s ability to record, process, summarize and report financial information; and


(b)         Any fraud, whether or not material, that involves management or other employees who have a significant role in the issuer’s internal control over financial reporting.


Date: March 28, 2013


/s/ David Garofalo


David Garofalo


Chief Executive Officer


(Principal Executive Officer)


EX-99.7 8 a13-8934_1ex99d7.htm EX-99.7

Exhibit 99.7


Certification by the Chief Financial Officer Pursuant to

Section 302 of the Sarbanes-Oxley Act of 2002


I, David S. Bryson, certify that:


1)             I have reviewed this annual report on Form 40-F of HudBay Minerals Inc.;


2)             Based on my knowledge, this report does not contain any untrue statement of a material fact or omit to state a material fact necessary to make the statements made, in light of the circumstances under which such statements were made, not misleading with respect to the period covered by this report;


3)             Based on my knowledge, the financial statements, and other financial information included in this report, fairly present in all material respects the financial condition, results of operations and cash flows of the issuer as of, and for, the periods presented in this report;


4)             The issuer’s other certifying officer and I are responsible for establishing and maintaining disclosure controls and procedures (as defined in Exchange Act Rules 13a-15(e) and 15d-15(e)) and internal control over financial reporting (as defined in Exchange  Act Rules 13a-15(f) and 15d-15(f)) for the issuer and have:


(a)         Designed such disclosure controls and procedures, or caused such disclosure controls and procedures to be designed under our supervision, to ensure that material information relating to the issuer, including its consolidated subsidiaries, is made known to us by others within those entities, particularly during the period in which this report is being prepared;


(b)         Designed such internal control over financial reporting, or caused such internal control over financial reporting to be designed under our supervision, to provide reasonable assurance regarding the reliability of financial reporting and the preparation of financial statements for external purposes in accordance with generally accepted accounting principles;


(c)          Evaluated the effectiveness of the issuer’s disclosure controls and procedures and presented in this report our conclusions about the effectiveness of the disclosure controls and procedures, as of the end of the period covered by this report based on such evaluation; and


(d)         Disclosed in this report any change in the issuer’s internal control over financial reporting that occurred during the period covered by the annual report that has materially affected, or is reasonably likely to materially affect, the issuer’s internal control over financial reporting; and


5)             The issuer’s other certifying officer and I have disclosed, based on our most recent evaluation of internal control over financial reporting, to the issuer’s auditors and the audit committee of the issuer’s board of directors (or persons performing the equivalent functions):


(a)         All significant deficiencies and material weaknesses in the design or operation of internal control over financial reporting which are reasonably likely to adversely affect the issuer’s ability to record, process, summarize and report financial information; and


(b)         Any fraud, whether or not material, that involves management or other employees who have a significant role in the issuer’s internal control over financial reporting.


Date: March 28, 2013


/s/ David S. Bryson


David S. Bryson


Chief Financial Officer


(Principal Financial Officer)


EX-99.8 9 a13-8934_1ex99d8.htm EX-99.8

Exhibit 99.8


CERTIFICATION PURSUANT TO


18 U.S.C. §1350,


AS ADOPTED PURSUANT TO


SECTION 906 OF THE SARBANES-OXLEY ACT OF 2002


In connection with the Annual Report of HudBay Minerals Inc. (the “Registrant”) on Form 40-F for the period ended December 31, 2012, as filed with the Securities and Exchange Commission on the date hereof (the “Report”), I, David Garofalo, Chief Executive Officer of the Registrant, hereby certify, pursuant to 18 U.S.C. §1350, as adopted pursuant to Section 906 of the Sarbanes-Oxley Act of 2002, that, to the best of my knowledge:


(1) the Report fully complies with the requirements of Section 13(a) or 15(d) of the Securities Exchange Act of 1934; and


(2) the information contained in this Report fairly presents, in all material respects, the financial condition and results of operations of the Registrant.


March 28, 2013


/s/ David Garofalo


David Garofalo


Chief Executive Officer


(Principal Executive Officer)


EX-99.9 10 a13-8934_1ex99d9.htm EX-99.9

Exhibit 99.9


CERTIFICATION PURSUANT TO


18 U.S.C. §1350,


AS ADOPTED PURSUANT TO


SECTION 906 OF THE SARBANES-OXLEY ACT OF 2002


In connection with the Annual Report of HudBay Minerals Inc. (the “Registrant”) on Form 40-F for the period ended December 31, 2012, as filed with the Securities and Exchange Commission on the date hereof (the “Report”), I, David S. Bryson, Chief Financial Officer of the Registrant, hereby certify, pursuant to 18 U.S.C. §1350, as adopted pursuant to Section 906 of the Sarbanes-Oxley Act of 2002, that, to the best of my knowledge:


(1) the Report fully complies with the requirements of Section 13(a) or 15(d) of the Securities Exchange Act of 1934; and


(2) the information contained in this Report fairly presents, in all material respects, the financial condition and results of operations of the Registrant.


March 28, 2013


/s/ David S. Bryson


David S. Bryson


Chief Financial Officer


(Principal Financial Officer)


EX-99.10 11 a13-8934_1ex99d10.htm EX-99.10

Exhibit 99.10


LETTER OF CONSENT


I, Cashel Meagher, P.Geo., refer to (i) the Annual Report (“Annual Report”) on Form 40-F of HudBay Minerals Inc. (the “Registrant”) filed with the Securities and Exchange Commission on March 28, 2013 and (ii) Registration Statement No. 333-170295 on Form S-8 and Registration Statement No. 333-185723 on Form F-10 (the “Registration Statements”). I consent to (i) the appearance of my name in the Annual Report and (ii) the incorporation by reference of my name in the Registration Statements.


Yours very truly,


/s/ Cashel Meagher


Cashel Meagher, P.Geo.


Dated: March 28, 2013


EX-99.11 12 a13-8934_1ex99d11.htm EX-99.11

Exhibit 99.11


LETTER OF CONSENT


I, Robert Carter, P. Eng., refer to (i) the Annual Report (“Annual Report”) on Form 40-F of HudBay Minerals Inc. (the “Registrant”) filed with the Securities and Exchange Commission on March 28, 2013 and (ii) Registration Statement No. 333-170295 on Form S-8 and Registration Statement No. 333-185723 on Form F-10 (the “Registration Statements”). I consent to (i) the appearance of my name in the Annual Report and (ii) the incorporation by reference of my name in the Registration Statements.


Yours very truly,


/s/ Robert Carter


Robert Carter, P. Eng.


Dated: March 28, 2013


EX-99.12 13 a13-8934_1ex99d12.htm EX-99.12

Exhibit 99.12


CONSENT OF INDEPENDENT REGISTERED CHARTERED ACCOUNTANTS


We consent to the incorporation by reference in Registration Statement No. 333-170295 on Form S-8 and in Registration Statement No. 333-185723 on Form F-10 and to the use of our reports dated February 20, 2013 relating to the consolidated financial statements of HudBay Minerals Inc. (the “Company”) and the effectiveness of the Company’s internal control over financial reporting appearing in this Annual Report on Form 40-F of the Company for the year ended December 31, 2012.


/s/ Deloitte LLP


Independent Registered Chartered Accountants

Licensed Public Accountants


Toronto, Canada
March 28, 2013


GRAPHIC 14 g89341mmi001.gif GRAPHIC begin 644 g89341mmi001.gif M1TE&.#EAMP`?`/4```````P,#!45%1L;&R0D)"LK*S0T-#L[.T1$1$M+2U14 M5%I:6F-C8VIJ:G%Q<7Q\?/\M%_\T'O\V(?\X)/\^*?]`+/]$,?]30?]J6_]O M8/]Q8O]\;O^$=_^*?82$A(R,C)24E)Z>GJ2DI*VMK;2TM+R\O/^2AO^GG?^Q MJ?^WL/^]M\3$Q,O+R]/3T]O;V__&P/_+Q?_6TO_8U/_^+SQS(`MJ"R`Z`(B)BB)R.`**D(!R&!`3$I>8$3%R-8^0GY\" M"B1[90V@J)`'(*5S2@>IB`A*+@&Q)64TGJBXJ+:,K4L#J8#!2!H3%A45RLL5 M,IS#L;$$(UMDI].0MHD$1ZY)+=H!<4D@`-R?LUO9G[8-2+&,93C2VP"291H2 MSOT4T/3L:4.EH`:[@;$"K`"'Y,'`?$@,Q(I2JD6Z3P-HQ`/UJ]&N3\7*8)C0 MS]D_3A\1?B*@<8F.4Q=5)C)@3`H.`@,-<-%1(M;^`2D,8AG:B`K8M92*($K9 MYV_9R3(U!,I,9*M`JW93(/:S*52UF)75\"H@$ M]Z!A$***(L5R7!(';S76@;0`"L%\I9-!0'B(Z M^480#2VTX,('^07(WTZGA3)"CT8-)F-67WUHF2*V"(A=7`4ZM6(2MZ5U37NI M"*`1A#)%-T>#H,PB$2@)E!$D0A(JN612D$%I4FU4MEBD$F6A<@27*BE71IV? M&.(>1^4L1YJ&4JP)BI-)S#87!5)&HV`C,P*`2U`]:D-`"S]*\:<[06H4:&@EDVI4$YQ(M+E@&AI]$@:>E#P2Z!:R*G`7F)[T!-9"'6YAZJFQ0 M,MHH5')FN@2NBN`R*T(F=@6*(61L^@FF6QR94)+!"IN(8')L$(%<*D+Z:"[^ ME4ZZ)C=IVLAI.*D(9LR9H#@`CK>)P%.3"1$T8RP%%MR`TKE;()=*',^JI-9H M8;JD`W,K??D>H650,^+%]\WQ@IO,3(#!'"[$\J(29"20R@"`$=3""BRPL,(* M>-9(!@E9%D#`S02TJ*<4]"K2;K=%*:M'B[UNH0$$_4PP`0QR^*Z&E@DX MZ9_8>V_I;\#[.-`1HF+!*1WBZ?"KD`"["UT*K214`HK,Z#;#(NW0] MOKCL\?Q`H<'M[5!*``\)V-HO(C1LTX`;OA(L5'H7^RF;^N+DVP"!"$(@@@(2 MD(#64H49.$*X[!W.2JC3QE`,1P^R1.HNHH.)H?RB`U&127*IP-9@QE>ZX8FM M>-IH``7E,(++3>4`1X`1["RS`/-]9S![(`-[$L@F)9`P>*;3W?QCD;C/M\%L035D8F!?B`K4A&`@7H;R`! F((`"/B!".9Q/$0,X@`,5QJ`$FJ$"?&4`("060X8?;H]J GRAPHIC 15 g54121mm07i001.gif GRAPHIC begin 644 g54121mm07i001.gif M1TE&.#EAMP`?`/4```````P,#!45%1L;&R0D)"LK*S0T-#L[.T1$1$M+2U14 M5%I:6F-C8VIJ:G%Q<7Q\?/\M%_\T'O\V(?\X)/\^*?]`+/]$,?]30?]J6_]O M8/]Q8O]\;O^$=_^*?82$A(R,C)24E)Z>GJ2DI*VMK;2TM+R\O/^2AO^GG?^Q MJ?^WL/^]M\3$Q,O+R]/3T]O;V__&P/_+Q?_6TO_8U/_^+SQS(`MJ"R`Z`(B)BB)R.`**D(!R&!`3$I>8$3%R-8^0GY\" M"B1[90V@J)`'(*5S2@>IB`A*+@&Q)64TGJBXJ+:,K4L#J8#!2!H3%A45RLL5 M,IS#L;$$(UMDI].0MHD$1ZY)+=H!<4D@`-R?LUO9G[8-2+&,93C2VP"291H2 MSOT4T/3L:4.EH`:[@;$"K`"'Y,'`?$@,Q(I2JD6Z3P-HQ`/UJ]&N3\7*8)C0 MS]D_3A\1?B*@<8F.4Q=5)C)@3`H.`@,-<-%1(M;^`2D,8AG:B`K8M92*($K9 MYV_9R3(U!,I,9*M`JW93(/:S*52UF)75\"H@$ M]Z!A$***(L5R7!(';S76@;0`"L%\I9-!0'B(Z M^480#2VTX,('^07(WTZGA3)"CT8-)F-67WUHF2*V"(A=7`4ZM6(2MZ5U37NI M"*`1A#)%-T>#H,PB$2@)E!$D0A(JN612D$%I4FU4MEBD$F6A<@27*BE71IV? M&.(>1^4L1YJ&4JP)BI-)S#87!5)&HV`C,P*`2U`]:D-`"S]*\:<[06H4:&@EDVI4$YQ(M+E@&AI]$@:>E#P2Z!:R*G`7F)[T!-9"'6YAZJFQ0 M,MHH5')FN@2NBN`R*T(F=@6*(61L^@FF6QR94)+!"IN(8')L$(%<*D+Z:"[^ ME4ZZ)C=IVLAI.*D(9LR9H#@`CK>)P%.3"1$T8RP%%MR`TKE;()=*',^JI-9H M8;JD`W,K??D>H650,^+%]\WQ@IO,3(#!'"[$\J(29"20R@"`$=3""BRPL,(* M>-9(!@E9%D#`S02TJ*<4]"K2;K=%*:M'B[UNH0$$_4PP`0QR^*Z&E@DX MZ9_8>V_I;\#[.-`1HF+!*1WBZ?"KD`"["UT*K214`HK,Z#;#(NW0] MOKCL\?Q`H<'M[5!*``\)V-HO(C1LTX`;OA(L5'H7^RF;^N+DVP"!"$(@@@(2 MD(#64H49.$*X[!W.2JC3QE`,1P^R1.HNHH.)H?RB`U&127*IP-9@QE>ZX8FM M>-IH``7E,(++3>4`1X`1["RS`/-]9S![(`-[$L@F)9`P>*;3W?QCD;C/M\%L035D8F!?B`K4A&`@7H;R`! F((`"/B!".9Q/$0,X@`,5QJ`$FJ$"?&4`("060X8?;H]J GRAPHIC 16 g89341mm01i001.jpg GRAPHIC begin 644 g89341mm01i001.jpg M_]C_X``02D9)1@`!`0$`8`!@``#_VP!#``H'!P@'!@H("`@+"@H+#A@0#@T- M#AT5%A$8(Q\E)"(?(B$F*S7J#A(6&AXB)BI*3E)66EYB9FJ*CI*6FIZBIJK*SM+6VM[BYNL+#Q,7& MQ\C)RM+3U-76U]C9VN'BX^3EYN?HZ>KQ\O/T]?;W^/GZ_\0`'P$``P$!`0$! M`0$!`0````````$"`P0%!@<("0H+_\0`M1$``@$"!`0#!`<%!`0``0)W``$" M`Q$$!2$Q!A)!40=A<1,B,H$(%$*1H;'!"2,S4O`58G+1"A8D-.$E\1<8&1HF M)R@I*C4V-S@Y.D-$149'2$E*4U155E=865IC9&5F9VAI:G-T=79W>'EZ@H.$ MA8:'B(F*DI.4E9:7F)F:HJ.DI::GJ*FJLK.TM;:WN+FZPL/$Q<;'R,G*TM/4 MU=;7V-G:XN/DY>;GZ.GJ\O/T]?;W^/GZ_]H`#`,!``(1`Q$`/P#U#Q'XBL_# M&E'4;Y)6A#JF(ERV3TKE/^%S^&?^??4/^_(_^*J?XP_\B,W_`%]1_P!:\'JX MI-$2DTSW)/C+X:=U407^6(`S"/\`&N_!R,U\HP?\?,7_`%T7^=?5P^Z*4E8< M7<*XG5/BMH&DZI-9_Z^WHBKA)V/5/ M^%S^&O\`GWU#_OR/_BJZ'PMXRTWQ^L?[\7\FIN*2)4FV>K5FZYK5MH-B+RZ61HRX3$8RM>45H:!_P`C#IW_`%\I_P"A"N15YMGU%7)L+&G*2OHGU/YE@>"_W1.R-B(8R#@]ZC_X7/X9_P"??4/^_(_^*KQG5?\`D,7W M_7S)_P"A&JE::9G!1SN>(>JG^E)Q[%*?<]]KC]?^)FB>'=7ETN]ANVFB"EC'&"O(R. MX_\`"Y_#/_/# M4/\`OR/_`(JKEG\6O"5TX1[N:V)[SPD#\QFO`J*.5!SL^JK.^M-0MEN;*YBN M(6Z/$X8'\JL5\S^%O%%]X5U5+NUD8PEAY\&?EE7OQZ^AKZ2M;F*\M(;J%MT4 MR!T/J",BH:L6GAZ!>ZG(1_H\190>[=%'XG%(HYO5/BOX>TG5 M+C3YH[N22V:5BTDC%G8 M]R3DTVM.5&7.SW>S^+_AN\O8+58[R-II%C#R1`*I)P"3GI7=$X!(&?:OD[.. M1P1T-?2O@S61K_A2QORV96C"2_[Z\'^6?QJ9*Q497.?N/B_X?M+F6VN+348Y MHG*.AA&5(X(^]4?_``N?PS_S[ZA_WY'_`,56#\8?"GE2IXDM(_DD(CNP!T;H MK_CT/X5Y9323$Y-'T9X8\>:-XLNIK:P\^.:%`Y29`I9'=; MF\.Z]:ZI!DF%_G4?QH>&7\17TO:7<%[90W=O('AF0.C>H(S2DK%1=S+\3^+= M,\)VD5QJ)D/G/L1(EW,>,DX]!_6N:_X7/X:_Y]]0_P"_(_\`BJ\V^(?B7_A) M/%$TD3YM+7,-OZ$`\M^)_3%^L?[\7\FKR.O7/@= M_P`>^L?[\7\FIRV%'<]6KDOB3_R+`_Z^$_K76UR7Q)_Y%@?]?"?UKGJ?`ST\ MO_WJGZH\IK0T#_D8=._Z^4_]"%9]:&@?\C#IW_7RG_H0KSX[H^\K_P`*7HSW M*BBBO3/S8^6=5_Y#%]_U\R?^A&JE6]5_Y#%]_P!?,G_H1JI6Q@=CX1^'-UXN MTI[^#48;94E,6QXRQ)`!SQ]:T[_X+Z[;6[26=]:WCJ,^5@H3]">*ZOX+_P#( MH7'_`%^-_P"@K7H50Y.YHHJQ\I7%M/9W,EM?;Y/09PP M_,@_B:Y/XJ?\E`OO]R/_`-!%1?#*Y:U\?Z:0>)2\3>X*G_`5+\5/^2@7W^Y' M_P"@BI^T/[)R%=Y\*_#6D>([W48]6M/M"PQHT8+LN"2<]#7!U?TK7=5T-Y'T MN^EM&E`#F/'S`=.HJF);GK?B_P"&GAJU\,WM[86YLI[6)I5<2L0<3IMGHL;?-GYG^5>GFOG#Q[K7]N^,+ZZ1 MMT,;^3%Z;5XS^)R?QI16I4GH<[3MCF,R;3L!VEL<9]*;7IVG>#_.^#-S<>5F M[E_1A_(UY56MX6U MAM!\36.I`D)%*!(/5#PWZ&DU=`G9GTI?V-OJ5C/9748D@G0HZGN#7S5XET&X M\-:[<:9/DB,YC?'^L0_=;_/>OIM75T#*0589!'<5Q'Q2\)_V]H7V^UCW7U@" MZXZR1_Q+_4?_`%ZB+LS22NCP:NTTGX@7&F^`;S00S_:6;9;2#^"-L[_RYQ_O M>U<7UZ45I:YDG8*GL;*XU*^@L;1#)/<.$C4=R:@KUWX/^$_*A;Q)>1_/(#': M`CHO\3_CT'MGUH;L-*[._P##.@V_AO0K?3+?!\M\?&'_D1F_Z^H_ZUX/6D=C*>X=:L_V;J'_0/N_^_#_X M5#!_Q\1?[Z_SKZN7H*-RDB,C`X*L,$ M?45]8U\U>./^1XUG_K[>DI7!QL85>M?`YQY>L)GG=$2UWOP@U=-/\6- M92MM2_B*+G^^.1_6G+84=SW6N5^(L+R^%791GRI4=OIT_K74U'<6\5U`\$T8 MDCD4JZMT(-827,FCLH5?8U8U.SN>`UJ>&87N/$VG(@R1.K?@.3_*NQN_A=$\ MY:SU%HHR>$D3<5_'-;GAOP=9^'G:<2-<7+#;YKC&T>@':N2-&7-J?5XG.,,Z M,E!W;6UCH1THH%9/BK68]!\-7VHNP#1Q$1CU<\*/S(KM/CCYMU-@^K7CJ$='DT] M],DNB\QEWK*%`R`,8Q[5LW_QNN)(&73]&6&4C`>>7<%]\`#-9N+N:*2L'QMU M**2ZTS3$8&2%7FD`_AW8`_D:\LJQ?W]UJ=]+>WL[3W$S;G=N_P#@/:J]:)61 M#=V=1\-;=KCQ_I84?ZMFD/T"FI_BI_R4"^_W(_\`T$5TOP6T)SO2H0BK] MG@)[GJQ'Z#\ZYKXJ?\E`OO\`E4:]"^$FN:7H=]J4FJ7T-HLL2!#*V-Q!.<53V$M6O%/B!K=CX@\63WVG` MFWV+&)"N/,('WL?YZ5*;8VDCG8)YK6=9[>9X94.5>-BK#\17N'PQ\<3^)+>7 M3=3P>-] M:_L'PE?WJMB7R_+A_P!]N!^77\*^;/UKU+XU:UYEW8Z)&_$:_:)@/4\*/RR? MQKRVE%:!)ZDD$:2W$44DHB1W"M(W1`3R?PKZ`M_'/@BVL([&/6[;R(XA$%PW MW0,8Z>E?/=%-JXD[%K5(;:WU2ZALIUGMDE80R+T9,\'\JJT44Q'T-\-=;_MK MP9:%VW3VO^CR9Z_+T/Y8KJSR*\3^#6M?8_$$^DR-B.^CW(#_`,]%Y_49_*O; M:RDK,UB[H^?OB9X73PYXC,ML`MI?9EB4?P-GYE^F3D?6N.KU3XX_\?6C_P"Y M+_-:\KK2.QG+%?"#_`)'M/^O:3^E>]5$MRX;!1114EG"_&'_D1F_Z^8_ZUX/7 MTQXK\-Q>*]%.F37,ENAD63?&`3QVYKB?^%'Z=_T&KO\`[]K5Q:2,Y1;9Y!!_ MQ\Q?]=%_G7U5(Y!KU_\`X4?IW_0:N_\`OVM'_"C]._Z#5W_W[6JYD1RLZ'P+ MX\L_%-DL,[I#JD:_O82<;_\`:7U'MVKKJ\SC^"=E#*LL6O7L%0_\`WT.OXU#MT-%?J:]%%1RK(T;")PCD<,5W M8_"D,;=74%E;O<7,R0PQC<\CM@*/K7@_Q%\<_P#"57RVEB673+9LIG@S-_>( M]/2O1M>^'5UXE?.J>*+V2,'*PI$BQK_P$?S-8_\`PH_3O^@U=_\`?M:I61$K ML\=HKV+_`(4?IW_0:N_^_:T?\*/T[_H-7?\`W[6KYD3RL\=HKV+_`(4?IW_0 M:N_^_:T]/@AI0;,FL7C#T"(*.9!RL\:KI_!_@74O%ETCA&MM/#?O+IAP1Z)Z MG]*];TKX6^%=+D64V37DB\AKI]XS_N\#]*ZY(TB14C1411A548`%2Y=AJ'!=J*/\]:\'^*G_)0+[_)OA;9^)=#T5[%_PH_3O^@U=_\`?M:/^%'Z=_T&KO\` M[]K5\R(Y6>.T5[%_PH_3O^@U=_\`?M:DB^".DJV9=6O7'HJJO]*.9!R,\9KV M/X4^$9]'MY_$&J1F"2:+;"CC!2/J6/IG`_"NHT3X>>&M!E6>VL!-<+RLUP?, M8?3/`_`5M:QIQU72+K3Q4^6#V0<*/R`K+KV+_`(4?IW_0:N_^_:T?\*/T[_H-7?\`W[6GS(GE9F^$ MOA18ZYX@`P*FJ+LOE1Y)XB^$%AIGA^]OM/O;N:XMHC(LXKS-_@AIC2,RZQ=(I)(41KP/2J4NY+CV/)M*U"72=6M M=1A/[RVE60>^#R/Q'%?4-I=17MG#=0-NBG02(?4$9%>:_P#"C]._Z#5W_P!^ MUKO?#NC?V!HEOI8NI+I;<%4DD`!VYR!QZ4I-,<4T>:?''_CZT?\`W)?YK7E= M?1'C+P);>,I+5[B^FMC;!@/+4'=G'K]*YG_A1^G?]!J[_P"_:U2DDA2BVSE? MA!_R/:?]>LG]*]ZKB/"OPRL_"NM#4X-2GN'$;1[)$4#G'/'TKMZF3NRHJR"B MBBI*"BBB@`HHHH`****`"BBB@`HHHH`****`"BBB@`HHHH`****`"BBB@`HH MHH`****`"BBB@`HHHH`****`"BBB@`HHHH`****`"BBB@`HHHH`****`/__9 ` end GRAPHIC 17 g89341mm01i002.jpg GRAPHIC begin 644 g89341mm01i002.jpg M_]C_X``02D9)1@`!`0$`8`!@``#_VP!#``H'!P@'!@H("`@+"@H+#A@0#@T- M#AT5%A$8(Q\E)"(?(B$F*S7J#A(6&AXB)BI*3E)66EYB9FJ*CI*6FIZBI MJK*SM+6VM[BYNL+#Q,7&Q\C)RM+3U-76U]C9VN'BX^3EYN?HZ>KQ\O/T]?;W M^/GZ_]H`"`$!```_`/9J**************************************** M************************************************************ M*************************PY3J5[KUW:V^IM:0V\,3!4A1BQ8ODDL#_=% M2_V7JW_0PS_^`T7_`,31_9>K?]##/_X#1?\`Q-']EZM_T,,__@-%_P#$T?V7 MJW_0PS_^`T7_`,31_9>K?]##/_X#1?\`Q-']EZM_T,,__@-%_P#$T?V7JW_0 MPS_^`T7_`,31_9>K?]##/_X#1?\`Q-']EZM_T,,__@-%_P#$T?V7JW_0PS_^ M`T7_`,31_9>K?]##/_X#1?\`Q-']EZM_T,,__@-%_P#$T?V7JW_0PS_^`T7_ M`,31_9>K?]##/_X#1?\`Q-']EZM_T,,__@-%_P#$U4U:'6=,TJYODUV21H(R MX1K:+#8['`KHJ*********************************************** M*************************R;+_D:-4_ZX6_\`[4K6HHHHHHHHHHHHHHK) M\4_\BOJ/_7NW\JUJ******************************************** M****************************R;+_`)&C5/\`KA;_`/M2M:BBBBBBBBBB MBBBBLGQ3_P`BOJ/_`%[M_*M:BBBBBBBBBBBBBBBBBBBBBBBBBBBBBBBBBBBB MBBBBBBBBBBBBBBBBBBBBBBBBBBBBBBBBBBBBLFR_Y&C5/^N%O_[4K6K/.N:: M"0;D<77V3[K?Z[&=O3T[]*A?Q1HL=E%>O>@036[W*/L;YHUQN;&,\9''7FD? MQ3I$<0D:>0,9EA\K[/)YH=@64;-N[D`D<5)_PD6D$:>1>HPU,[;0J"1(<9ZX MX_''I3X-@SCNI!STI[>(],%RELLL MLLSM(H2*"1SE&"OG`X`)`R>*6U\1:5>74EM#74]M;R&1X&*2$(VT,. MH#8P2.X!XJE'XMT*6XCMTU!3++#).BE&&Y(V*N1QV*MQUXJQ#KNG7$\4,,YE M>5$D&R-B%5AE=QQA#I6OS>?:!YAU?[;CS7V^5MQMV?=W>^/QJG)X(U&;1! MIK7-J/LNGRV5LX+?O-Y7YG&/EP%'`SUJ;4O"6IZE=#4)'M15F\AB10F3QQUW88?2F:=X2UBRN=/NK MFXMKN:W-P9F6>6'<9)%8-\H.>%Y4\9--;P1J40N6M+Z%9+M+F*1G9V$:RR[@ MT8_A;;D$#`)QZ5,GA35[*\26VN[6YCBOEO$24&'GRFC8?*I`_A(X]:TM.T.Z MM/$EQJ0:*V@G1O.@@D=EGD)&'*D84@#&1USS6&W@*_-@Z+>6Z7<=NZVTH#82 M0S2/SQ]TK)M/XUK:-H.IZ%)*+>2TECN8H?,,C,"DB1!#@`<9K.\4_\BOJ/_7NW\JUJ******************* M*****************************************************R;+_D:- M4_ZX6_\`[4K6HHHHKG=:UVXT^_N(X0"(+:(A6^Z7EE\M2>^%P3^-/O-*JS>*;J]T^WGT^UV(TL"SRM(/W>Z?RR`I&6Z-SQU'X.N/%@D:<08 M3[)+`S%#O$L3R>7C)``.?0GIUKJ:****R?%/_(KZC_U[M_*M:BBBBBBBBBBB MBBBBBBBBBBBBBBBBBBBBBBBBBBBBBBBBBBBBBBBBBBBBBBBBBBBBBBBBBBBB MBLFR_P"1HU3_`*X6_P#[4K6HHHHJA/I,%QJ+W0]I&8^2`.,$MO)!['=SGU MJ(>'-'7R,6$0^SG,0Y^4[MX/O\W//>HG\,Z:#_HT*V^^6-Y=HSYBHV\)ST&X MYXK8HHHHK)\4_P#(KZC_`->[?RK6HHHHHHHHHHHHHHHHHHHHHHHHHHHHHHHH MHHHHHHHHHHHHHHHHHHHHHHHHHHHHHHHHHHHHHHHHK)LO^1HU3_KA;_\`M2M: MBBBBBBBBBBBBBBLGQ3_R*^H_]>[?RK6HHHHHHHHHHHHHHHHHHHHHHHHHHHHH MHHHHHHHHHHHHHHHHHHHHHHHHHHHHHHHHHHHHHHHHHHHK)LO^1HU3_KA;_P#M M2M:BBBBBBBBBBBBBBLGQ3_R*^H_]>[?RK6HHHHHHHHHHHHHHHHHHHHHHHHHH MHHHHHHHHHHHHHHHHHHHHHHHHHHHHHHHHHHHHHHHHHHHHHHK(LV4>*-4R0/W% MOW_ZZ5J[U_O#\Z-Z_P!X?G1O7^\/SHWK_>'YT;U_O#\Z-Z_WA^=&]?[P_.C> MO]X?G1O7^\/SHWK_`'A^=&]?[P_.C>O]X?G1O7^\/SHWK_>'YT;U_O#\ZRO% M+K_PB^H_,/\`CW;O[5KT4444444444444444444444444444444444444444 M444444444444444444444444444444453NM'TR^F\Z\TZUN),;=\L*LV/3)' MN:@_X1O0O^@+8?\`@,G^%'_"-Z%_T!;#_P`!D_PH_P"$;T+_`*`MA_X#)_A1 M_P`(WH7_`$!;#_P&3_"C_A&]"_Z`MA_X#)_A1_PC>A?]`6P_\!D_PH_X1O0O M^@+8?^`R?X5E>(]%TFSTQ);;2K&)S=VZ%EMD^ZTJJPZ=P2*U?^$;T+_H"V'_ M`(#)_A1_PC>A?]`6P_\``9/\*/\`A&]"_P"@+8?^`R?X4?\`"-Z%_P!`6P_\ M!D_PH_X1O0O^@+8?^`R?X4?\(WH7_0%L/_`9/\*/^$;T+_H"V'_@,G^%*/#F MA@@C1K`$<@_9D_PK2HHHHHHHHHHHHHHHHHHHHHHHHHHHHHHHHHHHHHHHHHHH MHHHHHHHHHHHHHHHHHHHHHHHHHHHHHHHHHHHHHK$\6?\`('C_`.OVU_\`1Z5M MT44444444444444444444444444444444444444444444444444444444444 M44444444444444444444444444445B>+/^0/'_U^VO\`Z/2MNBBBBBBBBBBB MBBBBBBBBBBBBBBBBBBBBBBBBBBBBBBBBBBBBBBBBBBBBBBBBBBBBBBBBBBBB MLW6M5DTJ&V,-H;N:YG$$<8D"9)!.23TX4U5_M7Q!_P!"T/\`P/3_``H_M7Q! M_P!"T/\`P/3_``H_M7Q!_P!"T/\`P/3_``H_M7Q!_P!"T/\`P/3_``H_M7Q! M_P!"T/\`P/3_``H_M7Q!_P!"T/\`P/3_``H_M7Q!_P!"T/\`P/3_``H_M7Q! M_P!"T/\`P/3_``H_M7Q!_P!"T/\`P/3_``H_M7Q!_P!"T/\`P/3_``H_M7Q! M_P!"T/\`P/3_``H_M7Q!_P!"T/\`P/3_``H_M7Q!_P!"T/\`P/3_``H_M7Q! M_P!"T/\`P/3_``H_M7Q!_P!"T/\`P/3_``H_M7Q!_P!"T/\`P/3_``K/UJ;Q M'J-@D">&\%;B&3_C^CZ)(K'MZ"M#^U?$'_0M#_P/3_"C^U?$'_0M#_P/3_"C M^U?$'_0M#_P/3_"C^U?$'_0M#_P/3_"C^U?$'_0M#_P/3_"C^U?$'_0M#_P/ M3_"C^U?$'_0M#_P/3_"C^U?$'_0M#_P/3_"C^U?$'_0M#_P/3_"C^U?$'_0M M#_P/3_"C^U?$'_0M#_P/3_"C^U?$'_0M#_P/3_"C^U?$'_0M#_P/3_"C^U?$ M'_0M#_P/3_"C^U?$'_0M#_P/3_"C^U?$'_0M#_P/3_"C^U?$'_0M#_P/3_"C M^U?$'_0M#_P/3_"I=,UF[N]3FTZ^TPV4T4*3#]^L@969E[=.5-:]%%%%%%%% M%%%%%%%%%%%%%%%%%%%%%%%%%%%%%%%%%%%%%%%%%%%%8?B/_CZT/_L)K_Z+ MDK1!=0EHD#R+Y@RBGH3Z#WJ<$,H92"",@CO2T44444444444 M44444444444444457.H62Q32F\@$=NVV9O,&(SZ,>QY[TG]HV.^!/MMONN!N MA7S5S*/5>>?PIT5[:3QI)#=0R([%$9)`0S>@/<\'\JRXO^1YN?\`L&0_^C9* MVZ*********************************************I7^KV&F-&EY<" M)I02B[2Q8#&3@`],C\ZJ_P#"5:+_`,_A_P"_+_\`Q-'_``E6B_\`/X?^_+__ M`!-'_"5:+_S^'_OR_P#\31_PE6B_\_A_[\O_`/$T?\)5HO\`S^'_`+\O_P#$ MT?\`"5:+_P`_A_[\O_\`$UDZYX@TRYN-(:&X=Q#?K)(1!)\J['&3\OJ1^=9F MN:CI][XDBN;164-8SVTEX(R-I<`)_M$#![=ZQ[8+!=V&H,V5M(HH)+,*P>* M=+%O&+B\!FV#S-D,FW=CG'R],U)_PE6B_P#/X?\`OR__`,31_P`)5HO_`#^' M_OR__P`34MIX@TJ^NEM;>[#3."50HREL=<9`K2HHHHHHHHHHHHHHHHHHHHJM M?:A::9`)[R80QE@@)!.6/0`"J/\`PE6B_P#/X?\`OR__`,31_P`)5HO_`#^' M_OR__P`31_PE6B_\_A_[\O\`_$UPT%Q:Q/>M!;M;0C6(K^.';_KHU0!E&.`V M03S[1DZ9/#8&WOGZUJ:?<1:?X@M[F+4 M'-BFY5BDC+;!T+-\OWB`H&WH!@]ZWAK^E#Q*U[]I_=-9B(MY3\L')Q]WT/ZU MH_\`"5:+_P`_A_[\O_\`$T?\)5HO_/X?^_+_`/Q-'_"5:+_S^'_OR_\`\31_ MPE6B_P#/X?\`OR__`,31_P`)5HO_`#^'_OR__P`31_PE6B_\_A_[\O\`_$TA M\5Z(.6O@H]6C<`?B16Q1111111111111111111111111111111111111167/ M_P`C59?]>5Q_Z'#6I1131(A0#3J****:)$9V174LGW@#R/K0)$ M9V0.I9<;E!Y&>F:=161J7_(P:+_OS?\`HLUKT44444444444444444445D:[ M_KM)_P"P@G_H#UKT4444T.C.R*ZEEQN`/(^M.HHHHHHK)\4_\BQJ'_7`UK44 M4444444444444444444444444444444444445ES_`/(U67_7E)W0DLF%&TCYCSC\:R[&\\26EM8V4<%WO'V78KPG:( M_LYWAFQQ^\`SDY%5X'UV*2]U*,7QN)+:T\TR6Q5I'!D,D2$(<!6/<:=K0OM4LXK M:\-KK5U<":3YOW*QDL"/0.ORC'7BI])CUZ);6!8[NU686D<\JP`/M%J=V6*G MD.`,GH>*=82^);B\MVE2ZMGNQ;"ZFCM0K']Q(6R2O&&"]>A..]/TO6M9N=9T MQ=3N[BTC"PI,OE@+),T9;RV&,@DX/4=,8YKOZR-2_P"1AT7_`'YO_19K7HHH MHHHHHHHHHHHHHHHHHK(U[_7:3_V$$_\`0'K7HHKB_%-IK$VM:B^G*1&VA/&2 MT3N';:MZ-?:SK'AW79+QI&D@ADLDC1,%I8T97=<&)[^YT**;4EE6Y:27*S)L8+YC;^ M\6Z9;2644$R74E[+"J+&W1)#@/GI[X[XJP^OVB:O/II5]UK")KB3@+$IR03D MY(X/(!`[TEOXFT2[GC@@U*"221@J*#U)&X?F.1Z]J@NO%FFPQPR6\@ND>Y$# ME"?DRK'=C'S#Y3C'6JMCXIT2>9-258[9+VTCE-Q*=LA^?:J%>O4\'IDUHOXF MT6..WD;4(]MR0(L`G)+;<<#CYN.>_%22ZQ$NJG3H8)KB:-%>!$L_LJQZD_E0-;NZ MF(9D>'.TYSP"#R*OZSX876;^.YEN5C$*L(RD(\P90KC?G)3YB2N.3WJJG@B% M)(6-\Y$3VK8\L#=Y,;)CKWW9]J9I_@2WL$MXTN5Q;2QLD@B(D9$#@*S%B#]_ ML!].:(_`ZJEDKZDS?8HH84Q"!N6.42+GGKP`?SK&N]*_LWQ!']FN8IGA=I5: M9XQ&A,IED\Q2=PVHX((SSCI762:(3K$^IVEYY/VV)([E/+#B15SM*G/RG#$9 MY^E4]-\)RZ4T9!#':PGR1Q`C[BAYY)'&[CZ5LZ8E]'81KJ4T&$U/64U)KMHRBPKY80$'RY?,Z^_2H]+\*G2;K[1; M7[;W5UEW1`[P9&D7'/!!;8$WGN<#@?2I:6BBB MLGQ5_P`BOJ'_`%Q-:U%%%%%%%%%%%%%%%%%%%%%%%%%%%%%%%%%%%%%%9<__ M`"-5E_UY7'_H<-:E%%%<5>ZY,@UB*2ZWO!J]O%%$)=C(C&+/W<'&6/USBH6\ M;ZJD+3F"R*+!)/M`;.U+CRBN<]2"#GMZ&HK7Q#J5OJ)E2;?:11:A(;5B7>9H MI<`*Q/!QT'0#/'HMWXPU6?19%>*WM&GMIG2Z+84A8@V%"N2&RW!)_ASCM6A: M>'KG4=%BF-_M:>W9D!4-O,L*J=Y(SUST/I74VL'V:TAM]V[RHU3/K@8J:BBL MC4O^1AT7_?F_]%FM>BBBBBBBBBBBBBBBBBBBBLC7O]=I/_803_T!ZUZ*XG4M M3O9);@PW$T3'4)80JW*Q`!(QMY<8`SR1WS5G_A(;^X@=D:)8HWLDW%65V:4I MDGG@?-TQS4.FZUJPTR*2:Y@N;L02L2?D4$2*N&4MRP&>,CT]ZOV6J7LFH>>L MT,MI,\*,"C*V63JH)(49[<_6AM1;^U-1EN;]X7L7Q!9*Z@2IL#9((RVXD].F M*KC7;JXFM6,]O+AO,S:D["#$[;&Y.2"`?RX%22^)KJ>>.#3FLV,C*HD;+JN8 M7D/`(S]S'7O6?-XDU"ZCTTO/:V'M2EOKZ]W9$;PVURJEBVPR)RO/ M;Y1^=;U9/BK_`)%?4/\`KB:UJ*********************************** M***RY_\`D:K+_KRN/_0X:U****@-E:-,9C;0F4]7,8W'\?PIWV:#&/(CQ@C& MP=,Y_GS2_9X-RMY,>48LIVCY2>I'N:C6PLU38MI`%W;]HC&-WK]?>IP`JA5` M`'``[4M%%%9&I?\`(PZ+_OS?^BS6O1111111111111111111161KW^NTG_L( M)_Z`]:]%4QI5EYL\CPK+]HD$C)(`RA@H7(!Z<`59,41SF-.2"?E')'2HVLK5 MT='MH65R2X,8(8^I]:D$<8Z(HQCH/3I2-!"TRS-$AE085RHW*/8TD=M!",10 MQQC<6PJ@)EP!M9`1@=!^IH>UM MY4V26\3KP<,@(XZ?E3;:QAM9KB:,'?<,&BBBBBBBBBBBBBBBBBBBBLC7O]=I/ M_803_P!`>M>BBBBBBBBBBBBLGQ5_R*^H?]<36M1111111111111111111111 M11111111111111115#4-(AU">&=KBYMY859%>WE*$JQ!(/KRHJO_`,(\/^@O MJO\`X%'_``H_X1X?]!?5?_`H_P"%'_"/#_H+ZK_X%'_"C_A'A_T%]5_\"C_A M1_PCP_Z"^J_^!1_PH_X1X?\`07U7_P`"C_A69K&F364^F)#K&J`7-ZL,F;G. M5*.?3U45I_\`"/#_`*"^J_\`@4?\*/\`A'A_T%]5_P#`H_X4?\(\/^@OJO\` MX%'_``H_X1X?]!?5?_`H_P"%'_"/#_H+ZK_X%'_"C_A'A_T%]5_\"C_A3[;0 M8;>]BNWO+VYDA#>6)YRRKD8)Q]*U*********************I:GIW]I10J+ MF2VD@E$LI_\`0PW7_?B'_P"(H_LO4_\`H8;K M_OQ#_P#$4?V7J?\`T,-U_P!^(?\`XBC^R]3_`.AANO\`OQ#_`/$5#=:#>7ML M]MHHR/44UI8U.&=0?)Q"<.C%67W!'2JZ^%[0H#]OU7D?]!&;_ M`.*IW_"+6G_/_JO_`(,9O_BJ/^$6M/\`G_U7_P`&,W_Q5'_"+6G_`#_ZK_X, M9O\`XJC_`(1:T_Y_]5_\&,W_`,51_P`(M:?\_P#JO_@QF_\`BJ/^$6M/^?\` MU7_P8S?_`!5'_"+6G_/_`*K_`.#&;_XJC_A%K3_G_P!5_P#!C-_\51_PBUI_ MS_ZK_P"#&;_XJC_A%K3_`)_]5_\`!C-_\51_PBUI_P`_^J_^#&;_`.*IK^$K M&0J7O-38H=R[M0E.T^H^;K3O^$6M/^?_`%7_`,&,W_Q5'_"+6G_/_JO_`(,9 MO_BJ/^$6M/\`G_U7_P`&,W_Q5'_"+6G_`#_ZK_X,9O\`XJC_`(1:T_Y_]5_\ M&,W_`,51_P`(M:?\_P#JO_@QF_\`BJ/^$6M/^?\`U7_P8S?_`!5'_"+6G_/_ M`*K_`.#&;_XJC_A%K3_G_P!5_P#!C-_\51_PBUI_S_ZK_P"#&;_XJC_A%K3_ M`)_]5_\`!C-_\52'PO:!3B_U7I_T$9O_`(JIO#,KS>&[&229YG,0S([;F8^Y M[FM6BBBBBBBBBBBHKEBEK,RG#*C$'TXKG?#^@V-[X>TZZN3<_P#X%2__`!5'_",:7_SSG_\``J7_`.*I&\*Z0ZE7 MAF=3U5KF0@_^/5'_`,(9X?\`^?`_]_Y/_BJ/^$,\/_\`/@?^_P#)_P#%4?\` M"&>'_P#GP/\`W_D_^*H'@SP]WTU#[M(Y/ZFE_P"$-\/?]`R/_OIO\:3_`(0S MP[_T"X_^^F_QI?\`A#?#O_0+B/L68_UH_P"$-\-_]`>V_P"^:/\`A#?#?_0' MMO\`OFC_`(0WPW_T![;_`+YJ6+PKH,*E4TFU`)S_`*L&G_\`"-Z)_P!`JU_[ M]"C_`(1O1/\`H%6O_?H4?\(WHG_0*M/^_0JF^G6&F>(=,^P6-M:F83+(8850 ML`H(!P/6M^BBBBBBBBBBBBBBBBBBBBBBBBBBBBBBLKQ/_P`BUJ'_`%Q-::?Z MM?H*=111111111111111111111116'X,_P"13L?H_P#Z&U;E%%%%%%%%%%%0 MWG_'E/\`]D_]>47_`*`*U:****************R=1_Y&+1_K M/_Z!6M11111111111111111111111111111165XG_P"1:U#_`*XFLWQC=?8[ M72YAJ$UKB^@W)&^T2)O7=NQR5`R3V]:YK5K[Q"L^IM8271O%GN1)&I8A+8!? M*95Z#C)!').:L/)K4>^_TNXFN;6WNG^PP-*Y,R!03R?O+G<,MTQQSBNK\*W< MM[H,4TV\R;F#2,Q82D$Y920/E/;@8K9HHHHHHHHHHHHHHHHKGO'-]=:;X4N[ MRSOQ931`,'(4EN?NC/`S6)JWB+5(=9N#97!E>&Y2*&T7!6:(VYD+XZGYAU![ M8JO:ZQK2'4FN+:)+:9VW+N,LBDM&..1D#Y.OS#FNG\*:O-K.GRW5RC1SF M3YHMP98P1PH(]!USSG-+X,_Y%.Q^C_\`H;5N444444444445#>?\>4__`%S; M^5>?R/JD5AX?-C<,SR6%JMO!',59'W#>Y3HZE..>F#]:O>'+^]L]9N/[0O&G MME01S3K(TJ27#2D)M&/D^4@%1P,#/K63-<:[$EV@O9)5`C2YN$G8PM+Y_))' M,2[,A@O(&*>MUXALM+M]2AN+B>9K=D\N5FQ"H4S MZ/:RF.2,M$#MD8LWYGD_6KM%%%%%%%%%KZ`XU&6`&^"R0(V%="K9 M9L=0#M'/'-O MXUTU%%%%%%%%%%%%%%%%%%%%%%%%%%97B:22+0+AHI9(F+1KOC8JP!=0<$L_^?C4?_!C/_\`%T?\(]9_\_&H_P#@QG_^+H_X M1ZS_`.?C4?\`P8S_`/Q='_"/6?\`S\:C_P"#&?\`^+J.YT&UCMI76XU$,J$@ M_P!HS]1T M;&<$*2#5&VTBYEM8I6U[4]SH&.&B[C_G+H,J`A-;U%03D[3$,GN?]745GX8^P6J6MKK6 MIQPQYVKOC.,G/=/>IO[$G_Z#VI_]]1?_`!%']B3_`/0>U/\`[ZB_^(I'T6X5 M&;^WM3X&?O1?_$59T2>6ZT'3[B=]\LMK&[L1CL_P#GXU'_`,&,_P#\ M71_PCUG_`,_&H_\`@QG_`/BZ/^$>L_\`GXU'_P`&,_\`\71_PCUG_P`_&H_^ M#&?_`.+IO]@V!;;]JO\`=C./[2GS_P"AT[_A'K/_`)^-1_\`!C/_`/%T?\(] M9_\`/QJ/_@QG_P#BZ3PV\CZ)'YDLDK++,@:1RS$"5@,D\G@"M6BBBBBBBBBB MBBBBBBBLCQ3_`,B_/_OQ?^C%K7HHHKAK7QU?"U@NKRP_=&VFE8J5`E*2J@V? M,2!AN-`'DA6P_TA9I$ M$+3A2%12Q9CC`RHR`,Y]14VE^+XM4U"&WCLI(X;AV2.5V&2RQK)@KU'RM^8K M,@\97D&KWB7ZQ?9$EN8H-J8+-$R@`$,3DYYR!VQFK=CXYBO)K6W.G313W;[( MHV8AZE';3HHCDLY9U<[B2Z% M0%P`>#GK[4RS\964ME;37,4D4DK0QN%&51Y(O-ZYZ`9YK(N_'MREUFWM4CMI M3:^2UTI!VRB0[SL)R,(,#KSS6K:^,K9M.TNYO+=H'U':H02(VURVT#&03SQP M#C/.*LVGBFSU&WGDLXY6,-I]I<.H`7EAL;GALH>*PD^($[Z=IC_8(OMESMB?QEIUO=3VC13M<0O&GEQ[&+EWV+C#.W%A//=63,\2 MRR@+^[.U;CR@I!Y!Z$U7UKQGJ$4AN-/B6.U6WNRAD`?SGB9$R5X(P2W&>:LI MXV>QT>[NM0CCDFM+AXVCYAD9%4-DQG)#8.<=,8.1FM.Q\4QWVL_V6EG(LRM) MYA+#Y$"JRN?9MXQ^/I6%9^.;Z);J[O(TN+2$S+)Y,+(8'6;RXD+$D-OSDXZ8 M-::^--ZG9IDF4M9KF7<^T!8C@[<@%LDC!P*T]'UU-7N;F%(&B-ND+DE@=WF( M''Y9Q6K1161X5_Y%JR_W#_Z$:UZ****RO"__`"*^F?\`7JG\JU:Y[7?$-QI. MM6MHD#RPS6D\I$4+2.&0IMZ=!\QS^%4M/\<"2PM9+NU/F.;9)60X4&6'S2P' M7`P1BLZY\9ZN]ZK01?9X+F.T:&,Q"=@LID^8!<$G"KQGBM&W\<"/3M,DO(8G MN;MA'+'%+AHW,GECY>*5U>"Z:WM7C:UMA)*78$)+E@8S[C M;D_45@Z9XUU673DNKM80J"TGFW0-&WDRY#E5)^ZIQANA`/%:^D>(;[4-:@A= M81:727,L)53N*1R*B'.>^2?Q%4X?'4T,,ANK'SC$T[N\3!0L:7'E#@YRW0_G MTK?TS5GU@730VYBMXY'ABG+C+LI*M\O4<@X]?:LNR\.7EMJBWQD&UQ$&ASDQ M[0,\^@P0`.NXYZ5U%%9/AG_D"K_U\3_^CGK6HHHHHHHHHHHHHHHHHK(\4_\` M(OS_`._%_P"C%K7HHJI9:K8:DT@LKN*X\HX?RSD`YQ_0U%>QZ5IVGRW%U;V\ M=K!$P<^2"%0\L,`=#W'>I%TK3"D8&GVNV,EHQY*_*3U(XXZ"F7-CI$-K*]S9 MV:0;_.E+Q+MW?WCQU]ZDMTL9II'A@C\R&5@S>5M(?`R02.>,#(H_LG3?,FD_ ML^UWW`(F;R5S)GKNXY_&HUT73DN[6ZCM8XWLUD$`C4*J;\;B`.,G%3W5[;V0 MA-Q)L\^588^"=SMT'%6**AN_^/.?_KFW\JJ^'_\`D7-,_P"O.+_T`5H445GZ M]_R+VI?]>DO_`*`:LV/_`!X6_P#UR7^0J&YTJTN[O[5*K&7[.]OD,1\CD%AC M\!S5!?!^CK+#((9,0B/:GFMM)1"BDC/)VG'TJ(>"=(14"&[1XS$8Y%N&W)Y8 M8(`>P`Z+F8^8?GW$-S]"H(]#TK%EN?# MEU+%;7#W\G^C2(MP[\20R.(V!(/3..WI6K?>#].N;*>*$-%+(7='9RP5S%Y6 M<9Y&WM2:7X8$6CW6FZDRRVURP*VZ2.R0@`?=9OFZC=[$U6S%QO);+#!W'.3D8X/8"EL])LK/Q->:@L\9N;FWBB6$8#1QIG MWRHHK(\*_P#( MM67^X?\`T(UKT4445E>%_P#D5],_Z]4_E6K5:;3[2XNDNIH%>9(WB5SU"-C< M/QP/RJ@V@:!9R07+V4$30^7'$Q)`!7Y4&,XSS@=^<5##X;\,W"R);VEN^UE# MF*0Y0J25&02>-EU2\::1V`4,TF%5>O/8>_XT^#PYHEG9RV,=C"L%S'Y#QN2V],'":W%M#"DEI"8(0AYCCXRH'IP*@E\/Z&D4GFV4"QR*RN6.`0S M[R#SW?GZU(=`THSM-]C3>\RSDY./,4Y#8S@'//OWK1HHK)\,_P#(%7_KXG_] M'/6M1111111111111111161XI_Y%^?\`WXO_`$8M:]%%<3_PAVK'0/[+2ZBM MI%N&E6ZCN97(!+G`0@!,[MI`/0D]<54;P=K&H-J09H;-9))UCS(S>8K1HJKC M^X""1WR.E7+OP9J5T;E?ML2^;G=*)'#S@RJX#XZ;54J,9Z]J74/!=]?:A?R& MXMQ:W%M)`D1+8P=OEY7'\)4\Y/7@"G7/A#4IQ)MFME2220I#O?9;[D15=,#E MD*G`P!SU%7-+\,WNGZVFH/=I)F2X,QRVZ1'V[`>W!!/X\5GCP7J0 MR6\UQ')+%O;$@5G)XP,95@,9/3K1;>"]3CNM.EN+R"X^R/`V]VX_&NVHJ&[_X\Y_\`KFW\JJ^'_P#D7-,_Z\XO_0!6A116?KW_`"+VI?\` M7I+_`.@&K-C_`,>%O_UR7^0J>BBN$WZEI>H:K]FMKJ\BF8N;I8FCFA+2`;"2 M&#JH)(95)`'0U1CG\3GR]0:TN%NGM(H;B4Q,K!!/)DC"GG;M/"D\YQ6YI%UK MJZQI\=[-+>0S6Q$C1PM&D;#)WMN49S\H[$'^'!S6;<#Q!!+J"67VV%7N+^<% M(MVYE5#%C(/!.0`.O-;.EZIJ"374^JQ7V]614MXK8E/+8+AA@==Q;//&.@Q5 MH>$M-^SQ0D2-Y1PC,Y.U=X?:!T&2`"0,G%;E%%,E_P!4_P#NFJ'AW_D6=+_Z M\X?_`$`5I5F^(_\`D6=4_P"O.7_T`UH)_JU^@IU%%%8&W1A M@<`$*=G!/05HZ5#=:7`/;/M[UJJH50JC``P!2T445D>%?\`D6K+_J?RK5HK'U_>+C1V!(B&H)YGT*.%S_`,"*_I7/Z9I& MJ*)(_)N8%81QR.%6!@!+DA2A^8%2V6//3UJ>[T:\_M7[4MO'\(DMQ=V%P9[59'W.^UR57>S+*B3)DX)P"J@C)Y.3SFNDT2QU"V MO//N9+IO.\_S5EF+J/WI\O`)X^3T[=:WZ**R?#/_`"!5_P"OB?\`]'/6M111 M1111111111111161XI_Y%^?_`'XO_1BUKT45C^(KZ[LTL([2>.![N\6!I)$W MA5*L>!D<_**R+'QI=W$T5DFDR7MQEA)-;G;&5#LBN,]CMR>>/>FK\04GAA>R MTBXNFF<1*B.,[PF^1>G5>GU]*;;>,YK=+O[5`\YAGN)&!(0QPK)L"@`?,XST M_6IG\=JDJQC368R3&&+$XY(F6([N/EY8$>O--_X3W;"6DTIP[#$*)+OWL)O* M(.!P-W?G([=JF7QE(;Q+9])DA8M!&_FR@,CRABHQCIE>3[Y]JU?#>H76J:!: M7MXD23S)N81-E?\`/M6I14-W_P`><_\`US;^55?#_P#R+FF?]><7_H`K0HHK M/U[_`)%[4O\`KTE_]`-6;'_CPM_^N2_R%3T452U:^.G:>TZ*K2,Z1QJW0N[! M5SCW-5K;6Y+EYYDLR;"%Y(_/#Y=F0[3A`.F01G/;I4;>*]+7R03/F52Q`A8^ M6`^QB_'RX;@YJ:7Q!8PS3PN)A+#CY/);,F3M&P?Q<\57L/$T%Q9V\]Q')";B M>2)/W;87$C(NXG[I)`X]35_2;YM1L!/(BI*KO'(JG(5U8J1GZBKM%%,E_P!4 M_P#NFJ'AW_D6=+_Z\X?_`$`5I5F^(_\`D6=4_P"O.7_T`UH)_JU^@IU%%%9V MIZHUA-'&D2R$PRS."V,*@_J2!52/Q/#'`QOH3%*C[2D#&88VABP(`X`//'%7 M(=:LY[IK>,R,0XC\SRSL+%=V`W0\-[A"V50E`1DX MW>N%-*OB6Q>V,R)=,=P"Q"W;S'R,@JN,D8R<^U5T\3>=I+W,-L\EQ%:"YD0* M=@XW;=W]['05L006N\W<,$:R3*"TBH`SCMD]ZGHHHK)\,_\`(%7_`*^)_P#T M<]:U%%%%%%%%%%%%%%%%%9'BG_D7Y_\`?B_]&+6O15(:O9M?R62R,TL7^L8( MQ1#C."V,`XYQFFW4VCWMK']KDLKBWD;*>:R.C'IQG@GG'XTC_P!BN;>1_L+& M,XMV;8=I!Q\I[<\<=Z26#1#%+;RQ6!C23S)8V5,*Y_B8>I]33A'I$OED)9/M M<21G"'#MT8>Y]>]4+;^PK/[2EK:"5UO5BN,1Y82LP<$ENH!<'OCM5S.B3`PC M[!+Y@*>6-AWY^8KCOGKC\:JZ=J7AZZ5U@2UMWMHXI98G1$,(QE,]AC/KQFI; M[5M-T2WB2%8]UPQ,4,`7YB0S;L#L<'FH-.UZ:\O8K=U@*N2I:,MUV;N`>V>, M^];U0W?_`!YS_P#7-OY55\/_`/(N:9_UYQ?^@"M"BBL_7O\`D7M2_P"O27_T M`U9L?^/"W_ZY+_(5/116?K=C)J&FF*$@31RQS1[C@;D<,`3[XQ5:;PU!+#3WD5W#+%WMG>YN7-O()E:>C6,EAI_ES[/.DEDFEV$D;G3+;S@_>*.!]W\5%1WOAG3KNUM[=(8X%MB?+V01L!GK\K*5YP M.U3R:-$T)2*>:!O/$ZR1[HM.T=K#43+OW0Q6J6\)8YD.&+, M6/OE?R-:U%%%%9'A7_D6K+_;B95-Q]H95"\M\O0D97[HZ$=34!\)V)N8)S+,3`FU0=A[$==N1PQX!`] MJLRZ'"_EM'&=EG(MG&7G35+:._\`*M-38R2IY675RH4D-G[O MRC@C\:I7'@2.[69<1S*X6W`C4R!!E5SQ@1^O))YJM?>!);G5)!%<0I9 MW$4XD8Q`M'YC1G:@SP<(?F]3TJRO@5?[4DO9M0\T/,DA5HL[@LHD`;+8[;>` M./4TEKX+:TUS3)TF#VEHCM,N`HE<.QB^7_8WMS["K4WA6:6[NG-^@M[B_BOM MGD?.KILXW;L8.ST[U6M?`<%JEN$NUW01VR!Q``28I&4D&>8U9=JL6 M)52&SCGGOS73B.-=N$4;!A<#[H]!3ZAN_P#CSG_ZYM_*JOA__D7-,_Z\XO\` MT`5H445GZ]_R+VI?]>DO_H!JS8_\>%O_`-<_\`US;^55?#_P#R+FF?]><7 M_H`K0HHK/U[_`)%[4O\`KTE_]`-6;'_CPM_^N2_R%3T44444444444R7_5/_ M`+IJAX=_Y%G2_P#KSA_]`%:59OB/_D6=4_Z\Y?\`T`UH)_JU^@IU%%%%%%%% M%%%%9'A7_D6K+_J?RK5HHHHHHHHHHHHK)\ M,_\`(%7_`*^)_P#T<]:U%%%%%%%%%%%%%%%%%9'BG_D7Y_\`?B_]&+6O1114 M<\$5S!)!/&LD4BE71AD,#U!IR(L:*BJ`JC`'H*=28J.YMH;RWDM[B)98I!M= M&'##T-2`8&!2T45#=_\`'G/_`-_P"1 M>U+_`*])?_0#5FR_X\+?_KDO\A4]%%%%%%%%%%%,E_U3_P"Z:H>'?^19TO\` MZ\X?_0!6E6;XC_Y%G5/^O.7_`-`-:"?<7Z"G4444444444445D>%?^1:LO\` M_M9+6ZC$D,@PRDD9[]JS_P#A%])_YY3_ M`/@7-_\`%4?\(OI/_/*?_P`"YO\`XJC_`(1?2?\`GE/_`.!4_\`X%S?_%4?\(OI/_/*?_P+F_\`BJ/^$7TG M_GE/_P"!%M(4!5AG`'``NY>/_'J/^$7TG_GE/_X%S?\` MQ5'_``B^D_\`/*?_`,"YO_BJ/^$7TG_GE/\`^!4_\`X%S?_%4?\(OI/_/*?_P+F_\`BJ/^$7TG_GE/_P"! M4__@7-_P#%4?\`"+Z3_P`\I_\` MP+F_^*H_X1?2?^>4_P#X%S?_`!5'_"+Z3_SRG_\``N;_`.*H_P"$7TDC!AG_ M`/`N7_XJM.W@BM;>*W@0)%$@1%'15`P!^525'<6\5U;2VTZ"2*9"CH>C*1@C M\JS/^$7TG_GE/_X%R_\`Q5'_``B^D_\`/*?_`,"YO_BJ/^$7TG_GE/\`^!4_\`X%S?_%4?\(OI/_/*?_P+ MF_\`BJ/^$7TG_GE/_P"!4__@7- M_P#%4?\`"+Z3_P`\I_\`P+F_^*H_X1?2?^>4_P#X%S?_`!5'_"+Z3_SRG_\` M`N;_`.*H_P"$7TG_`)Y3_P#@7-_\51_PB^D_\\I__`N;_P"*K1M+2"QM8[6U MC$<,2[40=A4U%%%%8Z^%='10B6\J*.`J7,H`^@#<4O\`PB^D_P#/*?\`\"YO M_BJ/^$7TG_GE/_X%S?\`Q5'_``B^D_\`/*?_`,"YO_BJ/^$7TG_GE/\`^!4_\`X%S?_%4?\(OI/_/*?_P+ MF_\`BJ/^$7TG_GE/_P"!4__@7- M_P#%4?\`"+Z3_P`\I_\`P+F_^*H_X1?2?^>4_P#X%S?_`!5'_"+Z3_SRG_\` M`N;_`.*K0L[.WT^U2UM8Q'"F=JY)ZG)Y//4FIZ********************** M************************************************************ M************************************************************ D*********************************************__9 ` end GRAPHIC 18 g54121mm17i001.gif GRAPHIC begin 644 g54121mm17i001.gif M1TE&.#EAMP`?`/4```````P,#!45%1L;&R0D)"LK*S0T-#L[.T1$1$M+2U14 M5%I:6F-C8VIJ:G%Q<7Q\?/\M%_\T'O\V(?\X)/\^*?]`+/]$,?]30?]J6_]O M8/]Q8O]\;O^$=_^*?82$A(R,C)24E)Z>GJ2DI*VMK;2TM+R\O/^2AO^GG?^Q MJ?^WL/^]M\3$Q,O+R]/3T]O;V__&P/_+Q?_6TO_8U/_^+SQS(`MJ"R`Z`(B)BB)R.`**D(!R&!`3$I>8$3%R-8^0GY\" M"B1[90V@J)`'(*5S2@>IB`A*+@&Q)64TGJBXJ+:,K4L#J8#!2!H3%A45RLL5 M,IS#L;$$(UMDI].0MHD$1ZY)+=H!<4D@`-R?LUO9G[8-2+&,93C2VP"291H2 MSOT4T/3L:4.EH`:[@;$"K`"'Y,'`?$@,Q(I2JD6Z3P-HQ`/UJ]&N3\7*8)C0 MS]D_3A\1?B*@<8F.4Q=5)C)@3`H.`@,-<-%1(M;^`2D,8AG:B`K8M92*($K9 MYV_9R3(U!,I,9*M`JW93(/:S*52UF)75\"H@$ M]Z!A$***(L5R7!(';S76@;0`"L%\I9-!0'B(Z M^480#2VTX,('^07(WTZGA3)"CT8-)F-67WUHF2*V"(A=7`4ZM6(2MZ5U37NI M"*`1A#)%-T>#H,PB$2@)E!$D0A(JN612D$%I4FU4MEBD$F6A<@27*BE71IV? M&.(>1^4L1YJ&4JP)BI-)S#87!5)&HV`C,P*`2U`]:D-`"S]*\:<[06H4:&@EDVI4$YQ(M+E@&AI]$@:>E#P2Z!:R*G`7F)[T!-9"'6YAZJFQ0 M,MHH5')FN@2NBN`R*T(F=@6*(61L^@FF6QR94)+!"IN(8')L$(%<*D+Z:"[^ ME4ZZ)C=IVLAI.*D(9LR9H#@`CK>)P%.3"1$T8RP%%MR`TKE;()=*',^JI-9H M8;JD`W,K??D>H650,^+%]\WQ@IO,3(#!'"[$\J(29"20R@"`$=3""BRPL,(* M>-9(!@E9%D#`S02TJ*<4]"K2;K=%*:M'B[UNH0$$_4PP`0QR^*Z&E@DX MZ9_8>V_I;\#[.-`1HF+!*1WBZ?"KD`"["UT*K214`HK,Z#;#(NW0] MOKCL\?Q`H<'M[5!*``\)V-HO(C1LTX`;OA(L5'H7^RF;^N+DVP"!"$(@@@(2 MD(#64H49.$*X[!W.2JC3QE`,1P^R1.HNHH.)H?RB`U&127*IP-9@QE>ZX8FM M>-IH``7E,(++3>4`1X`1["RS`/-]9S![(`-[$L@F)9`P>*;3W?QCD;C/M\%L035D8F!?B`K4A&`@7H;R`! F((`"/B!".9Q/$0,X@`,5QJ`$FJ$"?&4`("060X8?;H]J GRAPHIC 19 g54121mm11i001.gif GRAPHIC begin 644 g54121mm11i001.gif M1TE&.#EAMP`?`/4```````P,#!45%1L;&R0D)"LK*S0T-#L[.T1$1$M+2U14 M5%I:6F-C8VIJ:G%Q<7Q\?/\M%_\T'O\V(?\X)/\^*?]`+/]$,?]30?]J6_]O M8/]Q8O]\;O^$=_^*?82$A(R,C)24E)Z>GJ2DI*VMK;2TM+R\O/^2AO^GG?^Q MJ?^WL/^]M\3$Q,O+R]/3T]O;V__&P/_+Q?_6TO_8U/_^+SQS(`MJ"R`Z`(B)BB)R.`**D(!R&!`3$I>8$3%R-8^0GY\" M"B1[90V@J)`'(*5S2@>IB`A*+@&Q)64TGJBXJ+:,K4L#J8#!2!H3%A45RLL5 M,IS#L;$$(UMDI].0MHD$1ZY)+=H!<4D@`-R?LUO9G[8-2+&,93C2VP"291H2 MSOT4T/3L:4.EH`:[@;$"K`"'Y,'`?$@,Q(I2JD6Z3P-HQ`/UJ]&N3\7*8)C0 MS]D_3A\1?B*@<8F.4Q=5)C)@3`H.`@,-<-%1(M;^`2D,8AG:B`K8M92*($K9 MYV_9R3(U!,I,9*M`JW93(/:S*52UF)75\"H@$ M]Z!A$***(L5R7!(';S76@;0`"L%\I9-!0'B(Z M^480#2VTX,('^07(WTZGA3)"CT8-)F-67WUHF2*V"(A=7`4ZM6(2MZ5U37NI M"*`1A#)%-T>#H,PB$2@)E!$D0A(JN612D$%I4FU4MEBD$F6A<@27*BE71IV? M&.(>1^4L1YJ&4JP)BI-)S#87!5)&HV`C,P*`2U`]:D-`"S]*\:<[06H4:&@EDVI4$YQ(M+E@&AI]$@:>E#P2Z!:R*G`7F)[T!-9"'6YAZJFQ0 M,MHH5')FN@2NBN`R*T(F=@6*(61L^@FF6QR94)+!"IN(8')L$(%<*D+Z:"[^ ME4ZZ)C=IVLAI.*D(9LR9H#@`CK>)P%.3"1$T8RP%%MR`TKE;()=*',^JI-9H M8;JD`W,K??D>H650,^+%]\WQ@IO,3(#!'"[$\J(29"20R@"`$=3""BRPL,(* M>-9(!@E9%D#`S02TJ*<4]"K2;K=%*:M'B[UNH0$$_4PP`0QR^*Z&E@DX MZ9_8>V_I;\#[.-`1HF+!*1WBZ?"KD`"["UT*K214`HK,Z#;#(NW0] MOKCL\?Q`H<'M[5!*``\)V-HO(C1LTX`;OA(L5'H7^RF;^N+DVP"!"$(@@@(2 MD(#64H49.$*X[!W.2JC3QE`,1P^R1.HNHH.)H?RB`U&127*IP-9@QE>ZX8FM M>-IH``7E,(++3>4`1X`1["RS`/-]9S![(`-[$L@F)9`P>*;3W?QCD;C/M\%L035D8F!?B`K4A&`@7H;R`! F((`"/B!".9Q/$0,X@`,5QJ`$FJ$"?&4`("060X8?;H]J GRAPHIC 20 g54121mo01i001.jpg GRAPHIC begin 644 g54121mo01i001.jpg M_]C_X``02D9)1@`!`0$`8`!@``#_VP!#``H'!P@'!@H("`@+"@H+#A@0#@T- M#AT5%A$8(Q\E)"(?(B$F*S7J#A(6&AXB)BI*3E)66EYB9FJ*CI*6FIZBIJK*SM+6VM[BYNL+#Q,7& MQ\C)RM+3U-76U]C9VN'BX^3EYN?HZ>KQ\O/T]?;W^/GZ_\0`'P$``P$!`0$! M`0$!`0````````$"`P0%!@<("0H+_\0`M1$``@$"!`0#!`<%!`0``0)W``$" M`Q$$!2$Q!A)!40=A<1,B,H$(%$*1H;'!"2,S4O`58G+1"A8D-.$E\1<8&1HF M)R@I*C4V-S@Y.D-$149'2$E*4U155E=865IC9&5F9VAI:G-T=79W>'EZ@H.$ MA8:'B(F*DI.4E9:7F)F:HJ.DI::GJ*FJLK.TM;:WN+FZPL/$Q<;'R,G*TM/4 MU=;7V-G:XN/DY>;GZ.GJ\O/T]?;W^/GZ_]H`#`,!``(1`Q$`/P#U36/$.DZ` MD3:K?1VHFR(]X/S8QGH/<5D#XE^#BVW^W(L_]W/C.RNKF"_CMA;R!"KQEMV1GUKKA1@Z?/)F;D^:R/>M.\2Z)JS!;#5;6 M=ST191N_+K6G7S/XI\%ZSX,N8VN?GA?F.YASMSZ'T->E?"CQ[*YU&3V1=TCHZQ[WQ9X?TZ[DM+S5[:">/`>-WP5 MR,_R-:5K=V][`L]K/'/$W1XV!%?.GQ0_Y*)JW^]'_P"BUK6C2525F3.7*CZ+ MM;J"]M8[JUE66&5=R.IR&'J*FKG_``%_R(FC?]>B?RJUJ7BG0M'D\O4-4MX' M[J6R1^`K)Q?,TBKZ7-:BL*S\:^&;]MMOK-JQ]&;;_/%;BLKJ&4AE(R"#P:3B MUNAW,-_&WAB.5HWUNT#JVTJ9.A]*W*\!O/`NGR:I/*?%NFHS3LVPJ/A5JMIIGC+[3J-VL$/V:1=\AXR<<5[%XB\2:1_PB%Y20]%W;2?SQ67+*U[ M%71M4445(PHHHH`\D^/'^HT3_>G_`))5GX%?\@35/^OE?_0:K?'C_4:)_O3_ M`,DI/@MJEAI^C:FMY>P6Y:X4@2R!Z,R=3*;74O[9M+D63%I(HLEAE6`^G_UJX;XH?\E$U;_> MC_\`1:TH2C*LW'L#34=3T>X\3OX6^#>E7-N<7=Q;)#;G^ZQ!.[\`#^E>8>%/ M#-_XYUZ2W%R5(0RSSR9;`S_,DUUWC.TFF^#OAFYC4M';A/,Q_"&4@'\^/QJ' MX)ZO:V.NWUA<.L;WL2F)F.`2A/R_4AOTJ8^[3E*.^HWJTF6X+2=D>>ZC_P`AVZ_Z^G_]"->K?&#P?- M&)/%NM_V9%<);MY32;V!(XQQ^M>FZ_\`#:YC^'EIIYU"(MHXN+EVVG$@.6P* MXSX1WUM8^.8WNIDA62WD16W:Y.Y-N\4L@B8-A=W4X_/\*JNVYQCT8H;-GD7A_2I?&WB&=M3U5+_-'C#PS!X6O[<6.J1WL4REEDC/S(1C@X^M9_AS1X==U5;";48;`R`[)) ML[6;^[GM7<2?!>YBB\V37[!8\9W$D"M934):OY$I76QZ3\//$$WB3P?:WMR< MW$9,,K?WF7O^(P:Z>N7\"^'&\'^&GL[B[CG!E:-6K485>5R2OL;IV2N7Z***HH\_\`BIX2U/Q5%IBZ<(\VS2E]^[^+ M;CH#Z&O/%^$/B=F"_P"C#)ZDR8'_`(Y7T'171#$3A'E1#@F[GCFC_`V?[0CZ MUJD8B!RT5J"2W_`F`Q^1KU71]&L-!TZ/3]-MQ!;Q\A0IJ]16/WGP^\4:?>/;KIMS/@[? M-MX)&0_CMZ5]*T5I3Q$X*VXI03/-?A5X,UOPU-J*4*TH-M#<4T?/FA?"?Q%K@>:Y(T]0W/VJ.0.?<`@9_.O:O"WAFQ\*:,FG M666YW2RL/FE?N3_05LT45*TJFCV",$CP2\^%/B2;5)[A!;['G9Q_K.A;/]RO M;-H-:QV M';K1O!C:;JD:[IY79D`(^5@!@Y`.>#78T5=2O M*<>5B4$G<^?_`!9\*]7T;4#_`&7#+J%G*S&+RHG=XQV#X7'X]Z[?X3>%;[2= M)U5-8M=D=\43R9$96*@,&R"!P=U>DT42Q$I0Y6"@D[GB?BWX.W=I-->:#()K M0G*VK!FD3V&`=P_SS7,:?\//%&I7*6S:?<6RDX#W,,B(OX[:^DZ*J.*FE83I MHS+73KA/#4&FW$JO<1VR1/(N<,P4#/TR*R](TBX%^LLRM&L+9Y!&X^W'2NGH 6KR,1@J>(K1K3WB4XIM,****[2C__V3\_ ` end GRAPHIC 21 g54121mo01i002.jpg GRAPHIC begin 644 g54121mo01i002.jpg M_]C_X``02D9)1@`!`0$`8`!@``#_VP!#``H'!P@'!@H("`@+"@H+#A@0#@T- M#AT5%A$8(Q\E)"(?(B$F*S7J#A(6&AXB)BI*3E)66EYB9FJ*CI*6FIZBI MJK*SM+6VM[BYNL+#Q,7&Q\C)RM+3U-76U]C9VN'BX^3EYN?HZ>KQ\O/T]?;W M^/GZ_]H`"`$!```_`/9J0G%&X'I2T4444444444444444444444444445E^) M);>#P_?SW;2BWC@9Y#$VU@`,\'L:S4\'K;JKV.L:C#*`,.\WF`_4&I(==O-* MD6V\11I$'D"17D?^JDSTS_=)]#70@YI:*JO?P17\5E(X2:96:)3_`!A<;ORR M*LTM%%)2T4444444444444E9FJ:]9Z9-';N7EN9O]7!"I9V]3@=![FJ,FI>) MV8O!H47E]A+<@.?P'2KVAZW!KEI)-"KQR02M#/%(,-'(O4&M2L;Q;/:P>%]1 M^VR>7!+;M"S;2<%QM'3W85-S]2H-5/%C6Z>%=4>Z57B6U MD8AAG)VG'ZXJ]IT4D.FVT4S%I4A178]2P`R?SJM=>(]&L;MK6ZU.UAG7&Y'E M`*YZ9]*T@ZI9:99B[O+A( M8"0`[=R>@J+3-=T_5T+6=P'Y.%92C$`XR`<$C/?I2ZEK%MI4UC%B@=2:F1Q(@=2"K#(([BG4444E97]M+!XB31KA<2W$3S6Y'1D7 M:&S[Y;]*U:6J#:K$FNQZ0RL)9;=KA&[$*P5A]?F%7Z*I7VK:?IH7[=>P6P?. MTRR!5=Z(3\D?7(`7''K6W<>*="MO ME;5+9W)P$C<.S'T"KDFJ_A6SN8O[3U"[MC:RZE>&<0MC*(%5%SC^(A MWMX%"O''$J@+R`H';\*YK49E\7WL.FV0:32H9A)>W(^Y*4.1$O\`>!8#<1Q@ M8I;+_A+=(A-K+;P:LB.WESM.4D*%B5#9'4#`S7.7/AC7+VZN&NM&1X+F\:ZF M59E$D@(PL>_J%&!TKJA?>*9`(H-$M+91@!IKG<`/HHIM_HVKR^"]5T^2]%_J M%Y#*JLX"(I<8"@#H!5?Q3:3)<^&YFMY+BSLKK==+&N_'[IE5MOX%OFX)X!^7WK6\=12/X/OYH$+7-JJW,!5,D=0>Q%<7XMT1])TVUO[C7=2GB@O;?>990 M1$I<*7!QP0">>V:WSX5_=DQZWK!../\`36YKG=2C\3V_A#5K.]LS-!+;3&2: M6[\QHE*'(7(R<-JUC::AIBV\6I`FV*3!W'&[YU'08[]JUY/ M$FEQZI#I@NA)=RG`CC!;;_O$<#IWK4'2EKB?$-]:Z9\2-&O+V40P)I]P"Y!P M"63`XK9'C'1F4LLLY0?QBVDV_GBI$\7>'Y`NW5(UB3*PAI[:X<*3A'0,,X_VD'YUK0^+-`G`*:I;C/]YMO\Z=)XLT"/.[ M5;?CT;/\JFM[C3]>M3*L`G@#%09H"`?N6^'>G:=J'@ZV-]I]I/=6\L ML$C20*6!1V`!./3%==;Z3IUJP:WL+:%AT,<*J?T%6Z,9J&XL[:[C,=Q!'*A[ M.H(JC_PC.BY_Y!MO]"@Q6A!;PVT*PPQK'&@PJJ,`"I*,4448%`4#H,4%01@C M(-``'2H+VQMM1M9+2\@2>"08>-QE6^HJ95"J%`P`,`5'=6L-[:36LZ;XIXVC MD7U4C!'Y5#)IZ#2_[/MWDMXUB$4;1MAHP!@8/M6./"DMRK1ZGK%[>0.NUH3) MM5@>N<4L'@?1H+@S".8G&%!F;Y1Z=>E:]EI-AIRXM+2*'/4JN"?J:M]*6HY( M(I2#)&KD=-PSBG>6@&-BX^E5WTVRDF65[2%I$.58H,@^M6&17&&4'ZBJDND: M;.VZ6Q@ GRAPHIC 22 g54121mo01i003.jpg GRAPHIC begin 644 g54121mo01i003.jpg M_]C_X``02D9)1@`!`0$`8`!@``#_VP!#``H'!P@'!@H("`@+"@H+#A@0#@T- M#AT5%A$8(Q\E)"(?(B$F*S7J#A(6&AXB)BI*3E)66EYB9FJ*CI*6FIZBIJK*SM+6VM[BYNL+#Q,7& MQ\C)RM+3U-76U]C9VN'BX^3EYN?HZ>KQ\O/T]?;W^/GZ_\0`'P$``P$!`0$! M`0$!`0````````$"`P0%!@<("0H+_\0`M1$``@$"!`0#!`<%!`0``0)W``$" M`Q$$!2$Q!A)!40=A<1,B,H$(%$*1H;'!"2,S4O`58G+1"A8D-.$E\1<8&1HF M)R@I*C4V-S@Y.D-$149'2$E*4U155E=865IC9&5F9VAI:G-T=79W>'EZ@H.$ MA8:'B(F*DI.4E9:7F)F:HJ.DI::GJ*FJLK.TM;:WN+FZPL/$Q<;'R,G*TM/4 MU=;7V-G:XN/DY>;GZ.GJ\O/T]?;W^/GZ_]H`#`,!``(1`Q$`/P#TGQ/XPTKP MDEN^J&8"Y+",1)NSMQGO[BN<'QI\*[L>7?\`U\E1DY2YK(]7TOXD^%-5D6 M*+5%AD8X"3J8_P!3Q^M=17SOXX^'-]X0"W<4ANK!B!YV,&-CT!']:ZGX/^-; MB6Z/AO49S(K*6LV'.`7/4^@'>N2_X7%X3\[R_-NL=-_D\?SKGC3E+5(MM([NN5U?XC^&]#U2; M3;ZYE2X@(#JL1(&0".?H16WI&MZ;KUG]JTRZ2XBS@E>JGT([5\^_%#_DHFK? M[T?_`*+6M:%)3FXR)G*RT/H?3=0M]5TZ"_M&+07"!XR1@D'VJU7/^`O^1$T; M_KT3^55-8^)/A?1;EK>>^,LJ'#+`N_::RY&Y-115]+LZNBN+L_BSX2NVVF\D MMS_TVCP/TS77V]S#=VZ7%O*LL4@W(Z'((I2A*.Z!-/8Y&7XK^$X;AX'NY@Z. M4(\ENH.*ZZXN8+.![BYFC@A09:21@JK]2:\&O-%\"MJD[2>([Q93.Q91".&W M=*[KXM>)=,@\.WWA^25A?SQQR(@7@CS`>OT4UT2HQYHJ-]2%)V=SL;+Q)HNI M7GV.QU2VN9]I;9%(&.!U/%:+ND<;22,$102S,<``=R:^"W.S[SA2N#Z7A M>X3AXH5W%?K573/BGX4U.X6!;Q[=V.!YZ;03]:S]G-J]BN9'8T4G6EK,8444 M4`>2?'C_`%&B?[T_\DJS\"O^0)JG_7RO_H-5OCQ_J-$_WI_Y)5#X2>*]$\/: M3J$6JWR6SRSJR*P)R-OM7>DWAK+^M3'[9Z7XY@M[CP1K"7.-@M'<$]F497]0 M*\#\`,Z^/-&*9S]J4<>AX/Z9KKOB/\3K77+!]$T4,UM(09KE@5W@'.T`\XSC MDU%\'/"LU]K8U^=&6ULLB(D<22$8_0'/UQ3IITZ+<@D^:2L8_P`4?$%QK/C& M[MF9-H+)9#]GOE>.1,\9"EE/UR,?C5#XH?\E$U;_>C_\` M1:UZ!X)\"^&HO$*:GH_B'^T9-.;/SK)^$ M/B:RT#7+NVU"9+>"]C4"9SA5=2<`GMD,:F-U3DX[W8WJU:!,VZ.!//@)ZJ"0&'TR0?Q-9'QD\3Z?K- M[8Z=I\Z7"V@=Y)8V#+N;`V@CTQS]:L_`O3IFU74M3*$0I`(`V."Q8-C\`H_, M43O+#WGN"TGH><:C_P`AVZ_Z^G_]"->P?%WPA;7.GW7BAKF03VT,<2Q`#:1O MQG/_``+]*\?U'_D.W7_7T_\`Z$:^@?BFA?X=:KCL(S_Y$6G5DU.%OZV"*NF> M*^`_#-OXL\1?V9YC;:,N2" MV#7FOPPUJQT+QC'=:C,(('A>,R-T4G!&?RKV^^U:QU[P;JUSIEPMS%]EGCWI MT+!#Q^M9XB4U-6V'!)H^=O#.E1ZYXDL=+FD:..YE",ZCD5[/JS: M?<27$DK@QF0`;7;"CIZ=?PKQSPAJ-OI'BW3+^[8K!!<*TC`9VKT)_#->Q>.] M0L/&/@'4UT*Z2]>R,STC5]:D?Q)JA MM;<*9&K;<8)_`BNOKG?">@V?A#PVT%O=/ M,H]/6"Y\C[*9"?D#9W;?5A_=KB5^!]^6`;5``3R?(''_`(_7M=%;1KS@K)DN M">IYIH_P2T>SN$FU.^FU`*<^4%\I&^N"3^HKT2TL[:PM8[6S@C@@C&$CC4*J M_A4]%1.I*?Q,:BELV M"`*O((.0QR1S^9K*\7?"F]\0^*+W58KX1I<%2%\H'&%`Z[QZ>E>IT4>VFI9^*O@Q(DS7/AR225'8G[*Y7 MY/HQ8']+BT[3H?*@B_$L>[$]R:OT45*LZFX1BEL>-77P8U"?4)KD:B`))6<#R1W M.?[]>MZEI]OJNFW&GW2[H+F,QN/8CM[U:HI3JRG:_0%%(\'U?X-:Y;:@T>E@ MWMMU65C&A'L07KU'P%X8F\,^%QIEXXE>21I'4J`!N`&W@D'I73T54Z\YQY6" M@D[H\6\6?!R\CU`S^'%:>WF9F,#,B^1[`LPR*Z[X8^#;[PMI]^-3`WWC)F(A M3@*&[@D'.[]*[NBG*O.4>5B4$G<\J\6_!NWNYIK_`$&4P.YS]C"KLSWVDD;1 M[^T4XXFHE8'!,S[72_L^@0:4\[2^3 M;K#YI&"VT``X_"L_2]"EAO!-<\"(Y097P=*O5C5FM8C<4]0HH &HKK*/__9 ` end GRAPHIC 23 g89341mm03i001.jpg GRAPHIC begin 644 g89341mm03i001.jpg M_]C_X``02D9)1@`!`0$`8`!@``#_VP!#``H'!P@'!@H("`@+"@H+#A@0#@T- M#AT5%A$8(Q\E)"(?(B$F*S7J#A(6&AXB)BI*3E)66EYB9FJ*CI*6FIZBIJK*SM+6VM[BYNL+#Q,7& MQ\C)RM+3U-76U]C9VN'BX^3EYN?HZ>KQ\O/T]?;W^/GZ_\0`'P$``P$!`0$! M`0$!`0````````$"`P0%!@<("0H+_\0`M1$``@$"!`0#!`<%!`0``0)W``$" M`Q$$!2$Q!A)!40=A<1,B,H$(%$*1H;'!"2,S4O`58G+1"A8D-.$E\1<8&1HF M)R@I*C4V-S@Y.D-$149'2$E*4U155E=865IC9&5F9VAI:G-T=79W>'EZ@H.$ MA8:'B(F*DI.4E9:7F)F:HJ.DI::GJ*FJLK.TM;:WN+FZPL/$Q<;'R,G*TM/4 MU=;7V-G:XN/DY>;GZ.GJ\O/T]?;W^/GZ_]H`#`,!``(1`Q$`/P#V:BBB@`HH MHH`****`"BBB@`HHHH`****`"BBB@`HHHH`****`"BBB@`HHHH`****`"BBB M@`HHHH`****`"BBB@`HHHH`****`"N#N?'UZ;A_LMM`(,_()5);'O@X_SWK8 MUGQE;:7>&U@@^UNG$I$FT(?3.#D^OI^>.'U6^.I:IP6=G!86J M6UM'Y<29VKDG&3D\GW-`$]%%%`!1110`4444`%%%%`!1110`4444`%%%%`!1 M110`4444`%%%%`!1110`4444`%%%%`!1110`4444`%%%%`!1110`4444`%%% M%`!1110`4444`%%%%`!1110`4444`%%%%`!1110`4444`%9OB"^FT[0[FZMR M!*@`4D9QE@,_K57Q1K-YHMK#-:P1R"1]K/(,@8!!YYY]O>JDGB?1M7T6> M*ZE^RM(OELDB;RK$<,`.H!'7CH.F10!P4TTEQ/)/*VZ21B['&,DG)IE6+ZQF MT^X,,P!X#(ZG*R*>C*>X-5Z`'PPR7$\<$2[I)&"*,XR2<"O5]'MY[31[6WN7 MW2QQ!6X`V^B\>@XSWQFO):]:T;_D!V'_`%[1_P#H(H`NT444`%%%%`!1110` M4444`%%%=>'=C\B'/3CJ>O<8_,4`=*[I&C22,$102S, M<`#U-5/[9TK_`*"=G_W_`%_QKS*_UC4-4VB\NGE5>B\*N>><#C/)YJE0![%; MW5O=H9+:>.9`<%HW#`'TXK,U;Q1IVCW`MYO,EEQEEB`.STSDCK_GM7"Z?XCO M]+MX[>S,<:*Y=QMSYI./O9Z<#'&*S9II+B>2>5MTDC%V.,9).30!ZUIM_%JE MA'>0*ZQR9P'`!X)';Z5:K`\%W"3>'(HU!!@=T;/YR,_E3]_7U[&N'O/"6L62RR-`D MD42EVE21<8`R>#@_I5V;QA-!8Z=!IK/&UM$$G$D:E9"`H&.^.#Z=:I7OBS5K MZ*>&25%BG7:4C7:%'&<'KSC!R3U-`#]*TN77[3R$A='MHB(KAF(C)WY*'"^C M$COG.G^$T*>&;,$@\,> M&!ZL3VKS.;RO/D\C?Y6X^7OQNVYXSCOBO4/#:VR>'[1;21Y(MI(9UP21VDD8N[$EF8Y)/J:`-B; MQ=KP.,CZYS6.[O([22,7=B2S,I!)))'I^M`'IM%5;#4K35(&GLY?-C5MA.TKS@'N/<5:H`****`"BBB@ M`HHHH`****`"BBB@`HHHH`***P[[Q?H]D2HG-RX(!6`;NV87 MWBC5+N_-U'^>OTXK7T7QM=&ZAM]2\MXG.TS`!64D\$ M]L#Z#CGZ@'<4444`%%%%`!1110`4444`%%%%`!1110`4444`%-=TC1I)&"(H M)9F.`!ZFG5B^++*6]T"813>7Y/[YASAU4$E3_/Z@?6@#C_%6NQZU>1K`F+>W MW!'/5R<9/L.!C_(%'2=8O-&N#-:L/F&'C<95O3(]O\]ZH44`=EJFE3>)]-L] M7L+>,7#H1.N=ID((7C/'!#=3G&/I5"V\#ZM/$[3&&W8<*CODL>/[N<#&?RZ= MZA\.>))-'G*7#32V94CRU.=ASD$`_CGIUSVK2U#QT\]DBV4,EM(Y](640L MI?RC)SN`&Y>GJ,'VY[\5O^&?$.I77VZ>_?S[:U@,C$(H92.0!C&<@-^0Z5CB MSEO;234%'EWLTQN%*Y7:H_"LYU(P2/K]T%M81S$!P9)8Q_$,C;D_4-Q[?2M!F#!X=FE@\Z34-.M MU+%1YETIW$`$X*Y'<=Z]!T2UM[/2+>WM;@7,2`XE4@ACDDXQ[YKR>MO1O$6T9/FRE6@.T%4;HQ/X8QU&10!Z917F5CXKU:SO#/)A[=Q0!UE%9MIXATB^?R[>^C+Y`"O ME"Q/0#=C/X5I4`5[^^ATVREO+@D1Q#)VC)/.`!]217&W_CVYDW)86J0K\P#R M'+_^18O/^`?^AK7F5`$MSN.W'<9K M"HHH`****`+":A>QV_V9+R=8""/*$A"X/48SCG-7].\3ZMIJI''<>;$G2*8; MAC&`,]0!Z`UD44`>AV/C?2[B(F[WVD@ZJ5+@]>A`_F!UJ2'QKI$UX+?,R*S; M1,Z@)['KD`^X^N*\XHH`]E1TD19(V#HP!5E.01ZBG5YGHD-R+62XL[R:WF$G M`5L(V,$;AWZFNLT?Q(CJUIJ\D=M=Q#_6.P5)E_O`],^W_P!<#.-2,I.*>J%< MZ"BLW5M__`-:N9N[O6-9&)YA96KC_`%$6=Q'/ M#'W!Y[>U.=2,%>3'NV;((-16 MXB4GY+IDT8W1GKU`R1T M'K^%=%#-%<1"6"5)8VZ.C!@?Q%;IIJZ&25'-#'<0202KNCD4HPSC((P:DHI@ M8;^&](L$:]MM-+SVX,L:K*Y+,O(`Y/<>E>;S-&\\CQ1^5&S$JF[=M&>!GOBO M6M3\W^RKOR-_F^0_E[,[MVTXQCOFO)'1XW:.12CJ2&5A@@^AH`;13YI%EE+I M"D*GHB$D#\R3^M,H`Z>Q_P"2>:E_U\C^<=7H@BPHL6/+"@+@Y&.U8.B:Y_9F M^WN+=+JRG8&6)QNQCNH/&>G7K@=*TI;3^S'MK[3W\S2[]E"HS`M$Q[?A@_D0 M>@-3S:;=0:K;$[H2%E4'&]">A__5WSVJ]XBO\`1]8FM["2^G@. M%D24)^Y&X`@N#@].A[;N>]:4)J=-,%L?H[QNLD;%'4@JRG!!]16MI>O:I'J,`;4Y`CN MJ.;ARZ!21DD$_KD'W%`'1W/@&R-N_P!EN9Q/CY#*P*Y]\#/^>]<,Z/&[1R*4 M=20RL,$'T->RUP7CK3K:UO+>Z@38]UO,H'0D8YQZG//_`.N@#E:***`"BBB@ M`HHHH`****`)8H1(DCM-'&$'&\G+'L``">W7H.Y&16GX4EAA\1VKS.4Y*IA< MY9@5`/IUZ_\`ZQCUVOA3PO-!<#4-2@"[0##$_+`\'<1VQZ'G/I@4`=E1110` M4444`%%%%`!1110`4444`97B:VFN_#UW#;QF20A2%7J<,"SUP7B7 MPIFVWF6TG)BB',9X!`7N">>.G/``H`Y6BBB@`HHHH`****`"BBB@#H M_#W_`!X/_P!=3_(5H36\-PNV:)7&"!D>]7:**RE*4OB=Q!1114@%%%%``RAE*L`01@ M@]#61J5I%81?;+/S8)U;AH6(QGKGT&,CCUK7H90RE6`((P0>AK6G4=.2:&G8 MZ3291-I-HXG%Q^Y4&4$G>0,$Y//7/7FI'U"RCN/LSWD"SD@>49`&R>@QG/.: MXE])@?*>9,L)?S/(5\1[NF<4DNBV3P/'''Y;-T<$D@_C7H_7*97,CH-3\4I8 MW[V%O8S7-S&5W#(5<$`YSSZCJ!7+^);V]U/;/<:;%;I&0%D5MS@>A(.",^W' MX\R'4+R]UBSDO(VCG$302'9A9`N2&!]`;0"=]Q&G49'4C/OZ=ZVH?"1N;>7[/JME<72`LL$$@;<..^1CKZ8Z<\U?^ MPVG_`#ZP_P#?L5#-I-C-DF!5.,`I\N/P'%)8V'5!S'."TN([IXFM6E>!]LD8 M!89!Y!*_0]#727=]!K5M;6&F6SVEA:L'+MPVX9P%P3ZY)ZY/YRVEI%90^5%N MQG)+'))J:LYXQNZBACMTCN)IU+;IMNX'H,#'%2UQQFX;/01'JNKB^\.:?ID$AFN;R)#(S@\!?O$D M]]RGUZ'VI=ODV^V%-VQ<(F>N!P,U2TK338J[2E6D8XRO(`_+_/%:#,%4LQ`` M&23T%;XFM[25ELAMW-'P8$.@B82;Y)IG>7D?*V<8XZ<`'\:WZY7P7*QDU".$ M,UF9`\;A`JAB.5]!7K1U2+. M1\<:39VQCU"%A'-.^UXA_'QDN!^6?J._7D*ZKQX(&U.)TN4:98@CP`'*C)(. M>G?IUZ>MP]^<5?70=6M;Z$I8?:E+*\; M*OF0R#/&2.-I]\<'M615BQO[K3;@7%G,8I`",C!R#V(/!H`]?KC?B$CE+"0* M2BF0%L<`G;@?H?RK=\-ZF^K:-%<2N&G4E)2%Q\P_Q!!XXYK(\?&X-A;1QPEH M`Y>1PI.PC`7)Z#.XT`<)14\%I+<133*,10+ND<@X7/`'U)X'^`)$%`!1110` M4444`%/AAEN)1%!$\LC=$12Q/X"F5V_@+3F2*XU&1,>9^ZB)R"0.6]B,XY]C M0!-X;\(_8)5O=1V/.N#%&#D1GU/JP_(=>>,=5110`4444`%%%%`!1110`444 M4`%%%%`&+K?B>RT;,7^ONAC]RIQ@'N3CCCMUY'KFN5M_'&K12R-,(9E?)5"F MT(><8QVSCKGIU'6JGB'P]-HEQD9DM9#^[E]/]EO?^?Y@8]`%B_OIM2O9;RX( M,DIR=HP!Q@`?0`57HHH`****`"BBB@`HHHH`Z/P]_P`>#_\`74_R%:E9?A[_ M`(\'_P"NI_D*U*\3$?Q9&;W"BBBL!!1110`4444`%%%%`!1110`4444`%%%% M`!1110`4444`5RES>ZQ;Z=:S-!N1GDD$0<*.WZC'XBL;4H3INN?8KVYEO+>" M1&DR2-RD`G`SP<$CK73^%(&GU74-1<,%0_9H_F!''+<=>RG\3UKG_&-U;76O MR&W7F)1%*VW&YP3GZXX&?;TKVZ%-1@M-31(ZK1?$FB3>5I]HKV@&$B210`QY MZ$$\_7J3W-+XOT^_O]+"V4A*QG=+`HYE';'KCKCO]0*X;2M,O]2FA,D`# MY#;<'(Q@]`>_4=#7<>%[;7;;[0NK.YC.#&)'$C9[X8$X'`X/KQCG.XSD-/\` M"NK:@[K]G-L$&=URK(#[#C)J_?\`@74+?:;.1+Q3P1Q&P//8G&.G?OTKT"B@ M#QIT>-VCD4HZDAE88(/H:;7KLVF:?<2F6>QMI9&ZN\2L3^)%.M]/LK1S);6< M$+D8+1QA21Z<"@#F/!%K"7N+ZUEG2,CRVMY!D`\$'>,!N_8$9_$]:[I&C22, M$102S,<`#U-.JEK/_(#O_P#KVD_]!-`'G6K^(K_5W=9)3';D_+`APH''7^]T M!Y[],5E444`%%%%`!3D1Y'6.-2[L0%51DD^@IM=;X`M(I;RZNG&9(%54R!@; MLY/UXQ^)H`9H?@NYN)8Y]37R;?KY6?G?H0#_`'1Z]^.@ZUW:(D:+'&H1%`"J MHP`/04ZB@`HHHH`****`"BBB@`HHHH`****`"BBB@".:&*XB,4\22QMU1U#` M_@:K?V-I7_0,L_\`OPO^%,UK6(M$L?M,L;R;FV*JXY;!(R>PX]Z\[U3Q#J6K M96XFVQ'_`)8Q_*G;KZ\C/.:`+OBNWT>RGBM-,A02+DS.LC/@YQMY8X/!R,>E M<_110`4444`%%%%`!1110!T?A[_CP?\`ZZG^0K4K+\/?\>#_`/74_P`A6I7B M8C^+(S>X4456U+4K32+"2_OYO)MXL;WVEL9(`X`)ZD5BE?1"+-%%%(`HHHH` M****`"BBB@`HHHH`****`"BBB@!&944LQ`4#))[56LVU#6)2-*MT\E"5>>?( M7/MCG_\`6,XJ2TL_[;UIK&4R"TMD$DP48$C<84GL.?T/U':(B1HL<:A$4`*J MC``]!7I8?#1<>:9:1GZ!IKZ3I$5I+Y9E4L7:/HQ).#T&>,#\*=>:%IE]%*DM ME"K2Y+2H@5\]<[L=7D%A:O MA#G`:12BMQG.3P/3G'(^E6!KV MDM>1VB7\+RR_<"-N!/IN'&?;/IZT`:%%%%`!371)$:.10Z,"&5AD$>AIU%`' MFOBK0H]%O(V@?-O<;BB'JA&,CW'(Q_DG"KU77-%AUNR\B0B.13F.7;DISSW' M4_44`5****`"O2_"FDOI6DCS@!/<$ M2.-N&48&%.>>.?H2:\YM;=[NZAMHR`\SJBEN@)..:];LK?[)8V]MOW^3$L>[ M&,X&,XH`GHHHH`****`"BBB@`HHHH`****`"BBB@`HHHH`PO%>CWNL6,4=I* MG[IB[1-QO..,'L>H].?:O.)H9;>4Q3Q/%(O5'4J1^!KV2N0\;:+=7DT%[:02 M3E4*2!,'`S\N!U/WCTSTH`X>BG.CQNT_X\'_ZZG^0K4JDNEZGX=A87 M%J+BV)WM+;G=LX.<@X...O0>M)_;5CY(D\TY(^YM.[/I_GBO(KT:GM&TMR&G MK:/XJUJ2"]U"V72M.;;$OVH(+J4CYF/(^5>@('.20Q!Q7>)>S"]2V MN;.2V:5"\8D^\PR1R,<=#U]*MUA.,J=XO1B.,\$Z[:Q3R>&3?PW(ME#6,PF# MM-$4W3ZTS5FD:V2UA&9KF01 M(H;!.3_D?C774I0RLY*D_=!(`Q]= MWYUT=16MNEI:PVT9)2%%12W4@#'-2UZZT.H****`"L7Q?_R+%Y_P#_T-:VJY M[QJTIT:*WB8+]HN4C;/0CDC]0*-@,Z2*.9=LL:N`N"UG_D%3?\``?\`T(5WM>Q0J^UC=HM.X45SWB#Q+)H^HVUO'"'0J)+@E(,1^((_E67?^"=2MYU2S'VR,KDOE8\')XP6^GYU MZ)10!P&B^$M5CU:WFNHA;Q0N)"Q=6S@@X`![_P"?2N_HHH`****`"BBB@`HH MHH`****`"BBB@`HHHH`****`"BBB@#SW5O"FLS:M=S0VHECEF9U82*,@G/<@ M]Z9<^"[^SMWN+B\LHXHQEF+OQ_X[7HM<%XN\21W_`/Q+K)MT"-F24'B0CL/5 M1^I`QTR0#E:[WP+IUS:V=Q=3IL2ZV&('J0,\X]#GC_\`56;X3\,I>A-2O@&M MP3Y477>0<9;V!'3O].O>4`%%%%`!1110`5733[*.X^TI9P+.23YHC`;)ZG., M\YJQ10!B>*=)DU&P6>WXNK,F2/@DL.Z@>IP,<'ICO6):7*7=NLR$>`3]#5'5K>YM'M=2MVAF\C]] M&W#I(I`.0>_^2.U5_%D6A7\]EHM[K)LKRT+9NJ%+DM);KS_`];ZD_8QG& M_,];6Z=[]>GWG8V=W%?6<5U`O`:<79F17U"W>[LI((RH9L8 M+=.H-74\5:E`#%72IWS-9G"$GEHST/4].GL"HJC5*\G MFTVZ@U6V)W0D+*H.-Z$]#_\`J[Y[5O0Q#=7WNHT]3O:*CAFCN((YXFW1R*'4 MXQD$9%25Z984444`%%%%`!1110`4444`%%%%`!1110`4444`%%%%`!1110`5 M'--%;Q&6>5(HUZN[!0/Q-25!>6<%_:O;7,?F1/C,*1G`/7]!I:/X)M;4++J6+F<'.P$^6.>/0GIWXY MQCO720PQ6\0B@B2*->B(H4#\!4E`#41(T6.-0B*`%51@`>@IU%%`!1110`44 M44`%%%%`!5>^L+74K_5?6I:\?%QM4V(EN M%%%%E/T^*2&R1)?O#/&< MX'858HKH=:]+V:1DJ5JG.V4;SPEH>H:V=5ENI8XI6,L]F$)+OR3A\\`G^N". M,7;G2M$N?$7]O2+>OG/8'K^G%+11]8EV1Z+QV(=KR>BM\A ME^\,JR370&W=O/7&Y'?/I[U?GMXKF/9,NY2?YUK3Q"A2:3?,_NM]_7KH>7*$W54K*R^^_W?J7+' MQ7/:NL&N0"-<8%U&"5/'&0.YP>GMP*W?[9TK_H)V?_?]?\:YMT21"DB*ZGJ& M&0:KR:;92KM:VC`SGY1M/Z5K#&JWO(Z^8[FL?7]?BT:`(BB:\E'[J$<_B?;^ M?YD5O!@*:72'-8;9-IEI):Q.TS#S)FW,B@!5/L!Q^7'Y5=HHKQIR)I-*CAL=5M=L,:K&ES!DK@``9!^A)Q^5= M/:7EM?0">UG2:,]U.<'&<'T//0URS*&4JP!!&"#T-0:2(],\4VQC$<<5W&\3 M9/?KQZ9(4"O5H8GVCY9+4M.YV]%%%=A04444`%%%%`!1110`4444`%%%%`!1 M110`4444`%%%%`!1110`4444`%%%%`!1110`4444`%%%%`!1110!EZ_HPUFQ M"(XBN(FWPR8Z'T)Z@'V]`><8KF=/NFN8"LJE)XCLE5N"&'MV_P#UUW5-H)K^) M"4$I`8_B2W7ICTJSIEM+:V*13,"V2<#^'/;WKAQ4HKM%<'-#^7\22E_:?\`TXWO_?K_`.O1_:?_`$XW MO_?K_P"O5VBCFA_+^(%+^T_^G&]_[]?_`%Z/[3_Z<;W_`+]?_7J[11S0_E_$ M"E_:?_3C>_\`?K_Z]']I_P#3C>_]^O\`Z]7:*.:'\OX@4O[3_P"G&]_[]?\` MUZ:=8@C=5GAN(`V<-)'@5?HHYH?R_B!7AU"SGQY=PA).`"<$GZ&K%5YM/LY\ M^9;H23DD#!)^HJJ-,FM7+V%R4!.?*DY4\_X?C[T^6F]G;U_K]`T-*BLX:MY# M+'?P/`Y_B`W*>/7_`/76@CI(@>-U=3T*G(-1*$H[@+1114""BBB@!LLJ0Q-) M(P5%&2362U]_:I:!)X[.V',TLK@-MQV7.3T/`SGCIFD\12OY<4(C;9G<7QQG MD`9_/]*33!;NP6[MY'N+@E_,G3<'[\$^W/\`D5W481A#VDE=E+N:<][X-@LX M;9;5[M5ZO'&5?/JS':3G)XZ?3BMBU\,>'[NUAN8[`A)D5U#2OD`C//S5SFH1 MJ]W9VL\I@L)'"2,@`V\]\\`?RY.#BO0$1(T6.-0B*`%51@`>@KT*4_:1YBEJ M8.I6FD^&])DO+;3[8RHP,7F_,=Y(Q@G)XZX'H>G6O.G=Y':21B[L269CDD^I MKTWQ-I%QK6G1VUL\:.LPW>8-!-L&?+B9BQ^@(&:T M&6=(\<36R)!J,1N$48$J']YWZYX;L.WXUW$,T=Q!'/$VZ.10ZG&,@C(KR.XL MKJSV_:;::#?G;YD97..N,UZ-X0_Y%BS_`.!_^AM0!M4444`%%%%`!1110`44 M44`%%%%`!1110`4444`%%%%`!1110`4444`%%%%`!1110`4444`%%%%`!111 M0`4444`1BW>K;L1+<****Y"0HHHH`****`"BBB@`HHHH`****`$=$D0I(B MNIZAAD&LR&)-,U81K\L%RN%&>C#MDG/_`.NM2L?Q5976H:*\%J8A\VZ4R,5/ ME@'<%(!^8].01R?:MJ4M>5[,:(++Q?9W>K-9/&88I)&CM+EG!2X93AL8Z.***RMD1$>"07;[H2H!4@^7QCZ^O-;D6IS0Z=#%,T=U MJ.P!A`2ZLPZMD`>F<8[X]Z2A*:^&SOM>_P`_\Q*YK56DU*RB7G1J6OFDOIFZN[E1^`!STQU)Z=J[*-)U+3V71 M%)7,!KVUU`BR:.8+."4Z4T"6.J7C3?=CMRWF`CH!MZ? M3@^W2MO7=!O9-4M[G2HHR#%Y)#D!8`.A`)X&#T`['@YK1T7PY:Z0ID8BYNF8 ML;AUY'7IUQP>?7^6\*#A+W7H.QH6$=U%91)>SB>X`_>2*H4$Y[`>G3\*L445 MTC(+BRM;S;]IMH9]F=OF1AL9ZXS4]%%`!1110`4444`%%%%`!1110`4444`% M%%%`!1110`4444`%%%%`!1110`4444`%%%%`!1110`4444`%%%%`!1110!Q= MQ"UCXBOK8[MDY^TQDX/WOO=/]KC\/SDI_B@26>NVE\X'V>6+[.S?W3DGD]!U M'Y&F5Y&+C:I?N1+<****Y"0HHHH`****`"BBB@`HHHH`****`"F3Q^=;R19V M[U*YQTR*?133MJ!F1:)'A13"B$#&0O./K4 MM%7*I.6['<*K7.HVMH2LLHW@?<7D_P#UOQJ.YU$1W,-M;HMQ+*^P*)`"&R`` M?Q-;_AW19+5IK_4($%Y-)E`=K&)0,``@<$@G.#R,>]=%##.>LMAI&9H5M?W^ MLVNHM:&"S@#E7D."^Y<#`_$'TZ\UV-%%>I&*@N5%A1115`%%%%`!1110`444 M4`%%%%`!1110`4444`%%%%`!1110`4444`%%%%`!1110`4444`%%%%`!1110 M`4444`%%%%`!1110`4444`4-:TU-6TN:T;`=AF-C_"XZ'H<>A]B:Y/3YW>-[ M><$7-LWER@\\@D=>_2N[KD?%5C)87Z:Y`,QOMCN5"DGV;VX`';D#KFL,12]I M"W435QM%(CI(@>-U=3T*G(-+7BF84444@"BBB@`HHHH`****`"BBB@`HHHH` M***;+*D,322,%11DDTTK@0Z%H]G=^(;IY9I%EM9(YXD5@-V3N.1CD`XZ>M=Q M7)^%([F\U.;5C#Y=J83#$6ZO\P.?T/\`+G!KK*]ZG=05]S5!1115@%%%%`!1 M110`4444`%%%%`!1110`4444`%%%%`!1110`4444`%%%%`!1110`4444`%%% M%`!1110`4444`%%%%`!1110`4444`%%%%`!371)$:.10Z,"&5AD$>AIU%`') M:CX5EL6DO-$EV*%RUJP+;L`G@\DD\<>YY[5DPZM-=8^S6#R`#YB7"@'N,]Z] M#KAM9LO[(UHQ0'R;34%/EA>DUE&2YK:B:(;?6()'\JX5K M:4=5DX'Y_3UQUJ_7/*";.&XNY6GB$YBN(Y`-T1QD$');!`/IRI%::Z2B#;'= M74:9X1)<`?3BN*M1A!KI^*):++W5O&Y22XB1AU#.`14JL&4,I!!&01T-4X]* MLT1@T?FL_P!YY#EC^/;KVJH))-&N/+D!:RD8[&'/E^W^?KZUDH1EI!Z_F*QK MT56?4K)&53327K6T]E+;$(77S05)&<="*MT*B5V@LR2[NUM5 M3]VTLDC;8XTY+'_./SJ>U\-:AJ=TDFL*MO:QL2+='RS^F2.,>^<\=!G-)X8C MC?Q+?-];&M^&8K:&;4-,<6_EHS MRVY!,.W&>.G3IUK&T.RM]3TZYL7MPNHV\9GM9(R%9@0"`2.#SC[QS\W M&,5SU*//'E?R$T:=-EB2:)HY%#(PP0:JV=XIV6DXDBND4!XYE*L3@<\_GZU< MKR)1E"5F055TRQ2,H+9,-USR?S/(JK9/_9UZVG2/^[;YH68\\]OY^G/UK4J" M\LH;Z(),#PC"Y'>?:YY[>PLL":Z)`W)^N*[>O.=;M]0TN(6]SYA,4J MM!=H"`_7&3V8?GQ^)]&K.A&4(JPQ(Q9 MEVLQV_,A[#D]^.W&36187INT=9(S%/$=LJ$$8/\`D'BNZKBKV3'B_4HL?>6- MLYZ81?\`&N3%4U*FY=42UH2T445Y!`[PZ)(_%=TN\[);7?M!X."H&1Z]?SKK MJX62YGTG4XM5C(:%5$4Z8R2A;G'O_4#MFNUMKF&\MTN+>0212#*L.]>WAY*5 M-&BV):*R]?UD:-8AT02W$K;(8\]3ZD=2![>H'&6?,_/;G'XUE^'/MVJQ:NFH MW,DT4A^SA\@8P"&VKT7@KV_.J\WP^B:4F#472/LKQ!B/Q!'\JI.^H&M_PE^@ M_P#/]_Y!?_XFK=CK>F:B0MK>1NY)`0G:QP,\*<$\5S7_``KW_J*?^2__`-E6 M#K?AZ\T1U,N)(')"2IT^A]#CG'ZG!I@>I45P>C>-GL[>.VOX9+@*3F<29?!Y M&0>O/N./I7:6%]#J5E%>6Y)CE&1N&".<$'Z$&@"Q1110`4444`%%%%`!1110 M`4444`%%%%`!1110`4444`%%%%`!1110`4444`%%%%`!1110`4444`%%%%`! M1110`4444`%%%%`!1110`4444`%%%%`!1110`4444`%8^K^&K'5G,YW076!B M>,X.0.,COV]^!S6Q10!PEQ_:.BNJZM$'A8[4N8>5)Z\__J'0]:M(Z2('C=74 M]"IR#77NB2(T<_=SQVXSCCI M7%5PD9:QT)<2BRAE*L`01@@]#5.W&K:8DMOI=S%#;O()!O&Y@<8(Y!XZ?D/? M-N31_$-G(`J0:A&6/S*PC8#MG.`/PSWJ"YM]?M+-[V:QA$4;?-$&W.$_O<'& M/_UXQ6-.C7I-\HDFB&Z=HKD:EJEXUQ*B^7&1$%QU.,#ZGK44.H3:M>1V&F@1 M2RYQ)-T&`2>!GTK.U75!>;8H?]3@$[E&=W_UO\:J6%]-IM[%>6Y`DB.1N&0> M,$'Z@FMZ='G]^KJQI=SU#1])AT:P6UA8OSN=S_$QZG';H.*OUR%CX^MS;C[? M;2"<$Y,"@J1VZG(_6M>P\5:1J#Q11W!CFE.%CE0@Y],].?KW]:["C8J.:&*X MB,4\22QMU1U#`_@:DHH`I?V-I7_0,L_^_"_X5P7B5-61H8KZRAMK>#*Q?9H\ M1$DDD@^IQG!].E>E44`>2Z5_:0O-VE^=YZJ6/E==HY.1W'`X/7@5VVAZ[JLT ML=MJFE7*%N!<+`P&>,;ACC//(X]@.:Z2B@`HKF_$]CKUU/%)I5PZQ*NTQQS> M6V[)R3TR,8'7\.M;FGI-'IULER29UA02;FR=V!G)[\T`6****`"BBB@`HHHH M`****`"BBB@`HHHH`****`"BBB@`HHHH`****`"BBB@`HHHH`****`"BBB@` MHHHH`****`"BBB@`HHHH`****`"BBB@`HHHH`****`"BBB@`HHHH`YC5/!-M M?WCW4%T]NTK%Y%*[P2?3D8YR>_7M63J/@6YM;-Y[6Z^UNG)B$6TD=\0I(/X$9K0\8Z"]I=-J5M&3;S',ISG8Y M/)]@?Y^G%8VB:@FEZO;WLD9=(R=RJ><$$H MIU`!37=(T:21@B*"69C@`>IK'\3:S+I5G'':@&[NFV19_A]6].,CKZ]\5P^O M)*)HY+B\DN9W#%BYZ#/&!V')XZ5+FE)1ZL#TZ&:*XB$L$J2QMT=&#`_B*DKS M.P\6:CINGQ65ND`2(Y#,A+'YMQ!YQSDCIT_.MS1_'`FGD35A#!'MRCQHW7/0 MCG_(]ZH#L**Q?^$OT'_G^_\`(+__`!-.TWQ3I>IOY43 MTSGVH`V****`"BBB@`HHHH`****`"BBB@`HHHH`****`"BBB@`HHHH`****` M"BBB@`HHHH`****`"BL'Q9%=/I,SI<".W1`60#YG.X#!/85MQ?ZI/]T5;C:* MEEWL-]J'V0I9WNZ&"'S'_U M(8ZK8VY@M;9C;6ZAV;>1]]R6)^@[4`=G117,>, MK1[Y],MXSB1II#&?1Q$Q7]0*`.GHKD->O1K&DVTB<1I%'=2#T9F"J#^;_P#? M-7-7\07-C+>^7):I]D3>('1I))AC).5;]V.H&0>F>E`'1T5@KJNI7M]6V\Z.RCFEGDB8C#<*H4-DG`.3G\.>*\M[=ZEJ>D/ M`D4-U%+]6-$U>34+F]M96CD>T*8ECB:-7#`D?*Q)'0]S0!KT444`%%% M%`!1110`4444`-=$D1HY%#HP(96&01Z&N2\1^$;06\U_8LML8T+O$0=K=^/[ MO?CITZ5U]4=:MY+K1KJ"(%I&C.T#J3UQ512GZGX0C2^$\0G5'DB:(DX*COD#CGIWYKI=%ALY-=M9;" M.1O+@873RJQ*OC'5NA^G:K?Q`LA?>$+Q`V'0`ISQD_)S[?,:TK149:&.&G*< M+R=_Z^1YBNJ^,=CZ[+IMK.'C\\SR/T3;G.`X[=L5HZKJ]O=76G;OWUFL+I6*R0SH54GCE<\[>>^?3MDP7-N]I<-!(5++C M)7ITS7?&K&3LGJ).Y%1116@SK_"OBF87$&FWS!H6`CA8)\RG@*IQV_#.3UQ7 M<5XQ6_:>,]8M4V-)'<@`!?.3)&/<$$_CF@#TBBN/A^(,32@3Z,CKC%375F9]+ MFLHI/),D)B5PN=F1C./:K5%(HIZ=8?V=I%O8)+DP0B,2;<9('7'ZU%H.DC1- M'@T\2^=Y6XF3;MW$L3TR?6M&B@"L^FV$EV+Q[*W:Y&")C$I<8Z?-C-1WNG_: M[VQN?-V?8Y6DV[<[\J5QG/'7-7:*`,1?#4<>GWMI'<$?:Y_-#%<^6NX,$`ST M!S^=%SH%Q,FH00Z@(K;4"S2J8=SJ2H4X;=C''3'XUMT4`9EAHYLKB>8W'F&: MWAA("8QL##/7ONZ=JKVOAP6Z6R-=%U@L&LSA,%MQ7YNO'W>GO6W10!BP:)=V MODS6]_$MS';BW=VMB4D1?NY7?G<.><]^E-_X1UX39R6E\8YK9Y9&>2+>)7D^ M\6`(X]A6Y10!B-X>!SGWJQINE2V6H7M[/ M>?:)+P1[P(]@4J"..3Q@CCKQU-:=%`!1110`4444`%%%%`!1110`4444`%MW%N"L MN9UQQN;!'XUOVMY!>1EX7SC[P/!7ZUXU:C.#N]C-HE=TC0O(ZHHZEC@"N>UV M>VGFC,,BNZ@ARIR,=1[=S6EKD4;Z:\C*"T9!4^F2`:+G1;6:!8XE$+*>'`R? MQ]:N@X4VIR?<:T.:0JLBLZ[U!!*YQD>E=)]@TZ&V-W';*X6,NH8D@C&>AJ.# MP_;QG,TC2G/0?*/\?UK41%CC6-!A5``'H*TQ&(C)KD;!LXFBNH.B6)F:0QL0 MW\&["CZ8JS#96MOM\J!%*]&QD_GUK9XV%M$/F./52S!5!))P`.IKL_!LDFGZ MC-ID[8\^)9D!?C<.H`[GK_WQ2B*,2F41J)&&"P')_&H+JUE>>*ZM9S!17VL=S`VZ.094UDZYJ4-E<+!!Y$=_<)M\^0A1&GJ6/Z"K^D6]O:Z7!!:S+-$ M@P)$((8YY/'OFMI12@G8YH5).LXW32_#^NOR$U35H-)2V:X21A6`<, MV<$Y(XXJ]7,>.72*TTF21E1%U2$LS'```;))JSK.OZ8="OGM]0CN&2$DK9W" MF0`D+D$9QR1SCBL3I-J:58())F!*QJ6('7`&:ATV_BU33X;Z!76.==RAP`0/ M?%>>Z#L@UV>.U:W2*73)&DCM[EI@6]7)XW>PZ58C-O-IWAJSU6J01VD@;>P MMG,:998E?+,3R>6/7ZF@"Y6;IVN6NI7UY9Q)*DMFY5_,4`-R5RN";5PC.%U"[MY`O.=QRG_CR@?\``J`. MFL]7M[[4;NQB23?:;=[L!M;.1\ISV*D'W%7ZXR9/[,;4XI&D+_8K57:)]A9W MD?<=V#M!+')QT)JOJ$;6-UJ%HJ6=OOT:=Y8+-2%#<8)]3R><#B@#NCTZ9JLE M_&UU#:/')%<2PF;RVP2J@@')!(SEAT)K"CLK>PO='>UC$;W%O(L[#K-B,$;C M_$G'>N&1'D<)&C.QZ!1DFNS\9:8%O8=2,6ZV M=?*N"JC*'/#$]>X'3^$#OBJUCI]M9J7@)CZ48 M"+J<$28^1/[ON??V_P`BU-IH,_VBUE-M,2=S`9#9]14MY>K:*N5WLQP%SC\: MJZCYMW=QZ<@`C91)*V>=N>WY5POVLFJDM$[_`'+?0R4U*3BGJC/DNYKLBRGE M:1&N0HE0`!ES@]..X-=%4<5O#"BI'$JA3D8'?&,_7'>I*QJU%.RBK%-A1116 M(@HHHH`****`"J:V]Y8W$MQI5V+5I%`:/8"AQ^&/T]?6KE%:4ZDJ;O%C3L.& MM^(HX@"NGRLJ]2KY8_F!D_@*O:9XKMYV^SZFHL+D?WS\C\I],$UGU M'/;Q7,7ES('7.<&NJ&,DG[R'S':45PVFNVBZY9K#),+.Z)6/YD5+##%;QB*&)(HQT5%``_`5)13N[6)48IW2U(+JS MM;Z(17=M#<1@[@LJ!P#ZX/?DU%!H^F6IH.!R/:KE%(H MJQZ7I\(016%M&$#*NV%1M!Z@<<9[TYM/LGM!:/9P-;+TA,8*#_@.,58HH`KF MPLS;QVYM(/)C(*1^6-JD="!T%6***`"H?L=KL9/LT6UI/,9=@P7SG=]<\YJ: MB@")[6WD:1G@C8RJ$D)0'>HS@'U')X]ZA32=-B3RX]/M43:R[5A4#:WWATZ' MOZU;HH`C-O"3&3#&3$"$)4?)D8./3BHQ8V8\C%I`/L_^I_=C]U_N^GX58HH` MKQV%G#IIL>F6$,XN(K&V2900)%B4,,\GG&>YJU10 M!5DTVPFG:>6QMY)77:TC1*6(Z8)QTJRJJBA54*JC``&`!2T4`%%%%`!1110` M4444`%%%%`$5S;0WEN]O<1B2*0893WKB(8YM+OY-(NG+M&-T,A&`Z=L9_P#K M]".U=Y6%XKL7GTY;V#_CXL295YZK_$.H[#/X8[UE6IJI!H35SF[ZPN)6DDBF MW;ROR;1P![G\Z76]2B\-6-K?"W6\U"[4QHTP_=(J'YB5!Y)R/\CFW:W"W5M' M.O`<9QZ'N/SJQ*+:\L6L=1M5N[8L&",Q4JP[@CD=^GJ?4YX%B9-*G4MIY>G^ M1.$A1HU_:5$VGNKE:UU*'5+&RO;>U:V%PLN^-BS8*,H&&(&00W4<=NH-%S=P M6BJT\@0,<#@DG\J;?V-M>6<%I%$MK#:J5@2/HN>N<]<\$GO^)KD6`#$!@P!Z MCH:<*-.M*Z>WD:5.24VX*RZ'86][;7>?(E5R.HZ'\C4UW?\N,FM*=.527+$:5R73T;6M=@CMFQ;V4BS2R8 MR&(/`'Z]_4\XKN*IZ7IT.E6$=I"H^4?.P&-[=V/U_P#K5K=A91:=916D.=D8QD]2>I-;2DO9I7.6$)*NY6LK??V_I_+J87CJZ>TTRQ8 M7D]G&]]&DTL#E6$95MW3\_PK-T2\W^(;5=%UC4M4L65_MC7A9ECP/EP6`P('C7[+?1W#[R1E5SD#`//-02Z'/!XE75=/>)(;A=E]"Y($@[,, M#[WU_J:Q.HH6_CVTGU&.+[,JVDLOE1S_`&E"Y;.`3%]X*?6BZ\>VEMJ$L0ME M>TAE\J2?[2@<-G!(B^\P'J/>H=.\&7=C=0P'^S&LH9?,$QM%:Y<9R$)8$8]Q MS0_@R[2_F6`Z8UG/.9C-/:K)<1Y.2J[@01]:`+^H^)9A?7=AIVFS7GV6+=AJQX/GFNO"MC-<3/-*ZMN>1BS'YCU)JI=:!JL&K7MUH]U: M10ZC&JSK.C$QE1@%,?4]:T-!TAM/\.6^EWRPS%$99`!N1@6)QR.>OI0!K5Q^ MA.MAX@OIF8+#>W-RCDG@/&Y8'_ODM_WS74VME:6,9CM+6&W1CN*Q1A`3ZX%9 M-QX9CN;&:V>Y/[R]:Z#A,%0Q^9>O=25S[]*`,W3KB6SO]6U$QJ9IK6&X*RN( MP-S2;=Q/``7:#]*G;Q/<1?:T$MM=F.PDNXI8X'C3*_PD%CN'(.0:T+[0%O9K MR0W!C^T10HH"?<,;%@>O(R1Q[5#=>';J_GFN+K4D:26SEM-L=OM10^/F`+$Y MXYR>?:@!T.I:BES9)>I;-'?0LRK$K`Q,%#8)).X8SV%9FGW]PU]IEX6@@MO[ M)>9X(H2%4`ID*-V!VQQP`1SGC?DTOS);!_.Q]C1EQM^_E-OKQZU4MO#OV9;% M1!C/>L_2+R_TS01>-]G:R2ZD#1[3YFUIF!;=G'!/W<=NM:D6A3!;2WGOO-L[ M)U>&,1;7)7[N]LG./8#IS4<'AZ>.T%A-J`ELO.,K1^1AF^QMUN[)Y"RQQYWH#C`QU/7'?@9XJ.TU M*UO.(WP_]QN#_P#7Z=J[JLO5/#VFZMEKB';*?^6T?ROVZ^O`QSFN:KAH5-=F M)JYS]S(8;:650"40L,].!7&5O7^E7BWEY8?;WG^RA,!L@2;ANYY_G^E83*58 MJP((."#U%+#4U3O&^H)6$HHHKJ&=587T$MI`&G7S"H4JSC<3T_6KM<17;UY& M)HJFTUU(:L%%%%6.N`!EF M_`?TJWIDTEQI=K/*VZ22%68XQDD[=,GL*JV%YXBCU*.VU6PM7AF4D3V;-MB([-N_I4&INT5DMXH MT1-2_LYM1B%SNV[><9]-V,9]LT7_`(HT73+B6WO+Y8I8=N]"C$\C(Q@<_ATH M`UJ*RKWQ-HVG6\$]U?QI'<+NB*@L6'K@`G%4]:\76.EQZ=*DLI2WL:VDOW).3N]@.I/!XQVJK=>( MK:32(]0TR\M6C>=(B\RN1R>1A1D-]:`-NBLF^\4:+IMZ+*[U".*?C*X8[<], MD#`_&M4$$`@Y![T`+145S(8;6650"R(6&>G`K"75-7B\/Q:W-+921>0L\D"6 M[(VT@$@,7(SSZUN%FS%>,%@;:?G)!([<<`]:MT`% M%%%`!1110`4444`%%%%`!115;4+V/3=-NK^96:*UA>9P@!8A02<9[\4`. M1XMU)-A(*QDMV&$''Z_I7`:IK<4/B6XM!$SVPN!`;M2"OGL-WEX'IT)['J!U MJ;4_&VN78O\`4;+P]<6ANXT9+A@TB1*%QO\`N@'CD=OJ*H0VLX\.1Z4NF6OV M26W4C=>L6`<;MW,6-V6SZ`]*\^8K%MP[$Y`Y[?AG/-7:]`H*[&TN4N[=9D(Y'(!^Z>XKCJMZ??O83% MU7>K##+G&:YL31]I'3=":N=9138I!-"DJ@@.H89Z\TZO'V,PHJK=:A%;,L2@ MS3N=JQ1\L3V_I^=6;3P]K.HV_FW=Z+`2`%8DCRP^O(([=SU[=*Z*>'G45UHA MI7*EZHN[JTTT;R;F91((P"0F>3[>N?8UW$,,=O!'!$NV.-0BC.<`#`K,TSPW M8Z9=M=HTT\Y&!).P8K].!]/\FM>O4HT_9PY2TK!1116HPHHHH`****`"BBB@ M`HHHH`****`"BBB@`HHHH`****`,+6=%O;R6XNK6]VL]N8A"8@=P[@,3QGUJ M_HMMDV\%U)OD1`,8`V#'W>.N/6KU%:.I)QY68QH0C4=1;OS,3Q/87=U!9 MW5C'YL]AN.W7^5;=OITH\0ZZ\MO(Z26D4 M<Q&Z5#D_(\3#IWSFIV MMM4@\.:+//IDC/9WXF>"V@4/Y>3SL7C//Z\UW5%`'GFOV^K7MUJT2Z?J"K,B MO$MK`BI*H`/[Q^K,/[O)[5M:38R'Q,+B:TD$7]E11AY(R`#W7GOZBNIHH`\^ ML-.U&RT/P]?/IUS+_9\TQGM1&?,PS'#!3U(_K6AJ:W&IZ(TL&@RV1>_B<)Y? M[V4`\NZ@XE*JP4=8V;:,'MCBMZB@#D[FTN;:XU6)WU+%Y(T MD4=K"CI,"H&TL8VVGC')`QTJYI.GSV^I7T;QR!?L5M$DC\[BJN"-V`"1QG%= M!10!R5H+C^S]`L#8W2RV=PGV@M"P5-J,,[L8(YZC(KK:**`"BBB@`HHHH`** M**`"BBB@#F]8U:6+6C:+JRZ?$D2\F`2;F)/Y<8J]KL$MSX1U&W219I9;"5%< MD('8QD9R3@`GWP*K:E:ZI]JO4M[2"YAO8@@,MZT_50=)\'30G]Z8 M[<0DYQG=A<_AG-;U.7D5OZ_KS..CS^TES7M\^_K;;M\SS6&;Q#<>&5TZ+P[N M1K3[,)OML8_AV;MO]*KV,;PV%O%(,.D2JP]"`*['9Y>A%-FPBV.1C&#MY_6N M5KRL'"$>?D5M?/\`5G=*I.I\3V"BBBNXD***T=-TE[T>8[&.$'KCEO7'^-3. M<8*\@+WAU7%O,Y;Y"P`&>A`Y_F/RK3NKA;6VDG;D(,X]3V'YT^*)(8ECC4*B MC``JI>0F_OK+3%S_`*1*#)M<`A!UZ^V3^%>1_'K>IGNSH/"VE1VFG)?.`]W> M+YCR>S<@#CCMGW^@K=HHKV30****`"BBB@`HHHH`****`"BBB@`HHHH`**** M`"BBB@`HHHH`****`"BL?6=5N+.[M[:U>TC:56=WNV*HH&,<@]ZTK0W#6L;7 M1A,Q&6,.=A],9]JMP:BI/J9QJQE-P70FHK-UW6HM"L!+Q)9SZK?Z=$R&:R4' MYI5`E."2!_NXP?0U8M]7MSI<%]?2V]F)1GYKA&0'T#]#^%`&A14#7MHEJ+M[ MJ%;F:]9ZC$@>:""X=W46YF!_6@#1HJNM_9O=FT6[@-R!DPB0;Q_ MP'K5B@`HHHH`****`"BBB@`HHHH`****`"L7Q?\`\BQ>?\`_]#6MJN>\9@OI M=M#O94FNT1]IQD8/]0#^%)NRN!E7W_'AS5([B?2/M]N83&#&A=U;.>1G&/?&?>K MGA^UN++18(+GB09.W.=H)R!6E16CJ-QY3"-!1J.I?^M/\C!\8&'^Q@+O37OK M4RKYWEN5:$?WQ@'./ZU@Z'J$RZE<1:1?7VKZ8EH[M]H#960#A%8@'/3@>M=Y M169N>6Z(T+Z[HIC$+H^*DT.!XE>&`QQK&4)7&6PN,@$9P/>NXUC1;76 M[>.*Y:5#$XDCDA?:Z,.X--TC0K71O.>*6>XFN"#+/<2;Y'QTR?:@#E]-;3+W MQ%I#>'K5H?LR.+UEB*!1MP%?CYFS_GT[":2_6Y58+:W>`XW.]PRL/7"A"#^8 M_"K5%`&3K\;A;&\6-Y%LKI99%09.S:RD@=\;L_A4L>N65S<1P6,JWDCGYO)( M81#N7/\`#]#SFM&B@#BUC1/!<.T)N5D#Y9B3(..N6Q@@UW5%%`!1110 M`4444`%%%%`!1110`4444`%W:%(T;9F M1B,G&3C`/J/SK(KUC1+$Z=HUK:L"'1,N"0<,>6''N30!6\/>'H=$M\G$EU(/ MWDOI_LK[?S_(#8HHH`****`"BBB@`HHHH`****`"BBB@`HHHH`****`"BBB@ M`HHHH`****`"BBB@`HKF-?:2[UM+`V[FT2 M286]O->_;!:0^46$4C-R&YYQ_GB@#M**Y5?$NIV.J75IK%M;*MKIYNF-L6/F M$,!P3T'.,$=1UJKH'CB74M8@LKG[(RW0)C^SB0-$0,[7W``^F5]*`.THKBK? MQ7KSZ?;:I+96/V)[GR)-K,)#EMN0.@].]2>(?&%_H]_.D2Z=Y,#*/*DE+339 MQD@+PO\`P+ZT`=C13(I!+"D@&`ZAL?6H=0N&M--NKE%W-#"\@'J0":`+-%8= MIH-G,MYC,# M@`*1C@9)YZ]*`->BN3_MU/MB:Q+"5\K3)R\0/\2RJI`/U'6M)M1U*QGMEOQ; M.EV&5/)1E,3A2P4Y)W#`//'TH`VJ*YFVUK69K?29F2RQJ8VA0C#RCM+;L[OF M&`>./K4%_?7UX]E$5@-U::P(=P!5&_=,V[&21PW3/;K0!UM%<[?:M<06][:7 MD5K<3VS0,#Y9\N1'D`!VDG!!![GG!INK>(KFP:]9)+0?8^1;%6DDE7`.25/[ MOOU!Z9.!0!TE%,BD$L22#@.H8?C3Z`"BBB@`HHHH`*X/396N4N+MH]@N;AY5 M7.<`G_'-=AJSO'H][)&Q1UMY"K*<$':>17!Z%>^8@L_+QY:EM^[KSZ?C7+BT MW3T%+8K>()Q)=I",$1+SQSD__6Q636CKCAM3%;75='-S>>^>OH/QYK3[=+O4;:VD)"33(C% M>H!('%>KV%C#IME%9VX(CB&!N.2>QT'2]-E,MI9HDG9R2Q'7H2 M3CKVK0HHH`****`"BBB@`HHHH`****`"BBB@`HHHH`****`"BBB@`HHHH`** M**`"BBB@`HHHH`S=1TJ2ZN4N[6\:TN40Q^8$#[E/."#5C3K"+3;&.UA)*IGY MFZDGDFK5%4YR<>7H9JE!3'[U-1 MCO=3UN>^:!66)%C$*C/7(4\UO45)HW2WA76)#!:W2W$$1MUP"#GYB. M6//7/'I6QIFB#3UU)6N#*+^YDG.$V[-W;J:OJ]Y=:G'?&":P^RR/>0B%W8L#\J#H`!^=;FDZ!>:?GS8/SD#N:W**`.>3PKL\.Q:1]MSY=P)O-\KK\^[&,_AUJM?>" MGNYM0\O5I(+>_8R21"!6._(/WNNW(^Z,?6NJHH`K-86]Q91VMY##=(@&1)&& M4D#&<'-21VT$5N+>*&..$+M$:*`H'I@5+10!D1Z1?6]L+&WU7R[-1M7]SF9% M[*'W8X'`)4FGMI$L%RT^FW2VS21)%()(S*"%R%(^888`]3GZ5J44`8:>%[58 MQ"TKO!]DDMG4CYG+L&+Y]2JP[/F*E=S')W'!/3 M`YZ5KT4`9,.A^3;Z1#]HS_9F.=G^L_=E/7CKGO4-QX=DEE:6*_,3G4/MJGRL MX/E[-O7D=\_A[UN44`8TN@/$6]O'"N,(H&0,9]ZXL9.T%'N3 M(Y?4Y/-U*=L8PVWKZRCU.5";F8'9O7'EKDCCZCG/H?KGJ*BM7ADM87 MM@!`R*8]JX&W'&!VXJ6J`****`"BBB@`HHHH`****`"BBB@`HHHH`****`"B MBB@`HHHH`****`"BBB@`HHHH`****`"BBB@`HHHH`****`"BBB@`HHHH`*** M*`"BBB@`HHHH`****`"BBB@`HHHH`****`"BBB@`HHHH`YCQ=.9+K3+%&CRT MIG<$_,-O3\#EORJM2:JYN?%TQ,0`M;=8]Q.>3\V?;AB/P]Z6O)QDKU+=B);G M'WW_`!_W'_75OYFFVUM->7"6]O&9)9#A5'>F.[22-(YRS$DGU-=SX'TA[:WD MU&="KSC;$",?)USU[G';M[UZL59)%G2:?;O::=;6TA!>&%$8KT)``XJQ113` M****`"BBB@`HHHH`****`"BBB@`HHHH`****`"BBB@`HHHH`****`"BBB@`H MHHH`****`"BBB@`HHHH`****`"BBB@`HHHH`****`"BBB@`HHHH`****`"BB MB@`HHHH`****`"BBB@`HHHH`X[Q'`^FZ_'J&3]FO0(Y2>B.!@>PX`Z_[5+70 MZUIJ:MI7$\2M&F`-JD<#`Z<5Q. MJV1O;0J@!E0Y3M]1_GVKH=(\3V]\XM+L"TO5`#(Y`5VSCY3GGMQ[\9ZUT8>K M[2&NXT[FY11172,****`"BBB@`HHHH`****`"BBB@`HHHH`****`"BBB@`HH MHH`****`"BBB@`HHHH`***R_$4^JP:+<'1;-KJ_=2D(5T01D@_.2YP0.N.ZC`8M.IR(.>.P+=>NTXY!Z[PWKT'B/1 M8M1AC,+$E)H&8%H9%.&4_P`QG!P0<#-<%9^&]?M+<(="O))&)>65IX"TKG[S ML3*223[U:T+2?$VC^+(M0M]#F2VO`(;]9;J(*%R-L@"NCV5B;*Q8^$QN,<9^T&*VZX' MS??W>_3-=%>6_P!KLI[;=L\Z-DW8SC(QG%4+6QUBUMH;==1LFCA14&;)\D`8 M_P">O6O0+*U[K-_:ZI_9:V\;W%RP-G)M.SR_XR_/5<>VWNKI@ZF`[G4HH)1B>,\C.&Z4`1G5A;:EJ-Y!'YK7$=FD*L M<`LY8+GVYJ?4-:U'2([F.Z^S33+:/<021QLJDIC*LI8GN.<_E5F;P[#,]R?. M:-95@$01>86B)*D'OR1^51W7A^?44N6OKY9)Y;9K:-HX-B1*W4[2Q))P._:@ M`N=3U"TBMA<3V,+7))$K(=L8P"$V;]SMDGD8&!G%9TVJWNJ6-L\,T4,D.J+; MNWDOMD(((.TL"!R,@_G6U=:5,]W:WEI=)#/;1-%F6(R(RG&>`P(.5'.:JQ^' M)8K66-;_`'3/?"]662'(#\9!`(R.#T(Z^U`$<>K3BX>SMH+>.YGOI8E?80H" MJ&9V`.6/0=1GBDO->O[*.YMVBMY+RWF@4,`RQR)(V`<9)4\$=3T[U:_L%E8S MQW86Z6Z>YBD\O*J67:5*YY&/<4R7PZUPDTD]YON9YX99)!%A0(V!"JN>!UZD M]:`+%E>WG]KSZ=>^0Y6%9XY(4*#!)&""3R".N?PK,U1=/;Q<@U"S^U1_8/E7 M[(T^#YG7`4X^M;:V.-8?4/,^];K#Y>WIABV<_C2?V?\`\3K^TO-_Y=O(\O;_ M`+6[.<_I0!@K<7.DK]F ML(9+02VB*TTSPMM=FR555WY7@#)R>O2KFIZ?_:,4">;Y?DW$<^=N<[&!QU[X MZU%/IDXOY;VPNTMY)T5)A)%YBMMS@@9&&&?<>U`&?!KM_J-Q80V<=O";B&5I MC,K/Y;1N%.,$;AG/IZ^U-E\3/$J6LTEG;71N9())9FQ"FP!BV"03D,N%SU/7 MBD_L:YLM7TV+3Y71;>UFW3RQ&169G4D-@CDDD]1TJZN@F)8YHKLB^29YC.T> M0[.,,"N1\N`!@'/`YH`HGQ-,]K(ML]GM.719KF%1W4\T=TL2W%FUK*K1;N#NP0(0ERM MFEWIU@8[>.1FNS@,6'"J-PP!CKSC(XJ/_A*)+BWLYDEM;&*XB9FN+A6DB\P- MM*`@J!SSDGIVK2.D7$$XGL+Q8)&A2*7S(?,5PO1@-PP>3W(]J>=/OXH(HK;4 MMP6/9)]KA\[S#W;AE.?QQCM0!4^Y,^QP,BIJJ:981Z7I M\5G$Q98P>2`,DDD\#IR3Q5N@`HHHH`****`"L76_#D&J!KF`_9[\#Y9E)&<= MFQ^6>O3TQ6U10!P+WLNFW+66K)Y4J#(D4$K(/48'^>>G2H)4_M^86NGVAF?( M!N""JQCKR?3[W7\,UZ+17.L-3C/F0K(BM8G@M889)3*\:*K2-U<@8R?K4M%% M=`PHHHH`****`"BBB@`HHHH`****`"BBB@`HHHH`****`"BBB@`HHHH`**** M`"BBB@`HHHH`**\3T.P\2:SI$&H?\)EJD/G;OD\V1L88CKO'I71>!UU:P\=3 M:=?Z[>:G$=,:<">1RJGS57H6//!Y]ZYH8NA.JZ49>\KZ6?0UE1J1@IM:'I5% M5-5=H](O'1BKK;N593@@[3R*Q-*;3YK6S9VUIIW1"S,;W86('.?NXS^'X5TF M1TU%8MUX@-I>R6#6A:\9U%M$'XG5OXLXX`P<]<8[YI&UZZ#7[QZ8'M]/D*2O MY^&8!0Q*KMY(!Z$C\:`-NBN?.LK:ZEJ,[/)/#Y=J((E;[S/N`P#P,G%2W7B" M?3XKD7UBD<\-LUQ&D<^]957J-Q4$$9';OWH`VZ*R7U6^2*(MI\:/-ED+W!$: MI@'+OL^5N<8`/UK/N->N[VRMI;".$.-06VF'VCY20>@8*:*-X$ER&$A M`5E;`R.O4#IVH`W**SK/4II=1FL+NU6":.-95,"VM9'GBN()7C6X MF9C'(F#]\Y)!!/!SR*R=/.IS?V%%(SM'=PM<2M_:,NZ0[5Y/R_+@-G:#@DX[ M9(!VE%85KK;206<%G:&2XN1(ZQS7#814;!+.03UQ@8/Z58;5KKS+>U33P+Z9 M&D:&28!(U4@%BZ@]21CC/KB@#5HK#;Q'\D,:6R)=23O`R3S;$1D&3EP#U&". M.<]JU;26>:W#7-M]GER0R;PX^H(Z@_@?84`3T444`%%%%`!1110`4444`%%% M%`!1110`4444`%%%%`!1110`4444`%%%%`!1110`4444`%%%%`!1110`4444 M`%%%%`!1110`4444`%%%%`'CWAR[U'2-"MK"X\,:\TL6[<8[!BO+$\9QZUN^ M$/MMYX^EU&71]2L;<:68=UY;&,%_-5L`].A_0UZ)17'3P5&G6=:*]YW_`!-I M5YR@H/9%>_@:ZT^YMT(#RQ,BEN@)!'-4;(:U:V=O;&RL&$,:QEA>OS@8SCRJ MUJ*[#$P;S1;ZZU!]3%Q&MW`X%DH8^6J#[P?CJV3GCCC'2JMI!J5V=;M8/LRP MW%V\;N[-NBS&@)`Q\W![D5U%%`&!-X<=Y+CRI4C7;;&V)R2K0DD;AZ'C]:9J M.BZCJZ7,MR;:&4VCV\$<HH+(A''R]"5Z'U[5TE%`& M"-$NXY_ML;P_:8[R2>-"QV,CJ%*DXR#QUP>E,N-!O;S[13S@=:Z&B@"BME*->DO]R>4UJL(&3NW!F/YSV]]=6VG7EQ&C1O!,I\HJ3D88AB&&.N.%RHWRM M(L4;$I"#_`I/.!CT'4\"M&B@`HHHH`****`"BBB@`HHHH`****`"BBB@`HHH MH`****`"BBB@`HHHH`****`"BBB@`HHHH`****`"BBB@`HHHH`****`"BBB@ M`HHHH`*CFFCMX))Y6VQQJ78XS@`9-244`>'ZYX@OM2U.2>24;A\O`X`]`#T` M_P#K\YKM?ASKEU?>=97#M(J)N3V"._&/>LW6_AQ?&\9[`^?&QX.X M!@/]H''/T].@KJ_"GA2/P["TDCA[EP5)0G:%S^I.!S^`]\(1J*;;>AZN(JX2 M6%A&G'W^OZW?7^MC:OYVM=/N;A`"\43.H;H2`3S6/)J6K6FC1ZO/+930^6DD MD*6[1MM;&<,7(R,^G-:NJHTFD7B(I9VMW"JHR2=IX%4=,T.T&G61N([AW2*- MC'/<2NJL`/X&8@$'VXK<\HM_VS8&\DM1,QEA;;+B)]L9V[OF;&!QW)]?2BUU MBQO9A##,V]E+J'C9-ZCNI8#4'V-][?LQC&?O<5@H9I(-!LAIURD MME/&)R86"1[8V7AL8()[@_6H"ES'H::5]ANFN(]1#L1`Q39Y^_<&Q@C!'0G' M>@#H[C6M/M9VAFG*LF/,(C9ECSTW,!A<^Y%1/K=E;&7[5>)@7/V=0L3#:^T, M$/7)QSD8'('6J=G)+H]WJ236=U.US=&>%H(2XD4JHQNZ*1@CYB*IM9W+:D'- MK+M_MP2Y,9QL\C&[Z9XSTS0!NQZS826TUP)]B0-ME$B,C(>P*L`03D8XYHMM M8L;N=X(I6$L:>8\2.WTH`O0:IJE]>V]O`]K;B: MS^U$R0,Y`+8`P'';&??-7+;4Y([JZL]2,*26T:S>4* M^]CANF>@W#ZT`:XU[33#+*9G588_-;?"ZDI_>`(RP]QD5:>]MHY88WE`:<,8 M^#@@#).>PQZUAVMJ=0U6&65]2GCBAD5VO(DA5=X`*8$:EL^H.!CJ:I6&EZE> M6E_;W,;Q26MF^GVKR#&_K\X/H0$&?8T`=%;:S87DHB@F)9U+1EHV59`.I4D` M-^&:JZ?K\4FCV-U>MMN+N+>(H(GAPW&E+IUW=6ESY9TU8&"0L[Q.&)P5`WYVQF7R?F1@P?^Z5QD'V(K MG]LME>Z==7%K*!-J%Q.L*IN=$9&P=HSSWP.>?6IY;2XNM0^W+;3+#-J4#HK1 MD,%1""Y7JH)]?04`:A\2:4%[C;E1[G`JQ=:O8V;B.65BQ M3?B.-I"%_O':#A?<\5EW5I,3XE*V[DW%N!&0A_>'RB,#UYXJLMM=65]-/)+J M,*7$$.S[);I+DJF"C`HQ4YYYP.30!MSZWI\$J1-.7DDC$J+%&TA=#W`4'(J" M77[<7FG10!IHK[=B1(W8``<=!Z]<].]4=$TZ:QU6T#6\L:1Z9LRY#[&,F=A8 M``D>P[5#I]O<6JZ1)+:SA8[JZ#@1,2N]GVD@#(!XYZGK437][I^H6]OJ$MM-%.E`#H M]?TV6W^T),YB)4*WDO\`O"3534Q*US-J?V24037MFL M4;H5>78QR=IY&<@#.#Q0!TL&JV5Q'-(LQ00#=*)4:-D&,Y(8`@8[TR+6K"99 M&69E$49E821.A*#^(`@%A[C-8NJ65SK;7]Q:0S1QM:)"@EC,32L)-Y`5QGIQ MR,<^E-GMIKYY)E;5+AH;.=>?+#^61L;>'_`+NS&[=[8S4MG?VU^CM;N28V MVNKHR,A]"K`$?B*P([&-H+NZN8=4E6:YC=9=H68%5P)`BJI7TQ@DXZ5I:')> MNURL\L\ULK*+>6YA\J5N/F!&!P.,'`SS0!K4444`%%%%`!1110`4444`%%%% M`!1110`4444`%%%%`!1110`4444`%%%%`!1110`4444`%%8L^LW$5Q)&J1$( MY49!['ZT^QU6>YNTA=(PK9R0#GH3ZUS+$TW+E%=&O14-YYV[_)C9]N M<9P,XS64=;OX-.CU*ZTZ!;1E5W,5T7=%;'.TH`<9YYKI&;=%5_[0LOM(M?MD M'GEBHB\U=Y(&2,9SG!!IJ:II\@F,=_;.(`3+MF4^6!UW<\?C0!:HK(TOQ!;Z MAISZA-):VUL&PK&Y#$?[_`"GH<9/6KS:A9);I0+!)]R4RJ%;@G@YP>`3^ M%`%FBJBZKISO&B7]JS2D!`)E)>*?'?V^,D'&2"".001R"/44VTT^VLB[0HV^3&^221I';'3+,2<#ZU5 MU'7;2P&Q989K@21HT`F`=0SAE:=`!16?#JT3WM];S;(%M)4B$CR`! MRR@CKT.6QCO5J2ZMX699;B)&10[!G`*KG&3[9[T`3454BU&VN)HTMKFUF1MX M8K."P*XR`!G/7GD8X]:=;:A97DCQVMY!.\?WUBE5BOU`/%`%FBLQ]=M#J%I9 MVTL-RT\K1.8Y@3$0C-R!G^[C'%6!J-M'9+=75S:PQDD;_/!CSDCACCTH`EEM M89IX)Y$W26Y+1MD_*2"#]>":FK-FUVPBU&SLOM$+->*61A*N,<`?7).!ZX-3 MC4K:.PCN[JZM88W'^L$X,>?9CC-`%NBJ\E_9Q1)+)=P)'("4=I``P`R<'OQS M0-0LC:?:Q>0&V'_+;S!L_P"^LXH`L45%;W,%W$)K::.:,]'C8,#^(J6@`HHH MH`*AN+6&[6-9TWB.19%Y(PRG(/'O4U%`!1110`4444`%%%%`!1110`4444`% M%%%`!1110`4444`%%%%`!1110`4444`%%%%`!1110`4444`%%%%`!1110!RM MY_Q^S_\`71OYU-I/_(2B_'^1KI**X5A+3YN;J3RE/6/^0+??]>TG_H)K-T[1 M_M>C62W>H7=Q`88V-NWEJAP`0#M0,1[$_7-;U%=Q1RK6\TT/BI;12;EY"J%? MO$^4N`/S/YTFG.MUJ>F""^M93:JP,=K9E#$FW!60F0[><<8SD5U=%`'$VWG1 M:;X2:TB\.6=A.4_M&*^C,L9'SA_.&YR.N M#GKT.175ZIJ']F01W#1;XC*J2ONP(E/5SQT'&:NT4`<;>_OX=6U"']Y:MJ%M M(LJ(+VVOFUF2UF6:,:4@\Q#E2?,;H>AKM:*`,'588?[ M7TZ)E*Q&UN581@YV[4'`'.<5E&69X#I^FW5IJ;?8I8XIHHPL]K\G`8CID@#H MIS]*[.B@#DENM,N-6\.1V7EF2$R*55<&(>2WRM_=.>Q]*BTR1+631[R\=8[- M(KE!+(<)'(9.,D\#(!`KLJ*`.<:YT]=8T::U\N&U?[1&C;/+5G8K@#(&23G' MK[U0T66*S71KR^=8K06#)'+(<(DA89R3P"5Z?0UV5%`'&6D2R:MI["+%I)JE MQ);*RX&WRB<@>A8,14TL=M]KU,S79LO)U-)8I=FY$?R5Y8=`#D\G'.. GRAPHIC 24 g54121mm13i001.gif GRAPHIC begin 644 g54121mm13i001.gif M1TE&.#EAMP`?`/4```````P,#!45%1L;&R0D)"LK*S0T-#L[.T1$1$M+2U14 M5%I:6F-C8VIJ:G%Q<7Q\?/\M%_\T'O\V(?\X)/\^*?]`+/]$,?]30?]J6_]O M8/]Q8O]\;O^$=_^*?82$A(R,C)24E)Z>GJ2DI*VMK;2TM+R\O/^2AO^GG?^Q MJ?^WL/^]M\3$Q,O+R]/3T]O;V__&P/_+Q?_6TO_8U/_^+SQS(`MJ"R`Z`(B)BB)R.`**D(!R&!`3$I>8$3%R-8^0GY\" M"B1[90V@J)`'(*5S2@>IB`A*+@&Q)64TGJBXJ+:,K4L#J8#!2!H3%A45RLL5 M,IS#L;$$(UMDI].0MHD$1ZY)+=H!<4D@`-R?LUO9G[8-2+&,93C2VP"291H2 MSOT4T/3L:4.EH`:[@;$"K`"'Y,'`?$@,Q(I2JD6Z3P-HQ`/UJ]&N3\7*8)C0 MS]D_3A\1?B*@<8F.4Q=5)C)@3`H.`@,-<-%1(M;^`2D,8AG:B`K8M92*($K9 MYV_9R3(U!,I,9*M`JW93(/:S*52UF)75\"H@$ M]Z!A$***(L5R7!(';S76@;0`"L%\I9-!0'B(Z M^480#2VTX,('^07(WTZGA3)"CT8-)F-67WUHF2*V"(A=7`4ZM6(2MZ5U37NI M"*`1A#)%-T>#H,PB$2@)E!$D0A(JN612D$%I4FU4MEBD$F6A<@27*BE71IV? M&.(>1^4L1YJ&4JP)BI-)S#87!5)&HV`C,P*`2U`]:D-`"S]*\:<[06H4:&@EDVI4$YQ(M+E@&AI]$@:>E#P2Z!:R*G`7F)[T!-9"'6YAZJFQ0 M,MHH5')FN@2NBN`R*T(F=@6*(61L^@FF6QR94)+!"IN(8')L$(%<*D+Z:"[^ ME4ZZ)C=IVLAI.*D(9LR9H#@`CK>)P%.3"1$T8RP%%MR`TKE;()=*',^JI-9H M8;JD`W,K??D>H650,^+%]\WQ@IO,3(#!'"[$\J(29"20R@"`$=3""BRPL,(* M>-9(!@E9%D#`S02TJ*<4]"K2;K=%*:M'B[UNH0$$_4PP`0QR^*Z&E@DX MZ9_8>V_I;\#[.-`1HF+!*1WBZ?"KD`"["UT*K214`HK,Z#;#(NW0] MOKCL\?Q`H<'M[5!*``\)V-HO(C1LTX`;OA(L5'H7^RF;^N+DVP"!"$(@@@(2 MD(#64H49.$*X[!W.2JC3QE`,1P^R1.HNHH.)H?RB`U&127*IP-9@QE>ZX8FM M>-IH``7E,(++3>4`1X`1["RS`/-]9S![(`-[$L@F)9`P>*;3W?QCD;C/M\%L035D8F!?B`K4A&`@7H;R`! F((`"/B!".9Q/$0,X@`,5QJ`$FJ$"?&4`("060X8?;H]J GRAPHIC 25 g54121mm03i001.gif GRAPHIC begin 644 g54121mm03i001.gif M1TE&.#EAMP`?`/4```````P,#!45%1L;&R0D)"LK*S0T-#L[.T1$1$M+2U14 M5%I:6F-C8VIJ:G%Q<7Q\?/\M%_\T'O\V(?\X)/\^*?]`+/]$,?]30?]J6_]O M8/]Q8O]\;O^$=_^*?82$A(R,C)24E)Z>GJ2DI*VMK;2TM+R\O/^2AO^GG?^Q MJ?^WL/^]M\3$Q,O+R]/3T]O;V__&P/_+Q?_6TO_8U/_^+SQS(`MJ"R`Z`(B)BB)R.`**D(!R&!`3$I>8$3%R-8^0GY\" M"B1[90V@J)`'(*5S2@>IB`A*+@&Q)64TGJBXJ+:,K4L#J8#!2!H3%A45RLL5 M,IS#L;$$(UMDI].0MHD$1ZY)+=H!<4D@`-R?LUO9G[8-2+&,93C2VP"291H2 MSOT4T/3L:4.EH`:[@;$"K`"'Y,'`?$@,Q(I2JD6Z3P-HQ`/UJ]&N3\7*8)C0 MS]D_3A\1?B*@<8F.4Q=5)C)@3`H.`@,-<-%1(M;^`2D,8AG:B`K8M92*($K9 MYV_9R3(U!,I,9*M`JW93(/:S*52UF)75\"H@$ M]Z!A$***(L5R7!(';S76@;0`"L%\I9-!0'B(Z M^480#2VTX,('^07(WTZGA3)"CT8-)F-67WUHF2*V"(A=7`4ZM6(2MZ5U37NI M"*`1A#)%-T>#H,PB$2@)E!$D0A(JN612D$%I4FU4MEBD$F6A<@27*BE71IV? M&.(>1^4L1YJ&4JP)BI-)S#87!5)&HV`C,P*`2U`]:D-`"S]*\:<[06H4:&@EDVI4$YQ(M+E@&AI]$@:>E#P2Z!:R*G`7F)[T!-9"'6YAZJFQ0 M,MHH5')FN@2NBN`R*T(F=@6*(61L^@FF6QR94)+!"IN(8')L$(%<*D+Z:"[^ ME4ZZ)C=IVLAI.*D(9LR9H#@`CK>)P%.3"1$T8RP%%MR`TKE;()=*',^JI-9H M8;JD`W,K??D>H650,^+%]\WQ@IO,3(#!'"[$\J(29"20R@"`$=3""BRPL,(* M>-9(!@E9%D#`S02TJ*<4]"K2;K=%*:M'B[UNH0$$_4PP`0QR^*Z&E@DX MZ9_8>V_I;\#[.-`1HF+!*1WBZ?"KD`"["UT*K214`HK,Z#;#(NW0] MOKCL\?Q`H<'M[5!*``\)V-HO(C1LTX`;OA(L5'H7^RF;^N+DVP"!"$(@@@(2 MD(#64H49.$*X[!W.2JC3QE`,1P^R1.HNHH.)H?RB`U&127*IP-9@QE>ZX8FM M>-IH``7E,(++3>4`1X`1["RS`/-]9S![(`-[$L@F)9`P>*;3W?QCD;C/M\%L035D8F!?B`K4A&`@7H;R`! F((`"/B!".9Q/$0,X@`,5QJ`$FJ$"?&4`("060X8?;H]J GRAPHIC 26 g54121mm15i001.gif GRAPHIC begin 644 g54121mm15i001.gif M1TE&.#EAMP`?`/4```````P,#!45%1L;&R0D)"LK*S0T-#L[.T1$1$M+2U14 M5%I:6F-C8VIJ:G%Q<7Q\?/\M%_\T'O\V(?\X)/\^*?]`+/]$,?]30?]J6_]O M8/]Q8O]\;O^$=_^*?82$A(R,C)24E)Z>GJ2DI*VMK;2TM+R\O/^2AO^GG?^Q MJ?^WL/^]M\3$Q,O+R]/3T]O;V__&P/_+Q?_6TO_8U/_^+SQS(`MJ"R`Z`(B)BB)R.`**D(!R&!`3$I>8$3%R-8^0GY\" M"B1[90V@J)`'(*5S2@>IB`A*+@&Q)64TGJBXJ+:,K4L#J8#!2!H3%A45RLL5 M,IS#L;$$(UMDI].0MHD$1ZY)+=H!<4D@`-R?LUO9G[8-2+&,93C2VP"291H2 MSOT4T/3L:4.EH`:[@;$"K`"'Y,'`?$@,Q(I2JD6Z3P-HQ`/UJ]&N3\7*8)C0 MS]D_3A\1?B*@<8F.4Q=5)C)@3`H.`@,-<-%1(M;^`2D,8AG:B`K8M92*($K9 MYV_9R3(U!,I,9*M`JW93(/:S*52UF)75\"H@$ M]Z!A$***(L5R7!(';S76@;0`"L%\I9-!0'B(Z M^480#2VTX,('^07(WTZGA3)"CT8-)F-67WUHF2*V"(A=7`4ZM6(2MZ5U37NI M"*`1A#)%-T>#H,PB$2@)E!$D0A(JN612D$%I4FU4MEBD$F6A<@27*BE71IV? M&.(>1^4L1YJ&4JP)BI-)S#87!5)&HV`C,P*`2U`]:D-`"S]*\:<[06H4:&@EDVI4$YQ(M+E@&AI]$@:>E#P2Z!:R*G`7F)[T!-9"'6YAZJFQ0 M,MHH5')FN@2NBN`R*T(F=@6*(61L^@FF6QR94)+!"IN(8')L$(%<*D+Z:"[^ ME4ZZ)C=IVLAI.*D(9LR9H#@`CK>)P%.3"1$T8RP%%MR`TKE;()=*',^JI-9H M8;JD`W,K??D>H650,^+%]\WQ@IO,3(#!'"[$\J(29"20R@"`$=3""BRPL,(* M>-9(!@E9%D#`S02TJ*<4]"K2;K=%*:M'B[UNH0$$_4PP`0QR^*Z&E@DX MZ9_8>V_I;\#[.-`1HF+!*1WBZ?"KD`"["UT*K214`HK,Z#;#(NW0] MOKCL\?Q`H<'M[5!*``\)V-HO(C1LTX`;OA(L5'H7^RF;^N+DVP"!"$(@@@(2 MD(#64H49.$*X[!W.2JC3QE`,1P^R1.HNHH.)H?RB`U&127*IP-9@QE>ZX8FM M>-IH``7E,(++3>4`1X`1["RS`/-]9S![(`-[$L@F)9`P>*;3W?QCD;C/M\%L035D8F!?B`K4A&`@7H;R`! F((`"/B!".9Q/$0,X@`,5QJ`$FJ$"?&4`("060X8?;H]J GRAPHIC 27 g54121mm09i001.gif GRAPHIC begin 644 g54121mm09i001.gif M1TE&.#EAMP`?`/4```````P,#!45%1L;&R0D)"LK*S0T-#L[.T1$1$M+2U14 M5%I:6F-C8VIJ:G%Q<7Q\?/\M%_\T'O\V(?\X)/\^*?]`+/]$,?]30?]J6_]O M8/]Q8O]\;O^$=_^*?82$A(R,C)24E)Z>GJ2DI*VMK;2TM+R\O/^2AO^GG?^Q MJ?^WL/^]M\3$Q,O+R]/3T]O;V__&P/_+Q?_6TO_8U/_^+SQS(`MJ"R`Z`(B)BB)R.`**D(!R&!`3$I>8$3%R-8^0GY\" M"B1[90V@J)`'(*5S2@>IB`A*+@&Q)64TGJBXJ+:,K4L#J8#!2!H3%A45RLL5 M,IS#L;$$(UMDI].0MHD$1ZY)+=H!<4D@`-R?LUO9G[8-2+&,93C2VP"291H2 MSOT4T/3L:4.EH`:[@;$"K`"'Y,'`?$@,Q(I2JD6Z3P-HQ`/UJ]&N3\7*8)C0 MS]D_3A\1?B*@<8F.4Q=5)C)@3`H.`@,-<-%1(M;^`2D,8AG:B`K8M92*($K9 MYV_9R3(U!,I,9*M`JW93(/:S*52UF)75\"H@$ M]Z!A$***(L5R7!(';S76@;0`"L%\I9-!0'B(Z M^480#2VTX,('^07(WTZGA3)"CT8-)F-67WUHF2*V"(A=7`4ZM6(2MZ5U37NI M"*`1A#)%-T>#H,PB$2@)E!$D0A(JN612D$%I4FU4MEBD$F6A<@27*BE71IV? M&.(>1^4L1YJ&4JP)BI-)S#87!5)&HV`C,P*`2U`]:D-`"S]*\:<[06H4:&@EDVI4$YQ(M+E@&AI]$@:>E#P2Z!:R*G`7F)[T!-9"'6YAZJFQ0 M,MHH5')FN@2NBN`R*T(F=@6*(61L^@FF6QR94)+!"IN(8')L$(%<*D+Z:"[^ ME4ZZ)C=IVLAI.*D(9LR9H#@`CK>)P%.3"1$T8RP%%MR`TKE;()=*',^JI-9H M8;JD`W,K??D>H650,^+%]\WQ@IO,3(#!'"[$\J(29"20R@"`$=3""BRPL,(* M>-9(!@E9%D#`S02TJ*<4]"K2;K=%*:M'B[UNH0$$_4PP`0QR^*Z&E@DX MZ9_8>V_I;\#[.-`1HF+!*1WBZ?"KD`"["UT*K214`HK,Z#;#(NW0] MOKCL\?Q`H<'M[5!*``\)V-HO(C1LTX`;OA(L5'H7^RF;^N+DVP"!"$(@@@(2 MD(#64H49.$*X[!W.2JC3QE`,1P^R1.HNHH.)H?RB`U&127*IP-9@QE>ZX8FM M>-IH``7E,(++3>4`1X`1["RS`/-]9S![(`-[$L@F)9`P>*;3W?QCD;C/M\%L035D8F!?B`K4A&`@7H;R`! F((`"/B!".9Q/$0,X@`,5QJ`$FJ$"?&4`("060X8?;H]J GRAPHIC 28 g54121mm05i001.gif GRAPHIC begin 644 g54121mm05i001.gif M1TE&.#EAMP`?`/4```````P,#!45%1L;&R0D)"LK*S0T-#L[.T1$1$M+2U14 M5%I:6F-C8VIJ:G%Q<7Q\?/\M%_\T'O\V(?\X)/\^*?]`+/]$,?]30?]J6_]O M8/]Q8O]\;O^$=_^*?82$A(R,C)24E)Z>GJ2DI*VMK;2TM+R\O/^2AO^GG?^Q MJ?^WL/^]M\3$Q,O+R]/3T]O;V__&P/_+Q?_6TO_8U/_^+SQS(`MJ"R`Z`(B)BB)R.`**D(!R&!`3$I>8$3%R-8^0GY\" M"B1[90V@J)`'(*5S2@>IB`A*+@&Q)64TGJBXJ+:,K4L#J8#!2!H3%A45RLL5 M,IS#L;$$(UMDI].0MHD$1ZY)+=H!<4D@`-R?LUO9G[8-2+&,93C2VP"291H2 MSOT4T/3L:4.EH`:[@;$"K`"'Y,'`?$@,Q(I2JD6Z3P-HQ`/UJ]&N3\7*8)C0 MS]D_3A\1?B*@<8F.4Q=5)C)@3`H.`@,-<-%1(M;^`2D,8AG:B`K8M92*($K9 MYV_9R3(U!,I,9*M`JW93(/:S*52UF)75\"H@$ M]Z!A$***(L5R7!(';S76@;0`"L%\I9-!0'B(Z M^480#2VTX,('^07(WTZGA3)"CT8-)F-67WUHF2*V"(A=7`4ZM6(2MZ5U37NI M"*`1A#)%-T>#H,PB$2@)E!$D0A(JN612D$%I4FU4MEBD$F6A<@27*BE71IV? M&.(>1^4L1YJ&4JP)BI-)S#87!5)&HV`C,P*`2U`]:D-`"S]*\:<[06H4:&@EDVI4$YQ(M+E@&AI]$@:>E#P2Z!:R*G`7F)[T!-9"'6YAZJFQ0 M,MHH5')FN@2NBN`R*T(F=@6*(61L^@FF6QR94)+!"IN(8')L$(%<*D+Z:"[^ ME4ZZ)C=IVLAI.*D(9LR9H#@`CK>)P%.3"1$T8RP%%MR`TKE;()=*',^JI-9H M8;JD`W,K??D>H650,^+%]\WQ@IO,3(#!'"[$\J(29"20R@"`$=3""BRPL,(* M>-9(!@E9%D#`S02TJ*<4]"K2;K=%*:M'B[UNH0$$_4PP`0QR^*Z&E@DX MZ9_8>V_I;\#[.-`1HF+!*1WBZ?"KD`"["UT*K214`HK,Z#;#(NW0] MOKCL\?Q`H<'M[5!*``\)V-HO(C1LTX`;OA(L5'H7^RF;^N+DVP"!"$(@@@(2 MD(#64H49.$*X[!W.2JC3QE`,1P^R1.HNHH.)H?RB`U&127*IP-9@QE>ZX8FM M>-IH``7E,(++3>4`1X`1["RS`/-]9S![(`-[$L@F)9`P>*;3W?QCD;C/M\%L035D8F!?B`K4A&`@7H;R`! F((`"/B!".9Q/$0,X@`,5QJ`$FJ$"?&4`("060X8?;H]J