UNITED STATES
SECURITIES AND EXCHANGE
COMMISSION
Washington, D.C. 20549
FORM N-CSR
CERTIFIED SHAREHOLDER
REPORT OF REGISTERED MANAGEMENT
INVESTMENT COMPANIES
Investment Company Act file number 811-21749
CRM Mutual Fund Trust
(Exact
name of registrant as specified in charter)
c/o Cramer
Rosenthal McGlynn, LLC.
300 First
Stamford Place, Suite 440
Stamford, CT 06902
(Address
of principal executive offices) (Zip code)
Corporation
Service Company
2711 Centerville
Road Suite 400
Wilmington,
DE 19808
(Name
and address of agent for service)
Copy to:
Lea Anne
Copenhefer
Morgan,
Lewis & Bockius LLP
One Federal
Street
Boston,
MA 02110
Registrant’s telephone number, including area code: 212-326-5300
Date of fiscal year end: June 30
Date of reporting period: June 30, 2024
Item 1. Reports to Stockholders.
(a)
0001322252falseN-CSRCRM Mutual Fund TrustN-1A2024-06-300001322252cmft:C000037909Member2023-07-012024-06-3000013222522023-07-012024-06-300001322252cmft:Russell3000TotalReturn2134BroadBasedIndexMember2014-06-300001322252cmft:Russell3000ValueTotalReturn2134AdditionalIndexMember2014-06-300001322252cmft:Russell3000TotalReturn2134BroadBasedIndexMember2015-06-300001322252cmft:Russell3000ValueTotalReturn2134AdditionalIndexMember2015-06-300001322252cmft:Russell3000TotalReturn2134BroadBasedIndexMember2016-06-300001322252cmft:Russell3000ValueTotalReturn2134AdditionalIndexMember2016-06-300001322252cmft:Russell3000TotalReturn2134BroadBasedIndexMember2017-06-300001322252cmft:Russell3000ValueTotalReturn2134AdditionalIndexMember2017-06-300001322252cmft:Russell3000TotalReturn2134BroadBasedIndexMember2018-06-300001322252cmft:Russell3000ValueTotalReturn2134AdditionalIndexMember2018-06-300001322252cmft:Russell3000TotalReturn2134BroadBasedIndexMember2019-06-300001322252cmft:Russell3000ValueTotalReturn2134AdditionalIndexMember2019-06-300001322252cmft:Russell3000TotalReturn2134BroadBasedIndexMember2020-06-300001322252cmft:Russell3000ValueTotalReturn2134AdditionalIndexMember2020-06-300001322252cmft:Russell3000TotalReturn2134BroadBasedIndexMember2021-06-300001322252cmft:Russell3000ValueTotalReturn2134AdditionalIndexMember2021-06-300001322252cmft:Russell3000TotalReturn2134BroadBasedIndexMember2022-06-300001322252cmft:Russell3000ValueTotalReturn2134AdditionalIndexMember2022-06-300001322252cmft:Russell3000TotalReturn2134BroadBasedIndexMember2023-06-300001322252cmft:Russell3000ValueTotalReturn2134AdditionalIndexMember2023-06-300001322252cmft:Russell3000TotalReturn2134BroadBasedIndexMember2024-06-300001322252cmft:Russell3000ValueTotalReturn2134AdditionalIndexMember2024-06-300001322252cmft:C000037909Memberoef:WithoutSalesLoadMember2023-07-012024-06-300001322252cmft:C000037909Memberoef:WithoutSalesLoadMember2019-07-012024-06-300001322252cmft:C000037909Memberoef:WithoutSalesLoadMember2014-07-012024-06-300001322252cmft:Russell3000TotalReturn2134BroadBasedIndexMember2023-07-012024-06-300001322252cmft:Russell3000TotalReturn2134BroadBasedIndexMember2019-07-012024-06-300001322252cmft:Russell3000TotalReturn2134BroadBasedIndexMember2014-07-012024-06-300001322252cmft:Russell3000ValueTotalReturn2134AdditionalIndexMember2023-07-012024-06-300001322252cmft:Russell3000ValueTotalReturn2134AdditionalIndexMember2019-07-012024-06-300001322252cmft:Russell3000ValueTotalReturn2134AdditionalIndexMember2014-07-012024-06-300001322252cmft:C000037909Member2024-06-300001322252cmft:C000037909Membercmft:InvestmentTypeCollateralforSecuritiesLoanedCTIMember2024-06-300001322252cmft:C000037909Membercmft:InvestmentTypeCommonStocksCTIMember2024-06-300001322252cmft:C000037909Membercmft:InvestmentTypeMoneyMarketFundsCTIMember2024-06-300001322252cmft:C000037909Membercmft:RepurchaseAgreementsSectorMember2024-06-300001322252cmft:C000037909Memberoef:ConsumerStaplesSectorMember2024-06-300001322252cmft:C000037909Memberoef:UtilitiesSectorMember2024-06-300001322252cmft:C000037909Membercmft:MoneyMarketFundsSectorMember2024-06-300001322252cmft:C000037909Memberus-gaap:EnergySectorMember2024-06-300001322252cmft:C000037909Memberoef:ConsumerDiscretionarySectorMember2024-06-300001322252cmft:C000037909Memberus-gaap:RealEstateSectorMember2024-06-300001322252cmft:C000037909Memberus-gaap:HealthcareSectorMember2024-06-300001322252cmft:C000037909Membercmft:IndustrialsSectorMember2024-06-300001322252cmft:C000037909Memberoef:MaterialsSectorMember2024-06-300001322252cmft:C000037909Membercmft:FinancialsSectorMember2024-06-300001322252cmft:C000037909Memberus-gaap:TechnologySectorMember2024-06-300001322252cmft:C000037909Membercmft:A31620M106CTIMember2024-06-300001322252cmft:C000037909Membercmft:A565849106CTIMember2024-06-300001322252cmft:C000037909Membercmft:A88146M101CTIMember2024-06-300001322252cmft:C000037909Membercmft:G25508105CTIMember2024-06-300001322252cmft:C000037909Membercmft:A866674104CTIMember2024-06-300001322252cmft:C000037909Membercmft:A15872M104CTIMember2024-06-300001322252cmft:C000037909Membercmft:A122017106CTIMember2024-06-300001322252cmft:C000037909Membercmft:A00790R104CTIMember2024-06-300001322252cmft:C000037909Membercmft:A09062W204CTIMember2024-06-300001322252cmft:C000037909Membercmft:A69370C100CTIMember2024-06-300001322252cmft:C000037908Member2023-07-012024-06-300001322252cmft:C000037908Member2013-07-012014-06-300001322252cmft:Russell3000TotalReturn2115BroadBasedIndexMember2013-07-012014-06-300001322252cmft:Russell3000ValueTotalReturn2115AdditionalIndexMember2013-07-012014-06-300001322252cmft:C000037908Member2014-06-300001322252cmft:Russell3000TotalReturn2115BroadBasedIndexMember2014-06-300001322252cmft:Russell3000ValueTotalReturn2115AdditionalIndexMember2014-06-300001322252cmft:C000037908Member2015-06-300001322252cmft:Russell3000TotalReturn2115BroadBasedIndexMember2015-06-300001322252cmft:Russell3000ValueTotalReturn2115AdditionalIndexMember2015-06-300001322252cmft:C000037908Member2016-06-300001322252cmft:Russell3000TotalReturn2115BroadBasedIndexMember2016-06-300001322252cmft:Russell3000ValueTotalReturn2115AdditionalIndexMember2016-06-300001322252cmft:C000037908Member2017-06-300001322252cmft:Russell3000TotalReturn2115BroadBasedIndexMember2017-06-300001322252cmft:Russell3000ValueTotalReturn2115AdditionalIndexMember2017-06-300001322252cmft:C000037908Member2018-06-300001322252cmft:Russell3000TotalReturn2115BroadBasedIndexMember2018-06-300001322252cmft:Russell3000ValueTotalReturn2115AdditionalIndexMember2018-06-300001322252cmft:C000037908Member2019-06-300001322252cmft:Russell3000TotalReturn2115BroadBasedIndexMember2019-06-300001322252cmft:Russell3000ValueTotalReturn2115AdditionalIndexMember2019-06-300001322252cmft:C000037908Member2020-06-300001322252cmft:Russell3000TotalReturn2115BroadBasedIndexMember2020-06-300001322252cmft:Russell3000ValueTotalReturn2115AdditionalIndexMember2020-06-300001322252cmft:C000037908Member2021-06-300001322252cmft:Russell3000TotalReturn2115BroadBasedIndexMember2021-06-300001322252cmft:Russell3000ValueTotalReturn2115AdditionalIndexMember2021-06-300001322252cmft:C000037908Member2022-06-300001322252cmft:Russell3000TotalReturn2115BroadBasedIndexMember2022-06-300001322252cmft:Russell3000ValueTotalReturn2115AdditionalIndexMember2022-06-300001322252cmft:C000037908Member2023-06-300001322252cmft:Russell3000TotalReturn2115BroadBasedIndexMember2023-06-300001322252cmft:Russell3000ValueTotalReturn2115AdditionalIndexMember2023-06-300001322252cmft:C000037908Member2024-06-300001322252cmft:Russell3000TotalReturn2115BroadBasedIndexMember2024-06-300001322252cmft:Russell3000ValueTotalReturn2115AdditionalIndexMember2024-06-300001322252cmft:C000037908Memberoef:WithoutSalesLoadMember2023-07-012024-06-300001322252cmft:C000037908Memberoef:WithoutSalesLoadMember2019-07-012024-06-300001322252cmft:C000037908Memberoef:WithoutSalesLoadMember2014-07-012024-06-300001322252cmft:Russell3000TotalReturn2115BroadBasedIndexMember2023-07-012024-06-300001322252cmft:Russell3000TotalReturn2115BroadBasedIndexMember2019-07-012024-06-300001322252cmft:Russell3000TotalReturn2115BroadBasedIndexMember2014-07-012024-06-300001322252cmft:Russell3000ValueTotalReturn2115AdditionalIndexMember2023-07-012024-06-300001322252cmft:Russell3000ValueTotalReturn2115AdditionalIndexMember2019-07-012024-06-300001322252cmft:Russell3000ValueTotalReturn2115AdditionalIndexMember2014-07-012024-06-300001322252cmft:C000037908Membercmft:InvestmentTypeCollateralforSecuritiesLoanedCTIMember2024-06-300001322252cmft:C000037908Membercmft:InvestmentTypeCommonStocksCTIMember2024-06-300001322252cmft:C000037908Membercmft:InvestmentTypeMoneyMarketFundsCTIMember2024-06-300001322252cmft:C000037908Membercmft:RepurchaseAgreementsSectorMember2024-06-300001322252cmft:C000037908Memberoef:ConsumerStaplesSectorMember2024-06-300001322252cmft:C000037908Memberoef:UtilitiesSectorMember2024-06-300001322252cmft:C000037908Membercmft:MoneyMarketFundsSectorMember2024-06-300001322252cmft:C000037908Memberus-gaap:EnergySectorMember2024-06-300001322252cmft:C000037908Memberoef:ConsumerDiscretionarySectorMember2024-06-300001322252cmft:C000037908Memberus-gaap:RealEstateSectorMember2024-06-300001322252cmft:C000037908Memberus-gaap:HealthcareSectorMember2024-06-300001322252cmft:C000037908Membercmft:IndustrialsSectorMember2024-06-300001322252cmft:C000037908Memberoef:MaterialsSectorMember2024-06-300001322252cmft:C000037908Membercmft:FinancialsSectorMember2024-06-300001322252cmft:C000037908Memberus-gaap:TechnologySectorMember2024-06-300001322252cmft:C000037908Membercmft:A31620M106CTIMember2024-06-300001322252cmft:C000037908Membercmft:A565849106CTIMember2024-06-300001322252cmft:C000037908Membercmft:A88146M101CTIMember2024-06-300001322252cmft:C000037908Membercmft:G25508105CTIMember2024-06-300001322252cmft:C000037908Membercmft:A866674104CTIMember2024-06-300001322252cmft:C000037908Membercmft:A15872M104CTIMember2024-06-300001322252cmft:C000037908Membercmft:A122017106CTIMember2024-06-300001322252cmft:C000037908Membercmft:A00790R104CTIMember2024-06-300001322252cmft:C000037908Membercmft:A09062W204CTIMember2024-06-300001322252cmft:C000037908Membercmft:A69370C100CTIMember2024-06-300001322252cmft:C000171454Member2023-07-012024-06-300001322252cmft:C000171454Member2014-07-012024-06-300001322252cmft:C000171454Memberoef:WithoutSalesLoadMember2023-07-012024-06-300001322252cmft:C000171454Memberoef:WithoutSalesLoadMember2019-07-012024-06-300001322252cmft:C000171454Memberoef:WithoutSalesLoadMember2016-08-162024-06-300001322252cmft:SP500Index2128BroadBasedIndexMember2023-07-012024-06-300001322252cmft:SP500Index2128BroadBasedIndexMember2019-07-012024-06-300001322252cmft:SP500Index2128BroadBasedIndexMember2016-08-162024-06-300001322252cmft:C000171454Member2024-06-300001322252cmft:C000171454Membercmft:InvestmentTypeCommonStocksCTIMember2024-06-300001322252cmft:C000171454Membercmft:InvestmentTypeExchangeMinusTradedFundsCTIMember2024-06-300001322252cmft:C000171454Membercmft:InvestmentTypeMoneyMarketFundsCTIMember2024-06-300001322252cmft:C000171454Memberoef:ConsumerStaplesSectorMember2024-06-300001322252cmft:C000171454Memberus-gaap:EnergySectorMember2024-06-300001322252cmft:C000171454Memberoef:CommunicationsSectorMember2024-06-300001322252cmft:C000171454Memberus-gaap:HealthcareSectorMember2024-06-300001322252cmft:C000171454Membercmft:EquityFundSectorMember2024-06-300001322252cmft:C000171454Memberus-gaap:RealEstateSectorMember2024-06-300001322252cmft:C000171454Membercmft:FinancialsSectorMember2024-06-300001322252cmft:C000171454Memberoef:UtilitiesSectorMember2024-06-300001322252cmft:C000171454Memberoef:MaterialsSectorMember2024-06-300001322252cmft:C000171454Memberus-gaap:TechnologySectorMember2024-06-300001322252cmft:C000171454Memberoef:ConsumerDiscretionarySectorMember2024-06-300001322252cmft:C000171454Membercmft:MoneyMarketFundsSectorMember2024-06-300001322252cmft:C000171454Membercmft:IndustrialsSectorMember2024-06-300001322252cmft:C000171454Membercmft:BlackrockLiquidityFundsTMinusFundCTIMember2024-06-300001322252cmft:C000171454Membercmft:FederatedHermesTreasuryObligationsFundCTIMember2024-06-300001322252cmft:C000171454Membercmft:ArcosaIncCTIMember2024-06-300001322252cmft:C000171454Membercmft:BurlingtonStoresIncCTIMember2024-06-300001322252cmft:C000171454Membercmft:CanadianPacificKansasCityLtdCTIMember2024-06-300001322252cmft:C000171454Membercmft:CleanHarborsIncCTIMember2024-06-300001322252cmft:C000171454Membercmft:ItronIncCTIMember2024-06-300001322252cmft:C000171454Membercmft:NextEraEnergyIncCTIMember2024-06-300001322252cmft:C000171454Membercmft:SkylineChampionCorporationCTIMember2024-06-300001322252cmft:C000171454Membercmft:DigitalRealtyTrustIncCTIMember2024-06-300001322252cmft:C000003538Member2023-07-012024-06-300001322252cmft:RussellMidcapValueTotalReturn2123AdditionalIndexMember2014-06-300001322252cmft:Russell3000TotalReturn2123BroadBasedIndexMember2014-06-300001322252cmft:RussellMidcapValueTotalReturn2123AdditionalIndexMember2015-06-300001322252cmft:Russell3000TotalReturn2123BroadBasedIndexMember2015-06-300001322252cmft:RussellMidcapValueTotalReturn2123AdditionalIndexMember2016-06-300001322252cmft:Russell3000TotalReturn2123BroadBasedIndexMember2016-06-300001322252cmft:RussellMidcapValueTotalReturn2123AdditionalIndexMember2017-06-300001322252cmft:Russell3000TotalReturn2123BroadBasedIndexMember2017-06-300001322252cmft:RussellMidcapValueTotalReturn2123AdditionalIndexMember2018-06-300001322252cmft:Russell3000TotalReturn2123BroadBasedIndexMember2018-06-300001322252cmft:RussellMidcapValueTotalReturn2123AdditionalIndexMember2019-06-300001322252cmft:Russell3000TotalReturn2123BroadBasedIndexMember2019-06-300001322252cmft:RussellMidcapValueTotalReturn2123AdditionalIndexMember2020-06-300001322252cmft:Russell3000TotalReturn2123BroadBasedIndexMember2020-06-300001322252cmft:RussellMidcapValueTotalReturn2123AdditionalIndexMember2021-06-300001322252cmft:Russell3000TotalReturn2123BroadBasedIndexMember2021-06-300001322252cmft:RussellMidcapValueTotalReturn2123AdditionalIndexMember2022-06-300001322252cmft:Russell3000TotalReturn2123BroadBasedIndexMember2022-06-300001322252cmft:RussellMidcapValueTotalReturn2123AdditionalIndexMember2023-06-300001322252cmft:Russell3000TotalReturn2123BroadBasedIndexMember2023-06-300001322252cmft:RussellMidcapValueTotalReturn2123AdditionalIndexMember2024-06-300001322252cmft:Russell3000TotalReturn2123BroadBasedIndexMember2024-06-300001322252cmft:C000003538Memberoef:WithoutSalesLoadMember2023-07-012024-06-300001322252cmft:C000003538Memberoef:WithoutSalesLoadMember2019-07-012024-06-300001322252cmft:C000003538Memberoef:WithoutSalesLoadMember2014-07-012024-06-300001322252cmft:RussellMidcapValueTotalReturn2123AdditionalIndexMember2023-07-012024-06-300001322252cmft:RussellMidcapValueTotalReturn2123AdditionalIndexMember2019-07-012024-06-300001322252cmft:RussellMidcapValueTotalReturn2123AdditionalIndexMember2014-07-012024-06-300001322252cmft:Russell3000TotalReturn2123BroadBasedIndexMember2023-07-012024-06-300001322252cmft:Russell3000TotalReturn2123BroadBasedIndexMember2019-07-012024-06-300001322252cmft:Russell3000TotalReturn2123BroadBasedIndexMember2014-07-012024-06-300001322252cmft:C000003538Member2024-06-300001322252cmft:C000003538Membercmft:InvestmentTypeCollateralforSecuritiesLoanedCTIMember2024-06-300001322252cmft:C000003538Membercmft:InvestmentTypeCommonStocksCTIMember2024-06-300001322252cmft:C000003538Membercmft:InvestmentTypeMoneyMarketFundsCTIMember2024-06-300001322252cmft:C000003538Membercmft:RepurchaseAgreementsSectorMember2024-06-300001322252cmft:C000003538Membercmft:CollateralforSecuritiesLoanedSectorMember2024-06-300001322252cmft:C000003538Membercmft:MoneyMarketFundsSectorMember2024-06-300001322252cmft:C000003538Memberus-gaap:HealthcareSectorMember2024-06-300001322252cmft:C000003538Memberoef:UtilitiesSectorMember2024-06-300001322252cmft:C000003538Memberus-gaap:EnergySectorMember2024-06-300001322252cmft:C000003538Memberoef:ConsumerDiscretionarySectorMember2024-06-300001322252cmft:C000003538Memberus-gaap:RealEstateSectorMember2024-06-300001322252cmft:C000003538Membercmft:FinancialsSectorMember2024-06-300001322252cmft:C000003538Memberus-gaap:TechnologySectorMember2024-06-300001322252cmft:C000003538Memberoef:MaterialsSectorMember2024-06-300001322252cmft:C000003538Membercmft:IndustrialsSectorMember2024-06-300001322252cmft:C000003538Membercmft:FidelityNationalInformationServicesIncCTIMember2024-06-300001322252cmft:C000003538Membercmft:VontierCorporationCTIMember2024-06-300001322252cmft:C000003538Membercmft:ChampionXCorporationCTIMember2024-06-300001322252cmft:C000003538Membercmft:BurlingtonStoresIncCTIMember2024-06-300001322252cmft:C000003538Membercmft:NisourceIncCTIMember2024-06-300001322252cmft:C000003538Membercmft:TerrenoRealtyCorporationCTIMember2024-06-300001322252cmft:C000003538Membercmft:WoodwardIncCTIMember2024-06-300001322252cmft:C000003538Membercmft:MartinMariettaMaterialsIncCTIMember2024-06-300001322252cmft:C000003538Membercmft:CanadianPacificKansasCityLtdCTIMember2024-06-300001322252cmft:C000003538Membercmft:AshlandIncCTIMember2024-06-300001322252cmft:C000003539Member2023-07-012024-06-300001322252cmft:C000003539Member2013-07-012014-06-300001322252cmft:RussellMidcapValueTotalReturn2124AdditionalIndexMember2013-07-012014-06-300001322252cmft:Russell3000TotalReturn2124BroadBasedIndexMember2013-07-012014-06-300001322252cmft:C000003539Member2014-06-300001322252cmft:RussellMidcapValueTotalReturn2124AdditionalIndexMember2014-06-300001322252cmft:Russell3000TotalReturn2124BroadBasedIndexMember2014-06-300001322252cmft:C000003539Member2015-06-300001322252cmft:RussellMidcapValueTotalReturn2124AdditionalIndexMember2015-06-300001322252cmft:Russell3000TotalReturn2124BroadBasedIndexMember2015-06-300001322252cmft:C000003539Member2016-06-300001322252cmft:RussellMidcapValueTotalReturn2124AdditionalIndexMember2016-06-300001322252cmft:Russell3000TotalReturn2124BroadBasedIndexMember2016-06-300001322252cmft:C000003539Member2017-06-300001322252cmft:RussellMidcapValueTotalReturn2124AdditionalIndexMember2017-06-300001322252cmft:Russell3000TotalReturn2124BroadBasedIndexMember2017-06-300001322252cmft:C000003539Member2018-06-300001322252cmft:RussellMidcapValueTotalReturn2124AdditionalIndexMember2018-06-300001322252cmft:Russell3000TotalReturn2124BroadBasedIndexMember2018-06-300001322252cmft:C000003539Member2019-06-300001322252cmft:RussellMidcapValueTotalReturn2124AdditionalIndexMember2019-06-300001322252cmft:Russell3000TotalReturn2124BroadBasedIndexMember2019-06-300001322252cmft:C000003539Member2020-06-300001322252cmft:RussellMidcapValueTotalReturn2124AdditionalIndexMember2020-06-300001322252cmft:Russell3000TotalReturn2124BroadBasedIndexMember2020-06-300001322252cmft:C000003539Member2021-06-300001322252cmft:RussellMidcapValueTotalReturn2124AdditionalIndexMember2021-06-300001322252cmft:Russell3000TotalReturn2124BroadBasedIndexMember2021-06-300001322252cmft:C000003539Member2022-06-300001322252cmft:RussellMidcapValueTotalReturn2124AdditionalIndexMember2022-06-300001322252cmft:Russell3000TotalReturn2124BroadBasedIndexMember2022-06-300001322252cmft:C000003539Member2023-06-300001322252cmft:RussellMidcapValueTotalReturn2124AdditionalIndexMember2023-06-300001322252cmft:Russell3000TotalReturn2124BroadBasedIndexMember2023-06-300001322252cmft:C000003539Member2024-06-300001322252cmft:RussellMidcapValueTotalReturn2124AdditionalIndexMember2024-06-300001322252cmft:Russell3000TotalReturn2124BroadBasedIndexMember2024-06-300001322252cmft:C000003539Memberoef:WithoutSalesLoadMember2023-07-012024-06-300001322252cmft:C000003539Memberoef:WithoutSalesLoadMember2019-07-012024-06-300001322252cmft:C000003539Memberoef:WithoutSalesLoadMember2014-07-012024-06-300001322252cmft:RussellMidcapValueTotalReturn2124AdditionalIndexMember2023-07-012024-06-300001322252cmft:RussellMidcapValueTotalReturn2124AdditionalIndexMember2019-07-012024-06-300001322252cmft:RussellMidcapValueTotalReturn2124AdditionalIndexMember2014-07-012024-06-300001322252cmft:Russell3000TotalReturn2124BroadBasedIndexMember2023-07-012024-06-300001322252cmft:Russell3000TotalReturn2124BroadBasedIndexMember2019-07-012024-06-300001322252cmft:Russell3000TotalReturn2124BroadBasedIndexMember2014-07-012024-06-300001322252cmft:C000003539Membercmft:InvestmentTypeCollateralforSecuritiesLoanedCTIMember2024-06-300001322252cmft:C000003539Membercmft:InvestmentTypeCommonStocksCTIMember2024-06-300001322252cmft:C000003539Membercmft:InvestmentTypeMoneyMarketFundsCTIMember2024-06-300001322252cmft:C000003539Membercmft:RepurchaseAgreementsSectorMember2024-06-300001322252cmft:C000003539Membercmft:CollateralforSecuritiesLoanedSectorMember2024-06-300001322252cmft:C000003539Membercmft:MoneyMarketFundsSectorMember2024-06-300001322252cmft:C000003539Memberus-gaap:HealthcareSectorMember2024-06-300001322252cmft:C000003539Memberoef:UtilitiesSectorMember2024-06-300001322252cmft:C000003539Memberus-gaap:EnergySectorMember2024-06-300001322252cmft:C000003539Memberoef:ConsumerDiscretionarySectorMember2024-06-300001322252cmft:C000003539Memberus-gaap:RealEstateSectorMember2024-06-300001322252cmft:C000003539Membercmft:FinancialsSectorMember2024-06-300001322252cmft:C000003539Memberus-gaap:TechnologySectorMember2024-06-300001322252cmft:C000003539Memberoef:MaterialsSectorMember2024-06-300001322252cmft:C000003539Membercmft:IndustrialsSectorMember2024-06-300001322252cmft:C000003539Membercmft:FidelityNationalInformationServicesIncCTIMember2024-06-300001322252cmft:C000003539Membercmft:VontierCorporationCTIMember2024-06-300001322252cmft:C000003539Membercmft:ChampionXCorporationCTIMember2024-06-300001322252cmft:C000003539Membercmft:BurlingtonStoresIncCTIMember2024-06-300001322252cmft:C000003539Membercmft:NisourceIncCTIMember2024-06-300001322252cmft:C000003539Membercmft:TerrenoRealtyCorporationCTIMember2024-06-300001322252cmft:C000003539Membercmft:WoodwardIncCTIMember2024-06-300001322252cmft:C000003539Membercmft:MartinMariettaMaterialsIncCTIMember2024-06-300001322252cmft:C000003539Membercmft:CanadianPacificKansasCityLtdCTIMember2024-06-300001322252cmft:C000003539Membercmft:AshlandIncCTIMember2024-06-300001322252cmft:C000003540Member2023-07-012024-06-300001322252cmft:Russell3000TotalReturn2118BroadBasedIndexMember2014-06-300001322252cmft:Russell2000ValueTotalReturn2118AdditionalIndexMember2014-06-300001322252cmft:Russell3000TotalReturn2118BroadBasedIndexMember2015-06-300001322252cmft:Russell2000ValueTotalReturn2118AdditionalIndexMember2015-06-300001322252cmft:Russell3000TotalReturn2118BroadBasedIndexMember2016-06-300001322252cmft:Russell2000ValueTotalReturn2118AdditionalIndexMember2016-06-300001322252cmft:Russell3000TotalReturn2118BroadBasedIndexMember2017-06-300001322252cmft:Russell2000ValueTotalReturn2118AdditionalIndexMember2017-06-300001322252cmft:Russell3000TotalReturn2118BroadBasedIndexMember2018-06-300001322252cmft:Russell2000ValueTotalReturn2118AdditionalIndexMember2018-06-300001322252cmft:Russell3000TotalReturn2118BroadBasedIndexMember2019-06-300001322252cmft:Russell2000ValueTotalReturn2118AdditionalIndexMember2019-06-300001322252cmft:Russell3000TotalReturn2118BroadBasedIndexMember2020-06-300001322252cmft:Russell2000ValueTotalReturn2118AdditionalIndexMember2020-06-300001322252cmft:Russell3000TotalReturn2118BroadBasedIndexMember2021-06-300001322252cmft:Russell2000ValueTotalReturn2118AdditionalIndexMember2021-06-300001322252cmft:Russell3000TotalReturn2118BroadBasedIndexMember2022-06-300001322252cmft:Russell2000ValueTotalReturn2118AdditionalIndexMember2022-06-300001322252cmft:Russell3000TotalReturn2118BroadBasedIndexMember2023-06-300001322252cmft:Russell2000ValueTotalReturn2118AdditionalIndexMember2023-06-300001322252cmft:Russell3000TotalReturn2118BroadBasedIndexMember2024-06-300001322252cmft:Russell2000ValueTotalReturn2118AdditionalIndexMember2024-06-300001322252cmft:C000003540Memberoef:WithoutSalesLoadMember2023-07-012024-06-300001322252cmft:C000003540Memberoef:WithoutSalesLoadMember2019-07-012024-06-300001322252cmft:C000003540Memberoef:WithoutSalesLoadMember2014-07-012024-06-300001322252cmft:Russell3000TotalReturn2118BroadBasedIndexMember2023-07-012024-06-300001322252cmft:Russell3000TotalReturn2118BroadBasedIndexMember2019-07-012024-06-300001322252cmft:Russell3000TotalReturn2118BroadBasedIndexMember2014-07-012024-06-300001322252cmft:Russell2000ValueTotalReturn2118AdditionalIndexMember2023-07-012024-06-300001322252cmft:Russell2000ValueTotalReturn2118AdditionalIndexMember2019-07-012024-06-300001322252cmft:Russell2000ValueTotalReturn2118AdditionalIndexMember2014-07-012024-06-300001322252cmft:C000003540Member2024-06-300001322252cmft:C000003540Membercmft:InvestmentTypeCollateralforSecuritiesLoanedCTIMember2024-06-300001322252cmft:C000003540Membercmft:InvestmentTypeCommonStocksCTIMember2024-06-300001322252cmft:C000003540Membercmft:InvestmentTypeMoneyMarketFundsCTIMember2024-06-300001322252cmft:C000003540Membercmft:RepurchaseAgreementsSectorMember2024-06-300001322252cmft:C000003540Membercmft:MoneyMarketFundsSectorMember2024-06-300001322252cmft:C000003540Memberoef:MaterialsSectorMember2024-06-300001322252cmft:C000003540Memberoef:UtilitiesSectorMember2024-06-300001322252cmft:C000003540Memberus-gaap:HealthcareSectorMember2024-06-300001322252cmft:C000003540Memberus-gaap:EnergySectorMember2024-06-300001322252cmft:C000003540Memberoef:ConsumerDiscretionarySectorMember2024-06-300001322252cmft:C000003540Memberus-gaap:RealEstateSectorMember2024-06-300001322252cmft:C000003540Memberus-gaap:TechnologySectorMember2024-06-300001322252cmft:C000003540Membercmft:FinancialsSectorMember2024-06-300001322252cmft:C000003540Membercmft:IndustrialsSectorMember2024-06-300001322252cmft:C000003540Membercmft:ArcosaIncCTIMember2024-06-300001322252cmft:C000003540Membercmft:EnvestnetIncCTIMember2024-06-300001322252cmft:C000003540Membercmft:ChampionXCorporationCTIMember2024-06-300001322252cmft:C000003540Membercmft:CentralPacificFinancialCorporationCTIMember2024-06-300001322252cmft:C000003540Membercmft:ACVAuctionsIncCTIMember2024-06-300001322252cmft:C000003540Membercmft:SkylineChampionCorporationCTIMember2024-06-300001322252cmft:C000003540Membercmft:HoraceMannEducatorsCorporationCTIMember2024-06-300001322252cmft:C000003540Membercmft:MuellerWaterProductsIncCTIMember2024-06-300001322252cmft:C000003540Membercmft:ItronIncCTIMember2024-06-300001322252cmft:C000003540Membercmft:StericycleIncCTIMember2024-06-300001322252cmft:C000003541Member2023-07-012024-06-300001322252cmft:C000003541Member2013-07-012014-06-300001322252cmft:Russell3000TotalReturn2119BroadBasedIndexMember2013-07-012014-06-300001322252cmft:Russell2000ValueTotalReturn2119AdditionalIndexMember2013-07-012014-06-300001322252cmft:C000003541Member2014-06-300001322252cmft:Russell3000TotalReturn2119BroadBasedIndexMember2014-06-300001322252cmft:Russell2000ValueTotalReturn2119AdditionalIndexMember2014-06-300001322252cmft:C000003541Member2015-06-300001322252cmft:Russell3000TotalReturn2119BroadBasedIndexMember2015-06-300001322252cmft:Russell2000ValueTotalReturn2119AdditionalIndexMember2015-06-300001322252cmft:C000003541Member2016-06-300001322252cmft:Russell3000TotalReturn2119BroadBasedIndexMember2016-06-300001322252cmft:Russell2000ValueTotalReturn2119AdditionalIndexMember2016-06-300001322252cmft:C000003541Member2017-06-300001322252cmft:Russell3000TotalReturn2119BroadBasedIndexMember2017-06-300001322252cmft:Russell2000ValueTotalReturn2119AdditionalIndexMember2017-06-300001322252cmft:C000003541Member2018-06-300001322252cmft:Russell3000TotalReturn2119BroadBasedIndexMember2018-06-300001322252cmft:Russell2000ValueTotalReturn2119AdditionalIndexMember2018-06-300001322252cmft:C000003541Member2019-06-300001322252cmft:Russell3000TotalReturn2119BroadBasedIndexMember2019-06-300001322252cmft:Russell2000ValueTotalReturn2119AdditionalIndexMember2019-06-300001322252cmft:C000003541Member2020-06-300001322252cmft:Russell3000TotalReturn2119BroadBasedIndexMember2020-06-300001322252cmft:Russell2000ValueTotalReturn2119AdditionalIndexMember2020-06-300001322252cmft:C000003541Member2021-06-300001322252cmft:Russell3000TotalReturn2119BroadBasedIndexMember2021-06-300001322252cmft:Russell2000ValueTotalReturn2119AdditionalIndexMember2021-06-300001322252cmft:C000003541Member2022-06-300001322252cmft:Russell3000TotalReturn2119BroadBasedIndexMember2022-06-300001322252cmft:Russell2000ValueTotalReturn2119AdditionalIndexMember2022-06-300001322252cmft:C000003541Member2023-06-300001322252cmft:Russell3000TotalReturn2119BroadBasedIndexMember2023-06-300001322252cmft:Russell2000ValueTotalReturn2119AdditionalIndexMember2023-06-300001322252cmft:C000003541Member2024-06-300001322252cmft:Russell3000TotalReturn2119BroadBasedIndexMember2024-06-300001322252cmft:Russell2000ValueTotalReturn2119AdditionalIndexMember2024-06-300001322252cmft:C000003541Memberoef:WithoutSalesLoadMember2023-07-012024-06-300001322252cmft:C000003541Memberoef:WithoutSalesLoadMember2019-07-012024-06-300001322252cmft:C000003541Memberoef:WithoutSalesLoadMember2014-07-012024-06-300001322252cmft:Russell3000TotalReturn2119BroadBasedIndexMember2023-07-012024-06-300001322252cmft:Russell3000TotalReturn2119BroadBasedIndexMember2019-07-012024-06-300001322252cmft:Russell3000TotalReturn2119BroadBasedIndexMember2014-07-012024-06-300001322252cmft:Russell2000ValueTotalReturn2119AdditionalIndexMember2023-07-012024-06-300001322252cmft:Russell2000ValueTotalReturn2119AdditionalIndexMember2019-07-012024-06-300001322252cmft:Russell2000ValueTotalReturn2119AdditionalIndexMember2014-07-012024-06-300001322252cmft:C000003541Membercmft:InvestmentTypeCollateralforSecuritiesLoanedCTIMember2024-06-300001322252cmft:C000003541Membercmft:InvestmentTypeCommonStocksCTIMember2024-06-300001322252cmft:C000003541Membercmft:InvestmentTypeMoneyMarketFundsCTIMember2024-06-300001322252cmft:C000003541Membercmft:RepurchaseAgreementsSectorMember2024-06-300001322252cmft:C000003541Membercmft:MoneyMarketFundsSectorMember2024-06-300001322252cmft:C000003541Memberoef:MaterialsSectorMember2024-06-300001322252cmft:C000003541Memberoef:UtilitiesSectorMember2024-06-300001322252cmft:C000003541Memberus-gaap:HealthcareSectorMember2024-06-300001322252cmft:C000003541Memberus-gaap:EnergySectorMember2024-06-300001322252cmft:C000003541Memberoef:ConsumerDiscretionarySectorMember2024-06-300001322252cmft:C000003541Memberus-gaap:RealEstateSectorMember2024-06-300001322252cmft:C000003541Memberus-gaap:TechnologySectorMember2024-06-300001322252cmft:C000003541Membercmft:FinancialsSectorMember2024-06-300001322252cmft:C000003541Membercmft:IndustrialsSectorMember2024-06-300001322252cmft:C000003541Membercmft:ArcosaIncCTIMember2024-06-300001322252cmft:C000003541Membercmft:EnvestnetIncCTIMember2024-06-300001322252cmft:C000003541Membercmft:ChampionXCorporationCTIMember2024-06-300001322252cmft:C000003541Membercmft:CentralPacificFinancialCorporationCTIMember2024-06-300001322252cmft:C000003541Membercmft:ACVAuctionsIncCTIMember2024-06-300001322252cmft:C000003541Membercmft:SkylineChampionCorporationCTIMember2024-06-300001322252cmft:C000003541Membercmft:HoraceMannEducatorsCorporationCTIMember2024-06-300001322252cmft:C000003541Membercmft:MuellerWaterProductsIncCTIMember2024-06-300001322252cmft:C000003541Membercmft:ItronIncCTIMember2024-06-300001322252cmft:C000003541Membercmft:StericycleIncCTIMember2024-06-300001322252cmft:C000003543Member2023-07-012024-06-300001322252cmft:Russell3000TotalReturn2125BroadBasedIndexMember2014-06-300001322252cmft:Russell2500ValueTotalReturn2125AdditionalIndexMember2014-06-300001322252cmft:Russell3000TotalReturn2125BroadBasedIndexMember2015-06-300001322252cmft:Russell2500ValueTotalReturn2125AdditionalIndexMember2015-06-300001322252cmft:Russell3000TotalReturn2125BroadBasedIndexMember2016-06-300001322252cmft:Russell2500ValueTotalReturn2125AdditionalIndexMember2016-06-300001322252cmft:Russell3000TotalReturn2125BroadBasedIndexMember2017-06-300001322252cmft:Russell2500ValueTotalReturn2125AdditionalIndexMember2017-06-300001322252cmft:Russell3000TotalReturn2125BroadBasedIndexMember2018-06-300001322252cmft:Russell2500ValueTotalReturn2125AdditionalIndexMember2018-06-300001322252cmft:Russell3000TotalReturn2125BroadBasedIndexMember2019-06-300001322252cmft:Russell2500ValueTotalReturn2125AdditionalIndexMember2019-06-300001322252cmft:Russell3000TotalReturn2125BroadBasedIndexMember2020-06-300001322252cmft:Russell2500ValueTotalReturn2125AdditionalIndexMember2020-06-300001322252cmft:Russell3000TotalReturn2125BroadBasedIndexMember2021-06-300001322252cmft:Russell2500ValueTotalReturn2125AdditionalIndexMember2021-06-300001322252cmft:Russell3000TotalReturn2125BroadBasedIndexMember2022-06-300001322252cmft:Russell2500ValueTotalReturn2125AdditionalIndexMember2022-06-300001322252cmft:Russell3000TotalReturn2125BroadBasedIndexMember2023-06-300001322252cmft:Russell2500ValueTotalReturn2125AdditionalIndexMember2023-06-300001322252cmft:Russell3000TotalReturn2125BroadBasedIndexMember2024-06-300001322252cmft:Russell2500ValueTotalReturn2125AdditionalIndexMember2024-06-300001322252cmft:C000003543Memberoef:WithoutSalesLoadMember2023-07-012024-06-300001322252cmft:C000003543Memberoef:WithoutSalesLoadMember2019-07-012024-06-300001322252cmft:C000003543Memberoef:WithoutSalesLoadMember2014-07-012024-06-300001322252cmft:Russell3000TotalReturn2125BroadBasedIndexMember2023-07-012024-06-300001322252cmft:Russell3000TotalReturn2125BroadBasedIndexMember2019-07-012024-06-300001322252cmft:Russell3000TotalReturn2125BroadBasedIndexMember2014-07-012024-06-300001322252cmft:Russell2500ValueTotalReturn2125AdditionalIndexMember2023-07-012024-06-300001322252cmft:Russell2500ValueTotalReturn2125AdditionalIndexMember2019-07-012024-06-300001322252cmft:Russell2500ValueTotalReturn2125AdditionalIndexMember2014-07-012024-06-300001322252cmft:C000003543Member2024-06-300001322252cmft:C000003543Membercmft:InvestmentTypeCommonStocksCTIMember2024-06-300001322252cmft:C000003543Membercmft:InvestmentTypeMoneyMarketFundsCTIMember2024-06-300001322252cmft:C000003543Membercmft:MoneyMarketFundsSectorMember2024-06-300001322252cmft:C000003543Memberoef:ConsumerStaplesSectorMember2024-06-300001322252cmft:C000003543Memberus-gaap:EnergySectorMember2024-06-300001322252cmft:C000003543Memberoef:UtilitiesSectorMember2024-06-300001322252cmft:C000003543Memberoef:MaterialsSectorMember2024-06-300001322252cmft:C000003543Memberus-gaap:RealEstateSectorMember2024-06-300001322252cmft:C000003543Memberus-gaap:HealthcareSectorMember2024-06-300001322252cmft:C000003543Memberoef:ConsumerDiscretionarySectorMember2024-06-300001322252cmft:C000003543Memberus-gaap:TechnologySectorMember2024-06-300001322252cmft:C000003543Membercmft:FinancialsSectorMember2024-06-300001322252cmft:C000003543Membercmft:IndustrialsSectorMember2024-06-300001322252cmft:C000003543Membercmft:BurlingtonStoresIncCTIMember2024-06-300001322252cmft:C000003543Membercmft:AshlandIncCTIMember2024-06-300001322252cmft:C000003543Membercmft:StericycleIncCTIMember2024-06-300001322252cmft:C000003543Membercmft:ItronIncCTIMember2024-06-300001322252cmft:C000003543Membercmft:MatadorResourcesCompanyCTIMember2024-06-300001322252cmft:C000003543Membercmft:TerrenoRealtyCorporationCTIMember2024-06-300001322252cmft:C000003543Membercmft:CleanHarborsIncCTIMember2024-06-300001322252cmft:C000003543Membercmft:ArcosaIncCTIMember2024-06-300001322252cmft:C000003543Membercmft:FirstAmericanFinancialCorporationCTIMember2024-06-300001322252cmft:C000003543Membercmft:BioLifeSolutionsIncCTIMember2024-06-300001322252cmft:C000003544Member2023-07-012024-06-300001322252cmft:C000003544Member2013-07-012014-06-300001322252cmft:Russell3000TotalReturn2127BroadBasedIndexMember2013-07-012014-06-300001322252cmft:Russell2500ValueTotalReturn2127AdditionalIndexMember2013-07-012014-06-300001322252cmft:C000003544Member2014-06-300001322252cmft:Russell3000TotalReturn2127BroadBasedIndexMember2014-06-300001322252cmft:Russell2500ValueTotalReturn2127AdditionalIndexMember2014-06-300001322252cmft:C000003544Member2015-06-300001322252cmft:Russell3000TotalReturn2127BroadBasedIndexMember2015-06-300001322252cmft:Russell2500ValueTotalReturn2127AdditionalIndexMember2015-06-300001322252cmft:C000003544Member2016-06-300001322252cmft:Russell3000TotalReturn2127BroadBasedIndexMember2016-06-300001322252cmft:Russell2500ValueTotalReturn2127AdditionalIndexMember2016-06-300001322252cmft:C000003544Member2017-06-300001322252cmft:Russell3000TotalReturn2127BroadBasedIndexMember2017-06-300001322252cmft:Russell2500ValueTotalReturn2127AdditionalIndexMember2017-06-300001322252cmft:C000003544Member2018-06-300001322252cmft:Russell3000TotalReturn2127BroadBasedIndexMember2018-06-300001322252cmft:Russell2500ValueTotalReturn2127AdditionalIndexMember2018-06-300001322252cmft:C000003544Member2019-06-300001322252cmft:Russell3000TotalReturn2127BroadBasedIndexMember2019-06-300001322252cmft:Russell2500ValueTotalReturn2127AdditionalIndexMember2019-06-300001322252cmft:C000003544Member2020-06-300001322252cmft:Russell3000TotalReturn2127BroadBasedIndexMember2020-06-300001322252cmft:Russell2500ValueTotalReturn2127AdditionalIndexMember2020-06-300001322252cmft:C000003544Member2021-06-300001322252cmft:Russell3000TotalReturn2127BroadBasedIndexMember2021-06-300001322252cmft:Russell2500ValueTotalReturn2127AdditionalIndexMember2021-06-300001322252cmft:C000003544Member2022-06-300001322252cmft:Russell3000TotalReturn2127BroadBasedIndexMember2022-06-300001322252cmft:Russell2500ValueTotalReturn2127AdditionalIndexMember2022-06-300001322252cmft:C000003544Member2023-06-300001322252cmft:Russell3000TotalReturn2127BroadBasedIndexMember2023-06-300001322252cmft:Russell2500ValueTotalReturn2127AdditionalIndexMember2023-06-300001322252cmft:C000003544Member2024-06-300001322252cmft:Russell3000TotalReturn2127BroadBasedIndexMember2024-06-300001322252cmft:Russell2500ValueTotalReturn2127AdditionalIndexMember2024-06-300001322252cmft:C000003544Memberoef:WithoutSalesLoadMember2023-07-012024-06-300001322252cmft:C000003544Memberoef:WithoutSalesLoadMember2019-07-012024-06-300001322252cmft:C000003544Memberoef:WithoutSalesLoadMember2014-07-012024-06-300001322252cmft:Russell3000TotalReturn2127BroadBasedIndexMember2023-07-012024-06-300001322252cmft:Russell3000TotalReturn2127BroadBasedIndexMember2019-07-012024-06-300001322252cmft:Russell3000TotalReturn2127BroadBasedIndexMember2014-07-012024-06-300001322252cmft:Russell2500ValueTotalReturn2127AdditionalIndexMember2023-07-012024-06-300001322252cmft:Russell2500ValueTotalReturn2127AdditionalIndexMember2019-07-012024-06-300001322252cmft:Russell2500ValueTotalReturn2127AdditionalIndexMember2014-07-012024-06-300001322252cmft:C000003544Membercmft:InvestmentTypeCommonStocksCTIMember2024-06-300001322252cmft:C000003544Membercmft:InvestmentTypeMoneyMarketFundsCTIMember2024-06-300001322252cmft:C000003544Membercmft:MoneyMarketFundsSectorMember2024-06-300001322252cmft:C000003544Memberoef:ConsumerStaplesSectorMember2024-06-300001322252cmft:C000003544Memberus-gaap:EnergySectorMember2024-06-300001322252cmft:C000003544Memberoef:UtilitiesSectorMember2024-06-300001322252cmft:C000003544Memberoef:MaterialsSectorMember2024-06-300001322252cmft:C000003544Memberus-gaap:RealEstateSectorMember2024-06-300001322252cmft:C000003544Memberus-gaap:HealthcareSectorMember2024-06-300001322252cmft:C000003544Memberoef:ConsumerDiscretionarySectorMember2024-06-300001322252cmft:C000003544Memberus-gaap:TechnologySectorMember2024-06-300001322252cmft:C000003544Membercmft:FinancialsSectorMember2024-06-300001322252cmft:C000003544Membercmft:IndustrialsSectorMember2024-06-300001322252cmft:C000003544Membercmft:BurlingtonStoresIncCTIMember2024-06-300001322252cmft:C000003544Membercmft:AshlandIncCTIMember2024-06-300001322252cmft:C000003544Membercmft:StericycleIncCTIMember2024-06-300001322252cmft:C000003544Membercmft:ItronIncCTIMember2024-06-300001322252cmft:C000003544Membercmft:MatadorResourcesCompanyCTIMember2024-06-300001322252cmft:C000003544Membercmft:TerrenoRealtyCorporationCTIMember2024-06-300001322252cmft:C000003544Membercmft:CleanHarborsIncCTIMember2024-06-300001322252cmft:C000003544Membercmft:ArcosaIncCTIMember2024-06-300001322252cmft:C000003544Membercmft:FirstAmericanFinancialCorporationCTIMember2024-06-300001322252cmft:C000003544Membercmft:BioLifeSolutionsIncCTIMember2024-06-30iso4217:USDxbrli:sharesiso4217:USDxbrli:sharesxbrli:pureutr:Dcmft:Holding
Institutional Class (CRIEX)
Annual Shareholder Report - June 30, 2024
This annual shareholder report contains important information about CRM All Cap Value Fund for the period of July 1, 2023 to June 30, 2024. You can find additional information about the Fund at http://www.crmfunds.com/funds-overview/shareholder-resources/documents/. You can also request this information by contacting us at 800-CRM-2883.
What were the Fund’s costs for the last year?
(based on a hypothetical $10,000 investment)
Class Name | Costs of a $10,000 investment | Costs paid as a percentage of a $10,000 investment |
|---|
Institutional | $128 | 1.20% |
How did the Fund perform during the reporting period?
During the fiscal year, the Fund underperformed the Primary Benchmark Index (Russell 3000 Total Return Index) and outperformed the Secondary Benchmark Index (Russell 3000 Value Total Return Index). Against the Secondary Benchmark Index, relative outperformance was attributed to stock selection within the Consumer Discretionary, Industrials, and Materials sectors. Conversely, stock selection within the Consumer Staples, Information Technology, and Real Estate sectors was a headwind to relative performance. We saw an improving earnings outlook for small to mid-cap companies as we progressed through 2024. Down cap companies’ earnings were more negatively impacted by the inflationary pressures and rise in interest rates than larger cap companies in 2023. Updated performance information is available at www.crmfunds.com/funds-overview/performance/.
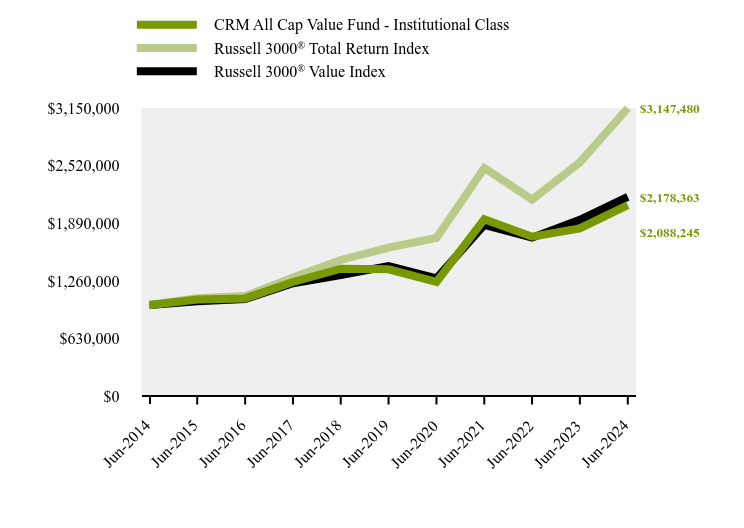
How has the Fund performed over the last ten years?
Total Return Based on $1,000,000 Investment
| CRM All Cap Value Fund - Institutional Class | Russell 3000® Total Return Index | Russell 3000® Value Index |
|---|
Jun-2014 | $1,000,000 | $1,000,000 | $1,000,000 |
Jun-2015 | $1,058,164 | $1,072,942 | $1,038,621 |
Jun-2016 | $1,070,916 | $1,095,885 | $1,063,729 |
Jun-2017 | $1,249,906 | $1,298,727 | $1,236,135 |
Jun-2018 | $1,395,242 | $1,490,655 | $1,325,770 |
Jun-2019 | $1,388,140 | $1,624,553 | $1,423,059 |
Jun-2020 | $1,251,143 | $1,730,629 | $1,288,997 |
Jun-2021 | $1,935,045 | $2,494,951 | $1,874,152 |
Jun-2022 | $1,745,151 | $2,149,011 | $1,734,307 |
Jun-2023 | $1,835,577 | $2,556,327 | $1,928,888 |
Jun-2024 | $2,088,245 | $3,147,480 | $2,178,363 |
Average Annual Total Returns
| 1 Year | 5 Years | 10 Years |
|---|
CRM All Cap Value Fund - Institutional Class | 13.77% | 8.51% | 7.64% |
Russell 3000® Total Return Index | 23.13% | 14.14% | 12.15% |
Russell 3000® Value Index | 12.93% | 8.89% | 8.10% |
The Fund's past performance is not a good predictor of how the Fund will perform in the future. The graph and table do not reflect the deduction of taxes that a shareholder would pay on fund distributions or redemption of fund shares.
Effective May 23, 2024, the Fund adopted the Russell 3000 Total Return Index as its broad-based benchmark index that represents the overall equity market. The Fund also compares its performance to the Russell 3000 Value Index, which is a more narrowly based index that reflects the market sector in which the Fund invests. The Russell 3000 Value Index was formerly the Fund's primary benchmark. These changes were made to comply with a new regulatory requirement.
Net Assets | $23,338,121 |
Number of Portfolio Holdings | 47 |
Advisory Fee (net of waivers) | $152,323 |
Portfolio Turnover | 54% |
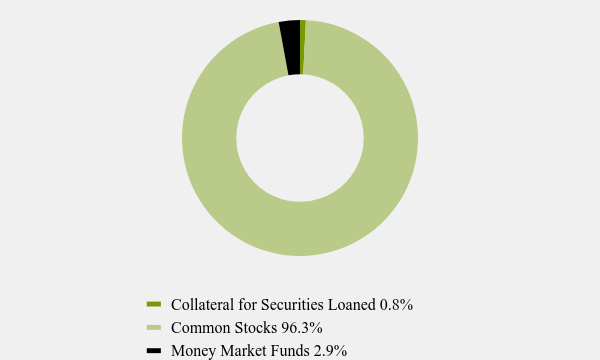
Asset Weighting (% of total investments)
Value | Value |
|---|
Collateral for Securities Loaned | 0.8% |
Common Stocks | 96.3% |
Money Market Funds | 2.9% |
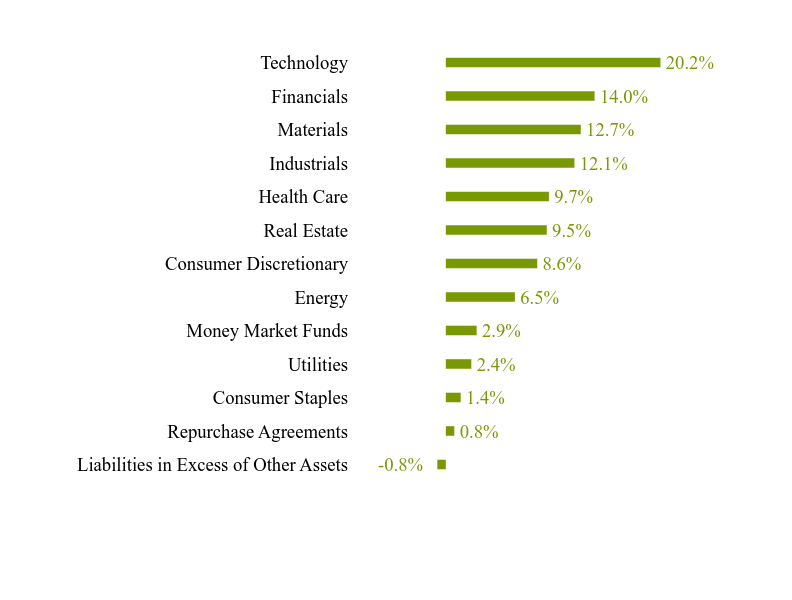
What did the Fund invest in?
Sector Weighting (% of net assets)
Value | Value |
|---|
Liabilities in Excess of Other Assets | -0.8% |
Repurchase Agreements | 0.8% |
Consumer Staples | 1.4% |
Utilities | 2.4% |
Money Market Funds | 2.9% |
Energy | 6.5% |
Consumer Discretionary | 8.6% |
Real Estate | 9.5% |
Health Care | 9.7% |
Industrials | 12.1% |
Materials | 12.7% |
Financials | 14.0% |
Technology | 20.2% |
Top 10 Holdings (% of net assets)
Holding Name | % of Net Assets |
Fidelity National Information Services, Inc. | 3.7% |
Marathon Oil Corporation | 3.7% |
Terreno Realty Corporation | 3.1% |
CRH PLC | 2.9% |
Sun Communities, Inc. | 2.9% |
ChampionX Corporation | 2.8% |
Burlington Stores, Inc. | 2.8% |
Advanced Drainage Systems, Inc. | 2.8% |
BioLife Solutions, Inc. | 2.7% |
PTC, Inc. | 2.7% |
No material changes occurred during the year ended June 30, 2024.
Institutional Class (CRIEX)
Annual Shareholder Report - June 30, 2024
Where can I find additional information about the Fund?
Additional information is available on the Fund's website ( http://www.crmfunds.com/funds-overview/shareholder-resources/documents/ ), including its:
Prospectus
Financial information
Holdings
Proxy voting information
Distributed by ALPS Distributors, Inc.
Annual Shareholder Report - June 30, 2024
This annual shareholder report contains important information about CRM All Cap Value Fund for the period of July 1, 2023 to June 30, 2024. You can find additional information about the Fund at http://www.crmfunds.com/funds-overview/shareholder-resources/documents/. You can also request this information by contacting us at 800-CRM-2883.
What were the Fund’s costs for the last year?
(based on a hypothetical $10,000 investment)
Class Name | Costs of a $10,000 investment | Costs paid as a percentage of a $10,000 investment |
|---|
Investor | $155 | 1.45% |
How did the Fund perform during the reporting period?
During the fiscal year, the Fund underperformed the Primary Benchmark Index (Russell 3000 Total Return Index) and outperformed the Secondary Benchmark Index (Russell 3000 Value Total Return Index). Against the Secondary Benchmark Index, relative outperformance was attributed to stock selection within the Consumer Discretionary, Industrials, and Materials sectors. Conversely, stock selection within the Consumer Staples, Information Technology, and Real Estate sectors was a headwind to relative performance. We saw an improving earnings outlook for small to mid-cap companies as we progressed through 2024. Down cap companies’ earnings were more negatively impacted by the inflationary pressures and rise in interest rates than larger cap companies in 2023. Updated performance information is available at www.crmfunds.com/funds-overview/performance/.
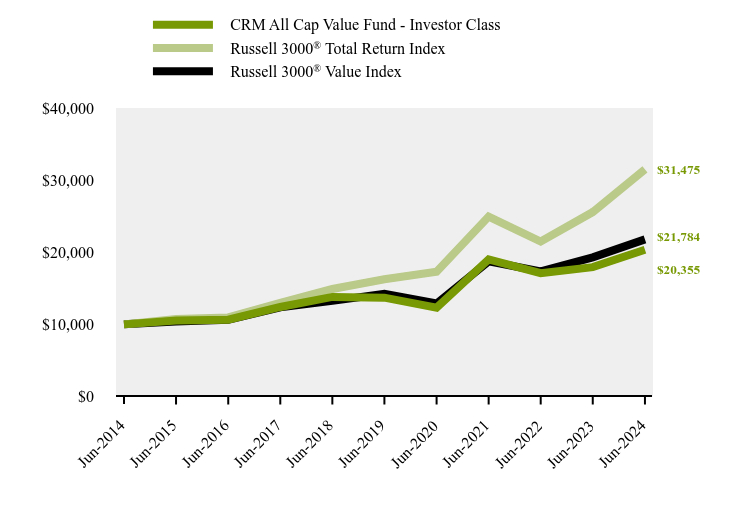
How has the Fund performed over the last ten years?
Total Return Based on $10,000 Investment
| CRM All Cap Value Fund - Investor Class | Russell 3000® Total Return Index | Russell 3000® Value Index |
|---|
Jun-2014 | $10,000 | $10,000 | $10,000 |
Jun-2015 | $10,548 | $10,729 | $10,386 |
Jun-2016 | $10,640 | $10,959 | $10,637 |
Jun-2017 | $12,413 | $12,987 | $12,361 |
Jun-2018 | $13,803 | $14,907 | $13,258 |
Jun-2019 | $13,704 | $16,246 | $14,231 |
Jun-2020 | $12,312 | $17,306 | $12,890 |
Jun-2021 | $19,013 | $24,950 | $18,742 |
Jun-2022 | $17,095 | $21,490 | $17,343 |
Jun-2023 | $17,939 | $25,563 | $19,289 |
Jun-2024 | $20,355 | $31,475 | $21,784 |
Average Annual Total Returns
| 1 Year | 5 Years | 10 Years |
|---|
CRM All Cap Value Fund - Investor Class | 13.47% | 8.23% | 7.37% |
Russell 3000® Total Return Index | 23.13% | 14.14% | 12.15% |
Russell 3000® Value Index | 12.93% | 8.89% | 8.10% |
The Fund's past performance is not a good predictor of how the Fund will perform in the future. The graph and table do not reflect the deduction of taxes that a shareholder would pay on fund distributions or redemption of fund shares.
Effective May 23, 2024, the Fund adopted the Russell 3000 Total Return Index as its broad-based benchmark index that represents the overall equity market. The Fund also compares its performance to the Russell 3000 Value Index, which is a more narrowly based index that reflects the market sector in which the Fund invests. The Russell 3000 Value Index was formerly the Fund's primary benchmark. These changes were made to comply with a new regulatory requirement.
Net Assets | $23,338,121 |
Number of Portfolio Holdings | 47 |
Advisory Fee (net of waivers) | $152,323 |
Portfolio Turnover | 54% |
Asset Weighting (% of total investments)
Value | Value |
|---|
Collateral for Securities Loaned | 0.8% |
Common Stocks | 96.3% |
Money Market Funds | 2.9% |
What did the Fund invest in?
Sector Weighting (% of net assets)
Value | Value |
|---|
Liabilities in Excess of Other Assets | -0.8% |
Repurchase Agreements | 0.8% |
Consumer Staples | 1.4% |
Utilities | 2.4% |
Money Market Funds | 2.9% |
Energy | 6.5% |
Consumer Discretionary | 8.6% |
Real Estate | 9.5% |
Health Care | 9.7% |
Industrials | 12.1% |
Materials | 12.7% |
Financials | 14.0% |
Technology | 20.2% |
Top 10 Holdings (% of net assets)
Holding Name | % of Net Assets |
Fidelity National Information Services, Inc. | 3.7% |
Marathon Oil Corporation | 3.7% |
Terreno Realty Corporation | 3.1% |
CRH PLC | 2.9% |
Sun Communities, Inc. | 2.9% |
ChampionX Corporation | 2.8% |
Burlington Stores, Inc. | 2.8% |
Advanced Drainage Systems, Inc. | 2.8% |
BioLife Solutions, Inc. | 2.7% |
PTC, Inc. | 2.7% |
No material changes occurred during the year ended June 30, 2024.
Annual Shareholder Report - June 30, 2024
Where can I find additional information about the Fund?
Additional information is available on the Fund's website ( http://www.crmfunds.com/funds-overview/shareholder-resources/documents/ ), including its:
Prospectus
Financial information
Holdings
Proxy voting information
Distributed by ALPS Distributors, Inc.
CRM Long/Short Opportunities Fund
Institutional Class (CRIHX)
Annual Shareholder Report - June 30, 2024
This annual shareholder report contains important information about CRM Long/Short Opportunities Fund for the period of July 1, 2023 to June 30, 2024. You can find additional information about the Fund at http://www.crmfunds.com/funds-overview/shareholder-resources/documents/. You can also request this information by contacting us at 800-CRM-2883.
What were the Fund’s costs for the last year?
(based on a hypothetical $10,000 investment)
Class Name | Costs of a $10,000 investment | Costs paid as a percentage of a $10,000 investment |
|---|
Institutional | $236 | 2.25% |
How did the Fund perform during the reporting period?
Despite positive absolute performance during the fiscal year, the Fund underperformed relative to the stated benchmark during the period. From a sector perspective, Industrials, Information Technology, and Materials contributed most to Fund performance during the fiscal year. The Consumer Staples and Consumer Discretionary sectors were the largest detractors to performance. In terms of exposure during the period, the Fund averaged approximately 94% gross long, 45% gross short, and 49% net long. Fund net exposure increased during the period from roughly 37% net long to 55% net long, largely through the reduction in short exposure. The largest sector exposure changes were: Consumer Discretionary and Financials net exposure increased by over 7% each while Real Estate and Information Technology increased by a more modest amount. At the same time, both Consumer Staples and Health Care net exposure decreased by roughly 2% each. Updated performance information is available at www.crmfunds.com/funds-overview/performance/.
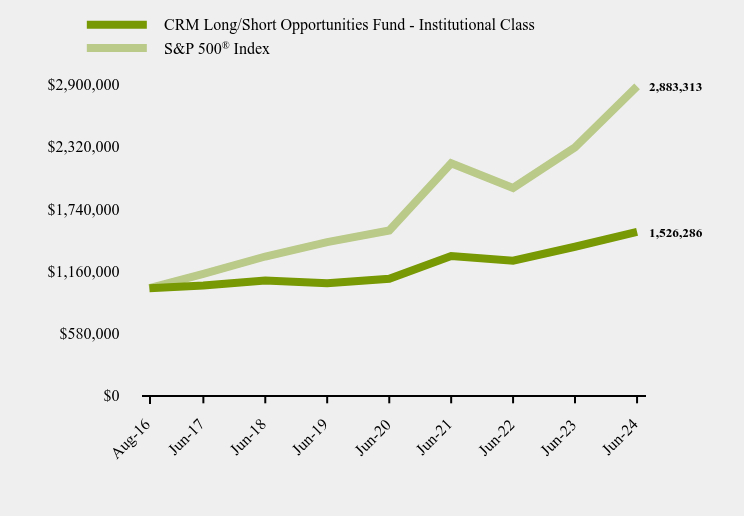
How has the Fund performed since inception?
Total Return Based on $10,000 Investment
| CRM Long/Short Opportunities Fund - Institutional Class | S&P 500® Index |
|---|
Aug-16 | $1,000,000 | $1,000,000 |
Jun-17 | 1,025,000 | 1,132,863 |
Jun-18 | 1,071,538 | 1,295,702 |
Jun-19 | 1,047,197 | 1,430,681 |
Jun-20 | 1,088,390 | 1,538,054 |
Jun-21 | 1,300,532 | 2,165,491 |
Jun-22 | 1,257,278 | 1,935,607 |
Jun-23 | 1,386,638 | 2,314,870 |
Jun-24 | 1,526,286 | 2,883,313 |
Average Annual Total Returns
| 1 Year | 5 Years | Since Inception (August 16, 2016) |
|---|
CRM Long/Short Opportunities Fund - Institutional Class | 10.07% | 7.83% | 5.52% |
S&P 500® Index | 24.56% | 15.05% | 14.40% |
The Fund's past performance is not a good predictor of how the Fund will perform in the future. The graph and table do not reflect the deduction of taxes that a shareholder would pay on fund distributions or redemption of fund shares.
Net Assets | $195,995,806 |
Number of Portfolio Holdings | 106 |
Advisory Fee (net of waivers) | $2,519,234 |
Portfolio Turnover | 113% |
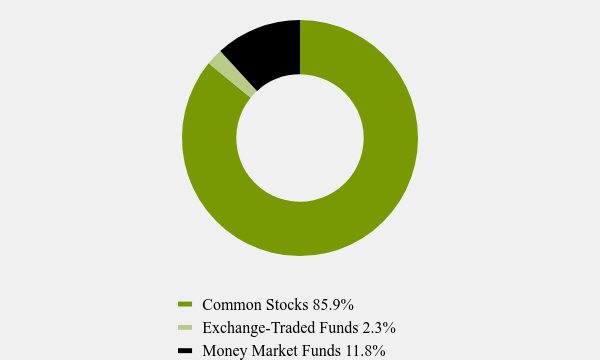
Asset Weighting (% of total investments)
Value | Value |
|---|
Common Stocks | 85.9% |
Exchange-Traded Funds | 2.3% |
Money Market Funds | 11.8% |
What did the Fund invest in?
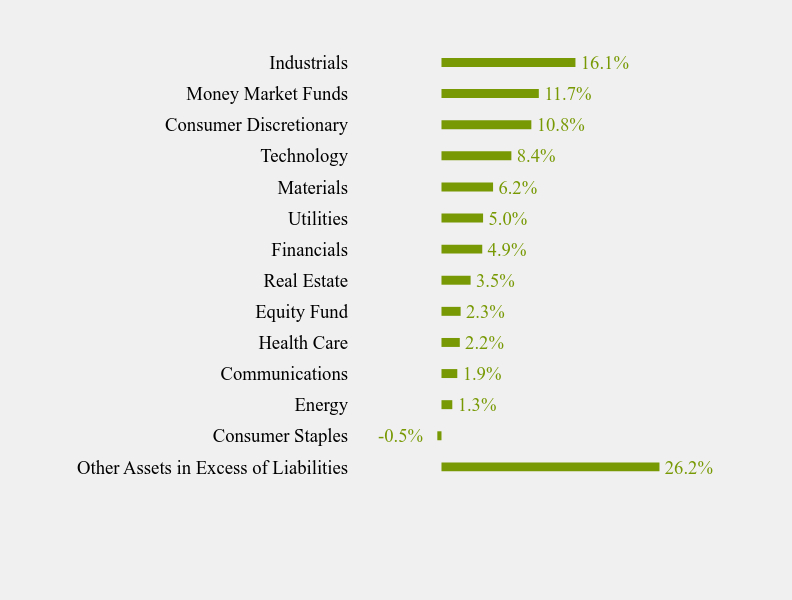
Sector Weighting (% of net assets)
Value | Value |
|---|
Other Assets in Excess of Liabilities | 26.2% |
Consumer Staples | |
Energy | 1.3% |
Communications | 1.9% |
Health Care | 2.2% |
Equity Fund | 2.3% |
Real Estate | 3.5% |
Financials | 4.9% |
Utilities | 5.0% |
Materials | 6.2% |
Technology | 8.4% |
Consumer Discretionary | 10.8% |
Money Market Funds | 11.7% |
Industrials | 16.1% |
Top 10 Holdings (% of net assets)
Holding Name | % of Net Assets |
Blackrock Liquidity Funds T-Fund, Institutional Shares | 5.8% |
Federated Hermes Treasury Obligations Fund, Institutional Shares | 5.8% |
Arcosa, Inc. | 4.0% |
Burlington Stores, Inc. | 3.9% |
Canadian Pacific Kansas City Ltd. | 3.7% |
Clean Harbors, Inc. | 3.6% |
Itron, Inc. | 3.1% |
NextEra Energy, Inc. | 3.1% |
Skyline Champion Corporation | 3.0% |
Digital Realty Trust, Inc. | 2.8% |
No material changes occurred during the year ended June 30, 2024.
CRM Long/Short Opportunities Fund
Institutional Class (CRIHX)
Annual Shareholder Report - June 30, 2024
Where can I find additional information about the Fund?
Additional information is available on the Fund's website ( http://www.crmfunds.com/funds-overview/shareholder-resources/documents/ ), including its:
Prospectus
Financial information
Holdings
Proxy voting information
Distributed by ALPS Distributors, Inc.
Institutional Class (CRIMX)
Annual Shareholder Report - June 30, 2024
This annual shareholder report contains important information about CRM Mid Cap Value Fund for the period of July 1, 2023 to June 30, 2024. You can find additional information about the Fund at http://www.crmfunds.com/funds-overview/shareholder-resources/documents/. You can also request this information by contacting us at 800-CRM-2883.
What were the Fund’s costs for the last year?
(based on a hypothetical $10,000 investment)
Class Name | Costs of a $10,000 investment | Costs paid as a percentage of a $10,000 investment |
|---|
Institutional | $104 | 0.99% |
How did the Fund perform during the reporting period?
During the fiscal year, the Fund underperformed both the Primary Benchmark Index (Russell 3000 Total Return Index) and Secondary Benchmark Index (Russell MidCap Value Total Return Index). Against the Secondary Benchmark Index, relative underperformance during the fiscal year was mainly attributed to stock selection within the Industrials, Health Care, and Utilities sectors. Stock selection within the Consumer Discretionary and Materials sectors was a tailwind to performance. We saw an improving earnings outlook for mid-cap companies as we progressed through 2024. Down cap companies’ earnings were more negatively impacted by the inflationary pressures and rise in interest rates than larger cap companies in 2023. Updated performance information is available at www.crmfunds.com/funds-overview/performance/.
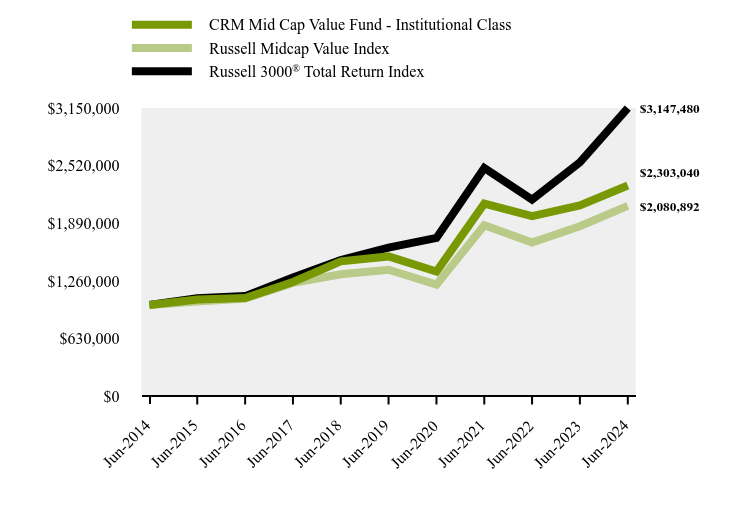
How has the Fund performed over the last ten years?
Total Return Based on $1,000,000 Investment
| CRM Mid Cap Value Fund - Institutional Class | Russell Midcap Value Index | Russell 3000® Total Return Index |
|---|
Jun-2014 | $1,000,000 | $1,000,000 | $1,000,000 |
Jun-2015 | $1,059,112 | $1,036,717 | $1,072,942 |
Jun-2016 | $1,076,173 | $1,070,367 | $1,095,885 |
Jun-2017 | $1,250,393 | $1,240,829 | $1,298,727 |
Jun-2018 | $1,476,002 | $1,335,073 | $1,490,655 |
Jun-2019 | $1,529,270 | $1,384,221 | $1,624,553 |
Jun-2020 | $1,363,659 | $1,220,718 | $1,730,629 |
Jun-2021 | $2,105,998 | $1,868,481 | $2,494,951 |
Jun-2022 | $1,968,100 | $1,681,690 | $2,149,011 |
Jun-2023 | $2,086,229 | $1,858,313 | $2,556,327 |
Jun-2024 | $2,303,040 | $2,080,892 | $3,147,480 |
Average Annual Total Returns
| 1 Year | 5 Years | 10 Years |
|---|
CRM Mid Cap Value Fund - Institutional Class | 10.39% | 8.53% | 8.70% |
Russell Midcap Value Index | 11.98% | 8.49% | 7.60% |
Russell 3000® Total Return Index | 23.13% | 14.14% | 12.15% |
The Fund's past performance is not a good predictor of how the Fund will perform in the future. The graph and table do not reflect the deduction of taxes that a shareholder would pay on fund distributions or redemption of fund shares.
Effective May 23, 2024, the Fund adopted the Russell 3000 Total Return Index as its broad-based benchmark index that represents the overall equity market. The Fund also compares its performance to the Russell MidCap Value Index, which is a more narrowly based index that reflects the market sector in which the Fund invests. The Russell MidCap Value Index was formerly the Fund's primary benchmark. These changes were made to comply with a new regulatory requirement.
Net Assets | $372,057,285 |
Number of Portfolio Holdings | 62 |
Advisory Fee | $2,889,555 |
Portfolio Turnover | 47% |
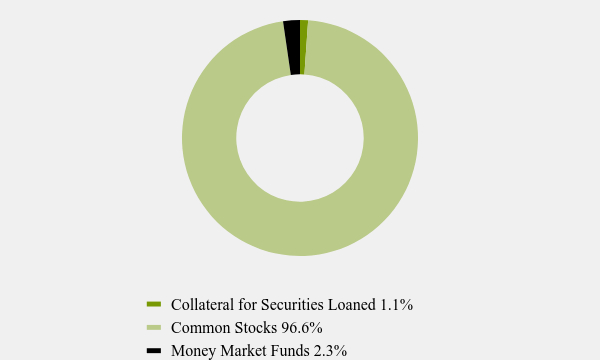
Asset Weighting (% of total investments)
Value | Value |
|---|
Collateral for Securities Loaned | 1.1% |
Common Stocks | 96.6% |
Money Market Funds | 2.3% |
What did the Fund invest in?
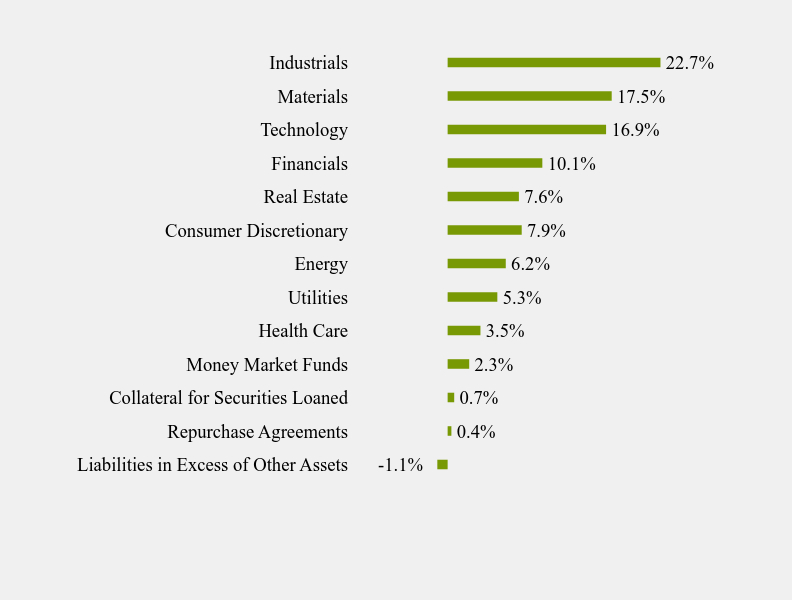
Sector Weighting (% of net assets)
Value | Value |
|---|
Liabilities in Excess of Other Assets | -1.1% |
Repurchase Agreements | 0.4% |
Collateral for Securities Loaned | 0.7% |
Money Market Funds | 2.3% |
Health Care | 3.5% |
Utilities | 5.3% |
Energy | 6.2% |
Consumer Discretionary | 7.9% |
Real Estate | 7.6% |
Financials | 10.1% |
Technology | 16.9% |
Materials | 17.5% |
Industrials | 22.7% |
Top 10 Holdings (% of net assets)
Holding Name | % of Net Assets |
Fidelity National Information Services, Inc. | 3.7% |
Vontier Corporation | 3.5% |
ChampionX Corporation | 2.9% |
Burlington Stores, Inc. | 2.9% |
Nisource, Inc. | 2.9% |
Terreno Realty Corporation | 2.8% |
Woodward, Inc. | 2.8% |
Martin Marietta Materials, Inc. | 2.8% |
Canadian Pacific Kansas City Ltd. | 2.8% |
Ashland, Inc. | 2.7% |
No material changes occurred during the year ended June 30, 2024.
CRM Mid Cap Value Fund - Institutional (CRIMX)
Institutional Class (CRIMX)
Annual Shareholder Report - June 30, 2024
Where can I find additional information about the Fund?
Additional information is available on the Fund's website ( http://www.crmfunds.com/funds-overview/shareholder-resources/documents/ ), including its:
Prospectus
Financial information
Holdings
Proxy voting information
Distributed by ALPS Distributors, Inc.
Annual Shareholder Report - June 30, 2024
This annual shareholder report contains important information about CRM Mid Cap Value Fund for the period of July 1, 2023 to June 30, 2024. You can find additional information about the Fund at http://www.crmfunds.com/funds-overview/shareholder-resources/documents/. You can also request this information by contacting us at 800-CRM-2883.
What were the Fund’s costs for the last year?
(based on a hypothetical $10,000 investment)
Class Name | Costs of a $10,000 investment | Costs paid as a percentage of a $10,000 investment |
|---|
Investor | $122 | 1.16% |
How did the Fund perform during the reporting period?
During the fiscal year, the Fund underperformed both the Primary Benchmark Index (Russell 3000 Total Return Index) and Secondary Benchmark Index (Russell MidCap Value Total Return Index). Against the Secondary Benchmark Index, relative underperformance during the fiscal year was mainly attributed to stock selection within the Industrials, Health Care, and Utilities sectors. Stock selection within the Consumer Discretionary and Materials sectors was a tailwind to performance. We saw an improving earnings outlook for mid-cap companies as we progressed through 2024. Down cap companies’ earnings were more negatively impacted by the inflationary pressures and rise in interest rates than larger cap companies in 2023. Updated performance information is available at www.crmfunds.com/funds-overview/performance/.
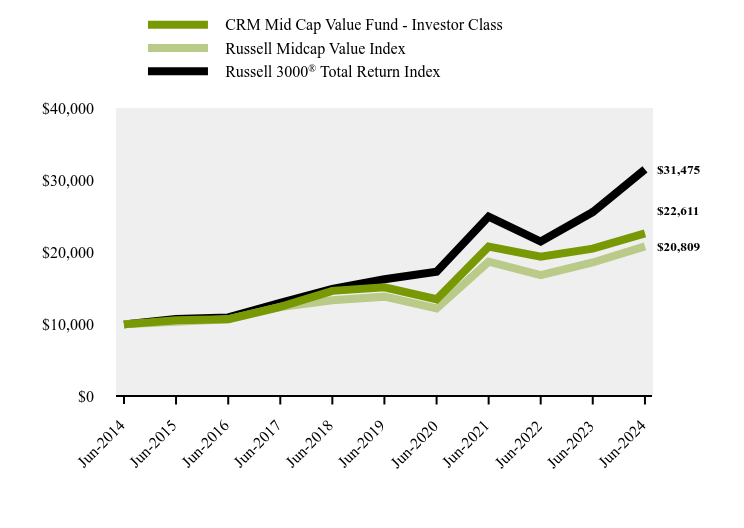
How has the Fund performed over the last ten years?
Total Return Based on $10,000 Investment
| CRM Mid Cap Value Fund - Investor Class | Russell Midcap Value Index | Russell 3000® Total Return Index |
|---|
Jun-2014 | $10,000 | $10,000 | $10,000 |
Jun-2015 | $10,573 | $10,367 | $10,729 |
Jun-2016 | $10,724 | $10,704 | $10,959 |
Jun-2017 | $12,432 | $12,408 | $12,987 |
Jun-2018 | $14,646 | $13,351 | $14,907 |
Jun-2019 | $15,143 | $13,842 | $16,246 |
Jun-2020 | $13,480 | $12,207 | $17,306 |
Jun-2021 | $20,771 | $18,685 | $24,950 |
Jun-2022 | $19,384 | $16,817 | $21,490 |
Jun-2023 | $20,505 | $18,583 | $25,563 |
Jun-2024 | $22,611 | $20,809 | $31,475 |
Average Annual Total Returns
| 1 Year | 5 Years | 10 Years |
|---|
CRM Mid Cap Value Fund - Investor Class | 10.27% | 8.35% | 8.50% |
Russell Midcap Value Index | 11.98% | 8.49% | 7.60% |
Russell 3000® Total Return Index | 23.13% | 14.14% | 12.15% |
The Fund's past performance is not a good predictor of how the Fund will perform in the future. The graph and table do not reflect the deduction of taxes that a shareholder would pay on fund distributions or redemption of fund shares.
Effective May 23, 2024, the Fund adopted the Russell 3000 Total Return Index as its broad-based benchmark index that represents the overall equity market. The Fund also compares its performance to the Russell MidCap Value Index, which is a more narrowly based index that reflects the market sector in which the Fund invests. The Russell MidCap Value Index was formerly the Fund's primary benchmark. These changes were made to comply with a new regulatory requirement.
Net Assets | $372,057,285 |
Number of Portfolio Holdings | 62 |
Advisory Fee | $2,889,555 |
Portfolio Turnover | 47% |
Asset Weighting (% of total investments)
Value | Value |
|---|
Collateral for Securities Loaned | 1.1% |
Common Stocks | 96.6% |
Money Market Funds | 2.3% |
What did the Fund invest in?
Sector Weighting (% of net assets)
Value | Value |
|---|
Liabilities in Excess of Other Assets | -1.1% |
Repurchase Agreements | 0.4% |
Collateral for Securities Loaned | 0.7% |
Money Market Funds | 2.3% |
Health Care | 3.5% |
Utilities | 5.3% |
Energy | 6.2% |
Consumer Discretionary | 7.9% |
Real Estate | 7.6% |
Financials | 10.1% |
Technology | 16.9% |
Materials | 17.5% |
Industrials | 22.7% |
Top 10 Holdings (% of net assets)
Holding Name | % of Net Assets |
Fidelity National Information Services, Inc. | 3.7% |
Vontier Corporation | 3.5% |
ChampionX Corporation | 2.9% |
Burlington Stores, Inc. | 2.9% |
Nisource, Inc. | 2.9% |
Terreno Realty Corporation | 2.8% |
Woodward, Inc. | 2.8% |
Martin Marietta Materials, Inc. | 2.8% |
Canadian Pacific Kansas City Ltd. | 2.8% |
Ashland, Inc. | 2.7% |
No material changes occurred during the year ended June 30, 2024.
CRM Mid Cap Value Fund - Investor (CRMMX)
Annual Shareholder Report - June 30, 2024
Where can I find additional information about the Fund?
Additional information is available on the Fund's website ( http://www.crmfunds.com/funds-overview/shareholder-resources/documents/ ), including its:
Prospectus
Financial information
Holdings
Proxy voting information
Distributed by ALPS Distributors, Inc.
Institutional Class (CRISX)
Annual Shareholder Report - June 30, 2024
This annual shareholder report contains important information about CRM Small Cap Value Fund for the period of July 1, 2023 to June 30, 2024. You can find additional information about the Fund at http://www.crmfunds.com/funds-overview/shareholder-resources/documents/. You can also request this information by contacting us at 800-CRM-2883.
What were the Fund’s costs for the last year?
(based on a hypothetical $10,000 investment)
Class Name | Costs of a $10,000 investment | Costs paid as a percentage of a $10,000 investment |
|---|
Institutional | $114 | 1.07% |
How did the Fund perform during the reporting period?
During the fiscal year, the Fund underperformed the Primary Benchmark Index (Russell 3000 Total Return Index) and outperformed the Secondary Benchmark Index (Russell 2000 Value Total Return Index). Against the Secondary Benchmark Index, stock selection was the primary driver of outperformance during the period, most notably in the Information Technology, Industrials, and Consumer Staples sectors. The portfolio also benefited from our underweight to the Communication Services sector relative to the Russell 2000® Value Total Return Index. We saw an improving earnings outlook for small-cap companies as we progressed through 2024. Down cap companies’ earnings were more negatively impacted by the inflationary pressures and rise in interest rates than larger cap companies in 2023. Updated performance information is available at www.crmfunds.com/funds-overview/performance/.
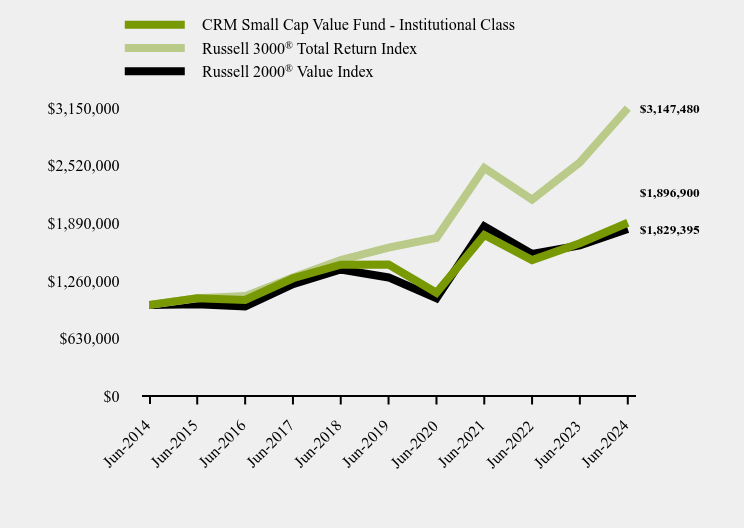
How has the Fund performed over the last ten years?
Total Return Based on $1,000,000 Investment
| CRM Small Cap Value Fund - Institutional Class | Russell 3000® Total Return Index | Russell 2000® Value Index |
|---|
Jun-2014 | $1,000,000 | $1,000,000 | $1,000,000 |
Jun-2015 | $1,073,833 | $1,072,942 | $1,007,756 |
Jun-2016 | $1,053,585 | $1,095,885 | $981,738 |
Jun-2017 | $1,290,740 | $1,298,727 | $1,225,768 |
Jun-2018 | $1,438,359 | $1,490,655 | $1,386,334 |
Jun-2019 | $1,439,982 | $1,624,553 | $1,299,890 |
Jun-2020 | $1,132,771 | $1,730,629 | $1,072,708 |
Jun-2021 | $1,763,548 | $2,494,951 | $1,858,785 |
Jun-2022 | $1,489,719 | $2,149,011 | $1,556,166 |
Jun-2023 | $1,673,336 | $2,556,327 | $1,649,653 |
Jun-2024 | $1,896,900 | $3,147,480 | $1,829,395 |
Average Annual Total Returns
| 1 Year | 5 Years | 10 Years |
|---|
CRM Small Cap Value Fund - Institutional Class | 13.36% | 5.67% | 6.61% |
Russell 3000® Total Return Index | 23.13% | 14.14% | 12.15% |
Russell 2000® Value Index | 10.90% | 7.07% | 6.23% |
The Fund's past performance is not a good predictor of how the Fund will perform in the future. The graph and table do not reflect the deduction of taxes that a shareholder would pay on fund distributions or redemption of fund shares.
Effective May 23, 2024, the Fund adopted the Russell 3000 Total Return Index as its broad-based benchmark index that represents the overall equity market. The Fund also compares its performance to the Russell 2000 Value Index, which is a more narrowly based index that reflects the market sector in which the Fund invests. The Russell 2000 Value Index was formerly the Fund's primary benchmark. These changes were made to comply with a new regulatory requirement.
Net Assets | $75,275,015 |
Number of Portfolio Holdings | 48 |
Advisory Fee | $556,273 |
Portfolio Turnover | 77% |
Asset Weighting (% of total investments)
Value | Value |
|---|
Collateral for Securities Loaned | 1.7% |
Common Stocks | 95.2% |
Money Market Funds | 3.1% |
What did the Fund invest in?
Sector Weighting (% of net assets)
Value | Value |
|---|
Liabilities in Excess of Other Assets | -1.9% |
Repurchase Agreements | 1.7% |
Money Market Funds | 3.2% |
Materials | 4.4% |
Utilities | 4.5% |
Health Care | 5.0% |
Energy | 5.5% |
Consumer Discretionary | 7.2% |
Real Estate | 9.5% |
Technology | 13.0% |
Financials | 22.1% |
Industrials | 25.8% |
Top 10 Holdings (% of net assets)
Holding Name | % of Net Assets |
Arcosa, Inc. | 3.7% |
Envestnet, Inc. | 3.5% |
ChampionX Corporation | 3.1% |
Central Pacific Financial Corporation | 3.0% |
ACV Auctions, Inc. | 3.0% |
Skyline Champion Corporation | 2.9% |
Horace Mann Educators Corporation | 2.9% |
Mueller Water Products, Inc. | 2.8% |
Itron, Inc. | 2.7% |
Stericycle, Inc. | 2.7% |
No material changes occurred during the year ended June 30, 2024.
CRM Small Cap Value Fund - Institutional (CRISX)
Institutional Class (CRISX)
Annual Shareholder Report - June 30, 2024
Where can I find additional information about the Fund?
Additional information is available on the Fund's website ( http://www.crmfunds.com/funds-overview/shareholder-resources/documents/ ), including its:
Prospectus
Financial information
Holdings
Proxy voting information
Distributed by ALPS Distributors, Inc.
Annual Shareholder Report - June 30, 2024
This annual shareholder report contains important information about CRM Small Cap Value Fund for the period of July 1, 2023 to June 30, 2024. You can find additional information about the Fund at http://www.crmfunds.com/funds-overview/shareholder-resources/documents/. You can also request this information by contacting us at 800-CRM-2883.
What were the Fund’s costs for the last year?
(based on a hypothetical $10,000 investment)
Class Name | Costs of a $10,000 investment | Costs paid as a percentage of a $10,000 investment |
|---|
Investor | $134 | 1.26% |
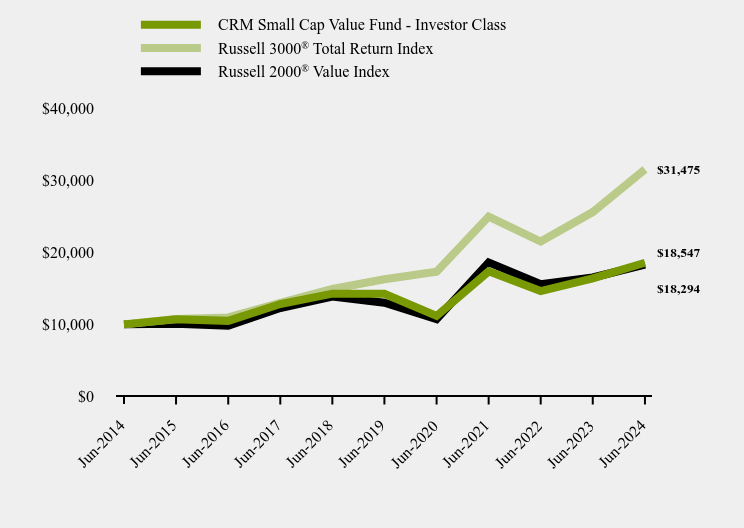
How did the Fund perform during the reporting period?
During the fiscal year, the Fund underperformed the Primary Benchmark Index (Russell 3000 Total Return Index) and outperformed the Secondary Benchmark Index (Russell 2000 Value Total Return Index). Against the Secondary Benchmark Index, stock selection was the primary driver of outperformance during the period, most notably in the Information Technology, Industrials, and Consumer Staples sectors. The portfolio also benefited from our underweight to the Communication Services sector relative to the Russell 2000® Value Total Return Index. We saw an improving earnings outlook for small-cap companies as we progressed through 2024. Down cap companies’ earnings were more negatively impacted by the inflationary pressures and rise in interest rates than larger cap companies in 2023. Updated performance information is available at www.crmfunds.com/funds-overview/performance/.
How has the Fund performed over the last ten years?
Total Return Based on $10,000 Investment
| CRM Small Cap Value Fund - Investor Class | Russell 3000® Total Return Index | Russell 2000® Value Index |
|---|
Jun-2014 | $10,000 | $10,000 | $10,000 |
Jun-2015 | $10,714 | $10,729 | $10,078 |
Jun-2016 | $10,486 | $10,959 | $9,817 |
Jun-2017 | $12,823 | $12,987 | $12,258 |
Jun-2018 | $14,255 | $14,907 | $13,863 |
Jun-2019 | $14,231 | $16,246 | $12,999 |
Jun-2020 | $11,167 | $17,306 | $10,727 |
Jun-2021 | $17,350 | $24,950 | $18,588 |
Jun-2022 | $14,620 | $21,490 | $15,562 |
Jun-2023 | $16,388 | $25,563 | $16,497 |
Jun-2024 | $18,547 | $31,475 | $18,294 |
Average Annual Total Returns
| 1 Year | 5 Years | 10 Years |
|---|
CRM Small Cap Value Fund - Investor Class | 13.17% | 5.44% | 6.37% |
Russell 3000® Total Return Index | 23.13% | 14.14% | 12.15% |
Russell 2000® Value Index | 10.90% | 7.07% | 6.23% |
The Fund's past performance is not a good predictor of how the Fund will perform in the future. The graph and table do not reflect the deduction of taxes that a shareholder would pay on fund distributions or redemption of fund shares.
Effective May 23, 2024, the Fund adopted the Russell 3000 Total Return Index as its broad-based benchmark index that represents the overall equity market. The Fund also compares its performance to the Russell 2000 Value Index, which is a more narrowly based index that reflects the market sector in which the Fund invests. The Russell 2000 Value Index was formerly the Fund's primary benchmark. These changes were made to comply with a new regulatory requirement.
Net Assets | $75,275,015 |
Number of Portfolio Holdings | 48 |
Advisory Fee | $556,273 |
Portfolio Turnover | 77% |
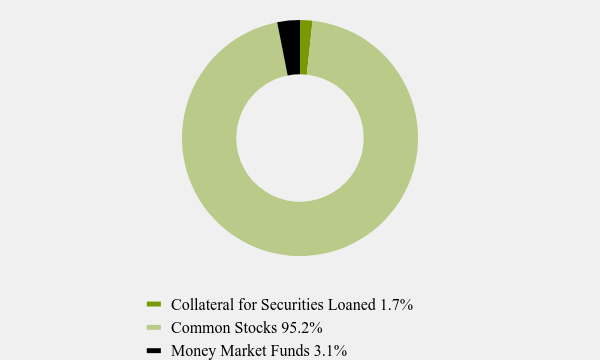
Asset Weighting (% of total investments)
Value | Value |
|---|
Collateral for Securities Loaned | 1.7% |
Common Stocks | 95.2% |
Money Market Funds | 3.1% |
What did the Fund invest in?
Sector Weighting (% of net assets)
Value | Value |
|---|
Liabilities in Excess of Other Assets | -1.9% |
Repurchase Agreements | 1.7% |
Money Market Funds | 3.2% |
Materials | 4.4% |
Utilities | 4.5% |
Health Care | 5.0% |
Energy | 5.5% |
Consumer Discretionary | 7.2% |
Real Estate | 9.5% |
Technology | 13.0% |
Financials | 22.1% |
Industrials | 25.8% |
Top 10 Holdings (% of net assets)
Holding Name | % of Net Assets |
Arcosa, Inc. | 3.7% |
Envestnet, Inc. | 3.5% |
ChampionX Corporation | 3.1% |
Central Pacific Financial Corporation | 3.0% |
ACV Auctions, Inc. | 3.0% |
Skyline Champion Corporation | 2.9% |
Horace Mann Educators Corporation | 2.9% |
Mueller Water Products, Inc. | 2.8% |
Itron, Inc. | 2.7% |
Stericycle, Inc. | 2.7% |
No material changes occurred during the year ended June 30, 2024.
CRM Small Cap Value Fund - Investor (CRMSX)
Annual Shareholder Report - June 30, 2024
Where can I find additional information about the Fund?
Additional information is available on the Fund's website ( http://www.crmfunds.com/funds-overview/shareholder-resources/documents/ ), including its:
Prospectus
Financial information
Holdings
Proxy voting information
Distributed by ALPS Distributors, Inc.
CRM Small/Mid Cap Value Fund
Institutional Class (CRIAX)
Annual Shareholder Report - June 30, 2024
This annual shareholder report contains important information about CRM Small/Mid Cap Value Fund for the period of July 1, 2023 to June 30, 2024. You can find additional information about the Fund at http://www.crmfunds.com/funds-overview/shareholder-resources/documents/. You can also request this information by contacting us at 800-CRM-2883.
What were the Fund’s costs for the last year?
(based on a hypothetical $10,000 investment)
Class Name | Costs of a $10,000 investment | Costs paid as a percentage of a $10,000 investment |
|---|
Institutional | $110 | 1.05% |
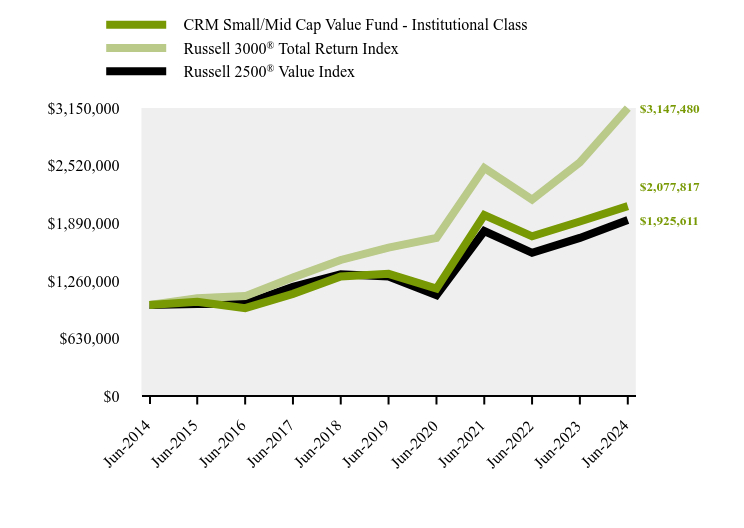
How did the Fund perform during the reporting period?
During the fiscal year, the Fund underperformed both the Primary Benchmark Index (Russell 3000 Total Return Index) and Secondary Benchmark Index (Russell 2500 Value Total Return Index). Against the Secondary Benchmark Index, relative underperformance during the period was mainly attributed to stock selection, most notably in the Utilities, Financials, and Consumer Staples sectors. Conversely, stock selection in Materials, Information Technology, and Consumer Discretionary was a positive contributor to performance. We saw an improving earnings outlook for small to mid-cap companies as we progressed through 2024. Down cap companies’ earnings were more negatively impacted by the inflationary pressures and rise in interest rates than larger cap companies in 2023. Updated performance information is available at www.crmfunds.com/funds-overview/performance/.
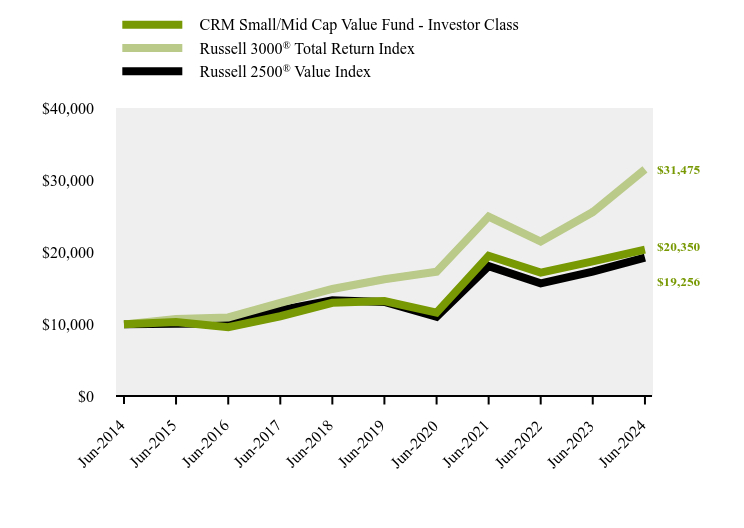
How has the Fund performed over the last ten years?
Total Return Based on $1,000,000 Investment
| CRM Small/Mid Cap Value Fund - Institutional Class | Russell 3000® Total Return Index | Russell 2500® Value Index |
|---|
Jun-2014 | $1,000,000 | $1,000,000 | $1,000,000 |
Jun-2015 | $1,034,074 | $1,072,942 | $1,009,939 |
Jun-2016 | $964,358 | $1,095,885 | $1,012,110 |
Jun-2017 | $1,120,461 | $1,298,727 | $1,197,940 |
Jun-2018 | $1,311,266 | $1,490,655 | $1,335,570 |
Jun-2019 | $1,339,182 | $1,624,553 | $1,309,872 |
Jun-2020 | $1,177,754 | $1,730,629 | $1,106,860 |
Jun-2021 | $1,981,669 | $2,494,951 | $1,806,736 |
Jun-2022 | $1,748,309 | $2,149,011 | $1,568,366 |
Jun-2023 | $1,910,634 | $2,556,327 | $1,731,014 |
Jun-2024 | $2,077,817 | $3,147,480 | $1,925,611 |
Average Annual Total Returns
| 1 Year | 5 Years | 10 Years |
|---|
CRM Small/Mid Cap Value Fund - Institutional Class | 8.75% | 9.18% | 7.59% |
Russell 3000® Total Return Index | 23.13% | 14.14% | 12.15% |
Russell 2500® Value Index | 11.24% | 8.01% | 6.77% |
The Fund's past performance is not a good predictor of how the Fund will perform in the future. The graph and table do not reflect the deduction of taxes that a shareholder would pay on fund distributions or redemption of fund shares.
Effective May 23, 2024, the Fund adopted the Russell 3000 Total Return Index as its broad-based benchmark index that represents the overall equity market. The Fund also compares its performance to the Russell 2500 Value Index, which is a more narrowly based index that reflects the market sector in which the Fund invests. The Russell 2500 Value Index was formerly the Fund's primary benchmark. These changes were made to comply with a new regulatory requirement.
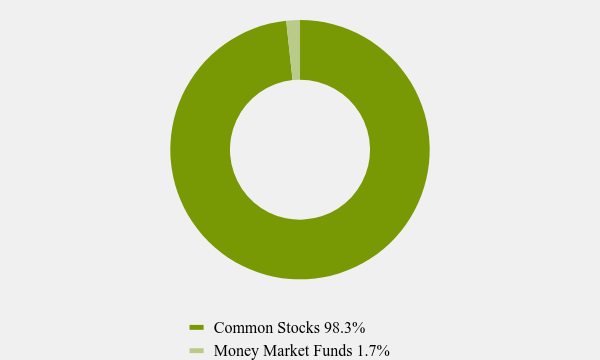
Net Assets | $169,225,405 |
Number of Portfolio Holdings | 48 |
Advisory Fee | $1,526,156 |
Portfolio Turnover | 72% |
Asset Weighting (% of total investments)
Value | Value |
|---|
Common Stocks | 98.3% |
Money Market Funds | 1.7% |
What did the Fund invest in?
Sector Weighting (% of net assets)
Value | Value |
|---|
Liabilities in Excess of Other Assets | -0.6% |
Money Market Funds | 1.7% |
Consumer Staples | 2.2% |
Energy | 3.4% |
Utilities | 4.5% |
Materials | 8.1% |
Real Estate | 8.3% |
Health Care | 8.6% |
Consumer Discretionary | 12.0% |
Technology | 13.3% |
Financials | 16.5% |
Industrials | 22.0% |
Top 10 Holdings (% of net assets)
Holding Name | % of Net Assets |
Burlington Stores, Inc. | 4.3% |
Ashland, Inc. | 4.0% |
Stericycle, Inc. | 3.6% |
Itron, Inc. | 3.5% |
Matador Resources Company | 3.5% |
Terreno Realty Corporation | 3.2% |
Clean Harbors, Inc. | 3.1% |
Arcosa, Inc. | 3.1% |
First American Financial Corporation | 3.0% |
BioLife Solutions, Inc. | 2.8% |
No material changes occurred during the year ended June 30, 2024.
CRM Small/Mid Cap Value Fund - Institutional (CRIAX)
Institutional Class (CRIAX)
Annual Shareholder Report - June 30, 2024
Where can I find additional information about the Fund?
Additional information is available on the Fund's website ( http://www.crmfunds.com/funds-overview/shareholder-resources/documents/ ), including its:
Prospectus
Financial information
Holdings
Proxy voting information
Distributed by ALPS Distributors, Inc.
CRM Small/Mid Cap Value Fund
Annual Shareholder Report - June 30, 2024
This annual shareholder report contains important information about CRM Small/Mid Cap Value Fund for the period of July 1, 2023 to June 30, 2024. You can find additional information about the Fund at http://www.crmfunds.com/funds-overview/shareholder-resources/documents/. You can also request this information by contacting us at 800-CRM-2883.
What were the Fund’s costs for the last year?
(based on a hypothetical $10,000 investment)
Class Name | Costs of a $10,000 investment | Costs paid as a percentage of a $10,000 investment |
|---|
Investor | $126 | 1.21% |
How did the Fund perform during the reporting period?
During the fiscal year, the Fund underperformed both the Primary Benchmark Index (Russell 3000 Total Return Index) and Secondary Benchmark Index (Russell 2500 Value Total Return Index). Against the Secondary Benchmark Index, relative underperformance during the period was mainly attributed to stock selection, most notably in the Utilities, Financials, and Consumer Staples sectors. Conversely, stock selection in Materials, Information Technology, and Consumer Discretionary was a positive contributor to performance. We saw an improving earnings outlook for small to mid-cap companies as we progressed through 2024. Down cap companies’ earnings were more negatively impacted by the inflationary pressures and rise in interest rates than larger cap companies in 2023. Updated performance information is available at www.crmfunds.com/funds-overview/performance/.
How has the Fund performed over the last ten years?
Total Return Based on $10,000 Investment
| CRM Small/Mid Cap Value Fund - Investor Class | Russell 3000® Total Return Index | Russell 2500® Value Index |
|---|
Jun-2014 | $10,000 | $10,000 | $10,000 |
Jun-2015 | $10,316 | $10,729 | $10,099 |
Jun-2016 | $9,604 | $10,959 | $10,121 |
Jun-2017 | $11,127 | $12,987 | $11,979 |
Jun-2018 | $12,992 | $14,907 | $13,356 |
Jun-2019 | $13,239 | $16,246 | $13,099 |
Jun-2020 | $11,627 | $17,306 | $11,069 |
Jun-2021 | $19,509 | $24,950 | $18,067 |
Jun-2022 | $17,185 | $21,490 | $15,684 |
Jun-2023 | $18,743 | $25,563 | $17,310 |
Jun-2024 | $20,350 | $31,475 | $19,256 |
Average Annual Total Returns
| 1 Year | 5 Years | 10 Years |
|---|
CRM Small/Mid Cap Value Fund - Investor Class | 8.57% | 8.98% | 7.36% |
Russell 3000® Total Return Index | 23.13% | 14.14% | 12.15% |
Russell 2500® Value Index | 11.24% | 8.01% | 6.77% |
The Fund's past performance is not a good predictor of how the Fund will perform in the future. The graph and table do not reflect the deduction of taxes that a shareholder would pay on fund distributions or redemption of fund shares.
Effective May 23, 2024, the Fund adopted the Russell 3000 Total Return Index as its broad-based benchmark index that represents the overall equity market. The Fund also compares its performance to the Russell 2500 Value Index, which is a more narrowly based index that reflects the market sector in which the Fund invests. The Russell 2500 Value Index was formerly the Fund's primary benchmark. These changes were made to comply with a new regulatory requirement.
Net Assets | $169,225,405 |
Number of Portfolio Holdings | 48 |
Advisory Fee | $1,526,156 |
Portfolio Turnover | 72% |
Asset Weighting (% of total investments)
Value | Value |
|---|
Common Stocks | 98.3% |
Money Market Funds | 1.7% |
What did the Fund invest in?
Sector Weighting (% of net assets)
Value | Value |
|---|
Liabilities in Excess of Other Assets | -0.6% |
Money Market Funds | 1.7% |
Consumer Staples | 2.2% |
Energy | 3.4% |
Utilities | 4.5% |
Materials | 8.1% |
Real Estate | 8.3% |
Health Care | 8.6% |
Consumer Discretionary | 12.0% |
Technology | 13.3% |
Financials | 16.5% |
Industrials | 22.0% |
Top 10 Holdings (% of net assets)
Holding Name | % of Net Assets |
Burlington Stores, Inc. | 4.3% |
Ashland, Inc. | 4.0% |
Stericycle, Inc. | 3.6% |
Itron, Inc. | 3.5% |
Matador Resources Company | 3.5% |
Terreno Realty Corporation | 3.2% |
Clean Harbors, Inc. | 3.1% |
Arcosa, Inc. | 3.1% |
First American Financial Corporation | 3.0% |
BioLife Solutions, Inc. | 2.8% |
No material changes occurred during the year ended June 30, 2024.
CRM Small/Mid Cap Value Fund - Investor (CRMAX)
Annual Shareholder Report - June 30, 2024
Where can I find additional information about the Fund?
Additional information is available on the Fund's website ( http://www.crmfunds.com/funds-overview/shareholder-resources/documents/ ), including its:
Prospectus
Financial information
Holdings
Proxy voting information
Distributed by ALPS Distributors, Inc.
Item 2. Code of Ethics.
| (a) |
The
registrant has, as of the end of the period covered by this report, adopted a code of ethics that applies to the registrant's principal
executive officer, principal financial officer, and principal accounting officer or controller, or persons performing similar functions,
regardless of whether these individuals are employed by the registrant or a third party. |
| (b) |
Not
applicable |
| (c) |
During
the period covered by this report, there were no amendments to any provision of the code of ethics. |
| (d) |
During
the period covered by this report, there were no waivers or implicit waivers of a provision of the code of ethics. |
| (e) |
Not
applicable |
| (f) |
See
Item 19(a)(1) |
Item 3. Audit Committee Financial Expert.
(a)(1) The Registrant’s board of trustees has determined that
F. Gregory Ahern and Rodney P. Wood are audit committee financial experts, as defined in Item 3 of Form N-CSR. Mr. Ahern and Mr.
Wood are independent for purposes of this Item 3.
(a)(2) Not applicable.
(a)(3) Not applicable.
Item 4. Principal Accountant Fees
and Services.
| (a) |
Audit Fees. The aggregate fees billed for each
of the last two fiscal years for professional services rendered by the registrant's principal accountant for the audit of the registrant's
annual financial statements or services that are normally provided by the accountant in connection with statutory and regulatory filings
or engagements for those fiscal years are as follows: |
2024 – $80,000
2023 – $80,000
| (b) |
Audit-Related
Fees. There were no fees billed in each of the last two fiscal years for assurances and related services by the principal accountant
that are reasonably related to the performance of the audit of the registrant’s financial statements and are not reported under
paragraph (a) of this item. |
| (c) |
Tax
Fees. The aggregate fees billed in each of the last two fiscal years for professional services rendered by the principal accountant
for tax compliance are as follows: |
2024 – $18,000
2023 – $18,000
Preparation of Federal
& State income tax returns, assistance with calculation of required income, capital gain and excise distributions and preparation
of Federal excise tax returns.
| (d) |
All
Other Fees. The aggregate fees billed in each of the last two fiscal years for products and services provided by the registrant’s
principal accountant, other than the services reported in paragraphs (a) through (c) of this item were $0 and $0 for the fiscal years
ended June 30, 2023 and 2024, respectively. |
| (e)(1) |
The audit committee
does not have pre-approval policies and procedures. Instead, the audit committee or audit committee chairman approves on a case-by-case
basis each audit or non-audit service before the principal accountant is engaged by the registrant.
|
| (e)(2) |
There were no services
described in each of paragraphs (b) through (d) of this Item that were approved by the audit committee pursuant to paragraph (c)(7)(i)(C)
of Rule 2-01 of Regulation S-X.
|
| (f) |
Not
applicable. |
| (g) |
All non-audit fees billed by the registrant's
principal accountant for services rendered to the registrant for the fiscal years ended June 30, 2023 and 2024, respectively are disclosed
in (b)-(d) above. There were no audit or non-audit services performed by the registrant's principal accountant for the registrant's adviser.
|
| (h)
|
Not applicable.
|
| (i)
|
Not applicable.
|
| (j)
|
Not
applicable. |
Item 5. Audit Committee of Listed Companies. Not applicable
Item 6. Investments. Schedule of investments in securities of
unaffiliated issuers is included under Item 7.
Item 7. Financial Statements and Financial Highlights for Open-End
Management Investment Companies.
(a)
|
June
30, 2024
CRM
Small Cap Value Fund
CRM
Small/Mid Cap Value Fund
CRM
Mid Cap Value Fund
CRM
All Cap Value Fund
CRM
Long/Short Opportunities Fund |
FINANCIAL
STATEMENTS
[THIS
PAGE INTENTIONALLY LEFT BLANK]
|
CRM
FUNDS
CRM
SMALL CAP VALUE FUND
SCHEDULE
OF INVESTMENTS
June
30, 2024 |
| |
Shares |
|
|
|
Value |
|
|
COMMON
STOCK — 97.0% |
|
Consumer
Discretionary — 7.2% |
|
Apparel
& Textile Products — 1.4% |
| |
|
24,539 |
|
Steven
Madden Ltd. |
|
$ |
1,038,000 |
|
|
Home
Construction — 2.9% |
| |
|
32,668 |
|
Skyline
Champion Corporation1 |
|
|
2,213,256 |
|
|
Leisure
Facilities & Services — 2.0% |
| |
|
42,276 |
|
BJ’s
Restaurants, Inc.1 |
|
|
1,466,977 |
|
|
Retail
— Discretionary — 0.9% |
| |
|
40,177 |
|
Victoria’s
Secret & Company1 |
|
|
709,928 |
|
|
Total
Consumer Discretionary |
|
|
5,428,161 |
|
|
Energy
— 5.5% |
|
Oil
& Gas Producers — 2.4% |
| |
|
31,008 |
|
Matador
Resources Company |
|
|
1,848,077 |
|
|
Oil
& Gas Services & Equipment — 3.1% |
| |
|
69,694 |
|
ChampionX
Corporation |
|
|
2,314,538 |
|
|
Total
Energy |
|
|
4,162,615 |
|
|
Financials
— 22.1% |
|
Banking
— 14.8% |
| |
|
13,206 |
|
Bank
of Hawaii Corporation |
|
|
755,515 |
|
| |
|
52,911 |
|
Cadence
Bank |
|
|
1,496,323 |
|
| |
|
286,018 |
|
Capitol
Federal Financial, Inc. |
|
|
1,570,239 |
|
| |
|
107,568 |
|
Central
Pacific Financial Corporation |
|
|
2,280,441 |
|
| |
|
25,027 |
|
First
Interstate Bancsystem, Inc., Class A |
|
|
695,000 |
|
| |
|
37,654 |
|
Hancock
Whitney Corporation |
|
|
1,800,991 |
|
| |
|
140,624 |
|
TFS
Financial Corporation |
|
|
1,774,675 |
|
| |
|
26,580 |
|
TrustCo
Bank Corporation |
|
|
764,707 |
|
| |
|
|
|
|
|
|
11,137,891 |
|
| |
Shares |
|
|
|
Value |
|
|
Financials
— (continued) |
|
Institutional
Financial Services — 2.0% |
| |
|
27,351 |
|
Moelis
& Company, Class A |
|
$ |
1,555,178 |
|
|
Insurance
— 2.9% |
| |
|
66,945 |
|
Horace
Mann Educators Corporation |
|
|
2,183,746 |
|
|
Specialty
Finance — 2.4% |
| |
|
28,762 |
|
Stewart
Information Services Corporation |
|
|
1,785,545 |
|
|
Total
Financials |
|
|
16,662,360 |
|
|
Health
Care — 5.0% |
|
Medical
Equipment & Devices — 5.0% |
| |
|
83,378 |
|
BioLife
Solutions Inc1 |
|
|
1,786,791 |
|
| |
|
23,817 |
|
LeMaitre
Vascular, Inc. |
|
|
1,959,662 |
|
|
Total
Health Care |
|
|
3,746,453 |
|
|
Industrials
— 25.8% |
|
Commercial
Support Services — 5.2% |
| |
|
8,259 |
|
Clean
Harbors, Inc.1 |
|
|
1,867,773 |
|
| |
|
34,947 |
|
Stericycle,
Inc.1 |
|
|
2,031,469 |
|
| |
|
|
|
|
|
|
3,899,242 |
|
|
Electrical
Equipment — 6.4% |
| |
|
105,322 |
|
Hayward
Holdings, Inc.1 |
|
|
1,295,461 |
|
| |
|
20,745 |
|
Itron,
Inc.1 |
|
|
2,052,924 |
|
| |
|
10,613 |
|
SPX
Technologies, Inc.1 |
|
|
1,508,532 |
|
| |
|
|
|
|
|
|
4,856,917 |
|
|
Engineering
& Construction — 4.2% |
| |
|
33,666 |
|
Arcosa,
Inc. |
|
|
2,808,081 |
|
| |
|
16,664 |
|
Centuri
Holdings, Inc.1,2 |
|
|
324,615 |
|
| |
|
|
|
|
|
|
3,132,696 |
|
|
Industrial
Support Services — 1.3% |
| |
|
4,848 |
|
Applied
Industrial Technologies, Inc. |
|
|
940,512 |
|
|
Machinery
— 4.5% |
| |
|
24,271 |
|
Cactus,
Inc., Class A2 |
|
|
1,280,053 |
|
|
See
accompanying notes to financial statements. |
CRM
Funds |
| |
1 |
|
|
CRM
FUNDS
CRM
SMALL CAP VALUE FUND
SCHEDULE
OF INVESTMENTS (Continued)
June
30, 2024 |
| |
Shares |
|
|
|
Value |
|
|
Industrials
— (continued) |
|
Machinery
— (continued) |
| |
|
118,381 |
|
Mueller
Water Products, Inc. |
|
$ |
2,121,387 |
|
| |
|
|
|
|
|
|
3,401,440 |
|
|
Transportation
& Logistics — 4.2% |
| |
|
31,060 |
|
Hub
Group, Inc., Class A |
|
|
1,337,133 |
|
| |
|
15,580 |
|
Kirby
Corporation1 |
|
|
1,865,393 |
|
| |
|
|
|
|
|
|
3,202,526 |
|
|
Total
Industrials |
|
|
19,433,333 |
|
|
Materials
— 4.4% |
|
Chemicals
— 4.4% |
| |
|
18,451 |
|
HB
Fuller Company |
|
|
1,419,989 |
|
| |
|
15,488 |
|
Rogers
Corporation1 |
|
|
1,868,008 |
|
|
Total
Materials |
|
|
3,287,997 |
|
|
Real
Estate — 9.5% |
|
REIT
— 9.5% |
| |
|
79,487 |
|
COPT
Defense Properties |
|
|
1,989,559 |
|
| |
|
31,232 |
|
Terreno
Realty Corporation |
|
|
1,848,310 |
|
| |
|
83,870 |
|
Urban
Edge Properties |
|
|
1,549,079 |
|
| |
|
121,472 |
|
Xenia
Hotels & Resorts, Inc. |
|
|
1,740,694 |
|
|
Total
Real Estate |
|
|
7,127,642 |
|
|
Technology
— 13.0% |
|
Software
— 10.9% |
| |
|
122,802 |
|
ACV
Auctions, Inc.1 |
|
|
2,241,137 |
|
| |
|
15,539 |
|
Agilysys,
Inc.1 |
|
|
1,618,231 |
|
| |
|
41,825 |
|
Envestnet,
Inc.1 |
|
|
2,617,828 |
|
| |
|
48,047 |
|
Intapp
Inc1 |
|
|
1,761,883 |
|
| |
|
|
|
|
|
|
8,239,079 |
|
|
Technology
Hardware — 2.1% |
| |
|
89,355 |
|
Knowles
Corporation1 |
|
|
1,542,267 |
|
|
Total
Technology |
|
|
9,781,346 |
|
| |
Shares |
|
|
|
Value |
|
|
Utilities
— 4.5% |
|
Gas
& Water Utilities — 4.5% |
| |
|
17,520 |
|
Chesapeake
Utilities Corporation |
|
$ |
1,860,624 |
|
| |
|
29,259 |
|
Middlesex
Water Company |
|
|
1,529,075 |
|
|
Total
Utilities |
|
|
3,389,699 |
|
|
TOTAL
COMMON STOCK (Cost $57,905,749) |
|
|
73,019,606 |
|
|
SHORT-TERM
INVESTMENTS — 3.2% |
| |
|
1,185,836 |
|
Blackrock
Liquidity Funds T-Fund, Institutional Shares, 4.83%3 |
|
|
1,185,836 |
|
| |
|
1,185,836 |
|
Federated
Hermes Treasury Obligations Fund, Institutional Shares, 5.17%3 |
|
|
1,185,836 |
|
|
TOTAL
SHORT-TERM INVESTMENTS (Cost $2,371,672) |
|
|
2,371,672 |
|
|
TOTAL
INVESTMENTS BEFORE SHORT-TERM INVESTMENTS HELD AS COLLATERAL FOR LOANED SECURITIES – 100.2% (Cost $60,277,421) |
|
|
75,391,278 |
|
|
See
accompanying notes to financial statements. |
CRM
Funds |
| |
2 |
|
|
CRM
FUNDS
CRM
SMALL CAP VALUE FUND
SCHEDULE
OF INVESTMENTS (Continued)
June
30, 2024 |
| |
Principal
($) |
|
|
|
Value |
|
|
COLLATERAL
FOR SECURITIES LOANED — 1.7% |
| |
|
298,767 |
|
With
Mizuho Securities USA LLC: at 5.32%, dated 6/28/24, to be repurchased on 7/1/24, repurchase price $298,899 (collateralized by US Treasury
Securities, par values ranging from $597 - $140,677, coupon rates ranging from 0.50% to 5.00%, 7/31/24 - 9/30/29; total market value $304,742)
|
|
$ |
298,767 |
|
| |
Principal
($) |
|
|
|
Value |
|
|
COLLATERAL
FOR SECURITIES LOANED — (continued) |
| |
|
1,000,000 |
|
With
National Bank Financial, Inc.: at 5.34%, dated 6/28/24, to be repurchased on 7/1/24, repurchase price $1,000,445 (collateralized by US
Treasury Securities, par values ranging from $1 - $313,333, coupon rates ranging from 0.75% to 4.375%, 7/1/24 - 9/9/49; total market value
$1,020,003) |
|
$ |
1,000,000 |
|
|
TOTAL
SHORT-TERM INVESTMENTS HELD AS COLLATERAL FOR LOANED SECURITIES (Cost $1,298,767) |
|
|
1,298,767 |
|
|
TOTAL
INVESTMENTS — 101.9% (Cost $61,576,188) |
|
$ |
76,690,045 |
4 |
|
LIABILITIES
IN EXCESS OF OTHER ASSETS — (1.9)% |
|
|
(1,415,030 |
) |
|
NET
ASSETS — 100.0% |
|
$ |
75,275,015 |
|
|
See
accompanying notes to financial statements. |
CRM
Funds |
| |
3 |
|
|
CRM
FUNDS
CRM
SMALL CAP VALUE FUND
SCHEDULE
OF INVESTMENTS (Concluded)
June
30, 2024 |
A
summary of inputs used to value the Fund’s investments as of June 30, 2024 is as follows (see Note 2 in Notes to Financial Statements):
|
Assets |
|
Level
1
Quoted Prices |
|
|
Level
2
Significant
Observable
Inputs |
|
|
Level
3
Significant
Unobservable
Inputs |
|
|
Investments
in Securities
(Value) |
|
|
Common
Stock |
|
$ |
73,019,606 |
|
|
|
— |
|
|
|
— |
|
|
$ |
73,019,606 |
|
|
Short-Term
Investments |
|
|
2,371,672 |
|
|
|
— |
|
|
|
— |
|
|
|
2,371,672 |
|
|
Short-Term
Investments Held As Collateral for Loaned Securities |
|
|
— |
|
|
$ |
1,298,767 |
|
|
|
— |
|
|
|
1,298,767 |
|
|
Total |
|
$ |
75,391,278 |
|
|
$ |
1,298,767 |
|
|
|
— |
|
|
$ |
76,690,045 |
|
There
were no transfers into or out of Level 3 related to securities held at June 30, 2024.
|
1 |
Non-income producing security.
|
|
2 |
Security partially or fully
on loan. |
|
3 |
Rate disclosed is the seven
day effective yield as of June 30, 2024. |
|
4 |
At June 30, 2024, the market
value of securities on loan for CRM Small Cap Value Fund was $1,288,332. In the event that the collateral received is insufficient to
cover the value of the loaned securities and provided such collateral shortfall is not the result of investment losses, the Fund’s
securities lending agent, The Bank of New York Mellon, has agreed to pay the amount of the shortfall to the Fund, or at its discretion,
replace the loaned securities. |
|
See
accompanying notes to financial statements. |
CRM
Funds |
| |
4 |
|
|
CRM
FUNDS
CRM
SMALL/MID CAP VALUE FUND
SCHEDULE
OF INVESTMENTS
June
30, 2024 |
| |
Shares |
|
|
|
Value |
|
|
COMMON
STOCK — 98.9% |
|
Consumer
Discretionary — 12.0% |
|
Apparel
& Textile Products — 1.7% |
| |
|
65,346 |
|
Steven
Madden Ltd. |
|
$ |
2,764,136 |
|
|
Home
& Office Products — 1.5% |
| |
|
34,007 |
|
SharkNinja,
Inc.1 |
|
|
2,555,626 |
|
|
Home
Construction — 2.5% |
| |
|
62,282 |
|
Skyline
Champion Corporation1 |
|
|
4,219,606 |
|
|
Retail
— Discretionary — 6.3% |
| |
|
30,555 |
|
Burlington
Stores, Inc.1 |
|
|
7,333,199 |
|
| |
|
7,914 |
|
RH1
|
|
|
1,934,498 |
|
| |
|
81,386 |
|
Victoria’s
Secret & Company1 |
|
|
1,438,091 |
|
| |
|
|
|
|
|
|
10,705,788 |
|
|
Total
Consumer Discretionary |
|
|
20,245,156 |
|
|
Consumer
Staples — 2.2% |
|
Food
— 2.2% |
| |
|
16,918 |
|
Lamb
Weston Holdings, Inc. |
|
|
1,422,465 |
|
| |
|
11,952 |
|
Lancaster
Colony Corporation |
|
|
2,258,570 |
|
|
Total
Consumer Staples |
|
|
3,681,035 |
|
|
Energy
— 3.4% |
|
Oil
& Gas Producers — 3.4% |
| |
|
98,027 |
|
Matador
Resources Company |
|
|
5,842,409 |
|
|
Financials
— 16.5% |
|
Banking
— 5.6% |
| |
|
30,169 |
|
Bank
of Hawaii Corporation |
|
|
1,725,968 |
|
| |
|
146,091 |
|
Cadence
Bank |
|
|
4,131,454 |
|
| |
|
286,467 |
|
TFS
Financial Corporation |
|
|
3,615,214 |
|
| |
|
|
|
|
|
|
9,472,636 |
|
|
Institutional
Financial Services — 5.3% |
| |
|
20,014 |
|
Evercore
Partners, Inc., Class A |
|
|
4,171,518 |
|
| |
Shares |
|
|
|
Value |
|
|
Financials
— (continued) |
|
Institutional
Financial Services — (continued) |
| |
|
83,590 |
|
Moelis
& Company, Class A |
|
$ |
4,752,927 |
|
| |
|
|
|
|
|
|
8,924,445 |
|
|
Insurance
— 2.6% |
| |
|
136,876 |
|
Horace
Mann Educators Corporation |
|
|
4,464,895 |
|
|
Specialty
Finance — 3.0% |
| |
|
92,862 |
|
First
American Financial Corporation |
|
|
5,009,905 |
|
|
Total
Financials |
|
|
27,871,881 |
|
|
Health
Care — 8.6% |
|
Biotech
& Pharma — 1.2% |
| |
|
143,666 |
|
Elanco
Animal Health, Inc.1 |
|
|
2,073,100 |
|
|
Medical
Equipment & Devices — 7.4% |
| |
|
222,430 |
|
BioLife
Solutions, Inc.1 |
|
|
4,766,675 |
|
| |
|
49,203 |
|
Bio-Techne
Corporation |
|
|
3,525,395 |
|
| |
|
40,934 |
|
LeMaitre
Vascular, Inc. |
|
|
3,368,050 |
|
| |
|
6,700 |
|
Masimo
Corporation1 |
|
|
843,798 |
|
| |
|
|
|
|
|
|
12,503,918 |
|
|
Total
Health Care |
|
|
14,577,018 |
|
|
Industrials
— 22.0% |
|
Aerospace
& Defense — 1.3% |
| |
|
5,796 |
|
Teledyne
Technologies, Inc.1 |
|
|
2,248,732 |
|
|
Commercial
Support Services — 6.7% |
| |
|
23,159 |
|
Clean
Harbors, Inc.1 |
|
|
5,237,408 |
|
| |
|
105,173 |
|
Stericycle,
Inc.1 |
|
|
6,113,706 |
|
| |
|
|
|
|
|
|
11,351,114 |
|
|
Electrical
Equipment — 6.6% |
| |
|
236,059 |
|
Hayward
Holdings, Inc.1 |
|
|
2,903,526 |
|
| |
|
59,130 |
|
Itron,
Inc.1 |
|
|
5,851,504 |
|
| |
|
65,473 |
|
Vontier
Corporation |
|
|
2,501,069 |
|
| |
|
|
|
|
|
|
11,256,099 |
|
|
See
accompanying notes to financial statements. |
CRM
Funds |
| |
5 |
|
|
CRM
FUNDS
CRM
SMALL/MID CAP VALUE FUND
SCHEDULE
OF INVESTMENTS (Continued)
June
30, 2024 |
| |
Shares |
|
|
|
Value |
|
|
Industrials
— (continued) |
|
Engineering
& Construction — 3.1% |
| |
|
61,927 |
|
Arcosa,
Inc. |
|
$ |
5,165,331 |
|
|
Machinery
— 1.9% |
| |
|
23,894 |
|
Regal
Rexnord Corporation |
|
|
3,230,947 |
|
|
Transportation
& Logistics — 2.4% |
| |
|
71,287 |
|
Hub
Group, Inc., Class A |
|
|
3,068,906 |
|
| |
|
7,469 |
|
Kirby
Corporation1 |
|
|
894,263 |
|
| |
|
|
|
|
|
|
3,963,169 |
|
|
Total
Industrials |
|
|
37,215,392 |
|
|
Materials
— 8.1% |
|
Chemicals
— 4.0% |
| |
|
72,419 |
|
Ashland,
Inc. |
|
|
6,842,871 |
|
|
Construction
Materials — 4.1% |
| |
|
20,766 |
|
Advanced
Drainage Systems, Inc. |
|
|
3,330,659 |
|
| |
|
16,595 |
|
Eagle
Materials, Inc. |
|
|
3,608,749 |
|
| |
|
|
|
|
|
|
6,939,408 |
|
|
Total
Materials |
|
|
13,782,279 |
|
|
Real
Estate — 8.3% |
|
REIT
— 8.3% |
| |
|
39,423 |
|
Sun
Communities, Inc. |
|
|
4,744,164 |
|
| |
|
92,765 |
|
Terreno
Realty Corporation |
|
|
5,489,832 |
|
| |
|
266,378 |
|
Xenia
Hotels & Resorts, Inc. |
|
|
3,817,197 |
|
|
Total
Real Estate |
|
|
14,051,193 |
|
|
Technology
— 13.3% |
|
Software
— 9.3% |
| |
|
233,488 |
|
ACV
Auctions, Inc.1 |
|
|
4,261,155 |
|
| |
|
60,803 |
|
Envestnet,
Inc.1 |
|
|
3,805,660 |
|
| |
|
93,646 |
|
Intapp,
Inc.1 |
|
|
3,433,999 |
|
| |
|
13,798 |
|
PTC,
Inc.1 |
|
|
2,506,683 |
|
| |
|
38,760 |
|
Tenable
Holdings, Inc.1 |
|
|
1,689,161 |
|
| |
|
|
|
|
|
|
15,696,658 |
|
| |
Shares |
|
|
|
Value |
|
|
Technology
— (continued) |
|
Technology
Hardware — 1.9% |
| |
|
67,254 |
|
Ciena
Corporation1 |
|
$ |
3,240,298 |
|
|
Technology
Services — 2.1% |
| |
|
11,891 |
|
Morningstar,
Inc. |
|
|
3,517,952 |
|
|
Total
Technology |
|
|
22,454,908 |
|
|
Utilities
— 4.5% |
|
Gas
& Water Utilities — 4.5% |
| |
|
28,833 |
|
Atmos
Energy Corporation |
|
|
3,363,369 |
|
| |
|
150,132 |
|
Nisource,
Inc. |
|
|
4,325,303 |
|
|
Total
Utilities |
|
|
7,688,672 |
|
|
TOTAL
COMMON STOCK (Cost $133,148,922) |
|
|
167,409,943 |
|
|
SHORT-TERM
INVESTMENTS — 1.7% |
| |
|
1,420,236 |
|
Blackrock
Liquidity Funds T-Fund, Institutional Shares, 4.83%2 |
|
|
1,420,236 |
|
| |
|
1,420,235 |
|
Federated
Hermes Treasury Obligations Fund, Institutional Shares, 5.17%2 |
|
|
1,420,235 |
|
|
TOTAL
SHORT-TERM INVESTMENTS (Cost $2,840,471) |
|
|
2,840,471 |
|
|
TOTAL
INVESTMENTS — 100.6% (Cost $135,989,393) |
|
$ |
170,250,414 |
|
|
LIABILITIES
IN EXCESS OF OTHER ASSETS — (0.6)% |
|
|
(1,025,009 |
) |
|
NET
ASSETS — 100.0% |
|
$ |
169,225,405 |
|
|
See
accompanying notes to financial statements. |
CRM
Funds |
| |
6 |
|
|
CRM
FUNDS
CRM
SMALL/MID CAP VALUE FUND
SCHEDULE
OF INVESTMENTS (Concluded)
June
30, 2024 |
A
summary of inputs used to value the Fund’s investments as of June 30, 2024 is as follows (see Note 2 in Notes to Financial Statements):
|
Assets |
|
Level
1
Quoted Prices |
|
|
Level
2
Significant
Observable
Inputs |
|
|
Level
3
Significant
Unobservable
Inputs |
|
|
Investments
in Securities
(Value) |
|
|
Common
Stock |
|
$ |
167,409,943 |
|
|
|
— |
|
|
|
— |
|
|
$ |
167,409,943 |
|
|
Short-Term
Investments |
|
|
2,840,471 |
|
|
|
— |
|
|
|
— |
|
|
|
2,840,471 |
|
|
Total |
|
$ |
170,250,414 |
|
|
|
— |
|
|
|
— |
|
|
$ |
170,250,414 |
|
There
were no transfers into or out of Level 3 related to securities held at June 30, 2024.
|
1 |
Non-income producing security.
|
|
2 |
Rate disclosed is the seven
day effective yield as of June 30, 2024. |
|
See
accompanying notes to financial statements. |
CRM
Funds |
| |
7 |
|
|
CRM
FUNDS
CRM
MID CAP VALUE FUND
SCHEDULE
OF INVESTMENTS
June
30, 2024 |
| |
Shares |
|
|
|
Value |
|
|
COMMON
STOCK — 97.7% |
|
Consumer
Discretionary — 7.9% |
|
Apparel
& Textile Products — 1.5% |
| |
|
128,305 |
|
Steven
Madden Ltd. |
|
$ |
5,427,302 |
|
|
Home
& Office Products — 2.0% |
| |
|
100,267 |
|
SharkNinja,
Inc.1 |
|
|
7,535,065 |
|
|
Retail
— Discretionary — 4.4% |
| |
|
45,405 |
|
Burlington
Stores, Inc.1 |
|
|
10,897,200 |
|
| |
|
126,390 |
|
Valvoline,
Inc.1 |
|
|
5,460,048 |
|
| |
|
|
|
|
|
|
16,357,248 |
|
|
Total
Consumer Discretionary |
|
|
29,319,615 |
|
|
Energy
— 6.2% |
|
Oil
& Gas Producers — 3.3% |
| |
|
308,918 |
|
Marathon
Oil Corporation |
|
|
8,856,679 |
|
| |
|
54,449 |
|
Matador
Resources Company |
|
|
3,245,161 |
|
| |
|
|
|
|
|
|
12,101,840 |
|
|
Oil
& Gas Services & Equipment — 2.9% |
| |
|
329,190 |
|
ChampionX
Corporation |
|
|
10,932,400 |
|
|
Total
Energy |
|
|
23,034,240 |
|
|
Financials
— 10.1% |
|
Banking
— 5.4% |
| |
|
208,733 |
|
Cadence
Bank |
|
|
5,902,969 |
|
| |
|
232,178 |
|
Truist
Financial Corporation |
|
|
9,020,116 |
|
| |
|
114,832 |
|
Webster
Financial Corporation |
|
|
5,005,527 |
|
| |
|
|
|
|
|
|
19,928,612 |
|
|
Insurance
— 2.3% |
| |
|
53,337 |
|
Allstate
Corporation |
|
|
8,515,785 |
|
|
Specialty
Finance — 2.4% |
| |
|
166,583 |
|
First
American Financial Corporation |
|
|
8,987,153 |
|
|
Total
Financials |
|
|
37,431,550 |
|
| |
Shares |
|
|
|
Value |
|
|
Health
Care — 3.5% |
|
Biotech
& Pharma — 1.2% |
| |
|
319,576 |
|
Elanco
Animal Health, Inc.1 |
|
$ |
4,611,482 |
|
|
Medical
Equipment & Devices — 2.3% |
| |
|
117,922 |
|
Bio-Techne
Corporation |
|
|
8,449,111 |
|
|
Total
Health Care |
|
|
13,060,593 |
|
|
Industrials
— 22.7% |
|
Aerospace
& Defense — 5.0% |
| |
|
20,787 |
|
Teledyne
Technologies, Inc.1 |
|
|
8,064,940 |
|
| |
|
60,259 |
|
Woodward,
Inc. |
|
|
10,507,965 |
|
| |
|
|
|
|
|
|
18,572,905 |
|
|
Commercial
Support Services — 2.4% |
| |
|
153,419 |
|
Stericycle,
Inc.1 |
|
|
8,918,246 |
|
|
Electrical
Equipment — 6.1% |
| |
|
57,498 |
|
AMETEK,
Inc. |
|
|
9,585,491 |
|
| |
|
343,013 |
|
Vontier
Corporation |
|
|
13,103,096 |
|
| |
|
|
|
|
|
|
22,688,587 |
|
|
Industrial
Support Services — 1.5% |
| |
|
29,645 |
|
Applied
Industrial Technologies, Inc. |
|
|
5,751,130 |
|
|
Machinery
— 4.9% |
| |
|
63,020 |
|
Regal
Rexnord Corporation |
|
|
8,521,564 |
|
| |
|
72,888 |
|
Xylem,
Inc. |
|
|
9,885,800 |
|
| |
|
|
|
|
|
|
18,407,364 |
|
|
Transportation
& Logistics — 2.8% |
| |
|
131,087 |
|
Canadian
Pacific Kansas City Ltd.2 |
|
|
10,320,480 |
|
|
Total
Industrials |
|
|
84,658,712 |
|
|
Materials
— 17.5% |
|
Chemicals
— 9.7% |
| |
|
107,374 |
|
Ashland,
Inc. |
|
|
10,145,768 |
|
| |
|
45,405 |
|
Avery
Dennison Corporation |
|
|
9,927,803 |
|
| |
|
179,364 |
|
Corteva,
Inc. |
|
|
9,674,894 |
|
|
See
accompanying notes to financial statements. |
CRM
Funds |
| |
8 |
|
|
CRM
FUNDS
CRM
MID CAP VALUE FUND
SCHEDULE
OF INVESTMENTS (Continued)
June
30, 2024 |
| |
Shares |
|
|
|
Value |
|
|
Materials
— (continued) |
|
Chemicals
— (continued) |
| |
|
57,107 |
|
RPM
International, Inc. |
|
$ |
6,149,282 |
|
| |
|
|
|
|
|
|
35,897,747 |
|
|
Construction
Materials — 7.8% |
| |
|
58,302 |
|
Advanced
Drainage Systems, Inc. |
|
|
9,351,058 |
|
| |
|
123,835 |
|
CRH
PLC3 |
|
|
9,285,148 |
|
| |
|
19,267 |
|
Martin
Marietta Materials, Inc. |
|
|
10,438,861 |
|
| |
|
|
|
|
|
|
29,075,067 |
|
|
Total
Materials |
|
|
64,972,814 |
|
|
Real
Estate — 7.6% |
|
REIT
— 7.6% |
| |
|
102,863 |
|
CBRE
Group, Inc., Class A1 |
|
|
9,166,122 |
|
| |
|
71,446 |
|
Sun
Communities, Inc. |
|
|
8,597,812 |
|
| |
|
177,646 |
|
Terreno
Realty Corporation |
|
|
10,513,090 |
|
|
Total
Real Estate |
|
|
28,277,024 |
|
|
Technology
— 16.9% |
|
Semiconductors
— 1.3% |
| |
|
54,099 |
|
Microchip
Technology, Inc. |
|
|
4,950,059 |
|
|
Software
— 6.0% |
| |
|
483,741 |
|
CCC
Intelligent Solutions Holdings, Inc.1 |
|
|
5,374,363 |
|
| |
|
48,516 |
|
PTC,
Inc.1 |
|
|
8,813,902 |
|
| |
|
188,173 |
|
Tenable
Holdings, Inc.1 |
|
|
8,200,579 |
|
| |
|
|
|
|
|
|
22,388,844 |
|
|
Technology
Hardware — 2.1% |
| |
|
160,011 |
|
Ciena
Corporation1 |
|
|
7,709,330 |
|
|
Technology
Services — 7.5% |
| |
|
1,123,683 |
|
Clarivate
PLC1,2,3 |
|
|
6,393,756 |
|
| |
|
184,980 |
|
Fidelity
National Information Services, Inc. |
|
|
13,940,092 |
|
| |
Shares |
|
|
|
Value |
|
|
Technology
— (continued) |
|
Technology
Services — (continued) |
| |
|
25,216 |
|
Morningstar,
Inc. |
|
$ |
7,460,154 |
|
| |
|
|
|
|
|
|
27,794,002 |
|
|
Total
Technology |
|
|
62,842,235 |
|
|
Utilities
— 5.3% |
|
Gas
& Water Utilities — 5.3% |
| |
|
76,617 |
|
Atmos
Energy Corporation |
|
|
8,937,373 |
|
| |
|
376,944 |
|
Nisource,
Inc. |
|
|
10,859,757 |
|
|
Total
Utilities |
|
|
19,797,130 |
|
|
TOTAL
COMMON STOCK (Cost $271,030,945) |
|
|
363,393,913 |
|
|
SHORT-TERM
INVESTMENTS — 2.3% |
| |
|
4,323,559 |
|
Blackrock
Liquidity Funds T-Fund, Institutional Shares, 4.83%4 |
|
|
4,323,559 |
|
| |
|
4,323,561 |
|
Federated
Hermes Treasury Obligations Fund, Institutional Shares, 5.17%4 |
|
|
4,323,561 |
|
|
TOTAL
SHORT-TERM INVESTMENTS (Cost $8,647,120) |
|
|
8,647,120 |
|
|
TOTAL
INVESTMENTS BEFORE INVESTMENTS HELD AS COLLATERAL FOR LOANED SECURITIES – 100.0% (Cost $279,678,065) |
|
|
372,041,033 |
|
|
See
accompanying notes to financial statements. |
CRM
Funds |
| |
9 |
|
|
CRM
FUNDS
CRM
MID CAP VALUE FUND
SCHEDULE
OF INVESTMENTS (Continued)
June
30, 2024 |
| |
Principal
($) |
|
|
|
Value |
|
|
SHORT-TERM
INVESTMENTS HELD AS COLLATERAL FOR LOANED SECURITIES — 1.1% |
|
TIME
DEPOSITS — 0.7% |
| |
|
180,000 |
|
Banco
Santander SA, 5.31%, due 7/1/24 |
|
$ |
180,000 |
|
| |
|
180,000 |
|
BNP
Paribas SA, 5.29%, due 7/1/24 |
|
|
180,000 |
|
| |
|
180,000 |
|
Canadian
Imperial Bank of Commerce, 5.31%, due 7/1/24 |
|
|
180,000 |
|
| |
|
180,000 |
|
Credit
Agricole Corporate and Investment Bank, 5.30%, due 7/1/24 |
|
|
180,000 |
|
| |
|
170,000 |
|
DNB
Bank ASA, 5.31%, due 7/1/24 |
|
|
170,000 |
|
| |
|
170,000 |
|
DZ
Bank AG, 5.30%, due 7/1/24 |
|
|
170,000 |
|
| |
|
180,000 |
|
HSBC
Bank PLC, 5.38%, due 7/1/243 |
|
|
180,000 |
|
| |
|
180,000 |
|
KBC
Bank NV, 5.31%, due 7/1/24 |
|
|
180,000 |
|
| |
|
170,000 |
|
Landesbank
Baden Wurttemberg, 5.32%, due 7/1/24 |
|
|
170,000 |
|
| |
|
160,000 |
|
Landesbank
Hessen Thueringen Girozentrale, 5.32%, due 7/1/24 |
|
|
160,000 |
|
| |
|
180,000 |
|
Mizuho
Bank Ltd., 5.32%, due 7/1/24 |
|
|
180,000 |
|
| |
|
170,000 |
|
Nordea
Bank Abp, 5.30%, due 7/1/24 |
|
|
170,000 |
|
| |
|
180,000 |
|
Royal
Bank of Canada, 5.32%, due 7/1/24 |
|
|
180,000 |
|
| |
|
180,000 |
|
Skandinaviska
Enskilda Banken AB, 5.31%, due 7/1/24 |
|
|
180,000 |
|
| |
|
170,000 |
|
Svenska
Handelsbanken AB, 5.31%, due 7/1/24 |
|
|
170,000 |
|
| |
|
|
|
|
|
|
2,630,000 |
|
| |
Principal
($) |
|
|
|
Value |
|
|
REPURCHASE
AGREEMENTS — 0.4% |
| |
|
466,232 |
|
With
Mizuho Securities USA LLC: at 5.32%, dated 6/28/24, to be repurchased on 7/1/24, repurchase price $468,439 (collateralized by US Treasury
Securities, par values ranging from $932 - $219,529, coupon rates ranging from 0.50% to 5.00%, 7/31/24 - 9/30/29; total market value $475,557)
|
|
$ |
466,232 |
|
| |
|
1,032,077 |
|
With
National Bank Financial, Inc.: at 5.34%, dated 6/28/24, to be repurchased on 7/1/24, repurchase price $1,032,536 (collateralized by US
Treasury Securities, par values ranging from $1 - $323,384, coupon rates ranging from 0.75% to 4.375%, 7/1/24 - 9/9/49; total market value
$1,052,722) |
|
|
1,032,077 |
|
| |
|
|
|
|
|
|
1,498,309 |
|
|
TOTAL
SHORT-TERM INVESTMENTS HELD AS COLLATERAL FOR LOANED SECURITIES (Cost $4,128,309) |
|
|
4,128,309 |
|
|
TOTAL
INVESTMENTS — 101.1% (Cost $283,806,374) |
|
$ |
376,169,342 |
5 |
|
LIABILITIES
IN EXCESS OF OTHER ASSETS — (1.1)% |
|
|
(4,112,057 |
) |
|
NET
ASSETS — 100.0% |
|
$ |
372,057,285 |
|
|
See
accompanying notes to financial statements. |
CRM
Funds |
| |
10 |
|
|
CRM
FUNDS
CRM
MID CAP VALUE FUND
SCHEDULE
OF INVESTMENTS (Concluded)
June
30, 2024 |
A
summary of inputs used to value the Fund’s investments as of June 30, 2024 is as follows (see Note 2 in Notes to Financial Statements):
|
Assets |
|
Level
1
Quoted Prices |
|
|
Level
2
Significant
Observable
Inputs |
|
|
Level
3
Significant
Unobservable
Inputs |
|
|
Investments
in Securities
(Value) |
|
|
Common
Stocks |
|
$ |
363,393,913 |
|
|
|
— |
|
|
|
— |
|
|
$ |
363,393,913 |
|
|
Short-Term
Investments |
|
|
8,647,120 |
|
|
|
— |
|
|
|
— |
|
|
|
8,647,120 |
|
|
Short-Term
Investments Held As Collateral For Loaned Securities |
|
|
— |
|
|
$ |
4,128,309 |
|
|
|
— |
|
|
|
4,128,309 |
|
|
Total |
|
$ |
372,041,033 |
|
|
$ |
4,128,309 |
|
|
|
— |
|
|
$ |
376,169,342 |
|
There
were no transfers into or out of Level 3 related to securities held at June 30, 2024.
|
1 |
Non-income producing security.
|
|
2 |
Security partially or fully
on loan. |
|
3 |
PLC – Public Limited
Company |
|
4 |
Rate disclosed is the seven
day effective yield as of June 30, 2024. |
|
5 |
At June 30, 2024, the market
value of securities on loan for CRM Mid Cap Value Fund was $3,974,192. In the event that the collateral received is insufficient to cover
the value of the loaned securities and provided such collateral shortfall is not the result of investment losses, the Fund’s securities
lending agent, The Bank of New York Mellon, has agreed to pay the amount of the shortfall to the Fund, or at its discretion, replace the
loaned securities. |
|
See
accompanying notes to financial statements. |
CRM
Funds |
| |
11 |
|
|
CRM
FUNDS
CRM
ALL CAP VALUE FUND
SCHEDULE
OF INVESTMENTS
June
30, 2024 |
| |
Shares |
|
|
|
Value |
|
|
COMMON
STOCK — 97.1% |
|
Consumer
Discretionary — 8.6% |
|
Apparel
& Textile Products — 1.4% |
| |
|
7,779 |
|
Steven
Madden Ltd. |
|
$ |
329,052 |
|
|
Home
& Office Products — 1.8% |
| |
|
5,586 |
|
SharkNinja,
Inc.1 |
|
|
419,788 |
|
|
Home
Construction — 1.2% |
| |
|
4,022 |
|
Skyline
Champion Corporation1 |
|
|
272,491 |
|
|
Retail
— Discretionary — 4.2% |
| |
|
2,754 |
|
Burlington
Stores, Inc.1 |
|
|
660,959 |
|
| |
|
7,651 |
|
Valvoline,
Inc.1 |
|
|
330,523 |
|
| |
|
|
|
|
|
|
991,482 |
|
|
Total
Consumer Discretionary |
|
|
2,012,813 |
|
|
Consumer
Staples — 1.4% |
|
Household
Products — 1.4% |
| |
|
3,162 |
|
Estee
Lauder Companies, Inc. (The), Class A |
|
|
336,437 |
|
|
Energy
— 6.5% |
|
Oil
& Gas Producers — 3.7% |
| |
|
29,759 |
|
Marathon
Oil Corporation |
|
|
853,191 |
|
|
Oil
& Gas Services & Equipment — 2.8% |
| |
|
19,973 |
|
ChampionX
Corporation |
|
|
663,303 |
|
|
Total
Energy |
|
|
1,516,494 |
|
|
Financials
— 14.0% |
|
Asset
Management — 2.4% |
| |
|
7,440 |
|
Charles
Schwab Corporation (The) |
|
|
548,254 |
|
|
Banking
— 6.3% |
| |
|
6,172 |
|
Bank
of Hawaii Corporation |
|
|
353,100 |
|
| |
|
8,074 |
|
Citigroup,
Inc. |
|
|
512,376 |
|
| |
|
15,762 |
|
Truist
Financial Corporation |
|
|
612,353 |
|
| |
|
|
|
|
|
|
1,477,829 |
|
| |
Shares |
|
|
|
Value |
|
|
Financials
— (continued) |
|
Institutional
Financial Services — 3.1% |
| |
|
6,504 |
|
Moelis
& Company, Class A |
|
$ |
369,817 |
|
| |
|
3,599 |
|
Morgan
Stanley |
|
|
349,787 |
|
| |
|
|
|
|
|
|
719,604 |
|
|
Insurance
— 2.2% |
| |
|
3,222 |
|
Allstate
Corporation |
|
|
514,425 |
|
|
Total
Financials |
|
|
3,260,112 |
|
|
Health
Care — 9.7% |
|
Medical
Equipment & Devices — 9.7% |
| |
|
29,887 |
|
BioLife
Solutions, Inc.1 |
|
|
640,479 |
|
| |
|
7,296 |
|
Bio-Techne
Corporation |
|
|
522,758 |
|
| |
|
2,354 |
|
Danaher
Corporation |
|
|
588,147 |
|
| |
|
6,353 |
|
LeMaitre
Vascular, Inc. |
|
|
522,725 |
|
|
Total
Health Care |
|
|
2,274,109 |
|
|
Industrials
— 12.1% |
|
Aerospace
& Defense — 2.5% |
| |
|
3,350 |
|
Woodward,
Inc. |
|
|
584,173 |
|
|
Commercial
Support Services — 1.2% |
| |
|
4,603 |
|
Stericycle,
Inc.1 |
|
|
267,572 |
|
|
Machinery
— 3.8% |
| |
|
2,301 |
|
Crane
Company |
|
|
333,599 |
|
| |
|
4,105 |
|
Xylem,
Inc. |
|
|
556,761 |
|
| |
|
|
|
|
|
|
890,360 |
|
|
Transportation
& Logistics — 4.6% |
| |
|
6,361 |
|
Canadian
Pacific Kansas City Ltd. |
|
|
500,802 |
|
| |
|
4,859 |
|
Kirby
Corporation1 |
|
|
581,768 |
|
| |
|
|
|
|
|
|
1,082,570 |
|
|
Total
Industrials |
|
|
2,824,675 |
|
|
Materials
— 12.7% |
|
Chemicals
— 7.0% |
| |
|
5,938 |
|
Ashland,
Inc. |
|
|
561,082 |
|
| |
|
2,196 |
|
Avery
Dennison Corporation |
|
|
480,155 |
|
|
See
accompanying notes to financial statements. |
CRM
Funds |
| |
12 |
|
|
CRM
FUNDS
CRM
ALL CAP VALUE FUND
SCHEDULE
OF INVESTMENTS (Continued)
June
30, 2024 |
| |
Shares |
|
|
|
Value |
|
|
Materials
— (continued) |
|
Chemicals
— (continued) |
| |
|
11,178 |
|
Corteva,
Inc. |
|
$ |
602,942 |
|
| |
|
|
|
|
|
|
1,644,179 |
|
|
Construction
Materials — 5.7% |
| |
|
4,067 |
|
Advanced
Drainage Systems, Inc. |
|
|
652,306 |
|
| |
|
8,935 |
|
CRH
PLC2 |
|
|
669,946 |
|
| |
|
|
|
|
|
|
1,322,252 |
|
|
Total
Materials |
|
|
2,966,431 |
|
|
Real
Estate — 9.5% |
|
REIT
— 9.5% |
| |
|
5,327 |
|
CBRE
Group, Inc., Class A1 |
|
|
474,689 |
|
| |
|
5,553 |
|
Sun
Communities, Inc. |
|
|
668,248 |
|
| |
|
12,208 |
|
Terreno
Realty Corporation |
|
|
722,469 |
|
| |
|
24,002 |
|
Xenia
Hotels & Resorts, Inc. |
|
|
343,949 |
|
|
Total
Real Estate |
|
|
2,209,355 |
|
|
Technology
— 20.2% |
|
Semiconductors
— 1.3% |
| |
|
3,297 |
|
Microchip
Technology, Inc. |
|
|
301,676 |
|
|
Software
— 11.1% |
| |
|
31,404 |
|
ACV
Auctions, Inc.1 |
|
|
573,123 |
|
| |
|
37,312 |
|
CCC
Intelligent Solutions Holdings, Inc.1 |
|
|
414,536 |
|
| |
|
12,820 |
|
Intapp,
Inc.1 |
|
|
470,109 |
|
| |
|
3,426 |
|
PTC,
Inc.1 |
|
|
622,401 |
|
| |
|
11,469 |
|
Tenable
Holdings, Inc.1 |
|
|
499,819 |
|
| |
|
|
|
|
|
|
2,579,988 |
|
|
Technology
Hardware — 2.0% |
| |
|
9,734 |
|
Ciena
Corporation1 |
|
|
468,984 |
|
|
Technology
Services — 5.8% |
| |
|
87,066 |
|
Clarivate
PLC1,2,3 |
|
|
495,406 |
|
| |
Shares |
|
|
|
Value |
|
|
Technology
— (continued) |
|
Technology
Services — (continued) |
| |
|
11,371 |
|
Fidelity
National Information Services, Inc. |
|
$ |
856,918 |
|
| |
|
|
|
|
|
|
1,352,324 |
|
|
Total
Technology |
|
|
4,702,972 |
|
|
Utilities
— 2.4% |
|
Electric
Utilities — 2.4% |
| |
|
7,742 |
|
NextEra
Energy, Inc. |
|
|
548,211 |
|
|
TOTAL
COMMON STOCK (Cost $18,170,315) |
|
|
22,651,609 |
|
|
SHORT-TERM
INVESTMENTS — 2.9% |
| |
|
342,035 |
|
Blackrock
Liquidity Funds T-Fund, Institutional Shares, 4.83%4 |
|
|
342,035 |
|
| |
|
342,034 |
|
Federated
Hermes Treasury Obligations Fund, Institutional Shares, 5.17%4 |
|
|
342,034 |
|
|
TOTAL
SHORT-TERM INVESTMENTS (Cost $684,069) |
|
|
684,069 |
|
|
TOTAL
INVESTMENTS BEFORE SHORT-TERM INVESTMETNTS HELD AS COLLATERAL FOR SECURITIES LOANED – 100.0% (Cost $18,854,384) |
|
|
23,335,678 |
|
|
See
accompanying notes to financial statements. |
CRM
Funds |
| |
13 |
|
|
CRM
FUNDS
CRM
ALL CAP VALUE FUND
SCHEDULE
OF INVESTMENTS (Continued)
June
30, 2024 |
| |
Principal
($) |
|
|
|
Value |
|
|
SHORT-TERM
INVESTMENTS HELD AS COLLATERAL FOR LOANED SECURITIES — 0.8% |
|
REPURCHASE
AGREEMENT — 0.8% |
| |
|
183,480 |
|
With
National Bank Financial, Inc.: at 5.34%, dated 6/28/24, to be repurchased on 7/1/24, repurchase price $183,562 (collateralized by US Treasury
Securities, par values ranging from $1 - $57,490, coupon rates ranging from 0.75% to 4.375%, 7/1/24 - 9/9/49; total market value $187,150)
(Cost - $183,480) |
|
$ |
183,480 |
|
|
TOTAL
INVESTMENTS — 100.8% (Cost $19,037,864) |
|
$ |
23,519,158 |
5 |
|
LIABILITIES
IN EXCESS OF OTHER ASSETS — (0.8)% |
|
|
(181,037 |
) |
|
NET
ASSETS — 100.0% |
|
$ |
23,338,121 |
|
|
See
accompanying notes to financial statements. |
CRM
Funds |
| |
14 |
|
|
CRM
FUNDS
CRM
ALL CAP VALUE FUND
SCHEDULE
OF INVESTMENTS (Concluded)
June
30, 2024 |
A
summary of inputs used to value the Fund’s investments as of June 30, 2024 is as follows (see Note 2 in Notes to Financial Statements):
|
Assets |
|
Level
1
Quoted Prices |
|
|
Level
2
Significant
Observable
Inputs |
|
|
Level
3
Significant
Unobservable
Inputs |
|
|
Investments
in Securities
(Value) |
|
|
Common
Stocks |
|
$ |
22,651,609 |
|
|
|
— |
|
|
|
— |
|
|
$ |
22,651,609 |
|
|
Short-Term
Investments |
|
|
684,069 |
|
|
|
— |
|
|
|
— |
|
|
|
684,069 |
|
|
Short-Term
Investments Held As Collateral For Loaned Securities |
|
|
— |
|
|
$ |
183,480 |
|
|
|
— |
|
|
|
183,480 |
|
|
Total |
|
$ |
23,335,678 |
|
|
$ |
183,480 |
|
|
|
— |
|
|
$ |
23,519,158 |
|
There
were no transfers into or out of Level 3 related to securities held at June 30, 2024.
|
1 |
Non-income producing security.
|
|
2 |
PLC – Public Limited
Company |
|
3 |
Security partially or fully
on loan |
|
4 |
Rate disclosed is the seven
day effective yield as of June 30, 2024. |
|
5 |
At June 30, 2024, the market
value of securities on loan for CRM All Cap Value Fund was $173,243. In the event that the collateral received is insufficient to cover
the value of the loaned securities and provided such collateral shortfall is not the result of investment losses, the Fund’s securities
lending agent, The Bank of New York Mellon, has agreed to pay the amount of the shortfall to the Fund, or at its discretion, replace the
loaned securities. |
|
See
accompanying notes to financial statements. |
CRM
Funds |
| |
15 |
|
|
CRM
FUNDS
CRM
LONG/SHORT OPPORTUNITIES FUND
SCHEDULE
OF INVESTMENTS
June
30, 2024 |
| |
Shares |
|
|
|
Value |
|
|
COMMON
STOCK — 85.0% |
|
Communications
— 2.7% |
|
Internet
Media & Services — 2.7% |
| |
|
10,505 |
|
Meta
Platforms, Inc., Class A |
|
$ |
5,296,832 |
|
|
Consumer
Discretionary — 14.9% |
|
Apparel
& Textile Products — 1.8% |
| |
|
84,863 |
|
Steven
Madden Ltd. |
|
|
3,589,705 |
|
|
Automotive
— 1.5% |
| |
|
105,474 |
|
Mobileye
Global, Inc., Class A1 |
|
|
2,962,237 |
|
|
Home
& Office Products — 1.8% |
| |
|
47,465 |
|
SharkNinja,
Inc.1 |
|
|
3,566,995 |
|
|
Home
Construction — 3.0% |
| |
|
87,902 |
|
Skyline
Champion Corporation1 |
|
|
5,955,360 |
|
|
Leisure
Facilities & Services — 1.3% |
| |
|
74,522 |
|
BJ’s
Restaurants, Inc.1 |
|
|
2,585,914 |
|
|
Retail
— Discretionary — 5.5% |
| |
|
31,710 |
|
Burlington
Stores, Inc.1 |
|
|
7,610,400 |
|
| |
|
6,498 |
|
RH1
|
|
|
1,588,371 |
|
| |
|
92,544 |
|
Victoria’s
Secret & Company1 |
|
|
1,635,252 |
|
| |
|
|
|
|
|
|
10,834,023 |
|
|
Total
Consumer Discretionary |
|
|
29,494,234 |
|
|
Consumer
Staples — 2.7% |
|
Beverages
— 2.0% |
| |
|
2,218,034 |
|
Becle
SAB de CV |
|
|
4,000,717 |
|
|
Household
Products — 0.7% |
| |
|
12,499 |
|
Estee
Lauder Companies, Inc. (The), Class A |
|
|
1,329,894 |
|
|
Total
Consumer Staples |
|
|
5,330,611 |
|
|
Energy
— 1.6% |
|
Oil
& Gas Producers — 1.6% |
| |
|
54,248 |
|
Matador
Resources Company |
|
|
3,233,181 |
|
| |
Shares |
|
|
|
Value |
|
|
Financials
— 7.1% |
|
Institutional
Financial Services — 2.5% |
| |
|
23,645 |
|
Evercore
Partners, Inc., Class A |
|
$ |
4,928,328 |
|
|
Insurance
— 2.1% |
| |
|
25,558 |
|
Allstate
Corporation |
|
|
4,080,590 |
|
|
Specialty
Finance — 2.5% |
| |
|
90,505 |
|
First
American Financial Corporation |
|
|
4,882,744 |
|
|
Total
Financials |
|
|
13,891,662 |
|
|
Health
Care — 3.7% |
|
Biotech
& Pharma — 0.9% |
| |
|
121,259 |
|
Elanco
Animal Health, Inc.1 |
|
|
1,749,767 |
|
|
Medical
Equipment & Devices — 2.8% |
| |
|
17,596 |
|
BioLife
Solutions, Inc.1 |
|
|
377,082 |
|
| |
|
20,242 |
|
Danaher
Corporation |
|
|
5,057,464 |
|
| |
|
|
|
|
|
|
5,434,546 |
|
|
Total
Health Care |
|
|
7,184,313 |
|
|
Industrials
— 26.2% |
|
Commercial
Support Services — 3.6% |
| |
|
31,351 |
|
Clean
Harbors, Inc.1 |
|
|
7,090,029 |
|
|
Electrical
Equipment — 9.1% |
| |
|
22,167 |
|
GE
Vernova LLC1 |
|
|
3,801,862 |
|
| |
|
333,034 |
|
Hayward
Holdings, Inc.1 |
|
|
4,096,318 |
|
| |
|
60,846 |
|
Itron,
Inc.1 |
|
|
6,021,321 |
|
| |
|
101,551 |
|
Vontier
Corporation |
|
|
3,879,248 |
|
| |
|
|
|
|
|
|
17,798,749 |
|
|
Engineering
& Construction — 4.0% |
| |
|
94,726 |
|
Arcosa,
Inc. |
|
|
7,901,096 |
|
|
Machinery
— 2.2% |
| |
|
31,584 |
|
Xylem,
Inc. |
|
|
4,283,738 |
|
|
Transportation
& Logistics — 7.3% |
| |
|
93,116 |
|
Canadian
Pacific Kansas City Ltd. |
|
|
7,331,022 |
|
| |
|
80,725 |
|
Hub
Group, Inc., Class A |
|
|
3,475,211 |
|
|
See
accompanying notes to financial statements. |
CRM
Funds |
| |
16 |
|
|
CRM
FUNDS
CRM
LONG/SHORT OPPORTUNITIES FUND
SCHEDULE
OF INVESTMENTS (Continued)
June
30, 2024 |
| |
Shares |
|
|
|
Value |
|
|
Industrials
— (continued) |
|
Transportation
& Logistics — (continued) |
| |
|
14,965 |
|
Union
Pacific Corporation |
|
$ |
3,385,981 |
|
| |
|
|
|
|
|
|
14,192,214 |
|
|
Total
Industrials |
|
|
51,265,826 |
|
|
Materials
— 6.2% |
|
Chemicals
— 3.9% |
| |
|
43,454 |
|
Ashland,
Inc. |
|
|
4,105,969 |
|
| |
|
16,122 |
|
Avery
Dennison Corporation |
|
|
3,525,075 |
|
| |
|
|
|
|
|
|
7,631,044 |
|
|
Construction
Materials — 2.3% |
| |
|
15,251 |
|
Advanced
Drainage Systems, Inc. |
|
|
2,446,108 |
|
| |
|
3,648 |
|
Martin
Marietta Materials, Inc. |
|
|
1,976,486 |
|
| |
|
|
|
|
|
|
4,422,594 |
|
|
Total
Materials |
|
|
12,053,638 |
|
|
Real
Estate — 4.0% |
|
REIT
— 4.0% |
| |
|
36,260 |
|
Digital
Realty Trust, Inc. |
|
|
5,513,333 |
|
| |
|
19,355 |
|
Sun
Communities, Inc. |
|
|
2,329,181 |
|
|
Total
Real Estate |
|
|
7,842,514 |
|
|
Technology
— 10.9% |
|
Software
— 7.2% |
| |
|
249,213 |
|
ACV
Auctions, Inc.1 |
|
|
4,548,137 |
|
| |
|
208,632 |
|
CCC
Intelligent Solutions Holdings, Inc.1 |
|
|
2,317,901 |
|
| |
|
61,658 |
|
Intapp,
Inc.1 |
|
|
2,260,999 |
|
| |
|
27,168 |
|
PTC,
Inc.1 |
|
|
4,935,611 |
|
| |
|
|
|
|
|
|
14,062,648 |
|
|
Technology
Services — 3.7% |
| |
|
47,926 |
|
Fidelity
National Information Services, Inc. |
|
|
3,611,703 |
|
| |
Shares |
|
|
|
Value |
|
|
Technology
— (continued) |
|
Technology
Services — (continued) |
| |
|
8,190 |
|
MasterCard,
Inc., Class A |
|
$ |
3,613,101 |
|
| |
|
|
|
|
|
|
7,224,804 |
|
|
Total
Technology |
|
|
21,287,452 |
|
|
Utilities
— 5.0% |
|
Electric
Utilities — 3.1% |
| |
|
84,605 |
|
NextEra
Energy, Inc. |
|
|
5,990,880 |
|
|
Gas
& Water Utilities — 1.9% |
| |
|
32,251 |
|
Atmos
Energy Corporation |
|
|
3,762,079 |
|
|
Total
Utilities |
|
|
9,752,959 |
|
|
TOTAL
COMMON STOCK (Cost $136,571,877) |
|
|
166,633,222 |
|
|
EXCHANGE-TRADED
FUNDS — 2.3% |
|
EQUITY
— 2.3% |
| |
|
48,857 |
|
SPDR
S&P Biotech ETF (Cost $4,301,383) |
|
|
4,529,532 |
|
|
SHORT-TERM
INVESTMENTS — 11.7% |
| |
|
11,437,013 |
|
Blackrock
Liquidity Funds T-Fund, Institutional Shares, 4.83%2 |
|
|
11,437,013 |
|
| |
|
11,437,013 |
|
Federated
Hermes Treasury Obligations Fund, Institutional Shares, 5.17%2 |
|
|
11,437,013 |
|
|
TOTAL
SHORT-TERM INVESTMENTS (Cost $22,874,026) |
|
|
22,874,026 |
|
|
TOTAL
INVESTMENTS IN SECURITIES (Cost $163,747,286) |
|
|
194,036,780 |
|
|
See
accompanying notes to financial statements. |
CRM
Funds |
| |
17 |
|
|
CRM
FUNDS
CRM
LONG/SHORT OPPORTUNITIES FUND
SCHEDULE
OF INVESTMENTS (Continued)
June
30, 2024 |
| |
Shares |
|
|
|
Value |
|
|
COMMON
STOCK SOLD SHORT — (25.2)% |
|
Communications
— (0.8)% |
|
Advertising
& Marketing — (0.8)% |
| |
|
(17,305 |
) |
Omnicom
Group, Inc. |
|
$ |
(1,552,258 |
) |
|
Consumer
Discretionary — (4.1)% |
|
Leisure
Facilities & Services — (1.5)% |
| |
|
(14,134 |
) |
Dutch
Bros, Inc. |
|
|
(585,148 |
) |
| |
|
(15,210 |
) |
Hyatt
Hotels Corporation, Class A |
|
|
(2,310,703 |
) |
| |
|
|
|
|
|
|
(2,895,851 |
) |
|
Leisure
Products — (0.7)% |
| |
|
(38,025 |
) |
Yeti
Holdings, Inc. |
|
|
(1,450,654 |
) |
|
Retail
- Discretionary — (1.9)% |
| |
|
(7,133 |
) |
Abercrombie
& Fitch Company, Class A |
|
|
(1,268,533 |
) |
| |
|
(11,341 |
) |
Bath
& Body Works, Inc. |
|
|
(442,866 |
) |
| |
|
(22,532 |
) |
Caleres,
Inc. |
|
|
(757,075 |
) |
| |
|
(35,729 |
) |
Kohl’s
Corporation |
|
|
(821,410 |
) |
| |
|
(3,265 |
) |
Pandora
A/S |
|
|
(491,486 |
) |
| |
|
|
|
|
|
|
(3,781,370 |
) |
|
Total
Consumer Discretionary |
|
|
(8,127,875 |
) |
| |
|
|
|
|
|
|
|
|
|
Consumer
Staples — (3.2)% |
|
Food
— (0.9)% |
| |
|
(27,556 |
) |
Simply
Good Foods Company (The) |
|
|
(995,599 |
) |
| |
|
(43,894 |
) |
WK
Kellogg Company |
|
|
(722,495 |
) |
| |
|
|
|
|
|
|
(1,718,094 |
) |
|
Retail
- Consumer Staples — (2.3)% |
| |
|
(49,794 |
) |
Kroger
Company (The) |
|
|
(2,486,214 |
) |
| |
|
(24,633 |
) |
Sprouts
Farmers Market, Inc. |
|
|
(2,060,797 |
) |
| |
|
|
|
|
|
|
(4,547,011 |
) |
|
Total
Consumer Staples |
|
|
(6,265,105 |
) |
|
Energy
— (0.3)% |
|
Renewable
Energy — (0.3)% |
| |
|
(29,123 |
) |
Fluence
Energy, Inc. |
|
|
(504,993 |
) |
| |
Shares |
|
|
|
Value |
|
|
Financials
— (2.2)% |
|
Banking
— (0.4)% |
| |
|
(19,808 |
) |
Bank
OZK |
|
$ |
(812,128 |
) |
|
Insurance
— (0.8)% |
| |
|
(22,960 |
) |
Trupanion,
Inc. |
|
|
(675,024 |
) |
| |
|
(12,405 |
) |
W.R.
Berkley Corporation |
|
|
(974,785 |
) |
| |
|
|
|
|
|
|
(1,649,809 |
) |
|
Specialty
Finance — (1.0)% |
| |
|
(38,321 |
) |
Arbor
Realty Trust, Inc. |
|
|
(549,906 |
) |
| |
|
(25,262 |
) |
Blackstone
Mortgage Trust, Inc., Class A |
|
|
(440,064 |
) |
| |
|
(1,843 |
) |
Credit
Acceptance Corporation |
|
|
(948,555 |
) |
| |
|
|
|
|
|
|
(1,938,525 |
) |
|
Total
Financials |
|
|
(4,400,462 |
) |
|
Health
Care — (1.5)% |
|
Health
Care Facilities & Services — (1.5)% |
| |
|
(12,442 |
) |
Ensign
Group, Inc. (The) |
|
|
(1,538,951 |
) |
| |
|
(49,549 |
) |
Option
Care Health, Inc. |
|
|
(1,372,507 |
) |
|
Total
Health Care |
|
|
(2,911,458 |
) |
|
Industrials
— (10.1)% |
|
Diversified
Industrials — (0.8)% |
| |
|
(20,972 |
) |
Pentair
PLC3 |
|
|
(1,607,923 |
) |
|
Electrical
Equipment — (3.3)% |
| |
|
(12,373 |
) |
Acuity
Brands, Inc. |
|
|
(2,987,337 |
) |
| |
|
(93,840 |
) |
Bloom
Energy Corporation, Class A |
|
|
(1,148,602 |
) |
| |
|
(15,477 |
) |
Carrier
Global Corporation |
|
|
(976,289 |
) |
| |
|
(9,807 |
) |
Generac
Holdings, Inc. |
|
|
(1,296,682 |
) |
| |
|
|
|
|
|
|
(6,408,910 |
) |
|
Industrial
Intermediate Products — (0.9)% |
| |
|
(6,699 |
) |
Valmont
Industries, Inc. |
|
|
(1,838,541 |
) |
|
See
accompanying notes to financial statements. |
CRM
Funds |
| |
18 |
|
|
CRM
FUNDS
CRM
LONG/SHORT OPPORTUNITIES FUND
SCHEDULE
OF INVESTMENTS (Continued)
June
30, 2024 |
| |
Shares |
|
|
|
Value |
|
|
Industrials
— (continued) |
|
Industrial
Support Services — (1.7)% |
| |
|
(91,864 |
) |
Resideo
Technologies, Inc. |
|
$ |
(1,796,860 |
) |
| |
|
(2,384 |
) |
United
Rentals, Inc. |
|
|
(1,541,804 |
) |
| |
|
|
|
|
|
|
(3,338,664 |
) |
|
Machinery
— (2.6)% |
| |
|
(18,009 |
) |
Franklin
Electric Company, Inc. |
|
|
(1,734,627 |
) |
| |
|
(18,332 |
) |
Oshkosh
Corporation |
|
|
(1,983,522 |
) |
| |
|
(25,545 |
) |
Terex
Corporation |
|
|
(1,400,888 |
) |
| |
|
|
|
|
|
|
(5,119,037 |
) |
|
Transportation
& Logistics — (0.8)% |
| |
|
(8,863 |
) |
Old
Dominion Freight Line, Inc. |
|
|
(1,565,206 |
) |
|
Total
Industrials |
|
|
(19,878,281 |
) |
|
Real
Estate — (0.5)% |
|
Reit
— (0.5)% |
| |
|
(29,024 |
) |
Kilroy
Realty Corporation |
|
|
(904,678 |
) |
|
Technology
— (2.5)% |
|
Software
— (1.8)% |
| |
|
(139,380 |
) |
Evolent
Health, Inc., Class A |
|
|
(2,664,946 |
) |
| |
|
(5,793 |
) |
Qualys,
Inc. |
|
|
(826,082 |
) |
| |
|
|
|
|
|
|
(3,491,028 |
) |
|
Technology
Hardware — (0.2)% |
| |
|
(10,065 |
) |
Cisco
Systems, Inc. |
|
|
(478,188 |
) |
|
Technology
Services — (0.5)% |
| |
|
(5,190 |
) |
International
Business Machines Corporation |
|
|
(897,610 |
) |
|
Total
Technology |
|
|
(4,866,826 |
) |
|
TOTAL
COMMON STOCK SOLD SHORT — (Proceeds - $47,286,645) |
|
|
(49,411,936 |
) |
|
OTHER
ASSETS IN EXCESS OF LIABILITIES — 26.2% |
|
|
51,370,962 |
|
|
NET
ASSETS — 100.0% |
|
$ |
195,995,806 |
|
|
See
accompanying notes to financial statements. |
CRM
Funds |
| |
19 |
|
|
CRM
FUNDS
CRM
LONG/SHORT OPPORTUNITIES FUND
SCHEDULE
OF INVESTMENTS (Continued)
June
30, 2024 |
A
summary of inputs used to value the Fund’s investments as of June 30, 2024 is as follows (see Note 2 to Financial Statements):
| |
|
Level
1 |
|
|
Level
2 |
|
|
Level
3 |
|
|
Total |
|
|
Assets:
Investments in Securities: Common Stocks |
|
$ |
166,633,222 |
|
|
|
— |
|
|
|
— |
|
|
$ |
166,633,222 |
|
|
Exchange-Traded
Funds |
|
|
4,529,532 |
|
|
|
— |
|
|
|
— |
|
|
|
4,529,532 |
|
|
Short-Term
Investments |
|
|
22,874,026 |
|
|
|
— |
|
|
|
— |
|
|
|
22,874,026 |
|
|
Total
Assets – Investments in Securities |
|
$ |
194,036,780 |
|
|
|
— |
|
|
|
— |
|
|
$ |
194,036,780 |
|
|
Other
Financial Instruments:*Total Return Swap Agreements |
|
|
|
|
|
|
|
|
|
|
|
|
|
|
|
|
|
— Equity Contracts |
|
|
— |
|
|
$ |
2,429,323 |
|
|
|
— |
|
|
$ |
2,429,323 |
|
|
Total
Assets – Other Financial Instruments |
|
|
— |
|
|
$ |
2,429,323 |
|
|
|
— |
|
|
$ |
2,429,323 |
|
|
Liabilities:
Investments in Securities: Common Stock Sold Short |
|
$ |
(49,411,936 |
) |
|
|
— |
|
|
|
— |
|
|
$ |
(49,411,936 |
) |
|
Total
Liabilities – Investments in Securities |
|
$ |
(49,411,936 |
) |
|
|
— |
|
|
|
— |
|
|
$ |
(49,411,936 |
) |
|
Other
Financial Instruments:*Total Return Swap Agreements |
|
|
|
|
|
|
|
|
|
|
|
|
|
|
|
|
|
— Equity Contracts |
|
|
— |
|
|
$ |
(71,391 |
) |
|
|
— |
|
|
$ |
(71,391 |
) |
|
Total
Liabilities – Other Financial Instruments |
|
|
— |
|
|
$ |
(71,391 |
) |
|
|
— |
|
|
$ |
(71,391 |
) |
|
*
|
Other financial instruments
are derivative instruments not reflected in the Schedule of Investments, such as total return swap agreements, which are recorded at fair
value. |
There
were no transfers into or out of Level 3 related to securities held at June 30, 2024.
|
1 |
Non-income producing security.
|
|
2 |
Rate disclosed is the seven
day effective yield as of June 30, 2024. |
|
3 |
PLC – Public Limited
Company |
|
See
accompanying notes to financial statements. |
CRM
Funds |
| |
20 |
|
[THIS
PAGE INTENTIONALLY LEFT BLANK]
|
CRM
FUNDS
CRM
LONG/SHORT OPPORTUNITIES FUND
SCHEDULE
OF INVESTMENTS (Continued)
June
30, 2024 |
OTC
Total return swap agreements outstanding at June 30, 2024:
|
Counterparty |
Financing
Rate(1) |
|
Termination
Date |
|
|
Long
(Short)
Notional
Amount(2) |
|
|
Reference
Entity |
|
Fair
Value |
|
|
Upfront
Premiums
Paid
(Received) |
|
|
Unrealized
Appreciation
(Depreciation) |
|
|
Morgan
Stanley |
5.98%
(Fed Funds Rate + 0.65%) |
|
|
3/25/2025 |
|
|
$ |
3,312,386 |
|
|
Eagle
Materials, Inc. |
|
$ |
1,177,429 |
|
|
$ |
— |
|
|
$ |
1,177,429 |
|
|
Morgan
Stanley |
5.98%
(Fed Funds Rate + 0.65%) |
|
|
3/25/2025 |
|
|
|
6,886,393 |
|
|
Microsoft
Corporation |
|
|
1,113,101 |
|
|
|
— |
|
|
|
1,113,101 |
|
|
Morgan
Stanley |
4.88%
(Fed Funds Rate - 0.45%) |
|
|
7/31/2024 |
|
|
|
(1,303,533 |
) |
|
Morgan
Stanley Custom Swap (MSCM1057) Index(3) |
|
|
(3,859 |
) |
|
|
— |
|
|
|
(3,859 |
) |
|
Morgan
Stanley |
4.88%
(Fed Funds Rate - 0.45%) |
|
|
7/31/2024 |
|
|
|
(1,304,224 |
) |
|
Morgan
Stanley Custom Swap (MSCM1058) Index(3) |
|
|
33,769 |
|
|
|
— |
|
|
|
33,769 |
|
|
Morgan
Stanley |
4.88%
(Fed Funds Rate - 0.45%) |
|
|
7/31/2024 |
|
|
|
(1,299,795 |
) |
|
Morgan
Stanley Custom Swap (MSCM1059) Index(3) |
|
|
(12,926 |
) |
|
|
— |
|
|
|
(12,926 |
) |
|
Morgan
Stanley |
4.88%
(Fed Funds Rate - 0.45%) |
|
|
7/31/2024 |
|
|
|
(1,289,698 |
) |
|
Morgan
Stanley Custom Swap (MSCM1060) Index(3) |
|
|
14,821 |
|
|
|
— |
|
|
|
14,821 |
|
|
Morgan
Stanley |
4.88%
(Fed Funds Rate - 0.45%) |
|
|
7/31/2024 |
|
|
|
(1,312,154 |
) |
|
Morgan
Stanley Custom Swap (MSCM1061) Index(3) |
|
|
11,711 |
|
|
|
— |
|
|
|
11,711 |
|
|
Morgan
Stanley |
4.88%
(Fed Funds Rate - 0.45%) |
|
|
7/31/2024 |
|
|
|
(1,299,050 |
) |
|
Morgan
Stanley Custom Swap (MSCM1062) Index(3) |
|
|
(12,900 |
) |
|
|
— |
|
|
|
(12,900 |
) |
|
Morgan
Stanley |
4.88%
(Fed Funds Rate - 0.45%) |
|
|
7/31/2024 |
|
|
|
(1,293,223 |
) |
|
Morgan
Stanley Custom Swap (MSCM1063) Index(3) |
|
|
(12,854 |
) |
|
|
— |
|
|
|
(12,854 |
) |
|
Morgan
Stanley |
4.88%
(Fed Funds Rate - 0.45%) |
|
|
7/31/2024 |
|
|
|
(1,300,415 |
) |
|
Morgan
Stanley Custom Swap (MSCM1064) Index(3) |
|
|
(7,580 |
) |
|
|
— |
|
|
|
(7,580 |
) |
|
Morgan
Stanley |
4.88%
(Fed Funds Rate - 0.45%) |
|
|
7/31/2024 |
|
|
|
(1,310,083 |
) |
|
Morgan
Stanley Custom Swap (MSCM1065) Index(3) |
|
|
9,623 |
|
|
|
— |
|
|
|
9,623 |
|
|
Morgan
Stanley |
4.88%
(Fed Funds Rate - 0.45%) |
|
|
7/31/2024 |
|
|
|
(1,309,646 |
) |
|
Morgan
Stanley Custom Swap (MSCM1066) Index(3) |
|
|
16,362 |
|
|
|
— |
|
|
|
16,362 |
|
|
Morgan
Stanley |
4.88%
(Fed Funds Rate - 0.45%) |
|
|
7/31/2024 |
|
|
|
(1,295,200 |
) |
|
Morgan
Stanley Custom Swap (MSCM1067) Index(3) |
|
|
5,437 |
|
|
|
— |
|
|
|
5,437 |
|
|
Morgan
Stanley |
4.88%
(Fed Funds Rate - 0.45%) |
|
|
7/31/2024 |
|
|
|
(1,292,553 |
) |
|
Morgan
Stanley Custom Swap (MSCM1068) Index(3) |
|
|
(11,609 |
) |
|
|
— |
|
|
|
(11,609 |
) |
|
Morgan
Stanley |
4.88%
(Fed Funds Rate - 0.45%) |
|
|
7/31/2024 |
|
|
|
(1,299,733 |
) |
|
Morgan
Stanley Custom Swap (MSCM1069) Index(3) |
|
|
4,278 |
|
|
|
— |
|
|
|
4,278 |
|
|
Morgan
Stanley |
4.88%
(Fed Funds Rate - 0.45%) |
|
|
7/31/2024 |
|
|
|
(1,294,472 |
) |
|
Morgan
Stanley Custom Swap (MSCM1070) Index(3) |
|
|
10,672 |
|
|
|
— |
|
|
|
10,672 |
|
|
Morgan
Stanley |
4.88%
(Fed Funds Rate - 0.45%) |
|
|
7/31/2024 |
|
|
|
(1,294,247 |
) |
|
Morgan
Stanley Custom Swap (MSCM1071) Index(3) |
|
|
15,934 |
|
|
|
— |
|
|
|
15,934 |
|
|
Morgan
Stanley |
4.88%
(Fed Funds Rate - 0.45%) |
|
|
7/31/2024 |
|
|
|
(1,296,968 |
) |
|
Morgan
Stanley Custom Swap (MSCM1072) Index(3) |
|
|
14,279 |
|
|
|
— |
|
|
|
14,279 |
|
|
Morgan
Stanley |
4.88%
(Fed Funds Rate - 0.45%) |
|
|
7/31/2024 |
|
|
|
(1,309,494 |
) |
|
Morgan
Stanley Custom Swap (MSCM1073) Index(3) |
|
|
(5,970 |
) |
|
|
— |
|
|
|
(5,970 |
) |
|
Morgan
Stanley |
4.88%
(Fed Funds Rate - 0.45%) |
|
|
7/31/2024 |
|
|
|
(1,282,427 |
) |
|
Morgan
Stanley Custom Swap (MSCM1074) Index(3) |
|
|
1,907 |
|
|
|
— |
|
|
|
1,907 |
|
|
Morgan
Stanley |
4.88%
(Fed Funds Rate - 0.45%) |
|
|
7/31/2024 |
|
|
|
(1,294,354 |
) |
|
Morgan
Stanley Custom Swap (MSCM1075) Index(3) |
|
|
(2,512 |
) |
|
|
— |
|
|
|
(2,512 |
) |
|
Morgan
Stanley |
4.88%
(Fed Funds Rate - 0.45%) |
|
|
7/31/2024 |
|
|
|
(1,299,150 |
) |
|
Morgan
Stanley Custom Swap (MSCM1076) Index(3) |
|
|
(1,181 |
) |
|
|
— |
|
|
|
(1,181 |
) |
| |
|
|
|
|
|
|
|
|
|
|
Total
Unrealized Appreciation |
|
|
|
|
|
|
|
|
|
$ |
2,429,323 |
|
| |
|
|
|
|
|
|
|
|
|
|
Total
Unrealized (Depreciation) |
|
|
|
|
|
|
|
|
|
$ |
(71,391 |
) |
| |
|
|
|
|
|
|
|
|
|
|
Total |
|
$ |
2,357,932 |
|
|
$ |
— |
|
|
$ |
2,357,932 |
|
|
See
accompanying notes to financial statements. |
CRM
Funds |
| |
22 |
|
|
CRM
FUNDS
CRM
LONG/SHORT OPPORTUNITIES FUND
SCHEDULE
OF INVESTMENTS (Continued)
June
30, 2024 |
OTC
Total return swap agreements outstanding at June 30, 2024 (continued):
|
(2) |
Morgan Stanley
acts as the counterparty to the total return swap contracts listed above. The Fund either receives fees from, or pays fees to, the counterparty,
depending upon the total return of the benchmark, and the agreed -upon floating rate financing rate. |
|
(3) |
See the tables
below for the swap constituents. |
|
See
accompanying notes to financial statements. |
CRM
Funds |
| |
23 |
|
|
CRM
FUNDS
CRM
LONG/SHORT OPPORTUNITIES FUND
SCHEDULE
OF INVESTMENTS (Continued)
June
30, 2024 |
The
following table represents the individual positions and related values of underlying securities of Morgan Stanley Custom Basket (MSCM1057)
Index total return swap with Morgan Stanley Bank as of June 30, 2024, termination date 7/31/24:
|
Reference
Entity |
|
Shares |
|
|
Market
Value |
|
|
%
of Total
Index Value |
|
|
Iron
Mountain, Inc. |
|
|
292 |
|
|
$ |
26,166 |
|
|
|
2.00 |
% |
|
NetApp,
Inc. |
|
|
200 |
|
|
|
25,707 |
|
|
|
1.97 |
% |
|
Apple,
Inc. |
|
|
122 |
|
|
|
25,601 |
|
|
|
1.96 |
% |
|
AT&T,
Inc. |
|
|
1,320 |
|
|
|
25,218 |
|
|
|
1.93 |
% |
|
Discover
Financial Services |
|
|
192 |
|
|
|
25,114 |
|
|
|
1.92 |
% |
|
Motorola
Solutions, Inc. |
|
|
65 |
|
|
|
24,956 |
|
|
|
1.91 |
% |
|
Rockwell
Automation, Inc. |
|
|
90 |
|
|
|
24,888 |
|
|
|
1.90 |
% |
|
General
Motors Company |
|
|
536 |
|
|
|
24,885 |
|
|
|
1.90 |
% |
|
Ford
Motor Company |
|
|
1,976 |
|
|
|
24,773 |
|
|
|
1.89 |
% |
|
Moody’s
Corporation |
|
|
59 |
|
|
|
24,747 |
|
|
|
1.89 |
% |
|
Cognizant
Technology Solutions Corporation |
|
|
359 |
|
|
|
24,408 |
|
|
|
1.87 |
% |
|
Cintas
Corporation |
|
|
35 |
|
|
|
24,330 |
|
|
|
1.86 |
% |
|
Constellation
Brands, Inc. |
|
|
94 |
|
|
|
24,260 |
|
|
|
1.86 |
% |
|
Ecolab,
Inc. |
|
|
102 |
|
|
|
24,197 |
|
|
|
1.85 |
% |
|
Amgen,
Inc. |
|
|
77 |
|
|
|
24,136 |
|
|
|
1.85 |
% |
|
Blackstone,
Inc. |
|
|
195 |
|
|
|
24,123 |
|
|
|
1.84 |
% |
|
Old
Dominion Freight Line, Inc. |
|
|
134 |
|
|
|
23,730 |
|
|
|
1.81 |
% |
|
Capital
One Financial Corporation |
|
|
171 |
|
|
|
23,639 |
|
|
|
1.81 |
% |
|
Mettler-Toledo
International, Inc. |
|
|
17 |
|
|
|
23,487 |
|
|
|
1.80 |
% |
|
Cardinal
Health, Inc. |
|
|
238 |
|
|
|
23,397 |
|
|
|
1.79 |
% |
|
CDW
Corporation |
|
|
104 |
|
|
|
23,356 |
|
|
|
1.79 |
% |
|
Progressive
Corporation |
|
|
112 |
|
|
|
23,339 |
|
|
|
1.79 |
% |
|
Western
Digital Corporation |
|
|
308 |
|
|
|
23,332 |
|
|
|
1.78 |
% |
|
West
Pharmaceutical Services, Inc. |
|
|
71 |
|
|
|
23,271 |
|
|
|
1.78 |
% |
|
United
Parcel Service - Class B |
|
|
170 |
|
|
|
23,250 |
|
|
|
1.78 |
% |
|
International
Flavors & Fragrances, Inc. |
|
|
243 |
|
|
|
23,172 |
|
|
|
1.77 |
% |
|
Sysco
Corporation |
|
|
325 |
|
|
|
23,167 |
|
|
|
1.77 |
% |
|
W.
W. Grainger, Inc. |
|
|
26 |
|
|
|
23,118 |
|
|
|
1.77 |
% |
|
Church
& Dwight Company, Inc. |
|
|
223 |
|
|
|
23,100 |
|
|
|
1.77 |
% |
|
Emerson
Electric Company |
|
|
210 |
|
|
|
23,097 |
|
|
|
1.77 |
% |
|
Pfizer,
Inc. |
|
|
825 |
|
|
|
23,070 |
|
|
|
1.76 |
% |
|
Cummins,
Inc. |
|
|
83 |
|
|
|
23,069 |
|
|
|
1.76 |
% |
|
Automatic
Data Processing, Inc. |
|
|
97 |
|
|
|
23,038 |
|
|
|
1.76 |
% |
|
Sherwin-Williams
Company (The) |
|
|
77 |
|
|
|
22,973 |
|
|
|
1.76 |
% |
|
Agilent
Technologies, Inc. |
|
|
177 |
|
|
|
22,935 |
|
|
|
1.75 |
% |
|
Steris
Corporation |
|
|
104 |
|
|
|
22,868 |
|
|
|
1.75 |
% |
|
LyondellBasell
Industries N.V. - Class A |
|
|
239 |
|
|
|
22,860 |
|
|
|
1.75 |
% |
|
Caterpillar,
Inc. |
|
|
69 |
|
|
|
22,830 |
|
|
|
1.75 |
% |
|
See
accompanying notes to financial statements. |
CRM
Funds |
| |
24 |
|
|
CRM
FUNDS
CRM
LONG/SHORT OPPORTUNITIES FUND
SCHEDULE
OF INVESTMENTS (Continued)
June
30, 2024 |
|
Reference
Entity |
|
Shares |
|
|
Market
Value |
|
|
%
of Total
Index Value |
|
|
United
Rentals, Inc. |
|
|
35 |
|
|
$ |
22,811 |
|
|
|
1.74 |
% |
|
General
Dynamics Corporation |
|
|
79 |
|
|
|
22,785 |
|
|
|
1.74 |
% |
|
PACCAR,
Inc. |
|
|
220 |
|
|
|
22,634 |
|
|
|
1.73 |
% |
|
Carlisle
Companies, Inc. |
|
|
56 |
|
|
|
22,585 |
|
|
|
1.73 |
% |
|
Fastenal
Company |
|
|
358 |
|
|
|
22,528 |
|
|
|
1.72 |
% |
|
Allstate
Corporation (The) |
|
|
141 |
|
|
|
22,502 |
|
|
|
1.72 |
% |
|
PepsiCo,
Inc. |
|
|
136 |
|
|
|
22,495 |
|
|
|
1.72 |
% |
|
Tractor
Supply Company |
|
|
83 |
|
|
|
22,358 |
|
|
|
1.71 |
% |
|
Kroger
Company (The) |
|
|
447 |
|
|
|
22,335 |
|
|
|
1.71 |
% |
|
HCA
Healthcare, Inc. |
|
|
69 |
|
|
|
22,293 |
|
|
|
1.71 |
% |
|
Hershey
Company (The) |
|
|
120 |
|
|
|
22,132 |
|
|
|
1.69 |
% |
|
ON
Semiconductor Corporation |
|
|
322 |
|
|
|
22,104 |
|
|
|
1.69 |
% |
|
General
Mills, Inc. |
|
|
349 |
|
|
|
22,069 |
|
|
|
1.69 |
% |
|
Canadian
Imperial Bank of Commerce |
|
|
460 |
|
|
|
21,846 |
|
|
|
1.67 |
% |
|
Eaton
Corporation PLC |
|
|
70 |
|
|
|
21,815 |
|
|
|
1.67 |
% |
|
Hubbell,
Inc. |
|
|
60 |
|
|
|
21,752 |
|
|
|
1.66 |
% |
|
Westinghouse
Air Brake Technologies Corporation |
|
|
138 |
|
|
|
21,740 |
|
|
|
1.66 |
% |
|
Marvell
Technology, Inc. |
|
|
303 |
|
|
|
21,149 |
|
|
|
1.62 |
% |
| |
|
|
|
|
|
$ |
1,307,540 |
|
|
|
100.00 |
% |
The
following table represents the individual positions and related values of underlying securities of Morgan Stanley Custom Basket (MSCM1058)
Index total return swap with Morgan Stanley Bank as of June 30, 2024, termination date 7/31/24:
|
Reference
Entity |
|
Shares |
|
|
Market
Value |
|
|
%
of Total
Index Value |
|
|
Ford
Motor Company |
|
|
13,470 |
|
|
$ |
168,910 |
|
|
|
13.29 |
% |
|
Marvell
Technology, Inc. |
|
|
2,374 |
|
|
|
165,976 |
|
|
|
13.06 |
% |
|
International
Flavors & Fragrances, Inc. |
|
|
1,699 |
|
|
|
161,740 |
|
|
|
12.73 |
% |
|
Sysco
Corporation |
|
|
2,244 |
|
|
|
160,179 |
|
|
|
12.61 |
% |
|
PepsiCo,
Inc. |
|
|
945 |
|
|
|
155,856 |
|
|
|
12.27 |
% |
|
Kroger
Company (The) |
|
|
3,120 |
|
|
|
155,775 |
|
|
|
12.26 |
% |
|
Hershey
Company (The) |
|
|
826 |
|
|
|
151,825 |
|
|
|
11.95 |
% |
|
General
Mills, Inc. |
|
|
2,377 |
|
|
|
150,340 |
|
|
|
11.83 |
% |
| |
|
|
|
|
|
$ |
1,270,601 |
|
|
|
100.00 |
% |
|
See
accompanying notes to financial statements. |
CRM
Funds |
| |
25 |
|
|
CRM
FUNDS
CRM
LONG/SHORT OPPORTUNITIES FUND
SCHEDULE
OF INVESTMENTS (Continued)
June
30, 2024 |
The
following table represents the individual positions and related values of underlying securities of Morgan Stanley Custom Basket (MSCM1059)
Index total return swap with Morgan Stanley Bank as of June 30, 2024, termination date 7/31/24:
|
Reference
Entity |
|
Shares |
|
|
Market
Value |
|
|
%
of Total
Index Value |
|
|
Iron
Mountain, Inc. |
|
|
298 |
|
|
$ |
26,742 |
|
|
|
2.04 |
% |
|
Apple,
Inc. |
|
|
124 |
|
|
|
26,149 |
|
|
|
1.99 |
% |
|
NetApp,
Inc. |
|
|
202 |
|
|
|
26,081 |
|
|
|
1.99 |
% |
|
Extra
Space Storage, Inc. |
|
|
166 |
|
|
|
25,827 |
|
|
|
1.97 |
% |
|
Rockwell
Automation, Inc. |
|
|
93 |
|
|
|
25,706 |
|
|
|
1.96 |
% |
|
Discover
Financial Services |
|
|
196 |
|
|
|
25,658 |
|
|
|
1.95 |
% |
|
AT&T,
Inc. |
|
|
1,338 |
|
|
|
25,560 |
|
|
|
1.95 |
% |
|
Motorola
Solutions, Inc. |
|
|
66 |
|
|
|
25,381 |
|
|
|
1.93 |
% |
|
Moody’s
Corporation |
|
|
60 |
|
|
|
25,245 |
|
|
|
1.92 |
% |
|
Prologis,
Inc. |
|
|
224 |
|
|
|
25,190 |
|
|
|
1.92 |
% |
|
Old
Dominion Freight Line, Inc. |
|
|
142 |
|
|
|
25,123 |
|
|
|
1.91 |
% |
|
Costco
Wholesale Corporation |
|
|
30 |
|
|
|
25,111 |
|
|
|
1.91 |
% |
|
Blackstone,
Inc. |
|
|
202 |
|
|
|
25,016 |
|
|
|
1.91 |
% |
|
Cintas
Corporation |
|
|
36 |
|
|
|
25,007 |
|
|
|
1.90 |
% |
|
Cognizant
Technology Solutions Corporation |
|
|
366 |
|
|
|
24,902 |
|
|
|
1.90 |
% |
|
Ford
Motor Company |
|
|
1,976 |
|
|
|
24,780 |
|
|
|
1.89 |
% |
|
Constellation
Brands, Inc. |
|
|
96 |
|
|
|
24,759 |
|
|
|
1.89 |
% |
|
Marvell
Technology, Inc. |
|
|
353 |
|
|
|
24,686 |
|
|
|
1.88 |
% |
|
Ecolab,
Inc. |
|
|
103 |
|
|
|
24,614 |
|
|
|
1.88 |
% |
|
Amgen,
Inc. |
|
|
78 |
|
|
|
24,483 |
|
|
|
1.87 |
% |
|
General
Motors Company |
|
|
527 |
|
|
|
24,468 |
|
|
|
1.86 |
% |
|
W.
W. Grainger, Inc. |
|
|
27 |
|
|
|
24,460 |
|
|
|
1.86 |
% |
|
United
Rentals, Inc. |
|
|
38 |
|
|
|
24,437 |
|
|
|
1.86 |
% |
|
Western
Digital Corporation |
|
|
321 |
|
|
|
24,343 |
|
|
|
1.85 |
% |
|
Emerson
Electric Company |
|
|
221 |
|
|
|
24,339 |
|
|
|
1.85 |
% |
|
Capital
One Financial Corporation |
|
|
176 |
|
|
|
24,323 |
|
|
|
1.85 |
% |
|
Tractor
Supply Company |
|
|
90 |
|
|
|
24,309 |
|
|
|
1.85 |
% |
|
Cummins,
Inc. |
|
|
88 |
|
|
|
24,239 |
|
|
|
1.85 |
% |
|
Caterpillar,
Inc. |
|
|
73 |
|
|
|
24,215 |
|
|
|
1.84 |
% |
|
West
Pharmaceutical Services, Inc. |
|
|
73 |
|
|
|
24,137 |
|
|
|
1.84 |
% |
|
LyondellBasell
Industries N.V. - Class A |
|
|
252 |
|
|
|
24,129 |
|
|
|
1.84 |
% |
|
CDW
Corporation |
|
|
108 |
|
|
|
24,127 |
|
|
|
1.84 |
% |
|
Mettler-Toledo
International, Inc. |
|
|
17 |
|
|
|
24,057 |
|
|
|
1.83 |
% |
|
Progressive
Corporation |
|
|
115 |
|
|
|
23,897 |
|
|
|
1.82 |
% |
|
Realty
Income Corporation |
|
|
452 |
|
|
|
23,867 |
|
|
|
1.82 |
% |
|
United
Parcel Service - Class B |
|
|
174 |
|
|
|
23,816 |
|
|
|
1.81 |
% |
|
Sherwin-Williams
Company (The) |
|
|
80 |
|
|
|
23,802 |
|
|
|
1.81 |
% |
|
Cardinal
Health, Inc. |
|
|
242 |
|
|
|
23,801 |
|
|
|
1.81 |
% |
|
Agilent
Technologies, Inc. |
|
|
183 |
|
|
|
23,764 |
|
|
|
1.81 |
% |
|
See
accompanying notes to financial statements. |
CRM
Funds |
| |
26 |
|
|
CRM
FUNDS
CRM
LONG/SHORT OPPORTUNITIES FUND
SCHEDULE
OF INVESTMENTS (Continued)
June
30, 2024 |
|
Reference
Entity |
|
Shares |
|
|
Market
Value |
|
|
%
of Total
Index Value |
|
|
McDonald’s
Corporation |
|
|
93 |
|
|
$ |
23,634 |
|
|
|
1.80 |
% |
|
Automatic
Data Processing, Inc. |
|
|
99 |
|
|
|
23,563 |
|
|
|
1.80 |
% |
|
Fastenal
Company |
|
|
375 |
|
|
|
23,538 |
|
|
|
1.79 |
% |
|
PACCAR,
Inc. |
|
|
228 |
|
|
|
23,507 |
|
|
|
1.79 |
% |
|
Allstate
Corporation (The) |
|
|
147 |
|
|
|
23,434 |
|
|
|
1.79 |
% |
|
General
Dynamics Corporation |
|
|
81 |
|
|
|
23,433 |
|
|
|
1.79 |
% |
|
Eaton
Corporation PLC |
|
|
74 |
|
|
|
23,279 |
|
|
|
1.77 |
% |
|
Church
& Dwight Company, Inc. |
|
|
225 |
|
|
|
23,278 |
|
|
|
1.77 |
% |
|
HCA
Healthcare, Inc. |
|
|
72 |
|
|
|
23,262 |
|
|
|
1.77 |
% |
|
Steris
Corporation |
|
|
105 |
|
|
|
23,157 |
|
|
|
1.76 |
% |
|
Pfizer,
Inc. |
|
|
822 |
|
|
|
22,996 |
|
|
|
1.75 |
% |
|
Westinghouse
Air Brake Technologies Corporation |
|
|
145 |
|
|
|
22,974 |
|
|
|
1.75 |
% |
|
Canadian
Imperial Bank of Commerce |
|
|
483 |
|
|
|
22,940 |
|
|
|
1.75 |
% |
|
Hubbell,
Inc. |
|
|
62 |
|
|
|
22,823 |
|
|
|
1.74 |
% |
|
ON
Semiconductor Corporation |
|
|
329 |
|
|
|
22,562 |
|
|
|
1.72 |
% |
| |
|
|
|
|
|
$ |
1,312,930 |
|
|
|
100.00 |
% |
The
following table represents the individual positions and related values of underlying securities of Morgan Stanley Custom Basket (MSCM1060)
Index total return swap with Morgan Stanley Bank as of June 30, 2024, termination date 7/31/24:
|
Reference
Entity |
|
Shares |
|
|
Market
Value |
|
|
%
of Total
Index Value |
|
|
Discover
Financial Services |
|
|
594 |
|
|
$ |
77,689 |
|
|
|
6.09 |
% |
|
Capital
One Financial Corporation |
|
|
535 |
|
|
|
74,045 |
|
|
|
5.81 |
% |
|
Constellation
Brands, Inc. |
|
|
287 |
|
|
|
73,916 |
|
|
|
5.80 |
% |
|
Costco
Wholesale Corporation |
|
|
87 |
|
|
|
73,887 |
|
|
|
5.79 |
% |
|
Restaurant
Brands International, Inc. |
|
|
1,028 |
|
|
|
72,313 |
|
|
|
5.67 |
% |
|
Tractor
Supply Company |
|
|
267 |
|
|
|
72,000 |
|
|
|
5.65 |
% |
|
International
Flavors & Fragrances, Inc. |
|
|
747 |
|
|
|
71,101 |
|
|
|
5.58 |
% |
|
Target
Corporation |
|
|
478 |
|
|
|
70,723 |
|
|
|
5.55 |
% |
|
Dollar
General Corporation |
|
|
535 |
|
|
|
70,703 |
|
|
|
5.55 |
% |
|
Sysco
Corporation |
|
|
989 |
|
|
|
70,626 |
|
|
|
5.54 |
% |
|
CVS
Health Corporation |
|
|
1,194 |
|
|
|
70,490 |
|
|
|
5.53 |
% |
|
Lululemon
Athletica, Inc. |
|
|
234 |
|
|
|
70,028 |
|
|
|
5.49 |
% |
|
McDonald’s
Corporation |
|
|
274 |
|
|
|
69,765 |
|
|
|
5.47 |
% |
|
Kroger
Company (The) |
|
|
1,382 |
|
|
|
69,006 |
|
|
|
5.41 |
% |
|
PepsiCo,
Inc. |
|
|
414 |
|
|
|
68,216 |
|
|
|
5.35 |
% |
|
Starbucks
Corporation |
|
|
869 |
|
|
|
67,631 |
|
|
|
5.30 |
% |
|
General
Mills, Inc. |
|
|
1,056 |
|
|
|
66,771 |
|
|
|
5.24 |
% |
|
Hershey
Company (The) |
|
|
359 |
|
|
|
66,084 |
|
|
|
5.18 |
% |
| |
|
|
|
|
|
$ |
1,274,994 |
|
|
|
100.00 |
% |
|
See
accompanying notes to financial statements. |
CRM
Funds |
| |
27 |
|
|
CRM
FUNDS
CRM
LONG/SHORT OPPORTUNITIES FUND
SCHEDULE
OF INVESTMENTS (Continued)
June
30, 2024 |
The
following table represents the individual positions and related values of underlying securities of Morgan Stanley Custom Basket (MSCM1061)
Index total return swap with Morgan Stanley Bank as of June 30, 2024, termination date 7/31/24:
|
Reference
Entity |
|
Shares |
|
|
Market
Value |
|
|
%
of Total
Index Value |
|
|
Discover
Financial Services |
|
|
1,070 |
|
|
$ |
139,936 |
|
|
|
10.76 |
% |
|
Capital
One Financial Corporation |
|
|
964 |
|
|
|
133,514 |
|
|
|
10.27 |
% |
|
Target
Corporation |
|
|
887 |
|
|
|
131,262 |
|
|
|
10.09 |
% |
|
Tractor
Supply Company |
|
|
483 |
|
|
|
130,471 |
|
|
|
10.03 |
% |
|
Restaurant
Brands International, Inc. |
|
|
1,844 |
|
|
|
129,765 |
|
|
|
9.98 |
% |
|
Dollar
General Corporation |
|
|
972 |
|
|
|
128,521 |
|
|
|
9.88 |
% |
|
McDonald’s
Corporation |
|
|
503 |
|
|
|
128,062 |
|
|
|
9.85 |
% |
|
CVS
Health Corporation |
|
|
2,152 |
|
|
|
127,120 |
|
|
|
9.77 |
% |
|
Lululemon
Athletica, Inc. |
|
|
424 |
|
|
|
126,594 |
|
|
|
9.73 |
% |
|
Starbucks
Corporation |
|
|
1,610 |
|
|
|
125,322 |
|
|
|
9.64 |
% |
| |
|
|
|
|
|
$ |
1,300,567 |
|
|
|
100.00 |
% |
The
following table represents the individual positions and related values of underlying securities of Morgan Stanley Custom Basket (MSCM1062)
Index total return swap with Morgan Stanley Bank as of June 30, 2024, termination date 7/31/24:
|
Reference
Entity |
|
Shares |
|
|
Market
Value |
|
|
%
of Total
Index Value |
|
|
Apple,
Inc. |
|
|
142 |
|
|
$ |
30,003 |
|
|
|
2.29 |
% |
|
Rockwell
Automation, Inc. |
|
|
109 |
|
|
|
29,877 |
|
|
|
2.28 |
% |
|
NetApp,
Inc. |
|
|
228 |
|
|
|
29,376 |
|
|
|
2.24 |
% |
|
Iron
Mountain, Inc. |
|
|
327 |
|
|
|
29,265 |
|
|
|
2.23 |
% |
|
Extra
Space Storage, Inc. |
|
|
187 |
|
|
|
28,997 |
|
|
|
2.21 |
% |
|
AT&T,
Inc. |
|
|
1,516 |
|
|
|
28,962 |
|
|
|
2.21 |
% |
|
West
Pharmaceutical Services, Inc. |
|
|
88 |
|
|
|
28,952 |
|
|
|
2.21 |
% |
|
Motorola
Solutions, Inc. |
|
|
75 |
|
|
|
28,869 |
|
|
|
2.20 |
% |
|
Old
Dominion Freight Line, Inc. |
|
|
163 |
|
|
|
28,807 |
|
|
|
2.20 |
% |
|
Emerson
Electric Company |
|
|
261 |
|
|
|
28,800 |
|
|
|
2.19 |
% |
|
Ford
Motor Company |
|
|
2,295 |
|
|
|
28,783 |
|
|
|
2.19 |
% |
|
Blackstone,
Inc. |
|
|
232 |
|
|
|
28,781 |
|
|
|
2.19 |
% |
|
Moody’s
Corporation |
|
|
68 |
|
|
|
28,665 |
|
|
|
2.18 |
% |
|
Constellation
Brands, Inc. |
|
|
111 |
|
|
|
28,499 |
|
|
|
2.17 |
% |
|
Cintas
Corporation |
|
|
41 |
|
|
|
28,440 |
|
|
|
2.17 |
% |
|
Marvell
Technology, Inc. |
|
|
407 |
|
|
|
28,437 |
|
|
|
2.17 |
% |
|
W.
W. Grainger, Inc. |
|
|
32 |
|
|
|
28,436 |
|
|
|
2.17 |
% |
|
United
Rentals, Inc. |
|
|
44 |
|
|
|
28,417 |
|
|
|
2.17 |
% |
|
Cognizant
Technology Solutions Corporation |
|
|
418 |
|
|
|
28,410 |
|
|
|
2.17 |
% |
|
Amgen,
Inc. |
|
|
91 |
|
|
|
28,317 |
|
|
|
2.16 |
% |
|
See
accompanying notes to financial statements. |
CRM
Funds |
| |
28 |
|
|
CRM
FUNDS
CRM
LONG/SHORT OPPORTUNITIES FUND
SCHEDULE
OF INVESTMENTS (Continued)
June
30, 2024 |
|
Reference
Entity |
|
Shares |
|
|
Market
Value |
|
|
%
of Total
Index Value |
|
|
Prologis,
Inc. |
|
|
252 |
|
|
$ |
28,284 |
|
|
|
2.16 |
% |
|
General
Motors Company |
|
|
607 |
|
|
|
28,221 |
|
|
|
2.15 |
% |
|
Caterpillar,
Inc. |
|
|
84 |
|
|
|
28,110 |
|
|
|
2.14 |
% |
|
Cummins,
Inc. |
|
|
101 |
|
|
|
27,978 |
|
|
|
2.13 |
% |
|
CDW
Corporation |
|
|
125 |
|
|
|
27,958 |
|
|
|
2.13 |
% |
|
Western
Digital Corporation |
|
|
368 |
|
|
|
27,896 |
|
|
|
2.13 |
% |
|
LyondellBasell
Industries N.V. - Class A |
|
|
291 |
|
|
|
27,826 |
|
|
|
2.12 |
% |
|
Eaton
Corporation PLC |
|
|
88 |
|
|
|
27,712 |
|
|
|
2.11 |
% |
|
Cardinal
Health, Inc. |
|
|
280 |
|
|
|
27,570 |
|
|
|
2.10 |
% |
|
United
Parcel Service - Class B |
|
|
201 |
|
|
|
27,561 |
|
|
|
2.10 |
% |
|
Ecolab,
Inc. |
|
|
115 |
|
|
|
27,414 |
|
|
|
2.09 |
% |
|
Fastenal
Company |
|
|
433 |
|
|
|
27,198 |
|
|
|
2.07 |
% |
|
Sherwin-Williams
Company (The) |
|
|
91 |
|
|
|
27,191 |
|
|
|
2.07 |
% |
|
Allstate
Corporation (The) |
|
|
170 |
|
|
|
27,117 |
|
|
|
2.07 |
% |
|
Agilent
Technologies, Inc. |
|
|
209 |
|
|
|
27,039 |
|
|
|
2.06 |
% |
|
Progressive
Corporation |
|
|
130 |
|
|
|
26,992 |
|
|
|
2.06 |
% |
|
Realty
Income Corporation |
|
|
511 |
|
|
|
26,969 |
|
|
|
2.06 |
% |
|
General
Dynamics Corporation |
|
|
93 |
|
|
|
26,949 |
|
|
|
2.05 |
% |
|
Mettler-Toledo
International, Inc. |
|
|
19 |
|
|
|
26,925 |
|
|
|
2.05 |
% |
|
Pfizer,
Inc. |
|
|
962 |
|
|
|
26,915 |
|
|
|
2.05 |
% |
|
Westinghouse
Air Brake Technologies Corporation |
|
|
169 |
|
|
|
26,699 |
|
|
|
2.03 |
% |
|
Automatic
Data Processing, Inc. |
|
|
112 |
|
|
|
26,667 |
|
|
|
2.03 |
% |
|
Church
& Dwight Company, Inc. |
|
|
257 |
|
|
|
26,618 |
|
|
|
2.03 |
% |
|
HCA
Healthcare, Inc. |
|
|
82 |
|
|
|
26,426 |
|
|
|
2.01 |
% |
|
Steris
Corporation |
|
|
120 |
|
|
|
26,389 |
|
|
|
2.01 |
% |
|
ON
Semiconductor Corporation |
|
|
382 |
|
|
|
26,213 |
|
|
|
2.00 |
% |
|
PACCAR,
Inc. |
|
|
254 |
|
|
|
26,140 |
|
|
|
1.99 |
% |
| |
|
|
|
|
|
$ |
1,312,070 |
|
|
|
100.00 |
% |
The
following table represents the individual positions and related values of underlying securities of Morgan Stanley Custom Basket (MSCM1063)
Index total return swap with Morgan Stanley Bank as of June 30, 2024, termination date 7/31/24:
|
Reference
Entity |
|
Shares |
|
|
Market
Value |
|
|
%
of Total
Index Value |
|
|
Rockwell
Automation, Inc. |
|
|
106 |
|
|
$ |
29,053 |
|
|
|
2.22 |
% |
|
Apple,
Inc. |
|
|
137 |
|
|
|
28,892 |
|
|
|
2.21 |
% |
|
NetApp,
Inc. |
|
|
223 |
|
|
|
28,754 |
|
|
|
2.20 |
% |
|
AT&T,
Inc. |
|
|
1,492 |
|
|
|
28,515 |
|
|
|
2.18 |
% |
|
Blackstone,
Inc. |
|
|
230 |
|
|
|
28,427 |
|
|
|
2.18 |
% |
|
Extra
Space Storage, Inc. |
|
|
182 |
|
|
|
28,341 |
|
|
|
2.17 |
% |
|
Iron
Mountain, Inc. |
|
|
316 |
|
|
|
28,320 |
|
|
|
2.17 |
% |
|
See
accompanying notes to financial statements. |
CRM
Funds |
| |
29 |
|
|
CRM
FUNDS
CRM
LONG/SHORT OPPORTUNITIES FUND
SCHEDULE
OF INVESTMENTS (Continued)
June
30, 2024 |
|
Reference
Entity |
|
Shares |
|
|
Market
Value |
|
|
%
of Total
Index Value |
|
|
Old
Dominion Freight Line, Inc. |
|
|
160 |
|
|
$ |
28,302 |
|
|
|
2.17 |
% |
|
West
Pharmaceutical Services, Inc. |
|
|
86 |
|
|
|
28,271 |
|
|
|
2.16 |
% |
|
Moody’s
Corporation |
|
|
67 |
|
|
|
28,161 |
|
|
|
2.16 |
% |
|
Motorola
Solutions, Inc. |
|
|
73 |
|
|
|
28,099 |
|
|
|
2.15 |
% |
|
Ford
Motor Company |
|
|
2,223 |
|
|
|
27,875 |
|
|
|
2.13 |
% |
|
Cognizant
Technology Solutions Corporation |
|
|
410 |
|
|
|
27,852 |
|
|
|
2.13 |
% |
|
Marvell
Technology, Inc. |
|
|
397 |
|
|
|
27,767 |
|
|
|
2.13 |
% |
|
Cintas
Corporation |
|
|
40 |
|
|
|
27,725 |
|
|
|
2.12 |
% |
|
Constellation
Brands, Inc. |
|
|
108 |
|
|
|
27,692 |
|
|
|
2.12 |
% |
|
Amgen,
Inc. |
|
|
89 |
|
|
|
27,666 |
|
|
|
2.12 |
% |
|
Sherwin-Williams
Company (The) |
|
|
93 |
|
|
|
27,608 |
|
|
|
2.11 |
% |
|
Emerson
Electric Company |
|
|
250 |
|
|
|
27,554 |
|
|
|
2.11 |
% |
|
Prologis,
Inc. |
|
|
245 |
|
|
|
27,525 |
|
|
|
2.11 |
% |
|
Cummins,
Inc. |
|
|
99 |
|
|
|
27,511 |
|
|
|
2.11 |
% |
|
General
Motors Company |
|
|
591 |
|
|
|
27,445 |
|
|
|
2.10 |
% |
|
Caterpillar,
Inc. |
|
|
82 |
|
|
|
27,350 |
|
|
|
2.09 |
% |
|
W.
W. Grainger, Inc. |
|
|
30 |
|
|
|
27,311 |
|
|
|
2.09 |
% |
|
Western
Digital Corporation |
|
|
360 |
|
|
|
27,293 |
|
|
|
2.09 |
% |
|
United
Rentals, Inc. |
|
|
42 |
|
|
|
27,148 |
|
|
|
2.08 |
% |
|
CDW
Corporation |
|
|
120 |
|
|
|
26,960 |
|
|
|
2.06 |
% |
|
Cardinal
Health, Inc. |
|
|
274 |
|
|
|
26,956 |
|
|
|
2.06 |
% |
|
Eaton
Corporation PLC |
|
|
86 |
|
|
|
26,899 |
|
|
|
2.06 |
% |
|
LyondellBasell
Industries N.V. - Class A |
|
|
281 |
|
|
|
26,896 |
|
|
|
2.06 |
% |
|
Ecolab,
Inc. |
|
|
113 |
|
|
|
26,874 |
|
|
|
2.06 |
% |
|
United
Parcel Service - Class B |
|
|
196 |
|
|
|
26,853 |
|
|
|
2.06 |
% |
|
Realty
Income Corporation |
|
|
507 |
|
|
|
26,755 |
|
|
|
2.05 |
% |
|
Fastenal
Company |
|
|
423 |
|
|
|
26,564 |
|
|
|
2.03 |
% |
|
Pfizer,
Inc. |
|
|
945 |
|
|
|
26,441 |
|
|
|
2.02 |
% |
|
Progressive
Corporation |
|
|
127 |
|
|
|
26,396 |
|
|
|
2.02 |
% |
|
Agilent
Technologies, Inc. |
|
|
203 |
|
|
|
26,328 |
|
|
|
2.02 |
% |
|
Mettler-Toledo
International, Inc. |
|
|
19 |
|
|
|
26,239 |
|
|
|
2.01 |
% |
|
Canadian
Imperial Bank of Commerce |
|
|
551 |
|
|
|
26,209 |
|
|
|
2.01 |
% |
|
General
Dynamics Corporation |
|
|
90 |
|
|
|
26,196 |
|
|
|
2.00 |
% |
|
Westinghouse
Air Brake Technologies Corporation |
|
|
166 |
|
|
|
26,161 |
|
|
|
2.00 |
% |
|
Steris
Corporation |
|
|
119 |
|
|
|
26,138 |
|
|
|
2.00 |
% |
|
Allstate
Corporation (The) |
|
|
164 |
|
|
|
26,125 |
|
|
|
2.00 |
% |
|
Church
& Dwight Company, Inc. |
|
|
252 |
|
|
|
26,078 |
|
|
|
2.00 |
% |
|
PACCAR,
Inc. |
|
|
251 |
|
|
|
25,822 |
|
|
|
1.98 |
% |
|
HCA
Healthcare, Inc. |
|
|
80 |
|
|
|
25,715 |
|
|
|
1.97 |
% |
|
ON
Semiconductor Corporation |
|
|
374 |
|
|
|
25,604 |
|
|
|
1.96 |
% |
|
Automatic
Data Processing, Inc. |
|
|
107 |
|
|
|
25,549 |
|
|
|
1.96 |
% |
| |
|
|
|
|
|
$ |
1,306,215 |
|
|
|
100.00 |
% |
|
See
accompanying notes to financial statements. |
CRM
Funds |
| |
30 |
|
|
CRM
FUNDS
CRM
LONG/SHORT OPPORTUNITIES FUND
SCHEDULE
OF INVESTMENTS (Continued)
June
30, 2024 |
The
following table represents the individual positions and related values of underlying securities of Morgan Stanley Custom Basket (MSCM1064)
Index total return swap with Morgan Stanley Bank as of June 30, 2024, termination date 7/31/24:
|
Reference
Entity |
|
Shares |
|
|
Market
Value |
|
|
%
of Total
Index Value |
|
|
Apple,
Inc. |
|
|
127 |
|
|
$ |
26,807 |
|
|
|
2.05 |
% |
|
O’Reilly
Automotive, Inc. |
|
|
25 |
|
|
|
26,619 |
|
|
|
2.04 |
% |
|
Rockwell
Automation, Inc. |
|
|
96 |
|
|
|
26,510 |
|
|
|
2.03 |
% |
|
AT&T,
Inc. |
|
|
1,376 |
|
|
|
26,300 |
|
|
|
2.01 |
% |
|
NetApp,
Inc. |
|
|
200 |
|
|
|
25,758 |
|
|
|
1.97 |
% |
|
Moody’s
Corporation |
|
|
61 |
|
|
|
25,746 |
|
|
|
1.97 |
% |
|
Extra
Space Storage, Inc. |
|
|
164 |
|
|
|
25,501 |
|
|
|
1.95 |
% |
|
Home
Depot, Inc. (The) |
|
|
74 |
|
|
|
25,442 |
|
|
|
1.95 |
% |
|
Blackstone,
Inc. |
|
|
205 |
|
|
|
25,421 |
|
|
|
1.94 |
% |
|
Motorola
Solutions, Inc. |
|
|
66 |
|
|
|
25,385 |
|
|
|
1.94 |
% |
|
Old
Dominion Freight Line, Inc. |
|
|
144 |
|
|
|
25,366 |
|
|
|
1.94 |
% |
|
West
Pharmaceutical Services, Inc. |
|
|
77 |
|
|
|
25,312 |
|
|
|
1.94 |
% |
|
Iron
Mountain, Inc. |
|
|
282 |
|
|
|
25,290 |
|
|
|
1.93 |
% |
|
Amgen,
Inc. |
|
|
81 |
|
|
|
25,203 |
|
|
|
1.93 |
% |
|
Cintas
Corporation |
|
|
36 |
|
|
|
25,157 |
|
|
|
1.92 |
% |
|
Sherwin-Williams
Company (The) |
|
|
84 |
|
|
|
25,025 |
|
|
|
1.91 |
% |
|
Cummins,
Inc. |
|
|
90 |
|
|
|
24,918 |
|
|
|
1.90 |
% |
|
Emerson
Electric Company |
|
|
226 |
|
|
|
24,903 |
|
|
|
1.90 |
% |
|
Ford
Motor Company |
|
|
1,985 |
|
|
|
24,897 |
|
|
|
1.90 |
% |
|
Cognizant
Technology Solutions Corporation |
|
|
365 |
|
|
|
24,853 |
|
|
|
1.90 |
% |
|
Caterpillar,
Inc. |
|
|
75 |
|
|
|
24,839 |
|
|
|
1.90 |
% |
|
Prologis,
Inc. |
|
|
221 |
|
|
|
24,831 |
|
|
|
1.90 |
% |
|
Marvell
Technology, Inc. |
|
|
354 |
|
|
|
24,731 |
|
|
|
1.89 |
% |
|
W.
W. Grainger, Inc. |
|
|
27 |
|
|
|
24,713 |
|
|
|
1.89 |
% |
|
McDonald’s
Corporation |
|
|
97 |
|
|
|
24,679 |
|
|
|
1.89 |
% |
|
United
Rentals, Inc. |
|
|
38 |
|
|
|
24,641 |
|
|
|
1.88 |
% |
|
Realty
Income Corporation |
|
|
466 |
|
|
|
24,631 |
|
|
|
1.88 |
% |
|
Costco
Wholesale Corporation |
|
|
29 |
|
|
|
24,627 |
|
|
|
1.88 |
% |
|
LyondellBasell
Industries N.V. - Class A |
|
|
257 |
|
|
|
24,605 |
|
|
|
1.88 |
% |
|
CDW
Corporation |
|
|
110 |
|
|
|
24,573 |
|
|
|
1.88 |
% |
|
Pfizer,
Inc. |
|
|
876 |
|
|
|
24,500 |
|
|
|
1.87 |
% |
|
Ecolab,
Inc. |
|
|
103 |
|
|
|
24,500 |
|
|
|
1.87 |
% |
|
Cardinal
Health, Inc. |
|
|
249 |
|
|
|
24,450 |
|
|
|
1.87 |
% |
|
United
Parcel Service - Class B |
|
|
179 |
|
|
|
24,431 |
|
|
|
1.87 |
% |
|
Fastenal
Company |
|
|
388 |
|
|
|
24,370 |
|
|
|
1.86 |
% |
|
Progressive
Corporation |
|
|
117 |
|
|
|
24,279 |
|
|
|
1.86 |
% |
|
Tractor
Supply Company |
|
|
90 |
|
|
|
24,254 |
|
|
|
1.85 |
% |
|
General
Dynamics Corporation |
|
|
83 |
|
|
|
24,201 |
|
|
|
1.85 |
% |
|
See
accompanying notes to financial statements. |
CRM
Funds |
| |
31 |
|
|
CRM
FUNDS
CRM
LONG/SHORT OPPORTUNITIES FUND
SCHEDULE
OF INVESTMENTS (Continued)
June
30, 2024 |
|
Reference
Entity |
|
Shares |
|
|
Market
Value |
|
|
%
of Total
Index Value |
|
|
Western
Digital Corporation |
|
|
319 |
|
|
$ |
24,155 |
|
|
|
1.85 |
% |
|
General
Motors Company |
|
|
517 |
|
|
|
24,006 |
|
|
|
1.84 |
% |
|
Steris
Corporation |
|
|
109 |
|
|
|
24,005 |
|
|
|
1.84 |
% |
|
Canadian
Imperial Bank of Commerce |
|
|
504 |
|
|
|
23,959 |
|
|
|
1.83 |
% |
|
Allstate
Corporation (The) |
|
|
150 |
|
|
|
23,957 |
|
|
|
1.83 |
% |
|
Agilent
Technologies, Inc. |
|
|
185 |
|
|
|
23,951 |
|
|
|
1.83 |
% |
|
Eaton
Corporation PLC |
|
|
76 |
|
|
|
23,862 |
|
|
|
1.82 |
% |
|
Mettler-Toledo
International, Inc. |
|
|
17 |
|
|
|
23,792 |
|
|
|
1.82 |
% |
|
Automatic
Data Processing, Inc. |
|
|
100 |
|
|
|
23,765 |
|
|
|
1.82 |
% |
|
Westinghouse
Air Brake Technologies Corporation |
|
|
150 |
|
|
|
23,725 |
|
|
|
1.81 |
% |
|
Church
& Dwight Company, Inc. |
|
|
228 |
|
|
|
23,657 |
|
|
|
1.81 |
% |
|
PACCAR,
Inc. |
|
|
229 |
|
|
|
23,552 |
|
|
|
1.80 |
% |
|
Starbucks
Corporation |
|
|
301 |
|
|
|
23,450 |
|
|
|
1.79 |
% |
|
HCA
Healthcare, Inc. |
|
|
72 |
|
|
|
23,140 |
|
|
|
1.77 |
% |
|
ON
Semiconductor Corporation |
|
|
334 |
|
|
|
22,924 |
|
|
|
1.75 |
% |
| |
|
|
|
|
|
$ |
1,308,168 |
|
|
|
100.00 |
% |
The
following table represents the individual positions and related values of underlying securities of Morgan Stanley Custom Basket (MSCM1065)
Index total return swap with Morgan Stanley Bank as of June 30, 2024, termination date 7/31/24:
|
Reference
Entity |
|
Shares |
|
|
Market
Value |
|
|
%
of Total
Index Value |
|
|
Rockwell
Automation, Inc. |
|
|
108 |
|
|
$ |
29,810 |
|
|
|
2.29 |
% |
|
AT&T,
Inc. |
|
|
1,547 |
|
|
|
29,557 |
|
|
|
2.27 |
% |
|
Moody’s
Corporation |
|
|
68 |
|
|
|
28,829 |
|
|
|
2.22 |
% |
|
Blackstone,
Inc. |
|
|
232 |
|
|
|
28,735 |
|
|
|
2.21 |
% |
|
Amgen,
Inc. |
|
|
92 |
|
|
|
28,703 |
|
|
|
2.21 |
% |
|
Ford
Motor Company |
|
|
2,281 |
|
|
|
28,604 |
|
|
|
2.20 |
% |
|
United
Rentals, Inc. |
|
|
44 |
|
|
|
28,448 |
|
|
|
2.19 |
% |
|
NetApp,
Inc. |
|
|
220 |
|
|
|
28,357 |
|
|
|
2.18 |
% |
|
Iron
Mountain, Inc. |
|
|
316 |
|
|
|
28,348 |
|
|
|
2.18 |
% |
|
Home
Depot, Inc. (The) |
|
|
82 |
|
|
|
28,324 |
|
|
|
2.18 |
% |
|
Motorola
Solutions, Inc. |
|
|
73 |
|
|
|
28,294 |
|
|
|
2.17 |
% |
|
Emerson
Electric Company |
|
|
257 |
|
|
|
28,278 |
|
|
|
2.17 |
% |
|
Cintas
Corporation |
|
|
40 |
|
|
|
28,159 |
|
|
|
2.16 |
% |
|
Cummins,
Inc. |
|
|
102 |
|
|
|
28,155 |
|
|
|
2.16 |
% |
|
Caterpillar,
Inc. |
|
|
84 |
|
|
|
28,112 |
|
|
|
2.16 |
% |
|
Apple,
Inc. |
|
|
133 |
|
|
|
28,086 |
|
|
|
2.16 |
% |
|
Old
Dominion Freight Line, Inc. |
|
|
159 |
|
|
|
28,051 |
|
|
|
2.16 |
% |
|
Cognizant
Technology Solutions Corporation |
|
|
412 |
|
|
|
28,048 |
|
|
|
2.16 |
% |
|
Sherwin-Williams
Company (The) |
|
|
93 |
|
|
|
27,850 |
|
|
|
2.14 |
% |
|
See
accompanying notes to financial statements. |
CRM
Funds |
| |
32 |
|
|
CRM
FUNDS
CRM
LONG/SHORT OPPORTUNITIES FUND
SCHEDULE
OF INVESTMENTS (Continued)
June
30, 2024 |
|
Reference
Entity |
|
Shares |
|
|
Market
Value |
|
|
%
of Total
Index Value |
|
|
West
Pharmaceutical Services, Inc. |
|
|
84 |
|
|
$ |
27,726 |
|
|
|
2.13 |
% |
|
W.
W. Grainger, Inc. |
|
|
31 |
|
|
|
27,683 |
|
|
|
2.13 |
% |
|
Costco
Wholesale Corporation |
|
|
33 |
|
|
|
27,646 |
|
|
|
2.12 |
% |
|
Pfizer,
Inc. |
|
|
985 |
|
|
|
27,574 |
|
|
|
2.12 |
% |
|
CDW
Corporation |
|
|
123 |
|
|
|
27,559 |
|
|
|
2.12 |
% |
|
United
Parcel Service - Class B |
|
|
201 |
|
|
|
27,523 |
|
|
|
2.12 |
% |
|
Progressive
Corporation |
|
|
132 |
|
|
|
27,520 |
|
|
|
2.12 |
% |
|
Fastenal
Company |
|
|
437 |
|
|
|
27,436 |
|
|
|
2.11 |
% |
|
LyondellBasell
Industries N.V. - Class A |
|
|
287 |
|
|
|
27,431 |
|
|
|
2.11 |
% |
|
Cardinal
Health, Inc. |
|
|
279 |
|
|
|
27,431 |
|
|
|
2.11 |
% |
|
Marvell
Technology, Inc. |
|
|
392 |
|
|
|
27,427 |
|
|
|
2.11 |
% |
|
General
Dynamics Corporation |
|
|
94 |
|
|
|
27,386 |
|
|
|
2.10 |
% |
|
Western
Digital Corporation |
|
|
361 |
|
|
|
27,353 |
|
|
|
2.10 |
% |
|
Canadian
Imperial Bank of Commerce |
|
|
575 |
|
|
|
27,347 |
|
|
|
2.10 |
% |
|
Ecolab,
Inc. |
|
|
115 |
|
|
|
27,324 |
|
|
|
2.10 |
% |
|
Allstate
Corporation (The) |
|
|
171 |
|
|
|
27,292 |
|
|
|
2.10 |
% |
|
Eaton
Corporation PLC |
|
|
87 |
|
|
|
27,137 |
|
|
|
2.09 |
% |
|
Agilent
Technologies, Inc. |
|
|
209 |
|
|
|
27,105 |
|
|
|
2.08 |
% |
|
Steris
Corporation |
|
|
123 |
|
|
|
26,900 |
|
|
|
2.07 |
% |
|
PACCAR,
Inc. |
|
|
261 |
|
|
|
26,826 |
|
|
|
2.06 |
% |
|
Westinghouse
Air Brake Technologies Corporation |
|
|
170 |
|
|
|
26,812 |
|
|
|
2.06 |
% |
|
Tractor
Supply Company |
|
|
99 |
|
|
|
26,800 |
|
|
|
2.06 |
% |
|
Mettler-Toledo
International, Inc. |
|
|
19 |
|
|
|
26,784 |
|
|
|
2.06 |
% |
|
Automatic
Data Processing, Inc. |
|
|
112 |
|
|
|
26,739 |
|
|
|
2.06 |
% |
|
General
Motors Company |
|
|
573 |
|
|
|
26,621 |
|
|
|
2.05 |
% |
|
Church
& Dwight Company, Inc. |
|
|
256 |
|
|
|
26,536 |
|
|
|
2.04 |
% |
|
HCA
Healthcare, Inc. |
|
|
82 |
|
|
|
26,389 |
|
|
|
2.03 |
% |
|
ON
Semiconductor Corporation |
|
|
373 |
|
|
|
25,596 |
|
|
|
1.97 |
% |
| |
|
|
|
|
|
$ |
1,300,651 |
|
|
|
100.00 |
% |
The
following table represents the individual positions and related values of underlying securities of Morgan Stanley Custom Basket (MSCM1066)
Index total return swap with Morgan Stanley Bank as of June 30, 2024, termination date 7/31/24:
|
Reference
Entity |
|
Shares |
|
|
Market
Value |
|
|
%
of Total
Index Value |
|
|
Dollar
General Corporation |
|
|
655 |
|
|
$ |
86,666 |
|
|
|
6.70 |
% |
|
Restaurant
Brands International, Inc. |
|
|
1,189 |
|
|
|
83,665 |
|
|
|
6.47 |
% |
|
Target
Corporation |
|
|
558 |
|
|
|
82,584 |
|
|
|
6.39 |
% |
|
PepsiCo,
Inc. |
|
|
500 |
|
|
|
82,431 |
|
|
|
6.37 |
% |
|
Sysco
Corporation |
|
|
1,151 |
|
|
|
82,180 |
|
|
|
6.35 |
% |
|
McDonald’s
Corporation |
|
|
322 |
|
|
|
81,997 |
|
|
|
6.34 |
% |
|
See
accompanying notes to financial statements. |
CRM
Funds |
| |
33 |
|
|
CRM
FUNDS
CRM
LONG/SHORT OPPORTUNITIES FUND
SCHEDULE
OF INVESTMENTS (Continued)
June
30, 2024 |
|
Reference
Entity |
|
Shares |
|
|
Market
Value |
|
|
%
of Total
Index Value |
|
|
Kroger
Company (The) |
|
|
1,632 |
|
|
$ |
81,490 |
|
|
|
6.30 |
% |
|
CVS
Health Corporation |
|
|
1,365 |
|
|
|
80,612 |
|
|
|
6.23 |
% |
|
International
Flavors & Fragrances, Inc. |
|
|
846 |
|
|
|
80,553 |
|
|
|
6.23 |
% |
|
Hershey
Company (The) |
|
|
437 |
|
|
|
80,399 |
|
|
|
6.22 |
% |
|
Starbucks
Corporation |
|
|
1,032 |
|
|
|
80,303 |
|
|
|
6.21 |
% |
|
Canadian
Imperial Bank of Commerce |
|
|
1,682 |
|
|
|
79,964 |
|
|
|
6.18 |
% |
|
General
Mills, Inc. |
|
|
1,254 |
|
|
|
79,335 |
|
|
|
6.13 |
% |
|
Lululemon
Athletica, Inc. |
|
|
264 |
|
|
|
78,945 |
|
|
|
6.10 |
% |
|
Marvell
Technology, Inc. |
|
|
1,116 |
|
|
|
78,019 |
|
|
|
6.03 |
% |
|
Williams-Sonoma,
Inc. |
|
|
263 |
|
|
|
74,343 |
|
|
|
5.75 |
% |
| |
|
|
|
|
|
$ |
1,293,486 |
|
|
|
100.00 |
% |
The
following table represents the individual positions and related values of underlying securities of Morgan Stanley Custom Basket (MSCM1067)
Index total return swap with Morgan Stanley Bank as of June 30, 2024, termination date 7/31/24:
|
Reference
Entity |
|
Shares |
|
|
Market
Value |
|
|
%
of Total
Index Value |
|
|
Constellation
Brands, Inc. |
|
|
512 |
|
|
$ |
131,671 |
|
|
|
10.21 |
% |
|
PepsiCo,
Inc. |
|
|
798 |
|
|
|
131,586 |
|
|
|
10.20 |
% |
|
Sysco
Corporation |
|
|
1,834 |
|
|
|
130,952 |
|
|
|
10.15 |
% |
|
International
Flavors & Fragrances, Inc. |
|
|
1,371 |
|
|
|
130,516 |
|
|
|
10.12 |
% |
|
Hershey
Company (The) |
|
|
702 |
|
|
|
129,074 |
|
|
|
10.01 |
% |
|
Canadian
Imperial Bank of Commerce |
|
|
2,713 |
|
|
|
128,981 |
|
|
|
10.00 |
% |
|
Kroger
Company (The) |
|
|
2,579 |
|
|
|
128,788 |
|
|
|
9.98 |
% |
|
Extra
Space Storage, Inc. |
|
|
822 |
|
|
|
127,745 |
|
|
|
9.90 |
% |
|
General
Mills, Inc. |
|
|
1,986 |
|
|
|
125,643 |
|
|
|
9.74 |
% |
|
Marvell
Technology, Inc. |
|
|
1,788 |
|
|
|
124,999 |
|
|
|
9.69 |
% |
| |
|
|
|
|
|
$ |
1,289,955 |
|
|
|
100.00 |
% |
The
following table represents the individual positions and related values of underlying securities of Morgan Stanley Custom Basket (MSCM1068)
Index total return swap with Morgan Stanley Bank as of June 30, 2024, termination date 7/31/24:
|
Reference
Entity |
|
Shares |
|
|
Market
Value |
|
|
%
of Total
Index Value |
|
|
AT&T,
Inc. |
|
|
1,531 |
|
|
$ |
29,257 |
|
|
|
2.24 |
% |
|
Rockwell
Automation, Inc. |
|
|
106 |
|
|
|
29,224 |
|
|
|
2.24 |
% |
|
Ford
Motor Company |
|
|
2,306 |
|
|
|
28,920 |
|
|
|
2.22 |
% |
|
Cognizant
Technology Solutions Corporation |
|
|
420 |
|
|
|
28,578 |
|
|
|
2.19 |
% |
|
United
Rentals, Inc. |
|
|
44 |
|
|
|
28,344 |
|
|
|
2.17 |
% |
|
See
accompanying notes to financial statements. |
CRM
Funds |
| |
34 |
|
|
CRM
FUNDS
CRM
LONG/SHORT OPPORTUNITIES FUND
SCHEDULE
OF INVESTMENTS (Continued)
June
30, 2024 |
|
Reference
Entity |
|
Shares |
|
|
Market
Value |
|
|
%
of Total
Index Value |
|
|
Amgen,
Inc. |
|
|
90 |
|
|
$ |
28,257 |
|
|
|
2.17 |
% |
|
Cummins,
Inc. |
|
|
101 |
|
|
|
28,065 |
|
|
|
2.15 |
% |
|
Caterpillar,
Inc. |
|
|
84 |
|
|
|
27,983 |
|
|
|
2.15 |
% |
|
Emerson
Electric Company |
|
|
254 |
|
|
|
27,945 |
|
|
|
2.14 |
% |
|
Moody’s
Corporation |
|
|
66 |
|
|
|
27,854 |
|
|
|
2.14 |
% |
|
Motorola
Solutions, Inc. |
|
|
72 |
|
|
|
27,772 |
|
|
|
2.13 |
% |
|
LyondellBasell
Industries N.V. - Class A |
|
|
289 |
|
|
|
27,618 |
|
|
|
2.12 |
% |
|
Old
Dominion Freight Line, Inc. |
|
|
156 |
|
|
|
27,610 |
|
|
|
2.12 |
% |
|
Blackstone,
Inc. |
|
|
223 |
|
|
|
27,574 |
|
|
|
2.11 |
% |
|
NetApp,
Inc. |
|
|
214 |
|
|
|
27,569 |
|
|
|
2.11 |
% |
|
Progressive
Corporation |
|
|
132 |
|
|
|
27,508 |
|
|
|
2.11 |
% |
|
Iron
Mountain, Inc. |
|
|
307 |
|
|
|
27,497 |
|
|
|
2.11 |
% |
|
Allstate
Corporation (The) |
|
|
172 |
|
|
|
27,452 |
|
|
|
2.10 |
% |
|
Pfizer,
Inc. |
|
|
981 |
|
|
|
27,448 |
|
|
|
2.10 |
% |
|
United
Parcel Service - Class B |
|
|
199 |
|
|
|
27,245 |
|
|
|
2.09 |
% |
|
Cintas
Corporation |
|
|
39 |
|
|
|
27,184 |
|
|
|
2.08 |
% |
|
Steris
Corporation |
|
|
124 |
|
|
|
27,161 |
|
|
|
2.08 |
% |
|
Sherwin-Williams
Company (The) |
|
|
91 |
|
|
|
27,137 |
|
|
|
2.08 |
% |
|
CDW
Corporation |
|
|
121 |
|
|
|
27,085 |
|
|
|
2.08 |
% |
|
Prologis,
Inc. |
|
|
241 |
|
|
|
27,011 |
|
|
|
2.07 |
% |
|
Agilent
Technologies, Inc. |
|
|
208 |
|
|
|
26,960 |
|
|
|
2.07 |
% |
|
Fastenal
Company |
|
|
428 |
|
|
|
26,916 |
|
|
|
2.06 |
% |
|
W.
W. Grainger, Inc. |
|
|
30 |
|
|
|
26,871 |
|
|
|
2.06 |
% |
|
General
Dynamics Corporation |
|
|
93 |
|
|
|
26,854 |
|
|
|
2.06 |
% |
|
General
Motors Company |
|
|
577 |
|
|
|
26,827 |
|
|
|
2.06 |
% |
|
Costco
Wholesale Corporation |
|
|
32 |
|
|
|
26,827 |
|
|
|
2.06 |
% |
|
Extra
Space Storage, Inc. |
|
|
172 |
|
|
|
26,806 |
|
|
|
2.06 |
% |
|
Home
Depot, Inc. (The) |
|
|
78 |
|
|
|
26,804 |
|
|
|
2.05 |
% |
|
Ecolab,
Inc. |
|
|
113 |
|
|
|
26,776 |
|
|
|
2.05 |
% |
|
Apple,
Inc. |
|
|
127 |
|
|
|
26,769 |
|
|
|
2.05 |
% |
|
West
Pharmaceutical Services, Inc. |
|
|
81 |
|
|
|
26,693 |
|
|
|
2.05 |
% |
|
Westinghouse
Air Brake Technologies Corporation |
|
|
168 |
|
|
|
26,624 |
|
|
|
2.04 |
% |
|
Automatic
Data Processing, Inc. |
|
|
111 |
|
|
|
26,569 |
|
|
|
2.04 |
% |
|
Eaton
Corporation PLC |
|
|
85 |
|
|
|
26,543 |
|
|
|
2.03 |
% |
|
Cardinal
Health, Inc. |
|
|
270 |
|
|
|
26,500 |
|
|
|
2.03 |
% |
|
Hubbell,
Inc. |
|
|
72 |
|
|
|
26,339 |
|
|
|
2.02 |
% |
|
Western
Digital Corporation |
|
|
346 |
|
|
|
26,194 |
|
|
|
2.01 |
% |
|
PACCAR,
Inc. |
|
|
253 |
|
|
|
26,050 |
|
|
|
2.00 |
% |
|
Church
& Dwight Company, Inc. |
|
|
251 |
|
|
|
25,998 |
|
|
|
1.99 |
% |
|
Mettler-Toledo
International, Inc. |
|
|
19 |
|
|
|
25,945 |
|
|
|
1.99 |
% |
|
Marvell
Technology, Inc. |
|
|
369 |
|
|
|
25,764 |
|
|
|
1.98 |
% |
|
ON
Semiconductor Corporation |
|
|
375 |
|
|
|
25,723 |
|
|
|
1.97 |
% |
|
See
accompanying notes to financial statements. |
CRM
Funds |
| |
35 |
|
|
CRM
FUNDS
CRM
LONG/SHORT OPPORTUNITIES FUND
SCHEDULE
OF INVESTMENTS (Continued)
June
30, 2024 |
|
Reference
Entity |
|
Shares |
|
|
Market
Value |
|
|
%
of Total
Index Value |
|
|
HCA
Healthcare, Inc. |
|
|
80 |
|
|
$ |
25,711 |
|
|
|
1.97 |
% |
| |
|
|
|
|
|
$ |
1,304,361 |
|
|
|
100.00 |
% |
The
following table represents the individual positions and related values of underlying securities of Morgan Stanley Custom Basket (MSCM1069)
Index total return swap with Morgan Stanley Bank as of June 30, 2024, termination date 7/31/24:
|
Reference
Entity |
|
Shares |
|
|
Market
Value |
|
|
%
of Total
Index Value |
|
|
AT&T,
Inc. |
|
|
1,290 |
|
|
$ |
24,654 |
|
|
|
1.90 |
% |
|
Rockwell
Automation, Inc. |
|
|
88 |
|
|
|
24,275 |
|
|
|
1.87 |
% |
|
Ford
Motor Company |
|
|
1,924 |
|
|
|
24,124 |
|
|
|
1.86 |
% |
|
United
Rentals, Inc. |
|
|
37 |
|
|
|
23,807 |
|
|
|
1.84 |
% |
|
Cognizant
Technology Solutions Corporation |
|
|
348 |
|
|
|
23,659 |
|
|
|
1.83 |
% |
|
Pfizer,
Inc. |
|
|
845 |
|
|
|
23,641 |
|
|
|
1.82 |
% |
|
Caterpillar,
Inc. |
|
|
71 |
|
|
|
23,553 |
|
|
|
1.82 |
% |
|
Amgen,
Inc. |
|
|
75 |
|
|
|
23,486 |
|
|
|
1.81 |
% |
|
Cummins,
Inc. |
|
|
84 |
|
|
|
23,389 |
|
|
|
1.81 |
% |
|
Emerson
Electric Company |
|
|
212 |
|
|
|
23,389 |
|
|
|
1.81 |
% |
|
NetApp,
Inc. |
|
|
181 |
|
|
|
23,296 |
|
|
|
1.80 |
% |
|
Moody’s
Corporation |
|
|
55 |
|
|
|
23,273 |
|
|
|
1.80 |
% |
|
LyondellBasell
Industries N.V. - Class A |
|
|
243 |
|
|
|
23,211 |
|
|
|
1.79 |
% |
|
Steris
Corporation |
|
|
105 |
|
|
|
23,157 |
|
|
|
1.79 |
% |
|
Old
Dominion Freight Line, Inc. |
|
|
131 |
|
|
|
23,148 |
|
|
|
1.79 |
% |
|
Iron
Mountain, Inc. |
|
|
258 |
|
|
|
23,145 |
|
|
|
1.79 |
% |
|
Blackstone,
Inc. |
|
|
187 |
|
|
|
23,103 |
|
|
|
1.78 |
% |
|
O’Reilly
Automotive, Inc. |
|
|
22 |
|
|
|
23,076 |
|
|
|
1.78 |
% |
|
Prologis,
Inc. |
|
|
205 |
|
|
|
23,008 |
|
|
|
1.78 |
% |
|
Motorola
Solutions, Inc. |
|
|
60 |
|
|
|
22,989 |
|
|
|
1.77 |
% |
|
United
Parcel Service - Class B |
|
|
168 |
|
|
|
22,964 |
|
|
|
1.77 |
% |
|
Allstate
Corporation (The) |
|
|
144 |
|
|
|
22,929 |
|
|
|
1.77 |
% |
|
McDonald’s
Corporation |
|
|
90 |
|
|
|
22,916 |
|
|
|
1.77 |
% |
|
International
Flavors & Fragrances, Inc. |
|
|
240 |
|
|
|
22,895 |
|
|
|
1.77 |
% |
|
Hershey
Company (The) |
|
|
125 |
|
|
|
22,894 |
|
|
|
1.77 |
% |
|
Canadian
Imperial Bank of Commerce |
|
|
480 |
|
|
|
22,820 |
|
|
|
1.76 |
% |
|
Progressive
Corporation |
|
|
109 |
|
|
|
22,738 |
|
|
|
1.75 |
% |
|
PepsiCo,
Inc. |
|
|
137 |
|
|
|
22,630 |
|
|
|
1.75 |
% |
|
Cintas
Corporation |
|
|
32 |
|
|
|
22,565 |
|
|
|
1.74 |
% |
|
CDW
Corporation |
|
|
101 |
|
|
|
22,544 |
|
|
|
1.74 |
% |
|
General
Dynamics Corporation |
|
|
78 |
|
|
|
22,510 |
|
|
|
1.74 |
% |
|
Sherwin-Williams
Company (The) |
|
|
75 |
|
|
|
22,464 |
|
|
|
1.73 |
% |
|
Home
Depot, Inc. (The) |
|
|
65 |
|
|
|
22,453 |
|
|
|
1.73 |
% |
|
See
accompanying notes to financial statements. |
CRM
Funds |
| |
36 |
|
|
CRM
FUNDS
CRM
LONG/SHORT OPPORTUNITIES FUND
SCHEDULE
OF INVESTMENTS (Continued)
June
30, 2024 |
|
Reference
Entity |
|
Shares |
|
|
Market
Value |
|
|
%
of Total
Index Value |
|
|
W.
W. Grainger, Inc. |
|
|
25 |
|
|
$ |
22,419 |
|
|
|
1.73 |
% |
|
Agilent
Technologies, Inc. |
|
|
173 |
|
|
|
22,416 |
|
|
|
1.73 |
% |
|
Constellation
Brands, Inc. |
|
|
87 |
|
|
|
22,357 |
|
|
|
1.73 |
% |
|
General
Motors Company |
|
|
481 |
|
|
|
22,344 |
|
|
|
1.72 |
% |
|
West
Pharmaceutical Services, Inc. |
|
|
68 |
|
|
|
22,343 |
|
|
|
1.72 |
% |
|
Costco
Wholesale Corporation |
|
|
26 |
|
|
|
22,326 |
|
|
|
1.72 |
% |
|
Sysco
Corporation |
|
|
313 |
|
|
|
22,312 |
|
|
|
1.72 |
% |
|
Ecolab,
Inc. |
|
|
94 |
|
|
|
22,309 |
|
|
|
1.72 |
% |
|
Westinghouse
Air Brake Technologies Corporation |
|
|
141 |
|
|
|
22,294 |
|
|
|
1.72 |
% |
|
Carlisle
Companies, Inc. |
|
|
55 |
|
|
|
22,250 |
|
|
|
1.72 |
% |
|
Fastenal
Company |
|
|
354 |
|
|
|
22,241 |
|
|
|
1.72 |
% |
|
Automatic
Data Processing, Inc. |
|
|
93 |
|
|
|
22,213 |
|
|
|
1.71 |
% |
|
Cardinal
Health, Inc. |
|
|
226 |
|
|
|
22,203 |
|
|
|
1.71 |
% |
|
Marvell
Technology, Inc. |
|
|
317 |
|
|
|
22,187 |
|
|
|
1.71 |
% |
|
Apple,
Inc. |
|
|
105 |
|
|
|
22,160 |
|
|
|
1.71 |
% |
|
ON
Semiconductor Corporation |
|
|
322 |
|
|
|
22,094 |
|
|
|
1.71 |
% |
|
Mettler-Toledo
International, Inc. |
|
|
16 |
|
|
|
22,007 |
|
|
|
1.70 |
% |
|
Eaton
Corporation PLC |
|
|
70 |
|
|
|
21,971 |
|
|
|
1.70 |
% |
|
HCA
Healthcare, Inc. |
|
|
68 |
|
|
|
21,832 |
|
|
|
1.69 |
% |
|
Hubbell,
Inc. |
|
|
60 |
|
|
|
21,832 |
|
|
|
1.68 |
% |
|
PACCAR,
Inc. |
|
|
212 |
|
|
|
21,779 |
|
|
|
1.68 |
% |
|
General
Mills, Inc. |
|
|
344 |
|
|
|
21,755 |
|
|
|
1.68 |
% |
|
Western
Digital Corporation |
|
|
285 |
|
|
|
21,629 |
|
|
|
1.67 |
% |
|
Church
& Dwight Company, Inc. |
|
|
209 |
|
|
|
21,624 |
|
|
|
1.67 |
% |
| |
|
|
|
|
|
$ |
1,295,602 |
|
|
|
100.00 |
% |
The
following table represents the individual positions and related values of underlying securities of Morgan Stanley Custom Basket (MSCM1070)
Index total return swap with Morgan Stanley Bank as of June 30, 2024, termination date 7/31/24:
|
Reference
Entity |
|
Shares |
|
|
Market
Value |
|
|
%
of Total
Index Value |
|
|
Ford
Motor Company |
|
|
3,147 |
|
|
$ |
39,466 |
|
|
|
3.07 |
% |
|
AT&T,
Inc. |
|
|
2,054 |
|
|
|
39,252 |
|
|
|
3.06 |
% |
|
Cognizant
Technology Solutions Corporation |
|
|
563 |
|
|
|
38,308 |
|
|
|
2.98 |
% |
|
West
Pharmaceutical Services, Inc. |
|
|
115 |
|
|
|
37,917 |
|
|
|
2.95 |
% |
|
Amgen,
Inc. |
|
|
121 |
|
|
|
37,857 |
|
|
|
2.95 |
% |
|
Pfizer,
Inc. |
|
|
1,353 |
|
|
|
37,845 |
|
|
|
2.95 |
% |
|
McDonald’s
Corporation |
|
|
148 |
|
|
|
37,673 |
|
|
|
2.93 |
% |
|
Steris
Corporation |
|
|
171 |
|
|
|
37,595 |
|
|
|
2.93 |
% |
|
Blackstone,
Inc. |
|
|
302 |
|
|
|
37,346 |
|
|
|
2.91 |
% |
|
Motorola
Solutions, Inc. |
|
|
97 |
|
|
|
37,311 |
|
|
|
2.91 |
% |
|
See
accompanying notes to financial statements. |
CRM
Funds |
| |
37 |
|
|
CRM
FUNDS
CRM
LONG/SHORT OPPORTUNITIES FUND
SCHEDULE
OF INVESTMENTS (Continued)
June
30, 2024 |
|
Reference
Entity |
|
Shares |
|
|
Market
Value |
|
|
%
of Total
Index Value |
|
|
Hershey
Company (The) |
|
|
203 |
|
|
$ |
37,298 |
|
|
|
2.90 |
% |
|
LyondellBasell
Industries N.V. - Class A |
|
|
389 |
|
|
|
37,183 |
|
|
|
2.90 |
% |
|
Moody’s
Corporation |
|
|
88 |
|
|
|
37,149 |
|
|
|
2.89 |
% |
|
NetApp,
Inc. |
|
|
288 |
|
|
|
37,100 |
|
|
|
2.89 |
% |
|
O’Reilly
Automotive, Inc. |
|
|
35 |
|
|
|
37,054 |
|
|
|
2.89 |
% |
|
Allstate
Corporation (The) |
|
|
232 |
|
|
|
36,982 |
|
|
|
2.88 |
% |
|
Sherwin-Williams
Company (The) |
|
|
124 |
|
|
|
36,857 |
|
|
|
2.87 |
% |
|
Canadian
Imperial Bank of Commerce |
|
|
775 |
|
|
|
36,834 |
|
|
|
2.87 |
% |
|
PepsiCo,
Inc. |
|
|
223 |
|
|
|
36,729 |
|
|
|
2.86 |
% |
|
Progressive
Corporation |
|
|
176 |
|
|
|
36,540 |
|
|
|
2.85 |
% |
|
Apple,
Inc. |
|
|
173 |
|
|
|
36,439 |
|
|
|
2.84 |
% |
|
General
Motors Company |
|
|
781 |
|
|
|
36,308 |
|
|
|
2.83 |
% |
|
Ecolab,
Inc. |
|
|
152 |
|
|
|
36,268 |
|
|
|
2.82 |
% |
|
Costco
Wholesale Corporation |
|
|
43 |
|
|
|
36,190 |
|
|
|
2.82 |
% |
|
Home
Depot, Inc. (The) |
|
|
105 |
|
|
|
36,065 |
|
|
|
2.81 |
% |
|
CDW
Corporation |
|
|
161 |
|
|
|
35,995 |
|
|
|
2.80 |
% |
|
ON
Semiconductor Corporation |
|
|
524 |
|
|
|
35,932 |
|
|
|
2.80 |
% |
|
Agilent
Technologies, Inc. |
|
|
275 |
|
|
|
35,626 |
|
|
|
2.77 |
% |
|
Marvell
Technology, Inc. |
|
|
507 |
|
|
|
35,432 |
|
|
|
2.76 |
% |
|
Cardinal
Health, Inc. |
|
|
356 |
|
|
|
35,019 |
|
|
|
2.73 |
% |
|
Western
Digital Corporation |
|
|
462 |
|
|
|
35,013 |
|
|
|
2.73 |
% |
|
Mettler-Toledo
International, Inc. |
|
|
25 |
|
|
|
34,985 |
|
|
|
2.72 |
% |
|
Church
& Dwight Company, Inc. |
|
|
337 |
|
|
|
34,973 |
|
|
|
2.72 |
% |
|
HCA
Healthcare, Inc. |
|
|
109 |
|
|
|
34,967 |
|
|
|
2.72 |
% |
|
Tractor
Supply Company |
|
|
128 |
|
|
|
34,520 |
|
|
|
2.69 |
% |
| |
|
|
|
|
|
$ |
1,284,028 |
|
|
|
100.00 |
% |
The
following table represents the individual positions and related values of underlying securities of Morgan Stanley Custom Basket (MSCM1071)
Index total return swap with Morgan Stanley Bank as of June 30, 2024, termination date 7/31/24:
|
Reference
Entity |
|
Shares |
|
|
Market
Value |
|
|
%
of Total
Index Value |
|
|
Rockwell
Automation, Inc. |
|
|
89 |
|
|
$ |
24,399 |
|
|
|
1.91 |
% |
|
AT&T,
Inc. |
|
|
1,275 |
|
|
|
24,366 |
|
|
|
1.91 |
% |
|
Ford
Motor Company |
|
|
1,934 |
|
|
|
24,251 |
|
|
|
1.90 |
% |
|
Restaurant
Brands International, Inc. |
|
|
335 |
|
|
|
23,584 |
|
|
|
1.85 |
% |
|
Emerson
Electric Company |
|
|
214 |
|
|
|
23,522 |
|
|
|
1.84 |
% |
|
ON
Semiconductor Corporation |
|
|
341 |
|
|
|
23,405 |
|
|
|
1.83 |
% |
|
Caterpillar,
Inc. |
|
|
70 |
|
|
|
23,370 |
|
|
|
1.83 |
% |
|
United
Rentals, Inc. |
|
|
36 |
|
|
|
23,362 |
|
|
|
1.83 |
% |
|
Old
Dominion Freight Line, Inc. |
|
|
132 |
|
|
|
23,349 |
|
|
|
1.83 |
% |
|
See
accompanying notes to financial statements. |
CRM
Funds |
| |
38 |
|
|
CRM
FUNDS
CRM
LONG/SHORT OPPORTUNITIES FUND
SCHEDULE
OF INVESTMENTS (Continued)
June
30, 2024 |
|
Reference
Entity |
|
Shares |
|
|
Market
Value |
|
|
%
of Total
Index Value |
|
|
NetApp,
Inc. |
|
|
181 |
|
|
$ |
23,332 |
|
|
|
1.83 |
% |
|
Hershey
Company (The) |
|
|
127 |
|
|
|
23,323 |
|
|
|
1.82 |
% |
|
Iron
Mountain, Inc. |
|
|
260 |
|
|
|
23,296 |
|
|
|
1.82 |
% |
|
Pfizer,
Inc. |
|
|
832 |
|
|
|
23,291 |
|
|
|
1.82 |
% |
|
Amgen,
Inc. |
|
|
75 |
|
|
|
23,282 |
|
|
|
1.82 |
% |
|
LyondellBasell
Industries N.V. - Class A |
|
|
243 |
|
|
|
23,239 |
|
|
|
1.82 |
% |
|
Apple,
Inc. |
|
|
110 |
|
|
|
23,195 |
|
|
|
1.81 |
% |
|
McDonald’s
Corporation |
|
|
91 |
|
|
|
23,186 |
|
|
|
1.81 |
% |
|
Motorola
Solutions, Inc. |
|
|
60 |
|
|
|
23,178 |
|
|
|
1.81 |
% |
|
Canadian
Imperial Bank of Commerce |
|
|
487 |
|
|
|
23,159 |
|
|
|
1.81 |
% |
|
West
Pharmaceutical Services, Inc. |
|
|
70 |
|
|
|
23,144 |
|
|
|
1.81 |
% |
|
Steris
Corporation |
|
|
105 |
|
|
|
23,115 |
|
|
|
1.81 |
% |
|
United
Parcel Service - Class B |
|
|
169 |
|
|
|
23,088 |
|
|
|
1.81 |
% |
|
Cognizant
Technology Solutions Corporation |
|
|
339 |
|
|
|
23,044 |
|
|
|
1.80 |
% |
|
Moody’s
Corporation |
|
|
55 |
|
|
|
22,994 |
|
|
|
1.80 |
% |
|
Cummins,
Inc. |
|
|
83 |
|
|
|
22,977 |
|
|
|
1.80 |
% |
|
Western
Digital Corporation |
|
|
303 |
|
|
|
22,934 |
|
|
|
1.79 |
% |
|
Blackstone,
Inc. |
|
|
185 |
|
|
|
22,928 |
|
|
|
1.79 |
% |
|
Cintas
Corporation |
|
|
33 |
|
|
|
22,887 |
|
|
|
1.79 |
% |
|
Sherwin-Williams
Company (The) |
|
|
77 |
|
|
|
22,867 |
|
|
|
1.79 |
% |
|
PepsiCo,
Inc. |
|
|
139 |
|
|
|
22,849 |
|
|
|
1.79 |
% |
|
W.
W. Grainger, Inc. |
|
|
25 |
|
|
|
22,762 |
|
|
|
1.78 |
% |
|
Costco
Wholesale Corporation |
|
|
27 |
|
|
|
22,758 |
|
|
|
1.78 |
% |
|
Progressive
Corporation |
|
|
110 |
|
|
|
22,747 |
|
|
|
1.78 |
% |
|
Allstate
Corporation (The) |
|
|
142 |
|
|
|
22,675 |
|
|
|
1.77 |
% |
|
Westinghouse
Air Brake Technologies Corporation |
|
|
143 |
|
|
|
22,584 |
|
|
|
1.77 |
% |
|
O’Reilly
Automotive, Inc. |
|
|
21 |
|
|
|
22,567 |
|
|
|
1.77 |
% |
|
Agilent
Technologies, Inc. |
|
|
174 |
|
|
|
22,552 |
|
|
|
1.76 |
% |
|
Ecolab,
Inc. |
|
|
95 |
|
|
|
22,533 |
|
|
|
1.76 |
% |
|
Home
Depot, Inc. (The) |
|
|
65 |
|
|
|
22,490 |
|
|
|
1.76 |
% |
|
General
Motors Company |
|
|
483 |
|
|
|
22,458 |
|
|
|
1.76 |
% |
|
Automatic
Data Processing, Inc. |
|
|
94 |
|
|
|
22,399 |
|
|
|
1.75 |
% |
|
Eaton
Corporation PLC |
|
|
71 |
|
|
|
22,399 |
|
|
|
1.75 |
% |
|
General
Dynamics Corporation |
|
|
77 |
|
|
|
22,360 |
|
|
|
1.75 |
% |
|
CDW
Corporation |
|
|
100 |
|
|
|
22,286 |
|
|
|
1.74 |
% |
|
Fastenal
Company |
|
|
355 |
|
|
|
22,283 |
|
|
|
1.74 |
% |
|
Carlisle
Companies, Inc. |
|
|
55 |
|
|
|
22,279 |
|
|
|
1.74 |
% |
|
Tractor
Supply Company |
|
|
82 |
|
|
|
22,248 |
|
|
|
1.74 |
% |
|
Hubbell,
Inc. |
|
|
61 |
|
|
|
22,205 |
|
|
|
1.74 |
% |
|
PACCAR,
Inc. |
|
|
215 |
|
|
|
22,167 |
|
|
|
1.73 |
% |
|
Mettler-Toledo
International, Inc. |
|
|
16 |
|
|
|
22,156 |
|
|
|
1.73 |
% |
|
Marvell
Technology, Inc. |
|
|
315 |
|
|
|
22,038 |
|
|
|
1.72 |
% |
|
Church
& Dwight Company, Inc. |
|
|
212 |
|
|
|
21,982 |
|
|
|
1.72 |
% |
|
See
accompanying notes to financial statements. |
CRM
Funds |
| |
39 |
|
|
CRM
FUNDS
CRM
LONG/SHORT OPPORTUNITIES FUND
SCHEDULE
OF INVESTMENTS (Continued)
June
30, 2024 |
|
Reference
Entity |
|
Shares |
|
|
Market
Value |
|
|
%
of Total
Index Value |
|
|
HCA
Healthcare, Inc. |
|
|
68 |
|
|
$ |
21,925 |
|
|
|
1.72 |
% |
|
General
Mills, Inc. |
|
|
346 |
|
|
|
21,903 |
|
|
|
1.71 |
% |
|
Cardinal
Health, Inc. |
|
|
221 |
|
|
|
21,752 |
|
|
|
1.70 |
% |
|
Best
Buy Company, Inc. |
|
|
250 |
|
|
|
21,071 |
|
|
|
1.65 |
% |
| |
|
|
|
|
|
$ |
1,278,495 |
|
|
|
100.00 |
% |
The
following table represents the individual positions and related values of underlying securities of Morgan Stanley Custom Basket (MSCM1072)
Index total return swap with Morgan Stanley Bank as of June 30, 2024, termination date 7/31/24:
|
Reference
Entity |
|
Shares |
|
|
Market
Value |
|
|
%
of Total
Index Value |
|
|
Rockwell
Automation, Inc. |
|
|
93 |
|
|
$ |
25,542 |
|
|
|
1.99 |
% |
|
Ford
Motor Company |
|
|
2,026 |
|
|
|
25,405 |
|
|
|
1.98 |
% |
|
AT&T,
Inc. |
|
|
1,304 |
|
|
|
24,913 |
|
|
|
1.94 |
% |
|
Restaurant
Brands International, Inc. |
|
|
346 |
|
|
|
24,379 |
|
|
|
1.90 |
% |
|
Emerson
Electric Company |
|
|
221 |
|
|
|
24,374 |
|
|
|
1.90 |
% |
|
Caterpillar,
Inc. |
|
|
73 |
|
|
|
24,372 |
|
|
|
1.90 |
% |
|
Apple,
Inc. |
|
|
116 |
|
|
|
24,349 |
|
|
|
1.90 |
% |
|
Amgen,
Inc. |
|
|
78 |
|
|
|
24,321 |
|
|
|
1.90 |
% |
|
Old
Dominion Freight Line, Inc. |
|
|
137 |
|
|
|
24,222 |
|
|
|
1.89 |
% |
|
United
Rentals, Inc. |
|
|
37 |
|
|
|
24,210 |
|
|
|
1.89 |
% |
|
NetApp,
Inc. |
|
|
188 |
|
|
|
24,205 |
|
|
|
1.89 |
% |
|
Pfizer,
Inc. |
|
|
865 |
|
|
|
24,195 |
|
|
|
1.89 |
% |
|
Iron
Mountain, Inc. |
|
|
270 |
|
|
|
24,192 |
|
|
|
1.89 |
% |
|
Steris
Corporation |
|
|
110 |
|
|
|
24,143 |
|
|
|
1.88 |
% |
|
LyondellBasell
Industries N.V. - Class A |
|
|
252 |
|
|
|
24,100 |
|
|
|
1.88 |
% |
|
Costco
Wholesale Corporation |
|
|
28 |
|
|
|
24,035 |
|
|
|
1.87 |
% |
|
United
Parcel Service - Class B |
|
|
176 |
|
|
|
24,031 |
|
|
|
1.87 |
% |
|
Canadian
Imperial Bank of Commerce |
|
|
505 |
|
|
|
24,027 |
|
|
|
1.87 |
% |
|
ON
Semiconductor Corporation |
|
|
350 |
|
|
|
23,998 |
|
|
|
1.87 |
% |
|
Motorola
Solutions, Inc. |
|
|
62 |
|
|
|
23,988 |
|
|
|
1.87 |
% |
|
Western
Digital Corporation |
|
|
317 |
|
|
|
23,987 |
|
|
|
1.87 |
% |
|
Cummins,
Inc. |
|
|
87 |
|
|
|
23,986 |
|
|
|
1.87 |
% |
|
Moody’s
Corporation |
|
|
57 |
|
|
|
23,932 |
|
|
|
1.86 |
% |
|
Blackstone,
Inc. |
|
|
193 |
|
|
|
23,925 |
|
|
|
1.86 |
% |
|
Cognizant
Technology Solutions Corporation |
|
|
351 |
|
|
|
23,868 |
|
|
|
1.86 |
% |
|
Allstate
Corporation (The) |
|
|
149 |
|
|
|
23,860 |
|
|
|
1.86 |
% |
|
Progressive
Corporation |
|
|
115 |
|
|
|
23,817 |
|
|
|
1.86 |
% |
|
Sherwin-Williams
Company (The) |
|
|
80 |
|
|
|
23,762 |
|
|
|
1.85 |
% |
|
West
Pharmaceutical Services, Inc. |
|
|
72 |
|
|
|
23,744 |
|
|
|
1.85 |
% |
|
Cintas
Corporation |
|
|
34 |
|
|
|
23,708 |
|
|
|
1.85 |
% |
|
See
accompanying notes to financial statements. |
CRM
Funds |
| |
40 |
|
|
CRM
FUNDS
CRM
LONG/SHORT OPPORTUNITIES FUND
SCHEDULE
OF INVESTMENTS (Continued)
June
30, 2024 |
|
Reference
Entity |
|
Shares |
|
|
Market
Value |
|
|
%
of Total
Index Value |
|
|
W.
W. Grainger, Inc. |
|
|
26 |
|
|
$ |
23,651 |
|
|
|
1.84 |
% |
|
McDonald’s
Corporation |
|
|
92 |
|
|
|
23,566 |
|
|
|
1.84 |
% |
|
Westinghouse
Air Brake Technologies Corporation |
|
|
149 |
|
|
|
23,543 |
|
|
|
1.83 |
% |
|
Eaton
Corporation PLC |
|
|
75 |
|
|
|
23,499 |
|
|
|
1.83 |
% |
|
Extra
Space Storage, Inc. |
|
|
151 |
|
|
|
23,456 |
|
|
|
1.83 |
% |
|
Constellation
Brands, Inc. |
|
|
91 |
|
|
|
23,421 |
|
|
|
1.83 |
% |
|
O’Reilly
Automotive, Inc. |
|
|
22 |
|
|
|
23,416 |
|
|
|
1.82 |
% |
|
Ecolab,
Inc. |
|
|
98 |
|
|
|
23,398 |
|
|
|
1.82 |
% |
|
General
Motors Company |
|
|
503 |
|
|
|
23,354 |
|
|
|
1.82 |
% |
|
Agilent
Technologies, Inc. |
|
|
180 |
|
|
|
23,335 |
|
|
|
1.82 |
% |
|
General
Dynamics Corporation |
|
|
80 |
|
|
|
23,335 |
|
|
|
1.82 |
% |
|
Marvell
Technology, Inc. |
|
|
334 |
|
|
|
23,323 |
|
|
|
1.82 |
% |
|
PACCAR,
Inc. |
|
|
226 |
|
|
|
23,303 |
|
|
|
1.82 |
% |
|
Carlisle
Companies, Inc. |
|
|
57 |
|
|
|
23,297 |
|
|
|
1.82 |
% |
|
Hubbell,
Inc. |
|
|
64 |
|
|
|
23,230 |
|
|
|
1.81 |
% |
|
Home
Depot, Inc. (The) |
|
|
67 |
|
|
|
23,208 |
|
|
|
1.81 |
% |
|
Automatic
Data Processing, Inc. |
|
|
97 |
|
|
|
23,089 |
|
|
|
1.80 |
% |
|
Fastenal
Company |
|
|
367 |
|
|
|
23,069 |
|
|
|
1.80 |
% |
|
Tractor
Supply Company |
|
|
85 |
|
|
|
23,002 |
|
|
|
1.79 |
% |
|
Mettler-Toledo
International, Inc. |
|
|
16 |
|
|
|
22,907 |
|
|
|
1.78 |
% |
|
Church
& Dwight Company, Inc. |
|
|
220 |
|
|
|
22,831 |
|
|
|
1.78 |
% |
|
CDW
Corporation |
|
|
102 |
|
|
|
22,800 |
|
|
|
1.78 |
% |
|
HCA
Healthcare, Inc. |
|
|
71 |
|
|
|
22,739 |
|
|
|
1.77 |
% |
|
Cardinal
Health, Inc. |
|
|
229 |
|
|
|
22,540 |
|
|
|
1.76 |
% |
| |
|
|
|
|
|
$ |
1,282,902 |
|
|
|
100.00 |
% |
The
following table represents the individual positions and related values of underlying securities of Morgan Stanley Custom Basket (MSCM1073)
Index total return swap with Morgan Stanley Bank as of June 30, 2024, termination date 7/31/24:
|
Reference
Entity |
|
Shares |
|
|
Market
Value |
|
|
%
of Total
Index Value |
|
|
Marvell
Technology, Inc. |
|
|
6,420 |
|
|
$ |
448,741 |
|
|
|
34.11 |
% |
|
ON
Semiconductor Corporation |
|
|
6,418 |
|
|
|
439,944 |
|
|
|
33.44 |
% |
|
Canadian
Imperial Bank of Commerce |
|
|
8,980 |
|
|
|
426,895 |
|
|
|
32.45 |
% |
| |
|
|
|
|
|
$ |
1,315,580 |
|
|
|
100.00 |
% |
|
See
accompanying notes to financial statements. |
CRM
Funds |
| |
41 |
|
|
CRM
FUNDS
CRM
LONG/SHORT OPPORTUNITIES FUND
SCHEDULE
OF INVESTMENTS (Continued)
June
30, 2024 |
The
following table represents the individual positions and related values of underlying securities of Morgan Stanley Custom Basket (MSCM1074)
Index total return swap with Morgan Stanley Bank as of June 30, 2024, termination date 7/31/24:
|
Reference
Entity |
|
Shares |
|
|
Market
Value |
|
|
%
of Total
Index Value |
|
|
Dollar
General Corporation |
|
|
630 |
|
|
$ |
83,287 |
|
|
|
6.50 |
% |
|
Tractor
Supply Company |
|
|
306 |
|
|
|
82,614 |
|
|
|
6.45 |
% |
|
ON
Semiconductor Corporation |
|
|
1,193 |
|
|
|
81,797 |
|
|
|
6.39 |
% |
|
Target
Corporation |
|
|
552 |
|
|
|
81,650 |
|
|
|
6.38 |
% |
|
Kroger
Company (The) |
|
|
1,625 |
|
|
|
81,129 |
|
|
|
6.33 |
% |
|
International
Flavors & Fragrances, Inc. |
|
|
844 |
|
|
|
80,368 |
|
|
|
6.27 |
% |
|
Church
& Dwight Company, Inc. |
|
|
772 |
|
|
|
80,047 |
|
|
|
6.25 |
% |
|
Hershey
Company (The) |
|
|
435 |
|
|
|
80,040 |
|
|
|
6.25 |
% |
|
Ecolab,
Inc. |
|
|
336 |
|
|
|
79,883 |
|
|
|
6.24 |
% |
|
PepsiCo,
Inc. |
|
|
484 |
|
|
|
79,779 |
|
|
|
6.23 |
% |
|
Constellation
Brands, Inc. |
|
|
309 |
|
|
|
79,589 |
|
|
|
6.21 |
% |
|
Starbucks
Corporation |
|
|
1,021 |
|
|
|
79,490 |
|
|
|
6.21 |
% |
|
CVS
Health Corporation |
|
|
1,339 |
|
|
|
79,102 |
|
|
|
6.18 |
% |
|
Lululemon
Athletica, Inc. |
|
|
262 |
|
|
|
78,234 |
|
|
|
6.11 |
% |
|
Sysco
Corporation |
|
|
1,087 |
|
|
|
77,612 |
|
|
|
6.06 |
% |
|
General
Mills, Inc. |
|
|
1,204 |
|
|
|
76,136 |
|
|
|
5.94 |
% |
| |
|
|
|
|
|
$ |
1,280,757 |
|
|
|
100.00 |
% |
The
following table represents the individual positions and related values of underlying securities of Morgan Stanley Custom Basket (MSCM1075)
Index total return swap with Morgan Stanley Bank as of June 30, 2024, termination date 7/31/24:
|
Reference
Entity |
|
Shares |
|
|
Market
Value |
|
|
%
of Total
Index Value |
|
|
Emerson
Electric Company |
|
|
239 |
|
|
$ |
26,373 |
|
|
|
2.03 |
% |
|
Ford
Motor Company |
|
|
2,098 |
|
|
|
26,308 |
|
|
|
2.03 |
% |
|
Rockwell
Automation, Inc. |
|
|
95 |
|
|
|
26,195 |
|
|
|
2.02 |
% |
|
United
Rentals, Inc. |
|
|
40 |
|
|
|
26,088 |
|
|
|
2.01 |
% |
|
Pfizer,
Inc. |
|
|
927 |
|
|
|
25,925 |
|
|
|
2.00 |
% |
|
Caterpillar,
Inc. |
|
|
78 |
|
|
|
25,901 |
|
|
|
2.00 |
% |
|
AT&T,
Inc. |
|
|
1,354 |
|
|
|
25,880 |
|
|
|
2.00 |
% |
|
West
Pharmaceutical Services, Inc. |
|
|
78 |
|
|
|
25,854 |
|
|
|
1.99 |
% |
|
Prologis,
Inc. |
|
|
230 |
|
|
|
25,843 |
|
|
|
1.99 |
% |
|
Steris
Corporation |
|
|
118 |
|
|
|
25,812 |
|
|
|
1.99 |
% |
|
General
Motors Company |
|
|
555 |
|
|
|
25,789 |
|
|
|
1.99 |
% |
|
Restaurant
Brands International, Inc. |
|
|
366 |
|
|
|
25,787 |
|
|
|
1.99 |
% |
|
Iron
Mountain, Inc. |
|
|
287 |
|
|
|
25,742 |
|
|
|
1.98 |
% |
|
See
accompanying notes to financial statements. |
CRM
Funds |
| |
42 |
|
|
CRM
FUNDS
CRM
LONG/SHORT OPPORTUNITIES FUND
SCHEDULE
OF INVESTMENTS (Continued)
June
30, 2024 |
|
Reference
Entity |
|
Shares |
|
|
Market
Value |
|
|
%
of Total
Index Value |
|
|
Tractor
Supply Company |
|
|
95 |
|
|
$ |
25,691 |
|
|
|
1.98 |
% |
|
Allstate
Corporation (The) |
|
|
160 |
|
|
|
25,614 |
|
|
|
1.98 |
% |
|
Home
Depot, Inc. (The) |
|
|
74 |
|
|
|
25,586 |
|
|
|
1.97 |
% |
|
Target
Corporation |
|
|
173 |
|
|
|
25,556 |
|
|
|
1.97 |
% |
|
Sherwin-Williams
Company (The) |
|
|
86 |
|
|
|
25,540 |
|
|
|
1.97 |
% |
|
O’Reilly
Automotive, Inc. |
|
|
24 |
|
|
|
25,532 |
|
|
|
1.97 |
% |
|
Motorola
Solutions, Inc. |
|
|
66 |
|
|
|
25,526 |
|
|
|
1.97 |
% |
|
Western
Digital Corporation |
|
|
337 |
|
|
|
25,507 |
|
|
|
1.97 |
% |
|
CDW
Corporation |
|
|
114 |
|
|
|
25,487 |
|
|
|
1.97 |
% |
|
Old
Dominion Freight Line, Inc. |
|
|
144 |
|
|
|
25,487 |
|
|
|
1.97 |
% |
|
Moody’s
Corporation |
|
|
61 |
|
|
|
25,483 |
|
|
|
1.96 |
% |
|
NetApp,
Inc. |
|
|
198 |
|
|
|
25,479 |
|
|
|
1.96 |
% |
|
Automatic
Data Processing, Inc. |
|
|
107 |
|
|
|
25,477 |
|
|
|
1.96 |
% |
|
Realty
Income Corporation |
|
|
482 |
|
|
|
25,473 |
|
|
|
1.96 |
% |
|
Amgen,
Inc. |
|
|
81 |
|
|
|
25,376 |
|
|
|
1.96 |
% |
|
LyondellBasell
Industries N.V. - Class A |
|
|
265 |
|
|
|
25,374 |
|
|
|
1.96 |
% |
|
Progressive
Corporation |
|
|
122 |
|
|
|
25,347 |
|
|
|
1.95 |
% |
|
Blackstone,
Inc. |
|
|
205 |
|
|
|
25,332 |
|
|
|
1.95 |
% |
|
Cognizant
Technology Solutions Corporation |
|
|
372 |
|
|
|
25,294 |
|
|
|
1.95 |
% |
|
Eaton
Corporation PLC |
|
|
81 |
|
|
|
25,267 |
|
|
|
1.95 |
% |
|
W.
W. Grainger, Inc. |
|
|
28 |
|
|
|
25,223 |
|
|
|
1.94 |
% |
|
Costco
Wholesale Corporation |
|
|
30 |
|
|
|
25,203 |
|
|
|
1.94 |
% |
|
Westinghouse
Air Brake Technologies Corporation |
|
|
159 |
|
|
|
25,199 |
|
|
|
1.94 |
% |
|
Fastenal
Company |
|
|
401 |
|
|
|
25,178 |
|
|
|
1.94 |
% |
|
United
Parcel Service - Class B |
|
|
184 |
|
|
|
25,167 |
|
|
|
1.94 |
% |
|
Extra
Space Storage, Inc. |
|
|
162 |
|
|
|
25,150 |
|
|
|
1.94 |
% |
|
Cintas
Corporation |
|
|
36 |
|
|
|
25,147 |
|
|
|
1.94 |
% |
|
McDonald’s
Corporation |
|
|
99 |
|
|
|
25,111 |
|
|
|
1.94 |
% |
|
Canadian
Imperial Bank of Commerce |
|
|
528 |
|
|
|
25,095 |
|
|
|
1.94 |
% |
|
Apple,
Inc. |
|
|
119 |
|
|
|
25,093 |
|
|
|
1.93 |
% |
|
PACCAR,
Inc. |
|
|
244 |
|
|
|
25,077 |
|
|
|
1.93 |
% |
|
General
Dynamics Corporation |
|
|
86 |
|
|
|
25,027 |
|
|
|
1.93 |
% |
|
Cummins,
Inc. |
|
|
90 |
|
|
|
24,978 |
|
|
|
1.93 |
% |
|
Hubbell,
Inc. |
|
|
68 |
|
|
|
24,976 |
|
|
|
1.93 |
% |
|
Mettler-Toledo
International, Inc. |
|
|
18 |
|
|
|
24,877 |
|
|
|
1.92 |
% |
|
Agilent
Technologies, Inc. |
|
|
191 |
|
|
|
24,745 |
|
|
|
1.91 |
% |
|
Cardinal
Health, Inc. |
|
|
251 |
|
|
|
24,707 |
|
|
|
1.91 |
% |
|
HCA
Healthcare, Inc. |
|
|
75 |
|
|
|
23,973 |
|
|
|
1.85 |
% |
| |
|
|
|
|
|
$ |
1,296,851 |
|
|
|
100.00 |
% |
|
See
accompanying notes to financial statements. |
CRM
Funds |
| |
43 |
|
|
CRM
FUNDS
CRM
LONG/SHORT OPPORTUNITIES FUND
SCHEDULE
OF INVESTMENTS (Concluded)
June
30, 2024 |
The
following table represents the individual positions and related values of underlying securities of Morgan Stanley Custom Basket (MSCM1076)
Index total return swap with Morgan Stanley Bank as of June 30, 2024, termination date 7/31/24:
|
Reference
Entity |
|
Shares |
|
|
Market
Value |
|
|
%
of Total
Index Value |
|
|
Ford
Motor Company |
|
|
10,603 |
|
|
$ |
132,957 |
|
|
|
10.23 |
% |
|
Marvell
Technology, Inc. |
|
|
1,887 |
|
|
|
131,877 |
|
|
|
10.14 |
% |
|
Dollar
General Corporation |
|
|
995 |
|
|
|
131,611 |
|
|
|
10.12 |
% |
|
CVS
Health Corporation |
|
|
2,222 |
|
|
|
131,225 |
|
|
|
10.09 |
% |
|
ON
Semiconductor Corporation |
|
|
1,911 |
|
|
|
130,989 |
|
|
|
10.08 |
% |
|
Tractor
Supply Company |
|
|
485 |
|
|
|
130,857 |
|
|
|
10.06 |
% |
|
CDW
Corporation |
|
|
579 |
|
|
|
129,543 |
|
|
|
9.96 |
% |
|
Western
Digital Corporation |
|
|
1,692 |
|
|
|
128,232 |
|
|
|
9.86 |
% |
|
Starbucks
Corporation |
|
|
1,637 |
|
|
|
127,403 |
|
|
|
9.80 |
% |
|
Lululemon
Athletica, Inc. |
|
|
421 |
|
|
|
125,632 |
|
|
|
9.66 |
% |
| |
|
|
|
|
|
$ |
1,300,326 |
|
|
|
100.00 |
% |
|
See
accompanying notes to financial statements. |
CRM
Funds |
| |
44 |
|
|
CRM
FUNDS
STATEMENTS
OF ASSETS AND LIABILITIES
June
30, 2024 |
| |
|
CRM
Small Cap
Value Fund |
|
|
CRM
Small/Mid
Cap Value Fund |
|
|
CRM
Mid Cap
Value Fund |
|
|
ASSETS: |
|
|
|
|
|
|
|
|
|
|
|
|
|
Investments
in securities |
|
|
|
|
|
|
|
|
|
|
|
|
|
Investments
in securities, at cost |
|
$ |
61,576,188 |
|
|
$ |
135,989,393 |
|
|
$ |
283,806,374 |
|
|
Net
unrealized appreciation |
|
|
15,113,857 |
|
|
|
34,261,021 |
|
|
|
92,362,968 |
|
|
Total
investments in securities, at value1 |
|
|
76,690,045 |
|
|
|
170,250,414 |
|
|
|
376,169,342 |
|
|
Dividends
and interest receivable |
|
|
119,391 |
|
|
|
174,079 |
|
|
|
340,645 |
|
|
Receivable
for fund shares sold |
|
|
1,187 |
|
|
|
15,741 |
|
|
|
87,934 |
|
|
Receivable
for securities lending income |
|
|
113 |
|
|
|
2 |
|
|
|
192 |
|
|
Other
assets |
|
|
2,993 |
|
|
|
15,065 |
|
|
|
30,378 |
|
|
Total
Assets |
|
|
76,813,729 |
|
|
|
170,455,301 |
|
|
|
376,628,491 |
|
| |
|
|
|
|
|
|
|
|
|
|
|
|
|
LIABILITIES: |
|
|
|
|
|
|
|
|
|
|
|
|
|
Obligation
to return securities lending collateral |
|
|
1,298,767 |
|
|
|
— |
|
|
|
4,128,309 |
|
|
Payable
for securities purchased |
|
|
12,225 |
|
|
|
848,508 |
|
|
|
— |
|
|
Payable
for fund shares redeemed |
|
|
129,082 |
|
|
|
167,378 |
|
|
|
23,456 |
|
|
Accrued
advisory fee |
|
|
46,022 |
|
|
|
104,912 |
|
|
|
230,364 |
|
|
Audit
and tax fees |
|
|
13,034 |
|
|
|
20,823 |
|
|
|
31,685 |
|
|
Trustees
fees payable |
|
|
597 |
|
|
|
1,847 |
|
|
|
3,273 |
|
|
Other
accrued expenses |
|
|
38,987 |
|
|
|
86,428 |
|
|
|
154,119 |
|
|
Total
Liabilities |
|
|
1,538,714 |
|
|
|
1,229,896 |
|
|
|
4,571,206 |
|
|
NET
ASSETS |
|
$ |
75,275,015 |
|
|
$ |
169,225,405 |
|
|
$ |
372,057,285 |
|
|
COMPONENTS
OF NET ASSETS |
|
|
|
|
|
|
|
|
|
|
|
|
|
Paid
in capital |
|
$ |
58,069,476 |
|
|
$ |
123,699,748 |
|
|
$ |
264,854,425 |
|
|
Total
distributable earnings |
|
|
17,205,539 |
|
|
|
45,525,657 |
|
|
|
107,202,860 |
|
|
NET
ASSETS |
|
$ |
75,275,015 |
|
|
$ |
169,225,405 |
|
|
$ |
372,057,285 |
|
|
NET
ASSET VALUE PER SHARE |
|
|
|
|
|
|
|
|
|
|
|
|
|
INVESTOR
CLASS SHARES |
|
|
|
|
|
|
|
|
|
|
|
|
|
Net
assets |
|
$ |
28,176,976 |
|
|
$ |
21,540,946 |
|
|
$ |
146,456,783 |
|
|
Shares
of Beneficial Interest Outstanding ($0.01 par value, unlimited authorized shares) |
|
|
2,087,846 |
|
|
|
1,958,163 |
|
|
|
6,530,621 |
|
|
Net
asset value, offering and redemption price per share |
|
$ |
13.50 |
|
|
$ |
11.00 |
|
|
$ |
22.43 |
|
|
INSTITUTIONAL
CLASS SHARES |
|
|
|
|
|
|
|
|
|
|
|
|
|
Net
assets |
|
$ |
47,098,039 |
|
|
$ |
147,684,459 |
|
|
$ |
225,600,502 |
|
|
Shares
of Beneficial Interest Outstanding ($0.01 par value, unlimited authorized shares) |
|
|
2,781,004 |
|
|
|
12,822,192 |
|
|
|
9,469,338 |
|
|
Net
asset value, offering and redemption price per share |
|
$ |
16.94 |
|
|
$ |
11.52 |
|
|
$ |
23.82 |
|
| |
|
|
|
|
|
|
|
|
|
|
|
|
|
1
Includes securities loaned of: |
|
$ |
1,288,332 |
|
|
$ |
— |
|
|
$ |
3,974,192 |
|
|
See
accompanying notes to financial statements. |
CRM
Funds |
| |
45 |
|
|
CRM
FUNDS
STATEMENTS
OF ASSETS AND LIABILITIES
June
30, 2024 |
| |
|
CRM
All Cap
Value Fund |
|
|
CRM
Long/Short
Opportunities Fund |
|
|
ASSETS: |
|
|
|
|
|
|
|
|
|
Investments
in securities |
|
|
|
|
|
|
|
|
|
Investments
in securities, at cost |
|
$ |
19,037,864 |
|
|
$ |
163,747,286 |
|
|
Net
unrealized appreciation |
|
|
4,481,294 |
|
|
|
30,289,494 |
|
|
Total
investments in securities, at value1 |
|
|
23,519,158 |
|
|
|
194,036,780 |
|
|
Cash
pledged with broker for securities sold short |
|
|
— |
|
|
|
51,123,884 |
|
|
Unrealized
appreciation on swap agreements |
|
|
— |
|
|
|
2,429,323 |
|
|
Receivable
for securities sold |
|
|
— |
|
|
|
2,041,088 |
|
|
Receivable
for fund shares sold |
|
|
— |
|
|
|
186,416 |
|
|
Dividends
and interest receivable |
|
|
21,337 |
|
|
|
137,044 |
|
|
Receivable
for securities lending income |
|
|
22 |
|
|
|
— |
|
|
Other
assets |
|
|
14,427 |
|
|
|
24,137 |
|
|
Total
Assets |
|
|
23,554,944 |
|
|
|
249,978,672 |
|
| |
|
|
|
|
|
|
|
|
|
LIABILITIES: |
|
|
|
|
|
|
|
|
|
Obligation
to return securities lending collateral |
|
|
183,480 |
|
|
|
— |
|
|
Cash
received from broker for swap agreements |
|
|
— |
|
|
|
2,444,895 |
|
|
Due
to Broker - Short Sales |
|
|
|
|
|
|
855,487 |
|
|
Securities
sold short, at value (proceeds $0 and $47,286,645, respectively) |
|
|
— |
|
|
|
49,411,936 |
|
|
Payable
for fund shares redeemed |
|
|
— |
|
|
|
433,785 |
|
|
Payable
for securities purchased |
|
|
— |
|
|
|
413,011 |
|
|
Unrealized
depreciation on swap agreements |
|
|
— |
|
|
|
71,391 |
|
|
Payable
for dividends on securities sold short |
|
|
— |
|
|
|
50,076 |
|
|
Accrued
advisory fee |
|
|
10,285 |
|
|
|
215,449 |
|
|
Audit
and tax fees |
|
|
9,960 |
|
|
|
22,498 |
|
|
Trustees
fees payable |
|
|
161 |
|
|
|
2,429 |
|
|
Other
accrued expenses |
|
|
12,937 |
|
|
|
61,909 |
|
|
Total
Liabilities |
|
|
216,823 |
|
|
|
53,982,866 |
|
|
NET
ASSETS |
|
$ |
23,338,121 |
|
|
$ |
195,995,806 |
|
|
COMPONENTS
OF NET ASSETS |
|
|
|
|
|
|
|
|
|
Paid
in capital |
|
$ |
17,999,007 |
|
|
$ |
161,798,599 |
|
|
Total
distributable earnings |
|
|
5,339,114 |
|
|
|
34,197,207 |
|
|
NET
ASSETS |
|
$ |
23,338,121 |
|
|
$ |
195,995,806 |
|
|
NET
ASSET VALUE PER SHARE |
|
|
|
|
|
|
|
|
|
INVESTOR
CLASS SHARES |
|
|
|
|
|
|
|
|
|
Net
assets |
|
$ |
6,767,058 |
|
|
|
|
|
|
Shares
of Beneficial Interest Outstanding ($0.01 par value, unlimited authorized shares) |
|
|
959,584 |
|
|
|
|
|
|
Net
asset value, offering and redemption price per share |
|
$ |
7.05 |
|
|
|
|
|
|
INSTITUTIONAL
CLASS SHARES |
|
|
|
|
|
|
|
|
|
Net
assets |
|
$ |
16,571,063 |
|
|
$ |
195,995,806 |
|
|
Shares
of Beneficial Interest Outstanding ($0.01 par value, unlimited authorized shares) |
|
|
2,266,955 |
|
|
|
15,051,006 |
|
|
Net
asset value, offering and redemption price per share |
|
$ |
7.31 |
|
|
$ |
13.02 |
|
| |
|
|
|
|
|
|
|
|
|
1
Includes securities loaned of: |
|
$ |
173,243 |
|
|
$ |
— |
|
|
See
accompanying notes to financial statements. |
CRM
Funds |
| |
46 |
|
|
CRM
FUNDS
STATEMENTS
OF OPERATIONS
FOR
THE YEAR ENDED June 30, 2024 |
| |
|
CRM
Small Cap
Value Fund |
|
|
CRM
Small/Mid
Cap Value Fund |
|
|
CRM
Mid Cap
Value Fund |
|
|
INVESTMENT
INCOME: |
|
|
|
|
|
|
|
|
|
|
|
|
|
Dividends
and interest |
|
$ |
1,248,333 |
|
|
$ |
2,925,957 |
|
|
$ |
5,108,622 |
|
|
Securities
lending income |
|
|
599 |
|
|
|
2,682 |
|
|
|
120,010 |
|
|
Foreign
tax withheld |
|
|
(2,252 |
) |
|
|
(5,962 |
) |
|
|
(12,512 |
) |
|
Total
investment income |
|
|
1,246,680 |
|
|
|
2,922,677 |
|
|
|
5,216,120 |
|
| |
|
|
|
|
|
|
|
|
|
|
|
|
|
EXPENSES: |
|
|
|
|
|
|
|
|
|
|
|
|
|
Investment
advisory fees |
|
|
556,273 |
|
|
|
1,526,156 |
|
|
|
2,889,555 |
|
|
Sub-Transfer
agent fees - Institutional Shares |
|
|
29,674 |
|
|
|
173,661 |
|
|
|
198,308 |
|
|
Shareholder
Services - Investor Shares |
|
|
68,675 |
|
|
|
55,013 |
|
|
|
380,200 |
|
|
Registration
fees |
|
|
41,953 |
|
|
|
73,323 |
|
|
|
50,928 |
|
|
Administration
and accounting fees |
|
|
34,831 |
|
|
|
80,994 |
|
|
|
146,404 |
|
|
Transfer
agent fees |
|
|
23,357 |
|
|
|
69,618 |
|
|
|
86,040 |
|
|
Custody
fees |
|
|
15,000 |
|
|
|
15,000 |
|
|
|
15,000 |
|
|
Audit
and tax fees |
|
|
13,034 |
|
|
|
20,823 |
|
|
|
31,685 |
|
|
Insurance
fees |
|
|
12,635 |
|
|
|
31,018 |
|
|
|
66,195 |
|
|
Trustee
fees and expenses |
|
|
12,300 |
|
|
|
39,905 |
|
|
|
72,141 |
|
|
Legal
fees |
|
|
7,931 |
|
|
|
24,019 |
|
|
|
43,415 |
|
|
Shareholder
reports |
|
|
6,587 |
|
|
|
20,914 |
|
|
|
40,070 |
|
|
Other
expenses |
|
|
20,644 |
|
|
|
38,654 |
|
|
|
57,997 |
|
|
Total
expenses |
|
|
842,894 |
|
|
|
2,169,098 |
|
|
|
4,077,938 |
|
|
NET
INVESTMENT INCOME |
|
|
403,786 |
|
|
|
753,579 |
|
|
|
1,138,182 |
|
| |
|
|
|
|
|
|
|
|
|
|
|
|
|
NET
REALIZED AND UNREALIZED GAIN (LOSS) ON INVESTMENTS |
|
|
|
|
|
|
|
|
|
|
|
|
|
Net
realized gain (loss) from: |
|
|
|
|
|
|
|
|
|
|
|
|
|
Investments
|
|
|
3,784,811 |
|
|
|
17,323,035 |
|
|
|
36,075,848 |
|
|
Foreign
currency transactions |
|
|
— |
|
|
|
— |
|
|
|
(725 |
) |
|
Net
realized gain |
|
|
3,784,811 |
|
|
|
17,323,035 |
|
|
|
36,075,123 |
|
|
Net
change in unrealized appreciation (depreciation) on: |
|
|
|
|
|
|
|
|
|
|
|
|
|
Investments
|
|
|
5,091,061 |
|
|
|
(977,558 |
) |
|
|
(1,271,008 |
) |
|
Foreign
currency transactions |
|
|
— |
|
|
|
— |
|
|
|
(20 |
) |
|
Net
change in unrealized appreciation (depreciation) |
|
|
5,091,061 |
|
|
|
(977,558 |
) |
|
|
(1,271,028 |
) |
|
Net
realized and unrealized gain on investments and foreign currency |
|
|
8,875,872 |
|
|
|
16,345,477 |
|
|
|
34,804,095 |
|
|
NET
INCREASE IN NET ASSETS RESULTING FROM OPERATIONS |
|
$ |
9,279,658 |
|
|
$ |
17,099,056 |
|
|
$ |
35,942,277 |
|
|
See
accompanying notes to financial statements. |
CRM
Funds |
| |
47 |
|
|
CRM
FUNDS
STATEMENTS
OF OPERATIONS
FOR
THE YEAR ENDED June 30, 2024 |
| |
|
CRM
All Cap
Value Fund |
|
|
CRM
Long/Short
Opportunities Fund |
|
|
INVESTMENT
INCOME: |
|
|
|
|
|
|
|
|
|
Dividends
and interest |
|
$ |
351,763 |
|
|
$ |
5,590,520 |
|
|
Securities
lending income |
|
|
2,424 |
|
|
|
— |
|
|
Foreign
tax withheld |
|
|
(784 |
) |
|
|
(7,370 |
) |
|
Total
investment income |
|
|
353,403 |
|
|
|
5,583,150 |
|
| |
|
|
|
|
|
|
|
|
|
EXPENSES: |
|
|
|
|
|
|
|
|
|
Investment
advisory fees |
|
|
159,832 |
|
|
|
2,813,860 |
|
|
Dividend
expense on securities sold short |
|
|
— |
|
|
|
1,226,837 |
|
|
Sub-Transfer
agent fees - Institutional Shares |
|
|
1,913 |
|
|
|
103,792 |
|
|
Shareholder
Services - Investor Shares |
|
|
16,815 |
|
|
|
— |
|
|
Registration
fees |
|
|
34,614 |
|
|
|
34,000 |
|
|
Administration
and accounting fees |
|
|
16,931 |
|
|
|
87,250 |
|
|
Custody
fees |
|
|
15,000 |
|
|
|
21,466 |
|
|
Transfer
agent fees |
|
|
13,968 |
|
|
|
44,290 |
|
|
Audit
and tax fees |
|
|
9,960 |
|
|
|
22,498 |
|
|
Trustee
fees and expenses |
|
|
4,334 |
|
|
|
38,335 |
|
|
Insurance
fees |
|
|
3,757 |
|
|
|
37,234 |
|
|
Legal
fees |
|
|
2,537 |
|
|
|
22,188 |
|
|
Shareholder
reports |
|
|
2,522 |
|
|
|
25,091 |
|
|
Other
expenses |
|
|
15,731 |
|
|
|
38,928 |
|
|
Total
expenses |
|
|
297,914 |
|
|
|
4,515,769 |
|
|
Expenses
waived |
|
|
(7,509 |
) |
|
|
(294,626 |
) |
|
Net
expenses |
|
|
290,405 |
|
|
|
4,221,143 |
|
|
NET
INVESTMENT INCOME |
|
|
62,998 |
|
|
|
1,362,007 |
|
| |
|
|
|
|
|
|
|
|
|
NET
REALIZED AND UNREALIZED GAIN (LOSS) ON INVESTMENTS, DERIVATIVES AND FOREIGN CURRENCY |
|
|
|
|
|
|
|
|
|
Net
realized gain (loss) from: |
|
|
|
|
|
|
|
|
|
Investments
|
|
|
1,727,332 |
|
|
|
18,133,715 |
|
|
Securities
sold short |
|
|
— |
|
|
|
976,609 |
|
|
Swap
agreements |
|
|
— |
|
|
|
2,409,956 |
|
|
Foreign
currency transactions |
|
|
(131 |
) |
|
|
143,191 |
|
|
Net
realized gain |
|
|
1,727,201 |
|
|
|
21,663,471 |
|
|
Net
change in unrealized appreciation (depreciation) on: |
|
|
|
|
|
|
|
|
|
Investments
|
|
|
1,079,275 |
|
|
|
(3,411,542 |
) |
|
Securities
sold short |
|
|
— |
|
|
|
(8,112,498 |
) |
|
Swap
agreements |
|
|
— |
|
|
|
386,367 |
|
|
Foreign
currency transactions |
|
|
— |
|
|
|
(223,361 |
) |
|
Net
change in unrealized appreciation (depreciation) |
|
|
1,079,275 |
|
|
|
(11,361,034 |
) |
|
Net
realized and unrealized gain on investments, derivatives and foreign currency |
|
|
2,806,476 |
|
|
|
10,302,437 |
|
|
NET
INCREASE IN NET ASSETS RESULTING FROM OPERATIONS |
|
$ |
2,869,474 |
|
|
$ |
11,664,444 |
|
|
See
accompanying notes to financial statements. |
CRM
Funds |
| |
48 |
|
|
CRM
FUNDS
STATEMENTS
OF CHANGES IN NET ASSETS
|
| |
|
CRM
Small Cap Value Fund |
|
| |
|
Year
Ended
June 30, 2024 |
|
|
Year
Ended
June 30, 2023 |
|
|
NET
ASSETS - BEGINNING OF YEAR |
|
$ |
77,425,561 |
|
|
$ |
118,775,543 |
|
| |
|
|
|
|
|
|
|
|
|
OPERATIONS
|
|
|
|
|
|
|
|
|
|
Net
investment income |
|
|
403,786 |
|
|
|
1,269,438 |
|
|
Net
realized gain from investments |
|
|
3,784,811 |
|
|
|
3,970,360 |
|
|
Net
change in unrealized appreciation on investments |
|
|
5,091,061 |
|
|
|
7,709,116 |
|
|
Net
increase in net assets resulting from operations |
|
|
9,279,658 |
|
|
|
12,948,914 |
|
| |
|
|
|
|
|
|
|
|
|
DISTRIBUTIONS
TO SHAREHOLDERS |
|
|
|
|
|
|
|
|
|
Investor
Class |
|
|
(1,207,084 |
) |
|
|
(711,393 |
) |
|
Institutional
Class |
|
|
(1,757,607 |
) |
|
|
(1,651,048 |
) |
|
Total
distributions to shareholders |
|
|
(2,964,691 |
) |
|
|
(2,362,441 |
) |
| |
|
|
|
|
|
|
|
|
|
CAPITAL
SHARE TRANSACTIONS |
|
|
|
|
|
|
|
|
|
Sale
of shares - Investor Shares |
|
|
121,454 |
|
|
|
119,137 |
|
|
Sale
of shares - Institutional Shares |
|
|
3,450,999 |
|
|
|
6,581,186 |
|
|
Reinvestment
of distributions - Investor Class |
|
|
1,113,318 |
|
|
|
667,950 |
|
|
Reinvestment
of distributions - Institutional Class |
|
|
1,492,966 |
|
|
|
1,285,743 |
|
|
Redemption
of shares - Investor Class |
|
|
(3,867,972 |
) |
|
|
(3,097,537 |
) |
|
Redemption
of shares - Institutional Class |
|
|
(10,776,278 |
) |
|
|
(57,492,934 |
) |
|
Net
decrease from capital share transactions |
|
|
(8,465,513 |
) |
|
|
(51,936,455 |
) |
|
Total
decrease in net assets |
|
|
(2,150,546 |
) |
|
|
(41,349,982 |
) |
| |
|
|
|
|
|
|
|
|
|
NET
ASSETS - END OF YEAR |
|
$ |
75,275,015 |
|
|
$ |
77,425,561 |
|
| |
|
|
|
|
|
|
|
|
|
SHARE
ACTIVITY |
|
|
|
|
|
|
|
|
|
Investor
Class: |
|
|
|
|
|
|
|
|
|
Sold
|
|
|
9,523 |
|
|
|
9,584 |
|
|
Issued
on reinvestment of distributions |
|
|
92,010 |
|
|
|
53,181 |
|
|
Redeemed
|
|
|
(307,693 |
) |
|
|
(253,170 |
) |
|
Net
decrease |
|
|
(206,160 |
) |
|
|
(190,405 |
) |
| |
|
|
|
|
|
|
|
|
|
Institutional
Class: |
|
|
|
|
|
|
|
|
|
Sold
|
|
|
219,901 |
|
|
|
431,761 |
|
|
Issued
on reinvestment of distributions |
|
|
98,416 |
|
|
|
82,419 |
|
|
Redeemed
|
|
|
(677,114 |
) |
|
|
(3,789,373 |
) |
|
Net
decrease |
|
|
(358,797 |
) |
|
|
(3,275,193 |
) |
|
See
accompanying notes to financial statements. |
CRM
Funds |
| |
49 |
|
|
CRM
FUNDS
STATEMENTS
OF CHANGES IN NET ASSETS
|
| |
|
CRM
Small/Mid Cap Value Fund |
|
| |
|
Year
Ended
June 30, 2024 |
|
|
Year
Ended
June 30, 2023 |
|
|
NET
ASSETS - BEGINNING OF YEAR |
|
$ |
220,259,152 |
|
|
$ |
140,297,796 |
|
| |
|
|
|
|
|
|
|
|
|
OPERATIONS
|
|
|
|
|
|
|
|
|
|
Net
investment income |
|
|
753,579 |
|
|
|
2,116,473 |
|
|
Net
realized gain from investments |
|
|
17,323,035 |
|
|
|
155,507 |
|
|
Net
change in unrealized appreciation/(depreciation) on investments |
|
|
(977,558 |
) |
|
|
9,686,921 |
|
|
Net
increase in net assets resulting from operations |
|
|
17,099,056 |
|
|
|
11,958,901 |
|
| |
|
|
|
|
|
|
|
|
|
DISTRIBUTIONS
TO SHAREHOLDERS |
|
|
|
|
|
|
|
|
|
Investor
Class |
|
|
(143,572 |
) |
|
|
(1,264,375 |
) |
|
Institutional
Class |
|
|
(1,453,671 |
) |
|
|
(8,541,502 |
) |
|
Total
distributions to shareholders |
|
|
(1,597,243 |
) |
|
|
(9,805,877 |
) |
| |
|
|
|
|
|
|
|
|
|
CAPITAL
SHARE TRANSACTIONS |
|
|
|
|
|
|
|
|
|
Sale
of shares - Investor Shares |
|
|
2,634,374 |
|
|
|
4,363,371 |
|
|
Sale
of shares - Institutional Shares |
|
|
33,249,945 |
|
|
|
107,199,891 |
|
|
Reinvestment
of distributions - Investor Class |
|
|
133,292 |
|
|
|
1,237,084 |
|
|
Reinvestment
of distributions - Institutional Class |
|
|
1,094,832 |
|
|
|
8,354,636 |
|
|
Redemption
of shares - Investor Class |
|
|
(5,927,585 |
) |
|
|
(4,113,640 |
) |
|
Redemption
of shares - Institutional Class |
|
|
(97,720,418 |
) |
|
|
(39,233,010 |
) |
|
Net
increase (decrease) from capital share transactions |
|
|
(66,535,560 |
) |
|
|
77,808,332 |
|
|
Total
increase (decrease) in net assets |
|
|
(51,033,747 |
) |
|
|
79,961,356 |
|
| |
|
|
|
|
|
|
|
|
|
NET
ASSETS - END OF YEAR |
|
$ |
169,225,405 |
|
|
$ |
220,259,152 |
|
| |
|
|
|
|
|
|
|
|
|
SHARE
ACTIVITY |
|
|
|
|
|
|
|
|
|
Investor
Class: |
|
|
|
|
|
|
|
|
|
Sold
|
|
|
258,534 |
|
|
|
440,007 |
|
|
Issued
on reinvestment of distributions |
|
|
13,315 |
|
|
|
123,585 |
|
|
Redeemed
|
|
|
(570,128 |
) |
|
|
(412,134 |
) |
|
Net
increase (decrease) |
|
|
(298,279 |
) |
|
|
151,458 |
|
| |
|
|
|
|
|
|
|
|
|
Institutional
Class: |
|
|
|
|
|
|
|
|
|
Sold
|
|
|
3,033,696 |
|
|
|
9,892,422 |
|
|
Issued
on reinvestment of distributions |
|
|
104,569 |
|
|
|
797,959 |
|
|
Redeemed
|
|
|
(8,786,863 |
) |
|
|
(3,725,029 |
) |
|
Net
increase (decrease) |
|
|
(5,648,598 |
) |
|
|
6,965,352 |
|
|
See
accompanying notes to financial statements. |
CRM
Funds |
| |
50 |
|
|
CRM
FUNDS
STATEMENTS
OF CHANGES IN NET ASSETS
|
| |
|
CRM
Mid Cap Value Fund |
|
| |
|
Year
Ended
June 30, 2024 |
|
|
Year
Ended
June 30, 2023 |
|
|
NET
ASSETS - BEGINNING OF YEAR |
|
$ |
412,887,936 |
|
|
$ |
384,065,255 |
|
| |
|
|
|
|
|
|
|
|
|
OPERATIONS
|
|
|
|
|
|
|
|
|
|
Net
investment income |
|
|
1,138,182 |
|
|
|
5,220,196 |
|
|
Net
realized gain from investments |
|
|
36,075,123 |
|
|
|
9,464,306 |
|
|
Net
change in unrealized appreciation (depreciation) on investments and foreign currency |
|
|
(1,271,028 |
) |
|
|
7,872,626 |
|
|
Net
increase in net assets resulting from operations |
|
|
35,942,277 |
|
|
|
22,557,128 |
|
| |
|
|
|
|
|
|
|
|
|
DISTRIBUTIONS
TO SHAREHOLDERS |
|
|
|
|
|
|
|
|
|
Investor
Class |
|
|
(9,626,587 |
) |
|
|
(7,142,897 |
) |
|
Institutional
Class |
|
|
(13,465,463 |
) |
|
|
(10,218,630 |
) |
|
Total
distributions to shareholders |
|
|
(23,092,050 |
) |
|
|
(17,361,527 |
) |
| |
|
|
|
|
|
|
|
|
|
CAPITAL
SHARE TRANSACTIONS |
|
|
|
|
|
|
|
|
|
Sale
of shares - Investor Shares |
|
|
7,386,528 |
|
|
|
18,136,050 |
|
|
Sale
of shares - Institutional Shares |
|
|
30,246,143 |
|
|
|
72,113,783 |
|
|
Reinvestment
of distributions - Investor Class |
|
|
9,467,390 |
|
|
|
7,031,109 |
|
|
Reinvestment
of distributions - Institutional Class |
|
|
12,666,657 |
|
|
|
9,472,114 |
|
|
Redemption
of shares - Investor Class |
|
|
(35,327,304 |
) |
|
|
(32,173,398 |
) |
|
Redemption
of shares - Institutional Class |
|
|
(78,120,292 |
) |
|
|
(50,952,578 |
) |
|
Net
increase (decrease) from capital share transactions |
|
|
(53,680,878 |
) |
|
|
23,627,080 |
|
|
Total
increase (decrease) in net assets |
|
|
(40,830,651 |
) |
|
|
28,822,681 |
|
| |
|
|
|
|
|
|
|
|
|
NET
ASSETS - END OF YEAR |
|
$ |
372,057,285 |
|
|
$ |
412,887,936 |
|
| |
|
|
|
|
|
|
|
|
|
SHARE
ACTIVITY |
|
|
|
|
|
|
|
|
|
Investor
Class: |
|
|
|
|
|
|
|
|
|
Sold
|
|
|
340,185 |
|
|
|
823,806 |
|
|
Issued
on reinvestment of distributions |
|
|
464,543 |
|
|
|
319,887 |
|
|
Redeemed
|
|
|
(1,627,828 |
) |
|
|
(1,478,388 |
) |
|
Net
decrease |
|
|
(823,100 |
) |
|
|
(334,695 |
) |
| |
|
|
|
|
|
|
|
|
|
Institutional
Class: |
|
|
|
|
|
|
|
|
|
Sold
|
|
|
1,315,903 |
|
|
|
3,124,549 |
|
|
Issued
on reinvestment of distributions |
|
|
585,606 |
|
|
|
407,578 |
|
|
Redeemed
|
|
|
(3,438,272 |
) |
|
|
(2,220,961 |
) |
|
Net
increase (decrease) |
|
|
(1,536,763 |
) |
|
|
1,311,166 |
|
|
See
accompanying notes to financial statements. |
CRM
Funds |
| |
51 |
|
|
CRM
FUNDS
STATEMENTS
OF CHANGES IN NET ASSETS
|
| |
|
CRM
All Cap Value Fund |
|
| |
|
Year
Ended
June 30, 2024 |
|
|
Year
Ended
June 30, 2023 |
|
|
NET
ASSETS - BEGINNING OF YEAR |
|
$ |
23,668,129 |
|
|
$ |
23,131,491 |
|
| |
|
|
|
|
|
|
|
|
|
OPERATIONS
|
|
|
|
|
|
|
|
|
|
Net
investment income |
|
|
62,998 |
|
|
|
45,749 |
|
|
Net
realized gain from investments |
|
|
1,727,201 |
|
|
|
474,916 |
|
|
Net
change in unrealized appreciation on investments and foreign currency |
|
|
1,079,275 |
|
|
|
659,221 |
|
|
Net
increase in net assets resulting from operations |
|
|
2,869,474 |
|
|
|
1,179,886 |
|
| |
|
|
|
|
|
|
|
|
|
DISTRIBUTIONS
TO SHAREHOLDERS |
|
|
|
|
|
|
|
|
|
Investor
Class |
|
|
(122,654 |
) |
|
|
(543,588 |
) |
|
Institutional
Class |
|
|
(343,247 |
) |
|
|
(1,112,197 |
) |
|
Total
distributions to shareholders |
|
|
(465,901 |
) |
|
|
(1,655,785 |
) |
| |
|
|
|
|
|
|
|
|
|
CAPITAL
SHARE TRANSACTIONS |
|
|
|
|
|
|
|
|
|
Sale
of shares - Investor Shares |
|
|
114,223 |
|
|
|
79,155 |
|
|
Sale
of shares - Institutional Shares |
|
|
444,553 |
|
|
|
634,169 |
|
|
Reinvestment
of distributions - Investor Class |
|
|
117,823 |
|
|
|
515,831 |
|
|
Reinvestment
of distributions - Institutional Class |
|
|
325,532 |
|
|
|
1,062,276 |
|
|
Redemption
of shares - Investor Class |
|
|
(1,710,121 |
) |
|
|
(438,501 |
) |
|
Redemption
of shares - Institutional Class |
|
|
(2,025,591 |
) |
|
|
(840,393 |
) |
|
Net
increase (decrease) from capital share transactions |
|
|
(2,733,581 |
) |
|
|
1,012,537 |
|
|
Total
increase (decrease) in net assets |
|
|
(330,008 |
) |
|
|
536,638 |
|
| |
|
|
|
|
|
|
|
|
|
NET
ASSETS - END OF YEAR |
|
$ |
23,338,121 |
|
|
$ |
23,668,129 |
|
| |
|
|
|
|
|
|
|
|
|
SHARE
ACTIVITY |
|
|
|
|
|
|
|
|
|
Investor
Class: |
|
|
|
|
|
|
|
|
|
Sold
|
|
|
16,865 |
|
|
|
11,555 |
|
|
Issued
on reinvestment of distributions |
|
|
19,065 |
|
|
|
79,359 |
|
|
Redeemed
|
|
|
(276,638 |
) |
|
|
(68,924 |
) |
|
Net
increase (decrease) |
|
|
(240,708 |
) |
|
|
21,990 |
|
| |
|
|
|
|
|
|
|
|
|
Institutional
Class: |
|
|
|
|
|
|
|
|
|
Sold
|
|
|
67,776 |
|
|
|
94,716 |
|
|
Issued
on reinvestment of distributions |
|
|
50,865 |
|
|
|
158,077 |
|
|
Redeemed
|
|
|
(296,821 |
) |
|
|
(126,864 |
) |
|
Net
increase (decrease) |
|
|
(178,180 |
) |
|
|
125,929 |
|
|
See
accompanying notes to financial statements. |
CRM
Funds |
| |
52 |
|
|
CRM
FUNDS
STATEMENTS
OF CHANGES IN NET ASSETS
|
| |
|
CRM
Long/Short Opportunities Fund |
|
| |
|
Year
Ended
June 30, 2024 |
|
|
Year
Ended
June 30, 2023 |
|
|
NET
ASSETS - BEGINNING OF YEAR |
|
$ |
255,340,562 |
|
|
$ |
185,463,235 |
|
| |
|
|
|
|
|
|
|
|
|
OPERATIONS
|
|
|
|
|
|
|
|
|
|
Net
investment income (loss) |
|
|
1,362,007 |
|
|
|
(58,492 |
) |
|
Net
realized gain (loss) from investments and foreign currency |
|
|
21,663,471 |
|
|
|
(5,723,712 |
) |
|
Net
change in unrealized appreciation (depreciation) on investments, derivatives, and foreign currency |
|
|
(11,361,034 |
) |
|
|
27,251,291 |
|
|
Net
increase in net assets resulting from operations |
|
|
11,664,444 |
|
|
|
21,469,087 |
|
| |
|
|
|
|
|
|
|
|
|
DISTRIBUTIONS
TO SHAREHOLDERS |
|
|
|
|
|
|
|
|
|
Institutional
Class |
|
|
(3,644,212 |
) |
|
|
(3,277,664 |
) |
|
Total
distributions to shareholders |
|
|
(3,644,212 |
) |
|
|
(3,277,664 |
) |
| |
|
|
|
|
|
|
|
|
|
CAPITAL
SHARE TRANSACTIONS |
|
|
|
|
|
|
|
|
|
Sale
of shares - Institutional Shares |
|
|
62,470,181 |
|
|
|
107,097,037 |
|
|
Reinvestment
of distributions - Institutional Class |
|
|
3,635,291 |
|
|
|
3,271,562 |
|
|
Redemption
of shares - Institutional Class |
|
|
(133,470,460 |
) |
|
|
(58,682,695 |
) |
|
Net
increase (decrease) from capital share transactions |
|
|
(67,364,988 |
) |
|
|
51,685,904 |
|
|
Total
increase (decrease) in net assets |
|
|
(59,344,756 |
) |
|
|
69,877,327 |
|
| |
|
|
|
|
|
|
|
|
|
NET
ASSETS - END OF YEAR |
|
$ |
195,995,806 |
|
|
$ |
255,340,562 |
|
| |
|
|
|
|
|
|
|
|
|
SHARE
ACTIVITY |
|
|
|
|
|
|
|
|
|
Institutional
Class: |
|
|
|
|
|
|
|
|
|
Sold
|
|
|
4,926,945 |
|
|
|
9,251,123 |
|
|
Issued
on reinvestment of distributions |
|
|
315,016 |
|
|
|
286,226 |
|
|
Redeemed
|
|
|
(11,271,054 |
) |
|
|
(5,096,169 |
) |
|
Net
increase (decrease) |
|
|
(6,029,093 |
) |
|
|
4,441,180 |
|
|
See
accompanying notes to financial statements. |
CRM
Funds |
| |
53 |
|
|
CRM
FUNDS
FINANCIAL
HIGHLIGHTS
|
The
following tables include selected data for a share outstanding throughout each year and other performance information derived from the
financial statements. The total returns in the tables represent the rate an investor would have earned or lost on an investment in the
funds (assuming reinvestment of all dividends and distributions). This information should be read in conjunction with the financial statements
and notes thereto.
| |
|
CRM
Small Cap Value Fund — Investor Shares |
|
| |
|
For
the Years Ended June 30, |
|
| |
|
2024 |
|
|
2023 |
|
|
2022 |
|
|
2021 |
|
|
2020 |
|
|
Net
Asset Value - Beginning of Year |
|
$ |
12.49 |
|
|
$ |
11.40 |
|
|
$ |
17.35 |
|
|
$ |
11.22 |
|
|
$ |
15.34 |
|
|
Investment
operations: |
|
|
|
|
|
|
|
|
|
|
|
|
|
|
|
|
|
|
|
|
|
Net
investment income1 |
|
|
0.05 |
|
|
|
0.14 |
|
|
|
— |
2 |
|
|
0.04 |
|
|
|
0.04 |
|
|
Net
realized and unrealized gain (loss) on investments |
|
|
1.53 |
|
|
|
1.24 |
|
|
|
(2.26 |
) |
|
|
6.16 |
|
|
|
(3.07 |
) |
|
Total
from investment operations |
|
|
1.58 |
|
|
|
1.38 |
|
|
|
(2.26 |
) |
|
|
6.20 |
|
|
|
(3.03 |
) |
|
Distributions
to shareholders: |
|
|
|
|
|
|
|
|
|
|
|
|
|
|
|
|
|
|
|
|
|
From
net investment income |
|
|
(0.23 |
) |
|
|
(0.06 |
) |
|
|
(0.01 |
) |
|
|
(0.07 |
) |
|
|
(0.03 |
) |
|
From
net realized gain on investments |
|
|
(0.34 |
) |
|
|
(0.23 |
) |
|
|
(3.68 |
) |
|
|
— |
|
|
|
(1.06 |
) |
|
Total
distributions to shareholders |
|
|
(0.57 |
) |
|
|
(0.29 |
) |
|
|
(3.69 |
) |
|
|
(0.07 |
) |
|
|
(1.09 |
) |
|
Net
Asset Value - End of Year |
|
$ |
13.50 |
|
|
$ |
12.49 |
|
|
$ |
11.40 |
|
|
$ |
17.35 |
|
|
$ |
11.22 |
|
|
Total
return |
|
|
13.17 |
% |
|
|
12.09 |
% |
|
|
(15.73 |
)% |
|
|
55.36 |
% |
|
|
(21.53 |
)% |
|
Ratios/Supplemental
Data: |
|
|
|
|
|
|
|
|
|
|
|
|
|
|
|
|
|
|
|
|
|
Ratios
to average net assets: |
|
|
|
|
|
|
|
|
|
|
|
|
|
|
|
|
|
|
|
|
|
Expenses
|
|
|
1.26 |
% |
|
|
1.21 |
% |
|
|
1.16 |
% |
|
|
1.15 |
% |
|
|
1.16 |
% |
|
Net
investment income |
|
|
0.43 |
% |
|
|
1.11 |
% |
|
|
0.01 |
% |
|
|
0.30 |
% |
|
|
0.27 |
% |
|
Portfolio
turnover rate |
|
|
77 |
% |
|
|
54 |
% |
|
|
54 |
% |
|
|
63 |
% |
|
|
60 |
% |
|
Net
Assets at end of year (000’s omitted) |
|
$ |
28,177 |
|
|
$ |
28,660 |
|
|
$ |
28,325 |
|
|
$ |
38,548 |
|
|
$ |
33,526 |
|
|
(1) |
Calculated using the average
shares method. |
|
(2) |
Amount represents less
than $0.005. |
|
See
accompanying notes to financial statements. |
CRM
Funds |
| |
54 |
|
|
CRM
FUNDS
FINANCIAL
HIGHLIGHTS
|
| |
|
CRM
Small Cap Value Fund — Institutional Shares |
|
| |
|
For
the Years Ended June 30, |
|
| |
|
2024 |
|
|
2023 |
|
|
2022 |
|
|
2021 |
|
|
2020 |
|
|
Net
Asset Value - Beginning of Year |
|
$ |
15.53 |
|
|
$ |
14.10 |
|
|
$ |
20.55 |
|
|
$ |
13.28 |
|
|
$ |
17.96 |
|
|
Investment
operations: |
|
|
|
|
|
|
|
|
|
|
|
|
|
|
|
|
|
|
|
|
|
Net
investment income1 |
|
|
0.10 |
|
|
|
0.19 |
|
|
|
0.03 |
|
|
|
0.09 |
|
|
|
0.08 |
|
|
Net
realized and unrealized gain (loss) on investments |
|
|
1.90 |
|
|
|
1.55 |
|
|
|
(2.75 |
) |
|
|
7.28 |
|
|
|
(3.63 |
) |
|
Total
from investment operations |
|
|
2.00 |
|
|
|
1.74 |
|
|
|
(2.72 |
) |
|
|
7.37 |
|
|
|
(3.55 |
) |
|
Distributions
to shareholders: |
|
|
|
|
|
|
|
|
|
|
|
|
|
|
|
|
|
|
|
|
|
From
net investment income |
|
|
(0.25 |
) |
|
|
(0.08 |
) |
|
|
(0.05 |
) |
|
|
(0.10 |
) |
|
|
(0.07 |
) |
|
From
net realized gain on investments |
|
|
(0.34 |
) |
|
|
(0.23 |
) |
|
|
(3.68 |
) |
|
|
— |
|
|
|
(1.06 |
) |
|
Total
distributions to shareholders |
|
|
(0.59 |
) |
|
|
(0.31 |
) |
|
|
(3.73 |
) |
|
|
(0.10 |
) |
|
|
(1.13 |
) |
|
Net
Asset Value - End of Year |
|
$ |
16.94 |
|
|
$ |
15.53 |
|
|
$ |
14.10 |
|
|
$ |
20.55 |
|
|
$ |
13.28 |
|
|
Total
return |
|
|
13.36 |
% |
|
|
12.33 |
% |
|
|
(15.53 |
)% |
|
|
55.68 |
% |
|
|
(21.34 |
)% |
|
Ratios/Supplemental
Data: |
|
|
|
|
|
|
|
|
|
|
|
|
|
|
|
|
|
|
|
|
|
Ratios
to average net assets: |
|
|
|
|
|
|
|
|
|
|
|
|
|
|
|
|
|
|
|
|
|
Expenses
|
|
|
1.07 |
% |
|
|
1.01 |
% |
|
|
0.93 |
% |
|
|
0.91 |
% |
|
|
0.92 |
% |
|
Net
investment income |
|
|
0.61 |
% |
|
|
1.27 |
% |
|
|
0.18 |
% |
|
|
0.54 |
% |
|
|
0.52 |
% |
|
Portfolio
turnover rate |
|
|
77 |
% |
|
|
54 |
% |
|
|
54 |
% |
|
|
63 |
% |
|
|
60 |
% |
|
Net
Assets at end of year (000’s omitted) |
|
$ |
47,098 |
|
|
$ |
48,766 |
|
|
$ |
90,451 |
|
|
$ |
299,170 |
|
|
$ |
198,589 |
|
|
(1) |
Calculated using
the average shares method. |
|
See
accompanying notes to financial statements. |
CRM
Funds |
| |
55 |
|
|
CRM
FUNDS
FINANCIAL
HIGHLIGHTS
|
| |
|
CRM
Small/Mid Cap Value Fund — Investor Shares |
|
| |
|
For
the Years Ended June 30, |
|
| |
|
2024 |
|
|
2023 |
|
|
2022 |
|
|
2021 |
|
|
2020 |
|
|
Net
Asset Value - Beginning of Year |
|
$ |
10.20 |
|
|
$ |
9.94 |
|
|
$ |
15.37 |
|
|
$ |
9.71 |
|
|
$ |
11.36 |
|
|
Investment
operations: |
|
|
|
|
|
|
|
|
|
|
|
|
|
|
|
|
|
|
|
|
|
Net
investment income1 |
|
|
0.03 |
|
|
|
0.10 |
|
|
|
0.10 |
|
|
|
0.11 |
|
|
|
0.02 |
|
|
Net
realized and unrealized gain (loss) on investments |
|
|
0.84 |
|
|
|
0.79 |
|
|
|
(1.39 |
) |
|
|
6.29 |
|
|
|
(1.35 |
) |
|
Total
from investment operations |
|
|
0.87 |
|
|
|
0.89 |
|
|
|
(1.29 |
) |
|
|
6.40 |
|
|
|
(1.33 |
) |
|
Distributions
to shareholders: |
|
|
|
|
|
|
|
|
|
|
|
|
|
|
|
|
|
|
|
|
|
From
net investment income |
|
|
(0.07 |
) |
|
|
(0.06 |
) |
|
|
(0.17 |
) |
|
|
(0.03 |
) |
|
|
(0.03 |
) |
|
From
net realized gain on investments |
|
|
— |
2 |
|
|
(0.57 |
) |
|
|
(3.97 |
) |
|
|
(0.71 |
) |
|
|
(0.29 |
) |
|
Total
distributions to shareholders |
|
|
(0.07 |
) |
|
|
(0.63 |
) |
|
|
(4.14 |
) |
|
|
(0.74 |
) |
|
|
(0.32 |
) |
|
Net
Asset Value - End of Year |
|
$ |
11.00 |
|
|
$ |
10.20 |
|
|
$ |
9.94 |
|
|
$ |
15.37 |
|
|
$ |
9.71 |
|
|
Total
return |
|
|
8.57 |
% |
|
|
9.07 |
% |
|
|
(11.92 |
)% |
|
|
67.80 |
% |
|
|
(12.18 |
)% |
|
Ratios/Supplemental
Data: |
|
|
|
|
|
|
|
|
|
|
|
|
|
|
|
|
|
|
|
|
|
Ratios
to average net assets: |
|
|
|
|
|
|
|
|
|
|
|
|
|
|
|
|
|
|
|
|
|
Expenses
|
|
|
1.21 |
% |
|
|
1.18 |
% |
|
|
1.18 |
% |
|
|
1.15 |
% |
|
|
1.17 |
% |
|
Net
investment income |
|
|
0.24 |
% |
|
|
1.02 |
% |
|
|
0.82 |
% |
|
|
0.83 |
% |
|
|
0.22 |
% |
|
Portfolio
turnover rate |
|
|
72 |
% |
|
|
42 |
% |
|
|
34 |
% |
|
|
59 |
% |
|
|
80 |
% |
|
Net
Assets at end of year (000’s omitted) |
|
$ |
21,541 |
|
|
$ |
23,018 |
|
|
$ |
20,914 |
|
|
$ |
26,464 |
|
|
$ |
16,259 |
|
|
(1) |
Calculated using
the average shares method. |
|
(2) |
Amount represents less
than $0.005. |
|
See
accompanying notes to financial statements. |
CRM
Funds |
| |
56 |
|
|
CRM
FUNDS
FINANCIAL
HIGHLIGHTS
|
| |
|
CRM
Small/Mid Cap Value Fund —
Institutional Shares |
|
| |
|
For
the Years Ended June 30, |
|
| |
|
2024 |
|
|
2023 |
|
|
2022 |
|
|
2021 |
|
|
2020 |
|
|
Net
Asset Value - Beginning of Year |
|
$ |
10.68 |
|
|
$ |
10.38 |
|
|
$ |
15.87 |
|
|
$ |
10.00 |
|
|
$ |
11.70 |
|
|
Investment
operations: |
|
|
|
|
|
|
|
|
|
|
|
|
|
|
|
|
|
|
|
|
|
Net
investment income1 |
|
|
0.04 |
|
|
|
0.13 |
|
|
|
0.13 |
|
|
|
0.13 |
|
|
|
0.05 |
|
|
Net
realized and unrealized gain (loss) on investments |
|
|
0.89 |
|
|
|
0.82 |
|
|
|
(1.46 |
) |
|
|
6.50 |
|
|
|
(1.41 |
) |
|
Total
from investment operations |
|
|
0.93 |
|
|
|
0.95 |
|
|
|
(1.33 |
) |
|
|
6.63 |
|
|
|
(1.36 |
) |
|
Distributions
to shareholders: |
|
|
|
|
|
|
|
|
|
|
|
|
|
|
|
|
|
|
|
|
|
From
net investment income |
|
|
(0.09 |
) |
|
|
(0.08 |
) |
|
|
(0.19 |
) |
|
|
(0.05 |
) |
|
|
(0.05 |
) |
|
From
net realized gain on investments |
|
|
— |
2 |
|
|
(0.57 |
) |
|
|
(3.97 |
) |
|
|
(0.71 |
) |
|
|
(0.29 |
) |
|
Total
distributions to shareholders |
|
|
(0.09 |
) |
|
|
(0.65 |
) |
|
|
(4.16 |
) |
|
|
(0.76 |
) |
|
|
(0.34 |
) |
|
Net
Asset Value - End of Year |
|
$ |
11.52 |
|
|
$ |
10.68 |
|
|
$ |
10.38 |
|
|
$ |
15.87 |
|
|
$ |
10.00 |
|
|
Total
return |
|
|
8.75 |
% |
|
|
9.28 |
% |
|
|
(11.78 |
)% |
|
|
68.26 |
% |
|
|
(12.06 |
)% |
|
Ratios/Supplemental
Data: |
|
|
|
|
|
|
|
|
|
|
|
|
|
|
|
|
|
|
|
|
|
Ratios
to average net assets: |
|
|
|
|
|
|
|
|
|
|
|
|
|
|
|
|
|
|
|
|
|
Expenses
|
|
|
1.05 |
% |
|
|
1.01 |
% |
|
|
1.00 |
% |
|
|
0.93 |
% |
|
|
0.95 |
% |
|
Net
investment income |
|
|
0.39 |
% |
|
|
1.21 |
% |
|
|
0.98 |
% |
|
|
0.99 |
% |
|
|
0.44 |
% |
|
Portfolio
turnover rate |
|
|
72 |
% |
|
|
42 |
% |
|
|
34 |
% |
|
|
59 |
% |
|
|
80 |
% |
|
Net
Assets at end of year (000’s omitted) |
|
$ |
147,684 |
|
|
$ |
197,242 |
|
|
$ |
119,384 |
|
|
$ |
286,762 |
|
|
$ |
220,919 |
|
|
(1) |
Calculated using
the average shares method. |
|
(2) |
Amount represents less
than $0.005. |
|
See
accompanying notes to financial statements. |
CRM
Funds |
| |
57 |
|
|
CRM
FUNDS
FINANCIAL
HIGHLIGHTS
|
| |
|
CRM
Mid Cap Value Fund — Investor Shares |
|
| |
|
For
the Years Ended June 30, |
|
| |
|
2024 |
|
|
2023 |
|
|
2022 |
|
|
2021 |
|
|
2020 |
|
|
Net
Asset Value - Beginning of Year |
|
$ |
21.73 |
|
|
$ |
21.43 |
|
|
$ |
27.71 |
|
|
$ |
18.34 |
|
|
$ |
21.22 |
|
|
Investment
operations: |
|
|
|
|
|
|
|
|
|
|
|
|
|
|
|
|
|
|
|
|
|
Net
investment income1 |
|
|
0.04 |
|
|
|
0.25 |
|
|
|
0.27 |
|
|
|
0.15 |
|
|
|
0.08 |
|
|
Net
realized and unrealized gain (loss) on investments |
|
|
2.05 |
|
|
|
1.00 |
|
|
|
(1.57 |
) |
|
|
9.67 |
|
|
|
(2.33 |
) |
|
Total
from investment operations |
|
|
2.09 |
|
|
|
1.25 |
|
|
|
(1.30 |
) |
|
|
9.82 |
|
|
|
(2.25 |
) |
|
Distributions
to shareholders: |
|
|
|
|
|
|
|
|
|
|
|
|
|
|
|
|
|
|
|
|
|
From
net investment income |
|
|
(0.24 |
) |
|
|
(0.26 |
) |
|
|
(0.26 |
) |
|
|
(0.09 |
) |
|
|
(0.09 |
) |
|
From
net realized gain on investments |
|
|
(1.15 |
) |
|
|
(0.69 |
) |
|
|
(4.72 |
) |
|
|
(0.36 |
) |
|
|
(0.54 |
) |
|
Total
distributions to shareholders |
|
|
(1.39 |
) |
|
|
(0.95 |
) |
|
|
(4.98 |
) |
|
|
(0.45 |
) |
|
|
(0.63 |
) |
|
Net
Asset Value - End of Year |
|
$ |
22.43 |
|
|
$ |
21.73 |
|
|
$ |
21.43 |
|
|
$ |
27.71 |
|
|
$ |
18.34 |
|
|
Total
return |
|
|
10.27 |
% |
|
|
5.78 |
% |
|
|
(6.68 |
)% |
|
|
54.09 |
% |
|
|
(10.98 |
)% |
|
Ratios/Supplemental
Data: |
|
|
|
|
|
|
|
|
|
|
|
|
|
|
|
|
|
|
|
|
|
Ratios
to average net assets: |
|
|
|
|
|
|
|
|
|
|
|
|
|
|
|
|
|
|
|
|
|
Expenses
|
|
|
1.16 |
% |
|
|
1.15 |
% |
|
|
1.14 |
% |
|
|
1.15 |
% |
|
|
1.16 |
% |
|
Net
investment income |
|
|
0.19 |
% |
|
|
1.16 |
% |
|
|
1.06 |
% |
|
|
0.66 |
% |
|
|
0.42 |
% |
|
Portfolio
turnover rate |
|
|
47 |
% |
|
|
43 |
% |
|
|
23 |
% |
|
|
63 |
% |
|
|
37 |
% |
|
Net
Assets at end of year (000’s omitted) |
|
$ |
146,457 |
|
|
$ |
159,797 |
|
|
$ |
164,743 |
|
|
$ |
187,541 |
|
|
$ |
152,370 |
|
|
(1) |
Calculated using
the average shares method. |
|
See
accompanying notes to financial statements. |
CRM
Funds |
| |
58 |
|
|
CRM
FUNDS
FINANCIAL
HIGHLIGHTS
|
| |
|
CRM
Mid Cap Value Fund — Institutional Shares |
|
| |
|
For
the Years Ended June 30, |
|
| |
|
2024 |
|
|
2023 |
|
|
2022 |
|
|
2021 |
|
|
2020 |
|
|
Net
Asset Value - Beginning of Year |
|
$ |
23.00 |
|
|
$ |
22.62 |
|
|
$ |
29.00 |
|
|
$ |
19.17 |
|
|
$ |
22.16 |
|
|
Investment
operations: |
|
|
|
|
|
|
|
|
|
|
|
|
|
|
|
|
|
|
|
|
|
Net
investment income1 |
|
|
0.08 |
|
|
|
0.31 |
|
|
|
0.33 |
|
|
|
0.20 |
|
|
|
0.12 |
|
|
Net
realized and unrealized gain (loss) on investments |
|
|
2.16 |
|
|
|
1.06 |
|
|
|
(1.67 |
) |
|
|
10.12 |
|
|
|
(2.44 |
) |
|
Total
from investment operations |
|
|
2.24 |
|
|
|
1.37 |
|
|
|
(1.34 |
) |
|
|
10.32 |
|
|
|
(2.32 |
) |
|
Distributions
to shareholders: |
|
|
|
|
|
|
|
|
|
|
|
|
|
|
|
|
|
|
|
|
|
From
net investment income |
|
|
(0.27 |
) |
|
|
(0.30 |
) |
|
|
(0.32 |
) |
|
|
(0.13 |
) |
|
|
(0.13 |
) |
|
From
net realized gain on investments |
|
|
(1.15 |
) |
|
|
(0.69 |
) |
|
|
(4.72 |
) |
|
|
(0.36 |
) |
|
|
(0.54 |
) |
|
Total
distributions to shareholders |
|
|
(1.42 |
) |
|
|
(0.99 |
) |
|
|
(5.04 |
) |
|
|
(0.49 |
) |
|
|
(0.67 |
) |
|
Net
Asset Value - End of Year |
|
$ |
23.82 |
|
|
$ |
23.00 |
|
|
$ |
22.62 |
|
|
$ |
29.00 |
|
|
$ |
19.17 |
|
|
Total
return |
|
|
10.39 |
% |
|
|
6.00 |
% |
|
|
(6.55 |
)% |
|
|
54.44 |
% |
|
|
(10.83 |
)% |
|
Ratios/Supplemental
Data: |
|
|
|
|
|
|
|
|
|
|
|
|
|
|
|
|
|
|
|
|
|
Ratios
to average net assets: |
|
|
|
|
|
|
|
|
|
|
|
|
|
|
|
|
|
|
|
|
|
Expenses
|
|
|
0.99 |
% |
|
|
0.99 |
% |
|
|
0.97 |
% |
|
|
0.94 |
% |
|
|
0.96 |
% |
|
Net
investment income |
|
|
0.36 |
% |
|
|
1.34 |
% |
|
|
1.23 |
% |
|
|
0.84 |
% |
|
|
0.59 |
% |
|
Portfolio
turnover rate |
|
|
47 |
% |
|
|
43 |
% |
|
|
23 |
% |
|
|
63 |
% |
|
|
37 |
% |
|
Net
Assets at end of year (000’s omitted) |
|
$ |
225,601 |
|
|
$ |
253,091 |
|
|
$ |
219,322 |
|
|
$ |
251,517 |
|
|
$ |
202,989 |
|
|
(1) |
Calculated using
the average shares method. |
|
See
accompanying notes to financial statements. |
CRM
Funds |
| |
59 |
|
|
CRM
FUNDS
FINANCIAL
HIGHLIGHTS
|
| |
|
CRM
All Cap Value Fund — Investor Shares |
|
| |
|
For
the Years Ended June 30, |
|
| |
|
2024 |
|
|
2023 |
|
|
2022 |
|
|
2021 |
|
|
2020 |
|
|
Net
Asset Value - Beginning of Year |
|
$ |
6.34 |
|
|
$ |
6.47 |
|
|
$ |
8.88 |
|
|
$ |
5.91 |
|
|
$ |
6.99 |
|
|
Investment
operations: |
|
|
|
|
|
|
|
|
|
|
|
|
|
|
|
|
|
|
|
|
|
Net
investment income1 |
|
|
0.01 |
|
|
|
— |
2 |
|
|
0.02 |
|
|
|
0.02 |
|
|
|
0.01 |
|
|
Net
realized and unrealized gain (loss) on investments |
|
|
0.83 |
|
|
|
0.33 |
|
|
|
(0.70 |
) |
|
|
3.16 |
|
|
|
(0.67 |
) |
|
Total
from investment operations |
|
|
0.84 |
|
|
|
0.33 |
|
|
|
(0.68 |
) |
|
|
3.18 |
|
|
|
(0.66 |
) |
|
Distributions
to shareholders: |
|
|
|
|
|
|
|
|
|
|
|
|
|
|
|
|
|
|
|
|
|
From
net investment income |
|
|
(0.01 |
) |
|
|
(0.01 |
) |
|
|
(0.04 |
) |
|
|
(0.02 |
) |
|
|
(0.01 |
) |
|
From
net realized gain on investments |
|
|
(0.12 |
) |
|
|
(0.45 |
) |
|
|
(1.69 |
) |
|
|
(0.19 |
) |
|
|
(0.41 |
) |
|
Total
distributions to shareholders |
|
|
(0.13 |
) |
|
|
(0.46 |
) |
|
|
(1.73 |
) |
|
|
(0.21 |
) |
|
|
(0.42 |
) |
|
Net
Asset Value - End of Year |
|
$ |
7.05 |
|
|
$ |
6.34 |
|
|
$ |
6.47 |
|
|
$ |
8.88 |
|
|
$ |
5.91 |
|
|
Total
return |
|
|
13.47 |
% |
|
|
4.94 |
% |
|
|
(10.09 |
)% |
|
|
54.42 |
% |
|
|
(10.16 |
)% |
|
Ratios/Supplemental
Data: |
|
|
|
|
|
|
|
|
|
|
|
|
|
|
|
|
|
|
|
|
|
Ratios
to average net assets: |
|
|
|
|
|
|
|
|
|
|
|
|
|
|
|
|
|
|
|
|
|
Expenses,
including waiver/reimbursement |
|
|
1.45 |
% |
|
|
1.41 |
% |
|
|
1.33 |
% |
|
|
1.37 |
% |
|
|
1.40 |
% |
|
Expenses,
excluding waiver/reimbursement |
|
|
1.47 |
% |
|
|
1.41 |
% |
|
|
1.33 |
% |
|
|
1.39 |
% |
|
|
1.50 |
% |
|
Net
investment income, including waiver/reimbursement |
|
|
0.09 |
% |
|
|
0.03 |
% |
|
|
0.32 |
% |
|
|
0.31 |
% |
|
|
0.22 |
% |
|
Portfolio
turnover rate |
|
|
54 |
% |
|
|
51 |
% |
|
|
38 |
% |
|
|
87 |
% |
|
|
65 |
% |
|
Net
Assets at end of year (000’s omitted) |
|
$ |
6,767 |
|
|
$ |
7,609 |
|
|
$ |
7,622 |
|
|
$ |
8,916 |
|
|
$ |
6,893 |
|
|
(1) |
Calculated using
the average shares method. |
|
(2) |
Amount represents less
than $0.005. |
|
See
accompanying notes to financial statements. |
CRM
Funds |
| |
60 |
|
|
CRM
FUNDS
FINANCIAL
HIGHLIGHTS
|
| |
|
CRM
All Cap Value Fund — Institutional Shares |
|
| |
|
For
the Years Ended June 30, |
|
| |
|
2024 |
|
|
2023 |
|
|
2022 |
|
|
2021 |
|
|
2020 |
|
|
Net
Asset Value - Beginning of Year |
|
$ |
6.57 |
|
|
$ |
6.69 |
|
|
$ |
9.12 |
|
|
$ |
6.07 |
|
|
$ |
7.16 |
|
|
Investment
operations: |
|
|
|
|
|
|
|
|
|
|
|
|
|
|
|
|
|
|
|
|
|
Net
investment income1 |
|
|
0.02 |
|
|
|
0.02 |
|
|
|
0.04 |
|
|
|
0.04 |
|
|
|
0.03 |
|
|
Net
realized and unrealized gain (loss) on investments |
|
|
0.87 |
|
|
|
0.34 |
|
|
|
(0.72 |
) |
|
|
3.24 |
|
|
|
(0.68 |
) |
|
Total
from investment operations |
|
|
0.89 |
|
|
|
0.36 |
|
|
|
(0.68 |
) |
|
|
3.28 |
|
|
|
(0.65 |
) |
|
Distributions
to shareholders: |
|
|
|
|
|
|
|
|
|
|
|
|
|
|
|
|
|
|
|
|
|
From
net investment income |
|
|
(0.03 |
) |
|
|
(0.03 |
) |
|
|
(0.06 |
) |
|
|
(0.04 |
) |
|
|
(0.03 |
) |
|
From
net realized gain on investments |
|
|
(0.12 |
) |
|
|
(0.45 |
) |
|
|
(1.69 |
) |
|
|
(0.19 |
) |
|
|
(0.41 |
) |
|
Total
distributions to shareholders |
|
|
(0.15 |
) |
|
|
(0.48 |
) |
|
|
(1.75 |
) |
|
|
(0.23 |
) |
|
|
(0.44 |
) |
|
Net
Asset Value - End of Year |
|
$ |
7.31 |
|
|
$ |
6.57 |
|
|
$ |
6.69 |
|
|
$ |
9.12 |
|
|
$ |
6.07 |
|
|
Total
return |
|
|
13.77 |
% |
|
|
5.18 |
% |
|
|
(9.81 |
)% |
|
|
54.66 |
% |
|
|
(9.87 |
)% |
|
Ratios/Supplemental
Data: |
|
|
|
|
|
|
|
|
|
|
|
|
|
|
|
|
|
|
|
|
|
Ratios
to average net assets: |
|
|
|
|
|
|
|
|
|
|
|
|
|
|
|
|
|
|
|
|
|
Expenses,
including waiver/reimbursement |
|
|
1.20 |
% |
|
|
1.18 |
% |
|
|
1.09 |
% |
|
|
1.11 |
% |
|
|
1.15 |
% |
|
Expenses,
excluding waiver/reimbursement |
|
|
1.24 |
% |
|
|
1.18 |
% |
|
|
1.09 |
% |
|
|
1.13 |
% |
|
|
1.25 |
% |
|
Net
investment income, including waiver/reimbursement |
|
|
0.35 |
% |
|
|
0.27 |
% |
|
|
0.56 |
% |
|
|
0.52 |
% |
|
|
0.47 |
% |
|
Portfolio
turnover rate |
|
|
54 |
% |
|
|
51 |
% |
|
|
38 |
% |
|
|
87 |
% |
|
|
65 |
% |
|
Net
Assets at end of year (000’s omitted) |
|
$ |
16,571 |
|
|
$ |
16,059 |
|
|
$ |
15,509 |
|
|
$ |
18,393 |
|
|
$ |
18,307 |
|
|
(1) |
Calculated using
the average shares method. |
|
See
accompanying notes to financial statements. |
CRM
Funds |
| |
61 |
|
|
CRM
FUNDS
FINANCIAL
HIGHLIGHTS
|
| |
|
CRM
Long/Short Opportunities Fund —
Institutional Shares |
|
| |
|
For
the Years Ended June 30, |
|
| |
|
2024 |
|
|
2023 |
|
|
2022 |
|
|
2021 |
|
|
2020 |
|
|
Net
Asset Value - Beginning of Year |
|
$ |
12.11 |
|
|
$ |
11.15 |
|
|
$ |
11.62 |
|
|
$ |
10.23 |
|
|
$ |
10.27 |
|
|
Investment
operations: |
|
|
|
|
|
|
|
|
|
|
|
|
|
|
|
|
|
|
|
|
|
Net
investment income (loss)1 |
|
|
0.09 |
|
|
|
— |
2 |
|
|
(0.23 |
) |
|
|
(0.25 |
) |
|
|
(0.10 |
) |
|
Net
realized and unrealized gain (loss) on investments, derivatives and foreign currency |
|
|
1.09 |
|
|
|
1.14 |
|
|
|
(0.15 |
) |
|
|
2.22 |
|
|
|
0.50 |
|
|
Total
from investment operations |
|
|
1.18 |
|
|
|
1.14 |
|
|
|
(0.38 |
) |
|
|
1.97 |
|
|
|
0.40 |
|
|
Distributions
to shareholders: |
|
|
|
|
|
|
|
|
|
|
|
|
|
|
|
|
|
|
|
|
|
From
net investment income |
|
|
(0.27 |
) |
|
|
— |
|
|
|
— |
|
|
|
— |
|
|
|
— |
|
|
From
net realized gain on investments |
|
|
— |
|
|
|
(0.18 |
) |
|
|
(0.09 |
) |
|
|
(0.58 |
) |
|
|
(0.44 |
) |
|
Total
distributions to shareholders |
|
|
(0.27 |
) |
|
|
(0.18 |
) |
|
|
(0.09 |
) |
|
|
(0.58 |
) |
|
|
(0.44 |
) |
|
Net
Asset Value - End of Year |
|
$ |
13.02 |
|
|
$ |
12.11 |
|
|
$ |
11.15 |
|
|
$ |
11.62 |
|
|
$ |
10.23 |
|
|
Total
return |
|
|
10.07 |
% |
|
|
10.29 |
% |
|
|
(3.33 |
)% |
|
|
19.49 |
% |
|
|
3.93 |
% |
|
Ratios
to average net assets: |
|
|
|
|
|
|
|
|
|
|
|
|
|
|
|
|
|
|
|
|
|
Expenses,
including waiver/reimbursement |
|
|
2.25 |
% |
|
|
2.48 |
% |
|
|
2.68 |
% |
|
|
2.79 |
% |
|
|
2.95 |
% |
|
Expenses,
including waiver/reimbursement and excluding interest and dividend expense relating to short sales |
|
|
1.60 |
% |
|
|
1.60 |
% |
|
|
1.60 |
% |
|
|
1.60 |
% |
|
|
1.59 |
% |
|
Expenses,
excluding waiver/reimbursement |
|
|
2.41 |
% |
|
|
2.60 |
% |
|
|
2.80 |
% |
|
|
2.90 |
% |
|
|
3.03 |
% |
|
Expenses,
excluding waiver/reimbursement and interest and dividend expense relating to short sales |
|
|
1.76 |
% |
|
|
1.72 |
% |
|
|
1.72 |
% |
|
|
1.71 |
% |
|
|
1.67 |
% |
|
Net
investment income (loss), including waiver/reimbursement |
|
|
0.73 |
% |
|
|
(0.03 |
)% |
|
|
(2.00 |
)% |
|
|
(2.18 |
)% |
|
|
(0.99 |
)% |
|
Portfolio
turnover rate |
|
|
113 |
% |
|
|
90 |
% |
|
|
157 |
% |
|
|
201 |
% |
|
|
177 |
% |
|
Net
Assets at end of year (000’s omitted) |
|
$ |
195,996 |
|
|
$ |
255,341 |
|
|
$ |
185,463 |
|
|
$ |
127,930 |
|
|
$ |
56,540 |
|
|
(1) |
Calculated using
the average shares method. |
|
(2) |
Amount represents less
than $(0.005). |
|
See
accompanying notes to financial statements. |
CRM
Funds |
| |
62 |
|
|
CRM
FUNDS
NOTES
TO FINANCIAL STATEMENTS — June 30, 2024
|
|
1. |
Description of the Funds.
CRM Small Cap Value Fund (“Small Cap Value Fund”), CRM Small/Mid
Cap Value Fund (“Small/Mid Cap Value Fund”), CRM Mid Cap Value Fund (“Mid Cap Value Fund”), CRM All Cap Value
Fund (“All Cap Value Fund”) and CRM Long/Short Opportunities Fund (“Long/Short Opportunities Fund”) (each, a “Fund”
and collectively, the “Funds”) are series of the CRM Mutual Fund Trust (the “Trust”). The Trust consists of five
funds. A shareholder of one series is not deemed to be a shareholder of any other series. The Trust is registered under the Investment
Company Act of 1940, as amended (the “1940 Act”), as an open-end management investment company and was organized as a Delaware
statutory trust on March 30, 2005. |
Small
Cap Value Fund, Small/Mid Cap Value Fund, Mid Cap Value Fund, and All Cap Value Fund:
Each Fund offers Investor and Institutional Shares. Each class has different minimum investment requirements, fees and expenses. All classes
of shares have identical voting, dividend and liquidation rights. Investor Shares are available to all investors and are subject to a
shareholder servicing fee. Institutional Shares are offered only to those investors who invest in a Fund through an intermediary (i.e.
broker) or through a consultant and who invest $1,000,000 or more or where related accounts total $1,000,000 or more when combined.
Long/Short
Opportunities Fund: The Fund offers Institutional Shares. Shares are generally
available for purchase and sale by registered investment advisers acting in a fiduciary capacity on behalf of their clients and by or
through other qualified intermediaries and programs sponsored by such qualified financial intermediaries. Initial investments in the Fund
are subject to a $10,000 minimum per registered investment adviser or qualified financial intermediary.
|
2. |
Significant Accounting
Policies. The Funds’ financial statements have been prepared in conformity
with U.S. generally accepted accounting principles (“U.S. GAAP”). The Funds are investment companies and follow the accounting
and reporting requirements for investment companies under Financial Accounting Standards Board (“FASB”), Accounting Standards
Codification Topic 946. The following is a summary of the significant accounting policies of the Funds: |
|
CRM
FUNDS
NOTES
TO FINANCIAL STATEMENTS — June 30, 2024 (Continued) |
Security
Valuation. The Funds value their investment securities based on current market
values when such values are available. These prices normally are supplied by a pricing service.
In
valuing a Fund’s investment securities, a security listed on the New York Stock Exchange (the “Exchange”) (and not subject
to restrictions against sale by the Fund on the Exchange) will be valued at its last sale price on the Exchange on the day the security
is valued. Lacking any sales on such day, the security will be valued at the mean between the closing asked price and the closing bid
price. Securities listed on other exchanges (and not subject to restriction against sale by the Fund on such exchanges) will be similarly
valued, using quotations on the exchange on which the security is traded most extensively. Securities that are quoted on the NASDAQ Stock
Market, for which there have been sales of such securities on such day, shall be valued at the last sale price reported on such system
on the day the security is valued. If there are no such sales on such day, the value shall be the mean between the closing asked price
and the closing bid price. The value of such securities quoted on the stock market system, but not listed on the national market system,
shall be valued at the mean between the closing asked price and the closing bid price. Unlisted securities that are not quoted on the
NASDAQ Stock Market and for which over-the-counter market quotations are readily available will be valued at the mean between the current
bid and asked prices for such security in the over-the-counter market.
Short-term
investments with remaining maturities of less than 61 days are valued at amortized cost, provided such amount approximates fair value.
A Fund’s currency valuations, if any, are also valued at the close of regular trading on the Exchange. Investments in other open-end
investment companies are valued at such investment company’s current day closing net asset value per share. Swaps and forward foreign
currency exchange contracts are valued utilizing market quotations provided by a third-party pricing service. Option contracts are generally
valued at the mean between the last bid and ask prices on the principal exchange where they are traded.
Pursuant
to Rule 2a-5 under the 1940 Act, the Board of Trustees of the Trust (the “Board” or “Trustees”) has designated
Cramer Rosenthal McGlynn, LLC, the adviser, to serve as the Trust’s Valuation Designee, to perform any fair value determinations
for securities and other assets held by the Funds for which market quotations are not readily available in accordance with the
|
CRM
FUNDS
NOTES
TO FINANCIAL STATEMENTS — June 30, 2024 (Continued) |
Trust’s
Securities Pricing Procedures. In addition, the Funds may use fair value methodologies if it is determined that a significant event has
occurred between the time at which a market price is determined and the time at which the Fund’s net asset value (“NAV”)
is calculated and that may materially affect the value of the security. In particular, the value of foreign securities may be materially
affected by events occurring after the close of the market on which they are valued, but before a Fund prices its shares. Securities trading
in overseas markets present time zone arbitrage opportunities when events affecting portfolio security values occur after the close of
the overseas market but prior to the close of the U.S. market. In addition, arbitrage opportunities may exist when trading in a portfolio
security or securities is halted and does not resume before a fund calculates its NAV. These arbitrage opportunities may enable short-term
traders to profit at the expense of long-term investors. Valuing securities using fair value methodologies involves greater reliance on
judgment than valuing securities based on readily available market quotations. A Fund, when using fair value methodologies to price securities,
may value those securities higher or lower than another fund using market quotations or its own fair value methodologies to price the
same securities. There can be no assurance that a Fund could obtain the fair value assigned to a security if it were to sell the security.
The
Funds disclose the value of their investments in a hierarchy based on the inputs used to value the investments. The disclosure hierarchy
consists of three broad levels:
| |
● |
Level 1 — quoted prices
in active markets for identical securities |
Investments
whose values are based on quoted market prices in active markets, and whose values are therefore classified as Level 1 prices, include
active listed equity securities. The Funds do not adjust the quoted price for such investments, even in situations where the Funds hold
a large position and a sale could reasonably impact the quoted price.
| |
● |
Level 2 — other significant
observable inputs (including quoted prices for similar securities, interest rates, prepayment speeds, credit risk, etc.) |
Investments
that trade in markets that are not considered to be active, but whose values are based on quoted market prices, dealer quotations or valuations
provided by alternative pricing sources supported by observable inputs are
|
CRM
FUNDS
NOTES
TO FINANCIAL STATEMENTS — June 30, 2024 (Continued) |
classified
as Level 2 prices. These generally include certain U.S. government and sovereign obligations, most government agency securities, investment-grade
corporate bonds and less liquid listed equity securities.
In
addition, foreign securities may require revised valuations if the values of the securities are materially affected by events occurring
after the close of the market on which they are valued, but before a Fund prices its shares. As investments whose values are classified
as Level 2 prices may include positions that are not traded in active markets and/or are subject to transfer restrictions, valuations
may be adjusted to reflect illiquidity and/or non-transferability, which are generally based on available market information.
| |
● |
Level 3 — significant
unobservable inputs (including the Fund’s own assumptions in determining the fair value of investments) |
Investments
whose values are classified as Level 3 prices have significant unobservable inputs, as they may trade infrequently or not at all. When
observable prices are not available for these securities, the Funds use one or more valuation techniques for which sufficient and reliable
data is available. The inputs used by the Funds in estimating the value of Level 3 prices may include the original transaction price,
quoted prices for comparable companies or assets in active markets, completed or pending third-party transactions in the underlying investment
or comparable issuers, and changes in financial ratios or cash flows. Level 3 prices may also be adjusted to reflect illiquidity and/or
non-transferability, with the amount of such discount estimated by the Funds in the absence of market information. Assumptions used by
the Funds due to the lack of observable inputs may significantly impact the resulting value and therefore the Funds’ results of
operations.
The
inputs or methodology used for valuing securities are not necessarily an indication of the risk associated with investing in those securities.
A financial instrument’s level within the fair value hierarchy is based on the lowest level of any inputs both individually and
in the aggregate that is significant to the fair value measurement. The Funds’ policy is to recognize transfers among levels as
of the beginning of the reporting period. A summary of the inputs used to value the Funds’ investments as of June 30, 2024 is included
with each Fund’s Schedule of Investments.
|
CRM
FUNDS
NOTES
TO FINANCIAL STATEMENTS — June 30, 2024 (Continued) |
Foreign
Currency Translations. The books and records of the Funds are maintained in
U.S. dollars. Transactions denominated in foreign currencies are recorded at the prevailing exchange rates on the valuation date. The
value of all assets and liabilities denominated in foreign currencies are translated into U.S. dollars at the exchange rate of such currencies
against the U.S. dollar daily. The Funds do not isolate that portion of the results of operations resulting from changes in foreign exchange
rates on investments from the fluctuations arising from changes in market prices of those investments. Such fluctuations are included
with the net realized and unrealized gain or loss from investments that are disclosed within each Fund’s statement of operations,
as applicable.
Federal
Income Taxes. Each Fund is treated as a separate entity for federal income tax
purposes and intends to continue to qualify as a “regulated investment company” (“RIC”) under Subchapter M of
the Internal Revenue Code of 1986, as amended, and to distribute substantially all of its taxable income to its shareholders. Therefore,
no Federal income tax provision has been made.
Accounting
for Uncertainty in Income Taxes sets forth a minimum threshold for financial statement recognition of the benefit of a tax position taken
or expected to be taken in a tax return. Management has analyzed each of the Fund’s tax positions and has concluded that no provision
for U.S. income tax is required in each of the Fund’s financial statements. Each of the Fund’s federal tax returns for the
prior three fiscal years remains subject to examination by the Internal Revenue Service. On an ongoing basis, management monitors the
Funds’ tax positions to determine if any adjustments to its conclusions are necessary.
The
Funds recognize interest and penalties, if any, related to unrecognized tax benefits as income tax expense on the Statements of Operations.
During the year ended June 30, 2024, the Funds did not incur any interest or penalties.
Security
Transactions and Investment Income. Investment security transactions are accounted
for on a trade date basis for financial reporting purposes. Each Fund uses the specific identification method for determining realized
gains and losses on investments for both financial and federal income tax reporting purposes. Interest income is recorded on the accrual
basis and includes the amortization of premium and the accretion of discount. Dividend income
|
CRM
FUNDS
NOTES
TO FINANCIAL STATEMENTS — June 30, 2024 (Continued) |
and
expense are recorded on the ex-dividend date. Foreign dividends are also recorded on the ex-dividend date, net of all tax withholdings
not eligible for rebates. Withholding taxes on foreign dividends are recorded in accordance with the Fund’s understanding of the
applicable country’s tax rules and rates. Distributions received from investments in Real Estate Investment Trusts (“REITs”)
are recorded as dividend income on the ex-dividend date, subject to reclassification upon notice of the character of the distributions
by the issuer or management estimate. The Funds record expenses as incurred. Common expenses of the Trust are allocated on a pro-rata
basis amongst the series of the Trust based on relative net assets.
The
Funds’ investments in certain countries are subjected to additional capital gain taxes. Such taxes are due upon sale of individual
securities. The Funds accrue for taxes on the capital gains throughout the holding period based on the unrealized gain of the underlying
securities, as applicable. The Funds held no such securities during the year ended June 30, 2024.
Class
Accounting. In calculating the NAV per share for each class, investment income,
realized and unrealized gains and losses and expenses other than class specific expenses, are allocated daily to each class of shares
based upon the proportion of net assets of each class at the beginning of each day.
Repurchase
Agreements. Each Fund (except Long/Short Opportunities Fund) may, through its
custodian, receive delivery of the underlying securities used to collateralize repurchase agreements, the market value of which is required
to be in an amount at least equal to 101% of the resale price. The Funds’ investment adviser is responsible for determining that
the market value of these underlying securities is maintained at all times at a level at least equal to 101% of the resale price. In event
of default of the obligation to repurchase, each Fund has the right to liquidate the collateral and apply the proceeds in satisfaction
of the obligation. Provisions of each agreement require that the market value of the collateral is sufficient in the event of default;
however, in the event of default or bankruptcy by the other party to the agreement, realization and/or retention of the collateral may
be subject to legal proceedings.
Repurchase
agreements are entered into by the Funds under Master Repurchase Agreements (“MRA”) which permit the Funds, under certain
circumstances including an event of default (such as bankruptcy or insolvency), to offset
|
CRM
FUNDS
NOTES
TO FINANCIAL STATEMENTS — June 30, 2024 (Continued) |
payables
and/or receivables under the MRA with collateral held and/or posted to the counterparty and create one single net payment due to or from
the Fund.
At
June 30, 2024, the open repurchase agreements by counterparty which are subject to a MRA on a net payment basis are as follows:
| |
|
Repurchase
Agreements |
|
|
Fair
Value
of Non-cash
Collateral
Received1 |
|
|
Cash
Collateral
Received |
|
|
Net
Amount2 |
|
| |
|
|
|
|
|
|
|
|
|
|
|
|
|
|
|
|
|
Small
Cap Value Fund |
|
|
|
|
|
|
|
|
|
|
|
|
|
|
|
|
|
Mizuho
Securities USA LLC |
|
$ |
298,767 |
|
|
$ |
298,767 |
|
|
$ |
— |
|
|
$ |
— |
|
|
National
Bank Financial, Inc. |
|
|
1,000,000 |
|
|
|
1,000,000 |
|
|
|
— |
|
|
|
— |
|
| |
|
$ |
1,298,767 |
|
|
$ |
1,298,767 |
|
|
$ |
— |
|
|
$ |
— |
|
|
Mid
Cap Value Fund |
|
|
|
|
|
|
|
|
|
|
|
|
|
|
|
|
|
Mizuho
Securities USA LLC |
|
$ |
466,232 |
|
|
$ |
466,232 |
|
|
$ |
— |
|
|
$ |
— |
|
|
National
Bank Financial, Inc. |
|
|
1,032,077 |
|
|
|
1,032,077 |
|
|
|
— |
|
|
|
— |
|
| |
|
$ |
1,498,309 |
|
|
$ |
1,498,309 |
|
|
$ |
— |
|
|
$ |
— |
|
|
All
Cap Value Fund |
|
|
|
|
|
|
|
|
|
|
|
|
|
|
|
|
|
National
Bank Financial, Inc. |
|
$ |
183,480 |
|
|
$ |
183,480 |
|
|
$ |
— |
|
|
$ |
— |
|
| |
|
$ |
183,480 |
|
|
$ |
183,480 |
|
|
$ |
— |
|
|
$ |
— |
|
| |
1 |
The value of collateral
shown in the table does not reflect value that exceeds the value of the repurchase agreement. Collateral with a value of $1,324,745, $1,528,279
and $187,150, respectively, has been received in connection with open repurchase agreements. |
| |
2 |
Net exposure represents
the receivable (payable) that would be due to (from) the counterparty in an event of default. |
Distributions
to Shareholders. Dividends and distributions to shareholders are recorded on
the ex-dividend date. Distributions from net investment income and net realized gains, if any, will be declared and paid annually.
Use
of Estimates in the Preparation of Financial Statements. The preparation of
financial statements in conformity with U.S. GAAP requires management to make estimates and assumptions that affect the reported amounts
of assets and liabilities at the date of the financial statements and the reported amounts of revenues and expenses during the reporting
period. Actual results could differ from those estimates.
|
CRM
FUNDS
NOTES
TO FINANCIAL STATEMENTS — June 30, 2024 (Continued) |
|
3. |
Transactions with Affiliates
and Other Servicing Agreements. Cramer Rosenthal McGlynn, LLC (“CRM”)
serves as investment adviser to the Funds. CRM receives an advisory fee from Small Cap Value Fund, Small/Mid Cap Value Fund, and Mid Cap
Value Fund of 0.75% of each Fund’s first $1 billion of average daily net assets; 0.70% of each Fund’s next $1 billion of average
daily net assets; and 0.65% of each Fund’s average daily net assets in excess of $2 billion. For its advisory services to All Cap
Value Fund, CRM receives 0.70% of the Fund’s first $1 billion of average daily net assets; 0.65% of the Fund’s next $1 billion
of average daily net assets; and 0.60% of the Fund’s average daily net assets in excess of $2 billion. |
CRM
has contractually agreed to waive a portion of its fees and assume certain expenses of the Funds to the extent that total annual fund
operating expenses (excluding taxes, extraordinary expenses, brokerage commissions, acquired fund fees and expenses and interest) exceeds
the percentage of average daily net assets as follows:
| |
Investor
Shares |
Institutional
Shares |
|
Small
Cap Value Fund |
1.50% |
1.25% |
|
Small/Mid
Cap Value Fund |
1.50% |
1.25% |
|
Mid
Cap Value Fund |
1.50% |
1.25% |
|
All
Cap Value Fund |
1.45% |
1.20% |
For
its advisory services to Long/Short Opportunities Fund, CRM receives 1.50% of the Fund’s first $1 billion of average daily net assets;
1.45% of the Fund’s next $1 billion of average daily net assets; and 1.40% of the Fund’s average daily net assets in excess
of $2 billion. CRM has contractually agreed to waive a portion of its fees and assume certain expenses of Long/Short Opportunities Fund
to the extent that total annual fund operating expenses (excluding taxes, extraordinary expenses, brokerage commissions, interest, dividend
and interest expenses related to short sales, and acquired fund fees and expenses) exceeds the percentage of average daily net assets
as follows:
| |
Institutional
Shares |
|
Long/Short
Opportunities Fund |
1.60% |
|
CRM
FUNDS
NOTES
TO FINANCIAL STATEMENTS — June 30, 2024 (Continued) |
The
expense limitations are in effect until November 1, 2025. Prior to that date, the arrangement may be terminated for a class of a Fund
only by the vote of the Board of Trustees of the Funds.
Compliance
Services. Northern Lights Compliance Services, LLC provides compliance services
to the Trust, including the services of a Chief Compliance Officer. The fees payable to Northern Lights are included in the Statements
of Operations under other expenses.
Compensation
of Trustees and Officers. Trustees and officers of the Funds who are interested
persons of CRM, as defined in the 1940 Act, receive no compensation from the Funds.
Trustees
of the Funds who are not interested persons of CRM, as defined in the 1940 Act (each an “Independent Trustee”), receive compensation
and reimbursement of expenses. Each Independent Trustee receives aggregate annual compensation from the Trust at an annual rate of $60,000
which is allocated on a pro-rata basis amongst the series of the Trust based on relative net assets. Under a Deferred Compensation Plan
(the “Plan”) adopted August 12, 2005, an Independent Trustee may elect to defer receipt of all, or a portion, of his annual
compensation. If an Independent Trustee opts for deferral, then the deferred amounts are credited to an Independent Trustee’s deferral
account and invested and reinvested in Institutional Shares of one or more of the Funds in the series of the Trust until such amounts
are distributed in accordance with the Plan. No Independent Trustee deferred their compensation earned for the year ended June 30, 2024.
Trustees’ fees reflected in the accompanying financial statements include total compensation earned, which were paid in cash. Each
trustee serves during the continued lifetime of the Funds, or the earlier of when his or her successor is elected or qualified, the Trustee
dies, resigns, is removed or becomes disqualified.
Shareholder
Servicing Fees. The Board has adopted a Shareholder Servicing Plan which allows
each Fund to obtain, for its Investor Shares, the services of CRM and other qualified financial institutions to act as shareholder servicing
agents for its shareholders. Under the Shareholder Servicing Plan, each Fund may pay shareholder servicing agents, including CRM, monthly
fees at an annual rate not to exceed 0.25% of the Fund’s average daily net assets attributable to its Investor Shares.
|
CRM
FUNDS
NOTES
TO FINANCIAL STATEMENTS — June 30, 2024 (Continued) |
Sub-Transfer
Agent Fees. Institutional Shares of each Fund are sold through certain intermediaries
that provide accounting, recordkeeping, and/or other services to shareholders. The Board of Trustees has approved payment of the fees
charged by these intermediaries for providing these sub-transfer agency services from the assets of the Institutional Shares of each Fund
based on reasonable charges for similar services in the industry, subject to certain limitations. CRM, as the Funds’ agent, remits
these payments to the intermediaries. In some cases, where the sub-transfer agency fees of an intermediary are greater than the amounts
paid to CRM by the Funds for that intermediary, CRM will pay the balance of those fees itself.
|
4. |
Investment Securities
Transactions. The cost of investments purchased and the proceeds from investments
sold (excluding in-kind transactions and short-term investments) for the year ended June 30, 2024, were as follows: |
| |
|
Purchases
|
|
|
Sales
|
|
|
Short
Sales |
|
|
Purchases
to
Cover Shorts |
|
|
Small
Cap Value Fund |
|
$ |
55,763,804 |
|
|
$ |
67,049,167 |
|
|
$ |
— |
|
|
$ |
— |
|
|
Small/Mid
Cap Value Fund |
|
|
143,958,005 |
|
|
|
205,292,525 |
|
|
|
— |
|
|
|
— |
|
|
Mid
Cap Value Fund |
|
|
176,551,910 |
|
|
|
247,998,101 |
|
|
|
— |
|
|
|
— |
|
|
All
Cap Value Fund |
|
|
11,902,466 |
|
|
|
14,733,228 |
|
|
|
— |
|
|
|
— |
|
|
Long/Short
Opportunities Fund |
|
|
135,897,803 |
|
|
|
196,800,942 |
|
|
|
74,973,565 |
|
|
|
148,196,380 |
|
|
5. |
Securities Lending Agreement.
Each Fund (except Long/Short Opportunities Fund) may lend their securities pursuant
to a securities lending agreement (“Lending Agreement”) with The Bank of New York Mellon. Security loans made pursuant to
the Lending Agreement are required at all times to be secured by cash collateral at least equal to 102% of the market value of the securities
loaned. The market value of the loaned securities is determined at the close of business of the Fund and any additional required collateral
is delivered to the Fund on the next business day. Cash collateral received, pursuant to investment guidelines established by the Funds
and approved by the Board of Trustees, is invested in short-term fixed income securities rated in the highest rating category by nationally
recognized statistical rating organizations (or of comparable quality if unrated) with a maturity date of 397 days or less, including
corporate obligations and money market mutual funds. All such investments are made at the risk of the Funds and, as such, the Funds are
liable for investment losses. |
|
CRM
FUNDS
NOTES
TO FINANCIAL STATEMENTS — June 30, 2024 (Continued) |
The
Bank of New York Mellon and the lender retain a portion of the earnings from the collateral investments, with the remainder being retained
by the Fund. The Funds record securities lending income net of such allocations.
In
the event the borrower fails to return loaned securities and the collateral received is insufficient to cover the value of the loaned
securities and provided such collateral shortfall is not the result of investment losses, The Bank of New York Mellon has agreed to pay
the amount of the shortfall to the Funds, or at its discretion, replace the loaned securities. In the event of default or bankruptcy by
The Bank of New York Mellon, realization and/or retention of the collateral may be subject to legal proceedings.
At
June 30, 2024, the following Funds had securities on loan:
| |
|
Market
Value |
|
|
Cash
Collateral* |
|
|
Small
Cap Value Fund |
|
$ |
1,288,332 |
|
|
$ |
1,298,767 |
|
|
Mid
Cap Value Fund |
|
|
3,974,192 |
|
|
|
4,128,309 |
|
|
All
Cap Value Fund |
|
|
173,243 |
|
|
|
183,480 |
|
| |
*
|
Please note any reported
shortfall in required collateral coverage of 102% is based on closing market value of securities on loan as of the date of the report.
Any required collateral adjustment needed in order to bring coverage to 102% is done on the next business day. |
|
6. |
Short Sale Transactions.
In short sale transactions, the Fund sells a security it does not hold in anticipation
of a decline in the market price of that security. When the Fund makes a short sale, it will borrow the security sold short (borrowed
bond) and deliver the security to the counterparty to which it sold the security short. An amount equal to the proceeds received by the
Fund is reflected as an asset and an equivalent liability. The amount of the liability is subsequently marked-to-market to reflect the
market value of the short sale. The Fund is required to repay the counterparty any dividends declared on the security sold short, which
is shown as dividend expense in the Statements of Operations. The Fund is exposed to market risk based on the amount, if any, that the
market value of the security increases beyond the market value at which the position was sold. Thus, a short sale of a security involves
the risk that instead of declining, the price of the security sold short will rise. The short sale of securities involves the possibility
of an unlimited loss since there is an unlimited potential for the market price of the security sold short to increase. A gain is limited
to the price at which the Fund sold the security short. A realized |
|
CRM
FUNDS
NOTES
TO FINANCIAL STATEMENTS — June 30, 2024 (Continued) |
gain
or loss is recognized upon the termination of a short sale if the market price is either less than or greater than the proceeds originally
received. There is no assurance that the Fund will be able to close out a short position at a particular time or at an acceptable price.
The
Fund is required to pledge cash or securities to the broker as collateral for the securities sold short. Collateral requirements are calculated
daily based on the current market value of the short positions. Cash that has been pledged to secure the Fund’s obligation to cover
the short positions is reported separately on the Statements of Assets and Liabilities. The Fund may receive from or pay to the broker
the net of the following amounts: (i) income on cash collateral held at the broker and (ii) a financing charge to the extent the cash
collateral is less than the margin requirement. The net amounts of income or fees are included as interest income or expense, as applicable,
on securities sold short in the Statements of Operations.
During
the year ended June 30, 2024, Long/Short Opportunities Fund participated in short sale transactions.
|
7. |
Federal Tax Information.
|
The
tax character of distributions utilized during the fiscal years ended June 30, 2024 and June 30, 2023 was as follows:
| |
|
For
the year ended June 30, 2024 |
|
|
Fund |
|
Ordinary
Income |
|
|
Long-Term
Capital
Gains |
|
|
Return
of
Capital |
|
|
Total |
|
|
Small
Cap Value Fund |
|
$ |
1,217,678 |
|
|
$ |
1,747,013 |
|
|
$ |
— |
|
|
$ |
2,964,691 |
|
|
Small
Mid Cap Value Fund |
|
|
1,589,627 |
|
|
|
7,616 |
|
|
|
— |
|
|
|
1,597,243 |
|
|
Mid
Cap Value Fund |
|
|
3,119,964 |
|
|
|
19,972,086 |
|
|
|
— |
|
|
|
23,092,050 |
|
|
All
Cap Value Fund |
|
|
246,289 |
|
|
|
219,612 |
|
|
|
— |
|
|
|
465,901 |
|
|
Long/Short
Opportunities Fund |
|
|
3,559,388 |
|
|
|
84,824 |
|
|
|
— |
|
|
|
3,644,212 |
|
|
CRM
FUNDS
NOTES
TO FINANCIAL STATEMENTS — June 30, 2024 (Continued) |
| |
|
For
the year ended June 30, 2023 |
|
|
Fund |
|
Ordinary
Income |
|
|
Long-Term
Capital
Gains |
|
|
Return
of
Capital |
|
|
Total |
|
|
Small
Cap Value Fund |
|
$ |
1,953,364 |
|
|
$ |
409,077 |
|
|
$ |
— |
|
|
$ |
2,362,441 |
|
|
Small
Mid Cap Value Fund |
|
|
1,677,117 |
|
|
|
8,128,760 |
|
|
|
— |
|
|
|
9,805,877 |
|
|
Mid
Cap Value Fund |
|
|
7,523,543 |
|
|
|
9,837,984 |
|
|
|
— |
|
|
|
17,361,527 |
|
|
All
Cap Value Fund |
|
|
292,912 |
|
|
|
1,362,873 |
|
|
|
— |
|
|
|
1,655,785 |
|
|
Long/Short
Opportunities Fund |
|
|
3,277,664 |
|
|
|
— |
|
|
|
— |
|
|
|
3,277,664 |
|
As
of June 30, 2024, the components of accumulated earnings/ (deficit) on a tax basis were as follows:
|
Fund |
|
Undistributed
Ordinary
Income |
|
|
Undistributed
Long-Term
Capital Gains |
|
|
Capital
Loss Carry
Forwards |
|
|
Other
Book/Tax
Differences |
|
|
Small
Cap Value Fund |
|
$ |
298,895 |
|
|
$ |
2,398,229 |
|
|
$ |
— |
|
|
$ |
— |
|
|
Small
Mid Cap Value Fund |
|
|
398,609 |
|
|
|
11,923,153 |
|
|
|
— |
|
|
|
— |
|
|
Mid
Cap Value Fund |
|
|
— |
|
|
|
17,886,478 |
|
|
|
— |
|
|
|
— |
|
|
All
Cap Value Fund |
|
|
258,128 |
|
|
|
764,489 |
|
|
|
— |
|
|
|
— |
|
|
Long/Short
Opportunities Fund |
|
|
— |
|
|
|
9,713,329 |
|
|
|
— |
|
|
|
— |
|
|
Fund |
|
Post
October
Loss and
Late Year
Loss |
|
|
Unrealized
Appreciation/
(Depreciation) |
|
|
Total
Accumulated
Earnings/
(Deficits) |
|
|
Small
Cap Value Fund |
|
$ |
— |
|
|
$ |
14,508,415 |
|
|
$ |
17,205,539 |
|
|
Small
Mid Cap Value Fund |
|
|
— |
|
|
|
33,203,895 |
|
|
|
45,525,657 |
|
|
Mid
Cap Value Fund |
|
|
— |
|
|
|
89,316,382 |
|
|
|
107,202,860 |
|
|
All
Cap Value Fund |
|
|
(19 |
) |
|
|
4,316,516 |
|
|
|
5,339,114 |
|
|
Long/Short
Opportunities Fund |
|
|
— |
|
|
|
24,483,878 |
|
|
|
34,197,207 |
|
The
difference between book basis and tax basis unrealized appreciation, undistributed net investment income (loss) and accumulated net realized
gains (losses) from investments is primarily attributable to the tax deferral of losses on wash sales, the mark-to-market on open Swaps,
deferral of unsettled short sale losses, and C-Corporation return of capital distributions.
Late
year losses incurred after December 31 within the fiscal year are deemed to arise on the first business day of the following fiscal year
for tax purposes.
|
CRM
FUNDS
NOTES
TO FINANCIAL STATEMENTS — June 30, 2024 (Continued) |
The
CRM All Cap Value Fund incurred and elected to defer such late year losses of $19.
During
the fiscal year ended June 30, 2024, certain of the Funds utilized tax equalization which is the use of earnings and profits distributions
to shareholders on redemption of shares as part of the dividends paid deduction for income tax purposes. Permanent book and tax differences,
primarily attributable to tax adjustments for realized gain (loss) on in-kind redemptions and the book/tax basis treatment of equalization
credits, resulted in reclassifications for the Funds for the fiscal year ended June 30, 2024 as follows:
|
Fund |
|
Paid
In
Capital |
|
|
Accumulated
Earnings (Losses) |
|
|
Small
Cap Value Fund |
|
$ |
238,645 |
|
|
$ |
(238,645 |
) |
|
Small
Mid Cap Value Fund |
|
|
3,322,416 |
|
|
|
(3,322,416 |
) |
|
Mid
Cap Value Fund |
|
|
2,582,017 |
|
|
|
(2,582,017 |
) |
|
All
Cap Value Fund |
|
|
29,580 |
|
|
|
(29,580 |
) |
|
Long/Short
Opportunities Fund |
|
|
272,649 |
|
|
|
(272,649 |
) |
The
total cost of investments and net unrealized appreciation or depreciation for federal income tax purposes were different from amounts
reported for financial reporting purposes. The federal tax cost, and related gross unrealized appreciation and depreciation of securities
held by the Funds as of June 30, 2024 were as follows:
|
Fund |
|
Tax
Cost |
|
|
Gross
Unrealized
Appreciation |
|
|
Gross
Unrealized
Depreciation |
|
|
Net
Unrealized
Appreciation/
Depreciation |
|
|
Small
Cap Value Fund |
|
$ |
62,181,630 |
|
|
$ |
16,022,364 |
|
|
$ |
(1,513,949 |
) |
|
$ |
14,508,415 |
|
|
Small
Mid Cap Value Fund |
|
|
137,046,519 |
|
|
|
36,074,721 |
|
|
|
(2,870,826 |
) |
|
|
33,203,895 |
|
|
Mid
Cap Value Fund |
|
|
286,852,940 |
|
|
|
102,919,500 |
|
|
|
(13,603,098 |
) |
|
|
89,316,402 |
|
|
All
Cap Value Fund |
|
|
19,202,642 |
|
|
|
5,514,940 |
|
|
|
(1,198,424 |
) |
|
|
4,316,516 |
|
|
Long/Short
Opportunities Fund |
|
|
120,183,010 |
|
|
|
37,685,147 |
|
|
|
(13,243,313 |
) |
|
|
24,441,834 |
|
|
8. |
Derivative Financial
Instruments. Each Fund may, but is not required to, invest in derivative contracts,
such as swaps and options on securities and securities indices, for a variety of purposes, including: in an attempt to hedge against adverse
changes in the market price of securities, interest rates or currency exchange rates; as a substitute for purchasing or selling securities,
including short sales; to attempt to increase the Fund’s return as a non- |
|
CRM
FUNDS
NOTES
TO FINANCIAL STATEMENTS — June 30, 2024 (Continued) |
hedging
strategy that may be considered speculative; to manage portfolio characteristics; and as a cash flow management technique. Using swaps,
options and other derivatives can increase Fund losses and reduce opportunities for gains when market prices, interest rates or the derivative
instruments themselves behave in a way not anticipated by the Fund. Using derivatives may increase the volatility of the Fund’s
net asset value and may not provide the result intended. Derivatives may have a leveraging effect on the Fund. Some derivatives have the
potential for unlimited loss, regardless of the size of the Fund’s initial investment. Changes in a derivative’s value may
not correlate well with the referenced asset or metric. The Fund also may have to sell assets at inopportune times to satisfy its obligations.
Derivatives may be difficult to sell, unwind or value, and the counterparty may default on its obligations to the Fund.
Options.
A Fund purchases and writes call and put options to increase or decrease its exposure to underlying instruments (including credit risk,
equity risk, foreign currency exchange rate risk and/or interest rate risk) and/or, in the case of options written, to generate gains
from options premiums.
A
call option gives the purchaser (holder) of the option the right (but not the obligation) to buy, and obligates the seller (writer) to
sell (when the option is exercised) the underlying instrument at the exercise or strike price at any time or at a specified time during
the option period. A put option gives the holder the right to sell and obligates the writer to buy the underlying instrument at the exercise
or strike price at any time or at a specified time during the option period.
Premiums
paid on options purchased and premiums received on options written, as well as the daily fluctuation in market value, are included in
the Statements of Assets and Liabilities. When an instrument is purchased or sold through the exercise of an option, the premium is offset
against the cost or proceeds of the underlying instrument. When an option expires, a realized gain or loss is recorded in the Statements
of Operations to the extent of the premiums received or paid. When an option is closed or sold, a gain or loss is recorded in the Statements
of Operations to the extent the cost of the closing transaction exceeds the premiums received or paid). When the Fund writes an option,
such option is covered by cash in an amount sufficient to cover the obligation. In purchasing and writing options, the Fund bears the
risk of an
|
CRM
FUNDS
NOTES
TO FINANCIAL STATEMENTS — June 30, 2024 (Continued) |
unfavorable
change in the value of the underlying instrument or the risk that the Fund may not be able to enter into a closing transaction due to
an illiquid market. Exercise of a written option could result in the Fund purchasing or selling a security when it otherwise would not,
or at a price different from the current market value.
As
of June 30, 2024, the Funds did not hold any option contracts.
Forward
Foreign Currency Exchange Contracts. A Fund enters into forward foreign currency
exchange contracts to gain or reduce exposure, to foreign currencies (foreign currency exchange rate risk). A forward foreign currency
exchange contract is an agreement between two parties to buy and sell a currency at a set exchange rate on a specified date. These contracts
help to manage the overall exposure to the currencies in which some of the investments held by the Fund are denominated and, in some cases,
may be used to obtain exposure to a particular market.
The
contract is marked to market daily and the change in market value is recorded as unrealized appreciation (depreciation) in the Statements
of Assets and Liabilities. When a contract is closed, a realized gain or loss is recorded in the Statements of Operations equal to the
difference between the value at the time it was opened and the value at the time it was closed. Non-deliverable forward foreign currency
exchange contracts are settled with the counterparty in cash without the delivery of foreign currency. The use of forward foreign currency
exchange contracts involves the risk that the value of a forward foreign currency exchange contract changes unfavorably due to movements
in the value of the referenced foreign currencies.
As
of June 30, 2024, the Funds did not hold any forward foreign currency exchange contracts.
Swaps.
A Fund enters into swap contracts to manage exposure to issuers, markets and securities. Such contracts are agreements between the Fund
and a counterparty to make periodic net payments on a specified notional amount or a net payment upon termination. Swap agreements are
privately negotiated in the OTC market and may be entered into as a bilateral contract (“OTC swaps”) or centrally cleared
(“centrally cleared swaps”). For OTC swaps, any upfront premiums paid are recorded as assets and any upfront fees received
are recorded as liabilities and are shown as swap premiums paid and swap
|
CRM
FUNDS
NOTES
TO FINANCIAL STATEMENTS — June 30, 2024 (Continued) |
premiums
received, respectively, in the Statements of Assets and Liabilities and amortized over the term of the OTC swap. Payments received or
made by the Fund for OTC swaps are recorded in the Statements of Operations as realized gains or losses, respectively. When an OTC swap
is terminated, the Fund will record a realized gain or loss equal to the difference between the proceeds from (or cost of) the closing
transaction and the Fund’s basis in the contract, if any. Generally, the basis of the contract is the premium received or paid.
In
a centrally cleared swap, immediately following execution of the swap agreement, the swap agreement is novated to a central counterparty
(the “CCP”) and the Fund’s counterparty on the swap agreement becomes the CCP. The Fund is required to interface with
the CCP through a broker. Upon entering into a centrally cleared swap, the Fund is required to deposit initial margin with the broker
in the form of cash or securities in an amount that varies depending on the size and risk profile of the particular swap. The daily change
in valuation of centrally cleared swaps is recorded as a receivable or payable for variation margin in the Statements of Assets and Liabilities.
Payments received from (paid to) the counterparty, including at termination, are recorded as realized gain (loss) in the Statements of
Operations.
Swap
transactions involve, to varying degrees, elements of interest rate, credit and market risk. Such risks involve the possibility that there
will be no liquid market for these agreements, that the counterparty to the agreements may default on its obligation to perform or disagree
as to the meaning of the contractual terms in the agreements, and that there may be unfavorable changes in interest rates and/or market
values associated with these transactions.
Collateral
Requirements. For derivatives traded under an International Swaps and Derivatives
Association, Inc. Master Agreement (“ISDA MA”), the collateral requirements are typically calculated by netting the mark-to-market
amount for each transaction under such agreement and comparing that amount to the value of any collateral currently pledged by the Fund
and the counterparty.
Generally,
the amount of collateral due from or to a counterparty is subject to a certain minimum transfer amount threshold before a transfer is
required, which is determined at the close of business of the Fund. Any additional required collateral is delivered to/pledged by the
Fund on the next business
|
CRM
FUNDS
NOTES
TO FINANCIAL STATEMENTS — June 30, 2024 (Continued) |
day.
Typically, the counterparty is not permitted to sell, re-pledge or use cash and non-cash collateral it receives. The Fund generally agrees
not to use non-cash collateral that it receives but may, absent default or certain other circumstances defined in the underlying ISDA
MA, be permitted to use cash collateral received. In such cases, interest may be paid pursuant to the collateral arrangement with the
counterparty. To the extent amounts due to the Fund from its counterparties are not fully collateralized, they bear the risk of loss from
counterparty non-performance. Likewise, to the extent the Fund has delivered collateral to a counterparty and stands ready to perform
under the terms of its agreement with such counterparty, they bear the risk of loss from a counterparty in the amount of the value of
the collateral in the event the counterparty fails to return such collateral. Based on the terms of agreements, collateral may not be
required for all derivative contracts.
The
following is a summary of the location of derivatives on Long/Short Opportunities Fund’s Statement of Assets and Liabilities as
of June 30, 2024:
| |
Location
on the Statement of Assets and Liabilities |
|
Derivative
Type |
Asset
Derivatives |
Liability
Derivatives |
|
Equity
Contracts |
Unrealized
appreciation on swap agreements |
Unrealized
depreciation on swap agreements |
| |
Asset
Derivative Value |
| |
Total
Value |
Equity
Contracts |
|
Swap
Agreements |
$2,429,323 |
$2,429,323 |
| |
Liability
Derivative Value |
| |
Total
Value |
Equity
Contracts |
|
Swap
Agreements |
$71,391 |
$71,391 |
|
CRM
FUNDS
NOTES
TO FINANCIAL STATEMENTS — June 30, 2024 (Continued) |
The
following is a summary of the location of derivatives on Long/Short Opportunities Fund’s Statement of Operations for the year ended
June 30, 2024:
| |
Location
on the Statements of Operations |
|
Derivative
Type |
Net
Realized Gain (Loss) |
Net
Change in Unrealized
Appreciation (Depreciation) |
|
Equity
Contracts |
Net
realized gain (loss) from: Swap Agreements, Purchased Option Contracts, and Written Option Contracts |
Net
change in unrealized appreciation (depreciation) on: Swap agreements |
| |
Net
Realized Gain (Loss) |
| |
Total
Value |
Equity
Contracts |
|
Swap
Agreements |
$2,409,956 |
$2,409,956 |
| |
Net
Change in Unrealized Appreciation (Depreciation) |
| |
Total
Value |
Equity
Contracts |
|
Swap
Agreements |
$386,367 |
$386,367 |
The
table below summarizes the average balance of derivative holdings by Long/Short Opportunities Fund during the year ended June 30, 2024.
The average balance of derivatives held is indicative of the trading volume of the Long/Short Opportunities Fund.
|
Derivative
Volume |
|
Swap
Contracts
(Notional Amount) |
|
$1,141,601 |
In
order to define its contractual rights and to secure rights that will help it mitigate its counterparty risk, a Fund may enter into an
ISDA MA or similar agreement with its counterparties. An ISDA MA is a bilateral agreement between the Fund and a counterparty that governs
certain OTC derivatives and typically contains, among other things, collateral posting terms and netting provisions in the event of a
default and/or termination event. Under an ISDA
|
CRM
FUNDS
NOTES
TO FINANCIAL STATEMENTS — June 30, 2024 (Continued) |
MA,
the Fund may, under certain circumstances, offset with the counterparty certain derivative financial instruments’ payables and/or
receivables with collateral held and/or posted and create one single net payment. The provisions of the ISDA MA typically permit a single
net payment in the event of default including the bankruptcy or insolvency of the counterparty. Bankruptcy or insolvency laws of a particular
jurisdiction may restrict or prohibit the right of offset in bankruptcy, insolvency or other events. For example, notwithstanding what
contractual rights may be included in an ISDA MA, such laws may prohibit the Fund from setting off amounts owed to a defaulting counterparty
under an ISDA MA against amounts owed to the Fund by affiliates of the defaulting counterparty. The insolvency regimes of many jurisdictions
do, however, generally permit set-off of simultaneous payables and receivables under certain types of financial contracts between the
same legal entity upon a default of the entity, regardless of the existence of a contractual set-off right in those contracts. In addition,
certain ISDA MA allow counterparties to OTC derivatives to terminate derivative contracts prior to maturity in the event the Fund’s
net assets decline by a stated percentage or the Fund fails to meet the terms of its ISDA MA, which would cause the Fund to accelerate
payment of any net liability owed to the counterparty.
Offsetting
of Financial and Derivative Assets and Liabilities. For financial reporting
purposes, the Funds do not offset derivative assets and derivative liabilities that are subject to netting arrangements in the Statements
of Assets and Liabilities.
The
following table presents derivative assets and liabilities net of amounts available for offset under an ISDA MA or similar agreement and,
as applicable, the related collateral and potential loss exposure to Long/Short Opportunities Fund as of June 30, 2024:
| |
|
Assets |
|
|
Liabilities |
|
|
Derivative
Financial Instruments: |
|
|
|
|
|
|
|
|
|
Swap
Agreements |
|
$ |
2,429,323 |
|
|
$ |
71,391 |
|
|
Total
derivative assets and liabilities in the Statements of Assets and Liabilities |
|
|
2,429,323 |
|
|
|
71,391 |
|
|
Derivatives
not subject to an ISDA MA or similar agreement |
|
|
— |
|
|
|
— |
|
|
Total
assets and liabilities subject to an ISDA MA |
|
$ |
2,429,323 |
|
|
$ |
71,391 |
|
|
CRM
FUNDS
NOTES
TO FINANCIAL STATEMENTS — June 30, 2024 (Continued) |
At
June 30, 2024, derivative assets and liabilities by counterparty net of amounts available for offset under an ISDA MA and net of the related
collateral received by the Long/Short Opportunities Fund are as follows:
|
Counterparty
|
Derivative
Assets
Subject to
an ISDA
MA |
Derivative
Liabilities
Subject to
an ISDA
MA |
Value
of
Derivatives
Subject to
an ISDA
MA |
Collateral
(Received)/
Pledged |
Net
Exposure1 |
|
Morgan
Stanley |
$2,429,323 |
$(71,391) |
$2,357,932 |
$2,357,932 |
$— |
| |
1 |
Net exposure represents
the receivable (payable) that would be due to (from) the counterparty in an event of default. |
|
9. |
Risks. In
the normal course of business, the Funds invest in securities and enter into transactions where risks exist due to fluctuations in the
market (market risk) or failure of the issuer to meet all its obligations, including the ability to pay principal and interest when due
(issuer credit risk). The market values of securities or other assets will fluctuate, sometimes sharply and unpredictably, due to factors
such as economic events, governmental actions or intervention, actions taken by the U.S. Federal Reserve or foreign central banks, market
disruptions caused by trade disputes or other factors, political developments, armed conflicts, economic sanctions and countermeasures
in response to sanctions, major cybersecurity events, the global and domestic effects of widespread or local health, weather or climate
events, and other factors that may or may not be related to the issuer of the security or other asset. |
In
addition to the risks discussed above, Long/Short Opportunities Fund may also be exposed to counterparty credit risk, or the risk that
an entity may fail to or be unable to perform on its commitments related to unsettled or open transactions. The Fund manages counterparty
credit risk by entering into transactions only with counterparties that CRM believes have the financial resources to honor its obligations
and by monitoring the financial stability of those counterparties. Financial assets, which potentially expose a Fund to market, issuer
and counterparty credit risks, consist principally of financial instruments and receivables due from counterparties. The extent of a Fund’s
exposure to market, issuer and counterparty credit risks with respect to these financial assets is approximately its value recorded in
the Statements of Assets and Liabilities, less any collateral held by the Fund.
|
CRM
FUNDS
NOTES
TO FINANCIAL STATEMENTS — June 30, 2024 (Continued) |
A
derivative contract may suffer mark-to-market loss if the value of the contract decreases due to an unfavorable change in the market rates
or values of the underlying instrument. Losses can also occur if the counterparty does not perform under the contract.
A
Fund’s risk of loss from counterparty credit risk on OTC derivatives is generally limited to the aggregate unrealized gain less
the value of any collateral held by the Fund.
For
OTC options purchased, a Fund bears the risk of loss in the amount of the premiums paid plus the positive change in market values net
of any collateral held by the Fund should the counterparty fail to perform under the contracts. Options written by a Fund do not typically
give rise to counterparty credit risk, as options written generally obligate the Fund, and not the counterparty, to perform. A Fund may
be exposed to counterparty credit risk with respect to options written to the extent the Fund deposits collateral with its counterparty
to a written option. With exchange-traded options purchased and centrally cleared swaps, there is less counterparty credit risk to a Fund
since the exchange or clearinghouse, as counterparty to such instruments, guarantees against possible default. The clearinghouse stands
between the buyer and the seller of the contract; therefore, credit risk is limited to failure of the clearinghouse. While offset rights
may exist under applicable law, the Fund does not have a contractual right of offset against a clearing broker or clearinghouse in event
of a default (including the bankruptcy or insolvency). Additionally, credit risk exists in centrally cleared swaps with respect to initial
and variation margin that is held in a clearing broker’s customer accounts. While clearing brokers are required to segregate customer
margin from their own assets, in the event that a clearing broker becomes insolvent or goes into bankruptcy and at that time there is
a shortfall in the aggregate amount of margin held by the clearing broker for all its clients, typically the shortfall would be allocated
on a pro rata basis across all the clearing broker’s customers, potentially resulting in losses to the Fund.
|
10. |
Contractual Obligations.
The Funds enter into contracts in the normal course of business that contain
a variety of indemnification obligations. The Funds’ maximum exposure under these arrangements is unknown. However, the Funds have
not had prior claims or losses pursuant to these contracts. Management |
|
CRM
FUNDS
NOTES
TO FINANCIAL STATEMENTS — June 30, 2024 (Concluded) |
has
reviewed the Funds’ existing contracts and expects the risk of liability for indemnity claims to be remote.
|
11. |
Subsequent Events. Management
has evaluated the impact of all subsequent events on the Funds and has determined that no subsequent event currently requires recognition
or disclosure in the financial statements. |
|
CRM
FUNDS
REPORT
OF INDEPENDENT REGISTERED PUBLIC ACCOUNTING FIRM
|
To
the Shareholders and Board of Trustees of CRM Mutual Fund Trust
Opinion
on the Financial Statements
We
have audited the accompanying statements of assets and liabilities of CRM Small Cap Value Fund, CRM Small/Mid Cap Value Fund, CRM Mid
Cap Value Fund, CRM All Cap Value Fund, and the CRM Long/Short Opportunities Fund (the “Funds”), each a series of CRM Mutual
Fund Trust (the “Trust”), including the schedules of investments, as of June 30, 2024, the related statements of operations
for the year then ended, the statements of changes in net assets for each of the two years in the period then ended, financial highlights
for each of the five years in the period then ended, and the related notes (collectively referred to as the “financial statements”).
In our opinion, the financial statements present fairly, in all material respects, the financial position of the Funds as of June 30,
2024, the results of their operations for the year then ended, the changes in their net assets for each of the two years in the period
then ended and their financial highlights for each of the five years in the period then ended, in conformity with accounting principles
generally accepted in the United States of America.
Basis
for Opinion
These
financial statements are the responsibility of the Funds’ management. Our responsibility is to express an opinion on the Funds’
financial statements based on our audits. We are a public accounting firm registered with the Public Company Accounting Oversight Board
(United States) (“PCAOB”) and are required to be independent with respect to the Funds in accordance with the U.S. federal
securities laws and the applicable rules and regulations of the Securities and Exchange Commission and the PCAOB. We have served as the
auditor of one or more of the funds in the Trust since 2020.
We
conducted our audits in accordance with the standards of the PCAOB. Those standards require that we plan and perform the audits to obtain
reasonable assurance about whether the financial statements are free of material misstatement, whether due to error or fraud. The Funds
are not required to have, nor were we engaged to perform, an audit of the Funds’ internal control over financial reporting. As part
of our audits we are required to obtain an understanding of internal control over financial reporting, but not for the purpose of expressing
an opinion on the effectiveness of the Funds’ internal control over financial reporting. Accordingly, we express no such opinion.
|
CRM
FUNDS
REPORT
OF INDEPENDENT REGISTERED PUBLIC ACCOUNTING FIRM
(Concluded)
|
Our
audits included performing procedures to assess the risks of material misstatement of the financial statements, whether due to error or
fraud, and performing procedures that respond to those risks. Such procedures included examining, on a test basis, evidence regarding
the amounts and disclosures in the financial statements. Our audits also included evaluating the accounting principles used and significant
estimates made by management, as well as evaluating the overall presentation of the financial statements. Our procedures included confirmation
of securities owned as of June 30, 2024 by correspondence with the custodian and brokers; when replies were not received from brokers,
we performed other auditing procedures. We believe that our audits provide a reasonable basis for our opinion.

TAIT,
WELLER & BAKER LLP
Philadelphia,
Pennsylvania
August 28, 2024
|
CRM
FUNDS
TAX
INFORMATION (Unaudited)
|
For
the fiscal year ended June 30, 2024, certain dividends may be subject to a maximum tax rate of 20%. For individual shareholders, a percentage
of the ordinary income dividends (dividends from net investment income and short-term capital gains, if any) from the Funds qualifies
for a maximum tax rate of 20%. Complete information is computed and reported in conjunction with your Form 1099-DIV.
For
corporate shareholders, a percentage of the ordinary income dividends from the Funds qualify for the dividends-received deduction.
The
percentages of ordinary income dividends which qualify for the maximum tax rate of 20% (“Qualified Dividends”) and the dividends-received
deduction are as follows:
| |
Qualified
Dividends |
Dividends
Received
Deduction |
|
Small
Cap Value Fund |
92.21% |
92.21% |
|
Small/Mid
Cap Value Fund |
100.00% |
100.00% |
|
Mid
Cap Value Fund |
100.00% |
100.00% |
|
All
Cap Value Fund |
100.00% |
100.00% |
|
Long/Short
Opportunities Fund |
35.88% |
35.88% |
In
January 2025, shareholders of the Funds will receive Federal income tax information on all distributions paid to their accounts in calendar
year 2024, including any distributions paid between July 1, 2024 and December 31, 2024.
|
CRM
FUNDS
OTHER
INFORMATION (Unaudited) |
Discussion
of Board Considerations in Approving Continuance and Renewal of the Investment Advisory Agreement with CRM
In
order for Cramer Rosenthal McGlynn, LLC (“CRM”) to remain the Funds’ investment adviser, the Board of Trustees (the
“Board”) of CRM Mutual Fund Trust (the “Trust”) must determine annually whether to renew the Investment Advisory
Agreement between the Trust and CRM with respect to the Funds. The Board evaluates CRM’s services, performance, personnel, profitability,
risk management, compliance programs and other relevant factors throughout the year. In addition, in connection with its review of the
Investment Advisory Agreement, the Board reviewed and considered materials provided by CRM at a meeting held on May 23, 2024.
The
materials and information reviewed and considered by the Board in connection with its review of the Investment Advisory Agreement included,
among other items: (1) a memorandum from independent counsel setting forth the legal standards under the Investment Company Act of 1940,
as amended, and the factors the Board could consider in its evaluation of the Investment Advisory Agreement; and (2) reports prepared
by CRM, based on information provided by Broadridge Financial Solutions, Inc. (“Broadridge”) and Morningstar, Inc. (“Morningstar”),
comparing each Fund’s investment performance to the performance of the Fund’s then-current benchmark indices1 and
other mutual funds, and comparing each Fund’s investment advisory fee and net expenses to those of other mutual funds. The Board
also discussed and considered, with the assistance of independent counsel, information provided by CRM that described: (i) the nature,
extent and quality of CRM’s services provided to the Funds; (ii) the experience and qualifications of the personnel providing those
services; (iii) CRM’s investment philosophies and processes; (iv) CRM’s assets under management (“AUM”); (v) the
investment advisory fees charged by CRM to the Funds as compared with the fees charged by CRM to other advisory accounts with similar
investment objectives and strategies; (vi) CRM’s compliance and risk management procedures; and (vii) an analysis of the profits
of CRM related to its services to the Funds. In addition, the Board considered information related to the Funds and CRM previously provided
at Board meetings or otherwise.
|
1 |
Effective July 24, 2024,
certain Funds’ primary benchmarks were changed to comply with SEC Rules. The Funds’ current primary benchmarks are: for CRM
Small Cap Value Fund, CRM Small/Mid Cap Value Fund, CRM Mid Cap Value Fund and CRM All Cap Value Fund, the Russell 3000 Index; and, for
CRM Long/Short Opportunities Fund, the S&P 500 Index. References in this section to comparisons against a Fund’s benchmark refer
to that Fund’s benchmark prior to July 24, 2024. |
|
CRM
FUNDS
OTHER
INFORMATION (Unaudited) (Continued)
|
At
the meeting held on May 23, 2024, the Board, including the Independent Trustees voting separately, in the exercise of the Trustees’
business judgment, approved the continuance and renewal of the Investment Advisory Agreement for another year with respect to each Fund.
In
considering the continuance and renewal of the Investment Advisory Agreement, the Board considered the following factors, none of which
was determinative or controlling, and reached the following conclusions:
Nature,
Extent and Quality of Services Provided
The
Board considered the nature, extent and quality of services provided by CRM to the Funds and expected to be provided in the future. The
Board reviewed the quality, size and experience of, and changes in, CRM’s professional portfolio management team. The Board reviewed
CRM’s investment approach and research process, including CRM’s capabilities and experience in the development and implementation
of its value-oriented investment process. Additionally, the Board considered CRM’s compliance programs and compliance record, marketing
strategies, CRM’s personnel and the Board’s dealings with CRM. Based on the foregoing, the Board concluded that CRM is able
to provide investment and related services that are appropriate in nature, extent and quality in light of the Funds’ investment
objectives, policies, strategies and operations, the competitive landscape of the investment company business and investor needs.
Performance
Information
In
reaching its conclusions, the Board considered the investment performance of each Fund. The Board considered CRM’s focus on achieving
long-term performance in a manner consistent with each Fund’s investment objective and investment strategies, as well as CRM’s
value-oriented, research-driven investment philosophy. The Board considered CRM’s experience in implementing its investment philosophy
and concluded that this, along with CRM’s overall approach to investing, supported approval of the continuance of the Investment
Advisory Agreement. The Board also considered reports prepared by CRM which compared each Fund’s performance against its benchmark,
an additional index (other than for the CRM Long/Short Opportunities Fund), and other mutual funds with similar investment objectives
and strategies using peer groups provided by Broadridge for each Fund (a “Fund’s peer group”) and performance data provided
by Morningstar (“Focused Performance Information”). The Board also received
|
CRM
FUNDS
OTHER
INFORMATION (Unaudited) (Continued)
|
relative
performance information for a broader universe of comparable funds prepared by Broadridge. Where the Funds had underperformed their peer
groups and/or benchmark indices, the Board considered CRM’s explanations for such underperformance and, as applicable, measures
CRM had taken or proposed to take to improve performance. In particular, because CRM pursues a value strategy with respect to the Funds,
the Board noted CRM’s explanation regarding past underperformance of value strategies generally versus growth strategies. Further,
the Board considered that, in order to provide a relevant sample size, the peer groups for the Funds (other than CRM Long/Short Opportunities
Fund) consisted of funds that pursue a “core” strategy. In comparing performance, it was observed that the funds in the 1st
percentile represented the best-performing funds, while the funds in the 99th percentile represented the worst-performing funds. The Focused
Performance Information is summarized below.
CRM
Small Cap Value Fund
The
Board noted that Institutional Shares of CRM Small Cap Value Fund had underperformed the Fund’s benchmark, the Russell 2000 Value
Index, as well as the Russell 2000 Index, for the one-year, five-year and ten-year periods ended December 31, 2023. Further, the Board
noted that the Fund had outperformed the Russell 2000 Index but underperformed the Russell 2000 Value Index for the three-year period
ended December 31, 2023. The Board noted that Institutional Shares of the Fund ranked in the bottom quartile of the Fund’s peer
group for the one-year and five-year periods ended December 31, 2023 and ranked in the third quartile of the Fund’s peer group for
the three-year and ten-year periods ended December 31, 2023.
CRM
Small/Mid Cap Value Fund
The
Board noted that Institutional Shares of CRM Small/Mid Cap Value Fund had underperformed the Fund’s benchmark, the Russell 2500
Value Index, as well as the Russell 2500 Index, for the one-year period ended December 31, 2023. Further, the Board noted that the Fund
outperformed the Russell 2500 Index and underperformed the Russell 2500 Value Index for the three-year period ended December 31, 2023.
Further, the Board noted that the Fund had outperformed both the Russell 2500 Index and the Russell 2500 Value Index for the five-year
period ended December 31, 2023. Further, the Board noted that the Fund underperformed the Russell 2500 Index and outperformed the Russell
2500 Value Index for the ten-year period ended December 31, 2023. The Board noted that Institutional Shares
|
CRM
FUNDS
OTHER
INFORMATION (Unaudited) (Continued)
|
of
the Fund ranked in the bottom quartile of the Fund’s peer group for the one-year and three-year periods ended December 31, 2023,
and ranked in the second quartile of the Fund’s peer group for the five-year and ten-year periods ended December 31, 2023.
CRM
Mid Cap Value Fund
The
Board noted that Institutional Shares of CRM Mid Cap Value Fund had underperformed the Fund’s benchmark, the Russell Midcap Value
Index, as well as the Russell Midcap Index, for the one-year period ended December 31, 2023. Further, the Board noted that the Fund outperformed
the Russell Midcap Index and underperformed the Russell MidCap Value Index for the three-year period ended December 31, 2023. Further,
the Board noted that the Fund had outperformed the Russell Midcap Value Index for the five-year and ten-year periods ended December 31,
2023 and underperformed the Russell Midcap Index for the same periods. The Board noted further that Institutional Shares of the Fund ranked
in the bottom quartile of the Fund’s peer group for the one-year and three-year periods ended December 31, 2023, the third quartile
of the Fund’s peer group for the five-year period ended December 31, 2023 and the second quartile of the Fund’s peer group
for the ten-year period ended December 31, 2023.
CRM
All Cap Value Fund
The
Board noted that Institutional Shares of CRM All Cap Value Fund had underperformed the Fund’s benchmark, the Russell 3000 Value
Index, as well as the Russell 3000 Index, for the one-year, three-year, five-year and ten-year periods ended December 31, 2023. The Board
also noted that Institutional Shares of the Fund ranked in the bottom quartile of the Fund’s peer group for the one-year, three-year,
five-year and ten-year periods ended December 31, 2023.
CRM
Long/Short Opportunities Fund
The
Board noted that Institutional Shares of CRM Long/Short Opportunities Fund had underperformed the Fund’s benchmark, the S&P
500 Index, for the one-year, three-year and five-year periods ended December 31, 2023. The Board also noted that Institutional Shares
of the Fund ranked in the third quartile of the Fund’s peer group for the one-year and five-year periods ended December 31, 2023,
and in the bottom quartile of the Fund’s peer group for the three-year period ended December 31, 2023.
|
CRM
FUNDS
OTHER
INFORMATION (Unaudited) (Continued)
|
Conclusion
as to Investment Performance
The
Board determined that it would continue to monitor each Fund’s performance, but that the information it considered supported approval
of the Investment Advisory Agreement.
Fees
and Expenses
In
reaching its conclusions, the Board considered the fees and expenses paid by each class of each Fund.
The
Board considered the research and analysis conducted by CRM in order to identify investment opportunities for the Funds and attempt to
distinguish itself from each Fund’s respective benchmark. The Board observed that CRM relies heavily on its own proprietary research
to implement its value-oriented investment philosophy, and considered CRM’s experience in implementing its value-oriented investment
philosophy. Further, the Board compared the management fee schedule for each Fund with the standard management fee schedule applicable
to institutional separate accounts managed by CRM in a similar investment strategy to that of the applicable Fund. The Board noted the
fee schedule for each Fund was lower than or equal to the standard management fee schedule applicable to the respective institutional
separate accounts managed by CRM in a similar investment strategy up to an AUM size of $25 million. However, citing the fee schedule detailed
in Item 5 of Part 2A of CRM’s Form ADV, the Board noted that, for certain Funds, investors in comparable separate accounts may ultimately
pay lower fees than the Funds. In comparing the overall expenses paid by the Funds to the overall expenses paid by institutional separate
accounts, the Board considered that the costs associated with the management of the Funds generally are greater than those associated
with providing investment advisory services to separately managed accounts. The Board noted the additional complexities involved in the
management of the Funds resulting from more frequent and less predictable cash flows and regulatory requirements, among other factors.
The Board considered the additional services provided to the Funds that CRM does not perform for its separate account clients, or services
that are broader in scope, including oversight of compliance with the regulatory and tax regimes to which the Funds are subject, oversight
of third-party service providers, preparation of prospectuses, shareholder reports and other disclosure documents and preparation of materials
for, and participation in, Board meetings. Additionally, the Board considered the risks that CRM faces regarding the Funds, including
regulatory and reputational risks with respect to CRM’s investment decisions and
|
CRM
FUNDS
OTHER
INFORMATION (Unaudited) (Continued)
|
compliance
oversight on behalf of the Funds, and the substantial entrepreneurial risks that CRM assumes with respect to its sponsorship of the Funds.
The Board also considered that there may be historical reasons for certain separate account fees, and the element of negotiation with
respect to the level of fees paid by CRM’s separate account clients.
The
Board received information related to fees and expenses of a universe of comparable funds prepared by Broadridge. The Board also considered
a report prepared by CRM which compared the fees and expenses paid by each Fund with the fees and expenses paid by other mutual funds
with similar investment objectives and strategies using peer groups provided by Broadridge and fee and expense data provided by Morningstar.
In comparing expenses, it was observed that the funds in the 1st percentile represented the most expensive funds, while the funds in the
99th percentile represented the least expensive funds. It was also observed that, for purposes of the comparison of investment advisory
fees, the CRM report presented the Funds’ and their peers’ contractual management fees exclusive of any separate administrative
fees and net of waivers/reimbursements. The data referenced below is based on the information included in the report prepared by CRM.
CRM
Small Cap Value Fund
The
Board noted that, based on the information provided, the investment advisory fee for CRM Small Cap Value Fund ranked at the 75th percentile
for the Fund’s peer group. The Board noted that the Fund’s investment advisory fee was lower than both the median and average
advisory fee paid by funds in the Fund’s peer group. The Board noted that, based on the information provided, the total net annual
operating expenses of Institutional Shares of CRM Small Cap Value Fund ranked approximately in the 50th percentile for the Fund’s
peer group. The Board noted that the total net annual operating expenses of Institutional Shares of the Fund were lower than the average
and higher than the median net expenses paid by funds in the Fund’s peer group.
CRM
Small/Mid Cap Value Fund
The
Board noted that, based on the information provided, the investment advisory fee for CRM Small/Mid Cap Value Fund fell in between the
50th and 75th percentiles for the Fund’s peer group. The Board noted that the Fund’s investment advisory fee was the same
as the median and lower than the average advisory fee paid by funds in the Fund’s peer group. The Board noted that, based on the
information provided,
|
CRM
FUNDS
OTHER
INFORMATION (Unaudited) (Continued)
|
the
total net annual operating expenses of Institutional Shares of CRM Small/Mid Cap Value Fund ranked approximately in the 25th percentile
for the Fund’s peer group. The Board noted that the total net annual operating expenses of Institutional Shares of the Fund were
higher than both the median and the average net expenses paid by funds in the Fund’s peer group.
CRM
Mid Cap Value Fund
The
Board noted that based on the information provided, the investment advisory fee for CRM Mid Cap Value Fund fell in between the 25th and
50th percentiles for the Fund’s peer group. The Board noted that the Fund’s investment advisory fee was equal to the median
and higher than the average advisory fee paid by funds in the Fund’s peer group. The Board noted that, based on the information
provided, the total net annual operating expenses of Institutional Shares of CRM Mid Cap Value Fund ranked in the first percentile for
the Fund’s peer group. The Board noted that the total net annual operating expenses of Institutional Shares of the Fund were higher
than both the median and the average net expenses paid by funds in the Fund’s peer group.
CRM
All Cap Value Fund
The
Board noted that, based on the information provided, the investment advisory fee for CRM All Cap Value Fund ranked in the 50th percentile
for the Fund’s peer group. The Board noted that the Fund’s current investment advisory fee was equal to the median and lower
than the average advisory fees paid by funds in the Fund’s peer group. The Board noted that, based on the information provided,
the total net annual operating expenses of Institutional Shares of CRM All Cap Value Fund ranked in the first percentile for the Fund’s
peer group. The Board noted that the total net annual operating expenses of Institutional Shares of the Fund were higher than both the
median and the average net expenses paid by funds in the Fund’s peer group.
CRM
Long/Short Opportunities Fund
The
Board noted that, based on the information provided, the investment advisory fee for CRM Long/Short Opportunities Fund ranked in the first
percentile for the Fund’s peer group. The Board noted that the Fund’s investment advisory fee was higher than both the median
and average advisory fees paid by funds in the Fund’s peer group. The Board noted that, based on the information provided, the
|
CRM
FUNDS
OTHER
INFORMATION (Unaudited) (Continued)
|
total
net annual operating expenses of Institutional Shares of CRM Long/Short Opportunities Fund ranked in the first percentile for the Fund’s
peer group. The Board noted that the total net annual operating expenses of Institutional Shares of the Fund were higher than both the
median and the average net expenses paid by funds in the Fund’s peer group.
Conclusion
as to Fees and Expenses
In
view of what it understood to be the costs of CRM’s proprietary research and CRM’s experience in implementing its value-oriented
investment philosophy, the Board concluded that the investment advisory fee paid by each Fund was reasonable in relation to the nature
and quality of the services provided by CRM. The Board also indicated it would continue to monitor the Funds’ fees and expenses.
Economies
of Scale
The
Board considered whether economies of scale would be realized by CRM as each Fund’s assets increased, and the extent to which such
economies of scale were reflected in the fees charged under the Investment Advisory Agreement. The Board observed that the Investment
Advisory Agreement contains breakpoints that reduce the investment advisory fee rate paid by each Fund on assets above specified levels.
The Board concluded that breakpoints were an effective way to share any economies of scale or other efficiencies with Fund shareholders
as the Funds grow larger. In addition, the Board noted that expense subsidization (where applicable), investment by CRM in proprietary
research, and CRM’s commitment and resource allocation to the Funds may be relevant in considering the sharing of economies of scale,
and that profitability also may be an indicator of the existence of any economies of scale. Accordingly, the Board determined that economies
of scale, if any, were being appropriately shared with the Funds.
Profitability
The
Board considered the information provided by CRM regarding CRM’s profitability in relation to the Funds and considered the methodology
used by CRM in preparing the profitability information. The Board reviewed the financial results of CRM in relation to the Funds for the
year ended December 31, 2023. The Board considered CRM’s profit margins with respect to the Funds. The Board indicated that the
profitability of any adviser was affected by numerous factors, including its organizational structure, method for allocating expenses
and the compensation to be
|
CRM
FUNDS
OTHER
INFORMATION (Unaudited) (Concluded)
|
paid
to its employees, and, therefore, acknowledged the limitations inherent in any comparison of adviser profitability information. The Board
concluded that, based on the information provided, the profit to CRM on the fees paid by the Funds was not excessive in view of the nature,
quality and extent of services provided.
Other
Benefits
The
Board considered the other benefits which CRM receives from its relationship with the Funds. The Board noted that CRM acts as the shareholder
servicing agent for Investor Shares of the Funds and receives fees under a shareholder service plan in connection with the services CRM
provides or arranges as the Funds’ shareholder servicing agent. The Board considered the fees received by CRM under the shareholder
service plan, and the amounts paid by CRM to third-party shareholder servicing agents. The Board considered how CRM uses “soft”
commission dollars generated by the Funds to pay for research and brokerage services and the ways in which CRM conducts portfolio transactions
for the Funds and selects brokers. The Board concluded that any other benefits derived by CRM from managing the Funds were reasonable.
General
Conclusion
Based
on the foregoing considerations, the Board, including the Independent Trustees voting separately, in the exercise of the Trustees’
business judgment, concluded that the terms of the Investment Advisory Agreement, including the fees payable thereunder, are fair and
reasonable, and voted to approve the continuance and renewal of the Investment Advisory Agreement.

TRUSTEES
F. Gregory Ahern
Rodney P. Wood
INVESTMENT
ADVISER
Cramer Rosenthal McGlynn, LLC
300 First Stamford Place, Suite 440
Stamford, CT 06902
DISTRIBUTOR
ALPS Distributors, Inc.
1290 Broadway, Suite 1000
Denver, CO 80203
ADMINISTRATOR
& TRANSFER AGENT
Ultimus Fund Solutions, LLC
225 Pictoria Drive, Suite 450
Cincinnati, OH 45246
CUSTODIAN
The Bank of New York Mellon
2 Hanson Place, 7th Floor
Brooklyn, NY 11217
LEGAL
COUNSEL
Morgan, Lewis & Bockius LLP
One Federal Street
Boston, MA 02110
Investor
Information:
800-CRM-2883
www.crmfunds.com
This
report is authorized for distribution only to shareholders and to others who have received current prospectuses of the CRM Funds.
Item 8. Changes in and Disagreements with Accountants for Open-End
Management Investment Companies.
Not applicable
Item 9. Proxy Disclosures for Open-End Management Investment Companies.
Not applicable
Item 10. Remuneration Paid to Directors, Officers, and Others of
Open-End Management Investment Companies.
Included under Item 7
Item 11. Statement Regarding Basis for Approval of Investment Advisory
Contract.
Included under Item 7
Item 12. Disclosure of Proxy Voting Policies and Procedures for
Closed-End Management Investment Companies.
Not applicable
Item 13. Portfolio Managers of Closed-End Management Investment
Companies.
Not applicable
Item 14. Purchases of Equity Securities by Closed-End Management
Investment Company and Affiliated Purchasers.
Not applicable
Item 15. Submission of Matters to a Vote of Security Holders.
None
Item 16. Controls and Procedures.
(a) The registrant’s Principal Executive
Officer and Principal Financial Officer have concluded that the registrant’s disclosure controls and procedures (as defined in Rule
30a-3(c) under the Act) are effective in design and operation and are sufficient to form the basis of the certifications required by Rule
30a-(2) under the Act, based on their evaluation of these disclosure controls and procedures as of a date within 90 days of this report
on Form N-CSR.
(b) There were no changes in the registrant’s
internal control over financial reporting (as defined in Rule 30a-3(d) under the Act) during the period covered by this report that have
materially affected, or are reasonably likely to materially affect, the registrant’s internal control over financial reporting.
Item 17. Disclosure of Securities Lending Activities for Closed-End
Management Investment Companies.
Not applicable
Item 18. Recovery of Erroneously Awarded Compensation.
(a) Not applicable
(b) Not applicable
Item 19. Exhibits.
(a)(1) Code of Ethics for Principal Executive and Senior Financial Officers.
(a)(2) Not applicable
(a)(3)
A separate certification for each principal executive officer and principal financial officer of the registrant as required by Rule 30a-2(a)
under the Act (17 CFR 270.30a-2(a)): Attached hereto.
(a)(4) Not applicable
(b)
Certifications required by Rule 30a-2(b) under the Act (17 CFR 270.30a-2(b)): Attached hereto
SIGNATURES
Pursuant to the requirements of the Securities
Exchange Act of 1934 and the Investment Company Act of 1940, the registrant has duly caused this report to be signed on its behalf by
the undersigned, thereunto duly authorized.
| (Registrant) |
CRM Mutual
Fund Trust |
|
| By (Signature and Title)* |
/s/
Christopher Barnett |
|
| |
Christopher Barnett, President
and Chief Executive Officer |
| |
(Principal Executive Officer) |
Pursuant to the requirements of the Securities
Exchange Act of 1934 and the Investment Company Act of 1940, this report has been signed below by the following persons on behalf of the
registrant and in the capacities and on the dates indicated.
| By (Signature and Title)* |
/s/
Christopher Barnett |
|
| |
Christopher Barnett, President
and Chief Executive Officer |
| |
(Principal Executive Officer) |
| By (Signature and Title)* |
/s/ Laura
Szalyga |
|
| |
Laura Szalyga, Treasurer |
|
| |
(Principal Financial Officer) |
|
|
* |
Print the name and title of each signing officer under his or her signature. |