0001320461DEF 14AFALSE00013204612023-01-012023-12-31iso4217:USD00013204612022-01-012022-12-3100013204612021-01-012021-12-3100013204612020-01-012020-12-310001320461cps:ChangeInPensionValueMembercps:EdwardsMemberecd:PeoMember2023-01-012023-12-310001320461cps:ChangeInPensionValueMembercps:EdwardsMemberecd:PeoMember2022-01-012022-12-310001320461cps:ChangeInPensionValueMembercps:EdwardsMemberecd:PeoMember2021-01-012021-12-310001320461cps:ChangeInPensionValueMembercps:EdwardsMemberecd:PeoMember2020-01-012020-12-310001320461cps:ChangeInPensionValueMemberecd:NonPeoNeoMember2023-01-012023-12-310001320461cps:ChangeInPensionValueMemberecd:NonPeoNeoMember2022-01-012022-12-310001320461cps:ChangeInPensionValueMemberecd:NonPeoNeoMember2021-01-012021-12-310001320461cps:ChangeInPensionValueMemberecd:NonPeoNeoMember2020-01-012020-12-310001320461cps:PensionServiceCostMembercps:EdwardsMemberecd:PeoMember2023-01-012023-12-310001320461cps:PensionServiceCostMembercps:EdwardsMemberecd:PeoMember2022-01-012022-12-310001320461cps:PensionServiceCostMembercps:EdwardsMemberecd:PeoMember2021-01-012021-12-310001320461cps:PensionServiceCostMembercps:EdwardsMemberecd:PeoMember2020-01-012020-12-310001320461cps:PensionServiceCostMemberecd:NonPeoNeoMember2023-01-012023-12-310001320461cps:PensionServiceCostMemberecd:NonPeoNeoMember2022-01-012022-12-310001320461cps:PensionServiceCostMemberecd:NonPeoNeoMember2021-01-012021-12-310001320461cps:PensionServiceCostMemberecd:NonPeoNeoMember2020-01-012020-12-310001320461cps:EdwardsMemberecd:PeoMembercps:EquityValueMember2023-01-012023-12-310001320461cps:EdwardsMemberecd:PeoMembercps:EquityValueMember2022-01-012022-12-310001320461cps:EdwardsMemberecd:PeoMembercps:EquityValueMember2021-01-012021-12-310001320461cps:EdwardsMemberecd:PeoMembercps:EquityValueMember2020-01-012020-12-310001320461cps:EquityValueMemberecd:NonPeoNeoMember2023-01-012023-12-310001320461cps:EquityValueMemberecd:NonPeoNeoMember2022-01-012022-12-310001320461cps:EquityValueMemberecd:NonPeoNeoMember2021-01-012021-12-310001320461cps:EquityValueMemberecd:NonPeoNeoMember2020-01-012020-12-310001320461cps:EdwardsMemberecd:PeoMembercps:FairValueAsOfYearEndOfEquityAwardsGrantedDuringTheYearMember2023-01-012023-12-310001320461cps:EdwardsMemberecd:PeoMembercps:FairValueAsOfYearEndOfEquityAwardsGrantedDuringTheYearMember2022-01-012022-12-310001320461cps:EdwardsMemberecd:PeoMembercps:FairValueAsOfYearEndOfEquityAwardsGrantedDuringTheYearMember2021-01-012021-12-310001320461cps:EdwardsMemberecd:PeoMembercps:FairValueAsOfYearEndOfEquityAwardsGrantedDuringTheYearMember2020-01-012020-12-310001320461ecd:NonPeoNeoMembercps:FairValueAsOfYearEndOfEquityAwardsGrantedDuringTheYearMember2023-01-012023-12-310001320461ecd:NonPeoNeoMembercps:FairValueAsOfYearEndOfEquityAwardsGrantedDuringTheYearMember2022-01-012022-12-310001320461ecd:NonPeoNeoMembercps:FairValueAsOfYearEndOfEquityAwardsGrantedDuringTheYearMember2021-01-012021-12-310001320461ecd:NonPeoNeoMembercps:FairValueAsOfYearEndOfEquityAwardsGrantedDuringTheYearMember2020-01-012020-12-310001320461cps:FairValueAsOfVestDateOfEquityAwardsGrantedDuringTheYearMembercps:EdwardsMemberecd:PeoMember2023-01-012023-12-310001320461cps:FairValueAsOfVestDateOfEquityAwardsGrantedDuringTheYearMembercps:EdwardsMemberecd:PeoMember2022-01-012022-12-310001320461cps:FairValueAsOfVestDateOfEquityAwardsGrantedDuringTheYearMembercps:EdwardsMemberecd:PeoMember2021-01-012021-12-310001320461cps:FairValueAsOfVestDateOfEquityAwardsGrantedDuringTheYearMembercps:EdwardsMemberecd:PeoMember2020-01-012020-12-310001320461cps:FairValueAsOfVestDateOfEquityAwardsGrantedDuringTheYearMemberecd:NonPeoNeoMember2023-01-012023-12-310001320461cps:FairValueAsOfVestDateOfEquityAwardsGrantedDuringTheYearMemberecd:NonPeoNeoMember2022-01-012022-12-310001320461cps:FairValueAsOfVestDateOfEquityAwardsGrantedDuringTheYearMemberecd:NonPeoNeoMember2021-01-012021-12-310001320461cps:FairValueAsOfVestDateOfEquityAwardsGrantedDuringTheYearMemberecd:NonPeoNeoMember2020-01-012020-12-310001320461cps:EdwardsMemberecd:PeoMembercps:IncreaseDecreaseFromPriorYearEndInFairValueOfAwardsThatVestedDuringTheYearMember2023-01-012023-12-310001320461cps:EdwardsMemberecd:PeoMembercps:IncreaseDecreaseFromPriorYearEndInFairValueOfAwardsThatVestedDuringTheYearMember2022-01-012022-12-310001320461cps:EdwardsMemberecd:PeoMembercps:IncreaseDecreaseFromPriorYearEndInFairValueOfAwardsThatVestedDuringTheYearMember2021-01-012021-12-310001320461cps:EdwardsMemberecd:PeoMembercps:IncreaseDecreaseFromPriorYearEndInFairValueOfAwardsThatVestedDuringTheYearMember2020-01-012020-12-310001320461cps:IncreaseDecreaseFromPriorYearEndInFairValueOfAwardsThatVestedDuringTheYearMemberecd:NonPeoNeoMember2023-01-012023-12-310001320461cps:IncreaseDecreaseFromPriorYearEndInFairValueOfAwardsThatVestedDuringTheYearMemberecd:NonPeoNeoMember2022-01-012022-12-310001320461cps:IncreaseDecreaseFromPriorYearEndInFairValueOfAwardsThatVestedDuringTheYearMemberecd:NonPeoNeoMember2021-01-012021-12-310001320461cps:IncreaseDecreaseFromPriorYearEndInFairValueOfAwardsThatVestedDuringTheYearMemberecd:NonPeoNeoMember2020-01-012020-12-310001320461cps:YearOverYearIncreaseDecreaseInFairValueOfUnvestedAwardsGrantedInPriorYearsMembercps:EdwardsMemberecd:PeoMember2023-01-012023-12-310001320461cps:YearOverYearIncreaseDecreaseInFairValueOfUnvestedAwardsGrantedInPriorYearsMembercps:EdwardsMemberecd:PeoMember2022-01-012022-12-310001320461cps:YearOverYearIncreaseDecreaseInFairValueOfUnvestedAwardsGrantedInPriorYearsMembercps:EdwardsMemberecd:PeoMember2021-01-012021-12-310001320461cps:YearOverYearIncreaseDecreaseInFairValueOfUnvestedAwardsGrantedInPriorYearsMembercps:EdwardsMemberecd:PeoMember2020-01-012020-12-310001320461cps:YearOverYearIncreaseDecreaseInFairValueOfUnvestedAwardsGrantedInPriorYearsMemberecd:NonPeoNeoMember2023-01-012023-12-310001320461cps:YearOverYearIncreaseDecreaseInFairValueOfUnvestedAwardsGrantedInPriorYearsMemberecd:NonPeoNeoMember2022-01-012022-12-310001320461cps:YearOverYearIncreaseDecreaseInFairValueOfUnvestedAwardsGrantedInPriorYearsMemberecd:NonPeoNeoMember2021-01-012021-12-310001320461cps:YearOverYearIncreaseDecreaseInFairValueOfUnvestedAwardsGrantedInPriorYearsMemberecd:NonPeoNeoMember2020-01-012020-12-310001320461cps:EdwardsMemberecd:PeoMembercps:FairValueAtTheEndOfThePriorYearOfAwardsThatFailedToMeetVestingConditionsInTheYearMember2023-01-012023-12-310001320461cps:EdwardsMemberecd:PeoMembercps:FairValueAtTheEndOfThePriorYearOfAwardsThatFailedToMeetVestingConditionsInTheYearMember2022-01-012022-12-310001320461cps:EdwardsMemberecd:PeoMembercps:FairValueAtTheEndOfThePriorYearOfAwardsThatFailedToMeetVestingConditionsInTheYearMember2021-01-012021-12-310001320461cps:EdwardsMemberecd:PeoMembercps:FairValueAtTheEndOfThePriorYearOfAwardsThatFailedToMeetVestingConditionsInTheYearMember2020-01-012020-12-310001320461ecd:NonPeoNeoMembercps:FairValueAtTheEndOfThePriorYearOfAwardsThatFailedToMeetVestingConditionsInTheYearMember2023-01-012023-12-310001320461ecd:NonPeoNeoMembercps:FairValueAtTheEndOfThePriorYearOfAwardsThatFailedToMeetVestingConditionsInTheYearMember2022-01-012022-12-310001320461ecd:NonPeoNeoMembercps:FairValueAtTheEndOfThePriorYearOfAwardsThatFailedToMeetVestingConditionsInTheYearMember2021-01-012021-12-310001320461ecd:NonPeoNeoMembercps:FairValueAtTheEndOfThePriorYearOfAwardsThatFailedToMeetVestingConditionsInTheYearMember2020-01-012020-12-310001320461cps:ValueOfDividendsOrOtherEarningsPaidOnStockOrOptionAwardsNotOtherwiseReflectedInFairValueOfTotalMembercps:EdwardsMemberecd:PeoMember2023-01-012023-12-310001320461cps:ValueOfDividendsOrOtherEarningsPaidOnStockOrOptionAwardsNotOtherwiseReflectedInFairValueOfTotalMembercps:EdwardsMemberecd:PeoMember2022-01-012022-12-310001320461cps:ValueOfDividendsOrOtherEarningsPaidOnStockOrOptionAwardsNotOtherwiseReflectedInFairValueOfTotalMembercps:EdwardsMemberecd:PeoMember2021-01-012021-12-310001320461cps:ValueOfDividendsOrOtherEarningsPaidOnStockOrOptionAwardsNotOtherwiseReflectedInFairValueOfTotalMembercps:EdwardsMemberecd:PeoMember2020-01-012020-12-310001320461cps:ValueOfDividendsOrOtherEarningsPaidOnStockOrOptionAwardsNotOtherwiseReflectedInFairValueOfTotalMemberecd:NonPeoNeoMember2023-01-012023-12-310001320461cps:ValueOfDividendsOrOtherEarningsPaidOnStockOrOptionAwardsNotOtherwiseReflectedInFairValueOfTotalMemberecd:NonPeoNeoMember2022-01-012022-12-310001320461cps:ValueOfDividendsOrOtherEarningsPaidOnStockOrOptionAwardsNotOtherwiseReflectedInFairValueOfTotalMemberecd:NonPeoNeoMember2021-01-012021-12-310001320461cps:ValueOfDividendsOrOtherEarningsPaidOnStockOrOptionAwardsNotOtherwiseReflectedInFairValueOfTotalMemberecd:NonPeoNeoMember2020-01-012020-12-31000132046112023-01-012023-12-31000132046122023-01-012023-12-31000132046132023-01-012023-12-31
UNITED STATES
SECURITIES AND EXCHANGE COMMISSION
Washington, D.C. 20549
SCHEDULE 14A
Proxy Statement Pursuant to Section 14(a) of the
Securities Exchange Act of 1934
Filed by the Registrant ☒ Filed by a party other than the Registrant ☐
Check the appropriate box:
| | | | | | | | |
| ☐ | | Preliminary Proxy Statement |
| ☐ | | Confidential, for Use of the Commission Only (as permitted by Rule 14a-6(e)(2)) |
| ☒ | | Definitive Proxy Statement |
| ☐ | | Definitive Additional Materials |
| ☐ | | Soliciting Material Pursuant to Rule14a-12 |
Cooper-Standard Holdings Inc.
(Name of Registrant as Specified In Its Charter)
(Name of Person(s) Filing Proxy Statement, if Other Than The Registrant)
Payment of Filing Fee (Check all boxes that apply):
| | | | | | | | | | | | | | |
| ☒ | | No fee required |
| ☐ | | Fee paid previously with preliminary materials |
| ☐ | | Fee computed on table in exhibit required by Item 25(b) per Exchange Act Rules 14a-6(i)(1) and 0-11 |
A Letter from our Chairman and Chief Executive Officer
To Our Investors,
On behalf of the Board of Directors of Cooper-Standard Holdings Inc. (the “Board”), I am pleased to invite you to electronically attend the 2024 Annual Meeting of the Stockholders (the “Annual Meeting”) to be held May 16, 2024, beginning at 9:00 a.m., Eastern Time.
The Cooper Standard team continues to work together to strengthen every aspect of our business. Our unwavering commitment to excellence once again drove world-class results in safety, product quality, program launches and service to our customers. In addition, our groundbreaking product innovations are winning in the marketplace and our commercial team has strengthened contracts with our customers. These achievements are a testament to our outstanding team and the culture we have created together.
Our achievements in 2023 include:
•Improved financial results with a 11.5% increase in sales and 124.0% increase in gross profit compared to 2022;
•Improved net cash provided by operating activities by $153.4 million vs. 2022;
•Outperformed world-class safety benchmarks with a safety incident rate of 0.32 per 200,000 hours worked, including 24 plants that completed the year with a perfect safety record of zero reported incidents;
•Delivered world-class product quality, launches and customer service, including 98% green customer scorecards for product quality, 97% green customer scorecards for program launches;
•Earned GM’s Supplier of the Year award for the sixth consecutive year;
•Received recognition as one of Newsweek’s America’s Most Responsible Companies for the fifth consecutive year;
•Named an SPE Automotive Innovation Finalist for our FlushSeal™ Sealing System;
•Earned Ecovadis silver status for our ESG initiatives and Leader in Sustainability recognition from Nissan; and
•Recognized as one of IndustryWeek’s Best Plants at our Aguascalientes, Mexico mixing location.
Building on the successes of 2023, we believe we are well positioned to drive further profitable growth and increased value for all our stakeholders in 2024.
I encourage you to participate in our Annual Meeting, as your vote and engagement are important to the ongoing success of the Company. This year’s Annual Meeting will again be in a virtual format. You will be able to attend the meeting online, vote your shares electronically and submit your questions during the meeting via a live webcast by visiting www.virtualshareholdermeeting.com/CPS2024. Details of the business to be conducted at the Annual Meeting are given in the Notice of the 2024 Annual Meeting of the Stockholders and the proxy statement.
Thank you in advance for your participation in the meeting and for your continued support.
Sincerely,
Jeffrey S. Edwards
Chairman and Chief Executive Officer
2024 ANNUAL MEETING OF THE STOCKHOLDERS
Meeting Notice
| | | | | | | | |
| | |
When:
Thursday, May 16, 2024 9:00 a.m. Eastern Time Online check-in will begin at 8:45 a.m. Eastern Time, and you should allow ample time for the online check-in procedures. | Where:
Online via live webcast at www.virtualshareholdermeeting.com/CPS2024
You may vote your shares electronically and submit questions during the webcast | How to attend:
Use the 16-digit control number included on your Notice Regarding the Availability of Proxy Materials, on your proxy card (if you received a printed copy of the proxy materials), or on the instructions that accompanied your proxy material |
Items of Business
•To elect the director nominees described in the proxy statement for a one-year term ending at the next annual meeting of the stockholders;
•To hold an advisory vote on named executive officer compensation;
•To ratify the appointment of the independent registered public accounting firm for the 2024 fiscal year; and
•To conduct any other business if properly brought before the Annual Meeting.
You will find more information about the matters to be voted on at the Annual Meeting in the proxy statement.
Who can vote
Holders of the Company’s common stock as of the close of business on March 22, 2024, the record date, are entitled to vote at the Annual Meeting. A list of these stockholders will be open for examination by any stockholder for any purpose germane to the Annual Meeting for a period of 10 days prior to the Annual Meeting at our principal executive offices at 40300 Traditions Drive, Northville, Michigan, 48168, and electronically during the Annual Meeting at
www.virtualshareholdermeeting.com/CPS2024 when you enter your 16-digit control number.
Pre-meeting Questions to Management
The online format used by the Company for the Annual Meeting also allows us to communicate more effectively with you. Stockholders can submit appropriate questions in advance of the Annual Meeting by visiting www.proxyvote.com. Stockholders will need their 16-digit control number to enter the website.
Your vote is important! We strongly encourage you to exercise your right to vote as a stockholder. You may revoke your proxy at any time before it is exercised. You will find instructions on how to vote on page 5 of the proxy statement.
By Order of the Board of Directors,
MaryAnn Peterson Kanary
Senior Vice President, Chief Legal Officer & Secretary
April 4, 2024
| | |
Important Notice Regarding the Availability of Proxy Materials for the
Annual Meeting of Stockholders to be Held on May 16, 2024 |
The Notice of the 2024 Annual Meeting, the 2024 Proxy Statement, and the Company’s Annual Report to Stockholders on Form 10-K for the year ended December 31, 2023 are available free of charge at: https://www.proxyvote.com. |
2024 ANNUAL MEETING OF STOCKHOLDERS
Proxy Statement
April 4, 2024
Table of Contents
| | | | | |
| PROXY SUMMARY | |
| |
| |
| |
Director Nominee Overview: Diversity, Tenure, Skills and Experience | |
| |
| |
| |
| |
| |
| |
| |
| |
| |
| |
| |
| |
| |
| |
| |
| |
| |
| |
| |
| |
| |
| |
| |
| |
| |
| |
| |
| |
| |
| |
| |
| |
| |
| |
This proxy statement was first sent or made available to stockholders on or about April 4, 2024.
Proxy Summary
Proposals and Board Recommendations
| | | | | | | | | | | |
| Proposal | Board Recommendation | Page |
| | | |
| 1 | Election of Directors | ü FOR ALL | |
| | | |
| | | |
| 2 | Advisory Vote on Named Executive Officer Compensation | ü FOR | |
| | | |
| | | |
| 3 | Ratification of Appointment of Ernst & Young LLP as the Company’s Independent Registered Public Accounting Firm for 2024 | ü FOR | |
| | | |
Director Nominees
2023 Business and Financial Highlights | | | | | | | | | | | |
| | Functional Excellence •Delivered world-class safety performance with 0.32 incident rate per 200,000 hours worked •Achieved 98% green customer score cards for product quality •Achieved 97% green customer score cards for new program launches •Received awards for $175 million in annualized net new business |
| | Product and Technology Advancements •Continued to introduce industry leading products and new technologies to support customer priorities •Accelerated the expansion of our Fluid Handling Systems product line to expand total addressable market and competitive advantage •Advanced patented FlushSeal™ technology into production on four vehicle programs •Expanded use of digital technologies, including advanced analytics, robotics, and artificial intelligence, to modernize operating systems and enhance engineering capabilities
|
| | Profitable Growth •Successfully negotiated enhanced commercial agreements with sustainable pricing and inflation recoveries in all regions •Achieved revenue growth of 12% which significantly outpaced global light vehicle production •Delivered $61 million in cost savings through manufacturing efficiency and purchasing lean initiatives •Achieved positive adjusted EBITDA in all four reporting segments for the first time in Company history
|
Compensation Highlights
| | | | | | | | | | | | | | |
2023 Highlights - •True pay-for-performance approach demonstrated by (i) 2023 annual incentive payments that were above target and (ii) payouts on performance-based long-term incentive awards with performance periods ending in 2023, both of which are aligned with the significant improvement in company performance on a year-over-year basis •Introduction of Free Cash Flow (“FCF”) as financial metric for the annual incentive plan to align with company objectives for 2023 •Continued use of performance-based long-term incentive awards, with performance measured against both Company financial targets and the Relative Total Shareholder Return of comparable companies |
Compensation programs that are designed to: •Link executive compensation to Company performance; •Attract and retain a highly-qualified executive leadership team; •Align the interests of executives with those of our stockholders; •Focus our leadership team on increasing profitability and return on invested capital (“ROIC”); and •Motivate our leadership team to execute our long-term growth strategy while delivering consistently strong financial results. | |
Sound and effective compensation and related governance practices, such as: •Independent compensation consultant retained by the Compensation Committee; •Annual benchmarking using general industry surveys and a peer group proxy analysis; •Majority of long-term incentive compensation is performance-based; •Balanced mix of performance measures aligned with long-term strategy; •Clawback policy covering cash and equity in addition to adoption of an Incentive Compensation Clawback Policy pursuant to Dodd-Frank; •Anti-hedging and anti-pledging policy; and •Executive and non-employee director stock ownership guidelines. |
| | |
Governance Highlights |
•Independent Lead Director •9 of the 10 director nominees are independent •Minimum stock ownership requirements for directors •Board committees composed of independent directors •Annual Board evaluations •Board considers diversity when evaluating prospective directors •Board comprised of members with the key skills and experiences integral to the Company’s success •Board meets regularly in executive sessions •Strong governance framework for the oversight of environmental, social and governance (“ESG”) matters |
2023 Board Engagement
| | | | | | | | | | | | | | | | | | | | |
7 Board Meetings | | 22 Committee Meetings | | 93% Attendance1 | | 7 Executive Sessions |
| | | | | |
Risk Oversight | Corporate Responsibility |
•Robust enterprise risk management approach •Active participation from leaders of the Company with the Board’s oversight •Culture of integrity and risk awareness throughout the Company •The Board’s ESG governance framework that integrates ESG risks and opportunities into the Company’s long-term strategy and enterprise risk management processes
| •Global Sustainability Council providing executive-level oversight for the Company’s sustainability strategy •Long term ESG goals aligned with business goals and stakeholder priorities •Materiality assessment refreshed every three years •Rating agency analyses showing continued ESG score improvement •Named to Newsweek’s 2024 list of America's Most Responsible Companies based on key areas of ESG for the fifth consecutive year •Integration of select ESG goals and milestones into bonus-eligible employee compensation plans |
1 Percentage represents average attendance of the directors based on the total number of meetings of the Board and of the committees on which each such director served during 2023. Each director attended 75% or more of the total number of meetings of the Board and of the committees on which each such director served during 2023.
Awards and Recognitions
| | | | | | | | |
| | |
| | |
GM Supplier of the Year for the sixth consecutive year | | Newsweek’s America’s Most Responsible Companies for the fifth consecutive year |
| | |
| | |
2023 SPE Automotive Innovation Finalist for our FlushSeal™ Sealing System | | Leader in Sustainability recognized by Nissan North America |
|
| | |
IndustryWeek’s Best Plant Award Winner Aguascalientes, Mexico |
Voting and Virtual Meeting Information
Holders of the Company’s common stock as of the close of business on March 22, 2024, the record date, are entitled to vote at the Annual Meeting. On March 22, 2024, 17,290,145 shares of common stock were outstanding and, thus, eligible to be voted. Each outstanding share of common stock will be entitled to one vote on each proposal.
What is the vote required to approve each proposal?
You may vote for or against or abstain from voting on each proposal submitted for voting. Provided that there is no competing proxy, if you are a beneficial owner and do not provide voting instructions to your broker, trustee, or other nominee under the New York Stock Exchange (“NYSE”) rules, your broker, trustee, or other nominee has the discretion to vote those shares only on matters that are routine. A broker cannot vote shares on non-routine matters without your instructions. This is referred to as a “broker non-vote.”
The following table sets forth the vote required for approval and the effect of abstentions and broker non-votes for each of the following Proposals for the Annual Meeting.
| | | | | | | | | | | |
| Proposal | Vote Required for Approval | Effect of Abstentions and Broker Non-Votes |
| 1 | Election of Directors | More votes are cast “for” than “against” a nominee. | Abstentions and Broker non-votes have no effect on the outcome of the vote. |
| | | |
| 2 | Advisory Vote on Named Executive Officer Compensation | More votes are cast “for” than “against” the proposal. | Abstentions and Broker non-votes have no effect on the outcome of the vote. |
| | | |
| 3 | Ratification of Appointment of Ernst & Young LLP as the Company’s Independent Registered Public Accounting Firm for 2024 | More votes are cast “for” than “against” the proposal. | Abstentions have no effect on the outcome of the vote.
NYSE rules permit brokers to vote uninstructed shares at their discretion on this proposal in uncontested situations. |
How do I vote before the Annual Meeting?
We encourage stockholders to submit their votes in advance of the Annual Meeting. If your shares are registered directly in your name with our transfer agent, you are considered the “stockholder of record” with respect to those shares. By following the instruction provided in your proxy card, you may submit your votes in the following ways:
| | | | | | | | | | | | | | | | | |
| | |
Vote online at www.proxyvote.com until 11:59 p.m. Eastern Time on May 15, 2024
| Call 1-800-690-6903 until 11:59 p.m. Eastern Time on May 15, 2024 | Mail Proxy Card to: Vote Processing c/o Broadridge 51 Mercedes Way Edgewood, NY 11717 |
If your shares are held in a brokerage account, by a trustee or by another nominee (that is, in “street name”), you are considered to be the beneficial owner of those shares, and you have the right to give instructions to your broker, trustee or other nominee on how to vote your shares following the instructions provided in the voting instructions form.
How do I vote online during the Annual Meeting?
You may vote your shares by completing a ballot online during the designated time during the Annual Meeting if you are a stockholder of record or a “street name” holder.
How can I change my vote?
After you have submitted your proxy or voting instructions by the Internet, telephone, or mail, you may revoke your proxy at any time until it is voted at the Annual Meeting. If your shares are registered in your name, you may do this by (i) written notice of revocation to the secretary of the Company; (ii) timely delivery of a valid, later-dated proxy or later-dated vote by telephone or Internet; or (iii) voting your shares online during the Annual Meeting. If your shares are held in street name, you may revoke your vote (i) through your broker, trustee or other nominee in accordance with their voting instructions, or (ii) by subsequently voting online during the Annual Meeting.
What constitutes a quorum at the Annual Meeting?
The presence of the holders of a majority of the outstanding shares of our common stock, in person or by proxy, will constitute a quorum for transacting business at the Annual Meeting. Abstentions and broker non-votes are counted as present for purposes of establishing a quorum at the Annual Meeting.
What if I do not specify how I want my shares voted?
If you return your proxy card with no votes marked or do not specify when giving your proxy by telephone or online how you want to vote your shares, we will vote them:
•FOR the election of all nominees for director (Proposal 1);
•FOR the approval of named executive officer compensation (Proposal 2);
•FOR the ratification of the appointment of Ernst & Young LLP as the Company’s independent registered public accounting firm for 2024 (Proposal 3).
Who pays for this proxy solicitation?
This solicitation of proxies is made by and on behalf of the Board of Directors. We will bear the cost of the solicitation of proxies. We do not currently plan to hire a proxy solicitor to help us solicit proxies from brokers, bank nominees, or other institutions or stockholders although we reserve the right to do so. In addition, our officers, directors, and employees may solicit proxies in person, by telephone, or other means of communication, but they will not receive any additional compensation in connection with such solicitation.
How can I attend the Annual Meeting?
This year’s annual meeting will be a completely virtual meeting of stockholders, which will be conducted through an audio webcast. You will be able to attend the annual meeting of stockholders online and submit your questions during the meeting by visiting www.virtualshareholdermeeting.com/CPS2024. To participate in the annual meeting, you will need the 16-digit control number included on your notice of Internet availability of the proxy materials, on your proxy card, or on the instructions that accompanied your proxy materials.
The virtual meeting platform is fully supported across browsers (Internet Explorer, Firefox, Chrome, and Safari) and devices (desktops, laptops, tablets, and cell phones) running the most updated version of applicable software and plugins. Participants should ensure that they have a strong WiFi connection wherever they intend to participate in the meeting. Participants should also give themselves plenty of time to log in and ensure that they can hear streaming audio prior to the start of the meeting.
The meeting webcast will begin promptly at 9:00 a.m., Eastern Time. We encourage you to access the meeting prior to the start time. Online access to the meeting will open at 8:45 a.m., Eastern Time, and you should allow ample time to log in to the meeting webcast and test your computer audio system.
What if during the check-in time or during the meeting I have technical difficulties or trouble accessing the virtual meeting website?
For technical difficulties, you may call the telephone numbers provided on the login page of the virtual meeting platform at www.virtualshareholdermeeting.com/CPS2024.
How do I submit a question at the 2024 Annual Meeting?
If you wish to submit a question, you may do so in two ways:
•Before the meeting: Once you receive your proxy materials, you may log into www.proxyvote.com and enter your 16-digit control number. Once past the login screen, click on "Question for Management," type in your question, and click "Submit." You may submit questions through this pre-meeting forum until the start of the meeting.
•During the meeting: Log into the virtual meeting platform at www.virtualshareholdermeeting.com/CPS2024 to attend the meeting, during which you may type your question into the "Ask a Question" field, and click "Submit."
Questions pertinent to meeting matters will be answered during the meeting, subject to time constraints. Questions regarding personal matters, including those related to employment, product or service issues, or suggestions for product innovations, are not pertinent to meeting matters and therefore will not be answered. Any questions pertinent to meeting matters that cannot be answered during the meeting due to time constraints will be posted online and answered at http://www.ir.cooperstandard.com. The questions and answers will be available as soon as practical after the meeting and will remain available until one week after posting.
Proposal 1: Election of Directors
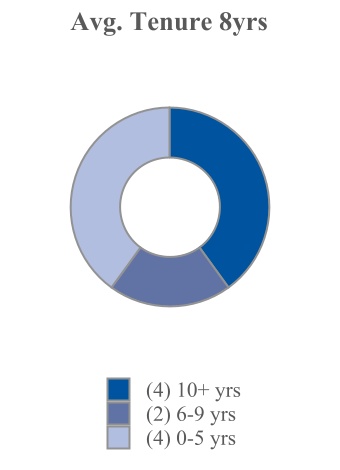
| | | | | | | | | | | | | | |
Director Nominee Overview: Tenure, Skills, Experience and Diversity |
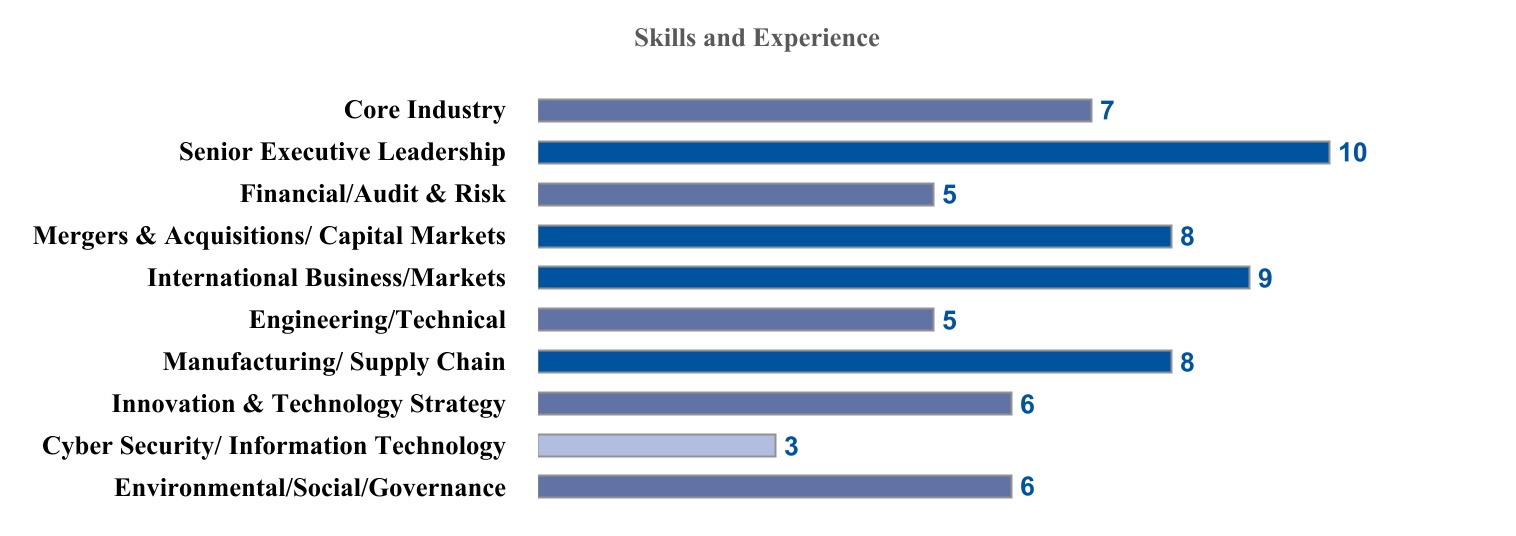
The Board considers the following skills and experiences to be integral to the success of the Company:
•Core Industry experience is important to providing relevant understanding of our business, strategy, and marketplace dynamics.
•Senior Executive Leadership experience is important to providing the Company with unique insights on developing talent, a productive work culture, and strategy in solving problems in large, complex organizations.
•Financial/Audit & Risk experience is important in overseeing accurate financial reporting, informed decision making on value-adding initiatives, and robust auditing.
•Mergers & Acquisitions/ Capital Markets experience is critical to strategically pursuing complementary acquisitions and joint ventures that enhance our customer base, geographic penetration, scale and technology.
•International Business/Markets experience is critical to cultivating and sustaining business and governmental relationships internationally and providing oversight of our multinational operations.
•Engineering/Technical experience is critical to ensuring we are able to provide our customers with market-leading solutions with predictable quality that meet and exceed expectations.
•Manufacturing/Supply Chain experience is critical to ensuring optimal processes are used in the creation of our products.
•Innovation & Technology Strategy experience is integral to furthering our commitment to having a culture that encourages innovative ideas that are translated into development of new and advanced technologies.
•Cybersecurity/Information Technology experience is important because the Board plays a vital role in recognizing the sense of urgency regarding IT/cybersecurity risks and ensuring the Company has the appropriate plans in place to prevent and respond to cyber attacks that could result in reputational, legal, and operational issues for the Company.
•Environmental/ Social/ Governance experience is vital to ensure that the Company fulfills its commitment to good corporate citizenship and sustainability with world-class performance in all areas of our business and our action to elevate our value for all our stakeholders.
Our Board is committed to ensuring that it has the right mix of skills, background, tenure, and experience. A particular director or director nominee may possess additional experience, qualifications, attributes and skills that are valuable to the Company, even if not expressly indicated below.
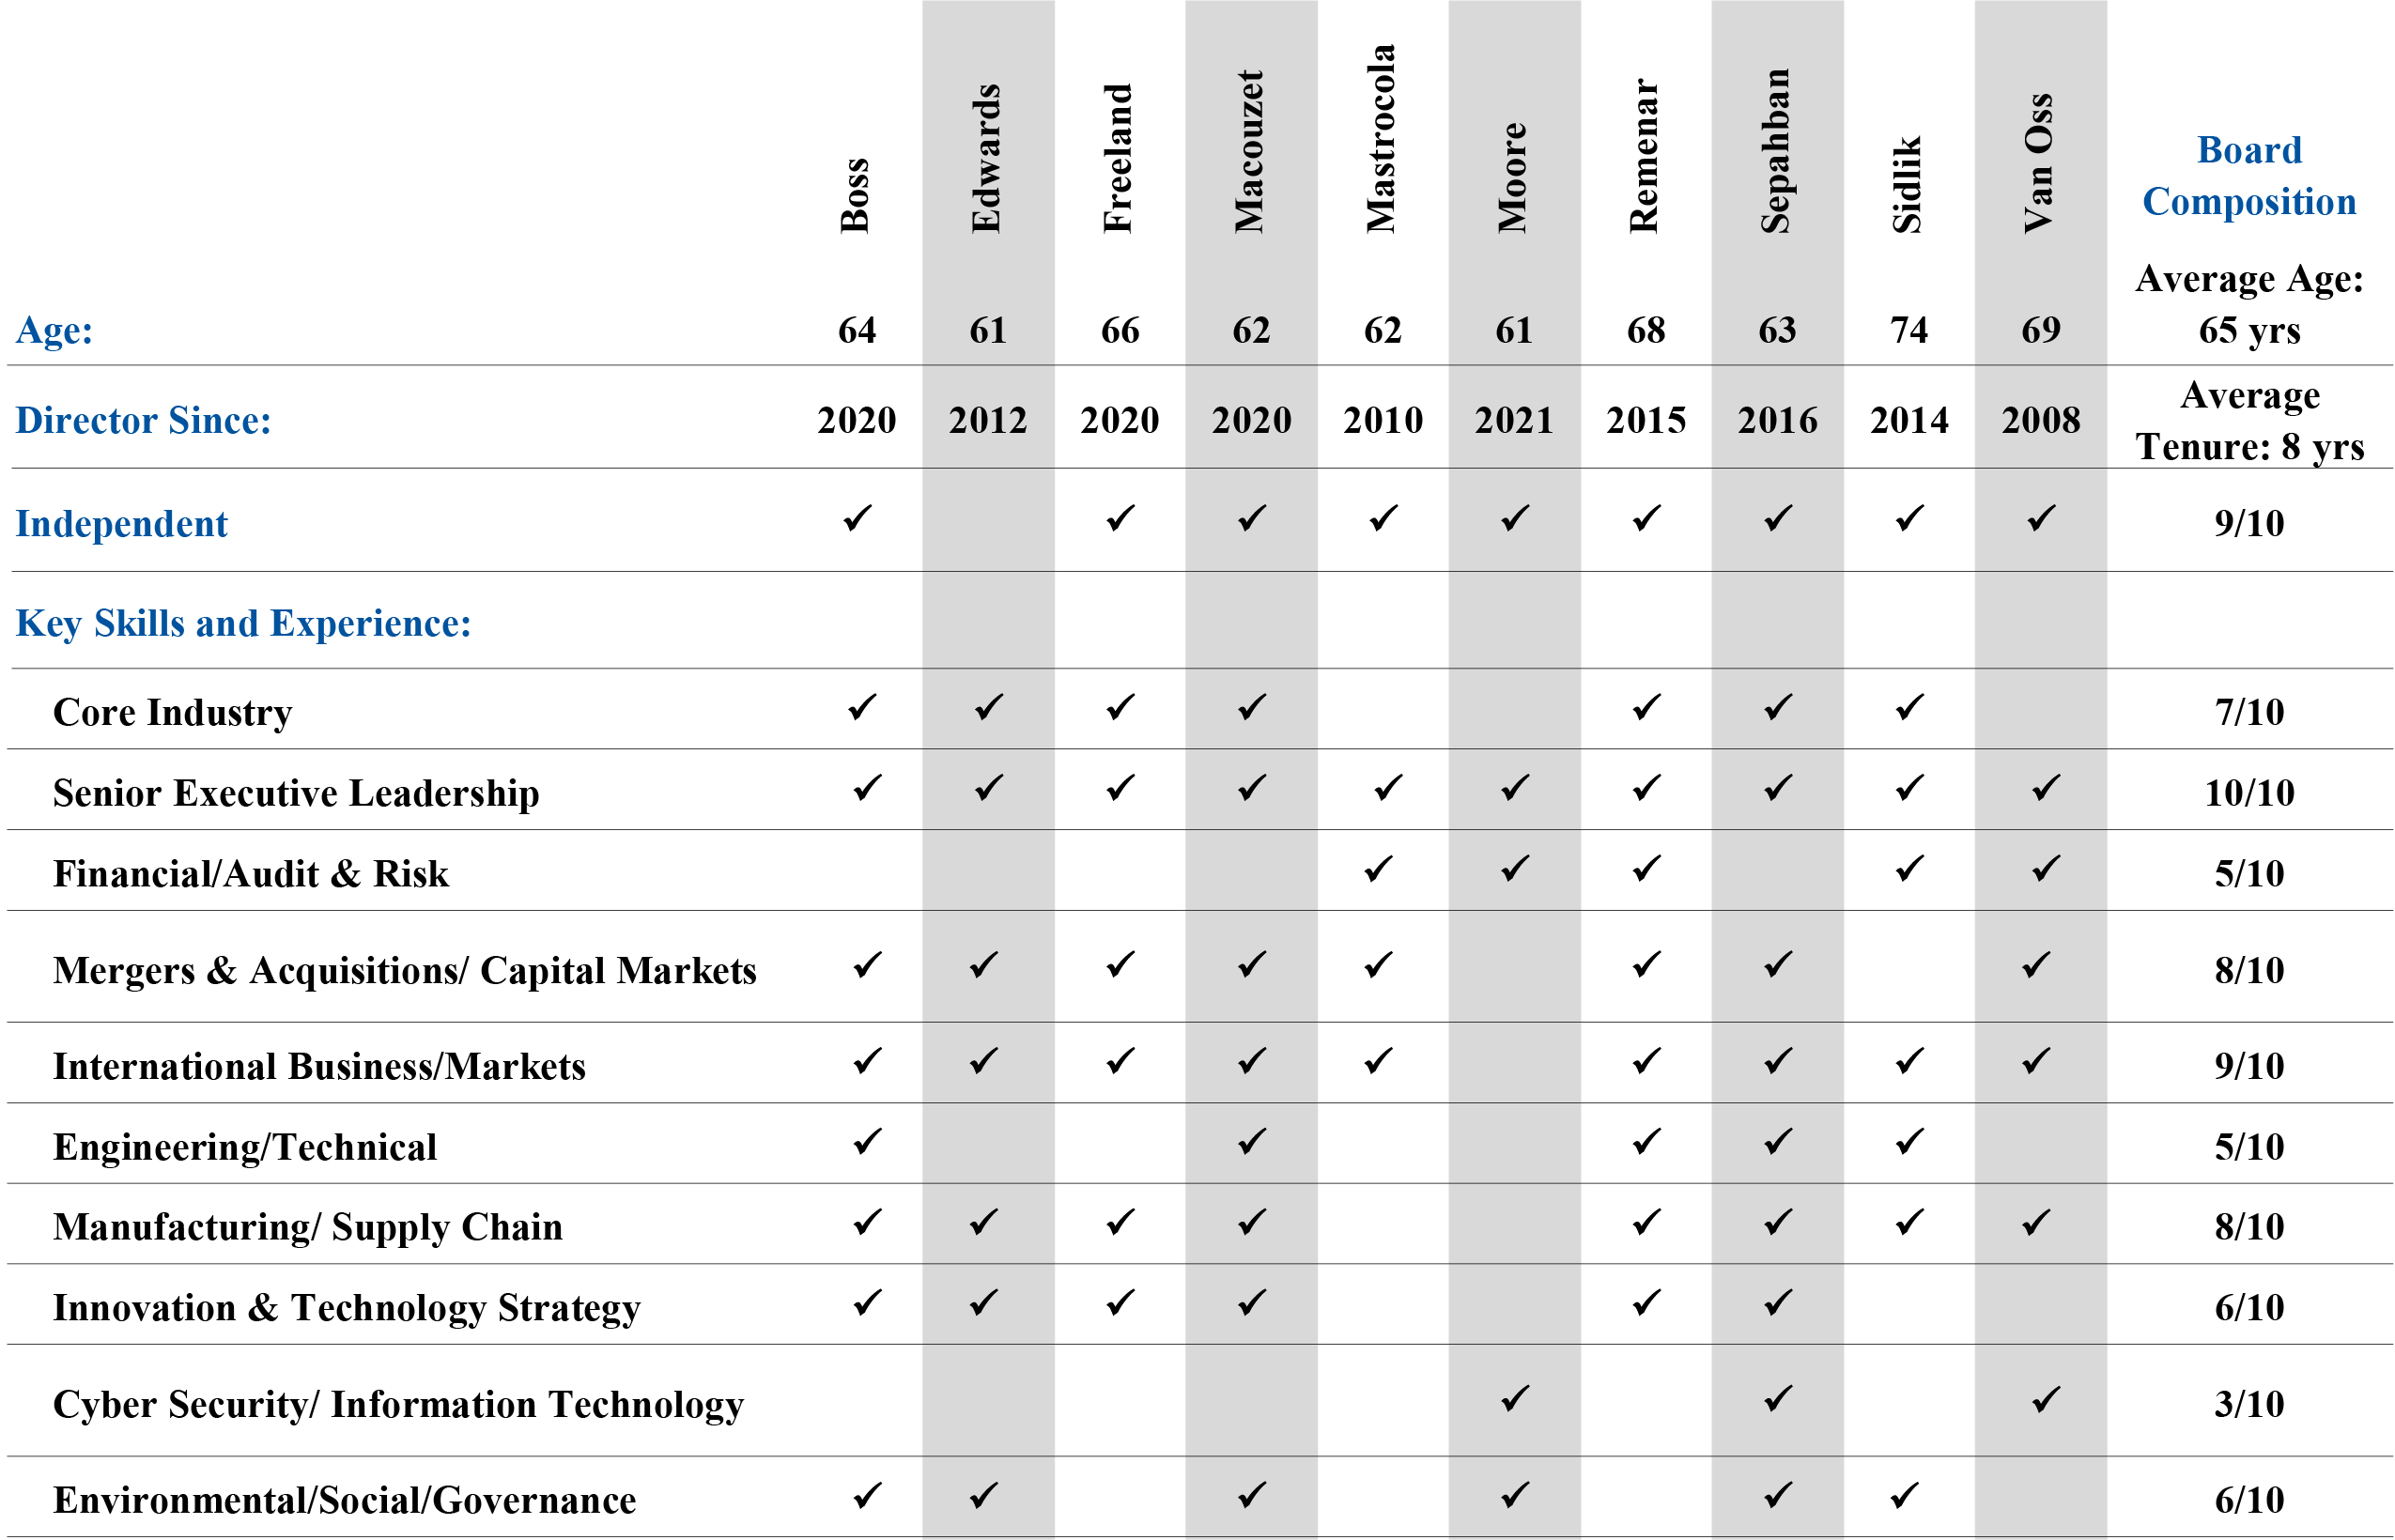
The Company recognizes the value of differing perspectives on our Board. We regularly add directors to bring new perspectives and ideas into the boardroom. Four out of the nine independent director nominees standing for this year’s election have joined our Board within the past four years, including two of our women directors. Among many factors, our Nominating and Corporate Governance Committee of the Board (the “Nominating and Corporate Governance Committee”) considers the diversity of experience and viewpoint when evaluating new board members. The Nominating and Corporate Governance Committee and the Board as a whole are continually looking for ways to advance in these areas and leverage our diversity of thought to further the strength of our Company.
| | | | | | | | | | | | | | |
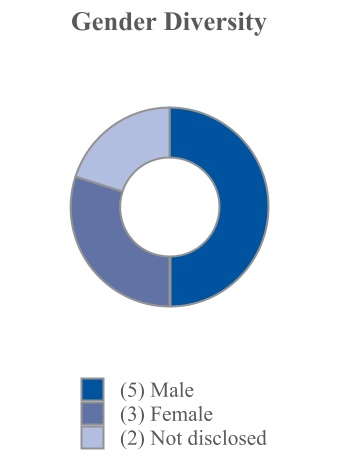
| Board Diversity Matrix |
Total Number of Directors:
| 10 |
| Part I: Gender Identity | Female | Male | Non-Binary | Did not Disclose Gender |
| Directors | 3 | 5 | | 2 |
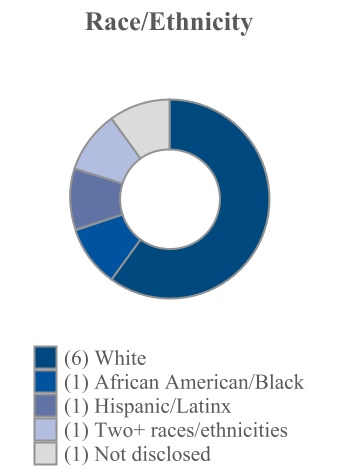
| Part II: Demographic Background |
| African American or Black | 1 | | | |
| Alaskan Native or Native American | | | | |
| Asian | | | | |
| Hispanic or Latinx | 1 | | | |
| Native Hawaiian or Pacific Islander | | | | |
| White | | 5 | | 1 |
| Two or More Races or Ethnicities | 1 | | | |
| LGBTQ+ | | | | |
| Did Not Disclose Demographic Background | 1 |
| | | | | | | | | | | | | | |
| Director Recruitment Process |
| | | | | | | | |
| |
Process
The Board is responsible for selecting its own members and recommending them for election by the stockholders. The Board delegates the screening process to the Nominating and Corporate Governance Committee. The Nominating and Corporate Governance Committee, with the active involvement and input from the Chairman and CEO and other members of the Board, as appropriate, will consider candidates recommended by stockholders, management, members of the Board, and other sources as necessary, including search firms it may engage to assist in the identification and evaluation of qualified director candidates. The procedures for a stockholder to nominate director candidates are described under “Submitting Stockholder Proposals and Nominations for the 2025 Annual Meeting” in this proxy statement. The Nominating and Corporate Governance Committee will evaluate candidates recommended by the stockholders using the same criteria that it uses in evaluating any other candidate.
The Nominating and Corporate Governance Committee is responsible for reviewing with the Board, on an annual basis, the appropriate skills and characteristics required of Board members, considering current Board composition, Company strategy and all relevant facts and circumstances at that time.
In identifying and evaluating the suitability of nominees for director, the Nominating and Corporate Governance Committee takes into account the applicable requirements for directors under the Exchange Act and the NYSE listing rules. In addition, the Nominating and Corporate Governance Committee considers other criteria it deems appropriate and which may vary over time depending on the Board’s needs, including criteria such as automotive or manufacturing industry experience, general understanding of various business disciplines (e.g., marketing, finance, etc.), the Company’s business environment, educational and professional background, analytical ability, diversity of experience and viewpoint, ESG skills and expertise, and willingness to devote adequate time to Board duties. Director candidates should demonstrate commitment to the highest personal and professional ethical standards, integrity, and the core values of the Company and will be evaluated on their ability to consider and balance the legitimate interests and concerns of the Company’s stockholders and other stakeholders effectively, consistently, and appropriately in reaching decisions. The Company’s Corporate Governance Guidelines also require that the potential pool of Board candidates reflects diversity in gender, race, ethnic background, country of citizenship, and professional experience. The Board evaluates each individual in the context of the Board as a whole, with the objective of retaining a group that can best enhance the Company’s success and represent the interests of stockholders and other stakeholders through sound judgment.
The Nominating and Corporate Governance Committee will present its recommendations for director nominees to the Board of Directors who will analyze the committee’s findings and select the nominees to be presented to the stockholders for a vote at the annual meeting of the stockholders.
|
Our 2024 Director Nominees
Upon the recommendation of the Nominating and Corporate Governance Committee, the Board has nominated the ten individuals listed below to stand for election to the Board for a one-year term ending at the annual meeting of the stockholders in 2025 and until their successors, if any, are elected or appointed and qualified, or until their earlier resignation, removal, or death. All of these nominees have consented to being named in this proxy statement and to serve, if elected. If any of them is unable or declines to serve as a director, proxies voting for that nominee may be voted for a substitute nominee selected by the Board. The Board may also choose to reduce the number of directors to be elected at the meeting.
Each incumbent director who has been nominated for reelection by the Board must submit or have submitted an irrevocable resignation. If an incumbent director is not reelected, then (within 90 days of receiving the certified vote pertaining to the election of directors) the Nominating and Corporate Governance Committee will make a recommendation to the Board as to whether to accept or reject the resignation, or whether to take other action. The Nominating and Corporate Governance Committee, in making its recommendation, and the Board, in making its determination, may consider any factors they determine appropriate.
Because this is an uncontested election, a nominee will be elected if more votes are cast “for” than “against” that nominee’s election, and any abstentions or broker non-votes will not be counted as a vote “for” or “against” that nominee’s election. If a nominee is not elected, or if the Board accepts an unsuccessful incumbent director’s resignation, then the Board may fill the resulting vacancy.
The names of the nominees, along with their present positions, their principal occupations, directorships held with other public corporations currently and during the past five years, their ages, and the year first elected as a director are set forth below. In addition, certain individual qualifications, experiences, and skills of our nominees that led the Board to the conclusion to nominate each such individual are set forth below.
| | | | | |
| John G. Boss Director Since: 2020 Independent: Yes Age: 64 |
Professional Experience: Until his retirement in March 2020, Mr. Boss was the president and chief executive officer of Momentive Performance Materials Inc. (“MPM”), a global producer of silicones, quartz and specialty ceramic materials, serving in this capacity for six years. Mr. Boss also served as a director of MPM Holdings Inc. from October 2014 to March 2020 and served as President of the Silicones & Quartz Division of MPM from March 2014 to December 2014. Mr. Boss’ career spans more than 30 years in the specialty chemicals and materials industry, including various executive leadership positions with Honeywell International, a producer of commercial, industrial and consumer products. Mr. Boss also serves on the board of directors of Wabash National Corporation, where he chairs the Compensation Committee and serves on the Finance Committee, Libbey, Inc., where he serves on the Audit Committee, and Calumet Specialty Products Partners L.P, where he chairs the Talent and Leadership Development Committee and serves on the Conflicts, Audit and Finance, and Strategy and Growth Committees. Mr. Boss has a Master of Business Administration degree in Marketing and Finance from Rutgers Graduate School of Management in 1996 and a Bachelor’s Degree in Mechanical Engineering from West Virginia University in 1981.
Skills and Experience: Core Industry; Senior Executive Leadership; Mergers & Acquisitions/Capital Markets; International Business/ Markets; Engineering/Technical; Manufacturing/Supply Chain; Innovation & Technology Strategy; Environmental/Social/Governance
Committees: Compensation (Chair); Innovation and Business Diversification
Other Current Public Company Directorships: Wabash National Corporation; Calumet Specialty Products Partners L.P.
Former Public Company Directorships (past 5 years): MPM Holdings Inc.
| | | | | |
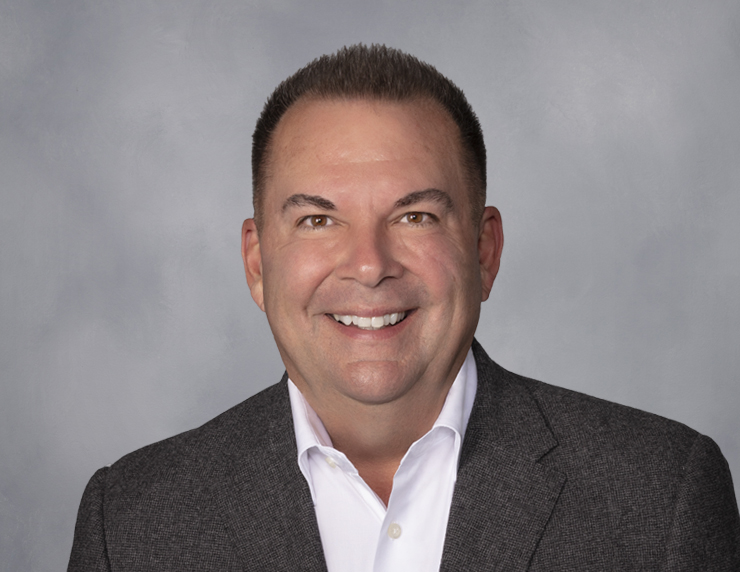
| Jeffrey S. Edwards (Chairman) Director Since: 2012 Independent: No Age: 61 |
Professional Experience: With more than 38 years of automotive industry experience, Jeffrey Edwards serves as chairman and CEO of Cooper Standard, a position he has held since May 2013. He joined Cooper Standard as CEO and became a member of the Company's board of directors in October 2012. Since joining Cooper Standard, Edwards has been focused on driving value through culture, innovation and results.
Mr. Edwards also serves on the board of directors of Standex International Corp., where he serves on the Compensation and Nominating and Corporate Governance Committees.
Prior to joining Cooper Standard, Mr. Edwards held positions of increasing responsibility at Johnson Controls, Inc. from 1984 to 2012. Most recently, he led the Automotive Experience Asia Group, serving as corporate vice president as well as group vice president and general manager.
Mr. Edwards earned a Bachelor of Science degree in business administration in 1984 from Clarion University in Pennsylvania. He has also completed an executive training program at INSEAD, an international graduate business school and research institution.
Skills and Experience: Core Industry; Senior Executive Leadership; Mergers & Acquisitions/Capital Markets; International Business/Markets; Manufacturing/Supply Chain; Innovation & Technology Strategy; Environmental/Social/Governance.
Other Current Public Company Directorships: Standex International Corp.
Former Public Company Directorships (past 5 years): None
| | | | | |
| Richard J. Freeland Director Since: 2020 Independent: Yes Age: 66 |
Professional Experience: Mr. Freeland served as president and chief operating officer of Cummins Inc., a global manufacturer of engines, power systems, and related components, from July 2014 to October 2019, prior to which he served in various senior leadership positions, including vice president and president of the Engine Business from 2010 to 2014, president of the Components Group from 2008 to 2010, and president of Worldwide Distribution Business from 2005 to 2008. Mr. Freeland serves as chair of the board of directors of Valvoline Inc. and serves on the board of directors of Hyliion Holdings Corp. and as a member of its Compensation and Technology Committees. He is also a member of the Advisory Council of Purdue University, Krannert School of Management and a member of the Strategic Advisory Board of Embark Trucks, Inc. Mr. Freeland received a Bachelor of Science degree from Purdue University in 1979 and a Master of Business Administration degree from Indiana University in 1987.
Skills and Experience: Core Industry; Senior Executive Leadership; Mergers & Acquisitions/Capital Markets; International Business/Markets; Manufacturing/Supply Chain; Innovation & Technology Strategy
Committees: Nominating and Corporate Governance (Chair); Innovation & Business Diversification
Other Current Public Company Directorships: Valvoline Inc.; Hyliion Holdings Corp
Former Public Company Directorships (past 5 years): Cummins Inc.
| | | | | |
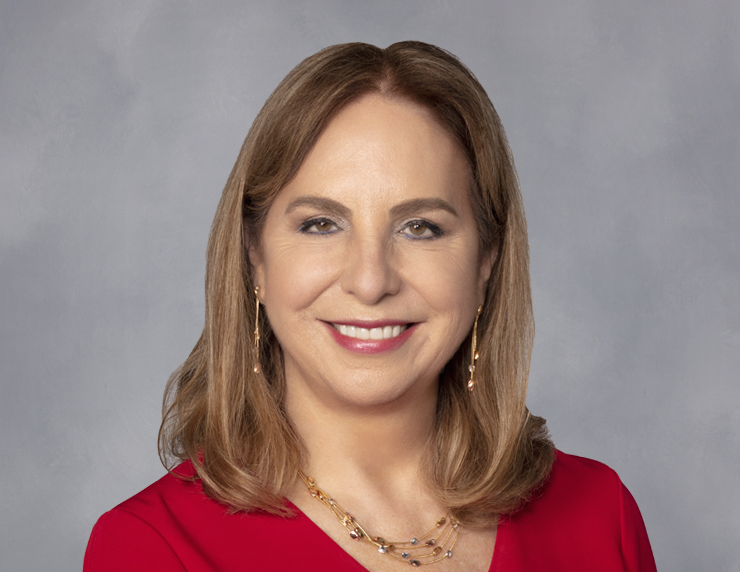
| Adriana E. Macouzet-Flores Director Since: 2020 Independent: Yes Age: 62 |
Professional Experience: Ms. Macouzet-Flores is vice president, Latin America and PMC general manager, Latin America of PPG Industries de Mexico, S.A. de C.V., a subsidiary of PPG Industries Inc., a manufacturer and distributor of a broad range of paints, coatings and specialty materials, prior to which she served as its general manager, Latin America North and general manager, Automotive OEM Coatings from January 2012 to June 2017. Ms. Macouzet-Flores held several other positions of increasing responsibility at PPG Industries since she started with the company in 1989.
Ms. Macouzet-Flores has over 25 years of leadership experience in multinational settings. She earned an undergraduate degree in chemical engineering from Universidad La Salle, Mexico City; Mexico City, Mexico, and has completed executive training courses in Finance Management at University of Michigan Ross School of Business; Corporate Strategy at The University of Chicago Booth School of Business; and Women on Boards at Harvard Business School.
Skills and Experience: Core Industry; Senior Executive Leadership; Mergers & Acquisitions/ Capital Markets; International Business/Markets; Engineering/Technical; Manufacturing/Supply Chain; Innovation & Technology Strategy; Environmental/Social/Governance
Committees: Nominating and Corporate Governance; Innovation and Business Diversification
Other Current Public Company Directorships: None
Former Public Company Directorships (past 5 years): None
| | | | | |
| David J. Mastrocola Director Since: 2010 Lead Director Since: 2011 Independent: Yes Age: 62 |
Professional Experience: Mr. Mastrocola is a private investor. Previously, Mr. Mastrocola served as partner and managing director of Goldman, Sachs & Co. During his 22 years at Goldman, Sachs & Co., he held a number of senior management positions in the Investment Banking Division, including heading or coheading the corporate finance, mergers/strategic advisory and industrials/natural resources departments, as well as serving as a member of firm-wide capital and commitments committees. Prior to this, Mr. Mastrocola was a senior auditor at Arthur Anderson & Co. Mr. Mastrocola also served on the Board of Trustees of Save the Children Foundation for 12 years. Mr. Mastrocola earned his Master of Business Administration degree from Harvard University and his undergraduate degree from Boston College.
Skills and Experience: Senior Executive Leadership; Financial/Audit & Risk; Mergers & Acquisitions/Capital Markets; International Business/Markets
Committees: Compensation
Other Current Public Company Directorships: None
Former Public Company Directorships (past 5 years): None
| | | | | |
| Christine M. Moore Director Since: August 2021 Independent: Yes Age: 61 |
Professional Experience: Ms. Moore is executive vice president and general auditor of Comerica Bank, a financial services company, a position she has held since 2016. Prior to that time she held positions at Comerica Bank of increasing responsibility, including Senior Vice President & Deputy General Auditor from 2014 to 2016, Senior Vice President & Audit Director from 2004 to 2014 and Senior Auditor, Audit Manager, Audit Director from 1991 to 1999. She has also served as Controller, Jordan Services Inc. from 2000 to 2004 and began her accounting and auditing career at PricewaterhouseCoopers. Ms. Moore holds a Bachelor of Business Administration degree from Marygrove College and a Master of Business Administration degree from University of Detroit Mercy. She has participated in the Leadership at the Peak, a Center for Creative Leadership Executive Leadership Program, Inforum’s Center for Women’s Leadership Executive Leadership Program, as well as earned: the Certified Public Accountant (CPA); Certified Information System Auditor (CISA); Certified Anti-Money Laundering Specialists (CAMS); Certified Fiduciary and Investment Risk Specialist (CFIRS) designations; and NACD Directorship Certification. She currently serves as an executive board member of the Alternative for Girls organization and is a member of the Michigan Association of CPAs, Information Systems Audit & Control Association, Institute of Internal Auditors, Association of Certified Anti-Money Laundering Specialists, the Executive Leadership Council, National Association of Corporate Directors, and is the executive sponsor for Comerica’s African American Network employee resource group.
Skills and Experience: Senior Executive Leadership; Financial/Audit & Risk; Cybersecurity/Information Technology; Environmental/Social/ Governance
Committees: Audit
Other Current Public Company Directorships: None
Former Public Company Directorships (past 5 years): None
| | | | | |
| Robert J. Remenar Director Since: 2015 Independent: Yes Age: 68 |
Professional Experience: Mr. Remenar served as chief operating officer of Kensington Capital Acquisition Corp. IV, a special purpose acquisition company from March 2022 to September 2022. Mr. Remenar was president of Kensington Capital Acquisition Corp. II, a special purpose acquisition company, from February 2021 to October 2021 and served as vice chairman of its board of directors. From June 2020 to November 2020, he was president of Kensington Capital Acquisition Corp. I, a special purpose acquisition company, also serving as vice chairman of its board of directors. Mr. Remenar also served as president and chief executive officer of Chassix Inc., a manufacturer of chassis systems, from July 2012 to June 2014, and he served as president and chief executive officer of Nexteer Automotive from December 2009 to June 2012, and president of Delphi Steering/Nexteer Automotive from April 2002 to November 2012. Prior to this, he held a number of executive positions within Delphi Corp. since 1998 and several executive and managerial positions within General Motors since 1985. Mr. Remenar also serves on the board of directors of Samvardhana Motherson International Limited, where he serves on the Risk Management Committee, and the board of directors of Stellium Inc. He earned his Master of Business and Professional Accountancy degrees from Walsh College and his undergraduate degree from Central Michigan University.
Skills and Experience: Core Industry; Senior Executive Leadership; Financial/Audit & Risk; Mergers & Acquisitions/Capital Markets; International Business/Markets; Engineering/Technical; Manufacturing/Supply Chain; Innovation & Technology Strategy
Committees: Compensation; Audit
Other Current Public Company Directorships: Samvardhana Motherson International Limited (formerly known as Motherson Sumi Systems Limited)
Former Public Company Directorships (past 5 years): Kensington Capital Acquisition Corp.; Kensington Capital Acquisition Corp. II
| | | | | |
| Sonya F. Sepahban Director Since: 2016 Independent: Yes Age: 63 |
Professional Experience: Ms. Sepahban is the CEO and a director of OurOffice, Inc., developer of an enterprise software platform to measure, benchmark and improve diversity and inclusion and workplace culture. From 2009 to 2015, she served as senior vice president of engineering, development and technology at General Dynamics Land Systems, a business unit of General Dynamics Combat Systems Group, a global aerospace and defense company. From 1997 to 2009, she held a number of leadership positions with Northrop Grumman Space Technology, including chief technology officer and senior vice president and chief engineer. Prior to this, Ms. Sepahban held a number of technical and management positions at the NASA Johnson Space Center. Ms. Sepahban earned a Master of Business Administration degree from the University of Houston, a master’s degree in chemical engineering from Rice University, a bachelor’s degree in chemical engineering from Cornell University, and a political science degree from the Institute of Political Sciences.
Skills and Experience: Core Industry; Senior Executive Leadership; Mergers & Acquisitions/Capital Markets; International Business/Markets; Engineering/Technical; Manufacturing/Supply Chain; Innovation & Technology Strategy; Cybersecurity/Information Technology; Environmental/Social/ Governance
Committees: Innovation & Business Diversification (Chair)
Other Current Public Company Directorships: None
Former Public Company Directorships (past 5 years): None
| | | | | |
| Thomas W. Sidlik Director Since: 2014 Independent: Yes Age: 74 |
Professional Experience: Mr. Sidlik spent 34 years in the automotive industry until his retirement in 2007 from the board of management of DaimlerChrysler AG. Prior to this, he served as chairman and CEO of Chrysler Financial Corp. He also served as chairman of the Michigan Minority Business Development Council, and as the vice chairman and chairman of the board of regents of Eastern Michigan University. He earned his Master of Business Administration degree from the University of Chicago and his undergraduate degree from New York University.
Skills and Experience: Core Industry; Senior Executive Leadership; Financial/Audit & Risk; International Business/Markets; Engineering/Technical; Manufacturing/Supply Chain; Environmental/Social/Governance
Committees: Nominating and Corporate Governance; Audit
Other Current Public Company Directorships: None
Former Public Company Directorships (past 5 years): Aptiv PLC
| | | | | |
| Stephen A. Van Oss Director Since: 2008 Independent: Yes Age: 69 |
Professional Experience: Mr. Van Oss currently serves as an Operating Partner, Distribution for Gamut Capital Management, a New York based private equity firm. From 2009 until his retirement in December 2015, Mr. Van Oss served as senior vice president and chief operating officer and director of WESCO International, Inc., a supply chain solutions company. He served as a senior vice president and chief financial and administrative officer of WESCO from 2004 to 2009 and as vice president and chief financial officer of WESCO from 2000 to 2004. Prior to this, he served as WESCO’s director of information technology from 1997 to 2000 and as its director of acquisition management in 1997. Mr. Van Oss serves on the board of directors of JPW Industries as the chairman and is a member of the audit and compensation committees. He earned his graduate degree from Cleveland State University, undergraduate degree from Wright State University and is a Certified Public Accountant licensed in Ohio.
Skills and Experience: Senior Executive Leadership; Financial/Audit & Risk; Mergers & Acquisitions/Capital Markets; International Business/Markets; Manufacturing/Supply Chain; Cybersecurity/Information Technology
Committees: Audit (Chair); Compensation
Other Current Public Company Directorships: None
Former Public Company Directorships (past 5 years): None
| | | | | |
| þ | The Board of Directors recommends that the stockholders vote FOR each of our nominees.
|
Corporate Governance
Independence of Directors
Board’s Guidelines on Director Independence:
Our Corporate Governance Guidelines provide that a majority of the members of the Board must meet the criteria for independence set forth under applicable law and the New York Stock Exchange (“NYSE”) listing standards. The Board determines on an annual basis whether each director qualifies as independent under these criteria. In addition to applying the NYSE independence rules, the Board will consider all relevant facts and circumstances of which it is aware in making an independence determination with respect to any director. Furthermore, our Audit, Compensation and Nominating and Corporate Governance Committees are constituted so as to comply with the NYSE listing standards regarding independence, including committee independence.
Application of Guidelines:
The Board has determined that all of our directors and director nominees are independent as determined pursuant to NYSE rules, except for Mr. Edwards who serves as our CEO.
Board Leadership Structure
The Board’s leadership structure currently includes a combined chairman and chief executive officer role with a non-employee lead director, as permitted by our Corporate Governance Guidelines.
Chairman and Chief Executive Officer
Mr. Edwards serves as chairman of the board of directors as well as our CEO. The Board believes that this structure is in the best interests of our stockholders at this time because it takes into consideration the importance of having a chairman with in-depth knowledge of, and experience in, our industry and promotes communication between management and the Board, in particular with respect to the Board’s oversight of the Company’s strategic direction. In addition, this structure helps ensure that the non-employee directors’ attention is devoted to the issues of greatest importance to the Company and our stockholders. Our Board periodically reviews its determination to have a single individual serve as both chairman and CEO.
Lead Director
The lead director position is elected by the non-employee members of the Board upon the recommendation of the Nominating and Corporate Governance Committee. The Board believes that the role of the lead director, together with the existence of a substantial majority of independent directors, fully independent Board committees, and the use of regular executive sessions of non-employee and independent directors achieves an appropriate balance between the effective development of key strategic and operational objectives and independent oversight of management.
As the lead director, Mr. Mastrocola:
1.presides at all meetings of the Board at which the chair is not present, including executive sessions of the independent directors, and communicates with management concerning the substance of such meetings and sessions;
2.serves as liaison between the chair and the independent directors;
3.approves the Board’s meeting agendas, schedules and information sent to the Board;
4.in consultation with the Compensation Committee, assists the Board with its evaluation of the performance
of the CEO; and
5.if requested by major stockholders, ensures that he is available for consultation and direct communication.
Board of Director Attendance Requirements for Meetings
Meetings
Our Board of Directors met seven times in 2023. As set forth in our Corporate Governance Guidelines, Board members are expected to attend Board meetings and meetings of the committees on which they serve. All directors are also strongly encouraged to attend our annual meeting of the stockholders. All director nominees attended at least 75% of the meetings of our Board and the committees on which such director served during 2023. All of the then-serving directors attended the 2023 Annual Meeting.
Meetings of Non-Employee Directors
In accordance with our Corporate Governance Guidelines and the listing standards of NYSE, our non-employee directors meet regularly in executive sessions of the Board without management present. Executive sessions of non-employee directors are led by Mr. Mastrocola, the lead director, and are held in conjunction with each regularly scheduled Board meeting. Each committee of the Board also meets in executive session without management in conjunction with regularly scheduled committee meetings, as appropriate. At least once a year, the independent directors meet in an executive session led by one of the independent directors who is selected by all of the independent directors to lead the session.
Evaluation of Board Performance
The Board believes that its annual evaluation process illustrated below is integral to enhancing our Board’s effectiveness. These annual self-evaluations are intended to facilitate a candid assessment and discussion by the Board of its effectiveness as a group in fulfilling its responsibilities, its performance as measured against the Corporate Governance Guidelines, and areas for improvement. Each Committee of the Board also conducts a similar annual self-evaluation of its performance and procedures.
| | | | | | | | |
| Questionnaire | » | Questionnaire enables candid director feedback. |
| | |
| Board Assessments & Discussions | » | During an executive session of the Board led by the Chair of the Nominating and Corporate Governance Committee and the lead director, the questionnaires are used to facilitate assessments of the following areas:
•Individual performances of the directors, including in the capacity of lead director and committee chair •Board and committee operations •Board performance •Committee performance |
| | |
| Follow-Up | » | Policies and practices updated as appropriate. |
| | | | | | | | | | | | | | |
| Board Committees and Their Functions |
Committees of the Board of Directors
Our Board currently has four standing committees: the Audit Committee, the Compensation Committee, the Nominating and Corporate Governance Committee and the Innovation and Business Diversification Committee. The Board determined that each member of each Committee is independent under applicable NYSE listing standards and SEC rules. Each Committee is organized and conducts its business pursuant to a written charter adopted by the Board and available on our website at www.cooperstandard.com under the “Investors” tab.
The following chart sets forth our Board’s standing committees and membership on these committees.
| | | | | | | | | | | | | | |
| Directors | Audit Committee | Compensation Committee | Nominating and Corporate Governance Committee | Innovation and Business Diversification Committee |
| John G. Boss | | C | | ● |
| Jeffrey S. Edwards * | | | | |
| Richard J. Freeland | | | C | ● |
| Adriana E. Macouzet-Flores | | | ● | ● |
| David J. Mastrocola ** | | ● | | |
| Christine M. Moore† | ● | | | |
| Robert J. Remenar† | ● | ● | | |
| Sonya F. Sepahban | | | | C |
| Thomas W. Sidlik | ● | | ● | |
| Stephen A. Van Oss† | C | ● | | |
| Number of Meetings in 2023 | 7 | 6 | 5 | 4 |
* Chairman of Board
** Lead Director
† Financial Expert
“C” Denotes member and Chair of Committee
“●” Denotes member
| | | | | | | | | | | | | | |
| Audit Committee | | | | |
| | | | |
Chair Stephen A. Van Oss Members Christine M. Moore Robert J. Remenar Thomas W. Sidlik | Committee’s Key Responsibilities |
| •Select independent registered public accounting firm and regularly review and evaluate the firm’s independence, qualifications and performance •Oversee accounting and financial reporting processes and the annual audit and quarterly review of financial statements •Oversee, review and evaluate the Company’s internal audit function •Oversee compliance with legal and regulatory requirements •Review and oversee our system of internal controls regarding finance, accounting, cybersecurity and legal compliance •Review and oversee the Company’s assessment and management of the Company’s major litigation, and any significant compliance, cybersecurity and financial risk exposures •Oversee ESG disclosures, processes, and controls
|
| Audit Committee Financial Expertise and Independence |
| Our Board has determined that each member of the Audit Committee is financially literate and that Messrs. Van Oss and Remenar and Ms. Moore qualify as audit committee financial experts as defined by the rules and regulations of the Securities and Exchange Commission (“SEC”). |
| | | | | | | | | | | | | | | | | |
| Compensation Committee | |
| | | | | |
Chair John G. Boss Members David J. Mastrocola Robert J. Remenar Stephen A. Van Oss | | Committee’s Key Responsibilities |
| | •Review and approve corporate goals, objectives, and other criteria relevant to the chief executive officer’s and the other executive officers’ compensation •Evaluate the performance of all executive officers and determine their compensation •Establish overall compensation philosophy and review and approve executive compensation programs, and assess related risks •Review and approve any employment or severance arrangement with executive officers •Review and approve equity-based compensation plans and awards made pursuant to such plans •Review and approve equity-based compensation plans and awards made pursuant to such plans •Oversee the Company’s employee benefit plans, including the delegation of responsibility for such programs to the Company’s Benefit Plan Committee •Integration of select ESG goals and milestones into executive compensation plans |
| Compensation Consultant | | |
The Compensation Committee has engaged FW Cook as its independent compensation consultant. The consultant reports directly to the Compensation Committee, including with respect to management’s recommendations of compensation programs and awards. The consultant advises the Compensation Committee on a number of compensation-related considerations, including compensation practices among our peer group companies, pay-for-performance measures, competitiveness of pay levels, program design, and market trends. Other than consulting on executive compensation matters, FW Cook has performed no other services for the Compensation Committee or the Company. The Compensation Committee maintains a formal process to ensure the independence of any executive compensation advisor engaged by the Compensation Committee, including consideration of all factors relevant to the advisor’s independence from management as required by applicable NYSE listing standards. In connection with its engagement of FW Cook, the Compensation Committee considered these factors and determined that FW Cook qualified as independent and that its engagement does not raise any conflict of interest. |
| | | | | | | | | | | | | | | | | |
| Nominating and Corporate Governance Committee |
| | | | | |
Chair Richard J. Freeland Members Adriana E. Macouzet-Flores Thomas W. Sidlik
| | Committee’s Key Responsibilities |
| | •Identify and evaluate individuals qualified to become members of the Board consistent with criteria approved by the Board •Select or recommend to the Board the director nominees to stand for election by the stockholders or to fill vacancies on the Board and board committee memberships •Develop and ensure compliance with corporate governance principles and practices applicable to the Company •Review our legal compliance and ethics programs and policies •Review and make recommendations to the Board on director compensation, as well as indemnification and insurance matters •Oversee the annual performance evaluation of the Board and its committees •Ensure effective Company communication with investors and other stakeholders on ESG matters •Ensure the Board has the skills, expertise and continued education necessary to oversee the successful execution of the Company’s ESG priorities |
| | | | | | | | | | | | | | | | | |
| Innovation and Business Diversification Committee |
| | | | | |
Chair Sonya F. Sepahban Members John G. Boss Richard J. Freeland Adriana E. Macouzet-Flores
| | Committee’s Key Responsibilities |
| | •Work to understand megatrends affecting the automotive industry and its adjacent markets and provide insights, and together with Company management assess any impacts on the Company’s innovation and business diversification strategy, competitive landscape, and opportunities and risks, including start-up investments and M&A activities •Advise management regarding the Company's innovation and business diversification strategy, implementation plans and performance targets •Review and advise management regarding the Company's commercialization strategy for new products in its core market, adjacent markets, and business model innovations
|
| | | | | | | | | | | | | | |
| Corporate Governance Principles and Code of Conduct |
Cooper Standard is committed to sound corporate governance principles. Having such principles is essential to maintaining our integrity in the marketplace and ensuring that we are managed for the long-term benefit of our stockholders. Our business is overseen by our Board. Our Board strives to promote the success and continuity of our business through the selection of a qualified management team. It is also responsible for making certain that our activities are conducted responsibly, lawfully, and ethically.
The Board has adopted Corporate Governance Guidelines which provide a framework for the effective governance of the Company. The Board has also adopted a Code of Conduct which applies to all directors, officers, and employees, including our chief executive officer, our chief financial officer, and our chief accounting officer. All of our corporate governance documents, including the Corporate Governance Guidelines, the Code of Conduct, and committee charters are available on our website at www.cooperstandard.com under the “Investors” tab or in printed form upon request by contacting Cooper Standard at 40300 Traditions Drive, Northville, Michigan, 48168, Attention: Investor Relations. The Board regularly reviews corporate governance developments and modifies our policies as warranted. Any modifications will be reflected on our website. In addition, if the Board grants any waivers from our Code of Conduct to any of our directors or executive officers, or if we amend our Code of Conduct, we will, if required, disclose these matters through the “Investor” section of our website on a timely basis. The information on our website is not part of this proxy statement and is not deemed to be incorporated by reference in this proxy statement.
| | |
| Board’s Role in Risk Oversight |
The Board, as a whole and through its committees, has responsibility for the oversight of risk management, while management is responsible for the day-to-day management of risks to the Company. The effective oversight and management of the risks facing the Company are supported through a top-down and bottom-up communication framework that includes a robust enterprise risk management approach and active participation from leaders across all functional areas of the Company, along with our Global Leadership Team and our Board, fostering an appropriate culture of integrity and risk awareness throughout the Company.
The Board has also developed a strong governance framework for overseeing management’s strategy that integrates ESG risks and opportunities into the Company’s long-term strategy and enterprise risk management processes.
Risk Oversight
The Board has implemented a risk governance framework designed to:
•understand material risks in the Company’s business, strategy and ESG priorities;
•allocate responsibilities for risk oversight among the full Board and its committees;
•evaluate the Company’s enterprise risk management processes and whether they are functioning adequately; and
•facilitate open communication between management and Directors.
The Board delegates to its committees the task of reviewing and overseeing specific risks that align with their functional responsibilities, as presented below:
| | | | | | | | |
| Audit Committee | | Nominating and Corporate Governance Committee |
•Effectiveness of Company policies with respect to risk assessment and risk management. •Exposure to major litigation or other significant compliance, cybersecurity and financial risks and the mitigation of such risks. •Effectiveness of Company’s system of disclosure controls and system of internal controls over financial reporting and ESG disclosures. •Compliance with legal and regulatory requirements. | | •Risks related to our governance structure and processes, related party transactions, and our legal and ethical compliance programs, including our Code of Conduct. |
Compensation Committee | | Innovation and Business Diversification Committee |
•Compensation programs and practices. The Committee determines whether any such programs or practices create risks that are likely to have a material adverse effect on the Company and, if necessary, recommends changes to our compensation programs to eliminate such risks. | | •Risks related to the Company's diversification and innovation strategy, including pursuits of new and innovative processes, products, markets and business models. |
Enterprise Risk Management Approach
Our enterprise risk management (ERM) approach is designed to inform the Board and the strategic and business planning processes through identification, detection, prevention and mitigation of risks that could impede the achievement of the Company’s strategic objectives and business goals. The results of the Company’s annual risk assessment process are reviewed with the Audit Committee on an annual basis. A priority in our approach is to connect the ERM process with strategic planning and corporate responsibility initiatives to ensure the sustainability of the enterprise.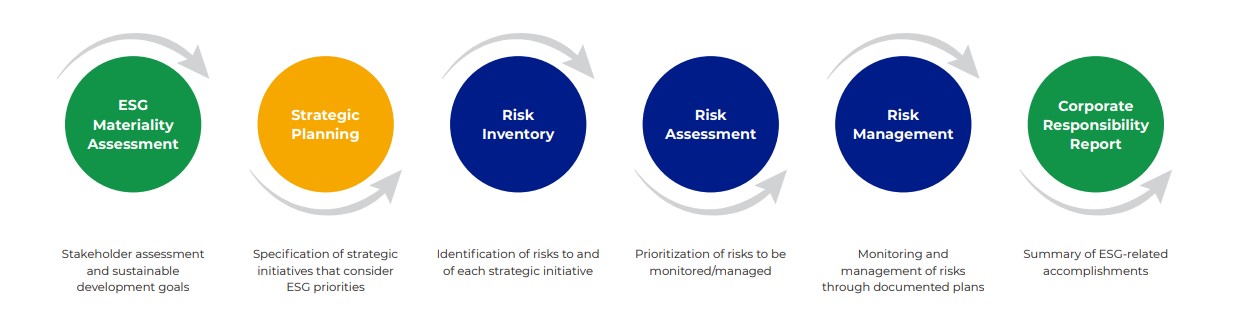
The ERM committee is comprised of senior-level leaders from each of the functional areas of the company working in concert with our Global Leadership Team and the Board. On an annual basis, the ERM committee is charged with pursuing a holistic, consolidated risk management approach for all risk classes, including strategic, operational, financial and compliance. The ERM committee has adopted a common risk management language, process, and metrics that are designed to inventory, assess and rank unmitigated and mitigated risks so that the leadership team can determine the appropriate response and mitigation strategies in alignment with the Company’s risk appetite. The committee considers the likelihood, magnitude and timeframe of individual risks (short-term, intermediate-term or long-term) when assessing response and mitigation strategies. This comprehensive risk management process allows for effective risk management and efficient capital allocation, and fosters a risk-aware culture embedded into daily operations across the organization at all levels.
To learn more about risks facing the Company, you can review the factors included in Part I, “Item 1A. Risk Factors” in the Company’s most recent Annual Report on Form 10-K for the fiscal year ended December 31, 2023, which are aligned to the risks that are identified during the annual ERM risk assessment process. The risks described in the Form 10-K are not the only risks facing the Company. Additional risks and uncertainties not currently known or that may currently be deemed to be immaterial based on the information known to the Company also may materially adversely affect the Company’s business, financial condition or results of operations in future periods.
Cooper Standard is dedicated to demonstrating strong corporate citizenship to fulfill its purpose of Creating Sustainable Solutions TOGETHER. Through consistent actions aligned with our core values, we uphold our reputation as an honest, ethical and responsible company. As we work to deliver innovative products and systems, we remain focused on meeting our sustainability and ESG commitments to Be the First Choice of the Stakeholders We Serve.
In 2023, Cooper Standard was named one of America's Most Responsible Companies by Newsweek, for the fifth consecutive year. We are proud of this acknowledgment of our efforts to continue building upon our performance to address the evolving needs of our stakeholders. We focus on corporate responsibility to deliver value to all our stakeholders and ensure the Company’s long-term sustainability through our ESG initiatives.
ESG Board Governance Framework
The Board is responsible for oversight of our ESG strategy and ensures the management of ESG risks and opportunities are integrated into the Company’s long-term strategy and Enterprise Risk Management. The Board delegates certain ESG oversight responsibilities to its committees as set forth below:
| | | | | | | | |
Audit Committee | Compensation Committee | Nominating and Corporate Governance Committee |
ESG disclosures, processes and controls, and their assurance ensuring: •ESG disclosures (both qualitative and quantitative) are high quality and follow appropriate ESG frameworks and/or standards •Processes and controls are in place to ensure ESG disclosures are accurate, comparable and consistent •Whether independent assurance is required
| ESG accountability: •Integration of select ESG goals and milestones into executive compensation plans
| ESG engagement, board composition and education ensuring: •Effective communication of the Company’s ESG priorities and performance to investors and other stakeholders •The Board has the necessary ESG skills and expertise on the Board •ESG Board education
|
The full Board and its committees receive regular updates on key ESG topics according to a standard Board calendar, including but not limited to corporate governance topics, which are reviewed by the Nominating and Corporate Governance Committee at least twice per year and by the full Board annually, and ethics and compliance topics, which are reviewed by the Audit and Nominating and Corporate Governance Committees at least three times per year and by the full Board annually. In addition to reporting on our progress, we regularly invite expert speakers to Board meetings to report on emerging trends in our evolving global landscape.
Global Sustainability Council
Our commitment to sustainability and corporate responsibility is demonstrated through our Global Sustainability Council (GSC). This cross-functional council, led by an executive chair and comprising subject matter experts from Cooper Standard, provides executive-level oversight for the company's sustainability strategy to ensure alignment and integration with operational business goals and stakeholder priorities. The GSC cross-functional team meets quarterly and takes a holistic look at the Company's ESG initiatives, tracks rapidly evolving best practices and further develops long-term goals to drive world-class ESG performance.
Significant ESG Topics
Our corporate responsibility efforts have the greatest impact when we concentrate on the issues that are most significant to our business and stakeholders. To identify priority topics, challenges, and opportunities, we conduct regular materiality assessments, providing dedicated and formal checkpoints for our sustainability strategy and reporting efforts. In 2021, we refreshed Cooper Standard's ESG materiality assessment to evaluate the business's emerging ESG risks and opportunities. Through an objective third party, we engaged twenty stakeholders, including Cooper Standard leaders, subject matter experts, customers, shareholders, and industry associations. We also evaluated over a dozen recognized resources and frameworks to
identify our industry and stakeholders' most significant sustainability issues. The results validated our previous ESG investments and ongoing initiatives and identified seven high-priority topics for Cooper Standard to manage. In 2023, we reevaluated certain of our goals and made certain adjustments in terms of priority and focus. By making these adjustments, we continue to make progress toward the goals most aligned with our ESG strategy and commitments. We intend to maintain and increase disclosure and transparency around these topics moving forward. The detailed results of our materiality assessment are discussed in our annual Corporate Responsibility Report and are also available on our website.
Employee Engagement, Diversity and Human Capital
Our employees are our most important asset, so we take action to attract, develop, engage, retain and recognize world-class talent. We work to create and maintain a physically and psychologically safe workplace for all our employees through our Total Safety Culture. We also support our employees by giving back to the communities where we work and live, focusing on our local impact. As we aim to strengthen our world-class reputation and stay competitive in the market, we remain focused on several human capital-related topics among our top material ESG focus areas, including Workplace Health & Safety, Talent Engagement, Talent Development, Performance Management, and Diversity & Inclusion.
Innovation, Materials and Product Lifecycle
At Cooper Standard, we continuously evolve and embrace innovative ideas to exceed stakeholder expectations. Our unwavering commitment to making our products more sustainable guides our innovation processes, material selection, and product lifecycle considerations. We intentionally provide internal and external visibility of our product portfolio to further our culture of innovation and transparency. Our highly engaged workforce pursues technological innovations and implements manufacturing and business processes that deliver high quality and robust solutions. These innovative solutions enable us to meet the evolving needs of our customers and the global industries we serve as we face the challenges of today and into the future.
Climate Change, Greenhouse Gas Emissions, and Waste
As we experience the effects of climate change, we share the growing concerns of our stakeholders and take decisive action to manage climate risks. Cooper Standard recognizes that mitigating our environmental impact is crucial for the longevity of our business and the health of our planet. In 2023, we continued to focus on identifying technology investments and energy efficiency programs to reduce our carbon footprint, all part of our sustainability strategy to advance the low-carbon and circular economy. Cooper Standard aspires to be a leader in sustainable manufacturing, striving for excellence through efficient resource use and driving a prosperous future for generations to come.
We have adopted environmental programs to address our Company’s climate-associated risks, including industry changes, market changes and emerging regulations. Since 2011, we have reported our climate-related risks to the Carbon Disclosure Project. We are aggregating our Scope 3 emissions data to reach our goal of being able to set climate science-based emission reduction targets in the future. Furthermore, through the formation of our Carbon Neutrality Action Committee, we are revisiting our renewable energy goals to ensure they are appropriately challenging, inclusive of the correct stakeholder contributions, and in line with our overall strategy.
ESG Reporting
Cooper Standard reports progress towards our ESG commitments in our Corporate Responsibility Report annually. Through our goal-review exercise that took place in 2023, we identified successes, challenges and relevance of our goals. The exercise resulted in a shift to how we measure and evaluate our goals and the creation of some new goals that will guide our teams in the coming years. We continue to report in alignment with both the Global Reporting Initiative (GRI) Standards and the Sustainable Accounting Standards Board (SASB) Auto Part sector standard. Our archive of annual Corporate Responsibility Reports is available on our website at www.cooperstandard.com/about-us/corporate-responsibility. Please view the reports for further information about the Company’s ESG efforts, including ESG goals and metrics. Please note that our Corporate Responsibility Report is not a part of our proxy solicitation materials.
Summary of Compensation
Members of the Board who are not Cooper Standard employees receive an annual cash fee of $100,000 and, if they chair a committee, an additional fee of $10,000 per year. The lead director receives an additional fee of $20,000 per year, less any amount the lead director may receive in fees as chair of a committee. Non-employee directors were also eligible to receive equity grants under the Amended and Restated 2021 Omnibus Incentive Plan (“2021 Plan”). In 2023, the value of the equity awards granted to non-employee directors was approximately equal in value to 120% of the annual base director fee. Consistent with its charter, the Nominating and Corporate Governance Committee reviews and recommends to the Board any changes with respect to the compensation of directors. With respect to fiscal year 2023, the Nominating and Corporate Governance Committee determined not to recommend any changes to the Company’s director compensation program relative to the prior year.
The following table sets forth information regarding the compensation earned by each non-employee director during the year ended December 31, 2023.
| | | | | | | | | | | | | | |
| Name (a) | Fees Earned or
Paid in Cash
(b) | | Stock Awards (c)1 | Total
(f) |
| John G. Boss | $110,000 | | 2 | $120,000 | | $230,000 | |
| Richard J. Freeland | $110,000 | | 3 | $120,000 | | $230,000 | |
| Adriana E. Macouzet-Flores | $100,000 | |
| $120,000 | | $220,000 | |
| David J. Mastrocola | $120,000 | | 4 | $120,000 | | $240,000 | |
| Christine M. Moore | $100,000 | |
| $120,000 | | $220,000 | |
| Robert J. Remenar | $100,000 | |
| $120,000 | | $220,000 | |
| Sonya F. Sepahban | $110,000 | | 5 | $120,000 | | $230,000 | |
| Thomas W. Sidlik | $100,000 | |
| $120,000 | | $220,000 | |
| Stephen A. Van Oss | $110,000 | | 6 | $120,000 | | $230,000 | |
1 The amount shown in column (c) represents the grant-date fair value of 10,092 time-vested RSUs granted to each of the non-employee directors who were directors on the grant date, May 18, 2023, under the Company’s 2021 Plan. These RSUs will vest, assuming continued service as a director, on the earlier of the first annual stockholder meeting after the grant date or the one year anniversary of the grant date. Each RSU represents a contingent right to receive, at the Company’s option, either one share of common stock or the cash equivalent upon satisfaction of the vesting requirements. Under the Cooper-Standard Holdings Inc. Deferred Compensation Plan for Non-Employee Directors, the directors may make an irrevocable election to defer their RSU awards. Messrs. Freeland, Mastrocola, Remenar, Sidlik and Van Oss, and Ms. Sepahban each deferred their 2023 RSU awards.
As of December 31, 2023, the aggregate number of deferred RSUs and outstanding and unvested RSUs held by current non-employee directors were as follows:
| | | | | | | | |
| Name | Deferred
RSUs | Outstanding and Unvested RSUs |
| John G. Boss | — | 10,092 |
| Richard J. Freeland | 36,553 | 10,092 |
| Adriana E. Macouzet-Flores | — | 10,092 |
| David J. Mastrocola | 44,732 | 10,092 |
| Christine M. Moore | — | 10,092 |
| Robert J. Remenar | 19,802 | 10,092 |
| Sonya F. Sepahban | 39,149 | 10,092 |
| Thomas W. Sidlik | 44,732 | 10,092 |
| Stephen A. Van Oss | 44,732 | 10,092 |
2 Represents Mr. Boss’s annual outside director fee, plus $10,000 for his services as the chair of the Compensation Committee.
3 Represents Mr. Freeland’s annual outside director fee, plus $10,000 for his services as the chair of the Nominating and Corporate Governance Committee.
4 Represents Mr. Mastrocola’s annual outside director fee, plus $20,000 for his services as the lead director.
5 Represents Ms. Sepahban’s annual outside director fee plus $10,000 for her services as the chair of the Innovation and Business Diversification Committee.
6 Represents Mr. Van Oss’s annual outside director fee plus $10,000 for his services as the chair of the Audit Committee.
Stock Ownership Policy for Non-Employee Directors
To align the interests of our non-employee directors with the interests of our stockholders, the Board has a policy requiring that non-employee directors achieve a level of ownership of our common stock equal to five times their base annual director fee. Under this policy, non-employee directors are required to hold 75% of the net shares resulting from stock option exercises or vesting of other stock-based awards until they reach their applicable stock ownership level. For purposes of the policy, “stock ownership” or “stock owned” shall include the following, whether owned directly by, or held in trust for the benefit of, the director or any member of his or her immediate family:
•Common stock of the Company, except to the extent such stock is subject to vesting conditions other than conditions based solely on the passage of time.
•Company stock units or similar stock rights granted under the Company’s Omnibus Incentive Plan (or any predecessor or successor plan) or credited under any deferred compensation plan of the Company which are to be settled in shares of common stock, except to the extent such stock units or rights are subject to vesting conditions other than conditions based solely on the passage of time.
In the case of time-vested common stock or stock units in the categories above which are not yet fully vested and not deferred, only a portion representing the net after-tax holdings at vesting will count as stock owned. For purposes of calculating these estimated net holdings, the applicable rate assumed to apply at vesting shall equal 50%.
All of our incumbent non-employee directors meet the requirements of this policy or are retaining their acquired amounts until they reach their applicable stock ownership level.
| | | | | | | | | | | | | | |
| Stock Ownership and Related Stockholder Matters |
Ownership of Certain Beneficial Owners and Management
The following table and accompanying footnotes show information regarding the beneficial ownership of the issued and outstanding common stock of Cooper-Standard Holdings Inc. by (i) each person known by us to beneficially own more than 5% of the issued and outstanding common stock of Cooper-Standard Holdings Inc. as of the dates indicated in the footnotes and (ii) (A) each of our directors, (B) each named executive officer, and (C) all directors and executive officers as a group, each as of March 17, 2024. Unless otherwise indicated, (i) the address of each beneficial owner is c/o Cooper-Standard Holdings Inc., 40300 Traditions Drive, Northville, Michigan, 48168; and (ii) each of the beneficial owners listed below has sole voting and dispositive (investment) power over the shares beneficially owned.
As of March 17, 2024 there were 17,290,145 shares of our common stock outstanding.
| | | | | | | | | | | | | | | | | | | | | | | | | | |
| Common Stock Beneficially Owned |
| Named Executive Officers and Directors | Number of Common Shares1 | | Common Shares Underlying Exercisable Options2 | | Common Shares Underlying Restricted Stock Units3 | | Total Number of
Shares of
Common Stock Beneficially Owned | Percentage of Common
Stock Beneficially Owned |
| Jeffrey S. Edwards | 234,423 | | 4 | 371,267 | | 5 | 2,814 | | 6 | 608,504 | | 3.4 | % |
| Jonathan P. Banas | 20,225 | | | 53,031 | | | — | | | 73,256 | | * |
| Patrick R. Clark | 20,718 | | | 19,645 | | | — | | | 40,363 | | * |
Christopher E. Couch | 11,152 | | | 27,217 | | | — | | | 38,369 | | * |
| Larry E. Ott | 26,790 | | | 29,805 | | | 359 | | 7 | 56,954 | | * |
| John G. Boss | 61,553 | | | — | | | — | | | 61,553 | | * |
| Richard J. Freeland | — | | | — | | | 46,645 | | | 46,645 | | * |
| Adriana E. Macouzet-Flores | 34,574 | | | — | | | — | | | 34,574 | | * |
| David J. Mastrocola | 8,115 | | | — | | | 54,824 | | | 62,939 | | * |
| Christine M. Moore | 23,511 | | | — | | | — | | | 23,511 | | * |
| Robert J. Remenar | 27,575 | | | — | | | 29,894 | | | 57,469 | | * |
| Sonya F. Sepahban | 3,357 | | | — | | | 49,241 | | | 52,598 | | * |
| Thomas W. Sidlik | 4,750 | | | — | | | 54,824 | | | 59,574 | | * |
| Stephen A. Van Oss | 77,846 | | | — | | | 54,824 | | | 132,670 | | * |
| | | | | | | | |
| Current directors and executive officers as a group (17 persons) | 561,804 | | | 507,968 | | | 293,425 | | | 1,363,197 | | 7.5 | % |
| | | | | | | | |
| Significant Owners | | | | | | | | |
Thrivent Financial for Lutherans8 | 2,504,430 | | | | | | | | 14.5 | % |
BlackRock Inc.9 | 1,475,836 | | | | | | | | 8.5 | % |
The Vanguard Group10 | 871,587 | | | | | | | | 5.0 | % |
* Less than 1%
1 Includes common stock directly or indirectly owned by each listed person.
2 Includes shares underlying options exercisable on March 17, 2024, and options that become exercisable within 60 days thereafter.
3 Includes Restricted Stock Units credited to non-employee directors as of March 17, 2024, or within 60 days thereafter, which have been deferred under the Company’s Deferred Compensation Plan for Non-Employee Directors and are payable within 45 days following termination of board service or a change of control.
Not included are the following Restricted Stock Units that are payable within 60 days of March 17, 2024, or with respect to Messrs. Edwards and Ott, would be payable if he retired from the Company, as in each case, the Restricted Stock Units may be paid in cash or shares of common stock at the election of the Company:
| | | | | |
| John G. Boss | 10,092 |
| Adriana E. Macouzet-Flores | 10,092 |
| Christine M. Moore | 10,092 |
| Jeffrey S. Edwards | 1,026 |
| Larry E. Ott | 128 |
4 The number of common shares reported for Mr. Edwards includes 13,200 shares held by an irrevocable family trust for which his spouse is a beneficiary. Mr. Edwards disclaims beneficial ownership of the stock held by the trust except to the extent of his pecuniary interest therein.
5 The number of common shares underlying exercisable options reported for Mr. Edwards as of March 17, 2024, includes 31,900 options that were not longer exercisable as of March 20, 2024, the date of their expiration.
6 The number of common shares underlying Restricted Stock Units reported for Mr. Edwards represents the number of common shares underlying Restricted Stock Units, which can only be paid in shares of common stock, payable to Mr. Edwards if he retired from the Company as of March 17, 2024.
7 The number of common shares underlying Restricted Stock Units reported for Mr. Ott represents the number of common shares underlying Restricted Stock Units, which can only be paid in shares of common stock, payable to Mr. Ott if he retired from the Company as of March 17, 2024.
8 Based solely on the Schedule 13G/A filed with the SEC on February 7, 2024, Thrivent Financial for Lutherans reported being the beneficial holder of 2,504,430 shares of common stock as of December 31, 2023, which represents shares held by Thrivent Financial for Lutherans in its general account and shares held in the Thrivent Defined Benefit Plan Trust for which Thrivent Financial for Lutherans serves as investment adviser. Out of the 2,504,430 shares reported, 719,354 shares were held by registered investment companies for which Thrivent Financial for Lutherans serves as investment adviser, and 1,771,452 shares were held by registered investment companies for which Thrivent Asset Management, LLC, a Delaware limited liability company and a wholly-owned subsidiary of Thrivent Financial for Lutherans, serves as investment adviser. As of December 31, 2023, Thrivent Financial for Lutherans had the sole power to vote 13,624 shares of common stock and the sole power to dispose of 13,624 shares of common stock; and the shared power to vote 2,490,806 shares of common stock and the shared power to dispose of 2,490,806 shares of common stock. The address for Thrivent Financial for Lutherans is 901 Marquette Avenue, Suite 2500, Minneapolis, Minnesota 55402.
9 Based solely on the Schedule 13G filed with the SEC on January 25, 2024, BlackRock, Inc. reported being the beneficial holder of 1,475,836 shares of common stock as of December 31, 2023. BlackRock, Inc. has the sole power to vote 1,430,925 shares of common stock and the sole power to dispose of 1,475,836 shares of common stock. The address for BlackRock, Inc., is 50 Hudson Yards, New York, New York 10001.
10 Based solely on a Schedule 13G filed with the SEC on February 13, 2024, The Vanguard Group reported being the beneficial holder of 871,587 shares of common stock as of December 31, 2023. The Vanguard Group has the sole power to dispose of 847,054 shares, the shared power to vote 18,584 shares, and the shared power to dispose of 24,533 shares of common stock. The address for The Vanguard Group is 100 Vanguard Boulevard, Malvern, Pennsylvania 19355.
Securities Authorized for Issuance under Equity Compensation Plans
The following table provides information about our equity compensation plans as of December 31, 2023:
| | | | | | | | | | | | | | | | | | | | |
| Plan Category | Number of securities to be
issued upon exercise of
outstanding options, warrants
and rights | Weighted average exercise
price of outstanding options,
warrants and rights | Number of securities
remaining available for future
issuance (excluding securities
reflected in column (a)) |
(a)1 | (b)2 | (c)3 |
| Equity compensation plans approved by security holders | 1,444,002 | | $58.16 | | 1,654,231 |
| Equity compensation plans not approved by security holders | — | | — | | — |
| Total | | 1,444,002 | | | | 1,654,231 |
1 Included in column (a) are stock-settled restricted stock unit awards and stock-settled performance-based awards converted to shares by dividing the accounting value of the award by the grant date stock price. The number in column (a) includes 683,944 shares subject to options; 638,934 shares covered by stock-settled time-vested Restricted Stock Units; and 121,124 shares representing the target number of shares covered by Performance RSUs that may be earned pursuant to rights granted (assuming maximum payout level is achieved, Performance RSUs earned would be 242,248 and the total number of securities to be issued would be 1,565,126).
2 The weighted-average exercise price presented in column (b) reflects the weighted average exercise price of 683,944 options outstanding under the Long-Term Incentive Program, as further described herein. The price does not take into account the shares issuable upon vesting of outstanding restricted stock unit awards and stock-settled performance-based awards, which have no exercise price.
3 The number of securities remaining available for issuance under the Company's 2021 Plan is 1,654,231. At the date of grant, Performance RSUs are debited from the 2021 Plan number of securities remaining available assuming the maximum payout level. As of May 18, 2023, the date on which the 2021 Plan was most recently amended and restated, a total of 1,661,639 shares of common stock were reserved for awards granted under the 2021 Plan.
Set forth below is certain information with respect to the current executive officers of the Company.
| | | | | | | | | | | | | | |
| Name | | Age | | Position |
| Jeffrey S. Edwards | | 61 | | Chairman and Chief Executive Officer |
| Jonathan P. Banas | | 53 | | Executive Vice President and Chief Financial Officer |
| Patrick R. Clark | | 51 | | President, Sealing Systems and Chief Manufacturing Officer |
| Christopher E. Couch | | 54 | | President, Fluid Handling Systems and Chief Technology Officer |
| MaryAnn P. Kanary | | 49 | | Senior Vice President, Chief Legal Officer and Secretary |
| Larry E. Ott | | 64 | | Senior Vice President and Chief Human Resources Officer |
| Somasundhar Venkatasubramanian | | 54 | | Senior Vice President, Chief Information Technology Officer |
| Alison S. Nudd | | 53 | | Vice President, Chief Accounting Officer |
Jeffrey S. Edwards is our chairman and chief executive officer, a position he has held since May 2013, previously serving as chief executive officer and member of the Board of Directors of the Company since October 2012.
Jonathan P. Banas is our executive vice president and chief financial officer, a position he has held since June 2017, previously serving as our vice president, corporate controller, and chief accounting officer since September 2015.
Patrick R. Clark is our president, Sealing Systems and chief manufacturing officer, a position he has held since January 2024. Prior to his current position, Mr. Clark served in a series of roles in the Company with increasing levels of responsibility, including as senior vice president and managing director - Global Automotive from January 2022 to December 2023, senior vice president and chief global manufacturing officer from August 2020 to December 2021, senior vice president, chief global engineering and product strategy officer from January 2019 to July 2020, and vice president, business development, North America from May 2017 to December 2018.
Christopher E. Couch is our president, Fluid Handling Systems and chief technology officer, a position he has held since January 2024. Prior to his current position, Mr. Couch served in a series of roles in the Company with increasing levels of responsibility, including senior vice president, chief technology officer from July 2021 to December 2023, senior vice president and chief technology and procurement officer from January 2020 to December 2020, senior vice president and chief innovation officer from January 2019 to January 2020 and as vice president, product line strategy and innovation from 2016 to 2018.
MaryAnn P. Kanary is our senior vice president, chief legal officer, and secretary, a position she has held since August 2023. Prior to her current position, Ms. Kanary served as executive vice president and chief legal officer at Barton Malow Holdings LLC, a company specializing in commercial and institutional construction, beginning in October 2017.
Larry E. Ott is our senior vice president and chief human resources officer, a position he has held since January 2014.
Somasundhar Venkatasubramanian (Soma Venkat) is our senior vice president, chief information technology officer, a position he has held since September 2021. Prior to his current position, Dr. Venkat was chief information officer at IXS Coatings, a supplier of polyurea solutions, from January 2021 to September 2021, prior to which he served as our vice president, information technology from January 2016 to December 2020.
Alison S. Nudd is our vice president, chief accounting officer, a position she has held since March 2024. Beginning in August 2022 until she was promoted to her current position, Ms. Nudd served as the Company’s vice president, global internal audit and compliance, prior to which she served as the Company’s senior director, financial reporting beginning in August 2020 when she joined the Company. Prior to joining the Company, Ms. Nudd held roles of increasing responsibility at Owens Corning, a supplier of global building and construction materials, beginning in 2014.
| | | | | | | | | | | | | | |
| Transactions with Related Persons |
Related Persons Transactions Policies and Procedures
We have established a formal written policy regarding transactions with related persons as defined under Item 404(a) of Regulation S-K (the “Related Party Transaction Policy” or the “Policy”). The Policy assists us in identifying, reviewing, monitoring and, as appropriate, approving transactions with related parties. The Policy requires that any transaction involving the Company and a shareholder who owns greater than 5% of our shares, a director, a nominee for director, or an executive officer, and/or their immediate family members (“Related Party”) which exceeds $120,000 and in which a Related Party had or will have a direct or indirect material interest (“Related Party Transaction”) must be approved or ratified by the Nominating and Corporate Governance Committee.
The Chief Legal Officer, in consultation with members of management and external counsel, will determine if a transaction with a Related Party constitutes as Related Party Transaction under the Policy requiring approval from the Nominating and Corporate Governance Committee. In connection with the review and approval or ratification of a Related Party Transaction, the Nominating and Corporate Governance Committee will consider relevant facts and circumstances, including:
•whether the terms of the transaction would apply on the same basis if the transaction did not involve a Related Party;
•whether there are compelling business reasons for the Company to enter into the transaction and the nature of any alternative transactions;
•the timing of the transaction;
•whether the transaction would impair the independence of a director; and
•whether the transaction would present an improper conflict of interest.
We have implemented procedures to ensure compliance with the Related Party Transaction Policy. In particular, each director, nominee for director, and executive officer is required to complete a questionnaire in connection with the annual proxy statement that asks a series of questions aimed at identifying possible Related Party Transactions. In addition, on a quarterly basis, we seek to identify related party transactions through an internal inquiry across various departments, including finance, sales, and legal, which includes a review of payments to or from any party that may be considered related. In addition, our Code of Business Conduct and Ethics prohibits our directors, officers, employees, and associates from participating in transactions involving conflicts of interest and requires disclosure of any potential conflicts of interest.
Fiscal Year 2023 Related Persons Transactions
As of December 31, 2023, Mr. Van Oss, one of our directors, owned $3,000,000 in principal amount of the Company’s 5.625% Senior Notes due 2026 (described in Note 10 to the Consolidated Financial Statements in our Annual Report on Form 10-K for the fiscal year ended December 31, 2023), which he acquired through three open market purchases in the principal amount of $1,000,000 each on August 10, 2020, September 30, 2020, and March 2, 2022. The Company paid cash interest to Mr. Van Oss in the amounts of $112,500, $168,750 and $168,750, in the years ended December 31, 2021, December 31, 2022, and December 31, 2023, respectively, with respect to these securities.
| | | | | | | | | | | | | | |
| Other Matters Concerning Directors, Nominees and Executive Officers |
SEC regulations require the Company to describe certain legal proceedings, including bankruptcy and insolvency filings involving directors, nominees for director or executive officers of the Company or companies of which a director, nominee for director, or executive officer was an executive officer at the time of filing. Mr. Remenar, a director, was an executive officer of Chassix Inc. approximately nine months before Chassix Inc. filed for protection under Chapter 11 in March 2015. Mr. Boss, a director, was an executive officer at Momentive Performance Materials Inc. at the time it filed for protection under Chapter 11 in April 2014.
| | | | | | | | | | | | | | |
| Communications with the Board of Directors |
The Board has established procedures for the stockholders and other interested parties to communicate with the Board. A stockholder or other interested party may contact the Board by writing to the lead director or the non-employee or independent members of the Board to their attention at the Company’s principal executive offices at 40300 Traditions Drive, Northville, Michigan, 48168. Any stockholder must include the number of shares of the Company’s common stock he or she holds and any interested party must detail his or her relationship with the Company in any communication to the Board. Communications received in writing are distributed to the lead director or independent members of the Board as a group, as appropriate, unless such communications are considered, in the reasonable judgment of the Company’s secretary, improper for submission to the intended recipient(s). Examples of communications that would be considered improper for submission include, without limitation, customer complaints, solicitations, communications that do not relate directly or indirectly to the Company or the Company’s business, or communications that relate to improper or irrelevant topics.
Proposal 2: Advisory Vote on Named Executive Officer Compensation
Pursuant to Section 14A of the Securities Exchange Act of 1934, as amended (the “Exchange Act”), we are asking the stockholders to vote, on an advisory or non-binding basis, to approve the compensation of our named executive officers (“NEOs”) as disclosed in this proxy statement. A detailed description of our compensation program is available in the Compensation Discussion and Analysis section.
The advisory vote, commonly known as a say-on-pay vote, gives stockholders the opportunity to express their views on the overall compensation of our NEOs and the philosophy, policies and practices described in this proxy statement. Approval of this advisory proposal requires the affirmative vote of a majority of the votes cast by the stockholders present in person or represented by proxy at the Annual Meeting and entitled to vote. Abstentions and broker non-votes are not counted as votes FOR or AGAINST the proposal, and will therefore have no effect on such vote. The say-on-pay vote is an advisory vote only, and therefore it will not bind the Company or the Board. However, the Board and the Compensation Committee will consider the voting results as appropriate when making future decisions regarding executive compensation. We intend to hold the next advisory vote on the compensation of our named executive officers at the 2024 annual meeting of the stockholders.
The Board and the Compensation Committee believe that we have created an executive compensation program that is tied to performance, aligns with stockholder interests and merits stockholder support. Accordingly, we are asking the stockholders to indicate their support for our NEOs’ compensation by voting FOR the following resolution at the Annual Meeting:
RESOLVED, that the Company’s stockholders approve, on an advisory basis, the compensation of the named executive officers, as disclosed in the proxy statement pursuant to the compensation disclosure rules of the Securities and Exchange Commission, including the Compensation Discussion and Analysis, the compensation tables, and the narrative discussion contained in this proxy statement.
| | | | | |
| þ | The Board of Directors recommends that the stockholders vote FOR Proposal 2.
|
| | | | | | | | | | | | | | |
| Compensation Discussion and Analysis |
This Compensation Discussion and Analysis describes the key principles and material elements of the compensation programs applicable to our NEOs in 2023. The NEOs for 2023 are as follows:
| | | | | |
| Mr. Jeffrey S. Edwards | Chairman and Chief Executive Officer |
| Mr. Jonathan P. Banas | Executive Vice President and Chief Financial Officer |
| Mr. Patrick R. Clark | Senior Vice President and Managing Director - Global Automotive |
| Mr. Christopher E. Couch | Senior Vice President, Chief Technology Officer |
| Mr. Larry E. Ott | Senior Vice President, Chief Human Resources Officer |
Executive Summary
Cooper Standard’s financial performance improved significantly in 2023 over 2022. Importantly, the improvement was also reflected in our stock price. After three years in which global light vehicle production was depressed or disrupted by pandemic-related shut-downs and supply chain challenges, production began to stabilize in 2023, albeit at volumes below pre-pandemic levels. The cost reduction actions and enhanced commercial agreements that the Company put in place during those years are now beginning to drive expected benefits. Sales increased in 2023 by 11.5% to $2.82 billion. The growth, which significantly outpaced the industry, was primarily driven by positive volume and mix, and enhanced commercial agreements which included net customer price adjustments and partial recovery of inflation-related cost increases. These gains were partially offset by unfavorable foreign exchange. Our Adjusted EBITDA was $167.1 million (or $180.4 million for 2023 officer annual incentive plan purposes) compared to $37.9 million in 2022. The improvement was driven by positive volume and mix, enhanced commercial agreements, and operating efficiencies, partially offset by continued inflationary pressures and the impact of the United Autoworkers strike against our OEM customers in North America during the third and fourth quarters of the year. For purposes of determining Adjusted EBITDA for the annual incentive plan, Adjusted EBITDA was adjusted for the impact of the United Autoworkers strike. Additionally, our Free Cash Flow (“FCF”) for 2023 was a positive $36.5 million, compared to a negative $107.3 million in 2022. As a result of the improved financial performance and the successful refinancing of long-term debt, our stock price increased from $9.06 to $19.54, or a one-year total shareholder return (“TSR”) of over 115%.
In 2023, and consistent with prior years, Compensation Committee decisions and incentive program outcomes continue to reflect the strong pay-for-performance orientation of the program as highlighted below:
•The 2023 annual incentive program (“AIP”)was earned at 132% of target, reflective of the stronger operating performance noted above and out-performance on quantitatively determined ESG metrics. This is the first above target AIP payout since 2016.
•The 2022 performance share unit (“PSU”) awards, which were based on return on invested capital (“ROIC”) during 2022 and 2023, were earned at 100% of target. This is the first PSU earnout since the 2017-2019 PSU grant, and follows four consecutive zero earnouts
•Given current stock price levels, all outstanding stock options granted in 2021 and prior held by the NEOs as of December 31, 2023 were underwater
•The CEO has only received a single 4.0% base salary increase since 2017 and no other target total direct compensation (“TDC”) increases since 2019 (his long-term incentive target was temporarily decreased in 2020). Additionally, the CEO received no target TDC increase for 2024
•Below is the five-year history of payouts under the annual incentive program and the Performance RSUs in the Long-Term Incentive Plan. The figures presented represent payout levels for performance periods ending during the respective year. For performance periods ending in 2023, payouts are described more fully under “Long-Term Incentive Compensation.”
| | | | | | | | | | | | | | | | | | | | |
| Payout (% of Target) | |
| Incentive Award | 2019 | 2020 | 2021 | 2022 | 2023 | 5-Year Average |
| Annual Incentive Program | 0.0% | 70.0% | 0.0% | 74.7% | 132.0% | 55.3% |
Long-Term Incentive Plan1 | 0.0% | 0.0% | 0.0% | 0.0% | 100.0% | 20.0% |
1Payouts represents those awards whose performance cycles were completed in the year and final payout of the award was known.
Compensation Philosophy and Objectives
Our compensation programs are designed to:
•Link executive compensation to Company performance;
•Attract and retain a highly-qualified executive leadership team;
•Align the interests of executives with those of our stockholders;
•Motivate our leadership team to execute our long-term growth strategy while delivering consistently strong financial results.
To help achieve these goals, we believe compensation for executive officers should include the following components:
•Base salary;
•Annual performance-based cash incentives;
•Long-term equity incentives;
•Regular and change-of-control termination benefits; and
•Competitive health, welfare, and retirement benefits.
The Compensation Committee regularly reviews these components and evaluates each in connection with furthering our compensation philosophy and objectives. To assist with determining appropriate target compensation levels and components, the Compensation Committee reviews market data and best practices, including benchmarking our senior executive target compensation levels to those provided to similarly-situated executives at comparable companies as discussed below. The Compensation Committee generally targets compensation for our NEOs at approximately the 50th percentile of market practice (based on our benchmarking peer group and general industry survey data), recognizing that actual compensation levels will fluctuate above or below median levels depending on our performance. In addition, target compensation for specific executives can be above or below the market median based on the individual’s importance to the organization, the difficulty and cost of replacement, the expected future contribution to the organization, tenure at current position, and skill set relative to the external marketplace.
We are committed to sound and effective compensation and related governance practices. As such, we have adopted the following:
•Independent compensation consultant retained by the Compensation Committee;
•Regular benchmarking using general industry surveys and a peer group proxy analysis;
•Majority of long-term incentive compensation is performance-based;
•Balanced mix of performance measures aligned with long-term strategy;
•Clawback policy covering incentive awards of our executive officers;
•Anti-hedging and anti-pledging policy; and
•Executive and non-employee director stock ownership guidelines.
Processes Relating to Executive Compensation
The Compensation Committee assists the Board in discharging its responsibilities relating to the compensation of our NEOs and overseeing our compensation plans, policies, and benefit programs. Our human resources team supports the Compensation Committee in its work. In evaluating and determining target compensation levels for our NEOs, the Compensation Committee relies on data received from its independent compensation consultant and the Chief Human Resources Officer, as well as recommendations from the CEO. The Compensation Committee, following discussions with the CEO, determines the base salary and target annual and long-term incentive compensation of the other NEOs. Executives whose compensation is under consideration are not present during the Compensation Committee’s review meetings, and neither the CEO nor management has any input into the compensation decisions for the CEO. The considerations, criteria and procedures applicable to these determinations are discussed more fully under “Executive Compensation Components.”
Executive Compensation Review for 2023
As discussed above, the Compensation Committee has engaged FW Cook as its independent compensation consultant. FW Cook has served as the Compensation Committee’s independent consultant since 2013. Prior to its engagement of FW Cook, the Compensation Committee considers all factors relevant to FW Cook’s independence from management as required by applicable NYSE standards. Apart from the work it performed for the Compensation Committee, FW Cook provided no other services to the Company in 2023. As a result of this and the consideration of other factors, the Compensation Committee determined that the engagement of FW Cook in 2023 was appropriate and raised no conflict of interest.
As part of its engagement, FW Cook benchmarks the target compensation levels of our NEOs to assess the competitiveness of our executive compensation programs in the markets in which we compete for talent, focusing in particular on base salaries, target annual incentive opportunities and long-term incentive opportunities. FW Cook also uses the peer group to benchmark the Company’s aggregate LTI grant practices, incentive program design and other policies and practices. In 2022, FW Cook compared our programs in these areas to a peer group comprised of 14 publicly-traded automotive suppliers with annual revenues between $0.8 billion and $5.6 billion and with median revenues of $3.4 billion at the time of the benchmarking analysis. FW Cook also supplements its analysis of peer group proxy data with general industry survey data, which was adjusted to reflect the revenue responsibility of each executive.
The 14-company peer group below was used in December 2022 to inform the compensation planning process for 2023. In comparison to 2022, Cooper Tire and Rubber was removed from the peer group due to the it’s acquisition by Goodyear Tire and Rubber in 2021. At the time the market analysis was completed in the winter of 2022, Cooper Standard was positioned between the 25th and 50th percentile of the peer group for revenue and below the 25th percentile for market capitalization.
| | | | | | | | | | | | | | | | | | | | | | | |
| • | American Axle & Mfg. Holdings, Inc. | | • | Linamar | | • | Superior Industries Int’l |
| • | Garrett Motion | | • | Martinrea International Inc. | | • | Terex |
| • | Gentherm | | • | Meritor, Inc. | | • | Visteon Corp. |
| • | Greenbrier Companies | | • | Modine Manufacturing Co. | | • | Wabash National |
| • | LCI Industries | | • | Stoneridge | | | |
The peer group was again reviewed in June 2023 to inform the compensation planning process for 2024. As part of this review, the Committee made changes intended to (1) add companies given the August 2022 acquisition of Meritor so as to bring back the number of peer companies to between 15 and 20, making the resulting compensation data more robust and (2) add generally smaller market cap companies to demonstrate responsiveness to the widening gap between the Company’s market cap and the peer median in prior years. As a result of this review, Meritor was removed from the peer group and the following five companies were added: Commercial Vehicle Group, Patrick Industries, REV Group, Standard Motor Products and Trinity Industries. The resulting peer group had 18 companies.
“Say-on-Pay” Vote
Our annual stockholder advisory vote on the compensation of our NEOs was held in May 2023. Our stockholders approved the compensation of the NEOs as disclosed in the 2023 Proxy Statement, with nearly 95% of shares voted in favor of the “say-on-pay” advisory proposal. The Compensation Committee has determined that our executive compensation philosophy, compensation objectives, and compensation elements continue to be appropriate and did not make any material changes to our executive compensation program in direct response to the 2023 “say-on-pay” vote. We continue to believe that our executive compensation program has a strong performance orientation and aligns with stockholder interests.
Executive Compensation Components
The following describes the components of our 2023 executive compensation program as approved by the Compensation Committee.
Base Salary
Our NEOs are paid a base salary determined early in each fiscal year or upon changes in roles or positions within the Company. The Compensation Committee determines the CEO’s base salary and, taking into account recommendations from the CEO, the salaries of the other NEOs. Generally, our practice is to pay base salaries that are competitive in the markets in which we compete for talent and commensurate with the responsibilities and contributions of each executive. Based upon the Compensation Committee’s evaluation of data supplied by FW Cook, the Compensation Committee determined to adjust certain NEO salaries, representing an average increase of 4.1% across all NEOs. Base salary adjustments in 2023 for the NEOs were as follows:
| | | | | | | | | | | | | | | | | | | | |
| | 2022 Base Salary | | 2023 Base Salary | | Increase |
Mr. Edwards1 | | $1,000,000 | | $1,040,000 | | 4.0% |
Mr. Banas2 | | $515,000 | | $536,000 | | 4.1% |
Mr. Clark3 | | $500,000 | | $520,000 | | 4.0% |
Mr. Couch4 | | $480,000 | | $500,000 | | 4.2% |
Mr. Ott5 | | $465,000 | | $484,000 | | 4.1% |
1 Mr. Edwards’s base salary increased effective August 8, 2023, in conjunction with the global salaried merit effective date and US merit budget of 4.0%. As previously noted, this is the first increase to Mr. Edwards’ salary since 2017.
2 Mr. Banas’ base salary increased effective August 8, 2023, in conjunction with the global salaried merit effective date and US merit budget of 4.0%.
3 Mr. Clark’s base salary increased effective January 1, 2023, in light of his assumption of responsibilities for the Company’s global purchasing function and the criticality of the role.
4 Mr. Couch’s base salary increased effective August 8, 2023, in conjunction with the global salaried merit effective date and US merit budget of 4.0%.
5 Mr. Ott’s base salary increased effective August 8, 2023, in conjunction with the global salaried merit effective date and US merit budget of 4.0%.
Annual Incentive Award
Prior to or early in each fiscal year, the Compensation Committee determines target annual incentive opportunities payable to the NEOs upon the achievement of performance targets approved by the Compensation Committee for the year. For 2023, the Compensation Committee determined that the relevant performance metrics would include both Company financial performance metrics, namely Adjusted EBITDA and FCF, along with strategic ESG performance metrics. Incorporating strategic ESG metrics for purposes of annual incentive opportunities for NEOs was deemed appropriate by the Compensation Committee as ESG initiatives are believed to support delivery of value to all of our stakeholders and ensure the long-term sustainability of the Company. For purposes of evaluating potential 2023 incentive payouts, achievement against the Adjusted EBITDA and FCF financial metrics determined 85% of funded incentive amounts (weighted 75% and 25% respectively), with the remaining 15% of funded incentive amounts dependent upon achievement relative to prescribed ESG metrics. No payout was to be funded with respect to achievement against strategic ESG metrics unless a threshold payout was earned with respect to the financial performance metrics.
Adjusted EBITDA and FCF are deemed by the Compensation Committee to be appropriate objective measurements of the financial performance of the Company because they are indicators of our strategy to achieve sustained profitable growth, generate positive cash flows and align executive compensation with the interests of our stockholders over the long term. With
respect to our strategic ESG performance metrics, the Compensation Committee focused on the following three, each of which contribute equally to the 15% funding of annual incentive amounts at target:
•Safety, as measured by achieved Total Incident Rate (TIR)
•Energy consumption, as measured by year-over-year improvement in electricity consumption as a percentage of normalized hours worked, and
•Overall talent, as measured by the Company’s ability to create and sustain a high-performance organization through the identification, recruitment, development, and retention of a diverse, high-quality workforce.
Each ESG metric is equally weighted at 5% and could be earned from 0-200% of target.
For 2023, the Compensation Committee established a “threshold” or minimum performance Adjusted EBITDA goal of 50% of the Adjusted EBITDA target, the achievement of which would entitle the NEOs to a payment equal to 25% of the target incentive for that metric consistent with the 2022 program design. Additionally, the Company established threshold, target and maximum level performance for FCF. The Compensation Committee’s future expectation, upon return to greater levels of certainty and reduced volatility within the business and industry, is to return to a structure similar to the historical program of setting threshold performance at 80% of target earning a payout of 50% of the target incentive, where appropriate and applicable related to Company financial metrics.
The Compensation Committee further established “threshold,” “target” and “maximum” performance safety and energy consumption goals, as disclosed further below. No formulaic performance levels were established for purposes of the overall talent ESG metric. Instead, performance as it relates to overall talent was measured on a qualitative basis, supported by a number of factors which included: (1) diversity of candidates on senior leadership team succession plans, (2) diversity hiring and staffing by function and level, (3) salaried employee training hours, (4) salaried employee turnover rates, and (5) salaried employee internal fill rates. Detailed objectives for each of these factors were presented and approved by the Compensation Committee at the beginning of the year and performance against the objectives was presented to the Committee at the end of the year to provide the Committee with data to make an overall determination on performance.
The Company sets challenging targets in the annual incentive plan as evidenced by below target payouts in 2020 and 2022 and no payouts in all other years since 2017. No annual incentive award is payable if the Company fails to meet the threshold company financial performance metrics, unless the Compensation Committee applies a discretionary adjustment in extraordinary situations. The Compensation Committee also sets a “superior performance” level, the achievement of which entitles the NEOs to a maximum payout equal to 200% of the target amounts. The superior performance level represents a goal deemed difficult to achieve at the beginning of the year based on the assumptions underlying our business plan. Actual annual incentive payments are determined using linear interpolation for performance attainment between “threshold” and “target” and between “target” and “superior.”
While funding of the bonus pool is determined based on company financial performance metrics (Adjusted EBITDA and FCF) and ESG performance, the annual incentive plan provides that the Compensation Committee may recommend a discretionary adjustment to the potential award amount for any participant based upon overall individual performance and/or other factors; provided that the final total awarded amount may not be greater than 200% of target amount for the performance award. As such, with respect to the NEOs, the calculated payout may be subject to downward adjustment to 0% and to upward adjustment to 200% of target at the discretion of the Compensation Committee in extraordinary situations.
For 2023, the Compensation Committee established target awards under the AIP for each NEO based on a percentage of base salary as follows: 120% for Mr. Edwards; 75% for Messrs. Banas and Clark and 70% for Mr. Couch; and 65% for Mr. Ott. Compared to 2022, the target award percentage for Mr. Clark increased from 70% to 75% effective January 1, 2023, in recognition of the criticality of his position, his assumption of responsibilities for the global purchasing function and alignment with market data. The target award percentages for Messrs. Edwards, Banas, Couch and Ott remained unchanged from 2022.
The Compensation Committee set Adjusted EBITDA and FCF targets applicable to the Company as a whole in accordance with our 2023 business plan as approved by the Board of Directors, as outlined below. For 2023, achievement against the Adjusted EBITDA and FCF financial metrics determined 85% of funded incentive amounts.
| | | | | | | | | | | | | | |
| 2023 Achievement Level (75% of the 85% Financial Metrics Weighting) | | Adjusted EBITDA1 (000) | | Award Payout as % of Award Target |
| Below Threshold | | Below $90,000 | | 0% |
| Threshold (50% of target performance) | | $90,000 | | 25% |
| Target | | $180,000 | | 100% |
| Superior (115% of target performance) | | $207,000+ | | 200% |
1Adjusted EBITDA is not a measure recognized under U.S. GAAP and is defined as net income plus income tax expense, interest expense net of interest income, depreciation and amortization, and certain items that management does not consider to be reflective of the Company's core operating performance. Adjusted EBITDA, for AIP purposes, was adjusted for the impact of the United Autoworkers strike. The impact of this strike was not budgeted for and was outside of the control of the NEOs. The adjustment increased Adjusted EBITDA from $167.1 million to $180.4 million for purposes of AIP.
| | | | | | | | | | | | | | |
| 2023 Achievement Level (25% of the 85% Financial Metrics Weighting) | | FCF1 (000) | | Award Payout as % of Award Target |
| Below Threshold | | Below $0 | | 0% |
| Threshold | | $0 | | 25% |
| Target | | $5,000 | | 100% |
| Superior | | $20,000+ | | 200% |
1Free Cash Flow is not a measure recognized under U.S. GAAP and is defined as new cash provided by operating activities minus capital expenditures.
For 2023, the Compensation Committee set safety (TIR) and energy consumption improvement (electricity usage as a percentage of normalized hours worked) targets applicable to the Company as a whole, as described below. For 2023, these two metrics were evenly weighted with achievement against each determining 5% of funded incentive amounts. Each could be earned from 0-200% of target.
| | | | | | | | | | | | | | |
2023 Achievement Level - Safety
(5% Weighting) | | Total Incident Rate (TIR) | | Award Payout as % of Award Target |
| Below Threshold | | Above 0.68 | | 0% |
| Threshold (80% of target performance) | | 0.68 | | 50% |
| Target | | 0.57 | | 100% |
| Superior (130% of target performance) | | 0.4 (or below) | | 200% |
| | | | | | | | | | | | | | |
2023 Achievement Level - Energy Consumption
(5% Weighting) | | Electricity Consumption Improvement as a % of Normalized Hours Worked | | Award Payout as % of Award Target |
| Below Threshold | | Below 1.6% Improvement | | 0% |
| Threshold (80% of target performance) | | 1.6% Improvement | | 50% |
| Target | | 2.0% Improvement | | 100% |
| Superior (120% of target performance) | | 2.4%+ Improvement | | 200% |
In 2023, for purposes of the AIP, our Adjusted EBITDA was $180.4 million, which was slightly above target performance and FCF was $36.5 million which exceeded superior performance. Further, with respect to our measurable ESG metrics, TIR achievement was 0.32 for 2023, which was above the superior performance level, and our improvement in electricity consumption was 2.7%, which was also above superior performance. Finally, the Compensation Committee assessed that achievement of our overall talent ESG metric satisfied the target level, given favorable results associated with salaried turnover and objectives related to diversity of candidates on senior leadership team succession plans and in the area of diverse hiring.
| | | | | | | | | | | | | | |
| 2023 AIP Metrics | Overall Weighting | Actual
Performance | Payout
Achievement | Weighted Payout (as % of Award Target) |
| Adjusted EBITDA | 63.75% | $180.4 million | 100.2% | 64% |
| Free Cash Flow | 21.25% | $36.5 million | 200%+ | 43% |
| Strategic ESG Metrics: | | | | |
| Safety (TIR) | 5% | 0.32 TIR | 200% (Superior) | 10% |
| Energy Consumption | 5% | 3.0% | 200% (Superior) | 10% |
| Overall Talent | 5% | Achieved | 100% (Target) | 5% |
| Total 2023 Payout | 100% | | | 132% |
Overall performance achievement for 2023 resulted in a payout at 132% of target on a weighted basis, resulting in the following AIP award payments to our NEOs.
| | | | | | | | | | | | | | |
| NEOs | 2023 Year- End
Base Salary | Target
Bonus
Opportunity | Weighted Achievement as a Percent of Target Award | 2023 Amount Earned Under AIP |
| Mr. Edwards | $1,040,000 | 120% | 132.0% | $1,647,360 |
| Mr. Banas | $536,000 | 75% | 132.0% | $530,640 |
| Mr. Clark | $520,000 | 75% | 132.0% | $514,800 |
| Mr. Couch | $500,000 | 70% | 132.0% | $462,000 |
| Mr. Ott | $484,000 | 65% | 132.0% | $415,272 |
Long-Term Incentive Compensation
2023 Long-Term Incentive Program
The 2021 Plan authorizes the Compensation Committee to award stock options, stock appreciation rights, shares of common stock, restricted stock, RSUs, incentive awards, and certain other types of awards to our key employees and directors. Except in the case of newly hired or promoted executives, it has been the practice of the Compensation Committee to grant incentive awards, including equity-based incentive awards, during the first quarter of the calendar year so that all elements of executive target TDC can be considered in a coordinated, comprehensive manner.
For 2023, the Compensation Committee, following consultation with FW Cook, determined that equity-based awards to our NEOs should have a value generally equal to or below the typically targeted market median for executives in comparable positions due to the decline in Company stock price, a lower market capitalization and the limited number of shares available under the 2021 Plan. The equity-based awards we granted in 2023 consisted of stock-settled time-vested RSUs, and performance-based RSUs (“Performance RSUs”) that will be settled in cash. Performance RSUs can be earned based on both Company financial (ROIC) performance (“Financial Performance RSUs”) and Relative Total Shareholder Return (“RTSR”) performance relative to a comparator group (“TSR Performance RSUs”), similarly to the awards issued in 2022.
The percentage mix of the three Long-Term Incentive Program (“LTIP”) awards granted in 2023 (on a grant date fair value basis) was approximately 40%, 20%, and 40% for Financial Performance RSUs, TSR Performance RSUs, and time-vested RSUs, respectively, consistent with the approach in 2022. For 2023, the Compensation Committee determined that continuing with the mix of awards established in 2022, provides alignment between pay and shareholder value.
All NEOs other than Mr. Clark, received no increase to their targeted 2023 LTIP value as compared to 2022. Mr. Clark’s targeted LTIP value increased from $550,000 to $750,000 due to an increase in scope of his role as well as an adjustment to the external market data for his role. Mr. Clark’s new target LTIP value is slightly below market median. The percentage of targeted LTIP value increased from 2022 to 2023, the grant value approved by the Compensation Committee for the 2023 annual equity awards, and the number of units granted in 2023 are as follows:
| | | | | | | | | | | | | | | | | | | | |
| | | | Number of Awards Granted in 20231 |
| 2022
Targeted LTIP
Grant Value | 2023
Targeted LTIP
Grant Value | % Change
from
2022 to 2023 | Financial
Performance
RSUs
at Target | TSR Performance RSUs at Target2 | Time
Vested
RSUs |
| Mr. Edwards | $3,800,000 | $3,800,000 | —% | 103,755 | 50,871 | 103,755 |
| Mr. Banas | $825,000 | $825,000 | —% | 22,526 | 11,045 | 22,526 |
| Mr. Clark | $550,000 | $750,000 | 36.4% | 20,478 | 10,041 | 20,478 |
| Mr. Couch | $485,000 | $485,000 | —% | 13,243 | 6,493 | 13,243 |
| Mr. Ott | $475,000 | $475,000 | —% | 12,970 | 6,359 | 12,970 |
1 The Company’s 20-day average closing stock price as of the fifth day preceding the date of grant was used to convert targeted LTIP award levels to units granted in 2023. For NEO grants in 2023, the number of units were calculated using price of $14.65. The closing stock price on the grant date, used for accounting values in the Summary Compensation Table was $18.32.
2 The number of TSR Performance Units granted to NEOs in 2023 were calculated using a price of $14.94 which reflects the 20-day average closing stock price as of the fifth day preceding date of grant ($14.65) and a factor of 1.0197, reflecting an the accounting fair value pursuant to the Monte-Carlo simulation.
Impact of Stock Price Averaging on Reported Grant Values
Due to the Company’s stock price volatility in recent years, since 2022, the Committee has used the 20-day average price as of the five days preceding the grant date to convert grant values into a number of shares. In 2023, this average stock price used to convert grant value to shares was $14.65 and the accounting value on the grant date was $18.32. As a result, the equity grant values reported in the Summary Compensation and Grants of Plan Based Awards Tables, which require reporting on an accounting value basis, are meaningfully higher than the intended grant value. For example, the CEO’s 2023 target LTIP grant value of $3.8M is reported in the Summary Compensation Table as $4.75M. In 2022, the opposite dynamic occurred, where the average stock price used to convert value to shares was $21.64 and the accounting value on the grant date was $15.95, such that the same $3.8M of grant value was reported as $2.7M. In summary, the significant reported CEO LTI grant value increase from $2.7M to $4.75M is solely attributable to the averaging methodology as the Committee’ target grant value of $3.8M was unchanged from 2022 and 2023, as noted in the table above. The dynamic impacted all NEOs in a similar manner.
2023 Performance-Based Restricted Stock Units
Following its review of the benchmarking analysis by FW Cook, and considering peer group prevalence data, the Compensation Committee determined that the value of the Performance RSUs granted in 2023 should approximate 60% of the total value of each NEO’s annual long-term incentive opportunity. Further, the Compensation Committee determined that Performance RSUs granted in 2023 should be comprised of a mix of Financial Performance RSUs and TSR Performance RSUs. Financial Performance RSU payout is based on the Company’s capital efficiency during two, one-year performance periods (2023 and 2024). TSR Performance RSU payout is based on the Company’s RTSR performance versus a pre-established comparator group over the three-year performance period (2023-2025). We believe Performance RSUs align the interests of our NEOs with those of our stockholders and further emphasize the importance of our long-term performance. For the 2023 grant, all Performance RSUs will be settled in cash.
The Financial Performance RSUs provide a grant of units earned based on two separate one-year performance periods ending on December 31, 2023 and 2024, respectively, where:
•Half of the Financial Performance RSUs granted in 2023 can vest as of December 31, 2024 if the financial performance goals for the performance period ending December 31, 2023 are achieved at the target level, subject to the NEO’s continued employment through December 31, 2024. Actual achieved units are based on performance achieved during 2023. If the Company’s ROIC for 2023 is at target, the full one-half of total target Financial Performance RSUs granted will be eligible to vest. Further, if the Company’s ROIC for 2023 is 80% of the target performance goal, then 50% of such units granted will be eligible to vest. If the Company’s ROIC for 2023 is 120% of the target performance goal, then the maximum of two times the number of such units will be eligible to vest. Achievement of the performance goal between threshold and target, and between target and maximum will be linearly interpolated. Our ROIC for the one-year period ending December 31, 2023 was 4.1%, which was more than 120% above the pre-established target performance level set at a 3.1% ROIC. As such, the first half of the Financial Performance RSUs granted in 2023 achieved a 200% payout.
•The second half of total Financial Performance RSUs granted can vest as of December 31, 2025 if the financial performance goals for the performance period ending December 31, 2024 are achieved at the target level, subject to the NEO’s continued employment through December 31, 2025. Actual achieved units are based on performance achieved during 2024, with goals for the 2024 performance period having been set by the Compensation Committee in
early 2024. Further, the Compensation Committee will also set threshold and maximum payout goals for the second half of the Financial Performance RSUs in early 2024.
The structure of the 2023 grants of Financial Performance RSUs which use two separate one-year performance periods is similar to the approach taken with respect to the Financial Performance RSUs issued in 2022. In adopting this approach, the goal of the Compensation Committee was to retain the long-term orientation of the program while also balancing the continued difficulty in forecasting business performance over two or three years given industry and macroeconomic uncertainty. Additionally, the Compensation Committee determined that continued use of TSR Performance Units granted in 2023, based on standalone TSR performance relative to a comparator group more easily allows for performance measurement over a traditional 3-year period.
Similar to the 2022 awards, the TSR Performance RSUs issued in 2023 provide a standalone grant of units that cliff vest after three years if we achieve established performance goals based on RTSR performance of the Company relative to that of a comparator group for a single, three-year performance period ending on December 31, 2025. If the Company’s RTSR performance for the three-year performance period ending December 31, 2025 is at target, or median of the comparator group, 100% of the TSR Performance RSUs will vest. If the Company’s RTSR performance achieves the threshold level, or 25th percentile of the comparator group, one half of the TSR Performance Units will vest. If the Company’s RTSR performance achieves the maximum level, or 75th percentile of the comparator group, then the maximum of two times the number of TSR Performance Units will vest. No payout occurs if the Company’s RTSR is below the 25th percentile of the comparator group. Achievement of the performance goal between threshold and target, and between target and maximum, will be linearly interpolated.
The comparator group for RTSR is different from the benchmarking peer group identified in “Executive Compensation Review for 2023” under the Processes Relating to Executive Compensation section above, but consistent with the peer group that was used for the 2022 RTSR awards, with one exception, Tenneco Inc. was removed from the comparator group as they are no longer a publicly-traded company following their acquisition by Apollo Funds in November 2022.
The RTSR comparator group: (1) is less encumbered by company size than the benchmarking peer group since target TDC levels are strongly correlated to size, (2) is designed to be comprised of closer business peers whose stock prices are similarly correlated to ensure that performance comparisons are meaningful, and (3) needs to be large enough to sustain three years of merger and acquisition activity given the multi-year nature of the award. The 2023 RTSR comparator group companies were:
| | | | | | | | | | | | | | | | | | | | | | | |
| • | Adient plc | | • | Gentex Corporation | | • | Martinrea International Inc. |
| • | American Axle & Manufacturing Holdings, Inc. | | • | Gentherm Incorporated | | • | Standard Motor Products Inc. |
| • | Aptiv PLC | | • | LCI Industries | | • | Stoneridge, Inc. |
| • | Autoliv, Inc. | | • | Lear Corporation | | • | The Goodyear Tire & Rubber Company |
| • | BorgWarner Inc. | | • | Linamar Corporation | | • | TI Fluid Systems plc |
| • | Dana Incorporated | | • | Magna International Inc. | | • | Visteon Corporation |
2023 Time-Vested Cash-Settled Restricted Stock Unit Awards
For 2023, we granted time-vested stock settled RSUs to our NEOs, similar to the time-vested stock settled RSUs granted in 2022. The 2023 RSUs vest ratably over a three-year period, beginning as of March 1, 2023 (“Vest-From Date”). Following its review of a benchmarking analysis by FW Cook, the Compensation Committee determined that the value of time-vested RSUs granted in 2023 should continue to constitute approximately 40% of the total value of the long-term incentive awards granted. We believe that the use of time-vested RSUs as a component of compensation helps retain executives and aligns the interests of our executives and stockholders, as the value of RSUs is directly linked to the price of our common stock.
Payouts under the 2022 and 2023 Performance-Based Restricted Stock Units
In 2022, the Compensation Committee granted performance-based RSUs for each of the NEOs who was employed by us at the time. These performance-based RSUs were comprised of a mix of Financial Performance RSUs and TSR Performance RSUs. The Financial Performance RSUs for each of the NEOs were issued with two separate one-year performance periods ending December 31, 2022 and 2023, respectively and both performance periods were based on the Company’s ROIC metric during each performance period. Payouts under the TSR Performance RSUs were based on the Company’s RTSR performance versus a pre-established comparator group over the three-year performance period (2022 - 2024 for the awards issued in 2022 and 2023-2025 for the awards issued in 2023).
Payouts under the Financial Performance RSU awards for the performance period ending December 31, 2022 were based on the achievement of a target ROIC in 2022 and would vest as of December 31, 2023, subject to continued service through that date. Pursuant to the terms of the awards and as previously described in the Company’s 2023 annual proxy filing, threshold was not
achieved for the performance period ending December 31, 2022 and therefore no payout was achieved for the first half of the award.
However, similar to the first half of the awards issued in 2023 (described above), the second half of total Financial Performance RSUs granted in 2022 can vest as of December 31, 2024 if the financial performance goals for the performance period ending December 31, 2023 are achieved at the target level, subject to the NEO’s continued employment through December 31, 2024.
For both the second half of the Financial Performance RSU awards issued in 2022 and the first half of the Financial RSU awards issued in 2023, the actual achieved units are based on ROIC performance achieved during 2023.
| | | | | | | | | | | | | | |
| Achievement Level | |
Return on Invested Capital for One-Year Period Ending December 31, 2023 | | Award Payout as % of Award Target |
| Below Threshold | | <2.5% | | 0% |
| Threshold (80% of target performance) | | 2.5% | | 50% |
| Target | | 3.1% | | 100% |
| Superior (120% of target performance) | | 3.7% | | 200% |
Actual payouts are determined using linear interpolation for performance attainment between “threshold” and “target” and between “target” and “superior.” As described above, the actual ROIC of the Company for the performance period ending December 31, 2023 was 4.1%, which resulted in payouts of 200% for both the second half of the total target units granted under the Financial Performance RSU awards issued in 2022 and for the first half of the total target units granted under the Financial Performance RSU awards issued in 2023.
The total payout under the Financial Performance RSU awards issued in 2022 was 100% of the target (0% payout on the first half for 2022 ROIC performance and 200% of target payout for 2023 ROIC performance).
For the Financial Performance RSU awards issued in 2023, the second half of the total target units granted under the Financial Performance RSU awards may be earned based on ROIC achievement against targets for the performance period ending December 31, 2024.
Special Bonuses
In addition to the annual cash incentive program, we may from time to time pay our NEOs discretionary bonuses as determined by the board of directors or the Compensation Committee to reflect superior individual performance, to recognize new roles and responsibilities, to attract new hires or to compensate new hires for amounts forfeited from their previous employer. No such bonuses were provided to NEOs in respect of 2023.
Retirement Plan Benefits
Our NEOs participate in a tax-qualified 401(k) retirement savings plan (the “CSA Savings Plan”) and our nonqualified retirement plan. Benefits under these plans provide executives with an income source during their retirement years and reward executives for long-term service to the Company. We believe that our retirement plans are generally competitive in the automotive industry and assist the Company in attracting and retaining a high caliber executive leadership team. Please see the 2023 Nonqualified Deferred Compensation table and the accompanying narrative for further information regarding our retirement plans.
Termination and Change of Control Benefits
Our NEOs receive certain benefits upon certain termination events including following a change of control of the Company under the Executive Severance Pay Plan. These benefits, described in detail under “Terms Applicable to Payments upon Termination of Employment,” are intended to ensure that the executive leadership team is able to objectively evaluate potential change of control transactions without the distraction of the potential impact such transactions may have on their employment.
Health Benefits
We provide our NEOs with health and welfare benefits that are available to all of our salaried employees. Our plan is a flexible plan which permits participants to choose among various co-pay options and available benefits, including medical, prescription drug, dental, long-term disability and life insurance, and other benefits depending on the needs of the participant and his or her dependents. These benefits help us remain competitive in attracting and retaining a high-caliber management team.
Perquisites
Our executives are provided with a vehicle allowance. This program helps us to attract and retain a high-caliber management team in the very competitive automotive supplier industry. The value of this benefit is treated as ordinary income for tax purposes at the full extent of its value, and participants, including the NEOs, do not receive any tax “gross up” payments or similar compensation to cover this tax.
Stock Ownership Policy
We require that our officers achieve and maintain levels of ownership of our common stock. The levels are based on multiples of each officer’s base salary. The Compensation Committee reviewed the stock ownership policy in June 2023 for market appropriateness and best practices. Based on its review, and input from FW Cook and management, the committee concluded that the terms and provisions of the policy remained appropriate; therefore, no changes were recommended and no changes were approved by the Compensation Committee. Under our policy, officers are required to hold 50% of the net shares resulting from stock option exercises or vesting of other stock-based awards until they reach the applicable ownership level based on position. Only shares owned outright and time-vested RSUs count toward satisfaction of the guideline (time-vested RSUs are counted on an after-tax basis assuming a 35% tax rate for ease of administration). The “in-the-money” spread of outstanding stock options and the value of unearned performance-based restricted stock units do not count toward satisfaction of the guideline. This policy is intended to align the interests of our key executives with the interests of our stockholders by maintaining a strong link between the Company’s long-term success and the ultimate compensation of key executives. The 2023 stock ownership requirement was as follows:
| | | | | | | | | | | |
| Positions | | Stock Ownership Level
(Multiple of Base Salary) |
| Chief Executive Officer | | 6X |
| Chief Financial Officer | | 3X |
| All Other NEOs | | 2X |
All NEOs are in compliance with the required multiple of base salary or are retaining their acquired amounts until they reach the required multiple.
Policy Concerning Transactions Involving Company Securities
We have a policy applicable to all directors, officers, and employees that prohibits certain transactions involving our stock, including engaging in short-term speculative transactions, which includes hedging transactions and buying or selling put or call options. The policy also prohibits holding the Company’s securities in a margin account, pledging the Company’s securities as collateral for a loan, and engaging in short sales of the Company’s securities.
Clawback Policy
Cooper Standard has an incentive compensation clawback policy which addresses the recoupment of incentive-based compensation from current or former executive officers to ensure compliance with the requirements of the Dodd-Frank Act, Rule 10D-1 of the Exchange Act and new NYSE Rule 303A.14. Under the policy, upon the occurrence of an accounting restatement of the Company’s financial statements to correct an error, the Compensation Committee must recoup incentive-based compensation that was erroneously granted, earned or vested to our current and former “officers” (as defined under Rule 16a-1 of the Exchange Act) based wholly or in part upon the attainment of any financial reporting measure, subject to limited exceptions. Recoupment will be required regardless of whether or not any of the covered officers engaged in fraud or misconduct or contributed to the restatement. Further, the policy allows the Compensation Committee to recoup additional amounts of incentive compensation in certain situations if the Compensation Committee determines that the covered executive officer has engaged in misconduct.
| | | | | | | | | | | | | | |
| Compensation Committee Report |
The Compensation Committee of the Board of Directors of Cooper-Standard Holdings Inc. oversees our executive compensation program. In fulfilling its oversight responsibilities, the Compensation Committee reviewed and discussed with management the Compensation Discussion and Analysis set forth in this proxy statement.
In reliance on the review and discussions referred to above, the Compensation Committee recommended to the Board that the Compensation Discussion and Analysis be incorporated in the Company’s Annual Report on Form 10-K for the fiscal year ended December 31, 2023, and included in this Proxy Statement.
Compensation Committee
John G. Boss, Chair
David J. Mastrocola
Robert J. Remenar
Stephen A. Van Oss
Set forth below is information regarding compensation for services to the Company in all capacities of the following NEOs during the year ended December 31, 2023: (i) our current chief executive officer; (ii) our current chief financial officer; and (iii) the three most highly compensated executive officers other than the chief executive officer and chief financial officer who were serving as executive officers at December 31, 2023.
2023 Summary Compensation Table
| | | | | | | | | | | | | | | | | | | | | | | | | | | | | | | | | | | | | | | | | | | | | | | | | | | | | | | | |
| Name and Principal Position(1) | | Year | | Salary(2) | | Bonus | | Stock Awards(3) | | Option Awards | | Non-Equity Incentive Plan Compensation(4) | | Change in Pension Value and Nonqualified Deferred Compensation Earnings(5) | | All Other Compensation | | Total |
| (a) | | (b) | | (c) | | (d) | | (e) | | (f) | | (g) | | (h) | | (i) | | (j) |
Jeffrey S. Edwards,
Chairman and Chief Executive Officer | | 2023 | | $1,015,385 | | | — | | | $4,751,899 | | | — | | | $1,647,360 | | | — | | | $219,542 | | (6) | $7,634,186 | |
| 2022 | | $1,000,000 | | | — | | | $2,689,813 | | | — | | | $896,400 | | | — | | | $121,545 | | | $4,707,758 | |
| 2021 | | $1,000,000 | | | — | | | $2,738,195 | | | $1,140,004 | | | — | | | — | | | $209,745 | | | $5,087,944 | |
Jonathan P. Banas,
Executive Vice President and Chief Financial Officer | | 2023 | | $523,077 | | | — | | | $1,031,683 | | | — | | | $530,640 | | | — | | | $100,411 | | (7) | $2,185,811 | |
| 2022 | | $510,385 | | | — | | | $583,992 | | | — | | | $288,529 | | | — | | | $68,260 | | | $1,451,166 | |
| 2021 | | $500,000 | | | $15,000 | | | $540,441 | | | $225,008 | | | — | | | — | | | $96,308 | | | $1,376,757 | |
Patrick R. Clark,
Senior Vice President and Managing Director - Global Automotive | | 2023 | | $519,615 | | | — | | | $937,889 | | | — | | | $514,800 | | | — | | | $379,795 | | (8) | $2,352,099 | |
| 2022 | | $481,539 | | | — | | | $389,343 | | | — | | | $261,450 | | | — | | | $565,009 | | | $1,697,341 | |
| | | | | | | | | | | | | | | | |
Christopher E. Couch,
Senior Vice President, Chief Technology Officer | | 2023 | | $487,692 | | | — | | | $606,519 | | | — | | | $462,000 | | | — | | | $94,134 | | (9) | $1,650,345 | |
| 2022 | | $475,385 | | | — | | | $343,308 | | | — | | | $250,992 | | | — | | | $64,487 | | | $1,134,172 | |
| 2021 | | $456,346 | | | $13,950 | | $302,262 | | | $155,016 | | | — | | | — | | | $82,101 | | | $1,009,675 | |
Larry E. Ott,
Senior Vice President, Chief Human Resources Officer | | 2023 | | $472,308 | | | — | | | $594,013 | | | — | | | $415,272 | | | — | | | $96,063 | | (10) | $1,577,656 | |
| | | | | | | | | | | | | | | | |
| | | | | | | | | | | | | | | | |
1The column reflects each NEO’s position as of December 31, 2023.
2Amounts shown reflect the NEO's annual base salary earned during the fiscal year and are not reduced to reflect the NEOs’ elections, if any, to defer receipt of salary into the CSA Savings Plan for salaried U.S. employees.
3The amounts shown in column (e) represent the aggregate grant-date fair value of time-vested RSUs, Financial Performance RSUs and TSR Performance RSUs, which were granted under the 2021 Plan on February 15, 2023, computed in accordance with Financial Accounting Standards Board Accounting Standards Codification 718, Stock Compensation (“ASC Topic 718”). In the case of Financial Performance RSUs and TSR Performance RSUs, the amounts shown are based on the probable outcome of performance conditions at the time of the grant, consistent with the estimate of aggregate compensation cost to be recognized over the service period determined as of the grant date under ASC Topic 718 as follows: Mr. Edwards, $2,851,108; Mr. Banas, $619,007; Mr. Clark, $562,732; Mr. Couch, $363,907; and Mr. Ott, $356,402. Assuming the highest level of performance is achieved for the Financial Performance RSUs, the maximum value of the Financial Performance RSU awards at the grant date would be as follows: Mr. Edwards, $3,801,583; Mr. Banas, $825,353; Mr. Clark, $750,314; Mr. Couch, $485,224; and Mr. Ott, $475,221. The value of the TSR Performance RSUs is market-based; thus no maximum grant date fair value is known. The fair value of the TSR Performance RSU awards at the grant date would be as follows: Mr. Edwards, $950,316; Mr. Banas, $206,331; Mr. Clark, $187,575; Mr. Couch, $121,295; and Mr. Ott, $118,792. The amounts shown exclude the impact of estimated forfeitures related to service-based vesting conditions. Assumptions used in the calculation of these amounts are included in Note 20 to the Company’s audited financial statements included in our Annual Report on Form 10-K for the fiscal year ended December 31, 2023. Note that these accounting fair values differ than the intended grant values as discussed above in the Impact of Stock Price Averaging on Reported Grant Values section
4The amounts shown in column (g) represent the bonus payments for 2023 under the Company’s annual incentive award program. Payouts under the annual incentive program were made based on achievement by the Company of Adjusted EBITDA and FCF as compared to the established targets, as well as performance against strategic ESG metrics and related established targets. The determination of the amounts achieved is described under “Annual Incentive Award” under the Executive Compensation Components section of the Compensation Discussion and Analysis.
5The amount shown in column (h) represents for each NEO the sum of the aggregate annualized change in the actuarial present value of accumulated benefits under all defined benefit and actuarial pension plans (qualified and non-qualified, including supplemental plans) from the plan measurement date used for financial statement reporting purposes with respect to the prior completed fiscal year to the plan measurement date used for financial statement reporting purposes with respect to the covered fiscal year. Mr. Clark is the only executive that has a defined benefit, and he elected to receive his benefit as a lump sum during December 2023. The Change in Pension Value shown for Mr. Clark is the difference between his 2023 lump sum payment amount and the Present Value of Accumulated Benefits as of the end of the prior year which was negative. Negative amounts are reported as zero for this purpose.
6The amount shown in column (i) for Mr. Edwards represents Company contributions under the CSA Savings Plan ($23,100) and nonqualified Supplemental Executive Retirement Plan ($178,897); car allowance ($12,000); and life insurance premiums paid by the Company ($5,545).
7The amount shown in column (i) for Mr. Banas represents Company contributions under the CSA Savings Plan ($23,100) and nonqualified Supplemental Executive Retirement Plan ($63,379); car allowance ($12,000); and life insurance premiums paid by the Company ($1,932).
8The amount shown in column (i) for Mr. Clark represents Company contributions under the CSA Savings Plan ($23,100) and nonqualified Supplemental Executive Retirement Plan ($60,026); car allowance ($10,615); life insurance premiums paid by the Company ($1,244); and the value of Company-paid costs (including tax equalization) associated with the completion of Mr. Clark's expatriate assignment ($284,810).
9The amount shown in column (i) for Mr. Couch represents Company contributions under the CSA Savings Plan ($23,100) and nonqualified Supplemental Executive Retirement Plan ($55,722); car allowance ($12,000); and life insurance premiums paid by the Company ($3,312).
10The amount shown in column (i) for Mr. Ott represents Company contributions under the CSA Savings Plan ($23,100) and nonqualified Supplemental Executive Retirement Plan ($51,459); car allowance ($12,000); and life insurance premiums paid by the Company ($9,504).
2023 Grants of Plan-based Awards
The following table sets forth information regarding plan-based awards made to the NEOs during 2023.
| | | | | | | | | | | | | | | | | | | | | | | | | | | | | | | | | | | | | | | | | | | | | | | | | | | | | | | | | | | | | | | | | | | | |
| | | | | Estimated Future Payouts Under
Non-Equity Incentive Plan Awards | | Estimated Future Payouts Under Equity Incentive Plan Awards (#) (1) | | All Other Stock Awards: Number of Shares of Stock or Units (#) | | All Other Option Awards; Number of Securities Underlying Options | | Exercise or Base Price of Option Awards ($/sh) | | Grant Date Fair value of Stock and Option Awards ($) (2) |
| Name | Award Type | Grant Date | | Threshold | | Target | | Maximum | | Threshold | | Target | | Maximum | |
| (a) | | (b) | | (c) | | (d) | | (e) | | (f) | | (g) | | (h) | | (i) | | (j) | | (k) | | (l) |
| Jeffrey S. Edwards | Annual Bonus (3) | N/A | | $312,000 | | $1,248,000 | | $2,496,000 | | — | | — | | — | | — | | — | | — | | — |
| RSUs (4) | 2/15/2023 | | — | | — | | — | | — | | — | | — | | 103,755 | | — | | — | | $1,900,792 |
| Financial Performance RSUs (5) | 2/15/2023 | | — | | — | | — | | 51,877 | | 103,755 | | 207,510 | | — | | — | | — | | $1,900,792 |
| TSR Performance RSUs (6) | 2/15/2023 | | — | | — | | — | | 25,435 | | 50,871 | | 101,742 | | — | | — | | — | | $950,316 |
| Jonathan P. Banas | Annual Bonus (3) | N/A | | $100,500 | | $402,000 | | $804,000 | | — | | — | | — | | — | | — | | — | | |
| RSUs (4) | 2/15/2023 | | — | | — | | — | | — | | — | | — | | 22,526 | | — | | — | | $412,676 |
| Financial Performance RSUs (5) | 2/15/2023 | | — | | — | | — | | 11,263 | | 22,526 | | 45,052 | | — | | — | | — | | $412,676 |
| TSR Performance RSUs (6) | 2/15/2023 | | — | | — | | — | | 5,522 | | 11,045 | | 22,090 | | — | | — | | — | | $206,331 |
| Patrick R. Clark | Annual Bonus (3) | N/A | | $97,500 | | $390,000 | | $780,000 | | — | | — | | — | | — | | — | | — | | |
| RSUs (4) | 2/15/2023 | | — | | — | | — | | — | | — | | — | | 20,478 | | — | | — | | $375,157 |
| Financial Performance RSUs (5) | 2/15/2023 | | — | | — | | — | | 10,239 | | 20,478 | | 40,956 | | — | | — | | — | | $375,157 |
| TSR Performance RSUs (6) | 2/15/2023 | | — | | — | | — | | 5,020 | | 10,041 | | 20,082 | | — | | — | | — | | $187,575 |
| Christopher E. Couch | Annual Bonus (3) | N/A | | $87,500 | | $350,000 | | $700,000 | | — | | — | | — | | — | | — | | — | | — |
| RSUs (4) | 2/15/2023 | | — | | — | | — | | — | | — | | — | | 13,243 | | — | | — | | $242,612 |
| Financial Performance RSUs (5) | 2/15/2023 | | — | | — | | — | | 6,621 | | 13,243 | | 26,486 | | — | | — | | — | | $242,612 |
| TSR Performance RSUs (6) | 2/15/2023 | | — | | — | | — | | 3,246 | | 6,493 | | 12,986 | | — | | — | | — | | $121,295 |
| Larry E. Ott | Annual Bonus (3) | N/A | | $78,650 | | $314,600 | | $629,200 | | — | | — | | — | | — | | — | | — | | — |
| RSUs (4) | 2/15/2023 | | — | | — | | — | | — | | — | | — | | 12,970 | | — | | — | | $237,610 |
| Financial Performance RSUs (5) | 2/15/2023 | | — | | — | | — | | 6,485 | | 12,970 | | 25,940 | | — | | — | | — | | $237,610 |
| TSR Performance RSUs (6) | 2/15/2023 | | — | | — | | — | | 3,179 | | 6,359 | | 12,718 | | — | | — | | — | | $118,792 |
1The number of shares represents the range of potential payouts under the Financial Performance RSU and TSR Performance RSU awards granted under the 2021 Plan. The number of performance units that are earned, if any, associated with the Financial Performance RSUs awards will be based on performance for fiscal years 2023 and 2024, and will be determined after the end of both fiscal year 2023 and 2024, in each case with respect to one-half of the target total units granted. The number of performance units that are earned, if any, associated with the TSR Performance RSUs awards, will be based on performance for fiscal years 2023 to 2025, and will be determined after the end of fiscal year 2025.
2Represents the grant-date fair value of time-vested RSU, Financial Performance RSU and TSR Performance RSU awards granted under the 2021 Plan on February 15, 2023, computed in accordance with ASC Topic 718. Assumptions used in the calculation of these amounts are included in Note 20 to the Company’s audited financial statements included in our Annual Report on Form 10-K for the fiscal year ended December 31, 2023.
3For 2023, the Compensation Committee approved target annual incentive awards under the AIP for executive officers and, as the basis for determining the entitlement of executives to actual payment of annual incentive awards, set Adjusted EBITDA and FCF performance target for the year in accordance with the Company’s 2023 business plan approved by the Company’s Board. Funding of the bonus pool was determined 85% based on Adjusted EBITDA and FCF performance, and 15% based on performance of executive officers against strategic ESG metrics, with earnout based on ESG metrics performance only available to the extent there is earnout based on Adjusted EBITDA and FCF performance. The determination of annual incentive award payments is described under “Annual Incentive Award” under the Executive Compensation Components section. The amounts set forth under “Estimated Future Payouts under Non-Equity Incentive Plan Awards” reflects the possible payouts of cash annual incentive awards under the AIP. Amounts reported in the “Threshold” column assume that the NEO only earns the minimum payout under the AIP (or 25% of target). For 2023, payouts under the annual incentive
program were made based on achievement by the Company of Adjusted EBITDA and FCF targets as well as performance against strategic ESG targets. The determination of the amounts achieved is described under “Annual Incentive Award” under the Executive Compensation Components section of the Compensation Discussion and Analysis. Payouts, as approved by the Company's Compensation Committee, are noted under column (g) of the Summary Compensation Table.
4Represents time-vested RSUs granted under the 2021 Plan. These RSUs vest ratably, with one-third of the RSUs vesting on each of the first three anniversaries of March 1, 2023 ("vest from" date).
5Represents Financial Performance RSUs granted under the 2021 Plan. One-half of the Financial Performance RSUs are subject to the achievement of a ROIC performance goal during the one-year period commencing on January 1, 2023 and ending on December 31, 2023, and the remaining one-half are subject to the achievement of a ROIC performance goal during the one-year period commencing on January 1, 2024 and ending on December 31, 2024. The number of achieved Financial Performance RSUs for each of the two performance years is determined as soon as practicable after the end of the respective performance year, December 31, 2023 and December 31, 2024. The Company will settle achieved Financial Performance RSUs in an amount of cash equal to the number of achieved Financial Performance RSUs multiplied by the closing stock price on the performance achievement determination date for the award.
The determination of the amounts achieved is described under “Long-Term Incentive Compensation” under the Executive Compensation Components section of the Compensation Discussion and Analysis.
6Represents TSR Performance RSUs granted under the 2021 Plan. The TSR Performance RSUs are subject to the achievement of a Relative Total Shareholder Return (RTSR) performance goal during the performance period commencing on January 1, 2023 and ending on December 31, 2025. RTSR performance is measured relative to the performance of an identified comparator group during the performance period. The number of achieved TSR Performance RSUs will be determined as soon as practicable after the end of the performance period, December 31, 2025.
Subject to performance, the total achieved TSR Performance RSUs will vest if employment with the Company continues until December 31, 2025. The Company will settle the total achieved TSR Performance RSUs by delivering an amount of cash equal to the number of achieved TSR Performance RSUs multiplied by the closing stock price on the performance achievement determination date.
The determination of the amounts achieved is described under “Long-Term Incentive Compensation” under the Executive Compensation Components section of the Compensation Discussion and Analysis.
Outstanding Equity Awards at 2023 Fiscal Year End
The following table sets forth information concerning outstanding equity awards held by the NEOs at December 31, 2023.
| | | | | | | | | | | | | | | | | | | | | | | | | | | | | | | | | | | | | | | | | | | | | | | | | | |
| | Option Awards(1) | | Stock Awards |
| Name | Number of Securities Underlying Unexercised Options (#) Exercisable (2) | | Number of Securities Underlying Unexercised Options (#) Unexercisable
| | Number of
Securities
Underlying
Unearned
Options (#) Unexercisable | | Option Exercise Price ($) | | Option Expiration Date | | Number of Shares or Units of Stock That Have Not Vested (#) | | Market Value of Shares or Units of Stock That Have Not vested ($) (3) | Equity Incentive Plan Awards; Number of Unearned Shares, Units or Other Rights That Have Not Vested (#) | | Equity Incentive Plan Awards; Market or Payout Value of Unearned Shares, Units or Other Rights That Have Not Vested ($) (3) |
| (a) | (b) | | (c) | | (d) | | (e) | | (f) | | (g) | | (h) | (i) | | (j) |
| Jeffrey S. Edwards | 31,900 | | | — | | | | | $66.23 | | 3/20/2024 | (4) | 20,387 | | (5) | $398,362 | 70,240 | | (6) | $1,372,490 |
| 38,900 | | | — | | | | | $56.27 | | 2/19/2025 | (4) | 46,828 | | (7) | $915,019 | 36,965 | | (8) | $722,296 |
| 35,200 | | | — | | | | | $68.50 | | 2/18/2026 | (4) | 103,755 | | (9) | $2,027,373 | 155,633 | | (10) | $3,041,069 |
| 26,573 | | | — | | | | | $107.48 | | 2/13/2027 | (4) | | | | 50,871 | | (12) | $994,019 |
| 25,117 | | | — | | | | | $112.71 | | 2/13/2028 | (11) | | | | | | |
| 45,293 | | | — | | | | | $74.15 | | 2/14/2029 | (11) | | | | | | |
| 101,695 | | | — | | | | | $25.19 | | 2/13/2030 | (11) | | | | | | |
| 44,392 | | | 22,197 | | (13) | | | $37.28 | | 2/16/2031 | (11) | | | | | | |
| Jonathan P. Banas | 2,000 | | | — | | | | | $68.50 | | 2/18/2026 | (4) | 4,024 | | (5) | $78,629 | 15,250 | | (6) | $297,985 |
| 1,384 | | | — | | | | | $107.48 | | 2/13/2027 | (4) | 10,167 | | (7) | $198,663 | 8,026 | | (8) | $156,828 |
| 3,152 | | | — | | | | | $108.00 | | 6/7/2027 | (11) | 22,526 | | (9) | $440,158 | 33,789 | | (10) | $660,237 |
| 4,248 | | | — | | | | | $112.71 | | 2/13/2028 | (11) | | | | 11,045 | | (12) | $215,819 |
| 7,748 | | | — | | | | | $74.15 | | 2/14/2029 | (11) | | | | | | |
| 21,356 | | | — | | | | | $25.19 | | 2/13/2030 | (11) | | | | | | |
| 8,762 | | | 4,381 | | (13) | | | $37.28 | | 2/16/2031 | (11) | | | | | | |
| Patrick R. Clark | 1,478 | | | — | | | | | $112.71 | | 2/13/2028 | (11) | 2,146 | | (5) | $41,933 | 10,166 | | (6) | $198,644 |
| 2,682 | | | — | | | | | $74.15 | | 2/14/2029 | (11) | 6,778 | | (7) | $132,442 | 5,351 | | (8) | $104,559 |
| 8,475 | | | — | | | | | $25.19 | | 2/13/2030 | (11) | 20,478 | | (9) | $400,140 | 30,717 | | (10) | $600,210 |
| 4,673 | | | 2,337 | | (13) | | | $37.28 | | 2/16/2031 | (11) | | | | 10,041 | | (12) | $196,201 |
| Christopher E. Couch | 2,700 | | | — | | | | | $81.45 | | 7/11/2026 | (4) | 1,878 | | (5) | $36,696 | 8,964 | | (6) | $175,157 |
| 1,897 | | | — | | | | | $107.48 | | 2/13/2027 | (4) | 2,034 | | (14) | $39,744 | 4,718 | | (8) | $92,190 |
| 1,581 | | | — | | | | | $112.71 | | 2/13/2028 | (11) | 5,977 | | (7) | $116,791 | 19,865 | | (10) | $388,162 |
| 3,576 | | | — | | | | | $74.15 | | 2/14/2029 | (11) | 13,243 | | (9) | $258,768 | 6,493 | | (12) | $126,873 |
| 8,475 | | | — | | | | | $25.19 | | 2/13/2030 | (11) | | | | | | |
| 4,089 | | | 2,045 | | (13) | | | $37.28 | | 2/16/2031 | (11) | | | | | | |
| 2,854 | | | 1,427 | | (15) | | | $24.59 | | 7/28/2031 | (11) | | | | | | |
| Larry E. Ott | 1,833 | | | — | | | | | $68.50 | | 2/18/2026 | (4) | 2,281 | | (5) | $44,571 | 8,780 | | (6) | $171,561 |
| 2,444 | | | — | | | | | $107.48 | | 2/13/2027 | (4) | 5,854 | | (7) | $114,387 | 4,621 | | (8) | $90,294 |
| 2,955 | | | — | | | | | $112.71 | | 2/13/2028 | (11) | 12,970 | | (9) | $253,434 | 19,455 | | (10) | $380,151 |
| 5,364 | | | — | | | | | $74.15 | | 2/14/2029 | (11) | | | | 6,359 | | (12) | $124,255 |
| 11,782 | | | — | | | | | $25.19 | | 2/13/2030 | (11) | | | | | | |
| 4,965 | | | 2,483 | | (13) | | | $37.28 | | 2/16/2031 | (11) | | | | | | |
1All of the amounts presented in this portion of the table relate to options to purchase shares of the Company’s common stock granted to the NEOs under the following Plans:
- 2011 Plan (for awards granted in 2014, 2015, 2016, and on February 13, 2017);
- 2017 Plan (for awards granted on June 7, 2017 and in 2018, 2019, 2020, and on February 16, 2021); and,
- 2021 Plan (for awards granted on July 28, 2021).
2Represents options which have vested and were exercisable as of December 31, 2023.
3The values in column (h) equal the total number of shares of stock or RSUs listed in column (g) for each NEO multiplied by the value of Company common stock as of December 31, 2023. The values in column (j) equal the total number of shares of stock or Performance RSUs listed in column (i) for each NEO multiplied by the value of Company common stock as of December 31, 2023. The value of common stock as of December 31, 2023 was $19.54 per share, which was the closing price of Company stock listed on the NYSE on December 30, 2023.
4Options listed expire on the earliest to occur of: (i) the tenth anniversary of the date of grant; (ii) the first anniversary of the date of the optionee’s termination of employment due to death or disability, or in connection with a change of control; (iii) the third anniversary of the date of the optionee’s termination of employment due to retirement after attaining age 65 or
attaining age 60 with at least five years of service; or (iv) 90 days following the date of the optionee’s termination of employment by the Company and its affiliates for any reason not described in clauses (ii) through (iii) above.
5Represents time-vested RSUs granted on February 16, 2021, under the 2017 Plan that had not yet vested as of December 31, 2023. These RSUs cliff vest on the third anniversary of the date of grant.
6Target awards of Financial Performance RSUs with optionality to be settled in cash or stock were granted in February 2022 under the 2021 Plan to be earned in a multiple ranging from zero to two times the target awards based on our performance during the performance period commencing on January 1, 2022 and ending on December 31, 2023, subject to continued employment during the performance period. One-half of the total target awards granted will be earned based on our performance during the one-year period commencing on January 1, 2022 and ending on December 31, 2022, with earned Financial Performance RSUs vesting as of December 31, 2023 and settled in 2024. The remaining half of the total target awards granted will be earned based on performance during the one-year period commencing on January 1, 2023 and ending on December 31, 2023, with earned Financial Performance RSUs vesting as of December 31, 2024 and settled in 2025. Performance for 2022 paid out at 0% of target, with no units earned with respect to one-half of the total target awards granted. Actual number of units earned are reflected in the table. Performance for 2023 was 200% of target with respect to the second-half of the total target awards granted. Actual number of units earned are reflected in the table.
7Represents time-vested RSUs granted on February 16, 2022, under the 2021 Plan that had not yet vested as of December 31, 2023. These RSUs vest ratably over three years.
8Target awards of TSR Performance RSUs with optionality to be settled in cash or stock were granted in February 2022 under the 2021 Plan to be earned in a multiple ranging from zero to two times the target awards based on relative Total Shareholder Return (RTSR) performance to a comparator group during the performance period commencing on January 1, 2022 and ending on December 31, 2024, subject to continued employment during the performance period. The TSR Performance RSUs earned will be settled in 2025. The actual number of shares that will be issued is not yet determinable.
9Represents time-vested RSUs granted on February 15, 2023, under the 2021 Plan that had not yet vested as of December 31, 2023. These RSUs vest ratably over three years.
10Target awards of Financial Performance RSUs that will be settled in cash were granted in February 2023 under the 2021 Plan to be earned in a multiple ranging from zero to two times the target awards based on our performance during the performance period commencing on January 1, 2023 and ending on December 31, 2025, subject to continued employment during the performance period. One-half of the total target awards granted will be earned based on our performance during the one-year period commencing on January 1, 2023 and ending on December 31, 2023, with earned Financial Performance RSUs vesting as of December 31, 2023 and settled in 2025. The remaining half of the total target awards granted will be earned based on performance during the one-year period commencing on January 1, 2024 and ending on December 31, 2024, with earned Financial Performance RSUs vesting as of December 31, 2025 and settled in 2026. Performance for 2023 was 200% of target with respect to the second-half of the total target awards granted. Actual number of units earned are reflected in the table. Performance for 2024 is to be determined; therefore, the target amounts shown are in accordance with SEC rules for the remaining half of the total target awards granted.
11Options listed expire on the earliest to occur of: (i) the tenth anniversary of the date of grant; provided, however, that (other than as would otherwise result in the violation of Section 409A of the Internal Revenue Code (the “Code”)), to the extent an option would expire at a time when the holder of such option is prohibited by applicable law or by the Company’s insider trading policy from exercising the option (the closed window period), then such option shall remain exercisable until the thirtieth (30th) day following the end of the closed window period; (ii) the first anniversary (as defined in the 2017 Plan) of the date of the optionee’s termination of employment due to death or disability, or in connection with a change of control; (iii) the third anniversary of the date of the optionee’s termination of employment due to retirement after attaining age 65 or attaining age 60 with at least five years of service; or (iv) 90 days following the date of the optionee’s termination of employment by the Company or its affiliates for any reason not described in clauses (ii) or (iii) above.
12Target awards of TSR Performance RSUs will be settled in cash and were granted in February 2023 under the 2021 Plan to be earned in a multiple ranging from zero to two times the target awards based on relative Total Shareholder Return (RTSR) performance relative to the performance of a comparator group during the performance period commencing on January 1, 2023 and ending on December 31, 2025, subject to continued employment during the performance period. The TSR Performance RSUs earned will be settled in 2026. The actual number of shares that will be issued is not yet determinable.
13Represents outstanding options granted February 16, 2021 under the 2017 Plan, which have not vested and were unexercisable as of December 31, 2023. These options vest ratably over three years.
14Represents time-vested RSUs granted on July 28, 2021 under the 2021 Plan, which had not yet vested as of December 31, 2023. These RSUs cliff vest on the third anniversary of the date of grant.
15Represents outstanding options granted July 28, 2021 under the 2021 Plan, which have not vested and were unexercisable as of December 31, 2023. These options vest ratably over three years.
2023 Option Exercises and Stock Vested
The following table sets forth information concerning the exercise of stock options and vesting of stock for each NEO during 2023.
| | | | | | | | | | | | | | | | | | | | | | | | | | |
| | Option Awards | | Stock Awards |
| Name | | Number of Shares Acquired on Exercise (#) | | Value Realized on Exercise ($) | | Number of Shares Acquired on Vesting (#) (1) | | Value Realized on Vesting ($) (2) |
| (a) | | (b) | | (c) | | (d) | | (e) |
| Jeffrey S. Edwards | | — | | — | | 47,232 | | $786,479 |
| Jonathan P. Banas | | — | | — | | 10,085 | | $167,804 |
| Patrick R. Clark | | — | | — | | 5,374 | | $88,404 |
| Christopher E. Couch | | — | | — | | 4,973 | | $82,028 |
| Larry E. Ott | | — | | — | | 5,945 | | $99,022 |
1The number of shares reported includes the number of shares withheld by the Company for the payment of tax liabilities incurred upon the vesting of restricted stock units.
2The amount represents the market price of the underlying shares on the date of vesting.
2023 Pension Benefits
The following table sets forth the actuarial present value of accumulated benefit under the Cooper-Standard Automotive Inc. Salaried Retirement Plan (“Cooper Standard Retirement Plan”), which is frozen, as described in the narrative following this table, assuming benefits are paid at normal retirement age or the earliest retirement age at which participants receive unreduced benefits. The table also shows the number of years of credited service under the Cooper Standard Retirement Plan computed as of the same pension plan measurement date used in our audited financial statements for the year ended December 31, 2023. Mr. Clark is the only NEO who was a participant in the Cooper Standard Retirement Plan. Mr. Edwards, who was hired in 2012, Mr. Ott, who was hired in 2013, Mr. Banas, who was hired in 2015, and Mr. Couch who was hired in 2016 are not eligible to participate in the Cooper Standard Retirement Plan.
| | | | | | | | | | | | | | |
| Name | Plan Name | Number of Years
Credited Service
(#) | Present Value of Accumulated Benefit (1) ($) | Payments
During Last
Fiscal Year
($) |
| (a) | (b) | (c) | (d) | (e) |
| Patrick R. Clark | Cooper Standard Retirement Plan2 | 14.58 | $0 | $129,828 |
1Present values determined using a December 31, 2023 measurement date and reflect benefits accrued based on service and pay earned through such date. In October of 2022, the Board approved the termination of the Cooper-Standard Automotive, Inc. Salaried Retirement Plan, with a Date of Plan Termination on December 31, 2022. The termination process includes offering active and deferred participants a lump sum option, which was completed in fourth quarter of 2023, then subsequently purchasing annuities for all remaining participants with a qualified insurance company in early 2024. As a result, plan termination liabilities were determined for December 31, 2023 reporting. However, Mr. Clark elected to receive his benefit as a lump sum in December 2023. Because he is no longer due a benefit from the Plan, his Present Value of Accumulated Benefits is $0.
2Mr. Clark was covered under the cash balance design for purposes of the qualified CSA Retirement Plan, which was frozen January 31, 2009. Mr. Clark elected to receive his benefit as a lump sum in December 2023 and is no longer due a benefit.
Cooper Standard Retirement Plan
The Cooper Standard Retirement Plan is a defined benefit plan that covers non-union employees of the Company in the United States, including eligible NEOs. The applicable provisions of the Cooper Standard Retirement Plan for eligible NEOs (cash balance provisions) state benefits in the form of a hypothetical account established for each participant. Prior to the freeze of the
Cooper Standard Retirement Plan effective January 31, 2009, annual pay credits were added to a participant’s cash balance account at the end of each year, based on the participant’s compensation for the year and the sum of the participant’s age and service as of the beginning of that year.
Subsequent to the freeze, participants continue to receive interest credits each year equal to their cash balance account value on the last day of each plan year, multiplied by an applicable interest rate for such year. The applicable interest rate is equal to the rate of interest on 30-year Treasury securities as of the third calendar month preceding the first day of the plan year.
The normal form of retirement benefit is defined as a monthly life annuity amount that is actuarially equivalent to the cash balance account projected to normal retirement age with interest credits. Other optional forms were available as well.
2023 Nonqualified Deferred Compensation
The following table sets forth annual contributions, withdrawals, earnings and fiscal year-end balances for each NEO under the Company’s non-qualified Supplemental Executive Retirement Plan (“SERP”).
| | | | | | | | | | | | | | | | | | | | | | | | | | | | | | | | |
| Name (a) | | Executive
Contributions
in Last FY ($)
(b) | | Registrant
Contributions in
Last FY ($) (1)
(c) | | Aggregate
Earnings
in Last FY ($)(2)
(d) | | Aggregate
Withdrawals/
Distributions ($)
(e) | | Aggregate
Balance at Last
FYE ($)
(f) |
| Jeffrey S. Edwards | | — | | $178,897 | | $312,061 | | — | | $2,610,026 |
| Jonathan P. Banas | | — | | $63,379 | | $48,430 | | — | | $374,041 |
| Patrick R. Clark | | — | | $60,026 | | $28,747 | | — | | $244,434 |
| Christopher E. Couch | | — | | $55,722 | | $33,469 | | — | | $270,417 |
| Larry E. Ott | | — | | $51,459 | | $79,854 | | — | | $706,353 |
1Amounts are included in column (i) of the Summary Compensation Table and represent nonqualified Company contributions under the SERP for the 2023 plan year.
2Includes earnings/(losses) from the SERP for the 2023 plan year.
SERP
The SERP provides a benefit equal to one and one-half times the percentage of Company contributions actually credited to the participant’s account under the CSA Savings Plan, multiplied by the participant’s compensation (without regard to qualified plan limits prescribed by the Code), but offset by the amount of Company contributions made for such participant under the CSA Savings Plan.
Under the SERP, benefits are payable after a period of six months from the date of termination. Benefits vest under the SERP at the same time as Company contributions under the CSA Savings Plan vest (generally after two years of service). Accounts under the SERP are credited with hypothetical investment earnings based on participant investment elections made from among the options available under the CSA Savings Plan. From among the available investment alternatives, participants may change their instructions relating to their deferred compensation daily via the third-party administrator for the Company’s SERP. Earnings on a participant’s balance are determined solely by the performance of the investments that the participant has chosen for his or her plan balance; the Company does not guarantee any minimum return on investments and accounts are not credited with above-market earnings.
The table below reflects the investment fund options available under the SERP as of December 31, 2023, and the annualized rates of return for the calendar year ended December 31, 2023. | | | | | | | | | | | | | | | | | | | | |
| Name of Fund | | Rate of
Return | | Name of Fund | | Rate of
Return |
| American Funds EuroPacific Growth Fund® Class R-5 | | 15.97 | % | | Vanguard High Dividend Yield Index Fund Admiral | | 6.51 | % |
| DFA U.S. Targeted Value Portfolio Institutional Class | | 19.31 | % | | T. Rowe Price Retirement 2005 Trust Class F | | 11.92 | % |
| Fidelity® 500 Index Fund | | 26.29 | % | | T. Rowe Price Retirement 2010 Trust Class F | | 12.53 | % |
| Fidelity® Inflation-Protected Bond Index Fund | | 3.78 | % | | T. Rowe Price Retirement 2015 Trust Class F | | 13.06 | % |
| Fidelity® International Index Fund | | 18.31 | % | | T. Rowe Price Retirement 2020 Trust Class F | | 13.65 | % |
| Fidelity® Mid Cap Index Fund | | 17.21 | % | | T. Rowe Price Retirement 2025 Trust Class F | | 14.73 | % |
| Fidelity® Small Cap Index Fund | | 17.12 | % | | T. Rowe Price Retirement 2030 Trust Class F | | 16.54 | % |
| Fidelity® U.S. Bond Index Fund | | 5.55 | % | | T. Rowe Price Retirement 2035 Trust Class F | | 18.47 | % |
| Loomis Sayles Bond Fund Institutional Class | | 8.05 | % | | T. Rowe Price Retirement 2040 Trust Class F | | 19.90 | % |
| T. Rowe Price Growth Stock Fund | | 45.27 | % | | T. Rowe Price Retirement 2045 Trust Class F | | 20.85 | % |
| T. Rowe Price Retirement Balanced Trust Class F | | 11.50 | % | | T. Rowe Price Retirement 2050 Trust Class F | | 21.11 | % |
| T. Rowe Price Stable Value Common Trust Fund A | | 2.42 | % | | T. Rowe Price Retirement 2055 Trust Class F | | 21.22 | % |
| The Hartford MidCap Fund Class R6 | | 14.77 | % | | T. Rowe Price Retirement 2060 Trust Class F | | 21.20 | % |
CSA Savings Plan
The Company maintains the CSA Savings Plan, a tax-qualified 401(k) retirement savings plan pursuant to which all U.S. non-union employees, including eligible NEOs, may contribute the lesser of up to 50% of their compensation or the limit prescribed by the Code. The CSA Savings Plan provides a 40% fixed match on employee contributions of up to 5% of compensation and permits additional discretionary contributions depending on Company performance. An additional non-matching employer contribution of 3% to 5% of compensation (depending on a participant’s age plus years of service with the Company) is also made to the CSA Savings Plan. The account balances for NEOs under the CSA Savings Plan are not reflected in the table above, which reflects only nonqualified benefits.
Potential Payments Upon Termination or Change of Control
As indicated in the table below, compensation upon termination of employment varies depending on the circumstances of the termination and whether or not it occurred following a change of control. Amounts presented in the table are calculated as if employment terminated effective December 31, 2023. Payments due to any one of the NEOs upon actual termination of employment can only be determined at the time of termination. There can be no assurance that an actual termination or change of control would produce the same or similar results as those described below if it were to occur on any other date or if the actual circumstances at the time of termination were different.
Amounts accrued under the normal terms of our deferred compensation plans are not included in this table and are instead presented under “Nonqualified Deferred Compensation.” Similarly, information concerning vested equity awards is not included in the table and is presented under “Outstanding Equity Awards at Fiscal Year End.”
| | | | | | | | | | | | | | | | | | | | | | | | | | | | | | | | | | | | | | | | | |
| Name | | Severance Payment1 | | Health/Life2 | | Outplacement Services3 | | Accelerated Vesting of Equity Awards4 | | 280G Treatment/Cut-Back5 | | Totals |
| Jeffrey S. Edwards | | | | | | | | | | | | |
| • | Change in Control Without Termination | | — | | — | | — | | — | | — | | — |
| • | Termination Without Cause or Resignation for Good Reason, After Change in Control | | $4,576,000 | | $18,259 | | $50,000 | | $7,770,674 | | — | | $12,414,933 |
| • | Termination Without Cause or Resignation for Good Reason, with no Change in Control | | $4,576,000 | | $18,259 | | $50,000 | | — | | N/A | | $4,644,259 |
| • | Termination for Cause or Resignation Without Good Reason | | — | | — | | — | | — | | N/A | | — |
| • | Termination due to Death | | — | | — | | — | | $7,770,667 | | N/A | | $7,770,667 |
| • | Termination due to Disability | | — | | — | | — | | $7,770,667 | | N/A | | $7,770,667 |
| | | | | | | | | | | | | |
| Jonathan P. Banas | | | | | | | | | | | | |
| • | Change in Control Without Termination | | — | | — | | — | | — | | — | | — |
| • | Termination Without Cause or Resignation for Good Reason, After Change in Control | | $1,876,000 | | $26,754 | | $50,000 | | $1,679,242 | | — | | $3,631,996 |
| • | Termination Without Cause or Resignation for Good Reason, with no Change in Control | | $1,407,000 | | $26,754 | | $50,000 | | — | | N/A | | $1,483,754 |
| • | Termination for Cause or Resignation Without Good Reason | | — | | — | | — | | — | | N/A | | — |
| • | Termination due to Death | | — | | — | | — | | $1,679,248 | | N/A | | $1,679,248 |
| • | Termination due to Disability | | — | | — | | — | | $1,679,248 | | N/A | | $1,679,248 |
| | | | | | | | | | | | | |
| Patrick R. Clark | | | | | | | | | | |
| • | Change in Control Without Termination | | — | | — | | — | | — | | — | | — |
| • | Termination Without Cause or Resignation for Good Reason, After Change in Control | | $1,820,000 | | $26,756 | | $50,000 | | $1,374,737 | | — | | $3,271,493 |
| • | Termination Without Cause or Resignation for Good Reason, with no Change in Control | | $1,365,000 | | $26,756 | | $50,000 | | — | | N/A | | $1,441,756 |
| • | Termination for Cause or Resignation Without Good Reason | | — | | — | | — | | — | | N/A | | — |
| • | Termination due to Death | | — | | — | | — | | $1,374,737 | | N/A | | $1,374,737 |
| • | Termination due to Disability | | — | | — | | — | | $1,374,737 | | N/A | | $1,374,737 |
| | | | | | | | | | | | | |
| | | | | | | | | | | | | | | | | | | | | | | | | | | | | | | | | | | | | | | | | |
| Name | | Severance Payment1 | | Health/Life2 | | Outplacement Services3 | | Accelerated Vesting of Equity Awards4 | | 280G Treatment/Cut-Back5 | | Totals |
| Christopher E. Couch | | | | | | | | | | |
| • | Change in Control Without Termination | | — | | — | | — | | — | | — | | — |
| • | Termination Without Cause or Resignation for Good Reason, After Change in Control | | $1,700,000 | | $26,740 | | $50,000 | | $1,017,402 | | — | | $2,794,142 |
| • | Termination Without Cause or Resignation for Good Reason, with no Change in Control | | $1,275,000 | | $26,740 | | $50,000 | | — | | N/A | | $1,351,740 |
| • | Termination for Cause or Resignation Without Good Reason | | — | | — | | — | | — | | N/A | | — |
| • | Termination due to Death | | — | | — | | — | | $1,017,409 | | N/A | | $1,017,409 |
| • | Termination due to Disability | | — | | — | | — | | $1,017,409 | | N/A | | $1,017,409 |
| | | | | | | | | | | | | |
| Larry E. Ott | | | | | | | | | | |
| • | Change in Control Without Termination | | — | | — | | — | | — | | — | | — |
| • | Termination Without Cause or Resignation for Good Reason, After Change in Control | | $1,597,200 | | $17,973 | | 50,000 | | $966,155 | | — | | $2,631,328 |
| • | Termination Without Cause or Resignation for Good Reason, with no Change in Control | | $1,197,900 | | $17,973 | | 50,000 | | — | | N/A | | $1,265,873 |
| • | Termination for Cause or Resignation Without Good Reason | | — | | — | | — | | — | | N/A | | — |
| • | Termination due to Death | | — | | — | | — | | $966,155 | | N/A | | $966,155 |
| • | Termination due to Disability | | — | | — | | — | | $966,155 | | N/A | | $966,155 |
1Pursuant to the January 1, 2011 Executive Severance Pay Plan, as amended and restated on June 9, 2021, Mr. Edwards', Mr. Banas', Mr. Couch’s, Mr. Clark's and Mr. Ott's cash severance for termination without cause prior to a change of control is two times for Mr. Edwards and one and a half times for Mr. Banas, Mr. Couch, Mr. Clark and Mr. Ott's the sum of (i) their annual base pay as in effect immediately prior to the date of termination plus (ii) their target cash incentive compensation award for the year in which termination occurs, with payments to be made in accordance with the Company's regular payroll schedule, plus the prorated annual incentive award based on actual performance for the year of termination; for termination without cause after a change of control, Mr. Edwards', Mr. Banas', Mr. Couch's, Mr. Clark's and Mr. Ott's cash severance is two times the sum of (i) their base pay as in effect immediately prior to the date of termination plus (ii) their target annual cash incentive compensation award for the year in which termination occurs, and will be paid in a single lump sum cash payment, plus (iii) a pro rata portion of the greater of their target or actual annual bonus for the year of termination; for disclosure purposes we have only reported the incremental value by which the target annual incentive exceeds the actual annual incentive, if any. Further description of the terms applicable to cash severance payments is included under “Terms Applicable to Payments Upon Termination of Employment”
2Health benefits are continued for the NEOs and their covered dependents after termination of employment under certain circumstances. In such cases, the commitment is generally to provide for coverage for these benefits in a manner such that (i) benefits provided are substantially similar to those at termination and (ii) recipients of such benefits will not pay higher share of cost for such benefits than had been required prior to termination of employment based on elections in place at that time. Further description of the terms applicable to health and life insurance benefits is included under ‘‘Terms Applicable to Payments Upon Termination of Employment.’’ For Messrs. Edwards, Banas, Couch, Clark and Ott's, upon termination without cause or by the employee for good reason with or without a change in control, they are entitled to receive continued health coverage for 18 months.
3Upon termination without cause (or resignation for good reason) after a change of control, the NEOs are entitled to payment of the cost of outplacement services in an amount equal to the lesser of 15% of annual base salary at the time of termination, or $50,000. Pursuant to the January 1, 2011 Executive Severance Pay Plan, the NEOs are also entitled to payment of the cost of outplacement services in an amount equal to the lesser of 15% of annual base salary at the time of termination, or $50,000 upon termination without cause (or resignation for good reason) prior to a change of control.
4For the NEOs, represents the effect of accelerated vesting related to time-based RSUs, stock options, and performance-based RSUs. In the event of a change in control without termination: For the stock options, time-based RSUs, and performance-based RSUs granted in February and July 2021, February 2022, and February 2023 pursuant to the award agreements, 100% of all outstanding and unvested options and RSUs would become immediately vested and exercisable if the successor in the change in control does not assume the options or stock units or does not issue replacement awards. For purposes of this disclosure, we have assumed that the awards will be assumed or replaced by the successor of the change in control and, therefore, have not reflected 100% immediate vesting on either the February and July 2021, February 2022, or February 2023 awards. In the event of a change in control with termination within two years of a change in control: For all other unvested time-based restricted stock and stock options granted in February and July 2021, February 2022, and
February 2023, 100% of the outstanding and unvested grants become fully vested and exercisable. For purposes of this disclosure, we have assumed that 100% of the outstanding and unvested target level of performance-based RSUs granted in February 2022 and February 2023 will become fully vested. In the event of a termination upon death or disability prior to a change in control: For time-based RSUs and stock options granted in February and July 2021, February 2022, and February 2023, 100% of the unvested awards become fully vested and exercisable. For performance-based RSUs granted in February 2022 and February 2023, 100% of the target level of the unvested award become fully vested and exercisable.
5Upon a change of control of the Company, each executive may be subject to certain excise taxes pursuant to Section 280G of the Internal Revenue Code. Pursuant to the January 1, 2011 Executive Severance Pay Plan, Messrs. Edwards, Banas, Couch, Clark, and Ott's, will receive the treatment that provides the best after-tax benefit (taking into account the applicable federal, state, and local income taxes and the excise tax) between (i) total payments being delivered in full, or (ii) total payments cutback to such amount so that no portion of such total payments would be subject to the excise tax. These amounts assume that no amounts will be discounted as attributable to reasonable compensation and no value will be attributed to the non-competition covenants included in the agreement. Amounts will be discounted to the extent the Company can demonstrate by clear and convincing evidence that the non-competition covenants included in the agreement substantially constrains the executive’s ability to perform services and there is a reasonable likelihood that the non-competition covenants will be enforced against the individual.
Terms Applicable to Payments upon Termination of Employment
The terms applicable to payments upon termination of employment with respect to Messrs. Edwards, Banas, Clark and Couch, and Mr. Ott are governed by the Executive Severance Pay Plan.
Named Executive Officers Covered by the Executive Severance Pay Plan (“Severance Plan”)
The Severance Plan, adopted in 2011 and amended and restated as of June 9, 2021, applies to officers of the Company, including our NEOs (currently Messrs. Edwards, Banas, Clark, Couch and Ott, the “Covered NEOs”) who are not covered by employment agreements that specifically provide for benefits upon termination of employment. Under the Severance Plan, if a Covered NEO is terminated by the Company without “Cause,” as the term is defined in the Severance Plan and described below, prior to a change of control of the Company, then the Company will pay or provide the following:
•In the case of Mr. Edwards, the sum of his base pay as in effect immediately prior to his termination and the target annual cash incentive amount for the year in which his termination occurs multiplied by two; in the case of Messrs. Banas, Clark, Couch, and Ott, the sum of each executive’s current base pay as in effect immediately prior to their termination and the target annual cash incentive amount for the year in which their termination occurs multiplied by one and one-half. Cash Severance payments are to be made in installment payments in accordance with the Company’s regular payroll schedule;
• A pro rata portion of the Covered NEO’s annual cash incentive compensation award for the year in which the termination occurs, based on actual performance;
• Continued health insurance coverage at the active employee rate for 18 months following the termination; and
• Outplacement services.
If a Covered NEO terminates employment for “Good Reason,” as the term is defined in the Severance Plan and described below, or is terminated by the Company without Cause during the two-year period following a change of control of the Company, then the Company will pay or provide to the Covered NEO the following:
• The sum of the Covered NEO’s current base salary and the previous year’s target annual bonus, multiplied by two;
• A pro rata portion of the Covered NEO’s annual cash incentive compensation award for the year in which the termination occurs, based on target performance;
• Continued health insurance coverage at active employee rates for 18 months following the termination; and
• Outplacement services.
Termination for “Cause” under the Severance Plan means termination for any of the following reasons: (i) the executive’s material breach of his or her significant obligations to, or agreements with, the Company or its affiliates, if the breach is or may be materially injurious to the Company or its affiliates (and is not cured within 30 days of notice); (ii) the executive’s commission of and indictment for a felony, or certain other criminal or civil verdicts against the executive; or (iii) any other willful act or omission which is or may be materially injurious to the financial condition or business reputation of, or otherwise is or may be materially injurious to, the Company or its affiliates (and that is not cured within 30 days of notice).
Termination by an executive for “Good Reason” under the Severance Plan means termination during the two-year period following a change of control of the Company after any of the following: (i) a significant adverse change in the nature or scope of the authorities, powers, functions, responsibilities or duties compared to immediately prior to the change of control (subject to cure within 30 days of notice); (ii) a reduction in base pay or opportunities for incentive compensation other than a reduction that is applied generally to other executives in a similar manner (subject to cure within 30 days of notice); or (iii) a requirement that the executive change his or her principal location of work by more than 50 miles.
In exchange for these benefits, the Covered NEOs would be required to agree to (i) non-competition and non-solicitation provisions for the period represented by the applicable severance multiple, (ii) confidentiality and non-disparagement provisions, and (iii) a release of claims.
A “Change of Control” under the Severance Plan means the occurrence of any of the following events: (i) the sale or disposition, in one or a series of related transactions, of all or substantially all of the assets of the Company to any “person” or “group” (as such terms are defined in Sections 13(d)(3) and 14(d)(2) of the Exchange Act) other than certain permitted entities affiliated with the Company; or (ii) any person or group, other than such permitted entities, becomes the “beneficial owner” (as defined in Rules 13d-3 and l3d-5 under the Exchange Act), directly or indirectly, of greater than or equal to 50% of the total voting power of the voting stock of the Company, including by way of merger, consolidation or otherwise. A transaction or series of transactions that would otherwise not constitute a Change of Control is treated as a Change of Control for purposes of the Covered NEO’s entitlements under the plan if clause (i) above is satisfied in respect of the business or division in which such executive is principally engaged.
The Severance Plan also provides that if any payment or the amount of benefits due under the plan or otherwise would be considered an excess parachute payment that subjects the Covered NEO to excise tax under Section 4999 of the Code, then the benefits will either be delivered in full or delivered in an amount such that no portion of the benefits would be subject to the excise tax, whichever would result in the receipt by the executive of the greatest benefit on an after-tax basis.
If a Covered NEO’s employment is terminated for any other reason, then no amounts are payable under the Severance Plan.
| | | | | | | | | | | | | | |
| Ratio of the Annual Total Compensation of the Median-Paid Employee to the CEO |
Cooper Standard has approximately 23,000 employees, including 3,000 contingent workers, with 128 facilities in 21 countries. With our global footprint, a significant percentage (approximately 84%) of our employee population is located outside of the United States. In line with the customary nature of manufacturing organizations, a large segment of our employees is operations-based and paid on an hourly basis (approximately 77%). To attract and retain employees globally, we pay what we believe to be market competitive rates in each market where we operate. Our pay ratio (i.e., the total annual compensation of our CEO to the median of the annual total compensation of all our employees, other than the CEO (the “CEO Pay Ratio”)) below is a reasonable estimate that has been calculated in a manner consistent with Item 402(u) of Regulation S-K using the data and assumptions summarized below.
In accordance with the pay ratio regulations, the Company is required to identify the median employee every three years at a minimum. For the 2023 Proxy Statement disclosure, to determine the Pay Ratio required by Item 402(u) of Regulation S-K, the Company first identified the median employee using our global employee population as of December 31, 2023, which included all global full-time, part-time, temporary, and seasonal employees who were employed on that date. In determining our median employee, we used the consistently applied compensation measure of "gross compensation, excluding equity compensation", provided by the employer during the period from January 1 through December 31, 2023. We annualized the gross compensation for newly-hired permanent employees who were not employed for the entire year.
Our median employee represents the composition of our workforce, as the individual was located outside of the United States, in Czech Republic, and was in an hourly and production-based position.
Our median employee's 2023 compensation1 was $14,765. Comparing this to the Chief Executive Officer's 2023 compensation ($7,634,186), we estimate that the CEO Pay Ratio was 517:1.
Supplemental Ratio: The following is provided in addition to (and not as a substitute for) the required pay ratio disclosed above. If we accounted for the cost of living differences, the ratio of the annual total compensation of our CEO compared to that of the median employee identified above would be reduced approximately 55%. Specifically, the median employee's 2023 total compensation1 with the cost of living adjustment3 would have been $26,683. Comparing this to the Chief Executive Officer's 2023 compensation ($7,634,186), the CEO Pay Ratio would have been 286:1.
The SEC rules for identifying the median employee and calculating the pay ratio based on that employee’s annual total compensation allow companies to adopt a variety of methodologies, apply certain exclusions and make reasonable estimates and assumptions that reflect their compensation practices.
As such, the pay ratio reported by other companies may not be comparable to the pay ratio reported above, as other companies may have different employment and compensation practices and may utilize different methodologies, exclusions, estimates and assumptions in calculating their own pay ratios.
1 The median employee's annual total compensation was calculated using the Summary Compensation Table methodology as detailed in Item 402(c)(2)(x) of Regulation S-K.
2 We calculated the total compensation of Mr. Jeffrey S. Edwards, our CEO, as detailed in the Summary Compensation Table for 2023, and compared it to the median employee’s total compensation for 2023 to arrive at the Pay Ratio.
3 Utilized the World Bank, Price level ratio of PPP Conversion Factor (GDP) to Market Exchange Rate for 2022.
Set forth below is information demonstrating the relationship between executive compensation actually paid, calculated in accordance with the applicable SEC regulations (“CAP”) and the financial performance of the Company over the four-year period 2020 through 2023.
Pay Versus Performance Table | | | | | | | | | | | | | | | | | | | | | | | | | | |
Year
(a) | Summary Compensation Table Total for PEO(1) (b) | Compensation Actually Paid to PEO(2) (c) | Average Summary Compensation Table Total for Non-PEO NEOs(3) (d) | Average Compensation Actually Paid to Non-PEO NEOs(4) (e) | Value of Initial Fixed $100 Investment Based on: | GAAP Net Income(7) ($ Millions) (h) | Company Selected Measure:
Adjusted EBITDA(8) ($ Millions) (i) |
Company Total Shareholder Return(5) (f) | Peer Group Total Shareholder Return(6) (g) |
| 2023 | $7,634,186 | $11,439,878 | $1,941,477 | $2,570,224 | $59 | $108 | $(202.0) | $180.4 |
| 2022 | $4,707,758 | $1,890,963 | $1,349,459 | $924,716 | $27 | $102 | $(215.4) | $43.4 |
| 2021 | $5,087,944 | $1,178,083 | $1,208,695 | $567,824 | $68 | $151 | $(322.8) | $(8.0) |
| 2020 | $4,909,345 | $4,700,156 | $1,374,266 | $1,346,729 | $105 | $123 | $(267.6) | $35.7 |
1The amounts shown in column (b) represent total compensation amount for the principal executive officer (“PEO”), Mr. Edwards, for each respective year as reflected in column (j) of the Summary Compensation Table ("SCT Compensation").
2The amounts shown in column (c) represent, for each respective year, the PEO's SCT Compensation, reduced by the grant date fair value of equity-based compensation for the PEO as reported in columns (e) and (f) of the applicable Summary Compensation Table; and increased (or decreased, as applicable) by the change in value of equity awards for the PEO during the year (as of year-end, or upon vesting or forfeiture, if earlier). Mr. Jeffrey Edwards served as the PEO for years 2020 through 2023.
Mr. Edwards does not have a defined benefit pension; thus, the amounts in column (c) are not reflective of any adjustment
associated with pension benefits or costs.
| | | | | | | | | | | | | | | | | | | | | | | | | | | | | |
| | PEO | Other Non-PEO NEOs (average) |
| | 2023 | 2022 | 2021 | 2020 | 2023 | 2022 | 2021 | 2020 |
| Summary Compensation Table (SCT) Total Compensation | (a) | $7,634,186 | $4,707,758 | $5,087,944 | $4,909,345 | $1,941,477 | $1,349,459 | $1,208,695 | $1,374,266 |
| SCT Change in Pension Value | (b) | — | — | — | — | — | — | — | — |
| CAP Pension Service Cost | (c) | — | — | — | — | — | — | — | — |
| SCT Stock and Option Awards Value | (d) | $4,751,899 | $2,689,813 | $3,878,199 | $2,904,733 | $792,526 | $426,497 | $599,125 | $433,794 |
| Fair Value as of Year-End of Equity Awards Granted during the Year | (e) | $6,062,451 | $1,215,173 | $963,615 | $2,653,264 | $1,050,723 | $192,676 | $120,928 | $396,231 |
| Fair value as of Vest Date of Equity Awards Granted during the Year | (f) | — | — | — | — | — | — | $12,889 | — |
| Increase (Decrease) from Prior Year-End in Fair Value of Awards That Vested During the Year | (g) | $754,892 | $(253,996) | $104,808 | $(81,819) | $104,110 | $(42,014) | $(17,898) | $(13,776) |
| Year-over-Year Increase (Decrease) in Fair Value of Unvested Awards Granted in Prior Years | (h) | $1,740,247 | $(1,088,159) | $(1,100,085) | $124,099 | $266,440 | $(148,908) | $(106,829) | $23,802 |
| Fair Value at the End of the Prior Year of Awards that Failed to Meet Vesting Conditions in the Year | (i) | — | — | — | — | — | — | $50,836 | — |
| Value of Dividends or other Earnings Paid on Stock or Option Awards not Otherwise Reflected in Fair Value of Total | (j) | — | — | — | — | — | — | — | — |
Compensation Actually Paid (CAP)
(k) = (a) - (b) + (c) –(d) + (e) + (f) + (g) + (h) - (i) + (j) | (k) | $11,439,878 | $1,890,963 | $1,178,083 | $4,700,156 | $2,570,224 | $924,716 | $567,824 | $1,346,729 |
3The amounts shown in column (d) represent, for each respective year, the average of the total compensation amounts for all NEOs other than the PEO, as reflected in column (j) of the applicable Summary Compensation Table. See details in the table for footnote 2.
The non-PEO NEOs for each respective year, are as follows:
| | | | | | | | | | | |
| Non-PEO NEOs |
| 2023 | 2022 | 2021 | 2020 |
Mr. Jonathan P. Banas | Mr. Jonathan P. Banas | Mr. Jonathan P. Banas | Mr. Jonathan P. Banas |
Mr. Patrick R. Clark | Mr. Patrick R. Clark | Mr. D. William Pumphrey, Jr. | Mr. D. William Pumphrey, Jr. |
Mr. Christopher E. Couch | Mr. Christopher E. Couch | Mr. Christopher E. Couch | Mr. Jeffrey A. DeBest |
Mr. Larry E. Ott | Ms. Joanna M. Totsky | Ms. Joanna M. Totsky | Mr. Larry E. Ott |
| | | Mr. Juan Fernando de Miguel Posada |
4The amounts shown in column (e) represent the average, for each respective year, of the CAP for all non-PEO NEOs, equal to SCT Compensation, reduced by the grant date fair value of equity-based compensation as reported in columns (e) and (f) of the applicable Summary Compensation Table and the change in pension value as reported in column (h) of the applicable Summary Compensation Table; and increased (or decreased, as applicable) by the change in value of equity-based awards during the year (as of year-end, or upon vesting or forfeiture, if earlier) and the pension service cost (and prior service cost, if applicable) associated with any applicable defined benefit pension benefit. See details in the table for footnote 2.
For 2023, Mr. Clark was the only NEO with a defined benefit pension; however, both the change in his pension value as reported in column (h) of the Summary Compensation Table and the combined service and prior service costs for 2023
associated with his pension benefit were zero, having no impact on the calculation of his CAP. For 2022, 2021 and 2020, no non-PEO NEOs had a defined benefit pension; thus, there was no impact on the calculation of CAP.
5The amounts shown in column (f) represent the Company's Total Shareholder Return or cumulative growth of a hypothetical $100 investment in the Company made as of December 31, 2019, reflected as of the end of each respective year, and inclusive of the reinvestment of all dividends, where applicable.
6The amounts shown in column (g) represent the Total Shareholder Return or cumulative growth of a hypothetical $100 investment in the Standard & Poor's Supercomposite Auto Parts & Equipment Index, which we also use for purposes of the stock performance graph required by Item 201(e) of Regulation S-K included in our Annual Report for the year ended December 31, 2023, reflected as of the end of each respective year and inclusive of the reinvestment of all dividends, where applicable.
7The amounts shown in column (h) represent the Company's net income (loss) as reflected in Item 8. Financial Statements and Supplementary Data - Consolidated Statements of Operations on page 48 in our Annual Report on Form 10-K for the fiscal year ended December 31, 2023.
8For purposes of Item 401(v) of Regulation S-K, we have identified Adjusted EBITDA as our Company-Selected Measure, as described under “Annual Incentive Award” in the Executive Compensation Components section of the Compensation Discussion and Analysis. Additional information regarding the Adjusted EBITDA measure is also provided with the Financial Performance Measures list below.
Financial Performance Measures
Set forth below is a list of the financial performance measures used to link compensation actually paid to NEOs for the most recently completed fiscal year to company performance.
| | | | | |
| • | Adjusted Earnings Before Interest, Taxes, Depreciation and Amortization (Adjusted EBITDA)1 |
| • | Return on Invested Capital (ROIC)2 |
| • | Relative Total Shareholder Return (RTSR)3 |
1Adjusted EBITDA is defined as net income (loss) plus income tax expense (benefit), interest expense, net of interest income, depreciation and amortization (or “EBITDA”), as adjusted for items that management does not consider to be reflective of our core operating performance (including, but not limited to, restructuring costs, impairment charges, non-cash fair value adjustments and acquisition-related costs). Adjusted EBITDA, for AIP and pay versus performance disclosure purposes, for 2023 was adjusted for the impact of the United Autoworkers strike. The adjustment increased Adjusted EBITDA from $167.1 million to $180.4 million for purposes of AIP. Adjusted EBITDA is deemed by the Compensation Committee to be an appropriate objective measurement of the financial performance of the Company because it is an indicator of our strategy to achieve sustained profitable growth and align executive compensation with the interests of our stockholders over the long term. Further information regarding Adjusted EBITDA, including a description of the use of Adjusted EBITDA for NEO performance-based compensation for the most recently completed fiscal year is included under “Annual Incentive Award” under the Executive Compensation Components section.
2Return on Invested Capital (ROIC) is a non-GAAP financial measure defined as net operating profit after tax (NOPAT) plus joint venture earnings, including restructuring, divided by the five-quarter average of: (i) net working capital (the sum of net receivables, net inventory, and minimum cash minus current liabilities); plus (ii) net property, plant and equipment (PPE), joint venture investments and goodwill and intangibles. During the most recently completed fiscal year, ROIC was used as a financial measure within our long-term incentive compensation programs for NEOs, designed to motivate leadership to execute our long-term growth strategy while delivering consistently strong financial results. A description of the use of ROIC as a performance metric for NEO performance-based compensation for the most recently completed fiscal year is included under “Long-Term Incentive Compensation” under the Executive Compensation Components section.
3During the most recently completed fiscal year, Relative Total Shareholder Return (RTSR) was used, in addition to the ROIC performance metric, as a financial measure within our long-term incentive compensation programs for NEOs, which was designed to motivate leadership to execute our long-term growth strategy. A description of the use of RTSR as a performance metric for NEO performance-based compensation for the most recently completed fiscal year is included under “Long-Term Incentive Compensation” under the Executive Compensation Components section.
Relationship Between Financial Performance Measures and Executive Compensation Actually Paid
Set forth below are graphical depictions of the relationships between CAP for the PEO and the NEOs, with: (i) the Company’s TSR, (ii) peer group TSR, (iii) the Company’s net income, and (iv) Adjusted EBITDA, the Company-Selected Measure.
Proposal 3: Ratification of Appointment of Ernst & Young LLP as the Company’s Independent Registered Public Accounting Firm for 2024
Proposal 3 is the ratification of the Audit Committee’s selection and reappointment of Ernst & Young LLP as the independent registered public accounting firm to audit the financial statements of the Company for the 2024 fiscal year.
Each year, the Audit Committee reviews the performance, independence, and qualifications of the Company’s independent registered public accounting firm. Ernst & Young LLP has served as the Company’s independent registered public accounting firm since 2005, and the Audit Committee has selected Ernst & Young LLP to serve as the Company’s independent registered public accounting firm for 2024. In considering whether to reappoint Ernst & Young LLP in 2024, the Audit Committee considered, among other things:
•all relationships between Ernst & Young LLP and the Company to determine Ernst & Young LLP’s continuing independence;
•Ernst & Young LLP’s knowledge of and expertise in the automotive industry and the Company’s business;
•Ernst & Young LLP’s global capacity and ability to serve the Company’s worldwide operations;
•the qualifications and performance of the audit firm’s partners and managers who are responsible for the audit;
•the quality control procedures the audit firm has established;
•external data on audit quality and performance, including recent Public Company Accounting Oversight Board (United States) (“PCAOB”) reports on Ernst & Young LLP;
•the reasonableness of the fees paid to the audit firm for audit and permitted non-audit services, as more fully described below; and
•the firm’s known legal risks and any significant legal or regulatory proceedings in which it is involved.
Ratification on an advisory basis of the Audit Committee’s reappointment of Ernst & Young LLP as the Company’s independent registered public accounting firm for 2024 requires the affirmative vote of a majority of the votes cast by the stockholders present in person or represented by proxy at the Annual Meeting and entitled to vote. Abstentions are not counted as votes FOR or AGAINST ratification and will therefore have no effect on such vote. If the stockholders fail to ratify the reappointment on an advisory basis, the Audit Committee will reconsider this selection and take such actions as it deems appropriate as a result of such advisory vote. Even if the appointment of Ernst & Young LLP is ratified, the Audit Committee, in its discretion, may select a different independent registered public accounting firm at any time during the year if the Audit Committee determines that such a change would be in the Company’s and its stockholders’ best interests.
Representatives of Ernst & Young LLP are expected to be present at the Annual Meeting. They are expected to be available to respond to your questions and may make a statement if they desire.
| | | | | |
| þ | The Board of Directors recommends that the stockholders vote FOR Proposal 3.
|
| | | | | | | | | | | | | | |
| Fees and Services of Independent Registered Public Accounting Firm |
The Audit Committee has adopted procedures for pre-approving audit and non-audit services provided by Ernst & Young LLP. The Audit Committee is required to pre-approve all services Ernst & Young LLP provides to the Company. All services provided are to conform with SEC and Public Company Accounting Oversight Board permitted services guidelines. All fee and billing arrangements are reviewed with management of the Company prior to the commencement of services. Ernst & Young LLP regularly reports to the Audit Committee on services performed and to be performed by it with respect to which pre-approval is required. All of the audit, audit-related and tax services performed by Ernst & Young LLP were pre-approved by the Audit Committee pursuant to its pre-approval policies and procedures.
During 2022 and 2023, we retained Ernst & Young LLP as the Company’s independent registered public accounting firm to provide services in the following categories and amounts (dollar amounts in thousands):
| | | | | | | | | | | | | | |
| | 2023 | | 2022 |
Audit fees1 | | $ | 3,278 | | | $ | 3,112 | |
Audit-related fees2 | | $ | 44 | | | $ | 26 | |
Tax fees3 | | $ | 614 | | | $ | 723 | |
All other fees4 | | $ | — | | | $ | — | |
| Total | | $ | 3,936 | | | $ | 3,861 | |
1Audit fees include services related to the annual audit of our consolidated financial statements, the audit of our internal controls over financial reporting, the reviews of our Quarterly Reports on Form 10-Q, international statutory audits, audit services performed in connection with the issuance of comfort letters and consents audit services performed in connection with the issuance of comfort letters and consents, and other services that are normally provided by the independent accountants in connection with our regulatory filings.
2Audit-related fees include services related to due diligence in connection with acquisitions and divestitures and audit procedures related to IT implementations.
3Tax fees include services related to tax compliance, tax advice, and tax planning.
4All other fees are related to other advisory services.
The Audit Committee has considered whether the provision of services described under the line items “Tax fees” and “All other fees” are compatible with maintaining Ernst & Young LLP’s independence. In light of the nature of work performed and the amount of the fees paid to Ernst & Young LLP for those services, the Audit Committee concluded that the provision of such services is compatible with maintaining Ernst & Young LLP’s independence.
| | | | | | | | | | | | | | |
| Report of the Audit Committee |
The Audit Committee, which is comprised entirely of directors who have been determined to be independent under the applicable NYSE listing standards and SEC rules, was established for the purpose of assisting the Board in fulfilling its responsibility to oversee (i) the Company’s financial reporting process, (ii) the integrity of its financial statements, (iii) its compliance with legal and regulatory requirements, (iv) the independence and qualifications of its independent auditor, (v) the effectiveness of its internal controls and (vi) the performance of its internal audit function and its independent auditor.
The Audit Committee is responsible for the appointment, compensation (including negotiation of fees), and oversight of the Company’s independent registered public accounting firm. As part of its oversight and assessment of the independent registered public accounting firm, the Audit Committee considers the quality and efficiency of the services provided, the firm’s global capability, and the technical expertise and knowledge of the Company’s global operations and industry. The Audit Committee also considers the impact of changing auditors when assessing whether to retain the current external auditor. In connection with the mandatory rotation of the independent registered public accounting firm’s lead engagement partner, the Audit Committee is directly involved in the selection of the lead engagement partner. Based on its assessment, the Audit Committee has determined that its selection of Ernst & Young LLP, as the Company’s independent registered public accounting firm, is in the best interest of the Company.
The Company’s management is responsible for its internal controls and the financial reporting process. The Company’s independent registered public accounting firm is responsible for performing an independent audit of the Company’s consolidated financial statements and issuing an opinion on the conformity of those audited financial statements with U.S. GAAP and the effectiveness of the Company’s internal controls over financial reporting. The Audit Committee’s responsibility is to monitor and oversee these processes. In this context, the Audit Committee hereby reports as follows:
1.The Audit Committee has reviewed and discussed with management the Company’s 2023 audited financial statements.
2.The Audit Committee has discussed with Ernst & Young LLP, the Company’s independent registered public accounting firm responsible for expressing an opinion on the conformity of the Company’s audited financial statements with generally accepted accounting principles, the matters required to be discussed pursuant to the applicable standards adopted by the PCAOB, including Ernst & Young LLP’s evaluation of, and conclusions about, the qualitative aspects of the significant accounting principles and practices applied in the Company’s financial reporting.
3.The Audit Committee has received from the independent registered public accounting firm written disclosures and a letter as required by the applicable requirements of the PCAOB regarding the independent accountant’s communications with the Audit Committee concerning independence and discussed with the independent registered public accounting firm its independence from management and the Company. In considering the independence of the Company’s independent registered public accounting firm, the Audit Committee took into consideration the amount and nature of the fees paid to the firm for non-audit services, as described above.
4.Based on the review and discussions referred to in paragraphs (1) through (3) above, the Audit Committee recommended to the Board that the audited financial statements be included in the Company’s Annual Report on Form 10-K for the fiscal year ended December 31, 2023, for filing with the SEC.
Audit Committee
Stephen A. Van Oss, Chair
Christine M. Moore
Robert J. Remenar
Thomas W. Sidlik
Submitting Stockholder Proposals and Nominations for the 2025 Annual Meeting
Proposals received from stockholders will be carefully considered by the Company. Any proposal should be directed to the Company’s secretary at 40300 Traditions Drive, Northville, Michigan, 48168. Stockholder proposals are eligible for consideration for inclusion in the proxy statement for the 2025 Annual Meeting in accordance with Rule 14a-8 under the Exchange Act if they are received by the Company on or before December 5, 2024, 120 days before the first anniversary of the mailing date of the 2024 proxy statement.
In order for a stockholder proposal submitted outside of Rule 14a-8 to be considered “timely” within the meaning of Rule 14a-4(c), such proposal must be delivered to the Company’s secretary at the Company’s principal offices not later than the last date for submission of stockholder proposals under the Company’s By-Laws. In order for a proposal to be “timely” under the Company’s By-Laws, it must be received not later than February 15, 2025, and not earlier than January 16, 2025; provided, however, if we hold the 2025 Annual Meeting more than 30 days before or more than 60 days after the anniversary of the 2024 Annual Meeting, notice by stockholders to be timely must be received no earlier than the opening of business on the 120th day prior to the 2025 Annual Meeting date and no later than the close of business on (i) the 90th day prior to the 2025 Annual Meeting date or (ii) the 10th day after the day on which disclosure of the date of the 2025 Annual Meeting is made, whichever is later.
In addition to satisfying the foregoing requirements under the Company’s By-Laws, to comply with the universal proxy rules, stockholders who intend to solicit proxies in support of director nominees other than the Company’s nominees must provide notice that sets forth the information required by Rule 14a-19 under the Exchange Act no later than March 17, 2025, 60 days before the first anniversary of the 2024 Annual Meeting.
Additional Information
The SEC has adopted rules that permit companies and intermediaries such as brokers to satisfy delivery requirements for proxy statements and annual reports with respect to two or more stockholders sharing the same address by delivering a single proxy statement and annual report addressed to those stockholders. This process, which is commonly referred to as “householding,” potentially provides extra convenience for stockholders and cost savings for companies. The Company and some brokers household proxy materials, delivering a single proxy statement and annual report to multiple stockholders sharing an address unless contrary instructions have been received from the affected stockholders. Once you have received notice from your broker or the Company that your broker or the Company will be householding materials to your address, householding will continue until you are notified otherwise or until you revoke your consent. If, at any time, you no longer wish to participate in householding and would prefer to receive a separate proxy statement and annual report, please notify your broker if your shares are held in a brokerage account or the Company if you hold registered shares. You can notify the Company by phone at (248) 596-5900 or by sending a written request to the Company at 40300 Traditions Drive, Northville, Michigan, 48168, Attention: Secretary. If your household has received multiple copies of proxy statements and annual reports, you can request the delivery of single copies in the future by notifying the Company as listed above.
Discretionary Voting of Proxies on Other Matters
As of the date of this proxy statement, there are no other matters that the Company’s management intends to present, or have reason to believe others will present, at the Annual Meeting. If, however, other matters are brought before the Annual Meeting in a proper manner, the accompanying proxy authorizes the persons named as proxies or their substitutes to vote on such matters as they determine appropriate.
| | | | | |
COOPER-STANDARD HOLDINGS INC. ATTN: MaryAnn Peterson Kanary 40300 Traditions Drive Northville, Michigan, 48168 | |
| VOTE BY INTERNET Before The Meeting - Go to www.proxyvote.com or scan the QR Barcode above
Use the Internet to transmit your voting instructions, your questions to management and your request for electronic delivery of proxy materials up until 11:59 P.M. Eastern Time the day before the cut-off date or meeting date. Have your proxy card in hand when you access the website and follow the instructions to obtain your records and to create an electronic voting instruction form. During The Meeting - Go to www.virtualshareholdermeeting.com/CPS2024
You will be able to attend and vote at the Annual Meeting via the Internet by visiting the website referenced right above. Have the information that is printed in the box marked by the arrow available and follow the instructions.
VOTE BY PHONE - 1-800-690-6903 Use any touch-tone telephone to transmit your voting instructions up until 11:59 P.M. Eastern Time the day before the cut-off date or meeting date. Have your proxy card in hand when you call and then follow the instructions.
VOTE BY MAIL Mark, sign and date your proxy card and return it in the postage-paid envelope we have provided or return it to Vote Processing, c/o Broadridge, 51 Mercedes Way, Edgewood, NY 11717. |
| |
| |
| |
| | | | | | | | | | | | | | | | | | | | | | | | | | | | | | | | | | | | | | | | | | | | | | | | | | |
| TO VOTE, MARK BLOCKS BELOW IN BLUE OR BLACK INK AS FOLLOWS: | | | | | | | | | | |
| _ _ _ _ _ _ _ _ _ _ _ _ _ _ _ _ _ _ _ _ _ _ _ _ _ _ _ _ _ _ _ _ _ _ _ _ _ _ _ _ _ _ _ _ _ _ _ _ _ _ _ _ _ _ _ _ _ _ _ _ _ _ _ _ _ _ _ _ _ _ _ _ _ _ _ _ _ _ |
| THIS PROXY CARD IS VALID ONLY WHEN SIGNED AND DATED. |
| COOPER-STANDARD HOLDINGS INC. | | | | | | |
| | The Board of Directors recommends you vote FOR the listed nominees. | | | | | | |
| 1. | Election of Directors | | For | Against | Abstain | | | The Board of Directors recommends you vote FOR Proposals 2 and 3. | For | Against | Abstain | | |
| | 1a. John G. Boss
| | ☐ | ☐ | ☐ | | | 2. | Advisory Vote on Named Executive Officer Compensation. | | ☐ | ☐ | ☐ | | |
| | 1b. Jeffrey S. Edwards
| | ☐ | ☐ | ☐ | | | 3. | Ratification of Appointment of Independent Registered Public Accounting Firm. | | ☐ | ☐ | ☐ | | |
| | 1c. Richard J. Freeland | | ☐ | ☐ | ☐ | | | | | | | | | | |
| | 1d. Adriana E. Macouzet-Flores | | ☐ | ☐ | ☐ | | | | | | | | | | |
| | 1e. David J. Mastrocola
| | ☐ | ☐ | ☐ | | | | | | | | | | |
| | 1f. Christine M. Moore
| | ☐ | ☐ | ☐ | | | | | | | | | |
| | 1g. Robert J. Remenar
| | ☐ | ☐ | ☐ | | | | | | | | | | |
| | 1h. Sonya F. Sepahban
| | ☐ | ☐ | ☐ | | | | | | |
| | 1i. Thomas W. Sidlik
| | ☐ | ☐ | ☐ | | | NOTE: Conduct such other business as may properly come before the meeting or any adjournment thereof. | |
| | 1j. Stephen A. Van Oss
| | ☐ | ☐ | ☐ | | | | | | | | | | |
| | Please sign exactly as your name(s) appear(s) hereon. When signing as attorney, executor, administrator, or other fiduciary, please give full title as such. Joint owners should each sign personally. All holders must sign. If a corporation or partnership, please sign in full corporate or partnership name, by authorized officer. | |
| | | | | | | | | | | | | | | |
| | | | | | | | | | | | | | |
| | Signature [PLEASE SIGN WITHIN BOX] | Date | | | Signature (Joint Owners) | | | | Date | | |
| | | | | | | | | | | |
Important Notice Regarding the Availability of Proxy Materials for the Annual Meeting: The Notice, Proxy Statement and Annual Report on Form 10-K for the fiscal year ended December 31, 2023, are available at www.proxyvote.com |
| _ _ _ _ _ _ _ _ _ _ _ _ _ _ _ _ _ _ _ _ _ _ _ _ _ _ _ _ _ _ _ _ _ _ _ _ _ _ _ _ _ _ _ _ _ _ _ _ __ _ _ _ _ _ _ _ _ _ _ _ _ _ _ _ _ _ _ __ _ _ _ _ _ _ _ |
| | | | | |
| |
COOPER-STANDARD HOLDINGS INC. Annual Meeting of Stockholders May 16, 2024 9:00 AM This proxy is solicited by the Board of Directors The stockholder(s) hereby appoint(s) Jeffrey S. Edwards and MaryAnn Peterson Kanary, or either of them, as proxies, each with the power to appoint his or her substitute, and hereby authorizes them to represent and to vote, as designated on the reverse side of this ballot, all of the shares of Common Stock of COOPER-STANDARD HOLDINGS INC. that the stockholder(s) is/are entitled to vote at the Annual Meeting of Stockholders to be held at 9:00 AM, EDT on May 16, 2024, at www.virtualshareholdermeeting.com/CPS2024, and any adjournment or postponement thereof. This proxy, when properly executed and returned, will be voted in the manner directed herein. If no such direction is made, this proxy will be voted in accordance with the Board of Directors’ recommendations.
Continued and to be signed on reverse side |