| Exhibit 99.1
|

Exhibit 99.1
Treasurer
Deutsche Bank
20th Annual Leveraged Finance Conference
October 11, 2012
Allen Campbell
Chief Financial Officer
Glenn Dong
|
|
Safe harbor
In addition to historical information, certain statements contained herein are forward-looking statements within the meaning of federal securities laws, and Cooper-Standard Holdings, Inc. (Cooper Standard) intends that such forward-looking statements be subject to the safe-harbor created thereby. These forward-looking statements include statements concerning the company’s plans, objectives, goals, strategies, future events, future revenue or performance, capital expenditures, financing needs, plans or intentions relating to acquisitions, business trends, the impact of “fresh-start” accounting, the impact of the company’s bankruptcy on its future performance and other information that is not historical information. When used herein, the words “estimates,” “expects,” “anticipates,” “projects,” “plans,” “intends,” “believes,” “forecasts,” or future or conditional verbs, such as “will,” “should,” “could,” or “may,” and variations of such words or similar expressions are intended to identify forward-looking statements. All forward-looking statements, including, without limitation, management’s examination of historical operating trends and data, are based upon Cooper Standard’s current expectations and various assumptions. Cooper Standard’s expectations, beliefs and projections are expressed in good faith and Cooper Standard believes there is a reasonable basis for them. However, no assurances can be made that these expectations, beliefs and projections will be achieved. Forward-looking statements are not guarantees of future performance and are subject to significant risks and uncertainties that may cause actual results or achievements to be materially different from the future results or achievements expressed or implied by the forward-looking statements.
This presentation includes forward-looking statements, reflecting current analysis and expectations, based on what are believed to be reasonable assumptions. Forward-looking statements may involve known and unknown risks, uncertainties and other factors, which may cause actual results to differ materially from those projected, stated or implied, depending on many factors, including, without limitation: the Company’s dependence on the automotive industry; further restructuring of the Company’s customers; availability and cost of raw materials; pricing pressures and volume requirements of the Company’s customers; the ability to meet significant increase in customer demand; increased costs negatively impacting the Company’s profitability; competition in the automotive industry; sovereign and other risks related to conducting operations outside the United States; foreign currency fluctuations; the Company’s ability to achieve benefits from its joint venture operations not operated for the Company’s sole benefit; the Company’s exposure to the uncertainty of political disruptions and increased violence in Mexico; the uncertainty of the Company’s ability to achieve expected cost reduction savings; the Company’s dependence on certain major customers and platforms; the Company’s exposure to product liability and warranty claims; labor conditions; the Company’s ability to attract and retain key personnel; the Company’s ability to meet customers’ needs for new and improved products in a timely manner; the Company’s ability to select and integrate attractive business acquisitions; the Company’s legal rights to its intellectual property portfolio; environmental and other regulations; the outcome of legal proceedings the Company is or may become party to; volatility in the Company’s expected annual effective tax rate; impact of the Company’s capital structure on its
financial condition and ability to obtain financing in the future; the Company’s ability to generate cash to meet its debt and other cash obligations; the Company’s pension plans; any impairment of a significant amount of the Company’s goodwill or other intangible asset; potential conflicts of interest between the Company’s owners and the Company; limitations on flexibility in operating the Company’s business contained in its debt agreements; the Company’s exposure to natural disasters; and other risks described from time-to-time in the Company’s Securities and Exchange Commission filings. There may be other factors that may cause the company’s actual results to differ materially from those projected in any forward-looking statement. Accordingly, there can be no assurance that Cooper Standard will meet future results, performance or achievements expressed or implied by such forward-looking statements. This paragraph is included to provide a safe harbor for forward-looking statements, which are not generally required to be publicly revised as circumstances change and which Cooper Standard does not intend to update.
This presentation includes certain statements, estimates and forecasts of Cooper Standard with respect to the anticipated future performance of Cooper Standard that involve significant elements of subjective judgment and analysis that may or may not prove to be accurate or correct. There can be no assurance that these statements, estimates and forecasts will be attained and actual outcomes and results may differ materially from what is estimated or forecast herein. Cooper Standard undertakes no obligation to update any statement, estimate or forecast, whether as a result of new information, future events or otherwise.
This presentation has been prepared to assist interested parties in making their own evaluation of Cooper Standard and does not purport to be all-inclusive or to contain all the information that a interested parties may desire. In all cases, interested parties should conduct their own independent investigations and analyses of Cooper Standard. Interested parties can only rely on the results of their own investigations and the representations and warranties made in any definitive agreement that may be executed.
cooperstandard 2
|
|
Company Overview
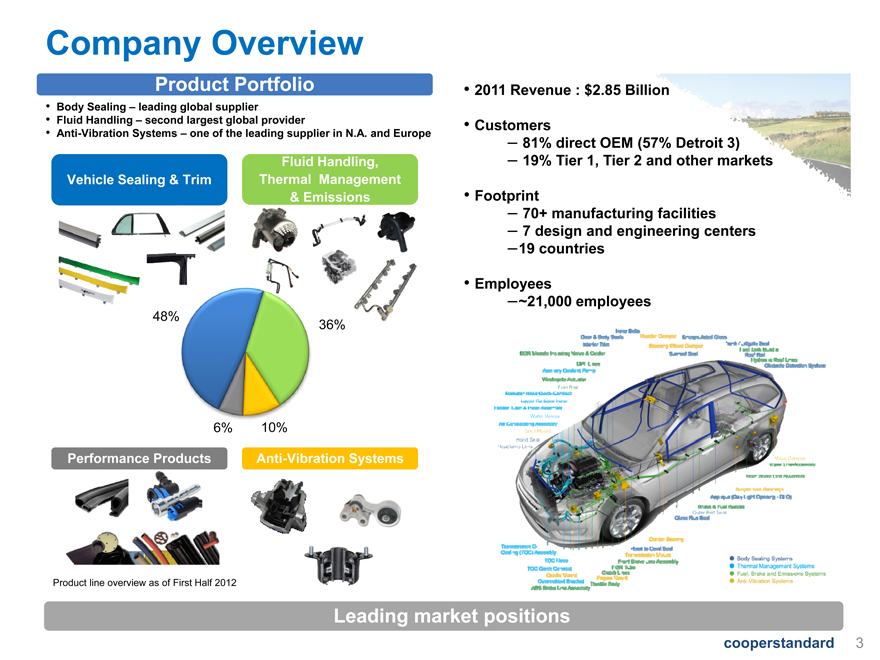
Product Portfolio
Body Sealing – leading global supplier
Fluid Handling – second largest global provider
Anti-Vibration Systems – one of the leading supplier in N.A. and Europe
Fluid Handling,
Vehicle Sealing & Trim Thermal Management
& Emissions
48% 36%
6% 10%
Performance Products Anti-Vibration Systems
Product line overview as of First Half 2012
2011 Revenue : $2.85 Billion
Customers
81% direct OEM (57% Detroit 3)
19% Tier 1, Tier 2 and other markets
Footprint
70+ manufacturing facilities
| 7 |
|
design and engineering centers |
19 countries
Employees
~21,000 employees
Leading market positions
cooperstandard 3
|
|
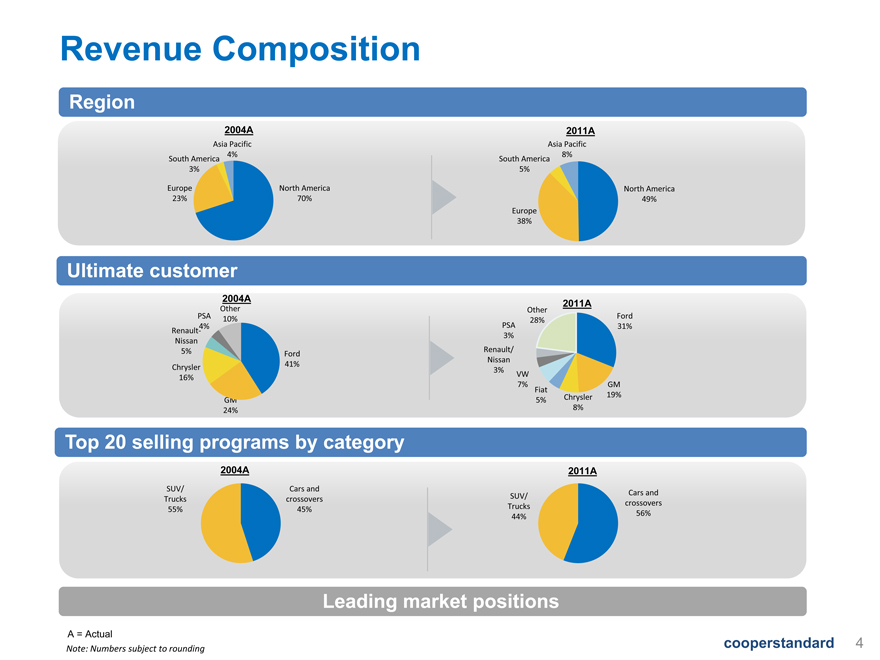
RegRevenue Composition
ion
2004A
Asia Pacific 4% South America 3%
Europe North America 23% 70%
Ultimate customer
2004A
Other PSA 10% 4% Renault-Nissan
5% Ford 41% Chrysler 16%
GM 24%
Top 20 selling programs by category
2004A
SUV/ Cars and Trucks crossovers 55% 45%
2011A
Asia Pacific 8% South America 5% North America
49% Europe 38%
2011A
Other Ford 28% PSA 31% 3% Renault/ Nissan 3% VW
7% GM
Fiat
Chrysler 19% 5% 8%
2011A
Cars and SUV/ crossovers Trucks 56% 44%
Leading market positions
A = Actual
Note- Numbers subject to rounding
cooperstandard 4
|
|
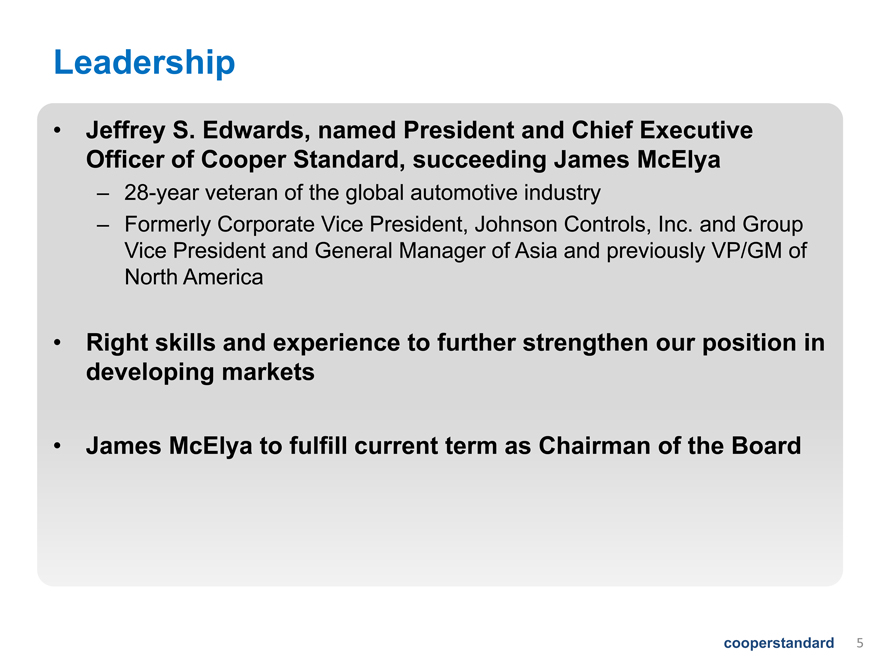
Leadership
Jeffrey S. Edwards, named President and Chief Executive Officer of Cooper Standard, succeeding James McElya
28-year veteran of the global automotive industry
Formerly Corporate Vice President, Johnson Controls, Inc. and Group Vice President and General Manager of Asia and previously VP/GM of North America
Right skills and experience to further strengthen our position in developing markets
James McElya to fulfill current term as Chairman of the Board
cooperstandard 5
|
|
Avenues for Growth
| 1 |
|
Developed market recovery |
| 2 |
|
Long-term growth in emerging markets |
| 3 |
|
Leading technology & engineering capabilities |
| 4 |
|
Trends toward global platforms |
| 5 |
|
Opportunities in adjacent markets |
cooperstandard 6
|
|
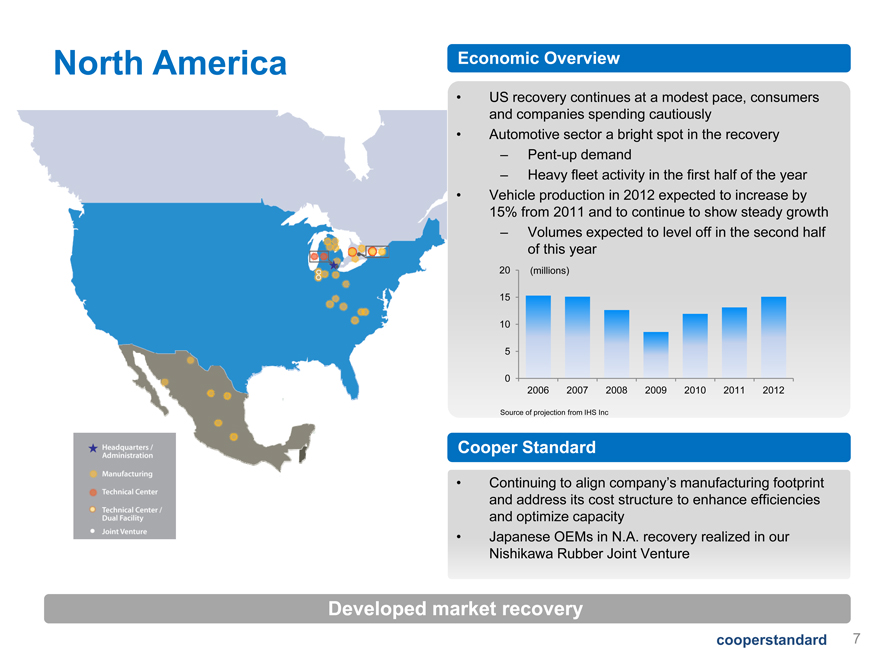
North America Economic Overview
US recovery continues at a modest pace, consumers and companies spending cautiously
Automotive sector a bright spot in the recovery
Pent-up demand
Heavy fleet activity in the first half of the year
Vehicle production in 2012 expected to increase by 15% from 2011 and to continue to show steady growth
Volumes expected to level off in the second half of this year
40 (millions)
30
20
10
0
2006 2007 2008 2009 2010 2011 2012
Source of projection from IHS Inc
Cooper Standard
Continuing to align company’s manufacturing footprint and address its cost structure to enhance efficiencies and optimize capacity
Japanese OEMs in N.A. recovery realized in our Nishikawa Rubber Joint Venture
Developed market recovery
cooperstandard 7
|
|
20 (millions)
15
10
| 5 |
|
0
2006 2007 2008 2009 2010 2011 2012
Source of projection from IHS Inc
Cooper Standard
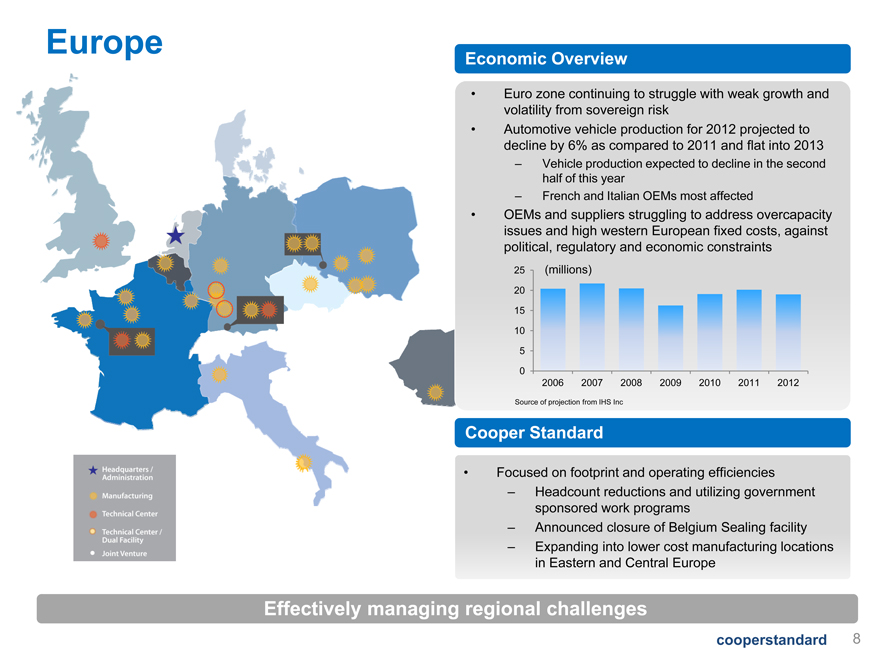
Europe
Economic Overview
Euro zone continuing to struggle with weak growth and volatility from sovereign risk
Automotive vehicle production for 2012 projected to decline by 6% as compared to 2011 and flat into 2013
Vehicle production expected to decline in the second half of this year
French and Italian OEMs most affected
OEMs and suppliers struggling to address overcapacity issues and high western European fixed costs, against political, regulatory and economic constraints
25 (millions)
20
15
10
| 5 |
|
0
2006 2007 2008 2009 2010 2011 2012
Source of projection from IHS Inc
Cooper Standard
Headcount reductions and utilizing government sponsored work programs
Announced closure of Belgium Sealing facility
Expanding into lower cost manufacturing locations in Eastern and Central Europe
Effectively managing regional challenges
cooperstandard 8
|
|
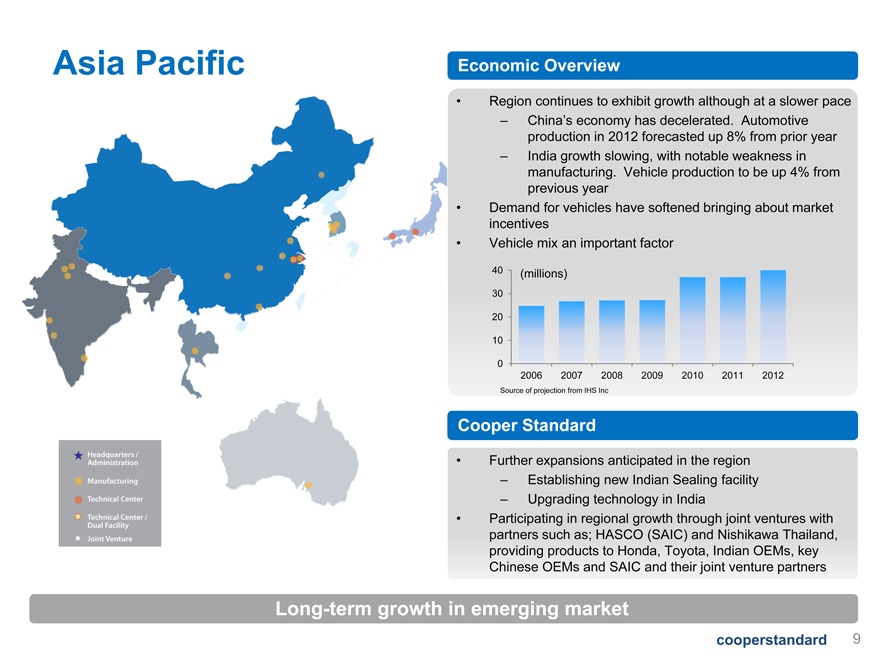
Asia Pacific Economic Overview
Region continues to exhibit growth although at a slower pace
China’s economy has decelerated. Automotive production in 2012 forecasted up 8% from prior year
India growth slowing, with notable weakness in manufacturing. Vehicle production to be up 4% from previous year
Demand for vehicles have softened bringing about market incentives
Vehicle mix an important factor
Further expansions anticipated in the region
Establishing new Indian Sealing facility
Upgrading technology in India
Participating in regional growth through joint ventures with partners such as; HASCO (SAIC) and Nishikawa Thailand, providing products to Honda, Toyota, Indian OEMs, key Chinese OEMs and SAIC and their joint venture partners
Long-term growth in emerging market
40 (millions)
30
20
10
0
2006 2007 2008 2009 2010 2011 2012
Source of projection from IHS Inc
Cooper Standard
cooperstandard 9
|
|
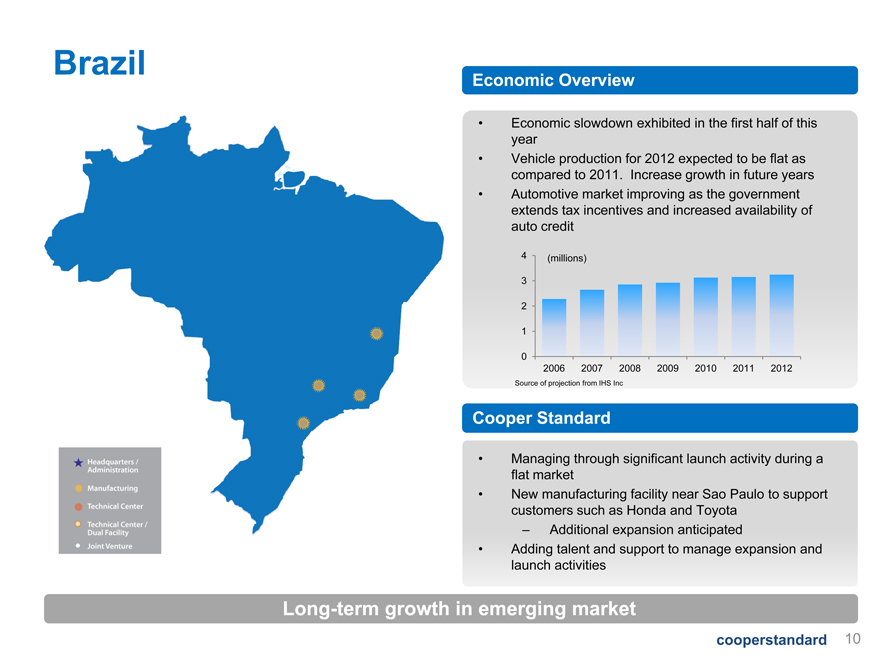
Brazil
Economic Overview
Economic slowdown exhibited in the first half of this year
Vehicle production for 2012 expected to be flat as compared to 2011. Increase growth in future years
Automotive market improving as the government extends tax incentives and increased availability of auto credit
| 4 |
|
(millions) 3 |
| 2 |
|
| 1 |
|
0
2006 2007 2008 2009 2010 2011 2012
Source of projection from IHS Inc
Cooper Standard
Managing through significant launch activity during a flat market
New manufacturing facility near Sao Paulo to support customers such as Honda and Toyota
Additional expansion anticipated
Adding talent and support to manage expansion and launch activities
Long-term growth in emerging market
cooperstandard 10
|
|
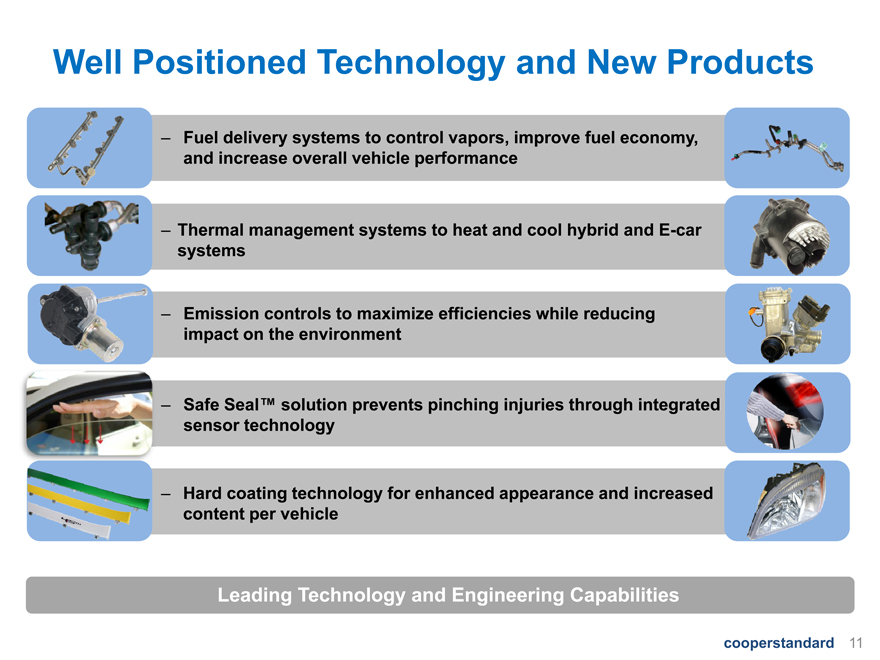
Well Positioned Technology and New Products
Fuel delivery systems to control vapors, improve fuel economy, and increase overall vehicle performance
Thermal management systems to heat and cool hybrid and E-car systems
Emission controls to maximize efficiencies while reducing impact on the environment
Safe Seal™ solution prevents pinching injuries through integrated sensor technology
Hard coating technology for enhanced appearance and increased content per vehicle
Leading Technology and Engineering Capabilities
cooperstandard 11
|
|
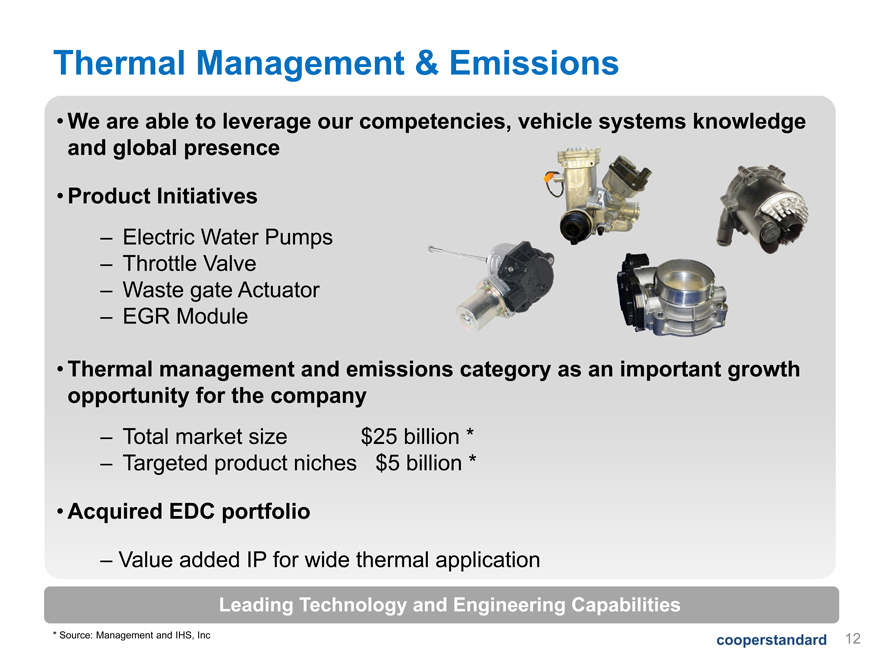
Thermal Management & Emissions
We are able to leverage our competencies, vehicle systems knowledge and global presence
Product Initiatives
Electric Water Pumps
Throttle Valve
Waste gate Actuator
EGR Module
Thermal management and emissions category as an important growth opportunity for the company
Total market size $25 billion *
Targeted product niches $5 billion *
Acquired EDC portfolio
Value added IP for wide thermal application
| * |
|
Source: Management and IHS, Inc |
cooperstandard 12
|
|
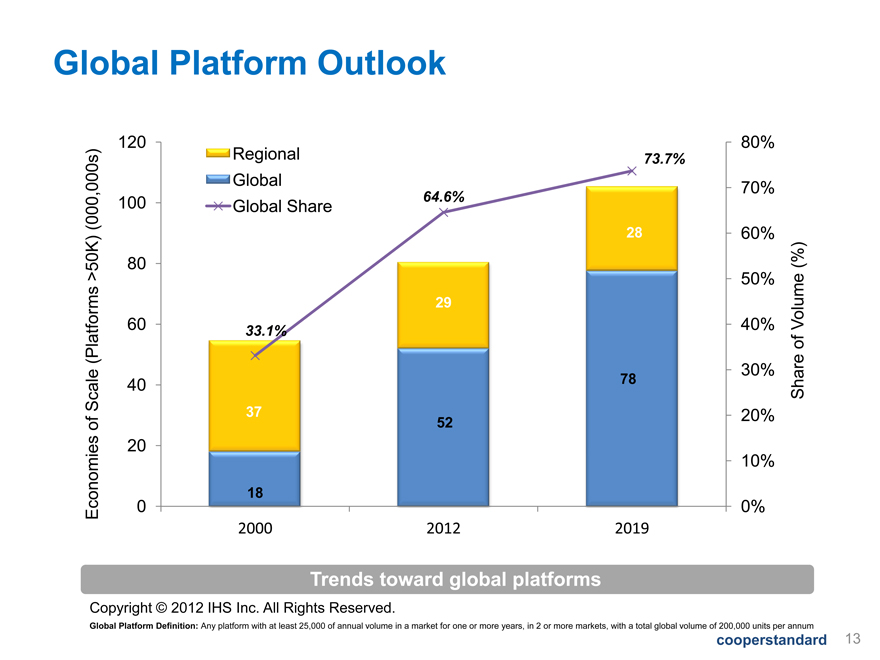
Global Platform Outlook
Economies of Scale (Platforms > 50K (000,000s)
120
100
80
60
40
20
0
Regional
Global
Global Share
33.1%
37
18
2000
64.6%
29
52
2012
73.7%
28
78
2019
Trends toward
80%
70%
60%
50%
40%
30%
20%
10%
0%
Shares of Volume (%)
global platforms
Copyright © 2012 IHS Inc. All Rights Reserved.
Global Platform Definition: Any platform with at least 25,000 of annual volume in a market for one or more years, in 2 or more markets, with a total global volume of 200,000 units per annum
cooperstandard 13
|
|
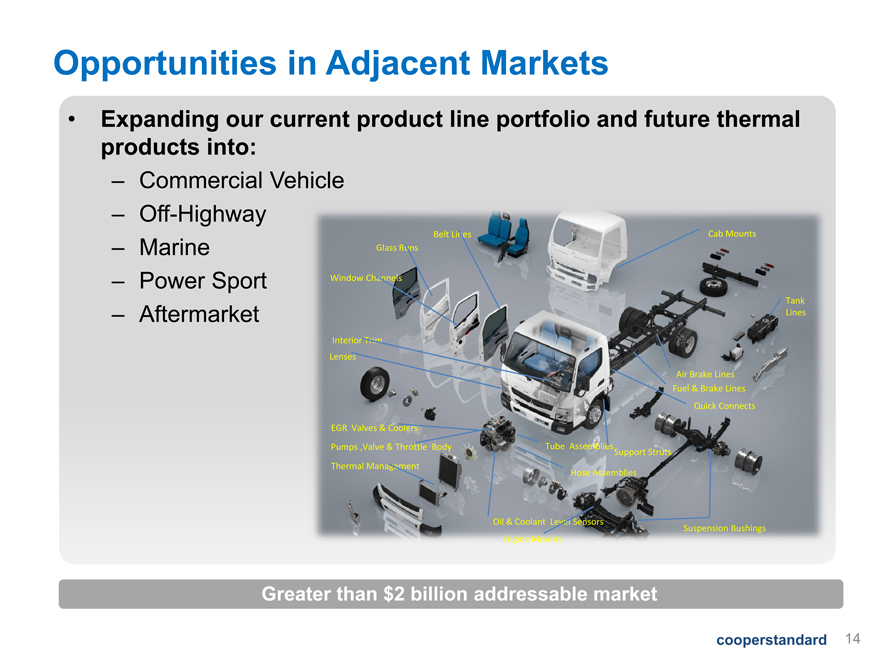
Opportunities in Adjacent Markets
Expanding our current product line portfolio and future thermal products into:
Commercial Vehicle
Off-Highway
Marine
Power Sport
Aftermarket market
Cooperstandard14
Greater than $ billion addressable market
|
|
Cooper Standard
Financials
|
|
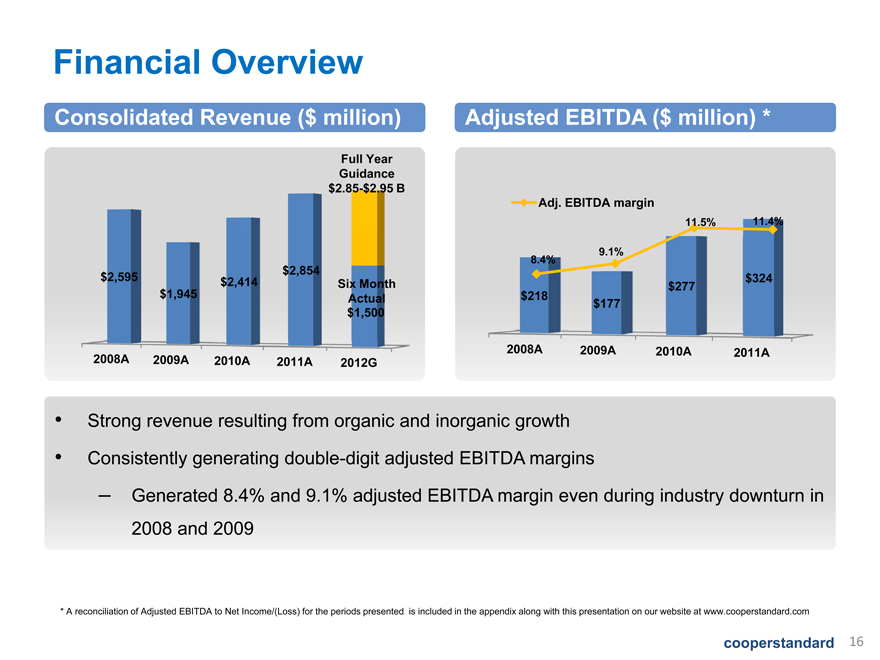
Financial Overview
Consolidated Revenue ($ million)
Full Year
Guidance
$2.85-$2.95 B
$2,854
$2,595 $2,414 onth
$1,945 Actual
$1,500
2008A 2009A 2010A 2011A 2012G
Strong revenue resulting from organic and inorganic growth
Consistently generating double-digit adjusted EBITDA margins
Generated 8.4% and 9.1% adjusted EBITDA margin even during industry downturn in 2008 and 2009
* A reconciliation of Adjusted EBITDA to Net Income/(Loss) for the periods presented is included in the appendix along with this presentation on our website at www.cooperstandard.com
40 (millions)
30
20
10
0
2006 2007 2008 2009 2010 2011 2012
Source of projection from IHS Inc
Cooper Standard
cooperstandard 16
|
|
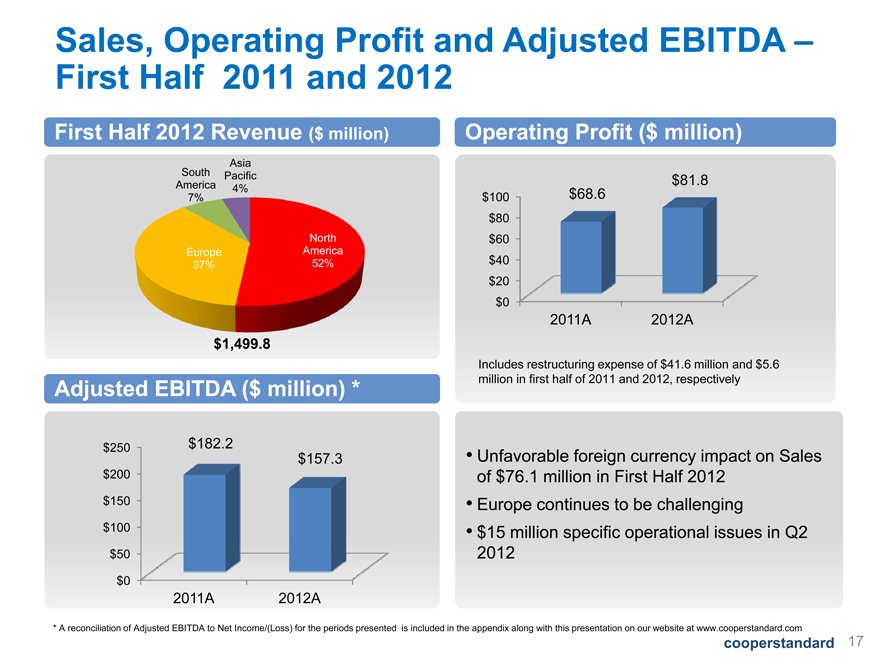
Sales, Operating Profit and Adjusted EBITDA –First Half 2011 and 2012
First Half 2012 Revenue ($ million)
Asia
South Pacific
America 4%
7%
North
Europe America
37% 52%
$1,499.8
Adjusted EBITDA ($ million) *
$250 $182.2
$157.3
$200
$150
$100
$50
$0
2011A 2012A
| * |
|
A reconciliation of Adjusted EBITDA to Net Income/(Loss) for the periods presented |
Operating Profit ($ million)
$81.8
$100 $68.6
$80
$60
$40
$20
$0
2011A 2012A
Includes restructuring expense of $41.6 million and $5.6
million in first half of 2011 and 2012, respectively
Unfavorable foreign currency impact on Sales of $76.1 million in First Half 2012
Europe continues to be challenging
$15 million specific operational issues in Q2 2012
is included in the appendix along with this presentation on our website at www.cooperstandard.com
cooperstandard 17
|
|
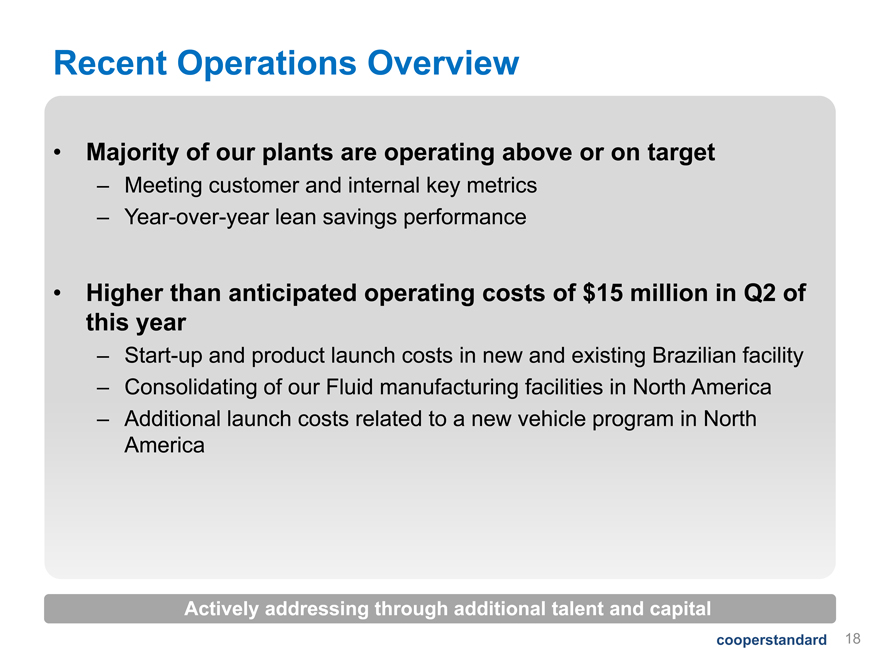
Recent Operations Overview
Majority of our plants are operating above or on target
Meeting customer and internal key metrics
Year-over-year lean savings performance
Higher than anticipated operating costs of $15 million in Q2 of this year
Start-up and product launch costs in new and existing Brazilian facility
Consolidating of our Fluid manufacturing facilities in North America
Additional launch costs related to a new vehicle program in North America
Actively addressing through additional talent and capital
cooperstandard18
|
|
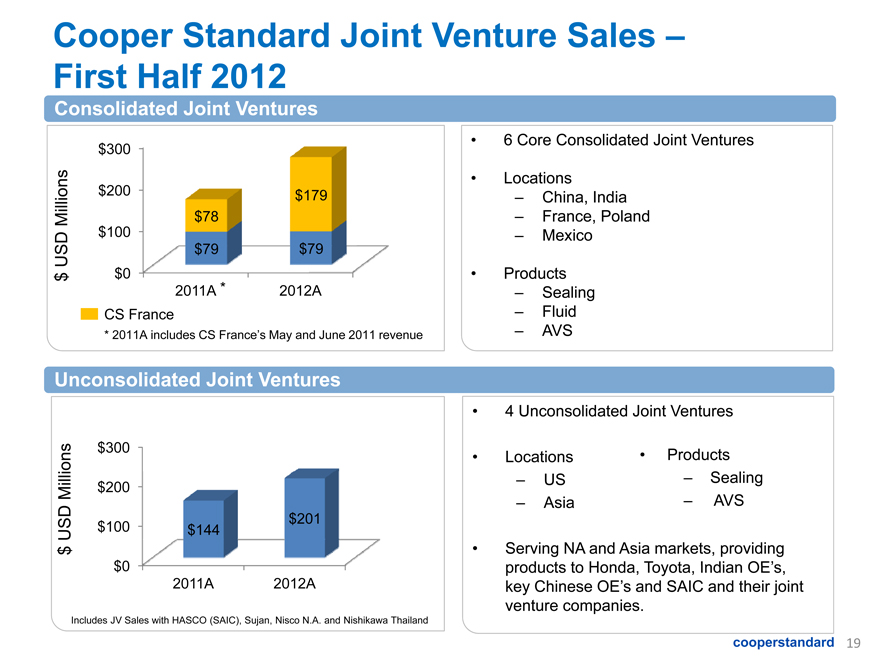
Cooper Standard Joint Venture Sales –First Half 2012
Consolidated Joint Ventures
$ USD Millions
$300
$200
$78
$100
$79
$0
2011A *
CS France
$179
$79
2012A
| * |
|
2011A includes CS France’s May and June 2011 revenue |
Unconsolidated Joint Ventures
$ USD Millions
$300
$200
$100
$0
$144
2011A
$201
2012A
Includes JV Sales with HASCO (SAIC), Sujan, Nisco N.A. and Nishikawa Thailand
| 4 |
|
Unconsolidated Joint Ventures |
Locations Products
US—Sealing
Asia – AVS
Serving NA and Asia markets, providing products to Honda, Toyota, Indian OE’s, key Chinese OE’s and SAIC and their joint venture companies.
| 6 |
|
Core Consolidated Joint Ventures |
Locations
China, India
France, Poland
Mexico
Products
Sealing
Fluid
AVS
cooperstandard 19
|
|
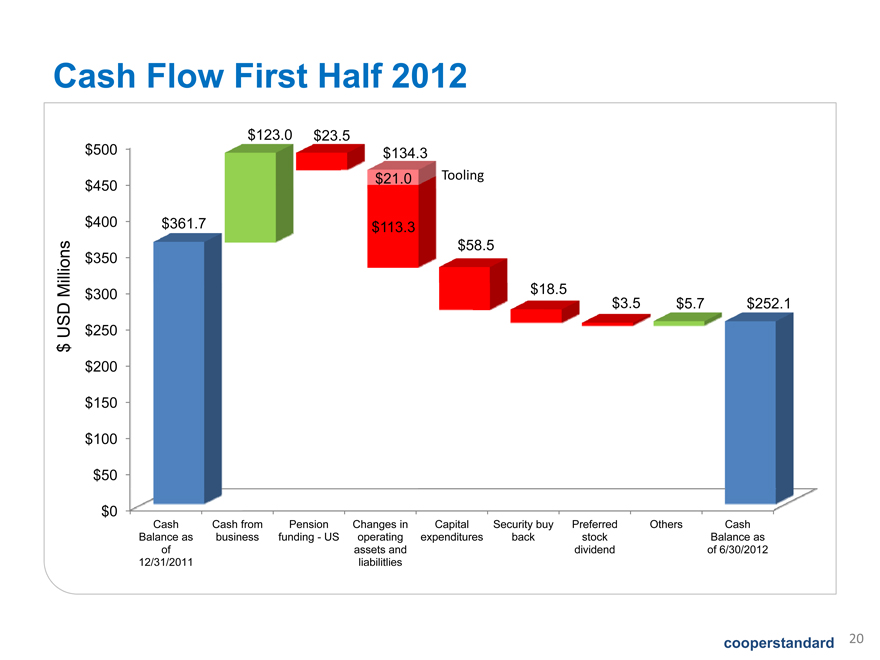
Cash Flow First Half 2012
$ USD Millions
$500
$450
$400
$350
$300
$250
$200
$150
$100
$50
$0
$361.7
$123.0
$23.5
$134.3
$21.0
$113.3
Tooling
$58.5
$18.5
$3.5
$5.7
$252.1
Cash
Cash
Cash
Balance as
of
12/31/2011
Cash from
business
Pension
funding—US
Changes in
operating
assets and
liabilitlies
Capital
expenditures
Security buy
back
Preferred
stock
dividend
Others
Cash
Balance as
of 6/30/2012
cooperstandard 20
|
|
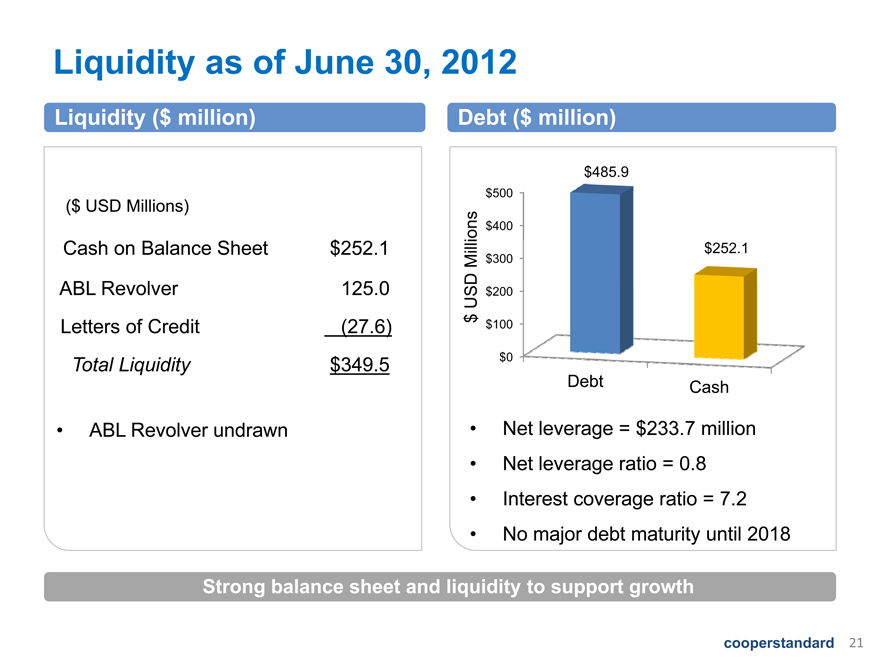
Strong balance sheet and liquidity to support growth
Liquidity as of June 30, 2012
Liquidity ($ million)
($ USD Millions)
Cash on Balance Sheet
ABL Revolver
Letters of Credit
Total Liquidity
ABL Revolver undrawn
$ 252.1
125.0
(27.6)
$ 349.5
Debt ($ million)
$ USD Millions
$485.9
$500
$400
$252.1
$300
$200
$100
$0
Debt Cash
Net leverage = $233.7 million
Net leverage ratio = 0.8
Interest coverage ratio = 7.2
No major debt maturity until 2018
cooperstandard 21
|
|
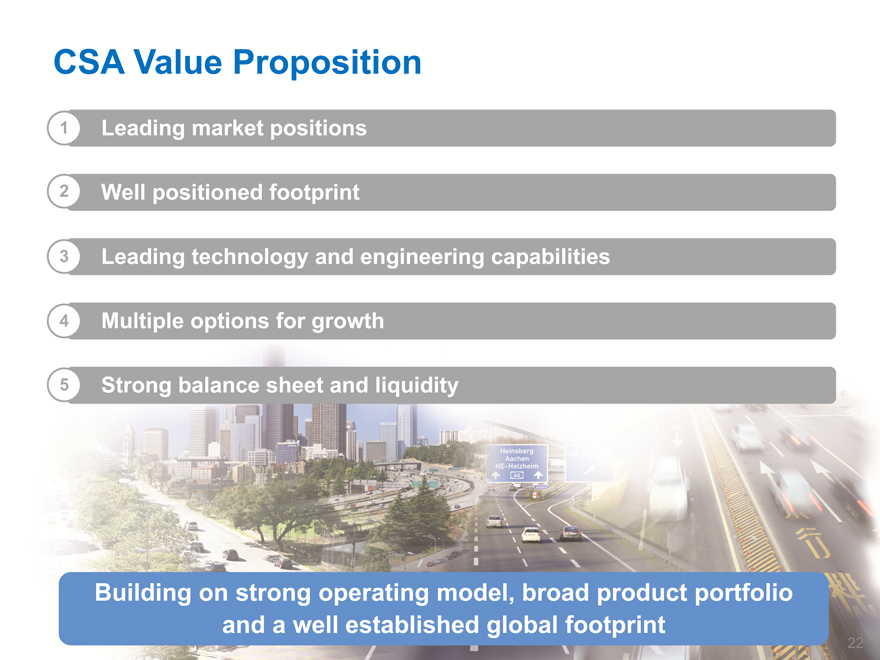
CSA Value Proposition
| 1 |
|
Leading market positions |
| 2 |
|
Well positioned footprint |
| 3 |
|
Leading technology and engineering capabilities |
| 4 |
|
Multiple options for growth |
| 5 |
|
Strong balance sheet and liquidity |
Building on strong operating model, broad product portfolio and a well established global footprint
cooperstandard
22
|
|
Cooper Standard
Appendix
|
|
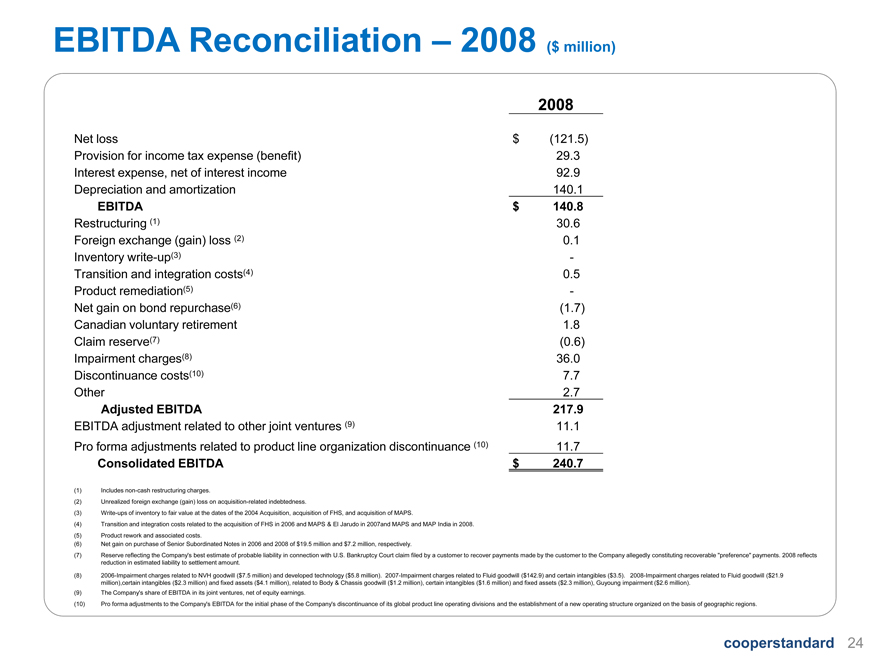
EBITDA Reconciliation – 2008 ($ million)
Net loss
Provision for income tax expense (benefit)
Interest expense, net of interest income
Depreciation and amortization
EBITDA
Restructuring (1)
Foreign exchange (gain) loss (2)
Inventory write-up(3)
Transition and integration costs(4)
Product remediation(5)
Net gain on bond repurchase(6)
Canadian voluntary retirement
Claim reserve(7)
Impairment charges(8)
Discontinuance costs(10)
Other
Adjusted EBITDA
EBITDA adjustment related to other joint ventures (9)
Pro forma adjustments related to product line organization discontinuance (10)
Consolidated EBITDA
2008
$ (121.5)
29.3
92.9
140.1
$ 140.8
30.6
0.1
-
0.5
-
(1.7)
1.8
(0.6)
36.0
| 7 |
|
7. |
2.7
217.9
11.1
11.7
$ 240.7
Includes non-cash restructuring charges.
Unrealized foreign exchange (gain) loss on acquisition-related indebtedness.
Write-ups of inventory to fair value at the dates of the 2004 Acquisition, acquisition of FHS, and acquisition of MAPS.
Transition and integration costs related to the acquisition of FHS in 2006 and MAPS & El Jarudo in 2007and MAPS and MAP India in 2008.
Product rework and associated costs.
Net gain on purchase of Senior Subordinated Notes in 2006 and 2008 of $19.5 million and $7.2 million, respectively.
Reserve reflecting the Company’s best estimate of probable liability in connection with U.S. Bankruptcy Court claim filed by a customer to recover payments made by the customer to the Company allegedly constituting recoverable “preference” payments. 2008 reflects reduction in estimated liability to settlement amount.
2006-Impairment charges related to NVH goodwill ($7.5 million) and developed technology ($5.8 million). 2007-Impairment charges related to Fluid goodwill ($142.9) and certain intangibles ($3.5). 2008-Impairment charges related to Fluid goodwill ($21.9 million),certain intangibles ($2.3 million) and fixed assets ($4.1 million), related to Body & Chassis goodwill ($1.2 million), certain intangibles ($1.6 million) and fixed assets ($2.3 million), Guyoung impairment ($2.6 million).
The Company’s share of EBITDA in its joint ventures, net of equity earnings.
Pro forma adjustments to the Company’s EBITDA for the initial phase of the Company’s discontinuance of its global product line operating divisions and the establishment of a new operating structure organized on the basis of geographic regions.
cooperstandard 24
|
|
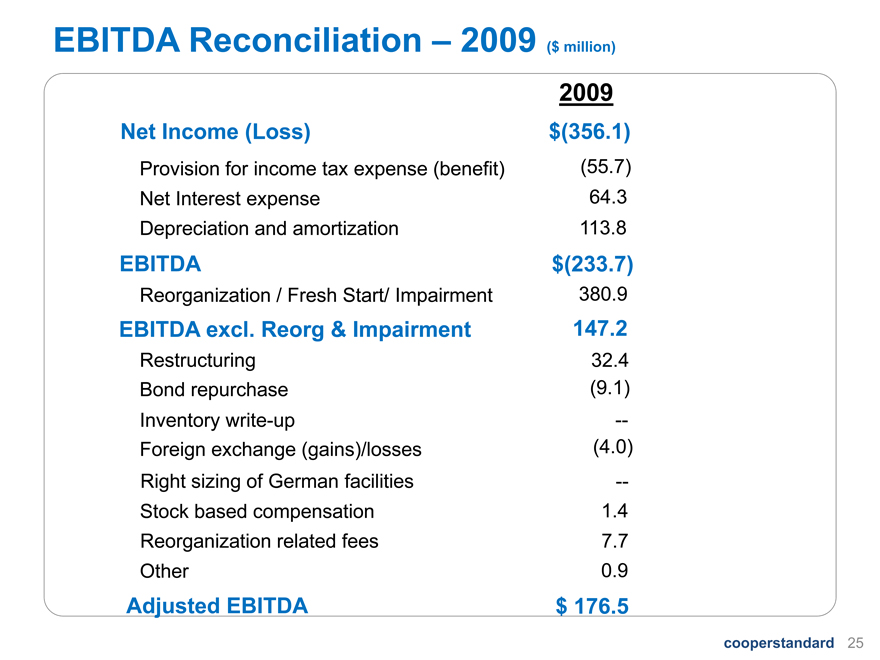
EBITDA Reconciliation – 2009 ($ million)
Net Income (Loss)
Provision for income tax expense (benefit)
Net Interest expense
Depreciation and amortization
EBITDA
Reorganization / Fresh Start/ Impairment
EBITDA excl. Reorg & Impairment
Restructuring
Bond repurchase
Inventory write-up
Foreign exchange (gains)/losses
Right sizing of German facilities
Stock based compensation
Reorganization related fees
Other
Adjusted EBITDA
2009
$(356.1)
(55.7)
64.3
113.8
$(233.7)
380.9
147.2
32.4
(9.1)
—
(4.0)
—
1.4
7.7
0.9
$ 176.5
cooperstandard 25
|
|
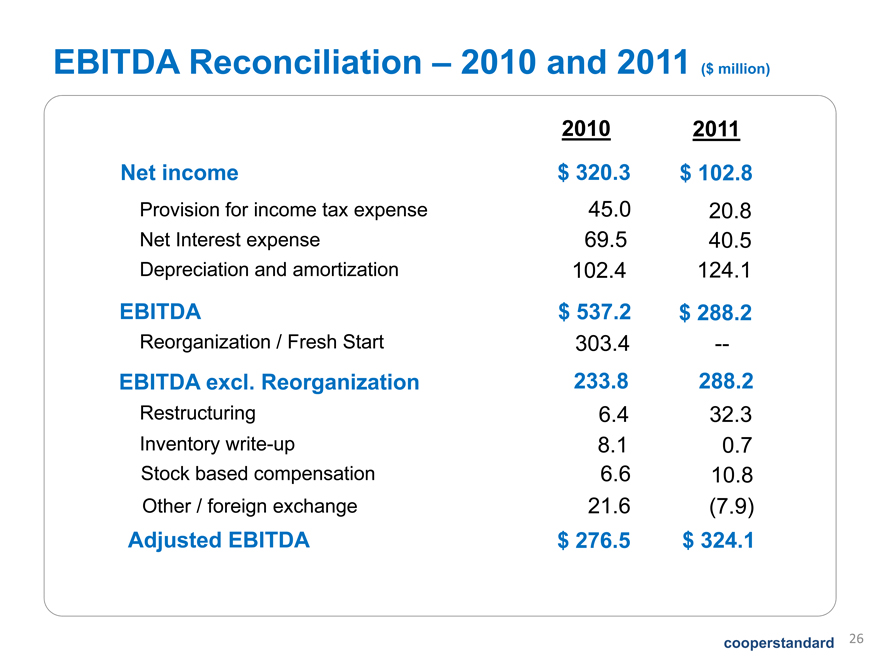
EBITDA Reconciliation – 2010 and 2011 ($ million)
Net income
Provision for income tax expense
Net Interest expense
Depreciation and amortization
EBITDA
Reorganization / Fresh Start
EBITDA excl. Reorganization
Restructuring
Inventory write-up
Stock based compensation
Other / foreign exchange
Adjusted EBITDA
2010
$ 320.3
45.0
69.5
102.4
$ 537.2
303.4
233.8
6.4
8.1
6.6
21.6
$ 276.5
2011
$ 102.8
20.8
40.5
124.1
$ 288.2
—
288.2
32.3
0.7
10.8
(7.9)
$ 324.1
cooperstandard 26
|
|
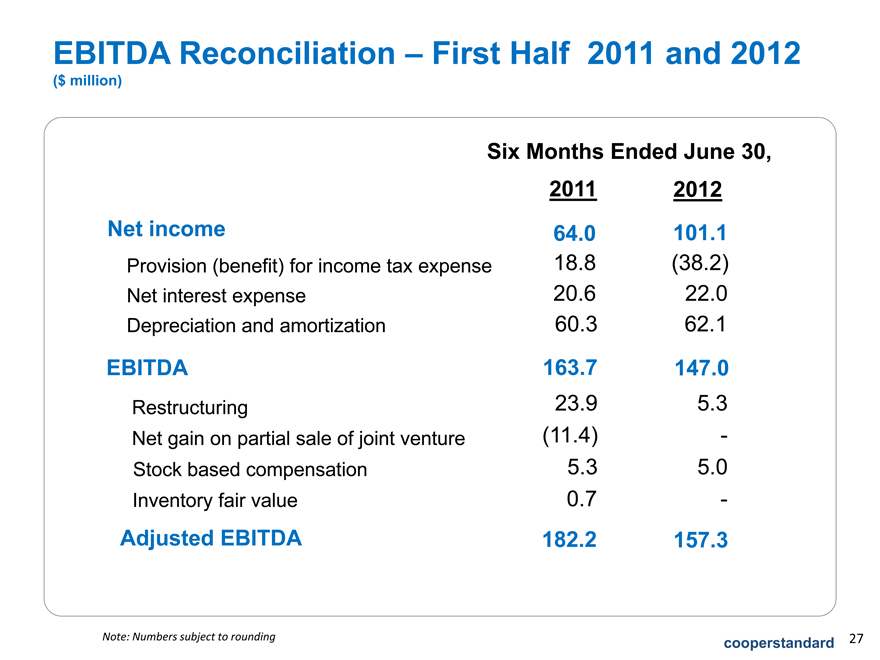
EBITDA Reconciliation – First Half 2011 and 2012
($ million)
Six Months Ended June 30,
Net income
Provision (benefit) for income tax expense
Net interest expense
Depreciation and amortization
EBITDA
Restructuring
Net gain on partial sale of joint venture
Stock based compensation
Inventory fair value
Adjusted EBITDA
2011
64.0
18.8
20.6
60.3
163.7
23.9
(11.4)
| 5.3 |
|
0.7
182.2
2012
101.1
(38.2)
22.0
62.1
147.0
5.3
-
| 50. |
|
-
157.3
Note: Numbers subject to rounding cooperstandard 27