
|
Neuberger Berman Class Funds
|
||
| Institutional Class Shares Class A Shares Class C Shares Class R6 Shares |
||
|
Global Allocation Fund Long Short Fund Long Short Credit Fund Multi-Asset Income Fund Risk Balanced Commodity Strategy Fund U.S. Equity Index PutWrite Strategy Fund |
Annual ReportOctober 31, 2016 |
| Contents | |||
|
THE FUNDS |
|||
| President’s Letter | 1 | ||
| PORTFOLIO COMMENTARY | |||
|
Global Allocation Fund |
2 | ||
|
Long Short Fund |
5 | ||
|
Long Short Credit Fund |
8 | ||
|
Multi-Asset Income Fund |
11 | ||
|
Risk Balanced Commodity Strategy Fund |
14 | ||
|
U.S. Equity Index PutWrite Strategy Fund |
17 | ||
| FUND EXPENSE INFORMATION | 24 | ||
| SCHEDULE OF INVESTMENTS | |||
|
Global Allocation Fund |
26 | ||
|
Positions by Industry |
51 | ||
|
Long Short Fund |
55 | ||
|
Long Short Credit Fund |
68 | ||
|
Multi-Asset Income Fund |
76 | ||
|
Risk Balanced Commodity Strategy Fund |
93 | ||
|
U.S. Equity Index PutWrite Strategy Fund |
100 | ||
| FINANCIAL STATEMENTS | 103 | ||
|
FINANCIAL HIGHLIGHTS (ALL CLASSES)/
PER SHARE DATA
|
|||
|
Global Allocation Fund |
144 | ||
|
Long Short Fund |
146 | ||
|
Long Short Credit Fund |
148 | ||
|
Multi-Asset Income Fund |
148 | ||
|
Risk Balanced Commodity Strategy Fund |
150 | ||
|
U.S. Equity Index PutWrite Strategy Fund |
152 | ||
|
Reports of Independent Registered Public Accounting Firms |
157 | ||
|
Directory |
159 | ||
|
Trustees and Officers |
160 | ||
|
Proxy Voting Policies and Procedures |
170 | ||
|
Quarterly Portfolio Schedule |
170 | ||
|
Board Consideration of the Management Agreements |
171 | ||
|
Notice to Shareholders |
177 |
The "Neuberger Berman" name and logo are registered service marks of Neuberger Berman Group LLC. "Neuberger Berman Investment Advisers LLC" and the individual Fund names in this piece are either service marks or registered service marks of Neuberger Berman Investment Advisers LLC. ©2016 Neuberger Berman LLC. All rights reserved.
President's Letter
Dear Shareholder,
I am pleased to present this annual shareholder report for Neuberger Berman Global Allocation Fund, Neuberger Berman Long Short Fund, Neuberger Berman Long Short Credit Fund, Neuberger Berman Multi-Asset Income Fund and Neuberger Berman Risk Balanced Commodity Strategy Fund. This report also includes the Neuberger Berman U.S. Equity Index PutWrite Strategy Fund, which launched on September 16, 2016.
While the global financial markets experienced several bouts of weakness, they posted positive returns overall for the 12 months ended October 31, 2016. Investor sentiment fluctuated at times given mixed global economic data, questions regarding future central bank monetary policy and several geopolitical issues, including "Brexit." However, demand for risk asset was solid for the fiscal year as a whole as investors looked to generate incremental returns in a low interest rate environment.
All told, the U.S. equity market, as measured by the S&P 500® Index, gained 4.51% over the 12 month period ended October 31, 2016. In contrast, international developed equities posted weak results, whereas emerging markets equities rallied sharply. Within fixed income, longer-term U.S. Treasury yields declined and the overall U.S. bond market, as measured by the Bloomberg Barclays U.S. Aggregate Bond Index, gained 4.37% during the period. Finally, inflation was generally well contained.
Looking ahead, the outcome of the U.S. election could significantly impact the market. Nevertheless, we anticipate seeing the U.S. economy expand at a relatively modest pace, still better than many other developed countries. We also anticipate an uptick in inflation expectations from today's excessively low levels. Against this backdrop, we believe the U.S. Federal Reserve will take a measured approach in terms of normalizing monetary policy. From an investment perspective, we maintain high conviction in our portfolio managers and believe their portfolios are well positioned for the current and coming environment.
Thank you for your continued support and trust. We look forward to continue serving your investment needs in the years to come.
Sincerely,

ROBERT CONTI
PRESIDENT AND CEO
NEUBERGER BERMAN MUTUAL FUNDS
1
Global Allocation Fund Commentary (Unaudited)
Neuberger Berman Global Allocation Fund Institutional Class generated a 0.87% total return for the 12 months ended October 31, 2016 and underperformed its custom benchmark, a blend consisting of 60% MSCI All Country World Index (ACWI) (Net) and 40% Bloomberg Barclays Global Aggregate Index, which provided a 3.59% return for the same period. (Performance for all share classes is provided in the table immediately following this letter.)
Global equity markets generated mixed results during the reporting period. Emerging markets (EM) equities posted the strongest performance; U.S. stocks performed positively while non-U.S. developed markets equities were a bit challenged, ending the period slightly negative. The global equity markets, as represented by the MSCI ACWI (Net), returned 2.05% over the period. In fixed income markets, all regions generated positive returns. EM debt was the strongest performing sector, followed by high yield debt. The return of the broad fixed income market, as measured by the Bloomberg Barclays Global Aggregate Index, was 5.59% for the period. Over the past 12 months, the U.S. continued to be among the strongest developed economies but has been challenged by sluggish GDP growth and weak corporate earnings. While the Eurozone was positioned to benefit from ongoing monetary stimulus, consumer sentiment remained volatile amidst increasing political risks, and corporate profitability has room for further improvement. Similarly, Japan maintained an accommodative stance fueled by stimulus from the Bank of Japan, but we did not see significant improvements in consumer confidence as corporate profits continued to decline while the yen strengthened.
The underperformance for the reporting period was primarily driven by security selection decisions in developed markets equities. Our underweight to fixed income in favor of more opportunistic strategies also detracted from performance, as fixed income was the best-performing asset class for the period. Positive contributions came from security selection within EM debt and our U.S. long duration positioning.
The Fund's aggregate use of futures, forward foreign currency and option contracts contributed to performance during the reporting period.
Looking ahead, we maintain a cautious stance on the global economy given additional geopolitical risks, growth concerns, and changing central bank policies. In the U.S., recent economic data reflect a rebound in U.S. economic growth, as October's advance estimate of Q3 2006 GDP growth surprised on the upside; likewise, Q3 earnings appeared to us to bode well for a long-awaited recovery. However, given a new political administration, uncertainty is likely to persist as changing economic policies and anti-trade sentiment continue to unfold. Data outside of the U.S. has been showing some signs of improvement as purchasing manager composite indices for China, the Eurozone and Japan all rose in October, but we believe further stimulus is needed. Overall, we anticipate a highly uncertain global growth backdrop as the U.S. balances pro-growth GOP policies with anti-trade rhetoric, Europe and Japan remain challenged as monetary stimulus ebbs; and EM may experience headwinds from potentially reduced trade. Given this outlook, we anticipate additional volatility and remain constructive on developed market equities with a bias towards the U.S. Within fixed income, we currently prefer credit over developed market government securities. We are cautious on both EM equities and debt as investors attempt to interpret the crosscurrents between greater trade tariffs and fiscal policy's positive impact on the commodity complex.
Sincerely,
ERIK KNUTZEN, BRADLEY TANK, WAI LEE AND AJAY JAIN
PORTFOLIO MANAGERS
Information about principal risks of investing in the Fund is set forth in the prospectus and statement of additional information.
The portfolio composition, industries and holdings of the Fund are subject to change without notice.
The opinions expressed are those of the Fund's portfolio managers. The opinions are as of the date of this report and are subject to change without notice.
2
Global Allocation Fund (Unaudited)
TICKER SYMBOLS
|
Institutional Class |
NGLIX |
||||||
|
Class A |
NGLAX |
||||||
|
Class C |
NGLCX |
||||||
PERFORMANCE HIGHLIGHTS3
|
Inception Date |
Average Annual Total Return Ended 10/31/2016 |
||||||||||||||
|
1 Year |
5 Year |
Life of Fund |
|||||||||||||
|
At NAV |
|||||||||||||||
|
Institutional Class |
12/29/2010 |
0.87 |
% |
4.89 |
% |
4.69 |
% |
||||||||
|
Class A |
12/29/2010 |
0.59 |
% |
4.53 |
% |
4.33 |
% |
||||||||
|
Class C |
12/29/2010 |
–0.19 |
% |
3.73 |
% |
3.55 |
% |
||||||||
|
With Sales Charge |
|||||||||||||||
|
Class A |
–5.18 |
% |
3.29 |
% |
3.28 |
% |
|||||||||
|
Class C |
–1.18 |
% |
3.73 |
% |
3.55 |
% |
|||||||||
|
Index |
|||||||||||||||
| 60% MSCI All Country World Index and 40% Bloomberg Barclays Global Aggregate Index1,2,4 |
3.95 |
% |
5.61 |
% |
5.05 |
% |
|||||||||
| MSCI All Country World Index1,2,4 |
2.64 |
% |
8.62 |
% |
6.72 |
% |
|||||||||
| 60% MSCI All Country World Index (Net) and 40% Bloomberg Barclays Global Aggregate Index1,2,4 |
3.59 |
% |
5.26 |
% |
4.71 |
% |
|||||||||
| MSCI All Country World Index (Net)1,2,4 |
2.05 |
% |
8.03 |
% |
6.14 |
% |
|||||||||
The performance data quoted represent past performance and do not indicate future results. Current performance may be lower or higher than the performance data quoted. For performance data current to the most recent month-end, please visit www.nb.com/performance.
The results shown in the table reflect the reinvestment of income dividends and other distributions, if any. The results do not reflect the effect of taxes a shareholder would pay on Fund distributions or on the redemption of Fund shares.
The investment return and principal value of an investment will fluctuate and shares, when redeemed, may be worth more or less than their original cost.
Returns would have been lower if Neuberger Berman Investment Advisers LLC ("Management") had not reimbursed certain expenses and/or waived a portion of the investment management fees during certain of the periods shown. Repayment by a class (of expenses previously reimbursed and/or fees previously waived by Management) will decrease the class's returns. Please see Note B in the Notes to Financial Statements for specific information regarding expense reimbursement and/or fee waiver arrangements.
As stated in the Fund's most recent prospectus, the total annual operating expense ratios for fiscal year 2015 were 3.59%, 3.99% and 4.75% for Institutional Class, Class A and Class C shares, respectively (before expense reimbursements and/or fee waivers, if any). The total annual operating expense ratios were 1.34%, 1.69% and 2.44% for Institutional Class, Class A and Class C shares, respectively, after expense reimbursements and/or fee waivers. The expense ratios for the annual period ended October 31, 2016 can be found in the Financial Highlights section of this report.
Returns shown with a sales charge reflect the deduction of the current maximum initial sales charge of 5.75% for Class A shares and the contingent deferred sales charge (CDSC) for Class C shares. The CDSC for Class C shares is 1%, which is reduced to 0% after 1 year. The performance of the Fund's share classes will differ primarily due to different sales charge structures and class expenses. Please see the prospectus for more information about sales charge structures, if any, and class expenses for your share class.
3
Global Allocation Fund (Unaudited)
COMPARISON OF A $1,000,000 INVESTMENT
(000's omitted)

This graph shows the change in value of a hypothetical $1,000,000 investment in the Fund over the past 10 fiscal years, or since the Fund's inception if it has not operated for 10 years. The graph is based on the Institutional Class shares only; the performance of the Fund's share classes will differ primarily due to different sales charge structures and class expenses (see Performance Highlights chart on previous page). The result is compared with benchmarks, which include a broad-based market index and may include a more narrowly based index. Market indices have not been reduced to reflect any of the fees and costs of investing. The results shown in the graph reflect the reinvestment of income dividends and other distributions, if any. The results do not reflect the effect of taxes a shareholder would pay on Fund distributions or on the redemption of Fund shares. Results represent past performance and do not indicate future results.
4
Long Short Fund Commentary (Unaudited)
Neuberger Berman Long Short Fund Institutional Class generated a –0.14% total return for the 12 months ended October 31, 2016 and outperformed its primary benchmark, the HFRX Equity Hedge Index, which returned –2.57% for the same period. The Fund, however, underperformed the S&P 500® Index, which provided a 4.51% return for the period. (Performance for all share classes is provided in the table immediately following this letter.)
Despite periods of weakness early and late in the reporting period, the U.S. stock market generated a positive return over the Fund's fiscal year as measured by the S&P 500 Index. Market volatility was elevated at times given mixed economic data, questions regarding the timing of future U.S. Federal Reserve (Fed) interest rate hikes and uncertainty surrounding geopolitical events.
We maintained our positive outlook on risk assets such as equities and high yield bonds during the reporting period. This was reflected in the Fund's net long exposure during the period. The Fund remained constructively positioned during the period for a continued economic recovery in the U.S., with the largest average sector weights in Consumer Discretionary and Information Technology.
We categorize our long investment exposure into three groups: Capital Growth, Total Return and Opportunistic. Capital Growth continues to represent our largest allocation followed by Total Return and Opportunistic. We continued to identify compelling opportunities in Capital Growth relative to Total Return, as we believe higher interest rates could negatively impact longer duration assets and cash flows. The portfolio's short exposure includes both single name "Fundamental" shorts and "Market" shorts. During the period, Fundamental short exposure increased against the backdrop of heightened market volatility and greater dispersion within sectors. As fundamentals came back into focus, Market shorts consisted primarily of sector and market cap-specific indices in an attempt to help manage broader portfolio exposures, which also increased during the period.
Equity and credit long exposure added to Fund performance, while Fundamental shorts and the Fund's aggregate use of futures, options and swap contracts detracted from performance during the period.
We believe the U.S. economy will continue to grow steadily, while a still highly accommodative Fed may create a longer than expected (albeit certainly slower than expected) U.S. business cycle. Should more robust growth eventually appear, we believe markets are much more prepared today for future interest rate hikes, especially for monetary tightening related to higher inflation. With modest but still positive earnings growth forecasted for the remainder of 2016, our outlook for S&P 500 earnings remains similarly subdued, primarily due to uncertainty surrounding global growth. However, in our opinion, potential tailwinds are on the horizon as investors shift their attention to company fundamentals for the third quarter corporate earnings season. All that said, we also believe that being selective in deploying capital is particularly important in today's environment. Nevertheless, we are very mindful of the complex world in which we live and invest. Given the vicissitudes of an increasingly global economy, we will also remain flexible in our decisions and open-minded to new ideas across different asset classes and geographies.
Sincerely,
CHARLES KANTOR
PORTFOLIO MANAGER
Information about principal risks of investing in the Fund is set forth in the prospectus and statement of additional information.
The portfolio composition, industries and holdings of the Fund are subject to change without notice.
The opinions expressed are those of the Fund's portfolio manager. The opinions are as of the date of this report and are subject to change without notice.
5
Long Short Fund (Unaudited)
TICKER SYMBOLS
|
Institutional Class |
NLSIX |
||||||
|
Class A |
NLSAX |
||||||
|
Class C |
NLSCX |
||||||
PORTFOLIO BY TYPE OF SECURITY
(as a % of Total Net Assets)
|
Long |
Short |
||||||||||
|
Common Stocks |
76.3 |
% |
(12.1 |
)% |
|||||||
|
Corporate Bonds |
9.4 |
(1.4 |
) |
||||||||
|
Exchange Traded Funds |
— |
(2.1 |
) |
||||||||
|
Master Limited Partnerships |
0.8 |
— |
|||||||||
|
Options Purchased |
0.3 |
— |
|||||||||
|
Preferred Stock |
0.5 |
— |
|||||||||
|
Short-Term Investment |
12.1 |
— |
|||||||||
|
Other Assets Less Liabilities |
16.2 |
* |
— |
||||||||
|
Total |
115.6 |
% |
(15.6 |
)% |
|||||||
* Includes the impact of the Fund's open positions in derivatives, if any.
PERFORMANCE HIGHLIGHTS
| Average Annual Total Return Ended 10/31/2016 |
|||||||||||||||
| Inception Date |
1 Year |
Life of Fund |
|||||||||||||
|
At NAV |
|||||||||||||||
|
Institutional Class |
12/29/2011 |
–0.14 |
% |
5.53 |
% |
||||||||||
|
Class A |
12/29/2011 |
–0.48 |
% |
5.17 |
% |
||||||||||
|
Class C |
12/29/2011 |
–1.30 |
% |
4.38 |
% |
||||||||||
|
With Sales Charge |
|||||||||||||||
|
Class A |
–6.20 |
% |
3.89 |
% |
|||||||||||
|
Class C |
–2.29 |
% |
4.38 |
% |
|||||||||||
|
Index |
|||||||||||||||
| HFRX Equity Hedge Index1,2 |
–2.57 |
% |
2.72 |
% |
|||||||||||
| S&P 500® Index1,2 |
4.51 |
% |
13.99 |
% |
|||||||||||
The performance data quoted represent past performance and do not indicate future results. Current performance may be lower or higher than the performance data quoted. For performance data current to the most recent month-end, please visit www.nb.com/performance.
The results shown in the table reflect the reinvestment of income dividends and other distributions, if any. The results do not reflect the effect of taxes a shareholder would pay on Fund distributions or on the redemption of Fund shares.
The investment return and principal value of an investment will fluctuate and shares, when redeemed, may be worth more or less than their original cost.
Returns would have been lower if Neuberger Berman Investment Advisers LLC ("Management") had not reimbursed certain expenses and/or waived a portion of the investment management fees during certain of the periods shown. Repayment by a class (of expenses previously reimbursed and/or fees previously waived by Management) will decrease the class's returns. Please see Note B in the Notes to Financial Statements for specific information regarding expense reimbursement and/or fee waiver arrangements.
As stated in the Fund's most recent prospectus, the total annual operating expense ratios for fiscal year 2015 were 1.67%, 2.05% and 2.79% for Institutional Class, Class A and Class C shares, respectively (before expense reimbursements and/or fee waivers, if any). The expense ratios for the annual period ended October 31, 2016 can be found in the Financial Highlights section of this report.
Returns shown with a sales charge reflect the deduction of the current maximum initial sales charge of 5.75% for Class A shares and the contingent deferred sales charge (CDSC) for Class C shares. The CDSC for Class C shares is 1%, which is reduced to 0% after 1 year. The performance of the Fund's share classes will differ primarily due to different sales charge structures and class expenses. Please see the prospectus for more information about sales charge structures, if any, and class expenses for your share class.
6
Long Short Fund (Unaudited)
COMPARISON OF A $1,000,000 INVESTMENT
(000's omitted)

This graph shows the change in value of a hypothetical $1,000,000 investment in the Fund over the past 10 fiscal years, or since the Fund's inception if it has not operated for 10 years. The graph is based on the Institutional Class shares only; the performance of the Fund's share classes will differ primarily due to different sales charge structures and class expenses (see Performance Highlights chart on previous page). The result is compared with benchmarks, which include a broad-based market index and may include a more narrowly based index. Market indices have not been reduced to reflect any of the fees and costs of investing. The results shown in the graph reflect the reinvestment of income dividends and other distributions, if any. The results do not reflect the effect of taxes a shareholder would pay on Fund distributions or on the redemption of Fund shares. Results represent past performance and do not indicate future results.
7
Long Short Credit Fund Commentary (Unaudited)
Neuberger Berman Long Short Credit Fund Institutional Class generated a –0.28% total return for the 12 months ended October 31, 2016 and underperformed its primary benchmark, the HFRX Fixed Income - Credit Index, which returned 0.07% for the same period. The Fund also underperformed the long only Bloomberg Barclays U.S. Aggregate Bond Index and the BofA Merrill Lynch U.S. High Yield Master II Index, which returned 4.37% and 10.16%, respectively, for the period. (Performance for all share classes is provided in the table immediately following this letter.)
Notwithstanding the volatile and difficult start to the period, the credit markets performed well this year. Underpinning this performance has been the positive performance of sovereign bonds globally. This was buttressed by an unprecedented level of G3 Central Bank intervention. These measures to stabilize financial markets and foster growth globally have included large scale purchases of equities and sovereign and corporate bonds. By the end of October, global growth appeared to have stabilized. We believe the narrative from the central bankers has begun to subtly change. The adverse longer term effects of zero and negative rates on the banking and financial systems, and concerns about diminishing marginal returns from the policies at hand, have become a concern. The Federal Reserve appears to be committed to a rate increase at its final meeting in December. This subtle change in narrative and the prospect of U.S. rate hikes will, in our view, play an important role in determining the direction of credit asset returns over the next 12 months.
We have throughout the year run a balanced portfolio of longs and shorts and have not levered up the portfolios, nor have we grossed up the exposures. By sector, the largest contributors to performance were our positions in Technology, Media, and Telecommunications and Financials. The largest detractors were our short positions in Health Care and Gaming.
The Fund's aggregate use of futures, forward foreign currency, swap and option contracts contributed to performance during the reporting period.
While we believe the upcoming period may be volatile, we are not bearish on credit assets but we are cautious. We think credit spreads are attractive for projected default rates and for growth prospects. Interest rate duration worries us. It is our intention to position for a volatile interest rate environment while attempting to benefit from the attractiveness of credit spreads.
Our portfolio comprises baskets of single name long and short positions based on fundamental analysis. We hope to be able to capture the idiosyncratic opportunities that we believe are mispriced. We believe this continues to be expressed through relative value trades, capital structure arbitrage trades and directional long and short positions.
The credit market has had a very good year directionally. We believe that the rally in rates, the search for yield and the intervention by central banks on an unprecedented historical scale has underpinned the move. The narrative has begun to change albeit ever so gently, and it's our opinion that to ignore this is a mistake. We believe that a portfolio of idiosyncratic longs and shorts, where duration risk is managed, may be able to capture some exciting opportunities.
Sincerely,
RICK DOWDLE AND NORMAN MILNER
PORTFOLIO MANAGERS
Information about principal risks of investing in the Fund is set forth in the prospectus and statement of additional information.
The portfolio composition, industries and holdings of the Fund are subject to change without notice.
The opinions expressed are those of the Fund's portfolio managers. The opinions are as of the date of this report and are subject to change without notice.
8
Long Short Credit Fund (Unaudited)
TICKER SYMBOLS
|
Institutional Class |
NLNIX |
||||||
|
Class A |
NLNAX |
||||||
|
Class C |
NLNCX |
||||||
|
Class R6 |
NRLNX |
||||||
PORTFOLIO BY TYPE OF SECURITY
(as a % of Total Net Assets)
|
Long |
Short |
||||||||||
|
Corporate Bonds |
84.5 |
% |
— |
% |
|||||||
|
Foreign Government Securities |
4.0 |
— |
|||||||||
|
Loan Assignments |
3.7 |
— |
|||||||||
|
Preferred Stock |
2.5 |
— |
|||||||||
|
Short Term Investment |
12.7 |
— |
|||||||||
|
Other Assets Less Liabilities |
(7.4 |
)* |
— |
||||||||
|
Total |
100.0 |
% |
0.0 |
% |
|||||||
* Includes the impact of the Fund's open positions in derivatives, if any.
PERFORMANCE HIGHLIGHTS
| Average Annual Total Return Ended 10/31/2016 |
|||||||||||||||
| Inception Date |
1 Year |
Life of Fund |
|||||||||||||
|
At NAV |
|||||||||||||||
|
Institutional Class |
06/29/2015 |
–0.28 |
% |
–1.73 |
% |
||||||||||
|
Class A |
06/29/2015 |
–0.55 |
% |
–2.02 |
% |
||||||||||
|
Class C |
06/29/2015 |
–1.10 |
% |
–2.60 |
% |
||||||||||
|
Class R6 |
06/29/2015 |
–0.12 |
% |
–1.60 |
% |
||||||||||
|
With Sales Charge |
|||||||||||||||
|
Class A |
–4.75 |
% |
–5.11 |
% |
|||||||||||
|
Class C |
–2.07 |
% |
–2.60 |
% |
|||||||||||
|
Index |
|||||||||||||||
| HFRX Fixed Income - Credit Index1,2 |
0.07 |
% |
–1.94 |
% |
|||||||||||
| Bloomberg Barclays U.S. Aggregate Bond Index1,2 |
4.37 |
% |
4.67 |
% |
|||||||||||
| BofA Merrill Lynch U.S. High Yield Master II Index1,2 |
10.16 |
% |
5.30 |
% |
|||||||||||
The performance data quoted represent past performance and do not indicate future results. Current performance may be lower or higher than the performance data quoted. For performance data current to the most recent month-end, please visit www.nb.com/performance.
The results shown in the table reflect the reinvestment of income dividends and other distributions, if any. The results do not reflect the effect of taxes a shareholder would pay on Fund distributions or on the redemption of Fund shares.
The investment return and principal value of an investment will fluctuate and shares, when redeemed, may be worth more or less than their original cost.
Returns would have been lower if Neuberger Berman Investment Advisers LLC ("Management") had not reimbursed certain expenses and/or waived a portion of the investment management fees during certain of the periods shown. Repayment by a class (of expenses previously reimbursed and/or fees previously waived by Management) will decrease the class's returns. Please see Note B in the Notes to Financial Statements for specific information regarding expense reimbursement and/or fee waiver arrangements.
For the period ended October 31, 2016, the 30-day SEC yields were 3.03%, 2.55%, 1.92% and 3.11% for Institutional Class, Class A, Class C and Class R6 shares, respectively. Absent expense reimbursements and/or fee waivers, the 30-day SEC yields would have been 2.60%, 0.75%, 0.02% and 2.49% for Institutional Class, Class A, Class C and Class R6 shares, respectively.
As stated in the Fund's most recent prospectus, the total annual operating expense ratios for fiscal year 2015 were 2.67%, 3.04%, 3.79% and 2.60% for Institutional Class, Class A, Class C and Class R6 shares, respectively (before expense reimbursements and/or fee waivers, if any). The total annual operating expense ratios are 2.38%, 2.75%, 3.50% and 2.31% for Institutional Class, Class A, Class C and Class R6 shares, respectively, after expense reimbursements and/or fee waivers. The expense ratios for the annual period ended October 31, 2016 can be found in the Financial Highlights section of this report.
Returns shown with a sales charge reflect the deduction of the current maximum initial sales charge of 4.25% for Class A shares and the contingent deferred sales charge (CDSC) for Class C shares. The CDSC for Class C shares is 1%, which is reduced to 0% after 1 year. The performance of the Fund's share classes will differ primarily due to different sales charge structures and class expenses. Please see the prospectus for more information about sales charge structures, if any, and class expenses for your share class.
9
Long Short Credit Fund (Unaudited)
COMPARISON OF A $1,000,000 INVESTMENT
(000's omitted)
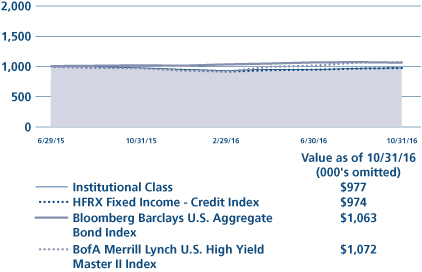
This graph shows the change in value of a hypothetical $1,000,000 investment in the Fund over the past 10 fiscal years, or since the Fund's inception if it has not operated for 10 years. The graph is based on the Institutional Class shares only; the performance of the Fund's share classes will differ primarily due to different sales charge structures and class expenses (see Performance Highlights chart on previous page). The result is compared with benchmarks, which include a broad-based market index and may include a more narrowly based index. Market indices have not been reduced to reflect any of the fees and costs of investing. The results shown in the graph reflect the reinvestment of income dividends and other distributions, if any. The results do not reflect the effect of taxes a shareholder would pay on Fund distributions or on the redemption of Fund shares. Results represent past performance and do not indicate future results.
10
Multi-Asset Income Fund Commentary (Unaudited)
Neuberger Berman Multi-Asset Income Fund Institutional Class generated a 6.09% total return for the 12 months ended October 31, 2016 and outperformed its custom benchmark, a blend consisting of 60% Bloomberg Barclays U.S. Aggregate Bond Index and 40% S&P 500® Index, which provided a 4.54% return for the period. (Performance for all share classes is provided in the table immediately following this letter.)
Global equity markets generated mixed results during the reporting period. Emerging markets (EM) equities posted the strongest performance. U.S. stocks performed positively while non-US developed markets equities were a bit challenged, ending the period slightly negative. The domestic equity market, as represented by the S&P 500 Index, returned 4.51% over the period. In fixed income markets, all regions generated positive returns. EM debt was the strongest performing sector, followed by high yield debt. The return of the domestic fixed income market, as measured by the Bloomberg Barclays U.S. Aggregate Bond Index, was 4.37% for the period. Over the past 12 months, the U.S. continued to be among the strongest developed economies but has been challenged by sluggish GDP growth and weak corporate earnings. While the Eurozone was positioned to benefit from ongoing monetary stimulus, consumer sentiment remained volatile amidst increasing political risks, and corporate profitability has room for further improvement. Similarly, Japan maintained an accommodative stance fueled by stimulus from the Bank of Japan, but we did not see significant improvements in consumer confidence as corporate profits continued to decline while the yen strengthened.
During the reporting period, fixed income assets were the largest positive contributors to the Fund's performance. The underweight to the asset class as a whole was additive, as the Bloomberg Barclays U.S. Aggregate underperformed the S&P 500. However, diverse allocations to EM debt, high yield debt, and U.S. investment grade credit, all of which posted strong returns, significantly boosted performance, as did security selection decisions across high dividend U.S. equities and master limited partnerships (MLPs).
Looking ahead, we maintain a cautious stance on the global economy given additional geopolitical risks, growth concerns, and changing central bank policies. In the U.S., recent economic data reflect a rebound in U.S. economic growth, as October's advanced estimate of Q3 2016 GDP growth surprised on the upside; likewise, Q3 earnings appeared to us to bode well for a long-awaited recovery. However, given a new political administration, uncertainty is likely to persist as changing economic policies and anti-trade sentiment continue to unfold. Data outside of the U.S. has been showing some signs of improvement as purchasing manager composite indices for China, the Eurozone and Japan all rose in October, but we believe further stimulus is needed. Overall, we anticipate a highly uncertain global growth backdrop as the U.S. balances pro-growth GOP policies with anti-trade rhetoric. Europe and Japan remain challenged as monetary stimulus ebbs; and EM may experience headwinds from potentially reduced trade. Against that backdrop, we will continue to seek opportunities for yield enhancement across a diversified set of exposures.
Sincerely,
ERIK KNUTZEN, BRADLEY TANK, WAI LEE AND AJAY JAIN
PORTFOLIO MANAGERS
Information about principal risks of investing in the Fund is set forth in the prospectus and statement of additional information.
The portfolio composition, industries and holdings of the Fund are subject to change without notice.
The opinions expressed are those of the Fund's portfolio managers. The opinions are as of the date of this report and are subject to change without notice.
11
Multi-Asset Income Fund (Unaudited)
TICKER SYMBOLS
|
Institutional Class |
NANIX |
||||||
|
Class A |
NANAX |
||||||
|
Class C |
NANCX |
||||||
|
Class R6 |
NRANX |
||||||
PORTFOLIO BY TYPE OF SECURITY
|
(as a % of Total Net Assets) |
|||||
|
Common Stocks |
29.5 |
% |
|||
|
Convertible Bonds |
0.3 |
||||
|
Convertible Preferred Stocks |
0.1 |
||||
|
Exchange Traded Funds |
6.9 |
||||
|
Master Limited Partnerships |
2.8 |
||||
|
Investment Companies |
43.3 |
||||
|
Preferred Stocks |
1.1 |
||||
|
U.S. Government Agency Securities |
2.0 |
||||
|
U.S. Treasury Obligations |
10.6 |
||||
|
Short-Term Investment |
3.3 |
||||
|
Other Assets Less Liabilities |
0.1 |
* |
|||
|
Total |
100.0 |
% |
|||
* Includes the impact of the Fund's open positions in derivatives, if any.
PERFORMANCE HIGHLIGHTS
| Average Annual Total Return Ended 10/31/2016 |
|||||||||||||||
| Inception Date |
1 Year |
Life of Fund |
|||||||||||||
|
At NAV |
|||||||||||||||
|
Institutional Class |
03/27/2015 |
6.09 |
% |
1.52 |
% |
||||||||||
|
Class A |
03/27/2015 |
5.70 |
% |
1.15 |
% |
||||||||||
|
Class C |
03/27/2015 |
4.91 |
% |
0.40 |
% |
||||||||||
|
Class R6 |
03/27/2015 |
6.16 |
% |
1.59 |
% |
||||||||||
|
With Sales Charge |
|||||||||||||||
|
Class A |
1.19 |
% |
–1.53 |
% |
|||||||||||
|
Class C |
3.91 |
% |
0.40 |
% |
|||||||||||
|
Index |
|||||||||||||||
| 60% Bloomberg Barclays U.S. Aggregrate Bond Index and 40% S&P 500® Index1,2 |
4.54 |
% |
3.49 |
% |
|||||||||||
| Bloomberg Barclays U.S. Aggregate Bond Index1,2 |
4.37 |
% |
2.69 |
% |
|||||||||||
The performance data quoted represent past performance and do not indicate future results. Current performance may be lower or higher than the performance data quoted. For performance data current to the most recent month-end, please visit www.nb.com/performance.
The results shown in the table reflect the reinvestment of income dividends and other distributions, if any. The results do not reflect the effect of taxes a shareholder would pay on Fund distributions or on the redemption of Fund shares.
The investment return and principal value of an investment will fluctuate and shares, when redeemed, may be worth more or less than their original cost.
Returns would have been lower if Neuberger Berman Investment Advisers LLC ("Management") had not reimbursed certain expenses and/or waived a portion of the investment management fees during certain of the periods shown. Repayment by a class (of expenses previously reimbursed and/or fees previously waived by Management) will decrease the class's returns. Please see Note B in the Notes to Financial Statements for specific information regarding expense reimbursement and/or fee waiver arrangements.
For the period ended October 31, 2016, the 30-day SEC yields were 3.39%, 2.84%, 2.18% and 3.46% for Institutional Class, Class A, Class C and Class R6 shares, respectively. Absent expense reimbursements and/or fee waivers, the 30-day SEC yields would have been –0.30%, –0.63%, –1.40% and –0.22% for Institutional Class, Class A, Class C and Class R6 shares, respectively. A negative 30-day SEC yield results when a fund's accrued expenses exceed its income for the relevant period. Please note, in such instances the 30-day SEC yield may not equal the Fund's actual rate of income earned and distributed by the Fund and, therefore, a per share distribution may still be paid to shareholders.
As stated in the Fund's most recent prospectus, the total annual operating expense ratios for fiscal year 2015 were 3.50%, 4.39%, 5.13% and 3.47% for Institutional Class, Class A, Class C and Class R6 shares, respectively (before expense reimbursements and/or fee waivers, if any). The total annual operating expense ratios were 0.69%, 1.06%, 1.81% and 0.62% for Institutional Class, Class A, Class C and Class R6 shares, respectively, after expense reimbursements and/or fee waivers. The expense ratios for the annual period ended October 31, 2016 can be found in the Financial Highlights section of this report.
Returns shown with a sales charge reflect the deduction of the current maximum initial sales charge of 4.25% for Class A shares and the contingent deferred sales charge (CDSC) for Class C shares. The CDSC for Class C shares is 1%, which is reduced to 0% after 1 year. The performance of the Fund's share classes will differ primarily due to different sales charge structures and class expenses. Please see the prospectus for more information about sales charge structures, if any, and class expenses for your share class.
12
Multi-Asset Income Fund (Unaudited)
COMPARISON OF A $1,000,000 INVESTMENT
(000's omitted)

This graph shows the change in value of a hypothetical $1,000,000 investment in the Fund over the past 10 fiscal years, or since the Fund's inception if it has not operated for 10 years. The graph is based on the Institutional Class shares only; the performance of the Fund's share classes will differ primarily due to different sales charge structures and class expenses (see Performance Highlights chart on previous page). The result is compared with benchmarks, which include a broad-based market index and may include a more narrowly based index. Market indices have not been reduced to reflect any of the fees and costs of investing. The results shown in the graph reflect the reinvestment of income dividends and other distributions, if any. The results do not reflect the effect of taxes a shareholder would pay on Fund distributions or on the redemption of Fund shares. Results represent past performance and do not indicate future results.
13
Risk Balanced Commodity Strategy Fund Commentary (Unaudited)
Neuberger Berman Risk Balanced Commodity Strategy Fund1 Institutional Class generated a total return of –3.39% for the 12 months ended October 31, 2016 and underperformed its benchmark, the Bloomberg Commodity Index, which posted a –2.62% return for the same period. (Performance for all share classes is provided in the table immediately following this letter.)
Commodity markets remained overall volatile and posted a negative return during the reporting period. That being said, there were periods of strength, most notably in March, April, June and September. Despite the market's decline over the 12-months as a whole, in general, we saw some firming in the commodity complex. This was evident by a reduction of the negativity surrounding the overall commodity market that has been in place over the last five calendar years.
The Fund seeks to gain exposure to the commodity markets by investing, directly or indirectly, in futures contracts on individual commodities and other commodity-linked derivative instruments. The Fund's tactical positioning detracted from performance during the reporting period.
Looking at the commodity sectors in which the Fund currently invests, soft commodities were the largest detractor from relative performance, followed by agriculture and livestock. On the upside, the Fund's positioning in the energy and industrial metals sectors was beneficial, whereas precious metals was largely flat over the reporting period. Within the soft commodities sector, an underweight to sugar was the largest headwind for results. This positioning was not rewarded as sugar prices rallied sharply. Elsewhere, out-of-benchmark allocations to gas oil and feeder cattle were headwinds for returns. In contrast, an underweight to crude oil was a positive for performance as it experienced a nearly 30% decline over the period. An underweight to natural gas positively contributed to results given the sector's weak performance. Finally, an out-of-benchmark allocation to lead contributed to results, as it posted a strong gain over the period.
We anticipate commodity prices to continue to improve over the medium to longer term. Despite their rally year-to-date, we still consider commodities to be undervalued across the board, particularly when evaluated based on inflation-adjusted historical prices. We also anticipate supply and demand in certain commodities markets to continue to move more into balance, which could lend support to prices. Additionally, while not currently problematic, we continue to monitor inflation, as commodities have historically done well in inflationary environments and, in our opinion, there have been some signs of a pick-up in inflation, such as the 10-year inflation breakeven rate. Finally, we believe commodities remain an attractive diversifier for investors' portfolios as they have become less correlated with stock and bonds. Pulling these views together, we believe in the near term the asset class may face some short term headwinds both from a potential Federal Reserve interest rate hike and some uncertainties around global growth. However, we believe that over the long term, the supply/demand balance in many commodity markets and other factors may be more supportive of continued strength in the asset class.
Sincerely,
WAI LEE, HAKAN KAYA, THOMAS SONTAG AND DAVID YI WAN
PORTFOLIO MANAGERS
1 Much of the Fund's investment exposure is accomplished through the use of derivatives which may not require the Fund to deposit the full notional amount of the investment with its counterparties, such as a futures commission merchant. The Fund's resulting cash balances are invested in a variety of conservative fixed income securities.
Information about principal risks of investing in the Fund is set forth in the prospectus and statement of additional information.
The portfolio composition, industries and holdings of the Fund are subject to change without notice.
The opinions expressed are those of the Fund's portfolio managers. The opinions are as of the date of this report and are subject to change without notice.
14
Risk Balanced Commodity Strategy Fund (Unaudited)
TICKER SYMBOLS
|
Institutional Class |
NRBIX |
||||||
|
Class A |
NRBAX |
||||||
|
Class C |
NRBCX |
||||||
PORTFOLIO BY TYPE OF SECURITY
|
(as a % of Total Net Assets) |
|||||
|
Asset-Backed Securities |
18.7 |
% |
|||
|
Corporate Bonds |
54.4 |
||||
|
U.S. Treasury Obligation |
5.5 |
||||
|
Short-Term Investment |
15.7 |
||||
|
Other Assets Less Liabilities |
5.7 |
* |
|||
|
Total |
100.0 |
% |
|||
* Includes the impact of the Fund's open positions in derivatives, if any.
COMMODITY DERIVATIVES
|
(as a % of Total Notional Value) |
|||||
|
Commodity Futures: |
|||||
|
Agriculture |
22.4 |
% |
|||
|
Energy |
29.0 |
||||
|
Industrial Metals |
17.9 |
||||
|
Livestock |
6.9 |
||||
|
Precious Metals |
17.1 |
||||
|
Softs |
6.7 |
||||
|
Total |
100.0 |
% |
|||
PERFORMANCE HIGHLIGHTS3
|
Inception |
Average Annual Total Return Ended 10/31/2016 |
||||||||||||||
|
Date |
1 Year |
Life of Fund |
|||||||||||||
|
At NAV |
|||||||||||||||
|
Institutional Class |
08/27/2012 |
–3.39 |
% |
–11.53 |
% |
||||||||||
|
Class A |
08/27/2012 |
–3.59 |
% |
–11.85 |
% |
||||||||||
|
Class C |
08/27/2012 |
–4.52 |
% |
–12.53 |
% |
||||||||||
|
With Sales Charge |
|||||||||||||||
|
Class A |
–9.09 |
% |
–13.09 |
% |
|||||||||||
|
Class C |
–5.47 |
% |
–12.53 |
% |
|||||||||||
|
Index |
|||||||||||||||
| Bloomberg Commodity Index1,2 |
–2.62 |
% |
–11.97 |
% |
|||||||||||
The performance data quoted represent past performance and do not indicate future results. Current performance may be lower or higher than the performance data quoted. For performance data current to the most recent month-end, please visit www.nb.com/performance.
The results shown in the table reflect the reinvestment of income dividends and other distributions, if any. The results do not reflect the effect of taxes a shareholder would pay on Fund distributions or on the redemption of Fund shares.
The investment return and principal value of an investment will fluctuate and shares, when redeemed, may be worth more or less than their original cost.
Returns would have been lower if Neuberger Berman Investment Advisers LLC ("Management") had not reimbursed certain expenses and/or waived a portion of the investment management fees during certain of the periods shown. Repayment by a class (of expenses previously reimbursed and/or fees previously waived by Management) will decrease the class's returns. Please see Note B in the Notes to Financial Statements for specific information regarding expense reimbursement and/or fee waiver arrangements.
As stated in the Fund's most recent prospectus, the total annual operating expense ratios for fiscal year 2015 were 1.47%,1.84% and 2.70% for Institutional Class, Class A and Class C shares, respectively (before expense reimbursements and/or fee waivers, if any). The total annual operating expense ratios were 1.10%, 1.46% and 2.21% for Institutional Class, Class A and Class C shares, respectively, after expense reimbursements and/or fee waivers. The expense ratios for the annual period ended October 31, 2016 can be found in the Financial Highlights section of this report.
Returns shown with a sales charge reflect the deduction of the current maximum initial sales charge of 5.75% for Class A shares and the contingent deferred sales charge (CDSC) for Class C shares. The CDSC for Class C shares is 1%, which is reduced to 0% after 1 year. The performance of the Fund's share classes will differ primarily due to different sales charge structures and class expenses. Please see the prospectus for more information about sales charge structures, if any, and class expenses for your share class.
15
Risk Balanced Commodity Strategy Fund (Unaudited)
COMPARISON OF A $1,000,000 INVESTMENT
(000's omitted)

This graph shows the change in value of a hypothetical $1,000,000 investment in the Fund over the past 10 fiscal years, or since the Fund's inception if it has not operated for 10 years. The graph is based on the Institutional Class shares only; the performance of the Fund's share classes will differ primarily due to different sales charge structures and class expenses (see Performance Highlights chart on previous page). The result is compared with benchmarks, which include a broad-based market index and may include a more narrowly based index. Market indices have not been reduced to reflect any of the fees and costs of investing. The results shown in the graph reflect the reinvestment of income dividends and other distributions, if any. The results do not reflect the effect of taxes a shareholder would pay on Fund distributions or on the redemption of Fund shares. Results represent past performance and do not indicate future results.
16
U.S. Equity Index PutWrite Strategy Fund Commentary (Unaudited)
Since its launch on September 16, 2016, the Neuberger Berman U.S. Equity Index PutWrite Strategy Fund Institutional Class generated a total return of 0.90% for the period ended October 31, 2016 and outperformed its primary benchmark, a blend consisting of 85% CBOE S&P 500 PutWrite Index and 15% Russell 2000 PutWrite Index, which had a return of 0.83% for the same period. (Performance for all share classes is provided in the table immediately following this letter.)
The Fund's investment strategy seeks to collect near-the-money index put option premiums and hold a fixed income portfolio of cash and limited duration U.S. Treasury Notes that "collateralize" the short index put option positions. The market value of the fixed income portfolio is generally equal to the notional exposure of the short index put option portfolio's aggregate notional value, rendering the strategy unlevered. Our first full month of performance, October, proved to be a well-defined example of the benefits of a put writing strategy. The Fund returned –0.30% during the month while the S&P 500® Index and the Russell 2000® Index returned –1.82% and –4.75%, respectively. As expected, the upfront collection of put option premiums on U.S. equity index exposures offset a portion of the losses associated with underlying index exposures. These results are consistent with our expectations of providing "structurally" lower volatility equity index exposure through index put writing. Shareholders should keep in mind that the Fund's upside can be limited in a rising equity market.
In general, index put option premiums have historically increased during times of greater market uncertainty, which may allow the Fund to partially offset the risk of decline during periods of equity market stress as well as provide an opportunity to improve its total return potential. The setting of option premiums is a continuous process that assimilates investor sentiments and market risk factors into explicit estimates of prospective index price distributions for specific time horizons, i.e., option implied volatilities. The CBOE S&P 500 Volatility Index and CBOE Russell 2000 Volatility Index are two popular measures of implied volatilities relevant to the Fund's investment strategy. Both indexes increased as equity markets declined in October and ended the month up approximately 28% and 18%, respectively. The anticipation of the U.S. Presidential election and corresponding uncertainties were, in our opinion, likely significant contributors to the declines in equity markets and increases in put option premiums as the election drew closer. In retrospect, equity markets appeared to be most concerned with the potential for a contested outcome rather than a Clinton or Trump win and seemed to have quickly found relative relief when results indicated a clear winner, albeit a controversial one.
With each passing month, we believe the likelihood of rising interest rates seems to increase, which raises questions about the potential impact on the Fund's fixed income exposures. The market value of the Fund's cash and short-duration U.S. Treasury positions, which had an average duration of less than one year, was roughly unchanged for the period. Despite a long history of interest rate data, most modern investment strategies have histories that only span a few brief periods of rising interest rates. So looking at history offers only a limited perspective. However, we remain firm in our conviction that our limited duration exposure has the potential to help the Fund avoid significant losses should rates increase substantially. Further, in our view, any increase in equity market volatility will likely lead to higher option premiums, which may improve the return prospects of the Fund's index put writing strategy.
Sincerely,
DEREK DEVENS
PORTFOLIO MANAGER
Information about principal risks of investing in the Fund is set forth in the prospectus and statement of additional information.
The portfolio composition, industries and holdings of the Fund are subject to change without notice.
The opinions expressed are those of the Fund's portfolio manager. The opinions are as of the date of this report and are subject to change without notice.
17
U.S. Equity Index PutWrite Strategy Fund (Unaudited)
TICKER SYMBOLS
|
Institutional Class |
NUPIX |
||||||
|
Class A |
NUPAX |
||||||
|
Class C |
NUPCX |
||||||
|
Class R6 |
NUPRX |
||||||
PORTFOLIO BY TYPE OF SECURITY
|
(as a % of Total Net Assets) |
|||||
|
U.S. Treasury Obligations |
94.9 |
% |
|||
|
Put Options Written |
(1.8 |
) |
|||
|
Short-Term Investment |
3.9 |
||||
|
Other Assets Less Liabilities |
3.0 |
||||
|
Total |
100.0 |
% |
|||
PERFORMANCE HIGHLIGHTS
| Inception Date |
Cumulative Total Return Ended 10/31/2016 Life of Fund |
||||||||||
|
At NAV |
|||||||||||
|
Institutional Class |
09/16/2016 |
0.90 |
% |
||||||||
|
Class A |
09/16/2016 |
0.90 |
% |
||||||||
|
Class C |
09/16/2016 |
0.80 |
% |
||||||||
|
Class R6 |
09/16/2016 |
1.00 |
% |
||||||||
|
With Sales Charge |
|||||||||||
|
Class A |
–4.90 |
% |
|||||||||
|
Class C |
–0.20 |
% |
|||||||||
|
Index |
|||||||||||
| 85% CBOE S&P 500 PutWrite Index and 15% Russell 2000 PutWrite Index1,2 |
0.83 |
% |
|||||||||
The performance data quoted represent past performance and do not indicate future results. Current performance may be lower or higher than the performance data quoted. For performance data current to the most recent month-end, please visit www.nb.com/performance.
The results shown in the table reflect the reinvestment of income dividends and other distributions, if any. The results do not reflect the effect of taxes a shareholder would pay on Fund distributions or on the redemption of Fund shares.
The investment return and principal value of an investment will fluctuate and shares, when redeemed, may be worth more or less than their original cost.
Returns would have been lower if Neuberger Berman Investment Advisers LLC ("Management") had not reimbursed certain expenses and/or waived a portion of the investment management fees during the period shown. Repayment by a class (of expenses previously reimbursed and/or fees previously waived by Management) will decrease the class's returns. Please see Note B in the Notes to Financial Statements for specific information regarding expense reimbursement and/or fee waiver arrangements.
As stated in the Fund's most recent prospectus, the estimated total annual operating expense ratios for fiscal year 2016 are 1.49%, 1.85%, 2.60% and 1.42% for Institutional Class, Class A, Class C and Class R6 shares, respectively (before expense reimbursements and/or fee waivers, if any). The estimated total annual operating expense ratios for the current fiscal year are 0.65%, 1.01%, 1.76% and 0.58% for Institutional Class, Class A, Class C and Class R6 shares, respectively, after expense reimbursements and/or fee waivers. The expense ratios for the period from September 16, 2016 to October 31, 2016 can be found in the Financial Highlights section of this report.
Returns shown with a sales charge reflect the deduction of the current maximum initial sales charge of 5.75% for Class A shares and the contingent deferred sales charge (CDSC) for Class C shares. The CDSC for Class C shares is 1%, which is reduced to 0% after 1 year. The performance of the Fund's share classes will differ primarily due to different sales charge structures and class expenses. Please see the prospectus for more information about sales charge structures, if any, and class expenses for your share class.
18
U.S. Equity Index PutWrite Strategy Fund (Unaudited)
COMPARISON OF A $1,000,000 INVESTMENT
(000's omitted)

This graph shows the change in value of a hypothetical $1,000,000 investment in the Fund over the past 10 fiscal years, or since the Fund's inception if it has not operated for 10 years. The graph is based on the Institutional Class shares only; the performance of the Fund's share classes will differ primarily due to different sales charge structures and class expenses (see Performance Highlights chart on previous page). The result is compared with benchmarks, which include a broad-based market index and may include a more narrowly based index. Market indices have not been reduced to reflect any of the fees and costs of investing. The results shown in the graph reflect the reinvestment of income dividends and other distributions, if any. The results do not reflect the effect of taxes a shareholder would pay on Fund distributions or on the redemption of Fund shares. Results represent past performance and do not indicate future results.
19
Endnotes
1 Please see "Glossary of Indices" on page 21 for a description of indices. Please note that individuals cannot invest directly in any index. The HFRX Equity Hedge Index and HFRX Fixed Income-Credit Index do take into account fees and expenses of investing since they are based on the underlying hedge funds' net returns. The other indices described in this report do not take into account any fees, expenses or tax consequences of investing in the individual securities that they track. Data about the performance of an index are prepared or obtained by Neuberger Berman Investment Advisers LLC* and reflect the reinvestment of income dividends and other distributions, if any. The Fund may invest in securities not included in a described index and generally does not invest in all securities included in a described index.
2 The date used to calculate Life of Fund performance for the index is the inception date of the oldest share class.
3 During the period from December 2010 through April 2011, Neuberger Berman Global Allocation Fund had only one shareholder and the Fund was relatively small, which could have impacted Fund performance. During the period from August 2012 through January 2013, Neuberger Berman Risk Balanced Commodity Strategy Fund was relatively small, which could have impacted Fund performance. The same techniques used to produce returns in a small fund may not work to produce similar returns in a larger fund.
4 Effective September 30, 2016, the Board approved a change in the benchmark of Global Allocation Fund so that the Fund will use the version of its current benchmark that is net of foreign tax withholdings rather than gross of foreign tax withholdings, which is a more appropriate benchmark for the Fund. Net total return indexes reinvest dividends after the deduction of withholding taxes, using (for international indexes) a tax rate applicable to non-resident institutional investors who do not benefit from double taxation treaties. Gross total return indexes reinvest as much as possible of a company's dividend distributions, regardless of withholding taxes that a non-resident may experience.
* On January 1, 2016, Neuberger Berman Management LLC ("NBM") and Neuberger Berman LLC ("Neuberger Berman") transferred to Neuberger Berman Fixed Income LLC ("NBFI") their rights and obligations pertaining to all services they provided to any Fund under any investment management, investment sub-advisory, and/or administration agreement, as applicable (the "Agreements"). Following such transfer, NBFI was renamed Neuberger Berman Investment Advisers LLC ("NBIA" or "Management"). In addition, on the date of the transfer, the services previously provided by NB Alternative Investment Management LLC ("NBAIM") are provided by NBIA. Following the consolidation, the investment professionals of NBM and NBAIM who provided services to any Fund under the Agreements continue to provide the same services, except that they provide those services in their new capacities as investment professionals of NBIA. Further, the consolidation did not result in any change in the investment processes employed by any Fund, the nature or level of services provided to any Fund, or the fees any Fund pays under its Agreements.
On July 1, 2016, NBM was reorganized into Neuberger Berman (the "Reorganization"). Upon the completion of the Reorganization, Neuberger Berman assumed all rights and obligations pertaining to all services NBM provided to any Fund under any distribution agreement or distribution and services agreement (the "Agreements") or plan adopted pursuant to Rule 12b-1 under the Investment Company Act of 1940, as amended, (the "Plans"). Accordingly, after the Reorganization, Neuberger Berman became each Fund's distributor and the services previously provided by NBM under the Agreements and Plans are provided by Neuberger Berman.
Following the Reorganization, the employees of NBM provide the same services to each Fund under the Agreements and Plans, except that they provide those services in their capacities as employees of Neuberger Berman. Further, the Reorganization did not result in any change in the nature or level of services provided to each Fund, or the fees, if any, each Fund pays under the Agreements or the Plans.
On or about January 1, 2017, Neuberger Berman the Funds' distributor, ("Distributor"), will change its name to Neuberger Berman BD LLC.
For more complete information on any of the Neuberger Berman Alternative and Multi-Asset Class Funds, call us at (800) 877-9700, or visit our website at www.nb.com.
20
Glossary of Indices
|
Bloomberg Barclays Global Aggregate Index: |
The index measures global investment grade debt from twenty-four different local currency markets and includes fixed-rate treasury, government-related, corporate and securitized bonds from both developed and emerging markets issuers. The index is largely comprised of three major regional aggregate components: the Bloomberg Barclays U.S. Aggregate Bond Index, the Bloomberg Barclays Pan-European Aggregate Bond Index, and the Bloomberg Barclays Asian-Pacific Aggregate Index. In addition to securities from these three indices, the Bloomberg Barclays Global Aggregate Index also includes investment grade Eurodollar, Euro-Yen, Canadian, and 144A Index-eligible securities not already in these three indices. On August 24, 2016, Bloomberg acquired the Barclays fixed income benchmark indices from Barclays. Barclays and Bloomberg have agreed to co-brand the indices as the Bloomberg Barclays Indices for an initial term of five years. For more information, please visit www.bloombergindices.com/. |
||
|
Bloomberg Barclays U.S. Aggregate Bond Index: |
The index measures the investment grade, U.S. dollar-denominated, fixed-rate, taxable bond market and includes Treasuries, government-related and corporate securities, mortgage-backed securities (MBS) (agency fixed-rate and hybrid adjustable rate mortgage (ARM) pass-throughs), asset-backed securities (ABS), and commercial mortgage-backed securities (CMBS) (agency and nonagency). On August 24, 2016, Bloomberg acquired the Barclays fixed income benchmark indices from Barclays. Barclays and Bloomberg have agreed to co-brand the indices as the Bloomberg Barclays Indices for an initial term of five years. For more information, please visit www.bloombergindices.com/. |
||
| 60% Bloomberg Barclays U.S. Aggregate Bond Index and 40% S&P 500® Index: | The blended index is composed of 60% Bloomberg Barclays U.S. Aggregate Bond Index (described above) and 40% S&P 500® Index (described below), and is rebalanced monthly. | ||
|
Bloomberg Commodity Index: |
The index is a rolling index composed of exchange-traded futures contracts on physical commodities. The index relies primarily on liquidity data of futures contracts, along with U.S. dollar-adjusted production data, in determining the relative quantities of included commodities. The index is designed to be a highly liquid and diversified benchmark for commodities investments. The version of the index that is calculated on a total return basis reflects the returns on a fully collateralized investment in the underlying commodity futures contracts, combined with the returns on cash collateral invested in Treasury Bills. |
||
|
BofA Merrill Lynch U.S. High Yield Master II Index: |
The index is an unmanaged market value-weighted index of all domestic and Yankee high-yield bonds, including deferred interest bonds and payment-in-kind securities. Qualifying bonds must have at least one year remaining to maturity, a fixed coupon schedule and a minimum amount outstanding of $100 million. Qualifying bonds are capitalization weighted. |
||
| 85% CBOE S&P 500® PutWrite Index and 15% CBOE Russell 2000® PutWrite Index: |
The blended index is composed of 85% CBOE S&P 500 PutWrite Index (described below) and 15% CBOE Russell 2000 PutWrite Index (described below), and is rebalanced monthly. |
||
| CBOE S&P 500® PutWrite Index: |
The index tracks the value of a passive investment strategy which consists of overlaying S&P 500 (SPX) short put options over a money market account invested in one- and three-months Treasury bills. The SPX puts are struck at-the-money and are sold on a monthly basis. |
||
| CBOE Russell 2000® PutWrite Index: |
The index tracks the value of a passive investment strategy which consists of overlaying Russell 2000 (RUT) short put options over a money market account invested in one-month Treasury bills. The RUT puts are struck at-the-money and are sold on a monthly basis. |
21
Glossary of Indices (cont'd)
|
HFRX Fixed Income-
Credit Index:
|
The index tracks the performance of hedge fund strategies with exposure to credit across a broad continuum of credit sub-strategies, including Corporate, Sovereign, Distressed, Convertible, Asset Backed, Capital Structure Arbitrage, Multi-Strategy and other Relative Value and Event Driven sub-strategies. The investment thesis across all strategies is predicated on realization of a valuation discrepancy between the related credit instruments. Strategies may also include and utilize equity securities, credit derivatives, government fixed income, commodities, currencies or other hybrid securities. Constituent funds are selected from an eligible pool of the more than 7,500 funds worldwide that report to the Hedge Fund Research (HFR) Database. Constituent funds must meet all of the following criteria: report monthly; report performance net of all fees; be U.S. dollar-denominated; be active and accepting new investments; have a minimum 24 months track record; and the fund's manager must have at least $50 million in assets under management. Constituents are weighted by a representative optimization methodology. The index is rebalanced quarterly. |
||
|
HFRX Equity Hedge Index: |
The index comprises equity hedge strategies. Equity hedge strategies maintain positions both long and short in primarily equity and equity derivative securities. A wide variety of investment processes can be employed to arrive at an investment decision, including both quantitative and fundamental techniques; strategies can be broadly diversified or narrowly focused on specific sectors and can range broadly in terms of levels of net exposure, leverage employed, holding period, concentrations of market capitalizations and valuation ranges of typical portfolios. Equity hedge managers would typically maintain at least 50%, and may in some cases be substantially entirely invested, in equities, both long and short. Constituent funds are selected from an eligible pool of the more than 7,500 funds worldwide that report to the Hedge Fund Research (HFR) Database. Constituent funds must meet all of the following criteria: report monthly; report performance net of all fees; be U.S. dollar-denominated; be active and accepting new investments; have a minimum 24 months track record; and the fund's manager must have at least $50 million in assets under management. The index is rebalanced quarterly. |
||
|
MSCI All Country World Index: |
The index is a free float-adjusted market capitalization weighted index that is designed to measure the equity market performance of developed and emerging markets. The index consists of 46 country indices comprising 23 developed and 23 emerging market country indices. The developed market country indices included are: Australia, Austria, Belgium, Canada, Denmark, Finland, France, Germany, Hong Kong, Ireland, Israel, Italy, Japan, the Netherlands, New Zealand, Norway, Portugal, Singapore, Spain, Sweden, Switzerland, the United Kingdom and the United States. The emerging market country indices included are: Brazil, Chile, China, Colombia, Czech Republic, Egypt, Greece, Hungary, India, Indonesia, Korea, Malaysia, Mexico, Peru, the Philippines, Poland, Qatar, Russia, South Africa, Taiwan, Thailand, Turkey, and the UAE. Net total return indexes reinvest dividends after the deduction of withholding taxes, using (for international indexes) a tax rate applicable to non-resident institutional investors who do not benefit from double taxation treaties. Gross total return indexes reinvest as much as possible of a company's dividend distributions, regardless of withholding taxes that a non-resident may experience. |
22
Glossary of Indices (cont'd)
| 60% MSCI All Country World Index and 40% Bloomberg Barclays Global Aggregate Index: |
The blended index is composed of 60% MSCI All Country World Index (described above) and 40% Bloomberg Barclays Global Aggregate Index (described above), and is rebalanced monthly. Net total return indexes reinvest dividends after the deduction of withholding taxes, using (for international indexes) a tax rate applicable to non-resident institutional investors who do not benefit from double taxation treaties. Gross total return indexes reinvest as much as possible of a company's dividend distributions, regardless of withholding taxes that a non-resident may experience. |
||
| S&P 500® Index: |
The index is a float-adjusted market capitalization-weighted index that focuses on the large-cap segment of the U.S. equity market, and includes a significant portion of the total value of the market. |
23
Information About Your Fund's Expenses (Unaudited)
As a Fund shareholder, you incur two types of costs: (1) transaction costs, including sales charges (loads) on purchase payments or redemption proceeds (if applicable); and (2) ongoing costs, including management fees, distribution and/or service (12b-1) fees (if applicable), and other Fund expenses. This example is intended to help you understand your ongoing costs (in U.S. dollars) of investing in a Fund and compare these costs with the ongoing costs of investing in other mutual funds.
This table is designed to provide information regarding costs related to your investments. The following examples are based on an investment of $1,000 made at the beginning of the six month period ended October 31, 2016 and held for the entire period. The table illustrates each Fund's costs in two ways:
|
Actual Expenses and Performance: |
The first section of the table provides information about actual account values and actual expenses in dollars, based on the Fund's actual performance during the period indicated. You may use the information in this line, together with the amount you invested, to estimate the expenses you paid over the period. Simply divide your account value by $1,000 (for example, an $8,600 account value divided by $1,000 = 8.6), then multiply the result by the number in the first section of the table under the heading entitled "Expenses Paid During the Period" to estimate the expenses you paid over the period. |
||
|
Hypothetical Example for Comparison Purposes: |
The second section of the table provides information about hypothetical account values and hypothetical expenses based on the Fund's actual expense ratio and an assumed rate of return at 5% per year before expenses. This return is not the Fund's actual return. The hypothetical account values and expenses may not be used to estimate the actual ending account balance or expenses you paid for the period. You may use this information to compare the ongoing costs of investing in a Fund versus other funds. To do so, compare the expenses shown in this 5% hypothetical example with the 5% hypothetical examples that appear in the shareholder reports of other funds. |
Please note that the expenses in the table are meant to highlight your ongoing costs only and do not include any transaction costs, such as sales charges (loads) (if applicable). Therefore, the information under the heading "Hypothetical (5% annual return before expenses)" is useful in comparing ongoing costs only, and will not help you determine the relative total costs of owning different funds. In addition, if these transaction costs were included, your costs would have been higher.
24
Expense Example (Unaudited)
|
Neuberger Berman Alternative Funds |
|||||||||||||||||||||||||||||||||||
|
ACTUAL |
HYPOTHETICAL (5% ANNUAL RETURN BEFORE EXPENSES)(3) | ||||||||||||||||||||||||||||||||||
| Beginning Account Value 5/1/16 |
Ending Account Value 10/31/16 |
Expenses Paid During the Period(1) 5/1/16 - 10/31/16 |
Expense Ratio |
Beginning Account Value 5/1/16 |
Ending Account Value 10/31/16 |
Expenses Paid During the Period(1) 5/1/16 - 10/31/16 |
Expense Ratio |
||||||||||||||||||||||||||||
|
Global Allocation Fund |
|||||||||||||||||||||||||||||||||||
|
Institutional Class |
$ |
1,000.00 |
$ |
1,017.50 |
$ |
5.27 |
1.04 |
% |
$ |
1,000.00 |
$ |
1,019.91 |
$ |
5.28 |
1.04 |
% |
|||||||||||||||||||
|
Class A |
$ |
1,000.00 |
$ |
1,015.60 |
$ |
7.25 |
1.43 |
% |
$ |
1,000.00 |
$ |
1,017.95 |
$ |
7.25 |
1.43 |
% |
|||||||||||||||||||
|
Class C |
$ |
1,000.00 |
$ |
1,011.00 |
$ |
11.07 |
2.19 |
% |
$ |
1,000.00 |
$ |
1,014.13 |
$ |
11.09 |
2.19 |
% |
|||||||||||||||||||
|
Long Short Fund |
|||||||||||||||||||||||||||||||||||
|
Institutional Class |
$ |
1,000.00 |
$ |
1,004.70 |
$ |
9.62 |
1.91 |
% |
$ |
1,000.00 |
$ |
1,015.53 |
$ |
9.68 |
1.91 |
% |
|||||||||||||||||||
|
Class A |
$ |
1,000.00 |
$ |
1,003.20 |
$ |
11.43 |
2.27 |
% |
$ |
1,000.00 |
$ |
1,013.72 |
$ |
11.49 |
2.27 |
% |
|||||||||||||||||||
|
Class C |
$ |
1,000.00 |
$ |
999.20 |
$ |
15.13 |
3.01 |
% |
$ |
1,000.00 |
$ |
1,010.00 |
$ |
15.21 |
3.01 |
% |
|||||||||||||||||||
|
Long Short Credit Fund |
|||||||||||||||||||||||||||||||||||
|
Institutional Class |
$ |
1,000.00 |
$ |
1,025.30 |
$ |
8.71 |
1.71 |
% |
$ |
1,000.00 |
$ |
1,016.54 |
$ |
8.67 |
1.71 |
% |
|||||||||||||||||||
|
Class A |
$ |
1,000.00 |
$ |
1,023.70 |
$ |
10.63 |
2.09 |
% |
$ |
1,000.00 |
$ |
1,014.63 |
$ |
10.58 |
2.09 |
% |
|||||||||||||||||||
|
Class C |
$ |
1,000.00 |
$ |
1,020.60 |
$ |
13.97 |
2.75 |
% |
$ |
1,000.00 |
$ |
1,011.31 |
$ |
13.90 |
2.75 |
% |
|||||||||||||||||||
|
Class R6 |
$ |
1,000.00 |
$ |
1,026.70 |
$ |
7.79 |
1.53 |
% |
$ |
1,000.00 |
$ |
1,017.44 |
$ |
7.76 |
1.53 |
% |
|||||||||||||||||||
|
Multi-Asset Income Fund |
|||||||||||||||||||||||||||||||||||
|
Institutional Class |
$ |
1,000.00 |
$ |
1,040.20 |
$ |
2.36 |
0.46 |
% |
$ |
1,000.00 |
$ |
1,022.82 |
$ |
2.34 |
0.46 |
% |
|||||||||||||||||||
|
Class A |
$ |
1,000.00 |
$ |
1,038.30 |
$ |
4.25 |
0.83 |
% |
$ |
1,000.00 |
$ |
1,020.96 |
$ |
4.22 |
0.83 |
% |
|||||||||||||||||||
|
Class C |
$ |
1,000.00 |
$ |
1,034.40 |
$ |
8.08 |
1.58 |
% |
$ |
1,000.00 |
$ |
1,017.19 |
$ |
8.01 |
1.58 |
% |
|||||||||||||||||||
|
Class R6 |
$ |
1,000.00 |
$ |
1,040.60 |
$ |
2.00 |
0.39 |
% |
$ |
1,000.00 |
$ |
1,023.18 |
$ |
1.98 |
0.39 |
% |
|||||||||||||||||||
|
Risk Balanced Commodity Strategy Fund |
|||||||||||||||||||||||||||||||||||
|
Institutional Class |
$ |
1,000.00 |
$ |
988.40 |
$ |
5.50 |
1.10 |
% |
$ |
1,000.00 |
$ |
1,019.61 |
$ |
5.58 |
1.10 |
% |
|||||||||||||||||||
|
Class A |
$ |
1,000.00 |
$ |
986.60 |
$ |
7.29 |
1.46 |
% |
$ |
1,000.00 |
$ |
1,017.80 |
$ |
7.41 |
1.46 |
% |
|||||||||||||||||||
|
Class C |
$ |
1,000.00 |
$ |
981.10 |
$ |
11.01 |
2.21 |
% |
$ |
1,000.00 |
$ |
1,014.03 |
$ |
11.19 |
2.21 |
% |
|||||||||||||||||||
|
U.S. Equity Index PutWrite Strategy Fund |
|||||||||||||||||||||||||||||||||||
|
Institutional Class |
$ |
1,000.00 |
$ |
1,009.00 |
$ |
0.82 |
(2) |
0.65 |
% |
$ |
1,000.00 |
$ |
1,021.87 |
$ |
3.30 |
0.65 |
% |
||||||||||||||||||
|
Class A |
$ |
1,000.00 |
$ |
1,009.00 |
$ |
1.28 |
(2) |
1.01 |
% |
$ |
1,000.00 |
$ |
1,020.06 |
$ |
5.13 |
1.01 |
% |
||||||||||||||||||
|
Class C |
$ |
1,000.00 |
$ |
1,008.00 |
$ |
2.22 |
(2) |
1.76 |
% |
$ |
1,000.00 |
$ |
1,016.29 |
$ |
8.92 |
1.76 |
% |
||||||||||||||||||
|
Class R6 |
$ |
1,000.00 |
$ |
1,010.00 |
$ |
0.73 |
(2) |
0.58 |
% |
$ |
1,000.00 |
$ |
1,022.22 |
$ |
2.95 |
0.58 |
% |
||||||||||||||||||
(1) For each class, expenses are equal to the annualized expense ratio for the class, multiplied by the average account value over the period, multiplied by 184/366 (to reflect the one-half year period shown), unless otherwise indicated.
(2) For each class, expenses are equal to the annualized expense ratio for the class, multiplied by the average account value over the period, multiplied by 46/366 (to reflect the period shown of September 16, 2016 (Commencement of Operations) to October 31, 2016.
(3) Hypothetical expenses are equal to the annualized expense ratios for each class, multiplied by the average account value over the period (assuming a 5% annual return), multiplied by 184/366 (to reflect the one-half year period shown).
25
Schedule of Investments Global Allocation Fund 10/31/16
Number of Shares |
Value (000's omitted) |
||||||||||
|
Long Positions (103.9%) |
|||||||||||
|
Common Stocks (31.4%) |
|||||||||||
|
Australia (0.6%) |
|||||||||||
|
AGL Energy Ltd. |
235 |
$ |
3 |
||||||||
| Aristocrat Leisure Ltd. |
509 |
6 |
|||||||||
| Australia & New Zealand Banking Group Ltd. |
340 |
7 |
|||||||||
| BlueScope Steel Ltd. |
2,668 |
16 |
(d) |
||||||||
|
CIMIC Group Ltd. |
425 |
10 |
|||||||||
|
CSL Ltd. |
18 |
1 |
|||||||||
| Dexus Property Group |
1,781 |
12 |
|||||||||
| Fortescue Metals Group Ltd. |
929 |
4 |
|||||||||
|
Goodman Group |
666 |
3 |
|||||||||
|
GPT Group |
649 |
2 |
|||||||||
| Harvey Norman Holdings Ltd. |
417 |
2 |
|||||||||
|
Metcash Ltd. |
2,520 |
4 |
*(d) | ||||||||
|
Mirvac Group |
4,963 |
8 |
(d) |
||||||||
| National Australia Bank Ltd. |
67 |
1 |
|||||||||
| Newcrest Mining Ltd. |
51 |
1 |
|||||||||
| Northern Star Resources Ltd. |
3,023 |
9 |
(d) |
||||||||
| Qantas Airways Ltd. |
2,757 |
6 |
(d) |
||||||||
|
Scentre Group |
2,719 |
9 |
(d) |
||||||||
|
South32 Ltd. |
1,068 |
2 |
|||||||||
|
Stockland |
1,668 |
6 |
|||||||||
|
Vicinity Centres |
341 |
1 |
|||||||||
|
Wesfarmers Ltd. |
135 |
4 |
|||||||||
|
Westfield Corp. |
404 |
3 |
|||||||||
| Westpac Banking Corp. |
155 |
4 |
|||||||||
|
124 |
|||||||||||
|
Austria (0.2%) |
|||||||||||
|
Lenzing AG |
11 |
2 |
|||||||||
|
OMV AG |
1,066 |
33 |
(a) |
||||||||
|
35 |
|||||||||||
|
Belgium (0.1%) |
|||||||||||
|
Bekaert NV |
148 |
7 |
|||||||||
|
D'ieteren SA |
285 |
12 |
|||||||||
|
UCB SA |
75 |
5 |
|||||||||
|
24 |
|||||||||||
|
Canada (0.5%) |
|||||||||||
| Alimentation Couche-Tard, Inc. Class B |
68 |
4 |
(a) |
||||||||
|
Bank of Montreal |
147 |
9 |
|||||||||
Number of Shares |
Value (000's omitted) |
||||||||||
| Bank of Nova Scotia |
170 |
$ |
9 |
||||||||
| Canadian Tire Corp. Ltd. Class A |
8 |
1 |
|||||||||
| First Quantum Minerals Ltd. |
233 |
2 |
(a) |
||||||||
|
Fortis, Inc. |
63 |
3 |
|||||||||
| Genworth MI Canada, Inc. |
228 |
5 |
|||||||||
| George Weston Ltd. |
235 |
19 |
(a) |
||||||||
|
Goldcorp, Inc. |
215 |
3 |
(a) |
||||||||
|
Kinross Gold Corp. |
3,084 |
12 |
*(a) | ||||||||
| Magna International, Inc. |
23 |
1 |
(a) |
||||||||
|
Metro, Inc. |
205 |
6 |
(a) |
||||||||
| National Bank of Canada |
81 |
3 |
|||||||||
| Power Corp. of Canada |
292 |
6 |
|||||||||
| Royal Bank of Canada |
88 |
6 |
|||||||||
| Transcontinental, Inc. Class A |
87 |
1 |
|||||||||
| WestJet Airlines Ltd. |
756 |
12 |
|||||||||
|
102 |
|||||||||||
|
Denmark (0.2%) |
|||||||||||
| Carlsberg A/S Class B |
76 |
7 |
|||||||||
|
Dfds A/S |
420 |
20 |
|||||||||
|
DSV A/S |
121 |
6 |
|||||||||
|
ISS A/S |
241 |
10 |
|||||||||
| Vestas Wind Systems A/S |
117 |
9 |
|||||||||
|
52 |
|||||||||||
|
Finland (0.3%) |
|||||||||||
| Cargotec OYJ, B Shares |
35 |
1 |
|||||||||
| Kesko OYJ, B Shares |
20 |
1 |
|||||||||
|
Neste OYJ |
105 |
5 |
|||||||||
| Nokian Renkaat OYJ |
286 |
10 |
|||||||||
|
Outokumpu OYJ |
1,001 |
7 |
* |
||||||||
| Stora Enso OYJ, R Shares |
2,378 |
22 |
(d) |
||||||||
| UPM-Kymmene OYJ |
639 |
15 |
(d) |
||||||||
|
61 |
|||||||||||
|
France (1.3%) |
|||||||||||
|
Alstom SA |
234 |
6 |
* |
||||||||
|
AXA SA |
262 |
6 |
|||||||||
|
BNP Paribas SA |
514 |
30 |
(d) |
||||||||
| Casino Guichard Perrachon SA |
270 |
13 |
|||||||||
Number of Shares |
Value (000's omitted) |
||||||||||
| Cie de Saint-Gobain |
157 |
$ |
7 |
||||||||
| Cie Generale des Etablissements Michelin |
165 |
18 |
(d) |
||||||||
|
CNP Assurances |
758 |
13 |
|||||||||
|
Eiffage SA |
124 |
9 |
|||||||||
|
Engie SA |
128 |
2 |
|||||||||
|
Faurecia |
267 |
10 |
|||||||||
|
Orange SA |
882 |
14 |
|||||||||
|
Peugeot SA |
1,372 |
21 |
*(d) | ||||||||
|
Renault SA |
238 |
21 |
(d) |
||||||||
| Societe Generale SA |
577 |
22 |
(d) |
||||||||
|
Sodexo SA |
82 |
9 |
|||||||||
|
Tarkett SA |
112 |
4 |
|||||||||
|
Technip SA |
204 |
14 |
|||||||||
|
TOTAL SA |
395 |
19 |
(d) |
||||||||
|
Valeo SA |
147 |
8 |
|||||||||
|
Vallourec SA |
1,237 |
6 |
* |
||||||||
|
Vinci SA |
133 |
10 |
|||||||||
|
262 |
|||||||||||
|
Georgia (0.0%) |
|||||||||||
|
BGEO Group PLC |
167 |
6 |
|||||||||
|
Germany (1.0%) |
|||||||||||
|
adidas AG |
29 |
5 |
|||||||||
|
Allianz SE |
23 |
4 |
|||||||||
| Bayerische Motoren Werke AG, Preference Shares |
49 |
4 |
|||||||||
|
Continental AG |
31 |
6 |
|||||||||
| Deutsche Pfandbriefbank AG |
292 |
3 |
(b) |
||||||||
|
E.ON SE |
1,373 |
10 |
|||||||||
| Fresenius SE & Co. KGaA |
82 |
6 |
|||||||||
|
Hannover Rueck SE |
26 |
3 |
|||||||||
| HeidelbergCement AG |
138 |
13 |
|||||||||
| Henkel AG & Co. KGaA |
28 |
3 |
|||||||||
|
HOCHTIEF AG |
146 |
20 |
(d) |
||||||||
|
KION Group AG |
127 |
8 |
|||||||||
|
LANXESS AG |
145 |
9 |
|||||||||
|
METRO AG |
770 |
23 |
(d) |
||||||||
| MTU Aero Engines AG |
66 |
7 |
|||||||||
|
OSRAM Licht AG |
395 |
22 |
(d) |
||||||||
|
RWE AG |
426 |
7 |
* |
||||||||
| SMA Solar Technology AG |
355 |
9 |
|||||||||
|
Software AG |
22 |
1 |
|||||||||
| STADA Arzneimittel AG |
66 |
3 |
|||||||||
|
Suedzucker AG |
201 |
5 |
|||||||||
|
Uniper SE |
137 |
2 |
* |
||||||||
|
Volkswagen AG |
61 |
9 |
|||||||||
See Notes to Financial Statements
26
Schedule of Investments Global Allocation Fund (cont'd)
Number of Shares |
Value (000's omitted) |
||||||||||
| Volkswagen AG, Preference Shares |
137 |
$ |
19 |
(d) |
|||||||
|
Wincor Nixdorf AG |
100 |
7 |
* |
||||||||
|
208 |
|||||||||||
|
Hong Kong (0.3%) |
|||||||||||
|
CLP Holdings Ltd. |
1,000 |
10 |
|||||||||
| HK Electric Investments & HK Electric Investments Ltd. |
7,000 |
7 |
(b) |
||||||||
| Jardine Matheson Holdings Ltd. |
100 |
6 |
(a) |
||||||||
| Man Wah Holdings Ltd. |
2,400 |
2 |
(d) |
||||||||
|
MTR Corp. Ltd. |
500 |
3 |
|||||||||
|
WH Group Ltd. |
17,500 |
14 |
(b)(d) |
||||||||
| Wheelock & Co. Ltd. |
1,000 |
6 |
|||||||||
| Xinyi Glass Holdings Ltd. |
6,000 |
5 |
*(d) | ||||||||
| Yue Yuen Industrial Holdings Ltd. |
2,500 |
10 |
(d) |
||||||||
|
63 |
|||||||||||
|
India (0.0%) |
|||||||||||
| Vedanta Resources PLC |
870 |
8 |
(a) |
||||||||
|
Ireland (0.0%) |
|||||||||||
| Ryanair Holdings PLC ADR |
87 |
7 |
*(c) | ||||||||
|
Israel (0.1%) |
|||||||||||
| Teva Pharmaceutical Industries Ltd. ADR |
285 |
12 |
(d) |
||||||||
|
Italy (0.4%) |
|||||||||||
|
Amplifon SpA |
175 |
2 |
|||||||||
|
Brembo SpA |
140 |
9 |
|||||||||
|
DiaSorin SpA |
57 |
3 |
|||||||||
|
Enel SpA |
3,733 |
16 |
(d) |
||||||||
|
Eni SpA |
175 |
3 |
|||||||||
|
EXOR SpA |
159 |
7 |
(k) |
||||||||
|
Italmobiliare SpA |
111 |
5 |
|||||||||
| Leonardo- Finmeccanica SpA |
724 |
9 |
* |
||||||||
|
Recordati SpA |
683 |
19 |
|||||||||
|
Snam SpA |
153 |
1 |
|||||||||
|
74 |
|||||||||||
|
Japan (2.7%) |
|||||||||||
|
Adastria Co. Ltd. |
100 |
3 |
|||||||||
| Alfresa Holdings Corp. |
200 |
4 |
|||||||||
|
ANA Holdings, Inc. |
5,000 |
14 |
(d) |
||||||||
|
Bridgestone Corp. |
600 |
22 |
(d) |
||||||||
| Chubu Electric Power Co., Inc. |
1,000 |
15 |
|||||||||
Number of Shares |
Value (000's omitted) |
||||||||||
|
cocokara Fine, Inc. |
100 |
$ |
4 |
||||||||
| FamilyMart UNY Holdings Co. Ltd. |
100 |
6 |
|||||||||
| Fuji Heavy Industries Ltd. |
500 |
20 |
|||||||||
| FUJIFILM Holdings Corp. |
100 |
4 |
|||||||||
| Fujitsu General Ltd. |
1,000 |
23 |
(d) |
||||||||
|
Fujitsu Ltd. |
3,000 |
18 |
(d) |
||||||||
|
G-Tekt Corp. |
100 |
2 |
|||||||||
| Hisamitsu Pharmaceutical Co., Inc. |
100 |
5 |
|||||||||
| Idemitsu Kosan Co. Ltd. |
800 |
18 |
|||||||||
|
Isuzu Motors Ltd. |
200 |
2 |
|||||||||
|
ITOCHU Corp. |
2,000 |
25 |
(a) |
||||||||
| Japan Airlines Co. Ltd. |
400 |
12 |
(a) |
||||||||
|
Japan Tobacco, Inc. |
200 |
8 |
|||||||||
|
JTEKT Corp. |
500 |
7 |
|||||||||
|
JX Holdings, Inc. |
1,900 |
8 |
(a) |
||||||||
|
K's Holdings Corp. |
100 |
2 |
|||||||||
|
Kajima Corp. |
1,000 |
7 |
|||||||||
| Kansai Electric Power Co., Inc. |
1,000 |
10 |
*(d) | ||||||||
|
KDDI Corp. |
100 |
3 |
(d) |
||||||||
| Konami Holdings Corp. |
100 |
4 |
|||||||||
|
Kyocera Corp. |
100 |
5 |
|||||||||
|
Lion Corp. |
1,000 |
16 |
|||||||||
| Mazda Motor Corp. |
400 |
7 |
|||||||||
| Megmilk Snow Brand Co. Ltd. |
300 |
10 |
|||||||||
| Mitsubishi Motors Corp. |
700 |
4 |
(a) |
||||||||
| Mitsubishi UFJ Financial Group, Inc. |
600 |
3 |
(a) |
||||||||
| Mizuho Financial Group, Inc. |
7,800 |
13 |
(d) |
||||||||
| Namco Bandai Holdings, Inc. |
400 |
12 |
|||||||||
|
NEC Corp. |
4,000 |
11 |
(d) |
||||||||
| Nippon Steel & Sumitomo Metal Corp. |
300 |
6 |
|||||||||
| NipponTelegraph & Telephone Corp. |
400 |
18 |
(a) |
||||||||
| Nishimatsuya Chain Co. Ltd. |
100 |
1 |
|||||||||
| Nissan Motor Co. Ltd. |
100 |
1 |
|||||||||
| NTT DOCOMO, Inc. |
300 |
8 |
(a) |
||||||||
|
Obayashi Corp. |
1,200 |
12 |
(a) |
||||||||
|
ORIX Corp. |
500 |
8 |
|||||||||
|
Panasonic Corp. |
700 |
7 |
|||||||||
Number of Shares |
Value (000's omitted) |
||||||||||
| Resona Holdings, Inc. |
3,100 |
$ |
14 |
(a) |
|||||||
|
Seiko Epson Corp. |
700 |
14 |
|||||||||
|
Shiseido Co. Ltd. |
400 |
10 |
|||||||||
|
Sojitz Corp. |
3,000 |
8 |
(a) |
||||||||
|
Sony Corp. |
200 |
6 |
|||||||||
| Sumitomo Chemical Co. Ltd. |
1,000 |
5 |
(a) |
||||||||
|
Sumitomo Corp. |
1,600 |
18 |
(d) |
||||||||
| Sumitomo Dainippon Pharma Co. Ltd. |
1,300 |
23 |
(a)(d) |
||||||||
| Sumitomo Electric Industries Ltd. |
500 |
7 |
|||||||||
| Sumitomo Mitsui Financial Group, Inc. |
500 |
17 |
(d) |
||||||||
| Sumitomo Rubber Industries Ltd. |
100 |
2 |
|||||||||
|
Sundrug Co. Ltd. |
100 |
8 |
|||||||||
|
Taisei Corp. |
1,000 |
7 |
|||||||||
| Toyota Tsusho Corp. |
300 |
7 |
|||||||||
| Tsuruha Holdings, Inc. |
100 |
12 |
|||||||||
|
Yahoo Japan Corp. |
400 |
2 |
|||||||||
| Yamazaki Baking Co. Ltd. |
500 |
11 |
|||||||||
|
559 |
|||||||||||
|
Luxembourg (0.0%) |
|||||||||||
|
APERAM SA |
74 |
3 |
|||||||||
|
Tenaris SA |
217 |
3 |
(a) |
||||||||
|
6 |
|||||||||||
|
Netherlands (0.4%) |
|||||||||||
| AerCap Holdings NV |
239 |
10 |
*(a) | ||||||||
|
Akzo Nobel NV |
137 |
9 |
|||||||||
| ASML Holding NV |
84 |
9 |
|||||||||
| Koninklijke Ahold Delhaize NV |
36 |
1 |
|||||||||
| Koninklijke KPN NV |
1,827 |
6 |
|||||||||
|
NN Group NV |
111 |
3 |
|||||||||
| NXP Semiconductors NV |
64 |
6 |
*(a) | ||||||||
| Royal Dutch Shell PLC, A Shares |
878 |
22 |
(d) |
||||||||
| STMicroelectronics NV |
855 |
8 |
|||||||||
|
74 |
|||||||||||
|
Norway (0.0%) |
|||||||||||
|
Salmar ASA |
73 |
2 |
|||||||||
|
Subsea 7 SA |
155 |
2 |
*(a) | ||||||||
|
4 |
|||||||||||
See Notes to Financial Statements
27
Schedule of Investments Global Allocation Fund (cont'd)
Number of Shares |
Value (000's omitted) |
||||||||||
|
Portugal (0.1%) |
|||||||||||
| Galp Energia SGPS SA |
998 |
$ |
14 |
(d) |
|||||||
| Jeronimo Martins SGPS SA |
309 |
5 |
|||||||||
|
19 |
|||||||||||
|
Singapore (0.1%) |
|||||||||||
| Oversea-Chinese Banking Corp. Ltd. |
600 |
4 |
|||||||||
| Wilmar International Ltd. |
5,200 |
12 |
(a) |
||||||||
|
16 |
|||||||||||
|
South Africa (0.0%) |
|||||||||||
|
Mondi PLC |
393 |
8 |
|||||||||
|
Spain (0.3%) |
|||||||||||
| Abertis Infraestructuras SA |
399 |
6 |
|||||||||
| ACS Actividades de Construccion y Servicios SA |
801 |
24 |
(d) |
||||||||
|
Aena SA |
86 |
13 |
(b) |
||||||||
| CIE Automotive SA |
287 |
6 |
|||||||||
| Gamesa Corporacion Tecnologica SA |
599 |
14 |
(a) |
||||||||
| Prosegur Cia de Seguridad SA |
132 |
1 |
|||||||||
|
Repsol SA |
96 |
1 |
|||||||||
|
65 |
|||||||||||
|
Sweden (0.4%) |
|||||||||||
|
Alfa Laval AB |
456 |
7 |
|||||||||
|
Boliden AB |
519 |
12 |
|||||||||
| Electrolux AB Series B |
478 |
11 |
|||||||||
| Fingerprint Cards AB, Class B |
973 |
9 |
* |
||||||||
| L E Lundbergforetagen AB, B Shares |
163 |
11 |
|||||||||
|
Mycronic AB |
613 |
6 |
|||||||||
|
Sandvik AB |
597 |
7 |
|||||||||
| Skanska AB, B Shares |
522 |
11 |
|||||||||
| Svenska Cellulosa AB SCA, B Shares |
53 |
2 |
|||||||||
|
Volvo AB, B Shares |
944 |
10 |
|||||||||
|
86 |
|||||||||||
|
Switzerland (0.7%) |
|||||||||||
|
Actelion Ltd. |
54 |
8 |
* |
||||||||
|
Aryzta AG |
23 |
1 |
* |
||||||||
|
BKW AG |
599 |
28 |
(a) |
||||||||
|
Bobst Group SA |
58 |
3 |
|||||||||
|
Lonza Group AG |
58 |
11 |
* |
||||||||
|
Nestle SA |
133 |
10 |
|||||||||
Number of Shares |
Value (000's omitted) |
||||||||||
| Oriflame Holding AG |
113 |
$ |
4 |
* |
|||||||
| Roche Holding AG |
38 |
9 |
|||||||||
| Schindler Holding AG |
37 |
7 |
|||||||||
| Swiss Life Holding AG |
119 |
31 |
*(a) | ||||||||
|
Swiss Re AG |
371 |
34 |
(a) |
||||||||
| Wizz Air Holdings PLC |
443 |
8 |
*(a)(b) | ||||||||
|
154 |
|||||||||||
|
United Kingdom (1.5%) |
|||||||||||
| 3i Group PLC |
3,001 |
25 |
(d) |
||||||||
|
Acacia Mining PLC |
188 |
1 |
|||||||||
| Amec Foster Wheeler PLC |
3,031 |
17 |
(d) |
||||||||
| Anglo American PLC |
793 |
11 |
*(a) | ||||||||
| BP PLC |
2,020 |
12 |
(a) |
||||||||
|
Centrica PLC |
3,149 |
8 |
(d) |
||||||||
|
Drax Group PLC |
2,794 |
11 |
(d) |
||||||||
|
easyJet PLC |
422 |
5 |
|||||||||
|
Evraz PLC |
10,290 |
26 |
*(d) | ||||||||
| Fiat Chrysler Automobiles NV |
2,567 |
19 |
(d) |
||||||||
| GlaxoSmithKline PLC |
633 |
12 |
|||||||||
|
Glencore PLC |
5,987 |
18 |
*(d) | ||||||||
| Hochschild Mining PLC |
246 |
1 |
|||||||||
| HSBC Holdings PLC |
1,843 |
14 |
(a) |
||||||||
|
Hunting PLC |
712 |
4 |
|||||||||
|
Indivior PLC |
4,107 |
16 |
(d) |
||||||||
|
J Sainsbury PLC |
2,382 |
7 |
(d) |
||||||||
| JD Sports Fashion PLC |
1,278 |
24 |
(d) |
||||||||
| Johnson Matthey PLC |
181 |
7 |
|||||||||
|
Kingfisher PLC |
1,616 |
7 |
|||||||||
|
Old Mutual PLC |
3,848 |
9 |
(d) |
||||||||
|
Pearson PLC |
872 |
8 |
|||||||||
| Royal Dutch Shell PLC, B Shares |
299 |
8 |
|||||||||
| RSA Insurance Group PLC |
1,193 |
8 |
|||||||||
| Smith & Nephew PLC |
601 |
9 |
(a) |
||||||||
|
Taylor Wimpey PLC |
442 |
1 |
|||||||||
|
Unilever NV |
222 |
9 |
(a) |
||||||||
| WM Morrison Supermarkets PLC |
8,883 |
25 |
(d) |
||||||||
|
322 |
|||||||||||
|
United States (20.2%) |
|||||||||||
| Abbott Laboratories |
20 |
1 |
|||||||||
|
AbbVie, Inc. |
103 |
6 |
(a) |
||||||||
Number of Shares |
Value (000's omitted) |
||||||||||
| ACCO Brands Corp. |
315 |
$ |
3 |
*(a)(c) | |||||||
| Activision Blizzard, Inc. |
209 |
9 |
(a) |
||||||||
| Adobe Systems, Inc. |
95 |
10 |
*(a) | ||||||||
| Advance Auto Parts, Inc. |
5 |
1 |
(c) |
||||||||
| Advanced Micro Devices, Inc. |
804 |
6 |
*(a)(c) | ||||||||
|
AECOM |
292 |
8 |
*(a) | ||||||||
|
AES Corp. |
878 |
10 |
(a) |
||||||||
|
Aetna, Inc. |
209 |
22 |
(a) |
||||||||
|
Aflac, Inc. |
311 |
21 |
(a) |
||||||||
| AGNC Investment Corp. |
329 |
7 |
|||||||||
| AK Steel Holding Corp. |
1,914 |
10 |
*(a)(c) | ||||||||
| Alaska Air Group, Inc. |
154 |
11 |
(a) |
||||||||
|
Albemarle Corp. |
210 |
18 |
(a) |
||||||||
|
Alleghany Corp. |
26 |
13 |
*(a) | ||||||||
|
Allergan PLC |
53 |
11 |
*(a) | ||||||||
| Allison Transmission Holdings, Inc. |
322 |
9 |
|||||||||
|
Ally Financial, Inc. |
409 |
7 |
(a) |
||||||||
| Alphabet, Inc. Class A |
43 |
35 |
*(a)(d) | ||||||||
| Alphabet, Inc. Class C |
67 |
53 |
*(d) | ||||||||
|
Altria Group, Inc. |
319 |
21 |
(a) |
||||||||
|
Amazon.com, Inc. |
26 |
21 |
*(a) | ||||||||
|
Ameren Corp. |
199 |
10 |
(a) |
||||||||
| American Electric Power Co., Inc. |
295 |
19 |
(a) |
||||||||
| American Financial Group, Inc. |
145 |
11 |
|||||||||
| American International Group, Inc. |
42 |
3 |
(a) |
||||||||
| American Tower Corp. |
115 |
13 |
(d) |
||||||||
|
Amgen, Inc. |
159 |
22 |
(a) |
||||||||
| Annaly Capital Management, Inc. |
815 |
8 |
(a) |
||||||||
|
Anthem, Inc. |
71 |
9 |
(a) |
||||||||
|
AO Smith Corp. |
148 |
7 |
(a) |
||||||||
|
Apache Corp. |
198 |
12 |
(a)(c) |
||||||||
|
Apple, Inc. |
563 |
64 |
(d) |
||||||||
|
Aramark |
244 |
9 |
(a) |
||||||||
| Archer-Daniels- Midland Co. |
124 |
5 |
|||||||||
| Arrow Electronics, Inc. |
302 |
18 |
*(a) | ||||||||
| Ashland Global Holdings, Inc. |
106 |
12 |
(d) |
||||||||
|
Assurant, Inc. |
222 |
18 |
(a) |
||||||||
| Assured Guaranty Ltd. |
63 |
2 |
(a) |
||||||||
|
AT&T, Inc. |
574 |
21 |
(a) |
||||||||
See Notes to Financial Statements
28
Schedule of Investments Global Allocation Fund (cont'd)
Number of Shares |
Value (000's omitted) |
||||||||||
| Avery Dennison Corp. |
79 |
$ |
6 |
(a) |
|||||||
|
Avnet, Inc. |
782 |
33 |
(a) |
||||||||
|
AVX Corp. |
565 |
8 |
(a) |
||||||||
| Axis Capital Holdings Ltd. |
110 |
6 |
(a) |
||||||||
| Bank of America Corp. |
1,823 |
30 |
(a) |
||||||||
| Bank of Hawaii Corp. |
136 |
10 |
(a)(c) |
||||||||
| Bank of New York Mellon Corp. |
154 |
7 |
(a) |
||||||||
|
BankUnited, Inc. |
489 |
14 |
(a) |
||||||||
| Barnes & Noble, Inc. |
157 |
2 |
(c) |
||||||||
| Baxter International, Inc. |
485 |
23 |
(a) |
||||||||
|
BB&T Corp. |
319 |
12 |
(a) |
||||||||
| Becton, Dickinson & Co. |
117 |
20 |
(a)(d) |
||||||||
| Bed Bath & Beyond, Inc. |
166 |
7 |
(a)(c) |
||||||||
| Berkshire Hathaway, Inc. Class B |
152 |
22 |
*(a) | ||||||||
|
Best Buy Co., Inc. |
455 |
18 |
(a)(c) |
||||||||
|
Biogen, Inc. |
9 |
3 |
*(a) | ||||||||
|
BlackRock, Inc. |
38 |
13 |
(a) |
||||||||
| Bloomin' Brands, Inc. |
295 |
5 |
|||||||||
| Boston Scientific Corp. |
116 |
3 |
*(a) | ||||||||
| Bristol-Myers Squibb Co. |
92 |
5 |
(a) |
||||||||
| Burlington Stores, Inc. |
270 |
20 |
*(a) | ||||||||
|
C.R. Bard, Inc. |
36 |
8 |
(a) |
||||||||
|
CA, Inc. |
125 |
4 |
(a)(c) |
||||||||
| Cabot Oil & Gas Corp. |
352 |
7 |
(a) |
||||||||
| Cadence Design Systems, Inc. |
118 |
3 |
*(a) | ||||||||
| Caesars Acquisition Co. Class A |
811 |
9 |
*(a) | ||||||||
| Caesars Entertainment Corp. |
178 |
1 |
*(c) | ||||||||
|
Campbell Soup Co. |
129 |
7 |
(a) |
||||||||
| Capital One Financial Corp. |
108 |
8 |
(a) |
||||||||
|
Carnival Corp. |
165 |
8 |
(a) |
||||||||
|
Carter's, Inc. |
62 |
5 |
(a) |
||||||||
| Casey's General Stores, Inc. |
7 |
1 |
(c) |
||||||||
| CBS Corp. Class B |
189 |
11 |
(a) |
||||||||
|
CDW Corp. |
592 |
27 |
(a) |
||||||||
| Celanese Corp. Series A |
93 |
7 |
(a) |
||||||||
|
Celgene Corp. |
45 |
5 |
*(a) | ||||||||
Number of Shares |
Value (000's omitted) |
||||||||||
|
Centene Corp. |
121 |
$ |
8 |
*(a) | |||||||
| CenterPoint Energy, Inc. |
270 |
6 |
(a) |
||||||||
| Central Garden & Pet Co. Class A |
133 |
3 |
*(a) | ||||||||
|
CenturyLink, Inc. |
948 |
25 |
(a)(c) |
||||||||
| Charter Communications, Inc. Class A |
69 |
17 |
*(a) | ||||||||
| Chesapeake Energy Corp. |
955 |
5 |
*(a) | ||||||||
| Children's Place, Inc. |
10 |
1 |
(c) |
||||||||
| Chimera Investment Corp. |
591 |
9 |
|||||||||
|
Chubb Ltd. |
170 |
22 |
(d) |
||||||||
|
Cigna Corp. |
47 |
6 |
(a) |
||||||||
| Cimarex Energy Co. |
49 |
6 |
(a) |
||||||||
| Cincinnati Financial Corp. |
143 |
10 |
|||||||||
|
Cisco Systems, Inc. |
1,602 |
49 |
(d) |
||||||||
|
CIT Group, Inc. |
270 |
10 |
(a) |
||||||||
|
Citigroup, Inc. |
707 |
35 |
(a) |
||||||||
|
Citrix Systems, Inc. |
73 |
6 |
*(a) | ||||||||
|
CME Group, Inc. |
100 |
10 |
(a) |
||||||||
| CNA Financial Corp. |
120 |
4 |
(a) |
||||||||
|
Coeur Mining, Inc. |
708 |
8 |
*(a) | ||||||||
| Colony Starwood Homes |
329 |
10 |
(c) |
||||||||
| Comcast Corp. Class A |
199 |
12 |
(d) |
||||||||
|
Comerica, Inc. |
199 |
10 |
(a) |
||||||||
| Communications Sales & Leasing, Inc. |
206 |
6 |
|||||||||
| Computer Sciences Corp. |
185 |
10 |
(a) |
||||||||
| ConAgra Foods, Inc. |
731 |
35 |
(d) |
||||||||
|
Corning, Inc. |
776 |
18 |
(c)(d) |
||||||||
| Corrections Corporation of America |
389 |
6 |
|||||||||
| Costco Wholesale Corp. |
98 |
14 |
(a) |
||||||||
|
CVS Health Corp. |
114 |
10 |
(a) |
||||||||
|
D.R. Horton, Inc. |
231 |
7 |
(a) |
||||||||
|
Danaher Corp. |
53 |
4 |
(a) |
||||||||
| Darden Restaurants, Inc. |
99 |
6 |
(c) |
||||||||
| Dave & Buster's Entertainment, Inc. |
47 |
2 |
*(a) | ||||||||
|
DaVita, Inc. |
258 |
15 |
*(a) | ||||||||
| Deckers Outdoor Corp. |
158 |
8 |
*(c) | ||||||||
| Dell Technologies, Inc. Class V |
30 |
1 |
* |
||||||||
|
Delta Air Lines, Inc. |
331 |
14 |
(a) |
||||||||
Number of Shares |
Value (000's omitted) |
||||||||||
| Denbury Resources, Inc. |
290 |
$ |
1 |
*(c) | |||||||
| DENTSPLY SIRONA, Inc. |
253 |
15 |
(a) |
||||||||
| Devon Energy Corp. |
140 |
5 |
(a) |
||||||||
| Diamond Offshore Drilling, Inc. |
819 |
14 |
(a)(c) |
||||||||
| Diamondback Energy, Inc. |
64 |
6 |
*(a) | ||||||||
| Dollar General Corp. |
58 |
4 |
(a) |
||||||||
|
Duke Energy Corp. |
160 |
13 |
(a) |
||||||||
| Eastman Chemical Co. |
92 |
7 |
(a) |
||||||||
|
Eaton Corp. PLC |
276 |
18 |
(a) |
||||||||
|
eBay, Inc. |
612 |
17 |
*(a) | ||||||||
| Edison International |
232 |
17 |
(d) |
||||||||
| Emergent BioSolutions, Inc. |
29 |
1 |
*(c) | ||||||||
|
Energen Corp. |
110 |
6 |
(a) |
||||||||
|
Ensco PLC Class A |
980 |
8 |
(a) |
||||||||
|
Entergy Corp. |
148 |
11 |
(a) |
||||||||
| EOG Resources, Inc. |
176 |
16 |
(a) |
||||||||
| EP Energy Corp. Class A |
319 |
1 |
*(c) | ||||||||
|
Equinix, Inc. |
26 |
9 |
|||||||||
| Everest Re Group Ltd. |
36 |
7 |
(a) |
||||||||
|
Exelixis, Inc. |
177 |
2 |
*(a)(c) | ||||||||
|
Exelon Corp. |
396 |
13 |
(d) |
||||||||
| Express Scripts Holding Co. |
57 |
4 |
*(a) | ||||||||
|
Exxon Mobil Corp. |
428 |
36 |
(a) |
||||||||
| Facebook, Inc. Class A |
171 |
22 |
*(a) | ||||||||
|
FedEx Corp. |
71 |
12 |
(a) |
||||||||
| Fidelity National Information Services, Inc. |
26 |
2 |
(a) |
||||||||
|
Fifth Third Bancorp |
695 |
15 |
|||||||||
|
FirstEnergy Corp. |
330 |
11 |
(a) |
||||||||
|
Fiserv, Inc. |
38 |
4 |
*(a) | ||||||||
|
Fitbit, Inc. Class A |
114 |
2 |
*(c) | ||||||||
| Five Prime Therapeutics, Inc. |
30 |
1 |
*(a) | ||||||||
|
Foot Locker, Inc. |
130 |
9 |
(a) |
||||||||
|
Ford Motor Co. |
2,345 |
28 |
(d) |
||||||||
| Forest City Realty Trust, Inc. Class A |
362 |
8 |
|||||||||
| Fresh Del Monte Produce, Inc. |
284 |
17 |
(a) |
||||||||
| General Electric Co. |
805 |
23 |
(a)(d) |
||||||||
| General Mills, Inc. |
185 |
11 |
(a) |
||||||||
| General Motors Co. |
138 |
4 |
(a) |
||||||||
|
Gentex Corp. |
687 |
12 |
(c) |
||||||||
See Notes to Financial Statements
29
Schedule of Investments Global Allocation Fund (cont'd)
Number of Shares |
Value (000's omitted) |
||||||||||
|
Genuine Parts Co. |
192 |
$ |
17 |
(a)(c) |
|||||||
| Gilead Sciences, Inc. |
178 |
13 |
(a) |
||||||||
|
Glaukos Corp. |
328 |
11 |
*(c) | ||||||||
| GNC Holdings, Inc. Class A |
235 |
3 |
|||||||||
| Goldman Sachs Group, Inc. |
70 |
12 |
(a) |
||||||||
| Goodyear Tire & Rubber Co. |
366 |
11 |
(a) |
||||||||
|
Greif, Inc. Class B |
81 |
5 |
|||||||||
|
Halliburton Co. |
20 |
1 |
(c) |
||||||||
|
Halyard Health, Inc. |
28 |
1 |
* |
||||||||
| Hartford Financial Services Group, Inc. |
35 |
2 |
(a) |
||||||||
|
Hasbro, Inc. |
76 |
6 |
(a) |
||||||||
| Hawaiian Holdings, Inc. |
511 |
23 |
*(c) | ||||||||
|
HCA Holdings, Inc. |
142 |
11 |
*(a) | ||||||||
| HD Supply Holdings, Inc. |
202 |
7 |
*(a) | ||||||||
|
Herbalife Ltd. |
103 |
6 |
*(c) | ||||||||
|
Hologic, Inc. |
202 |
7 |
*(a) | ||||||||
|
HP, Inc. |
2,001 |
29 |
(a)(d) |
||||||||
| Huntington Ingalls Industries, Inc. |
146 |
24 |
(a) |
||||||||
|
IBM Corp. |
84 |
13 |
(a) |
||||||||
|
ICON PLC |
100 |
8 |
*(a) | ||||||||
|
IHS Markit Ltd. |
553 |
20 |
*(a)(c) | ||||||||
| Ingram Micro, Inc. Class A |
772 |
29 |
(a) |
||||||||
|
Ingredion, Inc. |
165 |
22 |
(a) |
||||||||
|
Intel Corp. |
392 |
14 |
(a) |
||||||||
| Intercontinental Exchange, Inc. |
68 |
18 |
(a) |
||||||||
| International Game Game Technology PLC |
119 |
3 |
(a)(c) |
||||||||
| InterpublicGroup of Cos., Inc. |
289 |
6 |
(a) |
||||||||
| Intuitive Surgical, Inc. |
2 |
1 |
*(a) | ||||||||
|
J.M. Smucker Co. |
37 |
5 |
|||||||||
| Jacobs Engineering Group, Inc. |
443 |
23 |
*(a) | ||||||||
| JetBlue Airways Corp. |
1,310 |
23 |
*(a) | ||||||||
|
Johnson & Johnson |
323 |
37 |
(a) |
||||||||
|
Joy Global, Inc. |
418 |
12 |
(a) |
||||||||
| JPMorgan Chase & Co. |
1,328 |
92 |
(d) |
||||||||
| Juniper Networks, Inc. |
415 |
11 |
(a) |
||||||||
|
Knowles Corp. |
168 |
3 |
*(c) | ||||||||
|
Kohl's Corp. |
264 |
12 |
(a)(c) |
||||||||
|
Kroger Co. |
192 |
6 |
(a) |
||||||||
Number of Shares |
Value (000's omitted) |
||||||||||
| L-3 Communications Holdings, Inc. |
137 |
$ |
19 |
(d) |
|||||||
| Laboratory Corp. of America Holdings |
143 |
18 |
*(a) | ||||||||
| Lam Research Corp. |
130 |
13 |
(a) |
||||||||
| Laredo Petroleum, Inc. |
546 |
7 |
*(c) | ||||||||
|
Lear Corp. |
124 |
15 |
(a) |
||||||||
|
Leggett & Platt, Inc. |
143 |
7 |
(a) |
||||||||
| Leidos Holdings, Inc. |
545 |
23 |
(a) |
||||||||
| Lennar Corp. Class A |
392 |
16 |
(a) |
||||||||
| Level 3 Communications, Inc. |
198 |
11 |
*(a) | ||||||||
| Lincoln National Corp. |
192 |
9 |
|||||||||
| Lithia Motors, Inc. Class A |
51 |
4 |
|||||||||
|
Loews Corp. |
124 |
5 |
(a) |
||||||||
|
Lowe's Cos., Inc. |
157 |
10 |
(a) |
||||||||
|
M&T BankCorp. |
7 |
1 |
(c) |
||||||||
|
Macy's, Inc. |
326 |
12 |
(d) |
||||||||
| Manhattan Associates, Inc. |
92 |
5 |
*(a) | ||||||||
|
ManitowocCo., Inc. |
611 |
2 |
(c) |
||||||||
| Marriott International, Inc. Class A |
62 |
4 |
|||||||||
| MasterCard, Inc. Class A |
169 |
18 |
(a) |
||||||||
|
McKesson Corp. |
61 |
8 |
(a) |
||||||||
|
Medtronic PLC |
269 |
22 |
(a) |
||||||||
| Mentor Graphics Corp. |
141 |
4 |
(c) |
||||||||
|
Merck & Co., Inc. |
244 |
14 |
(a) |
||||||||
|
MetLife, Inc. |
131 |
6 |
(a) |
||||||||
|
MFA Financial, Inc. |
107 |
1 |
|||||||||
| MGM Resorts International |
399 |
10 |
*(a) | ||||||||
|
Michaels Cos., Inc |
752 |
17 |
*(a) | ||||||||
|
Microsoft Corp. |
945 |
57 |
(d) |
||||||||
| Molson Coors Brewing Co. Class B |
94 |
10 |
(a) |
||||||||
| Mondelez International, Inc. Class A |
320 |
14 |
(d) |
||||||||
| Motorola Solutions, Inc. |
247 |
18 |
(a) |
||||||||
| National Beverage Corp. |
185 |
9 |
*(a) | ||||||||
| National Fuel Gas Co. |
73 |
4 |
(c) |
||||||||
|
Nevro Corp. |
49 |
4 |
* |
||||||||
Number of Shares |
Value (000's omitted) |
||||||||||
| New Media Investment Group, Inc. |
79 |
$ |
1 |
(a)(c) |
|||||||
| New Residential Investment Corp. |
188 |
3 |
|||||||||
| Newell Brands, Inc. |
269 |
13 |
(a) |
||||||||
| Newfield Exploration Co. |
135 |
5 |
*(a) | ||||||||
| Newmont Mining Corp. |
278 |
10 |
(a) |
||||||||
|
NiSource, Inc. |
896 |
21 |
(a) |
||||||||
|
Nordstrom, Inc. |
117 |
6 |
|||||||||
| Northrop Grumman Corp. |
5 |
1 |
(a) |
||||||||
|
Nucor Corp. |
246 |
12 |
(a) |
||||||||
|
NVIDIA Corp. |
362 |
26 |
(c)(d) |
||||||||
|
Office Depot, Inc. |
930 |
3 |
(c) |
||||||||
|
OGE Energy Corp. |
286 |
9 |
(a) |
||||||||
| Old Republic International Corp. |
198 |
3 |
(a) |
||||||||
|
Oracle Corp. |
627 |
24 |
(a) |
||||||||
| Ormat Technologies, Inc. |
140 |
7 |
(c) |
||||||||
|
Owens Corning |
380 |
19 |
(a) |
||||||||
| Packaging Corp. of America |
90 |
7 |
(c) |
||||||||
| Party City Holdco, Inc. |
694 |
11 |
*(a)(c) | ||||||||
| PayPal Holdings, Inc. |
195 |
8 |
*(a) | ||||||||
|
PepsiCo, Inc. |
70 |
7 |
(a) |
||||||||
|
PerkinElmer, Inc. |
142 |
7 |
(a) |
||||||||
|
Pfizer, Inc. |
1,428 |
45 |
(a) |
||||||||
|
PG&E Corp. |
13 |
1 |
|||||||||
| Philip Morris International, Inc. |
76 |
7 |
|||||||||
|
Phillips 66 |
119 |
10 |
|||||||||
|
Pinnacle Foods, Inc. |
157 |
8 |
(a) |
||||||||
| Pinnacle West Capital Corp. |
87 |
7 |
(c) |
||||||||
| Pioneer Natural Resources Co. |
51 |
9 |
(a) |
||||||||
| Ply Gem Holdings, Inc. |
101 |
1 |
*(a) | ||||||||
| PNC Financial Services Group, Inc. |
310 |
30 |
(d) |
||||||||
|
Pool Corp. |
91 |
8 |
(a) |
||||||||
|
Popular, Inc. |
126 |
5 |
(a) |
||||||||
| PPG Industries, Inc. |
50 |
5 |
|||||||||
| Priceline Group, Inc. |
4 |
6 |
* |
||||||||
| Procter & Gamble Co. |
547 |
47 |
(a) |
||||||||
| Prudential Financial, Inc. |
285 |
24 |
(a) |
||||||||
|
PVH Corp. |
125 |
13 |
(a) |
||||||||
|
Qorvo, Inc. |
14 |
1 |
*(c) | ||||||||
See Notes to Financial Statements
30
Schedule of Investments Global Allocation Fund (cont'd)
Number of Shares |
Value (000's omitted) |
||||||||||
| Quad/Graphics, Inc. |
652 |
$ |
15 |
(a)(c) |
|||||||
| Quest Diagnostics, Inc. |
372 |
30 |
(a) |
||||||||
|
Ralph LaurenCorp. |
79 |
8 |
(a) |
||||||||
| Range Resources Corp. |
149 |
5 |
|||||||||
| Regions Financial Corp. |
1,552 |
17 |
(a) |
||||||||
| Reinsurance Group of America, Inc. |
182 |
20 |
(a) |
||||||||
| Reliance Steel & Aluminum Co. |
376 |
26 |
(a) |
||||||||
| Republic Services, Inc. |
171 |
9 |
(a) |
||||||||
| Roper Technologies, Inc. |
77 |
13 |
(a) |
||||||||
| RPM International, Inc. |
149 |
7 |
|||||||||
|
salesforce.com, inc. |
79 |
6 |
*(a) | ||||||||
|
Sanmina Corp. |
80 |
2 |
*(a) | ||||||||
|
SCANA Corp. |
87 |
6 |
(c) |
||||||||
|
Schlumberger Ltd. |
330 |
26 |
(a) |
||||||||
| Sensient Technologies Corp. |
161 |
12 |
(a) |
||||||||
| Service Corp. International |
318 |
8 |
|||||||||
| ServiceMaster Global Holdings, Inc. |
190 |
7 |
* |
||||||||
| Shenandoah Telecommunications Co. |
62 |
2 |
(c) |
||||||||
| Signet Jewelers Ltd. |
64 |
5 |
(a) |
||||||||
|
SkyWest, Inc. |
123 |
4 |
(c) |
||||||||
| Sonoco Products Co. |
242 |
12 |
(c) |
||||||||
| Southwest Airlines Co. |
282 |
11 |
(a) |
||||||||
|
Sprint Corp. |
1,007 |
6 |
*(a) | ||||||||
|
Starbucks Corp. |
136 |
7 |
|||||||||
| Steel Dynamics, Inc. |
786 |
22 |
(a)(c) |
||||||||
|
Stratasys Ltd. |
52 |
1 |
* |
||||||||
|
Stryker Corp. |
29 |
3 |
(a) |
||||||||
| SunTrust Banks, Inc. |
708 |
32 |
(a)(d) |
||||||||
|
SUPERVALU, Inc. |
204 |
1 |
*(c) | ||||||||
| Synchrony Financial |
225 |
6 |
(a) |
||||||||
|
SYNNEX Corp. |
23 |
2 |
(a)(c) |
||||||||
|
Sysco Corp. |
302 |
15 |
(a) |
||||||||
|
T-Mobile US, Inc. |
259 |
13 |
*(a) | ||||||||
| Tahoe Resources, Inc. |
171 |
2 |
(c) |
||||||||
|
Target Corp. |
170 |
12 |
(a) |
||||||||
|
Tech Data Corp. |
64 |
5 |
*(a)(c) | ||||||||
|
Teleflex, Inc. |
116 |
17 |
(a) |
||||||||
Number of Shares |
Value (000's omitted) |
||||||||||
| Telephone & Data Systems, Inc. |
112 |
$ |
3 |
(a) |
|||||||
| Texas Instruments, Inc. |
290 |
21 |
(a) |
||||||||
| Thermo Fisher Scientific, Inc. |
85 |
12 |
|||||||||
| Thomson Reuters Corp. |
56 |
2 |
|||||||||
| Tile Shop Holdings, Inc. |
356 |
6 |
*(c) | ||||||||
|
Time Warner, Inc. |
65 |
6 |
|||||||||
|
TiVo Corp. |
101 |
2 |
*(a)(c) | ||||||||
|
TJX Cos., Inc. |
72 |
5 |
(a) |
||||||||
| Total System Services, Inc. |
89 |
4 |
(a) |
||||||||
|
TransUnion |
442 |
14 |
*(a) | ||||||||
|
Travelers Cos., Inc. |
58 |
6 |
|||||||||
| Trinity Industries, Inc. |
81 |
2 |
(a)(c) |
||||||||
|
Trinseo SA |
355 |
19 |
(a) |
||||||||
| Twenty-First Century Fox, Inc. Class A |
384 |
10 |
(a) |
||||||||
| Tyler Technologies, Inc. |
49 |
8 |
*(a) | ||||||||
| Tyson Foods, Inc. Class A |
313 |
22 |
(a) |
||||||||
|
U.S. Bancorp |
201 |
9 |
(a) |
||||||||
| United Continental Holdings, Inc. |
85 |
5 |
*(a) | ||||||||
| United Natural Foods, Inc. |
215 |
9 |
*(a) | ||||||||
| United Rentals, Inc. |
162 |
12 |
*(a) | ||||||||
| United Therapeutics Corp. |
7 |
1 |
*(c) | ||||||||
| UnitedHealth Group, Inc. |
307 |
43 |
(a) |
||||||||
| Universal Display Corp. |
13 |
1 |
*(c) | ||||||||
| Universal Forest Products, Inc. |
98 |
8 |
|||||||||
| Universal Health Services, Inc. Class B |
126 |
15 |
(a) |
||||||||
|
Unum Group |
383 |
14 |
(a) |
||||||||
| Valmont Industries, Inc. |
77 |
10 |
(a) |
||||||||
|
Vantiv, Inc. Class A |
214 |
12 |
*(a) | ||||||||
|
VCA, Inc. |
38 |
2 |
*(a) | ||||||||
| Verint Systems, Inc. |
134 |
5 |
*(c) | ||||||||
|
VeriSign, Inc. |
116 |
10 |
*(c) | ||||||||
| Verisk Analytics, Inc. |
87 |
7 |
* |
||||||||
| Verizon Communications, Inc. |
755 |
36 |
(a)(d) |
||||||||
|
Visa, Inc. Class A |
132 |
11 |
(d) |
||||||||
Number of Shares |
Value (000's omitted) |
||||||||||
| VMware, Inc. Class A |
106 |
$ |
8 |
*(c) | |||||||
|
W. R. Berkley Corp. |
106 |
6 |
(a) |
||||||||
|
W.W. Grainger, Inc. |
36 |
7 |
(c) |
||||||||
| Wabash National Corp. |
125 |
1 |
*(c) | ||||||||
|
WageWorks, Inc. |
111 |
7 |
*(a) | ||||||||
| Wal-Mart Stores, Inc. |
455 |
32 |
(a)(d) |
||||||||
| Walgreens Boots Alliance, Inc. |
190 |
16 |
(a) |
||||||||
|
Walt Disney Co. |
95 |
9 |
(a) |
||||||||
| Waste Management, Inc. |
96 |
6 |
(a) |
||||||||
| Wayfair, Inc. Class A |
30 |
1 |
*(c) | ||||||||
| WellCare Health Plans, Inc. |
76 |
9 |
*(a) | ||||||||
|
Wells Fargo & Co. |
285 |
13 |
(a) |
||||||||
| West Pharmaceutical Services, Inc. |
249 |
19 |
(d) |
||||||||
|
Westar Energy, Inc. |
256 |
15 |
(a) |
||||||||
| Western Digital Corp. |
160 |
9 |
(a) |
||||||||
|
Western Union Co. |
425 |
9 |
(c) |
||||||||
|
Weyerhaeuser Co. |
358 |
11 |
|||||||||
|
Whirlpool Corp. |
65 |
10 |
(a)(c) |
||||||||
| WhiteWave Foods Co. |
160 |
9 |
* |
||||||||
| Whole Foods Market, Inc. |
424 |
12 |
(c) |
||||||||
| Worthington Industries, Inc. |
45 |
2 |
|||||||||
| Wyndham Worldwide Corp. |
85 |
6 |
(a) |
||||||||
|
Xencor, Inc. |
80 |
2 |
*(c) | ||||||||
|
Xerox Corp. |
2,301 |
22 |
(a) |
||||||||
|
Xilinx, Inc. |
114 |
6 |
(a) |
||||||||
|
Yahoo! Inc. |
36 |
1 |
*(a) | ||||||||
| Zimmer Biomet Holdings, Inc. |
100 |
11 |
(d) |
||||||||
|
Zoetis, Inc. |
162 |
8 |
|||||||||
|
4,182 |
|||||||||||
| Total Common Stocks (Cost $6,312) |
6,533 |
||||||||||
| Principal Amount(e) (000's omitted) |
|||||||||||
|
U.S. Treasury Obligations (4.6%) |
|||||||||||
| U.S. Treasury Bonds |
|||||||||||
| 4.50%, due 2/15/36 |
$ |
21 |
29 |
||||||||
| 3.88%, due 8/15/40 |
13 |
16 |
|||||||||
See Notes to Financial Statements
31
Schedule of Investments Global Allocation Fund (cont'd)
| Principal Amount(e) (000's omitted) |
Value (000's omitted) |
||||||||||
| 3.00%, due 11/15/44 |
$ |
65 |
$ |
71 |
(d) |
||||||
| 2.50%, due 2/15/46 |
10 |
10 |
|||||||||
| U.S. Treasury Inflation- Indexed Bonds |
|||||||||||
| 0.13%, due 7/15/24 |
61 |
61 |
(d)(m) |
||||||||
| 2.38%, due 1/15/25 |
19 |
23 |
(m) |
||||||||
| 0.63%, due 1/15/26 |
20 |
21 |
(m) |
||||||||
| 2.38%, due 1/15/27 |
18 |
22 |
(m) |
||||||||
| 1.75%, due 1/15/28 |
6 |
7 |
(m) |
||||||||
| 2.50%, due 1/15/29 |
34 |
42 |
(m) |
||||||||
| 3.88%, due 4/15/29 |
89 |
127 |
(m) |
||||||||
| 3.38%, due 4/15/32 |
43 |
63 |
(m) |
||||||||
| 2.13%, due 2/15/40 |
17 |
22 |
(m) |
||||||||
| 0.75%, due 2/15/42 |
13 |
13 |
(m) |
||||||||
| 0.63%, due 2/15/43 |
49 |
48 |
(m) |
||||||||
| 0.75%, due 2/15/45 |
66 |
67 |
(m) |
||||||||
| U.S. Treasury Inflation- Indexed Notes, 0.13%, due 1/15/23 |
31 |
32 |
(m) |
||||||||
| U.S. Treasury Notes |
|||||||||||
| 0.75%, due 1/31/18 |
221 |
221 |
|||||||||
| 1.38%, due 4/30/20 |
48 |
48 |
|||||||||
| 4.75%, due 2/15/37 |
3 |
4 |
|||||||||
| Total U.S. Treasury Obligations (Cost $937) |
947 |
||||||||||
|
U.S. Government Agency Security (0.3%) |
|||||||||||
| Federal Home Loan Bank, 5.50%, due 7/15/36 (Cost $57) |
40 |
56 |
(a) |
||||||||
| Principal Amount(e) (000's omitted) |
Value (000's omitted) |
||||||||||
|
Mortgage-Backed Securities (0.8%) |
|||||||||||
|
Fannie Mae (0.3%) |
|||||||||||
| 4.50%, TBA, 30 Year Maturity |
$ |
60 |
$ |
66 |
(f) |
||||||
|
Freddie Mac (0.5%) |
|||||||||||
| 4.00%, TBA, 30 Year Maturity |
85 |
91 |
(f) |
||||||||
| Total Mortgage- Backed Securities (Cost $157) |
157 |
||||||||||
|
Foreign Government Securities (8.0%) |
|||||||||||
| Australia Government Bond |
|||||||||||
| 3.25%, due 4/21/29 |
AUD |
30 |
25 |
(g) |
|||||||
| 2.00%, due 8/21/35 |
AUD |
15 |
15 |
(g) |
|||||||
| 3.25%, due 6/21/39 |
AUD |
40 |
32 |
(g) |
|||||||
| 1.25%, due 8/21/40 |
AUD |
20 |
17 |
(g) |
|||||||
| Canadian Government Bond |
|||||||||||
| 4.25%, due 6/1/18 |
CAD |
145 |
114 |
(a) |
|||||||
| 4.25%, due 12/1/21 |
CAD |
23 |
21 |
(a) |
|||||||
| 5.75%, due 6/1/33 |
CAD |
40 |
47 |
(a) |
|||||||
| 1.50%, due 12/1/44 |
CAD |
17 |
17 |
(a) |
|||||||
| 1.25%, due 12/1/47 |
CAD |
10 |
10 |
(a) |
|||||||
| French Republic Government Bond OAT |
|||||||||||
| 1.75%, due 11/25/24 |
EUR |
25 |
31 |
(g) |
|||||||
| 3.25%, due 5/25/45 |
EUR |
70 |
113 |
(g) |
|||||||
| Italy Buoni Poliennali Del Tesoro |
|||||||||||
| 3.10%, due 9/15/26 |
EUR |
32 |
43 |
(g) |
|||||||
| 4.00%, due 2/1/37 |
EUR |
30 |
41 |
(g) |
|||||||
| 2.55%, due 9/15/41 |
EUR |
11 |
15 |
(g) |
|||||||
| 2.70%, due 3/1/47 |
EUR |
5 |
5 |
(b)(g) |
|||||||
| Principal Amount(e) (000's omitted) |
Value (000's omitted) |
||||||||||
| Japanese Government Twenty Year Bond, 0.50%, due 9/20/36 |
JPY |
6,000 |
$ |
58 |
|||||||
| Japanese Government CPI Linked Bond, 0.10%, due 3/10/25 |
JPY |
11,155 |
112 |
(m) |
|||||||
| Mexican Bonos, Ser. M, 7.75%, due 11/13/42 |
MXN |
840 |
50 |
(a) |
|||||||
| New Zealand Government Bond |
|||||||||||
| Ser. 925, 2.00%, due 9/20/25 |
NZD |
15 |
12 |
(g) |
|||||||
| Ser. 427, 4.50%, due 4/15/27 |
NZD |
80 |
67 |
(g) |
|||||||
| Ser. 935, 2.50%, due 9/20/2035 |
NZD |
75 |
59 |
(g) |
|||||||
| South Africa Government Bond, Ser. R214, 6.50%, due 2/28/41 |
ZAR |
730 |
39 |
||||||||
| Spain Government Bond, 4.65%, due 7/30/25 |
EUR |
45 |
64 |
(a)(b)(g) |
|||||||
| Spain Government Inflation Linked Bond, 1.00%, due 11/30/30 |
EUR |
5 |
6 |
(a)(b)(g) |
|||||||
| United Kingdom Gilt |
|||||||||||
| 1.75%, due 7/22/19 |
GBP |
125 |
159 |
(g) |
|||||||
| 1.75%, due 9/7/22 |
GBP |
135 |
175 |
(g) |
|||||||
| 4.25%, due 12/7/27 |
GBP |
75 |
119 |
(g) |
|||||||
| United Kingdom Gilt Inflation Linked Bonds, 0.13%, due 11/22/19 |
GBP |
11 |
14 |
(g)(m) |
|||||||
See Notes to Financial Statements
32
Schedule of Investments Global Allocation Fund (cont'd)
| Principal Amount(e) (000's omitted) |
Value (000's omitted) |
||||||||||
| United Kingdom Gilt Inflation Linked Bonds |
|||||||||||
| 0.13%, due 3/22/2029 |
GBP |
22 |
$ |
35 |
(g)(m) |
||||||
| 0.13%, due 3/22/2044 |
GBP |
71 |
141 |
(g)(m) |
|||||||
| Total Foreign Government Securities (Cost $1,757) |
1,656 |
||||||||||
| Number of Shares |
|||||||||||
|
Exchange Traded Funds (2.4%) |
|||||||||||
| iShares 10+ Year Credit Bond ETF |
2,500 |
154 |
(a) |
||||||||
| iShares iBoxx $ Investment Grade Corporate Bond ETF |
1,400 |
169 |
(a) |
||||||||
| SPDR Barclays Long Term Corporate Bond ETF |
4,450 |
185 |
(a) |
||||||||
| Total Exchange Traded Funds (Cost $488) |
508 |
||||||||||
|
Investment Companies (55.0%) |
|||||||||||
| Neuberger Berman Emerging Markets Debt Fund Institutional Class |
122,360 |
1,089 |
(h) |
||||||||
| Neuberger Berman Emerging Markets Equity Fund Class R6 |
83,409 |
1,360 |
(h) |
||||||||
| Neuberger Berman Floating Rate Income Fund Institutional Class |
155,344 |
1,537 |
(h) |
||||||||
| Neuberger Berman Genesis Fund Class R6 |
19,987 |
1,092 |
(h) |
||||||||
| Neuberger Berman High Income Bond Fund Class R6 |
48,844 |
425 |
(h) |
||||||||
Number of Shares |
Value (000's omitted) |
||||||||||
| Neuberger Berman International Select Fund Institutional Class |
344,206 |
$ |
3,658 |
(h) |
|||||||
| Neuberger Berman Long Short Credit Fund Class R6 |
82,815 |
790 |
(h) |
||||||||
| Neuberger Berman Risk Balanced Commodity Strategy Fund Institutional Class |
97,139 |
582 |
*(h) | ||||||||
| Neuberger Berman U.S. Equity Index PutWrite Strategy Fund Class R6 |
86,224 |
871 |
(h) |
||||||||
| Total Investment Companies (Cost $11,503) |
11,404 |
||||||||||
|
Short-Term Investment (1.4%) |
|||||||||||
|
Investment Company (1.4%) |
|||||||||||
| State Street Institutional U.S. Government Money Market Fund Premier Class, 0.26% (Cost $292) |
292,006 |
292 |
(a)(i) |
||||||||
| Total Long Positions (103.9%) (Cost $21,503) |
21,553 |
||||||||||
| Short Positions ((11.2)%)(j) | |||||||||||
|
Common Stocks Sold Short (11.2%) |
|||||||||||
|
Australia (0.1%) |
|||||||||||
|
Amcor Ltd. |
(527 |
) |
(6 |
) |
|||||||
|
APA Group |
(950 |
) |
(6 |
) |
|||||||
| Woodside Petroleum Ltd. |
(307 |
) |
(6 |
) |
|||||||
|
(18 |
) |
||||||||||
|
Austria (0.0%) |
|||||||||||
|
ams AG |
(174 |
) |
(5 |
) |
|||||||
|
Belgium (0.1%) |
|||||||||||
| Anheuser-Busch InBev SA |
(53 |
) |
(6 |
) |
|||||||
|
Solvay SA |
(106 |
) |
(12 |
) |
|||||||
|
(18 |
) |
||||||||||
|
Canada (0.1%) |
|||||||||||
|
CI Financial Corp. |
(357 |
) |
(7 |
) |
|||||||
|
Dollarama, Inc. |
(81 |
) |
(6 |
) |
|||||||
| Franco-Nevada Corp. |
(89 |
) |
(6 |
) |
|||||||
Number of Shares |
Value (000's omitted) |
||||||||||
| Gildan Activewear, Inc. |
(273 |
) |
$ |
(7 |
) |
||||||
|
(26 |
) |
||||||||||
|
Chile (0.0%) |
|||||||||||
|
Antofagasta PLC |
(1,238 |
) |
(8 |
) |
|||||||
|
China (0.1%) |
|||||||||||
| Galaxy Entertainment Group Ltd. |
(1,000 |
) |
(4 |
) |
|||||||
| MGM China Holdings Ltd. |
(4,400 |
) |
(7 |
) |
|||||||
|
Wynn Macau Ltd. |
(4,800 |
) |
(8 |
) |
|||||||
|
(19 |
) |
||||||||||
|
Denmark (0.1%) |
|||||||||||
| Chr Hansen Holding A/S |
(106 |
) |
(6 |
) |
|||||||
|
Danske Bank A/S |
(233 |
) |
(7 |
) |
|||||||
|
Pandora A/S |
(83 |
) |
(11 |
) |
|||||||
| William Demant Holding A/S |
(473 |
) |
(9 |
)* |
|||||||
|
(33 |
) |
||||||||||
|
Finland (0.1%) |
|||||||||||
|
Konecranes OYJ |
(193 |
) |
(7 |
) |
|||||||
|
Wartsila OYJ Abp |
(213 |
) |
(9 |
) |
|||||||
|
(16 |
) |
||||||||||
|
France (0.8%) |
|||||||||||
|
Accor SA |
(163 |
) |
(6 |
) |
|||||||
| Aeroports de Paris |
(72 |
) |
(7 |
) |
|||||||
|
Air Liquide SA |
(110 |
) |
(11 |
) |
|||||||
|
Bollore SA |
(2,595 |
) |
(9 |
) |
|||||||
|
Capgemini SA |
(63 |
) |
(5 |
) |
|||||||
|
Danone SA |
(109 |
) |
(8 |
) |
|||||||
| Electricite de France SA |
(675 |
) |
(8 |
) |
|||||||
| Groupe Eurotunnel SE |
(612 |
) |
(6 |
) |
|||||||
|
Iliad SA |
(48 |
) |
(10 |
) |
|||||||
|
Imerys SA |
(134 |
) |
(9 |
) |
|||||||
|
Kering |
(31 |
) |
(7 |
) |
|||||||
|
L'Oreal SA |
(43 |
) |
(8 |
) |
|||||||
|
Legrand SA |
(139 |
) |
(8 |
) |
|||||||
|
Orpea |
(85 |
) |
(7 |
) |
|||||||
|
Pernod Ricard SA |
(52 |
) |
(6 |
) |
|||||||
| SFR Group SA |
(350 |
) |
(9 |
) |
|||||||
|
Suez |
(584 |
) |
(9 |
) |
|||||||
| Veolia Environnement SA |
(335 |
) |
(7 |
) |
|||||||
|
Virbac SA |
(29 |
) |
(5 |
)* |
|||||||
|
Wendel SA |
(77 |
) |
(9 |
) |
|||||||
|
Zodiac Aerospace |
(453 |
) |
(11 |
) |
|||||||
|
(165 |
) |
||||||||||
See Notes to Financial Statements
33
Schedule of Investments Global Allocation Fund (cont'd)
Number of Shares |
Value (000's omitted) |
||||||||||
|
Germany (0.4%) |
|||||||||||
|
Brenntag AG |
(131 |
) |
$ |
(7 |
) |
||||||
|
Daimler AG |
(105 |
) |
(7 |
) |
|||||||
| HUGO BOSS AG |
(132 |
) |
(8 |
) |
|||||||
| Infineon Technologies AG |
(417 |
) |
(8 |
) |
|||||||
| LEG Immobilien AG |
(78 |
) |
(7 |
)* |
|||||||
|
Merck KGaA |
(59 |
) |
(6 |
) |
|||||||
| ProSiebenSat.1 Media SE |
(237 |
) |
(10 |
) |
|||||||
|
Siemens AG |
(68 |
) |
(8 |
) |
|||||||
|
Symrise AG |
(82 |
) |
(6 |
) |
|||||||
|
Vonovia SE |
(211 |
) |
(7 |
) |
|||||||
|
Zalando SE |
(154 |
) |
(7 |
)*(b) | |||||||
|
(81 |
) |
||||||||||
|
Hong Kong (0.1%) |
|||||||||||
| Hong Kong Exchanges & Clearing Ltd. |
(200 |
) |
(5 |
) |
|||||||
| Melco International Development Ltd. |
(6,000 |
) |
(8 |
) |
|||||||
|
(13 |
) |
||||||||||
|
Ireland (0.1%) |
|||||||||||
|
CRH PLC |
(259 |
) |
(8 |
) |
|||||||
| Kerry Group PLC Class A |
(70 |
) |
(5 |
) |
|||||||
|
(13 |
) |
||||||||||
|
Italy (0.1%) |
|||||||||||
|
Atlantia SpA |
(279 |
) |
(7 |
) |
|||||||
| Terna Rete Elettrica Nazionale SpA |
(1,453 |
) |
(7 |
) |
|||||||
|
(14 |
) |
||||||||||
|
Japan (1.2%) |
|||||||||||
| Aeon Mall Co. Ltd. |
(500 |
) |
(7 |
) |
|||||||
| Ajinomoto Co., Inc. |
(200 |
) |
(5 |
) |
|||||||
|
Calbee, Inc. |
(200 |
) |
(7 |
) |
|||||||
|
Canon, Inc. |
(200 |
) |
(6 |
) |
|||||||
| Chugai Pharmaceutical Co. Ltd. |
(100 |
) |
(3 |
) |
|||||||
| Eisai Co. Ltd. |
(100 |
) |
(6 |
) |
|||||||
| Hokuriku Electric Power Co. |
(500 |
) |
(6 |
) |
|||||||
Number of Shares |
Value (000's omitted) |
||||||||||
| Hulic Co. Ltd. |
(800 |
) |
$ |
(8 |
) |
||||||
|
Inpex Corp. |
(1,107 |
) |
(10 |
) |
|||||||
| Japan Exchange Group, Inc. |
(600 |
) |
(9 |
) |
|||||||
| LIXIL Group Corp. |
(400 |
) |
(9 |
) |
|||||||
| Minebea Co. Ltd. |
(600 |
) |
(6 |
) |
|||||||
| NGK Insulators Ltd. |
(200 |
) |
(4 |
) |
|||||||
| NGK Spark Plug Co. Ltd. |
(300 |
) |
(6 |
) |
|||||||
| Nomura Holdings, Inc. |
(1,700 |
) |
(9 |
) |
|||||||
| NTT Urban Development Corp. |
(800 |
) |
(7 |
) |
|||||||
| Ono Pharmaceutical Co. Ltd. |
(300 |
) |
(8 |
) |
|||||||
| Oriental Land Co. Ltd. |
(200 |
) |
(12 |
) |
|||||||
| Otsuka Holdings Co. Ltd. |
(200 |
) |
(9 |
) |
|||||||
| Seibu Holdings, Inc. |
(400 |
) |
(7 |
) |
|||||||
| Seven & i Holdings Co. Ltd. |
(200 |
) |
(8 |
) |
|||||||
| Sony Financial Holdings, Inc. |
(500 |
) |
(7 |
) |
|||||||
| Sumitomo Metal Mining Co. Ltd. |
(1,000 |
) |
(13 |
) |
|||||||
| Suntory Beverage & Food Ltd. |
(200 |
) |
(9 |
) |
|||||||
|
Sysmex Corp. |
(100 |
) |
(7 |
) |
|||||||
| Takeda Pharmaceutical Co. Ltd. |
(300 |
) |
(13 |
) |
|||||||
| Tokyo Gas Co. Ltd. |
(3,000 |
) |
(14 |
) |
|||||||
|
Topcon Corp. |
(500 |
) |
(8 |
) |
|||||||
| Toray Industries, Inc. |
(1,000 |
) |
(9 |
) |
|||||||
| Unicharm Corp. |
(300 |
) |
(7 |
) |
|||||||
| Yakult Honsha Co. Ltd. |
(200 |
) |
(9 |
) |
|||||||
|
(248 |
) |
||||||||||
Number of Shares |
Value (000's omitted) |
||||||||||
|
Luxembourg (0.1%) |
|||||||||||
| Eurofins Scientific SE |
(24 |
) |
$ |
(11 |
) |
||||||
|
Netherlands (0.2%) |
|||||||||||
| Altice NV Class A |
(737 |
) |
(14 |
)* |
|||||||
| Altice NV Class B |
(398 |
) |
(7 |
)* |
|||||||
|
Heineken NV |
(101 |
) |
(8 |
) |
|||||||
| Koninklijke Philips NV |
(363 |
) |
(11 |
) |
|||||||
|
OCI NV |
(349 |
) |
(5 |
)* |
|||||||
|
(45 |
) |
||||||||||
|
Singapore (0.1%) |
|||||||||||
|
Broadcom Ltd. |
(68 |
) |
(12 |
) |
|||||||
| Genting Singapore PLC |
(13,200 |
) |
(7 |
) |
|||||||
|
(19 |
) |
||||||||||
|
Spain (0.1%) |
|||||||||||
| Amadeus IT Group SA |
(166 |
) |
(8 |
) |
|||||||
|
Iberdrola SA |
(1,213 |
) |
(8 |
) |
|||||||
|
(16 |
) |
||||||||||
|
Sweden (0.3%) |
|||||||||||
| Assa Abloy AB, B Shares |
(280 |
) |
(5 |
) |
|||||||
|
Betsson AB |
(587 |
) |
(6 |
)* |
|||||||
|
Castellum AB |
(439 |
) |
(6 |
) |
|||||||
| Hennes & Mauritz AB, B Shares |
(337 |
) |
(9 |
) |
|||||||
|
Hexpol AB |
(667 |
) |
(6 |
) |
|||||||
| Kinnevik AB, B Shares |
(243 |
) |
(6 |
) |
|||||||
| Lundin Petroleum AB |
(356 |
) |
(6 |
)* |
|||||||
| Skandinaviska Enskilda Banken AB Class A |
(665 |
) |
(7 |
) |
|||||||
| Svenska Handelsbanken AB, A Shares |
(489 |
) |
(7 |
) |
|||||||
| Telia Co. AB |
(1,536 |
) |
(6 |
) |
|||||||
|
(64 |
) |
||||||||||
|
Switzerland (0.1%) |
|||||||||||
| Adecco Group AG |
(105 |
) |
(6 |
) |
|||||||
|
Dufry AG |
(52 |
) |
(6 |
)* |
|||||||
| LafargeHolcim Ltd. |
(185 |
) |
(10 |
)* |
|||||||
See Notes to Financial Statements
34
Schedule of Investments Global Allocation Fund (cont'd)
Number of Shares |
Value (000's omitted) |
||||||||||
|
Nestle SA |
(77 |
) |
$ |
(6 |
) |
||||||
| Sonova Holding AG |
(44 |
) |
(6 |
) |
|||||||
|
(34 |
) |
||||||||||
|
United Arab Emirates (0.0%) |
|||||||||||
| NMC Health PLC |
(363 |
) |
(6 |
) |
|||||||
|
United Kingdom (1.0%) |
|||||||||||
|
Capita PLC |
(725 |
) |
(5 |
) |
|||||||
| Capital & Counties Properties PLC |
(2,247 |
) |
(8 |
) |
|||||||
| Croda International PLC |
(248 |
) |
(11 |
) |
|||||||
| Delphi Automotive PLC |
(144 |
) |
(9 |
) |
|||||||
|
Diageo PLC |
(216 |
) |
(6 |
) |
|||||||
|
Essentra PLC |
(929 |
) |
(6 |
) |
|||||||
| Hargreaves Lansdown PLC |
(380 |
) |
(5 |
) |
|||||||
| Imperial Brands PLC |
(115 |
) |
(6 |
) |
|||||||
|
Inmarsat PLC |
(909 |
) |
(8 |
) |
|||||||
| International Consolidated Airlines Group SA |
(1,189 |
) |
(6 |
) |
|||||||
|
ITV PLC |
(4,425 |
) |
(9 |
) |
|||||||
|
Next PLC |
(129 |
) |
(8 |
) |
|||||||
| Pennon Group PLC |
(525 |
) |
(5 |
) |
|||||||
|
Pentair PLC |
(95 |
) |
(5 |
) |
|||||||
| Provident Financial PLC |
(236 |
) |
(8 |
) |
|||||||
| Reckitt Benckiser Group PLC |
(64 |
) |
(6 |
) |
|||||||
| Rolls-Royce Holdings PLC |
(27,094 |
) |
(0 |
)*(k)(l)(n) | |||||||
| Rolls-Royce Holdings PLC |
(589 |
) |
(5 |
)* |
|||||||
|
Rotork PLC |
(2,885 |
) |
(7 |
) |
|||||||
|
Sky PLC |
(757 |
) |
(8 |
) |
|||||||
| Sophos Group PLC |
(1,889 |
) |
(5 |
)(b) | |||||||
| St. James's Place PLC |
(510 |
) |
(6 |
) |
|||||||
| Ted Baker PLC |
(359 |
) |
(11 |
) |
|||||||
| Travis Perkins PLC |
(286 |
) |
(5 |
) |
|||||||
Number of Shares |
Value (000's omitted) |
||||||||||
| Tullow Oil PLC |
(3,221 |
) |
$ |
(10 |
)* |
||||||
|
Unilever NV |
(184 |
) |
(8 |
) |
|||||||
| United Utilities Group PLC |
(837 |
) |
(10 |
) |
|||||||
| Vodafone Group PLC |
(2,213 |
) |
(6 |
) |
|||||||
|
Whitbread PLC |
(208 |
) |
(9 |
) |
|||||||
|
(201 |
) |
||||||||||
|
United States (6.0%) |
|||||||||||
|
3M Co. |
(66 |
) |
(11 |
) |
|||||||
| Accenture PLC Class A |
(67 |
) |
(8 |
) |
|||||||
| Acuity Brands, Inc. |
(22 |
) |
(5 |
) |
|||||||
| AdvanSix, Inc. |
(3 |
) |
(0 |
)*(l) | |||||||
|
Allegion PLC |
(86 |
) |
(5 |
) |
|||||||
|
Allergan PLC |
(25 |
) |
(5 |
)* |
|||||||
| Alliance Data Systems Corp. |
(30 |
) |
(6 |
) |
|||||||
| Amazon.com, Inc. |
(10 |
) |
(8 |
)* |
|||||||
| American Airlines Group, Inc. |
(227 |
) |
(9 |
) |
|||||||
| American Water Works Co., Inc. |
(80 |
) |
(6 |
) |
|||||||
| AmerisourceBergen Corp. |
(87 |
) |
(6 |
) |
|||||||
|
AMETEK, Inc. |
(243 |
) |
(11 |
) |
|||||||
| Anadarko Petroleum Corp. |
(109 |
) |
(6 |
) |
|||||||
| Analog Devices, Inc. |
(169 |
) |
(11 |
) |
|||||||
| Antero Resources Corp. |
(226 |
) |
(6 |
)* |
|||||||
| Applied Materials, Inc. |
(205 |
) |
(6 |
) |
|||||||
| Aqua America, Inc. |
(194 |
) |
(6 |
) |
|||||||
| Arch Capital Group Ltd. |
(91 |
) |
(7 |
)* |
|||||||
| Atmos Energy Corp. |
(82 |
) |
(6 |
) |
|||||||
| Autodesk, Inc. |
(97 |
) |
(7 |
)* |
|||||||
|
Ball Corp. |
(153 |
) |
(12 |
) |
|||||||
| Blue Buffalo Pet Products, Inc. |
(234 |
) |
(6 |
)* |
|||||||
| BorgWarner, Inc. |
(178 |
) |
(6 |
) |
|||||||
Number of Shares |
Value (000's omitted) |
||||||||||
| Brown-Forman Corp. Class A |
(166 |
) |
$ |
(8 |
) |
||||||
| Brown-Forman Corp. Class B |
(235 |
) |
(11 |
) |
|||||||
| Cabot Oil & Gas Corp. |
(237 |
) |
(5 |
) |
|||||||
| Caterpillar, Inc. |
(95 |
) |
(8 |
) |
|||||||
| CBRE Group, Inc. Class A |
(256 |
) |
(7 |
)* |
|||||||
|
Cerner Corp. |
(95 |
) |
(6 |
)* |
|||||||
| CF Industries Holdings, Inc. |
(390 |
) |
(9 |
) |
|||||||
| Charles Schwab Corp. |
(352 |
) |
(11 |
) |
|||||||
| Charter Communications, Inc. Class A |
(24 |
) |
(6 |
)* |
|||||||
| Cheniere Energy, Inc. |
(138 |
) |
(5 |
)* |
|||||||
| Chipotle Mexican Grill, Inc. |
(19 |
) |
(7 |
)* |
|||||||
| CME Group, Inc. |
(58 |
) |
(6 |
) |
|||||||
|
Coach, Inc. |
(194 |
) |
(7 |
) |
|||||||
| Colgate-Palmolive Co. |
(134 |
) |
(10 |
) |
|||||||
|
ConocoPhillips |
(228 |
) |
(10 |
) |
|||||||
| Continental Resources, Inc. |
(124 |
) |
(6 |
)* |
|||||||
| CVS Health Corp. |
(108 |
) |
(9 |
) |
|||||||
| Deere & Co. |
(107 |
) |
(9 |
) |
|||||||
| DISH Network Corp. Class A |
(123 |
) |
(7 |
)* |
|||||||
| Dominion Resources, Inc. |
(155 |
) |
(12 |
) |
|||||||
|
Dover Corp. |
(83 |
) |
(6 |
) |
|||||||
| Edwards Lifesciences Corp. |
(52 |
) |
(5 |
)* |
|||||||
| Electronic Arts, Inc. |
(74 |
) |
(6 |
)* |
|||||||
|
EQT Corp. |
(92 |
) |
(6 |
) |
|||||||
|
Equinix, Inc. |
(26 |
) |
(9 |
) |
|||||||
|
Exelon Corp. |
(178 |
) |
(6 |
) |
|||||||
|
Expedia, Inc. |
(84 |
) |
(11 |
) |
|||||||
| Exxon Mobil Corp. |
(75 |
) |
(6 |
) |
|||||||
| F5 Networks, Inc. |
(49 |
) |
(7 |
)* |
|||||||
See Notes to Financial Statements
35
Schedule of Investments Global Allocation Fund (cont'd)
Number of Shares |
Value (000's omitted) |
||||||||||
| FactSet Research Systems, Inc. |
(63 |
) |
$ |
(10 |
) |
||||||
|
Fastenal Co. |
(273 |
) |
(11 |
) |
|||||||
|
FedEx Corp. |
(56 |
) |
(10 |
) |
|||||||
| Flowserve Corp. |
(125 |
) |
(5 |
) |
|||||||
|
Gartner, Inc. |
(67 |
) |
(6 |
)* |
|||||||
| General Dynamics Corp. |
(46 |
) |
(7 |
) |
|||||||
| Global Payments, Inc. |
(80 |
) |
(6 |
) |
|||||||
| H&R Block, Inc. |
(375 |
) |
(9 |
) |
|||||||
| Hanesbrands, Inc. |
(443 |
) |
(11 |
) |
|||||||
| Harley-Davidson, Inc. |
(114 |
) |
(6 |
) |
|||||||
| Harman International Industries, Inc. |
(120 |
) |
(10 |
) |
|||||||
|
Harris Corp. |
(85 |
) |
(8 |
) |
|||||||
|
Hershey Co. |
(56 |
) |
(6 |
) |
|||||||
|
Hess Corp. |
(109 |
) |
(5 |
) |
|||||||
| Home Depot, Inc. |
(49 |
) |
(6 |
) |
|||||||
| Honeywell International, Inc. |
(87 |
) |
(10 |
) |
|||||||
| Hormel Foods Corp. |
(157 |
) |
(6 |
) |
|||||||
| Howard Hughes Corp. |
(71 |
) |
(8 |
)* |
|||||||
| Illumina, Inc. |
(35 |
) |
(5 |
)* |
|||||||
| Intercontinental Exchange, Inc. |
(22 |
) |
(6 |
) |
|||||||
| International Flavors & Fragrances, Inc. |
(61 |
) |
(8 |
) |
|||||||
|
Intuit, Inc. |
(76 |
) |
(8 |
) |
|||||||
| J.B. Hunt Transport Services, Inc. |
(87 |
) |
(7 |
) |
|||||||
| Kennedy-Wilson Holdings, Inc. |
(504 |
) |
(10 |
) |
|||||||
| Kraft Heinz Co. |
(68 |
) |
(6 |
) |
|||||||
| L Brands, Inc. |
(79 |
) |
(6 |
) |
|||||||
| Las Vegas Sands Corp. |
(118 |
) |
(7 |
) |
|||||||
| Linear Technology Corp. |
(111 |
) |
(7 |
) |
|||||||
| LinkedIn Corp. Class A |
(32 |
) |
(6 |
)* |
|||||||
Number of Shares |
Value (000's omitted) |
||||||||||
| Lockheed Martin Corp. |
(47 |
) |
$ |
(12 |
) |
||||||
| Marathon Petroleum Corp. |
(147 |
) |
(6 |
) |
|||||||
|
Markel Corp. |
(6 |
) |
(5 |
)* |
|||||||
| MasterCard, Inc. Class A |
(128 |
) |
(14 |
) |
|||||||
| McDonald's Corp. |
(84 |
) |
(9 |
) |
|||||||
| Mead Johnson Nutrition Co. |
(113 |
) |
(8 |
) |
|||||||
|
MEDNAX, Inc. |
(95 |
) |
(6 |
)* |
|||||||
| Microchip Technology, Inc. |
(180 |
) |
(11 |
) |
|||||||
| Micron Technology, Inc. |
(381 |
) |
(6 |
)* |
|||||||
| Middleby Corp. |
(63 |
) |
(7 |
)* |
|||||||
|
Monsanto Co. |
(106 |
) |
(11 |
) |
|||||||
| Monster Beverage Corp. |
(46 |
) |
(7 |
)* |
|||||||
|
Moody's Corp. |
(105 |
) |
(11 |
) |
|||||||
|
Mosaic Co. |
(210 |
) |
(5 |
) |
|||||||
| Motorola Solutions, Inc. |
(80 |
) |
(6 |
) |
|||||||
|
NetApp, Inc. |
(176 |
) |
(6 |
) |
|||||||
|
Netflix, Inc. |
(108 |
) |
(13 |
)* |
|||||||
| NetSuite, Inc. |
(56 |
) |
(5 |
)* |
|||||||
| Newell Brands, Inc. |
(125 |
) |
(6 |
) |
|||||||
| NextEra Energy, Inc. |
(75 |
) |
(10 |
) |
|||||||
| NIKE, Inc. Class B |
(176 |
) |
(9 |
) |
|||||||
| Noble Energy, Inc. |
(241 |
) |
(8 |
) |
|||||||
| Northern Trust Corp. |
(103 |
) |
(7 |
) |
|||||||
| Pacira Pharmaceuticals, Inc. |
(143 |
) |
(5 |
)* |
|||||||
| Pandora Media, Inc. |
(437 |
) |
(5 |
)* |
|||||||
| Parker-Hannifin Corp. |
(70 |
) |
(9 |
) |
|||||||
| Pattern Energy Group, Inc. |
(259 |
) |
(6 |
) |
|||||||
|
Paychex, Inc. |
(102 |
) |
(6 |
) |
|||||||
Number of Shares |
Value (000's omitted) |
||||||||||
| Perrigo Co. PLC |
(90 |
) |
$ |
(7 |
) |
||||||
| Pioneer Natural Resources Co. |
(34 |
) |
(6 |
) |
|||||||
| Platform Specialty Products Corp. |
(674 |
) |
(5 |
)* |
|||||||
| Polaris Industries, Inc. |
(78 |
) |
(6 |
) |
|||||||
| PPG Industries, Inc. |
(84 |
) |
(8 |
) |
|||||||
|
Praxair, Inc. |
(66 |
) |
(8 |
) |
|||||||
| QUALCOMM, Inc. |
(159 |
) |
(11 |
) |
|||||||
| Reynolds American, Inc. |
(124 |
) |
(7 |
) |
|||||||
| Rite Aid Corp. |
(950 |
) |
(6 |
)* |
|||||||
| Rockwell Automation, Inc. |
(93 |
) |
(11 |
) |
|||||||
| Roper Technologies, Inc. |
(70 |
) |
(12 |
) |
|||||||
| S&P Global, Inc. |
(92 |
) |
(11 |
) |
|||||||
|
Sabre Corp. |
(222 |
) |
(6 |
) |
|||||||
| SBA Communications Corp. Class A |
(91 |
) |
(10 |
)* |
|||||||
| Sealed Air Corp. |
(245 |
) |
(11 |
) |
|||||||
| SEI Investments Co. |
(160 |
) |
(7 |
) |
|||||||
|
Sempra Energy |
(98 |
) |
(10 |
) |
|||||||
| Signature Bank |
(86 |
) |
(10 |
)* |
|||||||
| Skyworks Solutions, Inc. |
(131 |
) |
(10 |
) |
|||||||
|
Southern Co. |
(155 |
) |
(8 |
) |
|||||||
| Southern Copper Corp. |
(470 |
) |
(13 |
) |
|||||||
| SS&C Technologies Holdings, Inc. |
(227 |
) |
(7 |
) |
|||||||
| St. Jude Medical, Inc. |
(141 |
) |
(11 |
) |
|||||||
| Starbucks Corp. |
(195 |
) |
(10 |
) |
|||||||
| Stericycle, Inc. |
(79 |
) |
(6 |
)* |
|||||||
|
Stryker Corp. |
(67 |
) |
(8 |
) |
|||||||
| SVB Financial Group |
(58 |
) |
(7 |
)* |
|||||||
See Notes to Financial Statements
36
Schedule of Investments Global Allocation Fund (cont'd)
Number of Shares |
Value (000's omitted) |
||||||||||
| TD Ameritrade Holding Corp. |
(312 |
) |
$ |
(11 |
) |
||||||
| Team Health Holdings, Inc. |
(180 |
) |
(8 |
)* |
|||||||
| Tiffany & Co. |
(106 |
) |
(8 |
) |
|||||||
| Tractor Supply Co. |
(96 |
) |
(6 |
) |
|||||||
| TransDigm Group, Inc. |
(22 |
) |
(6 |
) |
|||||||
| Ultimate Software Group, Inc. |
(30 |
) |
(6 |
)* |
|||||||
| Under Armour, Inc. Class A |
(283 |
) |
(9 |
)* |
|||||||
| Union Pacific Corp. |
(76 |
) |
(7 |
) |
|||||||
|
Valspar Corp. |
(112 |
) |
(11 |
) |
|||||||
Number of Shares |
Value (000's omitted) |
||||||||||
| Varian Medical Systems, Inc. |
(70 |
) |
$ |
(6 |
)* |
||||||
| Verisk Analytics, Inc. |
(75 |
) |
(6 |
)* |
|||||||
|
VF Corp. |
(174 |
) |
(9 |
) |
|||||||
| Visa, Inc. A Shares |
(145 |
) |
(12 |
) |
|||||||
| WABCO Holdings, Inc. |
(58 |
) |
(6 |
)* |
|||||||
|
Wabtec Corp. |
(115 |
) |
(9 |
) |
|||||||
| Walt Disney Co. |
(100 |
) |
(9 |
) |
|||||||
| WEC Energy Group, Inc. |
(150 |
) |
(9 |
) |
|||||||
|
WestRock Co. |
(138 |
) |
(6 |
) |
|||||||
| WhiteWave Foods Co. |
(204 |
) |
(11 |
)* |
|||||||
Number of Shares |
Value (000's omitted) |
||||||||||
| Whole Foods Market, Inc. |
(201 |
) |
$ |
(6 |
) |
||||||
| WW Grainger, Inc. |
(53 |
) |
(11 |
) |
|||||||
| Wynn Resorts Ltd. |
(94 |
) |
(9 |
) |
|||||||
| Yum! Brands, Inc. |
(69 |
) |
(6 |
) |
|||||||
|
Zoetis, Inc. |
(215 |
) |
(10 |
) |
|||||||
|
(1,244 |
) |
||||||||||
| Total Short Positions (Proceeds $(2,368)) |
(2,317 |
) |
|||||||||
| Total Investments (92.7%) (Cost $19,135) |
19,236 |
||||||||||
| Other Assets Less Liabilities (7.3%) |
1,515(n) | ||||||||||
|
Net Assets (100.0%) |
$ |
20,751 |
|||||||||
* Non-income producing security.
(a) All or a portion of this security is segregated in connection with obligations for TBAs and/or options written and/or securities sold short and/or futures and/or forward foreign currency contracts with a total value of approximately $4,167,000.
(b) Securities were purchased or sold short under Rule 144A of the Securities Act of 1933, as amended (the "1933 Act"), or are otherwise restricted and, unless registered under the 1933 Act or exempted from registration, may only be sold to qualified institutional investors or may have other restrictions on resale. At 10/31/2016, these securities amounted to approximately $120,000 of long positions and $(12,000) of short positions, or 0.6% and (0.1%), respectively, of net assets for the Fund. Securities denoted with a (b) but without a (k) have been deemed by the investment manager to be liquid.
(c) The security or a portion of this security is on loan at 10/31/2016. Total value of all such securities at 10/31/2016 amounted to approximately $227,000 for the Fund. (see Note A of the Notes to Financial Statements)
(d) All or a portion of the security is pledged as collateral for securities sold short and/or options written.
(e) Principal amount is stated in the currency in which the security is denominated.
AUD = Australian Dollar
CAD = Canadian Dollar
EUR = Euro
GBP = Pound Sterling
JPY = Japanese Yen
MXN = Mexican Peso
NZD = New Zealand Dollar
ZAR = South African Rand
See Notes to Financial Statements
37
Schedule of Investments Global Allocation Fund (cont'd)
(f) TBA (To Be Announced) Securities are purchased/sold on a forward commitment basis with an approximate principal amount and no defined maturity date. The actual principal and maturity date will be determined upon settlement when the specific mortgage pools are assigned. Total value of all such securities (excluding forward sales contracts, if any) at 10/31/2016 amounted to approximately $157,000, which represents 0.8% of net assets of the Fund.
(g) Security exempt from registration pursuant to Regulation S under the Securities Act of 1933. Regulation S applies to securities offerings that are made outside of the United States and do not involve direct selling efforts in the United States and as such may have restrictions on resale. Total value of all such securities at 10/31/2016 amounted to approximately $1,188,000, which represents 5.7% of net assets of the Fund.
(h) Affiliated company (see Note F of the Notes to Financial Statements).
(i) Represents 7-day effective yield as of 10/31/2016.
(j) At 10/31/2016 the Fund had approximately $1,383,000 deposited in one or more accounts to satisfy collateral requirements for borrowing in connection with securities sold short. This collateral is made up of the proceeds from the securities sold short and collateral received from security lending activities.
(k) Illiquid security.
(l) Amount less than one thousand.
(m) Index-linked bond whose principal amount adjusts according to a government retail price index.
(n) Security fair valued as of 10/31/2016 in accordance with procedures approved by the Board of Trustees ("Board"). Total value of all such securities at 10/31/2016 amounted to approximately $(0), which represents approximately (0.0)% of net assets of the Fund.
(o) Includes the impact of the Fund's open positions in derivatives at 10/31/2016.
See Notes to Financial Statements
38
Schedule of Investments Global Allocation Fund (cont'd)
Derivative Instruments
Futures contracts ("futures")
At October 31, 2016, open positions in futures for the Fund were as follows:
|
Expiration |
Open Contracts |
Position |
Unrealized Appreciation/ (Depreciation) |
||||||||||||
|
6/19/2017 |
1 Canadian Bankers Acceptance, 90 Day |
Long |
$ |
(28 |
) |
||||||||||
|
12/19/2016 |
2 Canadian Treasury Bond, 10 Year |
Long |
(3,048 |
) |
|||||||||||
|
12/19/2016 |
3 Euro |
Long |
(9,893 |
) |
|||||||||||
|
12/8/2016 |
1 Euro-BOBL |
Long |
(1,013 |
) |
|||||||||||
|
12/8/2016 |
1 Euro-BTP |
Long |
(6,204 |
) |
|||||||||||
|
12/8/2016 |
1 EUR Bund |
Long |
(3,746 |
) |
|||||||||||
|
12/8/2016 |
1 Euro-OAT |
Long |
(4,130 |
) |
|||||||||||
|
12/8/2016 |
2 Euro- SCHATZ |
Long |
(39 |
) |
|||||||||||
|
12/16/2016 |
4 FTSE 100 Index |
Long |
10,614 |
||||||||||||
|
12/19/2016 |
3 Japanese Yen |
Long |
(8,693 |
) |
|||||||||||
|
12/16/2016 |
5 Mini MSCI Emerging Markets Index |
Long |
(3,102 |
) |
|||||||||||
|
12/19/2016 |
1 Pound Sterling |
Long |
(5,954 |
) |
|||||||||||
|
12/16/2016 |
1 Russell 2000 Index Mini |
Long |
(2,090 |
) |
|||||||||||
|
12/16/2016 |
4 S&P 500 E-Mini Index |
Long |
(4,969 |
) |
|||||||||||
|
12/30/2016 |
4 U.S. Treasury Note, 2 Year |
Long |
(1,451 |
) |
|||||||||||
|
12/20/2016 |
8 U.S. Treasury Note, 10 Year |
Long |
(13,685 |
) |
|||||||||||
|
12/20/2016 |
2 Canadian Dollar |
Short |
2,822 |
||||||||||||
|
12/8/2016 |
2 Euro-Bund |
Short |
3,979 |
||||||||||||
|
12/19/2016 |
2 New Zealand Dollar |
Short |
1,592 |
||||||||||||
|
12/19/2016 |
4 Pound Sterling |
Short |
23,760 |
||||||||||||
|
12/28/2016 |
1 UK Long Gilt Bond |
Short |
7,513 |
||||||||||||
|
12/30/2016 |
7 U.S. Treasury Note, 5 Year |
Short |
4,717 |
||||||||||||
|
12/20/2016 |
1 U.S. Treasury Note, 10 Year |
Short |
1,762 |
||||||||||||
|
Total |
$ |
(11,286 |
) |
||||||||||||
At October 31, 2016, the notional value of futures for the Fund was $5,156,086 for long positions and $(2,082,744) for short positions. The Fund had $122,793 deposited in a segregated account to cover margin requirements on open futures.
For the year ended October 31, 2016, the average notional value of futures for the Fund was $4,721,962 for long positions and $(2,414,966) for short positions.
See Notes to Financial Statements
39
Schedule of Investments Global Allocation Fund (cont'd)
Forward foreign currency contracts ("forward contracts")
At October 31, 2016, open forward contracts for the Fund were as follows:
|
Contracts to Receive |
In Exchange For |
Counterparty |
Settlement Date |
Net Unrealized Appreciation/ (Depreciation) |
|||||||||||||||||||
| 94,962 |
Australian Dollar |
$ |
71,840 |
Deutsche Bank AG |
11/16/16 |
$ |
371 |
||||||||||||||||
| 92,883 |
Australian Dollar |
71,291 |
Goldman Sachs International |
11/16/16 |
(662 |
) |
|||||||||||||||||
| 34,396 |
Australian Dollar |
25,954 |
Goldman Sachs International |
11/16/16 |
201 |
||||||||||||||||||
| 15,770 |
Australian Dollar |
11,958 |
Royal Bank of Canada |
11/16/16 |
33 |
||||||||||||||||||
| 22,911 |
Australian Dollar |
17,469 |
Royal Bank of Canada |
11/16/16 |
(47 |
) |
|||||||||||||||||
| 231,910 |
Australian Dollar |
174,933 |
Societe Generale |
11/16/16 |
1,415 |
||||||||||||||||||
| 33,302 |
Australian Dollar |
25,255 |
Societe Generale |
11/16/16 |
68 |
||||||||||||||||||
| 53,676 |
Australian Dollar |
40,209 |
Societe Generale |
11/16/16 |
607 |
||||||||||||||||||
| 49,603 |
Australian Dollar |
37,374 |
Societe Generale |
11/16/16 |
345 |
||||||||||||||||||
| 94,962 |
Australian Dollar |
72,646 |
Societe Generale |
11/16/16 |
(436 |
) |
|||||||||||||||||
| 55,298 |
Australian Dollar |
42,292 |
State Street Bank and Trust Company |
11/16/16 |
(243 |
) |
|||||||||||||||||
| 65,948 |
Australian Dollar |
49,405 |
State Street Bank and Trust Company |
11/16/16 |
743 |
||||||||||||||||||
| 79,168 |
Australian Dollar |
60,230 |
State Street Bank and Trust Company |
11/16/16 |
(29 |
) |
|||||||||||||||||
| 91,395 |
Australian Dollar |
70,026 |
State Street Bank and Trust Company |
11/16/16 |
(528 |
) |
|||||||||||||||||
| 111,693 |
Australian Dollar |
85,623 |
State Street Bank and Trust Company |
11/16/16 |
(690 |
) |
|||||||||||||||||
| 30,821 |
Australian Dollar |
23,343 |
State Street Bank and Trust Company |
11/16/16 |
94 |
||||||||||||||||||
| 348,328 |
Canadian Dollar |
267,434 |
Deutsche Bank AG |
11/16/16 |
(7,714 |
) |
|||||||||||||||||
| 48,789 |
Canadian Dollar |
37,081 |
Goldman Sachs International |
11/16/16 |
(703 |
) |
|||||||||||||||||
| 82,737 |
Canadian Dollar |
61,808 |
Goldman Sachs International |
11/16/16 |
(117 |
) |
|||||||||||||||||
| 31,779 |
Canadian Dollar |
24,033 |
Goldman Sachs International |
11/16/16 |
(338 |
) |
|||||||||||||||||
| 40,479 |
Canadian Dollar |
30,754 |
Royal Bank of Canada |
11/16/16 |
(572 |
) |
|||||||||||||||||
| 348,328 |
Canadian Dollar |
266,122 |
Societe Generale |
11/16/16 |
(6,401 |
) |
|||||||||||||||||
| 697,390 |
Canadian Dollar |
532,764 |
Societe Generale |
11/16/16 |
(12,775 |
) |
|||||||||||||||||
| 29,555 |
Canadian Dollar |
22,556 |
Societe Generale |
11/16/16 |
(519 |
) |
|||||||||||||||||
| 200,819 |
Canadian Dollar |
151,547 |
Societe Generale |
11/16/16 |
(1,812 |
) |
|||||||||||||||||
| 152,718 |
Canadian Dollar |
117,298 |
State Street Bank and Trust Company |
11/16/16 |
(3,428 |
) |
|||||||||||||||||
| 147,495 |
Canadian Dollar |
112,497 |
State Street Bank and Trust Company |
11/16/16 |
(2,522 |
) |
|||||||||||||||||
| 56,789 |
Canadian Dollar |
43,681 |
State Street Bank and Trust Company |
11/16/16 |
(1,338 |
) |
|||||||||||||||||
| 55,163 |
Canadian Dollar |
41,687 |
State Street Bank and Trust Company |
11/16/16 |
(556 |
) |
|||||||||||||||||
| 21,921 |
Canadian Dollar |
16,672 |
State Street Bank and Trust Company |
11/16/16 |
(328 |
) |
|||||||||||||||||
| 36,217 |
Canadian Dollar |
28,232 |
State Street Bank and Trust Company |
11/16/16 |
(1,227 |
) |
|||||||||||||||||
| 19,874 |
Euro |
22,330 |
Deutsche Bank AG |
11/16/16 |
(502 |
) |
|||||||||||||||||
| 50,810 |
Euro |
56,787 |
Goldman Sachs International |
11/16/16 |
(980 |
) |
|||||||||||||||||
| 125,608 |
Euro |
140,835 |
Goldman Sachs International |
11/16/16 |
(2,873 |
) |
|||||||||||||||||
| 13,338 |
Euro |
14,967 |
Royal Bank of Canada |
11/16/16 |
(318 |
) |
|||||||||||||||||
| 43,295 |
Euro |
48,381 |
Royal Bank of Canada |
11/16/16 |
(828 |
) |
|||||||||||||||||
| 54,098 |
Euro |
60,685 |
Royal Bank of Canada |
11/16/16 |
(1,266 |
) |
|||||||||||||||||
| 12,768 |
Euro |
14,357 |
Royal Bank of Canada |
11/16/16 |
(333 |
) |
|||||||||||||||||
| 45,443 |
Euro |
50,845 |
Royal Bank of Canada |
11/16/16 |
(932 |
) |
|||||||||||||||||
| 38,615 |
Euro |
42,060 |
Societe Generale |
11/16/16 |
353 |
||||||||||||||||||
| 40,707 |
Euro |
45,741 |
Societe Generale |
11/16/16 |
(1,030 |
) |
|||||||||||||||||
See Notes to Financial Statements
40
Schedule of Investments Global Allocation Fund (cont'd)
|
Contracts to Receive |
In Exchange For |
Counterparty |
Settlement Date |
Net Unrealized Appreciation/ (Depreciation) |
|||||||||||||||||||
| 14,630 |
Euro |
$ |
16,236 |
Societe Generale |
11/16/16 |
$ |
(167 |
) |
|||||||||||||||
| 42,290 |
Euro |
46,546 |
Societe Generale |
11/16/16 |
(96 |
) |
|||||||||||||||||
| 48,485 |
Euro |
54,421 |
Societe Generale |
11/16/16 |
(1,167 |
) |
|||||||||||||||||
| 19,912 |
Euro |
22,284 |
State Street Bank and Trust Company |
11/16/16 |
(413 |
) |
|||||||||||||||||
| 37,390 |
Euro |
41,951 |
State Street Bank and Trust Company |
11/16/16 |
(884 |
) |
|||||||||||||||||
| 33,525 |
Euro |
37,726 |
State Street Bank and Trust Company |
11/16/16 |
(903 |
) |
|||||||||||||||||
| 144,056 |
Euro |
160,507 |
State Street Bank and Trust Company |
11/16/16 |
(2,282 |
) |
|||||||||||||||||
| 51,210 |
Euro |
56,476 |
State Street Bank and Trust Company |
11/16/16 |
(229 |
) |
|||||||||||||||||
| 97,780 |
Euro |
107,657 |
State Street Bank and Trust Company |
11/16/16 |
(259 |
) |
|||||||||||||||||
| 856,267,443 |
Indonesian Rupiah |
65,529 |
Barclays Bank PLC |
11/10/16 |
125 |
||||||||||||||||||
| 1,538,736 |
Japanese Yen |
14,900 |
Deutsche Bank AG |
11/16/16 |
(221 |
) |
|||||||||||||||||
| 3,032,798 |
Japanese Yen |
29,807 |
Goldman Sachs International |
11/16/16 |
(874 |
) |
|||||||||||||||||
| 2,263,537 |
Japanese Yen |
22,191 |
Goldman Sachs International |
11/16/16 |
(597 |
) |
|||||||||||||||||
| 3,953,301 |
Japanese Yen |
37,579 |
Goldman Sachs International |
11/16/16 |
136 |
||||||||||||||||||
| 6,471,114 |
Japanese Yen |
62,138 |
Royal Bank of Canada |
11/16/16 |
(404 |
) |
|||||||||||||||||
| 2,595,724 |
Japanese Yen |
25,661 |
Royal Bank of Canada |
11/16/16 |
(898 |
) |
|||||||||||||||||
| 5,507,418 |
Japanese Yen |
53,593 |
Royal Bank of Canada |
11/16/16 |
(1,053 |
) |
|||||||||||||||||
| 32,524,570 |
Japanese Yen |
315,003 |
Royal Bank of Canada |
11/16/16 |
(4,720 |
) |
|||||||||||||||||
| 9,673,497 |
Japanese Yen |
95,408 |
Societe Generale |
11/16/16 |
(3,123 |
) |
|||||||||||||||||
| 1,538,736 |
Japanese Yen |
15,217 |
Societe Generale |
11/16/16 |
(538 |
) |
|||||||||||||||||
| 2,989,209 |
Japanese Yen |
28,797 |
Societe Generale |
11/16/16 |
(280 |
) |
|||||||||||||||||
| 6,555,951 |
Japanese Yen |
62,940 |
Societe Generale |
11/16/16 |
(396 |
) |
|||||||||||||||||
| 1,169,894 |
Japanese Yen |
11,558 |
Societe Generale |
11/16/16 |
(397 |
) |
|||||||||||||||||
| 10,248,025 |
Japanese Yen |
98,697 |
State Street Bank and Trust Company |
11/16/16 |
(931 |
) |
|||||||||||||||||
| 6,524,884 |
Japanese Yen |
64,051 |
State Street Bank and Trust Company |
11/16/16 |
(1,804 |
) |
|||||||||||||||||
| 3,346,567 |
Japanese Yen |
32,757 |
State Street Bank and Trust Company |
11/16/16 |
(831 |
) |
|||||||||||||||||
| 3,560,219 |
Japanese Yen |
34,326 |
State Street Bank and Trust Company |
11/16/16 |
(362 |
) |
|||||||||||||||||
| 3,100,202 |
Japanese Yen |
29,882 |
State Street Bank and Trust Company |
11/16/16 |
(306 |
) |
|||||||||||||||||
| 148,717 |
Mexican Peso |
7,696 |
Barclays Bank PLC |
11/10/16 |
166 |
||||||||||||||||||
| 1,590,262 |
Mexican Peso |
82,268 |
State Street Bank and Trust Company |
11/16/16 |
1,746 |
||||||||||||||||||
| 10,762,834 |
New Taiwan Dollar |
342,820 |
Barclays Bank PLC |
11/10/16 |
(1,583 |
) |
|||||||||||||||||
| 166,866 |
New Zealand Dollar |
120,995 |
Deutsche Bank AG |
11/16/16 |
(1,738 |
) |
|||||||||||||||||
| 40,377 |
New Zealand Dollar |
29,485 |
Goldman Sachs International |
11/16/16 |
(629 |
) |
|||||||||||||||||
| 158,070 |
New Zealand Dollar |
112,763 |
Goldman Sachs International |
11/16/16 |
207 |
||||||||||||||||||
| 16,420 |
New Zealand Dollar |
11,951 |
Goldman Sachs International |
11/16/16 |
(215 |
) |
|||||||||||||||||
| 34,046 |
New Zealand Dollar |
24,146 |
Royal Bank of Canada |
11/16/16 |
187 |
||||||||||||||||||
| 199,810 |
New Zealand Dollar |
145,274 |
Royal Bank of Canada |
11/16/16 |
(2,473 |
) |
|||||||||||||||||
| 65,222 |
New Zealand Dollar |
48,435 |
Royal Bank of Canada |
11/16/16 |
(1,822 |
) |
|||||||||||||||||
| 138,478 |
New Zealand Dollar |
101,690 |
Royal Bank of Canada |
11/16/16 |
(2,722 |
) |
|||||||||||||||||
| 35,042 |
New Zealand Dollar |
25,326 |
Royal Bank of Canada |
11/16/16 |
(282 |
) |
|||||||||||||||||
| 59,938 |
New Zealand Dollar |
43,008 |
Royal Bank of Canada |
11/16/16 |
(171 |
) |
|||||||||||||||||
| 52,334 |
New Zealand Dollar |
37,944 |
Royal Bank of Canada |
11/16/16 |
(541 |
) |
|||||||||||||||||
| 62,469 |
New Zealand Dollar |
44,540 |
Societe Generale |
11/16/16 |
106 |
||||||||||||||||||
See Notes to Financial Statements
41
Schedule of Investments Global Allocation Fund (cont'd)
|
Contracts to Receive |
In Exchange For |
Counterparty |
Settlement Date |
Net Unrealized Appreciation/ (Depreciation) |
|||||||||||||||||||
| 60,493 |
New Zealand Dollar |
$ |
42,655 |
Societe Generale |
11/16/16 |
$ |
579 |
||||||||||||||||
| 32,857 |
New Zealand Dollar |
23,997 |
State Street Bank and Trust Company |
11/16/16 |
(514 |
) |
|||||||||||||||||
| 138,515 |
New Zealand Dollar |
100,104 |
State Street Bank and Trust Company |
11/16/16 |
(1,109 |
) |
|||||||||||||||||
| 34,929 |
New Zealand Dollar |
25,338 |
State Street Bank and Trust Company |
11/16/16 |
(374 |
) |
|||||||||||||||||
| 20,239 |
New Zealand Dollar |
14,679 |
State Street Bank and Trust Company |
11/16/16 |
(214 |
) |
|||||||||||||||||
| 47,618 |
New Zealand Dollar |
33,966 |
State Street Bank and Trust Company |
11/16/16 |
66 |
||||||||||||||||||
| 121,336 |
New Zealand Dollar |
87,466 |
State Street Bank and Trust Company |
11/16/16 |
(749 |
) |
|||||||||||||||||
| 15,887 |
New Zealand Dollar |
11,321 |
State Street Bank and Trust Company |
11/16/16 |
33 |
||||||||||||||||||
| 68,088 |
New Zealand Dollar |
49,599 |
State Street Bank and Trust Company |
11/16/16 |
(938 |
) |
|||||||||||||||||
| 388,086 |
Norwegian Krone |
48,236 |
Deutsche Bank AG |
11/16/16 |
(1,265 |
) |
|||||||||||||||||
| 107,842 |
Norwegian Krone |
12,991 |
Goldman Sachs International |
11/16/16 |
62 |
||||||||||||||||||
| 255,189 |
Norwegian Krone |
30,658 |
Royal Bank of Canada |
11/16/16 |
228 |
||||||||||||||||||
| 103,497 |
Norwegian Krone |
12,619 |
Royal Bank of Canada |
11/16/16 |
(92 |
) |
|||||||||||||||||
| 145,816 |
Norwegian Krone |
17,571 |
Royal Bank of Canada |
11/16/16 |
77 |
||||||||||||||||||
| 303,647 |
Norwegian Krone |
37,506 |
Royal Bank of Canada |
11/16/16 |
(754 |
) |
|||||||||||||||||
| 230,604 |
Norwegian Krone |
27,939 |
Societe Generale |
11/16/16 |
(28 |
) |
|||||||||||||||||
| 1,906,518 |
Norwegian Krone |
229,084 |
Societe Generale |
11/16/16 |
1,668 |
||||||||||||||||||
| 187,585 |
Norwegian Krone |
23,007 |
Societe Generale |
11/16/16 |
(303 |
) |
|||||||||||||||||
| 114,875 |
Norwegian Krone |
13,889 |
State Street Bank and Trust Company |
11/16/16 |
14 |
||||||||||||||||||
| 309,922 |
Norwegian Krone |
38,604 |
State Street Bank and Trust Company |
11/16/16 |
(1,094 |
) |
|||||||||||||||||
| 4,558,082 |
Norwegian Krone |
549,256 |
State Street Bank and Trust Company |
11/16/16 |
2,422 |
||||||||||||||||||
| 99,609 |
Norwegian Krone |
12,055 |
State Street Bank and Trust Company |
11/16/16 |
1 |
||||||||||||||||||
| 1,245,029 |
Polish Zloty |
324,788 |
Barclays Bank PLC |
11/10/16 |
(7,496 |
) |
|||||||||||||||||
| 45,386 |
Pound Sterling |
58,997 |
Deutsche Bank AG |
11/16/16 |
(3,430 |
) |
|||||||||||||||||
| 54,062 |
Pound Sterling |
71,810 |
Goldman Sachs International |
11/16/16 |
(5,620 |
) |
|||||||||||||||||
| 8,475 |
Pound Sterling |
11,000 |
Goldman Sachs International |
11/16/16 |
(624 |
) |
|||||||||||||||||
| 20,346 |
Pound Sterling |
26,894 |
Goldman Sachs International |
11/16/16 |
(1,984 |
) |
|||||||||||||||||
| 5,085 |
Pound Sterling |
6,751 |
Royal Bank of Canada |
11/16/16 |
(525 |
) |
|||||||||||||||||
| 23,724 |
Pound Sterling |
31,636 |
Royal Bank of Canada |
11/16/16 |
(2,590 |
) |
|||||||||||||||||
| 32,200 |
Pound Sterling |
41,887 |
Royal Bank of Canada |
11/16/16 |
(2,464 |
) |
|||||||||||||||||
| 44,311 |
Pound Sterling |
57,622 |
Royal Bank of Canada |
11/16/16 |
(3,370 |
) |
|||||||||||||||||
| 101,553 |
Pound Sterling |
134,963 |
Societe Generale |
11/16/16 |
(10,629 |
) |
|||||||||||||||||
| 24,990 |
Pound Sterling |
32,509 |
Societe Generale |
11/16/16 |
(1,913 |
) |
|||||||||||||||||
| 22,772 |
Pound Sterling |
28,312 |
Societe Generale |
11/16/16 |
(431 |
) |
|||||||||||||||||
| 56,186 |
Pound Sterling |
72,477 |
Societe Generale |
11/16/16 |
(3,687 |
) |
|||||||||||||||||
| 22,248 |
Pound Sterling |
28,139 |
State Street Bank and Trust Company |
11/16/16 |
(900 |
) |
|||||||||||||||||
| 21,790 |
Pound Sterling |
28,804 |
State Street Bank and Trust Company |
11/16/16 |
(2,126 |
) |
|||||||||||||||||
| 24,293 |
Pound Sterling |
31,773 |
State Street Bank and Trust Company |
11/16/16 |
(2,031 |
) |
|||||||||||||||||
| 35,055 |
Pound Sterling |
46,831 |
State Street Bank and Trust Company |
11/16/16 |
(3,912 |
) |
|||||||||||||||||
| 2,279,021 |
South African Rand |
164,923 |
Barclays Bank PLC |
11/10/16 |
3,830 |
||||||||||||||||||
| 228,470,630 |
South Korean Won |
205,164 |
Barclays Bank PLC |
11/10/16 |
(5,479 |
) |
|||||||||||||||||
| 648,720 |
Swedish Krona |
75,705 |
Deutsche Bank AG |
11/16/16 |
(3,837 |
) |
|||||||||||||||||
| 321,034 |
Swedish Krona |
35,558 |
Goldman Sachs International |
11/16/16 |
8 |
||||||||||||||||||
See Notes to Financial Statements
42
Schedule of Investments Global Allocation Fund (cont'd)
|
Contracts to Receive |
In Exchange For |
Counterparty |
Settlement Date |
Net Unrealized Appreciation/ (Depreciation) |
|||||||||||||||||||
| 2,777,601 |
Swedish Krona |
$ |
324,335 |
Goldman Sachs International |
11/16/16 |
$ |
(16,619 |
) |
|||||||||||||||
| 112,180 |
Swedish Krona |
13,143 |
Goldman Sachs International |
11/16/16 |
(716 |
) |
|||||||||||||||||
| 251,301 |
Swedish Krona |
29,668 |
Goldman Sachs International |
11/16/16 |
(1,828 |
) |
|||||||||||||||||
| 1,304,800 |
Swedish Krona |
152,521 |
Royal Bank of Canada |
11/16/16 |
(7,969 |
) |
|||||||||||||||||
| 263,198 |
Swedish Krona |
30,656 |
Royal Bank of Canada |
11/16/16 |
(1,498 |
) |
|||||||||||||||||
| 359,688 |
Swedish Krona |
42,081 |
Royal Bank of Canada |
11/16/16 |
(2,233 |
) |
|||||||||||||||||
| 600,831 |
Swedish Krona |
70,113 |
Royal Bank of Canada |
11/16/16 |
(3,550 |
) |
|||||||||||||||||
| 121,422 |
Swedish Krona |
14,204 |
Royal Bank of Canada |
11/16/16 |
(753 |
) |
|||||||||||||||||
| 635,618 |
Swedish Krona |
74,202 |
Societe Generale |
11/16/16 |
(3,785 |
) |
|||||||||||||||||
| 357,974 |
Swedish Krona |
40,658 |
Societe Generale |
11/16/16 |
(1,000 |
) |
|||||||||||||||||
| 835,235 |
Swedish Krona |
98,291 |
Societe Generale |
11/16/16 |
(5,760 |
) |
|||||||||||||||||
| 225,373 |
Swedish Krona |
25,299 |
Societe Generale |
11/16/16 |
(331 |
) |
|||||||||||||||||
| 125,172 |
Swedish Krona |
14,697 |
State Street Bank and Trust Company |
11/16/16 |
(829 |
) |
|||||||||||||||||
| 421,761 |
Swedish Krona |
47,948 |
State Street Bank and Trust Company |
11/16/16 |
(1,223 |
) |
|||||||||||||||||
| 331,715 |
Swedish Krona |
38,410 |
State Street Bank and Trust Company |
11/16/16 |
(1,661 |
) |
|||||||||||||||||
| 906,914 |
Swedish Krona |
106,057 |
State Street Bank and Trust Company |
11/16/16 |
(5,585 |
) |
|||||||||||||||||
| 521,993 |
Swedish Krona |
61,861 |
State Street Bank and Trust Company |
11/16/16 |
(4,032 |
) |
|||||||||||||||||
| 491,448 |
Swedish Krona |
57,593 |
State Street Bank and Trust Company |
11/16/16 |
(3,148 |
) |
|||||||||||||||||
| 5,162 |
Swiss Franc |
5,328 |
Deutsche Bank AG |
11/16/16 |
(108 |
) |
|||||||||||||||||
| 47,037 |
Swiss Franc |
47,340 |
Goldman Sachs International |
11/16/16 |
226 |
||||||||||||||||||
| 20,454 |
Swiss Franc |
20,950 |
Goldman Sachs International |
11/16/16 |
(266 |
) |
|||||||||||||||||
| 19,146 |
Swiss Franc |
19,380 |
Royal Bank of Canada |
11/16/16 |
(19 |
) |
|||||||||||||||||
| 24,562 |
Swiss Franc |
25,345 |
Societe Generale |
11/16/16 |
(507 |
) |
|||||||||||||||||
| 39,417 |
Swiss Franc |
40,237 |
Societe Generale |
11/16/16 |
(376 |
) |
|||||||||||||||||
| 28,090 |
Swiss Franc |
28,465 |
Societe Generale |
11/16/16 |
(59 |
) |
|||||||||||||||||
| 47,890 |
Swiss Franc |
49,292 |
Societe Generale |
11/16/16 |
(863 |
) |
|||||||||||||||||
| 24,273 |
Swiss Franc |
24,462 |
Societe Generale |
11/16/16 |
84 |
||||||||||||||||||
| 251,493 |
Swiss Franc |
258,304 |
State Street Bank and Trust Company |
11/16/16 |
(3,979 |
) |
|||||||||||||||||
| 52,271 |
Swiss Franc |
52,586 |
State Street Bank and Trust Company |
11/16/16 |
274 |
||||||||||||||||||
| 94,165 |
Swiss Franc |
95,277 |
State Street Bank and Trust Company |
11/16/16 |
(52 |
) |
|||||||||||||||||
| 38,761 |
Swiss Franc |
39,566 |
State Street Bank and Trust Company |
11/16/16 |
(369 |
) |
|||||||||||||||||
| 31,892 |
Swiss Franc |
32,631 |
State Street Bank and Trust Company |
11/16/16 |
(380 |
) |
|||||||||||||||||
| 15,155 |
Swiss Franc |
15,651 |
State Street Bank and Trust Company |
11/16/16 |
(325 |
) |
|||||||||||||||||
|
Total |
$ |
(212,188 |
) |
||||||||||||||||||||
See Notes to Financial Statements
43
Schedule of Investments Global Allocation Fund (cont'd)
|
Contracts to Deliver |
In Exchange For |
Counterparty |
Settlement Date |
Net Unrealized Appreciation/ (Depreciation) |
|||||||||||||||||||
| 94,962 |
Australian Dollar |
$ |
72,579 |
Deutsche Bank AG |
11/16/16 |
$ |
369 |
||||||||||||||||
| 261,829 |
Australian Dollar |
197,183 |
Goldman Sachs International |
11/16/16 |
(1,915 |
) |
|||||||||||||||||
| 49,012 |
Australian Dollar |
36,817 |
Goldman Sachs International |
11/16/16 |
(453 |
) |
|||||||||||||||||
| 68,128 |
Australian Dollar |
51,040 |
Goldman Sachs International |
11/16/16 |
(765 |
) |
|||||||||||||||||
| 42,977 |
Australian Dollar |
32,559 |
Goldman Sachs International |
11/16/16 |
(121 |
) |
|||||||||||||||||
| 91,379 |
Australian Dollar |
68,876 |
Royal Bank of Canada |
11/16/16 |
(610 |
) |
|||||||||||||||||
| 37,880 |
Australian Dollar |
28,316 |
Royal Bank of Canada |
11/16/16 |
(488 |
) |
|||||||||||||||||
| 62,062 |
Australian Dollar |
47,070 |
Royal Bank of Canada |
11/16/16 |
(123 |
) |
|||||||||||||||||
| 96,450 |
Australian Dollar |
73,655 |
Royal Bank of Canada |
11/16/16 |
313 |
||||||||||||||||||
| 76,021 |
Australian Dollar |
58,287 |
Societe Generale |
11/16/16 |
479 |
||||||||||||||||||
| 35,418 |
Australian Dollar |
26,892 |
Societe Generale |
11/16/16 |
(41 |
) |
|||||||||||||||||
| 286,267 |
Australian Dollar |
215,745 |
State Street Bank and Trust Company |
11/16/16 |
(1,936 |
) |
|||||||||||||||||
| 578,742 |
Australian Dollar |
438,495 |
State Street Bank and Trust Company |
11/16/16 |
(1,587 |
) |
|||||||||||||||||
| 46,928 |
Australian Dollar |
36,005 |
State Street Bank and Trust Company |
11/16/16 |
320 |
||||||||||||||||||
| 54,763 |
Brazilian Real |
16,712 |
Barclays Bank PLC |
11/10/16 |
(406 |
) |
|||||||||||||||||
| 348,328 |
Canadian Dollar |
266,182 |
Deutsche Bank AG |
11/16/16 |
6,461 |
||||||||||||||||||
| 318,679 |
Canadian Dollar |
243,224 |
Goldman Sachs International |
11/16/16 |
5,610 |
||||||||||||||||||
| 66,400 |
Canadian Dollar |
51,340 |
Goldman Sachs International |
11/16/16 |
1,831 |
||||||||||||||||||
| 38,513 |
Canadian Dollar |
29,426 |
Goldman Sachs International |
11/16/16 |
710 |
||||||||||||||||||
| 721,393 |
Canadian Dollar |
550,804 |
Royal Bank of Canada |
11/16/16 |
12,918 |
||||||||||||||||||
| 83,197 |
Canadian Dollar |
62,979 |
Royal Bank of Canada |
11/16/16 |
945 |
||||||||||||||||||
| 88,157 |
Canadian Dollar |
66,994 |
Royal Bank of Canada |
11/16/16 |
1,262 |
||||||||||||||||||
| 82,450 |
Canadian Dollar |
62,163 |
Royal Bank of Canada |
11/16/16 |
687 |
||||||||||||||||||
| 23,128 |
Canadian Dollar |
17,529 |
Royal Bank of Canada |
11/16/16 |
284 |
||||||||||||||||||
| 76,809 |
Canadian Dollar |
58,775 |
Societe Generale |
11/16/16 |
1,504 |
||||||||||||||||||
| 77,536 |
Canadian Dollar |
58,587 |
Societe Generale |
11/16/16 |
775 |
||||||||||||||||||
| 75,101 |
Canadian Dollar |
57,180 |
Societe Generale |
11/16/16 |
1,183 |
||||||||||||||||||
| 84,596 |
Canadian Dollar |
63,347 |
Societe Generale |
11/16/16 |
271 |
||||||||||||||||||
| 24,167 |
Canadian Dollar |
18,330 |
State Street Bank and Trust Company |
11/16/16 |
311 |
||||||||||||||||||
| 56,049 |
Canadian Dollar |
42,497 |
State Street Bank and Trust Company |
11/16/16 |
705 |
||||||||||||||||||
| 27,177 |
Canadian Dollar |
20,715 |
State Street Bank and Trust Company |
11/16/16 |
451 |
||||||||||||||||||
| 61,156 |
Canadian Dollar |
46,367 |
State Street Bank and Trust Company |
11/16/16 |
768 |
||||||||||||||||||
| 67,876 |
Canadian Dollar |
51,205 |
State Street Bank and Trust Company |
11/16/16 |
595 |
||||||||||||||||||
| 31,692 |
Canadian Dollar |
24,185 |
State Street Bank and Trust Company |
11/16/16 |
554 |
||||||||||||||||||
| 173,388,601 |
Chilean Peso |
260,578 |
Barclays Bank PLC |
11/10/16 |
(4,723 |
) |
|||||||||||||||||
| 1,471,808 |
Czech Koruna |
61,131 |
Barclays Bank PLC |
11/10/16 |
1,332 |
||||||||||||||||||
| 19,874 |
Euro |
22,333 |
Deutsche Bank AG |
11/16/16 |
505 |
||||||||||||||||||
| 26,352 |
Euro |
29,666 |
Goldman Sachs International |
11/16/16 |
722 |
||||||||||||||||||
| 22,855 |
Euro |
25,772 |
Goldman Sachs International |
11/16/16 |
669 |
||||||||||||||||||
| 35,197 |
Euro |
39,425 |
Goldman Sachs International |
11/16/16 |
766 |
||||||||||||||||||
| 15,936 |
Euro |
17,399 |
Goldman Sachs International |
11/16/16 |
(104 |
) |
|||||||||||||||||
| 44,963 |
Euro |
50,676 |
Royal Bank of Canada |
11/16/16 |
1,290 |
||||||||||||||||||
| 59,114 |
Euro |
66,744 |
Royal Bank of Canada |
11/16/16 |
1,815 |
||||||||||||||||||
See Notes to Financial Statements
44
Schedule of Investments Global Allocation Fund (cont'd)
|
Contracts to Deliver |
In Exchange For |
Counterparty |
Settlement Date |
Net Unrealized Appreciation/ (Depreciation) |
|||||||||||||||||||
| 57,234 |
Euro |
$ |
63,072 |
Royal Bank of Canada |
11/16/16 |
$ |
208 |
||||||||||||||||
| 27,358 |
Euro |
30,776 |
Societe Generale |
11/16/16 |
727 |
||||||||||||||||||
| 19,874 |
Euro |
22,326 |
Societe Generale |
11/16/16 |
497 |
||||||||||||||||||
| 14,543 |
Euro |
16,369 |
Societe Generale |
11/16/16 |
396 |
||||||||||||||||||
| 34,892 |
Euro |
38,995 |
Societe Generale |
11/16/16 |
671 |
||||||||||||||||||
| 38,142 |
Euro |
42,730 |
State Street Bank and Trust Company |
11/16/16 |
836 |
||||||||||||||||||
| 40,281 |
Euro |
45,418 |
State Street Bank and Trust Company |
11/16/16 |
1,175 |
||||||||||||||||||
| 27,943 |
Euro |
31,474 |
State Street Bank and Trust Company |
11/16/16 |
783 |
||||||||||||||||||
| 124,401 |
Euro |
140,108 |
State Street Bank and Trust Company |
11/16/16 |
3,471 |
||||||||||||||||||
| 86,216 |
Euro |
96,532 |
State Street Bank and Trust Company |
11/16/16 |
1,835 |
||||||||||||||||||
| 11,296 |
Euro |
12,290 |
State Street Bank and Trust Company |
11/16/16 |
(117 |
) |
|||||||||||||||||
| 70,315,358 |
Hungarian Forint |
257,939 |
Barclays Bank PLC |
11/10/16 |
7,938 |
||||||||||||||||||
| 1,538,736 |
Japanese Yen |
15,210 |
Deutsche Bank AG |
11/16/16 |
531 |
||||||||||||||||||
| 9,273,082 |
Japanese Yen |
89,782 |
Goldman Sachs International |
11/16/16 |
1,317 |
||||||||||||||||||
| 1,631,351 |
Japanese Yen |
15,827 |
Goldman Sachs International |
11/16/16 |
264 |
||||||||||||||||||
| 5,584,752 |
Japanese Yen |
55,177 |
Goldman Sachs International |
11/16/16 |
1,899 |
||||||||||||||||||
| 1,684,131 |
Japanese Yen |
16,778 |
Royal Bank of Canada |
11/16/16 |
712 |
||||||||||||||||||
| 33,488,766 |
Japanese Yen |
324,554 |
Societe Generale |
11/16/16 |
5,073 |
||||||||||||||||||
| 6,307,310 |
Japanese Yen |
61,979 |
Societe Generale |
11/16/16 |
1,808 |
||||||||||||||||||
| 7,644,948 |
Japanese Yen |
74,005 |
Societe Generale |
11/16/16 |
1,073 |
||||||||||||||||||
| 1,944,773 |
Japanese Yen |
18,724 |
Societe Generale |
11/16/16 |
171 |
||||||||||||||||||
| 22,677,943 |
Japanese Yen |
219,089 |
State Street Bank and Trust Company |
11/16/16 |
2,743 |
||||||||||||||||||
| 5,853,811 |
Japanese Yen |
57,678 |
State Street Bank and Trust Company |
11/16/16 |
1,833 |
||||||||||||||||||
| 6,610,015 |
Japanese Yen |
65,297 |
State Street Bank and Trust Company |
11/16/16 |
2,238 |
||||||||||||||||||
| 4,544,968 |
Japanese Yen |
43,815 |
State Street Bank and Trust Company |
11/16/16 |
456 |
||||||||||||||||||
| 1,590,621 |
Mexican Peso |
83,814 |
State Street Bank and Trust Company |
11/16/16 |
(219 |
) |
|||||||||||||||||
| 166,866 |
New Zealand Dollar |
121,922 |
Deutsche Bank AG |
11/16/16 |
2,666 |
||||||||||||||||||
| 29,792 |
New Zealand Dollar |
21,647 |
Goldman Sachs International |
11/16/16 |
355 |
||||||||||||||||||
| 24,576 |
New Zealand Dollar |
17,959 |
Goldman Sachs International |
11/16/16 |
395 |
||||||||||||||||||
| 23,999 |
New Zealand Dollar |
17,538 |
Royal Bank of Canada |
11/16/16 |
387 |
||||||||||||||||||
| 607,594 |
New Zealand Dollar |
442,386 |
Societe Generale |
11/16/16 |
8,147 |
||||||||||||||||||
| 90,306 |
New Zealand Dollar |
65,716 |
Societe Generale |
11/16/16 |
1,176 |
||||||||||||||||||
| 91,705 |
New Zealand Dollar |
66,704 |
Societe Generale |
11/16/16 |
1,164 |
||||||||||||||||||
| 80,842 |
New Zealand Dollar |
58,780 |
Societe Generale |
11/16/16 |
1,004 |
||||||||||||||||||
| 24,737 |
New Zealand Dollar |
17,622 |
Societe Generale |
11/16/16 |
(58 |
) |
|||||||||||||||||
| 113,922 |
New Zealand Dollar |
83,203 |
State Street Bank and Trust Company |
11/16/16 |
1,784 |
||||||||||||||||||
| 65,160 |
New Zealand Dollar |
47,267 |
State Street Bank and Trust Company |
11/16/16 |
698 |
||||||||||||||||||
| 159,325 |
New Zealand Dollar |
117,660 |
State Street Bank and Trust Company |
11/16/16 |
3,792 |
||||||||||||||||||
| 166,866 |
New Zealand Dollar |
121,063 |
State Street Bank and Trust Company |
11/16/16 |
1,806 |
||||||||||||||||||
| 69,950 |
New Zealand Dollar |
49,772 |
State Street Bank and Trust Company |
11/16/16 |
(221 |
) |
|||||||||||||||||
| 27,360 |
New Zealand Dollar |
19,567 |
State Street Bank and Trust Company |
11/16/16 |
13 |
||||||||||||||||||
| 388,086 |
Norwegian Krone |
46,822 |
Deutsche Bank AG |
11/16/16 |
(149 |
) |
|||||||||||||||||
| 420,118 |
Norwegian Krone |
50,413 |
Goldman Sachs International |
11/16/16 |
(436 |
) |
|||||||||||||||||
See Notes to Financial Statements
45
Schedule of Investments Global Allocation Fund (cont'd)
|
Contracts to Deliver |
In Exchange For |
Counterparty |
Settlement Date |
Net Unrealized Appreciation/ (Depreciation) |
|||||||||||||||||||
| 821,634 |
Norwegian Krone |
$ |
99,338 |
Goldman Sachs International |
11/16/16 |
$ |
(107 |
) |
|||||||||||||||
| 303,678 |
Norwegian Krone |
37,877 |
Royal Bank of Canada |
11/16/16 |
1,122 |
||||||||||||||||||
| 241,330 |
Norwegian Krone |
29,434 |
Royal Bank of Canada |
11/16/16 |
225 |
||||||||||||||||||
| 413,506 |
Norwegian Krone |
51,412 |
Societe Generale |
11/16/16 |
1,364 |
||||||||||||||||||
| 365,443 |
Norwegian Krone |
45,877 |
Societe Generale |
11/16/16 |
1,646 |
||||||||||||||||||
| 325,771 |
Norwegian Krone |
40,148 |
Societe Generale |
11/16/16 |
719 |
||||||||||||||||||
| 110,257 |
Norwegian Krone |
13,464 |
Societe Generale |
11/16/16 |
120 |
||||||||||||||||||
| 219,920 |
Norwegian Krone |
26,665 |
Societe Generale |
11/16/16 |
48 |
||||||||||||||||||
| 151,968 |
Norwegian Krone |
18,232 |
State Street Bank and Trust Company |
11/16/16 |
(161 |
) |
|||||||||||||||||
| 1,364,010 |
Norwegian Krone |
167,782 |
State Street Bank and Trust Company |
11/16/16 |
2,692 |
||||||||||||||||||
| 388,086 |
Norwegian Krone |
48,238 |
State Street Bank and Trust Company |
11/16/16 |
1,266 |
||||||||||||||||||
| 883,233 |
Norwegian Krone |
110,428 |
State Street Bank and Trust Company |
11/16/16 |
3,527 |
||||||||||||||||||
| 798,714 |
Norwegian Krone |
98,791 |
State Street Bank and Trust Company |
11/16/16 |
2,120 |
||||||||||||||||||
| 389,743 |
Norwegian Krone |
47,563 |
State Street Bank and Trust Company |
11/16/16 |
392 |
||||||||||||||||||
| 102,978 |
Norwegian Krone |
12,633 |
State Street Bank and Trust Company |
11/16/16 |
169 |
||||||||||||||||||
| 45,386 |
Pound Sterling |
60,614 |
Deutsche Bank AG |
11/16/16 |
5,047 |
||||||||||||||||||
| 25,911 |
Pound Sterling |
31,469 |
Goldman Sachs International |
11/16/16 |
(255 |
) |
|||||||||||||||||
| 17,216 |
Pound Sterling |
22,554 |
Royal Bank of Canada |
11/16/16 |
1,476 |
||||||||||||||||||
| 22,368 |
Pound Sterling |
29,697 |
Societe Generale |
11/16/16 |
2,312 |
||||||||||||||||||
| 45,386 |
Pound Sterling |
58,998 |
Societe Generale |
11/16/16 |
3,431 |
||||||||||||||||||
| 14,750 |
Pound Sterling |
17,989 |
Societe Generale |
11/16/16 |
(69 |
) |
|||||||||||||||||
| 30,600 |
Pound Sterling |
37,352 |
Societe Generale |
11/16/16 |
(113 |
) |
|||||||||||||||||
| 29,761 |
Pound Sterling |
39,654 |
State Street Bank and Trust Company |
11/16/16 |
3,217 |
||||||||||||||||||
| 27,697 |
Pound Sterling |
34,261 |
State Street Bank and Trust Company |
11/16/16 |
351 |
||||||||||||||||||
| 33,639 |
Pound Sterling |
41,281 |
State Street Bank and Trust Company |
11/16/16 |
96 |
||||||||||||||||||
| 11,620 |
Pound Sterling |
14,306 |
State Street Bank and Trust Company |
11/16/16 |
80 |
||||||||||||||||||
| 9,283 |
Pound Sterling |
11,330 |
State Street Bank and Trust Company |
11/16/16 |
(35 |
) |
|||||||||||||||||
| 704,680 |
Singapore Dollar |
514,560 |
Barclays Bank PLC |
11/10/16 |
8,026 |
||||||||||||||||||
| 648,720 |
Swedish Krona |
76,197 |
Deutsche Bank AG |
11/16/16 |
4,329 |
||||||||||||||||||
| 272,432 |
Swedish Krona |
32,135 |
Goldman Sachs International |
11/16/16 |
1,954 |
||||||||||||||||||
| 405,209 |
Swedish Krona |
48,166 |
Royal Bank of Canada |
11/16/16 |
3,275 |
||||||||||||||||||
| 1,120,945 |
Swedish Krona |
131,069 |
Societe Generale |
11/16/16 |
6,886 |
||||||||||||||||||
| 648,720 |
Swedish Krona |
75,681 |
Societe Generale |
11/16/16 |
3,812 |
||||||||||||||||||
| 319,131 |
Swedish Krona |
37,414 |
Societe Generale |
11/16/16 |
2,059 |
||||||||||||||||||
| 496,136 |
Swedish Krona |
57,404 |
Societe Generale |
11/16/16 |
2,440 |
||||||||||||||||||
| 359,475 |
Swedish Krona |
41,030 |
Societe Generale |
11/16/16 |
1,205 |
||||||||||||||||||
| 426,394 |
Swedish Krona |
50,414 |
State Street Bank and Trust Company |
11/16/16 |
3,176 |
||||||||||||||||||
| 282,395 |
Swedish Krona |
32,998 |
State Street Bank and Trust Company |
11/16/16 |
1,713 |
||||||||||||||||||
| 628,086 |
Swedish Krona |
73,531 |
State Street Bank and Trust Company |
11/16/16 |
3,948 |
||||||||||||||||||
| 261,819 |
Swedish Krona |
30,448 |
State Street Bank and Trust Company |
11/16/16 |
1,443 |
||||||||||||||||||
| 406,289 |
Swedish Krona |
46,012 |
State Street Bank and Trust Company |
11/16/16 |
1,001 |
||||||||||||||||||
| 210,249 |
Swedish Krona |
23,574 |
State Street Bank and Trust Company |
11/16/16 |
282 |
||||||||||||||||||
| 5,162 |
Swiss Franc |
5,294 |
Deutsche Bank AG |
11/16/16 |
73 |
||||||||||||||||||
See Notes to Financial Statements
46
Schedule of Investments Global Allocation Fund (cont'd)
|
Contracts to Deliver |
In Exchange For |
Counterparty |
Settlement Date |
Net Unrealized Appreciation/ (Depreciation) |
|||||||||||||||||||
| 8,992 |
Swiss Franc |
$ |
9,214 |
Goldman Sachs International |
11/16/16 |
$ |
121 |
||||||||||||||||
| 28,817 |
Swiss Franc |
29,702 |
Goldman Sachs International |
11/16/16 |
560 |
||||||||||||||||||
| 45,179 |
Swiss Franc |
46,307 |
Royal Bank of Canada |
11/16/16 |
619 |
||||||||||||||||||
| 11,754 |
Swiss Franc |
12,171 |
Royal Bank of Canada |
11/16/16 |
284 |
||||||||||||||||||
| 17,152 |
Swiss Franc |
17,673 |
Royal Bank of Canada |
11/16/16 |
328 |
||||||||||||||||||
| 49,600 |
Swiss Franc |
50,794 |
Royal Bank of Canada |
11/16/16 |
636 |
||||||||||||||||||
| 73,083 |
Swiss Franc |
75,283 |
Royal Bank of Canada |
11/16/16 |
1,377 |
||||||||||||||||||
| 26,946 |
Swiss Franc |
27,622 |
Royal Bank of Canada |
11/16/16 |
373 |
||||||||||||||||||
| 810,525 |
Swiss Franc |
830,529 |
Societe Generale |
11/16/16 |
10,876 |
||||||||||||||||||
| 32,057 |
Swiss Franc |
33,121 |
Societe Generale |
11/16/16 |
703 |
||||||||||||||||||
| 5,162 |
Swiss Franc |
5,328 |
Societe Generale |
11/16/16 |
107 |
||||||||||||||||||
| 34,215 |
Swiss Franc |
34,707 |
Societe Generale |
11/16/16 |
107 |
||||||||||||||||||
| 20,485 |
Swiss Franc |
21,211 |
State Street Bank and Trust Company |
11/16/16 |
496 |
||||||||||||||||||
| 11,019 |
Swiss Franc |
11,284 |
State Street Bank and Trust Company |
11/16/16 |
141 |
||||||||||||||||||
| 34,658 |
Swiss Franc |
35,067 |
State Street Bank and Trust Company |
11/16/16 |
19 |
||||||||||||||||||
|
Total |
$ |
187,024 |
|||||||||||||||||||||
For the year ended October 31, 2016, the Fund's investments in forward contracts had an average notional value of $17,284,551.
Written option contracts ("options written")
At October 31, 2016, the Fund had outstanding options written as follows:
|
Name of Issuer |
Contracts | Exercise Price |
Expiration Date |
Market Value of Options |
|||||||||||||||
|
iShares MSCI EAFE ETF, Call |
1 |
$ |
59 |
11/11/16 |
$ |
(16 |
) |
||||||||||||
|
iShares MSCI EAFE ETF, Call |
2 |
59.5 |
11/11/16 |
(13 |
) |
||||||||||||||
|
iShares MSCI EAFE ETF, Call |
5 |
59 |
11/18/16 |
(125 |
) |
||||||||||||||
|
iShares MSCI EAFE ETF, Call |
11 |
60 |
11/18/16 |
(77 |
) |
||||||||||||||
|
iShares MSCI EAFE ETF, Call |
11 |
59.5 |
11/25/16 |
(198 |
) |
||||||||||||||
|
iShares MSCI EAFE ETF, Call |
5 |
60 |
11/25/16 |
(42 |
) |
||||||||||||||
|
iShares MSCI EAFE ETF, Call |
5 |
59.5 |
12/2/16 |
(112 |
) |
||||||||||||||
|
iShares MSCI EAFE ETF, Put |
15 |
57 |
11/4/16 |
(195 |
) |
||||||||||||||
|
iShares MSCI EAFE ETF, Put |
2 |
57.5 |
11/4/16 |
(46 |
) |
||||||||||||||
|
iShares MSCI EAFE ETF, Put |
1 |
55.5 |
11/11/16 |
(15 |
) |
||||||||||||||
|
iShares MSCI EAFE ETF, Put |
6 |
56 |
11/11/16 |
(132 |
) |
||||||||||||||
|
iShares MSCI EAFE ETF, Put |
1 |
56.5 |
11/11/16 |
(29 |
) |
||||||||||||||
|
iShares MSCI EAFE ETF, Put |
9 |
57 |
11/11/16 |
(342 |
) |
||||||||||||||
|
iShares MSCI EAFE ETF, Put |
14 |
56 |
11/18/16 |
(406 |
) |
||||||||||||||
|
iShares MSCI EAFE ETF, Put |
3 |
57 |
11/18/16 |
(147 |
) |
||||||||||||||
|
iShares MSCI EAFE ETF, Put |
14 |
56 |
11/25/16 |
(511 |
) |
||||||||||||||
|
iShares MSCI EAFE ETF, Put |
1 |
56.5 |
11/25/16 |
(46 |
) |
||||||||||||||
|
iShares MSCI EAFE ETF, Put |
1 |
56 |
12/2/16 |
(45 |
) |
||||||||||||||
See Notes to Financial Statements
47
Schedule of Investments Global Allocation Fund (cont'd)
| Name of Issuer |
Contracts |
Exercise Price |
Expiration Date |
Market Value of Options |
|||||||||||||||
|
iShares MSCI Emerging Markets ETF, Call |
5 |
$ |
38 |
11/11/16 |
$ |
(163 |
) |
||||||||||||
|
iShares MSCI Emerging Markets ETF, Call |
6 |
38.5 |
11/11/16 |
(111 |
) |
||||||||||||||
|
iShares MSCI Emerging Markets ETF, Call |
4 |
38.5 |
11/18/16 |
(104 |
) |
||||||||||||||
|
iShares MSCI Emerging Markets ETF, Call |
6 |
39 |
11/18/16 |
(87 |
) |
||||||||||||||
|
iShares MSCI Emerging Markets ETF, Call |
7 |
39 |
11/25/16 |
(126 |
) |
||||||||||||||
|
iShares MSCI Emerging Markets ETF, Call |
3 |
39.5 |
11/25/16 |
(32 |
) |
||||||||||||||
|
iShares MSCI Emerging Markets ETF, Call |
4 |
38.5 |
12/2/16 |
(138 |
) |
||||||||||||||
|
iShares MSCI Emerging Markets ETF, Put |
9 |
36 |
11/4/16 |
(72 |
) |
||||||||||||||
|
iShares MSCI Emerging Markets ETF, Put |
2 |
36.5 |
11/4/16 |
(27 |
) |
||||||||||||||
|
iShares MSCI Emerging Markets ETF, Put |
2 |
35.5 |
11/11/16 |
(44 |
) |
||||||||||||||
|
iShares MSCI Emerging Markets ETF, Put |
3 |
36 |
11/11/16 |
(93 |
) |
||||||||||||||
|
iShares MSCI Emerging Markets ETF, Put |
6 |
36.5 |
11/11/16 |
(249 |
) |
||||||||||||||
|
iShares MSCI Emerging Markets ETF, Put |
1 |
35.5 |
11/18/16 |
(28 |
) |
||||||||||||||
|
iShares MSCI Emerging Markets ETF, Put |
9 |
36 |
11/18/16 |
(346 |
) |
||||||||||||||
|
iShares MSCI Emerging Markets ETF, Put |
1 |
36.5 |
11/18/16 |
(53 |
) |
||||||||||||||
|
iShares MSCI Emerging Markets ETF, Put |
4 |
35.5 |
11/25/16 |
(130 |
) |
||||||||||||||
|
iShares MSCI Emerging Markets ETF, Put |
2 |
36 |
11/25/16 |
(85 |
) |
||||||||||||||
|
iShares MSCI Emerging Markets ETF, Put |
5 |
36.5 |
11/25/16 |
(280 |
) |
||||||||||||||
|
iShares MSCI Emerging Markets ETF, Put |
1 |
35.5 |
12/2/16 |
(41 |
) |
||||||||||||||
|
S&P 500 Mini Index, Call |
3 |
220 |
11/4/16 |
(0 |
)(a) | ||||||||||||||
|
S&P 500 Mini Index, Call |
4 |
217 |
11/11/16 |
(272 |
) |
||||||||||||||
|
S&P 500 Mini Index, Call |
2 |
218 |
11/11/16 |
(85 |
) |
||||||||||||||
|
S&P 500 Mini Index, Call |
1 |
217 |
11/18/16 |
(93 |
) |
||||||||||||||
|
S&P 500 Mini Index, Call |
5 |
219 |
11/18/16 |
(205 |
) |
||||||||||||||
|
S&P 500 Mini Index, Call |
2 |
216.5 |
11/25/16 |
(248 |
) |
||||||||||||||
|
S&P 500 Mini Index, Call |
4 |
218.5 |
11/25/16 |
(240 |
) |
||||||||||||||
|
S&P 500 Mini Index, Call |
2 |
217.5 |
12/2/16 |
(235 |
) |
||||||||||||||
|
S&P 500 Mini Index, Put |
4 |
210.5 |
11/4/16 |
(246 |
) |
||||||||||||||
|
S&P 500 Mini Index, Put |
2 |
211 |
11/4/16 |
(143 |
) |
||||||||||||||
|
S&P 500 Mini Index, Put |
4 |
208.5 |
11/11/16 |
(636 |
) |
||||||||||||||
|
S&P 500 Mini Index, Put |
2 |
209.5 |
11/11/16 |
(367 |
) |
||||||||||||||
|
S&P 500 Mini Index, Put |
1 |
211 |
11/11/16 |
(226 |
) |
||||||||||||||
|
S&P 500 Mini Index, Put |
4 |
209 |
11/18/16 |
(830 |
) |
||||||||||||||
|
S&P 500 Mini Index, Put |
3 |
210 |
11/18/16 |
(703 |
) |
||||||||||||||
|
S&P 500 Mini Index, Put |
3 |
208 |
11/25/16 |
(598 |
) |
||||||||||||||
|
S&P 500 Mini Index, Put |
3 |
210 |
11/25/16 |
(753 |
) |
||||||||||||||
|
Total (premiums received: $13,297) |
$ |
(10,586 |
) |
||||||||||||||||
(a) Security fair valued as of October 31, 2016 in accordance with procedures approved by the Fund's Board.
See Notes to Financial Statements
48
Schedule of Investments Global Allocation Fund (cont'd)
At October 31, 2016, the Fund had $11,237 deposited in a segregated account to cover requirements on options written.
Options written for the Fund for the year ended October 31, 2016 were as follows:
| Number of Contracts |
Premium Received |
||||||||||
|
Outstanding 10/31/2015 |
— |
$ |
— |
||||||||
|
Options written |
545 |
26,983 |
|||||||||
|
Options expired |
— |
— |
|||||||||
|
Options exercised |
— |
— |
|||||||||
|
Options closed |
(309 |
) |
(13,686 |
) |
|||||||
|
Outstanding 10/31/2016 |
236 |
$ |
13,297 |
||||||||
For the year ended October 31, 2016, the Fund had an average market value of $(9,226) in options written.
The following is a summary, categorized by Level (see Note A of Notes to Financial Statements), of inputs used to value the Fund's investments as of October 31, 2016:
|
Asset Valuation Inputs |
|||||||||||||||||||
|
(000's omitted) |
Level 1 |
Level 2 |
Level 3 |
Total |
|||||||||||||||
|
Investments: |
|||||||||||||||||||
| Common Stocks(a) |
$ |
6,538 |
$ |
— |
$ |
— |
$ |
6,538 |
|||||||||||
|
U.S. Treasury Obligations |
— |
947 |
— |
947 |
|||||||||||||||
|
U.S. Government Agency Security |
— |
56 |
— |
56 |
|||||||||||||||
| Mortgage-Backed Securities(a) |
— |
157 |
— |
157 |
|||||||||||||||
| Foreign Government Securities(a) |
— |
1,656 |
— |
1,656 |
|||||||||||||||
|
Exchange Traded Funds |
508 |
— |
— |
508 |
|||||||||||||||
|
Investment Company |
— |
11,404 |
— |
11,404 |
|||||||||||||||
|
Short-Term Investment |
— |
292 |
— |
292 |
|||||||||||||||
|
Total Long Positions |
$ |
7,046 |
$ |
14,512 |
$ |
— |
$ |
21,558 |
|||||||||||
(a) The Schedule of Investments provides a geographic categorization as well as a Long Positions by Industry summary.
The following is a summary, categorized by Level (see Note A of Notes to Financial Statements), of inputs used to value the Fund's investments as of October 31, 2016:
|
Liability Valuation Inputs |
|||||||||||||||||||
|
(000's omitted) |
Level 1 |
Level 2 |
Level 3(c) |
Total |
|||||||||||||||
|
Investments: |
|||||||||||||||||||
| Common Stocks Sold Short(b) |
$ |
(2,322 |
) |
$ |
— |
$ |
— |
$ |
(2,322 |
) |
|||||||||
|
Total Short Positions |
$ |
(2,322 |
) |
$ |
— |
$ |
— |
$ |
(2,322 |
) |
|||||||||
(b) The Schedule of Investments provides a geographic categorization as well as a Short Positions by Industry summary.
See Notes to Financial Statements
49
Schedule of Investments Global Allocation Fund (cont'd)
(c) The following is a reconciliation between the beginning and ending balances of investments in which unobservable inputs (Level 3) were used in determining value:
|
(000's omitted) |
Beginning balance, as of 11/1/15 |
Accrued discounts/ (premiums) |
Realized gain/(loss) |
Change in unrealized appreciation/ (depreciation) |
Purchases to cover positions sold short |
Sales |
Transfers into Level 3 |
Transfers out of Level 3 |
Balance, as of 10/31/16 |
Net change in unrealized appreciation/ (depreciation) from investments still held as of 10/31/16 |
|||||||||||||||||||||||||||||||||
| Investments in Securities: |
|||||||||||||||||||||||||||||||||||||||||||
| Rights Sold Short(d) | |||||||||||||||||||||||||||||||||||||||||||
|
United States |
$ |
(18 |
) |
$ |
— |
$ |
— |
$ |
— |
$ |
18 |
$ |
— |
$ |
— |
$ |
— |
$ |
— |
$ |
— |
||||||||||||||||||||||
|
Total |
$ |
(18 |
) |
$ |
— |
$ |
— |
$ |
— |
$ |
18 |
$ |
— |
$ |
— |
$ |
— |
$ |
— |
$ |
— |
||||||||||||||||||||||
(d) At the beginning of the period, the Fund's Level 3 investments were valued based on using methods the Board has approved in the good-faith belief that the resulting valuation will reflect the fair value of the security. The Fund held no Level 3 investments at October 31, 2016.
As of the year ended October 31, 2016, no securities were transferred from one level (as of October 31, 2015) to another.
The following is a summary, categorized by Level (see Note A of Notes to Financial Statements), of inputs used to value the Fund's derivatives as of October 31, 2016:
|
Other Financial Instruments |
|||||||||||||||||||
|
(000's omitted) |
Level 1 |
Level 2 |
Level 3 |
Total |
|||||||||||||||
| Futures(e) | |||||||||||||||||||
|
Assets |
$ |
57 |
$ |
— |
$ |
— |
$ |
57 |
|||||||||||
|
Liabilities |
(68 |
) |
— |
— |
(68 |
) |
|||||||||||||
| Forward contracts(e) | |||||||||||||||||||
|
Assets |
— |
219 |
— |
219 |
|||||||||||||||
|
Liabilities |
— |
(244 |
) |
— |
(244 |
) |
|||||||||||||
|
Options written |
|||||||||||||||||||
|
Liabilities |
(11 |
) |
— |
— |
(11 |
) |
|||||||||||||
|
Total |
$ |
(22 |
) |
$ |
(25 |
) |
$ |
— |
$ |
(47 |
) |
||||||||
(e) Futures and forward contracts are reported at the cumulative appreciation/(depreciation) of the instrument.
See Notes to Financial Statements
50
Schedule of Investments Global Allocation Fund (cont'd)
LONG POSITIONS BY INDUSTRY GLOBAL ALLOCATION FUND
|
Industry |
Investments at Value (000's omitted) |
Percentage of Net Assets |
|||||||||
|
Investment Companies* |
$ |
11,404 |
55.0 |
% |
|||||||
|
Foreign Government Securities** |
1,656 |
8.0 |
% |
||||||||
|
U.S. Treasury Obligations |
947 |
4.6 |
% |
||||||||
|
Exchange Traded Funds |
508 |
2.4 |
% |
||||||||
|
Banks |
497 |
2.4 |
% |
||||||||
|
Insurance |
329 |
1.6 |
% |
||||||||
|
Oil, Gas & Consumable Fuels |
280 |
1.3 |
% |
||||||||
|
Food & Staples Retailing |
258 |
1.2 |
% |
||||||||
|
Metals & Mining |
241 |
1.2 |
% |
||||||||
|
Pharmaceuticals |
224 |
1.1 |
% |
||||||||
|
Food Products |
220 |
1.1 |
% |
||||||||
|
Health Care Providers & Services |
212 |
1.0 |
% |
||||||||
|
Electric Utilities |
205 |
1.0 |
% |
||||||||
|
Health Care Equipment & Supplies |
182 |
0.9 |
% |
||||||||
|
Electronic Equipment, Instruments & Components |
168 |
0.8 |
% |
||||||||
|
Automobiles |
159 |
0.8 |
% |
||||||||
|
Specialty Retail |
159 |
0.8 |
% |
||||||||
|
Mortgage-Backed Securities |
157 |
0.8 |
% |
||||||||
|
Software |
157 |
0.8 |
% |
||||||||
|
Airlines |
155 |
0.7 |
% |
||||||||
|
IT Services |
154 |
0.7 |
% |
||||||||
|
Construction & Engineering |
151 |
0.7 |
% |
||||||||
|
Auto Components |
144 |
0.7 |
% |
||||||||
|
Internet Software & Services |
140 |
0.7 |
% |
||||||||
|
Technology Hardware, Storage & Peripherals |
139 |
0.7 |
% |
||||||||
|
Diversified Telecommunication Services |
131 |
0.6 |
% |
||||||||
|
Real Estate Investment Trusts |
128 |
0.6 |
% |
||||||||
|
Chemicals |
119 |
0.6 |
% |
||||||||
|
Semiconductors & Semiconductor Equipment |
119 |
0.6 |
% |
||||||||
|
Household Durables |
103 |
0.5 |
% |
||||||||
|
Energy Equipment & Services |
95 |
0.5 |
% |
||||||||
|
Trading Companies & Distributors |
94 |
0.5 |
% |
||||||||
|
Capital Markets |
87 |
0.4 |
% |
||||||||
|
Hotels, Restaurants & Leisure |
85 |
0.4 |
% |
||||||||
|
Machinery |
82 |
0.4 |
% |
||||||||
|
Media |
80 |
0.4 |
% |
||||||||
|
Communications Equipment |
78 |
0.4 |
% |
||||||||
|
Multi-Utilities |
73 |
0.4 |
% |
||||||||
|
Household Products |
71 |
0.3 |
% |
||||||||
|
Biotechnology |
65 |
0.3 |
% |
||||||||
|
Electrical Equipment |
63 |
0.3 |
% |
||||||||
|
Aerospace & Defense |
60 |
0.3 |
% |
||||||||
|
U.S. Government Agency Security |
56 |
0.3 |
% |
||||||||
|
Multiline Retail |
49 |
0.2 |
% |
||||||||
|
Textiles, Apparel & Luxury Goods |
49 |
0.2 |
% |
||||||||
|
Professional Services |
48 |
0.2 |
% |
||||||||
|
Diversified Financial Services |
48 |
0.2 |
% |
||||||||
|
Industrial Conglomerates |
47 |
0.2 |
% |
||||||||
|
Building Products |
46 |
0.2 |
% |
||||||||
|
Commercial Services & Supplies |
45 |
0.2 |
% |
||||||||
|
Paper & Forest Products |
45 |
0.2 |
% |
||||||||
|
Life Sciences Tools & Services |
38 |
0.2 |
% |
||||||||
|
Distributors |
37 |
0.2 |
% |
||||||||
See Notes to Financial Statements
51
Schedule of Investments Global Allocation Fund (cont'd)
LONG POSITIONS BY INDUSTRY GLOBAL ALLOCATION FUND (cont'd)
|
Industry |
Investments at Value (000's omitted) |
Percentage of Net Assets |
|||||||||
|
Tobacco |
$ |
36 |
0.2 |
% |
|||||||
|
Wireless Telecommunication Services |
35 |
0.2 |
% |
||||||||
|
Beverages |
33 |
0.2 |
% |
||||||||
|
Containers & Packaging |
30 |
0.1 |
% |
||||||||
|
Independent Power and Renewable Electricity Producers |
30 |
0.1 |
% |
||||||||
|
Personal Products |
29 |
0.1 |
% |
||||||||
|
Internet & Catalog Retail |
28 |
0.1 |
% |
||||||||
|
Consumer Finance |
21 |
0.1 |
% |
||||||||
|
Marine |
20 |
0.1 |
% |
||||||||
|
Transportation Infrastructure |
19 |
0.1 |
% |
||||||||
|
Leisure Products |
18 |
0.1 |
% |
||||||||
|
Diversified Consumer Services |
15 |
0.1 |
% |
||||||||
|
Construction Materials |
13 |
0.1 |
% |
||||||||
|
Air Freight & Logistics |
12 |
0.1 |
% |
||||||||
|
Road & Rail |
9 |
0.0 |
% |
||||||||
|
Thrifts & Mortgage Finance |
8 |
0.0 |
% |
||||||||
|
Mortgage Real Estate Investment |
7 |
0.0 |
% |
||||||||
|
Real Estate Management & Development |
6 |
0.0 |
% |
||||||||
|
Gas Utilities |
5 |
0.0 |
% |
||||||||
|
Short-Term Investment and Other Assets-Net |
1,807 |
8.7 |
% |
||||||||
|
Short Positions (see summary below) |
(2,317 |
) |
(11.2 |
)% |
|||||||
|
$ |
20,751 |
100.0 |
% |
||||||||
* Each position is an Investment Company under the 1940 Act and is not treated as an industry for purposes of the Fund's policy on industry concentration. This represents the aggregate of all investment companies.
** Each foreign government is deemed its own industry. This represents the aggregate of all foreign governments.
See Notes to Financial Statements
52
Schedule of Investments Global Allocation Fund (cont'd)
SHORT POSITIONS BY INDUSTRY GLOBAL ALLOCATION FUND
|
Industry |
Investments at Value (000's omitted) |
Percentage of Net Assets |
|||||||||
|
Chemicals |
$ |
(137 |
) |
(0.7 |
)% |
||||||
|
Capital Markets |
(115 |
) |
(0.6 |
)% |
|||||||
|
Hotels, Restaurants & Leisure |
(114 |
) |
(0.5 |
)% |
|||||||
|
Oil, Gas & Consumable Fuels |
(107 |
) |
(0.5 |
)% |
|||||||
|
Machinery |
(97 |
) |
(0.5 |
)% |
|||||||
|
Textiles, Apparel & Luxury Goods |
(89 |
) |
(0.4 |
)% |
|||||||
|
Semiconductors & Semiconductor Equipment |
(87 |
) |
(0.4 |
)% |
|||||||
|
Food Products |
(83 |
) |
(0.4 |
)% |
|||||||
|
IT Services |
(77 |
) |
(0.4 |
)% |
|||||||
|
Pharmaceuticals |
(77 |
) |
(0.4 |
)% |
|||||||
|
Real Estate Management & Development |
(75 |
) |
(0.4 |
)% |
|||||||
|
Media |
(70 |
) |
(0.3 |
)% |
|||||||
|
Beverages |
(61 |
) |
(0.3 |
)% |
|||||||
|
Industrial Conglomerates |
(59 |
) |
(0.3 |
)% |
|||||||
|
Electric Utilities |
(53 |
) |
(0.3 |
)% |
|||||||
|
Health Care Equipment & Supplies |
(52 |
) |
(0.3 |
)% |
|||||||
|
Multi-Utilities |
(47 |
) |
(0.2 |
)% |
|||||||
|
Software |
(44 |
) |
(0.2 |
)% |
|||||||
|
Diversified Telecommunication Services |
(43 |
) |
(0.2 |
)% |
|||||||
|
Aerospace & Defense |
(41 |
) |
(0.2 |
)% |
|||||||
|
Specialty Retail |
(41 |
) |
(0.2 |
)% |
|||||||
|
Metals & Mining |
(40 |
) |
(0.2 |
)% |
|||||||
|
Internet & Catalog Retail |
(39 |
) |
(0.2 |
)% |
|||||||
|
Banks |
(38 |
) |
(0.2 |
)% |
|||||||
|
Electrical Equipment |
(35 |
) |
(0.2 |
)% |
|||||||
|
Containers & Packaging |
(35 |
) |
(0.2 |
)% |
|||||||
|
Trading Companies & Distributors |
(34 |
) |
(0.1 |
)% |
|||||||
|
Health Care Providers & Services |
(33 |
) |
(0.1 |
)% |
|||||||
|
Food & Staples Retailing |
(29 |
) |
(0.1 |
)% |
|||||||
|
Construction Materials |
(28 |
) |
(0.1 |
)% |
|||||||
|
Water Utilities |
(27 |
) |
(0.1 |
)% |
|||||||
|
Gas Utilities |
(26 |
) |
(0.1 |
)% |
|||||||
|
Insurance |
(25 |
) |
(0.1 |
)% |
|||||||
|
Household Products |
(23 |
) |
(0.1 |
)% |
|||||||
|
Auto Components |
(21 |
) |
(0.1 |
)% |
|||||||
|
Communications Equipment |
(21 |
) |
(0.1 |
)% |
|||||||
|
Transportation Infrastructure |
(20 |
) |
(0.1 |
)% |
|||||||
|
Air Freight & Logistics |
(19 |
) |
(0.1 |
)% |
|||||||
|
Building Products |
(19 |
) |
(0.1 |
)% |
|||||||
|
Professional Services |
(17 |
) |
(0.1 |
)% |
|||||||
|
Life Sciences Tools & Services |
(16 |
) |
(0.1 |
)% |
|||||||
|
Household Durables |
(16 |
) |
(0.1 |
)% |
|||||||
|
Personal Products |
(16 |
) |
(0.1 |
)% |
|||||||
|
Airlines |
(15 |
) |
(0.1 |
)% |
|||||||
|
Diversified Financial Services |
(15 |
) |
(0.1 |
)% |
|||||||
|
Multiline Retail |
(14 |
) |
(0.1 |
)% |
|||||||
|
Road & Rail |
(14 |
) |
(0.1 |
)% |
|||||||
|
Automobiles |
(13 |
) |
(0.1 |
)% |
|||||||
|
Tobacco |
(13 |
) |
(0.1 |
)% |
|||||||
|
Technology Hardware, Storage & Peripherals |
(12 |
) |
(0.1 |
)% |
|||||||
|
Internet Software & Services |
(11 |
) |
(0.1 |
)% |
|||||||
|
Diversified Consumer Services |
(9 |
) |
(0.0 |
)% |
|||||||
|
Real Estate Investment Trusts |
(9 |
) |
(0.0 |
)% |
|||||||
See Notes to Financial Statements
53
Schedule of Investments Global Allocation Fund (cont'd)
SHORT POSITIONS BY INDUSTRY GLOBAL ALLOCATION FUND (cont'd)
|
Industry |
Investments at Value (000's omitted) |
Percentage of Net Assets |
|||||||||
|
Electronic Equipment, Instruments & Components |
$ |
(8 |
) |
(0.0 |
)% |
||||||
|
Consumer Finance |
(8 |
) |
(0.0 |
)% |
|||||||
|
Independent Power and Renewable Electricity Producers |
(6 |
) |
(0.0 |
)% |
|||||||
|
Commercial Services & Supplies |
(6 |
) |
(0.0 |
)% |
|||||||
|
Health Care Technology |
(6 |
) |
(0.0 |
)% |
|||||||
|
Leisure Products |
(6 |
) |
(0.0 |
)% |
|||||||
|
Wireless Telecommunication Services |
(6 |
) |
(0.0 |
)% |
|||||||
|
Total Short Positions |
$ |
(2,317 |
) |
(11.2 |
)% |
||||||
See Notes to Financial Statements
54
Schedule of Investments Long Short Fund 10/31/16
Number of Shares |
Value (000's omitted) |
||||||||||
|
Long Positions (99.4%) |
|||||||||||
|
Common Stocks (76.3%) |
|||||||||||
|
Aerospace & Defense (1.9%) |
|||||||||||
| General Dynamics Corp. |
75,000 |
$ |
11,306 |
||||||||
| Wesco Aircraft Holdings, Inc. |
2,734,100 |
35,133 |
*(a) | ||||||||
|
46,439 |
|||||||||||
|
Airlines (1.4%) |
|||||||||||
| Delta Air Lines, Inc. |
825,900 |
34,498 |
(a) |
||||||||
|
Banks (3.0%) |
|||||||||||
| JPMorgan Chase & Co. |
484,100 |
33,529 |
|||||||||
|
U.S. Bancorp |
841,700 |
37,674 |
(b) |
||||||||
|
71,203 |
|||||||||||
|
Beverages (0.7%) |
|||||||||||
|
PepsiCo, Inc. |
160,800 |
17,238 |
|||||||||
|
Biotechnology (1.7%) |
|||||||||||
|
Celgene Corp. |
250,600 |
25,606 |
* |
||||||||
| Gilead Sciences, Inc. |
206,100 |
15,175 |
|||||||||
|
40,781 |
|||||||||||
|
Capital Markets (4.0%) |
|||||||||||
| Bats Global Markets, Inc. |
178,833 |
5,260 |
|||||||||
|
BlackRock, Inc. |
66,000 |
22,522 |
|||||||||
| Brookfield Asset Management, Inc. Class A |
1,291,300 |
45,221 |
(a) |
||||||||
| CME Group, Inc. |
218,700 |
21,892 |
(b) |
||||||||
|
94,895 |
|||||||||||
|
Chemicals (1.9%) |
|||||||||||
| Ashland Global Holdings, Inc. |
341,250 |
38,128 |
|||||||||
| Sherwin-Williams Co. |
33,000 |
8,080 |
|||||||||
|
46,208 |
|||||||||||
|
Commercial Services & Supplies (0.4%) |
|||||||||||
|
Stericycle, Inc. |
121,800 |
9,755 |
* |
||||||||
|
Construction & Engineering (0.5%) |
|||||||||||
| Valmont Industries, Inc. |
99,400 |
12,718 |
|||||||||
|
Construction Materials (0.2%) |
|||||||||||
|
Forterra, Inc. |
252,500 |
4,343 |
* |
||||||||
Number of Shares |
Value (000's omitted) |
||||||||||
|
Consumer Finance (1.4%) |
|||||||||||
| Synchrony Financial |
1,170,528 |
$ |
33,465 |
(b) |
|||||||
|
Containers & Packaging (0.4%) |
|||||||||||
| International Paper Co. |
190,502 |
8,578 |
|||||||||
|
Diversified Financial Services (0.4%) |
|||||||||||
|
CF Corp. |
927,700 |
9,518 |
* |
||||||||
| Diversified Telecommunication Services (1.8%) |
|||||||||||
| Level 3 Communications, Inc. |
333,260 |
18,712 |
* |
||||||||
| SBA Communications Corp. Class A |
224,600 |
25,443 |
*(b) | ||||||||
|
44,155 |
|||||||||||
|
Electric Utilities (2.8%) |
|||||||||||
| Brookfield Infrastructure Partners LP |
1,641,937 |
55,547 |
|||||||||
| NextEra Energy, Inc. |
98,900 |
12,659 |
|||||||||
|
68,206 |
|||||||||||
|
Electrical Equipment (0.4%) |
|||||||||||
| Sensata Technologies Holding NV |
265,000 |
9,468 |
* |
||||||||
| Electronic Equipment, Instruments & Components (2.5%) |
|||||||||||
| Amphenol Corp. Class A |
286,000 |
18,856 |
|||||||||
|
CDW Corp. |
927,100 |
41,636 |
(b) |
||||||||
|
60,492 |
|||||||||||
|
Energy Equipment & Services (0.4%) |
|||||||||||
| Schlumberger Ltd. |
134,900 |
10,553 |
|||||||||
| Equity Real Estate Investment Trusts (1.3%) |
|||||||||||
| Starwood Property Trust, Inc. |
701,000 |
15,590 |
|||||||||
| Weyerhaeuser Co. |
530,000 |
15,863 |
(a) |
||||||||
|
31,453 |
|||||||||||
|
Food & Staples Retailing (5.2%) |
|||||||||||
| Costco Wholesale Corp. |
107,000 |
15,822 |
|||||||||
| CVS Health Corp. |
519,000 |
43,648 |
(a) |
||||||||
Number of Shares |
Value (000's omitted) |
||||||||||
| Whole Foods Market, Inc. |
2,290,000 |
$ |
64,784 |
(a) |
|||||||
|
124,254 |
|||||||||||
|
Food Products (2.5%) |
|||||||||||
| ConAgra Foods, Inc. |
1,245,000 |
59,984 |
(a) |
||||||||
| Health Care Equipment & Supplies (1.8%) |
|||||||||||
| DENTSPLY SIRONA, Inc. |
754,000 |
43,408 |
(a) |
||||||||
|
Health Care Providers & Services (3.8%) |
|||||||||||
| Accretive Health, Inc. |
1,278,675 |
3,056 |
* |
||||||||
|
DaVita, Inc. |
1,060,900 |
62,190 |
*(a) | ||||||||
| UnitedHealth Group, Inc. |
189,400 |
26,768 |
|||||||||
|
92,014 |
|||||||||||
|
Hotels, Restaurants & Leisure (3.0%) |
|||||||||||
| Marriott International, Inc. Class A |
194,000 |
13,328 |
|||||||||
| McDonald's Corp. |
245,400 |
27,625 |
|||||||||
| Starbucks Corp. |
337,900 |
17,932 |
|||||||||
| Wyndham Worldwide Corp. |
202,000 |
13,300 |
|||||||||
|
72,185 |
|||||||||||
|
Household Durables (1.0%) |
|||||||||||
| Lennar Corp. Class A |
600,000 |
25,014 |
|||||||||
| Independent Power and Renewable Electricity Producers (0.2%) |
|||||||||||
|
Calpine Corp. |
290,000 |
3,451 |
* |
||||||||
|
Internet & Catalog Retail (1.7%) |
|||||||||||
| Amazon.com, Inc. |
25,100 |
19,824 |
* |
||||||||
| Priceline Group, Inc. |
13,400 |
19,755 |
* |
||||||||
|
39,579 |
|||||||||||
|
Internet Software & Services (3.4%) |
|||||||||||
| Alphabet, Inc. Class A |
56,000 |
45,355 |
*(b) | ||||||||
| Alphabet, Inc. Class C |
5,853 |
4,592 |
* |
||||||||
|
eBay, Inc. |
1,083,000 |
30,876 |
*(b) | ||||||||
|
80,823 |
|||||||||||
|
IT Services (3.0%) |
|||||||||||
|
Nets A/S |
150,400 |
2,872 |
*(c) | ||||||||
| Visa, Inc. Class A |
532,600 |
43,945 |
(a) |
||||||||
|
WEX, Inc. |
221,600 |
24,177 |
*(a) | ||||||||
|
70,994 |
|||||||||||
See Notes to Financial Statements
55
Schedule of Investments Long Short Fund (cont'd)
Number of Shares |
Value (000's omitted) |
||||||||||
|
Machinery (1.5%) |
|||||||||||
| Allison Transmission Holdings, Inc. |
716,800 |
$ |
20,995 |
||||||||
| Ingersoll-Rand PLC |
220,500 |
14,838 |
|||||||||
|
35,833 |
|||||||||||
|
Multi-Utilities (1.8%) |
|||||||||||
|
NiSource, Inc. |
216,100 |
5,026 |
|||||||||
| WEC Energy Group, Inc. |
625,000 |
37,325 |
(a) |
||||||||
|
42,351 |
|||||||||||
|
Oil, Gas & Consumable Fuels (3.6%) |
|||||||||||
| Cabot Oil & Gas Corp. |
277,400 |
5,792 |
|||||||||
| Cheniere Energy Partners LP |
381,522 |
10,110 |
|||||||||
|
Enbridge, Inc. |
1,214,700 |
52,439 |
(a) |
||||||||
| Kinder Morgan, Inc. |
869,300 |
17,760 |
|||||||||
|
86,101 |
|||||||||||
|
Pharmaceuticals (0.6%) |
|||||||||||
| Bristol-Myers Squibb Co. |
300,800 |
15,314 |
|||||||||
|
Professional Services (4.6%) |
|||||||||||
| IHS Markit Ltd. |
1,696,300 |
62,407 |
*(a) | ||||||||
| Nielsen Holdings PLC |
581,000 |
26,156 |
|||||||||
| Verisk Analytics, Inc. |
274,000 |
22,345 |
* |
||||||||
|
110,908 |
|||||||||||
|
Road & Rail (0.3%) |
|||||||||||
| Canadian Pacific Railway Ltd. |
47,800 |
6,833 |
|||||||||
| Semiconductors & Semiconductor Equipment (0.7%) |
|||||||||||
| ASML Holding NV |
166,000 |
17,533 |
|||||||||
|
Specialty Retail (4.6%) |
|||||||||||
| Asbury Automotive Group, Inc. |
200,000 |
10,190 |
* |
||||||||
| Five Below, Inc. |
260,000 |
9,771 |
*(a) | ||||||||
| Home Depot, Inc. |
404,000 |
49,292 |
(a) |
||||||||
| Party City Holdco, Inc. |
870,581 |
14,147 |
* |
||||||||
|
TJX Cos., Inc. |
53,000 |
3,909 |
|||||||||
| Tractor Supply Co. |
354,000 |
22,171 |
|||||||||
|
109,480 |
|||||||||||
Number of Shares |
Value (000's omitted) |
||||||||||
| Technology Hardware, Storage & Peripherals (1.7%) |
|||||||||||
|
Apple, Inc. |
266,000 |
$ |
30,202 |
(b) |
|||||||
| Western Digital Corp. |
166,000 |
9,701 |
|||||||||
|
39,903 |
|||||||||||
|
Textiles, Apparel & Luxury Goods (2.7%) |
|||||||||||
| lululemon athletica, Inc. |
44,200 |
2,531 |
* |
||||||||
|
PVH Corp. |
586,700 |
62,765 |
(a) |
||||||||
|
65,296 |
|||||||||||
|
Tobacco (0.6%) |
|||||||||||
| Philip Morris International, Inc. |
149,131 |
14,382 |
|||||||||
|
Water Utilities (0.9%) |
|||||||||||
| American Water Works Co., Inc. |
289,700 |
21,449 |
|||||||||
| Total Common Stocks (Cost $1,618,873) |
1,831,055 |
||||||||||
|
Preferred Stock (0.5%) |
|||||||||||
|
Health Care (0.5%) |
|||||||||||
| Moderna Therapeutics Ser. F (Cost $11,550) |
1,315,490 |
11,550 |
(d)(j) |
||||||||
| Principal Amount (000's omitted) |
|||||||||||
|
Corporate Bonds (9.4%) |
|||||||||||
|
Chemicals (0.2%) |
|||||||||||
| Valvoline, Inc., 5.50%, due 7/15/24 |
$ |
4,700 |
4,959 |
(c)(i) |
|||||||
|
Commercial Services (0.4%) |
|||||||||||
| Cenveo Corp., 11.50%, due 5/15/17 |
355 |
358 |
|||||||||
| Prime Security Services Borrower LLC/Prime Finance, Inc., 9.25%, due 5/15/23 |
9,510 |
10,084 |
(c)(i) |
||||||||
|
10,442 |
|||||||||||
| Principal Amount (000's omitted) |
Value (000's omitted) |
||||||||||
|
Food (1.1%) |
|||||||||||
| Fresh Market, Inc., 9.75%, due 5/1/23 |
$ |
30,280 |
$ |
25,814 |
(c) |
||||||
|
Healthcare-Services (1.0%) |
|||||||||||
| DaVita, Inc., 5.75%, due 8/15/22 |
8,740 |
8,969 |
|||||||||
| HCA, Inc., 5.88%, due 3/15/22 |
10,285 |
11,314 |
|||||||||
| Surgery Center Holdings, Inc., 8.88%, due 4/15/21 |
3,125 |
3,328 |
(c)(i) |
||||||||
|
23,611 |
|||||||||||
|
Internet (0.1%) |
|||||||||||
| Netflix, Inc., 4.38%, due 11/15/26 |
1,845 |
1,813 |
(c)(i) |
||||||||
|
Leisure Time (0.5%) |
|||||||||||
| Sabre GLBL, Inc., 5.25%, due 11/15/23 |
11,015 |
11,304 |
(c) |
||||||||
|
Oil & Gas (0.3%) |
|||||||||||
| Endeavor Energy Resources LP/EER Finance, Inc. |
|||||||||||
| 8.13%, due 9/15/23 |
4,615 |
4,926 |
(c)(i) |
||||||||
| 7.00%, due 8/15/21 |
1,870 |
1,903 |
(c)(i) |
||||||||
|
6,829 |
|||||||||||
|
Packaging & Containers (0.6%) |
|||||||||||
| Ball Corp., 4.38%, due 12/15/20 |
5,685 |
6,054 |
|||||||||
| Reynolds Group Issuer, Inc., 5.75%, due 10/15/20 |
9,610 |
9,863 |
|||||||||
|
15,917 |
|||||||||||
|
Pipelines (3.3%) |
|||||||||||
| Antero Midstream Partners L.P./Antero Midstream Finance Corp., 5.38%, due 9/15/24 |
4,635 |
4,667 |
(c) |
||||||||
See Notes to Financial Statements
56
Schedule of Investments Long Short Fund (cont'd)
| Principal Amount (000's omitted) |
Value (000's omitted) |
||||||||||
| Enterprise Products Operating LLC, 4.59%, due 8/1/66 |
$ |
27,922 |
$ |
26,561 |
(e) |
||||||
| NGPL PipeCo LLC, Ser. B, 7.77%, due 12/15/37 |
18,280 |
20,017 |
(c)(i) |
||||||||
| Niska Gas Storage Canada ULC/Niska Gas Storage Canada Finance Corp., 6.50%, due 4/1/19 |
24,132 |
23,649 |
|||||||||
| TransCanada PipeLines Ltd., 6.35%, due 5/15/67 |
7,369 |
5,895 |
(e) |
||||||||
|
80,789 |
|||||||||||
|
Retail (0.9%) |
|||||||||||
| JC Penney Corp., Inc. |
|||||||||||
| 5.75%, due 2/15/18 |
743 |
764 |
|||||||||
| 7.95%, due 4/1/17 |
5,480 |
5,590 |
|||||||||
| 8.13%, due 10/1/19 |
6,885 |
7,496 |
|||||||||
| Rite Aid Corp., 9.25%, due 3/15/20 |
6,702 |
7,046 |
|||||||||
|
20,896 |
|||||||||||
|
Semiconductors (0.2%) |
|||||||||||
| Magnachip Semiconductor Corp., 6.63%, due 7/15/21 |
5,775 |
5,024 |
|||||||||
|
Software (0.8%) |
|||||||||||
| First Data Corp., 6.75%, due 11/1/20 |
13,230 |
13,693 |
(c) |
||||||||
| IMS Health, Inc., 5.00%, due 10/15/26 |
4,625 |
4,775 |
(c) |
||||||||
|
18,468 |
|||||||||||
| Total Corporate Bonds (Cost $224,537) |
225,866 |
||||||||||
Contracts |
Value (000's omitted) |
||||||||||
|
Options Purchased (0.3%) |
|||||||||||
| KKR & Co. LP Call, expiring 12/16/16 @ 15 |
4,600 |
$ |
81 |
||||||||
| Nielsen Holdings PLC Put, expiring 12/16/16 @ 43 |
322 |
34 |
|||||||||
| Restoration Hardware Holdings, Inc. Call, expiring 1/20/17 @ 40 |
458 |
22 |
|||||||||
| Russell 2000 Index Put, expiring 12/16/16 @ 1,120 |
235 |
290 |
|||||||||
| S&P 500 Index Put, expiring 12/16/16 @ 1,950.00 |
64 |
69 |
|||||||||
| SPDR S&P Retail ETF Put, expiring 11/18/16 @ 41 |
3,300 |
101 |
|||||||||
| SPDR S&P Retail ETF Put, expiring 1/20/17 @ 55 |
4,050 |
5,275 |
|||||||||
| Stericycle, Inc. Call, expiring 11/18/16 @ 80 |
500 |
111 |
|||||||||
| Whole Foods Market, Inc. Call, expiring 11/18/16 @ 31 |
1,500 |
44 |
|||||||||
| Whole Foods Market, Inc. Call, expiring 1/20/17 @ 33 |
3,000 |
90 |
|||||||||
| Whole Foods Market, Inc. Call, expiring 1/20/17 @ 36 |
4,594 |
34 |
|||||||||
| Whole Foods Market, Inc. Call, expiring 2/1717 @ 31 |
2,000 |
203 |
|||||||||
Contracts |
Value (000's omitted) |
||||||||||
| Wyndham Worldwide Corp. Call, expiring 1/20/17 @ 67.5 |
1,380 |
$ |
235 |
||||||||
| Total Options Purchased (Cost $8,493) |
6,589 |
||||||||||
| Number of Shares |
|||||||||||
|
Master Limited Partnerships (0.8%) |
|||||||||||
|
Capital Markets (0.5%) |
|||||||||||
|
KKR & Co. LP |
923,342 |
13,102 |
|||||||||
|
Oil, Gas & Consumable Fuels (0.3%) |
|||||||||||
| Genesis Energy LP |
193,500 |
6,759 |
|||||||||
| Total Master Limited Partnerships (Cost $26,560) |
19,861 |
||||||||||
|
Short-Term Investment (12.1%) |
|||||||||||
|
Investment Company (12.1%) |
|||||||||||
| State Street Institutional U.S. Government Money Market Fund Premier Class, 0.26% (Cost $290,518) |
290,518,129 |
290,518 |
(b)(f) |
||||||||
| Total Long Positions (99.4%) (Cost $2,180,531) |
2,385,439 |
||||||||||
| Short Positions ((15.6)%)(g) | |||||||||||
|
Common Stocks Sold Short (12.1%) |
|||||||||||
|
Aerospace & Defense (0.3%) |
|||||||||||
|
Hexcel Corp. |
(75,000 |
) |
(3,412 |
) |
|||||||
| Spirit AeroSystems Holdings, Inc. Class A |
(75,000 |
) |
(3,777 |
)* |
|||||||
|
(7,189 |
) |
||||||||||
|
Auto Components (0.2%) |
|||||||||||
| Dorman Products, Inc. |
(93,100 |
) |
(5,981 |
)* | |||||||
|
Automobiles (0.2%) |
|||||||||||
| Ford Motor Co. |
(500,000 |
) |
(5,870 |
) |
|||||||
See Notes to Financial Statements
57
Schedule of Investments Long Short Fund (cont'd)
Number of Shares |
Value (000's omitted) |
||||||||||
|
Banks (0.3%) |
|||||||||||
| Citizens Financial Group, Inc. |
(298,800 |
) |
$ |
(7,870 |
) |
||||||
|
Capital Markets (1.2%) |
|||||||||||
| Franklin Resources, Inc. |
(430,100 |
) |
(14,477 |
) |
|||||||
|
Nasdaq, Inc. |
(119,400 |
) |
(7,638 |
) |
|||||||
| Prospect Capital Corp. |
(750,180 |
) |
(5,919 |
) |
|||||||
|
(28,034 |
) |
||||||||||
|
Construction & Engineering (0.4%) |
|||||||||||
|
Fluor Corp. |
(171,000 |
) |
(8,890 |
) |
|||||||
|
Consumer Finance (0.7%) |
|||||||||||
| Capital One Financial Corp. |
(88,000 |
) |
(6,516 |
) |
|||||||
| Discover Financial Services |
(108,200 |
) |
(6,095 |
) |
|||||||
| OneMain Holdings, Inc. |
(132,400 |
) |
(3,752 |
)* |
|||||||
|
(16,363 |
) |
||||||||||
|
Electric Utilities (0.4%) |
|||||||||||
|
Southern Co. |
(170,000 |
) |
(8,767 |
) |
|||||||
|
Energy Equipment & Services (0.5%) |
|||||||||||
| Core Laboratories NV |
(112,300 |
) |
(10,890 |
) |
|||||||
|
Food & Staples Retailing (0.2%) |
|||||||||||
| Sprouts Farmers Market, Inc. |
(240,000 |
) |
(5,316 |
)* | |||||||
|
Health Care Equipment & Supplies (0.7%) |
|||||||||||
| Edwards Lifesciences Corp. |
(42,800 |
) |
(4,075 |
)* |
|||||||
| Medtronic PLC |
(141,210 |
) |
(11,582 |
) |
|||||||
|
(15,657 |
) |
||||||||||
|
Health Care Providers & Services (0.2%) |
|||||||||||
| Fresenius Medical Care AG & Co. KGaA |
(71,700 |
) |
(5,841 |
) |
|||||||
|
Hotels, Restaurants & Leisure (1.6%) |
|||||||||||
| BJ's Restaurants, Inc. |
(95,000 |
) |
(3,429 |
)* |
|||||||
| Brinker International, Inc. |
(75,000 |
) |
(3,693 |
) |
|||||||
Number of Shares |
Value (000's omitted) |
||||||||||
|
Carnival Corp. |
(285,000 |
) |
$ |
(13,994 |
) |
||||||
| Cheesecake Factory, Inc. |
(78,000 |
) |
(4,149 |
) |
|||||||
| Chuy's Holdings, Inc. |
(199,300 |
) |
(5,660 |
)* |
|||||||
| Panera Bread Co. Class A |
(20,000 |
) |
(3,815 |
)* |
|||||||
| Texas Roadhouse, Inc. |
(95,500 |
) |
(3,870 |
) |
|||||||
|
(38,610 |
) |
||||||||||
|
Household Durables (0.3%) |
|||||||||||
| Newell Brands, Inc. |
(80,000 |
) |
(3,842 |
) |
|||||||
| Tempur Sealy International, Inc. |
(50,000 |
) |
(2,703 |
)* |
|||||||
|
(6,545 |
) |
||||||||||
|
IT Services (0.5%) |
|||||||||||
| CGI Group, Inc. Class A |
(260,000 |
) |
(12,342 |
)* | |||||||
|
Life Sciences Tools & Services (0.5%) |
|||||||||||
| Agilent Technologies, Inc. |
(53,300 |
) |
(2,322 |
) |
|||||||
| Thermo Fisher Scientific, Inc. |
(63,900 |
) |
(9,395 |
) |
|||||||
|
(11,717 |
) |
||||||||||
|
Machinery (0.2%) |
|||||||||||
|
PACCAR, Inc. |
(80,000 |
) |
(4,393 |
) |
|||||||
|
Multi-Utilities (0.4%) |
|||||||||||
| Consolidated Edison, Inc. |
(127,000 |
) |
(9,595 |
) |
|||||||
|
Multiline Retail (0.6%) |
|||||||||||
| Dollar General Corp. |
(224,500 |
) |
(15,511 |
) |
|||||||
|
Road & Rail (0.1%) |
|||||||||||
| Old Dominion Freight Line, Inc. |
(40,000 |
) |
(2,987 |
)* | |||||||
|
Software (0.4%) |
|||||||||||
| Citrix Systems, Inc. |
(116,800 |
) |
(9,905 |
)* | |||||||
|
Specialty Retail (1.1%) |
|||||||||||
| Group 1 Automotive, Inc. |
(53,000 |
) |
(3,194 |
) |
|||||||
| Restoration Hardware Holdings, Inc. |
(318,036 |
) |
(9,214 |
)* |
|||||||
| Sally Beauty Holdings, Inc. |
(188,000 |
) |
(4,877 |
)* |
|||||||
Number of Shares |
Value (000's omitted) |
||||||||||
| Sonic Automotive, Inc. Class A |
(350,000 |
) |
$ |
(6,265 |
) |
||||||
|
Tiffany & Co. |
(35,400 |
) |
(2,599 |
) |
|||||||
|
(26,149 |
) |
||||||||||
| Technology Hardware, Storage & Peripherals (0.2%) |
|||||||||||
| Seagate Technology PLC |
(110,000 |
) |
(3,774 |
) |
|||||||
|
Textiles, Apparel & Luxury Goods (0.9%) |
|||||||||||
| Ralph Lauren Corp. |
(105,000 |
) |
(10,301 |
) |
|||||||
| Under Armour, Inc. Class A |
(110,000 |
) |
(3,421 |
)* |
|||||||
| Under Armour, Inc. Class C |
(75,000 |
) |
(1,939 |
)* |
|||||||
|
VF Corp. |
(109,000 |
) |
(5,909 |
) |
|||||||
|
(21,570 |
) |
||||||||||
| Total Common Stocks Sold Short (Proceeds $(291,970)) |
(289,766 |
) |
|||||||||
| Principal Amount (000's omitted) |
|||||||||||
|
Corporate Bonds Sold Short (1.4%) |
|||||||||||
|
Entertainment (0.6%) |
|||||||||||
| Pinnacle Entertainment, Inc., 5.63%, due 5/1/24 |
$ |
(6,200 |
) |
(6,256 |
)(c)(i) | ||||||
| Scientific Games Int'l, Inc., 7.00%, due 1/1/22 |
(7,000 |
) |
(7,507 |
)(c) | |||||||
|
(13,763 |
) |
||||||||||
|
Food (0.2%) |
|||||||||||
| Whole Foods Market, Inc., 5.20%, due 12/3/25 |
(4,000 |
) |
(4,324 |
) |
|||||||
|
Internet (0.2%) |
|||||||||||
| Zayo Group LLC/Zayo Capital, Inc., 6.38%, due 5/15/25 |
(5,000 |
) |
(5,294 |
) |
|||||||
See Notes to Financial Statements
58
Schedule of Investments Long Short Fund (cont'd)
| Principal Amount (000's omitted) |
Value (000's omitted) |
||||||||||
|
Lodging (0.1%) |
|||||||||||
| Wynn Las Vegas LLC/Wynn Las Vegas Capital Corp., 5.50%, due 3/1/25 |
$ |
(4,000 |
) |
$ |
(4,030 |
)(c) | |||||
|
Packaging & Containers (0.3%) |
|||||||||||
| Reynolds Group Issuer, Inc., 7.00%, due 7/15/24 |
(6,600 |
) |
(7,078 |
)(c) | |||||||
| Total Corporate Bonds Sold Short (Cost $(33,135)) |
(34,489 |
) |
|||||||||
Number of Shares |
Value (000's omitted) |
||||||||||
|
Exchange Traded Funds Sold Short (2.1%) |
|||||||||||
| Consumer Discretionary Select Sector SPDR Fund |
(373,000 |
) |
$ |
(29,131 |
) |
||||||
| iShares Core S&P Small-Cap ETF |
(77,000 |
) |
(9,138 |
) |
|||||||
| Vanguard REIT ETF |
(146,600 |
) |
(11,986 |
) |
|||||||
| Total Exchange Traded Funds Sold Short (Proceeds $(43,979)) |
(50,255 |
) |
|||||||||
| Value (000's omitted) |
|||||||||||
| Total Short Positions (Proceeds $(369,084)) |
$ |
(374,510 |
) |
||||||||
| Total Investments (83.8%) (Cost $1,811,447) |
2,010,929 |
||||||||||
| Other Assets Less Liabilities (16.2%) |
387,548 |
(h) |
|||||||||
|
Net Assets (100.0%) |
$ |
2,398,477 |
|||||||||
* Non-income producing security.
(a) All or a portion of the security is pledged as collateral for futures and written options.
(b) All or a portion of this security is segregated in connection with obligations for securities sold short and/or options written and/or swap contracts and/or futures contracts with a total value of approximately $548,644,000.
(c) Securities were purchased or sold short under Rule 144A of the Securities Act of 1933, as amended (the "1933 Act"), or are otherwise restricted and, unless registered under the 1933 Act or exempted from registration, may only be sold to qualified institutional investors or may have other restrictions on resale. At 10/31/2016, these securities amounted to approximately $110,155,000 of long positions and $(24,871,000) of short positions, or 4.6% and (1.0%), respectively, of net assets for the Fund. Securities denoted with a (c) but without a (i) have been deemed by the investment manager to be liquid.
(d) Security fair valued as of 10/31/2016 in accordance with procedures approved by the Fund's Board of Trustees. Total value of all such securities at 10/31/2016 amounted to approximately $11,550,000, which represents 0.5% of net assets of the Fund.
(e) Variable or floating rate security. The interest rate shown was the current rate as of 10/31/2016 and changes periodically.
(f) Represents 7-day effective yield as of 10/31/2016.
(g) At 10/31/2016 the Fund had approximately $381,110,000 deposited, in one or more accounts to satisfy collateral requirements for borrowing in connection with securities sold short.
(h) Includes the impact of the Fund's open positions in derivatives at 10/31/2016.
(i) Illiquid security.
(j) This security has been deemed by the investment manager to be illiquid, and is subject to restrictions on resale.
At 10/31/2016, this security amounted to approximately $11,550,000, which represents 0.5% of net assets of the Fund.
|
(000's omitted) |
Acquisition Date |
Acquisition Cost |
Acquisition Cost Percentage of Net Assets |
Value as of 10/31/2016 |
Fair Value Percentage of Net Assets as of 10/31/2016 |
||||||||||||||||||
| Moderna Therapeutics (Series F Preferred Shares) |
8/10/2016 |
$ |
11,550 |
0.5 |
% |
$ |
11,550 |
0.5 |
% |
||||||||||||||
See Notes to Financial Statements
59
Schedule of Investments Long Short Fund (cont'd)
Derivative Instruments
Futures contracts ("futures")
At October 31, 2016, open positions in futures for the Fund were as follows:
|
Expiration |
Open Contracts |
Position |
Unrealized Appreciation/ (Depreciation) |
||||||||||||
|
12/16/2016 |
658 Russell 2000 Mini Index |
Short |
$ |
4,088,207 |
|||||||||||
|
12/16/2016 |
3,238 S&P 500 E-Mini Index |
Short |
7,940,475 |
||||||||||||
|
12/16/2016 |
160 S&P MidCap 400 E-Mini Index |
Short |
1,004,433 |
||||||||||||
|
12/20/2016 |
96 U.S. Treasury Long Bond |
Short |
152,470 |
||||||||||||
|
Total |
$ |
13,185,585 |
|||||||||||||
At October 31, 2016, the notional value of futures for the Fund was $(461,229,930) for short positions. The Fund had $19,805,200 deposited in a segregated account to cover margin requirements on open futures.
For the year ended October 31, 2016, the average notional value of futures for the Fund was $(419,459,784) for short positions.
Total return basket swap contracts ("total return basket swaps")
At October 31, 2016, the Fund had outstanding total return basket swaps(a) as follows:
|
Counterparty |
Description |
Expiration Date(s) |
Value |
||||||||||||
| Citibank, N.A. |
The Fund pays the total return on short positions and
receives a specified LIBOR or Federal Funds floating
rate, which is denominated in various foreign
currencies based on the local currencies of the
positions.
|
11/22/2017 |
$ |
167,001 | |||||||||||
(a) The following table represents the individual short positions and related values of the total return basket swaps as of October 31, 2016.
See Notes to Financial Statements
60
Schedule of Investments Long Short Fund (cont'd)
| Reference Entity |
Shares |
Notional Value(b) |
Net Unrealized Appreciation/ (Depreciation) |
||||||||||
|
Short Positions |
|||||||||||||
|
CGCBFOD2 |
|||||||||||||
|
United Natural Foods Inc. |
(26,987 |
) |
$ |
(2,878,894 |
) |
$ |
96,278 |
||||||
|
Sprouts Farmers Market Inc. |
(20,056 |
) |
(2,139,540 |
) |
71,552 |
||||||||
|
(47,043 |
) |
(5,018,434 |
) |
167,830 |
|||||||||
|
Total Short Positions of Total Return Basket Swaps |
$ |
167,830 |
|||||||||||
|
Net Cash and Other Receivables (Payables) |
(829 |
) |
|||||||||||
|
Total Return Basket Swaps, at Value — Citibank N.A. |
$ |
167,001 |
|||||||||||
|
Counterparty |
Description |
Expiration Date(s) |
Value |
||||||
| Goldman Sachs International |
The Fund pays the total return on short positions and
receives a specified LIBOR or Federal Funds floating rate, which is denominated in various foreign currencies based on the local currencies of the positions. |
4/16/2017- 3/14/2018 |
$ |
(3,721,554 |
) | ||||
| Reference Entity |
Shares |
Notional Value(b) |
Net Unrealized Appreciation/ (Depreciation) |
||||||||||
|
Short Positions |
|||||||||||||
|
GSCBNBCB |
|||||||||||||
|
Bank of Nova Scotia |
(6,580 |
) |
$ |
(592,158 |
) |
$ |
5,328 |
||||||
|
National Bank of Canada |
(6,421 |
) |
(577,883 |
) |
5,199 |
||||||||
|
Canadian Western Bank |
(5,837 |
) |
(525,349 |
) |
4,726 |
||||||||
|
Boardwalk Real Estate Investment Trust |
(5,785 |
) |
(520,691 |
) |
4,685 |
||||||||
|
CIBC |
(5,777 |
) |
(519,898 |
) |
4,677 |
||||||||
|
(30,400 |
) |
(2,735,979 |
) |
24,615 |
|||||||||
|
GSCBNBCB |
|||||||||||||
|
Bank of Nova Scotia |
(14,913 |
) |
(1,043,037 |
) |
(287,041 |
) |
|||||||
|
National Bank of Canada |
(14,554 |
) |
(1,017,892 |
) |
(280,121 |
) |
|||||||
|
Canadian Western Bank |
(13,230 |
) |
(925,359 |
) |
(254,656 |
) |
|||||||
|
Boardwalk Real Estate Investment Trust |
(13,113 |
) |
(917,154 |
) |
(252,399 |
) |
|||||||
|
CIBC |
(13,093 |
) |
(915,758 |
) |
(252,014 |
) |
|||||||
|
(68,903 |
) |
(4,819,200 |
) |
(1,326,231 |
) |
||||||||
|
GSCBNBCB |
|||||||||||||
|
Bank of Nova Scotia |
(6,152 |
) |
(413,577 |
) |
(135,129 |
) |
|||||||
|
National Bank of Canada |
(6,004 |
) |
(403,607 |
) |
(131,872 |
) |
|||||||
|
Canadian Western Bank |
(5,458 |
) |
(366,916 |
) |
(119,883 |
) |
|||||||
|
Boardwalk Real Estate Investment Trust |
(5,410 |
) |
(363,662 |
) |
(118,820 |
) |
|||||||
|
CIBC |
(5,401 |
) |
(363,109 |
) |
(118,639 |
) |
|||||||
|
(28,425 |
) |
(1,910,871 |
) |
(624,343 |
) |
||||||||
See Notes to Financial Statements
61
Schedule of Investments Long Short Fund (cont'd)
| Reference Entity |
Shares |
Notional Value(b) |
Net Unrealized Appreciation/ (Depreciation) |
||||||||||||
|
GSCBNBCB |
|||||||||||||||
|
Bank of Nova Scotia |
(5,267 |
) |
$ |
(403,893 |
) |
$ |
(65,860 |
) |
|||||||
|
National Bank of Canada |
(5,140 |
) |
(394,156 |
) |
(64,273 |
) |
|||||||||
|
Canadian Western Bank |
(4,673 |
) |
(358,325 |
) |
(58,430 |
) |
|||||||||
|
Boardwalk Real Estate Investment Trust |
(4,631 |
) |
(355,148 |
) |
(57,912 |
) |
|||||||||
|
CIBC |
(4,624 |
) |
(354,607 |
) |
(57,824 |
) |
|||||||||
|
(24,335 |
) |
(1,866,129 |
) |
(304,299 |
) |
||||||||||
|
GSCBNBCD |
|||||||||||||||
|
Restaurant Brands International Inc. |
(34,784 |
) |
(3,398,032 |
) |
(661,311 |
) |
|||||||||
|
Jack in the Box Inc. |
(26,046 |
) |
(2,544,355 |
) |
(495,172 |
) |
|||||||||
|
Sonic Corp. |
(11,506 |
) |
(1,123,994 |
) |
(218,747 |
) |
|||||||||
|
(72,336 |
) |
(7,066,381 |
) |
(1,375,230 |
) |
||||||||||
|
GSCBNINV |
|||||||||||||||
|
FS Investment Corp. |
(15,364 |
) |
(1,521,952 |
) |
(19,178 |
) |
|||||||||
|
Prospect Capital Corp. |
(12,426 |
) |
(1,230,992 |
) |
(15,512 |
) |
|||||||||
|
Triangle Capital Corp. |
(8,380 |
) |
(830,164 |
) |
(10,461 |
) |
|||||||||
|
Apollo Investment Corp. |
(8,171 |
) |
(809,412 |
) |
(10,200 |
) |
|||||||||
|
New Mountain Finance Corp. |
(7,424 |
) |
(735,415 |
) |
(9,267 |
) |
|||||||||
|
Fifth Street Finance Corp. |
(5,288 |
) |
(523,834 |
) |
(6,601 |
) |
|||||||||
|
PennantPark Investment Corp. |
(4,373 |
) |
(433,171 |
) |
(5,459 |
) |
|||||||||
|
Medley Capital Corp. |
(3,784 |
) |
(374,902 |
) |
(4,724 |
) |
|||||||||
|
THL Credit Inc. |
(2,936 |
) |
(290,829 |
) |
(3,665 |
) |
|||||||||
|
Ares Capital Corp. |
(2,354 |
) |
(233,179 |
) |
(2,938 |
) |
|||||||||
|
(70,500 |
) |
(6,983,850 |
) |
(88,005 |
) |
||||||||||
|
GSCBNINV |
|||||||||||||||
|
FS Investment Corp. |
(12,344 |
) |
(1,208,010 |
) |
(30,250 |
) |
|||||||||
|
Prospect Capital Corp. |
(9,985 |
) |
(977,068 |
) |
(24,467 |
) |
|||||||||
|
Triangle Capital Corp. |
(6,733 |
) |
(658,921 |
) |
(16,500 |
) |
|||||||||
|
Apollo Investment Corp. |
(6,565 |
) |
(642,450 |
) |
(16,088 |
) |
|||||||||
|
New Mountain Finance Corp. |
(5,965 |
) |
(583,717 |
) |
(14,617 |
) |
|||||||||
|
Fifth Street Finance Corp. |
(4,249 |
) |
(415,780 |
) |
(10,411 |
) |
|||||||||
|
PennantPark Investment Corp. |
(3,513 |
) |
(343,818 |
) |
(8,610 |
) |
|||||||||
|
Medley Capital Corp. |
(3,041 |
) |
(297,569 |
) |
(7,451 |
) |
|||||||||
|
THL Credit Inc. |
(2,359 |
) |
(230,838 |
) |
(5,780 |
) |
|||||||||
|
Ares Capital Corp. |
(1,891 |
) |
(185,080 |
) |
(4,635 |
) |
|||||||||
|
(56,645 |
) |
(5,543,251 |
) |
(138,809 |
) |
||||||||||
|
GSCBNML3 |
|||||||||||||||
|
Tallgrass Energy Partners LP |
(18,893 |
) |
(1,842,740 |
) |
35,825 |
||||||||||
|
Summit Midstream Partners LP |
(18,460 |
) |
(1,800,525 |
) |
35,004 |
||||||||||
|
Tesoro Logistics LP |
(11,610 |
) |
(1,132,389 |
) |
22,015 |
||||||||||
|
NuStar GP Holdings LLC |
(11,584 |
) |
(1,129,922 |
) |
21,967 |
||||||||||
|
Enable Midstream Partners LP |
(10,874 |
) |
(1,060,576 |
) |
20,618 |
||||||||||
| MPLX LP |
(3,912 |
) |
(381,543 |
) |
7,417 |
||||||||||
|
(75,333 |
) |
(7,347,695 |
) |
142,846 |
|||||||||||
See Notes to Financial Statements
62
Schedule of Investments Long Short Fund (cont'd)
| Reference Entity |
Shares |
Notional Value(b) |
Net Unrealized Appreciation/ (Depreciation) |
||||||||||||
|
GSCBNML3 |
|||||||||||||||
|
Tallgrass Energy Partners LP |
(2,599 |
) |
$ |
(252,298 |
) |
$ |
3,735 |
||||||||
|
Summit Midstream Partners LP |
(2,539 |
) |
(246,518 |
) |
3,649 |
||||||||||
|
Tesoro Logistics LP |
(1,597 |
) |
(155,041 |
) |
2,295 |
||||||||||
|
NuStar GP Holdings LLC |
(1,594 |
) |
(154,703 |
) |
2,290 |
||||||||||
|
Enable Midstream Partners LP |
(1,496 |
) |
(145,209 |
) |
2,149 |
||||||||||
| MPLX LP |
(538 |
) |
(52,239 |
) |
773 |
||||||||||
|
(10,363 |
) |
(1,006,008 |
) |
14,891 |
|||||||||||
|
Total Short Positions of Total Return Basket Swaps |
$ |
(3,674,565 |
) |
||||||||||||
|
Net Cash and Other Receivables (Payables) |
(46,989 |
) |
|||||||||||||
|
Total Return Basket Swaps, at Value — Goldman Sachs International |
$ |
(3,721,554 |
) |
||||||||||||
|
Total Return Basket Swaps, at Value |
$ |
(3,554,553 |
) |
||||||||||||
(b) Notional value represents the value (including any fees or commissions) of the short positions when they were established.
Total return swap contracts ("total return swaps")
At October 31, 2016, the Fund had outstanding over-the-counter ("OTC") total return swaps as follows:
Short Total Return Swaps
| Swap Counterparty |
Reference Entity |
Notional Value(c) |
Termination Date |
Fixed-rate |
Unrealized Appreciation/ (Depreciation) |
Accrued Net Interest Receivable/ (Payable) |
Total Fair Value |
||||||||||||||||||||||||
| Goldman Sachs International |
Russell Mid-Cap Index Fund |
$ |
(35,890,213 |
) |
11/29/2017 |
(0.02 |
)%(d) |
$ |
(1,576,765 |
) |
$ |
(6,802 |
) |
$ |
(1,583,567 |
)(f) | |||||||||||||||
| Citibank N.A. | Utilities Select Sector SPDR ETF |
(21,674,400 |
) |
9/21/2017 |
0.60 |
%(e) |
(74,800 |
) |
— |
(74,800 |
) |
||||||||||||||||||||
| Total |
$ |
(1,651,565 |
) |
$ |
(6,802 |
) |
$ |
(1,658,367 |
) |
||||||||||||||||||||||
(c) Notional value represents the value (including any fees or commissions) of the short positions when they were established.
(d) Variable-rate. 1-month LIBOR minus 0.55% as of 10/26/2016.
(e) Variable-rate. 1-month LIBOR plus 0.07% as of 10/19/2016.
At October 31, 2016, the Fund had cash collateral of $60,000 and $5,630,000 deposited in segregated accounts for Citibank, N.A and Goldman Sachs International, respectively, to cover collateral requirements on OTC derivatives.
For the year ended October 31, 2016, the average notional value of equity swaps, total return basket swaps and total return swaps for the Fund was $(71,104,604) for short positions.
See Notes to Financial Statements
63
Schedule of Investments Long Short Fund (cont'd)
Written option contracts ("options written")
At October 31, 2016, the Fund had outstanding options written as follows:
|
Name of Issuer |
Contracts |
Exercise Price |
Expiration Date |
Market Value of Options |
|||||||||||||||
|
Allison Transmission Holdings, Inc., Put |
3,653 |
$ |
22.5 |
11/18/16 |
$ |
(0 |
)(f) | ||||||||||||
|
Ashland Global Holdings, Inc., Put |
208 |
105 |
01/20/17 |
(50,440 |
) |
||||||||||||||
|
Cheniere Energy Partners LP, Put |
1,360 |
27 |
03/17/17 |
(309,400 |
) |
||||||||||||||
|
DaVita, Inc., Put |
225 |
55 |
11/18/16 |
(19,401 |
) |
||||||||||||||
|
Five Below, Inc., Put |
416 |
33 |
11/18/16 |
(6,240 |
) |
||||||||||||||
|
Five Below, Inc., Put |
500 |
36 |
11/18/16 |
(30,000 |
) |
||||||||||||||
|
Kinder Morgan, Inc., Call |
2,830 |
26 |
03/17/17 |
(59,430 |
) |
||||||||||||||
|
Kinder Morgan, Inc., Put |
2,830 |
18 |
03/17/17 |
(206,590 |
) |
||||||||||||||
|
KKR & Co. LP, Put |
4,600 |
10 |
03/17/17 |
(57,500 |
) |
||||||||||||||
|
Nielsen Holdings PLC, Call |
322 |
43 |
12/16/16 |
(9,016 |
) |
||||||||||||||
|
Party City Holdco, Inc., Put |
600 |
12.5 |
01/20/17 |
(16,500 |
) |
||||||||||||||
|
Restoration Hardware Holdings, Inc., Call |
458 |
50 |
01/20/17 |
(6,870 |
)(f) | ||||||||||||||
|
Restoration Hardware Holdings, Inc., Put |
458 |
27.5 |
01/20/17 |
(103,050 |
) |
||||||||||||||
|
Russell 2000 Index, Call |
235 |
1,250 |
12/16/16 |
(179,775 |
) |
||||||||||||||
|
Russell 2000 Index, Put |
235 |
1,000 |
12/16/16 |
(54,637 |
) |
||||||||||||||
|
Sally Beauty Holdings, Inc., Put |
900 |
25 |
12/16/16 |
(85,500 |
) |
||||||||||||||
|
SBA Communications Corp., Put |
350 |
100 |
01/20/17 |
(46,375 |
) |
||||||||||||||
|
Schlumberger Ltd., Put |
465 |
67.5 |
01/20/17 |
(37,898 |
) |
||||||||||||||
|
Sherwin-Williams Co., Put |
218 |
230 |
12/16/16 |
(70,850 |
) |
||||||||||||||
|
S&P 500 Index, Call |
67 |
2,175 |
12/16/16 |
(111,555 |
) |
||||||||||||||
|
S&P 500 Index, Put |
67 |
1,750 |
12/16/16 |
(17,252 |
) |
||||||||||||||
|
SPDR S&P Retail ETF, Call |
4,050 |
55 |
01/20/17 |
(0 |
)(f) | ||||||||||||||
|
SPDR S&P Retail ETF, Put |
6,600 |
37 |
11/18/16 |
(16,500 |
) |
||||||||||||||
|
Starbucks Corp., Put |
1,000 |
48.75 |
01/20/17 |
(81,000 |
) |
||||||||||||||
|
Stericycle, Inc., Put |
500 |
70 |
11/18/16 |
(16,250 |
) |
||||||||||||||
|
Stericycle, Inc., Put |
250 |
75 |
11/18/16 |
(15,000 |
) |
||||||||||||||
|
Wells Fargo & Co., Put |
875 |
42 |
04/21/17 |
(114,625 |
) |
||||||||||||||
|
Wesco Aircraft Holdings, Inc., Put |
2,836 |
12.5 |
12/16/16 |
(97,168 |
)(g) | ||||||||||||||
|
Wex, Inc., Call |
460 |
95 |
11/18/16 |
(710,700 |
) |
||||||||||||||
|
Wex, Inc., Call |
460 |
105 |
02/17/17 |
(423,200 |
) |
||||||||||||||
|
Weyerhaeuser Co., Put |
510 |
28 |
01/20/17 |
(36,975 |
) |
||||||||||||||
|
Whole Foods Market, Inc., Put |
1,000 |
25 |
01/20/17 |
(54,000 |
) |
||||||||||||||
|
Whole Foods Market, Inc., Put |
3,000 |
26 |
01/20/17 |
(235,500 |
) |
||||||||||||||
|
Whole Foods Market, Inc., Put |
3,000 |
28 |
01/20/17 |
(466,500 |
) |
||||||||||||||
|
Whole Foods Market, Inc., Put |
1,000 |
25 |
02/17/17 |
(81,500 |
) |
||||||||||||||
|
Wyndham Worldwide Corp., Put |
1,380 |
60 |
01/20/17 |
(124,200 |
) |
||||||||||||||
|
Total (premium received: $5,858,296) |
$ |
(3,951,397 |
) |
||||||||||||||||
At October 31, 2016, the Fund had $50,827 deposited in a segregated account to cover requirements on options written.
See Notes to Financial Statements
64
Schedule of Investments Long Short Fund (cont'd)
Options written for the Fund for the year ended October 31, 2016 were as follows:
| Number of Contracts |
Premium Received |
||||||||||
|
Outstanding 10/31/2015 |
9,404 |
$ |
7,434,936 |
||||||||
|
Options written |
182,692 |
20,755,006 |
|||||||||
|
Options expired |
(81,450 |
) |
(7,536,715 |
) |
|||||||
|
Options exercised |
(26,904 |
) |
(6,032,988 |
) |
|||||||
|
Options closed |
(35,824 |
) |
(8,761,943 |
) |
|||||||
|
Outstanding 10/31/2016 |
47,918 |
$ |
5,858,296 |
||||||||
For the year ended October 31, 2016, the Fund had an average market value of $5,756,735 in options purchased contracts, and $(4,787,766) in options written, respectively. At October 31, 2016 Long Short had pledged securities in the amount of $39,992,203 to cover collateral requirements for options written.
(f) Security fair valued as of 10/31/2016 in accordance with procedures approved by the Fund's Board of Trustees.
(g) OTC option. Counterparty is Goldman Sachs International.
The following is a summary, categorized by Level (see Note A of Notes to Financial Statements), of inputs used to value the Fund's investments as of October 31, 2016:
|
Asset Valuation Inputs |
|||||||||||||||||||
|
(000's omitted) |
Level 1 |
Level 2 |
Level 3(b) |
Total |
|||||||||||||||
|
Investments: |
|||||||||||||||||||
| Common Stocks(a) |
$ |
1,831,055 |
$ |
— |
$ |
— |
$ |
1,831,055 |
|||||||||||
| Preferred Stock(a) |
— |
— |
11,550 |
11,550 |
|||||||||||||||
| Corporate Bonds(a) |
— |
225,866 |
— |
225,866 |
|||||||||||||||
|
Options Purchased |
6,589 |
— |
— |
6,589 |
|||||||||||||||
| Master Limited Partnerships(a) |
19,861 |
— |
— |
19,861 |
|||||||||||||||
|
Short-Term Investment |
— |
290,518 |
— |
290,518 |
|||||||||||||||
|
Total Long Positions |
$ |
1,857,505 |
$ |
516,384 |
$ |
11,550 |
$ |
2,385,439 |
|||||||||||
(a) The Schedule of Investments provides information on the industry or sector categorization for the portfolio.
(b) The following is a reconciliation between the beginning and ending balances of investments in which unobservable inputs (Level 3) were used in determining value:
| Beginning balance, as of 11/1/16 |
Accrued discounts/ (premiums) |
Realized gain/loss |
Change in unrealized appreciation/ (depreciation) |
Purchases |
Sales |
Transfers into Level 3 |
Transfers out of Level 3 |
Balance, as of 10/31/16 |
Net change in unrealized appreciation/ (depreciation) from investments still held as of 10/31/16 |
||||||||||||||||||||||||||||||||||
| Investments in Securities: |
|||||||||||||||||||||||||||||||||||||||||||
|
Preferred Stock |
|||||||||||||||||||||||||||||||||||||||||||
|
Health Care |
$ |
— |
$ |
— |
$ |
— |
$ |
— |
$ |
11,550 |
$ |
— |
$ |
— |
$ |
— |
$ |
11,550 |
$ |
— |
|||||||||||||||||||||||
|
Total |
$ |
— |
$ |
— |
$ |
— |
$ |
— |
$ |
11,550 |
$ |
— |
$ |
— |
$ |
— |
$ |
11,550 |
$ |
— |
|||||||||||||||||||||||
See Notes to Financial Statements
65
Schedule of Investments Long Short Fund (cont'd)
The following table presents additional information about valuation techniques and inputs used for investments that are measured at fair value and categorized within Level 3 as of October 31, 2016.
|
Asset class |
Fair value at 10/31/16 |
Valuation techniques |
Unobservable input |
Amount or range per unit |
Input value per unit |
Impact to valuation from decrease in input(c) |
|||||||||||||||||||||
|
Preferred Stock |
$ |
11,550,002 |
Market Transaction Method |
Transaction Price |
$ |
8.78 |
$ |
8.78 |
Decrease |
||||||||||||||||||
(c) Represents the expected directional change in the fair value of the Level 3 investments that would result from a decrease in the corresponding input. An increase to the unobservable input would have the opposite effect. Significant changes in these inputs could result in significantly higher or lower fair value measurements.
The following is a summary, categorized by Level (see Note A of Notes to Financial Statements), of inputs used to value the Fund's investments as of October 31, 2016:
|
Liability Valuation Inputs |
|||||||||||||||||
|
(000's omitted) |
Level 1 |
Level 2 |
Level 3 |
Total |
|||||||||||||
|
Investments: |
|||||||||||||||||
| Common Stocks Sold Short(d) |
$ |
(289,766 |
) |
$ |
— |
$ |
— |
$ |
(289,766 |
) |
|||||||
| Corporate Bonds Sold Short(d) |
— |
(34,489 |
) |
— |
(34,489 |
) |
|||||||||||
|
Exchange Traded Funds Sold Short |
(50,255 |
) |
— |
— |
(50,255 |
) |
|||||||||||
|
Total Short Positions |
$ |
(340,021 |
) |
$ |
(34,489 |
) |
$ |
— |
$ |
(374,510 |
) |
||||||
(d) The Schedule of Investments provides information on the industry or sector categorization for the portfolio.
As of the year ended October 31, 2016, no securities were transferred from one level (as of October 31, 2015) to another.
The following is a summary, categorized by Level (see Note A of Notes to Financial Statements), of inputs used to value the Fund's derivatives as of October 31, 2016:
|
Other Financial Instruments |
|||||||||||||||||
|
(000's omitted) |
Level 1 |
Level 2 |
Level 3(f) |
Total |
|||||||||||||
| Futures(e) | |||||||||||||||||
|
Assets |
$ |
13,186 |
$ |
— |
$ |
— |
$ |
13,186 |
|||||||||
| Swap contracts(e) | |||||||||||||||||
|
Assets |
— |
353 |
— |
353 |
|||||||||||||
|
Liabilities |
— |
(5,566 |
) |
— |
(5,566 |
) |
|||||||||||
|
Options written |
|||||||||||||||||
|
Liabilities |
(3,847 |
) |
(97 |
) |
(7 |
) |
(3,951 |
) |
|||||||||
|
Total |
$ |
9,339 |
$ |
(5,310 |
) |
$ |
(7 |
) |
$ |
4,022 |
|||||||
(e) Futures are reported at the cumulative appreciation/(depreciation) of the instrument. Swap contracts are reported at the cumulative unrealized appreciation/(depreciation), with the exception of total return swaps, which are reported in the table at value.
See Notes to Financial Statements
66
Schedule of Investments Long Short Fund (cont'd)
(f) The following is a reconciliation between the beginning and ending balances of investments in which unobservable inputs (Level 3) were used in determining value:
|
(000's omitted) |
Beginning balance, as of 11/1/15 |
Accrued discounts/ (premiums) |
Realized gain/loss |
Change in unrealized appreciation/ (depreciation) |
Purchases |
Sales |
Transfers into Level 3 |
Transfers out of Level 3 |
Balance, as of 10/31/16 |
Net change in unrealized appreciation/ (depreciation) from investments still held as of 10/31/16 |
|||||||||||||||||||||||||||||||||
| Other Financial Instruments: |
|||||||||||||||||||||||||||||||||||||||||||
| Options Written(g) |
$ |
— |
$ |
— |
$ |
— |
$ |
15 |
$ |
— |
$ |
(22 |
) |
$ |
— |
$ |
— |
$ |
(7 |
) |
$ |
15 |
|||||||||||||||||||||
|
Total |
$ |
— |
$ |
— |
$ |
— |
$ |
15 |
$ |
— |
$ |
(22 |
) |
$ |
— |
$ |
— |
$ |
(7 |
) |
$ |
15 |
|||||||||||||||||||||
(g) As of the year ended October 31, 2016, these investments did not have a material impact on the Fund's net assets and, therefore, disclosure of unobservable inputs used in formulating valuations is not presented.
See Notes to Financial Statements
67
Schedule of Investments Long Short Credit Fund 10/31/16
| Principal Amount(a) (000's omitted) |
Value (000's omitted) |
||||||||||
|
Loan Assignments(b) (3.7%) |
|||||||||||
|
All Telecom (1.0%) |
|||||||||||
| Thomas Reuters LP, Term Loan B, 4.75%, due 9/15/23 |
$ |
300 |
$ |
300 |
|||||||
|
Lodging & Casinos (1.6%) |
|||||||||||
| Caesars Growth Properties Holdings LLC, Term Loan B, due 5/8/21 |
499 |
498 |
(c)(d) |
||||||||
|
Oil & Gas (1.1%) |
|||||||||||
| Chesapeake Energy Corp., First Lien Term Loan, due 8/23/21 |
300 |
321 |
(c)(d) |
||||||||
| Total Loan Assignments1,119 (Cost $1,078) |
|||||||||||
| Number of Shares |
|||||||||||
|
Preferred Stock (2.5%) |
|||||||||||
|
Banks (2.5%) |
|||||||||||
| GMAC Capital Trust I, Ser. 2, 6.60% (Cost $752) |
30,000 |
766 |
(b) |
||||||||
| Principal Amount(a) (000's omitted) |
|||||||||||
|
Corporate Bonds (84.5%) |
|||||||||||
|
Agriculture (0.8%) |
|||||||||||
| Philip Morris Int'l, Inc., 1.13%, due 8/21/17 |
$ |
235 |
235 |
||||||||
|
Auto Manufacturers (6.5%) |
|||||||||||
| American Honda Finance Corp., 0.49%, due 11/7/16 |
250 |
250 |
|||||||||
| Daimler Finance North America LLC, 1.20%, due 3/10/17 |
500 |
500 |
(b)(e) |
||||||||
| Nissan Motor Acceptance Corp., 1.39%, due 3/03/17 |
400 |
401 |
(b)(e) |
||||||||
| Principal Amount(a) (000's omitted) |
Value (000's omitted) |
||||||||||
| Toyota Motor Credit Corp. |
|||||||||||
| 0.10%, due 1/4/17 |
$ |
250 |
$ |
250 |
|||||||
| 1.02%, due 5/16/17 |
583 |
583 |
(b) |
||||||||
|
1,984 |
|||||||||||
|
Banks (12.6%) |
|||||||||||
| Capital One N.A., 1.46%, due 2/05/18 |
400 |
400 |
(b) |
||||||||
| HSBC USA, Inc., 1.16%, due 6/23/17 |
500 |
499 |
(b) |
||||||||
| JPMorgan Chase & Co. |
|||||||||||
| 7.90%, due 12/29/49 |
800 |
825 |
(b) |
||||||||
| 1.34%, due 2/15/17 |
300 |
300 |
(b) |
||||||||
| Lloyds Bank PLC, 12.00%, due 12/29/49 |
1,000 |
1,360 |
(b)(e)(f) |
||||||||
| US Bancorp, 1.65%, due 5/15/17 |
450 |
451 |
|||||||||
|
3,835 |
|||||||||||
|
Biotechnology (0.3%) |
|||||||||||
| Amgen, Inc., 1.19%, due 5/22/17 |
100 |
100 |
(b) |
||||||||
|
Computers (0.7%) |
|||||||||||
| Diamond 1 Finance Corp./ Diamond 2 Finance Corp., 5.88%, due 6/15/21 |
200 |
210 |
(e) |
||||||||
|
Distribution/Wholesale (1.6%) |
|||||||||||
| Mitsubishi Int'l Co., 0.10%, due 12/22/16 |
500 |
499 |
|||||||||
|
Diversified Financial Services (3.4%) |
|||||||||||
| Nationstar Mortgage LLC/ Nationstar Capital Corp., 9.63%, due 5/1/19 |
1,000 |
1,048 |
(f) |
||||||||
|
Electric (0.7%) |
|||||||||||
| Duke Energy Progress LLC, 1.04%, due 3/6/17 |
200 |
200 |
(b) |
||||||||
| Principal Amount(a) (000's omitted) |
Value (000's omitted) |
||||||||||
|
Food (0.5%) |
|||||||||||
| JBS USA LUX SA/JBS USA Finance, Inc., 7.25%, due 6/1/21 |
$ |
150 |
$ |
154 |
(e) |
||||||
|
Forest Products & Paper (1.4%) |
|||||||||||
| Suzano Trading Ltd., 5.88%, due 1/23/21 |
400 |
413 |
(e) |
||||||||
|
Healthcare—Services (2.2%) |
|||||||||||
| HCA, Inc., 6.50%, due 2/15/20 |
250 |
277 |
|||||||||
| Roche Holdings, Inc., 0.94%, due 9/29/17 |
400 |
400 |
(b)(e) |
||||||||
|
677 |
|||||||||||
|
Insurance (2.1%) |
|||||||||||
| Berkshire Hathaway Finance Corp. |
|||||||||||
| 1.60%, due 5/15/17 |
150 |
151 |
|||||||||
| 1.03%, due 1/10/17 |
500 |
500 |
(b) |
||||||||
|
651 |
|||||||||||
|
Iron—Steel (1.7%) |
|||||||||||
| BlueScope Steel Finance Ltd./ BlueScope Steel Finance USA LLC, 7.13%, due 5/1/18 |
500 |
510 |
(e) |
||||||||
| Machinery—Construction & Mining (0.8%) |
|||||||||||
| Caterpillar Finance Services Co., 0.10%, due 11/08/16 |
250 |
250 |
|||||||||
|
Media (10.9%) |
|||||||||||
| Altice Financing SA, 7.50%, due 5/15/26 |
500 |
516 |
(e) |
||||||||
| Altice US Finance I Corp., 5.50%, due 5/15/26 |
200 |
204 |
(e) |
||||||||
| Cablevision Systems Corp., 8.63%, due 9/15/17 |
300 |
314 |
(f) |
||||||||
| CCO Holdings LLC/CCO Holdings Capital Corp., 5.88%, due 4/1/24 |
200 |
211 |
(e) |
||||||||
See Notes to Financial Statements
68
Schedule of Investments Long Short Credit Fund (cont'd)
| Principal Amount(a) (000's omitted) |
Value (000's omitted) |
||||||||||
| CSC Holdings LLC, 10.88%, due 10/15/25 |
$ |
700 |
$ |
805 |
(e)(f) |
||||||
| NBCUniversal Enterprise, Inc., 1.57%, due 4/15/18 |
400 |
403 |
(b)(e) |
||||||||
| SFR Group SA, 7.38%, due 5/1/26 |
200 |
202 |
(e) |
||||||||
| WideOpenWest Finance LLC/Wide OpenWest Capital Corp. |
|||||||||||
| 13.38%, due 10/15/19 |
45 |
48 |
|||||||||
| 10.25%, due 7/15/19 |
600 |
630 |
|||||||||
|
3,333 |
|||||||||||
|
Mining (1.3%) |
|||||||||||
| First Quantum Minerals Ltd., 7.25%, due 10/15/19 |
200 |
197 |
(e) |
||||||||
| HudBay Minerals, Inc., 9.50%, due 10/1/20 |
200 |
205 |
|||||||||
|
402 |
|||||||||||
|
Oil & Gas (12.8%) |
|||||||||||
| Chevron Corp., 1.15%, due 11/9/17 |
500 |
501 |
(b) |
||||||||
| Citgo Holding, Inc., 10.75%, due 2/15/20 |
500 |
512 |
(e) |
||||||||
| Exxon Mobil Corp., 0.54%, due 12/16/16 |
500 |
500 |
|||||||||
| PBF Holding Co. LLC/PBF Finance Corp., 8.25%, due 2/15/20 |
415 |
423 |
|||||||||
| Petrobras Global Finance BV |
|||||||||||
| 5.88%, due 3/7/22 |
EUR |
300 |
345 |
||||||||
| 4.38%, due 5/20/23 |
$ |
250 |
226 |
||||||||
| Seadrill Ltd., 6.13%, due 9/15/17 |
250 |
111 |
(e)(g) |
||||||||
| Shell Int'l Finance BV, 1.13%, due 5/10/17 |
500 |
501(b) | |||||||||
| Principal Amount(a) (000's omitted) |
Value (000's omitted) |
||||||||||
| YPF SA, 8.50%, due 3/23/21 |
$ |
700 |
$ |
770 |
(e)(f) |
||||||
|
3,889 |
|||||||||||
|
Packaging & Containers (3.9%) |
|||||||||||
| Ardagh Packaging Finance PLC/ Ardagh Holdings USA, Inc., 6.25%, due 1/31/19 |
650 |
662 |
(e) |
||||||||
| Reynolds Group Issuer, Inc. |
|||||||||||
| 8.25%, due 2/15/21 |
200 |
209 |
|||||||||
| 9.88%, due 8/15/19 |
100 |
103 |
|||||||||
| 4.38%, due 7/15/21 |
200 |
204 |
(b)(e) |
||||||||
|
1,178 |
|||||||||||
|
Pipelines (1.7%) |
|||||||||||
| Access Midstream Partners L.P., 4.88%, due 5/15/23 |
250 |
253 |
|||||||||
| DCP Midstream Operating L.P., 2.50%, due 12/1/17 |
250 |
248 |
|||||||||
|
501 |
|||||||||||
|
Software (1.6%) |
|||||||||||
| Oracle Corp., 1.07%, due 7/7/17 |
500 |
500 |
(b) |
||||||||
|
Telecommunications (17.0%) |
|||||||||||
| AT&T, Inc., 1.26%, due 3/30/17 |
300 |
300 |
(b) |
||||||||
| DigitalGlobe, Inc., 5.25%, due 2/01/21 |
300 |
302 |
(e) |
||||||||
|
EarthLink, Inc. |
|||||||||||
| 8.88%, due 5/15/19 |
69 |
71 |
|||||||||
| 7.38%, due 6/1/20 |
1,000 |
1,050 |
(f) |
||||||||
| Frontier Communications Corp., 11.00%, due 9/15/25 |
350 |
357 |
|||||||||
| Intelsat Jackson Holdings SA, 7.25%, due 4/01/19 |
235 |
188 |
|||||||||
| Intelsat Luxembourg SA |
|||||||||||
| 8.13%, due 6/1/23 |
200 |
66 |
|||||||||
| Principal Amount(a) (000's omitted) |
Value (000's omitted) |
||||||||||
| 7.75%, due 6/1/21 |
$ |
75 |
$ |
24 |
|||||||
| Sprint Corp., 7.13%, due 6/15/24 |
250 |
238 |
|||||||||
|
Sprint Nextel Corp. |
|||||||||||
| 7.00%, due 8/15/20 |
300 |
311 |
|||||||||
| 9.00%, due 11/15/18 |
850 |
935 |
(e)(f) |
||||||||
| Verizon Communications, Inc., 1.23%, due 6/9/17 |
500 |
501 |
(b) |
||||||||
| Wind Acquisition Finance SA, 7.38%, due 4/23/21 |
800 |
820 |
(e)(f) |
||||||||
|
5,163 |
|||||||||||
| Total Corporate Bonds (Cost $25,768) |
25,732 |
||||||||||
|
Foreign Government Securities (4.0%) |
|||||||||||
| Argentine Republic Government International Bond |
|||||||||||
| 2.50%, due 12/31/38 |
400 |
273 |
(g) |
||||||||
| 6.25%, due 4/22/19 |
400 |
424 |
(e) |
||||||||
| Brazilian Government International Bond, 4.88%, due 1/22/21 |
500 |
529 |
|||||||||
| Total Foreign Government Securities (Cost $1,233) |
1,226 |
||||||||||
| Number of Shares |
|||||||||||
|
Short-Term Investment (12.7%) |
|||||||||||
|
Investment Company (12.7%) |
|||||||||||
| State Street Institutional U.S. Government Money Market Fund Premier Class, 0.26% (Cost $3,877) |
3,876,538 |
3,877 |
(h)(f) |
||||||||
| Total Investments (107.4%) (Cost $32,708) |
32,720 |
||||||||||
| Other Assets Less Liabilities [(7.4%)] |
(2,257 |
)(i) | |||||||||
|
Net Assets (100.0%) |
$ |
30,463 |
|||||||||
See Notes to Financial Statements
69
Schedule of Investments Long Short Credit Fund (cont'd)
(a) Principal amount is stated in the currency in which the security is denominated.
EUR = Euro
(b) Variable or floating rate security. The interest rate shown was the current rate as of 10/31/2016 and changes periodically.
(c) All or a portion of this security was purchased on a delayed delivery basis.
(d) All or a portion of this security has not settled as of 10/31/2016 and thus may not have an interest rate in effect. Interest rates do not take effect until settlement.
(e) Securities were purchased under Rule 144A of the Securities Act of 1933, as amended (the "1933 Act"), or are otherwise restricted and, unless registered under the 1933 Act or exempted from registration, may only be sold to qualified institutional investors or may have other restrictions on resale. At 10/31/2016, these securities amounted to approximately $11,226,000 or 36.8% of net assets for the fund. These securities have been deemed by the investment manager to be liquid.
(f) All or a portion of this security is segregated in connection with obligations for forward foreign currency contracts and/or written options and/or futures and/or swaps with a total value of approximately $10,715,000.
(g) Step Bond. Coupon rate is a fixed rate for an initial period that either resets at a specific date or may reset in the future contingent upon a rating change made by a rating agency. The interest rate shown was the current rate as of 10/31/2016.
(h) Represents 7-day effective yield as of 10/31/2016.
(i) Includes the impact of the Fund's open positions in derivatives at 10/31/2016.
Derivative Instruments
Futures contracts ("futures")
At October 31, 2016, open positions in futures for the Fund were as follows:
|
Expiration |
Open Contracts |
Position |
Unrealized Appreciation/ (Depreciation) |
||||||||||||
|
12/8/2016 |
3 Euro-BTP |
Short |
$ |
17,249 |
|||||||||||
|
12/8/2016 |
15 Euro-Bund |
Short |
5,901 |
||||||||||||
|
12/8/2016 |
3 Euro-Buxl Bond, 30 Year |
Short |
31,785 |
||||||||||||
|
Total |
$ |
54,935 |
|||||||||||||
At October 31, 2016, the notional value of futures for the Fund was $(3,719,035) for short positions. The Fund had $60,984 deposited in a segregated account to cover margin requirements on open futures.
For the year ended October 31, 2016, the average notional value of futures for the Fund was $3,522,202 for long positions and $(1,321,284) for short positions.
See Notes to Financial Statements
70
Schedule of Investments Long Short Credit Fund (cont'd)
Forward foreign currency contracts ("forward contracts")
At October 31, 2016, open forward contracts for the Fund were as follows:
|
Contracts to Deliver |
In Exchange For |
Counterparty |
Settlement Date |
Net Unrealized Appreciation/ (Depreciation) |
|||||||||||||||||||
| 4,600 |
Euro |
$ |
5,179 |
Goldman Sachs International |
11/16/16 |
$ |
127 |
||||||||||||||||
| 220,400 |
Euro |
248,120 |
Goldman Sachs International |
11/16/16 |
6,041 |
||||||||||||||||||
| 125,000 |
Euro |
137,651 |
Goldman Sachs International |
11/16/16 |
356 |
||||||||||||||||||
|
Total |
$ |
6,524 |
|||||||||||||||||||||
For the year ended October 31, 2016, the Fund's investments in forward contracts had an average notional value of $675,867.
Credit default swap contracts ("credit default swaps")
At October 31, 2016, the Fund had outstanding over-the-counter ("OTC") credit default swaps as follows:
OTC Credit Default Swaps — Buy Protection
| Swap Counterparty |
Reference Entity |
Notional Amount(a) |
Contract Annual Fixed Rate(b) |
Termination Date |
Unamortized Upfront Payments (Received) Paid |
Unrealized Appreciation/ (Depreciation) |
Accrued Net Interest Receivable/ (Payable) |
Total Fair Value |
|||||||||||||||||||||||||||
| Goldman Sachs International |
South Africa (Republic of), Senior Unsecured Notes, 5.50%, due 3/9/2020 |
$ |
500,000 |
1.00 |
% |
12/20/2021 |
$ |
37,999 |
$ |
(4,588 |
) |
$ |
(583 |
) |
$ |
32,828 |
|||||||||||||||||||
| JPMorgan Chase Bank, N.A. |
Societe Generale SA, Senior Unsecured Notes, 3.75%, due 3/1/2017 |
EUR |
500,000 |
1.00 |
% |
12/20/2021 |
(7,063 |
) |
(991 |
) |
(646 |
) |
(8,700 |
) |
|||||||||||||||||||||
| Goldman Sachs International |
Chile (Republic of), Senior Unsecured Notes, 3.88%, due 8/5/2020 |
$ |
500,000 |
1.00 |
% |
12/20/2021 |
(1,479 |
) |
(1,263 |
) |
(569 |
) |
(3,311 |
) |
|||||||||||||||||||||
| Goldman Sachs International |
KB Home, Senior Unsecured Notes, 9.10%, due 9/15/2017 |
$ |
250,000 |
5.00 |
% |
12/20/2021 |
(16,879 |
) |
(898 |
) |
(1,458 |
) |
(19,235 |
) |
|||||||||||||||||||||
|
Total |
$ |
12,578 |
$ |
(7,740 |
) |
$ |
(3,256 |
) |
$ |
1,582 |
|||||||||||||||||||||||||
(a) The notional amount is stated in the currency in which the contract is denominated.
EUR = Euro
(b) The contract annual fixed rate represents the annual fixed rate of interest paid by the Fund (as a buyer of protection) on the notional amount of the credit default swaps.
See Notes to Financial Statements
71
Schedule of Investments Long Short Credit Fund (cont'd)
OTC Credit Default Swaps — Sell Protection
| Swap Counterparty |
Reference Entity |
Notional Amount |
Contract Annual Fixed Rate(c) |
Termination Date |
Unamortized Upfront Payments (Received) Paid |
Unrealized Appreciation/ (Depreciation) |
Accrued Net Interest Receivable/ (Payable) |
Total Fair Value |
|||||||||||||||||||||||||||
| Goldman Sachs International |
United Mexican States, Senior Unsecured Medium Term Notes, 5.95%, due 3/19/2019 |
$ |
500,000 |
1.00 |
% |
12/20/2021 |
$ |
(15,955 |
) |
$ |
2,772 |
$ |
583 |
$ |
(12,600 |
) |
|||||||||||||||||||
| Goldman Sachs International |
Brazil, Federative Republic of (Government), 4.25%, due 1/7/2025 |
500,000 |
1.00 |
% |
12/20/2021 |
(42,103 |
) |
2,207 |
583 |
(39,313 |
) |
||||||||||||||||||||||||
| JPMorgan Chase Bank, N.A. |
Dell, Inc., Senior Unsecured Notes, 7.10%, due 4/15/2028 |
250,000 |
1.00 |
% |
12/20/2021 |
(25,202 |
) |
1,618 |
292 |
(23,292 |
) |
||||||||||||||||||||||||
| Goldman Sachs International |
Dell, Inc., Senior Unsecured Notes, 7.10%, due 4/15/2028 |
250,000 |
1.00 |
% |
12/20/2021 |
(25,202 |
) |
1,618 |
292 |
(23,292 |
) |
||||||||||||||||||||||||
|
Total |
$ |
(108,462 |
) |
$ |
8,215 |
$ |
1,750 |
$ |
(98,497 |
) |
|||||||||||||||||||||||||
(c) The contract annual fixed rate represents the annual fixed rate of interest received by the Fund (as a seller of protection) on the notional amount of the credit default swaps.
At October 31, 2016, the Fund had outstanding centrally cleared credit default swaps as follows:
Centrally Cleared Credit Default Swaps — Sell Protection
|
Clearinghouse |
Reference Entity |
Notional Amount |
Contract Annual Fixed Rate(d) |
Termination Date |
Unamortized Upfront Payments (Received) Paid |
Unrealized Appreciation/ (Depreciation) |
Accrued Net Interest Receivable/ (Payable) |
Total Fair Value |
|||||||||||||||||||||||||||
|
ICE Clear Credit LLC |
CDX.EM.26.V1 |
$ |
2,500,000 |
1.00 |
% |
12/20/2021 |
$ |
(158,777 |
) |
$ |
(5,117 |
) |
$ |
2,917 |
$ |
(160,977 |
) |
||||||||||||||||||
|
Total |
$ |
(158,777 |
) |
$ |
(5,117 |
) |
$ |
2,917 |
$ |
(160,977 |
) |
||||||||||||||||||||||||
(d) The contract annual fixed rate represents the annual fixed rate of interest received by the Fund (as a seller of protection) on the notional amount of the credit default swaps.
For the year ended October 31, 2016, the average notional value of credit default swaps for the Fund was $2,889,825 for buy protection and $1,753,171 for sell protection.
See Notes to Financial Statements
72
Schedule of Investments Long Short Credit Fund (cont'd)
Total return swap contracts ("total return swaps")
At October 31, 2016, the Fund had outstanding OTC total return swaps as follows:
Long Total Return Swaps
| Swap Counterparty |
Reference Entity |
Notional Value(e) |
Termination Date |
Fixed-rate |
Unrealized Appreciation/ (Depreciation) |
Accrued Net Interest Receivable/ (Payable) |
Total Fair Value |
||||||||||||||||||||||||
| Goldman Sachs International |
iShares iBoxx $ High Yield Corporate Bond ETF |
$ |
435,150 |
4/12/2018 |
(0.77 |
)%(f) |
(5,050 |
) |
205 |
(4,845 |
) |
||||||||||||||||||||
| Goldman Sachs International |
NXP Semiconductors NV US Equity |
314,564 |
4/25/2018 |
0.92 |
%(g) |
(14,564 |
) |
(64 |
) |
(14,628 |
) |
||||||||||||||||||||
|
Total |
$ |
(19,614 |
) |
$ |
141 |
$ |
(19,473 |
) |
|||||||||||||||||||||||
(e) Notional value represents the value (including any fees or commissions) of the long positions when they were established and is stated in the currency in which the contract is denominated.
(f) Variable-rate. 1-month LIBOR minus 1.30% as of 10/13/2016.
(g) Variable-rate. 1-month LIBOR plus 0.40% as of 10/19/2016.
Short Total Return Swaps
| Swap Counterparty |
Reference Entity |
Notional Value(h) |
Termination Date |
Fixed-rate |
Unrealized Appreciation/ (Depreciation) |
Accrued Net Interest Receivable/ (Payable) |
Total Fair Value |
||||||||||||||||||||||||
| BNP Paribas SA | Hexion, Inc., First Lien, 10.00%, due 4/15/2020 |
$ |
(100,000 |
) |
9/15/2017 |
(0.03 |
)%(i) |
$ |
1,821 |
$ |
— |
$ |
1,821 | ||||||||||||||||||
| BNP Paribas SA | Sabine Pass Long LP, First Lien, 7.50%, due 11/30/2016 |
(500,000 |
) |
9/15/2017 |
(0.03 |
)%(i) |
(4,032 |
) |
(3 |
) |
(4,035 |
) |
|||||||||||||||||||
| BNP Paribas SA | Senior Unsecured HCA, Inc., Notes, 5.38%, due 2/1/2025 |
(200,000 |
) |
9/15/2017 |
(0.03 |
)%(i) |
10,006 |
(1 |
) |
10,005 |
|||||||||||||||||||||
| BNP Paribas SA | Michaels Stores, Inc., Senior Subordinated, 5.88%, due 12/15/2020 |
(500,000 |
) |
9/15/2017 |
(0.03 |
)%(i) |
(4,459 |
) |
(3 |
) |
(4,462 |
) |
|||||||||||||||||||
| BNP Paribas SA | SBA Communications Corp., Senior Unsecured Notes, 4.88%, due 7/15/2022 |
(250,000 |
) |
9/15/2017 |
(0.03 |
)%(i) |
460 |
(1 |
) |
459 |
|||||||||||||||||||||
| BNP Paribas SA | Tenet Healthcare Corp., Senior Unsecured Notes, 6.75%, due 6/15/2023 |
(550,000 |
) |
9/15/2017 |
(0.03 |
)%(j) |
34,771 |
(4 |
) |
34,767 |
|||||||||||||||||||||
| BNP Paribas SA | HCA, Inc., Senior Unsecured Notes, 5.88%, due 2/15/2026 |
(250,000 |
) |
9/15/2017 |
(0.03 |
)%(k) |
9,877 |
(1 |
) |
9,876 |
|||||||||||||||||||||
See Notes to Financial Statements
73
Schedule of Investments Long Short Credit Fund (cont'd)
| Swap Counterparty |
Reference Entity |
Notional Value(h) |
Termination Date |
Fixed-rate | Unrealized Appreciation/ (Depreciation) |
Accrued Net Interest Receivable/ (Payable) |
Total Fair Value |
||||||||||||||||||||||||
| BNP Paribas SA |
SFR Group SA/Numericable Group SA, First Lien, 5.38%, due 5/15/2022 |
EUR |
(500,000 |
) |
10/9/2017 |
(1.12 |
)%(l) |
$ |
(7,709 |
) |
$ |
(250 |
) |
$ |
(7,959 |
) |
|||||||||||||||
|
BNP Paribas SA |
Intesa Sanpaolo SPA, Senior Unsecures Notes, 1.13%, due 3/4/2022 |
EUR |
(300,000 |
) |
11/17/2017 |
(1.07 |
)%(m) |
6,003 |
(126 |
) |
5,877 |
||||||||||||||||||||
|
BNP Paribas SA |
Intesa Sanpaolo SPA, Senior Unsecured Notes, 1.13%, due 3/4/2022 |
EUR |
(200,000 |
) |
11/17/2017 |
(0.97 |
)%(n) |
(471 |
) |
(76 |
) |
(547 |
) |
||||||||||||||||||
| Total |
$ |
46,267 |
$ |
(465 |
) |
$ |
45,802 |
||||||||||||||||||||||||
(h) Notional value represents the value (including any fees or commissions) of the short positions when they were established and is stated in the currency in which the contract is denominated.
EUR = Euro
(i) Variable-rate. 1-month LIBOR minus 0.50% as of 10/13/2016.
(j) Variable-rate. 1-month LIBOR minus 0.50% as of 10/6/2016.
(k) Variable-rate. 1-month LIBOR minus 0.50% as of 10/4/2016.
(l) Variable-rate. 1-month Euribor minus 0.75% as of 10/13/2016.
(m) Variable-rate. 1-month Euribor minus 0.70% as of 10/13/2016.
(n) Variable-rate. 1-month Euribor minus 0.60% as of 10/13/2016.
At October 31, 2016, the Fund had cash collateral of $60,000 and $1,220,00 deposited in a segregated account for Goldman Sachs International and BNP Paribas SA, respectively, to cover collateral requirements on OTC derivatives.
For the year ended October 31, 2016, the average notional value of equity swaps, total return basket swaps and total return swaps for the Fund was $134,884 for long positions and $(1,705,882) for short positions.
See Notes to Financial Statements
74
Schedule of Investments Long Short Credit Fund (cont'd)
Written option contracts ("options written")
At October 31, 2016, the Fund had no outstanding options written.
Options written for the Fund for the year ended October 31, 2016 were as follows:
| Number of Contracts |
Notional Amount—Swaptions(a) (000's omitted) |
Premium Received |
|||||||||||||||||
|
EUR |
USD |
USD |
|||||||||||||||||
|
Outstanding 10/31/2015 |
150 |
— |
$ |
— |
$ |
13,362 |
|||||||||||||
|
Options written |
235 |
2,500 |
20,500 |
135,823 |
|||||||||||||||
|
Options expired |
(10 |
) |
(8,000 |
) |
(43,391 |
) |
|||||||||||||
|
Options exercised |
— |
(2,500 |
) |
(10,000 |
) |
(12,394 |
) |
||||||||||||
|
Options closed |
(375 |
) |
— |
(2,500 |
) |
(93,400 |
) |
||||||||||||
|
Outstanding 10/31/2016 |
— |
— |
$ |
— |
$ |
— |
|||||||||||||
(a) The notional amount is stated in the currency in which the contract is denominated.
EUR = Euro
For the year ended October 31, 2016, the Fund had an average market value of $19,443 in options purchased, and $(3,837) in options written, respectively.
The following is a summary, categorized by Level (see Note A of Notes to Financial Statements), of inputs used to value the Fund's investments as of October 31, 2016:
|
Asset Valuation Inputs |
|||||||||||||||||||
|
(000's omitted) |
Level 1 |
Level 2 |
Level 3 |
Total |
|||||||||||||||
|
Investments: |
|||||||||||||||||||
| Loan Assignments(a) |
$ |
— |
$ |
1,119 |
$ |
— |
$ |
1,119 |
|||||||||||
| Preferred Stock(a) |
766 |
— |
— |
766 |
|||||||||||||||
| Corporate Bonds(a) |
— |
25,732 |
— |
25,732 |
|||||||||||||||
| Foreign Government Securities(a) |
— |
1,226 |
— |
1,226 |
|||||||||||||||
|
Short-Term Investment |
— |
3,877 |
— |
3,877 |
|||||||||||||||
|
Total Long Positions |
$ |
766 |
$ |
31,954 |
$ |
— |
$ |
32,720 |
|||||||||||
(a) The Schedule of Investments provides information on the industry or sector categorization for the portfolio.
As of the year ended October 31, 2016, no securities were transferred from one level (as of October 31, 2015) to another.
The following is a summary, categorized by Level (see Note A of Notes to Financial Statements), of inputs used to value the Fund's derivatives as of October 31, 2016:
|
Other Financial Instruments |
|||||||||||||||||||
|
(000's omitted) |
Level 1 |
Level 2 |
Level 3 |
Total |
|||||||||||||||
| Futures(b) | |||||||||||||||||||
|
Assets |
$ |
55 |
$ |
— |
$ |
— |
$ |
55 |
|||||||||||
| Forwards(b) | |||||||||||||||||||
|
Assets |
— |
7 |
— |
7 |
|||||||||||||||
|
Swap contracts |
|||||||||||||||||||
|
Assets |
— |
96 |
— |
96 |
|||||||||||||||
|
Liabilities |
— |
(327 |
) |
— |
(327 |
) |
|||||||||||||
|
Total |
$ |
55 |
$ |
(224 |
) |
$ |
— |
$ |
(169 |
) |
|||||||||
(b) Futures and forward contracts are reported at the cumulative appreciation/(depreciation) of the instrument.
See Notes to Financial Statements
75
Schedule of Investments Multi-Asset Income Fund 10/31/16
Number of Shares |
Value (000's omitted) |
||||||||||
|
Common Stocks (29.5%) |
|||||||||||
|
Aerospace & Defense (0.5%) |
|||||||||||
|
BAE Systems PLC |
2,008 |
$ |
13 |
||||||||
|
Boeing Co. |
122 |
18 |
|||||||||
| Huntington Ingalls Industries, Inc. |
24 |
4 |
|||||||||
| Lockheed Martin Corp. |
216 |
53 |
|||||||||
|
Raytheon Co. |
37 |
5 |
|||||||||
|
93 |
|||||||||||
|
Air Freight & Logistics (0.3%) |
|||||||||||
| Expeditors International of Washington, Inc. |
39 |
2 |
|||||||||
|
Royal Mail PLC |
231 |
1 |
|||||||||
| United Parcel Service, Inc. Class B |
379 |
41 |
(a) |
||||||||
|
44 |
|||||||||||
|
Airlines (0.1%) |
|||||||||||
| Cathay Pacific Airways Ltd. |
2,000 |
3 |
|||||||||
| Copa Holdings SA Class A |
48 |
4 |
|||||||||
|
easyJet PLC |
89 |
1 |
|||||||||
| Japan Airlines Co. Ltd. |
100 |
3 |
|||||||||
| Singapore Airlines Ltd. |
500 |
4 |
|||||||||
|
15 |
|||||||||||
|
Auto Components (0.2%) |
|||||||||||
|
Brembo SpA |
88 |
5 |
|||||||||
|
CIE Automotive SA |
223 |
5 |
|||||||||
|
Gentex Corp. |
32 |
1 |
|||||||||
| Metaldyne Performance Group, Inc. |
24 |
0 |
(b) |
||||||||
| Nokian Renkaat OYJ |
140 |
5 |
|||||||||
| Sumitomo Rubber Industries Ltd. |
200 |
3 |
|||||||||
| Superior Industries International, Inc. |
78 |
2 |
|||||||||
| Xinyi Glass Holdings Ltd. |
8,000 |
7 |
* |
||||||||
|
28 |
|||||||||||
|
Automobiles (0.1%) |
|||||||||||
| Bayerische Motoren Werke AG, Preference Shares |
77 |
6 |
|||||||||
|
Ford Motor Co. |
551 |
6 |
|||||||||
Number of Shares |
Value (000's omitted) |
||||||||||
|
General Motors Co. |
19 |
$ |
1 |
||||||||
|
Isuzu Motors Ltd. |
100 |
1 |
|||||||||
|
Renault SA |
38 |
3 |
|||||||||
|
17 |
|||||||||||
|
Banks (1.2%) |
|||||||||||
| Australia & New Zealand Banking Group Ltd. |
2,235 |
47 |
|||||||||
| Bank of Queensland Ltd. |
66 |
1 |
|||||||||
| Bendigo & Adelaide Bank Ltd. |
847 |
7 |
|||||||||
|
BGEO Group PLC |
82 |
3 |
|||||||||
|
BNP Paribas SA |
34 |
2 |
|||||||||
| BOC Hong Kong Holdings Ltd. |
4,000 |
14 |
|||||||||
| Dah Sing Financial Holdings Ltd. |
400 |
3 |
|||||||||
| First Hawaiian, Inc. |
500 |
14 |
* |
||||||||
| Fulton Financial Corp. |
338 |
5 |
|||||||||
| Hang Seng Bank Ltd. |
200 |
3 |
|||||||||
|
HSBC Holdings PLC |
546 |
4 |
|||||||||
| JPMorgan Chase & Co. |
705 |
49 |
(a) |
||||||||
|
Nordea Bank AB |
108 |
1 |
|||||||||
| Oversea-Chinese Banking Corp. Ltd. |
400 |
2 |
|||||||||
| PNC Financial Services Group, Inc. |
200 |
19 |
|||||||||
|
Popular, Inc. |
18 |
1 |
|||||||||
| Resona Holdings, Inc. |
200 |
1 |
|||||||||
| Societe Generale SA |
100 |
4 |
|||||||||
| Swedbank AB, A Shares |
27 |
1 |
|||||||||
| Umpqua Holdings Corp. |
2,450 |
37 |
|||||||||
|
218 |
|||||||||||
|
Beverages (0.5%) |
|||||||||||
| Anheuser-Busch InBev NV ADR |
175 |
20 |
|||||||||
|
Coca-Cola Co. |
771 |
33 |
(a) |
||||||||
|
PepsiCo, Inc. |
299 |
32 |
(a) |
||||||||
|
85 |
|||||||||||
|
Capital Markets (0.1%) |
|||||||||||
| 3i Group PLC |
1,366 |
11 |
|||||||||
| Aberdeen Asset Management PLC |
173 |
1 |
|||||||||
|
ASX Ltd. |
69 |
3 |
|||||||||
|
BlackRock, Inc. |
15 |
5 |
|||||||||
Number of Shares |
Value (000's omitted) |
||||||||||
| Donnelley Financial Solutions, Inc. |
6 |
$ |
0 |
*(b) | |||||||
|
20 |
|||||||||||
|
Chemicals (0.6%) |
|||||||||||
|
Agrium, Inc. |
200 |
18 |
|||||||||
| Air Products & Chemicals, Inc. |
29 |
4 |
|||||||||
|
BASF SE |
681 |
60 |
|||||||||
|
Dow Chemical Co. |
213 |
11 |
(a) |
||||||||
| E.I. du Pont de Nemours & Co. |
143 |
10 |
(a) |
||||||||
| LyondellBasell Industries NV Class A |
70 |
6 |
(a) |
||||||||
|
109 |
|||||||||||
|
Commercial Services & Supplies (0.1%) |
|||||||||||
| ABM Industries, Inc. |
90 |
4 |
|||||||||
|
De La Rue PLC |
274 |
2 |
|||||||||
| LSC Communications, Inc. |
6 |
0 |
*(b) | ||||||||
|
Quad/Graphics, Inc. |
219 |
5 |
|||||||||
| R.R. Donnelley & Sons Co. |
16 |
0 |
(b) |
||||||||
| Republic Services, Inc. |
95 |
5 |
|||||||||
| Waste Management, Inc. |
25 |
2 |
|||||||||
|
18 |
|||||||||||
|
Communications Equipment (0.4%) |
|||||||||||
|
Cisco Systems, Inc. |
2,268 |
70 |
(a) |
||||||||
|
Construction & Engineering (0.2%) |
|||||||||||
| ACS Actividades de Construccion y Servicios SA |
45 |
1 |
|||||||||
|
CIMIC Group Ltd. |
192 |
4 |
|||||||||
|
Peab AB |
170 |
2 |
|||||||||
| Skanska AB, B Shares |
353 |
8 |
|||||||||
|
Vinci SA |
335 |
24 |
|||||||||
|
39 |
|||||||||||
|
Construction Materials (0.0%) |
|||||||||||
| Fletcher Building Ltd. |
242 |
2 |
|||||||||
|
Consumer Finance (0.0%) |
|||||||||||
|
Navient Corp. |
153 |
2 |
|||||||||
|
Containers & Packaging (0.1%) |
|||||||||||
|
Greif, Inc. Class B |
53 |
3 |
|||||||||
| International Paper Co. |
500 |
23 |
(a) |
||||||||
| Sonoco Products Co. |
7 |
0 |
(b) |
||||||||
|
26 |
|||||||||||
See Notes to Financial Statements
76
Schedule of Investments Multi-Asset Income Fund (cont'd)
Number of Shares |
Value (000's omitted) |
||||||||||
|
Distributors (0.1%) |
|||||||||||
|
D'ieteren SA |
41 |
$ |
2 |
||||||||
|
Genuine Parts Co. |
86 |
8 |
|||||||||
|
10 |
|||||||||||
|
Diversified Financial Services (0.0%) |
|||||||||||
| Aker ASA, A Shares |
59 |
2 |
|||||||||
| L E Lundbergforetagen AB, B Shares |
81 |
5 |
|||||||||
|
7 |
|||||||||||
|
Diversified Telecommunication Services (0.7%) |
|||||||||||
|
AT&T, Inc. |
1,404 |
52 |
(a) |
||||||||
|
CenturyLink, Inc. |
146 |
4 |
|||||||||
|
Elisa OYJ |
69 |
2 |
|||||||||
| HKT Trust & HKT Ltd. |
5,000 |
7 |
|||||||||
|
Orange SA |
98 |
2 |
|||||||||
|
PCCW Ltd. |
11,003 |
7 |
|||||||||
| Singapore Telecommunications Ltd. |
5,800 |
16 |
|||||||||
| Spark New Zealand Ltd. |
840 |
2 |
|||||||||
|
TDC A/S |
948 |
5 |
* |
||||||||
|
Telefonica SA |
362 |
4 |
|||||||||
|
Telenor ASA |
411 |
6 |
|||||||||
|
Telstra Corp. Ltd. |
4,000 |
15 |
|||||||||
| Verizon Communications, Inc. |
13 |
1 |
|||||||||
|
123 |
|||||||||||
|
Electric Utilities (1.6%) |
|||||||||||
|
ALLETE, Inc. |
31 |
2 |
|||||||||
| American Electric Power Co., Inc. |
110 |
7 |
|||||||||
|
AusNet Services |
5,194 |
6 |
|||||||||
|
BKW AG |
147 |
7 |
|||||||||
|
CLP Holdings Ltd. |
1,500 |
15 |
|||||||||
| Contact Energy Ltd. |
201 |
1 |
|||||||||
| Duke Energy Corp. |
210 |
17 |
(a) |
||||||||
| Edison International |
326 |
24 |
|||||||||
| EDP—Energias de Portugal SA |
1,511 |
5 |
|||||||||
|
Enel SpA |
1,876 |
8 |
|||||||||
|
Entergy Corp. |
390 |
29 |
(a) |
||||||||
| Eversource Energy |
27 |
1 |
|||||||||
|
EVN AG |
248 |
3 |
|||||||||
|
Exelon Corp. |
950 |
32 |
(a) |
||||||||
|
Fortum OYJ |
628 |
10 |
|||||||||
Number of Shares |
Value (000's omitted) |
||||||||||
| HK Electric Investments & HK Electric Investments Ltd. |
3,907 |
$ |
4 |
(c) |
|||||||
|
Mercury NZ Ltd |
984 |
2 |
|||||||||
| NextEra Energy, Inc. |
408 |
52 |
(a) |
||||||||
| OGE Energy Corp. |
88 |
3 |
|||||||||
|
PG&E Corp. |
75 |
5 |
|||||||||
| Pinnacle West Capital Corp. |
48 |
3 |
|||||||||
| Power Assets Holdings Ltd. |
500 |
5 |
|||||||||
|
PPL Corp. |
82 |
3 |
|||||||||
|
Southern Co. |
210 |
11 |
(a) |
||||||||
|
SSE PLC |
555 |
11 |
|||||||||
| Terna Rete Elettrica Nazionale SpA |
1,194 |
6 |
|||||||||
| Westar Energy, Inc. |
8 |
0 |
(b) |
||||||||
|
Xcel Energy, Inc. |
90 |
4 |
|||||||||
|
276 |
|||||||||||
|
Electrical Equipment (0.0%) |
|||||||||||
|
Eaton Corp. PLC |
62 |
4 |
|||||||||
|
OSRAM Licht AG |
14 |
1 |
|||||||||
|
5 |
|||||||||||
|
Electronic Equipment, Instruments & Components (0.1%) |
|||||||||||
|
Avnet, Inc. |
188 |
8 |
|||||||||
|
Corning, Inc. |
134 |
3 |
|||||||||
|
11 |
|||||||||||
|
Energy Equipment & Services (0.3%) |
|||||||||||
| Amec Foster Wheeler PLC |
1,380 |
7 |
|||||||||
| Diamond Offshore Drilling, Inc. |
237 |
4 |
|||||||||
| Ensco PLC Class A |
259 |
2 |
|||||||||
| Helmerich & Payne, Inc. |
545 |
34 |
|||||||||
| National Oilwell Varco, Inc. |
33 |
1 |
|||||||||
|
Petrofac Ltd. |
249 |
2 |
|||||||||
|
RPC, Inc. |
32 |
1 |
* |
||||||||
|
Tenaris SA |
59 |
1 |
|||||||||
| WorleyParsons Ltd. |
91 |
1 |
* |
||||||||
|
53 |
|||||||||||
|
Food & Staples Retailing (0.6%) |
|||||||||||
|
Axfood AB |
118 |
2 |
|||||||||
| Casino Guichard Perrachon SA |
90 |
4 |
|||||||||
|
J Sainsbury PLC |
1,588 |
5 |
|||||||||
Number of Shares |
Value (000's omitted) |
||||||||||
| Kesko OYJ, B Shares |
131 |
$ |
7 |
||||||||
|
METRO AG |
16 |
1 |
|||||||||
|
Rallye SA |
57 |
1 |
|||||||||
|
Sysco Corp. |
158 |
8 |
|||||||||
| Wal-Mart Stores, Inc. |
347 |
24 |
(a) |
||||||||
|
Weis Markets, Inc. |
33 |
2 |
|||||||||
|
Wesfarmers Ltd. |
908 |
28 |
|||||||||
| WM Morrison Supermarkets PLC |
1,561 |
4 |
|||||||||
|
Woolworths Ltd. |
747 |
13 |
|||||||||
|
99 |
|||||||||||
|
Food Products (0.4%) |
|||||||||||
| Archer-Daniels- Midland Co. |
144 |
6 |
|||||||||
| Austevoll Seafood ASA |
312 |
3 |
|||||||||
|
Campbell Soup Co. |
11 |
1 |
(a) |
||||||||
| ConAgra Foods, Inc. |
800 |
39 |
(a) |
||||||||
| Fresh Del Monte Produce, Inc. |
91 |
5 |
|||||||||
|
General Mills, Inc. |
99 |
6 |
|||||||||
|
Ingredion, Inc. |
39 |
5 |
|||||||||
|
Salmar ASA |
205 |
7 |
|||||||||
|
Tate & Lyle PLC |
273 |
3 |
|||||||||
|
WH Group Ltd. |
500 |
0 |
(c)(b) |
||||||||
|
75 |
|||||||||||
|
Gas Utilities (0.1%) |
|||||||||||
|
Enagas SA |
58 |
1 |
|||||||||
| Gas Natural SDG SA |
192 |
4 |
|||||||||
|
ONE Gas, Inc. |
98 |
6 |
|||||||||
| Southwest Gas Corp. |
26 |
2 |
|||||||||
|
Spire, Inc. |
63 |
4 |
|||||||||
|
17 |
|||||||||||
| Health Care Equipment & Supplies (0.0%) |
|||||||||||
|
DiaSorin SpA |
55 |
3 |
|||||||||
|
Health Care Providers & Services (0.2%) |
|||||||||||
|
Ansell Ltd. |
37 |
1 |
|||||||||
|
Anthem, Inc. |
38 |
5 |
|||||||||
| National HealthCare Corp. |
38 |
2 |
|||||||||
| Owens & Minor, Inc. |
114 |
4 |
|||||||||
| Quest Diagnostics, Inc. |
67 |
5 |
|||||||||
| Sonic Healthcare Ltd. |
294 |
5 |
|||||||||
| UnitedHealth Group, Inc. |
38 |
5 |
|||||||||
|
27 |
|||||||||||
See Notes to Financial Statements
77
Schedule of Investments Multi-Asset Income Fund (cont'd)
Number of Shares |
Value (000's omitted) |
||||||||||
|
Hotels, Restaurants & Leisure (0.4%) |
|||||||||||
|
Carnival Corp. |
663 |
$ |
32 |
(a) |
|||||||
| Extended Stay America, Inc. |
120 |
2 |
|||||||||
| International Game Technology PLC |
146 |
4 |
|||||||||
| Las Vegas Sands Corp. |
62 |
4 |
|||||||||
|
McDonald's Corp. |
134 |
15 |
(a) |
||||||||
|
Sands China Ltd. |
800 |
3 |
|||||||||
| Six Flags Entertainment Corp. |
33 |
2 |
|||||||||
|
Tatts Group Ltd. |
162 |
1 |
|||||||||
|
63 |
|||||||||||
|
Household Durables (0.0%) |
|||||||||||
| Berkeley Group Holdings PLC |
46 |
1 |
|||||||||
|
Persimmon PLC |
134 |
3 |
|||||||||
|
4 |
|||||||||||
|
Household Products (0.7%) |
|||||||||||
| Colgate-Palmolive Co. |
134 |
9 |
|||||||||
| Kimberly-Clark Corp. |
84 |
10 |
(a) |
||||||||
| Procter & Gamble Co. |
1,132 |
98 |
(a) |
||||||||
|
117 |
|||||||||||
|
Independent Power and Renewable Electricity Producers (0.2%) |
|||||||||||
|
Drax Group PLC |
559 |
2 |
|||||||||
| Meridian Energy Ltd. |
1,087 |
2 |
|||||||||
| NextEra Energy Partners LP |
1,225 |
34 |
|||||||||
|
Uniper SE |
23 |
0 |
*(b) | ||||||||
|
38 |
|||||||||||
|
Industrial Conglomerates (0.4%) |
|||||||||||
| General Electric Co. |
900 |
26 |
(a) |
||||||||
|
Keppel Corp. Ltd. |
1,100 |
4 |
|||||||||
| Koninklijke Philips NV |
550 |
16 |
|||||||||
| NWS Holdings Ltd. |
2,000 |
4 |
|||||||||
|
Siemens AG ADR |
150 |
17 |
|||||||||
|
67 |
|||||||||||
|
Insurance (2.0%) |
|||||||||||
|
Aflac, Inc. |
128 |
9 |
|||||||||
|
Allianz SE |
361 |
56 |
|||||||||
| American Financial Group, Inc. |
86 |
6 |
|||||||||
Number of Shares |
Value (000's omitted) |
||||||||||
| American National Insurance Co. |
56 |
$ |
6 |
||||||||
| Assicurazioni Generali SpA |
200 |
3 |
|||||||||
|
Assurant, Inc. |
7 |
1 |
|||||||||
|
AXA SA |
1,615 |
36 |
|||||||||
| Axis Capital Holdings Ltd. |
73 |
4 |
|||||||||
|
Beazley PLC |
283 |
1 |
|||||||||
|
Chubb Ltd. |
14 |
2 |
|||||||||
| Cincinnati Financial Corp. |
146 |
10 |
|||||||||
| CNA Financial Corp. |
113 |
4 |
|||||||||
|
CNP Assurances |
635 |
11 |
|||||||||
| Direct Line Insurance Group PLC |
473 |
2 |
|||||||||
| Erie Indemnity Co. Class A |
10 |
1 |
|||||||||
| Everest Re Group Ltd. |
10 |
2 |
|||||||||
| Gjensidige Forsikring ASA |
31 |
1 |
|||||||||
|
Hannover Rueck SE |
68 |
8 |
|||||||||
| Insurance Australia Group Ltd. |
1,848 |
8 |
|||||||||
| Legal & General Group PLC |
3,447 |
9 |
|||||||||
| Medibank Pvt Ltd. |
221 |
0 |
(b) |
||||||||
|
MetLife, Inc. |
675 |
32 |
(a) |
||||||||
| Muenchener Rueckversicherungs- Gesellschaft AG in Muenchen |
117 |
23 |
|||||||||
|
NN Group NV |
18 |
1 |
|||||||||
|
Old Mutual PLC |
5,544 |
14 |
|||||||||
|
Progressive Corp. |
52 |
2 |
|||||||||
| Prudential Financial, Inc. |
16 |
1 |
|||||||||
| Reinsurance Group of America, Inc. |
8 |
1 |
|||||||||
| RSA Insurance Group PLC |
207 |
1 |
|||||||||
| Sampo OYJ, A Shares |
109 |
5 |
|||||||||
|
SCOR SE |
164 |
5 |
|||||||||
| Selective Insurance Group, Inc. |
21 |
1 |
|||||||||
|
Standard Life PLC |
704 |
3 |
|||||||||
| Suncorp Group Ltd. |
75 |
1 |
|||||||||
| Swiss Life Holding AG |
19 |
5 |
* |
||||||||
|
Swiss Re AG |
385 |
36 |
|||||||||
Number of Shares |
Value (000's omitted) |
||||||||||
| Travelers Cos., Inc. |
49 |
$ |
5 |
||||||||
| Zurich Insurance Group AG |
124 |
32 |
* |
||||||||
|
348 |
|||||||||||
|
IT Services (0.6%) |
|||||||||||
| Automatic Data Processing, Inc. |
400 |
35 |
(a) |
||||||||
|
Convergys Corp. |
70 |
2 |
|||||||||
|
IBM Corp. |
209 |
32 |
(a) |
||||||||
| Leidos Holdings, Inc. |
649 |
27 |
|||||||||
|
Western Union Co. |
287 |
6 |
|||||||||
|
Xerox Corp. |
612 |
6 |
|||||||||
|
108 |
|||||||||||
|
Machinery (0.0%) |
|||||||||||
|
Cummins, Inc. |
9 |
1 |
|||||||||
|
Weir Group PLC |
80 |
2 |
|||||||||
| Yangzijiang Shipbuilding Holdings Ltd. |
1,500 |
1 |
|||||||||
|
4 |
|||||||||||
|
Marine (0.0%) |
|||||||||||
|
Dfds A/S |
82 |
4 |
|||||||||
|
Media (0.3%) |
|||||||||||
| New Media Investment Group, Inc. |
21 |
0 |
(b) |
||||||||
|
Pearson PLC |
918 |
8 |
|||||||||
| Regal Entertainment Group Class A |
1,900 |
41 |
(a) |
||||||||
| Viacom, Inc. Class B |
21 |
1 |
|||||||||
|
Vivendi SA |
129 |
3 |
|||||||||
|
53 |
|||||||||||
|
Metals & Mining (1.2%) |
|||||||||||
| Acacia Mining PLC |
253 |
2 |
|||||||||
| Anglo American PLC |
1,383 |
19 |
*(a) | ||||||||
|
Bekaert NV |
167 |
7 |
|||||||||
|
BHP Billiton Ltd. |
2,223 |
39 |
|||||||||
|
BHP Billiton PLC |
1,380 |
21 |
(a) |
||||||||
| BlueScope Steel Ltd. |
807 |
5 |
|||||||||
|
Boliden AB |
92 |
2 |
|||||||||
|
Centamin PLC |
440 |
1 |
|||||||||
| Evolution Mining Ltd. |
289 |
0 |
(b) |
||||||||
| Fortescue Metals Group Ltd. |
461 |
2 |
|||||||||
| Franco-Nevada Corp. |
200 |
13 |
|||||||||
|
Glencore PLC |
1,104 |
3 |
* |
||||||||
See Notes to Financial Statements
78
Schedule of Investments Multi-Asset Income Fund (cont'd)
Number of Shares |
Value (000's omitted) |
||||||||||
| Hitachi Metals Ltd. |
100 |
$ |
1 |
||||||||
| Northern Star Resources Ltd. |
518 |
2 |
|||||||||
|
OZ Minerals Ltd. |
218 |
1 |
|||||||||
| Reliance Steel & Aluminum Co. |
107 |
7 |
|||||||||
|
Rio Tinto Ltd. |
389 |
16 |
|||||||||
|
Rio Tinto PLC |
1,109 |
39 |
|||||||||
| Southern Copper Corp. |
775 |
22 |
(a) |
||||||||
| Steel Dynamics, Inc. |
155 |
4 |
|||||||||
| Vedanta Resources PLC |
196 |
2 |
|||||||||
|
voestalpine AG |
19 |
1 |
|||||||||
| Worthington Industries, Inc. |
36 |
2 |
|||||||||
|
211 |
|||||||||||
|
Multi-Utilities (0.8%) |
|||||||||||
|
ACEA SpA |
137 |
2 |
|||||||||
|
Ameren Corp. |
650 |
33 |
(a) |
||||||||
|
Avista Corp. |
9 |
0 |
(b) |
||||||||
|
Black Hills Corp. |
300 |
19 |
(a) |
||||||||
|
Centrica PLC |
4,244 |
11 |
|||||||||
| Consolidated Edison, Inc. |
69 |
5 |
|||||||||
|
DUET Group |
249 |
0 |
(b) |
||||||||
|
E.ON SE |
237 |
2 |
|||||||||
|
Engie SA |
78 |
1 |
|||||||||
|
National Grid PLC |
2,636 |
34 |
|||||||||
|
RWE AG |
348 |
6 |
* |
||||||||
|
SCANA Corp. |
13 |
1 |
|||||||||
| WEC Energy Group, Inc. |
325 |
19 |
(a) |
||||||||
|
133 |
|||||||||||
|
Multiline Retail (0.3%) |
|||||||||||
|
Big Lots, Inc. |
29 |
1 |
|||||||||
| Dollar General Corp. |
15 |
1 |
|||||||||
| Harvey Norman Holdings Ltd. |
858 |
3 |
|||||||||
|
Kohl's Corp. |
96 |
4 |
|||||||||
|
Macy's, Inc. |
30 |
1 |
|||||||||
| Marks & Spencer Group PLC |
532 |
2 |
|||||||||
|
Nordstrom, Inc. |
18 |
1 |
|||||||||
|
Target Corp. |
516 |
36 |
(a) |
||||||||
|
49 |
|||||||||||
|
Oil, Gas & Consumable Fuels (3.6%) |
|||||||||||
|
Apache Corp. |
107 |
6 |
|||||||||
| BP PLC |
240 |
1 |
|||||||||
|
Chevron Corp. |
348 |
36 |
(a) |
||||||||
| DCP Midstream Partners LP |
500 |
17 |
|||||||||
| Denbury Resources, Inc. |
557 |
1 |
* |
||||||||
Number of Shares |
Value (000's omitted) |
||||||||||
| EQT GP Holdings LP |
1,050 |
$ |
25 |
||||||||
| Exxon Mobil Corp. |
1,029 |
86 |
(a) |
||||||||
| Idemitsu Kosan Co. Ltd. |
100 |
2 |
|||||||||
| Occidental Petroleum Corp. |
450 |
33 |
(a) |
||||||||
|
OMV AG |
118 |
4 |
|||||||||
|
ONEOK, Inc. |
1,225 |
59 |
(a) |
||||||||
|
Phillips 66 |
73 |
6 |
|||||||||
| Royal Dutch Shell PLC, A Shares |
2,221 |
55 |
|||||||||
| Royal Dutch Shell PLC, B Shares |
1,419 |
37 |
|||||||||
| Spectra Energy Corp. |
1,650 |
69 |
(a) |
||||||||
|
Statoil ASA |
664 |
11 |
|||||||||
| Suncor Energy, Inc. |
1,925 |
58 |
|||||||||
| Targa Resources Corp. |
675 |
30 |
|||||||||
|
TOTAL SA |
1,657 |
79 |
|||||||||
| Valero Energy Corp. |
55 |
3 |
(a) |
||||||||
| Williams Cos., Inc. |
400 |
12 |
|||||||||
| Woodside Petroleum Ltd. |
32 |
1 |
|||||||||
|
631 |
|||||||||||
|
Paper & Forest Products (0.1%) |
|||||||||||
|
Domtar Corp. |
17 |
1 |
|||||||||
|
Navigator Co. SA |
790 |
2 |
|||||||||
| Stora Enso OYJ, R Shares |
147 |
1 |
|||||||||
| UPM-Kymmene OYJ |
420 |
10 |
|||||||||
|
14 |
|||||||||||
|
Personal Products (0.0%) |
|||||||||||
| Oriflame Holding AG |
19 |
1 |
* |
||||||||
|
Pharmaceuticals (2.6%) |
|||||||||||
|
AstraZeneca PLC |
919 |
52 |
(a) |
||||||||
| Bristol-Myers Squibb Co. |
500 |
25 |
(a) |
||||||||
|
Eli Lilly & Co. |
372 |
27 |
(a) |
||||||||
| GlaxoSmithKline PLC |
3,911 |
78 |
|||||||||
| GlaxoSmithKline PLC ADR |
225 |
9 |
(a) |
||||||||
|
Indivior PLC |
1,592 |
6 |
|||||||||
| Johnson & Johnson |
839 |
97 |
(a) |
||||||||
|
Merck & Co., Inc. |
574 |
34 |
(a) |
||||||||
|
Pfizer, Inc. |
1,291 |
41 |
(a) |
||||||||
|
Recordati SpA |
166 |
5 |
|||||||||
|
Sanofi |
890 |
69 |
|||||||||
Number of Shares |
Value (000's omitted) |
||||||||||
| STADA Arzneimittel AG |
10 |
$ |
1 |
||||||||
| Sumitomo Dainippon Pharma Co. Ltd. |
100 |
2 |
|||||||||
| Takeda Pharmaceutical Co. Ltd. |
300 |
13 |
|||||||||
|
459 |
|||||||||||
|
Real Estate Investment Trusts (3.0%) |
|||||||||||
| American Campus Communities, Inc. |
202 |
11 |
|||||||||
| Annaly Capital Management, Inc. |
923 |
10 |
|||||||||
| Blackstone Mortgage Trust, Inc. Class A |
348 |
10 |
|||||||||
| Brandywine Realty Trust |
521 |
8 |
|||||||||
| Care Capital Properties, Inc. |
152 |
4 |
|||||||||
| CBL & Associates Properties, Inc. |
426 |
5 |
|||||||||
| Corporate Office Properties Trust |
362 |
10 |
|||||||||
| Crown Castle International Corp. |
478 |
43 |
(a) |
||||||||
| DCT Industrial Trust, Inc. |
650 |
30 |
|||||||||
| Digital Realty Trust, Inc. |
173 |
16 |
|||||||||
| Douglas Emmett, Inc. |
550 |
20 |
|||||||||
|
EPR Properties |
576 |
42 |
|||||||||
|
Equinix, Inc. |
55 |
20 |
(a) |
||||||||
| Highwoods Properties, Inc. |
214 |
11 |
|||||||||
| Iron Mountain, Inc. |
275 |
9 |
|||||||||
| Kimco Realty Corp. |
555 |
15 |
|||||||||
| LaSalle Hotel Properties |
183 |
4 |
|||||||||
| Liberty Property Trust |
246 |
10 |
|||||||||
|
Life Storage, Inc. |
57 |
5 |
|||||||||
| Mid-America Apartment Communities, Inc. |
96 |
9 |
|||||||||
| National Retail Properties, Inc. |
185 |
8 |
|||||||||
| OMEGA Healthcare Investors, Inc. |
451 |
14 |
|||||||||
|
Prologis, Inc. |
862 |
45 |
(a) |
||||||||
|
Public Storage |
64 |
14 |
|||||||||
See Notes to Financial Statements
79
Schedule of Investments Multi-Asset Income Fund (cont'd)
Number of Shares |
Value (000's omitted) |
||||||||||
| Retail Opportunity Investments Corp. |
271 |
$ |
5 |
||||||||
| Simon Property Group, Inc. |
131 |
24 |
(a) |
||||||||
| Spirit Realty Capital, Inc. |
693 |
8 |
|||||||||
|
STAG Industrial, Inc. |
413 |
10 |
|||||||||
| Starwood Property Trust, Inc. |
1,543 |
34 |
(a) |
||||||||
| Sun Communities, Inc. |
72 |
6 |
|||||||||
|
Ventas, Inc. |
253 |
17 |
|||||||||
| Washington Prime Group, Inc. |
631 |
7 |
|||||||||
|
Welltower, Inc. |
135 |
9 |
|||||||||
|
Weyerhaeuser Co. |
1,243 |
37 |
(a) |
||||||||
|
530 |
|||||||||||
|
Road & Rail (0.3%) |
|||||||||||
|
CSX Corp. |
17 |
1 |
|||||||||
| Norfolk Southern Corp. |
87 |
8 |
|||||||||
|
Union Pacific Corp. |
425 |
37 |
(a) |
||||||||
|
46 |
|||||||||||
|
Semiconductors & Semiconductor Equipment (1.0%) |
|||||||||||
| Brooks Automation, Inc. |
198 |
2 |
|||||||||
|
Intel Corp. |
1,054 |
37 |
(a) |
||||||||
|
Intersil Corp. |
138 |
3 |
|||||||||
|
KLA-Tencor Corp. |
34 |
2 |
|||||||||
| Maxim Integrated Products, Inc. |
975 |
39 |
(a) |
||||||||
| MKS Instruments, Inc. |
157 |
8 |
|||||||||
|
NVIDIA Corp. |
31 |
2 |
|||||||||
| QUALCOMM, Inc. |
943 |
65 |
(a) |
||||||||
| Texas Instruments, Inc. |
263 |
19 |
(a) |
||||||||
| Versum Materials, Inc. |
14 |
0 |
*(b) | ||||||||
|
177 |
|||||||||||
|
Software (0.7%) |
|||||||||||
|
Microsoft Corp. |
2,042 |
122 |
(a) |
||||||||
|
Specialty Retail (0.5%) |
|||||||||||
| American Eagle Outfitters, Inc. |
193 |
3 |
|||||||||
|
Best Buy Co., Inc. |
1,043 |
40 |
(a) |
||||||||
|
Cato Corp. Class A |
93 |
3 |
|||||||||
| Children's Place, Inc. |
5 |
0 |
(b) |
||||||||
|
Foot Locker, Inc. |
41 |
3 |
|||||||||
|
Gap, Inc. |
69 |
2 |
|||||||||
Number of Shares |
Value (000's omitted) |
||||||||||
| Hennes & Mauritz AB, B Shares |
387 |
$ |
11 |
||||||||
| K's Holdings Corp. |
100 |
2 |
|||||||||
|
TJX Cos., Inc. |
11 |
1 |
|||||||||
| Williams-Sonoma, Inc. |
375 |
17 |
|||||||||
|
82 |
|||||||||||
|
Technology Hardware, Storage & Peripherals (0.7%) |
|||||||||||
|
Apple, Inc. |
525 |
60 |
(a) |
||||||||
|
Canon, Inc. |
500 |
14 |
|||||||||
|
HP, Inc. |
871 |
13 |
|||||||||
| Western Digital Corp. |
550 |
32 |
|||||||||
|
119 |
|||||||||||
| Textiles, Apparel & Luxury Goods (0.0%) |
|||||||||||
| Yue Yuen Industrial Holdings Ltd. |
1,000 |
4 |
|||||||||
|
Tobacco (1.2%) |
|||||||||||
|
Altria Group, Inc. |
531 |
35 |
(a) |
||||||||
| British American Tobacco PLC |
1,363 |
78 |
|||||||||
|
Imperial Brands PLC |
549 |
27 |
|||||||||
| Philip Morris International, Inc. |
788 |
76 |
|||||||||
|
216 |
|||||||||||
| Trading Companies & Distributors (0.0%) |
|||||||||||
|
ITOCHU Corp. |
100 |
1 |
|||||||||
|
Rexel SA |
36 |
1 |
|||||||||
|
Sojitz Corp. |
1,500 |
4 |
|||||||||
|
6 |
|||||||||||
|
Transportation Infrastructure (0.1%) |
|||||||||||
|
Sydney Airport |
1,800 |
9 |
|||||||||
| Wireless Telecommunication Services (0.3%) |
|||||||||||
| Millicom International Cellular SA SDR |
9 |
0 |
(b) |
||||||||
|
StarHub Ltd. |
100 |
0 |
(b) |
||||||||
| Vodafone Group PLC |
20,561 |
57 |
(a) |
||||||||
|
57 |
|||||||||||
| Total Common Stocks (Cost $5,055) |
5,164 |
||||||||||
Number of Shares |
Value (000's omitted) |
||||||||||
|
Convertible Preferred Stocks (0.1%) |
|||||||||||
|
Oil, Gas & Consumable Fuels (0.1%) |
|||||||||||
| El Paso Energy Capital Trust I, 4.75%, due 3/31/28 |
400 |
$ |
20 |
||||||||
|
Pharmaceuticals (0.0%) |
|||||||||||
| Allergan PLC, Ser. A, Ser. A, 5.50%, due 3/01/18 |
10 |
8 |
|||||||||
| Total Convertible Preferred Stocks (Cost $26) |
28 |
||||||||||
|
Preferred Stocks (1.1%) |
|||||||||||
|
Real Estate Investment Trusts (1.1%) |
|||||||||||
| American Homes 4 Rent, Ser. D, 6.50% |
500 |
13 |
|||||||||
| Cedar Realty Trust, Inc., Ser. B, 7.25% |
600 |
15 |
|||||||||
| DuPont Fabros Technology, Inc., Ser. C, 6.63% |
500 |
14 |
|||||||||
| General Growth Properties, Inc., Ser. A, 6.38% |
200 |
5 |
|||||||||
| Hersha Hospitality Trust, Ser. C, 6.88% |
600 |
16 |
|||||||||
| National Retail Properties, Inc., Ser. D, 6.63% |
600 |
15 |
|||||||||
| Pebblebrook Hotel Trust, Ser. D, 6.38% |
700 |
18 |
|||||||||
| Regency Centers Corp., Ser. 6, 6.63% |
900 |
23 |
|||||||||
| Retail Properties of America, Inc., Ser. A, 7.00% |
600 |
16 |
|||||||||
| Rexford Industrial Realty, Inc., , 5.88% |
500 |
13 |
|||||||||
| SL Green Realty Corp., Ser. I, 6.50% |
900 |
23 |
|||||||||
| VEREIT, Inc., Ser. F, 6.70% |
600 |
16 |
|||||||||
| Total Preferred Stocks (Cost $183) |
187 |
||||||||||
See Notes to Financial Statements
80
Schedule of Investments Multi-Asset Income Fund (cont'd)
| Principal Amount (000's omitted) |
Value (000's omitted) |
||||||||||
|
Convertible Bonds (0.3%) |
|||||||||||
| Equity Real Estate Investment Trust (0.2%) |
|||||||||||
| Extra Space Storage LP, 3.13%, due 10/1/35 |
$ |
50 |
$ |
53 |
(c) |
||||||
|
Internet Software & Services (0.1%) |
|||||||||||
| Twitter, Inc., 1.00.%, due 9/15/21 |
10 |
9 |
|||||||||
| Total Convertible Bonds (Cost $60) |
62 |
||||||||||
|
U.S. Treasury Obligations (10.6%) |
|||||||||||
|
U.S. Treasury Bonds |
|||||||||||
| 5.50%, due 8/15/28 |
126 |
173 |
|||||||||
| 3.88%, due 8/15/40 |
161 |
202 |
(d) |
||||||||
| 2.50%, due 2/15/46 |
247 |
243 |
|||||||||
| 4.50%, due 2/15/36 |
98 |
133 |
|||||||||
| 3.00%, due 11/15/44 |
183 |
199 |
|||||||||
| U.S. Treasury Inflation-Indexed Bonds |
|||||||||||
| 1.75%, due 1/15/28 |
11 |
14 |
(e) |
||||||||
| 0.75%, due 2/15/42 |
37 |
38 |
|||||||||
| 3.88%, due 4/15/29 |
37 |
52 |
(e) |
||||||||
| 0.63%, due 2/15/43 |
84 |
82 |
(e) |
||||||||
| 3.38%, due 4/15/32 |
156 |
226 |
(e) |
||||||||
| U.S. Treasury Notes, 4.75%, due 2/15/37 |
346 |
485 |
(d) |
||||||||
| Total U.S. Treasury Obligations (Cost $1,864) |
1,847 |
||||||||||
| U.S. Government Agency Securities (2.0%) |
|||||||||||
| Federal Home Loan Bank, 5.50%, due 7/15/36 |
110 |
154 |
|||||||||
| Federal Home Loan Mortgage Corp., 6.75%, due 3/15/31 |
100 |
151 |
|||||||||
| Tennessee Valley Authority, Notes, 5.38%, due 4/1/56 |
30 |
41 |
|||||||||
| Total U.S. Government Agency Securities (Cost $351) |
346 |
||||||||||
Number of Shares |
Value (000's omitted) |
||||||||||
|
Exchange Traded Funds (6.9%) |
|||||||||||
| iShares 10+ Year Credit Bond ETF |
4,560 |
$ |
280 |
||||||||
| iShares Core U.S. Aggregate Bond ETF |
366 |
41 |
|||||||||
| iShares Emerging Markets Dividend ETF |
9,272 |
335 |
|||||||||
| SPDR Barclays International Treasury Bond ETF |
1,434 |
39 |
* |
||||||||
| SPDR Barclays Long Term Corporate Bond ETF |
10,860 |
452 |
|||||||||
| Vanguard S&P 500 ETF |
280 |
55 |
|||||||||
| Total Exchange Traded Funds (Cost $1,184) |
1,202 |
||||||||||
|
Master Limited Partnerships (2.8%) |
|||||||||||
|
Hotels, Restaurants & Leisure (0.3%) |
|||||||||||
|
Cedar Fair LP |
1,000 |
57 |
|||||||||
|
Oil, Gas & Consumable Fuels (2.4%) |
|||||||||||
| Alliance Holdings GP LP |
1,325 |
40 |
|||||||||
| Energy Transfer Equity LP |
6,000 |
90 |
|||||||||
| Energy Transfer Partners LP |
1,699 |
59 |
(a) |
||||||||
| Enterprise Products Partners LP |
2,000 |
51 |
(a) |
||||||||
| EQT Midstream Partners LP |
575 |
43 |
|||||||||
|
NuStar Energy LP |
900 |
42 |
|||||||||
| Teekay LNG Partners LP |
1,725 |
26 |
|||||||||
| Western Gas Equity Partners LP |
1,575 |
67 |
|||||||||
|
418 |
|||||||||||
|
Real Estate Management & Development (0.1%) |
|||||||||||
| Brookfield Property Partners LP |
372 |
8 |
* |
||||||||
| Total Master Limited Partnerships (Cost $552) |
483 |
||||||||||
Number of Shares |
Value (000's omitted) |
||||||||||
|
Investment Companies (43.3%) |
|||||||||||
| Neuberger Berman Emerging Markets Debt Fund Institutional Class |
156,831 |
$ |
1,396 |
(f) |
|||||||
| Neuberger Berman Floating Rate Income Fund Institutional Class |
322,521 |
3,192 |
(f) |
||||||||
| Neuberger Berman High Income Bond Fund Class R6 |
276,284 |
2,404 |
(f) |
||||||||
| Neuberger Berman Long Short Credit Fund Class R6 |
59,625 |
568 |
(f) |
||||||||
| Total Investment Companies (Cost $7,537) |
7,560 |
||||||||||
|
Short-Term Investment (3.3%) |
|||||||||||
|
Investment Company (3.3%) |
|||||||||||
| State Street Institutional U.S. Government Money Market Fund Premier Class, 0.26% (Cost $575) |
574,616 |
575 |
(a)(g) |
||||||||
| Total Investments (99.9%) (Cost $17,387) |
17,454 |
||||||||||
| Other Assets Less Liabilities (0.1%) |
23 |
(h) |
|||||||||
|
Net Assets (100.0%) |
$ |
17,477 |
|||||||||
See Notes to Financial Statements
81
Schedule of Investments Multi-Asset Income Fund (cont'd)
* Non-income producing security.
(a) All or a portion of this security is segregated in connection with obligations for futures and/or forward foreign currency and/or options written with a total value of approximately $2,835,000.
(b) Amount less than one thousand.
(c) Securities were purchased under Rule 144A of the Securities Act of 1933, as amended (the "1933 Act"), or are otherwise restricted and, unless registered under the 1933 Act or exempted from registration, may only be sold to qualified institutional investors or may have other restrictions on resale. At 10/31/2016, these securities amounted to approximately $57,000 or 0.3% of the net assets for the Fund. These securities have been deemed by the investment manager to be liquid.
(d) All or a portion of the security is pledged as collateral for options written.
(e) Index-linked bond whose principal amount adjusts according to a government retail price index.
(f) Affiliated company as defined under the Investment Company Act of 1940.
(g) Represents 7-day effective yield as of 10/31/2016.
(h) Includes the impact of the Fund's open positions in derivatives at 10/31/2016.
See Notes to Financial Statements
82
Schedule of Investments Multi-Asset Income Fund (cont'd)
Derivative Instruments
Futures contracts ("futures")
At October 31, 2016, open positions in futures for the Fund were as follows:
|
Expiration |
Open Contracts |
Position |
Unrealized Appreciation/ (Depreciation) |
||||||||||||
|
12/19/2016 |
1 Canadian Treasury Bond, 10 Year |
Long |
$ |
(1,524 |
) |
||||||||||
|
12/8/2016 |
1 Euro-BOBL |
Long |
(1,013 |
) |
|||||||||||
|
12/8/2016 |
1 Euro-BTP |
Long |
(6,205 |
) |
|||||||||||
|
12/8/2016 |
1 Euro-Bund |
Long |
(2,209 |
) |
|||||||||||
|
12/8/2016 |
1 Euro-OAT |
Long |
(4,130 |
) |
|||||||||||
|
12/16/2016 |
3 FTSE 100 Index |
Long |
7,960 |
||||||||||||
|
12/16/2016 |
4 Mini MSCI Emerging Markets Index |
Long |
(2,188 |
) |
|||||||||||
|
12/16/2016 |
1 Russell 2000 Index Mini |
Long |
(2,090 |
) |
|||||||||||
|
12/16/2016 |
3 S&P 500 E-Mini Index |
Long |
(3,245 |
) |
|||||||||||
|
12/20/2016 |
6 U.S. Treasury Note, 10 Year |
Long |
(10,264 |
) |
|||||||||||
|
12/30/2016 |
3 U.S. Treasury Note, 2 Year |
Long |
(1,089 |
) |
|||||||||||
|
12/16/2016 |
16 S&P 500 E-Mini Index |
Short |
2,500 |
||||||||||||
|
12/30/2016 |
5 U.S. Treasury Note, 5 Year |
Short |
3,928 |
||||||||||||
|
Total |
$ |
(19,569 |
) |
||||||||||||
At October 31, 2016, the notional value of futures for the Fund was $3,057,702 for long positions and $(2,300,064) for short positions. The Fund had $59,691 deposited in a segregated account to cover margin requirements on open futures.
For the year ended October 31, 2016, the average notional value of futures for the Fund was $1,837,400 for long positions and $(673,704) for short positions.
Forward foreign currency contracts ("forward contracts")
At October 31, 2016, open forward contracts for the Fund were as follows:
|
Contracts to Receive |
In Exchange For |
Counterparty |
Settlement Date |
Net Unrealized Appreciation/ (Depreciation) |
|||||||||||||||||||
| 67,391 |
Australian Dollar |
$ |
50,982 |
Deutsche Bank AG |
11/16/16 |
$ |
263 |
||||||||||||||||
| 74,511 |
Australian Dollar |
57,190 |
Goldman Sachs International |
11/16/16 |
(531 |
) |
|||||||||||||||||
| 25,715 |
Australian Dollar |
19,404 |
Goldman Sachs International |
11/16/16 |
151 |
||||||||||||||||||
| 184,718 |
Australian Dollar |
139,335 |
Societe Generale |
11/16/16 |
1,127 |
||||||||||||||||||
| 67,391 |
Australian Dollar |
51,554 |
Societe Generale |
11/16/16 |
(309 |
) |
|||||||||||||||||
| 49,747 |
Australian Dollar |
37,266 |
Societe Generale |
11/16/16 |
562 |
||||||||||||||||||
| 24,829 |
Australian Dollar |
18,829 |
Societe Generale |
11/16/16 |
51 |
||||||||||||||||||
| 40,627 |
Australian Dollar |
30,611 |
Societe Generale |
11/16/16 |
283 |
||||||||||||||||||
| 41,398 |
Australian Dollar |
31,661 |
State Street Bank and Trust Company |
11/16/16 |
(182 |
) |
|||||||||||||||||
| 89,326 |
Australian Dollar |
68,477 |
State Street Bank and Trust Company |
11/16/16 |
(552 |
) |
|||||||||||||||||
| 54,106 |
Australian Dollar |
40,534 |
State Street Bank and Trust Company |
11/16/16 |
609 |
||||||||||||||||||
| 63,007 |
Australian Dollar |
47,935 |
State Street Bank and Trust Company |
11/16/16 |
(23 |
) |
|||||||||||||||||
See Notes to Financial Statements
83
Schedule of Investments Multi-Asset Income Fund (cont'd)
|
Contracts to Receive |
In Exchange For |
Counterparty |
Settlement Date |
Net Unrealized Appreciation/ (Depreciation) |
|||||||||||||||||||
| 77,837 |
Australian Dollar |
$ |
59,638 |
State Street Bank and Trust Company |
11/16/16 |
$ |
(450 |
) |
|||||||||||||||
| 24,754 |
Australian Dollar |
18,748 |
State Street Bank and Trust Company |
11/16/16 |
76 |
||||||||||||||||||
| 21,475 |
Australian Dollar |
16,254 |
State Street Bank and Trust Company |
11/16/16 |
76 |
||||||||||||||||||
| 233,829 |
Canadian Dollar |
179,526 |
Deutsche Bank AG |
11/16/16 |
(5,178 |
) |
|||||||||||||||||
| 66,109 |
Canadian Dollar |
49,386 |
Goldman Sachs International |
11/16/16 |
(94 |
) |
|||||||||||||||||
| 39,072 |
Canadian Dollar |
29,696 |
Goldman Sachs International |
11/16/16 |
(563 |
) |
|||||||||||||||||
| 25,009 |
Canadian Dollar |
18,913 |
Goldman Sachs International |
11/16/16 |
(266 |
) |
|||||||||||||||||
| 33,347 |
Canadian Dollar |
25,336 |
Royal Bank of Canada |
11/16/16 |
(471 |
) |
|||||||||||||||||
| 233,829 |
Canadian Dollar |
178,645 |
Societe Generale |
11/16/16 |
(4,297 |
) |
|||||||||||||||||
| 159,536 |
Canadian Dollar |
120,393 |
Societe Generale |
11/16/16 |
(1,439 |
) |
|||||||||||||||||
| 453,135 |
Canadian Dollar |
346,168 |
Societe Generale |
11/16/16 |
(8,301 |
) |
|||||||||||||||||
| 24,355 |
Canadian Dollar |
18,588 |
Societe Generale |
11/16/16 |
(428 |
) |
|||||||||||||||||
| 121,162 |
Canadian Dollar |
93,061 |
State Street Bank and Trust Company |
11/16/16 |
(2,720 |
) |
|||||||||||||||||
| 28,452 |
Canadian Dollar |
22,179 |
State Street Bank and Trust Company |
11/16/16 |
(964 |
) |
|||||||||||||||||
| 16,719 |
Canadian Dollar |
12,716 |
State Street Bank and Trust Company |
11/16/16 |
(250 |
) |
|||||||||||||||||
| 117,701 |
Canadian Dollar |
89,773 |
State Street Bank and Trust Company |
11/16/16 |
(2,012 |
) |
|||||||||||||||||
| 43,355 |
Canadian Dollar |
32,764 |
State Street Bank and Trust Company |
11/16/16 |
(437 |
) |
|||||||||||||||||
| 53,681 |
Canadian Dollar |
41,291 |
State Street Bank and Trust Company |
11/16/16 |
(1,265 |
) |
|||||||||||||||||
| 12,710 |
Euro |
14,281 |
Deutsche Bank AG |
11/16/16 |
(321 |
) |
|||||||||||||||||
| 81,341 |
Euro |
91,202 |
Goldman Sachs International |
11/16/16 |
(1,860 |
) |
|||||||||||||||||
| 39,650 |
Euro |
44,315 |
Goldman Sachs International |
11/16/16 |
(765 |
) |
|||||||||||||||||
| 10,875 |
Euro |
12,203 |
Royal Bank of Canada |
11/16/16 |
(259 |
) |
|||||||||||||||||
| 35,935 |
Euro |
40,206 |
Royal Bank of Canada |
11/16/16 |
(737 |
) |
|||||||||||||||||
| 34,037 |
Euro |
38,036 |
Royal Bank of Canada |
11/16/16 |
(651 |
) |
|||||||||||||||||
| 42,083 |
Euro |
47,207 |
Royal Bank of Canada |
11/16/16 |
(985 |
) |
|||||||||||||||||
| 10,027 |
Euro |
11,275 |
Royal Bank of Canada |
11/16/16 |
(262 |
) |
|||||||||||||||||
| 11,493 |
Euro |
12,755 |
Societe Generale |
11/16/16 |
(131 |
) |
|||||||||||||||||
| 32,497 |
Euro |
36,516 |
Societe Generale |
11/16/16 |
(822 |
) |
|||||||||||||||||
| 47,239 |
Euro |
53,022 |
Societe Generale |
11/16/16 |
(1,137 |
) |
|||||||||||||||||
| 33,981 |
Euro |
37,401 |
Societe Generale |
11/16/16 |
(77 |
) |
|||||||||||||||||
| 23,290 |
Euro |
25,368 |
Societe Generale |
11/16/16 |
213 |
||||||||||||||||||
| 29,412 |
Euro |
33,000 |
State Street Bank and Trust Company |
11/16/16 |
(695 |
) |
|||||||||||||||||
| 36,246 |
Euro |
39,973 |
State Street Bank and Trust Company |
11/16/16 |
(162 |
) |
|||||||||||||||||
| 78,523 |
Euro |
86,455 |
State Street Bank and Trust Company |
11/16/16 |
(208 |
) |
|||||||||||||||||
| 114,231 |
Euro |
127,276 |
State Street Bank and Trust Company |
11/16/16 |
(1,809 |
) |
|||||||||||||||||
| 26,902 |
Euro |
30,273 |
State Street Bank and Trust Company |
11/16/16 |
(725 |
) |
|||||||||||||||||
| 17,345 |
Euro |
19,411 |
State Street Bank and Trust Company |
11/16/16 |
(360 |
) |
|||||||||||||||||
| 943,525 |
Japanese Yen |
9,136 |
Deutsche Bank AG |
11/16/16 |
(135 |
) |
|||||||||||||||||
| 3,165,356 |
Japanese Yen |
30,089 |
Goldman Sachs International |
11/16/16 |
109 |
||||||||||||||||||
| 2,398,593 |
Japanese Yen |
23,574 |
Goldman Sachs International |
11/16/16 |
(691 |
) |
|||||||||||||||||
| 1,741,009 |
Japanese Yen |
17,069 |
Goldman Sachs International |
11/16/16 |
(459 |
) |
|||||||||||||||||
| 23,511,634 |
Japanese Yen |
227,712 |
Royal Bank of Canada |
11/16/16 |
(3,412 |
) |
|||||||||||||||||
| 2,056,843 |
Japanese Yen |
20,334 |
Royal Bank of Canada |
11/16/16 |
(712 |
) |
|||||||||||||||||
See Notes to Financial Statements
84
Schedule of Investments Multi-Asset Income Fund (cont'd)
|
Contracts to Receive |
In Exchange For |
Counterparty |
Settlement Date |
Net Unrealized Appreciation/ (Depreciation) |
|||||||||||||||||||
| 4,413,490 |
Japanese Yen |
$ |
42,948 |
Royal Bank of Canada |
11/16/16 |
$ |
(844 |
) |
|||||||||||||||
| 5,021,911 |
Japanese Yen |
48,222 |
Royal Bank of Canada |
11/16/16 |
(313 |
) |
|||||||||||||||||
| 7,740,079 |
Japanese Yen |
76,339 |
Societe Generale |
11/16/16 |
(2,499 |
) |
|||||||||||||||||
| 943,525 |
Japanese Yen |
9,331 |
Societe Generale |
11/16/16 |
(330 |
) |
|||||||||||||||||
| 1,074,084 |
Japanese Yen |
10,611 |
Societe Generale |
11/16/16 |
(365 |
) |
|||||||||||||||||
| 2,412,117 |
Japanese Yen |
23,237 |
Societe Generale |
11/16/16 |
(226 |
) |
|||||||||||||||||
| 5,311,227 |
Japanese Yen |
50,990 |
Societe Generale |
11/16/16 |
(321 |
) |
|||||||||||||||||
| 5,125,971 |
Japanese Yen |
50,319 |
State Street Bank and Trust Company |
11/16/16 |
(1,417 |
) |
|||||||||||||||||
| 2,832,011 |
Japanese Yen |
27,305 |
State Street Bank and Trust Company |
11/16/16 |
(288 |
) |
|||||||||||||||||
| 2,426,094 |
Japanese Yen |
23,385 |
State Street Bank and Trust Company |
11/16/16 |
(240 |
) |
|||||||||||||||||
| 2,706,655 |
Japanese Yen |
26,494 |
State Street Bank and Trust Company |
11/16/16 |
(672 |
) |
|||||||||||||||||
| 7,610,682 |
Japanese Yen |
73,297 |
State Street Bank and Trust Company |
11/16/16 |
(692 |
) |
|||||||||||||||||
| 1,257,186 |
Mexican Peso |
65,037 |
State Street Bank and Trust Company |
11/16/16 |
1,380 |
||||||||||||||||||
| 105,958 |
New Zealand Dollar |
76,830 |
Deutsche Bank AG |
11/16/16 |
(1,103 |
) |
|||||||||||||||||
| 124,657 |
New Zealand Dollar |
88,927 |
Goldman Sachs International |
11/16/16 |
163 |
||||||||||||||||||
| 31,933 |
New Zealand Dollar |
23,319 |
Goldman Sachs International |
11/16/16 |
(497 |
) |
|||||||||||||||||
| 14,302 |
New Zealand Dollar |
10,409 |
Goldman Sachs International |
11/16/16 |
(188 |
) |
|||||||||||||||||
| 100,110 |
New Zealand Dollar |
72,786 |
Royal Bank of Canada |
11/16/16 |
(1,239 |
) |
|||||||||||||||||
| 53,173 |
New Zealand Dollar |
39,487 |
Royal Bank of Canada |
11/16/16 |
(1,485 |
) |
|||||||||||||||||
| 106,001 |
New Zealand Dollar |
77,841 |
Royal Bank of Canada |
11/16/16 |
(2,083 |
) |
|||||||||||||||||
| 44,913 |
New Zealand Dollar |
32,563 |
Royal Bank of Canada |
11/16/16 |
(464 |
) |
|||||||||||||||||
| 20,761 |
New Zealand Dollar |
15,005 |
Royal Bank of Canada |
11/16/16 |
(167 |
) |
|||||||||||||||||
| 49,059 |
New Zealand Dollar |
35,202 |
Royal Bank of Canada |
11/16/16 |
(140 |
) |
|||||||||||||||||
| 21,674 |
New Zealand Dollar |
15,371 |
Royal Bank of Canada |
11/16/16 |
119 |
||||||||||||||||||
| 48,260 |
New Zealand Dollar |
34,409 |
Societe Generale |
11/16/16 |
82 |
||||||||||||||||||
| 49,074 |
New Zealand Dollar |
34,603 |
Societe Generale |
11/16/16 |
470 |
||||||||||||||||||
| 98,802 |
New Zealand Dollar |
71,222 |
State Street Bank and Trust Company |
11/16/16 |
(610 |
) |
|||||||||||||||||
| 24,628 |
New Zealand Dollar |
17,987 |
State Street Bank and Trust Company |
11/16/16 |
(385 |
) |
|||||||||||||||||
| 109,516 |
New Zealand Dollar |
79,147 |
State Street Bank and Trust Company |
11/16/16 |
(877 |
) |
|||||||||||||||||
| 25,927 |
New Zealand Dollar |
18,807 |
State Street Bank and Trust Company |
11/16/16 |
(278 |
) |
|||||||||||||||||
| 16,078 |
New Zealand Dollar |
11,661 |
State Street Bank and Trust Company |
11/16/16 |
(170 |
) |
|||||||||||||||||
| 38,301 |
New Zealand Dollar |
27,320 |
State Street Bank and Trust Company |
11/16/16 |
53 |
||||||||||||||||||
| 54,235 |
New Zealand Dollar |
39,508 |
State Street Bank and Trust Company |
11/16/16 |
(747 |
) |
|||||||||||||||||
| 13,314 |
New Zealand Dollar |
9,488 |
State Street Bank and Trust Company |
11/16/16 |
28 |
||||||||||||||||||
| 378,210 |
Norwegian Krone |
47,008 |
Deutsche Bank AG |
11/16/16 |
(1,232 |
) |
|||||||||||||||||
| 162,177 |
Norwegian Krone |
19,484 |
Royal Bank of Canada |
11/16/16 |
145 |
||||||||||||||||||
| 127,605 |
Norwegian Krone |
15,558 |
Royal Bank of Canada |
11/16/16 |
(114 |
) |
|||||||||||||||||
| 77,344 |
Norwegian Krone |
9,320 |
Royal Bank of Canada |
11/16/16 |
41 |
||||||||||||||||||
| 312,056 |
Norwegian Krone |
38,544 |
Royal Bank of Canada |
11/16/16 |
(775 |
) |
|||||||||||||||||
| 1,772,486 |
Norwegian Krone |
212,979 |
Societe Generale |
11/16/16 |
1,551 |
||||||||||||||||||
| 206,956 |
Norwegian Krone |
25,074 |
Societe Generale |
11/16/16 |
(24 |
) |
|||||||||||||||||
| 143,898 |
Norwegian Krone |
17,649 |
Societe Generale |
11/16/16 |
(232 |
) |
|||||||||||||||||
| 3,467,849 |
Norwegian Krone |
417,881 |
State Street Bank and Trust Company |
11/16/16 |
1,843 |
||||||||||||||||||
See Notes to Financial Statements
85
Schedule of Investments Multi-Asset Income Fund (cont'd)
|
Contracts to Receive |
In Exchange For |
Counterparty |
Settlement Date |
Net Unrealized Appreciation/ (Depreciation) |
|||||||||||||||||||
| 240,923 |
Norwegian Krone |
$ |
30,010 |
State Street Bank and Trust Company |
11/16/16 |
$ |
(850 |
) |
|||||||||||||||
| 102,283 |
Norwegian Krone |
12,367 |
State Street Bank and Trust Company |
11/16/16 |
13 |
||||||||||||||||||
| 91,313 |
Norwegian Krone |
11,051 |
State Street Bank and Trust Company |
11/16/16 |
1 |
||||||||||||||||||
| 31,214 |
Pound Sterling |
40,575 |
Deutsche Bank AG |
11/16/16 |
(2,359 |
) |
|||||||||||||||||
| 6,673 |
Pound Sterling |
8,661 |
Goldman Sachs International |
11/16/16 |
(491 |
) |
|||||||||||||||||
| 16,399 |
Pound Sterling |
21,676 |
Goldman Sachs International |
11/16/16 |
(1,599 |
) |
|||||||||||||||||
| 8,749 |
Pound Sterling |
11,621 |
Goldman Sachs International |
11/16/16 |
(910 |
) |
|||||||||||||||||
| 3,524 |
Pound Sterling |
4,678 |
Royal Bank of Canada |
11/16/16 |
(364 |
) |
|||||||||||||||||
| 9,713 |
Pound Sterling |
11,897 |
Royal Bank of Canada |
11/16/16 |
(5 |
) |
|||||||||||||||||
| 18,593 |
Pound Sterling |
24,794 |
Royal Bank of Canada |
11/16/16 |
(2,030 |
) |
|||||||||||||||||
| 25,194 |
Pound Sterling |
32,773 |
Royal Bank of Canada |
11/16/16 |
(1,928 |
) |
|||||||||||||||||
| 38,030 |
Pound Sterling |
49,454 |
Royal Bank of Canada |
11/16/16 |
(2,893 |
) |
|||||||||||||||||
| 110,605 |
Pound Sterling |
146,993 |
Societe Generale |
11/16/16 |
(11,576 |
) |
|||||||||||||||||
| 19,007 |
Pound Sterling |
23,631 |
Societe Generale |
11/16/16 |
(360 |
) |
|||||||||||||||||
| 19,679 |
Pound Sterling |
25,600 |
Societe Generale |
11/16/16 |
(1,507 |
) |
|||||||||||||||||
| 43,713 |
Pound Sterling |
56,387 |
Societe Generale |
11/16/16 |
(2,868 |
) |
|||||||||||||||||
| 16,302 |
Pound Sterling |
20,619 |
State Street Bank and Trust Company |
11/16/16 |
(660 |
) |
|||||||||||||||||
| 29,100 |
Pound Sterling |
38,876 |
State Street Bank and Trust Company |
11/16/16 |
(3,248 |
) |
|||||||||||||||||
| 16,837 |
Pound Sterling |
22,257 |
State Street Bank and Trust Company |
11/16/16 |
(1,642 |
) |
|||||||||||||||||
| 19,390 |
Pound Sterling |
25,361 |
State Street Bank and Trust Company |
11/16/16 |
(1,621 |
) |
|||||||||||||||||
| 423,655 |
Swedish Krona |
49,440 |
Deutsche Bank AG |
11/16/16 |
(2,506 |
) |
|||||||||||||||||
| 2,045,601 |
Swedish Krona |
238,860 |
Goldman Sachs International |
11/16/16 |
(12,240 |
) |
|||||||||||||||||
| 346,872 |
Swedish Krona |
38,420 |
Goldman Sachs International |
11/16/16 |
8 |
||||||||||||||||||
| 85,575 |
Swedish Krona |
10,026 |
Goldman Sachs International |
11/16/16 |
(546 |
) |
|||||||||||||||||
| 198,767 |
Swedish Krona |
23,466 |
Goldman Sachs International |
11/16/16 |
(1,445 |
) |
|||||||||||||||||
| 965,664 |
Swedish Krona |
112,878 |
Royal Bank of Canada |
11/16/16 |
(5,898 |
) |
|||||||||||||||||
| 258,777 |
Swedish Krona |
30,275 |
Royal Bank of Canada |
11/16/16 |
(1,607 |
) |
|||||||||||||||||
| 478,136 |
Swedish Krona |
55,795 |
Royal Bank of Canada |
11/16/16 |
(2,825 |
) |
|||||||||||||||||
| 284,047 |
Swedish Krona |
33,085 |
Royal Bank of Canada |
11/16/16 |
(1,617 |
) |
|||||||||||||||||
| 82,791 |
Swedish Krona |
9,685 |
Royal Bank of Canada |
11/16/16 |
(513 |
) |
|||||||||||||||||
| 128,927 |
Swedish Krona |
14,640 |
Royal Bank of Canada |
11/16/16 |
(357 |
) |
|||||||||||||||||
| 676,804 |
Swedish Krona |
79,647 |
Societe Generale |
11/16/16 |
(4,668 |
) |
|||||||||||||||||
| 501,386 |
Swedish Krona |
58,532 |
Societe Generale |
11/16/16 |
(2,986 |
) |
|||||||||||||||||
| 339,540 |
Swedish Krona |
38,565 |
Societe Generale |
11/16/16 |
(949 |
) |
|||||||||||||||||
| 182,395 |
Swedish Krona |
20,475 |
Societe Generale |
11/16/16 |
(268 |
) |
|||||||||||||||||
| 746,140 |
Swedish Krona |
87,256 |
State Street Bank and Trust Company |
11/16/16 |
(4,595 |
) |
|||||||||||||||||
| 410,087 |
Swedish Krona |
48,599 |
State Street Bank and Trust Company |
11/16/16 |
(3,168 |
) |
|||||||||||||||||
| 92,052 |
Swedish Krona |
10,808 |
State Street Bank and Trust Company |
11/16/16 |
(610 |
) |
|||||||||||||||||
| 280,133 |
Swedish Krona |
32,437 |
State Street Bank and Trust Company |
11/16/16 |
(1,403 |
) |
|||||||||||||||||
| 333,459 |
Swedish Krona |
37,909 |
State Street Bank and Trust Company |
11/16/16 |
(967 |
) |
|||||||||||||||||
| 465,368 |
Swedish Krona |
54,537 |
State Street Bank and Trust Company |
11/16/16 |
(2,981 |
) |
|||||||||||||||||
| 7,916 |
Swiss Franc |
8,170 |
Deutsche Bank AG |
11/16/16 |
(165 |
) |
|||||||||||||||||
| 30,060 |
Swiss Franc |
30,254 |
Goldman Sachs International |
11/16/16 |
145 |
||||||||||||||||||
See Notes to Financial Statements
86
Schedule of Investments Multi-Asset Income Fund (cont'd)
|
Contracts to Receive |
In Exchange For |
Counterparty |
Settlement Date |
Net Unrealized Appreciation/ (Depreciation) |
|||||||||||||||||||
| 14,892 |
Swiss Franc |
$ |
15,253 |
Goldman Sachs International |
11/16/16 |
$ |
(193 |
) |
|||||||||||||||
| 35,406 |
Swiss Franc |
36,443 |
Societe Generale |
11/16/16 |
(637 |
) |
|||||||||||||||||
| 19,684 |
Swiss Franc |
19,837 |
Societe Generale |
11/16/16 |
68 |
||||||||||||||||||
| 21,917 |
Swiss Franc |
22,616 |
Societe Generale |
11/16/16 |
(452 |
) |
|||||||||||||||||
| 29,539 |
Swiss Franc |
30,154 |
Societe Generale |
11/16/16 |
(282 |
) |
|||||||||||||||||
| 23,481 |
Swiss Franc |
23,794 |
Societe Generale |
11/16/16 |
(49 |
) |
|||||||||||||||||
| 39,110 |
Swiss Franc |
39,345 |
State Street Bank and Trust Company |
11/16/16 |
205 |
||||||||||||||||||
| 167,049 |
Swiss Franc |
171,573 |
State Street Bank and Trust Company |
11/16/16 |
(2,643 |
) |
|||||||||||||||||
| 95,225 |
Swiss Franc |
96,350 |
State Street Bank and Trust Company |
11/16/16 |
(52 |
) |
|||||||||||||||||
| 20,400 |
Swiss Franc |
20,824 |
State Street Bank and Trust Company |
11/16/16 |
(194 |
) |
|||||||||||||||||
| 16,077 |
Swiss Franc |
16,450 |
State Street Bank and Trust Company |
11/16/16 |
(192 |
) |
|||||||||||||||||
| 12,948 |
Swiss Franc |
13,372 |
State Street Bank and Trust Company |
11/16/16 |
(278 |
) |
|||||||||||||||||
|
Total |
$ |
(153,486 |
) |
||||||||||||||||||||
|
Contracts to Deliver |
In Exchange For |
Counterparty |
Settlement Date |
Net Unrealized Appreciation/ (Depreciation) |
|||||||||||||||||||
| 67,391 |
Australian Dollar |
$ |
51,507 |
Deutsche Bank AG |
11/16/16 |
$ |
262 |
||||||||||||||||
| 208,002 |
Australian Dollar |
156,646 |
Goldman Sachs International |
11/16/16 |
(1,521 |
) |
|||||||||||||||||
| 38,765 |
Australian Dollar |
29,119 |
Goldman Sachs International |
11/16/16 |
(358 |
) |
|||||||||||||||||
| 55,468 |
Australian Dollar |
41,556 |
Goldman Sachs International |
11/16/16 |
(623 |
) |
|||||||||||||||||
| 46,148 |
Australian Dollar |
34,961 |
Goldman Sachs International |
11/16/16 |
(130 |
) |
|||||||||||||||||
| 70,909 |
Australian Dollar |
53,447 |
Royal Bank of Canada |
11/16/16 |
(473 |
) |
|||||||||||||||||
| 26,093 |
Australian Dollar |
19,505 |
Royal Bank of Canada |
11/16/16 |
(336 |
) |
|||||||||||||||||
| 48,339 |
Australian Dollar |
36,662 |
Royal Bank of Canada |
11/16/16 |
(96 |
) |
|||||||||||||||||
| 85,963 |
Australian Dollar |
65,647 |
Royal Bank of Canada |
11/16/16 |
279 |
||||||||||||||||||
| 59,893 |
Australian Dollar |
45,921 |
Societe Generale |
11/16/16 |
378 |
||||||||||||||||||
| 31,863 |
Australian Dollar |
24,192 |
Societe Generale |
11/16/16 |
(37 |
) |
|||||||||||||||||
| 233,185 |
Australian Dollar |
175,740 |
State Street Bank and Trust Company |
11/16/16 |
(1,577 |
) |
|||||||||||||||||
| 441,840 |
Australian Dollar |
334,769 |
State Street Bank and Trust Company |
11/16/16 |
(1,212 |
) |
|||||||||||||||||
| 46,530 |
Australian Dollar |
35,700 |
State Street Bank and Trust Company |
11/16/16 |
318 |
||||||||||||||||||
| 233,829 |
Canadian Dollar |
178,685 |
Deutsche Bank AG |
11/16/16 |
4,337 |
||||||||||||||||||
| 239,696 |
Canadian Dollar |
182,942 |
Goldman Sachs International |
11/16/16 |
4,220 |
||||||||||||||||||
| 52,548 |
Canadian Dollar |
40,630 |
Goldman Sachs International |
11/16/16 |
1,449 |
||||||||||||||||||
| 30,460 |
Canadian Dollar |
23,273 |
Goldman Sachs International |
11/16/16 |
561 |
||||||||||||||||||
| 452,701 |
Canadian Dollar |
345,650 |
Royal Bank of Canada |
11/16/16 |
8,106 |
||||||||||||||||||
| 66,646 |
Canadian Dollar |
50,450 |
Royal Bank of Canada |
11/16/16 |
757 |
||||||||||||||||||
| 69,420 |
Canadian Dollar |
52,755 |
Royal Bank of Canada |
11/16/16 |
994 |
||||||||||||||||||
| 65,479 |
Canadian Dollar |
49,368 |
Royal Bank of Canada |
11/16/16 |
546 |
||||||||||||||||||
| 18,281 |
Canadian Dollar |
13,855 |
Royal Bank of Canada |
11/16/16 |
225 |
||||||||||||||||||
| 61,211 |
Canadian Dollar |
46,839 |
Societe Generale |
11/16/16 |
1,199 |
||||||||||||||||||
| 61,681 |
Canadian Dollar |
46,607 |
Societe Generale |
11/16/16 |
616 |
||||||||||||||||||
| 60,614 |
Canadian Dollar |
46,150 |
Societe Generale |
11/16/16 |
955 |
||||||||||||||||||
See Notes to Financial Statements
87
Schedule of Investments Multi-Asset Income Fund (cont'd)
|
Contracts to Deliver |
In Exchange For |
Counterparty |
Settlement Date |
Net Unrealized Appreciation/ (Depreciation) |
|||||||||||||||||||
| 68,807 |
Canadian Dollar |
$ |
51,524 |
Societe Generale |
11/16/16 |
$ |
220 |
||||||||||||||||
| 18,708 |
Canadian Dollar |
14,190 |
State Street Bank and Trust Company |
11/16/16 |
241 |
||||||||||||||||||
| 44,095 |
Canadian Dollar |
33,433 |
State Street Bank and Trust Company |
11/16/16 |
555 |
||||||||||||||||||
| 21,691 |
Canadian Dollar |
16,534 |
State Street Bank and Trust Company |
11/16/16 |
360 |
||||||||||||||||||
| 48,304 |
Canadian Dollar |
36,623 |
State Street Bank and Trust Company |
11/16/16 |
606 |
||||||||||||||||||
| 54,218 |
Canadian Dollar |
40,902 |
State Street Bank and Trust Company |
11/16/16 |
476 |
||||||||||||||||||
| 25,475 |
Canadian Dollar |
19,440 |
State Street Bank and Trust Company |
11/16/16 |
446 |
||||||||||||||||||
| 12,710 |
Euro |
14,283 |
Deutsche Bank AG |
11/16/16 |
323 |
||||||||||||||||||
| 20,841 |
Euro |
23,462 |
Goldman Sachs International |
11/16/16 |
571 |
||||||||||||||||||
| 18,122 |
Euro |
20,435 |
Goldman Sachs International |
11/16/16 |
530 |
||||||||||||||||||
| 27,693 |
Euro |
31,020 |
Goldman Sachs International |
11/16/16 |
603 |
||||||||||||||||||
| 9,061 |
Euro |
9,893 |
Goldman Sachs International |
11/16/16 |
(59 |
) |
|||||||||||||||||
| 35,582 |
Euro |
40,103 |
Royal Bank of Canada |
11/16/16 |
1,021 |
||||||||||||||||||
| 46,116 |
Euro |
52,068 |
Royal Bank of Canada |
11/16/16 |
1,416 |
||||||||||||||||||
| 40,055 |
Euro |
44,141 |
Royal Bank of Canada |
11/16/16 |
146 |
||||||||||||||||||
| 21,409 |
Euro |
24,084 |
Societe Generale |
11/16/16 |
569 |
||||||||||||||||||
| 12,710 |
Euro |
14,278 |
Societe Generale |
11/16/16 |
318 |
||||||||||||||||||
| 11,865 |
Euro |
13,355 |
Societe Generale |
11/16/16 |
323 |
||||||||||||||||||
| 27,527 |
Euro |
30,764 |
Societe Generale |
11/16/16 |
529 |
||||||||||||||||||
| 26,511 |
Euro |
29,700 |
State Street Bank and Trust Company |
11/16/16 |
581 |
||||||||||||||||||
| 31,644 |
Euro |
35,679 |
State Street Bank and Trust Company |
11/16/16 |
923 |
||||||||||||||||||
| 22,029 |
Euro |
24,813 |
State Street Bank and Trust Company |
11/16/16 |
617 |
||||||||||||||||||
| 97,702 |
Euro |
110,038 |
State Street Bank and Trust Company |
11/16/16 |
2,726 |
||||||||||||||||||
| 68,212 |
Euro |
76,374 |
State Street Bank and Trust Company |
11/16/16 |
1,451 |
||||||||||||||||||
| 943,525 |
Japanese Yen |
9,327 |
Deutsche Bank AG |
11/16/16 |
325 |
||||||||||||||||||
| 6,455,541 |
Japanese Yen |
62,502 |
Goldman Sachs International |
11/16/16 |
917 |
||||||||||||||||||
| 1,243,904 |
Japanese Yen |
12,068 |
Goldman Sachs International |
11/16/16 |
201 |
||||||||||||||||||
| 4,338,445 |
Japanese Yen |
42,864 |
Goldman Sachs International |
11/16/16 |
1,475 |
||||||||||||||||||
| 1,628,555 |
Japanese Yen |
16,225 |
Royal Bank of Canada |
11/16/16 |
688 |
||||||||||||||||||
| 26,567,693 |
Japanese Yen |
257,479 |
Societe Generale |
11/16/16 |
4,024 |
||||||||||||||||||
| 5,153,012 |
Japanese Yen |
50,637 |
Societe Generale |
11/16/16 |
1,477 |
||||||||||||||||||
| 6,156,486 |
Japanese Yen |
59,597 |
Societe Generale |
11/16/16 |
864 |
||||||||||||||||||
| 1,554,341 |
Japanese Yen |
14,965 |
Societe Generale |
11/16/16 |
137 |
||||||||||||||||||
| 15,678,974 |
Japanese Yen |
151,473 |
State Street Bank and Trust Company |
11/16/16 |
1,896 |
||||||||||||||||||
| 4,536,255 |
Japanese Yen |
44,696 |
State Street Bank and Trust Company |
11/16/16 |
1,420 |
||||||||||||||||||
| 5,347,331 |
Japanese Yen |
52,824 |
State Street Bank and Trust Company |
11/16/16 |
1,810 |
||||||||||||||||||
| 3,642,028 |
Japanese Yen |
35,110 |
State Street Bank and Trust Company |
11/16/16 |
366 |
||||||||||||||||||
| 1,257,470 |
Mexican Peso |
66,259 |
State Street Bank and Trust Company |
11/16/16 |
(174 |
) |
|||||||||||||||||
| 105,958 |
New Zealand Dollar |
77,419 |
Deutsche Bank AG |
11/16/16 |
1,693 |
||||||||||||||||||
| 30,977 |
New Zealand Dollar |
22,508 |
Goldman Sachs International |
11/16/16 |
369 |
||||||||||||||||||
| 19,357 |
New Zealand Dollar |
14,145 |
Goldman Sachs International |
11/16/16 |
311 |
||||||||||||||||||
| 18,434 |
New Zealand Dollar |
13,471 |
Royal Bank of Canada |
11/16/16 |
297 |
||||||||||||||||||
| 454,077 |
New Zealand Dollar |
330,611 |
Societe Generale |
11/16/16 |
6,088 |
||||||||||||||||||
See Notes to Financial Statements
88
Schedule of Investments Multi-Asset Income Fund (cont'd)
|
Contracts to Deliver |
In Exchange For |
Counterparty |
Settlement Date |
Net Unrealized Appreciation/ (Depreciation) |
|||||||||||||||||||
| 74,397 |
New Zealand Dollar |
$ |
54,139 |
Societe Generale |
11/16/16 |
$ |
969 |
||||||||||||||||
| 72,658 |
New Zealand Dollar |
52,850 |
Societe Generale |
11/16/16 |
922 |
||||||||||||||||||
| 60,481 |
New Zealand Dollar |
43,976 |
Societe Generale |
11/16/16 |
751 |
||||||||||||||||||
| 20,027 |
New Zealand Dollar |
14,266 |
Societe Generale |
11/16/16 |
(47 |
) |
|||||||||||||||||
| 65,482 |
New Zealand Dollar |
47,825 |
State Street Bank and Trust Company |
11/16/16 |
1,026 |
||||||||||||||||||
| 60,560 |
New Zealand Dollar |
43,930 |
State Street Bank and Trust Company |
11/16/16 |
649 |
||||||||||||||||||
| 125,169 |
New Zealand Dollar |
92,436 |
State Street Bank and Trust Company |
11/16/16 |
2,979 |
||||||||||||||||||
| 105,958 |
New Zealand Dollar |
76,874 |
State Street Bank and Trust Company |
11/16/16 |
1,147 |
||||||||||||||||||
| 57,248 |
New Zealand Dollar |
40,734 |
State Street Bank and Trust Company |
11/16/16 |
(181 |
) |
|||||||||||||||||
| 23,763 |
New Zealand Dollar |
16,994 |
State Street Bank and Trust Company |
11/16/16 |
11 |
||||||||||||||||||
| 378,210 |
Norwegian Krone |
45,630 |
Deutsche Bank AG |
11/16/16 |
(146 |
) |
|||||||||||||||||
| 454,019 |
Norwegian Krone |
54,481 |
Goldman Sachs International |
11/16/16 |
(471 |
) |
|||||||||||||||||
| 648,260 |
Norwegian Krone |
78,376 |
Goldman Sachs International |
11/16/16 |
(84 |
) |
|||||||||||||||||
| 250,251 |
Norwegian Krone |
31,213 |
Royal Bank of Canada |
11/16/16 |
924 |
||||||||||||||||||
| 82,915 |
Norwegian Krone |
10,113 |
Royal Bank of Canada |
11/16/16 |
77 |
||||||||||||||||||
| 335,169 |
Norwegian Krone |
41,672 |
Societe Generale |
11/16/16 |
1,106 |
||||||||||||||||||
| 318,124 |
Norwegian Krone |
39,937 |
Societe Generale |
11/16/16 |
1,433 |
||||||||||||||||||
| 251,794 |
Norwegian Krone |
31,031 |
Societe Generale |
11/16/16 |
556 |
||||||||||||||||||
| 91,980 |
Norwegian Krone |
11,233 |
Societe Generale |
11/16/16 |
100 |
||||||||||||||||||
| 178,228 |
Norwegian Krone |
21,610 |
Societe Generale |
11/16/16 |
39 |
||||||||||||||||||
| 1,082,440 |
Norwegian Krone |
133,147 |
State Street Bank and Trust Company |
11/16/16 |
2,136 |
||||||||||||||||||
| 378,210 |
Norwegian Krone |
47,010 |
State Street Bank and Trust Company |
11/16/16 |
1,234 |
||||||||||||||||||
| 690,094 |
Norwegian Krone |
86,280 |
State Street Bank and Trust Company |
11/16/16 |
2,756 |
||||||||||||||||||
| 621,423 |
Norwegian Krone |
76,862 |
State Street Bank and Trust Company |
11/16/16 |
1,649 |
||||||||||||||||||
| 390,456 |
Norwegian Krone |
47,650 |
State Street Bank and Trust Company |
11/16/16 |
392 |
||||||||||||||||||
| 85,677 |
Norwegian Krone |
10,510 |
State Street Bank and Trust Company |
11/16/16 |
141 |
||||||||||||||||||
| 31,214 |
Pound Sterling |
41,687 |
Deutsche Bank AG |
11/16/16 |
3,471 |
||||||||||||||||||
| 17,114 |
Pound Sterling |
20,785 |
Goldman Sachs International |
11/16/16 |
(168 |
) |
|||||||||||||||||
| 14,406 |
Pound Sterling |
18,873 |
Royal Bank of Canada |
11/16/16 |
1,235 |
||||||||||||||||||
| 17,097 |
Pound Sterling |
22,699 |
Societe Generale |
11/16/16 |
1,767 |
||||||||||||||||||
| 31,214 |
Pound Sterling |
40,576 |
Societe Generale |
11/16/16 |
2,360 |
||||||||||||||||||
| 7,205 |
Pound Sterling |
8,787 |
Societe Generale |
11/16/16 |
(34 |
) |
|||||||||||||||||
| 30,727 |
Pound Sterling |
37,507 |
Societe Generale |
11/16/16 |
(113 |
) |
|||||||||||||||||
| 25,798 |
Pound Sterling |
34,374 |
State Street Bank and Trust Company |
11/16/16 |
2,789 |
||||||||||||||||||
| 20,770 |
Pound Sterling |
25,692 |
State Street Bank and Trust Company |
11/16/16 |
263 |
||||||||||||||||||
| 38,144 |
Pound Sterling |
46,809 |
State Street Bank and Trust Company |
11/16/16 |
108 |
||||||||||||||||||
| 9,767 |
Pound Sterling |
12,025 |
State Street Bank and Trust Company |
11/16/16 |
67 |
||||||||||||||||||
| 423,655 |
Swedish Krona |
49,762 |
Deutsche Bank AG |
11/16/16 |
2,827 |
||||||||||||||||||
| 205,217 |
Swedish Krona |
24,207 |
Goldman Sachs International |
11/16/16 |
1,472 |
||||||||||||||||||
| 313,682 |
Swedish Krona |
37,286 |
Royal Bank of Canada |
11/16/16 |
2,535 |
||||||||||||||||||
| 881,098 |
Swedish Krona |
103,024 |
Societe Generale |
11/16/16 |
5,412 |
||||||||||||||||||
| 423,655 |
Swedish Krona |
49,424 |
Societe Generale |
11/16/16 |
2,490 |
||||||||||||||||||
| 294,357 |
Swedish Krona |
34,510 |
Societe Generale |
11/16/16 |
1,899 |
||||||||||||||||||
See Notes to Financial Statements
89
Schedule of Investments Multi-Asset Income Fund (cont'd)
|
Contracts to Deliver |
In Exchange For |
Counterparty |
Settlement Date |
Net Unrealized Appreciation/ (Depreciation) |
|||||||||||||||||||
| 381,418 |
Swedish Krona |
$ |
44,131 |
Societe Generale |
11/16/16 |
$ |
1,876 |
||||||||||||||||
| 295,030 |
Swedish Krona |
33,674 |
Societe Generale |
11/16/16 |
988 |
||||||||||||||||||
| 349,843 |
Swedish Krona |
41,363 |
State Street Bank and Trust Company |
11/16/16 |
2,606 |
||||||||||||||||||
| 204,101 |
Swedish Krona |
23,849 |
State Street Bank and Trust Company |
11/16/16 |
1,238 |
||||||||||||||||||
| 498,942 |
Swedish Krona |
58,412 |
State Street Bank and Trust Company |
11/16/16 |
3,136 |
||||||||||||||||||
| 213,173 |
Swedish Krona |
24,791 |
State Street Bank and Trust Company |
11/16/16 |
1,175 |
||||||||||||||||||
| 456,767 |
Swedish Krona |
51,728 |
State Street Bank and Trust Company |
11/16/16 |
1,126 |
||||||||||||||||||
| 144,427 |
Swedish Krona |
16,194 |
State Street Bank and Trust Company |
11/16/16 |
193 |
||||||||||||||||||
| 7,916 |
Swiss Franc |
8,118 |
Deutsche Bank AG |
11/16/16 |
113 |
||||||||||||||||||
| 5,644 |
Swiss Franc |
5,784 |
Goldman Sachs International |
11/16/16 |
76 |
||||||||||||||||||
| 22,793 |
Swiss Franc |
23,493 |
Goldman Sachs International |
11/16/16 |
443 |
||||||||||||||||||
| 44,663 |
Swiss Franc |
45,778 |
Royal Bank of Canada |
11/16/16 |
612 |
||||||||||||||||||
| 23,416 |
Swiss Franc |
24,127 |
Royal Bank of Canada |
11/16/16 |
447 |
||||||||||||||||||
| 35,454 |
Swiss Franc |
36,308 |
Royal Bank of Canada |
11/16/16 |
454 |
||||||||||||||||||
| 66,971 |
Swiss Franc |
68,987 |
Royal Bank of Canada |
11/16/16 |
1,262 |
||||||||||||||||||
| 19,466 |
Swiss Franc |
19,955 |
Royal Bank of Canada |
11/16/16 |
269 |
||||||||||||||||||
| 12,815 |
Swiss Franc |
12,972 |
Royal Bank of Canada |
11/16/16 |
13 |
||||||||||||||||||
| 586,684 |
Swiss Franc |
601,164 |
Societe Generale |
11/16/16 |
7,873 |
||||||||||||||||||
| 24,875 |
Swiss Franc |
25,701 |
Societe Generale |
11/16/16 |
546 |
||||||||||||||||||
| 7,916 |
Swiss Franc |
8,170 |
Societe Generale |
11/16/16 |
165 |
||||||||||||||||||
| 25,867 |
Swiss Franc |
26,239 |
Societe Generale |
11/16/16 |
81 |
||||||||||||||||||
| 14,955 |
Swiss Franc |
15,485 |
State Street Bank and Trust Company |
11/16/16 |
362 |
||||||||||||||||||
| 27,123 |
Swiss Franc |
27,443 |
State Street Bank and Trust Company |
11/16/16 |
14 |
||||||||||||||||||
|
Total |
$ |
132,031 |
|||||||||||||||||||||
For the year ended October 31, 2016, the Fund's investments in forward contracts had an average notional value of $21,963,431.
Written option contracts ("options written")
At October 31, 2016, the Fund had outstanding options written as follows:
|
Name of Issuer |
Contracts |
Exercise Price |
Expiration Date |
Market Value of Options |
|||||||||||||||
|
S&P 500 Mini Index, Call |
10 |
$ |
220 |
11/04/16 |
$ |
(0 |
)(a) | ||||||||||||
|
S&P 500 Mini Index, Call |
10 |
217 |
11/11/16 |
(680 |
) |
||||||||||||||
|
S&P 500 Mini Index, Call |
9 |
218 |
11/11/16 |
(382 |
) |
||||||||||||||
|
S&P 500 Mini Index, Call |
19 |
219 |
11/18/16 |
(779 |
) |
||||||||||||||
|
S&P 500 Mini Index, Call |
9 |
216.5 |
11/25/16 |
(1,116 |
) |
||||||||||||||
|
S&P 500 Mini Index, Call |
10 |
218.5 |
11/25/16 |
(600 |
) |
||||||||||||||
|
S&P 500 Mini Index, Call |
5 |
217.5 |
12/02/16 |
(587 |
) |
||||||||||||||
|
S&P 500 Mini Index, Put |
9 |
210.5 |
11/04/16 |
(554 |
) |
||||||||||||||
|
S&P 500 Mini Index, Put |
9 |
211 |
11/04/16 |
(644 |
) |
||||||||||||||
|
S&P 500 Mini Index, Put |
1 |
212.5 |
11/04/16 |
(117 |
) |
||||||||||||||
|
S&P 500 Mini Index, Put |
11 |
208.5 |
11/11/16 |
(1,749 |
) |
||||||||||||||
See Notes to Financial Statements
90
Schedule of Investments Multi-Asset Income Fund (cont'd)
|
Name of Issuer |
Contracts |
Exercise Price |
Expiration Date |
Market Value of Options |
|||||||||||||||
|
S&P 500 Mini Index, Put |
9 |
$ |
209.5 |
11/11/16 |
$ |
(1,652 |
) |
||||||||||||
|
S&P 500 Mini Index, Put |
9 |
209 |
11/18/16 |
(1,868 |
) |
||||||||||||||
|
S&P 500 Mini Index, Put |
11 |
210 |
11/18/16 |
(2,579 |
) |
||||||||||||||
|
S&P 500 Mini Index, Put |
9 |
208 |
11/25/16 |
(1,795 |
) |
||||||||||||||
|
S&P 500 Mini Index, Put |
11 |
210 |
11/25/16 |
(2,761 |
) |
||||||||||||||
|
S&P 500 Mini Index, Put |
1 |
208.5 |
12/02/16 |
(246 |
) |
||||||||||||||
|
Total (premium received: $21,463) |
$ |
(18,109 |
) |
||||||||||||||||
(a) Security fair valued as of 10/31/2016 in accordance with procedures approved by the Fund's Board of Trustees ("Board").
Options written for the Fund for the year ended October 31, 2016 were as follows:
| Number of Contracts |
Premium Received |
||||||||||
|
Outstanding 10/31/2015 |
126 |
$ |
5,860 |
||||||||
|
Options written |
742 |
68,529 |
|||||||||
|
Options expired |
(238 |
) |
(9,322 |
) |
|||||||
|
Options exercised |
(18 |
) |
(1,379 |
) |
|||||||
|
Options closed |
(460 |
) |
(42,225 |
) |
|||||||
|
Outstanding 10/31/2016 |
152 |
$ |
21,463 |
||||||||
For the year ended October 31, 2016, the Fund had an average market value of $(13,115) in options written. At October 31, 2016, Multi-Asset Income had pledged securities in the amount of $489,879 to cover collateral requirements for options written.
The following is a summary, categorized by Level (see Note A of Notes to Financial Statements), of inputs used to value the Fund's investments as of October 31, 2016:
|
Asset Valuation Inputs |
|||||||||||||||||||
|
(000's omitted) |
Level 1 |
Level 2 |
Level 3 |
Total |
|||||||||||||||
|
Investments: |
|||||||||||||||||||
| Common Stocks(a) |
$ |
5,164 |
$ |
— |
$ |
— |
$ |
5,164 |
|||||||||||
| Convertible Preferred Stocks(a) |
28 |
— |
— |
28 |
|||||||||||||||
| Preferred Stocks(a) |
187 |
— |
— |
187 |
|||||||||||||||
| Convertible Bonds(a) |
— |
62 |
— |
62 |
|||||||||||||||
|
U.S. Treasury Obligations |
— |
1,847 |
— |
1,847 |
|||||||||||||||
|
U.S. Government Agency Securities |
— |
346 |
— |
346 |
|||||||||||||||
|
Exchange Traded Funds |
1,202 |
— |
— |
1,202 |
|||||||||||||||
| Master Limited Partnerships(a) |
483 |
— |
— |
483 |
|||||||||||||||
|
Investment Companies |
— |
7,560 |
— |
7,560 |
|||||||||||||||
|
Short-Term Investment |
— |
575 |
— |
575 |
|||||||||||||||
|
Total Investments |
$ |
7,064 |
$ |
10,390 |
$ |
— |
$ |
17,454 |
|||||||||||
(a) The Schedule of Investments provides information on the industry categorization for the portfolio
See Notes to Financial Statements
91
Schedule of Investments Multi-Asset Income Fund (cont'd)
As of the year ended October 31, 2016, certain securities were transferred from one level (as of October 31, 2015) to another. Based on beginning of period market values as of November 1, 2015, $240 was transferred from Level 2 to Level 1. Interactive Data Pricing and Reference Data, Inc. provided adjusted prices for these securities as of October 31, 2015, as stated in the description of the valuation methods of foreign equity securities in Note A of Notes to Financial Statements.
The following is a summary, categorized by Level (see Note A of Notes to Financial Statements), of inputs used to value the Fund's derivatives as of October 31, 2016:
|
Other Financial Instruments |
|||||||||||||||||||
|
(000's omitted) |
Level 1 |
Level 2 |
Level 3 |
Total |
|||||||||||||||
| Futures(b) | |||||||||||||||||||
|
Assets |
$ |
14 |
$ |
— |
$ |
— |
$ |
14 |
|||||||||||
|
Liabilities |
(34 |
) |
— |
— |
(34 |
) |
|||||||||||||
| Forward contracts(b) | |||||||||||||||||||
|
Assets |
— |
150 |
— |
150 |
|||||||||||||||
|
Liabilities |
— |
(171 |
) |
— |
(171 |
) |
|||||||||||||
|
Options written |
|||||||||||||||||||
|
Liabilities |
(18 |
) |
— |
— |
(18 |
) |
|||||||||||||
|
Total |
$ |
(38 |
) |
$ |
(21 |
) |
$ |
— |
$ |
(59 |
) |
||||||||
(b) Futures and forward contracts are reported at the cumulative appreciation/(depreciation) of the instrument.
See Notes to Financial Statements
92
Consolidated Schedule of Investments Risk Balanced Commodity Strategy Fund 10/31/16
|
PRINCIPAL AMOUNT |
VALUE |
||||||||||
|
(000's omitted) |
(000's omitted) |
||||||||||
|
U.S. Treasury Obligation (5.5%) |
|||||||||||
|
$ |
4,500 |
U.S. Treasury Notes, 0.63%, due 12/15/16 (Cost $4,502) |
$ |
4,502 |
|||||||
|
Asset-Backed Securities (18.7%) |
|||||||||||
|
Ally Auto Receivables Trust |
|||||||||||
|
140 |
Ser. 2015-1, Class A2, 0.92%, due 2/15/18 |
140 |
|||||||||
|
565 |
Ser. 2016-3, Class A2, 1.19%, due 12/17/18 |
566 |
|||||||||
|
875 |
Ser. 2016-1, Class A3, 1.47%, due 4/15/20 |
878 |
|||||||||
|
375 |
Bank of America Credit Card Trust, Ser. 2014-A2, Class A, 0.80%, due 9/16/19 |
375 |
(a) |
||||||||
|
1,230 |
BMW Vehicle Owner Trust, Ser. 2016-A, Class A2A, 0.99%, due 5/25/19 |
1,229 |
|||||||||
|
990 |
Capital One Multi-Asset Execution Trust, Ser. 2007-A2, Class A2, 0.61%, due 12/16/19 |
990 |
(a) |
||||||||
|
2,100 |
Chase Issuance Trust, Ser. 2015-A1, Class A1, 0.85%, due 2/18/20 |
2,104 |
(a) |
||||||||
|
445 |
Citibank Credit Card Issuance Trust, Ser. 2013-A2, Class A2, 0.80%, due 5/26/20 |
446 |
(a) |
||||||||
|
590 |
Ford Credit Auto Owner Trust, Ser. 2016-C, Class A2A, 1.04%, due 9/15/19 |
590 |
(a) |
||||||||
|
Honda Auto Receivables Owner Trust |
|||||||||||
|
624 |
Ser. 2016-1, Class A2, 1.01%, due 6/18/18 |
624 |
|||||||||
|
685 |
Ser. 2016-2, Class A2, 1.13%, due 9/17/18 |
685 |
|||||||||
|
420 |
Hyundai Auto Receivables Trust, Ser. 2016-A, Class A2A, 1.21%, due 6/17/19 |
421 |
|||||||||
|
1,725 |
Mercedes-Benz Auto Receivables Trust, Ser. 2016-1, Class A2A, 1.11%, due 3/15/19 |
1,725 |
|||||||||
|
Navient Student Loan Trust |
|||||||||||
|
43 |
Ser. 2014-8, Class A1, 0.81%, due 8/25/20 |
43 |
(a) |
||||||||
|
1,270 |
Ser. 2016-3A, Class A1, 1.13%, due 6/25/65 |
1,273 |
(a)(b) |
||||||||
|
Nissan Auto Receivables Owner Trust |
|||||||||||
|
4 |
Ser. 2013-B, Class A3, 0.84%, due 11/15/17 |
4 |
|||||||||
|
300 |
Ser. 2016-B, Class A2A, 1.05%, due 4/15/19 |
300 |
|||||||||
|
1,000 |
Ser. 2016-C, Class A2A, 1.07%, due 5/15/19 |
999 |
|||||||||
|
590 |
Penarth Master Issuer PLC, Ser. 2015-2A, Class A1, 0.94%, due 5/18/19 |
590 |
(a)(b) |
||||||||
|
Toyota Auto Receivables Owner Trust |
|||||||||||
|
495 |
Ser. 2016-A, Class A2A, 1.03%, due 7/16/18 |
495 |
|||||||||
|
385 |
Ser. 2016-C, Class A2A, 1.00%, due 1/15/19 |
385 |
|||||||||
|
329 |
Ser. 2015-A, Class A3, 1.12%, due 2/15/19 |
329 |
|||||||||
|
243 |
USAA Auto Owner Trust, Ser. 2015-1, Class A2, 0.82%, due 3/15/18 |
243 |
|||||||||
|
Total Asset-Backed Securities (Cost $15,425) |
15,434 |
||||||||||
|
Corporate Bonds (54.4%) |
|||||||||||
|
Aerospace & Defense (1.0%) |
|||||||||||
|
805 |
Rockwell Collins, Inc., 1.20%, due 12/15/16 |
805 |
(a) |
||||||||
|
Auto Manufacturers (5.0%) |
|||||||||||
|
1,100 |
Daimler Finance N.A. LLC, 1.23%, due 8/1/17 |
1,101 |
(a)(b) |
||||||||
|
Ford Motor Credit Co. LLC |
|||||||||||
|
500 |
1.66%, due 1/17/17 |
501 |
(a) |
||||||||
|
300 |
8.00%, due 12/15/16 |
302 |
|||||||||
|
575 |
4.25%, due 2/3/17 |
580 |
|||||||||
|
Toyota Motor Credit Corp. |
|||||||||||
|
520 |
1.01%, due 2/16/17 |
520 |
(a) |
||||||||
|
335 |
1.63%, due 2/19/19 |
339 |
(a) |
||||||||
|
785 |
1.24%, due 4/6/18 |
786 |
(a) |
||||||||
|
4,129 |
|||||||||||
|
Banks (15.2%) |
|||||||||||
|
960 |
Bank of America N.A., 1.29%, due 11/14/16 |
960 |
(a) |
||||||||
|
1,265 |
Citigroup, Inc., 1.69%, due 12/7/18 |
1,270 |
(a) |
||||||||
See Notes to Financial Statements
93
Consolidated Schedule of Investments Risk Balanced Commodity Strategy Fund (cont'd)
|
PRINCIPAL AMOUNT |
VALUE |
||||||||||
|
(000's omitted) |
(000's omitted) |
||||||||||
|
$ |
1,200 |
Goldman Sachs Group, Inc., 1.46%, due 6/4/17 |
$ |
1,202 |
(a) |
||||||
|
1,755 |
JPMorgan Chase & Co., 1.34%, due 2/15/17 |
1,757 |
(a) |
||||||||
|
530 |
Mizuho Bank Ltd., 1.31%, due 4/16/17 |
530 |
(a)(b) |
||||||||
|
1,200 |
Morgan Stanley, 1.73%, due 1/24/19 |
1,206 |
(a) |
||||||||
|
800 |
National Australia Bank Ltd., 1.12%, due 6/30/17 |
800 |
(a)(b) |
||||||||
|
Royal Bank of Canada |
|||||||||||
|
525 |
1.14%, due 2/3/17 |
525 |
(a) |
||||||||
|
750 |
1.20%, due 1/23/17 |
750 |
|||||||||
|
1,130 |
U.S. Bank N.A., 1.12%, due 1/30/17 |
1,130 |
(a) |
||||||||
|
1,740 |
Wells Fargo & Co., 1.10%, due 9/8/17 |
1,740 |
(a) |
||||||||
|
650 |
Westpac Banking Corp., 1.14%, due 5/19/17 |
650 |
(a) |
||||||||
|
12,520 |
|||||||||||
|
Beverages (1.6%) |
|||||||||||
|
300 |
Anheuser-Busch InBev Finance, Inc., 1.08%, due 1/27/17 |
300 |
(a) |
||||||||
|
1,025 |
SABMiller Holdings, Inc., 2.45%, due 1/15/17 |
1,028 |
(b) |
||||||||
|
1,328 |
|||||||||||
|
Commercial Services (2.1%) |
|||||||||||
|
1,720 |
ERAC USA Finance LLC, 6.20%, due 11/1/16 |
1,720 |
(b)(c) |
||||||||
|
Computers (1.1%) |
|||||||||||
|
900 |
Apple, Inc., 1.64%, due 2/22/19 |
915 |
(a) |
||||||||
|
Cosmetics—Personal Care (1.0%) |
|||||||||||
|
790 |
Procter & Gamble Co., 0.85%, due 11/4/16 |
790 |
(a) |
||||||||
|
Diversified Financial Services (2.2%) |
|||||||||||
|
850 |
American Express Credit Corp., 1.56%, due 11/5/18 |
856 |
(a) |
||||||||
|
955 |
Capital One Bank USA N.A., 1.20%, due 2/13/17 |
955 |
|||||||||
|
1,811 |
|||||||||||
|
Electric (2.9%) |
|||||||||||
|
780 |
Dominion Resources, Inc., 1.25%, due 3/15/17 |
781 |
|||||||||
|
Duke Energy Progress LLC |
|||||||||||
|
340 |
1.04%, due 3/6/17 |
340 |
(a) |
||||||||
|
790 |
1.01%, due 11/20/17 |
790 |
(a) |
||||||||
|
460 |
Electricite de France, 1.34%, due 1/20/17 |
460 |
(a)(b) |
||||||||
|
2,371 |
|||||||||||
|
Healthcare—Products (1.8%) |
|||||||||||
|
1,470 |
Medtronic, Inc., 0.92%, due 2/27/17 |
1,471 |
(a) |
||||||||
|
Healthcare—Services (1.0%) |
|||||||||||
|
495 |
Aetna, Inc., 1.49%, due 12/8/17 |
497 |
(a) |
||||||||
|
370 |
UnitedHealth Group, Inc., 1.33%, due 1/17/17 |
371 |
(a) |
||||||||
|
868 |
|||||||||||
See Notes to Financial Statements
94
Consolidated Schedule of Investments Risk Balanced Commodity Strategy Fund (cont'd)
|
PRINCIPAL AMOUNT |
VALUE |
||||||||||
|
(000's omitted) |
(000's omitted) |
||||||||||
|
Insurance (0.6%) |
|||||||||||
|
$ |
470 |
Berkshire Hathaway Finance Corp., 1.54%, due 3/15/19 |
$ |
476 |
(a) |
||||||
|
Machinery—Construction & Mining (1.3%) |
|||||||||||
|
1,100 |
Caterpillar Financial Services Corp., 1.06%, due 11/20/17 |
1,102 |
(a) |
||||||||
|
Media (1.1%) |
|||||||||||
|
900 |
NBCUniversal Enterprise, Inc., 1.57%, due 4/15/18 |
906 |
(a)(b) |
||||||||
|
Oil & Gas (6.3%) |
|||||||||||
|
BP Capital Markets PLC |
|||||||||||
|
865 |
2.25%, due 11/1/16 |
865 |
|||||||||
|
535 |
1.21%, due 11/7/16 |
535 |
(a) |
||||||||
|
Chevron Corp. |
|||||||||||
|
310 |
0.89%, due 11/9/16 |
310 |
(a) |
||||||||
|
1,350 |
1.01%, due 3/2/18 |
1,349 |
(a) |
||||||||
|
530 |
Exxon Mobil Corp., 1.43%, due 2/28/18 |
534 |
(a) |
||||||||
|
Shell Int'l Finance BV |
|||||||||||
|
780 |
0.90%, due 11/15/16 |
780 |
|||||||||
|
810 |
1.13%, due 5/10/17 |
811 |
(a) |
||||||||
|
5,184 |
|||||||||||
|
Pharmaceuticals (1.6%) |
|||||||||||
|
305 |
Johnson & Johnson, 1.11%, due 3/1/19 |
306 |
(a) |
||||||||
|
1,015 |
Teva Pharmaceutical Finance Co. BV, 2.40%, due 11/10/16 |
1,015 |
|||||||||
|
1,321 |
|||||||||||
|
Real Estate Investment Trusts (1.0%) |
|||||||||||
|
855 |
Simon Property Group L.P., 2.80%, due 1/30/17 |
855 |
|||||||||
|
Retail (1.7%) |
|||||||||||
|
630 |
CVS Health Corp., 1.20%, due 12/5/16 |
630 |
|||||||||
|
750 |
Home Depot, Inc., 1.22%, due 9/15/17 |
752 |
(a) |
||||||||
|
1,382 |
|||||||||||
|
Software (1.0%) |
|||||||||||
|
825 |
Oracle Corp., 1.07%, due 7/7/17 |
826 |
(a) |
||||||||
|
Telecommunications (4.9%) |
|||||||||||
|
1,290 |
AT&T, Inc., 1.70%, due 6/1/17 |
1,295 |
|||||||||
|
1,450 |
Cisco Systems, Inc., 1.12%, due 3/3/17 |
1,452 |
(a) |
||||||||
|
1,300 |
Verizon Communications, Inc., 1.23%, due 6/9/17 |
1,302 |
(a) |
||||||||
|
4,049 |
|||||||||||
|
Total Corporate Bonds (Cost $44,785) |
44,829 |
||||||||||
|
Short-Term Investments (15.7%) |
|||||||||||
|
U.S. Treasury Obligation (3.7%) |
|||||||||||
|
3,000 |
U.S. Treasury Bill, Disc. Notes, 0.14%, due 12/15/16 |
3,000 |
(d) |
||||||||
See Notes to Financial Statements
95
Consolidated Schedule of Investments Risk Balanced Commodity Strategy Fund (cont'd)
|
NUMBER OF SHARES |
VALUE |
||||||||||
|
(000's omitted) |
|||||||||||
|
Investment Company (12.0%) |
|||||||||||
|
9,911,141 |
State Street Institutional U.S. Government Money Market Fund Premier Class, 0.26% |
$ |
9,911 |
(e)(f)(g) |
|||||||
|
Total Short-Term Investments (Cost $12,911) |
12,911 |
||||||||||
|
Total Investments (94.3%) (Cost $77,623) |
77,676 |
||||||||||
|
Other Assets Less Liabilities (5.7%) |
4,692 |
(h) |
|||||||||
|
Net Assets (100.0%) |
$ |
82,368 |
|||||||||
(a) Variable or floating rate security. The interest rate shown was the current rate as of 10/31/2016 and changes periodically.
(b) Securities were purchased under Rule 144A of the Securities Act of 1933, as amended (the "1933 Act"), or are otherwise restricted and, unless registered under the 1933 Act or exempted from registration, may only be sold to qualified institutional investors or may have other restrictions on resale. At 10/31/2016, these securities amounted to approximately $8,408,000 or 10.2% of net assets for the Fund. These securities have been deemed by the investment manager to be liquid.
(c) Step Bond. Coupon rate is a fixed rate for an initial period that either resets at a specific date or may reset in the future contingent upon a rating change made by a rating agency. The interest rate shown was the current rate as of 10/31/2016.
(d) Rate shown was the discount rate at the date of purchase.
(e) All or a portion represents positions held by the Neuberger Berman Cayman Commodity Fund I Ltd. (the "Subsidiary").
(f) Represents 7-day effective yield as of 10/31/2016.
(g) All or a portion of this security is segregated in connection with obligations for futures contracts with a total value of approximately $9,911,000.
(h) Includes the impact of the Fund's open positions in derivatives at 10/31/2016.
See Notes to Financial Statements
96
Consolidated Schedule of Investments Risk Balanced Commodity Strategy Fund (cont'd)
Derivative Instruments Risk Balanced Commodity Strategy Fund
Futures contracts ("futures")
At October 31, 2016, open positions in futures(a) for the Fund were as follows:
|
Expiration |
Open Contracts |
Position |
Unrealized Appreciation/ (Depreciation) |
||||||||||||
|
12/29/2016 |
96 Brent Crude Oil |
Long |
$ |
(135,407 |
) |
||||||||||
|
3/16/2017 |
60 Cocoa |
Long |
(23,845 |
) |
|||||||||||
|
3/21/2017 |
16 Coffee 'C' |
Long |
73,265 |
||||||||||||
|
3/14/2017 |
366 Corn |
Long |
427,894 |
||||||||||||
|
3/9/2017 |
45 Cotton No. 2 |
Long |
33,224 |
||||||||||||
|
1/26/2017 |
24 Feeder Cattle |
Long |
(45,678 |
) |
|||||||||||
|
2/24/2017 |
52 Gold 100 Oz. |
Long |
(244,181 |
) |
|||||||||||
|
3/14/2017 |
114 Hard Red Winter Wheat |
Long |
(7,521 |
) |
|||||||||||
|
3/29/2017 |
66 High Grade Copper |
Long |
10,764 |
||||||||||||
|
11/14/2016 |
68 Lead |
Long |
427,325 |
||||||||||||
|
12/19/2016 |
60 Lead |
Long |
269,250 |
||||||||||||
|
1/16/2017 |
63 Lead |
Long |
(101,218 |
) |
|||||||||||
|
2/14/2017 |
114 Lean Hogs |
Long |
159,745 |
||||||||||||
|
2/28/2017 |
43 Live Cattle |
Long |
24,054 |
||||||||||||
|
1/12/2017 |
62 Low Sulphur Gasoil |
Long |
(34,294 |
) |
|||||||||||
|
3/29/2017 |
68 Natural Gas |
Long |
34,641 |
||||||||||||
|
12/30/2016 |
76 New York Harbor RBOB Gasoline |
Long |
(93,249 |
) |
|||||||||||
|
11/14/2016 |
47 Nickel |
Long |
(19,554 |
) |
|||||||||||
|
12/19/2016 |
52 Nickel |
Long |
202,956 |
||||||||||||
|
1/16/2017 |
54 Nickel |
Long |
(29,356 |
) |
|||||||||||
|
1/27/2017 |
87 Platinum |
Long |
(324,511 |
) |
|||||||||||
|
11/14/2016 |
38 Primary Aluminum |
Long |
100,225 |
||||||||||||
|
12/19/2016 |
40 Primary Aluminum |
Long |
108,500 |
||||||||||||
|
1/16/2017 |
43 Primary Aluminum |
Long |
61,159 |
||||||||||||
|
12/30/2016 |
84 RBOB Gasoline |
Long |
7,824 |
||||||||||||
|
3/29/2017 |
36 Silver |
Long |
(245,013 |
) |
|||||||||||
|
3/14/2017 |
44 Soybean |
Long |
121,722 |
||||||||||||
|
1/13/2017 |
90 Soybean Meal |
Long |
90,880 |
||||||||||||
|
1/13/2017 |
80 Soybean Oil |
Long |
102,273 |
||||||||||||
|
2/28/2017 |
56 Sugar 11 |
Long |
46,485 |
||||||||||||
|
3/14/2017 |
117 Wheat |
Long |
65,649 |
||||||||||||
|
12/20/2016 |
94 WTI Crude Oil |
Long |
(157,730 |
) |
|||||||||||
|
11/14/2016 |
52 Zinc |
Long |
302,344 |
||||||||||||
|
12/19/2016 |
52 Zinc |
Long |
190,580 |
||||||||||||
|
1/16/2017 |
51 Zinc |
Long |
96,074 |
||||||||||||
See Notes to Financial Statements
97
Consolidated Schedule of Investments Risk Balanced Commodity Strategy Fund (cont'd)
|
Expiration |
Open Contracts |
Position |
Unrealized Appreciation/ (Depreciation) |
||||||||||||
|
11/14/2016 |
68 Lead |
Short |
$ |
(305,150 |
) |
||||||||||
|
12/19/2016 |
60 Lead |
Short |
98,602 |
||||||||||||
|
1/16/2017 |
5 Lead |
Short |
(1,683 |
) |
|||||||||||
|
11/14/2016 |
38 Primary Aluminum |
Short |
(108,775 |
) |
|||||||||||
|
12/19/2016 |
40 Primary Aluminum |
Short |
(64,765 |
) |
|||||||||||
|
11/14/2016 |
47 Nickel |
Short |
(184,146 |
) |
|||||||||||
|
12/19/2016 |
52 Nickel |
Short |
27,111 |
||||||||||||
|
1/16/2017 |
3 Nickel |
Short |
(4,649 |
) |
|||||||||||
|
11/14/2016 |
52 Zinc |
Short |
(187,200 |
) |
|||||||||||
|
12/19/2016 |
52 Zinc |
Short |
(95,245 |
) |
|||||||||||
|
1/16/2017 |
1 Zinc |
Short |
(3,919 |
) |
|||||||||||
|
Total |
$ |
665,457 |
|||||||||||||
(a) Commodity futures are held by the Subsidiary, a wholly-owned subsidiary of the Fund. See Note A in the Notes to Financial Statements.
At October 31, 2016, the notional value of futures was $105,491,677 for long positions and $(23,060,614) for short positions. The Fund had $4,059,870 deposited in a segregated account to cover margin requirements on open futures.
For the year ended October 31, 2016, the average notional value of futures for the Fund was $95,178,323 for long positions and $(20,414,317) for short positions.
The following is a summary, categorized by Level (see Note A of Notes to Financial Statements), of inputs used to value the Fund's investments as of October 31, 2016:
|
Asset Valuation Inputs |
|||||||||||||||||
|
(000's omitted) |
Level 1 |
Level 2 |
Level 3 |
Total |
|||||||||||||
|
Investments: |
|||||||||||||||||
|
U.S. Treasury Obligation |
$ |
— |
$ |
4,502 |
$ |
— |
$ |
4,502 |
|||||||||
|
Asset-Backed Securities |
— |
15,434 |
— |
15,434 |
|||||||||||||
| Corporate Bonds(a) |
— |
44,829 |
— |
44,829 |
|||||||||||||
| Short-Term Investments(a) |
— |
12,911 |
— |
12,911 |
|||||||||||||
|
Total Investments |
$ |
— |
$ |
77,676 |
$ |
— |
$ |
77,676 |
|||||||||
(a) The Consolidated Schedule of Investments provides information on the industry or sector categorization for the portfolio.
See Notes to Financial Statements
98
Consolidated Schedule of Investments Risk Balanced Commodity Strategy Fund (cont'd)
As of the year ended October 31, 2016, no securities were transferred from one level (as of October 31, 2015) to another.
The following is a summary, categorized by Level (see Note A of Notes to Financial Statements), of inputs used to value the Fund's derivatives as of October 31, 2016:
|
Other Financial Instruments |
|||||||||||||||||
|
(000's omitted) |
Level 1 |
Level 2 |
Level 3 |
Total |
|||||||||||||
| Futures(b) | |||||||||||||||||
|
Assets |
$ |
3,082 |
$ |
— |
$ |
— |
$ |
3,082 |
|||||||||
|
Liabilities |
(2,417 |
) |
— |
— |
(2,417 |
) |
|||||||||||
|
Total |
$ |
665 |
$ |
— |
$ |
— |
$ |
665 |
|||||||||
(b) Futures are reported at the cumulative unrealized appreciation/(depreciation) of the instrument.
See Notes to Financial Statements
99
Schedule of Investments U.S. Equity Index PutWrite Strategy Fund 10/31/16
|
PRINCIPAL AMOUNT |
VALUE |
||||||||||
|
(000's omitted) |
(000's omitted) |
||||||||||
|
U.S. Treasury Obligations (94.9%) |
|||||||||||
|
U.S. Treasury Notes |
|||||||||||
|
$ |
675 |
0.75%, due 6/30/17 |
$ |
676 |
|||||||
|
1,250 |
0.88%, due 6/15/17 |
1,252 |
|||||||||
|
2,500 |
0.88%, due 6/15/19 |
2,495 |
(a) |
||||||||
|
3,000 |
1.00%, due 9/15/17 |
3,008 |
(a) |
||||||||
|
3,550 |
1.00%, due 12/15/17 |
3,560 |
(a) |
||||||||
|
2,000 |
1.00%, due 3/15/18 |
2,006 |
|||||||||
|
5,000 |
1.00%, due 9/15/18 |
5,012 |
|||||||||
|
2,000 |
1.00%, due 3/15/19 |
2,003 |
|||||||||
|
1,900 |
1.13%, due 6/15/18 |
1,909 |
|||||||||
|
3,250 |
1.25%, due 12/15/18 |
3,273 |
|||||||||
|
Total U.S. Treasury Obligations (Cost $25,211) |
25,194 |
||||||||||
|
NUMBER OF SHARES |
|||||||||||
|
Short-Term Investment (3.9%) |
|||||||||||
|
Investment Company (3.9%) |
|||||||||||
|
1,022,934 |
State Street Institutional U.S. Government Money Market Fund Premier Class, 0.26% (Cost $1,023) |
1,023 |
(b) |
||||||||
|
Total Investments (98.7%) (Cost $26,234) |
26,217 |
||||||||||
|
Other Assets Less Liabilities (1.2%) |
317 |
(c) |
|||||||||
|
Net Assets (100.0%) |
$ |
26,534 |
|||||||||
(a) All or a portion of the security is pledged as collateral for written options for the Fund.
(b) Represents 7-day effective yield as of 10/31/2016.
(c) Includes the impact of the Fund's open positions in derivatives at 10/31/2016.
See Notes to Financial Statements
100
Schedule of Investments U.S. Equity Index PutWrite Strategy Fund (cont'd)
Derivative Instruments
Written option contracts ("options written")
At October 31, 2016, the Fund had outstanding options written as follows:
|
Name of Issuer |
Contracts |
Exercise Price |
Expiration Date |
Market Value of Options |
|||||||||||||||
|
Russell 2000 Index, Put |
7 |
$ |
1,220 |
11/18/16 |
$ |
(25,340 |
) |
||||||||||||
|
Russell 2000 Index, Put |
1 |
1,220 |
11/11/16 |
(3,350 |
) |
||||||||||||||
|
Russell 2000 Index, Put |
6 |
1,210 |
11/11/16 |
(16,440 |
) |
||||||||||||||
|
Russell 2000 Index, Put |
1 |
1,210 |
11/18/16 |
(3,035 |
) |
||||||||||||||
|
Russell 2000 Index, Put |
8 |
1,220 |
11/25/16 |
(30,520 |
) |
||||||||||||||
|
Russell 2000 Index, Put |
2 |
1,210 |
12/02/16 |
(7,120 |
) |
||||||||||||||
|
Russell 2000 Index, Put |
3 |
1,190 |
11/04/16 |
(2,325 |
) |
||||||||||||||
|
Russell 2000 Index, Put |
2 |
1,190 |
12/02/16 |
(5,280 |
) |
||||||||||||||
|
Russell 2000 Index, Put |
1 |
1,180 |
12/02/16 |
(2,260 |
) |
||||||||||||||
|
Russell 2000 Index, Put |
2 |
1,185 |
11/04/16 |
(1,220 |
) |
||||||||||||||
|
S&P 500 Index, Put |
2 |
2,125 |
11/18/16 |
(6,470 |
) |
||||||||||||||
|
S&P 500 Index, Put |
3 |
2,140 |
11/18/16 |
(11,625 |
) |
||||||||||||||
|
S&P 500 Index, Put |
1 |
2,150 |
11/25/16 |
(4,575 |
) |
||||||||||||||
|
S&P 500 Index, Put |
5 |
2,125 |
11/11/16 |
(14,400 |
) |
||||||||||||||
|
S&P 500 Index, Put |
8 |
2,155 |
11/04/16 |
(24,960 |
) |
||||||||||||||
|
S&P 500 Index, Put |
2 |
2,160 |
11/04/16 |
(7,120 |
) |
||||||||||||||
|
S&P 500 Index, Put |
4 |
2,140 |
11/11/16 |
(14,040 |
) |
||||||||||||||
|
S&P 500 Index, Put |
2 |
2,130 |
11/04/16 |
(2,990 |
) |
||||||||||||||
|
S&P 500 Index, Put |
17 |
2,135 |
11/18/16 |
(62,050 |
) |
||||||||||||||
|
S&P 500 Index, Put |
13 |
2,135 |
11/11/16 |
(42,705 |
) |
||||||||||||||
|
S&P 500 Index, Put |
3 |
2,140 |
11/25/16 |
(12,240 |
) |
||||||||||||||
|
S&P 500 Index, Put |
3 |
2,145 |
11/18/16 |
(12,360 |
) |
||||||||||||||
|
S&P 500 Index, Put |
22 |
2,135 |
11/25/16 |
(84,920 |
) |
||||||||||||||
|
S&P 500 Index, Put |
2 |
2,140 |
12/02/16 |
(9,010 |
) |
||||||||||||||
|
S&P 500 Index, Put |
2 |
2,135 |
12/02/16 |
(8,570 |
) |
||||||||||||||
|
S&P 500 Index, Put |
13 |
2,120 |
12/02/16 |
(47,905 |
) |
||||||||||||||
|
S&P 500 Index, Put |
3 |
2,125 |
12/02/16 |
(11,128 |
) |
||||||||||||||
|
Total (premium received: $415,694) |
$ |
(473,958 |
) |
||||||||||||||||
At October 31, 2016, the Fund had $9,746 deposited in a segregated account to cover requirements on options written.
Options written for the Fund for the year ended October 31, 2016 were as follows:
| Number of Contracts |
Premium Received |
||||||||||
|
Outstanding 9/16/2016 |
— |
$ |
— |
||||||||
|
Options written |
237 |
708,719 |
|||||||||
|
Options expired |
(51 |
) |
(172,501 |
) |
|||||||
|
Options exercised |
— |
— |
|||||||||
|
Options closed |
(48 |
) |
(120,524 |
) |
|||||||
|
Outstanding 10/31/2016 |
138 |
$ |
415,694 |
||||||||
See Notes to Financial Statements
101
Schedule of Investments U.S. Equity Index PutWrite Strategy Fund (cont'd)
For the year ended October 31, 2016, the Fund had an average market value of $(46,194) in options written. At October 31, 2016, U.S. Equity Index PutWrite Strategy had pledged securities in the amount of $5,509,180 to cover collateral requirements for options written.
The following is a summary, categorized by Level (see Note A of Notes to Financial Statements), of inputs used to value the Fund's investments as of October 31, 2016:
|
Asset Valuation Inputs |
|||||||||||||||||
|
(000's omitted) |
Level 1 |
Level 2 |
Level 3 |
Total |
|||||||||||||
|
Investments: |
|||||||||||||||||
|
U.S. Treasury Obligations |
$ |
— |
$ |
25,194 |
$ |
— |
$ |
25,194 |
|||||||||
|
Short-Term Investment |
— |
1,023 |
— |
1,023 |
|||||||||||||
|
Total Investments |
$ |
— |
$ |
26,217 |
$ |
— |
$ |
26,217 |
|||||||||
As of the period ended October 31, 2016, no securities were transferred from one level (as of October 31, 2015) to another.
The following is a summary, categorized by Level (see Note A of Notes to Financial Statements), of inputs used to value the Fund's derivatives as of October 31, 2016:
|
Other Financial Instruments |
|||||||||||||||||
|
(000's omitted) |
Level 1 |
Level 2 |
Level 3 |
Total |
|||||||||||||
|
Options written |
|||||||||||||||||
|
Liabilities |
$ |
(474 |
) |
$ |
— |
$ |
— |
$ |
(474 |
) |
|||||||
|
Total |
$ |
(474 |
) |
$ |
— |
$ |
— |
$ |
(474 |
) |
|||||||
See Notes to Financial Statements
102
Statements of Assets and Liabilities
Neuberger Berman Alternative Funds
(000's omitted, except per share amounts)
| GLOBAL ALLOCATION FUND |
LONG SHORT FUND |
LONG SHORT CREDIT FUND |
|||||||||||||
|
October 31, 2016 |
October 31, 2016 |
October 31, 2016 |
|||||||||||||
|
Assets |
|||||||||||||||
| Investments in securities, at value*† (Notes A & F)—see Schedule of Investments: |
|||||||||||||||
|
Unaffiliated issuers |
$ |
10,149 |
$ |
2,385,439 |
$ |
32,720 |
|||||||||
|
Affiliated issuers |
11,404 |
— |
— |
||||||||||||
|
21,553 |
2,385,439 |
32,720 |
|||||||||||||
|
Cash |
— |
1,825 |
— |
||||||||||||
|
Foreign currency* |
71 |
— |
11 |
||||||||||||
|
Cash collateral segregated for short sales (Note A) |
1,150 |
381,110 |
— |
||||||||||||
|
Cash collateral segregated for futures contracts (Note A) |
123 |
19,805 |
61 |
||||||||||||
|
Cash collateral segregated for option contracts (Note A) |
11 |
51 |
— |
||||||||||||
|
Cash collateral segregated for swap contracts (Note A) |
— |
5,690 |
1,661 |
||||||||||||
|
Cash collateral for securities loaned (Note A) |
233 |
— |
— |
||||||||||||
|
Dividends and interest receivable |
39 |
5,930 |
399 |
||||||||||||
|
Receivable for securities sold |
650 |
40,812 |
34 |
||||||||||||
|
Receivable for variation margin on futures contracts (Note A) |
54 |
153 |
104 |
||||||||||||
|
Receivable for Fund shares sold |
— |
1,865 |
1 |
||||||||||||
|
Receivable from Management—net (Note B) |
85 |
— |
4 |
||||||||||||
|
OTC swap contracts, at value (Note A) |
— |
353 |
96 |
||||||||||||
|
Receivable for forward foreign currency contracts (Note A) |
219 |
— |
7 |
||||||||||||
|
Prepaid expenses and other assets |
18 |
141 |
13 |
||||||||||||
|
Total Assets |
24,206 |
2,843,174 |
35,111 |
||||||||||||
|
Liabilities |
|||||||||||||||
|
Investments sold short, at value** (Note A) |
2,317 |
374,510 |
— |
||||||||||||
|
OTC swap contracts, at value (Note A) |
— |
5,566 |
166 |
||||||||||||
|
Dividends and interest payable for short sales |
4 |
1,019 |
— |
||||||||||||
|
Cash collateral segregated for option contracts due to broker (Note A) |
— |
— |
— |
||||||||||||
|
Payable for collateral on securities loaned (Note A) |
233 |
— |
— |
||||||||||||
|
Payable to investment manager—net (Notes A & B) |
5 |
2,294 |
21 |
||||||||||||
|
Option contracts written, at value*** (Note A) |
11 |
3,951 |
— |
||||||||||||
|
Due to custodian |
234 |
— |
14 |
||||||||||||
|
Payable for securities purchased |
179 |
45,558 |
4,348 |
||||||||||||
|
Payable for Fund shares redeemed |
21 |
10,808 |
— |
||||||||||||
|
Payable to administrator—net (Note B) |
— |
485 |
— |
||||||||||||
|
Payable to trustees |
6 |
6 |
6 |
||||||||||||
|
Payable for organization costs |
— |
— |
— |
||||||||||||
|
Payable for variation margin on futures contracts (Note A) |
— |
— |
— |
||||||||||||
|
Payable for variation margin on centrally cleared swap contracts (Note A) |
— |
— |
2 |
||||||||||||
|
Payable for forward foreign currency contracts (Note A) |
244 |
— |
— |
||||||||||||
|
Distributions payable |
— |
— |
— |
||||||||||||
|
Accrued expenses and other payables |
201 |
500 |
91 |
||||||||||||
|
Total Liabilities |
3,455 |
444,697 |
4,648 |
||||||||||||
|
Net Assets |
$ |
20,751 |
$ |
2,398,477 |
$ |
30,463 |
|||||||||
See Notes to Financial Statements
103
Statements of Assets and Liabilities (cont'd)
Neuberger Berman Alternative Funds (cont'd)
(000's omitted, except per share amounts)
| GLOBAL ALLOCATION FUND |
LONG SHORT FUND |
LONG SHORT CREDIT FUND |
|||||||||||||
|
October 31, 2016 |
October 31, 2016 |
October 31, 2016 |
|||||||||||||
|
Net Assets consist of: |
|||||||||||||||
|
Paid-in capital |
$ |
21,067 |
$ |
2,296,893 |
$ |
31,761 |
|||||||||
|
Undistributed net investment income (loss) |
15 |
— |
— |
||||||||||||
|
Distributions in excess of net investment income |
— |
(9,127 |
) |
(63 |
) |
||||||||||
|
Accumulated net realized gains (losses) on investments |
(398 |
) |
(98,651 |
) |
(1,331 |
) |
|||||||||
|
Net unrealized appreciation (depreciation) in value of investments |
67 |
209,362 |
96 |
||||||||||||
|
Net Assets |
$ |
20,751 |
$ |
2,398,477 |
$ |
30,463 |
|||||||||
|
Net Assets |
|||||||||||||||
|
Institutional Class |
$ |
10,109 |
$ |
2,074,729 |
$ |
22,340 |
|||||||||
|
Class A |
5,942 |
206,414 |
999 |
||||||||||||
|
Class C |
4,700 |
117,334 |
979 |
||||||||||||
|
Class R6 |
— |
— |
6,145 |
||||||||||||
| Shares Outstanding ($.001 par value; unlimited shares authorized) |
|||||||||||||||
|
Institutional Class |
964 |
162,848 |
2,343 |
||||||||||||
|
Class A |
572 |
16,431 |
105 |
||||||||||||
|
Class C |
463 |
9,669 |
103 |
||||||||||||
|
Class R6 |
— |
— |
644 |
||||||||||||
|
Net Asset Value, offering and redemption price per share |
|||||||||||||||
|
Institutional Class |
$ |
10.49 |
$ |
12.74 |
$ |
9.53 |
|||||||||
|
Class R6 |
— |
— |
9.54 |
||||||||||||
|
Net Asset Value and redemption price per share |
|||||||||||||||
|
Class A |
$ |
10.40 |
$ |
12.56 |
$ |
9.53 |
|||||||||
|
Offering Price per share |
|||||||||||||||
|
Class A‡ |
$ |
11.03 |
$ |
13.33 |
$ |
9.95 |
|||||||||
|
Net Asset Value and offering price per share |
|||||||||||||||
|
Class C^ |
$ |
10.14 |
$ |
12.13 |
$ |
9.53 |
|||||||||
|
†Securities on loan, at value: |
|||||||||||||||
|
Unaffiliated issuers |
$ |
227 |
$ |
— |
$ |
— |
|||||||||
|
*Cost of Investments: |
|||||||||||||||
|
Unaffiliated issuers |
$ |
10,000 |
$ |
2,180,531 |
$ |
32,708 |
|||||||||
|
Affiliated issuers |
11,503 |
— |
— |
||||||||||||
|
Total cost of investments |
$ |
21,503 |
$ |
2,180,531 |
$ |
32,708 |
|||||||||
|
Total cost of foreign currency |
$ |
71 |
$ |
— |
$ |
11 |
|||||||||
|
**Proceeds from investments sold short |
$ |
2,368 |
$ |
369,084 |
$ |
— |
|||||||||
|
***Premium received from option contracts written |
$ |
13 |
$ |
5,858 |
$ |
— |
|||||||||
‡ On single retail sales of less than $50,000. On sales of $50,000 or more or in certain other circumstances described in the Fund's prospectus, offering price is reduced.
^ Redemption price per share is equal to net asset value less any applicable contingent deferred sales charge.
See Notes to Financial Statements
104
Statements of Assets and Liabilities (cont'd)
Neuberger Berman Alternative Funds
(000's omitted, except per share amounts)
| MULTI-ASSET INCOME FUND |
RISK BALANCED COMMODITY STRATEGY FUNDa |
U.S. EQUITY INDEX PUTWRITE STRATEGY FUND |
|||||||||||||
|
October 31, 2016 |
October 31, 2016 |
October 31, 2016 |
|||||||||||||
|
Assets |
|||||||||||||||
| Investments in securities, at value*† (Notes A & F)—see Schedule of Investments: |
|||||||||||||||
|
Unaffiliated issuers |
$ |
9,894 |
$ |
77,676 |
$ |
26,217 |
|||||||||
|
Affiliated issuers |
7,560 |
— |
— |
||||||||||||
|
17,454 |
77,676 |
26,217 |
|||||||||||||
|
Cash |
— |
503 |
227 |
||||||||||||
|
Foreign currency* |
4 |
— |
— |
||||||||||||
|
Cash collateral segregated for short sales (Note A) |
— |
— |
— |
||||||||||||
|
Cash collateral segregated for futures contracts (Note A) |
60 |
4,060 |
— |
||||||||||||
|
Cash collateral segregated for option contracts (Note A) |
— |
— |
10 |
||||||||||||
|
Cash collateral segregated for swap contracts (Note A) |
— |
— |
— |
||||||||||||
|
Cash collateral for securities loaned (Note A) |
— |
— |
— |
||||||||||||
|
Dividends and interest receivable |
51 |
207 |
67 |
||||||||||||
|
Receivable for securities sold |
22 |
— |
14 |
||||||||||||
|
Receivable for variation margin on futures contracts (Note A) |
119 |
794 |
— |
||||||||||||
|
Receivable for Fund shares sold |
— |
20 |
500 |
||||||||||||
|
Receivable from Management—net (Note B) |
52 |
— |
39 |
||||||||||||
|
OTC swap contracts, at value (Note A) |
— |
— |
— |
||||||||||||
|
Receivable for forward foreign currency contracts (Note A) |
150 |
— |
— |
||||||||||||
|
Prepaid expenses and other assets |
12 |
26 |
83 |
||||||||||||
|
Total Assets |
17,924 |
83,286 |
27,157 |
||||||||||||
|
Liabilities |
|||||||||||||||
|
Investments sold short, at value** (Note A) |
— |
— |
— |
||||||||||||
|
OTC swap contracts, at value (Note A) |
— |
— |
— |
||||||||||||
|
Dividends and interest payable for short sales |
— |
— |
— |
||||||||||||
|
Cash collateral segregated for option contracts due to broker (Note A) |
38 |
— |
— |
||||||||||||
|
Payable for collateral on securities loaned (Note A) |
— |
— |
— |
||||||||||||
|
Payable to investment manager—net (Notes A & B) |
4 |
65 |
8 |
||||||||||||
|
Option contracts written, at value*** (Note A) |
18 |
— |
474 |
||||||||||||
|
Due to custodian |
2 |
— |
— |
||||||||||||
|
Payable for securities purchased |
29 |
588 |
10 |
||||||||||||
|
Payable for Fund shares redeemed |
20 |
90 |
— |
||||||||||||
|
Payable to administrator—net (Note B) |
— |
6 |
— |
||||||||||||
|
Payable to trustees |
6 |
6 |
6 |
||||||||||||
|
Payable for organization costs |
— |
— |
74 |
||||||||||||
|
Premium received on swap contracts (Note A) |
— |
— |
— |
||||||||||||
|
Payable for open forward foreign currency contracts (Note A) |
171 |
— |
— |
||||||||||||
|
Distributions payable |
10 |
— |
— |
||||||||||||
|
Accrued expenses and other payables |
149 |
163 |
51 |
||||||||||||
|
Total Liabilities |
447 |
918 |
623 |
||||||||||||
|
Net Assets |
$ |
17,477 |
$ |
82,368 |
$ |
26,534 |
|||||||||
See Notes to Financial Statements
105
Statements of Assets and Liabilities (cont'd)
Neuberger Berman Alternative Funds (cont'd)
(000's omitted, except per share amounts)
| MULTI-ASSET INCOME FUND |
RISK BALANCED COMMODITY STRATEGY FUNDa |
U.S. EQUITY INDEX PUTWRITE STRATEGY FUND |
|||||||||||||
|
October 31, 2016 |
October 31, 2016 |
October 31, 2016 |
|||||||||||||
|
Net Assets consist of: |
|||||||||||||||
|
Paid-in capital |
$ |
17,973 |
$ |
82,016 |
$ |
26,440 |
|||||||||
|
Undistributed net investment income (loss) |
6 |
(268 |
) |
8 |
|||||||||||
|
Distributions in excess of net investment income |
— |
— |
— |
||||||||||||
|
Accumulated net realized gains (losses) on investments |
(531 |
) |
(98 |
) |
161 |
||||||||||
|
Net unrealized appreciation (depreciation) in value of investments |
29 |
718 |
(75 |
) |
|||||||||||
|
Net Assets |
$ |
17,477 |
$ |
82,368 |
$ |
26,534 |
|||||||||
|
Net Assets |
|||||||||||||||
|
Institutional Class |
$ |
12,406 |
$ |
48,957 |
$ |
21,201 |
|||||||||
|
Class A |
563 |
33,326 |
422 |
||||||||||||
|
Class C |
642 |
85 |
103 |
||||||||||||
|
Class R6 |
3,866 |
— |
4,808 |
||||||||||||
| Shares Outstanding ($.001 par value; unlimited shares authorized) |
|||||||||||||||
|
Institutional Class |
1,292 |
8,177 |
2,100 |
||||||||||||
|
Class A |
59 |
5,652 |
42 |
||||||||||||
|
Class C |
67 |
15 |
10 |
||||||||||||
|
Class R6 |
403 |
— |
476 |
||||||||||||
|
Net Asset Value, offering and redemption price per share |
|||||||||||||||
|
Institutional Class |
$ |
9.60 |
$ |
5.99 |
$ |
10.09 |
|||||||||
|
Class R6 |
9.60 |
— |
10.10 |
||||||||||||
|
Net Asset Value and redemption price per share |
|||||||||||||||
|
Class A |
$ |
9.60 |
$ |
5.90 |
$ |
10.09 |
|||||||||
|
Offering Price per share |
|||||||||||||||
|
Class A‡ |
$ |
10.03 |
$ |
6.26 |
$ |
10.71 |
|||||||||
|
Net Asset Value and offering price per share |
|||||||||||||||
|
Class C^ |
$ |
9.60 |
$ |
5.71 |
$ |
10.08 |
|||||||||
|
†Securities on loan, at value: |
|||||||||||||||
|
Unaffiliated issuers |
$ |
— |
$ |
— |
$ |
— |
|||||||||
|
*Cost of Investments: |
|||||||||||||||
|
Unaffiliated issuers |
$ |
9,850 |
$ |
77,623 |
$ |
26,234 |
|||||||||
|
Affiliated issuers |
7,537 |
— |
— |
||||||||||||
|
Total cost of investments |
$ |
17,387 |
$ |
77,623 |
$ |
26,234 |
|||||||||
|
Total cost of foreign currency |
$ |
4 |
$ |
— |
$ |
— |
|||||||||
|
**Proceeds from investments sold short |
$ |
— |
$ |
— |
$ |
— |
|||||||||
|
***Premium received from option contracts written |
$ |
21 |
$ |
— |
$ |
416 |
|||||||||
a Consolidated financial statement, see Note A of the Notes to Financial Statements for additional information.
‡ On single retail sales of less than $50,000. On sales of $50,000 or more or in certain other circumstances described in the Fund's prospectus, offering price is reduced.
^ Redemption price per share is equal to net asset value less any applicable contingent deferred sales charge.
See Notes to Financial Statements
106
Statements of Operations
Neuberger Berman Alternative Funds
(000's omitted)
| GLOBAL ALLOCATION FUND |
LONG SHORT FUND |
LONG SHORT CREDIT FUND |
|||||||||||||
| For the Year Ended October 31, 2016 |
For the Year Ended October 31, 2016 |
For the Year Ended October 31, 2016 |
|||||||||||||
|
Investment Income: |
|||||||||||||||
|
Income (Note A): |
|||||||||||||||
|
Dividend income—unaffiliated issuers |
$ |
272 |
$ |
32,689 |
$ |
23 |
|||||||||
|
Dividend income—affiliated issuers (Notes A & F) |
138 |
— |
— |
||||||||||||
|
Interest and other income—unaffiliated issuers |
46 |
14,250 |
1,093 |
||||||||||||
|
Income from securities loaned—net (Note A) |
2 |
— |
— |
||||||||||||
|
Foreign taxes withheld (Note A) |
(10 |
) |
(576 |
) |
— |
||||||||||
|
Total income |
$ |
448 |
$ |
46,363 |
$ |
1,116 |
|||||||||
|
Expenses: |
|||||||||||||||
|
Investment management fees (Note B) |
138 |
30,470 |
254 |
||||||||||||
|
Administration fees (Note B) |
13 |
1,645 |
19 |
||||||||||||
|
Administration fees (Note B): |
|||||||||||||||
|
Institutional Class |
8 |
2,089 |
22 |
||||||||||||
|
Class A |
13 |
542 |
3 |
||||||||||||
|
Class C |
11 |
298 |
2 |
||||||||||||
|
Class R6 |
— |
— |
1 |
||||||||||||
|
Distribution fees (Note B): |
|||||||||||||||
|
Class A |
17 |
677 |
3 |
||||||||||||
|
Class C |
55 |
1,490 |
10 |
||||||||||||
|
Shareholder servicing agent fees: |
|||||||||||||||
|
Institutional Class |
— |
216 |
1 |
||||||||||||
|
Class A |
3 |
44 |
1 |
||||||||||||
|
Class C |
2 |
12 |
— |
||||||||||||
|
Class R3 |
— |
— |
— |
||||||||||||
|
Class R6 |
— |
— |
— |
||||||||||||
|
Organization expense (Note A) |
— |
— |
— |
||||||||||||
|
Subsidiary Administration Fees |
— |
— |
— |
||||||||||||
|
Audit fees |
70 |
35 |
43 |
||||||||||||
|
Custodian and accounting fees |
259 |
510 |
89 |
||||||||||||
|
Insurance expense |
1 |
100 |
1 |
||||||||||||
|
Legal fees |
106 |
156 |
139 |
||||||||||||
|
Registration and filing fees |
61 |
199 |
96 |
||||||||||||
|
Shareholder reports |
4 |
332 |
5 |
||||||||||||
|
Trustees' fees and expenses |
52 |
55 |
52 |
||||||||||||
|
Dividend and interest expense on securities sold short (Note A) |
111 |
16,038 |
271 |
||||||||||||
|
Interest expense |
— |
23 |
1 |
||||||||||||
|
Miscellaneous |
45 |
198 |
19 |
||||||||||||
|
Total expenses |
969 |
55,129 |
1,032 |
||||||||||||
|
Expenses reimbursed by Management (Note B) |
(582 |
) |
— |
(366 |
) |
||||||||||
|
Investment management fees waived (Note A) |
(64 |
) |
— |
(36 |
) |
||||||||||
|
Total net expenses |
323 |
55,129 |
630 |
||||||||||||
|
Net investment income (loss) |
$ |
125 |
$ |
(8,766 |
) |
$ |
486 |
||||||||
See Notes to Financial Statements
107
Statements of Operations (cont'd)
Neuberger Berman Alternative Funds (cont'd)
(000's omitted)
| GLOBAL ALLOCATION FUND |
LONG SHORT FUND |
LONG SHORT CREDIT FUND |
|||||||||||||
| For the Year Ended October 31, 2016 |
For the Year Ended October 31, 2016 |
For the Year Ended October 31, 2016 |
|||||||||||||
|
Realized and Unrealized Gain (Loss) on Investments (Note A): |
|||||||||||||||
|
Net realized gain (loss) on: |
|||||||||||||||
|
Sales of investment securities of unaffiliated issuers |
37 |
(43,072 |
) |
(788 |
) |
||||||||||
|
Sales of investment securities of affiliated issuers |
(41 |
) |
— |
— |
|||||||||||
|
Sales of investment securities of unaffiliated issuers sold short |
(254 |
) |
(14,133 |
) |
(360 |
) |
|||||||||
|
Forward foreign currency contracts |
75 |
— |
13 |
||||||||||||
|
Foreign currency |
(5 |
) |
(18 |
) |
(13 |
) |
|||||||||
|
Futures contracts |
27 |
(43,877 |
) |
13 |
|||||||||||
|
Option contracts and swaptions written |
12 |
7,856 |
33 |
||||||||||||
|
Swap contracts |
— |
(1,516 |
) |
176 |
|||||||||||
|
Change in net unrealized appreciation (depreciation) in value of: |
|||||||||||||||
|
Unaffiliated investment securities |
(247 |
) |
48,201 |
409 |
|||||||||||
|
Affiliated investment securities |
219 |
— |
— |
||||||||||||
|
Unaffiliated investment securities sold short |
136 |
5,338 |
10 |
||||||||||||
|
Forward foreign currency contracts |
(39 |
) |
— |
(3 |
) |
||||||||||
|
Foreign currency |
(1 |
) |
1 |
— |
|||||||||||
|
Futures contracts |
(35 |
) |
28,035 |
80 |
|||||||||||
|
Option contracts and swaptions written |
2 |
1,860 |
5 |
||||||||||||
|
Swap contracts |
— |
(2,931 |
) |
(69 |
) |
||||||||||
|
Net gain (loss) on investments |
(114 |
) |
(14,256 |
) |
(494 |
) |
|||||||||
|
Net increase (decrease) in net assets resulting from operations |
$ |
11 |
$ |
(23,022 |
) |
$ |
(8 |
) |
|||||||
See Notes to Financial Statements
108
Statements of Operations (cont'd)
Neuberger Berman Alternative Funds
(000's omitted)
| MULTI-ASSET INCOME FUND |
RISK BALANCED COMMODITY STRATEGY FUNDa |
U.S. EQUITY INDEX PUTWRITE STRATEGY FUND |
|||||||||||||
| For the Year Ended October 31, 2016 |
For the Year Ended October 31, 2016 |
Period from September 16, 2016 (Commencement of Operations) to October 31, 2016 |
|||||||||||||
|
Investment Income: |
|||||||||||||||
|
Income (Note A): |
|||||||||||||||
|
Dividend income—unaffiliated issuers |
$ |
331 |
$ |
— |
$ |
— |
|||||||||
|
Dividend income—affiliated issuers (Notes A & F) |
234 |
— |
— |
||||||||||||
|
Interest and other income—unaffiliated issuers |
32 |
487 |
21 |
||||||||||||
|
Income from securities loaned—net (Note A) |
— |
— |
— |
||||||||||||
|
Foreign taxes withheld (Note A) |
(6 |
) |
— |
— |
|||||||||||
|
Total income |
$ |
591 |
$ |
487 |
$ |
21 |
|||||||||
|
Expenses: |
|||||||||||||||
|
Investment management fees (Note B) |
70 |
521 |
11 |
||||||||||||
|
Administration fees (Note B) |
9 |
45 |
1 |
||||||||||||
|
Administration fees (Note B): |
|||||||||||||||
|
Institutional Class |
10 |
36 |
2 |
||||||||||||
|
Class A |
1 |
66 |
— |
||||||||||||
|
Class C |
1 |
2 |
— |
||||||||||||
|
Class R6 |
1 |
— |
— |
||||||||||||
|
Distribution fees (Note B): |
|||||||||||||||
|
Class A |
1 |
82 |
— |
||||||||||||
|
Class C |
5 |
10 |
— |
||||||||||||
|
Shareholder servicing agent fees: |
|||||||||||||||
|
Institutional Class |
— |
1 |
— |
||||||||||||
|
Class A |
— |
10 |
— |
||||||||||||
|
Class C |
— |
3 |
— |
||||||||||||
|
Class R6 |
— |
— |
— |
||||||||||||
|
Organization expense (Note A) |
— |
— |
148 |
||||||||||||
|
Subsidiary Administration Fees |
— |
50 |
— |
||||||||||||
|
Audit fees |
53 |
81 |
20 |
||||||||||||
|
Custodian and accounting fees |
202 |
69 |
18 |
||||||||||||
|
Insurance expense |
1 |
3 |
— |
||||||||||||
|
Legal fees |
100 |
116 |
10 |
||||||||||||
|
Registration and filing fees |
83 |
52 |
2 |
||||||||||||
|
Shareholder reports |
— |
39 |
1 |
||||||||||||
|
Trustees' fees and expenses |
52 |
52 |
6 |
||||||||||||
|
Dividend and interest expense on securities sold short (Note A) |
— |
— |
— |
||||||||||||
|
Interest expense |
— |
— |
— |
||||||||||||
|
Miscellaneous |
18 |
41 |
1 |
||||||||||||
|
Total expenses |
607 |
1,279 |
220 |
||||||||||||
|
Expenses reimbursed by Management (Note B) |
(501 |
) |
(329 |
) |
(205 |
) |
|||||||||
|
Investment management fees waived (Note A) |
(33 |
) |
— |
— |
|||||||||||
|
Total net expenses |
73 |
950 |
15 |
||||||||||||
|
Net investment income (loss) |
$ |
518 |
$ |
(463 |
) |
$ |
6 |
||||||||
See Notes to Financial Statements
109
Statements of Operations (cont'd)
Neuberger Berman Alternative Funds (cont'd)
(000's omitted)
| MULTI-ASSET INCOME FUND |
RISK BALANCED COMMODITY STRATEGY FUNDa |
U.S. EQUITY INDEX PUTWRITE STRATEGY FUND |
|||||||||||||
| For the Year Ended October 31, 2016 |
For the Year Ended October 31, 2016 |
Period from September 16, 2016 (Commencement of Operations) to October 31, 2016 |
|||||||||||||
|
Realized and Unrealized Gain (Loss) on Investments (Note A): |
|||||||||||||||
|
Net realized gain (loss) on: |
|||||||||||||||
|
Sales of investment securities of unaffiliated issuers |
(176 |
) |
(95 |
) |
— |
||||||||||
|
Sales of investment securities of affiliated issuers |
(252 |
) |
— |
— |
|||||||||||
|
Sales of investment securities of unaffiliated issuers sold short |
— |
— |
— |
||||||||||||
|
Forward foreign currency contracts |
19 |
— |
— |
||||||||||||
|
Foreign currency |
(5 |
) |
— |
— |
|||||||||||
|
Futures contracts |
(9 |
) |
(1,333 |
) |
— |
||||||||||
|
Option contracts and swaptions written |
40 |
— |
161 |
||||||||||||
|
Swap contracts |
— |
— |
— |
||||||||||||
|
Change in net unrealized appreciation (depreciation) in value of: |
|||||||||||||||
|
Unaffiliated investment securities |
460 |
195 |
(17 |
) |
|||||||||||
|
Affiliated investment securities |
371 |
— |
— |
||||||||||||
|
Unaffiliated investment securities sold short |
— |
— |
— |
||||||||||||
|
Forward foreign currency contracts |
(24 |
) |
— |
— |
|||||||||||
|
Foreign currency |
(1 |
) |
— |
— |
|||||||||||
|
Futures contracts |
(38 |
) |
6 |
— |
|||||||||||
|
Option contracts and swaptions written |
10 |
— |
(58 |
) |
|||||||||||
|
Swap contracts |
— |
— |
— |
||||||||||||
|
Net gain (loss) on investments |
395 |
(1,227 |
) |
86 |
|||||||||||
|
Net increase (decrease) in net assets resulting from operations |
$ |
913 |
$ |
(1,690 |
) |
$ |
92 |
||||||||
a Consolidated financial statement, see Note A of the Notes to Financial Statements for additional information.
See Notes to Financial Statements
110
This page has been left blank intentionally
111
Statements of Changes in Net Assets
Neuberger Berman Alternative Funds
(000's omitted)
|
GLOBAL ALLOCATION FUND |
LONG SHORT FUND |
|||||||||||||||
| Year Ended October 31, 2016 |
Year Ended October 31, 2015 |
Year Ended October 31, 2016 |
Year Ended October 31, 2015 |
|||||||||||||
|
Increase (Decrease) in Net Assets: |
||||||||||||||||
|
From Operations (Note A): |
||||||||||||||||
|
Net investment income (loss) |
$ |
125 |
$ |
31 |
$ |
(8,766 |
) |
$ |
1,761 |
|||||||
|
Net realized gain (loss) on investments |
(149 |
) |
297 |
(94,760 |
) |
(16,597 |
) |
|||||||||
| Change in net unrealized appreciation (depreciation) of investments |
35 |
(609 |
) |
80,504 |
(42,736 |
) |
||||||||||
|
Net increase (decrease) in net assets resulting from operations |
11 |
(281 |
) |
(23,022 |
) |
(57,572 |
) |
|||||||||
|
Distributions to Shareholders From (Note A): |
||||||||||||||||
|
Net investment income: |
||||||||||||||||
|
Institutional Class |
— |
(291 |
) |
(361 |
) |
(4,410 |
) |
|||||||||
|
Class A |
— |
(213 |
) |
— |
— |
|||||||||||
|
Class C |
— |
(120 |
) |
— |
— |
|||||||||||
|
Class R6 |
— |
— |
— |
— |
||||||||||||
|
Net realized gain on investments: |
||||||||||||||||
|
Institutional Class |
(16 |
) |
— |
— |
(10,560 |
) |
||||||||||
|
Class A |
(14 |
) |
— |
— |
(1,445 |
) |
||||||||||
|
Class C |
(13 |
) |
— |
— |
(780 |
) |
||||||||||
|
Tax return of capital: |
||||||||||||||||
|
Institutional Class |
— |
— |
— |
— |
||||||||||||
|
Class A |
— |
— |
— |
— |
||||||||||||
|
Class C |
— |
— |
— |
— |
||||||||||||
|
Class R6 |
— |
— |
— |
— |
||||||||||||
|
Total distributions to shareholders |
(43 |
) |
(624 |
) |
(361 |
) |
(17,195 |
) |
||||||||
|
From Fund Share Transactions (Note D): |
||||||||||||||||
|
Proceeds from shares sold: |
||||||||||||||||
|
Institutional Class |
3,603 |
2,516 |
858,721 |
1,207,864 |
||||||||||||
|
Class A |
1,982 |
2,375 |
45,394 |
153,230 |
||||||||||||
|
Class C |
826 |
2,006 |
9,572 |
44,433 |
||||||||||||
|
Class R6 |
— |
— |
— |
— |
||||||||||||
|
Proceeds from reinvestment of dividends and distributions: |
||||||||||||||||
|
Institutional Class |
16 |
288 |
185 |
9,520 |
||||||||||||
|
Class A |
14 |
196 |
— |
1,289 |
||||||||||||
|
Class C |
12 |
112 |
— |
570 |
||||||||||||
|
Class R6 |
— |
— |
— |
— |
||||||||||||
|
Payments for shares redeemed: |
||||||||||||||||
|
Institutional Class |
(2,526 |
) |
(5,994 |
) |
(1,488,015 |
) |
(1,066,159 |
) |
||||||||
|
Class A |
(4,077 |
) |
(3,761 |
) |
(196,288 |
) |
(172,179 |
) |
||||||||
|
Class C |
(2,625 |
) |
(2,298 |
) |
(79,785 |
) |
(59,121 |
) |
||||||||
|
Class R6 |
— |
— |
— |
— |
||||||||||||
|
Net increase (decrease) from Fund share transactions |
(2,775 |
) |
(4,560 |
) |
(850,216 |
) |
119,447 |
|||||||||
|
Net Increase (Decrease) in Net Assets |
(2,807 |
) |
(5,465 |
) |
(873,599 |
) |
44,680 |
|||||||||
|
Net Assets: |
||||||||||||||||
|
Beginning of year |
23,558 |
29,023 |
3,272,076 |
3,227,396 |
||||||||||||
|
End of year |
$ |
20,751 |
$ |
23,558 |
$ |
2,398,477 |
$ |
3,272,076 |
||||||||
|
Undistributed net investment income (loss) at end of year |
$ |
15 |
$ |
— |
$ |
— |
$ |
— |
||||||||
|
Distributions in excess of net investment income at end of year |
$ |
— |
$ |
(250 |
) |
$ |
(9,127 |
) |
$ |
(6,400 |
) |
|||||
a Consolidated financial statement, see Note A of the Notes to Financial Statements for additional information.
See Notes to Financial Statements
112
|
LONG SHORT CREDIT FUND |
MULTI-ASSET INCOME FUND |
RISK BALANCED COMMODITY STRATEGY FUNDa |
U.S. EQUITY INDEX PUTWRITE STRATEGY FUND |
|||||||||||||||||||||||
| Year Ended October 31, 2016 |
Period from June 29, 2015 (Commencement of Operations) to October 31, 2015 |
Year Ended October 31, 2016 |
Period from March 27, 2015 (Commencement of Operations) to October 31, 2015 |
Year Ended October 31, 2016 |
Year Ended October 31, 2015 |
Period from September 16, 2016 (Commencement of Operations) to October 31, 2016 |
||||||||||||||||||||
|
$ |
486 |
$ |
52 |
$ |
518 |
$ |
361 |
$ |
(463 |
) |
$ |
(822 |
) |
$ |
6 |
|||||||||||
|
(926 |
) |
(264 |
) |
(383 |
) |
(164 |
) |
(1,428 |
) |
(27,882 |
) |
161 |
||||||||||||||
|
432 |
(336 |
) |
778 |
(749 |
) |
201 |
4,679 |
(75 |
) |
|||||||||||||||||
|
(8 |
) |
(548 |
) |
913 |
(552 |
) |
(1,690 |
) |
(24,025 |
) |
92 |
|||||||||||||||
|
(499 |
) |
(85 |
) |
(344 |
) |
(255 |
) |
— |
— |
— |
||||||||||||||||
|
(21 |
) |
(3 |
) |
(14 |
) |
(11 |
) |
— |
— |
— |
||||||||||||||||
|
(11 |
) |
(1 |
) |
(10 |
) |
(8 |
) |
— |
— |
— |
||||||||||||||||
|
(102 |
) |
(24 |
) |
(122 |
) |
(94 |
) |
— |
— |
— |
||||||||||||||||
|
— |
— |
— |
— |
— |
(2 |
) |
— |
|||||||||||||||||||
|
— |
— |
— |
— |
— |
(5 |
) |
— |
|||||||||||||||||||
|
— |
— |
— |
— |
— |
(0 |
) |
— |
|||||||||||||||||||
|
— |
— |
(104 |
) |
— |
— |
— |
— |
|||||||||||||||||||
|
— |
— |
(5 |
) |
— |
— |
— |
— |
|||||||||||||||||||
|
— |
— |
(4 |
) |
— |
— |
— |
— |
|||||||||||||||||||
|
— |
— |
(36 |
) |
— |
— |
— |
— |
|||||||||||||||||||
|
(633 |
) |
(113 |
) |
(639 |
) |
(368 |
) |
— |
(7 |
) |
— |
|||||||||||||||
|
7,628 |
23,254 |
1,594 |
11,175 |
27,038 |
26,234 |
21,148 |
||||||||||||||||||||
|
135 |
1,342 |
122 |
505 |
16,243 |
43,996 |
422 |
||||||||||||||||||||
|
25 |
1,032 |
206 |
503 |
135 |
1,946 |
102 |
||||||||||||||||||||
|
1,353 |
5,000 |
— |
4,000 |
— |
— |
4,770 |
||||||||||||||||||||
|
399 |
4 |
306 |
57 |
— |
2 |
— |
||||||||||||||||||||
|
7 |
— |
5 |
2 |
— |
5 |
— |
||||||||||||||||||||
|
3 |
— |
4 |
1 |
— |
0 |
— |
||||||||||||||||||||
|
29 |
— |
44 |
13 |
— |
— |
— |
||||||||||||||||||||
|
(7,971 |
) |
(5 |
) |
(279 |
) |
(2 |
) |
(9,690 |
) |
(7,817 |
) |
— |
||||||||||||||
|
(423 |
) |
— |
(51 |
) |
— |
(17,175 |
) |
(59,467 |
) |
— |
||||||||||||||||
|
(33 |
) |
— |
(47 |
) |
(3 |
) |
(2,899 |
) |
(1,943 |
) |
— |
|||||||||||||||
|
(14 |
) |
— |
(32 |
) |
— |
— |
— |
— |
||||||||||||||||||
|
1,138 |
30,627 |
1,872 |
16,251 |
13,652 |
2,956 |
26,442 |
||||||||||||||||||||
|
497 |
29,966 |
2,146 |
15,331 |
11,962 |
(21,076 |
) |
26,534 |
|||||||||||||||||||
|
29,966 |
— |
15,331 |
— |
70,406 |
91,482 |
— |
||||||||||||||||||||
|
$ |
30,463 |
$ |
29,966 |
$ |
17,477 |
$ |
15,331 |
$ |
82,368 |
$ |
70,406 |
$ |
26,534 |
|||||||||||||
|
$ |
— |
$ |
— |
$ |
6 |
$ |
— |
$ |
(268 |
) |
$ |
(566 |
) |
$ |
8 |
|||||||||||
|
$ |
(63 |
) |
$ |
(21 |
) |
$ |
— |
$ |
(7 |
) |
$ |
— |
$ |
— |
$ |
— |
||||||||||
113
Notes to Financial Statements Alternative Fundsß
Note A—Summary of Significant Accounting Policies:
1 General: Neuberger Berman Alternative Funds (the "Trust") is a Delaware statutory trust organized pursuant to an Amended and Restated Trust Instrument dated March 27, 2014. The Trust is registered as an open-end management investment company under the Investment Company Act of 1940, as amended (the "1940 Act"), and its shares are registered under the Securities Act of 1933, as amended (the "1933 Act"). Each of Neuberger Berman Global Allocation Fund ("Global Allocation"), Neuberger Berman Long Short Fund ("Long Short"), Neuberger Berman Long Short Credit Fund ("Long Short Credit"), Neuberger Berman Multi-Asset Income Fund ("Multi-Asset Income"), Neuberger Berman Risk Balanced Commodity Strategy Fund ("Risk Balanced Commodity Strategy") and Neuberger Berman U.S. Equity Index PutWrite Strategy Fund ("U.S. Equity Index PutWrite Strategy"), (each individually a "Fund," and collectively, the "Funds") is a separate operating series of the Trust. Under the 1940 Act, the status of a Fund that was registered as non-diversified may, under certain circumstances, change to that of a diversified Fund (Global Allocation, Long Short and Risk Balanced Commodity Strategy became diversified in December 2013, December 2014 and August 2015, respectively). Long Short Credit, Multi-Asset Income and U.S. Equity Index PutWrite Strategy are each diversified. Long Short Credit had no operations until June 29, 2015, other than matters relating to its organization and its registration of shares under the 1933 Act. Multi-Asset Income had no operations until March 27, 2015, other than matters relating to its organization and its registration of shares under the 1933 Act. U.S. Equity Index PutWrite Strategy had no operations until September 16, 2016, other than matters relating to its organization and its registration of shares under the 1933 Act. Each Fund offers Institutional Class shares, Class A shares and Class C shares. Long Short Credit, Multi-Asset Income and U.S. Equity Index PutWrite Strategy also offer Class R6 shares. The Neuberger Berman Alternative Funds' Board of Trustees (the "Board") may establish additional series or classes of shares without the approval of shareholders.
A zero balance, if any, reflects an actual amount rounding to less than $1,000.
The assets of each Fund belong only to that Fund, and the liabilities of each Fund are borne solely by that Fund and no other.
Each Fund is an investment company and accordingly follows the investment company accounting and reporting guidance of the Financial Accounting Standards Board ("FASB") Accounting Standard Codification Topic 946 "Financial Services—Investment Companies."
The preparation of financial statements in accordance with U.S. generally accepted accounting principles ("GAAP") requires Neuberger Berman Investment Advisers LLC ("NBIA" or "Management") to make estimates and assumptions at the date of the financial statements. Actual results could differ from those estimates.
Risk Balanced Commodity Strategy invests in commodity-related instruments through Neuberger Berman Cayman Commodity Fund I Ltd. (the "Subsidiary"), which is organized under the laws of the Cayman Islands. Subscription agreements were entered into between the Fund and the Subsidiary with the intent that Risk Balanced Commodity Strategy will remain the sole shareholder of the Subsidiary. The Subsidiary is governed by its own Board of Directors.
As of October 31, 2016, the value of Risk Balanced Commodity Strategy's investment in the Subsidiary was as follows:
| Investment in Subsidiary |
Percentage of Net Assets |
||||||
| $ |
13,805,044 |
16.8 |
% |
||||
ß Consolidated Notes to Financial Statements for Risk Balanced Commodity Strategy
114
The Consolidated Financial Statements include all investments and other accounts of the Subsidiary as if held directly by Risk Balanced Commodity Strategy. A summary of the Subsidiary's financial information is presented below:
| Subsidiary Financial Statement Information (000's omitted) |
Amount |
||||||
|
Total Assets |
$ |
14,001 |
|||||
|
Total Liabilities |
196 |
||||||
|
Net Assets |
13,805 |
||||||
|
Net investment income (loss) |
(127 |
) |
|||||
|
Net realized gain (loss) |
(1,333 |
) |
|||||
|
Change in net unrealized appreciation (depreciation) |
6 |
||||||
|
Net increase (decrease) in net assets resulting from operations |
$ |
(1,454 |
) |
||||
2 Consolidation: The accompanying financial statements of Risk Balanced Commodity Strategy present the consolidated accounts of Risk Balanced Commodity Strategy and the Subsidiary. All intercompany accounts and transactions have been eliminated in consolidation.
3 Portfolio valuation: In accordance with Accounting Standards Codification ("ASC") 820 "Fair Value Measurement" ("ASC 820"), all investments held by each of the Funds are carried at the value that Management believes a Fund would receive upon selling an investment in an orderly transaction to an independent buyer in the principal or most advantageous market for the investment under current market conditions. Various inputs, including the volume and level of activity for the asset or liability in the market, are considered in valuing the Funds' investments, some of which are discussed below. Significant Management judgment may be necessary to value investments in accordance with ASC 820.
ASC 820 established a three-tier hierarchy of inputs to create a classification of value measurements for disclosure purposes. The three-tier hierarchy of inputs is summarized in the three broad Levels listed below.
• Level 1 – quoted prices in active markets for identical investments
• Level 2 – other observable inputs (including quoted prices for similar investments, interest rates, prepayment speeds, credit risk, amortized cost, etc.)
• Level 3 – unobservable inputs (including the Fund's own assumptions in determining the fair value of investments)
The inputs or methodology used for valuing an investment are not necessarily an indication of the risk associated with investing in those securities.
The value of the Funds' investments (long and short positions) in equity securities, exchange-traded funds, preferred stocks, exchange-traded options purchased and options written, for which market quotations are readily available, is generally determined by Management by obtaining valuations from independent pricing services based on the latest sale price quoted on a principal exchange or market for that security (Level 1 inputs). Securities traded primarily on the NASDAQ Stock Market are normally valued at the NASDAQ Official Closing Price ("NOCP") provided by NASDAQ each business day. The NOCP is the most recently reported price as of 4:00:02 p.m., Eastern Time, unless that price is outside the range of the "inside" bid and asked prices (i.e., the bid and asked prices that dealers quote to each other when trading for their own accounts); in that case, NASDAQ will adjust the price to equal the inside bid or asked price, whichever is closer. Because of delays in reporting trades, the NOCP may not be based on the price of the last trade to occur before the market closes. If there is no sale of a security on a particular day, the independent pricing services may value the security based on market quotations.
The value of the Funds' investments in debt securities for long and short positions is determined by Management primarily by obtaining valuations from independent pricing services based on readily available bid or offer quotations, respectively, or if quotations are not available, by methods which include various considerations based on security type (generally Level 2 inputs). In addition to the consideration of yields or prices of securities of
115
comparable quality, coupon, maturity and type, indications as to values from dealers, and general market conditions, the following is a description of other Level 2 inputs and related valuation techniques used by independent pricing services to value certain types of debt securities held by the Funds:
Corporate Bonds. Inputs used to value corporate debt securities generally include relative credit information, observed market movements, sector news, U.S. Treasury yield curve or relevant benchmark curve, and other market information, which may include benchmark yields, reported trades, broker-dealer quotes, issuer spreads, benchmark securities, bids, offers, and reference data, such as market research publications, when available ("Other Market Information").
Convertible Bonds. Inputs used to value convertible bonds generally include underlying stock data, dealer quotes, conversion premiums, listed bond and preferred stock prices and other market information, which may include benchmark curves, trade execution data, and sensitivity analysis, when available.
U.S. Treasury Obligations. Inputs used to value U.S. Treasury securities generally include quotes from several inter-dealer brokers and Other Market Information.
U.S. Government Agency Securities. Inputs used to value U.S. Government Agency securities generally include obtaining benchmark quotes and Other Market Information.
Asset-Backed Securities and Mortgage-Backed Securities. Inputs used to value asset-backed securities and mortgage-backed securities generally include models that consider a number of factors, which may include the following: prepayment speeds, cash flows, spread adjustments and Other Market Information.
Emerging Markets Debt, Sovereign Debt and Quasi-Sovereign Debt. Inputs used to value emerging markets debt, sovereign debt and quasi-sovereign debt generally include dealer quotes, bond market activity, discounted cash flow models, and other relevant information such as credit spreads, benchmark curves and Other Market Information.
The value of loan assignments is determined by Management primarily by obtaining valuations from independent pricing services based on broker quotes (generally Level 2 or Level 3 inputs depending on the number of quotes available).
The value of futures is determined by Management by obtaining valuations from independent pricing services at the settlement price at the market close (Level 1 inputs).
The value of forward contracts is determined by Management by obtaining valuations from independent pricing services based on actual traded currency rates on independent pricing services' networks, along with other traded and quoted currency rates provided to the pricing services by leading market participants (Level 2 inputs).
The value of credit default swaps is determined by Management by obtaining valuations from independent pricing services using a model that considers a number of factors, which may include default probabilities, credit curves, recovery rates and cash flows (Level 2 inputs).
The value of total return swaps and total return basket swaps is determined by Management by obtaining valuations from independent pricing services using the underlying asset and stated London Interbank Offered Rate ("LIBOR") or Federal Funds floating rate (Level 2 inputs).
Option contracts that are traded OTC are generally valued on the basis of quotations provided by broker-dealers or prices provided by independent pricing services who use a series of techniques including simulated pricing models and/or curve fitting (bootstrapping), which aids in determining the present value of the contracts. The pricing models use inputs that are observed from actively quoted markets such as issuer details, indices, spreads, interest rates, yield curves, credit curves, volatility surfaces, and exchange rates (Level 2 inputs).
Management has developed a process to periodically review information provided by independent pricing services for all types of securities.
Investments in non-exchange traded investment companies are valued using the respective fund's daily calculated net asset value per share (Level 2 inputs).
116
If a valuation is not available from an independent pricing service, or if Management has reason to believe that the valuation received does not represent the amount a Fund might reasonably expect to receive on a current sale in an orderly transaction, Management seeks to obtain quotations from brokers or dealers (generally considered Level 2 or Level 3 inputs depending on the number of quotes available). If such quotations are not readily available, the security is valued using methods the Board has approved in the good-faith belief that the resulting valuation will reflect the fair value of the security. Numerous factors may be considered when determining the fair value of a security based on Level 2 or Level 3 inputs, including available analyst, media or other reports, securities within the same industry with recent highly correlated performance, trading in futures or American Depositary Receipts ("ADRs") and whether the issuer of the security being fair valued has other securities outstanding.
The value of the Funds' investments in foreign securities is generally determined using the same valuation methods and inputs as other Fund investments, as discussed above. Foreign security prices expressed in local currency values are normally translated from the local currency into U.S. dollars using the exchange rates as of 4:00 p.m., Eastern Time on days the New York Stock Exchange ("NYSE") is open for business. The Board has approved the use of Interactive Data Pricing and Reference Data, Inc. ("Interactive") to assist in determining the fair value of foreign equity securities when changes in the value of a certain index suggest that the closing prices on the foreign exchanges may no longer represent the amount that a Fund could expect to receive for those securities or on days when foreign markets are closed and U.S. markets are open. In each of these events, Interactive will provide adjusted prices for certain foreign equity securities using a statistical analysis of historical correlations of multiple factors (Level 2 inputs). The Board has also approved the use of Interactive to evaluate the prices of foreign debt securities as of the time as of which a Fund's share price is calculated. Interactive utilizes benchmark spread and yield curves and evaluates available market activity from the local close to the time as of which a Fund's share price is calculated (Level 2 inputs) to assist in determining prices for certain foreign debt securities. In the case of both foreign equity and foreign income securities, in the absence of precise information about the market values of these foreign securities as of the time as of which a Fund's share price is calculated, the Board has determined on the basis of available data that prices adjusted or evaluated in this way are likely to be closer to the prices a Fund could realize on a current sale than are the prices of those securities established at the close of the foreign markets in which the securities primarily trade.
Fair value prices are necessarily estimates, and there is no assurance that such a price will be at or close to the price at which the security is next quoted or next trades.
4 Foreign currency translation: The accounting records of the Funds and Subsidiary are maintained in U.S. dollars. Foreign currency amounts are normally translated into U.S. dollars using the exchange rate as of 4:00 p.m. Eastern Time, on days the NYSE is open for business to determine the value of investments, other assets and liabilities. Purchase and sale prices of securities, and income and expenses, are translated into U.S. dollars at the prevailing rate of exchange on the respective dates of such transactions. Net unrealized foreign currency gain (loss), if any, arises from changes in the value of assets and liabilities, other than investments in securities, as a result of changes in exchange rates and is stated separately in the Statements of Operations.
5 Securities transactions and investment income: Securities transactions are recorded on trade date for financial reporting purposes. Dividend income is recorded on the ex-dividend date or, for certain foreign dividends, as soon as a Fund becomes aware of the dividends. Non-cash dividends included in dividend income, if any, are recorded at the fair market value of the securities received. Interest income, including accretion of discount on securities, accretion of original issue discount, where applicable, and accretion of discount on short-term investments, if any, is recorded on the accrual basis. Realized gains and losses from securities transactions and foreign currency transactions, if any, are recorded on the basis of identified cost and stated separately in the Statements of Operations.
6 Income tax information: Each Fund is treated as a separate entity for U.S. federal income tax purposes. It is the policy of each Fund, except U.S. Equity Index PutWrite Strategy, to continue to, and the intention of U.S. Equity Index PutWrite Strategy to, qualify for treatment as a regulated investment company ("RIC") by complying with the requirements of the U.S. Internal Revenue Code applicable to RICs and to distribute substantially all of its net investment income and net realized capital gains to its shareholders. To the extent a Fund distributes substantially all of its net investment income and net realized capital gains to shareholders, no federal income or excise tax provision is required.
117
The Funds have adopted the provisions of ASC 740 "Income Taxes" ("ASC 740"). ASC 740 sets forth a minimum threshold for financial statement recognition of a tax position taken, or expected to be taken, in a tax return. The Funds recognize interest and penalties, if any, related to unrecognized tax positions as an income tax expense in the Statements of Operations. The Funds are subject to examination by U.S. federal and state tax authorities for returns filed for the tax years for which the applicable statutes of limitations have not yet expired. As of October 31, 2016, the Funds did not have any unrecognized tax positions.
The Subsidiary is a controlled foreign corporation under the U.S. Internal Revenue Code. As a U.S. shareholder of a controlled foreign corporation, Risk Balanced Commodity Strategy will include in its taxable income its share of the Subsidiary's current earnings and profits (including net realized gains). Any deficit generated by the Subsidiary will be disregarded for purposes of computing Risk Balanced Commodity Strategy's taxable income in the current period and also disregarded for all future periods.
As of October 31, 2016, selected fund information on a U.S. federal income tax basis was as follows:
|
(000's omitted) |
Cost of Investments |
Gross Unrealized Appreciation |
Gross Unrealized Depreciation |
Net Unrealized Appreciation/ (Depreciation) |
|||||||||||||||
|
Global Allocation |
$ |
21,621 |
$ |
490 |
$ |
553 |
$ |
(63 |
) |
||||||||||
|
Long Short |
2,195,596 |
328,034 |
138,191 |
189,843 |
|||||||||||||||
|
Long Short Credit |
32,731 |
327 |
338 |
(11 |
) |
||||||||||||||
|
Multi-Asset Income |
17,367 |
407 |
320 |
87 |
|||||||||||||||
|
Risk Balanced Commodity Strategy |
77,623 |
59 |
6 |
53 |
|||||||||||||||
|
U.S. Equity Index PutWrite Strategy |
26,234 |
15 |
32 |
(17 |
) |
||||||||||||||
Income distributions and capital gain distributions are determined in accordance with income tax regulations, which may differ from GAAP. These differences are primarily due to differing treatments of income and gains on various investment securities held by each Fund, timing differences and differing characterization of distributions made by each Fund.
As determined on October 31, 2016, permanent differences resulting primarily from different book and tax accounting were reclassified at year end. Such differences may be attributed to the tax treatment of one or more of the following: net operating loss netted against short term capital gains or written-off, current and prior year partnership basis adjustments, net operating losses, return of capital distributions, non-taxable distributions from real estate investment trusts ("REITs") and other underlying investments, paydown losses on mortgage backed and asset backed securities, Subsidiary income and gain (loss), gains and losses on swap contracts and futures, foreign currency gains and losses, tax adjustments related to short sales gains and losses from forwards, gains and losses from passive foreign investment companies ("PFICs"), non-deductible stock issuance fees, affiliated capital gain reclass to ordinary income, distributions in excess and re-designated, deemed distributions on shareholder redemptions and deflation adjustments on U.S. Treasury inflation-indexed bonds ("TIPs"). These reclassifications had no effect on net income, net asset value ("NAV") or NAV per share of each Fund. For the year ended October 31, 2016, the Funds recorded the following permanent reclassifications:
|
Paid-in Capital |
Undistributed Net Investment Income (Loss) |
Accumulated Net Realized Gains (Losses) on Investments |
|||||||||||||
|
Global Allocation |
$ |
(50,363 |
) |
$ |
139,647 |
$ |
(89,284 |
) |
|||||||
|
Long Short |
(5,998,740 |
) |
6,400,392 |
(401,652 |
) |
||||||||||
|
Long Short Credit |
(1,049 |
) |
105,143 |
(104,094 |
) |
||||||||||
|
Multi-Asset Income |
(206 |
) |
(15,419 |
) |
15,625 |
||||||||||
|
Risk Balanced Commodity Strategy |
(2,093,593 |
) |
760,448 |
1,333,145 |
|||||||||||
|
U.S. Equity Index PutWrite Strategy |
(1,681 |
) |
1,681 |
— |
|||||||||||
118
The tax character of distributions paid during the years ended October 31, 2016 and October 31, 2015 was as follows:
|
Distributions Paid From: |
|||||||||||||||||||||||||||||||||||||||||||
|
Ordinary Income |
Tax-Exempt Income |
Long-Term Capital Gain |
Return of Capital |
Total |
|||||||||||||||||||||||||||||||||||||||
|
2016 |
2015 |
2016 |
2015 |
2016 |
2015 |
2016 |
2015 |
2016 |
2015 |
||||||||||||||||||||||||||||||||||
|
Global Allocation |
$ |
— |
$ |
624,099 |
$ |
— |
$ |
— |
$ |
43,247 |
$ |
64 |
$ |
— |
$ |
— |
$ |
43,247 |
$ |
624,163 |
|||||||||||||||||||||||
|
Long Short |
361,261 |
4,409,898 |
— |
— |
— |
12,784,739 |
— |
— |
361,261 |
17,194,637 |
|||||||||||||||||||||||||||||||||
|
Long Short Credit |
633,046 |
112,839 |
(a) |
— |
— |
(a) |
— |
— |
(a) |
— |
— |
(a) |
633,046 |
112,839 |
(a) |
||||||||||||||||||||||||||||
|
Multi-Asset Income |
489,748 |
367,993 |
(b) |
— |
— |
(b) |
— |
— |
(b) |
149,478 |
— |
(b) |
639,226 |
367,993 |
(b) |
||||||||||||||||||||||||||||
| Risk Balanced Commodity Strategy |
— |
5,572 |
— |
— |
— |
1,857 |
— |
— |
— |
7,429 |
|||||||||||||||||||||||||||||||||
| U.S. Equity Index PutWrite Strategy |
— |
(c) |
— |
— |
(c) |
— |
— |
(c) |
— |
— |
(c) |
— |
— |
(c) |
— |
||||||||||||||||||||||||||||
(a) Period from June 29, 2015 (Commencement of Operations) to October 31, 2015.
(b) Period from March 27, 2015 (Commencement of Operations) to October 31, 2015.
(c) Period from September 16, 2016 (Commencement of Operations) to October 31, 2016.
As of October 31, 2016, the components of distributable earnings (accumulated losses) on a U.S. federal income tax basis were as follows:
| Undistributed Ordinary Income |
Undistributed Long-Term Capital Gain |
Unrealized Appreciation/ (Depreciation) |
Loss Carryforwards and Deferrals |
Other Temporary Differences |
Total |
||||||||||||||||||||
|
Global Allocation |
$ |
— |
$ |
— |
$ |
(7,524 |
) |
$ |
(265,750 |
) |
$ |
(42,213 |
) |
$ |
(315,487 |
) |
|||||||||
|
Long Short |
— |
— |
185,956,312 |
(84,394,384 |
) |
21,714 |
101,583,642 |
||||||||||||||||||
|
Long Short Credit |
— |
— |
(11,093 |
) |
(1,266,289 |
) |
(20,636 |
) |
(1,298,018 |
) |
|||||||||||||||
|
Multi-Asset Income |
— |
— |
85,667 |
(560,863 |
) |
(20,586 |
) |
(495,782 |
) |
||||||||||||||||
|
Risk Balanced Commodity Strategy |
— |
— |
53,071 |
(366,023 |
) |
664,890 |
351,938 |
||||||||||||||||||
|
U.S. Equity Index PutWrite Strategy |
53,798 |
61,369 |
(16,945 |
) |
— |
(5,170 |
) |
93,052 |
|||||||||||||||||
The temporary differences between book basis and tax basis distributable earnings are primarily due to: losses disallowed and recognized on wash sales, straddles and unsettled short sales; timing differences of distribution payments, swaps, futures contracts and forward contracts; adjustments related to post-October capital loss and late-year ordinary loss deferrals, unamortized organization expenses, mark-to-market adjustments on option contracts and tax adjustments related to REITs, TIPs, PFICs, short sales, partnerships, futures, swap contracts and other investments.
To the extent each Fund's net realized capital gains, if any, can be offset by capital loss carryforwards, if any, it is the policy of each Fund not to distribute such gains. Capital loss carryforward rules allow for regulated investment companies to carry forward capital losses indefinitely and to retain the character of capital loss carryforwards as short-term or long-term. As determined at October 31, 2016, the Funds had unused capital loss carryforwards available for federal income tax purposes to offset net realized capital gains, if any, as follows:
|
Capital Loss Carryforwards |
|||||||||||
|
Long-Term |
Short-Term |
||||||||||
|
Global Allocation |
$ |
— |
$ |
265,750 |
|||||||
|
Long Short |
14,737,120 |
55,591,523 |
|||||||||
|
Long Short Credit |
89,293 |
1,176,996 |
|||||||||
|
Multi-Asset Income |
85,276 |
475,587 |
|||||||||
|
Risk Balanced Commodity Strategy |
89,554 |
8,790 |
|||||||||
119
Under current tax regulations, capital losses realized on investment transactions after October 31 may be deferred and treated as occurring on the first day of the following fiscal year. Under the Regulated Investment Company Modernization Act of 2010, the Funds may also defer any realized late-year ordinary losses as occurring on the first day of the following fiscal year. Late-year ordinary losses represent ordinary losses realized on investment transactions after December 31 and specified losses (ordinary losses from the sale, exchange, or other disposition of property, net foreign currency losses and net passive foreign investment company mark to market losses) realized on investment transactions after October 31. For the year ended October 31, 2016, Long Short and Risk Balanced Commodity Strategy elected to defer the following late-year ordinary losses:
| Late-Year Ordinary Loss Deferral |
|||||||
|
Long Short |
$ |
14,065,741 |
|||||
|
Risk Balanced Commodity Strategy |
267,679 |
||||||
7 Foreign taxes: Foreign taxes withheld, if any, represent amounts withheld by foreign tax authorities, net of refunds recoverable.
Foreign capital gains on certain foreign securities may be subject to foreign taxes, which are accrued as applicable. At October 31, 2016, there were no outstanding balances of accrued capital gains taxes for any Fund.
8 Distributions to shareholders: Each Fund may earn income, net of expenses, daily on its investments. Distributions from net investment income, if any, are recorded on the ex-date and generally distributed once a year (usually in December) for Global Allocation, Long Short and Risk Balanced Commodity Strategy, monthly for Multi-Asset Income and quarterly for Long Short Credit (monthly prior to October 1, 2016) and U.S. Equity Index PutWrite Strategy. Distributions from net realized capital gains, if any, generally are distributed once a year (usually in December) and are recorded on the ex-date.
It is the policy of each of Global Allocation, Long Short and Multi-Asset Income to pass through to its shareholders substantially all REIT distributions and other income it receives, less operating expenses. The distributions received from REITs are generally composed of income, capital gains, and/or return of REIT capital, but the REITs do not report this information to these Funds until the following calendar year. At October 31, 2016, these Funds estimated these amounts for the period January 1, 2016 to October 31, 2016 within the financial statements because the 2016 information is not available from the REITs until after each Fund's fiscal year-end. All estimates are based upon REIT information sources available to these Funds together with actual IRS Forms 1099-DIV received to date. For the year ended October 31, 2016, the character of distributions paid to shareholders of these Funds disclosed within the Statements of Changes in Net Assets is based on estimates made at that time. Based on past experience it is possible that a portion of these Funds' distributions during the current fiscal year will be considered tax return of capital, but the actual amount of the tax return of capital, if any, is not determinable until after each Fund's fiscal year-end. After calendar year-end, when these Funds learn the nature of the distributions paid by REITs during that year, distributions previously identified as income are often recharacterized as return of capital and/or capital gain. After all applicable REITs have informed these Funds of the actual breakdown of distributions paid to these Funds during their fiscal year, estimates previously recorded are adjusted on the books of these Funds to reflect actual results. As a result, the composition of these Funds' distributions as reported herein may differ from the final composition determined after calendar year-end and reported to these Funds shareholders on IRS Form 1099-DIV.
9 Expense allocation: Certain expenses are applicable to multiple funds within the complex of related investment companies. Expenses directly attributable to a Fund are charged to that Fund. Expenses of the Trust that are not directly attributable to a particular series of the Trust (e.g., a Fund) are allocated among the series of the Trust, on the basis of relative net assets, except where a more appropriate allocation of expenses to each of the series can otherwise be made fairly. Expenses borne by the complex of related investment companies, which includes open-end and closed-end investment companies for which Management serves as investment manager, that are not
120
directly attributable to a particular investment company in the complex (e.g., the Trust) or series thereof are allocated among the investment companies or series thereof in the complex on the basis of relative net assets, except where a more appropriate allocation of expenses to each of the investment companies or series thereof in the complex can otherwise be made fairly. Each Fund's expenses (other than those specific to each class) are allocated proportionally each day among the classes based upon the relative net assets of each class.
10 Investments in foreign securities: Investing in foreign securities may involve sovereign and other risks, in addition to the credit and market risks normally associated with domestic securities. These additional risks include the possibility of adverse political and economic developments (including political instability, nationalization, expropriation, or confiscatory taxation) and the potentially adverse effects of unavailability of public information regarding issuers, less governmental supervision and regulation of financial markets, reduced liquidity of certain financial markets, and the lack of uniform accounting, auditing, and financial reporting standards or the application of standards that are different or less stringent than those applied in the United States. Foreign securities also may experience greater price volatility, higher rates of inflation, and delays in settlement.
11 Dollar rolls: The Funds may enter into dollar roll transactions with respect to mortgage-backed securities. In a dollar roll transaction, a Fund sells securities for delivery in the current month and simultaneously agrees to repurchase substantially similar (i.e., same type and coupon) securities on a specified future date from the same party. During the period before this repurchase, a Fund forgoes principal and interest payments on the securities. A Fund is compensated by the difference between the current sales price and the forward price for the future purchase (often referred to as the "drop"), as well as by the interest earned on the cash proceeds of the initial sale. Dollar rolls may increase fluctuations in a Fund's NAV and may be viewed as a form of leverage. There is a risk that the counterparty will be unable or unwilling to complete the transaction as scheduled, which may result in losses to a Fund.
12 Securities sold short: Each Fund may engage in short sales, which are sales of securities which have been borrowed from a third party on the expectation that the market price will decline. If the price of the securities decreases, a Fund will make a profit by purchasing the securities in the open market at a price lower than the one at which it sold the securities. If the price of the securities increases, a Fund may have to cover its short positions at a price higher than the short sale price, resulting in a loss. Gains are limited to the price at which a Fund sold the security short, while losses are potentially unlimited in size. The Funds pledge securities and/or other assets, which may include cash collateral from securities lending activities, to the lender as collateral. Proceeds received from short sales may be maintained by the lender as collateral or may be released to the Funds and used to purchase additional securities or for any other purpose. Proceeds maintained by the lender are included in the "Cash collateral segregated for short sales" on the Statements of Assets and Liabilities. The Funds are required to segregate an amount of cash or liquid securities in an amount at least equal to the current market value of the securities sold short (less any additional collateral pledged to the lender). The Funds are contractually responsible to remit to the lender any dividends and interest payable on securities while those securities are being borrowed by the Fund. The Funds may receive or pay the net of the interest charged by the prime broker on the borrowed securities and a financing charge for the difference in the market value of the short position and the cash collateral deposited with the broker. This income or fee is calculated daily based upon the market value of each borrowed security and a variable rate that is dependent on the availability of the security. These costs related to short sales (i.e., dividend and interest remitted to the lender and interest charged by the prime broker) are recorded as an expense of the Funds and are excluded from the contractual expense limitation. The net amount of fees incurred during the year ended October 31, 2016, are included in the "Dividend and interest expense on securities sold short" on the Statements of Operations and are as follows:
|
Global Allocation |
$ |
30,243 |
|||||
|
Long Short |
2,521,707 |
||||||
|
Long Short Credit |
23,837 |
||||||
121
At October 31, 2016, Global Allocation had cash pledged in the amount of $1,150,000 to State Street Bank and Trust Company ("State Street"), as collateral for short sales, in addition to cash collateral received from securities lending activities for the Fund. In addition, State Street has a perfected security interest in these Global Allocation assets. At October 31, 2016, Long Short had cash pledged in the amount of $381,109,733 to State Street to cover collateral requirements for borrowing in connection with securities sold short.
At October 31, 2016, Global Allocation had securities pledged in the amount of $1,585,923 to State Street to cover collateral requirements for borrowing in connection with securities sold short.
13 Security lending: Each Fund using State Street as its lending agent, may loan securities to qualified brokers and dealers in exchange for negotiated lender's fees. These fees disclosed within the Statements of Operations under the caption, "Income from securities loaned-net" are net of expenses retained by State Street as compensation for its services as lending agent. For the year ended October 31, 2016, Global Allocation received net income under the securities lending arrangement of $1,604. The Funds receive cash collateral at the beginning of each transaction equal to at least 102% of the prior day's market value of the loaned securities (105% in the case of international securities). Some or all of the cash collateral may be used to finance short sales. As of October 31, 2016, approximately 100% of the cash collateral received by Global Allocation was used to finance short sales.
As of October 31, 2016, Global Allocation had outstanding loans of securities to certain approved brokers for which it received collateral as follows:
| Value of Loaned Securities |
Value of Collateral |
||||||||||
|
Global Allocation |
$ |
227,216 |
$ |
232,719 |
|||||||
All securities on loan are classified as Common Stocks in the Portfolio's Schedule of Investments as of October 31, 2016 with a contractual maturity of overnight and continuous.
14 Investment company securities and exchange-traded funds: The Funds may invest in shares of other registered investment companies, including exchange-traded funds ("ETFs"), within the limitations prescribed by the 1940 Act or pursuant to an exemptive order from the Securities and Exchange Commission ("SEC") that permits the Funds to invest in both affiliated and unaffiliated investment companies, including exchange-traded funds, in excess of the limits in Section 12(d)(1)(A) of the 1940 Act, as amended, subject to the terms and conditions of such order (see Note A-17 for more information about the exemptive order). Some ETFs seek to track the performance of a particular market index. These indices include both broad-based market indices and more narrowly-based indices, including those relating to particular sectors, markets, regions or industries. However, some ETFs have an actively-managed investment objective. ETF shares are traded like traditional equity securities on a national securities exchange or NASDAQ. A Fund will indirectly bear its proportionate share of any management fees and other expenses paid by such other investment companies, which will increase expenses and decrease returns.
15 Derivative instruments: Certain of the Funds' use of derivatives during the year ended October 31, 2016, is described below. Please see the Schedule of Investments for each Fund's open positions in derivatives, if any, at October 31, 2016. The Funds have adopted the provisions of ASC 815 "Derivatives and Hedging" ("ASC 815"). The disclosure requirements of ASC 815 distinguish between derivatives that qualify for hedge accounting and those that do not. Because investment companies value their derivatives at fair value and recognize changes in fair value through the Statements of Operations, they do not qualify for hedge accounting. Accordingly, even though a Fund's investments in derivatives may represent economic hedges, they are considered non-hedge transactions for purposes of this disclosure.
Futures contracts: During the year ended October 31, 2016, Global Allocation used futures in an effort to enhance returns and to manage or adjust the risk profile and the investment exposure of the Fund to certain asset classes, countries and regions. In addition, Global Allocation also utilized futures to provide investment exposure to certain indices and markets other than the benchmark indices. During the year ended October 31, 2016, Long
122
Short used futures on broader market indices and U.S. Treasuries in an effort either to enhance returns or to manage or adjust the risk profile and the investment exposure of the Fund. During the year ended October 31, 2016, Long Short Credit used futures in an effort to manage or adjust the risk profile of the Fund or the risk of individual positions, to adjust the duration of the Fund's portfolio, to hedge risk and to alter the Fund's exposure to currencies, interest rates, sectors and individual issuers. During the year ended October 31, 2016, Multi-Asset Income used futures in an effort to adjust the investment exposure and/or risk profile of the portfolio based on the portfolio managers team's market views. During the year ended October 31, 2016, Risk Balanced Commodity Strategy used futures (through investments in the Subsidiary) to provide investment exposure to individual commodities, as well as in an effort to manage and/or adjust the risk profile of the Fund.
At the time a Fund or Subsidiary enters into a futures contract, it is required to deposit with the futures commission merchant a specified amount of cash or liquid securities, known as "initial margin," which is a percentage of the value of the futures being traded that is set by the exchange upon which the futures contract is traded. Each day, the futures contract is valued at the official settlement price of the board of trade or U.S. commodity exchange on which such futures contract is traded. Subsequent payments, known as "variation margin," to and from the broker are made on a daily basis, or as needed, as the market price of the futures contract fluctuates. Daily variation margin adjustments, arising from this "mark to market," are recorded by a Fund or Subsidiary as unrealized gains or losses.
Although some futures by their terms call for actual delivery or acquisition of the underlying securities or currency, in most cases the contracts are closed out prior to delivery by offsetting purchases or sales of matching futures. When the contracts are closed, a Fund recognizes a gain or loss. Risks of entering into futures contracts include the possibility there may be an illiquid market, possibly at a time of rapidly declining prices, and/or a change in the value of the contract may not correlate with changes in the value of the underlying securities. Futures executed on regulated futures exchanges have minimal counterparty risk to a Fund because the exchange's clearinghouse assumes the position of the counterparty in each transaction. Thus, a Fund is exposed to risk only in connection with the clearinghouse and not in connection with the original counterparty to the transaction.
For U.S. federal income tax purposes, the futures transactions undertaken by a Fund or Subsidiary may cause the Fund or Subsidiary to recognize gains or losses from marking contracts to market even though its positions have not been sold or terminated, may affect the character of the gains or losses recognized as long-term or short-term, and may affect the timing of some capital gains and losses realized by the Fund or Subsidiary. Also, a Fund's or Subsidiary's losses on transactions involving futures contracts may be deferred rather than being taken into account currently in calculating the Fund's or Subsidiary's taxable income.
Forward foreign currency contracts: During the year ended October 31, 2016, Global Allocation used forward contracts to manage or adjust the risk profile and investment exposure of the Fund. During the year ended October 31, 2016, Long Short Credit used forward contracts to alter the Fund's exposure to currencies, interest rates, sectors and individual issuers. During the year ended October 31, 2016, Multi-Asset Income used forward contracts to obtain or reduce exposure to certain markets, establish net short or long positions for currencies and alter the Fund's exposure to markets and currencies.
A forward contract is an agreement between two parties to buy or sell a specific currency for another at a set price on a future date, and is individually negotiated and privately traded by currency traders and their customers in the interbank market. The market value of a forward contract fluctuates with changes in forward currency exchange rates. Forward contracts are marked to market daily, and the change in value is recorded by a Fund as an unrealized gain or loss. At the consummation of a forward contract to purchase or sell currency, a Fund may either exchange the currencies specified at the maturity of the forward contract or enter into a closing transaction involving the purchase or sale of an offsetting forward contract. Closing transactions with respect to forward contracts are usually performed with the counterparty to the original forward contract. The gain or loss arising from the difference between the U.S. dollar cost of the original contract and the value of the foreign currency in U.S. dollars upon closing a contract is included in "Net realized gain (loss) on forward foreign currency contracts" in the
123
Statements of Operations. These contracts may involve market risk in excess of the unrealized gain or loss reflected in a Fund's Statement of Assets and Liabilities. In addition, a Fund could be exposed to risks associated with fluctuations in foreign currency and the risk the counterparty will fail to fulfill its obligation.
Credit default swap contracts: During the year ended October 31, 2016, Long Short Credit used credit default swaps to replace more traditional direct investments, to establish net short or long positions for individual markets, currencies or securities and to hedge risk. When a Fund is the buyer of an OTC credit default swap contract, it is entitled to receive the notional amount of the swap from the counterparty if a credit event occurs. In return, the Fund pays the counterparty a periodic stream of payments over the term of the contract provided that no credit event has occurred. If no credit event occurs, the Fund would have spent the stream of payments and received no proceeds from the contract. When a Fund is the seller of an OTC credit default swap contract, it receives the stream of payments, but is obligated to pay to the buyer of the protection an amount up to the notional amount of the swap and in certain instances take delivery of securities of the reference entity upon the occurrence of a credit event, as defined under the terms of that particular swap agreement. Credit events are contract specific but may include bankruptcy, failure to pay, restructuring, obligation acceleration and repudiation/moratorium. If a Fund is a seller of protection and a credit event occurs, the maximum potential amount of future payments that the Fund could be required to make (or the risk of loss) would be an amount equal to the notional amount of the agreement. This potential amount would be partially offset by any recovery value of the respective referenced obligation, or net amount received from the settlement of a buy protection credit default swap agreement entered into by the Fund for the same referenced obligation. As the seller, the Fund may add economic leverage to its portfolio because, in addition to its total net assets, the Fund is subject to investment exposure on the notional amount of the swap. The net periodic payments paid or received on the swap contract are accrued daily as a component of unrealized appreciation/(depreciation) and are recorded as realized gain upon receipt or realized loss upon payment. The Fund also records an increase or decrease to unrealized appreciation/(depreciation) in an amount equal to the daily valuation of swaps.
Certain clearinghouses currently offer clearing for limited types of derivative transactions, including certain credit default swaps. In a cleared derivative transaction, a Fund typically enters into the transaction with a financial institution counterparty that is then cleared through a central clearinghouse. Upon acceptance of a swap by a central clearinghouse, the original swap is extinguished and replaced with a swap with the clearinghouse, thereby reducing or eliminating the Fund's exposure to the credit risk of the original counterparty. A Fund typically will be required to post specified levels of both initial and variation margin with the clearinghouse or at the instruction of the clearinghouse; the margin required by a clearinghouse may be greater than the margin the Fund would be required to post in an uncleared derivative transaction. The daily change in valuation is recorded as a receivable or payable for variation margin and settled in cash with the centrally clearing party. For financial reporting purposes, unamortized upfront payments, if any, are netted with unrealized appreciation or (depreciation) and net interest received or paid on swap contracts to determine the fair value of swaps.
Equity swap contracts: During the year ended October 31, 2016, Long Short used equity swap contracts ("equity swaps") to increase returns, reduce risks and for hedging purposes. During the year ended October 31, 2016, Long Short Credit used equity swaps to replace more traditional direct investments and to hedge risk.
Equity swaps are two-party contracts in which counterparties exchange the return on a specified reference security, basket of securities, security index or index component for the return based on a fixed or floating interest rate during the period of the swap. Equity swaps are marked to market daily based on the value of the underlying reference entity and the change, if any, is recorded as an unrealized gain or loss. Equity swaps normally do not involve the delivery of securities or other underlying assets. If the other party to an equity swap defaults, the Fund's risk of loss consists of the net amount of payments that the Fund is contractually entitled to receive, if any. Equity swaps are derivatives and their value can be very volatile. To the extent that future market trends, the values of assets or economic factors are not accurately analyzed and predicted, the Fund may suffer a loss, which may exceed the related amounts shown in the Statements of Assets and Liabilities. Periodic payments received or paid by the Fund are recorded as realized gains or losses.
124
Total return basket swap contracts: During the year ended October 31, 2016, Long Short used total return basket swaps to increase returns, reduce risks and for hedging purposes. During the year ended October 31, 2016, Long Short Credit used total return basket swaps to replace more traditional direct investments and to hedge risk. Certain Funds may enter into a total return basket swap agreement to obtain exposure to a portfolio of long and short securities. Under the terms of the agreement, the swap is designed to function as a portfolio of direct investments in long and short equity or fixed income positions. The Funds have the ability to trade in and out of long and short positions within the swap and will receive all of the economic benefits and risks equivalent to direct investments in these positions such as: capital appreciation/(depreciation), corporate actions, and dividends and interest received and paid, all of which are reflected in the swap value. The swap value also includes interest charges and credits related to the notional values of the long and short positions and cash balances within the swap. These interest charges and credits are based on defined market rates plus or minus a specified spread and are referred to herein as "financing costs". Positions within the swap are reset periodically, and financing costs are reset monthly. During a reset, any unrealized gains (losses) on positions and accrued financing costs become available for cash settlement between the Funds and the swap counterparty. Cash settlement in and out of the swap may occur at a reset date or any other date, at the discretion of the Funds and the counterparty, over the life of the agreement, and is generally determined based on limits and thresholds established as part of an International Swaps and Derivatives Association (ISDA) agreement between the Funds and the counterparty. A change in the market value of a total return basket swap contract is recognized as a change in unrealized appreciation/(depreciation) on swap contracts in the Statements of Operations. Cash settlements between a Fund and the counterparty are recognized as realized gains (losses) on swap contracts in the Statements of Operations.
Total return swap contracts: During the year ended October 31, 2016, Long Short used total return swaps to increase returns, reduce risks and for hedging purposes. During the year ended October 31, 2016, Long Short Credit used total return swaps to replace more traditional direct investments and to hedge risk. Total return swaps involve commitments to pay fixed or floating rate interest in exchange for a market-linked return based on a notional amount. To the extent the total return of the reference security or index underlying the total return swap exceeds or falls short of the offsetting interest rate obligation, a Fund will receive a payment or make a payment to the counterparty, respectively. Certain risks may arise when entering into total return swap transactions, including counterparty default, liquidity or unfavorable changes in the value of the underlying reference security or index. The value of the swap is adjusted daily and the change in value, if any, is recorded as unrealized appreciation or (depreciation) in the Statements of Assets and Liabilities. Payments received or made at the end of each measurement period are recorded as realized gain or loss in the Statements of Operations.
Options: During the year ended October 31, 2016, Global Allocation used options written to enhance returns, manage or adjust the risk profile of the Fund or the risk of individual positions replace more traditional direct investments and obtain exposure to certain markets. During the year ended October 31, 2016, Long Short used options written to generate incremental returns. During the year ended October 31, 2016, Long Short Credit used options written (including swaptions and options on futures) to establish net short or long positions for individual markets, currencies or securities, hedge risk and alter the Fund's exposure to currencies, interest rates, sectors and individual issuers. During the year ended October 31, 2016, Multi-Asset Income used options written primarily to seek to enhance yield. During the period ended October 31, 2016, U.S. Equity Index PutWrite Strategy used options written primarily to gain exposure to securities, markets, sectors or geographical areas and also to enhance income and gain exposure more efficiently than through a direct purchase of the underlying security.
Premiums received by a Fund upon writing a call option or a put option are recorded in the liability section of the Fund's Statement of Assets and Liabilities and are subsequently adjusted to the current market value. When an option is exercised, closed, or expired, a Fund realizes a gain or loss and the liability is eliminated.
When a Fund writes a call option on an underlying asset it does not own, its exposure on such an option is theoretically unlimited. When writing a covered call option, a Fund, in return for the premium, gives up the opportunity for profit from a price increase in the underlying security above the exercise price, but conversely
125
retains the risk of loss should the price of the security decline. When writing a put option, a Fund, in return for the premium, takes the risk that it must purchase the underlying security at a price that may be higher than the current market price of the security. If a covered call or put option that a Fund has written expires unexercised, a Fund will realize a gain in the amount of the premium. All securities covering outstanding written options are held in escrow by the custodian bank.
Swaptions are similar to options on securities except that instead of selling or purchasing the right to buy or sell a security, the writer or purchaser of the swaptions is granting or buying the right to enter into a previously agreed upon interest rate or credit default swap agreement at any time before the expiration of the option.
A Fund may write or purchase options on exchange-traded futures contracts ("futures option") to hedge an existing position or future investment, for speculative purposes or to manage exposure to market movements. A futures option is an option contract in which the underlying instrument is a specific futures contract.
Premiums paid by a Fund upon purchasing a call or put option are recorded in the asset section of the Fund's Statement of Assets and Liabilities and are subsequently adjusted to the current market value. When an option is exercised, closed, or expired, a Fund realizes a gain or loss and the asset is eliminated.
For purchased call options, a Fund's loss is limited to the amount of the option premium paid.
Purchased option transactions were used either for hedging purposes or to generate incremental returns for Long Short, Long Short Credit and Multi-Asset Income for the year ended October 31, 2016.
At October 31, 2016, the Funds had the following derivatives (which did not qualify as hedging instruments under ASC 815), grouped by primary risk exposure:
| Derivative Type |
Statements of Assets and Liabilities Location |
Interest Rate Risk |
Currency Risk |
Equity Risk |
Credit Risk |
Commodity Risk |
Total |
||||||||||||||||||||||||
|
Global Allocation |
|||||||||||||||||||||||||||||||
| Futures |
Receivable/Payable for variation margin on futures contracts(a) |
$ |
17,971 |
$ |
28,174 |
$ |
10,614 |
$ |
— |
$ |
— |
$ |
56,759 |
||||||||||||||||||
| Forward contracts |
Receivable for forward foreign currency contracts |
— |
218,711 |
— |
— |
— |
218,711 |
||||||||||||||||||||||||
|
Total Value—Assets |
$ |
17,971 |
$ |
246,885 |
$ |
10,614 |
$ |
— |
$ |
— |
$ |
275,470 |
|||||||||||||||||||
|
Long Short |
|||||||||||||||||||||||||||||||
| Futures |
Receivable/Payable for variation margin on futures contracts(a) |
$ |
152,470 |
$ |
— |
$ |
13,033,115 |
$ |
— |
$ |
— |
$ |
13,185,585 |
||||||||||||||||||
| OTC swaps |
OTC swap contracts, at value(b) |
— |
— |
352,834 |
— |
— |
352,834 |
||||||||||||||||||||||||
| Options purchased |
Investments in securities, at value |
— |
— |
6,588,954 |
— |
— |
6,588,954 |
||||||||||||||||||||||||
|
Total Value—Assets |
$ |
152,470 |
$ |
— |
$ |
19,974,903 |
$ |
— |
$ |
— |
$ |
20,127,373 |
|||||||||||||||||||
126
| Derivative Type |
Statements of Assets and Liabilities Location |
Interest Rate Risk |
Currency Risk |
Equity Risk |
Credit Risk |
Commodity Risk |
Total |
||||||||||||||||||||||||
|
Long Short Credit |
|||||||||||||||||||||||||||||||
| Futures |
Receivable/Payable for variation margin on futures contracts(a) |
$ |
54,935 |
$ |
— |
$ |
— |
$ |
— |
$ |
— |
$ |
54,935 |
||||||||||||||||||
| Forward contracts |
Receivable for forward foreign currency contracts |
— |
6,524 |
— |
— |
— |
6,524 |
||||||||||||||||||||||||
| OTC swaps |
OTC swap contracts, at value(b) |
— |
— |
— |
95,633 |
— |
95,633 |
||||||||||||||||||||||||
|
Total Value—Assets |
$ |
54,935 |
$ |
6,524 |
$ |
— |
$ |
95,633 |
$ |
— |
$ |
157,092 |
|||||||||||||||||||
|
Multi-Asset Income |
|||||||||||||||||||||||||||||||
| Futures |
Receivable/Payable for variation margin on futures contracts(a) |
$ |
3,928 |
$ |
— |
$ |
10,460 |
$ |
— |
$ |
— |
$ |
14,388 |
||||||||||||||||||
| Forward contracts |
Receivable for forward foreign currency contracts |
— |
149,706 |
— |
— |
— |
149,706 |
||||||||||||||||||||||||
|
Total Value—Assets |
$ |
3,928 |
$ |
149,706 |
$ |
10,460 |
$ |
— |
$ |
— |
$ |
164,094 |
|||||||||||||||||||
|
Risk Balanced Commodity Strategy |
|||||||||||||||||||||||||||||||
| Futures |
Receivable/Payable for variation margin on futures contracts(a) |
$ |
— |
$ |
— |
$ |
— |
$ |
— |
$ |
3,082,546 |
$ |
3,082,546 |
||||||||||||||||||
|
Total Value—Assets |
$ |
— |
$ |
— |
$ |
— |
$ |
— |
$ |
3,082,546 |
$ |
3,082,546 |
|||||||||||||||||||
|
Liability Derivatives |
|||||||||||||||||||||||||||||||
|
Global Allocation |
|||||||||||||||||||||||||||||||
| Futures |
Receivable/Payable for variation margin on futures contracts(a) |
$ |
(33,344 |
) |
$ |
(24,540 |
) |
$ |
(10,161 |
) |
$ |
— |
$ |
— |
$ |
(68,045 |
) |
||||||||||||||
| Forward contracts |
Payable for forward foreign currency contracts |
— |
(243,875 |
) |
— |
— |
— |
(243,875 |
) |
||||||||||||||||||||||
| Options written |
Option contracts written, at value |
— |
— |
(10,586 |
) |
— |
— |
(10,586 |
) |
||||||||||||||||||||||
|
Total Value—Liabilities |
$ |
(33,344 |
) |
$ |
(268,415 |
) |
$ |
(20,747 |
) |
$ |
— |
$ |
— |
$ |
(322,506 |
) |
|||||||||||||||
127
| Derivative Type |
Statements of Assets and Liabilities Location |
Interest Rate Risk |
Currency Risk |
Equity Risk |
Credit Risk |
Commodity Risk |
Total |
||||||||||||||||||||||||
|
Long Short |
|||||||||||||||||||||||||||||||
| OTC swaps |
OTC swap contracts, at value(b) |
$ |
— |
$ |
— |
$ |
(5,565,754 |
) |
$ |
— |
$ |
— |
$ |
(5,565,754 |
) |
||||||||||||||||
| Options written |
Option contracts written, at value |
— |
— |
(3,951,397 |
) |
— |
— |
(3,951,397 |
) |
||||||||||||||||||||||
|
Total Value—Liabilities |
$ |
— |
$ |
— |
$ |
(9,517,151 |
) |
$ |
— |
$ |
— |
$ |
(9,517,151 |
) |
|||||||||||||||||
|
Long Short Credit |
|||||||||||||||||||||||||||||||
| OTC swaps |
OTC swap contracts, at value(b) |
$ |
— |
$ |
— |
$ |
(14,628 |
) |
$ |
(151,591 |
) |
$ |
— |
$ |
(166,219 |
) |
|||||||||||||||
| Centrally cleared swaps |
Receivable/Payable for variation margin on centrally cleared swap contracts(c) |
— |
— |
— |
(160,977 |
) |
— |
(160,977 |
) |
||||||||||||||||||||||
|
Total Value—Liabilities |
$ |
— |
$ |
— |
$ |
(14,628 |
) |
$ |
(312,568 |
) |
$ |
— |
$ |
(327,196 |
) |
||||||||||||||||
|
Multi-Asset Income |
|||||||||||||||||||||||||||||||
| Futures |
Receivable/Payable for variation margin on futures contracts(a) |
$ |
(26,434 |
) |
$ |
— |
$ |
(7,523 |
) |
$ |
— |
$ |
— |
$ |
(33,957 |
) |
|||||||||||||||
| Forward contracts |
Payable for open forward foreign currency contracts |
— |
(171,161 |
) |
— |
— |
— |
(171,161 |
) |
||||||||||||||||||||||
| Options written |
Option contracts written, at value |
— |
— |
(18,109 |
) |
— |
— |
(18,109 |
) |
||||||||||||||||||||||
|
Total Value—Liabilities |
$ |
(26,434 |
) |
$ |
(171,161 |
) |
$ |
(25,632 |
) |
$ |
— |
$ |
— |
$ |
(223,227 |
) |
|||||||||||||||
|
Risk Balanced Commodity Strategy |
|||||||||||||||||||||||||||||||
| Futures |
Receivable/Payable for variation margin on futures contracts(a) |
$ |
— |
$ |
— |
$ |
— |
$ |
— |
$ |
(2,417,089 |
) |
$ |
(2,417,089 |
) |
||||||||||||||||
|
Total Value—Liabilities |
$ |
— |
$ |
— |
$ |
— |
$ |
— |
$ |
(2,417,089 |
) |
$ |
(2,417,089 |
) |
|||||||||||||||||
|
U.S. Equity Index PutWrite Strategy |
|||||||||||||||||||||||||||||||
| Options written |
Option contracts written, at value |
$ |
— |
$ |
— |
$ |
(473,958 |
) |
$ |
— |
$ |
— |
$ |
(473,958 |
) |
||||||||||||||||
|
Total Value—Liabilities |
$ |
— |
$ |
— |
$ |
(473,958 |
) |
$ |
— |
$ |
— |
$ |
(473,958 |
) |
|||||||||||||||||
(a) "Futures" reflects the cumulative appreciation/(depreciation) of futures contracts as of October 31, 2016, which is reflected in the Statements of Assets and Liabilities under the caption "Net unrealized appreciation/(depreciation) in value of investments." The current day's variation margin as of October 31, 2016, if any, is reflected in the Statements of Assets and Liabilities under the caption "Receivable/Payable for variation margin on futures contracts."
(b) "OTC swaps" reflects the appreciation/(depreciation) of the OTC swap contracts plus accrued interest as of October 31, 2016 which is reflected in the Statements of Assets and Liabilities under the caption "OTC swap contracts, at value."
128
(c) "Centrally cleared swaps" reflects cumulative unrealized appreciation or (depreciation). Variation margin on centrally cleared swaps is reported within the Statements of Assets and Liabilities as "Receivable/Payable for variation margin on centrally cleared swap contracts."
The impact of the use of these derivative instruments on the Statements of Operations during the year ended October 31, 2016, was as follows:
|
Realized Gain (Loss) |
|||||||||||||||||||||||||||||||
|
Derivative Type |
Statements of Operations Location |
Interest Rate Risk |
Currency Risk |
Equity Risk |
Credit Risk |
Commodity Risk |
Total |
||||||||||||||||||||||||
|
Global Allocation |
|||||||||||||||||||||||||||||||
| Futures |
Net realized gain (loss) on: futures contracts |
$ |
(45,334 |
) |
$ |
60,270 |
$ |
12,498 |
$ |
— |
$ |
— |
$ |
27,434 |
|||||||||||||||||
|
Forward contracts |
Net realized gain (loss) on: forward foreign currency contracts |
— |
74,609 |
— |
— |
— |
74,609 | ||||||||||||||||||||||||
| Options written | Net realized gain (loss) on: option contracts and swaptions written |
— |
— |
12,046 |
— |
— |
12,046 | ||||||||||||||||||||||||
| Total Realized Gain (Loss) |
$ |
(45,334 |
) |
$ |
134,879 |
$ |
24,544 |
$ |
— |
$ |
— |
$ |
114,089 |
||||||||||||||||||
|
Long Short |
|||||||||||||||||||||||||||||||
|
Futures |
Net realized gain (loss) on: futures contracts |
$ |
85,220 |
$ |
— |
$ |
(43,962,476 |
) |
$ |
— |
$ |
— |
$ |
(43,877,256 |
) |
||||||||||||||||
| Options purchased |
Net realized gain (loss) on: sales of investment securities of unaffiliated issuers |
— |
— |
(4,760,360 |
) |
— |
— |
(4,760,360 |
) |
||||||||||||||||||||||
|
Options written |
Net realized gain (loss) on: option contracts and swaptions written |
— |
— |
7,856,426 |
— |
— |
7,856,426 |
||||||||||||||||||||||||
|
Swaps |
Net realized gain (loss) on: swap contracts |
— |
— |
(1,516,058 |
) |
— |
— |
(1,516,058 |
) |
||||||||||||||||||||||
| Total Realized Gain (Loss) |
$ |
85,220 |
$ |
— |
$ |
(42,382,468 |
) |
$ |
— |
$ |
— |
$ |
(42,297,248 |
) |
|||||||||||||||||
|
Long Short Credit |
|||||||||||||||||||||||||||||||
|
Futures |
Net realized gain (loss) on: futures contracts |
$ |
59,938 |
$ |
— |
$ |
(46,911 |
) |
$ |
— |
$ |
— |
$ |
13,027 |
|||||||||||||||||
|
Forward contracts |
Net realized gain (loss) on: forward foreign currency contracts |
— |
13,411 |
— |
— |
— |
13,411 |
||||||||||||||||||||||||
|
Swaps |
Net realized gain (loss) on: swap contracts |
(166,758 |
) |
— |
417,910 |
(75,497 |
) |
— |
175,655 |
||||||||||||||||||||||
| Options purchased |
Net realized gain (loss) on: sales of investment securities of unaffiliated issuers |
(24,900 |
) |
(61,000 |
) |
(74,968 |
) |
— |
— |
(160,868 |
) |
||||||||||||||||||||
| Options and swaptions written |
Net realized gain (loss) on: option contracts and swaptions written |
62,899 |
— |
(29,778 |
) |
— |
— |
33,121 |
|||||||||||||||||||||||
| Total Realized Gain (Loss) |
$ |
(68,821 |
) |
$ |
(47,589 |
) |
$ |
266,253 |
$ |
(75,497 |
) |
$ |
— |
$ |
74,346 |
||||||||||||||||
129
|
Derivative Type |
Statements of Operations Location |
Interest Rate Risk |
Currency Risk |
Equity Risk |
Credit Risk |
Commodity Risk |
Total |
||||||||||||||||||||||||
|
Multi-Asset Income |
|||||||||||||||||||||||||||||||
|
Futures |
Net realized gain (loss) on: futures contracts |
$ |
328 |
$ |
— |
$ |
(9,743 |
) |
$ |
— |
$ |
— |
$ |
(9,415 |
) |
||||||||||||||||
|
Forward contracts |
Net realized gain (loss) on: forward foreign currency contracts |
— |
18,864 |
— |
— |
— |
18,864 |
||||||||||||||||||||||||
|
Options written |
Net realized gain (loss) on: option contracts and swaptions written |
— |
— |
40,212 |
— |
— |
40,212 |
||||||||||||||||||||||||
| Total Realized Gain (Loss) |
$ |
328 |
$ |
18,864 |
$ |
30,469 |
$ |
— |
$ |
— |
$ |
49,661 |
|||||||||||||||||||
|
Risk Balanced Commodity Strategy |
|||||||||||||||||||||||||||||||
|
Futures |
Net realized gain (loss) on: futures contracts |
$ |
— |
$ |
— |
$ |
— |
$ |
— |
$ |
(1,333,145 |
) |
$ |
(1,333,145 |
) |
||||||||||||||||
| Total Realized Gain (Loss) |
$ |
— |
$ |
— |
$ |
— |
$ |
— |
$ |
(1,333,145 |
) |
$ |
(1,333,145 |
) |
|||||||||||||||||
|
U.S. Equity Index PutWrite Strategy |
|||||||||||||||||||||||||||||||
|
Options written |
Net realized gain (loss) on: option contracts and swaptions written |
$ |
— |
$ |
— |
$ |
160,547 |
$ |
— |
$ |
— |
$ |
160,547 |
||||||||||||||||||
| Total Realized Gain (Loss) |
$ |
— |
$ |
— |
$ |
160,547 |
$ |
— |
$ |
— |
$ |
160,547 |
|||||||||||||||||||
|
Change in Appreciation/(Depreciation) |
|||||||||||||||||||||||||||||||
|
Global Allocation |
|||||||||||||||||||||||||||||||
|
Futures |
Change in net unrealized appreciation/(depreciation) in value of: futures contracts |
$ |
(20,033 |
) |
$ |
25,848 |
$ |
(41,307 |
) |
$ |
— |
$ |
— |
$ |
(35,492 |
) |
|||||||||||||||
|
Forward contracts |
Change in net unrealized appreciation/(depreciation) in value of: forward foreign currency contracts |
— |
(39,012 |
) |
— |
— |
— |
(39,012 |
) |
||||||||||||||||||||||
|
Options written |
Change in net unrealized appreciation/(depreciation) in value of: option contracts written and swaptions written |
— |
— |
2,711 |
— |
— |
2,711 |
||||||||||||||||||||||||
| Total Change in Appreciation/ (Depreciation) |
$ |
(20,033 |
) |
$ |
(13,164 |
) |
$ |
(38,596 |
) |
$ |
— |
$ |
— |
$ |
(71,793 |
) |
|||||||||||||||
130
|
Derivative Type |
Statements of Operations Location |
Interest Rate Risk |
Currency Risk |
Equity Risk |
Credit Risk |
Commodity Risk |
Total |
||||||||||||||||||||||||
|
Long Short |
|||||||||||||||||||||||||||||||
|
Futures |
Change in net unrealized appreciation/(depreciation) in value of: futures contracts |
$ |
152,470 |
$ |
— |
$ |
27,881,820 |
$ |
— |
$ |
— |
$ |
28,034,290 |
||||||||||||||||||
| Options purchased |
Change in net unrealized appreciation/(depreciation) in value of: unaffiliated investment securities |
— |
— |
(1,247,110 |
) |
— |
— |
(1,247,110 |
) |
||||||||||||||||||||||
|
Options written |
Change in net unrealized appreciation/(depreciation) in value of: option contracts written and swaptions written |
— |
— |
1,859,903 |
— |
— |
1,859,903 |
||||||||||||||||||||||||
|
Swaps |
Change in net unrealized appreciation/(depreciation) in value of: swap contracts |
— |
— |
(2,930,793 |
) |
— |
— |
(2,930,793 |
) |
||||||||||||||||||||||
| Total Change in Appreciation/ (Depreciation) |
$ |
152,470 |
$ |
— |
$ |
25,563,820 |
$ |
— |
$ |
— |
$ |
25,716,290 |
|||||||||||||||||||
|
Long Short Credit |
|||||||||||||||||||||||||||||||
|
Futures |
Change in net unrealized appreciation/(depreciation) in value of: futures contracts |
$ |
50,322 |
$ |
— |
$ |
29,688 |
$ |
— |
$ |
— |
$ |
80,010 |
||||||||||||||||||
|
Forward contracts |
Change in net unrealized appreciation/(depreciation) in value of: forward foreign currency contracts |
— |
(3,152 |
) |
— |
— |
— |
(3,152 |
) |
||||||||||||||||||||||
|
Swaps |
Change in net unrealized appreciation/(depreciation) in value of: swap contracts |
— |
— |
(61,792 |
) |
(7,720 |
) |
— |
(69,512 |
) |
|||||||||||||||||||||
|
Options written |
Change in net unrealized appreciation/(depreciation) in value of: option contracts written and swaptions written |
— |
— |
4,988 |
— |
— |
4,988 |
||||||||||||||||||||||||
| Total Change in Appreciation/ (Depreciation) |
$ |
50,322 |
$ |
(3,152 |
) |
$ |
(27,116 |
) |
$ |
(7,720 |
) |
$ |
— |
$ |
12,334 |
||||||||||||||||
131
|
Derivative Type |
Statements of Operations Location |
Interest Rate Risk |
Currency Risk |
Equity Risk |
Credit Risk |
Commodity Risk |
Total |
||||||||||||||||||||||||
|
Multi-Asset Income |
|||||||||||||||||||||||||||||||
|
Futures |
Change in net unrealized appreciation/(depreciation) in value of: futures contracts |
$ |
(23,660 |
) |
$ |
— |
$ |
(15,084 |
) |
$ |
— |
$ |
— |
$ |
(38,744 |
) |
|||||||||||||||
|
Forward contracts |
Change in net unrealized appreciation/(depreciation) in value of: forward foreign currency contracts |
— |
(24,047 |
) |
— |
— |
— |
(24,047 |
) |
||||||||||||||||||||||
|
Options written |
Change in net unrealized appreciation/(depreciation) in value of: option contracts written and swaptions written |
— |
— |
10,803 |
— |
— |
10,803 |
||||||||||||||||||||||||
| Total Change in Appreciation/ (Depreciation) |
$ |
(23,660 |
) |
$ |
(24,047 |
) |
$ |
(4,281 |
) |
$ |
— |
$ |
— |
$ |
(51,988 |
) |
|||||||||||||||
|
Risk Balanced Commodity Strategy |
|||||||||||||||||||||||||||||||
|
Futures |
Change in net unrealized appreciation/(depreciation) in value of: futures contracts |
$ |
— |
$ |
— |
$ |
— |
$ |
— |
$ |
6,067 |
$ |
6,067 |
||||||||||||||||||
| Total Change in Appreciation/ (Depreciation) |
$ |
— |
$ |
— |
$ |
— |
$ |
— |
$ |
6,067 |
$ |
6,067 |
|||||||||||||||||||
|
U.S. Equity Index PutWrite Strategy |
|||||||||||||||||||||||||||||||
|
Options written |
Change in net unrealized appreciation/(depreciation) in value of: option contracts written and swaptions written |
$ |
— |
$ |
— |
$ |
(58,264 |
) |
$ |
— |
$ |
— |
$ |
(58,264 |
) |
||||||||||||||||
| Total Change in Appreciation/ (Depreciation) |
$ |
— |
$ |
— |
$ |
(58,264 |
) |
$ |
— |
$ |
— |
$ |
(58,264 |
) |
|||||||||||||||||
While the Funds may receive redeemable preference shares, rights and warrants in connection with their investments in securities, these rights and warrants are not considered "derivative instruments" under ASC 815.
The Funds adopted the provisions of Accounting Standards Update 2011-11 Disclosures about Offsetting Assets and Liabilities ("ASU 2011-11"). ASU 2011-11 is intended to enhance disclosure requirements on the offsetting of financial assets and liabilities. Pursuant to ASU 2011-11, an entity is required to disclose both gross and net information for assets and liabilities related to derivatives, repurchase and reverse repurchase agreements, and securities lending and securities borrowing transactions that are eligible for offset or subject to an enforceable master netting or similar agreement. ASU 2011-11 is applicable to the Funds, except Risk Balanced Commodity Strategy and U.S. Equity Index PutWrite Strategy, at October 31, 2016. The Funds' derivative assets and liabilities at fair value by type are reported gross in the Statements of Assets and Liabilities. The following tables present derivative assets and liabilities by counterparty, net of amounts available for offset under a master netting agreement and net of the related collateral received by a Fund for assets and pledged by a Fund for liabilities as of October 31, 2016.
132
|
Description |
Gross Amounts of Recognized Assets |
Gross Amounts Offset in the Statements of Assets and Liabilities |
Net Amounts of Assets Presented in the Statements of Assets and Liabilities |
||||||||||||
|
Global Allocation |
|||||||||||||||
|
Forward contracts |
$ |
218,711 |
$ |
— |
$ |
218,711 |
|||||||||
|
Securities lending |
227,216 |
— |
227,216 |
||||||||||||
|
Total |
$ |
445,927 |
$ |
— |
$ |
445,927 |
|||||||||
|
Long Short |
|||||||||||||||
|
Swap contracts |
$ |
352,834 |
$ |
— |
$ |
352,834 |
|||||||||
|
Total |
$ |
352,834 |
$ |
— |
$ |
352,834 |
|||||||||
|
Long Short Credit |
|||||||||||||||
|
OTC swaps |
$ |
95,633 |
$ |
— |
$ |
95,633 |
|||||||||
|
Forward contracts |
6,524 |
— |
6,524 |
||||||||||||
|
Total |
$ |
102,157 |
$ |
— |
$ |
102,157 |
|||||||||
|
Multi-Asset Income |
|||||||||||||||
|
Forward contracts |
$ |
149,706 |
$ |
— |
$ |
149,706 |
|||||||||
|
Total |
$ |
149,706 |
$ |
— |
$ |
149,706 |
|||||||||
Gross Amounts Not Offset in the Statements of Assets and Liabilities
|
Counterparty |
Net Amounts of Assets Presented in the Statements of Assets and Liabilities |
Financial Instruments |
Cash Collateral Received(a) |
Net Amount(b) | |||||||||||||||
|
Global Allocation |
|||||||||||||||||||
|
Barclays Bank PLC |
$ |
21,417 |
$ |
(19,687 |
) |
$ |
— |
$ |
1,730 |
||||||||||
|
Deutsche Bank AG |
20,352 |
(18,964 |
) |
— |
1,388 |
||||||||||||||
|
Goldman Sachs International |
18,013 |
(18,013 |
) |
— |
— |
||||||||||||||
|
Royal Bank of Canada |
31,061 |
(31,061 |
) |
— |
— |
||||||||||||||
|
Societe Generale |
69,179 |
(59,090 |
) |
— |
10,089 |
||||||||||||||
|
State Street Bank and Trust Company |
285,905 |
(59,913 |
) |
(225,992 |
) |
— |
|||||||||||||
|
Total |
$ |
445,927 |
$ |
(206,728 |
) |
$ |
(225,992 |
) |
$ |
13,207 |
|||||||||
|
Long Short |
|||||||||||||||||||
|
Citibank, N.A. |
$ |
167,830 |
$ |
(74,800 |
) |
$ |
— |
$ |
93,030 |
||||||||||
|
Goldman Sachs International |
185,004 |
(185,004 |
) |
— |
— |
||||||||||||||
|
Total |
$ |
352,834 |
$ |
(259,804 |
) |
$ |
— |
$ |
93,030 |
||||||||||
|
Long Short Credit |
|||||||||||||||||||
|
BNP Paribas SA |
$ |
62,805 |
$ |
(17,003 |
) |
$ |
— |
$ |
45,802 |
||||||||||
|
Goldman Sachs International |
39,352 |
(39,352 |
) |
— |
— |
||||||||||||||
|
Total |
$ |
102,157 |
$ |
(75,828 |
) |
$ |
— |
$ |
26,329 |
||||||||||
|
Multi-Asset Income |
|||||||||||||||||||
|
Deutsche Bank AG |
$ |
13,614 |
$ |
(13,145 |
) |
$ |
— |
$ |
469 |
||||||||||
|
Goldman Sachs International |
13,774 |
(13,774 |
) |
— |
— |
||||||||||||||
|
Royal Bank of Canada |
22,608 |
(22,608 |
) |
— |
— |
||||||||||||||
|
Societe Generale |
53,437 |
(47,771 |
) |
— |
5,666 |
||||||||||||||
|
State Street Bank and Trust Company |
46,273 |
(46,273 |
) |
— |
— |
||||||||||||||
|
Total |
$ |
149,706 |
$ |
(143,571 |
) |
$ |
— |
$ |
6,135 |
||||||||||
133
|
Description |
Gross Amounts of Recognized Liabilities |
Gross Amounts Offset in the Statements of Assets and Liabilities |
Net Amounts of Liabilities Presented in the Statements of Assets and Liabilities |
||||||||||||
|
Global Allocation |
|||||||||||||||
|
Forward contracts |
$ |
(243,875 |
) |
$ |
— |
$ |
(243,875 |
) |
|||||||
|
Total |
$ |
(243,875 |
) |
$ |
— |
$ |
(243,875 |
) |
|||||||
|
Long Short |
|||||||||||||||
|
OTC swaps |
$ |
(5,565,754 |
) |
$ |
— |
$ |
(5,565,754 |
) |
|||||||
|
OTC options written |
(97,168 |
) |
— |
(97,168 |
) |
||||||||||
|
Total |
$ |
(5,662,922 |
) |
$ |
— |
$ |
(5,662,922 |
) |
|||||||
|
Long Short Credit |
|||||||||||||||
|
OTC swaps |
$ |
(166,219 |
) |
$ |
— |
$ |
(166,219 |
) |
|||||||
|
Total |
$ |
(166,219 |
) |
$ |
— |
$ |
(166,219 |
) |
|||||||
|
Multi-Asset Income |
|||||||||||||||
|
Forward contracts |
$ |
(171,161 |
) |
$ |
— |
$ |
(171,161 |
) |
|||||||
|
Total |
$ |
(171,161 |
) |
$ |
— |
$ |
(171,161 |
) |
|||||||
Gross Amounts Not Offset in the Statements of Assets and Liabilities
|
Counterparty |
Net Amounts of Liabilities Presented in the Statements of Assets and Liabilities |
Financial Instruments |
Cash Collateral Pledged(a) |
Net Amount(c) | |||||||||||||||
|
Global Allocation |
|||||||||||||||||||
|
Barclays Bank PLC |
$ |
(19,687 |
) |
$ |
19,687 |
$ |
— |
$ |
— |
||||||||||
|
Deutsche Bank AG |
(18,964 |
) |
18,964 |
— |
— |
||||||||||||||
|
Goldman Sachs International |
(39,801 |
) |
18,013 |
— |
(21,788 |
) |
|||||||||||||
|
Royal Bank of Canada |
(46,420 |
) |
31,061 |
— |
(15,359 |
) |
|||||||||||||
|
Societe Generale |
(59,090 |
) |
59,090 |
— |
— |
||||||||||||||
|
State Street Bank and Trust Company |
(59,913 |
) |
59,913 |
— |
— |
||||||||||||||
|
Total |
$ |
(243,875 |
) |
$ |
206,728 |
$ |
— |
$ |
(37,147 |
) |
|||||||||
|
Long Short |
|||||||||||||||||||
|
Citibank, N.A. |
$ |
(74,800 |
) |
$ |
74,800 |
$ |
— |
$ |
— |
||||||||||
|
Goldman Sachs International |
(5,588,122 |
) |
185,004 |
5,403,118 |
— |
||||||||||||||
|
Total |
$ |
(5,662,922 |
) |
$ |
259,804 |
$ |
5,403,118 |
$ |
— |
||||||||||
|
Long Short Credit |
|||||||||||||||||||
|
BNP Paribas SA |
$ |
(17,003 |
) |
$ |
17,003 |
$ |
— |
$ |
— |
||||||||||
|
Goldman Sachs International |
(117,224 |
) |
39,352 |
60,000 |
(17,872 |
) |
|||||||||||||
|
J.P. Morgan Chase Bank N.A |
(31,992 |
) |
— |
— |
(31,992 |
) |
|||||||||||||
|
Total |
$ |
(166,219 |
) |
$ |
56,355 |
$ |
60,000 |
$ |
(49,864 |
) |
|||||||||
|
Multi-Asset Income |
|||||||||||||||||||
|
Deutsche Bank AG |
$ |
(13,145 |
) |
$ |
13,145 |
$ |
— |
$ |
— |
||||||||||
|
Goldman Sachs International |
(26,752 |
) |
13,774 |
— |
(12,978 |
) |
|||||||||||||
|
Royal Bank of Canada |
(36,055 |
) |
22,608 |
— |
(13,447 |
) |
|||||||||||||
|
Societe Generale |
(47,771 |
) |
47,771 |
— |
— |
||||||||||||||
|
State Street Bank and Trust Company |
(47,438 |
) |
46,273 |
— |
(1,165 |
) |
|||||||||||||
|
Total |
$ |
(171,161 |
) |
$ |
143,571 |
$ |
— |
$ |
(27,590 |
) |
|||||||||
134
(a) Collateral received (or pledged) is limited to an amount not to exceed 100% of the net amount of assets (or liabilities) in the tables presented above, for each respective counterparty.
(b) Net Amount represents amounts subject to loss as of October 31, 2016, in the event of a counterparty failure.
(c) Net Amount represents amounts under-collateralized by Global Allocation, Long Short and Multi-Asset Income to each counterparty as of October 31, 2016.
16 Indemnifications: Like many other companies, the Trust's organizational documents provide that its officers ("Officers") and trustees ("Trustees") are indemnified against certain liabilities arising out of the performance of their duties to the Trust. In addition, both in some of its principal service contracts and in the normal course of its business, the Trust enters into contracts that provide indemnifications to other parties for certain types of losses or liabilities. The Trust's maximum exposure under these arrangements is unknown as this could involve future claims against the Trust.
17 Transactions with other funds managed by Neuberger Berman Investment Advisers LLC: Neuberger Berman Alternative Funds and Management have obtained an exemptive order from the Securities and Exchange Commission ("SEC") that permits the Funds to invest in both affiliated and unaffiliated investment companies, including exchange-traded funds, in excess of the limits in Section 12(d)(1)(A) of the 1940 Act, subject to the terms and conditions of such order. Through October 31, 2016, Global Allocation invested in Neuberger Berman Emerging Markets Debt Fund, Neuberger Berman Emerging Markets Equity Fund, Neuberger Berman Floating Rate Income Fund, Neuberger Berman Genesis Fund, Neuberger Berman High Income Bond Fund, Neuberger Berman International Equity Fund, Neuberger Berman International Select Fund, Neuberger Berman Long Short Credit Fund, Risk Balanced Commodity Strategy and U.S. Equity Index PutWrite Strategy (collectively the "Underlying Funds"). Through October 31, 2016, Multi-Asset Income invested in Neuberger Berman Emerging Markets Debt Fund, Neuberger Berman Floating Rate Income Fund, Neuberger Berman Global Long Short Fund, Neuberger Berman High Income Bond Fund and Long Short Credit (collectively the "Underlying Funds") (See Note F).
For the Funds' investments in the Underlying Funds, Management waived a portion of its management fee equal to the management fee it received from the Underlying Funds on those assets (the "Arrangement"). For the fiscal year ended October 31, 2016, management fees waived under this Arrangement are reflected in the Statements of Operations under the caption "Investment management fees waived." For the fiscal year ended October 31, 2016, income earned under this Arrangement on Global Allocation's and Multi-Asset Income's investments is reflected in the Statements of Operations under the caption "Dividend income—affiliated issuers." For the fiscal year ended October 31, 2016, management fees waived and income earned under this Arrangement on Global Allocation's and Multi-Asset Income's investments in the Underlying Funds were as follows:
|
Management fees waived |
Income earned |
||||||||||
|
Global Allocation |
$ |
64,526 |
$ |
137,537 |
|||||||
|
Multi-Asset Income |
33,494 |
233,710 |
|||||||||
18 Organization expenses: Costs incurred by U.S. Equity Index PutWrite Strategy in connection with its organization, which amounted to $148,112 and are reflected in Organization expense in the Statements of Operations, have been expensed as incurred.
19 Other: All net investment income and realized and unrealized capital gains and losses of each Fund are allocated, on the basis of relative net assets, pro rata among its respective classes.
135
Note B—Investment Management Fees, Administration Fees, Distribution Arrangements, and Other Transactions with Affiliates:
Each Fund retains Management as its investment manager under a Management Agreement. For such investment management services, each Fund pays Management a fee according to the following table:
Investment Management Fee as a Percentage of Average Daily Net Assets(a):
| First $250 million |
Next $250 million |
Next $250 million |
Next $250 million |
Next $500 million |
Next $500 million |
Next $500 million |
Next $1.5 billion |
Thereafter |
|||||||||||||||||||||||||||||||
|
For Global Allocation: |
|||||||||||||||||||||||||||||||||||||||
|
0.65 |
% |
0.65 |
% |
0.65 |
% |
0.65 |
% |
0.625 |
% |
0.625 |
% |
0.60 |
% |
0.60 |
% |
0.60 |
% |
||||||||||||||||||||||
|
For Long Short: |
|||||||||||||||||||||||||||||||||||||||
|
1.20 |
% |
1.175 |
% |
1.15 |
% |
1.125 |
% |
1.10 |
% |
1.075 |
% |
1.075 |
% |
1.075 |
% |
1.05 |
% |
||||||||||||||||||||||
|
For Long Short Credit: |
|||||||||||||||||||||||||||||||||||||||
|
0.80 |
% |
0.80 |
% |
0.80 |
% |
0.80 |
% |
0.80 |
% |
0.80 |
% |
0.80 |
% |
0.80 |
% |
0.80 |
% |
||||||||||||||||||||||
|
For Multi-Asset Income: |
|||||||||||||||||||||||||||||||||||||||
|
0.45 |
% |
0.425 |
% |
0.40 |
% |
0.375 |
% |
0.350 |
% |
0.325 |
% |
0.325 |
% |
0.325 |
% |
0.30 |
% |
||||||||||||||||||||||
|
For Risk Balanced Commodity Strategy and Subsidiary: |
|||||||||||||||||||||||||||||||||||||||
|
0.70 |
% |
0.675 |
% |
0.65 |
% |
0.625 |
% |
0.60 |
% |
0.575 |
% |
0.575 |
% |
0.575 |
% |
0.55 |
% |
||||||||||||||||||||||
|
For U.S. Equity Index PutWrite Strategy: |
|||||||||||||||||||||||||||||||||||||||
|
0.45 |
% |
0.45 |
% |
0.45 |
% |
0.45 |
% |
0.45 |
% |
0.45 |
% |
0.45 |
% |
0.45 |
% |
0.45 |
% |
||||||||||||||||||||||
(a) Less the net asset value of the Subsidiary for Risk Balanced Commodity Strategy.
Accordingly, for the year ended October 31, 2016, the investment management fee pursuant to the Management Agreement was equivalent to an annual effective rate of each Fund's average daily net assets(a), as follows:
|
Effective Rate |
|||||||
|
Global Allocation |
0.35 |
% |
|||||
|
Long Short |
1.11 |
% |
|||||
|
Multi-Asset Income |
0.24 |
% |
|||||
|
Risk Balanced Commodity Strategy |
0.70 |
% |
|||||
|
Subsidiary |
0.70 |
% |
|||||
(a) Less the net asset value of the Subsidiary for Risk Balanced Commodity Strategy.
Each Fund retains Management as its administrator under an Administration Agreement. Each Fund pays Management an administration fee at the annual rate of 0.06% of its average daily net assets under this agreement. In addition, Institutional Class of each Fund pays Management an administration fee at the annual rate of 0.09% of its average daily net assets under this agreement and Class A and Class C of each Fund (except Long Short Credit and Multi-Asset Income) pays Management an administration fee at the annual rate of 0.20% (0.21% for Long Short Credit and Multi-Asset Income) of its average daily net assets under this agreement. Long Short Credit's, Multi-Asset Income's and U.S. Equity Index PutWrite Strategy's Class R6 pays Management an administration fee of 0.02% of its average daily net assets. Additionally, Management retains State Street as its sub-administrator under a Sub-Administration Agreement. Management pays State Street a fee for all services received under the agreement. The Subsidiary also retains Management as its administrator, and State Street as its sub-administrator.
136
Management has contractually agreed to waive fees and/or reimburse certain expenses of the Institutional Class, Class A, Class C and Class R6 of each Fund so that the total annual operating expenses of those classes do not exceed the expense limitations as detailed in the following table. These undertakings exclude interest, taxes, brokerage commissions, acquired fund fees and expenses, dividend and interest expenses relating to short sales and extraordinary expenses, if any (commitment fees relating to borrowings are treated as interest for purposes of this exclusion); consequently, net expenses may exceed the contractual expense limitations. Each Fund has agreed that each of its respective classes will repay Management for fees and expenses waived or reimbursed for that class provided that repayment does not cause that class' annual operating expenses to exceed its contractual expense limitation in place at the time the fees and expenses were waived or reimbursed, or the expense limitation in place at the time the Fund repays Management, whichever is lower. Any such repayment must be made within three years after the year in which Management incurred the expense. The expenses of the Subsidiary are included in the total expenses used to calculate the reimbursement, which the Fund has agreed to share with the Subsidiary. For the year ended October 31, 2016, these Subsidiary expenses amounted to $141,930.
During the year ended October 31, 2016, there was no repayment to Management under these agreements.
At October 31, 2016, contingent liabilities to Management under the agreements were as follows:
| Expenses Reimbursed in Fiscal Year Ending October 31, |
|||||||||||||||||||||||
|
2014 |
2015 |
2016 |
|||||||||||||||||||||
| Subject to Repayment Until October 31, |
|||||||||||||||||||||||
|
Class |
Contractual Expense Limitation(a) |
Expiration |
2017 |
2018 |
2019 |
||||||||||||||||||
|
Global Allocation Institutional Class |
0.90 |
% |
10/31/19 |
$ |
297,504 |
$ |
219,561 |
$ |
249,350 |
||||||||||||||
|
Global Allocation Class A |
1.26 |
% |
10/31/19 |
168,872 |
187,516 |
182,783 |
|||||||||||||||||
|
Global Allocation Class C |
2.01 |
% |
10/31/19 |
105,371 |
142,390 |
149,577 |
|||||||||||||||||
|
Long Short Institutional Class |
1.70 |
% |
10/31/19 |
— |
— |
— |
|||||||||||||||||
|
Long Short Class A |
2.06 |
% |
10/31/19 |
— |
— |
— |
|||||||||||||||||
|
Long Short Class C |
2.81 |
% |
10/31/19 |
— |
— |
— |
|||||||||||||||||
|
Long Short Credit Institutional Class |
1.20 |
%(e) |
10/31/19 |
— |
189,748 |
(d) |
283,260 |
||||||||||||||||
|
Long Short Credit Class A |
1.57 |
%(e) |
10/31/19 |
— |
11,947 |
(d) |
14,957 |
||||||||||||||||
|
Long Short Credit Class C |
2.32 |
%(e) |
10/31/19 |
— |
11,656 |
(d) |
10,932 |
||||||||||||||||
|
Long Short Credit Class R6 |
1.13 |
%(e) |
10/31/19 |
— |
51,840 |
(d) |
56,434 |
||||||||||||||||
|
Multi-Asset Income Institutional Class |
0.65 |
%(c) |
10/31/19 |
— |
212,134 |
(b) |
349,252 |
||||||||||||||||
|
Multi-Asset Income Class A |
1.02 |
%(c) |
10/31/19 |
— |
11,192 |
(b) |
16,514 |
||||||||||||||||
|
Multi-Asset Income Class C |
1.77 |
%(c) |
10/31/19 |
— |
11,081 |
(b) |
15,614 |
||||||||||||||||
|
Multi-Asset Income Class R6 |
0.58 |
%(c) |
10/31/19 |
— |
77,638 |
(b) |
119,681 |
||||||||||||||||
| Risk Balanced Commodity Strategy Institutional Class |
1.10 |
% |
10/31/19 |
79,267 |
94,559 |
171,296 |
|||||||||||||||||
|
Risk Balanced Commodity Strategy Class A |
1.46 |
% |
10/31/19 |
260,968 |
210,384 |
150,132 |
|||||||||||||||||
|
Risk Balanced Commodity Strategy Class C |
2.21 |
% |
10/31/19 |
27,833 |
17,570 |
7,166 |
|||||||||||||||||
| U.S. Equity Index PutWrite Strategy Institutional Class |
0.65 |
% |
10/31/19 |
— |
— |
154,906 |
(g) |
||||||||||||||||
|
U.S. Equity Index PutWrite Strategy Class A |
1.01 |
% |
10/31/19 |
— |
— |
2,299 |
(g) |
||||||||||||||||
|
U.S. Equity Index PutWrite Strategy Class C |
1.76 |
% |
10/31/19 |
— |
— |
912 |
(g) |
||||||||||||||||
|
U.S. Equity Index PutWrite Strategy Class R6 |
0.58 |
% |
10/31/19 |
— |
— |
46,827 |
(g) |
||||||||||||||||
137
(a) Expense limitation per annum of the respective class' average daily net assets.
(b) Period from March 27, 2015 (Commencement of Operations) to October 31, 2015.
(c) In addition, Management voluntarily waived its fees as necessary to maintain a minimum yield for Multi-Asset Income on March 27, 2015, for Institutional Class, Class A, Class C and Class R6 and March 30, 2015, for Class A and Class C. For the period ended October 31, 2015, voluntary reimbursements for Institutional Class, Class A, Class C and Class R6 of Multi-Asset Income amounted to $456, $43, $84 and $159, respectively.
(d) Period from June 29, 2015 (Commencement of Operations) to October 31, 2015.
(e) In addition, Management voluntarily waived its fees as necessary to maintain a minimum yield for Long Short Credit from June 29, 2015 to July 2, 2015, for Institutional Class, Class A, Class C and Class R6. For the period ended October 31, 2015, voluntary reimbursements for Institutional Class, Class A, Class C and Class R6 of Long Short Credit amounted to $3,229, $257, $394 and $830, respectively. In addition, Management voluntarily waived its fees as necessary to maintain a minimum yield for Long Short Credit on several days in 2016, for Institutional Class, Class A, Class C and Class R6. For the year ended October 31, 2016, voluntary reimbursements for Institutional Class, Class A, Class C and Class R6 of Long Short Credit amounted to $26,236, $2,133, $2,908 and $4,880, respectively.
(g) Period from September 16, 2016 (Commencement of Operations) to October 31, 2016.
Until December 31, 2015, Neuberger Berman Fixed Income LLC ("NBFI"), as the sub-adviser to Global Allocation, Long Short Credit, Multi-Asset Income and Risk Balanced Commodity Strategy, was retained by Neuberger Berman Management LLC ("NBM") to provide day-to-day investment management services and received a monthly fee paid by NBM. As investment manager, NBM was responsible for overseeing the investment activities of NBFI. Until December 31, 2015, Neuberger Berman LLC ("Neuberger Berman"), was the sub-adviser to Long Short and was retained by NBM to furnish it with investment recommendations and research information without added cost to the Funds. Several individuals who are Officers and/or Trustees of the Trust are also employees of NBFI, Neuberger Berman and/or NBM. As a result of the entity consolidation described on page 20 of this Annual Report, the services previously provided by NBFI and Neuberger Berman under the respective sub-advisory agreements are being provided by NBIA as of January 1, 2016.
Each Fund also has a distribution agreement with Neuberger Berman with respect to each class of shares. Neuberger Berman acts as agent in arranging for the sale of class shares without sales commission or other compensation, except as described below for Class A and Class C shares, and bears the advertising and promotion expenses.
However, Neuberger Berman receives fees from Class A and Class C under their distribution plans (each a "Plan", collectively the "Plans") pursuant to Rule 12b-1 under the 1940 Act. The Plans provide that, as compensation for administrative and other services provided to these classes, Neuberger Berman's activities and expenses related to the sale and distribution of these classes, and ongoing services provided to investors in these classes, Neuberger Berman receives from each of these classes a fee at the annual rate of 0.25% of Class A's and 1.00% of Class C's average daily net assets. Neuberger Berman receives this amount to provide distribution and shareholder servicing for these classes and pays a portion of it to institutions that provide such services. Those institutions may use the payments for, among other purposes, compensating employees engaged in sales and/or shareholder servicing. The amount of fees paid by each class during any year may be more or less than the cost of distribution and other services provided to that class. FINRA rules limit the amount of annual distribution fees that may be paid by a mutual fund and impose a ceiling on the cumulative distribution fees paid. The Trust's Plans comply with those rules.
Class A shares of each Fund (except Long Short Credit and Multi-Asset Income) are generally sold with an initial sales charge of up to 5.75%. Class A shares of Long Short Credit and Multi-Asset Income are generally sold with an initial sales charge of up to 4.25%. Class A shares of each Fund are generally sold with no contingent deferred sales charge ("CDSC"), except that a CDSC of 1.00% will apply to certain redemptions made within 18 months following
138
purchases of $1 million or more without an initial sales charge. Class C shares of each Fund are sold with no initial sales charge and a 1.00% CDSC if shares are sold within one year after purchase.
For the year ended October 31, 2016, Neuberger Berman, acting as underwriter and broker-dealer, received net initial sales charges from the purchase of Class A shares and CDSCs from the redemption of Class A and Class C shares as follows:
|
Underwriter |
Broker-Dealer |
||||||||||||||||||
| Net Initial Sales Charge |
CDSC |
Net Initial Sales Charge |
CDSC |
||||||||||||||||
|
Global Allocation Class A |
$ |
559 |
$ |
— |
$ |
— |
$ |
— |
|||||||||||
|
Global Allocation Class C |
— |
867 |
— |
— |
|||||||||||||||
|
Long Short Class A |
41,039 |
— |
— |
— |
|||||||||||||||
|
Long Short Class C |
— |
44,372 |
— |
— |
|||||||||||||||
|
Long Short Credit Class A |
— |
— |
— |
— |
|||||||||||||||
|
Long Short Credit Class C |
— |
32 |
— |
— |
|||||||||||||||
|
Multi-Asset Income Class A |
— |
— |
— |
— |
|||||||||||||||
|
Multi-Asset Income Class C |
— |
— |
— |
— |
|||||||||||||||
|
Risk Balanced Commodity Strategy Class A |
— |
— |
— |
— |
|||||||||||||||
|
Risk Balanced Commodity Strategy Class C |
— |
1,140 |
— |
— |
|||||||||||||||
| U.S. Equity Index PutWrite Strategy Class A(1) |
— |
— |
— |
— |
|||||||||||||||
| U.S. Equity Index PutWrite Strategy Class C(1) |
— |
— |
— |
— |
|||||||||||||||
(1) Period from September 16, 2016 (Commencement of Operations) to October 31, 2016.
Note C—Securities Transactions:
During the year ended October 31, 2016, there were purchase and sale transactions of long-term securities (excluding swaps, futures, forward contracts and option contracts) as follows:
|
(000's omitted) |
Purchases of U.S. Government and Agency Obligations |
Purchases excluding U.S. Government and Agency Obligations |
Securities Sold Short |
Sales and Maturities of U.S. Government and Agency Obligations |
Sales and Maturities excluding U.S. Government and Agency Obligations |
Covers on Securities Sold Short |
|||||||||||||||||||||
|
Global Allocation |
$ |
3,115 |
$ |
38,096 |
$ |
4,160 |
$ |
3,015 |
$ |
41,822 |
$ |
5,532 |
|||||||||||||||
|
Long Short |
— |
1,581,205 |
639,372 |
— |
1,972,223 |
661,737 |
|||||||||||||||||||||
|
Long Short Credit |
26,507 |
34,368 |
4,457 |
25,998 |
15,837 |
6,815 |
|||||||||||||||||||||
|
Multi-Asset Income |
3,179 |
12,467 |
— |
2,199 |
12,377 |
— |
|||||||||||||||||||||
| Risk Balanced Commodity Strategy |
— |
25,193 |
— |
2,500 |
28,468 |
— |
|||||||||||||||||||||
| U.S. Equity Index PutWrite Strategy(1) |
33,809 |
— |
— |
— |
— |
— |
|||||||||||||||||||||
(1) Period from September 16, 2016 (Commencement of Operations) to October 31, 2016.
During the year ended October 31, 2016, no brokerage commissions on securities transactions were paid to affiliated brokers.
139
Note D—Fund Share Transactions:
Share activity for the years ended October 31, 2016 and October 31, 2015 was as follows:
|
For the Year Ended October 31, 2016 |
For the Year Ended October 31, 2015 |
||||||||||||||||||||||||||||||||||
|
(000's omitted) |
Shares Sold |
Shares Issued on Reinvestment of Dividends and Distributions |
Shares Redeemed |
Total |
Shares Sold |
Shares Issued on Reinvestment of Dividends and Distributions |
Shares Redeemed |
Total |
|||||||||||||||||||||||||||
|
Global Allocation |
|||||||||||||||||||||||||||||||||||
|
Institutional Class |
350 |
2 |
(244 |
) |
108 |
238 |
27 |
(560 |
) |
(295 |
) |
||||||||||||||||||||||||
|
Class A |
194 |
2 |
(404 |
) |
(208 |
) |
222 |
18 |
(350 |
) |
(110 |
) |
|||||||||||||||||||||||
|
Class C |
83 |
1 |
(266 |
) |
(182 |
) |
190 |
11 |
(217 |
) |
(16 |
) |
|||||||||||||||||||||||
|
Long Short |
|||||||||||||||||||||||||||||||||||
|
Institutional Class |
68,394 |
15 |
(118,738 |
) |
(50,329 |
) |
93,007 |
735 |
(82,335 |
) |
11,407 |
||||||||||||||||||||||||
|
Class A |
3,664 |
— |
(15,880 |
) |
(12,216 |
) |
11,849 |
100 |
(13,400 |
) |
(1,451 |
) |
|||||||||||||||||||||||
|
Class C |
795 |
— |
(6,641 |
) |
(5,846 |
) |
3,514 |
45 |
(4,714 |
) |
(1,155 |
) |
|||||||||||||||||||||||
|
Long Short Credit |
|||||||||||||||||||||||||||||||||||
|
Institutional Class |
811 |
42 |
(847 |
) |
6 |
2,337 |
0 |
z |
(0 |
)z |
2,337 |
(c) |
|||||||||||||||||||||||
|
Class A |
14 |
1 |
(45 |
) |
(30 |
) |
135 |
0 |
z |
— |
135 |
(c) |
|||||||||||||||||||||||
|
Class C |
3 |
— |
(3 |
) |
— |
103 |
0 |
z |
— |
103 |
(c) |
||||||||||||||||||||||||
|
Class R6 |
143 |
3 |
(2 |
) |
144 |
500 |
— |
— |
500 |
(c) |
|||||||||||||||||||||||||
|
Multi-Asset Income |
|||||||||||||||||||||||||||||||||||
|
Institutional Class |
166 |
32 |
(29 |
) |
169 |
1,117 |
6 |
(0 |
)z |
1,123 |
(a) |
||||||||||||||||||||||||
|
Class A |
13 |
1 |
(6 |
) |
8 |
51 |
0 |
z |
— |
51 |
(a) |
||||||||||||||||||||||||
|
Class C |
22 |
0 |
z |
(5 |
) |
17 |
50 |
0 |
z |
(0 |
)z |
50 |
(a) |
||||||||||||||||||||||
|
Class R6 |
— |
5 |
(3 |
) |
2 |
400 |
1 |
— |
401 |
(a) |
|||||||||||||||||||||||||
|
Risk Balanced Commodity Strategy |
|||||||||||||||||||||||||||||||||||
|
Institutional Class |
4,718 |
— |
(1,667 |
) |
3,051 |
3,787 |
0 |
z |
(1,104 |
) |
2,683 |
||||||||||||||||||||||||
|
Class A |
2,943 |
— |
(3,090 |
) |
(147 |
) |
6,256 |
1 |
(8,483 |
) |
(2,226 |
) |
|||||||||||||||||||||||
|
Class C |
25 |
— |
(534 |
) |
(509 |
) |
279 |
0 |
z |
(268 |
) |
11 |
|||||||||||||||||||||||
|
U.S. Equity Index PutWrite Strategy |
|||||||||||||||||||||||||||||||||||
| Institutional Class(d) |
2,100 |
— |
— |
2,100 |
— |
— |
— |
— |
|||||||||||||||||||||||||||
| Class A(d) |
42 |
— |
— |
42 |
— |
— |
— |
— |
|||||||||||||||||||||||||||
| Class C(d) |
10 |
— |
— |
10 |
— |
— |
— |
— |
|||||||||||||||||||||||||||
| Class R6(d) |
476 |
— |
— |
476 |
— |
— |
— |
— |
|||||||||||||||||||||||||||
(a) Period from March 27, 2015 (Commencement of Operations) to October 31, 2015.
(b) Period from May 11, 2015 (Commencement of Operations) to October 31, 2015.
(c) Period from June 29, 2015 (Commencement of Operations) to October 31, 2015.
(d) Period from September 16, 2016 (Commencement of Operations) to October 31, 2016.
z A zero balance reflects actual amounts rounding to less than $1,000.
140
Note E—Lines of Credit:
At October 31, 2016, each Fund (other than Neuberger Berman U.S. Equity Index PutWrite Strategy Fund) was a participant in a syndicated committed, unsecured $700,000,000 line of credit (the "Credit Facility"), to be used only for temporary or emergency purposes. Series of other investment companies managed by Management also participate in this line of credit on substantially the same terms except that some do not have access to the full amount of the Credit Facility. Interest is charged on borrowings under this Credit Facility at the higher of (a) a federal funds effective rate plus 1.00% per annum or (b) a eurodollar rate for a one-month period plus 1.00% per annum. The Credit Facility has an annual commitment fee of 0.15% per annum of the available line of credit, which is paid quarterly. Each Fund that is a participant has agreed to pay its pro rata share of the annual commitment fee, based on the ratio of its individual net assets to the net assets of all participants at the time the fee is due and payable and the level of its access to the Credit Facility, and interest charged on any borrowing made by such Fund and other costs incurred by such Fund. Because several mutual funds participate in the Credit Facility, there is no assurance that an individual Fund will have access to all or any part of the $700,000,000 at any particular time. There were no loans outstanding under the Credit Facility at October 31, 2016. During the period ended October 31, 2016, none of the Funds utilized the line of credit.
Note F—Investments in Affiliates(a):
| Balance of Shares Held October 31, 2015 |
Gross Purchases and Additions |
Gross Sales and Reductions |
Balance of Shares Held October 31, 2016 |
Value October 31, 2016 |
Distributions from Investments in Affiliated Issuers(b) |
Net Realized Gain (Loss) from Investments in Affiliated Issuers |
|||||||||||||||||||||||||
|
Global Allocation |
|||||||||||||||||||||||||||||||
| Neuberger Berman Emerging Markets Debt Fund Institutional Class |
76,021 |
97,018 |
50,679 |
122,360 |
$ |
1,088,994 |
$ |
5,738 |
$ |
(58,209 |
) |
||||||||||||||||||||
| Neuberger Berman Emerging Markets Equity Fund Institutional Class |
156,647 |
43,578 |
200,225 |
— |
— |
12,512 |
13,733 |
||||||||||||||||||||||||
| Neuberger Berman Emerging Markets Equity Fund R6 Class |
— |
159,688 |
76,279 |
83,409 |
1,359,573 |
— |
21,149 |
||||||||||||||||||||||||
| Neuberger Berman Floating Rate Income Fund Institutional Class |
— |
155,344 |
— |
155,344 |
1,537,567 |
4,974 |
— |
||||||||||||||||||||||||
| Neuberger Berman Genesis Fund Class R6 |
— |
19,987 |
— |
19,987 |
1,092,207 |
— |
— |
||||||||||||||||||||||||
| Neuberger Berman High Income Bond Fund Institutional Class |
134,797 |
23,579 |
158,376 |
— |
— |
51,377 |
(51,987 |
) |
|||||||||||||||||||||||
| Neuberger Berman High Income Bond Fund R6 Class |
— |
90,915 |
42,071 |
48,844 |
424,936 |
9,219 |
954 |
||||||||||||||||||||||||
141
| Balance of Shares Held October 31, 2015 |
Gross Purchases and Additions |
Gross Sales and Reductions |
Balance of Shares Held October 31, 2016 |
Value October 31, 2016 |
Distributions from Investments in Affiliated Issuers(b) |
Net Realized Gain (Loss) from Investments in Affiliated Issuers |
|||||||||||||||||||||||||
| Neuberger Berman International Equity Fund Institutional Class |
265,492 |
46,253 |
311,745 |
— |
$ |
— |
$ |
36,956 |
$ |
169,855 |
|||||||||||||||||||||
| Neuberger Berman International Equity R6 Shares |
— |
332,941 |
332,941 |
— |
— |
— |
(83,671 |
) |
|||||||||||||||||||||||
| Neuberger Berman International Select Fund Institutional Class |
— |
344,206 |
— |
344,206 |
3,658,225 |
— |
— |
||||||||||||||||||||||||
| Neuberger Berman Long Short Credit Fund Institutional Class |
105,628 |
1,361 |
106,989 |
— |
— |
13,926 |
(44,652 |
) |
|||||||||||||||||||||||
| Neuberger Berman Long Short Credit Fund R6 Class |
— |
82,815 |
— |
82,815 |
789,752 |
2,835 |
— |
||||||||||||||||||||||||
| Neuberger Berman Risk Balanced Commodity Strategy Fund Institutional Class |
101,752 |
— |
4,613 |
97,139 |
581,604 |
— |
* |
(8,395 |
) |
||||||||||||||||||||||
| Neuberger Berman U.S. Equity Index PutWrite Strategy Fund Class R6 |
— |
86,224 |
— |
86,224 |
871,201 |
— |
— |
||||||||||||||||||||||||
|
Total |
$ |
11,404,059 |
$ |
137,537 |
$ |
(41,223 |
) |
||||||||||||||||||||||||
|
Multi-Asset Income |
|||||||||||||||||||||||||||||||
| Neuberger Berman Emerging Markets Debt Fund Institutional Class |
182,438 |
20,110 |
45,717 |
156,831 |
$ |
1,395,784 |
$ |
14,598 |
$ |
(47,864 |
) |
||||||||||||||||||||
| Neuberger Berman Floating Rate Income Fund Institutional Class |
193,562 |
237,483 |
108,524 |
322,521 |
3,192,253 |
56,454 |
(67,444 |
) |
|||||||||||||||||||||||
| Neuberger Berman Global Long Short Fund Institutional Class |
43,732 |
385 |
44,117 |
— |
— |
3,918 |
(81,348 |
) |
|||||||||||||||||||||||
| Neuberger Berman High Income Bond Fund Institutional Class |
272,506 |
99,050 |
371,556 |
— |
— |
120,497 |
(36,901 |
) |
|||||||||||||||||||||||
| Neuberger Berman High Income Bond Fund R6 Class |
— |
276,284 |
— |
276,284 |
2,403,651 |
28,251 |
— |
||||||||||||||||||||||||
142
| Balance of Shares Held October 31, 2015 |
Gross Purchases and Additions |
Gross Sales and Reductions |
Balance of Shares Held October 31, 2016 |
Value October 31, 2016 |
Distributions from Investments in Affiliated Issuers(b) |
Net Realized Gain (Loss) from Investments in Affiliated Issuers |
|||||||||||||||||||||||||
| Neuberger Berman Long Short Credit Fund Institutional Class |
45,159 |
14,166 |
59,325 |
— |
$ |
— |
$ |
7,951 |
$ |
(18,746 |
) |
||||||||||||||||||||
| Neuberger Berman Long Short Credit Fund R6 Class |
— |
59,625 |
— |
59,625 |
568,640 |
2,041 |
— |
||||||||||||||||||||||||
|
Total |
$ |
7,560,328 |
$ |
233,710 |
$ |
(252,303 |
) |
||||||||||||||||||||||||
(a) Affiliated issuers, as defined in the 1940 Act.
(b) Distributions received include distributions from net investment income and net realized capital gains, if any, from the Underlying Fund.
* Security did not produce income during the period.
Other: At October 31, 2016, Global Allocation, which is also managed by Management, held 0.70% of the outstanding shares of Risk Balanced Commodity Strategy. Global Allocation and Multi-Asset Income, which are also managed by Management, held 2.59% and 1.87%, respectively, of the outstanding shares of Long Short Credit. At October 31, 2016, Global Allocation, who is also managed by Management, held 3.28% of the outstanding shares of U.S. Equity Index PutWrite Strategy Fund.
In addition, at October 31, 2016, there were affiliated investors owning 7.53%, 68.39%, 82.94% and 38.05% of Global Allocation's, Long Short Credit's, Multi-Asset Income's and U.S. Equity Index PutWrite Strategy's outstanding shares, respectively.
Note G—Recent Accounting Pronouncement:
In October 2016, the U.S. Securities and Exchange Commission ("SEC") adopted new rules and forms, and amendments to certain current rules and forms, to modernize reporting and disclosure of information by registered investment companies. The amendments to Regulation S-X will require standardized, enhanced disclosure about derivatives in investment company financial statements, and will also change the rules governing the form and content of such financial statements. The compliance date for the amendments to Regulation S-X is August 1, 2017. Management is currently evaluating the impact that the adoption of the amendments to Regulation S-X will have on the Funds' financial statements and related disclosures.
143
Financial Highlights
The following tables include selected data for a share outstanding throughout each period and other performance information derived from the Financial Statements. Per share amounts that round to less than $0.01 to $(0.01) per share are presented as $0.00 or $(0.00), respectively. Ratios that round to less than 0.00% or (0.00)% per share are presented as 0.00% or (0.00)%, respectively. Net Asset amounts with a zero balance may reflect actual amounts rounding to less than $0.1 million. A "—" indicates that the line item was not applicable in the corresponding period.
| Net Asset Value, Beginning of Year |
Net Investment Income (Loss)@ |
Net Gains or Losses on Securities (both realized and unrealized) |
Total From Investment Operations |
Dividends from Net Investment Income |
Distributions from Net Realized Capital Gains |
Tax Return of Capital |
Total Distributions |
Voluntary Contributions from Management |
||||||||||||||||||||||||||||
|
Global Allocation Fund |
||||||||||||||||||||||||||||||||||||
|
Institutional Class |
||||||||||||||||||||||||||||||||||||
|
10/31/2016 |
$ |
10.42 |
$ |
0.10 |
$ |
(0.01 |
) |
$ |
0.09 |
$ |
— |
$ |
(0.02 |
) |
$ |
— |
$ |
(0.02 |
) |
$ |
— |
|||||||||||||||
|
10/31/2015 |
$ |
10.81 |
$ |
0.06 |
$ |
(0.17 |
) |
$ |
(0.11 |
) |
$ |
(0.28 |
) |
$ |
(0.00 |
) |
$ |
— |
$ |
(0.28 |
) |
$ |
— |
|||||||||||||
|
10/31/2014 |
$ |
11.63 |
$ |
(0.12 |
) |
$ |
0.29 |
$ |
0.17 |
$ |
(0.99 |
) |
$ |
— |
$ |
— |
$ |
(0.99 |
) |
$ |
0.00 |
|||||||||||||||
|
10/31/2013 |
$ |
10.30 |
$ |
(0.09 |
) |
$ |
1.57 |
$ |
1.48 |
$ |
(0.15 |
) |
$ |
— |
$ |
— |
$ |
(0.15 |
) |
$ |
— |
|||||||||||||||
|
10/31/2012 |
$ |
10.30 |
$ |
(0.12 |
) |
$ |
1.02 |
$ |
0.90 |
$ |
(0.21 |
) |
$ |
(0.69 |
) |
$ |
— |
$ |
(0.90 |
) |
$ |
— |
||||||||||||||
|
Class A |
||||||||||||||||||||||||||||||||||||
|
10/31/2016 |
$ |
10.36 |
$ |
0.06 |
$ |
(0.00 |
) |
$ |
0.06 |
$ |
— |
$ |
(0.02 |
) |
$ |
— |
$ |
(0.02 |
) |
$ |
— |
|||||||||||||||
|
10/31/2015 |
$ |
10.76 |
$ |
0.02 |
$ |
(0.18 |
) |
$ |
(0.16 |
) |
$ |
(0.24 |
) |
$ |
(0.00 |
) |
$ |
— |
$ |
(0.24 |
) |
$ |
— |
|||||||||||||
|
10/31/2014 |
$ |
11.57 |
$ |
(0.16 |
) |
$ |
0.29 |
$ |
0.13 |
$ |
(0.94 |
) |
$ |
— |
$ |
— |
$ |
(0.94 |
) |
$ |
0.00 |
|||||||||||||||
|
10/31/2013 |
$ |
10.25 |
$ |
(0.14 |
) |
$ |
1.58 |
$ |
1.44 |
$ |
(0.12 |
) |
$ |
— |
$ |
— |
$ |
(0.12 |
) |
$ |
— |
|||||||||||||||
|
10/31/2012 |
$ |
10.27 |
$ |
(0.15 |
) |
$ |
1.01 |
$ |
0.86 |
$ |
(0.19 |
) |
$ |
(0.69 |
) |
$ |
— |
$ |
(0.88 |
) |
$ |
— |
||||||||||||||
|
Class C |
||||||||||||||||||||||||||||||||||||
|
10/31/2016 |
$ |
10.18 |
$ |
(0.01 |
) |
$ |
(0.01 |
) |
$ |
(0.02 |
) |
$ |
— |
$ |
(0.02 |
) |
$ |
— |
$ |
(0.02 |
) |
$ |
— |
|||||||||||||
|
10/31/2015 |
$ |
10.60 |
$ |
(0.06 |
) |
$ |
(0.18 |
) |
$ |
(0.24 |
) |
$ |
(0.18 |
) |
$ |
(0.00 |
) |
$ |
— |
$ |
(0.18 |
) |
$ |
— |
||||||||||||
|
10/31/2014 |
$ |
11.43 |
$ |
(0.25 |
) |
$ |
0.30 |
$ |
0.05 |
$ |
(0.88 |
) |
$ |
— |
$ |
— |
$ |
(0.88 |
) |
$ |
0.00 |
|||||||||||||||
|
10/31/2013 |
$ |
10.13 |
$ |
(0.21 |
) |
$ |
1.55 |
$ |
1.34 |
$ |
(0.04 |
) |
$ |
— |
$ |
— |
$ |
(0.04 |
) |
$ |
— |
|||||||||||||||
|
10/31/2012 |
$ |
10.21 |
$ |
(0.23 |
) |
$ |
1.00 |
$ |
0.77 |
$ |
(0.16 |
) |
$ |
(0.69 |
) |
$ |
— |
$ |
(0.85 |
) |
$ |
— |
||||||||||||||
See Notes to Financial Highlights
144
| Net Asset Value, End of Year |
Total Return†† |
Net Assets, End of Year (in millions) |
Ratio of Gross Expenses to Average Net Assets# |
Ratio of Gross Expenses to Average Net Assets (excluding dividend and interest expense relating to short sales)# |
Ratio of Net Expenses to Average Net Assets |
Ratio of Net Expenses to Average Net Assets (excluding dividend and interest expense relating to short sales) |
Ratio of Net Investment Income/ (Loss) to Average Net Assets |
Portfolio Turnover Rate (including securities sold short) |
Portfolio Turnover Rate (excluding securities sold short) |
||||||||||||||||||||||||||||||||
|
$ |
10.49 |
0.87 |
% |
$ |
10.1 |
4.17 |
% |
3.66 |
% |
1.11 |
% |
0.60 |
% |
0.97 |
% |
176 |
%a |
174 |
%a | ||||||||||||||||||||||
|
$ |
10.42 |
(1.12 |
)% |
|
|
$ |
8.9 |
3.29 |
% |
2.94 |
% |
1.03 |
% |
0.69 |
% |
0.51 |
% |
195 |
%a |
185 |
%a | ||||||||||||||||||||
|
$ |
10.81 |
1.37 |
%b |
$ |
12.5 |
3.25 |
% |
2.72 |
% |
1.50 |
% |
0.98 |
% |
(1.12 |
)% |
228 |
% |
216 |
% |
||||||||||||||||||||||
|
$ |
11.63 |
14.56 |
% |
$ |
17.2 |
3.23 |
% |
2.73 |
% |
1.48 |
% |
0.98 |
% |
(0.85 |
)% |
187 |
% |
158 |
% |
||||||||||||||||||||||
|
$ |
10.30 |
9.60 |
% |
$ |
8.9 |
5.01 |
% |
4.55 |
% |
1.68 |
% |
1.22 |
% |
(1.19 |
)% |
446 |
% |
423 |
% |
||||||||||||||||||||||
|
$ |
10.40 |
0.59 |
% |
$ |
5.9 |
4.53 |
% |
4.01 |
% |
1.49 |
% |
0.96 |
% |
0.64 |
% |
176 |
%a |
174 |
%a | ||||||||||||||||||||||
|
$ |
10.36 |
(1.52 |
)% |
|
|
$ |
8.1 |
3.69 |
% |
3.34 |
% |
1.39 |
% |
1.04 |
% |
0.16 |
% |
195 |
%a |
185 |
%a | ||||||||||||||||||||
|
$ |
10.76 |
1.03 |
%b |
$ |
9.6 |
3.68 |
% |
3.16 |
% |
1.86 |
% |
1.35 |
% |
(1.49 |
)% |
228 |
% |
216 |
% |
||||||||||||||||||||||
|
$ |
11.57 |
14.15 |
% |
$ |
7.9 |
3.58 |
% |
3.07 |
% |
1.84 |
% |
1.33 |
% |
(1.25 |
)% |
187 |
% |
158 |
% |
||||||||||||||||||||||
|
$ |
10.25 |
9.24 |
% |
$ |
3.4 |
5.41 |
% |
4.93 |
% |
2.07 |
% |
1.59 |
% |
(1.48 |
)% |
446 |
% |
423 |
% |
||||||||||||||||||||||
|
$ |
10.14 |
(0.19 |
)% |
|
|
$ |
4.7 |
5.26 |
% |
4.74 |
% |
2.24 |
% |
1.71 |
% |
(0.10 |
)% |
176 |
%a |
174 |
%a | ||||||||||||||||||||
|
$ |
10.18 |
(2.29 |
)% |
|
|
$ |
6.6 |
4.45 |
% |
4.10 |
% |
2.14 |
% |
1.79 |
% |
(0.57 |
)% |
195 |
%a |
185 |
%a | ||||||||||||||||||||
|
$ |
10.60 |
0.30 |
%b |
$ |
7.0 |
4.46 |
% |
3.95 |
% |
2.63 |
% |
2.11 |
% |
(2.27 |
)% |
228 |
% |
216 |
% |
||||||||||||||||||||||
|
$ |
11.43 |
13.30 |
% |
$ |
4.9 |
4.35 |
% |
3.85 |
% |
2.59 |
% |
2.09 |
% |
(1.99 |
)% |
187 |
% |
158 |
% |
||||||||||||||||||||||
|
$ |
10.13 |
8.34 |
% |
$ |
2.2 |
6.47 |
% |
6.03 |
% |
2.78 |
% |
2.34 |
% |
(2.26 |
)% |
446 |
% |
423 |
% |
||||||||||||||||||||||
145
Financial Highlights (cont'd)
| Net Asset Value, Beginning of Year |
Net Investment Income (Loss)@ |
Net Gains or Losses on Securities (both realized and unrealized) |
Total From Investment Operations |
Dividends from Net Investment Income |
Distributions from Net Realized Capital Gains |
Tax Return of Capital |
Total Distributions |
Voluntary Contributions from Management |
|||||||||||||||||||||||||||
|
Long Short Fund |
|||||||||||||||||||||||||||||||||||
|
Institutional Class |
|||||||||||||||||||||||||||||||||||
|
10/31/2016 |
$ |
12.76 |
$ |
(0.03 |
) |
$ |
0.01 |
$ |
(0.02 |
) |
$ |
(0.00 |
) |
$ |
— |
$ |
— |
$ |
(0.00 |
) |
$ |
— |
|||||||||||||
|
10/31/2015 |
$ |
13.02 |
$ |
0.02 |
$ |
(0.21 |
) |
$ |
(0.19 |
) |
$ |
(0.02 |
) |
$ |
(0.05 |
) |
$ |
— |
$ |
(0.07 |
) |
$ |
— |
||||||||||||
|
10/31/2014 |
$ |
12.48 |
$ |
0.02 |
$ |
0.58 |
$ |
0.60 |
$ |
— |
$ |
(0.06 |
) |
$ |
— |
$ |
(0.06 |
) |
$ | 0.00 | |||||||||||||||
|
10/31/2013 |
$ |
11.09 |
$ |
0.01 |
$ |
1.47 |
$ |
1.48 |
$ |
(0.01 |
) |
$ |
(0.08 |
) |
$ |
— |
$ |
(0.09 |
) |
$ |
— |
||||||||||||||
|
Period from
12/29/2011^ to 10/31/2012
|
$ |
10.00 |
$ |
0.04 |
$ |
1.05 |
$ |
1.09 |
$ |
— |
$ |
— |
$ |
— |
$ |
— |
$ |
— |
|||||||||||||||||
|
Class A |
|||||||||||||||||||||||||||||||||||
|
10/31/2016 |
$ |
12.62 |
$ |
(0.07 |
) |
$ |
0.01 |
$ |
(0.06 |
) |
$ |
— |
$ |
— |
$ |
— |
$ |
— |
$ |
— |
|||||||||||||||
|
10/31/2015 |
$ |
12.91 |
$ |
(0.03 |
) |
$ |
(0.21 |
) |
$ |
(0.24 |
) |
$ |
— |
$ |
(0.05 |
) |
$ |
— |
$ |
(0.05 |
) |
$ |
— |
||||||||||||
|
10/31/2014 |
$ |
12.41 |
$ |
(0.03 |
) |
$ |
0.58 |
$ |
0.55 |
$ |
— |
$ |
(0.05 |
) |
$ |
— |
$ |
(0.05 |
) |
$ | 0.00 | ||||||||||||||
|
10/31/2013 |
$ |
11.06 |
$ |
(0.03 |
) |
$ |
1.47 |
$ |
1.44 |
$ |
(0.01 |
) |
$ |
(0.08 |
) |
$ |
— |
$ |
(0.09 |
) |
$ |
— |
|||||||||||||
| Period from 12/29/2011^ to 10/31/2012 |
$ |
10.00 |
$ |
0.00 |
$ |
1.06 |
$ |
1.06 |
$ |
— |
$ |
— |
$ |
— |
$ |
— |
$ |
— |
|||||||||||||||||
|
Class C |
|||||||||||||||||||||||||||||||||||
|
10/31/2016 |
$ |
12.29 |
$ |
(0.16 |
) |
$ |
0.00 |
$ |
(0.16 |
) |
$ |
— |
$ |
— |
$ |
— |
$ |
— |
$ |
— |
|||||||||||||||
|
10/31/2015 |
$ |
12.66 |
$ |
(0.12 |
) |
$ |
(0.20 |
) |
$ |
(0.32 |
) |
$ |
— |
$ |
(0.05 |
) |
$ |
— |
$ |
(0.05 |
) |
$ |
— |
||||||||||||
|
10/31/2014 |
$ |
12.26 |
$ |
(0.12 |
) |
$ |
0.57 |
$ |
0.45 |
$ |
— |
$ |
(0.05 |
) |
$ |
— |
$ |
(0.05 |
) |
$ | 0.00 | ||||||||||||||
|
10/31/2013 |
$ |
10.99 |
$ |
(0.12 |
) |
$ |
1.46 |
$ |
1.34 |
$ |
(0.00 |
) |
$ |
(0.07 |
) |
$ |
— |
$ |
(0.07 |
) |
$ |
— |
|||||||||||||
| Period from 12/29/2011^ to 10/31/2012 |
$ |
10.00 |
$ |
(0.06 |
) |
$ |
1.05 |
$ |
0.99 |
$ |
— |
$ |
— |
$ |
— |
$ |
— |
$ |
— |
||||||||||||||||
See Notes to Financial Highlights
146
| Net Asset Value, End of Year |
Total Return†† |
Net Assets, End of Year (in millions) |
Ratio of Gross Expenses to Average Net Assets# |
Ratio of Gross Expenses to Average Net Assets (excluding dividend and interest expense relating to short sales)# |
Ratio of Net Expenses to Average Net Assets |
Ratio of Net Expenses to Average Net Assets (excluding dividend and interest expense relating to short sales) |
Ratio of Net Investment Income/ (Loss) to Average Net Assets |
Portfolio Turnover Rate (including securities sold short) |
Portfolio Turnover Rate (excluding securities sold short) |
||||||||||||||||||||||||||||||
|
|
|||||||||||||||||||||||||||||||||||||||
|
$ |
12.74 |
(0.14 |
)% |
$ |
2,074.7 |
1.91 |
% |
1.33 |
% |
1.91 |
% |
1.33 |
% |
(0.22 |
)% |
86 |
% |
72 |
% |
||||||||||||||||||||
|
$ |
12.76 |
(1.45 |
)% |
$ |
2,719.8 |
1.66 |
% |
1.31 |
% |
1.66 |
% |
1.31 |
% |
0.16 |
% |
91 |
% |
69 |
% |
||||||||||||||||||||
|
$ |
13.02 |
4.83 |
%b |
$ |
2,627.8 |
1.72 |
% |
1.48 |
% |
1.72 |
% |
1.48 |
% |
0.17 |
% |
61 |
% |
44 |
% |
||||||||||||||||||||
|
$ |
12.48 |
13.47 |
% |
$ |
1,038.2 |
1.75 |
% |
1.60 |
% |
1.75 |
%§ |
1.60 |
%§ |
0.10 |
% |
103 |
% |
52 |
% |
||||||||||||||||||||
|
$ |
11.09 |
10.90 |
%** |
$ |
92.6 |
2.78 |
%‡* |
2.65 |
%‡* |
1.83 |
%‡* |
1.70 |
%‡* |
0.40 |
%‡* |
93 |
%** |
56 |
%** |
||||||||||||||||||||
|
|
|||||||||||||||||||||||||||||||||||||||
|
$ |
12.56 |
(0.48 |
)% |
$ |
206.4 |
2.28 |
% |
1.69 |
% |
2.28 |
% |
1.69 |
% |
(0.59 |
)% |
86 |
% |
72 |
% |
||||||||||||||||||||
|
$ |
12.62 |
(1.89 |
)% |
$ |
361.7 |
2.03 |
% |
1.68 |
% |
2.03 |
% |
1.68 |
% |
(0.20 |
)% |
91 |
% |
69 |
% |
||||||||||||||||||||
|
$ |
12.91 |
4.47 |
%b |
$ |
388.6 |
2.09 |
% |
1.85 |
% |
2.09 |
% |
1.85 |
% |
(0.20 |
)% |
61 |
% |
44 |
% |
||||||||||||||||||||
|
$ |
12.41 |
13.08 |
% |
$ |
502.1 |
2.08 |
% |
1.94 |
% |
2.08 |
%§ |
1.94 |
%§ |
(0.23 |
)% |
103 |
% |
52 |
% |
||||||||||||||||||||
|
$ |
11.06 |
10.60 |
%** |
$ |
27.0 |
3.21 |
%‡* |
3.11 |
%‡* |
2.17 |
%‡* |
2.06 |
%‡* |
0.05 |
%‡* |
93 |
%** |
56 |
%** |
||||||||||||||||||||
|
|
|||||||||||||||||||||||||||||||||||||||
|
$ |
12.13 |
(1.30 |
)% |
$ |
117.3 |
3.02 |
% |
2.44 |
% |
3.02 |
% |
2.44 |
% |
(1.33 |
)% |
86 |
% |
72 |
% |
||||||||||||||||||||
|
$ |
12.29 |
(2.56 |
)% |
$ |
190.6 |
2.77 |
% |
2.42 |
% |
2.77 |
% |
2.42 |
% |
(0.94 |
)% |
91 |
% |
69 |
% |
||||||||||||||||||||
|
$ |
12.66 |
3.71 |
%b |
$ |
211.0 |
2.84 |
% |
2.60 |
% |
2.84 |
% |
2.60 |
% |
(0.94 |
)% |
61 |
% |
44 |
% |
||||||||||||||||||||
|
$ |
12.26 |
12.23 |
% |
$ |
115.1 |
2.83 |
% |
2.68 |
% |
2.83 |
%§ |
2.68 |
%§ |
(1.00 |
)% |
103 |
% |
52 |
% |
||||||||||||||||||||
|
$ |
10.99 |
9.90 |
%** |
$ |
3.4 |
4.34 |
%‡* |
4.20 |
%‡* |
2.95 |
%‡* |
2.81 |
%‡* |
(0.69 |
)%‡* |
93 |
%** |
56 |
%** |
||||||||||||||||||||
147
Financial Highlights (cont'd)
| Net Asset Value, Beginning of Year |
Net Investment Income (Loss)@ |
Net Gains or Losses on Securities (both realized and unrealized) |
Total From Investment Operations |
Dividends from Net Investment Income |
Distributions from Net Realized Capital Gains |
Tax Return of Capital |
Total Distributions |
Voluntary Contributions from Management |
||||||||||||||||||||||||||||
|
Long Short Credit Fund |
||||||||||||||||||||||||||||||||||||
|
Institutional Class |
||||||||||||||||||||||||||||||||||||
|
10/31/2016 |
$ |
9.75 |
$ |
0.15 |
$ |
(0.18 |
) |
$ |
(0.03 |
) |
$ |
(0.19 |
) |
$ |
— |
$ |
— |
$ |
(0.19 |
) |
$ |
— |
||||||||||||||
| Period from 6/29/2015^ to 10/31/2015 |
$ |
10.00 |
$ |
0.02 |
$ |
(0.23 |
) |
$ |
(0.21 |
) |
$ |
(0.04 |
) |
$ |
— |
$ |
— |
$ |
(0.04 |
) |
$ |
— |
||||||||||||||
|
Class A |
||||||||||||||||||||||||||||||||||||
|
10/31/2016 |
$ |
9.75 |
$ |
0.11 |
$ |
(0.17 |
) |
$ |
(0.06 |
) |
$ |
(0.16 |
) |
$ |
— |
$ |
— |
$ |
(0.16 |
) |
$ |
— |
||||||||||||||
| Period from 6/29/2015^ to 10/31/2015 |
$ |
10.00 |
$ |
0.01 |
$ |
(0.23 |
) |
$ |
(0.22 |
) |
$ |
(0.03 |
) |
$ |
— |
$ |
— |
$ |
(0.03 |
) |
$ |
— |
||||||||||||||
|
Class C |
||||||||||||||||||||||||||||||||||||
|
10/31/2016 |
$ |
9.75 |
$ |
0.06 |
$ |
(0.17 |
) |
$ |
(0.11 |
) |
$ |
(0.11 |
) |
$ |
— |
$ |
— |
$ |
(0.11 |
) |
$ |
— |
||||||||||||||
| Period from 6/29/2015^ to 10/31/2015 |
$ |
10.00 |
$ |
(0.01 |
) |
$ |
(0.23 |
) |
$ |
(0.24 |
) |
$ |
(0.01 |
) |
$ |
— |
$ |
— |
$ |
(0.01 |
) |
$ |
— |
|||||||||||||
|
Class R6 |
||||||||||||||||||||||||||||||||||||
|
10/31/2016 |
$ |
9.75 |
$ |
0.16 |
$ |
(0.18 |
) |
$ |
(0.02 |
) |
$ |
(0.19 |
) |
$ |
— |
$ |
— |
$ |
(0.19 |
) |
$ |
— |
||||||||||||||
| Period from 6/29/2015^ to 10/31/2015 |
$ |
10.00 |
$ |
0.02 |
$ |
(0.22 |
) |
$ |
(0.20 |
) |
$ |
(0.05 |
) |
$ |
— |
$ |
— |
$ |
(0.05 |
) |
$ |
— |
||||||||||||||
|
Multi-Asset Income Fund |
||||||||||||||||||||||||||||||||||||
|
Institutional Class |
||||||||||||||||||||||||||||||||||||
|
10/31/2016 |
$ |
9.43 |
$ |
0.31 |
$ |
0.25 |
$ |
0.56 |
$ |
(0.30 |
) |
$ |
— |
$ |
(0.09 |
) |
$ |
(0.39 |
) |
$ |
— |
|||||||||||||||
| Period from 3/27/2015^ to 10/31/2015 |
$ |
10.00 |
$ |
0.23 |
$ |
(0.57 |
) |
$ |
(0.34 |
) |
$ |
(0.23 |
) |
$ |
— |
$ |
— |
$ |
(0.23 |
) |
$ |
— |
||||||||||||||
See Notes to Financial Highlights
148
| Net Asset Value, End of Year |
Total Return†† |
Net Assets, End of Year (in millions) |
Ratio of Gross Expenses to Average Net Assets# |
Ratio of Gross Expenses to Average Net Assets (excluding dividend and interest expense relating to short sales)# |
Ratio of Net Expenses to Average Net Assets |
Ratio of Net Expenses to Average Net Assets (excluding dividend and interest expense relating to short sales) |
Ratio of Net Investment Income/ (Loss) to Average Net Assets |
Portfolio Turnover Rate (including securities sold short) |
Portfolio Turnover Rate (excluding securities sold short) |
|||||||||||||||||||||||||||||||
|
|
||||||||||||||||||||||||||||||||||||||||
|
$ |
9.53 |
(0.28 |
)% |
$ |
22.3 |
3.22 |
% |
2.36 |
% |
1.97 |
% |
1.10 |
% |
1.54 |
% |
190 |
% |
197 |
% |
|||||||||||||||||||||
|
$ |
9.75 |
(2.06 |
)%** |
$ |
22.8 |
3.50 |
%‡* |
3.45 |
%‡* |
1.21 |
%‡* |
1.15 |
%‡* |
0.64 |
%‡* |
32 |
%** |
18 |
%** |
|||||||||||||||||||||
|
|
||||||||||||||||||||||||||||||||||||||||
|
$ |
9.53 |
(0.55 |
)% |
$ |
1.0 |
3.72 |
% |
2.82 |
% |
2.29 |
% |
1.40 |
% |
1.16 |
% |
190 |
% |
197 |
% |
|||||||||||||||||||||
|
$ |
9.75 |
(2.17 |
)%** |
$ |
1.3 |
4.28 |
%‡* |
4.23 |
%‡* |
1.55 |
%‡* |
1.50 |
%‡* |
0.28 |
%‡* |
32 |
%** |
18 |
%** |
|||||||||||||||||||||
|
|
||||||||||||||||||||||||||||||||||||||||
|
$ |
9.53 |
(1.10 |
)% |
$ |
1.0 |
4.30 |
%* |
3.47 |
% |
2.85 |
% |
2.02 |
% |
0.64 |
% |
190 |
% |
197 |
% |
|||||||||||||||||||||
|
$ |
9.75 |
(2.41 |
)%** |
$ |
1.0 |
5.04 |
%‡* |
4.98 |
%‡* |
2.26 |
%‡* |
2.20 |
%‡* |
(0.43 |
)%‡* |
32 |
%** |
18 |
%** |
|||||||||||||||||||||
|
|
||||||||||||||||||||||||||||||||||||||||
|
$ |
9.54 |
(0.12 |
)% |
$ |
6.1 |
3.05 |
%* |
2.26 |
% |
1.83 |
% |
(1.04 |
)% |
1.71 |
% |
190 |
% |
197 |
% |
|||||||||||||||||||||
|
$ |
9.75 |
(2.03 |
)%** |
$ |
4.9 |
3.49 |
%‡* |
3.44 |
%‡* |
1.14 |
%‡* |
1.08 |
%‡* |
0.69 |
%‡* |
32 |
%** |
18 |
%** |
|||||||||||||||||||||
|
|
||||||||||||||||||||||||||||||||||||||||
|
|
||||||||||||||||||||||||||||||||||||||||
|
$ |
9.60 |
6.09 |
% |
$ |
12.4 |
3.86 |
% |
3.86 |
%* |
0.44 |
% |
0.44 |
% |
3.33 |
% |
94 |
% |
94 |
% |
|||||||||||||||||||||
|
$ |
9.43 |
(3.43 |
)%** |
$ |
10.6 |
3.66 |
%‡* |
3.66 |
%؇* |
0.43 |
%‡* |
0.43 |
%؇* |
3.87 |
%‡* |
33 |
%** |
33 |
%Ø** | |||||||||||||||||||||
149
Financial Highlights (cont'd)
| Net Asset Value, Beginning of Year |
Net Investment Income (Loss)@ |
Net Gains or Losses on Securities (both realized and unrealized) |
Total From Investment Operations |
Dividends from Net Investment Income |
Distributions from Net Realized Capital Gains |
Tax Return of Capital |
Total Distributions |
Voluntary Contributions from Management |
|||||||||||||||||||||||||||||
|
Multi-Asset Income Fund (cont'd) |
|||||||||||||||||||||||||||||||||||||
|
Class A |
|||||||||||||||||||||||||||||||||||||
|
10/31/2016 |
$ |
9.43 |
$ |
0.28 |
$ |
0.24 |
$ |
0.52 |
$ |
(0.26 |
) |
$ |
— |
$ |
(0.09 |
) |
$ |
(0.35 |
) |
$ |
— |
||||||||||||||||
| Period from 3/27/2015^ to 10/31/2015 |
$ |
10.00 |
$ |
0.20 |
$ |
(0.56 |
) |
$ |
(0.36 |
) |
$ |
(0.21 |
) |
$ |
— |
$ |
— |
$ |
(0.21 |
) |
$ |
— |
|||||||||||||||
|
Class C |
|||||||||||||||||||||||||||||||||||||
|
10/31/2016 |
$ |
9.43 |
$ |
0.20 |
$ |
0.25 |
$ |
0.45 |
$ |
(0.19 |
) |
$ |
— |
$ |
(0.09 |
) |
$ |
(0.28 |
) |
$ |
— |
||||||||||||||||
| Period from 3/27/2015^ to 10/31/2015 |
$ |
10.00 |
$ |
0.16 |
$ |
(0.56 |
) |
$ |
(0.40 |
) |
$ |
(0.17 |
) |
$ |
— |
$ |
— |
$ |
(0.17 |
) |
$ |
— |
|||||||||||||||
|
Class R6 |
|||||||||||||||||||||||||||||||||||||
|
10/31/2016 |
$ |
9.43 |
$ |
0.32 |
$ |
0.24 |
$ |
0.56 |
$ |
(0.30 |
) |
$ |
— |
$ |
(0.09 |
) |
$ |
(0.39 |
) |
$ |
— |
||||||||||||||||
| Period from 3/27/2015^ to 10/31/2015 |
$ |
10.00 |
$ |
0.23 |
$ |
(0.57 |
) |
$ |
(0.34 |
) |
$ |
(0.23 |
) |
$ |
— |
$ |
— |
$ |
(0.23 |
) |
$ |
— |
|||||||||||||||
| Risk Balanced Commodity Strategy Fundc | |||||||||||||||||||||||||||||||||||||
|
Institutional Class |
|||||||||||||||||||||||||||||||||||||
|
10/31/2016 |
$ |
6.20 |
$ |
(0.03 |
) |
$ |
(0.18 |
) |
$ |
(0.21 |
) |
$ |
— |
$ |
— |
$ |
— |
$ |
— |
$ |
— |
||||||||||||||||
|
10/31/2015 |
$ |
8.39 |
$ |
(0.05 |
) |
$ |
(2.14 |
) |
$ |
(2.19 |
) |
$ |
— |
$ |
(0.00 |
) |
$ |
— |
$ |
(0.00 |
) |
$ |
— |
||||||||||||||
|
10/31/2014 |
$ |
9.01 |
$ |
(0.07 |
) |
$ |
(0.55 |
) |
$ |
(0.62 |
) |
$ |
— |
$ |
— |
$ |
— |
$ |
— |
$ |
— |
||||||||||||||||
|
10/31/2013 |
$ |
9.84 |
$ |
(0.09 |
) |
$ |
(0.74 |
) |
$ |
(0.83 |
) |
$ |
— |
$ |
— |
$ |
— |
$ |
— |
$ |
— |
||||||||||||||||
| Period from 8/27/2012^ to 10/31/2012 |
$ |
10.00 |
$ |
(0.02 |
) |
$ |
(0.14 |
) |
$ |
(0.16 |
) |
$ |
— |
$ |
— |
$ |
— |
$ |
— |
$ |
— |
||||||||||||||||
See Notes to Financial Highlights
150
| Net Asset Value, End of Year |
Total Return†† |
Net Assets, End of Year (in millions) |
Ratio of Gross Expenses to Average Net Assets# |
Ratio of Gross Expenses to Average Net Assets (excluding dividend and interest expense relating to short sales)# |
Ratio of Net Expenses to Average Net Assets |
Ratio of Net Expenses to Average Net Assets (excluding dividend and interest expense relating to short sales) |
Ratio of Net Investment Income/ (Loss) to Average Net Assets |
Portfolio Turnover Rate (including securities sold short) |
Portfolio Turnover Rate (excluding securities sold short) |
|||||||||||||||||||||||||||||||
|
|
||||||||||||||||||||||||||||||||||||||||
|
$ |
9.60 |
5.70 |
% |
$ |
0.6 |
4.27 |
% |
4.27 |
% |
0.81 |
% |
0.81 |
% |
2.98 |
% |
94 |
% |
94 |
% |
|||||||||||||||||||||
|
$ |
9.43 |
(3.64 |
)%** |
$ |
0.5 |
4.55 |
%‡* |
4.55 |
%؇* |
0.79 |
%‡* |
0.79 |
%Ø*‡ |
3.50 |
%‡* |
33 |
%** |
33 |
%Ø** | |||||||||||||||||||||
|
|
||||||||||||||||||||||||||||||||||||||||
|
$ |
9.60 |
4.91 |
% |
$ |
0.6 |
4.99 |
% |
4.99 |
% |
1.56 |
% |
1.56 |
% |
2.20 |
% |
94 |
% |
94 |
% |
|||||||||||||||||||||
|
$ |
9.43 |
(4.07 |
)%** |
$ |
0.5 |
5.29 |
%‡* |
5.29 |
%؇* |
1.53 |
%‡* |
1.53 |
%Ø*‡ |
2.76 |
%‡* |
33 |
%** |
33 |
%Ø** | |||||||||||||||||||||
|
|
||||||||||||||||||||||||||||||||||||||||
|
$ |
9.60 |
6.16 |
% |
$ |
3.9 |
3.78 |
% |
3.78 |
% |
0.37 |
% |
0.37 |
% |
3.42 |
% |
94 |
% |
94 |
% |
|||||||||||||||||||||
|
$ |
9.43 |
(3.39 |
)%** |
$ |
3.8 |
3.63 |
%‡* |
3.63 |
%؇* |
0.36 |
%‡* |
0.36 |
%؇* |
3.93 |
%‡* |
33 |
%** |
33 |
%Ø** | |||||||||||||||||||||
|
$ |
5.99 |
(3.39 |
)% |
$ |
49.0 |
1.65 |
% |
1.65 |
%Ø* |
1.10 |
% |
1.10 |
%Ø* |
(0.44 |
)% |
58 |
%Ø |
58 |
%Ø | |||||||||||||||||||||
|
$ |
6.20 |
(26.09 |
)% |
$ |
31.8 |
1.47 |
% |
1.47 |
%Ø* |
1.10 |
% |
1.10 |
%Ø* |
(0.67 |
)% |
35 |
%Ø |
35 |
%Ø | |||||||||||||||||||||
|
$ |
8.39 |
(6.88 |
)% |
$ |
20.5 |
1.62 |
% |
1.62 |
%Ø* |
1.10 |
% |
1.10 |
%Ø* |
(0.73 |
)% |
21 |
%Ø |
21 |
%Ø | |||||||||||||||||||||
|
$ |
9.01 |
(8.43 |
)% |
$ |
9.6 |
3.69 |
% |
3.69 |
%Ø* |
1.10 |
% |
0.10 |
%Ø* |
(0.94 |
)% |
5 |
%Ø |
5 |
%Ø | |||||||||||||||||||||
|
$ |
9.84 |
(1.60 |
)%** |
$ |
5.0 |
25.60 |
%‡* |
25.60 |
%؇* |
1.10 |
%‡* |
1.10 |
%؇* |
(0.99 |
)%‡* |
0 |
%Ø** |
0 |
%Ø** | |||||||||||||||||||||
151
Financial Highlights (cont'd)
| Net Asset Value, Beginning of Year |
Net Investment Income (Loss)@ |
Net Gains or Losses on Securities (both realized and unrealized) |
Total From Investment Operations |
Dividends from Net Investment Income |
Distributions from Net Realized Capital Gains |
Tax Return of Capital |
Total Distributions |
Voluntary Contributions from Management |
|||||||||||||||||||||||||||||
| Risk Balanced Commodity Strategy Fundc (cont'd) | |||||||||||||||||||||||||||||||||||||
|
Class A |
|||||||||||||||||||||||||||||||||||||
|
10/31/2016 |
$ |
6.12 |
$ |
(0.05 |
) |
$ |
(0.17 |
) |
$ |
(0.22 |
) |
$ |
— |
$ |
— |
$ |
— |
$ |
— |
$ |
— |
||||||||||||||||
|
10/31/2015 |
$ |
8.32 |
$ |
(0.07 |
) |
$ |
(2.13 |
) |
$ |
(2.20 |
) |
$ |
— |
$ |
(0.00 |
) |
$ |
— |
$ |
(0.00 |
) |
$ |
— |
||||||||||||||
|
10/31/2014 |
$ |
8.97 |
$ |
(0.10 |
) |
$ |
(0.55 |
) |
$ |
(0.65 |
) |
$ |
— |
$ |
— |
$ |
— |
$ |
— |
$ |
— |
||||||||||||||||
|
10/31/2013 |
$ |
9.84 |
$ |
(0.12 |
) |
$ |
(0.75 |
) |
$ |
(0.87 |
) |
$ |
— |
$ |
— |
$ |
— |
$ |
— |
$ |
— |
||||||||||||||||
| Period from 8/27/2012^ to 10/31/2012 |
$ |
10.00 |
$ |
(0.03 |
) |
$ |
(0.13 |
) |
$ |
(0.16 |
) |
$ |
— |
$ |
— |
$ |
— |
$ |
— |
$ |
— |
||||||||||||||||
|
Class C |
|||||||||||||||||||||||||||||||||||||
|
10/31/2016 |
$ |
5.98 |
$ |
(0.09 |
) |
$ |
(0.18 |
) |
$ |
(0.27 |
) |
$ |
— |
$ |
— |
$ |
— |
$ |
— |
$ |
— |
||||||||||||||||
|
10/31/2015 |
$ |
8.19 |
$ |
(0.12 |
) |
$ |
(2.09 |
) |
$ |
(2.21 |
) |
$ |
— |
$ |
(0.00 |
) |
$ |
— |
$ |
(0.00 |
) |
$ |
— |
||||||||||||||
|
10/31/2014 |
$ |
8.88 |
$ |
(0.16 |
) |
$ |
(0.53 |
) |
$ |
(0.69 |
) |
$ |
— |
$ |
— |
$ |
— |
$ |
— |
$ |
— |
||||||||||||||||
|
10/31/2013 |
$ |
9.83 |
$ |
(0.18 |
) |
$ |
(0.77 |
) |
$ |
(0.95 |
) |
$ |
— |
$ |
— |
$ |
— |
$ |
— |
$ |
— |
||||||||||||||||
| Period from 8/27/2012^ to 10/31/2012 |
$ |
10.00 |
$ |
(0.04 |
) |
$ |
(0.13 |
) |
$ |
(0.17 |
) |
$ |
— |
$ |
— |
$ |
— |
$ |
— |
$ |
— |
||||||||||||||||
|
U.S. Equity Index PutWrite Strategy Fund |
|||||||||||||||||||||||||||||||||||||
|
Institutional Class |
|||||||||||||||||||||||||||||||||||||
| Period from 9/16/2016^ to10/31/2016 |
$ |
10.00 |
$ |
0.00 |
$ |
0.09 |
$ |
0.09 |
$ |
— |
$ |
— |
$ |
— |
$ |
— |
$ |
— |
|||||||||||||||||||
|
Class A |
|||||||||||||||||||||||||||||||||||||
| Period from 9/16/2016^ to 10/31/2016 |
$ |
10.00 |
$ |
(0.00 |
) |
$ |
0.09 |
$ |
0.09 |
$ |
— |
$ |
— |
$ |
— |
$ |
— |
$ |
— |
||||||||||||||||||
See Notes to Financial Highlights
152
| Net Asset Value, End of Year |
Total Return†† |
Net Assets, End of Year (in millions) |
Ratio of Gross Expenses to Average Net Assets# |
Ratio of Gross Expenses to Average Net Assets (excluding dividend and interest expense relating to short sales)# |
Ratio of Net Expenses to Average Net Assets |
Ratio of Net Expenses to Average Net Assets (excluding dividend and interest expense relating to short sales) |
Ratio of Net Investment Income/ (Loss) to Average Net Assets |
Portfolio Turnover Rate (including securities sold short) |
Portfolio Turnover Rate (excluding securities sold short) |
|||||||||||||||||||||||||||||||
|
$ |
5.90 |
(3.59 |
)% |
$ |
33.3 |
2.04 |
% |
2.04 |
%Ø |
1.46 |
% |
1.46 |
% |
(0.82 |
)% |
58 |
% |
58 |
% |
|||||||||||||||||||||
|
$ |
6.12 |
(26.43 |
)% |
$ |
35.5 |
1.84 |
% |
1.84 |
%Ø |
1.46 |
% |
1.46 |
% |
(1.05 |
)% |
35 |
% |
35 |
% |
|||||||||||||||||||||
|
$ |
8.32 |
(7.25 |
)% |
$ |
66.8 |
1.98 |
% |
1.98 |
%Ø |
1.46 |
% |
1.46 |
% |
(1.09 |
)% |
21 |
% |
21 |
% |
|||||||||||||||||||||
|
$ |
8.97 |
(8.84 |
)% |
$ |
35.0 |
3.81 |
% |
3.81 |
%Ø |
1.46 |
% |
1.46 |
% |
(1.27 |
)% |
5 |
% |
5 |
% |
|||||||||||||||||||||
|
$ |
9.84 |
(1.60 |
)%** |
$ |
0.1 |
33.04 |
%‡* |
33.04 |
%Ø |
1.46 |
% |
1.46 |
% |
(1.36 |
)% |
0 |
% |
0 |
% |
|||||||||||||||||||||
|
|
||||||||||||||||||||||||||||||||||||||||
|
$ |
5.71 |
(4.52 |
)% |
$ |
0.1 |
3.06 |
% |
3.06 |
%Ø* |
2.21 |
% |
2.21 |
%Ø* |
(1.65 |
)% |
58 |
%Ø |
58 |
%Ø | |||||||||||||||||||||
|
$ |
5.98 |
(26.98 |
)% |
$ |
3.1 |
2.70 |
% |
2.70 |
%Ø* |
2.21 |
% |
2.21 |
%Ø* |
(1.79 |
)% |
35 |
%Ø |
35 |
%Ø | |||||||||||||||||||||
|
$ |
8.19 |
(7.77 |
)% |
$ |
4.2 |
2.84 |
% |
2.84 |
%Ø* |
2.21 |
% |
2.21 |
%Ø* |
(1.84 |
)% |
21 |
%Ø |
21 |
%Ø | |||||||||||||||||||||
|
$ |
8.88 |
(9.66 |
)% |
$ |
3.6 |
4.69 |
% |
4.69 |
%Ø* |
2.21 |
% |
2.21 |
%Ø* |
(2.03 |
)% |
5 |
%Ø |
5 |
%Ø | |||||||||||||||||||||
|
$ |
9.83 |
(1.70 |
)%** |
$ |
0.1 |
35.12 |
%‡* |
35.12 |
%؇* |
2.21 |
%‡* |
2.21 |
%؇* |
(2.11 |
)%‡* |
0 |
%Ø** |
0 |
%Ø** | |||||||||||||||||||||
|
$ |
10.09 |
0.90 |
%** |
$ |
21.2 |
3.84 |
%‡* |
3.84 |
%؇* |
0.65 |
%‡* |
0.65 |
%؇* |
0.26 |
%‡* |
0 |
%Ø** |
0 |
%Ø** | |||||||||||||||||||||
|
|
||||||||||||||||||||||||||||||||||||||||
|
$ |
10.09 |
0.90 |
%** |
$ |
0.4 |
4.26 |
%‡* |
4.26 |
%؇* |
1.01 |
%‡* |
1.01 |
%؇* |
(0.05 |
)%‡* |
0 |
%Ø ** |
0 |
%Ø** | |||||||||||||||||||||
153
Financial Highlights (cont'd)
| Net Asset Value, Beginning of Year |
Net Investment Income (Loss)@ |
Net Gains or Losses on Securities (both realized and unrealized) |
Total From Investment Operations |
Dividends from Net Investment Income |
Distributions from Net Realized Capital Gains |
Tax Return of Capital |
Total Distributions |
Voluntary Contributions from Management |
|||||||||||||||||||||||||||||
|
U.S. Equity Index PutWrite Strategy Fund (cont'd) |
|||||||||||||||||||||||||||||||||||||
|
Class C |
|||||||||||||||||||||||||||||||||||||
| Period from 9/16/2016^ to 10/31/2016 |
$ |
10.00 |
$ |
(0.01 |
) |
$ |
0.09 |
$ |
0.08 |
$ |
— |
$ |
— |
$ |
— |
$ |
— |
$ |
— |
||||||||||||||||||
|
Class R6 |
|||||||||||||||||||||||||||||||||||||
| Period from 9/16/16^ to 10/31/2016 |
$ |
10.00 |
$ |
0.00 |
$ |
0.10 |
$ |
0.10 |
$ |
— |
$ |
— |
$ |
— |
$ |
— |
$ |
— |
|||||||||||||||||||
See Notes to Financial Highlights
154
| Net Asset Value, End of Year |
Total Return†† |
Net Assets, End of Year (in millions) |
Ratio of Gross Expenses to Average Net Assets# |
Ratio of Gross Expenses to Average Net Assets (excluding dividend and interest expense relating to short sales)# |
Ratio of Net Expenses to Average Net Assets |
Ratio of Net Expenses to Average Net Assets (excluding dividend and interest expense relating to short sales) |
Ratio of Net Investment Income/ (Loss) to Average Net Assets |
Portfolio Turnover Rate (including securities sold short) |
Portfolio Turnover Rate (excluding securities sold short) |
|||||||||||||||||||||||||||||||
|
|
||||||||||||||||||||||||||||||||||||||||
|
$ |
10.08 |
0.80 |
%** |
$ |
0.1 |
5.10 |
%‡* |
5.10 |
%؇* |
1.76 |
%‡* |
1.76 |
%؇* |
(0.86 |
)%‡* |
0 |
%Ø** |
0 |
%Ø** | |||||||||||||||||||||
|
|
||||||||||||||||||||||||||||||||||||||||
|
$ |
10.10 |
1.00 |
%** |
$ |
4.8 |
3.77 |
%‡* |
3.77 |
%؇* |
0.58 |
%‡* |
0.58 |
%؇* |
0.26 |
%‡* |
0 |
%Ø** |
0 |
%Ø** | |||||||||||||||||||||
155
Notes to Financial Highlights
|
††
|
Total return based on per share NAV reflects the effects of changes in NAV on the performance of each Fund during each fiscal period. Returns assume income dividends and other distributions, if any, were reinvested, but do not reflect the effect of sales charges. Results represent past performance and do not indicate future results. Current returns may be lower or higher than the performance data quoted. Investment returns and principal may fluctuate and shares when redeemed may be worth more or less than original cost. Total return would have been lower if Management had not reimbursed and/or waived certain expenses. Total return would have been higher if Management had not recouped previously reimbursed and/or waived expenses.
|
|
^
|
The date investment operations commenced.
|
|
‡
|
Organization expense, which is a non-recurring expense, is included in these ratios on a non-annualized basis.
|
|
@
|
Calculated based on the average number of shares outstanding during each fiscal period.
|
|
§
|
After repayment of expenses previously reimbursed and/or fees previously waived by Management, as applicable. Had the Fund not made such repayments, the annualized ratios of net expenses to average daily net assets would have been:
|
| Including Dividend and Interest Expense Relating to Short Sales |
Excluding Dividend and Interest Expense Relating to Short Sales |
||||||||||
|
Year Ended October 31, 2013 |
|||||||||||
|
Long Short Institutional Class |
1.69 |
% |
1.54 |
% |
|||||||
|
Long Short Class A |
2.06 |
% |
1.92 |
% |
|||||||
|
Long Short Class C |
2.81 |
% |
2.66 |
% |
|||||||
|
*
|
Annualized. |
|
**
|
Not annualized. |
|
#
|
Represents the annualized ratios of net expenses to average daily net assets if Management had not reimbursed certain expenses and/or waived a portion of the investment management fee. |
|
Ø
|
Multi-Asset Income, Risk Balanced Commodity Strategy and U.S. Equity Index PutWrite Strategy did not engage in short sales. |
|
a
|
The portfolio turnover rates including mortgage dollar roll transactions, including and excluding securities sold short, were 182% and 183%, respectively, for the year ended October 31, 2016 and 198% and 189%, respectively, for the year ended October 31, 2015, for Global Allocation. |
| b | The voluntary contributions received in 2014 had no impact on the Funds' total returns for the year ended October 31, 2014. |
| c | Consolidated financial highlights, see Note A in the Notes to Financial Statements. |
156
Report of Independent Registered Public Accounting Firm
To the Board of Trustees of Neuberger Berman Alternative Funds and Shareholders of:
Neuberger Berman Global Allocation Fund
Neuberger Berman Long Short Credit Fund
Neuberger Berman Multi-Asset Income Fund
Neuberger Berman Risk Balanced Commodity Strategy Fund
Neuberger Berman U.S. Equity Index PutWrite Strategy Fund
We have audited the accompanying statements of assets and liabilities of Neuberger Berman Global Allocation Fund, Neuberger Berman Long Short Credit Fund, Neuberger Berman Multi-Asset Income Fund, Neuberger Berman Risk Balanced Commodity Strategy Fund and Neuberger Berman U.S. Equity Index PutWrite Strategy Fund, five of the series constituting the Neuberger Berman Alternative Funds (the "Trust"), including the schedules of investments, as of October 31, 2016, the related statements of operations for the period then ended, and the statements of changes in net assets and the financial highlights for each of the periods indicated therein. These financial statements and financial highlights are the responsibility of the Trust's management. Our responsibility is to express an opinion on these financial statements and financial highlights based on our audits.
We conducted our audits in accordance with the standards of the Public Company Accounting Oversight Board (United States). Those standards require that we plan and perform the audit to obtain reasonable assurance about whether the financial statements and financial highlights are free of material misstatement. We were not engaged to perform an audit of the Trust's internal control over financial reporting. Our audits included consideration of internal control over financial reporting as a basis for designing audit procedures that are appropriate in the circumstances, but not for the purpose of expressing an opinion on the effectiveness of the Trust's internal control over financial reporting. Accordingly, we express no such opinion. An audit also includes examining, on a test basis, evidence supporting the amounts and disclosures in the financial statements and financial highlights, assessing the accounting principles used and significant estimates made by management, and evaluating the overall financial statement presentation. Our procedures included confirmation of securities owned as of October 31, 2016 by correspondence with the custodian and others or by other appropriate auditing procedures where replies from others were not received. We believe that our audits provide a reasonable basis for our opinion.
In our opinion, the financial statements and financial highlights referred to above present fairly, in all material respects, the financial position of Neuberger Berman Global Allocation Fund, Neuberger Berman Long Short Credit Fund, Neuberger Berman Multi-Asset Income Fund, Neuberger Berman Risk Balanced Commodity Strategy Fund and Neuberger Berman U.S. Equity Index PutWrite Strategy Fund, at October 31, 2016, the results of their operations for the period then ended, and the changes in their net assets and the financial highlights for each of the periods indicated therein, in conformity with U.S. generally accepted accounting principles.

Boston, Massachusetts
December 29, 2016
157
Report of Independent Registered Public Accounting Firm
To the Board of Trustees and Shareholders
Neuberger Berman Alternative Funds
We have audited the accompanying statement of assets and liabilities of the Neuberger Berman Long Short Fund, a series of the Neuberger Berman Alternative Funds (the "Trust"), including the schedule of investments, as of October 31, 2016, and the related statement of operations for the year then ended, and the statements of changes in net assets for each of the two years in the period then ended, and the financial highlights for each of the four years in the period then ended and for the period December 29, 2011 (commencement of operations) to October 31, 2012. These financial statements and financial highlights are the responsibility of the Trust's management. Our responsibility is to express an opinion on these financial statements and financial highlights based on our audit.
We conducted our audit in accordance with the standards of the Public Company Accounting Oversight Board (United States). Those standards require that we plan and perform the audit to obtain reasonable assurance about whether the financial statements and financial highlights are free of material misstatement. The Trust is not required to have, nor were we engaged to perform, an audit of its internal control over financial reporting. Our audit included consideration of internal control over financial reporting as a basis for designing audit procedures that are appropriate in the circumstances, but not for the purpose of expressing an opinion on the effectiveness of the Trust's internal control over financial reporting. Accordingly, we express no such opinion. An audit also includes examining, on a test basis, evidence supporting the amounts and disclosures in the financial statements, assessing the accounting principles used and significant estimates made by management, as well as evaluating the overall financial statement presentation. Our procedures included confirmation of securities owned as of October 31, 2016, by correspondence with the custodian and brokers or by other appropriate auditing procedures where replies from brokers were not received. We believe that our audit provides a reasonable basis for our opinion.
In our opinion, the financial statements and financial highlights referred to above present fairly, in all material respects, the financial position of the Neuberger Berman Long Short Fund, as of October 31, 2016, and the results of its operations for the year then ended, and the changes in its net assets for each of the two years in the period then ended, and the financial highlights for each of the four years in the period then ended and for the period December 29, 2011 (commencement of operations) to October 31, 2012, in conformity with accounting principles generally accepted in the United States of America.

Philadelphia, Pennsylvania
December 22, 2016
158
Directory
Investment Manager and Administrator
Neuberger Berman Investment Advisers LLC
1290 Avenue of the Americas
New York, NY 10104-0002
212.476.8800
Intermediary Client Services 800.366.6264
Distributor
Neuberger Berman LLC
1290 Avenue of the Americas
New York, NY 10104-0002
800.877.9700 or 212.476.8800
Intermediary Client Services 800.366.6264
Sub-Advisers (prior to January 1, 2016)
Neuberger Berman Fixed Income LLC
190 South LaSalle Street
Chicago, IL 60603
Neuberger Berman LLC
605 Third Avenue
New York, NY 10158-3698
Custodian and Shareholder Servicing Agent
State Street Bank and Trust Company
One Lincoln Street
Boston, MA 02111
For Institutional Class Shareholders
Address correspondence to:
Neuberger Berman Investment Advisers LLC
1290 Avenue of the Americas
New York, NY 10104-0002
Intermediary Client Services 800.366.6264
For Class A, Class C and Class R6 Shareholders:
Please contact your investment provider
Legal Counsel
K&L Gates LLP
1601 K Street, NW
Washington, DC 20006-1600
Independent Registered Public Accounting Firms
Ernst & Young LLP
200 Clarendon Street
Boston, MA 02116
Tait, Weller & Baker LLP
1818 Market Street
Suite 2400
Philadelphia, PA 19103
159
Trustee and Officer Information
The following tables set forth information concerning the Trustees and Officers of each of the Funds. All persons named as Trustees and Officers also serve in similar capacities for other funds administered or managed by Management or Neuberger Berman. Each Fund's Statement of Additional Information includes additional information about the Trustees as of the time of the Fund's most recent public offering and is available upon request, without charge, by calling (800) 877-9700.
Information about the Board of Trustees
| Name, (Year of Birth), and Address(1) |
Position(s) and Length of Time Served(2) |
Principal Occupation(s)(3) | Number of Funds in Fund Complex Overseen by Fund Trustee |
Other Directorships Held Outside Fund Complex by Fund Trustee(3) |
||||||
|
Independent Trustees |
||||||||||
|
Faith Colish (1935) |
Trustee since inception |
Counsel, Carter Ledyard & Milburn LLP (law firm) since October 2002; formerly, Attorney-at-Law and President, Faith Colish, A Professional Corporation, 1980 to 2002. |
55 |
Formerly, Director, 1997 to 2003, and Advisory Director, 2003 to 2006, ABA Retirement Funds (formerly, American Bar Retirement Association) (not-for-profit membership corporation). |
||||||
|
Michael J. Cosgrove (1949) |
Trustee since 2015 |
President, Carragh Consulting USA, since 2014; formerly, Executive, General Electric Company, 1970 to 2014, including President, Mutual Funds and Global Investment Programs, GE Asset Management, 2011 to 2014, President and Chief Executive Officer, Mutual Funds and Intermediary Business, GE Asset Management, 2007 to 2011, President, Institutional Sales and Marketing, GE Asset Management, 1998 to 2007, and Chief Financial Officer, GE Asset Management and Deputy Treasurer, GE Company, 1988 to 1993. |
55 |
Director, America Press, Inc. (not-for-profit Jesuit publisher), since 2015; Director, Fordham University, since 2001; formerly, Director, The Gabelli Go Anywhere Trust, June 2015 to June 2016; Director, Skin Cancer Foundation (not-for-profit), 2006 to 2015; Director, GE Investments Funds, Inc., 1997 to 2014; Trustee, GE Institutional Funds, 1997 to 2014; Director, GE Asset Management, 1988 to 2014; Director, Elfun Trusts, 1988 to 2014; Trustee, GE Pension & Benefit Plans, 1988 to 2014. |
||||||
160
| Name, (Year of Birth), and Address(1) |
Position(s) and Length of Time Served(2) |
Principal Occupation(s)(3) | Number of Funds in Fund Complex Overseen by Fund Trustee |
Other Directorships Held Outside Fund Complex by Fund Trustee(3) |
||||||
|
Marc Gary (1952) |
Trustee since 2015 |
Executive Vice Chancellor and Chief Operating Officer, Jewish Theological Seminary, since 2012; formerly, Executive Vice President and General Counsel, Fidelity Investments, 2007 to 2012; Executive Vice President and General Counsel, BellSouth Corporation, 2004 to 2007; Vice President and Associate General Counsel, BellSouth Corporation, 2000 to 2004; Associate, Partner, and National Litigation Practice Co-Chair, Mayer, Brown LLP, 1981 to 2000; Associate Independent Counsel, Office of Independent Counsel, 1990 to 1992. |
55 |
Trustee, Jewish Theological Seminary, since 2015; Director, Counsel on Call (privately held for-profit company), since 2012; Director, Lawyers Committee for Civil Rights Under Law (not-for-profit), since 2005; formerly, Director, Equal Justice Works (not-for-profit), 2005 to 2014; Director, Corporate Counsel Institute, Georgetown University Law Center, 2007 to 2012; Director, Greater Boston Legal Services (not-for-profit), 2007 to 2012. |
||||||
161
| Name, (Year of Birth), and Address(1) |
Position(s) and Length of Time Served(2) |
Principal Occupation(s)(3) | Number of Funds in Fund Complex Overseen by Fund Trustee |
Other Directorships Held Outside Fund Complex by Fund Trustee(3) |
||||||
|
Martha C. Goss (1949) |
Trustee since 2007 |
President, Woodhill Enterprises Inc./Chase Hollow Associates LLC (personal investment vehicle), since 2006; formerly, Consultant, Resources Global Professionals (temporary staffing), 2002 to 2006. |
55 |
Director, American Water (water utility), since 2003; Director, Allianz Life of New York (insurance), since 2005; Director, Berger Group Holdings, Inc. (engineering consulting firm), since 2013; Director, Financial Women's Association of New York (not-for-profit association), since 2003; Trustee Emerita, Brown University, since 1998; Director, Museum of American Finance (not-for-profit), since 2013; formerly, Non-Executive Chair and Director, Channel Reinsurance (financial guaranty reinsurance), 2006 to 2010; formerly, Director, Ocwen Financial Corporation (mortgage servicing), 2005 to 2010; formerly, Director, Claire's Stores, Inc. (retailer), 2005 to 2007; formerly, Director, Parsons Brinckerhoff Inc. (engineering consulting firm), 2007 to 2010; formerly, Director, Bank Leumi (commercial bank), 2005 to 2007; formerly, Advisory Board Member, Attensity (software developer), 2005 to 2007. |
||||||
162
| Name, (Year of Birth), and Address(1) |
Position(s) and Length of Time Served(2) |
Principal Occupation(s)(3) | Number of Funds in Fund Complex Overseen by Fund Trustee |
Other Directorships Held Outside Fund Complex by Fund Trustee(3) |
||||||
|
Michael M. Knetter (1960) |
Trustee since 2007 |
President and Chief Executive Officer, University of Wisconsin Foundation, since October 2010; formerly, Dean, School of Business, University of Wisconsin—Madison; formerly, Professor of International Economics and Associate Dean, Amos Tuck School of Business—Dartmouth College, 1998 to 2002. |
55 |
Board Member, American Family Insurance (a mutual company, not publicly traded), since March 2009; formerly, Trustee, Northwestern Mutual Series Fund, Inc., 2007 to 2011; formerly, Director, Wausau Paper, 2005 to 2011; formerly, Director, Great Wolf Resorts, 2004 to 2009. |
||||||
|
Deborah C. McLean (1954) |
Trustee since 2015 |
Member, Circle Financial Group (private wealth management membership practice), since 2011; Managing Director, Golden Seeds LLC (an angel investing group), since 2009; Adjunct Professor, Columbia University School of International and Public Affairs, since 2008; formerly, Visiting Assistant Professor, Fairfield University, Dolan School of Business, Fall 2007; formerly, Adjunct Associate Professor of Finance, Richmond, The American International University in London, 1999 to 2007. |
55 |
Board member, Norwalk Community College Foundation, since 2014; Dean's Advisory Council, Radcliffe Institute for Advanced Study, since 2014; formerly, Director and Treasurer, At Home in Darien (not-for-profit), 2012 to 2014; Director, National Executive Service Corps (not-for-profit), 2012 to 2013; Trustee, Richmond, The American International University in London, 1999 to 2013. |
||||||
|
Howard A. Mileaf (1937) |
Trustee since inception |
Retired; formerly, Vice President and General Counsel, WHX Corporation (holding company), 1993 to 2001. |
55 |
Formerly, Director, Webfinancial Corporation (holding company), 2002 to 2008; formerly, Director, WHX Corporation (holding company), 2002 to 2005; formerly, Director, State Theatre of New Jersey (not-for-profit theatre), 2000 to 2005. |
||||||
163
| Name, (Year of Birth), and Address(1) |
Position(s) and Length of Time Served(2) |
Principal Occupation(s)(3) | Number of Funds in Fund Complex Overseen by Fund Trustee |
Other Directorships Held Outside Fund Complex by Fund Trustee(3) |
||||||
|
George W. Morriss (1947) |
Trustee since 2007 |
Adjunct Professor, Columbia University School of International and Public Affairs, since October 2012; formerly, Executive Vice President and Chief Financial Officer, People's United Bank, Connecticut (a financial services company), 1991 to 2001. |
55 |
Director, National Association of Corporate Directors, Connecticut Chapter, since 2011; Trustee, Steben Alternative Investment Funds, Steben Select Multi-Strategy Fund, and Steben Select Multi-Strategy Master Fund, since 2013; formerly, Treasurer, National Association of Corporate Directors, Connecticut Chapter, 2011 to 2015; formerly, Manager, Larch Lane Multi-Strategy Fund complex (which consisted of three funds), 2006 to 2011; formerly, Member, NASDAQ Issuers' Affairs Committee, 1995 to 2003. |
||||||
|
Tom D. Seip (1950) |
Trustee since inception; Chairman of the Board since 2008; formerly Lead Independent Trustee from 2006 to 2008 |
General Partner, Ridgefield Farm LLC (a private investment vehicle); formerly, President and CEO, Westaff, Inc. (temporary staffing), May 2001 to January 2002; formerly, Senior Executive, The Charles Schwab Corporation, 1983 to 1998, including Chief Executive Officer, Charles Schwab Investment Management, Inc.; Trustee, Schwab Family of Funds and Schwab Investments, 1997 to 1998; and Executive Vice President-Retail Brokerage, Charles Schwab & Co., Inc., 1994 to 1997. |
55 |
Director, H&R Block, Inc. (financial services company), since May 2001; Chairman, Governance and Nominating Committee, H&R Block, Inc., since 2011; formerly, Chairman, Compensation Committee, H&R Block, Inc., 2006 to 2010; formerly, Director, Forward Management, Inc. (asset management company), 1999 to 2006. |
||||||
|
James G. Stavridis (1955) |
Trustee since 2015 |
Dean, Fletcher School of Law and Diplomacy, Tufts University since 2013; formerly, Admiral, United States Navy, 2006 to 2013, including Supreme Allied Commander, NATO and Commander, European Command, 2009 to 2013, and Commander, United States Southern Command, 2006 to 2009. |
55 |
Director, Utilidata Inc., since 2015; Director, BMC Software Federal, LLC, since 2014; Director, Vertical Knowledge, LLC, since 2013; formerly, Director, Navy Federal Credit Union, 2000-2002. |
||||||
164
| Name, (Year of Birth), and Address(1) |
Position(s) and Length of Time Served(2) |
Principal Occupation(s)(3) | Number of Funds in Fund Complex Overseen by Fund Trustee |
Other Directorships Held Outside Fund Complex by Fund Trustee(3) |
||||||
|
Candace L. Straight (1947) |
Trustee since inception |
Private investor and consultant specializing in the insurance industry; formerly, Advisory Director, Securitas Capital LLC (a global private equity investment firm dedicated to making investments in the insurance sector), 1998 to 2003. |
55 |
Formerly, Public Member, Board of Governors and Board of Trustees, Rutgers University, 2011 to 2016; formerly, Director, Montpelier Re Holdings Ltd. (reinsurance company), 2006 to 2015; formerly, Director, National Atlantic Holdings Corporation (property and casualty insurance company), 2004 to 2008; formerly, Director, The Proformance Insurance Company (property and casualty insurance company), 2004 to 2008; formerly, Director, Providence Washington Insurance Company (property and casualty insurance company), 1998 to 2006; formerly, Director, Summit Global Partners (insurance brokerage firm), 2000 to 2005. |
||||||
|
Peter P. Trapp (1944) |
Trustee since inception |
Retired; formerly, Regional Manager for Mid-Southern Region, Ford Motor Credit Company, September 1997 to 2007; formerly, President, Ford Life Insurance Company, April 1995 to August 1997. |
55 |
None. |
||||||
165
| Name, (Year of Birth), and Address(1) |
Position(s) and Length of Time Served(2) |
Principal Occupation(s)(3) | Number of Funds in Fund Complex Overseen by Fund Trustee |
Other Directorships Held Outside Fund Complex by Fund Trustee(3) |
||||||
|
Fund Trustees who are "Interested Persons" |
||||||||||
|
Joseph V. Amato* (1962) |
Trustee since 2009 |
President and Director, Neuberger Berman Group LLC, since 2009; President and Chief Executive Officer, Neuberger Berman LLC ("Neuberger Berman") and Neuberger Berman Holdings LLC (including its predecessor, Neuberger Berman Inc.), since 2007; Chief Investment Officer (Equities) and President (Equities), Neuberger Berman Investment Advisers LLC ("NBIA") (formerly, Neuberger Berman Fixed Income LLC ("NBFI") and including predecessor entities), since 2007, and Board Member of NBIA since 2006; formerly, Global Head of Asset Management of Lehman Brothers Holdings Inc.'s ("LBHI") Investment Management Division, 2006 to 2009; formerly, member of LBHI's Investment Management Division's Executive Management Committee, 2006 to 2009; formerly, Managing Director, Lehman Brothers Inc. ("LBI"), 2006 to 2008; formerly, Chief Recruiting and Development Officer, LBI, 2005 to 2006; formerly, Global Head of LBI's Equity Sales and a Member of its Equities Division Executive Committee, 2003 to 2005. |
55 |
Member of Board of Advisors, McDonough School of Business, Georgetown University, since 2001; Member of New York City Board of Advisors, Teach for America, since 2005; Trustee, Montclair Kimberley Academy (private school), since 2007; Member of Board of Regents, Georgetown University, since 2013. |
||||||
|
|
|
|
|
|
||||||
166
| Name, (Year of Birth), and Address(1) |
Position(s) and Length of Time Served(2) |
Principal Occupation(s)(3) | Number of Funds in Fund Complex Overseen by Fund Trustee |
Other Directorships Held Outside Fund Complex by Fund Trustee(3) |
||||||
|
Robert Conti* (1956) |
Chief Executive Officer, President and Trustee since 2008; prior thereto, Executive Vice President in 2008 and Vice President from inception to 2008 |
Managing Director, Neuberger Berman, since 2007; President—Mutual Funds, NBIA, since 2008; formerly, Senior Vice President, Neuberger Berman, 2003 to 2006; formerly, Vice President, Neuberger Berman, 1999 to 2003; President and Chief Executive Officer, twenty-eight registered investment companies for which NBIA acts as investment manager and/or administrator. |
55 |
Director, Staten Island Mental Health Society, since 1994; formerly, Chairman of the Board, Staten Island Mental Health Society, 2008 to 2011. |
||||||
|
(1)
|
The business address of each listed person is 1290 Avenue of the Americas New York, NY 10104.
|
|
(2)
|
Pursuant to the Trust's Trust Instrument, each of these Fund Trustees shall hold office for life or until his or her successor is elected or the Trust terminates; except that (a) any Fund Trustee may resign by delivering a written resignation; (b) any Fund Trustee may be removed with or without cause at any time by a written instrument signed by at least two-thirds of the other Fund Trustees; (c) any Fund Trustee who requests to be retired, or who has become unable to serve, may be retired by a written instrument signed by a majority of the other Fund Trustees; and (d) any Fund Trustee may be removed at any shareholder meeting by a vote of at least two-thirds of the outstanding shares.
|
|
(3)
|
Except as otherwise indicated, each individual has held the positions shown during at least the last five years.
|
|
*
|
Indicates a Fund Trustee who is an "interested person" within the meaning of the 1940 Act. Mr. Amato and Mr. Conti are interested persons of the Trust by virtue of the fact that each is an officer of NBIA and/or its affiliates.
|
167
Information about the Officers of the Trust
| Name, (Year of Birth), and Address(1) |
Position(s) and Length of Time Served(2) |
Principal Occupation(s)(3) | ||
|
Claudia A. Brandon (1956) |
Executive Vice President since 2008 and Secretary since inception |
Senior Vice President, Neuberger Berman, since 2007 and Employee since 1999; Senior Vice President, NBIA, since 2008 and Assistant Secretary since 2004; formerly, Vice President, Neuberger Berman, 2002 to 2006; formerly, Vice President—Mutual Fund Board Relations, NBIA, 2000 to 2008; formerly, Vice President, NBIA, 1986 to 1999 and Employee, 1984 to 1999; Executive Vice President, twenty-eight registered investment companies for which NBIA acts as investment manager and/or administrator; Secretary, fifteen registered investment companies for which NBIA acts as investment manager and/or administrator. |
||
|
Agnes Diaz (1971) |
Vice President since 2013 |
Senior Vice President, Neuberger Berman, since 2012; Senior Vice President, NBIA, since 2012 and Employee since 1996; formerly, Vice President, Neuberger Berman, 2007 to 2012; Vice President, twenty-eight registered investment companies for which NBIA acts as investment manager and/or administrator. |
||
|
Anthony DiBernardo (1979) |
Assistant Treasurer since 2011 |
Senior Vice President, NBIA, since 2014, and Employee since 2003; formerly, Vice President, Neuberger Berman, 2009 to 2014; Assistant Treasurer, ten registered investment companies for which NBIA acts as investment manager and/or administrator. |
||
|
Corey A. Issing (1978) |
Chief Legal Officer since 2016 (only for purposes of sections 307 and 406 of the Sarbanes-Oxley Act of 2002) and Anti-Money Laundering Compliance Officer since 2016 |
General Counsel and Head of Compliance—Mutual Funds since 2016 and Senior Vice President, NBIA, since 2013, formerly, Associate General Counsel (2015 to 2016), Counsel (2007 to 2015), Vice President (2009-2013); Chief Legal Officer (only for purposes of sections 307 and 406 of the Sarbanes-Oxley Act of 2002), twenty-eight registered investment companies for which NBIA acts as investment manager and/or administrator; Anti-Money Laundering Compliance Officer, twenty-eight registered investment companies for which NBIA acts as investment manager and/or administrator. |
||
|
Sheila R. James (1965) |
Assistant Secretary since inception |
Vice President, Neuberger Berman, since 2008 and Employee since 1999; Vice President, NBIA, since 2008; formerly, Assistant Vice President, Neuberger Berman, 2007; Employee, NBIA, 1991 to 1999; Assistant Secretary, twenty-eight registered investment companies for which NBIA acts as investment manager and/or administrator. |
168
| Name, (Year of Birth), and Address(1) |
Position(s) and Length of Time Served(2) |
Principal Occupation(s)(3) | ||
|
Brian Kerrane (1969) |
Chief Operating Officer since 2015 and Vice President since 2008 |
Managing Director, Neuberger Berman, since 2013; Chief Operating Officer—Mutual Funds and Managing Director, NBIA, since 2015 and Employee since 1991; formerly, Senior Vice President, Neuberger Berman, 2006 to 2014; Vice President, NBIA, 2008 to 2015 and Employee since 1991; Chief Operating Officer, ten registered investment companies for which NBIA acts as investment manager and/or administrator; Vice President, twenty-eight registered investment companies for which NBIA acts as investment manager and/or administrator. |
||
|
Kevin Lyons (1955) |
Assistant Secretary since inception |
Assistant Vice President, Neuberger Berman, since 2008 and Employee since 1999; Assistant Vice President, NBIA, since 2008; formerly, Employee, NBIA, 1993 to 1999; Assistant Secretary, ten registered investment companies for which NBIA acts as investment manager and/or administrator. |
||
|
Anthony Maltese (1959) |
Vice President since 2015 |
Senior Vice President, Neuberger Berman, since 2014 and Employee since 2000; Senior Vice President, NBIA, since 2014; Vice President, ten registered investment companies for which NBIA acts as investment manager and/or administrator. |
||
|
Owen F. McEntee, Jr. (1961) |
Vice President since 2008 |
Vice President, Neuberger Berman, since 2006; Vice President, NBIA, since 2006 and Employee since 1992; Vice President, ten registered investment companies for which NBIA acts as investment manager and/or administrator. |
||
|
John M. McGovern (1970) |
Treasurer and Principal Financial and Accounting Officer since inception |
Senior Vice President, Neuberger Berman, since 2007; Senior Vice President, NBIA, since 2007 and Employee since 1993; formerly, Vice President, Neuberger Berman, 2004 to 2006; formerly, Assistant Treasurer, 2002 to 2005; Treasurer and Principal Financial and Accounting Officer, twenty-eight registered investment companies for which NBIA acts as investment manager and/or administrator. |
||
|
Frank Rosato (1971) |
Assistant Treasurer since inception |
Vice President, Neuberger Berman, since 2006; Vice President, NBIA, since 2006 and Employee since 1995; Assistant Treasurer, ten registered investment companies for which NBIA acts as investment manager and/or administrator. |
||
|
Chamaine Williams (1971) |
Chief Compliance Officer since inception |
Chief Compliance Officer—Mutual Funds and Senior Vice President, NBIA, since 2006; formerly, Senior Vice President, LBI, 2007 to 2008; formerly, Vice President, LBI, 2003 to 2006; formerly, Chief Compliance Officer, Lehman Brothers Asset Management Inc., 2003 to 2007; formerly, Chief Compliance Officer, Lehman Brothers Alternative Investment Management LLC, 2003 to 2007; Chief Compliance Officer, fifteen registered investment companies for which NBIA acts as investment manager and/or administrator. |
|
(1)
|
The business address of each listed person is 1290 Avenue of the Americas New York, NY 10104.
|
|
(2)
|
Pursuant to the By-Laws of the Trust, each officer elected by the Fund Trustees shall hold office until his or her successor shall have been elected and qualified or until his or her earlier death, inability to serve, or resignation. Officers serve at the pleasure of the Fund Trustees and may be removed at any time with or without cause.
|
|
(3)
|
Except as otherwise indicated, each individual has held the positions shown during at least the last five years.
|
169
Proxy Voting Policies and Procedures
A description of the policies and procedures that the Trust uses to determine how to vote proxies relating to portfolio securities is available, without charge, by calling 800-877-9700 (toll-free) and on the Securities and Exchange Commission's website at www.sec.gov. Information regarding how the Trust voted proxies relating to portfolio securities during the most recent 12-month period ended June 30 is also available, without charge upon request, by calling 800-877-9700 (toll-free), on the Securities and Exchange Commission's website at www.sec.gov, and on Management's website at www.nb.com.
Quarterly Portfolio Schedule
The Trust files a complete schedule of portfolio holdings for each Fund with the Securities and Exchange Commission for the first and third quarters of the fiscal year on Form N-Q. The Trust's Forms N-Q are available on the Securities and Exchange Commission's website at www.sec.gov and may be reviewed and copied at the Securities and Exchange Commission's Public Reference Room in Washington, DC. Information on the operation of the Public Reference Room may be obtained by calling 800-SEC-0330. The information on Form N-Q is available upon request, without charge, by calling 800-877-9700 (toll-free).
170
Board Consideration of the Management Agreement
On an annual basis, the Board of Trustees (the "Board") of Neuberger Berman Alternative Funds (the "Trust"), including the Trustees who are not "interested persons" of Neuberger Berman Investment Advisers LLC ("Management") (including its affiliates) or the Trust ("Independent Fund Trustees"), considers whether to continue the management agreement with Management (the "Agreement") with respect to Neuberger Berman Global Allocation Fund, Neuberger Berman Long Short Fund, Neuberger Berman Long Short Credit Fund, Neuberger Berman Multi-Asset Income Fund, and Neuberger Berman Risk Balanced Commodity Strategy Fund (each, a "Fund"). Throughout the process, the Independent Fund Trustees are advised by counsel that is experienced in Investment Company Act of 1940 matters and that is independent of Management ("Independent Counsel"). At a meeting held on October 18, 2016, the Board, including the Independent Fund Trustees, approved the continuation of the Agreement for each Fund.
In evaluating the Agreement with respect to each Fund, the Board, including the Independent Fund Trustees, reviewed extensive materials provided by Management in response to questions submitted by the Independent Fund Trustees and Independent Counsel, and met with senior representatives of Management regarding its personnel, operations and financial condition as they relate to the Funds. The annual contract review extends over at least two regular meetings of the Board to ensure that Management has time to respond to any questions the Independent Fund Trustees may have on their initial review of the materials and that the Independent Fund Trustees have time to consider those responses.
In connection with its deliberations, the Board also considered the broad range of information relevant to the annual contract review that is provided to the Board (including its various standing committees) at meetings throughout the year, including investment performance reports and related portfolio information for each Fund, as well as periodic reports on, among other matters, pricing and valuation; brokerage and execution; compliance; and shareholder and other services provided by Management and its affiliates. To assist the Board in its deliberations regarding the annual contract review, the Board has established a Contract Review Committee comprised of Independent Fund Trustees. The Board has also established other committees that focus throughout the year on specific areas relevant to the annual contract review, such as Fund performance or compliance matters, and that are charged with specific responsibilities regarding the annual contract review. Those committees provide reports that feed into the Contract Review Committee, which reviews and takes account of the information.
The Independent Fund Trustees received from Independent Counsel a memorandum discussing the legal standards for their consideration of the proposed continuation of the Agreement. During the course of the year and during their deliberations regarding the annual contract review, the Contract Review Committee and the Independent Fund Trustees met with Independent Counsel separately from representatives of Management.
In connection with its approval of the continuation of the Agreement, the Board evaluated the terms of the Agreement, the overall fairness of the Agreement to each Fund and whether the Agreement was in the best interests of each Fund and Fund shareholders. The Board considered all factors it deemed relevant with respect to each Fund, including the following factors: (1) the nature, extent, and quality of the services provided by Management; (2) the investment performance of each Fund compared to an appropriate market index and a peer group of investment companies; (3) the costs of the services provided and the profit or loss realized by Management and its affiliates from their relationship with each Fund; (4) the extent to which economies of scale have been or might be realized as each Fund grows; and (5) whether fee or service levels reflect any such potential economies of scale for the benefit of each Fund's shareholders. The Board's determination to approve the continuation of the Agreement was based on a comprehensive consideration of all information provided to the Board throughout the year and specifically in connection with the annual contract review. The Board members did not identify any particular information or factor that was all-important or controlling, and each Trustee may have attributed different weights to the various factors. The Board focused on the overall costs and benefits of the Agreement to each Fund and, through the Funds, their shareholders.
With respect to the nature, extent and quality of the services provided, the Board considered the investment philosophy and decision-making processes of Management and the qualifications, experience, and capabilities of, and the resources available to, the portfolio management personnel of Management who perform services for the Funds. The Board noted that Management also provides certain administrative services, including fund accounting and compliance services. The
171
Board also considered Management's policies and practices regarding brokerage and allocation of portfolio transactions and reviewed the quality of the execution services that Management had provided. The Board also reviewed whether Management used brokers to execute Fund transactions that provide research and other services to Management and the types of benefits potentially derived from such services by Management, the Funds and other clients of Management. The Board also considered that Management's responsibilities include daily management of investment, operational, enterprise, legal, regulatory and compliance risks as they relate to the Funds, and considered information regarding Management's processes for managing risk. In addition, the Board noted the positive compliance history of Management, as no significant compliance problems were reported to the Board with respect to the firm. The Board also considered the general structure of the portfolio manager compensation program and whether this structure provides appropriate incentives to act in the best interests of the Funds.
As in past years, the Board also considered the manner in which Management addressed various non-routine matters that arose during the year, some of them a result of developments in the broader fund industry or the regulations governing it. In addition, the Board considered actions taken by Management in response to recent market conditions, such as regulatory concerns about changes in fixed-income market liquidity and potential volatility, and considered the overall performance of Management in this context.
The Board factored into its evaluation of the Funds' fees and performance a consideration of the limitations inherent in the methodology for constructing peer groups and determining which investment companies should be included in the peer groups. With respect to investment performance, the Board considered information regarding each Fund's short-, intermediate- and long-term performance, as applicable, both on an absolute basis and relative to an appropriate benchmark index and the average performance of a composite peer group (as constructed by an independent organization) of investment companies pursuing broadly similar strategies. The Board also reviewed performance in relation to certain measures of the degree of investment risk undertaken by the portfolio managers. In the case of those Funds that had underperformed their benchmark indices and/or peer groups, the Board discussed with Management each Fund's performance and steps that Management had taken, or intended to take, to improve performance. In the case of certain Funds, the Board met with the Portfolio Managers of those Funds during the period since the last contract renewal to discuss the Fund's performance. The Board also considered Management's responsiveness with respect to the Funds that experienced lagging performance. In this regard, the Board noted that performance, especially short-term performance, is only one of the factors that it deems relevant to its consideration of a Fund's Agreement and that, after considering all relevant factors, it may be appropriate to approve the continuation of the Agreement notwithstanding a Fund's underperformance.
With respect to the overall fairness of the Agreement, the Board considered the fee structure for each Fund under the Agreement as compared to a peer group of comparable funds. The Board also considered any fall-out (i.e. indirect) benefits likely to accrue to Management or its affiliates from their relationship with each Fund. With respect to Neuberger Berman Global Allocation Fund and Neuberger Berman Multi-Asset Income Fund, the Board considered that each Fund invests in affiliated underlying funds pursuant to exemptive relief obtained from the Securities and Exchange Commission. The Board further considered, for any assets that Neuberger Berman Global Allocation Fund and Neuberger Berman Multi-Asset Income Fund invest in an affiliated underlying fund, Management's undertaking to waive a portion of each Fund's advisory fee equal to the advisory fee it receives from such affiliated underlying fund. The Board also considered the profitability of Management and its affiliates from their association with the Funds, and year-over-year changes in each of Management's reported expense categories.
The Board reviewed a comparison of each Fund's management fee and total expense ratio to a peer group of comparable funds. The Board noted that the comparative management fee analysis includes, in each Fund's management fee, the separate administrative fees paid to Management, but it was not clear whether this was the case for all funds in the peer group. The Board compared each Fund's contractual and actual management fees to the mean and median of the contractual and actual management fees, respectively, of that Fund's peer group. (The actual management fees are the contractual management fees reduced by any fee waivers or other adjustments.) Where a Fund's management fee was higher than the peer group mean and/or median, the Board considered whether specific portfolio management, administration or oversight needs contributed to the management fee. In addition, the Board considered the contractual
172
limit on expenses of certain classes of each Fund. The Board noted that Management incurred a loss on certain of the Funds during the review period. The Board also noted that for some classes of certain Funds, the overall expense ratio of each class is maintained through expense reimbursements by Management.
With regard to the investment performance of each Fund and the costs of the services provided to each Fund, the Board considered the following information. Where a Fund has more than one class of shares outstanding, information for a single class has been provided as identified below. For each Fund, the Board looked at the Institutional Class as provided below as a proxy for all of the Fund's classes:
|
• |
Neuberger Berman Global Allocation Fund (Institutional Class)—The Board considered that, as compared to its peer group, the Fund's contractual management fee and the actual management fee net of fees waived by Management were both lower than the respective medians. The Board considered that, as compared to its peer group, the Fund's performance was lower than the median for the 1-year period and higher than the median for the 3-year period. Due to limited performance information for the funds in the peer group, the Fund was the only Fund in the group with five years of performance. The Board also considered that, as compared to its benchmark, the Fund's performance was lower for the 1-year period, but higher for the 3 and 5-year periods. The Fund was launched in 2010 and therefore does not have 10-year performance. |
|
• |
Neuberger Berman Long Short Fund (Institutional Class)—The Board considered that, as compared to its peer group, the Fund's contractual management fee and the actual management fee were both lower than the respective medians. The Board considered that, as compared to its peer group, the Fund's performance was lower than the median for the 1 and 3-year periods. The Board also considered that, as compared to its benchmark, the Fund's performance was lower for the 1-year period, but higher for the 3-year period. The Fund was launched in 2011 and therefore does not have 5 or 10-year performance. |
|
• |
Neuberger Berman Long Short Credit Fund (Institutional Class)—The Board considered that, as compared to its peer group, the Fund's contractual management fee was equal to the median, but the actual management fee net of fees waived by Management was higher than the median. The Board did not consider the Fund's performance relative to its peer group because the Fund has been in operation for less than one year and, as such, does not have comparable peer group performance. The Board also considered that, as compared to its benchmark, the Fund's performance was lower for the period since the Fund's inception. The Fund was launched in 2015 and while the Board reviewed its performance as compared to its benchmark, the Board recognizes the limitations of relying on very short-term performance. |
|
• |
Neuberger Berman Multi-Asset Income Fund (Institutional Class)—The Board considered that, as compared to its peer group, the Fund's contractual management fee and the actual management fee net of fees waived by Management were both lower than the respective medians. The Board considered that, as compared to its peer group, the Fund's performance was higher than the median for the period since the Fund's inception. The Board also considered that, as compared to its benchmark, the Fund's performance was lower for the period since the Fund's inception. The Fund was launched in 2015 and while the Board reviewed its performance as compared to its benchmark and peer group, the Board recognizes the limitations of relying on very short-term performance. |
|
• |
Neuberger Berman Risk Balanced Commodity Strategy Fund (Institutional Class)—The Board considered that, as compared to its peer group, the Fund's contractual management fee and the actual management fee net of fees waived by Management were both lower than the respective medians. The Board considered that, as compared to its peer group, the Fund's performance was lower than the median for the 1 and 3-year periods. The Board also considered that, as compared to its benchmark, the Fund's performance was lower for the 1 and 3-year periods. The Fund was launched in 2012 and therefore does not have 5 or 10-year performance. |
The Board also considered whether there were other funds or separate accounts that were advised or sub-advised by Management or its affiliates with investment objectives, policies and strategies that were similar to those of any of the
173
Funds. In the cases where such funds or separate accounts exist, the Board compared the fees charged to the comparable Fund to the fees charged to any such funds and/or separate accounts. The Board considered the appropriateness and reasonableness of any differences between the fees charged to a comparable Fund and any such funds and/or separate accounts, including any breakpoints, and determined that differences in fees and fee structures were consistent with the management and other services provided. The Board also evaluated any apparent or anticipated economies of scale in relation to the services Management provides to each Fund. The Board considered whether each Fund's fee structure provides for a reduction of payments resulting from the use of breakpoints and whether any such breakpoints are set at appropriate asset levels. As in past years, the Board gave careful thought to the size of any breakpoints in the Funds' advisory fees and the asset levels at which they are set. It also considered whether the fees were set at an appropriate level and compared the fee structures to that of the peer group. The Board also considered that Management has provided, at no added cost to the Funds, certain additional services that were required by new regulations or regulatory interpretations, impelled by changes in the securities markets or the business landscape, and/or requested by the Board. In concluding that the benefits accruing to Management and affiliates by virtue of their relationship with each Fund were reasonable in light of the costs of providing the investment advisory and other services and the benefits accruing to each Fund, the Board reviewed specific data as to Management's profit or loss on each Fund for a recent period. The Board also considered Management's cost allocation methodology. The Board recognized that Management should be entitled to earn a reasonable level of profits for services it provides to the Funds and, based on its review, concluded that Management's reported level of profitability on each Fund was reasonable.
Conclusions
In approving the continuation of the Agreement, the Board concluded that the terms of each Agreement are fair and reasonable to each Fund and that approval of the continuation of the Agreement is in the best interests of each Fund and its shareholders. In reaching this determination, the Board considered that Management could be expected to provide a high level of service to each Fund; that the performance of each Fund was satisfactory over time, or, in the case of an underperforming Fund, that it retained confidence in Management's capabilities to manage the Fund; that each Fund's fee structure appeared to the Board to be reasonable given the nature, extent and quality of services provided; and that the benefits accruing to Management and its affiliates by virtue of their relationship with the Funds were reasonable in light of the costs of providing the investment advisory and other services and the benefits accruing to each Fund. The Board's conclusions may be based in part on its consideration of materials prepared in connection with the approval or continuance of the Agreement in prior years and on the Board's ongoing regular review of Fund performance and operations throughout the year, in addition to material prepared specifically for the most recent annual review of the Agreement.
174
Neuberger Berman U.S. Equity Index PutWrite Strategy Fund: Initial Consideration of the Management Agreement
At meetings held on June 22-23, 2016, the Board of Trustees ("Board") of Neuberger Berman Alternative Funds ("Trust"), including the Trustees who are not "interested persons" of Neuberger Berman Investment Advisers LLC ("Management") (including its affiliates) or the Trust ("Independent Fund Trustees"), evaluated and approved the management agreement with Management (the "Agreement") with respect to Neuberger Berman U.S. Equity Index PutWrite Strategy Fund (the "Fund"). Throughout the process, the Independent Fund Trustees are advised by counsel that is experienced in Investment Company Act of 1940 matters and that is independent of Management ("Independent Counsel").
In evaluating the Agreement, the Board, including the Independent Fund Trustees, reviewed materials provided by Management and met with senior representatives of Management regarding its personnel, operations and financial condition as they relate to the Fund.
In connection with its deliberations, the Board also considered the broad range of information relevant to the annual contract review that is provided to the Board (including its various standing committees) at meetings throughout the year and for the annual consideration of continuance of contracts for other series of the Trust. To assist the Board in its deliberations regarding the annual contract review, the Board has established a Contract Review Committee comprised of Independent Fund Trustees. The Board has also established other committees that focus throughout the year on specific areas relevant to the annual contract review, such as Fund performance or compliance matters, and that are charged with specific responsibilities regarding the annual contract review. Those committees provide reports that feed into the Contract Review Committee, which reviews and takes account of the information.
The Independent Fund Trustees receive, at least annually, from Independent Counsel a memorandum discussing the legal standards for their consideration of management and advisory agreements. During the course of their deliberations regarding their review of the Agreement, the Independent Fund Trustees met with Independent Counsel separately from representatives of Management.
In connection with its approval of the Agreement, the Board evaluated the terms of the Agreement, the overall fairness of the Agreement to the Fund and whether the Agreement was in the best interests of the Fund and its shareholders. The Board considered all factors it deemed relevant with respect to the Fund, including the following factors: (1) the nature, extent, and quality of the services to be provided by Management; (2) the expected costs of the services to be provided by Management; (3) the extent to which economies of scale might be realized as the Fund grows; and (4) whether proposed fee levels reflect any such potential economies of scale for the benefit of the Fund's shareholders. The Board's determination to approve the Agreement was based on a comprehensive consideration of all information provided to the Board. The Board members did not identify any particular information or factor that was all-important or controlling, and each Trustee may have attributed different weights to the various factors. The Board focused on the overall costs and benefits of the Agreement to the Fund and, through the Fund, its shareholders.
With respect to the nature, extent and quality of the services to be provided, the Board considered the investment philosophy and decision-making processes of Management and the qualifications, experience, and capabilities of, and the resources available to, the portfolio management personnel of Management who would perform services for the Fund. The Board noted that Management also would provide certain administrative services, including fund accounting and compliance services. The Board also considered Management's policies and practices regarding brokerage and allocation of portfolio transactions for the Fund. The Board also reviewed whether Management would use brokers to execute Fund transactions that provide research and other services to Management and the types of benefits potentially derived from such services by Management, the Fund and other clients of Management. The Board also considered that Management's responsibilities include daily management of investment, operational, enterprise, legal, regulatory and compliance risks as they relate to the Fund, and considered information regarding Management's processes for managing risk. In addition, the Board noted the positive compliance history of Management as no significant compliance problems were reported to
175
the Board with respect to the firm. The Board also considered the general structure of the portfolio manager compensation program and whether this structure provides appropriate incentives to act in the best interests of the Fund.
The Board also considered the manner in which Management addressed various non-routine matters that arose during the year, some of them a result of developments in the broader fund industry or the regulations governing it. In addition, the Board considered actions taken by Management in response to recent market conditions, such as regulatory concerns about changes in fixed-income market liquidity and potential volatility, and considered the overall performance of Management in this context.
With respect to the overall fairness of the Agreement, the Board considered the fee structures proposed for the Fund under the Agreement for the four classes to be registered initially as compared to a peer group of comparable funds. The Board also considered any fall-out (i.e. indirect) benefits likely to accrue to Management or its affiliates from their relationship with the Fund. The Board reviewed a comparison of the Fund's proposed management fee and total expense ratio to a peer group of comparable funds and determined that the management fee and the overall expense ratio for Class A, Class C, Institutional Class and Class R6 are lower than the median for the peer group. The Board noted that the comparative management fee analysis includes, in the Fund's management fee, the separate administrative fees paid to Management, but it was not clear whether this was the case for all funds in the peer group. In addition, the Board considered the proposed contractual limit on expenses of each class of the Fund. The Board also considered whether it would be appropriate to evaluate any anticipated economies of scale in relation to the services Management would provide to the Fund, noting that it may be too soon to anticipate the economies at the start-up phase of a fund. The Board concluded that the benefits expected to accrue to Management and its affiliates by virtue of their relationship to the Fund were reasonable in light of the costs of providing the investment advisory and other services and the benefits expected to accrue to the Fund.
Conclusions
In approving the Agreement, the Board concluded that the terms of the Agreement are fair and reasonable to the Fund and that approval of the Agreement is in the best interests of the Fund and its shareholders. In reaching this determination, the Board considered that Management could be expected to provide a high level of service to the Fund; that the Fund's proposed fee structure appeared to the Board to be reasonable given the nature, extent and quality of services expected to be provided; and that the benefits expected to accrue to Management and its affiliates by virtue of their relationship with the Fund were reasonable in light of the costs of providing the investment advisory and other services and the benefits expected to accrue to the Fund.
176
Notice to Shareholders
In early 2017 you will receive information to be used in filing your 2016 tax returns, which will include a notice of the exact tax status of all distributions paid to you by the Fund during calendar year 2016. Please consult your own tax advisor for details as to how this information should be reflected on your tax returns.
For the fiscal year ended October 31, 2016, each Fund makes the following designation, or up to the maximum amount of such dividends allowable pursuant to the Internal Revenue Code, as qualified dividend income eligible for reduced tax rates. These lower rates range from 5% to 15% depending upon an individual's tax bracket. Complete information regarding each Funds distributions during the calendar year 2016 will be reported in conjunction with Form 1099-DIV.
|
Fund |
Qualified Dividend Income |
||||
|
Global Allocation |
$ |
409,686 |
|||
|
Long Short |
32,688,763 |
||||
|
Long Short Credit |
24,471 |
||||
|
Multi-Asset Income |
564,431 |
||||
|
U.S. Equity Index PutWrite Strategy |
— |
||||
Neuberger Berman Global Allocation Fund hereby designate $43,247 as a capital gain distribution.
177
|
||
|
Neuberger Berman Investment Advisers LLC |
||
|
Statistics and projections in this report are derived from sources deemed to be reliable but cannot be regarded as a representation of future results of the Funds. This report is prepared for the general information of shareholders and is not an offer of shares of the Funds. Shares are sold only through the currently effective prospectus which you can obtain by calling 887.628.2583. An investor should consider carefully a Fund's investment objectives, risks and fees and expenses, which are described in its prospectus, before investing |
||
 L0265 12/16 L0265 12/16 |
|
|
|
|
|
Neuberger Berman
Alternative and Multi-Asset Class Funds |
|
|
|
|
|
Institutional Class Shares
Class A Shares Class C Shares Class R6 Shares |
|
|
|
|
|
Absolute Return Multi-Manager Fund Long Short Multi-Manager Fund |
|
|
|
|
|
|
|
|
|
|
|
Annual Report October 31, 2016 |
|
|
|
|
|
|
|
|
|
|
|
Contents |
|
THE FUNDS |
||||
|
President's Letter |
1 |
|||
|
PORTFOLIO COMMENTARY |
||||
|
Absolute Return Multi-Manager Fund |
2 |
|||
|
Long Short Multi-Manager Fund |
5 |
|||
|
FUND EXPENSE INFORMATION |
10 |
|||
|
SCHEDULE OF INVESTMENTS |
||||
|
Absolute Return Multi-Manager Fund |
12 |
|||
|
Long Short Multi-Manager Fund |
56 |
|||
|
FINANCIAL STATEMENTS |
69 |
|||
| FINANCIAL HIGHLIGHTS (ALL CLASSES)/ PER SHARE DATA |
||||
|
Absolute Return Multi-Manager Fund |
95 |
|||
|
Long Short Multi-Manager Fund |
97 |
|||
|
Report of Independent Registered Public Accounting Firm |
101 |
|||
|
Directory |
102 |
|||
|
Trustees and Officers |
103 |
|||
|
Proxy Voting Policies and Procedures |
113 |
|||
|
Quarterly Portfolio Schedule |
113 |
|||
|
Notice to Shareholders |
113 |
|||
| Board Consideration of the Management and Sub-Advisory Agreements |
114 |
|||
The "Neuberger Berman" name and logo are registered service marks of Neuberger Berman Group LLC. "Neuberger Berman Investment Advisers LLC" and the individual Fund names in this piece are either service marks or registered service marks of Neuberger Berman Management LLC. ©2016 Neuberger Berman LLC, distributor. All rights reserved.
President's Letter
Dear Shareholder,
I am pleased to present this annual shareholder report for Neuberger Berman Absolute Return Multi-Manager Fund and Neuberger Berman Long Short Multi-Manager Fund.
U.S. equity markets experienced several periods of weakness and elevated volatility throughout the fiscal year, driven by the energy selloff to start the year, the "Brexit" decision in June and the uncertainty regarding the November U.S. elections. Still, U.S. equities were positive for the period overall. Corporate bonds and asset-backed securities started the period with significant spread widening despite no obvious changes to credit quality. Those markets subsequently rallied and ended higher for the period. Currency volatility picked up during the period as the U.S. dollar and yen strengthened while the euro and pound weakened. Commodity volatility was higher during the period as well, particularly in the energies and metals sectors.
Looking ahead, we believe the lows for interest rates are behind us and they may continue to trend higher in the long term. In our view, volatility across asset classes has the potential to remain elevated, driven by diverging growth trajectories and monetary policies across global economies. Lastly, we anticipate an interesting spread environment, whether that be in fixed income markets or merger arbitrage. This could be driven, for example, by higher interest rates, a robust merger and acquisition (M&A) environment with mega-deals, or strong fixed income exchange-traded fund (ETF) flows, among other dynamics. These three factors (rising rates, elevated volatility and interesting arbitrage) have historically been tailwinds for hedge fund strategy performance, in our opinion.
Thank you for your continued support and trust. We look forward to continue serving your investment needs in the years to come.
Sincerely,
ROBERT CONTI
PRESIDENT AND CEO
NEUBERGER BERMAN MUTUAL FUNDS
1
Absolute Return Multi-Manager Fund Commentary (Unaudited)
Neuberger Berman Absolute Return Multi-Manager Fund Institutional Class generated a -1.57% total return for the 12 months ended October 31, 2016. During the period, the Fund underperformed its primary benchmark, the HFRX Global Hedge Fund Index which posted a -1.30% return for the same period. (Performance for all share classes and benchmarks is provided in the table following this letter.)
Despite periods of weakness and elevated volatility throughout the year, U.S. equities were positive for the period overall. After a weak start, corporate bonds and asset-backed securities rallied and ended higher for the period. Currency volatility was higher for much of the period as the U.S. dollar and yen strengthened, while the euro and pound weakened. We observed several strong trends in commodities markets, including Energies and Metals.
Following a difficult start to the period for the Fund, characterized by technical selling pressure in crowded hedge fund trades, performance recovered partially and was in line with expectations for the last eight months. We added some value through our subadviser weighting decisions for the period, as the four subadvisers that had the largest weights throughout the fiscal year were among the top five performing subadvisers.
Overall, the Fund's allocation to credit strategies was the largest positive contributor. Both the corporate credit long/short and asset-backed securities subadvisers were active buyers after spreads widened out materially through mid-February 2016 and benefited from subsequent spread tightening over the next several months. Positive catalysts in a number of long and short positions were additive to performance as well.
The allocation to long/short equity strategies was the largest detractor, as a strong recovery in the second half of the period was overshadowed by a difficult first few months. Gains from longs outpaced losses from shorts. On a positive note, single name shorts generated strong alpha versus the broader market.
The Fund's merger arbitrage/event driven allocation was a marginal detractor. As a reminder, we materially reduced this allocation since the third quarter of 2015 and rotated the vast majority of capital in the strategy out of softer catalyst special situations and into merger arbitrage. This proved to be prudent as the latter contributed positively for the period, while the former detracted.
The allocation to global macro/managed futures strategy was another marginal detractor. Gains from the global macro subadviser that were primarily the result of U.S. dollar strengthening were offset by losses from the managed futures subadviser. The latter had a strong start to the period as long rates and short equities positioning paid off, but that ended up being costly later.
The Fund's aggregate use of futures, forward foreign currency, swap and option contracts detracted from performance during the reporting period.
Looking ahead, we believe the portfolio is well positioned to benefit from potentially rising interest rates, higher volatility and attractive spreads. With regard to rising rates, the 10 year U.S. Treasury yield bottomed on July 8, 2016 and ended the period 47 basis points higher. From July through September, the Fund outperformed its primary benchmark and the Bloomberg Barclays U.S. Aggregate Bond Index, in particular, as has historically been the case in similar environments. We have seen this trend strengthen in November 2016 and anticipate rates will continue rising in the long term. President-elect Trump's victory has created uncertainty regarding the direction of a long list of far reaching policies and we anticipate that uncertainty to drive volatility higher in the near term. In our view, our exposure to global macro/managed futures strategies should perform well in this environment. Finally, strong flows both into and out of fixed income markets that we have seen more recently, as well as higher interest rates, in our opinion, should create interesting spreads both in fixed income markets and for merger arbitrage.
Sincerely,
DAVID KUPPERMAN AND JEFF MAJIT
PORTFOLIO MANAGERS
Information about principal risks of investing in the Fund is set forth in the prospectus and statement of additional information.
The portfolio composition, industries and holdings of the Fund are subject to change without notice.
The opinions expressed are those of the Fund's portfolio managers and subadvisers. The opinions are as of the date of this report and are subject to change without notice.
2
TICKER SYMBOLS
|
Institutional Class |
NABIX |
||||||
|
Class A |
NABAX |
||||||
|
Class C |
NABCX |
||||||
|
Class R6 |
NRABX |
||||||
PORTFOLIO BY TYPE OF SECURITY
(as a % of Total Net Assets)
|
Long |
Short |
||||||||||
|
Asset-Backed Securities |
6.1 |
% |
— |
% |
|||||||
| Collateralized Mortgage Obligations |
1.9 |
— |
|||||||||
| Commercial Mortgage-Backed Securities |
6.6 |
— |
|||||||||
|
Common Stocks |
41.0 |
(15.3 |
) |
||||||||
|
Convertible Bonds |
0.8 |
— |
|||||||||
|
Corporate Bonds |
7.3 |
(2.2 |
) |
||||||||
|
Exchange Traded Funds |
— |
(2.3 |
) |
||||||||
|
Exchange Traded Note |
— |
(0.3 |
) |
||||||||
|
Loan Assignments |
8.5 |
— |
|||||||||
|
Master Limited Partnerships |
3.2 |
(0.2 |
) |
||||||||
|
Options Purchased |
0.0 |
— |
|||||||||
|
Preferred Stock |
0.0 |
— |
|||||||||
|
Rights |
0.3 |
— |
|||||||||
|
U.S. Treasury Obligation |
0.2 |
— |
|||||||||
|
Warrants |
0.0 |
— |
|||||||||
|
Short-Term Investments |
19.2 |
— |
|||||||||
|
Other Assets Less Liabilities |
25.2 |
* |
— |
||||||||
|
Total |
120.3 |
% |
(20.3 |
)% |
|||||||
* Includes the impact of the Fund's open positions in derivatives, if any.
PERFORMANCE HIGHLIGHTS3
|
Inception |
Average Annual Total Return Ended 10/31/2016 |
||||||||||||||
|
Date |
1 Year |
Life of Fund |
|||||||||||||
|
At NAV |
|||||||||||||||
|
Institutional Class |
05/15/2012 |
–1.57 |
% |
1.59 |
% |
||||||||||
|
Class A |
05/15/2012 |
–1.91 |
% |
1.21 |
% |
||||||||||
|
Class C |
05/15/2012 |
–2.66 |
% |
0.46 |
% |
||||||||||
| Class R64 |
12/31/2013 |
–1.58 |
% |
1.59 |
% |
||||||||||
|
With Sales Charge |
|||||||||||||||
|
Class A |
–7.51 |
% |
–0.12 |
% |
|||||||||||
|
Class C |
–3.62 |
% |
0.46 |
% |
|||||||||||
|
Index |
|||||||||||||||
| HFRX Global Hedge Fund Index1,2* |
–1.30 |
% |
0.97 |
% |
|||||||||||
| HFRX Absolute Return Index1,2 |
–0.66 |
% |
1.85 |
% |
|||||||||||
| S&P 500® Index1,2 |
4.51 |
% |
13.30 |
% |
|||||||||||
| Bloomberg Barclays U.S. Aggregate Bond Index1,2 |
4.37 |
% |
2.59 |
% |
|||||||||||
The performance data quoted represent past performance and do not indicate future results. Current performance may be lower or higher than the performance data quoted. For performance data current to the most recent month-end, please visit www.nb.com/performance.
The results shown in the table reflect the reinvestment of income dividends and other distributions, if any. The results do not reflect the effect of taxes a shareholder would pay on Fund distributions or on the redemption of Fund shares.
The investment return and principal value of an investment will fluctuate and shares, when redeemed, may be worth more or less than their original cost.
* The Fund's primary benchmark changed during the reporting period; the prior benchmark was the HFRX Absolute Return Index. The benchmark was modified because the HFRX Global Hedge Fund Index is believed to be a fairer representation of the Fund's investment universe.
Returns would have been lower if Neuberger Berman Investment Advisers LLC ("Management") had not reimbursed certain expenses and/or waived a portion of the investment management fees during certain of the periods shown. Repayment by a class (of expenses previously reimbursed and/or fees previously waived by Management) will decrease the class's returns. Please see Note B in the Notes to Financial Statements for specific information regarding expense reimbursement and/or fee waiver arrangements.
As stated in the Fund's most recent prospectus, the total annual operating expense ratios for fiscal year 2015 were 2.73%, 3.09%, 3.84% and 2.68% for Institutional Class, Class A, Class C and Class R6 shares, respectively (before expense reimbursements and/or fee waivers, if any). The total annual operating expense ratio for each of Institutional Class, Class A, Class C and Class R6 includes the class's repayment of expenses previously reimbursed and/or fees previously waived by Management. The expense ratios for the annual period ended October 31, 2016 can be found in the Financial Highlights section of this report.
Returns shown with a sales charge reflect the deduction of the current maximum initial sales charge of 5.75% for Class A shares and the contingent deferred sales charge (CDSC) for Class C shares. The CDSC for Class C shares is 1%, which is reduced to 0% after 1 year. The performance of the Fund's share classes will differ primarily due to different sales charge structures and class expenses. Please see the prospectus for more information about sales charge structures, if any, and class expenses for your share class.
3
COMPARISON OF A $1,000,000 INVESTMENT
(000's omitted)

This graph shows the change in value of a hypothetical $1,000,000 investment in the Fund over the past 10 fiscal years, or since the Fund's inception if it has not operated for 10 years. The graph is based on the Institutional Class shares only; the performance of the Fund's share classes will differ primarily due to different sales charge structures and class expenses (see Performance Highlights chart on previous page). The result is compared with benchmarks, which include a broad-based market index and may include a more narrowly based index. Market indices have not been reduced to reflect any of the fees and costs of investing. The results shown in the graph reflect the reinvestment of income dividends and other distributions, if any. The results do not reflect the effect of taxes a shareholder would pay on Fund distributions or on the redemption of Fund shares. Results represent past performance and do not indicate future results.
4
Neuberger Berman Long Short Multi-Manager Fund Institutional Class generated a -1.75% total return for the 12 months ended October 31, 2016. During this same time period, its primary benchmark, the HFRX Equity Hedge Index returned -2.57%. (Performance for all share classes and benchmarks is provided in the table immediately following this letter.)
Despite periods of weakness early and late in the reporting period, the U.S. stock market generated a positive return over the Fund's fiscal year. Market volatility was elevated at times given mixed economic data, questions regarding the timing of future U.S. Federal Reserve (Fed) interest rate hikes and numerous geopolitical issues.
While the Fund posted a negative return for its full fiscal year, losses were concentrated in the first four months of the period as equity markets struggled. Beginning in the middle of February 2016, however, the Fund staged a substantial recovery that benefited from rallying equity markets, as well as meaningful alpha generation from both long and short positions.
For the full fiscal year, positive contributions from the Fund's long positions were partly offset by losses from its short positions. From a sector perspective, Energy and Financials were the largest detractors, whereas gains were led by Information Technology (IT), Industrials and Consumer Staples.
Within Energy, the bulk of losses occurred during the fourth quarter of 2015 and the first quarter of 2016 when the price of oil fell sharply and reached a bottom in February 2016. The Fund's energy subadviser has since recovered some of its losses as commodity prices have stabilized and the U.S. energy infrastructure outlook has improved. Within Financials, persistently low and declining interest rates created headwinds in the sector. The Fund's long Financials positions modestly recovered as the U.S. economy showed signs of improvement and the market appears to have priced in a greater likelihood for interest rate hikes in the near to medium-term.
The Fund's aggregate use of futures, forward foreign currency, swap and option contracts detracted from performance during the reporting period.
On the positive side, some of the largest individual winners over the period were from the IT sector. Two of these positions benefited from merger and acquisition (M&A) activity, including a long position in an IT services provider and a long position in a semiconductor company, both of which reached deals to be acquired at substantial premiums to where their stocks were trading. Within Industrials, a long position in a security systems company was a meaningful contributor as the company completed its merger with a multinational conglomerate. The subadviser who holds the position believes there are substantial margin improvement opportunities for the combined business.
We believe the Fund is well positioned heading into the end of the calendar year and into 2017. We have been encouraged by the strong positive alpha from both longs and shorts that our long/short equity subadvisers generated in aggregate during much of the fiscal year. We believe President-elect Trump's victory has created the potential for a number of policies that could provide both long and short opportunities in select sectors such as financials, energy and health care. More broadly, we believe the results of the election may result in a period of elevated volatility as optimism and pessimism ebb and flow around the new administration's policies. We believe the resulting valuation inefficiencies should serve as a tailwind for long/short equity managers. Lastly, we look forward to kicking off earnings season over the next several weeks, which has historically benefited our fundamentally-focused subadvisers.
Sincerely,
DAVID KUPPERMAN AND JEFF MAJIT
PORTFOLIO MANAGERS
Information about principal risks of investing in the Fund is set forth in the prospectus and statement of additional information.
The portfolio composition, industries and holdings of the Fund are subject to change without notice.
The opinions expressed are those of the Fund's portfolio managers and subadvisers. The opinions are as of the date of this report and are subject to change without notice.
5
TICKER SYMBOLS
|
Institutional Class |
NLMIX |
||||||
|
Class A |
NLMAX |
||||||
|
Class C |
NLMCX |
||||||
PORTFOLIO BY TYPE OF SECURITY
(as a % of Total Net Assets)
|
Long |
Short |
||||||||||
|
Common Stocks |
69.2 |
% |
(29.2 |
)% |
|||||||
|
Exchange Traded Funds |
— |
(4.6 |
) |
||||||||
|
Exchange Traded Note |
— |
(0.7 |
) |
||||||||
|
Master Limited Partnerships |
7.7 |
(0.6 |
) |
||||||||
|
Option Purchased |
0.0 |
— |
|||||||||
|
Short-Term Investment |
20.6 |
— |
|||||||||
|
Other Assets Less Liabilities |
37.6 |
* |
— |
||||||||
|
Total |
135.1 |
% |
(35.1 |
)% |
|||||||
* Includes the impact of the Fund's open positions in derivatives, if any.
PERFORMANCE HIGHLIGHTS
|
Inception |
Average Annual Total Return Ended 10/31/2016 |
||||||||||||||
|
Date |
1 Year |
Life of Fund |
|||||||||||||
|
At NAV |
|||||||||||||||
|
Institutional Class |
12/19/2013 |
–1.75 |
% |
–0.12 |
% |
||||||||||
|
Class A |
12/19/2013 |
–2.09 |
% |
–0.46 |
% |
||||||||||
|
Class C |
12/19/2013 |
–2.84 |
% |
–1.21 |
% |
||||||||||
|
With Sales Charge |
|||||||||||||||
|
Class A |
–7.71 |
% |
–2.49 |
% |
|||||||||||
|
Class C |
–3.79 |
% |
–1.21 |
% |
|||||||||||
|
Index |
|||||||||||||||
| HFRX Equity Hedge Index1,2 |
–2.57 |
% |
–0.41 |
% |
|||||||||||
| S&P 500® Index1,2 |
4.51 |
% |
7.98 |
% |
|||||||||||
The performance data quoted represent past performance and do not indicate future results. Current performance may be lower or higher than the performance data quoted. For performance data current to the most recent month-end, please visit www.nb.com/performance.
The results shown in the table reflect the reinvestment of income dividends and other distributions, if any. The results do not reflect the effect of taxes a shareholder would pay on Fund distributions or on the redemption of Fund shares.
The investment return and principal value of an investment will fluctuate and shares, when redeemed, may be worth more or less than their original cost.
Returns would have been lower if Neuberger Berman Investment Advisers LLC ("Management") had not reimbursed certain expenses and/or waived a portion of the investment management fees during certain of the periods shown. Repayment by a class (of expenses previously reimbursed and/or fees previously waived by Management) will decrease the class's returns. Please see Note B in the Notes to Financial Statements for specific information regarding expense reimbursement and/or fee waiver arrangements.
As stated in the Fund's most recent prospectus, the total annual operating expense ratios for fiscal year 2015 were 4.22%, 4.65% and 5.45% for Institutional Class, Class A and Class C shares, respectively (before expense reimbursements and/or fee waivers, if any). The total annual operating expense ratios were 2.93%, 3.30% and 4.07% for Institutional Class, Class A and Class C shares, respectively, after expense reimbursements and/or fee waivers. The expense ratios for the annual period ended October 31, 2016 can be found in the Financial Highlights section of this report.
Returns shown with a sales charge reflect the deduction of the current maximum initial sales charge of 5.75% for Class A shares and the contingent deferred sales charge (CDSC) for Class C shares. The CDSC for Class C shares is 1%, which is reduced to 0% after 1 year. The performance of the Fund's share classes will differ primarily due to different sales charge structures and class expenses. Please see the prospectus for more information about sales charge structures, if any, and class expenses for your share class.
6
COMPARISON OF A $1,000,000 INVESTMENT
(000's omitted)

This graph shows the change in value of a hypothetical $1,000,000 investment in the Fund over the past 10 fiscal years, or since the Fund's inception if it has not operated for 10 years. The graph is based on the Institutional Class shares only; the performance of the Fund's share classes will differ primarily due to different sales charge structures and class expenses (see Performance Highlights chart on previous page). The result is compared with benchmarks, which include a broad-based market index and may include a more narrowly based index. Market indices have not been reduced to reflect any of the fees and costs of investing. The results shown in the graph reflect the reinvestment of income dividends and other distributions, if any. The results do not reflect the effect of taxes a shareholder would pay on Fund distributions or on the redemption of Fund shares. Results represent past performance and do not indicate future results.
7
1 Please see "Glossary of Indices" on page 9 for a description of indices. Please note that individuals cannot invest directly in any index. The S&P 500® and the Bloomberg Barclays U.S. Aggregate Bond indices do not take into account any fees, expenses or tax consequences of investing in the individual securities that they track. The HFRX Absolute Return, HFRX Equity Hedge and HFRX Global Hedge Fund indices do take into account fees and expenses of investing since they are based on the underlying hedge funds' net returns. Data about the performance of an index are prepared or obtained by Neuberger Berman Investment Advisers LLC* and reflect the reinvestment of income dividends and other distributions, if any. The Fund may invest in securities not included in a described index and generally does not invest in all securities included in a described index.
2 The date used to calculate Life of Fund performance for the index is the inception date of the oldest share class.
3 The investments for the Fund are managed by the same portfolio manager(s) who manage(s) one or more other registered funds that have names, investment objectives and investment styles that are similar to those of the Fund. You should be aware that the Fund is likely to differ from those other mutual fund(s) in size, cash flow pattern and tax matters. Accordingly, the holdings and performance of the Fund can be expected to vary from those of the other mutual fund(s).
4 The performance information for Class R6 prior to the class's inception date is that of the Institutional Class of Neuberger Berman Absolute Return Multi-Manager Fund. The performance information for the Institutional Class has not been adjusted to take into account differences in class specific operating expenses. The Institutional Class has higher expenses and typically lower returns than Class R6.
* On January 1, 2016, Neuberger Berman Management LLC ("NBM") and Neuberger Berman LLC ("Neuberger Berman") transferred to Neuberger Berman Fixed Income LLC ("NBFI") their rights and obligations pertaining to all services they provided to any Fund under any investment management, investment sub-advisory, and/or administration agreement, as applicable (the "Agreements"). Following such transfer, NBFI was renamed Neuberger Berman Investment Advisers LLC ("NBIA" or "Management"). In addition, on the date of the transfer, the services previously provided by NB Alternative Investment Management LLC ("NBAIM") are provided by NBIA. Following the consolidation, the investment professionals of NBM and NBAIM who provided services to any Fund under the Agreements continue to provide the same services, except that they provide those services in their new capacities as investment professionals of NBIA. Further, the consolidation did not result in any change in the investment processes employed by any Fund, the nature or level of services provided to any Fund, or the fees any Fund pays under its Agreements.
On July 1, 2016, NBM was reorganized into "Neuberger Berman" (the "Reorganization"). Upon the completion of the Reorganization, Neuberger Berman assumed all rights and obligations pertaining to all services NBM provided to any Fund under any distribution agreement or distribution and services agreement (the "Agreements") or plan adopted pursuant to Rule 12b-1 under the Investment Company Act of 1940, as amended, (the "Plans"). Accordingly, after the Reorganization, Neuberger Berman became each Fund's distributor and the services previously provided by NBM under the Agreements and Plans are provided by Neuberger Berman.
Following the Reorganization, the employees of NBM provide the same services to each Fund under the Agreements and Plans, except that they provide those services in their capacities as employees of Neuberger Berman. Further, the Reorganization did not result in any change in the nature or level of services provided to each Fund, or the fees, if any, each Fund pays under the Agreements or the Plans.
On or about January 1, 2017, Neuberger Berman, the Funds' distributor, ("Distributor"), will change its name to Neuberger Berman BD LLC.
For more complete information on any of the Neuberger Berman Alternative and Multi-Asset Class Funds, call us at (800) 877-9700, or visit our website at www.nb.com.
8
Glossary of Indices
|
Bloomberg Barclays U.S. Aggregate Bond Index: |
The index measures the investment grade, U.S. dollar-denominated, fixed-rate, taxable bond market and includes Treasuries, government-related and corporate securities, mortgage-backed securities (MBS) (agency fixed-rate and hybrid adjustable rate mortgage (ARM) pass-throughs), asset-backed securities (ABS), and commercial mortgage-backed securities (CMBS) (agency and non-agency). On August 24, 2016, Bloomberg acquired the Barclays fixed income benchmark indices from Barclays. Barclays and Bloomberg have agreed to co-brand the indices as the Bloomberg Barclays Indices for an initial term of five years. For more information, please visit www.bloombergindices.com/. |
||
|
HFRX Absolute Return Index: |
The index is designed to be representative of the overall composition of the hedge fund universe. The index comprises all eligible hedge fund strategies including, but not limited to, convertible arbitrage, distressed securities, equity hedge, equity market neutral, event driven, macro, merger arbitrage, and relative value arbitrage. The index employs a constituent weighting methodology that selects constituent funds which characteristically exhibit lower volatilities and lower correlations to standard directional benchmarks of equity market and hedge fund industry performance. Constituent funds are selected from an eligible pool of the more than 7,500 funds worldwide that report to the Hedge Fund Research (HFR) Database. Constituent funds must meet all of the following criteria: report monthly; report performance net of all fees; be U.S. dollar-denominated; be active and accepting new investments; have a minimum 24 months track record; and the fund's manager must have at least $50 million in assets under management. The index is rebalanced quarterly. |
||
|
HFRX Equity Hedge Index: |
The index comprises equity hedge strategies. Equity hedge strategies maintain positions both long and short in primarily equity and equity derivative securities. A wide variety of investment processes can be employed to arrive at an investment decision, including both quantitative and fundamental techniques; strategies can be broadly diversified or narrowly focused on specific sectors and can range broadly in terms of levels of net exposure, leverage employed, holding period, concentrations of market capitalizations and valuation ranges of typical portfolios. Equity hedge managers would typically maintain at least 50%, and may in some cases be substantially entirely invested, in equities, both long and short. Constituent funds are selected from an eligible pool of the more than 7,500 funds worldwide that report to the Hedge Fund Research (HFR) Database. Constituent funds must meet all of the following criteria: report monthly; report performance net of all fees; be U.S. dollar-denominated; be active and accepting new investments; have a minimum 24 months track record; and the fund's manager must have at least $50 million in assets under management. The index is rebalanced quarterly. |
||
|
HFRX Global Hedge Fund Index: |
The index is designed to be representative of the overall composition of the hedge fund universe. It is comprised of all eligible hedge fund strategies; including but not limited to convertible arbitrage, distressed securities, equity hedge, equity market neutral, event driven, macro, merger arbitrage, and relative value arbitrage. The strategies are asset weighted based on the distribution of assets in the hedge fund industry. Constituent funds are selected from an eligible pool of the more than 7,500 funds worldwide that report to the Hedge Fund Research (HFR) Database. Constituent funds must meet all of the following criteria: report monthly; report performance net of all fees; be U.S. dollar-denominated; be active and accepting new investments; have a minimum 24 months track record; and the fund's manager must have at least $50 million in assets under management. The index is rebalanced quarterly. |
||
| S&P 500® Index: |
The index is a float-adjusted market capitalization-weighted index that focuses on the large-cap segment of the U.S. equity market, and includes a significant portion of the total value of the market. |
9
Information About Your Fund's Expenses (Unaudited)
As a Fund shareholder, you incur two types of costs: (1) transaction costs, including sales charges (loads) on purchase payments or redemption proceeds (if applicable); and (2) ongoing costs, including management fees, distribution and/or service (12b-1) fees (if applicable), and other Fund expenses. This example is intended to help you understand your ongoing costs (in U.S. dollars) of investing in a Fund and compare these costs with the ongoing costs of investing in other mutual funds.
This table is designed to provide information regarding costs related to your investments. The following examples are based on an investment of $1,000 made at the beginning of the six month period ended October 31, 2016 and held for the entire period. The table illustrates each Fund's costs in two ways:
|
Actual Expenses and Performance: |
The first section of the table provides information about actual account values and actual expenses in dollars, based on the Fund's actual performance during the period indicated. You may use the information in this line, together with the amount you invested, to estimate the expenses you paid over the period. Simply divide your account value by $1,000 (for example, an $8,600 account value divided by $1,000 = 8.6), then multiply the result by the number in the first section of the table under the heading entitled "Expenses Paid During the Period" to estimate the expenses you paid over the period. |
||
| Hypothetical Example for Comparison Purposes: |
The second section of the table provides information about hypothetical account values and hypothetical expenses based on the Fund's actual expense ratio and an assumed rate of return at 5% per year before expenses. This return is not the Fund's actual return. The hypothetical account values and expenses may not be used to estimate the actual ending account balance or expenses you paid for the period. You may use this information to compare the ongoing costs of investing in a Fund versus other funds. To do so, compare the expenses shown in this 5% hypothetical example with the 5% hypothetical examples that appear in the shareholder reports of other funds. |
Please note that the expenses in the table are meant to highlight your ongoing costs only and do not include any transaction costs, such as sales charges (loads) (if applicable). Therefore, the information under the heading "Hypothetical (5% annual return before expenses)" is useful in comparing ongoing costs only, and will not help you determine the relative total costs of owning different funds. In addition, if these transaction costs were included, your costs would have been higher.
10
Expense Example (Unaudited)
|
Neuberger Berman Alternative Funds |
|||||||||||||||||||||||||||||||||||
|
ACTUAL |
HYPOTHETICAL (5% ANNUAL RETURN BEFORE EXPENSES) | ||||||||||||||||||||||||||||||||||
| Beginning Account Value 5/1/16 |
Ending Account Value 10/31/16 |
Expenses Paid During the Period(1) 5/1/16 - 10/31/16 |
Expense Ratio |
Beginning Account Value 5/1/16 |
Ending Account Value 10/31/16 |
Expenses Paid During the Period(2) 5/1/16 - 10/31/16 |
Expense Ratio |
||||||||||||||||||||||||||||
|
Absolute Return Multi-Manager Fund |
|||||||||||||||||||||||||||||||||||
|
Institutional Class |
$ |
1,000.00 |
$ |
1,029.30 |
$ |
14.38 |
(3) |
2.82 |
% |
$ |
1,000.00 |
$ |
1,010.96 |
$ |
14.25 |
(3) |
2.82 |
% |
|||||||||||||||||
|
Class A |
$ |
1,000.00 |
$ |
1,027.50 |
$ |
16.16 |
(3) |
3.17 |
% |
$ |
1,000.00 |
$ |
1,009.20 |
$ |
16.01 |
(3) |
3.17 |
% |
|||||||||||||||||
|
Class C |
$ |
1,000.00 |
$ |
1,023.00 |
$ |
19.98 |
(3) |
3.93 |
% |
$ |
1,000.00 |
$ |
1,005.38 |
$ |
19.81 |
(3) |
3.93 |
% |
|||||||||||||||||
|
Class R6 |
$ |
1,000.00 |
$ |
1,028.30 |
$ |
13.77 |
(3) |
2.70 |
% |
$ |
1,000.00 |
$ |
1,011.56 |
$ |
13.65 |
(3) |
2.70 |
% |
|||||||||||||||||
|
Long Short Multi-Manager Fund |
|||||||||||||||||||||||||||||||||||
|
Institutional Class |
$ |
1,000.00 |
$ |
1,026.80 |
$ |
15.69 |
3.08 |
% |
$ |
1,000.00 |
$ |
1,009.65 |
$ |
15.56 |
3.08 |
% |
|||||||||||||||||||
|
Class A |
$ |
1,000.00 |
$ |
1,025.90 |
$ |
17.47 |
3.43 |
% |
$ |
1,000.00 |
$ |
1,007.89 |
$ |
17.31 |
3.43 |
% |
|||||||||||||||||||
|
Class C |
$ |
1,000.00 |
$ |
1,020.80 |
$ |
21.39 |
4.21 |
% |
$ |
1,000.00 |
$ |
1,003.97 |
$ |
21.21 |
4.21 |
% |
|||||||||||||||||||
(1) For each class, expenses are equal to the annualized expense ratio for the class, multiplied by the average account value over the period, multiplied by 184/366 (to reflect the one-half year period shown), unless otherwise indicated.
(2) Hypothetical expenses are equal to the annualized expense ratios for each class, multiplied by the average account value over the period (assuming a 5% annual return), multiplied by 184/366 (to reflect the one-half year period shown).
(3) Includes expenses of the Fund's subsidiary (See Note A of the Notes to Financial Statements).
11
Consolidated Schedule of Investments Neuberger Berman Absolute Return Multi-Manager Fund 10/31/2016
|
Investments |
Shares |
Value (000) |
|||||||||
|
Long Positions (95.1%) |
|||||||||||
|
Common Stocks (41.0%) |
|||||||||||
|
Air Freight & Logistics (0.5%) |
|||||||||||
| FedEx Corp.(a) |
12,905 |
$ |
2,250 |
||||||||
| XPO Logistics Europe SADIR (France)*(a) |
2,000 |
450 |
|||||||||
|
2,700 |
|||||||||||
| Airlines (0.0%)(b) | |||||||||||
| AMR Corp. Escrow*(c) |
14,383 |
10 |
|||||||||
| Virgin America, Inc.*(a) |
3,700 |
201 |
|||||||||
|
211 |
|||||||||||
|
Auto Components (1.1%) |
|||||||||||
|
Adient plc* |
1,439 |
65 |
|||||||||
| Federal-Mogul Holdings Corp.*(a) |
4,400 |
41 |
|||||||||
| Johnson Controls International plc(a) |
157,787 |
6,362 |
|||||||||
|
6,468 |
|||||||||||
|
Banks (0.9%) |
|||||||||||
| Barclays plc (United Kingdom) |
136,811 |
319 |
|||||||||
| PrivateBancorp, Inc.(a) |
40,600 |
1,837 |
|||||||||
| Societe Generale SA (France)(a) |
16,890 |
659 |
|||||||||
| Synovus Financial Corp.(a) |
68,040 |
2,250 |
|||||||||
|
5,065 |
|||||||||||
|
Beverages (0.6%) |
|||||||||||
| Cott Corp. (Canada)(d) |
12,470 |
163 |
|||||||||
| Molson Coors Brewing Co., Class B(a) |
31,035 |
3,222 |
|||||||||
|
3,385 |
|||||||||||
|
Biotechnology (2.3%) |
|||||||||||
| Alexion Pharmaceuticals, Inc.* |
14,250 |
1,860 |
|||||||||
| BioMarin Pharmaceutical, Inc.* |
22,196 |
1,787 |
|||||||||
| Cepheid*(a) |
29,750 |
1,574 |
|||||||||
| Incyte Corp.*(a) |
19,940 |
1,734 |
|||||||||
| Ironwood Pharmaceuticals, Inc.* |
103,159 |
1,317 |
|||||||||
| Neurocrine Biosciences, Inc.* |
38,912 |
1,703 |
|||||||||
|
Investments |
Shares |
Value (000) |
|||||||||
| QLT, Inc. (Canada)*(d) |
378,858 |
$ |
640 |
||||||||
| TESARO, Inc.*(a) |
15,667 |
1,894 |
|||||||||
| Tobira Therapeutics, Inc.* |
6,900 |
290 |
|||||||||
| Vertex Pharmaceuticals, Inc.* |
14,493 |
1,100 |
|||||||||
|
13,899 |
|||||||||||
|
Capital Markets (0.7%) |
|||||||||||
| American Capital Ltd.*(a) |
38,200 |
649 |
|||||||||
| Electrum Special Acquisition Corp.*(d) |
3,600 |
35 |
|||||||||
| Evercore Partners, Inc., Class A |
30,330 |
1,630 |
|||||||||
| GP Investments Acquisition Corp.* |
141,413 |
1,372 |
|||||||||
| Intertrust NV (Netherlands)*(e) |
1,072 |
23 |
|||||||||
| Janus Capital Group, Inc. |
8,800 |
113 |
|||||||||
| NorthStar Asset Management Group, Inc.(d) |
3,481 |
48 |
|||||||||
| RCS Capital Corp., Class A*(c)(f)(g) |
183,806 |
— |
|||||||||
|
3,870 |
|||||||||||
|
Chemicals (2.1%) |
|||||||||||
| Air Products & Chemicals, Inc.(a) |
21,590 |
2,881 |
|||||||||
| Chemtura Corp.*(a) |
16,800 |
551 |
|||||||||
| Croda International plc (United Kingdom)(a) |
12,203 |
522 |
|||||||||
| Monsanto Co.(d) |
4,775 |
481 |
|||||||||
| PPG Industries, Inc.(a) |
24,090 |
2,244 |
|||||||||
| Syngenta AG, ADR (Switzerland)(d) |
28,749 |
2,312 |
|||||||||
| Valspar Corp. (The)(a) |
18,100 |
1,803 |
|||||||||
| WR Grace & Co.(a) |
24,900 |
1,667 |
|||||||||
|
12,461 |
|||||||||||
| Commercial Services & Supplies (0.0%)(b) | |||||||||||
| G&K Services, Inc., Class A |
1,600 |
152 |
|||||||||
|
Communications Equipment (0.6%) |
|||||||||||
| Harris Corp.(a) |
13,830 |
1,234 |
|||||||||
|
Investments |
Shares |
Value (000) |
|||||||||
| Palo Alto Networks, Inc.*(a) |
13,940 |
$ |
2,144 |
||||||||
|
3,378 |
|||||||||||
|
Construction Materials (0.7%) |
|||||||||||
| Forterra, Inc.*(a) |
95,896 |
1,649 |
|||||||||
| HeidelbergCement AG (Germany)(a) |
5,683 |
538 |
|||||||||
| Martin Marietta Materials, Inc.(a) |
10,190 |
1,889 |
|||||||||
|
4,076 |
|||||||||||
|
Containers & Packaging (0.2%) |
|||||||||||
| AEP Industries, Inc.(d) |
5,200 |
570 |
|||||||||
| Ball Corp.(a) |
7,298 |
562 |
|||||||||
|
1,132 |
|||||||||||
|
Diversified Consumer Services (0.1%) |
|||||||||||
| Apollo Education Group, Inc.*(a) |
46,292 |
407 |
|||||||||
| LifeLock, Inc.*(d) |
2,990 |
48 |
|||||||||
|
455 |
|||||||||||
|
Diversified Financial Services (0.6%) |
|||||||||||
| Acasta Enterprises, Inc., Class A (Canada)*(a) |
89,582 |
657 |
|||||||||
| Gores Holdings, Inc., Class A*(d) |
3,600 |
41 |
|||||||||
| Pace Holdings Corp.*(a) |
290,000 |
3,013 |
|||||||||
| Pace Holdings Corp.*(d) |
5,400 |
53 |
|||||||||
| Voya Financial, Inc.(d) |
3,398 |
104 |
|||||||||
|
3,868 |
|||||||||||
|
Electric Utilities (1.3%) |
|||||||||||
|
Exelon Corp. |
8,400 |
286 |
|||||||||
| Great Plains Energy, Inc.(a) |
18,683 |
531 |
|||||||||
| NextEra Energy, Inc.(a) |
36,165 |
4,629 |
|||||||||
| PG&E Corp.(a) |
16,705 |
1,038 |
|||||||||
| PNM Resources, Inc.(a) |
7,743 |
255 |
|||||||||
| Westar Energy, Inc.(d) |
18,700 |
1,072 |
|||||||||
|
7,811 |
|||||||||||
|
Electronic Equipment, Instruments & Components (0.4%) |
|||||||||||
| Axis Communications AB (Sweden)(a) |
16,400 |
629 |
|||||||||
|
DTS, Inc. |
7,300 |
309 |
|||||||||
| Ingram Micro, Inc., Class A(a) |
31,300 |
1,165 |
|||||||||
|
2,103 |
|||||||||||
See Notes to Financial Statements
12
Consolidated Schedule of Investments Neuberger Berman Absolute Return Multi-Manager Fund (cont'd)
|
Investments |
Shares |
Value (000) |
|||||||||
|
Energy Equipment & Services (0.2%) |
|||||||||||
| FMC Technologies, Inc.*(a) |
46,329 |
$ |
1,495 |
||||||||
|
Equity Real Estate Investment Trusts (REITs) (0.1%) |
|||||||||||
| New Senior Investment Group, Inc.(d) |
18,310 |
191 |
|||||||||
| New York REIT, Inc. |
49,143 |
463 |
|||||||||
| NorthStar Realty Finance Corp.(d) |
3,370 |
49 |
|||||||||
|
703 |
|||||||||||
|
Food & Staples Retailing (0.6%) |
|||||||||||
| Cia Brasileira de Distribuicao, ADR (Brazil) |
9,845 |
187 |
|||||||||
| Magnit PJSC, GDR (Russia)(a) |
9,690 |
385 |
|||||||||
| Rite Aid Corp.*(d) |
317,371 |
2,129 |
|||||||||
| Wal-Mart de Mexico SAB de CV (Mexico) |
118,600 |
251 |
|||||||||
| X5 Retail Group NV, GDR (Russia)*(a) |
26,030 |
777 |
|||||||||
|
3,729 |
|||||||||||
|
Food Products (0.7%) |
|||||||||||
| GrainCorp. Ltd., Class A (Australia) |
8,600 |
55 |
|||||||||
| Mead Johnson Nutrition Co. |
11,403 |
852 |
|||||||||
| Nomad Foods Ltd. (United Kingdom)*(d) |
28,772 |
354 |
|||||||||
| Warrnambool Cheese & Butter Factory Co. Holdings Ltd. (Australia)*(a) |
13,750 |
69 |
|||||||||
| WhiteWave Foods Co. (The)*(d) |
51,081 |
2,783 |
|||||||||
|
4,113 |
|||||||||||
|
Gas Utilities (0.1%) |
|||||||||||
| Atmos Energy Corp.(a) |
7,238 |
539 |
|||||||||
| Health Care Equipment & Supplies (3.3%) |
|||||||||||
|
ABIOMED, Inc.* |
9,783 |
1,027 |
|||||||||
|
Alere, Inc.* |
45,476 |
2,032 |
|||||||||
| Boston Scientific Corp.* |
49,885 |
1,097 |
|||||||||
|
CR Bard, Inc. |
5,508 |
1,193 |
|||||||||
| Danaher Corp.(a) |
21,370 |
1,679 |
|||||||||
|
Investments |
Shares |
Value (000) |
|||||||||
| DENTSPLY SIRONA, Inc.(a) |
25,935 |
$ |
1,493 |
||||||||
| Edwards Lifesciences Corp.* |
9,265 |
882 |
|||||||||
| EndoChoice Holdings, Inc.* |
10,500 |
84 |
|||||||||
| Hologic, Inc.*(a) |
41,980 |
1,512 |
|||||||||
| Integra LifeSciences Holdings Corp.* |
10,690 |
850 |
|||||||||
|
Masimo Corp.* |
16,165 |
889 |
|||||||||
|
NuVasive, Inc.* |
14,966 |
894 |
|||||||||
| Smith & Nephew plc (United Kingdom) |
7,345 |
106 |
|||||||||
| Smith & Nephew plc, ADR (United Kingdom) |
50,554 |
1,479 |
|||||||||
| St. Jude Medical, Inc. |
28,500 |
2,218 |
|||||||||
| West Pharmaceutical Services, Inc.(d) |
7,020 |
534 |
|||||||||
| Wright Medical Group NV* |
69,178 |
1,516 |
|||||||||
|
19,485 |
|||||||||||
|
Health Care Providers & Services (0.4%) |
|||||||||||
| Envision Healthcare Holdings, Inc.* |
3,800 |
75 |
|||||||||
| Humana, Inc.(d) |
12,023 |
2,062 |
|||||||||
| Shanghai Pharmaceuticals Holding Co. Ltd., Class H (China) |
77,407 |
200 |
|||||||||
| Sinopharm Group Co. Ltd., Class H (China) |
43,454 |
212 |
|||||||||
| Team Health Holdings, Inc.* |
2,600 |
111 |
|||||||||
|
2,660 |
|||||||||||
|
Hotels, Restaurants & Leisure (0.7%) |
|||||||||||
| Belmond Ltd., Class A (United Kingdom)*(d) |
3,000 |
39 |
|||||||||
| Bloomin' Brands, Inc.(a) |
89,120 |
1,542 |
|||||||||
| Fiesta Restaurant Group, Inc.*(d) |
5,312 |
140 |
|||||||||
| Morgans Hotel Group Co.*(a) |
40,000 |
82 |
|||||||||
|
Vail Resorts,
Inc.(a)
|
16,610 |
2,648 |
|||||||||
|
4,451 |
|||||||||||
|
Household Durables (0.6%) |
|||||||||||
| Lennar Corp., Class B(d) |
25,500 |
854 |
|||||||||
|
Investments |
Shares |
Value (000) |
|||||||||
| Mohawk Industries, Inc.*(d) |
13,325 |
$ |
2,456 |
||||||||
| WCI Communities, Inc.*(d) |
6,600 |
153 |
|||||||||
|
3,463 |
|||||||||||
|
Independent Power & Renewable Electricity Producers (0.8%) |
|||||||||||
| 8Point3 Energy Partners LP |
906 |
14 |
|||||||||
| Calpine Corp.*(a) |
23,718 |
282 |
|||||||||
| Dynegy, Inc.*(a) |
42,089 |
448 |
|||||||||
| NextEra Energy Partners LP(a) |
41,515 |
1,135 |
|||||||||
| NRG Yield, Inc., Class A(a) |
55,976 |
825 |
|||||||||
| Pattern Energy Group, Inc.(a) |
58,730 |
1,313 |
|||||||||
| Talen Energy Corp.*(a) |
46,800 |
652 |
|||||||||
|
4,669 |
|||||||||||
| Industrial Conglomerates (0.0%)(b) | |||||||||||
| Smiths Group plc (United Kingdom) |
9,113 |
158 |
|||||||||
|
Insurance (1.2%) |
|||||||||||
| Admiral Group plc (United Kingdom) |
9,710 |
228 |
|||||||||
| AIA Group Ltd. (Hong Kong) |
200,292 |
1,264 |
|||||||||
| American International Group, Inc.(a) |
21,210 |
1,309 |
|||||||||
| Endurance Specialty Holdings Ltd.(a) |
8,900 |
818 |
|||||||||
| Genworth Financial, Inc., Class A* |
2,700 |
11 |
|||||||||
| Hartford Financial Services Group, Inc. (The) |
46,770 |
2,063 |
|||||||||
| National Interstate Corp. |
24,027 |
779 |
|||||||||
| RSA Insurance Group plc (United Kingdom)(a) |
69,411 |
469 |
|||||||||
| Syncora Holdings Ltd.*(a) |
82,749 |
103 |
|||||||||
| WMIH Corp.*(d) |
29,234 |
61 |
|||||||||
|
7,105 |
|||||||||||
|
Internet & Direct Marketing Retail (0.4%) |
|||||||||||
| Amazon.com, Inc.*(a) |
311 |
246 |
|||||||||
| ASOS plc (United Kingdom)* |
5,535 |
356 |
|||||||||
| Expedia, Inc.(a) |
6,111 |
790 |
|||||||||
See Notes to Financial Statements
13
Consolidated Schedule of Investments Neuberger Berman Absolute Return Multi-Manager Fund (cont'd)
|
Investments |
Shares |
Value (000) |
|||||||||
| Priceline Group, Inc. (The)*(a) |
490 |
$ |
722 |
||||||||
|
2,114 |
|||||||||||
|
Internet Software & Services (3.1%) |
|||||||||||
| Alibaba Group Holding Ltd., ADR (China)*(a) |
11,763 |
1,196 |
|||||||||
| Alphabet, Inc., Class A*(a) |
1,889 |
1,530 |
|||||||||
|
Apigee Corp.* |
12,400 |
215 |
|||||||||
| Baidu, Inc., ADR (China)*(a) |
2,352 |
416 |
|||||||||
| Cvent, Inc.*(a) |
49,700 |
1,552 |
|||||||||
| eBay, Inc.*(a) |
13,204 |
377 |
|||||||||
| Facebook, Inc., Class A*(a) |
9,958 |
1,304 |
|||||||||
| inContact, Inc.*(a) |
118,500 |
1,648 |
|||||||||
| LinkedIn Corp., Class A*(a)(d) |
26,845 |
5,090 |
|||||||||
| Mail.Ru Group Ltd., GDR (Russia)* |
7,718 |
126 |
|||||||||
| MercadoLibre, Inc. (Argentina)(a) |
2,913 |
489 |
|||||||||
| Monster Worldwide, Inc.* |
55,000 |
188 |
|||||||||
| Rackspace Hosting, Inc.*(d) |
50,600 |
1,616 |
|||||||||
| Tencent Holdings Ltd. (China) |
26,398 |
701 |
|||||||||
| Twitter, Inc.*(d) |
2,600 |
47 |
|||||||||
| Yahoo!, Inc.*(d) |
39,813 |
1,654 |
|||||||||
| Yandex NV, Class A (Russia)* |
8,448 |
166 |
|||||||||
|
18,315 |
|||||||||||
|
IT Services (0.8%) |
|||||||||||
| PayPal Holdings, Inc.*(a) |
13,203 |
550 |
|||||||||
| Total System Services, Inc. |
31,155 |
1,554 |
|||||||||
| Visa, Inc., Class A(a)(d) |
27,590 |
2,276 |
|||||||||
| Xerox Corp.(d) |
10,698 |
105 |
|||||||||
|
4,485 |
|||||||||||
|
Life Sciences Tools & Services (0.6%) |
|||||||||||
| Gerresheimer AG (Germany)(a) |
14,947 |
1,127 |
|||||||||
| Pacific Biosciences of California, Inc.*(d) |
11,243 |
96 |
|||||||||
| QIAGEN NV*(a) |
100,462 |
2,449 |
|||||||||
|
3,672 |
|||||||||||
|
Machinery (0.6%) |
|||||||||||
| EnPro Industries, Inc. |
23,138 |
1,252 |
|||||||||
| Joy Global, Inc.(a) |
38,800 |
1,080 |
|||||||||
|
Investments |
Shares |
Value (000) |
|||||||||
| Mueller Water Products, Inc., Class A(a) |
101,416 |
$ |
1,250 |
||||||||
|
3,582 |
|||||||||||
|
Media (2.6%) |
|||||||||||
| Carmike Cinemas, Inc.*(a) |
15,812 |
516 |
|||||||||
| CBS Corp., Class B(a) |
57,017 |
3,228 |
|||||||||
| Crown Media Holdings, Inc., Class A*(c)(f) |
65,800 |
332 |
|||||||||
| DISH Network Corp., Class A*(a) |
21,903 |
1,283 |
|||||||||
| EW Scripps Co. (The), Class A* |
34,406 |
456 |
|||||||||
| Gray Television, Inc.*(a) |
89,014 |
792 |
|||||||||
| ITV plc (United Kingdom)(a) |
369,442 |
771 |
|||||||||
| Liberty Global plc, Series C (United Kingdom)* |
12,219 |
389 |
|||||||||
| Liberty Global plc LiLAC, Series C (United Kingdom)* |
1,668 |
46 |
|||||||||
| Loral Space & Communications, Inc.*(d) |
47,706 |
1,851 |
|||||||||
| Media General, Inc.*(d) |
91,726 |
1,546 |
|||||||||
| Nexstar Broadcasting Group, Inc., Class A |
7,846 |
383 |
|||||||||
| Sinclair Broadcast Group, Inc., Class A |
10,963 |
275 |
|||||||||
| Sirius XM Canada Holdings, Inc. (Canada) |
43,400 |
157 |
|||||||||
| Stroeer SE & Co. KGaA (Germany) |
47,839 |
2,181 |
|||||||||
|
Time Warner, Inc. |
1,500 |
133 |
|||||||||
| Tribune Co. Litigation, Class 1C*(c) |
300,000 |
1 |
|||||||||
| Tribune Media Co., Class A(a) |
37,586 |
1,225 |
|||||||||
| Tronc, Inc.(d) |
1,225 |
15 |
|||||||||
|
15,580 |
|||||||||||
|
Metals & Mining (0.1%) |
|||||||||||
| Constellium NV, Class A (Netherlands)*(a) |
162,259 |
852 |
|||||||||
|
Investments |
Shares |
Value (000) |
|||||||||
| Mortgage Real Estate Investment Trusts (REITs) (0.0%)(b) | |||||||||||
| Newcastle Investment Corp.(d) |
10,696 |
$ |
47 |
||||||||
|
Multi-Utilities (1.2%) |
|||||||||||
| Black Hills Corp.(a) |
66,533 |
4,115 |
|||||||||
| CMS Energy Corp.(a) |
11,066 |
466 |
|||||||||
| DTE Energy Co.(a) |
9,441 |
906 |
|||||||||
| SCANA Corp.(a) |
3,625 |
266 |
|||||||||
| Sempra Energy(a) |
14,440 |
1,547 |
|||||||||
|
7,300 |
|||||||||||
|
Oil, Gas & Consumable Fuels (1.4%) |
|||||||||||
| Cheniere Energy Partners LP Holdings LLC |
1,136 |
23 |
|||||||||
| Cheniere Energy, Inc.*(d) |
39,314 |
1,482 |
|||||||||
| Cobalt International Energy, Inc.* |
129,780 |
122 |
|||||||||
| Enbridge, Inc. (Canada)(a) |
14,522 |
627 |
|||||||||
| Golar LNG Ltd.(a) |
8,317 |
182 |
|||||||||
| InterOil Corp. (Singapore)*(d) |
2,500 |
124 |
|||||||||
| Kinder Morgan, Inc.(a) |
59,945 |
1,225 |
|||||||||
| Midstates Petroleum Co., Inc.* |
69,739 |
1,309 |
|||||||||
| Phillips 66(a) |
5,556 |
451 |
|||||||||
| SemGroup Corp., Class A |
6,628 |
214 |
|||||||||
| Targa Resources Corp.(a) |
18,648 |
818 |
|||||||||
| TransCanada Corp. (Canada)(a) |
13,091 |
593 |
|||||||||
| Williams Cos., Inc. (The)(a) |
36,995 |
1,080 |
|||||||||
|
8,250 |
|||||||||||
|
Pharmaceuticals (1.2%) |
|||||||||||
| Allergan plc*(d) |
14,207 |
2,968 |
|||||||||
| Aralez Pharmaceuticals, Inc. (Canada)*(d) |
345 |
1 |
|||||||||
| Depomed, Inc.*(d) |
2,404 |
54 |
|||||||||
| Dermira, Inc.*(a) |
41,327 |
1,296 |
|||||||||
| Hikma Pharmaceuticals plc (Jordan)(a) |
17,797 |
382 |
|||||||||
|
Merck & Co., Inc. |
32,350 |
1,899 |
|||||||||
|
Mylan NV* |
1,666 |
61 |
|||||||||
| Teva Pharmaceutical Industries Ltd., ADR (Israel) |
4,273 |
183 |
|||||||||
|
6,844 |
|||||||||||
See Notes to Financial Statements
14
Consolidated Schedule of Investments Neuberger Berman Absolute Return Multi-Manager Fund (cont'd)
|
Investments |
Shares |
Value (000) |
|||||||||
| Real Estate Management & Development (0.0%)(b) |
|||||||||||
| Conwert Immobilien Invest SE (Austria)*(a) |
7,700 |
$ |
137 |
||||||||
|
Road & Rail (0.8%) |
|||||||||||
| Kansas City Southern(a) |
22,145 |
1,944 |
|||||||||
| Norfolk Southern Corp.(d) |
27,660 |
2,572 |
|||||||||
|
4,516 |
|||||||||||
|
Semiconductors & Semiconductor Equipment (1.5%) |
|||||||||||
| Broadcom Ltd. (Singapore)(a) |
11,596 |
1,974 |
|||||||||
| Intersil Corp., Class A(a) |
31,700 |
700 |
|||||||||
| Linear Technology Corp.(a) |
23,922 |
1,437 |
|||||||||
| NXP Semiconductors NV (Netherlands)*(d) |
47,574 |
4,757 |
|||||||||
| SunEdison Semiconductor Ltd.*(a) |
24,200 |
288 |
|||||||||
|
9,156 |
|||||||||||
|
Software (1.7%) |
|||||||||||
| Activision Blizzard, Inc.(a) |
70,060 |
3,025 |
|||||||||
| Dell Technologies, Inc., Class V*(d) |
7,994 |
392 |
|||||||||
| Fleetmatics Group plc* |
38,000 |
2,276 |
|||||||||
| Imperva, Inc.*(d) |
4,200 |
155 |
|||||||||
| Infoblox, Inc.*(a) |
33,500 |
888 |
|||||||||
| Interactive Intelligence Group, Inc.* |
4,400 |
266 |
|||||||||
|
NetSuite, Inc.* |
8,566 |
798 |
|||||||||
|
PTC, Inc.* |
42,920 |
2,036 |
|||||||||
|
9,836 |
|||||||||||
|
Specialty Retail (0.8%) |
|||||||||||
| Cabela's, Inc.*(d) |
15,200 |
936 |
|||||||||
|
CST Brands,
Inc.(a)
|
26,700 |
1,282 |
|||||||||
| Hennes & Mauritz AB, Class B (Sweden) |
32,080 |
903 |
|||||||||
| Office Depot, Inc.(d) |
55,668 |
175 |
|||||||||
| Pets at Home Group plc (United Kingdom) |
18,604 |
49 |
|||||||||
|
Investments |
Shares |
Value (000) |
|||||||||
| Sports Direct International plc (United Kingdom)*(a) |
426,928 |
$ |
1,446 |
||||||||
|
4,791 |
|||||||||||
|
Technology Hardware, Storage & Peripherals (0.7%) |
|||||||||||
| Apple, Inc.(a) |
11,700 |
1,328 |
|||||||||
| Hewlett Packard Enterprise Co.(d) |
14,600 |
328 |
|||||||||
| Lexmark International, Inc., Class A(a) |
33,500 |
1,330 |
|||||||||
| Samsung Electronics Co. Ltd., GDR (South Korea)(a) |
927 |
654 |
|||||||||
| Silicon Graphics International Corp.* |
96,300 |
746 |
|||||||||
|
4,386 |
|||||||||||
|
Textiles, Apparel & Luxury Goods (1.5%) |
|||||||||||
| Burberry Group plc (United Kingdom) |
4,013 |
72 |
|||||||||
| Deckers Outdoor Corp.*(a) |
29,060 |
1,517 |
|||||||||
| G-III Apparel Group Ltd.*(a) |
41,000 |
1,071 |
|||||||||
| Michael Kors Holdings Ltd.*(a) |
11,495 |
584 |
|||||||||
| NIKE, Inc., Class B(a) |
15,997 |
803 |
|||||||||
| PVH Corp.(a) |
30,265 |
3,238 |
|||||||||
| Steven Madden Ltd.*(a) |
41,935 |
1,400 |
|||||||||
|
8,685 |
|||||||||||
|
Thrifts & Mortgage Finance (0.1%) |
|||||||||||
| Astoria Financial Corp.(d) |
9,000 |
132 |
|||||||||
| EverBank Financial Corp.(a) |
18,500 |
357 |
|||||||||
|
489 |
|||||||||||
|
Trading Companies & Distributors (0.3%) |
|||||||||||
| Brenntag AG (Germany) |
35,830 |
1,915 |
|||||||||
|
Transportation Infrastructure (0.6%) |
|||||||||||
| Macquarie Infrastructure Corp. |
40,432 |
3,308 |
|||||||||
|
Water Utilities (0.2%) |
|||||||||||
| American Water Works Co., Inc.(a) |
18,426 |
1,364 |
|||||||||
| Total Common Stocks (Cost $246,762) |
243,228 |
||||||||||
|
Investments |
Principal Amount |
Value (000) |
|||||||||
| Loan Assignments (8.5%)(h) | |||||||||||
|
Chemicals (0.1%) |
|||||||||||
| Avantor Performance Materials, Inc., Term Loan 6.00%, 6/17/2022 |
$ |
517,665 |
$ |
521 |
|||||||
| Commercial Services & Supplies (0.0%)(b) | |||||||||||
| GCA Services Group, Inc., 1st Lien Term Loan 6.25%, 11/25/2020 |
243,698 |
235 |
|||||||||
|
Diversified Consumer Services (0.5%) |
|||||||||||
| Affinion Group, Inc., 1st Lien Term Loan B 6.75%, 4/30/2018 |
3,191,361 |
3,106 |
|||||||||
|
Diversified Financial Services (0.8%) |
|||||||||||
| 4L Technologies, Inc., Term Loan B 5.50%, 4/3/2020 |
1,776,749 |
1,677 |
|||||||||
| Environmental Resources Management, 1st Lien Term Loan 5.00%, 5/9/2021 |
2,881,000 |
2,607 |
|||||||||
| IG Investments Holdings LLC, 1st Lien Term Loan 6.00%, 10/31/2021 |
308,199 |
311 |
|||||||||
|
4,595 |
|||||||||||
| Diversified Telecommunication Services (0.9%) |
|||||||||||
| ConvergeOne Holdings Corp., 1st Lien Term Loan 6.37%, 6/16/2020 |
2,400,524 |
2,383 |
|||||||||
| Global Telcom Link Corp., 2nd Lien Term Loan 9.00%, 5/21/2020 |
2,825,000 |
2,714 |
|||||||||
|
5,097 |
|||||||||||
See Notes to Financial Statements
15
Consolidated Schedule of Investments Neuberger Berman Absolute Return Multi-Manager Fund (cont'd)
|
Investments |
Principal Amount |
Value (000) |
|||||||||
| Electric Utilities (0.0%)(b) | |||||||||||
| Texas Competitive Electric Holdings Co. LLC, DIP Term Loan B 5.00%, 8/4/2023 |
$ |
91,200 |
$ |
92 |
|||||||
| Texas Competitive Electric Holdings Co. LLC, Term Loan 5.00%, 8/4/2023 |
20,800 |
21 |
|||||||||
|
113 |
|||||||||||
|
Energy Equipment & Services (0.4%) |
|||||||||||
| CGG Holding US, Inc., 1st Lien Term Loan 6.50%, 5/15/2019 |
2,618,610 |
2,324 |
|||||||||
| Pacific Drilling SA, Term Loan 4.50%, 5/18/2018(i) |
621,000 |
175 |
|||||||||
|
2,499 |
|||||||||||
|
Food Products (0.2%) |
|||||||||||
| Del Monte Corp., 2nd Lien Term Loan 8.25%, 7/26/2021 |
1,917,000 |
1,467 |
|||||||||
| Health Care Equipment & Supplies (0.1%) |
|||||||||||
| ABB Optical Group LLC, Term Loan B 6.00%, 6/14/2023 |
521,000 |
522 |
|||||||||
|
Health Care Providers & Services (1.0%) |
|||||||||||
| 21st Century Oncology, Inc., Term Loan 7.12%, 4/28/2022 |
3,052,803 |
2,809 |
|||||||||
| Beacon Health Strategies LLC, Term Loan B 5.00%, 9/30/2021 |
1,360,285 |
1,321 |
|||||||||
| Quorum Health Corp., Term Loan B 6.75%, 4/12/2022(i) |
1,697,617 |
1,574 |
|||||||||
|
5,704 |
|||||||||||
|
Investments |
Principal Amount |
Value (000) |
|||||||||
|
Hotels, Restaurants & Leisure (0.8%) |
|||||||||||
| Caesars Entertainment Operating Co., Inc., Term Loan B 3/1/2017(j) |
$ |
1,057,068 |
$ |
1,235 |
|||||||
| Caesars Entertainment Resort Properties LLC, 1st Lien Term Loan 7.00%, 10/9/2020 |
1,458,750 |
1,466 |
|||||||||
| Harrah's Entertainment, Inc., Term Loan B5 1/28/2018(j) |
1,732,971 |
1,877 |
|||||||||
|
4,578 |
|||||||||||
|
Independent Power & Renewable Electricity Producers (0.1%) |
|||||||||||
| Star West Generation LLC, Term Loan B 5.75%, 3/13/2020 |
771,058 |
636 |
|||||||||
|
Insurance (0.9%) |
|||||||||||
| Asurion LLC, 2nd Lien Term Loan 8.50%, 2/19/2021 |
2,009,000 |
2,023 |
|||||||||
| Confie Seguros Holding II Co., 2nd Lien Term Loan 10.25%, 5/8/2019 |
1,275,000 |
1,232 |
|||||||||
| Cunningham Lindsey US, Inc., 1st Lien Term Loan 5.00%, 12/10/2019 |
2,433,410 |
2,036 |
|||||||||
|
5,291 |
|||||||||||
|
Internet Software & Services (0.6%) |
|||||||||||
| Extreme Reach, Inc., 2nd Lien Term Loan 10.50%, 12/31/2025 |
1,593,000 |
1,516 |
|||||||||
| ProQuest LLC, Term Loan B 5.75%, 9/23/2021 |
1,733,079 |
1,731 |
|||||||||
|
3,247 |
|||||||||||
|
Investments |
Principal Amount |
Value (000) |
|||||||||
|
Media (0.1%) |
|||||||||||
| Cirque du Soleil, Inc., 2nd Lien Term Loan 9.25%, 6/25/2023 |
$ |
830,000 |
$ |
801 |
|||||||
|
Professional Services (0.3%) |
|||||||||||
| Duff & Phelps Corp., 2nd Lien Term Loan 9.50%, 8/14/2021 |
2,009,250 |
1,989 |
|||||||||
|
Road & Rail (0.2%) |
|||||||||||
| YRC Worldwide, Inc., 1st Lien Term Loan 8.00%, 2/12/2019 |
968,365 |
912 |
|||||||||
|
Semiconductors & Semiconductor Equipment (0.7%) |
|||||||||||
| SunEdison, Inc., 1st Lien DIP Term Loan 11.50%, 4/26/2017(i) |
1,936,031 |
1,944 |
|||||||||
| SunEdison, Inc., 2nd Lien Term Loan A2 7/2/2018(j) |
1,852,000 |
977 |
|||||||||
| SunEdison, Inc., Term Loan A 11.50%, 4/21/2017(f) |
1,087,000 |
1,098 |
|||||||||
|
4,019 |
|||||||||||
|
Software (0.3%) |
|||||||||||
| Epiq Systems, Inc., Term Loan 6.25%, 9/23/2023 |
1,634,000 |
1,618 |
|||||||||
|
Technology Hardware, Storage & Peripherals (0.5%) |
|||||||||||
| Eastman Kodak Co., Term Loan 7.25%, 7/31/2019 |
3,163,554 |
3,156 |
|||||||||
| Total Loan Assignments (Cost $50,552) |
50,106 |
||||||||||
|
Corporate Bonds (7.3%) |
|||||||||||
| Auto Components (0.0%)(b) | |||||||||||
| Icahn Enterprises LP 6.00%, 8/1/2020 |
257,000 |
251 |
|||||||||
See Notes to Financial Statements
16
Consolidated Schedule of Investments Neuberger Berman Absolute Return Multi-Manager Fund (cont'd)
|
Investments |
Principal Amount |
Value (000) |
|||||||||
|
Banks (2.0%) |
|||||||||||
| Emigrant Capital Trust V 2.40%, 7/1/2037(c)(e)(h) |
$ |
10,000,000 |
$ |
5,400 |
|||||||
| First National of Colorado Statutory Trust 5.25%, 9/15/2037(c)(h) |
5,000,000 |
2,675 |
|||||||||
| First National of Nebraska Statutory Trust II 6.47%, 3/15/2037(c)(h) |
7,500,000 |
4,012 |
|||||||||
|
12,087 |
|||||||||||
|
Capital Markets (1.2%) |
|||||||||||
| Sterling Capital Corp. 5.34%, 10/1/2037(c)(h) |
14,000,000 |
7,402 |
|||||||||
| Chemicals (0.0%)(b) | |||||||||||
| Momentive Performance Materials, Inc. Escrow 10.00%, 10/15/2020(c)(j) |
613,000 |
— |
(l) |
||||||||
|
Commercial Services & Supplies (0.2%) |
|||||||||||
| Constellis Holdings LLC 9.75%, 5/15/2020(a)(e) |
1,204,000 |
1,222 |
|||||||||
|
Energy Equipment & Services (0.3%) |
|||||||||||
| Transocean, Inc. 9.00%, 7/15/2023(d)(e) |
1,872,000 |
1,829 |
|||||||||
|
Health Care Providers & Services (0.1%) |
|||||||||||
| Centene Corp. 4.75%, 1/15/2025 |
104,000 |
104 |
|||||||||
| Quorum Health Corp. 11.63%, 4/15/2023(e) |
428,000 |
308 |
|||||||||
|
412 |
|||||||||||
|
Independent Power & Renewable Electricity Producers (0.2%) |
|||||||||||
| GenOn Energy, Inc. 9.50%, 10/15/2018 |
998,000 |
801 |
|||||||||
| 10/15/2020 9.88%, |
671,000 |
501 |
|||||||||
|
1,302 |
|||||||||||
|
Investments |
Principal Amount |
Value (000) |
|||||||||
|
Insurance (0.2%) |
|||||||||||
| Ambac Assurance Corp. 5.10%, 6/7/2020(e) |
$ |
828,509 |
$ |
965 |
|||||||
| Syncora Guarantee, Inc., 5% Short-Term Surplus Notes 6/7/2023 |
30,634 |
29 |
|||||||||
| Syncora Guarantee, Inc., 6% Long-Term Surplus Notes 6/7/2023 |
130,652 |
109 |
|||||||||
|
1,103 |
|||||||||||
|
Internet & Direct Marketing Retail (0.1%) |
|||||||||||
| Netflix, Inc. 4.38%, 11/15/2026(c)(e) |
601,000 |
590 |
|||||||||
| Machinery (0.0%)(b) | |||||||||||
| Xerium Technologies, Inc. 9.50%, 8/15/2021(d)(e) |
167,000 |
170 |
|||||||||
|
Media (0.9%) |
|||||||||||
| Cengage Learning, Inc. 9.50%, 6/15/2024(d)(e) |
1,114,000 |
1,036 |
|||||||||
| Cenveo Corp. 6.00%, 8/1/2019(a)(e) |
4,550,000 |
4,004 |
|||||||||
| Live Nation Entertainment, Inc. 4.88%, 11/1/2024(c)(e) |
104,000 |
104 |
|||||||||
|
5,144 |
|||||||||||
|
Metals & Mining (0.3%) |
|||||||||||
| Wise Metals Group LLC 8.75%, 12/15/2018(e) |
2,004,000 |
2,000 |
|||||||||
|
Oil, Gas & Consumable Fuels (0.5%) |
|||||||||||
| Midstates Petroleum Co., Inc. 10.00%, 6/1/2020(c)(f)(j) |
1,848,000 |
— |
|||||||||
| Niska Gas Storage Ltd. 6.50%, 4/1/2019(a) |
2,860,000 |
2,803 |
|||||||||
|
2,803 |
|||||||||||
|
Investments |
Principal Amount |
Value (000) |
|||||||||
|
Pharmaceuticals (0.7%) |
|||||||||||
| Endo Ltd. 6.50%, 2/1/2025(e) |
$ |
1,965,000 |
$ |
1,656 |
|||||||
| Valeant Pharmaceuticals International, Inc. 6.13%, 4/15/2025(e) |
2,930,000 |
2,256 |
|||||||||
|
3,912 |
|||||||||||
|
Professional Services (0.4%) |
|||||||||||
| Corporate Risk Holdings LLC 9.50%, 7/1/2019(e) |
2,229,000 |
2,290 |
|||||||||
|
Trading Companies & Distributors (0.2%) |
|||||||||||
| United Rentals North America, Inc. 4.63%, 7/15/2023 |
732,000 |
756 |
|||||||||
|
5.50%, 5/15/2027 |
207,000 |
207 |
|||||||||
|
963 |
|||||||||||
| Total Corporate Bonds (Cost $48,727) |
43,480 |
||||||||||
| Commercial Mortgage-Backed Securities (6.6%) |
|||||||||||
| BAMLL Commercial Mortgage Securities Trust Series 2016-ASMZ, Class MZA, 9.78%, 12/15/2017(c)(e)(h) |
5,000,000 |
5,009 |
|||||||||
| Series 2013-DSNY, Class F, 4.03%, 9/15/2026(a)(e)(h) |
4,600,000 |
4,558 |
|||||||||
| Series 2014-ICTS, Class E, 3.48%, 6/15/2028(a)(e)(h) |
3,450,000 |
3,398 |
|||||||||
| CDGJ Commercial Mortgage Trust Series 2014-BXCH, Class DPB, 4.38%, 12/15/2027(e)(h) |
— |
(l) |
— |
(l) |
|||||||
| Series 2014-BXCH, Class EPB, 5.53%, 12/15/2027(e)(h) |
1,335,438 |
1,316 |
|||||||||
| Series 2014-BXCH, Class EPA, 4.78%, 12/15/2027(e)(h) |
1,777,586 |
1,762 |
|||||||||
See Notes to Financial Statements
17
Consolidated Schedule of Investments Neuberger Berman Absolute Return Multi-Manager Fund (cont'd)
|
Investments |
Principal Amount |
Value (000) |
|||||||||
| Citigroup Commercial Mortgage Trust Series 2015-SHP2, Class E, 4.35%, 7/15/2027(e)(h) |
$ |
550,000 |
$ |
545 |
|||||||
| COMM Mortgage Trust Series 2014-PAT, Class E, 3.68%, 8/13/2027(a)(e)(h) |
4,800,000 |
4,732 |
|||||||||
| Series 2007-C9, Class G, 5.81%, 12/10/2049(e)(h) |
800,000 |
758 |
|||||||||
| JP Morgan Chase Commercial Mortgage Securities Trust Series 2014-INN, Class E, 4.14%, 6/15/2029(e)(h) |
4,150,000 |
4,082 |
|||||||||
| Series 2014-CBM, Class E, 4.39%, 10/15/2029(e)(h) |
1,700,000 |
1,631 |
|||||||||
| Series 2015-CSMO, Class D, 3.83%, 1/15/2032(e)(h) |
4,000,000 |
3,999 |
|||||||||
| Lone Star Portfolio Trust Series 2015-LSP, Class E, 6.13%, 9/15/2028(e)(h) |
1,109,189 |
1,118 |
|||||||||
| NorthStar Series 2013-1A, Class B, 5.53%, 8/25/2029(e)(h) |
199,255 |
199 |
|||||||||
| Palisades Center Trust Series 2016-PLSD, Class D, 4.74%, 4/13/2033(e) |
1,000,000 |
1,006 |
|||||||||
| PFP Ltd. Series 2015-2, Class D, 4.53%, 7/14/2034(e)(h) |
1,800,000 |
1,746 |
|||||||||
| Series 2015-2, Class E, 5.13%, 7/14/2034(e)(h) |
1,900,000 |
1,827 |
|||||||||
|
Investments |
Principal Amount |
Value (000) |
|||||||||
| Wells Fargo Commercial Mortgage Trust Series 2014-TISH, Class WTS2, 3.78%, 2/15/2027(e)(h) |
$ |
1,700,000 |
$ |
1,653 |
|||||||
| Total Commercial Mortgage-Backed Securities (Cost $39,872) |
39,339 |
||||||||||
|
Asset-Backed Securities (6.1%) |
|||||||||||
| Allegro CLO I Ltd. Series 2013-1A, Class C, 4.34%, 1/30/2026(e)(h) |
1,000,000 |
966 |
|||||||||
| Allegro CLO II Ltd. Series 2014-1A, Class C, 5.03%, 1/21/2027(e)(h) |
1,400,000 |
1,402 |
|||||||||
| Ares XXV CLO Ltd. Series 2012-3A, Class DR, 4.45%, 1/17/2024(e)(h) |
1,000,000 |
1,002 |
|||||||||
| Babson CLO Ltd. Series 2013-IA, Class D, 4.38%, 4/20/2025(e)(h) |
1,450,000 |
1,410 |
|||||||||
| Series 2015-2A, Class E, 6.43%, 7/20/2027(e)(h) |
550,000 |
498 |
|||||||||
| Catamaran CLO Ltd. Series 2013-1A, Class D, 4.64%, 1/27/2025(e)(h) |
1,000,000 |
958 |
|||||||||
| Series 2015-1A, Class E, 6.03%, 4/22/2027(e)(h) |
800,000 |
664 |
|||||||||
| Series 2015-1A, Class D, 4.53%, 4/22/2027(e)(h) |
1,200,000 |
1,138 |
|||||||||
| Cedar Funding III CLO Ltd. Series 2014-3A, Class E, 5.71%, 5/20/2026(e)(h) |
1,200,000 |
1,036 |
|||||||||
|
Investments |
Principal Amount |
Value (000) |
|||||||||
| Chrysler Capital Auto Receivables Trust Series 2015-BA, Class D, 4.17%, 1/16/2023(e) |
$ |
2,000,000 |
$ |
2,051 |
|||||||
| Series 2016-AA, Class D, 4.22%, 2/15/2023(e) |
1,000,000 |
1,028 |
|||||||||
| Countrywide Asset-Backed Certificates Trust Series 2005-7, Class AF4, 4.87%, 10/25/2035(h) |
276,047 |
282 |
|||||||||
| DT Auto Owner Trust Series 2015-1A, Class D, 4.26%, 2/15/2022(e) |
1,500,000 |
1,524 |
|||||||||
| Flagship Credit Auto Trust Series 2015-2, Class C, 4.08%, 12/15/2021(e) |
1,400,000 |
1,412 |
|||||||||
| Golub Capital Partners CLO 22B Ltd. Series 2015-22A, Class C, 4.96%, 2/20/2027(e)(h) |
900,000 |
903 |
|||||||||
| Halcyon Loan Advisors Funding Ltd. Series 2012-2A, Class E, 6.26%, 12/20/2024(e)(h) |
300,000 |
235 |
|||||||||
| JP Morgan Mortgage Acquisition Trust Series 2007-CH1, Class AF6, 5.03%, 11/25/2036(m) |
341,619 |
342 |
|||||||||
| Kingsland VI Ltd. Series 2013-6A, Class D, 4.54%, 10/28/2024(e)(h) |
3,000,000 |
2,880 |
|||||||||
| KKR CLO Trust Series 2012-1A, Class C, 5.35%, 12/15/2024(e)(h) |
600,000 |
604 |
|||||||||
See Notes to Financial Statements
18
Consolidated Schedule of Investments Neuberger Berman Absolute Return Multi-Manager Fund (cont'd)
|
Investments |
Principal Amount |
Value (000) |
|||||||||
| Nelder Grove CLO Ltd. Series 2014-1A, Class D1, 5.35%, 8/28/2026(e)(h) |
$ |
1,400,000 |
$ |
1,348 |
|||||||
| Ocean Trails CLO V Series 2014-5A, Class E, 6.23%, 10/13/2026(e)(h) |
400,000 |
339 |
|||||||||
| Series 2014-5A, Class D, 4.84%, 10/13/2026(a)(e)(h) |
2,050,000 |
1,993 |
|||||||||
| Octagon Investment Partners X Ltd. Series 2006-10A, Class D, 2.28%, 10/18/2020(e)(h) |
500,000 |
499 |
|||||||||
| Octagon Investment Partners XVII Ltd. Series 2013-1A, Class E, 5.38%, 10/25/2025(e)(h) |
600,000 |
517 |
|||||||||
| Octagon Investment Partners XX Ltd. Series 2014-1A, Class E, 6.07%, 8/12/2026(e)(h) |
250,000 |
211 |
|||||||||
| Octagon Investment Partners XXII Ltd. Series 2014-1A, Class E1, 6.13%, 11/25/2025(e)(h) |
600,000 |
533 |
|||||||||
| OZLM Funding IV Ltd. Series 2013-4A, Class C, 4.08%, 7/22/2025(e)(h) |
1,200,000 |
1,165 |
|||||||||
| OZLM Funding V Ltd. Series 2013-5A, Class D, 5.63%, 1/17/2026(a)(e)(h) |
1,650,000 |
1,503 |
|||||||||
| OZLM XI Ltd. Series 2015-11A, Class D, 6.16%, 1/30/2027(e)(h) |
1,200,000 |
1,059 |
|||||||||
|
Investments |
Principal Amount |
Value (000) |
|||||||||
| Sound Point CLO I Ltd. Series 2012-1A, Class E, 6.88%, 10/20/2023(e)(h) |
$ |
300,000 |
$ |
300 |
|||||||
| Sound Point CLO IX Ltd. Series 2015-2A, Class D, 4.43%, 7/20/2027(e)(h) |
1,600,000 |
1,538 |
|||||||||
| Venture XIV CLO Ltd. Series 2013-14A, Class D, 4.58%, 8/28/2025(e)(h) |
2,400,000 |
2,305 |
|||||||||
| Venture XIX CLO Ltd. Series 2014-19A, Class D, 4.88%, 1/15/2027(e)(h) |
2,500,000 |
2,455 |
|||||||||
| Total Asset-Backed Securities (Cost $36,041) |
36,100 |
||||||||||
|
Shares |
|||||||||||
|
Master Limited Partnerships (3.2%) |
|||||||||||
|
Oil, Gas & Consumable Fuels (3.2%) |
|||||||||||
| Antero Midstream Partners LP(a) |
45,253 |
1,319 |
|||||||||
| Boardwalk Pipeline Partners LP(a) |
84,636 |
1,457 |
|||||||||
| Buckeye Partners LP(a) |
7,598 |
490 |
|||||||||
| Cheniere Energy Partners LP |
2,807 |
74 |
|||||||||
| Delek Logistics Partners LP |
1,299 |
32 |
|||||||||
| Enable Midstream Partners LP |
310 |
5 |
|||||||||
| Energy Transfer Equity LP(a) |
73,174 |
1,093 |
|||||||||
| Energy Transfer Partners LP |
33,750 |
1,181 |
|||||||||
| Enterprise Products Partners LP(a) |
52,010 |
1,313 |
|||||||||
| EQT GP Holdings LP(a) |
29,143 |
681 |
|||||||||
| EQT Midstream Partners LP(a) |
10,796 |
808 |
|||||||||
| Magellan Midstream Partners LP |
208 |
14 |
|||||||||
| MPLX LP |
216 |
7 |
|||||||||
|
Investments |
Shares |
Value (000) |
|||||||||
| Noble Midstream Partners LP* |
2,396 |
$ |
72 |
||||||||
|
NuStar Energy LP |
348 |
16 |
|||||||||
| NuStar GP Holdings LLC(a) |
28,261 |
701 |
|||||||||
| ONEOK Partners LP |
13,823 |
549 |
|||||||||
| Phillips 66 Partners LP |
2,419 |
107 |
|||||||||
| Plains All American Pipeline LP |
8,412 |
255 |
|||||||||
| Rice Midstream Partners LP(a) |
21,542 |
467 |
|||||||||
| Shell Midstream Partners LP(a) |
47,052 |
1,277 |
|||||||||
| Spectra Energy Partners LP(a) |
4,108 |
175 |
|||||||||
| Sunoco Logistics Partners LP |
28,908 |
741 |
|||||||||
| Sunoco LP(a) |
35,849 |
1,021 |
|||||||||
|
Tesoro Logistics LP |
5,301 |
253 |
|||||||||
| Valero Energy Partners LP(a) |
37,114 |
1,512 |
|||||||||
| Western Gas Equity Partners LP(a) |
25,316 |
1,079 |
|||||||||
| Western Gas Partners LP(a) |
14,365 |
792 |
|||||||||
| Western Refining Logistics LP(d) |
73,791 |
1,682 |
|||||||||
| Total Master Limited Partnerships (Cost $19,773) |
19,173 |
||||||||||
| Principal Amount |
|||||||||||
| Collateralized Mortgage Obligations (1.9%) |
|||||||||||
| Alternative Loan Trust Series 2005-J2, Class 1A5, 1.03%, 4/25/2035(h) |
$ |
1,828,663 |
1,498 |
||||||||
| Series 2005-21CB, Class A17, 6.00%, 6/25/2035(a) |
1,335,230 |
1,324 |
|||||||||
| Chase Mortgage Finance Trust Series 2007-A2, Class 3A2, 3.03%, 7/25/2037(h) |
392,956 |
375 |
|||||||||
See Notes to Financial Statements
19
Consolidated Schedule of Investments Neuberger Berman Absolute Return Multi-Manager Fund (cont'd)
|
Investments |
Principal Amount |
Value (000) |
|||||||||
| Citicorp Mortgage Securities Trust Series 2006-3, Class 1A10, 6.25%, 6/25/2036 |
$ |
2,268,310 |
$ |
2,300 |
|||||||
| Freddie Mac Structured Agency Credit Risk Debt Notes Series 2015-HQA1, Class B, 9.33%, 3/25/2028(c)(h) |
3,999,803 |
4,040 |
|||||||||
| MASTR Alternative Loan Trust Series 2004-10, Class 4A1, 6.00%, 9/25/2019 |
79,671 |
81 |
|||||||||
| WaMu Mortgage Pass-Through Certificates Trust Series 2004-S1, Class 1A11, 5.50%, 3/25/2034 |
133,464 |
138 |
|||||||||
| Washington Mutual Mortgage Pass-Through Certificates Trust Series 2005-1, Class 1A1, 5.50%, 3/25/2035 |
689,094 |
682 |
|||||||||
| Wells Fargo Mortgage Backed Securities Trust Series 2007-14, Class 1A1, 6.00%, 10/25/2037(a) |
568,622 |
558 |
|||||||||
| Total Collateralized Mortgage Obligations (Cost $11,197) |
10,996 |
||||||||||
|
Convertible Bonds (0.8%) |
|||||||||||
|
Diversified Consumer Services (0.2%) |
|||||||||||
| Ascent Capital Group, Inc. 4.00%, 7/15/2020 |
1,568,000 |
1,135 |
|||||||||
|
Internet Software & Services (0.2%) |
|||||||||||
| Twitter, Inc. 0.25%, 9/15/2019 |
1,172,000 |
1,096 |
|||||||||
|
Investments |
Principal Amount |
Value (000) |
|||||||||
|
Oil, Gas & Consumable Fuels (0.2%) |
|||||||||||
| Cobalt International Energy, Inc. 3.13%, 5/15/2024(a) |
$ |
3,003,000 |
$ |
983 |
|||||||
|
Semiconductors & Semiconductor Equipment (0.2%) |
|||||||||||
| SunEdison, Inc. 5.00%, 7/2/2018(e)(j) |
2,809,000 |
1,327 |
|||||||||
| Total Convertible Bonds (Cost $5,828) |
4,541 |
||||||||||
|
U.S. Treasury Obligation (0.2%) |
|||||||||||
| U.S. Treasury Bond 2.50%, 5/15/2046(d) (Cost $1,004) |
983,000 |
966 |
|||||||||
| No. of Rights |
|||||||||||
|
Rights (0.3%) |
|||||||||||
| Biotechnology (0.0%)(b) | |||||||||||
| Ambit Biosciences Corp. (Daiichi Sankyo Co. Ltd.)*(c)(f) |
70,000 |
42 |
|||||||||
| Chelsea Therapeutics, Inc. (H Lundbeck A/S) (Denmark)*(c)(f) |
3,500 |
— |
(l) |
||||||||
| Durata Therapeutics, Inc. (Actavis plc)*(c)(f) |
40,000 |
— |
|||||||||
| Dyax Corp.*(c) |
40,350 |
51 |
|||||||||
| Prosensa Holding NV*(c)(f) |
20,000 |
— |
|||||||||
| Trius Therapeutics, Inc. (Cubist Pharmaceuticals, Inc.)*(c)(f) |
24,000 |
3 |
|||||||||
|
96 |
|||||||||||
| Food & Staples Retailing (0.0%)(b) | |||||||||||
| Safeway, Inc. (Casa Ley)*(c) |
112,000 |
28 |
|||||||||
| Safeway, Inc. (Property Development Centers)*(c) |
112,000 |
2 |
|||||||||
|
30 |
|||||||||||
| Health Care Providers & Services (0.0%)(b) | |||||||||||
| Community Health Systems, Inc., expiring 12/31/2049* |
19,082 |
— |
(l) |
||||||||
|
Investments |
No. of Rights |
Value (000) |
|||||||||
|
Pharmaceuticals (0.0%) |
|||||||||||
| Omthera Pharmaceuticals, Inc. (AstraZeneca plc)*(c)(f) |
100 |
$ |
— |
||||||||
|
Semiconductors & Semiconductor Equipment (0.2%) |
|||||||||||
| SunEdison, Inc., 2nd Lien DIP Roll Up Rights 4/22/2017 |
3,662,393 |
1,392 |
|||||||||
| Wireless Telecommunication Services (0.1%) |
|||||||||||
| Leap Wireless International, Inc. (AT&T, Inc.)*(c) |
60,000 |
189 |
|||||||||
| Total Rights (Cost $1,035) |
1,707 |
||||||||||
| No. of Contracts |
|||||||||||
| Options Purchased (0.0%)(b) | |||||||||||
| Put Options (0.0%)(b) | |||||||||||
| Icahn Enterprises LP 1/20/2017 @ 50.00 |
34 |
17 |
|||||||||
| Icahn Enterprises LP 1/20/2017 @ 60.00 |
97 |
131 |
|||||||||
| Imperva, Inc. 11/18/2016 @ 42.50 |
42 |
31 |
|||||||||
| iShares Russell 2000 Fund 12/30/2016 @ 114.00 |
266 |
61 |
|||||||||
| Molson Coors Brewing Co. 11/18/2016 @ 103.00 |
155 |
40 |
|||||||||
| Rite Aid Corp. 1/20/2017 @ 7.00 |
130 |
14 |
|||||||||
| Twitter, Inc. 11/18/2016 @ 18.00 |
12 |
1 |
|||||||||
| Twitter, Inc. 1/20/2017 @ 16.00 |
14 |
1 |
|||||||||
| Total Options Purchased (Cost $272) |
296 |
||||||||||
See Notes to Financial Statements
20
Consolidated Schedule of Investments Neuberger Berman Absolute Return Multi-Manager Fund (cont'd)
|
Investments |
No. of Warrants |
Value (000) |
|||||||||
| Warrants (0.0%)(b) | |||||||||||
| Capital Markets (0.0%)(b) | |||||||||||
| Electrum Special Acquisition Corp., expiring 6/11/2021*(d) |
3,600 |
$ |
1 |
||||||||
| Diversified Financial Services (0.0%)(b) | |||||||||||
| Acasta Enterprises, Inc., expiring 9/8/2020 (Canada)* |
219,049 |
39 |
|||||||||
| Gores Holdings, Inc., expiring 10/16/2020*(d) |
3,600 |
5 |
|||||||||
| Pace Holdings Corp., expiring 10/29/2020*(d) |
5,400 |
2 |
|||||||||
|
46 |
|||||||||||
| Insurance (0.0%)(b) | |||||||||||
| TIG Holdings, Inc., expiring 12/31/2016*(c)(f) |
73 |
— |
|||||||||
| Total Warrants (Cost $132) |
47 |
||||||||||
|
Shares |
|||||||||||
| Preferred Stock (0.0%)(b) | |||||||||||
| Thrifts & Mortgage Finance (0.0%)(b) | |||||||||||
| Federal National Mortgage Association, Series S, 8.25%, 12/31/2020 (Cost $28)*(d)(h)(n) |
6,533 |
26 |
|||||||||
|
Short-Term Investments (19.2%) |
|||||||||||
|
Investment Companies (19.2%) |
|||||||||||
| Dreyfus Treasury Securities Cash Management Institutional Class, 0.20%(o) |
460,935 |
461 |
|||||||||
| Morgan Stanley Institutional Liquidity Fund Treasury Portfolio Institutional Class, 0.19%(a)(o) |
88,726,125 |
88,726 |
|||||||||
|
Investments |
Shares |
Value (000) |
|||||||||
| Western Asset Institutional U.S. Treasury Reserves, 0.21%(a)(o)(p) |
24,564,936 |
$ |
24,565 |
||||||||
| Total Investment Companies (Cost $113,752) |
113,752 |
||||||||||
| Total Long Positions (Cost $574,975) |
563,757 |
||||||||||
| Short Positions (20.3%)(q) | |||||||||||
|
Common Stocks (15.3%) |
|||||||||||
|
Aerospace & Defense (0.2%) |
|||||||||||
| Triumph Group, Inc. |
(41,800 |
) |
(991 |
) |
|||||||
|
Air Freight & Logistics (0.2%) |
|||||||||||
| Royal Mail plc (United Kingdom) |
(194,150 |
) |
(1,167 |
) |
|||||||
|
Airlines (0.2%) |
|||||||||||
| Deutsche Lufthansa AG (Germany) |
(91,145 |
) |
(1,165 |
) |
|||||||
|
Auto Components (0.2%) |
|||||||||||
| Autoliv, Inc. (Sweden) |
(10,220 |
) |
(989 |
) |
|||||||
|
Banks (0.7%) |
|||||||||||
| Canadian Imperial Bank of Commerce (Canada) |
(14,849 |
) |
(1,113 |
) |
|||||||
| Canadian Western Bank (Canada) |
(47,190 |
) |
(895 |
) |
|||||||
| Home BancShares, Inc. |
(58,810 |
) |
(1,265 |
) |
|||||||
| National Bank of Canada (Canada) |
(27,810 |
) |
(993 |
) |
|||||||
|
(4,266 |
) |
||||||||||
|
Beverages (0.2%) |
|||||||||||
| Brown-Forman Corp., Class B |
(20,390 |
) |
(941 |
) |
|||||||
|
Biotechnology (0.2%) |
|||||||||||
|
AbbVie, Inc. |
(8,509 |
) |
(475 |
) |
|||||||
|
Amgen, Inc. |
(4,070 |
) |
(574 |
) |
|||||||
|
(1,049 |
) |
||||||||||
|
Capital Markets (0.5%) |
|||||||||||
| Ameriprise Financial, Inc. |
(10,450 |
) |
(924 |
) |
|||||||
|
Ares Capital Corp. |
(18,452 |
) |
(282 |
) |
|||||||
| Franklin Resources, Inc. |
(36,190 |
) |
(1,218 |
) |
|||||||
|
Investments |
Shares |
Value (000) |
|||||||||
| Waddell & Reed Financial, Inc., Class A |
(30,350 |
) |
$ |
(477 |
) |
||||||
|
(2,901 |
) |
||||||||||
|
Chemicals (0.1%) |
|||||||||||
| Axalta Coating Systems Ltd.* |
(19,590 |
) |
(492 |
) |
|||||||
|
Commercial Services & Supplies (0.2%) |
|||||||||||
| Quad/Graphics, Inc. |
(16,388 |
) |
(389 |
) |
|||||||
| RR Donnelley & Sons Co. |
(47,260 |
) |
(839 |
) |
|||||||
|
(1,228 |
) |
||||||||||
| Containers & Packaging (0.0%)(b) | |||||||||||
| Berry Plastics Group, Inc.* |
(6,503 |
) |
(285 |
) |
|||||||
|
Diversified Consumer Services (0.2%) |
|||||||||||
| ServiceMaster Global Holdings, Inc.* |
(33,530 |
) |
(1,200 |
) |
|||||||
|
Electric Utilities (0.4%) |
|||||||||||
| Duke Energy Corp. |
(4,390 |
) |
(351 |
) |
|||||||
|
Eversource Energy |
(5,944 |
) |
(327 |
) |
|||||||
| Southern Co. (The) |
(24,988 |
) |
(1,289 |
) |
|||||||
|
Xcel Energy, Inc. |
(3,217 |
) |
(134 |
) |
|||||||
|
(2,101 |
) |
||||||||||
|
Electrical Equipment (0.5%) |
|||||||||||
|
Acuity Brands, Inc. |
(5,410 |
) |
(1,209 |
) |
|||||||
| Emerson Electric Co. |
(19,920 |
) |
(1,010 |
) |
|||||||
| Sensata Technologies Holding NV* |
(28,800 |
) |
(1,029 |
) |
|||||||
|
(3,248 |
) |
||||||||||
|
Food & Staples Retailing (0.4%) |
|||||||||||
| Costco Wholesale Corp. |
(5,100 |
) |
(754 |
) |
|||||||
|
CVS Health Corp. |
(6,458 |
) |
(543 |
) |
|||||||
| Metro, Inc. (Canada) |
(16,200 |
) |
(501 |
) |
|||||||
| Walgreens Boots Alliance, Inc. |
(6,767 |
) |
(560 |
) |
|||||||
|
(2,358 |
) |
||||||||||
|
Food Products (0.3%) |
|||||||||||
| Flowers Foods, Inc. |
(34,900 |
) |
(542 |
) |
|||||||
| Hormel Foods Corp. |
(39,570 |
) |
(1,523 |
) |
|||||||
|
(2,065 |
) |
||||||||||
See Notes to Financial Statements
21
Consolidated Schedule of Investments Neuberger Berman Absolute Return Multi-Manager Fund (cont'd)
|
Investments |
Shares |
Value (000) |
|||||||||
| Health Care Equipment & Supplies (1.0%) |
|||||||||||
| Abbott Laboratories |
(24,993 |
) |
$ |
(981 |
) |
||||||
|
Danaher Corp. |
(6,227 |
) |
(489 |
) |
|||||||
| DENTSPLY SIRONA, Inc. |
(8,138 |
) |
(469 |
) |
|||||||
|
DexCom, Inc.* |
(4,517 |
) |
(353 |
) |
|||||||
| Halyard Health, Inc.* |
(29,400 |
) |
(951 |
) |
|||||||
|
ICU Medical, Inc.* |
(5,050 |
) |
(703 |
) |
|||||||
|
LivaNova plc* |
(30,470 |
) |
(1,727 |
) |
|||||||
|
Medtronic plc |
(5,545 |
) |
(455 |
) |
|||||||
|
(6,128 |
) |
||||||||||
|
Health Care Providers & Services (0.8%) |
|||||||||||
|
Aetna, Inc. |
(7,540 |
) |
(809 |
) |
|||||||
|
Amsurg Corp.* |
(1,270 |
) |
(76 |
) |
|||||||
|
Anthem, Inc. |
(5,300 |
) |
(646 |
) |
|||||||
| Cardinal Health, Inc. |
(6,775 |
) |
(465 |
) |
|||||||
|
DaVita, Inc.* |
(7,950 |
) |
(466 |
) |
|||||||
| Express Scripts Holding Co.* |
(6,659 |
) |
(449 |
) |
|||||||
| Henry Schein, Inc.* |
(2,835 |
) |
(423 |
) |
|||||||
| Patterson Cos., Inc. |
(7,528 |
) |
(321 |
) |
|||||||
| Quest Diagnostics, Inc. |
(4,796 |
) |
(391 |
) |
|||||||
| UnitedHealth Group, Inc. |
(3,699 |
) |
(523 |
) |
|||||||
|
VCA, Inc.* |
(6,438 |
) |
(396 |
) |
|||||||
|
(4,965 |
) |
||||||||||
|
Hotels, Restaurants & Leisure (0.5%) |
|||||||||||
| Darden Restaurants, Inc. |
(27,600 |
) |
(1,788 |
) |
|||||||
|
Starbucks Corp. |
(18,600 |
) |
(987 |
) |
|||||||
|
(2,775 |
) |
||||||||||
|
Household Durables (0.1%) |
|||||||||||
| Lennar Corp., Class A |
(20,400 |
) |
(850 |
) |
|||||||
|
Household Products (0.3%) |
|||||||||||
| Church & Dwight Co., Inc. |
(19,200 |
) |
(927 |
) |
|||||||
|
Clorox Co. (The) |
(9,290 |
) |
(1,115 |
) |
|||||||
|
(2,042 |
) |
||||||||||
|
Independent Power & Renewable Electricity Producers (0.1%) |
|||||||||||
| NRG Yield, Inc., Class C |
(15,499 |
) |
(239 |
) |
|||||||
| TerraForm Power, Inc., Class A* |
(44,230 |
) |
(549 |
) |
|||||||
|
(788 |
) |
||||||||||
|
Industrial Conglomerates (0.1%) |
|||||||||||
| Honeywell International, Inc. |
(4,700 |
) |
(516 |
) |
|||||||
|
Investments |
Shares |
Value (000) |
|||||||||
|
Insurance (0.5%) |
|||||||||||
|
Primerica, Inc. |
(38,325 |
) |
$ |
(2,097 |
) |
||||||
|
Unum Group |
(21,276 |
) |
(753 |
) |
|||||||
|
(2,850 |
) |
||||||||||
|
Internet Software & Services (0.3%) |
|||||||||||
| Alibaba Group Holding Ltd., ADR (China)* |
(13,899 |
) |
(1,414 |
) |
|||||||
|
Cvent, Inc.* |
(2,188 |
) |
(68 |
) |
|||||||
|
(1,482 |
) |
||||||||||
|
IT Services (0.5%) |
|||||||||||
| Cognizant Technology Solutions Corp., Class A* |
(19,990 |
) |
(1,026 |
) |
|||||||
|
EPAM Systems, Inc.* |
(7,530 |
) |
(485 |
) |
|||||||
| International Business Machines Corp. |
(9,240 |
) |
(1,420 |
) |
|||||||
| iPayment Holdings, Inc.*(c) |
(27,027 |
) |
(27 |
) |
|||||||
|
(2,958 |
) |
||||||||||
|
Life Sciences Tools & Services (0.3%) |
|||||||||||
| Agilent Technologies, Inc. |
(8,903 |
) |
(388 |
) |
|||||||
|
Bruker Corp. |
(23,570 |
) |
(483 |
) |
|||||||
| Quintiles IMS Holdings, Inc.* |
(8,035 |
) |
(577 |
) |
|||||||
| Thermo Fisher Scientific, Inc. |
(3,342 |
) |
(491 |
) |
|||||||
|
(1,939 |
) |
||||||||||
|
Media (0.7%) |
|||||||||||
| AMC Entertainment Holdings, Inc., Class A |
(2,378 |
) |
(75 |
) |
|||||||
| Comcast Corp., Class A |
(11,970 |
) |
(740 |
) |
|||||||
| New Media Investment Group, Inc. |
(33,358 |
) |
(480 |
) |
|||||||
| Nexstar Broadcasting Group, Inc., Class A |
(10,473 |
) |
(511 |
) |
|||||||
| SES SA, FDR (Luxembourg) |
(25,096 |
) |
(577 |
) |
|||||||
| Walt Disney Co. (The) |
(17,950 |
) |
(1,664 |
) |
|||||||
|
(4,047 |
) |
||||||||||
|
Multiline Retail (0.7%) |
|||||||||||
|
Big Lots, Inc. |
(25,700 |
) |
(1,116 |
) |
|||||||
| Dillard's, Inc., Class A |
(1,130 |
) |
(69 |
) |
|||||||
| JC Penney Co., Inc.* |
(100,736 |
) |
(865 |
) |
|||||||
|
Investments |
Shares |
Value (000) |
|||||||||
|
Kohl's Corp. |
(1,785 |
) |
$ |
(78 |
) |
||||||
|
Macy's, Inc. |
(1,999 |
) |
(73 |
) |
|||||||
|
Nordstrom, Inc. |
(1,756 |
) |
(91 |
) |
|||||||
|
Target Corp. |
(23,680 |
) |
(1,628 |
) |
|||||||
|
(3,920 |
) |
||||||||||
|
Multi-Utilities (0.8%) |
|||||||||||
|
Ameren Corp. |
(20,860 |
) |
(1,042 |
) |
|||||||
| Consolidated Edison, Inc. |
(31,621 |
) |
(2,389 |
) |
|||||||
| Dominion Resources, Inc. |
(15,992 |
) |
(1,203 |
) |
|||||||
| Public Service Enterprise Group, Inc. |
(4,574 |
) |
(192 |
) |
|||||||
|
(4,826 |
) |
||||||||||
|
Oil, Gas & Consumable Fuels (0.1%) |
|||||||||||
|
Exxon Mobil Corp. |
(1,271 |
) |
(106 |
) |
|||||||
|
ONEOK, Inc. |
(6,184 |
) |
(299 |
) |
|||||||
| Plains GP Holdings LP, Class A |
(14,782 |
) |
(186 |
) |
|||||||
| Tallgrass Energy GP LP |
(4,340 |
) |
(102 |
) |
|||||||
|
(693 |
) |
||||||||||
|
Pharmaceuticals (1.6%) |
|||||||||||
|
Allergan plc* |
(1,849 |
) |
(386 |
) |
|||||||
| GlaxoSmithKline plc, ADR (United Kingdom) |
(11,821 |
) |
(473 |
) |
|||||||
| Jazz Pharmaceuticals plc* |
(3,712 |
) |
(406 |
) |
|||||||
| Johnson & Johnson |
(3,625 |
) |
(420 |
) |
|||||||
|
Mallinckrodt plc* |
(7,054 |
) |
(418 |
) |
|||||||
|
Merck & Co., Inc. |
(8,138 |
) |
(478 |
) |
|||||||
|
Mylan NV* |
(11,123 |
) |
(406 |
) |
|||||||
| Novartis AG, ADR (Switzerland) |
(6,609 |
) |
(469 |
) |
|||||||
|
Perrigo Co. plc |
(8,170 |
) |
(680 |
) |
|||||||
|
Pfizer, Inc. |
(15,474 |
) |
(491 |
) |
|||||||
| Roche Holding AG (Switzerland) |
(7,790 |
) |
(1,791 |
) |
|||||||
| Sanofi, ADR (France) |
(13,611 |
) |
(529 |
) |
|||||||
| Teva Pharmaceutical Industries Ltd., ADR (Israel) |
(10,970 |
) |
(469 |
) |
|||||||
|
UCB SA (Belgium) |
(13,243 |
) |
(897 |
) |
|||||||
| Valeant Pharmaceuticals International, Inc.* |
(28,750 |
) |
(513 |
) |
|||||||
|
Zoetis, Inc. |
(15,312 |
) |
(732 |
) |
|||||||
|
(9,558 |
) |
||||||||||
See Notes to Financial Statements
22
Consolidated Schedule of Investments Neuberger Berman Absolute Return Multi-Manager Fund (cont'd)
|
Investments |
Shares |
Value (000) |
|||||||||
|
Road & Rail (0.2%) |
|||||||||||
| Union Pacific Corp. |
(10,320 |
) |
$ |
(910 |
) |
||||||
| YRC Worldwide, Inc.* |
(15,803 |
) |
(140 |
) |
|||||||
|
(1,050 |
) |
||||||||||
|
Semiconductors & Semiconductor Equipment (0.3%) |
|||||||||||
| Analog Devices, Inc. |
(5,341 |
) |
(342 |
) |
|||||||
| Applied Materials, Inc. |
(41,250 |
) |
(1,200 |
) |
|||||||
|
(1,542 |
) |
||||||||||
|
Software (0.3%) |
|||||||||||
| Citrix Systems, Inc.* |
(11,690 |
) |
(991 |
) |
|||||||
| SS&C Technologies Holdings, Inc. |
(15,790 |
) |
(504 |
) |
|||||||
| VMware, Inc., Class A* |
(2,285 |
) |
(180 |
) |
|||||||
|
(1,675 |
) |
||||||||||
|
Specialty Retail (0.9%) |
|||||||||||
| American Eagle Outfitters, Inc. |
(75,900 |
) |
(1,293 |
) |
|||||||
| Bed Bath & Beyond, Inc. |
(1,551 |
) |
(63 |
) |
|||||||
|
Best Buy Co., Inc. |
(19,035 |
) |
(741 |
) |
|||||||
| Dick's Sporting Goods, Inc. |
(1,189 |
) |
(66 |
) |
|||||||
|
DSW, Inc., Class A |
(26,690 |
) |
(554 |
) |
|||||||
|
Foot Locker, Inc. |
(8,616 |
) |
(575 |
) |
|||||||
| GameStop Corp., Class A |
(2,551 |
) |
(62 |
) |
|||||||
|
Gap, Inc. (The) |
(3,074 |
) |
(85 |
) |
|||||||
| GNC Holdings, Inc., Class A |
(2,768 |
) |
(37 |
) |
|||||||
| Hibbett Sports, Inc.* |
(6,136 |
) |
(239 |
) |
|||||||
|
L Brands, Inc. |
(985 |
) |
(71 |
) |
|||||||
|
Lowe's Cos., Inc. |
(17,930 |
) |
(1,195 |
) |
|||||||
| Williams-Sonoma, Inc. |
(1,302 |
) |
(60 |
) |
|||||||
|
(5,041 |
) |
||||||||||
|
Textiles, Apparel & Luxury Goods (0.2%) |
|||||||||||
| Kate Spade & Co.* |
(67,900 |
) |
(1,137 |
) |
|||||||
|
Thrifts & Mortgage Finance (0.2%) |
|||||||||||
|
BofI Holding, Inc.* |
(27,960 |
) |
(521 |
) |
|||||||
| Home Capital Group, Inc. (Canada) |
(41,777 |
) |
(827 |
) |
|||||||
| New York Community Bancorp, Inc. |
(9,000 |
) |
(129 |
) |
|||||||
|
(1,477 |
) |
||||||||||
|
Investments |
Shares |
Value (000) |
|||||||||
|
Trading Companies & Distributors (0.3%) |
|||||||||||
|
GATX Corp. |
(28,300 |
) |
$ |
(1,239 |
) |
||||||
| MSC Industrial Direct Co., Inc., Class A |
(10,360 |
) |
(754 |
) |
|||||||
|
(1,993 |
) |
||||||||||
| Total Common Stocks (Proceeds $(93,291)) |
(90,698 |
) |
|||||||||
|
Exchange Traded Funds (2.3%) |
|||||||||||
|
Alerian MLP Fund |
(253,112 |
) |
(3,096 |
) |
|||||||
| CurrencyShares Euro Trust* |
(27,300 |
) |
(2,914 |
) |
|||||||
| Energy Select Sector SPDR Fund |
(37,011 |
) |
(2,540 |
) |
|||||||
| Health Care Select Sector SPDR Fund |
(4,116 |
) |
(277 |
) |
|||||||
| iShares Russell 2000 Fund |
(1,997 |
) |
(237 |
) |
|||||||
| iShares U.S. Real Estate Fund |
(3,626 |
) |
(278 |
) |
|||||||
| SPDR S&P MidCap 400 Fund Trust |
(1,810 |
) |
(497 |
) |
|||||||
| SPDR S&P500 Fund Trust |
(1,877 |
) |
(399 |
) |
|||||||
| Utilities Select Sector SPDR Fund |
(65,811 |
) |
(3,253 |
) |
|||||||
| Total Exchange Traded Funds (Proceeds $(12,790)) |
(13,491 |
) |
|||||||||
| Principal Amount |
|||||||||||
|
Corporate Bonds (2.2%) |
|||||||||||
|
Chemicals (0.2%) |
|||||||||||
| Chemours Co. (The) 6.63%, 5/15/2023 |
$ |
(1,037,800 |
) |
(1,017 |
) |
||||||
|
Food Products (0.1%) |
|||||||||||
| Flowers Foods, Inc. 4.38%, 4/1/2022 |
(516,000 |
) |
(545 |
) |
|||||||
|
Hotels, Restaurants & Leisure (0.2%) |
|||||||||||
| Wynn Las Vegas LLC 5.50%, 3/1/2025(e) |
(1,395,000 |
) |
(1,405 |
) |
|||||||
|
Investments |
Principal Amount |
Value (000) |
|||||||||
|
IT Services (0.4%) |
|||||||||||
| iPayment, Inc. 9.50%, 12/15/2019(e) |
$ |
(312,962 |
) |
$ |
(318 |
) |
|||||
| Sungard Availability Services Capital, Inc. 8.75%, 4/1/2022(e) |
(2,830,000 |
) |
(1,981 |
) |
|||||||
|
(2,299 |
) |
||||||||||
|
Media (0.1%) |
|||||||||||
| Gray Television, Inc. 5.88%, 7/15/2026(c)(e) |
(742,000 |
) |
(742 |
) |
|||||||
| Metals & Mining (0.0%)(b) | |||||||||||
| Cliffs Natural Resources, Inc. 8.00%, 9/30/2020(e) |
(21,000 |
) |
(21 |
) |
|||||||
|
Multiline Retail (0.3%) |
|||||||||||
| Macy's Retail Holdings, Inc. 4.50%, 12/15/2034 |
(1,844,000 |
) |
(1,700 |
) |
|||||||
|
Pharmaceuticals (0.7%) |
|||||||||||
| Endo Finance LLC 5.75%, 1/15/2022(e) |
(1,965,000 |
) |
(1,788 |
) |
|||||||
| Valeant Pharmaceuticals International, Inc. 5.38%, 3/15/2020(e) |
(2,930,000 |
) |
(2,520 |
) |
|||||||
|
(4,308 |
) |
||||||||||
|
Specialty Retail (0.1%) |
|||||||||||
| Gap, Inc. (The) 5.95%, 4/12/2021 |
(226,000 |
) |
(243 |
) |
|||||||
|
Trading Companies & Distributors (0.1%) |
|||||||||||
| United Rentals North America, Inc. 5.75%, 11/15/2024 |
(706,000 |
) |
(740 |
) |
|||||||
| Total Corporate Bonds (Proceeds $(12,689)) |
(13,020 |
) |
|||||||||
|
Shares |
|||||||||||
|
Exchange Traded Note (0.3%) |
|||||||||||
| JPMorgan Alerian MLP Index ETN (Proceeds $(1,860)) |
(61,013 |
) |
(1,839 |
) |
|||||||
See Notes to Financial Statements
23
Consolidated Schedule of Investments Neuberger Berman Absolute Return Multi-Manager Fund (cont'd)
|
Investments |
Shares |
Value (000) |
|||||||||
|
Master Limited Partnerships (0.2%) |
|||||||||||
| Gas Utilities (0.0%)(b) | |||||||||||
| Ferrellgas Partners LP |
(26,965 |
) |
$ |
(235 |
) |
||||||
|
Oil, Gas & Consumable Fuels (0.2%) |
|||||||||||
| Crestwood Equity Partners LP |
(2,537 |
) |
(51 |
) |
|||||||
| Enable Midstream Partners LP |
(3,503 |
) |
(51 |
) |
|||||||
| Enbridge Energy Partners LP |
(2,427 |
) |
(60 |
) |
|||||||
| Golar LNG Partners LP (United Kingdom) |
(11,543 |
) |
(237 |
) |
|||||||
| Holly Energy Partners LP |
(7,142 |
) |
(218 |
) |
|||||||
| Midcoast Energy Partners LP |
(18,638 |
) |
(145 |
) |
|||||||
|
TC PipeLines LP |
(6,281 |
) |
(328 |
) |
|||||||
| Williams Partners LP |
(6,766 |
) |
(242 |
) |
|||||||
|
(1,332 |
) |
||||||||||
| Total Master Limited Partnerships (Proceeds $(1,829)) |
(1,567 |
) |
|||||||||
| Total Short Positions (Proceeds $(122,459)) |
(120,615 |
) |
|||||||||
| Total Investments (74.8%) (Cost $452,516) |
443,142 |
||||||||||
| Other Assets Less Liabilities (25.2%)(r) |
149,837 |
||||||||||
|
Net assets (100.0%) |
$ |
592,979 |
|||||||||
See Notes to Financial Statements
24
Consolidated Schedule of Investments Neuberger Berman Absolute Return Multi-Manager Fund (cont'd)
|
* |
Non-income producing security. |
|
(a) |
All or a portion of this security is segregated in connection with obligations for futures, swaps, options written, delayed delivery securities and/or forward foreign currency contracts with a total value of approximately $258,046,000. |
|
(b) |
Represents less than 0.05% of net assets. |
|
(c) |
Illiquid security. |
|
(d) |
All or a portion of this security is pledged with the custodian for securities sold short and options written. |
|
(e) |
Securities were purchased or sold short under Rule 144A of the Securities Act of 1933, as amended (the "1933 Act"), or are otherwise restricted and, unless registered under the 1933 Act or exempted from registration, may only be sold to qualified institutional investors or may have other restrictions on resale. At 10/31/2016, these securities amounted to approximately $99,995,000 of long positions and $(8,775,000) of short positions, or 16.9% and (1.5%), respectively, of net assets for the Fund. Securities denoted with "(e)" but without "(c)" have been deemed by the investment manager to be liquid. |
|
(f) |
Security fair valued as of 10/31/2016 in accordance with procedures approved by the Board of Trustees. Total value of all such securities at 10/31/2016 amounted to approximately $1,475,000, which represents approximately 0.2% of net assets of the Fund. |
|
(g) |
Issuer filed for bankruptcy. |
|
(h) |
Variable or floating rate security. The interest rate shown was the current rate as of 10/31/2016 and changes periodically. |
|
(i) |
All or a portion of this security had not settled as of 10/31/2016 and thus may not have an interest rate in effect. Interest rates do not take effect until settlement. |
|
(j) |
Defaulted security. |
|
(k) |
All or a portion of this security was purchased on a delayed delivery basis. |
|
(l) |
Amount less than one thousand. |
|
(m) |
Step bond. Coupon rate is a fixed rate for an initial period that either resets at a specific date or may reset in the future contingent upon a rating change made by a rating agency. The interest rate shown was the current rate as of 10/31/2016. |
|
(n) |
Perpetual Security. The rate reflected was the rate in effect on 10/31/2016. The maturity date reflects the next call date. |
|
(o) |
Represents 7-day effective yield as of 10/31/2016. |
|
(p) |
All or a portion represents positions held by Neuberger Berman Cayman ARMM Fund I Ltd. (the "Subsidiary") (See Note A in Notes to Financial Statements). |
|
(q) |
At 10/31/2016 the Fund had approximately $122,643,000 deposited in one or more accounts to satisfy collateral requirements for borrowing in connection with securities sold short. |
|
(r) |
Includes the impact of the Fund's open positions in derivatives at 10/31/2016. |
See Notes to Financial Statements
25
Consolidated Schedule of Investments Neuberger Berman Absolute Return Multi-Manager Fund (cont'd)
Abbreviations
ADR American Depositary Receipt
CLO Collateralized Loan Obligations
DIP Debtor-in-Possession
FDR Fiduciary Depositary Receipt
GDR Global Depositary Receipt
PJSC Public Joint Stock Company
SPDR Standard & Poor's Depositary Receipt
Derivative Instruments
Futures contracts ("futures")
At October 31, 2016, open positions in futures for the Fund were as follows:
|
Expiration |
Open Contracts |
Position |
Unrealized Appreciation/ (Depreciation) |
||||||||||||
|
11/10/2016 |
16 Low Sulphur Gas Oil(a) |
Long |
$ |
(38,575 |
) |
||||||||||
|
11/14/2016 |
5 Lead(a) |
Long |
28,454 |
||||||||||||
|
11/14/2016 |
20 Nickel(a) |
Long |
16,894 |
||||||||||||
|
11/14/2016 |
46 Premium High Grade Aluminum(a) |
Long |
86,970 |
||||||||||||
|
11/14/2016 |
20 Zinc(a) |
Long |
122,191 |
||||||||||||
|
11/15/2016 |
2 White Sugar(a) |
Long |
(932 |
) |
|||||||||||
|
11/18/2016 |
9 Amsterdam Index(a) |
Long |
334 |
||||||||||||
|
11/18/2016 |
16 CAC40 Index(a) |
Long |
(2,357 |
) |
|||||||||||
|
11/18/2016 |
80 OMXS30 Index(a) |
Long |
(5,528 |
) |
|||||||||||
|
11/21/2016 |
8 WTI Crude Oil(a) |
Long |
(29,668 |
) |
|||||||||||
|
11/24/2016 |
66 SGX Nifty 50 Index(a) |
Long |
(12,970 |
) |
|||||||||||
|
11/28/2016 |
19 Natural Gas(a) |
Long |
(78,053 |
) |
|||||||||||
|
11/29/2016 |
85 FTSE China A50 Index(a) |
Long |
(1,618 |
) |
|||||||||||
|
11/29/2016 |
7 Hang Seng Index(a) |
Long |
(18,659 |
) |
|||||||||||
|
11/29/2016 |
10 H-SHARES Index(a) |
Long |
(7,046 |
) |
|||||||||||
|
11/29/2016 |
23 MSCI Singapore Index(a) |
Long |
(5,120 |
) |
|||||||||||
|
11/29/2016 |
43 MSCI Taiwan Stock Index(a) |
Long |
(8,773 |
) |
|||||||||||
|
11/30/2016 |
15 Brent Crude Oil(a) |
Long |
(61,724 |
) |
|||||||||||
|
11/30/2016 |
12 New York Harbor ULSD(a) |
Long |
(44,684 |
) |
|||||||||||
|
11/30/2016 |
9 RBOB Gasoline(a) |
Long |
(26,798 |
) |
|||||||||||
|
12/7/2016 |
35 Cotton No. 2(a) |
Long |
(20,672 |
) |
|||||||||||
|
12/8/2016 |
50 Euro—Bobl(a) |
Long |
(32,149 |
) |
|||||||||||
|
12/8/2016 |
6 Euro-BTP Italian Government Bond(a) |
Long |
(27,101 |
) |
|||||||||||
|
12/8/2016 |
43 Euro-BTP Italian Government Bond(a) |
Long |
(19,467 |
) |
|||||||||||
|
12/8/2016 |
8 Euro—Bund(a) |
Long |
(20,616 |
) |
|||||||||||
|
12/8/2016 |
7 Euro—Bund |
Long |
(21,658 |
) |
|||||||||||
|
12/8/2016 |
2 Euro-Buxl 30-Year Bond(a) |
Long |
(19,969 |
) |
|||||||||||
|
12/8/2016 |
9 Euro—OAT(a) |
Long |
(29,260 |
) |
|||||||||||
|
12/8/2016 |
90 Euro—SCHATZ(a) |
Long |
(6,885 |
) |
|||||||||||
See Notes to Financial Statements
26
Consolidated Schedule of Investments Neuberger Berman Absolute Return Multi-Manager Fund (cont'd)
|
Expiration |
Open Contracts |
Position |
Unrealized Appreciation/ (Depreciation) |
||||||
|
12/8/2016 |
5 Nikkei 225(a) |
Long |
$ |
7,515 |
|||||
|
12/8/2016 |
1 TOPIX Index(a) |
Long |
1,188 |
||||||
|
12/13/2016 |
1 10-Year Japanese Government Bond(a) |
Long |
(5,815 |
) |
|||||
|
12/14/2016 |
7 Soybean Meal(a) |
Long |
(2,366 |
) |
|||||
|
12/14/2016 |
71 Soybean Oil(a) |
Long |
66,274 |
||||||
|
12/15/2016 |
19 Australia 10-Year Bond(a) |
Long |
(42,002 |
) |
|||||
|
12/15/2016 |
1 Australia 3-Year Bond(a) |
Long |
(450 |
) |
|||||
|
12/15/2016 |
15 S&P/Toronto Stock Exchange 60 Index(a) |
Long |
52,042 |
||||||
|
12/15/2016 |
11 SPI 200 Index(a) |
Long |
9,031 |
||||||
|
12/16/2016 |
3 DAX Index(a) |
Long |
12,804 |
||||||
|
12/16/2016 |
14 E-Mini DJIA CBOT(a) |
Long |
(22,288 |
) |
|||||
|
12/16/2016 |
1 E-Mini MSCI EAFE Index(a) |
Long |
(107 |
) |
|||||
|
12/16/2016 |
22 E-Mini MSCI Emerging Markets Index(a) |
Long |
1,510 |
||||||
|
12/16/2016 |
7 E-Mini Russell 2000(a) |
Long |
(17,204 |
) |
|||||
|
12/16/2016 |
17 FTSE 100 Index(a) |
Long |
59,704 |
||||||
|
12/16/2016 |
15 NASDAQ 100 E-Mini(a) |
Long |
4,131 |
||||||
|
12/16/2016 |
12 S&P 500 E-Mini Index(a) |
Long |
(19,521 |
) |
|||||
|
12/16/2016 |
6 S&P MID 400 E-Mini(a) |
Long |
(21,585 |
) |
|||||
|
12/16/2016 |
15 The EURO STOXX 600 Index(a) |
Long |
(2,238 |
) |
|||||
|
12/16/2016 |
15 The EURO STOXX 50 Index(a) |
Long |
6,147 |
||||||
|
12/19/2016 |
13 Australian Dollar(a) |
Long |
16,104 |
||||||
|
12/19/2016 |
13 Canadian 10-Year Bond(a) |
Long |
(18,958 |
) |
|||||
|
12/19/2016 |
25 Coffee 'C'(a) |
Long |
125,814 |
||||||
|
12/19/2016 |
8 Euro/Pound Sterling Cross Rate(a) |
Long |
52,731 |
||||||
|
12/19/2016 |
3 Euro/Swiss Franc Cross Rate(a) |
Long |
(2,398 |
) |
|||||
|
12/19/2016 |
7 Japanese Yen(a) |
Long |
(23,842 |
) |
|||||
|
12/19/2016 |
4 Lead(a) |
Long |
11,963 |
||||||
|
12/19/2016 |
14 New Zealand Dollar(a) |
Long |
(11,241 |
) |
|||||
|
12/19/2016 |
17 Nickel(a) |
Long |
51,082 |
||||||
|
12/19/2016 |
35 Premium High Grade Aluminum(a) |
Long |
95,515 |
||||||
|
12/19/2016 |
17 U.S. Dollar Index(a) |
Long |
1,966 |
||||||
|
12/19/2016 |
4 USD/Czech Koruna Cross Rate |
Long |
9,461 |
||||||
|
12/19/2016 |
2 USD/Norwegian Krone Cross Rate |
Long |
159 |
||||||
|
12/19/2016 |
2 USD/Swedish Krona Cross Rate |
Long |
12,646 |
||||||
|
12/19/2016 |
15 Zinc(a) |
Long |
87,549 |
||||||
|
12/20/2016 |
16 U.S. Treasury 10-Year Note(a) |
Long |
(21,507 |
) |
|||||
|
12/20/2016 |
9 U.S. Treasury 10-Year Note |
Long |
(2,115 |
) |
|||||
|
12/20/2016 |
2 U.S. Treasury Long Bond(a) |
Long |
(15,028 |
) |
|||||
|
12/28/2016 |
7 Gold 100 Oz.(a) |
Long |
(31,386 |
) |
|||||
|
12/28/2016 |
5 Long Gilt(a) |
Long |
(36,883 |
) |
|||||
|
12/28/2016 |
9 Nymex Palladium(a) |
Long |
(73,564 |
) |
|||||
See Notes to Financial Statements
27
Consolidated Schedule of Investments Neuberger Berman Absolute Return Multi-Manager Fund (cont'd)
|
Expiration |
Open Contracts |
Position |
Unrealized Appreciation/ (Depreciation) |
||||||||||||
|
12/28/2016 |
8 Silver(a) |
Long |
$ |
(47,338 |
) |
||||||||||
|
12/30/2016 |
21 U.S. Treasury 2-Year Note(a) |
Long |
(3,218 |
) |
|||||||||||
|
12/30/2016 |
25 U.S. Treasury 5-Year Note(a) |
Long |
(12,473 |
) |
|||||||||||
|
1/13/2017 |
12 Canola (WCE)(a) |
Long |
4,612 |
||||||||||||
|
1/13/2017 |
14 Soybean(a) |
Long |
3,154 |
||||||||||||
|
1/16/2017 |
5 Lead(a) |
Long |
6,354 |
||||||||||||
|
1/16/2017 |
19 Nickel(a) |
Long |
1,298 |
||||||||||||
|
1/16/2017 |
39 Premium High Grade Aluminum(a) |
Long |
72,591 |
||||||||||||
|
1/16/2017 |
17 Zinc(a) |
Long |
80,900 |
||||||||||||
|
1/31/2017 |
3 Robusta Coffee(a) |
Long |
156 |
||||||||||||
|
2/28/2017 |
46 Sugar 11(a) |
Long |
19,261 |
||||||||||||
|
6/8/2017 |
28 ASX 90 Day Bank Accepted Bills(a) |
Long |
(6,002 |
) |
|||||||||||
|
6/19/2017 |
15 Euro CHF 3-Month LIFFE(a) |
Long |
(1,949 |
) |
|||||||||||
|
9/18/2017 |
86 3-Month Euro Euribor(a) |
Long |
(15,354 |
) |
|||||||||||
|
9/18/2017 |
1 Canadian 3-Month Bank Acceptance(a) |
Long |
74 |
||||||||||||
|
9/20/2017 |
106 90-Day Sterling(a) |
Long |
(29,631 |
) |
|||||||||||
|
12/18/2017 |
43 90-Day EURODollar(a) |
Long |
(5,501 |
) |
|||||||||||
|
11/14/2016 |
5 Lead(a) |
Short |
(14,655 |
) |
|||||||||||
|
11/14/2016 |
20 Nickel(a) |
Short |
(73,438 |
) |
|||||||||||
|
11/14/2016 |
46 Premium High Grade Aluminum(a) |
Short |
(185,261 |
) |
|||||||||||
|
11/14/2016 |
20 Zinc(a) |
Short |
(118,197 |
) |
|||||||||||
|
12/8/2016 |
2 Euro-BTP Italian Government Bond |
Short |
5,014 |
||||||||||||
|
12/8/2016 |
2 Euro—OAT |
Short |
(225 |
) |
|||||||||||
|
12/13/2016 |
11 Cocoa(a) |
Short |
(838 |
) |
|||||||||||
|
12/14/2016 |
27 Cocoa(a) |
Short |
23,490 |
||||||||||||
|
12/14/2016 |
72 Corn(a) |
Short |
(57,463 |
) |
|||||||||||
|
12/14/2016 |
10 Hard Red Winter Wheat(a) |
Short |
144 |
||||||||||||
|
12/14/2016 |
47 Lean Hog(a) |
Short |
16,563 |
||||||||||||
|
12/14/2016 |
49 Wheat(a) |
Short |
(10,364 |
) |
|||||||||||
|
12/15/2016 |
32 FTSE/JSE Top 40 Index(a) |
Short |
29,329 |
||||||||||||
|
12/16/2016 |
2 FTSE/MIB Index(a) |
Short |
(7,343 |
) |
|||||||||||
|
12/16/2016 |
29 S&P 500 E-Mini Index |
Short |
(6,058 |
) |
|||||||||||
|
12/16/2016 |
319 The EURO STOXX 50 Index |
Short |
(209,106 |
) |
|||||||||||
|
12/19/2016 |
9 Australian Dollar |
Short |
(13,159 |
) |
|||||||||||
|
12/19/2016 |
7 British Pound |
Short |
38,671 |
||||||||||||
|
12/19/2016 |
15 British Pound(a) |
Short |
83,281 |
||||||||||||
|
12/19/2016 |
17 Canadian 10-Year Bond |
Short |
(2,004 |
) |
|||||||||||
|
12/19/2016 |
339 Euro Fx Future with American Style Options |
Short |
1,122,639 |
||||||||||||
|
12/19/2016 |
9 Euro Fx Future with American Style Options(a) |
Short |
(2,652 |
) |
|||||||||||
|
12/19/2016 |
5 Euro/Japanese Yen(a) |
Short |
(127 |
) |
|||||||||||
|
12/19/2016 |
78 Japanese Yen |
Short |
138,774 |
||||||||||||
See Notes to Financial Statements
28
Consolidated Schedule of Investments Neuberger Berman Absolute Return Multi-Manager Fund (cont'd)
|
Expiration |
Open Contracts |
Position |
Unrealized Appreciation/ (Depreciation) |
||||||||||||
|
12/19/2016 |
4 Lead(a) |
Short |
$ |
(6,112 |
) |
||||||||||
|
12/19/2016 |
25 Mexican Peso(a) |
Short |
(7,288 |
) |
|||||||||||
|
12/19/2016 |
3 New Zealand Dollar |
Short |
2,376 |
||||||||||||
|
12/19/2016 |
17 Nickel(a) |
Short |
(611 |
) |
|||||||||||
|
12/19/2016 |
1 Polish Zloty |
Short |
2,277 |
||||||||||||
|
12/19/2016 |
35 Premium High Grade Aluminum(a) |
Short |
(77,704 |
) |
|||||||||||
|
12/19/2016 |
9 Swiss Franc(a) |
Short |
(108 |
) |
|||||||||||
|
12/19/2016 |
8 Swiss Franc |
Short |
2,552 |
||||||||||||
|
12/19/2016 |
15 Zinc(a) |
Short |
(74,294 |
) |
|||||||||||
|
12/20/2016 |
3 Canadian Dollar |
Short |
4,122 |
||||||||||||
|
12/20/2016 |
3 Canadian Dollar(a) |
Short |
718 |
||||||||||||
|
12/28/2016 |
6 Copper(a) |
Short |
(14,301 |
) |
|||||||||||
|
12/28/2016 |
8 Long Gilt |
Short |
(3,349 |
) |
|||||||||||
|
12/30/2016 |
33 Live Cattle(a) |
Short |
47,240 |
||||||||||||
|
1/16/2017 |
6 Copper(a) |
Short |
(21,105 |
) |
|||||||||||
|
1/16/2017 |
1 Nickel(a) |
Short |
(1,491 |
) |
|||||||||||
|
1/26/2017 |
10 Feeder Cattle(a) |
Short |
(11,609 |
) |
|||||||||||
|
1/27/2017 |
8 Platinum(a) |
Short |
(14,317 |
) |
|||||||||||
|
Total |
$ |
680,344 |
|||||||||||||
(a) The investment is held by the Subsidiary (see Note A in Notes to Financial Statements.)
At October 31, 2016, the notional value of futures for the Fund was $175,377,199 for long positions and $(98,809,895) for short positions.
For the year ended October 31, 2016, the average notional value of futures for the Fund was $313,784,251 for long positions and $(86,024,627) for short positions. The Fund had $5,919,435 deposited in segregated accounts to cover margin requirements on open futures.
Forward foreign currency contracts ("forward contracts")
At October 31, 2016, open forward contracts for the Fund were as follows:
|
Contracts to Receive |
In Exchange For |
Counterparty |
Settlement Date |
Net Unrealized Appreciation/ (Depreciation) |
||||||||||||
| 132,614 |
Australian Dollar |
$ |
101,021 |
JPMorgan Chase Bank, NA |
11/16/2016 |
$ |
(179 |
) |
||||||||
| 1,425,411 |
Brazilian Real |
437,862 |
Bank of America, NA(a) |
11/3/2016 |
8,552 |
|||||||||||
| 26,964 |
Brazilian Real |
8,231 |
Bank of America, NA(a) |
11/3/2016 |
213 |
|||||||||||
| 3,724 |
Brazilian Real |
1,155 |
Bank of America, NA(a) |
11/3/2016 |
11 |
|||||||||||
| 769 |
Brazilian Real |
246 |
Bank of America, NA(a) |
11/3/2016 |
(5 |
) |
||||||||||
| 16,114 |
Brazilian Real |
5,131 |
Bank of America, NA(a) |
11/3/2016 |
(84 |
) |
||||||||||
| 11,450 |
Brazilian Real |
3,565 |
Bank of America, NA(a) |
11/3/2016 |
21 |
|||||||||||
| 3,717 |
Brazilian Real |
1,174 |
Bank of America, NA(a) |
11/3/2016 |
(10 |
) |
||||||||||
| 4,437 |
Brazilian Real |
1,392 |
Bank of America, NA(a) |
11/3/2016 |
(2 |
) |
||||||||||
| 4,894 |
Brazilian Real |
1,517 |
Bank of America, NA(a) |
11/3/2016 |
16 |
|||||||||||
See Notes to Financial Statements
29
Consolidated Schedule of Investments Neuberger Berman Absolute Return Multi-Manager Fund (cont'd)
|
Contracts to Receive |
In Exchange For |
Counterparty |
Settlement Date |
Net Unrealized Appreciation/ (Depreciation) |
|||||||||||
| 17,644 |
Brazilian Real |
$ |
5,414 |
Bank of America, NA(a) |
11/3/2016 |
$ |
112 |
||||||||
| 13,950 |
Brazilian Real |
4,452 |
Bank of America, NA(a) |
11/3/2016 |
(83 |
) |
|||||||||
| 1,748 |
Brazilian Real |
558 |
Bank of America, NA(a) |
11/3/2016 |
(10 |
) |
|||||||||
| 1,412,961 |
Brazilian Real |
440,583 |
Bank of America, NA(a) |
12/2/2016 |
(2,048 |
) |
|||||||||
| 10,250 |
Brazilian Real |
3,199 |
Bank of America, NA(a) |
12/2/2016 |
(18 |
) |
|||||||||
| 16,461 |
Brazilian Real |
5,136 |
Bank of America, NA(a) |
12/2/2016 |
(27 |
) |
|||||||||
| 659,155 |
Canadian Dollar |
502,863 |
JPMorgan Chase Bank, NA |
11/16/2016 |
(11,388 |
) |
|||||||||
| 3,110,242 |
Chilean Peso |
4,617 |
Bank of America, NA(a) |
12/21/2016 |
128 |
||||||||||
| 761,664,864 |
Chilean Peso |
1,124,393 |
Bank of America, NA(a) |
12/21/2016 |
37,502 |
||||||||||
| 1,924,098 |
Chilean Peso |
2,898 |
Bank of America, NA(a) |
12/21/2016 |
37 |
||||||||||
| 7,914,532 |
Chilean Peso |
11,776 |
Bank of America, NA(a) |
12/21/2016 |
297 |
||||||||||
| 1,274,679 |
Chilean Peso |
1,882 |
Bank of America, NA(a) |
12/21/2016 |
62 |
||||||||||
| 8,697 |
Chilean Peso |
13 |
Bank of America, NA(a) |
12/21/2016 |
— |
(b) |
|||||||||
| 423,917 |
Chilean Peso |
640 |
Bank of America, NA(a) |
12/21/2016 |
7 |
||||||||||
| 871,198 |
Chilean Peso |
1,294 |
Bank of America, NA(a) |
12/21/2016 |
35 |
||||||||||
| 3,924,729 |
Chilean Peso |
5,939 |
Bank of America, NA(a) |
12/21/2016 |
48 |
||||||||||
| 1,072,770 |
Chilean Peso |
1,634 |
Bank of America, NA(a) |
12/21/2016 |
2 |
||||||||||
| 4,910,545 |
Chilean Peso |
7,480 |
Bank of America, NA(a) |
12/21/2016 |
11 |
||||||||||
| 1,294,562 |
Chilean Peso |
1,983 |
Bank of America, NA(a) |
12/21/2016 |
(8 |
) |
|||||||||
| 1,444,748 |
Chilean Peso |
2,165 |
Bank of America, NA(a) |
12/21/2016 |
39 |
||||||||||
| 299,646 |
Chilean Peso |
450 |
Bank of America, NA(a) |
12/21/2016 |
7 |
||||||||||
| 1,272,998 |
Chilean Peso |
1,906 |
Bank of America, NA(a) |
12/21/2016 |
36 |
||||||||||
| 12,219,578 |
Czech Koruna |
508,939 |
Bank of America, NA(a) |
12/21/2016 |
(10,651 |
) |
|||||||||
| 4,029,713 |
Danish Krone |
608,226 |
JPMorgan Chase Bank, NA |
11/16/2016 |
(13,150 |
) |
|||||||||
| 129,000 |
Euro |
141,340 |
Bank of America, NA(a) |
11/7/2016 |
297 |
||||||||||
| 456,359 |
Euro |
497,237 |
JPMorgan Chase Bank, NA |
11/14/2016 |
3,967 |
||||||||||
| 519,501 |
Euro |
591,026 |
JPMorgan Chase Bank, NA |
11/16/2016 |
(20,429 |
) |
|||||||||
| 528,218 |
Euro |
598,091 |
JPMorgan Chase Bank, NA |
11/16/2016 |
(17,920 |
) |
|||||||||
| 980,561 |
Euro |
1,105,055 |
JPMorgan Chase Bank, NA |
11/16/2016 |
(28,051 |
) |
|||||||||
| 927,362 |
Euro |
1,047,390 |
JPMorgan Chase Bank, NA |
11/16/2016 |
(28,817 |
) |
|||||||||
| 2,356,777 |
Euro |
2,649,064 |
JPMorgan Chase Bank, NA |
11/16/2016 |
(60,485 |
) |
|||||||||
| 53,613 |
Euro |
59,471 |
JPMorgan Chase Bank, NA |
12/30/2016 |
(451 |
) |
|||||||||
| 109,319 |
Euro |
119,383 |
JPMorgan Chase Bank, NA |
12/30/2016 |
961 |
||||||||||
| 4,108,715 |
Hong Kong Dollar |
529,862 |
JPMorgan Chase Bank, NA |
11/14/2016 |
(53 |
) |
|||||||||
| 287,167 |
Hungarian Forint |
1,047 |
Bank of America, NA(a) |
12/21/2016 |
(25 |
) |
|||||||||
| 97,052 |
Hungarian Forint |
349 |
Bank of America, NA(a) |
12/21/2016 |
(4 |
) |
|||||||||
| 321,472 |
Hungarian Forint |
1,181 |
Bank of America, NA(a) |
12/21/2016 |
(37 |
) |
|||||||||
| 117,461 |
Hungarian Forint |
415 |
Bank of America, NA(a) |
12/21/2016 |
3 |
||||||||||
| 31,694 |
Hungarian Forint |
112 |
Bank of America, NA(a) |
12/21/2016 |
1 |
||||||||||
| 342,973 |
Hungarian Forint |
1,239 |
Bank of America, NA(a) |
12/21/2016 |
(19 |
) |
|||||||||
| 191,347 |
Hungarian Forint |
691 |
Bank of America, NA(a) |
12/21/2016 |
(10 |
) |
|||||||||
| 428,569 |
Hungarian Forint |
1,513 |
Bank of America, NA(a) |
12/21/2016 |
12 |
||||||||||
| 214,833 |
Hungarian Forint |
782 |
Bank of America, NA(a) |
12/21/2016 |
(18 |
) |
|||||||||
See Notes to Financial Statements
30
Consolidated Schedule of Investments Neuberger Berman Absolute Return Multi-Manager Fund (cont'd)
|
Contracts to Receive |
In Exchange For |
Counterparty |
Settlement Date |
Net Unrealized Appreciation/ (Depreciation) |
|||||||||||
| 191,656 |
Hungarian Forint |
$ |
703 |
Bank of America, NA(a) |
12/21/2016 |
$ |
(21 |
) |
|||||||
| 320,901 |
Hungarian Forint |
1,151 |
Bank of America, NA(a) |
12/21/2016 |
(9 |
) |
|||||||||
| 124,398 |
Hungarian Forint |
451 |
Bank of America, NA(a) |
12/21/2016 |
(8 |
) |
|||||||||
| 82,544,485 |
Hungarian Forint |
298,399 |
Bank of America, NA(a) |
12/21/2016 |
(4,703 |
) |
|||||||||
| 4,030,427 |
Indian Rupee |
59,502 |
Bank of America, NA(a) |
12/21/2016 |
503 |
||||||||||
| 806,058 |
Indian Rupee |
11,900 |
Bank of America, NA(a) |
12/21/2016 |
101 |
||||||||||
| 80,613 |
Indian Rupee |
1,190 |
Bank of America, NA(a) |
12/21/2016 |
10 |
||||||||||
| 806,142 |
Indian Rupee |
11,900 |
Bank of America, NA(a) |
12/21/2016 |
102 |
||||||||||
| 4,031,090 |
Indian Rupee |
59,503 |
Bank of America, NA(a) |
12/21/2016 |
512 |
||||||||||
| 80,625 |
Indian Rupee |
1,190 |
Bank of America, NA(a) |
12/21/2016 |
10 |
||||||||||
| 8,061,807 |
Indian Rupee |
119,004 |
Bank of America, NA(a) |
12/21/2016 |
1,020 |
||||||||||
| 806,142 |
Indian Rupee |
11,900 |
Bank of America, NA(a) |
12/21/2016 |
102 |
||||||||||
| 806,308 |
Indian Rupee |
11,900 |
Bank of America, NA(a) |
12/21/2016 |
104 |
||||||||||
| 806,507 |
Indian Rupee |
11,901 |
Bank of America, NA(a) |
12/21/2016 |
106 |
||||||||||
| 806,189 |
Indian Rupee |
11,900 |
Bank of America, NA(a) |
12/21/2016 |
102 |
||||||||||
| 4,031,337 |
Indian Rupee |
59,504 |
Bank of America, NA(a) |
12/21/2016 |
514 |
||||||||||
| 806,320 |
Indian Rupee |
11,900 |
Bank of America, NA(a) |
12/21/2016 |
104 |
||||||||||
| 806,273 |
Indian Rupee |
11,900 |
Bank of America, NA(a) |
12/21/2016 |
104 |
||||||||||
| 806,340 |
Indian Rupee |
11,901 |
Bank of America, NA(a) |
12/21/2016 |
104 |
||||||||||
| 976,498 |
Indian Rupee |
14,409 |
Bank of America, NA(a) |
12/21/2016 |
129 |
||||||||||
| 784,187 |
Indian Rupee |
11,649 |
Bank of America, NA(a) |
12/21/2016 |
26 |
||||||||||
| 201,326 |
Indian Rupee |
2,990 |
Bank of America, NA(a) |
12/21/2016 |
7 |
||||||||||
| 246,549 |
Indian Rupee |
3,660 |
Bank of America, NA(a) |
12/21/2016 |
11 |
||||||||||
| 157,643 |
Indian Rupee |
2,340 |
Bank of America, NA(a) |
12/21/2016 |
7 |
||||||||||
| 1,018,757 |
Indian Rupee |
15,105 |
Bank of America, NA(a) |
12/21/2016 |
62 |
||||||||||
| 921,022 |
Indian Rupee |
13,664 |
Bank of America, NA(a) |
12/21/2016 |
48 |
||||||||||
| 85,352 |
Indian Rupee |
1,266 |
Bank of America, NA(a) |
12/21/2016 |
5 |
||||||||||
| 278,130 |
Indian Rupee |
4,133 |
Bank of America, NA(a) |
12/21/2016 |
8 |
||||||||||
| 806,142 |
Indian Rupee |
11,900 |
Bank of America, NA(a) |
12/21/2016 |
102 |
||||||||||
| 1,433,047 |
Indian Rupee |
21,314 |
Bank of America, NA(a) |
12/21/2016 |
21 |
||||||||||
| 806,189 |
Indian Rupee |
11,900 |
Bank of America, NA(a) |
12/21/2016 |
102 |
||||||||||
| 164,420,616 |
Indian Rupee |
2,423,724 |
Bank of America, NA(a) |
12/21/2016 |
24,163 |
||||||||||
| 40,604 |
Indian Rupee |
603 |
Bank of America, NA(a) |
12/21/2016 |
2 |
||||||||||
| 436,035 |
Indian Rupee |
6,489 |
Bank of America, NA(a) |
12/21/2016 |
3 |
||||||||||
| 13,921 |
Indian Rupee |
207 |
Bank of America, NA(a) |
12/21/2016 |
— |
(b) |
|||||||||
| 237,338 |
Indian Rupee |
3,518 |
Bank of America, NA(a) |
12/21/2016 |
15 |
||||||||||
| 2,839,710,000 |
Indonesian Rupiah |
217,602 |
JPMorgan Chase Bank, NA |
11/16/2016 |
(86 |
) |
|||||||||
| 23,871 |
Israeli New Shekel |
6,263 |
Bank of America, NA(a) |
12/21/2016 |
(33 |
) |
|||||||||
| 385,306 |
Israeli New Shekel |
102,648 |
Bank of America, NA(a) |
12/21/2016 |
(2,090 |
) |
|||||||||
| 16,897 |
Israeli New Shekel |
4,505 |
Bank of America, NA(a) |
12/21/2016 |
(95 |
) |
|||||||||
| 22,786 |
Israeli New Shekel |
6,073 |
Bank of America, NA(a) |
12/21/2016 |
(126 |
) |
|||||||||
| 8,669 |
Israeli New Shekel |
2,251 |
Bank of America, NA(a) |
12/21/2016 |
11 |
||||||||||
| 5,896 |
Israeli New Shekel |
1,537 |
Bank of America, NA(a) |
12/21/2016 |
2 |
||||||||||
See Notes to Financial Statements
31
Consolidated Schedule of Investments Neuberger Berman Absolute Return Multi-Manager Fund (cont'd)
|
Contracts to Receive |
In Exchange For |
Counterparty |
Settlement Date |
Net Unrealized Appreciation/ (Depreciation) |
|||||||||||
| 3,421,641 |
Israeli New Shekel |
$ |
909,054 |
Bank of America, NA(a) |
12/21/2016 |
$ |
(16,069 |
) |
|||||||
| 11,888 |
Israeli New Shekel |
3,098 |
Bank of America, NA(a) |
12/21/2016 |
5 |
||||||||||
| 32,113 |
Israeli New Shekel |
8,374 |
Bank of America, NA(a) |
12/21/2016 |
7 |
||||||||||
| 451,460 |
Israeli New Shekel |
119,892 |
Bank of America, NA(a) |
12/21/2016 |
(2,069 |
) |
|||||||||
| 1,460 |
Israeli New Shekel |
388 |
Bank of America, NA(a) |
12/21/2016 |
(7 |
) |
|||||||||
| 100,249,276 |
Japanese Yen |
980,431 |
JPMorgan Chase Bank, NA |
11/16/2016 |
(24,057 |
) |
|||||||||
| 44,201,636 |
Japanese Yen |
431,782 |
JPMorgan Chase Bank, NA |
11/16/2016 |
(10,100 |
) |
|||||||||
| 247,558,500 |
Korean Won |
223,327 |
JPMorgan Chase Bank, NA |
11/16/2016 |
(6,964 |
) |
|||||||||
| 63,000,000 |
Korean Won |
56,308 |
Bank of America, NA(a) |
12/21/2016 |
(1,256 |
) |
|||||||||
| 488,712 |
Korean Won |
430 |
Bank of America, NA(a) |
12/21/2016 |
(3 |
) |
|||||||||
| 746,426 |
Korean Won |
667 |
Bank of America, NA(a) |
12/21/2016 |
(15 |
) |
|||||||||
| 1,637,621,706 |
Korean Won |
1,455,158 |
Bank of America, NA(a) |
12/21/2016 |
(24,142 |
) |
|||||||||
| 746,253 |
Korean Won |
657 |
Bank of America, NA(a) |
12/21/2016 |
(5 |
) |
|||||||||
| 7,215,621 |
Korean Won |
6,481 |
Bank of America, NA(a) |
12/21/2016 |
(176 |
) |
|||||||||
| 3,851,915 |
Korean Won |
3,487 |
Bank of America, NA(a) |
12/21/2016 |
(121 |
) |
|||||||||
| 4,533,825 |
Korean Won |
3,964 |
Bank of America, NA(a) |
12/21/2016 |
(2 |
) |
|||||||||
| 32,544,573 |
Korean Won |
28,918 |
Bank of America, NA(a) |
12/21/2016 |
(479 |
) |
|||||||||
| 264,028 |
Korean Won |
241 |
Bank of America, NA(a) |
12/21/2016 |
(10 |
) |
|||||||||
| 29,572,770 |
Korean Won |
26,011 |
Bank of America, NA(a) |
12/21/2016 |
(169 |
) |
|||||||||
| 4,586,909 |
Korean Won |
4,018 |
Bank of America, NA(a) |
12/21/2016 |
(10 |
) |
|||||||||
| 1,293,106 |
Korean Won |
1,166 |
Bank of America, NA(a) |
12/21/2016 |
(36 |
) |
|||||||||
| 6,413,178 |
Korean Won |
5,662 |
Bank of America, NA(a) |
12/21/2016 |
(58 |
) |
|||||||||
| 2,414,809 |
Korean Won |
2,196 |
Bank of America, NA(a) |
12/21/2016 |
(86 |
) |
|||||||||
| 1,843,808 |
Korean Won |
1,624 |
Bank of America, NA(a) |
12/21/2016 |
(13 |
) |
|||||||||
| 10,294,516 |
Korean Won |
9,351 |
Bank of America, NA(a) |
12/21/2016 |
(355 |
) |
|||||||||
| 10,901 |
Malaysian Ringgit |
2,624 |
Bank of America, NA(a) |
12/21/2016 |
(32 |
) |
|||||||||
| 6,482 |
Malaysian Ringgit |
1,536 |
Bank of America, NA(a) |
12/21/2016 |
5 |
||||||||||
| 7,770 |
Malaysian Ringgit |
1,849 |
Bank of America, NA(a) |
12/21/2016 |
(1 |
) |
|||||||||
| 2,491,943 |
Malaysian Ringgit |
599,730 |
Bank of America, NA(a) |
12/21/2016 |
(7,120 |
) |
|||||||||
| 2,929 |
Malaysian Ringgit |
707 |
Bank of America, NA(a) |
12/21/2016 |
(10 |
) |
|||||||||
| 8,680 |
Malaysian Ringgit |
2,094 |
Bank of America, NA(a) |
12/21/2016 |
(30 |
) |
|||||||||
| 9,246 |
Malaysian Ringgit |
2,229 |
Bank of America, NA(a) |
12/21/2016 |
(30 |
) |
|||||||||
| 1,614 |
Malaysian Ringgit |
382 |
Bank of America, NA(a) |
12/21/2016 |
2 |
||||||||||
| 9,926 |
Malaysian Ringgit |
2,364 |
Bank of America, NA(a) |
12/21/2016 |
(4 |
) |
|||||||||
| 1,577 |
Malaysian Ringgit |
373 |
Bank of America, NA(a) |
12/21/2016 |
2 |
||||||||||
| 1,311 |
Malaysian Ringgit |
318 |
Bank of America, NA(a) |
12/21/2016 |
(6 |
) |
|||||||||
| 5,157 |
Malaysian Ringgit |
1,238 |
Bank of America, NA(a) |
12/21/2016 |
(12 |
) |
|||||||||
| 7,739 |
Malaysian Ringgit |
1,869 |
Bank of America, NA(a) |
12/21/2016 |
(29 |
) |
|||||||||
| 631,527 |
Mexican Peso |
33,524 |
JPMorgan Chase Bank, NA |
11/14/2016 |
(158 |
) |
|||||||||
| 8,215 |
New Taiwan Dollar |
261 |
Bank of America, NA(a) |
12/21/2016 |
(1 |
) |
|||||||||
| 10,949 |
New Taiwan Dollar |
345 |
Bank of America, NA(a) |
12/21/2016 |
2 |
||||||||||
| 204,141 |
New Taiwan Dollar |
6,473 |
Bank of America, NA(a) |
12/21/2016 |
(2 |
) |
|||||||||
| 3,709,563 |
New Taiwan Dollar |
119,063 |
Bank of America, NA(a) |
12/21/2016 |
(1,470 |
) |
|||||||||
See Notes to Financial Statements
32
Consolidated Schedule of Investments Neuberger Berman Absolute Return Multi-Manager Fund (cont'd)
|
Contracts to Receive |
In Exchange For |
Counterparty |
Settlement Date |
Net Unrealized Appreciation/ (Depreciation) |
|||||||||||
| 113,799 |
New Taiwan Dollar |
$ |
3,602 |
Bank of America, NA(a) |
12/21/2016 |
$ |
5 |
||||||||
| 110,492 |
New Taiwan Dollar |
3,492 |
Bank of America, NA(a) |
12/21/2016 |
11 |
||||||||||
| 47,813 |
New Taiwan Dollar |
1,528 |
Bank of America, NA(a) |
12/21/2016 |
(12 |
) |
|||||||||
| 36,129,458 |
New Taiwan Dollar |
1,145,712 |
Bank of America, NA(a) |
12/21/2016 |
(411 |
) |
|||||||||
| 270,629 |
New Taiwan Dollar |
8,687 |
Bank of America, NA(a) |
12/21/2016 |
(108 |
) |
|||||||||
| 370,911 |
New Taiwan Dollar |
11,906 |
Bank of America, NA(a) |
12/21/2016 |
(148 |
) |
|||||||||
| 42,931 |
New Taiwan Dollar |
1,359 |
Bank of America, NA(a) |
12/21/2016 |
2 |
||||||||||
| 4,479 |
New Taiwan Dollar |
144 |
Bank of America, NA(a) |
12/21/2016 |
(2 |
) |
|||||||||
| 65,105 |
New Taiwan Dollar |
2,090 |
Bank of America, NA(a) |
12/21/2016 |
(26 |
) |
|||||||||
| 92,828 |
New Taiwan Dollar |
2,925 |
Bank of America, NA(a) |
12/21/2016 |
18 |
||||||||||
| 241,199 |
New Taiwan Dollar |
7,612 |
Bank of America, NA(a) |
12/21/2016 |
34 |
||||||||||
| 39,802 |
New Taiwan Dollar |
1,262 |
Bank of America, NA(a) |
12/21/2016 |
— |
(b) |
|||||||||
| 3,016,066 |
Norwegian Krone |
366,290 |
JPMorgan Chase Bank, NA |
11/16/2016 |
(1,247 |
) |
|||||||||
| 3,936,769 |
Norwegian Krone |
473,358 |
JPMorgan Chase Bank, NA |
11/16/2016 |
3,121 |
||||||||||
| 1,864 |
Norwegian Krone |
228 |
Bank of America, NA(a) |
12/21/2016 |
(2 |
) |
|||||||||
| 6,607 |
Norwegian Krone |
801 |
Bank of America, NA(a) |
12/21/2016 |
(1 |
) |
|||||||||
| 749,741 |
Norwegian Krone |
92,449 |
Bank of America, NA(a) |
12/21/2016 |
(1,698 |
) |
|||||||||
| 973,577 |
Norwegian Krone |
119,900 |
Bank of America, NA(a) |
12/21/2016 |
(2,055 |
) |
|||||||||
| 121,142 |
Norwegian Krone |
15,175 |
Bank of America, NA(a) |
12/21/2016 |
(512 |
) |
|||||||||
| 6,101 |
Norwegian Krone |
761 |
Bank of America, NA(a) |
12/21/2016 |
(23 |
) |
|||||||||
| 9,940 |
Norwegian Krone |
1,208 |
Bank of America, NA(a) |
12/21/2016 |
(5 |
) |
|||||||||
| 130,960 |
Norwegian Krone |
16,139 |
Bank of America, NA(a) |
12/21/2016 |
(287 |
) |
|||||||||
| 35,148 |
Norwegian Krone |
4,245 |
Bank of America, NA(a) |
12/21/2016 |
9 |
||||||||||
| 368,800 |
Norwegian Krone |
45,449 |
Bank of America, NA(a) |
12/21/2016 |
(808 |
) |
|||||||||
| 25,257 |
Norwegian Krone |
3,143 |
Bank of America, NA(a) |
12/21/2016 |
(86 |
) |
|||||||||
| 1,158,976 |
Norwegian Krone |
139,730 |
Bank of America, NA(a) |
12/21/2016 |
556 |
||||||||||
| 8,921 |
Norwegian Krone |
1,093 |
Bank of America, NA(a) |
12/21/2016 |
(13 |
) |
|||||||||
| 1,641 |
Norwegian Krone |
198 |
Bank of America, NA(a) |
12/21/2016 |
1 |
||||||||||
| 2,895 |
Norwegian Krone |
349 |
Bank of America, NA(a) |
12/21/2016 |
1 |
||||||||||
| 8,945 |
Norwegian Krone |
1,081 |
Bank of America, NA(a) |
12/21/2016 |
2 |
||||||||||
| 416,893 |
Norwegian Krone |
51,415 |
Bank of America, NA(a) |
12/21/2016 |
(953 |
) |
|||||||||
| 5,472 |
Norwegian Krone |
667 |
Bank of America, NA(a) |
12/21/2016 |
(5 |
) |
|||||||||
| 2,759 |
Norwegian Krone |
333 |
Bank of America, NA(a) |
12/21/2016 |
1 |
||||||||||
| 9,444 |
Norwegian Krone |
1,168 |
Bank of America, NA(a) |
12/21/2016 |
(25 |
) |
|||||||||
| 8,507 |
Norwegian Krone |
1,043 |
Bank of America, NA(a) |
12/21/2016 |
(13 |
) |
|||||||||
| 74,034,729 |
Philippine Peso |
1,531,637 |
Bank of America, NA(a) |
12/21/2016 |
(8,705 |
) |
|||||||||
| 114,684 |
Philippine Peso |
2,383 |
Bank of America, NA(a) |
12/21/2016 |
(24 |
) |
|||||||||
| 29,409 |
Philippine Peso |
611 |
Bank of America, NA(a) |
12/21/2016 |
(6 |
) |
|||||||||
| 126 |
Polish Zloty |
32 |
Bank of America, NA(a) |
12/21/2016 |
— |
(b) |
|||||||||
| 66,032 |
Polish Zloty |
17,226 |
Bank of America, NA(a) |
12/21/2016 |
(411 |
) |
|||||||||
| 707 |
Polish Zloty |
185 |
Bank of America, NA(a) |
12/21/2016 |
(5 |
) |
|||||||||
| 458,369 |
Polish Zloty |
119,899 |
Bank of America, NA(a) |
12/21/2016 |
(3,178 |
) |
|||||||||
| 277 |
Polish Zloty |
70 |
Bank of America, NA(a) |
12/21/2016 |
1 |
||||||||||
See Notes to Financial Statements
33
Consolidated Schedule of Investments Neuberger Berman Absolute Return Multi-Manager Fund (cont'd)
|
Contracts to Receive |
In Exchange For |
Counterparty |
Settlement Date |
Net Unrealized Appreciation/ (Depreciation) |
|||||||||||
| 73,972 |
Polish Zloty |
$ |
19,327 |
Bank of America, NA(a) |
12/21/2016 |
$ |
(491 |
) |
|||||||
| 694 |
Polish Zloty |
175 |
Bank of America, NA(a) |
12/21/2016 |
2 |
||||||||||
| 89 |
Polish Zloty |
23 |
Bank of America, NA(a) |
12/21/2016 |
— |
(b) |
|||||||||
| 627 |
Polish Zloty |
162 |
Bank of America, NA(a) |
12/21/2016 |
(2 |
) |
|||||||||
| 62 |
Polish Zloty |
16 |
Bank of America, NA(a) |
12/21/2016 |
— |
(b) |
|||||||||
| 455,805 |
Polish Zloty |
119,098 |
Bank of America, NA(a) |
12/21/2016 |
(3,030 |
) |
|||||||||
| 1,714 |
Polish Zloty |
444 |
Bank of America, NA(a) |
12/21/2016 |
(8 |
) |
|||||||||
| 4,887 |
Polish Zloty |
1,280 |
Bank of America, NA(a) |
12/21/2016 |
(36 |
) |
|||||||||
| 454 |
Polish Zloty |
116 |
Bank of America, NA(a) |
12/21/2016 |
(1 |
) |
|||||||||
| 831 |
Polish Zloty |
211 |
Bank of America, NA(a) |
12/21/2016 |
1 |
||||||||||
| 216 |
Polish Zloty |
56 |
Bank of America, NA(a) |
12/21/2016 |
(1 |
) |
|||||||||
| 133 |
Polish Zloty |
34 |
Bank of America, NA(a) |
12/21/2016 |
— |
(b) |
|||||||||
| 1,021,844 |
Pound Sterling |
1,334,528 |
JPMorgan Chase Bank, NA |
11/16/2016 |
(83,458 |
) |
|||||||||
| 2,707 |
Pound Sterling |
3,515 |
JPMorgan Chase Bank, NA |
11/16/2016 |
(201 |
) |
|||||||||
| 365,578 |
Pound Sterling |
475,452 |
JPMorgan Chase Bank, NA |
11/16/2016 |
(27,865 |
) |
|||||||||
| 833,171 |
Pound Sterling |
1,062,342 |
JPMorgan Chase Bank, NA |
12/30/2016 |
(40,997 |
) |
|||||||||
| 265,392 |
Pound Sterling |
344,948 |
JPMorgan Chase Bank, NA |
12/30/2016 |
(19,616 |
) |
|||||||||
| 20,778,829 |
Russian Ruble |
318,774 |
JPMorgan Chase Bank, NA |
11/16/2016 |
7,811 |
||||||||||
| 284 |
Singapore Dollar |
206 |
Bank of America, NA(a) |
12/21/2016 |
(2 |
) |
|||||||||
| 1,538,895 |
Singapore Dollar |
1,125,474 |
Bank of America, NA(a) |
12/21/2016 |
(19,003 |
) |
|||||||||
| 1,540 |
Singapore Dollar |
1,107 |
Bank of America, NA(a) |
12/21/2016 |
— |
(b) |
|||||||||
| 9,234 |
Singapore Dollar |
6,651 |
Bank of America, NA(a) |
12/21/2016 |
(12 |
) |
|||||||||
| 5,214 |
Singapore Dollar |
3,756 |
Bank of America, NA(a) |
12/21/2016 |
(7 |
) |
|||||||||
| 8,129 |
Singapore Dollar |
5,958 |
Bank of America, NA(a) |
12/21/2016 |
(113 |
) |
|||||||||
| 802 |
Singapore Dollar |
584 |
Bank of America, NA(a) |
12/21/2016 |
(7 |
) |
|||||||||
| 67 |
Singapore Dollar |
48 |
Bank of America, NA(a) |
12/21/2016 |
— |
(b) |
|||||||||
| 4,232 |
Singapore Dollar |
3,114 |
Bank of America, NA(a) |
12/21/2016 |
(71 |
) |
|||||||||
| 382 |
Singapore Dollar |
280 |
Bank of America, NA(a) |
12/21/2016 |
(5 |
) |
|||||||||
| 255 |
Singapore Dollar |
187 |
Bank of America, NA(a) |
12/21/2016 |
(4 |
) |
|||||||||
| 717 |
Singapore Dollar |
526 |
Bank of America, NA(a) |
12/21/2016 |
(10 |
) |
|||||||||
| 1,688 |
Singapore Dollar |
1,233 |
Bank of America, NA(a) |
12/21/2016 |
(19 |
) |
|||||||||
| 2,864 |
Singapore Dollar |
2,109 |
Bank of America, NA(a) |
12/21/2016 |
(50 |
) |
|||||||||
| 963 |
Singapore Dollar |
709 |
Bank of America, NA(a) |
12/21/2016 |
(17 |
) |
|||||||||
| 3,219 |
Singapore Dollar |
2,313 |
Bank of America, NA(a) |
12/21/2016 |
2 |
||||||||||
| 10,894,905 |
South African Rand |
797,333 |
JPMorgan Chase Bank, NA |
11/16/2016 |
8,437 |
||||||||||
| 686 |
South African Rand |
49 |
Bank of America, NA(a) |
12/21/2016 |
1 |
||||||||||
| 19,768 |
South African Rand |
1,366 |
Bank of America, NA(a) |
12/21/2016 |
85 |
||||||||||
| 59,247 |
South African Rand |
4,263 |
Bank of America, NA(a) |
12/21/2016 |
87 |
||||||||||
| 182,140 |
South African Rand |
13,084 |
Bank of America, NA(a) |
12/21/2016 |
288 |
||||||||||
| 805,031 |
South African Rand |
58,926 |
Bank of America, NA(a) |
12/21/2016 |
175 |
||||||||||
| 13,869 |
South African Rand |
1,008 |
Bank of America, NA(a) |
12/21/2016 |
10 |
||||||||||
| 33,400 |
South African Rand |
2,378 |
Bank of America, NA(a) |
12/21/2016 |
74 |
||||||||||
| 6,451 |
South African Rand |
448 |
Bank of America, NA(a) |
12/21/2016 |
26 |
||||||||||
See Notes to Financial Statements
34
Consolidated Schedule of Investments Neuberger Berman Absolute Return Multi-Manager Fund (cont'd)
|
Contracts to Receive |
In Exchange For |
Counterparty |
Settlement Date |
Net Unrealized Appreciation/ (Depreciation) |
|||||||||||
| 9,357 |
South African Rand |
$ |
684 |
Bank of America, NA(a) |
12/21/2016 |
$ |
3 |
||||||||
| 12,149 |
South African Rand |
866 |
Bank of America, NA(a) |
12/21/2016 |
26 |
||||||||||
| 29,276 |
South African Rand |
2,042 |
Bank of America, NA(a) |
12/21/2016 |
107 |
||||||||||
| 4,027,817 |
South African Rand |
277,770 |
Bank of America, NA(a) |
12/21/2016 |
17,932 |
||||||||||
| 22,214 |
South African Rand |
1,599 |
Bank of America, NA(a) |
12/21/2016 |
32 |
||||||||||
| 69,073 |
South African Rand |
4,896 |
Bank of America, NA(a) |
12/21/2016 |
175 |
||||||||||
| 18,066 |
South African Rand |
1,273 |
Bank of America, NA(a) |
12/21/2016 |
53 |
||||||||||
| 30,983 |
South African Rand |
2,240 |
Bank of America, NA(a) |
12/21/2016 |
35 |
||||||||||
| 19,689 |
South African Rand |
1,411 |
Bank of America, NA(a) |
12/21/2016 |
34 |
||||||||||
| 12,091 |
South African Rand |
856 |
Bank of America, NA(a) |
12/21/2016 |
32 |
||||||||||
| 11,704 |
South African Rand |
802 |
Bank of America, NA(a) |
12/21/2016 |
57 |
||||||||||
| 48,843 |
South African Rand |
3,378 |
Bank of America, NA(a) |
12/21/2016 |
208 |
||||||||||
| 10,146 |
South African Rand |
720 |
Bank of America, NA(a) |
12/21/2016 |
25 |
||||||||||
| 8,877 |
South African Rand |
636 |
Bank of America, NA(a) |
12/21/2016 |
16 |
||||||||||
| 1,070,955 |
Swedish Krona |
118,057 |
JPMorgan Chase Bank, NA |
11/14/2016 |
578 |
||||||||||
| 11,690 |
Swedish Krona |
1,368 |
JPMorgan Chase Bank, NA |
11/16/2016 |
(73 |
) |
|||||||||
| 2,753,014 |
Swedish Krona |
328,596 |
JPMorgan Chase Bank, NA |
11/16/2016 |
(23,605 |
) |
|||||||||
| 161,918 |
Swedish Krona |
18,911 |
Bank of America, NA(a) |
12/21/2016 |
(938 |
) |
|||||||||
| 7,289 |
Swedish Krona |
828 |
Bank of America, NA(a) |
12/21/2016 |
(19 |
) |
|||||||||
| 10,137 |
Swedish Krona |
1,182 |
Bank of America, NA(a) |
12/21/2016 |
(57 |
) |
|||||||||
| 227,459 |
Swedish Krona |
26,751 |
Bank of America, NA(a) |
12/21/2016 |
(1,503 |
) |
|||||||||
| 42,083 |
Swedish Krona |
4,932 |
Bank of America, NA(a) |
12/21/2016 |
(261 |
) |
|||||||||
| 2,113 |
Swedish Krona |
238 |
Bank of America, NA(a) |
12/21/2016 |
(4 |
) |
|||||||||
| 6,807 |
Swedish Krona |
801 |
Bank of America, NA(a) |
12/21/2016 |
(45 |
) |
|||||||||
| 52,438 |
Swedish Krona |
5,965 |
Bank of America, NA(a) |
12/21/2016 |
(145 |
) |
|||||||||
| 8,635 |
Swedish Krona |
1,018 |
Bank of America, NA(a) |
12/21/2016 |
(60 |
) |
|||||||||
| 5,866 |
Swedish Krona |
666 |
Bank of America, NA(a) |
12/21/2016 |
(15 |
) |
|||||||||
| 61,953 |
Swedish Krona |
7,179 |
Bank of America, NA(a) |
12/21/2016 |
(302 |
) |
|||||||||
| 3,968 |
Swedish Krona |
451 |
Bank of America, NA(a) |
12/21/2016 |
(11 |
) |
|||||||||
| 3,638 |
Swedish Krona |
409 |
Bank of America, NA(a) |
12/21/2016 |
(5 |
) |
|||||||||
| 6,212 |
Swedish Krona |
728 |
Bank of America, NA(a) |
12/21/2016 |
(38 |
) |
|||||||||
| 9,382 |
Swedish Krona |
1,098 |
Bank of America, NA(a) |
12/21/2016 |
(57 |
) |
|||||||||
| 43,277 |
Swedish Krona |
4,923 |
JPMorgan Chase Bank, NA |
12/30/2016 |
(117 |
) |
|||||||||
| 207,074 |
Swiss Franc |
208,333 |
JPMorgan Chase Bank, NA |
11/14/2016 |
1,050 |
||||||||||
| 1,580,543 |
Swiss Franc |
1,631,293 |
JPMorgan Chase Bank, NA |
11/16/2016 |
(32,956 |
) |
|||||||||
| 33,185 |
Turkish Lira |
10,632 |
JPMorgan Chase Bank, NA |
11/14/2016 |
66 |
||||||||||
| 11,496 |
Turkish Lira |
3,710 |
Bank of America, NA(a) |
12/21/2016 |
(34 |
) |
|||||||||
| 4,585 |
Turkish Lira |
1,473 |
Bank of America, NA(a) |
12/21/2016 |
(7 |
) |
|||||||||
| 3,982 |
Turkish Lira |
1,317 |
Bank of America, NA(a) |
12/21/2016 |
(44 |
) |
|||||||||
| 14,404 |
Turkish Lira |
4,749 |
Bank of America, NA(a) |
12/21/2016 |
(143 |
) |
|||||||||
| 12,560 |
Turkish Lira |
4,015 |
Bank of America, NA(a) |
12/21/2016 |
1 |
||||||||||
| 1,060 |
Turkish Lira |
338 |
Bank of America, NA(a) |
12/21/2016 |
1 |
||||||||||
| 12,529 |
Turkish Lira |
4,110 |
Bank of America, NA(a) |
12/21/2016 |
(104 |
) |
|||||||||
See Notes to Financial Statements
35
Consolidated Schedule of Investments Neuberger Berman Absolute Return Multi-Manager Fund (cont'd)
|
Contracts to Receive |
In Exchange For |
Counterparty |
Settlement Date |
Net Unrealized Appreciation/ (Depreciation) |
|||||||||||
| 3,056 |
Turkish Lira |
$ |
981 |
Bank of America, NA(a) |
12/21/2016 |
$ |
(4 |
) |
|||||||
| 4,894 |
Turkish Lira |
1,615 |
Bank of America, NA(a) |
12/21/2016 |
(50 |
) |
|||||||||
| 3,705 |
Turkish Lira |
1,190 |
Bank of America, NA(a) |
12/21/2016 |
(6 |
) |
|||||||||
| 230 |
Turkish Lira |
76 |
Bank of America, NA(a) |
12/21/2016 |
(2 |
) |
|||||||||
| 9,108 |
Turkish Lira |
2,889 |
Bank of America, NA(a) |
12/21/2016 |
23 |
||||||||||
| 4,713 |
Turkish Lira |
1,556 |
Bank of America, NA(a) |
12/21/2016 |
(49 |
) |
|||||||||
| 6,696 |
Turkish Lira |
2,135 |
Bank of America, NA(a) |
12/21/2016 |
6 |
||||||||||
| 761 |
Turkish Lira |
254 |
Bank of America, NA(a) |
12/21/2016 |
(11 |
) |
|||||||||
| 2,538 |
Turkish Lira |
837 |
Bank of America, NA(a) |
12/21/2016 |
(26 |
) |
|||||||||
| 4,064 |
Turkish Lira |
1,299 |
Bank of America, NA(a) |
12/21/2016 |
— |
(b) |
|||||||||
| 2,280,169 |
Turkish Lira |
751,458 |
Bank of America, NA(a) |
12/21/2016 |
(22,406 |
) |
|||||||||
| 16,160 |
Turkish Lira |
5,176 |
Bank of America, NA(a) |
12/21/2016 |
(9 |
) |
|||||||||
|
Total |
$ |
(473,318 |
) |
||||||||||||
|
Contracts to Deliver |
In Exchange For |
Counterparty |
Settlement Date |
Net Unrealized Appreciation/ (Depreciation) |
|||||||||||
| 132,614 |
Australian Dollar |
$ |
102,058 |
JPMorgan Chase Bank, NA |
11/16/2016 |
$ |
1,216 |
||||||||
| 158,898 |
Australian Dollar |
121,122 |
JPMorgan Chase Bank, NA |
12/30/2016 |
429 |
||||||||||
| 1,412,961 |
Brazilian Real |
444,202 |
Bank of America, NA(a) |
11/3/2016 |
1,687 |
||||||||||
| 3,347 |
Brazilian Real |
1,044 |
Bank of America, NA(a) |
11/3/2016 |
(4 |
) |
|||||||||
| 3,010 |
Brazilian Real |
942 |
Bank of America, NA(a) |
11/3/2016 |
(1 |
) |
|||||||||
| 13,304 |
Brazilian Real |
4,084 |
Bank of America, NA(a) |
11/3/2016 |
(83 |
) |
|||||||||
| 4,428 |
Brazilian Real |
1,397 |
Bank of America, NA(a) |
11/3/2016 |
10 |
||||||||||
| 41,635 |
Brazilian Real |
12,855 |
Bank of America, NA(a) |
11/3/2016 |
(184 |
) |
|||||||||
| 38,912 |
Brazilian Real |
11,926 |
Bank of America, NA(a) |
11/3/2016 |
(260 |
) |
|||||||||
| 3,812 |
Brazilian Real |
1,171 |
Bank of America, NA(a) |
11/3/2016 |
(23 |
) |
|||||||||
| 553 |
Brazilian Real |
171 |
Bank of America, NA(a) |
11/3/2016 |
(2 |
) |
|||||||||
| 8,859 |
Brazilian Real |
2,742 |
Bank of America, NA(a) |
11/3/2016 |
(33 |
) |
|||||||||
| 35,648 |
Canadian Dollar |
27,073 |
Bank of America, NA(a) |
11/7/2016 |
495 |
||||||||||
| 659,155 |
Canadian Dollar |
499,707 |
JPMorgan Chase Bank, NA |
11/16/2016 |
8,232 |
||||||||||
| 208,734 |
Canadian Dollar |
158,750 |
JPMorgan Chase Bank, NA |
12/30/2016 |
3,055 |
||||||||||
| 3,544,656 |
Chilean Peso |
5,334 |
Bank of America, NA(a) |
12/21/2016 |
(73 |
) |
|||||||||
| 183,543 |
Chilean Peso |
270 |
Bank of America, NA(a) |
12/21/2016 |
(10 |
) |
|||||||||
| 445,840 |
Chilean Peso |
659 |
Bank of America, NA(a) |
12/21/2016 |
(21 |
) |
|||||||||
| 1,261,037 |
Chilean Peso |
1,884 |
Bank of America, NA(a) |
12/21/2016 |
(40 |
) |
|||||||||
| 15,283,585 |
Chilean Peso |
23,072 |
Bank of America, NA(a) |
12/21/2016 |
(243 |
) |
|||||||||
| 12,237,750 |
Chilean Peso |
18,375 |
Bank of America, NA(a) |
12/21/2016 |
(293 |
) |
|||||||||
| 1,199,395 |
Chilean Peso |
1,785 |
Bank of America, NA(a) |
12/21/2016 |
(45 |
) |
|||||||||
| 190,394,563 |
Chilean Peso |
280,611 |
Bank of America, NA(a) |
12/21/2016 |
(9,830 |
) |
|||||||||
| 2,261,281 |
Chilean Peso |
3,364 |
Bank of America, NA(a) |
12/21/2016 |
(86 |
) |
|||||||||
| 148,251 |
Chilean Peso |
221 |
Bank of America, NA(a) |
12/21/2016 |
(5 |
) |
|||||||||
| 490,502 |
Chilean Peso |
735 |
Bank of America, NA(a) |
12/21/2016 |
(13 |
) |
|||||||||
See Notes to Financial Statements
36
Consolidated Schedule of Investments Neuberger Berman Absolute Return Multi-Manager Fund (cont'd)
|
Contracts to Deliver |
In Exchange For |
Counterparty |
Settlement Date |
Net Unrealized Appreciation/ (Depreciation) |
|||||||||||
| 2,889,823 |
Chilean Peso |
$ |
4,376 |
Bank of America, NA(a) |
12/21/2016 |
$ |
(32 |
) |
|||||||
| 722,781 |
Chilean Peso |
1,105 |
Bank of America, NA(a) |
12/21/2016 |
2 |
||||||||||
| 738,463 |
Chilean Peso |
1,100 |
Bank of America, NA(a) |
12/21/2016 |
(26 |
) |
|||||||||
| 4,583,580 |
Chilean Peso |
6,923 |
Bank of America, NA(a) |
12/21/2016 |
(69 |
) |
|||||||||
| 165,214 |
Chilean Peso |
246 |
Bank of America, NA(a) |
12/21/2016 |
(6 |
) |
|||||||||
| 4,360,093 |
Chilean Peso |
6,481 |
Bank of America, NA(a) |
12/21/2016 |
(170 |
) |
|||||||||
| 12,063 |
Czech Koruna |
487 |
Bank of America, NA(a) |
12/21/2016 |
(5 |
) |
|||||||||
| 2,446,973 |
Czech Koruna |
98,958 |
Bank of America, NA(a) |
12/21/2016 |
(824 |
) |
|||||||||
| 630,689 |
Czech Koruna |
25,664 |
Bank of America, NA(a) |
12/21/2016 |
(54 |
) |
|||||||||
| 30,697 |
Czech Koruna |
1,278 |
Bank of America, NA(a) |
12/21/2016 |
26 |
||||||||||
| 4,029,713 |
Danish Krone |
608,704 |
JPMorgan Chase Bank, NA |
11/16/2016 |
13,628 |
||||||||||
| 117,000 |
Euro |
128,247 |
Bank of America, NA(a) |
11/7/2016 |
(214 |
) |
|||||||||
| 32,104 |
Euro |
35,292 |
Bank of America, NA(a) |
11/7/2016 |
43 |
||||||||||
| 33,482 |
Euro |
36,468 |
Bank of America, NA(a) |
11/7/2016 |
(294 |
) |
|||||||||
| 7,560,463 |
Euro |
8,358,583 |
JPMorgan Chase Bank, NA |
11/14/2016 |
55,178 |
||||||||||
| 421,440 |
Euro |
473,787 |
JPMorgan Chase Bank, NA |
11/16/2016 |
10,896 |
||||||||||
| 2,865,832 |
Euro |
3,220,421 |
JPMorgan Chase Bank, NA |
11/16/2016 |
72,719 |
||||||||||
| 613,652 |
Euro |
692,481 |
JPMorgan Chase Bank, NA |
11/16/2016 |
18,473 |
||||||||||
| 509,314 |
Euro |
568,797 |
JPMorgan Chase Bank, NA |
11/16/2016 |
9,389 |
||||||||||
| 398,008 |
Euro |
448,165 |
JPMorgan Chase Bank, NA |
11/16/2016 |
11,011 |
||||||||||
| 504,173 |
Euro |
569,249 |
JPMorgan Chase Bank, NA |
11/16/2016 |
15,488 |
||||||||||
| 613,883 |
Euro |
690,992 |
JPMorgan Chase Bank, NA |
12/30/2016 |
15,200 |
||||||||||
| 51,186 |
Euro |
57,517 |
JPMorgan Chase Bank, NA |
12/30/2016 |
1,169 |
||||||||||
| 218,930 |
Hong Kong Dollar |
28,223 |
Bank of America, NA(a) |
11/7/2016 |
(6 |
) |
|||||||||
| 314,701 |
Hong Kong Dollar |
40,572 |
Bank of America, NA(a) |
11/7/2016 |
(6 |
) |
|||||||||
| 391,414 |
Hong Kong Dollar |
50,461 |
Bank of America, NA(a) |
11/7/2016 |
(9 |
) |
|||||||||
| 21,666,275 |
Hong Kong Dollar |
2,793,754 |
JPMorgan Chase Bank, NA |
11/14/2016 |
(58 |
) |
|||||||||
| 99,666 |
Hungarian Forint |
352 |
Bank of America, NA(a) |
12/21/2016 |
(3 |
) |
|||||||||
| 325,056 |
Hungarian Forint |
1,182 |
Bank of America, NA(a) |
12/21/2016 |
25 |
||||||||||
| 106,288 |
Hungarian Forint |
390 |
Bank of America, NA(a) |
12/21/2016 |
12 |
||||||||||
| 465,853 |
Hungarian Forint |
1,691 |
Bank of America, NA(a) |
12/21/2016 |
33 |
||||||||||
| 775,800 |
Hungarian Forint |
2,782 |
Bank of America, NA(a) |
12/21/2016 |
22 |
||||||||||
| 178,470 |
Hungarian Forint |
648 |
Bank of America, NA(a) |
12/21/2016 |
13 |
||||||||||
| 203,139 |
Hungarian Forint |
745 |
Bank of America, NA(a) |
12/21/2016 |
22 |
||||||||||
| 41,036 |
Hungarian Forint |
145 |
Bank of America, NA(a) |
12/21/2016 |
(1 |
) |
|||||||||
| 441,889 |
Hungarian Forint |
1,618 |
Bank of America, NA(a) |
12/21/2016 |
46 |
||||||||||
| 115,916 |
Hungarian Forint |
425 |
Bank of America, NA(a) |
12/21/2016 |
13 |
||||||||||
| 2,963,449 |
Hungarian Forint |
10,801 |
Bank of America, NA(a) |
12/21/2016 |
257 |
||||||||||
| 10,790 |
Hungarian Forint |
39 |
Bank of America, NA(a) |
12/21/2016 |
1 |
||||||||||
| 692,458 |
Hungarian Forint |
2,537 |
Bank of America, NA(a) |
12/21/2016 |
73 |
||||||||||
| 2,047,562 |
Hungarian Forint |
7,424 |
Bank of America, NA(a) |
12/21/2016 |
139 |
||||||||||
| 30,310 |
Hungarian Forint |
111 |
Bank of America, NA(a) |
12/21/2016 |
3 |
||||||||||
| 205,473 |
Hungarian Forint |
742 |
Bank of America, NA(a) |
12/21/2016 |
11 |
||||||||||
See Notes to Financial Statements
37
Consolidated Schedule of Investments Neuberger Berman Absolute Return Multi-Manager Fund (cont'd)
|
Contracts to Deliver |
In Exchange For |
Counterparty |
Settlement Date |
Net Unrealized Appreciation/ (Depreciation) |
|||||||||||
| 164,791 |
Indian Rupee |
$ |
2,425 |
Bank of America, NA(a) |
12/21/2016 |
$ |
(28 |
) |
|||||||
| 184,065 |
Indian Rupee |
2,726 |
Bank of America, NA(a) |
12/21/2016 |
(14 |
) |
|||||||||
| 227,537 |
Indian Rupee |
3,345 |
Bank of America, NA(a) |
12/21/2016 |
(43 |
) |
|||||||||
| 6,596,314 |
Indian Rupee |
97,983 |
Bank of America, NA(a) |
12/21/2016 |
(223 |
) |
|||||||||
| 23,959 |
Indian Rupee |
355 |
Bank of America, NA(a) |
12/21/2016 |
(2 |
) |
|||||||||
| 1,366,104 |
Indian Rupee |
20,293 |
Bank of America, NA(a) |
12/21/2016 |
(46 |
) |
|||||||||
| 327,422 |
Indian Rupee |
4,868 |
Bank of America, NA(a) |
12/21/2016 |
(7 |
) |
|||||||||
| 1,419,337 |
Indian Rupee |
21,117 |
Bank of America, NA(a) |
12/21/2016 |
(14 |
) |
|||||||||
| 850,031 |
Indian Rupee |
12,559 |
Bank of America, NA(a) |
12/21/2016 |
(96 |
) |
|||||||||
| 5,372,614 |
Indian Rupee |
79,832 |
Bank of America, NA(a) |
12/21/2016 |
(155 |
) |
|||||||||
| 29,466 |
Indian Rupee |
438 |
Bank of America, NA(a) |
12/21/2016 |
(1 |
) |
|||||||||
| 29,656 |
Indian Rupee |
441 |
Bank of America, NA(a) |
12/21/2016 |
(1 |
) |
|||||||||
| 821,965 |
Indian Rupee |
12,210 |
Bank of America, NA(a) |
12/21/2016 |
(27 |
) |
|||||||||
| 2,839,710,000 |
Indonesian Rupiah |
213,608 |
JPMorgan Chase Bank, NA |
11/16/2016 |
(3,908 |
) |
|||||||||
| 8,025 |
Israeli New Shekel |
2,120 |
Bank of America, NA(a) |
12/21/2016 |
26 |
||||||||||
| 513 |
Israeli New Shekel |
134 |
Bank of America, NA(a) |
12/21/2016 |
— |
(b) |
|||||||||
| 9,833 |
Israeli New Shekel |
2,622 |
Bank of America, NA(a) |
12/21/2016 |
56 |
||||||||||
| 1,703 |
Israeli New Shekel |
442 |
Bank of America, NA(a) |
12/21/2016 |
(3 |
) |
|||||||||
| 123 |
Israeli New Shekel |
33 |
Bank of America, NA(a) |
12/21/2016 |
1 |
||||||||||
| 664 |
Israeli New Shekel |
177 |
Bank of America, NA(a) |
12/21/2016 |
4 |
||||||||||
| 4,161 |
Israeli New Shekel |
1,092 |
Bank of America, NA(a) |
12/21/2016 |
6 |
||||||||||
| 1,459 |
Israeli New Shekel |
387 |
Bank of America, NA(a) |
12/21/2016 |
6 |
||||||||||
| 6,972 |
Israeli New Shekel |
1,847 |
Bank of America, NA(a) |
12/21/2016 |
27 |
||||||||||
| 2,999 |
Israeli New Shekel |
795 |
Bank of America, NA(a) |
12/21/2016 |
12 |
||||||||||
| 9,485 |
Israeli New Shekel |
2,466 |
Bank of America, NA(a) |
12/21/2016 |
(9 |
) |
|||||||||
| 5,340 |
Israeli New Shekel |
1,423 |
Bank of America, NA(a) |
12/21/2016 |
29 |
||||||||||
| 240 |
Israeli New Shekel |
64 |
Bank of America, NA(a) |
12/21/2016 |
1 |
||||||||||
| 30,928 |
Israeli New Shekel |
8,095 |
Bank of America, NA(a) |
12/21/2016 |
23 |
||||||||||
| 250,298 |
Israeli New Shekel |
66,316 |
Bank of America, NA(a) |
12/21/2016 |
993 |
||||||||||
| 144,450,912 |
Japanese Yen |
1,434,155 |
JPMorgan Chase Bank, NA |
11/16/2016 |
56,099 |
||||||||||
| 247,558,500 |
Korean Won |
221,707 |
JPMorgan Chase Bank, NA |
11/16/2016 |
5,344 |
||||||||||
| 7,683,989 |
Korean Won |
6,910 |
Bank of America, NA(a) |
12/21/2016 |
195 |
||||||||||
| 1,063,693 |
Korean Won |
956 |
Bank of America, NA(a) |
12/21/2016 |
27 |
||||||||||
| 550,129 |
Korean Won |
484 |
Bank of America, NA(a) |
12/21/2016 |
3 |
||||||||||
| 403,290,479 |
Korean Won |
360,084 |
Bank of America, NA(a) |
12/21/2016 |
7,673 |
||||||||||
| 878,026 |
Korean Won |
779 |
Bank of America, NA(a) |
12/21/2016 |
12 |
||||||||||
| 30,212,320 |
Korean Won |
27,348 |
Bank of America, NA(a) |
12/21/2016 |
947 |
||||||||||
| 1,389,004 |
Korean Won |
1,236 |
Bank of America, NA(a) |
12/21/2016 |
22 |
||||||||||
| 722,047 |
Korean Won |
646 |
Bank of America, NA(a) |
12/21/2016 |
15 |
||||||||||
| 778,307 |
Korean Won |
694 |
Bank of America, NA(a) |
12/21/2016 |
14 |
||||||||||
| 10,927,808 |
Korean Won |
9,893 |
Bank of America, NA(a) |
12/21/2016 |
344 |
||||||||||
| 124,480 |
Korean Won |
109 |
Bank of America, NA(a) |
12/21/2016 |
— |
(b) |
|||||||||
| 36,630,614 |
Korean Won |
32,862 |
Bank of America, NA(a) |
12/21/2016 |
853 |
||||||||||
See Notes to Financial Statements
38
Consolidated Schedule of Investments Neuberger Berman Absolute Return Multi-Manager Fund (cont'd)
|
Contracts to Deliver |
In Exchange For |
Counterparty |
Settlement Date |
Net Unrealized Appreciation/ (Depreciation) |
|||||||||||
| 10,431,053 |
Korean Won |
$ |
9,197 |
Bank of America, NA(a) |
12/21/2016 |
$ |
82 |
||||||||
| 30,400,000 |
Korean Won |
27,732 |
Bank of America, NA(a) |
12/21/2016 |
1,167 |
||||||||||
| 7,252,016 |
Korean Won |
6,608 |
Bank of America, NA(a) |
12/21/2016 |
271 |
||||||||||
| 70,073,024 |
Korean Won |
63,348 |
Bank of America, NA(a) |
12/21/2016 |
2,116 |
||||||||||
| 523,130 |
Korean Won |
465 |
Bank of America, NA(a) |
12/21/2016 |
8 |
||||||||||
| 49,481,581 |
Korean Won |
43,198 |
Bank of America, NA(a) |
12/21/2016 |
(41 |
) |
|||||||||
| 28,096,600 |
Korean Won |
25,032 |
Bank of America, NA(a) |
12/21/2016 |
480 |
||||||||||
| 2,229,104 |
Korean Won |
1,991 |
Bank of America, NA(a) |
12/21/2016 |
43 |
||||||||||
| 580,900 |
Korean Won |
512 |
Bank of America, NA(a) |
12/21/2016 |
4 |
||||||||||
| 14,321 |
Malaysian Ringgit |
3,420 |
Bank of America, NA(a) |
12/21/2016 |
14 |
||||||||||
| 6,651 |
Malaysian Ringgit |
1,604 |
Bank of America, NA(a) |
12/21/2016 |
22 |
||||||||||
| 19,882 |
Malaysian Ringgit |
4,816 |
Bank of America, NA(a) |
12/21/2016 |
88 |
||||||||||
| 3,327 |
Malaysian Ringgit |
791 |
Bank of America, NA(a) |
12/21/2016 |
— |
(b) |
|||||||||
| 2,892 |
Malaysian Ringgit |
699 |
Bank of America, NA(a) |
12/21/2016 |
11 |
||||||||||
| 624,651 |
Malaysian Ringgit |
150,336 |
Bank of America, NA(a) |
12/21/2016 |
1,788 |
||||||||||
| 4,511 |
Malaysian Ringgit |
1,080 |
Bank of America, NA(a) |
12/21/2016 |
7 |
||||||||||
| 4,001 |
Malaysian Ringgit |
962 |
Bank of America, NA(a) |
12/21/2016 |
11 |
||||||||||
| 20,715 |
Malaysian Ringgit |
5,017 |
Bank of America, NA(a) |
12/21/2016 |
91 |
||||||||||
| 2,089 |
Malaysian Ringgit |
497 |
Bank of America, NA(a) |
12/21/2016 |
— |
(b) |
|||||||||
| 955 |
Malaysian Ringgit |
227 |
Bank of America, NA(a) |
12/21/2016 |
— |
(b) |
|||||||||
| 662 |
Malaysian Ringgit |
158 |
Bank of America, NA(a) |
12/21/2016 |
1 |
||||||||||
| 555 |
Malaysian Ringgit |
134 |
Bank of America, NA(a) |
12/21/2016 |
2 |
||||||||||
| 6,384 |
Malaysian Ringgit |
1,526 |
Bank of America, NA(a) |
12/21/2016 |
8 |
||||||||||
| 13,280 |
Malaysian Ringgit |
3,149 |
Bank of America, NA(a) |
12/21/2016 |
(9 |
) |
|||||||||
| 11,070 |
Malaysian Ringgit |
2,656 |
Bank of America, NA(a) |
12/21/2016 |
24 |
||||||||||
| 119,540 |
Malaysian Ringgit |
28,902 |
Bank of America, NA(a) |
12/21/2016 |
474 |
||||||||||
| 1,719 |
Malaysian Ringgit |
410 |
Bank of America, NA(a) |
12/21/2016 |
1 |
||||||||||
| 13,793 |
Malaysian Ringgit |
3,315 |
Bank of America, NA(a) |
12/21/2016 |
35 |
||||||||||
| 7,276,695 |
Mexican Peso |
380,913 |
JPMorgan Chase Bank, NA |
11/14/2016 |
(3,544 |
) |
|||||||||
| 3,506,243 |
New Taiwan Dollar |
112,603 |
Bank of America, NA(a) |
12/21/2016 |
1,455 |
||||||||||
| 65,784 |
New Taiwan Dollar |
2,093 |
Bank of America, NA(a) |
12/21/2016 |
8 |
||||||||||
| 22,097 |
New Taiwan Dollar |
699 |
Bank of America, NA(a) |
12/21/2016 |
(1 |
) |
|||||||||
| 45,214 |
New Taiwan Dollar |
1,444 |
Bank of America, NA(a) |
12/21/2016 |
11 |
||||||||||
| 16,425 |
New Taiwan Dollar |
516 |
Bank of America, NA(a) |
12/21/2016 |
(5 |
) |
|||||||||
| 358,235 |
New Taiwan Dollar |
11,504 |
Bank of America, NA(a) |
12/21/2016 |
148 |
||||||||||
| 17,419 |
New Taiwan Dollar |
550 |
Bank of America, NA(a) |
12/21/2016 |
(2 |
) |
|||||||||
| 41,809 |
New Taiwan Dollar |
1,339 |
Bank of America, NA(a) |
12/21/2016 |
14 |
||||||||||
| 152,338 |
New Taiwan Dollar |
4,883 |
Bank of America, NA(a) |
12/21/2016 |
54 |
||||||||||
| 1,255,607 |
New Taiwan Dollar |
40,238 |
Bank of America, NA(a) |
12/21/2016 |
435 |
||||||||||
| 240,913 |
New Taiwan Dollar |
7,594 |
Bank of America, NA(a) |
12/21/2016 |
(43 |
) |
|||||||||
| 6,513 |
New Taiwan Dollar |
207 |
Bank of America, NA(a) |
12/21/2016 |
1 |
||||||||||
| 89,244 |
New Taiwan Dollar |
2,858 |
Bank of America, NA(a) |
12/21/2016 |
29 |
||||||||||
| 55,207 |
New Taiwan Dollar |
1,759 |
Bank of America, NA(a) |
12/21/2016 |
9 |
||||||||||
See Notes to Financial Statements
39
Consolidated Schedule of Investments Neuberger Berman Absolute Return Multi-Manager Fund (cont'd)
|
Contracts to Deliver |
In Exchange For |
Counterparty |
Settlement Date |
Net Unrealized Appreciation/ (Depreciation) |
|||||||||||
| 988,547 |
New Taiwan Dollar |
$ |
31,671 |
Bank of America, NA(a) |
12/21/2016 |
$ |
334 |
||||||||
| 305,302 |
New Taiwan Dollar |
9,645 |
Bank of America, NA(a) |
12/21/2016 |
(33 |
) |
|||||||||
| 5,593,643 |
Norwegian Krone |
683,535 |
JPMorgan Chase Bank, NA |
11/16/2016 |
6,520 |
||||||||||
| 1,359,192 |
Norwegian Krone |
165,077 |
JPMorgan Chase Bank, NA |
11/16/2016 |
570 |
||||||||||
| 10,751 |
Norwegian Krone |
1,307 |
Bank of America, NA(a) |
12/21/2016 |
6 |
||||||||||
| 3,149 |
Norwegian Krone |
382 |
Bank of America, NA(a) |
12/21/2016 |
1 |
||||||||||
| 8,232 |
Norwegian Krone |
1,008 |
Bank of America, NA(a) |
12/21/2016 |
12 |
||||||||||
| 9,009 |
Norwegian Krone |
1,095 |
Bank of America, NA(a) |
12/21/2016 |
5 |
||||||||||
| 6,611 |
Norwegian Krone |
821 |
Bank of America, NA(a) |
12/21/2016 |
21 |
||||||||||
| 892 |
Norwegian Krone |
108 |
Bank of America, NA(a) |
12/21/2016 |
— |
(b) |
|||||||||
| 33,927 |
Norwegian Krone |
4,169 |
Bank of America, NA(a) |
12/21/2016 |
62 |
||||||||||
| 77,939 |
Norwegian Krone |
9,607 |
Bank of America, NA(a) |
12/21/2016 |
173 |
||||||||||
| 2,872 |
Norwegian Krone |
351 |
Bank of America, NA(a) |
12/21/2016 |
3 |
||||||||||
| 5,235 |
Norwegian Krone |
634 |
Bank of America, NA(a) |
12/21/2016 |
— |
(b) |
|||||||||
| 6,591 |
Norwegian Krone |
812 |
Bank of America, NA(a) |
12/21/2016 |
14 |
||||||||||
| 25,174 |
Norwegian Krone |
3,159 |
Bank of America, NA(a) |
12/21/2016 |
112 |
||||||||||
| 31,591 |
Norwegian Krone |
3,918 |
Bank of America, NA(a) |
12/21/2016 |
94 |
||||||||||
| 1,320,121 |
Philippine Peso |
26,955 |
Bank of America, NA(a) |
12/21/2016 |
(201 |
) |
|||||||||
| 2,955,270 |
Philippine Peso |
61,024 |
Bank of America, NA(a) |
12/21/2016 |
233 |
||||||||||
| 2,310,686 |
Philippine Peso |
47,080 |
Bank of America, NA(a) |
12/21/2016 |
(452 |
) |
|||||||||
| 2,880,266 |
Philippine Peso |
59,244 |
Bank of America, NA(a) |
12/21/2016 |
(5 |
) |
|||||||||
| 67,850 |
Philippine Peso |
1,399 |
Bank of America, NA(a) |
12/21/2016 |
3 |
||||||||||
| 2,864,886 |
Philippine Peso |
58,878 |
Bank of America, NA(a) |
12/21/2016 |
(54 |
) |
|||||||||
| 1,910,197 |
Philippine Peso |
39,405 |
Bank of America, NA(a) |
12/21/2016 |
111 |
||||||||||
| 556,916 |
Philippine Peso |
11,462 |
Bank of America, NA(a) |
12/21/2016 |
6 |
||||||||||
| 556,916 |
Philippine Peso |
11,462 |
Bank of America, NA(a) |
12/21/2016 |
6 |
||||||||||
| 556,526 |
Philippine Peso |
11,462 |
Bank of America, NA(a) |
12/21/2016 |
14 |
||||||||||
| 72,107 |
Philippine Peso |
1,472 |
Bank of America, NA(a) |
12/21/2016 |
(11 |
) |
|||||||||
| 543,049 |
Philippine Peso |
11,172 |
Bank of America, NA(a) |
12/21/2016 |
1 |
||||||||||
| 556,916 |
Philippine Peso |
11,462 |
Bank of America, NA(a) |
12/21/2016 |
6 |
||||||||||
| 557,145 |
Philippine Peso |
11,462 |
Bank of America, NA(a) |
12/21/2016 |
1 |
||||||||||
| 2,894,266 |
Philippine Peso |
59,950 |
Bank of America, NA(a) |
12/21/2016 |
413 |
||||||||||
| 2,780,316 |
Philippine Peso |
56,863 |
Bank of America, NA(a) |
12/21/2016 |
(330 |
) |
|||||||||
| 1,044,826 |
Philippine Peso |
21,350 |
Bank of America, NA(a) |
12/21/2016 |
(143 |
) |
|||||||||
| 2,926,650 |
Philippine Peso |
59,949 |
Bank of America, NA(a) |
12/21/2016 |
(254 |
) |
|||||||||
| 2,894,883 |
Philippine Peso |
59,142 |
Bank of America, NA(a) |
12/21/2016 |
(407 |
) |
|||||||||
| 2,872,328 |
Philippine Peso |
58,864 |
Bank of America, NA(a) |
12/21/2016 |
(221 |
) |
|||||||||
| 2,917,741 |
Philippine Peso |
59,829 |
Bank of America, NA(a) |
12/21/2016 |
(190 |
) |
|||||||||
| 24,093,540 |
Philippine Peso |
497,749 |
Bank of America, NA(a) |
12/21/2016 |
2,133 |
||||||||||
| 65,674 |
Philippine Peso |
1,356 |
Bank of America, NA(a) |
12/21/2016 |
5 |
||||||||||
| 2,721,106 |
Philippine Peso |
55,907 |
Bank of America, NA(a) |
12/21/2016 |
(68 |
) |
|||||||||
| 14,924 |
Philippine Peso |
308 |
Bank of America, NA(a) |
12/21/2016 |
1 |
||||||||||
| 2,911,149 |
Philippine Peso |
59,846 |
Bank of America, NA(a) |
12/21/2016 |
(38 |
) |
|||||||||
See Notes to Financial Statements
40
Consolidated Schedule of Investments Neuberger Berman Absolute Return Multi-Manager Fund (cont'd)
|
Contracts to Deliver |
In Exchange For |
Counterparty |
Settlement Date |
Net Unrealized Appreciation/ (Depreciation) |
|||||||||||
| 2,915,788 |
Philippine Peso |
$ |
59,950 |
Bank of America, NA(a) |
12/21/2016 |
$ |
(29 |
) |
|||||||
| 2,697,202 |
Philippine Peso |
55,153 |
Bank of America, NA(a) |
12/21/2016 |
(330 |
) |
|||||||||
| 2,749,096 |
Philippine Peso |
56,312 |
Bank of America, NA(a) |
12/21/2016 |
(238 |
) |
|||||||||
| 77,558 |
Philippine Peso |
1,600 |
Bank of America, NA(a) |
12/21/2016 |
5 |
||||||||||
| 556,641 |
Philippine Peso |
11,462 |
Bank of America, NA(a) |
12/21/2016 |
12 |
||||||||||
| 593,385 |
Philippine Peso |
12,191 |
Bank of America, NA(a) |
12/21/2016 |
(15 |
) |
|||||||||
| 5,417,764 |
Philippine Peso |
111,718 |
Bank of America, NA(a) |
12/21/2016 |
272 |
||||||||||
| 593,385 |
Philippine Peso |
12,191 |
Bank of America, NA(a) |
12/21/2016 |
(15 |
) |
|||||||||
| 593,385 |
Philippine Peso |
12,191 |
Bank of America, NA(a) |
12/21/2016 |
(15 |
) |
|||||||||
| 593,372 |
Philippine Peso |
12,192 |
Bank of America, NA(a) |
12/21/2016 |
(14 |
) |
|||||||||
| 593,372 |
Philippine Peso |
12,192 |
Bank of America, NA(a) |
12/21/2016 |
(14 |
) |
|||||||||
| 587,484 |
Philippine Peso |
12,071 |
Bank of America, NA(a) |
12/21/2016 |
(14 |
) |
|||||||||
| 593,372 |
Philippine Peso |
12,192 |
Bank of America, NA(a) |
12/21/2016 |
(14 |
) |
|||||||||
| 107,904 |
Philippine Peso |
2,216 |
Bank of America, NA(a) |
12/21/2016 |
(4 |
) |
|||||||||
| 36,201 |
Philippine Peso |
742 |
Bank of America, NA(a) |
12/21/2016 |
(3 |
) |
|||||||||
| 2,159,498 |
Philippine Peso |
43,886 |
Bank of America, NA(a) |
12/21/2016 |
(536 |
) |
|||||||||
| 2,818,284 |
Philippine Peso |
57,824 |
Bank of America, NA(a) |
12/21/2016 |
(150 |
) |
|||||||||
| 593,263 |
Philippine Peso |
12,191 |
Bank of America, NA(a) |
12/21/2016 |
(13 |
) |
|||||||||
| 2,821,224 |
Philippine Peso |
57,825 |
Bank of America, NA(a) |
12/21/2016 |
(209 |
) |
|||||||||
| 593,372 |
Philippine Peso |
12,192 |
Bank of America, NA(a) |
12/21/2016 |
(14 |
) |
|||||||||
| 2,886,892 |
Philippine Peso |
59,950 |
Bank of America, NA(a) |
12/21/2016 |
565 |
||||||||||
| 2,886,245 |
Philippine Peso |
59,949 |
Bank of America, NA(a) |
12/21/2016 |
577 |
||||||||||
| 2,778,397 |
Philippine Peso |
57,097 |
Bank of America, NA(a) |
12/21/2016 |
(56 |
) |
|||||||||
| 43,821 |
Philippine Peso |
910 |
Bank of America, NA(a) |
12/21/2016 |
9 |
||||||||||
| 556,916 |
Philippine Peso |
11,462 |
Bank of America, NA(a) |
12/21/2016 |
6 |
||||||||||
| 556,916 |
Philippine Peso |
11,462 |
Bank of America, NA(a) |
12/21/2016 |
6 |
||||||||||
| 1,547,107 |
Philippine Peso |
31,884 |
Bank of America, NA(a) |
12/21/2016 |
59 |
||||||||||
| 1,027,247 |
Philippine Peso |
21,099 |
Bank of America, NA(a) |
12/21/2016 |
(32 |
) |
|||||||||
| 2,770,640 |
Philippine Peso |
56,899 |
Bank of America, NA(a) |
12/21/2016 |
(94 |
) |
|||||||||
| 556,469 |
Philippine Peso |
11,462 |
Bank of America, NA(a) |
12/21/2016 |
15 |
||||||||||
| 593,372 |
Philippine Peso |
12,192 |
Bank of America, NA(a) |
12/21/2016 |
(14 |
) |
|||||||||
| 15,144 |
Philippine Peso |
311 |
Bank of America, NA(a) |
12/21/2016 |
(1 |
) |
|||||||||
| 1,619,533 |
Philippine Peso |
33,345 |
Bank of America, NA(a) |
12/21/2016 |
30 |
||||||||||
| 2,673,930 |
Philippine Peso |
55,354 |
Bank of America, NA(a) |
12/21/2016 |
350 |
||||||||||
| 2,769,331 |
Philippine Peso |
56,899 |
Bank of America, NA(a) |
12/21/2016 |
(68 |
) |
|||||||||
| 89 |
Polish Zloty |
23 |
Bank of America, NA(a) |
12/21/2016 |
— |
(b) |
|||||||||
| 942,476 |
Polish Zloty |
243,426 |
Bank of America, NA(a) |
12/21/2016 |
3,431 |
||||||||||
| 473 |
Polish Zloty |
123 |
Bank of America, NA(a) |
12/21/2016 |
3 |
||||||||||
| 1,707 |
Polish Zloty |
442 |
Bank of America, NA(a) |
12/21/2016 |
7 |
||||||||||
| 3,881 |
Polish Zloty |
1,014 |
Bank of America, NA(a) |
12/21/2016 |
26 |
||||||||||
| 40 |
Polish Zloty |
10 |
Bank of America, NA(a) |
12/21/2016 |
— |
(b) |
|||||||||
| 2,473 |
Polish Zloty |
642 |
Bank of America, NA(a) |
12/21/2016 |
12 |
||||||||||
| 1,549 |
Polish Zloty |
394 |
Bank of America, NA(a) |
12/21/2016 |
— |
(b) |
|||||||||
See Notes to Financial Statements
41
Consolidated Schedule of Investments Neuberger Berman Absolute Return Multi-Manager Fund (cont'd)
|
Contracts to Deliver |
In Exchange For |
Counterparty |
Settlement Date |
Net Unrealized Appreciation/ (Depreciation) |
|||||||||||
| 2,683 |
Polish Zloty |
$ |
696 |
Bank of America, NA(a) |
12/21/2016 |
$ |
13 |
||||||||
| 78 |
Polish Zloty |
20 |
Bank of America, NA(a) |
12/21/2016 |
— |
(b) |
|||||||||
| 1,203 |
Polish Zloty |
313 |
Bank of America, NA(a) |
12/21/2016 |
7 |
||||||||||
| 38,618 |
Pound Sterling |
49,077 |
Bank of America, NA(a) |
11/7/2016 |
1,804 |
||||||||||
| 4,268,902 |
Pound Sterling |
5,217,704 |
JPMorgan Chase Bank, NA |
11/14/2016 |
(8,621 |
) |
|||||||||
| 452,728 |
Pound Sterling |
597,912 |
JPMorgan Chase Bank, NA |
11/16/2016 |
43,625 |
||||||||||
| 937,401 |
Pound Sterling |
1,238,522 |
JPMorgan Chase Bank, NA |
11/16/2016 |
90,838 |
||||||||||
| 1,098,563 |
Pound Sterling |
1,426,822 |
JPMorgan Chase Bank, NA |
12/30/2016 |
80,145 |
||||||||||
| 20,778,829 |
Russian Ruble |
312,887 |
JPMorgan Chase Bank, NA |
11/16/2016 |
(13,698 |
) |
|||||||||
| 10,984 |
Singapore Dollar |
7,916 |
Bank of America, NA(a) |
12/21/2016 |
18 |
||||||||||
| 515 |
Singapore Dollar |
370 |
Bank of America, NA(a) |
12/21/2016 |
— |
(b) |
|||||||||
| 447 |
Singapore Dollar |
322 |
Bank of America, NA(a) |
12/21/2016 |
1 |
||||||||||
| 257 |
Singapore Dollar |
186 |
Bank of America, NA(a) |
12/21/2016 |
2 |
||||||||||
| 2,097 |
Singapore Dollar |
1,538 |
Bank of America, NA(a) |
12/21/2016 |
30 |
||||||||||
| 51,835 |
Singapore Dollar |
37,964 |
Bank of America, NA(a) |
12/21/2016 |
695 |
||||||||||
| 773 |
Singapore Dollar |
558 |
Bank of America, NA(a) |
12/21/2016 |
2 |
||||||||||
| 950 |
Singapore Dollar |
693 |
Bank of America, NA(a) |
12/21/2016 |
10 |
||||||||||
| 4 |
Singapore Dollar |
3 |
Bank of America, NA(a) |
12/21/2016 |
— |
(b) |
|||||||||
| 4,141 |
Singapore Dollar |
3,041 |
Bank of America, NA(a) |
12/21/2016 |
63 |
||||||||||
| 854 |
Singapore Dollar |
614 |
Bank of America, NA(a) |
12/21/2016 |
— |
(b) |
|||||||||
| 11,280 |
Singapore Dollar |
8,215 |
Bank of America, NA(a) |
12/21/2016 |
104 |
||||||||||
| 23 |
Singapore Dollar |
17 |
Bank of America, NA(a) |
12/21/2016 |
— |
(b) |
|||||||||
| 39,509 |
Singapore Dollar |
28,882 |
Bank of America, NA(a) |
12/21/2016 |
475 |
||||||||||
| 6,794 |
Singapore Dollar |
5,020 |
Bank of America, NA(a) |
12/21/2016 |
135 |
||||||||||
| 561,352 |
South African Rand |
39,242 |
Bank of America, NA(a) |
11/07/2016 |
(2,349 |
) |
|||||||||
| 10,894,905 |
South African Rand |
795,192 |
JPMorgan Chase Bank, NA |
11/16/2016 |
(10,578 |
) |
|||||||||
| 4,866 |
South African Rand |
346 |
Bank of America, NA(a) |
12/21/2016 |
(11 |
) |
|||||||||
| 3,454 |
South African Rand |
250 |
Bank of America, NA(a) |
12/21/2016 |
(4 |
) |
|||||||||
| 5,766 |
South African Rand |
397 |
Bank of America, NA(a) |
12/21/2016 |
(26 |
) |
|||||||||
| 36,039 |
South African Rand |
2,535 |
Bank of America, NA(a) |
12/21/2016 |
(111 |
) |
|||||||||
| 143,821 |
South African Rand |
10,416 |
Bank of America, NA(a) |
12/21/2016 |
(143 |
) |
|||||||||
| 1,538 |
South African Rand |
110 |
Bank of America, NA(a) |
12/21/2016 |
(3 |
) |
|||||||||
| 17,674 |
South African Rand |
1,263 |
Bank of America, NA(a) |
12/21/2016 |
(35 |
) |
|||||||||
| 26,048 |
South African Rand |
1,845 |
Bank of America, NA(a) |
12/21/2016 |
(67 |
) |
|||||||||
| 16,282 |
South African Rand |
1,159 |
Bank of America, NA(a) |
12/21/2016 |
(36 |
) |
|||||||||
| 24,432 |
South African Rand |
1,709 |
Bank of America, NA(a) |
12/21/2016 |
(85 |
) |
|||||||||
| 171,643 |
South African Rand |
12,436 |
Bank of America, NA(a) |
12/21/2016 |
(165 |
) |
|||||||||
| 9,715,928 |
Swedish Krona |
1,104,957 |
JPMorgan Chase Bank, NA |
11/14/2016 |
28,679 |
||||||||||
| 2,764,704 |
Swedish Krona |
329,565 |
JPMorgan Chase Bank, NA |
11/16/2016 |
23,279 |
||||||||||
| 13,698 |
Swedish Krona |
1,605 |
Bank of America, NA(a) |
12/21/2016 |
85 |
||||||||||
| 5,671,753 |
Swedish Krona |
664,965 |
Bank of America, NA(a) |
12/21/2016 |
35,408 |
||||||||||
| 13,003 |
Swedish Krona |
1,478 |
Bank of America, NA(a) |
12/21/2016 |
35 |
||||||||||
| 692,966 |
Swedish Krona |
81,560 |
Bank of America, NA(a) |
12/21/2016 |
4,642 |
||||||||||
See Notes to Financial Statements
42
Consolidated Schedule of Investments Neuberger Berman Absolute Return Multi-Manager Fund (cont'd)
|
Contracts to Deliver |
In Exchange For |
Counterparty |
Settlement Date |
Net Unrealized Appreciation/ (Depreciation) |
|||||||||||
| 36,096 |
Swedish Krona |
$ |
4,204 |
Bank of America, NA(a) |
12/21/2016 |
$ |
197 |
||||||||
| 9,481 |
Swedish Krona |
1,114 |
Bank of America, NA(a) |
12/21/2016 |
62 |
||||||||||
| 4,169 |
Swedish Krona |
489 |
Bank of America, NA(a) |
12/21/2016 |
26 |
||||||||||
| 598 |
Swedish Krona |
70 |
Bank of America, NA(a) |
12/21/2016 |
4 |
||||||||||
| 571,982 |
Swedish Krona |
66,857 |
Bank of America, NA(a) |
12/21/2016 |
3,368 |
||||||||||
| 4,566 |
Swedish Krona |
522 |
Bank of America, NA(a) |
12/21/2016 |
15 |
||||||||||
| 24,252 |
Swedish Krona |
2,759 |
Bank of America, NA(a) |
12/21/2016 |
67 |
||||||||||
| 33,068 |
Swedish Krona |
3,669 |
Bank of America, NA(a) |
12/21/2016 |
(1 |
) |
|||||||||
| 13,194 |
Swedish Krona |
1,473 |
Bank of America, NA(a) |
12/21/2016 |
8 |
||||||||||
| 1,039 |
Swedish Krona |
117 |
Bank of America, NA(a) |
12/21/2016 |
2 |
||||||||||
| 1,066,781 |
Swedish Krona |
119,767 |
Bank of America, NA(a) |
12/21/2016 |
1,356 |
||||||||||
| 164 |
Swedish Krona |
19 |
Bank of America, NA(a) |
12/21/2016 |
1 |
||||||||||
| 263,897 |
Swedish Krona |
29,378 |
Bank of America, NA(a) |
12/21/2016 |
86 |
||||||||||
| 7,557 |
Swedish Krona |
858 |
Bank of America, NA(a) |
12/21/2016 |
19 |
||||||||||
| 342,293 |
Swedish Krona |
38,418 |
Bank of America, NA(a) |
12/21/2016 |
424 |
||||||||||
| 6,242,796 |
Swedish Krona |
731,042 |
JPMorgan Chase Bank, NA |
12/30/2016 |
37,700 |
||||||||||
| 102,655 |
Swiss Franc |
104,175 |
JPMorgan Chase Bank, NA |
11/14/2016 |
375 |
||||||||||
| 954,220 |
Swiss Franc |
986,003 |
JPMorgan Chase Bank, NA |
11/16/2016 |
21,040 |
||||||||||
| 306,739 |
Swiss Franc |
318,475 |
JPMorgan Chase Bank, NA |
11/16/2016 |
8,283 |
||||||||||
| 319,584 |
Swiss Franc |
331,297 |
JPMorgan Chase Bank, NA |
11/16/2016 |
8,115 |
||||||||||
| 83,000 |
Turkish Lira |
26,700 |
JPMorgan Chase Bank, NA |
11/14/2016 |
(56 |
) |
|||||||||
| 6,093 |
Turkish Lira |
1,966 |
Bank of America, NA(a) |
12/21/2016 |
18 |
||||||||||
| 5,585 |
Turkish Lira |
1,830 |
Bank of America, NA(a) |
12/21/2016 |
44 |
||||||||||
| 21,456 |
Turkish Lira |
6,831 |
Bank of America, NA(a) |
12/21/2016 |
(29 |
) |
|||||||||
| 15,690 |
Turkish Lira |
5,035 |
Bank of America, NA(a) |
12/21/2016 |
18 |
||||||||||
| 14,408 |
Turkish Lira |
4,799 |
Bank of America, NA(a) |
12/21/2016 |
192 |
||||||||||
| 60,399 |
Turkish Lira |
19,602 |
Bank of America, NA(a) |
12/21/2016 |
290 |
||||||||||
| 5,757 |
Turkish Lira |
1,858 |
Bank of America, NA(a) |
12/21/2016 |
17 |
||||||||||
| 75,886 |
Turkish Lira |
24,825 |
Bank of America, NA(a) |
12/21/2016 |
561 |
||||||||||
| 1,371 |
Turkish Lira |
437 |
Bank of America, NA(a) |
12/21/2016 |
(1 |
) |
|||||||||
| 3,875 |
Turkish Lira |
1,251 |
Bank of America, NA(a) |
12/21/2016 |
12 |
||||||||||
| 53 |
Turkish Lira |
17 |
Bank of America, NA(a) |
12/21/2016 |
— |
(b) |
|||||||||
| 3,250 |
Turkish Lira |
1,034 |
Bank of America, NA(a) |
12/21/2016 |
(5 |
) |
|||||||||
| 6,544 |
Turkish Lira |
2,101 |
Bank of America, NA(a) |
12/21/2016 |
9 |
||||||||||
|
Total |
$ |
667,738 |
|||||||||||||
(a) The investment is held by the Subsidiary (see Note A in Notes to Financial Statements.)
(b) Amount less than one dollar.
For the year ended October 31, 2016, the average notional value of forward contracts for the Fund was $43,921,935. The Fund had cash collateral of $277,945 deposited in a segregated account for JPMorgan Chase Bank, NA.
See Notes to Financial Statements
43
Consolidated Schedule of Investments Neuberger Berman Absolute Return Multi-Manager Fund (cont'd)
Credit default swap contracts ("credit default swaps")
At October 31, 2016, the Fund had outstanding over-the-counter ("OTC") credit default swaps as follows:
OTC Credit Default Swaps—Buy Protection
| Swap Counterparty |
Reference Entity |
Notional Amount |
Contract Annual Fixed Rate* |
Termination Date |
Unamortized Upfront Payments (Received) Paid |
Unrealized Appreciation/ (Depreciation) |
Accrued Net Interest Receivable/ (Payable) |
Total Fair Value |
|||||||||||||||||||||||||||
| JPMorgan Chase Bank, NA |
Assured Guaranty Municipal Corp., 0.00%, 12/31/2099 |
$ |
1,000,000 |
5.00 |
% |
12/20/2021 |
$ |
(144,644 |
) |
$ |
(16,256 |
) |
$ |
(5,833 |
) |
$ |
(166,733 |
) |
|||||||||||||||||
| JPMorgan Chase Bank, NA |
Avon Products, Inc., 6.50%, 3/1/2019 |
2,000,000 |
5.00 |
12/20/2021 |
137,868 |
(137,838 |
) |
(11,667 |
) |
(11,637 |
) |
||||||||||||||||||||||||
| JPMorgan Chase Bank, NA |
Best Buy Co., Inc., 5.50%, 3/15/2021 |
2,000,000 |
5.00 |
12/20/2021 |
(294,578 |
) |
(19,542 |
) |
(11,667 |
) |
(325,787 |
) |
|||||||||||||||||||||||
| JPMorgan Chase Bank, NA |
Gap, Inc. (The), 5.95%, 4/12/2021 |
2,000,000 |
1.00 |
12/20/2021 |
237,515 |
(38,173 |
) |
(2,333 |
) |
197,009 |
|||||||||||||||||||||||||
| JPMorgan Chase Bank, NA |
Goodyear Tire & Rubber Co. (The), 7.00%, 3/15/2028 |
1,000,000 |
5.00 |
12/20/2021 |
(145,663 |
) |
3,452 |
(5,833 |
) |
(148,044 |
) |
||||||||||||||||||||||||
| JPMorgan Chase Bank, NA |
Hertz Corp. (The), 5.88%, 10/15/2020 |
1,000,000 |
5.00 |
12/20/2021 |
(38,311 |
) |
27,975 |
(5,833 |
) |
(16,169 |
) |
||||||||||||||||||||||||
| JPMorgan Chase Bank, NA |
International Lease Finance Corp., 8.25%, 12/15/2020 |
1,000,000 |
5.00 |
12/20/2021 |
(152,612 |
) |
(6,692 |
) |
(5,833 |
) |
(165,137 |
) |
|||||||||||||||||||||||
| JPMorgan Chase Bank, NA |
JC Penney Corp., Inc., 6.38%, 10/15/2036 |
1,000,000 |
5.00 |
12/20/2021 |
29,543 |
2,700 |
(5,833 |
) |
26,410 |
||||||||||||||||||||||||||
| JPMorgan Chase Bank, NA |
Nordstrom, Inc., 6.95%, 3/15/2028 |
1,000,000 |
1.00 |
12/20/2021 |
28,355 |
(73 |
) |
(1,167 |
) |
27,115 |
|||||||||||||||||||||||||
| JPMorgan Chase Bank, NA |
Staples, Inc., 2.75%, 1/12/2018 |
2,000,000 |
1.00 |
12/20/2021 |
132,204 |
29,692 |
(2,333 |
) |
159,563 |
||||||||||||||||||||||||||
| JPMorgan Chase Bank, NA |
United States Steel Corp., 6.65%, 6/1/2037 |
2,000,000 |
5.00 |
9/20/2020 |
34,941 |
97,867 |
(11,667 |
) |
121,141 |
||||||||||||||||||||||||||
|
Total |
|
$ |
(175,382 |
) |
$ |
(56,888 |
) |
$ |
(69,999 |
) |
$ |
(302,269 |
) |
||||||||||||||||||||||
* The contract annual fixed rate represents the annual fixed rate of interest paid by the Fund (as a buyer of protection) on the notional amount of the OTC credit default swaps.
OTC Credit Default Swaps—Sell Protection
| Swap Counterparty |
Reference Entity |
Notional Amount |
Contract Annual Fixed Rate* |
Termination Date |
Unamortized Upfront Payments (Received) Paid |
Unrealized Appreciation/ (Depreciation) |
Accrued Net Interest Receivable/ (Payable) |
Total Fair Value |
|||||||||||||||||||||||||||
| JPMorgan Chase Bank, NA |
United States Steel Corp., 6.65%, 6/1/2037 |
$ |
2,000,000 |
5.00 |
% |
6/20/2019 |
$ |
(152,737 |
) |
$ |
167,107 |
$ |
11,667 |
$ |
26,037 |
||||||||||||||||||||
|
$ |
(152,737 |
) |
$ |
167,107 |
$ |
11,667 |
$ |
26,037 |
|||||||||||||||||||||||||||
* The contract annual fixed rate represents the annual fixed rate of interest received by the Fund (as a seller of protection) on the notional amount of the OTC credit default swaps.
See Notes to Financial Statements
44
Consolidated Schedule of Investments Neuberger Berman Absolute Return Multi-Manager Fund (cont'd)
For the year ended October 31, 2016, the average notional value of credit default swaps for the Fund was $20,538,462 for buy protection and $2,000,000 for sell protection.
At October 31, 2016, the Fund had outstanding centrally cleared credit default swaps as follows:
Centrally Cleared Credit Default Swaps—Buy Protection
| Clearinghouse | Reference Entity |
Notional Amount(a) |
Contract Annual Fixed Rate* |
Termination Date |
Unamortized Upfront Payments (Received) Paid |
Unrealized Appreciation/ (Depreciation) |
Accrued Net Interest Receivable/ (Payable) |
Total Fair Value |
|||||||||||||||||||||||||||
| ICE Clear Credit |
CDX North America Investment Grade |
$ |
5,000,000 |
1.00 |
% |
12/20/2021 |
$ |
(60,646 |
) |
$ |
8,826 |
$ |
(5,833 |
) |
$ |
(57,653 |
) |
||||||||||||||||||
| ICE Clear Credit |
iTraxx Europe Crossover Index |
EUR |
4,000,000 |
5.00 |
12/20/2021 |
(343,535 |
) |
4,681 |
(25,614 |
) |
(364,468 |
) |
|||||||||||||||||||||||
|
Total |
$ |
(404,181 |
) |
$ |
13,507 |
$ |
(31,447 |
) |
$ |
(422,121 |
) |
||||||||||||||||||||||||
(a) Notional amount is stated in the currency in which it is denominated.
EUR Euro
* The contract annual fixed rate represents the annual fixed rate of interest paid by the Fund (as a buyer of protection) on the notional amount of the centrally cleared credit default swaps.
For the year ended October 31, 2016, the average notional value of credit default swaps for the Fund was $19,469,000 for buy protection. The Fund had $377,899 deposited in segregated accounts to cover margin requirements on centrally cleared swaps.
Equity swap contracts ("equity swaps")
At October 31, 2016, the outstanding equity swaps* for the Fund were as follows:
|
Counterparty |
Description |
Expiration Date(s) |
Value |
||||||
| JPMorgan Chase Bank, NA |
The Fund receives the total return on long positions and pays a specified LIBOR or Federal Funds floating rate, which is denominated in various foreign currencies based on the local currencies of the positions. The Fund pays the total return on short positions and receives a specified LIBOR or Federal Funds floating rate, which is denominated in various foreign currencies based on the local currencies of the positions. |
12/19/2016- 10/31/2017 |
$(1,127,752) | ||||||
* The following table represents the individual long and short positions and related values of the equity swaps with JPMorgan Chase Bank, NA as of October 31, 2016.
|
Reference Entity |
Shares |
Notional Value(a)(b) |
Net Unrealized Appreciation/ (Depreciation) |
||||||||||
|
Long Positions |
|||||||||||||
|
Australia |
|||||||||||||
|
Bradken Ltd. |
51,270 |
$ |
125,394 |
$ |
190 |
||||||||
|
SAI Global Ltd. |
147,019 |
521,216 |
2,183 |
||||||||||
|
2,373 |
|||||||||||||
|
Brazil |
|||||||||||||
|
Porto Sudeste Royalties FIP |
3,867,765 |
2,335,635 |
(1,123,929 |
)(c)(d) | |||||||||
See Notes to Financial Statements
45
Consolidated Schedule of Investments Neuberger Berman Absolute Return Multi-Manager Fund (cont'd)
|
Reference Entity |
Shares |
Notional Value(a)(b) |
Net Unrealized Appreciation/ (Depreciation) |
||||||||||
|
Canada |
|||||||||||||
|
Athabasca Oil Corp. |
42,929 |
$ |
47,525 |
$ |
(7,198 |
) |
|||||||
|
Finland |
|||||||||||||
|
Powerflute OYJ |
194,600 |
211,886 |
1,890 |
||||||||||
|
Italy |
|||||||||||||
|
Buzzi Unicem SpA |
33,554 |
361,312 |
(18,757 |
) |
|||||||||
|
Netherlands |
|||||||||||||
|
Delta Lloyd NV |
3,800 |
21,913 |
1,071 |
||||||||||
|
United States |
|||||||||||||
|
Reynolds American, Inc. |
2,000 |
108,920 |
1,240 |
||||||||||
|
Safeway, Inc. |
429,292 |
0 |
(e) |
107,323 |
(c) |
||||||||
|
Safeway, Inc. |
429,292 |
0 |
(e) |
8,586 |
(c) |
||||||||
|
117,149 |
|||||||||||||
|
Total Long Positions of Equity Swaps |
(1,027,401 |
) |
|||||||||||
|
Short Positions |
|||||||||||||
|
France |
|||||||||||||
|
Technip SA |
(22,964 |
) |
(1,409,042 |
) |
(114,069 |
) |
|||||||
|
Germany |
|||||||||||||
|
Vonovia SE |
(2,830 |
) |
(106,107 |
) |
6,431 |
||||||||
|
Italy |
|||||||||||||
|
Buzzi Unicem SpA |
(18,107 |
) |
(358,136 |
) |
5,916 |
||||||||
|
United Kingdom |
|||||||||||||
|
British American Tobacco plc |
(1,100 |
) |
(61,505 |
) |
(1,662 |
) |
|||||||
|
Henderson Group plc |
(27,370 |
) |
(81,754 |
) |
4,133 |
||||||||
|
2,471 |
|||||||||||||
|
Total Short Positions of Equity Swaps |
(99,251 |
) |
|||||||||||
|
Total Long and Short Positions of Equity Swaps |
(1,126,652 |
) |
|||||||||||
|
Financing Costs and Other Receivables/(Payables) |
(1,100 |
) |
|||||||||||
|
Equity Swaps, at value—JPMorgan Chase Bank, NA |
$ |
(1,127,752 |
) |
||||||||||
|
Counterparty |
Description |
Expiration Date(s) |
Value |
||||||
| Morgan Stanley Capital Services LLC |
The Fund receives the total return on long positions and pays a specified LIBOR or Federal Funds floating rate, which is denominated in various foreign currencies based on the local currencies of the positions. The Fund pays the total return on short positions and receives a specified LIBOR or Federal Funds floating rate, which is denominated in various foreign currencies based on the local currencies of the positions. | 12/12/2016- 09/15/2017 |
$748,748 | ||||||
* The following table represents the individual long and short positions and related values of the equity swaps with Morgan Stanley Capital Services LLC as of October 31, 2016.
See Notes to Financial Statements
46
Consolidated Schedule of Investments Neuberger Berman Absolute Return Multi-Manager Fund (cont'd)
|
Reference Entity |
Shares |
Notional Value(a)(b) |
Net Unrealized Appreciation/ (Depreciation) |
||||||||||
|
Long Positions |
|||||||||||||
|
Brazil |
|||||||||||||
|
Hypermarcas SA |
35,704 |
$ |
224,665 |
$ |
74,658 |
||||||||
|
France |
|||||||||||||
|
Amundi SA |
6,909 |
344,306 |
(5,703 |
) |
|||||||||
|
BNP Paribas SA |
15,189 |
857,262 |
23,778 |
||||||||||
|
Iliad SA |
5,666 |
1,339,350 |
(150,736 |
) |
|||||||||
|
JCDecaux SA |
4,843 |
192,922 |
(44,834 |
) |
|||||||||
|
LVMH Moet Hennessy Louis Vuitton SE |
5,123 |
778,698 |
152,318 |
||||||||||
|
Publicis Groupe SA |
12,320 |
808,141 |
37,126 |
||||||||||
|
Remy Cointreau SA |
7,853 |
573,359 |
63,706 |
||||||||||
|
Societe Generale SA |
1,505 |
53,807 |
4,942 |
||||||||||
|
80,597 |
|||||||||||||
|
India |
|||||||||||||
|
Dr Reddy's Laboratories Ltd. |
7,821 |
363,701 |
21,796 |
||||||||||
|
Ireland |
|||||||||||||
|
Ryanair Holdings plc |
100,224 |
1,580,441 |
(194,178 |
) |
|||||||||
|
Jordan |
|||||||||||||
|
Hikma Pharmaceuticals plc |
13,775 |
402,635 |
(106,900 |
) |
|||||||||
|
Luxembourg |
|||||||||||||
|
Eurofins Scientific SE |
1,481 |
524,287 |
148,618 |
||||||||||
|
South Africa |
|||||||||||||
|
Aspen Pharmacare Holdings Ltd. |
13,787 |
273,382 |
26,954 |
||||||||||
|
South Korea |
|||||||||||||
|
NAVER Corp. |
549 |
297,228 |
113,953 |
||||||||||
|
Switzerland |
|||||||||||||
|
LafargeHolcim Ltd. |
23,536 |
1,048,051 |
208,963 |
||||||||||
|
Syngenta AG |
1,243 |
486,319 |
10,604 |
||||||||||
|
219,567 |
|||||||||||||
|
Turkey |
|||||||||||||
|
Migros Ticaret A/S |
44,527 |
267,640 |
(11,637 |
) |
|||||||||
|
United Kingdom |
|||||||||||||
|
Admiral Group plc |
7,515 |
178,002 |
(1,669 |
) |
|||||||||
|
Barclays plc |
105,890 |
224,333 |
22,313 |
||||||||||
|
Burberry Group plc |
3,106 |
47,809 |
8,266 |
||||||||||
|
Croda International plc |
9,445 |
350,803 |
53,589 |
||||||||||
|
ITV plc |
251,414 |
598,825 |
(74,144 |
) |
|||||||||
|
Pets At Home Group plc |
15,218 |
54,515 |
(14,765 |
) |
|||||||||
See Notes to Financial Statements
47
Consolidated Schedule of Investments Neuberger Berman Absolute Return Multi-Manager Fund (cont'd)
|
Reference Entity |
Shares |
Notional Value(a)(b) |
Net Unrealized Appreciation/ (Depreciation) |
||||||||||
|
RSA Insurance Group plc |
43,307 |
$ |
238,314 |
$ |
54,554 |
||||||||
|
Smith & Nephew plc |
5,686 |
89,219 |
(6,886 |
) |
|||||||||
|
Smiths Group plc |
7,053 |
79,899 |
42,515 |
||||||||||
|
Sports Direct International plc |
245,517 |
1,037,126 |
(205,607 |
) |
|||||||||
|
(121,834 |
) |
||||||||||||
|
United States |
|||||||||||||
|
Coach, Inc. |
18,638 |
628,447 |
40,470 |
||||||||||
|
Mead Johnson Nutrition Co. |
9,432 |
749,096 |
(43,865 |
) |
|||||||||
|
(3,395 |
) |
||||||||||||
|
Total Long Positions of Equity Swaps |
248,199 |
||||||||||||
|
Short Positions |
|||||||||||||
|
France |
|||||||||||||
|
Air France-KLM |
(54,160 |
) |
(405,740 |
) |
75,294 |
||||||||
|
Electricite de France SA |
(16,362 |
) |
(228,045 |
) |
44,659 |
||||||||
|
Kering |
(2,484 |
) |
(433,397 |
) |
(117,555 |
) |
|||||||
|
Lagardere SCA |
(22,437 |
) |
(649,250 |
) |
77,829 |
||||||||
|
Orange SA |
(45,293 |
) |
(782,056 |
) |
68,569 |
||||||||
|
148,796 |
|||||||||||||
|
Germany |
|||||||||||||
|
adidas AG |
(5,162 |
) |
(885,366 |
) |
38,778 |
||||||||
|
Deutsche Lufthansa AG |
(29,139 |
) |
(441,856 |
) |
69,364 |
||||||||
|
Deutsche Telekom AG |
(45,781 |
) |
(825,033 |
) |
78,981 |
||||||||
|
187,123 |
|||||||||||||
|
Italy |
|||||||||||||
|
Eni SpA |
(40,249 |
) |
(630,841 |
) |
47,179 |
||||||||
|
Netherlands |
|||||||||||||
|
Koninklijke Ahold Delhaize NV |
(39,946 |
) |
(923,751 |
) |
11,875 |
||||||||
|
Spain |
|||||||||||||
|
Industria de Diseno Textil SA |
(30,299 |
) |
(1,011,848 |
) |
(47,339 |
) |
|||||||
|
Switzerland |
|||||||||||||
|
Givaudan SA |
(385 |
) |
(720,817 |
) |
(24,244 |
) |
|||||||
|
Roche Holding AG |
(1,128 |
) |
(304,227 |
) |
44,897 |
||||||||
|
20,653 |
|||||||||||||
|
United Kingdom |
|||||||||||||
|
Bunzl plc |
(29,995 |
) |
(687,022 |
) |
(120,316 |
) |
|||||||
|
GlaxoSmithKline plc |
(24,091 |
) |
(393,694 |
) |
(83,559 |
) |
|||||||
|
Marks & Spencer Group plc |
(421,587 |
) |
(2,239,559 |
) |
482,502 |
||||||||
|
WPP plc |
(34,930 |
) |
(656,557 |
) |
(103,615 |
) |
|||||||
|
175,012 |
|||||||||||||
See Notes to Financial Statements
48
Consolidated Schedule of Investments Neuberger Berman Absolute Return Multi-Manager Fund (cont'd)
|
Reference Entity |
Shares |
Notional Value(a)(b) |
Net Unrealized Appreciation/ (Depreciation) |
||||||||||
|
United States |
|||||||||||||
|
Merck & Co., Inc. |
(4,871 |
) |
$ |
(260,010 |
) |
$ |
(26,016 |
) |
|||||
|
Pfizer, Inc. |
(8,353 |
) |
(267,845 |
) |
2,972 |
||||||||
|
(23,044 |
) |
||||||||||||
|
Total Short Positions of Equity Swaps |
520,255 |
||||||||||||
|
Total Long and Short Positions of Equity Swaps |
768,454 |
||||||||||||
|
Financing Costs and Other Receivables/(Payables) |
(19,706 |
) |
|||||||||||
|
Equity Swaps, at value—Morgan Stanley Capital Services LLC |
$ |
748,748 |
|||||||||||
|
Total Equity Swaps, at value |
$ |
(379,004 |
) |
||||||||||
(a) Notional value represents the value (including any fees or commissions) of the long and short positions when they were established.
(b) For the year ended October 31, 2016, the average notional value of equity swaps for the Fund was $59,122,644 for long positions and $(20,991,300) for short positions.
(c) Illiquid security.
(d) Security fair valued as of October 31, 2016 in accordance with procedures approved by the Board of Trustees.
(e) Amount less than one dollar.
At October 31, 2016, the Fund had cash collateral of $3,802,055, $1,920,604 and $4,770,000 deposited in a segregated account for JPMorgan Chase Bank, NA, Bank of America, N.A. and Morgan Stanley Capital Services LLC, respectively, to cover collateral requirements on OTC derivatives.
Total return swap contracts ("total return swaps")
At October 31, 2016, the Fund had outstanding total return swaps as follows:
Long Total Return Swaps
| Swap Counterparty |
Reference Entity |
Termination Date |
Notional Value(b) |
Unrealized Appreciation/ (Depreciation) |
|||||||||
|
Bank of America, NA |
FTSE Bursa Malaysia KLCI Index Futures(a) |
11/30/2016 |
MYR |
250,600 |
$ |
(42 |
) |
||||||
|
Bank of America, NA |
IBEX 35 Index Futures(a) |
11/18/2016 |
EUR |
450,336 |
6,541 |
||||||||
|
Bank of America, NA |
KOSPI 200 Index Futures(a) |
12/8/2016 |
KRW |
1,959,016,725 |
(31,625 |
) |
|||||||
|
Bank of America, NA |
SET50 Index Futures(a) |
12/29/2016 |
THB |
8,301,716 |
8,516 |
||||||||
|
Total |
$ |
(16,610 |
) |
||||||||||
(a) The investment is held by the Subsidiary (see Note A in Notes to Financial Statements.)
(b) Notional value represents the value (including any fees or commissions) of the long positions when they were established, and is stated in the currency in which it is denominated.
EUR Euro
KRW Korean Won
MYR Malaysian Ringgit
THB Thai Baht
See Notes to Financial Statements
49
Consolidated Schedule of Investments Neuberger Berman Absolute Return Multi-Manager Fund (cont'd)
For the year ended October 31, 2016, the average notional value of total return swaps for the Fund was $2,385,888 for long positions and $(2,647,348) for short positions.
Written option contracts ("options written")
At October 31, 2016, the Fund had outstanding options written as follows:
|
Name of Issuer |
Contracts |
Exercise Price |
Expiration Date |
Market Value of Options |
|||||||||||
|
Hewlett Packard Enterprise Co., Call |
6 |
$ |
21 |
11/18/2016 |
$ |
(945 |
) |
||||||||
|
Hewlett Packard Enterprise Co., Call |
65 |
22 |
11/18/2016 |
(5,362 |
) |
||||||||||
|
Imperva, Inc., Call |
42 |
55 |
11/18/2016 |
(735 |
) |
||||||||||
|
iShares Russell 2000 Fund, Put |
266 |
102 |
12/30/2016 |
(13,566 |
) |
||||||||||
|
Molson Coors Brewing Co., Put |
155 |
95 |
11/18/2016 |
(10,075 |
) |
||||||||||
|
NetSuite, Inc., Call |
14 |
110 |
11/18/2016 |
(1,050 |
) |
||||||||||
|
NXP Semiconductors NV, Call |
17 |
105 |
11/18/2016 |
(128 |
) |
||||||||||
|
Pacific Biosciences of California, Inc., Call |
112 |
10 |
11/18/2016 |
(2,240 |
) |
||||||||||
|
Rackspace Hosting, Inc., Call |
177 |
32 |
12/16/2016 |
(885 |
)(a) | ||||||||||
|
Rite Aid Corp., Call |
46 |
8 |
11/18/2016 |
(138 |
) |
||||||||||
|
Rite Aid Corp., Put |
130 |
5 |
1/20/2017 |
(3,965 |
) |
||||||||||
|
Time Warner, Inc., Put |
4 |
85 |
1/20/2017 |
(600 |
) |
||||||||||
|
Time Warner, Inc., Put |
16 |
87.5 |
1/20/2017 |
(4,056 |
) |
||||||||||
|
Twitter, Inc., Call |
12 |
18 |
11/18/2016 |
(1,116 |
) |
||||||||||
|
Twitter, Inc., Call |
14 |
19 |
11/18/2016 |
(812 |
) |
||||||||||
|
Total (Premium received $(72,594)) |
$ |
(45,673 |
) |
||||||||||||
(a) Security fair valued as of October 31, 2016 in accordance with procedures approved by the Board of Trustees.
Options written for the Fund for the year ended October 31, 2016 were as follows:
| Number of Contracts |
Premium Received |
||||||||||
|
Outstanding 10/31/15 |
13,969 |
$ |
4,939,440 |
||||||||
|
Options written |
22,197 |
1,540,678 |
|||||||||
|
Options closed |
(18,461 |
) |
(5,504,488 |
) |
|||||||
|
Options exercised |
(1 |
) |
(69 |
) |
|||||||
|
Options expired |
(16,628 |
) |
(902,967 |
) |
|||||||
|
Outstanding 10/31/16 |
1,076 |
$ |
72,594 |
||||||||
For the year ended October 31, 2016, the Fund had an average market value of $2,601,186 in purchased option contracts, and $(547,620) in options written, respectively.
See Notes to Financial Statements
50
Consolidated Schedule of Investments Neuberger Berman Absolute Return Multi-Manager Fund (cont'd)
The following is a summary, categorized by Level (see Note A of Notes to Financial Statements), of inputs used to value the Fund's investments as of October 31, 2016:
|
Asset Valuation Inputs |
|||||||||||||||||
|
(000's omitted) |
Level 1 |
Level 2 |
Level 3* |
Total |
|||||||||||||
|
Investments: |
|||||||||||||||||
|
Common Stocks |
|||||||||||||||||
|
Airlines |
$ |
201 |
$ |
— |
$ |
10 |
$ |
211 |
|||||||||
|
Capital Markets |
3,870 |
— |
— |
3,870 |
|||||||||||||
|
Media |
15,247 |
332 |
1 |
15,580 |
|||||||||||||
| Other Common Stocks(a) |
223,567 |
— |
— |
223,567 |
|||||||||||||
|
Total Common Stocks |
242,885 |
332 |
11 |
243,228 |
|||||||||||||
|
Loan Assignments |
|||||||||||||||||
|
Health Care Equipment & Supplies |
— |
— |
522 |
522 |
|||||||||||||
|
Independent Power & Renewable Electricity Producers |
— |
— |
636 |
636 |
|||||||||||||
|
Professional Services |
— |
— |
1,989 |
1,989 |
|||||||||||||
| Other Loan Assignments(a) |
— |
46,959 |
— |
46,959 |
|||||||||||||
|
Total Loan Assignments |
— |
46,959 |
3,147 |
50,106 |
|||||||||||||
|
Corporate Bonds |
|||||||||||||||||
|
Banks |
— |
— |
12,087 |
12,087 |
|||||||||||||
|
Capital Markets |
— |
— |
7,402 |
7,402 |
|||||||||||||
|
Oil, Gas & Consumable Fuels |
— |
2,803 |
— |
(b) |
2,803 |
||||||||||||
| Other Corporate Bonds(a) |
— |
21,188 |
— |
21,188 |
|||||||||||||
|
Total Corporate Bonds |
— |
23,991 |
19,489 |
43,480 |
|||||||||||||
|
Commercial Mortgage-Backed Securities |
— |
39,339 |
— |
39,339 |
|||||||||||||
|
Asset-Backed Securities |
— |
36,100 |
— |
36,100 |
|||||||||||||
|
Master Limited Partnerships |
19,173 |
— |
— |
19,173 |
|||||||||||||
|
Collateralized Mortgage Obligations |
— |
10,996 |
— |
10,996 |
|||||||||||||
| Convertible Bonds(a) |
— |
4,541 |
— |
4,541 |
|||||||||||||
|
U.S. Treasury Obligation |
— |
966 |
— |
966 |
|||||||||||||
|
Rights |
|||||||||||||||||
|
Biotechnology |
— |
— |
96 |
96 |
|||||||||||||
|
Food & Staples Retailing |
— |
— |
30 |
30 |
|||||||||||||
|
Pharmaceuticals |
— |
— |
— |
(b) |
— |
(b) |
|||||||||||
|
Semiconductors & Semiconductor Equipment |
— |
1,392 |
— |
1,392 |
|||||||||||||
|
Wireless Telecommunication Services |
— |
— |
189 |
189 |
|||||||||||||
| Other Rights(a) |
— |
(b) |
— |
— |
— |
(b) |
|||||||||||
|
Total Rights |
— |
1,392 |
315 |
1,707 |
|||||||||||||
|
Options Purchased |
296 |
— |
— |
296 |
|||||||||||||
See Notes to Financial Statements
51
Consolidated Schedule of Investments Neuberger Berman Absolute Return Multi-Manager Fund (cont'd)
|
Asset Valuation Inputs |
|||||||||||||||||
|
(000's omitted) |
Level 1 |
Level 2 |
Level 3* |
Total |
|||||||||||||
|
Warrants |
|||||||||||||||||
|
Insurance |
$ |
— |
$ |
— |
$ |
— |
(b) |
$ |
— |
(b) |
|||||||
|
Other Warrants(a) |
47 |
— |
— |
47 |
|||||||||||||
|
Total Warrants |
47 |
— |
— |
47 |
|||||||||||||
|
Preferred Stock(a) |
26 |
— |
— |
26 |
|||||||||||||
|
Short-Term Investments |
— |
113,752 |
— |
113,752 |
|||||||||||||
|
Total Long Positions |
$ |
262,427 |
$ |
278,368 |
$ |
22,962 |
$ |
563,757 |
|||||||||
(a) The Schedule of Investments provides information on the industry categorization for the portfolio.
(b) Amount less than one thousand.
* The following is a reconciliation between the beginning and ending balances of investments in which unobservable inputs (Level 3) were used in determining value:
|
(000's omitted) |
Beginning balance as of 11/1/2015 |
Accrued discounts/ (premiums) |
Realized gain/loss and change in unrealized appreciation/ (depreciation) |
Purchases |
Sales |
Transfers into Level 3 |
Transfers out of Level 3 |
Balance as of 10/31/2016 |
Net change in unrealized appreciation/ (depreciation) from investments still held as of 10/31/2016 |
||||||||||||||||||||||||||||
|
Investments in Securities: |
|||||||||||||||||||||||||||||||||||||
| Common Stocks(a) | |||||||||||||||||||||||||||||||||||||
|
Airlines |
$ |
— |
$ |
— |
$ |
(45 |
) |
$ |
— |
$ |
— |
$ |
55 |
$ |
— |
$ |
10 |
$ |
(45 |
) |
|||||||||||||||||
| Capital Markets |
— |
— |
(197 |
) |
— |
(60 |
) |
257 |
— |
— |
1,128 |
||||||||||||||||||||||||||
| Health Care Equipment & Supplies |
16 |
— |
(16 |
) |
— |
— |
— |
— |
— |
— |
|||||||||||||||||||||||||||
|
Media |
1 |
— |
— |
— |
— |
— |
— |
1 |
— |
||||||||||||||||||||||||||||
| Loan Assignments(b) | |||||||||||||||||||||||||||||||||||||
| Commercial Services & Supplies |
448 |
0 |
(c) |
(27 |
) |
— |
(421 |
) |
— |
— |
— |
— |
|||||||||||||||||||||||||
| Diversified Financial Services |
2,867 |
— |
— |
— |
— |
— |
(2,867 |
) |
— |
— |
|||||||||||||||||||||||||||
| Electronic Equipment, Instruments & Components |
289 |
0 |
(c) |
(12 |
) |
— |
(277 |
) |
— |
— |
— |
— |
|||||||||||||||||||||||||
|
Food Products |
1,843 |
5 |
11 |
5 |
(1,864 |
) |
— |
— |
— |
— |
|||||||||||||||||||||||||||
| Health Care Equipment & Supplies |
— |
0 |
(c) |
9 |
773 |
(260 |
) |
— |
— |
522 |
6 |
||||||||||||||||||||||||||
See Notes to Financial Statements
52
Consolidated Schedule of Investments Neuberger Berman Absolute Return Multi-Manager Fund (cont'd)
|
(000's omitted) |
Beginning balance as of 11/1/2015 |
Accrued discounts/ (premiums) |
Realized gain/loss and change in unrealized appreciation/ (depreciation) |
Purchases |
Sales |
Transfers into Level 3 |
Transfers out of Level 3 |
Balance as of 10/31/2016 |
Net change in unrealized appreciation/ (depreciation) from investments still held as of 10/31/2016 |
||||||||||||||||||||||||||||||
| Household Products |
$ |
376 |
$ |
0 |
(c) |
$ |
(11 |
) |
$ |
— |
$ |
(365 |
) |
$ |
— |
$ |
— |
$ |
— |
$ |
— |
||||||||||||||||||
| Independent Power & Renewable Electricity Producers |
687 |
11 |
95 |
518 |
(675 |
) |
— |
— |
636 |
109 |
|||||||||||||||||||||||||||||
|
Insurance |
771 |
0 |
(c) |
(24 |
) |
— |
(747 |
) |
— |
— |
— |
— |
|||||||||||||||||||||||||||
| Professional Services |
2,652 |
8 |
12 |
— |
(683 |
) |
— |
— |
1,989 |
(13 |
) |
||||||||||||||||||||||||||||
| Corporate Bonds(b) | |||||||||||||||||||||||||||||||||||||||
|
Banks |
14,887 |
217 |
(3,017 |
) |
— |
— |
— |
— |
12,087 |
(3,017 |
) |
||||||||||||||||||||||||||||
| Capital Markets |
9,870 |
123 |
(2,591 |
) |
— |
— |
— |
— |
7,402 |
(2,591 |
) |
||||||||||||||||||||||||||||
|
Chemicals |
1 |
— |
— |
— |
— |
— |
(1 |
) |
— |
— |
|||||||||||||||||||||||||||||
| Oil, Gas & Consumable Fuels |
— |
— |
— |
— |
(c) |
— |
— |
— |
— |
(c) |
— |
||||||||||||||||||||||||||||
| Rights(a) | |||||||||||||||||||||||||||||||||||||||
|
Biotechnology |
3 |
— |
65 |
— |
(40 |
) |
68 |
— |
96 |
24 |
|||||||||||||||||||||||||||||
| Food & Staples Retailing |
45 |
— |
(15 |
) |
— |
— |
— |
— |
30 |
(15 |
) |
||||||||||||||||||||||||||||
| Life Sciences Tools & Services |
15 |
— |
0 |
(c) |
— |
(15 |
) |
— |
— |
— |
— |
||||||||||||||||||||||||||||
|
Pharmaceuticals |
— |
(c) |
— |
— |
— |
— |
— |
— |
— |
(c) |
— |
||||||||||||||||||||||||||||
| Wireless Telecommunication Services |
222 |
— |
(33 |
) |
— |
— |
— |
— |
189 |
(33 |
) |
||||||||||||||||||||||||||||
| Warrants(a) | |||||||||||||||||||||||||||||||||||||||
|
Insurance |
— |
(c) |
— |
— |
— |
— |
— |
— |
— |
(c) |
— |
||||||||||||||||||||||||||||
|
Total |
$ |
34,993 |
$ |
364 |
$ |
(5,796 |
) |
$ |
1,296 |
$ |
(5,407 |
) |
$ |
380 |
$ |
(2,868 |
) |
$ |
22,962 |
$ |
(4,447 |
) |
|||||||||||||||||
(a) As of the year ended October 31, 2016, these investments did not have a material impact on the Fund's net assets and, therefore, disclosure of unobservable inputs used in formulating valuations is not presented.
(b) These securities are valued based on a single quotation obtained from a dealer. The Fund does not have access to unobservable inputs and therefore cannot disclose such inputs used in formulating such quotation.
(c) Amount less than one thousand.
See Notes to Financial Statements
53
Consolidated Schedule of Investments Neuberger Berman Absolute Return Multi-Manager Fund (cont'd)
As of the year ended October 31, 2016, certain securities were transferred from one level (as of October 31, 2015) to another. Based on beginning of period market values as of November 1, 2015, $2,867,361 was transferred from Level 3 to Level 2. In addition, $123,143 was transferred from Level 2 to Level 3. In addition, $256,611 was transferred from Level 1 to Level 3. Bank loans, corporate bonds and common stocks that transferred in or out of Level 3 were primarily due to the pricing methodology being based on a single broker quote (Level 3) or the pricing methodology being based on dated inputs by Management (Level 3). In addition, $183,849 was transferred from Level 2 to Level 1 due to active market activity on recognized exchanges as of October 31, 2016. As of October 31, 2015, these securities had been categorized as Level 2 due to the use of Interactive provided adjusted prices as stated in the description of the valuation methods of foreign equity securities.
The following is a summary, categorized by Level (see Note A of Notes to Financial Statements), of inputs used to value the Fund's short investments as of October 31, 2016:
|
Liability Valuation Inputs |
|||||||||||||||||
|
(000's omitted) |
Level 1 |
Level 2 |
Level 3* |
Total |
|||||||||||||
|
Investments: |
|||||||||||||||||
|
Common Stocks Sold Short |
|||||||||||||||||
|
IT Services |
$ |
(2,931 |
) |
$ |
— |
$ |
(27 |
) |
$ |
(2,958 |
) |
||||||
| Other Common Stocks Sold Short(a) |
(87,740 |
) |
— |
— |
(87,740 |
) |
|||||||||||
|
Total Common Stocks Sold Short |
(90,671 |
) |
— |
(27 |
) |
(90,698 |
) |
||||||||||
|
Exchange Traded Funds Sold Short |
(13,491 |
) |
— |
— |
(13,491 |
) |
|||||||||||
| Corporate Bonds Sold Short(a) |
— |
(13,020 |
) |
— |
(13,020 |
) |
|||||||||||
|
Exchange Traded Note Sold Short |
(1,839 |
) |
— |
— |
(1,839 |
) |
|||||||||||
| Master Limited Partnerships Sold Short(a) |
(1,567 |
) |
— |
— |
(1,567 |
) |
|||||||||||
|
Total Short Positions |
$ |
(107,568 |
) |
$ |
(13,020 |
) |
$ |
(27 |
) |
$ |
(120,615 |
) |
|||||
(a) The Schedule of Investments provides information on the industry categorization for the portfolio.
* The following is a reconciliation between the beginning and ending balances of short investments in which unobservable inputs (Level 3) were used in determining value:
|
(000's omitted) |
Beginning balance as of 11/1/2015 |
Accrued discounts/ (premiums) |
Realized gain/loss and change in unrealized appreciation/ (depreciation) |
Purchases to cover positions sold short |
Sales |
Transfers into Level 3 |
Transfers out of Level 3 |
Balance as of 10/31/2016 |
Net change in unrealized appreciation/ (depreciation) from investments still held as of 10/31/2016 |
||||||||||||||||||||||||||||||
|
Investments in Securities: |
|||||||||||||||||||||||||||||||||||||||
| Common Stocks Sold Short(a) | |||||||||||||||||||||||||||||||||||||||
|
IT Services |
$ |
(122 |
) |
$ |
— |
$ |
95 |
$ |
— |
$ |
— |
$ |
— |
$ |
— |
$ |
(27 |
) |
$ |
95 |
|||||||||||||||||||
|
Total |
$ |
(122 |
) |
$ |
— |
$ |
95 |
$ |
— |
$ |
— |
$ |
— |
$ |
— |
$ |
(27 |
) |
$ |
95 |
|||||||||||||||||||
(a) These securities are valued based on a single quotation obtained from a dealer. The Fund does not have access to unobservable inputs and therefore cannot disclose such inputs used in formulating such quotation.
See Notes to Financial Statements
54
Consolidated Schedule of Investments Neuberger Berman Absolute Return Multi-Manager Fund (cont'd)
The following is a summary, categorized by Level (see Note A of Notes to Financial Statements), of inputs used to value the Fund's derivatives as of October 31, 2016:
|
Other Financial Instruments |
|||||||||||||||||
|
(000's omitted) |
Level 1 |
Level 2 |
Level 3* |
Total |
|||||||||||||
| Forward contracts(a) | |||||||||||||||||
|
Assets |
$ |
— |
$ |
851 |
$ |
— |
$ |
851 |
|||||||||
|
Liabilities |
— |
(657 |
) |
— |
(657 |
) |
|||||||||||
| Futures(a) | |||||||||||||||||
|
Assets |
2,646 |
— |
— |
2,646 |
|||||||||||||
|
Liabilities |
(1,966 |
) |
— |
— |
(1,966 |
) |
|||||||||||
| Swap contracts(a) | |||||||||||||||||
|
Assets |
— |
2,747 |
116 |
2,863 |
|||||||||||||
|
Liabilities |
— |
(2,833 |
) |
(1,124 |
) |
(3,957 |
) |
||||||||||
|
Option contracts written |
|||||||||||||||||
|
Liabilities |
(45 |
) |
— |
(1 |
) |
(46 |
) |
||||||||||
|
Total |
$ |
635 |
$ |
108 |
$ |
(1,009 |
) |
$ |
(266 |
) |
|||||||
(a) Forward contracts and futures are reported at the cumulative unrealized appreciation/(depreciation) of the instrument. Swap contracts are reported at the cumulative unrealized appreciation/(depreciation), with the exception of credit default swaps, which are reported in the table at value.
* The following is a reconciliation between the beginning and ending balances of derivative investments in which unobservable inputs (Level 3) were used in determining value:
|
(000's omitted) |
Beginning balance as of 11/1/2015 |
Accrued discounts/ (premiums) |
Realized gain/loss and change in unrealized appreciation/ (depreciation) |
Purchases |
Sales |
Transfers into Level 3 |
Transfers out of Level 3 |
Balance as of 10/31/2016 |
Net change in unrealized appreciation/ (depreciation) from investments still held as of 10/31/2016 |
||||||||||||||||||||||||||||
|
Investments in Securities: |
|||||||||||||||||||||||||||||||||||||
| Equity Swaps(a) | |||||||||||||||||||||||||||||||||||||
|
Brazil |
$ |
— |
$ |
— |
$ |
1,189 |
$ |
— |
$ |
— |
$ |
(2,313 |
) |
$ |
— |
$ |
(1,124 |
) |
$ |
1,189 |
|||||||||||||||||
|
United States |
172 |
— |
(56 |
) |
— |
— |
— |
— |
116 |
(56 |
) |
||||||||||||||||||||||||||
| Option contracts written(b) | |||||||||||||||||||||||||||||||||||||
|
United States |
— |
— |
1 |
— |
0 |
(c) |
(2 |
) |
— |
(1 |
) |
2 |
|||||||||||||||||||||||||
|
Total |
$ |
172 |
$ |
— |
$ |
1,134 |
$ |
— |
$ |
0 |
(c) |
$ |
(2,315 |
) |
$ |
— |
$ |
(1,009 |
) |
$ |
1,135 |
||||||||||||||||
(a) These securities are valued based on a single quotation obtained from a dealer. The Fund does not have access to unobservable inputs and therefore cannot disclose such inputs used in formulating such quotation.
(b) As of the year ended October 31, 2016, these investments did not have a material impact on the Fund's net assets and, therefore, disclosure of unobservable inputs used in formulating valuations is not presented.
(c) Amount less than one thousand.
See Notes to Financial Statements
55
Schedule of Investments Neuberger Berman Long Short
Multi-Manager Fund 10/31/2016
|
Investments |
Shares |
Value (000) |
|||||||||
|
Long Positions (97.5%) |
|||||||||||
|
Common Stocks (69.2%) |
|||||||||||
|
Air Freight & Logistics (0.8%) |
|||||||||||
| FedEx Corp.(a) |
1,010 |
$ |
176 |
||||||||
|
Auto Components (2.2%) |
|||||||||||
|
Adient plc* |
110 |
5 |
|||||||||
| Johnson Controls International plc(a) |
12,394 |
500 |
|||||||||
|
505 |
|||||||||||
|
Banks (1.0%) |
|||||||||||
| Barclays plc (United Kingdom)(a) |
17,249 |
40 |
|||||||||
| Societe Generale SA (France)(a) |
392 |
16 |
|||||||||
| Synovus Financial Corp.(a) |
5,330 |
176 |
|||||||||
|
232 |
|||||||||||
|
Beverages (1.1%) |
|||||||||||
| Molson Coors Brewing Co., Class B(a) |
2,425 |
252 |
|||||||||
|
Biotechnology (6.4%) |
|||||||||||
| Alexion Pharmaceuticals, Inc.*(a) |
1,868 |
244 |
|||||||||
| BioMarin Pharmaceutical, Inc.*(a)(b) |
2,910 |
234 |
|||||||||
| Incyte Corp.*(b) |
2,614 |
228 |
|||||||||
| Ironwood Pharmaceuticals, Inc.*(b) |
13,528 |
173 |
|||||||||
| Neurocrine Biosciences, Inc.*(b) |
5,102 |
223 |
|||||||||
| TESARO, Inc.*(b) |
2,054 |
248 |
|||||||||
| Vertex Pharmaceuticals, Inc.* |
1,900 |
144 |
|||||||||
|
1,494 |
|||||||||||
|
Capital Markets (0.6%) |
|||||||||||
| Evercore Partners, Inc., Class A(a) |
2,375 |
127 |
|||||||||
| Intertrust NV (Netherlands)*(a)(c) |
130 |
3 |
|||||||||
|
130 |
|||||||||||
|
Chemicals (2.6%) |
|||||||||||
| Air Products & Chemicals, Inc.(a) |
1,700 |
227 |
|||||||||
| Croda International plc (United Kingdom)(a) |
1,650 |
71 |
|||||||||
| PPG Industries, Inc.(a) |
1,885 |
175 |
|||||||||
| WR Grace & Co.(a) |
1,975 |
132 |
|||||||||
|
605 |
|||||||||||
|
Investments |
Shares |
Value (000) |
|||||||||
|
Communications Equipment (1.1%) |
|||||||||||
| Harris Corp.(a) |
1,080 |
$ |
96 |
||||||||
| Palo Alto Networks, Inc.*(a) |
1,090 |
168 |
|||||||||
|
264 |
|||||||||||
|
Construction Materials (1.0%) |
|||||||||||
| HeidelbergCement AG (Germany)(a) |
808 |
77 |
|||||||||
| Martin Marietta Materials, Inc.(a) |
800 |
148 |
|||||||||
|
225 |
|||||||||||
|
Containers & Packaging (0.3%) |
|||||||||||
| Ball Corp.(a) |
1,038 |
80 |
|||||||||
|
Diversified Financial Services (1.0%) |
|||||||||||
| Pace Holdings Corp.*(a) |
22,750 |
236 |
|||||||||
|
Electric Utilities (2.5%) |
|||||||||||
|
Exelon Corp. |
792 |
27 |
|||||||||
| Great Plains Energy, Inc.(a) |
1,762 |
50 |
|||||||||
| NextEra Energy, Inc.(a) |
3,021 |
387 |
|||||||||
| PG&E Corp.(a) |
1,575 |
98 |
|||||||||
| PNM Resources, Inc.(a) |
730 |
24 |
|||||||||
|
586 |
|||||||||||
|
Food & Staples Retailing (1.0%) |
|||||||||||
| Cia Brasileira de Distribuicao, ADR (Brazil)(a) |
1,399 |
27 |
|||||||||
| Magnit PJSC, GDR (Russia)(a) |
1,377 |
55 |
|||||||||
| Wal-Mart de Mexico SAB de CV (Mexico)(a) |
16,859 |
36 |
|||||||||
| X5 Retail Group NV, GDR (Russia)*(a) |
3,704 |
110 |
|||||||||
|
228 |
|||||||||||
|
Food Products (0.5%) |
|||||||||||
| Mead Johnson Nutrition Co. |
1,495 |
112 |
|||||||||
|
Gas Utilities (0.2%) |
|||||||||||
| Atmos Energy Corp.(a) |
683 |
51 |
|||||||||
| Health Care Equipment & Supplies (7.7%) |
|||||||||||
|
ABIOMED, Inc.* |
1,283 |
135 |
|||||||||
| Boston Scientific Corp.* |
6,540 |
144 |
|||||||||
|
CR Bard, Inc. |
722 |
156 |
|||||||||
| Danaher Corp.(a) |
1,675 |
131 |
|||||||||
| DENTSPLY SIRONA, Inc.(a) |
2,030 |
117 |
|||||||||
| Edwards Lifesciences Corp.* |
1,215 |
116 |
|||||||||
| Hologic, Inc.*(b) |
5,506 |
198 |
|||||||||
| Integra LifeSciences Holdings Corp.* |
1,401 |
111 |
|||||||||
|
Investments |
Shares |
Value (000) |
|||||||||
| Masimo Corp.*(b) |
2,120 |
$ |
117 |
||||||||
|
NuVasive, Inc.* |
1,962 |
117 |
|||||||||
| Smith & Nephew plc (United Kingdom)(a) |
926 |
13 |
|||||||||
| Smith & Nephew plc, ADR (United Kingdom)(b) |
6,629 |
194 |
|||||||||
| West Pharmaceutical Services, Inc.(a) |
550 |
42 |
|||||||||
| Wright Medical Group NV*(b) |
9,071 |
199 |
|||||||||
|
1,790 |
|||||||||||
|
Health Care Providers & Services (0.2%) |
|||||||||||
| Shanghai Pharmaceuticals Holding Co. Ltd., Class H (China)(a) |
11,003 |
28 |
|||||||||
| Sinopharm Group Co. Ltd., Class H (China)(a) |
6,177 |
30 |
|||||||||
|
58 |
|||||||||||
|
Hotels, Restaurants & Leisure (1.4%) |
|||||||||||
| Bloomin' Brands, Inc.(a) |
6,990 |
121 |
|||||||||
| Vail Resorts, Inc.(a) |
1,295 |
206 |
|||||||||
|
327 |
|||||||||||
|
Household Durables (0.8%) |
|||||||||||
| Mohawk Industries, Inc.*(a) |
1,040 |
192 |
|||||||||
|
Independent Power & Renewable Electricity Producers (1.6%) |
|||||||||||
| 8Point3 Energy Partners LP(a) |
85 |
1 |
|||||||||
| Calpine Corp.*(a) |
2,237 |
27 |
|||||||||
| Dynegy, Inc.*(a) |
3,968 |
42 |
|||||||||
| NextEra Energy Partners LP(a) |
3,915 |
107 |
|||||||||
| NRG Yield, Inc., Class A(a) |
5,279 |
78 |
|||||||||
| Pattern Energy Group, Inc.(a) |
5,538 |
124 |
|||||||||
|
379 |
|||||||||||
|
Industrial Conglomerates (0.1%) |
|||||||||||
| Smiths Group plc (United Kingdom)(a) |
1,149 |
20 |
|||||||||
|
Insurance (2.3%) |
|||||||||||
| Admiral Group plc (United Kingdom)(a) |
1,225 |
29 |
|||||||||
| AIA Group Ltd. (Hong Kong)(a) |
27,649 |
175 |
|||||||||
| American International Group, Inc.(a) |
1,660 |
102 |
|||||||||
| Hartford Financial Services Group, Inc. (The)(a) |
3,655 |
161 |
|||||||||
See Notes to Financial Statements
56
Schedule of Investments Neuberger Berman Long Short
Multi-Manager Fund (cont'd)
|
Investments |
Shares |
Value (000) |
|||||||||
| RSA Insurance Group plc (United Kingdom)(a) |
8,751 |
$ |
59 |
||||||||
|
526 |
|||||||||||
|
Internet & Direct Marketing Retail (1.3%) |
|||||||||||
| Amazon.com, Inc.*(a) |
44 |
35 |
|||||||||
| ASOS plc (United Kingdom)*(a) |
665 |
43 |
|||||||||
| Expedia, Inc.(a) |
869 |
112 |
|||||||||
| Priceline Group, Inc. (The)*(a) |
70 |
103 |
|||||||||
|
293 |
|||||||||||
|
Internet Software & Services (3.9%) |
|||||||||||
| Alibaba Group Holding Ltd., ADR (China)*(a) |
1,624 |
165 |
|||||||||
| Alphabet, Inc., Class A*(a) |
261 |
211 |
|||||||||
| Baidu, Inc., ADR (China)*(a) |
334 |
59 |
|||||||||
| eBay, Inc.*(a) |
1,877 |
53 |
|||||||||
| Facebook, Inc., Class A*(a) |
1,375 |
180 |
|||||||||
| LinkedIn Corp., Class A*(a) |
194 |
37 |
|||||||||
| Mail.Ru Group Ltd., GDR (Russia)*(a) |
1,097 |
18 |
|||||||||
| MercadoLibre, Inc. (Argentina)(a) |
414 |
70 |
|||||||||
| Tencent Holdings Ltd. (China)(a) |
3,643 |
97 |
|||||||||
| Yandex NV, Class A (Russia)*(a) |
1,201 |
24 |
|||||||||
|
914 |
|||||||||||
|
IT Services (1.6%) |
|||||||||||
| PayPal Holdings, Inc.*(a) |
1,877 |
78 |
|||||||||
| Total System Services, Inc.(a) |
2,440 |
122 |
|||||||||
| Visa, Inc., Class A(a) |
2,150 |
177 |
|||||||||
|
377 |
|||||||||||
|
Life Sciences Tools & Services (1.8%) |
|||||||||||
| Gerresheimer AG (Germany)(a) |
2,130 |
160 |
|||||||||
| QIAGEN NV*(b) |
10,735 |
262 |
|||||||||
|
422 |
|||||||||||
|
Machinery (0.4%) |
|||||||||||
| Mueller Water Products, Inc., Class A(a) |
7,950 |
98 |
|||||||||
|
Investments |
Shares |
Value (000) |
|||||||||
|
Media (3.0%) |
|||||||||||
| CBS Corp., Class B(a) |
4,475 |
$ |
253 |
||||||||
| ITV plc (United Kingdom)(a) |
46,615 |
97 |
|||||||||
| Liberty Global plc, Series C (United Kingdom)*(a) |
1,686 |
54 |
|||||||||
| Liberty Global plc LiLAC, Series C (United Kingdom)*(a) |
237 |
7 |
|||||||||
| Stroeer SE & Co. KGaA (Germany)(a) |
6,602 |
301 |
|||||||||
|
712 |
|||||||||||
|
Multi-Utilities (2.7%) |
|||||||||||
| Black Hills Corp.(a) |
5,439 |
336 |
|||||||||
| CMS Energy Corp.(a) |
1,044 |
44 |
|||||||||
| DTE Energy Co.(a) |
890 |
86 |
|||||||||
| SCANA Corp.(a) |
342 |
25 |
|||||||||
| Sempra Energy(a) |
1,362 |
146 |
|||||||||
|
637 |
|||||||||||
|
Oil, Gas & Consumable Fuels (2.7%) |
|||||||||||
| Cheniere Energy Partners LP Holdings LLC(a) |
106 |
2 |
|||||||||
| Cheniere Energy, Inc.*(a) |
3,552 |
134 |
|||||||||
| Enbridge, Inc. (Canada)(a) |
1,368 |
59 |
|||||||||
| Golar LNG Ltd.(a) |
784 |
17 |
|||||||||
| Kinder Morgan, Inc.(a) |
5,653 |
115 |
|||||||||
| Phillips 66(a) |
524 |
43 |
|||||||||
| SemGroup Corp., Class A(a) |
625 |
20 |
|||||||||
| Targa Resources Corp.(a) |
1,709 |
75 |
|||||||||
| TransCanada Corp. (Canada)(a) |
1,235 |
56 |
|||||||||
| Williams Cos., Inc. (The)(a) |
3,487 |
102 |
|||||||||
|
623 |
|||||||||||
|
Pharmaceuticals (2.6%) |
|||||||||||
| Allergan plc*(a) |
990 |
207 |
|||||||||
| Dermira, Inc.*(b) |
5,418 |
170 |
|||||||||
| Hikma Pharmaceuticals plc (Jordan)(a) |
2,178 |
47 |
|||||||||
|
Merck & Co., Inc. |
2,540 |
149 |
|||||||||
| Teva Pharmaceutical Industries Ltd., ADR (Israel)(a) |
607 |
26 |
|||||||||
|
599 |
|||||||||||
|
Road & Rail (1.5%) |
|||||||||||
| Kansas City Southern(a) |
1,735 |
152 |
|||||||||
| Norfolk Southern Corp.(a) |
2,170 |
202 |
|||||||||
|
354 |
|||||||||||
|
Investments |
Shares |
Value (000) |
|||||||||
|
Semiconductors & Semiconductor Equipment (1.7%) |
|||||||||||
| Broadcom Ltd. (Singapore)(a) |
915 |
$ |
156 |
||||||||
| NXP Semiconductors NV (Netherlands)*(a) |
2,375 |
237 |
|||||||||
|
393 |
|||||||||||
|
Software (1.7%) |
|||||||||||
| Activision Blizzard, Inc.(a) |
5,490 |
237 |
|||||||||
| PTC, Inc.*(a) |
3,360 |
159 |
|||||||||
|
396 |
|||||||||||
|
Specialty Retail (1.3%) |
|||||||||||
| Hennes & Mauritz AB, Class B (Sweden)(a) |
4,568 |
129 |
|||||||||
| Pets at Home Group plc (United Kingdom)(a) |
2,873 |
7 |
|||||||||
| Sports Direct International plc (United Kingdom)*(a) |
49,105 |
166 |
|||||||||
|
302 |
|||||||||||
|
Technology Hardware, Storage & Peripherals (1.2%) |
|||||||||||
| Apple, Inc.(a) |
1,615 |
184 |
|||||||||
| Samsung Electronics Co. Ltd., GDR (South Korea)(a) |
132 |
93 |
|||||||||
|
277 |
|||||||||||
|
Textiles, Apparel & Luxury Goods (3.3%) |
|||||||||||
| Burberry Group plc (United Kingdom)(a) |
506 |
9 |
|||||||||
| Deckers Outdoor Corp.*(a) |
2,285 |
120 |
|||||||||
| G-III Apparel Group Ltd.*(a) |
3,225 |
84 |
|||||||||
| Michael Kors Holdings Ltd.*(a) |
1,634 |
83 |
|||||||||
| NIKE, Inc., Class B(a) |
2,209 |
111 |
|||||||||
| PVH Corp.(a) |
2,385 |
255 |
|||||||||
| Steven Madden Ltd.*(a) |
3,300 |
110 |
|||||||||
|
772 |
|||||||||||
|
Trading Companies & Distributors (1.1%) |
|||||||||||
| Brenntag AG (Germany)(a) |
4,946 |
264 |
|||||||||
|
Transportation Infrastructure (0.5%) |
|||||||||||
| Macquarie Infrastructure Corp. |
1,319 |
108 |
|||||||||
|
Water Utilities (0.5%) |
|||||||||||
| American Water Works Co., Inc.(a) |
1,738 |
129 |
|||||||||
| Total Common Stocks (Cost $16,082) |
16,138 |
||||||||||
See Notes to Financial Statements
57
Schedule of Investments Neuberger Berman Long Short
Multi-Manager Fund (cont'd)
|
Investments |
Shares |
Value (000) |
|||||||||
|
Master Limited Partnerships (7.7%) |
|||||||||||
|
Oil, Gas & Consumable Fuels (7.7%) |
|||||||||||
| Antero Midstream Partners LP(a) |
4,268 |
$ |
124 |
||||||||
| Boardwalk Pipeline Partners LP(a) |
7,981 |
137 |
|||||||||
| Buckeye Partners LP(a) |
717 |
46 |
|||||||||
| Cheniere Energy Partners LP |
264 |
7 |
|||||||||
| Delek Logistics Partners LP |
122 |
3 |
|||||||||
| Enable Midstream Partners LP |
29 |
— |
(e) |
||||||||
| Energy Transfer Equity LP(a) |
6,900 |
103 |
|||||||||
| Energy Transfer Partners LP(a) |
3,184 |
111 |
|||||||||
| Enterprise Products Partners LP(a) |
4,904 |
124 |
|||||||||
| EQT GP Holdings LP(a) |
2,748 |
64 |
|||||||||
| EQT Midstream Partners LP(a) |
1,018 |
76 |
|||||||||
| Magellan Midstream Partners LP(a) |
19 |
1 |
|||||||||
| MPLX LP |
20 |
1 |
|||||||||
| Noble Midstream Partners LP*(a) |
226 |
7 |
|||||||||
|
NuStar Energy LP |
33 |
2 |
|||||||||
| NuStar GP Holdings LLC(a) |
2,665 |
66 |
|||||||||
| ONEOK Partners LP(a) |
1,304 |
52 |
|||||||||
|
Phillips 66 Partners LP |
228 |
10 |
|||||||||
| Plains All American Pipeline LP(a) |
836 |
25 |
|||||||||
| Rice Midstream Partners LP(a) |
2,031 |
44 |
|||||||||
| Shell Midstream Partners LP |
4,438 |
120 |
|||||||||
| Spectra Energy Partners LP |
450 |
19 |
|||||||||
| Sunoco Logistics Partners LP(a) |
2,744 |
70 |
|||||||||
|
Sunoco LP |
3,387 |
97 |
|||||||||
| Tesoro Logistics LP(a) |
500 |
24 |
|||||||||
| Valero Energy Partners LP(a) |
3,500 |
143 |
|||||||||
| Western Gas Equity Partners LP(a) |
2,388 |
102 |
|||||||||
| Western Gas Partners LP(a) |
1,355 |
75 |
|||||||||
| Western Refining Logistics LP(a) |
6,958 |
159 |
|||||||||
| Total Master Limited Partnerships (Cost $1,786) |
1,812 |
||||||||||
|
Investments |
No. of Contracts |
Value (000) |
|||||||||
| Option Purchased (0.0%)(f) | |||||||||||
| Put Option (0.0%)(f) | |||||||||||
| Molson Coors Brewing Co. 11/18/2016 @ 103.00 (Cost $3) |
12 |
$ |
|
3 |
|||||||
|
Shares |
|||||||||||
|
Short-Term Investment (20.6%) |
|||||||||||
|
Investment Company (20.6%) |
|||||||||||
| Morgan Stanley Institutional Liquidity Fund Treasury Portfolio Institutional Class, 0.19% (Cost $4,807)(a)(g) |
4,806,748 |
4,807 |
|||||||||
| Total Long Positions (Cost $22,678) |
22,760 |
||||||||||
| Short Positions (35.1%)(h) | |||||||||||
|
Common Stocks (29.2%) |
|||||||||||
|
Aerospace & Defense (0.3%) |
|||||||||||
|
Triumph Group, Inc. |
(3,280 |
) |
(78 |
) |
|||||||
|
Air Freight & Logistics (0.4%) |
|||||||||||
| Royal Mail plc (United Kingdom) |
(15,250 |
) |
(92 |
) |
|||||||
|
Airlines (0.4%) |
|||||||||||
| Deutsche Lufthansa AG (Germany) |
(7,200 |
) |
(92 |
) |
|||||||
|
Auto Components (0.3%) |
|||||||||||
|
Autoliv, Inc. (Sweden) |
(800 |
) |
(77 |
) |
|||||||
|
Banks (1.1%) |
|||||||||||
| Canadian Western Bank (Canada) |
(3,700 |
) |
(70 |
) |
|||||||
|
Home BancShares, Inc. |
(4,610 |
) |
(99 |
) |
|||||||
| National Bank of Canada (Canada) |
(2,180 |
) |
(78 |
) |
|||||||
|
(247 |
) |
||||||||||
|
Beverages (0.3%) |
|||||||||||
| Brown-Forman Corp., Class B |
(1,600 |
) |
(74 |
) |
|||||||
|
Biotechnology (0.6%) |
|||||||||||
|
AbbVie, Inc. |
(1,116 |
) |
(62 |
) |
|||||||
|
Amgen, Inc. |
(533 |
) |
(75 |
) |
|||||||
|
(137 |
) |
||||||||||
|
Investments |
Shares |
Value (000) |
|||||||||
|
Capital Markets (0.9%) |
|||||||||||
| Ameriprise Financial, Inc. |
(815 |
) |
$ |
(72 |
) |
||||||
|
Franklin Resources, Inc. |
(2,830 |
) |
(95 |
) |
|||||||
| Waddell & Reed Financial, Inc., Class A |
(2,400 |
) |
(38 |
) |
|||||||
|
(205 |
) |
||||||||||
|
Chemicals (0.2%) |
|||||||||||
| Axalta Coating Systems Ltd.* |
(1,540 |
) |
(39 |
) |
|||||||
|
Commercial Services & Supplies (0.3%) |
|||||||||||
| RR Donnelley & Sons Co. |
(3,710 |
) |
(66 |
) |
|||||||
|
Diversified Consumer Services (0.4%) |
|||||||||||
| ServiceMaster Global Holdings, Inc.* |
(2,625 |
) |
(94 |
) |
|||||||
|
Electric Utilities (0.8%) |
|||||||||||
|
Duke Energy Corp. |
(414 |
) |
(33 |
) |
|||||||
|
Eversource Energy |
(561 |
) |
(31 |
) |
|||||||
|
Southern Co. (The) |
(2,044 |
) |
(105 |
) |
|||||||
|
Xcel Energy, Inc. |
(303 |
) |
(13 |
) |
|||||||
|
(182 |
) |
||||||||||
|
Electrical Equipment (1.1%) |
|||||||||||
|
Acuity Brands, Inc. |
(430 |
) |
(96 |
) |
|||||||
|
Emerson Electric Co. |
(1,560 |
) |
(79 |
) |
|||||||
| Sensata Technologies Holding NV* |
(2,250 |
) |
(81 |
) |
|||||||
|
(256 |
) |
||||||||||
|
Food & Staples Retailing (1.0%) |
|||||||||||
| Costco Wholesale Corp. |
(405 |
) |
(60 |
) |
|||||||
|
CVS Health Corp. |
(847 |
) |
(71 |
) |
|||||||
|
Metro, Inc. (Canada) |
(1,300 |
) |
(40 |
) |
|||||||
| Walgreens Boots Alliance, Inc. |
(887 |
) |
(74 |
) |
|||||||
|
(245 |
) |
||||||||||
|
Food Products (0.7%) |
|||||||||||
|
Flowers Foods, Inc. |
(2,750 |
) |
(43 |
) |
|||||||
|
Hormel Foods Corp. |
(3,100 |
) |
(119 |
) |
|||||||
|
(162 |
) |
||||||||||
| Health Care Equipment & Supplies (2.1%) |
|||||||||||
|
Danaher Corp. |
(816 |
) |
(64 |
) |
|||||||
|
DENTSPLY SIRONA, Inc. |
(1,067 |
) |
(62 |
) |
|||||||
|
DexCom, Inc.* |
(592 |
) |
(46 |
) |
|||||||
|
Halyard Health, Inc.* |
(2,300 |
) |
(74 |
) |
|||||||
|
ICU Medical, Inc.* |
(390 |
) |
(54 |
) |
|||||||
|
LivaNova plc* |
(2,400 |
) |
(136 |
) |
|||||||
|
Medtronic plc |
(727 |
) |
(60 |
) |
|||||||
|
(496 |
) |
||||||||||
See Notes to Financial Statements
58
Schedule of Investments Neuberger Berman Long Short
Multi-Manager Fund (cont'd)
|
Investments |
Shares |
Value (000) |
|||||||||
|
Health Care Providers & Services (2.2%) |
|||||||||||
|
Anthem, Inc. |
(695 |
) |
$ |
(85 |
) |
||||||
|
Cardinal Health, Inc. |
(888 |
) |
(61 |
) |
|||||||
|
DaVita, Inc.* |
(620 |
) |
(36 |
) |
|||||||
| Express Scripts Holding Co.* |
(873 |
) |
(59 |
) |
|||||||
|
Henry Schein, Inc.* |
(372 |
) |
(55 |
) |
|||||||
|
Patterson Cos., Inc. |
(987 |
) |
(42 |
) |
|||||||
|
Quest Diagnostics, Inc. |
(629 |
) |
(51 |
) |
|||||||
| UnitedHealth Group, Inc. |
(485 |
) |
(69 |
) |
|||||||
|
VCA, Inc.* |
(844 |
) |
(52 |
) |
|||||||
|
(510 |
) |
||||||||||
|
Hotels, Restaurants & Leisure (0.9%) |
|||||||||||
| Darden Restaurants, Inc. |
(2,150 |
) |
(139 |
) |
|||||||
|
Starbucks Corp. |
(1,500 |
) |
(80 |
) |
|||||||
|
(219 |
) |
||||||||||
|
Household Products (0.7%) |
|||||||||||
| Church & Dwight Co., Inc. |
(1,500 |
) |
(72 |
) |
|||||||
|
Clorox Co. (The) |
(725 |
) |
(87 |
) |
|||||||
|
(159 |
) |
||||||||||
|
Independent Power & Renewable Electricity Producers (0.1%) |
|||||||||||
| NRG Yield, Inc., Class C |
(1,462 |
) |
(22 |
) |
|||||||
|
Industrial Conglomerates (0.2%) |
|||||||||||
| Honeywell International, Inc. |
(370 |
) |
(41 |
) |
|||||||
|
Insurance (0.2%) |
|||||||||||
|
Unum Group |
(1,670 |
) |
(59 |
) |
|||||||
|
IT Services (1.0%) |
|||||||||||
| Cognizant Technology Solutions Corp., Class A* |
(1,570 |
) |
(81 |
) |
|||||||
|
EPAM Systems, Inc.* |
(590 |
) |
(38 |
) |
|||||||
| International Business Machines Corp. |
(725 |
) |
(111 |
) |
|||||||
|
(230 |
) |
||||||||||
|
Life Sciences Tools & Services (1.0%) |
|||||||||||
| Agilent Technologies, Inc. |
(1,167 |
) |
(51 |
) |
|||||||
|
Bruker Corp. |
(1,850 |
) |
(38 |
) |
|||||||
| Quintiles IMS Holdings, Inc.* |
(1,054 |
) |
(76 |
) |
|||||||
| Thermo Fisher Scientific, Inc. |
(438 |
) |
(64 |
) |
|||||||
|
(229 |
) |
||||||||||
|
Investments |
Shares |
Value (000) |
|||||||||
|
Media (0.8%) |
|||||||||||
| Comcast Corp., Class A |
(940 |
) |
$ |
(58 |
) |
||||||
|
Walt Disney Co. (The) |
(1,430 |
) |
(133 |
) |
|||||||
|
(191 |
) |
||||||||||
|
Multiline Retail (0.9%) |
|||||||||||
|
Big Lots, Inc. |
(2,000 |
) |
(87 |
) |
|||||||
|
Target Corp. |
(1,875 |
) |
(129 |
) |
|||||||
|
(216 |
) |
||||||||||
|
Multi-Utilities (1.7%) |
|||||||||||
|
Ameren Corp. |
(1,640 |
) |
(82 |
) |
|||||||
| Consolidated Edison, Inc. |
(2,768 |
) |
(209 |
) |
|||||||
| Dominion Resources, Inc. |
(1,286 |
) |
(97 |
) |
|||||||
| Public Service Enterprise Group, Inc. |
(431 |
) |
(18 |
) |
|||||||
|
(406 |
) |
||||||||||
|
Oil, Gas & Consumable Fuels (0.2%) |
|||||||||||
|
ONEOK, Inc. |
(583 |
) |
(28 |
) |
|||||||
| Plains GP Holdings LP, Class A |
(1,394 |
) |
(17 |
) |
|||||||
|
Tallgrass Energy GP LP |
(409 |
) |
(10 |
) |
|||||||
|
(55 |
) |
||||||||||
|
Pharmaceuticals (4.6%) |
|||||||||||
|
Allergan plc* |
(242 |
) |
(51 |
) |
|||||||
| GlaxoSmithKline plc, ADR (United Kingdom) |
(1,550 |
) |
(62 |
) |
|||||||
| Jazz Pharmaceuticals plc* |
(487 |
) |
(53 |
) |
|||||||
|
Johnson & Johnson |
(475 |
) |
(55 |
) |
|||||||
|
Mallinckrodt plc* |
(925 |
) |
(55 |
) |
|||||||
|
Merck & Co., Inc. |
(1,067 |
) |
(63 |
) |
|||||||
|
Mylan NV* |
(1,458 |
) |
(53 |
) |
|||||||
| Novartis AG, ADR (Switzerland) |
(866 |
) |
(62 |
) |
|||||||
|
Perrigo Co. plc |
(630 |
) |
(52 |
) |
|||||||
|
Pfizer, Inc. |
(2,029 |
) |
(64 |
) |
|||||||
| Roche Holding AG (Switzerland) |
(610 |
) |
(140 |
) |
|||||||
|
Sanofi, ADR (France) |
(1,784 |
) |
(69 |
) |
|||||||
| Teva Pharmaceutical Industries Ltd., ADR (Israel) |
(1,438 |
) |
(62 |
) |
|||||||
|
UCB SA (Belgium) |
(1,035 |
) |
(70 |
) |
|||||||
| Valeant Pharmaceuticals International, Inc.* |
(3,769 |
) |
(67 |
) |
|||||||
|
Zoetis, Inc. |
(2,008 |
) |
(96 |
) |
|||||||
|
(1,074 |
) |
||||||||||
|
Investments |
Shares |
Value (000) |
|||||||||
|
Road & Rail (0.3%) |
|||||||||||
|
Union Pacific Corp. |
(810 |
) |
$ |
(71 |
) |
||||||
|
Semiconductors & Semiconductor Equipment (0.4%) |
|||||||||||
|
Applied Materials, Inc. |
(3,240 |
) |
(94 |
) |
|||||||
|
Software (0.5%) |
|||||||||||
|
Citrix Systems, Inc.* |
(920 |
) |
(78 |
) |
|||||||
| SS&C Technologies Holdings, Inc. |
(1,225 |
) |
(39 |
) |
|||||||
|
(117 |
) |
||||||||||
|
Specialty Retail (1.2%) |
|||||||||||
| American Eagle Outfitters, Inc. |
(5,930 |
) |
(101 |
) |
|||||||
|
DSW, Inc., Class A |
(2,090 |
) |
(43 |
) |
|||||||
|
Foot Locker, Inc. |
(580 |
) |
(39 |
) |
|||||||
|
Lowe's Cos., Inc. |
(1,410 |
) |
(94 |
) |
|||||||
|
(277 |
) |
||||||||||
|
Textiles, Apparel & Luxury Goods (0.4%) |
|||||||||||
|
Kate Spade & Co.* |
(5,350 |
) |
(90 |
) |
|||||||
|
Thrifts & Mortgage Finance (0.3%) |
|||||||||||
| Home Capital Group, Inc. (Canada) |
(3,280 |
) |
(65 |
) |
|||||||
| Trading Companies & Distributors (0.7%) |
|||||||||||
|
GATX Corp. |
(2,210 |
) |
(97 |
) |
|||||||
| MSC Industrial Direct Co., Inc., Class A |
(815 |
) |
(59 |
) |
|||||||
|
(156 |
) |
||||||||||
| Total Common Stocks (Proceeds $(7,045)) |
(6,823 |
) |
|||||||||
|
Exchange Traded Funds (4.6%) |
|||||||||||
|
Alerian MLP Fund |
(23,869 |
) |
(292 |
) |
|||||||
| CurrencyShares Euro Trust* |
(2,125 |
) |
(227 |
) |
|||||||
| Energy Select Sector SPDR Fund |
(3,381 |
) |
(232 |
) |
|||||||
| Utilities Select Sector SPDR Fund |
(6,206 |
) |
(307 |
) |
|||||||
| Total Exchange Traded Funds (Proceeds $(970)) |
(1,058 |
) |
|||||||||
|
Exchange Traded Note (0.7%) |
|||||||||||
| JPMorgan Alerian MLP Index ETN (Proceeds $(155)) |
(5,752 |
) |
(173 |
) |
|||||||
|
Master Limited Partnerships (0.6%) |
|||||||||||
|
Gas Utilities (0.1%) |
|||||||||||
|
Ferrellgas Partners LP |
(2,543 |
) |
(22 |
) |
|||||||
See Notes to Financial Statements
59
Schedule of Investments Neuberger Berman Long Short
Multi-Manager Fund (cont'd)
|
Investments |
Shares |
Value (000) |
|||||||||
|
Oil, Gas & Consumable Fuels (0.5%) |
|||||||||||
| Crestwood Equity Partners LP |
(244 |
) |
$ |
(5 |
) |
||||||
| Enable Midstream Partners LP |
(350 |
) |
(5 |
) |
|||||||
| Enbridge Energy Partners LP |
(229 |
) |
(6 |
) |
|||||||
| Golar LNG Partners LP (United Kingdom) |
(1,089 |
) |
(22 |
) |
|||||||
| Holly Energy Partners LP |
(674 |
) |
(21 |
) |
|||||||
| Midcoast Energy Partners LP |
(1,860 |
) |
(14 |
) |
|||||||
|
TC PipeLines LP |
(592 |
) |
(31 |
) |
|||||||
|
Williams Partners LP |
(638 |
) |
(23 |
) |
|||||||
|
(127 |
) |
||||||||||
| Total Master Limited Partnerships (Proceeds $(167)) |
(149 |
) |
|||||||||
| Total Short Positions (Proceeds $(8,337)) |
(8,203 |
) |
|||||||||
| Total Investments 62.4% (Cost $14,341) |
14,557 |
||||||||||
| Other Assets Less Liabilities (37.6%)(i) |
8,778 |
||||||||||
|
Net assets (100.0%) |
$ |
23,335 |
|||||||||
See Notes to Financial Statements
60
Schedule of Investments Neuberger Berman Long Short
Multi-Manager Fund (cont'd)
* Non-income producing security.
(a) All or a portion of this security is segregated in connection with obligations for futures, swaps, options written, and/or forward foreign currency contracts with a total value of approximately $18,369,000.
(b) All or a portion of this security is pledged with the custodian for securities sold short and options written.
(c) Securities were purchased or sold short under Rule 144A of the Securities Act of 1933, as amended (the "1933 Act"), or are otherwise restricted and, unless registered under the 1933 Act or exempted from registration, may only be sold to qualified institutional investors or may have other restrictions on resale. At 10/31/2016, these securities amounted to approximately $3,000 of long positions or 0.0% of net assets for the Fund. These securities have been deemed by the investment manager to be liquid.
(e) Amount less than one thousand.
(f) Represents less than 0.05% of net assets.
(g) Represents 7-day effective yield as of 10/31/2016.
(h) At 10/31/2016, the Fund had approximately $7,870,000 deposited in one or more accounts to satisfy collateral requirements for borrowing in connection with securities sold short.
(i) Includes the impact of the Fund's open positions in derivatives at 10/31/2016.
Abbreviations
ADR American Depositary Receipt
GDR Global Depositary Receipt
PJSC Public Joint Stock Company
SPDR Standard & Poor's Depositary Receipt
Derivative Instruments
Futures contracts ("futures")
At October 31, 2016, open positions in futures for the Fund were as follows:
|
Expiration |
Open Contracts |
Position |
Unrealized Appreciation/ (Depreciation) |
||||||
|
12/16/2016 |
5 S&P 500 E-Mini Index |
Short |
$ |
(878 |
) |
||||
|
12/16/2016 |
42 The EURO STOXX 50 Index |
Short |
(29,164 |
) |
|||||
|
Total |
$ |
(30,042 |
) |
||||||
See Notes to Financial Statements
61
Schedule of Investments Neuberger Berman Long Short
Multi-Manager Fund (cont'd)
At October 31, 2016, the notional value of futures for the fund was $(1,937,626) for short positions.
For the year ended October 31, 2016, the average notional value of futures for the Fund was $(1,352,511) for short positions. The Fund had $133,489 deposited in segregated accounts to cover margin requirements on open futures.
Forward foreign currency contracts ("forward contracts")
At October 31, 2016, open forward contracts for the Fund were as follows:
|
Contracts to Receive |
In Exchange For |
Counterparty |
Settlement Date |
Net Unrealized Appreciation/ (Depreciation) |
||||||||||||
| 102,480 |
Canadian Dollar |
$ |
78,181 |
JPMorgan Chase Bank, NA |
11/16/2016 |
$ |
(1,770 |
) |
||||||||
| 654,118 |
Danish Krone |
98,729 |
JPMorgan Chase Bank, NA |
11/16/2016 |
(2,134 |
) |
||||||||||
| 741,208 |
Euro |
807,602 |
JPMorgan Chase Bank, NA |
11/14/2016 |
6,442 |
|||||||||||
| 61,016 |
Euro |
69,417 |
JPMorgan Chase Bank, NA |
11/16/2016 |
(2,400 |
) |
||||||||||
| 365,593 |
Euro |
410,934 |
JPMorgan Chase Bank, NA |
11/16/2016 |
(9,383 |
) |
||||||||||
| 150,779 |
Euro |
169,922 |
JPMorgan Chase Bank, NA |
11/16/2016 |
(4,313 |
) |
||||||||||
| 62,096 |
Euro |
70,310 |
JPMorgan Chase Bank, NA |
11/16/2016 |
(2,106 |
) |
||||||||||
| 40,264 |
Euro |
45,475 |
JPMorgan Chase Bank, NA |
11/16/2016 |
(1,251 |
) |
||||||||||
| 2,099,056 |
Hong Kong Dollar |
270,695 |
JPMorgan Chase Bank, NA |
11/14/2016 |
(27 |
) |
||||||||||
| 17,637,120 |
Japanese Yen |
172,490 |
JPMorgan Chase Bank, NA |
11/16/2016 |
(4,233 |
) |
||||||||||
| 29,101,500 |
Korean Won |
26,253 |
JPMorgan Chase Bank, NA |
11/16/2016 |
(819 |
) |
||||||||||
| 622,000 |
Mexican Peso |
33,018 |
JPMorgan Chase Bank, NA |
11/14/2016 |
(156 |
) |
||||||||||
| 354,423 |
Norwegian Krone |
43,043 |
JPMorgan Chase Bank, NA |
11/16/2016 |
(146 |
) |
||||||||||
| 463,390 |
Norwegian Krone |
55,718 |
JPMorgan Chase Bank, NA |
11/16/2016 |
367 |
|||||||||||
| 158,555 |
Pound Sterling |
192,952 |
JPMorgan Chase Bank, NA |
11/14/2016 |
1,164 |
|||||||||||
| 645 |
Pound Sterling |
838 |
JPMorgan Chase Bank, NA |
11/16/2016 |
(48 |
) |
||||||||||
| 30,826 |
Pound Sterling |
40,091 |
JPMorgan Chase Bank, NA |
11/16/2016 |
(2,350 |
) |
||||||||||
| 120,355 |
Pound Sterling |
157,184 |
JPMorgan Chase Bank, NA |
11/16/2016 |
(9,830 |
) |
||||||||||
| 2,444,764 |
Russian Ruble |
37,506 |
JPMorgan Chase Bank, NA |
11/16/2016 |
919 |
|||||||||||
| 1,283,135 |
South African Rand |
93,905 |
JPMorgan Chase Bank, NA |
11/16/2016 |
994 |
|||||||||||
| 1,170,000 |
Swedish Krona |
128,975 |
JPMorgan Chase Bank, NA |
11/14/2016 |
631 |
|||||||||||
| 1,034 |
Swedish Krona |
121 |
JPMorgan Chase Bank, NA |
11/16/2016 |
(6 |
) |
||||||||||
| 243,468 |
Swedish Krona |
29,060 |
JPMorgan Chase Bank, NA |
11/16/2016 |
(2,087 |
) |
||||||||||
| 20,720 |
Swiss Franc |
20,846 |
JPMorgan Chase Bank, NA |
11/14/2016 |
105 |
|||||||||||
| 243,476 |
Swiss Franc |
251,294 |
JPMorgan Chase Bank, NA |
11/16/2016 |
(5,077 |
) |
||||||||||
|
Total |
$ |
(37,514 |
) |
|||||||||||||
See Notes to Financial Statements
62
Schedule of Investments Neuberger Berman Long Short
Multi-Manager Fund (cont'd)
|
Contracts to Deliver |
In Exchange For |
Counterparty |
Settlement Date |
Net Unrealized Appreciation/ (Depreciation) |
||||||||||||
| 102,480 |
Canadian Dollar |
$ |
77,690 |
JPMorgan Chase Bank, NA |
11/16/2016 |
$ |
1,280 |
|||||||||
| 420,435 |
Danish Krone |
63,508 |
JPMorgan Chase Bank, NA |
11/16/2016 |
1,421 |
|||||||||||
| 233,683 |
Danish Krone |
35,013 |
JPMorgan Chase Bank, NA |
11/16/2016 |
505 |
|||||||||||
| 718,000 |
Euro |
790,547 |
JPMorgan Chase Bank, NA |
11/14/2016 |
1,991 |
|||||||||||
| 627,989 |
Euro |
692,509 |
JPMorgan Chase Bank, NA |
11/14/2016 |
2,810 |
|||||||||||
| 1,000 |
Euro |
1,091 |
JPMorgan Chase Bank, NA |
11/14/2016 |
(7 |
) |
||||||||||
| 216,560 |
Euro |
239,421 |
JPMorgan Chase Bank, NA |
11/14/2016 |
1,580 |
|||||||||||
| 49,480 |
Euro |
55,626 |
JPMorgan Chase Bank, NA |
11/16/2016 |
1,279 |
|||||||||||
| 62,511 |
Euro |
70,389 |
JPMorgan Chase Bank, NA |
11/16/2016 |
1,730 |
|||||||||||
| 336,166 |
Euro |
377,760 |
JPMorgan Chase Bank, NA |
11/16/2016 |
8,530 |
|||||||||||
| 72,452 |
Euro |
81,759 |
JPMorgan Chase Bank, NA |
11/16/2016 |
2,181 |
|||||||||||
| 78,729 |
Euro |
88,891 |
JPMorgan Chase Bank, NA |
11/16/2016 |
2,419 |
|||||||||||
| 80,410 |
Euro |
89,801 |
JPMorgan Chase Bank, NA |
11/16/2016 |
1,482 |
|||||||||||
| 2,000,000 |
Hong Kong Dollar |
257,829 |
JPMorgan Chase Bank, NA |
11/14/2016 |
(66 |
) |
||||||||||
| 781,000 |
Hong Kong Dollar |
100,706 |
JPMorgan Chase Bank, NA |
11/14/2016 |
(2 |
) |
||||||||||
| 1,734,963 |
Hong Kong Dollar |
223,689 |
JPMorgan Chase Bank, NA |
11/14/2016 |
(30 |
) |
||||||||||
| 14,832,179 |
Japanese Yen |
147,259 |
JPMorgan Chase Bank, NA |
11/16/2016 |
5,761 |
|||||||||||
| 2,804,941 |
Japanese Yen |
27,994 |
JPMorgan Chase Bank, NA |
11/16/2016 |
1,235 |
|||||||||||
| 29,101,500 |
Korean Won |
26,063 |
JPMorgan Chase Bank, NA |
11/16/2016 |
629 |
|||||||||||
| 195,000 |
Mexican Peso |
10,208 |
JPMorgan Chase Bank, NA |
11/14/2016 |
(95 |
) |
||||||||||
| 622,000 |
Mexican Peso |
32,619 |
JPMorgan Chase Bank, NA |
11/14/2016 |
(244 |
) |
||||||||||
| 519,023 |
Mexican Peso |
27,596 |
JPMorgan Chase Bank, NA |
11/14/2016 |
174 |
|||||||||||
| 159,249 |
Norwegian Krone |
19,341 |
JPMorgan Chase Bank, NA |
11/16/2016 |
67 |
|||||||||||
| 658,564 |
Norwegian Krone |
80,476 |
JPMorgan Chase Bank, NA |
11/16/2016 |
768 |
|||||||||||
| 300,000 |
Pound Sterling |
365,543 |
JPMorgan Chase Bank, NA |
11/14/2016 |
(1,741 |
) |
||||||||||
| 129,440 |
Pound Sterling |
158,209 |
JPMorgan Chase Bank, NA |
11/14/2016 |
(262 |
) |
||||||||||
| 253,180 |
Pound Sterling |
310,329 |
JPMorgan Chase Bank, NA |
11/14/2016 |
366 |
|||||||||||
| 31,000 |
Pound Sterling |
40,941 |
JPMorgan Chase Bank, NA |
11/16/2016 |
2,987 |
|||||||||||
| 120,826 |
Pound Sterling |
159,639 |
JPMorgan Chase Bank, NA |
11/16/2016 |
11,709 |
|||||||||||
| 2,444,764 |
Russian Ruble |
36,813 |
JPMorgan Chase Bank, NA |
11/16/2016 |
(1,612 |
) |
||||||||||
| 1,283,135 |
South African Rand |
93,653 |
JPMorgan Chase Bank, NA |
11/16/2016 |
(1,246 |
) |
||||||||||
| 353,573 |
Swedish Krona |
40,211 |
JPMorgan Chase Bank, NA |
11/14/2016 |
1,044 |
|||||||||||
| 975,142 |
Swedish Krona |
110,970 |
JPMorgan Chase Bank, NA |
11/14/2016 |
2,949 |
|||||||||||
| 1,170,000 |
Swedish Krona |
132,931 |
JPMorgan Chase Bank, NA |
11/14/2016 |
3,325 |
|||||||||||
| 244,502 |
Swedish Krona |
29,146 |
JPMorgan Chase Bank, NA |
11/16/2016 |
2,059 |
|||||||||||
| 70,000 |
Swiss Franc |
71,036 |
JPMorgan Chase Bank, NA |
11/14/2016 |
255 |
|||||||||||
| 39,798 |
Swiss Franc |
41,141 |
JPMorgan Chase Bank, NA |
11/16/2016 |
895 |
|||||||||||
| 93,764 |
Swiss Franc |
96,887 |
JPMorgan Chase Bank, NA |
11/16/2016 |
2,067 |
|||||||||||
| 80,299 |
Swiss Franc |
83,242 |
JPMorgan Chase Bank, NA |
11/16/2016 |
2,039 |
|||||||||||
| 29,615 |
Swiss Franc |
30,354 |
JPMorgan Chase Bank, NA |
11/16/2016 |
406 |
|||||||||||
| 5,000 |
Turkish Lira |
1,608 |
JPMorgan Chase Bank, NA |
11/14/2016 |
(4 |
) |
||||||||||
|
Total |
$ |
60,634 |
||||||||||||||
For the year ended October 31, 2016, the average notional value of forward contracts for the Fund was $2,820,564.
See Notes to Financial Statements
63
Schedule of Investments Neuberger Berman Long Short
Multi-Manager Fund (cont'd)
Equity swap contracts ("equity swaps")
At October 31, 2016, the outstanding equity swaps* for the Fund were as follows:
|
Counterparty |
Description | Expiration Date(s) |
Value |
||||||
| Morgan Stanley Capital Services LLC |
The Fund receives the total return on long positions and pays a specified LIBOR or Federal Funds floating rate, which is denominated in various foreign currencies based on the local currencies of the positions. The Fund pays the total return on short positions and receives a specified LIBOR or Federal Funds floating rate, which is denominated in various foreign currencies based on the local currencies of the positions. | 12/12/2016- 9/15/2017 |
$91,951 | ||||||
* The following table represents the individual long and short positions and related values of the equity swaps with Morgan Stanley Capital Services LLC as of October 31, 2016.
|
Reference Entity |
Shares |
Notional Value(a)(b) |
Net Unrealized Appreciation/ (Depreciation) |
||||||||||||
|
Long Positions |
|||||||||||||||
|
Brazil |
|||||||||||||||
|
Hypermarcas SA |
5,075 |
$ |
27,665 |
$ |
14,881 |
||||||||||
|
France |
|||||||||||||||
|
Amundi SA |
1,183 |
51,714 |
6,264 |
||||||||||||
|
BNP Paribas SA |
2,159 |
122,668 |
2,565 |
||||||||||||
|
Iliad SA |
782 |
186,920 |
(22,872 |
) |
|||||||||||
|
JCDecaux SA |
688 |
27,387 |
(6,350 |
) |
|||||||||||
|
LVMH Moet Hennessy Louis Vuitton SE |
707 |
106,708 |
21,777 |
||||||||||||
|
Publicis Groupe SA |
1,701 |
111,105 |
5,600 |
||||||||||||
|
Remy Cointreau SA |
1,078 |
76,507 |
10,944 |
||||||||||||
|
Societe Generale SA |
2,223 |
101,009 |
(14,232 |
) |
|||||||||||
|
3,696 |
|||||||||||||||
|
India |
|||||||||||||||
|
Dr Reddy's Laboratories Ltd. |
1,112 |
50,819 |
3,992 |
||||||||||||
|
Ireland |
|||||||||||||||
|
Ryanair Holdings plc |
13,835 |
220,754 |
(29,393 |
) |
|||||||||||
|
Jordan |
|||||||||||||||
|
Hikma Pharmaceuticals plc |
2,178 |
63,674 |
(16,915 |
) |
|||||||||||
|
Luxembourg |
|||||||||||||||
|
Eurofins Scientific SE |
204 |
72,506 |
20,183 |
||||||||||||
|
South Africa |
|||||||||||||||
|
Aspen Pharmacare Holdings Ltd. |
1,903 |
37,245 |
4,209 |
||||||||||||
|
South Korea |
|||||||||||||||
|
NAVER Corp. |
76 |
39,164 |
17,757 |
||||||||||||
|
Switzerland |
|||||||||||||||
|
LafargeHolcim Ltd. |
3,249 |
144,676 |
28,847 |
||||||||||||
|
Syngenta AG |
177 |
69,251 |
1,510 |
||||||||||||
|
30,357 |
|||||||||||||||
|
Turkey |
|||||||||||||||
|
Migros Ticaret A/S |
6,337 |
38,090 |
(1,656 |
) |
|||||||||||
See Notes to Financial Statements
64
Schedule of Investments Neuberger Berman Long Short
Multi-Manager Fund (cont'd)
|
Reference Entity |
Shares |
Notional Value(a)(b) |
Net Unrealized Appreciation/ (Depreciation) |
||||||||||||
|
United Kingdom |
|||||||||||||||
|
Admiral Group plc |
1,225 |
$ |
27,849 |
$ |
895 |
||||||||||
| ASOS plc |
99 |
3,492 |
2,878 |
||||||||||||
|
Barclays plc |
17,250 |
44,443 |
(4,264 |
) |
|||||||||||
|
Burberry Group plc |
506 |
7,271 |
1,864 |
||||||||||||
|
Croda International plc |
1,651 |
61,979 |
8,710 |
||||||||||||
|
ITV plc |
39,090 |
104,458 |
(22,881 |
) |
|||||||||||
|
Pets at Home Group plc |
2,874 |
9,735 |
(2,228 |
) |
|||||||||||
|
RSA Insurance Group plc |
6,809 |
33,439 |
12,608 |
||||||||||||
|
Smith & Nephew plc |
927 |
14,546 |
(1,123 |
) |
|||||||||||
|
Smiths Group plc |
1,149 |
12,580 |
7,363 |
||||||||||||
|
Sports Direct International plc |
43,786 |
184,251 |
(35,956 |
) |
|||||||||||
|
(32,134 |
) |
||||||||||||||
|
United States |
|||||||||||||||
|
Coach, Inc. |
2,572 |
84,710 |
7,599 |
||||||||||||
|
Mead Johnson Nutrition Co. |
1,302 |
100,592 |
(3,241 |
) |
|||||||||||
|
4,358 |
|||||||||||||||
|
Total Long Positions of Equity Swaps |
19,335 |
||||||||||||||
|
Short Positions |
|||||||||||||||
|
France |
|||||||||||||||
|
Air France-KLM |
(7,699 |
) |
(59,922 |
) |
12,948 |
||||||||||
|
Electricite de France SA |
(2,326 |
) |
(32,932 |
) |
6,862 |
||||||||||
|
Kering |
(353 |
) |
(59,900 |
) |
(18,395 |
) |
|||||||||
|
Lagardere SCA |
(3,192 |
) |
(93,358 |
) |
12,065 |
||||||||||
|
Orange SA |
(6,444 |
) |
(108,799 |
) |
7,288 |
||||||||||
|
20,768 |
|||||||||||||||
|
Germany |
|||||||||||||||
|
adidas AG |
(713 |
) |
(122,267 |
) |
5,333 |
||||||||||
|
Deutsche Lufthansa AG |
(4,142 |
) |
(65,915 |
) |
12,966 |
||||||||||
|
Deutsche Telekom AG |
(6,508 |
) |
(116,047 |
) |
9,992 |
||||||||||
|
28,291 |
|||||||||||||||
|
Italy |
|||||||||||||||
|
Eni SpA |
(5,721 |
) |
(85,063 |
) |
2,101 |
||||||||||
|
Netherlands |
|||||||||||||||
|
Koninklijke Ahold Delhaize NV |
(5,514 |
) |
(126,655 |
) |
783 |
||||||||||
|
Spain |
|||||||||||||||
|
Industria de Diseno Textil SA |
(4,183 |
) |
(139,114 |
) |
(7,115 |
) |
|||||||||
|
Switzerland |
|||||||||||||||
|
Givaudan SA |
(53 |
) |
(95,999 |
) |
(6,568 |
) |
|||||||||
|
Roche Holding AG |
(178 |
) |
(48,671 |
) |
7,748 |
||||||||||
|
1,180 |
|||||||||||||||
See Notes to Financial Statements
65
Schedule of Investments Neuberger Berman Long Short
Multi-Manager Fund (cont'd)
|
Reference Entity |
Shares |
Notional Value(a)(b) |
Net Unrealized Appreciation/ (Depreciation) |
||||||||||||
|
United Kingdom |
|||||||||||||||
|
Bunzl plc |
(4,271 |
) |
$ |
(94,784 |
) |
$ |
(20,173 |
) |
|||||||
|
GlaxoSmithKline plc |
(3,424 |
) |
(55,413 |
) |
(12,418 |
) |
|||||||||
|
Marks & Spencer Group plc |
(58,197 |
) |
(316,397 |
) |
73,849 |
||||||||||
|
WPP plc |
(4,822 |
) |
(88,755 |
) |
(16,185 |
) |
|||||||||
|
25,073 |
|||||||||||||||
|
United States |
|||||||||||||||
|
Merck & Co., Inc. |
(692 |
) |
(35,838 |
) |
(4,796 |
) |
|||||||||
|
Pfizer, Inc. |
(1,187 |
) |
(37,737 |
) |
97 |
||||||||||
|
(4,699 |
) |
||||||||||||||
|
Total Short Positions of Equity Swaps |
66,382 |
||||||||||||||
|
Total Long and Short Positions of Equity Swaps |
85,717 |
||||||||||||||
|
Financing Costs and Other Receivables/(Payables) |
6,234 |
||||||||||||||
|
Equity Swaps, at value—Morgan Stanley Capital Services LLC |
$ |
91,951 |
|||||||||||||
| Financing Costs and Other Receivables/(Payables)— JPMorgan Chase Bank, NA |
$ |
52 |
|||||||||||||
|
Total Equity Swaps, at value |
$ |
92,003 |
|||||||||||||
(a) Notional value represents the value (including any fees or commissions) of the long and short positions when they were established.
(b) For the year ended October 31, 2016, the average notional value of equity swaps was $4,036,045 for long positions and $(1,809,912) for short positions, respectively for the Fund.
At October 31, 2016, the Fund had cash collateral of $880,000 deposited in a segregated account for Morgan Stanley Capital Services LLC, to cover collateral requirements on OTC derivatives.
Total return swap contracts ("total return swaps")
For the year ended October 31, 2016, the average notional value of total return swaps for the Fund was $119,397 for long positions and $(91,404) for short positions. At October 31, 2016, the Fund had no total return swaps outstanding.
Written option contracts ("options written")
At October 31, 2016, the Fund had outstanding options written as follows:
|
Name of Issuer |
Contracts |
Exercise Price |
Expiration Date |
Market Value of Options |
|||||||||||||||
|
Molson Coors Brewing Co. |
12 |
$ |
95 |
11/18/2016 |
$ |
(780 |
) |
||||||||||||
|
Total (Premium received $(708)) |
$ |
(780 |
) |
||||||||||||||||
See Notes to Financial Statements
66
Schedule of Investments Neuberger Berman Long Short
Multi-Manager Fund (cont'd)
Options written for the Fund for the year ended October 31, 2016 were as follows:
| Number of Contracts |
Premium Received |
||||||||||
|
Outstanding 10/31/15 |
255 |
$ |
9,074 |
||||||||
|
Options written |
159 |
15,771 |
|||||||||
|
Options closed |
(126 |
) |
(14,005 |
) |
|||||||
|
Options exercised |
— |
— |
|||||||||
|
Options expired |
(276 |
) |
(10,132 |
) |
|||||||
|
Outstanding 10/31/16 |
12 |
$ |
708 |
||||||||
For the year ended October 31, 2016, the Fund had an average market value of $26,809 in purchased option contracts, and $(1,742) in options written, respectively.
The following is a summary, categorized by Level (see Note A of Notes to Financial Statements), of inputs used to value the Fund's investments as of October 31, 2016:
|
Asset Valuation Inputs |
|||||||||||||||||||
|
(000's omitted) |
Level 1 |
Level 2 |
Level 3 |
Total |
|||||||||||||||
|
Investments: |
|||||||||||||||||||
| Common Stocks(a) |
$ |
16,138 |
$ |
— |
$ |
— |
$ |
16,138 |
|||||||||||
|
Master Limited Partnerships |
1,812 |
— |
— |
1,812 |
|||||||||||||||
|
Option Purchased |
3 |
— |
— |
3 |
|||||||||||||||
|
Short-Term Investment |
— |
4,807 |
— |
4,807 |
|||||||||||||||
|
Total Long Positions |
$ |
17,953 |
$ |
4,807 |
$ |
— |
$ |
22,760 |
|||||||||||
(a) The Schedule of Investments provides information on the industry categorization for the portfolio.
As of the year ended October 31, 2016, there were no transfers between Levels 1, 2 or 3.
The following is a summary, categorized by Level (see Note A of Notes to Financial Statements), of inputs used to value the Fund's short investments as of October 31, 2016:
|
Liability Valuation Inputs |
|||||||||||||||||
|
(000's omitted) |
Level 1 |
Level 2 |
Level 3 |
Total |
|||||||||||||
|
Investments: |
|||||||||||||||||
| Common Stocks Sold Short(a) |
$ |
(6,823 |
) |
$ |
— |
$ |
— |
$ |
(6,823 |
) |
|||||||
|
Exchange Traded Funds Sold Short |
(1,058 |
) |
— |
— |
(1,058 |
) |
|||||||||||
|
Exchange Traded Note Sold Short |
(173 |
) |
— |
— |
(173 |
) |
|||||||||||
| Master Limited Partnerships Sold Short(a) |
(149 |
) |
— |
— |
(149 |
) |
|||||||||||
|
Total Short Positions |
$ |
(8,203 |
) |
$ |
— |
$ |
— |
$ |
(8,203 |
) |
|||||||
See Notes to Financial Statements
67
Schedule of Investments Neuberger Berman Long Short
Multi-Manager Fund (cont'd)
(a) The Schedule of Investments provides information on the industry categorization for the portfolio.
The following is a summary, categorized by Level (see Note A of Notes to Financial Statements), of inputs used to value the Fund's derivatives as of October 31, 2016:
|
Other Financial Instruments |
|||||||||||||||||
|
(000's omitted) |
Level 1 |
Level 2 |
Level 3 |
Total |
|||||||||||||
| Forward contracts(a) | |||||||||||||||||
|
Assets |
$ |
— |
$ |
76 |
$ |
— |
$ |
76 |
|||||||||
|
Liabilities |
— |
(53 |
) |
— |
(53 |
) |
|||||||||||
| Futures(a) | |||||||||||||||||
|
Liabilities |
(30 |
) |
— |
— |
(30 |
) |
|||||||||||
| Swap contracts(a) | |||||||||||||||||
|
Assets |
— |
339 |
— |
339 |
|||||||||||||
|
Liabilities |
— |
(247 |
) |
— |
(247 |
) |
|||||||||||
|
Option contracts written |
|||||||||||||||||
|
Liabilities |
(1 |
) |
— |
— |
(1 |
) |
|||||||||||
|
Total |
$ |
(31 |
) |
$ |
115 |
$ |
— |
$ |
84 |
||||||||
(a) Forward contracts, futures and swap contracts are reported at the cumulative unrealized appreciation/(depreciation) of the instrument.
See Notes to Financial Statements
68
Statements of Assets and Liabilities
Neuberger Berman Alternative Funds
(000's omitted, except per share amounts)
| ABSOLUTE RETURN MULTI-MANAGER FUND† |
LONG SHORT MULTI-MANAGER FUND |
||||||||||
|
October 31, 2016 |
October 31, 2016 |
||||||||||
|
Assets |
|||||||||||
|
Investments in securities, at value* (Note A)—see Schedule of Investments: |
|||||||||||
|
Unaffiliated issuers |
$ |
563,757 |
$ |
22,760 |
|||||||
|
Cash |
3,342 |
— |
|||||||||
|
Foreign currency* |
8,489 |
636 |
|||||||||
|
Cash collateral segregated for short sales (Note A) |
122,643 |
7,870 |
|||||||||
|
Cash collateral segregated for futures contracts (Note A) |
5,919 |
133 |
|||||||||
|
Cash collateral segregated for swap contracts (Note A) |
10,871 |
880 |
|||||||||
|
Cash collateral segregated for forward foreign currency contracts (Note A) |
278 |
— |
|||||||||
|
Dividends and interest receivable |
1,718 |
21 |
|||||||||
|
Receivable for securities sold |
37,806 |
2,290 |
|||||||||
|
Receivable for Fund shares sold |
444 |
— |
|||||||||
|
OTC swap contracts, at value (Note A) |
2,863 |
339 |
|||||||||
|
Receivable for variation margin on futures contracts (Note A) |
22 |
10 |
|||||||||
|
Receivable for forward foreign currency contracts (Note A) |
851 |
76 |
|||||||||
|
Prepaid expenses and other assets |
47 |
18 |
|||||||||
|
Total Assets |
759,050 |
35,033 |
|||||||||
|
Liabilities |
|||||||||||
|
Investments sold short, at value** (Note A) |
120,615 |
8,203 |
|||||||||
|
Option contracts written, at value*** (Note A) |
46 |
1 |
|||||||||
|
Due to custodian |
530 |
575 |
|||||||||
|
Dividends and interest payable for short sales |
314 |
9 |
|||||||||
|
OTC swap contracts, at value (Note A) |
3,535 |
247 |
|||||||||
|
Payable to administrator—net (Note B) |
80 |
15 |
|||||||||
|
Payable to investment manager (Note B) |
885 |
34 |
|||||||||
|
Payable for securities purchased |
35,035 |
2,439 |
|||||||||
|
Payable for variation margin on centrally cleared swap contracts |
1 |
— |
|||||||||
|
Payable for Fund shares redeemed |
3,997 |
— |
|||||||||
|
Payable for forward foreign currency contracts (Note A) |
657 |
53 |
|||||||||
|
Accrued expenses and other payables |
376 |
122 |
|||||||||
|
Total Liabilities |
166,071 |
11,698 |
|||||||||
|
Net Assets |
$ |
592,979 |
$ |
23,335 |
|||||||
|
Net Assets consist of: |
|||||||||||
|
Paid-in capital |
$ |
732,032 |
$ |
25,991 |
|||||||
|
Undistributed net investment income (loss) |
14 |
(395 |
) |
||||||||
|
Accumulated net realized gains (losses) on investments |
(130,196 |
) |
(2,543 |
) |
|||||||
|
Net unrealized appreciation (depreciation) in value of investments |
(8,871 |
) |
282 |
||||||||
|
Net Assets |
$ |
592,979 |
$ |
23,335 |
|||||||
|
Net Assets |
|||||||||||
|
Institutional Class |
$ |
485,799 |
$ |
22,173 |
|||||||
|
Class A |
62,891 |
423 |
|||||||||
|
Class C |
40,895 |
739 |
|||||||||
|
Class R6 |
3,394 |
— |
|||||||||
See Notes to Financial Statements
69
Statements of Assets and Liabilities (cont'd)
Neuberger Berman Alternative Funds (cont'd)
(000's omitted, except per share amounts)
| ABSOLUTE RETURN MULTI-MANAGER FUND† |
LONG SHORT MULTI-MANAGER FUND |
||||||||||
|
October 31, 2016 |
October 31, 2016 |
||||||||||
|
Shares Outstanding ($.001 par value; unlimited shares authorized) |
|||||||||||
|
Institutional Class |
47,733 |
2,313 |
|||||||||
|
Class A |
6,227 |
44 |
|||||||||
|
Class C |
4,181 |
79 |
|||||||||
|
Class R6 |
334 |
— |
|||||||||
|
Net Asset Value, offering and redemption price per share |
|||||||||||
|
Institutional Class |
$ |
10.18 |
$ |
9.59 |
|||||||
|
Class R6 |
$ |
10.17 |
— |
||||||||
|
Net Asset Value and redemption price per share |
|||||||||||
|
Class A |
$ |
10.10 |
$ |
9.52 |
|||||||
|
Offering Price per share |
|||||||||||
|
Class A‡ |
$ |
10.72 |
$ |
10.10 |
|||||||
|
Net Asset Value and offering price per share |
|||||||||||
|
Class C^ |
$ |
9.78 |
$ |
9.31 |
|||||||
|
*Cost of Investments: |
|||||||||||
|
Unaffiliated issuers |
$ |
574,975 |
$ |
22,678 |
|||||||
|
Total cost of foreign currency |
$ |
8,451 |
$ |
647 |
|||||||
|
**Proceeds from investments sold short |
$ |
122,459 |
$ |
8,337 |
|||||||
|
***Premium received from option contracts written |
$ |
73 |
$ |
1 |
|||||||
† Consolidated financial statement, see Note A of the Notes to Financial Statements for additional information.
‡ On single retail sales of less than $50,000. On sales of $50,000 or more or in certain other circumstances described in the Fund's prospectus, offering price is reduced.
^ Redemption price per share is equal to net asset value less any applicable contingent deferred sales charge.
See Notes to Financial Statements
70
Statements of Operations
Neuberger Berman Alternative Funds
(000's omitted)
| ABSOLUTE RETURN MULTI-MANAGER FUND† |
LONG SHORT MULTI-MANAGER FUND |
||||||||||
| For the Year Ended October 31, 2016 |
For the Year Ended October 31, 2016 |
||||||||||
|
Investment Income: |
|||||||||||
|
Income (Note A): |
|||||||||||
|
Dividend income—unaffiliated issuers |
$ |
10,943 |
$ |
653 |
|||||||
|
Interest and other income—unaffiliated issuers |
18,794 |
— |
|||||||||
|
Foreign taxes withheld (Note A) |
(139 |
) |
(12 |
) |
|||||||
|
Total income |
$ |
29,598 |
$ |
641 |
|||||||
|
Expenses: |
|||||||||||
|
Investment management fees (Note B) |
16,591 |
514 |
|||||||||
|
Administration fees (Note B) |
600 |
18 |
|||||||||
|
Administration fees (Note B): |
|||||||||||
|
Institutional Class |
721 |
26 |
|||||||||
|
Class A |
252 |
2 |
|||||||||
|
Class C |
124 |
2 |
|||||||||
|
Class R6 |
2 |
— |
|||||||||
|
Distribution fees (Note B): |
|||||||||||
|
Class A |
315 |
2 |
|||||||||
|
Class C |
622 |
11 |
|||||||||
|
Shareholder servicing agent fees: |
|||||||||||
|
Institutional Class |
9 |
— |
|||||||||
|
Class A |
50 |
— |
|||||||||
|
Class C |
13 |
— |
|||||||||
|
Organization expense (Note A) |
19 |
— |
|||||||||
|
Audit fees |
146 |
78 |
|||||||||
|
Custodian and accounting fees (Note A) |
740 |
183 |
|||||||||
|
Legal fees |
373 |
124 |
|||||||||
|
Registration and filing fees |
157 |
46 |
|||||||||
| Repayment to Management of expenses previously assumed by Management (Note B) |
128 |
— |
|||||||||
|
Shareholder reports |
324 |
2 |
|||||||||
|
Trustees' fees and expenses |
49 |
49 |
|||||||||
|
Dividend and interest expense on securities sold short (Note A) |
8,056 |
330 |
|||||||||
|
Interest expense |
11 |
— |
|||||||||
|
Miscellaneous |
116 |
5 |
|||||||||
|
Total expenses |
29,418 |
1,392 |
|||||||||
|
Expenses reimbursed by Management (Note B) |
(510 |
) |
(451 |
) |
|||||||
|
Expenses reduced by custodian fee expense offset arrangement (Note A) |
(2 |
) |
— |
||||||||
|
Total net expenses |
28,906 |
941 |
|||||||||
|
Net investment income (loss) |
$ |
692 |
$ |
(300 |
) |
||||||
See Notes to Financial Statements
71
Statements of Operations (cont'd)
Neuberger Berman Alternative Funds (cont'd)
(000's omitted)
| ABSOLUTE RETURN MULTI-MANAGER FUND† |
LONG SHORT MULTI-MANAGER FUND |
||||||||||
| For the Year Ended October 31, 2016 |
For the Year Ended October 31, 2016 |
||||||||||
|
Realized and Unrealized Gain (Loss) on Investments (Note A): |
|||||||||||
|
Net realized gain (loss) on: |
|||||||||||
|
Sales of investment securities of unaffiliated issuers |
(96,185 |
) |
(1,485 |
) |
|||||||
|
Sales of investment securities of unaffiliated issuers sold short |
11,941 |
52 |
|||||||||
|
Forward foreign currency contracts |
(3,545 |
) |
(165 |
) |
|||||||
|
Foreign currency |
(1,640 |
) |
(106 |
) |
|||||||
|
Futures contracts |
267 |
44 |
|||||||||
|
Option contracts written |
2,828 |
12 |
|||||||||
|
Swap contracts |
(8,150 |
) |
(63 |
) |
|||||||
|
Change in net unrealized appreciation (depreciation) in value of: |
|||||||||||
|
Unaffiliated investment securities |
50,962 |
1,036 |
|||||||||
|
Unaffiliated investment securities sold short |
(4,364 |
) |
(46 |
) |
|||||||
|
Forward foreign currency contracts |
2,315 |
117 |
|||||||||
|
Foreign currency |
(166 |
) |
(3 |
) |
|||||||
|
Futures contracts |
680 |
(30 |
) |
||||||||
|
Option contracts written |
(2,128 |
) |
— |
(a) |
|||||||
|
Swap contracts |
4,150 |
148 |
|||||||||
|
Net gain (loss) on investments |
(43,035 |
) |
(489 |
) |
|||||||
|
Net increase (decrease) in net assets resulting from operations |
$ |
(42,343 |
) |
$ |
(789 |
) |
|||||
† Consolidated financial statement, see Note A of the Notes to Financial Statements for additional information.
(a) Amount rounds to less than $1,000.
See Notes to Financial Statements
72
Statements of Changes in Net Assets
Neuberger Berman Alternative Funds
(000's omitted)
| ABSOLUTE RETURN MULTI-MANAGER FUND |
LONG SHORT MULTI-MANAGER FUND |
||||||||||||||||||
| Year Ended October 31, 2016† |
Year Ended October 31, 2015 |
Year Ended October 31, 2016 |
Year Ended October 31, 2015 |
||||||||||||||||
|
Increase (Decrease) in Net Assets: |
|||||||||||||||||||
|
From Operations (Note A): |
|||||||||||||||||||
|
Net investment income (loss) |
$ |
692 |
$ |
(8,136 |
) |
$ |
(300 |
) |
$ |
(536 |
) |
||||||||
|
Net realized gain (loss) on investments |
(94,484 |
) |
18,826 |
(1,711 |
) |
792 |
|||||||||||||
| Change in net unrealized appreciation (depreciation) of investments |
51,449 |
(56,709 |
) |
1,222 |
(1,544 |
) |
|||||||||||||
| Net increase (decrease) in net assets resulting from operations |
(42,343 |
) |
(46,019 |
) |
(789 |
) |
(1,288 |
) |
|||||||||||
|
Distributions to shareholders from (Note A): |
|||||||||||||||||||
|
Net investment income: |
|||||||||||||||||||
|
Institutional Class |
(2,529 |
) |
(8,525 |
) |
(35 |
) |
(46 |
) |
|||||||||||
|
Class A |
— |
(488 |
) |
— |
— |
||||||||||||||
|
Class R6 |
(53 |
) |
(231 |
) |
— |
— |
|||||||||||||
|
Net realized gain on investments: |
|||||||||||||||||||
|
Institutional Class |
(10,417 |
) |
(27,552 |
) |
(877 |
) |
(215 |
) |
|||||||||||
|
Class A |
(1,839 |
) |
(5,036 |
) |
(33 |
) |
(5 |
) |
|||||||||||
|
Class C |
(784 |
) |
(2,072 |
) |
(31 |
) |
(2 |
) |
|||||||||||
|
Class R6 |
(165 |
) |
(688 |
) |
— |
— |
|||||||||||||
|
Total distributions to shareholders |
(15,787 |
) |
(44,592 |
) |
(976 |
) |
(268 |
) |
|||||||||||
|
From Fund Share Transactions (Note D): |
|||||||||||||||||||
|
Proceeds from shares sold: |
|||||||||||||||||||
|
Institutional Class |
244,845 |
777,257 |
6,083 |
15,632 |
|||||||||||||||
|
Class A |
25,581 |
100,675 |
81 |
939 |
|||||||||||||||
|
Class C |
5,121 |
24,880 |
489 |
1,321 |
|||||||||||||||
|
Class R6 |
7,223 |
25,419 |
— |
— |
|||||||||||||||
| Proceeds from reinvestment of dividends and distributions: |
|||||||||||||||||||
|
Institutional Class |
11,386 |
31,496 |
897 |
253 |
|||||||||||||||
|
Class A |
1,650 |
4,809 |
33 |
5 |
|||||||||||||||
|
Class C |
583 |
1,512 |
31 |
2 |
|||||||||||||||
|
Class R6 |
218 |
919 |
— |
— |
|||||||||||||||
|
Payments for shares redeemed: |
|||||||||||||||||||
|
Institutional Class |
(1,067,992 |
) |
(668,142 |
) |
(16,697 |
) |
(11,780 |
) |
|||||||||||
|
Class A |
(166,834 |
) |
(126,053 |
) |
(828 |
) |
(541 |
) |
|||||||||||
|
Class C |
(48,443 |
) |
(29,562 |
) |
(1,001 |
) |
(200 |
) |
|||||||||||
|
Class R6 |
(20,564 |
) |
(39,577 |
) |
— |
— |
|||||||||||||
| Net increase (decrease) from Fund share transactions |
(1,007,226 |
) |
103,633 |
(10,912 |
) |
5,631 |
|||||||||||||
|
Net Increase (Decrease) in Net Assets |
(1,065,356 |
) |
13,022 |
(12,677 |
) |
4,075 |
|||||||||||||
|
Net Assets: |
|||||||||||||||||||
|
Beginning of year |
1,658,335 |
1,645,313 |
36,012 |
31,937 |
|||||||||||||||
|
End of year |
$ |
592,979 |
$ |
1,658,335 |
$ |
23,335 |
$ |
36,012 |
|||||||||||
| Undistributed net investment income (loss) at end of year |
14 |
4,302 |
(395 |
) |
36 |
||||||||||||||
† Consolidated financial statement, see Note A of the Notes to Financial Statements for additional information.
See Notes to Financial Statements
73
Notes to Financial Statements Alternative and Multi-Asset Class Fundsß
Note A—Summary of Significant Accounting Policies:
1 General: Neuberger Berman Alternative Funds (the "Trust") is a Delaware statutory trust organized pursuant to an Amended and Restated Trust Instrument dated March 27, 2014. The Trust is registered as an open-end management investment company under the Investment Company Act of 1940, as amended (the "1940 Act"), and its shares are registered under the 1933 Act. Each of Neuberger Berman Absolute Return Multi-Manager Fund ("Absolute Return Multi-Manager") and Neuberger Berman Long Short Multi-Manager Fund ("Long Short Multi-Manager"), (each individually a "Fund," and collectively, the "Funds") is a separate operating series of the Trust, and is diversified. Each Fund offers Institutional Class shares, Class A shares and Class C shares. Absolute Return Multi-Manager also offers Class R6 shares. Neuberger Berman Alternative Funds' Board of Trustees ("the Board") may establish additional series or classes of shares without the approval of shareholders.
A zero balance, if any, reflects an actual amount rounding to less than $1,000.
The assets of each Fund belong only to that Fund, and the liabilities of each Fund are borne solely by that Fund and no other.
Each Fund is an investment company and accordingly follows the investment company accounting and reporting guidance of the Financial Accounting Standards Board ("FASB") Accounting Standard Codification Topic 946 "Financial Services—Investment Companies."
The preparation of financial statements in accordance with U.S. generally accepted accounting principles
("GAAP") requires Neuberger Berman Investment Advisers LLC ("NBIA" or "Management") to make estimates and assumptions at the date of the financial statements. Actual results could differ from those estimates.
As of November 2, 2015, Absolute Return Multi-Manager invests in commodity-related instruments through the Subsidiary, which is organized under the laws of the Cayman Islands. Absolute Return Multi-Manager is and expects to be the sole shareholder of the Subsidiary. The Subsidiary is governed by its own Board of Directors.
As of October 31, 2016, the value of Absolute Return Multi-Manager's investment in the Subsidiary was as follows:
| Investment in Subsidiary |
Percentage of Net Assets |
||||||
| $ |
30,160,772 |
5.1 |
% |
||||
The Consolidated Financial Statements include all investments and other accounts of the Subsidiary as if held directly by Absolute Return Multi-Manager. A summary of the Subsidiary's financial information is presented below.
| Subsidiary Financial Statement Information | Amount ($000) |
||||||
|
Total Assets |
30,603 |
||||||
|
Total Liabilities |
(442 |
) |
|||||
|
Net Assets |
30,161 |
||||||
|
Net Investment Income (Loss) |
(180 |
) |
|||||
|
Realized Net Gain (Loss) |
(316 |
) |
|||||
|
Change in Unrealized Appreciation (Depreciation) |
(399 |
) |
|||||
|
Net Increase (Decrease) in Net Assets Resulting from Operations |
(895 |
) |
|||||
ß Consolidated Notes to Financial Statements for Absolute Return Multi-Manager
74
2 Consolidation: The accompanying financial statements of Absolute Return Multi-Manager present the consolidated accounts of the Fund and the Subsidiary. All intercompany accounts and transactions have been eliminated in consolidation.
3 Portfolio valuation: In accordance with Accounting Standards Codification ("ASC") 820 "Fair Value Measurement" ("ASC 820"), all investments held by each of the Funds are carried at the value that Management believes a Fund would receive upon selling an investment in an orderly transaction to an independent buyer in the principal or most advantageous market for the investment under current market conditions. Various inputs, including the volume and level of activity for the asset or liability in the market, are considered in valuing the Funds' investments, some of which are discussed below. Significant Management judgment may be necessary to value investments in accordance with ASC 820.
ASC 820 established a three-tier hierarchy of inputs to create a classification of value measurements for disclosure purposes. The three-tier hierarchy of inputs is summarized in the three broad Levels listed below.
• Level 1 — quoted prices in active markets for identical investments
• Level 2 — other observable inputs (including quoted prices for similar investments, interest rates, prepayment speeds, credit risk, amortized cost, etc.)
• Level 3 — unobservable inputs (including a Fund's own assumptions in determining the fair value of investments)
The inputs or methodology used for valuing an investment are not necessarily an indication of the risk associated with investing in those securities.
The value of the Funds' investments (long and short positions) in equity securities, preferred stocks, exchange-traded funds, exchange-traded notes, exchange-traded purchased option contracts, exchange-traded written option contracts, master limited partnerships, rights and warrants, for which market quotations are readily available, is generally determined by Management by obtaining valuations from independent pricing services based on the latest sale price quoted on a principal exchange or market for that security (Level 1 inputs). Securities traded primarily on the NASDAQ Stock Market are normally valued at the NASDAQ Official Closing Price ("NOCP") provided by NASDAQ each business day. The NOCP is the most recently reported price as of 4:00:02 p.m., Eastern Time, unless that price is outside the range of the "inside" bid and asked prices (i.e., the bid and asked prices that dealers quote to each other when trading for their own accounts); in that case, NASDAQ will adjust the price to equal the inside bid or asked price, whichever is closer. Because of delays in reporting trades, the NOCP may not be based on the price of the last trade to occur before the market closes. If there is no sale of a security on a particular day, the independent pricing services may value the security based on market quotations.
The value of the Funds' investments for long and short positions in debt securities is determined by Management primarily by obtaining valuations from independent pricing services based on readily available bid or offer quotations, respectively, or if quotations are not available, by methods which include various considerations based on security type (generally Level 2 inputs). In addition to the consideration of yields or prices of securities of comparable quality, coupon, maturity and type, indications as to values from dealers, and general market conditions, the following is a description of other Level 2 inputs and related valuation techniques used by independent pricing services to value certain types of debt securities held by the Funds:
Corporate Bonds. Inputs used to value corporate debt securities generally include relative credit information, observed market movements, sector news, U.S. Treasury yield curve or relevant benchmark curve, and other market information, which may include benchmark yields, reported trades, broker-dealer quotes, issuer spreads, benchmark securities, bids, offers, and reference data, such as market research publications, when available ("Other Market Information").
Asset-Backed Securities and Mortgage-Backed Securities. Inputs used to value asset-backed securities and mortgage-backed securities generally include models that consider a number of factors, which may include the following: prepayment speeds, cash flows, spread adjustments and Other Market Information.
75
U.S. Treasury Obligations. Inputs used to value U.S. Treasury securities generally include quotes from several inter-dealer brokers and Other Market Information.
The value of the Funds' investments in convertible bonds is determined by Management primarily by obtaining valuations from independent pricing services based on readily available bid quotations or, if quotations are not available, by methods which include various considerations such as yields or prices of securities of comparable quality, coupon, maturity and type, indications as to values from dealers, and general market conditions (generally Level 2 inputs).
The value of loan assignments is determined by Management primarily by obtaining valuations from independent pricing services based on broker quotes (generally Level 2 or Level 3 inputs depending on the number of quotes available).
The value of futures is determined by Management by obtaining valuations from independent pricing services at the settlement price at the market close (Level 1 inputs).
The value of forward contracts is determined by Management by obtaining valuations from independent pricing services based on actual traded currency rates on independent pricing services' networks, along with other traded and quoted currency rates provided to the pricing services by leading market participants (Level 2 inputs).
The value of total return swaps on futures contracts is determined by Management by obtaining valuations from independent pricing services based on the settlement price of the underlying futures contract.
The value of equity swaps is determined by Management by obtaining valuations from independent pricing services using the underlying asset and stated London Interbank Offered Rate ("LIBOR") or Federal Funds floating rate (generally Level 2 or Level 3 inputs).
The value of credit default swaps is determined by Management by obtaining valuations from independent pricing services using a model that considers a number of factors, which may include default probabilities, credit curves, recovery rates and cash flows (Level 2 inputs).
Management has developed a process to periodically review information provided by independent pricing services for all types of securities.
Investments in non-exchange traded investment companies are valued using the respective fund's daily calculated net asset value per share (Level 2 inputs).
If a valuation is not available from an independent pricing service, or if Management has reason to believe that the valuation received does not represent the amount a Fund might reasonably expect to receive on a current sale in an orderly transaction, Management seeks to obtain quotations from brokers or dealers (generally considered Level 2 or Level 3 inputs depending on the number of quotes available). If such quotations are not readily available, the security is valued using methods the Board has approved in the good-faith belief that the resulting valuation will reflect the fair value of the security. Numerous factors may be considered when determining the fair value of a security based on Level 2 or Level 3 inputs, including available analyst, media or other reports, securities within the same industry with recent highly correlated performance, trading in futures or American Depositary Receipts ("ADRs") and whether the issuer of the security being fair valued has other securities outstanding.
The value of the Funds' investments in foreign securities is generally determined using the same valuation methods and inputs as other Fund investments, as discussed above. Foreign security prices expressed in local currency values are normally translated from the local currency into U.S. dollars using the exchange rates as of 4:00 p.m. Eastern Time on days the New York Stock Exchange ("NYSE") is open for business. The Board has approved the use of Interactive Data Pricing and Reference Data, Inc. ("Interactive") to assist in determining the fair value of foreign equity securities when changes in the value of a certain index suggest that the closing prices on the foreign exchanges may no longer represent the amount that a Fund could expect to receive for those securities or on days when foreign markets are closed and U.S. markets are open. In each of these events, Interactive will provide adjusted prices for certain foreign equity securities using a statistical analysis of historical correlations of multiple
76
factors (Level 2 inputs). The Board has also approved the use of Interactive to evaluate the prices of foreign income debt as of the time as of which a Fund's share price is calculated. Interactive utilizes benchmark spread and yield curves and evaluates available market activity from the local close to the time as of which a Fund's share price is calculated (Level 2 inputs) to assist in determining prices for certain foreign income debt. In the case of both foreign equity and foreign income securities, in the absence of precise information about the market values of these foreign securities as of the time as of which a Fund's share price is calculated, the Board has determined on the basis of available data that prices adjusted or evaluated in this way are likely to be closer to the prices a Fund could realize on a current sale than are the prices of those securities established at the close of the foreign markets in which the securities primarily trade.
Fair value prices are necessarily estimates, and there is no assurance that such a price will be at or close to the price at which the security is next quoted or next trades.
4 Foreign currency translation: The accounting records of the Funds and Subsidiary are maintained in U.S. dollars. Foreign currency amounts are normally translated into U.S. dollars using the exchange rate as of 4:00 p.m. Eastern Time, on days the NYSE is open for business. to determine the value of investments, other assets and liabilities. Purchase and sale prices of securities, and income and expenses, are translated into U.S. dollars at the prevailing rate of exchange on the respective dates of such transactions. Net unrealized foreign currency gain (loss), if any, arises from changes in the value of assets and liabilities, other than investments in securities, as a result of changes in exchange rates and is stated separately in the Statements of Operations.
5 Securities transactions and investment income: Securities transactions are recorded on trade date for financial reporting purposes. Dividend income is recorded on the ex-dividend date or, for certain foreign dividends, as soon as a Fund becomes aware of the dividends. Non-cash dividends included in dividend income, if any, are recorded at the fair market value of the securities received. Interest income, including accretion of discount (adjusted for original issue discount, where applicable) and amortization of premium, where applicable, and accretion of discount on short-term investments, if any, is recorded on the accrual basis. Realized gains and losses from securities transactions and foreign currency transactions, if any, are recorded on the basis of identified cost and stated separately in the Statements of Operations. Included in net realized gain (loss) on investments are proceeds from the settlement of a class action litigation in which Absolute Return Multi-Manager participated as a class member. The amount of such proceeds for the year ended October 31, 2016, was $22,369.
6 Income tax information: Each Fund is treated as a separate entity for U.S. federal income tax purposes. It is the policy of each Fund to continue to qualify for treatment as regulated investment companies ("RIC") by complying with the requirements of the U.S. Internal Revenue Code applicable to RICs and to distribute substantially all of its net investment income and net realized capital gains to its shareholders. To the extent a Fund distributes substantially all of its net investment income and net realized capital gains to shareholders, no federal income or excise tax provision is required.
The Funds have adopted the provisions of ASC 740 "Income Taxes" ("ASC 740"). ASC 740 sets forth a minimum threshold for financial statement recognition of a tax position taken, or expected to be taken, in a tax return. The Funds recognize interest and penalties, if any, related to unrecognized tax positions as an income tax expense in the Statements of Operations. The Funds are subject to examination by U.S. federal and state tax authorities for returns filed for the tax years for which the applicable statutes of limitations have not yet expired. As of October 31, 2016, the Funds did not have any unrecognized tax positions.
At October 31, 2016, selected Fund information on a U.S. federal income tax basis was as follows:
|
(000's omitted) |
Cost |
Gross Unrealized Appreciation |
Gross Unrealized Depreciation |
Net Unrealized Appreciation/ (Depreciation) |
|||||||||||||||
|
Absolute Return Multi-Manager |
$ |
589,945 |
$ |
15,370 |
$ |
(41,558 |
) |
$ |
(26,188 |
) |
|||||||||
|
Long Short Multi-Manager |
23,407 |
877 |
(1,524 |
) |
(647 |
) |
|||||||||||||
77
The Subsidiary is a controlled foreign corporation under the U.S. Internal Revenue Code. As a U.S. shareholder of a controlled foreign corporation, Absolute Return Multi-Manager will include in its taxable income its share of the Subsidiary's current earnings and profits (including net realized gains). Any deficit generated by the Subsidiary will be disregarded for purposes of computing Absolute Return Multi-Manager's taxable income in the current period and also disregarded for all future periods.
Income distributions and capital gain distributions are determined in accordance with income tax regulations, which may differ from GAAP. These differences are primarily due to differing treatments of income and gains on various investment securities held by each Fund, timing differences and differing characterization of distributions made by each Fund.
As determined on October 31, 2016, permanent differences resulting primarily from different book and tax accounting were reclassified at year end. Such differences may be attributed to the tax treatment of one or more of the following: distributions re-designated, foreign currency gains and losses, paydown gains and losses, net operating losses, prior year partnership adjustments, partnership basis adjustments, Subsidiary income gain (loss), distributions in excess of current year earnings, prior period adjustments, and tax adjustments related to real estate investment trusts ("REITs"), passive foreign investment companies ("PFICs"), partnerships, futures, forward contracts, swap contracts, short sales, and other investments. These reclassifications had no effect on net income, net asset value ("NAV") or NAV per share of each Fund. For the year ended October 31, 2016, the Funds recorded the following permanent reclassifications:
|
Paid-in Capital |
Undistributed Net Investment Income/(Loss) |
Accumulated Net Realized Gains/(Losses) on Investments |
|||||||||||||
|
Absolute Return Multi-Manager |
$ |
(3,579,305 |
) |
$(2,397,422) |
$ |
5,976,727 |
|||||||||
|
Long Short Multi-Manager |
(231,159 |
) |
(95,556 |
) |
326,715 |
||||||||||
The tax character of distributions paid during the years ended October 31, 2016 and October 31, 2015 was as follows:
|
Distributions Paid From: |
|||||||||||||||||||||||||||||||||||||||||
|
Ordinary Income |
Tax-Exempt Income |
Long-Term Capital Gain |
Return of Capital |
Total |
|||||||||||||||||||||||||||||||||||||
|
2016 |
2015 |
2016 |
2015 |
2016 |
2015 |
2016 |
2015 |
2016 |
2015 |
||||||||||||||||||||||||||||||||
| Absolute Return Multi-Manager |
$ |
15,787,471 |
$ |
43,555,538 |
$ |
— |
$ |
— |
$ |
— |
$ |
1,036,454 |
$ |
— |
$ |
— |
$ |
15,787,471 |
$ |
44,591,992 |
|||||||||||||||||||||
| Long Short Multi-Manager |
843,144 |
268,302 |
— |
— |
132,209 |
— |
— |
— |
975,353 |
268,302 |
|||||||||||||||||||||||||||||||
As of October 31, 2016, the components of distributable earnings (accumulated losses) on a U.S. federal income tax basis were as follows:
| Undistributed Ordinary Income |
Undistributed Long-Term Capital Gain |
Unrealized Appreciation/ (Depreciation) |
Loss Carryforwards and Deferrals |
Other Temporary Differences |
Total |
||||||||||||||||||||||
| Absolute Return Multi-Manager |
$ |
— |
$ |
— |
$ |
(26,745,380 |
) |
$ |
(110,616,921 |
) |
$ |
(1,689,485 |
) |
$ |
(139,051,786 |
) |
|||||||||||
| Long Short Multi-Manager |
— |
— |
(746,548 |
) |
(1,568,234 |
) |
(340,733 |
) |
(2,655,515 |
) |
|||||||||||||||||
The temporary differences between book basis and tax basis distributable earnings are primarily due to: losses disallowed and recognized on wash sales, short sales, options and straddles, mark-to-market adjustments on swaps,
78
futures and forwards, unamortized organization expenses, tax adjustments related to REITs, PFICs, partnerships, swap contracts, short sales and other investments, capital loss carryforwards and partnership basis adjustments.
To the extent each Fund's net realized capital gains, if any, can be offset by capital loss carryforwards, if any, it is the policy of each Fund not to distribute such gains. As determined at October 31, 2016, for federal income tax purposes, the Funds had unused capital loss carryforwards, with no expiration, available to offset net realized capital gains, if any, as follows:
|
Long-Term |
Short-Term |
||||||||||
|
Absolute Return Multi-Manager |
$ |
44,286,401 |
$ |
66,330,520 |
|||||||
|
Long Short Multi-Manager |
790,506 |
777,728 |
|||||||||
7 Foreign taxes: Foreign taxes withheld, if any, represent amounts withheld by foreign tax authorities, net of refunds recoverable.
Foreign capital gains on certain foreign securities may be subject to foreign taxes, which are accrued as applicable. At October 31, 2016, there were no outstanding balances of accrued capital gains taxes for the Funds.
8 Distributions to shareholders: Each Fund may earn income, net of expenses, daily on its investments. Distributions from net investment income and net realized capital gains, if any, are generally distributed once a year (usually in December) and are recorded on the ex-date.
It is the policy of each of Absolute Return Multi-Manager and Long Short Multi-Manager to pass through to its shareholders substantially all Real Estate Investment Trust ("REIT") distributions and other income it receives, less operating expenses. The distributions received from REITs are generally composed of income, capital gains, and/or return of REIT capital, but the REITs do not report this information to these Funds until the following calendar year. At October 31, 2016, these Funds estimated these amounts for the period January 1, 2016 to October 31, 2016 within the financial statements because the 2016 information is not available from the REITs until after each Fund's fiscal year-end. All estimates are based upon REIT information sources available to these Funds together with actual IRS Forms 1099-DIV received to date. For the year ended October 31, 2016, the character of distributions paid to shareholders of these Funds disclosed within the Statements of Changes in Net Assets is based on estimates made at that time. Based on past experience it is possible that a portion of these Funds' distributions during the current fiscal year, if any, will be considered tax return of capital, but the actual amount of the tax return of capital, if any, is not determinable until after each Fund's fiscal year-end. After calendar year-end, when these Funds learn the nature of the distributions paid by REITs during that year, distributions previously identified as income are often recharacterized as return of capital and/or capital gain. After all applicable REITs have informed these Funds of the actual breakdown of distributions paid to these Funds during their fiscal year, estimates previously recorded are adjusted on the books of these Funds to reflect actual results. As a result, the composition of these Funds' distributions as reported herein may differ from the final composition determined after calendar year-end and reported to these Funds' shareholders on IRS Form 1099-DIV.
9 Organization expenses: Costs incurred by the Subsidiary in connection with its organization, which amounted to $19,302, and are reflected in "Organization expense" in the Statement of Operations of Absolute Return Multi-Manager and have been expensed as incurred.
10 Expense allocation: Certain expenses are applicable to multiple funds within the complex of related investment companies. Expenses directly attributable to a Fund are charged to that Fund. Expenses of the Trust that are not directly attributable to a particular series of the Trust (e.g., a Fund) are allocated among the series of the Trust, on the basis of relative net assets, except where a more appropriate allocation of expenses to each of the series can otherwise be made fairly. Expenses borne by the complex of related investment companies, which includes open-end and closed-end investment companies for which Management serves as investment manager, that are not directly attributable to a particular investment company in the complex (e.g., the Trust) or series thereof are allocated among the investment companies or series thereof in the complex on the basis of relative net assets,
79
except where a more appropriate allocation of expenses to each of the investment companies or series thereof in the complex can otherwise be made fairly. Each Fund's expenses (other than those specific to each class) are allocated proportionally each day among the classes based upon the relative net assets of each class.
11 Investments in foreign securities: Investing in foreign securities may involve sovereign and other risks, in addition to the credit and market risks normally associated with domestic securities. These additional risks include the possibility of adverse political and economic developments (including political instability, nationalization, expropriation, or confiscatory taxation) and the potentially adverse effects of unavailability of public information regarding issuers, less governmental supervision and regulation of financial markets, reduced liquidity of certain financial markets, and the lack of uniform accounting, auditing, and financial reporting standards or the application of standards that are different or less stringent than those applied in the United States. Foreign securities also may experience greater price volatility, higher rates of inflation, and delays in settlement.
12 Securities sold short: Each Fund may engage in short sales, which are sales of securities which have been borrowed from a third party on the expectation that the market price will decline. If the price of the securities decreases, a Fund will make a profit by purchasing the securities in the open market at a price lower than the one at which it sold the securities. If the price of the securities increases, a Fund may have to cover its short positions at a price higher than the short sale price, resulting in a loss. Gains are limited to the price at which a Fund sold the security short, while losses are potentially unlimited in size. The Funds pledge securities and/or other assets to the lender as collateral. Proceeds received from short sales may be maintained by the lender as collateral or may be released to the Funds and used to purchase additional securities or for any other purpose. Proceeds maintained by the lender are included in the "Cash collateral segregated for short sales" on the Statements of Assets and Liabilities. The Funds are required to segregate an amount of cash or liquid securities in an amount at least equal to the current market value of the securities sold short (less any additional collateral pledged to the lender). The Funds are contractually responsible to remit to the lender any dividends and interest payable on securities while those securities are being borrowed by the Fund. The Funds may receive or pay the net of the interest charged by the prime broker on the borrowed securities and a financing charge for the difference in the market value of the short position and the cash collateral deposited with the broker. This income or fee is calculated daily based upon the market value of each borrowed security and a variable rate that is dependent on the availability of the security. These costs related to short sales (i.e., dividend and interest remitted to the lender and interest charged by the prime broker) are recorded as an expense of the Funds and are excluded from the contractual expense limitation.
The net amount of fees incurred during the year ended October 31, 2016, are included in the "Dividend and interest expense on securities sold short" on the Statements of Operations and are as follows:
|
(000's omitted) |
|||||
|
Absolute Return Multi-Manager |
$ |
1,640 |
|||
|
Long Short Multi-Manager |
51 |
||||
At October 31, 2016, Absolute Return Multi-Manager and Long Short Multi-Manager had cash pledged in the amount of $122,642,837 and $7,870,464, respectively, to JPMorgan Chase Bank, NA ("JPM"), as collateral for short sales. In addition, JPM has a perfected security interest in these Absolute Return Multi-Manager and Long Short Multi-Manager assets. At October 31, 2016, Absolute Return Multi-Manager and Long Short Multi-Manager had securities pledged in the amount of $24,372,205 and $2,066,189, respectively, to JPM to cover collateral requirements for borrowing in connection with securities sold short and options written.
13 Investment company securities, exchange-traded funds and exchange-traded notes: The Funds may invest in shares of other registered investment companies, including exchange-traded funds ("ETFs"), within the limitations prescribed by the 1940 Act. Some ETFs seek to track the performance of a particular market index. These indices include both broad-based market indices and more narrowly-based indices, including those relating to particular sectors, markets, regions or industries. However, some ETFs have actively-managed investment objectives. ETF shares are traded like traditional equity securities on a national securities exchange or NASDAQ. A Fund will indirectly bear its proportionate share of any management fees and other expenses paid by such other investment
80
companies, which will increase expenses and decrease returns. The Funds may also invest in exchange-traded notes ("ETNs"). ETNs are senior, unsecured, unsubordinated debt securities that are linked to the performance of a particular market index or strategy. The issuer of the ETN pays the Fund an amount based on the returns of the underlying index or strategy, plus principal at maturity. A Fund will bear any applicable fees to the issuer upon redemption or maturity, which will increase expenses and decrease returns.
14 Derivative instruments: The Funds' use of derivatives during the year ended October 31, 2016, is described below. Please see the Schedule of Investments for each Fund's open positions in derivatives, if any, at October 31, 2016. The Funds have adopted the provisions of ASC 815 "Derivatives and Hedging" ("ASC 815"). The disclosure requirements of ASC 815 distinguish between derivatives that qualify for hedge accounting and those that do not. Because investment companies value their derivatives at fair value and recognize changes in fair value through the Statements of Operations, they do not qualify for hedge accounting. Accordingly, even though a Fund's investments in derivatives may represent economic hedges, they are considered non-hedge transactions for purposes of this disclosure.
Credit default swap contracts: During the year ended October 31, 2016, Absolute Return Multi-Manager used centrally cleared and OTC credit default swaps as part of its investment strategies, to enhance returns and to hedge against unfavorable changes in the value of investments and to protect against adverse movements in interest rates or credit performance with counterparties.
When a Fund is the buyer of a credit default swap contract, it is entitled to receive the notional amount of the swap from the counterparty if a credit event occurs. In return, the Fund pays the counterparty a periodic stream of payments over the term of the contract provided that no credit event has occurred. If no credit event occurs, the Fund would have spent the stream of payments and received no proceeds from the contract. When a Fund is the seller of an OTC credit default swap contract, it receives the stream of payments, but is obligated to pay to the buyer of the protection an amount up to the notional amount of the swap and in certain instances take delivery of securities of the reference entity upon the occurrence of a credit event, as defined under the terms of that particular swap agreement. Credit events are contract specific but may include bankruptcy, failure to pay, restructuring, obligation acceleration and repudiation/moratorium. If a Fund is a seller of protection and a credit event occurs, the maximum potential amount of future payments that the Fund could be required to make (or the risk of loss) would be an amount equal to the notional amount of the agreement. This potential amount would be partially offset by any recovery value of the respective referenced obligation, or net amount received from the settlement of a buy protection credit default swap agreement entered into by the Fund for the same referenced obligation. As the seller, the Fund may add economic leverage to its portfolio because, in addition to its total net assets, the Fund is subject to investment exposure on the notional amount of the swap. The net periodic payments paid or received on the swap contract are accrued daily as a component of unrealized appreciation (depreciation) and are recorded as realized gain upon receipt or realized loss upon payment. The Fund also records an increase or decrease to unrealized appreciation (depreciation) in an amount equal to the daily valuation of the swap.
Certain clearinghouses currently offer clearing for limited types of derivative transactions, including certain credit default swaps. In a cleared derivative transaction, a Fund typically enters into the transaction with a financial institution counterparty that is then cleared through a central clearinghouse. Upon acceptance of a swap by a central clearinghouse, the original swap is extinguished and replaced with a swap with the clearinghouse, thereby reducing or eliminating the Fund's exposure to the credit risk of the original counterparty. A Fund typically will be required to post specified levels of both initial and variation margin with the clearinghouse or at the instruction of the clearinghouse; the margin required by a clearinghouse may be greater than the margin the Fund would be required to post in an uncleared derivative transaction. The daily change in valuation is recorded as a receivable or payable for variation margin and settled in cash with the centrally clearing party daily. For financial reporting purposes, unamortized upfront payments, if any, are netted with unrealized appreciation or depreciation and net interest received or paid on swap contracts to determine the fair value of swaps. For the year ended October 31, 2016, only the credit default index swaps in Absolute Return Multi-Manager were centrally cleared.
81
Futures contracts: During the year ended October 31, 2016, Absolute Return Multi-Manager used futures for economic hedging purposes and to enhance returns. Long Short Multi-Manager used futures for economic hedging purposes.
At the time a Fund enters into a futures contract, it is required to deposit with the futures commission merchant a specified amount of cash or liquid securities, known as "initial margin," which is a percentage of the value of the futures contract being traded that is set by the exchange upon which the futures contract is traded. Each day, the futures contract is valued at the official settlement price of the board of trade or U.S. commodity exchange on which such futures contract is traded. Subsequent payments, known as "variation margin," to and from the broker are made on a daily basis, or as needed, as the market price of the futures contract fluctuates. Daily variation margin adjustments, arising from this "mark to market," are recorded by a Fund or Subsidiary as unrealized gains or losses.
Although some futures by their terms call for actual delivery or acquisition of the underlying securities or currency, in most cases the contracts are closed out prior to delivery by offsetting purchases or sales of matching futures. When the contracts are closed, the Fund recognizes a gain or loss. Risks of entering into futures contracts include the possibility there may be an illiquid market, possibly at a time of rapidly declining prices, and/or a change in the value of the contract may not correlate with changes in the value of the underlying securities. Futures executed on regulated futures exchanges have minimal counterparty risk to a Fund because the exchange's clearinghouse assumes the position of the counterparty in each transaction. Thus, a Fund is exposed to risk only in connection with the clearinghouse and not in connection with the original counterparty to the transaction.
For U.S. federal income tax purposes, the futures transactions undertaken by a Fund may cause that Fund to recognize gains or losses from marking contracts to market even though its positions have not been sold or terminated, may affect the character of the gains or losses recognized as long-term or short-term, and may affect the timing of some capital gains and losses realized by the Fund. Also, a Fund's losses on transactions involving futures contracts may be deferred rather than being taken into account currently in calculating such Fund's taxable income.
Equity swap contracts: During the year ended October 31, 2016, the Funds used equity swaps to provide investment exposure to certain investments, primarily foreign securities.
Equity swaps are two-party contracts in which counterparties exchange the return on a specified reference security, basket of securities, security index or index component for the return based on a fixed or floating interest rate during the period of the swap. Equity swaps are marked to market daily based on the value of the underlying reference entity and the change, if any, is recorded as an unrealized gain or loss. Equity swaps normally do not involve the delivery of securities or other underlying assets. If the other party to an equity swap defaults, a Fund's risk of loss consists of the net amount of payments that such Fund is contractually entitled to receive, if any. Equity swaps are derivatives and their value can be very volatile. To the extent that future market trends, the values of assets or economic factors are not accurately analyzed and predicted, the Fund may suffer a loss, which may exceed the related amounts shown in the Statements of Assets and Liabilities. Periodic payments received or paid by a Fund are recorded as realized gains or losses.
Total return swap contracts: During the year ended October 31, 2016, the Funds used total return swaps to hedge certain indices and provide investment exposure to certain investments, primarily foreign securities.
Total return swaps involve commitments to pay fixed or floating rate interest in exchange for a market-linked return based on a notional amount. To the extent the total return of the reference security or index underlying the total return swap exceeds or falls short of the offsetting interest rate obligation, a Fund will receive a payment or make a payment to the counterparty, respectively. Certain risks may arise when entering into total return swap transactions, including counterparty default, liquidity or unfavorable changes in the value of the underlying reference security or index. The value of total return swaps is adjusted daily and the change in value, if any, is recorded as unrealized appreciation or depreciation in the Statements of Assets and Liabilities. Payments received
82
or made at the end of each measurement period are recorded as realized gain or loss in the Statements of Operations.
Forward foreign currency contracts: During the year ended October 31, 2016, the Funds used forward foreign currency contracts to hedge foreign currency and to enhance returns.
A forward contract is an agreement between two parties to buy or sell a specific currency for another at a set price on a future date, and is individually negotiated and privately traded by currency traders and their customers in the interbank market. The market value of a forward contract fluctuates with changes in forward currency exchange rates. Forward contracts are marked to market daily, and the change in value is recorded by a Fund as an unrealized gain or loss. At the consummation of a forward contract to purchase or sell currency, a Fund may either exchange the currencies specified at the maturity of the forward contract or enter into a closing transaction involving the purchase or sale of an offsetting forward contract. Closing transactions with respect to forward contracts are usually performed with the counterparty to the original forward contract. The gain or loss arising from the difference between the U.S. dollar cost of the original contract and the value of the foreign currency in U.S. dollars upon closing a contract is included in "Net realized gain (loss) on forward foreign currency contracts" in the Statements of Operations. These contracts may involve market risk in excess of the unrealized gain or loss reflected in a Fund's Statements of Assets and Liabilities. In addition, a Fund could be exposed to risks associated with fluctuations in foreign currency and the risk the counterparty will fail to fulfill its obligations.
Options: For the year ended October, 31, 2016, the Funds used written options to generate incremental returns for the Funds. The Funds used purchased option contracts ("options purchased") to manage or adjust the risk profile and the investment exposure of the Fund to certain securities and to enhance returns.
Premiums paid by a Fund upon purchasing a call or put option are recorded in the asset section of the Fund's Statement of Assets and Liabilities and are subsequently adjusted to the current market value. When an option is exercised, closed, or expired, a Fund realizes a gain or loss and the asset is eliminated.
For purchased call options, a Fund's loss is limited to the amount of the option premium paid.
Premiums received by a Fund upon writing a call option or a put option are recorded in the liability section of the Statement of Assets and Liabilities and are subsequently adjusted to the current market value. When an option is exercised, closed, or expired, a Fund realizes a gain or loss and the liability is eliminated.
When a Fund writes a call option on an underlying asset it does not own, its exposure on such an option is theoretically unlimited. When writing a covered call option, a Fund, in return for the premium, gives up the opportunity for profit from a price increase in the underlying security above the exercise price, but conversely retains the risk of loss should the price of the security decline. When writing a put option, a Fund, in return for the premium, takes the risk that it must purchase the underlying security at a price that may be higher than the current market price of the security. If a covered call or put option that a Fund has written expires unexercised, the Fund will realize a gain in the amount of the premium.
A Fund may write or purchase options on exchange-traded futures contracts ("futures option") to hedge an existing position or future investment, for speculative purposes or to manage exposure to market movements. A futures option is an option contract in which the underlying instrument is a specific futures contract.
83
At October 31, 2016, the Funds had the following derivatives (which did not qualify as hedging instruments under ASC 815), grouped by primary risk exposure:
Asset Derivatives
| Derivative Type |
Statements of Assets and Liabilities Location |
Credit Risk |
Currency Risk |
Equity Risk |
Interest Rate Risk |
Commodity Risk |
Total |
||||||||||||||||||||
|
Absolute Return Multi-Manager |
|||||||||||||||||||||||||||
| OTC swaps |
OTC swap contracts, at value(1) |
$ |
557,275 |
$ |
— |
$ |
2,306,042 |
$ |
— |
$ |
— |
$ |
2,863,317 |
||||||||||||||
| Futures |
Receivable/Payable for variation margin on futures contracts(2) |
— |
1,488,477 |
183,735 |
5,088 |
968,469 |
2,645,769 |
||||||||||||||||||||
| Forward contracts |
Receivable for forward foreign currency contracts |
— |
851,152 |
— |
— |
— |
851,152 |
||||||||||||||||||||
| Options purchased |
Investments in securities, at value |
— |
— |
295,992 |
— |
— |
295,992 |
||||||||||||||||||||
|
Total Value—Assets |
$ |
557,275 |
$ |
2,339,629 |
$ |
2,785,769 |
$ |
5,088 |
$ |
968,469 |
$ |
6,656,230 |
|||||||||||||||
|
Long Short Multi-Manager |
|||||||||||||||||||||||||||
| OTC swaps |
OTC swap contracts, at value(1) |
$ |
— |
$ |
— |
$ |
338,764 |
$ |
— |
$ |
— |
$ |
338,764 |
||||||||||||||
| Forward contracts |
Receivable for forward foreign currency contracts |
— |
76,565 |
— |
— |
— |
76,565 |
||||||||||||||||||||
| Options purchased |
Investments in securities, at value |
— |
— |
3,090 |
— |
— |
3,090 |
||||||||||||||||||||
|
Total Value—Assets |
$ |
— |
$ |
76,565 |
$ |
341,854 |
$ |
— |
$ |
— |
$ |
418,419 |
|||||||||||||||
84
Liability Derivatives
| Derivative Type |
Statements of Assets and Liabilities Location |
Credit Risk |
Currency Risk |
Equity Risk |
Interest Rate Risk |
Commodity Risk |
Total |
||||||||||||||||||||
|
Absolute Return Multi-Manager |
|||||||||||||||||||||||||||
| OTC swap contracts |
OTC swap contracts, at value(1) |
$ |
(833,507 |
) |
$ |
— |
$ |
(2,701,656 |
) |
$ |
— |
$ |
— |
$ |
(3,535,163 |
) |
|||||||||||
| Centrally cleared swaps |
Receivable/Payable for variation margin on centrally cleared swap contracts(3) |
(422,121 |
) |
— |
— |
— |
— |
(422,121 |
) |
||||||||||||||||||
| Futures |
Receivable/Payable for variation margin on futures contracts(2) |
— |
(60,815 |
) |
(367,521 |
) |
(399,569 |
) |
(1,137,520 |
) |
(1,965,425 |
) |
|||||||||||||||
| Forward contracts |
Payable for forward foreign currency contracts |
— |
(656,732 |
) |
— |
— |
— |
(656,732 |
) |
||||||||||||||||||
| Options written |
Option contracts written, at value |
— |
— |
(45,673 |
) |
— |
— |
(45,673 |
) |
||||||||||||||||||
|
Total Value—Liabilities |
$ |
(1,255,628 |
) |
$ |
(717,547 |
) |
$ |
(3,114,850 |
) |
$ |
(399,569 |
) |
$ |
(1,137,520 |
) |
$ |
(6,625,114 |
) |
|||||||||
|
Long Short Multi-Manager |
|||||||||||||||||||||||||||
| OTC swaps |
OTC swap contracts, at value(1) |
$ |
— |
$ |
— |
$ |
(246,761 |
) |
$ |
— |
$ |
— |
$ |
(246,761 |
) |
||||||||||||
| Futures |
Receivable/Payable for variation margin on futures contracts(2) |
— |
— |
(30,042 |
) |
— |
— |
(30,042 |
) |
||||||||||||||||||
| Forward contracts |
Payable for forward foreign currency contracts |
— |
(53,445 |
) |
— |
— |
— |
(53,445 |
) |
||||||||||||||||||
| Options written |
Option contracts written, at value |
— |
— |
(780 |
) |
— |
— |
(780 |
) |
||||||||||||||||||
|
Total Value—Liabilities |
$ |
— |
$ |
(53,445 |
) |
$ |
(277,583 |
) |
$ |
— |
$ |
— |
$ |
(331,028 |
) |
||||||||||||
(1) "OTC swap contracts" reflects the appreciation/(depreciation) of the OTC swap contracts plus accrued interest as of October 31, 2016, which is reflected in the Statements of Assets and Liabilities under the caption "OTC swap contracts, at value."
(2) "Futures" reflects the cumulative appreciation/(depreciation) of futures contracts as of October 31, 2016, which is reflected in the Statements of Assets and Liabilities under the caption "Net unrealized appreciation/(depreciation) in value of investments." The current day's variation margin as of October 31, 2016, if any, is reflected in the Statements of Assets and Liabilities under the caption "Receivable/Payable for variation margin on futures contracts."
(3) "Centrally cleared swap contracts" reflects the cumulative unrealized appreciation/(depreciation) of centrally cleared default index swaps as of October 31, 2016, which is reflected in the Statements of Assets and Liabilities under the caption "Net unrealized appreciation (depreciation) in value of investments". Only the current day's
85
variation margin on centrally cleared swap contracts is reported within the Statements of Assets and Liabilities under the caption "Receivable/Payable for variation margin on centrally cleared swap contracts."
Realized Gain/(Loss)
| Derivative Type |
Statements of Operations Location |
Credit Risk | Currency Risk |
Equity Risk |
Interest Rate Risk |
Commodity Risk |
Total |
||||||||||||||||||||
|
Absolute Return Multi-Manager |
|||||||||||||||||||||||||||
| Forward contracts |
Net realized gain (loss) on: Forward foreign currency contracts |
$ |
— |
$ |
(3,544,707 |
) |
$ |
— |
$ |
— |
$ |
— |
$ |
(3,544,707 |
) |
||||||||||||
| Futures contracts |
Net realized gain (loss) on: Futures contracts |
— |
(640,923 |
) |
(1,432,937 |
) |
3,168,422 |
(827,987 |
) |
266,575 |
|||||||||||||||||
| Options written |
Net realized gain (loss) on: Option contracts written |
— |
— |
2,827,566 |
— |
— |
2,827,566 |
||||||||||||||||||||
| Options purchased |
Net realized gain (loss) on: Sales of investment securities of unaffiliated issuers |
— |
— |
(17,506,678 |
) |
— |
— |
(17,506,678 |
) |
||||||||||||||||||
| Swaps |
Net realized gain (loss) on: Swap contracts |
(1,996,124 |
) |
— |
(6,154,010 |
) |
— |
— |
(8,150,134 |
) |
|||||||||||||||||
|
Total Realized Gain/(Loss) |
$ |
(1,996,124 |
) |
$ |
(4,185,630 |
) |
$ |
(22,266,059 |
) |
$ |
3,168,422 |
$ |
(827,987 |
) |
$ |
(26,107,378 |
) |
||||||||||
|
Long Short Multi-Manager |
|||||||||||||||||||||||||||
| Forward contracts |
Net realized gain (loss) on: Forward foreign currency contracts |
$ |
— |
$ |
(165,377 |
) |
$ |
— |
$ |
— |
$ |
— |
$ |
(165,377 |
) |
||||||||||||
| Futures contracts |
Net realized gain (loss) on: Futures contracts |
— |
— |
44,096 |
— |
— |
44,096 |
||||||||||||||||||||
| Options written |
Net realized gain (loss) on: Option contracts written |
— |
— |
11,741 |
— |
— |
11,741 |
||||||||||||||||||||
| Options purchased |
Net realized gain (loss) on: Sales of investment securities of unaffiliated issuers |
— |
— |
(301,811 |
) |
— |
— |
(301,811 |
) |
||||||||||||||||||
| Swaps |
Net realized gain (loss) on: Swap contracts |
— |
— |
(63,281 |
) |
— |
— |
(63,281 |
) |
||||||||||||||||||
|
Total Realized Gain/(Loss) |
$ |
— |
$ |
(165,377 |
) |
$ |
(309,255 |
) |
$ |
— |
$ |
— |
$ |
(474,632 |
) |
||||||||||||
86
| Derivative Type |
Statements of Operations Location |
Credit Risk |
Currency Risk |
Equity Risk |
Interest Rate Risk |
Commodity Risk |
Total |
||||||||||||||||||||
|
Absolute Return Multi-Manager |
|||||||||||||||||||||||||||
| Forward contracts |
Change in net unrealized appreciation (depreciation) in value of: Forward foreign currency contracts |
$ |
— |
$ |
2,315,420 |
$ |
— |
$ |
— |
$ |
— |
$ |
2,315,420 |
||||||||||||||
| Futures contracts |
Change in net unrealized appreciation (depreciation) in value of: Futures contracts |
— |
1,427,662 |
(183,786 |
) |
(394,481 |
) |
(169,051 |
) |
680,344 |
|||||||||||||||||
| Options written |
Change in net unrealized appreciation (depreciation) in value of: Option contracts written |
— |
— |
(2,128,079 |
) |
— |
— |
(2,128,079 |
) |
||||||||||||||||||
| Options purchased |
Change in net unrealized appreciation (depreciation) in value of: Unaffiliated investment securities |
— |
— |
9,114,296 |
— |
— |
9,114,296 |
||||||||||||||||||||
| Swaps |
Change in net unrealized appreciation (depreciation) in value of: Swap contracts |
(439,740 |
) |
— |
4,589,939 |
— |
— |
4,150,199 |
|||||||||||||||||||
| Total Change in Appreciation/(Depreciation) |
$ |
(439,740 |
) |
$ |
3,743,082 |
$ |
11,392,370 |
$ |
(394,481 |
) |
$ |
(169,051 |
) |
$ |
14,132,180 |
||||||||||||
|
Long Short Multi-Manager |
|||||||||||||||||||||||||||
| Forward contracts |
Change in net unrealized appreciation (depreciation) in value of: Forward foreign currency contracts |
$ |
— |
$ |
117,120 |
$ |
— |
$ |
— |
$ |
— |
$ |
117,120 |
||||||||||||||
| Futures contracts |
Change in net unrealized appreciation (depreciation) in value of: Futures contracts |
— |
— |
(30,042 |
) |
— |
— |
(30,042 |
) |
||||||||||||||||||
| Options written |
Change in net unrealized appreciation (depreciation) in value of: Option contracts written |
— |
— |
(217 |
) |
— |
— |
(217 |
) |
||||||||||||||||||
| Options purchased |
Change in net unrealized appreciation (depreciation) in value of: Unaffiliated investment securities |
— |
— |
117,143 |
— |
— |
117,143 |
||||||||||||||||||||
| Swaps |
Change in net unrealized appreciation (depreciation) in value of: Swap contracts |
— |
— |
147,830 |
— |
— |
147,830 |
||||||||||||||||||||
| Total Change in Appreciation/(Depreciation) |
$ |
— |
$ |
117,120 |
$ |
234,714 |
$ |
— |
$ |
— |
$ |
351,834 |
|||||||||||||||
87
The Funds disclose both gross and net information for assets and liabilities related to derivatives, repurchase and reverse repurchase agreements, and securities lending and securities borrowing transactions that are eligible for offset or subject to an enforceable master netting or similar agreement. The Funds' derivative assets and liabilities at fair value by type are reported gross in the Statements of Assets and Liabilities. The following tables present the Funds' derivative assets and liabilities by counterparty, net of amounts available for offset under a master netting agreement and net of the related collateral received by the Funds for assets and pledged by the Funds for liabilities as of October 31, 2016.
Absolute Return Multi-Manager
|
Description |
Gross Amounts of Recognized Assets |
Gross Amounts Offset in the Statements of Assets and Liabilities |
Net Amounts of Assets Presented in the Statements of Assets and Liabilities |
||||||||||||
|
OTC swap contracts |
$ |
2,863,317 |
$ |
— |
$ |
2,863,317 |
|||||||||
|
Forward contracts |
851,152 |
— |
851,152 |
||||||||||||
|
Total |
$ |
3,714,469 |
$ |
— |
$ |
3,714,469 |
|||||||||
Gross Amounts Not Offset in the Statements of Assets and Liabilities
|
Counterparty |
Net Amounts of Assets Presented in the Statements of Assets and Liabilities |
Financial Instruments |
Cash Collateral Received(a) |
Net Amount(b) | |||||||||||||||
|
Bank of America, NA |
$ |
193,523 |
$ |
(193,523 |
) |
$ |
— |
$ |
— |
||||||||||
|
JPMorgan Chase Bank, NA |
1,368,924 |
(1,368,924 |
) |
— |
— |
||||||||||||||
|
Morgan Stanley Capital Services LLC |
2,152,022 |
(1,403,274 |
) |
— |
748,748 |
||||||||||||||
|
$ |
3,714,469 |
$ |
(2,965,721 |
) |
$ |
— |
$ |
748,748 |
|||||||||||
|
Description |
Gross Amounts of Recognized Liabilities |
Gross Amounts Offset in the Statements of Assets and Liabilities |
Net Amounts of Liabilities Presented in the Statements of Assets and Liabilities |
||||||||||||
|
OTC swap contracts |
$ |
(3,535,163 |
) |
$ |
— |
$ |
(3,535,163 |
) |
|||||||
|
Forward contracts |
(656,732 |
) |
— |
(656,732 |
) |
||||||||||
|
Total |
$ |
(4,191,895 |
) |
$ |
— |
$ |
(4,191,895 |
) |
|||||||
Gross Amounts Not Offset in the Statements of Assets and Liabilities
|
Counterparty |
Net Amounts of Liabilities Presented in the Statements of Assets and Liabilities |
Financial Instruments |
Cash Collateral Pledged(a) |
Net Amount(c) | |||||||||||||||
|
Bank of America, NA |
$ |
(195,513 |
) |
$ |
193,523 |
$ |
1,990 |
$ |
— |
||||||||||
|
JPMorgan Chase Bank, NA |
(2,593,108 |
) |
1,368,924 |
1,224,184 |
— |
||||||||||||||
|
Morgan Stanley Capital Services LLC |
(1,403,274 |
) |
1,403,274 |
— |
— |
||||||||||||||
|
$ |
(4,191,895 |
) |
$ |
2,965,721 |
$ |
1,226,174 |
$ |
— |
|||||||||||
(a) Collateral received (or pledged) is limited to an amount not to exceed 100% of the net amount of assets (or liabilities) in the tables presented above, for each respective counterparty.
(b) Net Amount represents amounts subject to loss as of October 31, 2016, in the event of a counterparty failure.
(c) Net Amount represents amounts under-collateralized by the Fund to each counterparty as of October 31, 2016.
88
Long Short Multi-Manager
|
Description |
Gross Amounts of Recognized Assets |
Gross Amounts Offset in the Statements of Assets and Liabilities |
Net Amounts of Assets Presented in the Statements of Assets and Liabilities |
||||||||||||
|
OTC swap contracts |
$ |
338,764 |
$ |
— |
$ |
338,764 |
|||||||||
|
Forward contracts |
76,565 |
— |
76,565 |
||||||||||||
|
Total |
$ |
415,329 |
$ |
— |
$ |
415,329 |
|||||||||
Gross Amounts Not Offset in the Statements of Assets and Liabilities
|
Counterparty |
Net Amounts of Assets Presented in the Statements of Assets and Liabilities |
Financial Instruments |
Cash Collateral Received(a) |
Net Amount(b) | |||||||||||||||
|
JPMorgan Chase Bank, NA |
$ |
76,617 |
$ |
(53,445 |
) |
$ |
— |
$ |
23,172 |
||||||||||
|
Morgan Stanley Capital Services LLC |
338,712 |
(246,761 |
) |
— |
91,951 |
||||||||||||||
|
$ |
415,329 |
$ |
(300,206 |
) |
$ |
— |
$ |
115,123 |
|||||||||||
|
Description |
Gross Amounts of Recognized Liabilities |
Gross Amounts Offset in the Statements of Assets and Liabilities |
Net Amounts of Liabilities Presented in the Statements of Assets and Liabilities |
||||||||||||
|
OTC swap contracts |
$ |
(246,761 |
) |
$ |
— |
$ |
(246,761 |
) |
|||||||
|
Forward contracts |
(53,445 |
) |
— |
(53,445 |
) |
||||||||||
|
Total |
$ |
(300,206 |
) |
$ |
— |
$ |
(300,206 |
) |
|||||||
Gross Amounts Not Offset in the Statements of Assets and Liabilities
|
Counterparty |
Net Amounts of Liabilities Presented in the Statements of Assets and Liabilities |
Financial Instruments |
Cash Collateral Pledged(a) |
Net Amount(c) | |||||||||||||||
|
JPMorgan Chase Bank, NA |
$ |
(53,445 |
) |
$ |
53,445 |
$ |
— |
$ |
— |
||||||||||
|
Morgan Stanley Capital Services LLC |
(246,761 |
) |
246,761 |
— |
— |
||||||||||||||
|
$ |
(300,206 |
) |
$ |
300,206 |
$ |
— |
$ |
— |
|||||||||||
(a) Collateral received (or pledged) is limited to an amount not to exceed 100% of the net amount of assets (or liabilities) in the tables presented above, for each respective counterparty.
(b) Net Amount represents amounts subject to loss as of October 31, 2016, in the event of a counterparty failure.
(c) Net Amount represents amounts under-collateralized by the Fund to each counterparty as of October 31, 2016.
15 Indemnifications: Like many other companies, the Trust's organizational documents provide that its officers ("Officers") and trustees ("Trustees") are indemnified against certain liabilities arising out of the performance of their duties to the Trust. In addition, both in some of its principal service contracts and in the normal course of its business, the Trust enters into contracts that provide indemnifications to other parties for certain types of losses or liabilities. The Trust's maximum exposure under these arrangements is unknown as this could involve future claims against the Trust.
16 Unfunded loan commitments: Absolute Return Multi-Manager may enter into certain credit agreements all or a portion of which may be unfunded. Absolute Return Multi-Manager is obligated to fund these commitments at the borrower's discretion. As of October 31, 2016, there were no outstanding unfunded loan commitments.
89
17 Expense offset arrangement: Absolute Return Multi-Manager has an expense offset arrangement in connection with its custodian contract. For the year ended October 31, 2016, the impact of this arrangement was a reduction of expenses of $2,127.
18 Other: All net investment income and realized and unrealized capital gains and losses of each Fund are allocated, on the basis of relative net assets, pro rata among its respective classes.
Note B—Investment Management Fees, Administration Fees, Distribution Arrangements, and Other Transactions with Affiliates:
Each Fund retains Management as its investment manager under a Management Agreement. For such investment management services, each Fund pays Management a fee at the annual rate of 1.700% of the first $250 million of the Fund's average daily net assets, 1.675% of the next $250 million, 1.650% of the next $250 million, 1.625% of the next $250 million, 1.600% of the next $500 million, 1.575% of the next $2.5 billion, and 1.550% of average daily net assets in excess of $4 billion. Accordingly, for the year ended October 31, 2016, the Investment Management fee pursuant to the Investment Management Agreement was equivalent to an annual effective rate of 1.66% and 1.70% of Absolute Return Multi-Manager's and Long Short Multi- Manager's average daily net assets, respectively.
Each Fund retains Management as its administrator under an Administration Agreement. Each Fund pays
Management an administration fee at the annual rate of 0.06% of its average daily net assets under this agreement. In addition, Institutional Class of each Fund pays Management an administration fee at the annual rate of 0.09% of its average daily net assets, Class A and Class C of each Fund pays Management an administration fee at the annual rate of 0.20% of its average daily net assets and Class R6 of Absolute Return Multi-Manager pays Management an administration fee at the annual rate of 0.02% of its average daily net assets under this agreement. Additionally, Management retains JPM as its sub-administrator under a Sub-Administration Agreement. Management pays JPM a fee for all services received under the agreement.
Management has contractually agreed to waive fees and/or reimburse certain expenses of the Institutional Class, Class A, Class C and Class R6 of each Fund that offers those classes so that the total annual operating expenses of those classes do not exceed the expense limitations as detailed in the following table. These undertakings exclude interest, taxes, brokerage commissions, acquired fund fees and expenses, extraordinary expenses, as of August 12, 2014, dividend and interest expenses relating to short sales, if any (commitment fees relating to borrowings are treated as interest for purposes of this exclusion); consequently, net expenses may exceed the contractual expense limitations. Each Fund has agreed that each of its respective classes will repay Management for fees and expenses waived or reimbursed for that class provided that repayment does not cause that class' annual operating expenses to exceed its contractual expense limitation in place at the time the fees and expenses were waived or reimbursed. Any such repayment must be made within three years after the year in which Management incurred the expense. The expenses of the Subsidiary are included in the total expenses used to calculate the reimbursement, which Absolute Return Multi-Manager has agreed to share with the Subsidiary. For the year ended October 31, 2016, these Subsidiary expenses amounted to $199,574.
During the year ended October 31, 2016, the following classes repaid Management under their contractual expense limitation agreements as follows:
|
Class |
Expenses Repaid to Management |
||||||
|
Absolute Return Multi-Manager Institutional Class |
$ |
117,074 |
|||||
|
Absolute Return Multi-Manager Class A |
6,019 |
||||||
|
Absolute Return Multi-Manager Class C |
3,776 |
||||||
|
Absolute Return Multi-Manager Class R6 |
965 |
||||||
90
At October 31, 2016, contingent liabilities to Management under the agreements were as follows:
| Expenses Reimbursed in Year Ending October 31, |
|||||||||||||||||||||||
|
2014 |
2015 |
2016 |
|||||||||||||||||||||
| Subject to Repayment until October 31, |
|||||||||||||||||||||||
|
Class |
Contractual Expense Limitation(1) |
Expiration |
2017 |
2018 |
2019 |
||||||||||||||||||
|
Absolute Return Multi-Manager Institutional Class |
1.97 |
% |
10/31/19 |
$ |
759,554 |
$ |
— |
$ |
377,847 |
||||||||||||||
|
Absolute Return Multi-Manager Class A |
2.33 |
% |
10/31/19 |
316,015 |
— |
89,779 |
|||||||||||||||||
|
Absolute Return Multi-Manager Class C |
3.08 |
% |
10/31/19 |
44,890 |
— |
40,256 |
|||||||||||||||||
|
Absolute Return Multi-Manager Class R6 |
1.90 |
% |
10/31/19 |
— |
— |
1,667 |
|||||||||||||||||
|
Long Short Multi-Manager Institutional Class |
1.97 |
% |
10/31/19 |
459,171 |
(2) |
448,751 |
422,780 |
||||||||||||||||
|
Long Short Multi-Manager Class A |
2.33 |
% |
10/31/19 |
13,772 |
(2) |
12,486 |
11,768 |
||||||||||||||||
|
Long Short Multi-Manager Class C |
3.08 |
% |
10/31/19 |
6,443 |
(2) |
8,317 |
16,491 |
||||||||||||||||
(1) Expense limitation per annum of the respective class's average daily net assets.
(2) Period from December 19, 2013 (Commencement of Operations) to October 31, 2014.
Until December 31, 2015, NB Alternative Investment Management LLC ("NBAIM"), was the investment adviser to the Funds, and was retained by Neuberger Berman Management LLC ("NBM") to provide day-to-day investment management services, including oversight of each Fund's investments and handling its day-to-day business, including the oversight of the subadvisers' investment activities, and received a monthly fee paid by NBM. As investment manager, NBM was responsible for overseeing the investment activities of NBAIM. Several individuals who are Officers and/or Trustees of the Trust are also employees of NBAIM and/or Management. As a result of the entity consolidation described on page 8 of this Annual Report, the services previously provided by NBAIM are being provided by NBIA as of January 1, 2016.
Management has retained Blue Jay Capital Management, LLC, Cramer Rosenthal McGlynn, LLC, GAMCO Asset Management Inc., Good Hill Partners LP, GSA Capital Partners LLP, Lazard Asset Management LLC, Levin Capital Strategies, L.P., P/E Global, LLC, Portland Hill Capital LLP, Sound Point Capital Management, L.P., and TPH Asset Management, LLC as subadvisers of Absolute Return Multi-Manager to provide investment management services. Management engages Blue Jay Capital Management, LLC, Cramer Rosenthal McGlynn, LLC, Lazard Asset Management LLC, Levin Capital Strategies, L.P., Portland Hill Capital LLP, and TPH Asset Management, LLC as subadvisers of Long Short Multi-Manager to provide investment management services. Management compensates the subadvisers out of the investment advisory fees it receives from each Fund.
Each Fund also has a distribution agreement with Neuberger Berman LLC ("Neuberger Berman") with respect to each class of shares. Neuberger Berman acts as agent in arranging for the sale of class shares without sales commission or other compensation, except as described below for Class A and Class C shares, and bears advertising and promotion expenses.
However, Neuberger Berman receives fees from Class A and Class C under their distribution plans (each a "Plan", collectively, the "Plans") pursuant to Rule 12b-1 under the 1940 Act. The Plans provide that, as compensation for administrative and other services provided to these classes, Neuberger Berman activities and expenses related to the sale and distribution of these classes, and ongoing services provided to investors in these classes, Neuberger Berman receives from each of these respective classes a fee at the annual rate of 0.25% of Class A's and 1.00% of Class C's average daily net assets. Neuberger Berman receives this amount to provide distribution and shareholder servicing for these classes and pays a portion of it to institutions that provide such services. Those institutions may use the payments for, among other purposes, compensating employees engaged in sales and/or shareholder
91
servicing. The amount of fees paid by each class during any year may be more or less than the cost of distribution and other services provided to that class. FINRA rules limit the amount of annual distribution fees that may be paid by a mutual fund and impose a ceiling on the cumulative distribution fees paid. The Trust's Plans comply with those rules.
Class A shares of each Fund are generally sold with an initial sales charge of up to 5.75% and no contingent deferred sales charge ("CDSC"), except that a CDSC of 1.00% applies to certain redemptions made within 18 months following purchases of $1 million or more without an initial sales charge. Class C shares of each Fund are sold with no initial sales charge and a 1.00% CDSC if shares are sold within one year after purchase.
For the year ended October 31, 2016, Neuberger Berman, acting as underwriter and broker-dealer, received net initial sales charges from the purchase of Class A shares and CDSCs from the redemption of Class A and Class C shares as follows:
|
Underwriter |
Broker-Dealer |
||||||||||||||||||
|
Net Initial Sales Charges |
CDSC |
Net Initial Sales Charges |
CDSC |
||||||||||||||||
|
Absolute Return Multi-Manager Class A |
$ |
10,125 |
$ |
— |
$ |
— |
$ |
— |
|||||||||||
|
Absolute Return Multi-Manager Class C |
— |
44,055 |
— |
— |
|||||||||||||||
|
Long Short Multi-Manager Class A |
— |
— |
— |
— |
|||||||||||||||
|
Long Short Multi-Manager Class C |
— |
1,873 |
— |
— |
|||||||||||||||
Note C—Securities Transactions:
During the year ended October 31, 2016, there were purchase and sale transactions of long-term securities (excluding equity swaps, total return swaps, credit default swaps, forward contracts, futures and option contracts) as follows:
|
(000's omitted) |
Purchases of U.S. Government and Agency Obligations |
Purchases excluding U.S. Government and Agency Obligations |
Securities Sold Short excluding U.S. Government and Agency Obligations |
Sales and Maturities of U.S. Government and Agency Obligations |
Sales and Maturities excluding U.S. Government and Agency Obligations |
Covers excluding U.S. Government and Agency Obligations on Securities Sold Short |
|||||||||||||||||||||
| Absolute Return Multi-Manager |
$ |
1,867 |
$ |
4,315,965 |
$ |
902,726 |
$ |
2,001 |
$ |
5,295,672 |
$ |
1,236,173 |
|||||||||||||||
| Long Short Multi-Manager |
— |
226,021 |
64,835 |
— |
235,682 |
70,265 |
|||||||||||||||||||||
During the year ended October 31, 2016, no brokerage commissions on securities transactions were paid to affiliated brokers.
92
Note D—Fund Share Transactions:
Share activity for the years ended October 31, 2016 and October 31, 2015 was as follows:
|
For the Year Ended October 31, 2016 |
For the Year Ended October 31, 2015 |
||||||||||||||||||||||||||||||||
| (000's omitted) | Shares Sold |
Shares Issued on Reinvestment of Dividends and Distributions |
Shares Redeemed |
Total |
Shares Sold |
Shares Issued on Reinvestment of Dividends and Distributions |
Shares Redeemed |
Total |
|||||||||||||||||||||||||
| Absolute Return Multi-Manager Fund: |
|||||||||||||||||||||||||||||||||
| Institutional Class |
24,318 |
1,124 |
(106,001 |
) |
(80,559 |
) |
71,126 |
2,935 |
(61,686 |
) |
12,375 |
||||||||||||||||||||||
|
Class A |
2,545 |
164 |
(16,727 |
) |
(14,018 |
) |
9,264 |
450 |
(11,647 |
) |
(1,933 |
) |
|||||||||||||||||||||
|
Class C |
523 |
59 |
(4,974 |
) |
(4,392 |
) |
2,336 |
144 |
(2,791 |
) |
(311 |
) |
|||||||||||||||||||||
|
Class R6 |
710 |
22 |
(2,059 |
) |
(1,327 |
) |
2,320 |
86 |
(3,693 |
) |
(1,287 |
) |
|||||||||||||||||||||
| Long Short Multi-Manager Fund: |
|||||||||||||||||||||||||||||||||
| Institutional Class |
636 |
94 |
(1,746 |
) |
(1,016 |
) |
1,472 |
25 |
(1,135 |
) |
362 |
||||||||||||||||||||||
|
Class A |
9 |
3 |
(89 |
) |
(77 |
) |
89 |
1 |
(52 |
) |
38 |
||||||||||||||||||||||
|
Class C |
52 |
3 |
(108 |
) |
(53 |
) |
128 |
0 |
(20 |
) |
108 |
||||||||||||||||||||||
Other: At October 31, 2016, there was an affiliated investor owning 48.3% of Long Short Multi-Manager's outstanding shares.
Note E—Lines of Credit:
At October 31, 2016, each Fund was a participant in a syndicated committed, unsecured $700,000,000 line of credit (the "Credit Facility"), to be used only for temporary or emergency purposes. Absolute Return Multi-Manager Fund, Long Short Multi-Manager Fund, and another multi-managed fund in the complex are subject to a separate limitation under the Credit Facility and collectively can only borrow $200,000,000 at any one time. Series of other investment companies managed by Management also participate in this line of credit on substantially the same terms except that they are not subject to that $200,000,000 limitation. Interest is charged on borrowings under this Credit Facility at the higher of (a) a Federal Funds effective rate plus 1.00% per annum or (b) a Eurodollar rate for a one-month period plus 1.00% per annum. The Credit Facility has an annual commitment fee of 0.15% per annum of the available line of credit, which is paid quarterly. Each Fund has agreed to pay its pro rata share of the annual commitment fee, based on the ratio of its individual net assets to the net assets of all participants at the time the fee is due and payable and the level of its access to the Credit Facility, and interest charged on any borrowing made by such Fund and other costs incurred by such Fund. Because several mutual funds participate in the Credit Facility, there is no assurance that an individual Fund will have access to all or any part of the $700,000,000 at any particular time. There were no loans outstanding under the Credit Facility at October 31, 2016. During the period ended October 31, 2016, none of the Funds utilized the line of credit.
Note F—Recent Accounting Pronouncement:
In October 2016, the U.S. Securities and Exchange Commission ("SEC") adopted new rules and forms, and amendments to certain current rules and forms, to modernize reporting and disclosure of information by registered investment companies. The amendments to Regulation S-X will require standardized, enhanced disclosure about derivatives in investment company financial statements, and will also change the rules governing the form and content of such financial statements. The compliance date for the amendments to Regulation S-X is August 1, 2017. Management is currently evaluating the impact that the adoption of the amendments to Regulation S-X will have on the Funds' financial statements and related disclosures.
93
This page has been left blank intentionally
94
Financial Highlights
The following tables include selected data for a share outstanding throughout each period and other performance information derived from the Financial Statements. Amounts that do not round to $0.01 or $(0.01) per share are presented as $0.00 or $(0.00), respectively. Ratios that do not round to 0.01% or (0.01)% are presented as 0.00% or (0.00)%, respectively. Net Asset amounts with a zero balance, if any, may reflect actual amounts rounding to less than $0.1 million. A "—" indicates that the line item was not applicable in the corresponding period.
| Net Asset Value, Beginning of Year |
Net Investment Income/ (Loss)@ |
Net Gains or Losses on Securities (both realized and unrealized) |
Total From Investment Operations |
Dividends from Net Investment Income |
Distributions from Net Realized Capital Gains |
Tax Return of Capital |
Total Distributions |
||||||||||||||||||||||||||
|
Absolute Return Multi-Manager Fund |
|||||||||||||||||||||||||||||||||
|
Institutional Class |
|||||||||||||||||||||||||||||||||
| 10/31/16ß |
$ |
10.47 |
$ |
0.02 |
$ |
(0.18 |
) |
$ |
(0.16 |
) |
$ |
(0.03 |
) |
$ |
(0.10 |
) |
$ |
— |
$ |
(0.13 |
) |
||||||||||||
|
10/31/15 |
$ |
11.00 |
$ |
(0.04 |
) |
$ |
(0.19 |
) |
$ |
(0.23 |
) |
$ |
(0.07 |
) |
$ |
(0.23 |
) |
$ |
— |
$ |
(0.30 |
) |
|||||||||||
|
10/31/14 |
$ |
10.86 |
$ |
(0.01 |
) |
$ |
0.22 |
$ |
0.21 |
$ |
— |
$ |
(0.07 |
) |
$ |
— |
$ |
(0.07 |
) |
||||||||||||||
|
10/31/13 |
$ |
10.00 |
$ |
(0.08 |
) |
$ |
1.00 |
$ |
0.92 |
$ |
(0.02 |
) |
$ |
(0.04 |
) |
$ |
— |
$ |
(0.06 |
) |
|||||||||||||
| Period from 05/15/2012^ to 10/31/2012 |
$ |
10.00 |
$ |
(0.08 |
) |
$ |
0.08 |
$ |
— |
$ |
— |
$ |
— |
$ |
— |
$ |
— |
||||||||||||||||
|
Class A |
|||||||||||||||||||||||||||||||||
| 10/31/16ß |
$ |
10.40 |
$ |
(0.02 |
) |
$ |
(0.18 |
) |
$ |
(0.20 |
) |
$ |
— |
$ |
(0.10 |
) |
$ |
— |
$ |
(0.10 |
) |
||||||||||||
|
10/31/15 |
$ |
10.92 |
$ |
(0.08 |
) |
$ |
(0.18 |
) |
$ |
(0.26 |
) |
$ |
(0.03 |
) |
$ |
(0.23 |
) |
$ |
— |
$ |
(0.26 |
) |
|||||||||||
|
10/31/14 |
$ |
10.82 |
$ |
(0.04 |
) |
$ |
0.21 |
$ |
0.17 |
$ |
— |
$ |
(0.07 |
) |
$ |
— |
$ |
(0.07 |
) |
||||||||||||||
|
10/31/13 |
$ |
9.99 |
$ |
(0.12 |
) |
$ |
0.99 |
$ |
0.87 |
$ |
— |
$ |
(0.04 |
) |
$ |
— |
$ |
(0.04 |
) |
||||||||||||||
| Period from 05/15/2012^ to 10/31/2012 |
$ |
10.00 |
$ |
(0.09 |
) |
$ |
0.08 |
$ |
(0.01 |
) |
$ |
— |
$ |
— |
$ |
— |
$ |
— |
|||||||||||||||
|
Class C |
|||||||||||||||||||||||||||||||||
| 10/31/16ß |
$ |
10.15 |
$ |
(0.09 |
) |
$ |
(0.18 |
) |
$ |
(0.27 |
) |
$ |
— |
$ |
(0.10 |
) |
$ |
— |
$ |
(0.10 |
) |
||||||||||||
|
10/31/15 |
$ |
10.72 |
$ |
(0.16 |
) |
$ |
(0.18 |
) |
$ |
(0.34 |
) |
$ |
— |
$ |
(0.23 |
) |
$ |
— |
$ |
(0.23 |
) |
||||||||||||
|
10/31/14 |
$ |
10.71 |
$ |
(0.13 |
) |
$ |
0.21 |
$ |
0.08 |
$ |
— |
$ |
(0.07 |
) |
$ |
— |
$ |
(0.07 |
) |
||||||||||||||
|
10/31/13 |
$ |
9.95 |
$ |
(0.21 |
) |
$ |
1.01 |
$ |
0.80 |
$ |
— |
$ |
(0.04 |
) |
$ |
— |
$ |
(0.04 |
) |
||||||||||||||
| Period from 05/15/2012^ to 10/31/2012 |
$ |
10.00 |
$ |
(0.13 |
) |
$ |
0.08 |
$ |
(0.05 |
) |
$ |
— |
$ |
— |
$ |
— |
$ |
— |
|||||||||||||||
|
Class R6 |
|||||||||||||||||||||||||||||||||
| 10/31/16ß |
$ |
10.47 |
$ |
0.04 |
$ |
(0.21 |
) |
$ |
(0.17 |
) |
$ |
(0.03 |
) |
$ |
(0.10 |
) |
$ |
— |
$ |
(0.13 |
) |
||||||||||||
|
10/31/15 |
$ |
11.01 |
$ |
(0.01 |
) |
$ |
(0.22 |
) |
$ |
(0.23 |
) |
$ |
(0.08 |
) |
$ |
(0.23 |
) |
$ |
— |
$ |
(0.31 |
) |
|||||||||||
| Period from 12/31/2013^ to 10/31/2014 |
$ |
10.99 |
$ |
0.01 |
$ |
0.01 |
$ |
0.02 |
$ |
— |
$ |
— |
$ |
— |
$ |
— |
|||||||||||||||||
See Notes to Financial Highlights
95
| Net Asset Value, End of Year |
Total Return†d |
Net Assets, End of Year (in millions) |
Ratio of Gross Expenses to Average Net Assets# |
Ratio of Gross Expenses to Average Net Assets (excluding dividend and interest expenses relating to securities sold short) |
Ratio of Net Expenses to Average Net Assets |
Ratio of Net Expenses to Average Net Assets (excluding dividend and interest expenses relating to securities sold short) |
Ratio of Net Investment Income/ (Loss) to Average Net Assets |
Portfolio Turnover Rate (including securities sold short) |
Portfolio Turnover Rate (excluding securities sold short) |
|||||||||||||||||||||||||||||||
|
|
||||||||||||||||||||||||||||||||||||||||
|
|
||||||||||||||||||||||||||||||||||||||||
|
$ |
10.18 |
(1.57 |
)% |
$ |
485.8 |
2.83 |
%‡ |
2.02 |
%‡ |
2.78 |
%ا‡ |
1.97 |
%ا‡ |
0.18 |
%‡ |
485 |
% |
474 |
% |
|||||||||||||||||||||
|
$ |
10.47 |
(2.10 |
)% |
$ |
1,343.3 |
2.71 |
% |
1.97 |
% |
2.71 |
%ا |
1.97 |
%ا |
(0.40 |
)% |
433 |
% |
452 |
% |
|||||||||||||||||||||
|
$ |
11.00 |
1.96 |
% |
$ |
1,275.3 |
2.64 |
% |
2.13 |
% |
2.55 |
%Ø |
2.04 |
%Ø |
(0.10 |
)% |
329 |
% |
257 |
% |
|||||||||||||||||||||
|
$ |
10.86 |
9.19 |
% |
$ |
324.3 |
2.89 |
% |
2.60 |
% |
2.30 |
%Ø |
2.01 |
%Ø |
(0.74 |
)% |
421 |
% |
330 |
% |
|||||||||||||||||||||
|
$ |
10.00 |
0.00 |
%** |
$ |
33.2 |
7.86 |
%*‡ |
7.50 |
%*‡ |
2.81 |
%*‡ |
2.45 |
%*‡ |
(1.81 |
)%*‡ |
270 |
%** |
213 |
%** |
|||||||||||||||||||||
|
|
||||||||||||||||||||||||||||||||||||||||
|
$ |
10.10 |
(1.91 |
)% |
$ |
62.9 |
3.20 |
%‡ |
2.40 |
%‡ |
3.13 |
%ا‡ |
2.33 |
%ا‡ |
(0.16 |
)%‡ |
485 |
% |
474 |
% |
|||||||||||||||||||||
|
$ |
10.40 |
(2.47 |
)% |
$ |
210.6 |
3.06 |
% |
2.33 |
% |
3.06 |
%ا |
2.33 |
%ا |
(0.71 |
)% |
433 |
% |
452 |
% |
|||||||||||||||||||||
|
$ |
10.92 |
1.60 |
% |
$ |
242.2 |
3.02 |
% |
2.49 |
% |
2.90 |
%Ø |
2.38 |
%Ø |
(0.40 |
)% |
329 |
% |
257 |
% |
|||||||||||||||||||||
|
$ |
10.82 |
8.70 |
% |
$ |
124.7 |
3.27 |
% |
2.99 |
% |
2.62 |
%Ø |
2.34 |
%Ø |
(1.17 |
)% |
421 |
% |
330 |
% |
|||||||||||||||||||||
|
$ |
9.99 |
(0.10 |
)%** |
$ |
1.8 |
8.67 |
%*‡ |
8.26 |
%*‡ |
3.22 |
%*‡ |
2.81 |
%*‡ |
(2.02 |
)%*‡ |
270 |
%** |
213 |
%** |
|||||||||||||||||||||
|
|
||||||||||||||||||||||||||||||||||||||||
|
$ |
9.78 |
(2.66 |
)% |
$ |
40.9 |
3.96 |
%‡ |
3.15 |
%‡ |
3.89 |
%ا‡ |
3.08 |
%ا‡ |
(0.96 |
)%‡ |
485 |
% |
474 |
% |
|||||||||||||||||||||
|
$ |
10.15 |
(3.21 |
)% |
$ |
87.1 |
3.81 |
% |
3.08 |
% |
3.81 |
%ا |
3.08 |
%ا |
(1.48 |
)% |
433 |
% |
452 |
% |
|||||||||||||||||||||
|
$ |
10.72 |
0.77 |
% |
$ |
95.3 |
3.77 |
% |
3.26 |
% |
3.66 |
%Ø |
3.15 |
%Ø |
(1.18 |
)% |
329 |
% |
257 |
% |
|||||||||||||||||||||
|
$ |
10.71 |
8.03 |
% |
$ |
21.3 |
4.01 |
% |
3.72 |
% |
3.38 |
%Ø |
3.09 |
%Ø |
(1.94 |
)% |
421 |
% |
330 |
% |
|||||||||||||||||||||
|
$ |
9.95 |
(0.50 |
)%** |
$ |
0.2 |
13.12 |
%*‡ |
12.74 |
%*‡ |
3.94 |
%*‡ |
3.56 |
%*‡ |
(2.86 |
)%*‡ |
270 |
%** |
213 |
%** |
|||||||||||||||||||||
|
|
||||||||||||||||||||||||||||||||||||||||
|
$ |
10.17 |
(1.58 |
)% |
$ |
3.4 |
2.71 |
%‡ |
1.92 |
%‡ |
2.69 |
%ا‡ |
1.90 |
%ا‡ |
0.37 |
%‡ |
485 |
% |
474 |
% |
|||||||||||||||||||||
|
$ |
10.47 |
(2.14 |
)% |
$ |
17.4 |
2.66 |
% |
1.90 |
% |
2.66 |
%ا |
1.90 |
%ا |
(0.08 |
)% |
433 |
% |
452 |
% |
|||||||||||||||||||||
|
$ |
11.01 |
0.18 |
%** |
$ |
32.5 |
2.56 |
%* |
2.08 |
%* |
2.46 |
%*Ø |
1.98 |
%*Ø |
0.10 |
%* |
329 |
%ØØ |
257 |
%ØØ | |||||||||||||||||||||
96
Financial Highlights (cont'd)
| Net Asset Value, Beginning of Year |
Net Investment Income/ (Loss)@ |
Net Gains or Losses on Securities (both realized and unrealized) |
Total From Investment Operations |
Dividends from Net Investment Income |
Distributions from Net Realized Capital Gains |
Tax Return of Capital |
Total Distributions |
||||||||||||||||||||||||||
|
Long Short Multi-Manager Fund |
|||||||||||||||||||||||||||||||||
|
Institutional Class |
|||||||||||||||||||||||||||||||||
|
10/31/16 |
$ |
10.06 |
$ |
(0.09 |
) |
$ |
(0.09 |
) |
$ |
(0.18 |
) |
$ |
(0.01 |
) |
$ |
(0.28 |
) |
$ |
— |
$ |
(0.29 |
) |
|||||||||||
|
10/31/15 |
$ |
10.39 |
$ |
(0.15 |
) |
$ |
(0.09 |
) |
$ |
(0.24 |
) |
$ |
(0.02 |
) |
$ |
(0.07 |
) |
$ |
— |
$ |
(0.09 |
) |
|||||||||||
| Period from 12/19/2013^ to 10/31/2014 |
$ |
10.00 |
$ |
(0.11 |
) |
$ |
0.50 |
$ |
0.39 |
$ |
— |
$ |
— |
$ |
— |
$ |
— |
||||||||||||||||
|
Class A |
|||||||||||||||||||||||||||||||||
|
10/31/16 |
$ |
10.01 |
$ |
(0.11 |
) |
$ |
(0.10 |
) |
$ |
(0.21 |
) |
$ |
— |
$ |
(0.28 |
) |
$ |
— |
$ |
(0.28 |
) |
||||||||||||
|
10/31/15 |
$ |
10.36 |
$ |
(0.19 |
) |
$ |
(0.09 |
) |
$ |
(0.28 |
) |
$ |
— |
$ |
(0.07 |
) |
$ |
— |
$ |
(0.07 |
) |
||||||||||||
| Period from 12/19/2013^ to 10/31/2014 |
$ |
10.00 |
$ |
(0.15 |
) |
$ |
0.51 |
$ |
0.36 |
$ |
— |
$ |
— |
$ |
— |
$ |
— |
||||||||||||||||
|
Class C |
|||||||||||||||||||||||||||||||||
|
10/31/16 |
$ |
9.87 |
$ |
(0.18 |
) |
$ |
(0.10 |
) |
$ |
(0.28 |
) |
$ |
— |
$ |
(0.28 |
) |
$ |
— |
$ |
(0.28 |
) |
||||||||||||
|
10/31/15 |
$ |
10.29 |
$ |
(0.26 |
) |
$ |
(0.09 |
) |
$ |
(0.35 |
) |
$ |
— |
$ |
(0.07 |
) |
$ |
— |
$ |
(0.07 |
) |
||||||||||||
| Period from 12/19/2013^ to 10/31/2014 |
$ |
10.00 |
$ |
(0.21 |
) |
$ |
0.50 |
$ |
0.29 |
$ |
— |
$ |
— |
$ |
— |
$ |
— |
||||||||||||||||
See Notes to Financial Highlights
97
| Net Asset Value, End of Year |
Total Return†d |
Net Assets, End of Year (in millions) |
Ratio of Gross Expenses to Average Net Assets# |
Ratio of Gross Expenses to Average Net Assets (excluding dividend and interest expenses relating to securities sold short) |
Ratio of Net Expenses to Average Net Assets |
Ratio of Net Expenses to Average Net Assets (excluding dividend and interest expenses relating to securities sold short) |
Ratio of Net Investment Income/ (Loss) to Average Net Assets |
Portfolio Turnover Rate (including securities sold short) |
Portfolio Turnover Rate (excluding securities sold short) |
||||||||||||||||||||||||||||||
|
|
|||||||||||||||||||||||||||||||||||||||
|
|
|||||||||||||||||||||||||||||||||||||||
|
$ |
9.59 |
(1.75 |
)% |
$ |
22.2 |
4.55 |
% |
3.46 |
% |
3.06 |
% |
1.97 |
% |
(0.95 |
)% |
752 |
% |
786 |
% |
||||||||||||||||||||
|
$ |
10.06 |
(2.36 |
)% |
$ |
33.5 |
4.15 |
% |
3.26 |
% |
2.86 |
% |
1.97 |
% |
(1.46 |
)% |
536 |
% |
570 |
% |
||||||||||||||||||||
|
$ |
10.39 |
3.90 |
%** |
$ |
30.8 |
5.09 |
%*‡ |
4.50 |
%*‡ |
2.64 |
%*‡ |
2.05 |
%*‡ |
(1.26 |
)%*‡ |
293 |
%** |
168 |
%** |
||||||||||||||||||||
|
|
|||||||||||||||||||||||||||||||||||||||
|
$ |
9.52 |
(2.09 |
)% |
$ |
0.4 |
4.93 |
% |
3.86 |
% |
3.40 |
% |
2.33 |
% |
(1.14 |
)% |
752 |
% |
786 |
% |
||||||||||||||||||||
|
$ |
10.01 |
(2.71 |
)% |
$ |
1.2 |
4.58 |
% |
3.68 |
% |
3.23 |
% |
2.33 |
% |
(1.79 |
)% |
536 |
% |
570 |
% |
||||||||||||||||||||
|
$ |
10.36 |
3.60 |
%** |
$ |
0.9 |
5.87 |
%*‡ |
5.30 |
%*‡ |
2.99 |
%*‡ |
2.42 |
%*‡ |
(1.66 |
)%*‡ |
293 |
%** |
168 |
%** |
||||||||||||||||||||
|
|
|||||||||||||||||||||||||||||||||||||||
|
$ |
9.31 |
(2.84 |
)% |
$ |
0.7 |
5.69 |
% |
4.61 |
% |
4.17 |
% |
3.08 |
% |
(1.96 |
)% |
752 |
% |
786 |
% |
||||||||||||||||||||
|
$ |
9.87 |
(3.41 |
)% |
$ |
1.3 |
5.38 |
% |
4.46 |
% |
4.00 |
% |
3.08 |
% |
(2.52 |
)% |
536 |
% |
570 |
% |
||||||||||||||||||||
|
$ |
10.29 |
2.90 |
%** |
$ |
0.3 |
8.18 |
%*‡ |
7.59 |
%*‡ |
3.73 |
%*‡ |
3.15 |
%*‡ |
(2.34 |
)%*‡ |
293 |
%** |
168 |
%** |
||||||||||||||||||||
98
Notes to Financial Highlights
@ Calculated based on the average number of shares outstanding during each fiscal period.
† Total return based on per share NAV reflects the effects of changes in NAV on the performance of each Fund during each fiscal period. Returns assume income dividends and other distributions, if any, were reinvested, but do not reflect the effect of sales charges. Results represent past performance and do not indicate future results. Current returns may be lower or higher than the performance data quoted. Investment returns and principal may fluctuate and shares when redeemed may be worth more or less than original cost. Total return would have been lower if Management had not reimbursed certain expenses. Total return would have been higher if Management had not recouped previously reimbursed and/or waived expenses.
d The class action proceeds listed in Note A-5 of the Notes to Financial Statements, if any, had no impact on the Funds' total returns for the year ended October 31, 2016.
# Represents the annualized ratios of net expenses to average daily net assets if Management had not reimbursed certain expenses and/or waived a portion of the investment management fee.
‡ Organization expense, which is a non-recurring expense, is included in these ratios on a non-annualized basis.
** Not annualized.
* Annualized.
^ The date investment operations commenced.
ß Consolidated financial highlights (see Note A in Notes to Financial Statements).
Ø After reimbursement of expenses and/or waiver of a portion of the investment management fee by Management. The Fund is required to calculate an expense ratio without taking into consideration any expense reductions related to expense offset arrangements. Had Absolute Return Multi-Manager not received expense reductions related to expense offset arrangements, the annualized ratios of net expenses to average daily net assets would have been:
| Including Dividend and Interest Expense Relating to Short Sales |
Excluding Dividend and Interest Expense Relating to Short Sales |
Including Dividend and Interest Expense Relating to Short Sales |
Excluding Dividend and Interest Expense Relating to Short Sales |
Including Dividend and Interest Expense Relating to Short Sales |
Excluding Dividend and Interest Expense Relating to Short Sales |
Including Dividend and Interest Expense Relating to Short Sales |
Excluding Dividend and Interest Expense Relating to Short Sales |
||||||||||||||||||||||||||
| Year Ended October 31, 2016 |
Year Ended October 31, 2015 |
Year Ended October 31, 2014 |
Year Ended October 31, 2013 |
||||||||||||||||||||||||||||||
| Absolute Return Multi-Manager Institutional Class |
2.78 |
% |
1.97 |
% |
2.71 |
% |
1.97 |
% |
2.55 |
% |
2.04 |
% |
2.30 |
% |
2.01 |
% |
|||||||||||||||||
| Absolute Return Multi-Manager Class A |
3.13 |
% |
2.33 |
% |
3.06 |
% |
2.33 |
% |
2.90 |
% |
2.38 |
% |
2.63 |
% |
2.35 |
% |
|||||||||||||||||
| Absolute Return Multi-Manager Class C |
3.89 |
% |
3.08 |
% |
3.81 |
% |
3.08 |
% |
3.66 |
% |
3.15 |
% |
3.39 |
% |
3.10 |
% |
|||||||||||||||||
| Absolute Return Multi-Manager Fund Class R6 |
2.69 |
% |
1.90 |
% |
2.66 |
% |
1.90 |
% |
2.46 |
% |
1.98 |
%(1) |
— |
— |
|||||||||||||||||||
99
Notes to Financial Highlights (cont'd)
(1) Period from December 31, 2013 (Commencement of Operations) to October 31, 2014.
ØØ Portfolio turnover is calculated at the Fund level. Percentage indicated was calculated for the year ended October 31, 2014 for Absolute Return Multi-Manager.
§ After repayment of expenses previously reimbursed and/or fees previously waived by Management, as applicable. Had Absolute Return Multi-Manager not made such repayments, the annualized ratios of net expenses to average daily net assets would have been:
| Including Dividend and Interest Expense Relating to Short Sales |
Excluding Dividend and Interest Expense Relating to Short Sales |
Including Dividend and Interest Expense Relating to Short Sales |
Excluding Dividend and Interest Expense Relating to Short Sales |
||||||||||||||||
| Year Ended October 31, 2016 |
Year Ended October 31, 2015 |
||||||||||||||||||
|
Absolute Return Multi-Manager Institutional Class |
2.77 |
% |
1.96 |
% |
2.64 |
% |
1.90 |
% |
|||||||||||
|
Absolute Return Multi-Manager Class A |
3.13 |
% |
2.33 |
% |
3.02 |
% |
2.29 |
% |
|||||||||||
|
Absolute Return Multi-Manager Class C |
3.88 |
% |
3.07 |
% |
3.75 |
% |
3.02 |
% |
|||||||||||
|
Absolute Return Multi-Manager Class R6 |
2.68 |
% |
1.89 |
% |
2.59 |
% |
1.83 |
% |
|||||||||||
100
Report of Independent Registered Public Accounting Firm
To the Board of Trustees of Neuberger Berman Alternative Funds and Shareholders of
Neuberger Berman Absolute Return Multi-Manager Fund
Neuberger Berman Long Short Multi-Manager Fund
We have audited the accompanying statements of assets and liabilities of Neuberger Berman Absolute Return Multi-Manager Fund and Neuberger Berman Long Short Multi-Manager Fund (the "Trust"), two of the series constituting the Neuberger Berman Alternative Funds, including the schedules of investments, as of October 31, 2016, the related statements of operations for the year then ended, and the statements of changes in net assets for each of two years in the period the ended and the financial highlights for each of the periods indicated therein. These financial statements and financial highlights are the responsibility of the Trust's management. Our responsibility is to express an opinion on these financial statements and financial highlights based on our audits.
We conducted our audits in accordance with the standards of the Public Company Accounting Oversight Board (United States). Those standards require that we plan and perform the audit to obtain reasonable assurance about whether the financial statements and financial highlights are free of material misstatement. We were not engaged to perform an audit of the Trust's internal control over financial reporting. Our audits included consideration of internal control over financial reporting as a basis for designing audit procedures that are appropriate in the circumstances, but not for the purpose of expressing an opinion on the effectiveness of the Trust's internal control over financial reporting. Accordingly, we express no such opinion. An audit also includes examining, on a test basis, evidence supporting the amounts and disclosures in the financial statements and financial highlights, assessing the accounting principles used and significant estimates made by management, and evaluating the overall financial statement presentation. Our procedures included confirmation of securities owned as of October 31, 2016 by correspondence with the custodian and others or by other appropriate auditing procedures where replies from others were not received. We believe that our audits provide a reasonable basis for our opinion.
In our opinion, the financial statements and financial highlights referred to above present fairly, in all material respects, the financial position of Neuberger Berman Absolute Return Multi-Manager Fund and Neuberger Berman Long Short Multi-Manager Fund, at October 31, 2016, the results of their operations for the year then ended, the changes in their net assets for each of the two years in the period then ended and the financial highlights for each of the periods indicated therein, in conformity with U.S. generally accepted accounting principles.
Boston, Massachusetts
December 27, 2016
101
Directory
Investment Manager and Administrator
Neuberger Berman Investment Advisers LLC
1290 Avenue of the Americas
New York, NY 10104-0002
212.476.8800
Intermediary Client Services 800.366.6264
Distributor
Neuberger Berman LLC
1290 Avenue of the Americas
New York, NY 10104-0002
800.877.9700 or 212.476.8800
Intermediary Client Services 800.366.6264
Sub-Adviser (prior to January 1, 2016)
NB Alternative Investment Management LLC
605 Third Avenue, 22nd Floor
New York, NY 10158
Sub-Advisers
Blue Jay Capital Management, LLC
2121 Avenue of the Stars, Suite 2420
Los Angeles, CA 90067
Cramer Rosenthal McGlynn, LLC
520 Madison Avenue, 20th Floor
New York, NY 10022
GAMCO Asset Management Inc.
One Corporate Center
Rye, NY 10580
Good Hill Partners LP
1599 Post Road East
Westport, CT 06880
GSA Capital Partners LLP
Stratton House
5 Stratton Street
London WIJ 8LA, United Kingdom
Lazard Asset Management LLC
30 Rockefeller Plaza
New York, NY 10112
Levin Capital Strategies, L.P.
595 Madison Avenue, 17th Floor
New York, NY 10022
P/E Global, LLC
75 State Street, 31st Floor
Boston, MA 02109
Portland Hill Capital LLP
21 Knightsbridge
London SW1X7LY, United Kingdom
Sound Point Capital Management, L.P.
375 Park Avenue
New York, NY 10152
TPH Asset Management, LLC
Heritage Plaza
1111 Bagby, Suite 4920
Houston, Texas 77002
Custodian
J.P. Morgan Chase Bank, N.A.
14201 Dallas Parkway
Dallas, TX 75254
Shareholder Servicing Agent
State Street Bank and Trust Company
One Lincoln Street
Boston, MA 02111
For Institutional Class Shareholders
Address correspondence to:
Neuberger Berman Investment Advisers LLC
1290 Avenue of the Americas
New York, NY 10104-0002
Intermediary Client Services
800.366.6264
For Class A, Class C and Class R6 Shareholders:
Please contact your investment provider
Legal Counsel
K&L Gates LLP
1601 K Street, NW
Washington, DC 20006-1600
Independent Registered Public Accounting Firm
Ernst & Young LLP
200 Clarendon Street
Boston, MA 02116
102
Trustee and Officer Information
The following tables set forth information concerning the Trustees and Officers of each of the Funds. All persons named as Trustees and Officers also serve in similar capacities for other funds administered or managed by Management or Neuberger Berman. Each Fund's Statement of Additional Information includes additional information about the Trustees as of the time of the Fund's most recent public offering and is available upon request, without charge, by calling (800) 877-9700.
Information about the Board of Trustees
| Name, (Year of Birth), and Address(1) |
Position(s) and Length of Time Served(2) |
Principal Occupation(s)(3) | Number of Funds in Fund Complex Overseen by Fund Trustee |
Other Directorships Held Outside Fund Complex by Fund Trustee(3) |
|||||||
|
Independent Fund Trustees |
|||||||||||
|
Faith Colish (1935) |
Trustee since inception |
Counsel, Carter Ledyard & Milburn LLP (law firm) since October 2002; formerly, Attorney-at-Law and President, Faith Colish, A Professional Corporation, 1980 to 2002. |
55 |
Formerly, Director, 1997 to 2003, and Advisory Director, 2003 to 2006, ABA Retirement Funds (formerly, American Bar Retirement Association) (not-for-profit membership corporation). |
|||||||
|
Michael J. Cosgrove (1949) |
Trustee since 2015 |
President, Carragh Consulting USA, since 2014; formerly, Executive, General Electric Company, 1970 to 2014, including President, Mutual Funds and Global Investment Programs, GE Asset Management, 2011 to 2014, President and Chief Executive Officer, Mutual Funds and Intermediary Business, GE Asset Management, 2007 to 2011, President, Institutional Sales and Marketing, GE Asset Management, 1998 to 2007, and Chief Financial Officer, GE Asset Management and Deputy Treasurer, GE Company, 1988 to 1993. |
55 |
Director, America Press, Inc. (not-for-profit Jesuit publisher), since 2015; Director, Fordham University, since 2001; formerly, Director, The Gabelli Go Anywhere Trust, June 2015 to June 2016; Director, Skin Cancer Foundation (not-for-profit), 2006 to 2015; Director, GE Investments Funds, Inc., 1997 to 2014; Trustee, GE Institutional Funds, 1997 to 2014; Director, GE Asset Management, 1988 to 2014; Director, Elfun Trusts, 1988 to 2014; Trustee, GE Pension & Benefit Plans, 1988 to 2014. |
|||||||
103
| Name, (Year of Birth), and Address(1) |
Position(s) and Length of Time Served(2) |
Principal Occupation(s)(3) | Number of Funds in Fund Complex Overseen by Fund Trustee |
Other Directorships Held Outside Fund Complex by Fund Trustee(3) |
|||||||
|
Marc Gary (1952) |
Trustee since 2015 |
Executive Vice Chancellor and Chief Operating Officer, Jewish Theological Seminary, since 2012; formerly, Executive Vice President and General Counsel, Fidelity Investments, 2007 to 2012; Executive Vice President and General Counsel, BellSouth Corporation, 2004 to 2007; Vice President and Associate General Counsel, BellSouth Corporation, 2000 to 2004; Associate, Partner, and National Litigation Practice Co-Chair, Mayer, Brown LLP, 1981 to 2000; Associate Independent Counsel, Office of Independent Counsel, 1990 to 1992. |
55 |
Trustee, Jewish Theological Seminary, since 2015; Director, Counsel on Call (privately held for-profit company), since 2012; Director, Lawyers Committee for Civil Rights Under Law (not-for-profit), since 2005; formerly, Director, Equal Justice Works (not-for-profit), 2005 to 2014; Director, Corporate Counsel Institute, Georgetown University Law Center, 2007 to 2012; Director, Greater Boston Legal Services (not-for-profit), 2007 to 2012. |
|||||||
104
| Name, (Year of Birth), and Address(1) |
Position(s) and Length of Time Served(2) |
Principal Occupation(s)(3) | Number of Funds in Fund Complex Overseen by Fund Trustee |
Other Directorships Held Outside Fund Complex by Fund Trustee(3) |
|||||||
|
Martha C. Goss (1949) |
Trustee since 2007 |
President, Woodhill Enterprises Inc./Chase Hollow Associates LLC (personal investment vehicle), since 2006; formerly, Consultant, Resources Global Professionals (temporary staffing), 2002 to 2006. |
55 |
Director, American Water (water utility), since 2003; Director, Allianz Life of New York (insurance), since 2005; Director, Berger Group Holdings, Inc. (engineering consulting firm), since 2013; Director, Financial Women's Association of New York (not-for-profit association), since 2003; Trustee Emerita, Brown University, since 1998; Director, Museum of American Finance (not-for-profit), since 2013; formerly, Non-Executive Chair and Director, Channel Reinsurance (financial guaranty reinsurance), 2006 to 2010; formerly, Director, Ocwen Financial Corporation (mortgage servicing), 2005 to 2010; formerly, Director, Claire's Stores, Inc. (retailer), 2005 to 2007; formerly, Director, Parsons Brinckerhoff Inc. (engineering consulting firm), 2007 to 2010; formerly, Director, Bank Leumi (commercial bank), 2005 to 2007; formerly, Advisory Board Member, Attensity (software developer), 2005 to 2007. |
|||||||
105
| Name, (Year of Birth), and Address(1) |
Position(s) and Length of Time Served(2) |
Principal Occupation(s)(3) | Number of Funds in Fund Complex Overseen by Fund Trustee |
Other Directorships Held Outside Fund Complex by Fund Trustee(3) |
|||||||
|
Michael M. Knetter (1960) |
Trustee since 2007 |
President and Chief Executive Officer, University of Wisconsin Foundation, since October 2010; formerly, Dean, School of Business, University of Wisconsin—Madison; formerly, Professor of International Economics and Associate Dean, Amos Tuck School of Business—Dartmouth College, 1998 to 2002. |
55 |
Board Member, American Family Insurance (a mutual company, not publicly traded), since March 2009; formerly, Trustee, Northwestern Mutual Series Fund, Inc., 2007 to 2011; formerly, Director, Wausau Paper, 2005 to 2011; formerly, Director, Great Wolf Resorts, 2004 to 2009. |
|||||||
|
Deborah C. McLean (1954) |
Trustee since 2015 |
Member, Circle Financial Group (private wealth management membership practice), since 2011; Managing Director, Golden Seeds LLC (an angel investing group), since 2009; Adjunct Professor, Columbia University School of International and Public Affairs, since 2008; formerly, Visiting Assistant Professor, Fairfield University, Dolan School of Business, Fall 2007; formerly, Adjunct Associate Professor of Finance, Richmond, The American International University in London, 1999 to 2007. |
55 |
Board member, Norwalk Community College Foundation, since 2014; Dean's Advisory Council, Radcliffe Institute for Advanced Study, since 2014; formerly, Director and Treasurer, At Home in Darien (not-for-profit), 2012 to 2014; Director, National Executive Service Corps (not-for-profit), 2012 to 2013; Trustee, Richmond, The American International University in London, 1999 to 2013. |
|||||||
|
Howard A. Mileaf (1937) |
Trustee since inception |
Retired; formerly, Vice President and General Counsel, WHX Corporation (holding company), 1993 to 2001. |
55 |
Formerly, Director, Webfinancial Corporation (holding company), 2002 to 2008; formerly, Director, WHX Corporation (holding company), 2002 to 2005; formerly, Director, State Theatre of New Jersey (not-for-profit theatre), 2000 to 2005. |
|||||||
106
| Name, (Year of Birth), and Address(1) |
Position(s) and Length of Time Served(2) |
Principal Occupation(s)(3) | Number of Funds in Fund Complex Overseen by Fund Trustee |
Other Directorships Held Outside Fund Complex by Fund Trustee(3) |
|||||||
|
George W. Morriss (1947) |
Trustee since 2007 |
Adjunct Professor, Columbia University School of International and Public Affairs, since October 2012; formerly, Executive Vice President and Chief Financial Officer, People's United Bank, Connecticut (a financial services company), 1991 to 2001. |
55 |
Director, National Association of Corporate Directors, Connecticut Chapter, since 2011; Trustee, Steben Alternative Investment Funds, Steben Select Multi-Strategy Fund, and Steben Select Multi-Strategy Master Fund, since 2013; formerly, Treasurer, National Association of Corporate Directors, Connecticut Chapter, 2011 to 2015; formerly, Manager, Larch Lane Multi-Strategy Fund complex (which consisted of three funds), 2006 to 2011; formerly, Member, NASDAQ Issuers' Affairs Committee, 1995 to 2003. |
|||||||
|
Tom D. Seip (1950) |
Trustee since inception; Chairman of the Board since 2008; formerly Lead Independent Trustee from 2006 to 2008 |
General Partner, Ridgefield Farm LLC (a private investment vehicle); formerly, President and CEO, Westaff, Inc. (temporary staffing), May 2001 to January 2002; formerly, Senior Executive, The Charles Schwab Corporation, 1983 to 1998, including Chief Executive Officer, Charles Schwab Investment Management, Inc.; Trustee, Schwab Family of Funds and Schwab Investments, 1997 to 1998; and Executive Vice President-Retail Brokerage, Charles Schwab & Co., Inc., 1994 to 1997. |
55 |
Director, H&R Block, Inc. (financial services company), since May 2001; Chairman, Governance and Nominating Committee, H&R Block, Inc., since 2011; formerly, Chairman, Compensation Committee, H&R Block, Inc., 2006 to 2010; formerly, Director, Forward Management, Inc. (asset management company), 1999 to 2006. |
|||||||
|
James G. Stavridis (1955) |
Trustee since 2015 |
Dean, Fletcher School of Law and Diplomacy, Tufts University since 2013; formerly, Admiral, United States Navy, 2006 to 2013, including Supreme Allied Commander, NATO and Commander, European Command, 2009 to 2013, and Commander, United States Southern Command, 2006 to 2009. |
55 |
Director, Utilidata Inc., since 2015; Director, BMC Software Federal, LLC, since 2014; Director, Vertical Knowledge, LLC, since 2013; formerly, Director, Navy Federal Credit Union, 2000-2002. |
|||||||
107
| Name, (Year of Birth), and Address(1) |
Position(s) and Length of Time Served(2) |
Principal Occupation(s)(3) | Number of Funds in Fund Complex Overseen by Fund Trustee |
Other Directorships Held Outside Fund Complex by Fund Trustee(3) |
|||||||
|
Candace L. Straight (1947) |
Trustee since inception |
Private investor and consultant specializing in the insurance industry; formerly, Advisory Director, Securitas Capital LLC (a global private equity investment firm dedicated to making investments in the insurance sector), 1998 to 2003. |
55 |
Formerly, Public Member, Board of Governors and Board of Trustees, Rutgers University, 2011 to 2016; formerly, Director, Montpelier Re Holdings Ltd. (reinsurance company), 2006 to 2015; formerly, Director, National Atlantic Holdings Corporation (property and casualty insurance company), 2004 to 2008; formerly, Director, The Proformance Insurance Company (property and casualty insurance company), 2004 to 2008; formerly, Director, Providence Washington Insurance Company (property and casualty insurance company), 1998 to 2006; formerly, Director, Summit Global Partners (insurance brokerage firm), 2000 to 2005. |
|||||||
|
Peter P. Trapp (1944) |
Trustee since inception |
Retired; formerly, Regional Manager for Mid-Southern Region, Ford Motor Credit Company, September 1997 to 2007; formerly, President, Ford Life Insurance Company, April 1995 to August 1997. |
55 |
None. |
|||||||
108
| Name, (Year of Birth), and Address(1) |
Position(s) and Length of Time Served(2) |
Principal Occupation(s)(3) | Number of Funds in Fund Complex Overseen by Fund Trustee |
Other Directorships Held Outside Fund Complex by Fund Trustee(3) |
|||||||
|
Fund Trustees who are "Interested Persons" |
|||||||||||
|
Joseph V. Amato* (1962) |
Trustee since 2009 |
President and Director, Neuberger Berman Group LLC, since 2009; President and Chief Executive Officer, Neuberger Berman LLC ("Neuberger Berman") and Neuberger Berman Holdings LLC (including its predecessor, Neuberger Berman Inc.), since 2007; Chief Investment Officer (Equities) and President (Equities), Neuberger Berman Investment Advisers LLC ("NBIA") (formerly, Neuberger Berman Fixed Income LLC ("NBFI") and including predecessor entities), since 2007, and Board Member of NBIA since 2006; formerly, Global Head of Asset Management of Lehman Brothers Holdings Inc.'s ("LBHI") Investment Management Division, 2006 to 2009; formerly, member of LBHI's Investment Management Division's Executive Management Committee, 2006 to 2009; formerly, Managing Director, Lehman Brothers Inc. ("LBI"), 2006 to 2008; formerly, Chief Recruiting and Development Officer, LBI, 2005 to 2006; formerly, Global Head of LBI's Equity Sales and a Member of its Equities Division Executive Committee, 2003 to 2005. |
55 |
Member of Board of Advisors, McDonough School of Business, Georgetown University, since 2001; Member of New York City Board of Advisors, Teach for America, since 2005; Trustee, Montclair Kimberley Academy (private school), since 2007; Member of Board of Regents, Georgetown University, since 2013. |
|||||||
109
| Name, (Year of Birth), and Address(1) |
Position(s) and Length of Time Served(2) |
Principal Occupation(s)(3) | Number of Funds in Fund Complex Overseen by Fund Trustee |
Other Directorships Held Outside Fund Complex by Fund Trustee(3) |
|||||||
|
Robert Conti* (1956) |
Chief Executive Officer, President and Trustee since 2008; prior thereto, Executive Vice President in 2008 and Vice President from inception to 2008 |
Managing Director, Neuberger Berman, since 2007; President—Mutual Funds, NBIA, since 2008; formerly, Senior Vice President, Neuberger Berman, 2003 to 2006; formerly, Vice President, Neuberger Berman, 1999 to 2003; President and Chief Executive Officer, twenty-eight registered investment companies for which NBIA acts as investment manager and/or administrator. |
55 |
Director, Staten Island Mental Health Society, since 1994; formerly, Chairman of the Board, Staten Island Mental Health Society, 2008 to 2011. |
|||||||
(1) The business address of each listed person is 1290 Avenue of the Americas New York, NY 10104.
(2) Pursuant to the Trust's Trust Instrument, each of these Fund Trustees shall hold office for life or until his or her successor is elected or the Trust terminates; except that (a) any Fund Trustee may resign by delivering a written resignation; (b) any Fund Trustee may be removed with or without cause at any time by a written instrument signed by at least two-thirds of the other Fund Trustees; (c) any Fund Trustee who requests to be retired, or who has become unable to serve, may be retired by a written instrument signed by a majority of the other Fund Trustees; and (d) any Fund Trustee may be removed at any shareholder meeting by a vote of at least two-thirds of the outstanding shares.
(3) Except as otherwise indicated, each individual has held the positions shown during at least the last five years.
* Indicates a Fund Trustee who is an "interested person" within the meaning of the 1940 Act. Mr. Amato and Mr. Conti are interested persons of the Trust by virtue of the fact that each is an officer of NBIA and/or its affiliates.
110
Information about the Officers of the Trust
| Name, (Year of Birth), and Address(1) |
Position(s) and Length of Time Served(2) |
Principal Occupation(s)(3) | |||
|
Claudia A. Brandon (1956) |
Executive Vice President since 2008 and Secretary since inception |
Senior Vice President, Neuberger Berman, since 2007 and Employee since 1999; Senior Vice President, NBIA, since 2008 and Assistant Secretary since 2004; formerly, Vice President, Neuberger Berman, 2002 to 2006; formerly, Vice President—Mutual Fund Board Relations, NBIA, 2000 to 2008; formerly, Vice President, NBIA, 1986 to 1999 and Employee, 1984 to 1999; Executive Vice President, twenty-eight registered investment companies for which NBIA acts as investment manager and/or administrator; Secretary, fifteen registered investment companies for which NBIA acts as investment manager and/or administrator. |
|||
|
Agnes Diaz (1971) |
Vice President since 2013 |
Senior Vice President, Neuberger Berman, since 2012; Senior Vice President, NBIA, since 2012 and Employee since 1996; formerly, Vice President, Neuberger Berman, 2007 to 2012; Vice President, twenty-eight registered investment companies for which NBIA acts as investment manager and/or administrator. |
|||
|
Anthony DiBernardo (1979) |
Assistant Treasurer since 2011 |
Senior Vice President, NBIA, since 2014, and Employee since 2003; formerly, Vice President, Neuberger Berman, 2009 to 2014; Assistant Treasurer, ten registered investment companies for which NBIA acts as investment manager and/or administrator. |
|||
|
Corey A. Issing (1978) |
Chief Legal Officer since 2016 (only for purposes of sections 307 and 406 of the Sarbanes-Oxley Act of 2002) and Anti-Money Laundering Compliance Officer since 2016 |
General Counsel and Head of Compliance—Mutual Funds since 2016 and Senior Vice President, NBIA, since 2013, formerly, Associate General Counsel (2015 to 2016), Counsel (2007 to 2015), Vice President (2009-2013); Chief Legal Officer (only for purposes of sections 307 and 406 of the Sarbanes-Oxley Act of 2002), twenty-eight registered investment companies for which NBIA acts as investment manager and/or administrator; Anti-Money Laundering Compliance Officer, twenty-eight registered investment companies for which NBIA acts as investment manager and/or administrator. |
|||
|
Sheila R. James (1965) |
Assistant Secretary since inception |
Vice President, Neuberger Berman, since 2008 and Employee since 1999; Vice President, NBIA, since 2008; formerly, Assistant Vice President, Neuberger Berman, 2007; Employee, NBIA, 1991 to 1999; Assistant Secretary, twenty-eight registered investment companies for which NBIA acts as investment manager and/or administrator. |
111
| Name, (Year of Birth), and Address(1) |
Position(s) and Length of Time Served(2) |
Principal Occupation(s)(3) | |||
|
Brian Kerrane (1969) |
Chief Operating Officer since 2015 and Vice President since 2008 |
Managing Director, Neuberger Berman, since 2013; Chief Operating Officer—Mutual Funds and Managing Director, NBIA, since 2015 and Employee since 1991; formerly, Senior Vice President, Neuberger Berman, 2006 to 2014; Vice President, NBIA, 2008 to 2015 and Employee since 1991; Chief Operating Officer, ten registered investment companies for which NBIA acts as investment manager and/or administrator; Vice President, twenty-eight registered investment companies for which NBIA acts as investment manager and/or administrator. |
|||
|
Kevin Lyons (1955) |
Assistant Secretary since inception |
Assistant Vice President, Neuberger Berman, since 2008 and Employee since 1999; Assistant Vice President, NBIA, since 2008; formerly, Employee, NBIA, 1993 to 1999; Assistant Secretary, ten registered investment companies for which NBIA acts as investment manager and/or administrator. |
|||
|
Anthony Maltese (1959) |
Vice President since 2015 |
Senior Vice President, Neuberger Berman, since 2014 and Employee since 2000; Senior Vice President, NBIA, since 2014; Vice President, ten registered investment companies for which NBIA acts as investment manager and/or administrator. |
|||
|
Owen F. McEntee, Jr. (1961) |
Vice President since 2008 |
Vice President, Neuberger Berman, since 2006; Vice President, NBIA, since 2006 and Employee since 1992; Vice President, ten registered investment companies for which NBIA acts as investment manager and/or administrator. |
|||
|
John M. McGovern (1970) |
Treasurer and Principal Financial and Accounting Officer since inception |
Senior Vice President, Neuberger Berman, since 2007; Senior Vice President, NBIA, since 2007 and Employee since 1993; formerly, Vice President, Neuberger Berman, 2004 to 2006; formerly, Assistant Treasurer, 2002 to 2005; Treasurer and Principal Financial and Accounting Officer, twenty-eight registered investment companies for which NBIA acts as investment manager and/or administrator. |
|||
|
Frank Rosato (1971) |
Assistant Treasurer since inception |
Vice President, Neuberger Berman, since 2006; Vice President, NBIA, since 2006 and Employee since 1995; Assistant Treasurer, ten registered investment companies for which NBIA acts as investment manager and/or administrator. |
|||
|
Chamaine Williams (1971) |
Chief Compliance Officer since inception |
Chief Compliance Officer—Mutual Funds and Senior Vice President, NBIA, since 2006; formerly, Senior Vice President, LBI, 2007 to 2008; formerly, Vice President, LBI, 2003 to 2006; formerly, Chief Compliance Officer, Lehman Brothers Asset Management Inc., 2003 to 2007; formerly, Chief Compliance Officer, Lehman Brothers Alternative Investment Management LLC, 2003 to 2007; Chief Compliance Officer, fifteen registered investment companies for which NBIA acts as investment manager and/or administrator. |
(1) The business address of each listed person is 1290 Avenue of the Americas New York, NY 10104.
(2) Pursuant to the By-Laws of the Trust, each officer elected by the Fund Trustees shall hold office until his or her successor shall have been elected and qualified or until his or her earlier death, inability to serve, or resignation. Officers serve at the pleasure of the Fund Trustees and may be removed at any time with or without cause.
(3) Except as otherwise indicated, each individual has held the positions shown during at least the last five years.
112
Proxy Voting Policies and Procedures
A description of the policies and procedures that the Trust uses to determine how to vote proxies relating to portfolio securities is available, without charge, by calling 800-877-9700 (toll-free) and on the Securities and Exchange Commission's website, at www.sec.gov. Information regarding how the Trust voted proxies relating to portfolio securities during the most recent 12-month period ended June 30 is also available, without charge, upon request, by calling 800-877-9700 (toll-free), on the Securities and Exchange Commission's website at www.sec.gov, and on Management's website at www.nb.com.
Quarterly Portfolio Schedule
The Trust files a complete schedule of portfolio holdings for each Fund with the Securities and Exchange Commission for the first and third quarters of each fiscal year on Form N-Q. The Trust's Forms N-Q are available on the Securities and Exchange Commission's website at www.sec.gov and may be reviewed and copied at the Securities and Exchange Commission's Public Reference Room in Washington, DC. Information on the operation of the Public Reference Room may be obtained by calling 800-SEC-0330. The information on Form N-Q is available upon request, without charge, by calling 800-877-9700 (toll-free).
Notice to Shareholders
In early 2017 you will receive information to be used in filing your 2016 tax returns, which will include a notice of the exact tax status of all distributions paid to you by a Fund during calendar year 2016. Please consult your own tax advisor for details as to how this information should be reflected on your tax returns.
For the fiscal year ended October 31, 2016, each Fund makes the following designation, or up to the maximum amount of such dividends allowable pursuant to the Internal Revenue Code, as qualified dividend income eligible for reduced tax rates. These lower rates range from 5% to 15% depending upon an individual's tax bracket. Complete information regarding each Funds distributions during the calendar year 2016 will be reported in conjunction with Form 1099-DIV. For the fiscal year ended October 31, 2016, Absolute Return Multi-Manager had Qualified Dividend Income of $13,091,773.
Long Short Multi-Manager designated $132,209 as a capital gain distribution.
113
Board Consideration of the Existing Management and Sub-Advisory Agreements
On an annual basis, the Board of Trustees (the "Board") of Neuberger Berman Alternative Funds (the "Trust"), including the Trustees who are not "interested persons" of Neuberger Berman Investment Advisers LLC ("Management") (including its affiliates) or the Trust ("Independent Fund Trustees"), considers whether to continue the management agreement with Management ("Management Agreement") and the separate sub-advisory agreements between Management and each sub-adviser (each a "Sub-Adviser" and collectively the "Sub-Advisers") with respect to Neuberger Berman Absolute Return Multi-Manager Fund ("ARMM") and Neuberger Berman Long Short Multi-Manager Fund ("LSMM") (each a "Fund" and collectively the "Funds"). With respect to ARMM, the Board considered the sub-advisory agreements between Management and each of the following sub-advisers: Blue Jay Capital Management, LLC, Cramer Rosenthal McGlynn, LLC, GAMCO Asset Management, Inc., Good Hill Partners LP, GSA Capital Partners LLP, Lazard Asset Management LLC, Levin Capital Strategies, L.P., Sound Point Capital Management, L.P., and TPH Asset Management, LLC (each a "Sub-Advisory Agreement"; collectively with the Management Agreement, the "Agreements"). With respect to LSMM, the Board considered the sub-advisory agreements among Management and each of the following sub-advisers: Blue Jay Capital Management, LLC, Cramer Rosenthal McGlynn, LLC, Lazard Asset Management LLC, Levin Capital Strategies, L.P., and TPH Asset Management, LLC (each, a "Sub-Advisory Agreement"; collectively with the Management Agreement, the "Agreements"). Throughout the process, the Independent Fund Trustees are advised by counsel that is experienced in Investment Company Act of 1940 matters and that is independent of Management ("Independent Counsel"). At a meeting held on October 18, 2016, the Board, including the Independent Fund Trustees, approved the continuation of the Agreements for each Fund.
In evaluating the Agreements with respect to each Fund, the Board, including the Independent Fund Trustees, reviewed extensive materials provided by Management and each Sub-Adviser in response to questions submitted by the Independent Fund Trustees, Independent Counsel, and (for the Sub-advisers), by Management, and met with senior representatives of Management regarding its personnel, operations and financial condition as they relate to the Funds. The annual contract review extends over at least three regular meetings of the Board to ensure that Management and each Sub-adviser have time to respond to any questions the Independent Fund Trustees may have on their initial review of the materials and that the Independent Fund Trustees have time to consider those responses.
In connection with its deliberations, the Board also considered the broad range of information relevant to the annual contract review that is provided to the Board (including its various standing committees) at meetings throughout the year, including investment performance reports and related portfolio information for each Fund, as well as periodic reports on, among other matters, pricing and valuation; brokerage and execution; compliance; and shareholder and other services provided by Management and its affiliates. To assist the Board in its deliberations regarding the annual contract review, the Board has established a Contract Review Committee comprised of Independent Fund Trustees. The Board has also established other committees that focus throughout the year on specific areas relevant to the annual contract review, such as Fund performance or compliance matters, and that are charged with specific responsibilities regarding the annual contract review. The Ethics and Compliance Committee received each quarter from the Funds' Chief Compliance Officer and reviewed a summary of the quarterly compliance questionnaire completed by each Sub-adviser in addition to any other information provided between meetings. The Board also considered the size and staffing of certain Sub-advisers, as warranted, and particularly their staffing of the portfolio management and compliance functions. Those committees provide reports that feed into the Contract Review Committee, which reviews and takes account of the information.
The Independent Fund Trustees received from Independent Counsel a memorandum discussing the legal standards for their consideration of the proposed continuation of the Agreements. During the course of the year and during their deliberations regarding the annual contract review, the Contract Review Committee and the Independent Fund Trustees met with Independent Counsel separately from representatives of Management and the Sub-advisers.
In connection with its approval of the continuation of the Agreements, the Board evaluated the terms of the Agreements, the overall fairness of the Agreements to each Fund and whether the Agreements were in the best interests of each Fund and Fund shareholders. The Board considered all factors it deemed relevant with respect to each Fund, including the following factors: (1) the nature, extent, and quality of the services provided by Management and the Sub-advisers; (2) the
114
investment performance of each Fund compared to an appropriate market index and a peer group of investment companies, and the contribution of each sleeve to each Fund's overall performance; (3) the costs of the services provided and the profit or loss realized by Management and its affiliates from their relationship with each Fund; (4) the extent to which economies of scale have been or might be realized as each Fund grows; and (5) whether fee or service levels reflect any such potential economies of scale for the benefit of each Fund's shareholders. The Board also inquired whether there are any other business relationships between Neuberger Berman and the Sub-advisers that might result in the negotiations between them being less than arms-length.
The Board's determination to approve the continuation of the Agreements was based on a comprehensive consideration of all information provided to the Board throughout the year and specifically in connection with the annual contract review. The Board members did not identify any particular information or factor that was all-important or controlling, and each Trustee may have attributed different weights to the various factors. The Board focused on the overall costs and benefits of the Agreements to each Fund and, through the Funds, their shareholders.
With respect to the nature, extent and quality of the services provided, the Board considered the investment philosophy and decision-making processes of Management and each Sub-adviser, and the qualifications, experience, and capabilities of, and the resources available to, the portfolio management personnel of Management and each Sub-adviser who perform services for the Funds. The Board noted that Management also provides certain administrative services, including fund accounting and compliance services. The Board also reviewed whether Management used brokers to execute Fund transactions that provide research and other services to Management and the types of benefits potentially derived from such services by Management, the Funds and other clients of Management. The Board noted that Management and the Funds had obtained from the Securities and Exchange Commission an exemptive order that permitted Management to add or replace sub-advisers to the Funds without a shareholder vote, provided the Independent Fund Trustees approve the new sub-adviser and certain other steps are taken. In this context, the Board considered Management's responsibilities for designing an overall investment program for each Fund and then identifying the Sub-advisers who will carry out the different portions of that program based on Management's due diligence of those Sub-advisers. The Board noted that under the multi-manager arrangement, Management is continually assessing the need for new sub-advisers and the appropriateness of potential candidates, and noted the likelihood Management would in the future have to due diligence additional sub-advisers. The Board noted that Management is responsible for allocating each Fund's portfolio among the various Sub-advisers and determining when and how to rebalance the allocations among the Sub-advisers in the wake of disparate growth and changes in the markets and the broader economy, to make certain other investment decisions and to engage in transactions to hedge or balance risks in the Sub-advisers' portfolios.
The Board further noted that Management is responsible for overseeing the Sub-advisers pursuant to the Agreements and related sub-adviser oversight policies and procedures approved by the Board. Under these procedures, Management is responsible for overseeing the investment performance of the Sub-advisers and evaluating the risk and return of each Sub-adviser and each Fund as a whole, in addition to other significant oversight responsibilities. The Board also considered that Management's responsibilities include daily management of investment, operational, enterprise, legal, regulatory and compliance risks as they relate to the Funds, and considered information regarding Management's processes for managing risk. The Board also considered the experience and staffing of the portfolio management and investment research personnel of Management, and the general structure of Management's portfolio manager compensation program and whether this structure provides appropriate incentives to act in the best interests of each Fund.
The Board also considered the size and scope of the activities necessary to periodically evaluate the compliance programs and other operational aspects of each Sub-adviser. In addition, the Board considered the scope and compliance history of the compliance programs of Management and each Sub-adviser, including the Funds' Chief Compliance Officer's and Management's assessment of the compliance programs of the Sub-advisers. The Board noted the positive compliance history of Management and each Sub-adviser as no significant compliance problems were reported to the Board with respect to any of the firms. The Board also considered whether there were any pending lawsuits, enforcement proceedings or regulatory investigations involving Management or any Sub-adviser, and reviewed information regarding their financial condition, history of operations and any conflicts of interests in managing the Funds. The Board discussed that
115
Management's Chief Information Security Officer had evaluated the Sub-advisers' responses on questions of cybersecurity, business continuity and disaster recovery. As in past years, the Board also considered the manner in which Management addressed various non-routine matters that arose during the year, some of them a result of developments in the broader fund industry or the regulations governing it. In addition, the Board considered actions taken by Management in response to recent market conditions, such as regulatory concerns about changes in fixed-income market liquidity and potential volatility, and considered the overall performance of Management in this context.
The Board considered the policies and practices regarding brokerage and allocation of portfolio transactions of each of the Sub-advisers and noted that Management monitored the quality of the execution services provided by each Sub-adviser.
The Board factored into its evaluation of the Funds' fees and performance a consideration of the limitations inherent in the methodology for constructing peer groups and determining which investment companies should be included in the peer groups. With respect to investment performance, the Board considered information regarding each Fund's short-, intermediate-, and long-term performance, as applicable, both on an absolute basis and relative to an appropriate benchmark index and the average performance of a composite peer group (as constructed by an independent organization) of investment companies pursuing broadly similar strategies. The Board also considered information regarding each Sub-adviser's performance. The Board also reviewed the Funds' performance in relation to certain measures of the degree of investment risk undertaken by the Fund. In the case of those Funds or Sub-advisers that had underperformed their benchmark indices and/or peer groups, the Board discussed with Management each Fund's and Sub-adviser's performance and steps that Management had taken, or intended to take, to improve performance. The Board also considered Management's responsiveness with respect to the Funds that experienced lagging performance. It also considered that the nature of the Funds makes it difficult to find an appropriate market index or truly comparable peer group. In this regard, the Board noted that performance, especially short-term performance, is only one of the factors that it deems relevant to its consideration of the Funds' Agreements and that, after considering all relevant factors, it may be appropriate to approve the continuation of the Agreements notwithstanding a Fund's underperformance.
With respect to the overall fairness of the Agreements, the Board considered the fee structure for each Fund under the Agreements as compared to a peer group of comparable funds and any fall-out (i.e. indirect) benefits likely to accrue to Management and its affiliates from its relationship with the Funds. The Board also considered the profitability of Management and its affiliates from their association with the Funds, and year-over-year changes in each of Management's reported expense categories.
The Board reviewed a comparison of each Fund's management fee and total expense ratio to a peer group of comparable funds. The Board noted that the comparative management fee analysis includes, in each Fund's management fees, the separate administrative fees paid to Management, but it was not clear whether this was the case for all funds in the peer group. The Board compared each Fund's contractual and actual management fees to the mean and median of the contractual and actual management fees, respectively, of that Fund's peer group. (The actual management fees are the contractual management fees reduced by any fee waivers or other adjustments.) Where a Fund's management fee was higher than the peer group mean and/or median, the Board considered whether specific portfolio management, administration or oversight needs contributed to the management fee. In addition, the Board considered the contractual limit on expenses of certain classes of each Fund. Management indicated that similar comparative information was not available with respect to the amount paid to each Sub-adviser. The Board did, however, consider the allocation of duties and responsibilities among Management and the Sub-advisers and, in light of that, the amount of fees retained by each. The Board noted, however, that Management, and not the Funds, pays the fee to the Sub-advisers. The Board also noted that for some classes of certain Funds, the overall expense ratio of each class is maintained through expense reimbursements by Management. The Board also monitors throughout the year the potential effect on the profitability of Management resulting from changes in Sub-advisers and/or their fees. The Board considered the fees the Sub-advisers charge for similar products, if any. In prior years, the Board also considered fees charged to an unregistered fund of funds managed by Management that uses some of the same strategies used by the Funds and noted differences that reduced the usefulness of the comparison. With regard to the investment performance of each Fund and the costs of the services provided to each Fund, the Board considered the following information. Where a Fund has more than one class of shares
116
outstanding, information for a single class has been provided as identified below. For each Fund, the Board looked at the Institutional Class as provided below as a proxy for all of the Fund's classes:
• Neuberger Berman Absolute Return Multi-Manager Fund (Institutional Class)—The Board considered that, as compared to its peer group, the Fund's contractual management fee was lower than the median, but the actual management fee net of fees waived by Management was higher than the median. The Board considered that as compared to its peer group, the Fund's performance was lower than the median for the 1-year period, and equal to the median for the 3-year period. The Board also considered that, as compared to its benchmark, the Fund's performance was lower for the 1-year period, but higher for the 3-year period. The Fund was launched in 2012 and therefore does not have 5 or 10-year performance.
• Neuberger Berman Long Short Multi-Manager Fund (Institutional Class)—The Board considered that, as compared to its peer group, the Fund's contractual management fee was higher than the median, but the actual management fee net of fees waived by Management was lower than the median. The Board considered that as compared to its peer group, the Fund's performance was lower than the median for the 1-year period. The Board also considered that, as compared to its benchmark, the Fund's performance was lower for the 1-year period. The Fund was launched in 2013 and therefore does not have 5 or 10-year performance.
The Board also evaluated any apparent or anticipated economies of scale in relation to the services Management provides to each Fund. The Board considered whether each Fund's fee structure provides for a reduction of payments resulting from the use of breakpoints and whether any such breakpoints are set at appropriate asset levels. As in past years, the Board gave careful thought to the size of any breakpoints in the Funds' advisory fees and the asset levels at which they are set. It also considered whether the fees were set at an appropriate level and compared the fee structures to that of the peer group. The Board also considered that Management has provided, at no added cost to the Funds, certain additional services that were required by new regulations or regulatory interpretations, impelled by changes in the securities markets or the business landscape, and/or requested by the Board. In concluding that the benefits accruing to Management and affiliates by virtue of their relationship with the Funds were reasonable in light of the costs of providing the investment advisory and other services and the benefits accruing to the Funds, the Board reviewed specific data as to Management's profit or loss on each Fund for a recent period. The Board also considered Management's cost allocation methodology. It also considered whether any of the Sub-Advisory Agreements will provide for breakpoints in the fees and, as a general matter, the way in which such breakpoints should factor into the fees paid by the Funds. The Board considered the profitability of Management and recognized that Management should be entitled to earn a reasonable level of profits for services it provides to the Funds, and, based on its review, concluded that the reported level of profitability of Management, if any, was reasonable.
Conclusions as to Existing Agreements
In approving the continuation of the Agreements, the Board concluded that the terms of each Agreement are fair and reasonable to each Fund and that approval of the continuation of the Agreements is in the best interests of each Fund and its shareholders. In reaching this determination, the Board considered that Management and each Sub-adviser could be expected to provide a high level of service to each Fund; that the performance of each Fund was satisfactory over time, or, in the case of an underperforming Fund, that it retained confidence in Management's and each Sub-adviser's capabilities to manage the Fund; that each Fund's fee structure appeared to the Board to be reasonable given the nature, extent and quality of services provided; and that the benefits accruing to Management and its affiliates by virtue of their relationship with the Funds were reasonable in light of the costs of providing the investment advisory and other services and the benefits accruing to each Fund. The Board's conclusions may be based in part on its consideration of materials prepared in connection with the approval or continuance of the Agreements in prior years and on the Board's ongoing regular review of Fund performance and operations throughout the year, in addition to material prepared specifically for the most recent annual review of the Agreements.
117
At meetings held on March 22-23, 2016, the Board of the Trust ("Board"), including the Trustees who are not "interested persons" of Neuberger Berman Investment Advisers LLC ("Management") (including its affiliates) or the Trust ("Independent Fund Trustees"), evaluated and approved the separate sub-advisory agreement ("Sub-Advisory Agreement") between Management and P/E Investments LLC (an "Additional Subadviser"), which will be responsible for managing a portion of the assets of the Fund. Throughout the process, the Independent Fund Trustees were advised by counsel that is experienced in Investment Company Act of 1940 matters and that is independent of Management ("Independent Counsel").
In evaluating the Sub-Advisory Agreement, the Board, including the Independent Fund Trustees, reviewed extensive materials furnished by the Additional Subadviser in response to questions submitted by Management, the Board and Independent Counsel, and met with representatives of Management regarding the Additional Subadviser's personnel, operations and financial condition as they relate to the Fund. In addition, the Board, including the Independent Fund Trustees, met with representatives of the Additional Subadviser regarding its personnel and operations.
The Board noted that Management and the Fund had obtained from the Securities and Exchange Commission an exemptive order that permitted Management to add or replace subadvisers to the Fund without a shareholder vote, provided the Independent Fund Trustees approve the new subadviser and certain other steps are taken and that Management, pursuant to its agreement with the Fund and related subadviser oversight policies and procedures approved by the Board, is responsible for overseeing the Additional Subadviser.
In connection with its approval of the Sub-Advisory Agreement, the Board evaluated the overall fairness of the Sub-Advisory Agreement to the Fund and whether the Sub-Advisory Agreement was in the best interests of the Fund and its shareholders. The Board considered all factors it deemed relevant with respect to the Fund, including the following factors, among others, in connection with its approval of the Sub-Advisory Agreement: (1) the nature, extent, and quality of the services to be provided by the Additional Subadviser; and (2) the expected costs of the services to be provided. The Board's determination to approve the Sub-Advisory Agreement was based on a comprehensive consideration of all information provided to the Board. In their deliberations, the Board members did not identify any particular information or factor that was all-important or controlling, and each Trustee may have attributed different weights to the various factors. The Board focused on the overall costs and benefits of the Sub-Advisory Agreement to the Fund and, through the Fund, its shareholders.
With respect to the nature, extent and quality of the services to be provided to the Fund by the Additional Subadviser under the Sub-Advisory Agreement, the Board considered the investment philosophy and decision-making processes of the Additional Subadviser and the qualifications, experience and capabilities of, and the resources available to, the portfolio management personnel of the Additional Subadviser who would perform services for the Fund. The Board reviewed the performance for accounts managed by the Additional Subadviser that were substantially similar in strategy to the strategy the Additional Subadviser will use for the Fund, noting that the accounts may not be subject to the same 1940 Act restrictions as the Fund. The Board considered the policies and practices regarding brokerage and allocation of portfolio transactions of the Additional Subadviser and noted that Management would monitor the quality of the execution services provided by the Additional Subadviser.
The Board also reviewed whether the Additional Subadviser would use brokers to execute transactions for the Fund that provide research and other services to the Additional Subadviser, and the types of benefits potentially derived from such services by the Additional Subadviser, the Fund and other clients of the Additional Subadviser. The Board also considered the compliance programs and compliance history of the Additional Subadviser, including the Fund's Chief Compliance Officer's and Management's assessment of the compliance programs of the Additional Subadviser. The Board also considered whether there were any pending lawsuits, enforcement proceedings or regulatory investigations involving the Additional Subadviser, and reviewed information regarding its financial condition, history of operations and any conflicts of interest in managing the Fund.
118
With respect to the overall fairness of the Sub-Advisory Agreement, the Board had previously considered the Fund's fee structure as compared to a peer group of comparable funds and any fall-out (i.e. indirect) benefits likely to accrue to Management or its affiliates. Management indicated that similar comparative information was not available with respect to the amount paid to the Additional Subadviser. The Board did, however, consider an estimate of the costs of the services to be provided and estimated profit or loss that would be realized by Management as a result of adding the Additional Subadviser. The Board also considered that the Additional Subadviser had no products managed in a similar style to the strategy it would use for the Fund. The Board noted, however, that Management, and not the Fund, pays the fee to the Additional Subadviser and therefore the fees charged by the Additional Subadviser will not change the overall expenses of the Fund. The Board also considered whether there are other business arrangements between Management and the Additional Subadviser that could give rise to potential conflicts. It considered whether the Sub-Advisory Agreement will or should provide for breakpoints in the fees and, as a general matter, the way in which any such breakpoints should factor into the fees paid by the Fund.
Conclusions as to Additional Sub-Advisory Agreement
In approving the Sub-Advisory Agreement, the Board concluded that the terms of the Sub-Advisory Agreement are fair and reasonable to the Fund and that approval of the Agreement is in the best interests of the Fund and its shareholders. In reaching this determination, the Board considered that the Additional Subadviser could be expected to provide a high level of service to the Fund; that the Additional Subadviser's fees appeared to the Board to be reasonable given the nature, extent and quality of services expected to be provided; and that the benefits expected to accrue to the Additional Subadviser and its affiliates and Management and its affiliates by virtue of their relationship with the Fund were reasonable in light of the expected costs of providing the sub-advisory services and the benefits expected to accrue to the Fund.
119
|
|
|
|
|
Neuberger Berman Investment Advisers LLC Statistics and projections in this report are derived from sources deemed to be reliable but cannot be regarded as a representation of future results of the Funds. This report is prepared for the general information of shareholders and is not an offer of shares of the Funds. Shares are sold only through the currently effective prospectus which you can obtain by calling 877.628.2583. An investor should consider carefully a Fund's investment objectives, risks and fees and expenses, which are described in its prospectus, before investing.
|
|
|
|
|
|
|
| (a) |
Based on an evaluation of the disclosure controls and procedures (as defined in Rule 30a-3(c) under the Act) as of a date within 90 days of the filing date of this report, the Chief Executive Officer and President and the Treasurer and Principal Financial and Accounting Officer of the Registrant have concluded that such disclosure controls and procedures are effectively designed to ensure that information required to be disclosed by the Registrant on Form N-CSR is accumulated and communicated to the Registrant’s management to allow timely decisions regarding required disclosure.
|
| (b) |
There were no significant changes in the Registrant’s internal controls over financial reporting (as defined in Rule 30a-3(d) under the Act) that occurred during the Registrant’s second fiscal quarter of
|
|
the period covered by this report that have materially affected, or are reasonably likely to materially affect, the Registrant’s internal control over financial reporting.
|
| (a)(1) |
A copy of the Code of Ethics is incorporated by reference to Neuberger Berman Advisers Management Trust’s Form N-CSRS, Investment Company Act file number 811-04255 (filed August 25, 2016).
|
| (a)(2) |
The certifications required by Rule 30a-2(a) under the Act and Section 302 of the Sarbanes-Oxley Act of 2002 (“Sarbanes-Oxley Act”) are filed herewith.
|
| (a)(3) |
Not applicable to the Registrant.
|
|
(b)
|
The certification required by Rule 30a-2(b) under the Act and Section 906 of the Sarbanes-Oxley Act is furnished herewith.
|
|
By:
|
/s/ Robert Conti
|
|
|
|
|
Robert Conti
|
|
|
|
|
Chief Executive Officer and President
|
|
|
|
|
|
|
By:
|
/s/ Robert Conti
|
|
|
|
|
Robert Conti
|
|
|
|
|
Chief Executive Officer and President
|
|
|
|
|
|
|
By:
|
/s/ John M. McGovern
|
|
|
|
|
John M. McGovern
|
|
|
|
|
Treasurer and Principal Financial
|
|
|
|
and Accounting Officer
|
|
|
|