JPMorgan Institutional Trust
UNITED STATES
SECURITIES AND EXCHANGE COMMISSION
Washington, D.C. 20549
FORM N-CSR
CERTIFIED SHAREHOLDER REPORT OF REGISTERED
MANAGEMENT INVESTMENT COMPANIES
Investment Company Act file number: 811-21638
JPMorgan
Institutional Trust
(Exact name of registrant as specified in charter)
270 Park Avenue
New
York, NY 10017
(Address of principal executive offices) (Zip code)
Frank J. Nasta
270 Park
Avenue
New York, NY 10017
(Name and Address of Agent for Service)
Registrant’s telephone number, including area code: (800) 343-1113
Date of fiscal year end: Last day of February
Date of reporting period: March 1, 2014 through August 31, 2014
Form N-CSR is to be used by management investment companies to file reports with the Commission not later than 10 days after the transmission to stockholders
of any report that is required to be transmitted to stockholders under Rule 30e-1 under the Investment Company Act of 1940 (17 CFR 270.30e-1). The Commission may use the information provided on Form N-CSR in its regulatory, disclosure review,
inspection, and policymaking roles.
A registrant is required to disclose the information specified by Form N-CSR, and the Commission will make this
information public. A registrant is not required to respond to the collection of information contained in Form N-CSR unless the Form displays a currently valid Office of Management and Budget (“OMB”) control number. Please direct comments
concerning the accuracy of the information collection burden estimate and any suggestions for reducing the burden to Secretary, Securities and Exchange Commission, 450 Fifth Street, NW, Washington, DC 20549-0609. The OMB has reviewed this collection
of information under the clearance requirements of 44 U.S.C. Section 3507.
ITEM 1. REPORTS TO STOCKHOLDERS.
The following is a copy of the report transmitted to shareholders pursuant to Rule 30e-1 under the Investment Company Act of 1940 (17 CFR 270.30e-1).
Semi-Annual Report
JPMorgan Institutional Trust Funds
August 31, 2014 (Unaudited)
JPMorgan Core Bond Trust
JPMorgan Equity Index Trust
JPMorgan Intermediate Bond Trust

CONTENTS
Investments in a Fund are not bank deposits or obligations of, or guaranteed or endorsed by, any bank and are not insured
or guaranteed by the FDIC, the Federal Reserve Board or any other government agency. You could lose money if you sell when the Fund’s share price is lower than when you invested.
Past performance is no guarantee of future performance. The general market views expressed in this report are opinions based on market and other conditions through the end of the reporting period and are
subject to change without notice. These views are not intended to predict the future performance of a Fund or the securities markets. References to specific securities and their issuers are for illustrative purposes only and are not intended to be,
and should not be interpreted as, recommendations to purchase or sell such securities. Such views are not meant as investment advice and may not be relied on as an indication of trading intent on behalf of any Fund.
This report is intended for distribution only to accredited investors. Distribution of this document to anyone other than the intended user is expressly
prohibited. This document may not be copied, faxed or otherwise distributed to the general public.
CEO’S LETTER
SEPTEMBER 18, 2014 (Unaudited)
Dear Shareholder,
With a backdrop of continued accommodative policies among the world’s central banks and low growth, low inflation and low volatility, global financial markets performed well overall during the six
months ended August 31, 2014. In the U.S., low borrowing costs, a surge in corporate mergers and healthy corporate earnings drove U.S. equity indices to successive record highs during the period. Fixed income markets also posted gains as
long-term interest rates declined during the six month period and demand for debt securities outpaced supply. Bond yields, which generally move in the opposite direction of prices, tumbled lower over the six months and yields on longer maturity U.S.
Treasury securities reached their lowest levels in more than a year. From May through June, market volatility retreated to lows not consistently seen since 2007, before spiking in July on geopolitical tensions, and then retreating again at the end
of August. The Barclays U.S. Aggregate Index returned 2.74% for the six month period. The Standard & Poor’s 500 Index put an exclamation point on the six months by breaching the 2,000-point level for the first time and closing at a
record high 2003.37 points on August 29, 2014.
|
|
|

|
|
“While both global bond and equity markets performed well during the past six months, there remained notable investor
uncertainty about the timing and scope of any change in Fed interest rate policy and uneasiness about the run up in equity prices.” |
In the broader U.S. economy, growth returned after a brief drop in the winter months and business investment and spending on
durable goods also improved during the reporting period. While housing data were mixed, the unemployment rate dropped to 6.10% in August from 6.70% in March, and other jobs numbers showed meaningful improvement. In response to sustained improvement
— particularly in jobs data — the U.S. Federal Reserve (the “Fed”) steadily reduced its Quantitative Easing program to $25 billion in monthly purchases of Treasury bonds and mortgage-backed securities by the end of August.
Meanwhile, Fed Chairwoman Janet Yellen sought to reassure investors and the public at large that central bank policy would remain accommodative into 2015. In August, she reiterated that stance at a closely watched global economic conference in
Jackson Hole, Wyoming.
While U.S. investors and policy makers were watching for signs of nascent inflationary pressures, the European Union began
to confront the threat of potential price deflation. In an unprecedented move in June, European Central Bank President Mario Draghi cut the deposit rate to negative 0.10% from 0.00% in a bid to push banks to extend lending by effectively charging
them for parking excess cash with the central bank. Draghi followed up in August with a statement that acknowledged the need to spur job creation and signaled his commitment to support growth and head off a destructive deflationary spiral. In Japan,
weaker-than-expected economic data fueled
fears that policies aimed at reviving growth were faltering. Consumer spending shrank sharply, potentially due to an April increase in the nation’s consumption tax. Throughout the six month
period, the Bank of Japan continued its aggressive program of bond purchases. For the six months ended August 31, 2014, the MSCI Europe, Australasian and Far East Index returned 4.02%.
Isolated geopolitical conflicts in Ukraine, Gaza and Iraq drove some investors toward so-called safe havens, particularly U.S. fixed income securities, but financial markets in general shrugged off much of
the impact from these events. Elsewhere, a long-running dispute over restructured payments to holders of Argentina’s sovereign debt made headlines but had little effect on global bond markets.
Emerging markets generally performed well during the six month period, rebounding from a sell-off in late 2013. In China, domestic economic data weakened
toward the end of the six month period. However, the government’s targeted stimulus appeared to be working to counter any slowdown in growth. Two of the world’s largest democracies, India and Indonesia, held generally peaceful elections,
and Turkey’s prime minister was elected the next president, as expected. In Brazil, the death of opposition presidential candidate Eduardo Campos in an airplane crash raised uncertainty about the upcoming elections and prospects for change in
Brazil’s economic policies. In Thailand, months of political unrest led to a military coup in May. For the six months ended August 31, 2014, the MSCI Emerging Markets Index returned 12.78%.
While both global bond and equity markets performed well during the past six months, there remained notable investor uncertainty about the timing and scope
of any change in Fed interest rate policy and uneasiness about the run up in equity prices. Policymakers and economists stated their fear that investors had grown complacent amid the extended period of low volatility across stock, bond, foreign
exchange and commodities markets. At the same time, moderate price inflation and a stronger dollar helped to dispel warnings that Fed policies would unleash rapid inflation and debase the U.S. currency. In the face of all these concerns, both bonds
and equities generated positive returns for the six month period and rewarded those investors who maintained a diversified portfolio and a long-term perspective.
On behalf of everyone at J.P. Morgan Asset Management, thank you for your continued support. We look forward to managing your investment needs for years to come.
Sincerely yours,

George C.W. Gatch
CEO, Global Funds Management
J.P. Morgan Asset
Management
|
|
|
|
|
|
|
|
|
|
|
|
|
| AUGUST 31, 2014 |
|
JPMORGAN INSTITUTIONAL TRUST FUNDS |
|
|
|
|
1 |
|
JPMorgan Institutional Trust Funds
MARKET OVERVIEW
SIX
MONTHS ENDED AUGUST 31, 2014 (Unaudited)
Financial markets
generally performed well, primarily driven by the accommodative stance of central banks throughout the six months ended August 31, 2014. The U.S. economy rebounded from a drop in gross domestic product in the winter months and returned to
steady, positive growth for the remainder of the reporting period. While signs of price inflation emerged, the employment rate and consumer spending remain below the U.S. Federal Reserve’s stated policy targets and allowed the central bank to
hold its policy guidance constant over the course of the six month period. In this environment, long term interest rates declined. Demand for longer maturity debt outpaced supply as investors sought the relatively attractive yields of U.S. Treasury
securities compared with yields on foreign government bonds and in non-U.S. developed markets.
Amid low interest rates and improving credit
quality, investors sought higher yields offered by longer maturity and lower quality debt securities. For the six month period, the Barclays U.S. Aggregate Index returned 2.74% and the Standard & Poor’s 500 Index returned 8.84%.
|
|
|
|
|
|
|
|
|
|
|
| 2 |
|
|
|
JPMORGAN INSTITUTIONAL TRUST FUNDS |
|
AUGUST 31, 2014 |
JPMorgan Core Bond Trust
FUND COMMENTARY
SIX MONTHS ENDED AUGUST 31, 2014 (Unaudited)
|
|
|
|
|
| REPORTING PERIOD RETURN: |
|
|
|
| Fund* |
|
|
2.56% |
|
| Barclays U.S. Aggregate Index |
|
|
2.74% |
|
|
|
| Net Assets as of 8/31/2014 (In Thousands) |
|
|
$3,820,339 |
|
| Duration as of 8/31/2014 |
|
|
4.81 years |
|
INVESTMENT OBJECTIVE**
The JPMorgan Core Bond Trust (the “Fund”) seeks to maximize total return by investing primarily in a diversified portfolio of intermediate- and long-term debt securities.
WHAT WERE THE MAIN DRIVERS OF THE FUND’S PERFORMANCE?
For the six months ended August 31, 2014, the Fund underperformed the Barclays U.S. Aggregate Index (the “Benchmark”). The Fund’s shorter duration relative to the Benchmark and, to a
lesser degree, its position on the yield curve both detracted from the Fund’s performance relative to the Benchmark. Duration measures the price sensitivity of a bond or a portfolio of bonds to relative changes in interest rates. Generally,
bonds with longer duration will experience a larger increase or decrease in price as interest rates go down or up, respectively, versus bonds with shorter duration. The yield curve shows the relationship between yields and maturity dates for a set
of similar bonds at a set point in time. The Fund’s overall corporate credit sector holdings and its mortgage pass-through holdings also detracted from relative performance.
The Fund’s overweight position and security selection in commercial mortgage-backed securities and asset-backed securities made a positive contribution to performance relative to the Benchmark.
HOW WAS THE FUND POSITIONED?
The
Fund continued to focus on security selection and relative value, which seeks to exploit pricing discrepancies between
individual securities or market sectors. The Fund’s portfolio managers used bottom-up fundamental research to construct, in their view, a portfolio of undervalued fixed income securities. At
the end of the reporting period, the Fund was underweight in U.S. Treasuries and overweight in mortgage-backed securities.
|
|
|
|
|
| PORTFOLIO COMPOSITION*** |
|
| U.S. Treasury Obligations |
|
|
26.4 |
% |
| Collateralized Mortgage Obligations |
|
|
23.3 |
|
| Corporate Bonds |
|
|
18.8 |
|
| Mortgage Pass-Through Securities |
|
|
14.9 |
|
| Asset-Backed Securities |
|
|
5.9 |
|
| Commercial Mortgage-Backed Securities |
|
|
3.7 |
|
| U.S. Government Agency Securities |
|
|
2.4 |
|
| Foreign Government Securities |
|
|
1.3 |
|
| Others (each less than 1.0%) |
|
|
0.8 |
|
| Short-Term Investment |
|
|
2.5 |
|
| * |
|
The return shown is based on net asset values calculated for shareholder transactions and may differ from the return shown in the financial highlights, which reflects
adjustments made to the net asset values in accordance with accounting principles generally accepted in the United States of America. |
| ** |
|
The adviser seeks to achieve the Fund’s objective. There can be no guarantee it will be achieved. |
| *** |
|
Percentages indicated are based on total investments as of August 31, 2014. The Fund’s portfolio composition is subject to change.
|
|
|
|
|
|
|
|
|
|
|
|
|
|
| AUGUST 31, 2014 |
|
JPMORGAN INSTITUTIONAL TRUST FUNDS |
|
|
|
|
3 |
|
JPMorgan Core Bond Trust
FUND COMMENTARY
SIX MONTHS ENDED AUGUST 31, 2014 (Unaudited) (continued)
|
|
|
|
|
|
|
|
|
|
|
|
|
|
|
|
|
|
|
|
|
|
|
|
|
| AVERAGE ANNUAL TOTAL RETURNS AS OF AUGUST 31,
2014 |
|
|
|
|
|
|
|
|
| |
|
INCEPTION DATE OF
FUND |
|
|
6 MONTH* |
|
|
1 YEAR |
|
|
3 YEAR |
|
|
5 YEAR |
|
|
SINCE
INCEPTION |
|
|
|
|
February 7, 2005 |
|
|
|
2.56 |
% |
|
|
5.32 |
% |
|
|
3.63 |
% |
|
|
5.69 |
% |
|
|
5.66 |
% |
LIFE OF FUND PERFORMANCE
(2/7/05 TO 8/31/14)
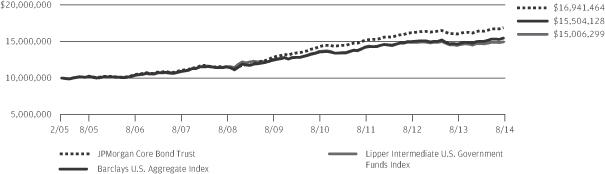
Source: Lipper, Inc. The performance quoted is past performance and is not a guarantee of future
results. Mutual funds are subject to certain market risks. Investment returns and principal value of an investment will fluctuate so that an investor’s shares, when redeemed, may be worth more or less than their original cost. Current
performance may be higher or lower than the performance data shown.
The Fund commenced operations on February 7, 2005.
The graph illustrates comparative performance for $10,000,000 invested in the JPMorgan Core Bond Trust, the Barclays U.S. Aggregate Index and the Lipper
Intermediate U.S. Government Funds Index from February 7, 2005 to August 31, 2014. The performance of the Lipper Intermediate U.S. Government Funds Index reflects an initial investment at the end of the month closest to the
Fund’s inception. The performance of the Fund assumes reinvestment of all dividends and capital gain distributions, if any, and does not include a sales charge. The performance of the Barclays U.S. Aggregate Index does not reflect the deduction
of expenses associated with a mutual fund and has been adjusted to reflect reinvestment of all dividends and capital gain distributions of the securities included in the benchmark, if applicable. The performance of the Lipper Intermediate U.S.
Government Funds Index includes expenses associated with a mutual fund, such as investment management fees. These expenses are
not identical to the expenses incurred by the Fund. The Barclays U.S. Aggregate Index is an unmanaged index that represents securities that are SEC-registered, taxable, and dollar denominated.
The index covers the U.S. investment grade fixed rate bond market, with index components for government and corporate securities, mortgage pass-through securities, and asset-backed securities. The Lipper Intermediate U.S. Government Funds Index is
an index based on total returns of certain mutual funds within the Fund’s designated category as determined by Lipper, Inc. Investors cannot invest directly in an index.
The Fund’s shares have a $10,000,000 minimum investment.
Fund performance may reflect the waiver
of the Fund’s fees and reimbursement of expenses for certain periods since the inception date. Without these waivers and reimbursements, performance would have been lower. Also, performance shown in this section does not reflect the deduction
of taxes that a shareholder would pay on Fund distributions or redemptions of Fund shares.
The returns shown are based on net asset values
calculated for shareholder transactions and may differ from the returns shown in the financial highlights, which reflect adjustments made to the net asset values in accordance with accounting principles generally accepted in the United States of
America.
|
|
|
|
|
|
|
|
|
|
|
| 4 |
|
|
|
JPMORGAN INSTITUTIONAL TRUST FUNDS |
|
AUGUST 31, 2014 |
JPMorgan Equity Index Trust
FUND COMMENTARY
SIX MONTHS ENDED AUGUST 31, 2014 (Unaudited)
|
|
|
|
|
| REPORTING PERIOD RETURN: |
|
|
|
| JPMorgan Equity Index Trust* |
|
|
8.77% |
|
| S&P 500 Index** |
|
|
8.84% |
|
|
|
| Net Assets as of 8/31/2014 (In Thousands) |
|
$ |
378,123 |
|
INVESTMENT OBJECTIVE***
The JPMorgan Equity Index Trust (the “Fund”) seeks investment results that correspond to the aggregate price and dividend performance of securities in the Standard & Poor’s 500
Composite Stock Price Index (S&P 500 Index).
WHAT WERE THE MAIN DRIVERS OF THE FUND’S PERFORMANCE?
The Fund performed in line with the S&P 500 Index (the “Benchmark”) for the six months ended August 31, 2014. This was consistent with its
indexing strategy and investment objective, as the Fund looks to generate returns that are comparable to that of the Benchmark.
Overall, the U.S.
equity market performed strongly during the six months ended August 31, 2014. Continued accommodative monetary policy from the U.S. Federal Reserve (the “Fed”), steady improvement in economic indicators, healthy corporate earnings and
mergers and acquisitions activity drove the Benchmark higher during the reporting period.
All sectors in the Benchmark posted positive returns.
The information technology and energy sectors were the greatest contributors to Benchmark performance, while the telecommunications and utilities sectors made the smallest contribution to Benchmark performance during the reporting period.
HOW WAS THE FUND POSITIONED?
Regardless of the market outlook, the Fund was managed in strict conformity with a full index replication strategy and aimed to hold the same stocks in
nearly the same proportions as those found in the Benchmark.
|
|
|
|
|
|
|
|
|
| TOP TEN EQUITY HOLDINGS OF THE PORTFOLIO**** |
|
| |
1. |
|
|
Apple, Inc. |
|
|
3.4 |
% |
| |
2. |
|
|
Exxon Mobil Corp. |
|
|
2.4 |
|
| |
3. |
|
|
Microsoft Corp. |
|
|
1.9 |
|
| |
4. |
|
|
Johnson & Johnson |
|
|
1.6 |
|
| |
5. |
|
|
General Electric Co. |
|
|
1.4 |
|
| |
6. |
|
|
Berkshire Hathaway, Inc., Class B |
|
|
1.4 |
|
| |
7. |
|
|
Wells Fargo & Co. |
|
|
1.4 |
|
| |
8. |
|
|
Chevron Corp. |
|
|
1.4 |
|
| |
9. |
|
|
JPMorgan Chase & Co. |
|
|
1.2 |
|
| |
10. |
|
|
Procter & Gamble Co. (The) |
|
|
1.2 |
|
|
|
|
|
|
| PORTFOLIO COMPOSITION BY SECTOR**** |
|
| Information Technology |
|
|
19.1 |
% |
| Financials |
|
|
15.9 |
|
| Health Care |
|
|
13.5 |
|
| Consumer Discretionary |
|
|
11.8 |
|
| Energy |
|
|
10.3 |
|
| Industrials |
|
|
10.1 |
|
| Consumer Staples |
|
|
9.3 |
|
| Materials |
|
|
3.5 |
|
| Utilities |
|
|
3.0 |
|
| Telecommunication Services |
|
|
2.3 |
|
| Exchange Traded Fund |
|
|
0.0 |
(a) |
| Short-Term Investments |
|
|
1.2 |
|
| * |
|
The return shown is based on net asset values calculated for shareholder transactions and may differ from the return shown in the financial highlights, which reflects
adjustments made to the net asset values in accordance with accounting principles generally accepted in the United States of America. |
| ** |
|
“S&P 500 Index” is a registered service mark of Standard & Poor’s Corporation, which does not sponsor, and is in no way affiliated with the Fund.
|
| *** |
|
The adviser seeks to achieve the Fund’s objective. There can be no guarantee it will be achieved. |
| **** |
|
Percentages indicated are based on total investments as of August 31, 2014. The Fund’s portfolio composition is subject to change. |
| (a) |
|
Amount rounds to less than 0.1%.
|
|
|
|
|
|
|
|
|
|
|
|
|
|
| AUGUST 31, 2014 |
|
JPMORGAN INSTITUTIONAL TRUST FUNDS |
|
|
|
|
5 |
|
JPMorgan Equity Index Trust
FUND COMMENTARY
SIX MONTHS ENDED AUGUST 31, 2014 (Unaudited) (continued)
|
|
|
|
|
|
|
|
|
|
|
|
|
|
|
|
|
|
|
|
|
|
|
|
|
| AVERAGE ANNUAL TOTAL RETURNS AS OF AUGUST 31,
2014 |
|
|
|
|
|
|
|
|
| |
|
INCEPTION DATE OF
FUND |
|
|
6 MONTH* |
|
|
1 YEAR |
|
|
3 YEAR |
|
|
5 YEAR |
|
|
SINCE
INCEPTION |
|
|
|
|
February 7, 2005 |
|
|
|
8.77 |
% |
|
|
25.07 |
% |
|
|
20.44 |
% |
|
|
16.72 |
% |
|
|
7.59 |
% |
LIFE OF FUND PERFORMANCE
(2/7/05 TO 8/31/14)
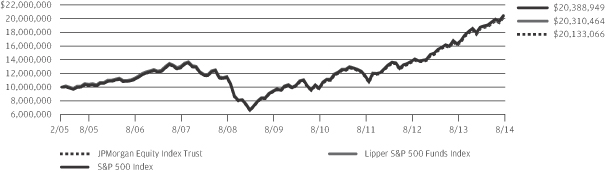
The performance quoted is past performance and is not a guarantee of future results. Mutual funds are
subject to certain market risks. Investment returns and principal value of an investment will fluctuate so that an investor’s shares, when redeemed, may be worth more or less than their original cost. Current performance may be higher or lower
than the performance data shown.
The Fund commenced operations on February 7, 2005.
The graph illustrates comparative performance for $10,000,000 invested in the JPMorgan Equity Index Trust, the S&P 500 Index and the Lipper S&P 500
Funds Index from February 7, 2005 to August 31, 2014. The performance of the Lipper S&P 500 Funds Index reflects an initial investment at the end of the month closest to the Fund’s inception. The performance of the Fund assumes
reinvestment of all dividends and capital gain distributions, if any, and does not include a sales charge. The performance of the S&P 500 Index does not reflect the deduction of expenses associated with a mutual fund and has been adjusted to
reflect reinvestment of all dividends and capital gain distributions of the securities included in the benchmark, if applicable. The performance of the Lipper S&P 500 Funds Index includes expenses associated with a mutual fund,
such as investment management fees. These expenses are not identical to the expenses incurred by the Fund. The S&P 500 Index is an unmanaged index generally representative of the performance
of large companies in the U.S. Stock Market. Index levels are based on total return in U.S. dollars. The Lipper S&P 500 Funds Index is an index based on total returns of certain mutual funds within the Fund’s designated category as
determined by Lipper, Inc. Investors cannot invest directly in an index.
The Fund’s shares have a $10,000,000 minimum investment.
Fund performance may reflect the waiver of the Fund’s fees and reimbursement of expenses for certain periods since the inception date.
Without these waivers and reimbursements, performance would have been lower. Also, performance shown in this section does not reflect the deduction of taxes that a shareholder would pay on Fund distributions or redemptions of Fund shares.
The returns shown are based on net asset values calculated for shareholder transactions and may differ from the returns shown in the financial
highlights, which reflect adjustments made to the net asset values in accordance with accounting principles generally accepted in the United States of America.
|
|
|
|
|
|
|
|
|
|
|
| 6 |
|
|
|
JPMORGAN INSTITUTIONAL TRUST FUNDS |
|
AUGUST 31, 2014 |
JPMorgan Intermediate Bond Trust
FUND COMMENTARY
SIX MONTHS ENDED AUGUST 31,
2014 (Unaudited)
|
|
|
|
|
| REPORTING PERIOD RETURN: |
|
|
|
| Fund* |
|
|
1.53% |
|
| Barclays Intermediate U.S. Government/Credit Index |
|
|
1.41% |
|
|
|
| Net Assets as of 8/31/2014 (In Thousands) |
|
|
$348,941 |
|
| Duration as of 8/31/2014 |
|
|
3.43 years |
|
INVESTMENT OBJECTIVE**
The JPMorgan Intermediate Bond Trust (the “Fund”) seeks current income consistent with the preservation of capital by investing in high- and medium-grade fixed income securities with intermediate
maturities.
WHAT WERE THE MAIN DRIVERS OF THE FUND’S PERFORMANCE?
During the six months ended August 31, 2014, the Fund outperformed the Barclays Intermediate U.S. Government/Credit Index (the “Benchmark”). The Fund’s position on the yield
curve — particularly its underweight position in the two-to-five year portion — made a positive contribution to performance relative to the Benchmark, as short-to-intermediate interest rates rose during the period, which decreased the
value of bonds with shorter maturities. The yield curve shows the relationship between yields and maturity dates for a set of similar bonds for a given point in time. The Fund’s out-of-Benchmark position in mortgage securities, including
mortgage pass-through, agency and non-agency collateralized mortgage obligations, also contributed to relative performance.
The Fund’s
security selection in the corporate credit sector and U.S. Treasury securities detracted from performance relative to the Benchmark for the six months ended August 31, 2014.
HOW WAS THE FUND POSITIONED?
The Fund continued to focus on security selection and relative
value, which seeks to exploit pricing discrepancies between individual securities or market sectors. The Fund’s portfolio
managers used bottom-up fundamental research to construct, in their view, a portfolio of undervalued fixed income securities. As of the end of the reporting period, the Fund was underweight in
U.S. Treasuries and in the corporate credit sector. The Fund was overweight in the intermediate part (5-10 years) of the yield curve.
|
|
|
|
|
| PORTFOLIO COMPOSITION*** |
|
| U.S. Treasury Obligations |
|
|
30.3 |
% |
| Collateralized Mortgage Obligations |
|
|
19.8 |
|
| Corporate Bonds |
|
|
19.0 |
|
| Mortgage Pass-Through Securities |
|
|
10.4 |
|
| Asset-Backed Securities |
|
|
5.8 |
|
| U.S. Government Agency Securities |
|
|
2.5 |
|
| Commercial Mortgage-Backed Securities |
|
|
2.0 |
|
| Foreign Government Securities |
|
|
1.0 |
|
| Supranational |
|
|
0.1 |
|
| Short-Term Investment |
|
|
9.1 |
|
| * |
|
The return shown is based on net asset values calculated for shareholder transactions and may differ from the return shown in the financial highlights, which reflects
adjustments made to the net asset values in accordance with accounting principles generally accepted in the United States of America. |
| ** |
|
The adviser seeks to achieve the Fund’s objective. There can be no guarantee it will be achieved. |
| *** |
|
Percentages indicated are based on total investments as of August 31, 2014. The Fund’s portfolio composition is subject to change.
|
|
|
|
|
|
|
|
|
|
|
|
|
|
| AUGUST 31, 2014 |
|
JPMORGAN INSTITUTIONAL TRUST FUNDS |
|
|
|
|
7 |
|
JPMorgan Intermediate Bond Trust
FUND COMMENTARY
SIX MONTHS ENDED AUGUST 31, 2014 (Unaudited) (continued)
|
|
|
|
|
|
|
|
|
|
|
|
|
|
|
|
|
|
|
|
|
|
|
|
|
| AVERAGE ANNUAL TOTAL RETURNS AS OF AUGUST 31,
2014 |
|
|
|
|
|
|
|
|
| |
|
INCEPTION DATE OF
FUND |
|
|
6 MONTH* |
|
|
1 YEAR |
|
|
3 YEAR |
|
|
5 YEAR |
|
|
SINCE
INCEPTION |
|
|
|
|
February 7, 2005 |
|
|
|
1.53 |
% |
|
|
3.62 |
% |
|
|
2.80 |
% |
|
|
4.65 |
% |
|
|
5.03 |
% |
LIFE OF FUND PERFORMANCE
(2/7/05 TO 8/31/14)
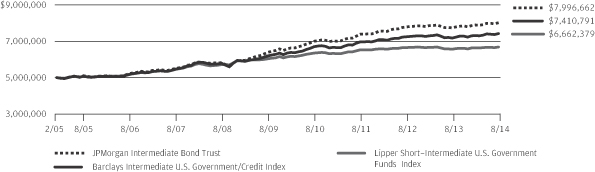
Source: Lipper, Inc. The performance quoted is past performance and is not a guarantee of future
results. Mutual funds are subject to certain market risks. Investment returns and principal value of an investment will fluctuate so that an investor’s shares, when redeemed, may be worth more or less than their original cost. Current
performance may be higher or lower than the performance data shown.
The Fund commenced operations on February 7, 2005.
The graph illustrates comparative performance for $5,000,000 invested in the JPMorgan Intermediate Bond Trust, the Barclays Intermediate U.S.
Government/Credit Index and the Lipper Short-Intermediate U.S. Government Funds Index from February 7, 2005 to August 31, 2014. The performance of the Lipper Short-Intermediate U.S. Government Funds Index reflects an initial investment at the
end of the month closest to the Fund’s inception. The performance of the Fund assumes reinvestment of all dividends and capital gain distributions, if any, and does not include a sales charge. The performance of the Barclays Intermediate U.S.
Government/Credit Index does not reflect the deduction of expenses associated with a mutual fund and has been adjusted to reflect reinvestment of all dividends and capital gain distributions of the securities included in the benchmark, if
applicable. The performance of the Lipper Short-Intermediate U.S. Government Funds Index includes expenses associated
with a mutual fund, such as investment management fees. These expenses are not identical to the expenses incurred by the Fund. The Barclays Intermediate U.S. Government/Credit Index is an
unmanaged index comprised of intermediate maturity U.S. Treasury and agency securities and investment grade corporate securities. The Lipper Short-Intermediate U.S. Government Funds Index is an index based on total returns of certain mutual funds
within the Fund’s designated category as determined by Lipper, Inc. Investors cannot invest directly in an index.
The Fund’s shares
have a $5,000,000 minimum investment.
Fund performance may reflect the waiver of the Fund’s fees and reimbursement of expenses for certain
periods since the inception date. Without these waivers and reimbursements, performance would have been lower. Also, performance shown in this section does not reflect the deduction of taxes that a shareholder would pay on Fund distributions or
redemptions of Fund shares.
The returns shown are based on net asset values calculated for shareholder transactions and may differ from the
returns shown in the financial highlights, which reflect adjustments made to the net asset values in accordance with accounting principles generally accepted in the United States of America.
|
|
|
|
|
|
|
|
|
|
|
| 8 |
|
|
|
JPMORGAN INSTITUTIONAL TRUST FUNDS |
|
AUGUST 31, 2014 |
JPMorgan Core Bond Trust
SCHEDULE OF PORTFOLIO INVESTMENTS
AS OF AUGUST 31, 2014 (Unaudited)
(Amounts in thousands)
|
|
|
|
|
|
|
|
|
PRINCIPAL
AMOUNT($) |
|
|
SECURITY DESCRIPTION |
|
VALUE($) |
|
| |
Asset-Backed Securities — 5.9% |
|
|
|
|
|
Academic Loan Funding Trust, |
|
|
|
|
| |
1,200 |
|
|
Series 2012-1A, Class A1, VAR, 0.955%, 12/27/22 (e) |
|
|
1,210 |
|
| |
2,337 |
|
|
Series 2013-1A, Class A, VAR, 0.955%, 12/26/44 (e) |
|
|
2,345 |
|
|
|
|
|
Ally Auto Receivables Trust, |
|
|
|
|
| |
282 |
|
|
Series 2012-1, Class A3, 0.930%, 02/16/16 |
|
|
282 |
|
| |
290 |
|
|
Series 2012-2, Class A3, 0.740%, 04/15/16 |
|
|
290 |
|
| |
565 |
|
|
Series 2012-3, Class A3, 0.850%, 08/15/16 |
|
|
566 |
|
| |
1,722 |
|
|
Series 2013-2, Class A3, 0.790%, 01/15/18 |
|
|
1,721 |
|
| |
300 |
|
|
Series 2013-2, Class A4, 1.240%, 11/15/18 |
|
|
301 |
|
|
|
|
|
American Credit Acceptance Receivables Trust, |
|
|
|
|
| |
266 |
|
|
Series 2012-3, Class A, 1.640%, 11/15/16 (e) |
|
|
267 |
|
| |
768 |
|
|
Series 2013-1, Class A, 1.450%, 04/16/18 (e) |
|
|
772 |
|
| |
463 |
|
|
Series 2013-2, Class A, 1.320%, 02/15/17 (e) |
|
|
464 |
|
| |
2,447 |
|
|
Series 2014-2, Class A, 0.990%, 10/10/17 (e) |
|
|
2,447 |
|
| |
1,182 |
|
|
Series 2014-2, Class B, 2.260%, 03/10/20 (e) |
|
|
1,181 |
|
|
|
|
|
AmeriCredit Automobile Receivables Trust, |
|
|
|
|
| |
49 |
|
|
Series 2011-5, Class A3, 1.550%, 07/08/16 |
|
|
49 |
|
| |
36 |
|
|
Series 2012-1, Class A3, 1.230%, 09/08/16 |
|
|
37 |
|
| |
44 |
|
|
Series 2012-2, Class A3, 1.050%, 10/11/16 |
|
|
44 |
|
| |
210 |
|
|
Series 2012-3, Class A3, 0.960%, 01/09/17 |
|
|
210 |
|
| |
267 |
|
|
Series 2012-5, Class A3, 0.620%, 06/08/17 |
|
|
268 |
|
| |
824 |
|
|
Series 2013-4, Class A2, 0.740%, 11/08/16 |
|
|
825 |
|
| |
590 |
|
|
Series 2013-5, Class A3, 0.900%, 09/10/18 |
|
|
590 |
|
| |
163 |
|
|
Ascentium Equipment Receivables LLC, Series 2012-1A, Class A, 1.830%, 09/15/19 (e) |
|
|
163 |
|
| |
2,050 |
|
|
Axis Equipment Finance Receivables II LLC, Series 2013-1A, Class A, 1.750%, 03/20/17 (e) |
|
|
2,050 |
|
| |
176 |
|
|
Bank of America Auto Trust, Series 2012-1, Class A3, 0.780%, 06/15/16 |
|
|
176 |
|
| |
1,811 |
|
|
Bayview Opportunity Master Fund IIa Trust, Series 2013-8NPL, Class A, VAR, 3.228%, 03/28/33 (e) |
|
|
1,815 |
|
| |
454 |
|
|
Bear Stearns Asset-Backed Securities Trust, Series 2006-SD1, Class A, VAR, 0.525%, 04/25/36 |
|
|
435 |
|
| |
678 |
|
|
BMW Vehicle Owner Trust, Series 2013-A, Class A3, 0.670%, 11/27/17 |
|
|
678 |
|
| |
937 |
|
|
BXG Receivables Note Trust, Series 2012-A, Class A, 2.660%, 12/02/27 (e) |
|
|
933 |
|
| |
700 |
|
|
Cabela’s Master Credit Card Trust, Series 2012-1A, Class A1, 1.630%, 02/18/20
(e) |
|
|
708 |
|
|
|
|
|
|
|
|
|
|
PRINCIPAL
AMOUNT($) |
|
|
SECURITY DESCRIPTION |
|
VALUE($) |
|
|
|
|
|
|
|
|
|
|
| |
701 |
|
|
California Republic Auto Receivables Trust, Series 2012-1, Class A, 1.180%, 08/15/17 (e) |
|
|
704 |
|
| |
1,500 |
|
|
Capital Auto Receivables Asset Trust, Series 2013-3, Class A1B, VAR, 0.586%, 11/20/15 |
|
|
1,500 |
|
|
|
|
|
CarFinance Capital Auto Trust, |
|
|
|
|
| |
280 |
|
|
Series 2013-1A, Class A, 1.650%, 07/17/17 (e) |
|
|
281 |
|
| |
320 |
|
|
Series 2013-2A, Class A, 1.750%, 11/15/17 (e) |
|
|
321 |
|
| |
923 |
|
|
Series 2014-1A, Class A, 1.460%, 12/17/18 (e) |
|
|
925 |
|
| |
375 |
|
|
Series 2014-1A, Class B, 2.720%, 04/15/20 (e) |
|
|
378 |
|
| |
3,207 |
|
|
Carlyle Global Market Strategies Commodities Funding Ltd., (Cayman Islands),
Series 2014-1A, Class A, VAR, 2.176%, 10/15/21 (e) (i) |
|
|
3,207 |
|
|
|
|
|
CarMax Auto Owner Trust, |
|
|
|
|
| |
543 |
|
|
Series 2011-1, Class A4, 2.160%, 09/15/16 |
|
|
547 |
|
| |
314 |
|
|
Series 2011-3, Class A3, 1.070%, 06/15/16 |
|
|
314 |
|
| |
676 |
|
|
Series 2013-4, Class A3, 0.800%, 07/16/18 |
|
|
675 |
|
| |
440 |
|
|
Series 2013-4, Class A4, 1.280%, 05/15/19 |
|
|
439 |
|
| |
453 |
|
|
Carnow Auto Receivables Trust, Series 2013-1A, Class A, 1.160%,
10/16/17 (e) |
|
|
453 |
|
| |
364 |
|
|
Centex Home Equity Loan Trust, Series 2004-D, Class AF4, SUB, 4.680%, 06/25/32 |
|
|
375 |
|
| |
1,339 |
|
|
Chase Funding Trust, Series 2003-6, Class 1A7, SUB, 4.277%, 11/25/34 |
|
|
1,354 |
|
| |
800 |
|
|
Citibank Credit Card Issuance Trust, Series 2007-A3, Class A3, 6.150%, 06/15/39 |
|
|
1,031 |
|
| |
314 |
|
|
Citigroup Mortgage Loan Trust, Inc., Series 2003-HE3, Class A, VAR, 0.535%, 12/25/33 |
|
|
301 |
|
|
|
|
|
CNH Equipment Trust, |
|
|
|
|
| |
541 |
|
|
Series 2011-A, Class A4, 2.040%, 10/17/16 |
|
|
544 |
|
| |
270 |
|
|
Series 2012-A, Class A3, 0.940%, 05/15/17 |
|
|
270 |
|
|
|
|
|
Concord Funding Co. LLC, |
|
|
|
|
| |
2,800 |
|
|
Series 2012-2, Class A, 3.145%, 01/15/17 (e) |
|
|
2,800 |
|
| |
1,650 |
|
|
Series 2013-1, Class A, 2.420%, 02/15/15 (e) |
|
|
1,653 |
|
| |
1,095 |
|
|
Conix Mortgage Asset Trust, Series 2013-1, Class A, VAR, 4.704%, 12/25/47 (e) (i) |
|
|
1,118 |
|
| |
832 |
|
|
Countrywide Asset -Backed Certificates, Series 2004-6, Class M1, VAR, 1.055%, 10/25/34 |
|
|
791 |
|
|
|
|
|
CPS Auto Receivables Trust, |
|
|
|
|
| |
556 |
|
|
Series 2011-C, Class A, 4.210%, 03/15/19 (e) |
|
|
571 |
|
SEE NOTES TO
FINANCIAL STATEMENTS.
|
|
|
|
|
|
|
|
|
|
|
|
|
| AUGUST 31, 2014 |
|
JPMORGAN INSTITUTIONAL TRUST FUNDS |
|
|
|
|
9 |
|
JPMorgan Core Bond Trust
SCHEDULE OF PORTFOLIO INVESTMENTS
AS OF AUGUST 31, 2014 (Unaudited) (continued)
(Amounts in thousands)
|
|
|
|
|
|
|
|
|
PRINCIPAL
AMOUNT($) |
|
|
SECURITY DESCRIPTION |
|
VALUE($) |
|
| |
Asset-Backed Securities — continued |
|
| |
292 |
|
|
Series 2012-A, Class A, 2.780%, 06/17/19 (e) |
|
|
297 |
|
| |
1,726 |
|
|
Series 2012-B, Class A, 2.520%, 09/16/19 (e) |
|
|
1,749 |
|
| |
2,495 |
|
|
Series 2013-C, Class A, 1.640%, 04/16/18 (e) |
|
|
2,509 |
|
| |
3,312 |
|
|
Series 2013-D, Class A, 1.540%, 07/16/18 (e) |
|
|
3,326 |
|
| |
438 |
|
|
Series 2014-A, Class A, 1.210%, 08/15/18 (e) |
|
|
438 |
|
|
|
|
|
CPS Auto Trust, |
|
|
|
|
| |
1,016 |
|
|
Series 2012-C, Class A, 1.820%, 12/16/19 (e) |
|
|
1,027 |
|
| |
162 |
|
|
Series 2012-D, Class A, 1.480%, 03/16/20 (e) |
|
|
163 |
|
|
|
|
|
Credit Acceptance Auto Loan Trust, |
|
|
|
|
| |
228 |
|
|
Series 2012-1A, Class A, 2.200%, 09/16/19 (e) |
|
|
229 |
|
| |
1,512 |
|
|
Series 2012-2A, Class A, 1.520%, 03/16/20 (e) |
|
|
1,517 |
|
| |
813 |
|
|
Discover Card Execution Note Trust, Series 2012-A1, Class A1, 0.810%, 08/15/17 |
|
|
815 |
|
|
|
|
|
Exeter Automobile Receivables Trust, |
|
|
|
|
| |
303 |
|
|
Series 2012-2A, Class A, 1.300%, 06/15/17 (e) |
|
|
304 |
|
| |
582 |
|
|
Series 2013-1A, Class A, 1.290%, 10/16/17 (e) |
|
|
583 |
|
| |
1,436 |
|
|
Series 2013-2A, Class A, 1.490%, 11/15/17 (e) |
|
|
1,441 |
|
| |
1,056 |
|
|
Series 2014-1A, Class A, 1.290%, 05/15/18 (e) |
|
|
1,058 |
|
| |
349 |
|
|
Fifth Third Auto Trust, Series 2013-1, Class A3, 0.880%, 10/16/17 |
|
|
350 |
|
| |
314 |
|
|
First Investors Auto Owner Trust, Series 2012-2A, Class A2, 1.470%,
05/15/18 (e) |
|
|
315 |
|
|
|
|
|
Flagship Credit Auto Trust, |
|
|
|
|
| |
885 |
|
|
Series 2013-1, Class A, 1.320%, 04/16/18 (e) |
|
|
886 |
|
| |
1,358 |
|
|
Series 2013-2, Class A, 1.940%, 01/15/19 (e) |
|
|
1,362 |
|
| |
1,347 |
|
|
Series 2014-1, Class A, 1.210%, 04/15/19 (e) |
|
|
1,346 |
|
| |
245 |
|
|
Series 2014-1, Class B, 2.550%, 02/18/20 (e) |
|
|
245 |
|
|
|
|
|
Ford Credit Auto Lease Trust, |
|
|
|
|
| |
503 |
|
|
Series 2013-B, Class A3, 0.760%, 09/15/16 |
|
|
504 |
|
| |
265 |
|
|
Series 2014-A, Class A2A, 0.500%, 10/15/16 |
|
|
265 |
|
|
|
|
|
|
|
|
|
|
PRINCIPAL
AMOUNT($) |
|
|
SECURITY DESCRIPTION |
|
VALUE($) |
|
|
|
|
|
|
|
|
|
|
|
|
|
|
Ford Credit Auto Owner Trust, |
|
|
|
|
| |
434 |
|
|
Series 2012-A, Class A3, 0.840%, 08/15/16 |
|
|
435 |
|
| |
252 |
|
|
Series 2012-B, Class A3, 0.720%, 12/15/16 |
|
|
252 |
|
| |
529 |
|
|
Series 2012-D, Class A3, 0.510%, 04/15/17 |
|
|
530 |
|
| |
669 |
|
|
Ford Credit Floorplan Master Owner Trust, Series 2013-1, Class A2, VAR, 0.535%, 01/15/18 |
|
|
670 |
|
| |
541 |
|
|
Freedom Trust, Series 2011-2, Class A11, VAR, 5.000%, 08/01/46 (e) |
|
|
553 |
|
|
|
|
|
FRT Trust, |
|
|
|
|
| |
1,017 |
|
|
Series 2013-1A, Class A1N, SUB, 3.960%, 10/25/33 (e) (i) |
|
|
1,025 |
|
| |
469 |
|
|
Series 2013-1A, Class AR, SUB, 4.210%, 10/25/18 (e) (i) |
|
|
468 |
|
| |
1,892 |
|
|
GCAT, Series 2014-1A, Class A1, VAR, 3.228%, 07/25/19 (e) |
|
|
1,892 |
|
| |
274 |
|
|
GE Capital Mortgage Services, Inc. Trust, Series 1999-HE1, Class M, VAR, 6.705%, 04/25/29 |
|
|
271 |
|
|
|
|
|
GE Equipment Midticket LLC, |
|
|
|
|
| |
515 |
|
|
Series 2012-1, Class A3, 0.600%, 05/23/16 |
|
|
516 |
|
| |
360 |
|
|
Series 2012-1, Class A4, 0.780%, 09/22/20 |
|
|
360 |
|
| |
3,844 |
|
|
GLC Trust, Series 2014-A, Class A, 3.000%, 07/15/21 (e) |
|
|
3,824 |
|
|
|
|
|
GMAT Trust, |
|
|
|
|
| |
1,777 |
|
|
Series 2013-1A, Class A, SUB, 3.967%, 11/25/43 (e) |
|
|
1,782 |
|
| |
1,228 |
|
|
Series 2014-1A, Class A, SUB, 3.721%, 02/25/44 (e) |
|
|
1,231 |
|
|
|
|
|
HLSS Servicer Advance Receivables Backed Notes, |
|
|
|
|
| |
2,662 |
|
|
Series 2013-T2, Class A2, 1.147%, 05/16/44 (e) |
|
|
2,664 |
|
| |
2,140 |
|
|
Series 2013-T7, Class AT7, 1.981%, 11/15/46 (e) |
|
|
2,148 |
|
|
|
|
|
HLSS Servicer Advance Receivables Trust, |
|
|
|
|
| |
1,560 |
|
|
Series 2012-T2, Class A2, 1.990%, 10/15/45 (e) |
|
|
1,572 |
|
| |
1,197 |
|
|
Series 2013-T1, Class A2, 1.495%, 01/16/46 (e) |
|
|
1,199 |
|
| |
497 |
|
|
Series 2013-T1, Class B2, 1.744%, 01/16/46 (e) |
|
|
496 |
|
| |
718 |
|
|
Series 2014-T1, Class AT1, 1.244%, 01/17/45 (e) |
|
|
719 |
|
| |
997 |
|
|
Series 2014-T2, Class AT2, 2.217%, 01/15/47 (e) |
|
|
1,005 |
|
| |
177 |
|
|
Home Equity Mortgage Loan Asset-Backed Trust, Series 2006-A, Class A3, VAR, 0.355%, 03/25/36 |
|
|
139 |
|
SEE NOTES TO
FINANCIAL STATEMENTS.
|
|
|
|
|
|
|
|
|
|
|
| 10 |
|
|
|
JPMORGAN INSTITUTIONAL TRUST FUNDS |
|
AUGUST 31, 2014 |
|
|
|
|
|
|
|
|
|
PRINCIPAL
AMOUNT($) |
|
|
SECURITY DESCRIPTION |
|
VALUE($) |
|
| |
Asset-Backed Securities — continued |
|
|
|
|
|
|
|
|
Honda Auto Receivables Owner Trust, |
|
|
|
|
| |
388 |
|
|
Series 2012-1, Class A4, 0.970%, 04/16/18 |
|
|
389 |
|
| |
187 |
|
|
Series 2012-2, Class A3, 0.700%, 02/16/16 |
|
|
188 |
|
| |
1 |
|
|
Series 2013-1, Class A2, 0.350%, 06/22/15 |
|
|
1 |
|
| |
1,527 |
|
|
Series 2013-4, Class A3, 0.690%, 09/18/17 |
|
|
1,528 |
|
| |
930 |
|
|
Series 2014-2, Class A3, 0.770%, 03/19/18 |
|
|
930 |
|
|
|
|
|
HSBC Home Equity Loan Trust USA, |
|
|
|
|
| |
680 |
|
|
Series 2006-1, Class A1, VAR, 0.316%, 01/20/36 |
|
|
676 |
|
| |
1,312 |
|
|
Series 2007-3, Class APT, VAR, 1.356%, 11/20/36 |
|
|
1,312 |
|
|
|
|
|
Huntington Auto Trust, |
|
|
|
|
| |
66 |
|
|
Series 2011-1A, Class A3, 1.010%, 01/15/16 (e) |
|
|
66 |
|
| |
1,000 |
|
|
Series 2011-1A, Class A4, 1.310%, 11/15/16 (e) |
|
|
1,005 |
|
| |
262 |
|
|
Series 2012-1, Class A3, 0.810%, 09/15/16 |
|
|
262 |
|
|
|
|
|
Hyundai Auto Receivables Trust, |
|
|
|
|
| |
360 |
|
|
Series 2010-B, Class A4, 1.630%, 03/15/17 |
|
|
362 |
|
| |
116 |
|
|
Series 2011-A, Class A4, 1.780%, 12/15/15 |
|
|
116 |
|
| |
427 |
|
|
Series 2011-B, Class A4, 1.650%, 02/15/17 |
|
|
428 |
|
| |
104 |
|
|
Series 2013-A, Class A2, 0.400%, 12/15/15 |
|
|
104 |
|
| |
581 |
|
|
John Deere Owner Trust, Series 2012-B, Class A4, 0.690%, 01/15/19 |
|
|
580 |
|
|
|
|
|
KGS-Alpha Capital Markets LP, |
|
|
|
|
| |
19,491 |
|
|
VAR, 11.244%, 08/25/38 |
|
|
746 |
|
| |
12,198 |
|
|
Series 2013-2, VAR, 18.053%, 03/25/39 |
|
|
702 |
|
| |
275 |
|
|
Kondaur Mortgage Asset Trust LLC, Series 2013-1, Class A, VAR, 4.458%, 08/25/52 (e) |
|
|
276 |
|
| |
269 |
|
|
Lake Country Mortgage Loan Trust, Series 2006-HE1, Class A3, VAR, 0.505%, 07/25/34 (e) |
|
|
267 |
|
| |
434 |
|
|
Long Beach Mortgage Loan Trust, Series 2006-WL2, Class 2A3, VAR, 0.355%, 01/25/36 |
|
|
411 |
|
|
|
|
|
LV Tower 52 Issuer LLC, |
|
|
|
|
| |
2,749 |
|
|
Series 2013-1, Class A, 5.500%, 06/15/18 (e) (i) |
|
|
2,752 |
|
| |
1,430 |
|
|
Series 2013-1, Class M, 7.500%, 06/15/18 (e) (i) |
|
|
1,430 |
|
| |
210 |
|
|
Macquarie Equipment Funding Trust, Series 2012-A, Class A2, 0.610%, 04/20/15 (e) |
|
|
210 |
|
| |
625 |
|
|
Madison Avenue Manufactured Housing Contract Trust, Series 2002-A, Class M2, VAR, 2.405%, 03/25/32 |
|
|
625 |
|
| |
1,076 |
|
|
Mid-State Capital Corp. Trust, Series 2006- 1, Class M1, 6.083%, 10/15/40 (e) |
|
|
1,109 |
|
| |
2,637 |
|
|
MMCA Auto Owner Trust, Series 2012-A, Class A4, 1.570%, 08/15/17 (e) |
|
|
2,658 |
|
|
|
|
|
|
|
|
|
|
PRINCIPAL
AMOUNT($) |
|
|
SECURITY DESCRIPTION |
|
VALUE($) |
|
|
|
|
|
|
|
|
|
|
|
|
|
|
Nationstar Agency Advance Funding Trust, |
|
|
|
|
| |
1,078 |
|
|
Series 2013-T1A, Class AT1, 0.997%,
02/15/45 (e) |
|
|
1,077 |
|
| |
439 |
|
|
Series 2013-T2A, Class AT2, 1.892%,
02/18/48 (e) |
|
|
428 |
|
| |
216 |
|
|
Series 2013-T2A, Class BT2, 2.487%,
02/18/48 (e) |
|
|
214 |
|
| |
930 |
|
|
Navitas Equipment Receivables LLC, Series 2013-1, Class A, 1.950%, 11/15/16 (e) |
|
|
930 |
|
| |
689 |
|
|
NCUA Guaranteed Notes Trust, Series 2010-A1, Class A, VAR, 0.509%, 12/07/20 |
|
|
690 |
|
| |
964 |
|
|
New Century Home Equity Loan Trust, Series 2003-5, Class AI6, SUB, 5.500%, 11/25/33 |
|
|
991 |
|
| |
2,417 |
|
|
New Residential Advance Receivables Trust, Series 2014-T1, Class A1, 1.274%, 03/15/45 (e) |
|
|
2,420 |
|
| |
611 |
|
|
Nissan Auto Lease Trust, Series 2013-B, Class A3, 0.750%, 06/15/16 |
|
|
610 |
|
| |
333 |
|
|
Nissan Auto Receivables Owner Trust, Series 2012-A, Class A4, 1.000%, 07/16/18 |
|
|
335 |
|
| |
5,697 |
|
|
Normandy Mortgage Loan Co. LLC, Series 2013-NPL3, Class A, SUB, 4.949%, 09/16/43 (e) |
|
|
5,688 |
|
|
|
|
|
NYMT Residential LLC, |
|
|
|
|
| |
1,500 |
|
|
Series 2012-RP1A, Class NOTE, VAR, 4.250%, 12/25/17 (e) (i) |
|
|
1,500 |
|
| |
2,298 |
|
|
Series 2013-RP3A, Class NOTE, SUB, 4.850%, 09/25/18 (e) (i) |
|
|
2,298 |
|
| |
1,952 |
|
|
OnDeck Asset Securitization Trust LLC, Series 2014-1A, Class A, 3.150%, 05/17/18 (e) |
|
|
1,958 |
|
|
|
|
|
OneMain Financial Issuance Trust, |
|
|
|
|
| |
2,744 |
|
|
Series 2014-1A, Class A, 2.430%, 06/18/24 (e) |
|
|
2,744 |
|
| |
402 |
|
|
Series 2014-1A, Class B, 3.240%, 06/18/24 (e) |
|
|
405 |
|
| |
3,672 |
|
|
Series 2014-2A, Class A, 2.470%, 09/18/24 (e) |
|
|
3,673 |
|
| |
1,491 |
|
|
Series 2014-2A, Class B, 3.020%, 09/18/24 (e) |
|
|
1,491 |
|
| |
1,012 |
|
|
Park Place Securities, Inc., Asset-Backed Pass-Through Certificates, Series 2004-MCW1, Class M1, VAR, 1.092%,
10/25/34 |
|
|
1,006 |
|
| |
670 |
|
|
PFS Tax Lien Trust, Series 2014-1, Class NOTE, 1.440%, 05/15/29 (e) |
|
|
672 |
|
| |
1,000 |
|
|
Progreso Receivables Funding I LLC, Series 2013-A, Class A, 4.000%, 07/09/18 (e) |
|
|
1,007 |
|
| |
2,353 |
|
|
Progreso Receivables Funding II LLC, Series 2014-A, Class A, 3.500%, 07/08/19 (e) |
|
|
2,353 |
|
| |
2,178 |
|
|
RAMP Trust, Series 2006-RZ1, Class A3, VAR, 0.455%, 03/25/36 |
|
|
2,123 |
|
| |
2,727 |
|
|
RBSHD Trust, Series 2013-1A, Class A, SUB, 4.685%, 10/25/47 (e) (i) |
|
|
2,738 |
|
SEE NOTES TO
FINANCIAL STATEMENTS.
|
|
|
|
|
|
|
|
|
|
|
|
|
| AUGUST 31, 2014 |
|
JPMORGAN INSTITUTIONAL TRUST FUNDS |
|
|
|
|
11 |
|
JPMorgan Core Bond Trust
SCHEDULE OF PORTFOLIO INVESTMENTS
AS OF AUGUST 31, 2014 (Unaudited) (continued)
(Amounts in thousands)
|
|
|
|
|
|
|
|
|
PRINCIPAL
AMOUNT($) |
|
|
SECURITY DESCRIPTION |
|
VALUE($) |
|
| |
Asset-Backed Securities — continued |
|
|
|
|
| |
296 |
|
|
Renaissance Home Equity Loan Trust, Series 2007-2, Class AF2, SUB, 5.675%, 06/25/37 |
|
|
160 |
|
| |
345 |
|
|
RMAT, Series 2012-1A, Class A1, VAR, 2.734%, 08/26/52 (e) (i) |
|
|
347 |
|
|
|
|
|
Santander Drive Auto Receivables Trust, |
|
|
|
|
| |
8 |
|
|
Series 2012-3, Class A3, 1.080%, 04/15/16 |
|
|
8 |
|
| |
59 |
|
|
Series 2012-6, Class A3, 0.620%, 07/15/16 |
|
|
59 |
|
| |
443 |
|
|
Saxon Asset Securities Trust, Series 2003-1, Class AF6, SUB, 4.795%, 06/25/33 |
|
|
448 |
|
| |
300 |
|
|
Securitized Asset-Backed Receivables LLC Trust, Series 2006-CB1, Class AF2, SUB, 3.509%, 01/25/36 |
|
|
224 |
|
| |
611 |
|
|
Selene Non-Performing Loans LLC, Series 2014-1A, Class A, SUB, 2.981%, 05/25/54 (e) |
|
|
611 |
|
|
|
|
|
SNAAC Auto Receivables Trust, |
|
|
|
|
| |
124 |
|
|
Series 2013-1A, Class A, 1.140%, 07/16/18 (e) |
|
|
124 |
|
| |
968 |
|
|
Series 2014-1A, Class A, 1.030%, 09/17/18 (e) |
|
|
968 |
|
|
|
|
|
SpringCastle America Funding LLC, |
|
|
|
|
| |
3,372 |
|
|
Series 2013-1A, Class A, 4.000%, 04/03/21 (e) |
|
|
3,385 |
|
| |
6,542 |
|
|
Series 2013-1A, Class B, 4.000%, 12/03/24 (e) |
|
|
6,561 |
|
|
|
|
|
Springleaf Funding Trust, |
|
|
|
|
| |
9,200 |
|
|
Series 2013-AA, Class A, 2.580%, 09/15/21 (e) |
|
|
9,268 |
|
| |
3,000 |
|
|
Series 2013-BA, Class A, 3.920%, 01/16/23 (e) |
|
|
3,069 |
|
| |
2,000 |
|
|
Series 2013-BA, Class B, 4.820%, 01/16/23 (e) |
|
|
2,082 |
|
| |
6,533 |
|
|
Series 2014-AA, Class A, 2.410%, 12/15/22 (e) |
|
|
6,529 |
|
| |
525 |
|
|
Series 2014-AA, Class B, 3.450%, 12/15/22 (e) |
|
|
525 |
|
|
|
|
|
Stanwich Mortgage Loan Co. LLC, |
|
|
|
|
| |
680 |
|
|
Series 2012-NPL4, Class A, 2.981%, 09/15/42 (e) |
|
|
680 |
|
| |
1,607 |
|
|
Series 2013-NPL2, Class A, 3.228%, 04/16/59 (e) |
|
|
1,610 |
|
| |
1,477 |
|
|
Stanwich Mortgage Loan Trust, Series 2013-NPL1, Class A, 2.981%, 02/16/43 (e) |
|
|
1,475 |
|
| |
179 |
|
|
Structured Asset Securities Corp. Mortgage Pass-Through Certificates, Series 2002-23XS, Class A7, SUB, 6.580%,
11/25/32 |
|
|
187 |
|
| |
3,844 |
|
|
Trafigura Securitisation Finance plc, (Ireland), Series 2012-1A, Class A, VAR, 2.555%, 10/15/15 (e) |
|
|
3,869 |
|
| |
3,085 |
|
|
Truman Capital Mortgage Loan Trust, Series 2014-NLP1, Class A1, SUB, 3.228%, 07/25/53 (e) |
|
|
3,081 |
|
|
|
|
|
|
|
|
|
|
PRINCIPAL
AMOUNT($) |
|
|
SECURITY DESCRIPTION |
|
VALUE($) |
|
|
|
|
|
|
|
|
|
|
| |
1,361 |
|
|
U.S. Residential Opportunity Fund Trust, Series 2014-1A, Class NOTE, SUB, 3.466%, 03/25/34 (e) |
|
|
1,365 |
|
|
|
|
|
Vericrest Opportunity Loan Transferee LLC, |
|
|
|
|
| |
578 |
|
|
Series 2013-NPL4, Class A1, SUB, 3.960%, 11/25/53 (e) |
|
|
581 |
|
| |
2,987 |
|
|
Series 2013-NPL7, Class A1, SUB, 3.625%, 11/25/53 (e) |
|
|
2,998 |
|
| |
2,757 |
|
|
Series 2014-NPL1, Class A1, SUB, 3.625%, 10/27/53 (e) |
|
|
2,762 |
|
| |
2,771 |
|
|
Series 2014-NPL2, Class A1, SUB, 3.625%, 11/25/53 (e) |
|
|
2,779 |
|
| |
5,111 |
|
|
Series 2014-NPL3, Class A1, SUB, 3.250%, 11/25/53 (e) |
|
|
5,121 |
|
| |
3,979 |
|
|
Series 2014-NPL4, Class A1, SUB, 3.125%, 04/27/54 (e) |
|
|
3,978 |
|
| |
2,449 |
|
|
Series 2014-NPL5, Class A1, SUB, 3.228%, 09/25/58 (e) |
|
|
2,440 |
|
| |
295 |
|
|
Volkswagen Auto Lease Trust, Series 2012-A, Class A3, 0.870%, 07/20/15 |
|
|
296 |
|
| |
853 |
|
|
Volkswagen Auto Loan Enhanced Trust, Series 2012-1, Class A3, 0.850%,
08/22/16 |
|
|
855 |
|
| |
1,547 |
|
|
VOLT NPL IX LLC, Series 2013-NPL3, Class A1, SUB, 4.250%, 04/25/53 (e) |
|
|
1,557 |
|
| |
2,059 |
|
|
VOLT XIX LLC, Series 2013-NPL5, Class A1, SUB, 3.625%, 04/25/55 (e) |
|
|
2,065 |
|
| |
1,149 |
|
|
VOLT XV LLC, Series 2014-3A, Class A1, SUB, 3.250%, 05/26/54 (e) |
|
|
1,157 |
|
|
|
|
|
VOLT XX LLC, |
|
|
|
|
| |
3,458 |
|
|
Series 2013-NPL6, Class A1, SUB, 3.625%, 03/25/54 (e) |
|
|
3,477 |
|
| |
1,299 |
|
|
Series 2013-NPL6, Class A2, SUB, 5.250%, 03/25/54 (e) |
|
|
1,305 |
|
|
|
|
|
Westgate Resorts LLC, |
|
|
|
|
| |
616 |
|
|
Series 2012-1, Class A, 4.500%, 09/20/25 (e) |
|
|
621 |
|
| |
949 |
|
|
Series 2012-2A, Class A, 3.000%, 01/20/25 (e) |
|
|
957 |
|
| |
512 |
|
|
Series 2012-3A, Class A, 2.500%, 03/20/25 (e) |
|
|
515 |
|
| |
1,081 |
|
|
Series 2013-1A, Class A, 2.250%, 08/20/25 (e) |
|
|
1,083 |
|
|
|
|
|
World Omni Auto Receivables Trust, |
|
|
|
|
| |
1,164 |
|
|
Series 2013-B, Class A3, 0.830%, 08/15/18 |
|
|
1,166 |
|
| |
413 |
|
|
Series 2013-B, Class A4, 1.320%, 01/15/20 |
|
|
413 |
|
|
|
|
|
|
|
|
|
|
|
|
|
|
Total Asset-Backed Securities
(Cost $223,188) |
|
|
225,104 |
|
|
|
|
|
|
|
|
|
|
SEE NOTES TO
FINANCIAL STATEMENTS.
|
|
|
|
|
|
|
|
|
|
|
| 12 |
|
|
|
JPMORGAN INSTITUTIONAL TRUST FUNDS |
|
AUGUST 31, 2014 |
|
|
|
|
|
|
|
|
|
PRINCIPAL
AMOUNT($) |
|
|
SECURITY DESCRIPTION |
|
VALUE($) |
|
| |
Collateralized Mortgage Obligations — 23.2% |
|
|
|
|
|
Agency CMO — 16.2% |
|
|
|
|
| |
652 |
|
|
Federal Home Loan Bank, Series TQ-2015, Class A, 5.065%, 10/20/15 |
|
|
679 |
|
| |
197 |
|
|
Federal Home Loan Mortgage Corp. - Government National Mortgage Association, Series 8, Class ZA, 7.000%, 03/25/23 |
|
|
219 |
|
|
|
|
|
Federal Home Loan Mortgage Corp. REMIC, |
|
|
|
|
| |
9 |
|
|
Series 11, Class D, 9.500%, 07/15/19 |
|
|
9 |
|
| |
8 |
|
|
Series 22, Class C, 9.500%, 04/15/20 |
|
|
9 |
|
| |
13 |
|
|
Series 23, Class F, 9.600%, 04/15/20 |
|
|
15 |
|
| |
— |
(h) |
|
Series 41, Class I, HB, 84.000%, 05/15/20 |
|
|
— |
(h) |
| |
1 |
|
|
Series 47, Class F, 10.000%, 06/15/20 |
|
|
1 |
|
| |
3 |
|
|
Series 99, Class Z, 9.500%, 01/15/21 |
|
|
4 |
|
| |
— |
(h) |
|
Series 204, Class E, HB, IF, 1,857.616%, 05/15/23 |
|
|
— |
(h) |
| |
— |
(h) |
|
Series 1045, Class G, HB, 1,066.209%, 02/15/21 |
|
|
— |
(h) |
| |
5 |
|
|
Series 1065, Class J, 9.000%, 04/15/21 |
|
|
6 |
|
| |
1 |
|
|
Series 1079, Class S, HB, IF, 33.473%, 05/15/21 |
|
|
2 |
|
| |
5 |
|
|
Series 1084, Class F, VAR, 1.105%, 05/15/21 |
|
|
5 |
|
| |
3 |
|
|
Series 1084, Class S, HB, IF, 44.528%, 05/15/21 |
|
|
6 |
|
| |
10 |
|
|
Series 1116, Class I, 5.500%, 08/15/21 |
|
|
11 |
|
| |
13 |
|
|
Series 1144, Class KB, 8.500%, 09/15/21 |
|
|
15 |
|
| |
— |
(h) |
|
Series 1172, Class L, HB, VAR, 1,181.250%, 11/15/21 |
|
|
— |
(h) |
| |
— |
(h) |
|
Series 1196, Class B, HB, IF, 1,180.777%, 01/15/22 |
|
|
5 |
|
| |
10 |
|
|
Series 1250, Class J, 7.000%, 05/15/22 |
|
|
11 |
|
| |
18 |
|
|
Series 1343, Class LA, 8.000%, 08/15/22 |
|
|
20 |
|
| |
22 |
|
|
Series 1343, Class LB, 7.500%, 08/15/22 |
|
|
26 |
|
| |
39 |
|
|
Series 1370, Class JA, VAR, 1.305%, 09/15/22 |
|
|
39 |
|
| |
40 |
|
|
Series 1455, Class WB, IF, 4.598%, 12/15/22 |
|
|
42 |
|
| |
177 |
|
|
Series 1466, Class PZ, 7.500%, 02/15/23 |
|
|
199 |
|
| |
3 |
|
|
Series 1470, Class F, VAR, 1.668%, 02/15/23 |
|
|
3 |
|
| |
198 |
|
|
Series 1498, Class I, VAR, 1.305%, 04/15/23 |
|
|
203 |
|
| |
291 |
|
|
Series 1502, Class PX, 7.000%, 04/15/23 |
|
|
322 |
|
| |
35 |
|
|
Series 1505, Class Q, 7.000%, 05/15/23 |
|
|
38 |
|
| |
81 |
|
|
Series 1518, Class G, IF, 8.875%, 05/15/23 |
|
|
96 |
|
| |
26 |
|
|
Series 1541, Class M, HB, IF, 24.849%, 07/15/23 |
|
|
42 |
|
| |
71 |
|
|
Series 1541, Class O, VAR, 1.830%, 07/15/23 |
|
|
72 |
|
|
|
|
|
|
|
|
|
|
PRINCIPAL
AMOUNT($) |
|
|
SECURITY DESCRIPTION |
|
VALUE($) |
|
|
|
|
|
|
|
|
|
|
| |
8 |
|
|
Series 1570, Class F, VAR, 2.168%, 08/15/23 |
|
|
8 |
|
| |
272 |
|
|
Series 1573, Class PZ, 7.000%, 09/15/23 |
|
|
305 |
|
| |
162 |
|
|
Series 1591, Class PV, 6.250%, 10/15/23 |
|
|
178 |
|
| |
27 |
|
|
Series 1602, Class SA, HB, IF, 22.246%, 10/15/23 |
|
|
48 |
|
| |
702 |
|
|
Series 1608, Class L, 6.500%, 09/15/23 |
|
|
769 |
|
| |
39 |
|
|
Series 1609, Class LG, IF, 16.997%, 11/15/23 |
|
|
41 |
|
| |
474 |
|
|
Series 1638, Class H, 6.500%, 12/15/23 |
|
|
524 |
|
| |
331 |
|
|
Series 1642, Class PJ, 6.000%, 11/15/23 |
|
|
369 |
|
| |
14 |
|
|
Series 1671, Class QC, IF, 10.000%, 02/15/24 |
|
|
18 |
|
| |
16 |
|
|
Series 1686, Class SH, IF, 18.889%, 02/15/24 |
|
|
23 |
|
| |
113 |
|
|
Series 1695, Class EB, 7.000%, 03/15/24 |
|
|
127 |
|
| |
23 |
|
|
Series 1699, Class FC, VAR, 0.755%, 03/15/24 |
|
|
23 |
|
| |
125 |
|
|
Series 1700, Class GA, PO, 02/15/24 |
|
|
117 |
|
| |
316 |
|
|
Series 1706, Class K, 7.000%, 03/15/24 |
|
|
358 |
|
| |
11 |
|
|
Series 1709, Class FA, VAR, 1.680%, 03/15/24 |
|
|
11 |
|
| |
35 |
|
|
Series 1745, Class D, 7.500%, 08/15/24 |
|
|
40 |
|
| |
683 |
|
|
Series 1760, Class ZD, VAR, 2.030%, 02/15/24 |
|
|
700 |
|
| |
255 |
|
|
Series 1798, Class F, 5.000%, 05/15/23 |
|
|
277 |
|
| |
4 |
|
|
Series 1807, Class G, 9.000%, 10/15/20 |
|
|
4 |
|
| |
66 |
|
|
Series 1829, Class ZB, 6.500%, 03/15/26 |
|
|
73 |
|
| |
70 |
|
|
Series 1863, Class Z, 6.500%, 07/15/26 |
|
|
77 |
|
| |
39 |
|
|
Series 1865, Class D, PO, 02/15/24 |
|
|
34 |
|
| |
52 |
|
|
Series 1890, Class H, 7.500%, 09/15/26 |
|
|
60 |
|
| |
146 |
|
|
Series 1899, Class ZE, 8.000%, 09/15/26 |
|
|
170 |
|
| |
9 |
|
|
Series 1935, Class FL, VAR, 0.855%, 02/15/27 |
|
|
9 |
|
| |
111 |
|
|
Series 1963, Class Z, 7.500%, 01/15/27 |
|
|
128 |
|
| |
16 |
|
|
Series 1970, Class PG, 7.250%, 07/15/27 |
|
|
18 |
|
| |
207 |
|
|
Series 1981, Class Z, 6.000%, 05/15/27 |
|
|
231 |
|
| |
78 |
|
|
Series 1987, Class PE, 7.500%, 09/15/27 |
|
|
87 |
|
| |
181 |
|
|
Series 2019, Class Z, 6.500%, 12/15/27 |
|
|
205 |
|
| |
54 |
|
|
Series 2033, Class SN, HB, IF, 28.431%, 03/15/24 |
|
|
24 |
|
| |
148 |
|
|
Series 2038, Class PN, IO, 7.000%, 03/15/28 |
|
|
29 |
|
| |
310 |
|
|
Series 2040, Class PE, 7.500%, 03/15/28 |
|
|
356 |
|
| |
47 |
|
|
Series 2043, Class CJ, 6.500%, 04/15/28 |
|
|
54 |
|
| |
250 |
|
|
Series 2054, Class PV, 7.500%, 05/15/28 |
|
|
287 |
|
| |
425 |
|
|
Series 2075, Class PH, 6.500%, 08/15/28 |
|
|
477 |
|
| |
478 |
|
|
Series 2075, Class PM, 6.250%, 08/15/28 |
|
|
539 |
|
SEE NOTES TO
FINANCIAL STATEMENTS.
|
|
|
|
|
|
|
|
|
|
|
|
|
| AUGUST 31, 2014 |
|
JPMORGAN INSTITUTIONAL TRUST FUNDS |
|
|
|
|
13 |
|
JPMorgan Core Bond Trust
SCHEDULE OF PORTFOLIO INVESTMENTS
AS OF AUGUST 31, 2014 (Unaudited) (continued)
(Amounts in thousands)
|
|
|
|
|
|
|
|
|
PRINCIPAL
AMOUNT($) |
|
|
SECURITY DESCRIPTION |
|
VALUE($) |
|
| |
Collateralized Mortgage Obligations — continued |
|
|
|
|
|
Agency CMO — continued |
|
|
|
|
| |
134 |
|
|
Series 2086, Class GB, 6.000%, 09/15/28 |
|
|
150 |
|
| |
201 |
|
|
Series 2089, Class PJ, IO, 7.000%, 10/15/28 |
|
|
39 |
|
| |
589 |
|
|
Series 2095, Class PE, 6.000%, 11/15/28 |
|
|
652 |
|
| |
183 |
|
|
Series 2125, Class JZ, 6.000%, 02/15/29 |
|
|
202 |
|
| |
43 |
|
|
Series 2132, Class SB, HB, IF, 29.875%, 03/15/29 |
|
|
78 |
|
| |
24 |
|
|
Series 2134, Class PI, IO, 6.500%, 03/15/19 |
|
|
3 |
|
| |
246 |
|
|
Series 2136, Class PG, 6.000%, 03/15/29 |
|
|
275 |
|
| |
73 |
|
|
Series 2141, Class IO, IO, 7.000%, 04/15/29 |
|
|
14 |
|
| |
65 |
|
|
Series 2163, Class PC, IO, 7.500%, 06/15/29 |
|
|
12 |
|
| |
687 |
|
|
Series 2169, Class TB, 7.000%, 06/15/29 |
|
|
788 |
|
| |
357 |
|
|
Series 2172, Class QC, 7.000%, 07/15/29 |
|
|
403 |
|
| |
320 |
|
|
Series 2176, Class OJ, 7.000%, 08/15/29 |
|
|
370 |
|
| |
182 |
|
|
Series 2201, Class C, 8.000%, 11/15/29 |
|
|
212 |
|
| |
166 |
|
|
Series 2209, Class TC, 8.000%, 01/15/30 |
|
|
199 |
|
| |
282 |
|
|
Series 2210, Class Z, 8.000%, 01/15/30 |
|
|
327 |
|
| |
57 |
|
|
Series 2224, Class CB, 8.000%, 03/15/30 |
|
|
69 |
|
| |
157 |
|
|
Series 2230, Class Z, 8.000%, 04/15/30 |
|
|
184 |
|
| |
122 |
|
|
Series 2234, Class PZ, 7.500%, 05/15/30 |
|
|
141 |
|
| |
105 |
|
|
Series 2247, Class Z, 7.500%, 08/15/30 |
|
|
121 |
|
| |
155 |
|
|
Series 2256, Class MC, 7.250%, 09/15/30 |
|
|
178 |
|
| |
305 |
|
|
Series 2259, Class ZM, 7.000%, 10/15/30 |
|
|
350 |
|
| |
9 |
|
|
Series 2261, Class ZY, 7.500%, 10/15/30 |
|
|
11 |
|
| |
36 |
|
|
Series 2262, Class Z, 7.500%, 10/15/30 |
|
|
42 |
|
| |
346 |
|
|
Series 2271, Class PC, 7.250%, 12/15/30 |
|
|
397 |
|
| |
414 |
|
|
Series 2283, Class K, 6.500%, 12/15/23 |
|
|
462 |
|
| |
154 |
|
|
Series 2296, Class PD, 7.000%, 03/15/31 |
|
|
178 |
|
| |
49 |
|
|
Series 2306, Class K, PO, 05/15/24 |
|
|
46 |
|
| |
115 |
|
|
Series 2306, Class SE, IF, IO, 8.070%, 05/15/24 |
|
|
21 |
|
| |
213 |
|
|
Series 2313, Class LA, 6.500%, 05/15/31 |
|
|
240 |
|
| |
276 |
|
|
Series 2325, Class PM, 7.000%, 06/15/31 |
|
|
296 |
|
| |
220 |
|
|
Series 2344, Class QG, 6.000%, 08/15/16 |
|
|
228 |
|
| |
1,618 |
|
|
Series 2344, Class ZD, 6.500%, 08/15/31 |
|
|
1,855 |
|
| |
138 |
|
|
Series 2344, Class ZJ, 6.500%, 08/15/31 |
|
|
157 |
|
| |
148 |
|
|
Series 2345, Class NE, 6.500%, 08/15/31 |
|
|
166 |
|
| |
85 |
|
|
Series 2345, Class PQ, 6.500%, 08/15/16 |
|
|
89 |
|
| |
137 |
|
|
Series 2351, Class PZ, 6.500%, 08/15/31 |
|
|
154 |
|
| |
1,261 |
|
|
Series 2353, Class AZ, 6.000%, 09/15/31 |
|
|
1,383 |
|
| |
93 |
|
|
Series 2353, Class TD, 6.000%, 09/15/16 |
|
|
97 |
|
| |
74 |
|
|
Series 2355, Class BP, 6.000%, 09/15/16 |
|
|
77 |
|
| |
48 |
|
|
Series 2359, Class PM, 6.000%, 09/15/16 |
|
|
50 |
|
|
|
|
|
|
|
|
|
|
PRINCIPAL
AMOUNT($) |
|
|
SECURITY DESCRIPTION |
|
VALUE($) |
|
|
|
|
|
|
|
|
|
|
|
|
|
|
Agency CMO — continued |
|
|
|
|
| |
542 |
|
|
Series 2359, Class ZB, 8.500%, 06/15/31 |
|
|
651 |
|
| |
131 |
|
|
Series 2360, Class PG, 6.000%, 09/15/16 |
|
|
136 |
|
| |
29 |
|
|
Series 2363, Class PF, 6.000%, 09/15/16 |
|
|
30 |
|
| |
59 |
|
|
Series 2366, Class MD, 6.000%, 10/15/16 |
|
|
62 |
|
| |
272 |
|
|
Series 2367, Class ME, 6.500%, 10/15/31 |
|
|
300 |
|
| |
192 |
|
|
Series 2391, Class QR, 5.500%, 12/15/16 |
|
|
199 |
|
| |
91 |
|
|
Series 2394, Class MC, 6.000%, 12/15/16 |
|
|
95 |
|
| |
543 |
|
|
Series 2396, Class FM, VAR, 0.605%, 12/15/31 |
|
|
548 |
|
| |
301 |
|
|
Series 2399, Class OH, 6.500%, 01/15/32 |
|
|
341 |
|
| |
497 |
|
|
Series 2399, Class TH, 6.500%, 01/15/32 |
|
|
560 |
|
| |
474 |
|
|
Series 2410, Class NG, 6.500%, 02/15/32 |
|
|
540 |
|
| |
183 |
|
|
Series 2410, Class OE, 6.375%, 02/15/32 |
|
|
197 |
|
| |
332 |
|
|
Series 2410, Class QS, IF, 19.097%, 02/15/32 |
|
|
502 |
|
| |
176 |
|
|
Series 2410, Class QX, IF, IO, 8.495%, 02/15/32 |
|
|
49 |
|
| |
368 |
|
|
Series 2412, Class SP, IF, 15.790%, 02/15/32 |
|
|
475 |
|
| |
548 |
|
|
Series 2420, Class XK, 6.500%, 02/15/32 |
|
|
621 |
|
| |
450 |
|
|
Series 2423, Class MC, 7.000%, 03/15/32 |
|
|
518 |
|
| |
417 |
|
|
Series 2423, Class MT, 7.000%, 03/15/32 |
|
|
480 |
|
| |
100 |
|
|
Series 2425, Class OB, 6.000%, 03/15/17 |
|
|
105 |
|
| |
874 |
|
|
Series 2430, Class WF, 6.500%, 03/15/32 |
|
|
984 |
|
| |
475 |
|
|
Series 2434, Class TC, 7.000%, 04/15/32 |
|
|
532 |
|
| |
565 |
|
|
Series 2435, Class CJ, 6.500%, 04/15/32 |
|
|
616 |
|
| |
393 |
|
|
Series 2436, Class MC, 7.000%, 04/15/32 |
|
|
442 |
|
| |
317 |
|
|
Series 2444, Class ES, IF, IO, 7.795%, 03/15/32 |
|
|
88 |
|
| |
216 |
|
|
Series 2450, Class GZ, 7.000%, 05/15/32 |
|
|
247 |
|
| |
254 |
|
|
Series 2450, Class SW, IF, IO, 7.845%, 03/15/32 |
|
|
57 |
|
| |
1,231 |
|
|
Series 2455, Class GK, 6.500%, 05/15/32 |
|
|
1,384 |
|
| |
45 |
|
|
Series 2458, Class QE, 5.500%, 06/15/17 |
|
|
47 |
|
| |
380 |
|
|
Series 2462, Class JG, 6.500%, 06/15/32 |
|
|
428 |
|
| |
839 |
|
|
Series 2464, Class SI, IF, IO, 7.845%, 02/15/32 |
|
|
223 |
|
| |
856 |
|
|
Series 2466, Class PH, 6.500%, 06/15/32 |
|
|
928 |
|
| |
369 |
|
|
Series 2474, Class NR, 6.500%, 07/15/32 |
|
|
415 |
|
| |
494 |
|
|
Series 2484, Class LZ, 6.500%, 07/15/32 |
|
|
558 |
|
| |
677 |
|
|
Series 2500, Class MC, 6.000%, 09/15/32 |
|
|
767 |
|
| |
39 |
|
|
Series 2503, Class BH, 5.500%, 09/15/17 |
|
|
41 |
|
| |
188 |
|
|
Series 2508, Class AQ, 5.500%, 10/15/17 |
|
|
199 |
|
| |
488 |
|
|
Series 2512, Class PG, 5.500%, 10/15/22 |
|
|
535 |
|
| |
276 |
|
|
Series 2535, Class BK, 5.500%, 12/15/22 |
|
|
303 |
|
| |
373 |
|
|
Series 2537, Class TE, 5.500%, 12/15/17 |
|
|
394 |
|
SEE NOTES TO
FINANCIAL STATEMENTS.
|
|
|
|
|
|
|
|
|
|
|
| 14 |
|
|
|
JPMORGAN INSTITUTIONAL TRUST FUNDS |
|
AUGUST 31, 2014 |
|
|
|
|
|
|
|
|
|
PRINCIPAL
AMOUNT($) |
|
|
SECURITY DESCRIPTION |
|
VALUE($) |
|
| |
Collateralized Mortgage Obligations — continued |
|
|
|
|
|
Agency CMO — continued |
|
|
|
|
| |
932 |
|
|
Series 2543, Class YX, 6.000%, 12/15/32 |
|
|
1,036 |
|
| |
837 |
|
|
Series 2544, Class HC, 6.000%, 12/15/32 |
|
|
930 |
|
| |
1,033 |
|
|
Series 2552, Class ME, 6.000%, 01/15/33 |
|
|
1,146 |
|
| |
1,025 |
|
|
Series 2567, Class QD, 6.000%, 02/15/33 |
|
|
1,130 |
|
| |
673 |
|
|
Series 2568, Class KG, 5.500%, 02/15/23 |
|
|
742 |
|
| |
111 |
|
|
Series 2571, Class SK, HB, IF, 33.832%, 09/15/23 |
|
|
200 |
|
| |
2,518 |
|
|
Series 2575, Class ME, 6.000%, 02/15/33 |
|
|
2,793 |
|
| |
303 |
|
|
Series 2586, Class WI, IO, 6.500%, 03/15/33 |
|
|
56 |
|
| |
799 |
|
|
Series 2587, Class WX, 5.000%, 03/15/18 |
|
|
843 |
|
| |
681 |
|
|
Series 2596, Class QG, 6.000%, 03/15/33 |
|
|
750 |
|
| |
267 |
|
|
Series 2611, Class UH, 4.500%, 05/15/18 |
|
|
280 |
|
| |
477 |
|
|
Series 2617, Class GR, 4.500%, 05/15/18 |
|
|
500 |
|
| |
391 |
|
|
Series 2626, Class NS, IF, IO, 6.395%, 06/15/23 |
|
|
29 |
|
| |
554 |
|
|
Series 2631, Class LC, 4.500%, 06/15/18 |
|
|
581 |
|
| |
269 |
|
|
Series 2636, Class Z, 4.500%, 06/15/18 |
|
|
282 |
|
| |
351 |
|
|
Series 2637, Class SA, IF, IO, 5.945%, 06/15/18 |
|
|
25 |
|
| |
24 |
|
|
Series 2638, Class DS, IF, 8.445%, 07/15/23 |
|
|
27 |
|
| |
257 |
|
|
Series 2650, Class PO, PO, 12/15/32 |
|
|
254 |
|
| |
1,059 |
|
|
Series 2650, Class SO, PO, 12/15/32 |
|
|
1,032 |
|
| |
406 |
|
|
Series 2651, Class VZ, 4.500%, 07/15/18 |
|
|
427 |
|
| |
237 |
|
|
Series 2672, Class ME, 5.000%, 11/15/22 |
|
|
240 |
|
| |
1,811 |
|
|
Series 2675, Class CK, 4.000%, 09/15/18 |
|
|
1,897 |
|
| |
2,861 |
|
|
Series 2684, Class PO, PO, 01/15/33 |
|
|
2,812 |
|
| |
215 |
|
|
Series 2691, Class ME, 4.500%, 04/15/32 |
|
|
217 |
|
| |
127 |
|
|
Series 2692, Class SC, IF, 12.977%, 07/15/33 |
|
|
154 |
|
| |
552 |
|
|
Series 2695, Class DG, 4.000%, 10/15/18 |
|
|
576 |
|
| |
28 |
|
|
Series 2696, Class CO, PO, 10/15/18 |
|
|
27 |
|
| |
1,565 |
|
|
Series 2710, Class HB, 5.500%, 11/15/23 |
|
|
1,716 |
|
| |
269 |
|
|
Series 2715, Class OG, 5.000%, 01/15/23 |
|
|
272 |
|
| |
999 |
|
|
Series 2716, Class UN, 4.500%, 12/15/23 |
|
|
1,067 |
|
| |
486 |
|
|
Series 2720, Class PC, 5.000%, 12/15/23 |
|
|
522 |
|
| |
435 |
|
|
Series 2744, Class PE, 5.500%, 02/15/34 |
|
|
464 |
|
| |
763 |
|
|
Series 2744, Class TU, 5.500%, 05/15/32 |
|
|
796 |
|
| |
51 |
|
|
Series 2764, Class TE, 5.000%, 10/15/32 |
|
|
51 |
|
| |
159 |
|
|
Series 2777, Class OM, PO, 12/15/32 |
|
|
159 |
|
| |
36 |
|
|
Series 2780, Class JG, 4.500%, 04/15/19 |
|
|
37 |
|
| |
998 |
|
|
Series 2783, Class AT, 4.000%, 04/15/19 |
|
|
1,045 |
|
| |
2,484 |
|
|
Series 2809, Class UC, 4.000%, 06/15/19 |
|
|
2,599 |
|
| |
87 |
|
|
Series 2827, Class XO, PO, 01/15/23 |
|
|
87 |
|
| |
76 |
|
|
Series 2835, Class QO, PO, 12/15/32 |
|
|
70 |
|
|
|
|
|
|
|
|
|
|
PRINCIPAL
AMOUNT($) |
|
|
SECURITY DESCRIPTION |
|
VALUE($) |
|
|
|
|
|
|
|
|
|
|
|
|
|
|
Agency CMO — continued |
|
|
|
|
| |
126 |
|
|
Series 2840, Class JO, PO, 06/15/23 |
|
|
117 |
|
| |
301 |
|
|
Series 2922, Class JN, 4.500%, 02/15/20 |
|
|
313 |
|
| |
668 |
|
|
Series 2934, Class EC, PO, 02/15/20 |
|
|
658 |
|
| |
3 |
|
|
Series 2934, Class EN, PO, 02/15/18 |
|
|
3 |
|
| |
557 |
|
|
Series 2934, Class HI, IO, 5.000%, 02/15/20 |
|
|
51 |
|
| |
514 |
|
|
Series 2934, Class KI, IO, 5.000%, 02/15/20 |
|
|
45 |
|
| |
438 |
|
|
Series 2958, Class QD, 4.500%, 04/15/20 |
|
|
460 |
|
| |
1,122 |
|
|
Series 2962, Class BE, 4.500%, 04/15/20 |
|
|
1,194 |
|
| |
2,270 |
|
|
Series 2965, Class GD, 4.500%, 04/15/20 |
|
|
2,401 |
|
| |
59 |
|
|
Series 2989, Class PO, PO, 06/15/23 |
|
|
59 |
|
| |
4,237 |
|
|
Series 2990, Class UZ, 5.750%, 06/15/35 |
|
|
4,518 |
|
| |
1,483 |
|
|
Series 3004, Class EK, 5.500%, 07/15/35 |
|
|
1,547 |
|
| |
15 |
|
|
Series 3007, Class AI, IO, 5.500%, 07/15/24 |
|
|
— |
(h) |
| |
73 |
|
|
Series 3014, Class OD, PO, 08/15/35 |
|
|
60 |
|
| |
3 |
|
|
Series 3047, Class OB, 5.500%, 12/15/33 |
|
|
3 |
|
| |
944 |
|
|
Series 3047, Class OD, 5.500%, 10/15/35 |
|
|
1,073 |
|
| |
507 |
|
|
Series 3049, Class XF, VAR, 0.505%, 05/15/33 |
|
|
507 |
|
| |
3,095 |
|
|
Series 3064, Class MC, 5.500%, 11/15/35 |
|
|
3,548 |
|
| |
65 |
|
|
Series 3068, Class AO, PO, 01/15/35 |
|
|
65 |
|
| |
373 |
|
|
Series 3068, Class QB, 4.500%, 06/15/20 |
|
|
387 |
|
| |
2,141 |
|
|
Series 3074, Class BH, 5.000%, 11/15/35 |
|
|
2,328 |
|
| |
527 |
|
|
Series 3085, Class WF, VAR, 0.955%, 08/15/35 |
|
|
536 |
|
| |
929 |
|
|
Series 3102, Class FB, VAR, 0.455%, 01/15/36 |
|
|
931 |
|
| |
225 |
|
|
Series 3102, Class HS, HB, IF, 23.998%, 01/15/36 |
|
|
327 |
|
| |
960 |
|
|
Series 3117, Class EO, PO, 02/15/36 |
|
|
884 |
|
| |
553 |
|
|
Series 3117, Class OK, PO, 02/15/36 |
|
|
508 |
|
| |
18 |
|
|
Series 3122, Class ZB, 6.000%, 03/15/36 |
|
|
24 |
|
| |
2,067 |
|
|
Series 3131, Class BK, 5.500%, 03/15/26 |
|
|
2,282 |
|
| |
179 |
|
|
Series 3134, Class PO, PO, 03/15/36 |
|
|
165 |
|
| |
848 |
|
|
Series 3138, Class PO, PO, 04/15/36 |
|
|
799 |
|
| |
31 |
|
|
Series 3149, Class SO, PO, 05/15/36 |
|
|
25 |
|
| |
739 |
|
|
Series 3151, Class UC, 5.500%, 08/15/35 |
|
|
785 |
|
| |
664 |
|
|
Series 3152, Class MO, PO, 03/15/36 |
|
|
618 |
|
| |
184 |
|
|
Series 3171, Class MO, PO, 06/15/36 |
|
|
172 |
|
| |
668 |
|
|
Series 3179, Class OA, PO, 07/15/36 |
|
|
621 |
|
| |
182 |
|
|
Series 3194, Class SA, IF, IO, 6.945%, 07/15/36 |
|
|
33 |
|
| |
666 |
|
|
Series 3211, Class SO, PO, 09/15/36 |
|
|
612 |
|
| |
322 |
|
|
Series 3218, Class AO, PO, 09/15/36 |
|
|
298 |
|
SEE NOTES TO
FINANCIAL STATEMENTS.
|
|
|
|
|
|
|
|
|
|
|
|
|
| AUGUST 31, 2014 |
|
JPMORGAN INSTITUTIONAL TRUST FUNDS |
|
|
|
|
15 |
|
JPMorgan Core Bond Trust
SCHEDULE OF PORTFOLIO INVESTMENTS
AS OF AUGUST 31, 2014 (Unaudited) (continued)
(Amounts in thousands)
|
|
|
|
|
|
|
|
|
PRINCIPAL
AMOUNT($) |
|
|
SECURITY DESCRIPTION |
|
VALUE($) |
|
| |
Collateralized Mortgage Obligations — continued |
|
|
|
|
|
Agency CMO — continued |
|
|
|
|
| |
701 |
|
|
Series 3219, Class DI, IO, 6.000%, 04/15/36 |
|
|
136 |
|
| |
1,500 |
|
|
Series 3229, Class HE, 5.000%, 10/15/26 |
|
|
1,649 |
|
| |
648 |
|
|
Series 3232, Class ST, IF, IO, 6.545%, 10/15/36 |
|
|
83 |
|
| |
287 |
|
|
Series 3233, Class OP, PO, 05/15/36 |
|
|
265 |
|
| |
85 |
|
|
Series 3242, Class NE, 5.750%, 02/15/34 |
|
|
85 |
|
| |
445 |
|
|
Series 3256, Class PO, PO, 12/15/36 |
|
|
405 |
|
| |
872 |
|
|
Series 3260, Class CS, IF, IO, 5.985%, 01/15/37 |
|
|
111 |
|
| |
464 |
|
|
Series 3261, Class OA, PO, 01/15/37 |
|
|
425 |
|
| |
260 |
|
|
Series 3274, Class JO, PO, 02/15/37 |
|
|
241 |
|
| |
218 |
|
|
Series 3275, Class FL, VAR, 0.595%, 02/15/37 |
|
|
218 |
|
| |
1,090 |
|
|
Series 3290, Class SB, IF, IO, 6.295%, 03/15/37 |
|
|
163 |
|
| |
2,133 |
|
|
Series 3315, Class HZ, 6.000%, 05/15/37 |
|
|
2,357 |
|
| |
87 |
|
|
Series 3318, Class AO, PO, 05/15/37 |
|
|
72 |
|
| |
155 |
|
|
Series 3326, Class JO, PO, 06/15/37 |
|
|
145 |
|
| |
521 |
|
|
Series 3331, Class PO, PO, 06/15/37 |
|
|
475 |
|
| |
563 |
|
|
Series 3385, Class SN, IF, IO, 5.845%, 11/15/37 |
|
|
70 |
|
| |
741 |
|
|
Series 3387, Class SA, IF, IO, 6.265%, 11/15/37 |
|
|
91 |
|
| |
1,150 |
|
|
Series 3404, Class SC, IF, IO, 5.845%, 01/15/38 |
|
|
135 |
|
| |
4,971 |
|
|
Series 3422, Class AI, IO, SUB, 0.250%, 01/15/38 |
|
|
69 |
|
| |
731 |
|
|
Series 3424, Class PI, IF, IO, 6.645%, 04/15/38 |
|
|
103 |
|
| |
1,397 |
|
|
Series 3481, Class SJ, IF, IO, 5.695%, 08/15/38 |
|
|
186 |
|
| |
974 |
|
|
Series 3505, Class SA, IF, IO, 5.845%, 01/15/39 |
|
|
142 |
|
| |
1,111 |
|
|
Series 3511, Class SA, IF, IO, 5.845%, 02/15/39 |
|
|
164 |
|
| |
415 |
|
|
Series 3549, Class FA, VAR, 1.355%, 07/15/39 |
|
|
422 |
|
| |
423 |
|
|
Series 3607, Class BO, PO, 04/15/36 |
|
|
384 |
|
| |
1,072 |
|
|
Series 3607, Class OP, PO, 07/15/37 |
|
|
979 |
|
| |
630 |
|
|
Series 3607, Class PO, PO, 05/15/37 |
|
|
589 |
|
| |
189 |
|
|
Series 3611, Class PO, PO, 07/15/34 |
|
|
175 |
|
| |
523 |
|
|
Series 3621, Class BO, PO, 01/15/40 |
|
|
482 |
|
| |
593 |
|
|
Series 3720, Class A, 4.500%, 09/15/25 |
|
|
644 |
|
| |
1,884 |
|
|
Series 3739, Class LI, IO, 4.000%, 03/15/34 |
|
|
119 |
|
| |
4,817 |
|
|
Series 3747, Class HI, IO, 4.500%, 07/15/37 |
|
|
500 |
|
|
|
|
|
|
|
|
|
|
PRINCIPAL
AMOUNT($) |
|
|
SECURITY DESCRIPTION |
|
VALUE($) |
|
|
|
|
|
|
|
|
|
|
|
|
|
|
Agency CMO — continued |
|
|
|
|
| |
1,000 |
|
|
Series 3747, Class PY, 4.000%, 10/15/40 |
|
|
1,043 |
|
| |
2,444 |
|
|
Series 3759, Class HI, IO, 4.000%, 08/15/37 |
|
|
280 |
|
| |
2,351 |
|
|
Series 3760, Class GI, IO, 4.000%, 10/15/37 |
|
|
218 |
|
| |
9,334 |
|
|
Series 3774, Class EW, 3.500%, 12/15/25 |
|
|
9,710 |
|
| |
5,000 |
|
|
Series 3793, Class AB, 3.500%, 01/15/26 |
|
|
5,162 |
|
| |
152 |
|
|
Series 3798, Class BF, VAR, 0.455%, 06/15/24 |
|
|
152 |
|
| |
864 |
|
|
Series 3804, Class FN, VAR, 0.605%, 03/15/39 |
|
|
865 |
|
| |
3,684 |
|
|
Series 3819, Class ZQ, 6.000%, 04/15/36 |
|
|
4,139 |
|
| |
750 |
|
|
Series 3852, Class QN, IF, 5.500%, 05/15/41 |
|
|
791 |
|
| |
2,073 |
|
|
Series 3852, Class TP, IF, 5.500%, 05/15/41 |
|
|
2,202 |
|
| |
2,803 |
|
|
Series 3920, Class LP, 5.000%, 01/15/34 |
|
|
3,062 |
|
| |
1,446 |
|
|
Series 3925, Class FL, VAR, 0.605%, 01/15/41 |
|
|
1,457 |
|
| |
1,222 |
|
|
Series 3957, Class B, 4.000%, 11/15/41 |
|
|
1,273 |
|
| |
1,493 |
|
|
Series 3966, Class NA, 4.000%, 12/15/41 |
|
|
1,553 |
|
| |
1,031 |
|
|
Series 3997, Class PF, VAR, 0.605%, 11/15/39 |
|
|
1,033 |
|
| |
3,391 |
|
|
Series 4048, Class FJ, VAR, 0.556%, 07/15/37 |
|
|
3,387 |
|
| |
2,000 |
|
|
Series 4217, Class KY, 3.000%, 06/15/43 |
|
|
1,860 |
|
| |
7,791 |
|
|
Series 4219, Class JA, 3.500%, 08/15/39 |
|
|
8,041 |
|
| |
2,501 |
|
|
Series 4240, Class B, 3.000%, 08/15/33 |
|
|
2,298 |
|
| |
3,684 |
|
|
Series 4251, Class KW, 2.500%, 04/15/28 |
|
|
3,432 |
|
|
|
|
|
Federal Home Loan Mortgage Corp. STRIPS, |
|
|
|
|
| |
2 |
|
|
Series 134, Class B, IO, 9.000%, 04/01/22 |
|
|
1 |
|
| |
1,390 |
|
|
Series 233, Class 11, IO, 5.000%, 09/15/35 |
|
|
218 |
|
| |
1,974 |
|
|
Series 233, Class 13, IO, 5.000%, 09/15/35 |
|
|
308 |
|
| |
375 |
|
|
Series 243, Class 16, IO, 4.500%, 11/15/20 |
|
|
28 |
|
| |
846 |
|
|
Series 243, Class 17, IO, 4.500%, 12/15/20 |
|
|
63 |
|
| |
8,509 |
|
|
Series 262, Class 35, 3.500%, 07/15/42 |
|
|
8,692 |
|
| |
2,382 |
|
|
Series 264, Class F1, VAR, 0.705%, 07/15/42 |
|
|
2,394 |
|
| |
2,201 |
|
|
Series 267, Class F5, VAR, 0.655%, 08/15/42 |
|
|
2,206 |
|
| |
2,703 |
|
|
Series 281, Class F1, VAR, 0.655%, 10/15/42 |
|
|
2,708 |
|
| |
9,145 |
|
|
Series 299, Class 300, 3.000%, 01/15/43 |
|
|
9,082 |
|
| |
2,452 |
|
|
Series 310, Class PO, PO, 09/15/43 |
|
|
1,813 |
|
| |
4,903 |
|
|
Series 323, Class 300, 3.000%, 01/15/44 |
|
|
4,929 |
|
SEE NOTES TO
FINANCIAL STATEMENTS.
|
|
|
|
|
|
|
|
|
|
|
| 16 |
|
|
|
JPMORGAN INSTITUTIONAL TRUST FUNDS |
|
AUGUST 31, 2014 |
|
|
|
|
|
|
|
|
|
PRINCIPAL
AMOUNT($) |
|
|
SECURITY DESCRIPTION |
|
VALUE($) |
|
| |
Collateralized Mortgage Obligations — continued |
|
|
|
|
|
Agency CMO — continued |
|
|
|
|
|
|
|
|
Federal Home Loan Mortgage Corp. Structured Pass-Through Securities, |
|
|
|
|
| |
531 |
|
|
Series T-41, Class 3A, VAR, 6.539%, 07/25/32 |
|
|
608 |
|
| |
315 |
|
|
Series T-51, Class 2A, VAR, 7.500%, 08/25/42 |
|
|
378 |
|
| |
1,865 |
|
|
Series T-54, Class 2A, 6.500%, 02/25/43 |
|
|
2,212 |
|
| |
559 |
|
|
Series T-54, Class 3A, 7.000%, 02/25/43 |
|
|
680 |
|
| |
225 |
|
|
Series T-58, Class APO, PO, 09/25/43 |
|
|
196 |
|
| |
493 |
|
|
Series T-59, Class 1AP, PO, 10/25/43 |
|
|
427 |
|
| |
1,953 |
|
|
Series T-76, Class 2A, VAR, 1.516%, 10/25/37 |
|
|
1,917 |
|
|
|
|
|
Federal National Mortgage Association — ACES, |
|
|
|
|
| |
3,300 |
|
|
Series 2010-M3, Class A3, VAR, 4.332%, 03/25/20 |
|
|
3,655 |
|
| |
1,416 |
|
|
Series 2011-M2, Class A2, 3.645%, 04/25/21 |
|
|
1,525 |
|
| |
8,500 |
|
|
Series 2011-M2, Class A3, 3.764%, 04/25/21 |
|
|
9,214 |
|
| |
527 |
|
|
Series 2012-M11, Class FA, VAR, 0.676%, 08/25/19 |
|
|
529 |
|
| |
4,100 |
|
|
Series 2012-M9, Class A2, 2.482%, 04/25/22 |
|
|
4,084 |
|
| |
4,200 |
|
|
Series 2013-M13, Class A2, VAR, 2.624%, 04/25/23 |
|
|
4,170 |
|
| |
1,878 |
|
|
Series 2013-M7, Class A2, 2.280%, 12/27/22 |
|
|
1,820 |
|
| |
8,000 |
|
|
Series 2013-M9, Class A2, VAR, 2.389%, 01/25/23 |
|
|
7,846 |
|
| |
2,664 |
|
|
Series 2014-M2, Class A2, VAR, 3.513%, 12/25/23 |
|
|
2,831 |
|
| |
2,500 |
|
|
Series 2014-M3, Class A2, VAR, 3.501%, 01/25/24 |
|
|
2,650 |
|
| |
4,545 |
|
|
Series 2014-M5, Class ASQ2, 2.034%, 03/25/19 |
|
|
4,598 |
|
| |
1,081 |
|
|
Series 2014-M5, Class FA, VAR, 0.521%, 01/25/17 |
|
|
1,083 |
|
|
|
|
|
Federal National Mortgage Association Grantor Trust, |
|
|
|
|
| |
910 |
|
|
Series 2002-T19, Class A2, 7.000%, 07/25/42 |
|
|
1,046 |
|
| |
695 |
|
|
Series 2004-T3, Class 1A3, 7.000%, 02/25/44 |
|
|
793 |
|
|
|
|
|
Federal National Mortgage Association REMIC, |
|
|
|
|
| |
4 |
|
|
Series 1988-7, Class Z, 9.250%, 04/25/18 |
|
|
5 |
|
| |
10 |
|
|
Series 1989-70, Class G, 8.000%, 10/25/19 |
|
|
11 |
|
| |
4 |
|
|
Series 1989-78, Class H, 9.400%, 11/25/19 |
|
|
4 |
|
| |
8 |
|
|
Series 1989-83, Class H, 8.500%, 11/25/19 |
|
|
9 |
|
|
|
|
|
|
|
|
|
|
PRINCIPAL
AMOUNT($) |
|
|
SECURITY DESCRIPTION |
|
VALUE($) |
|
|
|
|
|
|
|
|
|
|
|
|
|
|
Agency CMO — continued |
|
|
|
|
| |
6 |
|
|
Series 1989-89, Class H, 9.000%, 11/25/19 |
|
|
7 |
|
| |
6 |
|
|
Series 1990-1, Class D, 8.800%, 01/25/20 |
|
|
7 |
|
| |
1 |
|
|
Series 1990-60, Class K, 5.500%, 06/25/20 |
|
|
1 |
|
| |
3 |
|
|
Series 1990-63, Class H, 9.500%, 06/25/20 |
|
|
3 |
|
| |
2 |
|
|
Series 1990-93, Class G, 5.500%, 08/25/20 |
|
|
2 |
|
| |
— |
(h) |
|
Series 1990-94, Class H, HB, 505.000%, 08/25/20 |
|
|
— |
(h) |
| |
— |
(h) |
|
Series 1990-95, Class J, HB, 1,118.040%, 08/25/20 |
|
|
1 |
|
| |
15 |
|
|
Series 1990-102, Class J, 6.500%, 08/25/20 |
|
|
16 |
|
| |
17 |
|
|
Series 1990-120, Class H, 9.000%, 10/25/20 |
|
|
19 |
|
| |
2 |
|
|
Series 1990-134, Class SC, HB, IF, 21.368%, 11/25/20 |
|
|
3 |
|
| |
— |
(h) |
|
Series 1990-140, Class K, HB, 652.145%, 12/25/20 |
|
|
2 |
|
| |
— |
(h) |
|
Series 1991-7, Class K, HB, 908.500%, 02/25/21 |
|
|
— |
(h) |
| |
7 |
|
|
Series 1991-24, Class Z, 5.000%, 03/25/21 |
|
|
7 |
|
| |
1 |
|
|
Series 1992-101, Class J, 7.500%, 06/25/22 |
|
|
1 |
|
| |
39 |
|
|
Series 1992-136, Class PK, 6.000%, 08/25/22 |
|
|
42 |
|
| |
33 |
|
|
Series 1992-143, Class MA, 5.500%, 09/25/22 |
|
|
35 |
|
| |
91 |
|
|
Series 1992-163, Class M, 7.750%, 09/25/22 |
|
|
102 |
|
| |
147 |
|
|
Series 1992-188, Class PZ, 7.500%, 10/25/22 |
|
|
169 |
|
| |
59 |
|
|
Series 1993-21, Class KA, 7.700%, 03/25/23 |
|
|
67 |
|
| |
89 |
|
|
Series 1993-25, Class J, 7.500%, 03/25/23 |
|
|
100 |
|
| |
23 |
|
|
Series 1993-27, Class SA, IF, 15.500%, 02/25/23 |
|
|
32 |
|
| |
35 |
|
|
Series 1993-62, Class SA, IF, 18.975%, 04/25/23 |
|
|
51 |
|
| |
18 |
|
|
Series 1993-165, Class SD, IF, 13.440%, 09/25/23 |
|
|
23 |
|
| |
38 |
|
|
Series 1993-165, Class SK, IF, 12.500%, 09/25/23 |
|
|
44 |
|
| |
27 |
|
|
Series 1993-179, Class SB, HB, IF, 26.828%, 10/25/23 |
|
|
44 |
|
| |
18 |
|
|
Series 1993-179, Class SC, IF, 10.500%, 10/25/23 |
|
|
22 |
|
| |
40 |
|
|
Series 1993-199, Class FA, VAR, 0.705%, 10/25/23 |
|
|
40 |
|
| |
50 |
|
|
Series 1993-205, Class H, PO, 09/25/23 |
|
|
44 |
|
SEE NOTES TO
FINANCIAL STATEMENTS.
|
|
|
|
|
|
|
|
|
|
|
|
|
| AUGUST 31, 2014 |
|
JPMORGAN INSTITUTIONAL TRUST FUNDS |
|
|
|
|
17 |
|
JPMorgan Core Bond Trust
SCHEDULE OF PORTFOLIO INVESTMENTS
AS OF AUGUST 31, 2014 (Unaudited) (continued)
(Amounts in thousands)
|
|
|
|
|
|
|
|
|
PRINCIPAL
AMOUNT($) |
|
|
SECURITY DESCRIPTION |
|
VALUE($) |
|
| |
Collateralized Mortgage Obligations — continued |
|
|
|
|
|
Agency CMO — continued |
|
|
|
|
| |
79 |
|
|
Series 1993-225, Class UB, 6.500%, 12/25/23 |
|
|
89 |
|
| |
27 |
|
|
Series 1993-230, Class FA, VAR, 0.755%, 12/25/23 |
|
|
27 |
|
| |
70 |
|
|
Series 1993-247, Class FE, VAR, 1.155%, 12/25/23 |
|
|
72 |
|
| |
33 |
|
|
Series 1993-247, Class SU, IF, 12.282%, 12/25/23 |
|
|
42 |
|
| |
45 |
|
|
Series 1993-250, Class Z, 7.000%, 12/25/23 |
|
|
46 |
|
| |
282 |
|
|
Series 1994-37, Class L, 6.500%, 03/25/24 |
|
|
317 |
|
| |
1,406 |
|
|
Series 1994-40, Class Z, 6.500%, 03/25/24 |
|
|
1,544 |
|
| |
63 |
|
|
Series 1995-2, Class Z, 8.500%, 01/25/25 |
|
|
74 |
|
| |
269 |
|
|
Series 1995-19, Class Z, 6.500%, 11/25/23 |
|
|
307 |
|
| |
301 |
|
|
Series 1996-14, Class SE, IF, IO, 8.260%, 08/25/23 |
|
|
64 |
|
| |
7 |
|
|
Series 1996-27, Class FC, VAR, 0.655%, 03/25/17 |
|
|
7 |
|
| |
26 |
|
|
Series 1996-59, Class J, 6.500%, 08/25/22 |
|
|
28 |
|
| |
299 |
|
|
Series 1997-20, Class IO, IO, VAR, 1.840%, 03/25/27 |
|
|
14 |
|
| |
19 |
|
|
Series 1997-27, Class J, 7.500%, 04/18/27 |
|
|
21 |
|
| |
46 |
|
|
Series 1997-29, Class J, 7.500%, 04/20/27 |
|
|
54 |
|
| |
305 |
|
|
Series 1997-39, Class PD, 7.500%, 05/20/27 |
|
|
356 |
|
| |
26 |
|
|
Series 1997-42, Class ZC, 6.500%, 07/18/27 |
|
|
29 |
|
| |
534 |
|
|
Series 1997-61, Class ZC, 7.000%, 02/25/23 |
|
|
602 |
|
| |
90 |
|
|
Series 1997-81, Class PI, IO, 7.000%, 12/18/27 |
|
|
18 |
|
| |
11 |
|
|
Series 1998-4, Class C, PO, 04/25/23 |
|
|
11 |
|
| |
159 |
|
|
Series 1998-36, Class ZB, 6.000%, 07/18/28 |
|
|
177 |
|
| |
100 |
|
|
Series 1998-43, Class SA, IF, IO, 17.307%, 04/25/23 |
|
|
37 |
|
| |
198 |
|
|
Series 1998-66, Class SB, IF, IO, 7.995%, 12/25/28 |
|
|
37 |
|
| |
96 |
|
|
Series 1999-17, Class C, 6.350%, 04/25/29 |
|
|
107 |
|
| |
447 |
|
|
Series 1999-18, Class Z, 5.500%, 04/18/29 |
|
|
486 |
|
| |
108 |
|
|
Series 1999-38, Class SK, IF, IO, 7.895%, 08/25/23 |
|
|
12 |
|
| |
49 |
|
|
Series 1999-52, Class NS, HB, IF, 22.946%, 10/25/23 |
|
|
76 |
|
| |
140 |
|
|
Series 1999-62, Class PB, 7.500%, 12/18/29 |
|
|
161 |
|
| |
425 |
|
|
Series 2000-2, Class ZE, 7.500%, 02/25/30 |
|
|
488 |
|
|
|
|
|
|
|
|
|
|
PRINCIPAL
AMOUNT($) |
|
|
SECURITY DESCRIPTION |
|
VALUE($) |
|
|
|
|
|
|
|
|
|
|
|
|
|
|
Agency CMO — continued |
|
|
|
|
| |
259 |
|
|
Series 2000-20, Class SA, IF, IO, 8.945%, 07/25/30 |
|
|
66 |
|
| |
33 |
|
|
Series 2000-52, Class IO, IO, 8.500%, 01/25/31 |
|
|
8 |
|
| |
150 |
|
|
Series 2001-4, Class PC, 7.000%, 03/25/21 |
|
|
164 |
|
| |
93 |
|
|
Series 2001-7, Class PF, 7.000%, 03/25/31 |
|
|
107 |
|
| |
— |
(h) |
|
Series 2001-7, Class PR, 6.000%, 03/25/16 |
|
|
— |
(h) |
| |
— |
(h) |
|
Series 2001-10, Class PR, 6.000%, 04/25/16 |
|
|
— |
(h) |
| |
295 |
|
|
Series 2001-30, Class PM, 7.000%, 07/25/31 |
|
|
337 |
|
| |
318 |
|
|
Series 2001-33, Class ID, IO, 6.000%, 07/25/31 |
|
|
63 |
|
| |
289 |
|
|
Series 2001-36, Class DE, 7.000%, 08/25/31 |
|
|
331 |
|
| |
671 |
|
|
Series 2001-44, Class MY, 7.000%, 09/25/31 |
|
|
771 |
|
| |
100 |
|
|
Series 2001-44, Class PD, 7.000%, 09/25/31 |
|
|
114 |
|
| |
111 |
|
|
Series 2001-44, Class PU, 7.000%, 09/25/31 |
|
|
128 |
|
| |
1,066 |
|
|
Series 2001-48, Class Z, 6.500%, 09/25/21 |
|
|
1,179 |
|
| |
81 |
|
|
Series 2001-49, Class Z, 6.500%, 09/25/31 |
|
|
91 |
|
| |
85 |
|
|
Series 2001-52, Class KB, 6.500%, 10/25/31 |
|
|
95 |
|
| |
66 |
|
|
Series 2001-52, Class XN, 6.500%, 11/25/15 |
|
|
67 |
|
| |
972 |
|
|
Series 2001-61, Class Z, 7.000%, 11/25/31 |
|
|
1,100 |
|
| |
57 |
|
|
Series 2001-71, Class MB, 6.000%, 12/25/16 |
|
|
59 |
|
| |
118 |
|
|
Series 2001-71, Class QE, 6.000%, 12/25/16 |
|
|
123 |
|
| |
40 |
|
|
Series 2001-72, Class SX, IF, 17.105%, 12/25/31 |
|
|
50 |
|
| |
204 |
|
|
Series 2001-74, Class MB, 6.000%, 12/25/16 |
|
|
212 |
|
| |
86 |
|
|
Series 2002-1, Class HC, 6.500%, 02/25/22 |
|
|
95 |
|
| |
112 |
|
|
Series 2002-1, Class SA, HB, IF, 24.684%, 02/25/32 |
|
|
185 |
|
| |
70 |
|
|
Series 2002-1, Class UD, HB, IF, 23.957%, 12/25/23 |
|
|
108 |
|
| |
174 |
|
|
Series 2002-2, Class UC, 6.000%, 02/25/17 |
|
|
181 |
|
| |
390 |
|
|
Series 2002-3, Class OG, 6.000%, 02/25/17 |
|
|
405 |
|
| |
88 |
|
|
Series 2002-7, Class OG, 6.000%, 03/25/17 |
|
|
92 |
|
| |
244 |
|
|
Series 2002-7, Class TG, 6.000%, 03/25/17 |
|
|
253 |
|
| |
97 |
|
|
Series 2002-10, Class SB, IF, 18.828%, 03/25/17 |
|
|
113 |
|
SEE NOTES TO
FINANCIAL STATEMENTS.
|
|
|
|
|
|
|
|
|
|
|
| 18 |
|
|
|
JPMORGAN INSTITUTIONAL TRUST FUNDS |
|
AUGUST 31, 2014 |
|
|
|
|
|
|
|
|
|
PRINCIPAL
AMOUNT($) |
|
|
SECURITY DESCRIPTION |
|
VALUE($) |
|
| |
Collateralized Mortgage Obligations — continued |
|
|
|
|
|
Agency CMO — continued |
|
|
|
|
| |
1,046 |
|
|
Series 2002-13, Class SJ, IF, IO, 1.600%, 03/25/32 |
|
|
54 |
|
| |
16 |
|
|
Series 2002-13, Class ST, IF, 10.000%, 03/25/32 |
|
|
20 |
|
| |
88 |
|
|
Series 2002-19, Class PE, 6.000%, 04/25/17 |
|
|
91 |
|
| |
30 |
|
|
Series 2002-21, Class LO, PO, 04/25/32 |
|
|
28 |
|
| |
298 |
|
|
Series 2002-21, Class PE, 6.500%, 04/25/32 |
|
|
337 |
|
| |
236 |
|
|
Series 2002-24, Class AJ, 6.000%, 04/25/17 |
|
|
248 |
|
| |
85 |
|
|
Series 2002-25, Class SG, IF, 18.948%, 05/25/17 |
|
|
101 |
|
| |
767 |
|
|
Series 2002-28, Class PK, 6.500%, 05/25/32 |
|
|
863 |
|
| |
180 |
|
|
Series 2002-37, Class Z, 6.500%, 06/25/32 |
|
|
200 |
|
| |
171 |
|
|
Series 2002-42, Class C, 6.000%, 07/25/17 |
|
|
180 |
|
| |
1,047 |
|
|
Series 2002-48, Class GH, 6.500%, 08/25/32 |
|
|
1,180 |
|
| |
380 |
|
|
Series 2002-62, Class ZE, 5.500%, 11/25/17 |
|
|
400 |
|
| |
104 |
|
|
Series 2002-63, Class KC, 5.000%, 10/25/17 |
|
|
109 |
|
| |
178 |
|
|
Series 2002-77, Class S, IF, 14.199%, 12/25/32 |
|
|
231 |
|
| |
590 |
|
|
Series 2002-83, Class CS, 6.881%, 08/25/23 |
|
|
661 |
|
| |
743 |
|
|
Series 2002-94, Class BK, 5.500%, 01/25/18 |
|
|
777 |
|
| |
393 |
|
|
Series 2003-3, Class HJ, 5.000%, 02/25/18 |
|
|
414 |
|
| |
2,773 |
|
|
Series 2003-22, Class UD, 4.000%, 04/25/33 |
|
|
2,920 |
|
| |
1,099 |
|
|
Series 2003-33, Class IA, IO, 6.500%, 05/25/33 |
|
|
206 |
|
| |
720 |
|
|
Series 2003-34, Class AX, 6.000%, 05/25/33 |
|
|
795 |
|
| |
1,516 |
|
|
Series 2003-34, Class ED, 6.000%, 05/25/33 |
|
|
1,733 |
|
| |
44 |
|
|
Series 2003-35, Class UC, 3.750%, 05/25/33 |
|
|
46 |
|
| |
132 |
|
|
Series 2003-39, Class IO, IO, VAR, 6.000%, 05/25/33 |
|
|
32 |
|
| |
1,204 |
|
|
Series 2003-39, Class LW, 5.500%, 05/25/23 |
|
|
1,317 |
|
| |
964 |
|
|
Series 2003-41, Class PE, 5.500%, 05/25/23 |
|
|
1,047 |
|
| |
274 |
|
|
Series 2003-42, Class GB, 4.000%, 05/25/33 |
|
|
295 |
|
|
|
|
|
|
|
|
|
|
PRINCIPAL
AMOUNT($) |
|
|
SECURITY DESCRIPTION |
|
VALUE($) |
|
|
|
|
|
|
|
|
|
|
|
|
|
|
Agency CMO — continued |
|
|
|
|
| |
15 |
|
|
Series 2003-45, Class AI, IO, 5.500%, 05/25/33 |
|
|
— |
(h) |
| |
490 |
|
|
Series 2003-47, Class PE, 5.750%, 06/25/33 |
|
|
539 |
|
| |
177 |
|
|
Series 2003-52, Class SX, HB, IF, 22.485%, 10/25/31 |
|
|
284 |
|
| |
136 |
|
|
Series 2003-64, Class SX, IF, 13.360%, 07/25/33 |
|
|
166 |
|
| |
562 |
|
|
Series 2003-71, Class DS, IF, 7.259%, 08/25/33 |
|
|
583 |
|
| |
189 |
|
|
Series 2003-71, Class IM, IO, 5.500%, 12/25/31 |
|
|
3 |
|
| |
1,127 |
|
|
Series 2003-72, Class IE, IO, 5.500%, 08/25/33 |
|
|
229 |
|
| |
87 |
|
|
Series 2003-74, Class SH, IF, 9.891%, 08/25/33 |
|
|
100 |
|
| |
337 |
|
|
Series 2003-76, Class GQ, 4.500%, 08/25/18 |
|
|
355 |
|
| |
772 |
|
|
Series 2003-80, Class SY, IF, IO, 7.495%, 06/25/23 |
|
|
63 |
|
| |
592 |
|
|
Series 2003-81, Class LC, 4.500%, 09/25/18 |
|
|
623 |
|
| |
1,322 |
|
|
Series 2003-83, Class PG, 5.000%, 06/25/23 |
|
|
1,395 |
|
| |
264 |
|
|
Series 2003-91, Class SD, IF, 12.242%, 09/25/33 |
|
|
316 |
|
| |
1,508 |
|
|
Series 2003-116, Class SB, IF, IO, 7.445%, 11/25/33 |
|
|
319 |
|
| |
208 |
|
|
Series 2003-122, Class TE, 5.000%, 12/25/22 |
|
|
209 |
|
| |
354 |
|
|
Series 2003-128, Class NG, 4.000%, 01/25/19 |
|
|
370 |
|
| |
104 |
|
|
Series 2003-130, Class SX, IF, 11.287%, 01/25/34 |
|
|
123 |
|
| |
135 |
|
|
Series 2003-132, Class OA, PO, 08/25/33 |
|
|
125 |
|
| |
1,447 |
|
|
Series 2004-4, Class QI, IF, IO, 6.945%, 06/25/33 |
|
|
197 |
|
| |
137 |
|
|
Series 2004-4, Class QM, IF, 13.890%, 06/25/33 |
|
|
168 |
|
| |
638 |
|
|
Series 2004-10, Class SC, HB, IF, 27.980%, 02/25/34 |
|
|
857 |
|
| |
610 |
|
|
Series 2004-25, Class PC, 5.500%, 01/25/34 |
|
|
650 |
|
| |
1,070 |
|
|
Series 2004-25, Class SA, IF, 19.099%, 04/25/34 |
|
|
1,498 |
|
| |
2,030 |
|
|
Series 2004-27, Class HB, 4.000%, 05/25/19 |
|
|
2,145 |
|
| |
418 |
|
|
Series 2004-36, Class PC, 5.500%, 02/25/34 |
|
|
445 |
|
SEE NOTES TO
FINANCIAL STATEMENTS.
|
|
|
|
|
|
|
|
|
|
|
|
|
| AUGUST 31, 2014 |
|
JPMORGAN INSTITUTIONAL TRUST FUNDS |
|
|
|
|
19 |
|
JPMorgan Core Bond Trust
SCHEDULE OF PORTFOLIO INVESTMENTS
AS OF AUGUST 31, 2014 (Unaudited) (continued)
(Amounts in thousands)
|
|
|
|
|
|
|
|
|
PRINCIPAL
AMOUNT($) |
|
|
SECURITY DESCRIPTION |
|
VALUE($) |
|
| |
Collateralized Mortgage Obligations — continued |
|
|
|
|
|
Agency CMO — continued |
|
|
|
|
| |
1,377 |
|
|
Series 2004-36, Class SA, IF, 19.099%, 05/25/34 |
|
|
1,890 |
|
| |
441 |
|
|
Series 2004-36, Class SN, IF, 13.890%, 07/25/33 |
|
|
512 |
|
| |
1,205 |
|
|
Series 2004-37, Class AG, 4.500%, 11/25/32 |
|
|
1,244 |
|
| |
541 |
|
|
Series 2004-46, Class QB, HB, IF, 23.380%, 05/25/34 |
|
|
789 |
|
| |
1,775 |
|
|
Series 2004-46, Class SK, IF, 16.074%, 05/25/34 |
|
|
2,280 |
|
| |
284 |
|
|
Series 2004-51, Class SY, IF, 13.930%, 07/25/34 |
|
|
368 |
|
| |
335 |
|
|
Series 2004-53, Class NC, 5.500%, 07/25/24 |
|
|
367 |
|
| |
402 |
|
|
Series 2004-59, Class BG, PO, 12/25/32 |
|
|
367 |
|
| |
859 |
|
|
Series 2004-61, Class FH, VAR, 0.955%, 11/25/32 |
|
|
877 |
|
| |
113 |
|
|
Series 2004-61, Class SK, IF, 8.500%, 11/25/32 |
|
|
135 |
|
| |
248 |
|
|
Series 2004-76, Class CL, 4.000%, 10/25/19 |
|
|
259 |
|
| |
512 |
|
|
Series 2004-79, Class SP, IF, 19.374%, 11/25/34 |
|
|
688 |
|
| |
112 |
|
|
Series 2004-81, Class AC, 4.000%, 11/25/19 |
|
|
117 |
|
| |
2 |
|
|
Series 2004-92, Class JO, PO, 12/25/34 |
|
|
2 |
|
| |
118 |
|
|
Series 2005-52, Class PA, 6.500%, 06/25/35 |
|
|
126 |
|
| |
1,497 |
|
|
Series 2005-56, Class S, IF, IO, 6.555%, 07/25/35 |
|
|
279 |
|
| |
348 |
|
|
Series 2005-66, Class SG, IF, 16.987%, 07/25/35 |
|
|
460 |
|
| |
666 |
|
|
Series 2005-68, Class BC, 5.250%, 06/25/35 |
|
|
718 |
|
| |
1,626 |
|
|
Series 2005-68, Class PG, 5.500%, 08/25/35 |
|
|
1,793 |
|
| |
902 |
|
|
Series 2005-68, Class UC, 5.000%, 06/25/35 |
|
|
965 |
|
| |
685 |
|
|
Series 2005-74, Class CS, IF, 19.594%, 05/25/35 |
|
|
944 |
|
| |
5,864 |
|
|
Series 2005-84, Class XM, 5.750%, 10/25/35 |
|
|
6,377 |
|
| |
2,515 |
|
|
Series 2005-109, Class PC, 6.000%, 12/25/35 |
|
|
2,770 |
|
| |
8,506 |
|
|
Series 2005-110, Class GK, 5.500%, 08/25/34 |
|
|
8,995 |
|
| |
4,326 |
|
|
Series 2005-110, Class GL, 5.500%, 12/25/35 |
|
|
4,920 |
|
|
|
|
|
|
|
|
|
|
PRINCIPAL
AMOUNT($) |
|
|
SECURITY DESCRIPTION |
|
VALUE($) |
|
|
|
|
|
|
|
|
|
|
|
|
|
|
Agency CMO — continued |
|
|
|
|
| |
2,151 |
|
|
Series 2005-110, Class MN, 5.500%, 06/25/35 |
|
|
2,309 |
|
| |
496 |
|
|
Series 2005-116, Class PB, 6.000%, 04/25/34 |
|
|
516 |
|
| |
175 |
|
|
Series 2006-15, Class OT, PO, 01/25/36 |
|
|
170 |
|
| |
520 |
|
|
Series 2006-16, Class OA, PO, 03/25/36 |
|
|
478 |
|
| |
692 |
|
|
Series 2006-22, Class AO, PO, 04/25/36 |
|
|
609 |
|
| |
220 |
|
|
Series 2006-23, Class KO, PO, 04/25/36 |
|
|
207 |
|
| |
2,129 |
|
|
Series 2006-39, Class WC, 5.500%, 01/25/36 |
|
|
2,334 |
|
| |
112 |
|
|
Series 2006-42, Class CF, VAR, 0.605%, 06/25/36 |
|
|
112 |
|
| |
1,131 |
|
|
Series 2006-44, Class GO, PO, 06/25/36 |
|
|
1,066 |
|
| |
2,580 |
|
|
Series 2006-44, Class P, PO, 12/25/33 |
|
|
2,397 |
|
| |
1,609 |
|
|
Series 2006-46, Class UC, 5.500%, 12/25/35 |
|
|
1,768 |
|
| |
1,665 |
|
|
Series 2006-53, Class US, IF, IO, 6.425%, 06/25/36 |
|
|
277 |
|
| |
1,507 |
|
|
Series 2006-56, Class FC, VAR, 0.445%, 07/25/36 |
|
|
1,508 |
|
| |
1,523 |
|
|
Series 2006-56, Class PF, VAR, 0.505%, 07/25/36 |
|
|
1,527 |
|
| |
853 |
|
|
Series 2006-56, Class PO, PO, 07/25/36 |
|
|
777 |
|
| |
1,072 |
|
|
Series 2006-58, Class AP, PO, 07/25/36 |
|
|
1,003 |
|
| |
125 |
|
|
Series 2006-58, Class FL, VAR, 0.615%, 07/25/36 |
|
|
126 |
|
| |
503 |
|
|
Series 2006-58, Class PO, PO, 07/25/36 |
|
|
468 |
|
| |
683 |
|
|
Series 2006-59, Class QO, PO, 01/25/33 |
|
|
674 |
|
| |
3,396 |
|
|
Series 2006-60, Class DZ, 6.500%, 07/25/36 |
|
|
4,189 |
|
| |
767 |
|
|
Series 2006-65, Class QO, PO, 07/25/36 |
|
|
723 |
|
| |
188 |
|
|
Series 2006-72, Class TO, PO, 08/25/36 |
|
|
176 |
|
| |
3,169 |
|
|
Series 2006-77, Class PC, 6.500%, 08/25/36 |
|
|
3,588 |
|
| |
639 |
|
|
Series 2006-79, Class DO, PO, 08/25/36 |
|
|
603 |
|
| |
535 |
|
|
Series 2006-90, Class AO, PO, 09/25/36 |
|
|
511 |
|
| |
211 |
|
|
Series 2006-109, Class PO, PO, 11/25/36 |
|
|
200 |
|
| |
1,635 |
|
|
Series 2006-110, Class PO, PO, 11/25/36 |
|
|
1,517 |
|
| |
140 |
|
|
Series 2006-111, Class EO, PO, 11/25/36 |
|
|
129 |
|
| |
884 |
|
|
Series 2006-118, Class A2, VAR, 0.215%, 12/25/36 |
|
|
866 |
|
| |
196 |
|
|
Series 2006-119, Class PO, PO, 12/25/36 |
|
|
182 |
|
| |
3,092 |
|
|
Series 2006-124, Class HB, VAR, 5.974%, 11/25/36 |
|
|
3,155 |
|
| |
1,000 |
|
|
Series 2006-128, Class BP, 5.500%, 01/25/37 |
|
|
1,096 |
|
SEE NOTES TO
FINANCIAL STATEMENTS.
|
|
|
|
|
|
|
|
|
|
|
| 20 |
|
|
|
JPMORGAN INSTITUTIONAL TRUST FUNDS |
|
AUGUST 31, 2014 |
|
|
|
|
|
|
|
|
|
PRINCIPAL
AMOUNT($) |
|
|
SECURITY DESCRIPTION |
|
VALUE($) |
|
| |
Collateralized Mortgage Obligations — continued |
|
|
|
|
|
Agency CMO — continued |
|
|
|
|
| |
926 |
|
|
Series 2006-130, Class GI, IO, 6.500%, 07/25/32 |
|
|
158 |
|
| |
785 |
|
|
Series 2007-7, Class SG, IF, IO, 6.345%, 08/25/36 |
|
|
158 |
|
| |
2,523 |
|
|
Series 2007-14, Class ES, IF, IO, 6.285%, 03/25/37 |
|
|
376 |
|
| |
235 |
|
|
Series 2007-15, Class NO, PO, 03/25/22 |
|
|
229 |
|
| |
863 |
|
|
Series 2007-16, Class FC, VAR, 0.905%, 03/25/37 |
|
|
879 |
|
| |
286 |
|
|
Series 2007-42, Class AO, PO, 05/25/37 |
|
|
264 |
|
| |
340 |
|
|
Series 2007-48, Class PO, PO, 05/25/37 |
|
|
312 |
|
| |
1,005 |
|
|
Series 2007-54, Class FA, VAR, 0.555%, 06/25/37 |
|
|
1,007 |
|
| |
5,531 |
|
|
Series 2007-60, Class AX, IF, IO, 6.995%, 07/25/37 |
|
|
913 |
|
| |
260 |
|
|
Series 2007-77, Class FG, VAR, 0.655%, 03/25/37 |
|
|
262 |
|
| |
1,400 |
|
|
Series 2007-81, Class GE, 6.000%, 08/25/37 |
|
|
1,601 |
|
| |
1,440 |
|
|
Series 2007-84, Class PG, 6.000%, 12/25/36 |
|
|
1,505 |
|
| |
3,587 |
|
|
Series 2007-88, Class VI, IF, IO, 6.385%, 09/25/37 |
|
|
535 |
|
| |
2,434 |
|
|
Series 2007-91, Class ES, IF, IO, 6.305%, 10/25/37 |
|
|
323 |
|
| |
1,727 |
|
|
Series 2007-97, Class KI, IO, 7.000%, 05/25/33 |
|
|
345 |
|
| |
2,914 |
|
|
Series 2007-101, Class A2, VAR, 0.405%, 06/27/36 |
|
|
2,869 |
|
| |
621 |
|
|
Series 2007-106, Class A7, VAR, 6.061%, 10/25/37 |
|
|
688 |
|
| |
3,000 |
|
|
Series 2007-114, Class A6, VAR, 0.355%, 10/27/37 |
|
|
2,994 |
|
| |
2,105 |
|
|
Series 2007-116, Class HI, IO, VAR, 1.496%, 01/25/38 |
|
|
171 |
|
| |
36 |
|
|
Series 2007-118, Class IO, IO, 6.000%, 06/25/36 |
|
|
1 |
|
| |
1,319 |
|
|
Series 2008-1, Class BI, IF, IO, 5.755%, 02/25/38 |
|
|
140 |
|
| |
949 |
|
|
Series 2008-10, Class XI, IF, IO, 6.075%, 03/25/38 |
|
|
112 |
|
| |
542 |
|
|
Series 2008-16, Class IS, IF, IO, 6.045%, 03/25/38 |
|
|
86 |
|
| |
687 |
|
|
Series 2008-19, Class IC, IO, 5.000%, 03/25/23 |
|
|
47 |
|
| |
765 |
|
|
Series 2008-24, Class DY, 5.000%, 04/25/23 |
|
|
809 |
|
| |
582 |
|
|
Series 2008-27, Class SN, IF, IO, 6.745%, 04/25/38 |
|
|
89 |
|
|
|
|
|
|
|
|
|
|
PRINCIPAL
AMOUNT($) |
|
|
SECURITY DESCRIPTION |
|
VALUE($) |
|
|
|
|
|
|
|
|
Agency CMO — continued |
|
|
|
|
| |
341 |
|
|
Series 2008-39, Class CI, IO, 4.500%, 05/25/18 |
|
|
21 |
|
| |
443 |
|
|
Series 2008-42, Class AO, PO, 09/25/36 |
|
|
423 |
|
| |
46 |
|
|
Series 2008-44, Class PO, PO, 05/25/38 |
|
|
40 |
|
| |
707 |
|
|
Series 2008-47, Class SI, IF, IO, 6.345%, 06/25/23 |
|
|
75 |
|
| |
850 |
|
|
Series 2008-53, Class CI, IF, IO, 7.045%, 07/25/38 |
|
|
152 |
|
| |
361 |
|
|
Series 2008-76, Class GF, VAR, 0.805%, 09/25/23 |
|
|
363 |
|
| |
1,938 |
|
|
Series 2008-80, Class SA, IF, IO, 5.695%, 09/25/38 |
|
|
225 |
|
| |
1,184 |
|
|
Series 2008-81, Class SB, IF, IO, 5.695%, 09/25/38 |
|
|
136 |
|
| |
1,598 |
|
|
Series 2009-6, Class GS, IF, IO, 6.395%, 02/25/39 |
|
|
220 |
|
| |
772 |
|
|
Series 2009-9, Class IO, IO, 5.000%, 02/25/24 |
|
|
72 |
|
| |
707 |
|
|
Series 2009-18, Class IO, IO, 5.000%, 03/25/24 |
|
|
57 |
|
| |
2,500 |
|
|
Series 2009-19, Class IP, IO, 5.500%, 10/25/36 |
|
|
574 |
|
| |
1,276 |
|
|
Series 2009-60, Class HT, 6.000%, 08/25/39 |
|
|
1,431 |
|
| |
874 |
|
|
Series 2009-62, Class HJ, 6.000%, 05/25/39 |
|
|
970 |
|
| |
1,273 |
|
|
Series 2009-70, Class CO, PO, 01/25/37 |
|
|
1,179 |
|
| |
995 |
|
|
Series 2009-86, Class UI, IO, 4.000%, 10/25/14 |
|
|
— |
(h) |
| |
786 |
|
|
Series 2009-99, Class SC, IF, IO, 6.025%, 12/25/39 |
|
|
105 |
|
| |
1,016 |
|
|
Series 2009-103, Class MB, VAR, 2.365%, 12/25/39 |
|
|
1,035 |
|
| |
1,286 |
|
|
Series 2010-45, Class BD, 4.500%, 11/25/38 |
|
|
1,333 |
|
| |
1,473 |
|
|
Series 2010-49, Class SC, IF, 12.350%, 03/25/40 |
|
|
1,747 |
|
| |
940 |
|
|
Series 2010-64, Class DM, 5.000%, 06/25/40 |
|
|
1,029 |
|
| |
1,088 |
|
|
Series 2010-71, Class HJ, 5.500%, 07/25/40 |
|
|
1,220 |
|
| |
2,315 |
|
|
Series 2010-133, Class A, 5.500%, 05/25/38 |
|
|
2,534 |
|
| |
3,117 |
|
|
Series 2010-147, Class SA, IF, IO, 6.375%, 01/25/41 |
|
|
721 |
|
| |
1,375 |
|
|
Series 2010-148, Class MA, 4.000%, 02/25/39 |
|
|
1,450 |
|
| |
1,253 |
|
|
Series 2011-2, Class WA, VAR, 5.829%, 02/25/51 |
|
|
1,383 |
|
SEE NOTES TO
FINANCIAL STATEMENTS.
|
|
|
|
|
|
|
|
|
|
|
|
|
| AUGUST 31, 2014 |
|
JPMORGAN INSTITUTIONAL TRUST FUNDS |
|
|
|
|
21 |
|
JPMorgan Core Bond Trust
SCHEDULE OF PORTFOLIO INVESTMENTS
AS OF AUGUST 31, 2014 (Unaudited) (continued)
(Amounts in thousands)
|
|
|
|
|
|
|
|
|
PRINCIPAL
AMOUNT($) |
|
|
SECURITY DESCRIPTION |
|
VALUE($) |
|
| |
Collateralized Mortgage Obligations — continued |
|
|
|
|
|
Agency CMO — continued |
|
|
|
|
| |
1,737 |
|
|
Series 2011-22, Class MA, 6.500%, 04/25/38 |
|
|
1,964 |
|
| |
3,454 |
|
|
Series 2011-30, Class LS, IO, VAR, 1.968%, 04/25/41 |
|
|
271 |
|
| |
2,500 |
|
|
Series 2011-31, Class DB, 3.500%, 04/25/31 |
|
|
2,567 |
|
| |
7,500 |
|
|
Series 2011-44, Class EB, 3.000%, 05/25/26 |
|
|
7,508 |
|
| |
826 |
|
|
Series 2011-75, Class FA, VAR, 0.705%, 08/25/41 |
|
|
834 |
|
| |
1,681 |
|
|
Series 2011-118, Class MT, 7.000%, 11/25/41 |
|
|
1,935 |
|
| |
2,293 |
|
|
Series 2011-130, Class CA, 6.000%, 12/25/41 |
|
|
2,515 |
|
| |
1,430 |
|
|
Series 2012-14, Class FB, VAR, 0.605%, 08/25/37 |
|
|
1,438 |
|
| |
7,975 |
|
|
Series 2012-47, Class HF, VAR, 0.555%, 05/25/27 |
|
|
8,006 |
|
| |
3,000 |
|
|
Series 2012-66, Class CB, 3.000%, 06/25/32 |
|
|
2,796 |
|
| |
5,654 |
|
|
Series 2012-99, Class AE, 2.500%, 05/25/39 |
|
|
5,633 |
|
| |
3,570 |
|
|
Series 2012-108, Class F, VAR, 0.655%, 10/25/42 |
|
|
3,558 |
|
| |
4,414 |
|
|
Series 2012-137, Class CF, VAR, 0.455%, 08/25/41 |
|
|
4,369 |
|
| |
2,000 |
|
|
Series 2013-81, Class TA, 3.000%, 02/25/43 |
|
|
1,986 |
|
| |
1,694 |
|
|
Series 2013-90, Class PM, 3.500%, 09/25/43 |
|
|
1,713 |
|
| |
2,354 |
|
|
Series 2013-92, Class PO, PO, 09/25/43 |
|
|
1,769 |
|
| |
3,349 |
|
|
Series 2013-101, Class AE, 3.000%, 10/25/33 |
|
|
3,287 |
|
| |
3,563 |
|
|
Series 2013-101, Class DO, PO, 10/25/43 |
|
|
2,702 |
|
| |
3,000 |
|
|
Series 2013-101, Class E, 3.000%, 10/25/33 |
|
|
2,934 |
|
| |
3,500 |
|
|
Series 2013-103, Class VG, 3.000%, 03/25/30 |
|
|
3,345 |
|
| |
4,000 |
|
|
Series 2013-108, Class GU, 3.000%, 10/25/33 |
|
|
3,796 |
|
| |
4,777 |
|
|
Series 2013-128, Class PO, PO, 12/25/43 |
|
|
3,609 |
|
| |
— |
(h) |
|
Series G-17, Class S, HB, VAR, 1,064.924%, 06/25/21 |
|
|
5 |
|
| |
19 |
|
|
Series G-28, Class S, IF, 14.945%, 09/25/21 |
|
|
24 |
|
| |
24 |
|
|
Series G-35, Class M, 8.750%, 10/25/21 |
|
|
27 |
|
| |
8 |
|
|
Series G-51, Class SA, HB, IF, 23.983%, 12/25/21 |
|
|
12 |
|
|
|
|
|
|
|
|
|
|
PRINCIPAL
AMOUNT($) |
|
|
SECURITY DESCRIPTION |
|
VALUE($) |
|
|
|
|
|
|
|
|
Agency CMO — continued |
|
|
|
|
| |
— |
(h) |
|
Series G92-27, Class SQ, HB, IF, 1,858.090%, 05/25/22 |
|
|
1 |
|
| |
126 |
|
|
Series G92-35, Class E, 7.500%, 07/25/22 |
|
|
141 |
|
| |
— |
(h) |
|
Series G92-35, Class G, HB, 1,184.775%, 07/25/22 |
|
|
2 |
|
| |
15 |
|
|
Series G92-42, Class Z, 7.000%, 07/25/22 |
|
|
16 |
|
| |
307 |
|
|
Series G92-44, Class ZQ, 8.000%, 07/25/22 |
|
|
331 |
|
| |
20 |
|
|
Series G92-52, Class FD, VAR, 0.176%, 09/25/22 |
|
|
20 |
|
| |
147 |
|
|
Series G92-54, Class ZQ, 7.500%, 09/25/22 |
|
|
163 |
|
| |
19 |
|
|
Series G92-59, Class F, VAR, 1.368%, 10/25/22 |
|
|
19 |
|
| |
39 |
|
|
Series G92-61, Class Z, 7.000%, 10/25/22 |
|
|
45 |
|
| |
26 |
|
|
Series G92-62, Class B, PO, 10/25/22 |
|
|
25 |
|
| |
131 |
|
|
Series G93-1, Class KA, 7.900%, 01/25/23 |
|
|
150 |
|
| |
30 |
|
|
Series G93-5, Class Z, 6.500%, 02/25/23 |
|
|
33 |
|
| |
39 |
|
|
Series G93-14, Class J, 6.500%, 03/25/23 |
|
|
43 |
|
| |
91 |
|
|
Series G93-17, Class SI, IF, 6.000%, 04/25/23 |
|
|
101 |
|
| |
83 |
|
|
Series G93-27, Class FD, VAR, 1.035%, 08/25/23 |
|
|
85 |
|
| |
20 |
|
|
Series G93-37, Class H, PO, 09/25/23 |
|
|
18 |
|
| |
40 |
|
|
Series G95-1, Class C, 8.800%, 01/25/25 |
|
|
46 |
|
|
|
|
|
Federal National Mortgage Association REMIC Trust, |
|
|
|
|
| |
905 |
|
|
Series 2003-W1, Class 1A1, VAR, 5.887%, 12/25/42 |
|
|
1,022 |
|
| |
350 |
|
|
Series 2003-W1, Class 2A, VAR, 6.591%, 12/25/42 |
|
|
412 |
|
| |
132 |
|
|
Series 2003-W4, Class 2A, VAR, 6.364%, 10/25/42 |
|
|
147 |
|
| |
61 |
|
|
Series 2007-W7, Class 1A4, HB, IF, 38.250%, 07/25/37 |
|
|
92 |
|
| |
2,164 |
|
|
Series 2009-W1, Class A, 6.000%, 12/25/49 |
|
|
2,430 |
|
|
|
|
|
Federal National Mortgage Association STRIPS, |
|
|
|
|
| |
1 |
|
|
Series 23, Class 2, IO, 10.000%, 09/25/17 |
|
|
— |
(h) |
| |
— |
(h) |
|
Series 50, Class 2, IO, 10.500%, 03/25/19 |
|
|
— |
(h) |
| |
12 |
|
|
Series 218, Class 2, IO, 7.500%, 04/25/23 |
|
|
3 |
|
| |
13 |
|
|
Series 265, Class 2, 9.000%, 03/25/24 |
|
|
15 |
|
| |
150 |
|
|
Series 329, Class 1, PO, 01/25/33 |
|
|
139 |
|
| |
402 |
|
|
Series 339, Class 18, IO, 4.500%, 07/25/18 |
|
|
25 |
|
| |
575 |
|
|
Series 339, Class 21, IO, 4.500%, 08/25/18 |
|
|
31 |
|
| |
287 |
|
|
Series 339, Class 28, IO, 5.500%, 08/25/18 |
|
|
20 |
|
| |
201 |
|
|
Series 345, Class 6, IO, VAR, 5.000%, 12/25/33 |
|
|
36 |
|
SEE NOTES TO
FINANCIAL STATEMENTS.
|
|
|
|
|
|
|
|
|
|
|
| 22 |
|
|
|
JPMORGAN INSTITUTIONAL TRUST FUNDS |
|
AUGUST 31, 2014 |
|
|
|
|
|
|
|
|
|
PRINCIPAL
AMOUNT($) |
|
|
SECURITY DESCRIPTION |
|
VALUE($) |
|
| |
Collateralized Mortgage Obligations — continued |
|
|
|
|
|
Agency CMO — continued |
|
|
|
|
| |
705 |
|
|
Series 351, Class 7, IO, VAR, 5.000%, 04/25/34 |
|
|
111 |
|
| |
584 |
|
|
Series 355, Class 11, IO, 6.000%, 07/25/34 |
|
|
104 |
|
| |
243 |
|
|
Series 355, Class 31, IO, VAR, 4.500%, 12/25/18 |
|
|
15 |
|
| |
1,022 |
|
|
Series 365, Class 8, IO, 5.500%, 05/25/36 |
|
|
177 |
|
| |
127 |
|
|
Series 368, Class 3, IO, 4.500%, 11/25/20 |
|
|
9 |
|
| |
523 |
|
|
Series 374, Class 5, IO, 5.500%, 08/25/36 |
|
|
90 |
|
| |
274 |
|
|
Series 383, Class 32, IO, 6.000%, 01/25/38 |
|
|
51 |
|
| |
723 |
|
|
Series 383, Class 33, IO, 6.000%, 01/25/38 |
|
|
134 |
|
| |
171 |
|
|
Series 393, Class 6, IO, 5.500%, 04/25/37 |
|
|
30 |
|
|
|
|
|
Federal National Mortgage Association Trust, |
|
|
|
|
| |
240 |
|
|
Series 2004-W1, Class 2A2, 7.000%, 12/25/33 |
|
|
280 |
|
| |
1,002 |
|
|
Series 2004-W15, Class 2AF, VAR, 0.405%, 08/25/44 |
|
|
993 |
|
| |
701 |
|
|
Series 2004-W2, Class 2A2, 7.000%, 02/25/44 |
|
|
812 |
|
| |
2,552 |
|
|
Series 2005-W3, Class 2AF, VAR, 0.375%, 03/25/45 |
|
|
2,547 |
|
| |
884 |
|
|
Series 2006-W2, Class 1AF1, VAR, 0.375%, 02/25/46 |
|
|
880 |
|
|
|
|
|
Government National Mortgage Association, |
|
|
|
|
| |
1,375 |
|
|
Series 1994-7, Class PQ, 6.500%, 10/16/24 |
|
|
1,573 |
|
| |
939 |
|
|
Series 1999-4, Class ZB, 6.000%, 02/20/29 |
|
|
1,052 |
|
| |
964 |
|
|
Series 1999-10, Class ZC, 6.500%, 04/20/29 |
|
|
1,084 |
|
| |
90 |
|
|
Series 1999-30, Class S, IF, IO, 8.445%, 08/16/29 |
|
|
24 |
|
| |
197 |
|
|
Series 1999-40, Class ZW, 7.500%, 11/20/29 |
|
|
229 |
|
| |
277 |
|
|
Series 1999-41, Class Z, 8.000%, 11/16/29 |
|
|
328 |
|
| |
136 |
|
|
Series 2000-9, Class Z, 8.000%, 06/20/30 |
|
|
162 |
|
| |
1,303 |
|
|
Series 2000-9, Class ZJ, 8.500%, 02/16/30 |
|
|
1,554 |
|
| |
229 |
|
|
Series 2000-12, Class ST, HB, IF, 38.721%, 02/16/30 |
|
|
415 |
|
| |
1,777 |
|
|
Series 2000-21, Class Z, 9.000%, 03/16/30 |
|
|
2,124 |
|
| |
13 |
|
|
Series 2000-30, Class ST, IF, 11.050%, 12/16/22 |
|
|
15 |
|
| |
262 |
|
|
Series 2000-31, Class Z, 9.000%, 10/20/30 |
|
|
302 |
|
| |
151 |
|
|
Series 2000-35, Class ZA, 9.000%, 11/20/30 |
|
|
161 |
|
| |
21 |
|
|
Series 2000-36, Class IK, IO, 9.000%, 11/16/30 |
|
|
4 |
|
| |
110 |
|
|
Series 2001-6, Class SD, IF, IO, 8.395%, 03/16/31 |
|
|
32 |
|
| |
211 |
|
|
Series 2001-7, Class PK, 6.500%, 03/20/31 |
|
|
238 |
|
|
|
|
|
|
|
|
|
|
PRINCIPAL
AMOUNT($) |
|
|
SECURITY DESCRIPTION |
|
VALUE($) |
|
|
|
|
|
|
|
|
Agency CMO — continued |
|
|
|
|
| |
180 |
|
|
Series 2001-35, Class SA, IF, IO, 8.095%, 08/16/31 |
|
|
49 |
|
| |
148 |
|
|
Series 2001-36, Class S, IF, IO, 7.895%, 08/16/31 |
|
|
39 |
|
| |
771 |
|
|
Series 2001-64, Class MQ, 6.500%, 12/20/31 |
|
|
888 |
|
| |
198 |
|
|
Series 2002-3, Class SP, IF, IO, 7.235%, 01/16/32 |
|
|
58 |
|
| |
255 |
|
|
Series 2002-7, Class PG, 6.500%, 01/20/32 |
|
|
289 |
|
| |
788 |
|
|
Series 2002-24, Class AG, IF, IO, 7.795%, 04/16/32 |
|
|
182 |
|
| |
71 |
|
|
Series 2002-24, Class SB, IF, 11.692%, 04/16/32 |
|
|
90 |
|
| |
1,706 |
|
|
Series 2002-31, Class SE, IF, IO, 7.345%, 04/16/30 |
|
|
372 |
|
| |
493 |
|
|
Series 2002-40, Class UK, 6.500%, 06/20/32 |
|
|
562 |
|
| |
27 |
|
|
Series 2002-41, Class SV, IF, 9.000%, 06/16/32 |
|
|
33 |
|
| |
1,872 |
|
|
Series 2002-45, Class QE, 6.500%, 06/20/32 |
|
|
2,136 |
|
| |
633 |
|
|
Series 2002-47, Class PG, 6.500%, 07/16/32 |
|
|
725 |
|
| |
1,198 |
|
|
Series 2002-47, Class ZA, 6.500%, 07/20/32 |
|
|
1,367 |
|
| |
1,019 |
|
|
Series 2002-52, Class GH, 6.500%, 07/20/32 |
|
|
1,178 |
|
| |
444 |
|
|
Series 2002-70, Class PS, IF, IO, 7.544%, 08/20/32 |
|
|
37 |
|
| |
949 |
|
|
Series 2002-75, Class PB, 6.000%, 11/20/32 |
|
|
1,123 |
|
| |
831 |
|
|
Series 2003-11, Class SK, IF, IO, 7.545%, 02/16/33 |
|
|
198 |
|
| |
345 |
|
|
Series 2003-12, Class SP, IF, IO, 7.544%, 02/20/33 |
|
|
97 |
|
| |
74 |
|
|
Series 2003-24, Class PO, PO, 03/16/33 |
|
|
63 |
|
| |
1,319 |
|
|
Series 2003-40, Class TJ, 6.500%, 03/20/33 |
|
|
1,538 |
|
| |
753 |
|
|
Series 2003-46, Class MG, 6.500%, 05/20/33 |
|
|
885 |
|
| |
937 |
|
|
Series 2003-46, Class TC, 6.500%, 03/20/33 |
|
|
1,063 |
|
| |
320 |
|
|
Series 2003-52, Class AP, PO, 06/16/33 |
|
|
295 |
|
| |
1,707 |
|
|
Series 2003-58, Class BE, 6.500%, 01/20/33 |
|
|
1,941 |
|
| |
93 |
|
|
Series 2003-90, Class PO, PO, 10/20/33 |
|
|
85 |
|
| |
1,112 |
|
|
Series 2003-112, Class SA, IF, IO, 6.395%, 12/16/33 |
|
|
235 |
|
SEE NOTES TO
FINANCIAL STATEMENTS.
|
|
|
|
|
|
|
|
|
|
|
|
|
| AUGUST 31, 2014 |
|
JPMORGAN INSTITUTIONAL TRUST FUNDS |
|
|
|
|
23 |
|
JPMorgan Core Bond Trust
SCHEDULE OF PORTFOLIO INVESTMENTS
AS OF AUGUST 31, 2014 (Unaudited) (continued)
(Amounts in thousands)
|
|
|
|
|
|
|
|
|
PRINCIPAL
AMOUNT($) |
|
|
SECURITY DESCRIPTION |
|
VALUE($) |
|
| |
Collateralized Mortgage Obligations — continued |
|
|
|
|
|
Agency CMO — continued |
|
|
|
|
| |
918 |
|
|
Series 2003-112, Class TS, IF, IO, 6.795%, 10/20/32 |
|
|
54 |
|
| |
3,161 |
|
|
Series 2004-11, Class SW, IF, IO, 5.344%, 02/20/34 |
|
|
427 |
|
| |
78 |
|
|
Series 2004-15, Class SA, IF, 19.235%, 12/20/32 |
|
|
83 |
|
| |
423 |
|
|
Series 2004-28, Class S, IF, 19.236%, 04/16/34 |
|
|
590 |
|
| |
16 |
|
|
Series 2004-68, Class PO, PO, 05/20/31 |
|
|
16 |
|
| |
162 |
|
|
Series 2004-73, Class AE, IF, 14.535%, 08/17/34 |
|
|
206 |
|
| |
1,778 |
|
|
Series 2004-90, Class SI, IF, IO, 5.945%, 10/20/34 |
|
|
270 |
|
| |
1,216 |
|
|
Series 2005-3, Class SB, IF, IO, 5.945%, 01/20/35 |
|
|
177 |
|
| |
3,100 |
|
|
Series 2005-17, Class SL, IF, IO, 6.545%, 07/20/34 |
|
|
554 |
|
| |
318 |
|
|
Series 2005-35, Class FL, VAR, 0.506%, 03/20/32 |
|
|
318 |
|
| |
65 |
|
|
Series 2005-39, Class KI, IO, 5.500%, 03/20/34 |
|
|
2 |
|
| |
3,143 |
|
|
Series 2005-58, Class NI, IO, 5.500%, 08/20/35 |
|
|
587 |
|
| |
320 |
|
|
Series 2005-68, Class DP, IF, 16.060%, 06/17/35 |
|
|
425 |
|
| |
4,403 |
|
|
Series 2005-68, Class KI, IF, IO, 6.145%, 09/20/35 |
|
|
651 |
|
| |
527 |
|
|
Series 2005-69, Class SY, IF, IO, 6.595%, 11/20/33 |
|
|
78 |
|
| |
570 |
|
|
Series 2005-91, Class PI, IO, 6.000%, 12/20/35 |
|
|
114 |
|
| |
294 |
|
|
Series 2006-16, Class OP, PO, 03/20/36 |
|
|
278 |
|
| |
827 |
|
|
Series 2006-38, Class SW, IF, IO, 6.345%, 06/20/36 |
|
|
89 |
|
| |
959 |
|
|
Series 2006-59, Class SD, IF, IO, 6.545%, 10/20/36 |
|
|
155 |
|
| |
1,608 |
|
|
Series 2006-65, Class SA, IF, IO, 6.644%, 11/20/36 |
|
|
261 |
|
| |
1,025 |
|
|
Series 2007-9, Class DI, IF, IO, 6.355%, 03/20/37 |
|
|
142 |
|
| |
2,384 |
|
|
Series 2007-17, Class JI, IF, IO, 6.655%, 04/16/37 |
|
|
382 |
|
| |
256 |
|
|
Series 2007-17, Class JO, PO, 04/16/37 |
|
|
228 |
|
| |
1,434 |
|
|
Series 2007-19, Class SD, IF, IO, 6.045%, 04/20/37 |
|
|
223 |
|
| |
1,410 |
|
|
Series 2007-26, Class SC, IF, IO, 6.045%, 05/20/37 |
|
|
212 |
|
| |
1,095 |
|
|
Series 2007-27, Class SA, IF, IO, 6.045%, 05/20/37 |
|
|
167 |
|
|
|
|
|
|
|
|
|
|
PRINCIPAL
AMOUNT($) |
|
|
SECURITY DESCRIPTION |
|
VALUE($) |
|
|
|
|
|
|
|
|
Agency CMO — continued |
|
|
|
|
| |
339 |
|
|
Series 2007-28, Class BO, PO, 05/20/37 |
|
|
315 |
|
| |
905 |
|
|
Series 2007-36, Class SE, IF, IO, 6.315%, 06/16/37 |
|
|
147 |
|
| |
2,543 |
|
|
Series 2007-40, Class SB, IF, IO, 6.595%, 07/20/37 |
|
|
362 |
|
| |
1,521 |
|
|
Series 2007-42, Class SB, IF, IO, 6.595%, 07/20/37 |
|
|
220 |
|
| |
2,500 |
|
|
Series 2007-47, Class PH, 6.000%, 07/16/37 |
|
|
2,993 |
|
| |
1,090 |
|
|
Series 2007-50, Class AI, IF, IO, 6.620%, 08/20/37 |
|
|
173 |
|
| |
156 |
|
|
Series 2007-53, Class SW, IF, 19.738%, 09/20/37 |
|
|
213 |
|
| |
705 |
|
|
Series 2007-57, Class PO, PO, 03/20/37 |
|
|
672 |
|
| |
864 |
|
|
Series 2007-57, Class QA, IF, IO, 6.345%, 10/20/37 |
|
|
119 |
|
| |
899 |
|
|
Series 2007-71, Class SB, IF, IO, 6.545%, 07/20/36 |
|
|
70 |
|
| |
804 |
|
|
Series 2007-72, Class US, IF, IO, 6.395%, 11/20/37 |
|
|
108 |
|
| |
819 |
|
|
Series 2007-73, Class MI, IF, IO, 5.844%, 11/20/37 |
|
|
112 |
|
| |
1,587 |
|
|
Series 2007-76, Class SA, IF, IO, 6.374%, 11/20/37 |
|
|
235 |
|
| |
832 |
|
|
Series 2007-79, Class SY, IF, IO, 6.395%, 12/20/37 |
|
|
115 |
|
| |
520 |
|
|
Series 2007-81, Class SP, IF, IO, 6.495%, 12/20/37 |
|
|
74 |
|
| |
936 |
|
|
Series 2007-82, Class SA, IF, IO, 6.374%, 12/20/37 |
|
|
130 |
|
| |
459 |
|
|
Series 2008-2, Class MS, IF, IO, 7.005%, 01/16/38 |
|
|
83 |
|
| |
1,531 |
|
|
Series 2008-2, Class NS, IF, IO, 6.385%, 01/16/38 |
|
|
253 |
|
| |
890 |
|
|
Series 2008-10, Class S, IF, IO, 5.675%, 02/20/38 |
|
|
123 |
|
| |
83 |
|
|
Series 2008-23, Class IO, IO, 6.000%, 02/20/37 |
|
|
1 |
|
| |
647 |
|
|
Series 2008-25, Class SB, IF, IO, 6.744%, 03/20/38 |
|
|
101 |
|
| |
649 |
|
|
Series 2008-32, Class PI, IO, 5.500%, 10/16/37 |
|
|
85 |
|
| |
1,242 |
|
|
Series 2008-36, Class SH, IF, IO, 6.145%, 04/20/38 |
|
|
157 |
|
| |
6,316 |
|
|
Series 2008-40, Class SA, IF, IO, 6.245%, 05/16/38 |
|
|
1,141 |
|
| |
1,209 |
|
|
Series 2008-41, Class SA, IF, IO, 6.185%, 05/20/38 |
|
|
189 |
|
SEE NOTES TO
FINANCIAL STATEMENTS.
|
|
|
|
|
|
|
|
|
|
|
| 24 |
|
|
|
JPMORGAN INSTITUTIONAL TRUST FUNDS |
|
AUGUST 31, 2014 |
|
|
|
|
|
|
|
|
|
PRINCIPAL
AMOUNT($) |
|
|
SECURITY DESCRIPTION |
|
VALUE($) |
|
| |
Collateralized Mortgage Obligations — continued |
|
|
|
|
|
Agency CMO — continued |
|
|
|
|
| |
774 |
|
|
Series 2008-55, Class SA, IF, IO, 6.045%, 06/20/38 |
|
|
108 |
|
| |
252 |
|
|
Series 2008-60, Class PO, PO, 01/20/38 |
|
|
249 |
|
| |
669 |
|
|
Series 2008-65, Class ME, 5.750%, 09/20/37 |
|
|
682 |
|
| |
410 |
|
|
Series 2008-71, Class SC, IF, IO, 5.844%, 08/20/38 |
|
|
51 |
|
| |
899 |
|
|
Series 2008-93, Class AS, IF, IO, 5.545%, 12/20/38 |
|
|
116 |
|
| |
1,303 |
|
|
Series 2009-6, Class SA, IF, IO, 5.945%, 02/16/39 |
|
|
196 |
|
| |
864 |
|
|
Series 2009-10, Class SL, IF, IO, 6.345%, 03/16/34 |
|
|
64 |
|
| |
2,466 |
|
|
Series 2009-12, Class IE, IO, 5.500%, 03/20/39 |
|
|
438 |
|
| |
907 |
|
|
Series 2009-14, Class KI, IO, 6.500%, 03/20/39 |
|
|
185 |
|
| |
828 |
|
|
Series 2009-14, Class NI, IO, 6.500%, 03/20/39 |
|
|
171 |
|
| |
2,343 |
|
|
Series 2009-22, Class SA, IF, IO, 6.114%, 04/20/39 |
|
|
282 |
|
| |
656 |
|
|
Series 2009-25, Class SE, IF, IO, 7.445%, 09/20/38 |
|
|
117 |
|
| |
555 |
|
|
Series 2009-33, Class CI, IO, 5.500%, 05/20/39 |
|
|
97 |
|
| |
548 |
|
|
Series 2009-33, Class TI, IO, 6.000%, 05/20/39 |
|
|
104 |
|
| |
970 |
|
|
Series 2009-43, Class SA, IF, IO, 5.794%, 06/20/39 |
|
|
135 |
|
| |
815 |
|
|
Series 2009-65, Class IQ, IO, 6.000%, 12/20/38 |
|
|
115 |
|
| |
2,078 |
|
|
Series 2009-72, Class SM, IF, IO, 6.095%, 08/16/39 |
|
|
307 |
|
| |
456 |
|
|
Series 2009-79, Class OK, PO, 11/16/37 |
|
|
426 |
|
| |
688 |
|
|
Series 2010-14, Class CO, PO, 08/20/35 |
|
|
652 |
|
| |
516 |
|
|
Series 2010-130, Class CP, 7.000%, 10/16/40 |
|
|
606 |
|
| |
3,735 |
|
|
Series 2010-157, Class OP, PO, 12/20/40 |
|
|
3,025 |
|
| |
3,699 |
|
|
Series 2010-H17, Class XQ, VAR, 5.241%, 07/20/60 |
|
|
4,131 |
|
| |
1,196 |
|
|
Series 2011-22, Class WA, VAR, 5.967%, 02/20/37 |
|
|
1,335 |
|
| |
2,501 |
|
|
Series 2011-75, Class SM, IF, IO, 6.445%, 05/20/41 |
|
|
458 |
|
| |
3,069 |
|
|
Series 2012-61, Class FM, VAR, 0.555%, 05/16/42 |
|
|
3,091 |
|
| |
898 |
|
|
Series 2012-141, Class WC, VAR, 3.757%, 01/20/42 |
|
|
938 |
|
|
|
|
|
|
|
|
|
|
PRINCIPAL
AMOUNT($) |
|
|
SECURITY DESCRIPTION |
|
VALUE($) |
|
|
|
|
|
|
|
|
Agency CMO — continued |
|
|
|
|
| |
4,456 |
|
|
Series 2012-H10, Class FA, VAR, 0.706%, 12/20/61 |
|
|
4,465 |
|
| |
2,483 |
|
|
Series 2012-H15, Class FA, VAR, 0.606%, 05/20/62 |
|
|
2,485 |
|
| |
3,388 |
|
|
Series 2012-H21, Class CF, VAR, 0.856%, 05/20/61 |
|
|
3,410 |
|
| |
2,925 |
|
|
Series 2012-H21, Class DF, VAR, 0.805%, 05/20/61 |
|
|
2,934 |
|
| |
4,789 |
|
|
Series 2012-H22, Class FD, VAR, 0.625%, 01/20/61 |
|
|
4,794 |
|
| |
1,537 |
|
|
Series 2012-H24, Class FA, VAR, 0.606%, 03/20/60 |
|
|
1,538 |
|
| |
3,361 |
|
|
Series 2012-H24, Class FG, VAR, 0.585%, 04/20/60 |
|
|
3,363 |
|
| |
1,939 |
|
|
Series 2012-H26, Class MA, VAR, 0.706%, 07/20/62 |
|
|
1,945 |
|
| |
2,749 |
|
|
Series 2012-H28, Class FA, VAR, 0.736%, 09/20/62 |
|
|
2,752 |
|
| |
3,853 |
|
|
Series 2012-H30, Class PA, VAR, 0.601%, 11/20/59 |
|
|
3,856 |
|
| |
2,148 |
|
|
Series 2012-H31, Class FD, VAR, 0.496%, 12/20/62 |
|
|
2,133 |
|
| |
4,122 |
|
|
Series 2013-54, Class WA, VAR, 4.709%, 11/20/42 |
|
|
4,467 |
|
| |
3,263 |
|
|
Series 2013-75, Class WA, VAR, 5.233%, 06/20/40 |
|
|
3,685 |
|
| |
1,696 |
|
|
Series 2013-91, Class WA, VAR, 4.519%, 04/20/43 |
|
|
1,823 |
|
| |
1,300 |
|
|
Series 2013-116, Class JY, 4.000%, 08/16/43 |
|
|
1,371 |
|
| |
3,078 |
|
|
Series 2013-H01, Class FA, 1.650%, 01/20/63 |
|
|
3,050 |
|
| |
1,507 |
|
|
Series 2013-H03, Class FA, VAR, 0.455%, 08/20/60 |
|
|
1,505 |
|
| |
1,510 |
|
|
Series 2013-H04, Class BA, 1.650%, 02/20/63 |
|
|
1,495 |
|
| |
4,859 |
|
|
Series 2013-H05, Class FB, VAR, 0.556%, 02/20/62 |
|
|
4,860 |
|
| |
1,869 |
|
|
Series 2013-H07, Class HA, VAR, 0.566%, 03/20/63 |
|
|
1,860 |
|
| |
9,957 |
|
|
Series 2013-H07, Class JA, 1.750%, 03/20/63 |
|
|
9,891 |
|
| |
1,781 |
|
|
Series 2013-H08, Class FC, VAR, 0.606%, 02/20/63 |
|
|
1,776 |
|
| |
1,983 |
|
|
Series 2013-H09, Class HA, 1.650%, 04/20/63 |
|
|
1,962 |
|
| |
4,330 |
|
|
Series 2013-H18, Class JA, VAR, 0.755%, 08/20/63 |
|
|
4,349 |
|
SEE NOTES TO
FINANCIAL STATEMENTS.
|
|
|
|
|
|
|
|
|
|
|
|
|
| AUGUST 31, 2014 |
|
JPMORGAN INSTITUTIONAL TRUST FUNDS |
|
|
|
|
25 |
|
JPMorgan Core Bond Trust
SCHEDULE OF PORTFOLIO INVESTMENTS
AS OF AUGUST 31, 2014 (Unaudited) (continued)
(Amounts in thousands)
|
|
|
|
|
|
|
|
|
PRINCIPAL
AMOUNT($) |
|
|
SECURITY DESCRIPTION |
|
VALUE($) |
|
| |
Collateralized Mortgage Obligations — continued |
|
|
|
|
|
Agency CMO — continued |
|
|
|
|
| |
1,969 |
|
|
Series 2014-H01, Class FD, VAR, 0.805%, 01/20/64 |
|
|
1,983 |
|
|
|
|
|
Vendee Mortgage Trust, |
|
|
|
|
| |
483 |
|
|
Series 1994-1, Class 1, VAR, 5.576%, 02/15/24 |
|
|
529 |
|
| |
764 |
|
|
Series 1994-1, Class 2ZB, 6.500%, 02/15/24 |
|
|
837 |
|
| |
691 |
|
|
Series 1996-1, Class 1Z, 6.750%, 02/15/26 |
|
|
791 |
|
| |
554 |
|
|
Series 1996-2, Class 1Z, 6.750%, 06/15/26 |
|
|
640 |
|
| |
964 |
|
|
Series 1997-1, Class 2Z, 7.500%, 02/15/27 |
|
|
1,137 |
|
| |
1,156 |
|
|
Series 1998-1, Class 2E, 7.000%, 03/15/28 |
|
|
1,344 |
|
| |
2,189 |
|
|
Series 1999-1, Class 2Z, 6.500%, 01/15/29 |
|
|
2,489 |
|
| |
5,987 |
|
|
Series 2003-2, Class Z, 5.000%, 05/15/33 |
|
|
6,780 |
|
|
|
|
|
|
|
|
|
|
|
|
|
|
|
|
|
618,945 |
|
|
|
|
|
|
|
|
|
|
|
|
|
|
Non-Agency CMO — 7.0% |
|
|
|
|
| |
123 |
|
|
AAM ACE Resecuritization Trust, Series 2011-1, Class A20, VAR, 0.370%, 02/02/37 (e) |
|
|
121 |
|
|
|
|
|
AJAX Mortgage Loan Trust, |
|
|
|
|
| |
2,478 |
|
|
Series 2013-A, Class A, VAR, 3.500%, 02/25/51 (e) (i) |
|
|
2,454 |
|
| |
2,833 |
|
|
Series 2013-C, Class A, SUB, 4.500%, 03/25/35 (e) (i) |
|
|
2,865 |
|
|
|
|
|
Alternative Loan Trust, |
|
|
|
|
| |
13,673 |
|
|
Series 2004-2CB, Class 1A9, 5.750%, 03/25/34 |
|
|
14,008 |
|
| |
36 |
|
|
Series 2004-18CB, Class 2A4, 5.700%, 09/25/34 |
|
|
36 |
|
| |
1,908 |
|
|
Series 2005-1CB, Class 1A6, IF, IO, 6.945%, 03/25/35 |
|
|
405 |
|
| |
4,714 |
|
|
Series 2005-20CB, Class 3A8, IF, IO, 4.595%, 07/25/35 |
|
|
570 |
|
| |
7,994 |
|
|
Series 2005-22T1, Class A2, IF, IO, 4.915%, 06/25/35 |
|
|
1,074 |
|
| |
4,830 |
|
|
Series 2005-28CB, Class 1A4, 5.500%, 08/25/35 |
|
|
4,620 |
|
| |
167 |
|
|
Series 2005-28CB, Class 3A5, 6.000%, 08/25/35 |
|
|
140 |
|
| |
6,484 |
|
|
Series 2005-37T1, Class A2, IF, IO, 4.895%, 09/25/35 |
|
|
910 |
|
| |
4,238 |
|
|
Series 2005-54CB, Class 1A11, 5.500%, 11/25/35 |
|
|
3,915 |
|
| |
10,657 |
|
|
Series 2005-54CB, Class 1A2, IF, IO, 4.695%, 11/25/35 |
|
|
1,266 |
|
| |
2,638 |
|
|
Series 2005-57CB, Class 3A2, IF, IO, 4.945%, 12/25/35 |
|
|
369 |
|
| |
1,582 |
|
|
Series 2005-64CB, Class 1A9, 5.500%, 12/25/35 |
|
|
1,485 |
|
|
|
|
|
|
|
|
|
|
PRINCIPAL
AMOUNT($) |
|
|
SECURITY DESCRIPTION |
|
VALUE($) |
|
|
|
|
|
|
|
|
|
|
|
|
|
|
Non-Agency CMO — continued |
|
|
|
|
| |
5,930 |
|
|
Series 2005-J1, Class 1A4, IF, IO, 4.945%, 02/25/35 |
|
|
563 |
|
| |
2,340 |
|
|
Series 2006-26CB, Class A9, 6.500%, 09/25/36 |
|
|
2,063 |
|
|
|
|
|
American General Mortgage Loan Trust, |
|
|
|
|
| |
142 |
|
|
Series 2009-1, Class A7, VAR, 5.750%, 09/25/48 (e) |
|
|
141 |
|
| |
— |
(h) |
|
Series 2010-1A, Class A1, VAR, 5.150%, 03/25/58 (e) |
|
|
— |
(h) |
| |
718 |
|
|
Series 2010-1A, Class A2, VAR, 5.650%, 03/25/58 (e) |
|
|
724 |
|
| |
1,140 |
|
|
Series 2010-1A, Class A3, VAR, 5.650%, 03/25/58 (e) |
|
|
1,171 |
|
| |
473 |
|
|
Series 2010-1A, Class A4, VAR, 5.650%, 03/25/58 (e) |
|
|
491 |
|
|
|
|
|
ASG Resecuritization Trust, |
|
|
|
|
| |
632 |
|
|
Series 2009-1, Class A60, VAR, 2.056%, 06/26/37 (e) |
|
|
623 |
|
| |
246 |
|
|
Series 2009-2, Class A55, VAR, 4.872%, 05/24/36 (e) |
|
|
246 |
|
| |
1,000 |
|
|
Series 2009-2, Class G60, VAR, 4.872%, 05/24/36 (e) |
|
|
1,015 |
|
| |
3,047 |
|
|
Series 2009-3, Class A65, VAR, 2.066%, 03/26/37 (e) |
|
|
3,043 |
|
| |
1,699 |
|
|
Series 2009-4, Class A60, 6.000%, 06/28/37 (e) |
|
|
1,726 |
|
| |
725 |
|
|
Series 2010-2, Class A60, VAR, 1.841%, 01/28/37 (e) |
|
|
714 |
|
| |
810 |
|
|
Series 2011-1, Class 3A50, VAR, 2.563%, 11/28/35 (e) |
|
|
794 |
|
|
|
|
|
Banc of America Alternative Loan Trust, |
|
|
|
|
| |
169 |
|
|
Series 2003-2, Class PO, PO, 04/25/33 |
|
|
141 |
|
| |
148 |
|
|
Series 2003-9, Class 1CB2, 5.500%, 11/25/33 |
|
|
151 |
|
| |
294 |
|
|
Series 2003-11, Class PO, PO, 01/25/34 |
|
|
247 |
|
| |
143 |
|
|
Series 2004-6, Class 15PO, PO, 07/25/19 |
|
|
135 |
|
| |
1,445 |
|
|
Series 2005-5, Class 1CB1, 5.500%, 06/25/35 |
|
|
1,366 |
|
| |
3,855 |
|
|
Series 2005-6, Class CBIO, IO, 5.500%, 07/25/35 |
|
|
792 |
|
| |
1,199 |
|
|
Series 2006-4, Class 1A4, 6.000%, 05/25/46 |
|
|
803 |
|
| |
2,143 |
|
|
Banc of America Funding Corp., Series 2012-R6, Class 1A1, 3.000%, 10/26/39 (e)
(i) |
|
|
2,127 |
|
|
|
|
|
Banc of America Funding Trust, |
|
|
|
|
| |
352 |
|
|
Series 2004-1, Class PO, PO, 03/25/34 |
|
|
280 |
|
| |
513 |
|
|
Series 2004-2, Class 30PO, PO, 09/20/34 |
|
|
437 |
|
SEE NOTES TO
FINANCIAL STATEMENTS.
|
|
|
|
|
|
|
|
|
|
|
| 26 |
|
|
|
JPMORGAN INSTITUTIONAL TRUST FUNDS |
|
AUGUST 31, 2014 |
|
|
|
|
|
|
|
|
|
PRINCIPAL
AMOUNT($) |
|
|
SECURITY DESCRIPTION |
|
VALUE($) |
|
| |
Collateralized Mortgage Obligations — continued |
|
|
|
|
|
Non-Agency CMO — continued |
|
|
|
|
| |
266 |
|
|
Series 2004-C, Class 1A1, VAR, 5.045%, 12/20/34 |
|
|
264 |
|
| |
783 |
|
|
Series 2005-6, Class 2A7, 5.500%, 10/25/35 |
|
|
785 |
|
| |
520 |
|
|
Series 2005-7, Class 30PO, PO, 11/25/35 |
|
|
390 |
|
| |
345 |
|
|
Series 2005-8, Class 30PO, PO, 01/25/36 |
|
|
265 |
|
| |
1,428 |
|
|
Series 2005-E, Class 4A1, VAR, 2.683%, 03/20/35 |
|
|
1,431 |
|
| |
577 |
|
|
Series 2006-A, Class 3A2, VAR, 2.740%, 02/20/36 |
|
|
468 |
|
| |
446 |
|
|
Series 2010-R5, Class 1A1, 5.500%, 10/26/37 (e) |
|
|
455 |
|
|
|
|
|
Banc of America Mortgage Trust, |
|
|
|
|
| |
109 |
|
|
Series 2003-3, Class 2A1, VAR, 0.705%, 05/25/18 |
|
|
105 |
|
| |
99 |
|
|
Series 2003-6, Class 2A1, VAR, 0.605%, 08/25/18 |
|
|
97 |
|
| |
42 |
|
|
Series 2003-7, Class A2, 4.750%, 09/25/18 |
|
|
43 |
|
| |
142 |
|
|
Series 2003-8, Class APO, PO, 11/25/33 |
|
|
114 |
|
| |
903 |
|
|
Series 2004-3, Class 15IO, IO, VAR, 0.045%, 04/25/19 |
|
|
4 |
|
| |
59 |
|
|
Series 2004-4, Class APO, PO, 05/25/34 |
|
|
51 |
|
| |
994 |
|
|
Series 2004-5, Class 2A2, 5.500%, 06/25/34 |
|
|
1,014 |
|
| |
473 |
|
|
Series 2004-6, Class 2A5, PO, 07/25/34 |
|
|
393 |
|
| |
266 |
|
|
Series 2004-6, Class APO, PO, 07/25/34 |
|
|
240 |
|
| |
30 |
|
|
Series 2004-8, Class 5PO, PO, 05/25/32 |
|
|
27 |
|
| |
35 |
|
|
Series 2004-8, Class XPO, PO, 10/25/34 |
|
|
31 |
|
| |
263 |
|
|
Series 2004-A, Class 2A2, VAR, 2.679%, 02/25/34 |
|
|
264 |
|
| |
1,033 |
|
|
Series 2004-J, Class 3A1, VAR, 2.913%, 11/25/34 |
|
|
1,034 |
|
| |
1,004 |
|
|
Series 2005-10, Class 1A6, 5.500%, 11/25/35 |
|
|
990 |
|
|
|
|
|
BCAP LLC Trust, |
|
|
|
|
| |
374 |
|
|
Series 2009-RR13, Class 17A2, VAR, 5.500%, 04/26/37 (e) |
|
|
388 |
|
| |
484 |
|
|
Series 2009-RR5, Class 8A1, 5.500%, 11/26/34 (e) |
|
|
500 |
|
| |
659 |
|
|
Series 2010-RR12, Class 2A5, VAR, 4.500%, 01/26/36 (e) |
|
|
665 |
|
| |
196 |
|
|
Series 2010-RR4, Class 12A1, VAR, 4.000%, 07/26/36 (e) |
|
|
199 |
|
| |
610 |
|
|
Series 2010-RR6, Class 22A3, VAR, 4.370%, 06/26/36 (e) |
|
|
621 |
|
| |
427 |
|
|
Series 2010-RR7, Class 16A1, VAR, 0.818%, 02/26/47 (e) |
|
|
424 |
|
|
|
|
|
|
|
|
|
|
PRINCIPAL
AMOUNT($) |
|
|
SECURITY DESCRIPTION |
|
VALUE($) |
|
|
|
|
|
|
|
|
|
|
|
|
|
|
Non-Agency CMO — continued |
|
|
|
|
| |
216 |
|
|
Series 2010-RR7, Class 1A5, VAR, 4.924%, 04/26/35 (e) |
|
|
215 |
|
| |
1,996 |
|
|
Series 2010-RR7, Class 2A1, VAR, 2.073%, 07/26/45 (e) |
|
|
2,006 |
|
| |
263 |
|
|
Series 2010-RR8, Class 3A3, VAR, 5.067%, 05/26/35 (e) |
|
|
267 |
|
| |
1,500 |
|
|
Series 2010-RR8, Class 3A4, VAR, 5.067%, 05/26/35 (e) |
|
|
1,418 |
|
| |
866 |
|
|
Series 2011-R11, Class 25A5, VAR, 4.000%, 08/26/21 (e) |
|
|
878 |
|
| |
2,001 |
|
|
Series 2011-RR10, Class 2A1, VAR, 1.007%, 09/26/37 (e) |
|
|
1,835 |
|
| |
1,806 |
|
|
Series 2011-RR4, Class 6A3, VAR, 5.000%, 08/26/37 (e) |
|
|
1,833 |
|
| |
1,640 |
|
|
Series 2011-RR5, Class 11A3, VAR, 0.305%, 05/28/36 (e) |
|
|
1,610 |
|
| |
369 |
|
|
Series 2011-RR5, Class 14A3, VAR, 2.501%, 07/26/36 (e) |
|
|
367 |
|
| |
1,202 |
|
|
Series 2012-RR10, Class 3A1, VAR, 0.345%, 05/26/36 (e) |
|
|
1,138 |
|
| |
1,342 |
|
|
Series 2012-RR2, Class 1A1, VAR, 0.325%, 08/26/36 (e) |
|
|
1,309 |
|
| |
1,085 |
|
|
Series 2012-RR3, Class 2A5, VAR, 2.079%, 05/26/37 (e) |
|
|
1,087 |
|
|
|
|
|
Bear Stearns ARM Trust, |
|
|
|
|
| |
168 |
|
|
Series 2003-7, Class 3A, VAR, 2.423%, 10/25/33 |
|
|
169 |
|
| |
743 |
|
|
Series 2004-1, Class 12A1, VAR, 2.707%, 04/25/34 |
|
|
745 |
|
| |
163 |
|
|
Series 2004-2, Class 14A, VAR, 3.035%, 05/25/34 |
|
|
164 |
|
| |
1,636 |
|
|
Series 2005-5, Class A1, VAR, 2.180%, 08/25/35 |
|
|
1,658 |
|
| |
3,912 |
|
|
Series 2006-1, Class A1, VAR, 2.369%, 02/25/36 |
|
|
3,938 |
|
|
|
|
|
CAM Mortgage Trust, |
|
|
|
|
| |
147 |
|
|
Series 2014-1, Class A, SUB, 3.352%, 12/15/53 (e) |
|
|
148 |
|
| |
1,251 |
|
|
Series 2014-2, Class A, SUB, 2.600%, 05/15/48 (e) |
|
|
1,251 |
|
|
|
|
|
CHL Mortgage Pass-Through Trust, |
|
|
|
|
| |
201 |
|
|
Series 2003-J7, Class 4A3, IF, 9.572%, 08/25/18 |
|
|
210 |
|
| |
536 |
|
|
Series 2004-7, Class 2A1, VAR, 2.469%, 06/25/34 |
|
|
529 |
|
| |
310 |
|
|
Series 2004-8, Class 2A1, 4.500%, 06/25/19 |
|
|
320 |
|
| |
207 |
|
|
Series 2004-HYB1, Class 2A, VAR, 2.557%, 05/20/34 |
|
|
198 |
|
SEE NOTES TO
FINANCIAL STATEMENTS.
|
|
|
|
|
|
|
|
|
|
|
|
|
| AUGUST 31, 2014 |
|
JPMORGAN INSTITUTIONAL TRUST FUNDS |
|
|
|
|
27 |
|
JPMorgan Core Bond Trust
SCHEDULE OF PORTFOLIO INVESTMENTS
AS OF AUGUST 31, 2014 (Unaudited) (continued)
(Amounts in thousands)
|
|
|
|
|
|
|
|
|
PRINCIPAL
AMOUNT($) |
|
|
SECURITY DESCRIPTION |
|
VALUE($) |
|
| |
Collateralized Mortgage Obligations — continued |
|
|
|
|
|
Non-Agency CMO — continued |
|
|
|
|
| |
750 |
|
|
Series 2004-HYB3, Class 2A, VAR, 2.329%, 06/20/34 |
|
|
721 |
|
| |
646 |
|
|
Series 2004-HYB6, Class A3, VAR, 2.479%, 11/20/34 |
|
|
623 |
|
| |
267 |
|
|
Series 2004-J8, Class 1A2, 4.750%, 11/25/19 |
|
|
274 |
|
| |
1,354 |
|
|
Series 2005-16, Class A23, 5.500%, 09/25/35 |
|
|
1,264 |
|
| |
3,367 |
|
|
Series 2005-22, Class 2A1, VAR, 2.554%, 11/25/35 |
|
|
2,870 |
|
|
|
|
|
Citicorp Mortgage Securities REMIC Pass- Through Certificates Trust, |
|
|
|
|
| |
148 |
|
|
Series 2005-5, Class APO, PO, 08/25/35 |
|
|
131 |
|
| |
142 |
|
|
Series 2005-8, Class APO, PO, 11/25/35 |
|
|
114 |
|
|
|
|
|
Citigroup Mortgage Loan Trust, |
|
|
|
|
| |
1,240 |
|
|
Series 2008-AR4, Class 1A1A, VAR, 2.734%, 11/25/38 (e) |
|
|
1,245 |
|
| |
530 |
|
|
Series 2009-10, Class 2A1A, 7.000%, 12/25/35 (e) |
|
|
553 |
|
| |
4,278 |
|
|
Series 2010-8, Class 5A6, 4.000%, 11/25/36 (e) |
|
|
4,406 |
|
| |
4,593 |
|
|
Series 2010-8, Class 6A6, 4.500%, 12/25/36 (e) |
|
|
4,724 |
|
|
|
|
|
Citigroup Mortgage Loan Trust, Inc., |
|
|
|
|
| |
289 |
|
|
Series 2003-1, Class 2A5, 5.250%, 10/25/33 |
|
|
295 |
|
| |
150 |
|
|
Series 2003-1, Class 2A6, PO, 10/25/33 |
|
|
128 |
|
| |
102 |
|
|
Series 2003-1, Class PO2, PO, 10/25/33 |
|
|
92 |
|
| |
111 |
|
|
Series 2003-1, Class PO3, PO, 09/25/33 |
|
|
99 |
|
| |
113 |
|
|
Series 2003-UP3, Class A3, 7.000%, 09/25/33 |
|
|
117 |
|
| |
175 |
|
|
Series 2003-UST1, Class A1, 5.500%, 12/25/18 |
|
|
180 |
|
| |
33 |
|
|
Series 2003-UST1, Class PO1, PO, 12/25/18 |
|
|
31 |
|
| |
33 |
|
|
Series 2003-UST1, Class PO3, PO, 12/25/18 |
|
|
33 |
|
| |
161 |
|
|
Series 2004-UST1, Class A6, VAR, 2.616%, 08/25/34 |
|
|
156 |
|
| |
419 |
|
|
Series 2005-1, Class 2A1A, VAR, 2.674%, 04/25/35 |
|
|
323 |
|
| |
504 |
|
|
Series 2005-2, Class 2A11, 5.500%, 05/25/35 |
|
|
527 |
|
| |
525 |
|
|
Series 2005-5, Class 1A2, VAR, 2.832%, 08/25/35 |
|
|
388 |
|
| |
471 |
|
|
Series 2012-A, Class A, 2.500%, 06/25/51 (e) (i) |
|
|
457 |
|
|
|
|
|
Credit Suisse First Boston Mortgage Securities Corp., |
|
|
|
|
| |
634 |
|
|
Series 2003-1, Class DB1, VAR, 6.685%, 02/25/33 |
|
|
642 |
|
|
|
|
|
|
|
|
|
|
PRINCIPAL
AMOUNT($) |
|
|
SECURITY DESCRIPTION |
|
VALUE($) |
|
|
|
|
|
|
|
|
Non-Agency CMO — continued |
|
|
|
|
| |
107 |
|
|
Series 2003-17, Class 2A1, 5.000%, 07/25/18 |
|
|
110 |
|
| |
374 |
|
|
Series 2003-21, Class 1A4, 5.250%, 09/25/33 |
|
|
386 |
|
| |
523 |
|
|
Series 2003-25, Class 1P, PO, 10/25/33 |
|
|
453 |
|
| |
32 |
|
|
Series 2004-5, Class 5P, PO, 08/25/19 |
|
|
32 |
|
| |
2,143 |
|
|
Series 2005-4, Class 3A18, 5.500%, 06/25/35 |
|
|
2,165 |
|
| |
2,384 |
|
|
Series 2005-4, Class 3A23, 5.500%, 06/25/35 |
|
|
2,367 |
|
|
|
|
|
CSMC, |
|
|
|
|
| |
849 |
|
|
Series 2011-9R, Class A1, VAR, 2.155%, 03/27/46 (e) |
|
|
852 |
|
| |
1,644 |
|
|
Series 2011-16R, Class 7A3, VAR, 3.500%, 12/27/36 (e) |
|
|
1,661 |
|
|
|
|
|
CSMC Trust, |
|
|
|
|
| |
627 |
|
|
Series 2010-16, Class A3, VAR, 3.519%, 06/25/50 (e) |
|
|
639 |
|
| |
8,315 |
|
|
Series 2010-11R, Class A6, VAR, 1.156%, 06/28/47 (e) |
|
|
7,965 |
|
| |
475 |
|
|
Series 2011-1R, Class A1, VAR, 1.155%, 02/27/47 (e) |
|
|
475 |
|
| |
805 |
|
|
Series 2011-6R, Class 3A1, VAR, 2.616%, 07/28/36 (e) |
|
|
810 |
|
| |
766 |
|
|
Series 2012-3R, Class 1A1, VAR, 2.357%, 07/27/37 (e) |
|
|
763 |
|
| |
70 |
|
|
Deutsche Mortgage Securities, Inc., Mortgage Loan Resecuritization Trust,
Series 2009-RS2, Class 4A1, VAR, 0.282%, 04/26/37 (e) |
|
|
69 |
|
| |
590 |
|
|
FDIC Trust, Series 2013-N1, Class A, 4.500%, 10/25/18 (e) |
|
|
596 |
|
| |
4 |
|
|
First Boston Mortgage Securities Corp. 1987 STRIPS, Series C, Class PO, PO, 04/25/17 |
|
|
4 |
|
|
|
|
|
First Horizon Alternative Mortgage Securities Trust, |
|
|
|
|
| |
1,134 |
|
|
Series 2004-AA4, Class A1, VAR, 2.233%, 10/25/34 |
|
|
1,132 |
|
| |
1,666 |
|
|
Series 2005-FA8, Class 1A19, 5.500%, 11/25/35 |
|
|
1,475 |
|
| |
2,834 |
|
|
Series 2007-FA4, Class 1A2, IF, IO, 5.495%, 08/25/37 |
|
|
564 |
|
|
|
|
|
First Horizon Mortgage Pass-Through Trust, |
|
|
|
|
| |
695 |
|
|
Series 2004-AR2, Class 2A1, VAR, 2.628%, 05/25/34 |
|
|
695 |
|
| |
1,491 |
|
|
Series 2005-AR1, Class 2A2, VAR, 2.575%, 04/25/35 |
|
|
1,498 |
|
| |
282 |
|
|
Freedom Trust, Series 2011-4, Class A18, VAR, 5.000%, 03/25/37 (e) |
|
|
284 |
|
SEE NOTES TO
FINANCIAL STATEMENTS.
|
|
|
|
|
|
|
|
|
|
|
| 28 |
|
|
|
JPMORGAN INSTITUTIONAL TRUST FUNDS |
|
AUGUST 31, 2014 |
|
|
|
|
|
|
|
|
|
PRINCIPAL
AMOUNT($) |
|
|
SECURITY DESCRIPTION |
|
VALUE($) |
|
| Collateralized Mortgage Obligations — continued |
|
| |
|
|
Non-Agency CMO — continued |
|
|
|
|
|
GMACM Mortgage Loan Trust, |
|
|
|
|
| |
609 |
|
|
Series 2003-AR1, Class A4, VAR, 2.911%, 10/19/33 |
|
|
607 |
|
| |
294 |
|
|
Series 2004-J5, Class A7, 6.500%, 01/25/35 |
|
|
308 |
|
| |
116 |
|
|
Series 2004-J6, Class 1A1, 5.000%, 01/25/20 |
|
|
120 |
|
| |
4,605 |
|
|
Series 2005-AR3, Class 3A4, VAR, 2.800%, 06/19/35 |
|
|
4,570 |
|
|
|
|
|
GSMPS Mortgage Loan Trust, |
|
|
|
|
| |
935 |
|
|
Series 2001-2, Class A, VAR, 7.500%, 06/19/32 (e) |
|
|
981 |
|
| |
1,358 |
|
|
Series 2005-RP3, Class 1AF, VAR, 0.505%, 09/25/35 (e) |
|
|
1,161 |
|
| |
1,026 |
|
|
Series 2005-RP3, Class 1AS, IO, VAR, 4.823%, 09/25/35 (e) |
|
|
141 |
|
| |
4,522 |
|
|
Series 2006-RP2, Class 1AS2, IF, IO, 5.893%, 04/25/36 (e) |
|
|
580 |
|
|
|
|
|
GSR Mortgage Loan Trust, |
|
|
|
|
| |
662 |
|
|
Series 2004-6F, Class 3A4, 6.500%, 05/25/34 |
|
|
711 |
|
| |
634 |
|
|
Series 2004-8F, Class 2A3, 6.000%, 09/25/34 |
|
|
660 |
|
| |
652 |
|
|
Series 2004-13F, Class 3A3, 6.000%, 11/25/34 |
|
|
645 |
|
| |
293 |
|
|
Series 2005-4F, Class AP, PO, 05/25/35 |
|
|
264 |
|
| |
2,736 |
|
|
Series 2005-7F, Class 3A9, 6.000%, 09/25/35 |
|
|
2,837 |
|
| |
3,348 |
|
|
Series 2006-1F, Class 2A4, 6.000%, 02/25/36 |
|
|
3,067 |
|
| |
2,880 |
|
|
Series 2007-1F, Class 2A4, 5.500%, 01/25/37 |
|
|
2,883 |
|
| |
3,783 |
|
|
Homeowner Assistance Program Reverse Mortgage Loan Trust, Series 2013-RM1, Class A, 4.000%,
05/26/53 (e) (i) |
|
|
3,703 |
|
| |
312 |
|
|
Impac CMB Trust, Series 2005-4, Class 2A1, VAR, 0.455%, 05/25/35 |
|
|
312 |
|
|
|
|
|
Impac Secured Assets Trust, |
|
|
|
|
| |
650 |
|
|
Series 2006-1, Class 2A1, VAR, 0.505%, 05/25/36 |
|
|
645 |
|
| |
763 |
|
|
Series 2006-2, Class 2A1, VAR, 0.505%, 08/25/36 |
|
|
752 |
|
| |
14,765 |
|
|
IndyMac INDX Mortgage Loan Trust, Series 2005-AR11, Class A7, IO, VAR, 0.000%, 08/25/35 |
|
|
5 |
|
|
|
|
|
JP Morgan Mortgage Trust, |
|
|
|
|
| |
1,406 |
|
|
Series 2006-A2, Class 4A1, VAR, 2.495%, 08/25/34 |
|
|
1,405 |
|
|
|
|
|
|
|
|
|
|
PRINCIPAL
AMOUNT($) |
|
|
SECURITY DESCRIPTION |
|
VALUE($) |
|
| |
|
| |
|
|
Non-Agency CMO — continued |
|
| |
1,935 |
|
|
Series 2006-A2, Class 5A3, VAR, 2.518%, 11/25/33 |
|
|
1,932 |
|
| |
349 |
|
|
Series 2006-A3, Class 6A1, VAR, 3.128%, 08/25/34 |
|
|
353 |
|
| |
427 |
|
|
JP Morgan Resecuritization Trust, Series |
|
|
|
|
|
|
|
|
2009-6, Class 4A1, VAR, 2.528%, 09/26/36 (e) |
|
|
431 |
|
|
|
|
|
Lehman Mortgage Trust, |
|
|
|
|
| |
666 |
|
|
Series 2006-2, Class 1A1, VAR, 6.127%, 04/25/36 |
|
|
631 |
|
| |
1,258 |
|
|
Series 2008-2, Class 1A6, 6.000%, 03/25/38 |
|
|
1,137 |
|
| |
1,000 |
|
|
LVII Resecuritization Trust, Series 2009-3, Class M3, VAR, 5.180%, 11/27/37 (e) |
|
|
1,011 |
|
|
|
|
|
MASTR Adjustable Rate Mortgages Trust, |
|
|
|
|
| |
86 |
|
|
Series 2004-4, Class 2A1, VAR, 1.933%, 05/25/34 |
|
|
78 |
|
| |
795 |
|
|
Series 2004-13, Class 2A1, VAR, 2.642%, 04/21/34 |
|
|
804 |
|
| |
1,902 |
|
|
Series 2004-13, Class 3A7, VAR, 2.636%, 11/21/34 |
|
|
1,940 |
|
| |
388 |
|
|
Series 2004-15, Class 3A1, VAR, 2.893%, 12/25/34 |
|
|
391 |
|
|
|
|
|
MASTR Alternative Loan Trust, |
|
|
|
|
| |
209 |
|
|
Series 2003-3, Class 1A1, 6.500%, 05/25/33 |
|
|
221 |
|
| |
543 |
|
|
Series 2003-9, Class 8A1, 6.000%, 01/25/34 |
|
|
544 |
|
| |
629 |
|
|
Series 2004-3, Class 2A1, 6.250%, 04/25/34 |
|
|
665 |
|
| |
901 |
|
|
Series 2004-4, Class 10A1, 5.000%, 05/25/24 |
|
|
953 |
|
| |
469 |
|
|
Series 2004-6, Class 30PO, PO, 07/25/34 |
|
|
367 |
|
| |
683 |
|
|
Series 2004-6, Class 7A1, 6.000%, 07/25/34 |
|
|
695 |
|
| |
324 |
|
|
Series 2004-7, Class 30PO, PO, 08/25/34 |
|
|
259 |
|
| |
1,172 |
|
|
Series 2004-8, Class 6A1, 5.500%, 09/25/19 |
|
|
1,215 |
|
| |
178 |
|
|
Series 2004-10, Class 1A1, 4.500%, 09/25/19 |
|
|
182 |
|
|
|
|
|
MASTR Asset Securitization Trust, |
|
|
|
|
| |
52 |
|
|
Series 2003-2, Class 2A1, 4.500%, 03/25/18 |
|
|
52 |
|
| |
18 |
|
|
Series 2003-3, Class 4A1, 5.000%, 04/25/18 |
|
|
18 |
|
| |
82 |
|
|
Series 2003-4, Class 3A2, 5.000%, 05/25/18 |
|
|
83 |
|
| |
115 |
|
|
Series 2003-12, Class 30PO, PO, 12/25/33 |
|
|
104 |
|
SEE NOTES TO
FINANCIAL STATEMENTS.
|
|
|
|
|
|
|
|
|
|
|
|
|
| AUGUST 31, 2014 |
|
JPMORGAN INSTITUTIONAL TRUST FUNDS |
|
|
|
|
29 |
|
JPMorgan Core Bond Trust
SCHEDULE OF PORTFOLIO INVESTMENTS
AS OF AUGUST 31, 2014 (Unaudited) (continued)
(Amounts in thousands)
|
|
|
|
|
|
|
|
|
PRINCIPAL
AMOUNT($) |
|
|
SECURITY DESCRIPTION |
|
VALUE($) |
|
| Collateralized Mortgage Obligations — continued |
|
| |
|
|
Non-Agency CMO — continued |
|
| |
85 |
|
|
Series 2004-1, Class 30PO, PO, 02/25/34 |
|
|
74 |
|
| |
28 |
|
|
Series 2004-4, Class 3A1, 4.500%, 04/25/19 |
|
|
28 |
|
| |
49 |
|
|
Series 2004-6, Class 15PO, PO, 07/25/19 |
|
|
48 |
|
| |
70 |
|
|
Series 2004-8, Class 1A1, 4.750%, 08/25/19 |
|
|
72 |
|
| |
31 |
|
|
Series 2004-8, Class PO, PO, 08/25/19 |
|
|
28 |
|
| |
2,669 |
|
|
MASTR Reperforming Loan Trust, Series 2005-2, Class 1A1F, VAR, 0.505%, 05/25/35 (e) |
|
|
2,202 |
|
| |
1,090 |
|
|
MASTR Resecuritization Trust, Series 2005-PO, Class 3PO, PO, 05/28/35 (e) |
|
|
872 |
|
|
|
|
|
Merrill Lynch Mortgage Investors Trust, |
|
|
|
|
| |
344 |
|
|
Series 2003-E, Class A1, VAR, 0.775%, 10/25/28 |
|
|
341 |
|
| |
810 |
|
|
Series 2004-1, Class 2A1, VAR, 2.147%, 12/25/34 |
|
|
794 |
|
| |
619 |
|
|
Series 2004-A, Class A1, VAR, 0.615%, 04/25/29 |
|
|
596 |
|
| |
29 |
|
|
ML Trust XLVII, Series 47, Class Z, 8.985%, 10/20/20 |
|
|
31 |
|
| |
646 |
|
|
MortgageIT Trust, Series 2005-1, Class 1A1, VAR, 0.475%, 02/25/35 |
|
|
633 |
|
| |
492 |
|
|
NACC Reperforming Loan REMIC Trust, Series 2004-R2, Class A1, VAR, 6.500%, 10/25/34 (e) |
|
|
502 |
|
|
|
|
|
Nomura Asset Acceptance Corp. Alternative Loan Trust, |
|
|
|
|
| |
260 |
|
|
Series 2003-A1, Class A1, 5.500%, 05/25/33 |
|
|
268 |
|
| |
116 |
|
|
Series 2003-A1, Class A2, 6.000%, 05/25/33 |
|
|
120 |
|
| |
47 |
|
|
Series 2003-A1, Class A5, 7.000%, 04/25/33 |
|
|
49 |
|
| |
6 |
|
|
Series 2003-A1, Class A7, 5.000%, 04/25/18 |
|
|
6 |
|
|
|
|
|
PaineWebber CMO Trust, |
|
|
|
|
| |
1 |
|
|
Series H, Class 4, 8.750%, 04/01/18 |
|
|
1 |
|
| |
8 |
|
|
Series P, Class 4, 8.500%, 08/01/19 |
|
|
8 |
|
| |
318 |
|
|
Provident Funding Mortgage Loan Trust, Series 2005-1, Class 2A1, VAR, 2.495%, 05/25/35 |
|
|
324 |
|
|
|
|
|
RALI Trust, |
|
|
|
|
| |
87 |
|
|
Series 2002-QS16, Class A3, IF, 16.299%, 10/25/17 |
|
|
90 |
|
| |
276 |
|
|
Series 2002-QS8, Class A5, 6.250%, 06/25/17 |
|
|
280 |
|
| |
4,482 |
|
|
Series 2003-QR19, Class CB4, 5.750%, 10/25/33 |
|
|
4,664 |
|
|
|
|
|
|
|
|
|
|
PRINCIPAL
AMOUNT($) |
|
|
SECURITY DESCRIPTION |
|
VALUE($) |
|
| |
|
| |
|
|
Non-Agency CMO — continued |
|
| |
589 |
|
|
Series 2003-QS12, Class A2A, IF, IO, 7.445%, 06/25/18 |
|
|
62 |
|
| |
179 |
|
|
Series 2003-QS12, Class A5, IO, 5.000%, 06/25/18 |
|
|
13 |
|
| |
1,260 |
|
|
Series 2003-QS14, Class A1, 5.000%, 07/25/18 |
|
|
1,281 |
|
| |
403 |
|
|
Series 2003-QS18, Class A1, 5.000%, 09/25/18 |
|
|
413 |
|
| |
1,512 |
|
|
Series 2003-QS19, Class A1, 5.750%, 10/25/33 |
|
|
1,594 |
|
| |
232 |
|
|
Series 2003-QS3, Class A2, IF, 16.159%, 02/25/18 |
|
|
261 |
|
| |
78 |
|
|
Series 2003-QS3, Class A8, IF, IO, 7.445%, 02/25/18 |
|
|
2 |
|
| |
577 |
|
|
Series 2003-QS9, Class A3, IF, IO, 7.395%, 05/25/18 |
|
|
61 |
|
| |
2,159 |
|
|
Series 2004-QA6, Class NB2, VAR, 2.961%, 12/26/34 |
|
|
1,807 |
|
|
|
|
|
RBSSP Resecuritization Trust, |
|
|
|
|
| |
441 |
|
|
Series 2009-2, Class 1A1, 7.000%, 08/26/37 (e) |
|
|
468 |
|
| |
8 |
|
|
Series 2009-6, Class 15A1, 5.500%, 01/26/21 (e) |
|
|
8 |
|
| |
549 |
|
|
Series 2009-9, Class 7A4, VAR, 6.000%, 07/26/37 (e) |
|
|
562 |
|
| |
794 |
|
|
Series 2009-12, Class 1A1, VAR, 5.860%, 11/25/33 (e) |
|
|
839 |
|
| |
776 |
|
|
Series 2010-9, Class 7A5, VAR, 4.000%, 05/26/37 (e) |
|
|
789 |
|
| |
145 |
|
|
Series 2010-12, Class 8A1, 4.000%, 06/27/21 (e) |
|
|
146 |
|
|
|
|
|
Residential Asset Securitization Trust, |
|
|
|
|
| |
333 |
|
|
Series 2003-A13, Class A3, 5.500%, 01/25/34 |
|
|
343 |
|
| |
26 |
|
|
Series 2003-A14, Class A1, 4.750%, 02/25/19 |
|
|
27 |
|
| |
2,935 |
|
|
Series 2005-A2, Class A4, IF, IO, 4.895%, 03/25/35 |
|
|
412 |
|
| |
763 |
|
|
Series 2006-A4, Class 2A5, 6.000%, 05/25/36 |
|
|
705 |
|
|
|
|
|
RFMSI Trust, |
|
|
|
|
| |
464 |
|
|
Series 2003-S13, Class A3, 5.500%, 06/25/33 |
|
|
466 |
|
| |
98 |
|
|
Series 2003-S14, Class A4, PO, 07/25/18 |
|
|
97 |
|
| |
203 |
|
|
Series 2004-S3, Class A1, 4.750%, 03/25/19 |
|
|
207 |
|
| |
459 |
|
|
Series 2004-S6, Class 2A6, PO, 06/25/34 |
|
|
393 |
|
| |
97 |
|
|
Series 2004-S9, Class 2A1, 4.750%, 12/25/19 |
|
|
98 |
|
SEE NOTES TO
FINANCIAL STATEMENTS.
|
|
|
|
|
|
|
|
|
|
|
| 30 |
|
|
|
JPMORGAN INSTITUTIONAL TRUST FUNDS |
|
AUGUST 31, 2014 |
|
|
|
|
|
|
|
|
|
PRINCIPAL
AMOUNT($) |
|
|
SECURITY DESCRIPTION |
|
VALUE($) |
|
| Collateralized Mortgage Obligations — continued |
|
| |
|
|
Non-Agency CMO — continued |
|
| |
798 |
|
|
Series 2005-SA4, Class 1A1, VAR, 2.669%, 09/25/35 |
|
|
670 |
|
| |
19 |
|
|
RFSC Trust, Series 2003-RM2, Class AP-3, PO, 05/25/33 |
|
|
17 |
|
|
|
|
|
Salomon Brothers Mortgage Securities VII, Inc., |
|
|
|
|
| |
290 |
|
|
Series 2003-HYB1, Class A, VAR, 2.612%, 09/25/33 |
|
|
296 |
|
| |
39 |
|
|
Series 2003-UP2, Class PO1, PO, 12/25/18 |
|
|
35 |
|
|
|
|
|
Springleaf Mortgage Loan Trust, |
|
|
|
|
| |
1,283 |
|
|
Series 2011-1A, Class A1, VAR, 4.050%, 01/25/58 (e) |
|
|
1,334 |
|
| |
2,100 |
|
|
Series 2011-1A, Class A2, VAR, 5.450%, 01/25/58 (e) |
|
|
2,200 |
|
| |
1,600 |
|
|
Series 2012-1A, Class M3, VAR, 6.000%, 09/25/57 (e) |
|
|
1,706 |
|
| |
2,000 |
|
|
Series 2012-2A, Class M4, VAR, 6.000%, 10/25/57 (e) |
|
|
2,091 |
|
| |
2,704 |
|
|
Series 2012-3A, Class A, VAR, 1.570%, 12/25/59 (e) |
|
|
2,703 |
|
| |
1,130 |
|
|
Series 2012-3A, Class M1, VAR, 2.660%, 12/25/59 (e) |
|
|
1,130 |
|
| |
589 |
|
|
Series 2012-3A, Class M2, VAR, 3.560%, 12/25/59 (e) |
|
|
598 |
|
| |
455 |
|
|
Series 2012-3A, Class M3, VAR, 4.440%, 12/25/59 (e) |
|
|
466 |
|
| |
267 |
|
|
Series 2012-3A, Class M4, VAR, 5.300%, 12/25/59 (e) |
|
|
275 |
|
| |
2,161 |
|
|
Series 2013-1A, Class A, VAR, 1.270%, 06/25/58 (e) |
|
|
2,154 |
|
| |
1,116 |
|
|
Series 2013-1A, Class M1, VAR, 2.310%, 06/25/58 (e) |
|
|
1,092 |
|
| |
900 |
|
|
Series 2013-1A, Class M2, VAR, 3.140%, 06/25/58 (e) |
|
|
895 |
|
| |
634 |
|
|
Series 2013-1A, Class M3, VAR, 3.790%, 06/25/58 (e) |
|
|
639 |
|
| |
3,414 |
|
|
Series 2013-2A, Class A, VAR, 1.780%, 12/25/65 (e) |
|
|
3,409 |
|
| |
1,058 |
|
|
Series 2013-2A, Class M1, VAR, 3.520%, 12/25/65 (e) |
|
|
1,080 |
|
| |
849 |
|
|
Series 2013-3A, Class A, VAR, 1.870%, 09/25/57 (e) |
|
|
847 |
|
| |
2,131 |
|
|
Series 2013-3A, Class M1, VAR, 3.790%, 09/25/57 (e) |
|
|
2,147 |
|
| |
3,500 |
|
|
Station Place Securitization Trust, Series 2013-1, Class A, VAR, 1.377%,
02/25/15 |
|
|
3,500 |
|
| |
941 |
|
|
Structured Adjustable Rate Mortgage Loan Trust, Series 2004-6, Class 5A4, VAR, 2.371%, 06/25/34 |
|
|
936 |
|
|
|
|
|
|
|
|
|
|
PRINCIPAL
AMOUNT($) |
|
|
SECURITY DESCRIPTION |
|
VALUE($) |
|
| |
|
| |
|
|
Non-Agency CMO — continued |
|
| |
820 |
|
|
Structured Asset Mortgage Investments II Trust, Series 2004-AR5, Class 1A1, VAR, 0.486%, 10/19/34 |
|
|
780 |
|
|
|
|
|
Structured Asset Securities Corp. Mortgage Pass-Through Certificates, |
|
|
|
|
| |
909 |
|
|
Series 2003-33H, Class 1A1, 5.500%, 10/25/33 |
|
|
930 |
|
| |
1,614 |
|
|
Series 2004-5H, Class A4, 5.540%, 12/25/33 |
|
|
1,660 |
|
|
|
|
|
Structured Asset Securities Corp. Trust, |
|
|
|
|
| |
172 |
|
|
Series 2005-6, Class 4A1, 5.000%, 05/25/35 |
|
|
174 |
|
| |
238 |
|
|
Series 2005-10, Class 5A9, 5.250%, 12/25/34 |
|
|
241 |
|
|
|
|
|
Thornburg Mortgage Securities Trust, |
|
|
|
|
| |
491 |
|
|
Series 2003-4, Class A1, VAR, 0.795%, 09/25/43 |
|
|
482 |
|
| |
455 |
|
|
Series 2004-4, Class 3A, VAR, 2.000%, 12/25/44 |
|
|
457 |
|
|
|
|
|
WaMu Mortgage Pass-Through Certificates Trust, |
|
|
|
|
| |
182 |
|
|
Series 2003-AR8, Class A, VAR, 2.397%, 08/25/33 |
|
|
188 |
|
| |
2,678 |
|
|
Series 2003-AR9, Class 1A6, VAR, 2.408%, 09/25/33 |
|
|
2,773 |
|
| |
388 |
|
|
Series 2003-AR9, Class 2A, VAR, 2.442%, 09/25/33 |
|
|
394 |
|
| |
225 |
|
|
Series 2003-S8, Class A6, 4.500%, 09/25/18 |
|
|
228 |
|
| |
1,460 |
|
|
Series 2003-S9, Class A8, 5.250%, 10/25/33 |
|
|
1,502 |
|
| |
146 |
|
|
Series 2003-S9, Class P, PO, 10/25/33 |
|
|
113 |
|
| |
236 |
|
|
Series 2004-AR3, Class A1, VAR, 2.377%, 06/25/34 |
|
|
241 |
|
| |
197 |
|
|
Series 2004-AR3, Class A2, VAR, 2.377%, 06/25/34 |
|
|
202 |
|
| |
2,156 |
|
|
Series 2004-RS2, Class A4, 5.000%, 11/25/33 |
|
|
2,209 |
|
| |
299 |
|
|
Series 2006-AR10, Class 2P, VAR, 2.297%, 09/25/36 |
|
|
265 |
|
| |
224 |
|
|
Series 2006-AR12, Class 2P, VAR, 1.949%, 10/25/36 |
|
|
164 |
|
|
|
|
|
Washington Mutual Mortgage Pass- Through Certificates WMALT Trust, |
|
|
|
|
| |
9,794 |
|
|
Series 2005-2, Class 1A4, IF, IO, 4.895%, 04/25/35 |
|
|
1,399 |
|
| |
1,932 |
|
|
Series 2005-2, Class 2A3, IF, IO, 4.845%, 04/25/35 |
|
|
248 |
|
SEE NOTES TO
FINANCIAL STATEMENTS.
|
|
|
|
|
|
|
|
|
|
|
|
|
| AUGUST 31, 2014 |
|
JPMORGAN INSTITUTIONAL TRUST FUNDS |
|
|
|
|
31 |
|
JPMorgan Core Bond Trust
SCHEDULE OF PORTFOLIO INVESTMENTS
AS OF AUGUST 31, 2014 (Unaudited) (continued)
(Amounts in thousands)
|
|
|
|
|
|
|
|
|
PRINCIPAL
AMOUNT($) |
|
|
SECURITY DESCRIPTION |
|
VALUE($) |
|
| Collateralized Mortgage Obligations — continued |
|
| |
|
|
Non-Agency CMO — continued |
|
| |
2,464 |
|
|
Series 2005-3, Class CX, IO, 5.500%, 05/25/35 |
|
|
519 |
|
| |
3,002 |
|
|
Series 2005-4, Class CB7, 5.500%, 06/25/35 |
|
|
2,804 |
|
| |
2,456 |
|
|
Series 2005-4, Class CX, IO, 5.500%, 06/25/35 |
|
|
520 |
|
| |
699 |
|
|
Series 2005-6, Class 2A4, 5.500%, 08/25/35 |
|
|
647 |
|
| |
4,476 |
|
|
Series 2005-6, Class 2A9, 5.500%, 08/25/35 |
|
|
4,155 |
|
| |
1,919 |
|
|
Wells Fargo Mortgage Loan Trust, Series 2012-RR1, Class A1, VAR, 2.847%, 08/27/37
(e) |
|
|
1,930 |
|
|
|
|
|
Wells Fargo Mortgage-Backed Securities Trust, |
|
|
|
|
| |
237 |
|
|
Series 2003-K, Class 1A1, VAR, 2.491%, 11/25/33 |
|
|
241 |
|
| |
448 |
|
|
Series 2003-K, Class 1A2, VAR, 2.491%, 11/25/33 |
|
|
458 |
|
| |
552 |
|
|
Series 2004-EE, Class 2A1, VAR, 2.612%, 12/25/34 |
|
|
563 |
|
| |
607 |
|
|
Series 2004-EE, Class 3A1, VAR, 2.533%, 12/25/34 |
|
|
616 |
|
| |
2,881 |
|
|
Series 2004-P, Class 2A1, VAR, 2.613%, 09/25/34 |
|
|
2,945 |
|
| |
577 |
|
|
Series 2004-V, Class 1A1, VAR, 2.608%, 10/25/34 |
|
|
584 |
|
| |
273 |
|
|
Series 2005-16, Class APO, PO, 01/25/36 |
|
|
214 |
|
| |
413 |
|
|
Series 2005-AR16, Class 2A1, VAR, 2.619%, 02/25/34 |
|
|
420 |
|
| |
5,014 |
|
|
Series 2005-AR3, Class 1A1, VAR, 2.619%, 03/25/35 |
|
|
5,097 |
|
| |
531 |
|
|
Series 2005-AR8, Class 2A1, VAR, 2.600%, 06/25/35 |
|
|
535 |
|
| |
579 |
|
|
Series 2006-2, Class APO, PO, 03/25/36 |
|
|
369 |
|
| |
288 |
|
|
Series 2006-4, Class 1APO, PO, 04/25/36 |
|
|
223 |
|
| |
1,440 |
|
|
Series 2007-7, Class A7, 6.000%, 06/25/37 |
|
|
1,426 |
|
| |
409 |
|
|
Series 2007-11, Class A14, 6.000%, 08/25/37 |
|
|
408 |
|
|
|
|
|
|
|
|
|
|
|
|
|
|
|
|
|
267,026 |
|
|
|
|
|
|
|
|
|
|
|
|
|
|
Total Collateralized Mortgage Obligations
(Cost $836,935) |
|
|
885,971 |
|
|
|
|
|
|
|
|
|
|
| |
Commercial Mortgage-Backed Securities — 3.7% |
|
|
|
|
|
A10 Securitization LLC, |
|
|
|
|
| |
803 |
|
|
Series 2012-1, Class A, 3.492%, 04/15/24 (e) |
|
|
805 |
|
| |
1,016 |
|
|
Series 2013-1, Class A, 2.400%, 11/15/25 (e) |
|
|
1,019 |
|
|
|
|
|
|
|
|
|
|
PRINCIPAL
AMOUNT($) |
|
|
SECURITY DESCRIPTION |
|
VALUE($) |
|
| |
|
|
|
|
|
A10 Term Asset Financing LLC, |
|
|
|
|
| |
3,566 |
|
|
Series 2013-2, Class A, 2.620%, 11/15/27 (e) |
|
|
3,562 |
|
| |
696 |
|
|
Series 2013-2, Class B, 4.380%, 11/15/27 (e) |
|
|
697 |
|
|
|
|
|
ACRE Commercial Mortgage Trust, (Cayman Islands), |
|
|
|
|
| |
360 |
|
|
Series 2014-FL2, Class B, VAR, 2.200%, 08/15/31 (e) |
|
|
360 |
|
| |
360 |
|
|
Series 2014-FL2, Class C, VAR, 2.650%, 08/15/31 (e) |
|
|
359 |
|
| |
560 |
|
|
BAMLL Commercial Mortgage Securities Trust, Series 2012-PARK, Class A, 2.959%, 12/10/30 (e) |
|
|
557 |
|
|
|
|
|
Banc of America Commercial Mortgage Trust, |
|
|
|
|
| |
385 |
|
|
Series 2006-1, Class A4, VAR, 5.372%, 09/10/45 |
|
|
403 |
|
| |
2,195 |
|
|
Series 2006-4, Class A4, 5.634%, 07/10/46 |
|
|
2,329 |
|
| |
915 |
|
|
Series 2006-5, Class A4, 5.414%, 09/10/47 |
|
|
975 |
|
| |
1,500 |
|
|
Series 2007-5, Class A4, 5.492%, 02/10/51 |
|
|
1,620 |
|
|
|
|
|
Banc of America Merrill Lynch Commercial Mortgage, Inc., |
|
|
|
|
| |
400 |
|
|
Series 2005-3, Class A4, 4.668%, 07/10/43 |
|
|
408 |
|
| |
1,610 |
|
|
Series 2005-3, Class AM, 4.727%, 07/10/43 |
|
|
1,645 |
|
| |
1,300 |
|
|
Banc of America Re-REMIC Trust, Series 2014-520M, Class C, VAR, 4.354%, 08/15/46
(e) |
|
|
1,248 |
|
|
|
|
|
BB-UBS Trust, |
|
|
|
|
| |
4,400 |
|
|
Series 2012-SHOW, Class A, 3.430%, 11/05/36 (e) |
|
|
4,375 |
|
| |
2,500 |
|
|
Series 2012-TFT, Class A, 2.892%, 06/05/30 (e) |
|
|
2,438 |
|
|
|
|
|
Bear Stearns Commercial Mortgage Securities Trust, |
|
|
|
|
| |
37,145 |
|
|
Series 2005-PWR8, Class X1, IO, VAR, 0.942%, 06/11/41 (e) |
|
|
134 |
|
| |
3,148 |
|
|
Series 2006-PW11, Class A4, VAR, 5.600%, 03/11/39 |
|
|
3,304 |
|
| |
89,588 |
|
|
CD Commercial Mortgage Trust, Series 2007-CD4, Class XC, IO, VAR, 0.556%,
12/11/49 (e) |
|
|
685 |
|
| |
900 |
|
|
CGBAM Commercial Mortgage Trust, Series 2014 -HD, Class A, VAR, 0.955%, 02/15/31 (e) |
|
|
900 |
|
| |
1,250 |
|
|
Citigroup Commercial Mortgage Trust, Series 2005-C3, Class AM, VAR, 4.830%, 05/15/43 |
|
|
1,276 |
|
SEE NOTES TO
FINANCIAL STATEMENTS.
|
|
|
|
|
|
|
|
|
|
|
| 32 |
|
|
|
JPMORGAN INSTITUTIONAL TRUST FUNDS |
|
AUGUST 31, 2014 |
|
|
|
|
|
|
|
|
|
PRINCIPAL
AMOUNT($) |
|
|
SECURITY DESCRIPTION |
|
VALUE($) |
|
| Commercial Mortgage-Backed Securities — continued |
|
|
|
|
|
COBALT CMBS Commercial Mortgage Trust, |
|
|
|
|
| |
551 |
|
|
Series 2006-C1, Class A4, 5.223%, 08/15/48 |
|
|
587 |
|
| |
17,313 |
|
|
Series 2006-C1, Class IO, IO, VAR, 0.978%, 08/15/48 |
|
|
279 |
|
|
|
|
|
COMM Mortgage Trust, |
|
|
|
|
| |
1,100 |
|
|
Series 2005-LP5, Class A4, VAR, 4.982%, 05/10/43 |
|
|
1,116 |
|
| |
2,986 |
|
|
Series 2012-CR2, Class XA, IO, VAR, 2.081%, 08/15/45 |
|
|
311 |
|
| |
3,500 |
|
|
Series 2013-300P, Class A1, 4.353%, 08/10/30 (e) |
|
|
3,807 |
|
| |
1,060 |
|
|
Series 2013-SFS, Class A2, VAR, 3.086%, 04/12/35 (e) |
|
|
1,052 |
|
| |
1,000 |
|
|
Series 2014-TWC, Class A, VAR, 1.006%, 02/13/32 (e) |
|
|
1,000 |
|
| |
300 |
|
|
Commercial Mortgage Pass-Through Certificates, Series 2012-MVP, Class A, VAR, 2.094%, 11/17/26 (e) |
|
|
302 |
|
|
|
|
|
Commercial Mortgage Trust, |
|
|
|
|
| |
500 |
|
|
Series 2005-GG3, Class AJ, VAR, 4.859%, 08/10/42 |
|
|
505 |
|
| |
300 |
|
|
Series 2006-GG7, Class AM, VAR, 6.014%, 07/10/38 |
|
|
322 |
|
| |
700 |
|
|
Credit Suisse Commercial Mortgage Trust, Series 2006-C2, Class A3, VAR, 5.857%, 03/15/39 |
|
|
737 |
|
| |
2,018 |
|
|
CSMC, Series 2014-ICE, Class A, VAR, 1.050%, 04/15/27 (e) |
|
|
2,021 |
|
| |
1,183 |
|
|
DBRR Trust, Series 2013-EZ2, Class A, VAR, 0.853%, 02/25/45 (e) |
|
|
1,181 |
|
| |
— |
(h) |
|
FDIC Guaranteed Notes Trust, Series 2010-C1, Class A, 2.980%, 12/06/20 (e) |
|
|
— |
(h) |
|
|
|
|
Federal Home Loan Mortgage Corp., Multifamily Structured Pass-Through Certificates, |
|
|
|
|
| |
2,557 |
|
|
Series K029, Class A2, VAR, 3.320%, 02/25/23 |
|
|
2,678 |
|
| |
2,500 |
|
|
Series KSMC, Class A2, 2.615%, 01/25/23 |
|
|
2,484 |
|
| |
1,866 |
|
|
GE Capital Commercial Mortgage Corp., Series 2005-C1, Class AJ, VAR, 4.826%, 06/10/48 |
|
|
1,887 |
|
| |
3,925 |
|
|
GMAC Commercial Mortgage Securities, Inc. Trust, Series 2006-C1, Class A4, VAR, 5.238%, 11/10/45 |
|
|
4,067 |
|
| |
1,396 |
|
|
GS Mortgage Securities Corp. II, Series 2013-KING, Class A, 2.706%, 12/10/27
(e) |
|
|
1,412 |
|
| |
488 |
|
|
GS Mortgage Securities Corp. Trust, Series 2013-NYC5, Class A, 2.318%, 01/10/30 (e) |
|
|
492 |
|
|
|
|
|
|
|
|
|
|
PRINCIPAL
AMOUNT($) |
|
|
SECURITY DESCRIPTION |
|
VALUE($) |
|
| |
|
| |
865 |
|
|
GS Mortgage Securities Trust, Series 2006-GG6, Class A4, VAR, 5.553%,
04/10/38 |
|
|
904 |
|
| |
1,000 |
|
|
GSMS Trust, Series 2009-RR1, Class JPB, 5.374%, 05/17/45 (e) |
|
|
1,074 |
|
|
|
|
|
JP Morgan Chase Commercial Mortgage Securities Trust, |
|
|
|
|
| |
1,000 |
|
|
Series 2005-CB11, Class AJ, VAR, 5.568%, 08/12/37 |
|
|
1,022 |
|
| |
400 |
|
|
Series 2006-LDP9, Class AMS, 5.337%, 05/15/47 |
|
|
402 |
|
| |
1,000 |
|
|
Series 2007-C1, Class A4, 5.716%, 02/15/51 |
|
|
1,092 |
|
| |
998 |
|
|
Ladder Capital Commercial Mortgage Trust, Series 2013-GCP, Class A2, 3.985%, 02/15/36 (e) |
|
|
1,028 |
|
|
|
|
|
LB-UBS Commercial Mortgage Trust, |
|
|
|
|
| |
1,000 |
|
|
Series 2006-C1, Class A4, 5.156%, 02/15/31 |
|
|
1,040 |
|
| |
39,781 |
|
|
Series 2006-C7, Class XW, IO, VAR, 0.849%, 11/15/38 (e) |
|
|
507 |
|
| |
300 |
|
|
Series 2007-C1, Class AM, 5.455%, 02/15/40 |
|
|
325 |
|
| |
819 |
|
|
Series 2007-C2, Class A3, 5.430%, 02/15/40 |
|
|
892 |
|
| |
2,834 |
|
|
Merrill Lynch Mortgage Trust, Series 2005- LC1, Class A4, VAR, 5.291%, 01/12/44 |
|
|
2,957 |
|
|
|
|
|
ML-CFC Commercial Mortgage Trust, |
|
|
|
|
| |
3,088 |
|
|
Series 2006-1, Class A4, VAR, 5.651%, 02/12/39 |
|
|
3,245 |
|
| |
28,867 |
|
|
Series 2006-4, Class XC, IO, VAR, 0.274%, 12/12/49 (e) |
|
|
325 |
|
| |
2,000 |
|
|
Morgan Stanley Bank of America Merrill Lynch Trust, Series 2014-C14, Class A3, 3.669%, 02/15/47 |
|
|
2,094 |
|
|
|
|
|
Morgan Stanley Capital I Trust, |
|
|
|
|
| |
34,541 |
|
|
Series 2006-IQ12, Class X1, IO, VAR, 0.679%, 12/15/43 (e) |
|
|
330 |
|
| |
66,930 |
|
|
Series 2007-HQ11, Class X, IO, VAR, 0.392%, 02/12/44 (e) |
|
|
280 |
|
| |
764 |
|
|
Series 2011-C3, Class A3, 4.054%, 07/15/49 |
|
|
817 |
|
|
|
|
|
Morgan Stanley Re-REMIC Trust, |
|
|
|
|
| |
1,146 |
|
|
Series 2012-IO, Class AXA, 1.000%, 03/27/51 (e) |
|
|
1,149 |
|
| |
4,252 |
|
|
Series 2012-XA, Class A, 2.000%, 07/27/49 (e) |
|
|
4,274 |
|
| |
1,800 |
|
|
Series 2012-XA, Class B, 0.250%, 07/27/49 (e) |
|
|
1,557 |
|
SEE NOTES TO
FINANCIAL STATEMENTS.
|
|
|
|
|
|
|
|
|
|
|
|
|
| AUGUST 31, 2014 |
|
JPMORGAN INSTITUTIONAL TRUST FUNDS |
|
|
|
|
33 |
|
JPMorgan Core Bond Trust
SCHEDULE OF PORTFOLIO INVESTMENTS
AS OF AUGUST 31, 2014 (Unaudited) (continued)
(Amounts in thousands)
|
|
|
|
|
|
|
|
|
PRINCIPAL
AMOUNT($) |
|
|
SECURITY DESCRIPTION |
|
VALUE($) |
|
| Commercial Mortgage-Backed Securities — continued |
|
|
|
|
|
NCUA Guaranteed Notes Trust, |
|
|
|
|
| |
20,500 |
|
|
Series 2010-C1, Class A2, 2.900%, 10/29/20 |
|
|
21,172 |
|
| |
10,035 |
|
|
Series 2010-C1, Class APT, 2.650%, 10/29/20 |
|
|
10,208 |
|
|
|
|
|
NorthStar, (Cayman Islands), |
|
|
|
|
| |
2,324 |
|
|
Series 2013-1A, Class A, VAR, 2.005%, 08/25/29 (e) |
|
|
2,326 |
|
| |
1,392 |
|
|
Series 2013-1A, Class B, VAR, 5.155%, 08/25/29 (e) |
|
|
1,406 |
|
| |
1,667 |
|
|
NorthStar Mortgage Trust, Series 2012-1, Class A, VAR, 1.355%, 08/25/29 (e) |
|
|
1,669 |
|
| |
1,719 |
|
|
ORES NPL LLC, Series 2013-LV2, Class A, 3.081%, 09/25/25 (e) |
|
|
1,719 |
|
| |
664 |
|
|
RBS Commercial Funding, Inc. Trust, Series 2013 -SMV, Class A, 3.260%, 03/11/31 (e) |
|
|
650 |
|
| |
1,414 |
|
|
RCMC LLC, Series 2012-CRE1, Class A, 5.623%, 11/15/44 (e) |
|
|
1,457 |
|
| |
1,342 |
|
|
TIAA Seasoned Commercial Mortgage Trust, Series 2007-C4, Class A3, VAR, 5.560%, 08/15/39 |
|
|
1,353 |
|
| |
2,236 |
|
|
UBS-BAMLL Trust, Series 2012-WRM, Class A, 3.663%, 06/10/30 (e) |
|
|
2,258 |
|
|
|
|
|
UBS-Barclays Commercial Mortgage Trust, |
|
|
|
|
| |
1,053 |
|
|
Series 2012-C2, Class A4, 3.525%, 05/10/63 |
|
|
1,090 |
|
| |
10,293 |
|
|
Series 2012-C2, Class XA, IO, VAR, 1.929%, 05/10/63 (e) |
|
|
864 |
|
| |
857 |
|
|
Series 2013-C6, Class A4, 3.244%, 04/10/46 |
|
|
865 |
|
|
|
|
|
VNDO Mortgage Trust, |
|
|
|
|
| |
1,398 |
|
|
Series 2012-6AVE, Class A, 2.996%, 11/15/30 (e) |
|
|
1,384 |
|
| |
4,000 |
|
|
Series 2013-PENN, Class A, 3.808%, 12/13/29 (e) |
|
|
4,225 |
|
| |
2,500 |
|
|
Wells Fargo Commercial Mortgage Trust, Series 2013-120B, Class A, VAR, 2.800%, 03/18/28 (e) |
|
|
2,502 |
|
| |
1,405 |
|
|
Wells Fargo Resecuritization Trust, Series 2012-IO, Class A, 1.750%,
08/20/21 (e) |
|
|
1,406 |
|
|
|
|
|
WFRBS Commercial Mortgage Trust, |
|
|
|
|
| |
1,700 |
|
|
Series 2011-C3, Class A4, 4.375%, 03/15/44 (e) |
|
|
1,856 |
|
| |
800 |
|
|
Series 2012-C6, Class A4, 3.440%, 04/15/45 |
|
|
830 |
|
| |
400 |
|
|
Series 2013-C11, Class D, VAR, 4.322%, 03/15/45 (e) |
|
|
381 |
|
|
|
|
|
|
|
|
|
|
|
|
|
|
Total Commercial Mortgage-Backed Securities
(Cost $136,600) |
|
|
140,274 |
|
|
|
|
|
|
|
|
|
|
|
|
|
|
|
|
|
|
|
PRINCIPAL
AMOUNT($) |
|
|
SECURITY DESCRIPTION |
|
VALUE($) |
|
| |
Corporate Bonds — 18.8% |
|
|
|
|
|
Consumer Discretionary — 1.3% |
|
|
|
|
|
|
|
|
Auto Components — 0.1% |
|
|
|
|
|
|
|
|
Johnson Controls, Inc., |
|
|
|
|
| |
591 |
|
|
3.750%, 12/01/21 |
|
|
618 |
|
| |
675 |
|
|
4.250%, 03/01/21 |
|
|
729 |
|
| |
173 |
|
|
4.950%, 07/02/64 |
|
|
179 |
|
| |
1,000 |
|
|
5.250%, 12/01/41 |
|
|
1,098 |
|
|
|
|
|
|
|
|
|
|
|
|
|
|
|
|
|
2,624 |
|
|
|
|
|
|
|
|
|
|
|
|
|
|
Automobiles — 0.1% |
|
|
|
|
|
|
|
|
Daimler Finance North America LLC, |
|
|
|
|
| |
421 |
|
|
1.650%, 04/10/15 (e) |
|
|
424 |
|
| |
532 |
|
|
1.875%, 01/11/18 (e) |
|
|
536 |
|
| |
981 |
|
|
2.375%, 08/01/18 (e) |
|
|
1,002 |
|
| |
739 |
|
|
2.625%, 09/15/16 (e) |
|
|
762 |
|
| |
1,425 |
|
|
2.950%, 01/11/17 (e) |
|
|
1,480 |
|
|
|
|
|
|
|
|
|
|
|
|
|
|
|
|
|
4,204 |
|
|
|
|
|
|
|
|
|
|
|
|
|
|
Media — 0.9% |
|
|
|
|
|
|
|
|
21st Century Fox America, Inc., |
|
|
|
|
| |
100 |
|
|
6.200%, 12/15/34 |
|
|
124 |
|
| |
400 |
|
|
6.650%, 11/15/37 |
|
|
512 |
|
| |
250 |
|
|
6.900%, 08/15/39 |
|
|
331 |
|
| |
1,075 |
|
|
7.300%, 04/30/28 |
|
|
1,360 |
|
| |
505 |
|
|
8.000%, 10/17/16 |
|
|
578 |
|
| |
430 |
|
|
8.875%, 04/26/23 |
|
|
582 |
|
|
|
|
|
CBS Corp., |
|
|
|
|
| |
475 |
|
|
3.700%, 08/15/24 |
|
|
480 |
|
| |
360 |
|
|
4.900%, 08/15/44 |
|
|
370 |
|
| |
140 |
|
|
5.500%, 05/15/33 |
|
|
156 |
|
| |
265 |
|
|
5.750%, 04/15/20 |
|
|
305 |
|
| |
250 |
|
|
Comcast Cable Communications Holdings, Inc., 9.455%, 11/15/22 |
|
|
364 |
|
|
|
|
|
Comcast Corp., |
|
|
|
|
| |
555 |
|
|
4.200%, 08/15/34 |
|
|
570 |
|
| |
1,082 |
|
|
4.250%, 01/15/33 |
|
|
1,125 |
|
| |
2,910 |
|
|
5.900%, 03/15/16 |
|
|
3,139 |
|
| |
400 |
|
|
6.450%, 03/15/37 |
|
|
524 |
|
| |
1,355 |
|
|
6.500%, 11/15/35 |
|
|
1,782 |
|
|
|
|
|
Cox Communications, Inc., |
|
|
|
|
| |
446 |
|
|
3.250%, 12/15/22 (e) |
|
|
438 |
|
| |
162 |
|
|
5.450%, 12/15/14 |
|
|
164 |
|
| |
125 |
|
|
8.375%, 03/01/39 (e) |
|
|
182 |
|
| |
450 |
|
|
Cox Enterprises, Inc., 7.375%, 07/15/27 (e) |
|
|
576 |
|
|
|
|
|
DIRECTV Holdings LLC/DIRECTV Financing Co., Inc., |
|
|
|
|
| |
435 |
|
|
3.800%, 03/15/22 |
|
|
453 |
|
| |
1,000 |
|
|
4.600%, 02/15/21 |
|
|
1,100 |
|
SEE NOTES TO
FINANCIAL STATEMENTS.
|
|
|
|
|
|
|
|
|
|
|
| 34 |
|
|
|
JPMORGAN INSTITUTIONAL TRUST FUNDS |
|
AUGUST 31, 2014 |
|
|
|
|
|
|
|
|
|
PRINCIPAL
AMOUNT($) |
|
|
SECURITY DESCRIPTION |
|
VALUE($) |
|
| Corporate Bonds — continued |
|
| |
|
|
Media — continued |
|
| |
862 |
|
|
5.000%, 03/01/21 |
|
|
966 |
|
| |
2,000 |
|
|
6.000%, 08/15/40 |
|
|
2,378 |
|
|
|
|
|
Discovery Communications LLC, |
|
|
|
|
| |
1,016 |
|
|
4.375%, 06/15/21 |
|
|
1,107 |
|
| |
319 |
|
|
4.950%, 05/15/42 |
|
|
335 |
|
| |
1,197 |
|
|
Historic TW, Inc., 9.150%, 02/01/23 |
|
|
1,671 |
|
|
|
|
|
NBCUniversal Media LLC, |
|
|
|
|
| |
310 |
|
|
4.375%, 04/01/21 |
|
|
343 |
|
| |
800 |
|
|
5.950%, 04/01/41 |
|
|
1,005 |
|
| |
515 |
|
|
6.400%, 04/30/40 |
|
|
681 |
|
|
|
|
|
Thomson Reuters Corp., (Canada), |
|
|
|
|
| |
1,278 |
|
|
3.950%, 09/30/21 |
|
|
1,349 |
|
| |
441 |
|
|
4.500%, 05/23/43 |
|
|
435 |
|
| |
325 |
|
|
4.700%, 10/15/19 |
|
|
358 |
|
|
|
|
|
Time Warner Cable, Inc., |
|
|
|
|
| |
359 |
|
|
5.500%, 09/01/41 |
|
|
416 |
|
| |
1,218 |
|
|
5.850%, 05/01/17 |
|
|
1,360 |
|
| |
400 |
|
|
6.550%, 05/01/37 |
|
|
512 |
|
| |
800 |
|
|
8.250%, 04/01/19 |
|
|
1,006 |
|
|
|
|
|
Time Warner Entertainment Co. LP, |
|
|
|
|
| |
160 |
|
|
8.375%, 03/15/23 |
|
|
217 |
|
| |
1,250 |
|
|
8.375%, 07/15/33 |
|
|
1,880 |
|
|
|
|
|
Time Warner, Inc., |
|
|
|
|
| |
555 |
|
|
4.750%, 03/29/21 |
|
|
615 |
|
| |
313 |
|
|
5.375%, 10/15/41 |
|
|
346 |
|
| |
150 |
|
|
6.200%, 03/15/40 |
|
|
181 |
|
| |
172 |
|
|
6.250%, 03/29/41 |
|
|
211 |
|
| |
265 |
|
|
6.500%, 11/15/36 |
|
|
332 |
|
| |
250 |
|
|
7.625%, 04/15/31 |
|
|
346 |
|
| |
171 |
|
|
7.700%, 05/01/32 |
|
|
241 |
|
|
|
|
|
Viacom, Inc., |
|
|
|
|
| |
153 |
|
|
1.250%, 02/27/15 |
|
|
154 |
|
| |
500 |
|
|
3.125%, 06/15/22 |
|
|
497 |
|
| |
67 |
|
|
3.250%, 03/15/23 |
|
|
66 |
|
| |
808 |
|
|
3.875%, 12/15/21 |
|
|
852 |
|
| |
464 |
|
|
4.375%, 03/15/43 |
|
|
434 |
|
| |
100 |
|
|
4.500%, 03/01/21 |
|
|
109 |
|
| |
250 |
|
|
4.500%, 02/27/42 |
|
|
241 |
|
| |
130 |
|
|
6.250%, 04/30/16 |
|
|
142 |
|
| |
333 |
|
|
Walt Disney Co. (The), 0.450%, 12/01/15 |
|
|
333 |
|
|
|
|
|
|
|
|
|
|
|
|
|
|
|
|
|
36,334 |
|
|
|
|
|
|
|
|
|
|
|
|
|
|
Multiline Retail — 0.1% |
|
| |
280 |
|
|
Kohl’s Corp., 6.250%, 12/15/17 |
|
|
320 |
|
|
|
|
|
|
|
|
|
|
PRINCIPAL
AMOUNT($) |
|
|
SECURITY DESCRIPTION |
|
VALUE($) |
|
| |
|
| |
|
|
Multiline Retail — continued |
|
|
|
|
|
Macy’s Retail Holdings, Inc., |
|
|
|
|
| |
516 |
|
|
2.875%, 02/15/23 |
|
|
502 |
|
| |
462 |
|
|
4.375%, 09/01/23 |
|
|
494 |
|
| |
157 |
|
|
5.125%, 01/15/42 |
|
|
172 |
|
| |
230 |
|
|
7.450%, 07/15/17 |
|
|
268 |
|
| |
455 |
|
|
Nordstrom, Inc., 4.000%, 10/15/21 |
|
|
491 |
|
| |
200 |
|
|
Target Corp., 6.000%, 01/15/18 |
|
|
229 |
|
|
|
|
|
|
|
|
|
|
|
|
|
|
|
|
|
2,476 |
|
|
|
|
|
|
|
|
|
|
|
|
|
|
Specialty Retail — 0.1% |
|
| |
217 |
|
|
Bed Bath & Beyond, Inc., 4.915%, 08/01/34 |
|
|
226 |
|
| |
533 |
|
|
Gap, Inc. (The), 5.950%, 04/12/21 |
|
|
617 |
|
| |
1,785 |
|
|
Home Depot, Inc. (The), 5.400%, 03/01/16 |
|
|
1,913 |
|
|
|
|
|
Lowe’s Cos., Inc., |
|
|
|
|
| |
739 |
|
|
4.650%, 04/15/42 |
|
|
799 |
|
| |
326 |
|
|
5.125%, 11/15/41 |
|
|
375 |
|
| |
750 |
|
|
Series B, 7.110%, 05/15/37 |
|
|
1,030 |
|
|
|
|
|
|
|
|
|
|
|
|
|
|
|
|
|
4,960 |
|
|
|
|
|
|
|
|
|
|
|
|
|
|
Total Consumer Discretionary |
|
|
50,598 |
|
|
|
|
|
|
|
|
|
|
|
|
|
|
Consumer Staples — 1.0% |
|
|
|
|
|
Beverages — 0.3% |
|
|
|
|
|
Anheuser-Busch Cos. LLC, |
|
|
|
|
| |
600 |
|
|
5.500%, 01/15/18 |
|
|
676 |
|
| |
920 |
|
|
5.750%, 04/01/36 |
|
|
1,150 |
|
| |
900 |
|
|
Anheuser-Busch InBev Finance, Inc., 3.700%, 02/01/24 |
|
|
945 |
|
| |
359 |
|
|
Anheuser-Busch InBev Worldwide, Inc., 7.750%, 01/15/19 |
|
|
443 |
|
| |
440 |
|
|
Coca-Cola Co. (The), 4.875%, 03/15/19 |
|
|
496 |
|
|
|
|
|
Diageo Capital plc, (United Kingdom), |
|
|
|
|
| |
264 |
|
|
1.500%, 05/11/17 |
|
|
267 |
|
| |
510 |
|
|
4.828%, 07/15/20 |
|
|
574 |
|
| |
800 |
|
|
Diageo Finance B.V., (Netherlands), 5.300%, 10/28/15 |
|
|
844 |
|
| |
255 |
|
|
Diageo Investment Corp., 8.000%, 09/15/22 |
|
|
336 |
|
| |
890 |
|
|
FBG Finance Pty Ltd., (Australia), 5.125%, 06/15/15 (e) |
|
|
922 |
|
| |
355 |
|
|
Heineken N.V., (Netherlands), 1.400%, 10/01/17 (e) |
|
|
354 |
|
|
|
|
|
PepsiCo, Inc., |
|
|
|
|
| |
287 |
|
|
1.250%, 08/13/17 |
|
|
288 |
|
| |
368 |
|
|
3.000%, 08/25/21 |
|
|
378 |
|
| |
59 |
|
|
7.900%, 11/01/18 |
|
|
73 |
|
| |
500 |
|
|
VAR, 0.445%, 02/26/16 |
|
|
501 |
|
SEE NOTES TO
FINANCIAL STATEMENTS.
|
|
|
|
|
|
|
|
|
|
|
|
|
| AUGUST 31, 2014 |
|
JPMORGAN INSTITUTIONAL TRUST FUNDS |
|
|
|
|
35 |
|
JPMorgan Core Bond Trust
SCHEDULE OF PORTFOLIO INVESTMENTS
AS OF AUGUST 31, 2014 (Unaudited) (continued)
(Amounts in thousands)
|
|
|
|
|
|
|
|
|
PRINCIPAL
AMOUNT($) |
|
|
SECURITY DESCRIPTION |
|
VALUE($) |
|
| Corporate Bonds — continued |
|
| |
|
|
Beverages — continued |
|
|
|
|
|
SABMiller Holdings, Inc., |
|
|
|
|
| |
574 |
|
|
1.850%, 01/15/15 (e) |
|
|
577 |
|
| |
698 |
|
|
3.750%, 01/15/22 (e) |
|
|
733 |
|
| |
250 |
|
|
SABMiller plc, (United Kingdom), 6.500%, 07/01/16 (e) |
|
|
274 |
|
|
|
|
|
|
|
|
|
|
|
|
|
|
|
|
|
9,831 |
|
|
|
|
|
|
|
|
|
|
|
|
|
|
Food & Staples Retailing — 0.3% |
|
|
|
|
|
CVS Caremark Corp., |
|
|
|
|
| |
536 |
|
|
4.000%, 12/05/23 |
|
|
565 |
|
| |
322 |
|
|
5.300%, 12/05/43 |
|
|
376 |
|
| |
979 |
|
|
5.750%, 05/15/41 |
|
|
1,198 |
|
| |
250 |
|
|
6.125%, 09/15/39 |
|
|
320 |
|
| |
1,042 |
|
|
CVS Pass-Through Trust, 5.926%, 01/10/34 (e) |
|
|
1,228 |
|
|
|
|
|
Kroger Co. (The), |
|
|
|
|
| |
900 |
|
|
4.000%, 02/01/24 |
|
|
940 |
|
| |
1,100 |
|
|
5.000%, 04/15/42 |
|
|
1,199 |
|
| |
2,480 |
|
|
7.500%, 04/01/31 |
|
|
3,365 |
|
| |
1,031 |
|
|
Walgreen Co., 3.100%, 09/15/22 |
|
|
1,022 |
|
|
|
|
|
Wal-Mart Stores, Inc., |
|
|
|
|
| |
762 |
|
|
5.250%, 09/01/35 |
|
|
909 |
|
| |
255 |
|
|
6.200%, 04/15/38 |
|
|
337 |
|
| |
350 |
|
|
7.550%, 02/15/30 |
|
|
508 |
|
|
|
|
|
|
|
|
|
|
|
|
|
|
|
|
|
11,967 |
|
|
|
|
|
|
|
|
|
|
|
|
|
|
Food Products — 0.4% |
|
| |
200 |
|
|
Archer-Daniels-Midland Co., 5.935%, 10/01/32 |
|
|
251 |
|
| |
1,415 |
|
|
Bunge Ltd. Finance Corp., 8.500%, 06/15/19 |
|
|
1,772 |
|
| |
191 |
|
|
Bunge N.A. Finance LP, 5.900%, 04/01/17 |
|
|
212 |
|
|
|
|
|
Cargill, Inc., |
|
|
|
|
| |
600 |
|
|
3.300%, 03/01/22 (e) |
|
|
618 |
|
| |
535 |
|
|
4.307%, 05/14/21 (e) |
|
|
587 |
|
| |
850 |
|
|
7.350%, 03/06/19 (e) |
|
|
1,030 |
|
|
|
|
|
ConAgra Foods, Inc., |
|
|
|
|
| |
223 |
|
|
1.300%, 01/25/16 |
|
|
225 |
|
| |
227 |
|
|
2.100%, 03/15/18 |
|
|
227 |
|
| |
365 |
|
|
Kellogg Co., 1.750%, 05/17/17 |
|
|
370 |
|
|
|
|
|
Kraft Foods Group, Inc., |
|
|
|
|
| |
814 |
|
|
3.500%, 06/06/22 |
|
|
837 |
|
| |
694 |
|
|
5.000%, 06/04/42 |
|
|
755 |
|
| |
1,187 |
|
|
6.125%, 08/23/18 |
|
|
1,370 |
|
| |
1,793 |
|
|
6.875%, 01/26/39 |
|
|
2,382 |
|
| |
1,500 |
|
|
Mondelez International, Inc., 4.000%, 02/01/24 |
|
|
1,577 |
|
|
|
|
|
|
|
|
|
|
PRINCIPAL
AMOUNT($) |
|
|
SECURITY DESCRIPTION |
|
VALUE($) |
|
| |
|
| |
|
|
Food Products — continued |
|
| |
777 |
|
|
Tyson Foods, Inc., 3.950%, 08/15/24 |
|
|
795 |
|
|
|
|
|
|
|
|
|
|
|
|
|
|
|
|
|
13,008 |
|
|
|
|
|
|
|
|
|
|
|
|
|
|
Household Products — 0.0% (g) |
|
|
|
|
|
Kimberly-Clark Corp., |
|
|
|
|
| |
220 |
|
|
2.400%, 03/01/22 |
|
|
216 |
|
| |
71 |
|
|
7.500%, 11/01/18 |
|
|
87 |
|
| |
728 |
|
|
Procter & Gamble — ESOP, Series A, 9.360%, 01/01/21 |
|
|
918 |
|
| |
140 |
|
|
Procter & Gamble Co. (The), 5.500%, 02/01/34 |
|
|
174 |
|
|
|
|
|
|
|
|
|
|
|
|
|
|
|
|
|
1,395 |
|
|
|
|
|
|
|
|
|
|
|
|
|
|
Total Consumer Staples |
|
|
36,201 |
|
|
|
|
|
|
|
|
|
|
|
|
|
|
Energy — 1.7% |
|
|
|
|
|
Energy Equipment & Services — 0.2% |
|
| |
199 |
|
|
Cameron International Corp., 4.000%, 12/15/23 |
|
|
209 |
|
|
|
|
|
Halliburton Co., |
|
|
|
|
| |
714 |
|
|
3.500%, 08/01/23 |
|
|
740 |
|
| |
1,620 |
|
|
7.450%, 09/15/39 |
|
|
2,387 |
|
| |
188 |
|
|
National Oilwell Varco, Inc., 1.350%, 12/01/17 |
|
|
188 |
|
|
|
|
|
Noble Holding International Ltd., (Cayman Islands), |
|
|
|
|
| |
113 |
|
|
3.950%, 03/15/22 |
|
|
117 |
|
| |
83 |
|
|
5.250%, 03/15/42 |
|
|
87 |
|
| |
441 |
|
|
Schlumberger Investment S.A., (Luxembourg), 3.300%, 09/14/21 (e) |
|
|
461 |
|
|
|
|
|
Transocean, Inc., (Cayman Islands), |
|
|
|
|
| |
361 |
|
|
3.800%, 10/15/22 |
|
|
352 |
|
| |
256 |
|
|
6.375%, 12/15/21 |
|
|
290 |
|
| |
905 |
|
|
6.500%, 11/15/20 |
|
|
1,024 |
|
| |
198 |
|
|
7.350%, 12/15/41 |
|
|
237 |
|
| |
100 |
|
|
7.500%, 04/15/31 |
|
|
119 |
|
|
|
|
|
Weatherford International Ltd., (Bermuda), |
|
|
|
|
| |
311 |
|
|
4.500%, 04/15/22 |
|
|
332 |
|
| |
113 |
|
|
5.950%, 04/15/42 |
|
|
130 |
|
| |
110 |
|
|
6.500%, 08/01/36 |
|
|
133 |
|
| |
350 |
|
|
9.875%, 03/01/39 |
|
|
554 |
|
|
|
|
|
|
|
|
|
|
|
|
|
|
|
|
|
7,360 |
|
|
|
|
|
|
|
|
|
|
|
|
|
|
Oil, Gas & Consumable Fuels — 1.5% |
|
| |
160 |
|
|
Alberta Energy Co., Ltd., (Canada), 7.375%, 11/01/31 |
|
|
215 |
|
| |
330 |
|
|
Anadarko Petroleum Corp., 8.700%, 03/15/19 |
|
|
421 |
|
|
|
|
|
Apache Corp., |
|
|
|
|
| |
138 |
|
|
3.250%, 04/15/22 |
|
|
141 |
|
SEE NOTES TO
FINANCIAL STATEMENTS.
|
|
|
|
|
|
|
|
|
|
|
| 36 |
|
|
|
JPMORGAN INSTITUTIONAL TRUST FUNDS |
|
AUGUST 31, 2014 |
|
|
|
|
|
|
|
|
|
PRINCIPAL
AMOUNT($) |
|
|
SECURITY DESCRIPTION |
|
VALUE($) |
|
| Corporate Bonds — continued |
|
| |
|
|
Oil, Gas & Consumable Fuels — continued |
|
| |
556 |
|
|
4.750%, 04/15/43 |
|
|
590 |
|
| |
500 |
|
|
6.900%, 09/15/18 |
|
|
594 |
|
| |
235 |
|
|
BG Energy Capital plc, (United Kingdom), 5.125%, 10/15/41 (e) |
|
|
264 |
|
|
|
|
|
BP Capital Markets plc, (United Kingdom), |
|
|
|
|
| |
92 |
|
|
1.375%, 11/06/17 |
|
|
92 |
|
| |
929 |
|
|
1.846%, 05/05/17 |
|
|
946 |
|
| |
1,283 |
|
|
2.237%, 05/10/19 |
|
|
1,290 |
|
| |
882 |
|
|
2.750%, 05/10/23 |
|
|
858 |
|
| |
437 |
|
|
3.814%, 02/10/24 |
|
|
458 |
|
| |
900 |
|
|
4.742%, 03/11/21 |
|
|
1,009 |
|
| |
200 |
|
|
Burlington Resources Finance Co., (Canada), 7.400%, 12/01/31 |
|
|
290 |
|
|
|
|
|
Canadian Natural Resources Ltd., (Canada), |
|
|
|
|
| |
350 |
|
|
6.250%, 03/15/38 |
|
|
442 |
|
| |
1,000 |
|
|
6.750%, 02/01/39 |
|
|
1,333 |
|
|
|
|
|
Cenovus Energy, Inc., (Canada), |
|
|
|
|
| |
208 |
|
|
3.000%, 08/15/22 |
|
|
206 |
|
| |
490 |
|
|
4.450%, 09/15/42 |
|
|
498 |
|
| |
450 |
|
|
6.750%, 11/15/39 |
|
|
598 |
|
|
|
|
|
Chevron Corp., |
|
|
|
|
| |
560 |
|
|
2.355%, 12/05/22 |
|
|
545 |
|
| |
1,000 |
|
|
4.950%, 03/03/19 |
|
|
1,132 |
|
| |
1,789 |
|
|
CNOOC Nexen Finance 2014 ULC, (Canada), 4.250%, 04/30/24 |
|
|
1,861 |
|
| |
230 |
|
|
Conoco Funding Co., (Canada), 7.250%, 10/15/31 |
|
|
334 |
|
|
|
|
|
ConocoPhillips, |
|
|
|
|
| |
325 |
|
|
5.200%, 05/15/18 |
|
|
364 |
|
| |
525 |
|
|
5.750%, 02/01/19 |
|
|
608 |
|
| |
150 |
|
|
6.000%, 01/15/20 |
|
|
178 |
|
| |
200 |
|
|
6.500%, 02/01/39 |
|
|
271 |
|
| |
1,045 |
|
|
ConocoPhillips Canada Funding Co. I, (Canada), 5.625%, 10/15/16 |
|
|
1,150 |
|
|
|
|
|
Devon Energy Corp., |
|
|
|
|
| |
750 |
|
|
3.250%, 05/15/22 |
|
|
764 |
|
| |
522 |
|
|
4.750%, 05/15/42 |
|
|
553 |
|
| |
360 |
|
|
6.300%, 01/15/19 |
|
|
421 |
|
|
|
|
|
Encana Corp., (Canada), |
|
|
|
|
| |
545 |
|
|
6.500%, 05/15/19 |
|
|
642 |
|
| |
150 |
|
|
6.500%, 08/15/34 |
|
|
190 |
|
| |
925 |
|
|
Eni S.p.A., (Italy), Series EX2, 5.700%, 10/01/40 (e) |
|
|
1,059 |
|
|
|
|
|
Enterprise Products Operating LLC, |
|
|
|
|
| |
475 |
|
|
3.900%, 02/15/24 |
|
|
495 |
|
| |
318 |
|
|
5.100%, 02/15/45 |
|
|
351 |
|
|
|
|
|
|
|
|
|
|
PRINCIPAL
AMOUNT($) |
|
|
SECURITY DESCRIPTION |
|
VALUE($) |
|
| |
|
| |
|
|
Oil, Gas & Consumable Fuels — continued |
|
|
|
|
|
EOG Resources, Inc., |
|
|
|
|
| |
379 |
|
|
2.625%, 03/15/23 |
|
|
369 |
|
| |
600 |
|
|
4.100%, 02/01/21 |
|
|
654 |
|
| |
180 |
|
|
Hess Corp., 7.875%, 10/01/29 |
|
|
252 |
|
|
|
|
|
Kerr-McGee Corp., |
|
|
|
|
| |
200 |
|
|
6.950%, 07/01/24 |
|
|
256 |
|
| |
1,000 |
|
|
7.875%, 09/15/31 |
|
|
1,425 |
|
|
|
|
|
Magellan Midstream Partners LP, |
|
|
|
|
| |
1,127 |
|
|
5.150%, 10/15/43 |
|
|
1,260 |
|
| |
250 |
|
|
6.550%, 07/15/19 |
|
|
296 |
|
|
|
|
|
Marathon Oil Corp., |
|
|
|
|
| |
902 |
|
|
5.900%, 03/15/18 |
|
|
1,027 |
|
| |
1,620 |
|
|
6.000%, 10/01/17 |
|
|
1,841 |
|
| |
402 |
|
|
Occidental Petroleum Corp., 1.750%, 02/15/17 |
|
|
408 |
|
|
|
|
|
Petrobras Global Finance B.V., (Netherlands), |
|
|
|
|
| |
841 |
|
|
4.375%, 05/20/23 |
|
|
830 |
|
| |
2,622 |
|
|
6.250%, 03/17/24 |
|
|
2,881 |
|
|
|
|
|
Petrobras International Finance Co., (Cayman Islands), |
|
|
|
|
| |
1,020 |
|
|
5.375%, 01/27/21 |
|
|
1,075 |
|
| |
110 |
|
|
6.750%, 01/27/41 |
|
|
123 |
|
| |
175 |
|
|
7.875%, 03/15/19 |
|
|
204 |
|
|
|
|
|
Petro-Canada, (Canada), |
|
|
|
|
| |
324 |
|
|
6.050%, 05/15/18 |
|
|
372 |
|
| |
1,045 |
|
|
6.800%, 05/15/38 |
|
|
1,403 |
|
|
|
|
|
Petroleos Mexicanos, (Mexico), |
|
|
|
|
| |
393 |
|
|
4.875%, 01/18/24 (e) |
|
|
427 |
|
| |
846 |
|
|
6.375%, 01/23/45 (e) |
|
|
1,024 |
|
|
|
|
|
Phillips 66, |
|
|
|
|
| |
314 |
|
|
2.950%, 05/01/17 |
|
|
328 |
|
| |
182 |
|
|
4.300%, 04/01/22 |
|
|
197 |
|
| |
831 |
|
|
Sinopec Group Overseas Development Ltd., (United Kingdom), 4.375%, 10/17/23 (e) |
|
|
874 |
|
|
|
|
|
Spectra Energy Capital LLC, |
|
|
|
|
| |
1,500 |
|
|
5.650%, 03/01/20 |
|
|
1,690 |
|
| |
500 |
|
|
6.200%, 04/15/18 |
|
|
572 |
|
| |
400 |
|
|
8.000%, 10/01/19 |
|
|
502 |
|
|
|
|
|
Spectra Energy Partners LP, |
|
|
|
|
| |
524 |
|
|
2.950%, 09/25/18 |
|
|
543 |
|
| |
452 |
|
|
5.950%, 09/25/43 |
|
|
546 |
|
|
|
|
|
Statoil ASA, (Norway), |
|
|
|
|
| |
906 |
|
|
1.150%, 05/15/18 |
|
|
893 |
|
| |
353 |
|
|
1.200%, 01/17/18 |
|
|
351 |
|
| |
406 |
|
|
2.450%, 01/17/23 |
|
|
395 |
|
SEE NOTES TO
FINANCIAL STATEMENTS.
|
|
|
|
|
|
|
|
|
|
|
|
|
| AUGUST 31, 2014 |
|
JPMORGAN INSTITUTIONAL TRUST FUNDS |
|
|
|
|
37 |
|
JPMorgan Core Bond Trust
SCHEDULE OF PORTFOLIO INVESTMENTS
AS OF AUGUST 31, 2014 (Unaudited) (continued)
(Amounts in thousands)
|
|
|
|
|
|
|
|
|
PRINCIPAL
AMOUNT($) |
|
|
SECURITY DESCRIPTION |
|
VALUE($) |
|
| Corporate Bonds — continued |
|
| |
|
|
Oil, Gas & Consumable Fuels — continued |
|
| |
1,071 |
|
|
2.650%, 01/15/24 |
|
|
1,043 |
|
| |
313 |
|
|
2.900%, 11/08/20 |
|
|
322 |
|
| |
467 |
|
|
3.125%, 08/17/17 |
|
|
492 |
|
| |
300 |
|
|
3.150%, 01/23/22 |
|
|
310 |
|
| |
253 |
|
|
4.250%, 11/23/41 |
|
|
260 |
|
|
|
|
|
Suncor Energy, Inc., (Canada), |
|
|
|
|
| |
180 |
|
|
5.950%, 12/01/34 |
|
|
219 |
|
| |
250 |
|
|
6.850%, 06/01/39 |
|
|
339 |
|
|
|
|
|
Talisman Energy, Inc., (Canada), |
|
|
|
|
| |
1,125 |
|
|
5.500%, 05/15/42 |
|
|
1,243 |
|
| |
185 |
|
|
5.850%, 02/01/37 |
|
|
208 |
|
| |
190 |
|
|
6.250%, 02/01/38 |
|
|
224 |
|
| |
850 |
|
|
7.750%, 06/01/19 |
|
|
1,047 |
|
| |
554 |
|
|
Texas Eastern Transmission LP, 2.800%, 10/15/22 (e) |
|
|
530 |
|
|
|
|
|
Tosco Corp., |
|
|
|
|
| |
310 |
|
|
7.800%, 01/01/27 |
|
|
439 |
|
| |
400 |
|
|
8.125%, 02/15/30 |
|
|
602 |
|
| |
124 |
|
|
Total Capital Canada Ltd., (Canada), VAR, 0.614%, 01/15/16 |
|
|
125 |
|
|
|
|
|
Total Capital International S.A., (France), |
|
|
|
|
| |
135 |
|
|
0.750%, 01/25/16 |
|
|
136 |
|
| |
262 |
|
|
1.500%, 02/17/17 |
|
|
265 |
|
| |
508 |
|
|
1.550%, 06/28/17 |
|
|
514 |
|
| |
500 |
|
|
2.750%, 06/19/21 |
|
|
502 |
|
| |
233 |
|
|
2.875%, 02/17/22 |
|
|
235 |
|
|
|
|
|
Total Capital S.A., (France), |
|
|
|
|
| |
1,400 |
|
|
2.300%, 03/15/16 |
|
|
1,436 |
|
| |
370 |
|
|
4.125%, 01/28/21 |
|
|
405 |
|
|
|
|
|
TransCanada PipeLines Ltd., (Canada), |
|
|
|
|
| |
550 |
|
|
6.200%, 10/15/37 |
|
|
709 |
|
| |
340 |
|
|
6.500%, 08/15/18 |
|
|
400 |
|
| |
1,100 |
|
|
7.250%, 08/15/38 |
|
|
1,562 |
|
|
|
|
|
|
|
|
|
|
|
|
|
|
|
|
|
57,748 |
|
|
|
|
|
|
|
|
|
|
|
|
|
|
Total Energy |
|
|
65,108 |
|
|
|
|
|
|
|
|
|
|
|
|
|
|
Financials — 8.5% |
|
|
|
|
|
Banks — 3.6% |
|
| |
669 |
|
|
ABN AMRO Bank N.V., (Netherlands), 2.500%, 10/30/18 (e) |
|
|
680 |
|
| |
550 |
|
|
ANZ New Zealand International Ltd., (New Zealand), 3.125%, 08/10/15 (e) |
|
|
563 |
|
|
|
|
|
Australia & New Zealand Banking Group Ltd., (Australia), |
|
|
|
|
| |
1,268 |
|
|
2.400%, 11/23/16 (e) |
|
|
1,309 |
|
| |
900 |
|
|
3.250%, 03/01/16 (e) |
|
|
934 |
|
| |
228 |
|
|
4.875%, 01/12/21 (e) |
|
|
258 |
|
|
|
|
|
|
|
|
|
|
PRINCIPAL
AMOUNT($) |
|
|
SECURITY DESCRIPTION |
|
VALUE($) |
|
| |
|
| |
|
|
Banks — continued |
|
|
|
|
|
Bank of America Corp., |
|
|
|
|
| |
600 |
|
|
2.000%, 01/11/18 |
|
|
603 |
|
| |
1,500 |
|
|
Series L, 2.650%, 04/01/19 |
|
|
1,515 |
|
| |
520 |
|
|
3.625%, 03/17/16 |
|
|
541 |
|
| |
972 |
|
|
4.000%, 04/01/24 |
|
|
1,002 |
|
| |
547 |
|
|
4.100%, 07/24/23 |
|
|
571 |
|
| |
2,065 |
|
|
5.000%, 05/13/21 |
|
|
2,309 |
|
| |
2,730 |
|
|
5.625%, 10/14/16 |
|
|
2,977 |
|
| |
740 |
|
|
5.625%, 07/01/20 |
|
|
848 |
|
| |
645 |
|
|
Series L, 5.650%, 05/01/18 |
|
|
725 |
|
| |
420 |
|
|
5.750%, 12/01/17 |
|
|
471 |
|
| |
400 |
|
|
5.875%, 01/05/21 |
|
|
467 |
|
| |
2,996 |
|
|
6.400%, 08/28/17 |
|
|
3,404 |
|
| |
1,564 |
|
|
6.875%, 04/25/18 |
|
|
1,824 |
|
| |
875 |
|
|
7.625%, 06/01/19 |
|
|
1,071 |
|
| |
1,510 |
|
|
7.800%, 09/15/16 |
|
|
1,697 |
|
|
|
|
|
Bank of Montreal, (Canada), |
|
|
|
|
| |
741 |
|
|
1.300%, 10/31/14 (e) |
|
|
742 |
|
| |
1,666 |
|
|
1.400%, 09/11/17 |
|
|
1,670 |
|
| |
1,106 |
|
|
2.550%, 11/06/22 |
|
|
1,078 |
|
|
|
|
|
Bank of Nova Scotia (The), (Canada), |
|
|
|
|
| |
1,034 |
|
|
1.650%, 10/29/15 (e) |
|
|
1,048 |
|
| |
2,000 |
|
|
2.550%, 01/12/17 |
|
|
2,069 |
|
| |
737 |
|
|
3.400%, 01/22/15 |
|
|
746 |
|
|
|
|
|
Bank of Tokyo-Mitsubishi UFJ Ltd. (The), (Japan), |
|
|
|
|
| |
1,275 |
|
|
2.350%, 02/23/17 (e) |
|
|
1,310 |
|
| |
679 |
|
|
3.850%, 01/22/15 (e) |
|
|
688 |
|
| |
1,600 |
|
|
Banque Federative du Credit Mutuel S.A., (France), 1.700%, 01/20/17 (e) |
|
|
1,609 |
|
|
|
|
|
Barclays Bank plc, (United Kingdom), |
|
|
|
|
| |
276 |
|
|
2.250%, 05/10/17 (e) |
|
|
284 |
|
| |
800 |
|
|
2.500%, 09/21/15 (e) |
|
|
817 |
|
| |
1,735 |
|
|
2.750%, 02/23/15 |
|
|
1,753 |
|
| |
324 |
|
|
3.750%, 05/15/24 |
|
|
331 |
|
| |
310 |
|
|
Series 1, 5.000%, 09/22/16 |
|
|
335 |
|
| |
1,000 |
|
|
6.050%, 12/04/17 (e) |
|
|
1,125 |
|
|
|
|
|
BB&T Corp., |
|
|
|
|
| |
750 |
|
|
3.950%, 04/29/16 |
|
|
790 |
|
| |
740 |
|
|
4.900%, 06/30/17 |
|
|
809 |
|
| |
380 |
|
|
6.850%, 04/30/19 |
|
|
458 |
|
| |
632 |
|
|
BNZ International Funding Ltd., (New Zealand), 2.350%, 03/04/19 (e) |
|
|
635 |
|
| |
695 |
|
|
Branch Banking & Trust Co., 5.625%, 09/15/16 |
|
|
757 |
|
SEE NOTES TO
FINANCIAL STATEMENTS.
|
|
|
|
|
|
|
|
|
|
|
| 38 |
|
|
|
JPMORGAN INSTITUTIONAL TRUST FUNDS |
|
AUGUST 31, 2014 |
|
|
|
|
|
|
|
|
|
PRINCIPAL
AMOUNT($) |
|
|
SECURITY DESCRIPTION |
|
VALUE($) |
|
| Corporate Bonds — continued |
|
| |
|
|
Banks — continued |
|
|
|
|
|
Canadian Imperial Bank of Commerce, (Canada), |
|
|
|
|
| |
226 |
|
|
0.900%, 10/01/15 |
|
|
227 |
|
| |
4,000 |
|
|
2.600%, 07/02/15 (e) |
|
|
4,075 |
|
| |
1,650 |
|
|
Capital One Bank USA N.A., 3.375%, 02/15/23 |
|
|
1,644 |
|
|
|
|
|
Citigroup, Inc., |
|
|
|
|
| |
423 |
|
|
3.375%, 03/01/23 |
|
|
425 |
|
| |
871 |
|
|
3.750%, 06/16/24 |
|
|
889 |
|
| |
500 |
|
|
4.450%, 01/10/17 |
|
|
536 |
|
| |
433 |
|
|
4.500%, 01/14/22 |
|
|
472 |
|
| |
42 |
|
|
4.587%, 12/15/15 |
|
|
44 |
|
| |
871 |
|
|
4.700%, 05/29/15 |
|
|
897 |
|
| |
483 |
|
|
4.750%, 05/19/15 |
|
|
497 |
|
| |
3,127 |
|
|
5.000%, 09/15/14 |
|
|
3,133 |
|
| |
250 |
|
|
5.300%, 05/06/44 |
|
|
268 |
|
| |
298 |
|
|
5.375%, 08/09/20 |
|
|
341 |
|
| |
865 |
|
|
5.500%, 09/13/25 |
|
|
969 |
|
| |
321 |
|
|
5.875%, 01/30/42 |
|
|
395 |
|
| |
2,154 |
|
|
6.000%, 08/15/17 |
|
|
2,422 |
|
| |
526 |
|
|
6.010%, 01/15/15 |
|
|
537 |
|
| |
475 |
|
|
6.125%, 11/21/17 |
|
|
539 |
|
| |
250 |
|
|
6.625%, 01/15/28 |
|
|
313 |
|
| |
400 |
|
|
8.125%, 07/15/39 |
|
|
614 |
|
| |
1,409 |
|
|
8.500%, 05/22/19 |
|
|
1,785 |
|
|
|
|
|
Comerica, Inc., |
|
|
|
|
| |
260 |
|
|
3.000%, 09/16/15 |
|
|
266 |
|
| |
148 |
|
|
3.800%, 07/22/26 |
|
|
149 |
|
| |
1,080 |
|
|
Commonwealth Bank of Australia, (Australia), 2.250%, 03/16/17 (e) |
|
|
1,111 |
|
|
|
|
|
Cooperatieve Centrale Raiffeisen-Boerenleenbank B.A., (Netherlands), |
|
|
|
|
| |
143 |
|
|
2.125%, 10/13/15 |
|
|
146 |
|
| |
2,400 |
|
|
3.200%, 03/11/15 (e) |
|
|
2,435 |
|
| |
455 |
|
|
3.375%, 01/19/17 |
|
|
480 |
|
| |
789 |
|
|
3.875%, 02/08/22 |
|
|
844 |
|
| |
500 |
|
|
5.800%, 09/30/10 (e) (††) |
|
|
583 |
|
|
|
|
|
Discover Bank, |
|
|
|
|
| |
1,000 |
|
|
3.200%, 08/09/21 |
|
|
1,003 |
|
| |
601 |
|
|
4.200%, 08/08/23 |
|
|
635 |
|
| |
2,011 |
|
|
DNB Boligkreditt A.S., (Norway), 2.100%, 10/14/15 (e) |
|
|
2,047 |
|
|
|
|
|
Fifth Third Bancorp, |
|
|
|
|
| |
70 |
|
|
2.300%, 03/01/19 |
|
|
70 |
|
| |
760 |
|
|
5.450%, 01/15/17 |
|
|
830 |
|
| |
600 |
|
|
Fifth Third Bank, 2.375%, 04/25/19 |
|
|
605 |
|
|
|
|
|
|
|
|
|
|
PRINCIPAL
AMOUNT($) |
|
|
SECURITY DESCRIPTION |
|
VALUE($) |
|
| |
|
| |
|
|
Banks — continued |
|
|
|
|
|
HSBC Bank plc, (United Kingdom), |
|
|
|
|
| |
1,438 |
|
|
1.500%, 05/15/18 (e) |
|
|
1,424 |
|
| |
666 |
|
|
4.125%, 08/12/20 (e) |
|
|
724 |
|
| |
575 |
|
|
4.750%, 01/19/21 (e) |
|
|
646 |
|
|
|
|
|
HSBC Holdings plc, (United Kingdom), |
|
|
|
|
| |
500 |
|
|
4.000%, 03/30/22 |
|
|
535 |
|
| |
530 |
|
|
4.875%, 01/14/22 |
|
|
598 |
|
| |
556 |
|
|
5.100%, 04/05/21 |
|
|
637 |
|
| |
600 |
|
|
6.100%, 01/14/42 |
|
|
780 |
|
| |
300 |
|
|
KeyCorp, 5.100%, 03/24/21 |
|
|
341 |
|
| |
2,100 |
|
|
Manufacturers & Traders Trust Co., 6.625%, 12/04/17 |
|
|
2,424 |
|
|
|
|
|
National Australia Bank Ltd., (Australia), |
|
|
|
|
| |
1,500 |
|
|
2.000%, 06/20/17 (e) |
|
|
1,530 |
|
| |
750 |
|
|
2.750%, 09/28/15 (e) |
|
|
768 |
|
| |
1,000 |
|
|
3.000%, 07/27/16 (e) |
|
|
1,041 |
|
| |
795 |
|
|
3.750%, 03/02/15 (e) |
|
|
808 |
|
| |
250 |
|
|
National City Bank, 5.800%, 06/07/17 |
|
|
280 |
|
|
|
|
|
Nordea Bank AB, (Sweden), |
|
|
|
|
| |
1,000 |
|
|
1.625%, 05/15/18 (e) |
|
|
997 |
|
| |
1,800 |
|
|
3.125%, 03/20/17 (e) |
|
|
1,885 |
|
| |
945 |
|
|
4.875%, 05/13/21 (e) |
|
|
1,033 |
|
| |
837 |
|
|
Oversea-Chinese Banking Corp., Ltd., (Singapore), 1.625%, 03/13/15 (e) |
|
|
841 |
|
| |
400 |
|
|
PNC Bank N.A., 6.875%, 04/01/18 |
|
|
468 |
|
| |
182 |
|
|
PNC Financial Services Group, Inc. (The), 3.900%, 04/29/24 |
|
|
186 |
|
|
|
|
|
PNC Funding Corp., |
|
|
|
|
| |
709 |
|
|
3.300%, 03/08/22 |
|
|
728 |
|
| |
567 |
|
|
4.375%, 08/11/20 |
|
|
624 |
|
| |
970 |
|
|
5.250%, 11/15/15 |
|
|
1,022 |
|
| |
950 |
|
|
5.625%, 02/01/17 |
|
|
1,040 |
|
| |
595 |
|
|
6.700%, 06/10/19 |
|
|
714 |
|
|
|
|
|
Royal Bank of Canada, (Canada), |
|
|
|
|
| |
985 |
|
|
1.200%, 09/19/17 |
|
|
982 |
|
| |
1,789 |
|
|
2.000%, 10/01/18 |
|
|
1,814 |
|
| |
1,000 |
|
|
2.200%, 07/27/18 |
|
|
1,020 |
|
| |
402 |
|
|
Skandinaviska Enskilda Banken AB, (Sweden), 1.750%, 03/19/18 (e) |
|
|
402 |
|
| |
927 |
|
|
SpareBank 1 Boligkreditt A.S., (Norway), 1.750%, 11/15/19 (e) |
|
|
908 |
|
| |
1,148 |
|
|
Stadshypotek AB, (Sweden), 1.875%, 10/02/19 (e) |
|
|
1,135 |
|
| |
1,300 |
|
|
Standard Chartered plc, (United Kingdom), 5.200%, 01/26/24 (e) |
|
|
1,408 |
|
| |
880 |
|
|
SunTrust Banks, Inc., 6.000%, 09/11/17 |
|
|
990 |
|
SEE NOTES TO
FINANCIAL STATEMENTS.
|
|
|
|
|
|
|
|
|
|
|
|
|
| AUGUST 31, 2014 |
|
JPMORGAN INSTITUTIONAL TRUST FUNDS |
|
|
|
|
39 |
|
JPMorgan Core Bond Trust
SCHEDULE OF PORTFOLIO INVESTMENTS
AS OF AUGUST 31, 2014 (Unaudited) (continued)
(Amounts in thousands)
|
|
|
|
|
|
|
|
|
PRINCIPAL
AMOUNT($) |
|
|
SECURITY DESCRIPTION |
|
VALUE($) |
|
| Corporate Bonds — continued |
|
| |
|
|
Banks — continued |
|
| |
1,411 |
|
|
Svenska Handelsbanken AB, (Sweden), 3.125%, 07/12/16 |
|
|
1,471 |
|
|
|
|
|
Toronto-Dominion Bank (The), (Canada), |
|
|
|
|
| |
2,350 |
|
|
1.500%, 03/13/17 (e) |
|
|
2,375 |
|
| |
1,140 |
|
|
2.200%, 07/29/15 (e) |
|
|
1,159 |
|
|
|
|
|
U.S. Bancorp, |
|
|
|
|
| |
550 |
|
|
1.650%, 05/15/17 |
|
|
557 |
|
| |
675 |
|
|
2.450%, 07/27/15 |
|
|
688 |
|
| |
540 |
|
|
3.000%, 03/15/22 |
|
|
548 |
|
| |
566 |
|
|
4.125%, 05/24/21 |
|
|
622 |
|
| |
1,277 |
|
|
7.500%, 06/01/26 |
|
|
1,726 |
|
| |
4,780 |
|
|
Wachovia Corp., 5.750%, 02/01/18 |
|
|
5,433 |
|
|
|
|
|
Wells Fargo & Co., |
|
|
|
|
| |
1,826 |
|
|
2.625%, 12/15/16 |
|
|
1,894 |
|
| |
850 |
|
|
3.500%, 03/08/22 |
|
|
885 |
|
| |
484 |
|
|
4.100%, 06/03/26 |
|
|
495 |
|
| |
702 |
|
|
4.480%, 01/16/24 |
|
|
752 |
|
| |
500 |
|
|
4.600%, 04/01/21 |
|
|
558 |
|
| |
1,280 |
|
|
5.606%, 01/15/44 |
|
|
1,503 |
|
| |
2,350 |
|
|
5.625%, 12/11/17 |
|
|
2,658 |
|
| |
1,045 |
|
|
SUB, 3.676%, 06/15/16 |
|
|
1,099 |
|
|
|
|
|
Wells Fargo Bank N.A., |
|
|
|
|
| |
1,515 |
|
|
Series AI, 4.750%, 02/09/15 |
|
|
1,544 |
|
| |
1,000 |
|
|
5.600%, 03/15/16 |
|
|
1,073 |
|
| |
250 |
|
|
5.750%, 05/16/16 |
|
|
271 |
|
| |
250 |
|
|
6.000%, 11/15/17 |
|
|
284 |
|
|
|
|
|
Westpac Banking Corp., (Australia), |
|
|
|
|
| |
900 |
|
|
4.200%, 02/27/15 |
|
|
917 |
|
| |
2,141 |
|
|
4.875%, 11/19/19 |
|
|
2,417 |
|
|
|
|
|
|
|
|
|
|
|
|
|
|
|
|
|
136,711 |
|
|
|
|
|
|
|
|
|
|
|
|
|
|
Capital Markets — 1.7% |
|
| |
1,500 |
|
|
Ameriprise Financial, Inc., 4.000%, 10/15/23 |
|
|
1,590 |
|
|
|
|
|
Bank of New York Mellon Corp. (The), |
|
|
|
|
| |
357 |
|
|
1.200%, 02/20/15 |
|
|
358 |
|
| |
1,789 |
|
|
2.400%, 01/17/17 |
|
|
1,844 |
|
| |
900 |
|
|
Series 001, 2.950%, 06/18/15 |
|
|
919 |
|
| |
413 |
|
|
3.550%, 09/23/21 |
|
|
436 |
|
| |
950 |
|
|
3.650%, 02/04/24 |
|
|
992 |
|
| |
760 |
|
|
4.600%, 01/15/20 |
|
|
845 |
|
|
|
|
|
BlackRock, Inc., |
|
|
|
|
| |
660 |
|
|
3.375%, 06/01/22 |
|
|
685 |
|
| |
540 |
|
|
3.500%, 12/10/14 |
|
|
545 |
|
| |
540 |
|
|
3.500%, 03/18/24 |
|
|
553 |
|
| |
867 |
|
|
Series 2, 5.000%, 12/10/19 |
|
|
991 |
|
| |
385 |
|
|
6.250%, 09/15/17 |
|
|
440 |
|
|
|
|
|
|
|
|
|
|
PRINCIPAL
AMOUNT($) |
|
|
SECURITY DESCRIPTION |
|
VALUE($) |
|
| |
|
| |
|
|
Capital Markets — continued |
|
| |
1,940 |
|
|
Blackstone Holdings Finance Co. LLC, 5.875%, 03/15/21 (e) |
|
|
2,282 |
|
| |
340 |
|
|
Charles Schwab Corp. (The), 3.225%, 09/01/22 |
|
|
346 |
|
| |
728 |
|
|
Credit Suisse, (Switzerland), 2.300%, 05/28/19 |
|
|
729 |
|
|
|
|
|
Deutsche Bank AG, (Germany), |
|
|
|
|
| |
650 |
|
|
3.250%, 01/11/16 |
|
|
672 |
|
| |
355 |
|
|
6.000%, 09/01/17 |
|
|
400 |
|
| |
500 |
|
|
FMR LLC, 6.450%, 11/15/39 (e) |
|
|
648 |
|
|
|
|
|
Goldman Sachs Group, Inc. (The), |
|
|
|
|
| |
545 |
|
|
2.625%, 01/31/19 |
|
|
552 |
|
| |
764 |
|
|
2.900%, 07/19/18 |
|
|
786 |
|
| |
400 |
|
|
3.300%, 05/03/15 |
|
|
408 |
|
| |
3,060 |
|
|
3.625%, 02/07/16 |
|
|
3,177 |
|
| |
492 |
|
|
3.700%, 08/01/15 |
|
|
506 |
|
| |
800 |
|
|
4.000%, 03/03/24 |
|
|
825 |
|
| |
848 |
|
|
5.250%, 07/27/21 |
|
|
956 |
|
| |
1,366 |
|
|
5.375%, 03/15/20 |
|
|
1,543 |
|
| |
760 |
|
|
5.500%, 11/15/14 |
|
|
768 |
|
| |
800 |
|
|
5.750%, 01/24/22 |
|
|
928 |
|
| |
4,310 |
|
|
5.950%, 01/18/18 |
|
|
4,863 |
|
| |
949 |
|
|
Series D, 6.000%, 06/15/20 |
|
|
1,104 |
|
| |
245 |
|
|
6.150%, 04/01/18 |
|
|
279 |
|
| |
175 |
|
|
6.250%, 09/01/17 |
|
|
198 |
|
| |
685 |
|
|
6.750%, 10/01/37 |
|
|
845 |
|
| |
2,678 |
|
|
7.500%, 02/15/19 |
|
|
3,236 |
|
|
|
|
|
ING Bank N.V., (Netherlands), |
|
|
|
|
| |
500 |
|
|
1.375%, 03/07/16 (e) |
|
|
504 |
|
| |
216 |
|
|
2.000%, 09/25/15 (e) |
|
|
219 |
|
| |
1,445 |
|
|
3.750%, 03/07/17 (e) |
|
|
1,526 |
|
| |
657 |
|
|
Invesco Finance plc, (United Kingdom), 4.000%, 01/30/24 |
|
|
695 |
|
|
|
|
|
Jefferies Group LLC, |
|
|
|
|
| |
450 |
|
|
3.875%, 11/09/15 |
|
|
465 |
|
| |
1,015 |
|
|
5.125%, 04/13/18 |
|
|
1,109 |
|
| |
1,010 |
|
|
6.450%, 06/08/27 |
|
|
1,145 |
|
| |
325 |
|
|
6.875%, 04/15/21 |
|
|
384 |
|
| |
555 |
|
|
8.500%, 07/15/19 |
|
|
693 |
|
|
|
|
|
Macquarie Bank Ltd., (Australia), |
|
|
|
|
| |
373 |
|
|
2.000%, 08/15/16 (e) |
|
|
380 |
|
| |
291 |
|
|
2.600%, 06/24/19 (e) |
|
|
294 |
|
| |
2,847 |
|
|
5.000%, 02/22/17 (e) |
|
|
3,086 |
|
|
|
|
|
Macquarie Group Ltd., (Australia), |
|
|
|
|
| |
1,200 |
|
|
6.000%, 01/14/20 (e) |
|
|
1,361 |
|
SEE NOTES TO
FINANCIAL STATEMENTS.
|
|
|
|
|
|
|
|
|
|
|
| 40 |
|
|
|
JPMORGAN INSTITUTIONAL TRUST FUNDS |
|
AUGUST 31, 2014 |
|
|
|
|
|
|
|
|
|
PRINCIPAL
AMOUNT($) |
|
|
SECURITY DESCRIPTION |
|
VALUE($) |
|
| Corporate Bonds — continued |
|
| |
|
|
Capital Markets — continued |
|
| |
1,400 |
|
|
6.250%, 01/14/21 (e) |
|
|
1,614 |
|
| |
250 |
|
|
7.625%, 08/13/19 (e) |
|
|
302 |
|
|
|
|
|
Morgan Stanley, |
|
|
|
|
| |
179 |
|
|
1.750%, 02/25/16 |
|
|
181 |
|
| |
625 |
|
|
4.000%, 07/24/15 |
|
|
644 |
|
| |
893 |
|
|
4.200%, 11/20/14 |
|
|
900 |
|
| |
871 |
|
|
5.000%, 11/24/25 |
|
|
935 |
|
| |
1,000 |
|
|
5.450%, 01/09/17 |
|
|
1,095 |
|
| |
1,021 |
|
|
5.500%, 07/24/20 |
|
|
1,161 |
|
| |
380 |
|
|
5.500%, 07/28/21 |
|
|
437 |
|
| |
1,265 |
|
|
5.625%, 09/23/19 |
|
|
1,446 |
|
| |
360 |
|
|
5.750%, 01/25/21 |
|
|
418 |
|
| |
400 |
|
|
6.625%, 04/01/18 |
|
|
463 |
|
| |
970 |
|
|
7.300%, 05/13/19 |
|
|
1,174 |
|
|
|
|
|
Nomura Holdings, Inc., (Japan), |
|
|
|
|
| |
1,050 |
|
|
4.125%, 01/19/16 |
|
|
1,093 |
|
| |
150 |
|
|
5.000%, 03/04/15 |
|
|
153 |
|
| |
547 |
|
|
6.700%, 03/04/20 |
|
|
658 |
|
|
|
|
|
State Street Corp., |
|
|
|
|
| |
369 |
|
|
3.100%, 05/15/23 |
|
|
364 |
|
| |
1,164 |
|
|
3.700%, 11/20/23 |
|
|
1,223 |
|
|
|
|
|
UBS AG, (Switzerland), |
|
|
|
|
| |
1,337 |
|
|
3.875%, 01/15/15 |
|
|
1,354 |
|
| |
365 |
|
|
4.875%, 08/04/20 |
|
|
411 |
|
| |
244 |
|
|
5.750%, 04/25/18 |
|
|
278 |
|
| |
247 |
|
|
5.875%, 12/20/17 |
|
|
280 |
|
|
|
|
|
|
|
|
|
|
|
|
|
|
|
|
|
64,694 |
|
|
|
|
|
|
|
|
|
|
|
|
|
|
Consumer Finance — 0.8% |
|
| |
700 |
|
|
American Express Co., 7.000%, 03/19/18 |
|
|
824 |
|
|
|
|
|
American Express Credit Corp., |
|
|
|
|
| |
480 |
|
|
2.375%, 03/24/17 |
|
|
494 |
|
| |
1,028 |
|
|
2.800%, 09/19/16 |
|
|
1,067 |
|
|
|
|
|
American Honda Finance Corp., |
|
|
|
|
| |
667 |
|
|
1.450%, 02/27/15 (e) |
|
|
671 |
|
| |
363 |
|
|
1.500%, 09/11/17 (e) |
|
|
364 |
|
| |
533 |
|
|
1.600%, 02/16/18 (e) |
|
|
533 |
|
| |
565 |
|
|
2.125%, 02/28/17 (e) |
|
|
579 |
|
| |
417 |
|
|
2.125%, 10/10/18 |
|
|
423 |
|
| |
1,599 |
|
|
2.600%, 09/20/16 (e) |
|
|
1,656 |
|
| |
150 |
|
|
7.625%, 10/01/18 (e) |
|
|
183 |
|
|
|
|
|
Capital One Financial Corp., |
|
|
|
|
| |
273 |
|
|
1.000%, 11/06/15 |
|
|
273 |
|
| |
1,281 |
|
|
3.500%, 06/15/23 |
|
|
1,290 |
|
|
|
|
|
|
|
|
|
|
PRINCIPAL
AMOUNT($) |
|
|
SECURITY DESCRIPTION |
|
VALUE($) |
|
| |
|
| |
|
|
Consumer Finance — continued |
|
|
|
|
|
Caterpillar Financial Services Corp., |
|
|
|
|
| |
402 |
|
|
2.850%, 06/01/22 |
|
|
403 |
|
| |
560 |
|
|
5.500%, 03/15/16 |
|
|
601 |
|
| |
340 |
|
|
7.050%, 10/01/18 |
|
|
410 |
|
| |
585 |
|
|
7.150%, 02/15/19 |
|
|
713 |
|
|
|
|
|
Ford Motor Credit Co. LLC, |
|
|
|
|
| |
513 |
|
|
2.375%, 03/12/19 |
|
|
514 |
|
| |
1,653 |
|
|
3.000%, 06/12/17 |
|
|
1,714 |
|
| |
1,917 |
|
|
3.984%, 06/15/16 |
|
|
2,014 |
|
| |
561 |
|
|
4.207%, 04/15/16 |
|
|
589 |
|
| |
200 |
|
|
4.250%, 09/20/22 |
|
|
214 |
|
| |
803 |
|
|
VAR, 1.483%, 05/09/16 |
|
|
815 |
|
|
|
|
|
HSBC Finance Corp., |
|
|
|
|
| |
3,538 |
|
|
5.000%, 06/30/15 |
|
|
3,665 |
|
| |
207 |
|
|
7.350%, 11/27/32 |
|
|
263 |
|
|
|
|
|
HSBC USA, Inc., |
|
|
|
|
| |
800 |
|
|
1.625%, 01/16/18 |
|
|
802 |
|
| |
1,500 |
|
|
2.375%, 02/13/15 |
|
|
1,514 |
|
|
|
|
|
John Deere Capital Corp., |
|
|
|
|
| |
759 |
|
|
1.200%, 10/10/17 |
|
|
757 |
|
| |
335 |
|
|
1.700%, 01/15/20 |
|
|
329 |
|
| |
400 |
|
|
2.250%, 04/17/19 |
|
|
406 |
|
| |
233 |
|
|
3.150%, 10/15/21 |
|
|
241 |
|
| |
874 |
|
|
Nissan Motor Acceptance Corp., 1.800%, 03/15/18 (e) |
|
|
874 |
|
| |
663 |
|
|
PACCAR Financial Corp., 1.600%, 03/15/17 |
|
|
672 |
|
|
|
|
|
Toyota Motor Credit Corp., |
|
|
|
|
| |
1,120 |
|
|
1.000%, 02/17/15 |
|
|
1,124 |
|
| |
2,480 |
|
|
2.000%, 09/15/16 |
|
|
2,539 |
|
| |
558 |
|
|
2.000%, 10/24/18 |
|
|
563 |
|
| |
962 |
|
|
3.200%, 06/17/15 |
|
|
983 |
|
|
|
|
|
|
|
|
|
|
|
|
|
|
|
|
|
31,076 |
|
|
|
|
|
|
|
|
|
|
|
|
|
|
Diversified Financial Services — 1.1% |
|
| |
1,231 |
|
|
Associates Corp. of North America, 6.950%, 11/01/18 |
|
|
1,456 |
|
| |
1,455 |
|
|
Bank of America N.A., 5.300%, 03/15/17 |
|
|
1,587 |
|
|
|
|
|
Berkshire Hathaway, Inc., |
|
|
|
|
| |
1,387 |
|
|
3.400%, 01/31/22 |
|
|
1,449 |
|
| |
840 |
|
|
3.750%, 08/15/21 |
|
|
904 |
|
| |
725 |
|
|
Caisse Centrale Desjardins, (Canada), |
|
|
|
|
|
|
|
|
2.550%, 03/24/16 (e) |
|
|
747 |
|
|
|
|
|
CME Group, Inc., |
|
|
|
|
| |
1,230 |
|
|
3.000%, 09/15/22 |
|
|
1,237 |
|
| |
285 |
|
|
5.300%, 09/15/43 |
|
|
334 |
|
SEE NOTES TO
FINANCIAL STATEMENTS.
|
|
|
|
|
|
|
|
|
|
|
|
|
| AUGUST 31, 2014 |
|
JPMORGAN INSTITUTIONAL TRUST FUNDS |
|
|
|
|
41 |
|
JPMorgan Core Bond Trust
SCHEDULE OF PORTFOLIO INVESTMENTS
AS OF AUGUST 31, 2014 (Unaudited) (continued)
(Amounts in thousands)
|
|
|
|
|
|
|
|
|
PRINCIPAL
AMOUNT($) |
|
|
SECURITY DESCRIPTION |
|
VALUE($) |
|
| Corporate Bonds — continued |
|
| |
|
|
Diversified Financial Services — continued |
|
| |
400 |
|
|
Countrywide Financial Corp., 6.250%, 05/15/16 |
|
|
433 |
|
|
|
|
|
General Electric Capital Corp., |
|
|
|
|
| |
167 |
|
|
1.000%, 12/11/15 |
|
|
168 |
|
| |
1,100 |
|
|
1.625%, 07/02/15 |
|
|
1,112 |
|
| |
750 |
|
|
2.300%, 04/27/17 |
|
|
771 |
|
| |
2,000 |
|
|
3.150%, 09/07/22 |
|
|
2,028 |
|
| |
650 |
|
|
4.625%, 01/07/21 |
|
|
728 |
|
| |
2,100 |
|
|
4.650%, 10/17/21 |
|
|
2,353 |
|
| |
191 |
|
|
5.300%, 02/11/21 |
|
|
219 |
|
| |
2,500 |
|
|
5.400%, 02/15/17 |
|
|
2,753 |
|
| |
1,785 |
|
|
5.500%, 01/08/20 |
|
|
2,061 |
|
| |
4,380 |
|
|
5.625%, 05/01/18 |
|
|
4,985 |
|
| |
330 |
|
|
5.875%, 01/14/38 |
|
|
410 |
|
| |
2,772 |
|
|
Series A, 6.750%, 03/15/32 |
|
|
3,731 |
|
|
|
|
|
Intercontinental Exchange, Inc., |
|
|
|
|
| |
447 |
|
|
2.500%, 10/15/18 |
|
|
457 |
|
| |
884 |
|
|
4.000%, 10/15/23 |
|
|
940 |
|
| |
300 |
|
|
Murray Street Investment Trust I, SUB, 4.647%, 03/09/17 |
|
|
323 |
|
| |
290 |
|
|
National Rural Utilities Cooperative Finance Corp., 10.375%, 11/01/18 |
|
|
387 |
|
| |
550 |
|
|
Principal Life Global Funding I, 5.050%, 03/15/15 (e) |
|
|
563 |
|
|
|
|
|
Private Export Funding Corp., |
|
|
|
|
| |
5,000 |
|
|
Series EE, 2.800%, 05/15/22 |
|
|
5,112 |
|
| |
681 |
|
|
Series KK, 3.550%, 01/15/24 |
|
|
721 |
|
|
|
|
|
Shell International Finance B.V., (Netherlands), |
|
|
|
|
| |
212 |
|
|
1.125%, 08/21/17 |
|
|
212 |
|
| |
1,020 |
|
|
4.300%, 09/22/19 |
|
|
1,131 |
|
| |
1,005 |
|
|
4.375%, 03/25/20 |
|
|
1,123 |
|
| |
1,280 |
|
|
6.375%, 12/15/38 |
|
|
1,731 |
|
| |
300 |
|
|
Siemens Financieringsmaatschappij N.V., (Netherlands), 5.750%, 10/17/16 (e) |
|
|
330 |
|
|
|
|
|
|
|
|
|
|
|
|
|
|
|
|
|
42,496 |
|
|
|
|
|
|
|
|
|
|
|
|
|
|
Insurance — 1.0% |
|
|
|
|
|
ACE INA Holdings, Inc., |
|
|
|
|
| |
455 |
|
|
2.600%, 11/23/15 |
|
|
466 |
|
| |
410 |
|
|
5.600%, 05/15/15 |
|
|
424 |
|
| |
520 |
|
|
AIG SunAmerica Global Financing X, 6.900%, 03/15/32 (e) |
|
|
710 |
|
| |
651 |
|
|
Allstate Corp. (The), 3.150%, 06/15/23 |
|
|
658 |
|
|
|
|
|
American International Group, Inc., |
|
|
|
|
| |
471 |
|
|
4.125%, 02/15/24 |
|
|
501 |
|
| |
3,020 |
|
|
5.450%, 05/18/17 |
|
|
3,347 |
|
|
|
|
|
|
|
|
|
|
PRINCIPAL
AMOUNT($) |
|
|
SECURITY DESCRIPTION |
|
VALUE($) |
|
| |
|
| |
|
|
Insurance — continued |
|
|
|
|
|
Aon Corp., |
|
|
|
|
| |
402 |
|
|
3.125%, 05/27/16 |
|
|
416 |
|
| |
346 |
|
|
3.500%, 09/30/15 |
|
|
357 |
|
| |
306 |
|
|
6.250%, 09/30/40 |
|
|
392 |
|
|
|
|
|
Berkshire Hathaway Finance Corp., |
|
|
|
|
| |
404 |
|
|
1.300%, 05/15/18 |
|
|
399 |
|
| |
233 |
|
|
2.450%, 12/15/15 |
|
|
239 |
|
| |
1,111 |
|
|
2.900%, 10/15/20 |
|
|
1,142 |
|
| |
233 |
|
|
3.000%, 05/15/22 |
|
|
236 |
|
| |
748 |
|
|
4.300%, 05/15/43 |
|
|
766 |
|
| |
1,574 |
|
|
4.400%, 05/15/42 |
|
|
1,634 |
|
| |
1,810 |
|
|
5.400%, 05/15/18 |
|
|
2,047 |
|
| |
120 |
|
|
Chubb Corp. (The), 5.750%, 05/15/18 |
|
|
137 |
|
|
|
|
|
CNA Financial Corp., |
|
|
|
|
| |
750 |
|
|
5.850%, 12/15/14 |
|
|
761 |
|
| |
798 |
|
|
5.875%, 08/15/20 |
|
|
925 |
|
| |
408 |
|
|
Liberty Mutual Group, Inc., 5.000%, 06/01/21 (e) |
|
|
451 |
|
|
|
|
|
Lincoln National Corp., |
|
|
|
|
| |
345 |
|
|
4.200%, 03/15/22 |
|
|
371 |
|
| |
253 |
|
|
4.850%, 06/24/21 |
|
|
283 |
|
| |
280 |
|
|
Massachusetts Mutual Life Insurance Co., 5.375%, 12/01/41 (e) |
|
|
323 |
|
|
|
|
|
MassMutual Global Funding II, |
|
|
|
|
| |
1,500 |
|
|
2.000%, 04/05/17 (e) |
|
|
1,529 |
|
| |
626 |
|
|
2.500%, 10/17/22 (e) |
|
|
611 |
|
| |
540 |
|
|
3.125%, 04/14/16 (e) |
|
|
561 |
|
|
|
|
|
MetLife, Inc., |
|
|
|
|
| |
600 |
|
|
4.875%, 11/13/43 |
|
|
662 |
|
| |
555 |
|
|
Series A, 6.817%, 08/15/18 |
|
|
659 |
|
|
|
|
|
Metropolitan Life Global Funding I, |
|
|
|
|
| |
638 |
|
|
1.300%, 04/10/17 (e) |
|
|
639 |
|
| |
604 |
|
|
1.700%, 06/29/15 (e) |
|
|
611 |
|
| |
300 |
|
|
1.875%, 06/22/18 (e) |
|
|
300 |
|
| |
820 |
|
|
2.500%, 09/29/15 (e) |
|
|
838 |
|
| |
400 |
|
|
3.125%, 01/11/16 (e) |
|
|
413 |
|
| |
1,900 |
|
|
3.650%, 06/14/18 (e) |
|
|
2,028 |
|
| |
1,277 |
|
|
3.875%, 04/11/22 (e) |
|
|
1,367 |
|
| |
1,750 |
|
|
Nationwide Mutual Insurance Co., 9.375%, 08/15/39 (e) |
|
|
2,765 |
|
|
|
|
|
New York Life Global Funding, |
|
|
|
|
| |
740 |
|
|
0.750%, 07/24/15 (e) |
|
|
743 |
|
| |
350 |
|
|
1.300%, 01/12/15 (e) |
|
|
351 |
|
| |
951 |
|
|
2.150%, 06/18/19 (e) |
|
|
956 |
|
| |
650 |
|
|
Pacific Life Global Funding, 5.000%, 05/15/17 (e) |
|
|
700 |
|
SEE NOTES TO
FINANCIAL STATEMENTS.
|
|
|
|
|
|
|
|
|
|
|
| 42 |
|
|
|
JPMORGAN INSTITUTIONAL TRUST FUNDS |
|
AUGUST 31, 2014 |
|
|
|
|
|
|
|
|
|
PRINCIPAL
AMOUNT($) |
|
|
SECURITY DESCRIPTION |
|
VALUE($) |
|
| Corporate Bonds — continued |
|
| |
|
|
Insurance — continued |
|
| |
570 |
|
|
Pacific Life Insurance Co., 9.250%, 06/15/39 (e) |
|
|
898 |
|
| |
384 |
|
|
Pricoa Global Funding I, 1.600%, 05/29/18 (e) |
|
|
381 |
|
| |
166 |
|
|
Principal Financial Group, Inc., 1.850%, 11/15/17 |
|
|
167 |
|
|
|
|
|
Principal Life Global Funding II, |
|
|
|
|
| |
304 |
|
|
1.000%, 12/11/15 (e) |
|
|
305 |
|
| |
953 |
|
|
2.250%, 10/15/18 (e) |
|
|
961 |
|
| |
1,750 |
|
|
Prudential Insurance Co. of America (The), 8.300%, 07/01/25 (e) |
|
|
2,388 |
|
| |
285 |
|
|
Travelers Cos., Inc. (The), 5.800%, 05/15/18 |
|
|
324 |
|
|
|
|
|
|
|
|
|
|
|
|
|
|
|
|
|
38,142 |
|
|
|
|
|
|
|
|
|
|
|
|
|
|
Real Estate Investment Trusts (REITs) — 0.3% |
|
|
|
|
|
American Tower Corp., |
|
|
|
|
| |
450 |
|
|
3.500%, 01/31/23 |
|
|
443 |
|
| |
567 |
|
|
5.000%, 02/15/24 |
|
|
613 |
|
| |
471 |
|
|
American Tower Trust I, 1.551%, 03/15/18 (e) |
|
|
466 |
|
|
|
|
|
Equity Commonwealth, |
|
|
|
|
| |
600 |
|
|
5.875%, 09/15/20 |
|
|
652 |
|
| |
1,345 |
|
|
6.650%, 01/15/18 |
|
|
1,492 |
|
| |
608 |
|
|
ERP Operating LP, 4.625%, 12/15/21 |
|
|
675 |
|
|
|
|
|
HCP, Inc., |
|
|
|
|
| |
492 |
|
|
2.625%, 02/01/20 |
|
|
491 |
|
| |
234 |
|
|
3.875%, 08/15/24 |
|
|
236 |
|
| |
230 |
|
|
4.200%, 03/01/24 |
|
|
237 |
|
| |
598 |
|
|
4.250%, 11/15/23 |
|
|
621 |
|
| |
970 |
|
|
5.375%, 02/01/21 |
|
|
1,101 |
|
| |
732 |
|
|
Health Care REIT, Inc., 4.500%, 01/15/24 |
|
|
772 |
|
| |
534 |
|
|
Prologis LP, 4.250%, 08/15/23 |
|
|
563 |
|
|
|
|
|
Simon Property Group LP, |
|
|
|
|
| |
917 |
|
|
2.150%, 09/15/17 |
|
|
941 |
|
| |
579 |
|
|
4.125%, 12/01/21 |
|
|
629 |
|
| |
32 |
|
|
4.200%, 02/01/15 |
|
|
32 |
|
| |
200 |
|
|
4.375%, 03/01/21 |
|
|
221 |
|
| |
685 |
|
|
6.100%, 05/01/16 |
|
|
737 |
|
| |
345 |
|
|
6.125%, 05/30/18 |
|
|
399 |
|
|
|
|
|
|
|
|
|
|
|
|
|
|
|
|
|
11,321 |
|
|
|
|
|
|
|
|
|
|
|
|
|
|
Total Financials |
|
|
324,440 |
|
|
|
|
|
|
|
|
|
|
|
|
|
|
Health Care — 0.7% |
|
|
|
|
|
Biotechnology — 0.3% |
|
|
|
|
|
Amgen, Inc., |
|
|
|
|
| |
491 |
|
|
3.625%, 05/22/24 |
|
|
499 |
|
| |
1,000 |
|
|
3.875%, 11/15/21 |
|
|
1,065 |
|
| |
237 |
|
|
4.500%, 03/15/20 |
|
|
260 |
|
|
|
|
|
|
|
|
|
|
PRINCIPAL
AMOUNT($) |
|
|
SECURITY DESCRIPTION |
|
VALUE($) |
|
| |
|
| |
|
|
Biotechnology — continued |
|
| |
500 |
|
|
4.950%, 10/01/41 |
|
|
538 |
|
| |
2,000 |
|
|
5.150%, 11/15/41 |
|
|
2,213 |
|
| |
265 |
|
|
5.650%, 06/15/42 |
|
|
315 |
|
| |
680 |
|
|
5.700%, 02/01/19 |
|
|
780 |
|
| |
720 |
|
|
5.750%, 03/15/40 |
|
|
862 |
|
|
|
|
|
Celgene Corp., |
|
|
|
|
| |
1,336 |
|
|
3.250%, 08/15/22 |
|
|
1,356 |
|
| |
659 |
|
|
3.625%, 05/15/24 |
|
|
672 |
|
|
|
|
|
|
|
|
|
|
|
|
|
|
|
|
|
8,560 |
|
|
|
|
|
|
|
|
|
|
|
|
|
|
Health Care Equipment & Supplies — 0.0% (g) |
|
|
|
|
|
Baxter International, Inc., |
|
|
|
|
| |
286 |
|
|
1.850%, 06/15/18 |
|
|
287 |
|
| |
270 |
|
|
4.625%, 03/15/15 |
|
|
276 |
|
| |
100 |
|
|
Becton Dickinson and Co., 5.000%, 05/15/19 |
|
|
113 |
|
|
|
|
|
|
|
|
|
|
|
|
|
|
|
|
|
676 |
|
|
|
|
|
|
|
|
|
|
|
|
|
|
Health Care Providers & Services — 0.2% |
|
|
|
|
|
Aetna, Inc., |
|
|
|
|
| |
265 |
|
|
4.500%, 05/15/42 |
|
|
271 |
|
| |
440 |
|
|
6.750%, 12/15/37 |
|
|
594 |
|
| |
900 |
|
|
Express Scripts Holding Co., 3.500%, 06/15/24 |
|
|
904 |
|
| |
164 |
|
|
McKesson Corp., 0.950%, 12/04/15 |
|
|
165 |
|
| |
370 |
|
|
Medco Health Solutions, Inc., 2.750%, 09/15/15 |
|
|
378 |
|
|
|
|
|
UnitedHealth Group, Inc., |
|
|
|
|
| |
173 |
|
|
2.750%, 02/15/23 |
|
|
169 |
|
| |
400 |
|
|
2.875%, 03/15/23 |
|
|
397 |
|
| |
1,050 |
|
|
3.375%, 11/15/21 |
|
|
1,096 |
|
| |
620 |
|
|
6.625%, 11/15/37 |
|
|
838 |
|
| |
353 |
|
|
Ventas Realty LP, 3.750%, 05/01/24 |
|
|
353 |
|
|
|
|
|
WellPoint, Inc., |
|
|
|
|
| |
467 |
|
|
2.300%, 07/15/18 |
|
|
473 |
|
| |
615 |
|
|
3.125%, 05/15/22 |
|
|
616 |
|
| |
280 |
|
|
3.300%, 01/15/23 |
|
|
281 |
|
| |
500 |
|
|
4.625%, 05/15/42 |
|
|
508 |
|
| |
535 |
|
|
4.650%, 01/15/43 |
|
|
551 |
|
| |
648 |
|
|
4.650%, 08/15/44 |
|
|
670 |
|
|
|
|
|
|
|
|
|
|
|
|
|
|
|
|
|
8,264 |
|
|
|
|
|
|
|
|
|
|
|
|
|
|
Life Sciences Tools & Services — 0.0% (g) |
|
|
|
|
|
Thermo Fisher Scientific, Inc., |
|
|
|
|
| |
176 |
|
|
1.300%, 02/01/17 |
|
|
176 |
|
| |
687 |
|
|
4.150%, 02/01/24 |
|
|
726 |
|
|
|
|
|
|
|
|
|
|
|
|
|
|
|
|
|
902 |
|
|
|
|
|
|
|
|
|
|
SEE NOTES TO
FINANCIAL STATEMENTS.
|
|
|
|
|
|
|
|
|
|
|
|
|
| AUGUST 31, 2014 |
|
JPMORGAN INSTITUTIONAL TRUST FUNDS |
|
|
|
|
43 |
|
JPMorgan Core Bond Trust
SCHEDULE OF PORTFOLIO INVESTMENTS
AS OF AUGUST 31, 2014 (Unaudited) (continued)
(Amounts in thousands)
|
|
|
|
|
|
|
|
|
PRINCIPAL
AMOUNT($) |
|
|
SECURITY DESCRIPTION |
|
VALUE($) |
|
| Corporate Bonds — continued |
|
|
|
|
|
Pharmaceuticals — 0.2% |
|
|
|
|
|
AbbVie, Inc., |
|
|
|
|
| |
992 |
|
|
1.750%, 11/06/17 |
|
|
997 |
|
| |
609 |
|
|
2.900%, 11/06/22 |
|
|
599 |
|
| |
937 |
|
|
Actavis Funding SCS, (Luxembourg), 3.850%, 06/15/24 (e) |
|
|
948 |
|
| |
275 |
|
|
Actavis, Inc., 3.250%, 10/01/22 |
|
|
273 |
|
|
|
|
|
GlaxoSmithKline Capital, Inc., |
|
|
|
|
| |
750 |
|
|
5.650%, 05/15/18 |
|
|
859 |
|
| |
530 |
|
|
6.375%, 05/15/38 |
|
|
699 |
|
|
|
|
|
Merck & Co., Inc., |
|
|
|
|
| |
650 |
|
|
1.300%, 05/18/18 |
|
|
646 |
|
| |
474 |
|
|
2.400%, 09/15/22 |
|
|
461 |
|
| |
562 |
|
|
2.800%, 05/18/23 |
|
|
558 |
|
| |
560 |
|
|
Novartis Capital Corp., 3.400%, 05/06/24 |
|
|
576 |
|
| |
650 |
|
|
Pfizer, Inc., 3.000%, 06/15/23 |
|
|
657 |
|
|
|
|
|
Zoetis, Inc., |
|
|
|
|
| |
193 |
|
|
1.875%, 02/01/18 |
|
|
193 |
|
| |
123 |
|
|
4.700%, 02/01/43 |
|
|
128 |
|
|
|
|
|
|
|
|
|
|
|
|
|
|
|
|
|
7,594 |
|
|
|
|
|
|
|
|
|
|
|
|
|
|
Total Health Care |
|
|
25,996 |
|
|
|
|
|
|
|
|
|
|
|
|
|
|
Industrials — 1.2% |
|
|
|
|
|
Aerospace & Defense — 0.2% |
|
| |
557 |
|
|
Airbus Group Finance B.V., (Netherlands), 2.700%, 04/17/23 (e) |
|
|
542 |
|
| |
400 |
|
|
BAE Systems Holdings, Inc., 6.375%, 06/01/19 (e) |
|
|
468 |
|
| |
676 |
|
|
BAE Systems plc, (United Kingdom), 5.800%, 10/11/41 (e) |
|
|
829 |
|
| |
200 |
|
|
Boeing Co. (The), 7.950%, 08/15/24 |
|
|
282 |
|
| |
415 |
|
|
Honeywell International, Inc., 5.300%, 03/01/18 |
|
|
469 |
|
|
|
|
|
Lockheed Martin Corp., |
|
|
|
|
| |
387 |
|
|
2.125%, 09/15/16 |
|
|
397 |
|
| |
1,281 |
|
|
4.070%, 12/15/42 |
|
|
1,271 |
|
| |
292 |
|
|
4.850%, 09/15/41 |
|
|
323 |
|
| |
300 |
|
|
Northrop Grumman Systems Corp., 7.750%, 02/15/31 |
|
|
420 |
|
| |
215 |
|
|
Precision Castparts Corp., 0.700%, 12/20/15 |
|
|
215 |
|
|
|
|
|
United Technologies Corp., |
|
|
|
|
| |
214 |
|
|
1.800%, 06/01/17 |
|
|
218 |
|
| |
681 |
|
|
3.100%, 06/01/22 |
|
|
695 |
|
| |
914 |
|
|
4.500%, 06/01/42 |
|
|
984 |
|
| |
1,261 |
|
|
6.125%, 02/01/19 |
|
|
1,482 |
|
|
|
|
|
|
|
|
|
|
|
|
|
|
|
|
|
8,595 |
|
|
|
|
|
|
|
|
|
|
|
|
|
|
|
|
|
|
|
PRINCIPAL
AMOUNT($) |
|
|
SECURITY DESCRIPTION |
|
VALUE($) |
|
| |
|
|
|
|
|
Air Freight & Logistics — 0.0% (g) |
|
|
|
|
|
United Parcel Service of America, Inc., |
|
|
|
|
| |
355 |
|
|
8.375%, 04/01/20 |
|
|
463 |
|
| |
160 |
|
|
SUB, 8.375%, 04/01/30 |
|
|
239 |
|
| |
214 |
|
|
United Parcel Service, Inc., 2.450%, 10/01/22 |
|
|
209 |
|
|
|
|
|
|
|
|
|
|
|
|
|
|
|
|
|
911 |
|
|
|
|
|
|
|
|
|
|
|
|
|
|
Airlines — 0.1% |
|
| |
430 |
|
|
Air Canada 2013-1 Class A Pass-Through Trust, (Canada), 4.125%, 05/15/25 (e) |
|
|
437 |
|
| |
235 |
|
|
American Airlines 2011-1 Class A Pass-Through Trust, 5.250%, 01/31/21 |
|
|
255 |
|
| |
649 |
|
|
American Airlines 2013-2 Class A Pass-Through Trust, 4.950%, 01/15/23 |
|
|
700 |
|
| |
213 |
|
|
Continental Airlines 1999-2 Class A-1 Pass-Through Trust, 7.256%,
03/15/20 |
|
|
241 |
|
| |
421 |
|
|
Continental Airlines 2007-1 Class A Pass-Through Trust, 5.983%, 04/19/22 |
|
|
470 |
|
| |
206 |
|
|
Continental Airlines 2012-2 Class A Pass-Through Trust, 4.000%, 10/29/24 |
|
|
211 |
|
| |
479 |
|
|
Delta Air Lines 2010-2 Class A Pass-Through Trust, 4.950%, 05/23/19 |
|
|
514 |
|
| |
178 |
|
|
Delta Air Lines 2011-1 Class A Pass-Through Trust, 5.300%, 04/15/19 |
|
|
194 |
|
| |
432 |
|
|
Delta Air Lines 2012-1 Class A Pass-Through Trust, 4.750%, 05/07/20 |
|
|
469 |
|
|
|
|
|
|
|
|
|
|
|
|
|
|
|
|
|
3,491 |
|
|
|
|
|
|
|
|
|
|
|
|
|
|
Commercial Services & Supplies — 0.1% |
|
|
|
|
|
ADT Corp. (The), |
|
|
|
|
| |
820 |
|
|
3.500%, 07/15/22 |
|
|
732 |
|
| |
264 |
|
|
4.125%, 06/15/23 |
|
|
245 |
|
| |
328 |
|
|
4.875%, 07/15/42 |
|
|
279 |
|
| |
200 |
|
|
Pitney Bowes, Inc., 5.600%, 03/15/18 |
|
|
221 |
|
| |
614 |
|
|
Republic Services, Inc., 3.550%, 06/01/22 |
|
|
641 |
|
|
|
|
|
Waste Management, Inc., |
|
|
|
|
| |
214 |
|
|
4.750%, 06/30/20 |
|
|
239 |
|
| |
465 |
|
|
7.375%, 03/11/19 |
|
|
567 |
|
|
|
|
|
|
|
|
|
|
|
|
|
|
|
|
|
2,924 |
|
|
|
|
|
|
|
|
|
|
|
|
|
|
Construction & Engineering — 0.1% |
|
|
|
|
|
ABB Finance USA, Inc., |
|
|
|
|
| |
226 |
|
|
1.625%, 05/08/17 |
|
|
228 |
|
| |
292 |
|
|
2.875%, 05/08/22 |
|
|
292 |
|
| |
145 |
|
|
4.375%, 05/08/42 |
|
|
153 |
|
| |
789 |
|
|
Fluor Corp., 3.375%, 09/15/21 |
|
|
822 |
|
|
|
|
|
|
|
|
|
|
|
|
|
|
|
|
|
1,495 |
|
|
|
|
|
|
|
|
|
|
SEE NOTES TO
FINANCIAL STATEMENTS.
|
|
|
|
|
|
|
|
|
|
|
| 44 |
|
|
|
JPMORGAN INSTITUTIONAL TRUST FUNDS |
|
AUGUST 31, 2014 |
|
|
|
|
|
|
|
|
|
PRINCIPAL
AMOUNT($) |
|
|
SECURITY DESCRIPTION |
|
VALUE($) |
|
| Corporate Bonds — continued |
|
|
|
|
|
Electrical Equipment — 0.0% (g) |
|
|
|
|
|
Eaton Corp., |
|
|
|
|
| |
182 |
|
|
1.500%, 11/02/17 |
|
|
182 |
|
| |
170 |
|
|
4.000%, 11/02/32 |
|
|
173 |
|
| |
570 |
|
|
5.600%, 05/15/18 |
|
|
647 |
|
| |
300 |
|
|
7.625%, 04/01/24 |
|
|
387 |
|
|
|
|
|
|
|
|
|
|
|
|
|
|
|
|
|
1,389 |
|
|
|
|
|
|
|
|
|
|
|
|
|
|
Industrial Conglomerates — 0.1% |
|
| |
667 |
|
|
Danaher Corp., 3.900%, 06/23/21 |
|
|
726 |
|
|
|
|
|
General Electric Co., |
|
|
|
|
| |
212 |
|
|
2.700%, 10/09/22 |
|
|
209 |
|
| |
436 |
|
|
3.375%, 03/11/24 |
|
|
448 |
|
| |
539 |
|
|
Hutchison Whampoa International 12 II Ltd., (Cayman Islands), 3.250%, 11/08/22 (e) |
|
|
538 |
|
| |
412 |
|
|
Ingersoll-Rand Global Holding Co., Ltd., 4.250%, 06/15/23 |
|
|
439 |
|
|
|
|
|
Koninklijke Philips N.V., (Netherlands), |
|
|
|
|
| |
970 |
|
|
3.750%, 03/15/22 |
|
|
1,026 |
|
| |
409 |
|
|
5.750%, 03/11/18 |
|
|
465 |
|
| |
130 |
|
|
7.200%, 06/01/26 |
|
|
166 |
|
|
|
|
|
|
|
|
|
|
|
|
|
|
|
|
|
4,017 |
|
|
|
|
|
|
|
|
|
|
|
|
|
|
Machinery — 0.1% |
|
| |
164 |
|
|
Caterpillar, Inc., 2.600%, 06/26/22 |
|
|
161 |
|
|
|
|
|
Deere & Co., |
|
|
|
|
| |
819 |
|
|
2.600%, 06/08/22 |
|
|
807 |
|
| |
346 |
|
|
3.900%, 06/09/42 |
|
|
342 |
|
|
|
|
|
Illinois Tool Works, Inc., |
|
|
|
|
| |
400 |
|
|
3.500%, 03/01/24 |
|
|
417 |
|
| |
1,920 |
|
|
3.900%, 09/01/42 |
|
|
1,867 |
|
| |
290 |
|
|
Ingersoll-Rand Co., 6.391%, 11/15/27 |
|
|
354 |
|
| |
215 |
|
|
Parker Hannifin Corp., 5.500%, 05/15/18 |
|
|
243 |
|
|
|
|
|
|
|
|
|
|
|
|
|
|
|
|
|
4,191 |
|
|
|
|
|
|
|
|
|
|
|
|
|
|
Road & Rail — 0.5% |
|
|
|
|
|
Burlington Northern Santa Fe LLC, |
|
|
|
|
| |
200 |
|
|
3.000%, 03/15/23 |
|
|
197 |
|
| |
522 |
|
|
3.050%, 03/15/22 |
|
|
527 |
|
| |
300 |
|
|
3.450%, 09/15/21 |
|
|
313 |
|
| |
136 |
|
|
3.600%, 09/01/20 |
|
|
144 |
|
| |
249 |
|
|
3.750%, 04/01/24 |
|
|
259 |
|
| |
375 |
|
|
4.375%, 09/01/42 |
|
|
378 |
|
| |
769 |
|
|
5.150%, 09/01/43 |
|
|
861 |
|
| |
1,000 |
|
|
5.400%, 06/01/41 |
|
|
1,165 |
|
| |
540 |
|
|
5.650%, 05/01/17 |
|
|
603 |
|
| |
335 |
|
|
5.750%, 03/15/18 |
|
|
381 |
|
|
|
|
|
|
|
|
|
|
PRINCIPAL
AMOUNT($) |
|
|
SECURITY DESCRIPTION |
|
VALUE($) |
|
| |
|
| |
|
|
Road & Rail — continued |
|
| |
425 |
|
|
5.750%, 05/01/40 |
|
|
516 |
|
| |
250 |
|
|
6.700%, 08/01/28 |
|
|
315 |
|
| |
250 |
|
|
Canadian Pacific Railway Co., (Canada), 7.125%, 10/15/31 |
|
|
341 |
|
|
|
|
|
CSX Corp., |
|
|
|
|
| |
400 |
|
|
3.400%, 08/01/24 |
|
|
407 |
|
| |
191 |
|
|
4.100%, 03/15/44 |
|
|
187 |
|
| |
300 |
|
|
4.250%, 06/01/21 |
|
|
329 |
|
| |
575 |
|
|
5.500%, 04/15/41 |
|
|
677 |
|
| |
145 |
|
|
6.250%, 04/01/15 |
|
|
150 |
|
| |
215 |
|
|
7.375%, 02/01/19 |
|
|
261 |
|
| |
500 |
|
|
7.900%, 05/01/17 |
|
|
582 |
|
|
|
|
|
ERAC USA Finance LLC, |
|
|
|
|
| |
355 |
|
|
2.750%, 03/15/17 (e) |
|
|
367 |
|
| |
559 |
|
|
4.500%, 08/16/21 (e) |
|
|
612 |
|
| |
436 |
|
|
5.625%, 03/15/42 (e) |
|
|
511 |
|
| |
350 |
|
|
6.375%, 10/15/17 (e) |
|
|
400 |
|
| |
746 |
|
|
6.700%, 06/01/34 (e) |
|
|
961 |
|
|
|
|
|
Norfolk Southern Corp., |
|
|
|
|
| |
746 |
|
|
3.250%, 12/01/21 |
|
|
771 |
|
| |
595 |
|
|
3.950%, 10/01/42 |
|
|
574 |
|
| |
100 |
|
|
6.000%, 03/15/05 (†) |
|
|
126 |
|
| |
1,776 |
|
|
6.000%, 05/23/11 (†††) |
|
|
2,203 |
|
| |
365 |
|
|
7.700%, 05/15/17 |
|
|
426 |
|
| |
479 |
|
|
Penske Truck Leasing Co. LP/PTL Finance Corp., 2.875%, 07/17/18 (e) |
|
|
493 |
|
|
|
|
|
Ryder System, Inc., |
|
|
|
|
| |
484 |
|
|
2.500%, 03/01/17 |
|
|
499 |
|
| |
434 |
|
|
3.600%, 03/01/16 |
|
|
452 |
|
|
|
|
|
Union Pacific Corp., |
|
|
|
|
| |
182 |
|
|
2.950%, 01/15/23 |
|
|
183 |
|
| |
838 |
|
|
3.646%, 02/15/24 |
|
|
877 |
|
| |
710 |
|
|
4.163%, 07/15/22 |
|
|
780 |
|
| |
200 |
|
|
4.300%, 06/15/42 |
|
|
207 |
|
| |
235 |
|
|
4.875%, 01/15/15 |
|
|
239 |
|
|
|
|
|
|
|
|
|
|
|
|
|
|
|
|
|
19,274 |
|
|
|
|
|
|
|
|
|
|
|
|
|
|
Total Industrials |
|
|
46,287 |
|
|
|
|
|
|
|
|
|
|
|
|
|
|
Information Technology — 1.2% |
|
|
|
|
|
Communications Equipment — 0.1% |
|
|
|
|
|
Cisco Systems, Inc., |
|
|
|
|
| |
197 |
|
|
2.900%, 03/04/21 |
|
|
202 |
|
| |
500 |
|
|
3.625%, 03/04/24 |
|
|
521 |
|
| |
988 |
|
|
5.500%, 02/22/16 |
|
|
1,060 |
|
| |
350 |
|
|
5.500%, 01/15/40 |
|
|
419 |
|
SEE NOTES TO
FINANCIAL STATEMENTS.
|
|
|
|
|
|
|
|
|
|
|
|
|
| AUGUST 31, 2014 |
|
JPMORGAN INSTITUTIONAL TRUST FUNDS |
|
|
|
|
45 |
|
JPMorgan Core Bond Trust
SCHEDULE OF PORTFOLIO INVESTMENTS
AS OF AUGUST 31, 2014 (Unaudited) (continued)
(Amounts in thousands)
|
|
|
|
|
|
|
|
|
PRINCIPAL
AMOUNT($) |
|
|
SECURITY DESCRIPTION |
|
VALUE($) |
|
| Corporate Bonds — continued |
|
| |
|
|
Communications Equipment — continued |
|
| |
755 |
|
|
5.900%, 02/15/39 |
|
|
943 |
|
|
|
|
|
|
|
|
|
|
|
|
|
|
|
|
|
3,145 |
|
|
|
|
|
|
|
|
|
|
|
|
|
|
Electronic Equipment, Instruments & Components — 0.1% |
|
|
|
|
|
Arrow Electronics, Inc., |
|
|
|
|
| |
219 |
|
|
3.000%, 03/01/18 |
|
|
226 |
|
| |
575 |
|
|
3.375%, 11/01/15 |
|
|
591 |
|
| |
190 |
|
|
4.500%, 03/01/23 |
|
|
199 |
|
| |
165 |
|
|
6.000%, 04/01/20 |
|
|
187 |
|
| |
500 |
|
|
6.875%, 06/01/18 |
|
|
574 |
|
| |
1,163 |
|
|
7.500%, 01/15/27 |
|
|
1,449 |
|
|
|
|
|
|
|
|
|
|
|
|
|
|
|
|
|
3,226 |
|
|
|
|
|
|
|
|
|
|
|
|
|
|
Internet Software & Services — 0.1% |
|
|
|
|
|
eBay, Inc., |
|
|
|
|
| |
375 |
|
|
2.600%, 07/15/22 |
|
|
364 |
|
| |
1,125 |
|
|
2.875%, 08/01/21 |
|
|
1,127 |
|
| |
500 |
|
|
3.450%, 08/01/24 |
|
|
503 |
|
| |
271 |
|
|
4.000%, 07/15/42 |
|
|
248 |
|
|
|
|
|
|
|
|
|
|
|
|
|
|
|
|
|
2,242 |
|
|
|
|
|
|
|
|
|
|
|
|
|
|
IT Services — 0.3% |
|
|
|
|
|
International Business Machines Corp., |
|
|
|
|
| |
409 |
|
|
1.250%, 02/06/17 |
|
|
412 |
|
| |
3,267 |
|
|
1.625%, 05/15/20 |
|
|
3,151 |
|
| |
2,600 |
|
|
5.700%, 09/14/17 |
|
|
2,942 |
|
| |
765 |
|
|
6.220%, 08/01/27 |
|
|
978 |
|
| |
1,075 |
|
|
7.625%, 10/15/18 |
|
|
1,319 |
|
|
|
|
|
Xerox Corp., |
|
|
|
|
| |
271 |
|
|
2.950%, 03/15/17 |
|
|
282 |
|
| |
270 |
|
|
4.500%, 05/15/21 |
|
|
293 |
|
| |
610 |
|
|
5.625%, 12/15/19 |
|
|
698 |
|
| |
550 |
|
|
6.750%, 02/01/17 |
|
|
619 |
|
|
|
|
|
|
|
|
|
|
|
|
|
|
|
|
|
10,694 |
|
|
|
|
|
|
|
|
|
|
|
|
|
|
Semiconductors & Semiconductor Equipment — 0.1% |
|
|
|
|
|
Intel Corp., |
|
|
|
|
| |
772 |
|
|
3.300%, 10/01/21 |
|
|
806 |
|
| |
685 |
|
|
4.000%, 12/15/32 |
|
|
690 |
|
| |
1,460 |
|
|
National Semiconductor Corp., 6.600%, 06/15/17 |
|
|
1,675 |
|
| |
365 |
|
|
Texas Instruments, Inc., 1.650%, 08/03/19 |
|
|
358 |
|
|
|
|
|
|
|
|
|
|
|
|
|
|
|
|
|
3,529 |
|
|
|
|
|
|
|
|
|
|
|
|
|
|
Software — 0.2% |
|
| |
470 |
|
|
Intuit, Inc., 5.750%, 03/15/17 |
|
|
521 |
|
|
|
|
|
Microsoft Corp., |
|
|
|
|
| |
262 |
|
|
0.875%, 11/15/17 |
|
|
260 |
|
|
|
|
|
|
|
|
|
|
PRINCIPAL
AMOUNT($) |
|
|
SECURITY DESCRIPTION |
|
VALUE($) |
|
| |
|
| |
|
|
Software — continued |
|
| |
720 |
|
|
1.625%, 09/25/15 |
|
|
730 |
|
| |
384 |
|
|
2.125%, 11/15/22 |
|
|
370 |
|
| |
810 |
|
|
2.375%, 05/01/23 |
|
|
786 |
|
| |
1,155 |
|
|
3.625%, 12/15/23 |
|
|
1,223 |
|
| |
117 |
|
|
4.500%, 10/01/40 |
|
|
125 |
|
|
|
|
|
Oracle Corp., |
|
|
|
|
| |
586 |
|
|
Series NOTE, 2.800%, 07/08/21 |
|
|
592 |
|
| |
1,000 |
|
|
3.625%, 07/15/23 |
|
|
1,046 |
|
| |
457 |
|
|
4.300%, 07/08/34 |
|
|
477 |
|
| |
500 |
|
|
5.000%, 07/08/19 |
|
|
567 |
|
| |
1,422 |
|
|
5.250%, 01/15/16 |
|
|
1,514 |
|
| |
813 |
|
|
5.750%, 04/15/18 |
|
|
930 |
|
| |
475 |
|
|
6.500%, 04/15/38 |
|
|
628 |
|
|
|
|
|
|
|
|
|
|
|
|
|
|
|
|
|
9,769 |
|
|
|
|
|
|
|
|
|
|
|
|
|
|
Technology Hardware, Storage & Peripherals — 0.3% |
|
|
|
|
|
Apple, Inc., |
|
|
|
|
| |
2,556 |
|
|
2.400%, 05/03/23 |
|
|
2,452 |
|
| |
2,364 |
|
|
2.850%, 05/06/21 |
|
|
2,407 |
|
| |
2,069 |
|
|
VAR, 0.489%, 05/03/18 |
|
|
2,071 |
|
| |
300 |
|
|
Dell, Inc., 7.100%, 04/15/28 |
|
|
305 |
|
|
|
|
|
EMC Corp., |
|
|
|
|
| |
850 |
|
|
1.875%, 06/01/18 |
|
|
852 |
|
| |
1,000 |
|
|
3.375%, 06/01/23 |
|
|
1,014 |
|
|
|
|
|
Hewlett-Packard Co., |
|
|
|
|
| |
282 |
|
|
4.300%, 06/01/21 |
|
|
303 |
|
| |
472 |
|
|
4.375%, 09/15/21 |
|
|
511 |
|
| |
201 |
|
|
4.650%, 12/09/21 |
|
|
222 |
|
| |
849 |
|
|
6.000%, 09/15/41 |
|
|
1,006 |
|
|
|
|
|
|
|
|
|
|
|
|
|
|
|
|
|
11,143 |
|
|
|
|
|
|
|
|
|
|
|
|
|
|
Total Information Technology |
|
|
43,748 |
|
|
|
|
|
|
|
|
|
|
|
|
|
|
Materials — 0.6% |
|
|
|
|
|
|
|
|
Chemicals — 0.4% |
|
|
|
|
| |
500 |
|
|
CF Industries, Inc., 7.125%, 05/01/20 |
|
|
610 |
|
|
|
|
|
Dow Chemical Co. (The), |
|
|
|
|
| |
542 |
|
|
3.000%, 11/15/22 |
|
|
535 |
|
| |
470 |
|
|
4.125%, 11/15/21 |
|
|
503 |
|
| |
223 |
|
|
4.250%, 11/15/20 |
|
|
243 |
|
| |
200 |
|
|
5.250%, 11/15/41 |
|
|
223 |
|
| |
375 |
|
|
7.375%, 11/01/29 |
|
|
510 |
|
| |
73 |
|
|
8.550%, 05/15/19 |
|
|
93 |
|
|
|
|
|
E.I. du Pont de Nemours & Co., |
|
|
|
|
| |
635 |
|
|
1.950%, 01/15/16 |
|
|
647 |
|
| |
350 |
|
|
4.900%, 01/15/41 |
|
|
386 |
|
| |
1,740 |
|
|
6.000%, 07/15/18 |
|
|
2,020 |
|
SEE NOTES TO
FINANCIAL STATEMENTS.
|
|
|
|
|
|
|
|
|
|
|
| 46 |
|
|
|
JPMORGAN INSTITUTIONAL TRUST FUNDS |
|
AUGUST 31, 2014 |
|
|
|
|
|
|
|
|
|
PRINCIPAL
AMOUNT($) |
|
|
SECURITY DESCRIPTION |
|
VALUE($) |
|
| Corporate Bonds — continued |
|
| |
|
|
Chemicals — continued |
|
|
|
|
|
Ecolab, Inc., |
|
|
|
|
| |
447 |
|
|
1.450%, 12/08/17 |
|
|
447 |
|
| |
150 |
|
|
5.500%, 12/08/41 |
|
|
176 |
|
|
|
|
|
Monsanto Co., |
|
|
|
|
| |
664 |
|
|
2.750%, 07/15/21 |
|
|
667 |
|
| |
253 |
|
|
4.200%, 07/15/34 |
|
|
263 |
|
| |
278 |
|
|
4.700%, 07/15/64 |
|
|
288 |
|
|
|
|
|
Mosaic Co. (The), |
|
|
|
|
| |
280 |
|
|
3.750%, 11/15/21 |
|
|
293 |
|
| |
1,456 |
|
|
4.250%, 11/15/23 |
|
|
1,556 |
|
| |
79 |
|
|
4.875%, 11/15/41 |
|
|
82 |
|
| |
861 |
|
|
5.450%, 11/15/33 |
|
|
981 |
|
| |
347 |
|
|
5.625%, 11/15/43 |
|
|
401 |
|
| |
85 |
|
|
Potash Corp. of Saskatchewan, Inc., (Canada), 3.250%, 12/01/17 |
|
|
90 |
|
|
|
|
|
PPG Industries, Inc., |
|
|
|
|
| |
114 |
|
|
5.500%, 11/15/40 |
|
|
137 |
|
| |
700 |
|
|
6.650%, 03/15/18 |
|
|
813 |
|
| |
355 |
|
|
9.000%, 05/01/21 |
|
|
467 |
|
| |
662 |
|
|
Praxair, Inc., 4.625%, 03/30/15 |
|
|
678 |
|
|
|
|
|
Union Carbide Corp., |
|
|
|
|
| |
1,000 |
|
|
7.500%, 06/01/25 |
|
|
1,295 |
|
| |
850 |
|
|
7.750%, 10/01/96 |
|
|
1,109 |
|
|
|
|
|
|
|
|
|
|
|
|
|
|
|
|
|
15,513 |
|
|
|
|
|
|
|
|
|
|
|
|
|
|
Metals & Mining — 0.2% |
|
|
|
|
|
BHP Billiton Finance USA Ltd., (Australia), |
|
|
|
|
| |
815 |
|
|
3.850%, 09/30/23 |
|
|
868 |
|
| |
410 |
|
|
5.400%, 03/29/17 |
|
|
454 |
|
| |
560 |
|
|
6.500%, 04/01/19 |
|
|
671 |
|
|
|
|
|
Freeport-McMoRan, Inc., |
|
|
|
|
| |
1,329 |
|
|
2.150%, 03/01/17 |
|
|
1,354 |
|
| |
1,138 |
|
|
3.875%, 03/15/23 |
|
|
1,155 |
|
| |
299 |
|
|
5.450%, 03/15/43 |
|
|
323 |
|
| |
283 |
|
|
Nucor Corp., 4.000%, 08/01/23 |
|
|
296 |
|
| |
295 |
|
|
Placer Dome, Inc., (Canada), 6.450%, 10/15/35 |
|
|
334 |
|
|
|
|
|
Rio Tinto Finance USA Ltd., (Australia), |
|
|
|
|
| |
117 |
|
|
3.500%, 11/02/20 |
|
|
123 |
|
| |
550 |
|
|
3.750%, 09/20/21 |
|
|
586 |
|
| |
650 |
|
|
9.000%, 05/01/19 |
|
|
846 |
|
| |
393 |
|
|
Rio Tinto Finance USA plc, (United Kingdom), 1.625%, 08/21/17 |
|
|
398 |
|
|
|
|
|
|
|
|
|
|
PRINCIPAL
AMOUNT($) |
|
|
SECURITY DESCRIPTION |
|
VALUE($) |
|
| |
|
| |
|
|
Metals & Mining — continued |
|
| |
676 |
|
|
Teck Resources Ltd., (Canada), 4.750%, 01/15/22 |
|
|
716 |
|
|
|
|
|
|
|
|
|
|
|
|
|
|
|
|
|
8,124 |
|
|
|
|
|
|
|
|
|
|
|
|
|
|
Total Materials |
|
|
23,637 |
|
|
|
|
|
|
|
|
|
|
|
|
|
|
Telecommunication Services — 1.0% |
|
|
|
|
|
Diversified Telecommunication Services — 0.9% |
|
|
|
|
|
AT&T, Inc., |
|
|
|
|
| |
731 |
|
|
0.900%, 02/12/16 |
|
|
733 |
|
| |
840 |
|
|
3.900%, 03/11/24 |
|
|
880 |
|
| |
879 |
|
|
4.300%, 12/15/42 |
|
|
855 |
|
| |
462 |
|
|
4.350%, 06/15/45 |
|
|
450 |
|
| |
850 |
|
|
4.450%, 05/15/21 |
|
|
942 |
|
| |
375 |
|
|
5.350%, 09/01/40 |
|
|
419 |
|
| |
250 |
|
|
5.500%, 02/01/18 |
|
|
282 |
|
| |
2,700 |
|
|
6.300%, 01/15/38 |
|
|
3,372 |
|
| |
358 |
|
|
BellSouth Telecommunications LLC, 6.300%, 12/15/15 |
|
|
361 |
|
|
|
|
|
British Telecommunications plc, (United Kingdom), |
|
|
|
|
| |
200 |
|
|
2.000%, 06/22/15 |
|
|
202 |
|
| |
531 |
|
|
2.350%, 02/14/19 |
|
|
537 |
|
| |
150 |
|
|
9.625%, 12/15/30 |
|
|
242 |
|
| |
600 |
|
|
Centel Capital Corp., 9.000%, 10/15/19 |
|
|
727 |
|
|
|
|
|
Deutsche Telekom International Finance B.V., (Netherlands), |
|
|
|
|
| |
336 |
|
|
2.250%, 03/06/17 (e) |
|
|
343 |
|
| |
232 |
|
|
4.875%, 03/06/42 (e) |
|
|
247 |
|
| |
400 |
|
|
6.000%, 07/08/19 |
|
|
467 |
|
| |
325 |
|
|
8.607%, 06/15/30 |
|
|
486 |
|
| |
1,742 |
|
|
GTP Acquisition Partners I LLC, 4.347%, 06/15/16 (e) |
|
|
1,783 |
|
| |
267 |
|
|
Nippon Telegraph & Telephone Corp., (Japan), 1.400%, 07/18/17 |
|
|
268 |
|
|
|
|
|
Orange S.A., (France), |
|
|
|
|
| |
560 |
|
|
2.750%, 09/14/16 |
|
|
579 |
|
| |
1,305 |
|
|
9.000%, 03/01/31 |
|
|
1,993 |
|
| |
741 |
|
|
Qwest Corp., 6.750%, 12/01/21 |
|
|
862 |
|
|
|
|
|
Telefonica Emisiones S.A.U., (Spain), |
|
|
|
|
| |
252 |
|
|
3.192%, 04/27/18 |
|
|
263 |
|
| |
319 |
|
|
5.134%, 04/27/20 |
|
|
355 |
|
| |
316 |
|
|
5.462%, 02/16/21 |
|
|
359 |
|
| |
207 |
|
|
5.877%, 07/15/19 |
|
|
239 |
|
| |
300 |
|
|
6.421%, 06/20/16 |
|
|
328 |
|
|
|
|
|
Verizon Communications, Inc., |
|
|
|
|
| |
432 |
|
|
2.625%, 02/21/20 (e) |
|
|
433 |
|
SEE NOTES TO
FINANCIAL STATEMENTS.
|
|
|
|
|
|
|
|
|
|
|
|
|
| AUGUST 31, 2014 |
|
JPMORGAN INSTITUTIONAL TRUST FUNDS |
|
|
|
|
47 |
|
JPMorgan Core Bond Trust
SCHEDULE OF PORTFOLIO INVESTMENTS
AS OF AUGUST 31, 2014 (Unaudited) (continued)
(Amounts in thousands)
|
|
|
|
|
|
|
|
|
PRINCIPAL
AMOUNT($) |
|
|
SECURITY DESCRIPTION |
|
VALUE($) |
|
| Corporate Bonds — continued |
|
| |
|
|
Diversified Telecommunication Services — continued |
|
| |
381 |
|
|
3.450%, 03/15/21 |
|
|
395 |
|
| |
938 |
|
|
4.150%, 03/15/24 |
|
|
993 |
|
| |
1,762 |
|
|
4.500%, 09/15/20 |
|
|
1,936 |
|
| |
4,762 |
|
|
4.862%, 08/21/46 (e) |
|
|
4,991 |
|
| |
100 |
|
|
5.850%, 09/15/35 |
|
|
119 |
|
| |
980 |
|
|
6.400%, 09/15/33 |
|
|
1,237 |
|
| |
175 |
|
|
6.400%, 02/15/38 |
|
|
219 |
|
| |
500 |
|
|
Verizon New England, Inc., 7.875%, 11/15/29 |
|
|
648 |
|
|
|
|
|
Verizon Pennsylvania LLC, |
|
|
|
|
| |
750 |
|
|
6.000%, 12/01/28 |
|
|
830 |
|
| |
1,444 |
|
|
8.350%, 12/15/30 |
|
|
1,922 |
|
| |
500 |
|
|
8.750%, 08/15/31 |
|
|
685 |
|
|
|
|
|
|
|
|
|
|
|
|
|
|
|
|
|
32,982 |
|
|
|
|
|
|
|
|
|
|
|
|
|
|
Wireless Telecommunication Services — 0.1% |
|
|
|
|
|
America Movil S.A.B. de C.V., (Mexico), |
|
|
|
|
| |
640 |
|
|
2.375%, 09/08/16 |
|
|
656 |
|
| |
592 |
|
|
3.125%, 07/16/22 |
|
|
587 |
|
| |
485 |
|
|
Crown Castle Towers LLC, 3.214%, 08/15/15 (e) |
|
|
492 |
|
|
|
|
|
Rogers Communications, Inc., (Canada), |
|
|
|
|
| |
1,547 |
|
|
4.100%, 10/01/23 |
|
|
1,622 |
|
| |
400 |
|
|
8.750%, 05/01/32 |
|
|
578 |
|
|
|
|
|
Vodafone Group plc, (United Kingdom), |
|
|
|
|
| |
350 |
|
|
1.500%, 02/19/18 |
|
|
347 |
|
| |
1,200 |
|
|
1.625%, 03/20/17 |
|
|
1,208 |
|
|
|
|
|
|
|
|
|
|
|
|
|
|
|
|
|
5,490 |
|
|
|
|
|
|
|
|
|
|
|
|
|
|
Total Telecommunication Services |
|
|
38,472 |
|
|
|
|
|
|
|
|
|
|
|
|
|
|
Utilities — 1.6% |
|
|
|
|
|
Electric Utilities — 1.1% |
|
| |
239 |
|
|
Alabama Power Co., 6.125%, 05/15/38 |
|
|
315 |
|
| |
286 |
|
|
American Electric Power Co., Inc., 1.650%, 12/15/17 |
|
|
287 |
|
|
|
|
|
Arizona Public Service Co., |
|
|
|
|
| |
296 |
|
|
4.500%, 04/01/42 |
|
|
316 |
|
| |
467 |
|
|
5.050%, 09/01/41 |
|
|
541 |
|
| |
455 |
|
|
Baltimore Gas & Electric Co., 2.800%, 08/15/22 |
|
|
454 |
|
| |
1,025 |
|
|
Cleveland Electric Illuminating Co. (The), Series D, 7.880%, 11/01/17 |
|
|
1,220 |
|
| |
831 |
|
|
Comision Federal de Electricidad, (Mexico), 4.875%, 05/26/21 (e) |
|
|
900 |
|
| |
195 |
|
|
Connecticut Light & Power Co. (The), 5.650%, 05/01/18 |
|
|
222 |
|
| |
224 |
|
|
DTE Electric Co., 2.650%, 06/15/22 |
|
|
223 |
|
|
|
|
|
|
|
|
|
|
PRINCIPAL
AMOUNT($) |
|
|
SECURITY DESCRIPTION |
|
VALUE($) |
|
| |
|
| |
|
|
Electric Utilities — continued |
|
|
|
|
|
Duke Energy Carolinas LLC, |
|
|
|
|
| |
129 |
|
|
4.250%, 12/15/41 |
|
|
134 |
|
| |
660 |
|
|
5.100%, 04/15/18 |
|
|
740 |
|
| |
100 |
|
|
6.000%, 01/15/38 |
|
|
130 |
|
|
|
|
|
Duke Energy Florida, Inc., |
|
|
|
|
| |
290 |
|
|
5.650%, 06/15/18 |
|
|
333 |
|
| |
245 |
|
|
6.400%, 06/15/38 |
|
|
334 |
|
| |
1,320 |
|
|
Duke Energy Indiana, Inc., 6.350%, 08/15/38 |
|
|
1,802 |
|
|
|
|
|
Duke Energy Progress, Inc., |
|
|
|
|
| |
540 |
|
|
2.800%, 05/15/22 |
|
|
544 |
|
| |
273 |
|
|
4.100%, 05/15/42 |
|
|
277 |
|
| |
125 |
|
|
4.100%, 03/15/43 |
|
|
128 |
|
| |
325 |
|
|
5.300%, 01/15/19 |
|
|
370 |
|
|
|
|
|
Electricite de France S.A., (France), |
|
|
|
|
| |
770 |
|
|
2.150%, 01/22/19 (e) |
|
|
776 |
|
| |
1,300 |
|
|
6.000%, 01/22/14 (e) (††††) |
|
|
1,513 |
|
| |
950 |
|
|
Enel Finance International N.V., (Netherlands), 5.125%, 10/07/19 (e) |
|
|
1,057 |
|
|
|
|
|
Florida Power & Light Co., |
|
|
|
|
| |
420 |
|
|
5.950%, 10/01/33 |
|
|
550 |
|
| |
350 |
|
|
5.950%, 02/01/38 |
|
|
455 |
|
| |
210 |
|
|
Georgia Power Co., 5.950%, 02/01/39 |
|
|
265 |
|
| |
229 |
|
|
Great Plains Energy, Inc., 4.850%, 06/01/21 |
|
|
254 |
|
|
|
|
|
Hydro-Quebec, (Canada), |
|
|
|
|
| |
350 |
|
|
Series IO, 8.050%, 07/07/24 |
|
|
489 |
|
| |
1,000 |
|
|
Series HY, 8.400%, 01/15/22 |
|
|
1,323 |
|
| |
100 |
|
|
Indiana Michigan Power Co., 7.000%, 03/15/19 |
|
|
121 |
|
| |
100 |
|
|
Jersey Central Power & Light Co., 7.350%, 02/01/19 |
|
|
120 |
|
| |
808 |
|
|
John Sevier Combined Cycle Generation LLC, 4.626%, 01/15/42 |
|
|
893 |
|
|
|
|
|
Kansas City Power & Light Co., |
|
|
|
|
| |
403 |
|
|
3.150%, 03/15/23 |
|
|
407 |
|
| |
1,400 |
|
|
5.300%, 10/01/41 |
|
|
1,610 |
|
| |
125 |
|
|
MidAmerican Energy Co., 5.300%, 03/15/18 |
|
|
141 |
|
|
|
|
|
Nevada Power Co., |
|
|
|
|
| |
55 |
|
|
5.375%, 09/15/40 |
|
|
67 |
|
| |
305 |
|
|
5.450%, 05/15/41 |
|
|
377 |
|
| |
720 |
|
|
6.500%, 08/01/18 |
|
|
846 |
|
| |
100 |
|
|
Series N, 6.650%, 04/01/36 |
|
|
136 |
|
|
|
|
|
NextEra Energy Capital Holdings, Inc., |
|
|
|
|
| |
196 |
|
|
1.200%, 06/01/15 |
|
|
197 |
|
| |
371 |
|
|
2.400%, 09/15/19 |
|
|
373 |
|
| |
725 |
|
|
6.000%, 03/01/19 |
|
|
841 |
|
| |
300 |
|
|
7.875%, 12/15/15 |
|
|
327 |
|
SEE NOTES TO
FINANCIAL STATEMENTS.
|
|
|
|
|
|
|
|
|
|
|
| 48 |
|
|
|
JPMORGAN INSTITUTIONAL TRUST FUNDS |
|
AUGUST 31, 2014 |
|
|
|
|
|
|
|
|
|
PRINCIPAL
AMOUNT($) |
|
|
SECURITY DESCRIPTION |
|
VALUE($) |
|
| Corporate Bonds — continued |
|
| |
|
|
Electric Utilities — continued |
|
| |
300 |
|
|
Niagara Mohawk Power Corp., 4.881%, 08/15/19 (e) |
|
|
335 |
|
| |
510 |
|
|
Northern States Power Co., 6.250%, 06/01/36 |
|
|
690 |
|
| |
320 |
|
|
Ohio Power Co., 6.050%, 05/01/18 |
|
|
367 |
|
|
|
|
|
Oncor Electric Delivery Co. LLC, |
|
|
|
|
| |
840 |
|
|
6.800%, 09/01/18 |
|
|
992 |
|
| |
110 |
|
|
7.000%, 09/01/22 |
|
|
141 |
|
|
|
|
|
Pacific Gas & Electric Co., |
|
|
|
|
| |
544 |
|
|
2.450%, 08/15/22 |
|
|
527 |
|
| |
71 |
|
|
3.250%, 09/15/21 |
|
|
73 |
|
| |
250 |
|
|
3.250%, 06/15/23 |
|
|
252 |
|
| |
217 |
|
|
4.450%, 04/15/42 |
|
|
225 |
|
| |
390 |
|
|
4.500%, 12/15/41 |
|
|
407 |
|
| |
810 |
|
|
5.625%, 11/30/17 |
|
|
913 |
|
| |
100 |
|
|
6.050%, 03/01/34 |
|
|
125 |
|
| |
160 |
|
|
8.250%, 10/15/18 |
|
|
199 |
|
|
|
|
|
PacifiCorp, |
|
|
|
|
| |
180 |
|
|
5.500%, 01/15/19 |
|
|
206 |
|
| |
150 |
|
|
5.650%, 07/15/18 |
|
|
172 |
|
|
|
|
|
PECO Energy Co., |
|
|
|
|
| |
350 |
|
|
2.375%, 09/15/22 |
|
|
341 |
|
| |
175 |
|
|
5.350%, 03/01/18 |
|
|
196 |
|
| |
1,085 |
|
|
Potomac Electric Power Co., 6.500%, 11/15/37 |
|
|
1,471 |
|
| |
673 |
|
|
Progress Energy, Inc., 3.150%, 04/01/22 |
|
|
683 |
|
|
|
|
|
Public Service Co. of Colorado, |
|
|
|
|
| |
250 |
|
|
2.250%, 09/15/22 |
|
|
241 |
|
| |
90 |
|
|
3.200%, 11/15/20 |
|
|
93 |
|
| |
125 |
|
|
5.800%, 08/01/18 |
|
|
143 |
|
| |
2,490 |
|
|
Public Service Co. of Oklahoma, Series G, 6.625%, 11/15/37 |
|
|
3,335 |
|
|
|
|
|
Public Service Electric & Gas Co., |
|
|
|
|
| |
210 |
|
|
5.300%, 05/01/18 |
|
|
237 |
|
| |
317 |
|
|
5.375%, 11/01/39 |
|
|
388 |
|
| |
65 |
|
|
South Carolina Electric & Gas Co., 4.500%, 06/01/64 |
|
|
67 |
|
|
|
|
|
Southern California Edison Co., |
|
|
|
|
| |
318 |
|
|
Series C, 3.500%, 10/01/23 |
|
|
333 |
|
| |
175 |
|
|
4.150%, 09/15/14 |
|
|
175 |
|
| |
785 |
|
|
5.500%, 08/15/18 |
|
|
895 |
|
| |
200 |
|
|
Series 08-A, 5.950%, 02/01/38 |
|
|
257 |
|
| |
1,185 |
|
|
6.050%, 03/15/39 |
|
|
1,552 |
|
| |
363 |
|
|
Southern Co. (The), 1.950%, 09/01/16 |
|
|
371 |
|
| |
570 |
|
|
Southwestern Public Service Co., Series G, 8.750%, 12/01/18 |
|
|
722 |
|
|
|
|
|
|
|
|
|
|
PRINCIPAL
AMOUNT($) |
|
|
SECURITY DESCRIPTION |
|
VALUE($) |
|
| |
|
| |
|
|
Electric Utilities — continued |
|
| |
312 |
|
|
State Grid Overseas Investment Ltd., (United Kingdom), 1.750%, 05/22/18 (e) |
|
|
307 |
|
|
|
|
|
Virginia Electric and Power Co., |
|
|
|
|
| |
64 |
|
|
3.450%, 02/15/24 |
|
|
66 |
|
| |
1,415 |
|
|
5.400%, 04/30/18 |
|
|
1,600 |
|
| |
630 |
|
|
5.950%, 09/15/17 |
|
|
717 |
|
|
|
|
|
Wisconsin Electric Power Co., |
|
|
|
|
| |
21 |
|
|
2.950%, 09/15/21 |
|
|
21 |
|
| |
275 |
|
|
6.250%, 12/01/15 |
|
|
294 |
|
|
|
|
|
Xcel Energy, Inc., |
|
|
|
|
| |
162 |
|
|
0.750%, 05/09/16 |
|
|
162 |
|
| |
92 |
|
|
4.800%, 09/15/41 |
|
|
102 |
|
| |
200 |
|
|
6.500%, 07/01/36 |
|
|
267 |
|
|
|
|
|
|
|
|
|
|
|
|
|
|
|
|
|
43,068 |
|
|
|
|
|
|
|
|
|
|
|
|
|
|
Gas Utilities — 0.0% (g) |
|
|
|
|
|
Atmos Energy Corp., |
|
|
|
|
| |
828 |
|
|
4.150%, 01/15/43 |
|
|
852 |
|
| |
375 |
|
|
8.500%, 03/15/19 |
|
|
476 |
|
| |
308 |
|
|
Boston Gas Co., 4.487%, 02/15/42 (e) |
|
|
323 |
|
| |
335 |
|
|
CenterPoint Energy Resources Corp., 6.125%, 11/01/17 |
|
|
383 |
|
|
|
|
|
|
|
|
|
|
|
|
|
|
|
|
|
2,034 |
|
|
|
|
|
|
|
|
|
|
|
|
|
|
Independent Power & Renewable Electricity Producers — 0.1% |
|
|
|
|
|
Exelon Generation Co. LLC, |
|
|
|
|
| |
1,020 |
|
|
4.000%, 10/01/20 |
|
|
1,076 |
|
| |
235 |
|
|
5.750%, 10/01/41 |
|
|
266 |
|
|
|
|
|
PSEG Power LLC, |
|
|
|
|
| |
442 |
|
|
4.300%, 11/15/23 |
|
|
467 |
|
| |
772 |
|
|
5.125%, 04/15/20 |
|
|
862 |
|
| |
202 |
|
|
Southern Power Co., 5.150%, 09/15/41 |
|
|
229 |
|
|
|
|
|
|
|
|
|
|
|
|
|
|
|
|
|
2,900 |
|
|
|
|
|
|
|
|
|
|
|
|
|
|
Multi-Utilities — 0.4% |
|
|
|
|
|
AGL Capital Corp., |
|
|
|
|
| |
563 |
|
|
3.500%, 09/15/21 |
|
|
590 |
|
| |
208 |
|
|
4.400%, 06/01/43 |
|
|
214 |
|
| |
1,445 |
|
|
5.875%, 03/15/41 |
|
|
1,820 |
|
| |
1,243 |
|
|
6.375%, 07/15/16 |
|
|
1,359 |
|
| |
596 |
|
|
Consolidated Edison Co. of New York, Inc., 5.700%, 06/15/40 |
|
|
737 |
|
|
|
|
|
Consumers Energy Co., |
|
|
|
|
| |
216 |
|
|
2.850%, 05/15/22 |
|
|
218 |
|
| |
130 |
|
|
5.650%, 04/15/20 |
|
|
152 |
|
SEE NOTES TO
FINANCIAL STATEMENTS.
|
|
|
|
|
|
|
|
|
|
|
|
|
| AUGUST 31, 2014 |
|
JPMORGAN INSTITUTIONAL TRUST FUNDS |
|
|
|
|
49 |
|
JPMorgan Core Bond Trust
SCHEDULE OF PORTFOLIO INVESTMENTS
AS OF AUGUST 31, 2014 (Unaudited) (continued)
(Amounts in thousands)
|
|
|
|
|
|
|
|
|
PRINCIPAL
AMOUNT($) |
|
|
SECURITY DESCRIPTION |
|
VALUE($) |
|
| Corporate Bonds — continued |
|
| |
|
|
Multi-Utilities — continued |
|
| |
235 |
|
|
Delmarva Power & Light Co., 4.000%, 06/01/42 |
|
|
235 |
|
|
|
|
|
Dominion Resources, Inc., |
|
|
|
|
| |
920 |
|
|
Series F, 5.250%, 08/01/33 |
|
|
1,057 |
|
| |
300 |
|
|
7.000%, 06/15/38 |
|
|
414 |
|
| |
600 |
|
|
8.875%, 01/15/19 |
|
|
765 |
|
| |
289 |
|
|
DTE Energy Co., Series F, 3.850%, 12/01/23 |
|
|
303 |
|
|
|
|
|
NiSource Finance Corp., |
|
|
|
|
| |
370 |
|
|
3.850%, 02/15/23 |
|
|
384 |
|
| |
360 |
|
|
4.450%, 12/01/21 |
|
|
390 |
|
| |
1,256 |
|
|
5.800%, 02/01/42 |
|
|
1,460 |
|
|
|
|
|
San Diego Gas & Electric Co., |
|
|
|
|
| |
379 |
|
|
3.950%, 11/15/41 |
|
|
382 |
|
| |
275 |
|
|
6.000%, 06/01/26 |
|
|
344 |
|
|
|
|
|
Sempra Energy, |
|
|
|
|
| |
350 |
|
|
2.875%, 10/01/22 |
|
|
348 |
|
| |
236 |
|
|
3.550%, 06/15/24 |
|
|
241 |
|
| |
1,013 |
|
|
4.050%, 12/01/23 |
|
|
1,082 |
|
| |
1,150 |
|
|
6.150%, 06/15/18 |
|
|
1,329 |
|
| |
180 |
|
|
6.500%, 06/01/16 |
|
|
197 |
|
| |
460 |
|
|
9.800%, 02/15/19 |
|
|
605 |
|
|
|
|
|
|
|
|
|
|
|
|
|
|
|
|
|
14,626 |
|
|
|
|
|
|
|
|
|
|
|
|
|
|
Total Utilities |
|
|
62,628 |
|
|
|
|
|
|
|
|
|
|
|
|
|
|
Total Corporate Bonds
(Cost $664,804) |
|
|
717,115 |
|
|
|
|
|
|
|
|
|
|
| |
Foreign Government Securities — 1.3% |
|
|
|
|
|
Federative Republic of Brazil, (Brazil), |
|
|
|
|
| |
825 |
|
|
4.250%, 01/07/25 |
|
|
856 |
|
| |
472 |
|
|
5.000%, 01/27/45 |
|
|
484 |
|
|
|
|
|
Israel Government AID Bond, (Israel), |
|
|
|
|
| |
20,000 |
|
|
Zero Coupon, 03/15/18 |
|
|
18,923 |
|
| |
1,500 |
|
|
Zero Coupon, 11/01/23 |
|
|
1,155 |
|
| |
1,500 |
|
|
Zero Coupon, 11/01/24 |
|
|
1,110 |
|
| |
1,000 |
|
|
5.500%, 09/18/33 |
|
|
1,293 |
|
| |
1,776 |
|
|
Series 6-Z, Zero Coupon, 02/15/22 |
|
|
1,467 |
|
|
|
|
|
Province of Ontario, (Canada), |
|
|
|
|
| |
1,387 |
|
|
1.650%, 09/27/19 |
|
|
1,365 |
|
| |
700 |
|
|
2.700%, 06/16/15 |
|
|
714 |
|
| |
2,220 |
|
|
2.950%, 02/05/15 |
|
|
2,245 |
|
| |
377 |
|
|
Province of Quebec, (Canada), Series A, SUB, 7.365%, 03/06/26 |
|
|
513 |
|
| |
1,133 |
|
|
Republic of Poland, (Poland), 4.000%, 01/22/24 |
|
|
1,188 |
|
|
|
|
|
Republic of South Africa, (South Africa), |
|
|
|
|
| |
1,436 |
|
|
5.375%, 07/24/44 |
|
|
1,499 |
|
|
|
|
|
|
|
|
|
|
PRINCIPAL
AMOUNT($) |
|
|
SECURITY DESCRIPTION |
|
VALUE($) |
|
| |
|
| |
640 |
|
|
5.875%, 09/16/25 |
|
|
724 |
|
|
|
|
|
Republic of Turkey, (Turkey), |
|
|
|
|
| |
719 |
|
|
5.750%, 03/22/24 |
|
|
798 |
|
| |
351 |
|
|
6.625%, 02/17/45 |
|
|
420 |
|
| |
5,000 |
|
|
Tunisia Government AID Bond, (Tunisia), 1.686%, 07/16/19 |
|
|
4,977 |
|
|
|
|
|
United Mexican States, (Mexico), |
|
|
|
|
| |
2,030 |
|
|
3.500%, 01/21/21 |
|
|
2,111 |
|
| |
1,732 |
|
|
4.000%, 10/02/23 |
|
|
1,838 |
|
| |
120 |
|
|
4.750%, 03/08/44 |
|
|
126 |
|
| |
4,913 |
|
|
5.550%, 01/21/45 |
|
|
5,748 |
|
|
|
|
|
|
|
|
|
|
|
|
|
|
Total Foreign Government Securities
(Cost $47,752) |
|
|
49,554 |
|
|
|
|
|
|
|
|
|
|
| |
Mortgage Pass-Through Securities — 14.8% |
|
|
|
|
|
Federal Home Loan Mortgage Corp., |
|
|
|
|
| |
28 |
|
|
ARM, 2.089%, 07/01/19 |
|
|
28 |
|
| |
412 |
|
|
ARM, 2.125%, 10/01/36 |
|
|
437 |
|
| |
106 |
|
|
ARM, 2.220%, 10/01/36 |
|
|
111 |
|
| |
354 |
|
|
ARM, 2.226%, 12/01/36 |
|
|
377 |
|
| |
399 |
|
|
ARM, 2.290%, 11/01/36 |
|
|
425 |
|
| |
881 |
|
|
ARM, 2.304%, 04/01/34 |
|
|
937 |
|
| |
964 |
|
|
ARM, 2.309%, 03/01/37 |
|
|
1,029 |
|
| |
35 |
|
|
ARM, 2.314%, 04/01/30 |
|
|
37 |
|
| |
255 |
|
|
ARM, 2.348%, 02/01/36 |
|
|
273 |
|
| |
540 |
|
|
ARM, 2.355%, 12/01/33 |
|
|
577 |
|
| |
609 |
|
|
ARM, 2.375%, 05/01/36 - 11/01/36 |
|
|
651 |
|
| |
187 |
|
|
ARM, 2.505%, 02/01/37 |
|
|
201 |
|
| |
352 |
|
|
ARM, 2.693%, 12/01/34 |
|
|
376 |
|
| |
562 |
|
|
ARM, 2.785%, 10/01/36 |
|
|
602 |
|
| |
328 |
|
|
ARM, 3.473%, 07/01/36 |
|
|
342 |
|
| |
502 |
|
|
ARM, 3.555%, 02/01/36 |
|
|
533 |
|
| |
1,726 |
|
|
ARM, 4.000%, 07/01/40 |
|
|
1,836 |
|
| |
474 |
|
|
ARM, 5.045%, 01/01/35 |
|
|
499 |
|
|
|
|
|
Federal Home Loan Mortgage Corp. Gold Pools, 15 Year, Single Family, |
|
|
|
|
| |
— |
(h) |
|
4.000%, 05/01/19 |
|
|
— |
(h) |
| |
107 |
|
|
4.500%, 08/01/18 |
|
|
113 |
|
| |
269 |
|
|
5.000%, 12/01/18 |
|
|
284 |
|
| |
2,455 |
|
|
5.500%, 06/01/17 - 01/01/24 |
|
|
2,706 |
|
| |
40 |
|
|
6.000%, 04/01/18 |
|
|
42 |
|
| |
324 |
|
|
6.500%, 08/01/16 - 02/01/19 |
|
|
339 |
|
| |
3 |
|
|
7.000%, 04/01/17 |
|
|
3 |
|
| |
— |
(h) |
|
7.500%, 10/01/14 |
|
|
— |
(h) |
| |
— |
(h) |
|
8.500%, 11/01/15 |
|
|
— |
(h) |
SEE NOTES TO
FINANCIAL STATEMENTS.
|
|
|
|
|
|
|
|
|
|
|
| 50 |
|
|
|
JPMORGAN INSTITUTIONAL TRUST FUNDS |
|
AUGUST 31, 2014 |
|
|
|
|
|
|
|
|
|
PRINCIPAL
AMOUNT($) |
|
|
SECURITY DESCRIPTION |
|
VALUE($) |
|
| Mortgage Pass-Through Securities — continued |
|
|
|
|
|
Federal Home Loan Mortgage Corp. Gold Pools, 20 Year, Single Family, |
|
|
|
|
| |
2,674 |
|
|
3.500%, 01/01/32 - 03/01/32 |
|
|
2,801 |
|
| |
95 |
|
|
6.000%, 12/01/22 |
|
|
106 |
|
| |
278 |
|
|
6.500%, 11/01/22 |
|
|
313 |
|
|
|
|
|
Federal Home Loan Mortgage Corp. Gold Pools, 30 Year, Single Family, |
|
|
|
|
| |
4,436 |
|
|
3.500%, 04/01/43 |
|
|
4,564 |
|
| |
1,253 |
|
|
4.000%, 09/01/35 |
|
|
1,330 |
|
| |
5,561 |
|
|
4.500%, 05/01/41 |
|
|
6,037 |
|
| |
4,828 |
|
|
5.000%, 09/01/34 - 08/01/40 |
|
|
5,337 |
|
| |
1,860 |
|
|
5.500%, 10/01/33 - 07/01/35 |
|
|
2,072 |
|
| |
340 |
|
|
6.000%, 12/01/33 - 01/01/34 |
|
|
387 |
|
| |
1,704 |
|
|
6.500%, 11/01/34 - 11/01/36 |
|
|
1,940 |
|
| |
532 |
|
|
7.000%, 07/01/32 - 10/01/36 |
|
|
588 |
|
| |
631 |
|
|
Federal Home Loan Mortgage Corp. Gold Pools, FHA/VA, 10.000%, 10/01/30 |
|
|
718 |
|
|
|
|
|
Federal Home Loan Mortgage Corp. Gold Pools, Other, |
|
|
|
|
| |
2,877 |
|
|
3.000%, 03/01/33 |
|
|
2,956 |
|
| |
23,943 |
|
|
3.500%, 10/01/32 - 06/01/43 |
|
|
24,805 |
|
| |
9,301 |
|
|
4.000%, 01/01/32 - 01/01/43 |
|
|
9,911 |
|
| |
396 |
|
|
5.500%, 10/01/33 - 01/01/34 |
|
|
430 |
|
| |
577 |
|
|
6.000%, 02/01/33 |
|
|
626 |
|
| |
58 |
|
|
7.000%, 07/01/29 |
|
|
64 |
|
|
|
|
|
Federal Home Loan Mortgage Corp., 30 Year, Single Family, |
|
|
|
|
| |
1 |
|
|
12.000%, 08/01/15 - 07/01/19 |
|
|
1 |
|
|
|
|
|
Federal National Mortgage Association, |
|
|
|
|
| |
67 |
|
|
ARM, 1.688%, 09/01/34 |
|
|
70 |
|
| |
984 |
|
|
ARM, 1.784%, 01/01/33 |
|
|
1,043 |
|
| |
689 |
|
|
ARM, 1.788%, 07/01/33 |
|
|
749 |
|
| |
593 |
|
|
ARM, 1.834%, 05/01/35 |
|
|
632 |
|
| |
7 |
|
|
ARM, 1.875%, 03/01/19 |
|
|
7 |
|
| |
1,704 |
|
|
ARM, 1.899%, 01/01/35 |
|
|
1,793 |
|
| |
1,311 |
|
|
ARM, 1.910%, 09/01/35 |
|
|
1,382 |
|
| |
444 |
|
|
ARM, 1.921%, 11/01/34 |
|
|
473 |
|
| |
597 |
|
|
ARM, 1.940%, 07/01/36 |
|
|
637 |
|
| |
5 |
|
|
ARM, 1.973%, 01/01/19 |
|
|
5 |
|
| |
297 |
|
|
ARM, 2.038%, 04/01/34 |
|
|
312 |
|
| |
998 |
|
|
ARM, 2.046%, 11/01/34 |
|
|
1,054 |
|
| |
621 |
|
|
ARM, 2.120%, 01/01/35 |
|
|
659 |
|
| |
956 |
|
|
ARM, 2.124%, 06/01/35 |
|
|
1,017 |
|
| |
315 |
|
|
ARM, 2.135%, 08/01/34 |
|
|
340 |
|
| |
279 |
|
|
ARM, 2.142%, 01/01/36 |
|
|
296 |
|
| |
169 |
|
|
ARM, 2.143%, 09/01/35 |
|
|
181 |
|
| |
180 |
|
|
ARM, 2.170%, 07/01/34 |
|
|
192 |
|
|
|
|
|
|
|
|
|
|
PRINCIPAL
AMOUNT($) |
|
|
SECURITY DESCRIPTION |
|
VALUE($) |
|
| |
|
| |
774 |
|
|
ARM, 2.175%, 10/01/34 |
|
|
825 |
|
| |
486 |
|
|
ARM, 2.180%, 10/01/34 |
|
|
518 |
|
| |
286 |
|
|
ARM, 2.189%, 09/01/34 |
|
|
305 |
|
| |
259 |
|
|
ARM, 2.199%, 02/01/35 |
|
|
276 |
|
| |
170 |
|
|
ARM, 2.220%, 05/01/35 |
|
|
180 |
|
| |
230 |
|
|
ARM, 2.248%, 06/01/36 |
|
|
246 |
|
| |
20 |
|
|
ARM, 2.262%, 04/01/34 |
|
|
20 |
|
| |
596 |
|
|
ARM, 2.267%, 08/01/34 |
|
|
635 |
|
| |
296 |
|
|
ARM, 2.277%, 07/01/33 - 11/01/33 |
|
|
305 |
|
| |
210 |
|
|
ARM, 2.295%, 01/01/34 |
|
|
224 |
|
| |
606 |
|
|
ARM, 2.321%, 07/01/33 |
|
|
646 |
|
| |
478 |
|
|
ARM, 2.335%, 05/01/34 |
|
|
512 |
|
| |
1,631 |
|
|
ARM, 2.338%, 04/01/35 |
|
|
1,737 |
|
| |
395 |
|
|
ARM, 2.354%, 04/01/35 |
|
|
424 |
|
| |
205 |
|
|
ARM, 2.428%, 01/01/38 |
|
|
220 |
|
| |
443 |
|
|
ARM, 2.475%, 09/01/33 |
|
|
472 |
|
| |
295 |
|
|
ARM, 2.505%, 10/01/34 |
|
|
317 |
|
| |
67 |
|
|
ARM, 2.614%, 09/01/27 |
|
|
71 |
|
| |
634 |
|
|
ARM, 2.692%, 10/01/36 |
|
|
682 |
|
| |
106 |
|
|
ARM, 2.750%, 02/01/34 |
|
|
106 |
|
| |
72 |
|
|
ARM, 2.875%, 01/01/36 |
|
|
72 |
|
| |
49 |
|
|
ARM, 3.705%, 03/01/29 |
|
|
52 |
|
| |
2,000 |
|
|
3.760%, 11/01/23 |
|
|
2,155 |
|
|
|
|
|
Federal National Mortgage Association, 15 Year, Single Family, |
|
|
|
|
| |
617 |
|
|
3.500%, 09/01/18 - 07/01/19 |
|
|
653 |
|
| |
376 |
|
|
4.000%, 08/01/18 - 10/01/18 |
|
|
398 |
|
| |
1,994 |
|
|
4.500%, 06/01/18 - 12/01/19 |
|
|
2,120 |
|
| |
719 |
|
|
5.000%, 06/01/18 - 08/01/24 |
|
|
776 |
|
| |
680 |
|
|
5.500%, 03/01/20 - 07/01/20 |
|
|
721 |
|
| |
4,200 |
|
|
6.000%, 06/01/16 - 01/01/24 |
|
|
4,595 |
|
| |
176 |
|
|
6.500%, 03/01/17 - 08/01/20 |
|
|
185 |
|
| |
161 |
|
|
7.000%, 03/01/17 - 09/01/17 |
|
|
169 |
|
| |
3 |
|
|
7.500%, 03/01/17 |
|
|
3 |
|
| |
1 |
|
|
8.000%, 11/01/15 |
|
|
1 |
|
|
|
|
|
Federal National Mortgage Association, 20 Year, Single Family, |
|
|
|
|
| |
1,555 |
|
|
3.500%, 08/01/32 |
|
|
1,632 |
|
| |
108 |
|
|
4.500%, 04/01/24 |
|
|
116 |
|
| |
1,019 |
|
|
6.500%, 05/01/22 - 04/01/25 |
|
|
1,149 |
|
|
|
|
|
Federal National Mortgage Association, 30 Year, FHA/VA, |
|
|
|
|
| |
80 |
|
|
6.000%, 09/01/33 |
|
|
88 |
|
| |
1,022 |
|
|
6.500%, 03/01/29 - 08/01/39 |
|
|
1,134 |
|
| |
17 |
|
|
7.000%, 02/01/33 |
|
|
19 |
|
| |
48 |
|
|
8.000%, 06/01/28 |
|
|
55 |
|
SEE NOTES TO
FINANCIAL STATEMENTS.
|
|
|
|
|
|
|
|
|
|
|
|
|
| AUGUST 31, 2014 |
|
JPMORGAN INSTITUTIONAL TRUST FUNDS |
|
|
|
|
51 |
|
JPMorgan Core Bond Trust
SCHEDULE OF PORTFOLIO INVESTMENTS
AS OF AUGUST 31, 2014 (Unaudited) (continued)
(Amounts in thousands)
|
|
|
|
|
|
|
|
|
PRINCIPAL
AMOUNT($) |
|
|
SECURITY DESCRIPTION |
|
VALUE($) |
|
| Mortgage Pass-Through Securities — continued |
|
| |
14 |
|
|
9.000%, 05/01/18 - 12/01/25 |
|
|
15 |
|
|
|
|
|
Federal National Mortgage Association, 30 Year, Single Family, |
|
|
|
|
| |
356 |
|
|
4.500%, 11/01/33 - 02/01/35 |
|
|
386 |
|
| |
1,398 |
|
|
5.000%, 07/01/33 - 09/01/35 |
|
|
1,557 |
|
| |
1,870 |
|
|
5.500%, 09/01/31 - 03/01/34 |
|
|
2,112 |
|
| |
2,355 |
|
|
6.000%, 12/01/28 - 09/01/37 |
|
|
2,680 |
|
| |
1,093 |
|
|
6.500%, 11/01/29 - 08/01/31 |
|
|
1,252 |
|
| |
907 |
|
|
7.000%, 01/01/24 - 01/01/39 |
|
|
1,008 |
|
| |
356 |
|
|
7.500%, 08/01/36 - 11/01/37 |
|
|
391 |
|
| |
559 |
|
|
8.000%, 03/01/27 - 11/01/28 |
|
|
668 |
|
| |
1 |
|
|
9.000%, 04/01/26 |
|
|
1 |
|
| |
13 |
|
|
9.500%, 07/01/28 |
|
|
14 |
|
| |
— |
(h) |
|
12.500%, 01/01/16 |
|
|
— |
(h) |
|
|
|
|
Federal National Mortgage Association, Other, |
|
|
|
|
| |
1,453 |
|
|
VAR, 0.515%, 01/01/23 |
|
|
1,466 |
|
| |
2,902 |
|
|
VAR, 0.545%, 01/01/23 |
|
|
2,927 |
|
| |
4,931 |
|
|
VAR, 0.615%, 11/01/23 |
|
|
4,971 |
|
| |
4,000 |
|
|
VAR, 0.625%, 12/01/23 |
|
|
4,030 |
|
| |
3,000 |
|
|
VAR, 0.645%, 11/01/23 |
|
|
3,000 |
|
| |
952 |
|
|
VAR, 0.955%, 03/01/22 |
|
|
952 |
|
| |
2,408 |
|
|
VAR, 6.070%, 11/01/18 |
|
|
2,598 |
|
| |
2,000 |
|
|
1.690%, 12/01/19 |
|
|
1,957 |
|
| |
3,450 |
|
|
1.792%, 05/01/20 |
|
|
3,396 |
|
| |
3,917 |
|
|
1.808%, 06/01/20 |
|
|
3,854 |
|
| |
1,997 |
|
|
1.940%, 07/01/19 |
|
|
2,002 |
|
| |
1,500 |
|
|
2.066%, 12/01/20 |
|
|
1,470 |
|
| |
12,000 |
|
|
2.077%, 06/01/20 |
|
|
12,012 |
|
| |
4,569 |
|
|
2.097%, 08/01/19 |
|
|
4,580 |
|
| |
5,407 |
|
|
2.190%, 09/01/21 - 12/01/22 |
|
|
5,255 |
|
| |
1,987 |
|
|
2.211%, 04/01/19 |
|
|
2,016 |
|
| |
1,464 |
|
|
2.221%, 04/01/19 |
|
|
1,477 |
|
| |
3,971 |
|
|
2.283%, 12/01/22 |
|
|
3,881 |
|
| |
5,360 |
|
|
2.390%, 12/01/22 |
|
|
5,289 |
|
| |
5,389 |
|
|
2.418%, 12/01/22 |
|
|
5,306 |
|
| |
1,953 |
|
|
2.428%, 05/01/23 |
|
|
1,912 |
|
| |
3,375 |
|
|
2.449%, 11/01/22 |
|
|
3,335 |
|
| |
3,000 |
|
|
2.459%, 12/01/22 |
|
|
2,965 |
|
| |
3,500 |
|
|
2.480%, 12/01/22 |
|
|
3,461 |
|
| |
5,607 |
|
|
2.490%, 10/01/17 |
|
|
5,791 |
|
| |
2,940 |
|
|
2.500%, 06/01/23 |
|
|
2,886 |
|
| |
4,000 |
|
|
2.531%, 11/01/22 |
|
|
3,976 |
|
| |
2,903 |
|
|
2.542%, 02/01/23 |
|
|
2,874 |
|
| |
1,468 |
|
|
2.593%, 06/01/23 |
|
|
1,452 |
|
| |
6,955 |
|
|
2.604%, 10/01/22 - 05/01/23 |
|
|
6,874 |
|
| |
3,000 |
|
|
2.670%, 07/01/22 |
|
|
3,022 |
|
|
|
|
|
|
|
|
|
|
PRINCIPAL
AMOUNT($) |
|
|
SECURITY DESCRIPTION |
|
VALUE($) |
|
| |
|
| |
6,776 |
|
|
2.690%, 10/01/17 |
|
|
7,044 |
|
| |
3,363 |
|
|
2.703%, 04/01/23 |
|
|
3,380 |
|
| |
4,955 |
|
|
2.808%, 07/01/23 |
|
|
5,035 |
|
| |
3,214 |
|
|
2.841%, 03/01/22 |
|
|
3,197 |
|
| |
1,565 |
|
|
2.862%, 05/01/22 |
|
|
1,593 |
|
| |
3,740 |
|
|
2.970%, 11/01/18 |
|
|
3,897 |
|
| |
7,289 |
|
|
3.000%, 02/01/22 - 01/01/43 |
|
|
7,424 |
|
| |
1,444 |
|
|
3.038%, 05/01/22 |
|
|
1,484 |
|
| |
5,939 |
|
|
3.050%, 04/01/22 |
|
|
6,148 |
|
| |
6,986 |
|
|
3.070%, 01/01/22 |
|
|
7,249 |
|
| |
4,500 |
|
|
3.079%, 07/01/22 |
|
|
4,635 |
|
| |
2,000 |
|
|
3.120%, 01/01/22 |
|
|
2,082 |
|
| |
2,732 |
|
|
3.160%, 02/01/22 |
|
|
2,854 |
|
| |
1,831 |
|
|
3.224%, 05/01/22 |
|
|
1,904 |
|
| |
9,714 |
|
|
3.230%, 11/01/20 |
|
|
10,221 |
|
| |
1,458 |
|
|
3.255%, 12/01/21 |
|
|
1,525 |
|
| |
2,203 |
|
|
3.260%, 01/01/22 |
|
|
2,317 |
|
| |
1,974 |
|
|
3.290%, 10/01/20 |
|
|
2,083 |
|
| |
3,904 |
|
|
3.306%, 02/01/22 |
|
|
4,086 |
|
| |
943 |
|
|
3.375%, 11/01/20 |
|
|
1,002 |
|
| |
1,962 |
|
|
3.461%, 11/01/20 |
|
|
2,077 |
|
| |
48,128 |
|
|
3.500%, 12/01/32 - 08/01/43 |
|
|
49,634 |
|
| |
2,000 |
|
|
3.503%, 08/01/17 |
|
|
2,113 |
|
| |
1,925 |
|
|
3.520%, 01/01/18 |
|
|
2,047 |
|
| |
1,441 |
|
|
3.544%, 09/01/20 |
|
|
1,530 |
|
| |
2,500 |
|
|
3.590%, 08/01/23 |
|
|
2,687 |
|
| |
2,836 |
|
|
3.600%, 09/01/20 |
|
|
3,037 |
|
| |
7,394 |
|
|
3.621%, 09/01/20 |
|
|
7,881 |
|
| |
4,881 |
|
|
3.658%, 10/01/20 |
|
|
5,212 |
|
| |
1,500 |
|
|
3.690%, 11/01/23 |
|
|
1,608 |
|
| |
4,571 |
|
|
3.730%, 07/01/22 |
|
|
4,920 |
|
| |
1,879 |
|
|
3.740%, 07/01/20 |
|
|
2,025 |
|
| |
3,000 |
|
|
3.760%, 10/01/23 |
|
|
3,229 |
|
| |
972 |
|
|
3.761%, 01/01/25 |
|
|
1,026 |
|
| |
5,000 |
|
|
3.792%, 07/01/23 |
|
|
5,356 |
|
| |
2,915 |
|
|
3.802%, 09/01/20 |
|
|
3,134 |
|
| |
3,000 |
|
|
3.895%, 09/01/21 |
|
|
3,236 |
|
| |
2,869 |
|
|
3.906%, 09/01/21 |
|
|
3,104 |
|
| |
6,679 |
|
|
3.916%, 09/01/21 |
|
|
7,231 |
|
| |
1,943 |
|
|
3.930%, 07/01/20 |
|
|
2,111 |
|
| |
4,667 |
|
|
3.947%, 06/01/17 |
|
|
4,952 |
|
| |
4,750 |
|
|
3.980%, 11/01/16 |
|
|
4,798 |
|
| |
1,540 |
|
|
3.999%, 01/01/21 |
|
|
1,672 |
|
| |
9,407 |
|
|
4.000%, 10/01/32 - 07/01/42 |
|
|
9,984 |
|
| |
5,000 |
|
|
4.019%, 09/01/21 |
|
|
5,436 |
|
| |
1,984 |
|
|
4.061%, 01/01/21 |
|
|
2,159 |
|
SEE NOTES TO
FINANCIAL STATEMENTS.
|
|
|
|
|
|
|
|
|
|
|
| 52 |
|
|
|
JPMORGAN INSTITUTIONAL TRUST FUNDS |
|
AUGUST 31, 2014 |
|
|
|
|
|
|
|
|
|
PRINCIPAL
AMOUNT($) |
|
|
SECURITY DESCRIPTION |
|
VALUE($) |
|
| Mortgage Pass-Through Securities — continued |
|
| |
7,954 |
|
|
4.081%, 07/01/20 - 07/01/21 |
|
|
8,675 |
|
| |
1,410 |
|
|
4.130%, 07/01/20 |
|
|
1,546 |
|
| |
2,380 |
|
|
4.250%, 04/01/21 |
|
|
2,640 |
|
| |
1,654 |
|
|
4.257%, 04/01/20 |
|
|
1,813 |
|
| |
4,438 |
|
|
4.267%, 11/01/19 - 08/01/21 |
|
|
4,870 |
|
| |
2,096 |
|
|
4.290%, 06/01/20 |
|
|
2,314 |
|
| |
1,346 |
|
|
4.302%, 01/01/21 |
|
|
1,495 |
|
| |
1,439 |
|
|
4.317%, 07/01/21 |
|
|
1,599 |
|
| |
1,457 |
|
|
4.350%, 04/01/20 |
|
|
1,612 |
|
| |
944 |
|
|
4.368%, 04/01/20 |
|
|
1,048 |
|
| |
1,936 |
|
|
4.369%, 02/01/20 |
|
|
2,140 |
|
| |
1,429 |
|
|
4.380%, 01/01/21 |
|
|
1,587 |
|
| |
1,866 |
|
|
4.381%, 11/01/19 |
|
|
2,048 |
|
| |
1,981 |
|
|
4.390%, 05/01/21 |
|
|
2,205 |
|
| |
2,000 |
|
|
4.391%, 04/01/21 |
|
|
2,218 |
|
| |
2,000 |
|
|
4.402%, 07/01/21 |
|
|
2,217 |
|
| |
2,396 |
|
|
4.443%, 08/01/20 - 04/01/21 |
|
|
2,648 |
|
| |
2,106 |
|
|
4.474%, 04/01/21 |
|
|
2,341 |
|
| |
5,000 |
|
|
4.484%, 06/01/21 |
|
|
5,539 |
|
| |
917 |
|
|
4.500%, 03/01/20 |
|
|
1,013 |
|
| |
6,440 |
|
|
4.514%, 12/01/19 |
|
|
7,166 |
|
| |
4,226 |
|
|
4.540%, 01/01/20 |
|
|
4,675 |
|
| |
2,000 |
|
|
4.546%, 02/01/20 |
|
|
2,216 |
|
| |
2,870 |
|
|
4.629%, 02/01/21 |
|
|
3,205 |
|
| |
3,839 |
|
|
4.794%, 01/01/21 |
|
|
4,315 |
|
| |
1,878 |
|
|
5.414%, 07/01/19 |
|
|
2,123 |
|
| |
413 |
|
|
5.500%, 03/01/17 - 09/01/33 |
|
|
450 |
|
| |
1,170 |
|
|
6.000%, 09/01/37 - 06/01/39 |
|
|
1,273 |
|
| |
350 |
|
|
6.500%, 01/01/36 - 07/01/36 |
|
|
394 |
|
| |
61 |
|
|
7.000%, 10/01/46 |
|
|
67 |
|
| |
49 |
|
|
10.561%, 04/15/19 |
|
|
55 |
|
|
|
|
|
Government National Mortgage Association II, 30 Year, Single Family, |
|
|
|
|
| |
303 |
|
|
4.500%, 08/20/33 |
|
|
332 |
|
| |
3,131 |
|
|
6.000%, 09/20/38 |
|
|
3,524 |
|
| |
61 |
|
|
7.500%, 02/20/28 - 09/20/28 |
|
|
73 |
|
| |
96 |
|
|
8.000%, 12/20/25 - 09/20/28 |
|
|
113 |
|
| |
31 |
|
|
8.500%, 05/20/25 |
|
|
36 |
|
|
|
|
|
Government National Mortgage Association II, Other, |
|
|
|
|
| |
10,107 |
|
|
4.375%, 06/20/63 |
|
|
10,941 |
|
| |
10,415 |
|
|
4.433%, 05/20/63 |
|
|
11,418 |
|
| |
3,088 |
|
|
4.462%, 05/20/63 |
|
|
3,389 |
|
| |
2,055 |
|
|
4.479%, 04/20/63 |
|
|
2,231 |
|
|
|
|
|
|
|
|
|
|
PRINCIPAL
AMOUNT($) |
|
|
SECURITY DESCRIPTION |
|
VALUE($) |
|
| |
|
|
|
|
|
Government National Mortgage Association, 15 Year, Single Family, |
|
|
|
|
| |
44 |
|
|
6.500%, 06/15/17 |
|
|
45 |
|
| |
18 |
|
|
8.000%, 01/15/16 |
|
|
19 |
|
|
|
|
|
Government National Mortgage Association, 30 Year, Single Family, |
|
|
|
|
| |
313 |
|
|
6.500%, 03/15/28 - 04/15/33 |
|
|
358 |
|
| |
188 |
|
|
7.000%, 02/15/33 - 06/15/33 |
|
|
213 |
|
| |
43 |
|
|
7.500%, 11/15/22 - 09/15/28 |
|
|
48 |
|
| |
16 |
|
|
8.000%, 09/15/22 - 08/15/28 |
|
|
17 |
|
| |
2 |
|
|
9.000%, 12/15/16 |
|
|
2 |
|
| |
572 |
|
|
9.500%, 10/15/24 |
|
|
643 |
|
|
|
|
|
|
|
|
|
|
|
|
|
|
Total Mortgage Pass-Through Securities
(Cost $554,075) |
|
|
566,739 |
|
|
|
|
|
|
|
|
|
|
| |
Municipal Bonds — 0.3% (t) |
|
|
|
|
|
California — 0.0% (g) |
|
| |
440 |
|
|
Los Angeles City Department of Airports, International Airport, Series C, Rev., 6.582%, 05/15/39 |
|
|
562 |
|
| |
350 |
|
|
State of California, Various Purpose, GO, 7.300%, 10/01/39 |
|
|
506 |
|
|
|
|
|
|
|
|
|
|
|
|
|
|
|
|
|
1,068 |
|
|
|
|
|
|
|
|
|
|
|
|
|
|
Illinois — 0.0% (g) |
|
| |
160 |
|
|
State of Illinois, Taxable Pension, GO, 5.100%, 06/01/33 |
|
|
159 |
|
|
|
|
|
|
|
|
|
|
|
|
|
|
New York — 0.2% |
|
| |
360 |
|
|
New York State Dormitory Authority, State Personal Income Tax, General Purpose, Series D, 5.600%, 03/15/40 |
|
|
448 |
|
| |
2,500 |
|
|
Port Authority of New York & New Jersey, Consolidated, Rev., 4.458%, 10/01/62 |
|
|
2,628 |
|
| |
1,825 |
|
|
Port Authority of New York & New Jersey, Consolidated 164, Rev., 5.647%, 11/01/40 |
|
|
2,287 |
|
|
|
|
|
|
|
|
|
|
|
|
|
|
|
|
|
5,363 |
|
|
|
|
|
|
|
|
|
|
|
|
|
|
Ohio — 0.1% |
|
| |
1,315 |
|
|
American Municipal Power, Inc., Meldahl Hydroelectric Project, Series B, Rev., 7.499%, 02/15/50 |
|
|
1,877 |
|
| |
1,563 |
|
|
Ohio State University, General Receipts, Series A, Rev., 4.800%, 06/01/11 (†††) |
|
|
1,690 |
|
|
|
|
|
|
|
|
|
|
|
|
|
|
|
|
|
3,567 |
|
|
|
|
|
|
|
|
|
|
|
|
|
|
Total Municipal Bonds
(Cost $8,733) |
|
|
10,157 |
|
|
|
|
|
|
|
|
|
|
| |
Supranational — 0.1% |
|
| |
3,000 |
|
|
African Development Bank, 8.800%, 09/01/19 |
|
|
3,822 |
|
SEE NOTES TO
FINANCIAL STATEMENTS.
|
|
|
|
|
|
|
|
|
|
|
|
|
| AUGUST 31, 2014 |
|
JPMORGAN INSTITUTIONAL TRUST FUNDS |
|
|
|
|
53 |
|
JPMorgan Core Bond Trust
SCHEDULE OF PORTFOLIO INVESTMENTS
AS OF AUGUST 31, 2014 (Unaudited) (continued)
(Amounts in thousands)
|
|
|
|
|
|
|
|
|
PRINCIPAL
AMOUNT($) |
|
|
SECURITY DESCRIPTION |
|
VALUE($) |
|
| Supranational — continued |
|
| |
641 |
|
|
Corp. Andina de Fomento, 3.750%, 01/15/16 |
|
|
665 |
|
|
|
|
|
|
|
|
|
|
|
|
|
|
Total Supranational
(Cost $4,435) |
|
|
4,487 |
|
|
|
|
|
|
|
|
|
|
| |
U.S. Government Agency Securities — 2.4% |
|
| |
1,525 |
|
|
Federal Home Loan Bank, 5.500%, 07/15/36 |
|
|
2,021 |
|
| |
6,000 |
|
|
Federal National Mortgage Association, Zero Coupon, 06/01/17 |
|
|
5,827 |
|
|
|
|
|
Financing Corp. Fico, |
|
|
|
|
| |
4,500 |
|
|
Zero Coupon, 05/11/18 |
|
|
4,250 |
|
| |
2,000 |
|
|
Zero Coupon, 04/05/19 |
|
|
1,839 |
|
| |
1,240 |
|
|
Zero Coupon, 09/26/19 |
|
|
1,122 |
|
|
|
|
|
Government Trust Certificate, |
|
|
|
|
| |
4,000 |
|
|
Zero Coupon, 10/01/15 |
|
|
3,954 |
|
| |
5,000 |
|
|
Zero Coupon, 04/01/16 |
|
|
4,899 |
|
| |
13,319 |
|
|
Zero Coupon, 10/01/19 |
|
|
11,647 |
|
|
|
|
|
Residual Funding Corp. STRIPS, |
|
|
|
|
| |
7,300 |
|
|
Zero Coupon, 10/15/19 |
|
|
6,609 |
|
| |
30,450 |
|
|
Zero Coupon, 07/15/20 |
|
|
26,880 |
|
| |
12,930 |
|
|
Zero Coupon, 10/15/20 |
|
|
11,311 |
|
|
|
|
|
Tennessee Valley Authority, |
|
|
|
|
| |
304 |
|
|
4.625%, 09/15/60 |
|
|
339 |
|
| |
3,521 |
|
|
5.250%, 09/15/39 |
|
|
4,389 |
|
| |
1,115 |
|
|
5.880%, 04/01/36 |
|
|
1,489 |
|
|
|
|
|
Tennessee Valley Authority STRIPS, |
|
|
|
|
| |
2,000 |
|
|
Zero Coupon, 05/01/19 |
|
|
1,819 |
|
| |
5,000 |
|
|
Zero Coupon, 11/01/25 |
|
|
3,483 |
|
| |
800 |
|
|
Zero Coupon, 06/15/35 |
|
|
360 |
|
|
|
|
|
|
|
|
|
|
|
|
|
|
Total U.S. Government Agency Securities
(Cost $91,597) |
|
|
92,238 |
|
|
|
|
|
|
|
|
|
|
| |
U.S. Treasury Obligations — 26.3% |
|
|
|
|
|
U.S. Treasury Bonds, |
|
|
|
|
| |
200 |
|
|
4.250%, 05/15/39 |
|
|
244 |
|
| |
4,900 |
|
|
4.375%, 02/15/38 |
|
|
6,077 |
|
| |
7,575 |
|
|
4.500%, 02/15/36 |
|
|
9,550 |
|
| |
1,300 |
|
|
4.500%, 05/15/38 |
|
|
1,642 |
|
| |
1,750 |
|
|
4.500%, 08/15/39 |
|
|
2,219 |
|
| |
1,500 |
|
|
4.750%, 02/15/37 |
|
|
1,957 |
|
| |
15,370 |
|
|
5.000%, 05/15/37 |
|
|
20,721 |
|
| |
850 |
|
|
5.250%, 02/15/29 |
|
|
1,114 |
|
| |
1,250 |
|
|
5.375%, 02/15/31 |
|
|
1,686 |
|
| |
750 |
|
|
6.125%, 11/15/27 |
|
|
1,049 |
|
| |
300 |
|
|
6.125%, 08/15/29 |
|
|
428 |
|
| |
2,506 |
|
|
6.250%, 08/15/23 |
|
|
3,326 |
|
| |
900 |
|
|
6.250%, 05/15/30 |
|
|
1,310 |
|
| |
525 |
|
|
6.625%, 02/15/27 |
|
|
756 |
|
| |
4,690 |
|
|
7.500%, 11/15/16 |
|
|
5,393 |
|
|
|
|
|
|
|
|
|
|
PRINCIPAL
AMOUNT($) |
|
|
SECURITY DESCRIPTION |
|
VALUE($) |
|
| |
|
| |
1,881 |
|
|
7.875%, 02/15/21 |
|
|
2,566 |
|
| |
864 |
|
|
8.125%, 05/15/21 |
|
|
1,201 |
|
| |
1,845 |
|
|
8.500%, 02/15/20 |
|
|
2,499 |
|
| |
7,000 |
|
|
8.750%, 08/15/20 |
|
|
9,742 |
|
| |
20,115 |
|
|
8.875%, 08/15/17 |
|
|
24,754 |
|
|
|
|
|
U.S. Treasury Coupon STRIPS, |
|
|
|
|
| |
19,751 |
|
|
1.523%, 08/15/16 (n) |
|
|
19,535 |
|
| |
17,000 |
|
|
1.821%, 05/15/21 (n) |
|
|
14,783 |
|
| |
8,400 |
|
|
1.859%, 05/15/18 (n) |
|
|
7,998 |
|
| |
2,000 |
|
|
2.026%, 02/15/18 (n) |
|
|
1,916 |
|
| |
2,435 |
|
|
2.051%, 02/15/20 (n) |
|
|
2,203 |
|
| |
17,095 |
|
|
2.271%, 02/15/21 (n) |
|
|
14,998 |
|
| |
500 |
|
|
2.486%, 11/15/23 (n) |
|
|
399 |
|
| |
15,768 |
|
|
2.502%, 02/15/22 (n) |
|
|
13,368 |
|
| |
1,300 |
|
|
2.540%, 08/15/23 (n) |
|
|
1,047 |
|
| |
1,500 |
|
|
2.572%, 05/15/22 (n) |
|
|
1,261 |
|
| |
15,200 |
|
|
2.621%, 05/15/23 (n) |
|
|
12,343 |
|
| |
4,800 |
|
|
2.631%, 08/15/22 (n) |
|
|
4,003 |
|
| |
15,025 |
|
|
2.705%, 11/15/21 (n) |
|
|
12,846 |
|
| |
38,935 |
|
|
2.948%, 08/15/20 (n) |
|
|
34,655 |
|
| |
1,592 |
|
|
3.046%, 08/15/26 (n) |
|
|
1,152 |
|
| |
17,577 |
|
|
3.057%, 05/15/19 (n) |
|
|
16,259 |
|
| |
800 |
|
|
3.058%, 05/15/35 (n) |
|
|
420 |
|
| |
6,100 |
|
|
3.205%, 08/15/21 (n) |
|
|
5,262 |
|
| |
5,600 |
|
|
3.280%, 05/15/28 (n) |
|
|
3,789 |
|
| |
27,150 |
|
|
3.288%, 11/15/26 (n) |
|
|
19,464 |
|
| |
4,250 |
|
|
3.303%, 02/15/32 (n) |
|
|
2,506 |
|
| |
50,504 |
|
|
3.335%, 05/15/20 (n) |
|
|
45,331 |
|
| |
1,650 |
|
|
3.366%, 08/15/34 (n) |
|
|
890 |
|
| |
3,350 |
|
|
3.449%, 08/15/32 (n) |
|
|
1,939 |
|
| |
3,000 |
|
|
3.471%, 05/15/31 (n) |
|
|
1,818 |
|
| |
8,300 |
|
|
3.478%, 11/15/27 (n) |
|
|
5,726 |
|
| |
20,432 |
|
|
3.545%, 02/15/23 (n) |
|
|
16,729 |
|
| |
28,300 |
|
|
3.574%, 02/15/27 (n) |
|
|
20,100 |
|
| |
8,650 |
|
|
3.580%, 11/15/31 (n) |
|
|
5,147 |
|
| |
10,550 |
|
|
3.609%, 05/15/32 (n) |
|
|
6,165 |
|
| |
1,600 |
|
|
3.675%, 08/15/29 (n) |
|
|
1,033 |
|
| |
4,805 |
|
|
3.721%, 02/15/29 (n) |
|
|
3,159 |
|
| |
21,411 |
|
|
3.722%, 08/15/17 (n) |
|
|
20,793 |
|
| |
8,000 |
|
|
3.748%, 02/15/31 (n) |
|
|
4,891 |
|
| |
22,360 |
|
|
3.807%, 08/15/19 (n) |
|
|
20,544 |
|
| |
18,741 |
|
|
3.841%, 08/15/18 (n) |
|
|
17,724 |
|
| |
7,140 |
|
|
3.936%, 11/15/32 (n) |
|
|
4,098 |
|
| |
4,500 |
|
|
3.964%, 08/15/31 (n) |
|
|
2,701 |
|
| |
2,500 |
|
|
4.024%, 02/15/33 (n) |
|
|
1,422 |
|
| |
6,400 |
|
|
4.044%, 05/15/30 (n) |
|
|
4,020 |
|
SEE NOTES TO
FINANCIAL STATEMENTS.
|
|
|
|
|
|
|
|
|
|
|
| 54 |
|
|
|
JPMORGAN INSTITUTIONAL TRUST FUNDS |
|
AUGUST 31, 2014 |
|
|
|
|
|
|
|
|
|
PRINCIPAL
AMOUNT($) |
|
|
SECURITY DESCRIPTION |
|
VALUE($) |
|
| U.S. Treasury Obligations — continued |
|
| |
20,736 |
|
|
4.199%, 02/15/17 (n) |
|
|
20,339 |
|
| |
600 |
|
|
4.239%, 08/15/24 (n) |
|
|
467 |
|
| |
600 |
|
|
4.275%, 02/15/26 (n) |
|
|
443 |
|
| |
11,150 |
|
|
4.282%, 05/15/33 (n) |
|
|
6,285 |
|
| |
2,200 |
|
|
4.295%, 11/15/24 (n) |
|
|
1,697 |
|
| |
2,800 |
|
|
4.321%, 05/15/34 (n) |
|
|
1,524 |
|
| |
4,750 |
|
|
4.445%, 11/15/33 (n) |
|
|
2,630 |
|
| |
1,650 |
|
|
4.489%, 11/15/29 (n) |
|
|
1,055 |
|
| |
9,925 |
|
|
4.517%, 11/15/30 (n) |
|
|
6,128 |
|
| |
100 |
|
|
4.646%, 08/15/35 (n) |
|
|
52 |
|
| |
6,675 |
|
|
4.673%, 08/15/27 (n) |
|
|
4,651 |
|
| |
8,860 |
|
|
4.674%, 02/15/28 (n) |
|
|
6,053 |
|
| |
1,200 |
|
|
4.832%, 02/15/35 (n) |
|
|
636 |
|
| |
5,000 |
|
|
4.838%, 02/15/34 (n) |
|
|
2,744 |
|
| |
22,839 |
|
|
4.964%, 11/15/17 (n) |
|
|
22,020 |
|
| |
3,050 |
|
|
5.003%, 08/15/33 (n) |
|
|
1,703 |
|
| |
22,100 |
|
|
5.078%, 02/15/30 (n) |
|
|
14,019 |
|
| |
8,200 |
|
|
5.279%, 08/15/30 (n) |
|
|
5,104 |
|
| |
1,500 |
|
|
5.464%, 05/15/26 (n) |
|
|
1,095 |
|
| |
2,500 |
|
|
5.499%, 11/15/28 (n) |
|
|
1,660 |
|
| |
2,550 |
|
|
5.536%, 05/15/27 (n) |
|
|
1,794 |
|
| |
200 |
|
|
5.594%, 05/15/24 (n) |
|
|
157 |
|
| |
13,857 |
|
|
5.613%, 11/15/16 (n) |
|
|
13,659 |
|
| |
3,000 |
|
|
5.714%, 08/15/28 (n) |
|
|
2,011 |
|
| |
17,230 |
|
|
5.772%, 02/15/15 (n) |
|
|
17,223 |
|
| |
3,595 |
|
|
6.321%, 05/15/15 (n) |
|
|
3,592 |
|
| |
46,801 |
|
|
6.340%, 02/15/16 (n) |
|
|
46,574 |
|
| |
2,049 |
|
|
6.360%, 08/15/15 (n) |
|
|
2,046 |
|
| |
14,257 |
|
|
6.406%, 11/15/15 (n) |
|
|
14,225 |
|
| |
13,056 |
|
|
7.051%, 11/15/14 (n) |
|
|
13,054 |
|
|
|
|
|
U.S. Treasury Inflation Indexed Bonds, |
|
|
|
|
| |
300 |
|
|
2.500%, 01/15/29 |
|
|
425 |
|
| |
799 |
|
|
3.625%, 04/15/28 |
|
|
1,668 |
|
|
|
|
|
U.S. Treasury Inflation Indexed Notes, |
|
|
|
|
| |
1,000 |
|
|
0.500%, 04/15/15 |
|
|
1,105 |
|
| |
1,000 |
|
|
1.125%, 01/15/21 |
|
|
1,168 |
|
| |
630 |
|
|
1.375%, 07/15/18 |
|
|
750 |
|
|
|
|
|
U.S. Treasury Notes, |
|
|
|
|
| |
8,000 |
|
|
0.750%, 12/31/17 |
|
|
7,900 |
|
| |
3,560 |
|
|
0.875%, 01/31/18 |
|
|
3,526 |
|
| |
1,500 |
|
|
1.000%, 06/30/19 |
|
|
1,456 |
|
| |
4,510 |
|
|
1.000%, 11/30/19 |
|
|
4,348 |
|
| |
31,250 |
|
|
1.250%, 10/31/18 |
|
|
31,003 |
|
| |
11,635 |
|
|
1.375%, 11/30/18 |
|
|
11,595 |
|
| |
7,400 |
|
|
1.500%, 08/31/18 |
|
|
7,432 |
|
| |
10,000 |
|
|
2.000%, 02/15/22 |
|
|
9,937 |
|
|
|
|
|
|
|
|
|
|
PRINCIPAL
AMOUNT($) |
|
|
SECURITY DESCRIPTION |
|
VALUE($) |
|
| |
|
| |
12,245 |
|
|
2.125%, 12/31/15 |
|
|
12,550 |
|
| |
7,500 |
|
|
2.125%, 08/31/20 |
|
|
7,605 |
|
| |
1,000 |
|
|
2.125%, 01/31/21 |
|
|
1,010 |
|
| |
36,000 |
|
|
2.125%, 08/15/21 |
|
|
36,211 |
|
| |
10,000 |
|
|
2.250%, 07/31/18 |
|
|
10,341 |
|
| |
21,972 |
|
|
2.625%, 12/31/14 |
|
|
22,157 |
|
| |
1,000 |
|
|
2.625%, 02/29/16 |
|
|
1,034 |
|
| |
4,575 |
|
|
2.625%, 04/30/16 |
|
|
4,744 |
|
| |
9,300 |
|
|
2.625%, 01/31/18 |
|
|
9,750 |
|
| |
700 |
|
|
2.625%, 08/15/20 |
|
|
730 |
|
| |
2,300 |
|
|
2.625%, 11/15/20 |
|
|
2,395 |
|
| |
17,985 |
|
|
2.750%, 05/31/17 |
|
|
18,903 |
|
| |
2,000 |
|
|
2.750%, 12/31/17 |
|
|
2,105 |
|
| |
9,000 |
|
|
3.125%, 10/31/16 |
|
|
9,487 |
|
| |
6,015 |
|
|
3.125%, 04/30/17 |
|
|
6,379 |
|
| |
11,638 |
|
|
3.125%, 05/15/19 |
|
|
12,449 |
|
| |
7,250 |
|
|
3.125%, 05/15/21 |
|
|
7,773 |
|
| |
15,700 |
|
|
3.250%, 12/31/16 |
|
|
16,632 |
|
| |
12,300 |
|
|
3.250%, 03/31/17 |
|
|
13,070 |
|
| |
2,600 |
|
|
3.500%, 02/15/18 |
|
|
2,803 |
|
| |
450 |
|
|
3.500%, 05/15/20 |
|
|
492 |
|
| |
7,000 |
|
|
3.625%, 02/15/21 |
|
|
7,719 |
|
| |
2,500 |
|
|
3.750%, 11/15/18 |
|
|
2,737 |
|
| |
10,000 |
|
|
4.000%, 02/15/15 |
|
|
10,177 |
|
|
|
|
|
U.S. Treasury Principal STRIPS, |
|
|
|
|
| |
16,180 |
|
|
Zero Coupon, 02/15/15 |
|
|
16,174 |
|
| |
1,000 |
|
|
Zero Coupon, 05/15/16 |
|
|
993 |
|
|
|
|
|
|
|
|
|
|
|
|
|
|
Total U.S. Treasury Obligations
(Cost $955,567) |
|
|
1,006,044 |
|
|
|
|
|
|
|
|
|
|
| |
Loan Assignments — 0.3% |
|
|
|
|
|
Financials — 0.3% |
|
|
|
|
|
Real Estate Management & Development — 0.3% |
|
| |
1,657 |
|
|
Fiveten Group Holdings Ltd., Revolving Loan, (United Kingdom), VAR, 4.500%, 04/10/15 (i) |
|
|
1,648 |
|
| |
2,017 |
|
|
Invitation Homes, Revolving Loan, VAR, 3.750%, 03/15/15 (i) |
|
|
2,007 |
|
| |
5,974 |
|
|
Progress Residential LP, Revolving Loan, VAR, 4.000%, 09/04/15 (i) |
|
|
5,944 |
|
| |
4,193 |
|
|
Tricon Capital Group Inc., Revolving Loan, (Canada), VAR, 4.100%, 06/13/15 (i) |
|
|
4,172 |
|
|
|
|
|
|
|
|
|
|
|
|
|
|
Total Loan Assignments
(Cost $13,840) |
|
|
13,771 |
|
|
|
|
|
|
|
|
|
|
SEE NOTES TO
FINANCIAL STATEMENTS.
|
|
|
|
|
|
|
|
|
|
|
|
|
| AUGUST 31, 2014 |
|
JPMORGAN INSTITUTIONAL TRUST FUNDS |
|
|
|
|
55 |
|
JPMorgan Core Bond Trust
SCHEDULE OF PORTFOLIO INVESTMENTS
AS OF AUGUST 31, 2014 (Unaudited) (continued)
(Amounts in thousands)
|
|
|
|
|
|
|
|
|
SHARES |
|
|
|
|
VALUE($) |
|
| |
Short-Term Investment — 2.5% |
|
|
|
|
|
Investment Company — 2.5% |
|
| |
95,077 |
|
|
JPMorgan Liquid Assets Money Market Fund, Institutional Class Shares, 0.030% (b) (l) (m)
(Cost
$95,077) |
|
|
95,077 |
|
|
|
|
|
|
|
|
|
|
|
|
|
|
Total Investments — 99.6%
(Cost $3,632,603) |
|
|
3,806,531 |
|
|
|
|
|
Other Assets in Excess of
Liabilities — 0.4% |
|
|
13,808 |
|
|
|
|
|
|
|
|
|
|
|
|
|
|
NET ASSETS — 100.0% |
|
$ |
3,820,339 |
|
|
|
|
|
|
|
|
|
|
Percentages indicated are based on net assets.
SEE NOTES TO
FINANCIAL STATEMENTS.
|
|
|
|
|
|
|
|
|
|
|
| 56 |
|
|
|
JPMORGAN INSTITUTIONAL TRUST FUNDS |
|
AUGUST 31, 2014 |
JPMorgan Equity Index Trust
SCHEDULE OF PORTFOLIO INVESTMENTS
AS OF AUGUST 31, 2014 (Unaudited)
(Amounts in thousands)
|
|
|
|
|
|
|
|
|
| SHARES |
|
|
SECURITY DESCRIPTION |
|
VALUE($) |
|
|
|
|
|
|
|
|
|
|
| |
Common Stocks — 98.6% |
|
|
|
|
|
Consumer Discretionary — 11.7% |
|
|
|
|
|
Auto Components — 0.4% |
|
| |
5 |
|
|
BorgWarner, Inc. |
|
|
298 |
|
| |
6 |
|
|
Delphi Automotive plc, (United Kingdom) |
|
|
402 |
|
| |
6 |
|
|
Goodyear Tire & Rubber Co. (The) |
|
|
150 |
|
| |
14 |
|
|
Johnson Controls, Inc. |
|
|
679 |
|
|
|
|
|
|
|
|
|
|
|
|
|
|
|
|
|
1,529 |
|
|
|
|
|
|
|
|
|
|
|
|
|
|
Automobiles — 0.7% |
|
| |
83 |
|
|
Ford Motor Co. |
|
|
1,442 |
|
| |
28 |
|
|
General Motors Co. |
|
|
958 |
|
| |
5 |
|
|
Harley-Davidson, Inc. |
|
|
291 |
|
|
|
|
|
|
|
|
|
|
|
|
|
|
|
|
|
2,691 |
|
|
|
|
|
|
|
|
|
|
|
|
|
|
Distributors — 0.1% |
|
| |
3 |
|
|
Genuine Parts Co. |
|
|
282 |
|
|
|
|
|
|
|
|
|
|
|
|
|
|
Diversified Consumer Services — 0.1% |
|
| |
— |
(h) |
|
Graham Holdings Co., Class B |
|
|
68 |
|
| |
6 |
|
|
H&R Block, Inc. |
|
|
193 |
|
|
|
|
|
|
|
|
|
|
|
|
|
|
|
|
|
261 |
|
|
|
|
|
|
|
|
|
|
|
|
|
|
Hotels, Restaurants & Leisure — 1.6% |
|
| |
9 |
|
|
Carnival Corp. |
|
|
348 |
|
| |
1 |
|
|
Chipotle Mexican Grill, Inc. (a) |
|
|
442 |
|
| |
3 |
|
|
Darden Restaurants, Inc. |
|
|
131 |
|
| |
5 |
|
|
Marriott International, Inc., Class A |
|
|
319 |
|
| |
21 |
|
|
McDonald’s Corp. |
|
|
1,940 |
|
| |
16 |
|
|
Starbucks Corp. |
|
|
1,227 |
|
| |
4 |
|
|
Starwood Hotels & Resorts Worldwide, Inc. |
|
|
340 |
|
| |
3 |
|
|
Wyndham Worldwide Corp. |
|
|
216 |
|
| |
2 |
|
|
Wynn Resorts Ltd. |
|
|
327 |
|
| |
9 |
|
|
Yum! Brands, Inc. |
|
|
669 |
|
|
|
|
|
|
|
|
|
|
|
|
|
|
|
|
|
5,959 |
|
|
|
|
|
|
|
|
|
|
|
|
|
|
Household Durables — 0.4% |
|
| |
7 |
|
|
D.R. Horton, Inc. |
|
|
146 |
|
| |
3 |
|
|
Garmin Ltd., (Switzerland) |
|
|
140 |
|
| |
1 |
|
|
Harman International Industries, Inc. |
|
|
164 |
|
| |
3 |
|
|
Leggett & Platt, Inc. |
|
|
102 |
|
| |
4 |
|
|
Lennar Corp., Class A |
|
|
144 |
|
| |
1 |
|
|
Mohawk Industries, Inc. (a) |
|
|
187 |
|
| |
6 |
|
|
Newell Rubbermaid, Inc. |
|
|
194 |
|
| |
7 |
|
|
PulteGroup, Inc. |
|
|
137 |
|
| |
2 |
|
|
Whirlpool Corp. |
|
|
249 |
|
|
|
|
|
|
|
|
|
|
|
|
|
|
|
|
|
1,463 |
|
|
|
|
|
|
|
|
|
|
|
|
|
|
Internet & Catalog Retail — 1.3% |
|
| |
8 |
|
|
Amazon.com, Inc. (a) |
|
|
2,647 |
|
| |
2 |
|
|
Expedia, Inc. |
|
|
185 |
|
|
|
|
|
|
|
|
|
|
| SHARES |
|
|
SECURITY DESCRIPTION |
|
VALUE($) |
|
|
|
|
|
|
|
|
|
|
|
|
|
|
|
|
|
Internet & Catalog Retail — continued |
|
| |
1 |
|
|
Netflix, Inc. (a) |
|
|
599 |
|
| |
1 |
|
|
Priceline Group, Inc. (The) (a) |
|
|
1,366 |
|
| |
2 |
|
|
TripAdvisor, Inc. (a) |
|
|
231 |
|
|
|
|
|
|
|
|
|
|
|
|
|
|
|
|
|
5,028 |
|
|
|
|
|
|
|
|
|
|
|
|
|
|
Leisure Products — 0.1% |
|
| |
2 |
|
|
Hasbro, Inc. |
|
|
127 |
|
| |
7 |
|
|
Mattel, Inc. |
|
|
245 |
|
|
|
|
|
|
|
|
|
|
|
|
|
|
|
|
|
372 |
|
|
|
|
|
|
|
|
|
|
|
|
|
|
Media — 3.5% |
|
| |
5 |
|
|
Cablevision Systems Corp., Class A |
|
|
84 |
|
| |
10 |
|
|
CBS Corp. (Non-Voting), Class B |
|
|
605 |
|
| |
54 |
|
|
Comcast Corp., Class A |
|
|
2,980 |
|
| |
10 |
|
|
DIRECTV (a) |
|
|
848 |
|
| |
5 |
|
|
Discovery Communications, Inc., Class A (a) |
|
|
200 |
|
| |
5 |
|
|
Discovery Communications, Inc., Class C (a) |
|
|
196 |
|
| |
5 |
|
|
Gannett Co., Inc. |
|
|
160 |
|
| |
9 |
|
|
Interpublic Group of Cos., Inc. (The) |
|
|
173 |
|
| |
10 |
|
|
News Corp., Class A (a) |
|
|
184 |
|
| |
5 |
|
|
Omnicom Group, Inc. |
|
|
390 |
|
| |
2 |
|
|
Scripps Networks Interactive, Inc., Class A |
|
|
179 |
|
| |
6 |
|
|
Time Warner Cable, Inc. |
|
|
863 |
|
| |
18 |
|
|
Time Warner, Inc. |
|
|
1,423 |
|
| |
40 |
|
|
Twenty-First Century Fox, Inc., Class A |
|
|
1,420 |
|
| |
8 |
|
|
Viacom, Inc., Class B |
|
|
665 |
|
| |
34 |
|
|
Walt Disney Co. (The) |
|
|
3,031 |
|
|
|
|
|
|
|
|
|
|
|
|
|
|
|
|
|
13,401 |
|
|
|
|
|
|
|
|
|
|
|
|
|
|
Multiline Retail — 0.6% |
|
| |
6 |
|
|
Dollar General Corp. (a) |
|
|
406 |
|
| |
4 |
|
|
Dollar Tree, Inc. (a) |
|
|
232 |
|
| |
2 |
|
|
Family Dollar Stores, Inc. |
|
|
160 |
|
| |
4 |
|
|
Kohl’s Corp. |
|
|
240 |
|
| |
8 |
|
|
Macy’s, Inc. |
|
|
470 |
|
| |
3 |
|
|
Nordstrom, Inc. |
|
|
204 |
|
| |
13 |
|
|
Target Corp. |
|
|
797 |
|
|
|
|
|
|
|
|
|
|
|
|
|
|
|
|
|
2,509 |
|
|
|
|
|
|
|
|
|
|
|
|
|
|
Specialty Retail — 2.1% |
|
| |
1 |
|
|
AutoNation, Inc. (a) |
|
|
72 |
|
| |
1 |
|
|
AutoZone, Inc. (a) |
|
|
375 |
|
| |
4 |
|
|
Bed Bath & Beyond, Inc. (a) |
|
|
274 |
|
| |
6 |
|
|
Best Buy Co., Inc. |
|
|
184 |
|
| |
5 |
|
|
CarMax, Inc. (a) |
|
|
242 |
|
| |
2 |
|
|
GameStop Corp., Class A |
|
|
101 |
|
| |
5 |
|
|
Gap, Inc. (The) |
|
|
251 |
|
| |
29 |
|
|
Home Depot, Inc. (The) |
|
|
2,679 |
|
SEE NOTES TO
FINANCIAL STATEMENTS.
|
|
|
|
|
|
|
|
|
|
|
|
|
| AUGUST 31, 2014 |
|
JPMORGAN INSTITUTIONAL TRUST FUNDS |
|
|
|
|
57 |
|
JPMorgan Equity Index Trust
SCHEDULE OF PORTFOLIO INVESTMENTS
AS OF AUGUST 31, 2014 (Unaudited) (continued)
(Amounts in thousands)
|
|
|
|
|
|
|
|
|
| SHARES |
|
|
SECURITY DESCRIPTION |
|
VALUE($) |
|
|
|
|
|
|
|
|
|
|
| |
Common Stocks — continued |
|
|
|
|
|
Specialty Retail — continued |
|
| |
5 |
|
|
L Brands, Inc. |
|
|
328 |
|
| |
21 |
|
|
Lowe’s Cos., Inc. |
|
|
1,097 |
|
| |
2 |
|
|
O’Reilly Automotive, Inc. (a) |
|
|
347 |
|
| |
2 |
|
|
PetSmart, Inc. |
|
|
149 |
|
| |
4 |
|
|
Ross Stores, Inc. |
|
|
335 |
|
| |
14 |
|
|
Staples, Inc. |
|
|
158 |
|
| |
2 |
|
|
Tiffany & Co. |
|
|
235 |
|
| |
15 |
|
|
TJX Cos., Inc. (The) |
|
|
874 |
|
| |
3 |
|
|
Tractor Supply Co. |
|
|
194 |
|
| |
2 |
|
|
Urban Outfitters, Inc. (a) |
|
|
85 |
|
|
|
|
|
|
|
|
|
|
|
|
|
|
|
|
|
7,980 |
|
|
|
|
|
|
|
|
|
|
|
|
|
|
Textiles, Apparel & Luxury Goods — 0.8% |
|
| |
6 |
|
|
Coach, Inc. |
|
|
212 |
|
| |
1 |
|
|
Fossil Group, Inc. (a) |
|
|
101 |
|
| |
4 |
|
|
Michael Kors Holdings Ltd., (Hong Kong) (a) |
|
|
302 |
|
| |
15 |
|
|
NIKE, Inc., Class B |
|
|
1,213 |
|
| |
2 |
|
|
PVH Corp. |
|
|
201 |
|
| |
1 |
|
|
Ralph Lauren Corp. |
|
|
207 |
|
| |
3 |
|
|
Under Armour, Inc., Class A (a) |
|
|
232 |
|
| |
7 |
|
|
V.F. Corp. |
|
|
462 |
|
|
|
|
|
|
|
|
|
|
|
|
|
|
|
|
|
2,930 |
|
|
|
|
|
|
|
|
|
|
|
|
|
|
Total Consumer Discretionary |
|
|
44,405 |
|
|
|
|
|
|
|
|
|
|
|
|
|
|
Consumer Staples — 9.3% |
|
|
|
|
|
Beverages — 2.1% |
|
| |
3 |
|
|
Brown-Forman Corp., Class B |
|
|
315 |
|
| |
79 |
|
|
Coca-Cola Co. (The) |
|
|
3,302 |
|
| |
5 |
|
|
Coca-Cola Enterprises, Inc. |
|
|
234 |
|
| |
4 |
|
|
Constellation Brands, Inc., Class A (a) |
|
|
308 |
|
| |
4 |
|
|
Dr. Pepper Snapple Group, Inc. |
|
|
259 |
|
| |
3 |
|
|
Molson Coors Brewing Co., Class B |
|
|
246 |
|
| |
3 |
|
|
Monster Beverage Corp. (a) |
|
|
251 |
|
| |
32 |
|
|
PepsiCo, Inc. |
|
|
2,936 |
|
|
|
|
|
|
|
|
|
|
|
|
|
|
|
|
|
7,851 |
|
|
|
|
|
|
|
|
|
|
|
|
|
|
Food & Staples Retailing — 2.2% |
|
| |
9 |
|
|
Costco Wholesale Corp. |
|
|
1,111 |
|
| |
24 |
|
|
CVS Caremark Corp. |
|
|
1,945 |
|
| |
11 |
|
|
Kroger Co. (The) |
|
|
544 |
|
| |
5 |
|
|
Safeway, Inc. |
|
|
168 |
|
| |
12 |
|
|
Sysco Corp. |
|
|
463 |
|
| |
18 |
|
|
Walgreen Co. |
|
|
1,113 |
|
| |
34 |
|
|
Wal-Mart Stores, Inc. |
|
|
2,549 |
|
| |
8 |
|
|
Whole Foods Market, Inc. |
|
|
301 |
|
|
|
|
|
|
|
|
|
|
|
|
|
|
|
|
|
8,194 |
|
|
|
|
|
|
|
|
|
|
|
|
|
|
|
|
|
|
|
| SHARES |
|
|
SECURITY DESCRIPTION |
|
VALUE($) |
|
|
|
|
|
|
|
|
|
|
|
|
|
|
|
|
|
Food Products — 1.6% |
|
| |
14 |
|
|
Archer-Daniels-Midland Co. (m) |
|
|
683 |
|
| |
4 |
|
|
Campbell Soup Co. |
|
|
168 |
|
| |
9 |
|
|
ConAgra Foods, Inc. |
|
|
284 |
|
| |
13 |
|
|
General Mills, Inc. |
|
|
687 |
|
| |
3 |
|
|
Hershey Co. (The) |
|
|
286 |
|
| |
3 |
|
|
Hormel Foods Corp. |
|
|
143 |
|
| |
2 |
|
|
JM Smucker Co. (The) |
|
|
223 |
|
| |
5 |
|
|
Kellogg Co. |
|
|
347 |
|
| |
3 |
|
|
Keurig Green Mountain, Inc. |
|
|
354 |
|
| |
12 |
|
|
Kraft Foods Group, Inc. |
|
|
734 |
|
| |
3 |
|
|
McCormick & Co., Inc. (Non-Voting) |
|
|
190 |
|
| |
4 |
|
|
Mead Johnson Nutrition Co. |
|
|
405 |
|
| |
35 |
|
|
Mondelez International, Inc., Class A |
|
|
1,282 |
|
| |
6 |
|
|
Tyson Foods, Inc., Class A |
|
|
219 |
|
|
|
|
|
|
|
|
|
|
|
|
|
|
|
|
|
6,005 |
|
|
|
|
|
|
|
|
|
|
|
|
|
|
Household Products — 1.9% |
|
| |
3 |
|
|
Clorox Co. (The) |
|
|
239 |
|
| |
18 |
|
|
Colgate-Palmolive Co. |
|
|
1,179 |
|
| |
8 |
|
|
Kimberly-Clark Corp. |
|
|
852 |
|
| |
57 |
|
|
Procter & Gamble Co. (The) |
|
|
4,709 |
|
|
|
|
|
|
|
|
|
|
|
|
|
|
|
|
|
6,979 |
|
|
|
|
|
|
|
|
|
|
|
|
|
|
Personal Products — 0.1% |
|
| |
9 |
|
|
Avon Products, Inc. (m) |
|
|
128 |
|
| |
5 |
|
|
Estee Lauder Cos., Inc. (The), Class A |
|
|
406 |
|
|
|
|
|
|
|
|
|
|
|
|
|
|
|
|
|
534 |
|
|
|
|
|
|
|
|
|
|
|
|
|
|
Tobacco — 1.4% |
|
| |
42 |
|
|
Altria Group, Inc. |
|
|
1,792 |
|
| |
8 |
|
|
Lorillard, Inc. |
|
|
453 |
|
| |
33 |
|
|
Philip Morris International, Inc. |
|
|
2,819 |
|
| |
7 |
|
|
Reynolds American, Inc. |
|
|
381 |
|
|
|
|
|
|
|
|
|
|
|
|
|
|
|
|
|
5,445 |
|
|
|
|
|
|
|
|
|
|
|
|
|
|
Total Consumer Staples |
|
|
35,008 |
|
|
|
|
|
|
|
|
|
|
|
|
|
|
Energy — 10.3% |
|
|
|
|
|
Energy Equipment & Services — 2.0% |
|
| |
9 |
|
|
Baker Hughes, Inc. |
|
|
631 |
|
| |
4 |
|
|
Cameron International Corp. (a) |
|
|
318 |
|
| |
1 |
|
|
Diamond Offshore Drilling, Inc. |
|
|
63 |
|
| |
5 |
|
|
Ensco plc, (United Kingdom), Class A |
|
|
247 |
|
| |
5 |
|
|
FMC Technologies, Inc. (a) |
|
|
305 |
|
| |
18 |
|
|
Halliburton Co. |
|
|
1,196 |
|
| |
2 |
|
|
Helmerich & Payne, Inc. |
|
|
238 |
|
| |
5 |
|
|
Nabors Industries Ltd., (Bermuda) |
|
|
149 |
|
| |
9 |
|
|
National Oilwell Varco, Inc. |
|
|
777 |
|
SEE NOTES TO
FINANCIAL STATEMENTS.
|
|
|
|
|
|
|
|
|
|
|
| 58 |
|
|
|
JPMORGAN INSTITUTIONAL TRUST FUNDS |
|
AUGUST 31, 2014 |
|
|
|
|
|
|
|
|
|
| SHARES |
|
|
SECURITY DESCRIPTION |
|
VALUE($) |
|
|
|
|
|
|
|
|
|
|
| |
Common Stocks — continued |
|
|
|
|
|
Energy Equipment & Services — continued |
|
| |
5 |
|
|
Noble Corp. plc, (United Kingdom) |
|
|
151 |
|
| |
— |
(h) |
|
Paragon Offshore plc (a) |
|
|
— |
(h) |
| |
27 |
|
|
Schlumberger Ltd. |
|
|
2,990 |
|
| |
7 |
|
|
Transocean Ltd., (Switzerland) |
|
|
275 |
|
|
|
|
|
|
|
|
|
|
|
|
|
|
|
|
|
7,340 |
|
|
|
|
|
|
|
|
|
|
|
|
|
|
Oil, Gas & Consumable Fuels — 8.3% |
|
| |
11 |
|
|
Anadarko Petroleum Corp. |
|
|
1,192 |
|
| |
8 |
|
|
Apache Corp. |
|
|
822 |
|
| |
9 |
|
|
Cabot Oil & Gas Corp. |
|
|
293 |
|
| |
11 |
|
|
Chesapeake Energy Corp. |
|
|
288 |
|
| |
40 |
|
|
Chevron Corp. |
|
|
5,161 |
|
| |
2 |
|
|
Cimarex Energy Co. |
|
|
265 |
|
| |
26 |
|
|
ConocoPhillips |
|
|
2,088 |
|
| |
5 |
|
|
CONSOL Energy, Inc. |
|
|
194 |
|
| |
7 |
|
|
Denbury Resources, Inc. |
|
|
127 |
|
| |
8 |
|
|
Devon Energy Corp. |
|
|
606 |
|
| |
11 |
|
|
EOG Resources, Inc. |
|
|
1,258 |
|
| |
3 |
|
|
EQT Corp. |
|
|
315 |
|
| |
90 |
|
|
Exxon Mobil Corp. |
|
|
8,944 |
|
| |
6 |
|
|
Hess Corp. (m) |
|
|
559 |
|
| |
14 |
|
|
Kinder Morgan, Inc. |
|
|
563 |
|
| |
14 |
|
|
Marathon Oil Corp. |
|
|
590 |
|
| |
6 |
|
|
Marathon Petroleum Corp. |
|
|
550 |
|
| |
4 |
|
|
Murphy Oil Corp. |
|
|
221 |
|
| |
3 |
|
|
Newfield Exploration Co. (a) |
|
|
128 |
|
| |
8 |
|
|
Noble Energy, Inc. |
|
|
543 |
|
| |
16 |
|
|
Occidental Petroleum Corp. |
|
|
1,707 |
|
| |
4 |
|
|
ONEOK, Inc. |
|
|
306 |
|
| |
6 |
|
|
Peabody Energy Corp. |
|
|
90 |
|
| |
12 |
|
|
Phillips 66 |
|
|
1,031 |
|
| |
3 |
|
|
Pioneer Natural Resources Co. |
|
|
625 |
|
| |
4 |
|
|
QEP Resources, Inc. |
|
|
134 |
|
| |
4 |
|
|
Range Resources Corp. |
|
|
278 |
|
| |
7 |
|
|
Southwestern Energy Co. (a) |
|
|
304 |
|
| |
14 |
|
|
Spectra Energy Corp. |
|
|
585 |
|
| |
3 |
|
|
Tesoro Corp. |
|
|
175 |
|
| |
11 |
|
|
Valero Energy Corp. |
|
|
605 |
|
| |
15 |
|
|
Williams Cos., Inc. (The) |
|
|
919 |
|
|
|
|
|
|
|
|
|
|
|
|
|
|
|
|
|
31,466 |
|
|
|
|
|
|
|
|
|
|
|
|
|
|
Total Energy |
|
|
38,806 |
|
|
|
|
|
|
|
|
|
|
|
|
|
|
Financials — 15.9% |
|
|
|
|
|
Banks — 5.8% |
|
| |
220 |
|
|
Bank of America Corp. |
|
|
3,543 |
|
| |
15 |
|
|
BB&T Corp. |
|
|
562 |
|
| |
64 |
|
|
Citigroup, Inc. |
|
|
3,286 |
|
|
|
|
|
|
|
|
|
|
| SHARES |
|
|
SECURITY DESCRIPTION |
|
VALUE($) |
|
|
|
|
|
|
|
|
|
|
|
|
|
|
|
|
|
Banks — continued |
|
| |
4 |
|
|
Comerica, Inc. |
|
|
191 |
|
| |
18 |
|
|
Fifth Third Bancorp |
|
|
363 |
|
| |
17 |
|
|
Huntington Bancshares, Inc. |
|
|
171 |
|
| |
79 |
|
|
JPMorgan Chase & Co. (q) |
|
|
4,712 |
|
| |
18 |
|
|
KeyCorp |
|
|
252 |
|
| |
3 |
|
|
M&T Bank Corp. |
|
|
336 |
|
| |
11 |
|
|
PNC Financial Services Group, Inc. (The) |
|
|
948 |
|
| |
29 |
|
|
Regions Financial Corp. |
|
|
293 |
|
| |
11 |
|
|
SunTrust Banks, Inc. |
|
|
425 |
|
| |
38 |
|
|
U.S. Bancorp |
|
|
1,607 |
|
| |
100 |
|
|
Wells Fargo & Co. |
|
|
5,163 |
|
| |
4 |
|
|
Zions Bancorp |
|
|
121 |
|
|
|
|
|
|
|
|
|
|
|
|
|
|
|
|
|
21,973 |
|
|
|
|
|
|
|
|
|
|
|
|
|
|
Capital Markets — 2.2% |
|
| |
1 |
|
|
Affiliated Managers Group, Inc. (a) |
|
|
245 |
|
| |
4 |
|
|
Ameriprise Financial, Inc. |
|
|
500 |
|
| |
24 |
|
|
Bank of New York Mellon Corp. (The) |
|
|
936 |
|
| |
3 |
|
|
BlackRock, Inc. |
|
|
866 |
|
| |
25 |
|
|
Charles Schwab Corp. (The) |
|
|
699 |
|
| |
6 |
|
|
E*TRADE Financial Corp. (a) |
|
|
134 |
|
| |
8 |
|
|
Franklin Resources, Inc. |
|
|
475 |
|
| |
9 |
|
|
Goldman Sachs Group, Inc. (The) |
|
|
1,560 |
|
| |
9 |
|
|
Invesco Ltd. |
|
|
370 |
|
| |
2 |
|
|
Legg Mason, Inc. |
|
|
106 |
|
| |
29 |
|
|
Morgan Stanley |
|
|
1,006 |
|
| |
5 |
|
|
Northern Trust Corp. |
|
|
324 |
|
| |
9 |
|
|
State Street Corp. |
|
|
650 |
|
| |
6 |
|
|
T. Rowe Price Group, Inc. |
|
|
446 |
|
|
|
|
|
|
|
|
|
|
|
|
|
|
|
|
|
8,317 |
|
|
|
|
|
|
|
|
|
|
|
|
|
|
Consumer Finance — 0.9% |
|
| |
19 |
|
|
American Express Co. (m) |
|
|
1,707 |
|
| |
12 |
|
|
Capital One Financial Corp. |
|
|
982 |
|
| |
10 |
|
|
Discover Financial Services |
|
|
609 |
|
| |
9 |
|
|
Navient Corp. |
|
|
159 |
|
|
|
|
|
|
|
|
|
|
|
|
|
|
|
|
|
3,457 |
|
|
|
|
|
|
|
|
|
|
|
|
|
|
Diversified Financial Services — 1.9% |
|
| |
38 |
|
|
Berkshire Hathaway, Inc., Class B (a) |
|
|
5,175 |
|
| |
7 |
|
|
CME Group, Inc. |
|
|
506 |
|
| |
2 |
|
|
Intercontinental Exchange, Inc. |
|
|
456 |
|
| |
7 |
|
|
Leucadia National Corp. |
|
|
166 |
|
| |
6 |
|
|
McGraw Hill Financial, Inc. |
|
|
462 |
|
| |
4 |
|
|
Moody’s Corp. |
|
|
368 |
|
| |
2 |
|
|
NASDAQ OMX Group, Inc. (The) |
|
|
107 |
|
|
|
|
|
|
|
|
|
|
|
|
|
|
|
|
|
7,240 |
|
|
|
|
|
|
|
|
|
|
SEE NOTES TO
FINANCIAL STATEMENTS.
|
|
|
|
|
|
|
|
|
|
|
|
|
| AUGUST 31, 2014 |
|
JPMORGAN INSTITUTIONAL TRUST FUNDS |
|
|
|
|
59 |
|
JPMorgan Equity Index Trust
SCHEDULE OF PORTFOLIO INVESTMENTS
AS OF AUGUST 31, 2014 (Unaudited) (continued)
(Amounts in thousands)
|
|
|
|
|
|
|
|
|
| SHARES |
|
|
SECURITY DESCRIPTION |
|
VALUE($) |
|
|
|
|
|
|
|
|
|
|
| |
Common Stocks — continued |
|
|
|
|
|
Insurance — 2.8% |
|
| |
7 |
|
|
ACE Ltd., (Switzerland) |
|
|
752 |
|
| |
10 |
|
|
Aflac, Inc. (m) |
|
|
582 |
|
| |
9 |
|
|
Allstate Corp. (The) |
|
|
559 |
|
| |
30 |
|
|
American International Group, Inc. (m) |
|
|
1,698 |
|
| |
6 |
|
|
Aon plc, (United Kingdom) |
|
|
541 |
|
| |
2 |
|
|
Assurant, Inc. |
|
|
100 |
|
| |
5 |
|
|
Chubb Corp. (The) |
|
|
471 |
|
| |
3 |
|
|
Cincinnati Financial Corp. |
|
|
148 |
|
| |
10 |
|
|
Genworth Financial, Inc., Class A (a) |
|
|
148 |
|
| |
9 |
|
|
Hartford Financial Services Group, Inc. (The) |
|
|
349 |
|
| |
6 |
|
|
Lincoln National Corp. |
|
|
304 |
|
| |
6 |
|
|
Loews Corp. |
|
|
280 |
|
| |
12 |
|
|
Marsh & McLennan Cos., Inc. |
|
|
611 |
|
| |
24 |
|
|
MetLife, Inc. |
|
|
1,290 |
|
| |
6 |
|
|
Principal Financial Group, Inc. |
|
|
311 |
|
| |
11 |
|
|
Progressive Corp. (The) |
|
|
285 |
|
| |
10 |
|
|
Prudential Financial, Inc. |
|
|
868 |
|
| |
3 |
|
|
Torchmark Corp. |
|
|
151 |
|
| |
7 |
|
|
Travelers Cos., Inc. (The) |
|
|
689 |
|
| |
5 |
|
|
Unum Group |
|
|
196 |
|
| |
6 |
|
|
XL Group plc, (Ireland) |
|
|
194 |
|
|
|
|
|
|
|
|
|
|
|
|
|
|
|
|
|
10,527 |
|
|
|
|
|
|
|
|
|
|
|
|
|
|
Real Estate Investment Trusts (REITs) — 2.2% |
|
|
|
|
| |
8 |
|
|
American Tower Corp. (m) |
|
|
817 |
|
| |
3 |
|
|
Apartment Investment & Management Co., Class A (m) |
|
|
105 |
|
| |
3 |
|
|
AvalonBay Communities, Inc. (m) |
|
|
393 |
|
| |
3 |
|
|
Boston Properties, Inc. (m) |
|
|
389 |
|
| |
7 |
|
|
Crown Castle International Corp. (m) |
|
|
556 |
|
| |
7 |
|
|
Equity Residential (m) |
|
|
468 |
|
| |
1 |
|
|
Essex Property Trust, Inc. (m) |
|
|
253 |
|
| |
11 |
|
|
General Growth Properties, Inc. (m) |
|
|
268 |
|
| |
10 |
|
|
HCP, Inc. (m) |
|
|
416 |
|
| |
6 |
|
|
Health Care REIT, Inc. (m) |
|
|
432 |
|
| |
16 |
|
|
Host Hotels & Resorts, Inc. (m) |
|
|
362 |
|
| |
9 |
|
|
Kimco Realty Corp. (m) |
|
|
202 |
|
| |
3 |
|
|
Macerich Co. (The) (m) |
|
|
192 |
|
| |
4 |
|
|
Plum Creek Timber Co., Inc. (m) |
|
|
151 |
|
| |
10 |
|
|
Prologis, Inc. (m) |
|
|
428 |
|
| |
3 |
|
|
Public Storage (m) |
|
|
532 |
|
| |
7 |
|
|
Simon Property Group, Inc. (m) |
|
|
1,106 |
|
| |
6 |
|
|
Ventas, Inc. (m) |
|
|
406 |
|
| |
4 |
|
|
Vornado Realty Trust (m) |
|
|
386 |
|
| |
11 |
|
|
Weyerhaeuser Co. (m) |
|
|
374 |
|
|
|
|
|
|
|
|
|
|
|
|
|
|
|
|
|
8,236 |
|
|
|
|
|
|
|
|
|
|
|
|
|
|
|
|
|
|
|
| SHARES |
|
|
SECURITY DESCRIPTION |
|
VALUE($) |
|
|
|
|
|
|
|
|
|
|
|
|
|
|
|
|
|
Real Estate Management & Development — 0.0% (g) |
|
| |
6 |
|
|
CBRE Group, Inc., Class A (a) |
|
|
186 |
|
|
|
|
|
|
|
|
|
|
|
|
|
|
Thrifts & Mortgage Finance — 0.1% |
|
| |
10 |
|
|
Hudson City Bancorp, Inc. |
|
|
98 |
|
| |
6 |
|
|
People’s United Financial, Inc. |
|
|
97 |
|
|
|
|
|
|
|
|
|
|
|
|
|
|
|
|
|
195 |
|
|
|
|
|
|
|
|
|
|
|
|
|
|
Total Financials |
|
|
60,131 |
|
|
|
|
|
|
|
|
|
|
|
|
|
|
Health Care — 13.5% |
|
|
|
|
|
Biotechnology — 2.8% |
|
| |
4 |
|
|
Alexion Pharmaceuticals, Inc. (a) |
|
|
701 |
|
| |
16 |
|
|
Amgen, Inc. |
|
|
2,210 |
|
| |
5 |
|
|
Biogen Idec, Inc. (a) |
|
|
1,704 |
|
| |
17 |
|
|
Celgene Corp. (a) |
|
|
1,593 |
|
| |
32 |
|
|
Gilead Sciences, Inc. (a) |
|
|
3,460 |
|
| |
2 |
|
|
Regeneron Pharmaceuticals, Inc. (a) |
|
|
585 |
|
| |
5 |
|
|
Vertex Pharmaceuticals, Inc. (a) |
|
|
463 |
|
|
|
|
|
|
|
|
|
|
|
|
|
|
|
|
|
10,716 |
|
|
|
|
|
|
|
|
|
|
|
|
|
|
Health Care Equipment & Supplies — 2.1% |
|
| |
31 |
|
|
Abbott Laboratories (m) |
|
|
1,329 |
|
| |
11 |
|
|
Baxter International, Inc. |
|
|
852 |
|
| |
4 |
|
|
Becton, Dickinson & Co. (m) |
|
|
474 |
|
| |
28 |
|
|
Boston Scientific Corp. (a) |
|
|
351 |
|
| |
2 |
|
|
C.R. Bard, Inc. |
|
|
237 |
|
| |
4 |
|
|
CareFusion Corp. (a) |
|
|
199 |
|
| |
9 |
|
|
Covidien plc, (Ireland) |
|
|
820 |
|
| |
3 |
|
|
DENTSPLY International, Inc. |
|
|
142 |
|
| |
2 |
|
|
Edwards Lifesciences Corp. (a) |
|
|
219 |
|
| |
1 |
|
|
Intuitive Surgical, Inc. (a) |
|
|
354 |
|
| |
21 |
|
|
Medtronic, Inc. |
|
|
1,336 |
|
| |
6 |
|
|
St . Jude Medical, Inc. |
|
|
390 |
|
| |
6 |
|
|
Stryker Corp. |
|
|
516 |
|
| |
2 |
|
|
Varian Medical Systems, Inc. (a) |
|
|
185 |
|
| |
4 |
|
|
Zimmer Holdings, Inc. |
|
|
349 |
|
|
|
|
|
|
|
|
|
|
|
|
|
|
|
|
|
7,753 |
|
|
|
|
|
|
|
|
|
|
|
|
|
|
Health Care Providers & Services — 2.1% |
|
| |
7 |
|
|
Aetna, Inc. |
|
|
615 |
|
| |
5 |
|
|
AmerisourceBergen Corp. |
|
|
366 |
|
| |
7 |
|
|
Cardinal Health, Inc. |
|
|
525 |
|
| |
6 |
|
|
Cigna Corp. |
|
|
532 |
|
| |
4 |
|
|
DaVita HealthCare Partners, Inc. (a) |
|
|
278 |
|
| |
16 |
|
|
Express Scripts Holding Co. (a) |
|
|
1,197 |
|
| |
3 |
|
|
Humana, Inc. |
|
|
417 |
|
| |
2 |
|
|
Laboratory Corp. of America Holdings (a) |
|
|
191 |
|
| |
5 |
|
|
McKesson Corp. |
|
|
942 |
|
| |
2 |
|
|
Patterson Cos., Inc. |
|
|
69 |
|
SEE NOTES TO
FINANCIAL STATEMENTS.
|
|
|
|
|
|
|
|
|
|
|
| 60 |
|
|
|
JPMORGAN INSTITUTIONAL TRUST FUNDS |
|
AUGUST 31, 2014 |
|
|
|
|
|
|
|
|
|
| SHARES |
|
|
SECURITY DESCRIPTION |
|
VALUE($) |
|
|
|
|
|
|
|
|
|
|
| |
Common Stocks — continued |
|
|
|
|
|
Health Care Providers & Services — continued |
|
| |
3 |
|
|
Quest Diagnostics, Inc. |
|
|
191 |
|
| |
2 |
|
|
Tenet Healthcare Corp. (a) |
|
|
125 |
|
| |
21 |
|
|
UnitedHealth Group, Inc. |
|
|
1,779 |
|
| |
6 |
|
|
WellPoint, Inc. |
|
|
682 |
|
|
|
|
|
|
|
|
|
|
|
|
|
|
|
|
|
7,909 |
|
|
|
|
|
|
|
|
|
|
|
|
|
|
Health Care Technology — 0.1% |
|
| |
6 |
|
|
Cerner Corp. (a) |
|
|
356 |
|
|
|
|
|
|
|
|
|
|
|
|
|
|
Life Sciences Tools & Services — 0.5% |
|
| |
7 |
|
|
Agilent Technologies, Inc. |
|
|
399 |
|
| |
2 |
|
|
PerkinElmer, Inc. |
|
|
106 |
|
| |
8 |
|
|
Thermo Fisher Scientific, Inc. |
|
|
1,004 |
|
| |
2 |
|
|
Waters Corp. (a) |
|
|
184 |
|
|
|
|
|
|
|
|
|
|
|
|
|
|
|
|
|
1,693 |
|
|
|
|
|
|
|
|
|
|
|
|
|
|
Pharmaceuticals — 5.9% |
|
| |
33 |
|
|
AbbVie, Inc. |
|
|
1,841 |
|
| |
6 |
|
|
Actavis plc (a) |
|
|
1,258 |
|
| |
6 |
|
|
Allergan, Inc. |
|
|
1,020 |
|
| |
35 |
|
|
Bristol-Myers Squibb Co. |
|
|
1,758 |
|
| |
21 |
|
|
Eli Lilly & Co. |
|
|
1,311 |
|
| |
4 |
|
|
Hospira, Inc. (a) |
|
|
188 |
|
| |
59 |
|
|
Johnson & Johnson |
|
|
6,145 |
|
| |
2 |
|
|
Mallinckrodt plc (a) |
|
|
193 |
|
| |
61 |
|
|
Merck & Co., Inc. |
|
|
3,678 |
|
| |
8 |
|
|
Mylan, Inc. (a) |
|
|
380 |
|
| |
3 |
|
|
Perrigo Co. plc, (Ireland) |
|
|
417 |
|
| |
134 |
|
|
Pfizer, Inc. |
|
|
3,926 |
|
| |
10 |
|
|
Zoetis, Inc. |
|
|
372 |
|
|
|
|
|
|
|
|
|
|
|
|
|
|
|
|
|
22,487 |
|
|
|
|
|
|
|
|
|
|
|
|
|
|
Total Health Care |
|
|
50,914 |
|
|
|
|
|
|
|
|
|
|
|
|
|
|
Industrials — 10.1% |
|
|
|
|
|
Aerospace & Defense — 2.5% |
|
| |
14 |
|
|
Boeing Co. (The) |
|
|
1,781 |
|
| |
7 |
|
|
General Dynamics Corp. |
|
|
841 |
|
| |
16 |
|
|
Honeywell International, Inc. (m) |
|
|
1,562 |
|
| |
2 |
|
|
L-3 Communications Holdings, Inc. |
|
|
199 |
|
| |
6 |
|
|
Lockheed Martin Corp. |
|
|
971 |
|
| |
4 |
|
|
Northrop Grumman Corp. |
|
|
571 |
|
| |
3 |
|
|
Precision Castparts Corp. |
|
|
740 |
|
| |
7 |
|
|
Raytheon Co. |
|
|
631 |
|
| |
3 |
|
|
Rockwell Collins, Inc. |
|
|
218 |
|
| |
6 |
|
|
Textron, Inc. |
|
|
222 |
|
| |
18 |
|
|
United Technologies Corp. |
|
|
1,907 |
|
|
|
|
|
|
|
|
|
|
|
|
|
|
|
|
|
9,643 |
|
|
|
|
|
|
|
|
|
|
|
|
|
|
|
|
|
|
|
| SHARES |
|
|
SECURITY DESCRIPTION |
|
VALUE($) |
|
|
|
|
|
|
|
|
|
|
|
|
|
|
|
|
|
Air Freight & Logistics — 0.7% |
|
| |
3 |
|
|
C.H. Robinson Worldwide, Inc. |
|
|
212 |
|
| |
4 |
|
|
Expeditors International of Washington, Inc. |
|
|
171 |
|
| |
6 |
|
|
FedEx Corp. |
|
|
860 |
|
| |
15 |
|
|
United Parcel Service, Inc., Class B |
|
|
1,437 |
|
|
|
|
|
|
|
|
|
|
|
|
|
|
|
|
|
2,680 |
|
|
|
|
|
|
|
|
|
|
|
|
|
|
Airlines — 0.3% |
|
| |
18 |
|
|
Delta Air Lines, Inc. |
|
|
703 |
|
| |
14 |
|
|
Southwest Airlines Co. |
|
|
464 |
|
|
|
|
|
|
|
|
|
|
|
|
|
|
|
|
|
1,167 |
|
|
|
|
|
|
|
|
|
|
|
|
|
|
Building Products — 0.1% |
|
| |
2 |
|
|
Allegion plc, (Ireland) |
|
|
97 |
|
| |
7 |
|
|
Masco Corp. |
|
|
175 |
|
|
|
|
|
|
|
|
|
|
|
|
|
|
|
|
|
272 |
|
|
|
|
|
|
|
|
|
|
|
|
|
|
Commercial Services & Supplies — 0.5% |
|
| |
4 |
|
|
ADT Corp. (The) |
|
|
134 |
|
| |
2 |
|
|
Cintas Corp. |
|
|
140 |
|
| |
4 |
|
|
Iron Mountain, Inc. |
|
|
129 |
|
| |
4 |
|
|
Pitney Bowes, Inc. |
|
|
115 |
|
| |
6 |
|
|
Republic Services, Inc. |
|
|
220 |
|
| |
2 |
|
|
Stericycle, Inc. (a) |
|
|
211 |
|
| |
10 |
|
|
Tyco International Ltd., (Switzerland) |
|
|
431 |
|
| |
9 |
|
|
Waste Management, Inc. |
|
|
425 |
|
|
|
|
|
|
|
|
|
|
|
|
|
|
|
|
|
1,805 |
|
|
|
|
|
|
|
|
|
|
|
|
|
|
Construction & Engineering — 0.1% |
|
| |
3 |
|
|
Fluor Corp. |
|
|
246 |
|
| |
3 |
|
|
Jacobs Engineering Group, Inc. (a) |
|
|
149 |
|
| |
5 |
|
|
Quanta Services, Inc. (a) |
|
|
166 |
|
|
|
|
|
|
|
|
|
|
|
|
|
|
|
|
|
561 |
|
|
|
|
|
|
|
|
|
|
|
|
|
|
Electrical Equipment — 0.6% |
|
| |
5 |
|
|
AMETEK, Inc. |
|
|
272 |
|
| |
10 |
|
|
Eaton Corp. plc |
|
|
697 |
|
| |
15 |
|
|
Emerson Electric Co. |
|
|
941 |
|
| |
3 |
|
|
Rockwell Automation, Inc. |
|
|
338 |
|
|
|
|
|
|
|
|
|
|
|
|
|
|
|
|
|
2,248 |
|
|
|
|
|
|
|
|
|
|
|
|
|
|
Industrial Conglomerates — 2.3% |
|
| |
13 |
|
|
3M Co. |
|
|
1,874 |
|
| |
13 |
|
|
Danaher Corp. |
|
|
965 |
|
| |
210 |
|
|
General Electric Co. |
|
|
5,456 |
|
| |
2 |
|
|
Roper Industries, Inc. |
|
|
315 |
|
|
|
|
|
|
|
|
|
|
|
|
|
|
|
|
|
8,610 |
|
|
|
|
|
|
|
|
|
|
|
|
|
|
Machinery — 1.6% |
|
| |
13 |
|
|
Caterpillar, Inc. |
|
|
1,426 |
|
| |
4 |
|
|
Cummins, Inc. |
|
|
520 |
|
SEE NOTES TO
FINANCIAL STATEMENTS.
|
|
|
|
|
|
|
|
|
|
|
|
|
| AUGUST 31, 2014 |
|
JPMORGAN INSTITUTIONAL TRUST FUNDS |
|
|
|
|
61 |
|
JPMorgan Equity Index Trust
SCHEDULE OF PORTFOLIO INVESTMENTS
AS OF AUGUST 31, 2014 (Unaudited) (continued)
(Amounts in thousands)
|
|
|
|
|
|
|
|
|
| SHARES |
|
|
SECURITY DESCRIPTION |
|
VALUE($) |
|
|
|
|
|
|
|
|
|
|
| |
Common Stocks — continued |
|
|
|
|
|
Machinery — continued |
|
| |
8 |
|
|
Deere & Co. |
|
|
641 |
|
| |
3 |
|
|
Dover Corp. |
|
|
306 |
|
| |
3 |
|
|
Flowserve Corp. |
|
|
218 |
|
| |
8 |
|
|
Illinois Tool Works, Inc. |
|
|
701 |
|
| |
5 |
|
|
Ingersoll-Rand plc |
|
|
316 |
|
| |
2 |
|
|
Joy Global, Inc. |
|
|
132 |
|
| |
7 |
|
|
PACCAR, Inc. |
|
|
467 |
|
| |
2 |
|
|
Pall Corp. |
|
|
194 |
|
| |
3 |
|
|
Parker-Hannifin Corp. |
|
|
360 |
|
| |
4 |
|
|
Pentair plc, (United Kingdom) |
|
|
278 |
|
| |
1 |
|
|
Snap-on, Inc. |
|
|
152 |
|
| |
3 |
|
|
Stanley Black & Decker, Inc. |
|
|
299 |
|
| |
4 |
|
|
Xylem, Inc. |
|
|
143 |
|
|
|
|
|
|
|
|
|
|
|
|
|
|
|
|
|
6,153 |
|
|
|
|
|
|
|
|
|
|
|
|
|
|
Professional Services — 0.2% |
|
| |
1 |
|
|
Dun & Bradstreet Corp. (The) |
|
|
91 |
|
| |
3 |
|
|
Equifax, Inc. |
|
|
201 |
|
| |
6 |
|
|
Nielsen N.V. |
|
|
298 |
|
| |
3 |
|
|
Robert Half International, Inc. |
|
|
145 |
|
|
|
|
|
|
|
|
|
|
|
|
|
|
|
|
|
735 |
|
|
|
|
|
|
|
|
|
|
|
|
|
|
Road & Rail — 1.0% |
|
| |
21 |
|
|
CSX Corp. |
|
|
650 |
|
| |
2 |
|
|
Kansas City Southern |
|
|
266 |
|
| |
6 |
|
|
Norfolk Southern Corp. |
|
|
694 |
|
| |
1 |
|
|
Ryder System, Inc. |
|
|
101 |
|
| |
19 |
|
|
Union Pacific Corp. |
|
|
1,997 |
|
|
|
|
|
|
|
|
|
|
|
|
|
|
|
|
|
3,708 |
|
|
|
|
|
|
|
|
|
|
|
|
|
|
Trading Companies & Distributors — 0.2% |
|
| |
6 |
|
|
Fastenal Co. |
|
|
259 |
|
| |
1 |
|
|
W.W. Grainger, Inc. |
|
|
314 |
|
|
|
|
|
|
|
|
|
|
|
|
|
|
|
|
|
573 |
|
|
|
|
|
|
|
|
|
|
|
|
|
|
Total Industrials |
|
|
38,155 |
|
|
|
|
|
|
|
|
|
|
|
|
|
|
Information Technology — 19.1% |
|
|
|
|
|
Communications Equipment — 1.6% |
|
| |
107 |
|
|
Cisco Systems, Inc. |
|
|
2,681 |
|
| |
2 |
|
|
F5 Networks, Inc. (a) |
|
|
197 |
|
| |
2 |
|
|
Harris Corp. |
|
|
159 |
|
| |
10 |
|
|
Juniper Networks, Inc. |
|
|
230 |
|
| |
5 |
|
|
Motorola Solutions, Inc. |
|
|
281 |
|
| |
35 |
|
|
QUALCOMM, Inc. |
|
|
2,690 |
|
|
|
|
|
|
|
|
|
|
|
|
|
|
|
|
|
6,238 |
|
|
|
|
|
|
|
|
|
|
|
|
|
|
Electronic Equipment, Instruments & Components — 0.4% |
|
| |
3 |
|
|
Amphenol Corp., Class A |
|
|
339 |
|
| |
27 |
|
|
Corning, Inc. |
|
|
572 |
|
|
|
|
|
|
|
|
|
|
| SHARES |
|
|
SECURITY DESCRIPTION |
|
VALUE($) |
|
|
|
|
|
|
|
|
|
|
|
|
|
|
|
|
|
Electronic Equipment, Instruments & Components — continued |
|
| |
3 |
|
|
FLIR Systems, Inc. |
|
|
100 |
|
| |
4 |
|
|
Jabil Circuit, Inc. |
|
|
84 |
|
| |
9 |
|
|
TE Connectivity Ltd., (Switzerland) |
|
|
536 |
|
|
|
|
|
|
|
|
|
|
|
|
|
|
|
|
|
1,631 |
|
|
|
|
|
|
|
|
|
|
|
|
|
|
Internet Software & Services — 3.2% |
|
| |
4 |
|
|
Akamai Technologies, Inc. (a) |
|
|
225 |
|
| |
24 |
|
|
eBay, Inc. (a) |
|
|
1,326 |
|
| |
36 |
|
|
Facebook, Inc., Class A (a) |
|
|
2,694 |
|
| |
6 |
|
|
Google, Inc., Class A (a) |
|
|
3,454 |
|
| |
6 |
|
|
Google, Inc., Class C (a) |
|
|
3,391 |
|
| |
3 |
|
|
VeriSign, Inc. (a) |
|
|
148 |
|
| |
20 |
|
|
Yahoo!, Inc. (a) |
|
|
755 |
|
|
|
|
|
|
|
|
|
|
|
|
|
|
|
|
|
11,993 |
|
|
|
|
|
|
|
|
|
|
|
|
|
|
IT Services — 3.3% |
|
| |
13 |
|
|
Accenture plc, (Ireland), Class A |
|
|
1,075 |
|
| |
1 |
|
|
Alliance Data Systems Corp. (a) |
|
|
300 |
|
| |
10 |
|
|
Automatic Data Processing, Inc. |
|
|
843 |
|
| |
13 |
|
|
Cognizant Technology Solutions Corp., Class A (a) |
|
|
583 |
|
| |
3 |
|
|
Computer Sciences Corp. |
|
|
181 |
|
| |
6 |
|
|
Fidelity National Information Services, Inc. |
|
|
342 |
|
| |
5 |
|
|
Fiserv, Inc. (a) |
|
|
337 |
|
| |
20 |
|
|
International Business Machines Corp. |
|
|
3,832 |
|
| |
21 |
|
|
MasterCard, Inc., Class A |
|
|
1,595 |
|
| |
7 |
|
|
Paychex, Inc. |
|
|
282 |
|
| |
3 |
|
|
Teradata Corp. (a) |
|
|
151 |
|
| |
3 |
|
|
Total System Services, Inc. |
|
|
109 |
|
| |
11 |
|
|
Visa, Inc., Class A |
|
|
2,237 |
|
| |
11 |
|
|
Western Union Co. (The) |
|
|
197 |
|
| |
23 |
|
|
Xerox Corp. |
|
|
316 |
|
|
|
|
|
|
|
|
|
|
|
|
|
|
|
|
|
12,380 |
|
|
|
|
|
|
|
|
|
|
|
|
|
|
Semiconductors & Semiconductor Equipment — 2.4% |
|
| |
7 |
|
|
Altera Corp. |
|
|
232 |
|
| |
7 |
|
|
Analog Devices, Inc. |
|
|
336 |
|
| |
25 |
|
|
Applied Materials, Inc. |
|
|
589 |
|
| |
5 |
|
|
Avago Technologies Ltd., (Singapore) |
|
|
433 |
|
| |
12 |
|
|
Broadcom Corp., Class A |
|
|
458 |
|
| |
1 |
|
|
First Solar, Inc. (a) |
|
|
104 |
|
| |
104 |
|
|
Intel Corp. |
|
|
3,640 |
|
| |
3 |
|
|
KLA-Tencor Corp. |
|
|
267 |
|
| |
3 |
|
|
Lam Research Corp. |
|
|
244 |
|
| |
5 |
|
|
Linear Technology Corp. |
|
|
223 |
|
| |
4 |
|
|
Microchip Technology, Inc. |
|
|
205 |
|
| |
22 |
|
|
Micron Technology, Inc. (a) |
|
|
731 |
|
SEE NOTES TO
FINANCIAL STATEMENTS.
|
|
|
|
|
|
|
|
|
|
|
| 62 |
|
|
|
JPMORGAN INSTITUTIONAL TRUST FUNDS |
|
AUGUST 31, 2014 |
|
|
|
|
|
|
|
|
|
| SHARES |
|
|
SECURITY DESCRIPTION |
|
VALUE($) |
|
|
|
|
|
|
|
|
|
|
| |
Common Stocks — continued |
|
|
|
|
|
Semiconductors & Semiconductor Equipment — continued |
|
| |
12 |
|
|
NVIDIA Corp. |
|
|
227 |
|
| |
23 |
|
|
Texas Instruments, Inc. |
|
|
1,089 |
|
| |
6 |
|
|
Xilinx, Inc. |
|
|
238 |
|
|
|
|
|
|
|
|
|
|
|
|
|
|
|
|
|
9,016 |
|
|
|
|
|
|
|
|
|
|
|
|
|
|
Software — 3.6% |
|
| |
10 |
|
|
Adobe Systems, Inc. (a) |
|
|
697 |
|
| |
5 |
|
|
Autodesk, Inc. (a) |
|
|
256 |
|
| |
7 |
|
|
CA, Inc. |
|
|
189 |
|
| |
3 |
|
|
Citrix Systems, Inc. (a) |
|
|
241 |
|
| |
7 |
|
|
Electronic Arts, Inc. (a) |
|
|
249 |
|
| |
6 |
|
|
Intuit, Inc. |
|
|
494 |
|
| |
157 |
|
|
Microsoft Corp. |
|
|
7,151 |
|
| |
72 |
|
|
Oracle Corp. |
|
|
2,986 |
|
| |
4 |
|
|
Red Hat, Inc. (a) |
|
|
242 |
|
| |
12 |
|
|
salesforce.com, Inc. (a) |
|
|
699 |
|
| |
14 |
|
|
Symantec Corp. |
|
|
352 |
|
|
|
|
|
|
|
|
|
|
|
|
|
|
|
|
|
13,556 |
|
|
|
|
|
|
|
|
|
|
|
|
|
|
Technology Hardware, Storage & Peripherals — 4.6% |
|
| |
126 |
|
|
Apple, Inc. (m) |
|
|
12,943 |
|
| |
43 |
|
|
EMC Corp. |
|
|
1,266 |
|
| |
39 |
|
|
Hewlett-Packard Co. |
|
|
1,489 |
|
| |
7 |
|
|
NetApp, Inc. |
|
|
293 |
|
| |
5 |
|
|
SanDisk Corp. |
|
|
464 |
|
| |
7 |
|
|
Seagate Technology plc, (Ireland) |
|
|
428 |
|
| |
4 |
|
|
Western Digital Corp. |
|
|
451 |
|
|
|
|
|
|
|
|
|
|
|
|
|
|
|
|
|
17,334 |
|
|
|
|
|
|
|
|
|
|
|
|
|
|
Total Information Technology |
|
|
72,148 |
|
|
|
|
|
|
|
|
|
|
|
|
|
|
Materials — 3.4% |
|
|
|
|
|
Chemicals — 2.5% |
|
| |
4 |
|
|
Air Products & Chemicals, Inc. (m) |
|
|
592 |
|
| |
1 |
|
|
Airgas, Inc. |
|
|
155 |
|
| |
1 |
|
|
CF Industries Holdings, Inc. |
|
|
281 |
|
| |
25 |
|
|
Dow Chemical Co. (The) |
|
|
1,350 |
|
| |
19 |
|
|
E.I. du Pont de Nemours & Co. |
|
|
1,271 |
|
| |
3 |
|
|
Eastman Chemical Co. |
|
|
259 |
|
| |
6 |
|
|
Ecolab, Inc. |
|
|
650 |
|
| |
3 |
|
|
FMC Corp. |
|
|
184 |
|
| |
2 |
|
|
International Flavors & Fragrances, Inc. |
|
|
173 |
|
| |
9 |
|
|
LyondellBasell Industries N.V., Class A |
|
|
997 |
|
| |
11 |
|
|
Monsanto Co. |
|
|
1,270 |
|
| |
7 |
|
|
Mosaic Co. (The) |
|
|
324 |
|
| |
3 |
|
|
PPG Industries, Inc. |
|
|
596 |
|
| |
6 |
|
|
Praxair, Inc. |
|
|
807 |
|
| |
2 |
|
|
Sherwin-Williams Co. (The) |
|
|
387 |
|
|
|
|
|
|
|
|
|
|
| SHARES |
|
|
SECURITY DESCRIPTION |
|
VALUE($) |
|
|
|
|
|
|
|
|
|
|
|
|
|
|
|
|
|
Chemicals — continued |
|
| |
2 |
|
|
Sigma-Aldrich Corp. |
|
|
259 |
|
|
|
|
|
|
|
|
|
|
|
|
|
|
|
|
|
9,555 |
|
|
|
|
|
|
|
|
|
|
|
|
|
|
Construction Materials — 0.1% |
|
| |
1 |
|
|
Martin Marietta Materials, Inc. |
|
|
167 |
|
| |
3 |
|
|
Vulcan Materials Co. |
|
|
173 |
|
|
|
|
|
|
|
|
|
|
|
|
|
|
|
|
|
340 |
|
|
|
|
|
|
|
|
|
|
|
|
|
|
Containers & Packaging — 0.2% |
|
| |
2 |
|
|
Avery Dennison Corp. |
|
|
96 |
|
| |
3 |
|
|
Ball Corp. |
|
|
187 |
|
| |
2 |
|
|
Bemis Co., Inc. |
|
|
86 |
|
| |
4 |
|
|
MeadWestvaco Corp. |
|
|
151 |
|
| |
3 |
|
|
Owens-Illinois, Inc. (a) |
|
|
107 |
|
| |
4 |
|
|
Sealed Air Corp. |
|
|
147 |
|
|
|
|
|
|
|
|
|
|
|
|
|
|
|
|
|
774 |
|
|
|
|
|
|
|
|
|
|
|
|
|
|
Metals & Mining — 0.5% |
|
| |
25 |
|
|
Alcoa, Inc. (m) |
|
|
408 |
|
| |
2 |
|
|
Allegheny Technologies, Inc. |
|
|
96 |
|
| |
22 |
|
|
Freeport -McMoRan, Inc. |
|
|
791 |
|
| |
10 |
|
|
Newmont Mining Corp. (m) |
|
|
283 |
|
| |
7 |
|
|
Nucor Corp. |
|
|
362 |
|
|
|
|
|
|
|
|
|
|
|
|
|
|
|
|
|
1,940 |
|
|
|
|
|
|
|
|
|
|
|
|
|
|
Paper & Forest Products — 0.1% |
|
| |
9 |
|
|
International Paper Co. |
|
|
439 |
|
|
|
|
|
|
|
|
|
|
|
|
|
|
Total Materials |
|
|
13,048 |
|
|
|
|
|
|
|
|
|
|
|
|
|
|
Telecommunication Services — 2.3% |
|
|
|
|
|
Diversified Telecommunication Services — 2.3% |
|
| |
109 |
|
|
AT&T, Inc. |
|
|
3,800 |
|
| |
12 |
|
|
CenturyLink, Inc. |
|
|
492 |
|
| |
21 |
|
|
Frontier Communications Corp. |
|
|
143 |
|
| |
87 |
|
|
Verizon Communications, Inc. (m) |
|
|
4,320 |
|
| |
13 |
|
|
Windstream Holdings, Inc. |
|
|
142 |
|
|
|
|
|
|
|
|
|
|
|
|
|
|
Total Telecommunication Services |
|
|
8,897 |
|
|
|
|
|
|
|
|
|
|
|
|
|
|
Utilities — 3.0% |
|
|
|
|
|
Electric Utilities — 1.7% |
|
| |
10 |
|
|
American Electric Power Co., Inc. |
|
|
549 |
|
| |
15 |
|
|
Duke Energy Corp. |
|
|
1,096 |
|
| |
7 |
|
|
Edison International |
|
|
403 |
|
| |
4 |
|
|
Entergy Corp. |
|
|
291 |
|
| |
18 |
|
|
Exelon Corp. |
|
|
601 |
|
| |
9 |
|
|
FirstEnergy Corp. |
|
|
301 |
|
| |
9 |
|
|
NextEra Energy, Inc. |
|
|
899 |
|
| |
7 |
|
|
Northeast Utilities |
|
|
304 |
|
| |
5 |
|
|
Pepco Holdings, Inc. |
|
|
145 |
|
SEE NOTES TO
FINANCIAL STATEMENTS.
|
|
|
|
|
|
|
|
|
|
|
|
|
| AUGUST 31, 2014 |
|
JPMORGAN INSTITUTIONAL TRUST FUNDS |
|
|
|
|
63 |
|
JPMorgan Equity Index Trust
SCHEDULE OF PORTFOLIO INVESTMENTS
AS OF AUGUST 31, 2014 (Unaudited) (continued)
(Amounts in thousands, except number of Futures contracts)
|
|
|
|
|
|
|
|
|
| SHARES |
|
|
SECURITY DESCRIPTION |
|
VALUE($) |
|
|
|
|
|
|
|
|
|
|
| |
Common Stocks — continued |
|
|
|
|
|
Electric Utilities — continued |
|
| |
2 |
|
|
Pinnacle West Capital Corp. (m) |
|
|
132 |
|
| |
14 |
|
|
PPL Corp. |
|
|
482 |
|
| |
19 |
|
|
Southern Co. (The) |
|
|
828 |
|
| |
11 |
|
|
Xcel Energy, Inc. |
|
|
337 |
|
|
|
|
|
|
|
|
|
|
|
|
|
|
|
|
|
6,368 |
|
|
|
|
|
|
|
|
|
|
|
|
|
|
Gas Utilities — 0.1% |
|
| |
2 |
|
|
AGL Resources, Inc. |
|
|
133 |
|
|
|
|
|
|
|
|
|
|
|
|
|
|
Independent Power & Renewable Electricity Producers — 0.1% |
|
| |
14 |
|
|
AES Corp. |
|
|
210 |
|
| |
7 |
|
|
NRG Energy, Inc. |
|
|
217 |
|
|
|
|
|
|
|
|
|
|
|
|
|
|
|
|
|
427 |
|
|
|
|
|
|
|
|
|
|
|
|
|
|
Multi-Utilities — 1.1% |
|
| |
5 |
|
|
Ameren Corp. |
|
|
203 |
|
| |
9 |
|
|
CenterPoint Energy, Inc. |
|
|
224 |
|
| |
6 |
|
|
CMS Energy Corp. |
|
|
172 |
|
| |
6 |
|
|
Consolidated Edison, Inc. |
|
|
355 |
|
| |
12 |
|
|
Dominion Resources, Inc. |
|
|
855 |
|
| |
4 |
|
|
DTE Energy Co. |
|
|
290 |
|
| |
2 |
|
|
Integrys Energy Group, Inc. |
|
|
114 |
|
| |
7 |
|
|
NiSource, Inc. |
|
|
262 |
|
| |
10 |
|
|
PG&E Corp. |
|
|
452 |
|
| |
11 |
|
|
Public Service Enterprise Group, Inc. |
|
|
396 |
|
| |
3 |
|
|
SCANA Corp. |
|
|
154 |
|
| |
5 |
|
|
Sempra Energy |
|
|
506 |
|
| |
4 |
|
|
TECO Energy, Inc. |
|
|
78 |
|
|
|
|
|
|
|
|
|
|
| SHARES |
|
|
SECURITY DESCRIPTION |
|
VALUE($) |
|
|
|
|
|
|
|
|
|
|
|
|
|
|
|
|
|
Multi-Utilities — continued |
|
| |
5 |
|
|
Wisconsin Energy Corp. |
|
|
214 |
|
|
|
|
|
|
|
|
|
|
|
|
|
|
|
|
|
4,275 |
|
|
|
|
|
|
|
|
|
|
|
|
|
|
Total Utilities |
|
|
11,203 |
|
|
|
|
|
|
|
|
|
|
|
|
|
|
Total Common Stocks
(Cost $179,688) |
|
|
372,715 |
|
|
|
|
|
|
|
|
|
|
| |
Exchange Traded Fund — 0.0% (g) |
|
|
|
|
|
U.S. Equity — 0.0% (g) |
|
| |
— |
(h) |
|
SPDR S&P 500 ETF Trust
(Cost $8) |
|
|
20 |
|
|
|
|
|
|
|
|
|
|
|
|
|
PRINCIPAL
AMOUNT($) |
|
|
|
|
|
|
| |
Short-Term Investments — 1.2% |
|
|
|
|
|
U.S. Treasury Obligation — 0.1% |
|
| |
345 |
|
|
U.S. Treasury Bills, 0.048%, 01/08/15 (k) (n) |
|
|
345 |
|
|
|
|
|
|
|
|
|
|
|
|
|
| SHARES |
|
|
|
|
|
|
|
|
|
|
Investment Company — 1.1% |
|
| |
4,312 |
|
|
JPMorgan Liquid Assets Money Market Fund, Institutional Class Shares, 0.030% (b) (l) (m) |
|
|
4,312 |
|
|
|
|
|
|
|
|
|
|
|
|
|
|
Total Short-Term Investments
(Cost $4,657) |
|
|
4,657 |
|
|
|
|
|
|
|
|
|
|
|
|
|
|
Total Investments — 99.8%
(Cost $184,353) |
|
|
377,392 |
|
|
|
|
|
Other Assets in Excess of
Liabilities — 0.2% |
|
|
731 |
|
|
|
|
|
|
|
|
|
|
|
|
|
|
NET ASSETS — 100.0% |
|
$ |
378,123 |
|
|
|
|
|
|
|
|
|
|
Percentages indicated are based on net assets.
|
|
|
|
|
|
|
|
|
|
|
|
|
|
|
|
|
| Futures Contracts |
|
NUMBER OF
CONTRACTS |
|
|
DESCRIPTION |
|
EXPIRATION
DATE |
|
|
NOTIONAL
VALUE AT
AUGUST 31, 2014 |
|
|
NET
UNREALIZED
APPRECIATION
(DEPRECIATION) |
|
|
|
|
|
Long Futures Outstanding |
|
|
|
|
|
|
|
|
|
|
|
|
| |
47 |
|
|
E-mini S&P 500 |
|
|
09/19/14 |
|
|
$ |
4,703 |
|
|
$ |
196 |
|
|
|
|
|
|
|
|
|
|
|
|
|
|
|
|
|
|
SEE NOTES TO FINANCIAL
STATEMENTS.
|
|
|
|
|
|
|
|
|
|
|
| 64 |
|
|
|
JPMORGAN INSTITUTIONAL TRUST FUNDS |
|
AUGUST 31, 2014 |
JPMorgan Intermediate Bond Trust
SCHEDULE OF PORTFOLIO INVESTMENTS
AS OF AUGUST 31, 2014 (Unaudited)
(Amounts in thousands)
|
|
|
|
|
|
|
|
|
PRINCIPAL
AMOUNT($) |
|
|
SECURITY DESCRIPTION |
|
VALUE($) |
|
|
|
|
|
|
|
|
|
|
| |
Asset-Backed Securities — 5.8% |
|
| |
96 |
|
|
Academic Loan Funding Trust, Series 2012-1A, Class A1, VAR, 0.955%, 12/27/22 (e) |
|
|
97 |
|
|
|
|
|
Ally Auto Receivables Trust, |
|
|
|
|
| |
25 |
|
|
Series 2012-1, Class A3, 0.930%, 02/16/16 |
|
|
24 |
|
| |
112 |
|
|
Series 2012-2, Class A3, 0.740%, 04/15/16 |
|
|
112 |
|
| |
344 |
|
|
Series 2013-2, Class A3, 0.790%, 01/15/18 |
|
|
344 |
|
| |
120 |
|
|
Series 2013-2, Class A4, 1.240%, 11/15/18 |
|
|
120 |
|
|
|
|
|
American Credit Acceptance Receivables Trust, |
|
|
|
|
| |
18 |
|
|
Series 2012-2, Class A, 1.890%, 07/15/16 (e) |
|
|
19 |
|
| |
16 |
|
|
Series 2012-3, Class A, 1.640%, 11/15/16 (e) |
|
|
16 |
|
| |
87 |
|
|
Series 2013-2, Class A, 1.320%, 02/15/17 (e) |
|
|
87 |
|
|
|
|
|
AmeriCredit Automobile Receivables Trust, |
|
|
|
|
| |
9 |
|
|
Series 2011-5, Class A3, 1.550%, 07/08/16 |
|
|
9 |
|
| |
15 |
|
|
Series 2012-1, Class A3, 1.230%, 09/08/16 |
|
|
15 |
|
| |
18 |
|
|
Series 2013-1, Class A2, 0.490%, 06/08/16 |
|
|
18 |
|
| |
53 |
|
|
Series 2013-1, Class A3, 0.610%, 10/10/17 |
|
|
53 |
|
| |
264 |
|
|
Series 2013-4, Class A2, 0.740%, 11/08/16 |
|
|
264 |
|
| |
157 |
|
|
Series 2013-5, Class A3, 0.900%, 09/10/18 |
|
|
158 |
|
| |
246 |
|
|
AXIS Equipment Finance Receivables II LLC, Series 2013-1A, Class A, 1.750%, 03/20/17 (e) |
|
|
246 |
|
| |
41 |
|
|
Bear Stearns Asset-Backed Securities Trust, Series 2006-SD1, Class A, VAR, 0.525%, 04/25/36 |
|
|
40 |
|
| |
45 |
|
|
BMW Vehicle Lease Trust, Series 2013-1, Class A3, 0.540%, 09/21/15 |
|
|
45 |
|
| |
170 |
|
|
BMW Vehicle Owner Trust, Series 2013-A, Class A3, 0.670%, 11/27/17 |
|
|
170 |
|
| |
100 |
|
|
Cabela’s Master Credit Card Trust, Series 2012-1A, Class A1, 1.630%,
02/18/20 (e) |
|
|
101 |
|
| |
52 |
|
|
California Republic Auto Receivables Trust, Series 2012-1, Class A, 1.180%, 08/15/17 (e) |
|
|
53 |
|
|
|
|
|
Capital Auto Receivables Asset Trust, |
|
|
|
|
| |
185 |
|
|
Series 2013-1, Class A2, 0.620%, 07/20/16 |
|
|
185 |
|
| |
250 |
|
|
Series 2013-3, Class A1B, VAR, 0.586%, 11/20/15 |
|
|
250 |
|
|
|
|
|
CarFinance Capital Auto Trust, |
|
|
|
|
| |
40 |
|
|
Series 2013-2A, Class A, 1.750%, 11/15/17 (e) |
|
|
40 |
|
| |
266 |
|
|
Series 2014-1A, Class A, 1.460%, 12/17/18 (e) |
|
|
267 |
|
| |
125 |
|
|
Series 2014-1A, Class B, 2.720%, 04/15/20 (e) |
|
|
126 |
|
|
|
|
|
|
|
|
|
|
PRINCIPAL
AMOUNT($) |
|
|
SECURITY DESCRIPTION |
|
VALUE($) |
|
|
|
|
|
|
|
|
|
|
|
|
|
| |
250 |
|
|
Carlyle Global Market Strategies Commodities Funding Ltd., (Cayman Islands),
Series 2014-1A, Class A, VAR, 2.176%, 10/15/21 (e) (i) |
|
|
250 |
|
|
|
|
|
CarMax Auto Owner Trust, |
|
|
|
|
| |
154 |
|
|
Series 2013-4, Class A3, 0.800%, 07/16/18 |
|
|
154 |
|
| |
137 |
|
|
Series 2013-4, Class A4, 1.280%, 05/15/19 |
|
|
136 |
|
| |
337 |
|
|
Series 2014-2, Class A3, 0.980%, 01/15/19 |
|
|
337 |
|
| |
121 |
|
|
Centex Home Equity Loan Trust, Series 2004-D, Class AF4, SUB, 4.680%, 06/25/32 |
|
|
125 |
|
| |
350 |
|
|
CFC 2012-1 LLC, Series 2014-2A, Class A, 1.440%, 11/16/20 (e) |
|
|
350 |
|
| |
29 |
|
|
CNH Equipment Trust, Series 2012-A, Class A3, 0.940%, 05/15/17 |
|
|
29 |
|
|
|
|
|
Concord Funding Co. LLC, |
|
|
|
|
| |
300 |
|
|
Series 2012-2, Class A, 3.145%, 01/15/17 (e) |
|
|
300 |
|
| |
100 |
|
|
Series 2013-1, Class A, 2.420%, 02/15/15 (e) |
|
|
100 |
|
|
|
|
|
CPS Auto Receivables Trust, |
|
|
|
|
| |
30 |
|
|
Series 2011-C, Class A, 4.210%, 03/15/19 (e) |
|
|
30 |
|
| |
27 |
|
|
Series 2012-A, Class A, 2.780%, 06/17/19 (e) |
|
|
27 |
|
| |
168 |
|
|
Series 2012-B, Class A, 2.520%, 09/16/19 (e) |
|
|
170 |
|
| |
368 |
|
|
Series 2014-A, Class A, 1.210%, 08/15/18 (e) |
|
|
369 |
|
| |
333 |
|
|
Series 2014-B, Class A, 1.110%, 11/15/18 (e) |
|
|
333 |
|
| |
204 |
|
|
Discover Card Execution Note Trust, Series 2012-A1, Class A1, 0.810%,
08/15/17 |
|
|
204 |
|
|
|
|
|
Exeter Automobile Receivables Trust, |
|
|
|
|
| |
72 |
|
|
Series 2013-2A, Class A, 1.490%, 11/15/17 (e) |
|
|
72 |
|
| |
263 |
|
|
Series 2014-1A, Class A, 1.290%, 05/15/18 (e) |
|
|
264 |
|
| |
175 |
|
|
Fifth Third Auto Trust, Series 2013-1, Class A3, 0.880%, 10/16/17 |
|
|
176 |
|
|
|
|
|
First Investors Auto Owner Trust, |
|
|
|
|
| |
31 |
|
|
Series 2012-2A, Class A2, 1.470%, 05/15/18 (e) |
|
|
31 |
|
| |
44 |
|
|
Series 2013-1A, Class A2, 0.900%, 10/15/18 (e) |
|
|
45 |
|
| |
238 |
|
|
Flagship Credit Auto Trust, Series 2013-2, Class A, 1.940%, 01/15/19 (e) |
|
|
238 |
|
|
|
|
|
Ford Credit Auto Lease Trust, |
|
|
|
|
| |
235 |
|
|
Series 2013-B, Class A3, 0.760%, 09/15/16 |
|
|
236 |
|
| |
100 |
|
|
Series 2013-B, Class A4, 0.960%, 10/15/16 |
|
|
100 |
|
SEE NOTES TO
FINANCIAL STATEMENTS.
|
|
|
|
|
|
|
|
|
|
|
|
|
| AUGUST 31, 2014 |
|
JPMORGAN INSTITUTIONAL TRUST FUNDS |
|
|
|
|
65 |
|
JPMorgan Intermediate Bond Trust
SCHEDULE OF PORTFOLIO INVESTMENTS
AS OF AUGUST 31, 2014 (Unaudited) (continued)
(Amounts in thousands)
|
|
|
|
|
|
|
|
|
PRINCIPAL
AMOUNT($) |
|
|
SECURITY DESCRIPTION |
|
VALUE($) |
|
|
|
|
|
|
|
|
|
|
| |
Asset-Backed Securities — continued |
|
| |
53 |
|
|
Series 2014-A, Class A2A, 0.500%, 10/15/16 |
|
|
53 |
|
| |
83 |
|
|
Series 2014-B, Class A3, 0.890%, 09/15/17 |
|
|
83 |
|
| |
33 |
|
|
Series 2014-B, Class A4, 1.100%, 11/15/17 |
|
|
33 |
|
|
|
|
|
Ford Credit Auto Owner Trust, |
|
|
|
|
| |
44 |
|
|
Series 2012-A, Class A3, 0.840%, 08/15/16 |
|
|
44 |
|
| |
80 |
|
|
Series 2012-D, Class A3, 0.510%, 04/15/17 |
|
|
80 |
|
| |
140 |
|
|
Ford Credit Floorplan Master Owner Trust, Series 2013-1, Class A2, VAR, 0.535%, 01/15/18 |
|
|
140 |
|
| |
284 |
|
|
GCAT, Series 2014-1A, Class A1, VAR, 3.228%, 07/25/19 (e) |
|
|
284 |
|
| |
63 |
|
|
GE Capital Mortgage Services, Inc. Trust, Series 1999-HE1, Class M, VAR, 6.705%, 04/25/29 |
|
|
63 |
|
|
|
|
|
GE Equipment Midticket LLC, |
|
|
|
|
| |
129 |
|
|
Series 2012-1, Class A3, 0.600%, 05/23/16 |
|
|
129 |
|
| |
60 |
|
|
Series 2012-1, Class A4, 0.780%, 09/22/20 |
|
|
60 |
|
|
|
|
|
GMAT Trust, |
|
|
|
|
| |
289 |
|
|
Series 2013-1A, Class A, SUB, 3.967%, 11/25/43 (e) |
|
|
290 |
|
| |
137 |
|
|
Series 2014-1A, Class A, SUB, 3.721%, 02/25/44 (e) |
|
|
137 |
|
| |
357 |
|
|
HLSS Servicer Advance Receivables Backed Notes, Series 2013-T7, Class AT7, 1.981%, 11/15/46 (e) |
|
|
358 |
|
|
|
|
|
HLSS Servicer Advance Receivables Trust, |
|
|
|
|
| |
244 |
|
|
Series 2012-T2, Class A2, 1.990%, 10/15/45 (e) |
|
|
246 |
|
| |
165 |
|
|
Series 2013-T1, Class A2, 1.495%, 01/16/46 (e) |
|
|
165 |
|
| |
108 |
|
|
Series 2014-T1, Class AT1, 1.244%, 01/17/45 (e) |
|
|
108 |
|
| |
167 |
|
|
Series 2014-T2, Class AT2, 2.217%, 01/15/47 (e) |
|
|
169 |
|
|
|
|
|
Honda Auto Receivables Owner Trust, |
|
|
|
|
| |
37 |
|
|
Series 2012-1, Class A3, 0.770%, 01/15/16 |
|
|
38 |
|
| |
56 |
|
|
Series 2012-1, Class A4, 0.970%, 04/16/18 |
|
|
56 |
|
| |
— |
(h) |
|
Series 2013-1, Class A2, 0.350%, 06/22/15 |
|
|
— |
(h) |
| |
382 |
|
|
Series 2013-4, Class A3, 0.690%, 09/18/17 |
|
|
382 |
|
| |
140 |
|
|
Series 2013-4, Class A4, 1.040%, 02/18/20 |
|
|
140 |
|
| |
186 |
|
|
Series 2014-2, Class A3, 0.770%, 03/19/18 |
|
|
186 |
|
|
|
|
|
HSBC Home Equity Loan Trust USA, |
|
|
|
|
| |
34 |
|
|
Series 2006-1, Class A1, VAR, 0.316%, 01/20/36 |
|
|
34 |
|
| |
39 |
|
|
Series 2007-3, Class APT, VAR, 1.356%, 11/20/36 |
|
|
39 |
|
|
|
|
|
Huntington Auto Trust, |
|
|
|
|
| |
10 |
|
|
Series 2011-1A, Class A3, 1.010%, 01/15/16 (e) |
|
|
10 |
|
|
|
|
|
|
|
|
|
|
PRINCIPAL
AMOUNT($) |
|
|
SECURITY DESCRIPTION |
|
VALUE($) |
|
|
|
|
|
|
|
|
|
|
|
|
|
| |
100 |
|
|
Series 2011-1A, Class A4, 1.310%, 11/15/16 (e) |
|
|
100 |
|
| |
44 |
|
|
Series 2012-1, Class A3, 0.810%, 09/15/16 |
|
|
44 |
|
|
|
|
|
Hyundai Auto Receivables Trust, |
|
|
|
|
| |
10 |
|
|
Series 2012-A, Class A3, 0.720%, 03/15/16 |
|
|
10 |
|
| |
49 |
|
|
Series 2012-B, Class A3, 0.620%, 09/15/16 |
|
|
49 |
|
| |
281 |
|
|
Series 2014-B, Class A3, 0.900%, 12/17/18 |
|
|
281 |
|
| |
17 |
|
|
Macquarie Equipment Funding Trust, Series 2012-A, Class A2, 0.610%, 04/20/15 (e) |
|
|
17 |
|
| |
276 |
|
|
MMCA Auto Owner Trust, Series 2012-A, Class A4, 1.570%, 08/15/17 (e) |
|
|
279 |
|
| |
135 |
|
|
Nationstar Agency Advance Funding Trust, Series 2013-T1A, Class AT1, 0.997%, 02/15/45 (e) |
|
|
135 |
|
| |
124 |
|
|
Navitas Equipment Receivables LLC, Series 2013-1, Class A, 1.950%,
11/15/16 (e) |
|
|
124 |
|
| |
122 |
|
|
Nissan Auto Lease Trust, Series 2013-B, Class A3, 0.750%, 06/15/16 |
|
|
122 |
|
|
|
|
|
Nissan Auto Receivables Owner Trust, |
|
|
|
|
| |
117 |
|
|
Series 2012-A, Class A4, 1.000%, 07/16/18 |
|
|
117 |
|
| |
1 |
|
|
Series 2013-A, Class A2, 0.370%, 09/15/15 |
|
|
1 |
|
| |
475 |
|
|
Normandy Mortgage Loan Co. LLC, Series 2013-NPL3, Class A, SUB, 4.949%, 09/16/43
(e) |
|
|
474 |
|
| |
328 |
|
|
NYMT Residential LLC, Series 2013-RP3A, Class NOTE, SUB, 4.850%, 09/25/18 (e) (i) |
|
|
328 |
|
| |
552 |
|
|
OneMain Financial Issuance Trust, Series 2014-2A, Class A, 2.470%,
09/18/24 (e) |
|
|
552 |
|
| |
150 |
|
|
Park Place Securities, Inc., Asset-Backed Pass-Through Certificates, Series 2004-MCW1,
Class M1, VAR, 1.092%, 10/25/34 |
|
|
149 |
|
| |
500 |
|
|
Progreso Receivables Funding II LLC, Series 2014-A, Class A, 3.500%, 07/08/19 (e) |
|
|
500 |
|
| |
109 |
|
|
RAMP Trust, Series 2006-RZ1, Class A3, VAR, 0.455%, 03/25/36 |
|
|
106 |
|
|
|
|
|
Santander Drive Auto Receivables Trust, |
|
|
|
|
| |
25 |
|
|
Series 2012-5, Class A3, 0.830%, 12/15/16 |
|
|
25 |
|
| |
10 |
|
|
Series 2012-6, Class A3, 0.620%, 07/15/16 |
|
|
10 |
|
| |
41 |
|
|
Securitized Asset-Backed Receivables LLC Trust, Series 2006-CB1, Class AF2, SUB, 3.509%, 01/25/36 |
|
|
31 |
|
| |
204 |
|
|
Selene Non-Performing Loans LLC, Series 2014-1A, Class A, SUB, 2.981%, 05/25/54
(e) |
|
|
204 |
|
| |
16 |
|
|
SNAAC Auto Receivables Trust, Series 2013-1A, Class A, 1.140%, 07/16/18 (e) |
|
|
16 |
|
SEE NOTES TO
FINANCIAL STATEMENTS.
|
|
|
|
|
|
|
|
|
|
|
| 66 |
|
|
|
JPMORGAN INSTITUTIONAL TRUST FUNDS |
|
AUGUST 31, 2014 |
|
|
|
|
|
|
|
|
|
PRINCIPAL
AMOUNT($) |
|
|
SECURITY DESCRIPTION |
|
VALUE($) |
|
|
|
|
|
|
|
|
|
|
| |
Asset-Backed Securities — continued |
|
|
|
|
|
Springleaf Funding Trust, |
|
|
|
|
| |
950 |
|
|
Series 2013-AA, Class A, 2.580%, 09/15/21 (e) |
|
|
957 |
|
| |
840 |
|
|
Series 2014-AA, Class A, 2.410%, 12/15/22 (e) |
|
|
839 |
|
| |
31 |
|
|
Stanwich Mortgage Loan Co. LLC, Series 2012-NPL4, Class A, 2.981%,
09/15/42 (e) |
|
|
31 |
|
| |
148 |
|
|
Stanwich Mortgage Loan Trust, Series 2013-NPL1, Class A, 2.981%,
02/16/43 (e) |
|
|
148 |
|
| |
175 |
|
|
Tidewater Auto Receivables Trust, Series 2014-AA, Class A3, 1.400%,
07/15/18 (e) |
|
|
175 |
|
| |
455 |
|
|
Toyota Auto Receivables Owner Trust, Series 2014-A, Class A2, 0.410%, 08/15/16 |
|
|
455 |
|
| |
321 |
|
|
Trafigura Securitisation Finance plc, (Ireland), Series 2012-1A, Class A, VAR, 2.555%, 10/15/15 (e) |
|
|
323 |
|
| |
360 |
|
|
Truman Capital Mortgage Loan Trust, Series 2014-NLP1, Class A1, SUB, 3.228%, 07/25/53 (e) |
|
|
360 |
|
| |
154 |
|
|
USAA Auto Owner Trust, Series 2014-1, Class A2, 0.380%, 10/17/16 |
|
|
154 |
|
|
|
|
|
Vericrest Opportunity Loan Transferee LLC, |
|
|
|
|
| |
597 |
|
|
Series 2014-NPL4, Class A1, SUB, 3.125%, 04/27/54 (e) |
|
|
597 |
|
| |
429 |
|
|
Series 2014-NPL5, Class A1, SUB, 3.228%, 09/25/58 (e) |
|
|
427 |
|
| |
85 |
|
|
Volkswagen Auto Loan Enhanced Trust, Series 2012-1, Class A3, 0.850%, 08/22/16 |
|
|
86 |
|
| |
308 |
|
|
VOLT NPL IX LLC, Series 2013-NPL3, Class A1, SUB, 4.250%, 04/25/53 (e) |
|
|
310 |
|
| |
109 |
|
|
VOLT NPL X LLC, Series 2013-NPL4, Class A1, SUB, 3.960%, 11/25/53 (e) |
|
|
110 |
|
| |
258 |
|
|
VOLT XIX LLC, Series 2013-NPL5, Class A1, SUB, 3.625%, 04/25/55 (e) |
|
|
258 |
|
| |
383 |
|
|
VOLT XV LLC, Series 2014-3A, Class A1, SUB, 3.250%, 05/26/54 (e) |
|
|
385 |
|
| |
70 |
|
|
Westgate Resorts LLC, Series 2012-1, Class A, 4.500%, 09/20/25 (e) |
|
|
71 |
|
|
|
|
|
World Omni Auto Receivables Trust, |
|
|
|
|
| |
62 |
|
|
Series 2012-A, Class A3, 0.640%, 02/15/17 |
|
|
62 |
|
| |
407 |
|
|
Series 2013-B, Class A3, 0.830%, 08/15/18 |
|
|
408 |
|
| |
127 |
|
|
Series 2013-B, Class A4, 1.320%, 01/15/20 |
|
|
127 |
|
|
|
|
|
|
|
|
|
|
|
|
|
|
Total Asset-Backed Securities
(Cost $20,150) |
|
|
20,219 |
|
|
|
|
|
|
|
|
|
|
|
|
|
|
|
|
|
|
|
PRINCIPAL
AMOUNT($) |
|
|
SECURITY DESCRIPTION |
|
VALUE($) |
|
|
|
|
|
|
|
|
|
|
| |
Collateralized Mortgage Obligations — 19.7% |
|
|
|
|
|
Agency CMO — 15.9% |
|
| |
46 |
|
|
Federal Home Loan Mortgage Corp. - Government National Mortgage Association, Series 24, Class ZE, 6.250%,
11/25/23 |
|
|
51 |
|
|
|
|
|
Federal Home Loan Mortgage Corp. REMIC, |
|
|
|
|
| |
2 |
|
|
Series 11, Class D, 9.500%, 07/15/19 |
|
|
2 |
|
| |
— |
(h) |
|
Series 41, Class I, HB, 84.000%, 05/15/20 |
|
|
— |
(h) |
| |
1 |
|
|
Series 46, Class B, 7.800%, 09/15/20 |
|
|
2 |
|
| |
— |
(h) |
|
Series 47, Class F, 10.000%, 06/15/20 |
|
|
1 |
|
| |
— |
(h) |
|
Series 85, Class C, 8.600%, 01/15/21 |
|
|
— |
(h) |
| |
2 |
|
|
Series 99, Class Z, 9.500%, 01/15/21 |
|
|
2 |
|
| |
9 |
|
|
Series 114, Class H, 6.950%, 01/15/21 |
|
|
10 |
|
| |
— |
(h) |
|
Series 1079, Class S, HB, IF, 33.473%, 05/15/21 |
|
|
1 |
|
| |
— |
(h) |
|
Series 1084, Class F, VAR, 1.105%, 05/15/21 |
|
|
— |
(h) |
| |
— |
(h) |
|
Series 1084, Class S, HB, IF, 44.528%, 05/15/21 |
|
|
1 |
|
| |
8 |
|
|
Series 1144, Class KB, 8.500%, 09/15/21 |
|
|
9 |
|
| |
— |
(h) |
|
Series 1172, Class L, HB, VAR, 1,181.250%, 11/15/21 |
|
|
— |
(h) |
| |
— |
(h) |
|
Series 1196, Class B, HB, IF, 1,180.777%, 01/15/22 |
|
|
1 |
|
| |
6 |
|
|
Series 1206, Class IA, 7.000%, 03/15/22 |
|
|
7 |
|
| |
4 |
|
|
Series 1250, Class J, 7.000%, 05/15/22 |
|
|
4 |
|
| |
14 |
|
|
Series 1343, Class LA, 8.000%, 08/15/22 |
|
|
17 |
|
| |
62 |
|
|
Series 1466, Class PZ, 7.500%, 02/15/23 |
|
|
69 |
|
| |
1 |
|
|
Series 1470, Class F, VAR, 1.668%, 02/15/23 |
|
|
1 |
|
| |
23 |
|
|
Series 1491, Class I, 7.500%, 04/15/23 |
|
|
26 |
|
| |
23 |
|
|
Series 1518, Class G, IF, 8.875%, 05/15/23 |
|
|
27 |
|
| |
20 |
|
|
Series 1541, Class O, VAR, 1.830%, 07/15/23 |
|
|
20 |
|
| |
3 |
|
|
Series 1602, Class SA, HB, IF, 22.246%, 10/15/23 |
|
|
5 |
|
| |
72 |
|
|
Series 1608, Class L, 6.500%, 09/15/23 |
|
|
79 |
|
| |
11 |
|
|
Series 1609, Class LG, IF, 16.997%, 11/15/23 |
|
|
12 |
|
| |
4 |
|
|
Series 1671, Class L, 7.000%, 02/15/24 |
|
|
5 |
|
| |
13 |
|
|
Series 1700, Class GA, PO, 02/15/24 |
|
|
12 |
|
| |
126 |
|
|
Series 1706, Class K, 7.000%, 03/15/24 |
|
|
142 |
|
| |
419 |
|
|
Series 1720, Class PL, 7.500%, 04/15/24 |
|
|
479 |
|
| |
12 |
|
|
Series 1745, Class D, 7.500%, 08/15/24 |
|
|
14 |
|
| |
26 |
|
|
Series 1798, Class F, 5.000%, 05/15/23 |
|
|
28 |
|
| |
1 |
|
|
Series 1807, Class G, 9.000%, 10/15/20 |
|
|
1 |
|
| |
131 |
|
|
Series 1927, Class PH, 7.500%, 01/15/27 |
|
|
150 |
|
| |
54 |
|
|
Series 1981, Class Z, 6.000%, 05/15/27 |
|
|
60 |
|
| |
18 |
|
|
Series 1987, Class PE, 7.500%, 09/15/27 |
|
|
20 |
|
SEE NOTES TO
FINANCIAL STATEMENTS.
|
|
|
|
|
|
|
|
|
|
|
|
|
| AUGUST 31, 2014 |
|
JPMORGAN INSTITUTIONAL TRUST FUNDS |
|
|
|
|
67 |
|
JPMorgan Intermediate Bond Trust
SCHEDULE OF PORTFOLIO INVESTMENTS
AS OF AUGUST 31, 2014 (Unaudited) (continued)
(Amounts in thousands)
|
|
|
|
|
|
|
|
|
PRINCIPAL
AMOUNT($) |
|
|
SECURITY DESCRIPTION |
|
VALUE($) |
|
|
|
|
|
|
|
|
|
|
| |
Collateralized Mortgage Obligations — continued |
|
|
|
|
|
Agency CMO — continued |
|
| |
8 |
|
|
Series 2033, Class SN, HB, IF, 28.431%, 03/15/24 |
|
|
4 |
|
| |
21 |
|
|
Series 2038, Class PN, IO, 7.000%, 03/15/28 |
|
|
4 |
|
| |
109 |
|
|
Series 2040, Class PE, 7.500%, 03/15/28 |
|
|
125 |
|
| |
18 |
|
|
Series 2056, Class TD, 6.500%, 05/15/18 |
|
|
19 |
|
| |
121 |
|
|
Series 2063, Class PG, 6.500%, 06/15/28 |
|
|
135 |
|
| |
20 |
|
|
Series 2064, Class TE, 7.000%, 06/15/28 |
|
|
23 |
|
| |
84 |
|
|
Series 2075, Class PH, 6.500%, 08/15/28 |
|
|
94 |
|
| |
81 |
|
|
Series 2075, Class PM, 6.250%, 08/15/28 |
|
|
91 |
|
| |
26 |
|
|
Series 2089, Class PJ, IO, 7.000%, 10/15/28 |
|
|
5 |
|
| |
49 |
|
|
Series 2125, Class JZ, 6.000%, 02/15/29 |
|
|
54 |
|
| |
11 |
|
|
Series 2163, Class PC, IO, 7.500%, 06/15/29 |
|
|
2 |
|
| |
231 |
|
|
Series 2169, Class TB, 7.000%, 06/15/29 |
|
|
265 |
|
| |
77 |
|
|
Series 2172, Class QC, 7.000%, 07/15/29 |
|
|
86 |
|
| |
1 |
|
|
Series 2196, Class TL, 7.500%, 11/15/29 |
|
|
1 |
|
| |
39 |
|
|
Series 2201, Class C, 8.000%, 11/15/29 |
|
|
46 |
|
| |
95 |
|
|
Series 2210, Class Z, 8.000%, 01/15/30 |
|
|
110 |
|
| |
26 |
|
|
Series 2224, Class CB, 8.000%, 03/15/30 |
|
|
31 |
|
| |
47 |
|
|
Series 2256, Class MC, 7.250%, 09/15/30 |
|
|
54 |
|
| |
66 |
|
|
Series 2259, Class ZM, 7.000%, 10/15/30 |
|
|
75 |
|
| |
58 |
|
|
Series 2271, Class PC, 7.250%, 12/15/30 |
|
|
66 |
|
| |
54 |
|
|
Series 2283, Class K, 6.500%, 12/15/23 |
|
|
60 |
|
| |
25 |
|
|
Series 2296, Class PD, 7.000%, 03/15/31 |
|
|
29 |
|
| |
13 |
|
|
Series 2306, Class K, PO, 05/15/24 |
|
|
13 |
|
| |
32 |
|
|
Series 2306, Class SE, IF, IO, 8.070%, 05/15/24 |
|
|
6 |
|
| |
30 |
|
|
Series 2333, Class HC, 6.000%, 07/15/31 |
|
|
29 |
|
| |
10 |
|
|
Series 2344, Class QG, 6.000%, 08/15/16 |
|
|
11 |
|
| |
492 |
|
|
Series 2344, Class ZD, 6.500%, 08/15/31 |
|
|
563 |
|
| |
61 |
|
|
Series 2344, Class ZJ, 6.500%, 08/15/31 |
|
|
69 |
|
| |
48 |
|
|
Series 2345, Class NE, 6.500%, 08/15/31 |
|
|
54 |
|
| |
19 |
|
|
Series 2345, Class PQ, 6.500%, 08/15/16 |
|
|
20 |
|
| |
30 |
|
|
Series 2347, Class VP, 6.500%, 03/15/20 |
|
|
32 |
|
| |
53 |
|
|
Series 2351, Class PZ, 6.500%, 08/15/31 |
|
|
59 |
|
| |
13 |
|
|
Series 2355, Class BP, 6.000%, 09/15/16 |
|
|
14 |
|
| |
14 |
|
|
Series 2360, Class PG, 6.000%, 09/15/16 |
|
|
15 |
|
| |
13 |
|
|
Series 2366, Class MD, 6.000%, 10/15/16 |
|
|
13 |
|
| |
19 |
|
|
Series 2391, Class QR, 5.500%, 12/15/16 |
|
|
20 |
|
| |
43 |
|
|
Series 2410, Class NG, 6.500%, 02/15/32 |
|
|
49 |
|
| |
68 |
|
|
Series 2410, Class OE, 6.375%, 02/15/32 |
|
|
73 |
|
| |
28 |
|
|
Series 2410, Class QX, IF, IO, 8.495%, 02/15/32 |
|
|
8 |
|
| |
109 |
|
|
Series 2412, Class SP, IF, 15.790%, 02/15/32 |
|
|
141 |
|
| |
32 |
|
|
Series 2423, Class MC, 7.000%, 03/15/32 |
|
|
36 |
|
| |
67 |
|
|
Series 2423, Class MT, 7.000%, 03/15/32 |
|
|
77 |
|
|
|
|
|
|
|
|
|
|
PRINCIPAL
AMOUNT($) |
|
|
SECURITY DESCRIPTION |
|
VALUE($) |
|
|
|
|
|
|
|
|
|
|
|
|
|
|
|
|
|
Agency CMO — continued |
|
|
|
|
| |
243 |
|
|
Series 2435, Class CJ, 6.500%, 04/15/32 |
|
|
265 |
|
| |
73 |
|
|
Series 2441, Class GF, 6.500%, 04/15/32 |
|
|
82 |
|
| |
70 |
|
|
Series 2444, Class ES, IF, IO, 7.795%, 03/15/32 |
|
|
19 |
|
| |
86 |
|
|
Series 2450, Class GZ, 7.000%, 05/15/32 |
|
|
98 |
|
| |
28 |
|
|
Series 2450, Class SW, IF, IO, 7.845%, 03/15/32 |
|
|
6 |
|
| |
126 |
|
|
Series 2455, Class GK, 6.500%, 05/15/32 |
|
|
142 |
|
| |
165 |
|
|
Series 2466, Class DH, 6.500%, 06/15/32 |
|
|
186 |
|
| |
79 |
|
|
Series 2474, Class NR, 6.500%, 07/15/32 |
|
|
89 |
|
| |
148 |
|
|
Series 2484, Class LZ, 6.500%, 07/15/32 |
|
|
167 |
|
| |
182 |
|
|
Series 2500, Class MC, 6.000%, 09/15/32 |
|
|
206 |
|
| |
262 |
|
|
Series 2512, Class PG, 5.500%, 10/15/22 |
|
|
287 |
|
| |
50 |
|
|
Series 2535, Class BK, 5.500%, 12/15/22 |
|
|
54 |
|
| |
70 |
|
|
Series 2537, Class TE, 5.500%, 12/15/17 |
|
|
74 |
|
| |
302 |
|
|
Series 2543, Class YX, 6.000%, 12/15/32 |
|
|
336 |
|
| |
398 |
|
|
Series 2568, Class KG, 5.500%, 02/15/23 |
|
|
439 |
|
| |
541 |
|
|
Series 2575, Class ME, 6.000%, 02/15/33 |
|
|
601 |
|
| |
43 |
|
|
Series 2586, Class WI, IO, 6.500%, 03/15/33 |
|
|
8 |
|
| |
— |
(h) |
|
Series 2617, Class GR, 4.500%, 05/15/18 |
|
|
— |
(h) |
| |
76 |
|
|
Series 2622, Class PE, 4.500%, 05/15/18 |
|
|
80 |
|
| |
47 |
|
|
Series 2631, Class LC, 4.500%, 06/15/18 |
|
|
50 |
|
| |
76 |
|
|
Series 2651, Class VZ, 4.500%, 07/15/18 |
|
|
79 |
|
| |
25 |
|
|
Series 2672, Class ME, 5.000%, 11/15/22 |
|
|
26 |
|
| |
— |
(h) |
|
Series 2675, Class CK, 4.000%, 09/15/18 |
|
|
— |
(h) |
| |
172 |
|
|
Series 2684, Class PO, PO, 01/15/33 |
|
|
169 |
|
| |
93 |
|
|
Series 2744, Class TU, 5.500%, 05/15/32 |
|
|
97 |
|
| |
30 |
|
|
Series 2777, Class KO, PO, 02/15/33 |
|
|
30 |
|
| |
420 |
|
|
Series 2907, Class VC, 4.500%, 05/15/34 |
|
|
425 |
|
| |
111 |
|
|
Series 2934, Class EC, PO, 02/15/20 |
|
|
110 |
|
| |
129 |
|
|
Series 2990, Class SL, HB, IF, 23.925%, 06/15/34 |
|
|
179 |
|
| |
1,222 |
|
|
Series 2990, Class UZ, 5.750%, 06/15/35 |
|
|
1,303 |
|
| |
304 |
|
|
Series 2999, Class ND, 4.500%, 07/15/20 |
|
|
322 |
|
| |
36 |
|
|
Series 3068, Class AO, PO, 01/15/35 |
|
|
36 |
|
| |
154 |
|
|
Series 3117, Class EO, PO, 02/15/36 |
|
|
141 |
|
| |
17 |
|
|
Series 3117, Class OK, PO, 02/15/36 |
|
|
15 |
|
| |
248 |
|
|
Series 3122, Class OH, PO, 03/15/36 |
|
|
235 |
|
| |
239 |
|
|
Series 3137, Class XP, 6.000%, 04/15/36 |
|
|
263 |
|
| |
6 |
|
|
Series 3149, Class SO, PO, 05/15/36 |
|
|
5 |
|
| |
332 |
|
|
Series 3152, Class MO, PO, 03/15/36 |
|
|
309 |
|
| |
142 |
|
|
Series 3171, Class MO, PO, 06/15/36 |
|
|
133 |
|
| |
61 |
|
|
Series 3179, Class OA, PO, 07/15/36 |
|
|
56 |
|
| |
486 |
|
|
Series 3202, Class HI, IF, IO, 6.495%, 08/15/36 |
|
|
71 |
|
SEE NOTES TO
FINANCIAL STATEMENTS.
|
|
|
|
|
|
|
|
|
|
|
| 68 |
|
|
|
JPMORGAN INSTITUTIONAL TRUST FUNDS |
|
AUGUST 31, 2014 |
|
|
|
|
|
|
|
|
|
PRINCIPAL
AMOUNT($) |
|
|
SECURITY DESCRIPTION |
|
VALUE($) |
|
|
|
|
|
|
|
|
|
|
| |
Collateralized Mortgage Obligations — continued |
|
|
|
|
|
Agency CMO — continued |
|
| |
81 |
|
|
Series 3232, Class ST, IF, IO, 6.545%, 10/15/36 |
|
|
10 |
|
| |
90 |
|
|
Series 3253, Class PO, PO, 12/15/21 |
|
|
90 |
|
| |
54 |
|
|
Series 3316, Class JO, PO, 05/15/37 |
|
|
50 |
|
| |
279 |
|
|
Series 3481, Class SJ, IF, IO, 5.695%, 08/15/38 |
|
|
37 |
|
| |
122 |
|
|
Series 3607, Class AO, PO, 04/15/36 |
|
|
111 |
|
| |
34 |
|
|
Series 3607, Class EO, PO, 02/15/33 |
|
|
34 |
|
| |
76 |
|
|
Series 3611, Class PO, PO, 07/15/34 |
|
|
70 |
|
| |
200 |
|
|
Series 3666, Class VA, 5.500%, 12/15/22 |
|
|
202 |
|
| |
630 |
|
|
Series 3680, Class MA, 4.500%, 07/15/39 |
|
|
688 |
|
| |
308 |
|
|
Series 3804, Class FN, VAR, 0.605%, 03/15/39 |
|
|
309 |
|
| |
737 |
|
|
Series 3819, Class ZQ, 6.000%, 04/15/36 |
|
|
828 |
|
| |
309 |
|
|
Series 3997, Class PF, VAR, 0.605%, 11/15/39 |
|
|
310 |
|
| |
928 |
|
|
Series 4219, Class JA, 3.500%, 08/15/39 |
|
|
957 |
|
|
|
|
|
Federal Home Loan Mortgage Corp. STRIPS, |
|
|
|
|
| |
44 |
|
|
Series 243, Class 16, IO, 4.500%, 11/15/20 |
|
|
3 |
|
| |
892 |
|
|
Series 262, Class 35, 3.500%, 07/15/42 |
|
|
912 |
|
| |
880 |
|
|
Series 267, Class F5, VAR, 0.655%, 08/15/42 |
|
|
882 |
|
| |
903 |
|
|
Series 274, Class F1, VAR, 0.655%, 08/15/42 |
|
|
905 |
|
| |
880 |
|
|
Series 279, Class F6, VAR, 0.605%, 09/15/42 |
|
|
878 |
|
|
|
|
|
Federal Home Loan Mortgage Corp. Structured Pass-Through Securities, |
|
|
|
|
| |
41 |
|
|
Series T-41, Class 3A, VAR, 6.539%, 07/25/32 |
|
|
47 |
|
| |
34 |
|
|
Series T-51, Class 2A, VAR, 7.500%, 08/25/42 |
|
|
41 |
|
| |
346 |
|
|
Series T-54, Class 2A, 6.500%, 02/25/43 |
|
|
410 |
|
| |
120 |
|
|
Series T-54, Class 3A, 7.000%, 02/25/43 |
|
|
146 |
|
| |
905 |
|
|
Series T-56, Class A5, 5.231%, 05/25/43 |
|
|
979 |
|
| |
30 |
|
|
Series T-58, Class APO, PO, 09/25/43 |
|
|
26 |
|
| |
244 |
|
|
Series T-76, Class 2A, VAR, 1.516%, 10/25/37 |
|
|
240 |
|
|
|
|
|
Federal National Mortgage Association - ACES, |
|
|
|
|
| |
500 |
|
|
Series 2010-M3, Class A3, VAR, 4.332%, 03/25/20 |
|
|
554 |
|
| |
452 |
|
|
Series 2012-M11, Class FA, VAR, 0.676%, 08/25/19 |
|
|
454 |
|
| |
1,000 |
|
|
Series 2012-M9, Class A2, 2.482%, 04/25/22 |
|
|
996 |
|
| |
444 |
|
|
Series 2014-M2, Class A2, VAR, 3.513%, 12/25/23 |
|
|
471 |
|
|
|
|
|
|
|
|
|
|
PRINCIPAL
AMOUNT($) |
|
|
SECURITY DESCRIPTION |
|
VALUE($) |
|
|
|
|
|
|
|
|
|
|
|
|
|
|
|
|
|
Agency CMO — continued |
|
| |
2,000 |
|
|
Series 2014-M3, Class A2, VAR, 3.501%, 01/25/24 |
|
|
2,120 |
|
| |
101 |
|
|
Federal National Mortgage Association Grantor Trust, Series 2001-T10, Class A2, 7.500%, 12/25/41 |
|
|
117 |
|
|
|
|
|
Federal National Mortgage Association REMIC, |
|
|
|
|
| |
1 |
|
|
Series 1988-7, Class Z, 9.250%, 04/25/18 |
|
|
1 |
|
| |
5 |
|
|
Series 1989-70, Class G, 8.000%, 10/25/19 |
|
|
6 |
|
| |
3 |
|
|
Series 1989-78, Class H, 9.400%, 11/25/19 |
|
|
3 |
|
| |
2 |
|
|
Series 1989-83, Class H, 8.500%, 11/25/19 |
|
|
2 |
|
| |
2 |
|
|
Series 1989-89, Class H, 9.000%, 11/25/19 |
|
|
2 |
|
| |
1 |
|
|
Series 1990-1, Class D, 8.800%, 01/25/20 |
|
|
1 |
|
| |
1 |
|
|
Series 1990-7, Class B, 8.500%, 01/25/20 |
|
|
1 |
|
| |
1 |
|
|
Series 1990-60, Class K, 5.500%, 06/25/20 |
|
|
1 |
|
| |
1 |
|
|
Series 1990-63, Class H, 9.500%, 06/25/20 |
|
|
1 |
|
| |
1 |
|
|
Series 1990-93, Class G, 5.500%, 08/25/20 |
|
|
1 |
|
| |
— |
(h) |
|
Series 1990-94, Class H, HB, 505.000%, 08/25/20 |
|
|
— |
(h) |
| |
— |
(h) |
|
Series 1990-95, Class J, HB, 1,118.040%, 08/25/20 |
|
|
— |
(h) |
| |
8 |
|
|
Series 1990-102, Class J, 6.500%, 08/25/20 |
|
|
8 |
|
| |
2 |
|
|
Series 1990-120, Class H, 9.000%, 10/25/20 |
|
|
2 |
|
| |
1 |
|
|
Series 1990-134, Class SC, HB, IF, 21.368%, 11/25/20 |
|
|
1 |
|
| |
— |
(h) |
|
Series 1990-140, Class K, HB, 652.145%, 12/25/20 |
|
|
— |
(h) |
| |
— |
(h) |
|
Series 1991-7, Class K, HB, 908.500%, 02/25/21 |
|
|
— |
(h) |
| |
2 |
|
|
Series 1991-42, Class S, IF, 17.404%, 05/25/21 |
|
|
3 |
|
| |
41 |
|
|
Series 1992-107, Class SB, HB, IF, 29.609%, 06/25/22 |
|
|
67 |
|
| |
3 |
|
|
Series 1992-143, Class MA, 5.500%, 09/25/22 |
|
|
3 |
|
| |
20 |
|
|
Series 1993-25, Class J, 7.500%, 03/25/23 |
|
|
23 |
|
| |
134 |
|
|
Series 1993-37, Class PX, 7.000%, 03/25/23 |
|
|
151 |
|
| |
49 |
|
|
Series 1993-54, Class Z, 7.000%, 04/25/23 |
|
|
55 |
|
| |
10 |
|
|
Series 1993-62, Class SA, IF, 18.975%, 04/25/23 |
|
|
15 |
|
| |
13 |
|
|
Series 1993-122, Class M, 6.500%, 07/25/23 |
|
|
14 |
|
| |
5 |
|
|
Series 1993-165, Class SD, IF, 13.440%, 09/25/23 |
|
|
6 |
|
| |
21 |
|
|
Series 1993-178, Class PK, 6.500%, 09/25/23 |
|
|
23 |
|
| |
349 |
|
|
Series 1993-183, Class KA, 6.500%, 10/25/23 |
|
|
384 |
|
SEE NOTES TO
FINANCIAL STATEMENTS.
|
|
|
|
|
|
|
|
|
|
|
|
|
| AUGUST 31, 2014 |
|
JPMORGAN INSTITUTIONAL TRUST FUNDS |
|
|
|
|
69 |
|
JPMorgan Intermediate Bond Trust
SCHEDULE OF PORTFOLIO INVESTMENTS
AS OF AUGUST 31, 2014 (Unaudited) (continued)
(Amounts in thousands)
|
|
|
|
|
|
|
|
|
PRINCIPAL
AMOUNT($) |
|
|
SECURITY DESCRIPTION |
|
VALUE($) |
|
|
|
|
|
|
|
|
|
|
| |
Collateralized Mortgage Obligations — continued |
|
|
|
|
|
Agency CMO — continued |
|
| |
149 |
|
|
Series 1993-189, Class PL, 6.500%, 10/25/23 |
|
|
167 |
|
| |
32 |
|
|
Series 1993-247, Class SA, HB, IF, 28.053%, 12/25/23 |
|
|
55 |
|
| |
24 |
|
|
Series 1993-250, Class Z, 7.000%, 12/25/23 |
|
|
24 |
|
| |
2 |
|
|
Series 1994-9, Class E, PO, 11/25/23 |
|
|
2 |
|
| |
89 |
|
|
Series 1996-14, Class SE, IF, IO, 8.260%, 08/25/23 |
|
|
19 |
|
| |
3 |
|
|
Series 1996-27, Class FC, VAR, 0.655%, 03/25/17 |
|
|
3 |
|
| |
10 |
|
|
Series 1996-59, Class J, 6.500%, 08/25/22 |
|
|
11 |
|
| |
44 |
|
|
Series 1997-20, Class IB, IO, VAR, 1.840%, 03/25/27 |
|
|
2 |
|
| |
44 |
|
|
Series 1997-20, Class IO, IO, VAR, 1.840%, 03/25/27 |
|
|
2 |
|
| |
20 |
|
|
Series 1997-27, Class J, 7.500%, 04/18/27 |
|
|
23 |
|
| |
27 |
|
|
Series 1997-29, Class J, 7.500%, 04/20/27 |
|
|
32 |
|
| |
59 |
|
|
Series 1997-39, Class PD, 7.500%, 05/20/27 |
|
|
69 |
|
| |
18 |
|
|
Series 1997-81, Class PI, IO, 7.000%, 12/18/27 |
|
|
4 |
|
| |
2 |
|
|
Series 1998-4, Class C, PO, 04/25/23 |
|
|
2 |
|
| |
16 |
|
|
Series 1998-36, Class ZB, 6.000%, 07/18/28 |
|
|
18 |
|
| |
199 |
|
|
Series 1998-43, Class EA, PO, 04/25/23 |
|
|
191 |
|
| |
114 |
|
|
Series 2000-2, Class ZE, 7.500%, 02/25/30 |
|
|
131 |
|
| |
42 |
|
|
Series 2001-4, Class PC, 7.000%, 03/25/21 |
|
|
46 |
|
| |
79 |
|
|
Series 2001-33, Class ID, IO, 6.000%, 07/25/31 |
|
|
16 |
|
| |
95 |
|
|
Series 2001-36, Class DE, 7.000%, 08/25/31 |
|
|
110 |
|
| |
20 |
|
|
Series 2001-44, Class PD, 7.000%, 09/25/31 |
|
|
23 |
|
| |
152 |
|
|
Series 2001-48, Class Z, 6.500%, 09/25/21 |
|
|
168 |
|
| |
19 |
|
|
Series 2001-49, Class Z, 6.500%, 09/25/31 |
|
|
21 |
|
| |
31 |
|
|
Series 2001-71, Class MB, 6.000%, 12/25/16 |
|
|
32 |
|
| |
35 |
|
|
Series 2001-71, Class QE, 6.000%, 12/25/16 |
|
|
36 |
|
| |
230 |
|
|
Series 2001-74, Class MB, 6.000%, 12/25/16 |
|
|
239 |
|
| |
16 |
|
|
Series 2001-81, Class LO, PO, 01/25/32 |
|
|
15 |
|
| |
46 |
|
|
Series 2002-1, Class HC, 6.500%, 02/25/22 |
|
|
51 |
|
| |
23 |
|
|
Series 2002-1, Class SA, HB, IF, 24.684%, 02/25/32 |
|
|
38 |
|
| |
19 |
|
|
Series 2002-2, Class UC, 6.000%, 02/25/17 |
|
|
20 |
|
| |
34 |
|
|
Series 2002-3, Class OG, 6.000%, 02/25/17 |
|
|
35 |
|
| |
57 |
|
|
Series 2002-21, Class PE, 6.500%, 04/25/32 |
|
|
65 |
|
| |
74 |
|
|
Series 2002-24, Class AJ, 6.000%, 04/25/17 |
|
|
77 |
|
| |
59 |
|
|
Series 2002-28, Class PK, 6.500%, 05/25/32 |
|
|
66 |
|
| |
64 |
|
|
Series 2002-37, Class Z, 6.500%, 06/25/32 |
|
|
72 |
|
| |
97 |
|
|
Series 2002-94, Class BK, 5.500%, 01/25/18 |
|
|
101 |
|
|
|
|
|
|
|
|
|
|
PRINCIPAL
AMOUNT($) |
|
|
SECURITY DESCRIPTION |
|
VALUE($) |
|
|
|
|
|
|
|
|
|
|
|
|
|
|
|
|
|
Agency CMO — continued |
|
| |
202 |
|
|
Series 2003-22, Class UD, 4.000%, 04/25/33 |
|
|
213 |
|
| |
162 |
|
|
Series 2003-34, Class GB, 6.000%, 03/25/33 |
|
|
180 |
|
| |
304 |
|
|
Series 2003-34, Class GE, 6.000%, 05/25/33 |
|
|
355 |
|
| |
14 |
|
|
Series 2003-39, Class IO, IO, VAR, 6.000%, 05/25/33 |
|
|
3 |
|
| |
239 |
|
|
Series 2003-47, Class PE, 5.750%, 06/25/33 |
|
|
264 |
|
| |
28 |
|
|
Series 2003-52, Class SX, HB, IF, 22.485%, 10/25/31 |
|
|
45 |
|
| |
29 |
|
|
Series 2003-64, Class SX, IF, 13.360%, 07/25/33 |
|
|
36 |
|
| |
126 |
|
|
Series 2003-71, Class DS, IF, 7.259%, 08/25/33 |
|
|
131 |
|
| |
98 |
|
|
Series 2003-80, Class SY, IF, IO, 7.495%, 06/25/23 |
|
|
8 |
|
| |
102 |
|
|
Series 2003-83, Class PG, 5.000%, 06/25/23 |
|
|
107 |
|
| |
24 |
|
|
Series 2003-91, Class SD, IF, 12.242%, 09/25/33 |
|
|
28 |
|
| |
203 |
|
|
Series 2003-116, Class SB, IF, IO, 7.445%, 11/25/33 |
|
|
43 |
|
| |
— |
(h) |
|
Series 2003-128, Class NG, 4.000%, 01/25/19 |
|
|
— |
(h) |
| |
24 |
|
|
Series 2003-130, Class SX, IF, 11.287%, 01/25/34 |
|
|
29 |
|
| |
219 |
|
|
Series 2004-25, Class PC, 5.500%, 01/25/34 |
|
|
233 |
|
| |
143 |
|
|
Series 2004-25, Class SA, IF, 19.099%, 04/25/34 |
|
|
200 |
|
| |
146 |
|
|
Series 2004-36, Class PC, 5.500%, 02/25/34 |
|
|
155 |
|
| |
135 |
|
|
Series 2004-36, Class SA, IF, 19.099%, 05/25/34 |
|
|
186 |
|
| |
89 |
|
|
Series 2004-46, Class SK, IF, 16.074%, 05/25/34 |
|
|
114 |
|
| |
873 |
|
|
Series 2004-50, Class VZ, 5.500%, 07/25/34 |
|
|
955 |
|
| |
72 |
|
|
Series 2004-61, Class SH, HB, IF, 23.368%, 11/25/32 |
|
|
112 |
|
| |
68 |
|
|
Series 2004-74, Class SW, IF, 15.190%, 11/25/31 |
|
|
96 |
|
| |
90 |
|
|
Series 2004-76, Class CL, 4.000%, 10/25/19 |
|
|
94 |
|
| |
132 |
|
|
Series 2005-45, Class DC, HB, IF, 23.742%, 06/25/35 |
|
|
198 |
|
| |
31 |
|
|
Series 2005-52, Class PA, 6.500%, 06/25/35 |
|
|
33 |
|
| |
100 |
|
|
Series 2005-56, Class S, IF, IO, 6.555%, 07/25/35 |
|
|
19 |
|
| |
197 |
|
|
Series 2005-56, Class TP, IF, 17.685%, 08/25/33 |
|
|
262 |
|
| |
640 |
|
|
Series 2005-68, Class PG, 5.500%, 08/25/35 |
|
|
705 |
|
| |
246 |
|
|
Series 2005-73, Class PS, IF, 16.313%, 08/25/35 |
|
|
314 |
|
SEE NOTES TO
FINANCIAL STATEMENTS.
|
|
|
|
|
|
|
|
|
|
|
| 70 |
|
|
|
JPMORGAN INSTITUTIONAL TRUST FUNDS |
|
AUGUST 31, 2014 |
|
|
|
|
|
|
|
|
|
PRINCIPAL
AMOUNT($) |
|
|
SECURITY DESCRIPTION |
|
VALUE($) |
|
|
|
|
|
|
|
|
|
|
| |
Collateralized Mortgage Obligations — continued |
|
|
|
|
|
Agency CMO — continued |
|
| |
114 |
|
|
Series 2005-74, Class CS, IF, 19.594%, 05/25/35 |
|
|
157 |
|
| |
220 |
|
|
Series 2005-106, Class US, HB, IF, 23.998%, 11/25/35 |
|
|
332 |
|
| |
747 |
|
|
Series 2005-121, Class DX, 5.500%, 01/25/26 |
|
|
822 |
|
| |
242 |
|
|
Series 2006-27, Class OH, PO, 04/25/36 |
|
|
230 |
|
| |
74 |
|
|
Series 2006-44, Class P, PO, 12/25/33 |
|
|
69 |
|
| |
452 |
|
|
Series 2006-56, Class FC, VAR, 0.445%, 07/25/36 |
|
|
452 |
|
| |
114 |
|
|
Series 2006-59, Class QO, PO, 01/25/33 |
|
|
112 |
|
| |
75 |
|
|
Series 2006-65, Class QO, PO, 07/25/36 |
|
|
70 |
|
| |
111 |
|
|
Series 2006-72, Class GO, PO, 08/25/36 |
|
|
103 |
|
| |
240 |
|
|
Series 2006-77, Class PC, 6.500%, 08/25/36 |
|
|
271 |
|
| |
91 |
|
|
Series 2006-79, Class DO, PO, 08/25/36 |
|
|
86 |
|
| |
162 |
|
|
Series 2006-110, Class PO, PO, 11/25/36 |
|
|
150 |
|
| |
309 |
|
|
Series 2006-124, Class HB, VAR, 5.974%, 11/25/36 |
|
|
315 |
|
| |
126 |
|
|
Series 2007-14, Class ES, IF, IO, 6.285%, 03/25/37 |
|
|
19 |
|
| |
92 |
|
|
Series 2007-79, Class SB, HB, IF, 23.448%, 08/25/37 |
|
|
136 |
|
| |
500 |
|
|
Series 2007-81, Class GE, 6.000%, 08/25/37 |
|
|
572 |
|
| |
239 |
|
|
Series 2007-88, Class VI, IF, IO, 6.385%, 09/25/37 |
|
|
36 |
|
| |
609 |
|
|
Series 2007-91, Class ES, IF, IO, 6.305%, 10/25/37 |
|
|
81 |
|
| |
124 |
|
|
Series 2007-106, Class A7, VAR, 6.061%, 10/25/37 |
|
|
138 |
|
| |
153 |
|
|
Series 2007-116, Class HI, IO, VAR, 1.496%, 01/25/38 |
|
|
12 |
|
| |
68 |
|
|
Series 2008-10, Class XI, IF, IO, 6.075%, 03/25/38 |
|
|
8 |
|
| |
54 |
|
|
Series 2008-16, Class IS, IF, IO, 6.045%, 03/25/38 |
|
|
9 |
|
| |
98 |
|
|
Series 2008-28, Class QS, HB, IF, 20.235%, 04/25/38 |
|
|
133 |
|
| |
136 |
|
|
Series 2008-46, Class HI, IO, VAR, 1.742%, 06/25/38 |
|
|
14 |
|
| |
129 |
|
|
Series 2009-69, Class PO, PO, 09/25/39 |
|
|
122 |
|
| |
758 |
|
|
Series 2009-71, Class BC, 4.500%, 09/25/24 |
|
|
829 |
|
| |
254 |
|
|
Series 2009-103, Class MB, VAR, 2.365%, 12/25/39 |
|
|
259 |
|
| |
435 |
|
|
Series 2010-71, Class HJ, 5.500%, 07/25/40 |
|
|
488 |
|
| |
775 |
|
|
Series 2010-133, Class A, 5.500%, 05/25/38 |
|
|
848 |
|
| |
1,000 |
|
|
Series 2011-44, Class EB, 3.000%, 05/25/26 |
|
|
1,001 |
|
|
|
|
|
|
|
|
|
|
PRINCIPAL
AMOUNT($) |
|
|
SECURITY DESCRIPTION |
|
VALUE($) |
|
|
|
|
|
|
|
|
|
|
|
|
|
|
|
|
|
Agency CMO — continued |
|
| |
561 |
|
|
Series 2011-118, Class MT, 7.000%, 11/25/41 |
|
|
645 |
|
| |
537 |
|
|
Series 2011-118, Class NT, 7.000%, 11/25/41 |
|
|
623 |
|
| |
332 |
|
|
Series 2012-47, Class HF, VAR, 0.555%, 05/25/27 |
|
|
334 |
|
| |
— |
(h) |
|
Series 2012-108, Class F, VAR, 0.655%, 10/25/42 |
|
|
— |
(h) |
| |
903 |
|
|
Series 2012-112, Class FD, VAR, 0.655%, 10/25/42 |
|
|
901 |
|
| |
473 |
|
|
Series 2013-101, Class DO, PO, 10/25/43 |
|
|
359 |
|
| |
478 |
|
|
Series 2013-128, Class PO, PO, 12/25/43 |
|
|
361 |
|
| |
2 |
|
|
Series G-14, Class L, 8.500%, 06/25/21 |
|
|
3 |
|
| |
11 |
|
|
Series G-18, Class Z, 8.750%, 06/25/21 |
|
|
12 |
|
| |
1 |
|
|
Series G-22, Class G, 6.000%, 12/25/16 |
|
|
1 |
|
| |
9 |
|
|
Series G-35, Class M, 8.750%, 10/25/21 |
|
|
10 |
|
| |
36 |
|
|
Series G92-35, Class E, 7.500%, 07/25/22 |
|
|
40 |
|
| |
2 |
|
|
Series G92-42, Class Z, 7.000%, 07/25/22 |
|
|
2 |
|
| |
23 |
|
|
Series G92-44, Class ZQ, 8.000%, 07/25/22 |
|
|
25 |
|
| |
34 |
|
|
Series G92-54, Class ZQ, 7.500%, 09/25/22 |
|
|
37 |
|
| |
8 |
|
|
Series G93-5, Class Z, 6.500%, 02/25/23 |
|
|
9 |
|
| |
12 |
|
|
Series G95-1, Class C, 8.800%, 01/25/25 |
|
|
14 |
|
|
|
|
|
Federal National Mortgage Association REMIC Trust, |
|
|
|
|
| |
154 |
|
|
Series 2003-W1, Class 1A1, VAR, 5.887%, 12/25/42 |
|
|
174 |
|
| |
37 |
|
|
Series 2003-W4, Class 2A, VAR, 6.364%, 10/25/42 |
|
|
42 |
|
| |
36 |
|
|
Series 2007-W7, Class 1A4, HB, IF, 38.250%, 07/25/37 |
|
|
55 |
|
|
|
|
|
Federal National Mortgage Association STRIPS, |
|
|
|
|
| |
— |
(h) |
|
Series 50, Class 2, IO, 10.500%, 03/25/19 |
|
|
— |
(h) |
| |
2 |
|
|
Series 218, Class 2, IO, 7.500%, 04/25/23 |
|
|
1 |
|
| |
88 |
|
|
Series 300, Class 1, PO, 09/25/24 |
|
|
84 |
|
| |
15 |
|
|
Series 329, Class 1, PO, 01/25/33 |
|
|
14 |
|
|
|
|
|
Federal National Mortgage Association Trust, |
|
|
|
|
| |
84 |
|
|
Series 2004-W2, Class 2A2, 7.000%, 02/25/44 |
|
|
97 |
|
| |
263 |
|
|
Series 2005-W3, Class 2AF, VAR, 0.375%, 03/25/45 |
|
|
263 |
|
|
|
|
|
Government National Mortgage Association, |
|
|
|
|
| |
185 |
|
|
Series 1994-7, Class PQ, 6.500%, 10/16/24 |
|
|
211 |
|
| |
277 |
|
|
Series 1999-10, Class ZC, 6.500%, 04/20/29 |
|
|
311 |
|
| |
19 |
|
|
Series 1999-30, Class S, IF, IO, 8.445%, 08/16/29 |
|
|
5 |
|
| |
30 |
|
|
Series 1999-41, Class Z, 8.000%, 11/16/29 |
|
|
35 |
|
| |
12 |
|
|
Series 2000-9, Class Z, 8.000%, 06/20/30 |
|
|
15 |
|
SEE NOTES TO
FINANCIAL STATEMENTS.
|
|
|
|
|
|
|
|
|
|
|
|
|
| AUGUST 31, 2014 |
|
JPMORGAN INSTITUTIONAL TRUST FUNDS |
|
|
|
|
71 |
|
JPMorgan Intermediate Bond Trust
SCHEDULE OF PORTFOLIO INVESTMENTS
AS OF AUGUST 31, 2014 (Unaudited) (continued)
(Amounts in thousands)
|
|
|
|
|
|
|
|
|
PRINCIPAL
AMOUNT($) |
|
|
SECURITY DESCRIPTION |
|
VALUE($) |
|
|
|
|
|
|
|
|
|
|
| |
Collateralized Mortgage Obligations — continued |
|
|
|
|
|
Agency CMO — continued |
|
| |
257 |
|
|
Series 2000-9, Class ZJ, 8.500%, 02/16/30 |
|
|
306 |
|
| |
72 |
|
|
Series 2001-7, Class PK, 6.500%, 03/20/31 |
|
|
81 |
|
| |
166 |
|
|
Series 2001-64, Class MQ, 6.500%, 12/20/31 |
|
|
191 |
|
| |
27 |
|
|
Series 2002-7, Class PG, 6.500%, 01/20/32 |
|
|
31 |
|
| |
35 |
|
|
Series 2002-31, Class S, IF, IO, 8.545%, 01/16/31 |
|
|
11 |
|
| |
102 |
|
|
Series 2002-40, Class UK, 6.500%, 06/20/32 |
|
|
116 |
|
| |
96 |
|
|
Series 2002-47, Class PG, 6.500%, 07/16/32 |
|
|
110 |
|
| |
121 |
|
|
Series 2002-47, Class PY, 6.000%, 07/20/32 |
|
|
136 |
|
| |
121 |
|
|
Series 2002-47, Class ZA, 6.500%, 07/20/32 |
|
|
139 |
|
| |
20 |
|
|
Series 2003-24, Class PO, PO, 03/16/33 |
|
|
17 |
|
| |
304 |
|
|
Series 2003-40, Class TJ, 6.500%, 03/20/33 |
|
|
354 |
|
| |
106 |
|
|
Series 2003-52, Class AP, PO, 06/16/33 |
|
|
97 |
|
| |
25 |
|
|
Series 2004-28, Class S, IF, 19.236%, 04/16/34 |
|
|
35 |
|
| |
2 |
|
|
Series 2004-68, Class PO, PO, 05/20/31 |
|
|
2 |
|
| |
65 |
|
|
Series 2004-71, Class SB, HB, IF, 28.701%, 09/20/34 |
|
|
103 |
|
| |
43 |
|
|
Series 2004-73, Class AE, IF, 14.535%, 08/17/34 |
|
|
55 |
|
| |
346 |
|
|
Series 2004-90, Class SI, IF, IO, 5.945%, 10/20/34 |
|
|
53 |
|
| |
107 |
|
|
Series 2005-68, Class DP, IF, 16.060%, 06/17/35 |
|
|
142 |
|
| |
688 |
|
|
Series 2005-68, Class KI, IF, IO, 6.145%, 09/20/35 |
|
|
102 |
|
| |
75 |
|
|
Series 2006-59, Class SD, IF, IO, 6.545%, 10/20/36 |
|
|
12 |
|
| |
275 |
|
|
Series 2007-17, Class JI, IF, IO, 6.655%, 04/16/37 |
|
|
44 |
|
| |
328 |
|
|
Series 2007-27, Class SA, IF, IO, 6.045%, 05/20/37 |
|
|
50 |
|
| |
509 |
|
|
Series 2007-40, Class SB, IF, IO, 6.595%, 07/20/37 |
|
|
72 |
|
| |
306 |
|
|
Series 2007-45, Class QA, IF, IO, 6.485%, 07/20/37 |
|
|
44 |
|
| |
311 |
|
|
Series 2007-50, Class AI, IF, IO, 6.620%, 08/20/37 |
|
|
50 |
|
| |
76 |
|
|
Series 2007-53, Class ES, IF, IO, 6.395%, 09/20/37 |
|
|
11 |
|
| |
78 |
|
|
Series 2007-53, Class SW, IF, 19.738%, 09/20/37 |
|
|
107 |
|
| |
173 |
|
|
Series 2007-57, Class QA, IF, IO, 6.345%, 10/20/37 |
|
|
24 |
|
| |
90 |
|
|
Series 2007-71, Class SB, IF, IO, 6.545%, 07/20/36 |
|
|
7 |
|
|
|
|
|
|
|
|
|
|
PRINCIPAL
AMOUNT($) |
|
|
SECURITY DESCRIPTION |
|
VALUE($) |
|
|
|
|
|
|
|
|
|
|
|
|
|
|
|
|
|
Agency CMO — continued |
|
| |
161 |
|
|
Series 2007-72, Class US, IF, IO, 6.395%, 11/20/37 |
|
|
22 |
|
| |
159 |
|
|
Series 2007-76, Class SA, IF, IO, 6.374%, 11/20/37 |
|
|
24 |
|
| |
46 |
|
|
Series 2008-25, Class SB, IF, IO, 6.744%, 03/20/38 |
|
|
7 |
|
| |
93 |
|
|
Series 2008-33, Class XS, IF, IO, 7.545%, 04/16/38 |
|
|
21 |
|
| |
264 |
|
|
Series 2008-40, Class SA, IF, IO, 6.245%, 05/16/38 |
|
|
48 |
|
| |
421 |
|
|
Series 2008-50, Class KB, 6.000%, 06/20/38 |
|
|
472 |
|
| |
221 |
|
|
Series 2008-55, Class SA, IF, IO, 6.045%, 06/20/38 |
|
|
31 |
|
| |
225 |
|
|
Series 2008-93, Class AS, IF, IO, 5.545%, 12/20/38 |
|
|
29 |
|
| |
87 |
|
|
Series 2009-6, Class SA, IF, IO, 5.945%, 02/16/39 |
|
|
13 |
|
| |
99 |
|
|
Series 2009-14, Class NI, IO, 6.500%, 03/20/39 |
|
|
20 |
|
| |
347 |
|
|
Series 2009-22, Class SA, IF, IO, 6.114%, 04/20/39 |
|
|
42 |
|
| |
312 |
|
|
Series 2009-31, Class ST, IF, IO, 6.194%, 03/20/39 |
|
|
36 |
|
| |
312 |
|
|
Series 2009-31, Class TS, IF, IO, 6.145%, 03/20/39 |
|
|
35 |
|
| |
258 |
|
|
Series 2009-79, Class OK, PO, 11/16/37 |
|
|
241 |
|
| |
512 |
|
|
Series 2009-106, Class ST, IF, IO, 5.844%, 02/20/38 |
|
|
69 |
|
| |
143 |
|
|
Series 2010-14, Class AO, PO, 12/20/32 |
|
|
140 |
|
| |
172 |
|
|
Series 2010-130, Class CP, 7.000%, 10/16/40 |
|
|
202 |
|
| |
596 |
|
|
Series 2011-137, Class WA, VAR, 5.522%, 07/20/40 |
|
|
676 |
|
| |
488 |
|
|
Series 2012-H21, Class DF, VAR, 0.805%, 05/20/61 |
|
|
489 |
|
| |
406 |
|
|
Series 2012-H24, Class FA, VAR, 0.606%, 03/20/60 |
|
|
407 |
|
| |
485 |
|
|
Series 2012-H26, Class MA, VAR, 0.706%, 07/20/62 |
|
|
486 |
|
| |
848 |
|
|
Series 2013-91, Class WA, VAR, 4.519%, 04/20/43 |
|
|
912 |
|
| |
377 |
|
|
Series 2013-H03, Class FA, VAR, 0.455%, 08/20/60 |
|
|
376 |
|
| |
498 |
|
|
Series 2013-H07, Class JA, 1.750%, 03/20/63 |
|
|
494 |
|
| |
115 |
|
|
NCUA Guaranteed Notes Trust, Series 2010-R3, Class 3A, 2.400%,
12/08/20 |
|
|
116 |
|
|
|
|
|
Vendee Mortgage Trust, |
|
|
|
|
| |
541 |
|
|
Series 1993-1, Class ZB, 7.250%, 02/15/23 |
|
|
621 |
|
SEE NOTES TO
FINANCIAL STATEMENTS.
|
|
|
|
|
|
|
|
|
|
|
| 72 |
|
|
|
JPMORGAN INSTITUTIONAL TRUST FUNDS |
|
AUGUST 31, 2014 |
|
|
|
|
|
|
|
|
|
PRINCIPAL
AMOUNT($) |
|
|
SECURITY DESCRIPTION |
|
VALUE($) |
|
|
|
|
|
|
|
|
|
|
| |
Collateralized Mortgage Obligations — continued |
|
|
|
|
|
Agency CMO — continued |
|
| |
240 |
|
|
Series 1994-1, Class 1, VAR, 5.576%, 02/15/24 |
|
|
263 |
|
| |
345 |
|
|
Series 1996-1, Class 1Z, 6.750%, 02/15/26 |
|
|
395 |
|
| |
116 |
|
|
Series 1996-2, Class 1Z, 6.750%, 06/15/26 |
|
|
134 |
|
| |
461 |
|
|
Series 1997-1, Class 2Z, 7.500%, 02/15/27 |
|
|
543 |
|
| |
113 |
|
|
Series 1998-1, Class 2E, 7.000%, 03/15/28 |
|
|
132 |
|
|
|
|
|
|
|
|
|
|
|
|
|
|
|
|
|
55,442 |
|
|
|
|
|
|
|
|
|
|
|
|
|
|
Non-Agency CMO — 3.8% |
|
|
|
|
|
|
|
|
Alternative Loan Trust, |
|
|
|
|
| |
1,836 |
|
|
Series 2004-2CB, Class 1A9, 5.750%, 03/25/34 |
|
|
1,880 |
|
| |
4 |
|
|
Series 2004-18CB, Class 2A4, 5.700%, 09/25/34 |
|
|
4 |
|
| |
348 |
|
|
Series 2005-54CB, Class 1A11, 5.500%, 11/25/35 |
|
|
322 |
|
| |
13 |
|
|
American General Mortgage Loan Trust, Series 2009-1, Class A7, VAR, 5.750%, 09/25/48 (e) |
|
|
13 |
|
|
|
|
|
ASG Resecuritization Trust, |
|
|
|
|
| |
104 |
|
|
Series 2009-1, Class A60, VAR, 2.056%, 06/26/37 (e) |
|
|
102 |
|
| |
26 |
|
|
Series 2009-2, Class A55, VAR, 4.872%, 05/24/36 (e) |
|
|
26 |
|
| |
287 |
|
|
Series 2009-3, Class A65, VAR, 2.066%, 03/26/37 (e) |
|
|
287 |
|
|
|
|
|
Banc of America Alternative Loan Trust, |
|
|
|
|
| |
78 |
|
|
Series 2003-7, Class 2A4, 5.000%, 09/25/18 |
|
|
79 |
|
| |
30 |
|
|
Series 2003-9, Class 1CB2, 5.500%, 11/25/33 |
|
|
30 |
|
| |
36 |
|
|
Series 2003-11, Class PO, PO, 01/25/34 |
|
|
31 |
|
| |
34 |
|
|
Banc of America Funding Trust, Series 2004-1, Class PO, PO, 03/25/34 |
|
|
27 |
|
|
|
|
|
Banc of America Mortgage Trust, |
|
|
|
|
| |
17 |
|
|
Series 2003-8, Class APO, PO, 11/25/33 |
|
|
13 |
|
| |
20 |
|
|
Series 2004-1, Class APO, PO, 02/25/34 |
|
|
18 |
|
| |
53 |
|
|
Series 2004-3, Class 1A26, 5.500%, 04/25/34 |
|
|
54 |
|
| |
24 |
|
|
Series 2004-6, Class APO, PO, 07/25/34 |
|
|
22 |
|
|
|
|
|
BCAP LLC Trust, |
|
|
|
|
| |
336 |
|
|
Series 2010-RR7, Class 2A1, VAR, 2.073%, 07/26/45 (e) |
|
|
338 |
|
| |
306 |
|
|
Series 2011-RR10, Class 2A1, VAR, 1.007%, 09/26/37 (e) |
|
|
280 |
|
| |
23 |
|
|
Series 2011-RR5, Class 14A3, VAR, 2.501%, 07/26/36 (e) |
|
|
23 |
|
| |
190 |
|
|
Series 2012-RR2, Class 1A1, VAR, 0.325%, 08/26/36 (e) |
|
|
186 |
|
|
|
|
|
|
|
|
|
|
PRINCIPAL
AMOUNT($) |
|
|
SECURITY DESCRIPTION |
|
VALUE($) |
|
|
|
|
|
|
|
|
|
|
|
|
|
|
|
|
|
Non-Agency CMO — continued |
|
| |
108 |
|
|
Bear Stearns ARM Trust, Series 2005-5, Class A1, VAR, 2.180%, 08/25/35 |
|
|
110 |
|
| |
188 |
|
|
CAM Mortgage Trust, Series 2014-2, Class A, SUB, 2.600%, 05/15/48 (e) |
|
|
187 |
|
|
|
|
|
CHL Mortgage Pass-Through Trust, |
|
|
|
|
| |
12 |
|
|
Series 2003-J13, Class PO, PO, 01/25/34 |
|
|
11 |
|
| |
22 |
|
|
Series 2003-J7, Class 4A3, IF, 9.572%, 08/25/18 |
|
|
23 |
|
| |
79 |
|
|
Series 2004-5, Class 1A4, 5.500%, 06/25/34 |
|
|
85 |
|
| |
31 |
|
|
Series 2004-HYB3, Class 2A, VAR, 2.329%, 06/20/34 |
|
|
30 |
|
| |
328 |
|
|
Series 2005-22, Class 2A1, VAR, 2.554%, 11/25/35 |
|
|
279 |
|
|
|
|
|
Citigroup Mortgage Loan Trust, |
|
|
|
|
| |
144 |
|
|
Series 2008-AR4, Class 1A1A, VAR, 2.734%, 11/25/38 (e) |
|
|
145 |
|
| |
428 |
|
|
Series 2010-8, Class 5A6, 4.000%, 11/25/36 (e) |
|
|
441 |
|
| |
230 |
|
|
Series 2010-8, Class 6A6, 4.500%, 12/25/36 (e) |
|
|
236 |
|
|
|
|
|
Citigroup Mortgage Loan Trust, Inc., |
|
|
|
|
| |
30 |
|
|
Series 2003-UP3, Class A3, 7.000%, 09/25/33 |
|
|
31 |
|
| |
24 |
|
|
Series 2003-UST1, Class A1, 5.500%, 12/25/18 |
|
|
24 |
|
| |
3 |
|
|
Series 2003-UST1, Class PO1, PO, 12/25/18 |
|
|
3 |
|
| |
4 |
|
|
Series 2003-UST1, Class PO3, PO, 12/25/18 |
|
|
4 |
|
| |
41 |
|
|
Credit Suisse First Boston Mortgage Securities Corp., Series 2003-23, Class 2A5, 5.000%, 10/25/18 |
|
|
42 |
|
|
|
|
|
CSMC, |
|
|
|
|
| |
723 |
|
|
Series 2010-11R, Class A6, VAR, 1.156%, 06/28/47 (e) |
|
|
693 |
|
| |
125 |
|
|
Series 2011-9R, Class A1, VAR, 2.155%, 03/27/46 (e) |
|
|
125 |
|
| |
99 |
|
|
Series 2011-16R, Class 7A3, VAR, 3.500%, 12/27/36 (e) |
|
|
100 |
|
| |
149 |
|
|
Deutsche Alt-A Securities, Inc., Mortgage Loan Trust, Series 2005-3, Class 1A1, VAR, 5.347%, 06/25/20 |
|
|
150 |
|
| |
15 |
|
|
Deutsche Mortgage Securities, Inc., Mortgage Loan Trust, Series 2004-1, Class 2APO, PO, 10/25/18 |
|
|
14 |
|
| |
85 |
|
|
FDIC Trust, Series 2013-N1, Class A, 4.500%, 10/25/18 (e) |
|
|
86 |
|
|
|
|
|
First Horizon Mortgage Pass-Through Trust, |
|
|
|
|
| |
147 |
|
|
Series 2004-AR7, Class 2A2, VAR, 2.552%, 02/25/35 |
|
|
147 |
|
SEE NOTES TO
FINANCIAL STATEMENTS.
|
|
|
|
|
|
|
|
|
|
|
|
|
| AUGUST 31, 2014 |
|
JPMORGAN INSTITUTIONAL TRUST FUNDS |
|
|
|
|
73 |
|
JPMorgan Intermediate Bond Trust
SCHEDULE OF PORTFOLIO INVESTMENTS
AS OF AUGUST 31, 2014 (Unaudited) (continued)
(Amounts in thousands)
|
|
|
|
|
|
|
|
|
PRINCIPAL
AMOUNT($) |
|
|
SECURITY DESCRIPTION |
|
VALUE($) |
|
|
|
|
|
|
|
|
|
|
| |
Collateralized Mortgage Obligations — continued |
|
|
|
|
|
Non-Agency CMO — continued |
|
| |
166 |
|
|
Series 2005-AR1, Class 2A2, VAR, 2.575%, 04/25/35 |
|
|
167 |
|
| |
317 |
|
|
GSR Mortgage Loan Trust, Series 2006-1F, Class 1A3, 5.500%, 02/25/36 |
|
|
296 |
|
| |
51 |
|
|
Impac Secured Assets CMN Owner Trust, Series 2002-2, Class APO, PO,
04/25/33 |
|
|
29 |
|
| |
255 |
|
|
IndyMac INDX Mortgage Loan Trust, Series 2005-AR11, Class A7, IO, VAR, 0.000%,
08/25/35 |
|
|
— |
(h) |
|
|
|
|
JP Morgan Mortgage Trust, |
|
|
|
|
| |
70 |
|
|
Series 2006-A2, Class 4A1, VAR, 2.495%, 08/25/34 |
|
|
70 |
|
| |
248 |
|
|
Series 2006-A2, Class 5A3, VAR, 2.518%, 11/25/33 |
|
|
248 |
|
|
|
|
|
MASTR Adjustable Rate Mortgages Trust, |
|
|
|
|
| |
47 |
|
|
Series 2004-3, Class 4A2, VAR, 2.327%, 04/25/34 |
|
|
44 |
|
| |
201 |
|
|
Series 2004-13, Class 2A1, VAR, 2.642%, 04/21/34 |
|
|
203 |
|
|
|
|
|
MASTR Alternative Loan Trust, |
|
|
|
|
| |
155 |
|
|
Series 2003-9, Class 8A1, 6.000%, 01/25/34 |
|
|
155 |
|
| |
382 |
|
|
Series 2004-4, Class 10A1, 5.000%, 05/25/24 |
|
|
405 |
|
| |
27 |
|
|
Series 2004-7, Class 30PO, PO, 08/25/34 |
|
|
22 |
|
| |
29 |
|
|
Series 2004-10, Class 1A1, 4.500%, 09/25/19 |
|
|
29 |
|
| |
135 |
|
|
Series 2005-6, Class 3A1, 5.500%, 11/25/20 |
|
|
133 |
|
|
|
|
|
MASTR Asset Securitization Trust, |
|
|
|
|
| |
55 |
|
|
Series 2003-2, Class 1A1, 5.000%, 03/25/18 |
|
|
55 |
|
| |
8 |
|
|
Series 2004-8, Class PO, PO, 08/25/19 |
|
|
7 |
|
| |
76 |
|
|
MASTR Resecuritization Trust, Series 2005-PO, Class 3PO, PO, 05/28/35 (e) |
|
|
60 |
|
|
|
|
|
Merrill Lynch Mortgage Investors Trust, |
|
|
|
|
| |
86 |
|
|
Series 2003-E, Class A1, VAR, 0.775%, 10/25/28 |
|
|
85 |
|
| |
124 |
|
|
Series 2004-A, Class A1, VAR, 0.615%, 04/25/29 |
|
|
119 |
|
| |
51 |
|
|
MortgageIT Trust, Series 2005-1, Class 1A1, VAR, 0.475%, 02/25/35 |
|
|
50 |
|
| |
66 |
|
|
NACC Reperforming Loan REMIC Trust, Series 2004-R2, Class A1, VAR, 6.500%,
10/25/34 (e) |
|
|
67 |
|
|
|
|
|
Nomura Asset Acceptance Corp. Alternative Loan Trust, |
|
|
|
|
| |
47 |
|
|
Series 2003-A1, Class A1, 5.500%, 05/25/33 |
|
|
49 |
|
|
|
|
|
|
|
|
|
|
PRINCIPAL
AMOUNT($) |
|
|
SECURITY DESCRIPTION |
|
VALUE($) |
|
|
|
|
|
|
|
|
|
|
|
|
|
|
|
|
|
Non-Agency CMO — continued |
|
| |
23 |
|
|
Series 2003-A1, Class A2, 6.000%, 05/25/33 |
|
|
24 |
|
| |
10 |
|
|
Series 2003-A1, Class A5, 7.000%, 04/25/33 |
|
|
10 |
|
| |
— |
(h) |
|
PaineWebber CMO Trust, Series H, Class 4, 8.750%, 04/01/18 |
|
|
— |
(h) |
|
|
|
|
RALI Trust, |
|
|
|
|
| |
25 |
|
|
Series 2002-QS16, Class A3, IF, 16.299%, 10/25/17 |
|
|
26 |
|
| |
125 |
|
|
Series 2002-QS8, Class A5, 6.250%, 06/25/17 |
|
|
127 |
|
| |
37 |
|
|
Series 2003-QS3, Class A2, IF, 16.159%, 02/25/18 |
|
|
42 |
|
| |
142 |
|
|
Series 2003-QS9, Class A3, IF, IO, 7.395%, 05/25/18 |
|
|
15 |
|
| |
161 |
|
|
Series 2004-QS3, Class CB, 5.000%, 03/25/19 |
|
|
164 |
|
| |
118 |
|
|
Reperforming Loan REMIC Trust, Series 2005-R1, Class 2APO, PO, 03/25/35 (e) |
|
|
103 |
|
| |
13 |
|
|
Residential Asset Securitization Trust, Series 2003-A14, Class A1, 4.750%, 02/25/19 |
|
|
13 |
|
|
|
|
|
Salomon Brothers Mortgage Securities VII, Inc., |
|
|
|
|
| |
70 |
|
|
Series 2003-HYB1, Class A, VAR, 2.612%, 09/25/33 |
|
|
71 |
|
| |
6 |
|
|
Series 2003-UP2, Class PO1, PO, 12/25/18 |
|
|
5 |
|
|
|
|
|
Springleaf Mortgage Loan Trust, |
|
|
|
|
| |
128 |
|
|
Series 2011-1A, Class A1, VAR, 4.050%, 01/25/58 (e) |
|
|
133 |
|
| |
255 |
|
|
Series 2012-2A, Class A, VAR, 2.220%, 10/25/57 (e) |
|
|
258 |
|
| |
193 |
|
|
Series 2012-3A, Class A, VAR, 1.570%, 12/25/59 (e) |
|
|
193 |
|
| |
103 |
|
|
Series 2012-3A, Class M1, VAR, 2.660%, 12/25/59 (e) |
|
|
103 |
|
| |
130 |
|
|
Series 2013-1A, Class A, VAR, 1.270%, 06/25/58 (e) |
|
|
130 |
|
| |
273 |
|
|
Series 2013-2A, Class A, VAR, 1.780%, 12/25/65 (e) |
|
|
273 |
|
| |
125 |
|
|
Series 2013-2A, Class M1, VAR, 3.520%, 12/25/65 (e) |
|
|
128 |
|
| |
213 |
|
|
Series 2013-3A, Class A, VAR, 1.870%, 09/25/57 (e) |
|
|
213 |
|
| |
306 |
|
|
Series 2013-3A, Class M1, VAR, 3.790%, 09/25/57 (e) |
|
|
308 |
|
| |
110 |
|
|
Structured Asset Securities Corp. Mortgage Pass-Through Certificates, Series 2003-33H,
Class 1A1, 5.500%, 10/25/33 |
|
|
113 |
|
| |
64 |
|
|
Structured Asset Securities Corp. Trust, Series 2005-6, Class 4A1, 5.000%, 05/25/35 |
|
|
65 |
|
SEE NOTES TO
FINANCIAL STATEMENTS.
|
|
|
|
|
|
|
|
|
|
|
| 74 |
|
|
|
JPMORGAN INSTITUTIONAL TRUST FUNDS |
|
AUGUST 31, 2014 |
|
|
|
|
|
|
|
|
|
PRINCIPAL
AMOUNT($) |
|
|
SECURITY DESCRIPTION |
|
VALUE($) |
|
|
|
|
|
|
|
|
|
|
| |
Collateralized Mortgage Obligations — continued |
|
|
|
|
|
Non-Agency CMO — continued |
|
|
|
|
|
WaMu Mortgage Pass-Through Certificates Trust, |
|
|
|
|
| |
30 |
|
|
Series 2002-S8, Class 2A7, 5.250%, 01/25/18 |
|
|
30 |
|
| |
148 |
|
|
Series 2003-AR5, Class A7, VAR, 2.443%, 06/25/33 |
|
|
151 |
|
| |
79 |
|
|
Series 2004-AR3, Class A2, VAR, 2.377%, 06/25/34 |
|
|
80 |
|
| |
281 |
|
|
Washington Mutual Mortgage Pass-Through Certificates WMALT Trust, Series 2005-4, Class CB7, 5.500%, 06/25/35 |
|
|
262 |
|
|
|
|
|
Washington Mutual MSC Mortgage Pass-Through Certificates Trust, |
|
|
|
|
| |
36 |
|
|
Series 2003-MS2, Class 1A1, 5.750%, 02/25/33 |
|
|
38 |
|
| |
9 |
|
|
Series 2003-MS7, Class P, PO, 03/25/33 |
|
|
7 |
|
| |
211 |
|
|
Wells Fargo Mortgage Loan Trust, Series 2012-RR1, Class A1, VAR, 2.847%, 08/27/37
(e) |
|
|
212 |
|
|
|
|
|
Wells Fargo Mortgage-Backed Securities Trust, |
|
|
|
|
| |
58 |
|
|
Series 2003-K, Class 1A1, VAR, 2.491%, 11/25/33 |
|
|
59 |
|
| |
94 |
|
|
Series 2004-EE, Class 3A1, VAR, 2.533%, 12/25/34 |
|
|
95 |
|
| |
302 |
|
|
Series 2004-P, Class 2A1, VAR, 2.613%, 09/25/34 |
|
|
308 |
|
| |
501 |
|
|
Series 2005-AR3, Class 1A1, VAR, 2.619%, 03/25/35 |
|
|
510 |
|
|
|
|
|
|
|
|
|
|
|
|
|
|
|
|
|
13,263 |
|
|
|
|
|
|
|
|
|
|
|
|
|
|
Total Collateralized Mortgage Obligations
(Cost $65,427) |
|
|
68,705 |
|
|
|
|
|
|
|
|
|
|
| |
Commercial Mortgage-Backed Securities — 2.0% |
|
|
|
|
|
|
|
|
A10 Term Asset Financing LLC, |
|
|
|
|
| |
429 |
|
|
Series 2013-2, Class A, 2.620%, 11/15/27 (e) |
|
|
428 |
|
| |
250 |
|
|
Series 2014-1, Class A1, 1.720%, 04/15/33 (e) |
|
|
251 |
|
|
|
|
|
Banc of America Commercial Mortgage Trust, |
|
|
|
|
| |
50 |
|
|
Series 2006-1, Class A4, VAR, 5.372%, 09/10/45 |
|
|
52 |
|
| |
290 |
|
|
Series 2006-4, Class A4, 5.634%, 07/10/46 |
|
|
308 |
|
| |
300 |
|
|
Series 2007-5, Class A4, 5.492%, 02/10/51 |
|
|
324 |
|
| |
150 |
|
|
Banc of America Merrill Lynch Commercial Mortgage, Inc., Series 2005-3, Class AM, 4.727%, 07/10/43 |
|
|
153 |
|
| |
200 |
|
|
BB-UBS Trust, Series 2012-TFT, Class A, 2.892%, 06/05/30 (e) |
|
|
195 |
|
| |
360 |
|
|
Bear Stearns Commercial Mortgage Securities Trust, Series 2006-PW11, Class A4, VAR, 5.600%, 03/11/39 |
|
|
378 |
|
|
|
|
|
|
|
|
|
|
PRINCIPAL
AMOUNT($) |
|
|
SECURITY DESCRIPTION |
|
VALUE($) |
|
|
|
|
|
|
|
|
|
|
|
|
|
| |
14,450 |
|
|
CD Commercial Mortgage Trust, Series 2007-CD4, Class XC, IO, VAR, 0.556%,
12/11/49 (e) |
|
|
110 |
|
|
|
|
|
COMM Mortgage Trust, |
|
|
|
|
| |
500 |
|
|
Series 2012-9W57, Class A, 2.365%, 02/10/29 (e) |
|
|
513 |
|
| |
423 |
|
|
Series 2014-KYO, Class A, VAR, 1.057%, 06/11/27 (e) |
|
|
423 |
|
| |
90 |
|
|
Commercial Mortgage Pass-Through Certificates, Series 2012-MVP, Class A, VAR, 2.094%, 11/17/26 (e) |
|
|
91 |
|
| |
202 |
|
|
CSMC, Series 2014-ICE, Class A, VAR, 1.050%, 04/15/27 (e) |
|
|
202 |
|
| |
134 |
|
|
DBRR Trust, Series 2013-EZ2, Class A, VAR, 0.853%, 02/25/45 (e) |
|
|
134 |
|
| |
273 |
|
|
GMAC Commercial Mortgage Securities, Inc. Trust, Series 2006-C1, Class A4, VAR, 5.238%, 11/10/45 |
|
|
283 |
|
| |
50 |
|
|
LB-UBS Commercial Mortgage Trust, Series 2006-C1, Class A4, 5.156%, 02/15/31 |
|
|
52 |
|
| |
350 |
|
|
Morgan Stanley Re-REMIC Trust, Series 2012-XA, Class A, 2.000%, 07/27/49 (e) |
|
|
352 |
|
| |
653 |
|
|
NCUA Guaranteed Notes Trust, Series 2010-C1, Class APT, 2.650%, 10/29/20 |
|
|
664 |
|
|
|
|
|
NorthStar, (Cayman Islands), |
|
|
|
|
| |
325 |
|
|
Series 2013-1A, Class A, VAR, 2.005%, 08/25/29 (e) |
|
|
326 |
|
| |
250 |
|
|
Series 2013-1A, Class B, VAR, 5.155%, 08/25/29 (e) |
|
|
252 |
|
| |
91 |
|
|
NorthStar Mortgage Trust, Series 2012-1, Class A, VAR, 1.355%, 08/25/29 (e) |
|
|
91 |
|
| |
206 |
|
|
ORES NPL LLC, Series 2013-LV2, Class A, 3.081%, 09/25/25 (e) |
|
|
206 |
|
| |
239 |
|
|
TIAA Seasoned Commercial Mortgage Trust, Series 2007-C4, Class A3, VAR, 5.560%, 08/15/39 |
|
|
241 |
|
| |
116 |
|
|
UBS-BAMLL Trust, Series 2012-WRM, Class A, 3.663%, 06/10/30 (e) |
|
|
117 |
|
| |
104 |
|
|
UBS-Barclays Commercial Mortgage Trust, Series 2012-C2, Class A4, 3.525%, 05/10/63 |
|
|
108 |
|
| |
500 |
|
|
VNDO Mortgage Trust, Series 2013-PENN, Class A, 3.808%, 12/13/29 (e) |
|
|
528 |
|
| |
197 |
|
|
Wells Fargo Resecuritization Trust, Series 2012-IO, Class A, 1.750%,
08/20/21 (e) |
|
|
197 |
|
|
|
|
|
|
|
|
|
|
|
|
|
|
Total Commercial Mortgage-Backed Securities
(Cost $6,814) |
|
|
6,979 |
|
|
|
|
|
|
|
|
|
|
| |
Corporate Bonds — 18.9% |
|
|
|
|
|
|
|
|
Consumer Discretionary — 1.0% |
|
|
|
|
|
|
|
|
Auto Components — 0.0% (g) |
|
|
|
|
| |
99 |
|
|
Johnson Controls, Inc., 3.750%, 12/01/21 |
|
|
104 |
|
|
|
|
|
|
|
|
|
|
SEE NOTES TO
FINANCIAL STATEMENTS.
|
|
|
|
|
|
|
|
|
|
|
|
|
| AUGUST 31, 2014 |
|
JPMORGAN INSTITUTIONAL TRUST FUNDS |
|
|
|
|
75 |
|
JPMorgan Intermediate Bond Trust
SCHEDULE OF PORTFOLIO INVESTMENTS
AS OF AUGUST 31, 2014 (Unaudited) (continued)
(Amounts in thousands)
|
|
|
|
|
|
|
|
|
PRINCIPAL
AMOUNT($) |
|
|
SECURITY DESCRIPTION |
|
VALUE($) |
|
|
|
|
|
|
|
|
|
|
| |
Corporate Bonds — continued |
|
|
|
|
|
Automobiles — 0.1% |
|
|
|
|
|
|
|
|
Daimler Finance North America LLC, |
|
|
|
|
| |
150 |
|
|
1.650%, 04/10/15 (e) |
|
|
151 |
|
| |
150 |
|
|
1.875%, 01/11/18 (e) |
|
|
151 |
|
| |
150 |
|
|
2.625%, 09/15/16 (e) |
|
|
155 |
|
|
|
|
|
|
|
|
|
|
|
|
|
|
|
|
|
457 |
|
|
|
|
|
|
|
|
|
|
|
|
|
|
Media — 0.6% |
|
|
|
|
|
|
|
|
21st Century Fox America, Inc., |
|
|
|
|
| |
100 |
|
|
7.250%, 05/18/18 |
|
|
119 |
|
| |
100 |
|
|
7.700%, 10/30/25 |
|
|
132 |
|
|
|
|
|
CBS Corp., |
|
|
|
|
| |
94 |
|
|
3.700%, 08/15/24 |
|
|
95 |
|
| |
25 |
|
|
4.300%, 02/15/21 |
|
|
27 |
|
| |
25 |
|
|
5.750%, 04/15/20 |
|
|
29 |
|
| |
100 |
|
|
Comcast Corp., 5.900%, 03/15/16 |
|
|
108 |
|
| |
16 |
|
|
Cox Communications, Inc., 5.450%, 12/15/14 |
|
|
16 |
|
|
|
|
|
DIRECTV Holdings LLC/DIRECTV Financing Co., Inc., |
|
|
|
|
| |
150 |
|
|
4.600%, 02/15/21 |
|
|
165 |
|
| |
353 |
|
|
5.000%, 03/01/21 |
|
|
395 |
|
| |
78 |
|
|
Discovery Communications LLC, 4.375%, 06/15/21 |
|
|
85 |
|
|
|
|
|
Thomson Reuters Corp., (Canada), |
|
|
|
|
| |
105 |
|
|
3.950%, 09/30/21 |
|
|
111 |
|
| |
60 |
|
|
4.700%, 10/15/19 |
|
|
66 |
|
|
|
|
|
Time Warner Cable, Inc., |
|
|
|
|
| |
57 |
|
|
5.850%, 05/01/17 |
|
|
64 |
|
| |
50 |
|
|
6.750%, 07/01/18 |
|
|
59 |
|
| |
150 |
|
|
8.250%, 04/01/19 |
|
|
189 |
|
| |
35 |
|
|
8.750%, 02/14/19 |
|
|
44 |
|
|
|
|
|
Viacom, Inc., |
|
|
|
|
| |
18 |
|
|
1.250%, 02/27/15 |
|
|
18 |
|
| |
50 |
|
|
3.125%, 06/15/22 |
|
|
50 |
|
| |
11 |
|
|
3.250%, 03/15/23 |
|
|
11 |
|
| |
43 |
|
|
3.875%, 12/15/21 |
|
|
45 |
|
| |
50 |
|
|
4.500%, 03/01/21 |
|
|
55 |
|
| |
15 |
|
|
6.250%, 04/30/16 |
|
|
16 |
|
| |
42 |
|
|
Walt Disney Co. (The), 0.450%, 12/01/15 |
|
|
42 |
|
|
|
|
|
|
|
|
|
|
|
|
|
|
|
|
|
1,941 |
|
|
|
|
|
|
|
|
|
|
|
|
|
|
Multiline Retail — 0.2% |
|
| |
40 |
|
|
Kohl’s Corp., 6.250%, 12/15/17 |
|
|
46 |
|
|
|
|
|
Macy’s Retail Holdings, Inc., |
|
|
|
|
| |
37 |
|
|
2.875%, 02/15/23 |
|
|
36 |
|
| |
49 |
|
|
4.375%, 09/01/23 |
|
|
52 |
|
| |
25 |
|
|
7.450%, 07/15/17 |
|
|
29 |
|
|
|
|
|
|
|
|
|
|
PRINCIPAL
AMOUNT($) |
|
|
SECURITY DESCRIPTION |
|
VALUE($) |
|
|
|
|
|
|
|
|
|
|
|
|
|
|
|
|
|
Multiline Retail — continued |
|
|
|
|
| |
35 |
|
|
Nordstrom, Inc., 4.000%, 10/15/21 |
|
|
38 |
|
| |
400 |
|
|
Target Corp., 6.000%, 01/15/18 |
|
|
458 |
|
|
|
|
|
|
|
|
|
|
|
|
|
|
|
|
|
659 |
|
|
|
|
|
|
|
|
|
|
|
|
|
|
Specialty Retail — 0.1% |
|
| |
32 |
|
|
Bed Bath & Beyond, Inc., 4.915%, 08/01/34 |
|
|
33 |
|
| |
59 |
|
|
Gap, Inc. (The), 5.950%, 04/12/21 |
|
|
69 |
|
| |
130 |
|
|
Home Depot, Inc. (The), 5.400%, 03/01/16 |
|
|
139 |
|
|
|
|
|
|
|
|
|
|
|
|
|
|
|
|
|
241 |
|
|
|
|
|
|
|
|
|
|
|
|
|
|
Total Consumer Discretionary |
|
|
3,402 |
|
|
|
|
|
|
|
|
|
|
|
|
|
|
Consumer Staples — 0.8% |
|
|
|
|
|
Beverages — 0.3% |
|
|
|
|
| |
75 |
|
|
Anheuser-Busch Cos. LLC, 5.500%, 01/15/18 |
|
|
85 |
|
| |
150 |
|
|
Anheuser-Busch InBev Finance, Inc., 3.700%, 02/01/24 |
|
|
157 |
|
| |
139 |
|
|
Anheuser-Busch InBev Worldwide, Inc., 7.750%, 01/15/19 |
|
|
171 |
|
| |
50 |
|
|
Coca-Cola Co. (The), 4.875%, 03/15/19 |
|
|
56 |
|
| |
70 |
|
|
Diageo Capital plc, (United Kingdom), 4.828%, 07/15/20 |
|
|
79 |
|
| |
30 |
|
|
Diageo Finance B.V., (Netherlands), 5.300%, 10/28/15 |
|
|
32 |
|
| |
85 |
|
|
FBG Finance Pty Ltd., (Australia), 5.125%, 06/15/15 (e) |
|
|
88 |
|
| |
30 |
|
|
Heineken N.V., (Netherlands), 1.400%, 10/01/17 (e) |
|
|
30 |
|
|
|
|
|
PepsiCo, Inc., |
|
|
|
|
| |
180 |
|
|
1.250%, 08/13/17 |
|
|
181 |
|
| |
31 |
|
|
3.000%, 08/25/21 |
|
|
32 |
|
| |
6 |
|
|
7.900%, 11/01/18 |
|
|
7 |
|
| |
30 |
|
|
SABMiller plc, (United Kingdom), 6.500%, 07/01/16 (e) |
|
|
33 |
|
|
|
|
|
|
|
|
|
|
|
|
|
|
|
|
|
951 |
|
|
|
|
|
|
|
|
|
|
|
|
|
|
Food & Staples Retailing — 0.2% |
|
| |
179 |
|
|
CVS Caremark Corp., 4.000%, 12/05/23 |
|
|
189 |
|
| |
53 |
|
|
CVS Pass-Through Trust, 5.926%, 01/10/34 (e) |
|
|
62 |
|
|
|
|
|
Kroger Co. (The), |
|
|
|
|
| |
50 |
|
|
2.200%, 01/15/17 |
|
|
51 |
|
| |
90 |
|
|
4.000%, 02/01/24 |
|
|
94 |
|
| |
30 |
|
|
6.150%, 01/15/20 |
|
|
35 |
|
| |
75 |
|
|
6.400%, 08/15/17 |
|
|
86 |
|
| |
94 |
|
|
Walgreen Co., 3.100%, 09/15/22 |
|
|
93 |
|
|
|
|
|
|
|
|
|
|
|
|
|
|
|
|
|
610 |
|
|
|
|
|
|
|
|
|
|
|
|
|
|
Food Products — 0.3% |
|
| |
135 |
|
|
Bunge Ltd. Finance Corp., 8.500%, 06/15/19 |
|
|
169 |
|
| |
14 |
|
|
Bunge N.A. Finance LP, 5.900%, 04/01/17 |
|
|
16 |
|
SEE NOTES TO
FINANCIAL STATEMENTS.
|
|
|
|
|
|
|
|
|
|
|
| 76 |
|
|
|
JPMORGAN INSTITUTIONAL TRUST FUNDS |
|
AUGUST 31, 2014 |
|
|
|
|
|
|
|
|
|
PRINCIPAL
AMOUNT($) |
|
|
SECURITY DESCRIPTION |
|
VALUE($) |
|
|
|
|
|
|
|
|
|
|
| |
Corporate Bonds — continued |
|
|
|
|
|
Food Products — continued |
|
|
|
|
|
|
|
|
Cargill, Inc., |
|
|
|
|
| |
100 |
|
|
3.300%, 03/01/22 (e) |
|
|
103 |
|
| |
106 |
|
|
4.307%, 05/14/21 (e) |
|
|
116 |
|
| |
24 |
|
|
ConAgra Foods, Inc., 2.100%, 03/15/18 |
|
|
24 |
|
|
|
|
|
Kraft Foods Group, Inc., |
|
|
|
|
| |
52 |
|
|
5.375%, 02/10/20 |
|
|
59 |
|
| |
332 |
|
|
6.125%, 08/23/18 |
|
|
383 |
|
| |
150 |
|
|
Mondelez International, Inc., 4.000%, 02/01/24 |
|
|
158 |
|
| |
73 |
|
|
Tyson Foods, Inc., 3.950%, 08/15/24 |
|
|
75 |
|
|
|
|
|
|
|
|
|
|
|
|
|
|
|
|
|
1,103 |
|
|
|
|
|
|
|
|
|
|
|
|
|
|
Household Products — 0.0% (g) |
|
| |
20 |
|
|
Kimberly-Clark Corp., 2.400%, 03/01/22 |
|
|
20 |
|
| |
61 |
|
|
Procter & Gamble - ESOP, Series A, 9.360%, 01/01/21 |
|
|
76 |
|
|
|
|
|
|
|
|
|
|
|
|
|
|
|
|
|
96 |
|
|
|
|
|
|
|
|
|
|
|
|
|
|
Total Consumer Staples |
|
|
2,760 |
|
|
|
|
|
|
|
|
|
|
|
|
|
|
Energy — 1.6% |
|
|
|
|
|
Energy Equipment & Services — 0.1% |
|
|
|
|
| |
14 |
|
|
Cameron International Corp., 4.000%, 12/15/23 |
|
|
15 |
|
| |
107 |
|
|
Halliburton Co., 3.500%, 08/01/23 |
|
|
111 |
|
| |
15 |
|
|
National Oilwell Varco, Inc., 1.350%, 12/01/17 |
|
|
15 |
|
| |
12 |
|
|
Noble Holding International Ltd., (Cayman Islands), 3.950%, 03/15/22 |
|
|
12 |
|
| |
47 |
|
|
Schlumberger Investment S.A., (Luxembourg), 3.300%, 09/14/21 (e) |
|
|
49 |
|
|
|
|
|
Transocean, Inc., (Cayman Islands), |
|
|
|
|
| |
39 |
|
|
3.800%, 10/15/22 |
|
|
38 |
|
| |
35 |
|
|
6.375%, 12/15/21 |
|
|
40 |
|
| |
100 |
|
|
6.500%, 11/15/20 |
|
|
113 |
|
| |
33 |
|
|
Weatherford International Ltd., (Bermuda), 4.500%, 04/15/22 |
|
|
35 |
|
|
|
|
|
|
|
|
|
|
|
|
|
|
|
|
|
428 |
|
|
|
|
|
|
|
|
|
|
|
|
|
|
Oil, Gas & Consumable Fuels — 1.5% |
|
|
|
|
|
Apache Corp., |
|
|
|
|
| |
42 |
|
|
3.250%, 04/15/22 |
|
|
43 |
|
| |
25 |
|
|
6.900%, 09/15/18 |
|
|
30 |
|
|
|
|
|
BP Capital Markets plc, (United Kingdom), |
|
|
|
|
| |
20 |
|
|
1.375%, 11/06/17 |
|
|
20 |
|
| |
233 |
|
|
2.237%, 05/10/19 |
|
|
235 |
|
| |
106 |
|
|
2.750%, 05/10/23 |
|
|
103 |
|
| |
66 |
|
|
3.814%, 02/10/24 |
|
|
69 |
|
| |
100 |
|
|
4.742%, 03/11/21 |
|
|
112 |
|
| |
150 |
|
|
Canadian Natural Resources Ltd., (Canada), 5.900%, 02/01/18 |
|
|
170 |
|
|
|
|
|
|
|
|
|
|
PRINCIPAL
AMOUNT($) |
|
|
SECURITY DESCRIPTION |
|
VALUE($) |
|
|
|
|
|
|
|
|
|
|
|
|
|
|
|
|
|
Oil, Gas & Consumable Fuels — continued |
|
|
|
|
| |
21 |
|
|
Cenovus Energy, Inc., (Canada), 3.000%, 08/15/22 |
|
|
21 |
|
| |
40 |
|
|
Chevron Corp., 2.355%, 12/05/22 |
|
|
39 |
|
| |
200 |
|
|
CNOOC Nexen Finance 2014 ULC, (Canada), 4.250%, 04/30/24 |
|
|
208 |
|
| |
150 |
|
|
ConocoPhillips, 5.750%, 02/01/19 |
|
|
174 |
|
| |
190 |
|
|
ConocoPhillips Canada Funding Co. I, (Canada), 5.625%, 10/15/16 |
|
|
209 |
|
| |
150 |
|
|
Devon Energy Corp., 1.875%, 05/15/17 |
|
|
152 |
|
| |
80 |
|
|
Encana Corp., (Canada), 6.500%, 05/15/19 |
|
|
94 |
|
| |
200 |
|
|
Eni S.p.A., (Italy), 4.150%, 10/01/20 (e) |
|
|
213 |
|
| |
49 |
|
|
Enterprise Products Operating LLC, 3.900%, 02/15/24 |
|
|
51 |
|
|
|
|
|
EOG Resources, Inc., |
|
|
|
|
| |
23 |
|
|
2.625%, 03/15/23 |
|
|
22 |
|
| |
100 |
|
|
4.100%, 02/01/21 |
|
|
109 |
|
| |
50 |
|
|
Magellan Midstream Partners LP, 6.550%, 07/15/19 |
|
|
59 |
|
|
|
|
|
Marathon Oil Corp., |
|
|
|
|
| |
228 |
|
|
5.900%, 03/15/18 |
|
|
260 |
|
| |
175 |
|
|
6.000%, 10/01/17 |
|
|
199 |
|
| |
35 |
|
|
Occidental Petroleum Corp., 1.750%, 02/15/17 |
|
|
36 |
|
| |
40 |
|
|
PC Financial Partnership, 5.000%, 11/15/14 |
|
|
40 |
|
|
|
|
|
Petrobras Global Finance B.V., (Netherlands), |
|
|
|
|
| |
84 |
|
|
4.375%, 05/20/23 |
|
|
83 |
|
| |
295 |
|
|
6.250%, 03/17/24 |
|
|
324 |
|
|
|
|
|
Petrobras International Finance Co., (Cayman Islands), |
|
|
|
|
| |
90 |
|
|
5.375%, 01/27/21 |
|
|
95 |
|
| |
50 |
|
|
7.875%, 03/15/19 |
|
|
58 |
|
| |
97 |
|
|
Petro-Canada, (Canada), 6.050%, 05/15/18 |
|
|
111 |
|
| |
69 |
|
|
Petroleos Mexicanos, (Mexico), 4.875%, 01/18/24 (e) |
|
|
75 |
|
| |
43 |
|
|
Phillips 66, 2.950%, 05/01/17 |
|
|
45 |
|
| |
200 |
|
|
Sinopec Group Overseas Development Ltd., (United Kingdom), 4.375%, 10/17/23 (e) |
|
|
210 |
|
|
|
|
|
Spectra Energy Capital LLC, |
|
|
|
|
| |
150 |
|
|
5.650%, 03/01/20 |
|
|
169 |
|
| |
140 |
|
|
6.200%, 04/15/18 |
|
|
160 |
|
| |
50 |
|
|
8.000%, 10/01/19 |
|
|
63 |
|
| |
79 |
|
|
Spectra Energy Partners LP, 2.950%, 09/25/18 |
|
|
82 |
|
|
|
|
|
Statoil ASA, (Norway), |
|
|
|
|
| |
143 |
|
|
2.650%, 01/15/24 |
|
|
139 |
|
| |
42 |
|
|
2.900%, 11/08/20 |
|
|
43 |
|
| |
67 |
|
|
3.125%, 08/17/17 |
|
|
71 |
|
| |
83 |
|
|
3.150%, 01/23/22 |
|
|
86 |
|
SEE NOTES TO
FINANCIAL STATEMENTS.
|
|
|
|
|
|
|
|
|
|
|
|
|
| AUGUST 31, 2014 |
|
JPMORGAN INSTITUTIONAL TRUST FUNDS |
|
|
|
|
77 |
|
JPMorgan Intermediate Bond Trust
SCHEDULE OF PORTFOLIO INVESTMENTS
AS OF AUGUST 31, 2014 (Unaudited) (continued)
(Amounts in thousands)
|
|
|
|
|
|
|
|
|
PRINCIPAL
AMOUNT($) |
|
|
SECURITY DESCRIPTION |
|
VALUE($) |
|
|
|
|
|
|
|
|
|
|
| |
Corporate Bonds — continued |
|
|
|
|
|
Oil, Gas & Consumable Fuels — continued |
|
|
|
|
| |
50 |
|
|
Talisman Energy, Inc., (Canada), 7.750%, 06/01/19 |
|
|
62 |
|
|
|
|
|
Total Capital International S.A., (France), |
|
|
|
|
| |
27 |
|
|
0.750%, 01/25/16 |
|
|
27 |
|
| |
44 |
|
|
1.500%, 02/17/17 |
|
|
44 |
|
| |
75 |
|
|
1.550%, 06/28/17 |
|
|
76 |
|
| |
150 |
|
|
2.750%, 06/19/21 |
|
|
151 |
|
| |
175 |
|
|
Total Capital S.A., (France), 2.300%, 03/15/16 |
|
|
179 |
|
|
|
|
|
TransCanada PipeLines Ltd., (Canada), |
|
|
|
|
| |
100 |
|
|
6.500%, 08/15/18 |
|
|
118 |
|
| |
30 |
|
|
7.125%, 01/15/19 |
|
|
36 |
|
|
|
|
|
|
|
|
|
|
|
|
|
|
|
|
|
5,175 |
|
|
|
|
|
|
|
|
|
|
|
|
|
|
Total Energy |
|
|
5,603 |
|
|
|
|
|
|
|
|
|
|
|
|
|
|
Financials — 10.5% |
|
|
|
|
|
Banks — 4.3% |
|
| |
200 |
|
|
ABN AMRO Bank N.V., (Netherlands), 2.500%, 10/30/18 (e) |
|
|
203 |
|
| |
100 |
|
|
ANZ New Zealand International Ltd., (New Zealand), 3.125%, 08/10/15 (e) |
|
|
102 |
|
| |
250 |
|
|
Australia & New Zealand Banking Group Ltd., (Australia), 2.400%, 11/23/16 (e) |
|
|
258 |
|
|
|
|
|
Bank of America Corp., |
|
|
|
|
| |
42 |
|
|
4.100%, 07/24/23 |
|
|
44 |
|
| |
200 |
|
|
Series C, 5.000%, 01/15/15 |
|
|
203 |
|
| |
100 |
|
|
5.000%, 05/13/21 |
|
|
112 |
|
| |
130 |
|
|
5.625%, 07/01/20 |
|
|
149 |
|
| |
300 |
|
|
Series L, 5.650%, 05/01/18 |
|
|
337 |
|
| |
170 |
|
|
5.750%, 12/01/17 |
|
|
191 |
|
| |
50 |
|
|
5.875%, 01/05/21 |
|
|
58 |
|
| |
814 |
|
|
6.400%, 08/28/17 |
|
|
925 |
|
| |
100 |
|
|
6.500%, 08/01/16 |
|
|
110 |
|
| |
266 |
|
|
6.875%, 04/25/18 |
|
|
310 |
|
|
|
|
|
Bank of Montreal, (Canada), |
|
|
|
|
| |
250 |
|
|
1.300%, 10/31/14 (e) |
|
|
250 |
|
| |
85 |
|
|
2.550%, 11/06/22 |
|
|
83 |
|
|
|
|
|
Bank of Nova Scotia (The), (Canada), |
|
|
|
|
| |
121 |
|
|
1.650%, 10/29/15 (e) |
|
|
123 |
|
| |
175 |
|
|
2.550%, 01/12/17 |
|
|
181 |
|
| |
123 |
|
|
3.400%, 01/22/15 |
|
|
124 |
|
| |
136 |
|
|
Bank of Tokyo-Mitsubishi UFJ Ltd. (The), (Japan), 3.850%, 01/22/15 (e) |
|
|
138 |
|
| |
200 |
|
|
Banque Federative du Credit Mutuel S.A., (France), 1.700%, 01/20/17 (e) |
|
|
201 |
|
|
|
|
|
Barclays Bank plc, (United Kingdom), |
|
|
|
|
| |
200 |
|
|
2.500%, 09/21/15 (e) |
|
|
205 |
|
|
|
|
|
|
|
|
|
|
PRINCIPAL
AMOUNT($) |
|
|
SECURITY DESCRIPTION |
|
VALUE($) |
|
|
|
|
|
|
|
|
|
|
|
|
|
|
|
|
|
Banks — continued |
|
|
|
|
| |
100 |
|
|
2.750%, 02/23/15 |
|
|
101 |
|
| |
250 |
|
|
6.050%, 12/04/17 (e) |
|
|
281 |
|
|
|
|
|
BB&T Corp., |
|
|
|
|
| |
125 |
|
|
3.950%, 04/29/16 |
|
|
132 |
|
| |
100 |
|
|
4.900%, 06/30/17 |
|
|
109 |
|
| |
300 |
|
|
Capital One Bank USA N.A., 3.375%, 02/15/23 |
|
|
299 |
|
|
|
|
|
Citigroup, Inc., |
|
|
|
|
| |
13 |
|
|
1.250%, 01/15/16 |
|
|
13 |
|
| |
135 |
|
|
3.375%, 03/01/23 |
|
|
136 |
|
| |
73 |
|
|
3.750%, 06/16/24 |
|
|
74 |
|
| |
3 |
|
|
4.587%, 12/15/15 |
|
|
3 |
|
| |
59 |
|
|
4.750%, 05/19/15 |
|
|
61 |
|
| |
506 |
|
|
5.000%, 09/15/14 |
|
|
507 |
|
| |
14 |
|
|
5.375%, 08/09/20 |
|
|
16 |
|
| |
115 |
|
|
5.500%, 09/13/25 |
|
|
129 |
|
| |
13 |
|
|
6.000%, 08/15/17 |
|
|
15 |
|
| |
192 |
|
|
6.010%, 01/15/15 |
|
|
196 |
|
| |
300 |
|
|
6.125%, 11/21/17 |
|
|
340 |
|
|
|
|
|
Comerica, Inc., |
|
|
|
|
| |
55 |
|
|
3.000%, 09/16/15 |
|
|
57 |
|
| |
16 |
|
|
3.800%, 07/22/26 |
|
|
16 |
|
| |
250 |
|
|
Commonwealth Bank of Australia, (Australia), 2.250%, 03/16/17 (e) |
|
|
257 |
|
|
|
|
|
Cooperatieve Centrale Raiffeisen- Boerenleenbank B.A., (Netherlands), |
|
|
|
|
| |
250 |
|
|
3.200%, 03/11/15 (e) |
|
|
254 |
|
| |
34 |
|
|
3.375%, 01/19/17 |
|
|
36 |
|
| |
118 |
|
|
3.875%, 02/08/22 |
|
|
126 |
|
| |
350 |
|
|
Fifth Third Bancorp, 5.450%, 01/15/17 |
|
|
382 |
|
|
|
|
|
HSBC Holdings plc, (United Kingdom), |
|
|
|
|
| |
196 |
|
|
4.000%, 03/30/22 |
|
|
210 |
|
| |
300 |
|
|
4.875%, 01/14/22 |
|
|
338 |
|
| |
50 |
|
|
KeyCorp, 5.100%, 03/24/21 |
|
|
57 |
|
| |
300 |
|
|
Manufacturers & Traders Trust Co., 6.625%, 12/04/17 |
|
|
346 |
|
|
|
|
|
National Australia Bank Ltd., (Australia), |
|
|
|
|
| |
300 |
|
|
2.750%, 09/28/15 (e) |
|
|
307 |
|
| |
100 |
|
|
3.750%, 03/02/15 (e) |
|
|
102 |
|
| |
300 |
|
|
Nordea Bank AB, (Sweden), 3.125%, 03/20/17 (e) |
|
|
314 |
|
|
|
|
|
PNC Funding Corp., |
|
|
|
|
| |
133 |
|
|
4.375%, 08/11/20 |
|
|
146 |
|
| |
265 |
|
|
5.125%, 02/08/20 |
|
|
302 |
|
| |
110 |
|
|
5.250%, 11/15/15 |
|
|
116 |
|
| |
115 |
|
|
5.625%, 02/01/17 |
|
|
126 |
|
SEE NOTES TO
FINANCIAL STATEMENTS.
|
|
|
|
|
|
|
|
|
|
|
| 78 |
|
|
|
JPMORGAN INSTITUTIONAL TRUST FUNDS |
|
AUGUST 31, 2014 |
|
|
|
|
|
|
|
|
|
PRINCIPAL
AMOUNT($) |
|
|
SECURITY DESCRIPTION |
|
VALUE($) |
|
|
|
|
|
|
|
|
|
|
| |
Corporate Bonds — continued |
|
|
|
|
|
Banks — continued |
|
|
|
|
|
|
|
|
Royal Bank of Canada, (Canada), |
|
|
|
|
| |
239 |
|
|
2.000%, 10/01/18 |
|
|
242 |
|
| |
125 |
|
|
2.200%, 07/27/18 |
|
|
128 |
|
| |
200 |
|
|
2.300%, 07/20/16 |
|
|
206 |
|
| |
250 |
|
|
Stadshypotek AB, (Sweden), 1.875%, 10/02/19 (e) |
|
|
247 |
|
| |
200 |
|
|
Standard Chartered plc, (United Kingdom), 5.200%, 01/26/24 (e) |
|
|
217 |
|
|
|
|
|
Toronto-Dominion Bank (The), (Canada), |
|
|
|
|
| |
200 |
|
|
1.500%, 03/13/17 (e) |
|
|
202 |
|
| |
235 |
|
|
2.200%, 07/29/15 (e) |
|
|
239 |
|
|
|
|
|
U.S. Bancorp, |
|
|
|
|
| |
150 |
|
|
2.450%, 07/27/15 |
|
|
153 |
|
| |
208 |
|
|
2.875%, 11/20/14 |
|
|
209 |
|
| |
850 |
|
|
Wachovia Corp., 5.750%, 02/01/18 |
|
|
966 |
|
|
|
|
|
Wells Fargo & Co., |
|
|
|
|
| |
237 |
|
|
4.480%, 01/16/24 |
|
|
254 |
|
| |
415 |
|
|
5.625%, 12/11/17 |
|
|
469 |
|
| |
500 |
|
|
SUB, 3.676%, 06/15/16 |
|
|
526 |
|
|
|
|
|
Wells Fargo Bank N.A., |
|
|
|
|
| |
315 |
|
|
Series AI, 4.750%, 02/09/15 |
|
|
321 |
|
| |
250 |
|
|
6.000%, 11/15/17 |
|
|
284 |
|
| |
285 |
|
|
Westpac Banking Corp., (Australia), 4.875%, 11/19/19 |
|
|
322 |
|
|
|
|
|
|
|
|
|
|
|
|
|
|
|
|
|
15,196 |
|
|
|
|
|
|
|
|
|
|
|
|
|
|
Capital Markets — 2.4% |
|
| |
120 |
|
|
Ameriprise Financial, Inc., 4.000%, 10/15/23 |
|
|
127 |
|
|
|
|
|
Bank of New York Mellon Corp. (The), |
|
|
|
|
| |
250 |
|
|
Series 1, 2.950%, 06/18/15 |
|
|
255 |
|
| |
75 |
|
|
3.100%, 01/15/15 |
|
|
76 |
|
| |
100 |
|
|
3.650%, 02/04/24 |
|
|
104 |
|
| |
75 |
|
|
4.600%, 01/15/20 |
|
|
84 |
|
|
|
|
|
BlackRock, Inc., |
|
|
|
|
| |
325 |
|
|
3.500%, 12/10/14 |
|
|
328 |
|
| |
326 |
|
|
Series 2, 5.000%, 12/10/19 |
|
|
373 |
|
| |
150 |
|
|
Blackstone Holdings Finance Co. LLC, 5.875%, 03/15/21 (e) |
|
|
176 |
|
| |
40 |
|
|
Charles Schwab Corp. (The), 3.225%, 09/01/22 |
|
|
41 |
|
|
|
|
|
Goldman Sachs Group, Inc. (The), |
|
|
|
|
| |
100 |
|
|
1.600%, 11/23/15 |
|
|
101 |
|
| |
68 |
|
|
2.625%, 01/31/19 |
|
|
69 |
|
| |
100 |
|
|
3.300%, 05/03/15 |
|
|
102 |
|
| |
255 |
|
|
3.625%, 02/07/16 |
|
|
265 |
|
| |
66 |
|
|
3.700%, 08/01/15 |
|
|
68 |
|
| |
120 |
|
|
4.000%, 03/03/24 |
|
|
123 |
|
|
|
|
|
|
|
|
|
|
PRINCIPAL
AMOUNT($) |
|
|
SECURITY DESCRIPTION |
|
VALUE($) |
|
|
|
|
|
|
|
|
|
|
|
|
|
|
|
|
|
Capital Markets — continued |
|
|
|
|
| |
68 |
|
|
5.375%, 03/15/20 |
|
|
77 |
|
| |
300 |
|
|
5.500%, 11/15/14 |
|
|
303 |
|
| |
80 |
|
|
5.750%, 01/24/22 |
|
|
93 |
|
| |
1,100 |
|
|
5.950%, 01/18/18 |
|
|
1,241 |
|
| |
250 |
|
|
7.500%, 02/15/19 |
|
|
302 |
|
| |
200 |
|
|
ING Bank N.V., (Netherlands), 3.750%, 03/07/17 (e) |
|
|
211 |
|
| |
71 |
|
|
Invesco Finance plc, (United Kingdom), 4.000%, 01/30/24 |
|
|
75 |
|
|
|
|
|
Jefferies Group LLC, |
|
|
|
|
| |
111 |
|
|
3.875%, 11/09/15 |
|
|
115 |
|
| |
150 |
|
|
5.125%, 04/13/18 |
|
|
164 |
|
| |
45 |
|
|
6.875%, 04/15/21 |
|
|
53 |
|
| |
80 |
|
|
8.500%, 07/15/19 |
|
|
100 |
|
|
|
|
|
Macquarie Bank Ltd., (Australia), |
|
|
|
|
| |
93 |
|
|
2.000%, 08/15/16 (e) |
|
|
95 |
|
| |
263 |
|
|
5.000%, 02/22/17 (e) |
|
|
285 |
|
|
|
|
|
Macquarie Group Ltd., (Australia), |
|
|
|
|
| |
150 |
|
|
6.000%, 01/14/20 (e) |
|
|
170 |
|
| |
40 |
|
|
7.625%, 08/13/19 (e) |
|
|
48 |
|
|
|
|
|
Morgan Stanley, |
|
|
|
|
| |
104 |
|
|
4.000%, 07/24/15 |
|
|
107 |
|
| |
195 |
|
|
4.200%, 11/20/14 |
|
|
196 |
|
| |
93 |
|
|
5.000%, 11/24/25 |
|
|
100 |
|
| |
166 |
|
|
5.500%, 07/24/20 |
|
|
189 |
|
| |
100 |
|
|
5.500%, 07/28/21 |
|
|
115 |
|
| |
450 |
|
|
5.625%, 09/23/19 |
|
|
514 |
|
| |
100 |
|
|
5.750%, 01/25/21 |
|
|
116 |
|
| |
100 |
|
|
6.625%, 04/01/18 |
|
|
116 |
|
| |
100 |
|
|
7.300%, 05/13/19 |
|
|
121 |
|
|
|
|
|
Nomura Holdings, Inc., (Japan), |
|
|
|
|
| |
85 |
|
|
4.125%, 01/19/16 |
|
|
89 |
|
| |
84 |
|
|
6.700%, 03/04/20 |
|
|
101 |
|
|
|
|
|
State Street Corp., |
|
|
|
|
| |
36 |
|
|
3.100%, 05/15/23 |
|
|
35 |
|
| |
192 |
|
|
3.700%, 11/20/23 |
|
|
202 |
|
|
|
|
|
UBS AG, (Switzerland), |
|
|
|
|
| |
500 |
|
|
3.875%, 01/15/15 |
|
|
506 |
|
| |
100 |
|
|
5.750%, 04/25/18 |
|
|
114 |
|
| |
100 |
|
|
5.875%, 12/20/17 |
|
|
114 |
|
|
|
|
|
|
|
|
|
|
|
|
|
|
|
|
|
8,359 |
|
|
|
|
|
|
|
|
|
|
|
|
|
|
Consumer Finance — 1.1% |
|
| |
139 |
|
|
American Express Credit Corp., 2.800%, 09/19/16 |
|
|
144 |
|
|
|
|
|
American Honda Finance Corp., |
|
|
|
|
| |
333 |
|
|
1.450%, 02/27/15 (e) |
|
|
335 |
|
SEE NOTES TO
FINANCIAL STATEMENTS.
|
|
|
|
|
|
|
|
|
|
|
|
|
| AUGUST 31, 2014 |
|
JPMORGAN INSTITUTIONAL TRUST FUNDS |
|
|
|
|
79 |
|
JPMorgan Intermediate Bond Trust
SCHEDULE OF PORTFOLIO INVESTMENTS
AS OF AUGUST 31, 2014 (Unaudited) (continued)
(Amounts in thousands)
|
|
|
|
|
|
|
|
|
PRINCIPAL
AMOUNT($) |
|
|
SECURITY DESCRIPTION |
|
VALUE($) |
|
|
|
|
|
|
|
|
|
|
| |
Corporate Bonds — continued |
|
|
|
|
|
Consumer Finance — continued |
|
|
|
|
| |
200 |
|
|
2.125%, 02/28/17 (e) |
|
|
205 |
|
| |
83 |
|
|
2.125%, 10/10/18 |
|
|
84 |
|
| |
110 |
|
|
Capital One Financial Corp., 3.500%, 06/15/23 |
|
|
111 |
|
|
|
|
|
Caterpillar Financial Services Corp., |
|
|
|
|
| |
250 |
|
|
1.000%, 11/25/16 |
|
|
251 |
|
| |
58 |
|
|
2.850%, 06/01/22 |
|
|
58 |
|
| |
100 |
|
|
5.500%, 03/15/16 |
|
|
107 |
|
| |
65 |
|
|
7.050%, 10/01/18 |
|
|
78 |
|
| |
100 |
|
|
7.150%, 02/15/19 |
|
|
122 |
|
|
|
|
|
Ford Motor Credit Co. LLC, |
|
|
|
|
| |
550 |
|
|
2.375%, 03/12/19 |
|
|
551 |
|
| |
200 |
|
|
3.000%, 06/12/17 |
|
|
207 |
|
| |
200 |
|
|
4.250%, 09/20/22 |
|
|
214 |
|
| |
250 |
|
|
HSBC USA, Inc., 2.375%, 02/13/15 |
|
|
252 |
|
|
|
|
|
John Deere Capital Corp., |
|
|
|
|
| |
50 |
|
|
2.250%, 04/17/19 |
|
|
51 |
|
| |
33 |
|
|
3.150%, 10/15/21 |
|
|
34 |
|
| |
73 |
|
|
Nissan Motor Acceptance Corp., 1.800%, 03/15/18 (e) |
|
|
73 |
|
| |
66 |
|
|
PACCAR Financial Corp., 1.600%, 03/15/17 |
|
|
67 |
|
|
|
|
|
Toyota Motor Credit Corp., |
|
|
|
|
| |
225 |
|
|
1.750%, 05/22/17 |
|
|
229 |
|
| |
200 |
|
|
2.000%, 09/15/16 |
|
|
205 |
|
| |
105 |
|
|
2.000%, 10/24/18 |
|
|
106 |
|
| |
100 |
|
|
2.050%, 01/12/17 |
|
|
102 |
|
| |
154 |
|
|
3.200%, 06/17/15 |
|
|
157 |
|
|
|
|
|
|
|
|
|
|
|
|
|
|
|
|
|
3,743 |
|
|
|
|
|
|
|
|
|
|
|
|
|
|
Diversified Financial Services — 1.4% |
|
| |
161 |
|
|
Associates Corp. of North America, 6.950%, 11/01/18 |
|
|
190 |
|
| |
425 |
|
|
Bank of America N.A., 5.300%, 03/15/17 |
|
|
463 |
|
|
|
|
|
Berkshire Hathaway, Inc., |
|
|
|
|
| |
80 |
|
|
2.100%, 08/14/19 |
|
|
80 |
|
| |
202 |
|
|
3.400%, 01/31/22 |
|
|
211 |
|
| |
98 |
|
|
3.750%, 08/15/21 |
|
|
106 |
|
| |
25 |
|
|
Countrywide Financial Corp., 6.250%, 05/15/16 |
|
|
27 |
|
|
|
|
|
General Electric Capital Corp., |
|
|
|
|
| |
17 |
|
|
1.000%, 12/11/15 |
|
|
17 |
|
| |
220 |
|
|
4.375%, 09/16/20 |
|
|
242 |
|
| |
800 |
|
|
4.650%, 10/17/21 |
|
|
896 |
|
| |
500 |
|
|
5.400%, 02/15/17 |
|
|
551 |
|
| |
140 |
|
|
5.500%, 01/08/20 |
|
|
162 |
|
| |
335 |
|
|
5.625%, 05/01/18 |
|
|
381 |
|
|
|
|
|
Intercontinental Exchange, Inc., |
|
|
|
|
| |
47 |
|
|
2.500%, 10/15/18 |
|
|
48 |
|
| |
88 |
|
|
4.000%, 10/15/23 |
|
|
94 |
|
|
|
|
|
|
|
|
|
|
PRINCIPAL
AMOUNT($) |
|
|
SECURITY DESCRIPTION |
|
VALUE($) |
|
|
|
|
|
|
|
|
|
|
|
|
|
|
|
|
|
Diversified Financial Services — continued |
|
|
|
|
|
|
|
|
Private Export Funding Corp., |
|
|
|
|
| |
500 |
|
|
Series EE, 2.800%, 05/15/22 |
|
|
511 |
|
| |
200 |
|
|
Series KK, 3.550%, 01/15/24 |
|
|
212 |
|
|
|
|
|
Shell International Finance B.V., (Netherlands), |
|
|
|
|
| |
42 |
|
|
1.125%, 08/21/17 |
|
|
42 |
|
| |
184 |
|
|
3.100%, 06/28/15 |
|
|
188 |
|
| |
195 |
|
|
4.375%, 03/25/20 |
|
|
218 |
|
| |
100 |
|
|
Siemens Financieringsmaatschappij N.V., (Netherlands), 5.750%, 10/17/16 (e) |
|
|
110 |
|
|
|
|
|
|
|
|
|
|
|
|
|
|
|
|
|
4,749 |
|
|
|
|
|
|
|
|
|
|
|
|
|
|
Insurance — 1.0% |
|
|
|
|
|
ACE INA Holdings, Inc., |
|
|
|
|
| |
45 |
|
|
2.600%, 11/23/15 |
|
|
46 |
|
| |
50 |
|
|
5.600%, 05/15/15 |
|
|
52 |
|
| |
61 |
|
|
Allstate Corp. (The), 3.150%, 06/15/23 |
|
|
62 |
|
|
|
|
|
American International Group, Inc., |
|
|
|
|
| |
59 |
|
|
4.125%, 02/15/24 |
|
|
63 |
|
| |
350 |
|
|
5.450%, 05/18/17 |
|
|
388 |
|
| |
45 |
|
|
Aon Corp., 3.500%, 09/30/15 |
|
|
46 |
|
|
|
|
|
Berkshire Hathaway Finance Corp., |
|
|
|
|
| |
65 |
|
|
1.300%, 05/15/18 |
|
|
64 |
|
| |
356 |
|
|
2.900%, 10/15/20 |
|
|
366 |
|
| |
150 |
|
|
5.400%, 05/15/18 |
|
|
170 |
|
| |
90 |
|
|
CNA Financial Corp., 5.875%, 08/15/20 |
|
|
104 |
|
| |
80 |
|
|
Jackson National Life Global Funding, 4.700%, 06/01/18 (e) |
|
|
88 |
|
| |
41 |
|
|
Liberty Mutual Group, Inc., 5.000%, 06/01/21 (e) |
|
|
45 |
|
| |
35 |
|
|
Lincoln National Corp., 4.200%, 03/15/22 |
|
|
38 |
|
|
|
|
|
MassMutual Global Funding II, |
|
|
|
|
| |
300 |
|
|
2.000%, 04/05/17 (e) |
|
|
306 |
|
| |
100 |
|
|
3.125%, 04/14/16 (e) |
|
|
104 |
|
|
|
|
|
Metropolitan Life Global Funding I, |
|
|
|
|
| |
100 |
|
|
1.500%, 01/10/18 (e) |
|
|
100 |
|
| |
107 |
|
|
1.700%, 06/29/15 (e) |
|
|
108 |
|
| |
200 |
|
|
2.500%, 09/29/15 (e) |
|
|
204 |
|
| |
175 |
|
|
3.650%, 06/14/18 (e) |
|
|
187 |
|
| |
100 |
|
|
3.875%, 04/11/22 (e) |
|
|
107 |
|
|
|
|
|
New York Life Global Funding, |
|
|
|
|
| |
170 |
|
|
1.300%, 01/12/15 (e) |
|
|
171 |
|
| |
73 |
|
|
2.150%, 06/18/19 (e) |
|
|
73 |
|
| |
125 |
|
|
3.000%, 05/04/15 (e) |
|
|
127 |
|
| |
150 |
|
|
Pacific Life Global Funding, 5.000%, 05/15/17 (e) |
|
|
161 |
|
| |
16 |
|
|
Principal Financial Group, Inc., 1.850%, 11/15/17 |
|
|
16 |
|
SEE NOTES TO
FINANCIAL STATEMENTS.
|
|
|
|
|
|
|
|
|
|
|
| 80 |
|
|
|
JPMORGAN INSTITUTIONAL TRUST FUNDS |
|
AUGUST 31, 2014 |
|
|
|
|
|
|
|
|
|
PRINCIPAL
AMOUNT($) |
|
|
SECURITY DESCRIPTION |
|
VALUE($) |
|
|
|
|
|
|
|
|
|
|
| |
Corporate Bonds — continued |
|
|
|
|
|
Insurance — continued |
|
|
|
|
|
|
|
|
Principal Life Global Funding II, |
|
|
|
|
| |
35 |
|
|
1.000%, 12/11/15 (e) |
|
|
35 |
|
| |
106 |
|
|
2.250%, 10/15/18 (e) |
|
|
107 |
|
| |
150 |
|
|
Prudential Insurance Co. of America (The), 8.300%, 07/01/25 (e) |
|
|
205 |
|
|
|
|
|
|
|
|
|
|
|
|
|
|
|
|
|
3,543 |
|
|
|
|
|
|
|
|
|
|
|
|
|
|
Real Estate Investment Trusts (REITs) — 0.3% |
|
|
|
|
|
American Tower Corp., |
|
|
|
|
| |
80 |
|
|
3.500%, 01/31/23 |
|
|
79 |
|
| |
38 |
|
|
5.000%, 02/15/24 |
|
|
41 |
|
| |
45 |
|
|
American Tower Trust I, 1.551%, 03/15/18 (e) |
|
|
45 |
|
|
|
|
|
Equity Commonwealth, |
|
|
|
|
| |
125 |
|
|
5.875%, 09/15/20 |
|
|
136 |
|
| |
150 |
|
|
6.650%, 01/15/18 |
|
|
166 |
|
| |
27 |
|
|
ERP Operating LP, 4.625%, 12/15/21 |
|
|
30 |
|
|
|
|
|
HCP, Inc., |
|
|
|
|
| |
52 |
|
|
2.625%, 02/01/20 |
|
|
52 |
|
| |
23 |
|
|
3.875%, 08/15/24 |
|
|
23 |
|
| |
17 |
|
|
4.200%, 03/01/24 |
|
|
18 |
|
| |
38 |
|
|
4.250%, 11/15/23 |
|
|
39 |
|
| |
92 |
|
|
5.375%, 02/01/21 |
|
|
104 |
|
| |
73 |
|
|
Health Care REIT, Inc., 4.500%, 01/15/24 |
|
|
77 |
|
| |
53 |
|
|
Prologis LP, 4.250%, 08/15/23 |
|
|
56 |
|
|
|
|
|
Simon Property Group LP, |
|
|
|
|
| |
81 |
|
|
4.125%, 12/01/21 |
|
|
88 |
|
| |
17 |
|
|
4.200%, 02/01/15 |
|
|
17 |
|
| |
40 |
|
|
4.375%, 03/01/21 |
|
|
44 |
|
| |
50 |
|
|
5.650%, 02/01/20 |
|
|
58 |
|
| |
40 |
|
|
6.100%, 05/01/16 |
|
|
43 |
|
| |
50 |
|
|
6.125%, 05/30/18 |
|
|
58 |
|
|
|
|
|
|
|
|
|
|
|
|
|
|
|
|
|
1,174 |
|
|
|
|
|
|
|
|
|
|
|
|
|
|
Total Financials |
|
|
36,764 |
|
|
|
|
|
|
|
|
|
|
|
|
|
|
Health Care — 0.6% |
|
|
|
|
|
Biotechnology — 0.2% |
|
|
|
|
|
Amgen, Inc., |
|
|
|
|
| |
400 |
|
|
3.875%, 11/15/21 |
|
|
426 |
|
| |
44 |
|
|
4.500%, 03/15/20 |
|
|
48 |
|
| |
40 |
|
|
5.700%, 02/01/19 |
|
|
46 |
|
|
|
|
|
Celgene Corp., |
|
|
|
|
| |
98 |
|
|
3.250%, 08/15/22 |
|
|
100 |
|
| |
44 |
|
|
3.625%, 05/15/24 |
|
|
45 |
|
|
|
|
|
|
|
|
|
|
|
|
|
|
|
|
|
665 |
|
|
|
|
|
|
|
|
|
|
|
|
|
|
Health Care Equipment & Supplies — 0.0% (g) |
|
| |
50 |
|
|
Baxter International, Inc., 4.625%, 03/15/15 |
|
|
51 |
|
|
|
|
|
|
|
|
|
|
PRINCIPAL
AMOUNT($) |
|
|
SECURITY DESCRIPTION |
|
VALUE($) |
|
|
|
|
|
|
|
|
|
|
|
|
|
|
|
|
|
Health Care Equipment & Supplies — continued |
|
| |
40 |
|
|
Becton Dickinson and Co., 5.000%, 05/15/19 |
|
|
45 |
|
|
|
|
|
|
|
|
|
|
|
|
|
|
|
|
|
96 |
|
|
|
|
|
|
|
|
|
|
|
|
|
|
Health Care Providers & Services — 0.2% |
|
| |
72 |
|
|
Express Scripts Holding Co., 3.500%, 06/15/24 |
|
|
72 |
|
| |
17 |
|
|
McKesson Corp., 0.950%, 12/04/15 |
|
|
17 |
|
| |
50 |
|
|
Medco Health Solutions, Inc., 2.750%, 09/15/15 |
|
|
51 |
|
| |
112 |
|
|
UnitedHealth Group, Inc., 3.375%, 11/15/21 |
|
|
117 |
|
| |
44 |
|
|
Ventas Realty LP, 3.750%, 05/01/24 |
|
|
44 |
|
|
|
|
|
WellPoint, Inc., |
|
|
|
|
| |
93 |
|
|
2.300%, 07/15/18 |
|
|
95 |
|
| |
115 |
|
|
3.125%, 05/15/22 |
|
|
115 |
|
|
|
|
|
|
|
|
|
|
|
|
|
|
|
|
|
511 |
|
|
|
|
|
|
|
|
|
|
|
|
|
|
Life Sciences Tools & Services — 0.0% (g) |
|
|
|
|
|
Thermo Fisher Scientific, Inc., |
|
|
|
|
| |
22 |
|
|
1.300%, 02/01/17 |
|
|
22 |
|
| |
69 |
|
|
4.150%, 02/01/24 |
|
|
73 |
|
|
|
|
|
|
|
|
|
|
|
|
|
|
|
|
|
95 |
|
|
|
|
|
|
|
|
|
|
|
|
|
|
Pharmaceuticals — 0.2% |
|
|
|
|
|
AbbVie, Inc., |
|
|
|
|
| |
119 |
|
|
1.750%, 11/06/17 |
|
|
120 |
|
| |
87 |
|
|
2.900%, 11/06/22 |
|
|
85 |
|
| |
69 |
|
|
Actavis Funding SCS, (Luxembourg), 3.850%, 06/15/24 (e) |
|
|
70 |
|
| |
150 |
|
|
GlaxoSmithKline Capital, Inc., 5.650%, 05/15/18 |
|
|
171 |
|
|
|
|
|
Merck & Co., Inc., |
|
|
|
|
| |
75 |
|
|
1.300%, 05/18/18 |
|
|
75 |
|
| |
62 |
|
|
2.400%, 09/15/22 |
|
|
60 |
|
|
|
|
|
|
|
|
|
|
|
|
|
|
|
|
|
581 |
|
|
|
|
|
|
|
|
|
|
|
|
|
|
Total Health Care |
|
|
1,948 |
|
|
|
|
|
|
|
|
|
|
|
|
|
|
Industrials — 1.1% |
|
|
|
|
|
Aerospace & Defense — 0.1% |
|
| |
43 |
|
|
Airbus Group Finance B.V., (Netherlands), 2.700%, 04/17/23 (e) |
|
|
42 |
|
| |
70 |
|
|
BAE Systems Holdings, Inc., 6.375%, 06/01/19 (e) |
|
|
82 |
|
| |
100 |
|
|
Honeywell International, Inc., 5.300%, 03/01/18 |
|
|
113 |
|
| |
47 |
|
|
Lockheed Martin Corp., 2.125%, 09/15/16 |
|
|
48 |
|
| |
43 |
|
|
Precision Castparts Corp., 0.700%, 12/20/15 |
|
|
43 |
|
| |
50 |
|
|
United Technologies Corp., 6.125%, 02/01/19 |
|
|
59 |
|
|
|
|
|
|
|
|
|
|
|
|
|
|
|
|
|
387 |
|
|
|
|
|
|
|
|
|
|
SEE NOTES TO
FINANCIAL STATEMENTS.
|
|
|
|
|
|
|
|
|
|
|
|
|
| AUGUST 31, 2014 |
|
JPMORGAN INSTITUTIONAL TRUST FUNDS |
|
|
|
|
81 |
|
JPMorgan Intermediate Bond Trust
SCHEDULE OF PORTFOLIO INVESTMENTS
AS OF AUGUST 31, 2014 (Unaudited) (continued)
(Amounts in thousands)
|
|
|
|
|
|
|
|
|
PRINCIPAL
AMOUNT($) |
|
|
SECURITY DESCRIPTION |
|
VALUE($) |
|
|
|
|
|
|
|
|
|
|
| |
Corporate Bonds — continued |
|
|
|
|
|
Air Freight & Logistics — 0.2% |
|
| |
541 |
|
|
Federal Express Corp. 1998 Pass-Through Trust, 6.720%, 01/15/22 |
|
|
634 |
|
| |
115 |
|
|
United Parcel Service of America, Inc., 8.375%, 04/01/20 |
|
|
150 |
|
|
|
|
|
|
|
|
|
|
|
|
|
|
|
|
|
784 |
|
|
|
|
|
|
|
|
|
|
|
|
|
|
Airlines — 0.1% |
|
| |
189 |
|
|
American Airlines 2013-2 Class A Pass-Through Trust, 4.950%, 01/15/23 |
|
|
204 |
|
| |
30 |
|
|
Continental Airlines 1999-2 Class A-1 Pass-Through Trust, 7.256%,
03/15/20 |
|
|
34 |
|
| |
58 |
|
|
Delta Air Lines 2010-2 Class A Pass-Through Trust, 4.950%, 05/23/19 |
|
|
62 |
|
|
|
|
|
|
|
|
|
|
|
|
|
|
|
|
|
300 |
|
|
|
|
|
|
|
|
|
|
|
|
|
|
Commercial Services & Supplies — 0.1% |
|
|
|
|
|
ADT Corp. (The), |
|
|
|
|
| |
70 |
|
|
3.500%, 07/15/22 |
|
|
63 |
|
| |
24 |
|
|
4.125%, 06/15/23 |
|
|
22 |
|
| |
50 |
|
|
Pitney Bowes, Inc., 5.600%, 03/15/18 |
|
|
55 |
|
| |
60 |
|
|
Waste Management, Inc., 7.375%, 03/11/19 |
|
|
73 |
|
|
|
|
|
|
|
|
|
|
|
|
|
|
|
|
|
213 |
|
|
|
|
|
|
|
|
|
|
|
|
|
|
Construction & Engineering — 0.0% (g) |
|
|
|
|
|
ABB Finance USA, Inc., |
|
|
|
|
| |
32 |
|
|
1.625%, 05/08/17 |
|
|
32 |
|
| |
41 |
|
|
2.875%, 05/08/22 |
|
|
41 |
|
| |
70 |
|
|
Fluor Corp., 3.375%, 09/15/21 |
|
|
73 |
|
|
|
|
|
|
|
|
|
|
|
|
|
|
|
|
|
146 |
|
|
|
|
|
|
|
|
|
|
|
|
|
|
Electrical Equipment — 0.0% (g) |
|
|
|
|
|
Eaton Corp., |
|
|
|
|
| |
27 |
|
|
1.500%, 11/02/17 |
|
|
27 |
|
| |
50 |
|
|
5.600%, 05/15/18 |
|
|
57 |
|
|
|
|
|
|
|
|
|
|
|
|
|
|
|
|
|
84 |
|
|
|
|
|
|
|
|
|
|
|
|
|
|
Industrial Conglomerates — 0.1% |
|
| |
175 |
|
|
General Electric Co., 3.375%, 03/11/24 |
|
|
180 |
|
| |
34 |
|
|
Ingersoll-Rand Global Holding Co., Ltd., 4.250%, 06/15/23 |
|
|
36 |
|
| |
152 |
|
|
Koninklijke Philips N.V., (Netherlands), 3.750%, 03/15/22 |
|
|
161 |
|
|
|
|
|
|
|
|
|
|
|
|
|
|
|
|
|
377 |
|
|
|
|
|
|
|
|
|
|
|
|
|
|
Machinery — 0.1% |
|
|
|
|
|
Caterpillar, Inc., |
|
|
|
|
| |
74 |
|
|
1.500%, 06/26/17 |
|
|
75 |
|
| |
31 |
|
|
2.600%, 06/26/22 |
|
|
30 |
|
| |
89 |
|
|
Deere & Co., 2.600%, 06/08/22 |
|
|
88 |
|
|
|
|
|
|
|
|
|
|
PRINCIPAL
AMOUNT($) |
|
|
SECURITY DESCRIPTION |
|
VALUE($) |
|
|
|
|
|
|
|
|
|
|
|
|
|
|
|
|
|
Machinery — continued |
|
| |
25 |
|
|
Parker Hannifin Corp., 5.500%, 05/15/18 |
|
|
28 |
|
|
|
|
|
|
|
|
|
|
|
|
|
|
|
|
|
221 |
|
|
|
|
|
|
|
|
|
|
|
|
|
|
Road & Rail — 0.4% |
|
|
|
|
|
Burlington Northern Santa Fe LLC, |
|
|
|
|
| |
43 |
|
|
3.050%, 03/15/22 |
|
|
43 |
|
| |
32 |
|
|
3.450%, 09/15/21 |
|
|
33 |
|
| |
19 |
|
|
3.600%, 09/01/20 |
|
|
20 |
|
| |
100 |
|
|
3.750%, 04/01/24 |
|
|
104 |
|
| |
100 |
|
|
5.650%, 05/01/17 |
|
|
112 |
|
|
|
|
|
CSX Corp., |
|
|
|
|
| |
100 |
|
|
3.400%, 08/01/24 |
|
|
102 |
|
| |
30 |
|
|
6.250%, 04/01/15 |
|
|
31 |
|
| |
30 |
|
|
7.375%, 02/01/19 |
|
|
36 |
|
| |
50 |
|
|
7.900%, 05/01/17 |
|
|
58 |
|
|
|
|
|
ERAC USA Finance LLC, |
|
|
|
|
| |
48 |
|
|
2.750%, 03/15/17 (e) |
|
|
50 |
|
| |
27 |
|
|
4.500%, 08/16/21 (e) |
|
|
29 |
|
|
|
|
|
Norfolk Southern Corp., |
|
|
|
|
| |
138 |
|
|
3.250%, 12/01/21 |
|
|
143 |
|
| |
50 |
|
|
7.700%, 05/15/17 |
|
|
58 |
|
| |
53 |
|
|
Penske Truck Leasing Co. LP/PTL Finance Corp., 2.875%, 07/17/18 (e) |
|
|
55 |
|
|
|
|
|
Ryder System, Inc., |
|
|
|
|
| |
48 |
|
|
2.500%, 03/01/17 |
|
|
50 |
|
| |
55 |
|
|
3.600%, 03/01/16 |
|
|
57 |
|
|
|
|
|
Union Pacific Corp., |
|
|
|
|
| |
21 |
|
|
2.950%, 01/15/23 |
|
|
21 |
|
| |
75 |
|
|
3.646%, 02/15/24 |
|
|
78 |
|
| |
233 |
|
|
4.163%, 07/15/22 |
|
|
256 |
|
| |
100 |
|
|
4.875%, 01/15/15 |
|
|
102 |
|
|
|
|
|
|
|
|
|
|
|
|
|
|
|
|
|
1,438 |
|
|
|
|
|
|
|
|
|
|
|
|
|
|
Total Industrials |
|
|
3,950 |
|
|
|
|
|
|
|
|
|
|
|
|
|
|
Information Technology — 1.0% |
|
|
|
|
|
|
|
|
Communications Equipment — 0.0% (g) |
|
|
|
|
| |
55 |
|
|
Cisco Systems, Inc., 2.900%, 03/04/21 |
|
|
56 |
|
|
|
|
|
|
|
|
|
|
|
|
|
|
Electronic Equipment, Instruments & Components — 0.1% |
|
|
|
|
|
Arrow Electronics, Inc., |
|
|
|
|
| |
32 |
|
|
3.000%, 03/01/18 |
|
|
33 |
|
| |
55 |
|
|
3.375%, 11/01/15 |
|
|
56 |
|
| |
16 |
|
|
4.500%, 03/01/23 |
|
|
17 |
|
| |
100 |
|
|
6.875%, 06/01/18 |
|
|
115 |
|
| |
13 |
|
|
7.500%, 01/15/27 |
|
|
16 |
|
|
|
|
|
|
|
|
|
|
|
|
|
|
|
|
|
237 |
|
|
|
|
|
|
|
|
|
|
SEE NOTES TO
FINANCIAL STATEMENTS.
|
|
|
|
|
|
|
|
|
|
|
| 82 |
|
|
|
JPMORGAN INSTITUTIONAL TRUST FUNDS |
|
AUGUST 31, 2014 |
|
|
|
|
|
|
|
|
|
PRINCIPAL
AMOUNT($) |
|
|
SECURITY DESCRIPTION |
|
VALUE($) |
|
|
|
|
|
|
|
|
|
|
| |
Corporate Bonds — continued |
|
|
|
|
|
Internet Software & Services — 0.0% (g) |
|
| |
125 |
|
|
eBay, Inc., 2.875%, 08/01/21 |
|
|
125 |
|
|
|
|
|
|
|
|
|
|
|
|
|
|
IT Services — 0.3% |
|
|
|
|
|
International Business Machines Corp., |
|
|
|
|
| |
126 |
|
|
1.250%, 02/06/17 |
|
|
127 |
|
| |
309 |
|
|
1.625%, 05/15/20 |
|
|
298 |
|
| |
150 |
|
|
5.700%, 09/14/17 |
|
|
170 |
|
| |
200 |
|
|
7.625%, 10/15/18 |
|
|
245 |
|
|
|
|
|
Xerox Corp., |
|
|
|
|
| |
39 |
|
|
2.950%, 03/15/17 |
|
|
41 |
|
| |
50 |
|
|
5.625%, 12/15/19 |
|
|
57 |
|
| |
40 |
|
|
6.750%, 02/01/17 |
|
|
45 |
|
|
|
|
|
|
|
|
|
|
|
|
|
|
|
|
|
983 |
|
|
|
|
|
|
|
|
|
|
|
|
|
|
Semiconductors & Semiconductor Equipment — 0.0% (g) |
|
| |
30 |
|
|
National Semiconductor Corp., 6.600%, 06/15/17 |
|
|
34 |
|
| |
73 |
|
|
Texas Instruments, Inc., 1.650%, 08/03/19 |
|
|
72 |
|
|
|
|
|
|
|
|
|
|
|
|
|
|
|
|
|
106 |
|
|
|
|
|
|
|
|
|
|
|
|
|
|
Software — 0.3% |
|
| |
25 |
|
|
Intuit, Inc., 5.750%, 03/15/17 |
|
|
28 |
|
|
|
|
|
Microsoft Corp., |
|
|
|
|
| |
23 |
|
|
0.875%, 11/15/17 |
|
|
23 |
|
| |
120 |
|
|
1.625%, 09/25/15 |
|
|
121 |
|
| |
34 |
|
|
2.125%, 11/15/22 |
|
|
33 |
|
| |
68 |
|
|
2.375%, 05/01/23 |
|
|
66 |
|
| |
167 |
|
|
3.625%, 12/15/23 |
|
|
177 |
|
|
|
|
|
Oracle Corp., |
|
|
|
|
| |
200 |
|
|
3.625%, 07/15/23 |
|
|
209 |
|
| |
200 |
|
|
5.250%, 01/15/16 |
|
|
213 |
|
| |
100 |
|
|
5.750%, 04/15/18 |
|
|
115 |
|
|
|
|
|
|
|
|
|
|
|
|
|
|
|
|
|
985 |
|
|
|
|
|
|
|
|
|
|
|
|
|
|
Technology Hardware, Storage & Peripherals — 0.3% |
|
|
|
|
|
Apple, Inc., |
|
|
|
|
| |
199 |
|
|
2.400%, 05/03/23 |
|
|
191 |
|
| |
201 |
|
|
2.850%, 05/06/21 |
|
|
205 |
|
| |
207 |
|
|
VAR, 0.489%, 05/03/18 |
|
|
207 |
|
|
|
|
|
EMC Corp., |
|
|
|
|
| |
100 |
|
|
1.875%, 06/01/18 |
|
|
100 |
|
| |
100 |
|
|
3.375%, 06/01/23 |
|
|
102 |
|
|
|
|
|
Hewlett-Packard Co., |
|
|
|
|
| |
118 |
|
|
4.375%, 09/15/21 |
|
|
128 |
|
| |
45 |
|
|
4.650%, 12/09/21 |
|
|
49 |
|
|
|
|
|
|
|
|
|
|
|
|
|
|
|
|
|
982 |
|
|
|
|
|
|
|
|
|
|
|
|
|
|
Total Information Technology |
|
|
3,474 |
|
|
|
|
|
|
|
|
|
|
|
|
|
|
|
|
|
|
|
PRINCIPAL
AMOUNT($) |
|
|
SECURITY DESCRIPTION |
|
VALUE($) |
|
|
|
|
|
|
|
|
|
|
|
|
|
|
|
|
|
Materials — 0.6% |
|
|
|
|
|
Chemicals — 0.4% |
|
| |
125 |
|
|
CF Industries, Inc., 7.125%, 05/01/20 |
|
|
153 |
|
|
|
|
|
Dow Chemical Co. (The), |
|
|
|
|
| |
81 |
|
|
4.125%, 11/15/21 |
|
|
87 |
|
| |
38 |
|
|
4.250%, 11/15/20 |
|
|
41 |
|
| |
20 |
|
|
8.550%, 05/15/19 |
|
|
26 |
|
|
|
|
|
E.I. du Pont de Nemours & Co., |
|
|
|
|
| |
101 |
|
|
1.950%, 01/15/16 |
|
|
103 |
|
| |
100 |
|
|
6.000%, 07/15/18 |
|
|
116 |
|
| |
73 |
|
|
Monsanto Co., 2.750%, 07/15/21 |
|
|
73 |
|
|
|
|
|
Mosaic Co. (The), |
|
|
|
|
| |
34 |
|
|
3.750%, 11/15/21 |
|
|
36 |
|
| |
212 |
|
|
4.250%, 11/15/23 |
|
|
226 |
|
| |
25 |
|
|
Potash Corp. of Saskatchewan, Inc., (Canada), 3.250%, 12/01/17 |
|
|
26 |
|
| |
230 |
|
|
Praxair, Inc., 4.625%, 03/30/15 |
|
|
236 |
|
| |
150 |
|
|
Union Carbide Corp., 7.500%, 06/01/25 |
|
|
194 |
|
|
|
|
|
|
|
|
|
|
|
|
|
|
|
|
|
1,317 |
|
|
|
|
|
|
|
|
|
|
|
|
|
|
Metals & Mining — 0.2% |
|
|
|
|
|
|
|
|
BHP Billiton Finance USA Ltd., (Australia), |
|
|
|
|
| |
37 |
|
|
1.000%, 02/24/15 |
|
|
37 |
|
| |
95 |
|
|
3.850%, 09/30/23 |
|
|
101 |
|
| |
100 |
|
|
5.400%, 03/29/17 |
|
|
111 |
|
| |
100 |
|
|
6.500%, 04/01/19 |
|
|
120 |
|
|
|
|
|
Freeport-McMoRan, Inc., |
|
|
|
|
| |
128 |
|
|
2.150%, 03/01/17 |
|
|
130 |
|
| |
107 |
|
|
3.875%, 03/15/23 |
|
|
109 |
|
| |
27 |
|
|
Nucor Corp., 4.000%, 08/01/23 |
|
|
28 |
|
| |
27 |
|
|
Rio Tinto Finance USA Ltd., (Australia), 3.500%, 11/02/20 |
|
|
28 |
|
| |
58 |
|
|
Rio Tinto Finance USA plc, (United Kingdom), 1.625%, 08/21/17 |
|
|
59 |
|
| |
42 |
|
|
Teck Resources Ltd., (Canada), 4.750%, 01/15/22 |
|
|
45 |
|
|
|
|
|
|
|
|
|
|
|
|
|
|
|
|
|
768 |
|
|
|
|
|
|
|
|
|
|
|
|
|
|
Total Materials |
|
|
2,085 |
|
|
|
|
|
|
|
|
|
|
|
|
|
|
Telecommunication Services — 0.6% |
|
|
|
|
|
Diversified Telecommunication Services — 0.5% |
|
|
|
|
|
AT&T, Inc., |
|
|
|
|
| |
204 |
|
|
0.900%, 02/12/16 |
|
|
205 |
|
| |
100 |
|
|
4.450%, 05/15/21 |
|
|
111 |
|
| |
180 |
|
|
5.500%, 02/01/18 |
|
|
203 |
|
| |
41 |
|
|
BellSouth Telecommunications LLC, 6.300%, 12/15/15 |
|
|
41 |
|
SEE NOTES TO
FINANCIAL STATEMENTS.
|
|
|
|
|
|
|
|
|
|
|
|
|
| AUGUST 31, 2014 |
|
JPMORGAN INSTITUTIONAL TRUST FUNDS |
|
|
|
|
83 |
|
JPMorgan Intermediate Bond Trust
SCHEDULE OF PORTFOLIO INVESTMENTS
AS OF AUGUST 31, 2014 (Unaudited) (continued)
(Amounts in thousands)
|
|
|
|
|
|
|
|
|
PRINCIPAL
AMOUNT($) |
|
|
SECURITY DESCRIPTION |
|
VALUE($) |
|
|
|
|
|
|
|
|
|
|
| |
Corporate Bonds — continued |
|
|
|
|
|
Diversified Telecommunication Services — continued |
|
| |
100 |
|
|
British Telecommunications plc, (United Kingdom), 5.950%, 01/15/18 |
|
|
114 |
|
| |
27 |
|
|
Nippon Telegraph & Telephone Corp., (Japan), 1.400%, 07/18/17 |
|
|
27 |
|
| |
61 |
|
|
Orange S.A., (France), 2.750%, 09/14/16 |
|
|
63 |
|
| |
148 |
|
|
Qwest Corp., 6.750%, 12/01/21 |
|
|
172 |
|
|
|
|
|
Telefonica Emisiones S.A.U., (Spain), |
|
|
|
|
| |
19 |
|
|
5.134%, 04/27/20 |
|
|
21 |
|
| |
12 |
|
|
5.877%, 07/15/19 |
|
|
14 |
|
|
|
|
|
Verizon Communications, Inc., |
|
|
|
|
| |
115 |
|
|
2.625%, 02/21/20 (e) |
|
|
115 |
|
| |
72 |
|
|
3.450%, 03/15/21 |
|
|
75 |
|
| |
156 |
|
|
4.150%, 03/15/24 |
|
|
165 |
|
| |
353 |
|
|
4.500%, 09/15/20 |
|
|
388 |
|
|
|
|
|
|
|
|
|
|
|
|
|
|
|
|
|
1,714 |
|
|
|
|
|
|
|
|
|
|
|
|
|
|
Wireless Telecommunication Services — 0.1% |
|
| |
40 |
|
|
Crown Castle Towers LLC, 3.214%, 08/15/15 (e) |
|
|
40 |
|
| |
160 |
|
|
Rogers Communications, Inc., (Canada), 4.100%, 10/01/23 |
|
|
168 |
|
|
|
|
|
Vodafone Group plc, (United Kingdom), |
|
|
|
|
| |
100 |
|
|
1.500%, 02/19/18 |
|
|
99 |
|
| |
100 |
|
|
1.625%, 03/20/17 |
|
|
101 |
|
|
|
|
|
|
|
|
|
|
|
|
|
|
|
|
|
408 |
|
|
|
|
|
|
|
|
|
|
|
|
|
|
Total Telecommunication Services |
|
|
2,122 |
|
|
|
|
|
|
|
|
|
|
|
|
|
|
Utilities — 1.1% |
|
|
|
|
|
|
|
|
Electric Utilities — 0.8% |
|
|
|
|
| |
27 |
|
|
American Electric Power Co., Inc., 1.650%, 12/15/17 |
|
|
27 |
|
| |
43 |
|
|
Baltimore Gas & Electric Co., 2.800%, 08/15/22 |
|
|
43 |
|
| |
50 |
|
|
Cleveland Electric Illuminating Co. (The), Series D, 7.880%, 11/01/17 |
|
|
59 |
|
| |
30 |
|
|
Connecticut Light & Power Co. (The), 5.650%, 05/01/18 |
|
|
34 |
|
| |
20 |
|
|
DTE Electric Co., 2.650%, 06/15/22 |
|
|
20 |
|
| |
60 |
|
|
Duke Energy Indiana, Inc., 3.750%, 07/15/20 |
|
|
64 |
|
|
|
|
|
Duke Energy Progress, Inc., |
|
|
|
|
| |
40 |
|
|
2.800%, 05/15/22 |
|
|
40 |
|
| |
150 |
|
|
5.300%, 01/15/19 |
|
|
171 |
|
| |
60 |
|
|
Electricite de France S.A., (France), 2.150%, 01/22/19 (e) |
|
|
60 |
|
| |
100 |
|
|
Enel Finance International N.V., (Netherlands), 5.125%, 10/07/19 (e) |
|
|
111 |
|
|
|
|
|
Indiana Michigan Power Co., |
|
|
|
|
| |
100 |
|
|
Series J, 3.200%, 03/15/23 |
|
|
101 |
|
| |
135 |
|
|
7.000%, 03/15/19 |
|
|
163 |
|
|
|
|
|
|
|
|
|
|
PRINCIPAL
AMOUNT($) |
|
|
SECURITY DESCRIPTION |
|
VALUE($) |
|
|
|
|
|
|
|
|
|
|
|
|
|
|
|
|
|
Electric Utilities — continued |
|
| |
25 |
|
|
Jersey Central Power & Light Co., 7.350%, 02/01/19 |
|
|
30 |
|
| |
47 |
|
|
Kansas City Power & Light Co., 3.150%, 03/15/23 |
|
|
47 |
|
| |
60 |
|
|
Nevada Power Co., 7.125%, 03/15/19 |
|
|
73 |
|
|
|
|
|
NextEra Energy Capital Holdings, Inc., |
|
|
|
|
| |
25 |
|
|
1.200%, 06/01/15 |
|
|
25 |
|
| |
27 |
|
|
2.400%, 09/15/19 |
|
|
27 |
|
| |
150 |
|
|
7.875%, 12/15/15 |
|
|
164 |
|
| |
40 |
|
|
Niagara Mohawk Power Corp., 4.881%, 08/15/19 (e) |
|
|
45 |
|
| |
25 |
|
|
Ohio Power Co., 6.050%, 05/01/18 |
|
|
29 |
|
| |
50 |
|
|
Oncor Electric Delivery Co. LLC, 6.800%, 09/01/18 |
|
|
59 |
|
|
|
|
|
Pacific Gas & Electric Co., |
|
|
|
|
| |
68 |
|
|
2.450%, 08/15/22 |
|
|
66 |
|
| |
50 |
|
|
3.250%, 06/15/23 |
|
|
50 |
|
| |
125 |
|
|
5.625%, 11/30/17 |
|
|
141 |
|
|
|
|
|
PacifiCorp, |
|
|
|
|
| |
140 |
|
|
3.600%, 04/01/24 |
|
|
146 |
|
| |
100 |
|
|
3.850%, 06/15/21 |
|
|
108 |
|
| |
60 |
|
|
5.650%, 07/15/18 |
|
|
69 |
|
| |
75 |
|
|
PECO Energy Co., 5.350%, 03/01/18 |
|
|
84 |
|
| |
51 |
|
|
Public Service Co. of Colorado, 3.200%, 11/15/20 |
|
|
53 |
|
| |
74 |
|
|
Public Service Co. of Oklahoma, 4.400%, 02/01/21 |
|
|
82 |
|
| |
212 |
|
|
Southern California Edison Co., Series C, 3.500%, 10/01/23 |
|
|
222 |
|
| |
45 |
|
|
Southern Co. (The), 1.950%, 09/01/16 |
|
|
46 |
|
| |
30 |
|
|
Southwestern Public Service Co., Series G, 8.750%, 12/01/18 |
|
|
38 |
|
|
|
|
|
Virginia Electric and Power Co., |
|
|
|
|
| |
21 |
|
|
3.450%, 02/15/24 |
|
|
22 |
|
| |
100 |
|
|
5.400%, 04/30/18 |
|
|
113 |
|
| |
100 |
|
|
Wisconsin Electric Power Co., 6.250%, 12/01/15 |
|
|
107 |
|
| |
27 |
|
|
Xcel Energy, Inc., 0.750%, 05/09/16 |
|
|
27 |
|
|
|
|
|
|
|
|
|
|
|
|
|
|
|
|
|
2,766 |
|
|
|
|
|
|
|
|
|
|
|
|
|
|
Gas Utilities — 0.0% (g) |
|
| |
30 |
|
|
Atmos Energy Corp., 8.500%, 03/15/19 |
|
|
38 |
|
| |
50 |
|
|
CenterPoint Energy Resources Corp., 6.125%, 11/01/17 |
|
|
57 |
|
|
|
|
|
|
|
|
|
|
|
|
|
|
|
|
|
95 |
|
|
|
|
|
|
|
|
|
|
SEE NOTES TO
FINANCIAL STATEMENTS.
|
|
|
|
|
|
|
|
|
|
|
| 84 |
|
|
|
JPMORGAN INSTITUTIONAL TRUST FUNDS |
|
AUGUST 31, 2014 |
|
|
|
|
|
|
|
|
|
PRINCIPAL
AMOUNT($) |
|
|
SECURITY DESCRIPTION |
|
VALUE($) |
|
|
|
|
|
|
|
|
|
|
| |
Corporate Bonds — continued |
|
|
|
|
|
Independent Power & Renewable Electricity
Producers — 0.0% (g) |
|
| |
72 |
|
|
Exelon Generation Co. LLC, 4.000%, 10/01/20 |
|
|
76 |
|
| |
37 |
|
|
PSEG Power LLC, 4.300%, 11/15/23 |
|
|
39 |
|
|
|
|
|
|
|
|
|
|
|
|
|
|
|
|
|
115 |
|
|
|
|
|
|
|
|
|
|
|
|
|
|
Multi-Utilities — 0.3% |
|
|
|
|
|
AGL Capital Corp., |
|
|
|
|
| |
94 |
|
|
3.500%, 09/15/21 |
|
|
99 |
|
| |
100 |
|
|
6.375%, 07/15/16 |
|
|
109 |
|
| |
50 |
|
|
Consumers Energy Co., 5.650%, 04/15/20 |
|
|
58 |
|
| |
150 |
|
|
Dominion Resources, Inc., 8.875%, 01/15/19 |
|
|
191 |
|
| |
180 |
|
|
NiSource Finance Corp., 4.450%, 12/01/21 |
|
|
195 |
|
|
|
|
|
Sempra Energy, |
|
|
|
|
| |
48 |
|
|
4.050%, 12/01/23 |
|
|
51 |
|
| |
150 |
|
|
9.800%, 02/15/19 |
|
|
198 |
|
|
|
|
|
|
|
|
|
|
|
|
|
|
|
|
|
901 |
|
|
|
|
|
|
|
|
|
|
|
|
|
|
Total Utilities |
|
|
3,877 |
|
|
|
|
|
|
|
|
|
|
|
|
|
|
Total Corporate Bonds
(Cost $61,846) |
|
|
65,985 |
|
|
|
|
|
|
|
|
|
|
| |
Foreign Government Securities — 1.0% |
|
|
|
|
|
Israel Government AID Bond, (Israel), |
|
|
|
|
| |
1,557 |
|
|
Zero Coupon, 08/15/20 |
|
|
1,361 |
|
| |
500 |
|
|
Series 6-Z, Zero Coupon, 02/15/22 |
|
|
413 |
|
|
|
|
|
Province of Ontario, (Canada), |
|
|
|
|
| |
400 |
|
|
0.950%, 05/26/15 |
|
|
402 |
|
| |
250 |
|
|
2.700%, 06/16/15 |
|
|
255 |
|
| |
300 |
|
|
2.950%, 02/05/15 |
|
|
303 |
|
| |
92 |
|
|
Republic of Poland, (Poland), 4.000%, 01/22/24 |
|
|
96 |
|
| |
200 |
|
|
Republic of Turkey, (Turkey), 5.750%, 03/22/24 |
|
|
222 |
|
|
|
|
|
United Mexican States, (Mexico), |
|
|
|
|
| |
244 |
|
|
3.500%, 01/21/21 |
|
|
254 |
|
| |
116 |
|
|
4.000%, 10/02/23 |
|
|
123 |
|
|
|
|
|
|
|
|
|
|
|
|
|
|
Total Foreign Government Securities
(Cost $3,351) |
|
|
3,429 |
|
|
|
|
|
|
|
|
|
|
| |
Mortgage Pass-Through Securities — 10.3% |
|
|
|
|
|
Federal Home Loan Mortgage Corp., |
|
|
|
|
| |
133 |
|
|
ARM, 2.040%, 01/01/37 |
|
|
140 |
|
| |
242 |
|
|
ARM, 2.098%, 08/01/36 |
|
|
257 |
|
| |
29 |
|
|
ARM, 2.235%, 01/01/27 |
|
|
31 |
|
| |
13 |
|
|
ARM, 2.250%, 07/01/26 |
|
|
13 |
|
| |
193 |
|
|
ARM, 2.309%, 03/01/37 |
|
|
206 |
|
| |
116 |
|
|
ARM, 2.332%, 09/01/36 |
|
|
124 |
|
| |
63 |
|
|
ARM, 2.378%, 11/01/36 |
|
|
67 |
|
|
|
|
|
|
|
|
|
|
PRINCIPAL
AMOUNT($) |
|
|
SECURITY DESCRIPTION |
|
VALUE($) |
|
|
|
|
|
|
|
|
|
|
|
|
|
| |
323 |
|
|
ARM, 2.412%, 12/01/34 |
|
|
345 |
|
| |
150 |
|
|
ARM, 2.429%, 09/01/36 |
|
|
161 |
|
| |
280 |
|
|
ARM, 2.506%, 06/01/36 |
|
|
301 |
|
| |
161 |
|
|
ARM, 2.664%, 04/01/38 |
|
|
174 |
|
| |
100 |
|
|
ARM, 2.826%, 02/01/37 |
|
|
108 |
|
|
|
|
|
Federal Home Loan Mortgage Corp. Gold Pools, 15 Year, Single Family, |
|
|
|
|
| |
94 |
|
|
4.000%, 06/01/19 |
|
|
99 |
|
| |
26 |
|
|
4.500%, 10/01/18 |
|
|
28 |
|
| |
186 |
|
|
5.500%, 06/01/17 - 01/01/24 |
|
|
205 |
|
| |
18 |
|
|
6.000%, 10/01/17 - 04/01/18 |
|
|
19 |
|
| |
205 |
|
|
6.500%, 01/01/17 - 03/01/22 |
|
|
215 |
|
| |
— |
(h) |
|
7.500%, 10/01/14 |
|
|
— |
(h) |
|
|
|
|
Federal Home Loan Mortgage Corp. Gold Pools, 20 Year, Single Family, |
|
|
|
|
| |
8 |
|
|
6.000%, 12/01/22 |
|
|
9 |
|
| |
45 |
|
|
6.500%, 11/01/22 - 08/01/26 |
|
|
51 |
|
|
|
|
|
Federal Home Loan Mortgage Corp. Gold Pools, 30 Year, Single Family, |
|
|
|
|
| |
60 |
|
|
6.000%, 01/01/34 |
|
|
69 |
|
| |
71 |
|
|
7.000%, 04/01/26 - 02/01/37 |
|
|
81 |
|
| |
6 |
|
|
7.500%, 08/01/25 |
|
|
6 |
|
| |
7 |
|
|
8.000%, 07/01/20 - 11/01/24 |
|
|
7 |
|
| |
18 |
|
|
8.500%, 07/01/28 |
|
|
22 |
|
| |
308 |
|
|
Federal Home Loan Mortgage Corp. Gold Pools, FHA/VA, 10.000%, 10/01/30 |
|
|
350 |
|
|
|
|
|
Federal Home Loan Mortgage Corp. Gold Pools, Other, |
|
|
|
|
| |
2,663 |
|
|
3.500%, 05/01/33 - 05/01/43 |
|
|
2,749 |
|
| |
450 |
|
|
4.000%, 06/01/42 |
|
|
478 |
|
| |
165 |
|
|
6.000%, 02/01/33 |
|
|
179 |
|
|
|
|
|
Federal Home Loan Mortgage Corp., 30 Year, Single Family, |
|
|
|
|
| |
— |
(h) |
|
12.000%, 08/01/15 - 07/01/19 |
|
|
— |
(h) |
|
|
|
|
Federal National Mortgage Association, |
|
|
|
|
| |
54 |
|
|
ARM, 1.798%, 02/01/37 |
|
|
57 |
|
| |
3 |
|
|
ARM, 1.875%, 03/01/19 |
|
|
2 |
|
| |
81 |
|
|
ARM, 1.885%, 08/01/35 |
|
|
86 |
|
| |
183 |
|
|
ARM, 1.899%, 01/01/35 |
|
|
193 |
|
| |
164 |
|
|
ARM, 1.910%, 09/01/35 |
|
|
173 |
|
| |
265 |
|
|
ARM, 1.916%, 02/01/35 |
|
|
282 |
|
| |
213 |
|
|
ARM, 2.070%, 01/01/35 |
|
|
222 |
|
| |
113 |
|
|
ARM, 2.093%, 09/01/36 |
|
|
120 |
|
| |
106 |
|
|
ARM, 2.127%, 11/01/33 |
|
|
112 |
|
| |
169 |
|
|
ARM, 2.143%, 09/01/35 |
|
|
181 |
|
| |
300 |
|
|
ARM, 2.153%, 09/01/34 |
|
|
321 |
|
| |
173 |
|
|
ARM, 2.199%, 02/01/35 |
|
|
184 |
|
SEE NOTES TO
FINANCIAL STATEMENTS.
|
|
|
|
|
|
|
|
|
|
|
|
|
| AUGUST 31, 2014 |
|
JPMORGAN INSTITUTIONAL TRUST FUNDS |
|
|
|
|
85 |
|
JPMorgan Intermediate Bond Trust
SCHEDULE OF PORTFOLIO INVESTMENTS
AS OF AUGUST 31, 2014 (Unaudited) (continued)
(Amounts in thousands)
|
|
|
|
|
|
|
|
|
PRINCIPAL
AMOUNT($) |
|
|
SECURITY DESCRIPTION |
|
VALUE($) |
|
|
|
|
|
|
|
|
|
|
| |
Mortgage Pass-Through Securities — continued |
|
| |
71 |
|
|
ARM, 2.241%, 08/01/36 |
|
|
77 |
|
| |
147 |
|
|
ARM, 2.267%, 08/01/34 |
|
|
157 |
|
| |
132 |
|
|
ARM, 2.354%, 04/01/35 |
|
|
141 |
|
| |
— |
(h) |
|
ARM, 2.375%, 08/01/19 |
|
|
— |
(h) |
| |
205 |
|
|
ARM, 2.405%, 02/01/37 |
|
|
220 |
|
| |
126 |
|
|
ARM, 2.406%, 04/01/33 |
|
|
135 |
|
| |
122 |
|
|
ARM, 2.445%, 07/01/46 |
|
|
131 |
|
| |
177 |
|
|
ARM, 2.475%, 09/01/33 |
|
|
189 |
|
| |
147 |
|
|
ARM, 2.505%, 10/01/34 |
|
|
158 |
|
| |
12 |
|
|
ARM, 2.614%, 09/01/27 |
|
|
13 |
|
| |
281 |
|
|
ARM, 2.836%, 02/01/36 |
|
|
299 |
|
| |
9 |
|
|
ARM, 3.705%, 03/01/29 |
|
|
10 |
|
|
|
|
|
Federal National Mortgage Association, 15 Year, Single Family, |
|
|
|
|
| |
46 |
|
|
4.000%, 05/01/19 |
|
|
49 |
|
| |
236 |
|
|
4.500%, 05/01/18 - 05/01/19 |
|
|
251 |
|
| |
306 |
|
|
5.000%, 06/01/18 - 04/01/19 |
|
|
327 |
|
| |
193 |
|
|
5.500%, 01/01/20 - 06/01/20 |
|
|
205 |
|
| |
281 |
|
|
6.000%, 03/01/21 - 01/01/24 |
|
|
306 |
|
| |
41 |
|
|
6.500%, 03/01/17 - 08/01/20 |
|
|
43 |
|
|
|
|
|
Federal National Mortgage Association, 20 Year, Single Family, |
|
|
|
|
| |
72 |
|
|
6.000%, 04/01/24 |
|
|
81 |
|
| |
95 |
|
|
6.500%, 05/01/22 |
|
|
107 |
|
|
|
|
|
Federal National Mortgage Association, 30 Year, FHA/VA, |
|
|
|
|
| |
13 |
|
|
6.000%, 09/01/33 |
|
|
14 |
|
| |
25 |
|
|
6.500%, 03/01/29 |
|
|
29 |
|
| |
6 |
|
|
8.500%, 02/01/30 |
|
|
6 |
|
| |
8 |
|
|
9.000%, 09/01/19 - 12/01/30 |
|
|
8 |
|
| |
5 |
|
|
9.500%, 12/01/18 |
|
|
6 |
|
|
|
|
|
Federal National Mortgage Association, 30 Year, Single Family, |
|
|
|
|
| |
71 |
|
|
4.500%, 08/01/33 |
|
|
77 |
|
| |
1,082 |
|
|
5.000%, 07/01/33 - 08/01/40 |
|
|
1,204 |
|
| |
103 |
|
|
5.500%, 12/01/33 |
|
|
116 |
|
| |
523 |
|
|
6.000%, 12/01/32 - 09/01/37 |
|
|
595 |
|
| |
40 |
|
|
6.500%, 08/01/31 |
|
|
47 |
|
| |
6 |
|
|
7.000%, 09/01/27 - 08/01/32 |
|
|
7 |
|
| |
11 |
|
|
7.500%, 11/01/22 - 10/01/24 |
|
|
12 |
|
| |
380 |
|
|
8.000%, 03/01/21 - 11/01/32 |
|
|
439 |
|
| |
7 |
|
|
8.500%, 07/01/24 - 06/01/25 |
|
|
8 |
|
| |
— |
(h) |
|
9.000%, 04/01/26 |
|
|
— |
(h) |
| |
3 |
|
|
10.000%, 02/01/24 |
|
|
3 |
|
| |
— |
(h) |
|
12.500%, 01/01/16 |
|
|
— |
(h) |
|
|
|
|
Federal National Mortgage Association, Other, |
|
|
|
|
| |
500 |
|
|
VAR, 0.625%, 12/01/23 |
|
|
504 |
|
|
|
|
|
|
|
|
|
|
PRINCIPAL
AMOUNT($) |
|
|
SECURITY DESCRIPTION |
|
VALUE($) |
|
|
|
|
|
|
|
|
|
|
|
|
|
| |
1,000 |
|
|
VAR, 0.635%, 08/01/23 |
|
|
1,008 |
|
| |
948 |
|
|
1.940%, 01/01/17 |
|
|
954 |
|
| |
1,000 |
|
|
2.056%, 01/01/17 |
|
|
999 |
|
| |
1,000 |
|
|
2.294%, 12/01/22 |
|
|
978 |
|
| |
500 |
|
|
2.314%, 12/01/22 |
|
|
490 |
|
| |
990 |
|
|
2.480%, 06/01/19 |
|
|
1,011 |
|
| |
1,973 |
|
|
2.764%, 06/01/23 |
|
|
1,997 |
|
| |
2,352 |
|
|
3.590%, 12/01/20 |
|
|
2,517 |
|
| |
1,000 |
|
|
3.658%, 10/01/20 |
|
|
1,068 |
|
| |
1,500 |
|
|
3.760%, 10/01/23 - 11/01/23 |
|
|
1,616 |
|
| |
895 |
|
|
4.000%, 07/01/42 |
|
|
951 |
|
| |
408 |
|
|
4.271%, 06/01/21 |
|
|
447 |
|
| |
1,045 |
|
|
4.298%, 03/01/21 |
|
|
1,153 |
|
| |
1,942 |
|
|
4.380%, 01/01/21 - 04/01/21 |
|
|
2,159 |
|
| |
495 |
|
|
4.390%, 05/01/21 |
|
|
551 |
|
| |
786 |
|
|
4.443%, 04/01/21 |
|
|
872 |
|
| |
917 |
|
|
4.500%, 03/01/20 |
|
|
1,013 |
|
| |
109 |
|
|
5.500%, 04/01/38 |
|
|
119 |
|
| |
125 |
|
|
6.000%, 03/01/37 |
|
|
139 |
|
|
|
|
|
Government National Mortgage Association II, 30 Year, Single Family, |
|
|
|
|
| |
320 |
|
|
6.000%, 03/20/28 - 09/20/38 |
|
|
360 |
|
| |
12 |
|
|
7.500%, 02/20/28 - 09/20/28 |
|
|
15 |
|
| |
31 |
|
|
8.000%, 12/20/25 - 08/20/28 |
|
|
36 |
|
| |
20 |
|
|
8.500%, 03/20/25 - 05/20/25 |
|
|
22 |
|
|
|
|
|
Government National Mortgage Association, 15 Year, Single Family, |
|
|
|
|
| |
13 |
|
|
6.000%, 10/15/17 |
|
|
14 |
|
| |
3 |
|
|
8.000%, 01/15/16 |
|
|
3 |
|
|
|
|
|
Government National Mortgage Association, 30 Year, Single Family, |
|
|
|
|
| |
341 |
|
|
6.000%, 11/15/28 - 12/15/38 |
|
|
386 |
|
| |
294 |
|
|
6.500%, 01/15/24 - 12/15/35 |
|
|
340 |
|
| |
281 |
|
|
7.000%, 08/15/23 - 06/15/35 |
|
|
319 |
|
| |
25 |
|
|
7.500%, 11/15/22 - 09/15/28 |
|
|
28 |
|
| |
6 |
|
|
8.000%, 07/15/22 - 08/15/28 |
|
|
6 |
|
| |
3 |
|
|
8.500%, 11/15/17 |
|
|
3 |
|
| |
7 |
|
|
9.000%, 08/15/16 - 11/15/24 |
|
|
8 |
|
| |
128 |
|
|
9.500%, 09/15/18 - 12/15/25 |
|
|
145 |
|
| |
1 |
|
|
12.000%, 11/15/19 |
|
|
1 |
|
|
|
|
|
|
|
|
|
|
|
|
|
|
Total Mortgage Pass-Through Securities
(Cost $34,716) |
|
|
36,129 |
|
|
|
|
|
|
|
|
|
|
| |
Supranational — 0.1% |
|
| |
150 |
|
|
African Development Bank, 8.800%, 09/01/19
(Cost $189) |
|
|
191 |
|
|
|
|
|
|
|
|
|
|
SEE NOTES TO
FINANCIAL STATEMENTS.
|
|
|
|
|
|
|
|
|
|
|
| 86 |
|
|
|
JPMORGAN INSTITUTIONAL TRUST FUNDS |
|
AUGUST 31, 2014 |
|
|
|
|
|
|
|
|
|
PRINCIPAL
AMOUNT($) |
|
|
SECURITY DESCRIPTION |
|
VALUE($) |
|
|
|
|
|
|
|
|
|
|
| |
U.S. Government Agency Securities — 2.5% |
|
|
|
|
|
Federal National Mortgage Association, |
|
|
|
|
| |
1,000 |
|
|
Zero Coupon, 06/01/17 |
|
|
971 |
|
| |
800 |
|
|
5.000%, 05/11/17 |
|
|
886 |
|
| |
375 |
|
|
Federal National Mortgage Association STRIPS, Zero Coupon, 11/15/21 |
|
|
315 |
|
|
|
|
|
Financing Corp., |
|
|
|
|
| |
1,440 |
|
|
Zero Coupon, 05/11/18 |
|
|
1,360 |
|
| |
500 |
|
|
Zero Coupon, 04/05/19 |
|
|
460 |
|
| |
584 |
|
|
Zero Coupon, 09/26/19 |
|
|
528 |
|
| |
1,000 |
|
|
Government Trust Certificate, Zero Coupon, 10/01/15 |
|
|
988 |
|
|
|
|
|
Residual Funding Corp. STRIPS, |
|
|
|
|
| |
250 |
|
|
Zero Coupon, 10/15/19 |
|
|
226 |
|
| |
1,750 |
|
|
Zero Coupon, 07/15/20 |
|
|
1,545 |
|
| |
1,000 |
|
|
Tennessee Valley Authority, 5.500%, 07/18/17 |
|
|
1,126 |
|
| |
333 |
|
|
Tennessee Valley Authority STRIPS, Zero Coupon, 05/01/19 |
|
|
303 |
|
|
|
|
|
|
|
|
|
|
|
|
|
|
Total U.S. Government Agency Securities
(Cost $8,489) |
|
|
8,708 |
|
|
|
|
|
|
|
|
|
|
| |
U.S. Treasury Obligations — 30.1% |
|
|
|
|
|
U.S. Treasury Bonds, |
|
|
|
|
| |
1,225 |
|
|
7.500%, 11/15/16 |
|
|
1,408 |
|
| |
250 |
|
|
8.750%, 08/15/20 |
|
|
348 |
|
| |
1,500 |
|
|
8.875%, 08/15/17 |
|
|
1,846 |
|
| |
835 |
|
|
11.250%, 02/15/15 |
|
|
877 |
|
|
|
|
|
U.S. Treasury Coupon STRIPS, |
|
|
|
|
| |
700 |
|
|
0.925%, 05/15/18 (n) |
|
|
666 |
|
| |
2,200 |
|
|
1.837%, 02/15/18 (n) |
|
|
2,108 |
|
| |
2,150 |
|
|
1.967%, 05/15/21 (n) |
|
|
1,870 |
|
| |
3,275 |
|
|
2.257%, 02/15/21 (n) |
|
|
2,873 |
|
| |
4,446 |
|
|
2.283%, 08/15/17 (n) |
|
|
4,318 |
|
| |
3,750 |
|
|
2.410%, 02/15/20 (n) |
|
|
3,392 |
|
| |
2,400 |
|
|
2.464%, 02/15/22 (n) |
|
|
2,035 |
|
| |
300 |
|
|
2.484%, 05/15/23 (n) |
|
|
244 |
|
| |
150 |
|
|
2.487%, 11/15/23 (n) |
|
|
120 |
|
| |
1,495 |
|
|
2.497%, 05/15/19 (n) |
|
|
1,383 |
|
| |
150 |
|
|
2.514%, 05/15/22 (n) |
|
|
126 |
|
| |
6,700 |
|
|
2.557%, 08/15/21 (n) |
|
|
5,779 |
|
| |
3,577 |
|
|
2.597%, 08/15/16 (n) |
|
|
3,538 |
|
| |
3,720 |
|
|
2.681%, 02/15/23 (n) |
|
|
3,046 |
|
| |
53 |
|
|
2.683%, 02/15/28 (n) |
|
|
36 |
|
| |
1,000 |
|
|
2.686%, 08/15/22 (n) |
|
|
834 |
|
| |
4,350 |
|
|
2.713%, 08/15/19 (n) |
|
|
3,997 |
|
| |
2,300 |
|
|
2.852%, 11/15/21 (n) |
|
|
1,966 |
|
| |
1,224 |
|
|
2.913%, 02/15/17 (n) |
|
|
1,200 |
|
| |
47 |
|
|
3.041%, 08/15/26 (n) |
|
|
34 |
|
|
|
|
|
|
|
|
|
|
PRINCIPAL
AMOUNT($) |
|
|
SECURITY DESCRIPTION |
|
VALUE($) |
|
|
|
|
|
|
|
|
|
|
|
|
|
| |
10,348 |
|
|
3.056%, 05/15/20 (n) |
|
|
9,288 |
|
| |
300 |
|
|
3.148%, 11/15/26 (n) |
|
|
215 |
|
| |
12,550 |
|
|
3.292%, 08/15/20 (n) |
|
|
11,170 |
|
| |
100 |
|
|
3.317%, 08/15/27 (n) |
|
|
70 |
|
| |
150 |
|
|
3.344%, 11/15/27 (n) |
|
|
103 |
|
| |
700 |
|
|
3.722%, 11/15/16 (n) |
|
|
690 |
|
| |
2,290 |
|
|
3.771%, 11/15/17 (n) |
|
|
2,208 |
|
| |
3,325 |
|
|
5.853%, 02/15/15 (n) |
|
|
3,324 |
|
| |
4,266 |
|
|
6.310%, 02/15/16 (n) |
|
|
4,245 |
|
|
|
|
|
U.S. Treasury Inflation Indexed Notes, |
|
|
|
|
| |
1,700 |
|
|
0.500%, 04/15/15 |
|
|
1,878 |
|
| |
700 |
|
|
1.125%, 01/15/21 |
|
|
818 |
|
|
|
|
|
U.S. Treasury Notes, |
|
|
|
|
| |
593 |
|
|
0.875%, 01/31/18 |
|
|
587 |
|
| |
800 |
|
|
1.000%, 11/30/19 |
|
|
771 |
|
| |
1,500 |
|
|
1.250%, 10/31/18 |
|
|
1,488 |
|
| |
5,500 |
|
|
1.500%, 08/31/18 |
|
|
5,524 |
|
| |
350 |
|
|
2.625%, 08/15/20 |
|
|
365 |
|
| |
400 |
|
|
2.625%, 11/15/20 |
|
|
417 |
|
| |
1,500 |
|
|
2.750%, 11/30/16 |
|
|
1,571 |
|
| |
1,000 |
|
|
3.125%, 04/30/17 |
|
|
1,061 |
|
| |
850 |
|
|
3.125%, 05/15/21 |
|
|
911 |
|
| |
7,900 |
|
|
3.250%, 12/31/16 |
|
|
8,369 |
|
| |
1,050 |
|
|
3.500%, 02/15/18 |
|
|
1,132 |
|
| |
1,550 |
|
|
3.500%, 05/15/20 |
|
|
1,694 |
|
| |
450 |
|
|
3.625%, 02/15/21 |
|
|
496 |
|
| |
700 |
|
|
4.000%, 02/15/15 |
|
|
713 |
|
| |
400 |
|
|
4.250%, 11/15/17 |
|
|
440 |
|
| |
200 |
|
|
4.500%, 02/15/16 |
|
|
212 |
|
| |
1,000 |
|
|
4.750%, 08/15/17 |
|
|
1,111 |
|
|
|
|
|
|
|
|
|
|
|
|
|
|
Total U.S. Treasury Obligations
(Cost $102,027) |
|
|
104,915 |
|
|
|
|
|
|
|
|
|
|
|
|
|
| SHARES |
|
|
|
|
|
|
| |
Short-Term Investment — 9.0% |
|
|
|
|
|
Investment Company — 9.0% |
|
|
|
|
| |
31,493 |
|
|
JPMorgan Liquid Assets Money Market Fund, Institutional Class Shares, 0.030% (b) (l) (m)
(Cost $31,493) |
|
|
31,493 |
|
|
|
|
|
|
|
|
|
|
|
|
|
|
Total Investments — 99.4%
(Cost $334,502) |
|
|
346,753 |
|
|
|
|
|
Other Assets in Excess of
Liabilities — 0.6% |
|
|
2,188 |
|
|
|
|
|
|
|
|
|
|
|
|
|
|
NET ASSETS — 100.0% |
|
$ |
348,941 |
|
|
|
|
|
|
|
|
|
|
Percentages indicated are based on net assets.
SEE NOTES TO
FINANCIAL STATEMENTS.
|
|
|
|
|
|
|
|
|
|
|
|
|
| AUGUST 31, 2014 |
|
JPMORGAN INSTITUTIONAL TRUST FUNDS |
|
|
|
|
87 |
|
JPMorgan Institutional Trust Funds
NOTES TO SCHEDULE OF PORTFOLIO INVESTMENTS
AS OF AUGUST 31, 2014 (Unaudited)
|
|
|
| ARM |
|
— Adjustable Rate Mortgage. The interest rate shown is the rate in effect as of August 31,
2014. |
| CDO |
|
— Collateralized Debt Obligation |
| CMBS |
|
— Commercial Mortgage Backed Security |
| CMO |
|
— Collateralized Mortgage Obligation |
| ESOP |
|
— Employee Stock Ownership Program |
| ETF |
|
— Exchange Traded Fund |
| FHA |
|
— Federal Housing Administration |
| FHLMC |
|
— Federal Home Loan Mortgage Corp. |
| GMAC |
|
— General Motors Acceptance Corp. |
| GO |
|
— General Obligation |
| HB |
|
— High Coupon Bonds (a.k.a. “IOettes”) represent the right to receive interest payments on an
underlying pool of mortgages with similar features as those associated with IO securities. Unlike IOs, the owner also has a right to receive a very small portion of principal. The high interest rates result from taking interest payments from other
classes in the Real Estate Mortgage Investment Conduit trust and allocating them to the small principal of the HB class. |
| IF |
|
— Inverse Floaters represent securities that pay interest at a rate that increases (decreases) with a decline
(incline) in a specified index. The interest rate shown is the rate in effect as of August 31, 2014. The rate may be subject to a cap and floor. |
| IO |
|
— Interest Only represents the right to receive the monthly interest payments on an underlying pool of mortgage
loans. The principal amount shown represents the par value on the underlying pool. The yields on these securities are subject to accelerated principal paydowns as a result of prepayment or refinancing of the underlying pool of mortgage instruments.
As a result, interest income may be reduced considerably. |
| PO |
|
— Principal Only represents the right to receive the principal portion only on an underlying pool of mortgage
loans. The market value of these securities is extremely volatile in response to changes in market interest rates. As prepayments on the underlying mortgages of these securities increase, the yield on these securities increases. |
| REMIC |
|
— Real Estate Mortgage Investment Conduit |
| Rev. |
|
— Revenue |
| SPDR |
|
— Standard & Poor’s Depository Receipts |
| STRIPS |
|
— Separate Trading of Registered Interest and Principal of Securities. The STRIPS Program lets investors hold and
trade individual interest and principal components of eligible notes and bonds as separate securities. |
|
|
|
| SUB |
|
— Step-Up Bond. The interest rate shown is the rate in effect as of August 31, 2014. |
| VA |
|
— Veterans Administration |
| VAR |
|
— Variable Rate Security. The interest rate shown is the rate in effect as of August 31,
2014. |
|
|
| (a) |
|
— Non-income producing security. |
| (b) |
|
— Investment in affiliate. Money market fund registered under the Investment Company Act of 1940, as amended, and
advised by J.P. Morgan Investment Management Inc. |
| (e) |
|
— Security is exempt from registration under Rule 144A of the Securities Act of 1933, as amended. Unless
otherwise indicated, this security has been determined to be liquid under procedures established by the Board of Trustees and may be resold in transactions exempt from registration, normally to qualified institutional buyers. |
| (g) |
|
— Amount rounds to less than 0.1%. |
| (h) |
|
— Amount rounds to less than one thousand (shares or dollars). |
| (i) |
|
— Security has been deemed illiquid pursuant to procedures approved by the Board of Trustees and may be difficult
to sell. |
| (k) |
|
— All or a portion of this security is deposited with the broker as collateral for futures or with brokers as
initial margin for futures contracts. |
| (l) |
|
— The rate shown is the current yield as of August 31, 2014. |
| (m) |
|
— All or a portion of this security is reserved and/or pledged with the custodian for current or potential
holdings of futures, swaps, options, TBAs, when-issued securities, delayed delivery securities, reverse repurchase agreements, unfunded commitments and/or forward foreign currency exchange contracts. |
| (n) |
|
— The rate shown is the effective yield at the date of purchase. |
| (q) |
|
— Investment in affiliate which is a security in the Fund’s index. |
| (t) |
|
— The date shown represents the earliest of the prerefunded date, next put date or final maturity
date. |
| (†) |
|
— Security matures in 2105. |
| (††) |
|
— Security matures in 2110. |
| (†††) |
|
— Security matures in 2111. |
| (††††) |
|
— Security matures in 2114. |
SEE NOTES TO
FINANCIAL STATEMENTS.
|
|
|
|
|
|
|
|
|
|
|
| 88 |
|
|
|
JPMORGAN INSTITUTIONAL TRUST FUNDS |
|
AUGUST 31, 2014 |
STATEMENTS OF ASSETS AND LIABILITIES
AS OF AUGUST 31, 2014 (Unaudited)
(Amounts in
thousands, except per share amounts)
|
|
|
|
|
|
|
|
|
|
|
|
|
| |
|
Core Bond
Trust |
|
|
Equity Index
Trust |
|
|
Intermediate
Bond Trust |
|
| ASSETS: |
|
|
|
|
|
|
|
|
|
|
|
|
| Investments in non-affiliates, at value |
|
$ |
3,711,454 |
|
|
$ |
368,368 |
|
|
$ |
315,260 |
|
| Investments in affiliates, at value |
|
|
95,077 |
|
|
|
9,024 |
|
|
|
31,493 |
|
|
|
|
|
|
|
|
|
|
|
|
|
|
| Total investment securities, at value |
|
|
3,806,531 |
|
|
|
377,392 |
|
|
|
346,753 |
|
| Cash |
|
|
— |
|
|
|
— |
|
|
|
41 |
|
| Receivables: |
|
|
|
|
|
|
|
|
|
|
|
|
| Investment securities sold |
|
|
387 |
|
|
|
— |
|
|
|
93 |
|
| Fund shares sold |
|
|
610 |
|
|
|
— |
|
|
|
1,000 |
|
| Interest and dividends from non-affiliates |
|
|
15,802 |
|
|
|
789 |
|
|
|
1,248 |
|
| Dividends from affiliates |
|
|
2 |
|
|
|
— |
(a) |
|
|
1 |
|
| Variation margin on futures contracts |
|
|
— |
|
|
|
11 |
|
|
|
— |
|
| Prepaid expenses |
|
|
41 |
|
|
|
3 |
|
|
|
4 |
|
|
|
|
|
|
|
|
|
|
|
|
|
|
| Total Assets |
|
|
3,823,373 |
|
|
|
378,195 |
|
|
|
349,140 |
|
|
|
|
|
|
|
|
|
|
|
|
|
|
|
|
|
|
| LIABILITIES: |
|
|
|
|
|
|
|
|
|
|
|
|
| Payables: |
|
|
|
|
|
|
|
|
|
|
|
|
| Due to custodian |
|
|
1,638 |
|
|
|
— |
|
|
|
— |
|
| Distributions |
|
|
268 |
|
|
|
— |
|
|
|
68 |
|
| Fund shares redeemed |
|
|
384 |
|
|
|
— |
|
|
|
— |
|
| Unrealized depreciation on unfunded commitments |
|
|
31 |
|
|
|
— |
|
|
|
— |
|
| Accrued liabilities: |
|
|
|
|
|
|
|
|
|
|
|
|
| Investment advisory fees |
|
|
306 |
|
|
|
15 |
|
|
|
13 |
|
| Administration fees |
|
|
104 |
|
|
|
6 |
|
|
|
5 |
|
| Custodian and accounting fees |
|
|
218 |
|
|
|
29 |
|
|
|
75 |
|
| Trustees’ and Chief Compliance Officer’s fees |
|
|
6 |
|
|
|
— |
(a) |
|
|
— |
(a) |
| Audit fees |
|
|
44 |
|
|
|
21 |
|
|
|
36 |
|
| Other |
|
|
35 |
|
|
|
1 |
|
|
|
2 |
|
|
|
|
|
|
|
|
|
|
|
|
|
|
| Total Liabilities |
|
|
3,034 |
|
|
|
72 |
|
|
|
199 |
|
|
|
|
|
|
|
|
|
|
|
|
|
|
| Net Assets |
|
$ |
3,820,339 |
|
|
$ |
378,123 |
|
|
$ |
348,941 |
|
|
|
|
|
|
|
|
|
|
|
|
|
|
|
|
|
|
| NET ASSETS: |
|
|
|
|
|
|
|
|
|
|
|
|
| Paid-in-Capital |
|
$ |
3,633,329 |
|
|
$ |
215,227 |
|
|
$ |
334,959 |
|
| Accumulated undistributed (distributions in excess of) net investment income |
|
|
4,364 |
|
|
|
1,499 |
|
|
|
287 |
|
| Accumulated net realized gains (losses) |
|
|
8,749 |
|
|
|
(31,838 |
) |
|
|
1,444 |
|
| Net unrealized appreciation (depreciation) |
|
|
173,897 |
|
|
|
193,235 |
|
|
|
12,251 |
|
|
|
|
|
|
|
|
|
|
|
|
|
|
| Total Net Assets |
|
$ |
3,820,339 |
|
|
$ |
378,123 |
|
|
$ |
348,941 |
|
|
|
|
|
|
|
|
|
|
|
|
|
|
|
|
|
|
| Outstanding units of beneficial interest (shares) |
|
|
|
|
|
|
|
|
|
|
|
|
| ($0.0001 par value; unlimited number of shares authorized): |
|
|
358,892 |
|
|
|
15,591 |
|
|
|
33,512 |
|
|
|
|
|
| Net asset value, offering and redemption price per share (b) |
|
$ |
10.64 |
|
|
$ |
24.25 |
|
|
$ |
10.41 |
|
|
|
|
|
|
|
|
|
|
|
|
|
|
|
|
|
|
| Cost of investments in non-affiliates |
|
$ |
3,537,526 |
|
|
$ |
177,228 |
|
|
$ |
303,009 |
|
| Cost of investments in affiliates |
|
|
95,077 |
|
|
|
7,125 |
|
|
|
31,493 |
|
| (a) |
Amount rounds to less than $1,000. |
| (b) |
Per share amounts may not recalculate due to rounding of net assets and/or shares outstanding. |
SEE NOTES TO FINANCIAL STATEMENTS.
|
|
|
|
|
|
|
|
|
|
|
|
|
| AUGUST 31, 2014 |
|
JPMORGAN INSTITUTIONAL TRUST FUNDS |
|
|
|
|
89 |
|
STATEMENTS OF OPERATIONS
FOR THE SIX MONTHS ENDED AUGUST 31, 2014 (Unaudited)
(Amounts in thousands)
|
|
|
|
|
|
|
|
|
|
|
|
|
| |
|
Core Bond
Trust |
|
|
Equity Index
Trust |
|
|
Intermediate
Bond Trust |
|
| INVESTMENT INCOME: |
|
|
|
|
|
|
|
|
|
|
|
|
| Interest income from non-affiliates |
|
$ |
68,898 |
|
|
$ |
— |
|
|
$ |
5,281 |
|
| Dividend income from non-affiliates |
|
|
— |
|
|
|
3,673 |
|
|
|
— |
|
| Dividend income from affiliates |
|
|
9 |
|
|
|
64 |
|
|
|
2 |
|
|
|
|
|
|
|
|
|
|
|
|
|
|
| Total investment income |
|
|
68,907 |
|
|
|
3,737 |
|
|
|
5,283 |
|
|
|
|
|
|
|
|
|
|
|
|
|
|
|
|
|
|
| EXPENSES: |
|
|
|
|
|
|
|
|
|
|
|
|
| Investment advisory fees |
|
|
5,839 |
|
|
|
465 |
|
|
|
508 |
|
| Administration fees |
|
|
1,946 |
|
|
|
186 |
|
|
|
169 |
|
| Custodian and accounting fees |
|
|
193 |
|
|
|
19 |
|
|
|
72 |
|
| Professional fees |
|
|
62 |
|
|
|
22 |
|
|
|
35 |
|
| Trustees’ and Chief Compliance Officer’s fees |
|
|
22 |
|
|
|
2 |
|
|
|
2 |
|
| Printing and mailing costs |
|
|
14 |
|
|
|
1 |
|
|
|
3 |
|
| Transfer agent fees |
|
|
— |
|
|
|
2 |
|
|
|
— |
(a) |
| Other |
|
|
110 |
|
|
|
9 |
|
|
|
8 |
|
|
|
|
|
|
|
|
|
|
|
|
|
|
| Total expenses |
|
|
8,186 |
|
|
|
706 |
|
|
|
797 |
|
|
|
|
|
|
|
|
|
|
|
|
|
|
| Less amounts waived |
|
|
(5,312 |
) |
|
|
(524 |
) |
|
|
(552 |
) |
| Less expense reimbursements |
|
|
(23 |
) |
|
|
— |
|
|
|
— |
|
|
|
|
|
|
|
|
|
|
|
|
|
|
| Net expenses |
|
|
2,851 |
|
|
|
182 |
|
|
|
245 |
|
|
|
|
|
|
|
|
|
|
|
|
|
|
| Net investment income (loss) |
|
|
66,056 |
|
|
|
3,555 |
|
|
|
5,038 |
|
|
|
|
|
|
|
|
|
|
|
|
|
|
|
|
|
|
| REALIZED/UNREALIZED GAINS (LOSSES): |
|
|
|
|
|
|
|
|
|
|
|
|
| Net realized gain (loss) on transactions from: |
|
|
|
|
|
|
|
|
|
|
|
|
| Investments in non-affiliates |
|
|
6,064 |
|
|
|
8,615 |
|
|
|
601 |
|
| Investment in affiliates |
|
|
— |
|
|
|
50 |
|
|
|
— |
|
| Futures |
|
|
— |
|
|
|
429 |
|
|
|
— |
|
|
|
|
|
|
|
|
|
|
|
|
|
|
| Net realized gain (loss) |
|
|
6,064 |
|
|
|
9,094 |
|
|
|
601 |
|
|
|
|
|
|
|
|
|
|
|
|
|
|
| Change in net unrealized appreciation/depreciation of: |
|
|
|
|
|
|
|
|
|
|
|
|
| Investments in non-affiliates |
|
|
25,002 |
|
|
|
18,329 |
|
|
|
(573 |
) |
| Investments in affiliates |
|
|
— |
|
|
|
153 |
|
|
|
— |
|
| Futures |
|
|
— |
|
|
|
119 |
|
|
|
— |
|
| Unfunded commitments |
|
|
(11 |
) |
|
|
— |
|
|
|
— |
|
|
|
|
|
|
|
|
|
|
|
|
|
|
| Change in net unrealized appreciation/depreciation |
|
|
24,991 |
|
|
|
18,601 |
|
|
|
(573 |
) |
|
|
|
|
|
|
|
|
|
|
|
|
|
| Net realized/unrealized gains (losses) |
|
|
31,055 |
|
|
|
27,695 |
|
|
|
28 |
|
|
|
|
|
|
|
|
|
|
|
|
|
|
| Change in net assets resulting from operations |
|
$ |
97,111 |
|
|
$ |
31,250 |
|
|
$ |
5,066 |
|
|
|
|
|
|
|
|
|
|
|
|
|
|
| (a) |
Amount rounds to less than $1,000. |
SEE NOTES TO FINANCIAL STATEMENTS.
|
|
|
|
|
|
|
|
|
|
|
| 90 |
|
|
|
JPMORGAN INSTITUTIONAL TRUST FUNDS |
|
AUGUST 31, 2014 |
STATEMENTS OF CHANGES IN NET ASSETS
FOR THE PERIODS INDICATED
(Amounts in thousands)
|
|
|
|
|
|
|
|
|
|
|
|
|
|
|
|
|
| |
|
Core Bond Trust |
|
|
Equity Index Trust |
|
| |
|
Six Months Ended
August 31, 2014
(Unaudited) |
|
|
Year Ended
February 28, 2014 |
|
|
Six Months Ended
August 31, 2014
(Unaudited) |
|
|
Year Ended
February 28, 2014 |
|
| CHANGE IN NET ASSETS RESULTING FROM OPERATIONS: |
|
|
|
|
|
|
|
|
|
|
|
|
|
|
|
|
| Net investment income (loss) |
|
$ |
66,056 |
|
|
$ |
137,789 |
|
|
$ |
3,555 |
|
|
$ |
6,962 |
|
| Net realized gain (loss) |
|
|
6,064 |
|
|
|
7,055 |
|
|
|
9,094 |
|
|
|
12,219 |
|
| Distributions of capital gains received from investment company affiliates |
|
|
— |
|
|
|
1 |
|
|
|
— |
|
|
|
— |
(a) |
| Change in net unrealized appreciation/depreciation |
|
|
24,991 |
|
|
|
(123,685 |
) |
|
|
18,601 |
|
|
|
58,781 |
|
|
|
|
|
|
|
|
|
|
|
|
|
|
|
|
|
|
| Change in net assets resulting from operations |
|
|
97,111 |
|
|
|
21,160 |
|
|
|
31,250 |
|
|
|
77,962 |
|
|
|
|
|
|
|
|
|
|
|
|
|
|
|
|
|
|
|
|
|
|
|
| DISTRIBUTIONS TO SHAREHOLDERS: |
|
|
|
|
|
|
|
|
|
|
|
|
|
|
|
|
| From net investment income |
|
|
(68,238 |
) |
|
|
(133,909 |
) |
|
|
(3,214 |
) |
|
|
(6,806 |
) |
| From net realized gains |
|
|
— |
|
|
|
(2,110 |
) |
|
|
— |
|
|
|
— |
|
|
|
|
|
|
|
|
|
|
|
|
|
|
|
|
|
|
| Total distributions to shareholders |
|
|
(68,238 |
) |
|
|
(136,019 |
) |
|
|
(3,214 |
) |
|
|
(6,806 |
) |
|
|
|
|
|
|
|
|
|
|
|
|
|
|
|
|
|
| CAPITAL TRANSACTIONS: |
|
|
|
|
|
|
|
|
|
|
|
|
|
|
|
|
| Proceeds from shares issued |
|
|
255,966 |
|
|
|
667,144 |
|
|
|
8,222 |
|
|
|
14,789 |
|
| Subscriptions in-kind (See Note 7) |
|
|
14,902 |
|
|
|
— |
|
|
|
— |
|
|
|
— |
|
| Distributions reinvested |
|
|
66,095 |
|
|
|
131,927 |
|
|
|
3,214 |
|
|
|
6,806 |
|
| Cost of shares redeemed |
|
|
(410,631 |
) |
|
|
(532,846 |
) |
|
|
(28,727 |
) |
|
|
(48,708 |
) |
|
|
|
|
|
|
|
|
|
|
|
|
|
|
|
|
|
| Change in net assets resulting from capital transactions |
|
|
(73,668 |
) |
|
|
266,225 |
|
|
|
(17,291 |
) |
|
|
(27,113 |
) |
|
|
|
|
|
|
|
|
|
|
|
|
|
|
|
|
|
|
|
|
|
|
| NET ASSETS: |
|
|
|
|
|
|
|
|
|
|
|
|
|
|
|
|
| Change in net assets |
|
|
(44,795 |
) |
|
|
151,366 |
|
|
|
10,745 |
|
|
|
44,043 |
|
| Beginning of period |
|
|
3,865,134 |
|
|
|
3,713,768 |
|
|
|
367,378 |
|
|
|
323,335 |
|
|
|
|
|
|
|
|
|
|
|
|
|
|
|
|
|
|
| End of period |
|
$ |
3,820,339 |
|
|
$ |
3,865,134 |
|
|
$ |
378,123 |
|
|
$ |
367,378 |
|
|
|
|
|
|
|
|
|
|
|
|
|
|
|
|
|
|
| Accumulated undistributed (distributions in excess of) net investment income |
|
$ |
4,364 |
|
|
$ |
6,546 |
|
|
$ |
1,499 |
|
|
$ |
1,158 |
|
|
|
|
|
|
|
|
|
|
|
|
|
|
|
|
|
|
|
|
|
|
|
| SHARE TRANSACTIONS: |
|
|
|
|
|
|
|
|
|
|
|
|
|
|
|
|
| Issued |
|
|
24,160 |
|
|
|
62,858 |
|
|
|
362 |
|
|
|
723 |
|
| Subscriptions in-kind (See Note 7) |
|
|
1,394 |
|
|
|
— |
|
|
|
— |
|
|
|
— |
|
| Reinvested |
|
|
6,240 |
|
|
|
12,447 |
|
|
|
137 |
|
|
|
336 |
|
| Redeemed |
|
|
(38,734 |
) |
|
|
(50,404 |
) |
|
|
(1,242 |
) |
|
|
(2,373 |
) |
|
|
|
|
|
|
|
|
|
|
|
|
|
|
|
|
|
| Change in Shares |
|
|
(6,940 |
) |
|
|
24,901 |
|
|
|
(743 |
) |
|
|
(1,314 |
) |
|
|
|
|
|
|
|
|
|
|
|
|
|
|
|
|
|
| (a) |
Amount rounds to less than $1,000. |
SEE NOTES TO FINANCIAL STATEMENTS.
|
|
|
|
|
|
|
|
|
|
|
|
|
| AUGUST 31, 2014 |
|
JPMORGAN INSTITUTIONAL TRUST FUNDS |
|
|
|
|
91 |
|
STATEMENTS OF CHANGES IN NET ASSETS
FOR THE PERIODS INDICATED
(Amounts in thousands)
|
|
|
|
|
|
|
|
|
| |
|
Intermediate Bond Trust |
|
| |
|
Six Months Ended
August 31, 2014
(Unaudited) |
|
|
Year Ended
February 28, 2014 |
|
| CHANGE IN NET ASSETS RESULTING FROM OPERATIONS: |
|
|
|
|
|
|
|
|
| Net investment income (loss) |
|
$ |
5,038 |
|
|
$ |
11,308 |
|
| Net realized gain (loss) |
|
|
601 |
|
|
|
1,299 |
|
| Distributions of capital gains received from investment company affiliates |
|
|
— |
|
|
|
— |
(a) |
| Change in net unrealized appreciation/depreciation |
|
|
(573 |
) |
|
|
(10,852 |
) |
|
|
|
|
|
|
|
|
|
| Change in net assets resulting from operations |
|
|
5,066 |
|
|
|
1,755 |
|
|
|
|
|
|
|
|
|
|
|
|
|
| DISTRIBUTIONS TO SHAREHOLDERS: |
|
|
|
|
|
|
|
|
| From net investment income |
|
|
(5,046 |
) |
|
|
(11,070 |
) |
| From net realized gains |
|
|
— |
|
|
|
(219 |
) |
|
|
|
|
|
|
|
|
|
| Total distributions to shareholders |
|
|
(5,046 |
) |
|
|
(11,289 |
) |
|
|
|
|
|
|
|
|
|
|
|
|
| CAPITAL TRANSACTIONS: |
|
|
|
|
|
|
|
|
| Proceeds from shares issued |
|
|
34,289 |
|
|
|
35,383 |
|
| Distributions reinvested |
|
|
4,600 |
|
|
|
10,598 |
|
| Cost of shares redeemed |
|
|
(38,623 |
) |
|
|
(65,743 |
) |
|
|
|
|
|
|
|
|
|
| Change in net assets resulting from capital transactions |
|
|
266 |
|
|
|
(19,762 |
) |
|
|
|
|
|
|
|
|
|
|
|
|
| NET ASSETS: |
|
|
|
|
|
|
|
|
| Change in net assets |
|
|
286 |
|
|
|
(29,296 |
) |
| Beginning of period |
|
|
348,655 |
|
|
|
377,951 |
|
|
|
|
|
|
|
|
|
|
| End of period |
|
$ |
348,941 |
|
|
$ |
348,655 |
|
|
|
|
|
|
|
|
|
|
| Accumulated undistributed (distributions in excess of) net investment income |
|
$ |
287 |
|
|
$ |
295 |
|
|
|
|
|
|
|
|
|
|
|
|
|
| SHARE TRANSACTIONS: |
|
|
|
|
|
|
|
|
| Issued |
|
|
3,292 |
|
|
|
3,386 |
|
| Reinvested |
|
|
442 |
|
|
|
1,014 |
|
| Redeemed |
|
|
(3,720 |
) |
|
|
(6,290 |
) |
|
|
|
|
|
|
|
|
|
| Change in Shares |
|
|
14 |
|
|
|
(1,890 |
) |
|
|
|
|
|
|
|
|
|
| (a) |
Amount rounds to less than $1,000. |
SEE NOTES TO FINANCIAL STATEMENTS.
|
|
|
|
|
|
|
|
|
|
|
| 92 |
|
|
|
JPMORGAN INSTITUTIONAL TRUST FUNDS |
|
AUGUST 31, 2014 |
THIS PAGE IS
INTENTIONALLY LEFT BLANK
|
|
|
|
|
|
|
|
|
|
|
|
|
| AUGUST 31, 2014 |
|
JPMORGAN INSTITUTIONAL TRUST FUNDS |
|
|
|
|
93 |
|
FINANCIAL HIGHLIGHTS
FOR THE PERIODS INDICATED
|
|
|
|
|
|
|
|
|
|
|
|
|
|
|
|
|
|
|
|
|
|
|
|
|
|
|
|
|
|
|
|
|
| |
|
Per share operating performance |
|
| |
|
|
|
|
Investment operations |
|
|
Distributions |
|
| |
|
Net asset
value,
beginning
of period |
|
|
Net
investment
income
(loss) |
|
|
Net realized
and unrealized
gains
(losses) on
investments |
|
|
Total from
investment
operations |
|
|
Net
investment
income |
|
|
Net
realized
gain |
|
|
Return
of
capital |
|
|
Total
distributions |
|
| Core Bond Trust |
|
|
|
|
|
|
|
|
|
|
|
|
|
|
|
|
|
|
|
|
|
|
|
|
|
|
|
|
|
|
|
|
| Six Months Ended August 31, 2014 (Unaudited) |
|
$ |
10.57 |
|
|
$ |
0.18 |
|
|
$ |
0.08 |
|
|
$ |
0.26 |
|
|
$ |
(0.19 |
) |
|
$ |
— |
|
|
$ |
— |
|
|
$ |
(0.19 |
) |
| Year Ended February 28, 2014 |
|
|
10.89 |
|
|
|
0.38 |
|
|
|
(0.32 |
) |
|
|
0.06 |
|
|
|
(0.37 |
) |
|
|
(0.01 |
) |
|
|
— |
|
|
|
(0.38 |
) |
| Year Ended February 28, 2013 |
|
|
10.82 |
|
|
|
0.43 |
|
|
|
0.08 |
|
|
|
0.51 |
|
|
|
(0.43 |
) |
|
|
(0.01 |
) |
|
|
— |
|
|
|
(0.44 |
) |
| Year Ended February 29, 2012 |
|
|
10.50 |
|
|
|
0.50 |
|
|
|
0.35 |
|
|
|
0.85 |
|
|
|
(0.51 |
) |
|
|
(0.02 |
) |
|
|
— |
|
|
|
(0.53 |
) |
| Year Ended February 28, 2011 |
|
|
10.27 |
|
|
|
0.55 |
|
|
|
0.23 |
|
|
|
0.78 |
|
|
|
(0.55 |
) |
|
|
— |
|
|
|
— |
|
|
|
(0.55 |
) |
| Year Ended February 28, 2010 |
|
|
9.53 |
|
|
|
0.63 |
|
|
|
0.74 |
|
|
|
1.37 |
|
|
|
(0.63 |
) |
|
|
— |
|
|
|
— |
|
|
|
(0.63 |
) |
|
|
|
|
|
|
|
|
|
| Equity Index Trust |
|
|
|
|
|
|
|
|
|
|
|
|
|
|
|
|
|
|
|
|
|
|
|
|
|
|
|
|
|
|
|
|
| Six Months Ended August 31, 2014 (Unaudited) |
|
|
22.49 |
|
|
|
0.23 |
|
|
|
1.74 |
|
|
|
1.97 |
|
|
|
(0.21 |
) |
|
|
— |
|
|
|
— |
|
|
|
(0.21 |
) |
| Year Ended February 28, 2014 |
|
|
18.32 |
|
|
|
0.42 |
|
|
|
4.15 |
|
|
|
4.57 |
|
|
|
(0.40 |
) |
|
|
— |
|
|
|
— |
|
|
|
(0.40 |
) |
| Year Ended February 28, 2013 |
|
|
16.53 |
|
|
|
0.38 |
|
|
|
1.79 |
|
|
|
2.17 |
|
|
|
(0.38 |
) |
|
|
— |
|
|
|
— |
|
|
|
(0.38 |
) |
| Year Ended February 29, 2012 |
|
|
16.10 |
|
|
|
0.31 |
|
|
|
0.46 |
|
|
|
0.77 |
|
|
|
(0.34 |
) |
|
|
— |
|
|
|
— |
|
|
|
(0.34 |
) |
| Year Ended February 28, 2011 |
|
|
13.42 |
|
|
|
0.28 |
|
|
|
2.67 |
|
|
|
2.95 |
|
|
|
(0.27 |
) |
|
|
— |
|
|
|
— |
|
|
|
(0.27 |
) |
| Year Ended February 28, 2010 |
|
|
8.98 |
|
|
|
0.30 |
|
|
|
4.44 |
|
|
|
4.74 |
|
|
|
(0.30 |
) |
|
|
— |
|
|
|
— |
|
|
|
(0.30 |
) |
|
|
|
|
|
|
|
|
|
| Intermediate Bond Trust |
|
|
|
|
|
|
|
|
|
|
|
|
|
|
|
|
|
|
|
|
|
|
|
|
|
|
|
|
|
|
|
|
| Six Months Ended August 31, 2014 (Unaudited) |
|
|
10.41 |
|
|
|
0.16 |
|
|
|
— |
|
|
|
0.16 |
|
|
|
(0.16 |
) |
|
|
— |
|
|
|
— |
|
|
|
(0.16 |
) |
| Year Ended February 28, 2014 |
|
|
10.68 |
|
|
|
0.32 |
|
|
|
(0.26 |
) |
|
|
0.06 |
|
|
|
(0.32 |
) |
|
|
(0.01 |
) |
|
|
— |
|
|
|
(0.33 |
) |
| Year Ended February 28, 2013 |
|
|
10.63 |
|
|
|
0.36 |
|
|
|
0.04 |
|
|
|
0.40 |
|
|
|
(0.35 |
) |
|
|
— |
|
|
|
— |
|
|
|
(0.35 |
) |
| Year Ended February 29, 2012 |
|
|
10.38 |
|
|
|
0.43 |
|
|
|
0.38 |
|
|
|
0.81 |
|
|
|
(0.47 |
) |
|
|
(0.06 |
) |
|
|
(0.03 |
) |
|
|
(0.56 |
) |
| Year Ended February 28, 2011 |
|
|
10.28 |
|
|
|
0.48 |
|
|
|
0.10 |
|
|
|
0.58 |
|
|
|
(0.48 |
) |
|
|
— |
|
|
|
— |
|
|
|
(0.48 |
) |
| Year Ended February 28, 2010 |
|
|
9.70 |
|
|
|
0.53 |
|
|
|
0.58 |
|
|
|
1.11 |
|
|
|
(0.53 |
) |
|
|
— |
|
|
|
— |
|
|
|
(0.53 |
) |
| (a) |
Annualized for periods less than one year, unless otherwise noted. |
| (b) |
Not annualized for periods less than one year. |
| (c) |
Includes adjustments in accordance with accounting principles generally accepted in the United States of America and as such, the net asset values for financial reporting
purposes and the returns based upon those net asset values may differ from the net asset values and returns for shareholder transactions. |
| (d) |
Includes earnings credits and interest expense, if applicable, each of which is less than 0.01% unless otherwise noted. |
| (e) |
Portfolio turnover is calculated by dividing the lesser of total purchases or sales of portfolio securities for the reporting period by the monthly average value of
portfolio securities owned during the reporting period. Excluded from both the numerator and denominator are amounts relating to derivatives and securities whose maturities or expiration dates at the time of acquisition were one year or less.
|
SEE NOTES TO FINANCIAL STATEMENTS.
|
|
|
|
|
|
|
|
|
|
|
| 94 |
|
|
|
JPMORGAN INSTITUTIONAL TRUST FUNDS |
|
AUGUST 31, 2014 |
|
|
|
|
|
|
|
|
|
|
|
|
|
|
|
|
|
|
|
|
|
|
|
|
|
|
|
| |
|
|
Ratios/Supplemental data |
|
| |
|
|
|
|
|
|
|
|
Ratios to average net assets (a) |
|
|
|
|
Net asset
value,
end of
period |
|
|
Total
return (b)(c) |
|
|
Net assets,
end of
period
(000’s) |
|
|
Net
expenses (d) |
|
|
Net
investment
income
(loss) |
|
|
Expenses
without waivers,
reimbursements and
earnings credits |
|
|
Portfolio
turnover
rate (b)(e) |
|
|
|
|
|
|
|
|
|
|
|
|
|
|
|
|
|
|
|
|
|
|
|
|
|
|
|
|
| $ |
10.64 |
|
|
|
2.46 |
% |
|
$ |
3,820,339 |
|
|
|
0.15 |
% |
|
|
3.39 |
% |
|
|
0.42 |
% |
|
|
6 |
% |
| |
10.57 |
|
|
|
0.58 |
|
|
|
3,865,134 |
|
|
|
0.14 |
|
|
|
3.60 |
|
|
|
0.42 |
|
|
|
18 |
|
| |
10.89 |
|
|
|
4.70 |
|
|
|
3,713,768 |
|
|
|
0.15 |
|
|
|
3.97 |
|
|
|
0.42 |
|
|
|
16 |
|
| |
10.82 |
|
|
|
8.24 |
|
|
|
3,458,321 |
|
|
|
0.15 |
|
|
|
4.66 |
|
|
|
0.42 |
|
|
|
21 |
|
| |
10.50 |
|
|
|
7.71 |
|
|
|
3,022,640 |
|
|
|
0.14 |
|
|
|
5.23 |
|
|
|
0.42 |
|
|
|
20 |
|
| |
10.27 |
|
|
|
14.70 |
|
|
|
2,808,694 |
|
|
|
0.14 |
|
|
|
6.24 |
|
|
|
0.42 |
|
|
|
19 |
|
|
|
|
|
|
|
|
|
|
|
|
|
|
|
|
|
|
|
|
|
|
|
|
|
|
|
|
|
|
|
|
|
|
|
| |
24.25 |
|
|
|
8.77 |
|
|
|
378,123 |
|
|
|
0.10 |
|
|
|
1.91 |
|
|
|
0.38 |
|
|
|
2 |
|
| |
22.49 |
|
|
|
25.21 |
|
|
|
367,378 |
|
|
|
0.10 |
|
|
|
2.01 |
|
|
|
0.38 |
|
|
|
5 |
|
| |
18.32 |
|
|
|
13.34 |
|
|
|
323,335 |
|
|
|
0.10 |
|
|
|
2.22 |
|
|
|
0.38 |
|
|
|
7 |
|
| |
16.53 |
|
|
|
4.97 |
|
|
|
301,098 |
|
|
|
0.10 |
|
|
|
2.03 |
|
|
|
0.38 |
|
|
|
8 |
|
| |
16.10 |
|
|
|
22.38 |
|
|
|
341,196 |
|
|
|
0.10 |
|
|
|
1.95 |
|
|
|
0.40 |
|
|
|
13 |
|
| |
13.42 |
|
|
|
53.50 |
|
|
|
304,822 |
|
|
|
0.10 |
|
|
|
2.37 |
|
|
|
0.42 |
|
|
|
18 |
|
|
|
|
|
|
|
|
|
|
|
|
|
|
|
|
|
|
|
|
|
|
|
|
|
|
|
|
|
|
|
|
|
|
|
| |
10.41 |
|
|
|
1.53 |
|
|
|
348,941 |
|
|
|
0.14 |
|
|
|
2.97 |
|
|
|
0.47 |
|
|
|
8 |
|
| |
10.41 |
|
|
|
0.53 |
|
|
|
348,655 |
|
|
|
0.14 |
|
|
|
3.07 |
|
|
|
0.46 |
|
|
|
17 |
|
| |
10.68 |
|
|
|
3.76 |
|
|
|
377,951 |
|
|
|
0.14 |
|
|
|
3.33 |
|
|
|
0.47 |
|
|
|
15 |
|
| |
10.63 |
|
|
|
7.98 |
|
|
|
361,305 |
|
|
|
0.14 |
|
|
|
4.05 |
|
|
|
0.48 |
|
|
|
35 |
|
| |
10.38 |
|
|
|
5.72 |
|
|
|
366,920 |
|
|
|
0.14 |
|
|
|
4.60 |
|
|
|
0.46 |
|
|
|
28 |
|
| |
10.28 |
|
|
|
11.72 |
|
|
|
359,197 |
|
|
|
0.15 |
|
|
|
5.33 |
|
|
|
0.47 |
|
|
|
23 |
|
SEE NOTES TO FINANCIAL
STATEMENTS.
|
|
|
|
|
|
|
|
|
|
|
|
|
| AUGUST 31, 2014 |
|
JPMORGAN INSTITUTIONAL TRUST FUNDS |
|
|
|
|
95 |
|
NOTES TO FINANCIAL STATEMENTS
AS OF AUGUST 31, 2014 (Unaudited)
1. Organization
JPMorgan Institutional Trust
(the “Trust”) was organized on September 14, 2004 as a Delaware statutory trust and is registered under the Investment Company Act of 1940, as amended (the “1940 Act”), as an open-end management investment company. Three
separate diversified series of the Trust (collectively, the “Funds”) covered by this report commenced operations on February 7, 2005: Core Bond Trust, Equity Index Trust and Intermediate Bond Trust.
The investment objective of Core Bond Trust is to seek to maximize total return by investing primarily in a diversified portfolio of intermediate- and
long-term debt securities.
The investment objective of Equity Index Trust is to seek investment results that correspond to the aggregate price
and dividend performance of securities in the Standard and Poor’s 500 Composite Stock Price Index.
The investment objective of Intermediate
Bond Trust is to seek current income consistent with the preservation of capital by investing in high- and medium-grade fixed income securities with intermediate maturities.
2. Significant Accounting Policies
The following is a summary of significant accounting policies
followed by the Funds in the preparation of their financial statements. The Funds are investment companies and, accordingly, follow the investment company accounting and reporting guidance of the Financial Accounting Standards Board Accounting
Standards Codification Topic 946 — Investment Companies, which is part of U.S. generally accepted accounting principles (“GAAP”). The preparation of financial statements in conformity with GAAP requires management to
make estimates and assumptions that affect the reported amounts of assets and liabilities and disclosure of contingent assets and liabilities at the date of the financial statements and the reported amounts of increases and decreases in net assets
from operations during the reporting period. Actual results could differ from those estimates.
A. Valuation of Investments — Fixed
income securities (other than certain short-term investments maturing in less than 61 days) are valued each day based on prices received from independent or affiliated pricing services approved by the Board of Trustees or third party broker-dealers.
The pricing services or broker-dealers use multiple valuation techniques to determine fair value. In instances where sufficient market activity exists, the pricing services or broker-dealers may utilize a market-based approach through which quotes
from market makers are used to determine fair value. In instances where sufficient market activity may not exist or is limited, the pricing services or broker-dealers also utilize proprietary valuation models which may consider market transactions
in comparable securities and the various relationships between securities in determining fair value and/or market characteristics such as benchmark yield curves, option-adjusted spreads, credit spreads, estimated default rates, coupon rates,
anticipated timing of principal repayments, underlying collateral, various forms of credit enhancements, such as bond insurance, and other unique security features in order to estimate the relevant cash flows, which are then discounted to calculate
the fair values. Equity securities listed on a North American, Central American, South American or Caribbean securities exchange shall generally be valued at the last sale price on the exchange on which the security is principally traded that is
reported before the time when the net assets of the Funds are valued. Securities listed on the NASDAQ Stock Market LLC are generally valued at the NASDAQ Official Closing Price. Generally, short-term investments of sufficient credit quality maturing
in less than 61 days are valued at amortized cost, which approximates fair value. Investments in open-end investment companies are valued at each underlying investment company’s net asset value per share (“NAV”) as of the report date.
Certain investments of the Funds may, depending upon market conditions, trade in relatively thin markets and/or in markets that experience
significant volatility. As a result of these conditions, the prices used by the Funds to value these securities may differ from the value that would be realized if these securities were sold, and the differences could be material. Futures and
options are generally valued on the basis of available market quotations. Swaps and other derivatives are valued daily, primarily using independent or affiliated pricing services approved by the Board of Trustees. If valuations are not available
from such pricing services or values received are deemed not representative of fair value, values will be obtained from a third party broker-dealer or counterparty.
Securities or other assets for which market quotations are not readily available or for which market quotations are deemed to not represent the fair value of the security or asset at the time of pricing
(including certain illiquid securities) are fair valued in accordance with procedures established by and under the supervision and responsibility of the Board of Trustees. The Board of Trustees has established an Audit and Valuation Committee to
assist with the oversight of the valuation of the Funds’ securities. JPMorgan Funds Management, Inc. (the “Administrator”, or “JPMFM”), has established a Valuation Committee (“VC”) that is comprised of senior
representatives from JPMFM, J.P. Morgan Investment Management Inc. (the “Adviser” or “JPMIM”) and J.P. Morgan Asset Management’s Legal, Compliance and Risk Management groups and the Funds’ Chief Compliance Officer. The
VC’s responsibilities include making determinations regarding Level 3 fair value measurements (“Fair Values”) and/or providing recommendations for approval to the Board of Trustees’ Audit and Valuation Committee, in accordance
with the Funds’ valuation policies.
The VC or Board of Trustees, as applicable, primarily employs a market-based approach which may use
related or comparable assets or liabilities, recent transactions, market multiples, book values, and other relevant information for the investment to determine the fair value of the investment. The VC or Board of Trustees may also use an
income-based valuation approach in which the anticipated future cash flows of the investment are discounted to calculate fair value. Discounts may also be applied due to the nature or duration of any restrictions on the disposition of the
investments. Valuations may be based upon current market prices of securities that are comparable in coupon, rating, maturity and industry. It is possible that the estimated values may differ significantly from the values that would have been used
had a ready market for the investments existed, and such differences could be material. JPMFM and JPMIM are responsible for monitoring developments that may impact Fair Values and for discussing and assessing Fair Values on an ongoing, and at least
a quarterly basis with the VC and Board of Trustees, as applicable. The appropriateness of Fair
|
|
|
|
|
|
|
|
|
|
|
| 96 |
|
|
|
JPMORGAN INSTITUTIONAL TRUST FUNDS |
|
AUGUST 31, 2014 |
Values is assessed based on results of unchanged price review and consideration of macro or security specific events, back testing, and broker and vendor due diligence.
See the table on “Quantitative Information about Level 3 Fair Value Measurements” for information on the valuation techniques and inputs used to
value Level 3 securities held by Core Bond Trust and Intermediate Bond Trust at August 31, 2014.
Valuations reflected in this report are as
of the report date. As a result, changes in valuation due to market and/or issuer related events after the report date and prior to issuance of the report are not reflected herein.
The various inputs that are used in determining the fair value of the Funds’ investments are summarized into the three broad levels listed below.
| Ÿ |
|
Level 1 — quoted prices in active markets for identical securities |
| Ÿ |
|
Level 2 — other significant observable inputs (including quoted prices for similar securities, interest rates, prepayment speeds, credit risk, etc.)
|
| Ÿ |
|
Level 3 — significant unobservable inputs (including the Funds’ own assumptions in determining the fair value of investments)
|
A financial instrument’s level within the fair value hierarchy is based on the lowest level of any input, both
individually and in the aggregate, that is significant to the fair value measurement. The inputs or methodology used for valuing securities are not necessarily an indication of the risk associated with investing in those securities.
The following tables represent each valuation input by sector as presented on the Schedules of Portfolio Investments (“SOIs”) (amounts in
thousands):
Core Bond Trust
|
|
|
|
|
|
|
|
|
|
|
|
|
|
|
|
|
| |
|
Level 1
Quoted prices |
|
|
Level 2
Other significant
observable inputs |
|
|
Level 3
Significant
unobservable inputs |
|
|
Total |
|
| Investments in Securities |
|
|
|
|
|
|
|
|
|
|
|
|
|
|
|
|
| Debt Securities |
|
|
|
|
|
|
|
|
|
|
|
|
|
|
|
|
| Asset-Backed Securities |
|
$ |
— |
|
|
$ |
107,695 |
|
|
$ |
117,409 |
|
|
$ |
225,104 |
|
| Collateralized Mortgage Obligations |
|
|
|
|
|
|
|
|
|
|
|
|
|
|
|
|
| Agency CMO |
|
|
— |
|
|
|
614,116 |
|
|
|
4,829 |
|
|
|
618,945 |
|
| Non-Agency CMO |
|
|
— |
|
|
|
220,132 |
|
|
|
46,894 |
|
|
|
267,026 |
|
|
|
|
|
|
|
|
|
|
|
|
|
|
|
|
|
|
| Total Collateralized Mortgage Obligations |
|
|
— |
|
|
|
834,248 |
|
|
|
51,723 |
|
|
|
885,971 |
|
|
|
|
|
|
|
|
|
|
|
|
|
|
|
|
|
|
| Commercial Mortgage-Backed Securities |
|
|
— |
|
|
|
122,647 |
|
|
|
17,627 |
|
|
|
140,274 |
|
| Corporate Bonds |
|
|
|
|
|
|
|
|
|
|
|
|
|
|
|
|
| Consumer Discretionary |
|
|
— |
|
|
|
50,598 |
|
|
|
— |
|
|
|
50,598 |
|
| Consumer Staples |
|
|
— |
|
|
|
36,201 |
|
|
|
— |
|
|
|
36,201 |
|
| Energy |
|
|
— |
|
|
|
65,108 |
|
|
|
— |
|
|
|
65,108 |
|
| Financials |
|
|
— |
|
|
|
324,440 |
|
|
|
— |
|
|
|
324,440 |
|
| Health Care |
|
|
— |
|
|
|
25,996 |
|
|
|
— |
|
|
|
25,996 |
|
| Industrials |
|
|
— |
|
|
|
42,796 |
|
|
|
3,491 |
|
|
|
46,287 |
|
| Information Technology |
|
|
— |
|
|
|
43,748 |
|
|
|
— |
|
|
|
43,748 |
|
| Materials |
|
|
— |
|
|
|
23,637 |
|
|
|
— |
|
|
|
23,637 |
|
| Telecommunication Services |
|
|
— |
|
|
|
38,472 |
|
|
|
— |
|
|
|
38,472 |
|
| Utilities |
|
|
— |
|
|
|
62,628 |
|
|
|
— |
|
|
|
62,628 |
|
|
|
|
|
|
|
|
|
|
|
|
|
|
|
|
|
|
| Total Corporate Bonds |
|
|
— |
|
|
|
713,624 |
|
|
|
3,491 |
|
|
|
717,115 |
|
|
|
|
|
|
|
|
|
|
|
|
|
|
|
|
|
|
| Foreign Government Securities |
|
|
— |
|
|
|
49,554 |
|
|
|
— |
|
|
|
49,554 |
|
| Mortgage Pass-Through Securities |
|
|
— |
|
|
|
566,739 |
|
|
|
— |
|
|
|
566,739 |
|
| Municipal Bonds |
|
|
— |
|
|
|
10,157 |
|
|
|
— |
|
|
|
10,157 |
|
| Supranational |
|
|
— |
|
|
|
4,487 |
|
|
|
— |
|
|
|
4,487 |
|
| U.S. Government Agency Securities |
|
|
— |
|
|
|
92,238 |
|
|
|
— |
|
|
|
92,238 |
|
| U.S. Treasury Obligations |
|
|
— |
|
|
|
1,006,044 |
|
|
|
— |
|
|
|
1,006,044 |
|
| Loan Assignments |
|
|
|
|
|
|
|
|
|
|
|
|
|
|
|
|
| Financials |
|
|
— |
|
|
|
— |
|
|
|
13,771 |
|
|
|
13,771 |
|
| Short-Term Investment |
|
|
|
|
|
|
|
|
|
|
|
|
|
|
|
|
| Investment Company |
|
|
95,077 |
|
|
|
— |
|
|
|
— |
|
|
|
95,077 |
|
|
|
|
|
|
|
|
|
|
|
|
|
|
|
|
|
|
| Total Investments in Securities |
|
$ |
95,077 |
|
|
$ |
3,507,433 |
|
|
$ |
204,021 |
|
|
$ |
3,806,531 |
|
|
|
|
|
|
|
|
|
|
|
|
|
|
|
|
|
|
|
|
|
|
|
|
|
|
|
|
|
|
|
| AUGUST 31, 2014 |
|
JPMORGAN INSTITUTIONAL TRUST FUNDS |
|
|
|
|
97 |
|
NOTES TO FINANCIAL STATEMENTS
AS OF AUGUST 31, 2014 (Unaudited) (continued)
Equity Index Trust
|
|
|
|
|
|
|
|
|
|
|
|
|
|
|
|
|
| |
|
Level 1
Quoted prices |
|
|
Level 2
Other significant
observable inputs |
|
|
Level 3
Significant
unobservable inputs |
|
|
Total |
|
| Total Investments in Securities (a) |
|
$ |
377,047 |
|
|
$ |
345 |
|
|
$ |
— |
|
|
$ |
377,392 |
|
|
|
|
|
|
|
|
|
|
|
|
|
|
|
|
|
|
| Appreciation in Other Financial Instruments |
|
|
|
|
|
|
|
|
|
|
|
|
|
|
|
|
| Futures Contracts |
|
$ |
196 |
|
|
$ |
— |
|
|
$ |
— |
|
|
$ |
196 |
|
|
|
|
|
|
|
|
|
|
|
|
|
|
|
|
|
|
|
|
|
|
|
| JPMorgan Intermediate Bond Trust |
|
|
|
|
|
|
|
|
|
|
|
|
|
|
|
|
| |
|
Level 1
Quoted prices |
|
|
Level 2
Other significant
observable inputs |
|
|
Level 3
Significant
unobservable inputs |
|
|
Total |
|
| Investments in Securities |
|
|
|
|
|
|
|
|
|
|
|
|
|
|
|
|
| Debt Securities |
|
|
|
|
|
|
|
|
|
|
|
|
|
|
|
|
| Asset-Backed Securities |
|
$ |
— |
|
|
$ |
13,346 |
|
|
$ |
6,873 |
|
|
$ |
20,219 |
|
| Collateralized Mortgage Obligations |
|
|
|
|
|
|
|
|
|
|
|
|
|
|
|
|
| Agency CMO |
|
|
— |
|
|
|
55,395 |
|
|
|
47 |
|
|
|
55,442 |
|
| Non-Agency CMO |
|
|
— |
|
|
|
12,303 |
|
|
|
960 |
|
|
|
13,263 |
|
|
|
|
|
|
|
|
|
|
|
|
|
|
|
|
|
|
| Total Collateralized Mortgage Obligations |
|
|
— |
|
|
|
67,698 |
|
|
|
1,007 |
|
|
|
68,705 |
|
|
|
|
|
|
|
|
|
|
|
|
|
|
|
|
|
|
| Commercial Mortgage-Backed Securities |
|
|
— |
|
|
|
6,067 |
|
|
|
912 |
|
|
|
6,979 |
|
| Corporate Bonds |
|
|
|
|
|
|
|
|
|
|
|
|
|
|
|
|
| Consumer Discretionary |
|
|
— |
|
|
|
3,402 |
|
|
|
— |
|
|
|
3,402 |
|
| Consumer Staples |
|
|
— |
|
|
|
2,760 |
|
|
|
— |
|
|
|
2,760 |
|
| Energy |
|
|
— |
|
|
|
5,603 |
|
|
|
— |
|
|
|
5,603 |
|
| Financials |
|
|
— |
|
|
|
36,764 |
|
|
|
— |
|
|
|
36,764 |
|
| Health Care |
|
|
— |
|
|
|
1,948 |
|
|
|
— |
|
|
|
1,948 |
|
| Industrials |
|
|
— |
|
|
|
3,016 |
|
|
|
934 |
|
|
|
3,950 |
|
| Information Technology |
|
|
— |
|
|
|
3,474 |
|
|
|
— |
|
|
|
3,474 |
|
| Materials |
|
|
— |
|
|
|
2,085 |
|
|
|
— |
|
|
|
2,085 |
|
| Telecommunication Services |
|
|
— |
|
|
|
2,122 |
|
|
|
— |
|
|
|
2,122 |
|
| Utilities |
|
|
— |
|
|
|
3,877 |
|
|
|
— |
|
|
|
3,877 |
|
|
|
|
|
|
|
|
|
|
|
|
|
|
|
|
|
|
| Total Corporate Bonds |
|
|
— |
|
|
|
65,051 |
|
|
|
934 |
|
|
|
65,985 |
|
|
|
|
|
|
|
|
|
|
|
|
|
|
|
|
|
|
| Foreign Government Securities |
|
|
— |
|
|
|
3,429 |
|
|
|
— |
|
|
|
3,429 |
|
| Mortgage Pass-Through Securities |
|
|
— |
|
|
|
36,129 |
|
|
|
— |
|
|
|
36,129 |
|
| Supranational |
|
|
— |
|
|
|
191 |
|
|
|
— |
|
|
|
191 |
|
| U.S. Government Agency Securities |
|
|
— |
|
|
|
8,708 |
|
|
|
— |
|
|
|
8,708 |
|
| U.S. Treasury Obligations |
|
|
— |
|
|
|
104,915 |
|
|
|
— |
|
|
|
104,915 |
|
| Short-Term Investment |
|
|
|
|
|
|
|
|
|
|
|
|
|
|
|
|
| Investment Company |
|
|
31,493 |
|
|
|
— |
|
|
|
— |
|
|
|
31,493 |
|
|
|
|
|
|
|
|
|
|
|
|
|
|
|
|
|
|
| Total Investments in Securities |
|
$ |
31,493 |
|
|
$ |
305,534 |
|
|
$ |
9,726 |
|
|
$ |
346,753 |
|
|
|
|
|
|
|
|
|
|
|
|
|
|
|
|
|
|
| (a) |
Portfolio holdings designated as Level 1 and Level 2 are disclosed individually on the SOIs. Level 2 consists of U.S. Treasury Bills held as collateral for futures
contracts. Please refer to the SOIs for industry specifics of portfolio holdings. |
For each of the Funds, there were no transfers
among Levels 1 and 2 during the six months ended August 31, 2014.
|
|
|
|
|
|
|
|
|
|
|
| 98 |
|
|
|
JPMORGAN INSTITUTIONAL TRUST FUNDS |
|
AUGUST 31, 2014 |
The following is a summary of investments for which significant unobservable inputs (Level 3) were used in
determining fair value (amounts in thousands):
|
|
|
|
|
|
|
|
|
|
|
|
|
|
|
|
|
|
|
|
|
|
|
|
|
|
|
|
|
|
|
|
|
|
|
|
|
| Core Bond Trust |
|
Balance as
of 02/28/14 |
|
|
Realized
gain (loss) |
|
|
Change in
unrealized
appreciation
(depreciation) |
|
|
Net
accretion
(amortization) |
|
|
Purchases1 |
|
|
Sales2 |
|
|
Transfers
into Level 3 |
|
|
Transfers
out
of Level 3 |
|
|
Balance as
of 08/31/14 |
|
| Investments in Securities |
|
|
|
|
|
|
|
|
|
|
|
|
|
|
|
|
|
|
|
|
|
|
|
|
|
|
|
|
|
|
|
|
|
|
|
|
| Asset-Backed Securities |
|
$ |
95,936 |
|
|
$ |
73 |
|
|
$ |
83 |
|
|
$ |
26 |
|
|
$ |
48,028 |
|
|
$ |
(25,137 |
) |
|
$ |
— |
|
|
$ |
(1,600 |
) |
|
$ |
117,409 |
|
| Collateralized Mortgage Obligations — Agency CMO |
|
|
5,515 |
|
|
|
(2 |
) |
|
|
84 |
|
|
|
(839 |
) |
|
|
1,185 |
|
|
|
(113 |
) |
|
|
2,731 |
|
|
|
(3,732 |
) |
|
|
4,829 |
|
| Collateralized Mortgage Obligations — Non-Agency CMO |
|
|
48,682 |
|
|
|
— |
|
|
|
(1,187 |
) |
|
|
509 |
|
|
|
5 |
|
|
|
(2,923 |
) |
|
|
3,741 |
|
|
|
(1,933 |
) |
|
|
46,894 |
|
| Commercial Mortgage-Backed Securities |
|
|
18,872 |
|
|
|
— |
|
|
|
339 |
|
|
|
(1,122 |
) |
|
|
2,338 |
|
|
|
(2,800 |
) |
|
|
— |
|
|
|
— |
|
|
|
17,627 |
|
| Corporate Bonds — Industrials |
|
|
3,605 |
|
|
|
— |
|
|
|
(4 |
) |
|
|
(1 |
) |
|
|
35 |
|
|
|
(144 |
) |
|
|
— |
|
|
|
— |
|
|
|
3,491 |
|
| Loan Assignments — Financials |
|
|
13,732 |
|
|
|
— |
|
|
|
(12 |
) |
|
|
— |
|
|
|
11,237 |
|
|
|
(11,186 |
) |
|
|
— |
|
|
|
— |
|
|
|
13,771 |
|
|
|
|
|
|
|
|
|
|
|
|
|
|
|
|
|
|
|
|
|
|
|
|
|
|
|
|
|
|
|
|
|
|
|
|
|
|
| Total |
|
$ |
186,342 |
|
|
$ |
71 |
|
|
$ |
(697 |
) |
|
$ |
(1,427 |
) |
|
$ |
62,828 |
|
|
$ |
(42,303 |
) |
|
$ |
6,472 |
|
|
$ |
(7,265 |
) |
|
$ |
204,021 |
|
|
|
|
|
|
|
|
|
|
|
|
|
|
|
|
|
|
|
|
|
|
|
|
|
|
|
|
|
|
|
|
|
|
|
|
|
|
|
|
|
|
|
|
|
|
|
|
|
|
|
|
|
|
|
|
|
|
|
|
|
|
|
|
|
|
|
|
|
|
|
|
|
|
|
| JPMorgan Intermediate Bond Trust |
|
Balance as
of 02/28/14 |
|
|
Realized
gain (loss) |
|
|
Change in
unrealized
appreciation
(depreciation) |
|
|
Net
accretion
(amortization) |
|
|
Purchases1 |
|
|
Sales2 |
|
|
Transfers
into Level 3 |
|
|
Transfers
out
of Level 3 |
|
|
Balance as
of 08/31/14 |
|
| Investments in Securities |
|
|
|
|
|
|
|
|
|
|
|
|
|
|
|
|
|
|
|
|
|
|
|
|
|
|
|
|
|
|
|
|
|
|
|
|
| Asset-Backed Securities |
|
$ |
3,909 |
|
|
$ |
— |
|
|
$ |
— |
(a) |
|
$ |
— |
(a) |
|
$ |
4,012 |
|
|
$ |
(1,048 |
) |
|
$ |
— |
|
|
$ |
— |
|
|
$ |
6,873 |
|
| Collateralized Mortgage Obligations — Agency CMO |
|
|
251 |
|
|
|
— |
|
|
|
2 |
|
|
|
(4 |
) |
|
|
(2 |
) |
|
|
(2 |
) |
|
|
52 |
|
|
|
(250 |
) |
|
|
47 |
|
| Collateralized Mortgage Obligations — Non-Agency CMO |
|
|
981 |
|
|
|
— |
|
|
|
(26 |
) |
|
|
30 |
|
|
|
— |
|
|
|
(74 |
) |
|
|
49 |
|
|
|
— |
|
|
|
960 |
|
| Commercial Mortgaged Backed — Securities |
|
|
1,116 |
|
|
|
— |
|
|
|
(3 |
) |
|
|
(25 |
) |
|
|
— |
|
|
|
(176 |
) |
|
|
— |
|
|
|
— |
|
|
|
912 |
|
| Common Stocks — Industrials |
|
|
945 |
|
|
|
— |
|
|
|
3 |
|
|
|
(1 |
) |
|
|
— |
|
|
|
(13 |
) |
|
|
— |
|
|
|
— |
|
|
|
934 |
|
|
|
|
|
|
|
|
|
|
|
|
|
|
|
|
|
|
|
|
|
|
|
|
|
|
|
|
|
|
|
|
|
|
|
|
|
|
|
|
$ |
7,202 |
|
|
$ |
— |
|
|
$ |
(24 |
) |
|
$ |
— |
|
|
$ |
4,010 |
|
|
$ |
(1,313 |
) |
|
$ |
101 |
|
|
$ |
(250 |
) |
|
$ |
9,726 |
|
|
|
|
|
|
|
|
|
|
|
|
|
|
|
|
|
|
|
|
|
|
|
|
|
|
|
|
|
|
|
|
|
|
|
|
|
|
| (1) |
Purchases include all purchases of securities and securities received in corporate actions. |
| (2) |
Sales include all sales of securities, maturities, paydowns and securities tendered in corporate actions. |
| (a) |
Amount rounds to less than $1,000. |
Transfers into,
and out of, Level 3 are valued utilizing values as of the beginning of the period.
Transfers from Level 2 to Level 3 or from Level 3 to Level 2
are due to a decline or an increase in market activity (e.g. frequency of trades),
respectively, which resulted in a lack of or increase in
available market inputs to determine price.
The change in unrealized appreciation (depreciation) attributable to securities owned at
August 31, 2014, which were valued using significant unobservable inputs (Level 3) were as follows (amounts in thousands):
|
|
|
|
|
| |
|
Value |
|
| Core Bond Trust |
|
$ |
(606 |
) |
| Intermediate Bond Trust |
|
|
(19 |
) |
These amounts are included in Change in net unrealized appreciation (depreciation) of investments in non-affiliates on the
Statements of Operations.
Core Bond Trust Fund
Quantitative Information about Level 3 Fair Value Measurements #
|
|
|
|
|
|
|
|
|
|
|
|
|
| |
|
Fair Value at
August 31, 2014 |
|
|
Valuation Technique(s) |
|
Unobservable Input |
|
Range (Weighted Average) |
|
|
|
$ |
65,362 |
|
|
Discounted Cash Flow |
|
Constant Prepayment Rate |
|
|
0.00% - 17.15% (0.94%) |
|
|
|
|
|
|
|
|
|
Constant Default Rate |
|
|
0.00% - 6.95% (2.61%) |
|
|
|
|
|
|
|
|
|
Yield (Discount Rate of Cash Flows) |
|
|
0.00% - 6.95% (2.61%) |
|
|
|
|
|
|
|
|
|
|
|
|
|
|
| Asset-Backed Securities |
|
|
65,362 |
|
|
|
|
|
|
|
|
|
| |
|
|
|
|
|
|
|
|
|
|
|
|
|
|
| AUGUST 31, 2014 |
|
JPMORGAN INSTITUTIONAL TRUST FUNDS |
|
|
|
|
99 |
|
NOTES TO FINANCIAL STATEMENTS
AS OF AUGUST 31, 2014 (Unaudited) (continued)
|
|
|
|
|
|
|
|
|
|
|
|
|
| |
|
Fair Value at
August 31, 2014 |
|
|
Valuation Technique(s) |
|
Unobservable Input |
|
Range (Weighted Average) |
|
|
|
$ |
40,631 |
|
|
Discounted Cash Flow |
|
Constant Prepayment Rate |
|
|
0.00% - 35.77% (7.08%) |
|
|
|
|
|
|
|
|
|
Constant Default Rate |
|
|
0.00% - 9.16% (2.96%) |
|
|
|
|
|
|
|
|
|
PSA Prepayment Model |
|
|
144.00% - 1,085.00% (419.28%) |
|
|
|
|
|
|
|
|
|
Yield (Discount Rate of Cash Flows) |
|
|
(150.74%) - 77.63% (4.93%) |
|
|
|
|
|
|
|
|
|
|
|
|
|
|
| Collateralized Mortgage Obligations |
|
|
40,631 |
|
|
|
|
|
|
|
|
|
| |
|
|
|
|
6,587 |
|
|
Discounted Cash Flow |
|
Constant Prepayment Rate |
|
|
0.00% - 100.00% (56.40%) |
|
|
|
|
|
|
|
|
|
Yield (Discount Rate of Cash Flows) |
|
|
(5.15%) - 4.98% (1.88%) |
|
|
|
|
|
|
|
|
|
|
|
|
|
|
| Commercial Mortgage-Backed Securities |
|
|
6,587 |
|
|
|
|
|
|
|
|
|
| |
|
| Total |
|
$ |
112,580 |
|
|
|
|
|
|
|
|
|
| |
|
| # |
The table above does not include certain level 3 securities that are valued by brokers and pricing services that have inputs that are not readily available or cannot be
reasonably estimated. These securities’ inputs are generally described in Note 2.A. At August 31, 2014, the value of these securities was approximately $91,441,000. The appropriateness of fair values for these securities is monitored
on an ongoing basis which may include results of back testing, unchanged price review, results of broker and vendor due diligence and consideration of macro or security specific events. |
The significant unobservable inputs used in the fair value measurement of the Fund’s investments are listed above. Generally, a change in the
assumptions used in any input in isolation may be accompanied by a change in another input. Significant changes in any of the unobservable inputs may significantly impact the fair value measurement. The impact is based on the relationship
between each unobservable input and the fair value measurement. Significant increases (decreases) in the yield and default rate may decrease (increase) the fair value measurement. A significant change in the prepayment rate (Constant Prepayment
Rate or PSA Prepayment Model) may decrease or increase the fair value measurement.
Intermediate Bond Trust Fund
Quantitative Information about Level 3 Fair Value Measurements #
|
|
|
|
|
|
|
|
|
|
|
|
|
| |
|
Fair Value at
August 31, 2014 |
|
|
Valuation Technique(s) |
|
Unobservable Input |
|
Range (Weighted Average) |
|
|
|
$ |
3,107 |
|
|
Discounted Cash Flow |
|
Constant Prepayment Rate |
|
|
0.00% - 5.00% (0.62%) |
|
|
|
|
|
|
|
|
|
Constant Default Rate |
|
|
0.00% - 30.00% (15.60%) |
|
|
|
|
|
|
|
|
|
Yield (Discount Rate of Cash Flows) |
|
|
0.00% - 6.95% (2.54%) |
|
|
|
|
|
|
|
|
|
|
|
|
|
|
| Asset-Backed Securities |
|
|
3,107 |
|
|
|
|
|
|
|
|
|
| |
|
|
|
|
1,007 |
|
|
Discounted Cash Flow |
|
Constant Prepayment Rate |
|
|
0.00% - 35.77% (5.40%) |
|
|
|
|
|
|
|
|
|
Constant Default Rate |
|
|
0.00% - 5.10% (0.94%) |
|
|
|
|
|
|
|
|
|
PSA Prepayment Model |
|
|
284.00% - 1,085.00% (543.38%) |
|
|
|
|
|
|
|
|
|
Yield (Discount Rate of Cash Flows) |
|
|
(8.70%) - 23.82% (4.01%) |
|
|
|
|
|
|
|
|
|
|
|
|
|
|
| Collateralized Mortgage Obligations |
|
|
1,007 |
|
|
|
|
|
|
|
|
|
| |
|
|
|
|
110 |
|
|
Discounted Cash Flow |
|
Constant Prepayment Rate |
|
|
100.00% (N/A) |
|
|
|
|
|
|
|
|
|
Yield (Discount Rate of Cash Flows) |
|
|
1.26% (N/A) |
|
|
|
|
|
|
|
|
|
|
|
|
|
|
| Commercial Mortgage-Backed Securities |
|
|
110 |
|
|
|
|
|
|
|
|
|
| |
|
| Total |
|
$ |
4,224 |
|
|
|
|
|
|
|
|
|
| |
|
| # |
The table above does not include certain level 3 securities that are valued by brokers and pricing services that have inputs that are not readily available or cannot be
reasonably estimated. These securities’ inputs are generally described in Note 2.A. At August 31, 2014, the value of these securities was approximately $5,502,000. The appropriateness of fair values for these securities is monitored
on an ongoing basis which may include results of back testing, unchanged price review, results of broker and vendor due diligence and consideration of macro or security specific events. |
The significant unobservable inputs used in the fair value measurement of the Fund’s investments are listed above. Generally, a change in the
assumptions used in any input in isolation may be accompanied by a change in another input. Significant changes in any of the unobservable inputs may significantly impact the fair value measurement. The impact is based on the relationship
between each unobservable input and the fair value measurement. Significant increases (decreases) in the yield and default rate may decrease (increase) the fair value measurement. A significant change in the prepayment rate (Constant Prepayment
Rate or PSA Prepayment Model) may decrease or increase the fair value measurement.
B. Restricted and Illiquid Securities — Certain
securities held by the Funds may be subject to legal or contractual restrictions on resale and/or are illiquid. Restricted securities generally are resold in transactions exempt from registration under the Securities Act of 1933 (the
“Securities Act”).
|
|
|
|
|
|
|
|
|
|
|
| 100 |
|
|
|
JPMORGAN INSTITUTIONAL TRUST FUNDS |
|
AUGUST 31, 2014 |
Illiquid securities are securities which cannot be disposed of promptly (within seven days) and in the usual course of business at approximately their fair value and include, but are not limited
to, repurchase agreements maturing in excess of seven days, time deposits with a withdrawal penalty, non-negotiable instruments and instruments for which no market exists. Disposal of these securities may involve time-consuming negotiations and
expense. Prompt sale at the current valuation may be difficult and could adversely affect the net assets of the Funds. As of August 31, 2014, the Funds had no investments in restricted securities other than securities sold to the Funds under
Rule 144A under the Securities Act.
The following are the value and percentage of net assets of illiquid securities as of August 31, 2014
(amounts in thousands):
|
|
|
|
|
|
|
|
|
| |
|
Value |
|
|
Percentage |
|
| Core Bond Trust |
|
$ |
42,260 |
|
|
|
1.11 |
% |
| Intermediate Bond Trust |
|
|
578 |
|
|
|
0.17 |
|
C. Loan Assignments — Core Bond Trust invests in loan assignments of all or a portion of the loans. When the Fund
purchases a loan assignment the Fund has direct rights against the borrower on a loan provided, however, the Fund’s rights may be more limited than the lender from which it acquired the assignment and the Fund may be able to enforce its rights
only through an administrative agent. As a result, the Fund assumes the credit risk of the Borrower (“Intermediate Participants”) and any other persons interpositioned between the Fund and the Borrower. Although certain loan assignments
are secured by collateral, the Fund could experience delays or limitations in realizing the value on such collateral or have its interest subordinated to other indebtedness of the Borrower. In addition, loan assignments are vulnerable to market
conditions such that economic conditions or other events may reduce the demand for assignments and certain assignments which were liquid, when purchased, may become illiquid.
D. Unfunded Commitments — Core Bond Trust may enter into commitments to buy and sell investments including commitments to buy loan assignments to settle on future dates as part of its normal
investment activities. Unfunded commitments may include revolving loan facilities which may obligate the Fund to provide cash to the borrower on demand. Commitments are generally traded and priced as part of a related loan assignment (Note 2.C.).
The value of the unfunded portion of the investment is determined using a pro-rata allocation, based on its par value relative to the par value of the entire investment. The unrealized appreciation (depreciation) from unfunded commitments is
reported in the Statements of Assets and Liabilities. The Fund segregates security positions such that sufficient liquid assets will be available for the commitments on a future date. Credit risk exists on these commitments to the extent of any
difference between the sales price and current value of the underlying securities sold. Market risk exists on these commitments to buy to the same extent as if the securities were owned on a settled basis and gains and losses are recorded and
reported in the same manner. The Fund may receive an ongoing commitment fee based on the undrawn portion of the underlying loan facility, which is recorded as a component of interest income on the Statements of Operations.
At August 31, 2014, Core Bond Trust had the following loan commitments in which all or a portion of the commitment was unfunded which could be extended
at the option of the borrower (amounts in thousands):
|
|
|
|
|
|
|
|
|
|
|
|
|
|
|
|
|
|
|
|
|
|
|
|
|
|
|
|
|
|
|
|
|
|
|
|
|
|
|
| |
|
Term |
|
Maturity
Date |
|
|
Commitment
Fee Rate |
|
|
Rate if
Funded |
|
|
Unfunded
Commitment |
|
|
Funded
Commitment |
|
|
Total
Commitment |
|
| Security Description |
|
|
|
|
|
Par
Amount |
|
|
Value |
|
|
Par
Amount |
|
|
Value |
|
|
Par
Amount |
|
|
Value |
|
| FiveTen Group Holding, Ltd. (i) |
|
Revolving Loan |
|
|
04/10/15 |
|
|
|
0.500 |
% |
|
|
4.500 |
% |
|
$ |
843 |
|
|
$ |
839 |
|
|
$ |
1,657 |
|
|
$ |
1,648 |
|
|
$ |
2,500 |
|
|
$ |
2,487 |
|
| Invitation Homes (i) |
|
Revolving Loan |
|
|
03/15/15 |
|
|
|
0.500 |
|
|
|
3.750 |
|
|
|
176 |
|
|
|
175 |
|
|
|
2,017 |
|
|
|
2,007 |
|
|
|
2,193 |
|
|
|
2,182 |
|
| Progress Residential LP (i) |
|
Revolving Loan |
|
|
09/04/15 |
|
|
|
0.500 |
|
|
|
3.734 |
|
|
|
3,026 |
|
|
|
3,011 |
|
|
|
5,974 |
|
|
|
5,944 |
|
|
|
9,000 |
|
|
|
8,955 |
|
| Tricon Capital Group, Inc. (i) |
|
Revolving Loan |
|
|
06/13/15 |
|
|
|
0.500 |
|
|
|
4.100 |
|
|
|
2,307 |
|
|
|
2,296 |
|
|
|
4,193 |
|
|
|
4,172 |
|
|
|
6,500 |
|
|
|
6,468 |
|
|
|
|
|
|
|
|
|
|
|
|
|
|
|
|
|
|
|
|
|
|
|
|
|
|
|
|
|
|
|
|
|
|
|
|
|
|
|
|
|
|
|
|
|
|
|
|
|
|
|
|
|
|
|
|
$ |
6,352 |
|
|
$ |
6,321 |
|
|
$ |
13,841 |
|
|
$ |
13,771 |
|
|
$ |
20,193 |
|
|
$ |
20,092 |
|
|
|
|
|
|
|
|
|
|
|
|
|
|
|
|
|
|
|
|
|
|
|
|
|
|
|
|
|
|
|
|
|
|
|
|
|
|
|
|
| (i) |
Security has been deemed illiquid pursuant to procedures approved by the Board of Trustees and may be difficult to sell. |
E. Futures Contracts — Equity Index Trust uses index futures contracts to gain or reduce exposure to its index, maintain liquidity and minimize
transaction costs. The Fund also buys futures contracts to immediately invest incoming cash in the market or sells futures in response to cash outflows, thereby simulating an invested position in the underlying index while maintaining a cash balance
for liquidity. The use of futures contracts exposes the Fund to equity price risk.
Futures contracts provide for the delayed delivery of the
underlying instrument at a fixed price or are settled for a cash amount based on the change in the value of the underlying instrument at a specific date in the future. Upon entering into a futures contract, the Fund is required to deposit with the
broker, cash or securities in an amount equal to a certain percentage of the contract amount, which is referred to as the initial margin deposit. Subsequent payments, referred to as variation margin, are made or received by the Fund periodically and
are based on changes in the market value of open futures contracts. Changes in the market value of open futures contracts are recorded as change in net unrealized appreciation/depreciation in the Statements of Operations. Realized gains or losses,
representing the difference between the value of the contract at the time it was opened and the value at the time it was closed, are reported in the Statements of Operations at the closing or expiration of the futures contract. Securities deposited
as initial margin are designated in the SOI and cash deposited is recorded on the Statements of Assets and Liabilities. A receivable from and/or a payable to brokers for the daily variation margin is also recorded on the Statements of Assets and
Liabilities.
The Fund may be subject to the risk that the change in the value of the futures contract may not correlate perfectly with the
underlying instrument. Use of long futures contracts subjects the Fund to risk of loss in excess of the amounts shown on the Statements of Assets and Liabilities, up to the
|
|
|
|
|
|
|
|
|
|
|
|
|
| AUGUST 31, 2014 |
|
JPMORGAN INSTITUTIONAL TRUST FUNDS |
|
|
|
|
101 |
|
NOTES TO FINANCIAL STATEMENTS
AS OF AUGUST 31, 2014 (Unaudited) (continued)
notional amount of the futures contracts. Use of short futures contracts subjects the Fund to unlimited risk of loss. The Fund may enter into futures contracts only on exchanges or boards of
trade. The exchange or board of trade acts as the counterparty to each futures transaction; therefore, the Fund’s credit risk is limited to failure of the exchange or board of trade. Under some circumstances, futures exchanges may establish
daily limits on the amount that the price of a futures contract can vary from the previous day’s settlement price, which could effectively prevent timely liquidation of positions.
The table below discloses the volume of the Fund’s futures contracts activity during the six months ended August 31, 2014 (amounts in thousands):
|
|
|
|
|
| |
|
Equity
Index
Trust |
|
| Futures Contracts: |
|
|
|
|
| Average Notional Balance Long |
|
$ |
3,388 |
|
| Ending Notional Balance Long |
|
|
4,703 |
|
The Fund’s futures contracts are not subject to master netting arrangements (the right to close out all transactions
traded with a counterparty and net amounts owed or due across transactions).
F. Investment Transactions with Affiliates — An issuer
which is under common control with the Funds may be considered an affiliate. For the purposes of the report, the Funds assume the following to be affiliated issuers (amounts in thousands):
|
|
|
|
|
|
|
|
|
|
|
|
|
|
|
|
|
|
|
|
|
|
|
|
|
|
|
|
|
| Affiliate |
|
Value at
February 28,
2014 |
|
|
Purchase
Cost |
|
|
Sales
Proceeds |
|
|
Realized
Gain/Loss |
|
|
Dividend/
Interest
Income |
|
|
Shares at
August 31,
2014 |
|
|
Value at
August 31,
2014 |
|
| Core Bond Trust |
|
|
|
|
|
|
|
|
|
|
|
|
|
|
|
|
|
|
|
|
|
|
|
|
|
|
|
|
| JPMorgan Liquid Assets Money Market Fund, Institutional Class Shares |
|
$ |
44,100 |
|
|
$ |
423,964 |
|
|
$ |
372,987 |
|
|
$ |
— |
|
|
$ |
9 |
|
|
|
95,077 |
|
|
$ |
95,077 |
|
|
|
|
|
|
|
|
|
|
|
|
|
|
|
|
|
|
|
|
|
|
|
|
|
|
|
|
|
|
| Equity Index Trust |
|
|
|
|
|
|
|
|
|
|
|
|
|
|
|
|
|
|
|
|
|
|
|
|
|
|
|
|
| JPMorgan Chase & Co. (common stock)* |
|
$ |
4,667 |
|
|
$ |
69 |
|
|
$ |
228 |
|
|
$ |
50 |
|
|
$ |
63 |
|
|
|
79 |
|
|
$ |
4,712 |
|
| JPMorgan Liquid Assets Money Market Fund, Institutional Class Shares |
|
|
2,082 |
|
|
|
23,650 |
|
|
|
21,420 |
|
|
|
— |
|
|
|
1 |
|
|
|
4,312 |
|
|
|
4,312 |
|
|
|
|
|
|
|
|
|
|
|
|
|
|
|
|
|
|
|
|
|
|
|
|
|
|
|
|
|
|
|
|
$ |
6,749 |
|
|
$ |
23,719 |
|
|
$ |
21,648 |
|
|
$ |
50 |
|
|
$ |
64 |
|
|
|
4,391 |
|
|
$ |
9,024 |
|
|
|
|
|
|
|
|
|
|
|
|
|
|
|
|
|
|
|
|
|
|
|
|
|
|
|
|
|
|
| Intermediate Bond Trust |
|
|
|
|
|
|
|
|
|
|
|
|
|
|
|
|
|
|
|
|
|
|
|
|
|
|
|
|
| JPMorgan Liquid Assets Money Market Fund, Institutional Class Shares |
|
$ |
6,291 |
|
|
$ |
61,939 |
|
|
$ |
36,737 |
|
|
$ |
|
|
|
$ |
2 |
|
|
|
31,493 |
|
|
$ |
31,493 |
|
|
|
|
|
|
|
|
|
|
|
|
|
|
|
|
|
|
|
|
|
|
|
|
|
|
|
|
|
|
| * |
Investment in affiliate which is a security in the Fund’s index. |
G. Security Transactions and Investment Income — Investment transactions are accounted for on the trade date (the date the order to buy or sell is executed). Securities gains and losses are
calculated on a specifically identified cost basis. Interest income is determined on the basis of coupon interest accrued using the effective interest method which adjusts for amortization of premiums and accretion of discounts. Dividend income, net
of foreign taxes withheld, if any, is recorded on the ex-dividend date or when a Fund first learns of the dividend.
H. Allocation of Expenses
— Expenses directly attributable to a fund are charged directly to that fund, while the expenses attributable to more than one fund of the Trust are allocated among the respective funds.
I. Federal Income Taxes — Each Fund is treated as a separate taxable entity for Federal income tax purposes. Each Fund’s policy is to comply
with the provisions of the Internal Revenue Code of 1986, as amended (the “Code”), applicable to regulated investment companies and to distribute to shareholders all of its distributable net investment income and net realized capital gains
on investments. Accordingly, no provision for Federal income tax is necessary. Management has reviewed the Funds’ tax positions for all open tax years and has determined that as of August 31, 2014, no liability for income tax is required
in the Funds’ financial statements for net unrecognized tax benefits. However, management’s conclusions may be subject to future review based on changes in, or the interpretation of, the accounting standards or tax laws and regulations.
Each of the Fund’s Federal tax returns for the prior three fiscal years remains subject to examination by the Internal Revenue Service.
J. Distributions to Shareholders — Distributions from net investment income are generally declared and paid monthly for Core Bond Trust and
Intermediate Bond Trust, and declared and paid quarterly for Equity Index Trust. Net realized capital gains, if any, are distributed by each Fund at least annually. The amount of distributions from net investment income and net realized capital
gains is determined in accordance with Federal income tax regulations, which may differ from GAAP. To the extent these “book/tax” differences are permanent in nature (i.e., that they result from other than timing of recognition —
“temporary differences”), such amounts are reclassified within the capital accounts based on their Federal tax-basis treatment.
|
|
|
|
|
|
|
|
|
|
|
| 102 |
|
|
|
JPMORGAN INSTITUTIONAL TRUST FUNDS |
|
AUGUST 31, 2014 |
3. Fees and Other Transactions with Affiliates
A. Investment Advisory Fee — Pursuant to the Investment Advisory Agreement, the Adviser, an indirect, wholly-owned subsidiary of JPMorgan Chase & Co. (“JPMorgan”), supervises
the investments of each Fund and for such services is paid a fee. The fee is accrued daily and paid monthly based on each Fund’s respective average daily net assets. The annual rate for each Fund is as follows:
|
|
|
|
|
| Core Bond Trust |
|
|
0.30 |
% |
| Equity Index Trust |
|
|
0.25 |
|
| Intermediate Bond Trust |
|
|
0.30 |
|
The Adviser waived Investment Advisory fees and/or reimbursed expenses as outlined in Note 3.E.
B. Administration Fee — Pursuant to an Administration Agreement, the Administrator, an indirect, wholly-owned subsidiary of JPMorgan, provides
certain administration services to the Funds. In consideration of these services, the Administrator receives a fee accrued daily and paid monthly at a rate of 0.10% of the Funds’ average daily net assets, notwithstanding any fee waivers and/or
expense reimbursements.
The Administrator waived Administration fees as outlined in Note 3.E.
JPMorgan Chase Bank, N.A. (“JPMCB”), a wholly-owned subsidiary of JPMorgan, serves as the Funds’ sub-administrator (the
“Sub-administrator”). For its services as Sub-administrator, JPMCB receives a portion of the fees payable to the Administrator.
C.
Custodian and Accounting Fees — JPMCB provides portfolio custody and accounting services to the Funds. For these services, the Funds pay JPMCB transaction and asset-based fees that vary according to the number of transactions and positions,
plus out-of-pocket expenses. The amounts paid directly to JPMCB by the Funds for custody and accounting services are included in Custodian and accounting fees in the Statements of Operations. Payments to the custodian may be reduced by credits
earned by each Fund, based on uninvested cash balances held by the custodian. Such earnings credits, if any, are presented separately in the Statements of Operations.
Interest expense paid to the custodian related to cash overdrafts, if any, is included in Interest expense to affiliates in the Statements of Operations.
D. Placement Agent — J.P. Morgan Institutional Investments, Inc. (the “Placement Agent”), a registered broker-dealer affiliated with
the Adviser, serves as the Funds’ Placement Agent. The Placement Agent processes subscriptions for shares and provides various sales support activities in connection with the Funds’ private placement of its shares.
E. Waivers and Reimbursements — The Adviser and Administrator have contractually agreed to waive fees and/or reimburse the Funds to the extent
that total annual operating expenses (excluding acquired fund fees and expenses, dividend expenses related to short sales, interest, taxes, expenses related to litigation and potential litigation, extraordinary expenses and expenses related to the
Board of Trustees’ deferred compensation plan) exceed the percentages of the Funds’ respective average daily net assets as shown in the table below:
|
|
|
|
|
| Core Bond Trust |
|
|
0.15 |
% |
| Equity Index Trust |
|
|
0.10 |
|
| Intermediate Bond Trust |
|
|
0.15 |
|
The expense limitation agreements were in effect for the six months ended August 31, 2014. The contractual expense
limitation percentages in the table above are in place until at least June 30, 2015.
For the six months ended August 31, 2014, the
Funds’ service providers waived fees and/or reimbursed expenses for each of the Funds as follows (amounts in thousands). None of these parties expect the Funds to repay any such waived fees and reimbursed expenses in future years.
|
|
|
|
|
|
|
|
|
|
|
|
|
|
|
|
|
| |
|
Contractual Waivers |
|
|
|
|
| |
|
Investment
Advisory |
|
|
Administration |
|
|
Total |
|
|
Contractual
Reimbursement |
|
| Core Bond Trust |
|
$ |
4,156 |
|
|
$ |
1,088 |
|
|
$ |
5,244 |
|
|
$ |
36 |
|
| Equity Index Trust |
|
|
388 |
|
|
|
133 |
|
|
|
521 |
|
|
|
— |
|
| Intermediate Bond Trust |
|
|
427 |
|
|
|
116 |
|
|
|
543 |
|
|
|
— |
|
Additionally, the Funds may invest in one or more money market funds advised by the Adviser or its affiliates. The Adviser
and Administrator waive fees in an amount sufficient to offset the respective fees each charges to the affiliated money market fund on the Funds’ investment in such affiliated money market fund. A portion of the waiver is voluntary.
The amounts of waivers resulting from investments in these money market funds for the six months ended August 31, 2014 were as follows (amounts in
thousands):
|
|
|
|
|
| Core Bond Trust |
|
$ |
68 |
|
| Equity Index Trust |
|
|
3 |
|
| Intermediate Bond Trust |
|
|
9 |
|
|
|
|
|
|
|
|
|
|
|
|
|
|
| AUGUST 31, 2014 |
|
JPMORGAN INSTITUTIONAL TRUST FUNDS |
|
|
|
|
103 |
|
NOTES TO FINANCIAL STATEMENTS
AS OF AUGUST 31, 2014 (Unaudited) (continued)
F. Other — Certain officers of the Trust are affiliated with the Adviser and Administrator. Such officers, with the exception of the Chief Compliance Officer, receive no compensation from the
Funds for serving in their respective roles.
The Board of Trustees appointed a Chief Compliance Officer to the Funds in accordance with Federal
securities regulations. Each Fund, along with other affiliated funds, makes reimbursement payments, on a pro-rata basis, to the Administrator for a portion of the fees associated with the Office of the Chief Compliance Officer. Such fees are
included in Trustees’ and Chief Compliance Officer’s fees in the Statements of Operations.
The Trust adopted a Trustee Deferred
Compensation Plan (“the Plan”) which allows the Independent Trustees to defer the receipt of all or a portion of compensation related to performance of their duties as Trustees. The deferred fees are invested in various J.P. Morgan Funds
until distribution in accordance with the Plan.
During the six months ended August 31, 2014, the Funds purchased securities from an
underwriting syndicate in which the principal underwriter or members of the syndicate are affiliated with the Adviser.
The Funds may use related
party broker-dealers. For the six months ended August 31, 2014, the Funds did not incur any brokerage commissions with broker-dealers affiliated with the Adviser.
The Securities and Exchange Commission has granted an exemptive order permitting the Funds to engage in principal transactions with J.P. Morgan Securities, Inc., an affiliated broker, involving taxable money
market instruments, subject to certain conditions.
4. Investment Transactions
During the six months ended August 31, 2014, purchases and sales of investments (excluding short-term investments) were as follows (amounts in thousands):
|
|
|
|
|
|
|
|
|
|
|
|
|
|
|
|
|
| |
|
Purchases
(excluding
U.S. Government) |
|
|
Sales
(excluding
U.S. Government) |
|
|
Purchases
of U.S.
Government |
|
|
Sales
of U.S.
Government |
|
| Core Bond Trust |
|
$ |
139,575 |
|
|
$ |
264,603 |
|
|
$ |
80,402 |
|
|
$ |
111,580 |
|
| Equity Index Trust |
|
|
5,495 |
|
|
|
24,197 |
|
|
|
— |
|
|
|
— |
|
| Intermediate Bond Trust |
|
|
16,787 |
|
|
|
28,215 |
|
|
|
7,578 |
|
|
|
22,983 |
|
5. Federal Income Tax Matters
For Federal income tax purposes, the cost and unrealized appreciation (depreciation) in value of investment securities held at August 31, 2014 were as follows (amounts in thousands):
|
|
|
|
|
|
|
|
|
|
|
|
|
|
|
|
|
| |
|
Aggregate
Cost |
|
|
Gross
Unrealized
Appreciation |
|
|
Gross
Unrealized
Depreciation |
|
|
Net Unrealized
Appreciation
(Depreciation) |
|
| Core Bond Trust |
|
$ |
3,632,603 |
|
|
$ |
189,571 |
|
|
$ |
15,643 |
|
|
$ |
173,928 |
|
| Equity Index Trust |
|
|
184,353 |
|
|
|
194,352 |
|
|
|
1,313 |
|
|
|
193,039 |
|
| Intermediate Bond Trust |
|
|
334,502 |
|
|
|
13,039 |
|
|
|
788 |
|
|
|
12,251 |
|
Under the Regulated Investment Company Modernization Act of 2010 (the “Act”), net capital losses recognized by the
Funds after February 28, 2011 are carried forward indefinitely, and retain their character as short-term and/or long-term losses. Prior to the Act, net capital losses incurred by the Funds were carried forward for eight years and treated as
short-term losses. The Act requires that post-enactment net capital losses be used before pre-enactment net capital losses.
As of August 31,
2014, the Funds did not have any post-enactment net capital loss carryforwards.
As of February 28, 2014, the following Funds had the
following pre-enactment net capital loss carryforwards, expiring during the year indicated, which are available to offset future realized gains (amounts in thousands):
|
|
|
|
|
|
|
|
|
|
|
|
|
|
|
|
|
| |
|
2017 |
|
|
2018 |
|
|
2019 |
|
|
Total |
|
| Equity Index Trust |
|
$ |
2,174 |
|
|
$ |
14,260 |
|
|
$ |
7,018 |
|
|
$ |
23,452 |
|
6. Risks, Concentrations and Indemnifications
In the normal course of business, the Funds enter into contracts that contain a variety of representations which provide general indemnifications. Each Fund’s maximum exposure under these arrangements
is unknown. The amount of exposure would depend on future claims that may be made against each Fund that have not yet occurred. However, based on experience, the Funds expect the risk of loss to be remote.
Shares of the Funds are offered only to certain clients of the Funds’ investment adviser or its affiliates who maintain one or more separately managed
private accounts. One or more affiliates of the Adviser have investment discretion with respect to their clients’ holdings in the Funds, which collectively represent a significant portion of the Fund’s assets for each of the Core Bond
Trust, Equity Index Trust and Intermediate Bond Trust.
Exchange Traded Funds may use derivative instruments in connection with their individual
investment strategies including futures contracts, forward foreign currency exchange contracts, options, swaps and other derivatives, which are also subject to specific risks related to their structure, sector or market and may be riskier than
investments in securities.
|
|
|
|
|
|
|
|
|
|
|
| 104 |
|
|
|
JPMORGAN INSTITUTIONAL TRUST FUNDS |
|
AUGUST 31, 2014 |
Risks applicable only to Core Bond Trust and Intermediate Bond Trust:
The Funds are subject to interest rate and credit risk. The value of debt securities may decline as interest rates increase. The Funds could lose money if
the issuer of a fixed income security is unable to pay interest or repay principal when it is due. The Funds invest in floating rate loans and other floating rate debt securities. Although these securities are generally less sensitive to interest
rate changes than other fixed rate instruments, the value of floating rate loans and other floating rate securities may decline if their rates do not rise as quickly, or as much, as general interest rates. Many factors can cause interest rates to
rise. Some examples include central bank monetary policy, rising inflation rates and general economic conditions. Given the historically low interest rate environment, risks associated with rising rates are heightened. The ability of the issuers of
debt to meet their obligations may be affected by the economic and political developments in a specific industry or region.
The Funds are subject
to risks associated with securities with contractual cash flows including asset-backed and mortgage-related securities such as collateralized mortgage obligations, mortgage pass-through securities and commercial mortgage-backed securities, including
securities backed by sub-prime mortgage loans. The value, liquidity and related income of these securities are sensitive to changes in economic conditions, including real estate value, pre-payments, delinquencies and/or defaults, and may be
adversely affected by shifts in the market’s perception of the issuers and changes in interest rates. A significant portion of the Funds’ investments is comprised of asset-backed or mortgage-related securities, including securities backed
by sub-prime mortgages.
The Funds are subject to the risk that should the Funds decide to sell an illiquid investment when a ready buyer is not
available at a price the Funds deem representative of its value, the value of the Funds’ net assets could be adversely affected.
7.
Transfers-In-Kind
During the six months ended August 31, 2014, certain shareholders of Core Bond Trust purchased shares and Core Bond
Trust received portfolio securities primarily by means of a subscription in-kind in exchange for shares of the Fund. Cash and portfolio securities were transferred as of the close of business on the dates and at the market values listed below
(amounts in thousands):
|
|
|
|
|
|
|
|
|
| Date |
|
Market Value |
|
|
Type |
|
| May 28, 2014 |
|
$ |
14,902 |
|
|
|
Subscriptions-in-kind |
|
|
|
|
|
|
|
|
|
|
|
|
|
|
| AUGUST 31, 2014 |
|
JPMORGAN INSTITUTIONAL TRUST FUNDS |
|
|
|
|
105 |
|
SCHEDULE OF SHAREHOLDER EXPENSES
(Unaudited)
Hypothetical $1,000 Investment
As a shareholder of the Funds, you incur ongoing costs, including investment advisory fees, administration
fees, and other Fund expenses. The examples below are intended to help you understand your ongoing costs (in dollars) of investing in the Funds and to compare these ongoing costs with the ongoing costs of investing in other mutual funds. The
examples assume that you had a $1,000 investment in the Funds at the beginning of the reporting period, March 1, 2014, and continued to hold your shares at the end of the reporting period, August 31, 2014.
Actual Expenses
For each Fund in the table
below, the first line provides information about actual account values and actual expenses. You may use the information in this line, together with the amount you invested, to estimate the expenses that you paid over the period. Simply divide your
account value by $1,000 (for example, an $8,600 account value divided by $1,000 = 8.6), then multiply the result by the number in the first line of each Fund under the heading entitled “Expenses Paid During the Period” to estimate the
expenses you paid on your account during this period.
Hypothetical Example for Comparison Purposes
The second line of each Fund in the table below provides information about hypothetical account values and hypothetical expenses based on the actual expense ratio and an assumed rate of return of 5% per
year before expenses, which is not the Funds’ actual return. The hypothetical account values and expenses may not be used to estimate the actual ending account balance or expenses you paid for the period. You may use this information to compare
the ongoing costs of investing in the Funds and other funds. To do so, compare this 5% hypothetical example with the 5% hypothetical examples that appear in the shareholder reports of the other funds. Please note that the expenses shown in the table
are meant to highlight your ongoing costs only and do not reflect any transaction costs or the costs associated with the investment advisory accounts through which the Fund is held. Therefore, the second line in the table is useful in comparing
ongoing costs only, and will not help you determine the relative total costs of owning different funds. In addition, if these transaction costs were included, your costs would have been higher. The examples also assume all dividends and
distributions have been reinvested.
|
|
|
|
|
|
|
|
|
|
|
|
|
|
|
|
|
| |
|
Beginning
Account Value
March 1, 2014 |
|
|
Ending
Account Value
August 31, 2014 |
|
|
Expenses
Paid During
the Period* |
|
|
Annualized
Expense
Ratio |
|
| Core Bond Trust |
|
|
|
|
|
|
|
|
|
|
|
|
|
|
|
|
| Actual |
|
$ |
1,000.00 |
|
|
$ |
1,024.60 |
|
|
$ |
0.77 |
|
|
|
0.15 |
% |
| Hypothetical |
|
|
1,000.00 |
|
|
|
1,024.45 |
|
|
|
0.77 |
|
|
|
0.15 |
|
|
|
|
|
|
| Equity Index Trust |
|
|
|
|
|
|
|
|
|
|
|
|
|
|
|
|
| Actual |
|
|
1,000.00 |
|
|
|
1,087.70 |
|
|
|
0.53 |
|
|
|
0.10 |
|
| Hypothetical |
|
|
1,000.00 |
|
|
|
1,024.70 |
|
|
|
0.51 |
|
|
|
0.10 |
|
|
|
|
|
|
| Intermediate Bond Trust |
|
|
|
|
|
|
|
|
|
|
|
|
|
|
|
|
| Actual |
|
|
1,000.00 |
|
|
|
1,015.30 |
|
|
|
0.71 |
|
|
|
0.14 |
|
| Hypothetical |
|
|
1,000.00 |
|
|
|
1,024.50 |
|
|
|
0.71 |
|
|
|
0.14 |
|
| * |
Expenses are equal to each Fund’s respective annualized expense ratio, multiplied by the average account value over the period, multiplied by 184/365 (to reflect the
one-half year period). |
|
|
|
|
|
|
|
|
|
|
|
| 106 |
|
|
|
JPMORGAN INSTITUTIONAL TRUST FUNDS |
|
AUGUST 31, 2014 |
BOARD APPROVAL OF INVESTMENT ADVISORY AGREEMENTS
(Unaudited)
The Board of Trustees has established various standing committees composed of Trustees with diverse
backgrounds, to which the Board of Trustees has assigned specific subject matter responsibilities to further enhance the effectiveness of the Board’s oversight and decision making. The Board of Trustees and its investment committees (money
market and alternative products, equity, and fixed income) meet regularly throughout the year and consider factors that are relevant to their annual consideration of investment advisory agreements at each meeting. They also meet for the specific
purpose of considering investment advisory agreement annual renewals. The Board of Trustees held meetings in person in June and August 2014, at which the Trustees considered the continuation of the investment advisory agreements for each of the
Funds whose semi-annual report is contained herein (each an “Advisory Agreement” and collectively, the “Advisory Agreements”). At the June meeting, the Board’s investment committees met to review and consider performance,
expense and related information for the J.P. Morgan Funds. Each investment committee reported to the full Board, which then considered the investment committee’s preliminary findings. At the August meeting, the Trustees continued their review
and consideration. The Trustees, including a majority of the Trustees who are not “interested persons” (as defined in the 1940 Act) of any party to the Advisory Agreements or any of their affiliates, approved the continuation of each
Advisory Agreement on August 20, 2014.
As part of their review of the Advisory Agreements, the Trustees considered and reviewed performance
and other information about the Funds received from the Adviser. This information includes the Funds’ performance as compared to the performance of their peers and benchmarks and analyses by the Adviser of the Funds’ performance. In
addition, the Trustees have engaged an independent management consulting firm (“independent consultant”) to report on the performance of certain J.P. Morgan Funds at each of the Trustees’ regular meetings. The Adviser also
periodically provides comparative information regarding the Funds’ expense ratios and those of their peer groups. In addition, in preparation for the June and August meetings, the Trustees requested, received and evaluated extensive materials
from the Adviser, including performance and expense information compiled by Lipper Inc. (“Lipper”), an independent provider of investment company data. The Trustees’ independent consultant also provided additional analyses of the
performance of the Funds in connection with the Trustees’ review of the Advisory Agreements. Before voting on the proposed Advisory Agreements, the Trustees reviewed the proposed agreements with representatives of the Adviser, counsel to the
Trust and independent legal counsel and received a memorandum from independent legal counsel to the Trustees discussing the legal standards for their consideration of the proposed agreements. The Trustees also discussed the proposed agreements in
executive sessions with
independent legal counsel at which no representatives of the Adviser were present. Set forth below is a summary of the material factors evaluated by the Trustees in determining whether to approve
each Advisory Agreement.
The Trustees considered information provided with respect to the Funds over the course of the year. Each Trustee
attributed different weights to the various factors and no factor alone was considered determinative. From year to year, the Trustees consider and place emphasis on relevant information in light of changing circumstances in market and economic
conditions. The Trustees determined that the compensation to be received by the Adviser from each Fund under the applicable Advisory Agreement was fair and reasonable and that the continuance of the Advisory Agreement was in the best interests of
each Fund and its shareholders.
The factors summarized below were considered and discussed by the Trustees in reaching their conclusions:
Nature, Extent and Quality of Services Provided by the Adviser
The Trustees received and considered information regarding the nature, extent and quality of the services provided to each Fund under the Advisory Agreement. The Trustees took into account information
furnished throughout the year at Trustee meetings, as well as the materials furnished specifically in connection with this annual review process. The Trustees considered the background and experience of the Adviser’s senior management and the
expertise of, and the amount of attention given to each Fund by, investment personnel of the Adviser. In addition, the Trustees reviewed the qualifications, backgrounds and responsibilities of the portfolio management team primarily responsible for
the day-to-day management of each Fund and the infrastructure supporting the team. The Trustees also reviewed information relating to the Adviser’s risk governance model and reports showing the Adviser’s compliance structure and ongoing
compliance processes. The Trustees also considered the quality of administrative services provided by JPMorgan Funds Management, Inc. (“JPMFM”), an affiliate of the Adviser.
The Trustees also considered its knowledge of the nature and quality of the services provided by the Adviser to the Funds gained from their experience as Trustees of the J.P. Morgan Funds. In addition, they
considered the overall reputation and capabilities of the Adviser and its affiliates, the commitment of the Adviser to provide high quality service to the Funds, their overall confidence in the Adviser’s integrity and the Adviser’s
responsiveness to questions or concerns raised by them, including the Adviser’s willingness to consider and implement organizational and operational changes designed to improve investment results and the services provided to each Fund.
Based upon these considerations and other factors, the Trustees concluded that they were satisfied with the nature, extent and quality of the
investment advisory services provided to the Funds by the Adviser.
|
|
|
|
|
|
|
|
|
|
|
|
|
| AUGUST 31, 2014 |
|
JPMORGAN INSTITUTIONAL TRUST FUNDS |
|
|
|
|
107 |
|
BOARD APPROVAL OF INVESTMENT ADVISORY AGREEMENTS
(Unaudited) (continued)
Costs of Services Provided and Profitability to the Adviser and its Affiliates
The Trustees received and considered information regarding the profitability to the Adviser and its affiliates in providing services to each of the Funds.
The Trustees reviewed and discussed this data. The Trustees recognized that this data is not audited and represents the Adviser’s determination of its and its affiliates’ revenues from the contractual services provided to the Funds, less
expenses of providing such services. Expenses include direct and indirect costs and are calculated using an allocation methodology developed by the Adviser. The Trustees also recognized that it is difficult to make comparisons of profitability from
fund investment advisory contracts because comparative information is not generally publicly available and is affected by numerous factors, including the structure of the particular adviser, the types of funds it manages, its business mix, numerous
assumptions regarding allocations and the fact that publicly-traded fund managers’ operating profits and net income are net of distribution and marketing expenses. Based on their review, the Trustees concluded that the profitability to the
Adviser under each of the Advisory Agreements was not unreasonable in light of the services and benefits provided to each Fund.
Fall-Out
Benefits
The Trustees reviewed information regarding potential “fallout” or ancillary benefits received by the Adviser and its
affiliates as a result of their relationship with the Funds. The Trustees also reviewed the Adviser’s allocation of fund brokerage for the J.P. Morgan Funds complex, including allocations to brokers who provide research to the Adviser.
The Trustees also considered that JPMFM, an affiliate of the Adviser, earns fees from the Funds for providing administrative services. These fees
were shown separately in the profitability analysis presented to the Trustees. The Trustees also considered the fees paid to JPMorgan Chase Bank, N.A. (“JPMCB”) for custody and fund accounting, and other related services.
Economies of Scale
The Trustees considered
the extent to which the Funds benefit from economies of scale. The Trustees noted that the proposed investment advisory fee schedule for the Funds does not contain breakpoints but that the Adviser has implemented fee waivers and expense limitations.
The Trustees considered whether it would be appropriate to add advisory fee breakpoints and the Trustees concluded that the current fee structure was reasonable in light of the fee waivers and expense limitations that the Advisor and Administrator
have in place that serve to limit the overall net expense ratio for each Fund at competitive levels, and that shareholders of the Funds effectively participated in the economies of scale through the fee waivers and expense limitations.
Independent Written Evaluation of the Funds’ Chief Compliance Officer
The Trustees noted that, upon their direction, the Chief Compliance Officer for the Funds had prepared an independent written evaluation in order to assist
the Trustees in determining the reasonableness of the proposed management fees. The Trustees considered the written evaluation in determining whether to continue the Advisory Agreements.
Fees Relative to Adviser’s Other Clients
The Trustees received and considered information
about the nature and extent of investment advisory services and fee rates offered to other clients of the Adviser for investment management styles substantially similar to that of each Fund. The Trustees also considered the complexity of investment
management for the Funds relative to the Adviser’s other clients and the differences in the nature and extent of the services provided to the different clients. The Trustees concluded that the fee rates charged to each Fund in comparison to
those charged to the Adviser’s other clients were reasonable.
Investment Performance
The Trustees received and considered absolute and/or relative performance for the Funds in a report prepared by Lipper. The Trustees considered the total
return performance information, which included the ranking of the Funds within a performance universe made up of funds with the same Lipper investment classification and objective (the “Universe Group”) by total return for applicable one-,
three- and five-year periods. The Trustees reviewed a description of Lipper’s methodology for selecting mutual funds in each Fund’s Universe Group. As part of this review, the Trustees also reviewed each Fund’s performance against its
benchmark and considered the performance information provided for the Funds at regular Board meetings by the Adviser and the Trustees’ independent consultant and also considered the special analysis prepared by the Trustees’ independent
consultant. The Lipper performance data noted by the Trustees as part of their review and the determinations made by the Trustees with respect to each Fund’s performance is summarized below:
The Trustees noted that Core Bond Trust’s performance was in the first quintile for each of the one-, three-, and five-year periods ended
December 31, 2013. The Trustees also noted that the independent consultant indicated that the Fund’s overall performance was attractive. The Trustees discussed the performance and investment strategy of the Fund with the Adviser and, based
upon this discussion and various other factors, concluded that the performance was reasonable.
The Trustees noted that Equity Index Trust’s
performance was in the first quintile for each of the one-, three- and five-year periods ended December 31, 2013, and that the independent consultant indicated that Fund’s overall performance was
|
|
|
|
|
|
|
|
|
|
|
| 108 |
|
|
|
JPMORGAN INSTITUTIONAL TRUST FUNDS |
|
AUGUST 31, 2014 |
satisfactory. The Trustees discussed the performance and investment strategy of the Fund with the Adviser and, based upon this discussion and various other factors, concluded that the performance
was reasonable.
The Trustees noted that Intermediate Bond Trust’s performance was in the first quintile for each of the one-, three-, and
five-year periods ended December 31, 2013, and that the independent consultant indicated that the Fund’s overall performance was attractive. The Trustees discussed the performance and investment strategy of the Fund with the Adviser and,
based upon this discussion and various other factors, concluded that the performance was reasonable.
Advisory Fees and Expense Ratios
The Trustees considered the contractual advisory fee rate paid by each Fund to the Adviser and compared that rate to the information prepared
by Lipper concerning management fee rates paid by other funds in the same Lipper category as each Fund. The Trustees recognized that Lipper reported each Fund’s management fee rate as the combined contractual advisory fee and the administration
fee rates. The Trustees also reviewed information about other expenses and the expense ratios for each Fund. The Trustees considered the fee waiver
and/or expense reimbursement arrangements currently in place for each Fund and considered the net advisory fee rate after taking into account any waivers and/or reimbursements. The Trustees
recognized that it is difficult to make comparisons of advisory fees because there are variations in the services that are included in the fees paid by other funds. The Trustees’ determinations as a result of the review of each Fund’s
advisory fees and expense ratios are summarized below:
The Trustees noted that Core Bond Trust’s net advisory fee and actual total expenses
were in the first quintile of the Universe Group. After considering the factors identified above, in light of this information, the Trustees concluded that the advisory fee was reasonable.
The Trustees noted that Equity Index Trust’s net advisory fee and actual total expenses were in the first quintile of the Universe Group. After considering the factors identified above, in light of this
information, the Trustees concluded that the advisory fee was reasonable.
The Trustees noted that Intermediate Bond Trust’s net advisory fee
and actual total expenses were in the first quintile of the Universe Group. After considering the factors identified above, in light of this information, the Trustees concluded that the advisory fee was reasonable.
|
|
|
|
|
|
|
|
|
|
|
|
|
| AUGUST 31, 2014 |
|
JPMORGAN INSTITUTIONAL TRUST FUNDS |
|
|
|
|
109 |
|
SPECIAL SHAREHOLDER MEETING RESULTS
(Unaudited)
The Trust held a meeting of shareholders on July 23, 2014, for the purpose of considering and voting upon the election of Trustees.
Trustees were elected by the shareholders of all of the series of the Trust, including each of the Funds. The results of the voting were as follows:
|
|
|
|
|
| |
|
Votes Received
(Amounts in
thousands) |
|
| John F. Finn |
|
|
|
|
| In Favor |
|
|
4,607,844 |
|
| Withheld |
|
|
0 |
|
|
|
| Dr. Matthew Goldstein |
|
|
|
|
| In Favor |
|
|
4,607,844 |
|
| Withheld |
|
|
0 |
|
|
|
| Robert J. Higgins |
|
|
|
|
| In Favor |
|
|
4,607,844 |
|
| Withheld |
|
|
0 |
|
|
|
| Frankie D. Hughes |
|
|
|
|
| In Favor |
|
|
4,607,844 |
|
| Withheld |
|
|
0 |
|
|
|
| Peter C. Marshall |
|
|
|
|
| In Favor |
|
|
4,607,844 |
|
| Withheld |
|
|
0 |
|
|
|
| Mary E. Martinez |
|
|
|
|
| In Favor |
|
|
4,607,844 |
|
| Withheld |
|
|
0 |
|
|
|
| Marilyn McCoy |
|
|
|
|
| In Favor |
|
|
4,607,844 |
|
| Withheld |
|
|
0 |
|
|
|
|
|
|
| |
|
Votes Received
(Amounts in
thousands) |
|
| Mitchell M. Merin |
|
|
|
|
| In Favor |
|
|
4,607,844 |
|
| Withheld |
|
|
0 |
|
|
|
| William G. Morton, Jr. |
|
|
|
|
| In Favor |
|
|
4,607,844 |
|
| Withheld |
|
|
0 |
|
|
|
| Robert A. Oden, Jr. |
|
|
|
|
| In Favor |
|
|
4,607,844 |
|
| Withheld |
|
|
0 |
|
|
|
| Marian U. Pardo |
|
|
|
|
| In Favor |
|
|
4,607,844 |
|
| Withheld |
|
|
0 |
|
|
|
| Frederick W. Ruebeck |
|
|
|
|
| In Favor |
|
|
4,607,844 |
|
| Withheld |
|
|
0 |
|
|
|
| James J. Schonbachler |
|
|
|
|
| In Favor |
|
|
4,607,844 |
|
| Withheld |
|
|
0 |
|
|
|
|
|
|
|
|
|
|
|
|
| 110 |
|
|
|
JPMORGAN INSTITUTIONAL TRUST FUNDS |
|
AUGUST 31, 2014 |
J.P. Morgan
Funds are distributed by JPMorgan Distribution Services, Inc., which is an affiliate of JPMorgan Chase & Co. Affiliates of JPMorgan Chase & Co. receive fees for providing various services to the funds.
Investors may obtain information about the Securities Investor Protection Corporation (SIPC), including the SIPC brochure by visiting www.sipc.org or by
calling SIPC at 202-371-8300.
Each Fund files a complete
schedule of its fund holdings for the first and third quarters of its fiscal year with the SEC on Form N-Q. The Funds’ Forms N-Q are available on the
SEC’s website at http://www.sec.gov and may be reviewed and copied at the SEC’s Public Reference Room in Washington, DC. Information on the operation of the SEC’s Public Reference Room may be obtained by calling 1-800-SEC-0330. Shareholders may request the Form N-Q without charge by calling 1-800-480-4111 or by visiting the J.P. Morgan Funds’ website at www.jpmorganfunds.com.
A description of each Fund’s policies and procedures with respect to the disclosure of each Fund’s holdings is available in the prospectus and
Statement of Additional Information.
A copy of proxy policies and procedures is available without charge upon request by calling 1-800-480-4111 and on the Funds’ website at www.jpmorganfunds.com. A description of such policies and procedures is on the
SEC’s website at www.sec.gov. The Trustees have delegated the authority to vote proxies for securities owned by the Funds to the Adviser. A copy of the Funds’ voting record for the most recent
12-month period ended June 30 is available on the SEC’s website at www.sec.gov or at the Funds’ website at www.jpmorganfunds.com no later than August 31 of each year. The Funds’ proxy
voting record will include, among other things, a brief description of the matter voted on for each fund security, and will state how each vote was cast, for example, for or against the proposal.


J.P. Morgan Asset Management is the marketing name for the asset management business of JPMorgan Chase & Co. Those
businesses include, but are not limited to, J.P. Morgan Investment Management Inc., Security Capital Research & Management Incorporated and J.P. Morgan Alternative Asset Management, Inc.
|
|
|
|
|
|
|
© JPMorgan Chase &
Co., 2014. All rights reserved. August 2014. |
|
SAN-INSTT-814 |
ITEM 2. CODE OF ETHICS.
Disclose whether, as of the end of the period covered by the report, the registrant has adopted a code of ethics that applies to the registrant’s
principal executive officer, principal financial officer, principal accounting officer or controller, or persons performing similar functions, regardless of whether these individuals are employed by the registrant or a third party. If the registrant
has not adopted such a code of ethics, explain why it has not done so.
The registrant must briefly describe the nature of any amendment, during the
period covered by the report, to a provision of its code of ethics that applies to the registrant’s principal executive officer, principal financial officer, principal accounting officer or controller, or persons performing similar functions,
regardless of whether these individuals are employed by the registrant or a third party, and that relates to any element of the code of ethics definition enumerated in paragraph (b) of this Item. The registrant must file a copy of any such
amendment as an exhibit pursuant to Item 12(a)(1), unless the registrant has elected to satisfy paragraph (f) of this Item by positing its code of ethics on its website pursuant to paragraph (f)(2) of this Item, or by undertaking to
provide its code of ethics to any person without charge, upon request, pursuant to paragraph (f)(3) of this Item.
If the registrant has, during the
period covered by the report, granted a waiver, including an implicit waiver, from a provision of the code of ethics that applies to the registrant’s principal executive officer, principal financial officer, principal accounting officer or
controller, or persons performing similar functions, regardless of whether these individuals are employed by the registrant or third party, that relates to one or more items set forth in paragraph (b) of this Item, the registrant must briefly
describe the nature of the waiver, the name of the person to whom the waiver was granted, and the date of the waiver.
Not applicable to a semi-annual
report.
ITEM 3. AUDIT COMMITTEE FINANCIAL EXPERT.
(a) (1) Disclose that the registrant’s board of directors has determined that the registrant either:
(i) Has at least one audit committee financial expert serving on its audit committee; or
(ii) Does not have an audit committee financial expert serving on its audit committee.
(2) If the registrant provides the disclosure required by paragraph (a)(1)(i) of this Item, it must disclose the name of the audit committee
financial expert and whether that person is “independent.” In order to be considered “independent” for purposes of this Item, a member of an audit committee may not, other than in his or her capacity as a member of the audit
committee, the board of directors, or any other board committee:
(i) Accept directly or indirectly any consulting, advisory, or other
compensatory fee from the issuer; or
(ii) Be an “interested person” of the investment company as defined in
Section 2(a)(19) of the Act (15 U.S.C. 80a-2(a)(19)).
(3) If the registrant provides the disclosure required by paragraph (a)(1)(ii)
of this Item, it must explain why it does not have an audit committee financial expert.
Not applicable to a semi-annual report.
ITEM 4. PRINCIPAL ACCOUNTANT FEES AND SERVICES.
(a) Disclose, under the caption Audit Fees, the aggregate fees billed for each of the last two fiscal years for professional services rendered by the principal
accountant for the audit of the registrant’s annual financial statements or services that are normally provided by the accountant in connection with statutory and regulatory filings or engagements for those fiscal years.
(b) Disclose, under the caption Audit-Related Fees, the aggregate fees billed in each of the last two fiscal years for assurance and related services by the
principal accountant that are reasonably related to the performance of the audit of the registrant’s financial statements and are not reported under paragraph (a) of this Item. Registrants shall describe the nature of the services
comprising the fees disclosed under this category.
(c) Disclose, under the caption Tax Fees, the aggregate fees billed in each of the last two fiscal
years for professional services rendered by the principal accountant for tax compliance, tax advice, and tax planning. Registrants shall describe the nature of the services comprising the fees disclosed under this category.
(d) Disclose, under the caption All Other Fees, the aggregate fees billed in each of the last two fiscal years for products and services provided by the
principal accountant, other than the services reported in paragraphs (a) through (c) of this Item. Registrants shall describe the nature of the services comprising the fees disclosed under this category.
(e) (1) Disclose the audit committee’s pre-approval policies and procedures described in paragraph (c)(7) of Rule 2-01 of Regulation S-X.
(2) Disclose the percentage of services described in each of paragraphs (b) through (d) of this Item that were approved by the audit
committee pursuant to paragraph (c)(7)(i)(C) of Rule 2-01 of Regulation S-X.
(f) If greater than 50 percent, disclose the percentage of hours expended on
the principal accountant’s engagement to audit the registrant’s financial statements for the most recent fiscal year that were attributed to work performed by persons other than the principal accountant’s full-time, permanent
employees.
(g) Disclose the aggregate non-audit fees billed by the registrant’s accountant for services rendered to the registrant, and rendered to
the registrant’s investment adviser (not including any sub-adviser whose role is primarily portfolio management and is subcontracted with or overseen by another investment adviser), and any entity controlling, controlled by, or under common
control with the adviser that provides ongoing services to the registrant for each of the last two fiscal years of the registrant.
(h) Disclose whether
the registrant’s audit committee of the board of directors has considered whether the provision of non-audit services that were rendered to the registrant’s investment adviser (not including any subadviser whose role is primarily portfolio
management and is subcontracted with or overseen by another investment adviser), and any entity controlling, controlled by, or under common control with the investment adviser that provides ongoing services to the registrant that were not
pre-approved pursuant to paragraph (c)(7)(ii) of Rule 2-01 of Regulation S-X is compatible with maintaining the principal accountant’s independence.
Not applicable to a semi-annual report.
ITEM 5.
AUDIT COMMITTEE OF LISTED REGISTRANTS.
(a) If the registrant is a listed issuer as defined in Rule 10A-3 under the Exchange Act (17CFR 240.10A-3), state
whether or not the registrant has a separately-designated standing audit committee established in accordance with Section 3(a)(58)(A) of the Exchange Act (15 U.S.C. 78c(a)(58)(A)). If the registrant has such a committee, however designated,
identify each committee member. If the entire board of directors is acting as the registrant’s audit committee as specified in Section 3(a)(58)(B) of the Exchange Act (15 U.S.C. 78c(a)(58)(B)), so state.
(b) If applicable, provide the disclosure required by Rule 10A-3(d) under the Exchange Act (17CFR 240.10A-3(d)) regarding an exemption from the listing
standards for all audit committees.
Not applicable.
ITEM 6. SCHEDULE OF INVESTMENTS.
File Schedule I – Investments in securities of unaffiliated issuers as of the close of the reporting period as set forth in Section 210.12-12 of
Regulation S-X, unless the schedule is included as part of the report to shareholders filed under Item 1 of this Form.
Included in Item 1.
ITEM 7. DISCLOSURE OF PROXY VOTING POLICIES AND PROCEDURES FOR CLOSED-END MANAGEMENT INVESTMENT COMPANIES.
A closed-end management investment company that is filing an annual report on this Form N-CSR must, unless it invests exclusively in non-voting securities,
describe the policies and procedures that it uses to determine how to vote proxies relating to portfolio securities, including the procedures that the company uses when a vote presents a conflict between the interests of its shareholders, on the one
hand, and those of the company’s investment adviser; principal underwriter; or any affiliated person (as defined in Section 2(a)(3) of the Investment Company Act of 1940 (15 U.S.C. 80a-2(a)(3)) and the rules thereunder) of the company, its
investment adviser, or its principal underwriter, on the other. Include any policies and procedures of the company’s investment adviser, or any other third party, that the company uses, or that are used on the company’s behalf, to
determine how to vote proxies relating to portfolio securities.
Not applicable.
ITEM 8. PORTFOLIO MANAGERS OF CLOSED-END MANAGEMENT INVESTMENT COMPANIES.
Not applicable.
ITEM 9. PURCHASE OF EQUITY
SECURITIES BY CLOSED-END MANAGEMENT INVESTMENT COMPANY AND AFFILIATED PURCHASERS.
(a) If the registrant is a closed-end management investment company,
provide the information specified in paragraph (b) of this Item with respect to any purchase made by or on behalf of the registrant or any “affiliated purchaser,” as defined in Rule 10b-18(a)(3) under the Exchange Act (17 CFR
240.10b-18(a)(3)), of shares or other units of any class of the registrant’s equity securities that is registered by the registrant pursuant to Section 12 of the Exchange Act (15 U.S.C. 781).
Not applicable.
ITEM 10. SUBMISSION OF MATTERS TO
A VOTE OF SECURITY HOLDERS.
Describe any material changes to the procedures by which shareholders may recommend nominees to the registrant’s board of
directors, where those changes were implemented after the registrant last provided disclosure in response to the requirements of Item 7(d)(2)(ii)(G) of Schedule 14A (17 CFR 240.14a-101), or this Item.
No material changes to report.
ITEM 11. CONTROLS
AND PROCEDURES.
(a) Disclose the conclusions of the registrant’s principal executive and principal financial officers, or persons performing similar
functions, regarding the effectiveness of the registrant’s disclosure controls and procedures (as defined in Rule 30a-3(c) under the Act (17 CFR 270.30a-3(c))) as of a date within 90 days of the filing date of the report that includes the
disclosure required by this paragraph, based on the evaluation of these controls and procedures required by Rule 30a-3(b) under the Act (17 CFR 270.30a-3(b)) and Rules 13a-15(b) or 15d-15(b) under the Exchange Act (17 CFR 240.13a-15(b) or
240.15d-15(b)).
The Registrant’s principal executive and principal financial officers have concluded, based on their evaluation of the
Registrant’s disclosure controls and procedures as of a date within 90 days of the filing date of this report, that the Registrant’s disclosure controls and procedures are reasonably designed to ensure that information required to be
disclosed by the Registrant on Form N-CSR is recorded, processed, summarized and reported within the required time
periods and that information required to be disclosed by the Registrant in the reports that it files or submits on Form N-CSR is accumulated and communicated to the Registrant’s management,
including its principal executive and principal financial officers, as appropriate to allow timely decisions regarding required disclosure.
(b)
Disclose any change in the registrant’s internal control over financial reporting (as defined in Rule 30a-3(d) under the Act (17 CFR 270.30a-3(d)) that occurred during the registrant’s second fiscal quarter of the period covered by this
report that has materially affected, or is reasonably likely to materially affect, the registrant’s internal control over financial reporting.
There were no changes in the Registrant’s internal control over financial reporting that occurred during the last fiscal quarter covered by this
report that have materially affected, or are reasonably likely to materially affect, the Registrant’s internal control over financial reporting.
ITEM 12. EXHIBITS.
| (a) |
File the exhibits listed below as part of this Form. Letter or number the exhibits in the sequence indicated. |
(a)(1) Any code of ethics, or amendment thereto, that is the subject of the disclosure required by Item 2, to the extent
that the registrant intends to satisfy the Item 2 requirements through filing of an exhibit.
Not applicable.
(a)(2) A separate certification for each principal executive officer and principal financial officer of the registrant as required by Rule
30a-2(a) under the Act (17 CFR 270.30a-2).
Certifications pursuant to Rule 30a-2(a) under the Investment Company Act of 1940 are attached hereto.
(a)(3) Any written solicitation to purchase securities under Rule 23c-1 under the Act (17 CFR 270.23c-1) sent or given during the
period covered by the report by or on behalf of the registrant to 10 or more persons.
Not applicable.
(b) A separate or combined certification for each principal executive officer and principal officer of the registrant as required by Rule
30a-2(b) under the Act of 1940.
Certifications pursuant to Rule 30a-2(b) under the Investment Company Act of 1940 are attached hereto.
SIGNATURES
Pursuant to the requirements of the Securities Exchange Act of 1934 and the Investment Company Act of 1940, the registrant has duly caused this report to be
signed on its behalf by the undersigned, thereunto duly authorized.
JPMorgan Institutional Trust
|
|
|
| By: |
|
/s/ Robert L. Young |
|
|
Robert L. Young |
|
|
President and Principal Executive Officer |
|
|
November 7, 2014 |
Pursuant to the requirements of the Securities Exchange Act of 1934 and the Investment Company Act of 1940, this report has
been signed below by the following persons on behalf of the registrant and in the capacities and on the dates indicated.
|
|
|
| By: |
|
/s/ Robert L. Young |
|
|
Robert L. Young |
|
|
President and Principal Executive Officer |
|
|
November 7, 2014 |
|
|
| By: |
|
/s/ Laura M. Del Prato |
|
|
Laura M. Del Prato |
|
|
Treasurer and Principal Financial Officer |
|
|
November 7, 2014 |