0.252.4972.82.9692.492.7892.9562.9692.8002.4972.7892.4902.9562.9692.8002.4970.2270.2030.0600.0180.0330.0350.0030.0110.0040.0010.0030.0360.1270.0012.4972.8002.9690.0030.0070.0110.2470.1780.0652.6812.9553.1670.0440.0280.0170.2960.2400.1590.0500.0340.0310.0110.0060.0050.1910.0540.0890.0170.0110.0070.0060.0010.1570.1030.2120.0080.0220.0450.0020.0220.0090.0430.0620.0142.7892.4902.9560.0240.0050.0350.0600.2250.2030.0020.0330.0340.0180.0180.0040.0030.0113.3043.3303.2480.0030.0010.036falseFY00013035230.1260.0012.1562.1042.1780.0030.0070.0112.6732.9443.153P5Y2.9562.7892.4900.0660.1770.2470.54450.54450.54450.54450.0170.0280.0440.1580.2390.2950.0310.0340.0500.0050.0060.0110.1900.0540.0110.0170.0880.0010.0060.0070.1560.0080.2120.1030.0020.0450.0220.0430.0090.0220.0620.0140.0240.0050.0350.0020.0183.2903.3173.238Revenue is net of duty, excise and other taxes of £38,595 million, £39,172 million and £39,826 million for the years ended 31 December 2021, 2020 and 2019, respectively. 0001303523 2021-01-01 2021-12-31 0001303523 2020-01-01 2020-12-31 0001303523 2019-01-01 2019-12-31 0001303523 2021-12-31 0001303523 2020-12-31 0001303523 2019-03-01 0001303523 2019-12-31 0001303523 2018-01-01 2018-12-31 0001303523 2021-12-30 2021-12-31 0001303523 2020-10-31 0001303523 2020-11-30 0001303523 2021-09-27 2021-09-27 0001303523 1998-11-30 0001303523 2013-08-01 2013-09-30 0001303523 2019-01-01 2021-12-31 0001303523 1999-09-22 0001303523 2006-08-17 2006-08-17 0001303523 2021-01-01 0001303523 2015-01-01 2015-12-31 0001303523 2021-02-28 2021-02-28 0001303523 2020-11-30 2020-11-30 0001303523 2021-11-30 2021-11-30 0001303523 2020-08-31 2020-08-31 0001303523 2021-08-31 2021-08-31 0001303523 2020-05-31 2020-05-31 0001303523 2021-05-31 2021-05-31 0001303523 2017-01-01 2021-12-31 0001303523 2012-05-01 2012-05-31 0001303523 2014-09-01 2014-09-30 0001303523 2019-12-11 2019-12-11 0001303523 2018-12-31 0001303523 bti:LeaseholdPropertyMember 2021-01-01 2021-12-31 0001303523 bti:LongTermIncentivePlanMember 2021-01-01 2021-12-31 0001303523 bti:GroupsShareInAssociatesAndJointVenturesMember 2021-01-01 2021-12-31 0001303523 bti:AdjustedAtConstantRatesMember 2021-01-01 2021-12-31 0001303523 country:PE 2021-01-01 2021-12-31 0001303523 bti:NetSettledDerivativeFinancialInstrumentsMember 2021-01-01 2021-12-31 0001303523 bti:ITCLtdMember 2021-01-01 2021-12-31 0001303523 ifrs-full:PropertyPlantAndEquipmentMember 2021-01-01 2021-12-31 0001303523 ifrs-full:BrandNamesMember 2021-01-01 2021-12-31 0001303523 ifrs-full:ComputerSoftwareMember 2021-01-01 2021-12-31 0001303523 country:CH 2021-01-01 2021-12-31 0001303523 country:NL 2021-01-01 2021-12-31 0001303523 country:CA 2021-01-01 2021-12-31 0001303523 country:DE 2021-01-01 2021-12-31 0001303523 country:GB 2021-01-01 2021-12-31 0001303523 country:US 2021-01-01 2021-12-31 0001303523 bti:LongTermIncentivePlanMember bti:RelatedPartyOneMember 2021-01-01 2021-12-31 0001303523 bti:LongTermIncentivePlanMember bti:RelatedPartyTwoMember 2021-01-01 2021-12-31 0001303523 bti:BritishAmericanTobaccoBangladeshCompanyLimitedMember 2021-01-01 2021-12-31 0001303523 ifrs-full:PensionDefinedBenefitPlansMember 2021-01-01 2021-12-31 0001303523 ifrs-full:PostemploymentMedicalDefinedBenefitPlansMember 2021-01-01 2021-12-31 0001303523 country:BR 2021-01-01 2021-12-31 0001303523 bti:DeferredShareBonusSchemeMember 2021-01-01 2021-12-31 0001303523 ifrs-full:OrdinarySharesMember 2021-01-01 2021-12-31 0001303523 ifrs-full:RestructuringProvisionMember 2021-01-01 2021-12-31 0001303523 bti:EmployeeRelatedBenefitsMember 2021-01-01 2021-12-31 0001303523 ifrs-full:MiscellaneousOtherProvisionsMember 2021-01-01 2021-12-31 0001303523 bti:TradeAndOtherPayablesMember 2021-01-01 2021-12-31 0001303523 bti:CashSettledDeferredShareBonusSchemeMember 2021-01-01 2021-12-31 0001303523 bti:EquitySettledDeferredShareBonusSchemeMember 2021-01-01 2021-12-31 0001303523 bti:CashSettledLongTermIncentivePlanMember 2021-01-01 2021-12-31 0001303523 bti:EquitySettledLongTermIncentivePlanMember 2021-01-01 2021-12-31 0001303523 bti:ReynoldsAmericanIncMember bti:UnitedStatesSegmentMember 2021-01-01 2021-12-31 0001303523 ifrs-full:ForeignCountriesMember 2021-01-01 2021-12-31 0001303523 ifrs-full:CountryOfDomicileMember 2021-01-01 2021-12-31 0001303523 ifrs-full:FinancialAssetsAtFairValueThroughProfitOrLossCategoryMember 2021-01-01 2021-12-31 0001303523 ifrs-full:FinancialAssetsAtFairValueThroughOtherComprehensiveIncomeCategoryMember 2021-01-01 2021-12-31 0001303523 bti:CashSettledMember 2021-01-01 2021-12-31 0001303523 bti:EquitySettledMember 2021-01-01 2021-12-31 0001303523 bti:EquitySettledOtherSchemesMember 2021-01-01 2021-12-31 0001303523 bti:CombustiblesMember 2021-01-01 2021-12-31 0001303523 bti:NewCategoriesMember 2021-01-01 2021-12-31 0001303523 bti:VapourMember bti:NewCategoriesMember 2021-01-01 2021-12-31 0001303523 bti:THPMember bti:NewCategoriesMember 2021-01-01 2021-12-31 0001303523 bti:ModernOralMember bti:NewCategoriesMember 2021-01-01 2021-12-31 0001303523 bti:TraditionalOralMember 2021-01-01 2021-12-31 0001303523 bti:OthersMember 2021-01-01 2021-12-31 0001303523 bti:VuseLitigationIllinoisSchoolDistrictsMember 2021-01-01 2021-12-31 0001303523 bti:BrazilAssociacaoDeDefesaDaSaudeDoFumanteClassActionMember 2021-01-01 2021-12-31 0001303523 bti:UKSeriousFraudOfficeSFOInvestigationMember 2021-01-01 2021-12-31 0001303523 bti:PerryMember 2021-01-01 2021-12-31 0001303523 bti:AntimonopolyCommitteeOfUkraineMember 2021-01-01 2021-12-31 0001303523 bti:JTIIndemnitiesMember 2021-01-01 2021-12-31 0001303523 bti:GroupsAssociatesAndJointVenturesMember 2021-01-01 2021-12-31 0001303523 bti:OtherAssociatesMember 2021-01-01 2021-12-31 0001303523 ifrs-full:PensionDefinedBenefitPlansMember ifrs-full:PresentValueOfDefinedBenefitObligationMember 2021-01-01 2021-12-31 0001303523 ifrs-full:PostemploymentMedicalDefinedBenefitPlansMember ifrs-full:PresentValueOfDefinedBenefitObligationMember 2021-01-01 2021-12-31 0001303523 ifrs-full:PresentValueOfDefinedBenefitObligationMember 2021-01-01 2021-12-31 0001303523 bti:LongTermIncentivePlanMember bti:AggregateCompanyMember 2021-01-01 2021-12-31 0001303523 bti:AggregateCompanyMember bti:DeferredShareBonusSchemeMember 2021-01-01 2021-12-31 0001303523 bti:FilterCasesUSTobaccoRelatedMember 2021-01-01 2021-12-31 0001303523 bti:BroinIICasesUSTobaccoRelatedMember 2021-01-01 2021-12-31 0001303523 bti:EngleProgenyCasesUSTobaccoRelatedMember 2021-01-01 2021-12-31 0001303523 bti:IndividualSmokingAndHealthCasesUSTobaccoRelatedMember 2021-01-01 2021-12-31 0001303523 bti:ClassActionsUSTobaccoRelatedMember 2021-01-01 2021-12-31 0001303523 bti:MedicalReimbursementCasesUSTobaccoRelatedMember 2021-01-01 2021-12-31 0001303523 bti:IndividualSmokingAndHealthCasesNonUSTobaccoRelatedMember 2021-01-01 2021-12-31 0001303523 bti:ClassActionsNonUSTobaccoRelatedMember 2021-01-01 2021-12-31 0001303523 bti:MedicalReimbursementCasesNonUSTobaccoRelatedMember 2021-01-01 2021-12-31 0001303523 bti:StateSettlementAgreementsEnforcementAndValidityUSTobaccoRelatedMember 2021-01-01 2021-12-31 0001303523 bti:WinstonKoolSalemOrMaverickMember 2021-01-01 2021-12-31 0001303523 ifrs-full:TradeReceivablesMember 2021-01-01 2021-12-31 0001303523 bti:LoansAndOtherReceivablesMember 2021-01-01 2021-12-31 0001303523 bti:UnitedStatesSegmentMember srt:SubsidiariesMember 2021-01-01 2021-12-31 0001303523 bti:AsiaPacificAndMiddleEastMember srt:SubsidiariesMember 2021-01-01 2021-12-31 0001303523 bti:AmericasAndSubSaharanAfricaMember srt:SubsidiariesMember 2021-01-01 2021-12-31 0001303523 bti:EuropeAndNorthAfricaSegmentMember srt:SubsidiariesMember 2021-01-01 2021-12-31 0001303523 srt:SubsidiariesMember 2021-01-01 2021-12-31 0001303523 ifrs-full:AssociatesMember 2021-01-01 2021-12-31 0001303523 country:MM 2021-01-01 2021-12-31 0001303523 bti:KPMGLLPFirmsAndAssociatesMember 2021-01-01 2021-12-31 0001303523 bti:KPMGLLPFirmsAndAssociatesMember bti:SECRegulationsMember 2021-01-01 2021-12-31 0001303523 country:PE bti:IncreaseInDiscountRateMember 2021-01-01 2021-12-31 0001303523 country:PE bti:DecreaseInCashFlowsMember 2021-01-01 2021-12-31 0001303523 country:PE bti:IncreaseInTerminalValueMember 2021-01-01 2021-12-31 0001303523 bti:StockReliefMember 2021-01-01 2021-12-31 0001303523 bti:ExcessCapitalAllowancesMember 2021-01-01 2021-12-31 0001303523 ifrs-full:UnusedTaxLossesMember 2021-01-01 2021-12-31 0001303523 bti:UndistributedEarningsOfAssociatesAndSubsidiariesMember 2021-01-01 2021-12-31 0001303523 bti:RetirementBenefitsMember 2021-01-01 2021-12-31 0001303523 bti:TradeMarkMember 2021-01-01 2021-12-31 0001303523 ifrs-full:OtherTemporaryDifferencesMember 2021-01-01 2021-12-31 0001303523 bti:RelatedPartyFourMember bti:EquitySettledLongTermIncentivePlanMember 2021-01-01 2021-12-31 0001303523 bti:EquitySettledLongTermIncentivePlanMember bti:RelatedPartyThreeMember 2021-01-01 2021-12-31 0001303523 bti:AssociatesAndJointVenturesMember 2021-01-01 2021-12-31 0001303523 bti:FunctionalCurrencyMember ifrs-full:CurrencySwapContractMember 2021-01-01 2021-12-31 0001303523 currency:GBP ifrs-full:CurrencySwapContractMember 2021-01-01 2021-12-31 0001303523 currency:EUR ifrs-full:CurrencySwapContractMember 2021-01-01 2021-12-31 0001303523 ifrs-full:CurrencySwapContractMember 2021-01-01 2021-12-31 0001303523 bti:FunctionalCurrencyMember ifrs-full:ForwardContractMember 2021-01-01 2021-12-31 0001303523 ifrs-full:ForwardContractMember currency:USD 2021-01-01 2021-12-31 0001303523 currency:EUR ifrs-full:ForwardContractMember 2021-01-01 2021-12-31 0001303523 ifrs-full:ForwardContractMember bti:OtherCurrencyMember 2021-01-01 2021-12-31 0001303523 ifrs-full:ForwardContractMember 2021-01-01 2021-12-31 0001303523 bti:AntimonopolyCommitteeOfUkraineMember country:UA 2021-01-01 2021-12-31 0001303523 bti:UKSeriousFraudOfficeSFOInvestigationMember country:GB 2021-01-01 2021-12-31 0001303523 bti:BrazilAssociacaoDeDefesaDaSaudeDoFumanteClassActionMember country:BR 2021-01-01 2021-12-31 0001303523 country:US bti:VuseLitigationIllinoisSchoolDistrictsMember 2021-01-01 2021-12-31 0001303523 bti:ImperialTobaccoCanadaMember 2021-01-01 2021-12-31 0001303523 bti:ReynoldsAmericanIncMember bti:RAIGoodwillMember 2021-01-01 2021-12-31 0001303523 bti:ReynoldsAmericanIncMember bti:NewportMember 2021-01-01 2021-12-31 0001303523 bti:CamelMember bti:ReynoldsAmericanIncMember 2021-01-01 2021-12-31 0001303523 bti:FactoryRationalisationPartialReversalOfPreviouslyEstimatedImpairmentMember 2021-01-01 2021-12-31 0001303523 bti:NotLaterThanTwentyYearsMember 2021-01-01 2021-12-31 0001303523 bti:NotLaterThanTenYearsMember 2021-01-01 2021-12-31 0001303523 bti:NoExpiryPeriodMember 2021-01-01 2021-12-31 0001303523 bti:LoewsMember 2021-01-01 2021-12-31 0001303523 bti:AllLitigationsMember bti:EngleAndOtherLitigationsCostsMember 2021-01-01 2021-12-31 0001303523 bti:FrankedInvestmentIncomeGroupLitigationOrderMember 2021-01-01 2021-12-31 0001303523 bti:EngleProgenyCasesMember 2021-01-01 2021-12-31 0001303523 bti:TotalDirectorsMember 2021-01-01 2021-12-31 0001303523 bti:ExecutiveDirectorsMember 2021-01-01 2021-12-31 0001303523 bti:ReynoldsAmericanIncMember 2021-01-01 2021-12-31 0001303523 bti:AccountingFirmsMember bti:SECRegulationsMember 2021-01-01 2021-12-31 0001303523 bti:KamaranIndustryAndInvestmentCompanyMember 2021-01-01 2021-12-31 0001303523 ifrs-full:TopOfRangeMember ifrs-full:BrandNamesMember 2021-01-01 2021-12-31 0001303523 bti:MasterSettlementAgreementMember bti:RJRTMember 2021-01-01 2021-12-31 0001303523 bti:ExciseDisputeInTurkeySouthKoreaAndRussiaMember 2021-01-01 2021-12-31 0001303523 bti:ShortTermAndLongTermLeaseholdPropertyMember 2021-01-01 2021-12-31 0001303523 bti:RightOfUsePropertiesMember bti:IFRS16Member 2021-01-01 2021-12-31 0001303523 bti:PropertyAcquiredMember bti:IAS16Member 2021-01-01 2021-12-31 0001303523 bti:IndividualSmokingAndHealthCasesMember 2021-01-01 2021-12-31 0001303523 bti:BroinIICasesMember 2021-01-01 2021-12-31 0001303523 bti:FilterCasesMember 2021-01-01 2021-12-31 0001303523 bti:PlaintiffsMember 2021-01-01 2021-12-31 0001303523 bti:EurobondsOneMember 2021-01-01 2021-12-31 0001303523 bti:EurobondsTwoMember 2021-01-01 2021-12-31 0001303523 bti:EurobondsThreeMember 2021-01-01 2021-12-31 0001303523 bti:EurobondsFourMember 2021-01-01 2021-12-31 0001303523 bti:BondsIssuedOneMember 2021-01-01 2021-12-31 0001303523 bti:BondsIssuedTwoMember 2021-01-01 2021-12-31 0001303523 bti:AdjustedAtConstantRatesMember bti:AsiaPacificAndMiddleEastSegmentMember 2021-01-01 2021-12-31 0001303523 bti:TranslationExchangeMember bti:AsiaPacificAndMiddleEastSegmentMember 2021-01-01 2021-12-31 0001303523 bti:AdjustedAtCurrentRatesMember bti:AsiaPacificAndMiddleEastSegmentMember 2021-01-01 2021-12-31 0001303523 bti:AdjustingItemsMember bti:AsiaPacificAndMiddleEastSegmentMember 2021-01-01 2021-12-31 0001303523 bti:ReportedMember bti:AsiaPacificAndMiddleEastSegmentMember 2021-01-01 2021-12-31 0001303523 bti:AdjustedAtConstantRatesMember bti:AmericasAndSubSaharanAfricaSegmentMember 2021-01-01 2021-12-31 0001303523 bti:TranslationExchangeMember bti:AmericasAndSubSaharanAfricaSegmentMember 2021-01-01 2021-12-31 0001303523 bti:AdjustedAtCurrentRatesMember bti:AmericasAndSubSaharanAfricaSegmentMember 2021-01-01 2021-12-31 0001303523 bti:AdjustingItemsMember bti:AmericasAndSubSaharanAfricaSegmentMember 2021-01-01 2021-12-31 0001303523 bti:ReportedMember bti:AmericasAndSubSaharanAfricaSegmentMember 2021-01-01 2021-12-31 0001303523 bti:AdjustedAtConstantRatesMember bti:EuropeAndNorthAfricaSegmentMember 2021-01-01 2021-12-31 0001303523 bti:TranslationExchangeMember bti:EuropeAndNorthAfricaSegmentMember 2021-01-01 2021-12-31 0001303523 bti:AdjustedAtCurrentRatesMember bti:EuropeAndNorthAfricaSegmentMember 2021-01-01 2021-12-31 0001303523 bti:AdjustingItemsMember bti:EuropeAndNorthAfricaSegmentMember 2021-01-01 2021-12-31 0001303523 bti:ReportedMember bti:EuropeAndNorthAfricaSegmentMember 2021-01-01 2021-12-31 0001303523 bti:TranslationExchangeMember 2021-01-01 2021-12-31 0001303523 bti:AdjustedAtCurrentRatesMember 2021-01-01 2021-12-31 0001303523 bti:AdjustingItemsMember 2021-01-01 2021-12-31 0001303523 bti:ReportedMember 2021-01-01 2021-12-31 0001303523 bti:AdjustedAtConstantRatesMember bti:UnitedStatesSegmentMember 2021-01-01 2021-12-31 0001303523 bti:TranslationExchangeMember bti:UnitedStatesSegmentMember 2021-01-01 2021-12-31 0001303523 bti:AdjustedAtCurrentRatesMember bti:UnitedStatesSegmentMember 2021-01-01 2021-12-31 0001303523 bti:AdjustingItemsMember bti:UnitedStatesSegmentMember 2021-01-01 2021-12-31 0001303523 bti:ReportedMember bti:UnitedStatesSegmentMember 2021-01-01 2021-12-31 0001303523 bti:TisakDDMember 2021-01-01 2021-12-31 0001303523 ifrs-full:InterestRateSwapContractMember ifrs-full:NotLaterThanOneYearMember ifrs-full:InterestRateRiskMember 2021-01-01 2021-12-31 0001303523 ifrs-full:InterestRateSwapContractMember ifrs-full:LaterThanTwoYearsAndNotLaterThanThreeYearsMember ifrs-full:InterestRateRiskMember 2021-01-01 2021-12-31 0001303523 ifrs-full:InterestRateSwapContractMember ifrs-full:LaterThanThreeYearsAndNotLaterThanFourYearsMember ifrs-full:InterestRateRiskMember 2021-01-01 2021-12-31 0001303523 ifrs-full:InterestRateSwapContractMember ifrs-full:LaterThanFiveYearsMember ifrs-full:InterestRateRiskMember 2021-01-01 2021-12-31 0001303523 ifrs-full:CurrencySwapContractMember ifrs-full:NotLaterThanOneYearMember ifrs-full:InterestRateRiskMember 2021-01-01 2021-12-31 0001303523 ifrs-full:CurrencySwapContractMember ifrs-full:LaterThanOneYearAndNotLaterThanTwoYearsMember ifrs-full:InterestRateRiskMember 2021-01-01 2021-12-31 0001303523 ifrs-full:CurrencySwapContractMember ifrs-full:LaterThanThreeYearsAndNotLaterThanFourYearsMember ifrs-full:InterestRateRiskMember 2021-01-01 2021-12-31 0001303523 ifrs-full:CurrencySwapContractMember ifrs-full:LaterThanFiveYearsMember ifrs-full:InterestRateRiskMember 2021-01-01 2021-12-31 0001303523 ifrs-full:CurrencySwapContractMember ifrs-full:InterestRateRiskMember 2021-01-01 2021-12-31 0001303523 ifrs-full:AssociatesMember 2021-01-01 2021-12-31 0001303523 bti:RightOfUseLeasedPropertiesMember 2021-01-01 2021-12-31 0001303523 bti:AdjustingItemsWhichHaveBeenAdjustedWithinNetFinanceCostsMember 2021-01-01 2021-12-31 0001303523 bti:FunctionalCurrencyMember 2021-01-01 2021-12-31 0001303523 currency:USD 2021-01-01 2021-12-31 0001303523 currency:GBP 2021-01-01 2021-12-31 0001303523 currency:EUR 2021-01-01 2021-12-31 0001303523 bti:OtherCurrencyMember 2021-01-01 2021-12-31 0001303523 bti:KPMGLLPFirmsAndAssociatesMember bti:ParentCompanyAndGroupAuditMember 2021-01-01 2021-12-31 0001303523 bti:KPMGLLPFirmsAndAssociatesMember bti:LocalStatutoryAndGroupReportingAuditsMember 2021-01-01 2021-12-31 0001303523 bti:KPMGLLPFirmsAndAssociatesMember bti:ParentCompanyLocalStatutoryAndGroupAuditsMember 2021-01-01 2021-12-31 0001303523 bti:ParentCompanyLocalStatutoryAndGroupAuditsMember bti:OtherFirmsMember 2021-01-01 2021-12-31 0001303523 bti:ParentCompanyLocalStatutoryAndGroupAuditsMember bti:AuditProviderMember 2021-01-01 2021-12-31 0001303523 bti:RJReynoldsTobaccoCompanyMember bti:FinalResolutionMember bti:TexasAndMinnesotaMember 2021-01-01 2021-12-31 0001303523 ifrs-full:PensionDefinedBenefitPlansMember ifrs-full:PlanAssetsMember 2021-01-01 2021-12-31 0001303523 ifrs-full:PostemploymentMedicalDefinedBenefitPlansMember ifrs-full:PlanAssetsMember 2021-01-01 2021-12-31 0001303523 ifrs-full:PlanAssetsMember 2021-01-01 2021-12-31 0001303523 bti:COVIDNineteenCrisisMember country:PE 2021-01-01 2021-12-31 0001303523 ifrs-full:BottomOfRangeMember bti:BrazilBangladeshGermanyMexicoRomaniaSingaporeAndVietnamMember bti:LeaseholdPropertyMember 2021-01-01 2021-12-31 0001303523 bti:AdjustingItemsWhichHaveBeenAdjustedWithinNetFinanceCostsMember bti:RussiaExciseDisputeMember 2021-01-01 2021-12-31 0001303523 bti:AdjustingItemsWhichHaveBeenAdjustedWithinNetFinanceCostsMember bti:AmnestyTaxPaymentInTurkeyMember 2021-01-01 2021-12-31 0001303523 bti:AdjustingItemsWhichHaveBeenAdjustedWithinNetFinanceCostsMember bti:FrankedInvestmentIncomeGroupLitigationOrderMember 2021-01-01 2021-12-31 0001303523 bti:OrganigramIncMember 2021-01-01 2021-12-31 0001303523 bti:RegisteredBATCAPBondsMember bti:BATPLCMember 2021-01-01 2021-12-31 0001303523 bti:RegisteredBATCAPBondsMember bti:BATCAPMember 2021-01-01 2021-12-31 0001303523 bti:RegisteredBATCAPBondsMember bti:BATIFMember 2021-01-01 2021-12-31 0001303523 bti:RegisteredBATCAPBondsMember bti:RAIMember 2021-01-01 2021-12-31 0001303523 bti:RelatedPartyThreeMember bti:AwardTwoThousandEighteenMember 2021-01-01 2021-12-31 0001303523 bti:RelatedPartyFourMember bti:AwardTwoThousandEighteenMember 2021-01-01 2021-12-31 0001303523 bti:IndividualSmokingAndHealthCasesUSTobaccoRelatedMember bti:USTobaccoRelatedActionsMember 2021-01-01 2021-12-31 0001303523 bti:EurobondsOneMember ifrs-full:BottomOfRangeMember 2021-01-01 2021-12-31 0001303523 bti:EurobondsOneMember ifrs-full:TopOfRangeMember 2021-01-01 2021-12-31 0001303523 bti:EurobondsThreeMember ifrs-full:BottomOfRangeMember 2021-01-01 2021-12-31 0001303523 bti:EurobondsThreeMember ifrs-full:TopOfRangeMember 2021-01-01 2021-12-31 0001303523 bti:BondsIssuedOneMember ifrs-full:BottomOfRangeMember 2021-01-01 2021-12-31 0001303523 bti:BondsIssuedOneMember ifrs-full:TopOfRangeMember 2021-01-01 2021-12-31 0001303523 ifrs-full:BottomOfRangeMember ifrs-full:ComputerSoftwareMember 2021-01-01 2021-12-31 0001303523 ifrs-full:TopOfRangeMember ifrs-full:ComputerSoftwareMember 2021-01-01 2021-12-31 0001303523 bti:NonDerivativeRelatedNetInvestmentHedgesMember ifrs-full:LongtermBorrowingsMember 2021-01-01 2021-12-31 0001303523 bti:ForeignCurrencyRiskExposureMember bti:DerivativeRelatedNetInvestmentHedgesMember ifrs-full:ForwardContractMember 2021-01-01 2021-12-31 0001303523 bti:ForeignCurrencyRiskExposureMember ifrs-full:CashFlowHedgesMember ifrs-full:ForwardContractMember 2021-01-01 2021-12-31 0001303523 ifrs-full:CurrencySwapContractMember ifrs-full:CashFlowHedgesMember bti:InterestRateRiskExposureMember 2021-01-01 2021-12-31 0001303523 bti:InterestRateRiskExposureMember ifrs-full:FairValueHedgesMember ifrs-full:CurrencySwapContractMember 2021-01-01 2021-12-31 0001303523 ifrs-full:InterestRateSwapContractMember ifrs-full:FairValueHedgesMember bti:InterestRateRiskExposureMember 2021-01-01 2021-12-31 0001303523 bti:RegisteredBATCAPBondsMember bti:BATPLCMember bti:TransactionsWithNonIssuerNonGuarantorSubsidiariesMember 2021-01-01 2021-12-31 0001303523 bti:RegisteredBATCAPBondsMember bti:RAIMember bti:TransactionsWithNonIssuerNonGuarantorSubsidiariesMember 2021-01-01 2021-12-31 0001303523 bti:RegisteredBATCAPBondsMember bti:BATHTNMember bti:TransactionsWithNonIssuerNonGuarantorSubsidiariesMember 2021-01-01 2021-12-31 0001303523 bti:RegisteredBATCAPBondsMember bti:BATHTNMember 2021-01-01 2021-12-31 0001303523 ifrs-full:NotLaterThanOneYearMember ifrs-full:InterestRateRiskMember 2021-01-01 2021-12-31 0001303523 ifrs-full:LaterThanOneYearAndNotLaterThanTwoYearsMember ifrs-full:InterestRateRiskMember 2021-01-01 2021-12-31 0001303523 ifrs-full:LaterThanTwoYearsAndNotLaterThanThreeYearsMember ifrs-full:InterestRateRiskMember 2021-01-01 2021-12-31 0001303523 ifrs-full:LaterThanThreeYearsAndNotLaterThanFourYearsMember ifrs-full:InterestRateRiskMember 2021-01-01 2021-12-31 0001303523 ifrs-full:LaterThanFourYearsAndNotLaterThanFiveYearsMember ifrs-full:InterestRateRiskMember 2021-01-01 2021-12-31 0001303523 ifrs-full:LaterThanFiveYearsMember ifrs-full:InterestRateRiskMember 2021-01-01 2021-12-31 0001303523 ifrs-full:InterestRateRiskMember 2021-01-01 2021-12-31 0001303523 bti:KPMGLLPFirmsAndAssociatesMember bti:AuditRelatedAssuranceServicesMember 2021-01-01 2021-12-31 0001303523 bti:KPMGLLPFirmsAndAssociatesMember bti:OtherAssuranceServicesMember 2021-01-01 2021-12-31 0001303523 bti:KPMGLLPFirmsAndAssociatesMember bti:DefinedBenefitSchemesMember 2021-01-01 2021-12-31 0001303523 bti:KPMGLLPFirmsAndAssociatesMember 2021-01-01 2021-12-31 0001303523 ifrs-full:IntangibleAssetsUnderDevelopmentMember 2021-01-01 2021-12-31 0001303523 ifrs-full:BrandNamesMember 2021-01-01 2021-12-31 0001303523 ifrs-full:ComputerSoftwareMember 2021-01-01 2021-12-31 0001303523 ifrs-full:GoodwillMember 2021-01-01 2021-12-31 0001303523 bti:CurrentFinancialAssetsRelatedToNetDebtMember 2021-01-01 2021-12-31 0001303523 bti:CashAndCashEquivalentsRelatedToNetDebtMember 2021-01-01 2021-12-31 0001303523 bti:BorrowingsExcludingLeaseLiabilitiesMember 2021-01-01 2021-12-31 0001303523 bti:DerivativeRelatedToNetDebtMember 2021-01-01 2021-12-31 0001303523 ifrs-full:LeaseLiabilitiesMember 2021-01-01 2021-12-31 0001303523 ifrs-full:TopOfRangeMember ifrs-full:RestructuringProvisionMember 2021-01-01 2021-12-31 0001303523 ifrs-full:TopOfRangeMember bti:FoxRiverMember 2021-01-01 2021-12-31 0001303523 bti:EmployeeRelatedBenefitsMember ifrs-full:TopOfRangeMember 2021-01-01 2021-12-31 0001303523 bti:FoxRiverMember 2021-01-01 2021-12-31 0001303523 bti:MSALitigationMember ifrs-full:MiscellaneousOtherProvisionsMember 2021-01-01 2021-12-31 0001303523 bti:MSALitigationMember 2021-01-01 2021-12-31 0001303523 bti:OtherProvisionsForLiabilitiesMember ifrs-full:RestructuringProvisionMember 2021-01-01 2021-12-31 0001303523 bti:OtherProvisionsForLiabilitiesMember bti:EmployeeRelatedBenefitsMember 2021-01-01 2021-12-31 0001303523 bti:OtherProvisionsForLiabilitiesMember bti:FoxRiverMember 2021-01-01 2021-12-31 0001303523 bti:OtherProvisionsForLiabilitiesMember ifrs-full:MiscellaneousOtherProvisionsMember 2021-01-01 2021-12-31 0001303523 bti:OtherProvisionsForLiabilitiesMember 2021-01-01 2021-12-31 0001303523 bti:BATPLCMember 2021-01-01 2021-12-31 0001303523 bti:RegisteredBATCAPBondsMember bti:BATNFMember 2021-01-01 2021-12-31 0001303523 bti:RegisteredBATCAPBondsMember bti:BATCAPMember bti:TransactionsWithNonIssuerNonGuarantorSubsidiariesMember 2021-01-01 2021-12-31 0001303523 bti:RegisteredBATCAPBondsMember bti:BATIFMember bti:TransactionsWithNonIssuerNonGuarantorSubsidiariesMember 2021-01-01 2021-12-31 0001303523 bti:GlobalSoftwareSolutionsMember bti:AccountingEstimateMember 2021-01-01 2021-12-31 0001303523 ifrs-full:NotInternallyGeneratedMember 2021-01-01 2021-12-31 0001303523 ifrs-full:NotInternallyGeneratedMember ifrs-full:IntangibleAssetsUnderDevelopmentMember 2021-01-01 2021-12-31 0001303523 ifrs-full:NotInternallyGeneratedMember ifrs-full:BrandNamesMember 2021-01-01 2021-12-31 0001303523 ifrs-full:InternallyGeneratedMember 2021-01-01 2021-12-31 0001303523 ifrs-full:InternallyGeneratedMember ifrs-full:IntangibleAssetsUnderDevelopmentMember 2021-01-01 2021-12-31 0001303523 ifrs-full:FairValueHedgesMember 2021-01-01 2021-12-31 0001303523 ifrs-full:CashFlowHedgesMember 2021-01-01 2021-12-31 0001303523 ifrs-full:SubsidiariesMember 2021-01-01 2021-12-31 0001303523 bti:RetainedEarningsOtherMember 2021-01-01 2021-12-31 0001303523 bti:NonParticipatingManufacturerAdjustmentClaimsRelatedToPeriodFrom2003To2012Member bti:MasterSettlementAgreementMember bti:RJReynoldsTobaccoCompanyMember 2021-01-01 2021-12-31 0001303523 bti:FreeholdPropertyMember 2021-01-01 2021-12-31 0001303523 bti:PlantEquipmentAndOtherOwnedMember 2021-01-01 2021-12-31 0001303523 bti:PlantEquipmentAndOtherLeasedMember 2021-01-01 2021-12-31 0001303523 ifrs-full:ConstructionInProgressMember 2021-01-01 2021-12-31 0001303523 bti:FreeholdLandOrAssetsClassifiedAsHeldForSaleMember 2021-01-01 2021-12-31 0001303523 bti:CTBATInternationalLimitedMember 2021-01-01 2021-12-31 0001303523 ifrs-full:SharePremiumMember bti:SharesRepurchasedAndNotCancelledMember 2021-01-01 2021-12-31 0001303523 ifrs-full:SharePremiumMember bti:OrdinarySharesIssuedUnderShareOptionSchemesMember 2021-01-01 2021-12-31 0001303523 bti:PlantAndEquipmentMember ifrs-full:BottomOfRangeMember 2021-01-01 2021-12-31 0001303523 bti:PlantAndEquipmentMember ifrs-full:TopOfRangeMember 2021-01-01 2021-12-31 0001303523 ifrs-full:LandAndBuildingsMember ifrs-full:BottomOfRangeMember 2021-01-01 2021-12-31 0001303523 ifrs-full:LandAndBuildingsMember ifrs-full:TopOfRangeMember 2021-01-01 2021-12-31 0001303523 bti:RJReynoldsTobaccoCompanyMember bti:MSAAndStateSettlementAgreementsMember 2021-01-01 2021-12-31 0001303523 ifrs-full:RightofuseAssetsMember 2021-01-01 2021-12-31 0001303523 ifrs-full:RightofuseAssetsMember bti:PlantEquipmentAndOtherLeasedMember 2021-01-01 2021-12-31 0001303523 ifrs-full:RightofuseAssetsMember bti:LeaseholdPropertyMember 2021-01-01 2021-12-31 0001303523 stpr:CA-BC 2021-01-01 2021-12-31 0001303523 stpr:CA-NB 2021-01-01 2021-12-31 0001303523 stpr:CA-ON 2021-01-01 2021-12-31 0001303523 stpr:CA-NL 2021-01-01 2021-12-31 0001303523 stpr:CA-SK 2021-01-01 2021-12-31 0001303523 stpr:CA-MB 2021-01-01 2021-12-31 0001303523 stpr:CA-AB 2021-01-01 2021-12-31 0001303523 stpr:CA-QC 2021-01-01 2021-12-31 0001303523 stpr:CA-PE 2021-01-01 2021-12-31 0001303523 stpr:CA-NS 2021-01-01 2021-12-31 0001303523 bti:EngleClassActionAndEngleProgenyCasesFloridaMember 2021-01-01 2021-12-31 0001303523 bti:ChairmanMember 2021-01-01 2021-12-31 0001303523 bti:NonExecutiveDirectorsMember 2021-01-01 2021-12-31 0001303523 ifrs-full:ReserveOfExchangeDifferencesOnTranslationMember 2021-01-01 2021-12-31 0001303523 ifrs-full:OtherReservesMember 2021-01-01 2021-12-31 0001303523 ifrs-full:RetainedEarningsMember 2021-01-01 2021-12-31 0001303523 ifrs-full:EquityAttributableToOwnersOfParentMember 2021-01-01 2021-12-31 0001303523 ifrs-full:NoncontrollingInterestsMember 2021-01-01 2021-12-31 0001303523 bti:HedgingReserveMember 2021-01-01 2021-12-31 0001303523 ifrs-full:KeyManagementPersonnelOfEntityOrParentMember bti:PortionOfShareOptionSchemesExercisedMember 2021-01-01 2021-12-31 0001303523 bti:USTobaccoRelatedActionsMember bti:IndividualSmokingAndHealthCasesUSTobaccoRelatedMember 2021-01-01 2021-12-31 0001303523 bti:LorillardTobaccoMember 2021-01-01 2021-12-31 0001303523 bti:OutsideUnitedStatesMember 2021-01-01 2021-12-31 0001303523 currency:ARS 2021-01-01 2021-12-31 0001303523 currency:CAD 2021-01-01 2021-12-31 0001303523 country:IT 2021-01-01 2021-12-31 0001303523 country:CL 2021-01-01 2021-12-31 0001303523 country:IE 2021-01-01 2021-12-31 0001303523 country:VE 2021-01-01 2021-12-31 0001303523 bti:SharesaveSchemeSAYEMember ifrs-full:TopOfRangeMember 2021-01-01 2021-12-31 0001303523 bti:SharesaveSchemeSAYEMember ifrs-full:BottomOfRangeMember 2021-01-01 2021-12-31 0001303523 bti:LongTermIncentivePlanMember bti:RestrictedSharePlanMember 2021-01-01 2021-12-31 0001303523 bti:PerformanceSharePlansMember bti:LongTermIncentivePlanMember 2021-01-01 2021-12-31 0001303523 bti:EngleDefendantsMember bti:EngleProgenyCasesUSTobaccoRelatedMember 2021-01-01 2021-12-31 0001303523 bti:TwoQuebecClassActionsMember 2021-01-01 2021-12-31 0001303523 bti:TwoQuebecClassActionsMember currency:CAD 2021-01-01 2021-12-31 0001303523 stpr:CA-NB ifrs-full:BottomOfRangeMember 2021-01-01 2021-12-31 0001303523 ifrs-full:TopOfRangeMember stpr:CA-NB 2021-01-01 2021-12-31 0001303523 bti:PerformanceSharePlansMember bti:LongTermIncentivePlanMember bti:NetTurnoverMember 2021-01-01 2021-12-31 0001303523 bti:LongTermIncentivePlanMember bti:PerformanceSharePlansMember bti:ShareholderReturnMember 2021-01-01 2021-12-31 0001303523 bti:LongTermIncentivePlanMember bti:PerformanceSharePlansMember bti:OperatingCashFlowMember 2021-01-01 2021-12-31 0001303523 bti:PerformanceSharePlansMember bti:LongTermIncentivePlanMember bti:EarningsPerShareMember 2021-01-01 2021-12-31 0001303523 bti:ReynoldsAmericanIncMember bti:VestingDateMaximumMember bti:LongTermIncentivePlanMember 2021-01-01 2021-12-31 0001303523 bti:FilterCasesMember bti:LorillardTobaccoAndRJRTMember 2021-01-01 2021-12-31 0001303523 country:US bti:UKBasedGroupCompanyExcludingBritishAmericanTobaccoInvestmentsDefendantMember 2021-01-01 2021-12-31 0001303523 bti:RJRTBAndWAndLorillardTobaccoMember country:US 2021-01-01 2021-12-31 0001303523 ifrs-full:ReserveOfCashFlowHedgesMember 2021-01-01 2021-12-31 0001303523 bti:BritishAmericanTobaccoInvestmentsDefendantMember 2021-01-01 2021-12-31 0001303523 bti:BritishAmericanTobaccoEgyptLLCMember bti:TaxReassessmentMember country:EG 2021-01-01 2021-12-31 0001303523 country:US bti:USTobaccoLitigationMember 2021-01-01 2021-12-31 0001303523 country:US bti:ReynoldsDefendantsMember ifrs-full:BottomOfRangeMember 2021-01-01 2021-12-31 0001303523 country:US bti:ReynoldsDefendantsMember ifrs-full:TopOfRangeMember 2021-01-01 2021-12-31 0001303523 bti:EngleProgenyCasesMember stpr:FL 2021-01-01 2021-12-31 0001303523 bti:RJReynoldsTobaccoCompanyMember 2021-01-01 2021-12-31 0001303523 bti:BroinVPhilipMorrisIncMember bti:USTobaccoRelatedActionsMember 2021-01-01 2021-12-31 0001303523 bti:PresentedInCIEMember ifrs-full:OtherReservesMember 2021-01-01 2021-12-31 0001303523 bti:PresentedInCIEMember ifrs-full:EquityAttributableToOwnersOfParentMember 2021-01-01 2021-12-31 0001303523 bti:PresentedInCIEMember 2021-01-01 2021-12-31 0001303523 bti:StarrBlundellAndHardinVsRJRTMember 2021-01-01 2021-12-31 0001303523 bti:GroupsIndonesianSubsidiaryMember 2021-01-01 2021-12-31 0001303523 bti:SharesaveSchemeSAYEMember 2021-01-01 2021-12-31 0001303523 bti:USTobaccoRelatedActionsMember bti:StateSettlementAgreementsMember 2021-01-01 2021-12-31 0001303523 ifrs-full:AtFairValueMember 2021-01-01 2021-12-31 0001303523 bti:ShareRewardSchemeSRSAndInternationalShareRewardSchemeISRSMember 2021-01-01 2021-12-31 0001303523 bti:RJRTBAndWAndLorillardTobaccoMember bti:CrowCreekSiouxTribeAndAmericanTobaccoCoMember 2021-01-01 2021-12-31 0001303523 bti:FiveYearTranchesMember 2021-01-01 2021-12-31 0001303523 bti:NewCategoryProductsMember ifrs-full:TopOfRangeMember 2021-01-01 2021-12-31 0001303523 bti:DifferenceOnExchangeRelatingToIranMember 2021-01-01 2021-12-31 0001303523 bti:DifferenceOnExchangeRelatingToOtherEntitiesMember 2021-01-01 2021-12-31 0001303523 ifrs-full:LiquidityRiskMember 2021-01-01 2021-12-31 0001303523 bti:ThreePercentPerpetualHybridBondMemberMember bti:SeptemberTwoThousandAndTwentyOneEquityClassifiedBondsOneAndTwoMemberMember 2021-01-01 2021-12-31 0001303523 bti:ImascoPensionFundSocietyPlanMember country:CA 2021-01-01 2021-12-31 0001303523 bti:GlobalTravelRetailMember 2021-01-01 2021-12-31 0001303523 bti:SouthAfricaCashGeneratingUnitMember 2021-01-01 2021-12-31 0001303523 ifrs-full:InterestRateRiskMember bti:DerivativesMaturingInJuneTwentyTwentyTwoMember ifrs-full:FairValueHedgesMember ifrs-full:InterestRateSwapContractMember bti:ImpactedByInterestRateBenchmarkReformMember 2021-01-01 2021-12-31 0001303523 ifrs-full:InterestRateRiskMember bti:ImpactedByInterestRateBenchmarkReformMember 2021-01-01 2021-12-31 0001303523 ifrs-full:LiquidityRiskMember bti:BilateralFacilitiesMember 2021-01-01 2021-12-31 0001303523 bti:HrvatskiDuhaniDDTobaccoLeafProcessingMember 2021-01-01 2021-12-31 0001303523 bti:BatParsCompanyPjscMember 2021-01-01 2021-12-31 0001303523 bti:PartnershipShareSchemeMember 2021-01-01 2021-12-31 0001303523 country:AO 2021-01-01 2021-12-31 0001303523 bti:NigerianCourtMember bti:OyoMember 2021-01-01 2021-12-31 0001303523 bti:NigerianCourtMember 2021-01-01 2021-12-31 0001303523 country:US ifrs-full:PensionDefinedBenefitPlansMember 2021-01-01 2021-12-31 0001303523 bti:FundedDefinedBenefitMember ifrs-full:WhollyOrPartlyFundedDefinedBenefitPlansMember 2021-01-01 2021-12-31 0001303523 bti:BritishAmericanTobaccoUkPensionFundMember country:GB ifrs-full:WhollyOrPartlyFundedDefinedBenefitPlansMember 2021-01-01 2021-12-31 0001303523 ifrs-full:PensionDefinedBenefitPlansMember country:DE ifrs-full:WhollyOrPartlyFundedDefinedBenefitPlansMember 2021-01-01 2021-12-31 0001303523 bti:GroupOfCountriesMember ifrs-full:PensionDefinedBenefitPlansMember ifrs-full:WhollyOrPartlyFundedDefinedBenefitPlansMember 2021-01-01 2021-12-31 0001303523 ifrs-full:WhollyOrPartlyFundedDefinedBenefitPlansMember 2021-01-01 2021-12-31 0001303523 bti:USTobaccoRelatedActionsMember 2021-01-01 2021-12-31 0001303523 bti:BatParsCompanyPjscMember bti:HeldForSaleImpairmentChargeMember 2021-01-01 2021-12-31 0001303523 bti:BatParsCompanyPjscMember bti:ForeignExchangeTranslationGainLossReclassifiedFromTheIncomeStatementMember 2021-01-01 2021-12-31 0001303523 dei:BusinessContactMember 2021-01-01 2021-12-31 0001303523 bti:AmericanDepositarySharesEvidencedByAmericanDepositaryReceiptsMember 2021-01-01 2021-12-31 0001303523 bti:OnePointSixSixEightPercentageNotesDueTwoThousandAndTwentySixMember 2021-01-01 2021-12-31 0001303523 bti:TwoPointTwoFiveNinePercentageNotesDueTwoThousandAndTwentyEightMember 2021-01-01 2021-12-31 0001303523 bti:TwoPointSevenTwoSixPercentageNotesDueTwoThousandAndThirtyOneMember 2021-01-01 2021-12-31 0001303523 bti:ThreePointSevenThreeFourPercentageNotesDueTwoThousandAndFortyMember 2021-01-01 2021-12-31 0001303523 bti:ThreePointNineEightFourPercentageNotesDueTwoThousandAndFiftyMember 2021-01-01 2021-12-31 0001303523 bti:FourPointSevenZeroZeroPercentageNotesDueTwoThousandAndTwentySevenMember 2021-01-01 2021-12-31 0001303523 bti:FourPointNineZeroSixPercentageNotesDueTwoThousandAndThirtyMember 2021-01-01 2021-12-31 0001303523 bti:FivePointTwoEightTwoPercentageNotesDueTwoThousandAndFiftyMember 2021-01-01 2021-12-31 0001303523 bti:TwoPointSevenEightNinePercentageNotesDueTwoThousandAndTwentyFourMember 2021-01-01 2021-12-31 0001303523 bti:ThreePointTwoOneFivePercentageNotesDueTwoThousandAndTwentySixMember 2021-01-01 2021-12-31 0001303523 bti:ThreePointFourSixTwoPercentageNotesDueTwoThousandAndTwentyNineMember 2021-01-01 2021-12-31 0001303523 bti:FourPointSevenFiveEightPercentageNotesDueTwoThousandAndFortyNineMember 2021-01-01 2021-12-31 0001303523 bti:TwoPointSevenSixFourPercentageNotesDueTwoThousandAndTwentyTwoMember 2021-01-01 2021-12-31 0001303523 bti:ThreePointTwoTwoTwoPercentageNotesDueTwoThousandAndTwentyFourMember 2021-01-01 2021-12-31 0001303523 bti:ThreePointFiveFiveSevenPercentageNotesDueTwoThousandAndTwentySevenMember 2021-01-01 2021-12-31 0001303523 bti:FourPointThreeNineZeroPercentageNotesDueTwoThousandAndThirtySevenMember 2021-01-01 2021-12-31 0001303523 bti:FourPointFiveFourZeroPercentageNotesDueTwoThousandAndFortySevenMember 2021-01-01 2021-12-31 0001303523 bti:FloatingRateNotesDueTwoThousandAndTwentyTwoMember 2021-01-01 2021-12-31 0001303523 bti:ImperialTobaccoCanadaMember 2021-01-01 2021-12-31 0001303523 bti:EquitySettledLongTermIncentivePlanMember bti:ReynoldsAmericanIncMember 2021-01-01 2021-12-31 0001303523 ifrs-full:TopOfRangeMember 2021-01-01 2021-12-31 0001303523 country:CA bti:ImperialTobaccoCanadaMember 2021-01-01 2021-12-31 0001303523 bti:SFNTCMember 2021-01-01 2021-12-31 0001303523 bti:TreatmentOfSmokingAndHealthRelatedDiseasesMember country:CA 2021-01-01 2021-12-31 0001303523 bti:CanadianProvinceMember bti:TreatmentOfSmokingAndHealthRelatedDiseasesMember 2021-01-01 2021-12-31 0001303523 bti:ReynoldsAmericanIncMember ifrs-full:BrandNamesMember ifrs-full:TopOfRangeMember 2021-01-01 2021-12-31 0001303523 country:US bti:SFNTCMember 2021-01-01 2021-12-31 0001303523 bti:FederalHighCourtMember country:NG 2021-01-01 2021-12-31 0001303523 bti:KanoMember bti:BritishAmericanTobaccoNigeriaLimitedMember 2021-01-01 2021-12-31 0001303523 bti:BritishAmericanTobaccoNigeriaLimitedMember bti:OyoMember 2021-01-01 2021-12-31 0001303523 bti:BritishAmericanTobaccoNigeriaLimitedMember bti:LagosMember 2021-01-01 2021-12-31 0001303523 bti:BritishAmericanTobaccoNigeriaLimitedMember bti:OgunMember 2021-01-01 2021-12-31 0001303523 bti:BritishAmericanTobaccoNigeriaLimitedMember bti:GombeMember 2021-01-01 2021-12-31 0001303523 bti:JonesVAmericanTobaccoCoIncMember 2021-01-01 2021-12-31 0001303523 bti:YoungVAmericanTobaccoCoIncMember 2021-01-01 2021-12-31 0001303523 bti:SharePremiumCapitalRedemptionAndMergerReservesMember 2021-01-01 2021-12-31 0001303523 country:AR 2021-01-01 2021-12-31 0001303523 bti:ComputerSoftwareAndIntangibleAssetsUnderDevelopmentMember ifrs-full:GrossCarryingAmountMember ifrs-full:InternallyGeneratedMember 2021-01-01 2021-12-31 0001303523 country:US bti:ReynoldsAmericanFundedRetirementPlanMember 2021-01-01 2021-12-31 0001303523 bti:NationalHealthInsuranceServiceMember country:KR 2021-01-01 2021-12-31 0001303523 bti:GrowersClassActionMember country:CA 2021-01-01 2021-12-31 0001303523 ifrs-full:ReserveOfGainsAndLossesOnRemeasuringAvailableforsaleFinancialAssetsMember 2021-01-01 2021-12-31 0001303523 bti:AsiaPacificAndMiddleEastMember 2021-01-01 2021-12-31 0001303523 bti:AmericasAndSubSaharanAfricaMember 2021-01-01 2021-12-31 0001303523 bti:EuropeAndNorthAfricaMember 2021-01-01 2021-12-31 0001303523 bti:TwispProprietaryLimitedMember 2021-01-01 2021-12-31 0001303523 bti:FoxRiverMember bti:NCRMember 2021-01-01 2021-12-31 0001303523 bti:MalaysiaGTRSouthAfricaAndPeruvianMember ifrs-full:TopOfRangeMember 2021-01-01 2021-12-31 0001303523 ifrs-full:PensionDefinedBenefitPlansMember country:GB 2021-01-01 2021-12-31 0001303523 bti:SequanaMember bti:FoxRiverMember 2021-01-01 2021-12-31 0001303523 bti:HeldInEmployeeShareOwnershipTrustsMember ifrs-full:RetainedEarningsMember 2021-01-01 2021-12-31 0001303523 bti:HeldInEmployeeShareOwnershipTrustsMember ifrs-full:EquityAttributableToOwnersOfParentMember 2021-01-01 2021-12-31 0001303523 bti:HeldInEmployeeShareOwnershipTrustsMember 2021-01-01 2021-12-31 0001303523 bti:NCRMember bti:KalamazooRiverMember 2021-01-01 2021-12-31 0001303523 ifrs-full:TopOfRangeMember ifrs-full:LiquidityRiskMember 2021-01-01 2021-12-31 0001303523 country:US ifrs-full:PostemploymentMedicalDefinedBenefitPlansMember 2021-01-01 2021-12-31 0001303523 ifrs-full:LiquidityRiskMember bti:ThreeSixtyFourDayTranchesMember 2021-01-01 2021-12-31 0001303523 bti:BrascubaCigarrillosSAMember 2021-01-01 2021-12-31 0001303523 bti:PerpetualHybridBondsMember 2021-01-01 2021-12-31 0001303523 bti:BritishColumbiaMember bti:OtherCanadianSmokingAndHealthClassActionsMember 2021-01-01 2021-12-31 0001303523 bti:QuebecClassActionsMember country:CA 2021-01-01 2021-12-31 0001303523 bti:ReynoldsAmericanIncMember bti:RAIGoodwillMember 2021-01-01 2021-12-31 0001303523 bti:NewportMember 2021-01-01 2021-12-31 0001303523 bti:CamelMember 2021-01-01 2021-12-31 0001303523 bti:RetainedEarningsTreasurySharesMember 2021-01-01 2021-12-31 0001303523 ifrs-full:LiquidityRiskMember bti:BondsIssuedMaturingInTwoThousandTwentyTwoMember 2021-01-01 2021-12-31 0001303523 ifrs-full:CurrencyRiskMember 2021-01-01 2021-12-31 0001303523 ifrs-full:InterestRateRiskMember ifrs-full:FixedInterestRateMember 2021-01-01 2021-12-31 0001303523 ifrs-full:CreditRiskMember 2021-01-01 2021-12-31 0001303523 ifrs-full:HedgesOfNetInvestmentInForeignOperationsMember 2021-01-01 2021-12-31 0001303523 bti:LeaseholdPropertyMember 2020-01-01 2020-12-31 0001303523 bti:LongTermIncentivePlanMember 2020-01-01 2020-12-31 0001303523 bti:GroupsShareInAssociatesAndJointVenturesMember 2020-01-01 2020-12-31 0001303523 bti:AdjustedAtConstantRatesMember 2020-01-01 2020-12-31 0001303523 bti:ITCLtdMember 2020-01-01 2020-12-31 0001303523 ifrs-full:PropertyPlantAndEquipmentMember 2020-01-01 2020-12-31 0001303523 ifrs-full:BrandNamesMember 2020-01-01 2020-12-31 0001303523 ifrs-full:ComputerSoftwareMember 2020-01-01 2020-12-31 0001303523 bti:EurobondsTwoMember 2020-01-01 2020-12-31 0001303523 bti:BritishAmericanTobaccoBangladeshCompanyLimitedMember 2020-01-01 2020-12-31 0001303523 ifrs-full:PensionDefinedBenefitPlansMember 2020-01-01 2020-12-31 0001303523 ifrs-full:PostemploymentMedicalDefinedBenefitPlansMember 2020-01-01 2020-12-31 0001303523 country:BR 2020-01-01 2020-12-31 0001303523 ifrs-full:OrdinarySharesMember 2020-01-01 2020-12-31 0001303523 bti:ExciseDisputeInRussiaMember 2020-01-01 2020-12-31 0001303523 ifrs-full:RestructuringProvisionMember 2020-01-01 2020-12-31 0001303523 bti:EmployeeRelatedBenefitsMember 2020-01-01 2020-12-31 0001303523 ifrs-full:MiscellaneousOtherProvisionsMember 2020-01-01 2020-12-31 0001303523 bti:TradeAndOtherPayablesMember 2020-01-01 2020-12-31 0001303523 bti:RestructuringMember country:ID 2020-01-01 2020-12-31 0001303523 country:JP 2020-01-01 2020-12-31 0001303523 bti:CashSettledDeferredShareBonusSchemeMember 2020-01-01 2020-12-31 0001303523 bti:EquitySettledDeferredShareBonusSchemeMember 2020-01-01 2020-12-31 0001303523 bti:EquitySettledLongTermIncentivePlanMember 2020-01-01 2020-12-31 0001303523 bti:CashSettledLongTermIncentivePlanMember 2020-01-01 2020-12-31 0001303523 bti:ReynoldsAmericanIncMember bti:UnitedStatesSegmentMember 2020-01-01 2020-12-31 0001303523 ifrs-full:ForeignCountriesMember 2020-01-01 2020-12-31 0001303523 ifrs-full:CountryOfDomicileMember 2020-01-01 2020-12-31 0001303523 ifrs-full:FinancialAssetsAtFairValueThroughProfitOrLossCategoryMember 2020-01-01 2020-12-31 0001303523 ifrs-full:FinancialAssetsAtFairValueThroughOtherComprehensiveIncomeCategoryMember 2020-01-01 2020-12-31 0001303523 bti:CashSettledMember 2020-01-01 2020-12-31 0001303523 bti:EquitySettledMember 2020-01-01 2020-12-31 0001303523 bti:EquitySettledOtherSchemesMember 2020-01-01 2020-12-31 0001303523 bti:CombustiblesMember 2020-01-01 2020-12-31 0001303523 bti:NewCategoriesMember 2020-01-01 2020-12-31 0001303523 bti:VapourMember bti:NewCategoriesMember 2020-01-01 2020-12-31 0001303523 bti:THPMember bti:NewCategoriesMember 2020-01-01 2020-12-31 0001303523 bti:ModernOralMember bti:NewCategoriesMember 2020-01-01 2020-12-31 0001303523 bti:TraditionalOralMember 2020-01-01 2020-12-31 0001303523 bti:OthersMember 2020-01-01 2020-12-31 0001303523 country:GB 2020-01-01 2020-12-31 0001303523 bti:GroupsAssociatesAndJointVenturesMember 2020-01-01 2020-12-31 0001303523 bti:OtherAssociatesMember 2020-01-01 2020-12-31 0001303523 ifrs-full:PensionDefinedBenefitPlansMember ifrs-full:PresentValueOfDefinedBenefitObligationMember 2020-01-01 2020-12-31 0001303523 ifrs-full:PostemploymentMedicalDefinedBenefitPlansMember ifrs-full:PresentValueOfDefinedBenefitObligationMember 2020-01-01 2020-12-31 0001303523 ifrs-full:PresentValueOfDefinedBenefitObligationMember 2020-01-01 2020-12-31 0001303523 bti:LongTermIncentivePlanMember bti:AggregateCompanyMember 2020-01-01 2020-12-31 0001303523 bti:DeferredShareBonusSchemeMember bti:AggregateCompanyMember 2020-01-01 2020-12-31 0001303523 bti:FilterCasesUSTobaccoRelatedMember 2020-01-01 2020-12-31 0001303523 bti:BroinIICasesUSTobaccoRelatedMember 2020-01-01 2020-12-31 0001303523 bti:EngleProgenyCasesUSTobaccoRelatedMember 2020-01-01 2020-12-31 0001303523 bti:IndividualSmokingAndHealthCasesUSTobaccoRelatedMember 2020-01-01 2020-12-31 0001303523 bti:ClassActionsUSTobaccoRelatedMember 2020-01-01 2020-12-31 0001303523 bti:MedicalReimbursementCasesUSTobaccoRelatedMember 2020-01-01 2020-12-31 0001303523 bti:IndividualSmokingAndHealthCasesNonUSTobaccoRelatedMember 2020-01-01 2020-12-31 0001303523 bti:ClassActionsNonUSTobaccoRelatedMember 2020-01-01 2020-12-31 0001303523 bti:MedicalReimbursementCasesNonUSTobaccoRelatedMember 2020-01-01 2020-12-31 0001303523 bti:StateSettlementAgreementsEnforcementAndValidityUSTobaccoRelatedMember 2020-01-01 2020-12-31 0001303523 ifrs-full:TradeReceivablesMember 2020-01-01 2020-12-31 0001303523 bti:LoansAndOtherReceivablesMember 2020-01-01 2020-12-31 0001303523 bti:UnitedStatesSegmentMember srt:SubsidiariesMember 2020-01-01 2020-12-31 0001303523 bti:AsiaPacificAndMiddleEastMember srt:SubsidiariesMember 2020-01-01 2020-12-31 0001303523 bti:AmericasAndSubSaharanAfricaMember srt:SubsidiariesMember 2020-01-01 2020-12-31 0001303523 bti:EuropeAndNorthAfricaSegmentMember srt:SubsidiariesMember 2020-01-01 2020-12-31 0001303523 srt:SubsidiariesMember 2020-01-01 2020-12-31 0001303523 ifrs-full:AssociatesMember 2020-01-01 2020-12-31 0001303523 bti:PTBentoelInternasionalInvestamaTbkMember 2020-01-01 2020-12-31 0001303523 bti:KPMGLLPFirmsAndAssociatesMember 2020-01-01 2020-12-31 0001303523 bti:KPMGLLPFirmsAndAssociatesMember bti:SECRegulationsMember 2020-01-01 2020-12-31 0001303523 bti:StockReliefMember 2020-01-01 2020-12-31 0001303523 bti:ExcessCapitalAllowancesMember 2020-01-01 2020-12-31 0001303523 ifrs-full:UnusedTaxLossesMember 2020-01-01 2020-12-31 0001303523 bti:UndistributedEarningsOfAssociatesAndSubsidiariesMember 2020-01-01 2020-12-31 0001303523 bti:RetirementBenefitsMember 2020-01-01 2020-12-31 0001303523 bti:TradeMarkMember 2020-01-01 2020-12-31 0001303523 ifrs-full:OtherTemporaryDifferencesMember 2020-01-01 2020-12-31 0001303523 bti:AssociatesAndJointVenturesMember 2020-01-01 2020-12-31 0001303523 bti:FunctionalCurrencyMember ifrs-full:CurrencySwapContractMember 2020-01-01 2020-12-31 0001303523 currency:GBP ifrs-full:CurrencySwapContractMember 2020-01-01 2020-12-31 0001303523 currency:EUR ifrs-full:CurrencySwapContractMember 2020-01-01 2020-12-31 0001303523 bti:OtherCurrencyMember ifrs-full:CurrencySwapContractMember 2020-01-01 2020-12-31 0001303523 ifrs-full:CurrencySwapContractMember 2020-01-01 2020-12-31 0001303523 bti:FunctionalCurrencyMember ifrs-full:ForwardContractMember 2020-01-01 2020-12-31 0001303523 currency:USD ifrs-full:ForwardContractMember 2020-01-01 2020-12-31 0001303523 currency:EUR ifrs-full:ForwardContractMember 2020-01-01 2020-12-31 0001303523 bti:OtherCurrencyMember ifrs-full:ForwardContractMember 2020-01-01 2020-12-31 0001303523 ifrs-full:ForwardContractMember 2020-01-01 2020-12-31 0001303523 bti:AllLitigationsMember bti:EngleAndOtherLitigationsCostsMember 2020-01-01 2020-12-31 0001303523 bti:RJReynoldsTobaccoCompanyMember bti:PaymentObligationMember bti:FloridaTexasMinnesotaAndMississippiMember 2020-01-01 2020-12-31 0001303523 bti:RJReynoldsTobaccoCompanyMember bti:PaymentObligationMember stpr:FL 2020-01-01 2020-12-31 0001303523 bti:RJReynoldsTobaccoCompanyMember bti:PaymentObligationMember bti:TexasMinnesotaAndMississippiMember 2020-01-01 2020-12-31 0001303523 bti:CashAndCashEquivalentsRelatedToNetDebtMember 2020-01-01 2020-12-31 0001303523 ifrs-full:LeaseLiabilitiesMember 2020-01-01 2020-12-31 0001303523 bti:EngleProgenyCasesMember 2020-01-01 2020-12-31 0001303523 bti:TotalDirectorsMember 2020-01-01 2020-12-31 0001303523 bti:ExecutiveDirectorsMember 2020-01-01 2020-12-31 0001303523 bti:AccountingFirmsMember bti:SECRegulationsMember 2020-01-01 2020-12-31 0001303523 bti:AdjustingItemsWhichHaveBeenAdjustedWithinNetFinanceCostsMember 2020-01-01 2020-12-31 0001303523 ifrs-full:MachineryMember country:ID 2020-01-01 2020-12-31 0001303523 bti:ExciseDisputeInTurkeySouthKoreaAndRussiaMember 2020-01-01 2020-12-31 0001303523 bti:ShortTermAndLongTermLeaseholdPropertyMember 2020-01-01 2020-12-31 0001303523 bti:IFRS16Member bti:RightOfUsePropertiesMember 2020-01-01 2020-12-31 0001303523 bti:PropertyAcquiredMember bti:IAS16Member 2020-01-01 2020-12-31 0001303523 country:US 2020-01-01 2020-12-31 0001303523 country:DE 2020-01-01 2020-12-31 0001303523 country:CA 2020-01-01 2020-12-31 0001303523 country:CH 2020-01-01 2020-12-31 0001303523 country:NL 2020-01-01 2020-12-31 0001303523 bti:AdjustedAtCurrentRatesMember bti:UnitedStatesSegmentMember 2020-01-01 2020-12-31 0001303523 bti:AdjustingItemsMember bti:UnitedStatesSegmentMember 2020-01-01 2020-12-31 0001303523 bti:ReportedMember bti:UnitedStatesSegmentMember 2020-01-01 2020-12-31 0001303523 bti:AdjustedAtCurrentRatesMember bti:AsiaPacificAndMiddleEastSegmentMember 2020-01-01 2020-12-31 0001303523 bti:AdjustingItemsMember bti:AsiaPacificAndMiddleEastSegmentMember 2020-01-01 2020-12-31 0001303523 bti:ReportedMember bti:AsiaPacificAndMiddleEastSegmentMember 2020-01-01 2020-12-31 0001303523 bti:AdjustedAtCurrentRatesMember bti:AmericasAndSubSaharanAfricaSegmentMember 2020-01-01 2020-12-31 0001303523 bti:AdjustingItemsMember bti:AmericasAndSubSaharanAfricaSegmentMember 2020-01-01 2020-12-31 0001303523 bti:ReportedMember bti:AmericasAndSubSaharanAfricaSegmentMember 2020-01-01 2020-12-31 0001303523 bti:AdjustedAtCurrentRatesMember bti:EuropeAndNorthAfricaSegmentMember 2020-01-01 2020-12-31 0001303523 bti:AdjustingItemsMember bti:EuropeAndNorthAfricaSegmentMember 2020-01-01 2020-12-31 0001303523 bti:ReportedMember bti:EuropeAndNorthAfricaSegmentMember 2020-01-01 2020-12-31 0001303523 bti:AdjustedAtCurrentRatesMember 2020-01-01 2020-12-31 0001303523 bti:AdjustingItemsMember 2020-01-01 2020-12-31 0001303523 bti:ReportedMember 2020-01-01 2020-12-31 0001303523 bti:AdjustedAtConstantRatesMember bti:UnitedStatesSegmentMember 2020-01-01 2020-12-31 0001303523 bti:TranslationExchangeMember bti:UnitedStatesSegmentMember 2020-01-01 2020-12-31 0001303523 bti:AdjustedAtConstantRatesMember bti:AsiaPacificAndMiddleEastSegmentMember 2020-01-01 2020-12-31 0001303523 bti:TranslationExchangeMember bti:AsiaPacificAndMiddleEastSegmentMember 2020-01-01 2020-12-31 0001303523 bti:AdjustedAtConstantRatesMember bti:AmericasAndSubSaharanAfricaSegmentMember 2020-01-01 2020-12-31 0001303523 bti:TranslationExchangeMember bti:AmericasAndSubSaharanAfricaSegmentMember 2020-01-01 2020-12-31 0001303523 bti:AdjustedAtConstantRatesMember bti:EuropeAndNorthAfricaSegmentMember 2020-01-01 2020-12-31 0001303523 bti:TranslationExchangeMember bti:EuropeAndNorthAfricaSegmentMember 2020-01-01 2020-12-31 0001303523 bti:TranslationExchangeMember 2020-01-01 2020-12-31 0001303523 ifrs-full:InterestRateSwapContractMember ifrs-full:NotLaterThanOneYearMember ifrs-full:InterestRateRiskMember 2020-01-01 2020-12-31 0001303523 ifrs-full:InterestRateSwapContractMember ifrs-full:LaterThanOneYearAndNotLaterThanTwoYearsMember ifrs-full:InterestRateRiskMember 2020-01-01 2020-12-31 0001303523 ifrs-full:CurrencySwapContractMember ifrs-full:NotLaterThanOneYearMember ifrs-full:InterestRateRiskMember 2020-01-01 2020-12-31 0001303523 ifrs-full:CurrencySwapContractMember ifrs-full:LaterThanTwoYearsAndNotLaterThanThreeYearsMember ifrs-full:InterestRateRiskMember 2020-01-01 2020-12-31 0001303523 ifrs-full:CurrencySwapContractMember ifrs-full:LaterThanFourYearsAndNotLaterThanFiveYearsMember ifrs-full:InterestRateRiskMember 2020-01-01 2020-12-31 0001303523 ifrs-full:CurrencySwapContractMember ifrs-full:LaterThanFiveYearsMember ifrs-full:InterestRateRiskMember 2020-01-01 2020-12-31 0001303523 ifrs-full:CurrencySwapContractMember ifrs-full:InterestRateRiskMember 2020-01-01 2020-12-31 0001303523 ifrs-full:AssociatesMember 2020-01-01 2020-12-31 0001303523 bti:RightOfUseLeasedPropertiesMember 2020-01-01 2020-12-31 0001303523 bti:FunctionalCurrencyMember 2020-01-01 2020-12-31 0001303523 currency:USD 2020-01-01 2020-12-31 0001303523 currency:GBP 2020-01-01 2020-12-31 0001303523 currency:EUR 2020-01-01 2020-12-31 0001303523 bti:OtherCurrencyMember 2020-01-01 2020-12-31 0001303523 bti:KPMGLLPFirmsAndAssociatesMember bti:ParentCompanyAndGroupAuditMember 2020-01-01 2020-12-31 0001303523 bti:KPMGLLPFirmsAndAssociatesMember bti:LocalStatutoryAndGroupReportingAuditsMember 2020-01-01 2020-12-31 0001303523 bti:KPMGLLPFirmsAndAssociatesMember bti:ParentCompanyLocalStatutoryAndGroupAuditsMember 2020-01-01 2020-12-31 0001303523 bti:ParentCompanyLocalStatutoryAndGroupAuditsMember bti:OtherFirmsMember 2020-01-01 2020-12-31 0001303523 bti:ParentCompanyLocalStatutoryAndGroupAuditsMember bti:AuditProviderMember 2020-01-01 2020-12-31 0001303523 ifrs-full:PensionDefinedBenefitPlansMember ifrs-full:PlanAssetsMember 2020-01-01 2020-12-31 0001303523 ifrs-full:PostemploymentMedicalDefinedBenefitPlansMember ifrs-full:PlanAssetsMember 2020-01-01 2020-12-31 0001303523 ifrs-full:PlanAssetsMember 2020-01-01 2020-12-31 0001303523 country:MY 2020-01-01 2020-12-31 0001303523 bti:TwispProprietaryLimitedMember 2020-01-01 2020-12-31 0001303523 bti:BlueNileCigaretteCompanyLimitedMember 2020-01-01 2020-12-31 0001303523 bti:AdjustingItemsWhichHaveBeenAdjustedWithinNetFinanceCostsMember bti:RussiaExciseDisputeMember 2020-01-01 2020-12-31 0001303523 bti:AdjustingItemsWhichHaveBeenAdjustedWithinNetFinanceCostsMember bti:AmnestyTaxPaymentInTurkeyMember 2020-01-01 2020-12-31 0001303523 bti:AdjustingItemsWhichHaveBeenAdjustedWithinNetFinanceCostsMember bti:FrankedInvestmentIncomeGroupLitigationOrderMember 2020-01-01 2020-12-31 0001303523 bti:FrankedInvestmentIncomeGroupLitigationOrderMember 2020-01-01 2020-12-31 0001303523 bti:RegisteredBATCAPBondsMember bti:BATPLCMember 2020-01-01 2020-12-31 0001303523 bti:RegisteredBATCAPBondsMember bti:BATCAPMember 2020-01-01 2020-12-31 0001303523 bti:RegisteredBATCAPBondsMember bti:BATIFMember 2020-01-01 2020-12-31 0001303523 bti:RegisteredBATCAPBondsMember bti:RAIMember 2020-01-01 2020-12-31 0001303523 ifrs-full:TopOfRangeMember bti:GlobalSoftwareSolutionsMember 2020-01-01 2020-12-31 0001303523 bti:MSALitigationMember ifrs-full:MiscellaneousOtherProvisionsMember 2020-01-01 2020-12-31 0001303523 bti:MSALitigationMember 2020-01-01 2020-12-31 0001303523 bti:OtherProvisionsForLiabilitiesMember bti:EmployeeRelatedBenefitsMember 2020-01-01 2020-12-31 0001303523 ifrs-full:MiscellaneousOtherProvisionsMember bti:OtherProvisionsForLiabilitiesMember 2020-01-01 2020-12-31 0001303523 bti:OtherProvisionsForLiabilitiesMember 2020-01-01 2020-12-31 0001303523 ifrs-full:RestructuringProvisionMember bti:OtherProvisionsForLiabilitiesMember 2020-01-01 2020-12-31 0001303523 bti:ForeignCurrencyRiskExposureMember bti:DerivativeRelatedNetInvestmentHedgesMember ifrs-full:ForwardContractMember 2020-01-01 2020-12-31 0001303523 bti:NonDerivativeRelatedNetInvestmentHedgesMember ifrs-full:LongtermBorrowingsMember 2020-01-01 2020-12-31 0001303523 ifrs-full:ForwardContractMember ifrs-full:CashFlowHedgesMember bti:ForeignCurrencyRiskExposureMember 2020-01-01 2020-12-31 0001303523 bti:InterestRateRiskExposureMember ifrs-full:CashFlowHedgesMember ifrs-full:CurrencySwapContractMember 2020-01-01 2020-12-31 0001303523 ifrs-full:CurrencySwapContractMember ifrs-full:FairValueHedgesMember bti:InterestRateRiskExposureMember 2020-01-01 2020-12-31 0001303523 bti:InterestRateRiskExposureMember ifrs-full:FairValueHedgesMember ifrs-full:InterestRateSwapContractMember 2020-01-01 2020-12-31 0001303523 bti:RegisteredBATCAPBondsMember bti:BATHTNMember 2020-01-01 2020-12-31 0001303523 bti:RegisteredBATCAPBondsMember bti:BATPLCMember bti:TransactionsWithNonIssuerNonGuarantorSubsidiariesMember 2020-01-01 2020-12-31 0001303523 bti:RegisteredBATCAPBondsMember bti:RAIMember bti:TransactionsWithNonIssuerNonGuarantorSubsidiariesMember 2020-01-01 2020-12-31 0001303523 bti:RegisteredBATCAPBondsMember bti:BATHTNMember bti:TransactionsWithNonIssuerNonGuarantorSubsidiariesMember 2020-01-01 2020-12-31 0001303523 ifrs-full:NotLaterThanOneYearMember ifrs-full:InterestRateRiskMember 2020-01-01 2020-12-31 0001303523 ifrs-full:LaterThanOneYearAndNotLaterThanTwoYearsMember ifrs-full:InterestRateRiskMember 2020-01-01 2020-12-31 0001303523 ifrs-full:LaterThanTwoYearsAndNotLaterThanThreeYearsMember ifrs-full:InterestRateRiskMember 2020-01-01 2020-12-31 0001303523 ifrs-full:LaterThanThreeYearsAndNotLaterThanFourYearsMember ifrs-full:InterestRateRiskMember 2020-01-01 2020-12-31 0001303523 ifrs-full:LaterThanFourYearsAndNotLaterThanFiveYearsMember ifrs-full:InterestRateRiskMember 2020-01-01 2020-12-31 0001303523 ifrs-full:LaterThanFiveYearsMember ifrs-full:InterestRateRiskMember 2020-01-01 2020-12-31 0001303523 ifrs-full:InterestRateRiskMember 2020-01-01 2020-12-31 0001303523 bti:KPMGLLPFirmsAndAssociatesMember bti:AuditRelatedAssuranceServicesMember 2020-01-01 2020-12-31 0001303523 bti:KPMGLLPFirmsAndAssociatesMember bti:OtherAssuranceServicesMember 2020-01-01 2020-12-31 0001303523 bti:KPMGLLPFirmsAndAssociatesMember bti:DefinedBenefitSchemesMember 2020-01-01 2020-12-31 0001303523 bti:KPMGLLPFirmsAndAssociatesMember 2020-01-01 2020-12-31 0001303523 ifrs-full:GoodwillMember 2020-01-01 2020-12-31 0001303523 ifrs-full:ComputerSoftwareMember 2020-01-01 2020-12-31 0001303523 ifrs-full:BrandNamesMember 2020-01-01 2020-12-31 0001303523 bti:DerivativeRelatedToNetDebtMember 2020-01-01 2020-12-31 0001303523 bti:CurrentFinancialAssetsRelatedToNetDebtMember 2020-01-01 2020-12-31 0001303523 bti:BorrowingsExcludingLeaseLiabilitiesMember 2020-01-01 2020-12-31 0001303523 bti:FoxRiverMember 2020-01-01 2020-12-31 0001303523 bti:ExciseDisputeInRussiaMember ifrs-full:MiscellaneousOtherProvisionsMember 2020-01-01 2020-12-31 0001303523 bti:ExciseDisputeInRussiaMember 2020-01-01 2020-12-31 0001303523 bti:FoxRiverMember bti:OtherProvisionsForLiabilitiesMember 2020-01-01 2020-12-31 0001303523 bti:RegisteredBATCAPBondsMember bti:BATCAPMember bti:TransactionsWithNonIssuerNonGuarantorSubsidiariesMember 2020-01-01 2020-12-31 0001303523 bti:RegisteredBATCAPBondsMember bti:BATIFMember bti:TransactionsWithNonIssuerNonGuarantorSubsidiariesMember 2020-01-01 2020-12-31 0001303523 ifrs-full:IntangibleAssetsUnderDevelopmentMember ifrs-full:InternallyGeneratedMember 2020-01-01 2020-12-31 0001303523 ifrs-full:InternallyGeneratedMember 2020-01-01 2020-12-31 0001303523 ifrs-full:NotInternallyGeneratedMember 2020-01-01 2020-12-31 0001303523 ifrs-full:NotInternallyGeneratedMember ifrs-full:BrandNamesMember 2020-01-01 2020-12-31 0001303523 ifrs-full:NotInternallyGeneratedMember ifrs-full:IntangibleAssetsUnderDevelopmentMember 2020-01-01 2020-12-31 0001303523 ifrs-full:FairValueHedgesMember 2020-01-01 2020-12-31 0001303523 ifrs-full:CashFlowHedgesMember 2020-01-01 2020-12-31 0001303523 bti:RetainedEarningsOtherMember 2020-01-01 2020-12-31 0001303523 bti:FreeholdPropertyMember 2020-01-01 2020-12-31 0001303523 bti:PlantEquipmentAndOtherOwnedMember 2020-01-01 2020-12-31 0001303523 bti:PlantEquipmentAndOtherLeasedMember 2020-01-01 2020-12-31 0001303523 ifrs-full:ConstructionInProgressMember 2020-01-01 2020-12-31 0001303523 bti:OrdinarySharesIssuedUnderShareOptionSchemesMember ifrs-full:SharePremiumMember 2020-01-01 2020-12-31 0001303523 ifrs-full:SharePremiumMember bti:SharesRepurchasedAndNotCancelledMember 2020-01-01 2020-12-31 0001303523 bti:TexasMinnesotaAndMississippiMember bti:ResolutionOfClaimsMember bti:RJReynoldsTobaccoCompanyMember 2020-01-01 2020-12-31 0001303523 bti:RJReynoldsTobaccoCompanyMember bti:MSAAndStateSettlementAgreementsMember 2020-01-01 2020-12-31 0001303523 bti:LeaseholdPropertyMember ifrs-full:RightofuseAssetsMember 2020-01-01 2020-12-31 0001303523 bti:PlantEquipmentAndOtherLeasedMember ifrs-full:RightofuseAssetsMember 2020-01-01 2020-12-31 0001303523 ifrs-full:RightofuseAssetsMember 2020-01-01 2020-12-31 0001303523 bti:ChairmanMember 2020-01-01 2020-12-31 0001303523 bti:NonExecutiveDirectorsMember 2020-01-01 2020-12-31 0001303523 bti:RJReynoldsTobaccoCompanyMember bti:TexasMinnesotaAndMississippiMember 2020-01-01 2020-12-31 0001303523 ifrs-full:IntangibleAssetsUnderDevelopmentMember 2020-01-01 2020-12-31 0001303523 ifrs-full:ReserveOfExchangeDifferencesOnTranslationMember 2020-01-01 2020-12-31 0001303523 ifrs-full:OtherReservesMember 2020-01-01 2020-12-31 0001303523 ifrs-full:RetainedEarningsMember 2020-01-01 2020-12-31 0001303523 ifrs-full:EquityAttributableToOwnersOfParentMember 2020-01-01 2020-12-31 0001303523 ifrs-full:NoncontrollingInterestsMember 2020-01-01 2020-12-31 0001303523 bti:HedgingReserveMember 2020-01-01 2020-12-31 0001303523 bti:PerformanceSharePlansMember bti:LongTermIncentivePlanMember bti:NetTurnoverMember 2020-01-01 2020-12-31 0001303523 bti:ShareholderReturnMember bti:PerformanceSharePlansMember bti:LongTermIncentivePlanMember 2020-01-01 2020-12-31 0001303523 bti:LongTermIncentivePlanMember bti:PerformanceSharePlansMember bti:OperatingCashFlowMember 2020-01-01 2020-12-31 0001303523 bti:EarningsPerShareMember bti:LongTermIncentivePlanMember bti:PerformanceSharePlansMember 2020-01-01 2020-12-31 0001303523 ifrs-full:ReserveOfCashFlowHedgesMember 2020-01-01 2020-12-31 0001303523 ifrs-full:OtherReservesMember bti:PresentedInCIEMember 2020-01-01 2020-12-31 0001303523 ifrs-full:EquityAttributableToOwnersOfParentMember bti:PresentedInCIEMember 2020-01-01 2020-12-31 0001303523 bti:PresentedInCIEMember 2020-01-01 2020-12-31 0001303523 bti:NewCategoryProductsMember ifrs-full:TopOfRangeMember 2020-01-01 2020-12-31 0001303523 bti:EquitySettledLongTermIncentivePlanMember bti:ReynoldsAmericanIncMember 2020-01-01 2020-12-31 0001303523 bti:SharePremiumCapitalRedemptionAndMergerReservesMember 2020-01-01 2020-12-31 0001303523 bti:SouthAfricaAndBelizeBrandsMember 2020-01-01 2020-12-31 0001303523 bti:ComputerSoftwareAndIntangibleAssetsUnderDevelopmentMember ifrs-full:GrossCarryingAmountMember ifrs-full:InternallyGeneratedMember 2020-01-01 2020-12-31 0001303523 bti:ImperialTobaccoGroupPLCMember 2020-01-01 2020-12-31 0001303523 bti:RJRTAndITGMember bti:TexasStateSettlementAgreementMember 2020-01-01 2020-12-31 0001303523 bti:AsiaPacificAndMiddleEastMember 2020-01-01 2020-12-31 0001303523 bti:AmericasAndSubSaharanAfricaMember 2020-01-01 2020-12-31 0001303523 bti:EuropeAndNorthAfricaMember 2020-01-01 2020-12-31 0001303523 bti:RJReynoldsTobaccoCompanyMember 2020-01-01 2020-12-31 0001303523 ifrs-full:PensionDefinedBenefitPlansMember bti:SolvencyLiabilitiesBasisMember country:GB 2020-01-01 2020-12-31 0001303523 bti:FoxRiverMember bti:NCRMember 2020-01-01 2020-12-31 0001303523 ifrs-full:RetainedEarningsMember bti:HeldInEmployeeShareOwnershipTrustsMember 2020-01-01 2020-12-31 0001303523 ifrs-full:EquityAttributableToOwnersOfParentMember bti:HeldInEmployeeShareOwnershipTrustsMember 2020-01-01 2020-12-31 0001303523 bti:HeldInEmployeeShareOwnershipTrustsMember 2020-01-01 2020-12-31 0001303523 ifrs-full:LiquidityRiskMember 2020-01-01 2020-12-31 0001303523 ifrs-full:ReserveOfGainsAndLossesOnRemeasuringAvailableforsaleFinancialAssetsMember 2020-01-01 2020-12-31 0001303523 country:US ifrs-full:PostemploymentMedicalDefinedBenefitPlansMember 2020-01-01 2020-12-31 0001303523 country:US ifrs-full:PensionDefinedBenefitPlansMember 2020-01-01 2020-12-31 0001303523 ifrs-full:PensionDefinedBenefitPlansMember country:GB 2020-01-01 2020-12-31 0001303523 bti:BrascubaCigarrillosSAMember 2020-01-01 2020-12-31 0001303523 bti:RetainedEarningsTreasurySharesMember 2020-01-01 2020-12-31 0001303523 ifrs-full:LiquidityRiskMember bti:BondsIssuedMaturingInTwoThousandTwentyTwoMember 2020-01-01 2020-12-31 0001303523 ifrs-full:CurrencyRiskMember 2020-01-01 2020-12-31 0001303523 ifrs-full:HedgesOfNetInvestmentInForeignOperationsMember 2020-01-01 2020-12-31 0001303523 bti:QuebecClassActionsMember 2019-01-01 2019-12-31 0001303523 bti:GroupsShareInAssociatesAndJointVenturesMember 2019-01-01 2019-12-31 0001303523 bti:AdjustedAtConstantRatesMember 2019-01-01 2019-12-31 0001303523 bti:ResearchAndDevelopmentMember 2019-01-01 2019-12-31 0001303523 bti:ExciseDisputeInRussiaMember 2019-01-01 2019-12-31 0001303523 ifrs-full:PropertyPlantAndEquipmentMember 2019-01-01 2019-12-31 0001303523 ifrs-full:BrandNamesMember 2019-01-01 2019-12-31 0001303523 ifrs-full:ComputerSoftwareMember 2019-01-01 2019-12-31 0001303523 bti:BritishAmericanTobaccoBangladeshCompanyLimitedMember 2019-01-01 2019-12-31 0001303523 country:BR 2019-01-01 2019-12-31 0001303523 ifrs-full:OrdinarySharesMember 2019-01-01 2019-12-31 0001303523 bti:ReynoldsAmericanIncMember bti:UnitedStatesSegmentMember 2019-01-01 2019-12-31 0001303523 bti:ITCLtdMember 2019-01-01 2019-12-31 0001303523 ifrs-full:ForeignCountriesMember 2019-01-01 2019-12-31 0001303523 ifrs-full:CountryOfDomicileMember 2019-01-01 2019-12-31 0001303523 bti:CashSettledMember 2019-01-01 2019-12-31 0001303523 bti:EquitySettledMember 2019-01-01 2019-12-31 0001303523 bti:EquitySettledOtherSchemesMember 2019-01-01 2019-12-31 0001303523 bti:CashSettledDeferredShareBonusSchemeMember 2019-01-01 2019-12-31 0001303523 bti:EquitySettledDeferredShareBonusSchemeMember 2019-01-01 2019-12-31 0001303523 bti:CashSettledLongTermIncentivePlanMember 2019-01-01 2019-12-31 0001303523 bti:EquitySettledLongTermIncentivePlanMember 2019-01-01 2019-12-31 0001303523 bti:CombustiblesMember 2019-01-01 2019-12-31 0001303523 bti:NewCategoriesMember 2019-01-01 2019-12-31 0001303523 bti:VapourMember bti:NewCategoriesMember 2019-01-01 2019-12-31 0001303523 bti:THPMember bti:NewCategoriesMember 2019-01-01 2019-12-31 0001303523 bti:ModernOralMember bti:NewCategoriesMember 2019-01-01 2019-12-31 0001303523 bti:TraditionalOralMember 2019-01-01 2019-12-31 0001303523 bti:OthersMember 2019-01-01 2019-12-31 0001303523 country:GB 2019-01-01 2019-12-31 0001303523 bti:GroupsAssociatesAndJointVenturesMember 2019-01-01 2019-12-31 0001303523 bti:OtherAssociatesMember 2019-01-01 2019-12-31 0001303523 bti:KPMGLLPFirmsAndAssociatesMember 2019-01-01 2019-12-31 0001303523 bti:KPMGLLPFirmsAndAssociatesMember bti:SECRegulationsMember 2019-01-01 2019-12-31 0001303523 ifrs-full:PensionDefinedBenefitPlansMember 2019-01-01 2019-12-31 0001303523 ifrs-full:PostemploymentMedicalDefinedBenefitPlansMember 2019-01-01 2019-12-31 0001303523 bti:AssociatesAndJointVenturesMember 2019-01-01 2019-12-31 0001303523 bti:AllLitigationsMember bti:EngleAndOtherLitigationsCostsMember 2019-01-01 2019-12-31 0001303523 bti:TotalDirectorsMember 2019-01-01 2019-12-31 0001303523 bti:ExecutiveDirectorsMember 2019-01-01 2019-12-31 0001303523 bti:AccountingFirmsMember bti:SECRegulationsMember 2019-01-01 2019-12-31 0001303523 bti:ExciseDisputeInTurkeySouthKoreaAndRussiaMember 2019-01-01 2019-12-31 0001303523 bti:AdjustedAtCurrentRatesMember bti:UnitedStatesSegmentMember 2019-01-01 2019-12-31 0001303523 bti:AdjustingItemsMember bti:UnitedStatesSegmentMember 2019-01-01 2019-12-31 0001303523 bti:ReportedMember bti:UnitedStatesSegmentMember 2019-01-01 2019-12-31 0001303523 bti:AdjustedAtCurrentRatesMember bti:AsiaPacificAndMiddleEastSegmentMember 2019-01-01 2019-12-31 0001303523 bti:AdjustingItemsMember bti:AsiaPacificAndMiddleEastSegmentMember 2019-01-01 2019-12-31 0001303523 bti:ReportedMember bti:AsiaPacificAndMiddleEastSegmentMember 2019-01-01 2019-12-31 0001303523 bti:AdjustedAtCurrentRatesMember bti:AmericasAndSubSaharanAfricaSegmentMember 2019-01-01 2019-12-31 0001303523 bti:AdjustingItemsMember bti:AmericasAndSubSaharanAfricaSegmentMember 2019-01-01 2019-12-31 0001303523 bti:ReportedMember bti:AmericasAndSubSaharanAfricaSegmentMember 2019-01-01 2019-12-31 0001303523 bti:AdjustedAtCurrentRatesMember bti:EuropeAndNorthAfricaSegmentMember 2019-01-01 2019-12-31 0001303523 bti:AdjustingItemsMember bti:EuropeAndNorthAfricaSegmentMember 2019-01-01 2019-12-31 0001303523 bti:ReportedMember bti:EuropeAndNorthAfricaSegmentMember 2019-01-01 2019-12-31 0001303523 bti:AdjustedAtCurrentRatesMember 2019-01-01 2019-12-31 0001303523 bti:AdjustingItemsMember 2019-01-01 2019-12-31 0001303523 bti:ReportedMember 2019-01-01 2019-12-31 0001303523 bti:KodiakAndOtherBrandsMember 2019-01-01 2019-12-31 0001303523 ifrs-full:AssociatesMember 2019-01-01 2019-12-31 0001303523 bti:KPMGLLPFirmsAndAssociatesMember bti:ParentCompanyAndGroupAuditMember 2019-01-01 2019-12-31 0001303523 bti:KPMGLLPFirmsAndAssociatesMember bti:LocalStatutoryAndGroupReportingAuditsMember 2019-01-01 2019-12-31 0001303523 bti:KPMGLLPFirmsAndAssociatesMember bti:ParentCompanyLocalStatutoryAndGroupAuditsMember 2019-01-01 2019-12-31 0001303523 bti:ParentCompanyLocalStatutoryAndGroupAuditsMember bti:OtherFirmsMember 2019-01-01 2019-12-31 0001303523 bti:ParentCompanyLocalStatutoryAndGroupAuditsMember bti:AuditProviderMember 2019-01-01 2019-12-31 0001303523 bti:BentoelMember 2019-01-01 2019-12-31 0001303523 bti:VapeWildMember 2019-01-01 2019-12-31 0001303523 bti:HighendsmokeMember 2019-01-01 2019-12-31 0001303523 bti:AdjustingItemsWhichHaveBeenAdjustedWithinNetFinanceCostsMember bti:RussiaExciseDisputeMember 2019-01-01 2019-12-31 0001303523 bti:AdjustingItemsWhichHaveBeenAdjustedWithinNetFinanceCostsMember bti:AmnestyTaxPaymentInTurkeyMember 2019-01-01 2019-12-31 0001303523 bti:AdjustingItemsWhichHaveBeenAdjustedWithinNetFinanceCostsMember bti:FrankedInvestmentIncomeGroupLitigationOrderMember 2019-01-01 2019-12-31 0001303523 bti:AdjustingItemsWhichHaveBeenAdjustedWithinNetFinanceCostsMember 2019-01-01 2019-12-31 0001303523 bti:FrankedInvestmentIncomeGroupLitigationOrderMember 2019-01-01 2019-12-31 0001303523 bti:KPMGLLPFirmsAndAssociatesMember bti:AuditRelatedAssuranceServicesMember 2019-01-01 2019-12-31 0001303523 bti:KPMGLLPFirmsAndAssociatesMember bti:OtherAssuranceServicesMember 2019-01-01 2019-12-31 0001303523 bti:KPMGLLPFirmsAndAssociatesMember bti:DefinedBenefitSchemesMember 2019-01-01 2019-12-31 0001303523 bti:KPMGLLPFirmsAndAssociatesMember 2019-01-01 2019-12-31 0001303523 bti:RetainedEarningsOtherMember 2019-01-01 2019-12-31 0001303523 bti:NonParticipatingManufacturerAdjustmentClaimsRelatedToPeriodFrom2004To2017Member bti:NonParticipatingManufacturerDisputesMember bti:RJReynoldsTobaccoCompanyMember bti:FiveYearPeriodFrom2019Member 2019-01-01 2019-12-31 0001303523 ifrs-full:SharePremiumMember bti:OrdinarySharesIssuedUnderShareOptionSchemesMember 2019-01-01 2019-12-31 0001303523 bti:SharesRepurchasedAndNotCancelledMember ifrs-full:SharePremiumMember 2019-01-01 2019-12-31 0001303523 bti:RJReynoldsTobaccoCompanyMember bti:MSAAndStateSettlementAgreementsMember 2019-01-01 2019-12-31 0001303523 bti:ChairmanMember 2019-01-01 2019-12-31 0001303523 bti:NonExecutiveDirectorsMember 2019-01-01 2019-12-31 0001303523 ifrs-full:ReserveOfExchangeDifferencesOnTranslationMember 2019-01-01 2019-12-31 0001303523 ifrs-full:OtherReservesMember 2019-01-01 2019-12-31 0001303523 ifrs-full:RetainedEarningsMember 2019-01-01 2019-12-31 0001303523 ifrs-full:EquityAttributableToOwnersOfParentMember 2019-01-01 2019-12-31 0001303523 ifrs-full:NoncontrollingInterestsMember 2019-01-01 2019-12-31 0001303523 bti:HedgingReserveMember 2019-01-01 2019-12-31 0001303523 bti:PerformanceSharePlansMember bti:LongTermIncentivePlanMember bti:NetTurnoverMember 2019-01-01 2019-12-31 0001303523 bti:ShareholderReturnMember bti:PerformanceSharePlansMember bti:LongTermIncentivePlanMember 2019-01-01 2019-12-31 0001303523 bti:OperatingCashFlowMember bti:PerformanceSharePlansMember bti:LongTermIncentivePlanMember 2019-01-01 2019-12-31 0001303523 bti:EarningsPerShareMember bti:LongTermIncentivePlanMember bti:PerformanceSharePlansMember 2019-01-01 2019-12-31 0001303523 ifrs-full:ReserveOfCashFlowHedgesMember 2019-01-01 2019-12-31 0001303523 ifrs-full:OtherReservesMember bti:PresentedInCIEMember 2019-01-01 2019-12-31 0001303523 ifrs-full:EquityAttributableToOwnersOfParentMember bti:PresentedInCIEMember 2019-01-01 2019-12-31 0001303523 bti:PresentedInCIEMember 2019-01-01 2019-12-31 0001303523 bti:MozambicanIPLitigationMember 2019-01-01 2019-12-31 0001303523 bti:ReynoldsAmericanIncMember bti:EquitySettledLongTermIncentivePlanMember 2019-01-01 2019-12-31 0001303523 bti:SharePremiumCapitalRedemptionAndMergerReservesMember 2019-01-01 2019-12-31 0001303523 bti:TDRMember 2019-01-01 2019-12-31 0001303523 bti:BlueNileCigaretteCompanyLimitedMember 2019-01-01 2019-12-31 0001303523 bti:ExpressLogisticandDistributionEOODMember 2019-01-01 2019-12-31 0001303523 bti:RJReynoldsTobaccoCompanyMember 2019-01-01 2019-12-31 0001303523 bti:FoxRiverMember bti:NCRMember 2019-01-01 2019-12-31 0001303523 ifrs-full:RetainedEarningsMember bti:HeldInEmployeeShareOwnershipTrustsMember 2019-01-01 2019-12-31 0001303523 ifrs-full:EquityAttributableToOwnersOfParentMember bti:HeldInEmployeeShareOwnershipTrustsMember 2019-01-01 2019-12-31 0001303523 bti:HeldInEmployeeShareOwnershipTrustsMember 2019-01-01 2019-12-31 0001303523 ifrs-full:ReserveOfGainsAndLossesOnRemeasuringAvailableforsaleFinancialAssetsMember 2019-01-01 2019-12-31 0001303523 bti:BrascubaCigarrillosSAMember 2019-01-01 2019-12-31 0001303523 bti:RetainedEarningsTreasurySharesMember 2019-01-01 2019-12-31 0001303523 ifrs-full:CurrencyRiskMember 2019-01-01 2019-12-31 0001303523 ifrs-full:InterestRateRiskMember 2019-01-01 2019-12-31 0001303523 bti:ReynoldsAmericanIncMember 2021-12-31 0001303523 bti:LongLeaseholdPropertyMember 2021-12-31 0001303523 bti:ShortLeaseholdPropertyMember 2021-12-31 0001303523 bti:ShortTermAndLongTermLeaseholdPropertyMember 2021-12-31 0001303523 bti:EurobondsTwoMember 2021-12-31 0001303523 ifrs-full:NotLaterThanOneYearMember 2021-12-31 0001303523 ifrs-full:LaterThanOneYearAndNotLaterThanFiveYearsMember 2021-12-31 0001303523 ifrs-full:LaterThanFiveYearsMember 2021-12-31 0001303523 bti:FreeholdLandMember ifrs-full:GrossCarryingAmountMember 2021-12-31 0001303523 ifrs-full:FactoringOfReceivablesMember 2021-12-31 0001303523 bti:FunctionalCurrencyMember 2021-12-31 0001303523 currency:USD 2021-12-31 0001303523 currency:EUR 2021-12-31 0001303523 bti:OtherCurrencyMember 2021-12-31 0001303523 ifrs-full:GrossCarryingAmountMember 2021-12-31 0001303523 ifrs-full:AccumulatedImpairmentMember 2021-12-31 0001303523 bti:SharePremiumCapitalRedemptionAndMergerReservesMember 2021-12-31 0001303523 ifrs-full:MergerReserveMember 2021-12-31 0001303523 ifrs-full:CapitalRedemptionReserveMember 2021-12-31 0001303523 ifrs-full:SharePremiumMember 2021-12-31 0001303523 bti:BATPLCMember 2021-12-31 0001303523 bti:RJRTBAndWAndLorillardTobaccoMember country:US 2021-12-31 0001303523 ifrs-full:PensionDefinedBenefitPlansMember 2021-12-31 0001303523 ifrs-full:PostemploymentMedicalDefinedBenefitPlansMember 2021-12-31 0001303523 bti:ImperialTobaccoCanadaMember 2021-12-31 0001303523 bti:AssociatesAndJointVenturesMember bti:OtherListedAssociatesMember 2021-12-31 0001303523 bti:AssociatesAndJointVenturesMember bti:ITCLtdMember 2021-12-31 0001303523 country:PE ifrs-full:GrossCarryingAmountMember 2021-12-31 0001303523 currency:IRR 2021-12-31 0001303523 ifrs-full:HedgingInstrumentsMember 2021-12-31 0001303523 bti:UnvestedAwardsMember 2021-12-31 0001303523 bti:VestedAwardsMember 2021-12-31 0001303523 bti:UnvestedDeferredShareBonusSchemeMember 2021-12-31 0001303523 bti:VestedDeferredShareBonusSchemeMember 2021-12-31 0001303523 bti:UnvestedLongTermIncentivePlanMember 2021-12-31 0001303523 bti:VestedLongTermIncentivePlanMember 2021-12-31 0001303523 ifrs-full:PensionDefinedBenefitPlansMember bti:ActiveMember 2021-12-31 0001303523 ifrs-full:PostemploymentMedicalDefinedBenefitPlansMember bti:ActiveMember 2021-12-31 0001303523 bti:ActiveMember 2021-12-31 0001303523 ifrs-full:PensionDefinedBenefitPlansMember bti:DeferredMember 2021-12-31 0001303523 ifrs-full:PostemploymentMedicalDefinedBenefitPlansMember bti:DeferredMember 2021-12-31 0001303523 bti:DeferredMember 2021-12-31 0001303523 ifrs-full:PensionDefinedBenefitPlansMember bti:RetiredMember 2021-12-31 0001303523 ifrs-full:PostemploymentMedicalDefinedBenefitPlansMember bti:RetiredMember 2021-12-31 0001303523 bti:RetiredMember 2021-12-31 0001303523 bti:ITCLtdMember 2021-12-31 0001303523 country:PE 2021-12-31 0001303523 currency:GBP 2021-12-31 0001303523 bti:ReynoldsAmericanIncMember bti:UnitedStatesSegmentMember 2021-12-31 0001303523 ifrs-full:CashFlowHedgesMember 2021-12-31 0001303523 ifrs-full:NotLaterThanOneYearMember ifrs-full:CashFlowHedgesMember 2021-12-31 0001303523 ifrs-full:LaterThanFiveYearsMember ifrs-full:CashFlowHedgesMember 2021-12-31 0001303523 country:BR 2021-12-31 0001303523 bti:EngleProgenyCasesMember 2021-12-31 0001303523 bti:FilterCasesMember 2021-12-31 0001303523 bti:BroinIICasesMember 2021-12-31 0001303523 bti:IndividualSmokingAndHealthCasesMember 2021-12-31 0001303523 ifrs-full:FactoringOfReceivablesMember bti:CollectionAgentMember 2021-12-31 0001303523 country:GB ifrs-full:PensionDefinedBenefitPlansMember 2021-12-31 0001303523 ifrs-full:PensionDefinedBenefitPlansMember country:DE 2021-12-31 0001303523 country:CA ifrs-full:PensionDefinedBenefitPlansMember 2021-12-31 0001303523 country:US ifrs-full:PensionDefinedBenefitPlansMember 2021-12-31 0001303523 ifrs-full:WhollyOrPartlyFundedDefinedBenefitPlansMember ifrs-full:PensionDefinedBenefitPlansMember 2021-12-31 0001303523 bti:RestOfGroupMember ifrs-full:PensionDefinedBenefitPlansMember 2021-12-31 0001303523 country:NL ifrs-full:PensionDefinedBenefitPlansMember 2021-12-31 0001303523 country:CH ifrs-full:PensionDefinedBenefitPlansMember 2021-12-31 0001303523 bti:ReynoldsAmericanIncMember 2021-12-31 0001303523 srt:EuropeMember 2021-12-31 0001303523 country:CA 2021-12-31 0001303523 country:AU 2021-12-31 0001303523 country:ZA 2021-12-31 0001303523 country:SG 2021-12-31 0001303523 bti:GlobalTravelRetailMember 2021-12-31 0001303523 country:MY 2021-12-31 0001303523 bti:OtherCountriesMember 2021-12-31 0001303523 bti:SupplyChainFinancingArrangementsMember 2021-12-31 0001303523 ifrs-full:ActuarialAssumptionOfLifeExpectancyAfterRetirementMember bti:OneYearIncreaseMember 2021-12-31 0001303523 ifrs-full:ActuarialAssumptionOfExpectedRatesOfInflationMember bti:OneYearIncreaseMember 2021-12-31 0001303523 ifrs-full:ActuarialAssumptionOfDiscountRatesMember bti:OneYearIncreaseMember 2021-12-31 0001303523 bti:AssociatesAndJointVenturesMember 2021-12-31 0001303523 bti:UnlistedAssociatesMember 2021-12-31 0001303523 bti:OtherListedAssociatesMember 2021-12-31 0001303523 ifrs-full:FactoringOfReceivablesMember bti:NonCollectionAgentMember 2021-12-31 0001303523 bti:ReynoldsAmericanIncMember bti:RAIGoodwillMember bti:DecreaseInRevenueMember 2021-12-31 0001303523 bti:ReynoldsAmericanIncMember bti:NewportMember bti:DecreaseInRevenueMember 2021-12-31 0001303523 bti:CamelMember bti:ReynoldsAmericanIncMember bti:DecreaseInRevenueMember 2021-12-31 0001303523 bti:ImperialTobaccoCanadaMember bti:DecreaseInRevenueMember 2021-12-31 0001303523 ifrs-full:InterestRateSwapContractMember ifrs-full:FairValueHedgesMember 2021-12-31 0001303523 ifrs-full:ForwardContractMember ifrs-full:CashFlowHedgesMember 2021-12-31 0001303523 ifrs-full:CurrencySwapContractMember ifrs-full:FairValueHedgesMember 2021-12-31 0001303523 ifrs-full:CurrencySwapContractMember ifrs-full:CashFlowHedgesMember 2021-12-31 0001303523 ifrs-full:ForwardContractMember ifrs-full:HedgesOfNetInvestmentInForeignOperationsMember 2021-12-31 0001303523 ifrs-full:InterestRateSwapContractMember bti:HeldForTradingMember 2021-12-31 0001303523 ifrs-full:ForwardContractMember bti:HeldForTradingMember 2021-12-31 0001303523 ifrs-full:PostemploymentMedicalDefinedBenefitPlansMember ifrs-full:WhollyOrPartlyFundedDefinedBenefitPlansMember 2021-12-31 0001303523 ifrs-full:WhollyOrPartlyFundedDefinedBenefitPlansMember 2021-12-31 0001303523 ifrs-full:WhollyUnfundedDefinedBenefitPlansMember ifrs-full:PensionDefinedBenefitPlansMember 2021-12-31 0001303523 ifrs-full:PostemploymentMedicalDefinedBenefitPlansMember ifrs-full:WhollyUnfundedDefinedBenefitPlansMember 2021-12-31 0001303523 ifrs-full:WhollyUnfundedDefinedBenefitPlansMember 2021-12-31 0001303523 ifrs-full:NotLaterThanOneYearMember ifrs-full:InterestRateSwapContractMember bti:NetSettledMember 2021-12-31 0001303523 bti:NetSettledMember ifrs-full:InterestRateSwapContractMember ifrs-full:LaterThanOneYearAndNotLaterThanTwoYearsMember 2021-12-31 0001303523 bti:NetSettledMember ifrs-full:InterestRateSwapContractMember ifrs-full:LaterThanTwoYearsAndNotLaterThanThreeYearsMember 2021-12-31 0001303523 bti:NetSettledMember ifrs-full:InterestRateSwapContractMember ifrs-full:LaterThanThreeYearsAndNotLaterThanFourYearsMember 2021-12-31 0001303523 bti:NetSettledMember 2021-12-31 0001303523 ifrs-full:Level1OfFairValueHierarchyMember 2021-12-31 0001303523 ifrs-full:Level3OfFairValueHierarchyMember 2021-12-31 0001303523 ifrs-full:ActuarialAssumptionOfDiscountRatesMember bti:OneYearDecreaseMember 2021-12-31 0001303523 ifrs-full:ActuarialAssumptionOfExpectedRatesOfInflationMember bti:OneYearDecreaseMember 2021-12-31 0001303523 ifrs-full:ActuarialAssumptionOfLifeExpectancyAfterRetirementMember bti:OneYearDecreaseMember 2021-12-31 0001303523 bti:IranianSubsidiaryMember 2021-12-31 0001303523 bti:ReynoldsAmericanIncMember bti:RAIGoodwillMember bti:DecreaseInTerminalValueRateMember 2021-12-31 0001303523 bti:ReynoldsAmericanIncMember bti:NewportMember bti:DecreaseInTerminalValueRateMember 2021-12-31 0001303523 bti:CamelMember bti:ReynoldsAmericanIncMember bti:DecreaseInTerminalValueRateMember 2021-12-31 0001303523 ifrs-full:LaterThanOneYearAndNotLaterThanTwoYearsMember 2021-12-31 0001303523 ifrs-full:LaterThanTwoYearsAndNotLaterThanThreeYearsMember 2021-12-31 0001303523 ifrs-full:LaterThanThreeYearsAndNotLaterThanFourYearsMember 2021-12-31 0001303523 ifrs-full:LaterThanFourYearsAndNotLaterThanFiveYearsMember 2021-12-31 0001303523 bti:ContractualGrossMaturityAmountMember ifrs-full:NotLaterThanOneYearMember 2021-12-31 0001303523 bti:ContractualGrossMaturityAmountMember ifrs-full:LaterThanOneYearAndNotLaterThanTwoYearsMember 2021-12-31 0001303523 bti:ContractualGrossMaturityAmountMember ifrs-full:LaterThanTwoYearsAndNotLaterThanThreeYearsMember 2021-12-31 0001303523 bti:ContractualGrossMaturityAmountMember ifrs-full:LaterThanThreeYearsAndNotLaterThanFourYearsMember 2021-12-31 0001303523 bti:ContractualGrossMaturityAmountMember ifrs-full:LaterThanFourYearsAndNotLaterThanFiveYearsMember 2021-12-31 0001303523 bti:ContractualGrossMaturityAmountMember ifrs-full:LaterThanFiveYearsMember 2021-12-31 0001303523 bti:ContractualGrossMaturityAmountMember 2021-12-31 0001303523 bti:NotLaterThanTwentyYearsMember 2021-12-31 0001303523 bti:NoExpiryPeriodMember 2021-12-31 0001303523 country:GB 2021-12-31 0001303523 ifrs-full:ForeignCountriesMember 2021-12-31 0001303523 bti:SFRTIIndemnityMember 2021-12-31 0001303523 bti:InterestRateRiskExposureMember ifrs-full:FairValueHedgesMember ifrs-full:InterestRateSwapContractMember 2021-12-31 0001303523 bti:InterestRateRiskExposureMember ifrs-full:FairValueHedgesMember ifrs-full:CurrencySwapContractMember 2021-12-31 0001303523 bti:InterestRateRiskExposureMember ifrs-full:CashFlowHedgesMember ifrs-full:CurrencySwapContractMember 2021-12-31 0001303523 bti:ForeignCurrencyRiskExposureMember ifrs-full:CashFlowHedgesMember ifrs-full:ForwardContractMember 2021-12-31 0001303523 bti:ForeignCurrencyRiskExposureMember bti:DerivativeRelatedNetInvestmentHedgesMember ifrs-full:ForwardContractMember 2021-12-31 0001303523 bti:NonDerivativeRelatedNetInvestmentHedgesMember ifrs-full:LongtermBorrowingsMember 2021-12-31 0001303523 bti:CashSettledDeferredShareBonusSchemeMember 2021-12-31 0001303523 bti:CashSettledLongTermIncentivePlanMember 2021-12-31 0001303523 bti:EquitySettledLongTermIncentivePlanMember 2021-12-31 0001303523 ifrs-full:Level2OfFairValueHierarchyMember ifrs-full:InterestRateSwapContractMember 2021-12-31 0001303523 ifrs-full:InterestRateSwapContractMember 2021-12-31 0001303523 ifrs-full:Level2OfFairValueHierarchyMember ifrs-full:CurrencySwapContractMember 2021-12-31 0001303523 ifrs-full:CurrencySwapContractMember 2021-12-31 0001303523 ifrs-full:Level2OfFairValueHierarchyMember ifrs-full:ForwardContractMember 2021-12-31 0001303523 ifrs-full:ForwardContractMember 2021-12-31 0001303523 country:US 2021-12-31 0001303523 country:DE 2021-12-31 0001303523 country:NL 2021-12-31 0001303523 country:CH 2021-12-31 0001303523 bti:NetSettledMember ifrs-full:InterestRateSwapContractMember ifrs-full:LaterThanFourYearsAndNotLaterThanFiveYearsMember 2021-12-31 0001303523 ifrs-full:LaterThanFiveYearsMember ifrs-full:InterestRateSwapContractMember bti:NetSettledMember 2021-12-31 0001303523 bti:USUKBangladeshIndonesiaAndSouthKoreaMember bti:FreeholdPropertyMember 2021-12-31 0001303523 bti:LeaseholdPropertiesAcquiredAndAnotherMember 2021-12-31 0001303523 bti:BritishAmericanTobaccoBangladeshCompanyLimitedMember 2021-12-31 0001303523 bti:NotLaterThanTenYearsMember 2021-12-31 0001303523 bti:BilateralFacilitiesMember 2021-12-31 0001303523 bti:TermLoansMember 2021-12-31 0001303523 bti:RegisteredBATCAPBondsMember bti:BATPLCMember 2021-12-31 0001303523 bti:RegisteredBATCAPBondsMember bti:BATCAPMember 2021-12-31 0001303523 bti:RegisteredBATCAPBondsMember bti:BATIFMember 2021-12-31 0001303523 bti:RegisteredBATCAPBondsMember bti:BATNFMember 2021-12-31 0001303523 bti:RegisteredBATCAPBondsMember bti:RAIMember 2021-12-31 0001303523 bti:RegisteredBATCAPBondsMember bti:BATHTNMember 2021-12-31 0001303523 bti:RegisteredBATCAPBondsInConnectionWithTheAcquisitionOfRAIMember 2021-12-31 0001303523 bti:InflowMember ifrs-full:NotLaterThanOneYearMember ifrs-full:ForwardContractMember bti:GrossSettledMember 2021-12-31 0001303523 bti:InflowMember ifrs-full:NotLaterThanOneYearMember ifrs-full:CurrencySwapContractMember bti:GrossSettledMember 2021-12-31 0001303523 bti:InflowMember ifrs-full:LaterThanOneYearAndNotLaterThanTwoYearsMember ifrs-full:ForwardContractMember bti:GrossSettledMember 2021-12-31 0001303523 bti:GrossSettledMember ifrs-full:CurrencySwapContractMember ifrs-full:LaterThanOneYearAndNotLaterThanTwoYearsMember bti:InflowMember 2021-12-31 0001303523 bti:GrossSettledMember ifrs-full:CurrencySwapContractMember ifrs-full:LaterThanTwoYearsAndNotLaterThanThreeYearsMember bti:InflowMember 2021-12-31 0001303523 bti:InflowMember ifrs-full:LaterThanThreeYearsAndNotLaterThanFourYearsMember ifrs-full:CurrencySwapContractMember bti:GrossSettledMember 2021-12-31 0001303523 bti:InflowMember ifrs-full:LaterThanFourYearsAndNotLaterThanFiveYearsMember ifrs-full:CurrencySwapContractMember bti:GrossSettledMember 2021-12-31 0001303523 bti:InflowMember ifrs-full:LaterThanFiveYearsMember ifrs-full:CurrencySwapContractMember bti:GrossSettledMember 2021-12-31 0001303523 bti:InflowMember bti:GrossSettledMember 2021-12-31 0001303523 bti:FinancialDerivativeAssetsMember 2021-12-31 0001303523 bti:FinancialDerivativeLiabilitiesMember 2021-12-31 0001303523 bti:AggregateCompanyMember bti:DeferredShareBonusSchemeMember 2021-12-31 0001303523 bti:ManagementBoardMember bti:DeferredShareBonusSchemeMember 2021-12-31 0001303523 bti:AggregateCompanyMember bti:LongTermIncentivePlanMember 2021-12-31 0001303523 bti:ManagementBoardMember bti:LongTermIncentivePlanMember 2021-12-31 0001303523 bti:OrganigramIncMember 2021-12-31 0001303523 ifrs-full:FairValueHedgesMember 2021-12-31 0001303523 bti:RegisteredBATCAPBondsMember 2021-12-31 0001303523 bti:RegisteredBATIFBondsMember 2021-12-31 0001303523 ifrs-full:AccumulatedDepreciationAmortisationAndImpairmentMember ifrs-full:ComputerSoftwareMember 2021-12-31 0001303523 ifrs-full:AccumulatedDepreciationAmortisationAndImpairmentMember ifrs-full:BrandNamesMember 2021-12-31 0001303523 ifrs-full:AccumulatedDepreciationAmortisationAndImpairmentMember 2021-12-31 0001303523 ifrs-full:AtFairValueMember 2021-12-31 0001303523 ifrs-full:MarketComparablePricesMember ifrs-full:AtFairValueMember ifrs-full:Level1OfFairValueHierarchyMember 2021-12-31 0001303523 ifrs-full:Level3OfFairValueHierarchyMember ifrs-full:AtFairValueMember ifrs-full:DiscountedCashFlowMember 2021-12-31 0001303523 bti:LorillardIncMember 2021-12-31 0001303523 bti:ReynoldsAmericanIncMember 2021-12-31 0001303523 bti:IndividualSmokingAndHealthCasesUSTobaccoRelatedMember bti:USTobaccoRelatedActionsMember 2021-12-31 0001303523 bti:TisakDDMember 2021-12-31 0001303523 ifrs-full:FinancialAssetsAtFairValueThroughProfitOrLossCategoryMember 2021-12-31 0001303523 ifrs-full:FinancialAssetsAtFairValueThroughOtherComprehensiveIncomeCategoryMember 2021-12-31 0001303523 bti:OutflowMember bti:GrossSettledMember 2021-12-31 0001303523 bti:OutflowMember ifrs-full:LaterThanFiveYearsMember ifrs-full:CurrencySwapContractMember bti:GrossSettledMember 2021-12-31 0001303523 bti:GrossSettledMember ifrs-full:CurrencySwapContractMember ifrs-full:LaterThanFourYearsAndNotLaterThanFiveYearsMember bti:OutflowMember 2021-12-31 0001303523 bti:OutflowMember ifrs-full:LaterThanThreeYearsAndNotLaterThanFourYearsMember ifrs-full:CurrencySwapContractMember bti:GrossSettledMember 2021-12-31 0001303523 bti:OutflowMember ifrs-full:LaterThanTwoYearsAndNotLaterThanThreeYearsMember ifrs-full:CurrencySwapContractMember bti:GrossSettledMember 2021-12-31 0001303523 bti:OutflowMember ifrs-full:LaterThanOneYearAndNotLaterThanTwoYearsMember ifrs-full:CurrencySwapContractMember bti:GrossSettledMember 2021-12-31 0001303523 bti:OutflowMember ifrs-full:LaterThanOneYearAndNotLaterThanTwoYearsMember ifrs-full:ForwardContractMember bti:GrossSettledMember 2021-12-31 0001303523 bti:OutflowMember ifrs-full:NotLaterThanOneYearMember ifrs-full:CurrencySwapContractMember bti:GrossSettledMember 2021-12-31 0001303523 bti:OutflowMember ifrs-full:NotLaterThanOneYearMember ifrs-full:ForwardContractMember bti:GrossSettledMember 2021-12-31 0001303523 ifrs-full:Level2OfFairValueHierarchyMember 2021-12-31 0001303523 bti:PropertyPlantAndEquipmentInventoryAndReceivablesMember 2021-12-31 0001303523 bti:EmployeeRelatedBenefitsMember 2021-12-31 0001303523 bti:BentoelMember 2021-12-31 0001303523 bti:HrvastskiDuhaniDDTobaccoLeafProcessingMember 2021-12-31 0001303523 bti:SamfruitMember 2021-12-31 0001303523 ifrs-full:RestructuringProvisionMember 2021-12-31 0001303523 bti:FoxRiverMember 2021-12-31 0001303523 ifrs-full:MiscellaneousOtherProvisionsMember 2021-12-31 0001303523 ifrs-full:PensionDefinedBenefitPlansMember bti:ListedMember ifrs-full:PlanAssetsMember 2021-12-31 0001303523 ifrs-full:PostemploymentMedicalDefinedBenefitPlansMember bti:ListedMember ifrs-full:PlanAssetsMember 2021-12-31 0001303523 bti:ListedMember 2021-12-31 0001303523 ifrs-full:PensionDefinedBenefitPlansMember bti:UnlistedMember ifrs-full:PlanAssetsMember 2021-12-31 0001303523 ifrs-full:PostemploymentMedicalDefinedBenefitPlansMember bti:UnlistedMember ifrs-full:PlanAssetsMember 2021-12-31 0001303523 bti:UnlistedMember 2021-12-31 0001303523 bti:EurobondsOneMember ifrs-full:BottomOfRangeMember 2021-12-31 0001303523 bti:EurobondsOneMember ifrs-full:TopOfRangeMember 2021-12-31 0001303523 bti:EurobondsThreeMember ifrs-full:BottomOfRangeMember 2021-12-31 0001303523 bti:EurobondsThreeMember ifrs-full:TopOfRangeMember 2021-12-31 0001303523 bti:EurobondsFourMember 2021-12-31 0001303523 bti:BondsIssuedOneMember ifrs-full:BottomOfRangeMember 2021-12-31 0001303523 bti:BondsIssuedOneMember ifrs-full:TopOfRangeMember 2021-12-31 0001303523 bti:RegisteredBATCAPBondsMember bti:BATPLCMember bti:TransactionsWithNonIssuerNonGuarantorSubsidiariesMember 2021-12-31 0001303523 bti:RegisteredBATCAPBondsMember bti:BATCAPMember bti:TransactionsWithNonIssuerNonGuarantorSubsidiariesMember 2021-12-31 0001303523 bti:RegisteredBATCAPBondsMember bti:BATIFMember bti:TransactionsWithNonIssuerNonGuarantorSubsidiariesMember 2021-12-31 0001303523 bti:RegisteredBATCAPBondsMember bti:RAIMember bti:TransactionsWithNonIssuerNonGuarantorSubsidiariesMember 2021-12-31 0001303523 bti:RegisteredBATCAPBondsMember bti:BATHTNMember bti:TransactionsWithNonIssuerNonGuarantorSubsidiariesMember 2021-12-31 0001303523 bti:TaxAssessmentMember bti:BATTutunMember country:TR 2021-12-31 0001303523 country:EG bti:BritishAmericanTobaccoEgyptLLCMember bti:TaxAssessmentMember 2021-12-31 0001303523 country:NL bti:TaxReassessmentMember 2021-12-31 0001303523 bti:SouzaCruzMember bti:TaxReassessmentMember country:BR 2021-12-31 0001303523 bti:BATTutunMember bti:LatePaymentInterestMember country:TR 2021-12-31 0001303523 bti:BATTutunMember bti:TaxAndPenaltiesMember country:TR 2021-12-31 0001303523 country:US bti:ReynoldsDefendantsMember 2021-12-31 0001303523 country:US bti:ReynoldsDefendantsMember bti:IndividualSmokingAndHealthCasesMember 2021-12-31 0001303523 country:US bti:ReynoldsDefendantsMember bti:FilterCasesMember 2021-12-31 0001303523 bti:OtherNonSmokingAndHealthCasesMember bti:ReynoldsDefendantsMember country:US 2021-12-31 0001303523 country:US bti:EngleProgenyCasesMember 2021-12-31 0001303523 bti:BroinVPhilipMorrisIncMember bti:USTobaccoRelatedActionsMember 2021-12-31 0001303523 ifrs-full:BuildingsMember 2021-12-31 0001303523 bti:PlantEquipmentAndOtherMember 2021-12-31 0001303523 bti:SharesaveSchemeSAYEMember 2021-12-31 0001303523 country:UZ bti:SamfruitMember 2021-12-31 0001303523 bti:StarrBlundellAndHardinVsRJRTMember 2021-12-31 0001303523 bti:SamfruitMember country:UZ 2021-12-31 0001303523 bti:OrganigramIncMember bti:LaurentianOrganicIncMember 2021-12-31 0001303523 bti:EdiblesInfusionsCorporationMember bti:OrganigramIncMember 2021-12-31 0001303523 bti:CrowCreekSiouxTribeAndAmericanTobaccoCoMember bti:RJRTBAndWAndLorillardTobaccoMember 2021-12-31 0001303523 bti:RJReynoldsTobaccoCompanyMember 2021-12-31 0001303523 bti:ReynoldsAmericanIncMember bti:RAIGoodwillMember 2021-12-31 0001303523 ifrs-full:GrossCarryingAmountMember bti:NewportMember bti:ReynoldsAmericanIncMember 2021-12-31 0001303523 bti:ReynoldsAmericanIncMember bti:CamelMember 2021-12-31 0001303523 bti:ImperialTobaccoCanadaMember 2021-12-31 0001303523 bti:RothmansGroupMember 2021-12-31 0001303523 bti:ETIMember 2021-12-31 0001303523 bti:SkandinaviskTobakskompagniMember 2021-12-31 0001303523 bti:EurobondsOneMember 2021-12-31 0001303523 bti:EurobondsThreeMember 2021-12-31 0001303523 bti:BondsIssuedOneMember 2021-12-31 0001303523 bti:BondsIssuedTwoMember 2021-12-31 0001303523 bti:TobaccoProductLiabilityClaimsMember 2021-12-31 0001303523 bti:HrvatskiDuhaniDDTobaccoLeafProcessingMember 2021-12-31 0001303523 country:US bti:ReynoldsAmericanFundedRetirementPlanMember 2021-12-31 0001303523 country:GB ifrs-full:WhollyOrPartlyFundedDefinedBenefitPlansMember bti:BritishAmericanTobaccoUkPensionFundMember 2021-12-31 0001303523 bti:BritishAmericanTobaccoUkPensionFundMember 2021-12-31 0001303523 country:GB bti:BuyInContractMember 2021-12-31 0001303523 bti:ImascoPensionFundSocietyPlanMember 2021-12-31 0001303523 bti:BatParsCompanyPjscMember bti:AdjustingItemsWhichHaveBeenAdjustedWithinNetFinanceCostsMember 2021-12-31 0001303523 bti:ReynoldsAmericanIncMember bti:EquitySettledLongTermIncentivePlanMember 2021-12-31 0001303523 bti:KnightClassActionMember 2021-12-31 0001303523 ifrs-full:HedgesOfNetInvestmentInForeignOperationsMember 2021-12-31 0001303523 bti:ReynoldsAmericanIncMember ifrs-full:BrandNamesMember 2021-12-31 0001303523 bti:TrademarksAndSimilarIntangiblesMember bti:ReynoldsAmericanIncMember 2021-12-31 0001303523 bti:TrademarksAndSimilarIntangiblesMember bti:DryftSciencesLLCMember 2021-12-31 0001303523 country:CA ifrs-full:PensionDefinedBenefitPlansMember bti:SchemesInSurplusOnlyMember 2021-12-31 0001303523 country:NL ifrs-full:PensionDefinedBenefitPlansMember bti:SchemesInSurplusOnlyMember 2021-12-31 0001303523 bti:SFNTCMember 2021-12-31 0001303523 currency:CAD 2021-12-31 0001303523 currency:EUR 2021-12-31 0001303523 currency:BRL 2021-12-31 0001303523 currency:AOA 2021-12-31 0001303523 currency:NGN 2021-12-31 0001303523 currency:KRW 2021-12-31 0001303523 currency:HRK 2021-12-31 0001303523 currency:JPY 2021-12-31 0001303523 currency:QAR 2021-12-31 0001303523 currency:SAR 2021-12-31 0001303523 currency:ARS 2021-12-31 0001303523 bti:NewportMember 2021-12-31 0001303523 bti:CamelMember 2021-12-31 0001303523 ifrs-full:BottomOfRangeMember 2021-12-31 0001303523 ifrs-full:TopOfRangeMember 2021-12-31 0001303523 country:CA bti:QuebecClassActionsMember 2021-12-31 0001303523 country:CA bti:OtherCanadianSmokingAndHealthClassActionsMember 2021-12-31 0001303523 bti:OtherCanadianSmokingAndHealthClassActionsMember bti:BritishColumbiaMember 2021-12-31 0001303523 ifrs-full:PensionDefinedBenefitPlansMember bti:GroupOfCountriesMember 2021-12-31 0001303523 ifrs-full:LiquidityRiskMember 2021-12-31 0001303523 ifrs-full:LiquidityRiskMember bti:MoneyMarketFundMember 2021-12-31 0001303523 ifrs-full:PostemploymentMedicalDefinedBenefitPlansMember country:CA 2021-12-31 0001303523 ifrs-full:PostemploymentMedicalDefinedBenefitPlansMember country:US 2021-12-31 0001303523 ifrs-full:LiquidityRiskMember bti:BilateralFacilitiesMember 2021-12-31 0001303523 ifrs-full:InterestRateRiskMember 2021-12-31 0001303523 bti:AllOtherCountriesMember ifrs-full:TopOfRangeMember 2021-12-31 0001303523 bti:AllOtherCountriesMember ifrs-full:BottomOfRangeMember 2021-12-31 0001303523 ifrs-full:CurrencyRiskMember currency:USD 2021-12-31 0001303523 ifrs-full:CurrencyRiskMember bti:RestOfGroupMember 2021-12-31 0001303523 ifrs-full:CurrencyRiskMember currency:GBP 2021-12-31 0001303523 ifrs-full:CurrencyRiskMember currency:EUR 2021-12-31 0001303523 ifrs-full:InterestRateRiskMember ifrs-full:FixedInterestRateMember 2021-12-31 0001303523 ifrs-full:FairValueHedgesMember ifrs-full:InterestRateSwapContractMember bti:DerivativesMaturingInJuneTwentyTwentyTwoMember ifrs-full:InterestRateRiskMember 2021-12-31 0001303523 ifrs-full:FairValueHedgesMember ifrs-full:CurrencySwapContractMember bti:DerivativesMaturingInOctoberTwentyTwentyThreeMember ifrs-full:InterestRateRiskMember 2021-12-31 0001303523 bti:LeafSupplyArrangementsMember 2021-12-31 0001303523 bti:ShortTermCreditFacilityMember 2021-12-31 0001303523 ifrs-full:CashFlowHedgesMember ifrs-full:CurrencyRiskMember 2021-12-31 0001303523 bti:ReynoldsAmericanIncMember 2020-12-31 0001303523 bti:LongLeaseholdPropertyMember 2020-12-31 0001303523 bti:ShortLeaseholdPropertyMember 2020-12-31 0001303523 bti:ShortTermAndLongTermLeaseholdPropertyMember 2020-12-31 0001303523 bti:EurobondsTwoMember 2020-12-31 0001303523 ifrs-full:NotLaterThanOneYearMember 2020-12-31 0001303523 ifrs-full:LaterThanOneYearAndNotLaterThanFiveYearsMember 2020-12-31 0001303523 ifrs-full:LaterThanFiveYearsMember 2020-12-31 0001303523 bti:FreeholdLandMember ifrs-full:GrossCarryingAmountMember 2020-12-31 0001303523 ifrs-full:FactoringOfReceivablesMember 2020-12-31 0001303523 bti:FunctionalCurrencyMember 2020-12-31 0001303523 currency:USD 2020-12-31 0001303523 currency:EUR 2020-12-31 0001303523 bti:OtherCurrencyMember 2020-12-31 0001303523 ifrs-full:GrossCarryingAmountMember 2020-12-31 0001303523 ifrs-full:AccumulatedImpairmentMember 2020-12-31 0001303523 bti:SharePremiumCapitalRedemptionAndMergerReservesMember 2020-12-31 0001303523 ifrs-full:MergerReserveMember 2020-12-31 0001303523 ifrs-full:CapitalRedemptionReserveMember 2020-12-31 0001303523 ifrs-full:SharePremiumMember 2020-12-31 0001303523 bti:BATPLCMember 2020-12-31 0001303523 ifrs-full:PensionDefinedBenefitPlansMember 2020-12-31 0001303523 ifrs-full:PostemploymentMedicalDefinedBenefitPlansMember 2020-12-31 0001303523 bti:ImperialTobaccoCanadaMember 2020-12-31 0001303523 bti:AssociatesAndJointVenturesMember bti:OtherListedAssociatesMember 2020-12-31 0001303523 bti:AssociatesAndJointVenturesMember bti:ITCLtdMember 2020-12-31 0001303523 currency:IRR 2020-12-31 0001303523 ifrs-full:HedgingInstrumentsMember 2020-12-31 0001303523 bti:UnvestedAwardsMember 2020-12-31 0001303523 bti:VestedAwardsMember 2020-12-31 0001303523 bti:UnvestedDeferredShareBonusSchemeMember 2020-12-31 0001303523 bti:VestedDeferredShareBonusSchemeMember 2020-12-31 0001303523 bti:UnvestedLongTermIncentivePlanMember 2020-12-31 0001303523 bti:VestedLongTermIncentivePlanMember 2020-12-31 0001303523 ifrs-full:PensionDefinedBenefitPlansMember bti:ActiveMember 2020-12-31 0001303523 ifrs-full:PostemploymentMedicalDefinedBenefitPlansMember bti:ActiveMember 2020-12-31 0001303523 bti:ActiveMember 2020-12-31 0001303523 ifrs-full:PensionDefinedBenefitPlansMember bti:DeferredMember 2020-12-31 0001303523 ifrs-full:PostemploymentMedicalDefinedBenefitPlansMember bti:DeferredMember 2020-12-31 0001303523 bti:DeferredMember 2020-12-31 0001303523 ifrs-full:PensionDefinedBenefitPlansMember bti:RetiredMember 2020-12-31 0001303523 ifrs-full:PostemploymentMedicalDefinedBenefitPlansMember bti:RetiredMember 2020-12-31 0001303523 bti:RetiredMember 2020-12-31 0001303523 bti:ITCLtdMember 2020-12-31 0001303523 currency:GBP 2020-12-31 0001303523 bti:ReynoldsAmericanIncMember bti:UnitedStatesSegmentMember 2020-12-31 0001303523 ifrs-full:CashFlowHedgesMember 2020-12-31 0001303523 ifrs-full:NotLaterThanOneYearMember ifrs-full:CashFlowHedgesMember 2020-12-31 0001303523 ifrs-full:LaterThanFiveYearsMember ifrs-full:CashFlowHedgesMember 2020-12-31 0001303523 bti:EngleProgenyCasesMember 2020-12-31 0001303523 bti:FilterCasesMember 2020-12-31 0001303523 bti:BroinIICasesMember 2020-12-31 0001303523 bti:IndividualSmokingAndHealthCasesMember 2020-12-31 0001303523 ifrs-full:FactoringOfReceivablesMember bti:CollectionAgentMember 2020-12-31 0001303523 country:GB ifrs-full:PensionDefinedBenefitPlansMember 2020-12-31 0001303523 country:DE ifrs-full:PensionDefinedBenefitPlansMember 2020-12-31 0001303523 country:CA ifrs-full:PensionDefinedBenefitPlansMember 2020-12-31 0001303523 country:US ifrs-full:PensionDefinedBenefitPlansMember 2020-12-31 0001303523 ifrs-full:WhollyOrPartlyFundedDefinedBenefitPlansMember ifrs-full:PensionDefinedBenefitPlansMember 2020-12-31 0001303523 bti:RestOfGroupMember ifrs-full:PensionDefinedBenefitPlansMember 2020-12-31 0001303523 country:NL ifrs-full:PensionDefinedBenefitPlansMember 2020-12-31 0001303523 country:CH ifrs-full:PensionDefinedBenefitPlansMember 2020-12-31 0001303523 bti:OtherCountriesMember 2020-12-31 0001303523 bti:ReynoldsAmericanIncMember 2020-12-31 0001303523 srt:EuropeMember 2020-12-31 0001303523 country:CA 2020-12-31 0001303523 country:AU 2020-12-31 0001303523 country:ZA 2020-12-31 0001303523 country:SG 2020-12-31 0001303523 bti:GlobalTravelRetailMember 2020-12-31 0001303523 country:MY 2020-12-31 0001303523 country:PE 2020-12-31 0001303523 bti:SupplyChainFinancingArrangementsMember 2020-12-31 0001303523 bti:AssociatesAndJointVenturesMember 2020-12-31 0001303523 bti:UnlistedAssociatesMember 2020-12-31 0001303523 bti:OtherListedAssociatesMember 2020-12-31 0001303523 ifrs-full:FactoringOfReceivablesMember bti:NonCollectionAgentMember 2020-12-31 0001303523 ifrs-full:CurrencySwapContractMember ifrs-full:CashFlowHedgesMember 2020-12-31 0001303523 ifrs-full:InterestRateSwapContractMember ifrs-full:FairValueHedgesMember 2020-12-31 0001303523 ifrs-full:CurrencySwapContractMember ifrs-full:FairValueHedgesMember 2020-12-31 0001303523 ifrs-full:ForwardContractMember ifrs-full:CashFlowHedgesMember 2020-12-31 0001303523 ifrs-full:ForwardContractMember ifrs-full:HedgesOfNetInvestmentInForeignOperationsMember 2020-12-31 0001303523 ifrs-full:InterestRateSwapContractMember bti:HeldForTradingMember 2020-12-31 0001303523 ifrs-full:ForwardContractMember bti:HeldForTradingMember 2020-12-31 0001303523 ifrs-full:PostemploymentMedicalDefinedBenefitPlansMember ifrs-full:WhollyOrPartlyFundedDefinedBenefitPlansMember 2020-12-31 0001303523 ifrs-full:WhollyOrPartlyFundedDefinedBenefitPlansMember 2020-12-31 0001303523 ifrs-full:PensionDefinedBenefitPlansMember ifrs-full:WhollyUnfundedDefinedBenefitPlansMember 2020-12-31 0001303523 ifrs-full:PostemploymentMedicalDefinedBenefitPlansMember ifrs-full:WhollyUnfundedDefinedBenefitPlansMember 2020-12-31 0001303523 ifrs-full:WhollyUnfundedDefinedBenefitPlansMember 2020-12-31 0001303523 bti:NetSettledMember ifrs-full:InterestRateSwapContractMember ifrs-full:NotLaterThanOneYearMember 2020-12-31 0001303523 ifrs-full:LaterThanOneYearAndNotLaterThanTwoYearsMember ifrs-full:InterestRateSwapContractMember bti:NetSettledMember 2020-12-31 0001303523 bti:NetSettledMember ifrs-full:InterestRateSwapContractMember ifrs-full:LaterThanTwoYearsAndNotLaterThanThreeYearsMember 2020-12-31 0001303523 bti:NetSettledMember 2020-12-31 0001303523 ifrs-full:Level1OfFairValueHierarchyMember 2020-12-31 0001303523 ifrs-full:Level3OfFairValueHierarchyMember 2020-12-31 0001303523 bti:IranianSubsidiaryMember 2020-12-31 0001303523 ifrs-full:LaterThanOneYearAndNotLaterThanTwoYearsMember 2020-12-31 0001303523 ifrs-full:LaterThanTwoYearsAndNotLaterThanThreeYearsMember 2020-12-31 0001303523 ifrs-full:LaterThanThreeYearsAndNotLaterThanFourYearsMember 2020-12-31 0001303523 ifrs-full:LaterThanFourYearsAndNotLaterThanFiveYearsMember 2020-12-31 0001303523 bti:ContractualGrossMaturityAmountMember ifrs-full:NotLaterThanOneYearMember 2020-12-31 0001303523 bti:ContractualGrossMaturityAmountMember ifrs-full:LaterThanOneYearAndNotLaterThanTwoYearsMember 2020-12-31 0001303523 bti:ContractualGrossMaturityAmountMember ifrs-full:LaterThanTwoYearsAndNotLaterThanThreeYearsMember 2020-12-31 0001303523 bti:ContractualGrossMaturityAmountMember ifrs-full:LaterThanThreeYearsAndNotLaterThanFourYearsMember 2020-12-31 0001303523 bti:ContractualGrossMaturityAmountMember ifrs-full:LaterThanFourYearsAndNotLaterThanFiveYearsMember 2020-12-31 0001303523 bti:ContractualGrossMaturityAmountMember ifrs-full:LaterThanFiveYearsMember 2020-12-31 0001303523 bti:ContractualGrossMaturityAmountMember 2020-12-31 0001303523 bti:NotLaterThanTwentyYearsMember 2020-12-31 0001303523 bti:NoExpiryPeriodMember 2020-12-31 0001303523 country:GB 2020-12-31 0001303523 ifrs-full:ForeignCountriesMember 2020-12-31 0001303523 bti:InterestRateRiskExposureMember ifrs-full:FairValueHedgesMember ifrs-full:InterestRateSwapContractMember 2020-12-31 0001303523 bti:InterestRateRiskExposureMember ifrs-full:FairValueHedgesMember ifrs-full:CurrencySwapContractMember 2020-12-31 0001303523 bti:InterestRateRiskExposureMember ifrs-full:CashFlowHedgesMember ifrs-full:CurrencySwapContractMember 2020-12-31 0001303523 bti:ForeignCurrencyRiskExposureMember ifrs-full:CashFlowHedgesMember ifrs-full:ForwardContractMember 2020-12-31 0001303523 bti:NonDerivativeRelatedNetInvestmentHedgesMember ifrs-full:LongtermBorrowingsMember 2020-12-31 0001303523 bti:ForeignCurrencyRiskExposureMember bti:DerivativeRelatedNetInvestmentHedgesMember ifrs-full:ForwardContractMember 2020-12-31 0001303523 bti:EquitySettledDeferredShareBonusSchemeMember 2020-12-31 0001303523 bti:CashSettledDeferredShareBonusSchemeMember 2020-12-31 0001303523 bti:CashSettledLongTermIncentivePlanMember 2020-12-31 0001303523 bti:EquitySettledLongTermIncentivePlanMember 2020-12-31 0001303523 ifrs-full:Level2OfFairValueHierarchyMember ifrs-full:InterestRateSwapContractMember 2020-12-31 0001303523 ifrs-full:InterestRateSwapContractMember 2020-12-31 0001303523 ifrs-full:Level2OfFairValueHierarchyMember ifrs-full:CurrencySwapContractMember 2020-12-31 0001303523 ifrs-full:CurrencySwapContractMember 2020-12-31 0001303523 ifrs-full:Level2OfFairValueHierarchyMember ifrs-full:ForwardContractMember 2020-12-31 0001303523 ifrs-full:ForwardContractMember 2020-12-31 0001303523 country:US 2020-12-31 0001303523 country:DE 2020-12-31 0001303523 country:NL 2020-12-31 0001303523 country:CH 2020-12-31 0001303523 bti:USUKBangladeshIndonesiaAndSouthKoreaMember bti:FreeholdPropertyMember 2020-12-31 0001303523 bti:LeaseholdPropertiesAcquiredAndAnotherMember 2020-12-31 0001303523 bti:BritishAmericanTobaccoBangladeshCompanyLimitedMember 2020-12-31 0001303523 bti:NotLaterThanTenYearsMember 2020-12-31 0001303523 bti:TermLoansMember 2020-12-31 0001303523 bti:BilateralFacilitiesMember 2020-12-31 0001303523 bti:RegisteredBATCAPBondsMember bti:BATPLCMember 2020-12-31 0001303523 bti:RegisteredBATCAPBondsMember bti:BATCAPMember 2020-12-31 0001303523 bti:RegisteredBATCAPBondsMember bti:BATIFMember 2020-12-31 0001303523 bti:RegisteredBATCAPBondsMember bti:BATNFMember 2020-12-31 0001303523 bti:RegisteredBATCAPBondsMember bti:RAIMember 2020-12-31 0001303523 bti:RegisteredBATCAPBondsMember bti:BATHTNMember 2020-12-31 0001303523 bti:InflowMember ifrs-full:NotLaterThanOneYearMember ifrs-full:ForwardContractMember bti:GrossSettledMember 2020-12-31 0001303523 bti:InflowMember ifrs-full:LaterThanOneYearAndNotLaterThanTwoYearsMember ifrs-full:ForwardContractMember bti:GrossSettledMember 2020-12-31 0001303523 bti:InflowMember ifrs-full:NotLaterThanOneYearMember ifrs-full:CurrencySwapContractMember bti:GrossSettledMember 2020-12-31 0001303523 bti:InflowMember ifrs-full:LaterThanOneYearAndNotLaterThanTwoYearsMember ifrs-full:CurrencySwapContractMember bti:GrossSettledMember 2020-12-31 0001303523 bti:InflowMember ifrs-full:LaterThanTwoYearsAndNotLaterThanThreeYearsMember ifrs-full:CurrencySwapContractMember bti:GrossSettledMember 2020-12-31 0001303523 bti:GrossSettledMember ifrs-full:CurrencySwapContractMember ifrs-full:LaterThanThreeYearsAndNotLaterThanFourYearsMember bti:InflowMember 2020-12-31 0001303523 bti:InflowMember ifrs-full:LaterThanFourYearsAndNotLaterThanFiveYearsMember ifrs-full:CurrencySwapContractMember bti:GrossSettledMember 2020-12-31 0001303523 bti:InflowMember ifrs-full:LaterThanFiveYearsMember ifrs-full:CurrencySwapContractMember bti:GrossSettledMember 2020-12-31 0001303523 bti:InflowMember bti:GrossSettledMember 2020-12-31 0001303523 bti:FinancialDerivativeAssetsMember 2020-12-31 0001303523 bti:FinancialDerivativeLiabilitiesMember 2020-12-31 0001303523 bti:AggregateCompanyMember bti:DeferredShareBonusSchemeMember 2020-12-31 0001303523 bti:DeferredShareBonusSchemeMember bti:ManagementBoardMember 2020-12-31 0001303523 bti:AggregateCompanyMember bti:LongTermIncentivePlanMember 2020-12-31 0001303523 bti:ManagementBoardMember bti:LongTermIncentivePlanMember 2020-12-31 0001303523 ifrs-full:FairValueHedgesMember 2020-12-31 0001303523 ifrs-full:AccumulatedDepreciationAmortisationAndImpairmentMember 2020-12-31 0001303523 ifrs-full:AccumulatedDepreciationAmortisationAndImpairmentMember ifrs-full:BrandNamesMember 2020-12-31 0001303523 ifrs-full:AccumulatedDepreciationAmortisationAndImpairmentMember ifrs-full:ComputerSoftwareMember 2020-12-31 0001303523 ifrs-full:AtFairValueMember 2020-12-31 0001303523 ifrs-full:MarketComparablePricesMember ifrs-full:AtFairValueMember ifrs-full:Level1OfFairValueHierarchyMember 2020-12-31 0001303523 ifrs-full:Level3OfFairValueHierarchyMember ifrs-full:AtFairValueMember ifrs-full:DiscountedCashFlowMember 2020-12-31 0001303523 bti:LorillardIncMember 2020-12-31 0001303523 bti:ReynoldsAmericanIncMember 2020-12-31 0001303523 ifrs-full:FinancialAssetsAtFairValueThroughProfitOrLossCategoryMember 2020-12-31 0001303523 ifrs-full:FinancialAssetsAtFairValueThroughOtherComprehensiveIncomeCategoryMember 2020-12-31 0001303523 bti:GrossSettledMember bti:OutflowMember 2020-12-31 0001303523 bti:GrossSettledMember ifrs-full:CurrencySwapContractMember ifrs-full:LaterThanFiveYearsMember bti:OutflowMember 2020-12-31 0001303523 bti:OutflowMember ifrs-full:LaterThanFourYearsAndNotLaterThanFiveYearsMember ifrs-full:CurrencySwapContractMember bti:GrossSettledMember 2020-12-31 0001303523 bti:OutflowMember ifrs-full:LaterThanThreeYearsAndNotLaterThanFourYearsMember ifrs-full:CurrencySwapContractMember bti:GrossSettledMember 2020-12-31 0001303523 bti:OutflowMember ifrs-full:LaterThanTwoYearsAndNotLaterThanThreeYearsMember ifrs-full:CurrencySwapContractMember bti:GrossSettledMember 2020-12-31 0001303523 bti:GrossSettledMember ifrs-full:CurrencySwapContractMember ifrs-full:LaterThanOneYearAndNotLaterThanTwoYearsMember bti:OutflowMember 2020-12-31 0001303523 bti:OutflowMember ifrs-full:NotLaterThanOneYearMember ifrs-full:CurrencySwapContractMember bti:GrossSettledMember 2020-12-31 0001303523 bti:OutflowMember ifrs-full:LaterThanOneYearAndNotLaterThanTwoYearsMember ifrs-full:ForwardContractMember bti:GrossSettledMember 2020-12-31 0001303523 bti:OutflowMember ifrs-full:NotLaterThanOneYearMember ifrs-full:ForwardContractMember bti:GrossSettledMember 2020-12-31 0001303523 ifrs-full:Level2OfFairValueHierarchyMember 2020-12-31 0001303523 bti:PropertyPlantAndEquipmentInventoryAndReceivablesMember 2020-12-31 0001303523 bti:SamfruitMember 2020-12-31 0001303523 ifrs-full:RestructuringProvisionMember 2020-12-31 0001303523 bti:EmployeeRelatedBenefitsMember 2020-12-31 0001303523 bti:FoxRiverMember 2020-12-31 0001303523 ifrs-full:MiscellaneousOtherProvisionsMember 2020-12-31 0001303523 ifrs-full:PensionDefinedBenefitPlansMember bti:ListedMember ifrs-full:PlanAssetsMember 2020-12-31 0001303523 ifrs-full:PostemploymentMedicalDefinedBenefitPlansMember bti:ListedMember ifrs-full:PlanAssetsMember 2020-12-31 0001303523 bti:ListedMember 2020-12-31 0001303523 ifrs-full:PensionDefinedBenefitPlansMember bti:UnlistedMember ifrs-full:PlanAssetsMember 2020-12-31 0001303523 ifrs-full:PostemploymentMedicalDefinedBenefitPlansMember bti:UnlistedMember ifrs-full:PlanAssetsMember 2020-12-31 0001303523 bti:UnlistedMember 2020-12-31 0001303523 bti:TransactionsWithNonIssuerNonGuarantorSubsidiariesMember bti:BATPLCMember bti:RegisteredBATCAPBondsMember 2020-12-31 0001303523 bti:RegisteredBATCAPBondsMember bti:BATCAPMember bti:TransactionsWithNonIssuerNonGuarantorSubsidiariesMember 2020-12-31 0001303523 bti:RegisteredBATCAPBondsMember bti:BATIFMember bti:TransactionsWithNonIssuerNonGuarantorSubsidiariesMember 2020-12-31 0001303523 bti:TransactionsWithNonIssuerNonGuarantorSubsidiariesMember bti:RAIMember bti:RegisteredBATCAPBondsMember 2020-12-31 0001303523 bti:RegisteredBATCAPBondsMember bti:BATHTNMember bti:TransactionsWithNonIssuerNonGuarantorSubsidiariesMember 2020-12-31 0001303523 bti:TexasMinnesotaAndMississippiMember bti:ITGBrandsLLCMSALitigationAgreementsMember 2020-12-31 0001303523 ifrs-full:BuildingsMember 2020-12-31 0001303523 bti:PlantEquipmentAndOtherMember 2020-12-31 0001303523 country:UZ bti:SamfruitMember 2020-12-31 0001303523 bti:SamfruitMember country:UZ 2020-12-31 0001303523 bti:RAIGoodwillMember bti:ReynoldsAmericanIncMember 2020-12-31 0001303523 bti:ReynoldsAmericanIncMember bti:NewportMember ifrs-full:GrossCarryingAmountMember 2020-12-31 0001303523 bti:ReynoldsAmericanIncMember bti:CamelMember 2020-12-31 0001303523 bti:RothmansGroupMember 2020-12-31 0001303523 bti:ImperialTobaccoCanadaMember 2020-12-31 0001303523 bti:ETIMember 2020-12-31 0001303523 bti:SkandinaviskTobakskompagniMember 2020-12-31 0001303523 bti:EurobondsOneMember 2020-12-31 0001303523 bti:EurobondsThreeMember 2020-12-31 0001303523 bti:EurobondsFourMember 2020-12-31 0001303523 bti:BondsIssuedOneMember 2020-12-31 0001303523 bti:BondsIssuedTwoMember 2020-12-31 0001303523 country:US bti:ReynoldsAmericanFundedRetirementPlanMember 2020-12-31 0001303523 bti:BritishAmericanTobaccoUkPensionFundMember 2020-12-31 0001303523 country:GB bti:BuyInContractMember 2020-12-31 0001303523 bti:BritishAmericanTobaccoUkPensionFundMember country:GB ifrs-full:WhollyOrPartlyFundedDefinedBenefitPlansMember 2020-12-31 0001303523 bti:EquitySettledLongTermIncentivePlanMember bti:ReynoldsAmericanIncMember 2020-12-31 0001303523 ifrs-full:HedgesOfNetInvestmentInForeignOperationsMember 2020-12-31 0001303523 bti:ReynoldsAmericanIncMember ifrs-full:BrandNamesMember 2020-12-31 0001303523 bti:TrademarksAndSimilarIntangiblesMember bti:ReynoldsAmericanIncMember 2020-12-31 0001303523 country:CA ifrs-full:PensionDefinedBenefitPlansMember bti:SchemesInSurplusOnlyMember 2020-12-31 0001303523 country:NL ifrs-full:PensionDefinedBenefitPlansMember bti:SchemesInSurplusOnlyMember 2020-12-31 0001303523 bti:NewportMember 2020-12-31 0001303523 bti:CamelMember 2020-12-31 0001303523 ifrs-full:LiquidityRiskMember 2020-12-31 0001303523 country:US ifrs-full:PostemploymentMedicalDefinedBenefitPlansMember 2020-12-31 0001303523 bti:AllOtherCountriesMember ifrs-full:TopOfRangeMember 2020-12-31 0001303523 bti:AllOtherCountriesMember ifrs-full:BottomOfRangeMember 2020-12-31 0001303523 ifrs-full:CurrencyRiskMember bti:RestOfGroupMember 2020-12-31 0001303523 ifrs-full:CurrencyRiskMember currency:GBP 2020-12-31 0001303523 ifrs-full:CurrencyRiskMember currency:USD 2020-12-31 0001303523 ifrs-full:CurrencyRiskMember currency:EUR 2020-12-31 0001303523 bti:LeafSupplyArrangementsMember 2020-12-31 0001303523 bti:ShortTermCreditFacilityMember 2020-12-31 0001303523 ifrs-full:CurrencyRiskMember ifrs-full:CashFlowHedgesMember 2020-12-31 0001303523 country:US 2021-10-07 0001303523 country:US 2021-10-07 2021-10-07 0001303523 country:KR bti:ValueAddedTaxMember bti:BATKoreaMember bti:TaxReassessmentMember 2021-09-16 2021-09-16 0001303523 bti:PerpetualHybridBondsMember 2021-09-27 0001303523 bti:MalawiGroupMember 2020-12-31 2020-12-31 0001303523 country:CA bti:OrganigramIncMember 2021-12-31 2021-12-31 0001303523 bti:QuebecClassActionsMember 2019-03-01 0001303523 bti:ImperialTobaccoCanadaMember country:CA 2019-03-01 0001303523 country:CA bti:ImperialTobaccoCanadaMember 2019-03-01 0001303523 bti:QuebecClassActionsMember country:CA 2019-03-01 0001303523 bti:ImperialTobaccoCanadaLimitedMember bti:QuebecClassActionsMember country:CA 2019-03-01 0001303523 ifrs-full:TopOfRangeMember bti:GlobalSoftwareSolutionsMember 2021-01-01 2021-01-01 0001303523 bti:EventsAfterReportingPeriodMember 2022-01-01 2022-12-31 0001303523 bti:GlobalSoftwareSolutionsMember bti:AccountingEstimateMember 2022-01-01 2022-12-31 0001303523 ifrs-full:LiquidityRiskMember 2022-01-01 2022-12-31 0001303523 ifrs-full:LaterThanOneYearMember bti:EventsAfterReportingPeriodMember ifrs-full:BottomOfRangeMember 2023-01-01 2023-12-31 0001303523 bti:GlobalSoftwareSolutionsMember bti:AccountingEstimateMember 2023-01-01 2023-12-31 0001303523 bti:SharePremiumCapitalRedemptionAndMergerReservesMember 2019-12-31 0001303523 ifrs-full:MergerReserveMember 2019-12-31 0001303523 ifrs-full:CapitalRedemptionReserveMember 2019-12-31 0001303523 ifrs-full:SharePremiumMember 2019-12-31 0001303523 bti:AssociatesAndJointVenturesMember 2019-12-31 0001303523 bti:BritishAmericanTobaccoBangladeshCompanyLimitedMember 2019-12-31 0001303523 ifrs-full:AccumulatedDepreciationAmortisationAndImpairmentMember ifrs-full:ComputerSoftwareMember 2019-12-31 0001303523 ifrs-full:AccumulatedDepreciationAmortisationAndImpairmentMember ifrs-full:BrandNamesMember 2019-12-31 0001303523 ifrs-full:AccumulatedDepreciationAmortisationAndImpairmentMember 2019-12-31 0001303523 bti:VapeWildHoldingsLLCMember 2019-12-31 0001303523 bti:ExciseDisputeInRussiaMember 2019-12-31 0001303523 bti:QuebecClassActionsMember 2019-12-31 0001303523 bti:BritishAmericanTobaccoUkPensionFundMember country:GB ifrs-full:WhollyOrPartlyFundedDefinedBenefitPlansMember 2019-12-31 0001303523 bti:TDRMember 2019-12-31 0001303523 country:TR bti:BATTutunMember bti:TaxDisputesInTurkeyMember bti:TaxationMember 2021-11-01 2021-11-30 0001303523 country:TR bti:BATTutunMember bti:TaxDisputesInTurkeyMember 2021-11-01 2021-11-30 0001303523 bti:TaxDisputesInTurkeyMember country:TR bti:BATTutunMember bti:ExciseAndPenaltiesDisputesMember 2021-11-01 2021-11-30 0001303523 bti:TaxDisputesInTurkeyMember country:TR bti:BATTutunMember bti:InterestInNetFinanceCostsMember 2021-11-01 2021-11-30 0001303523 country:TR bti:BATTutunMember 2021-11-01 2021-11-30 0001303523 bti:BATParsCompanyPJSCMember 2021-08-06 2021-08-06 0001303523 bti:ITCLtdMember 2018-01-01 2018-12-31 0001303523 bti:NonParticipatingManufacturerAdjustmentClaimsRelatedToPeriodFrom2004To2017Member bti:NonParticipatingManufacturerDisputesMember bti:RJReynoldsTobaccoCompanyMember bti:FiveYearPeriodFrom2018Member 2018-01-01 2018-12-31 0001303523 bti:NewportMember 2018-01-01 2018-12-31 0001303523 bti:ExpressLogisticandDistributionEOODMember 2018-01-01 2018-12-31 0001303523 bti:BlueNileCigaretteCompanyLimitedMember 2018-01-01 2018-12-31 0001303523 bti:MississippiSettlementAgreementMember bti:ImperialTobaccoGroupPLCMember 2018-01-01 2018-12-31 0001303523 country:US 2018-01-01 2018-12-31 0001303523 bti:RJRTMember 2018-01-01 2018-12-31 0001303523 bti:TisakDDMember 2017-01-01 2017-12-31 0001303523 bti:NonParticipatingManufacturerAdjustmentClaimsRelatedToPeriodFrom2004To2014Member bti:NonParticipatingManufacturerDisputesMember bti:RJReynoldsTobaccoCompanyMember bti:FiveYearPeriodFrom2017Member 2017-01-01 2017-12-31 0001303523 country:BD bti:BATBangladeshMember bti:TaxAssessmentMember 2017-01-01 2017-12-31 0001303523 bti:BlueNileCigaretteCompanyLimitedMember 2017-01-01 2017-12-31 0001303523 country:US 2017-01-01 2017-12-31 0001303523 bti:FrankedInvestmentIncomeGroupLitigationOrderMember 2014-01-01 2014-12-31 0001303523 bti:NonParticipatingManufacturerAdjustmentClaimsRelatedToPeriodFrom2003To2012Member bti:MasterSettlementAgreementMember bti:RJReynoldsTobaccoCompanyMember 2014-01-01 2014-12-31 0001303523 bti:NCRMember bti:FoxRiverMember 2014-01-01 2014-12-31 0001303523 bti:FoxRiverMember ifrs-full:BottomOfRangeMember 2014-01-01 2014-12-31 0001303523 bti:FoxRiverMember ifrs-full:TopOfRangeMember 2014-01-01 2014-12-31 0001303523 bti:FrankedInvestmentIncomeGroupLitigationOrderMember 2015-01-01 2015-12-31 0001303523 bti:NonParticipatingManufacturerAdjustmentClaimsRelatedToPeriodFrom2004To2014Member bti:NonParticipatingManufacturerDisputesMember bti:RJReynoldsTobaccoCompanyMember bti:FiveYearPeriodFrom2016Member 2015-01-01 2015-12-31 0001303523 bti:EngleProgenyCasesMember 2015-01-01 2015-12-31 0001303523 bti:EngleProgenyCasesMember bti:RJReynoldsTobaccoCompanyMember 2015-01-01 2015-12-31 0001303523 bti:PhilipMorrisUSAIncMember bti:EngleProgenyCasesMember 2015-01-01 2015-12-31 0001303523 bti:EngleProgenyCasesMember bti:LorillardTobaccoMember 2015-01-01 2015-12-31 0001303523 country:BR 2015-01-01 2015-12-31 0001303523 bti:NonParticipatingManufacturerAdjustmentClaimsRelatedToPeriodFrom2003To2012Member bti:RJReynoldsTobaccoCompanyMember bti:MasterSettlementAgreementMember 2012-01-01 2012-12-31 0001303523 bti:FrankedInvestmentIncomeGroupLitigationOrderMember 2021-07-01 2021-07-31 0001303523 bti:PerpetualHybridBondsMember 2021-09-27 2021-09-27 0001303523 bti:FiveYearTranchesMember 2021-09-27 2021-09-27 0001303523 bti:EightYearTranchesMember 2021-09-27 2021-09-27 0001303523 bti:SeptemberTwoThousandAndTwentyOneEquityClassifiedBondsOneAndTwoMemberMember ifrs-full:TopOfRangeMember bti:ThreePointSevenFivePercentPerpetualHybridBondMember 2021-09-27 2021-09-27 0001303523 bti:ThreePointSevenFivePercentPerpetualHybridBondMember ifrs-full:BottomOfRangeMember bti:SeptemberTwoThousandAndTwentyOneEquityClassifiedBondsOneAndTwoMemberMember 2021-09-27 2021-09-27 0001303523 bti:SeptemberTwoThousandAndTwentyOneEquityClassifiedBondsOneAndTwoMemberMember ifrs-full:TopOfRangeMember bti:ThreePercentPerpetualHybridBondMemberMember 2021-09-27 2021-09-27 0001303523 bti:SeptemberTwoThousandAndTwentyOneEquityClassifiedBondsOneAndTwoMemberMember ifrs-full:BottomOfRangeMember bti:ThreePercentPerpetualHybridBondMemberMember 2021-09-27 2021-09-27 0001303523 bti:OrganigramIncMember 2021-03-11 0001303523 bti:OrganigramIncMember country:CA 2021-03-11 0001303523 bti:PTBentoelInternasionalInvestamaTbkMember 2016-01-01 2016-12-31 0001303523 bti:TisakDDMember 2016-01-01 2016-12-31 0001303523 bti:BlueNileCigaretteCompanyLimitedMember 2016-01-01 2016-12-31 0001303523 bti:OrganigramIncMember ifrs-full:IntangibleAssetsOtherThanGoodwillMember 2021-03-11 2021-03-11 0001303523 bti:OrganigramIncMember ifrs-full:GoodwillMember 2021-03-11 2021-03-11 0001303523 country:CA bti:OrganigramIncMember 2021-03-11 2021-03-11 0001303523 bti:BilateralFacilitiesMember ifrs-full:LiquidityRiskMember 2020-04-30 0001303523 bti:COVIDNineteenCrisisMember bti:BilateralFacilitiesMember 2020-04-30 0001303523 ifrs-full:LiquidityRiskMember 2020-04-01 2020-04-30 0001303523 ifrs-full:LiquidityRiskMember bti:EuroMediumTermNoteProgrammeMember 2020-04-01 2020-04-30 0001303523 bti:EasternTobaccoCompanyMember 2020-11-12 0001303523 bti:VapeWildHoldingsLLCMember bti:FortyFivePercentInterestMember 2019-04-08 2019-04-08 0001303523 bti:VapeWildHoldingsLLCMember bti:FortyFivePercentInterestMember 2019-04-08 0001303523 bti:VapeWildHoldingsLLCMember bti:FifteenPercentInterestMember 2019-06-24 2019-06-24 0001303523 bti:VapeWildHoldingsLLCMember bti:SixtyPercentInterestMember 2019-06-24 2019-06-24 0001303523 bti:VapeWildHoldingsLLCMember bti:FifteenPercentInterestMember 2019-06-24 0001303523 bti:VapeWildHoldingsLLCMember bti:SixtyPercentInterestMember 2019-06-24 0001303523 bti:VapeWildHoldingsLLCMember 2019-06-24 0001303523 bti:TwispProprietaryLimitedMember 2017-12-21 2017-12-21 0001303523 bti:TwispProprietaryLimitedMember 2019-09-30 0001303523 bti:BATIndustriesPlcMember 2018-12-31 0001303523 bti:ExpressLogisticandDistributionEOODMember 2017-05-05 0001303523 bti:ExpressLogisticandDistributionEOODMember 2017-05-05 2017-05-05 0001303523 bti:WinningtonHoldingABMember 2017-01-04 0001303523 bti:WinningtonHoldingABMember 2017-01-04 2017-01-04 0001303523 bti:BlueNileCigaretteCompanyLimitedMember 2015-11-17 2015-11-17 0001303523 bti:TDRMember 2015-09-30 2015-09-30 0001303523 bti:BlueNileCigaretteCompanyLimitedMember 2015-11-17 0001303523 bti:ExpressLogisticandDistributionEOODMember 2015-11-17 0001303523 bti:TDRMember 2015-09-30 0001303523 country:GB bti:BuyInContractMember 2021-05-19 2021-05-19 0001303523 bti:SharesaveSchemeSAYEMember 2010-01-01 2010-12-31 0001303523 bti:RothmansGroupMember ifrs-full:MergerReserveMember 1999-12-31 0001303523 bti:ReynoldsAmericanIncMember ifrs-full:MergerReserveMember 2017-07-25 0001303523 bti:ReynoldsAmericanIncMember 2017-07-25 0001303523 ifrs-full:LiquidityRiskMember 2022-02-28 2022-02-28 0001303523 ifrs-full:MajorOrdinaryShareTransactionsMember 2022-02-28 2022-02-28 0001303523 bti:RothmansMember 2004-12-31 0001303523 country:AR 2020-02-28 2020-02-28 0001303523 bti:BritishAmericanTobaccoUkPensionFundMember country:GB ifrs-full:WhollyOrPartlyFundedDefinedBenefitPlansMember 2023-07-31 0001303523 ifrs-full:LiquidityRiskMember 2020-10-31 0001303523 ifrs-full:LiquidityRiskMember 2020-09-30 0001303523 ifrs-full:LiquidityRiskMember 2020-07-31 0001303523 ifrs-full:LiquidityRiskMember 2020-08-31 0001303523 ifrs-full:LiquidityRiskMember 2020-05-31 0001303523 ifrs-full:LiquidityRiskMember 2020-06-30 0001303523 bti:QuebecClassActionsMember country:CA 2020-06-30 0001303523 ifrs-full:LiquidityRiskMember 2021-09-30 0001303523 ifrs-full:LiquidityRiskMember 2021-07-31 0001303523 ifrs-full:LiquidityRiskMember 2021-08-31 0001303523 ifrs-full:LiquidityRiskMember 2021-11-30 0001303523 ifrs-full:LiquidityRiskMember 2021-02-28 0001303523 bti:DiscontinuedOperationsMemberMember bti:BatParsCompanyPjscMember 2021-06-25 0001303523 bti:LorillardTobaccoMember bti:EngleProgenyCasesUSTobaccoRelatedMember 2020-06-30 2020-07-31 0001303523 bti:BAndWMember bti:EngleProgenyCasesUSTobaccoRelatedMember 2020-06-30 2020-07-31 0001303523 bti:RJRTMember bti:EngleProgenyCasesUSTobaccoRelatedMember 2020-06-30 2020-07-31 0001303523 bti:USTobaccoRelatedActionsMember bti:EngleProgenyCasesUSTobaccoRelatedMember 2020-06-30 2020-07-31 0001303523 bti:USTobaccoRelatedActionsMember bti:EngleProgenyCasesUSTobaccoRelatedMember 2006-11-30 2006-12-31 0001303523 country:US bti:RJRTBAndWAndLorillardTobaccoMember 2018-12-29 2018-12-31 0001303523 bti:LorillardTobaccoAndRJRTMember bti:FilterCasesMember 2019-01-01 2021-12-31 0001303523 bti:ReynoldsDefendantsMember country:US 2019-01-01 2021-12-31 0001303523 stpr:FL bti:ReynoldsDefendantsMember 2019-01-01 2021-12-31 0001303523 stpr:OR bti:ReynoldsDefendantsMember 2019-01-01 2021-12-31 0001303523 stpr:MA bti:ReynoldsDefendantsMember 2019-01-01 2021-12-31 0001303523 bti:ReynoldsDefendantsMember 2019-01-01 2021-12-31 0001303523 stpr:NM bti:ReynoldsDefendantsMember 2019-01-01 2021-12-31 0001303523 stpr:FL 2019-01-01 2021-12-31 0001303523 stpr:NY 2019-01-01 2021-12-31 0001303523 stpr:CT 2019-01-01 2021-12-31 0001303523 stpr:MA 2019-01-01 2021-12-31 0001303523 bti:PhaseIIMember 2000-06-30 2000-07-31 0001303523 bti:RJReynoldsTobaccoCompanyMember bti:PhaseIIMember 2000-06-30 2000-07-31 0001303523 bti:BrownAndWilliamsonHoldingsIncMember bti:PhaseIIMember 2000-06-30 2000-07-31 0001303523 bti:LorillardIncMember bti:PhaseIIMember 2000-06-30 2000-07-31 0001303523 stpr:FL bti:BroinVPhilipMorrisIncMember 1997-09-30 1997-10-31 0001303523 bti:BroinVPhilipMorrisIncMember stpr:FL bti:RJReynoldsTobaccoCompanyMember 1997-09-30 1997-10-31 0001303523 bti:BroinVPhilipMorrisIncMember stpr:FL bti:BrownAndWilliamsonHoldingsIncMember 1997-09-30 1997-10-31 0001303523 bti:BroinVPhilipMorrisIncMember stpr:FL bti:LorillardTobaccoMember 1997-09-30 1997-10-31 0001303523 bti:BroinIICasesMember 2007-01-31 2021-12-31 0001303523 bti:RJReynoldsTobaccoCompanyMember bti:MasterSettlementAgreementMember 1998-10-31 1998-11-30 0001303523 ifrs-full:BottomOfRangeMember 2003-01-31 2012-12-31 0001303523 bti:NPMAdjustmentSettlementAgreementMember 2003-01-31 2012-12-31 0001303523 bti:ImperialTobaccoGroupPLCMember bti:FloridaStateSettlementAgreementMember 2017-01-17 2017-01-18 0001303523 bti:ImperialTobaccoGroupPLCMember bti:NPMAdjustmentSettlementAgreementMember 2017-01-17 2017-01-18 0001303523 bti:RJReynoldsTobaccoCompanyMember bti:FloridaStateSettlementAgreementMember 2018-01-01 2018-01-31 0001303523 bti:RJReynoldsTobaccoCompanyMember stpr:FL 2018-01-01 2018-01-31 0001303523 bti:PhilipMorrisUSAIncMember 2018-01-01 2018-01-31 0001303523 bti:RJReynoldsTobaccoCompanyMember 2000-06-10 0001303523 bti:RJReynoldsTobaccoCompanyMember 2000-06-09 0001303523 bti:RJReynoldsTobaccoCompanyMember 2020-10-05 0001303523 bti:RJReynoldsTobaccoCompanyMember stpr:FL 2010-10-05 2010-10-05 0001303523 bti:ImperialTobaccoGroupPLCMember 2017-02-16 2017-02-17 0001303523 bti:MinnesotaStateSettlementAgreementMember bti:RJReynoldsTobaccoCompanyMember 2018-03-26 2018-03-26 0001303523 bti:RJRTAndITGMember bti:TexasStateSettlementAgreementMember 2019-01-28 2019-01-28 0001303523 bti:ImperialTobaccoGroupPLCMember 2019-01-28 2019-01-28 0001303523 stpr:CA-BC 2017-02-13 2017-02-13 0001303523 stpr:CA-ON ifrs-full:BottomOfRangeMember 2018-06-15 2018-06-15 0001303523 ifrs-full:TopOfRangeMember stpr:CA-ON 2018-06-15 2018-06-15 0001303523 stpr:CA-ON bti:LossContingencyMember ifrs-full:BottomOfRangeMember 2019-01-31 0001303523 stpr:CA-ON bti:LossContingencyMember ifrs-full:TopOfRangeMember 2019-01-31 0001303523 bti:OrganigramMember 2021-03-31 0001303523 country:KR bti:BATKoreaMember bti:TaxAssessmentMember 2016-12-31 0001303523 country:KR bti:BATKoreaMember bti:ValueAddedTaxMember bti:TaxAssessmentMember 2019-08-23 0001303523 country:AO 2016-11-01 2016-11-30 0001303523 country:BR bti:FederalAttorneysOfficeMember 2019-05-21 2019-05-21 0001303523 country:CA bti:QuebecClassActionsMember 2005-02-21 2005-02-21 0001303523 country:CA bti:QuebecClassActionsMember 2015-05-27 2015-05-27 0001303523 bti:ImperialTobaccoCanadaLimitedMember bti:QuebecClassActionsMember country:CA 2015-05-27 2015-05-27 0001303523 bti:QuebecClassActionsMember country:CA 2015-06-26 2015-06-26 0001303523 country:CA bti:QuebecClassActionsMember bti:ImperialTobaccoCanadaLimitedMember 2015-06-26 2015-06-26 0001303523 bti:QuebecClassActionsMember country:CA 2015-10-27 2015-10-27 0001303523 country:CA bti:QuebecClassActionsMember bti:ImperialTobaccoCanadaLimitedMember 2015-10-27 2015-10-27 0001303523 bti:QuebecClassActionsMember country:CA 2017-03-31 2017-03-31 0001303523 country:CA bti:QuebecClassActionsMember 2016-12-31 2016-12-31 0001303523 bti:QuebecClassActionsMember country:CA 2017-06-30 2017-06-30 0001303523 bti:QuebecClassActionsMember country:CA 2016-03-31 2016-03-31 0001303523 bti:QuebecClassActionsMember country:CA 2016-09-30 2016-09-30 0001303523 country:CA bti:QuebecClassActionsMember 2015-12-31 2015-12-31 0001303523 country:CA bti:QuebecClassActionsMember 2016-06-30 2016-06-30 0001303523 bti:QuebecClassActionsMember country:CA 2019-03-01 2019-03-01 0001303523 bti:ImperialTobaccoCanadaLimitedMember bti:QuebecClassActionsMember country:CA 2019-03-01 2019-03-01 0001303523 bti:ImperialTobaccoCanadaLimitedMember bti:QuebecClassActionsMember country:CA 2018-02-28 2018-02-28 0001303523 bti:TwoJurisdictionsMember 2021-12-30 2021-12-31 0001303523 country:IE 2021-12-30 2021-12-31 0001303523 country:CL 2021-12-30 2021-12-31 0001303523 country:AR 2021-12-30 2021-12-31 0001303523 country:CA 2021-12-30 2021-12-31 0001303523 country:IT 2021-12-30 2021-12-31 0001303523 country:BR 2021-12-30 2021-12-31 0001303523 bti:NonTobaccoRelatedLitigationMember 2018-04-30 2018-04-30 0001303523 bti:ShareholderLitigationMember 2017-07-01 2017-07-31 0001303523 bti:ShareholderLitigationMember 2017-11-29 0001303523 bti:ShareholderLitigationMember 2017-11-29 2017-11-29 0001303523 bti:ShareholderLitigationMember 2020-04-27 2020-04-27 0001303523 bti:ShareholderLitigationMember bti:ConclusionOfMajorLitigationMember 2022-01-01 2022-01-01 0001303523 bti:GloLitigationMember 2019-01-17 2019-01-17 0001303523 bti:MozambicanIPLitigationMember 2018-07-01 2019-03-31 0001303523 bti:AliBinAliEstablishmentMember 2020-08-16 2020-08-16 0001303523 bti:AlNaghiMember 2021-01-25 2021-01-25 0001303523 bti:NCRMember bti:FoxRiverMember 2019-11-30 0001303523 bti:NCRMember bti:FoxRiverMember 2019-11-01 2019-11-30 0001303523 bti:NCRMember bti:FoxRiverMember 2012-05-01 2012-05-31 0001303523 bti:NCRMember bti:FoxRiverMember 2014-09-01 2014-09-30 0001303523 bti:WindwardMember bti:FoxRiverMember 2014-09-01 2014-09-30 0001303523 bti:WindwardDividendClaimMember 2008-01-01 2008-12-31 0001303523 bti:WindwardDividendClaimMember bti:SequanaMember 2009-01-01 2009-12-31 0001303523 bti:WindwardDividendClaimMember 2009-01-01 2009-12-31 0001303523 bti:WindwardDividendClaimMember 2019-02-06 2019-02-06 0001303523 bti:SequanaMember bti:WindwardDividendClaimMember 2019-02-06 2019-02-06 0001303523 bti:NCRMember bti:KalamazooRiverMember bti:GeorgiaPacificMember 2018-03-29 2018-03-29 0001303523 bti:NCRMember bti:GeorgiaPacificMember bti:KalamazooRiverMember 2019-12-11 2019-12-11 0001303523 bti:NCRAndAppvionMember bti:FundingMember bti:KalamazooRiverMember 2015-10-01 2015-12-31 0001303523 country:BD bti:BATBangladeshMember bti:TaxAssessmentMember 2018-07-25 0001303523 ifrs-full:LiquidityRiskMember bti:BondsIssuedMaturingInTwoThousandTwentyTwoMember 2020-11-01 2020-11-30 0001303523 bti:LongTermIncentivePlanMember bti:ReynoldsAmericanIncMember 2021-07-24 2021-07-25 0001303523 ifrs-full:MajorOrdinaryShareTransactionsMember 2022-05-01 2022-05-31 0001303523 ifrs-full:MajorOrdinaryShareTransactionsMember 2022-08-01 2022-08-31 0001303523 ifrs-full:MajorOrdinaryShareTransactionsMember 2022-11-01 2022-11-30 0001303523 ifrs-full:MajorOrdinaryShareTransactionsMember 2023-02-01 2023-02-28 0001303523 bti:ShareRepurchaseProgrammeForTwentyTwentyTwoMember 2022-02-10 2022-02-10 0001303523 bti:PTBentoelInternasionalInvestamaTbkMember 2011-01-01 2011-12-31 0001303523 bti:FoxRiverMember 2011-01-01 2011-12-31 0001303523 ifrs-full:LiquidityRiskMember bti:ThreeSixtyFourDayTranchesMember 2022-03-01 2022-03-31 0001303523 bti:ThreeSixtyFourDayTranchesMember ifrs-full:LiquidityRiskMember 2023-03-31 0001303523 bti:BatParsCompanyPjscMember 2021-08-06 0001303523 bti:DiscontinuedOperationsMemberMember bti:BatParsCompanyPjscMember 2021-06-25 2021-06-25 0001303523 bti:AYRLimitedMember 2019-01-10 0001303523 bti:AYRLimitedMember 2019-01-10 2019-01-10 0001303523 bti:ShareholderLitigationMember 2019-06-01 2019-06-30 0001303523 ifrs-full:LiquidityRiskMember bti:CreditFacilitiesMember bti:TrancheOneMember 2019-06-01 2019-06-30 0001303523 bti:NonTobaccoRelatedLitigationMember 2017-08-22 2017-08-22 0001303523 country:AR 2020-12-28 2020-12-28 0001303523 ifrs-full:LiquidityRiskMember 2021-06-30 0001303523 ifrs-full:LiquidityRiskMember 2022-01-01 2023-01-31 0001303523 ifrs-full:LiquidityRiskMember 2022-01-01 2022-10-31 0001303523 ifrs-full:LiquidityRiskMember 2022-01-01 2023-04-30 0001303523 bti:DryftSciencesLLCMember 2020-10-20 0001303523 ifrs-full:LiquidityRiskMember bti:CreditFacilitiesMember bti:TrancheOneMember 2020-03-01 2020-03-31 0001303523 ifrs-full:LiquidityRiskMember bti:MarchTwoThousandAndTwentyFiveMember 2022-01-01 2025-03-31 0001303523 ifrs-full:LiquidityRiskMember bti:FiveYearTranchesMember 2022-01-01 2025-03-31 0001303523 ifrs-full:LiquidityRiskMember bti:FiveYearTranchesMember 2026-04-01 2027-03-31 0001303523 ifrs-full:LiquidityRiskMember bti:MarchTwoThousandAndTwentySixMember 2025-04-01 2026-03-31 0001303523 ifrs-full:OrdinarySharesMember 2020-12-31 0001303523 ifrs-full:PensionDefinedBenefitPlansMember ifrs-full:PresentValueOfDefinedBenefitObligationMember 2020-12-31 0001303523 ifrs-full:PostemploymentMedicalDefinedBenefitPlansMember ifrs-full:PresentValueOfDefinedBenefitObligationMember 2020-12-31 0001303523 ifrs-full:PresentValueOfDefinedBenefitObligationMember 2020-12-31 0001303523 bti:StockReliefMember 2020-12-31 0001303523 bti:ExcessCapitalAllowancesMember 2020-12-31 0001303523 ifrs-full:UnusedTaxLossesMember 2020-12-31 0001303523 bti:UndistributedEarningsOfAssociatesAndSubsidiariesMember 2020-12-31 0001303523 bti:RetirementBenefitsMember 2020-12-31 0001303523 bti:TradeMarkMember 2020-12-31 0001303523 ifrs-full:OtherTemporaryDifferencesMember 2020-12-31 0001303523 ifrs-full:TradeReceivablesMember 2020-12-31 0001303523 bti:LoansAndOtherReceivablesMember 2020-12-31 0001303523 ifrs-full:OrdinarySharesMember 2021-12-31 0001303523 ifrs-full:LeaseLiabilitiesMember 2020-12-31 0001303523 bti:DerivativeRelatedToNetDebtMember 2020-12-31 0001303523 bti:BorrowingsExcludingLeaseLiabilitiesMember 2020-12-31 0001303523 bti:CashAndCashEquivalentsRelatedToNetDebtMember 2020-12-31 0001303523 bti:CurrentFinancialAssetsRelatedToNetDebtMember 2020-12-31 0001303523 bti:PropertyAcquiredMember bti:IAS16Member 2020-12-31 0001303523 bti:RightOfUsePropertiesMember bti:IFRS16Member 2020-12-31 0001303523 bti:EquitySettledDeferredShareBonusSchemeMember 2021-12-31 0001303523 ifrs-full:PensionDefinedBenefitPlansMember ifrs-full:PlanAssetsMember 2020-12-31 0001303523 ifrs-full:PostemploymentMedicalDefinedBenefitPlansMember ifrs-full:PlanAssetsMember 2020-12-31 0001303523 ifrs-full:PlanAssetsMember 2020-12-31 0001303523 ifrs-full:ReserveOfExchangeDifferencesOnTranslationMember 2020-12-31 0001303523 ifrs-full:ReserveOfCashFlowHedgesMember 2020-12-31 0001303523 ifrs-full:ReserveOfGainsAndLossesOnRemeasuringAvailableforsaleFinancialAssetsMember 2020-12-31 0001303523 ifrs-full:RevaluationSurplusMember 2020-12-31 0001303523 ifrs-full:MiscellaneousOtherReservesMember 2020-12-31 0001303523 ifrs-full:OtherReservesMember 2020-12-31 0001303523 bti:RetainedEarningsTreasurySharesMember 2020-12-31 0001303523 bti:RetainedEarningsOtherMember 2020-12-31 0001303523 ifrs-full:IntangibleAssetsUnderDevelopmentMember 2020-12-31 0001303523 ifrs-full:BrandNamesMember 2020-12-31 0001303523 ifrs-full:ComputerSoftwareMember 2020-12-31 0001303523 ifrs-full:GoodwillMember 2020-12-31 0001303523 ifrs-full:GrossCarryingAmountMember ifrs-full:IntangibleAssetsUnderDevelopmentMember 2020-12-31 0001303523 ifrs-full:GrossCarryingAmountMember ifrs-full:BrandNamesMember 2020-12-31 0001303523 ifrs-full:GrossCarryingAmountMember ifrs-full:ComputerSoftwareMember 2020-12-31 0001303523 ifrs-full:GrossCarryingAmountMember ifrs-full:GoodwillMember 2020-12-31 0001303523 ifrs-full:TradeReceivablesMember 2021-12-31 0001303523 bti:LoansAndOtherReceivablesMember 2021-12-31 0001303523 bti:PropertyAcquiredMember bti:IAS16Member 2021-12-31 0001303523 bti:RightOfUsePropertiesMember bti:IFRS16Member 2021-12-31 0001303523 ifrs-full:PreviouslyStatedMember 2020-12-31 0001303523 ifrs-full:ConstructionInProgressMember ifrs-full:PreviouslyStatedMember 2020-12-31 0001303523 ifrs-full:PreviouslyStatedMember bti:PlantEquipmentAndOtherLeasedMember 2020-12-31 0001303523 ifrs-full:PreviouslyStatedMember bti:PlantEquipmentAndOtherOwnedMember 2020-12-31 0001303523 bti:LeaseholdPropertyMember ifrs-full:PreviouslyStatedMember 2020-12-31 0001303523 bti:FreeholdPropertyMember ifrs-full:PreviouslyStatedMember 2020-12-31 0001303523 bti:PlantEquipmentAndOtherLeasedMember ifrs-full:AccumulatedDepreciationAmortisationAndImpairmentMember 2020-12-31 0001303523 ifrs-full:AccumulatedDepreciationAmortisationAndImpairmentMember bti:PlantEquipmentAndOtherOwnedMember 2020-12-31 0001303523 bti:LeaseholdPropertyMember ifrs-full:AccumulatedDepreciationAmortisationAndImpairmentMember 2020-12-31 0001303523 bti:FreeholdPropertyMember ifrs-full:AccumulatedDepreciationAmortisationAndImpairmentMember 2020-12-31 0001303523 ifrs-full:ConstructionInProgressMember ifrs-full:GrossCarryingAmountMember 2020-12-31 0001303523 ifrs-full:GrossCarryingAmountMember bti:PlantEquipmentAndOtherLeasedMember 2020-12-31 0001303523 bti:PlantEquipmentAndOtherOwnedMember ifrs-full:GrossCarryingAmountMember 2020-12-31 0001303523 bti:LeaseholdPropertyMember ifrs-full:GrossCarryingAmountMember 2020-12-31 0001303523 ifrs-full:GrossCarryingAmountMember bti:FreeholdPropertyMember 2020-12-31 0001303523 ifrs-full:IssuedCapitalMember 2020-12-31 0001303523 ifrs-full:RetainedEarningsMember 2020-12-31 0001303523 ifrs-full:EquityAttributableToOwnersOfParentMember 2020-12-31 0001303523 ifrs-full:NoncontrollingInterestsMember 2020-12-31 0001303523 bti:PerpetualHybridBondsMember 2020-12-31 0001303523 bti:StockReliefMember 2021-12-31 0001303523 bti:ExcessCapitalAllowancesMember 2021-12-31 0001303523 ifrs-full:UnusedTaxLossesMember 2021-12-31 0001303523 bti:UndistributedEarningsOfAssociatesAndSubsidiariesMember 2021-12-31 0001303523 bti:RetirementBenefitsMember 2021-12-31 0001303523 bti:TradeMarkMember 2021-12-31 0001303523 ifrs-full:OtherTemporaryDifferencesMember 2021-12-31 0001303523 ifrs-full:PensionDefinedBenefitPlansMember ifrs-full:PresentValueOfDefinedBenefitObligationMember 2021-12-31 0001303523 ifrs-full:PostemploymentMedicalDefinedBenefitPlansMember ifrs-full:PresentValueOfDefinedBenefitObligationMember 2021-12-31 0001303523 ifrs-full:PresentValueOfDefinedBenefitObligationMember 2021-12-31 0001303523 ifrs-full:PensionDefinedBenefitPlansMember ifrs-full:PlanAssetsMember 2021-12-31 0001303523 ifrs-full:PostemploymentMedicalDefinedBenefitPlansMember ifrs-full:PlanAssetsMember 2021-12-31 0001303523 ifrs-full:PlanAssetsMember 2021-12-31 0001303523 ifrs-full:LeaseLiabilitiesMember 2021-12-31 0001303523 bti:DerivativeRelatedToNetDebtMember 2021-12-31 0001303523 bti:BorrowingsExcludingLeaseLiabilitiesMember 2021-12-31 0001303523 bti:CashAndCashEquivalentsRelatedToNetDebtMember 2021-12-31 0001303523 bti:CurrentFinancialAssetsRelatedToNetDebtMember 2021-12-31 0001303523 ifrs-full:GrossCarryingAmountMember ifrs-full:GoodwillMember 2021-12-31 0001303523 ifrs-full:GrossCarryingAmountMember ifrs-full:ComputerSoftwareMember 2021-12-31 0001303523 ifrs-full:GrossCarryingAmountMember ifrs-full:BrandNamesMember 2021-12-31 0001303523 ifrs-full:GrossCarryingAmountMember ifrs-full:IntangibleAssetsUnderDevelopmentMember 2021-12-31 0001303523 ifrs-full:GoodwillMember 2021-12-31 0001303523 ifrs-full:ComputerSoftwareMember 2021-12-31 0001303523 ifrs-full:BrandNamesMember 2021-12-31 0001303523 ifrs-full:IntangibleAssetsUnderDevelopmentMember 2021-12-31 0001303523 bti:FreeholdPropertyMember 2021-12-31 0001303523 ifrs-full:AccumulatedDepreciationAmortisationAndImpairmentMember bti:FreeholdPropertyMember 2021-12-31 0001303523 ifrs-full:GrossCarryingAmountMember bti:FreeholdPropertyMember 2021-12-31 0001303523 bti:PlantEquipmentAndOtherOwnedMember 2021-12-31 0001303523 ifrs-full:AccumulatedDepreciationAmortisationAndImpairmentMember bti:PlantEquipmentAndOtherOwnedMember 2021-12-31 0001303523 bti:PlantEquipmentAndOtherOwnedMember ifrs-full:GrossCarryingAmountMember 2021-12-31 0001303523 bti:LeaseholdPropertyMember 2021-12-31 0001303523 bti:LeaseholdPropertyMember ifrs-full:AccumulatedDepreciationAmortisationAndImpairmentMember 2021-12-31 0001303523 bti:LeaseholdPropertyMember ifrs-full:GrossCarryingAmountMember 2021-12-31 0001303523 ifrs-full:ConstructionInProgressMember 2021-12-31 0001303523 ifrs-full:GrossCarryingAmountMember ifrs-full:ConstructionInProgressMember 2021-12-31 0001303523 bti:PlantEquipmentAndOtherLeasedMember 2021-12-31 0001303523 bti:PlantEquipmentAndOtherLeasedMember ifrs-full:AccumulatedDepreciationAmortisationAndImpairmentMember 2021-12-31 0001303523 bti:PlantEquipmentAndOtherLeasedMember ifrs-full:GrossCarryingAmountMember 2021-12-31 0001303523 ifrs-full:IssuedCapitalMember 2021-12-31 0001303523 ifrs-full:OtherReservesMember 2021-12-31 0001303523 ifrs-full:RetainedEarningsMember 2021-12-31 0001303523 ifrs-full:EquityAttributableToOwnersOfParentMember 2021-12-31 0001303523 bti:PerpetualHybridBondsMember 2021-12-31 0001303523 ifrs-full:NoncontrollingInterestsMember 2021-12-31 0001303523 ifrs-full:ReserveOfExchangeDifferencesOnTranslationMember 2021-12-31 0001303523 ifrs-full:ReserveOfCashFlowHedgesMember 2021-12-31 0001303523 ifrs-full:ReserveOfGainsAndLossesOnRemeasuringAvailableforsaleFinancialAssetsMember 2021-12-31 0001303523 ifrs-full:RevaluationSurplusMember 2021-12-31 0001303523 ifrs-full:MiscellaneousOtherReservesMember 2021-12-31 0001303523 bti:RetainedEarningsTreasurySharesMember 2021-12-31 0001303523 bti:RetainedEarningsOtherMember 2021-12-31 0001303523 ifrs-full:OrdinarySharesMember 2019-12-31 0001303523 ifrs-full:FinancialAssetsAtFairValueThroughProfitOrLossCategoryMember 2019-12-31 0001303523 ifrs-full:FinancialAssetsAtFairValueThroughOtherComprehensiveIncomeCategoryMember 2019-12-31 0001303523 bti:CashSettledLongTermIncentivePlanMember 2019-12-31 0001303523 bti:EquitySettledLongTermIncentivePlanMember 2019-12-31 0001303523 bti:CashSettledDeferredShareBonusSchemeMember 2019-12-31 0001303523 bti:EquitySettledDeferredShareBonusSchemeMember 2019-12-31 0001303523 ifrs-full:PensionDefinedBenefitPlansMember 2019-12-31 0001303523 ifrs-full:PostemploymentMedicalDefinedBenefitPlansMember 2019-12-31 0001303523 ifrs-full:PensionDefinedBenefitPlansMember ifrs-full:PresentValueOfDefinedBenefitObligationMember 2019-12-31 0001303523 ifrs-full:PostemploymentMedicalDefinedBenefitPlansMember ifrs-full:PresentValueOfDefinedBenefitObligationMember 2019-12-31 0001303523 ifrs-full:PresentValueOfDefinedBenefitObligationMember 2019-12-31 0001303523 bti:StockReliefMember 2019-12-31 0001303523 bti:ExcessCapitalAllowancesMember 2019-12-31 0001303523 ifrs-full:UnusedTaxLossesMember 2019-12-31 0001303523 bti:UndistributedEarningsOfAssociatesAndSubsidiariesMember 2019-12-31 0001303523 bti:RetirementBenefitsMember 2019-12-31 0001303523 bti:TradeMarkMember 2019-12-31 0001303523 ifrs-full:OtherTemporaryDifferencesMember 2019-12-31 0001303523 ifrs-full:TradeReceivablesMember 2019-12-31 0001303523 bti:LoansAndOtherReceivablesMember 2019-12-31 0001303523 bti:BorrowingsExcludingLeaseLiabilitiesMember 2019-12-31 0001303523 ifrs-full:LeaseLiabilitiesMember 2019-12-31 0001303523 bti:DerivativeRelatedToNetDebtMember 2019-12-31 0001303523 bti:CashAndCashEquivalentsRelatedToNetDebtMember 2019-12-31 0001303523 bti:CurrentFinancialAssetsRelatedToNetDebtMember 2019-12-31 0001303523 bti:PropertyAcquiredMember bti:IAS16Member 2019-12-31 0001303523 bti:RightOfUsePropertiesMember bti:IFRS16Member 2019-12-31 0001303523 bti:ShortTermAndLongTermLeaseholdPropertyMember 2019-12-31 0001303523 ifrs-full:RestructuringProvisionMember 2019-12-31 0001303523 bti:EmployeeRelatedBenefitsMember 2019-12-31 0001303523 bti:FoxRiverMember 2019-12-31 0001303523 ifrs-full:MiscellaneousOtherProvisionsMember 2019-12-31 0001303523 ifrs-full:PensionDefinedBenefitPlansMember ifrs-full:PlanAssetsMember 2019-12-31 0001303523 ifrs-full:PostemploymentMedicalDefinedBenefitPlansMember ifrs-full:PlanAssetsMember 2019-12-31 0001303523 ifrs-full:PlanAssetsMember 2019-12-31 0001303523 ifrs-full:ReserveOfExchangeDifferencesOnTranslationMember 2019-12-31 0001303523 ifrs-full:ReserveOfCashFlowHedgesMember 2019-12-31 0001303523 ifrs-full:ReserveOfGainsAndLossesOnRemeasuringAvailableforsaleFinancialAssetsMember 2019-12-31 0001303523 ifrs-full:RevaluationSurplusMember 2019-12-31 0001303523 ifrs-full:MiscellaneousOtherReservesMember 2019-12-31 0001303523 ifrs-full:OtherReservesMember 2019-12-31 0001303523 bti:RetainedEarningsTreasurySharesMember 2019-12-31 0001303523 bti:RetainedEarningsOtherMember 2019-12-31 0001303523 ifrs-full:GrossCarryingAmountMember ifrs-full:GoodwillMember 2019-12-31 0001303523 ifrs-full:GrossCarryingAmountMember ifrs-full:ComputerSoftwareMember 2019-12-31 0001303523 ifrs-full:GrossCarryingAmountMember ifrs-full:BrandNamesMember 2019-12-31 0001303523 ifrs-full:GrossCarryingAmountMember ifrs-full:IntangibleAssetsUnderDevelopmentMember 2019-12-31 0001303523 ifrs-full:GrossCarryingAmountMember 2019-12-31 0001303523 ifrs-full:GoodwillMember 2019-12-31 0001303523 ifrs-full:ComputerSoftwareMember 2019-12-31 0001303523 ifrs-full:BrandNamesMember 2019-12-31 0001303523 ifrs-full:IntangibleAssetsUnderDevelopmentMember 2019-12-31 0001303523 bti:FreeholdPropertyMember ifrs-full:GrossCarryingAmountMember 2019-12-31 0001303523 bti:LeaseholdPropertyMember ifrs-full:GrossCarryingAmountMember 2019-12-31 0001303523 bti:PlantEquipmentAndOtherOwnedMember ifrs-full:GrossCarryingAmountMember 2019-12-31 0001303523 bti:PlantEquipmentAndOtherLeasedMember ifrs-full:GrossCarryingAmountMember 2019-12-31 0001303523 ifrs-full:ConstructionInProgressMember ifrs-full:GrossCarryingAmountMember 2019-12-31 0001303523 bti:FreeholdPropertyMember ifrs-full:AccumulatedDepreciationAmortisationAndImpairmentMember 2019-12-31 0001303523 bti:LeaseholdPropertyMember ifrs-full:AccumulatedDepreciationAmortisationAndImpairmentMember 2019-12-31 0001303523 bti:PlantEquipmentAndOtherOwnedMember ifrs-full:AccumulatedDepreciationAmortisationAndImpairmentMember 2019-12-31 0001303523 bti:PlantEquipmentAndOtherLeasedMember ifrs-full:AccumulatedDepreciationAmortisationAndImpairmentMember 2019-12-31 0001303523 bti:FreeholdPropertyMember ifrs-full:PreviouslyStatedMember 2019-12-31 0001303523 bti:LeaseholdPropertyMember ifrs-full:PreviouslyStatedMember 2019-12-31 0001303523 bti:PlantEquipmentAndOtherOwnedMember ifrs-full:PreviouslyStatedMember 2019-12-31 0001303523 bti:PlantEquipmentAndOtherLeasedMember ifrs-full:PreviouslyStatedMember 2019-12-31 0001303523 ifrs-full:ConstructionInProgressMember ifrs-full:PreviouslyStatedMember 2019-12-31 0001303523 ifrs-full:PreviouslyStatedMember 2019-12-31 0001303523 ifrs-full:IssuedCapitalMember 2019-12-31 0001303523 ifrs-full:RetainedEarningsMember 2019-12-31 0001303523 ifrs-full:EquityAttributableToOwnersOfParentMember 2019-12-31 0001303523 ifrs-full:NoncontrollingInterestsMember 2019-12-31 0001303523 bti:FreeholdPropertyMember 2020-12-31 0001303523 bti:LeaseholdPropertyMember 2020-12-31 0001303523 bti:PlantEquipmentAndOtherOwnedMember 2020-12-31 0001303523 bti:PlantEquipmentAndOtherLeasedMember 2020-12-31 0001303523 ifrs-full:ConstructionInProgressMember 2020-12-31 0001303523 ifrs-full:OrdinarySharesMember 2018-12-31 0001303523 ifrs-full:PensionDefinedBenefitPlansMember 2018-12-31 0001303523 ifrs-full:PostemploymentMedicalDefinedBenefitPlansMember 2018-12-31 0001303523 ifrs-full:ReserveOfExchangeDifferencesOnTranslationMember 2018-12-31 0001303523 ifrs-full:ReserveOfCashFlowHedgesMember 2018-12-31 0001303523 ifrs-full:ReserveOfGainsAndLossesOnRemeasuringAvailableforsaleFinancialAssetsMember 2018-12-31 0001303523 ifrs-full:RevaluationSurplusMember 2018-12-31 0001303523 ifrs-full:MiscellaneousOtherReservesMember 2018-12-31 0001303523 ifrs-full:OtherReservesMember 2018-12-31 0001303523 bti:RetainedEarningsTreasurySharesMember 2018-12-31 0001303523 bti:RetainedEarningsOtherMember 2018-12-31 0001303523 ifrs-full:IssuedCapitalMember 2018-12-31 0001303523 bti:SharePremiumCapitalRedemptionAndMergerReservesMember 2018-12-31 0001303523 ifrs-full:RetainedEarningsMember 2018-12-31 0001303523 ifrs-full:EquityAttributableToOwnersOfParentMember 2018-12-31 0001303523 ifrs-full:NoncontrollingInterestsMember 2018-12-31 0001303523 bti:BritishAmericanTobaccoBangladeshCompanyLimitedMember 2018-12-31 iso4217:GBP xbrli:pure iso4217:CAD iso4217:USD xbrli:shares utr:Year bti:ACTION iso4217:EUR iso4217:ARS iso4217:TRY iso4217:BRL iso4217:KRW iso4217:SAR iso4217:HRK iso4217:CHF iso4217:AOA iso4217:JPY utr:Day iso4217:QAR iso4217:NGN iso4217:GBP xbrli:shares bti:Employee bti:People bti:CASE bti:CLAIM bti:Case bti:ProductLiabilityAction bti:CorporateGroup bti:BOND bti:INSTALMENT bti:State bti:REPRESENTATIVE bti:STATE bti:Jurisdiction bti:CLASS bti:REIMBURSEMENT bti:MARKET bti:Derivative bti:Directors bti:SUBJECT bti:CLASSACTION iso4217:USD xbrli:shares bti:DISTRICTCOURT bti:JURISDICTION bti:FARMER bti:CASHGENERATINGUNIT bti:DISEASE bti:CIGARETTE bti:PACKYEAR utr:Y
Table of Contents

 
UNITED STATES
SECURITIES AND EXCHANGE COMMISSION
WASHINGTON, D.C. 20549
 
 
FORM
20-F
 
 
(Mark One)
REGISTRATION STATEMENT PURSUANT TO SECTION 12(b) OR (g) OF THE SECURITIES EXCHANGE ACT OF 193
4
OR
 
ANNUAL REPORT PURSUANT TO SECTION 13 OR 15(d) OF THE SECURITIES EXCHANGE ACT OF 1934
For the fiscal year ended December 31, 2021
OR
 
TRANSITION REPORT PURSUANT TO SECTION 13 OR 15(d) OF THE SECURITIES EXCHANGE ACT OF 1934
OR
 
SHELL COMPANY REPORT PURSUANT TO SECTION 13 OR 15(d) OF THE SECURITIES EXCHANGE ACT OF 1934
Date of event requiring this shell company report
                    
For the transition period from
                    
to
                    
Commission file number
001-38159
 
 
British American Tobacco p.l.c.
(Exact name of Registrant as specified in its charter)
 
 
(Translation of Registrant’s name into English)
England and Wales
(Jurisdiction of incorporation or organization)
Globe House, 4 Temple Place, London WC2R 2PG, United Kingdom
(Address of principal executive offices)
Paul McCrory, Company Secretary Tel: +44 (0)20 7845 1000
Fax: +44 (0)20 7240 0555
Globe House, 4 Temple Place, London WC2R 2PG, United Kingdom
(Name, Telephone,
E-mail
and/or Facsimile number and Address of Company Contact Person)
Securities registered or to be registered pursuant to Section 12(b) of the Act.
 
Title of each class
 
Trading
symbol(s)
 
Name of each exchange
on which registered
American Depositary Shares (evidenced by American Depositary Receipts)
 
BTI
 
New York Stock Exchange
each representing one ordinary share
       
Ordinary shares, nominal value 25 pence per share
 
BTI
 
New York Stock Exchange*
1.668% Notes due 2026
 
BTI26A
 
New York Stock Exchange
2.259% Notes due 2028
 
BTI28
 
New York Stock Exchange
2.726% Notes due 2031
 
BTI31
 
New York Stock Exchange
3.734% Notes due 2040
 
BTI40
 
New York Stock Exchange
3.984% Notes due 2050
 
BTI50A
 
New York Stock Exchange
4.700% Notes due 2027
 
BTI27A
 
New York Stock Exchange
4.906% Notes due 203
0
 
BTI30
 
New York Stock Exchange
5.282% Notes due 2050
 
BTI50
 
New York Stock Exchange
2.789% Notes due 2024
 
BTI24
 
New York Stock Exchange
3.215% Notes due 2026
 
BTI26
 
New York Stock Exchange
3.462% Notes due 2029
 
BTI29
 
New York Stock Exchange
4.758% Notes due 2049
 
BTI49
 
New York Stock Exchange
2.764% Notes due 2022
 
BTI22
 
New York Stock Exchange
3.222% Notes due 2024
 
BTI24A
 
New York Stock Exchange
3.557% Notes due 2027
 
BTI27
 
New York Stock Exchange
4.390% Notes due 2037
 
BTI37
 
New York Stock Exchange
4.540% Notes due 2047
 
BTI47
 
New York Stock Exchange
Floating Rate Notes due 2022
 
BTI22A
 
New York Stock Exchange
 
*
Application made for registration purposes only, not for trading, and only in connection with the registration of the American Depositary Shares pursuant to the requirements of the Securities and Exchange Commission.
Securities registered or to be registered pursuant to Section 12(g) of the Act.
None
Securities for which there is a reporting obligation pursuant to Section 15(d) of the Act.
None
 
 
Indicate the number of outstanding shares of each of the issuer’s classes of capital or common stock as of the close of the period covered by the Annual Report.
2,456,617,788 ordinary shares
Indicate by check mark if the registrant is a well-known seasoned issuer, as defined in Rule 405 of the Securities Act.    ☒  Yes    ☐  No
If this report is an annual or transition report, indicate by check mark if the registrant is not required to file reports pursuant to Section 13 or 15(d) of the Securities Exchange Act of 1934.    ☐  Yes    ☒  No
Note – Checking the box above will not relieve any registrant required to file reports pursuant to Section 13 or 15(d) of the Securities Exchange Act of 1934 from their obligations under those Sections.
Indicate by check mark whether the registrant (1) has filed all reports required to be filed by Section 13 or 15(d) of the Securities Exchange Act of 1934 during the preceding 12 months (or for such shorter period that the registrant was required to file such reports), and (2) has been subject to such filing requirements for the past 90 days.    ☒  Yes    ☐  No
Indicate by check mark whether the registrant has submitted electronically every Interactive Data File required to be submitted pursuant to Rule 405 of Regulation
S-T
(§232.405 of this chapter) during the preceding 12 months (or for such shorter period that the registrant was required to submit such files).    ☒  
Yes    
☐  No
Indicate by check mark whether the registrant is a large accelerated filer, an accelerated filer, a
non-accelerated
filer, or an emerging growth company. See definition of “large accelerated filer,” “accelerated filer,” and “emerging growth company” in Rule
12b-2
of the Exchange Act.
 
Large accelerated filer      Accelerated filer  
       
Non-accelerated
filer
     Emerging growth company  
If an emerging growth company that prepares its financial statements in accordance with US GAAP, indicate by check mark if the registrant has elected not to use the extended transition period for complying with any new or revised financial accounting standards† provided pursuant to Section 13(a) of the Exchange Act.  ☐
 
The term “new or revised financial accounting standard” refers to any update issued by the Financial Accounting Standards Board to its Accounting Standards Codification after April 5, 2012.
Indicate by check mark whether the registrant has filed a report on and attestation to its management’s assessment of the effectiveness of its internal control over financial reporting under Section 404(b) of the Sarbanes-Oxley Act (15 U.S.C. 7262(b)) by the registered public accounting firm that prepared or issued its audit report.  
Indicate by check mark which basis of accounting the registrant has used to prepare the financial statements included in this filing:
 
US GAAP  ☐   
International Financial Reporting Standards as issued by the
International Accounting Standards Board  ☒
   Other  ☐
If “Other” has been checked in response to the previous question, indicate by check mark which financial statement item the registrant has elected to follow.    ☐  Item 17    ☐  Item 18
If this is an annual report, indicate by check mark whether the registrant is a shell company (as defined in Rule
12b-2
of the Exchange Act).    ☐  Yes      No
 
Name of the auditor’s firm    KPMG LLP
Auditors’ firm ID/ PCAOB issued Audit Firm Identifier    1118
Auditors’ Location – City, State/Province, Country    15 Canada Square, London, E14 5GL
For the forward-looking
non-GAAP
information contained in this Annual Report on Form
20-F,
no comparable GAAP or IFRS information is available on a forward-looking basis and our forward-looking revenue cannot be estimated, as the effect of rates of exchange, which could be significant, may be highly variable and cannot be estimated with reasonable certainty. In addition, other components of the Group’s results, including the revenue generated from combustibles, cannot be estimated with reasonable certainty due to, among other things, the impact of foreign exchange, pricing and volume, which could be significant, being highly variable. As such, no reconciliations for this forward-looking
non-GAAP
information are available and we are unable to: present revenue before presenting New Category revenue or constant currency revenue.


Table of Contents
Accelerating A Better Tomorrow Annual Report and Form 20-F 2021

Table of Contents
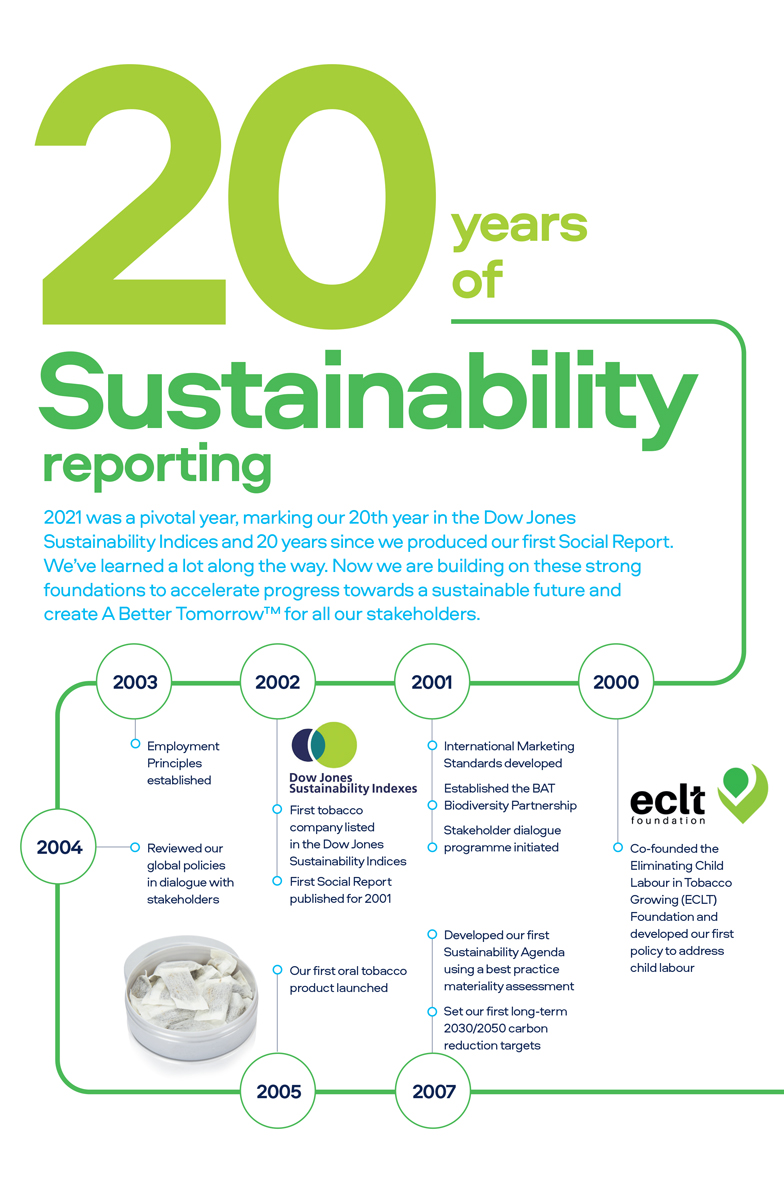
years years of of ustainability Sustainability eporting eporting was a 2021 pivotal was year, a pivotal marking year, our marking 20th year our in 20th the year Dowin Jon thesDow Jones inability Sustainability Indices andIndic 20 yes ars and since 20 years we produced since we our produced first Social our Report first Social . Report. learned We've a lot learned along a the lot way along . Now the we way are . Now building we are onbuilding these strong on these strong ations foundations to accelerate to accelerate progress towards progress a sustainable towards a sus future ainable and future and A Better create T om


Table of Contents

CO e 2 Our first vapour CO e targets 2 product launched approved by the in the UK Science-Based Targets Initiative 2013 2014 2016 2017 2019 Listed in the Dow Jones Sustainability Indices for the 20th consecutive year Thrive farmer Our first tobacco Signed up to the livelihoods heating product UN-backed Race programme launched to Zero global developed campaign Enhanced global ethics programme, 2021 Delivery with Integrity, introduced 2022 BAT celebrates 120th Accelerating anniversary Our A Better TomorrowTM ambitions in numbers £5 billion in New Category revenues Carbon 100% Neutral NetZero of plastic packaging capable operations value chain of being reusable, recyclable or (Scope 1 and 2) In October 2021, we signed compostable and unnecessary up to the UN-backed Race to Zero global campaign, single-use plastic removed 50million committing to set science- based targets aiming non-combustible for net zero value chain Zero product consumers emissions by 2050 child labour ambition for our tobacco supply chain 2025 2030 2050

Table of Contents

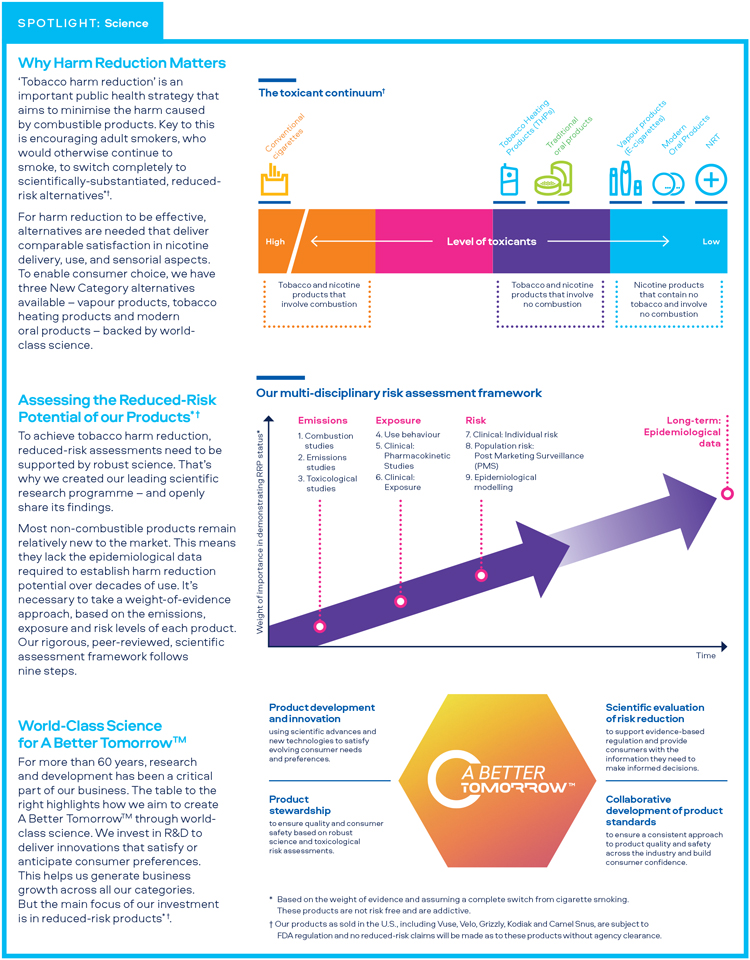
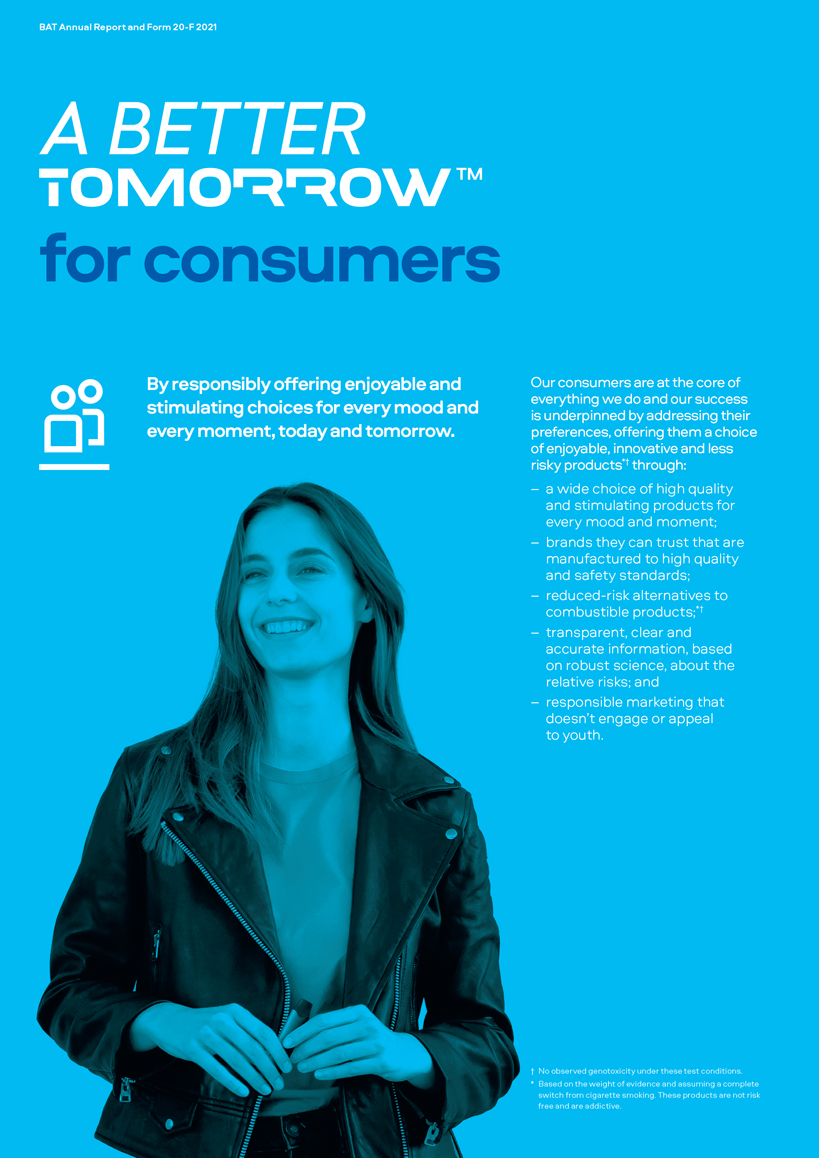
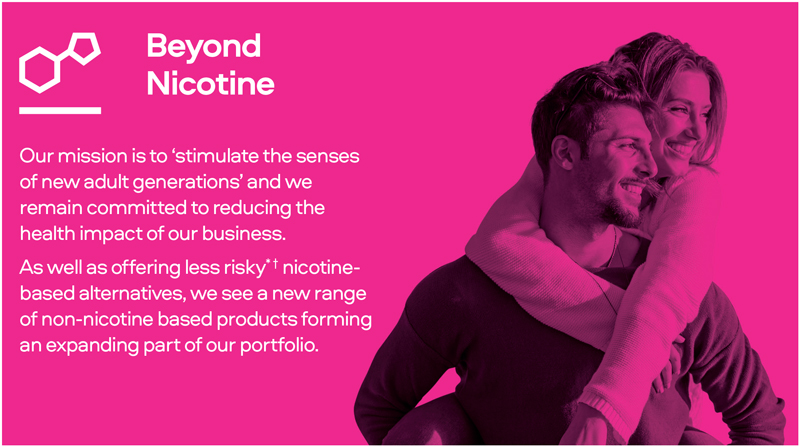
Our Purpose To reduce the health impact of our business by offering a greater choice of enjoyable and less risky products for our consumers. We are clear that combustible cigarettes pose serious health risks. The only way to avoid these risks is not to start or to quit. However, we encourage those who would otherwise continue to smoke to switch completely to scientifically-substantiated, reduced-risk alternatives.* In order to deliver this, BAT is transforming into a truly multi-category consumer products business, with a mission to stimulate the senses of new adult generations. years of 20Sustainability reporting Sustainability isnt new at BAT. 2021 was a pivotal year, marking our 20th year in the Dow Jones Sustainability Indices and 20 years since producing our first Social Report. Weve learned a lot along the way. And now we are building on these strong foundations to accelerate progress towards a sustainable future and create A Better Tomorrow

Table of Contents
BAT Annual Report and Form 20-F 2021    
 
Strategic Report        
 
Governance Report        
  
Financial Statements        
  
Other Information        
 
 
Inside This Report


02


03


04


07


09


10


12


14


16


18


20


21


22


24


26


28


29


Explore the story
of our year
 
Featuring downloadable
versions of this report,
along with our ESG report
and other content – all accessible on desktop,
tablet and mobile.
 
www.bat.com/reporting


Delivering A Better Tomorrow
TM


34


35


37


39


41


42


44


45


46


47


48


49


50


52


54


56


58


68


69


70


74


75


80


82


84
 
 
Business Environment


92


Directors’ Report
 
98
 
99
 
100
 
102
 
103
 
104
 
106
 
110
 
111
 
112
 
114
 
116
 
120
 
 
128
 
Group Financial Statements
 
 
176
 
282


299
 
353
British American Tobacco p.l.c. (No. 3407696)
Annual Report 2021
This document constitutes the Annual Report and Accounts of British American Tobacco p.l.c. (the Company) and the British American Tobacco Group prepared in accordance with UK requirements and the Annual Report on Form
20-F
prepared in accordance with the US Securities Exchange Act of 1934 (the Exchange Act) and the rules promulgated thereunder for the year ended 31 December 2021, except that certain phrases, paragraphs or similar sections denoted with a ‘@’ symbol do not form part of the Annual Report on Form
20-F
as filed with the US Securities and Exchange Commission (the SEC) and certain phrases, paragraphs or similar sections denoted with a ‘»’ symbol do not form part of the Annual Report and Accounts. In addition, the Report of Independent Registered Public Accounting Firm on pages 176 and 177 will only be included in the Annual Report on Form
20-F.
Moreover, the information in this document may be updated or supplemented only for purposes of the Annual Report on Form
20-F
at the time of filing with the SEC or later amended if necessary. Any such updates, supplements or amendments will also be denoted with a ‘»’ symbol. Insofar as this document constitutes the Annual Report and Accounts, it has been prepared and is presented in accordance with, and reliance upon, applicable English company law and the liabilities of the Directors in connection with this report shall be subject to the limitations and restrictions provided by such law.
This document is made up of the Strategic Report, the Governance Report, the Financial Statements and Notes, and certain other information. Our Strategic Report, pages 2 to 97, includes our purpose and strategy, global market overview, business model, global performance, as well as our financial performance and principal Group risks. The Strategic Report has been approved by the Board of Directors and signed on its behalf by Paul McCrory, Company Secretary. Our Governance Report on pages 98 to 166 contains detailed corporate governance information and our Committee reports. The Directors’ Report on pages 98 to 127 (the Governance pages) and 299 to 379 (the Additional Disclosure and Shareholder Information pages) has been approved by the Board of Directors and signed on its behalf by Paul McCrory, Company Secretary. Our Financial Statements and Notes are on pages 167 to 298. The Other Information section commences on page 299.
This document provides alternative performance measures (APMs) which are not defined or specified under the requirements of International Financial Reporting Standards (IFRS). We believe these APMs provide readers with important additional information on our business. We have included a
Non-GAAP
measures section on pages 304 to 313 which provides a comprehensive list of the APMs that we use, an explanation of how they are calculated, why we use them and a reconciliation to the most directly comparable IFRS measure where relevant.
 
British American Tobacco p.l.c. has shares listed on the London Stock Exchange (BATS) and the Johannesburg Stock Exchange (BTI), and, as American Depositary Shares, on the New York Stock Exchange (BTI).
The Annual Report is published on bat.com. A printed copy is mailed to shareholders on the UK main register who have elected to receive it. Otherwise, shareholders are notified that the Annual Report is available on the website and will, at the time of that notification, receive a short Performance Summary (which sets out an overview of the Group’s performance, headline facts and figures and key dates in the Company’s financial calendar) and Proxy Form. Specific local mailing and/or notification requirements will apply to shareholders on the South Africa branch register.
References in this publication to ‘British American Tobacco’, ‘BAT’, ‘Group’, ‘we’, ‘us’ and ‘our’ when denoting opinion refer to British American Tobacco p.l.c. and when denoting business activity refer to British American Tobacco Group operating companies, collectively or individually as the case may be.
The material in this Annual Report is provided for the purpose of giving information about the Company to investors only and is not intended for general consumers. The Company, its Directors, employees, agents or advisers do not accept or assume responsibility to any other person to whom this material is shown or into whose hands it may come and any such responsibility or liability is expressly disclaimed. The material in this Annual Report is not provided for product advertising, promotional or marketing purposes. This material does not constitute and should not be construed as constituting an offer to sell, or a solicitation of an offer to buy, any of our products. Our products are sold only in compliance with the laws of the particular jurisdictions in which they are sold.
References in this document to information on websites, including the web address of BAT, have been included as inactive textual references only. These websites and the information contained therein or connected thereto are not intended to be incorporated into or to form part of the Annual Report and Form
20-F.
Cautionary statement
This document contains forward-looking statements. For our full cautionary statement, please see page 352.
 
01


Table of Contents
BAT Annual Report and Form 20-F 2021
 
Overview
Chairman’s Introduction
Accelerating A Better Tomorrow
TM
 
 
Welcome to our combined Annual Report and Form
20-F
for 2021.
2021 has been a year of accelerated delivery, important strategic progress and continued adaptation – all achieved in the face of the ongoing pandemic.
Our teams around the world have worked tirelessly to deliver strong results across the business. Their efforts have helped ensure we continue to perform well as we build A Better Tomorrow
TM
by reducing the health impact of the business, and, in so doing, creating value for all stakeholders.
My appointment as Chairman was a great honour. I have enormous respect for the responsibilities that come with the role and I will do my utmost to provide thoughtful leadership to the Board and support for Jack Bowles and his team as we advance BAT’s transformation.
The strong position BAT occupies is a mark of the work done by my predecessor as Chairman, Richard Burrows. During his tenure, Richard did an outstanding job of guiding the Group through challenging times. I want to thank him, on behalf of the Board, for his dedication.
Having served as a
Non-Executive
Director prior to my appointment as Chairman, I am fortunate to have worked with many colleagues on the Board for some time. I believe we have a wide-ranging combination of diversity, expertise, experience and knowledge that will help steer BAT through a landscape that is both uncertain and full of opportunities.
 
*
As verified by Vertis based on product Life Cycle Assessment data provided by an independent third party, taking into account the Group’s purchase of carbon credits through reforestation projects.
Enhancing Organisational
Culture and Capabilities
The Board is very encouraged by the progress we have made this year in terms of talent and culture. We have continued to embed our ethos and have strengthened skills in numerous key areas, notably digital capabilities and the supply chain of our New Category products.
Our people have continued to demonstrate resilience and effectiveness in very testing conditions. Their commitment to our transformation has brought tangible improvements to execution across the Group.
Jack and his leadership team have developed a very coherent and compelling cultural agenda founded on purpose and responsibility. This has helped unite and inspire colleagues. Our purpose to build A Better Tomorrow
TM
encapsulates why we exist and what we aspire to accomplish as an organisation.
Strong ESG Foundations
BAT has been on its sustainability journey for more than 20 years. Sustainability and ESG are a core part of our long-term business strategy and are ingrained in our identity as a responsible,
purpose-led
business.
We continue to invest significant resources and energy in our sustainability agenda. BAT has set ambitious targets, including reaching 50 million consumers of its
non-combustible
products by 2030, and becoming carbon neutral in its operations for Scope 1 and 2 by 2030 and net zero across its wider value chain for Scope 1, 2 and 3 by 2050.
The performance of our New Category products has propelled the number of
non-combustible
product consumers to 18.3 million, ensuring we are well on track to meet our 2030 target of 50 million consumers.
Our commitment to delivering carbon neutrality was highlighted earlier this year when Vuse became the first global carbon neutral vape brand*.
Dividends and Share Buyback
The Board has declared a dividend of 217.8p per ordinary share, payable in four equal instalments of 54.45p per ordinary share, to shareholders registered on the UK main register or the South Africa branch register and to American Depository Shares (ADS) holders, each on the applicable record dates. The dividends receivable by ADS holders in US dollars will be calculated based on the exchange rate on the applicable payment dates. Further information on dividends can be found on pages 79 and 354.
The Board has also announced a £2 billion share repurchase programme for 2022, as part of our commitment to enhance shareholder returns.
Board Composition
Krishnan ‘Kandy’ Anand will join the Board as an independent
Non-Executive
Director and member of the Nominations and Remuneration Committees from 14 February 2022. Dr Marion Helmes will step down as a
Non-Executive
Director from the conclusion of the 2022 Annual General Meeting and will not stand for
re-election.
Looking Forward
2021 was a pivotal year for BAT. Our performance was strong, we are building capabilities, actively managing our portfolio and transforming our culture. We expect 2022 to be a year of further strategic progress and we remain confident that we will meet our medium-term targets as we continue to build A Better Tomorrow
TM
.
Luc Jobin
Chairman
 
02


Table of Contents


As the global COVID-19 pandemic continues to evolve, so does the Group’s response. We remain fully committed to supporting all our stakeholders throughout the pandemic and have responded rapidly to the evolving situation, taking action to protect their interests.


Keeping the Group Operating in a Time of Crisis
 
The COVID-19 pandemic continues to impact the lives of many people around the world, with temporary restrictions and lockdowns across many countries leading to changes in consumer behaviour and in our operating environments.
 
The Group continues to navigate the challenges associated with the pandemic with effective crisis management and risk management processes in place, and remains a financially resilient business.
 
Our Board has maintained close oversight of the Group’s response to the impact of COVID-19 throughout this period.
 
The Group remains financially robust.
 
Looking After our People
 
Throughout the pandemic, we have prioritised the health and wellbeing of our people. We have not furloughed any staff or utilised any government schemes (or subsidies) as a result of the pandemic, other than in respect of the deferral of tax instalment payments, largely in the U.S. in 2020.
 
We continue to strictly adhere to guidance from governments and public health authorities, as well as our own health and safety risk assessments, to ensure that our workplaces are COVID-19 secure.
 
Our digital transformation has enabled us to continue to utilise remote home working when needed, ensuring all employees and customers stay connected, while continuing to invest in the development of new capabilities through virtual training programmes.
 
In many parts of the world, including our global headquarters in the UK, we have introduced a hybrid working model as appropriate and as the local regulations allow. We have implemented COVID-19-secure workplace measures for employees who have returned to their workplace. These include regular cleaning and sanitising, temperature checkpoints and COVID-19 testing.
 
For all employees, we are also making sure they are aware of the extensive wellbeing support available to them, including:
 
– Online medical consultations;
 
– Counselling services; and
 
– Mental health support.
 
Vaccine Development
 
In December of 2020 an initial New Drug Application for our COVID candidate vaccine was approved by the U.S. Food and Drug Administration (FDA) and we progressed into a Phase 1 study. This study has now been fully recruited and remains ongoing. We expect data to be available during Q1 of 2022 and will determine next steps based on these data, but also the rapidly evolving COVID-19 and treatment landscape.
 
In addition to the ongoing clinical studies, further pre-clinical work was also completed which reinforced the potential of the plant-based platform. The team successfully produced 19 different monoclonal antibodies that met pharmaceutical requirements in about 10 days, demonstrating the flexibility, consistency and speed of the plant-based system to produce clinical-quality antibodies.
 
To accelerate the research, development and production of novel treatments, BAT launched KBio Holdings Limited (KBio) in January 2022. The company has been created to leverage the existing and extensive plant-based technology capabilities of BAT and Kentucky BioProcessing Inc (KBP), the existing BAT-owned U.S. plant biologics organisation.
 
Testing and Logistical Support
 
The forms of direct support we have deployed to address the global impact of COVID-19 have continued to evolve. We have:
 
– Provided personal protective
equipment and other essential items
to communities in which we operate;
 
– Loaned testing equipment to the
UK Government;
 
– Provided access to 3D printers to help
produce protective face shields; and
 
– Donated to many funds around the
world focusing on supporting local
COVID-19 responses.
 
Supporting our Suppliers and Communities
 
Protecting the communities where we operate is an important pillar of our response to the pandemic.
 
We have harnessed our strengths in science, engineering and logistics to support national responses to COVID-19.
 
We have distributed thousands of items of PPE, sanitation kits, food and other essential items to our contracted farmers and their communities. We have also leveraged our existing farmer communication channels, including mobile apps, web portals, local media spots, videos and fact sheets, to rapidly deploy essential COVID-19 information, often to remote rural communities.
 
Some tobacco growing communities may be particularly vulnerable to both the virus and the economic implications of a global pandemic. We are taking great care that we don’t increase the immediate vulnerability of these communities and are committed to supporting them during the inevitable economic recovery that will follow.
     
   
03
   

Table of Contents
BAT Annual Report and Form 20-F 2021
 
Overview
Chief Executive’s Review
A pivotal year on our journey to build A Better Tomorrow
TM


 2021 was a pivotal year in BAT’s
transformation. Our commitment
to change, while delivering value to
stakeholders, can be seen in the
progress that has been made on
our strategic priorities. 
 
 
As part of a new longer-term active capital allocation framework,
we have announced a £2 billion share repurchase programme for 2022, to enhance shareholder returns,
in addition to growing our dividend.


With strong foundations in place,
we now embark on the next phase of our journey – Faster Transformation
– towards A Better Tomorrow
TM
.


As consumer preferences and technology rapidly evolve,
the availability of scientifically-substantiated, less risky*
products is crucial
to effective tobacco harm reduction and we are determined to transform our business.
 
*
Based on the weight of evidence and assuming a complete switch from cigarette smoking. These products are not risk free and are addictive.
 
Our products as sold in the U.S., including Vuse, Velo, Grizzly, Kodiak, and Camel Snus, are subject to FDA regulation and no reduced-risk claims will be made as to these products without agency clearance.
Dear Stakeholders,
2021 was a pivotal year in BAT’s transformation. Our commitment to change, while delivering value to stakeholders, can be seen in the progress that has been made on our strategic priorities.
We reached a total of 18.3 million (up 4.8 million) consumers of our non-combustible products and New Categories losses^ reduced for the first time, contributing to earnings growth.
Foreign exchange has been a significant headwind on our reported results, with revenue down 0.4%. However, at constant rates of exchange, we have delivered strong financial results, with revenue up 6.9%.
As part of a new longer-term active capital allocation framework, we have announced a £2 billion share repurchase programme for 2022, in addition to maintaining a growing dividend. This reflects our commitment to enhance shareholder returns.
I would like to thank all our people and our partners for their continued focus and commitment in delivering our strong results throughout this difficult COVID-19 period.
With strong foundations in place, we now embark on the next phase of our journey – Faster Transformation – towards A Better Tomorrow
TM
: £5 billion of revenue and profitability from New Categories by 2025 and development of opportunities Beyond Nicotine, leveraging our knowledge and capabilities from New Categories.
Building A Better Tomorrow
TM
Our purpose of building A Better Tomorrow
TM
by reducing the health impact of our business means that we are committed to our business transformation.
During 2021, our focus has been on developing and delivering consumer-focused products and brands:
 
 
The growth, from 13.5 million to 18.3 million, in consumers of non-combustible products was our strongest to date;
 
 
Non-combustible products now account for 12% of Group revenue, up from 4% in 2017;
 
 
Revenue from our vapour products was up 52%, with our global brand, Vuse, now the leading global vapour brand by value share;
 
 
Following volume share gains in ENA and Japan, revenue from our THP, glo, was up 34%; and
 
 
Revenue in the Modern Oral category, largely through Velo, was up 39%.
As consumer preferences and technology rapidly evolve, the availability of scientifically-substantiated, less risky*
products is crucial to effective tobacco harm reduction and we are determined to transform our business.
ESG Front and Centre
Sustainability has been central to our business and ethos for more than two decades.
In 2001, we established our first group-wide environment, health and safety systems, the BAT Biodiversity Partnership and a programme of independently facilitated social dialogue. This year, we published our 20
th
ESG Report.
 
04


Table of Contents
BAT Annual Report and Form 20-F 2021    
 
Strategic Report        
 
Governance Report        
  
Financial Statements        
  
Other Information        


Our strategy has a clear focus on environmental, social and governance (ESG) priorities, including addressing climate change and excellence in environmental management, delivering a positive social impact and ensuring robust corporate governance.
We have many bold ESG targets, including becoming a carbon neutral business by 2030 and making all plastic packaging reusable, recyclable or compostable by 2025.
In 2021, we also signed up to the UN-backed Race to Zero global campaign and committed to setting science-based targets aiming for net zero value chain emissions by 2050.
Our sustainability actions have long been recognised externally and, in 2021, we were named in the Dow Jones Sustainability Indices (DJSI) for the 20th consecutive year.
We continue to strive for excellence and look for new ways to reduce our resource use, preserve the natural environment, improve the lives of farmers and communities, and uphold robust corporate governance standards.
Our Performance for Year Ended 31 December 2021
We performed strongly across our key indicators during the year ended 31 December 2021.
Due to a foreign currency headwind of 7.3%, revenue was lower than 2020 (down 0.4%) at £25,684 million. At constant rates of exchange, the Group revenue increased 6.9%.
Currency headwinds also impacted profit from operations, increasing by 2.7% to £10,234 million with diluted earnings per share up 6.0%.
Excluding adjusting items and the impact of foreign exchange, adjusted profit from operations, at constant rates of exchange, grew by 5.2% and adjusted diluted earnings per share grew by 6.6%.
Reported operating margin grew by 120 bps to 39.8%. On an adjusted basis, it fell by 70 bps at current rates.
We have continued to demonstrate the ongoing strength of the Group in turning operating performance into cash.
Delivering a Step Change in New Categories
Fundamental to building A Better Tomorrow
TM
is the acceleration of our transformation and investing to provide our consumers with enjoyable, less risky*
products.
We encourage those consumers who would otherwise continue to smoke to switch completely to scientifically-substantiated, reduced-risk alternatives*
.
Each of our New Category brands grew revenue by more than 30%, with total New Categories revenue up 42.4% to £2,054 million. Excluding the impact of foreign exchange, adjusted revenue from New Categories, at constant rates of exchange, grew 50.9%.
The performance of our reduced-risk*
portfolio of New Category products, encompassing our strong global brands, Vuse, glo and Velo, places us on track to reach the targets we set ourselves of:
 
 
£5 billion of revenue and profitability in our New Categories by 2025; and
 
 
50 million consumers of
non-combustible
products by 2030.
Driving Value from Combustibles
The continued performance of our combustibles business will generate the funds necessary to invest in New Categories and transform the business.
Group cigarette value share increased by 10 bps compared with 2020, driven by the continued positive performance of the strategic cigarette brands in the U.S. (up 80 bps).
Group cigarette volume share fell 10 bps. Pricing continued to be strong, with combustibles price/mix of 4.3%.
Group cigarette volume was largely in line with 2020, down just 0.1% to 637 bn sticks, (with the industry estimated to be broadly in line with 2020), driven by our performance in emerging markets and partly due to trade inventory movements in the U.S. (mainly linked to the timing of price increases and uncertainty about a potential excise increase) which are expected to unwind in early 2022.
 
 
Our strategy has a
clear focus on environmental, social and governance (ESG) priorities,
including addressing climate change and excellence in environmental management, delivering a positive social impact and ensuring robust corporate governance.


We
performed strongly across our key indicators
during the year ended 31 December 2021.


Each of our
New Category brands grew revenue by more than
30%, with total New Categories revenue up 42.4% to £2,054
million.


Group cigarette
value share increased by
10 bps
compared with 2020,
driven by the continued positive performance of the strategic cigarette brands in the U.S. (up 80 bps).
 
^ Based upon Category Contribution – defined as profit from the sale of brands after directly attributable costs (including marketing expenses) and before the allocation of overheads
         
 
05


Table of Contents
BAT Annual Report and Form 20-F 2021
Overview
Chief Executive’s Review
Continued


The next phase of our transformation to build A Better Tomorrow
TM
focuses on creating a sustainable Enterprise of the Future.
 
 
Across the business, we are already seeing the
benefits of our organisational transformation programme, Quest.
 
 
The
BAT of tomorrow will be a high-growth, consumer goods company:
global, consumer- centric and multi-category.
 
 
Through this transformation we are committed to
generating sustainable shareholder and societal value – building A Better Tomorrow
TM
.
 
 
Quest is delivering this enterprise of the future, an organisation
with sustainability at its core, founded on strong global brands, driven by innovation, enabled by digital tools and
technology, simplified by Quantum, and powered by our people.
Simplifying the Business
The next phase of our transformation to build A Better Tomorrow
TM
focuses on creating a sustainable Enterprise of the Future.
Across the business, we are already seeing the benefits of our organisational transformation programme, Quest, which has been designed to enhance our existing strengths and extract further value for the business. The five Quest accelerators are:
 
 
Quantum
, our multi-year simplification programme, which continues to drive efficiencies and, in 2021, enabled incremental annual savings of £595 million;
 
 
Unleashing Innovation
is becoming increasingly ingrained across the business. Our digital hubs, corporate venturing initiative and innovation centres are helping us stay ahead, while our continued investment in R&D enables us to satisfy or anticipate consumer preferences and generate growth for the business across all categories;
 
 
Empowering our Organisation
and enabling our people to deliver remains a key driver of growth. We are providing more tools and training across the business to support and drive new ways of working;
 
 
Shaping Sustainability
continues to be front and centre in our decision-making, finding ways of accelerating and connecting our sustainability journey with our purpose; and
 
 
Technology and Digital
is advancing at speed, with new digital channels, data and analytics supporting growth of our New Categories in
e-commerce
with margins above other retail channels and higher customer loyalty.
Confidence in Our Future
The BAT of tomorrow will be a high-growth, consumer goods company: global, consumer-centric and multi-category.
We are confident in delivering a faster transformation, continued robust financial performance and superior cash returns to shareholders in what remains a turbulent external environment.
Quest is delivering this enterprise of the future, an organisation with sustainability at its core, founded on strong global brands, driven by innovation, enabled by digital tools and technology, simplified by Quantum, and powered by our people.
Through this transformation we are committed to generating sustainable shareholder and societal value – building A Better Tomorrow
TM
.
Jack Bowles
Chief Executive
 
06
 

Table of Contents
BAT Annual Report and Form 20-F 2021    
 
Strategic Report        
 
Governance Report        
  
Financial Statements        
  
Other Information        


Financial Review
Finance and Transformation
Director’s Overview
 
 
Revenue growth from New Categories performance and strong combustibles pricing, particularly in the U.S., more than offset by foreign exchange headwinds.


Profit from operations was up 2.7% (2020: up 10.5%), as growth in revenue and reduction in losses from New Categories, a strong combustibles pricing environment and operational efficiencies were partly offset by foreign
exchange.
Group Transformation
Underpinned by Financial Delivery
2021 was a pivotal year in our transformational journey. We have delivered a step change in New Categories, reconfigured our business capabilities for the future, delivered value through combustibles and deleveraged the balance sheet. We believe these achievements position us well for the future, and have allowed us to deliver growth in our key financial indicators (excluding translational foreign exchange impacts) in the year.
Pricing and New Categories Drive Revenue Growth
Revenue declined 0.4% to £25,684 million compared to 2020 (while 2020 was marginally lower than 2019, down 0.4% to £25,776 million).
Revenue from New Categories was up 42.4% in 2021 and 14.9% in 2020, while combustibles pricing remained strong (particularly in the U.S.), with Group price/mix of 4.3% in 2021 compared to 7% in 2020. Price/mix was lower largely due to negative geographic mix as markets began to recover from the impact of COVID-19, the impact of structural excise changes and a competitive environment in Australasia (estimated at £260 million) and the disposal of the Group’s operations in Iran. These were partly offset by the benefit of trade inventory movements in the U.S. (the impact of which is estimated to be £200 million and expected to unwind in 2022). A translational currency headwind, due to the relative strength of sterling, negatively impacted both periods, by approximately 7.3% in 2021 and 3.5% in 2020.
On a constant currency basis, revenue was up 6.9% in 2021 and 3.3% in 2020, with 2020 also negatively impacted by COVID-19 (approximately 2.5%) due to the disruption and restrictions affecting certain markets (including South Africa and in Global Travel Retail).
Growth in Profit from Operations While Investing in New Categories
Profit from operations increased by 2.7% to £10,234 million, with 2020 up 10.5% to £9,962 million. Revenue growth, a reduction in losses from New Categories and operational efficiencies achieved under the Group’s restructuring programme (Project Quantum) were partly outweighed by the translational foreign exchange headwinds and a transactional foreign exchange headwind of 1.7%. 2021 included a number of one-off items, including in respect of the disposal of the Group’s subsidiary in Iran (£358 million related to foreign exchange losses and asset write-off costs), an impairment charge of £54 million in Peru and a combined credit in the U.S. of £94 million (related to the partial buy-out of the pension fund and the finalisation of the dissenting shareholders litigation). However, these were lower than those recognised in 2020 in respect of goodwill impairment (£209 million largely related to Malaysia) and charges in the U.S. (£400 million) largely related to the state settlement agreements in respect of brands sold to a third party in a prior period.
Our operating margin was 120 bps higher at 39.8% in 2021 (2020: up 380 bps to 38.6%).
On an adjusted constant currency basis, profit from operations grew by 5.2% (2020: up 4.8%). This was driven by higher revenue and efficiencies delivered in both 2021 and 2020 as part of Project Quantum and lower losses from New Categories. Adjusted operating margin (at current rates) fell 70 bps to 43.4% (2020: up 100 bps to 44.1%), partly due to the proportionate growth in New Categories revenue (with the Group continuing to invest in those categories), higher revenue in lower margin markets and a transactional foreign exchange headwind of 1.7%.
 
07


Table of Contents
BAT Annual Report and Form 20-F 2021
Financial Review
Finance and Transformation
Director’s Overview
Continued


Dividends per share increasing by a further 1.0%, underpinned by the financial strength of our business.


Cash flow generation remains extremely robust, allowing us to deleverage while investing for the future.


We remain committed to consistent and sustainable long-term 3-5% revenue growth (excluding currency) and a growth in dividend.


The Group continues to deliver against the financial objectives. This has allowed the Group to continue to reward shareholders with growth in dividends and announce a £2 billion share repurchase programme all while investing in A Better
Tomorrow
TM
.
 
Future Funding
De-Risked
Through Proactive Action
Our liquidity profile remains strong, with average debt maturity close to 10 years and maximum debt maturities in any one calendar year of around £4 billion.
In September 2021, the Group issued perpetual hybrid bonds totalling
2 billion. These euro-denominated securities contribute to a more efficient alignment of the Group’s earnings currency. They also contribute to the diversification of the Group’s sources of funding and further strengthens its capital structure. The issuance provides the additional benefit of supporting the deleveraging journey with the addition of a small benefit to the credit metrics.
Net finance costs in 2021 were £1,486 million, a decrease of 14.8% on 2020 (£1,745 million, itself an increase of 8.9%). The reduction in 2021 was partly driven by a foreign exchange tailwind. However, 2020 included net charges of £142 million in respect of the early redemption and tender offer in that year as the Group reduced future refinancing risk by raising £8.9 billion in the US dollar, euro and sterling markets, using the proceeds to repurchase and redeem £3.1 billion of bonds. This
de-risked
the future repayment profile by securing lower interest rates and future liquidity in uncertain times. On an adjusted, constant rate basis, net finance costs declined 4.5% in 2021 (2020: up 5.9%).
As part of the Group’s
de-risking
of future funding, during 2020 gross interest cover ceased to be a covenant in the Group’s debt facilities.
EPS Growth Underpins
Dividend Increase
On a reported basis, basic EPS was up
6.0% at 296.9p (2020: up 12.1% at 280.0p) with diluted EPS up 6.0% to 295.6p (2020: up 12.0% to 278.9p), largely due to the net reduction in adjusting charges in 2021 and lower net finance costs, which more than offset the impact of foreign exchange on the Group’s operations.
Excluding the adjusting items (discussed on pages 76 and 77) and the effect of foreign exchange on the Group’s results, adjusted diluted earnings per share, at constant rates, increased by 6.6% to 353.5p, with 2020 ahead of 2019 by 5.5%.
Cash Generation Drives Debt Deleveraging
We continue to focus on a balanced approach of deleveraging, while investing for the future and providing a return via dividends to shareholders.
The Group’s cash conversion ratio, based upon net cash generated from operations, was 95% (2020: 98%). The Group realised £9.7 billion (2020: £9.8 billion) of net cash generated from operating activities.
Consequently, in 2021, total borrowings (including lease liabilities) have reduced from £43,968 million in 2020 to £39,658 million in 2021, due to the net repayment of borrowings in the year (including refinancing via issuance of perpetual hybrid bonds) and a currency tailwind of £409 million (2020: tailwind of £219 million).
Active Capital Allocation Framework
Our deleverage and cash flow generation provide the flexibility to adopt a more active capital allocation framework to deliver long-term value for shareholders.
This will include:
 
 
continuing to grow the dividend;
 
 
maintaining our target leverage corridor;
 
 
potential
bolt-on
M&A opportunities; and
 
 
share buybacks to enhance shareholder returns.
The Board will prioritise capital allocation opportunities each year
in-line
with this new longer-term active capital allocation framework, while continuing to take into account macro and fiscal influences, and potential regulatory and litigation outcomes.
As a first step, we have announced a dividend increase of 1.0% to 217.8p (with a dividend
pay-out
ratio of 66.2%) and a £2 billion share repurchase programme for 2022.
Tadeu Marroco
Finance and Transformation Director
 
08
 

Table of Contents
 
BAT Annual Report and Form 20-F 2021    
 
Strategic Report        
 
Governance Report        
  
Financial Statements        
  
Other Information        


Our Year in Numbers


Our performance metrics
 
 Target/Ambition
   
2021
    
%
    
2020
    
%
    
2019


Consumer


Number of
Non-Combustible
Product Consumers
 
 
50 million consumers by 2030


18.3m


13.5m


10.5m


Market Share


Cigarette and THP volume share growth (bps)
 
 
Grow by
0-10
bps (2021)


+10 bps


+30 bps


+20 bps


Cigarette and THP value share growth (bps)


+20 bps


+20 bps


+30 bps


Volume


Cigarettes (bn sticks)


637


0%


638


-5%


668


Other Tobacco Products (bn stick equivalents)


18


-9%


20


-2%


21


Vapour (mn 10ml units/pods)


535


+56%


344


+52%


226


THP (bn sticks)


19


+79%


11


+19%


9


Modern Oral (mn pouches)


3,296


+70%


1,934


+62%


1,194


Traditional Oral (bn stick equivalents)


8


-4%


8


-1%


8


Financial


Revenue (£m)


25,684


-0.4%


25,776


-0.4%


25,877


Adjusted Revenue at cc (%)
1,2
 
 
3-5%
CAGR


+6.9%


+3.3%


Revenue from New Categories (£m)
 
 
£5 billion by 2025


2,054


+42.4%


1,443


+14.9%


1,255


Revenue from New Categories at cc (%)
1


+50.9%


+15.4%


Profit from Operations (£m)


10,234


+2.7%


9,962


+10.5%


9,016


Adjusted Profit from Operations at cc (%)
1,
2
 
 
Increase 4.0% to 6.5% (2021)


+5.2%


+4.8%


Operating Margin (%)


39.8%


38.6%


34.8%


Adjusted Operating Margin (%)
2


43.4%


44.1%


43.1%


Diluted Earnings per Share (p)


295.6


+6.0%


278.9


+12.0%


249.0


Adjusted Diluted Earnings per Share (p)
2


329.0


-0.8%


331.7


+2.4%


323.8


Adjusted Diluted Earnings per Share at cc (%)
1,
2


+6.6%


+5.5%


Dividends per Share (p)


217.8


+1.0%


215.6


+2.5%


210.4


Dividend
Pay-Out
Ratio (%)


66%


65%


65%


Net Cash Generated from Operating Activities (£m)


9,717


-0.7%


9,786


+8.8%


8,996


Cash Conversion (%)


95%


98%


100%


Borrowings, including Lease Liabilities (£m)


39,658


-9.8%


43,968


-3.1%


45,366


Total Shareholder Return (rank)


17 of 24


20 of 23


21 of 23


ESG


Find our key ESG goals, targets and metrics
in our ESG Roadmap on page 47.
 
 
Please refer to pages 304 to 313 for definitions of the
Non-GAAP
measures. See the section
‘Non-Financial
Measures’ on page 302 for more information on these
non-financial
KPIs.
 
1.
Where measures are presented ‘at constant rates’ or ‘at cc’, the measures are calculated based on a
re-translation,
at the prior year’s exchange rates, of the current year results of the Group and, where applicable, its segments. See page 83 for the major foreign exchange rates used for Group reporting.
 
2.
Where measures are presented as ‘adjusted’, they are presented before the impact of adjusting items. Adjusting items represent certain items of income and expense which the Group considers distinctive based on their size, nature or incidence.
 
09


Table of Contents
BAT Annual Report and Form 20-F 2021
 
Overview
Investment Case
 
Transformation Driving
Sustainable Growth
 
Delivering growth by reducing harm
and expanding our portfolio
 
Our corporate purpose is to build A Better Tomorrow
TM
. Reducing the health impact of our business, by encouraging those smokers who would otherwise continue to smoke to switch completely to scientifically-substantiated, reduced-risk alternatives*
, is the greatest contribution we can make to society. This means growing our New Categories business as fast as possible and developing opportunities Beyond Nicotine to consolidate our position as a high growth, multi-category consumer products company.
 
Revenue growth in the global nicotine industry is accelerating through the development of New Categories, which offer reduced-risk alternatives to combustible products.*
 
To capitalise on this growth, our established consumer-centric, multi-category strategy is activated on a global scale, leveraging our insights on consumer satisfaction, innovation needs and taste. We are building strong global brands, specifically positioned in each target consumer segment. In addition, we are taking a disciplined approach to our Beyond Nicotine strategy to further drive our transformation and long-term business sustainability.
 
We have set ourselves ambitious targets to reach 50 million consumers of our
non-combustible
products by 2030, with revenue reaching £5 billion (and profitability) from New Categories by 2025. These ambitions will be met through the delivery of our three clear strategic priorities:
 
–  to drive a step change in New Categories, to accelerate growth supported by increased investment;
 
–  to generate value through Combustibles, to provide the capabilities and funding; and
 
–  to simplify the Group, to create a stronger, faster, more agile organisation.
 
*  Based on the weight of evidence and assuming a complete switch from cigarette smoking. These products are not risk free and are addictive.
  Our products as sold in the U.S., including Vuse, Velo, Grizzly, Kodiak and Camel Snus, are subject to FDA regulation and no reduced-risk claims will be made as to these products without agency clearance.


Reducing the Health and Environmental Impact of our Business
 
Creating value for all our stakeholders
 
 
Our work to reduce the health and environmental impact of the business will drive growth and create shared value, delivering results that benefit shareholders and wider society.
 
We will continue to create a stronger BAT by:
 
–  focusing on excellence in environmental management;
 
–  delivering a positive social impact; and
 
–  adhering to robust corporate governance.
 
This builds on our strong ESG foundations including our status as:
 
–  the first tobacco company to produce a Sustainability Report in 2001;
 
–  publication of a Human Rights focus report in 2020, the first of its kind by a tobacco company to be aligned with the UN framework of Human Rights reporting;
 
–  named in the Dow Jones Sustainability Indices for 20 consecutive years; and
 
–  named third highest
ESG-rated
FTSE 100 company by Refinitv in 2020^.
 
Our commitments are anchored in challenging targets against which we will track and share the progress of our transformation – including achieving Net Zero across our supply chain by 2050.
 
Meanwhile, our ‘delivery with integrity’ programme is focused on ensuring that our ethical standards are never compromised for the sake of results.
 
^
A rating, whether by Refinitiv or any other organisation, is not a recommendation to buy, sell or hold securities. A rating may be subject to withdrawal or revision at any time. Each rating should be evaluated separately from any other rating. In addition, the criteria used in ratings may differ among ESG rating organisations. Companies may also supply different information to such organisations (or none at all) and this lack of consistency may impact rankings. Companies may also supply different information to such organisations (or none at all) and this lack of consistency may impact rankings.


10


Table of Contents
BAT Annual Report and Form 20-F 2021    
 
Strategic Report        
 
Governance Report        
  
Financial Statements        
  
Other Information        


Creating the Enterprise of the Future
 
Leveraging proven expertise and developing new capabilities to deliver our ambitions
 
Our New Category portfolio benefits from decades of insights and expertise that have driven our No. 1 global revenue position in combustibles (excl. China). This combined with increased investment behind new capabilities gives us confidence that we can deliver our medium- to long-term ambitions.
 
Our three global New Category brands leverage the benefits of our world-class R&D and our manufacturing, distribution, marketing and brand building capabilities, which are supported by our unrivalled global footprint across 175+ markets, with more than 11 million points of sale, reaching more than 150 million consumers daily.
 
Together with our long-standing experience operating within complex regulatory, legal and fiscal frameworks, these provide BAT with a compelling competitive advantage to drive portfolio growth and transformation within the wider tobacco industry.
 
Building on Quantum’s success to date, Quest will accelerate our organisational and business transformation programme, driving next generation innovations:
 
–  new digital capabilities;
 
–  empowering our people; and
 
–  enhancing our future sustainability.
 
Through Quest, we are creating the Enterprise of the Future.
 
We are attracting new senior talent from a diverse range of industries globally to further enhance our capabilities, which will enable us to deliver on our growth ambitions over the medium to long term.
 
           
Continuing our Track Record
of Delivery
 
Commitment to deliver returns and cash to shareholders
 
We are confident in our growth outlook, and have a proven track record of performance whatever the external environment.
 
Over the last 10 years, we have delivered 9% adjusted diluted EPS growth (at constant rates) and a 6% dividend CAGR and are confident in our medium-term targets of
3-5%
revenue growth, increased operating margin and high-single digit adjusted EPS growth (at constant rates).
 
This will be driven by:
 
–  accelerated New Category revenue growth;
 
–  continued value growth in combustibles; and
 
–  business simplification to eliminate cost and improve returns, to become a stronger, simpler, more agile organisation.
 
We have adopted a more active capital allocation framework to deliver long-term value for shareholders. This will include:
 
–  continuing to grow the dividend;
 
–  maintaining our target leverage corridor;
 
–  considering potential
bolt-on
M&A opportunities; and
 
–  share buybacks to enhance shareholder returns.


11


Table of Contents
BAT Annual Report and Form 20-F 2021
 
Strategic Management
Our Global Business
To build A Better Tomorrow
TM
, our marketplace analysis delivers insights regarding consumer trends and segmentation, which facilitates our geographic brand prioritisation across over 175 markets. Our business is divided into four complementary regions, with a balanced presence in both high-growth emerging markets and highly profitable developed markets.


United States
                            
  
U.S.  


Americas and
  
AmSSA
 
   
of America
 
  
Sub-Saharan 
Africa
            
 
To achieve a step-change in New Categories, we are creating the Enterprise of the Future – building new capabilities around the world focused on science, innovation and digital information.
Consumer preferences and technology are evolving rapidly, and we are staying ahead of the curve with our digital hubs, the creation of innovation hubs and further development of our world-class R&D laboratories. We are also leveraging the expertise of our external partners and are looking forward to exciting results from our venturing initiative, Btomorrow Ventures.


Revenue by region


Our performance across New Categories is accelerating and we now have over 18m consumers of non-combustible products. 
  
The U.S. business continues
its accelerated journey towards
A Better Tomorrow
TM
. We
delivered a year of outstanding
results, with vapour fast
approaching value leadership. 
  
The growth of New Categories across AmSSA, including our Canadian subsidiary cementing its leadership of the closed system vapour category, demonstrates our excellent post-COVID-19 recovery. 
           
Paul Lageweg
Director,
New Categories
 
  
Guy Meldrum
President and
CEO (Reynolds
American Inc.)
  
  
Luciano Comin
Regional Director,
AmSSA
  
 
12
 

Table of Contents
BAT Annual Report and Form 20-F 2021    
 
Strategic Report        
 
Governance Report        
  
Financial Statements        
  
Other Information        


BAT Annual Report and Form 20-F 2021 Strategic Report Governance Report Financial Statements Other Information Our supply chain has shown exceptional resilience against major global challenges, including the semiconductor shortage and unprecedented logistics volatility. This is testament to our industry-leading capabilities, collaboration with our suppliers and the commitment of our people throughout the pandemic. Zafar Khan Director, Operations Europe and Asia-Pacific and North Africa ENA Middle East APME 175+ markets 150m daily consumer interactions 18.3m non-combustible product consumers 52,000+ employees 141 nationalities Map is accurate as at 31 Dec 2021 and is representative of general geographic regions and does not suggest that the Group operates in each country of every region. Across ENA, revenue from I’m delighted that APME In 2021, we published the New Categories grew 74%, approached 4m active 6-month results from our one-powered by the roll-out of glo consumers of non-combustible year study of our flagship THP, glo. Hyper. It augurs well that, in products in 2021, driven by a The biggest study we have ever key THP markets, our segment strong performance from our undertaken, it makes a significant share is approaching overtaking New Category platforms. contribution to the evidence-base combustibles. for this categor ory. Johan Michael (Mihovil) Dr David O’Reilly Vandermeulen Dijanosic Director, Scientific Regional Director, Regional Director, Research ENA APME 13
 
13


Table of Contents
BAT Annual Report and Form 20-F 2021
    
 
Strategic Management
Our Consumer-Centric
Multi-Category Portfolio
BAT is a leading consumer-centric, multi-category consumer goods business
dedicated to stimulating the senses of adult consumers worldwide. Our portfolio
reflects our commitment to meeting the evolving and varied needs of today’s adult
consumer who seeks sensorial enjoyment for different moods and moments.
 
 
Strategic Portfolio Category These are our key brands in both the combustible and non-combustible categories. This ensures focus and investment on the brands and categories Handheld, battery-powered that will underpin the Group’s future devices that heat a liquid (called performance. The strategic portfolio is: Vapour an e-liquid, usually containing nicotine) and creates a vapour Non-Combustibles to be inhaled. All brands within New Categories and the strategic traditional oral brands in moist *† and snus. Combustibles THPs do not burn tobacco, so Dunhill, Kent, Lucky Strike, Pall Mall, no smoke (which is a key source Rothmans, Newport (U.S.), Natural of toxicants) is produced. American Spirit (U.S.), Camel (U.S.). THP Research indicates that by Categories heating tobacco rather than burning it, THPs have the Combustibles) potential to be reduced-risk - New compared to smoking. Revenue by product category (Non This is our most recent innovation across oral products – offering consumers a Modern satisfying experience with a Oral range of different flavours. Portfolio Two formulations are available: one containing lower levels of £25.7bn tobacco, and one that contains nicotine but no tobacco. Total revenue - Risk Traditional Oral products contain tobacco, but there is Traditional no burning. There is strong Reduced epidemiological evidence, Oral from countries such as Sweden, New Categories £2.1bn that switching completely to Traditional Oral £1.1bn Our snus can reduce risk compared Combustibles £22.0bn to smoking. Other £0.5bn The Group sold 637 billion cigarette sticks and 18 billion OTP (stick equivalents) in 2021. The Group operates in over 175 markets, with 42 fully integrated cigarette * Based on the weight of evidence and assuming a complete manufacturing facilities in switch from cigarette smoking. These products are not risk free and are addictive. Combustibles 40 markets. † Our products as sold in the U.S., including Vuse, Velo, Grizzly, Kodiak and Camel Snus, are subject to FDA regulation and no reduced-risk claims will be made as to these products without agency clearance. 14
 
14
 

Table of Contents
BAT Annual Report and Form 20-F 2021    
 
Strategic Report        
 
Governance Report        
  
Financial Statements        
  
Other Information        


Global Drive Brands Market Footprint 30 markets where our vapour products are currently available 25 markets where our THPs are currently available 23 markets where our modern oral products are currently available 3 markets where our traditional oral products are currently available U.S. specific
 
15


Table of Contents
BAT Annual Report and Form 20-F 2021
    
 
Strategic Management
Our Nine-Step Business Model
Our global business understands our diverse consumers, develops products to satisfy
their preferences and ultimately distributes them across over 175 markets.
Seven key enablers support us in turning powerful insights into products that provide
enjoyment to our consumers, while engagement helps our key stakeholders benefit
from our sustainable growth.
 
 
16
 

Table of Contents
BAT Annual Report and Form 20-F 2021    
 
Strategic Report        
 
    Governance Report        
  
Financial Statements        
  
Other Information        


Seeing Over
the Horizon
As one of the most long-standing and established consumer goods businesses in the world, we have a unique view of the consumer across our product categories, which is increasingly driven by powerful data and analytics. These insights ensure that the development and responsible marketing of our products is fit to satisfy consumer needs.
Driven by our unique and data-driven consumer insight platform (PRISM), we focus on product categories and consumer segments across our global business that have the best potential for long-term sustainable growth.
Link to risks
Tobacco, New Categories and other regulation interrupts growth strategy
Inability to develop, commercialise and deliver the New Categories strategy
Accelerating Tobacco
Harm Reduction
World-class science is needed to substantiate the quality, safety and reduced-risk potential of our New Category products. This is crucial for building consumer trust and encouraging adult smokers to completely switch to less risky alternatives*
.
We have an extensive scientific research programme in a broad spectrum of scientific fields, including molecular biology, toxicology and chemistry. We are transparent about our science and publish details of our research programmes on our dedicated website,
www.bat-science.com,
and the results of our studies in peer-reviewed journals.
Link to risks
Inability to develop, commercialise and deliver the New Categories strategy


Read more about our science on pages 19, 31, 35, 37, 39 and 50
Staying Ahead
of the Curve
As consumer preferences and technology rapidly evolve, we rely on our growing global network of digital hubs, innovation hubs, world-class R&D laboratories, external partnerships and our corporate venturing initiative, Btomorrow Ventures, to stay ahead of the curve.
Driving sustainable growth is at the core of our innovation. We make significant investments in research and development to deliver innovations that satisfy or anticipate consumer preferences and generate growth for the business.
Led by our strength in developing consumer insights, each innovation helps us on our journey to build A Better Tomorrow
by reducing the health impact of our business.
Link to risks
Inability to develop, commercialise and deliver the New Categories strategy
Sourcing Materials
Responsibly
The majority of our tobacco is sourced by our own BAT leaf operations through direct contracts with over 75,000 farmers. The remainder is from third-party suppliers that, in turn, contract with an estimated 264,000 farmers. The vast majority of tobacco farms in our supply chain are smallholder family farms.
Beyond tobacco, we source product materials like paper and filters for cigarettes and, for our New Category products, we have a growing supply chain in consumer electronics and
e-liquids.
We also have a vast number of suppliers of indirect goods and services that are not related to our products, such as for IT services and facilities management.
Link to risks
Geopolitical tensions
Injury, illness or death in the workplace Solvency and liquidity
 
 
Read more about our supply chain on pages 52 to 55
 
Utilising our Global
Manufacturing Footprint
We manufacture high-quality products in facilities all over the world. We also ensure that these products and the tobacco leaf we purchase are in the right place at the right time.
Our New Category products are manufactured in a mix of our own and third-party factories. We work to ensure that our costs are globally competitive and that we use our resources as effectively as possible.
Link to risks
Injury, illness or death in the workplace Disputed taxes, interest and penalties Foreign exchange rate exposures Geopolitical tensions Solvency and liquidity
Moving our Products
Seamlessly Everywhere
By applying modern technologies, including AI and machine learning, we ensure our products are where they are needed when they are needed.
Our products are sold around the world and we distribute them effectively and efficiently using a variety of distribution models suited to local circumstances and conditions. These distribution models include retailers, supplied through our direct distribution capability or exclusive distributors, and our
Direct-to-Consumer
business – which has been accelerated through the deployment of owned
e-commerce
sites.
Link to risks
Tobacco, New Categories and other regulation interrupts growth strategy Inability to develop, commercialise and deliver the New Categories strategy
Litigation
Foreign exchange rate exposures
Significant increases or structural changes in tobacco, nicotine and New Categories related taxes
Marketing our
Products Responsibly
Tobacco and nicotine products should be marketed responsibly to adult-only consumers and not designed to appeal to youth.
Through a globally responsible approach to marketing, we help to raise standards and prevent underage access, while growing our market share and encouraging adult consumers to choose our products over our competitors.
Our International Marketing Principles (IMP) govern our marketing across all product categories. They include strict requirements to be responsible, accurate and targeted at adult consumers only. Our IMP are applied even when they are stricter than local laws.
Link to risks
Tobacco, New Categories and other regulation interrupts growth strategy Inability to develop, commercialise and deliver the New Categories strategy
Litigation
Foreign exchange rate exposures


Read more about responsible marketing on page 57
Offering Consumer
Choice
We have a powerful brand portfolio that we are proud of. Our global brands are well positioned, with leading-edge insights, science and innovation behind our product pipeline.
We offer adult consumers a range of products, including combustible products, vapour, modern oral and THPs, in markets around the world. Our range of high-quality products covers all segments, from
value-for-money
to premium.
Link to risks
Competition from illicit trade
Significant increases or structural changes in tobacco, nicotine and New Categories related taxes
Foreign exchange rate exposures
Geopolitical tensions
Disputed taxes, interest and penalties
 
*
Based on the weight of evidence and assuming a complete switch from cigarette smoking. These products are not risk free and are addictive.
 
Our products as sold in the U.S., including Vuse, Velo, Grizzly, Kodiak and Camel Snus, are subject to FDA regulation and no reduced-risk claims will be made as to these products without agency clearance.
 
17


Table of Contents
BAT Annual Report and Form 20-F 2021
Strategic Management
Our Business Model
Continued


18
 

Table of Contents
BAT Annual Report and Form 20-F 2021    
 
Strategic Report        
 
    Governance Report        
  
Financial Statements        
  
Other Information        


19


Table of Contents
BAT Annual Report and Form 20-F 2021
Engaging with Our Stakeholders
Engaging with our Stakeholders


We work with, take into account and respond to the views and concerns
of our stakeholders, adapting to emerging risks and striving to meet the
expectations placed upon us as a multinational business.
Listening to our stakeholders helps us better understand their views and
concerns, and enables us to respond to them appropriately. It gives us
valuable inputs to, and feedback on, our strategic approach, as well as
our policies, procedures and ways of working.
 
 
20
 

Table of Contents
BAT Annual Report and Form 20-F 2021    
 
Strategic Report        
 
    Governance Report        
  
Financial Statements        
  
Other Information        


Suppliers Customers and Governments wider society Effective relationships with farmers Our customers include retailers, We seek to be part of the debate that UK Companies Act: and suppliers of tobacco leaf, product distributors and wholesalers who shapes the regulatory environment Section 172(1) Statement materials and indirect services are are essential for driving growth in which we operate, and to work essential to an efficient, productive and embedding responsible collaboratively to develop joint Our Directors have a duty, and secure supply chain. marketing practices. solutions to common challenges. individually and collectively as the Board, to act as they consider most likely to promote the success of the Company for the benefit of our members as a whole. As part of this duty, our Directors must have regard for likely long- – Extension Services farmer support – account Ongoing management dialogue and – Meetings and ongoing dialogue term consequences of decisions – Ongoing relationship dialogue management and – ‘Customer Voice’ survey – advisory Submissions committees to government and and the desirability of maintaining a reputation for high standards of – ‘Supplier supplier summits Voice’ survey, events and – Audits/performance reviews – and Multi working -stakeholder groups, partnerships such as the    business conduct. Our Directors – Sales calls and visits by trade reps must also have regard for our – Strategic partnerships ECLT Foundation employees’ interests, business – B2B programmes – External Scientific Panel relationships with our wider – Peer-reviewed research stakeholders, the impact of our operations on the environment and – Attending events at the COP 26 climate summit in the UK communities in which we operate and the need to act fairly between – Community investment programmes and NGO partnerships shareholders. Consideration of these factors and other relevant matters is embedded into all Board decision-making, strategy Read more on pages 3, 48, 53 to 55 Read more on pages 3, 57 and 109 Read more on pages 36, 45 to 67 development and risk assessment and 109 and 109 throughout the year. Our key stakeholders and primary – Productivity/quality/cost –
Route-to-market
planning – Product regulation ways in which we engage with – Sustainable agriculture – Contingency planning – Tax/excise/illicit trade them are set out in the table to the left. Pages 106 to 109 and 163 – Farmer livelihoods – Cost, price and quality – Responsible marketing to 165 provide further explanation – Human rights – Stock availability – Public health impacts of our Board’s approach to – Health and safety – Consumer buying behaviour – Human rights understanding stakeholder interests – Climate change/ – Youth access prevention – Climate change/ to enable relevant considerations environmental impacts environmental impacts to be drawn on in Board discussion –
COVID-19
impacts –
COVID-19
impacts –
COVID-19
impacts and decision-making. Where the Board delegates authority for decision-making – Supplier Code of Conduct – Customer and incentives loyalty    programmes – (SoBC) Standards of Business Conduct to management, our Group – Thrive sustainable agriculture and governance framework farmer livelihoods programme – (YAP) Global Guidelines Youth Access Prevention – Delivery with Integrity programme discussed on page 103 mandates – Leaf operational standards for PPE – Carbon neutrality target for 2030 consideration of these factors and and child labour prevention –
COVID-19
support and net zero for 2050 other relevant matters as a critical – Farmer Extension Services support – Human rights and climate part of delegated authorities. and training impact assessments Examples of some of the –
COVID-19
support – Community investment ways that these factors have charitable programmes donations and shaped Group strategy and initiatives during the year are –
COVID-19
support illustrated in the table to the left. Examples of how these factors have been taken into account in Board decision-making and – Inability to develop, commercialise – Inability to develop, commercialise – Geopolitical tensions strategy development during and deliver New Categories and deliver New Categories the year are provided on page 110. – Geopolitical tensions – Geopolitical tensions – Competition from illicit trade – Significant excise increases – Significant excise increases – Regulation that inhibits growth
 
21


Table of Contents
BAT Annual Report and Form 20-F 2021
Strategic Management
Our Markets and Megatrends


We are a global business, operating at scale, in a fast-paced world. Our markets are shaped by
long-term consumer, economic, cultural and social trends, as well as the regulatory environment.
Generational differences and shifts in taste are continuing to emerge, as health and wellness
become ever-more important. We continue to respond to this changing environment by
advancing our strategy and long-term priorities.
 
 
22
 

Table of Contents
BAT Annual Report and Form 20-F 2021    
 
Strategic Report        
 
    Governance Report        
  
Financial Statements        
  
Other Information        


Overview
Today, the tobacco and nicotine market serves a growing base of more than one billion adult consumers. Generational differences and shifts in taste are continuing to emerge, as health and wellness become ever-more important. We anticipate growth in new categories of products, including – and beyond – tobacco and nicotine. Consumers expect these to provide stimulation and pleasure, in ways previously associated with combustible products. We believe such growth will offset the predicted decline in cigarette consumption.
Global Combustible Market
The most recent sales data for the legal global tobacco market (2020) indicate it was worth approximately US$850 billion.
The largest global tobacco category remains combustible cigarettes. With over 2.7 billion cigarettes consumed annually (excl. China), it is valued at US$484 billion in 2020. Over 19% of the world’s adult population (incl. China) still chooses to smoke and will likely continue to do so unless offered suitable alternatives.
However, excluding China, the global cigarette market experienced a 4.2% volume decline in 2020 vs 2019. This is largely due to increased regulation and changing societal attitudes to smoking.
The illicit market
A further reason for the decline of legal tobacco volumes is the continued rise in illicit product consumption. While global (excl. China) illicit cigarette penetration declined from 11.9% in 2019 to 11.7% in 2020 as border closures and mobility restrictions resulting from the pandemic hindered consumer access to black market products, analysts expect illicit volume growth to return in several markets as travel measures ease, pressures on disposable income grow and governments raise excise.
Price differentials between markets, regulatory changes and broader macroeconomic pressures have the potential to further exacerbate the problem.
It is generally accepted that there is a direct correlation between steep or ad hoc increases in taxes and illicit sales. The current sanctions in many countries often fail to deter criminals in search of profit.


See pages 92 to 97 to read more about our Principal Group Risks


For further discussion regarding the regulation of our business, please see pages 340 to 344
Global combustible regulation
As one of the world’s most regulated and taxed industries, tobacco contributes billions of dollars to government treasuries annually.
Manufacturers are subject to wide-ranging regulation, varying considerably from market to market.
Over the years, legislators have largely focused on the introduction of plain packaging, product-specific regulations, graphic health warnings on packs, tougher restrictions on smoking in enclosed public places and bans on shops displaying tobacco products at the point of sale.
They have also begun considering and adopting regulations aimed at menthol flavourings.
Environmental concerns resulting from litter associated with cigarette consumption have led to an increased number of policy initiatives, with the EU leading the way with its
Single-Use
Plastic legislation.
Impact of
COVID-19
Beyond disruption to supply chains, the short-term impact of
COVID-19
on the tobacco industry is likely to be relatively limited.
The impact on volumes is expected to be felt unequally across geographies, with resilience seen in more developed markets while developing markets experience potentially greater numbers of consumers turning to the illicit market. A case in point is the U.S., where, although the general trend is a gradual decline in annual volumes, the Federal Trade Commission, in its annual Cigarette Report, said that manufacturers sold 203.7 billion cigarettes in 2020, up from 202.9 billion in 2019 – an increase of 0.4%.
Production of the principal raw material – tobacco leaf – remains broadly diversified across a number of continents. The industry has proven adept at dealing with supply-side shocks.
Global New Categories Market
Over recent years, innovation in the tobacco and nicotine marketplace has developed new nicotine products that do not involve the combustion of tobacco leaf and the inhalation of smoke. These growing smoke-free categories include vapour products, tobacco heating products (THP) and modern oral nicotine pouches.
The success of these New Categories in offering viable alternatives to displace the use of cigarettes is based on many factors. One is their ability to offer consumers satisfaction in circumstances where using combustible tobacco is no longer permitted or socially acceptable.
Another is their ability to offer a less risky but fulfilling alternative to cigarettes.
There is also a growing focus on leading a healthier, personalised lifestyle among the new generation of adult consumers. This, in addition to technological innovation, is expected to further accelerate the growth of new categories, as these products better meet evolving preferences and demands.
Evidence of this shift can be seen in global revenues from vapour and THPs, with both currently standing at around US$21 billion, an increase from 2019 of US$0.8 billion and US$5.8 billion, respectively.
Traditional oral products show steady, incremental growth. Meanwhile, growing sales of Modern Oral nicotine pouches registered an accelerated volume expansion especially in established oral tobacco markets such as the U.S. and Scandinavia. With a global value of US$1.2 billion in 2020, the category is projected to expand to over US$6 billion by 2025.
New Categories Regulations
At a global level, the THP and vapour markets are still emerging. Regulation is growing alongside the growth in the categories, but perception and attitudes towards these products have been mixed and regulation is often not designed around their characteristics and potential for risk reduction.* †
Whereas some regulators, including those in the UK and New Zealand, aim to encourage their use as less risky alternatives to cigarettes, while being mindful of the risks of youth usage, other governments view them with greater scepticism, with some imposing bans
Beyond Nicotine
The emerging and rapidly growing market for well-being and ‘new active’ products is expected to continue to grow as the consumer trend towards bespoke lifestyles evolves. One such market, cannabidiol (CBD), is expected to gain wider use, as evidenced by its recent growth in market size and certain governments, such as that of Germany, considering the legalisation of its recreational use.
 
*
Based on the weight of evidence and assuming a complete switch from cigarette smoking. These products are not risk free and are addictive.
 
Our products as sold in the U.S., including Vuse, Velo, Grizzly, Kodiak and Camel Snus, are subject to FDA regulation and no reduced-risk claims will be made as to these products without agency clearance.
 
**
All data sources on this page are from Euromonitor International and based on 2020 data (the latest full year available) unless otherwise stated.
 
23


Table of Contents
BAT Annual Report and Form 20-F 2021
Strategic Management
The Foundations of
our Evolved Strategy
 
We are committed to providing A Better Tomorrow
TM
for all our
stakeholders. Our ambition is to deliver long-term sustainable
growth with a range of innovative and less harmful products that
stimulate the senses of new adult generations.
 
 
24
 

Table of Contents
BAT Annual Report and Form 20-F 2021    
 
Strategic Report        
 
    Governance Report        
  
Financial Statements        
  
Other Information        


A Developing Parameters to Guide Portfolio Growth Opportunities Reduced health impact compared to cigarettes Science and regulatory expertise Beyond New Category nicotine BAT’s global Leveraging acceptability marketing Growth delivery    reach Opportunities platforms Social New categories nicotine Strategic and financial Tobacco attractiveness Positive environmental contribution Usage Less Switch Additional A wider portfolio of products that offer sensorial Our new growth opportunities will capitalise on our enjoyment for different moods and moments core business strengths, creating clear boundaries will allow us to capture the consumer moments for our portfolio development: previously associated with tobacco use, as well as – reducing the health and environmental satisfy new evolving consumer needs, through: impacts of our business; – scientifically-substantiated, reduced-risk*† – leveraging our global marketing reach tobacco and nicotine products; and scale; – building the brands of the future; and – building on our knowledge of delivery – ultimately, a portfolio of products beyond platforms and technology; nicotine that leverages our proven expertise. – relying on our experience in managing complex regulatory and scientific matters; and – meeting stringent strategic and financial metrics. * Based on the weight of evidence and assuming a complete switch from cigarette smoking. These products are not risk free and are addictive. † Our products as sold in the U.S., including Vuse, Velo, Grizzly, Kodiak and Camel Snus, are subject to FDA regulation and no reduced-risk claims will be made as to these products without agency clearance.
 
25


Table of Contents
BAT Annual Report and Form 20-F 2021
Strategic Management
A Strategy for Accelerated Growth


In 2021, 12% of Group revenue was from
non-combustible
products. This was achieved
through a multi-category approach which is the very essence of our purpose to build
A Better Tomorrow
TM
– providing adult consumers with a range of enjoyable and less risky*
choices for every mood and moment.
The model below outlines the key components of how we are building A Better Tomorrow
TM
,
from our mission to stimulate the senses of adult consumers worldwide and the outcomes
this will deliver for stakeholders, to the ethos that guides our decision making.
 
 
Our Mission
Stimulating the Senses
of New Adult Generations
Today, we see opportunities to capture consumer moments which have, over time, become limited by societal and regulatory shifts, and to satisfy evolving consumer needs and preferences.
Our mission is to anticipate and satisfy this ever-evolving consumer: provide pleasure, reduce risk, increase choice and stimulate the senses of adult consumers worldwide.
 
 
*
Based on the weight of evidence and assuming a complete switch from cigarette smoking. These products are not risk free and are addictive.
 
Our products as sold in the U.S., including Vuse, Velo, Grizzly, Kodiak and Camel Snus, are subject to FDA regulation and no reduced-risk claims will be made as to these products without agency clearance.
Must Wins
 
High Growth Segments
 
Driven by our unique and data-driven consumer insight platform (PRISM), we will focus on product categories and consumer segments across our global business that have the best potential for long-term sustainable growth.
 
Priority Markets
 
By relying on a rigorous market prioritisation system (MAPS), we will focus the strengths of our unparalleled retail and marketing reach, as well as our regulatory and scientific expertise, on those markets and marketplaces with the greatest opportunities for growth.
 
How We Win
 
Inspirational Foresights
 
Built on our successful history, we have a unique view of the consumer across all of our product categories, which is increasingly driven by powerful data and analytics.
 
These insights ensure that the development and responsible marketing of our products is fit to satisfy consumer needs.
Remarkable Innovation
As consumer preferences and technology evolve rapidly, we rely on our growing global network of digital hubs, innovation super centres, world-class R&D laboratories, external partnerships and our corporate venturing initiative to stay ahead of the curve.
Powerful Brands
For over a century, we have built trusted and powerful brands that satisfy our consumers and serve as a promise for quality and enjoyment. We will build the brands of the future by focusing on fewer, stronger and global brands across all our product categories, delivered through our deep understanding and segmenting of our consumers.
Connected Organisation
Few companies can claim over 150 million daily consumer interactions, over 11 million retail points of sale and a global network of expert employees around the world. Cultivating an ecosystem that directly connects us with consumers and stakeholders, especially through the power of digital technology, ensures we can build the brands of the future, deliver access to markets and foster innovations that offer sensorial enjoyment and satisfy consumer needs.
 
26
 

Table of Contents
BAT Annual Report and Form 20-F 2021    
 
Strategic Report        
 
Governance Report        
  
Financial Statements        
  
Other Information        


 2021 was indeed a pivotal year, with constant
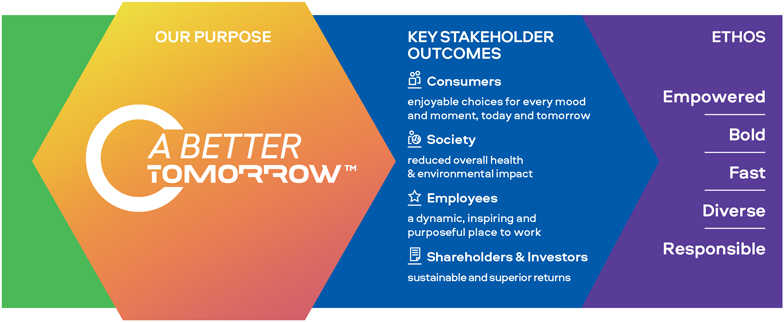
currency New Category revenue growth of over
50% combined with our reaching a total of 18.3 million
consumers (up 4.8 million) of our
non-combustible

products. It is clear that our transformation towards
A Better Tomorrow
TM
is accelerating.
 
  
Kingsley Wheaton
Chief Marketing Officer
 
 
People and Partnerships
Our highly-motivated people are being empowered through a new ethos that is responsive to constant change, embodies a learning culture and is dedicated to continuous improvement. But we cannot succeed on our own, and our partnerships with farmers, suppliers and customers are also key for ensuring sustainable future growth.
U.S. Focus
The United States comprises nearly half of our global business. It is also the single largest economy in the world, the largest single centre for technology and the key driver of global consumer trends, and is where we have the deep consumer understanding and financial strength to support the delivery of our mission to stimulate consumer senses around the rest of the world.
Our Purpose
 
By stimulating the senses of new adult generations, our purpose is to create A Better Tomorrow
TM
for all our stakeholders.
 
We will create A Better Tomorrow
TM
for:
 
 
By responsibly offering enjoyable and stimulating choices for every mood and every moment, today and tomorrow;
 
 
By reducing the health impact of our business by offering a range of alternative products, as well as by reducing our environmental and social impacts;
 
 
By creating a dynamic, inspiring and purposeful place to work; and
 
 
By delivering sustainable and superior returns.
 
     
For more information about our purpose see inside front cover
Short-Term Deliverables to Fuel A Better Tomorrow
TM
 
 
Simplify the Business


For more key detail see pages 29 to 33


Ensure a Step Change in New Categories Performance
With our unique cross-category consumer understanding, we are clear there is a huge opportunity for our New Categories.
 
 
For more key detail see pages 35 to 40


Drive Value From Combustibles
We drive value from Combustibles to fuel our investment in, and transition revenue to, New Categories.


For more key detail see pages 42 to 43
 
27


Table of Contents
BAT Annual Report and Form 20-F 2021
 
Strategic Management
Short-Term Deliverables to
Fuel A Better Tomorrow
TM
Our purpose is to build A Better Tomorrow
TM
by reducing the health impact of our business through offering a greater choice of enjoyable and less risky products* † for our consumers. To accelerate this, we must become a stronger, simpler and faster organisation, which will be achieved through the delivery of three short-term priorities.


Through Quantum we have fundamentally
re-evaluated
how we are organised and have reduced management layers to eliminate duplication and entrenched accountability.
We continue to create new capabilities and release valuable funds for further investment in our growth ambition, ensuring the Group is stronger, faster and more agile.
We are steadfast in realising operational efficiencies, supply chain productivity and a focus on excellence in our
route-to-market.
Over the years, consumer moments that used to be satisfied by cigarettes have been replaced by other products.
With our unique cross-category consumer understanding, we are clear there is a huge opportunity to recapture these moments with a broader portfolio of products that are less risky than combustible products.*
We are clear that any portfolio expansion will leverage our strengths. We will maximise and seek to constantly improve our delivery platforms in vapour, THP and modern oral, thereby reducing the health impact and making a positive environmental contribution.
We aim to increase our consumers of
non-combustible
products from 11 million (2019) to 50 million by 2030, driving revenue from New Categories to at least £5 billion by 2025.
We are building new capabilities around the world focused on science, innovation, and digital information. Consumer preferences and technology are evolving rapidly, and we are staying ahead of the curve with our digital hubs, the creation of innovation super centres, and further development of our world-class R&D laboratories. We are also leveraging the expertise of our external partners, and are looking forward to exciting results from our venturing initiative.
Our ambition is to increasingly transition our revenues from cigarettes to New Categories over time.
In order to fund the development of our New Categories, we will continue to focus on generating value from our Combustibles business, driving sustainable increases in revenue, with volume share and value share growth.
Our performance is a direct function of the strength of our brand portfolio. We will continue to develop and invest in our brands for equity and future value by offering winning brand and product propositions, enabled by purposeful innovation.
Revenue Growth Management is a critical enabler to unlock future value, and our resource allocation is focused and prioritised to deliver better results with fewer initiatives.
We will further consolidate our portfolio of strategic brands and deliver efficiencies through a much leaner portfolio, with far fewer stock-keeping units designed to a margin.
 
*
Based on the weight of evidence and assuming a complete switch from cigarette smoking. These products are not risk free and are addictive.
 
Our products as sold in the U.S., including Vuse, Velo, Grizzly, Kodiak, and Camel Snus, are subject to FDA regulation and no reduced-risk claims will be made as to these products without agency clearance.
 
28


Table of Contents
BAT Annual Report and Form 20-F 2021    
 
Strategic Report        
 
    Governance Report        
  
Financial Statements        
  
Other Information        


Short-Term Deliverables to Fuel A Better Tomorrow
TM


Simplify the Business
 
Highlights
 
Quantum enabled more than £595 million gross savings through organisational change and productivity initiatives
 
BAT Digital Business Services is transforming by building new capabilities while simplifying the existing ways of working
 
Technology and Digital focus on simplification and automation saved more than 100,000 hours, ensuring undisrupted delivery of our commitments despite the global pandemic
To enable us to deliver on our commitments and to become a simpler, faster and stronger organisation, we embarked on our Quantum journey in 2019. Quantum is our ongoing simplification programme that is fuelling New Category investment and delivery against our financial guidance.
The first phase of Quantum delivered a large-scale organisational change and the journey continued in 2020 and 2021. This has enabled us to remain agile in a fast-paced and ever-changing environment.
The effects of the global pandemic have demonstrated the importance of retaining simplification at the heart of our agenda.
In 2021, we continued to realise benefits from Quantum, generating more than £595 million of savings in the year. These benefits came through various simplification initiatives:
 
In our UK Headquarters, we have implemented a new organisational design. This has been key to ensuring decision-making where the knowledge sits and seizing the opportunities from synergies and integration.
 
In our markets, we have assessed and streamlined our footprint through an Operating Model review. This optimisation of our footprint is expected to deliver more than £100 million of annualised savings, enabling a sharper focus on New Categories.
 
Our initiatives addressing both our Centre and End Markets are underpinned by our BAT Digital Business Services* (DBS) transformation and enabled by Technology & Digital simplification.
 
In 2021, our DBS organisation has built new capabilities in consumer, customer, and Business Intelligence areas. Simultaneously, within our existing capabilities, DBS delivered optimisations to drive excellence and efficiency.
We are continuing our Technology & Digital transformation with a focus on automation and data-driven optimisation. In the past year, we have saved more than 100,000 hours in total, ensuring undisrupted delivery of our commitments. Technology & Digital will continue to underpin our simplification journey.
We have delivered our £1 billion savings commitment from Quantum 12 months earlier than planned.
All the elements which underpin our simplification agenda will sharpen the focus on core capabilities critical for delivering our A Better Tomorrow
strategy while enabling us to fuel the growth in New Categories to become a stronger, simpler and faster organisation.


*
Prior to 2021, Digital Business Services was called Global Shared Services.
 
29


Table of Contents
BAT Annual Report and Form 20-F 2021
 
Strategic Management
Simplifying the Business and Accelerating the Enterprise of the Future
BAT is moving towards the Enterprise of the Future – a global, consumer-centric, multi-category company, with sustainability at its core. We are redefining ourselves, not by the products we sell, but the consumer needs that we meet.
We are creating brands with purpose, and are reshaping our product portfolio, building a multi-category portfolio of
non-combustible
products backed by science, and expanding “beyond nicotine”. We are driven by digital transformation, technology and innovation, and by our people, living our ethos.
Quest is accelerating our transformation towards the Enterprise of the Future: it is delivering the capabilities required to build our multi-category platform business, enhance our future sustainability and deliver our digital transformation. It is underpinned by five accelerators.
 
Five ‘Accelerators’
to enable the Enterprise
of the Future…
 
Deliver
Q
uantum
Quantum is generating the resources to be reinvested in our New Categories by optimising our organisational design; leveraging our shared services; embedding productivity discipline; and delivering Revenue Growth Management (RGM) and Marketing Spend Effectiveness (MSE) initiatives.
U
nleash
Innovation
Unleash Innovation is delivering a step change in critical capabilities, enabling BAT to further build and successfully execute consumer focused and remarkable innovation. Utilising Quantum productivity savings, we are fuelling an ambitious portfolio transformation towards a multi-category product company.
E
mpowered
Organisation
Developing our people, teams and culture is at the heart of Quest. The Empowered Organisation programme is building an engaged, agile and high-performing organisation with capabilities to deliver our Enterprise of the Future.
Shaping
S
ustainability
Shaping Sustainability is accelerating our corporate journey towards a sustainable enterprise, fulfilling our A Better Tomorrow
purpose. Developing world-class science to support our new portfolio and embedding industry leading ESG ambitions is at the heart of this programme.
T
echnology &
Digital
Technology & Digital underpins all Quest initiatives to accelerate our transformation towards a top quartile, digitally-enabled consumer packaged goods (CPG) business. Our digital transformation is focusing on digital marketing; agile organisation; value from data & analytics and intelligent automation at scale.
 
30


Table of Contents
BAT Annual Report and Form 20-F 2021    
 
Strategic Report        
 
    Governance Report        
  
Financial Statements        
  
Other Information        


We Are Well On-track with our Journey Across all Accelerators
Quantum is continuing to simplify the organisation and generate funds to fuel growth in New Categories. In 2021, our new organisational design was announced and implemented, focused on simpler ways of working in our UK Headquarters. Our DBS Hubs are transforming to drive efficiencies in existing capabilities and build additional capabilities at the same time. We have reviewed and streamlined our End Markets’ Operating Model, simplifying and optimising our business footprint. Additionally, we continue to deploy our Revenue Growth Management and Marketing Spend Effectiveness tools, which have delivered £100m+ value creation in the U.S. and other key markets in relation to pricing, assortment, promotions and trade investment.
Unleash Innovation is transforming our capabilities to win as a multi-category business
 
As we evolve the range of consumer needs we serve, we are transforming capabilities in R&D and across the value chain to ensure BAT is positioned to make a step change in innovation. This transformation takes a multifaceted approach from sharpening the insights and foresights approach that drives our technology and product investments; how we are actively managing the innovation portfolio; how we partner externally; and also how we execute with excellence across our innovation pipeline.
We have achieved many milestones, including the initiation of our New Categories R&D Transformation, the launch of our “Innovation Hub” in Trieste, Italy, with further hubs planned, hosting a manufacturing site for our New Category products, a digital boutique, innovation lab and centre of excellence for digital transformation and marketing. Additionally, our venture organisation Btomorrow Ventures is leading investments in creative and innovative companies aligned with our vision for A Better Tomorrow
TM
.
Empowered Organisation is strengthening our talent pool
In 2021, the Empowered Organisation Programme launched a new Employee Brand Proposition which is fully aligned with our A Better Tomorrow
TM
strategy along with a modern
best-in-class
career website.
Our focus on developing our people led to continuous investment in learning & development. This resulted in a global portfolio of 57 programmes all delivered 100% virtually, while providing online learning tools to all managers and global graduates enabling anytime anywhere access to learning and development support from both internal and external experts. We have also implemented a transformational leadership assessment across all management helping our people to develop qualities required that are bigger, broader, more complex and challenging. We have recruited more than 1,300 new people in 2021 to further accelerate our transformation.
Our dedicated focus on Diversity & Inclusion also led to an industry-first National Equality Standard (NES) and Global Equality Standard (GES) certification. This is a reflection of our focus on our D&I strategy and of our inclusive culture and practices.
Shaping Sustainability continues to put sustainability front and centre of everything we do
In 2021, Vuse became the first global carbon neutral vape brand*, demonstrating our commitment to carbon neutrality and to reducing our impact on the environment. Vuse Solo became the first vaping product to receive marketing granted orders from the U.S. Food and Drug Administration (FDA), which confirms that the marketing of Vuse Solo products is appropriate for the protection of the public health and is evidence of our robust, world-class science.
We are building awareness and confidence in the science that underpins our New Category products, engaging with external stakeholders (including regulators) to ensure these new products can help build A Better Tomorrow
TM
. In 2021, we also accelerated our targets, including to have 100% of operations sites be zero waste to landfill by 2025; and to be net zero across our value chain by 2050. We are proud that our ESG efforts continue to be recognised externally.
Technology & Digital is creating new channels to connect with our consumers and enabling the simplification of our organisation
 
Through digital marketing initiatives, our
e-commerce
footprint is developing quickly, with consumer subscription programmes growing in priority New Category markets, enabling us to provide a more personalised experience for our consumers.
End-to-end
simplification through automation has improved our data analytics capabilities, our enterprise agility and efficiency, and our ability to respond faster to an ever-changing environment. We continue to digitally transform manufacturing in order to reduce waste, lessen energy usage, limit stoppages to production and save personnel time. Our ongoing ranking in the Gartner Supply Chain Top 25 demonstrates how the digital transformation and increased automation of our supply chain is having a positive impact.
100m+
value creation in the U.S. and other key markets in areas related to pricing, assortment, promotions and trade investment.
 
*
As verified by Vertis based on product Life Cycle
 
Assessment data provided by an independent third party,
 
taking into account the Group’s purchase of carbon credits through
 
reforestation projects.
 
31


Table of Contents
BAT Annual Report and Form 20-F 2021
 
Strategic Management
Technology & Digital Unlocking the Enterprise
of the Future
Digital Transformation across BAT is about leveraging technology to deliver value for all our stakeholders. We are investing in digital skills, providing tools and capabilities to our people and driving an entrepreneurial mindset, which is essential for identifying and scaling up solutions across the enterprise to maximise the value of our investments.
 
 
32


Table of Contents
BAT Annual Report and Form 20-F 2021    
 
Strategic Report        
 
    Governance Report        
  
Financial Statements        
  
Other Information        


Leveraging Technology and Data to Grow at Speed
We have over 150 million daily consumer interactions and over 11 million retail points of sale. Digital channels and capabilities allow us to connect with them, ensuring better consumer engagement with brands, innovations and services that can stimulate the senses of new adult generations.
 
 
33


Table of Contents
 
BAT Annual Report and Form 20-F 2021 for consumers By responsibly offering enjoyable and stimulating choices for every mood and every moment, today and tomorrow. Our consumers are at the core of everything we do and our success is underpinned by addressing their preferences, offering them a choice of enjoyable, innovative and less risky products*† through: – a wide choice of high quality and stimulating products for every mood and moment; – brands they can trust that are manufactured to high quality and safety standards; – reduced-risk alternatives to combustible products;*† – transparent, clear and accurate information, based on robust science, about the relative risks; and – responsible marketing that doesn’t engage or appeal to youth. † No observed genotoxicity under these test conditions. * Based on the weight of evidence and assuming a complete switch from cigarette smoking. These products are not risk free and are addictive.

Table of Contents
BAT Annual Report and Form 20-F 2021    
 
Strategic Report        
 
    Governance Report        
  
Financial Statements        
  
Other Information        


Strategic Management
Short-Term Deliverables to Fuel A Better Tomorrow
TM


Ensure a Step Change in New Categories Performance


Highlights
 
Vuse achieves Global value leadership.
 
Vuse value share up 800 bps vs 2020 to reach 33.5% share in our Top 5 markets.
 
Consumer acquisition up 1.8m reaching 8.4m, with growth in all Top 5 markets.
 
Vapour volume up 56% with revenue 59% higher at constant rates of exchange.
 
Vuse first global vapour brand independently verified by Vertis as carbon neutral^ in May 2021.
 
 
Toxicology tests
Cigarette vs ePen 2
 
Notes:
1. No observed mutagenicity under these test conditions.
2. No observed genotoxicity under these test conditions.
The Scientific Evidence*
There is growing consensus among many in the public health community and academia about the role of vapour products as a reduced-risk*† alternative to smoking. This is supported by a wealth of global reviews, studies and reports.
In the UK, for example, Public Health England** issued a series of expert reviews of the latest evidence, concluding: “based on current knowledge, vaping is at least 95% less harmful than smoking”. According to the UK’s Office for National Statistics, vaping now stands at 6.3% of the population, and smoking levels have dropped to 14.1%, from 23% in 2012, which means the UK has one of the lowest smoking incidences in Europe.
In 2021, we published a comprehensive review of the scientific evidence for vaping products, their potential health effects, and their role in tobacco harm reduction. This is a summary of more than 300 peer-reviewed scientific papers and other evidence published by around 50 institutions over the past decade.
According to adult population modelling studies cited in the review, a significant reduction in premature deaths could be achieved if current smokers switched exclusively to vaping rather than continuing to smoke cigarettes.
the current best estimate is that
e-cigarettes
are around 95% less harmful than smoking. 
Public Health England** 2015
 
Number of markets where the Group’s vapour products are sold
 
 
Vapour Top 5 markets
U.S., UK, France, Germany and Canada.
 
*
Based on the weight of evidence and assuming a complete switch from cigarette smoking. These products are not risk free and are addictive.
 
Our products as sold in the U.S., including Vuse, Velo, Grizzly, Kodiak, and Camel Snus, are subject to FDA regulation and no reduced-risk claims will be made as to these products without agency clearance.
 
^
As verified by Vertis based on product Life Cycle Assessment data provided by an independent third party, taking into account the Group’s purchase of carbon credits through reforestation projects.
 
**
Public Health England was replaced in Oct 2021 by UK Health Security Agency and Office for Health Improvement and Disparities
 
35


Table of Contents
BAT Annual Report and Form 20-F 2021
Strategic Management
Short-Term Deliverables to Fuel A Better Tomorrow
TM


Ensure a Step Change in New Categories Performance
Continued
 
 
Vuse Certified as Carbon Neutral
Vuse is one example of how we are driving our ESG purpose. We are very proud that Vuse has been independently certified by Vertis as the first global carbon neutral^ vapour brand. We have removed all unnecessary single use plastics from our Vuse packaging and implemented Device Take Back schemes in all our vapour markets – examples of our many projects aimed at making Vuse one of the most sustainable and trusted vaping brand worldwide with a clear
consumer-led
purpose.
Regulation and PMTA
The future of tobacco harm reduction has always depended on robust science, and ensuring that this is accessible to audiences outside the scientific community is critical. This need is growing stronger than ever – with a number of cases of acute lung diseases (referred to as EVALI) reported among vapers in the U.S. in 2019, consumers want to be clear on the risk profile of these products. In addition, consumer perceptions of nicotine are evolving with many consumers over-estimating the risks associated with nicotine generally.
This also demonstrates the importance of having, and enforcing, a robust and effective regulatory framework that ensures high product standards and prevents access and appeal to youth – things we have long advocated. Robust science has to be at the centre of any regulatory development and engagement.
We are fully committed to working in a regulated market, where adult consumers can be confident that marketed tobacco products are appropriate for the protection of the public health and underpinned by science. This approach is underscored by the U.S. Food and Drug Administration’s Premarket Tobacco Product Application (PMTA) process.
PMTAs are based on a summary of all research findings to demonstrate that the marketing of a product meets the FDA’s criteria as “appropriate for the protection of the public health”.
2020 value share in Germany has been rebased by AC Nielsen from 50.1% to 49.9%.
 
^
As verified by Vertis based on product Life Cycle Assessment data provided by an independent third party, taking into account the Group’s purchase of carbon credits through reforestation projects.
In October 2021, Vuse Solo received the first of its kind FDA marketing authorisation for vapour products in Original flavour. This confirmed that the marketing of Vuse Solo products is appropriate for the protection of the public health, the culmination of years of scientific study and research. The Vuse Alto PMTA, which was submitted nearly a year after Vuse Solo, shares the same foundational science. We are confident in the quality of our applications.
We support efforts by the FDA to both address the increasing availability of flavoured synthetic nicotine products and enhance enforcement actions against flavoured disposable vapour products. The FDA is under increased scrutiny from Congress to act against these types of products, including clarifying the regulatory framework within which such products should be regulated and enforced, which we believe is likely to lead to substantive action by the FDA.
Performance Summary
Vapour continued its strong momentum driven by Vuse. Total volume of consumables was up 56% to 535 million units, having grown 52% (to 344 million units) in 2020. Combined with consumable pricing across all T5 markets, this drove revenue up 52% to £927 million, or 59% at constant rates of exchange, with 2020 up 52% to £611 million (or an increase of 53% at 2019 rates of exchange).
In 2021, Vuse achieved global vapour value share leadership (in July 2021) with a full year value share of 33.5% (up 780 bps vs 2020). Vuse is now at or approaching value share leadership in all T5 markets. We consolidated our volume share leadership of devices in all T5 markets, driven by industry leading consumer acquisition up 1.8 million to 8.4 million consumers.
In the U.S., we are approaching vapour value leadership, driven by Vuse Alto, with total vapour value share for the year up 760 bps to 32.5%, maintaining the momentum of 2020 which was up from 16.6% in 2019. Vuse consumables volume grew 67% in 2021, having grown 70% (to 174 million units) in 2020, outperforming the total vapour industry in both years (up 21% in 2021 and down 13% in 2020). In 2020, the industry in the U.S. was impacted by the EVALI crisis in 2019 and implementation of flavour regulations in early 2020. We retained leadership (by volume) of closed system devices, with growth of 500 bps to 57.4% compared to 2020.
We performed well in 2021 and 2020 in the other top vapour markets, and extended our leadership positions, with all T5 Vype migrations to Vuse completed during the year. Specifically:
 
in the UK, total vapour value share of the category was 31%, compared to 36% in 2020. Vuse performed well, with value share up 210 bps to 16.9% driven by both ePen 3 and ePod;
 
in France, vapour value share reached 45.7% in 2021, an increase of 14.2 ppts (versus 2020), driven by ePen 3 and ePod;
 
in Canada, having gained value share leadership in 2020, we continued to grow, with total vapour value share up 34.3 ppts to 80.4% in 2021, driven by ePod; and
 
in Germany, our value share of total vapour was 59.9%, up 10.1 ppts (2020: 49.9%), driven by ePen 3 and ePod.
In January 2021, we pilot-launched our first CBD vaping product (Vuse CBD Zone) as a city test in Manchester, England, providing valuable insights into the product and consumer behaviour.
We continued the expansion of
e-commerce,
with Vuse ranked No.1 overall for branded consumer search and web traffic across all our T5 markets. Despite the impact of regulatory changes in the U.S., the number of consumers utilising our subscription programme globally increased to around 25,000, up 43% compared to 2020.


36


Table of Contents
BAT Annual Report and Form 20-F 2021    
 
Strategic Report        
 
    Governance Report        
  
Financial Statements        
  
Other Information        


Highlights
 
glo THP category volume share up 480 bps in Top 9 markets vs 2020 to reach 18.1%.
 
glo consumer acquisition up 2.7m reaching 6.7m with growth in all T9 markets.
 
glo consumable volume up 79%, over three times industry volume growth of 26%.
 
glo revenue growth up 34% with year on year and sequential growth accelerating in H2 2021.
 
 
Toxicants of interest
Cigarette vs glo
 

The Scientific Evidence*
By heating tobacco rather than burning, THPs offer a reduced risk*† alternative compared to smoking for those who completely switch. To date, most research has been conducted by industry scientists, but an increasing number of independent reports are broadly aligned with these findings and support the role of THPs as a less risky*
alternative to smoking.
For example, a study commissioned by the UK Department of Health in 2017 found that people using THPs were exposed to around 50–90% less of the “harmful and potentially harmful” compounds compared with conventional cigarettes. In 2018, Public Health England**, while highlighting the need for more research, found that “compared with cigarettes, heated tobacco products are likely to expose users and bystanders to lower levels of particulate matter, and harmful and potentially harmful compounds”.
Compared with cigarettes, heated tobacco products are likely to expose users and bystanders to lower levels of particulate matter, and harmful and potentially harmful compounds.
Public Health England**, 2018
 
Number of markets where the Group’s Tobacco Heating Products are sold
 
 
THP Top 9 markets
Japan, South Korea, Russia, Italy, Romania, Germany, Ukraine, Poland and the Czech Republic.
 
*
Based on the weight of evidence and assuming a complete switch from cigarette smoking. These products are not risk free and are addictive.
 
Our products as sold in the U.S., including Vuse, Velo, Grizzly, Kodiak, and Camel Snus, are subject to FDA regulation and no reduced-risk claims will be made as to these products without agency clearance.
 
**
Public Health England was replaced in Oct 2021 by UK Health Security Agency and Office for Health Improvement and Disparities.
 
37


Table of Contents
BAT Annual Report and Form 20-F 2021
Strategic Management
Short-Term Deliverables to Fuel A Better Tomorrow
TM


Ensure a Step Change in New Categories Performance
Continued
 
 
Our commitment to reducing the health impact of our business is helping to deliver ground-breaking scientific advances and supports consumer choice.
The results of 329 tests and studies we have conducted have generated evidence that supports our belief that glo is a reduced-risk product compared to continuing to smoke cigarettes*
.
While glo is not risk free and nicotine is addictive, the aerosol contains considerably fewer and lower levels of certain toxic substances compared to cigarette smoke, and has a significantly reduced impact in various toxicology tests.
As more long-term data is needed to support the category, we undertook a year-long clinical study to evaluate the reduced risk potential of glo. The
six-month
results were published in a peer-reviewed journal in 2021. The data from the study provides the first real-world evidence that people switching from cigarettes to exclusive use of glo can significantly reduce their exposure to certain toxicants and indicators of potential harm related to several smoking-related diseases, compared with continuing to smoke.
Designed with Purpose
Our new glo pro, Hyper, and Hyper+ models feature induction heating, enabling devices to reach their operating temperatures of around
240-280°C
faster. This makes them more efficient and enjoyable for consumers to use.
The system also requires fewer components susceptible to temperature degradation, enabling the use of a wider range of temperatures, which are still substantially lower than temperatures needed for combustion. This helps to unlock a broader range of sensory experiences.
This more-powerful heating system produces a much faster and more precise device, offering consumers more flexibility, while still tightly controlling temperature and avoiding combustion.
Performance Summary
Driven by the continued success of glo Hyper in Japan and across ENA, total consumable volume grew 79% to 19.1 billion sticks in 2021. In 2020, consumables grew by 19% to 10.7 billion sticks, having been impacted by the withdrawal of Sens in that period. Excluding Sens, THP consumable volume would have increased 29% in 2020, demonstrating an acceleration in 2021 as average daily consumption increased across our key markets.
In 2021, glo achieved record THP category volume share in the T9 markets, up 480 bps in 2021 to 18.1%, with growth in all T9 markets.
This performance was underpinned by glo Hyper, which was launched in April 2020 initially in Japan (and accounts for 72% of the glo portfolio), with subsequent launches in other markets (notably in ENA) from the second half of 2020 and continuing in 2021. glo Hyper is the
first-to-world
THP launched with induction heating which provides a step change in consumer satisfaction with 30% more tobacco, faster heating and a boost button. The success of glo Hyper was achieved despite the impact of
COVID-19
restrictions as the launches and ongoing marketing campaigns were successfully switched to digital platforms.
Revenue increased 34.4% to £853 million (2020: down 12.9% to £634 million) largely driven by the higher volume, with growth increasing sequentially between the first and second half of 2021. The decrease in 2020 was largely due to the decision to withdraw glo Sens from the market (being a reduction to revenue of £50 million) and the impact of excise harmonisation in Japan. Excluding the impact of the relative movements in sterling, at constant rates of exchange impacting both years, revenue grew 46% in 2021, compared to a decrease of 12.7% in 2020.
In APME, where the most mature THP markets are, our consumable volume grew 27%, with device volume up 36% as we continued to invest in consumer acquisition. Revenue was up 2.8% or 13.0% at constant exchange, with acceleration in the second half of 2021 driven by consumable pricing and as we lap the impact of the Sens withdrawal in the prior year comparator, partly offset by excise increases in Japan in October. In Japan, glo’s category volume share of THP reached 21.2%, an increase of 180 bps on 2020 (2020: 19.4%).
In ENA, which has seen strong industry volume growth of 41% in 2021, we grew around five times faster than the market, with glo volume up 195%, with consecutive quarterly growth in our key markets. Accordingly, revenue increased 150% or 167% at constant currency, having grown 143% (or 159% at constant rates of exchange) in 2020. Notably in Russia, glo’s volume share (of THP) was up 1,070 bps at 19.3%, while in Ukraine our volume share of THP was 20.9% (an increase of 990 bps) on 2020. Furthermore, in Italy, glo reached 12.8% THP category volume share, up 870 bps, with Hyper driving 100% of the growth, and in Romania glo reached 22.1% category volume share, up 530 bps on 2020.
COVID-19
continued to impact our consumer engagement plans in 2020 and 2021, yet we still made good progress in Kazakhstan, Poland, Egypt, the Czech Republic and across other smaller ENA launch markets, and Hyper is now in 22 of glo’s 25 markets, with further market roll-outs planned in 2022.


38


Table of Contents
BAT Annual Report and Form 20-F 2021    
 
Strategic Report        
 
    Governance Report        
  
Financial Statements        
  
Other Information        


Highlights
 
Continued strong global volume growth (up 70.5%), with consumer numbers up 0.6m to 2.1m.
 
ENA revenue up 44%, with volume up 46% driving volume share to 69.4%, up 380 bps.
 
US volume up 272%, with volume share of Modern Oral at 11.7%, up 410 bps vs 2020 in a highly competitive market.
 
 
Toxicology tests
Cigarette vs Velo
 
Notes:
1. Toxtracker assay (rtkn and bscl2).
2. At equivalent nicotine doses (7.85µg/ml velo vs. 4.34µg/ml cigarette).
3. High content screening.
The Scientific Evidence*
Laboratory chemical studies for our Modern Oral products show they produce substantially lower levels of toxicants than cigarette smoke and even lower levels than snus – a traditional oral tobacco product which is already regarded as a reduced risk*† alternative to smoking. Toxicology tests assessing the biological effects of our Modern Oral products on human cells also show they have little effect relative to snus and cigarettes.
In 2021, we published new peer-reviewed evidence, which suggests our Modern Oral tobacco-free nicotine pouches have a toxicant profile that is comparable to nicotine replacement therapy products (NRT). The pouches were also found to have a toxicant profile that is far lower than snus.
Smokeless tobacco products are much cleaner and less hazardous than cigarettes. Their use could reduce harm to smokers if they switched entirely to these products.
Professor Neal Benowitz
Professor of Medicine at the University of California, San Francisco
 
Number of markets where the Group’s Modern Oral products are sold
 
 
Modern Oral Top 5 markets
U.S., Sweden, Norway, Denmark and Switzerland
 
 
*
Based on the weight of evidence and assuming a complete switch from cigarette smoking. These products are not risk free and are addictive.
 
Our products as sold in the U.S., including Vuse, Velo, Grizzly, Kodiak, and Camel Snus, are subject to FDA regulation and no reduced-risk claims will be made as to these products without agency clearance.
 
39


Table of Contents
BAT Annual Report and Form 20-F 2021
Strategic Management
Short-Term Deliverables to Fuel A Better Tomorrow
TM


Ensure a Step Change in New Categories Performance
Continued
 
 
This study compared BAT’s nicotine pouch products to both snus and NRTs. Each was tested for 26 compounds, some of which are known harmful and potentially harmful constituents (HPHCs). For our products, 22 of the 26 compounds tested were below measurable limits. For NRTs,
20-22
compounds were below measurable limits, whereas snus was found to have 11 compounds below measurable limits.
On the basis of our evidence and informed by the wealth of independent evidence regarding snus, switching completely to Modern Oral products can be expected to reduce the risk of smoking-related disease when compared to continued smoking. That is why we are investing so much in refining and improving these innovative products. This is part of our commitment to providing adult consumers with a wide range of enjoyable and less risky*
alternatives to cigarettes.
Our Products
Our Modern Oral products are white in colour and contain high-purity nicotine, water and other high-quality food-grade ingredients, including eucalyptus and pine tree fibres, flavouring and sweeteners.
Originating in Scandinavia, Velo is now a leading global brand of nicotine pouches. These typically appeal to a broader audience than traditional oral tobacco, and because of their affordability and lack of batteries, they can be particularly popular in
low-to-middle
income countries. For example, our subsidiary in Indonesia has delivered encouraging results from its expansion activities in Jakarta. Following a promising performance in June 2020, the test has been expanded to 5,000 consumers, which is being closely monitored to gain consumer insights.
We are also delivering a step-change in Modern Oral manufacturing. Truly living our ethos, our Modern Oral factory in Pécs, Hungary, put together a bold plan to implement food industry standards for Modern Oral manufacturing. This has enabled us to ensure the availability of products that comply with regulations in different countries.
With a cross-functional team across quality, production, engineering and EHS teams delivering technical changes and process improvements, Pécs became the first site in BAT’s history to obtain the ISO 22000 certification for food safety standard.
Performance Summary
Having consolidated our leadership position in Modern Oral outside the U.S. and expanded the U.S. portfolio with the Dryft acquisition in 2020, 2021 has been a year of further growth in volume and value.
Our growth accelerated globally in 2021, with volume up 71% to 3.3 billion pouches (2020: up 62% to 1.9 billion pouches).
Revenue increased 39% to £274 million (2020: up 57% to £198 million). Excluding the impact of foreign exchange, this was an increase of 41% in 2021 and 57% in 2020, on a constant rates basis.
Volume share of the Modern Oral category in our T5 markets was 34.7%, in line with 2020.
This was largely driven by the U.S., where our volume share of Modern Oral increased by 410 bps as volume grew 272% to 602 million pouches (2020: up 45% to 162 million pouches). This growth was due to the acquisition of the nicotine pouch products of Dryft Sciences, LLC (Dryft) in October 2020. These products are now present in over 110,000 stores nationally, driving volume share expansion to 11.7%, up 410 bps on 2020 in a highly competitive market. Due to discounting to drive consumer trial, which is recognised as a deduction to revenue under IFRS, revenue declined 82% to £2 million, having grown 14% to £10 million in 2020.
While we are excited about the long-term potential of the Modern Oral market in the U.S., it currently represents less than 2% of the nicotine industry by revenue (in the U.S.) and 51% and 38% of global Modern Oral volume and value share, respectively.
The majority of Velo consumers (in the U.S.) adopted the brand as their first in Modern Oral, sourced evenly from Combustible, snus, Traditional Oral and Vapour consumers. Our insights suggest that a high percentage of Modern Oral users are already poly-users of other categories.
In ENA, we are volume share leaders of the Modern Oral category in 15 of the 17 markets where we are active. Revenue increased by 44% (2020: up 59%) or 46% (2020: up 59%) at constant rates of exchange. We continue to drive innovation in the category, with the success of our Sachet, Black range and Velo Mini launches, as well as new flavours generated alongside consumers in our LAB
co-creation
hubs in Sweden.
Furthermore:
 
In Sweden, where Modern Oral has grown to represent 13.5% of the total oral category, our volume share of the Modern Oral category reached 59.6%, an increase of 580 bps on 2020**;
 
In Norway, where Modern Oral now represents 28.7% of the total oral category, our volume share of the Modern Oral category grew to 63.9%, up 180 bps on 2020, having declined 270 bps in 2020 from 64.8% in 2019; and
 
In Denmark, where Modern Oral now represents 90.5% of the total oral category, our volume share of Modern Oral category fell 130 bps to 92.6%.
Our pilot launches in emerging markets (including Pakistan and Indonesia) continue to deliver valuable insights, as we
roll-out
in key urban markets. We believe that Modern Oral is an exciting longer-term opportunity to commercialise reduced risk products
*
by offering affordable New Category alternatives to adult nicotine consumers.
In Kenya, we continue to engage with the relevant authorities on the regulatory and fiscal framework to support a commercially sustainable
re-entry
into the Modern Oral category.
In Germany, sales of Modern Oral have been suspended pending engagement with the authorities regarding the classification of tobacco-free nicotine pouches.
 
 
*
Based on the weight of evidence and assuming a complete switch from cigarette smoking. These products are not risk free and are addictive.
 
 
**
Sweden volume share has been
re-based
to include Nicotine free pouches in all periods. Accordingly, our 2020 volume share of Modern Oral was
re-based
to 53.8%.
 
 
Our products as sold in the U.S., including Vuse, Velo, Grizzly, Kodiak, and Camel Snus, are subject to FDA regulation and no reduced-risk claims will be made as to these products without agency clearance.
 
 
40


Table of Contents
BAT Annual Report and Form 20-F 2021    
 
Strategic Report        
 
    Governance Report        
  
Financial Statements        
  
Other Information        


Our Products
We also sell a range of traditional oral products, including Swedish-style snus and American moist snuff, available in loose tobacco form or as
pre-packed
pouches. We have long sold snus in Sweden and Norway through our Fiedler & Lundgren business, whose brands include Granit and Mocca; and in the US we market snus under the Camel brand. Our American moist snuff products include our flagship Grizzly brand, as well as the premium moist snuff brand Kodiak.
The Modified Risk Tobacco Product (MRTP) applications for Camel Snus were discussed by the Tobacco Products Scientific Advisory Committee (TPSAC) of the FDA in September 2018. After extensive additional work with the FDA, we expect that the applications will remain under review until the second half of 2022.
Performance Summary
In 2021, volume was lower (down 3.9%) on the prior year (at 8.0 billion stick equivalents), with 2020 0.9% lower than 2019.
Total revenue declined 3.6% to £1,118 million (2020: up 7.2% to £1,160 million), as pricing in both 2021 and 2020 was more than offset in 2021 by a translational foreign exchange headwind of 6.6% due to the relative strength of sterling in the year. On a constant rates basis, revenue grew 3.0% in 2021 and 7.7% in 2020.
In the U.S., which accounts for approximately 96% of the Group’s revenue from Traditional Oral, volume declined 5.1% in 2021 (2020: down 1.3%). Value share of moist was up 10 bps, while volume share was down 50 bps, compared to 2020. This followed a decline in value share in 2020 of 25 bps. The improvement in 2021 was driven by Grizzly through the use of RGM capabilities which stabilised the performance from the second half of 2020 and delivered value growth in 2021.
Outside the U.S., being 4% of Group revenue from the category, volume was 6.1% higher in 2021, driven by Sweden where the Group’s volume share (as a proportion of total oral) increased 50 bps (2020: down 80 bps). This was driven by growth in Lundgrens in both periods offset, in 2020, by declines in the remainder of the portfolio.
 
 
41


Table of Contents
BAT Annual Report and Form 20-F 2021
Strategic Management
Short-Term Deliverables to Fuel A Better Tomorrow
TM


Drive Value From Combustibles


Highlights
 
Group value share up 10 bps, driven by the U.S. up 60 bps.
 
Volume share down 10 bps.
 
Strong price/mix +4.3%.
Value and Volume Share
Group cigarette value share increased 10 bps in 2021 (2020: up 20 bps), driven by the continued performance of the strategic cigarette brands in the U.S. (up 80 bps), with total U.S. value share up 60 bps. This combined with higher cigarette value share (in Japan, Bangladesh, Germany, Turkey, Taiwan, Pakistan, the Czech Republic, Colombia and Malaysia) to more than offset lower value share in Indonesia, Saudi Arabia, Canada, Australia, South Africa, Poland, France and Italy.
Group cigarette volume share was down 10 bps in 2021 (2020: up 40 bps). The decrease in 2021 was driven by the U.S. (as we focused on value generation), South Africa, Australia, Saudi Arabia, Brazil, New Zealand and Russia more than offsetting growth in Bangladesh, Pakistan, Turkey and Japan. In 2020, this was an increase of 40 bps as growth in Bangladesh, Mexico, Vietnam, Russia and Turkey was partly offset by lower volume share in Indonesia and Saudi Arabia.
Volume Performance
In 2021, Group cigarette volume was in line with 2020, at 637 billion sticks (2020: down 4.6% to 638 billion), with the total cigarette market also estimated to be largely in line with 2020, having declined between 5.0-5.5% against 2019.
In 2021, cigarette volume grew in South Africa (which recovered from the impact of the
COVID-19
lockdown and sales ban in 2020), Pakistan (due to lower illicit trade), Bangladesh (due to the strength of the local portfolio) and Vietnam (as the market recovered from
COVID-19).
However, these were more than offset by the disposal of the Group’s operations in Iran partway through the year, while volume was lower in both Indonesia (as the Group focussed on value delivery with pricing ahead of the industry) and the U.S.
In the U.S., Group cigarette volume was down 5.0% to 69.5 billion, having increased 0.5% to 73.1 billion in 2020. The movement in 2021 was partly benefiting from trade inventory movements (mainly linked to the timing of price increases and uncertainty about a potential excise increase) which are expected to unwind in 2022.
In 2020, Group cigarette volume was also negatively impacted by the
COVID-19
production and other supply chain restrictions.
 
 
42
 

Table of Contents
BAT Annual Report and Form 20-F 2021    
 
Strategic Report        
 
    Governance Report        
  
Financial Statements        
  
Other Information        


This affected sales in several markets including Canada and Mexico. While not a significant part of the Group, travel restrictions due to
COVID-19
impacted our Global Travel Retail (GTR) business (which did not recover in 2021), negatively impacting Group cigarette and THP volume by an estimated 1.0% (in 2020 compared to 2019). Furthermore, volume declined in Indonesia (due to the impact of tax increases and minimum retail price compliance) and in Pakistan, where illicit trade grew significantly following
excise-led
price increases in prior years. These were partly offset by growth in Brazil (where enhanced border security and restricted population mobility due to
COVID-19
led to an increase in duty paid volume), in Turkey (driven by Kent and the local portfolio), and in Bangladesh (driven by the continued strength of the local portfolio).
Developed markets were generally relatively resilient, with little evidence of accelerated downtrading despite the pressures of
COVID-19.
Strategic Brand Performance
The performance was underpinned by the strategic cigarette brands, with value share 20 bps higher in 2021 (2020: up 40 bps):
 
 
Dunhill’s overall value share was down 10 bps (2020: down 10 bps) as growth in Romania, Pakistan, Taiwan and Brazil was more than offset by declines in Indonesia, South Korea, Australia and Saudi Arabia. Volume was 8.9% lower (2020: down 17%), largely due to the impact of the tax increases and minimum retail price compliance in Indonesia;
 
 
Kent’s value share was stable (2020: stable) as growth in Turkey, Russia, South Korea, Saudi Arabia and Ukraine was offset by lower value share in Japan, Romania and Brazil. Volume was down 2.6% (2020: up 2.0%) as growth in Turkey was more than offset by lower volume in Japan and the Middle East (due to the sale of the business in Iran partway through the year);
 
 
Lucky Strike’s value share grew 30 bps (2020: up 10 bps), as growth in the U.S. (following launch in December 2020), AMSSA (particularly Brazil, Colombia and Chile), Japan, Russia and Germany more than offset lower value share in Indonesia, France and Spain. Volume grew 19.6% (2020: down 2.0%) driven by Russia, the U.S., Brazil, Algeria and Japan, partially offset by the impact of the tax increases and minimum retail price compliance in Indonesia;
 
 
Rothmans’ value share was 10 bps lower (2020: up 10 bps) as growth in Brazil, the Czech Republic and Malaysia was offset by lower value share in Russia, Australia,
 
New Zealand, Poland, South Korea, South Africa, Ukraine and the UK. Volume was 3.0% lower (2020: up 6.1%) as growth in Brazil and Cuba was more than offset by lower volume in Russia, Ukraine and Kazakhstan; and
 
 
Pall Mall’s value share was 20 bps lower (2020: stable) as growth in Mexico and Germany was more than offset by lower value share in the U.S., Saudi Arabia, Australia, Canada, Chile, Romania and New Zealand. Volume was up 2.2% (2020: down 6.0%) largely driven by Pakistan.
The Group’s US domestic strategic combustible portfolio performed well:
 
 
Newport value share increased 70 bps (2020: up 50 bps), while volume declined 3.3% (2020: up 2.3%);
 
 
Natural American Spirit performed well with value share up 20 bps (2020: up 20 bps). Volume was marginally lower than 2020 (down 0.8%), having increased 6.0% in 2020 vs 2019; and
 
 
Camel’s value share declined 30 bps in the US (2020: stable) with volume 9.0% down (2020: up 1.2%), driven by competitive pricing pressures.
Volume of other tobacco products (OTP) declined 9.2% to 18.3 billion sticks equivalent (2020: 1.7% decline), being 3% of the Group portfolio (2020: 3%).
Revenue
In 2021, revenue from combustibles was down 3.2% at £22,029 million (2020: £22,752 million, down 1.1%). 2021 benefited from an estimated £200 million benefit from the U.S. trade inventory movement discussed earlier. This was more than offset by the estimated £260 million impact of structural excise change and competitive pricing in Australasia and the impact of the sale of the Group’s operations in Iran (as described on page 196). While pricing in both years was strong, this led to 2021 price/mix at 4.3% being lower than 2020 (7.3%).
A translational foreign exchange headwind of 7.2% led to the decline in revenue in 2021 from combustibles.
Revenue in 2020 was also negatively impacted by the
COVID-19
volume disruption and a translational foreign exchange headwind of 3.7%.
COVID-19
continued to affect the Group as travel restrictions impacted GTR in 2021 and 2020.
After adjusting for the short-term impact of excise on
bought-in
goods (impacting 2019) and the currency headwinds, adjusted revenue from combustibles at constant rates of exchange was up 4.0% to £23,669 million. In 2020, this was an increase of 2.8%.
 
Change in cigarette volume share in key markets
(bps)
 
-10 bps
 
Definition:
Annual
change in cigarette volume share – being the number of cigarettes bought by consumers of the Group’s brands in key markets as a proportion of the total cigarettes bought by consumers in those markets (see page 302).


Change in cigarette value share in key markets
(bps)
 
+10 bps
 
Definition:
Annual
change in cigarette value share – being the value of cigarettes bought by consumers of the Group’s brands in key markets as a proportion of the total value of cigarettes bought by consumers in those markets (see page 302).
 
Number of cigarette factories in 40 countries
 
43


Table of Contents
BAT Annual Report and Form 20-F 2021
Strategic Management


As consumers increasingly seek products offering wellbeing and stimulation characteristics, we are working with our venturing unit, Btomorrow Ventures (BTV), and selected third-parties to strengthen our understanding of this market. We are applying these learnings and developing our own portfolio of products addressing consumer needs not just today, but into the future.
BTV has completed 17 investments since launch in 2020, with 9 new investments during 2021, in innovative consumer, new sciences and technology businesses and one fund investment.
The companies in which we invest are carefully selected for original ideas across a range of criteria, as well as a cultural fit which allows us to work together to leverage the strength of the BAT Group in helping entrepreneurial candidates accelerate and sustain growth. This approach provides us with evolving capabilities for the future across both our New Categories and Beyond Nicotine.
In March 2021, we entered a strategic collaboration agreement with Organigram Inc., a wholly owned subsidiary of publicly traded Organigram Holdings Inc., focused on research and product development activities of next generation adult cannabis products, with an initial focus on cannabidiol (CBD).
 
As described on page 213, under the terms of the transaction, a Group subsidiary acquired a 19.9% equity stake in Organigram Holdings Inc. (listed on both the Nasdaq and Toronto Stock Exchange under the symbol “OGI”) to become its largest shareholder.
In January 2022, we announced the launch of KBio Holdings Limited (KBio) to accelerate the research, development and production of novel treatments for rare and infectious diseases. KBio will leverage the existing plant-based technology capabilities of BAT and Kentucky BioProcessing Inc. (KBP), the existing
BAT-owned
U.S. plant biologics organisation.
 
 
Find out more at
www.btomorrowv.com
 
 
*
Based on the weight of evidence and assuming a complete switch from cigarette smoking. These products are not risk free and are addictive.
 
Our products as sold in the U.S., including Vuse, Velo, Grizzly, Kodiak, and Camel Snus, are subject to FDA regulation and no reduced-risk claims will be made as to these products without agency clearance.
 
44
 

Table of Contents
 
for society and the environment By reducing the health impact of Sustainability is front and centre our business by offering a range in all that we do. As we set about creating the enterprise of the future, of alternative products, as well we are driving a step-change in our as by reducing our environmental sustainability ambition. We have developed a set of goals and targets and social impacts. that will act as a catalyst for action and build A Better TomorrowTM for all our stakeholders. These include: – increasing our number of
non-combustible
product consumers to 50 million by 2030; – achieving carbon neutrality for our business operations by 2030 (Scope 1 and 2) and net zero across our value chain (Scope 1, 2 and 3) by 2050; and – net positive impact on forests in our tobacco supply chain by 2025.

Table of Contents
BAT Annual Report and Form 20-F 2021
Strategic Management
ESG Front and Centre


Our Sustainability Agenda is integral to our Group strategy and purpose to build A Better Tomorrow
TM
. It reflects our commitment to reducing the health impact of our business as our principal focus area. This is underpinned by excellence across environmental, social and governance (ESG) priorities.
 
Our strategic approach is driven by extensive stakeholder insights. Each year, we commission an independent assessment to identify our most material ESG topics.
Through this robust process, we engage with a wide range of stakeholders to understand what matters most to them, complemented with ongoing risk monitoring, research and benchmarking.
 
 
Our Sustainability Agenda
This ensures we keep pace with emerging topics and stakeholder expectations.
Outlined below are the priority areas that form the core of our Sustainability Agenda. These are backed by clear and measurable goals and targets for each area, as detailed in our
ESG
 Roadmap
on the next page.
 
  
Details of how we identify our focus areas can be found in the Materiality section of our 2021 ESG Report at
www.bat.com/esgreport.
 
All energy and emissions data in the table on page 47 are calculated in accordance with the Greenhouse Gas (GHG) Protocol Corporate Standard. For further details of our energy and emissions methodologies. please see www.bat.com/reporting
 
1.
UK-based
activities include 2,276 tonnes of Scope 1 CO
2
e emissions (2020: 2,200) and 173 tonnes of our Scope 2 CO
2
e emissions (2020: 398). See pages
52-53
and 61 for details of the principal measures taken for the purposes of increasing energy efficiency across the Group.
 
2.
Due to the complexity of consolidating and verifying Scope 3 data in accordance with the GHG Protocol, we report one year behind. As such, 2021 Scope 3 data will be reported in the 2022 Report.
 
3.
Energy consumption from activities for which the Company is responsible (in million kWh): 2021: 1,508, 2020: 1,572, 2019: 1,820. Of the total figure reported for the Group for 2021, 10 million kWh is from the
UK-based
activities (2020: 10 million kWh). Energy consumption resulting from the purchase of electricity by the Company for its own use (in million kWh): 2021: 972, 2020: 996, 2019: 1,054. Of the total figure reported for the Group for 2021, 16 million kWh is from the
UK-based
activities (2020: 17 million kWh).
 
46
 

Table of Contents
    

Table of Contents
BAT Annual Report and Form 20-F 2021
Strategic Management
ESG Framework


We have a clearly defined governance framework to ensure Board level oversight and management of our Sustainability Agenda and ESG priority areas across the Group. This provides a flexible channel for the structured flow of information, management and oversight of ESG from local business units up to Board level.
 
Our Board has strategic oversight of our Sustainability Agenda and ESG priorities. The Board is supported by the Audit Committee, which monitors performance, risks and adherence to our standards. The Audit Committee is underpinned by our Regional Audit and CSR Committees.
Our Management Board, chaired by the Chief Executive, has overall responsibility for overseeing the implementation of Group strategy and policies, including those relating to ESG. Members of the Management Board are responsible for overseeing delivery against ESG targets for areas under their individual remit.
Management of ESG priorities are embedded across relevant business areas at Group, regional and local levels.
This approach provides a flexible channel for the structured flow of information, monitoring and oversight of ESG at the level and format best suited to the context.
Our Group policies (indicated by* in the table below) are endorsed at Board level and aligned with international standards.
Our Group policies are adopted by all Group companies and support the effective identification, management and mitigation of risks and issues for our business in these and other areas.
They are underpinned by a range of principles, statements, operational procedures, standards, guidelines and controls to help ensure effective implementation of our policy commitments.
 
 
Full details and downloads of our policies and standards can be found at bat.com/principles.
 
Name (*Board endorsed)
  
Summary of areas covered
  
Stakeholder groups
Standards of Business Conduct (SoBC)*
  
Sets out our policies for: Speak Up, respect in the workplace, human rights, health, safety and welfare, environment, lobbying and engagement, conflicts of interest, anti-bribery and corruption (ABAC), gifts and entertainment, political contributions, community investment, corporate assets and financial integrity, competition and anti-trust, anti-money laundering and tax evasion, sanctions, anti-illicit trade, data privacy and information security.
 
  
Supplier Code of Conduct*
  
Covers: human rights, health and safety, environmental sustainability, responsible marketing, anti-illicit trade, ABAC, gifts and entertainment, conflicts of interest, tax evasion, sanctions, data privacy and cyber risk.
 
  
Environmental Policy*
  
Our commitments to following high standards of environmental protection, adhering to the principles of sustainable development and protecting biodiversity covering our direct operations and supply chain, including agricultural, manufacturing and distribution operations.
  
International Marketing Principles (IMP)*
  
The standards that govern marketing across all our product categories and including the requirement for all our marketing to be targeted at adult consumers only.
  
Youth Access Prevention (YAP) Guidelines
  
Support our strict IMP requirement to only direct marketing at adult consumers by setting out clear requirements for YAP activities in all markets where our products are sold.
 
  
Biodiversity Statement
  
Sets out the principles we follow to manage our biodiversity footprint across our operations.
  

Circular Economy Position Statement
  
Our commitment to applying circular economy principles across our operations and product categories.
  
Operational standard on child labour prevention
  
Detailed guidance and procedures for our leaf operations in tackling the risk of child labour in our tobacco supply chain.
  
Community Investment Framework
  
Sets out the Group strategy for community investment and charitable donations, aligned to the United Nations Sustainable Development Goals.
  
Group Quality Policy Statement
  
Formalises how we strive to deliver defect-free products, processes and capabilities that create sustainable value for our brands.
  
 
48
 

Table of Contents
BAT Annual Report and Form 20-F 2021    
 
Strategic Report        
 
        Governance Report        
  
Financial Statements        
  
Other Information        


Awards and Recognition
 
2021 was a pivotal year for sustainability at BAT. It marks the 20th year of our inclusion in the Dow Jones Sustainability Indices, as well as the 20th anniversary of publishing our first Social Report. We are proud of how much we have achieved over the last 20 years. Today, we are building on these strong foundations to accelerate progress towards A Better Tomorrow
TM
.
  
A rating and award is not a recommendation to buy, sell or hold securities. A rating and award may be subject to withdrawal or revision at any time. Each rating and award should be evaluated separately of any other rating. The methodologies of any rating or award presented here may not be the same as those of other ratings, awards or methodologies that may be used by our stakeholders, and may emphasize different aspects of ESG practices and performance, and, thus, may not be representative of our ESG performance in all respects.
Sustainability Ratings
 
Awards and Recognition
 
 
15.
Our listing in the Dow Jones Sustainability Indices (DJSI) is based on November 2021 score in the S&P Global Corporate Sustainability Assessment.
 
16.
An MSCI ESG Rating is designed to measure a company’s resilience to long-term, industry material environmental, social and governance (ESG) risks.
 
17.
A Sustainalytics score of zero out of 100 represents the lowest ESG risk. BAT’s ESG Risk Rating places the company in the 16th percentile of the industry group which we are assessed in.
 
49


Table of Contents
BAT Annual Report and Form 20-F 2021
Strategic Management
Reducing the Health
Impact of Our Business


We have a clear purpose to build A Better Tomorrow
by reducing the health impact of our business. That’s why we are changing: creating new products, backed by science and industry-leading standards, that provide adult smokers with less risky alternatives*
.
 
  
Why harm reduction matters
 
We know combustible products pose serious health risks. The only way to avoid those risks is to not start – or to quit – smoking. Yet more than 1.1 billion people today continue to consume tobacco and nicotine products globally. ‘Tobacco harm reduction’ is a well-recognised public health strategy that aims to minimise the harm caused by combustible cigarettes by encouraging adult smokers, who would otherwise continue to smoke, to switch completely to scientifically substantiated, reduced-risk alternatives*
.
 
Some 100 million adult smokers worldwide have already switched to reduced risk tobacco and nicotine products. We encourage those who would otherwise continue to smoke, to switch. This means enabling consumer choice through making available a range of alternatives to smoking that deliver comparable satisfaction in nicotine delivery, use and sensorial aspects.
 
For example, some studies suggest that vapour products are more successful than nicotine replacement therapy in providing a satisfactory alternative to cigarettes,
1,2
despite not being smoking cessation products nor marketed as such.
 
These products need to be supported by world-class science and industry-leading standards.
 
Responsible, science-backed and well-thought-through regulation is also crucial for enabling adult consumers to access and enjoy reduced-risk products*† with confidence, while governments and health bodies can be assured that these products are manufactured to high safety and quality standards.
 
*  Based on the weight of evidence and assuming a complete switch from cigarette smoking. These products are not risk free and are addictive.
†   Our products as sold in the U.S., including Vuse, Velo, Grizzly, Kodiak and Camel Snus, are subject to FDA regulation and no reduced-risk claims will be made as to these products without agency clearance.
  
1.  Cox et al, (2019). Effects of
e-cigarettes
versus nicotine replacement therapy on short-term smoking abstinence when delivered at a community pharmacy. Addict Behav Rep 2019.
https://doi.org/10.1016/j.abrep.2019.100202
.
2.  Hajek et al. (2019). A Randomized Trial of
E-Cigarettes
versus Nicotine-Replacement Therapy. N Engl J Med 2019.
https://doi.org/10.1056/NEJMoa1808779
.
 
 
50
 

Table of Contents
BAT Annual Report and Form 20-F 2021    
 
Strategic Report        
 
        Governance Report        
  
Financial Statements        
  
Other Information        


Consumer choice
We are creating new products, backed by science and industry-leading standards, that provide adult smokers with less risky alternatives*
.
Fuelled by our deep consumer insights, innovation is a driving force within our business, enabling us to anticipate trends to meet evolving consumer needs.
We do this through our growing global network of digital hubs, innovation super centres and world-class R&D laboratories. Collaborations with external partners and our corporate venturing initiative are also helping us to stay ahead of the curve.
For example, in 2020, we established our Open Innovation team, as part of our New Categories R&D function. Working in partnership with Btomorrow Ventures, the Group’s corporate venture capital unit, the team is focused on identifying partners (including
start-ups)
that have innovative technologies and materials that hold promise for our product pipeline.


Find out more about our New Category products on pages 35 to 40
World-class science
For more than 60 years, research and development has been a critical part of our business. We invest almost £350 million a year in R&D to deliver innovations that satisfy or anticipate consumer preferences.
The main focus of our R&D investment is on developing and scientifically substantiating New Category products to assess their reduced-risk profile*
.
We use a wide range of analytical techniques, specialised laboratory technology and expertise to test our products and ensure they meet high quality standards. This is supplemented by collaborations with global external researchers who bring independent and specialist expertise that augment and enhance our internal capabilities.
We follow strict best practice standards for all our scientific research. And, regardless of the results, we submit to high-quality, peer-reviewed journals owned by leading publishers, with well-respected standards for how they run the peer-review process. We work to make our science accessible and understandable to a wider audience. We refreshed our dedicated
bat-science.
com website in 2021, and published a new Science and Innovation Report. We also introduced new quarterly science updates to provide the latest information in this rapidly evolving area in a concise way.


Find details of our world-class science on pages 35, 37 and 39
Standards and regulation
Regulation of New Category products continues to evolve. Globally, there are regulators passing progressive laws that allow and encourage adult smokers to switch to New Category products, and some regulators who view them more cautiously. As the science and evidence to substantiate these products grows, we expect to see more countries passing progressive regulations, further accelerating New Category growth.
We believe a stakeholder-inclusive,
whole-of-society
dialogue that includes regulators, policymakers, consumers and the industry is key to developing effective policies that can accelerate tobacco harm reduction as fast as possible. Any regulation around New Category products should be founded in science, not opinion.
We hold ourselves to high standards and hope these will become an industry benchmark and are used as the basis for future regulation. That’s why we share our approach, information and expertise with industry groups, governmental technical advisory committees, standards bodies and other key stakeholders.

 
51


Table of Contents
BAT Annual Report and Form 20-F 2021
Strategic Management
Excellence in
Environmental Management
    
 
We have a global footprint and rely on natural resources to run our business. Securing resources in a climate-resilient supply chain is key to delivering our business strategy. We are driving environmental excellence for a greener tomorrow.


on-site
generation solar coming online in Pakistan, Indonesia, Germany, and South Korea. In places like South Africa, solar plays an important role in the overall site’s electricity decarbonisation. In 2021 the site generated green electricity equivalent to avoiding 1,840 tCO
2
. Factories in Brazil and Chile, and Switzerland’s manufacturing and commercial sites also passed independent carbon neutral certification in 2021 against PAS 2060 – an internationally recognised certification on carbon neutrality.
 
In our tobacco supply chain, we support over 75,000 contracted farmers globally, helping them to reduce emissions through innovative technologies and ‘carbon-smart’ farming practices throughout the growing cycle. We also continue to actively work with our largest 30 direct product materials suppliers that represent 15% of CO
2
e emissions for this part of our supply chain. In 2021, they participated in a detailed,
one-to-one
assessment of their current ESG practices and performance, with a strong focus on carbon emissions, as well as waste, water and biodiversity.
 
Our products are intrinsically linked to our sustainability ambitions. By building sustainable brands with purpose, we are bringing our consumers on our journey with us. So, in 2021, we were proud to announce that Vuse was certified as the first global carbon neutral vape brand.
1
 
Eliminating Waste
 
Our Circular Economy Position Statement sets out our key principles across our operations and product categories. In 2021, we developed new Circular Economy Guidelines and training to provide our people with a common understanding and details of how to apply these principles across different business areas, products and geographies.
 
We have conducted studies to map our waste footprint intensity across our value chain and have established cross-functional sustainability workstreams for all our product categories.
 
We are focused on eliminating unnecessary
single-use
plastic across all packaging and, by the end of 2021, had achieved a 13% reduction in total weight.
 
1.  Based on ePod, ePen, eTank mini, Alto devices and consumables internal sales forecast (calculated March 2021) for 12 months starting from April 2021.
 
Our Environmental Policy is adopted by all our Group companies. It outlines our commitment to high standards of environmental protection, adhering to the principles of sustainable development and protecting biodiversity.
 
Tackling Climate Change
 
Our ambition to be a carbon neutral (Scope 1 and 2) business by 2030 is supported by a range of operational targets. Already, we’re making significant progress with a reduction of 42.7% in Scope 1 and 2 CO
2
e emissions against our 2017 baseline.
 
We also recognise the importance of looking beyond the operations we directly control – so we have set a target for net zero carbon emissions across our value chain by 2050.
  
 
To deliver these stretching targets, we have an integrated climate strategy covering both our own business operations and our wider value chain. This includes utilising multiple opportunities, from
on-site
renewable energy generation and purchasing renewable electricity, to transitioning our distribution fleet to electric and hybrid vehicles.
 
In addition, in 2021, we incorporated internal carbon pricing into business plans to ensure the impact on environmental performance and targets is formally considered and quantified. This has supported the prioritisation of sustainability projects such as
on-site
renewable energy generation.
 
By the end of 2021, 32 of our operations sites were purchasing 100% renewable electricity and 19 were generating renewable energy
on-site,
such as with solar panels. As of last year, we had
 
 
52


Table of Contents
BAT Annual Report and Form 20-F 2021    
 
Strategic Report        
 
        Governance Report        
  
Financial Statements        
  
Other Information        


Examples of initiatives undertaken include: removing silicone caps from
e-liquid
pods, replacing plastic trays with a pulp-based alternative and removing plastic film overwrap.
We’re also aiming for 100% of plastic packaging to be capable of being reusable, recyclable or compostable by 2025 – by the end of 2021, this was achieved for 75% of our packaging.
To help drive responsible disposal, we have take-back schemes for consumers to return our vapour and THP devices in all markets where they are available.
In 2021, we also supported 12 consumer education and awareness-raising initiatives to prevent cigarette butt littering in five countries. And we are actively looking for new, innovative ways to tackle the issue. For example, we are partnering with an innovate
start-up
to test a new solution to processing factory waste and cigarette butts from the streets to extract the cellulose acetate.
In our operations, we’re driving a zero waste to landfill mindset with an ambitious target for 100% of sites to achieve this by 2025. Despite challenges in some locations that have limited recycling and waste management facilities, 35% of our sites had reached zero waste to landfill by the end of 2021, and a further 7% are close to achieving this and are recycling at least 95% of total waste generated.
Our Integrated Work Systems (IWS) are crucial in helping to achieve this through optimising our overall performance, minimising machine unplanned downtime, reducing waste, optimising energy and water usage and saving personnel time and effort. Significant benefits have been obtained in the last year ranging from a 5 to 15% reduction in waste to a smaller carbon footprint, 4 ppt efficiency improvement, lower energy consumption and utility costs, and the saving of 1,000s of working hours.
Sustainable Water Stewardship
While our manufacturing facilities are not particularly water intensive compared to other industries, with the changing climate, water scarcity is a growing concern.
Our sites implement a range of initiatives to eliminate water losses and improve water efficiency. As a result, we have been making steady progress decreasing water use, with a 27.6% reduction achieved from our 2017 baseline year. At the same time, we’ve also increased the amount of water we recycle to 16.7% (compared to 15.3% in 2020).
To accelerate progress and deliver further water stewardship opportunities, we are members of the Alliance for Water Stewardship (AWS). AWS is a global collaboration of businesses, NGOs and
the public sector that are contributing to the sustainability of local water-resources through adoption of the global AWS Standard.
We have committed to 100% of our manufacturing sites being certified against the AWS standard by 2025. In 2021, 11 sites achieved AWS certification and a further 23 sites are expected to complete the certification process during 2022.
Water stewardship in tobacco growing
Water management is vital to sustainable farming, especially given that agriculture accounts for an average of 70% of freshwater withdrawals globally. Rainwater is commonly sufficient for watering many tobacco crops – due to the variety of locations in which we source our tobacco, only 31% require irrigation.
Our leaf operations in these areas are actively looking at ways to work with our contracted farmers to reduce water usage, with different techniques applied depending on the local circumstances and growing conditions.
Our global leaf agronomy centre in Brazil is playing a vital role in researching, developing and customising cutting-edge innovations to drive water efficiency in tobacco growing. For example, innovative ‘floating’ systems for growing tobacco seedlings, based on hydroponics, use about 85% less water per hectare. These have been successfully introduced to some 17,000 contracted farmers in six countries, with trials underway in six more countries.
We have also developed innovate drip irrigation technology, that increases water-usage efficiency by up to 90% – so far, this is being used by our contracted farmers in six countries.
Biodiversity and Afforestation
Our Biodiversity Statement sets out the principles we follow to manage our biodiversity footprint across our operations.
In 2021, we announced a new commitment for net zero deforestation of managed forests across our tobacco and paper- and pulp-based product supply chains by 2025. This means that for every tree that is chopped down, we will aim for another to be planted by ourselves or others in our supply chain. In our tobacco supply chain, we take this further by aiming to have a net positive impact on forests by 2025. This means that not only will a tree be planted for each one used, but we will strive to have a net positive impact – planting more trees than are removed.
To achieve these ambitious targets, our leaf operations and third-party suppliers continue to work with tobacco farmers in our supply chain to provide training
 
in forest and biodiversity management, distribute tree saplings for a sustainable source of fuel for curing and help farmers to switch to locally available alternative fuels.
In 2021, monitoring of our contracted farmers wood fuel use for tobacco curing showed that 99.9% is from sustainable sources.
In addition, we support afforestation, biodiversity and environmental conservation programmes around the world as part of our wider community-based initiatives. In 2021, this included 18 projects in 13 countries, including long-standing afforestation programmes in Bangladesh, Brazil, Kenya, Pakistan and Vietnam that have collectively distributed an estimated 380 million trees over the last 40 years.
In our paper- and pulp-based product supply chain, we are committed to working with suppliers that can demonstrate that the material is sourced sustainably, with certification from the Forest Stewardship Council (FSC) or the Programme for the Endorsement of Forest Certification (PEFC). So far, this is the case for 89% of the paper and pulp volumes we purchase – we aim to reach 100% by 2025 as part of our net zero deforestation target.
In addition, we signed up in 2021 as a signatory to Business for Nature’s Call to Action, a global coalition uniting influential organisations and forward-thinking businesses to amplify calls for collective action to reverse nature loss in this decade.


53


Table of Contents
BAT Annual Report and Form 20-F 2021
Strategic Management
Delivering a Positive
Social Impact


We have an important role to play in delivering a positive social impact for our employees and people across our supply chain. By enhancing farmer livelihoods, respecting human rights and ensuring a safe, diverse and inclusive working environment, we can help ensure the long-term sustainability of our business and build a fairer tomorrow for society.


Community investment
 
In many parts of the world, we partner with NGOs and other stakeholders on projects to support the local communities where we operate. These programmes focus on a range of issues, such as women’s empowerment, financial inclusion, access to healthcare, clean water and sanitation and supporting national responses to the
COVID-19
pandemic.
 
Our community investment policy in our SoBC is supported by our Community Investment Framework, which sets out how Group companies should develop, deliver and monitor community investment programmes. In 2021, the Framework was revised to align our community investment strategy with the UN Sustainable Development Goals. Across the Group, £19 million was reported for community investment programmes in 2021, including £12.6 million in cash spend and a further £6.4 million estimated for
in-kind
donations. This includes £0.96 million given for charitable purposes by UK Group companies.
 
Human Rights
 
Our integrated human rights strategy is aligned to the UNGPs and includes policies, due diligence, grievance channels and remediation procedures for our own business operations and supply chain.
 
Our Human Rights policy forms part of our Standards of Business Conduct and is reflected in our Supplier Code of Conduct. This is complemented by our operational standard on child labour prevention, which provides detailed guidance and procedures for our leaf operations in tackling the risk of child labour in our tobacco supply chain.
 
Tobacco supply chain
 
The most significant challenges for human rights are in our tobacco supply chain and this has been a priority area for us for many years.
 
Human rights issues in agriculture can be complex, and we know that the situation on the ground can be nuanced and that remediation requires cooperation and dialogue, rather than confrontation. This is why our approach emphasises working with families and communities to find sustainable solutions while respecting local context and the challenges of operating small,
family-run
farms.
Farmer Livelihoods
 
If farmers have sustainable living incomes, farming is more attractive to the next generation. It also reduces the risks of exploitation, as well as child and forced labour, and helps encourage improved adherence to safety and environmental standards. That’s why enhancing farmer livelihoods is such an important priority area of our Sustainability Agenda and is central to our tobacco supply chain strategy.
 
Our Extension Services of expert field technicians support our 75,000+ contracted farmers throughout the growing cycle, helping to develop their skills, promote better yields and build their resilience.
  
This includes providing new tobacco varieties that produce higher quality leaf and increase yields by up to 20%, as well as mechanised solutions and technology to help farmers scale up production and reduce manual labour.
 
We have been measuring farmers’ yields, profit margins and revenues from tobacco as part of our
Thrive
assessments since 2015. In 2021, we took a step-change in building upon, and strengthening, this approach, undertaking further assessments of the living income generation in our farmer base.
 
 
54


Table of Contents
BAT Annual Report and Form 20-F 2021    
 
Strategic Report        
 
        Governance Report        
  
Financial Statements        
  
Other Information        


This is where our direct contracts with farmers enables us to have a real impact. Our field technicians visit our contracted farmers approximately once a month during the growing season. As well as providing agronomy and livelihoods support, this is an important way of monitoring the farms.
In 2021, a total of 1,790 incidents of child labour were identified on 0.7% of our contracted farms and those supplying our strategic third-party suppliers. The majority related to
under-18s
working on tasks such as preparing bales, watering and weeding, and harvesting and stitching tobacco. Of these, 100% were reported as resolved, where a remediation plan that considers the individual circumstances is implemented with the farmer.
Wherever possible, this plan involves local community or school support. In a small number of cases, where there is persistent
non-compliance,
the farmer’s contract is not renewed for the next growing season.
We maintain a relentless focus on addressing the root causes. Our leaf operations and strategic third-party suppliers deliver human rights training and communication programmes for farmers and community members. More than 350,000 people were reported to be engaged via this training in 2021.
We support a range of local community-based programmes in collaboration with local stakeholders. These include child labour prevention programmes in Brazil, Kenya and Mexico. We also continue as active members of the Eliminating Child Labour in Tobacco Growing (ECLT) Foundation which, since 2011, has supported over one million children, farmers and families.
In addition, human rights impact assessments, aligned to the UNGPs, have been conducted in six of our tobacco sourcing countries, covering nine suppliers – India and Indonesia in 2019, Mozambique in 2020, and Macedonia, Turkey and Zimbabwe in 2021. Collectively, these assessments have engaged over 2,200 rights-holders and are a best practice approach to identifying, assessing and responding to actual and potential human rights impacts, including the root causes and how they manifest.
Product materials supply chain
Beyond tobacco, we source product materials like paper and filters for cigarettes and, for our New Category products, we have a growing supply chain in consumer electronics and
e-liquids.
Labour factors are considered right at the outset, before we even start working with a new supplier. This includes mandatory scoring criteria as part of the supplier selection process.
Once selected, suppliers must then undergo an independent labour audit performed by our partner Intertek. The audit assesses workplace conditions, and we expect suppliers to achieve a minimum score of 70% to qualify. We maintain a rigorous focus on human rights in the supply chain and conduct an annual risk assessment on 100% of our existing materials suppliers. Using independent human rights indices developed by Verisk Maplecroft, we assess suppliers’ inherent risk exposure based on their country location and the goods or services they provide. Suppliers identified as high risk are then prioritised for audits.
In 2021, 142 audits were conducted by Intertek on our suppliers in 38 countries. Over the last three years, 22% of our product materials suppliers have undergone at least one independent labour audit, and we’re committed to achieving 100% by 2025.
Human rights risk assessments
The policies, procedures and controls adopted by Group companies help to substantially mitigate human rights risks in our businesses. We recognise that circumstances in some countries present a higher risk for human rights issues, such as where regulation or enforcement is weak, or there are high levels of corruption, criminality or unrest.
We have a defined process in place to identify and carefully monitor BAT operations in high-risk countries. This process includes an annual risk assessment of all countries with Group company employees present, using Verisk Maplecroft’s human rights indices (including its Modern Slavery Index). Our operating companies in each high-risk country identified must complete a human rights assessment, confirming compliance with Group policies, standards and controls and providing details of measures in place to enhance human rights management.
The process is reviewed by the Audit Committee at each stage, including action plans for any areas for improvement identified. In 2021, our operations in 26 countries were identified as high risk from a human rights perspective and completed the risk assessment.
Health and Safety
We are always working to protect the health, safety and wellbeing of people – through the
COVID-19
pandemic and beyond – as well as striving for zero accidents Group-wide. We have a mature and well-established approach, based on risk management and assessment, employee training and awareness, and tailored initiatives for specific issues and higher-risk areas.
For example, in Trade Marketing & Distribution, the highest risks relate to road traffic accidents, particularly in countries with poor road infrastructure and driving behaviour, or attacks and assaults from armed robberies where our goods have a high street value. So, we have comprehensive driver safety and security programmes in place, including regular training and awareness campaigns, telematic systems in all our vehicles and clear security protocols.
Overall, total accidents across the Group reduced by 19% – from 155 accidents in 2020, down to 126 in 2021. Sadly, however, there were 3 fatalities in 2021 to one employee and two contractors in Brazil, Mexico and Bangladesh (compared to three contractors in 2020). In addition, 4 members of the public lost their lives in road traffic accidents involving BAT vehicles in Bangladesh, Honduras, Poland and Zambia. Our drivers were found not to be at fault in three cases, while an employee in Zambia was charged with dangerous driving and is facing disciplinary action.


Find out about our Group risk factors related to workplace health and safety on page 96.
People and Culture
Attracting and retaining an increasingly diverse workforce and providing a welcoming, inclusive working environment are key drivers in BAT’s transformation journey to build A Better Tomorrow
.
We are creating value for our employees by having a diverse range of excellent people, engaged teams and being a great place to work.
We have extensive health and wellbeing support available to our employees, including medical and counselling services, and health insurance. We also offer regular webinars and information on a range of topics, including mindfulness, stress management and financial wellbeing. During the
COVID-19
pandemic, this support has played an even more important role in keeping our people connected and supporting one another during such difficult times.


Find out details of our approach to people and culture on pages
68-73.
 
55


Table of Contents
BAT Annual Report and Form 20-F 2021    
Strategic Management
Robust Governance
 
Robust governance is key to our sustainable long-term growth. We are committed to achieving our business objectives in an honest, transparent and accountable way, and sustaining a culture of integrity in everything we do. Our policies and standards set out how we do this consistently, everywhere we operate.


Business Ethics
Our Standards of Business Conduct (SoBC) express the high standards we are committed to upholding. Our SoBC comprise our policies referenced on page 48, including anti-bribery and corruption (ABAC), political contributions, anti-money laundering and tax evasion, and is available in 14 languages. SoBC awareness and understanding are promoted through regular training and communications. Our SoBC are complemented by our Supplier Code of Conduct, which outlines the minimum standards expected of our suppliers.
We conduct a detailed review of our SoBC and Supplier Code of Conduct every two years to ensure they remain at the forefront of best practice, with the most recent review taking place in 2021.
 
This included external benchmarking against peer companies, external legal reviews in the UK and U.S., and drew on extensive insights from investor ratings and indices. The updated versions of our SoBC and Supplier Code of Conduct were approved by the Board in 2021 and took effect from January 2022. This was supported by their adoption by our Group companies and
roll-out
to Group company employees worldwide.
Our Group entities complete an annual assessment of audit controls to assess and confirm they have complied with SoBC controls and compliance procedures. SoBC compliance is monitored through the year by our Corporate Audit Committee and Regional Audit and CSR Committees, and quarterly by the Audit Committee.


Delivery with Integrity
Our
Delivery with Integrity
global compliance programme promotes an ethical culture and communicates expected behaviours as set out in our SoBC.
Over the past five years, we have strengthened our procedures and guidelines across areas including ABAC, anti-money laundering and tax evasion, competition law, sanctions and data privacy. With these strong foundations in place, we are now focusing on automation and data analytics to identify and mitigate such risks as they arise, improving the lifecycle risk management of the third parties BAT engages with.


Read more about our Group risk factors related to corporate behaviour and compliance with sanctions regimes and competition laws on pages 317 to 339.
While policies and procedures are key to a consistent approach to compliance, we know that engagement and awareness are crucial to sustaining a culture of integrity across the Group. That’s why we have focused on ensuring everyone at BAT understands their role from day one in the organisation and that this is sustained throughout the year.
Our SoBC app provides easy access to SoBC policies, procedures and guidance, as well as our global ‘Speak Up’ channels, which are multilingual. From 2022, the app now incorporates our Supplier Code of Conduct in 15 languages to help increase accessibility for suppliers. To date, the app has been downloaded more than 27,500 times. In 2021, we launched our new SoBC
e-induction
training and automated conflicts of interest disclosure requirement for all new management-level employees. We also launched new training targeted at relevant employees on areas such as sanctions, competing fairly and ethically and data privacy.
In 2021, we held two global integrity events at the start and middle of the year. The first week-long campaign focused on the role of line managers in leading by example as SoBC role models. It also included our new campaign –
‘Speak-Listen-Act’
– focused on raising awareness of our Speak Up channels and for them to be seen as a trusted tool by our people. Later in the year, our global
24-hour
‘integrity pledge’ event focused on reaffirming our commitment to ethical behaviour, with employees making personal pledges across the Group.
 
56


Table of Contents
BAT Annual Report and Form 20-F 2021    
 
Strategic Report        
 
        Governance Report        
  
Financial Statements        
  
Other Information        


We ended the year with our global SoBC compliance campaign. Our Group company employees completed a formal SoBC
sign-off
during which they completed training and assessment, affirmed their commitment to the SoBC and declared any new or existing personal conflicts of interest. In 2021, this was successfully completed by 100% of our Group company employees.
Over 24,000 did this through our online SoBC portal and remaining Group company employees were given various options to complete the process, including via our SoBC app. The app has proved important in helping everyone to participate in training and
sign-off
safely, given
COVID-19
continued to hinder usual
face-to-face
gatherings in many of our markets.
Speak Up and SoBC compliance
Our SoBC and Supplier Code of Conduct make it clear that our employees, partners and suppliers should speak up if they have a concern about actual or suspected wrongdoing, including in relation to accounting or auditing matters. We will always listen to these concerns and do not tolerate victimisation or reprisals of any kind against anyone raising a concern; such conduct is itself a breach of the SoBC and is a serious disciplinary matter. Our speak up channels include an independently managed Speak Up online portal and telephone hotlines, available 24 hours a day. Speak Up channels can be used in confidence, and anonymously where preferred, and are available in multiple local languages.
Not all contacts made via our SoBC Portal involve alleged SoBC breaches; some relate to questions regarding the SoBC or other matters. In 2021, there were 581 SoBC contacts (2020: 554), of which 304 SoBC contacts were assessed as alleged SoBC breaches and reported to the Audit Committee (2020: 321), including 145 contacts where the person raising the case chose to remain anonymous.
Our SoBC Assurance Procedure defines how all reports of alleged SoBC breaches should be investigated and remediated fairly and objectively. And our Business Integrity Panel promotes a consistent approach to investigation and remediation of all alleged breaches of the SoBC. For the detailed investigations conducted into all of the reported cases in 2021:
 
 
No wrongdoing was found in 154 cases (2020: 158);
 
 
The investigation continued at
year-end
for 51 cases (2020: 47); and
 
 
99 cases were established as breaches and appropriate action taken (2020: 116).
We take strong action for all cases established as breaches, which will vary from case to case depending on the circumstances. In 2021, established SoBC breaches resulted in 46 people leaving the Group and 72 written warnings. In addition, where any weakness in internal controls is identified, appropriate measures are taken to strengthen them. Our SoBC, and information on the total number of breaches reported under it, are available at bat.com/sobc.


Please refer to the Governance Report for more information about Board and Audit Committee oversight and monitoring of SoBC compliance.
Responsible Marketing
Our International Marketing Principles (IMP) govern our approach to marketing our products across the Group. Our IMP are applied consistently everywhere we operate, even when they are stricter than applicable local laws. All marketing materials are subject to review by our Legal & External Affairs (LEX) function. Our Supplier Code of Conduct also includes a requirement for our suppliers, agents and third parties to comply with the IMP. To support our strict requirement to only direct marketing at adult consumers, our markets are expected to adhere to our global Youth Access Prevention (YAP) Guidelines. These apply to all markets where our products are sold, including where distributed through third parties. IMP and YAP compliance is monitored by our Regional Audit and CSR Committees and by the Audit Committee annually. All of our markets reported alignment with our YAP Guidelines in 2021. We report further on compliance in our 2021 ESG Report at
www.bat.com/esgreport
.
As we accelerate our transformation, driving growth in New Categories, building strong brands of the future and digitising our business, our new
e-commerce
and social media channels are playing an ever more prominent role in our marketing strategy.
Digitisation around the world has been rapidly accelerated by the
COVID-19
pandemic and, in this changing environment, we continue to embed new digital channels and ensure our people and partners have the right tools and capabilities to support IMP and YAP compliance. Our digital marketing toolkit includes
in-depth
guidance on topics such as content standards, social media and search engines, and ensuring robust online age verification procedures. And our digital marketing hub supports our markets by providing guidance on how to achieve long-term consumer satisfaction and product awareness in a responsible way.
In 2021, we reinforced this work with new toolkits and guidance, such as for applying our YAP Guidelines and age verification standards on our own and third-party
e-commerce
sites. We also launched a new training programme, called iCommit, covering measures for digital channels with a mix of theory and practical training, based on real-life scenarios.
Regulation and Engagement
Our SoBC includes our Lobbying and Engagement Policy and Political Contributions Policy, adopted by all Group companies and applicable to all Group company employees. These policies require all our engagement activities with external stakeholders to be conducted with transparency, openness and integrity.
We are committed to conducting all our engagement activities with external stakeholders with transparency, openness and integrity. For global regulatory priorities, the views we advocate are the same as those we publish on our website, and we have long supported the OECD’s Principles for Transparency and Integrity in Lobbying. We also respect the call for transparent and accountable interaction between governments and the tobacco industry established in Article 5.3 of the World Health Organization’s Framework Convention on Tobacco Control (FCTC). We are open about what we think and always try to offer constructive solutions that will best meet the objectives of regulation, while minimising any negative unintended consequences.
Regulatory engagement by our businesses is monitored throughout the year by our Regional Audit and CSR Committees. The Management Board’s Regulation Committee, chaired by the Legal and External Affairs Director, meets three times a year and is responsible for reviewing key regulatory and excise trends, Group priority focus areas, and the execution of global plans regarding regulation and monitoring progress. Our Board is kept updated on regulatory engagement activities during the year. Details of any political contributions are reported twice each year to the Audit Committee. The Group does not make contributions to UK or EU political organisations or incur UK or EU political expenditure. Details of political contributions outside these jurisdictions are set out on page 127.
Find details of our other governance priorities, including data privacy and cyber security, in our 2021 ESG Report at
www.bat.com/esgreport
.
 
***
Waivers from YAP Guidelines are granted where there is a government ban on
point-of-sale
materials or YAP retailer engagement cannot be ensured due to practical or cultural limitations.
 
57


Table of Contents
BAT Annual Report and Form 20-F 2021
Strategic Management
TCFD Reporting
    
 
We recognise the importance of providing consistent and reliable climate-related information to investors and other stakeholders. We have aligned our reporting with the recommendations and recommended disclosures of the Task Force on Climate-related Financial Disclosures (TCFD). A summary of our response to each of the TCFD recommendations and recommended disclosures, together with references to further information in this report, is set out below. Our reporting against other frameworks, including the Sustainable Accounting Standards Board (SASB) framework, can be found at
www.bat.com/esgreport
.
 
Since 2019, we have worked with an external consultancy with expertise in TCFD reporting and climate scenario modelling to deliver an iterative process to identify, measure, manage, assure and report on climate-related risks and opportunities.
We have taken a phased approach, integrating TCFD into our Group risk management process. This included generation of a climate related gap analysis to highlight and understand key areas for improvement. We selected appropriate climate scenarios and performed initial high-level, scenario-based modelling of material risks and business impacts, to prioritise the climate-related risks and opportunities for BAT.
In 2021, we undertook detailed financial modelling to further understand the timing and materiality of these key risks and opportunities. This process included:
 
 
Selection of risks and opportunities for deep dive modelling based on relative strategic importance, and availability of value adding methodologies and data. This process was supported by two external consultancies. We will broaden and deepen this analysis in future years as data and methodologies improve.
 
 
Engagement with colleagues across the Group, which was crucial to gather data and test assumptions. Multiple workshops and interviews were held with teams across the organisation, including our Management Board, and our Risk Management, Finance, Treasury, New Categories, Legal, Government Affairs, Investor Relations, Supply Chain and Leaf teams.
An overview of our approach to identifying, assessing and managing climate risk is provided on page 59.
Governance
Board oversight
The Board is collectively responsible for the sustainable, long-term success of the Company and the Group’s strategic direction, purpose, values and governance. This includes responsibility for the Group’s strategy and ensuring that resources are in place to meet the objectives and to manage risks, including internal controls.
The Board has approved all Group environmental targets, including our carbon emissions targets, and receives an update on progress and performance twice a year from the Director, Operations. In 2021, the Board also received a deep-dive ESG briefing covering our climate strategy, progress against our climate-related goals and targets, and approach to reporting in alignment with the TCFD framework.
The Audit Committee is responsible for reviewing the effectiveness of the Group’s risk management and internal controls systems, including those relating to climate change. The Audit Committee also receives reports from the Group’s Regional Audit and CSR committees and Corporate Audit Committee, which monitor the effectiveness of business risk management and internal controls across the regions and the central functions.
Our Management Board, chaired by our Chief Executive, is responsible for overseeing the implementation of the Group’s strategy and policies set by the Board, and for creating the framework for the
day-to-day
operation of the Group’s subsidiaries.


Details of key climate-related matters considered by the Board in 2021 can be found on page 105 and 120
Management’s role
The assessment and management of climate-related risks is embedded across relevant business areas at Group, regional and local levels, with appropriate management oversight at each level, as shown on the chart on page 59.
This approach provides a flexible channel for the structured flow of information, monitoring and oversight of climate-related risks and environmental matters at the level and format best suited to the context.
All relevant employees, from the Management Board to managers at Group, regional and local level, have individual performance objectives that are linked to remuneration, including delivery against
ESG-
and climate-related priorities and metrics, that form part of their responsibilities.
The Management Board receive regular updates on material risks and strategic plans, including those relating to climate change, along with associated risk mitigation plans. This includes regular monitoring by the Group Risk Management Committee, chaired by the Finance and Transformation Director.
The Chief Marketing Officer has overall responsibility for the delivery of the Group Sustainability Agenda, supported by the Business Communications and Sustainability (BC&S) team, including the Head of ESG and sustainability
subject-matter
experts.
The Shaping Sustainability Programme Board oversees the cross-functional delivery of the ‘Shaping Sustainability’ of our QUEST transformation programme. Members of the programme board include the Chief Marketing Officer, the Director, Operations and the Group Head of BC&S. This is underpinned by a drive team, including the Head of ESG and Head of Operations Development and Sustainability.
The Director, Operations has overall responsibility for delivery of the Group’s climate strategy and environmental targets, supported by the Group Head of Operations Development and Sustainability, and the Operations Sustainability team, including the central Sustainability team and regional sustainability managers.
Reporting units that contribute to 98% of Group Scope 1 & 2 CO
2
e emissions (incorporating all factories and green leaf threshing plants) report quarterly, those contributing to around 2% of Group Scope 1 & 2 CO
2
e emissions report semi-annually and annual reporting is completed by units reporting less than 0.3% of emissions. Monitoring and reporting of consolidated Group performance and metrics is completed quarterly by the Group Operations Sustainability team. Each directly-reporting business unit of the Group (DRBU) has an Environment, Health & Safety (EHS) Steering Committee, with overall responsibility to deliver environmental targets at site level held by the General Manager or site manager. EHS is also a standing agenda item for management meetings and governance committees at area, regional and global levels.
 
58


Table of Contents
BAT Annual Report and Form 20-F 2021    
 
Strategic Report        
 
        Governance Report        
  
Financial Statements        
  
Other Information        


These local management meetings and committees report into the Operations Sustainability Forum, chaired by the Director, Operations. This acts as a conduit for tracking delivery of environmental targets and gaining visibility of new and emerging risks posed by climate change.
The Operations Sustainability Forum oversees business plans to mitigate risks identified, reviews performance and tracks progress of our regions and business units in delivering the Group’s environmental targets. The Environmental Sustainability Committee, also chaired by the Director,
Operations, is responsible for reviewing environmental roadmaps and strategies for the Operations Leadership Team.


Read more about our Quest programme for accelerating our transformation towards the Enterprise of the Future on pages
30-31
 
 
TCFD at a glance
Summary of our response
 
Governance:
Disclose the organisation’s governance around climate-related issues and opportunities.
 
 
a)
Describe the board’s oversight of climate-related risks and opportunities.
Our Board has oversight of our climate-related risks and opportunities. The Board reviews the Group’s environment strategy, targets and performance twice per year and reviews the Group risk register, which includes climate-related risks, annually. In 2021, the Board also received a deep-dive ESG briefing covering our climate strategy, performance and approach to reporting in alignment with the TCFD framework. The Audit Committee reviews the Group risk register twice per year.


Read more on page 58
b)
Describe management’s role in assessing and managing climate-related risks and opportunities.
The assessment and management of climate-related risks is embedded across relevant business areas and markets at Group, regional and local levels.


Read more on page 60
 
 
Strategy:
Disclose the actual and potential impacts of climate-related risks and opportunities on the organisation’s businesses, strategy, and financial planning where such information is material.


a)
Describe the climate-related risks and opportunities the organisation has identified over the short, medium, and long term
We have identified 11 climate-related risks and opportunities. For each, the level of likelihood and impact has been analysed across three time horizons: short-term (2020-2025), medium-term (2026-2035) and long-term (2036-2050).


Read more on pages
61-64
b)
Describe the impact of climate-related risks and opportunities on the organisation’s businesses, strategy, and financial planning.
We have assessed the impact of these risks and opportunities on our strategy and financial planning. The results show that, while there are financial risks that would need to be managed, these are not substantive enough to require a material change to our business model.


Read more on pages
64-67
c)
Describe the resilience of the organisation’s strategy, taking into consideration different climate-related scenarios, including a 2°C or lower scenario.
We have conducted an assessment of the resilience of our strategy, taking into consideration two climate-related scenarios: sustainable transition (based on a global temperature increase scenario of 1.5°C) and climate change inaction (based on a global temperature increase scenario of 3°C or more).


Read more on pages
62-64
 
 
Risk management:
Disclose how the organisation identifies, assesses, and manages climate-related risks.
 
a)
Describe the organisation’s processes for identifying and assessing climate-related risks.
 
DRBUs and functions identify risks and opportunities, including climate-related physical risks, which are captured on risk registers and assessed against the materiality thresholds defined by our Risk Management Framework. Transitional risks of climate change have been assessed centrally and are included as a risk on our Group risk register.


Read more on pages
62-66
 
b)
Describe the organisation’s processes for managing climate-related risks.
 
Mitigation plans are required to be in place to manage risks identified, and progress against those plans is monitored. At Group level, specific responsibility for managing each identified risk is allocated to a member of the Management Board.


Read more on pages
62-66
c)
Describe how processes for identifying, assessing, and managing climate-related risks are integrated into the organisation’s overall risk management.
Our processes for identifying, assessing, and managing climate-related risks are integrated into our Risk Management Framework. This includes regular reviews of the Group risk register by our Group Risk Management Committee, chaired by the Finance and Transformation Director. The Group risk register is also reviewed annually by the Board and biannually by Audit Committee.


Read more on pages
62-66
 
 
Metrics and targets
: Disclose the metrics and targets used to assess and manage relevant climate-related risks and opportunities where such information is material.
 
a)
Disclose the metrics used by the organisation to assess climate-related risks and opportunities in line with its strategy and risk management process.
We have clearly defined metrics for each of our ESG priority areas, including climate change, against which we report on our performance and progress each year.


Read more on pages 47 and 61
 
b)
Disclose Scope 1, Scope 2, and, if appropriate, Scope 3 greenhouse gas (GHG) emissions, and the related risks.
We disclose Scope 1, Scope 2 and Scope 3 emissions and the related risks in our reporting.


Read more on pages 47 and 61
 
c)
Describe the targets used by the organisation to manage climate-related risks and opportunities and performance against targets.
Our targets to manage climate-related risks and opportunities include targets for carbon neutrality across our operations (Scopes 1 and 2) by 2030 and net zero carbon emissions across our value chain (Scopes 1, 2 and 3) by 2050. These are supported by a range of other environmental targets against which we report our performance and progress each year.


Read more on pages 47 and 61
 
59


Table of Contents
BAT Annual Report and Form 20-F 2021
Strategic Management
TCFD Reporting
Continued
 
 
Governance of ESG & Sustainability


60


Table of Contents
BAT Annual Report and Form 20-F 2021    
 
Strategic Report        
 
    Governance Report        
  
Financial Statements        
  
Other Information        


Strategy
Our purpose to build A Better Tomorrow
TM
and our Group strategy is
set-out
on pages
26-27.
Our Sustainability Agenda, with climate change as a key priority under the environmental pillar, is set out on page 46.
Taking an active approach to tackling climate change isn’t new at BAT. As a business that depends on natural resources, we have been focusing on addressing our environmental impacts and preparing our business for the risks ahead for over 20 years. Yet with the impacts of climate change rapidly increasing, we are making a step-change in our ambition and accelerating the pace of progress.
In 2021, we signed up to the UN-backed Race to Zero global campaign. This campaign aims to halve global carbon emissions by 2030 and achieve net zero carbon emissions by 2050. BAT has previously committed to Science Based Targets, aligned to a 2°C pathway; subject to approval from the Science Based Targets initiative (SBTi), we intend to align our targets to a 1.5°C pathway in 2022.
To meet our ambitions for carbon neutrality across our operations by 2030 (Scopes 1 and 2 CO
2
e emissions) and across our value chain by 2050, we have an integrated climate strategy, highlighted below, covering our own operations and our wider value chain. This focuses on reducing our impact on the environment, addressing climate-related risks and opportunities, and building climate resilience for the future.
Key attributes of our climate strategy include:
 
 
the performance of climate scenario analysis to inform our understanding of risks and opportunities;
 
 
the performance of life cycle assessments of our products and the incorporation of end of life treatment to reduce their environmental impact. Reducing the use of embodied carbon and single use plastic, and increasing recyclability to reduce the level of waste generated;
 
 
enhancing the resilience of our internal supply chain and wider value chain to maintain access to critical raw materials, and insulating our business from the impact of supply constraint-driven inflationary pressures;
 
 
the environmental impact of our direct operations, including the reduction of CO
2
e generated by our sites and fleet through energy saving initiatives and increased use of renewable energy (both purchased and self-generated), as well as reducing the waste generated and maximising the share of waste directed to recycling;
 
 
ensuring effective and efficient use of natural resources throughout our value chain, including where possible greater use of green energy and reduction of water usage and waste generation. This supports the allocation of these critical natural resources to food generation and other activities, and reduces our susceptibility to energy cost premiums and future carbon taxes; and
 
 
continued investment in R&D activity to underpin product innovations, technical deployment of agronomy best practices, low carbon curing technologies and farming techniques based on science.
 
Financial planning is key to the execution of our strategy. Through our embedded governance, we consider the impact of climate change on future anticipated operating costs (including the cost of regulation), access to capital and potential growth opportunities to facilitate resource allocation and to ensure that decision making is robust.
In 2021, internal carbon pricing (ICP) was incorporated into our financial appraisal to facilitate delivery against our glidepaths. These actions position us to be successful now and into the future as climate challenges arise.
To further enhance our strategy to mitigate the impacts of climate change, we performed an assessment of risks and opportunities using two climate evolution scenarios and over three time horizons. The approach taken to this assessment, outcomes, and mitigations are set out below on pages 62 to 64.
 
 
61


Table of Contents
BAT Annual Report and Form 20-F 2021    
Strategic Management
TCFD Reporting
Continued
 
 
Climate scenario modelling
Identification
Identification of risks and opportunities posed by climate change is an ongoing process and draws upon internal and external expertise, resources and other information, including:
 
 
internal senior management spanning all functions of the Group, based at DRBU, Regional, and Group level;
 
 
external consultants supporting our preparations for and resilience to climate change;
 
 
relevant industry publications outlining expected impacts of climate change on our key inputs (including agriculture);
 
 
relevant regulation (enacted or draft) that may impact the Group’s products, locations, or operations;
 
 
TCFD guidance on potential risks and opportunities; and
 
 
existing risks and opportunities identified and managed as part of our Group risk management processes.
A comprehensive list of potential climate related risks and opportunities were identified and refined down to 11 material risks and opportunities detailed on page 64, using the methodology defined in the Group Risk Management Framework and overseen by the Group Risk Management Committee. This materiality assessment will be reassessed annually to ensure it remains appropriate in the context of a dynamic business and physical environment, and to take account of improved data or modelling which may become available.
Assessment
We have considered the impact of risks and opportunities arising from climate change and the overall resilience of our business, calibrating these against two potential climate scenarios and three time horizons.
The two climate scenarios are aligned with the UN Intergovernmental Panel on Climate Change (IPCC) methodology, and greenhouse gas concentration trajectories known as Representative Concentration Pathways (RCP) 2.6 and 8.5, with differing levels of transitional and physical risk arising from each trajectory.
 
 
Climate scenario models used
 
 
62


Table of Contents
BAT Annual Report and Form 20-F 2021    
 
Strategic Report        
 
        Governance Report        
  
Financial Statements        
  
Other Information        


Whilst the impact of climate change is indefinite, for the purposes of assessment, we considered these risks and opportunities across three time horizons: short term (2021 – 2025), medium term (2026 – 2035), and longer term (2036 – 2050). These time horizons reflect how these risks and opportunities are internally considered and prioritised and are aligned to a number of our key
ESG-related
targets.
Climate-related risks and opportunities have the potential to impact our business over time. Through the identification and measurement processes outlined above, which are aligned to TCFD recommendations, we are taking the necessary steps to assess the likelihood and severity of these impacts to enable us to maximise positive impacts and minimise adverse impacts on our business.
Scenario analysis was performed to model how the impact and likelihood of our material risks and opportunities might change under each time horizon and climate scenario. We identified three climate-related opportunity areas and eight climate-related threats, which span transitional and physical risks in nature. The results of the scenario analysis performed is shown on page 64.
Material risks are those that could have a significant effect on our operations, strategy and financial planning if they are not managed appropriately. In contrast, material opportunities may improve our financial performance over time in the event they can be realised.
Through our ESG strategy we aim to effectively manage the impact of our business on the planet over time.
We have also undertaken a deep-dive modelling and financial impact analysis on six risks and opportunities, drawing on internal and external data sources, such as carbon pricing projections, potential future surcharges on
single-use
plastics in our products, Group financial data, energy consumption and costs by BAT site, business growth projections and consumer trends. This allowed us to refine our initial qualitative assessment and quantify the expected financial impact based on assumptions of future developments. We will continue to revisit these assumptions to reflect new and emerging developments.
Specifically, in relation to future access to tobacco and nicotine, a detailed assessment of future growing conditions was undertaken across our 10 largest tobacco source countries, utilising a UN IPCC model for climate change. Regional temperature behaviour, precipitation and soil water levels (surplus or deficit) were assessed, enabling us to estimate the likely impact on crop yields, and the cost of, or access to, tobacco in the future.
 
 
BAT Greenhouse Gas Emissions
         
Total Emissions (thousand tonnes tCO
2
e)
 
           
Emission Source
  
Category
  
                    2017
    
                    2018
    
                    2019
    
                    2020
 
           
Scope 1


415


396


342
 
           
Scope 2 Market-based


426


386


199
 
           
Scope 2 Location-based


490


453


418
 
           
Total Scope 3


6,956


6,781


5,587
 
           
Purchased Goods and Services
  
Category 1 Total
           
 
4,363


4,049


4,011
 
           
Purchased goods – Directs (excluding NGP)
  
Category 1
           
 
1,550


1,488


1,140
 
           
Purchased goods – NGP
  
Category 1
           
 
43


55


47
 
           
Purchased Services
  
Category 1
           
 
35


107


720
 
           
Purchased Tobacco Leaf – Combustibles
  
Category 1
           
 
2,550


2,184


1,966
 
           
Tobacco Leaf – NGP
  
Category 1
           
 
18


5


2
 
           
Other Purchased Goods & Services
  
Category 1
           
 
167


210


135
 
           
Capital Goods
  
Category 2 Total
           
 
519


463


177
 
           
Fuel and Energy Related Emissions
  
Category 3 Total
           
 
177


166


134
 
           
Upstream Transportation & Distribution
  
Category 4 Total
           
 
192


197


225
 
           
Waste Generated in Operations
  
Category 5 Total
           
 
5


5


9
 
           
Business Travel
  
Category 6 Total
           
 
38


33


8
 
           
Employee Commuting
  
Category 7 Total
           
 
27


23


53
 
           
Use of Sold Products
  
Category 11 Total
           
 
662


587


641
 
           
End-of-Life
Treatment of Sold Products
  
Category 12 Total
           
 
967


1,253


324
 
           
Franchises
  
Category 14 Total
           
 
5


5


5
 
Note:
Total emissions include biogenic and biogenic removals.
 
63


Table of Contents
BAT Annual Report and Form 20-F 2021
Strategic Management
TCFD Reporting
Continued


Material climate-related risks and opportunities identified
 
                
Level of likelihood/impact by
Type
        
Scenario
    
2020    
    – 2025    
  
2026    
    – 2035    
  
2036    
    – 2050    
 
Opportunities
associated with transitioning to low carbon economy
 
           
Products & services
   Increased revenues due to shift in consumer preferences resulting in access to new and emerging markets and increased demands for our products*   
 
1.5ºC


>3-4ºC


Energy sourcing
   Reduced costs due to use of lower-emission sources of energy within our direct operations*   
 
1.5ºC


>3-4ºC


Resource efficiency
   Reduced costs due to use of more efficient production and distribution processes   
 
1.5ºC


>3ºC


Transition risks
associated with transitioning to low carbon economy
 
           
Emerging regulation
   Increased costs due to new carbon pricing mechanisms on the emissions within our value chain   
 
1.5ºC


>3-4ºC


Emerging regulation
   Increased costs due to mandates on, and regulation of, products and services*   
 
1.5ºC


>3-4ºC


Market
   Increased costs due to contraction of insurance markets, higher premiums or losses arising from uninsured assets   
 
1.5ºC


>3-4ºC


Market
   Increased costs due to increasing energy prices impacting direct operating costs as well as the cost of raw materials*   
 
1.5ºC


>3-4ºC


Market
   Increased costs and/or reduced access to capital markets due to climate change driven increases to operating costs and ESG concerns from investors   
 
1.5ºC


>3-4ºC


Physical risks
associated with physical impacts of climate change – either acute risks (such as relating to extreme weather events) or chronic risks (such as relating to longer-term shifts in climate patterns and higher temperatures)
 
           
Acute
   Decreased revenues due to increased severity and frequency of extreme weather events such as cyclones and floods, leading to agricultural supply chain disruption and reduced production capacity   
 
1.5ºC


>3-4ºC


Chronic
   Decreased revenues due to water stress leading to agricultural supply chain disruption and reduced production capacity*   
 
1.5ºC


>3-4ºC


Chronic
   Decreased revenues due to changes in precipitation patterns and extreme variability in weather patterns leading to agricultural supply chain disruption and reduced production capacity*   
 
1.5ºC


>3-4ºC


*Advanced financial scenario modelling conducted
The analysis demonstrated that whilst there were some favourable and unfavourable impacts on yield, the potential financial impact on annual cost of tobacco is less than 5% and current climate change trajectories indicate it is unlikely that the Group would face reduced production capacity as a consequence of consistent supply constraints. We believe the impacts on yield can be effectively mitigated through agronomy action plans to avoid yield driven cost of production increases.
In 2021, we also built on our decades of experience in agriculture to develop a new carbon-smart farming programme. This takes a strategic approach focused on reducing emissions from tobacco farming and leveraging the positive effect agriculture could have in removing carbon from the atmosphere.
Scenario analysis highlighted the increased cost of compliance with emerging regulation, cost of green energy and carbon taxation arising from Government policies seeking to deliver a Sustainable Transition (Scenario 1). Potential adverse impacts from higher costs and reduced access to both insurance and capital markets were identified.
Given the nature of transition risks, we anticipate the magnitude of these risks will be lower, and impact delayed, under Climate Inaction (Scenario 2) as little or no change to current regulation is projected. We will continue to update both our scenario analysis and business plans to ensure our business remains resilient and best able to mitigate the impact of climate policies as they emerge.
 
64


Table of Contents
SPOTLIGHT Carbon-smart farming So, in 2021, we conducted a detailed To me it is an honour analysis to estimate removals resulting In 2021, we built on our decades of to be one of the first from carbon-smart farming best practice, experience in sustainable agriculture, against international methodologies, such farmers participating in this to develop a new carbon-smart farming as those of the Intergovernmental Panel on programme. I’m excited to learn programme. This takes a strategic Climate Change (IPCC) and Greenhouse approach focused on both reducing new conservation practices to Gas (GHG) Protocol. emissions from tobacco farming and, deploy on my farm. And I think crucially, leveraging the positive effect We are now working in partnership with getting to see real data showing agriculture could have in removing a specialist consultancy to validate this the tangible impact this will carbon from the atmosphere. approach and to monitor, report and verify the results. This will enable us to develop a have in both reducing and The latter can be achieved by planting system that can be easily applied by small removing carbon emissions will trees, as well as through methods like farmers. The systems will form the basis be a game-changer and provide cover crops and conservation tillage of our carbon-smart farming programme, new opportunities for income that may keep the soil covered and empowering our contracted farmers to undisturbed, to reduce the possibility generation. incorporate carbon-smart farming into of carbon escaping. their business model. As well as storing carbon, these Laercio Celestino Adami It will also provide us with verified data methods may also increase water- BAT contracted tobacco farmer, to measure progress against our 2050 retention capacity, improving drainage Brazil ambition and to validate the impact of and making the soil richer and more different carbon-smart strategies. In 2021, fertile. This results in increased yields 35 of our contracted farmers in Brazil and better-quality crops for farmers
signed-up
as the first pilot group for the helping to boost their profits. programme. We will expand the pilot Many of our contracted farmers to farmers in Bangladesh, Mexico and already use these best practices. Pakistan in 2022. Learnings from the pilots The challenge has been to find effective will help in further developing and scaling-ways to measure impact and quantify up the programme as part of our wider the amount of carbon they remove, climate strategy. compared to how much they emit.

Table of Contents
BAT Annual Report and Form 20-F 2021
Strategic Management
TCFD Reporting
Continued


While the products we offer continue to evolve, we will continue to need to access raw materials, including tobacco and tobacco extracts. This increases our exposure to the physical risks of climate change due to the increased risk of asset production disruption, damage or loss. In contrast to transition risks, physical risks are most severe under Climate Inaction (Scenario 2) given this scenario sees a world where warming exceeds a 3°C threshold, increasing the frequency and severity of climate-related events and likely financial impact on our business. In response, more extensive mitigation may be required including investments in working capital to increase our supply chain resilience.
While a sustainable transition (Scenario 1) is not anticipated to fully shield our operations from such climatic events, we assessed these may be less frequent and more controllable through tailored adjustments to our existing risk management policies.
While there are challenges ahead, we believe that the Group is well placed to address them. Supported by our global reach, supply chain flexibility, diverse product portfolio, leading brands and capital strength, we believe that we have the resilience and agility to transition and create new growth opportunities.
The insights gained from the modelling performed further strengthen the importance and relevance of our climate strategy and net zero carbon emissions target to mitigate these risks. We will continue to review each material climate-related risk and opportunity and build upon our existing mitigation strategies to enhance the resilience of our business to climate change.
Risk Management
Our Risk Management Framework and procedures are clearly defined and well-established across the Group.
Risk registers, based on a standardised methodology, are used at Group, functional, and DRBU level to identify, assess, monitor and mitigate the risks (both financial and
non-financial).
Risks, including climate-related risks, are assessed and prioritised at three levels by reference to their impact (high/medium/ low) and likelihood (probable/possible/ unlikely), as defined in our Group Risk Management Manual. Mitigation plans are required to be in place to manage the risks identified, and progress against those plans is monitored. Decisions on how to manage the risk are based on a variety of considerations including risk score, our ability to influence or control the risk, and cost and effectiveness of mitigation. The risk registers are reviewed on a biannual basis.
At the Group level, specific responsibility for managing each identified risk is allocated to a member of the Management Board. The Group risk register is reviewed biannually by the Group Risk Management Committee, chaired by the Finance and Transformation Director. In addition, the Group risk register is reviewed annually by the Board and biannually by the Audit Committee.
During 2021, we continued to integrate and embed climate-related risks into our Group risk management procedures. This followed an update to our Group risk register in 2020 to incorporate transitional risks of climate change as a Group risk.
Each of our DRBUs and functions is required to identify and assess risks and opportunities, including climate-related physical risks, which are captured on risk registers and assessed against the materiality thresholds defined in our Risk Management Framework. Additionally, the transitional risks of climate change have been assessed centrally and are captured on our Group risk register in accordance with our Risk Management Framework.
Transitional risks of climate change takes into account factors including net zero commitments, stakeholder interests and emerging and current climate-related regulations.
In recognition of ESG being fundamental to all that we do in the organisation and the global risks of climate change, in 2021 our risks were updated to incorporate ESG factors across all relevant risks across the Group.
In 2022, we plan to further enhance our assessment of the transitional and physical climate risks and opportunities through conducting further analysis.
It is envisaged that the transitional climate risk will remain as a separate risk, and the physical climate risks and opportunities will be reflected further as necessary, in individual DRBU and functional risks.


See our Group risk factor for climate change on page 321 and details of our risk management and internal control procedures on pages 124.
 
66
 

Table of Contents
BAT Annual Report and Form 20-F 2021    
 
Strategic Report        
 
        Governance Report        
  
Financial Statements        
  
Other Information        


Metrics and Targets
We have been reporting against energy and carbon emissions metrics since 2001 and set out our first long-term targets in our 2007 Annual Report to reduce Scopes 1 and 2 CO
2
e emissions intensity by 50% by 2030 and 80% by 2050 against our 2000 baseline. By the end of 2017, we had achieved a 42.7% reduction from that baseline.
In 2019, we set new long-term CO
2
e targets, and gained the Science Based Targets initiative’s (SBTi) formal approval for these.
Since then, we have developed our commitment to addressing climate change, including accelerating our existing environmental targets to 2025 and committing to be carbon neutral across our operations (Scopes 1 and 2) by 2030 and net zero across our value chain (Scopes
1, 2 and 3) by 2050. In addition, we have incorporated internal carbon pricing into business plans to ensure the impact on environmental performance and targets are formally considered and quantified. This has supported the prioritisation of sustainability projects such as
on-site
renewable energy generation.
These actions are complemented by a range of other environmental targets and metrics, covering areas such as renewable energy, eliminating waste, water stewardship and biodiversity and afforestation.
Our goals, targets and metrics are summarised in our ESG Roadmap on page 47, including performance in 2019, 2020 and 2021 in relation to carbon emissions, renewable energy, waste, water, and biodiversity to demonstrate trends and how we are consistently delivering improvements to our environmental performance.
In 2021, we signed up to the
UN-backed
Race to Zero campaign.* Race to Zero is the largest ever alliance aiming to halve global emissions by 2030 and achieve net zero carbon emissions by 2050. The campaign represents over 4,000 businesses estimated to cover nearly 25% of global CO
2
emissions and more than 50% of GDP.
Limiting the rise in average global temperature to 1.5°C above
pre-industrial
levels requires major and widespread action and companies have an important role to play.** We are realigning our existing CO
2
e emission targets with this trajectory and set a new target for
net-zero
carbon emissions across our value chain (Scopes 1, 2 and 3) by no later than 2050.
Next Steps
We recognise that the impact of climate change is uncertain and will be affected by multiple factors including severity of climate variation and extent of government regulation.
Through the adoption of the TCFD recommendations we have sought to analyse, as best as possible, the impact of potential outcomes considering two climate scenarios over the short, medium, and long term time horizons, however our assessments will need to continually evolve to respond to new information and insights.
In light of this evolving landscape, our work will continue in 2022 to further strengthen our approach including the consideration of the following focus areas:
 
 
further embedding climate-related considerations into our business and strategic decision making, financial planning, as well as governance and risk management frameworks;
 
 
continuing to identify opportunities to further strengthen our activities to manage and mitigate climate-related risks and build climate-change resilience;
 
 
continuing to work with our suppliers to enhance data relating to our Scope 3 emissions;
 
 
continuing to monitor ESG measures and drive performance across our comprehensive suite of objectives across all areas of ESG;
 
 
continuing to identify, assess, manage, and disclose climate-related risks and opportunities;
 
 
reviewing our metrics and targets to ensure they remain aligned with our strategy and risk management processes, and best practice guidelines;
 
 
enhancing our assessment of the transitional and physical climate risks and opportunities through further analysis; and
 
 
tailoring future disclosures, taking into account key government, investor, and other stakeholder frameworks and guidance.
 
*
Via the Science Based Targets Business Ambition for 1.5C Campaign.
 
**
Science Based Targets must represent reductions needed to restrict global warming to 1.5 degrees Celsius from
pre-industrial
levels. BAT had previously committed to Science Based Targets, aligned to a 2°C pathway, and has existing targets to become carbon neutral across its operations by 2030 and value chain by 2050. These will be realigned to the 1.5°C pathway (subject to SBTi verification) and accommodate
net-zero
criteria and definitions.
 
67


Table of Contents
for employees By creating a dynamic, inspiring Attracting and retaining an and purposeful place to work. increasingly diverse workforce and providing a welcoming and inclusive working environment are key drivers in BAT’s transformation journey. We are creating value for our employees by: – providing opportunities for a rewarding career with a major international business; – creating a diverse and inclusive workplace culture that treats everyone equally; and – listening to their views and safeguarding their wellbeing.

Table of Contents
BAT Annual Report and Form 20-F 2021    
 
Strategic Report        
 
Governance Report        
  
Financial Statements        
  
Other Information        


Ethos
 
Our purpose is to build A Better Tomorrow
TM
by reducing the health impact of our business through offering a greater choice of enjoyable and less risky products for our consumers.
 
A key driver to delivering this is our Ethos, which guides our culture and behaviours across the entire Group. Developed with significant input from our employees, it ensures an organisation that is future fit for sustainable growth. These five key principles – bold, fast, empowered, diverse, responsible – underpin how we deliver on both our purpose and our strategy.


We are
Bold
 
 
Dream big – with innovative ideas
 
 
Make tough decisions quickly and proudly stand accountable for them
 
 
Resilient and fearless to compete


We are
Fast
 
 
Speed matters. Set clear direction and move fast
 
 
Keep it simple. Focus on outcomes
 
 
Learn quickly and share learnings


We are
Empowered
 
 
Set the context for our teams and trust their expertise
 
 
Challenge each other. Once in agreement, we commit collectively
 
 
Collaborate and hold each other accountable to deliver


We are
Responsible
 
 
Take action to reduce the health impact of our business
 
 
Ensure the best quality products for our consumers, the best place to work for our people, and the best results for shareholders
 
 
Act with integrity, never compromising our standards and ethics


We are
Diverse
 
 
Value different perspectives
 
 
Build on each others’ ideas, knowledge and experiences
 
 
Challenge ourselves to be open-minded recognising unconscious bias


 Our ongoing commitment to fostering a diverse and inclusive culture at BAT is underpinned by our ethos, which encourages our employees to be Bold, Fast, Empowered, Responsible and Diverse. Our transformation is driven by our people. By combining existing and new capabilities, we are radically redefining our organisation. Together, we will build A Better Tomorrow. 
 
Hae In Kim
Director, Talent, Culture and Inclusion
    
 
69


Table of Contents
BAT Annual Report and Form 20-F 2021
Strategic Management
People and Culture


Investing in Leaders
We are accelerating our transformation agenda and delivering A Better Tomorrow
TM
by attracting the right talent with new experiences and developing our ‘must win’ capabilities.
In 2021, we launched our new Employer Brand – ‘Be the change’ – reflecting our corporate purpose and Ethos. The new brand has been brought to life through our social media channels and on our revamped website –
careers.bat.com
. The updated site leverages the latest technologies to personalise a candidate’s experience, with
round-the-clock
support in 14 languages. In 2021, 44% of our external recruits brought new capabilities into the organisation to accelerate our business transformation.
Our unwavering commitment and investment into the development of leadership and functional ‘must win’ capabilities has resulted in an average of 17.9 training hours delivered per full-time equivalent (FTE), with an average of £311 invested per FTE in 2021. This included 239 training programmes delivered across our leadership, functional and digital portfolios.
All functional ‘must win’ capabilities have foundational learning programmes in place, creating a level playing field of knowledge and skills, with 31% of programmes developing advanced level capabilities. In the leadership space, over 6,600 employees attended our core leadership programmes, including four international cohorts of our Women in Leadership programme and two cohorts of our Global Graduate Academy.
To enable quantity, while ensuring quality of all our programmes, we have shifted all our programmes to 100% virtual format.
This has been a game changer, making it more accessible for more people across the Group. Our digital learning platform, The GRID, is the gateway to our learning portfolio – accessible to 100% of our management population, providing digital learning anytime, anywhere. In addition, over 13,000 managers have completed our leadership potential assessment – Leadermeter, which enables early identification of talent for accelerated development.


You can read about our Group risk factor related to talent on page 320
Inclusive Culture
We are focused on creating a supportive and inclusive culture where all our people can flourish.
Our SoBC Respect in the Workplace Policy makes clear our commitment to providing equal opportunities to, and fair treatment of, all our employees and to creating an inclusive workforce by promoting employment equality. The policy was updated in 2021 to include enhanced provisions relating to not practising any form of unlawful discrimination, providing fair wages and benefits and supporting employees’ work-life balance. Our revised SoBC takes effect from January 2022.
We are official signatories to the UK Race at Work Charter for supporting equality and race in the workplace. We are also certified as a level 1 Disability Confident Committed employer under the UK Government’s accreditation scheme. This demonstrates our commitment to providing equal opportunities for disabled employees, training and development for them, and reasonable adjustments and support in the workplace and in recruitment processes.
 
 
Group diversity as at 31 December 2021
 
Main Board
 

Senior Leadership Teams
 

Total Group Employees


Employee retention
In 2021, total voluntary turnover of management-grade employees was 1,236, representing 8.6% of our Group’s total management population.
 
Voluntary turnover rate for all employees across our Group in 2021 was 9.1%.
 
Diversity
Representation of women on senior leadership teams was 24% in 2019, 27% in 2020 and 27% in 2021.


Senior managers:
Companies Act 2006
 
For the purposes of disclosure under Section 414C(8) of the Companies Act 2006, the Group had 181 male and 42 female senior managers as at 31 December 2021. Senior managers are defined here as the members of the Management Board (excluding the Executive Directors) and the Directors of the Group’s principal subsidiary undertakings. The principal subsidiary undertakings, as set out in the Financial Statements, represented approximately 66% of the Group’s employees and contributed over 89% of Group revenue and 100% of profit from operations in 2021.
 
 
Nationalities represented
     
Total
 
   
Main Board
  
 
7
 
   
Global headquarters
  
 
81
 
   
Management level globally
  
 
141
 
 
70


Table of Contents
BAT Annual Report and Form 20-F 2021    
 
Strategic Report        
 
    Governance Report        
  
Financial Statements        
  
Other Information        


Our D&I Strategy
 
We are proud to be a diverse global company and, as our Ethos shows, diversity is one of our core values. As we transform our business, we need fresh, diverse skills, perspectives and mindsets to challenge the status quo and drive innovation. Our diversity and inclusion (D&I) strategy is built on the following three pillars and underpinned by an inclusive culture.
 
 
Pillar 1
Driving ownership
and accountability


Ensuring ownership of, and accountability for, our D&I strategy across all business areas and leadership teams is key to driving progress and achieving our 2025 ambitions.
 
Our Director for Talent, Culture and Inclusion has overall responsibility for all employee and human resources matters, while our Management Board oversees the development and management of talent within the Group’s regions and functions.
 
Our D&I governance structure ensures clear accountability for our business leaders and leadership teams for achieving our 2025 ambitions. This includes a D&I dashboard and quarterly reviews by our Management Board to ensure close monitoring of progress and plans. Diversity also remains fully embedded in our talent review processes and meetings across all levels of the Group.
 
Our ‘Diversity Champions’ continue to be key in driving D&I initiatives throughout the organisation. Our ‘Mastering Inclusion’ training helps to further empower our people and increase their awareness. In 2021, more than 8,300 employees completed the training. We also launched a new D&I toolkit for all our managers in 2021, as well as LGBT+ and Race and Ethnicity Allyship Guides.


Pillar 2
Building diverse
talent pipelines


We focus on building diverse talent pipelines at all levels of the organisation through recruiting, developing and retaining the best diverse talent.
 
In 2021, the proportion of women in management roles was 39% and 27% on senior leadership teams – we are committed to increase these by 2025 to 45% and 40%, respectively. To achieve this, we are focused on recruiting, developing and retaining the best female talent.
 
In 2021, 47% of our external management-level recruits were women. Women also comprised 51% of our new graduate intake in 2021, helping to build a sustainable pipeline of future female leaders. We also provide a range of training, mentoring, coaching and sponsorship programmes to support women’s development.
 
As well as striving for gender balance, we focus on diversity of nationalities and ethnicities. Our target is for at least a 50% spread of distinct nationalities in all our regional and functional leadership teams. We have 141 different nationalities, from a wide range of ethnic backgrounds, in management roles across the Group.


Pillar 3
Creating enablers


To realise our diversity ambitions, we know we must have enablers in place that provide a supportive environment for people to thrive and realise their full potential.
 
We provide women and diverse groups with an opportunity to connect, engage and share experiences, such as through our Women in BAT UK and our
B-United
LGBT+ communities. And our Parents@BAT programme continues to provide a range of benefits to support new parents working in all BAT businesses worldwide. In 2021, the return rate from parental leave was 95% for women and 99% for men.
 
We work to continually raise awareness of diversity issues through campaigns and events that showcase best practice and provide platforms for role models to amplify their profiles across the Group. For example, each year, we celebrate events such as National Inclusion Week, International Women’s Day and International Day of Women and Girls in Science.
 
Following a successful pilot in the UK in 2020, we launched our IGNITE programme in eight more countries in 2021. IGNITE focuses on supporting experienced professionals returning to the workplace after a career break.


71


Table of Contents
BAT Annual Report and Form 20-F 2021
Strategic Management
People and Culture
Continued
    
 
Global Top Employer
BAT has been accredited as a Global Top Employer for the last four consecutive years.
 
Financial Times Diversity Leader
BAT has been ranked in the top 10% of companies in 2021 for achieving a diverse and inclusive workforce.
 
Global Equality Standard certified
In 2021, we achieved accreditation under the Global Equality Standard, as well as the UK National Equality Standard.
 
Corporate Equality Index
In 2021, for the second consecutive year, our business in the U.S. and Mexico scored 100% on the Human Rights Campaign Foundation’s Corporate Equality Index for LGBT+ workplace equality.
 
1.
The Board has taken account of the requirements of the UK Corporate Governance Code in its approach to engagement with the Group’s workforce. We define the Group’s workforce as comprising all Group company employees and individuals contracted directly to undertake permanent and temporary roles.
 
Workforce Engagement
Ensuring we have open engagement, where we can listen and learn from our people, is crucial to an inclusive culture. The Group has a range of well-established engagement channels worldwide covering the Group’s global workforce
1
, including:
 
 
market and site visits by our Directors and Management Board members to meet local employees;
 
 
town halls and listening sessions;
 
 
meetings with works councils, trade unions and the European Employee Council;
 
 
global, functional and regional webcasts, and webcasts and podcasts with the Chief Executive and Management Board members;
 
 
our global ‘Your Voice’ employee survey every two years, most recently in 2021;
 
 
our annual global leaders meeting with the top 120 senior leaders across the Group; and
 
 
global, independently-managed and multilingual Speak Up channels, discussed further on page 57.
These engagement channels are implemented as appropriate for the composition of local workforce populations, at market, regional or functional levels. With
COVID-19
continuing to affect our ways of working throughout the year, workforce engagement forums in 2021 continued to be conducted primarily through virtual formats, leveraging the success of Group digital transformation initiatives.
Given the scale, spread and diversity of the Group’s workforce, the Board considers it effective to use these established engagement channels, augmented by Group-wide reporting structures to capture feedback from engagement at market, regional and functional levels.
Employee feedback from workforce engagement channels is collected across the Group and analysed to define priority themes. Consolidated feedback and themes from engagement are reviewed by our Board each year, as part of our Workforce Voice in the Boardroom programme.
This focuses on ensuring the Board understands the views of our workforce, and reviews details of the key themes identified and how we have responded. Feedback from the Board, with associated action planning, is cascaded back across our workforce and the Board is kept updated on progress against identified actions during the year.
 
The overarching themes identified from engagement in 2021 related to transformation, innovation and staying connected (particularly in the context of the
COVID-19
pandemic). We have responded to this feedback with a range of initiatives, including enhanced communications activities to increase our connectivity and provide greater visibility of the Group’s work around transformation and innovation.
For example, we held a virtual TIME: Technology Inspiring a Modern Enterprise Automation summit in 2021, demonstrating how our digital transformation can empower our people. Broadcast live and available to all Group company employees, the
four-day
summit saw speakers from the business and tech world join BAT senior leaders to discuss how automation is changing our lives.
We also held a global competition for employees to develop creative and engaging videos about the Group’s strategic purpose. This provided an opportunity for employees to share what makes them proud to work for BAT and what it means to be part of the Group’s transformation. In addition, we published a new Science & Innovation Report in 2021 and introduced quarterly science updates, providing our employees with details of the latest developments in tobacco harm reduction science and innovation in a concise and engaging way.
Your Voice
In our 2021 Your Voice global employee survey, we were pleased to surpass our 2019 response rate with 93% of all employees globally choosing to respond (7% higher than our global FMCG comparator group).
Our 2021 Your Voice results outperform our FMCG comparator group in most categories, with strong results in diversity and inclusion, people management, corporate responsibility and empowerment. Our 2021 results were 1% higher than our FMCG comparator group for our Employee Engagement Index and 4% higher than our FMCG comparator group for our High Performance Index. These results reflect a connected, committed, energised and high performing organisation.
We use these results as the basis for further shaping the priorities of the organisation.
 
72
 

Table of Contents
BAT Annual Report and Form 20-F 2021    
 
Strategic Report        
 
        Governance Report        
  
Financial Statements        
  
Other Information        


Our Employment Principles
Our Employment Principles set out a common approach for our Group companies’ policies and procedures, recognising that each Group company must take account of local labour law and practice, and the local political, economic and cultural context.
In developing our Employment Principles, we have sought the views of a cross-section of internal and external stakeholders, and have consulted with employee representatives and (where relevant) with our works councils. All Group companies have adopted our Employment Principles and, through our internal audit processes, are required to demonstrate how these are embedded into the workplace.
In addition to our Employment Principles, our Board Diversity Policy applies specifically to our Board and Management Board, discussed at page 119.
Responsible restructuring
Our Employment Principles make clear that, where restructuring is necessary, we are committed to doing so in a responsible manner. Where such situations do occur, our companies adopt responsible local approaches and procedures to address each instance, such as severance pay and outplacement support to help displaced employees find alternative employment.
In 2021, we continued Project Quantum to restructure our business globally by redesigning management layers and eliminating duplications, while simultaneously reinvesting in new capabilities and roles to ensure delivery of our strategy.
Rewarding People
Our SoBC makes clear our commitment to providing fair, clear and competitive wages and benefits. In line with good equal pay practices, we have clearly defined pay scales for all roles across the Group worldwide. This approach ensures pay, bonuses and benefits are consistently applied and not influenced by factors such as gender or ethnicity.
Reward is a key pillar in ensuring that we have the right people to drive the business forward. Reward is necessarily local and we strongly support this through global frameworks to ensure leading edge policies, processes and technology are available to all markets.
Base pay rewards core competence relative to skills, experience and contribution to the Group, while annual bonuses, long-term incentives, recognition schemes and ad hoc incentives provide the right mix to ensure that sustained high performance is recognised and rewarded.
Our annual bonus and long-term incentive plans are aligned throughout the organisation, with eligible employees participating in plans with the same performance metrics as the Executive Directors, supporting line of sight throughout the organisation. We also offer our UK employees the chance to share in our success via our Sharesave Scheme, Partnership Share Scheme and Share Reward Scheme, and operate several similar schemes for employees in our Group companies. Our approach to rewarding Group company employees is discussed further at page 163.


Find details of our Directors’ Remuneration Policy on pages
152-165
Equal pay for equal work
We have been reporting data relating to UK gender pay gaps since 2017 in accordance with UK statutory requirements. For 2021, we have extended the scope of our voluntary reporting to include, for the first time, gender pay gap data for an additional eight markets, representing approximately 40% of our Group company employees. We have also published ethnicity pay gap data for UK employees for 2021.
We recognise that we have a gender pay gap in the UK, which refers to the percentage difference between the average pay for men and women and is not to be confused with equal pay for equal work. This situation is particular to the UK, which is home to our global headquarters, where at present we have more men than women in senior leadership roles.
Gender pay data from our international markets provides a broader assessment of our business and demonstrates that pay gaps are negligible or are in favour of women. In addition, we worked with a specialist consultancy in 2021 to conduct a Pay Equity Review on the data across nine countries, including the UK. The consolidated results show men and women are paid within 1% of one another for doing the same work or work of equal value across those countries. This confirms that our global efforts to provide fair compensation based on legitimate drivers of pay are working. In early 2022, we gained independent accreditation for our Pay Equity Review from Fair Pay Workplace, a
non-profit
organisation. Certification demonstrates a further commitment to Pay Equity, moving from self-disclosure to demonstrable actions.


Find out more, including our statutory UK gender pay gap data, in our 2021 Diversity and Inclusion Report, available at www.bat.com/genderpayreport
 
 
Our policies and principles


Summary of areas covered
  
Stakeholder groups
Employment Principles
*
  
Employment practices, including commitments to diversity, reasonable working hours, family-friendly policies, employee wellbeing, talent, performance, equal opportunities, and fair, clear and competitive remuneration and benefits and responsible restructuring.
  
Health and Safety Policy
*
  
Health, safety and welfare of all employees, other members of our workforce and third-party personnel.
  

Standards of Business Conduct (SoBC) *
  
Topics including respect in the workplace: promoting equality and diversity; preventing harassment and bullying; fair wages and benefits; and supporting work-life balance; as well as human rights, health, safety, welfare and compliance with our Group Data Privacy Procedures.
  

Group Data Privacy Procedure
  
The manner in which BAT processes personal data about all individuals, including consumers, employees, contractors and employees of suppliers.


*
These policies and principles are endorsed by our Board, are adopted by all Group companies and support the effective identification, management and mitigation of risks and issues for our business in these and other areas. Available at bat.com/principles.


73


Table of Contents
for shareholders and investors By delivering sustainable We are confident in our growth and superior returns. outlook and have a proven record of performance, whatever the external environment. We aim to deliver: –
3-5%
constant currency revenue growth over the medium term; – @high-single digit constant currency adjusted EPS growth; – 65% dividend
pay-out
ratio of long-term earnings;@ – enhance shareholder returns via share repurchase programmes; and – deleverage of the balance sheet @to
2-3x
adjusted net debt/ adjusted EBITDA@.

Table of Contents
BAT Annual Report and Form 20-F 2021    
 
Strategic Report        
 
Governance Report        
  
Financial Statements        
  
Other Information        


Financial Performance
Summary
 
 
New Categories revenue growth and strong pricing in combustibles offset by currency headwinds, with revenue down 0.4%;


Profit from operations was up 2.7%. On an adjusted, constant currency basis, profit from operations grew 5.2%, despite a further incremental increase in New Category investment;


Diluted EPS up 6.0%. Adjusted diluted EPS up 6.6% at constant rates of exchange;


Deleveraging continued, driven by strong cash generation;


Dividend per share up 1.0% at 217.8p; and


Share repurchase programme of £2 billion announced for 2022.
 
 
Non-GAAP
Measures
In the reporting of financial information, the Group uses certain measures that are not defined by IFRS, the Generally Accepted Accounting Principles (GAAP) under which the Group reports. The Group believes that these additional measures, which are used internally, are useful to users of the financial information in helping them understand the underlying business performance.
The principal
non-GAAP
measures which the Group uses are adjusted revenue, adjusted revenue from New Categories, adjusted profit from operations and adjusted diluted earnings per share. Adjusting items are significant items in revenue, profit from operations, net finance costs, taxation and the Group’s share of the
post-tax
results of associates and joint ventures which individually or, if of a similar type, in aggregate, are relevant to an understanding of the Group’s underlying financial performance. As an additional measure to indicate the results of the Group before the impact of exchange rates on the Group’s results, the movement in adjusted revenue, revenue from New Categories, adjusted profit from operations, adjusted net finance costs and adjusted diluted earnings per share are all also shown at constant rates of exchange.
These
non-GAAP
measures are explained, defined and reconciled from the most comparable GAAP metric on pages 304 to 313 and note 2 in the Notes on the Accounts. As reported in 2020, from 2021 adjusted revenue from the Strategic Portfolio ceased to be a KPI.
Revenue
In 2021, revenue was £25,684 million (down 0.4%), with 2020 also marginally lower (down 0.4%) than 2019 at £25,776 million. New Categories performed well in both years with revenue up 42.4% in 2021 and 14.9% in 2020. Strong pricing in combustibles drove price/mix of 4.3% in 2021 (2020: 7%), with 2021 lower than 2020 due to negative geographic mix as markets began to recover from
COVID-19,
an estimated £260 million impact in Australasia (due to a structural change in excise and competitive pricing environment) and the negative impact of the sale of the Group’s operations in Iran, partially offset by an estimated £200 million benefit from trade inventory movements in the U.S. mainly linked to the timing of price increases and uncertainty about a potential excise increase. Cigarette volume was largely in line with 2020 at 637 billion sticks (2020: 4.6% decline to 638 billion sticks).
COVID-19
was a headwind in 2020 of approximately 2.5%, largely due to restrictions in South Africa and a number of other markets across the Group, including the Group’s Global Travel Retail (GTR) business. During 2021, GTR continued to be impacted by the ongoing global travel restrictions.
Translational foreign exchange impacted both years, being a headwind of 7.3% in 2021 and 3.5% in 2020, due to the relative strength of sterling, which more than offset the operational performance and led to the decline in both years. Excluding the impact of currency (and excise on
bought-in
goods which affected 2019), adjusted revenue at constant rates of exchange increased 6.9% (2020: up 3.3%).
 

Revenue
(£m)
£25,684m
-0.4%
 

Definition:
Revenue recognised, net of duty, excise and other taxes.
 

Change in adjusted revenue
at constant rates
(%)
+6.9%
 

Definition:
Change in revenue before the impact of adjusting items and the impact of fluctuations in foreign exchange rates.
 
Reconciliation of revenue to adjusted revenue at constant rates


2021
    
2020
    
2019
 
  
£m
    
Change %
(vs 2020)
    
£m
    
Change %
(vs 2019)
    
£m
 
           
Revenue
  
 
25,684


-0.4%


25,776


-0.4%


25,877
 
Adjusting items


(50
           
Adjusted revenue
  
 
25,684


-0.4%


25,776


-0.2%


25,827
 
Impact of exchange
  
 
1,877


894


Adjusted revenue at constant rates
  
 
27,561


+6.9%


26,670


+3.3%


25,827
 
 
75


Table of Contents
BAT Annual Report and Form 20-F 2021
Financial Review
Financial Performance Summary
Continued
    
 
Profit From Operations
Profit from operations increased 2.7% to £10,234 million, compared to an increase of 10.5% to £9,962 million in 2020, largely driven by a translational foreign exchange headwind due to the relative strength of sterling compared to the Group’s operating currencies, including the US dollar. During 2021, Project Quantum (the Group’s restructuring and efficiency programme) delivered savings of £595 million in 2021, following £660 million in 2020.
Raw materials and other consumables costs
decreased 0.9% to £4,542 million in 2021, following a decline of 0.3% to £4,583 million in 2020. In 2021, our raw material costs were negatively impacted by a transactional foreign exchange headwind of 1.7%, offset by savings and translational tailwind (on costs). The decrease in 2020 was mainly due to the end of the contract manufacturing agreement which, due to excise recognition on
bought-in
products under that arrangement, led to an increase (in prior years) in revenue and in raw materials and other consumables costs.
Employee benefit costs
declined 1.0% to £2,717 million (2020: down 14.8% to £2,744 million). The reduction was partly due to translational foreign exchange, offsetting wage inflation and to operational efficiencies achieved through Quantum.
Depreciation, amortisation and impairment costs
decreased by £374 million to £1,076 million in 2021 compared to a decrease of £62 million to £1,450 million in 2020. This includes the amortisation and impairment charges of £306 million (2020: £339 million) largely related to the trademarks and similar intangibles capitalised following recent acquisitions. Also included were goodwill impairment charges of £54 million in Peru and £3 million following the exit from Myanmar (both in 2021) and £197 million (in 2020) in respect of Malaysia, recognised due to the ongoing operational challenges in those markets.
Profit from operations
(£m)
£10,234m
+2.7%
 
Definition:
Profit for the year before the impact of net finance costs/income, share of
post-tax
results of associates and joint ventures and taxation on ordinary activities.
Other operating expenses
declined by £199 million to £7,468 million (2020: decrease of £184 million to £7,667 million). The Group continued to incrementally increase the investment behind New Categories, with an increase in 2021 (compared to 2020) of £377 million, itself an increase on 2019 of £346 million, in part funded by the efficiencies delivered by Quantum.
Adjusting items
included within profit from operations
totalled £916 million in 2021 (2020: £1,403 million). These related to:
 
 
trademark amortisation and impairment (2021: £306 million; 2020: £339 million); 
 
 
other litigation costs of £80 million (2020: £487 million) which in 2021 was in respect of other litigation costs of £54 million (2020: £87 million) including Engle progeny and the net charge from settlements in Turkey and South Korea (£26 million). 2020 also included a £400 million charge largely in respect of developments in cases regarding payment obligations under the state settlement agreements with Florida, Texas, Minnesota and Mississippi for brands previously sold to a third party;
 
 
restructuring and integration costs of £150 million (2020: £408 million) partly related to Quantum which will simplify the business and create a more efficient and agile organisation to support the growth of New Categories;
Change in adjusted profit from operations at constant rates (%)
+5.2%
 
Definition:
Change in profit from operations before the impact of adjusting items and the impact of fluctuations in foreign exchange rates.
 
 
a credit, in 2021, of £59 million as an accrual related to the Reynolds American dissenting shareholders was released on successful conclusion of that complaint;
 
 
a credit, in 2021, of £35 million following the partial
buy-out
of the pension fund in the U.S.; and
 
 
charges in respect of the sale of the Group’s operations in Iran (£358 million) in 2021, largely in respect of the
write-off
of certain assets and the reclassification, from reserves to the income statement, of foreign exchange.
The Group also recognised charges in respect of the impairment of goodwill of £57 million in 2021 (related to Peru and Myanmar) and £209 million in 2020 (mainly in respect of Malaysia and Twisp) which was partly offset by a credit, in 2020, of £40 million (related to the 2019 charge associated with the excise dispute in Russia).
2020 also included an estimated £145 million in additional supply chain costs to maintain supply as a number of markets experienced temporary disruption due to
COVID-19,
with no material additional costs incurred in 2021.
Expenditure on research and development
was £304 million in 2021 (2020: £307 million) with a focus on products that could potentially reduce the risk associated with smoking conventional cigarettes.
 
Analysis of profit from operations, net finance costs and results from associates and joint ventures
 
    
2021
   
2020
 
     
Reported
£m
   
Adjusting
items £m
    
Adjusted
£m
   
Impact
of exchange
£m
   
Adjusted
at CC
£m
   
Reported
£m
   
Adjusting
items £m
   
Adjusted
£m
 
Profit from operations
                 
U.S.
  
 
5,566


321


5,887


456


6,343


4,975


809


5,784
 
APME
  
 
1,287


430


1,717


116


1,833


1,472


381


1,853
 
AmSSA
  
 
1,496


94


1,590


98


1,688


1,553


65


1,618
 
ENA
  
 
1,885


71


1,956


132


2,088


1,962


148


2,110
 
Total regions
  
 
10,234


916


11,150


802


11,952


9,962


1,403


11,365
 
Net finance (costs)/income
  
 
(1,486
 
 
55


(1,431
 
 
(89
 
 
(1,520
 
 
(1,745
 
 
153


(1,592
Associates and joint ventures
  
 
415


12


427


29


456


455


(13
 
 
442
 
Profit before tax
  
 
9,163


983


10,146


742


10,888


8,672


1,543


10,215
 
 
76
 

Table of Contents
BAT Annual Report and Form 20-F 2021    
 
Strategic Report        
 
        Governance Report        
  
Financial Statements        
  
Other Information        


Operating margin
(%)
39.8%
 
Definition:
Profit from operations as a percentage of revenue.
Adjusted profit from operations
is the Group’s profit from operations before adjusting items referred to above. Adjusted profit from operations fell 1.9% to £11,150 million, driven by the foreign exchange headwind. On a constant currency basis this would have been an increase of 5.2%. In 2020, adjusted profit from operations grew 2.1% to £11,365 million, being an increase of
4.8% on a constant currency basis.
Operating Margin
Operating margin in 2021 increased by 120 bps to 39.8% largely driven by lower charges in respect of items such as trademark amortisation, goodwill impairment, litigation and Quantum in 2021 compared to 2020, despite the impact of Iran described earlier. In 2020, operating margin was 38.6%, an increase of 380 bps as 2019 was impacted by a number of items (including Quebec and Russia) that did not repeat. These are described in note 6 in the Notes on the Accounts.
In 2021, adjusted operating margin declined 70 bps to 43.4%, compared to a growth of 100 bps in 2020 (to 44.1%). This was driven by the proportionate growth in New Categories revenue (with the Group continuing to invest in those categories), higher revenue in lower margin markets and a transactional foreign exchange headwind of 1.7%.
Adjusted operating margin
(%)
43.4%
 
Definition:
Adjusted profit from operations as a percentage of adjusted revenue.
 
Net Finance Costs
In 2021, net finance costs were £1,486 million, a decrease of £259 million on 2020 which, at £1,745 million, were £143 million higher than 2019.
The movement in 2021 was partly due to the impact of the charges incurred in 2020 (in relation to the redemptions and tender offer to repurchase certain bonds undertaken to
de-risk
the Group’s future financing programme which did not repeat) and a translational foreign exchange tailwind due to the strength of sterling. Also in 2021, the Group issued perpetual hybrid bonds totalling
2 billion, recognised, in line with IAS 32
Financial Instruments
, as equity. Interest on such instruments are recognised in reserves rather than as a charge to the income statement in net finance costs. In 2021, in line with IAS 33
Earnings Per Share
, £12 million has been recognised as a deduction to EPS similar to
non-controlling
interest. The increase in 2020 was also driven by a change in mix of borrowings towards the US dollar during the year (as the Group issued bonds totalling US$8.7 billion,
1.7 billion and £0.5 billion).
Before adjusting items in respect of interest on a settlement in Turkey in 2021 (£11 million), the Franked Investment Income Group Litigation Order (FIIGLO), as discussed on page 201 (£20 million;
2020: £21 million) and, in 2020, net costs of £142 million in respect of the bond redemption combined with a net credit of £10 million (largely in respect of interest in relation to the Russia excise dispute) and the translation impact of foreign exchange (in both years), adjusted net finance costs were 4.5% lower in 2021 and 5.9% higher in 2020. The Group’s average cost of debt in 2021 was 3.5%, compared to 3.6% in 2020.
Associates and Joint Ventures
Associates largely comprised the Group’s shareholding in its Indian associate, ITC. The Group’s share of
post-tax
results of associates and joint ventures, included at the
pre-tax
level under IFRS, decreased from £455 million to £415 million in 2021. This follows a decline in 2020 of 8.6% (from £498 million in 2019), as ITC continued to experience difficult trading conditions, including business disruption due to the impact of
COVID-19.
Included in the results for 2021 and 2020 are adjusting items, which included a gain of £6 million in 2021 (2020: £17 million), arising on the deemed disposal of part of the Group’s shareholding in ITC (due to issuances of ordinary shares under the ITC Employee Share Option Scheme).
In 2021, this was more than offset by other charges, including an £18 million charge in 2021 as the Group recognised an impairment in Yemen.
In 2020, the Group recognised a £4 million charge being the Group’s share of charges recognised by ITC in respect of the cost of leaf tobacco stocks destroyed in a third-party warehouse fire.
Excluding such adjusting items and the impact of translational foreign exchange, the Group’s share of associates and joint ventures on an adjusted, constant currency basis increased 3.3% in 2021, to £456 million. In 2020, this was a decrease of 1.2% on 2019.
 
Analysis of profit from operations, net finance costs and results from associates and joint ventures


2020
   
2019
 
     
Reported
£m
   
Adjusting
items
£m
   
Adjusted
£m
   
Impact
of exchange
£m
   
Adjusted
at CC
£m
   
Reported
£m
   
Adjusting
items
£m
   
Adjusted
£m
 
Profit from operations
                
U.S.
  
 
4,975


809


5,784


32


5,816


4,410


626


5,036
 
APME
  
 
1,472


381


1,853


56


1,909


1,753


306


2,059
 
AmSSA
  
 
1,553


65


1,618


178


1,796


1,204


638


1,842
 
ENA
  
 
1,962


148


2,110


30


2,140


1,649


544


2,193
 
Total regions
  
 
9,962


1,403


11,365


296


11,661


9,016


2,114


11,130
 
Net finance (costs)/income
  
 
(1,745
 
 
153


(1,592
 
 
(20
 
 
(1,612
 
 
(1,602
 
 
80


(1,522
Associates and joint ventures
  
 
455


(13
 
 
442


26


468


498


(25
 
 
473
 
Profit before tax
  
 
8,672


1,543


10,215


302


10,517


7,912


2,169


10,081
 
 
77


Table of Contents
BAT Annual Report and Form 20-F 2021
Financial Review
Financial Performance Summary
Continued
    
 
Tax
In 2021, the tax charge in the income statement was £2,189 million, compared to £2,108 million in 2020 and £2,063 million in 2019.
The effective tax rates in the income statement are therefore a charge of 23.9% in 2021, 24.3% in 2020 and 26.1% in 2019. These are also affected by the inclusion of adjusting items described earlier and the associates and joint ventures’
post-tax
profit in the Group’s
pre-tax
results. Excluding these items, the underlying tax rate for subsidiaries was 24.7% in 2021, 24.9% in 2020 and 26.0% in 2019. The decrease in underlying tax rate in 2021 largely reflects the prior and current year tax reclaims in Brazil together with mix of profits.
See the section
Non-GAAP
measures on page 309 for the computation of underlying tax rates for the periods presented.
Tax strategy
The Group’s global tax strategy is reviewed regularly by the Board. The operation of the strategy is managed by the Finance and Transformation Director and Group Head of Tax with the Group’s tax position reported to the Audit Committee on a regular basis. The Board considers tax risks that may arise as a result of our business operations. In summary, the strategy includes:
 
 
complying with all applicable laws and regulations in countries in which we operate;
 
 
being open and transparent with tax authorities and operating to build mature professional relationships;
 
 
supporting the business strategy of the Group by undertaking efficient management of our tax affairs in line with the Group’s commercial activity;
 
 
transacting on an
arm’s-length
basis for exchanges of goods and services between companies within the Group; and
 
 
engaging in
pro-active
discussions with tax authorities on occasions of differing legal interpretation.
Where resolution is not possible, tax disputes may proceed to litigation. The Group seeks to establish strong technical tax positions.
Where legislative uncertainty exists, resulting in differing interpretations, the Group seeks to establish that its position would be more likely than not to prevail. Transactions between Group subsidiaries are conducted on
arm’s-length
terms in accordance with appropriate transfer pricing rules and OECD principles.
The tax strategy outlined above is applicable to all Group companies, including the UK Group companies. Reference to tax authorities includes HMRC.
The publication of this strategy is considered to constitute compliance with the duty under paragraph 16(2) Schedule 19 Part 2 of the UK Finance Act 2016.
The taxation on ordinary activities was a charge of £2.2 billion in 2021, £2.1 billion in 2020 and £2.1 billion in 2019. Corporation Tax paid (due to the timing of Corporation Tax instalment payments which straddle different financial years) was £2.3 billion in 2021, £2.1 billion in 2020 and £2.2 billion in 2019.
Our tax footprint extends beyond Corporation Tax, including significant payment of employment taxes and other indirect taxes including customs and import duties. The Group also collects taxes on behalf of governments (including tobacco excise, employee taxes, VAT and other sales taxes). The total tax paid in 2021 of £40.5 billion (2020: £41.1 billion, 2019: £41.4 billion) therefore consists of both taxes borne and taxes collected as shown in the table provided.
In addition to the major taxes, there are a host of other taxes the Group bears and collects such as transport taxes, energy and environmental taxes, and banking and insurance taxes.
The movements in deferred tax, taken through other comprehensive income, mainly relate to the change in the valuation of retirement benefits in the year, as disclosed in note 16 in the Notes on the Accounts.


Deferred tax asset/(liability)
 
     
2021
£m
   
2020
£m
   
2019
£m
 
Opening balance
  
 
(15,780
 
 
(16,626
 
 
(17,432
Difference on exchange
  
 
(148
 
 
506


680
 
Changes in tax rates
  
 
158


133


47
 
Other credits/(charges) to the income statement
  
 
29


184


(55
Other (charges)/credits to other comprehensive income
  
 
(110
 
 
23


138
 
Other movements


(4
Closing balance
  
 
(15,851
 
 
(15,780
 
 
(16,626
 
78


Table of Contents
BAT Annual Report and Form 20-F 2021    
 
Strategic Report        
 
        Governance Report        
  
Financial Statements        
  
Other Information        


Earnings Per Share
Profit for the year was £6,974 million, a 6.2% increase compared to £6,564 million in 2020 (itself an increase of 12.2% on 2019). While the Group was impacted by foreign exchange headwinds, a good operational performance in both years was enhanced by efficiencies realised through Quantum and from a lower effective tax rate. Both 2021 and 2020 were impacted by a number of charges as described earlier with the improvement in profit for the year in 2020 (compared to 2019) also due to charges in relation to Quebec and Russia in 2019.
Consequently, and after accounting for the movement in
non-controlling
interests in the year, basic earnings per share were 6.0% higher at 296.9p (2020: 280.0p; 2019: 249.7p). After accounting for the dilutive effect of employee share schemes, diluted earnings per share were 295.6p, 6.0% higher than 2020 (2020: 278.9p; 2019: 249.0p).
Earnings per share are impacted by the adjusting items discussed earlier. Adjusted diluted EPS, as calculated in note 11 in the Notes on the Accounts, was down against the prior year by 0.8% at 329.0p, with 2020 ahead of 2019 by 2.4% at 331.7p. Adjusted diluted EPS at constant rates would have been 6.6% ahead of 2020 at 353.5p, with 2020 up 5.5% against 2019.
Dividends
The Group pays its dividends to shareholders over four quarterly interim dividends. Quarterly dividends provide shareholders with a more regular flow of dividend income and allow the Company to spread its substantial dividend payments more evenly over the year, aligning better with the cash flow generation of the Group and so enable the Company to fund the payments more efficiently. The Board seeks to reward shareholders with an increase in dividend, by reference to 65% of adjusted diluted EPS over the mid to long term.
The Board has declared an interim dividend of 217.8p per ordinary share of 25p, payable in four equal quarterly instalments of 54.45p per ordinary share in May 2022, August 2022, November 2022 and February 2023. This represents an increase of 1.0% on 2020 (2020: 215.6p per share, up 2.5%) and a payout ratio, on 2021 adjusted diluted earnings per share, of 66.2% (2020: 65.0%).
The quarterly dividends will be paid to shareholders registered on either the UK main register or the South Africa branch register and to ADS holders, each on the applicable record dates.
Under IFRS, the dividend is recognised in the year that it is approved by shareholders or, if declared as an interim dividend by Directors, in the period that it is paid.
The cash flow, prepared in accordance with IFRS, reflects the total cash paid in the period. Further details of the total amounts of dividends paid in 2021 and 2020 (with 2019 comparatives) are given in note 22 in the Notes on the Accounts.
Dividends are declared and payable in sterling except for those shareholders on the branch register in South Africa, where dividends are payable in rand. The equivalent dividends receivable by holders of ADSs in US dollars are calculated based on the exchange rate on the applicable payment date.
Further details of the quarterly dividends and key dates are set out under ‘Shareholder information’ on pages 354 and 355.
Diluted earnings per share (EPS)
(p)
295.6p
+6.0%
 
Definition:
Profit attributable to owners of BAT p.l.c. over weighted average number of shares outstanding, including the effects of all dilutive potential ordinary shares.
 
Change in adjusted diluted EPS
(%)
-0.8%
 
Definition:
Change in diluted earnings per share before the impact of adjusting items.
 
Change in adjusted diluted EPS
at constant rates
(%)
+6.6%
 
Definition:
Change in diluted earnings per share before the impact of adjusting items and the impact of fluctuations in foreign exchange rates.
 
 
The discussion of 2019 results that are not necessary to an understanding of the Group’s financial condition, changes in financial condition and results of operations is excluded from this Financial Review in accordance with applicable US Securities laws. Discussion of such 2019 metrics is contained in the Group’s Annual Report on Form
20-F
2020, which is available at bat.com/annualreport and has been filed with the SEC. Information contained in pages 34 to 42, pages 65 to the first column on page 72 and from the heading ‘Retirement benefit schemes’ on page 72 to page 73 of the Annual Report on Form
20-F
2020 are accordingly incorporated by reference into this Annual Report on Form
20-F
2021 only to the extent such information pertains to the Group’s financial condition and results of operations for the fiscal year ended 31 December 2019.
 
 
79


Table of Contents
BAT Annual Report and Form 20-F 2021
Financial Review
Treasury and Cash Flow


Treasury, Liquidity and
Capital Structure
The Treasury Function is responsible for raising finance for the Group and managing the Group’s cash resources and the financial risks arising from underlying operations. Clear parameters have been established, including levels of authority, on the type and use of financial instruments to manage the financial risks facing the Group. Such instruments are only used if they relate to an underlying exposure; speculative transactions are expressly forbidden under the Group’s treasury policy. All these activities are carried out under defined policies, procedures and limits, reviewed and approved by the Board, delegating oversight to the Finance and Transformation Director and Treasury Function. See note 26 in the Notes on the Accounts for further detail.
It is the policy of the Group to maximise financial flexibility and minimise refinancing risk by issuing debt with a range of maturities, generally matching the projected cash flows of the Group and obtaining this financing from a wide range of sources. The Group targets an average centrally managed debt maturity of at least five years of which no more than 20% matures in a single rolling year. As at 31 December 2021, the average centrally managed debt maturity was 10.1 years (2020: 9.9 years) with the highest proportion maturing in a single rolling
12-month
period was 18.6% (2020: 16.4%).
In order to manage its interest rate risk, the Group maintains both floating rate and fixed rate debt. The Group sets targets (within overall guidelines) for the desired ratio of floating to fixed rate debt on a net basis (at least 50% fixed on a net basis in the short to medium term). At 31 December 2021, the relevant ratio of floating to fixed rate borrowings was 10:90 (2020: 7:93). As part of the management of liquidity, funding and interest rate risk, the Group regularly evaluates market conditions and may enter into transactions, from time to time, to repurchase outstanding debt, pursuant to open market purchases, tender offers or other means.
The Group continues to maintain investment-grade credit ratings*, with ratings from Moody’s/S&P at Baa2 (stable outlook)/BBB+ (stable outlook). The strength of the ratings has underpinned debt issuance and the Group is confident of its ability to successfully access the debt capital markets.
 
*
A credit rating is not a recommendation to buy, sell or hold securities. A credit rating may be subject to withdrawal or revision at any time. Each rating should be evaluated separately of any other rating.
As at 31 December 2021, the Group’s floating rate borrowings have no exposure in relation to IBOR reform as its floating rate bond of US$750 million is due to mature in August 2022 before the USD LIBOR ceases.
Additionally, the Group has hedging instruments that are indexed to sterling LIBOR interest rates. The Group signed up to the ISDA 2020 IBOR Fallback Protocol as published by the International Swaps and Derivative Association Inc., ensuring that appropriate fallback rates will apply in relation to derivatives that are impacted by LIBOR cessation and therefore certainty on the basis of the further cash flows. The hedge relationship on these derivatives will continue with the resulting ineffectiveness likely to be immaterial.
Available facilities
The Group maintains a £25 billion Euro Medium Term Note (EMTN) programme, and US (US$4 billion) and European (£3 billion) commercial paper programmes to accommodate the liquidity needs of the Group. At 31 December 2021, there was £269 million commercial paper outstanding (2020: nil outstanding). Cashflows relating to commercial paper that have maturity periods of three months or less are presented on a net basis in the Group’s cashflow statement.
The Group’s main bank facility is a syndicated £5.85 billion committed revolving credit facility. This facility was undrawn at 31 December 2021 (31 December 2020: undrawn). In 2021, the Group exercised the first of the
one-year
extension options on both tranches of the revolving credit facility, with the second
one-year
extension subsequently exercised in February 2022. Effective March 2022, therefore, the £2.85 billion
364-day
tranche will be extended to March 2023 at the reduced amount of £2.7 billion and £2.5 billion of the five-year tranche will be extended from March 2026 to March 2027 (with £3.0 billion of this tranche remaining available until March 2025 and £2.85 billion remaining available from March 2025 to March 2026).
During 2021, the Group extended short-term bilateral facilities totalling £2.5 billion until March or April 2022, some with extension options to extend for further periods. As at 31 December 2021, £500 million was drawn on a short-term basis.
Of such short-term bilateral facilities, in December 2021, the Group amended and extended a total of £500 million until December 2022 and subsequent to year end, the Group amended and extended a further £500 million until January 2023 and effective April 2022, an additional £350 million was agreed to be extended until October 2022 and £500 million until
April 2023. Cashflows relating to bilateral facilities that have maturity periods of three months or less are presented on a net basis in the Group’s cashflow statement.
In July 2019, the Group filed a shelf registration statement on Form
F-3
with the SEC pursuant to which B.A.T Capital Corporation and B.A.T. International Finance p.l.c. may issue debt securities guaranteed by certain members of the Group from time to time. This forms part of the Group’s strategy to ensure flexible and agile access to capital markets and the registration statement is initially valid for three years.
Use of facilities
These facilities ensure that the Group has access to funding to supplement the cash available or generated by the business in the period to meet the operational (including working capital) and general corporate requirements including, but not limited to, the timing of payments in relation to:
 
 
dividends (2021: £4.9 billion; 2020: £4.8 billion);
 
 
capital expenditure (2021: £0.6 billion; 2020: £0.6 billion);
 
 
MSA in the U.S. (2021: £2.7 billion; 2020: £2.2 billion);
 
 
refinancing obligations;
 
 
share repurchase programme, as announced for 2022 (£2 billion); and
 
 
other corporate activity such as litigation or acquisitions as relevant.
Management believes that the Group has sufficient working capital for present requirements, taking into account the amounts of undrawn borrowing facilities and levels of cash and cash equivalents, and the ongoing ability to generate cash.
Issuance, drawdowns and repayment in the period
In 2021, the Group repaid:
 
 
650 million, £500 million,
1.1 billion, CHF 400 million and
500 million bonds at maturity; and
 
 
the £1,929 million term loan that had a maturity date in January 2022.
Also in 2021, the Group issued perpetual hybrid bonds totalling
2 billion. The issuance allowed the Group to raise incremental euro-denominated securities, which contributed to a more efficient alignment of the Group’s earnings currency. It also contributes to the diversification of the Group’s sources of funding and further strengthens its capital structure. The issuance provided the additional benefit of supporting the deleveraging journey with the addition of a small benefit to the credit metrics.
 
80
 

Table of Contents
BAT Annual Report and Form 20-F 2021    
 
Strategic Report        
 
    Governance Report        
  
Financial Statements        
  
Other Information        


During 2020, in light of the uncertainty and volatility in the external markets, the Group has
de-risked
future financing requirements by accessing the debt capital markets, raising a total of US$8.7 billion in the U.S. market, and
1.7 billion and £0.5 billion in the European market (in aggregate £8.9 billion). Also in 2020 as part of the
de-risking
programme, the Group repurchased and redeemed £3.1 billion of debt maturing in 2021 and 2022, reducing the ‘tower’ of debt due for repayment in 2022.
Cash Flow
Net cash generated from
operating activities
Net cash generated from operating activities decreased by 0.7% to £9,717 million in 2021, compared to an increase of £790 million to £9,786 million in 2020. 2021 was negatively impacted by a translational foreign exchange headwind and the timing of MSA payments in the U.S. and higher tax payments (mainly in Canada and the U.S.). These were largely offset by favourable movement in inventories (as stock builds in Australia in 2020 did not repeat), and lower payments in respect of litigation (2021: £248 million; 2020: £464 million). 2020 included the payment of the settlement agreed in 2019 in respect of the excise dispute in Russia (£205 million), U.S. litigation (including £169 million in respect of the Florida judgment described earlier). 2020 was also impacted by working capital movements driven by
COVID-19
of £131 million.
Net cash used in investing activities
In 2021, net cash used in investing activities increased to £1,140 million (2020: £783 million), largely due to a net outflow of £228 million from short-term investment products, including treasury bills (2020: £159 million net outflow), the disposal of the Group’s operations in Iran (£98 million) and the purchase of the equity stake in Organigram. Purchases of property, plant and equipment were largely in line with 2020, at £527 million (2020: £511 million).
In 2021, the Group invested £664 million, in gross capital expenditure, an increase of 2.5% on the prior year (2020: £648 million). This includes purchases of property, plant and equipment and certain intangibles, and the investment in the Group’s global operational infrastructure (including, but not limited to, the manufacturing network, trade marketing software and IT systems and the expansion of our New Categories portfolio). The Group expects gross capital expenditure in 2022 of £750 million.
Net cash used in financing activities
Net cash used in financing activities was an outflow of £8,749 million in 2021 (2020: £7,897 million outflow), with the outflow in each year largely driven by:
 
 
dividend payments (2021: £4,904 million, up 3.4%; 2020: £4,745 million, up 3.2%, with the growth in both years driven by the higher dividend per share); and
 
 
the net repayment of borrowings (2021: £3,865 million; 2020: £807 million) partly offset by the issuance of the hybrid bonds (£1,685 million in 2021).
In 2021, interest paid declined 14.9% to £1,479 million (2020: £1,737 million), with the movements largely driven by charges in relation to the refinancing programme in 2020 that did not repeat.
 
Summary cash flow
 
     
2021
£m
   
2020
£m
   
2019
£m
 
       
Cash generated from operations
  
 
11,678


11,567


10,948
 
       
Dividends received from associates
  
 
353


351


252
 
       
Tax paid
  
 
(2,314
 
 
(2,132
 
 
(2,204
       
Net cash generated from operating activities
  
 
9,717


9,786


8,996
 
       
Net cash used in investing activities
  
 
(1,140
 
 
(783
 
 
(639
       
Net cash used in financing activities
  
 
(8,749
 
 
(7,897
 
 
(8,593
       
Differences on exchange
  
 
(253
 
 
(253
 
 
(57
       
(Decrease)/increase in net cash and cash equivalents
  
 
(425
 
 
853


(293
In 2021, the Group repaid borrowings of £4.8 billion and issued £1.0 billion of new borrowings, while the Group issued perpetual hybrid bonds totalling
2 billion (£1.7 billion). The Group repaid borrowings of £10.6 billion in 2020, including £3.1 billion as part of the Group’s liquidity management strategy to
de-risk
future financing, largely offset by new borrowings of £9.8 billion. Please refer to note 26 in the Notes on the Accounts for further details.
Cash flow conversion
The conversion of profit from operations to net cash generated from operating activities may indicate the Group’s ability to generate cash from the profits earned. Based upon net cash generated from operating activities, the Group’s conversion rate was 95% compared to 98% in 2020, which was largely in line with 2019.
Restricted cash
Cash and cash equivalents include restricted amounts of £1,024 million (2020: £878 million) due to subsidiaries in CCAA protection (as described in note 32 in the Notes on the Accounts), as well as £305 million (2020: £455 million) principally due to exchange control restrictions, including amounts of £92 million (2020: £141 million) where the underlying restrictions are expected to be short-term in nature.
 
81


Table of Contents
BAT Annual Report and Form 20-F 2021
Financial Review
Other


Borrowings and Net Debt
Total borrowings (which includes lease liabilities) declined to £39,658 million in 2021 (2020: £43,968 million) largely due to the refinancing undertaken in 2021 (with the
2 billion perpetual hybrid bonds issued in the year recognised as equity) and the net repayment of borrowings in the year (partly due to the cash flow generated by the business in the period). The value of borrowings is also impacted by the relative movement of sterling against other currencies, particularly the US dollar and the euro. In 2021, this was a tailwind of £409 million compared to a tailwind of £219 million in 2020.
Total borrowings includes £754 million (31 December 2020: £790 million) in respect of the purchase price adjustments related to the acquisition of Reynolds American Inc.
As discussed on page 80, the Group remains confident about its ability to access the debt capital markets successfully and reviews its options on a continuing basis.
Net debt is a
non-GAAP
measure and is defined as total borrowings (including related derivatives and lease liabilities) less cash and cash equivalents and current investments held at fair value.
Net debt, at 31 December 2021, was £36,302 million (2020: £40,241 million; 2019: £42,574 million), with the movement in net debt largely due to the net repayment of borrowings (partly enabled by the issuance of perpetual hybrid bonds) and a foreign exchange headwind of £124 million, primarily due to the movement of the US dollar against sterling (2020: £69 million tailwind).
Retirement Benefit Schemes
The Group’s subsidiary undertakings operate defined benefit schemes, including pension and post-retirement healthcare schemes, and defined contribution schemes. The most significant arrangements are in the U.S., UK, Canada, Germany, Switzerland and the Netherlands. Together, schemes in these territories account for over 90% of the total underlying obligations of the Group’s defined benefit arrangements and over 70% of the defined benefit net costs charged to adjusted profit from operations. Benefits provided through defined contribution schemes are charged as an expense as payments fall due. The liabilities arising in respect of defined benefit schemes are determined in accordance with the advice of independent, professionally qualified actuaries, using the projected unit credit method. It is Group policy that all schemes are formally valued at least every three years. Contributions to the defined benefit schemes are determined after consultation with the respective trustees and actuaries of the individual externally funded schemes, taking into account regulatory environments.
The present total value of funded scheme liabilities as at 31 December 2021 was £10,084 million (2020: £12,223 million), while unfunded scheme liabilities amounted to £1,037 million (2020: £1,147 million). The schemes’ assets decreased to £10,816 million from £12,576 million in 2020, itself an increase from £11,860 million in 2019. The overall net liability for all pension and healthcare schemes in Group subsidiaries amounted to £321 million at the end of 2021, compared to £810 million at the end of 2020.
In addition, during 2021, the risk profiles and values of amounts relating to retirement benefit arrangements were impacted by a partial
buy-out
in the U.S. and through
buy-ins
in the UK and Canada. Please refer to note 15 in the Notes on the Accounts for further details.
Litigation and Settlements
As discussed in note 31 in the Notes on the Accounts, various legal proceedings or claims are pending or may be instituted against the Group.
 
82


Table of Contents
BAT Annual Report and Form 20-F 2021    
 
Strategic Report        
 
Governance Report        
  
Financial Statements        
  
Other Information        


Government Activity
The marketing, sale, taxation and use of tobacco products have been subject to substantial regulation by government and health officials for many years. For information about the risks related to regulation, see page 94 and pages 325 to 334.
Off-balance Sheet Arrangements and Contractual Obligations
Except for certain indemnities, the Group has no significant
off-balance
sheet arrangements other than in respect of leaf purchase obligations. The Group has contractual obligations to make future payments on debt guarantees. In the normal course of business, it enters into contractual arrangements where the Group commits to future purchases of goods and services from unaffiliated and related parties. See page 316 for a summary of the contractual obligations as at 31 December 2021.
Accounting Policies
The application of the accounting standards and the accounting policies adopted by the Group are set out in the Group Manual of Accounting Policies and Procedures (GMAPP).
GMAPP includes the Group instructions in respect of the accounting and reporting of business activities, such as revenue recognition, asset valuations and impairment testing, adjusting items, the accrual of obligations and the appraisal of contingent liabilities, which include taxes and litigation. Formal processes are in place whereby central management and
end-market
management confirm adherence to the principles and the procedures and to the completeness of reporting. Central analyses and revision of information are also performed to ensure and confirm adherence.
In order to prepare the Group’s consolidated financial information in accordance with IFRS, management has used estimates and assumptions that affect the reported amounts of revenue, expenses and assets, and the disclosure of contingent liabilities, at the date of the financial statements.
The critical accounting estimates are described in note 1 in the Notes on the Accounts and include:
 
 
review of asset values, including goodwill and impairment testing;
 
 
estimation and accounting for retirement benefit costs; and
 
 
estimation of provisions, including as related to taxation and legal matters.
The critical accounting judgements are described in note 1 in the Notes on the Accounts and include:
 
 
identification and quantification of adjusting items;
 
 
determination as to whether to recognise provisions and the exposures to contingent liabilities related to pending litigation or other outstanding claims;
 
 
determination as to whether control (subsidiaries), joint control (joint arrangements), or significant influence (associates) exist in relation to investments held by the Group;
 
 
review of applicable exchange rates for transactions with and translation of entities in territories where there are restrictions on the free access to foreign currency or multiple exchange rates; and
 
 
the determination as to whether perpetual hybrid bonds should be classified as equity instead of borrowings.
Foreign Exchange Rates
The principal exchange rates used to convert the results of the Group’s foreign operations to sterling, for the purposes of inclusion and consolidation within the Group’s financial statements, are indicated in the table below.
Where the Group has provided results at constant rates of exchange, this refers to the translation of the results from the foreign operations at rates of exchange prevailing in the prior period – thereby eliminating the potentially distorting impact of the movement in foreign exchange on the reported results.
Going Concern
A description of the Group’s business activities, its financial position, cash flows, liquidity position, facilities and borrowings position, together with the factors likely to affect its future development, performance and position, are set out in this Annual Report and
Form 20-F.
 
The key Group risks include analyses of financial risk and the Group’s approach to financial risk management. Notes 23 and 26 in the Notes on the Accounts provide further detail on the Group’s borrowings and management of financial risks.
The Group has, at the date of this report, sufficient existing financing available for its estimated requirements for at least the next 12 months and beyond in respect of general corporate purposes. This includes the payments arising in respect of the Master Settlement Agreement due in the U.S. in 2022 and other known liabilities or future payments (including interim dividends), as they fall due. Actions undertaken during 2021 and 2020 to
de-risk
future funding requirements, as previously described, provide further assurance with regards to the Group’s financial viability.
During 2021 and 2020,
COVID-19
has demonstrated the Group’s ability to navigate the uncertainties arising through operational, economic and societal volatility. Such challenges have been met through the Group’s geographic diversity and ability to flex operations. This, together with the ability to generate cash from trading activities, the performance of the Group’s Strategic Portfolio and its leading market positions in a number of countries, as well as numerous contracts with established customers and suppliers across different geographical areas and industries, provides the Directors with the confidence that the Group is well placed to manage its business risks successfully in the context of current financial conditions and the general outlook in the global economy.
After reviewing the Group’s annual budget, plans and financing arrangements, the Directors consider that the Group has adequate resources to continue operating and that it is therefore appropriate to continue to adopt the going concern basis in preparing the Annual Report
and Form 20-F.
 
Foreign exchange rates


Average
    
Closing


2021
    
2020
    
2019
    
2021
    
2020
    
2019
 
             
Australian dollar
  
 
1.832


1.862


1.836


1.863


1.771


1.885
 
             
Brazilian real
  
 
7.421


6.616


5.035


7.544


7.100


5.329
 
             
Canadian dollar
  
 
1.724


1.720


1.694


1.711


1.741


1.718
 
             
Euro
  
 
1.164


1.125


1.140


1.191


1.117


1.180
 
             
Indian rupee
  
 
  101.702


95.097


89.898


100.684


99.880


94.558
 
             
Japanese yen
  
 
151.124


  137.017


  139.234


  155.972


  141.131


  143.967
 
             
Russian rouble
  
 
101.388


92.844


82.623


101.592


101.106


82.282
 
             
South African rand
  
 
20.335


21.099


18.437


21.617


20.079


18.525
 
             
US dollar
  
 
1.376


1.284


1.277


1.354


1.367


1.325
 
 
83


Table of Contents
BAT Annual Report and Form 20-F 2021
 
Regional Review
U.S.
United States


 With Vuse approaching value
leadership and strong pricing, we are
delivering value across our portfolio
 
Guy Meldrum
President and CEO (Reynolds American Inc.)
 
                                                                                                                              
Volume


2021
units
    
vs 2020
%
    
2020
units
    
vs 2019
%
    
2019
units
 
           
Cigarettes (bn sticks)
  
 
70


-5.0%


73


+0.5%


73
 
           
Other (bn sticks eq)*


Combustibles (bn sticks)
  
 
70


-5.0%


73


+0.5%


73
 
           
New Categories:
                                            
           
Vapour (mn 10ml/pods)
  
 
291


+66.7%


174


+69.7%


103
 
           
THP (bn sticks)


Modern Oral (mn pouches)
  
 
602


+272%


162


+45.0%


112
 
           
Traditional Oral (bn sticks eq)
  
 
7


-5.1%


8


-1.3%


8
 
 
*
Other includes MYO/RYO.
 
                                                                                                                                                       
Revenue


2021
£m
    
vs 2020
%
    
vs 2020
(adj at cc)
%
    
2020
£m
    
vs 2019
%
    
vs 2019
(adj at cc)
%
 
             
Combustibles
  
 
10,015


+0.9%


+8.1%


9,926


+9.3%


+9.9%
 
             
New Categories:
                                                     
             
Vapour
  
 
561


+46.4%


+56.9%


383


+85.1%


+86.1%
 
             
THP
  
 
1


-21.8%


-16.2%


1


+0.0%


+0.5%
 
             
Modern Oral
  
 
2


-81.5%


-80.1%


10


+13.5%


+14.1%
 
             
Total New Categories
  
 
564


+43.0%


+53.3%


394


+81.9%


+82.9%
 
             
Traditional Oral
  
 
1,077


-4.3%


+2.6%


1,126


+7.0%


+7.6%
 
             
Other
  
 
35


+26.9%


+36.0%


27


+4.6%


+5.1%
 
             
Revenue
  
 
11,691


+1.9%


+9.2%


11,473


+10.6%


+11.2%


Profit from operations/Operating margin


2021
£m
    
vs 2020
%
    
vs 2020
(adj at cc)
%
    
2020
£m
    
vs 2019
%
    
vs 2019
(adj at cc)
%
 
             
Profit from operations
  
 
5,566


+11.9%


+9.7%


4,975


+12.8%


+15.5%
 
             
Operating margin (%)
  
 
47.6%


+420 bps


+20 bps


43.4%


+90 bps


+190bps


Revenue by category


+60 bps
 
Cigarette value
 
share change
 
4,405
 
Number
 
of employees
 
7
 
Owned
 
manufacturing
 
(inc R&D) sites


Key Markets
Our products are available in all regions of the U.S.
Revenue and Profit from Operations
In 2021, reported revenue grew 1.9% to £11,691 million, with 2020 up 10.6% to £11,473 million. Excluding the impact of translational foreign exchange, this was an increase of 9.2% in 2021 (2020: up 11.2%). This was driven, in both years, by pricing (supported by our Revenue Growth Management (RGM) capabilities) in cigarettes, Vapour and Traditional Oral and the continued growth in vapour volume. 2021 also benefited (by an estimated £200 million) from trade inventory movements mainly linked to the timing of price increases and uncertainty about a potential excise increase. This was offset by a decline in combustible volume (lapping a strong comparator period). 2020 volume was positively impacted by resilient consumer demand resulting from the increase in fiscal stimulus, lower gas prices and an extra selling day combined with higher supply chain inventories.
Reported profit from operations increased 11.9% to £5,566 million in 2021 (2020: up 12.8% to £4,975 million). This was driven by the higher revenue (in both years), lower losses from Vuse in 2021, initiatives including marketing spend effectiveness and the benefit from trade inventory movements. This was also driven by lower adjusting items in 2021, related to the ongoing efficiency programmes (Quantum), credits related to the partial
buy-out
of the pension fund (£35 million) and the finalisation of the dissenting shareholders litigation (£59 million). These were lower than in 2020, which included a £400 million charge related to payment obligations under the state settlement agreements with Florida, Texas, Minnesota and Mississippi for brands previously sold to a third party.
Excluding the adjusting items and the impact of a translational foreign exchange headwind, adjusted profit from operations increased by 9.7% (2020: 15.5%) on a constant currency basis.
New Categories
In 2021, Vuse performed well, gaining significant vapour value share and approaching value leadership, up 760 bps to 32.5% from 24.9% in 2020 and 16.6% in 2019.
 
84
 

Table of Contents
BAT Annual Report and Form 20-F 2021    
 
Strategic Report        
 
Governance Report        
  
Financial Statements        
  
Other Information        


*
Based on the weight of evidence and assuming a complete switch from cigarette smoking. These products are not risk free and are addictive.
 
 
Our products as sold in the U.S., including Vuse, Velo, Grizzly, Kodiak, and Camel Snus, are subject to FDA regulation and no reduced-risk claims will be made as to these products without agency clearance.
 
 
Vapour consumable volume increased 67% (2020: up 70%), with revenue increasing 46.4% to £561 million (2020: up 85.1% to £383 million). This was a growth of 56.9% (2020: 86.1% increase), at constant rates of exchange, with pricing on consumables in the second half of 2021 offsetting the roll-over impact of the negative mix from the successful launch of the quad-pack in 2020. The Alto variant now represents over 90% of Vuse revenues in the U.S., up from 83% in 2020 and 50% in 2019.
Industry vapour volumes were up 21.2% in 2021, following a decline of 13.1% in 2020 as the industry recovered from the effects of the EVALI crisis (in 2019) and implementation of the flavour regulations in early 2020.
In October 2021, Vuse Solo received the first marketing authorisation from the U.S. FDA as discussed below. We remain confident in the quality of the applications submitted for the rest of our New Category products, which are supported by scientific evidence that the continued marketing of our Vuse and Velo products is appropriate for the protection of public health.
In Modern Oral, volume increased by over 270% (2020: 45% higher) with volume share up 410 bps in 2021. Revenue declined 81.5% (2020: up 13.5%). The performance in 2021 was driven by promotional pricing and the national
roll-out
of the Velo-branded nicotine pouch products (available in over 110,000 stores), that were acquired in
October 2020 from Dryft Sciences, LLC (Dryft). While growing
year-on-year,
driven by distribution expansion, the Modern Oral segment remains small, representing only 1.6% of total nicotine value share.
Combustibles
Combustibles revenue was 0.9% higher in 2021 at £10,015 million (2020: up 9.3% to £9,926 million). However, excluding a translational foreign exchange headwind in both years, this was an increase of 8.1% (2020: 9.9% higher) at constant rates of exchange. The growth was driven by strong pricing (with four price increases announced in both 2021 and 2020, supported by our RGM capabilities) which more than offset a decline in volume of 5.0% to 70 billion sticks in 2021 (2020: 73 billion sticks; 0.5% increase). In 2021, the Group benefited from trade inventory movements (mainly linked to the timing of price increases and uncertainty about a potential excise increase) which are expected to unwind in 2022. Excluding this, volume would have been down 7.0%. Industry volume was down 6.5%, driven by rising gas prices and the partial unwinding of last year’s additional supply chain inventories and stronger consumption trends.
Value share of cigarettes increased 60 bps (2020: up 45 bps), driven by our strategic brands (up 80 bps) including Newport and Natural American Spirit. Total volume share declined 40 bps (2020: 10 bps increase) as we focused on value generation from combustibles in 2021.
The strategic portfolio performed well, partly due to Lucky Strike which was reintroduced in the final quarter of 2020 and reached 1% national volume share in the first year post launch.
On 29 April 2021, the FDA announced it is setting into motion the process of advancing two tobacco product standards regarding menthol in cigarettes and all flavoured cigars. The Group’s U.S. business will evaluate any proposed regulation and will participate in any consultation and rulemaking processes by submitting robust comments grounded in science-based evidence. The published science does not support regulating menthol cigarettes differently from
non-menthol.
The scientific evidence neither shows a difference in health risks between menthol and
non-menthol
cigarettes, nor indicates that menthol cigarettes adversely affect initiation, dependence, or cessation.
Traditional Oral
Traditional Oral revenue fell 4.3% (2020: up 7.0%), a growth of 2.6% (2020: 7.6%) at constant rates of exchange, driven by strong pricing in both years, which more than offset lower volume (down 5.1% in 2021, and 1.3% in 2020). Through the utilisation of RGM techniques, value share of moist oral grew 10 bps, having declined 25 bps in 2020, largely driven by Grizzly, which performed well in 2021, having been impacted by strong pricing in the final quarter of 2019 and early 2020.

 
85


Table of Contents
BAT Annual Report and Form 20-F 2021
Regional Review
AmSSA
Americas and
Sub-Saharan
Africa


 Leadership of vapour in
Canada demonstrates our
resilience in a challenging
environment
 
Luciano Comin
Regional Director
 
Volume


2021
units
    
    vs 2020
%
    
    2020
units
    
    vs 2019
%
    
        2019
units
 
Cigarettes (bn sticks)
  
 
147


+0.1%


147


-3.9%


152
 
Other (bn sticks eq)*
  
 
1


-7.7%


2


-1.7%


2
 
Combustibles (bn sticks)
  
 
148


0.0%


149


-3.8%


154
 
New Categories:
              
Vapour (mn 10ml/pods)
  
 
62


+102%


31


+118%


14
 
THP (bn sticks)


Modern Oral (mn pouches)


-100%


19


+142%


8
 
Traditional Oral (bn sticks eq)


*
Other includes MYO/RYO.
 
Revenue


2021
£m
    
vs 2020
%
    
vs 2020
(adj at cc)
%
    
2020
£m
    
vs 2019
%
    
vs 2019
(adj at cc)
%
 
Combustibles
  
 
3,435


-2.8%


+4.1%


3,535


-11.4%


+1.3%
 
New Categories:
                 
Vapour
  
 
141


+115%


+115%


65


+52.8%


+58.6%
 
THP


Modern Oral


-100%


-100%


1


-49.8%


-47.3%
 
Total New Categories
  
 
141


+114%


+114%


66


+51.3%


+57.1%
 
Traditional Oral


Other
  
 
225


+32.3%


+44.7%


171


-24.3%


-7.2%
 
Revenue
  
 
3,801


+0.8%


+7.8%


3,772


-11.5%


+1.4%
 
 
Profit from operations/Operating margin


2021
£m
    
vs 2020
%
    
vs 2020
(adj at cc)
%
    
2020
£m
    
vs 2019
%
    
vs 2019
(adj at cc)
%
 
Profit from operations
  
 
1,496


-3.7%


+4.3%


1,553


+29.0%


-2.5%
 
Operating margin (%)
  
 
39.3%


-190 bps


-140 bps


41.2%


+1,290bps


-160 bps


Revenue by category


-70 bps 
 
Cigarette value
 
share change
 
15,565
 
Number
 
of employees
 
27
 
Owned
 
manufacturing
 
(inc R&D) sites


Key markets
 
Argentina, Brazil, Canada, Chile, Colombia, Mexico, Nigeria, South Africa
Revenue and Profit from Operations
In 2021, reported revenue increased 0.8% to £3,801 million (2020: 11.5% decrease to £3,772 million). The reported results were negatively impacted by translational foreign exchange headwinds due to the relative strength of sterling against a number of currencies, particularly the Brazilian real, Argentinian peso, Nigerian naira and Kenyan shilling. Excluding the translational headwind, on a constant currency basis, revenue grew by 7.8% in 2021 (2020: increase of 1.4%), driven by combustibles pricing and growth in New Categories in both years. The lower growth rate in 2020 was due to the negative impact of
COVID-19
in that year, as a number of markets implemented temporary restrictions in response to the pandemic, with South Africa in particular restricting the production and sale of tobacco products for a period of five months.
Reported profit from operations fell 3.7% to £1,496 million partly due to the recognition of a £54 million charge related to goodwill in Peru and by the impact of translational foreign exchange on our reported results. In 2020, this was an increase of 29.0% to £1,553 million, with the growth largely from the absence of the £436 million charge in 2019 in relation to the Quebec Class Action. Excluding the adjusting items (largely related to Quantum and Peru) and the impact of foreign exchange in both periods, adjusted profit from operations increased 4.3% (2020: decrease of 2.5%) on a constant currency basis, largely driven by the growth in adjusted revenue. However, in 2021, this was partially offset by transactional foreign exchange headwinds and increased investment in New Categories. In 2020, the higher revenue was more than offset by the impact of
COVID-19
which led to supply restrictions in South Africa noted above and additional supply chain costs elsewhere (estimated to be £57 million) to manage the operational volatility.
While not yet back to
pre-COVID-19
levels, South Africa has recovered during 2021 and as such the risk of impairment of goodwill has reduced. Please refer to page 209.
 
86


Table of Contents
BAT Annual Report and Form 20-F 2021    
 
Strategic Report        
 
Governance Report        
  
Financial Statements        
  
Other Information        


New Categories
In 2021, New Categories revenue more than doubled, up 114% to £141 million (2021: up 51.3% to £66 million) driven by the growth of vapour in both years.
Having gained value leadership of the total vapour category in Canada in 2020, Vuse consolidated its leadership position with total value share up 34.3 ppts in 2021, having grown 22.2 ppts in 2020. This was driven by the growth of the ePod variant, including the upgraded 2.0 variant.
In South Africa, vapour revenue recovered following the suspension, alongside those of cigarettes, between March and August 2020 as part of the country’s
COVID-19
response. While this was a headwind in 2020, volume recovered and almost tripled in 2021, supported by the completion of the migration of Twisp to Vuse.
In Kenya, we continue to engage with the relevant authorities on the regulatory and fiscal framework to support a commercially sustainable
re-entry
into the Modern Oral category.
We continue to believe that Modern Oral represents an exciting opportunity to offer affordable New Category alternatives* to adult nicotine consumers in emerging markets, given the absence of an electronic device and a
pre-existing
ritual of oral product consumption in a number of markets.
Combustibles
Combustibles revenue declined 2.8% to £3,435 million (2020: 11.4% decrease to £3,535 million). A translational foreign exchange headwind impacted both years with revenue, on a constant currency basis, up 4.1% in 2021 and 1.3% in 2020.
Combustibles pricing in both years, supported by our RGM capabilities, was, in 2021, partially offset by negative mix as volume recovered from the impact of
COVID-19
in a number of markets including in South Africa (impacted by the sales suspension in 2020, with the market still recovering from the growth in illicit trade in 2020) and Colombia. In Brazil,
COVID-19
related lockdowns (in 2020 and 2021) and increased border security led to growth in the duty paid industry, with some growth in consumption at the lower end of the market. Having declined by 3.8% in 2020, combustible volume in AmSSA was flat in 2021.
Value share declined 70 bps driven by Canada, South Africa, Mexico, and Brazil. This compared to an increase in 2020 of 30 bps.
 
*
Based on the weight of evidence and assuming a complete switch from cigarette smoking. These products are not risk free and are addictive.


87


Table of Contents
BAT Annual Report and Form 20-F 2021
Regional Review
ENA
Europe and North Africa


 I am delighted that our multi-
category approach is delivering
excellent results
 
Johan Vandermeulen
Regional Director
 
Volume


      2021
units
    
    vs 2020
%
    
    2020
units
    
    vs 2019
%
    
        2019
units
 
Cigarettes (bn sticks)
  
 
214


-2.7%


220


-4.2%


230
 
Other (bn sticks eq)*
  
 
15


-8.7%


16


-2.5%


17
 
Combustibles (bn sticks)
  
 
229


-3.1%


236


-4.1%


247
 
New Categories:
              
Vapour (mn 10ml/pods)
  
 
173


+29.8%


133


+23.0%


108
 
THP (bn sticks)
  
 
9.8


+195%


3.3


+203%


1.1
 
Modern Oral (mn pouches)
  
 
2,440


+46.4%


1,667


+55.6%


1,071
 
Traditional Oral (bn sticks eq)
  
 
1


+6.1%


1


+2.8%


1
 
 
*
Other combustibles includes MYO/RYO.
 
Revenue


2021
£m
    
vs 2020
%
    
vs 2020
(adj at cc)
%
    
2020
£m
    
vs 2019
%
    
vs 2019
(adj at cc)
%
 
Combustibles
  
 
5,024


-6.2%


+1.1%


5,356


-3.4%


+0.5%
 
New Categories:
                 
Vapour
  
 
207


+40.2%


+43.8%


148


+0.4%


+0.2%
 
THP
  
 
341


+150%


+167%


136


+143%


+159%
 
Modern Oral
  
 
266


+43.9%


+45.6%


185


+58.5%


+59.3%
 
Total New Categories
  
 
814


+73.6%


+80.3%


469


+46.7%


+49.6%
 
Traditional Oral
  
 
41


+18.2%


+18.1%


34


+16.2%


+14.2%
 
Other
  
 
122


-8.9%


-4.9%


135


-31.6%


-31.7%
 
Revenue
  
 
6,001


+0.1%


+7.3%


5,994


-1.6%


+2.1%
 
 
Profit from operations/Operating margin


2021
£m
    
vs 2020
%
    
vs 2020
(adj at cc)
%
    
2020
£m
    
vs 2019
%
    
vs 2019
(adj at cc)
%
 
Profit from operations
  
 
1,885


-3.9%


-1.0%


1,962


+19.0%


-2.4%
 
Operating margin (%)
  
 
31.4%


-130 bps


-270 bps


32.7%


+560 bps


-160 bps


Revenue by category


-20 bps
 
Cigarette value
 
share change
 
22,333
 
Number
 
of employees
  
20
 
Owned
 
manufacturing
 
(inc R&D) sites


Key markets
 
Algeria, Belgium, Bulgaria, Czech Republic, Denmark, Egypt, France, Germany, Italy, Kazakhstan, Morocco, Netherlands, Poland, Romania, Russia, Spain, Sweden, Switzerland, Turkey, Ukraine, UK
Revenue and Profit from Operations
Reported revenue in 2021 was marginally higher than 2020 (2020: down 1.6%) as good pricing in Combustibles and growth in New Categories revenue (2021: up 80%, 2020: up 50%) in both years was largely offset by lower combustible volume (down 3.1% in 2021 and 4.1% in 2020) and a translational foreign exchange headwind of 7.2% (2020: 3.7% headwind).
Excluding the impact of adjusting items (that affected revenue in 2019) and the impact of currency, revenue grew 7.3% on an adjusted constant rates basis (2020: up 2.1%).
Reported profit from operations declined by 3.9% to £1,885 million as the strong New Category revenue growth, in combination with tight control of overheads and Quantum cost savings, were more than offset by incremental investment in New Categories and foreign exchange headwinds.
In 2020, reported profit from operations increased 19% to £1,962 million, largely due to the absence of the £202 million charge in respect of the Russian excise dispute that impacted the prior year (2019: down 13%). Excluding the impact of currency and adjusting items (in respect of Quantum and the factory rationalisation programme), adjusted profit from operations at constant rates was down 1.0% in 2021 (2020: down 2.4%) as the region continued to invest in New Categories.
New Categories
In 2021, revenue from Vapour was up
40.2% reflecting strong volume growth (up 30%), driven by an increase in industry volume, and higher consumables pricing. In 2020, revenue from Vapour was marginally higher than 2019 as the impact of
COVID-19
on our vape stores and an increase in marketing investment to drive consumer activation (recognised as a deduction to revenue in line with IFRS 15), largely offset higher volume (up 23%).
 
88


Table of Contents
BAT Annual Report and Form 20-F 2021    
 
Strategic Report        
 
Governance Report        
  
Financial Statements        
  
Other Information        


Vype was migrated to Vuse, with Vuse growing across the region, extending its value leadership position in all key markets. In the UK and France, trade margin optimisation, together with growth ahead of incremental marketing investment led to a reduced drag on regional profit from operations.
In 2021, THP volume grew by 195% (2020: up 203%), with revenue 150% higher at £341 million (2020: up 143% to £136 million). This was driven by the
roll-out
of glo Hyper, which has now been launched in 18 markets in the region. glo continued to increase volume share of the THP category in key markets for 2021, including in:
 
Russia, reaching 19.3% up 1,070 bps on 2020;
 
Italy, increasing by 870 bps to 12.8%;
 
Ukraine, being 20.9%, an increase of 990 bps; and
 
Romania, 530 bps higher than 2020 at 22.1%.
Hyper also continued to make good progress in Kazakhstan, Poland, Egypt, the Czech Republic and across other smaller ENA launch markets.
 
 
From 1 January 2022, the markets of North Africa (being Algeria, Egypt, Libya, Morocco, Sudan and Tunisia) will be reported under APME. From that date, ENA will be known as Europe.
 
*
Based on the weight of evidence and assuming a complete switch from cigarette smoking. These products are not risk free and are addictive.
In 2021, Modern Oral revenue grew 44% (2020: up 59%), led by 46% volume growth (2020: 56% increase). In both years, the Group continued to grow its volume share of the total oral category in more established markets such as Sweden and Norway, while also building the overall category, and our volume share of Modern Oral itself, in Denmark and Switzerland.
In Germany, sales of Modern Oral were suspended during the year, pending engagement with authorities regarding the classification of tobacco-free nicotine pouches.
In January 2021, we pilot-launched our first CBD vaping product, Vuse CBD Zone. This allowed us, for the first time, to offer adult consumers a range of high-quality CBD vaping products from our trusted, global brand, Vuse, gaining valuable insights into the product and consumer behaviour.
Combustibles
In 2021, revenue was 6.2% lower, compared to a decline of 3.4% in 2020. Good price/mix in both years (up 4% in 2021 and 5% in 2020) was more than offset by the impact of lower combustible volume, down 3.1% in 2021 and 4.1% in 2020, and the foreign exchange headwind described earlier. At constant rates of exchange, revenue increased 1.1% (2020: 0.5%).
 
The decrease in combustible volume in 2021 was driven by lower volume in Ukraine, Russia and Kazakhstan, in part due to industry contraction in those markets. In 2020, the decline in combustible volume was despite higher volume in Turkey (driven by Kent and the local portfolio) as this was more than offset by industry volume contraction in a number of markets, partly due to
COVID-19.
Cigarette value share was down 20 bps in 2021, while 2020 was in line with 2019. Cigarette volume share declined 30 bps (2020: up 30 bps) as growth in Turkey, Germany and the Czech Republic was more than offset by reductions in Russia, Poland, France, Italy, Spain, Romania, the UK, Ukraine and Denmark. The growth in 2020 was largely driven by Russia and Turkey, partly offset by lower volume share in France, Spain, the Netherlands, Denmark, Switzerland and the UK.
In 2020, menthol bans were introduced in Turkey, the UK and the EU. The Group has a long-standing track record of managing regulatory shifts. In 2021, the Group did not experience a material impact from the introduction of the new regulations.

 
89


Table of Contents
BAT Annual Report and Form 20-F 2021
Regional Review
APME
Asia-Pacific and Middle East


 Our New Categories continue
to grow despite difficult trading
conditions in key markets.
 
  
Michael (Mihovil) Dijanosic
Regional Director
 
Volume


  2021
units
    
    vs 2020
%
    
    2020
units
    
    vs 2019
%
    
        2019
units
 
Cigarettes (bn sticks)
  
 
206


+4.6%


198


-7.3%


213
 
Other (bn sticks eq)*
  
 
2


-14.1%


2


+3.3%


2
 
Combustibles (bn sticks)
  
 
208


+4.4%


200


-7.2%


215
 
New Categories:
              
Vapour (mn 10ml/pods)
  
 
9


+65.6%


6


+385%


1
 
THP (bn sticks)
  
 
9


+26.5%


7


-6.5%


8
 
Modern Oral (mn pouches)
  
 
254


+197%


86


n/m


3
 
Traditional Oral (bn sticks eq)


*
Other combustibles includes MYO/RYO.


Revenue


2021
£m
    
vs 2020
%
    
vs 2020
(adj at cc)
%
    
2020
£m
    
vs 2019
%
    
vs 2019
(adj at cc)
%
 
Combustibles
  
 
3,555


-9.6%


-2.3%


3,935


-10.3%


-7.7%
 
New Categories:
                 
Vapour
  
 
18


+26.0%


+27.5%


15


+255%


+260%
 
THP
  
 
511


+2.8%


+13.0%


497


-26.0%


-27.1%
 
Modern Oral
  
 
6


+179%


+199%


2


n/m


n/m
 
Total New Categories
  
 
535


+4.2%


+14.2%


514


-24.0%


-25.0%
 
Traditional Oral


Other
  
 
101


+13.0%


+20.1%


88


-1.3%


-0.4%
 
Revenue
  
 
4,191


-7.6%


0.0%


4,537


-11.9%


-9.9%


Profit from operations/Operating margin


2021
£m
    
vs 2020
%
    
vs 2020
(adj at cc)
%
    
2020
£m
    
vs 2019
%
    
vs 2019
(adj at cc)
%
 
Profit from operations
  
 
1,287


-12.6%


-1.1%


1,472


-16.0%


-7.3%
 
Operating margin (%)
  
 
30.7%


-170 bps


-40 bps


32.4%


-160 bps


+110 bps


Revenue by category


-20 bps
 
Cigarette value
 
share change
 
9,747
 
Number
 
of employees
  
21
 
Owned
 
manufacturing
 
(inc R&D) sites


Key markets
 
Australia, Bangladesh, Indonesia, Japan, Malaysia, Middle East (inc KSA), New Zealand, Pakistan, South Korea, Taiwan, Vietnam
Revenue and Profit from Operations
Reported revenue declined 7.6% to £4,191 million (2020: declined 11.9% to £4,537 million).
The performance in 2021 was impacted by the structural excise changes in Australia and New Zealand, and competitive pricing dynamics in Australia (in combination, an estimated headwind of £260 million), and negative geographic mix due to volume share growth and recovery from
COVID-19
in emerging markets, leading to a growth in combustible volume of 4.4% (largely due to Bangladesh, Vietnam and Pakistan). Revenue in 2021 was also negatively impacted by the sale of the Group’s operations in Iran, part way through the year.
In 2020, the decline in revenue was largely driven by lower cigarette volume (which fell 7.3%). This was partly due to the negative impact of
COVID-19
on GTR and other markets in the region and the impact of excise increases and minimum pricing in Indonesia. Revenue in 2020 was also impacted by the excise harmonisation of THP in Japan and a £50 million charge in respect of the withdrawal of glo Sens.
Excluding the impact of translational foreign exchange, in 2021 revenue was in line with 2020 (2020: declined 9.9%) on an adjusted constant rate basis.
Reported profit from operations declined 12.6% to £1,287 million, driven by the lower revenue and due to the £358 million charge (mainly in respect of foreign exchange previously charged to other comprehensive income) recognised in respect of the sale of the Group’s operations in Iran, and costs associated with the withdrawal from Myanmar.
In 2020, reported profit from operations was a decrease of 16.0% to £1,472 million, as the impact of
COVID-19
in a number of markets including GTR, the recognition of costs related to the ongoing factory rationalisation programme (principally in Southeast Asia), an impairment in goodwill in respect of the Group’s performance in Malaysia (£197 million) and unfavourable foreign exchange movements more than offset the efficiencies realised through Quantum.
 
90


Table of Contents
BAT Annual Report and Form 20-F 2021    
 
Strategic Report        
 
    Governance Report        
  
Financial Statements        
  
Other Information        


Excluding adjusting items in 2021 (largely related to Iran, Myanmar and Quantum) and the impact of translational foreign exchange, adjusted profit from operations at constant rates of exchange declined 1.1% in 2021 (2020: fell 7.3%), driven by the reduction in revenue and continued investment in New Categories.
New Categories
Total revenue from New Categories increased 4.2% to £535 million (2020: declined 24.0% to £514 million).
In 2021, this was driven by a 26.5% increase in THP consumable volume to 9.3 billion sticks, compared to a decline of 6.5% to 7.4 billion sticks in 2020. 2021 was underpinned by the success of glo Hyper (the
first-to-world
THP that uses induction heating technology to provide a step change in taste delivery leading to an increase in consumer satisfaction, driven by 30% more tobacco, faster heating and a boost function), launched in 2020. 2020 was impacted by excise harmonisation affecting the industry and a strong comparator period (2019) that included the launch of glo Pro, glo Nano and glo Sens.
 
*
Based on the weight of evidence and assuming a complete switch from cigarette smoking. These products are not risk free and are addictive.
THP revenue increased 2.8% (2020: decrease of 26%), or 13.0% (2020: down 27%) excluding the impact of currencies. The growth in 2021 was driven by increased Hyper volume, more than offsetting the continued impact of excise harmonisation, which negatively impacted revenue in 2020 (compared to 2019). The movement between the years was also due to a £50 million charge to revenue in respect of the withdrawal of glo Sens (in 2020, that did not repeat in 2021) as the product did not perform to expectations.
In Japan, the largest THP market in the world, glo is the fastest growing THP brand (by volume), with volume share increasing to 6.8% in 2021, up 140 bps, maintaining the momentum of 2020 which was up 50 bps on 2019.
Our Modern Oral pilot launches in emerging markets, including in Pakistan and Indonesia, continue to deliver valuable insights, as we roll out in key urban markets. We believe that Modern Oral is an exciting longer-term opportunity to commercialise reduced-risk products* by offering affordable New Category alternatives to adult nicotine consumers.
Combustibles
Revenue from combustibles declined 9.6% to £3,555 million (2020: down 10.3% to £3,935 million), or by 2.3% (2020: down 7.7%) at constant rates of exchange.
In 2021, this was despite an increase in combustible volume (up 4.4%) as emerging markets recovered from
COVID-19.
However, this led to a negative geographic mix which, combined with structural excise changes in Australia and New Zealand and competitive pricing dynamics in Australia (totalling approximately £260 million) and the negative impact of the sale of operations in Iran part way through the year, drove revenue down.
In 2021, value share decreased 20 bps (2020: up 10 bps), with volume share up 20 bps (2020: 55 bps higher), as volume share gains (including in Bangladesh, Japan, Pakistan and Taiwan) more than offset losses in Indonesia (as the Group drove for value growth with pricing ahead of the industry) and Saudi Arabia.
In 2020, pricing in Australia and Pakistan was more than offset by a 7.2% decline in combustible volume. Higher volume in Bangladesh was more than offset by the impact of
COVID-19
in a number of markets, notably within GTR, an increase in local taxes and the minimum retail price compliance in Indonesia, and the continued increase in illicit trade in Pakistan (following an
excise-led
price increase in 2019).

 
91


Table of Contents
BAT Annual Report and Form 20-F 2021
 
Group Principal Risks
 
Overview
The principal risks that may affect the Group are set out on the following pages.
Each risk is considered in the context of the Group’s strategy and business model, as set out in this Strategic Report on pages 16 to 19, and 26 to 28. On the following pages is a summary of each principal risk and its potential impact. Clear accountability is attached to each risk through the risk owner. BAT define the principal risks as those assessed with a high impact and probable likelihood. Additionally, the risks “Inability to commercialise and deliver New Categories”, “Litigation”, “Solvency and liquidity” are also recognised as principal risks; even though they are not assessed as having high impact and probable likelihood, they are material to the Group and the delivery of its strategic objectives.
This section focuses on those risks that the Directors believe to be the principal risks to the Group. Not all of these risks are within the control of the Group and other risks besides those listed may affect the Group’s performance. Some risks may be unknown at present. Other risks, currently regarded as less material, could become material in the future.
The risks listed in this section should be considered in the context of the Group’s internal control framework. This is described in the section on risk management
and internal control in the corporate governance statement on pages 125 to 126. This section should also be read in the context of the cautionary statement on page 352.
A summary of all the risk factors (including the principal risks) which are monitored by the Board through the Group’s risk register is set out in the Additional Disclosures section on pages 317 to 339.

 
92


Table of Contents
BAT Annual Report and Form 20-F 2021    
 
Strategic Report        
 
Governance Report        
  
Financial Statements        
  
Other Information        


Risks
Competition from illicit trade
 
Increased competition from illicit trade and illegal products – either local duty evaded, smuggled, counterfeits, or
non-regulatory
compliant, including products diverted from one country to another.


Impact
Erosion of goodwill, with lower volumes and/or increased operational costs (e.g. track and trace costs) and reduced profits. Reduced ability to take price increases.
Investment in trade marketing and distribution is undermined and the product is commoditised.
Counterfeit products (especially in New Categories) and other illicit products could harm consumers, damaging goodwill, and/or the category (with lower volumes and reduced profits), potentially leading to misplaced claims against BAT, further regulation and a failure to deliver the corporate harm reduction objective. Breach of legislation, criminal offences, contract breaches under the EU Cooperation Agreement, allegations of facilitating smuggling and reputational damage, including negative perceptions of our governance and our ESG credentials.
    
 
Geopolitical tensions
 
Geopolitical tensions, civil unrest, economic policy changes, global health crises, terrorism and organised crime have the potential to disrupt the Group’s business in multiple markets.


Impact
Potential injury or loss of life, loss of assets and disruption to supply chains and normal business processes.
Increased costs due to more complex supply chain and security arrangements and/or the cost of building new facilities or maintaining inefficient facilities.
Lower volumes as a result of not being able to trade in a country.
Higher taxes or other costs of doing business as a foreign company or the loss of assets as a result of nationalisation.
Reputational damage, including negative perceptions of our governance and protection of our people and our ESG credentials.


93


Table of Contents
BAT Annual Report and Form 20-F 2021
Group Principal Risks
Continued
 
 
Tobacco, New Categories and other regulation interrupts growth strategy
 
The enactment of, proposals for, or rumours of, regulation that significantly impairs the Group’s ability to communicate, differentiate, market or launch its products, and/or the lack of appropriate regulation for New Categories.


Impact
A lack of acceptance or rejection of tobacco harm reduction as a tobacco control policy could prevent a balanced regulatory framework for New Categories.
Restricted ability to sell and communicate New Categories could lead to failure of the harm reduction objective and loss of confidence in the Group’s ESG performance.
Inappropriate regulations for New Categories (e.g. pharma or food) or total bans of tobacco and/or New Categories products in certain markets.
Reduced ability to make scientific claims and compete in future product categories and make new market entries.
Erosion of brand value through commoditisation and the inability to launch innovations may negatively affect our ability to generate value growth.
Regulation with respect to bans or severe restrictions on menthol flavours, product design & features and nicotine levels may adversely impact individual brand portfolios.
Reduced consumer acceptability of new product specifications, leading to consumers seeking alternatives in illegal markets or irresponsible operators exploiting regulatory loopholes.
Shocks to share price on rumours, the announcement or enactment of restrictive regulation (e.g. sales ban to future generations).
Increased scope and severity of compliance regimes in new regulation (e.g. Extended Producer Responsibility (EPR) schemes) leading to higher costs, greater complexity and potential reputational damage or fines for breach, including inadvertent breach.


Please refer to pages 325 to 327 for details of tobacco and nicotine regulatory regimes under which the Group’s businesses operate.
 
94


Table of Contents
BAT Annual Report and Form 20-F 2021    
 
Strategic Report        
 
Governance Report        
  
Financial Statements        
  
Other Information        


Litigation
 
Product liability, regulatory or other significant cases (including investigations) may be lost or settled resulting in a material loss or other consequence.


Impact
Damages and fines, negative impact on reputation (including ESG credentials), disruption and loss of focus on the business.
Consolidated results of operations, cash flows and financial position could be materially affected by an unfavourable outcome or settlement of pending or future litigation, criminal prosecution or other contentious action.
Inability to sell products as a result of patent infringement action may restrict growth plans and competitiveness.
Potential share price impact.


Please refer to note 31 in the Notes on the Accounts for details of contingent liabilities applicable to the Group.
 
Significant increases or structural changes in tobacco, nicotine and New Categories related taxes
 
The Group is exposed to unexpected and/or significant increases or structural changes in tobacco, nicotine and New Categories related taxes in key markets.


Impact
Consumers reject the Group’s legitimate
tax-paid
products for products from illicit sources or cheaper alternatives.
Reduced legal industry volumes.
Reduced sales volume and/or portfolio erosion.
Partial absorption of excise increases leading to lower profitability.


95


Table of Contents
BAT Annual Report and Form 20-F 2021
Group Principal Risks
Continued
 
 
Inability to develop, commercialise and deliver the New Categories strategy
 
Risk of not capitalising on the opportunities in developing and commercialising successful, safe and consumer-appealing innovations.


Impact
Failure to deliver Group strategic imperative, 2025 growth ambition and 2030 consumer targets.
Potentially missed opportunities, unrecoverable costs and/or erosion of brand, with lower volumes and reduced profits.
Reputational damage and recall costs may arise in the event of defective product design or manufacture.
Loss of market share due to
non-compliance
of product portfolio with regulatory requirements.
Loss of investor confidence in ESG performance.
Failure to deliver our corporate purpose of harm reduction.


Injury, illness or death in the workplace
 
The risk of injury, death or ill health to employees and those who work with the business is a fundamental concern of the Group and can have a significant effect on its operations.


Impact
Serious injuries, ill health, disability or loss of life suffered by employees and the people who work with the Group.
Exposure to civil and criminal liability and the risk of prosecution from enforcement bodies and the cost of associated legal costs, fines and/or penalties.
Interruption of Group operations if issues are not addressed immediately.
High staff turnover or difficulty recruiting employees if perceived to have a poor Environment, Health and Safety (EHS) record.
Reputational damage to the Group.


Disputed taxes, interest and penalties
 
The Group may face significant financial penalties, including the payment of interest, in the event of an unfavourable ruling by a tax authority in a disputed area.
 
 
Impact
Significant fines and potential legal penalties.
Disruption and loss of focus on the business due to diversion of management time.
Impact on profit and dividend.


Please refer to note 31 in the Notes on the Accounts for details of contingent liabilities
applicable to the Group.
 
96


Table of Contents
BAT Annual Report and Form 20-F 2021    
 
Strategic Report        
 
    Governance Report        
  
Financial Statements        
  
Other Information        


Solvency and liquidity
 
Liquidity (access to cash and sources of finance) is essential to maintaining the Group as a going concern in the short term (liquidity) and medium term (solvency).


Impact
Inability to fund the business under the current capital structure resulting in missed strategic opportunities or inability to respond to threats.
Decline in our creditworthiness and increased funding costs for the Group.
Requirement to issue equity or seek new sources of capital.
Reputational risk of failure to manage the financial risk profile of the business, resulting in an erosion of shareholder value reflected in an underperforming share price.
                
 
Foreign exchange rate exposures
 
The Group faces translational and transactional foreign exchange (FX) rate exposure for earnings/cash flows from its global businesses.


Impact
Fluctuations in FX rates of key currencies against sterling introduce volatility in reported earnings per share (EPS), cash flow and the balance sheet driven by translation into sterling of our financial results and these exposures are not normally hedged.
The dividend may be impacted if the payout ratio is not adjusted.
Differences in translation between earnings and net debt may affect key ratios used by credit rating agencies.
Volatility and/or increased costs in our business, due to transactional FX, may adversely impact financial performance.


The Strategic Report was approved by the Board of Directors on 10 February 2022 and signed on its behalf by Paul McCrory, Company Secretary.
 
97


Table of Contents
BAT Annual Report and Form 20-F 2021
 
Governance
Chairman’s Introduction on Governance
 

Dear Shareholder
As your incoming Chairman, I’ve spent 2021 immersing myself fully in the work and culture of the Board and wider organisation, building on my prior experience as one of your
Non-Executive
Directors. My sentiments are unchanged: this is an outstanding organisation that is fully committed to realising its corporate purpose of building A Better Tomorrow
TM
.
I’m grateful to my predecessor, Richard Burrows, the Board and the management team, who have recognised that achieving this purpose is predicated on a consumer-centric strategy and empowering ethos. Our ambitious sustainability agenda, strong corporate governance, and robust control environment underpin the delivery of our corporate purpose more so than ever.
Strategic focus
We are clear on, and delivering against, our three commercial priorities of combustible value growth; step-change in New Categories; and simplifying the organisation. This year, the Board has also strongly supported executive management’s drive to deliver our Quest programme, setting out our five critical enablers for corporate transformation (discussed on page 104). I’m pleased to report that we’re confident this programme is progressing well and will accelerate our transformation to a multi-category business, in nicotine and beyond.
The Board’s consideration of the Group’s capital allocation for 2022 carefully balanced New Categories investment and our ongoing objective to
de-leverage
the balance sheet within an appropriate range, as well as laying foundations for our activities beyond nicotine.
With regard to our new longer-term active capital allocation framework, we are growing the dividend and have announced a £2 billion share repurchase programme for 2022.
Action on climate change is a vital pillar of our sustainability agenda, and momentum in this area must be maintained. The Board has reviewed progress against the glidepath towards achieving the Group’s commitment to net zero value chain emissions by 2050. This is also the first year we report to you in full alignment with the TCFD framework.
Given the importance of the sustainability agenda to our strategy, we extended the scope of external assurance of our reported ESG metrics this year (discussed on page 126) and our Audit Committee’s terms of reference were revised to formalise its oversight role in this area (see page 121). This enhanced assurance is something our stakeholders and society are rightly coming to expect as part of good corporate governance.
Culture and values
The Board recognises its role in shaping and overseeing Group culture and values. Acting with integrity is an important part of our ethos, and the Board ensures that embedding integrity across our business practices remains a priority.
In January 2022, we launched our revised Standards of Business Conduct (SoBC) and Supplier Code of Conduct (discussed on page 110). Regular evolution of these long-standing policies keeps them in step with our strategy, ethos, external requirements and stakeholder expectations.


These policies mandate responsible business practices without compromise, and the Company takes seriously any
non-compliance
with our standards or our legal obligations. As we accelerate our multi-category platform initiatives, I firmly believe these standards foster sustainable growth. You can read about our SoBC and Delivery with Integrity programme on page 56.
Stakeholder engagement
We had an active shareholder and investor engagement programme in 2021.
I met with a number of shareholders in the year, and the Remuneration Committee Chair has engaged extensively on our new Directors’ Remuneration Policy. My fellow Board members and I look forward to further dialogue with you ahead of the 2022 AGM, which we plan to hold in person subject to prevailing guidance at the time.
We also listen to the perspectives of our wider stakeholders and we review how we engage with them across the Group, which you can read about on pages 106 to 109.
Our people
The continuing resilience and commitment of our people to overcome the challenges of
COVID-19
has been inspirational to the Board. Their safety and well-being remains our top priority, and we devote time to satisfy ourselves that the right support is available and is responsive to change.
The Board maintains effective engagement with our people worldwide through a range of channels (discussed at page 108).
Board efficacy
While much of the Board’s interaction remained virtual in 2021, we have operated effectively and engaged consistently with management and staff throughout the year.
This year, I led an internal evaluation of the Board, its Committees and each individual Director, set out on page 114. The Board considers that it continues to function effectively and its working relationships with its Committees continue to be sound.
I’m confident that the corporate governance framework that I now oversee as your Chairman enables the Group’s strategic objectives. On behalf of the Board, I confirm that we believe that this combined Annual Report and Form
20-F
is fair, balanced and understandable, and presents the information necessary to assess the Company’s position, performance, business model and strategy.
Luc Jobin
Chairman
 
98
 

Table of Contents
BAT Annual Report and Form 20-F 2021    
 
Strategic Report        
 
Governance Report        
  
Financial Statements        
  
Other Information        


Governance
 
Throughout the year ended 31 December 2021, we applied the Principles of the UK Corporate Governance Code 2018.
The Company was compliant with all provisions of the Code during the year.
The Board considers that this Annual Report and Form
20-F,
and notably this Governance section, provides the information shareholders need to evaluate how we have complied with our obligations under the Code.
Pages noted opposite refer to particular discussion on the application of Principles of the Code in this Annual Report and Form
20-F.
For reference, we prepare a separate voluntary annual compliance report by reference to each Principle and Provision of the Code, available at bat.com/governance
Board Leadership and Company Purpose
 
Principle
    
   
A. Long-Term Sustainable Success
  
pages 2 to 91, 98 to 115
   
B. Purpose, Values and Culture
  
pages 2 to 27, 68 to 73, 98, 103 to 105, 114 to 115
   
C. Resources and Control Framework
  
pages 4 to 18, 92 to 97, 103, 120 to 127
   
D. Shareholder and Stakeholder Engagement
  
pages 20, 21, 72, 106 to 110, 128
   
E. Workforce Engagement, Policies, Practices
  
pages 57, 70 to 73, 103, 108,
   
    
163 to 165
Division of
Responsibilities
 
Principle
    
   
F. Leadership of the Board
  
pages 98 to 115
   
G. Board Composition and Division of Responsibilities
  
pages 100, 101, 112, 113
   
H. Role and Commitment of
Non-Executive
Directors
  
pages 112 to 113
   
I. Board Support
  
pages 98, 112 to 114
Composition,
Succession, Evaluation
 
Principle
    
   
J. Board Appointments, Succession and Diversity
  
pages 98, 105, 116 to 119
   
K. Board Skills and Experience
  
pages 100 to 101, 116 to 119
   
L. Board Evaluation
  
pages 114 to 115
Audit, Risk,
Internal Control
 
Principle
    
   
M. Internal and External Audit Functions
  
pages 123 to 126
   
N. Fair, Balanced and Understandable Assessment
  
pages 126 and 166
   
O. Risk Management and Internal Controls
  
pages 92 to 97, 105, 120 to 127
Remuneration
 
Principle
    
   
P. Remuneration Policies and Practices
  
pages 128 to 165
   
Q. Development of Policy on Remuneration
  
pages 128 to 165
   
R. Judgement and Discretion
  
pages 128 to 165
 
Disclosure guidance and transparency rules
We comply with the Disclosure Guidance and Transparency Rules requirements for corporate governance statements by virtue of the information included in this section, together with the information contained in the Other Information section.
The UK Corporate Governance Code 2018 is available at frc.org.uk.
US corporate governance
As a result of the listing of the Company’s American Depositary Shares (ADSs) on the NYSE, the Company is required to meet certain NYSE requirements relating to corporate governance matters.
Certain exceptions to these requirements apply to the Company as a foreign private issuer. For details of the significant differences between the NYSE requirements and the Company’s practices, please see page 349.
 
99


Table of Contents
BAT Annual Report and Form 20-F 2021
 
Governance
Board of Directors
As at 10 February 2022
 

Nationality:
Canadian
Appointed:
Chairman since April 2021
;
Non-Executive
Director since July 2017.
Experience:
Luc was President and Chief Executive Officer of Canadian National Railway Company from July 2016 until March 2018, having served as Executive Vice President and Chief Financial Officer since 2009. Previously, he was Executive Vice President of Power Corporation of Canada (an international financial services company) from 2005 to 2009. Luc was Chief Executive Officer of Imperial Tobacco Canada from 2003 to 2005 and Executive Vice President and Chief Financial Officer from 1998 to 2003. Luc previously served as an independent
Non-Executive
Director of Reynolds American Inc. from 2008 until its acquisition by the Group.
Relevant skills and contribution to the Board:
Luc brings significant financial, regulatory and consumer business experience to the Board, together with extensive North American knowledge and experience of enterprise transformation.
External appointments:
Gildan Activewear Inc.

Nationality:
French
Appointed:
Chief Executive since April 2019; Executive Director since January 2019.
Experience:
Jack joined the Group in 2004 and was appointed as Chairman of British American Tobacco France in 2005, before becoming Managing Director of British American Tobacco Malaysia in 2007. He joined the Management Board as Regional Director for Western Europe in 2009, becoming Regional Director for the Americas in 2011, then Regional Director for Asia-Pacific in 2013. He became Chief Operating Officer in 2017 and Chief Executive Designate in November 2018, before being appointed to the Board in January 2019.
Relevant skills and contribution to the Board:
Jack brings significant management, innovation, and strategic leadership to the Board, developed through his previous roles across many of the Group’s key geographies and areas of business. This enables him to effectively lead the Group and deliver our ambition to build A Better Tomorrow
TM
.
External appointments:
No external appointments.

Nationality:
Brazilian
Appointed:
August 2019
Experience:
Tadeu joined the Group in Brazil in 1992 and joined the Management Board as Director, Business Development in 2014, later becoming Regional Director, Western Europe in 2016, then Regional Director, Europe and North Africa in January 2018. He was appointed Director, Group Transformation in January 2019 and, in addition to this role, he was appointed Deputy Finance Director in March 2019, before joining the Board as Finance Director in August 2019. As Finance and Transformation Director. Tadeu’s role includes leadership of the design and delivery of the Group’s Quest transformation programme to accelerate delivery of Group strategy.
Relevant skills and contribution to the Board:
Tadeu brings broad experience gained in various national, regional and global finance and general leadership roles, through his previous roles across the Group. These experiences make Tadeu particularly well-placed to contribute to the Group’s transformation and broader strategic agenda.
External appointments:
No external appointments.

Nationality:
British
Appointed:
February 2015
Experience:
Sue’s extensive career includes Director, Strategic and Business Development of Chime Group and a number of senior marketing and communications positions, including: Director of Marketing BBC, Corporate Affairs Director of Thames Television and Director of Communications of Vauxhall Motors. Sue is a former Chairwoman of both the Marketing Society and the Marketing Group of Great Britain.
Relevant skills and contribution to the Board:
Sue contributes considerable expertise in relation to marketing, branding and consumer issues, which are key areas of focus for the Board.
External appointments:
Non-Executive
Director and Chair of the Remuneration Committee of Accsys Technologies PLC;
Non-Executive
Director of Helical plc; and
Non-Executive
Director of Unlimited Group Ltd.
 

Nationality:
British
Appointed:
September 2020
Experience:
Karen has held a variety of executive roles, including President and Director General of Colgate Palmolive France, and Chairman and Managing Director of Colgate Palmolive UK Limited. She was formerly a
Non-Executive
Director of Electrocomponents p.l.c., Davide Campari-Milano S.p.A, Paysafe PLC, Inchcape PLC, Samlerhuset BV and Swedish Match AB.
Relevant skills and contribution to the Board:
Karen brings valuable international experience, particularly in marketing, sales and consumer goods insight to the Board.
External appointments:
Non-Executive
Director of Amcor p.l.c.

Nationality:
German
Appointed:
August 2016 Experience: Marion’s extensive career includes Chief Financial Officer positions at Celesio,
Q-Cells
and ThyssenKrupp Elevator Technology and, more recently, she has served as a member of a variety of supervisory boards.
Relevant skills and contribution to the Board:
Marion brings significant financial expertise and operational experience gained at an international level, having spent her working life managing businesses across Europe, the Americas and Asia. Her experience as a member of various supervisory boards enables Marion to bring a range of insights to the Board’s discussions.
External appointments:
Vice Chairwoman of the Supervisory Board and
Co-Chairwoman
of the Presiding and Nomination Committee of ProSiebenSat.1 Media SE; Supervisory Board member and Chairman of the Audit Committee of Heineken N.V. and Supervisory Board member, Chairman of the Audit Committee of Siemens Healthineers AG and independent director of LONZA Group Ltd. (nominated for election on 5 May 2022).

Nationality:
American
Appointed:
July 2017
Experience:
Up until April 2018, Holly was a Senior Advisor to Corsair Capital LLC, where she had previously served as Managing Partner and
Co-Head
of Infrastructure from 2015 until her retirement in 2017. From 2010 to 2015, she served as
Co-Head
of Citi Infrastructure Investors and prior to 2010 she held financial and executive management roles with American Electric Power Company, Inc. and Consolidated Natural Gas Company. Holly previously served as an independent
Non-Executive
Director of Reynolds American Inc. from 2008 until its acquisition by the Group.
Relevant skills and contribution to the Board:
Holly’s extensive international operational and financial management experience in a range of industry sectors enables her to make important contributions to the Board.
External appointments:
Non-Executive
Director of Flutter Entertainment plc; Director and Chair of the Governance Committee of AES Corporation; and Director of Arch Coal Inc.
 

Nationality:
British
Appointed:
January 2014
Experience:
During his extensive career Savio has worked broadly in technology for General Electric, BTR plc and Alibaba Group, China’s largest internet business, where he was both Chief Operating Officer and, later, a
Non-Executive
Director.
Relevant skills and contribution to the Board:
Savio brings significant business leadership experience to the Board, together with a deep knowledge of Greater China and Asia, an important region for the Group.
External appointments:
Co-Founder
and CEO of A&K Consulting Co Ltd;
Non-Executive
Director of the Alibaba Hong Kong Entrepreneur Fund and Crossborder Innovative Ventures International Limited;
Non-Executive
Director and Advisory Board member of Homaer Financial; Independent
Non-Executive
Director of GOGOX and Southern England Wines Ltd.
 
100
 

Table of Contents
BAT Annual Report and Form 20-F 2021    
 
Strategic Report        
 
Governance Report        
  
Financial Statements        
  
Other Information        


Nationality:
Greek/British
Appointed:
Senior Independent Director since April 2020;
Non-Executive
Director since February 2015.
Experience:
Dimitri was Vice Chairman and Adviser to the Chairman and CEO of Procter & Gamble (P&G), where he started his career in 1977. During his time at P&G, Dimitri led on significant breakthrough innovations and continued to focus on this,
speed-to-market
and scale across all of P&G’s businesses while Vice Chairman of all the Global Business Units.
Relevant skills and contribution to the Board:
Dimitri has extensive general management, international sales and brand building expertise, which enables him to make valuable contributions to Board discussions on these important topics.
External appointments:
Senior Adviser at The Boston Consulting Group; Advisory Board member of JBS USA; Board Member of IRI; Board Member of North Atlantic Acquisition Corporation; and Director of Airway Therapeutics Inc.

Nationality:
American
Appointed:
December 2020
Experience:
Darrell is currently Vice President and Treasurer for Harley-Davidson, Inc., having previously held several senior finance positions including Interim Chief Financial Officer for Harley-Davidson, Inc., Chief Financial Officer for Harley-Davidson Financial Services, Inc. and Vice President and Assistant Treasurer, PepsiCo, Inc. Prior to joining PepsiCo, Inc. Darrell had a
19-year
career in banking with Commerzbank Securities, Swiss Re New Markets, ABN Amro Bank and Citicorp/Citibank where he held various capital markets and corporate finance roles.
Relevant skills and contribution to the Board:
Darrell brings extensive US, financial and regulatory experience to the Board.
External appointments:
Vice President and Treasurer for Harley-Davidson, Inc. (Darrell will retire from Harley-Davidson, Inc. on 1 March 2022); Board member of Sojourner Family Peace Center, Inc.; Independent Director of Dorman Products Inc.; and
Non-Executive
Director of Scotia Holdings (US) Inc.


Audit Committee

 
Nominations Committee

 
Remuneration Committee

 
Committee Chairman

 
Executive Director

 
Non-Executive
Director
 
Attendance at Board meetings in 2021
1


Attended/Eligible to attend
 
Name
  
 
Director since


Scheduled
4


Ad hoc
 
Luc Jobin
  
 
2017  


6/6


2/2
 
Jack Bowles
  
 
2019  


6/6


2/2
 
Tadeu Marroco
  
 
2019  


6/6


2/2
 
Sue Farr
  
 
2015  


6/6


2/2
 
Karen Guerra
  
 
2020  


6/6


2/2
 
Dr Marion Helmes
  
 
2016  


6/6


2/2
 
Holly Keller Koeppel
  
 
2017  


6/6


2/2
 
Savio Kwan
  
 
2014  


6/6


2/2
 
Dimitri Panayotopoulos
2
  
 
2015  


6/6


1/2
 
Darrell Thomas
  
 
2020  


6/6


2/2
 
Richard Burrows
3(a)
  
 
2009-2021  


2/2


2/2
 
Jerry Fowden
3(b)
  
 
2019-2021  


1/1


2/2
 
Notes:
1. 
Number of meetings in 2021: The Board held eight meetings in 2021, two of which were ad hoc and convened at short notice, to review Board Committee and Management Board appointments.
 
2. 
Dimitri Panayotopoulos did not attend the ad hoc meeting in March due to prior commitments. Directors that are unable to attend Board or Committee meetings have the opportunity to provide their comments to the Chairman in advance of the meeting.
 
3. 
Composition: The Board of Directors is shown as at the date of this Annual Report and Form
20-F;
(a) Richard Burrows retired as Chairman at the conclusion of the Company’s Annual General Meeting on 28 April 2021; and (b) Jerry Fowden stepped down from the Board with effect from 1 April 2021.
 
4.
 Number of meetings in 2022: Six Board meetings are scheduled for 2022.
 
101


Table of Contents
BAT Annual Report and Form 20-F 2021
 
Governance
Management Board
As at 10 February 2022


Nationality:
American
 
  
Nationality:
Italian/Brazilian
 
  
Nationality:
Italian/Argentinian
 
  
Jerry was appointed Director, Legal & External Affairs and General Counsel in May 2015, having joined the Management Board as Group Corporate & Regulatory Affairs Director in January 2015. Jerry was Regional General Counsel, Asia- Pacific from 2010 to 2014, before becoming Assistant General Counsel – Corporate & Commercial. He was a member of the Board of Reynolds American Inc. from February 2016 until July 2017.
  
Marina joined the Management Board as Director, Digital and Information in January 2019. She joined the Group as Chief Information Officer (CIO) in 2018, having previously served as Global CIO and Global Business Services SVP at Anheuser-Busch InBev, where she was responsible for information technology transformation, including consumer digital marketing.
  
Luciano joined the Management Board as Regional Director, Americas and Sub-Saharan Africa in January 2019. He joined the Group in 1992 and has held a wide range of roles, including Marketing Director in Venezuela, Marketing Director in Mexico and General Manager of BAT Mexico. Luciano was also Regional Marketing Manager for Western Europe and then Regional Head of Marketing, Americas and Sub-Saharan Africa before his appointment to the Management Board.


Nationality:
Australian
  
Nationality:
Pakistani
  
Nationality:
Korean
  
Nationality:
Dutch
Michael was appointed Regional Director for Asia-Pacific and Middle East in September 2020 and joined the Management Board at the same time. Previously, he was Area Director for Asia-Pacific and Global Travel Retail. Michael joined BAT in 1999 and has held several senior roles in the Group including General Manager (Papua New Guinea and Cambodia) and Regional Manager, Asia-Pacific.
  
Zafar was appointed Director, Operations in February 2021 and became a member of the Management Board at the same time. Previously, he was Group Head of New Categories Operations where he was responsible for successfully embedding an end-to-end supply chain for our New Category products to support their accelerated growth across the world. Zafar joined BAT in 1996 and has held several senior roles in the Group including Regional Head of Operations Asia Pacific & Middle East, Group Head of Plan, Service & Logistics, Regional Head of Plan and Service for Western Europe and Head of Operations, Bangladesh.
  
Hae In joined the Management Board as Director, Talent and Culture Designate in January 2019 and became Director, Talent and Culture in April 2019. Her role title changed to Director, Talent, Culture and Inclusion in November 2020. She was previously Group Head of Talent and Organisational Effectiveness and has held several other senior HR roles in the Group, including Regional HR Director, Asia-Pacific, and HR Director, Japan and North Asia. Prior to joining the Group in 2008, she gained experience at Samsung, IBM Consulting Services and PricewaterhouseCoopers.
  
Paul joined the Management Board as Director, New Categories in January 2019. He has been with the Group for 14 years in various senior roles, including Regional Marketing Manager, Asia-Pacific and Middle East, Area Director, East Asia and Global Head of Marketing Futures.


Nationality:
New Zealander
  
Nationality:
British
  
Nationality:
Belgian
  
Nationality:
British
Guy was appointed President and CEO of Reynolds American Inc. in September 2020, having joined the Management Board as Regional Director, Asia-Pacific and Middle East in January 2019. Previously he was Area Director, Australasia Area. Guy joined the Group in 1993 and has held several senior roles in the Group including Area Director, North Asia Area and Marketing Director, Russia.
  
David was appointed Director, Research and Science in January 2019, having joined the Management Board as Group Scientific Director in 2012, leading R&D’s focus on potentially reduced-risk products. He has been with the Group for more than 20 years and was previously Head of International Public Health and Scientific Affairs, responsible for engagement with scientific, medical and public health communities.
  
Johan was appointed Regional Director, Europe and North Africa in January 2019. From 1 January 2022, his role title is Regional Director, Europe. Johan joined the Management Board in 2014 as Regional Director for Eastern Europe, Middle East and Africa, then became Regional Director, Asia-Pacific and Middle East in January 2018. He has been with the Group for more than 25 years and his previous roles include General Manager in Russia, General Manager in Turkey and Global Brand Director for the Kent brand.
  
Kingsley was appointed Chief Marketing Officer in January 2019. He joined the Group in 1996 and held various senior marketing positions prior to being General Manager in Russia. He was appointed to the Management Board as Corporate and Regulatory Affairs Director in 2012. In January 2015, he was appointed Managing Director, Next Generation Products and then as Regional Director, Americas and Sub-Saharan Africa in January 2018.
 
102


Table of Contents
BAT Annual Report and Form 20-F 2021    
 
Strategic Report        
 
Governance Report        
  
Financial Statements        
  
Other Information        


Board Leadership and Purpose
Leadership Overview
 
Board Leadership
The Board is collectively responsible to our shareholders for the long-term sustainable success of the Company and for the Group’s strategic direction, purpose, values and governance. The Board provides the leadership necessary for the Group to meet its business objectives within a robust framework of internal controls. The Board’s primary responsibilities are summarised on page 111.
The Board has a comprehensive annual programme of meetings to review the Group’s strategy and monitor performance across all elements of the Group’s business model. The Board’s strategic priorities for 2021 are identified within the key performance indicators set out on page 9. The Chairman sets structured meeting agendas in consultation with the Chief Executive and the Company Secretary.
Key activities of the Board in 2021 are set out on pages 104 to 105. The Board considers stakeholder interests in its decision-making on an ongoing basis. Examples of principal decisions made by the Board during the year, and how it considered the long-term consequences of decisions, stakeholder interests, the impact of operations on the environment and corporate reputation in those contexts, are discussed on page 110.
Oversight of the impact of
COVID-19
and the Group’s response remained an important focus for the Board throughout 2021.
How our governance framework supports our strategy
An overview of our governance framework, including the structure of the Board and its principal Committees, is set out on page 111. As part of our internal controls framework, the Board has delegated certain authorities to executive management through our Group Statement of Delegated Authorities (SoDA) to enable effective delivery of Group strategy.
Our SoDA is designed to empower management at the right level of our organisation and promote high levels of accountability and ownership. Overseeing the implementation of Group strategy through our SoDA is one of the ways that the Board promotes robust corporate governance, risk management and internal controls across our Group. Our SoDA supports our Board members in managing their responsibility for promoting the success of the Company, in line with their directors’ duties.
Our Purpose and Ethos
Our purpose, to build A Better Tomorrow
TM
for all our stakeholders, is underpinned by our ethos.
We launched the BAT ethos in 2020, developed with significant employee input. It guides our culture and behaviours across our Group, enabling an organisation that is future fit for sustainable growth. We believe our ethos empowers our people and fosters a vibrant, rewarding and responsible workplace. Its focus on diversity and inclusion enables better understanding, connectivity and insights across our business.
The Board is committed to supporting the Management Board in continuing to promote the BAT ethos in every area of our business.


Read more about our purpose on page 27 and our ethos on page 69
 

Shaping and Overseeing Culture
The Board considers the Group’s culture and activities promoting our ethos in a range of contexts throughout the year, including through workforce engagement. Key examples of the Board’s oversight of culture are highlighted on page 105.
During 2021, Board oversight and monitoring of culture was supported by the Board’s annual review of the Group culture dashboard. This dashboard presents a series of insights measured over time across the organisation, including diversity at different levels, employee engagement (measured through our Your Voice global employee survey), leadership stability, employee retention, health and safety, and business conduct, including Speak Up allegations.
Following review, the Board is satisfied that our culture is aligned with the Group’s purpose, strategy and ethos, and reflected consistently in our workplace policies and practices.
Outside of the boardroom, the Directors typically participate in regular market and site visits to give them direct experience of our organisational culture in context. The Directors’ market and site visit programme continued to be impacted by travel restrictions in place due to
COVID-19.
Direct workforce engagement was instead enabled primarily through virtual forums in 2021 (discussed on page 108).
Delivery with integrity
How we execute our strategy is as important as its successful delivery. The Board remains focused on ensuring that we deliver with integrity in every aspect of our business. It is essential to our Group’s long-term, sustainable success that all our people act with consistently high standards of behaviour. We articulate this through our Group Standards of Business Conduct (SoBC). Compliance with our SoBC, in letter and spirit, is mandatory for all our people worldwide.
 

Our SoBC holds everyone responsible for compliance, and every line manager across our business must act as a role model for high standards of behaviour. The SoBC includes our Speak Up policy, reflecting the range of Speak Up channels for raising any concerns in confidence (anonymously if preferred) and without fear of reprisal. The SoBC also includes our Lobbying and Engagement policy, reinforcing the requirement for all our engagement activities with governments, regulators and other external stakeholders to be conducted with transparency, openness and integrity.
Our SoBC is regularly reviewed and updated. A revised version of our SoBC was introduced in January 2022 (discussed on page 110).
The Audit Committee is kept updated on SoBC allegations, and reports to the Board to enable Board oversight of behaviour falling short of our standards and the corrective action taken.


Read more about our commitment to delivery with integrity and our Group Standards of Business Conduct on pages 56 to 57
 
103


Table of Contents
BAT Annual Report and Form 20-F 2021
Board Leadership and Purpose
Board Activities
in 2021


Simplify the
Business
  
  
Step Change in
New Categories
Performance
  
  
Drive Value
From Combustibles
The Board understands our business is enabled by simplifying our structures, embracing digital transformation, and rigorous cost management.
  
Continued investment and development of New Categories to accelerate growth is a strategic focus of the Board’s agenda.
  
Driving value from combustibles is a core priority for the Board, to deliver today and build A Better Tomorrow
TM
.
 
Activities in 2021
 
 
reviewing Quantum implementation (part of Quest), including: effectiveness of Phase 1 organisational design and business unit simplification; impact of Phase 2 end market operating model and route-to-market optimisation; and progress in implementing Phase 3 UK head office restructuring;
 
oversight of progress against target savings to be realised through efficiencies implemented under Quantum to release funds for investment;
 
oversight of initiatives to drive a step-change in portfolio complexity reduction, including drive brand portfolio consolidation and stock-keeping unit rationalisation, as part of the Group’s focus on stronger, global brands;
 
reviewing revenue growth management capabilities and use of data and analytics to power insights and enhance forecasting and decision-making; and
 
reviewing key aspects of digital transformation to deliver enhanced user experience for consumers and customers, leverage Digital Business Solutions technology hubs to increase efficiencies, and cyber security developments.
Activities in 2021
 
 
reviewing Group performance against strategy to accelerate New Categories growth and KPIs, including New Categories revenue growth and market share;
 
reviewing industry and Group performance outlook in total nicotine and by product portfolio;
 
reviewing consumer adoption, trading environment and competitor landscape across New Categories portfolios;
 
reviewing our New Categories investment glidepath and innovation pipeline across all product portfolios;
 
reviewing the Group’s New Categories supply chain, its resilience, sourcing footprint and risk mitigation strategies (including in response to COVID-19);
 
reviewing regulatory landscapes in New Categories across key markets, with particular focus on the U.S. and EU;
 
overseeing the development of strategic opportunities beyond nicotine, including Btomorrow Ventures’ portfolio investments and the Group’s acquisition of a 19.9% investment in Organigram Holdings Inc.; and
 
assessing principles for laying foundations in wellbeing and stimulation.
Activities in 2021
 
 
reviewing Group performance against strategy to drive value from combustibles and KPIs, including value share growth;
 
reviewing industry outlook, trading environment and competitor landscape;
 
understanding the impact of growth in illicit trade, particularly in developing markets;
 
assessing the continuing impact of COVID-19 in highly impacted markets (such as South Africa and Brazil);
 
reviewing the impact of evolving tax regimes, with focus on excise tax developments in the U.S. and Asia-Pacific;
 
assessing principles applied to prioritise development and investment in our brand portfolio to generate sustainable value to fund New Categories development; and
 
reviewing combustible product portfolios, product development pipelines and developments in blending and product differentiation across the Group’s drive brand portfolio, emphasising innovation that is consumer relevant whilst reducing environmental impact.


The Enterprise of the Future
The Board supports management’s drive to implement our Quest programme, as it recognises that, for the Group to reach its long-term sustainability ambitions and to deliver its corporate purpose, it cannot rely on incremental delivery alone.
In 2021, the Board reviewed progress on Quest’s five capability accelerators (discussed to the right), via updates from the Executive Directors and other Management Board members.
The Finance and Transformation Director is the programme director for Quest and responsible for Quest implementation.
Quantum
Quantum’s objective is to simplify the organisation and generate funds through cost savings to reinvest in New Categories. Board oversight of Quantum is discussed above.
Unleash Innovation
Increasing focus and investment in transformational R&D, product innovation and partnering to create a powerful innovation eco-system.
Empowered Organisation
Building an engaged, agile and high performing organisation that can deliver the Enterprise of the Future, with winning capabilities, accountable and empowered leaders, a fit-for-purpose organisational design with an ambitious diversity and inclusion agenda.
Shaping Sustainability
Accelerating our path to becoming a truly sustainable enterprise and fulfilling our A Better Tomorrow
TM
purpose, through transparent engagement with scientists, regulators and policy-makers so that our strategy takes account of our views, and developing our New Categories science programmes whilst advocating for appropriate standards and regulations.
Technology and Digital
Driving digital transformation to unlock commercial value across our entire value chain, using data and analytics and developing enhanced digital capabilities.


Read more about our Quest programme and capability accelerators on pages 30 to 31
 
 
104


Table of Contents
BAT Annual Report and Form 20-F 2021    
 
Strategic Report        
 
Governance Report        
  
Financial Statements        
  
Other Information        


Financial and Risk
  
  
Environmental Social, Governance
  
  
Ethos, Culture, People
The Board pays close attention to Group performance and financial matters, internal control, and integrity of reporting and risk management.
  
The Board emphasises that our strategy, business, and product portfolio be sustainable for the long term and meet our evolving societal responsibilities.
  
The Board shapes and oversees the Group’s culture and ethos. Setting the ‘tone from the top’ is an important part of the Board’s role.
 
Activities
in 2021
 
 
approval of Group budget, consideration of capital allocation priorities, and oversight of resource allocation activities, to support strategy execution;
 
reviewing Group financial performance against key performance metrics, current outlook, challenges and opportunities for growth in each region, and FX impacts;
 
reviewing Group half-year results, trading updates,
year-end
results and the Annual Report and Form
20-F;
 
reviewing share price performance and investor and broker perspectives;
 
review of interim dividend proposals and assessment of distributable reserves of the Company prior to dividend payments;
 
determining Group viability, taking into account current position and principal risks;
 
reviewing compliance with Group financing principles, including liquidity, capital allocation and net debt/EBITDA;
 
reviewing the Group’s revolving credit facilities, refinancings, the Euro hybrid bond issuance, and debt issuance programmes;
 
reviewing Group cash flow performance and opportunities to optimise the balance sheet to enable investment, while reducing the carrying value of debt;
 
reviewing the appropriate level of authority to allot shares to maintain future flexibility for the Company;
 
reviewing the Group risk register, and risk appetite in the context of strategic objectives and emerging risks;
 
reviewing evolving global product regulation, including U.S. FDA regulation of menthol and flavours and evolving EU product and excise regulation;
 
reviewing status of litigation involving Group companies, including updates on the Canadian Companies’ Creditors Arrangement Act (CCAA) process in relation to Imperial Tobacco Canada;
 
reviewing Group insurance coverage; and
 
reviewing financial performance of associates of the Group periodically.
Activities
in 2021
 
 
oversight of climate-related issues and opportunities for the Group and the approach to embedding the elements of the TCFD framework across the Group;
 
reviewing environmental performance for the preceding year and progress against glidepaths towards achieving the Group’s environmental targets, including in relation to climate, renewable energy, water stewardship and recycling;
 
reviewing the Group’s ESG agenda, factors contributing to its increasing importance to key stakeholders, performance against ESG metrics and associated governance and controls;
 
approving revised terms of reference for the Audit Committee to include responsibilities for engagement and monitoring of external providers conducting assurance over ESG metrics;
 
reviewing the perspectives of the Group’s key stakeholders, the Group’s response to stakeholder perspectives, and the effectiveness of engagement mechanisms used;
 
assessing the impact of
COVID-19
on Group operations, and Group business continuity structures and plans to manage the Group’s response;
 
approving revisions to the Group’s Standards of Business Conduct and Supplier Code of Conduct, to take effect from 1 January 2022;
 
approving the annual Modern Slavery Act statement and annual Conflict Minerals Report; and
 
reviewing updates on compliance matters, including allegations of misconduct, reports from Speak Up channels and investigations, and the Group’s Delivery with Integrity programme initiatives.
 
Activities
in 2021
 
 
determining the independence of
Non-Executive
Directors prior to proposing them for
re-appointment
at the Company’s AGM;
 
revising the composition of the Audit and Remuneration Committees, on the recommendation of the Nominations Committee;
 
approving changes to Management Board composition, on the recommendation of the Nominations Committee;
 
reviewing proposed changes to the Directors’ Remuneration Policy, shareholder perspectives on new policy proposals, responses to shareholder engagement, and adopting the new Directors’ Remuneration Policy for shareholder approval at the 2022 AGM;
 
approving revisions to
Non-Executive
Director fees;
 
reviewing the outcomes of the annual Board evaluation in 2021;
 
monitoring corporate culture and its alignment with the Group’s purpose, ethos and strategy;
 
reviewing the Group’s talent strategy, employer brand, diversity and inclusion agenda, and progress against objectives;
 
reviewing approach to talent capability development, with a focus on capabilities needed for Group transformation;
 
considering feedback from the Group’s workforce engagement mechanisms;
 
reviewing the effectiveness of Speak Up channels; understanding the evolving impact of
COVID-19
on the Group’s workforce and reviewing strategies for securing safe
on-site
environments, effective connectivity for remote working, and safeguarding welfare;
 
reviewing health and safety performance for the preceding year, targets for the coming year and action plans; and
 
reviewing the funding positions relating to the Group’s retirement benefit schemes.
 
105


Table of Contents
BAT Annual Report and Form 20-F 2021
 
Board Leadership and Purpose
Board Engagement
with Stakeholders
 
Our Directors value engagement with our shareholders and wider stakeholders to understand their views and inform the Board’s decision-making, strategy development and risk assessment.
Shareholder and Investor Engagement
The Board is committed to open and transparent dialogue with shareholders and investors to ensure their views are understood and considered. The Chairman and Executive Directors’ annual engagement programme is discussed below.
The Senior Independent Director and other
Non-Executive
Directors are also available to meet with major shareholders on request.
 

Annual investor relations programme
A global engagement programme is conducted annually with shareholders, investors, potential investors and analysts. This is led by the Chairman and Executive Directors, supported by the Investor Relations team. The Executive Directors presented our Full and Half-Year results and
pre-close
statements with investor Q&A calls. Presentations and transcripts are published on bat.com.
In total we hosted 678 investor meetings in 2021 facilitated by virtual ways of working, covering 71% of our shareholder base with broad geographic coverage across the US, the UK, South Africa, Europe and other markets.
Investor interaction encompassed a broad range of event formats, including our virtual attendance at 11 investor conferences, 14 investor roadshows and four salesforce briefings. We launched our new IR website in February 2021 (see Spotlight on shareholder communication on page 107) enabling us to further leverage our digital interaction with investors.
We significantly increased our engagement on ESG topics (see Spotlight on ESG below), interacting with
ESG-focused
teams within our investment community through conference presentations and an ESG roadshow. This engagement also enabled investors to interact with members of our executive management team.
In February 2021, Jack Bowles and Tadeu Marroco presented for the first time at the Consumer Analyst Group of New York (CAGNY) conference via a live webcast and Q&A to over 150 investors. These presentations focused on our strengths and capabilities across brand-building, digital, ESG, science and R&D and articulated our commitment to deliver value for our stakeholders, driven by our A Better Tomorrow
TM
purpose.


106


Table of Contents
BAT Annual Report and Form 20-F 2021    
 
Strategic Report        
 
Governance Report        
  
Financial Statements        
  
Other Information        


Investor meetings: discussion focus
 

How the Board considers shareholder and investor views
The Chairman, the Executive Directors and Remuneration Committee Chair regularly update the Board on their dialogue with shareholders and investors. The Board also receives updates from the Head of Investor Relations and our brokers on key issues raised by shareholders and on stock performance.
Shareholder and investor perspectives considered by the Board in 2021 included transformation, New Categories strategy and performance, ESG targets, deleveraging, capital allocation and key regulatory developments. The Board takes shareholder feedback into account in decision-making and developing Group strategy (discussed further on this page and on pages 110 and 128 to 132).
Annual General Meeting (AGM)
Our AGM is an opportunity for further shareholder engagement, for the Chairman to set out progress, and for the Board to answer questions. Our 2021 AGM was held whilst the UK Government’s
COVID-19
‘Stay at Home’ measures were in force, prohibiting public gatherings of more than two people. Given those restrictions, our 2021 AGM was convened with a minimum quorum of two shareholders in accordance with the Company’s Articles of Association. Shareholders were given the opportunity to submit questions about AGM business in advance of the meeting and responses to the queries received were published at bat.com/agm.
Looking ahead, we plan to hold our 2022 AGM in person, subject to UK Government guidelines applicable at that time. Details of our 2022 AGM are set out on page 379.


For disclosures required by paragraph 7.2.6 of the Disclosure Guidance and Transparency Rules and the Companies Act 2006, see the Other Information section
 
Investor meetings: geographic scope
 

Update on 2021 AGM voting results
All resolutions were passed at the Company’s AGM held on 28 April 2021 with the requisite majority of votes. However, we acknowledge the vote against received in relation to the 2020 Directors’ Remuneration Report and the resolution to renew the Directors’ authority to allot shares, which we address below.
Directors’ Remuneration Report
Following the 2021 AGM and continuing into 2022, we have engaged with a broad cross-section of our shareholders and advisory bodies, including a number of shareholders that voted against this resolution at the 2021 AGM, to understand their perspectives on management of executive pay. Details of this engagement and how the Remuneration Committee has taken shareholder feedback into account in shaping the proposed new Directors’ Remuneration Policy are set out on pages 128 to 132.
Renewal of Directors’ authority to allot shares
In 2021, the Board reviewed the appropriate level of authority to allot shares to maintain future flexibility for the Company, and took into account the perspectives of shareholders unable to support an authority to allot shares of up to
two-thirds
of issued share capital as sought at our 2021 AGM.
In light of that review, the Board intends to propose shareholder approval of an authority to allot shares at a reduced level of up to
one-third
of issued share capital at our 2022 AGM, within the UK Investment Association’s share capital management guidelines. Full details of this resolution will be set out in the Company’s Notice of Meeting for our 2022 AGM.

 
107


Table of Contents
BAT Annual Report and Form 20-F 2021
 
Board Leadership and Purpose
Board Engagement with Stakeholders
Continued
 
Wider Stakeholder Engagement
A broad range of stakeholders are important to the Group at local, regional and functional levels. Key stakeholders are essential to our ability to generate long-term, sustainable value and we identify them by applying an established stakeholder engagement framework, which takes into account strategic objectives and risks to the Group.
Our key stakeholders are referenced in our business model on page 18, with an overview of their importance, what matters to them, and how we engage and respond to them set out on pages 20 to 21.
Transparency of engagement is woven into our Group policies, such as our Standards of Business Conduct and specific frameworks for stakeholder engagement. Matters reserved for the Board include responsibility for understanding the views of the Group’s wider stakeholders (including our workforce) and review of the effectiveness of engagement mechanisms.
The Board conducted a review of key stakeholders in 2021. This included how engagement is conducted across the Group, stakeholders’ perspectives, and how the Board is kept informed of those perspectives where engagement is not at Board level. Following its review, the Board remains satisfied there is well-established and effective engagement with the Group’s key stakeholders, which enables the Board to understand their perspectives. The Board will continue to monitor the ongoing effectiveness of stakeholder engagement.
Where the Board does not engage directly with our stakeholders, it is kept updated so Directors maintain an effective understanding of what matters to them and can draw on these perspectives, including in Board decision-making and strategy development. An overview of how the Board engaged with wider stakeholders and maintained its understanding of their interests during the year follows below, with further information on page 72 and on page 165 in relation to workforce engagement on remuneration matters.


The Board keeps up to date with the current views of our workforce through a combination of engagement methods across multiple channels at different levels of our organisation. These include town halls, works councils, webcasts, our ‘Your Voice‘ global employee survey, and direct engagement through Directors’ market and site visits (discussed on page 72). Given the spread, scale and diversity of the Group’s workforce, the Board considers it effective to use this blend of established channels, augmented by structured reporting.
These engagement channels, combined with Group-wide reporting structures to capture workforce feedback, cover all Group company employees and individuals contracted on a fixed-term basis to undertake permanent roles. Focus and action areas reviewed by the Board are then cascaded to our workforce.
Engagement across our organisation remained a top priority in 2021, as
COVID-19
continued to affect our organisation and ways of working. The Board reviewed our workforce engagement channels across the Group in 2021 and consolidated feedback from them. The overarching themes were transformation, innovation, and staying connected (particularly in the pandemic context), highlighted below.
Our Board’s usual programme of market and site visits allows Directors to engage directly with people across our organisation, but continued to be curtailed in 2021 due to
COVID-19
restrictions.
However, our Executive Directors led a series of virtual market visits and other forums to connect regularly with regional, local and functional teams (highlighted to left), and featured on our internal global news channel ‘BATV’. The Chairman delivered a personal video greeting to staff worldwide on his appointment and featured in our internal eZine.
Our Executive Directors also presented global, functional and market webcasts including discussions on our purpose, ethos, strategy, performance and business outlook in real time with Q&A.
The Board was briefed on London HQ return to site plans, staff perspectives on the positives and negatives, and how safeguarding measures would ensure a
COVID-19
secure return for staff working on site.
The Board noted that staff felt well supported during the pandemic, and the need to balance the advantages of more flexible working practices going forward, with recognition of
on-site
working as a powerful catalyst for collaborative and cohesive teamwork.


UK Companies Act: Employee engagement
 
This section summarises the Directors’ approach to engaging with the Group’s workforce, including employees of UK Group companies, and how the Directors have regard to their interests. Further information is provided on pages 20 to 21, 70 to 73, and pages 163 to 165 in relation to remuneration matters. Further details regarding the effect of that regard are provided on page 110.
 
108


Table of Contents
BAT Annual Report and Form 20-F 2021    
 
Strategic Report        
 
Governance Report        
  
Financial Statements        
  
Other Information        


Our consumers are at the core of everything we do.
Consumer-led
innovation and product science are central to achieving our purpose of building A Better Tomorrow
TM
. We believe that our multi-category approach is the most effective way to appeal to the diverse preferences of adult consumers worldwide.
The Board is regularly briefed by the Executive Directors and senior management on product performance across all portfolio categories and how product offerings continue to evolve to satisfy adult consumer preferences. In 2021, the Board was updated on how we are responding to consumer views on safety and quality of New Categories products, and our contribution to developing voluntary industry standards in various markets.
The Board was also briefed on how we understand our consumers’ shift to digital and
e-commerce
channels, and our development of mobile
e-commerce
and subscription tools.
Through its strategy sessions in 2021, the Board reviewed how we are actioning our wealth of consumer insights to support delivery of relevant product pipelines for a step-change in New Categories performance.
    

Whilst retailer, wholesaler and distributor relationships are managed at local market and business unit levels, the Board is briefed regularly on the Group’s
route-to-market
strategies and developments in the global retail environment.
In 2021, focus areas for Board updates included our response to retail customer feedback on the accelerating shift to
e-commerce,
including new tools for digital engagement
roll-out
across 40 markets, and how markets were adapting to maintain their engagement with customers, as
COVID-19
impacts continue and beyond.
The Audit Committee also reviews the Group’s Youth Access Prevention action plans annually, including for New Categories digital channels.
    

Our relationships with suppliers and contracted farmers are managed
day-to-day
by the Group’s Operations function and at local market level. The Board periodically reviews the Group’s supply chain strategies, supplier footprint and progress of sustainable agriculture and farmer livelihoods programmes.
In 2021, the Board was regularly updated on the impact of
COVID-19
on our operations and supply chain, mitigation plans to avoid supply chain disruption, and initiatives to support suppliers.
The Board reviewed the Group’s New Categories supplier network and geographic sourcing footprint, supply chain resilience and business continuity. The review focussed on sources of uncertainty and managing external impacts, through increased automation and efficiency improvements in collaboration with our suppliers.
The Board reviewed the annual Modern Slavery Statement, including commitments to ensure that operations are free from exploitation of labour and modern slavery, and the due diligence and monitoring programmes underpinning those commitments.
The Board approved the revised Supplier Code of Conduct (discussed on page 110). The Board also approved the Company’s annual Conflict Minerals Report which details due diligence undertaken to determine the origin of minerals at risk of being sourced in conditions of conflict.


We believe tobacco harm reduction can only be solved collaboratively, and that only through collaborative effort can effective regulation be developed to deliver public health objectives and also enable real consumer choice.
The Board is briefed on scientific engagement with regulators, public health bodies, and scientific communities. In 2021, this included updates covering engagement with the US FDA on vapour products, and the progress of US subsidiary Kentucky BioProcessing towards developing proprietary vaccine technology.
At every regular Board meeting, the Board reviews a report from our Legal & External Affairs Director covering evolving product regulation, regulatory engagement, developments in excise tax, anti-illicit trade initiatives, litigation and compliance.
For example, in 2021, these reports included briefings on developments in the US FDA’s approach to regulating menthol and flavours. The Board was also kept up to date on evolving product regulation and excise tax regimes, with focus on developments in the US and the EU, at its strategy sessions and through regular briefings from the Chief Executive.
The Board was briefed on investor and wider stakeholder expectations on sustainability policies, programmes and performance, including on alignment with the TCFD reporting framework and progress towards net zero carbon emissions. It also considered the Group’s range of responses to stakeholder feedback on the environmental impact of our products. Examples included our work to enable Vuse’s certification as the first carbon neutral global vapour brand, our reduction of single use plastics in our New Categories products, and take-back schemes for New Categories.
The Audit Committee regularly reviews the Group’s ESG performance against key metrics, and is briefed annually on our investment in community and charitable initiatives.
In 2021, the Audit Committee was briefed on enhanced due diligence and governance guidance for end markets and central functions when making charitable contributions and providing
in-kind
support under the revised Group Community Investment Framework.
The Audit Committee is also updated on engagement with tax authorities on material Group tax matters.
The
Non-Executive
Directors regularly attend the Corporate Audit Committee and Regional Audit & CSR Committees, where societal and community perspectives at regional and local levels are discussed. The Audit Committee also reviews feedback from these Committees.


UK Companies Act: Business relationships
 
This section summarises how the Directors have regard to the need to foster business relationships with customers, suppliers and other external stakeholders. Further information is provided on pages 20 to 21, Information regarding the effect of that regard is provided on page 110.
    
 
109


Table of Contents
BAT Annual Report and Form 20-F 2021
 
 
Board Leadership and Purpose
Principal Decisions
Made by the Board
Outlined below are some of the principal decisions made by the Board over the year, highlighting how the Board considered relevant factors including key stakeholder perspectives, the environment, corporate reputation, and the long-term impact of decisions.
 
Capital Allocation to Build A Better Tomorrow
TM
In approving the 2022 budget, the Board weighed a variety of imperatives for a multi-year, balanced capital allocation plan.
The budget emphasises New Categories investment and builds on the Group’s investment in Organigram Holdings Inc. and portfolio investments by Btommorow Ventures to develop an ecosystem of capabilities, technologies and insights. This investment enables our strategy for long-term sustainability in nicotine and beyond.
The budget is also designed to secure
mid-term,
high single digit EPS growth, achieve our shareholders’ deleverage expectations to maintain financial flexibility, and prioritise dividend distribution, whilst enabling commercial delivery across all categories in line with our guidance.
Our capital allocation anticipates developing our portfolios in nicotine and beyond to meet evolving consumer preferences, underpinned by robust product stewardship, scientific research and collaborative innovation to meet those needs, and considers the environmental impact of our operations and the complexity of navigating external fiscal and regulatory environments.
Amongst other factors, the 2022 budget also takes into account workforce remuneration and commercial arrangements with suppliers and customers.
 

Revised Standards of Business Conduct and Supplier Code of Conduct
The Board approved revised Standards of Business Conduct (SoBC) and a revised Supplier Code of Conduct, applicable from 1 January 2022. These revised policies are aligned with our strategy and ethos and take account of evolving external requirements and expectations of all our stakeholders for high standards of integrity in our business conduct.
Our revised SoBC emphasises that a key driver to delivering our corporate purpose is our ethos, which guides our culture and behaviours across the Group and enables an organisation
future-fit
for sustainable growth (discussed further on page 56). Our revised Supplier Code is aligned to our multi-category portfolio, sets expectations for suppliers to support our work to reduce the environmental impact of our products and operations, and reflects changes to our SoBC.
Updates to these policies were informed by feedback from our staff and business partners, international standards such as the ILO Declaration on Fundamental Principles and Rights at Work and OECD Guidelines for Multinational Enterprises, and external benchmarking. Continuous development of these policies demonstrates our commitment – within our organisation and in collaboration with our suppliers – to deliver results with high standards of integrity across our value chain.
 

Shaping the 2022 Directors’ Remuneration Policy
The Remuneration Committee conducted a comprehensive review of the current Directors’ Remuneration Policy during 2021, continuing into 2022.
This review included detailed consideration of the alignment of executive remuneration with our strategy, long-term interests of shareholders, and how best to reflect our ESG ambitions in short and long-term incentives, specifically our commitment to reducing the health impact of our business. The review also took account of the pay policies and practices applicable to our wider workforce, and the importance of promoting performance-based pay. Policy-related considerations are discussed in further detail on pages 128 to 132.
The review was informed by external market practices, corporate governance regulations, shareholder and governance advisory body guidelines, and advice from the Committee’s UK and U.S. remuneration consultants, supported by the Director, Talent, Culture & Inclusion. The Committee discussed initial policy proposals with the Board, and took into account perspectives from the Chairman and other Directors on those initial proposals, drawing on their ongoing dialogue with shareholders.
The Committee Chair then led several rounds of engagement with institutional shareholders and governance advisory bodies, and the Committee evaluated feedback and had active regard to addressing it when finalising the policy proposals. The Board accepted the recommendation of the Committee to put forward the proposed 2022 Directors’ Remuneration Policy to shareholders for approval at the forthcoming AGM.
 

Progress Towards Net Zero Emissions
The Board reviewed progress against the glidepath towards achieving the Group’s commitment to net zero value chain carbon emissions by 2050. This encompasses science-based targets across all emission scopes and is discussed on pages 47 and 61.
In setting environmental targets, regard was had to the emphasis placed across our key stakeholders – our shareholders and investors, our people, our consumers, our customers and suppliers, and wider society – on the importance of responding to climate change and maintaining high standards of environmental management, as well as to our broader, long-term sustainable success and corporate reputation.
Costs associated with progressing towards these targets were taken into account, balanced against the clear imperative to continue taking action to address worldwide implications of climate change, demonstrating our commitment to act as a responsible organisation and business partner.


We define principal decisions as those decisions and discussions by the Board that are strategic or material to the Group and those of significance to any of our key stakeholders.
 
110


Table of Contents
BAT Annual Report and Form 20-F 2021    
 
Strategic Report        
 
Governance Report        
  
Financial Statements        
  
Other Information        


Division of Responsibilities
Governance Framework
An overview of our governance framework is set out below. There is a clear and effective division of responsibility established between our Board, its Committees and operational management.


111


Table of Contents
BAT Annual Report and Form 20-F 2021
 
 
Division of Responsibilities
Our Approach to Division
of Responsibilities
 
The Board comprises the
Non-Executive
Chairman, two Executive Directors and seven independent
Non-Executive
Directors.


The responsibilities of the Chairman,
Executive Directors and Senior
Independent Director are available
at bat.com
This section sets out the roles and division of responsibilities between the Chairman, Executive Directors and
Non-Executive
Directors.
      
 
  Role
  
Responsibilities
     
  Chairman
  
–  Leadership of the Board and its overall effectiveness
 
–  Promotes constructive debate and effective decision-making
  
–  Sets the Board agenda
 
–  Facilitates Directors’ contributions
 
–  Interfaces with shareholders
  
–  Ensures effective shareholder engagement
 
–  Representational duties on behalf of the Company
        
  Chief Executive
  
–  Overall responsibility for Group performance
 
–  Leadership of the Group
  
–  Enables planning and execution of Group objectives and strategies
 
–  Stewardship of Group assets
  
–  Drives the cultural tone of the organisation
        
  Finance and
  Transformation
  Director
  
–  Leadership of the Group in respect of financial matters
  
–  Enables planning and execution of Group financial objectives and strategies
  
–  Leadership of the design and delivery of the Group’s QUEST transformation programme to accelerate delivery of Group strategy
        
  Senior Independent
  Director
  
–  Leads review of the Chairman’s performance
 
–  Presides at Board meetings in the Chairman’s absence
  
–  Chairs the Nominations Committee when Chairman succession considered
 
–  Sounding board for the Chairman
  
–  Intermediary for other Directors
 
–  Available to meet with shareholders
        
  Non-Executive
  Directors
  
–  Oversee Group strategy and resource allocation
 
–  Monitor Group performance and delivery of Group strategy
 
–  Oversee systems of control and risk management
  
–  Review management proposals and provide strategic guidance
 
–  Scrutinise and hold to account performance against objectives
  
–  Bring external judgement, perspective and effective challenge to management
 
Board Efficacy
Board meetings during the year continued to be convened virtually due to continuing
COVID-19
travel restrictions, with
in-person
meetings resuming in December 2021. Feedback from the annual Board evaluation confirmed that Board meetings continued to operate well and are considered to be chaired effectively.
 
The Chairman facilitates constructive Board relations, supporting effective contribution from
Non-Executive
Directors and promoting a culture of openness and debate. The Chairman seeks a consensus at Board meetings but, if necessary, decisions are taken by majority decision. If any Director has concerns on any issues that cannot be resolved, such concerns are noted in the Board minutes. No such concerns arose in 2021.
Non-Executive
Director meetings
 
 
The
Non-Executive
Directors, led by the Chairman, meet following Board meetings on a regular basis. Additional meetings led by the Chairman, and without the Executive Directors present, are scheduled in the Board calendar.
 
 
The Executive and the
Non-Executive
Directors also meet annually, led by the Senior Independent Director and without the Chairman present, to discuss the Chairman’s performance.
 
112


Table of Contents
BAT Annual Report and Form 20-F 2021    
 
Strategic Report        
 
Governance Report        
  
Financial Statements        
  
Other Information        


Independence
The Board considers all
Non-Executive
Directors to be independent, as they are free from any business or other relationships that could interfere materially with, or appear to affect, their judgement.
Luc Jobin was determined by the Board to be independent on his appointment as Chairman, as reported in the Company’s Annual Report and Form
20-F
for 2020.
The Board has determined Holly Keller Koeppel to be independent, having taken into account her service on the board of Reynolds American as an independent,
non-executive
director.
Luc and Holly were originally appointed to the Board in 2017 following the acquisition of Reynolds American Inc. (Reynolds American) and pursuant to the Agreement and Plan of Merger with Reynolds American.
The Board has also considered the independence requirements outlined in the NYSE’s listing standards and has determined that these are met by the Chairman and all the
Non-Executive
Directors. The Board considers that it includes an appropriate combination of Executive and
Non-Executive
Directors.
Commitment
Before appointing prospective Directors, the Board takes into account their other commitments and significant time commitments are disclosed prior to appointment. The letters of appointment for the Chairman and
Non-Executive
Directors set out their expected time commitment to the Company (see page 116).
Any additional external appointments following appointment to the Board require prior approval by the Board in accordance with the UK Corporate Governance Code. The Board assesses the significance of any additional external appointment notified by a Director, supported by the Company Secretary.
During 2021, the Board gave approval to Holly Keller Koeppel’s appointment as a
non-executive
director of Flutter Entertainment plc from 13 May 2021. This additional appointment was considered by the Board to be significant, but not to impair her ability to serve as a Director of the Company in view of the anticipated time commitment and given that she had stepped down as
non-executive
director of Vesuvius plc on 12 May 2021. Including the Company, Holly is currently a
non-executive
director of three listed companies.
In 2021, the Board considered and gave approval to Darrell Thomas’ appointment as an independent director of Dorman Products Inc. from 30 October 2021. The Board considered this additional appointment to be significant, but did not consider it to impair Darrell’s ability to serve as a Director of the Company as he would hold a total of two listed company mandates (within the voting guidelines of leading corporate governance advisory bodies). Following this appointment, Darrell is currently a
non-executive
director of two listed companies, including the Company.
Conflicts of Interests
The Board has formal procedures for managing conflicts of interest. Directors are required to give advance notice of any conflict issues to the Company Secretary. These are considered either at the next Board meeting or, if the timing requires it, at a meeting of the Board’s Conflicts Committee.
Each year, the Board also considers afresh all previously authorised situational conflicts. Directors are excluded from the quorum and vote in respect of any matters in which they have an interest.
In relation to Darrell’s appointment as a
non-executive
director of Scotia Holdings (US) Inc. from 4 February 2022, a potential situational conflict was reviewed and authorised by the Board as another company in the Bank of Nova Scotia group is a supplier to the Group in Colombia (although those supply arrangements are not material and Darrell has no involvement in the operations of that supplier or BAT subsidiary operations in Colombia). The Board determined that these arrangements did not impact Mr Thomas’ independence as a
Non-Executive
Director of the Company.
Directors Information and Advice
Directors receive effective support to assist them in meeting their responsibilities under the UK Corporate Governance Code and discharging their directors’ duties, both individually and collectively.
 
 
Directors receive papers for review in good time ahead of each Board and Committee meeting.
 
 
Papers and presentations to the Board and its Committees include discussion of specific stakeholder considerations as applicable.
 
 
The Company Secretary ensures effective information flow within and between the Board and its Committees, and between the
Non-Executive
Directors and senior management.
 
 
The Company Secretary, in conjunction with external advisers where appropriate, advises the Board on all governance matters.
 
 
All Directors have access to the advice and services of the Company Secretary. The appointment and replacement of the Company Secretary is a matter for the Board.
 
 
A procedure is in place for all Directors to take independent professional advice at the Company’s expense if required.
 
 
Each Board Committee may obtain independent legal or other professional advice, at the Company’s expense, and secure attendance at meetings of external participants if needed.


113


Table of Contents
BAT Annual Report and Form 20-F 2021
 
 
Composition, succession, evaluation
Board Effectiveness
 
Board Induction
All Directors receive a thorough and personalised induction on joining the Board, taking into account their skills, experience and scope of appointment.
Luc Jobin completed his induction as Chairman in 2021, discussed below. Darrell Thomas completed his
Non-Executive
Director’s induction in early 2021, as set out in the Annual Report and Form
20-F
for 2020.
Professional Development
Non-Executive
Directors receive a full programme of briefings during the year across all areas of the Group’s activities from the Executive Directors, members of the Management Board, the Company Secretary, other senior executives and outside advisors.
During 2021, key briefings for the Board included cyber security, patent portfolios, evolving product regulation, and other regulations impacting the Group’s business and governance arrangements, for example, the UK Financial Conduct Authority’s consultation on the proposed introduction of new regulations to enhance disclosure of the diversity of boards and executive management.
In the context of reviewing the Group’s climate strategy and enhanced sustainability targets, the Board was briefed on the objectives and requirements of the TCFD framework and stakeholder expectations on progress towards net zero carbon emissions across operational supply chains. The Board also recapped on directors’ duties under Section 172 of the UK Companies Act 2006 as part of its annual review of Group stakeholder engagement.
Committees of the Board are kept updated on developments within their respective remits. In 2021, the Audit Committee was updated on regulator and stakeholder expectations in respect of addressing climate risks in annual reporting, UK Government proposals to reform audit and corporate governance regulation, and in relation to revisions to applicable UK auditing standards and their impact. The Remuneration Committee was regularly updated by its external consultants on UK and U.S. corporate governance developments impacting executive remuneration.
Non-Executive
Directors regularly attend meetings of the Group’s Regional Audit and Corporate and Social Responsibility Committees and Corporate Audit Committee to gain a better understanding of the Group’s regions and central functions and the risks faced by the business at market, regional and functional levels. The Chairman meets with each
Non-Executive
Director individually towards the end of each year, to discuss their individual training and development plans.
Board Review Process
The performance and effectiveness of the Board, its Committees, the Executive and
Non-Executive
Directors and the Chairman were evaluated internally in 2021, facilitated by the Company Secretary. An external evaluation of the Board, its Committees and the Directors was conducted in 2019, facilitated by Independent Audit Limited.
The Chairman is responsible for the overall evaluation process and each Committee Chair is responsible for the evaluation of the performance and effectiveness of their Committee. The evaluations were conducted through a series of detailed questionnaires and all participants were requested to provide commentary to support their assessments.
All Directors participated in the evaluation process, assessing the Board, the Committees of which they were a member or regularly attended in 2021, and each of the Directors individually. In addition, several members of the Management Board and other senior management participated in elements of the evaluation.
Anonymised reports specifying the findings of the evaluations were prepared by the Company Secretary for the Board and each Committee. The Board and Committees then reviewed and discussed their respective reports and identified action areas for 2022 taking into account the evaluation findings.
The Chairman received reports from the Company Secretary on the performance and effectiveness of all Executive and
Non-Executive
Directors (other than himself) in 2021 and he provided individual feedback to each Director.
The Senior Independent Director received a report from the Company Secretary on the Chairman’s performance and effectiveness, and led a discussion reviewing the Chairman’s effectiveness with the other Directors (without the Chairman present). The Senior Independent Director then provided feedback to the Chairman.
 
        
2021: Internal Board Review Process


114


Table of Contents
BAT Annual Report and Form 20-F 2021    
 
Strategic Report        
 
Governance Report        
  
Financial Statements        
  
Other Information        


2021 Evaluation: Outcomes and Actions
The Board considers that it, its Committees and its Directors continue to
function effectively and that the working relationships between the Board
and its Committees continue to be sound.
 
Leadership and culture
The Board put their collective skillsets to good use in providing support to the Executive Directors’ drive to simplify the organisation and embed the BAT ethos. The Board continued to be adaptable in the face of
COVID-19,
and praised management’s consistent approach to prioritising staff welfare in 2021.
The Chairman and two new
Non-Executive
Directors were welcomed to the Board, refreshing the skillsets and perspectives of an already diverse and experienced team.
Non-Executive
Directors were seen to be supportive in the development of strategy and offering appropriate challenge. The candid nature of their discussions with the executive team was highlighted as a good example of the open culture at Board and senior management level.
The organisation’s resilience was clear to the Board in 2021, notwithstanding constraints on spending time in the wider business. The
Non-Executive
Directors look forward to resuming their usual programme of market and site visits in 2022.
Key Action for 2022


Plan for
Non-Executive
Director market and site visits.
Strategy
The Board considered its strategy discussions to be effective, leading to strong strategic objective setting, and notably in driving the ESG and people agendas forward in the year. The Remuneration Committee has been focused on ensuring that strategic objectives are reflected in the Group’s remuneration strategy.
Following up on actions arising from the 2020 Board evaluation to allow additional time for deep dives on strategic objectives and review of major initiatives, during the year the Board’s agenda included a series of
in-depth
reviews: for example on talent strategy, ESG agenda and the New Categories supply chain.
The Board is keen to build on this into 2022 with further emphasis on the competitor landscape, scenario planning, and emerging issues and trends.
Key Action for 2022


More detail for the Board on the competitive landscape and consumer trends, with more time in the Board agenda for in-depth scenario analysis and planning.
Composition and succession
The Board regards its composition to be well balanced in terms of skills, experience, geography and gender, with recent appointments demonstrating its effectiveness at bringing the right people around the table.
Following up on actions arising from the 2020 Board evaluation, the Nominations Committee completed its skills profile for future
non-executive
directors to support succession planning. The Nominations Committee is keen to see more of the executive management pipeline in 2022.
Key Action for 2022
 
 
Additional time to be allowed on the Board agenda for executive management succession planning.
Risk management
The continued focus on business controls and compliance is highly regarded by the Board, and the Board’s monitoring of key risks and oversight of compliance is considered to be effective. The Audit Committee’s oversight of the fundamental reporting environment was considered to be sound, with the Committee staying on top of key projects and activities.
In the context of the Group’s transformational agenda, Directors noted the benefit of understanding the risks and stresses of extensive business change and the pressure points from a people perspective.
Actions arising from the 2020 Board evaluation, to further enhance the Board’s understanding of strategic opportunities and risks presented by evolving technologies, were followed up during the year. For example, the Board reviewed developments in cyber security and the Audit Committee assessed digital transformation risks and the approach to managing risks identified.
Key Action for 2022
 
 
Further emphasis in the Board agenda on change management in the context of the Group’s transformational agenda, including from a people perspective.
Dynamics and information
Board and Committee meetings are considered to be chaired effectively, and well-supported by the Company Secretariat.
The Chairman was recognised for his inclusive style and fostering open discussion. Agendas are seen as well-balanced between business critical items and governance matters.
During the year the Board conducted several
in-depth
reviews of market analysis and the competitor environment in response to actions identified from the 2020 Board evaluation to emphasise time for these areas in the Board agenda.
Key Action for 2022
 
 
Additional
pre-read
material to be provided for key presentations to enable greater time for discussion in Board meetings.
 
115


Table of Contents
BAT Annual Report and Form 20-F 2021
 
Composition, Succession, Evaluation
Nominations Committee
 

Attendance at meetings in 2021
1(a),
2(a)
 
          
Attended/Eligible to attend
 
Name
 
 
Member since
 
    
Scheduled
 
    
Ad hoc
 
 
Luc Jobin
 
 
2017


2/2


4/4
 
Sue Farr
 
 
2015


2/2


4/4
 
Karen Guerra
 
 
2020


2/2


4/4
 
Dr Marion Helmes
 
 
2016


2/2


4/4
 
Holly Keller Koeppel
 
 
2017


2/2


4/4
 
Savio Kwan
 
 
2014


2/2


4/4
 
Dimitri Panayotopoulos
1(b)
 
 
2015


2/2


3/4
 
Darrell Thomas
 
 
2020


2/2


4/4
 
Richard Burrows
2(b)
 
 
2009 – 2021


1/1


2/2
 
Jerry Fowden
2(c)
 
 
2019 – 2021


1/1


2/2
 
Notes:
 
1.
Number of meetings in 2021: (a) the Committee held six meetings, four of which were ad hoc; and (b) Dimitri Panayotopoulos did not attend the ad hoc meeting in March, which was convened at short notice, due to prior commitments.
 
2.
Membership: (a) all members of the Committee are independent
Non-Executive
Directors in accordance with UK Corporate Governance Code 2018 Provisions 10 and 17, applicable US federal securities laws and NYSE listing standards; (b) Richard Burrows ceased to be a member of the Committee on stepping down from the Board at the conclusion of the Company’s AGM on 28 April 2021; and (c) Jerry Fowden ceased to be member of the Committee on stepping down from the Board with effect from 1 April 2021.
 
3.
Other attendees: the Chief Executive, the Director, Talent, Culture & Inclusion, and Group Head of Talent & Organisation Effectiveness regularly attend meetings by invitation but are not members.


Role
As set out in the Terms of Reference, the Nominations Committee is responsible for:
 
 
reviewing the structure, size and composition of the Board and Management Board on a regular basis to ensure both have an appropriate balance of skills, expertise, knowledge and, in relation to the Board, independence;
 
 
reviewing the succession plans for appointments to the Board, the Management Board and Company Secretary to maintain an appropriate balance of skills and experience and to ensure progressive refreshing of both the Board and the Management Board;
 
 
making recommendations to the Board on suitable candidates for appointments to the Board, the Management Board and Company Secretary, ensuring that the procedure for those appointments is rigorous, transparent, objective and merit-based and has regard for diversity;
 
 
assessing the time needed to fulfil the roles of Chairman, Senior Independent Director and
Non-Executive
Director, and ensuring
Non-Executive
Directors have sufficient time to fulfil their duties;
 
 
overseeing the development of a pipeline of diverse, high-performing potential Executive Directors, Management Board members and other senior managers; and
 
 
implementing the Board Diversity Policy and monitoring progress towards the achievement of its objectives, summarised on page 119.
Key Activities in 2021
 
 
Making recommendations to the Board in respect of Board Committee appointments, including appointment of Karen Guerra to the Audit Committee from 1 April 2021, as set out on page 120.
 
 
Making recommendations to the Board to appoint a new Director, Operations with effect from 1 February 2021, as set out at page 111.
 
 
Analysis of the profile, skills and experience required of future
Non-Executive
Directors in the context of the Group’s purpose and strategy, to support Board succession planning activities.
 
 
Making recommendations to the Board in relation to Directors’ annual appointment and
re-election
at the AGM, discussed further on page 117.
 
 
Reviewing the Executive Directors’ and Management Board members’ annual performance assessments and assessing the development of candidates for Management Board roles.
 
 
Overseeing the Group’s diversity and inclusion agenda, its role in promoting an inclusive and high-performing culture as part of the Group’s talent strategy, and progress in building diverse talent pipelines and creating enablers across the organisation.
 
 
Reviewing the Committee’s effectiveness in 2021, following the Committee evaluation process, discussed on pages 114 to 115.
Terms of Appointment to the Board
Details of the Directors’ terms of appointment to the Board and the Company’s policy on payments for loss of office are contained in the current Directors’ Remuneration Policy, which is set out in full in the Remuneration Report 2018, in the Company’s Annual Report and Form
20-F
for 2018 available on bat.com.
The Executive Directors have rolling
one-year
contracts.
Non-Executive
Directors do not have service contracts with the Company but instead have letters of appointment for one year, with an expected time commitment of 25 to 30 days per year.
 
116


Table of Contents
BAT Annual Report and Form 20-F 2021    
 
Strategic Report        
 
Governance Report        
  
Financial Statements        
  
Other Information        


Balance and Diversity
The Board appreciates the benefits of diversity in all of its forms, within its own membership and at all levels across our organisation. Our
Non-Executive
Directors come from a broad range of industry and professional backgrounds, with varied experience and expertise aligned to the Group’s strategy.
Biographies of the Directors, including a summary of their skills, experience and contribution brought to the Board, are set out on pages 100 to 101. The diversity of our Board is set out on this page and our Board Diversity Policy is discussed on page 119.
Board Succession Planning
The Board considers the length of service of the Board members as a whole and the need for it to refresh its membership progressively over time. The Nominations Committee is responsible for regularly reviewing the composition of the Board and Management Board to ensure both have an appropriate balance of skills, expertise and knowledge. The Committee is also responsible for identifying candidates for Board positions and ensuring that all appointments are made on merit, against objective criteria, and with due regard for our Board Diversity Policy (see page 119). This process includes a full evaluation of candidates’ attributes and how these would augment the Board’s mix of skills, expertise and knowledge and involves interviews with a range of candidates.
In 2021, the Committee assessed the profiles, skills and experience required of future
Non-Executive
Directors, taking into account the Group’s purpose and strategy. Following this assessment, the Committee developed candidate profile requirements to support
Non-Executive
Director succession planning. Heidrick & Struggles
1
was appointed to support the Committee with future
Non-Executive
Director search activities in 2021. The Committee will report on the process leading to the appointment of Krishnan ‘Kandy’ Anand as a
Non-Executive
Director from 14 February 2022 in the Annual Report and Form
20-F
for 2022.
Annual General Meeting 2022
With the exception of Marion Helmes, the Company will submit all eligible Directors for
re-election
and, in the case of Kandy Anand, election for the first time. Prior to making recommendations to the Board in respect of Directors’ submissions for
re-election,
the Committee carried out an assessment of each Director, including their performance, contribution to the long-term sustainable success of the Company and, in respect of each
of the Non-Executive
Directors, their continued independence.
In relation to the proposed reappointment of Savio Kwan, who will have served as a
Non-Executive
Director for just over eight years at the time of the 2022 AGM, the Committee conducted a particularly rigorous review, taking into account relevant considerations including his performance and his attendance record. The Committee concluded that Savio continues to make effective use of his experience, challenges management constructively and maintains independence of thought and approach, and considered it appropriate to recommend to the Board that Savio be submitted for
re-election
at the 2022 AGM.
The Chairman’s letter accompanying the 2022 AGM Notice confirms that all
Non-Executive
Directors being proposed for
re-election
are effective and that they continue to demonstrate commitment to their roles.
Board Retirements
Richard Burrows stepped down as Chairman and from the Board with effect from the conclusion of the Company’s AGM on 28 April 2021. Jerry Fowden stepped down from the Board with effect from 1 April 2021. Marion Helmes will step down from the Board with effect from the conclusion of the Company’s AGM on 28 April 2022.
Board Balance at 31 December 2021
 
 
Balance of Non-Executive Directors
and Executive Directors


Length of tenure of
Non-Executive Directors


Nationality of Directors


Directors: Ethnicity balance


Directors: Gender balance

Notes:
 
1.
Heidrick & Struggles International, Inc. is an independent executive search firm, compliant with the Standard and Enhanced Code of Conduct for Executive Search Firms. Heidrick & Struggles has no connections with the Company or its Directors other than in respect of provision of executive search services.
 
2.
Applying UK Office for National Statistics ethnicity categories of: Asian; Black; Mixed/multiple ethnic groups; Other
non-white
ethnic group, in alignment with the Parker Review.
 
117


Table of Contents
BAT Annual Report and Form 20-F 2021
 
Composition, Succession, Evaluation
Nominations Committee
Continued


Executive Succession Planning
As part of the Committee’s responsibility to oversee the development of a pipeline of diverse, high-performing senior management, it reviews succession plans and talent pools at short-,
mid-
and long-term time horizons for the Executive Directors, other Management Board members, and certain other members of senior management.
Talent Pipeline Development
The Board regularly reviews Group talent development more broadly, including progress on our talent and culture strategic priorities to:
 
 
attract the best talent
, including development of a strong employer brand and engagement with strategic talent pools;
 
 
develop future winning capabilities
through accelerating leadership and functional capability development and digital transformation;
 
 
enable an agile and empowered organisation
through proactive organisational design effectiveness, leaders who are accountable and empowered, and a strong learning culture; and
 
 
promote an inclusive and high-performing culture
through a bold diversity and inclusion agenda, and strong leadership teams.
Our talent and culture strategic priorities are underpinned by our Group diversity and inclusion agenda, discussed on pages 69 to 73.
Progress in 2021 against our objective to develop a pipeline of diverse, high-performing senior managers is set out on page 119.
Diversity and Inclusion Agenda
Our diversity and inclusion agenda focuses on the core areas of driving ownership and accountability, building diverse talent pipelines and creating enablers.
In the context of our talent and culture strategic priorities, the Board oversees and monitors progress of our Group diversity and inclusion agenda. In 2021, this included:
 
 
reviewing progress against the Group’s diversity and inclusion ambitions through to 2025, including to have women in 40% of senior leadership team roles and 45% of management roles, and a 50% spread of distinct nationalities in key leadership team roles;
 
 
the Group’s progress in gaining industry-leading employer certifications in diversity and inclusion and the Group’s ambitions to gain further recognition;
 
 
the
roll-out
of diversity and inclusion, LGBT+, and race and ethnicity allyship guides, including as part of leadership programmes; and
 
 
implementation of our IGNITE returners programme in multiple markets, which focuses on supporting experienced professionals return to the workplace after a career break.
Our Strategic Report discusses our diversity and inclusion agenda and initiatives further, and provides details on the representation of women and distinct nationalities in our workforce, and in our senior management population, on pages 69 to 73.
Notes:
 
1.
Applying UK Office for National Statistics ethnicity categories of: Asian; Black; Mixed/multiple ethnic groups; Other
non-white
ethnic group, in alignment with the Parker Review.
 
2.
Senior Management comprises the Management Board and Company Secretary in accordance with the UK Corporate Governance Code.
Executive Management balance at 31 December 2021
 
 
Management Board: Nationality


Management Board: Ethnicity balance


Management Board: Gender balance


Senior Management
2
and their
direct reports: gender balance

 
118


Table of Contents
BAT Annual Report and Form 20-F 2021    
 
Strategic Report        
 
Governance Report        
  
Financial Statements        
  
Other Information        


Board Diversity Policy
We believe that talent is our competitive advantage and diversity is a critical component of our success, providing better understanding, connectivity and insight to our consumers and our employees. ‘We are diverse‘ is one of the five key principles of our ethos, set out on page 69.
Our commitment to promoting diversity across our organisation is reflected in our Group Standards of Business Conduct, discussed further on pages 56 to 57. We respect and celebrate each other’s differences and value what makes each of us unique.
Diversity is taken into consideration in determining the composition of our Board and Management Board, through the application of our Board Diversity Policy.
Our Board Diversity Policy is aligned with our ethos. Our policy expresses how we think of diversity in its widest sense, as those attributes that make each of us unique. These include our race, ethnicity, cultural and social background, geographical origin, gender, age, any disability, sexual orientation, religion, skills, experience, education and professional background, perspectives and thinking styles.
Objectives and Progress Update
The objectives of our Board Diversity Policy (as applied in 2021) and progress against these objectives in the year are set out below. The Board complies with the recommendations on ethnic diversity made by the Parker Review.
As at 31 December 2021, the representation of women on the Board was 40%, compliant with the recommendations on gender diversity made by the Hampton-Alexander Review.
Our Commitment to Furthering Diversity
When Marion Helmes steps down from the Board at conclusion of the 2022 AGM, and following Kandy Anand’s appointment as a
Non-Executive
Director, the representation of women on the Board will be 30% at conclusion of the 2022 AGM (40% at conclusion of the 2021 AGM).
The Board is fully committed to enhancing its gender balance so that women represent at least 33% of the Board prior to the Company’s following AGM in 2023. The Nominations Committee will be actively progressing its
Non-Executive
Director succession planning to meet this objective, supported by the Board Diversity Policy.
In view of the UK Financial Conduct Authority (FCA) consultation on enhanced disclosure of the diversity of boards and executive management, the Board also anticipates that a revised Board Diversity Policy will be introduced during 2022, aligned to any new UK Listing Rules requirements implemented by the FCA.
 
Objective in 2021
  
Progress in 2021
Considering all aspects of diversity when reviewing the composition of, and succession planning for, the Board and Management Board.
  
–  The Nominations Committee has regard to diversity in its widest sense, including attributes such as gender, race, ethnicity, cultural and social backgrounds, and other personal attributes, when undertaking these activities.
Considering a wide pool of candidates across genders for appointment to the Board.
  
–  Executive search firms are engaged to support Board and Management Board succession planning where applicable and are required to provide gender-balanced shortlists of candidates. Succession planning for Executive Directors and Management Board members takes into account potential internal candidates from across the Group and potential external candidates.
Maintaining at least 30% female Board representation, with the ambition of progressing towards further gender balance.
  
–  The representation of women on the Board was 40% as at 31 December 2021 (2020: 33.3%). Please refer to the note above in relation to representation of women on the Board in 2022.
 
–  Non-Executive
Director succession planning takes into account the Board’s ambition to further improve gender diversity.
Giving preference, where appropriate, to engagement of executive search firms accredited under the Standard and Enhanced Codes of Conduct for Executive Search Firms.
  
–  Where executive search firms are engaged to provide executive search services to support Board succession planning, preference is given to those that are accredited under the Standard and Enhanced Codes of Conduct for Executive Search Firms.
Oversight of the development of a pipeline of diverse, high-performing potential Executive Directors, Management Board members and other senior managers.
  
–  The representation of women on the Management Board was 15.4% as at 31 December 2021 (2020: 15.4%) and remains so currently. Management Board succession planning takes into account the ambition to progress towards improved gender diversity.
 
–  Emphasis is placed on building diverse talent pools at all levels of the organisation through recruiting, developing and retaining diverse and high-performing talent.
 
–  In 2021, 47% of the Group’s external management recruits were women (2020: 43%) and women comprised 51% of our new graduate intake in 2021.
 
–  Please refer to pages 69 to 73 for further information about the Group’s diversity and inclusion agenda.
 
119


Table of Contents
BAT Annual Report and Form 20-F 2021
 
Audit, Risk, Internal Control
Audit Committee


Attendance at meetings in 2021
 
          
Attended/Eligible to attend
 
Name


Member since


Scheduled
1
 
(a) 


Ad hoc


Holly Keller Koeppel
2(a),(b)
 
 
2017


5/5


0/0
 
Karen Guerra
2(a),(c)
 
 
2021


4/4


0/0
 
Darrell Thomas
2(a),(b)
 
 
2020


5/5


0/0
 
Luc Jobin
2(d)
 
 
2019 – 2021


2/2


0/0
 
Jerry Fowden
2(e)


2019 – 2021


1/1


0/0


Notes:
 
1.
Meetings: (a) the Committee held five meetings in 2021; (b) five meetings of the Committee are scheduled for 2022.
 
2.
Membership: (a) all members of the Committee are independent
Non-Executive
Directors in accordance with the UK Corporate Governance Code 2018 Provisions 10 and 24 and applicable US federal securities laws and NYSE listing standards. The Board has determined each Committee member to meet the financial literacy requirements applicable under NYSE listing standards. Each member of the Committee has recent and relevant financial experience in accordance with the UK Corporate Governance Code 2018. The Committee members as a whole have competence relevant to the sectors the Group operates in; (b) Holly Keller Koeppel and Darrell Thomas are each designated as an audit committee financial expert in accordance with applicable US federal securities laws and NYSE listing standards; (c) Karen Guerra became a Committee member on 1 April 2021; (d) Luc Jobin ceased to be a Committee member on his appointment as Chairman from conclusion of the Company’s AGM on 28 April 2021; and (e) Jerry Fowden ceased to be a Committee member on stepping down from the Board with effect from 1 April 2021.
 
3.
The Finance and Transformation Director attends all Committee meetings but is not a member. Other Directors may attend by invitation. The Director, Legal & External Affairs and General Counsel, the Group Head of Internal Audit and the external auditors attend all meetings.
 
4.
The Committee meets alone with the external auditors, and, separately with the Group Head of Internal Audit, at the end of every Committee meeting. The Committee also meets periodically with management.


Introduction
On behalf of the Audit Committee, I am pleased to introduce our report for 2021. The report sets out the Committee’s role and responsibilities, and discusses our activities during the year.
Karen Guerra joined the Committee on 1 April 2021 and, later that month, Luc Jobin stepped down from the Committee on his appointment as Chairman. We welcome Karen and extend our thanks to Luc for his service to the Committee since 2019.
We have addressed a series of important topics this year. We assessed climate-related risks and their impact on the Group to ensure robust processes are in place to identify, assess and manage climate risks in alignment with the TCFD framework. We also reviewed the approach to managing cyber security and digital transformation risks across the Group and our role in monitoring cyber security controls is now expressly recognised in the Committee’s revised terms of reference.
We have given detailed consideration to a range of accounting matters during the year, including rigorous assessment of adjusting items. We also introduced a new Group accounting policy on biological assets in view of the Group’s acquisition of a
non-controlling
interest in Organigram Holdings Inc.
Alongside these activities, we maintained our focus on safeguarding a sound control environment, taking account of the continued impact of
COVID-19
on ways of working. We monitored progress on the internal audit plan during the year and are satisfied the blended approach to remote and
on-site
audits continues to be effective. The internal audit plan approved for 2022 builds on these principles and is designed to be responsive to the evolving nature of Group risks.
We appreciate the expectations of our shareholders and wider stakeholders for transparent, high quality reporting on our ESG metrics and progress on our sustainability agenda. Our Group sustainability reporting is well established, including procedures for reporting ESG metrics and related information. To enhance this, we have extended the scope of external assurance of reported ESG metrics, overseen by the Committee under our revised terms of reference.
Holly Keller Koeppel
Audit Committee Chair
 
120


Table of Contents
BAT Annual Report and Form 20-F 2021    
 
Strategic Report        
 
Governance Report        
  
Financial Statements        
  
Other Information        


Role
As set out in its terms of reference, the Audit Committee monitors and reviews the:
 
integrity of the Group’s financial statements and any formal announcements relating to the Company’s performance, considering any significant financial reporting issues, significant judgements and estimates reflected in them, before their submission to the Board;
 
consistency of the Group’s accounting policies;
 
effectiveness of, and makes recommendations to the Board on, the Group’s accounting, internal accounting and other financial controls, auditing matters and business risk management systems;
 
effectiveness of the Group’s internal audit function; and
 
independence, performance, effectiveness and objectivity of the Company’s external auditors, making recommendations to the Board as to their reappointment (or for a tender of audit services where appropriate), and approving their terms of engagement and the level of audit, audit-related and
non-audit
fees.
Revisions to the Audit Committee terms of reference in 2021
Revised Audit Committee terms of reference were adopted by the Board in September 2021 to:
 
extend the remit of the Committee to include responsibilities for the engagement of external providers to conduct assurance over defined ESG metrics and related information in annual reporting, monitoring that assurance work, and reviewing its effectiveness, taking into account applicable regulatory and professional requirements; and
 
make express reference to the Committee’s role in monitoring cyber security controls as part of the Committee’s oversight of the Group’s internal controls and business risk systems.
Key Activities in 2021
Regular work programme – reviewing:
 
the Group’s annual results, half-year results, the application of accounting standards, and the external auditors’ reports where results are audited;
 
the Group’s external auditors’
year-end
audit, including the key audit matters, critical audit matters, materiality assessments and the Group’s control environment, and confirming the independence of the Group’s external auditors;
 
the basis of preparation and accounting judgements;
 
the steps taken to validate the Group’s ‘going concern’ assessment at half-year and
year-end
and agreeing the process and steps taken to determine the Group’s viability statement at
year-end;
 
adjusting items, applicable accounting treatments and the use of alternative performance measures;
 
the annual assessment of goodwill and intangibles impairment;
 
the accounting applicable to retirement benefits liabilities and assets;
 
the Group’s liquidity position, including current facilities and financing needs;
 
the internal processes followed for the preparation of the Annual Report and Form
20-F
and confirming that the processes appropriately facilitated the preparation of an Annual Report and Form
20-F
that is ‘fair, balanced and understandable’;
 
the Group’s risk register, including prioritisation and categorisation of Group risks, and relevant mitigating factors;
oversight of management’s activities to ensure ongoing compliance with the US Sarbanes-Oxley Act of 2002 (SOx) (discussed on page 127);
 
the Company’s status as a Foreign Private Issuer for the purposes of US securities laws;
 
regular reports from the Group Head of Internal Audit on the internal audits of markets, business units, processes and operations, management responses to internal audit findings and action plans put in place to address any issues raised;
 
the 2022 internal audit plan and progress against the 2021 plan;
 
annual and interim reports on the Group’s ‘Delivery with Integrity’ compliance programme (discussed on pages 56 to 57), and monitoring compliance with the Standards of Business Conduct (SoBC), and monitoring SoBC incident reporting and the effectiveness of ‘Speak Up’ channels prior to review by the Board;
 
the Group’s sustainability performance on an annual basis, including performance against the Group’s ESG targets, the Group’s responsible marketing and youth access prevention activities, and the Group’s community investment activities in countries and communities in which the Group operates under the Group Strategic Framework for Community Investment, (discussed on page 54);
 
the outcomes of assessments of countries in which Group companies operate identified to have a higher degree of exposure to human rights risks in 2021, including local compliance with Group policies, standards and controls and local measures in place to enhance human rights risk management;
 
periodic reports from the Group’s Corporate Audit Committee and Regional Audit and Corporate Social Responsibility Committees;
 
the annual report from the Group Head of Security on security risks, losses and fraud arising during the preceding year;
 
half-year and
year-end
reports on political contributions, (discussed on page 127); and
 
the Committee’s effectiveness, following the annual evaluation of the Committee (discussed on pages 114 to 115).
Further specific matters considered by the Committee in relation to the financial statements:
 
segmental reporting:
the Committee reviewed the application of segmental reporting in accordance with IFRS 8 (
Operating Segments
) and assessed that the Group’s financial reporting segmentation would remain by geography for the 2021 financial statements, with revenue disclosures also provided by product category (see note 2 in the Notes on the Accounts).
 
revisions to Group accounting policies:
the Committee endorsed the introduction of a new Group accounting policy on biological assets in accordance with IAS 41 (
Agriculture
) to take effect from the acquisition by the Group of a 19.9% equity investment in Organigram Holdings Inc.
 
UK-adopted
IFRS:
following the incorporation of IFRS standards into UK regulations at the end of the transition of the UK’s exit from the EU, the Group’s financial reporting is prepared under
UK-adopted
international accounting standards from 1 January 2021 onwards.
 
Euro Hybrid Bond issuance:
the Committee reviewed the accounting treatment applicable to the
2 billion hybrid bond issuance and assessed its classification as equity in accordance with IAS 32 (
Financial Instruments
) and its impact on the earnings per share calculation (see note 11 in the Notes on the Accounts).
 
121


Table of Contents
BAT Annual Report and Form 20-F 2021
 
Audit, Risk, Internal Control
Audit Committee
Continued
 
Significant accounting judgements and estimates considered by the Committee in relation to the 2021 financial statements:
The significant accounting judgements and estimates considered in relation to the financial statements for the year ended 31 December 2021 are summarised below.
 
the Group’s significant tax exposures:
reviewing updates on corporate tax matters and reports from the Group Head of Tax on the status of the Franked Investment Income Group Litigation Order (FII GLO) and issues in various markets, including tax disputes in the Netherlands. The Committee concurred with management’s assessments and disclosures in respect of these (see note 31 in the Notes on the Accounts);
 
contingent liabilities, provisions and deposits in connection with ongoing litigation:
Imperial Tobacco Canada (ITCAN): monitoring the status of the ongoing Canadian Companies’ Creditors Arrangement Act (CCAA) proceedings under which Group subsidiary ITCAN filed for protection in March 2019 following the judgment of the Quebec Court of Appeal in the Quebec Class Action lawsuits. The Committee also reassessed the accounting treatment in respect of all other ongoing tobacco-related litigation to which ITCAN is a defendant and confirmed that it continued to be appropriate to make no provision in respect of that litigation, as it is not possible to reasonably estimate the amount of any potential settlement (see note 31 in the Notes on the Accounts) and that, whilst ITCAN is subject to the CCAA proceedings, it continued to be appropriate to consolidate ITCAN’s financial results in the Group financial statements;
Fox and Kalamazoo rivers: the Committee reassessed the provision in respect of the Fox River
clean-up
costs and related legal expenses and confirmed that the provision would continue to be retained at the prior year level (see note 24 in the Notes on the Accounts), although inherent uncertainties remain (see note 31 in the Notes on the Accounts). The Committee reviewed the position in respect of the Kalamazoo River claim and assessed that no provision should be recognised on the basis set out at note 31 in the Notes on the Accounts;
Reynolds American Companies: the Committee considered and endorsed management’s approach to accounting for the Master Settlement Agreement and the
Engle
class-action and progeny cases consistent with the prior year (see note 31 in the Notes on the Accounts); and
VAT on social contributions in Brazil: the Committee assessed the accounting treatment applicable to claims made by a Group subsidiary in Brazil for refunds of VAT on social contributions made in Brazil (see note 31 in the Notes on the Accounts) and in relation to the disposal of part of the associated contingent asset (see note 5 in the Notes on the Accounts);
 
foreign exchange and hyperinflation:
as the Group has operations in certain jurisdictions with severe currency restrictions where foreign currency is not readily available, including in hyperinflationary territories such as Venezuela, the Committee assessed management’s approach to applicable accounting treatment and confirmed that methodologies used to determine relevant exchange rates for accounting purposes were appropriate;
goodwill and intangibles impairment review:
the Committee reviewed management’s assessments of the carrying value of intangibles including goodwill (see note 12 in the Notes on the Accounts), with particular focus on:
US Business:
the Committee considered potential regulatory changes in the US in relation to menthol in cigarettes and assessed that no impairment was required for US business goodwill or intangible assets and that retaining indefinite-life designation for the Newport and Camel brand intangibles was appropriate;
GTR:
despite a delay in returning to normal operations after
COVID-19,
the Committee concurred with management’s assessment that there was no indication of impairment;
Peru:
the Committee reviewed the Group’s business in Peru and concluded that an impairment to goodwill or other intangibles of £54 million was required;
Imperial Tobacco Canada (ITCAN):
the Committee assessed that, notwithstanding ongoing proceedings (including the CCAA process) in respect of Group subsidiary ITCAN, there was no indication of impairment to goodwill;
 
changes in the Group:
the Committee considered the accounting treatment in relation to the Group’s disposal of operations in Iran (concurring with the accounting for the disposal including treatment of costs and foreign exchange) and acquisition of an initial 19.9% equity investment in Organigram Holdings Inc. and concurred with management’s assessment to account for this as an associate (see note 14 in the Notes on the Accounts);
 
hybrid bonds:
the Committee assessed the issuance of perpetual hybrid bonds, concurring with management’s assessment for such to be classified as equity instead of borrowings; and
 
adjusting items:
the Committee conducted a rigorous assessment of all adjusting items, including the appropriate application of adjusting items treatment to
Quantum programme implementation costs (see note 7 in the Notes on the Accounts) and costs arising from the disposal of the Group’s operations in Iran (see note 6(f) in the Notes on the Accounts).
Risk topics considered by the Committee included:
 
risks relating to the continued impact of
COVID-19
and the approach to incorporating those risks into existing risks to the Group managed under the Group’s risk register;
 
climate change risks and their impact on the Group, to ensure robust processes are in place to manage both physical and transitional climate change risks, and annual reporting on the identification, assessment and management of those risks, in alignment with the TCFD framework;
 
risks related to ESG and the approach to incorporating ESG risks into existing risks managed under the Group’s risk register, to ensure appropriate internal standards, strategic plans, governance, monitoring and reporting mechanisms are in place to align with recognised international standards, meet external expectations and identify emerging issues;
 
current and emerging risks in the context of the Group’s digital strategy, technology architecture and data management, with particular focus on digital transformation, cyber security, protection of the Group’s information systems and data, and the approach to managing those risks;
 
122


Table of Contents
BAT Annual Report and Form 20-F 2021    
 
Strategic Report        
 
Governance Report        
  
Financial Statements        
  
Other Information        


revisions to the Group’s risk appetite framework as it relates to the Group’s strategic objectives, and regular review of emerging risks to the Group prior to Board assessment;
 
the report on the effectiveness of the Company’s risk management system;
 
risks associated with continued exposure to interest rate changes on net finance costs, arising from existing and future refinanced debt;
 
re-assessment
of risks consequent to the UK’s EU exit (Brexit) in the context of the Group risk register (including costs of capital, FX exposures, supply chain continuity, taxation, customs duty and talent management), resulting in the removal of Brexit-related risk from the Group risk register in view of impacts assessed as below threshold; and
 
Group anti-bribery and anti-corruption, sanctions and supply chain controls and compliance programme.


For further information please refer to the Group Principal Risks on
pages 92 to 97 and the Group risk factors on pages 317 to 339
External Auditors
KPMG LLP (KPMG) were appointed as the Company’s auditors with effect from 23 March 2015, following a competitive tender process carried out in 2015. The Committee continually reviews its relationship with the auditors, including consideration as to when it next intends to complete a competitive tender process for the Company’s external audit. The Committee also reviews the quality of the audit and discusses opportunities for improvement with KPMG and management. These are taken into consideration in determining when the Committee next intends to complete a competitive tender process for the external audit.
The Committee considers the relationship with the auditors to be working well and remains satisfied with their effectiveness. The Committee’s review of external auditor effectiveness is discussed on page 124. In view of this, and having considered the continued independence and objectivity of the auditors, the Committee considers it to be in the best interests of the Company’s shareholders for KPMG to remain as auditors for the following financial year.
The Committee will continue to monitor this, taking into account the effectiveness and independence of the auditors and the best interests of shareholders, and will ensure that an audit tender is conducted no later than in respect of the 2025 financial year in accordance with applicable law and regulations.
 
UK Competition and Markets Authority Audit Order
The Company has complied with the Statutory Audit Services Order issued by the UK Competition and Markets Authority for the financial year ended 31 December 2021.
Group Auditor Independence Policy (AIP)
The Group has an established AIP, reflecting the requirements of applicable laws, to safeguard the independence and objectivity of the Group’s external auditors and to specify the approval processes for the engagement of the Group’s external auditors to provide audit, audit-related and other
non-audit
services. The key principle of the AIP is that the Group’s external auditors may only be engaged to provide services in cases where the provision of those services does not impair auditor independence and objectivity.
 
The Committee recognises that using the external auditors to provide services can be beneficial given their detailed knowledge of our business. However, the AIP does not permit the Committee to delegate its responsibilities to the external auditors and the external auditors are only permitted to provide audit, audit-related and
non-audit
services in accordance with the AIP.
The AIP does not permit the external auditors to maintain a financial, employment or business relationship with any Group company, or provide services to any Group company, which:
 
creates a mutual or conflicting interest with any Group company;
 
places the external auditors in the position of auditing their own work;
 
results in the external auditors acting as a manager or employee of any Group company; or
 
places the external auditor in the position of advocate for any Group company.
Audit services are approved in advance by the Committee on the basis of an annual engagement letter and the scope of audit services is agreed by the Committee with the external auditors.
Subject to the restrictions specified in the AIP, the external auditors may also provide certain
non-audit
services with the prior approval of the Committee. The requirement for the Committee’s
pre-approval
of
non-audit
services may be waived only if the aggregate amount of all
non-audit
services provided is less than 5% of the total amount paid to the external auditors during the reporting year, where those services were not recognised to be
non-audit
services at the time of engagement, and provided those services are promptly brought to the attention of the Committee and their provision is approved prior to completion of the audit in the relevant reporting year.
The provision of permitted
non-audit
services must be put to tender if expected spend exceeds limits specified in the AIP, unless a waiver of this requirement, in accordance with the terms of the AIP, is agreed by the Finance and Transformation Director and notified to the Committee.
The AIP:
 
requires Committee
pre-approval
for all audit, audit-related and other
non-audit
services, except in respect of
non-audit
services falling within the exceptions described above;
 
prohibits the provision of certain types of services by the external auditors, including those with contingent fee arrangements, expert services unrelated to audit and other services prohibited by US securities laws and the Public Company Accounting Oversight Board;
 
prohibits the Chief Executive, Finance and Transformation Director, Group Financial Controller and Group Chief Accountant from having been employed by the external auditors in any capacity in connection with the Group audit for two years before initiation of an audit;
 
specifies requirements in respect of audit partner rotation, including for both the lead and the concurring external audit partners to rotate off the Group audit engagement at least every five years, and not to recommence provision of audit or audit-related services to the Group for a further five years; and
 
provides authority for the Committee to oversee any allegations of improper influence, coercion, manipulation or purposeful misleading in connection with any external audit, and to review any issues arising in the course of engagement with the external auditors.
 
123


Table of Contents
BAT Annual Report and Form 20-F 2021
 
Audit, Risk, Internal Control
Audit Committee
Continued
 
 
External audit fees
The Committee reviews a schedule identifying the total fees for all audit and audit-related services, tax services and other
non-audit
services expected to be undertaken by the external auditors in the following year. Tax services and other
non-audit
services in excess of the tender thresholds referred to above must be itemised. Updated schedules are also submitted to the Committee at
mid-year
and
year-end,
so that it has full visibility of the Group spend on services provided by the Group’s external auditors.
A breakdown of audit, audit-related, tax and other
non-audit
fees paid to KPMG firms and associates in 2021 is provided in note 6(i) in the Notes on the Accounts and is summarised as follows:
Services provided by KPMG firms and associates 2021
 
     
2021
£m
    
            2020
            £m
 
Audit services
  
 
18.2


18.6
 
Audit of defined benefit schemes
  
 
0.4


0.5
 
Audit-related assurance services
  
 
8.0


8.5
 
Total audit and audit-related services
  
 
26.6


27.6
 
Other assurance services
  
 
0.3


0.5
 
Tax advisory services


Tax compliance


Other
non-audit
services


Total
non-audit
services
  
 
0.3


0.5
 
Note:
In 2021,
non-audit
fees paid to KPMG amounted to 1.1% of the audit and audit-related assurance fees paid to them (2020: 1.8%). All audit and
non-audit
services provided by the external auditors in 2021 were
pre-approved
by the Committee.
External auditor effectiveness
The Committee, on behalf of the Board, is responsible for the relationship with the external auditors. The Committee carries out an annual assessment of the Group’s external auditors, covering qualification, expertise and resources, objectivity and independence, and the effectiveness of the audit process. This assessment takes into account the Committee’s interactions with, and observations of, the external auditors and considers a range of factors, including:
 
experience and expertise of the external auditors in their direct communication with, and support to, the Committee;
 
their mindset and professional scepticism;
 
their effectiveness in completing the agreed external audit plan;
 
their approach to handling significant audit and accounting judgements;
 
content, quality and robustness of the external auditors’ reports; and
 
their provision of
non-audit
services, as noted above, and other matters that may impact independence.
The Committee’s assessment is also informed by an external audit satisfaction survey completed by members of the Group’s senior management. No material issues were identified during the external auditor assessment in 2021. The Committee is satisfied with the qualification, expertise and resources of its external auditors, and that the objectivity and independence of its external auditors are not in any way impaired by the
non-audit
services which they provide. The Committee has recommended to the Board the proposed reappointment of KPMG at the 2022 AGM.
The Committee Chair, Finance and Transformation Director, Director, Legal & External Affairs and General Counsel, Group Head of Internal Audit and the Company Secretary all meet with the external auditors regularly throughout the year to discuss relevant issues as well as the progress of the external audit. Any significant issues are included on the Committee’s agenda.
Audit Partner Rotation
In accordance with the requirements of the UK Financial Reporting Council (FRC) Ethical Standard and the US SEC independence rules on partner rotation, the previous audit partner’s term concluded at the end of the 2020
year-end
audit and the current audit partner’s tenure commenced from the start of the 2021
year-end
audit.
FRC review of Half Year report to 30 June 2021
The FRC carried out a review of the Company’s Half Year report to 30 June 2021. The FRC correspondence with the Company regarding the outcomes of that review confirmed there were no questions or queries that required substantive correspondence between the Company and the FRC.
The outcomes of the FRC review of the Company’s Half Year report were reviewed by the Committee and have been taken into account in the preparation of the Annual Report and Accounts for the year ended 31 December 2021.
The review conducted by the FRC was based solely on the Company’s published Half Year report to 30 June 2021. The FRC’s review does not provide any assurance that the Half Year Report is correct in all material respects; the FRC’s role is to consider compliance with reporting requirements, not to verify the information provided.
Risk Management and Internal Control
Overview
The Company maintains its system of risk management and internal control with a view to safeguarding shareholders’ investment and the Company’s assets. It is designed to identify, evaluate and manage risks that may impede the Company’s objectives. It cannot, and is not designed to, eliminate them entirely. The system therefore provides a reasonable, not absolute, assurance against material misstatement or loss. A description of the principal risks that may affect the Group’s business is provided in our Strategic Report on pages 92 to 97.
The main features of the risk management processes and system of internal control operated within the Group are described below. These have been in place throughout the year under review and remain in place to date. These do not cover associates of the Group.
Board oversight
During the year, the Board considered the nature and extent of the principal risks that the Group is willing to take to achieve its strategic objectives (its ‘risk appetite’) and its framework for maintaining sound risk management and internal control systems. Risk appetite is reviewed annually by the Board to ensure that it is appropriate. Alongside a robust assessment of the principal risks and uncertainties facing the Group (including those that would threaten its business model, future performance, solvency, liquidity and viability), the Board also considers emerging risks which may challenge the Group’s ability to achieve its strategic objectives in the future. Each emerging risk is assessed by the Board on its potential impact and likelihood and, where applicable, incorporated into the Group’s risk register with appropriate mitigating activities. Emerging risks are kept under regular review by the Committee, prior to Board assessment.
With the support of the Committee, the Board also conducts an annual review of the effectiveness of the Group’s risk management and internal control systems. This review covers all material controls including financial, operational and compliance controls and risk management systems, with the Committee continuing to have a strong focus on IT systems and controls.
 
124


Table of Contents
BAT Annual Report and Form 20-F 2021    
 
Strategic Report        
 
Governance Report        
  
Financial Statements        
  
Other Information        


Audit and Corporate Social Responsibility (CSR) Committee framework
The Group’s Regional Audit and CSR Committee framework underpins the Audit Committee. It provides a flexible channel for the structured flow of information through the Group, with committees for each of the three Group regions, for the US business, and for locally-listed Group entities and specific markets where considered appropriate.
The Regional Audit and CSR Committees are supported by Risk and Control Committees established at business unit level, and within certain Group functions where applicable.
This framework ensures that significant financial, social, environmental, governance and reputational risks faced by the Group are appropriately managed and that any failings or weaknesses are identified so that remedial action may be taken. The Group’s Regional Audit and CSR Committees are all chaired by an Executive Director, comprise members of the Management Board and regularly attended by one or more
Non-Executive
Directors.
In addition, the Corporate Audit Committee focuses on the Group’s risks and control environment that fall outside the regional committees’ remit, such as central functions, and global programmes, processes and projects. It comprises members of the Management Board and is chaired by a Regional Director. One or more of the
Non-Executive
Directors also regularly attend meetings of the Corporate Audit Committee.
External and internal auditors attend meetings of these committees and regularly have private audiences with members of the committees after meetings. Additionally, central, regional and individual market management, along with Internal Audit, support the Board in its role of ensuring a sound control environment.
Risk management
Risk registers, based on a standardised methodology, are used at Group, functional, directly-reporting business unit (DRBU), and individual market levels to identify, assess and monitor the risks (both financial and
non-financial)
faced by the business at each level. Risks are assessed and prioritised at three levels by reference to their impact (high/medium/low) and likelihood (probable/possible/unlikely).
Mitigation plans are required to be in place to manage the risks identified, and progress against those plans is monitored. The risk registers are reviewed on a regular basis. Functional and regional risk registers are reviewed regularly by the relevant Regional Audit and CSR Committee or the Corporate Audit Committee, as appropriate. DRBU and market risk registers are reviewed as part of local Risk and Controls meetings.
At the Group level, specific responsibility for managing each identified risk is allocated to a member of the Management Board. The Group risk register is reviewed regularly by a committee of senior managers, chaired by the Finance and Transformation Director. In addition, it is reviewed annually by the Board and twice yearly by the Committee. The Board and the Committee review changes in the status of identified risks and assess the changes in impact and likelihood. The Committee also conducts detailed reviews on selected risks, meeting senior managers responsible for managing and mitigating them, so that it can consider those risks at a more granular level.
As reported in the Company’s half-year report to 30 June 2021, the Group no longer maintains ‘market size reduction and consumer downtrading’ as a principal risk, due to the Group’s strategy to deliver long-term sustainable growth with a range of innovation and less harmful products. The Group’s current principal risks otherwise remain broadly unaltered from those maintained as at 31 December 2020.


For more information on risks see the Group Principal Risks
on pages 92 to 97 and the Group risk factors on pages 317 to 339
Internal control
Group operating companies and other business units are annually required to complete a controls self-assessment, called Control Navigator, of the key controls that they are expected to have in place. Its purpose is to enable them to self-assess their internal control environment, assist them in identifying any controls that may need strengthening and support them in implementing and monitoring action plans to address control weaknesses. The Control Navigator assessment is reviewed annually to ensure that it remains relevant to the business and covers all applicable key controls. In addition, at each
year-end,
Group operating companies and other business units are required to:
 
review their system of internal control, confirm whether it remains effective, and report on any specific control deficiencies and the action being taken to address them; and
 
review and confirm that policies and procedures to promote compliance with the SoBC are fully embedded and identify any material instances of
non-compliance.
The results of these reviews are reported to the relevant Regional Audit and CSR Committees or to the Corporate Audit Committee, and to the Audit Committee, to ensure that appropriate remedial action has been, or will be, taken where necessary. They are also considered by the SOx Steering Committee and the Disclosure Committee in determining management’s opinion on the internal controls over financial reporting (ICFR).
Annual review
The Financial Reporting Council’s ‘Guidance on Risk Management, Internal Control and Related Financial and Business Reporting’ provides guidance in relation to issues of risk and internal control management and related reporting.
The processes described above, and the reports that they give rise to, enable the Board and the Committee to monitor risk and internal control management on a continuing basis throughout the year and to review its effectiveness at the
year-end.
The Board, with advice from the Committee, has completed its annual review of the effectiveness of that system for 2021.
The Board is satisfied that the system of risk and internal control management accords with the UK Corporate Governance Code 2018 and satisfies the requirements for internal controls over financial reporting.
 
125


Table of Contents
BAT Annual Report and Form 20-F 2021
 
Audit, Risk, Internal Control
Audit Committee
Continued
 
 
Internal Audit function
The Group’s Internal Audit function is responsible for carrying out risk-based audits of Group companies, business units, and global processes. A separate Business Controls Team provides advice and guidance on controls to the Group’s businesses.
The Group’s Internal Audit function works to a rolling
18-month
audit plan, prioritising principal risk areas aligned to the Group’s risk register. During 2021, the Internal Audit plan was kept under regular review with the Committee, enabling flexibility to augment the plan to cover additional audit assignments in response to emerging risks where appropriate and ongoing monitoring of the continuing effectiveness of remote audit work.
In 2021, internal audits covered various markets, manufacturing facilities in various locations and a range of other business activities, including business continuity planning, cyber and data security and access controls, IT infrastructure, supply chain compliance, leaf sourcing, business transformation programmes, business to consumer (B2C)
e-commerce
channels and New Categories youth access prevention procedures. The Committee considered internal audit findings and action plans established to address any issues identified.
The scope of each internal audit is assessed for SOx impact and audit of applicable SOx controls is included where relevant. Reviews of SOx controls and their effectiveness are primarily conducted by the Group’s Business Controls Team and assurance is also undertaken by the Group’s external auditors, see page 127.
The Committee has approved the Internal Audit plan for 2022 and assessed its alignment with the Group’s risk register and coverage of Group risks. The design of the Internal Audit plan for 2022 builds on progress made in 2021, with enhanced use of data analytics, and takes account of the evolving nature of Group risks.
The strategic priorities for Internal Audit underpin the design of the Internal Audit plan for 2022, with continued emphasis on New Categories and innovation in ways of working, whilst maintaining thorough coverage of core business activities, lines of defence and IT controls. The Internal Audit plan for 2022 anticipates the continuation of
COVID-19
travel restrictions into 2022, balancing remote fieldwork and use of data analytics with focused site visits.
The Committee reviews the effectiveness of the Group’s internal audit function annually. The Committee considers the Internal Audit function to be effective and to have the necessary resources to enable it to fulfil its mandate.
Financial reporting controls
The Group has in place a series of policies, practices and controls in relation to the financial reporting and consolidation process, which are designed to address key financial reporting risks, including risks arising from changes in the business or accounting standards, and to provide assurance of the completeness and accuracy of the Annual Report and Form
20-F.
A key area of focus is to assess whether the Annual Report and Form
20-F
and financial statements are ‘fair, balanced and understandable’ in accordance with the UK Corporate Governance Code, with particular regard to:
Fair:
Consistency of reporting between the financial statements and narrative reporting of Group performance and coverage of an overall picture of the Group’s performance;
Balanced:
Consistency of narrative reporting of significant accounting judgements and key matters considered by the Committee with disclosures of material judgements and uncertainties noted in the financial statements; appropriate use, prominence and explanation of primary and adjusted performance measures; and
Understandable:
Clarity and structure of the Annual Report and Form
20-F
and financial statements, appropriate emphasis of key messages, and use of succinct and focused narrative with strong linkage throughout the report, to provide shareholders with the information needed to assess the Group’s business, performance, strategy and financial position.
The Group Manual of Accounting Policies and Procedures sets out the Group accounting policies, its treatment of transactions and its internal reporting requirements.
The internal reporting of financial information to prepare the Group’s annual and half-year financial statements is signed off by the heads of finance responsible for the Group’s markets and business units. The heads of finance responsible for the Group’s markets and all senior managers must also confirm annually that all information relevant to the Group audit has been provided to the Directors and that reasonable steps have been taken to ensure full disclosure in response to requests for information from the external auditors.
The Committee Chair participated in the 2021 Annual Report and Form
20-F
drafting and review processes, and engaged with the Finance and Transformation Director and the Group Head of Internal Audit during the drafting process.
External assurance of ESG metrics and related information
To further strengthen robust procedures in place for reporting ESG metrics and related information for the Group in the Annual Report and Form
20-F,
the scope of external assurance over annual reporting of ESG metrics and related information has been extended, with the work of the external assurance provider overseen by the Committee under its revised terms of reference discussed on page 121.
Following a competitive tender process, KPMG LLP were appointed as the external assurance provider in relation to defined ESG metrics and related information. The Committee approved KPMG’s provision of these services in accordance with the requirements of the Group Auditor Independence Policy. ESG metrics and related information subject to external assurance are identified in the assurance statement set out in our 2021 ESG Report.
 
126


Table of Contents
BAT Annual Report and Form 20-F 2021    
 
Strategic Report        
 
Governance Report        
  
Financial Statements        
  
Other Information        


SOx compliance oversight
The Company is subject to certain rules and regulations of US securities laws, including the US Securities Exchange Act 1934 and SOx. SOx places specific responsibility on our Chief Executive and the Finance and Transformation Director to certify or disclose information applicable to the financial statements, disclosure controls and procedures (DCP) and ICFR. This includes our Chief Executive and Finance and Transformation Director giving attestations in respect of ICFR effectiveness under §404 of SOx.
The Committee has oversight of processes established to ensure full and ongoing compliance with applicable US securities laws, including SOx. Two committees provided assurance during 2021 with regard to applicable SOx certifications. The Disclosure Committee reviews the Company’s financial statements for appropriate disclosure, designs and maintains DCPs, and reports to, and is subject to the oversight of, the Chief Executive and the Finance and Transformation Director.
A
sub-committee
of the Disclosure Committee, the SOx Steering Committee, provides assurance that ICFR have been designed, and are being operated, implemented, evaluated and disclosed appropriately, in accordance with applicable requirements and subject to the oversight of the Chief Executive and Finance and Transformation Director. The activities of this
sub-committee
are directly reported to the Disclosure Committee.
The outputs from the Disclosure Committee and SOx Steering Committee were presented to and reviewed by the Committee. No material weaknesses were identified and the Committee is satisfied that, where areas for improvement were identified, processes are in place to ensure that remedial action is taken and progress is monitored.
In 2021, the Committee also reviewed the scope of the external auditors’ SOx procedures, and received reports on their progress with their independent assessment of ICFR across the Group.
Code of Ethics for the Chief Executive and
Senior Financial Officers
The Company has adopted a Code of Ethics applicable to the Chief Executive, the Finance and Transformation Director, and other senior financial officers, as required by US securities laws and NYSE listing standards. No waivers or exceptions to the Code of Ethics were granted in 2021.
Group Standards of Business Conduct (SoBC)
The Committee is responsible for monitoring compliance with the SoBC, and reports on this to the Board. The SoBC requires all staff to act with a high degree of business integrity, comply with applicable laws and regulations, and ensure that standards are never compromised for the sake of results. Every Group company and all staff worldwide, including senior management and the Board, are expected to adhere to the SoBC. The SoBC and the Group’s Delivery with Integrity compliance programme are discussed on pages 56 to 57.
All Group companies have adopted the SoBC or local equivalent. Information on compliance with the SoBC is gathered at a regional and global level and reports of SoBC allegations, including details of the channels through which allegations are reported, are provided on a regular basis to the Regional Audit and CSR Committees, Corporate Audit Committee, and to the Committee. A breakdown of SoBC contacts and SoBC allegations reported across the Group in 2021 is set out on page 57.
The SoBC and information on the total number of SoBC contacts and SoBC allegations reported in 2021 (including established breaches) is available at bat.com/sobc.
Speak Up
The Group maintains Speak Up channels which enable concerns regarding SoBC compliance matters, including concerns about possible improprieties in financial reporting, to be raised in confidence (and anonymously should an individual wish) without fear of reprisal.
The SoBC includes the Group’s Speak Up policy, which is supplemented by local procedures throughout the Group that provide staff with further guidance on reporting matters and raising concerns, and the channels through which they can do so. The Board periodically reviews the Group’s Speak Up policy and reports arising from Speak Up channels. The Speak Up policy was revised with effect from 1 January 2022 (as part of the revised SoBC). The Board is satisfied that the Group’s Speak Up policy and procedures enable proportionate and independent investigation of matters raised, and ensure that appropriate
follow-up
action is taken.


Read more about Speak Up channels
and Speak Up reports on page 57
Political contributions
The Group does not make contributions to UK or European Union (EU) political organisations or incur UK or EU political expenditure. The total amount of political contributions made to
non-UK
and
non-EU
political parties in 2021 was £4,339,371 (2020: £4,851,616) as follows:
Reynolds American Companies reported political contributions totalling £4,339,371 (US$5,970,975) for the full year 2021 to US political organisations and to
non-federal-level
political party and candidate committees in accordance with their contributions programme. No corporate contributions were made to federal candidates or party committees and all contributions were made in accordance with applicable laws.
All political contributions made by Reynolds American Companies are assessed and approved in accordance with Reynolds American’s policies and procedures to ensure appropriate oversight and compliance with applicable laws.
In accordance with the US Federal Election Campaign Act, Reynolds American Companies continue to support an employee-operated Political Action Committee (PAC), a
non-partisan
committee registered with the US Federal Election Commission that facilitates voluntary political donations by eligible employees of Reynolds American Companies. According to US federal finance laws, the PAC is a separate segregated fund and is controlled by a governing board of individual employee-members of the PAC. In 2021, Reynolds American Companies incurred expenses, as authorised by US law, in providing administrative support to the PAC.
No other political contributions were reported.
 
127


Table of Contents
BAT Annual Report and Form 20-F 2021
 
Remuneration Report
Annual Statement on Remuneration


   Index to our Remuneration Report
 
 
   Policy Report


  133


  135


  136


  143


  144


  145


  148


  149


  152
 
The following Annual Report on Remuneration has been prepared in accordance with the relevant provisions of the Companies Act 2006 and as prescribed in The Large and
Medium-sized
Companies and Group (Accounts and Reports) (Amendment) Regulations 2013 (the UK Directors’ Remuneration Report Regulations).


Introduction
I am pleased to present to you the Directors’ Remuneration Report for the year ended 31 December 2021 which sets out our role and the new Remuneration Policy. This report contains:
 
The Annual Remuneration Report, explaining how the current Remuneration Policy has been implemented during 2021; and
 
The new Directors’ Remuneration Policy, which will be put forward for a binding vote at the 2022 AGM.
2021 has been a year of further volatility as we have continued to manage the disruption arising from the
COVID-19
pandemic across our business. We are incredibly proud of the collective effort made by the Group’s employees and management teams as they have remained focused on delivering growth, serving the needs of our customers and consumers, while managing through continued disruption.
Our response to the pandemic has continued to be guided by our Ethos and our primary focus has been on looking after our people and protecting their health, safety, and wellbeing. Throughout the disruption caused by
COVID-19
the Group has continued to focus on providing practical support to employees to navigate through this unprecedented period and has not entered furlough arrangements or made redundancies as a result of the pandemic.
Our Focus in 2021
We have completed the review of the Directors’ Remuneration Policy during 2021, which has focused on opportunities to strengthen alignment with 1) the Group’s strategy and ESG agenda, 2) shareholder and advisory body feedback arising from the AGM in 2021 and 3) an assessment of our position in the marketplace.
Our priority has been to ensure that the Remuneration Policy:
 
Creates close, long-term links between the Group’s senior management and our shareholders;
 
Enables the Group to attract and retain top quality talent in the global marketplace;
 
Directly supports Group strategy delivery and our A Better Tomorrow
TM
agenda, by rewarding high levels of sustainable long-term performance in both an appropriate and competitive manner; and
 
Continues to incorporate best practice policy features.
In summary we are proposing no changes to the headline operation or quantum of our Remuneration Policy. Our overarching objective has been to ensure that the new Remuneration Policy reflects our corporate purpose and our primary ESG ambition, to reduce the health impact of our business. Specifically, we have sought through the new Remuneration Policy to:
 
Strengthen focus on revenue growth in New Categories;
 
Ensure focus on improving profitability in New Categories; and
 
Incentivise the continued financial performance of the Group.
The Committee acknowledges that a significant minority of shareholders have been unable to support recent decisions regarding fixed pay increases for Executive Directors and have sought fuller disclosures as to the Committee’s decision-making process, which has been reflected through voting on the Directors’ Remuneration Reports in 2020 and 2019. This has been a key consideration throughout the Committee’s review process and our report this year is structured differently to provide greater detail on the perspectives of shareholders and how the Committee has responded, which are set out in the following pages.
Shareholder Engagement
and New Remuneration Policy
The latter part of 2021 was dedicated to a programme of engagement with shareholders on the proposals which are contained in the new Remuneration Policy. We have engaged with shareholders representing 60% of our issued share capital, together with the Investment Association, Institutional Shareholder Services and Glass Lewis.
Our objective has been to undertake a focused review of the Remuneration Policy, building on the work undertaken in 2018 which introduced a variety of changes to our policy, including alignment of Executive Directors’ pensions arrangements with those of the wider workforce and post-employment shareholding requirements. Our current Remuneration Policy was approved at the 2019 AGM with significant support from our shareholders.
Our programme of shareholder engagement has helped to refine proposals and ensure that proposed changes to the Remuneration Policy are targeted and focused. Initial feedback indicated:
 
That the proposals to strengthen the focus on New Categories performance within the short-term incentive plan (STI) and long-term incentive plan (LTI) are timely and appropriate for the Group, and
 
There were opportunities to reconsider some aspects of the proposed metrics for both the STI and LTI, such as the balance and weighting between metrics and some specific performance conditions.
The tables on pages 129 and 130 summarise the proposals put forward by the Committee during shareholder engagement, together with the key points of feedback received from shareholders and the adjustments made by the Committee taking into account the feedback received.
 
128


Table of Contents
BAT Annual Report and Form 20-F 2021    
 
Strategic Report        
 
Governance Report        
  
Financial Statements        
  
Other Information        


Incentive plans – Short-Term Incentive Plan (IEIS)
: The Group made changes to the IEIS for 2021 following engagement with shareholders and introduced New Categories revenue performance into the plan. Recent discussions with shareholders have focused on opportunities to further strengthen prioritisation of New Categories performance, together with the incentivisation of the continued financial performance of the Group.
The Committee considers that the proposed changes outlined below will strengthen alignment with the Group’s long-term strategy delivery and the interests of shareholders.
Summary of Changes
 
2021 measures
       
Original proposal
       
Final proposal
    
 
Short-term incentive
 
                        
Volume Share
  
15%
  
Volume Share
  
10%
  
Volume Share
  
10%
New Categories Revenue
  
20%
  
New Categories Revenue
  
15%
  
New Categories Revenue
  
15%
Adj Profit from Operations
  
30%
  
Adj Profit from Operations
  
25%
  
Adj Profit from Operations
  
25%
Deleverage (ex FX)
  
35%
  
Adj Cash Generated From Operations
  
30%
  
Adj Cash Generated From Operations
  
30%
         
New Categories Contribution
  
20%
  
New Categories Contribution
  
20%
Proposed change and rationale (I)
 
The introduction of a new measure ‘New Categories contribution’ with a 20% weighting. This measure will incentivise
year-on-year
improvement in New Categories profit contribution in line with the Group’s pathway to profitability by 2025. Further details are provided on page 143.
 
Shareholder feedback
 
Shareholders have welcomed the introduction of ‘New Categories contribution’ to the IEIS as both timely and relevant.
Some shareholders indicated that they need to understand how they may assess performance in this area, as at present the Group does not disclose details for New Categories contribution.
 
Committee response
 
The introduction of this new measure will be accompanied by a change in Group reporting from 2022 where we will provide revenue and category contribution as separate disclosures. Performance targets for this measure will be disclosed in the normal manner, following the close of the performance period.
 
Proposed change and rationale (II)
 
The introduction of ‘adjusted cash generated from operations’ with a 30% weighting. This measure will ensure continued focus on cash generation to fund further leverage reductions and returns to our shareholders. Further details are provided on page 143.
This measure will replace the ‘deleveraging excluding foreign exchange’ measure – the Committee is pleased with the progress made to
de-lever
the balance sheet over the last two years towards our medium-term corridor of
2-3x,
to the point that it is felt more appropriate to
re-focus
on cash performance within the IEIS.
 
Shareholder feedback
 
Shareholders have in general been supportive of the proposed change.
However, adjusting items within this measure have generated mixed views among some shareholders, with some expressing discomfort with adjusting for restructuring costs and litigation settlements, while other shareholders have been comfortable to adjust for litigation settlements on the basis that these are unpredictable and outside of management control.
 
Committee response
 
The Committee has considered the feedback carefully and understands shareholder views regarding adjusting for restructuring costs, which may be considered as an ongoing cost of doing business for purposes of the performance measure.
Consequently, adjusting for restructuring costs has been removed from the performance measure. Litigation settlements are considered unpredictable and outside of management control, accordingly, adjusting for these have been retained as part of this measure.
 
Proposed change and rationale (III)
 
Minor adjustments were proposed to the weightings for the ‘Group share of key markets’ measure (from 15% to 10%), the ‘New Categories revenue’ measure (from 20% to 15%) and the ‘adjusted profit from operations’ measure (from 30% to 25%).
 
 
Shareholder feedback
 
The majority of shareholders have been supportive of the proposed
re-weightings,
with some specific questions raised to understand the balance of weighting between performance measures.
 
Committee response
 
Weightings were maintained as originally proposed during shareholder engagement. The Committee considered it appropriate to retain a slightly higher weighting for the ‘adjusted cash generated from operations’ measure given the Group’s continued need to focus on cash generation to support returns to shareholders and provide flexibility with capital allocation.
The introduction of the ‘New Categories contribution’ measure also further strengthens the focus within the IEIS on financial performance, whereby financial metrics represent 75% of the weighting within the plan.
 
 
129


Table of Contents
BAT Annual Report and Form 20-F 2021
 
Remuneration Report
Annual Statement on Remuneration
Continued


Incentive plans – Long-Term Incentive Plan:
Changes are made with the aim of reflecting our corporate purpose more directly, in particular our commitment to reduce the health impact of our business as part of our A Better Tomorrow
TM
agenda. These changes take into account shareholder feedback and focus on harm reduction as an imperative to delivering long-term sustainable growth, as follows:
Summary of Changes
 
2021 measures


Original proposal


Final proposal


Long-term incentive


Adjusted revenue growth
  
20%
  
Adjusted revenue growth
  
20%
  
Adjusted revenue growth
  
15%
EPS (current / constant)
  
40%
  
EPS (current / constant)
  
20%
  
EPS (current / constant)
  
30%
Cash Conversion
  
20%
  
Cash Conversion
  
20%
  
Cash Conversion
  
20%
Relative TSR
  
20%
  
Relative TSR (streamlined comparator group)
  
20%
  
Relative TSR (streamlined comparator group)
  
20%


New Categories revenue growth
  
20%
  
New Categories revenue growth
  
15%
Proposed change and rationale (I)
 
The introduction of a new measure ‘New Categories revenue growth’, with a 15% weighting. Our strategic objective is to provide long-term sustainable growth for our shareholders and this performance measure is directly aligned with our transformation ambitions and stated targets and will measure future growth in New Categories. Further details are provided on page 144.
 
Shareholder feedback
 
The majority of shareholders have been supportive of the introduction of this new measure.
Some shareholders have wanted to understand the basis of measurement and the relationship with the ‘New Categories revenue’ metric in the IEIS.
When we presented our original proposals, some shareholders requested that the Committee reconsider the relative weight between revenue measures and EPS, such that there is a greater balance between profit delivery and revenue growth.
 
Committee response
 
The inclusion of New Categories revenue growth in both the IEIS and LTIP is an important step given New Categories growth is a critical part of our long-term strategy and ESG agenda. The IEIS measure will continue to provide focus on in year delivery, while the LTIP measure will focus on cumulative and sustained performance over a three-year period.
The Committee understands the views expressed by shareholders and as a result has adjusted the original proposals such that the weighting for the ‘New Categories revenue growth’ and ‘adjusted revenue growth’ measures have been reduced from 20% to 15% and the weighting for the ‘adjusted diluted earnings per share’ measure has been increased from 20% to 30% to increase the overall proportion based on profitability versus the original proposals.
 
Proposed change and rationale (II)
 
The ‘relative total shareholder return’ (TSR) measure is retained with the current weighting of 20%. The comparator group of companies has undergone a review as the constituents have been in place since 2013, other than the addition of the Altria Group in 2019. A review of comparator companies was believed to be timely and relevant considering changes in the Group’s business over the last eight years, our strategic focus and ambition to become to multi-category,
new-category
led business.
The review exercise has aimed to deliver a more focused and relevant comparator group comprised of businesses which are adjacent to the Group’s, well correlated and broadly comparable in terms of their size and scale. The final constituents represent the tobacco, soft drinks, alcohol and fast moving consumer goods sectors. Back testing of the comparator group changes for past awards confirmed that these changes would not have impacted vesting under the TSR measure. Further details are provided on page 144.
 
Shareholder feedback
 
The majority of shareholders have expressed comfort with the proposed comparator group changes and the intent to ensure the TSR comparator group is well calibrated and relevant for the future.
A small number of shareholders had requested that additional specific companies were considered for inclusion in the comparator group.
More broadly, the Committee is aware that relative TSR can attract strong and often conflicting opinions, with a small number of shareholders expressing a preference for the removal of the measure from the LTIP.
 
Committee response
 
The Committee is pleased that the comparator group changes have been met with support and has taken into consideration feedback as to the composition of the group. Consequently, Swedish Match, which was not part of the original proposal, will be included in the new TSR comparator group from 2022.
The Committee remains of the view that the relative TSR measure is an important component of the LTIP and helps to maintain alignment with shareholder interests, a view which is shared by the majority of our shareholders.
 
 
130


Table of Contents
BAT Annual Report and Form 20-F 2021    
 
Strategic Report        
 
Governance Report        
  
Financial Statements        
  
Other Information        


These changes to performance measures will apply to the IEIS from 2022 and to new awards made under the LTIP from 2022 for the Executive Directors and the Group’s wider management population. Importantly they will ensure that the Group’s transformation ambitions and core financial delivery are appropriately reflected in both the IEIS and LTIP.
Wider Themes from Shareholder Engagement
ESG measures:
A small number of shareholders have enquired whether the Committee considered the introduction of broader ESG measures to either the IEIS or the LTIP. The Committee gave consideration to broader ESG measures as part of the policy review process. In view of our primary ESG commitment, to reduce the health impact of our business, and accordingly, the importance of sustainable New Categories growth, the Committee concluded that the proposed changes to IEIS and LTIP would focus on incentivising delivery of our corporate purpose and stated ambitions of delivering £5 billion in revenues in New Categories by 2025, reaching profitability in New Categories over the same time period and the continued transformation of our portfolio. Discussions with shareholders have confirmed there is consensus that this is the right approach for the Group at this time, being both directly linked to Group strategy delivery and quantifiable. The Remuneration Committee will continue to monitor ESG measures and we will continue to drive performance across our comprehensive suite of objectives across all areas of ESG, which are discussed in the Strategic Report.
Returns measures:
A discrete group of shareholders have expressed a preference for a returns-type measure within the LTIP. While the Committee concurs that this is an important metric for the business to continue to track, it believes there are other important metrics to focus remuneration on at this time. We expect the Group’s return on capital performance will over the near to medium term be driven by organic profit growth which is a key performance metric already represented in the IEIS and LTIP. Further, at this stage of our transformation journey the Committee believes the IEIS and LTIP should be focused on measures more closely linked to the Group’s transformation agenda (such as New Categories revenue growth and category contribution) and key financial performance measures (such as adjusted profit from operations, EPS and cash). The Committee will continue to keep metric formulation and the orientation of our incentive plans under review as our transformation journey progresses.
Executive Director remuneration:
A significant minority of shareholders have been unable to support recent decisions regarding fixed pay increases for the Executive Directors and have requested fuller disclosures as to the Committee’s decision-making process in the future. During our engagement, shareholders have provided their feedback on decisions made in 2020 and 2021; while the rationale followed by the Remuneration Committee at the time has been understood, shareholders have explained their expectation of restraint with regard to fixed pay increases in future, with the majority wishing to see an employee
average-led
approach. The Remuneration Committee has considered the matters raised by shareholders in detail and the approach to be taken in 2022 is set out on page 132.
I would like to thank our shareholders, and wider stakeholders who have worked with us, for their feedback and help to maintain an ongoing and transparent dialogue regarding executive remuneration.
Group Performance
The performance measures included in our incentive plans are closely aligned with the Group’s strategy and the metrics as set out in the Strategic Report.
The Group has delivered a strong performance in 2021, accelerating growth in New Categories, delivering on its leverage commitment and advancing the ESG agenda while managing the ongoing impacts arising from the
COVID-19
pandemic. The performance targets set by the Committee early in the year have remained unchanged throughout the 2021 performance period.
Target setting for 2021 assumed a rate of recovery from lockdown impacts in emerging markets and Global Travel Retail, while expecting ongoing disruption from further lockdowns elsewhere in the Group, together with prolonged travel restrictions and excise shocks. A key focus area of target setting was growth in the New Categories business, founded on geographic expansion, growth in the consumer base and achieving leadership of the Vapour category in the US. Target setting also assumed a continuing strong profit performance in developed markets driven by an increase in pricing. The impact of price increases and consequent flow through to revenue and profit growth was expected to be constrained by less favourable geographical mix due to the weighting of the post-pandemic volume recovery towards emerging markets. In order to meet profit objectives, ambitious cost savings were also embedded in the targets, anticipated to be delivered from product costs and the continued simplification of the organisation. The Group’s continued emphasis on deleveraging was reflected in a stretch target which was calibrated in anticipation of further strong delivery in operating cash flow conversion as well as the Group delivering against its profit targets.
2021 Short-term Incentive
The Group has delivered combustibles and THP volume share gains of 6 bps over performance in 2020 together with a robust performance with growth in New Categories revenue at constant rates of 50.9% and growth in adjusted profit from operations at constant rates of 5.2%. In addition, there has been continued progress with the deleveraging ambition (excluding foreign exchange) with a full year performance of
-0.50x.
These results are reflected in the outcomes for the IEIS, for which the corporate result across the four measures (Group’s share of key markets, New Categories revenue, adjusted profit from operations and deleveraging excluding foreign exchange) was 85.7%.
2019 Long-term Incentive
The Group has delivered a compound annual growth rate in Group revenue of 5.3% at constant rates through the three year 2019 to 2021 period, a compound annual growth rate in adjusted, diluted EPS of 6.8% at constant rates and a corresponding operating cash flow conversion ratio of 101.0% at current rates over the same period.
These results are reflected in the outcomes for the 2019 LTIP award, for which the corporate result across relative total shareholder return (TSR), adjusted diluted EPS, adjusted revenue growth at constant rates and the operating cash flow conversion ratio, results in a vesting in March 2022 of 49.1%.
The vesting result reflects, through the relative TSR measure, movements in the Group’s share price during the performance period. The Committee applied a downward adjustment at grant to the 2019 LTIP award, whereby the number of shares awarded were calculated on the basis of the Group’s closing share price on 25 February 2019, increased by 15%. This adjustment was made in recognition of the decline in Group share price over the preceding 12 months. Given the share price is below that used to determine the grant, the Committee are comfortable that there has been no windfall gain.
 
131

Table of Contents
BAT Annual Report and Form 20-F 2021
 
Remuneration Report
Annual Statement on Remuneration
Continued


Following evaluation of the formulaic outcomes for both the 2021 IEIS and 2019 LTIP, the Committee considered the results against the underlying performance of the Group and the experience of our shareholders. The Committee concluded that the outcomes were a fair reflection of performance delivered in what continues to be challenging and volatile market conditions and no adjustments were required. In addition, share price fluctuations are reflected throughout the Executive Directors’ remuneration, in the vesting and holding periods as well as their individual shareholdings. The performance against the key measures that delivered the IEIS and LTIP remuneration outcomes are summarised on pages 138 and 139.
Executive Director Remuneration
The Remuneration Committee has considered in detail the views of shareholders and wider stakeholders with respect to annual salary reviews and the management of executive pay. This topic was discussed at length with shareholders during our engagement on the Remuneration Policy.
The Committee has also given due consideration to the total remuneration positioning of the Executive Directors in relation to the wider market, their individual performance, and the level of pay increases for UK employees generally. Pay increases for UK employees are expected to range between 0% and 7.2%, based on performance in the prior year, with the average of employee increases falling within the 2.6% to 3.8% range.
The Remuneration Committee has decided that the salaries of the Chief Executive and the Finance and Transformation Director will be maintained at their current levels, with no further increases to apply in April 2022.
Pay and Transparency
The Remuneration Committee recognises the importance of considering executive compensation in the broader context of the Group’s workforce and the role that large organisations may play in encouraging greater transparency in this respect. Consequently, from 2022 the Group has broadened the scope of its pay equality reporting as follows.
Gender Pay: UK
In March 2022, we will be publishing data relating to UK Gender Pay in line with the statutory requirements. As a result of our continued focus we have seen an improvement in both our mean and median pay gaps by 3 percentage points when compared to 2020 and an improvement in the median bonus gap by 7 percentage points compared to 2020.
These improvements are attributable to increased time at level among senior female employees reflecting our commitment to continue to nurture and retain our female talent in more senior roles. The Group is committed to driving further progress in this area and has a comprehensive set of diversity initiatives in place which are explained further on pages 3 to 5 in our Diversity and Inclusion Report.
Gender Pay: International Business
We will also be publishing in March 2022 voluntary disclosures on gender pay for our international business. We felt it important to complement the statutory reporting for the UK with a broader view of the Group. Our international business gender pay data includes gender pay information from a cross-section of key markets, representing each of the Group’s regions and functions. Further details are included on pages 7 to 10 in our Diversity and Inclusion Report.
Ethnicity Pay: UK
During 2021 we completed a data gathering exercise with the help of UK employees. I am delighted to say that 77% of employees in the UK supported this effort and this has allowed the Group to complete a review of UK ethnicity pay data. Further details are included on page 11 in our Diversity and Inclusion Report.
We will continue to review our approach to ensure the Group provides as much transparency as is practicable in this important area.
Looking Ahead to 2022
The annual report on remuneration details remuneration in 2021 and the decisions made by the Remuneration Committee during this period. The new Remuneration Policy will be put forward for a binding vote at the 2022 AGM.
The Group has delivered a strong performance in 2021 and I believe that our proposed new Remuneration Policy supports Group strategy, drives pay for performance and meets the needs of our stakeholders in a considered way.
I would once again like to thank our shareholders and wider stakeholders for the direct engagement and feedback during this past year on both our remuneration policy and practices. I look forward to continuing this dialogue in 2022.
Dimitri Panayotopoulos
Chairman, Remuneration Committee
10 February 2022
 
132


Table of Contents
BAT Annual Report and Form 20-F 2021    
 
Strategic Report        
 
Governance Report        
  
Financial Statements        
  
Other Information        


1 Summary of Our Current Directors’ Remuneration Policy
This section provides a summary of the Remuneration Policy for the Executive Directors and the
Non-Executive
Directors that was approved by shareholders at the AGM on 25 April 2019 and was in place during the year ended 31 December 2021.
The full Directors’ Remuneration Policy is set out in the Remuneration Report 2018 contained in the Annual Report for the year ended 31 December 2018, which is available at bat.com.
As referenced in the Annual Statement on Remuneration on pages 128 to 132, we will be putting forward to a vote the updated Directors’ Remuneration Policy at the AGM on 28 April 2022 and the full detail of the updated policy can be found on pages 152 to 162.
 
Strategic Purpose
  
Key Features
Salary
    
To attract and retain high-calibre individuals to deliver the Group’s long-term strategy and to offer market-competitive levels of guaranteed cash to reflect an individual’s skills, experience and role within the Group.
  
–  Normally paid in 12 equal monthly instalments during the year;
 
–  Reviewed annually in February (changes effective from April) or subject to
ad-hoc
review on significant change of responsibilities;
 
–  Reviewed taking into consideration several factors including individual performance and appropriate market data based on a Pay Comparator Group;
 
–  Annual increases will generally be in the range of the increases in the base pay of other
UK-based
employees in the Group and will not exceed 10% per annum; and
 
–  Recently appointed Executive Directors’ base salaries may exceed the top of the range of the salary increases for
UK-based
employees where the Remuneration Committee considers it appropriate to reflect the accrual of experience.
Benefits
    
To provide market-competitive benefits consistent with the role which:
 
–  attract and retain high-calibre individuals to deliver the Group’s long-term strategic plans; and
 
–  recognise that such talent is global in source and that the availability of certain benefits (e.g. relocation, repatriation, taxation compliance advice) will from time to time be necessary to avoid such factors being an inhibitor to accepting the role.
  
The Company offers the following contractual benefits to Executive Directors:
 
–  A car or car allowance;
 
–  Use of a car and driver for personal and business use;
 
–  Employment tax advice;
 
–  Tax equalisation payments (where appropriate);
 
–  Private medical insurance, including general practitioner ‘walk in’ medical services;
 
–  Personal life and accident insurance;
 
–  Housing, education allowances or similar arrangements as appropriate to family circumstances; and
 
–  Other benefits may include Executive Directors and their partners’ attendance at hospitality or similar functions, and the provision of benefits which may be treated as benefits for tax purposes, such as the provision of home security and reimbursement of expenses incurred in connection with their duties.
Pension
    
To provide competitive post-retirement benefit arrangements which recognise the external environment in the context of attracting and retaining senior high-calibre individuals to deliver the Group’s long-term strategy.
  
–  Only base salary is pensionable.
 
–  Defined Contribution (“DC”) benefits – Executive Directors are eligible to receive a pension benefit equivalent to a maximum of 15% of base salary as a contribution into the British American Tobacco UK Pension Plan or, as alternative provision, they can opt for either a cash allowance or accrual in a DC unfunded arrangement. The Company contribution rate is aligned with the benefit available to our wider UK population where the default contribution rate is 15%, comprising of a core 10% contribution rate and an additional 5% contribution on a matching basis to an employee’s pension contribution.
 
133


Table of Contents
BAT Annual Report and Form 20-F 2021
 
Remuneration Report
Annual Statement on Remuneration
Continued


Short-term incentives (STI)
  
 
– To incentivise the attainment of corporate targets aligned to the Group’s strategic objectives on an annual basis, with a deferred element to ensure alignment with shareholders’ interests.
 
– To ensure, overall, a market-competitive remuneration to attract and retain high-calibre individuals to deliver the Group’s long-term strategy.
  
Opportunity
 
– Chief Executive – Maximum 250%;
on-target
125%.
 
– Finance and Transformation Director – Maximum 190%;
on-target
95%.
 
Operation
 
– 50% of the incentive delivered as cash; 50% as deferred shares (DSBS) which vest after three years. Deferred shares attract a dividend equivalent which is delivered in additional quarterly interim dividend equivalent shares;
 
– The Remuneration Committee sets the performance targets each year at the beginning of the performance period and is able to vary the exact measures and the weighting of them from year to year;
 
– Performance measures for 2021 can be found on page 137 and for 2022 on page 143;
 
– The Remuneration Committee has discretion to adjust outcomes in circumstances where it considers it is appropriate to do so to reflect the overall performance of the Company;
 
– In cases of identified poor individual performance, the corporate result may be reduced by up to 50%; and
 
– Clawback and malus provisions are in place.
Long-term incentives (LTIP)
  
 
– To put in place a combination of measures with appropriately stretching targets around the long-term strategy delivery that provides a balance relevant to the Company’s business and market conditions as well as alignment between Executive Directors’ and shareholders’ interests.
 
– To facilitate the appointment of senior high-calibre individuals required to deliver the Group’s long-term strategy, and to promote the long-term success of the Company.
  
Opportunity
 
– Maximum annual award of shares of 500% of salary for all Executive Directors.
 
– Normal annual grants of 500% of salary for the Chief Executive and 400% of salary for the Finance and Transformation Director.
 
Operation
 
– LTIP awards vest only to the extent that:
 
– the performance conditions are satisfied at the end of the three-year performance period; and
 
– an additional vesting period of two years from the third anniversary of the date of grant has been completed;
 
– Dividend equivalent shares are awarded at the end of the extended vesting period to the extent that the awards vest;
 
– The Remuneration Committee sets the performance targets for the applicable performance period each year;
 
– Vesting levels are based on the achievement of appropriately stretching targets against performance measures aligned to the Group’s long-term strategy;
 
– Performance measures for the 2019-2021 performance period are detailed on page 138 and for the awards to be granted in 2022 are detailed on page 144;
 
– The Remuneration Committee has discretion to adjust the level of vesting in circumstances where it considers it is appropriate to do so to reflect the overall performance of the Company; and
 
– Clawback and malus provisions are in place.
Shareholding requirements
  
 
– To strengthen the alignment between the interests of the Executive Directors and those of shareholders by requiring Executive Directors to build up a high level of personal shareholding in the Company.
 
– To ensure long-term alignment between the interests of the Executive Directors and those of shareholders through the operation of post-employment shareholding requirements.
  
Executive Directors are required to hold shares in the Company:
 
– during service as a Director, equal to the value of the same multiple of salary at which LTIP awards are made to that Director (currently, 500% for the Chief Executive and 400% for the Finance and Transformation Director); and
 
– after ceasing service as a Director, equal to the value of 100% of the shareholding requirement that applied while a Director for a period until the second anniversary of cessation of employment with the Group.
All-employee
share plans
  
 
Executive Directors are eligible to participate in the Company’s
all-employee
share schemes which are designed to incentivise employees by giving them an opportunity to build shareholdings in the Company.
  
– All-employee
share schemes are the Partnership Share Scheme, the Sharesave Scheme and the Share Incentive Plan (SIP); and
 
– Executive Directors are subject to the same limits on participation as other employees, as defined by the applicable statutory provisions.
 
134


Table of Contents
BAT Annual Report and Form 20-F 2021    
 
Strategic Report        
 
Governance Report        
  
Financial Statements        
  
Other Information        


2 Overview of What Our Executive Directors Earned in 2021 and Why
What our Executive Directors earned in 2021
 
Single figure for Executive Directors
  
Jack Bowles   
    
Tadeu Marroco   
 
     
                        2021
£’000
    
                    
2020   
£’000   
    
                        2021
£’000
    
                    
2020   
£’000   
 
Fixed Pay
 
Salary
  
 
1,316


1,259  


803


775  
 
Taxable benefits
  
 
320


508  


100


152  
 
Pension
  
 
197


189  


121


116  
 
Total Fixed Pay
  
 
1,833


1,956  


1,024


1,043  
 
Variable Pay
           
Short-term incentives
  
 
2,820


2,238  


1,308


1,046  
 
Long-term incentives
1,2
  
 
2,815


757  


584


489  
 
Other emoluments
  
 
3


3  


3


18  
 
Total Variable Pay
  
 
5,638


2,998  


1,895


1,553  
 
Total Remuneration
  
 
7,471


4,954  


2,919


2,596  
 
Notes:
 
1.
The 2019 LTIP award is due to vest on 28 March 2022 for Jack Bowles (first award made as an Executive Director) and Tadeu Marroco based on completion of the three-year performance period on 31 December 2021. The value shown is based on the average share price for the three-month period ended 31 December 2021 of 2,616p. Given the share price performance since the date of grant of awards, none of the value shown in the table above is attributable to share price appreciation.
 
2.
Long-term incentives shown for 2020: in accordance with the UK Directors’ Remuneration Report Regulations, estimates for the values of the vesting 2018 LTIP awards were given in the Annual Report on Remuneration for the year ended 31 December 2020; these amounts have been
re-presented
to show the actual market value on the date of vesting in 2021.
Further information in respect of this remuneration can be found in Section 3 on page 136.
How this aligns to performance
 
Short-term incentives for the performance period ended in 2021
     
Performance summary:
Chief Executive: corporate performance – 214.3% of salary
Finance and Transformation Director: corporate performance – 162.8% of salary
Group share of Key Markets
  
Adjusted profit from operations (APFO)
+6 bps growth over 2020
  
at constant rates of exchange +5.2% growth
New Categories revenue
 
+50.9% growth
  
Deleveraging (excluding foreign exchange)
 
-0.50x at constant rates of exchange
Long-term incentives for the three-year performance period ended in 2021
     
Vesting at 49.1%
    
Total shareholder return (TSR)
  
0% achievement
17 out of 24 in FMCG comparator group 2019–2021
  
(0% of award vesting out of possible 20%)
Adjusted diluted earnings per share (EPS) growth
  
0% achievement
3.5% CAGR at current rates of exchange
  
(0% of award vesting out of possible 20%)
Adjusted diluted earnings per share (EPS) growth
  
45.5% achievement
6.8% CAGR at constant rates of exchange
  
(9.1% of award vesting out of possible 20%)
Adjusted revenue growth
  
100% achievement
5.3% CAGR at constant rates of exchange
  
(20% of award vesting out of possible 20%)
Adjusted operating cash flow conversion ratio
  
100% achievement
101.0% ratio over the performance period
  
(20% of award vesting out of possible 20%)
Non-GAAP
measures
Adjusted profit from operations (APFO), deleveraging (excluding foreign exchange), New Categories revenue, adjusted diluted EPS, adjusted revenue and adjusted operating cash flow conversion ratio are
non-GAAP
measures used by the Remuneration Committee to assess performance. Please refer to pages 302 to 311 for definitions of these measures.
 
135


Table of Contents
BAT Annual Report and Form 20-F 2021
 
Remuneration Report
Annual Statement on Remuneration
Continued


3 Executive Directors’ Remuneration for the Year Ended 31 December 2021
Total remuneration for the year ended 31 December 2021
 
    
Jack Bowles
    
Tadeu Marroco


2021
                        £’000
    
 
2020
                    £’000
    
2021
                    £’000
    
 
2020
                    £’000
 
Salary
  
 
1,316


1,259


803


775
 
Taxable benefits
1
           
–  car allowance
  
 
20


20


20


20
 
–  health insurance
  
 
15


15


13


13
 
–  life insurance
  
 
18


19


8


8
 
–  tax advice
  
 
49


65


21


30
 
–  use of Company driver
  
 
65


85


27


55
 
–  home and personal security
2
  
 
80


155


4


14
 
–  tax & social security
3
  
 
62


136


–  other expenses related to individual and/or accompanied attendance at Company functions/events
  
 
11


13


7


12
 
Total taxable benefits
  
 
320


508


100


152
 
Short-term incentives
           
STI vesting percentage (% of maximum)
  
 
85.7%


71.1%


85.7%


71.1%
 
STI: cash – Group performance cash element
  
 
1,410


1,119


654


523
 
STI: DSBS – Group performance deferred element
  
 
1,410


1,119


654


523
 
Total short-term incentives (page 137)
  
 
2,820


2,238


1,308


1,046
 
Long-term incentives
4,5
           
LTIP vesting percentage (% of maximum)
  
 
49.1%


54.2%


49.8%


54.2%
 
LTIP value to vest
  
 
2,267


612


470


395
 
Dividend equivalent
6
  
 
548


145


114


94
 
Total long-term incentives (page 138)
  
 
2,815


757


584


489
 
Total pension-related benefits (page 139)
  
 
197


189


121


116
 
Other emoluments
           
Share Reward Scheme (value of ordinary shares awarded)
  
 
3


3


3


3
 
Sharesave Scheme (face value of discount on options granted)


15
 
Total other emoluments
  
 
3


3


3


18
 
Total remuneration
  
 
7,471


4,954


2,919


2,596
 
Notes:
 
1.
Taxable benefits: the figures shown are gross amounts as, in line with the UK market, it is the normal practice for the Company to pay the tax which may be due on any benefits, with the exception of the car or car allowance. The numbers presented above for tax advice are inclusive of applicable VAT and income tax.
 
2.
Figure for home and personal security for Jack Bowles for 2020 related to necessary
one-off
security improvements to his residence and annual maintenance/monitoring. The figure reported for 2021 relates only to annual maintenance/monitoring. As noted in point 1 above, these amounts have been grossed up for UK tax purposes.
 
3.
The amount reported for Jack Bowles for 2020 in the Annual Report on Remuneration for the year ended 31 December 2020 was £220,000. This amount has been restated above to account for credits received in the UK in respect of overseas tax payments made by the Company. The figure reported for 2021 relates to overseas taxes paid by the Company in respect of employment income in order to protect Jack Bowles to his UK tax position in line with the Company policy for the wider workforce.
 
4.
The 2019 LTIP award is due to vest on 28 March 2022 based on completion of the three-year performance period on 31 December 2021. The value shown is based on the average share price for the three-month period ended 31 December 2021 of 2,616p. The LTIP vesting figure above for Jack Bowles reflects the first award made as an Executive Director. The LTIP vesting figure above for Tadeu Marroco reflects an award made prior to being appointed as an Executive Director.
 
5.
LTIP award shown for 2020: the values disclosed in the Annual Report on Remuneration for the year ended 31 December 2020 were estimated values as the award had not vested by the date of that report; these amounts have been
re-presented
based on the actual market value on the date of vesting of 27 March 2021 of 2,578p.
 
6.
LTIP dividend equivalent payments: the dividend equivalent payment that will attach to the LTIP award that is included in the Single Figure Table is reported. The values for the year ended 31 December 2020 have been restated on this basis. The amount reported for Jack Bowles will be delivered in shares following the end of the
two-year
additional holding period.
 
136


Table of Contents
BAT Annual Report and Form 20-F 2021    
 
Strategic Report        
 
Governance Report        
  
Financial Statements        
  
Other Information        


Short-Term Incentives for the Year Ended 31 December 2021
STI performance measures, weightings and results for year ended 31 December 2021
 
STI: performance measure and target 2021
  
Description of measure 2021
  
Actual performance 2021
  
Payout
(maximum)        
Group’s share of Key Markets
(growth over prior year)
Weighting: 15%
 
Threshold:
0 bps growth over 2020
 
Maximum:
10 bps growth over 2020
 
  
The Group’s volume share in its Key Markets accounts for around 80% of cigarettes volume and 90% of THP volume of the Group’s subsidiaries. The Group’s share is calculated from data as independently measured by retail audit agencies and scanner sales to consumers, or from estimated shipment share.
 
  
Global volume share in key markets grew by 6 bps.
 
Strategic Report: Delivering our strategy – A Better Tomorrow
TM
for Consumers
  
9.0% (15%)
New Categories revenue
(growth over prior year)
Weighting: 20%
 
Threshold:
15% growth over 2020
 
Maximum:
30% growth over 2020
  
New Categories Revenue is the revenue derived from the Vapour, THP and Modern Oral product categories. This measure is assessed at constant rates of exchange.
 
  
New Categories revenue grew by 50.9%.
 
Strategic Report: Delivering our
strategy –
 
A Better Tomorrow
TM
for Shareholders
  
20% (20%)
Adjusted profit from operations
(APFO)
(growth over prior year)
Weighting: 30%
 
Threshold:
3.0% growth over 2020
 
Maximum:
6.0% growth over 2020
 
  
APFO is the adjusted profit from operations at constant rates of exchange for the year ended 31 December 2021. Please refer to page 308 for the detailed description of APFO.
  
APFO growth over the prior year of 5.2%.
 
Strategic Report: Delivering our strategy – A Better Tomorrow
TM
for Shareholders
  
21.7% (30%)
Deleveraging (excluding foreign exchange)
Weighting: 35%
 
Threshold:
0.10x reduction versus 2020
 
Maximum:
0.30x reduction versus 2020
  
Deleveraging (excluding foreign exchange) refers to the reduction in Adjusted Net Debt to Adjusted EDITDA during the year ended 31 December 2021, assessed at constant rates of exchange.
 
  
Deleveraging (excluding foreign exchange) was 0.50x.
 
Strategic Report: Delivering our strategy – A Better Tomorrow
TM
for Shareholders
  
35% (35%)
              
85.7% (100%)    
STI outcome for year ended 31 December 2021
 
     
Available STI award as
% of base salary
    
STI award achieved
as % of maximum
opportunity
    
STI award achieved
% of base salary
    
STI award achieved  
£’000  
(Value shown in  
Single Figure Table)
1
,2
  
 
Jack Bowles
  
 
250%


85.7%


214.3%


2,820  
 
Tadeu Marroco
  
 
190%


85.7%


162.8%


1,308  
 
Notes:
 
1.
Malus and clawback provisions apply.
 
2.
50% of the STI award will be paid in cash and 50% as an award under the DSBS. Awards made under the DSBS are in the form of free ordinary shares in the Company that normally vest after three years and no further performance conditions apply in that period. In certain circumstances, such as resigning before the end of the three-year period, participants may forfeit all of the shares.
 
3.
The Remuneration Committee did not consider that any discretion to adjust the formulaic outcome need be applied.
 
137


Table of Contents
BAT Annual Report and Form 20-F 2021
 
Remuneration Report
Annual Statement on Remuneration
Continued


Long-Term Incentives (LTIP) for the Year Ended 31 December 2021
LTIP performance measures, weightings and results for the year ended 31 December 2021
 
LTIP: performance measure
 
Description of measure and target for 2019 LTIP
Performance period 1 January 2019 – 31 December 2021
  
Result achieved
  
Vesting percentage    
Relative TSR
1


Ranked 17
  
0%
 
Relative to a peer group of international
 
2019–2021 LTIP target


out of 24
  
(out of maximum
of 20%)
FMCG companies
 
Threshold
  
At median, 3% vests
  
 
Weighting: 20%
 
Maximum
  
At upper quartile, 20% vests


EPS growth at current rates
of exchange
       
3.5% CAGR
  
0%
 
2019–2021 LTIP target


Compound annual growth in adjusted diluted EPS measured at current rates of exchange
 
Threshold
  
At CAGR of 5%, 3% vests
     
(out of maximum
of 20%)
 
Maximum
  
At CAGR of 10%, 20% vests
  
          
Weighting: 20%


EPS growth at constant rates
of exchange
       
6.8% CAGR
  
9.1%
 
2019–2021 LTIP target


(out of maximum
of 20%)
Compound annual growth in adjusted
diluted EPS measured at constant rates of exchange
 
Threshold
  
At CAGR of 5%, 3% vests
  
 
Maximum
  
At CAGR of 10%, 20% vests
  
Weighting: 20%


Adjusted revenue
2
       
5.3% CAGR
  
20%
Compound annual growth measured at constant rates of exchange
 
2019–2021 LTIP target


(out of maximum
 
Threshold
  
At CAGR of 3%, 3% vests
     
of 20%)
 
Maximum
  
At CAGR of 5%, 20% vests
     
Weighting: 20%


Adjusted Operating cash flow
       
101.0% ratio
  
20%
conversion ratio
 
2019–2021 LTIP target


Ratio over the performance period at current rates of exchange
 
Threshold
  
Ratio of 85%, 3% vests
     
(out of maximum
of 20%)
 
Maximum
  
Ratio of 95%, 20% vests
  
Weighting: 20%


Total vesting level as a percentage of maximum opportunity


49.1%
Notes:
 
1.
Relative TSR:
the constituents of the FMCG peer group for the 2019-2021 LTIP were: Altria Group, Anheuser-Busch InBev, Campbell Soup, Carlsberg, Coca-Cola, Colgate-Palmolive, Danone, Diageo, Heineken, Imperial Brands, Japan Tobacco, Johnson & Johnson, Kellogg, Kimberly-Clark, LVMH, Mondelēz International, Nestlé, PepsiCo, Pernod Ricard, Philip Morris International, Procter & Gamble, Reckitt Benckiser and Unilever.
 
2.
The underpin for adjusted revenue growth measure:
the adjusted revenue growth measure can only vest provided the corresponding three-year CAGR of APFO exceeds the CAGR of the threshold performance level for APFO as approved annually in the STI and approved by the Board. The underpin was exceeded with reference to the APFO STI outcomes for 2019, 2020 and 2021.
 
3.
The Remuneration Committee did not consider that any discretion to adjust the formulaic outcome need be applied.
 
138


Table of Contents
BAT Annual Report and Form 20-F 2021    
 
Strategic Report        
 
Governance Report        
  
Financial Statements        
  
Other Information        


LTIP outcome for year ended 31 December 2021
 
     
Number of ordinary
shares subject
to award
    
Vesting % achieved
(based on 2019–2021
performance period)
    
Number of
ordinary shares
to vest
    
Value of ordinary
shares to vest
1
£’000
    
Dividend equivalent
payment on
vesting
2
£’000
    
Total value to vest  
£’000  
(Value shown in  
Single Figure Table)  
 
Jack Bowles
  
 
176,532


49.1%


86,677


2,267


548


2,815  
 
Tadeu Marroco
3
  
 
36,057


49.8%


17,956


470


114


584  
 
The 2019 LTIP award was granted to Tadeu Marroco prior to his appointment as Executive Director, therefore the vesting date is 28 March 2022 and the shares will become exercisable on that same date.
Notes:
 
1.
The value of ordinary shares to vest shown above is based on the average share price for the three-month period ended 31 December 2021 of 2,616p.
 
2.
The dividend equivalent amount shown above that will be delivered on vesting is the value of the dividend equivalents accrued on the proportion of the award that is due to vest. Dividend equivalent will be delivered as shares following the end of the
two-year
post-vesting holding period for Jack Bowles. Dividend equivalent will be delivered as cash on vesting date for Tadeu Marroco due to LTIP award being made prior to appointment as Executive Director.
 
3.
The number of shares subject to award made to Tadeu Marroco reflect the award opportunities available at the time of the award, prior to being appointed as Executive Director.
 
4.
The vesting percentage for Tadeu Marroco reflects the vesting percentage applicable to awards made prior to being appointed as Executive Director.
Executive Directors’ pension entitlements and accruals for the year ended 31 December 2021
 
    
Total Defined Contribution (DC) fund value as  

at
year-end
31 December 2021 £’000  
Pension values
  
Defined Contribution (DC)
Unapproved Unfunded
Retirement Benefit Scheme
(UURBS)
1
    
British American Tobacco UK  
Pension Plan  
Jack Bowles
  
 
1,117
 
  
359  
Tadeu Marroco
  
 
780
 
  
211  
Total
  
 
1,897
 
  
570  
Note:
 
1.
The DC UURBS credit accrued over the year is increased in line with the Company’s Weighted Average Cost of Debt (WACD) over the year. For the year ended 31 December 2021, a WACD of 3.5% has been used.
Jack Bowles
The total Company contribution to the DC arrangements over the period 1 January to 31 December 2021 was £197,526. Of this, £3,033 was paid to the British American Tobacco UK Pension Plan and £194,493 was credited to the DC UURBS. These total amounts are based on a Company contribution rate of 15% of salary per annum.
Tadeu Marroco
The total Company contribution paid to the DC arrangements over the period 1 January to 31 December 2021 was £120,643. Of this, £3,033 was paid to the funded British American Tobacco UK Pension Plan and £117,610 was credited to the DC UURBS. These total amounts are based on a Company contribution rate of 15% of salary per annum.
No excess retirement benefits have been paid to or are receivable by an Executive or former Executive Director.
 
 
139


Table of Contents
BAT Annual Report and Form 20-F 2021
 
Remuneration Report
Annual Statement on Remuneration
Continued


Other Information Relating to Chief Executives’ Remuneration for the year Ended 31 December 2021
Chief Executives’ pay – comparative figures 2012 to 2021
 
Year
  
2012
      
2013
      
2014
      
2015
      
2016
      
2017
      
2018
      
2019
      
2020
      
2021
 
Chief Executives’
‘single figure’ of total
remuneration (£’000)
 
Nicandro Durante
1
(to 1 April 2019)
  
 
6,340


6,674


3,617


4,543


8,313


10,244


8,651


3,054


n/a


n/a
 
Jack Bowles
(from 1 April 2019)
  
 
n/a


n/a


n/a


n/a


n/a


n/a


n/a


3,512


4,954


7,471
 
Annual bonus (STI) paid against maximum opportunity (%)
 
Nicandro Durante
1
(to 1 April 2019)
  
 
85.0


81.3


73.2


100


100


97.2


100


50.0


n/a


n/a
 
Jack Bowles
(from 1 April 2019)
  
 
n/a


n/a


n/a


n/a


n/a


n/a


n/a


96


71.1


85.7
 
Long-term incentive (LTIP) paid against maximum opportunity (%)
 
                                               
Nicandro Durante
1
(to 1 April 2019)
  
 
87.1


49.2


0.0


8.7


46.0


96.1


70.5


69.3


n/a


n/a
 
Jack Bowles
(from 1 April 2019)
  
 
n/a


n/a


n/a


n/a


n/a


n/a


n/a


69.9


54.2


49.1
 
Notes:
 
1.
Nicandro Durante retired as Chief Executive on 1 April 2019. Historical data are taken from the Directors’ Remuneration Reports for the relevant years and are recast (as appropriate) on the basis of the ‘single figure’ calculation as prescribed in the UK Directors’ Remuneration Report Regulations. His ‘single figure’ remuneration for the year ended 31 December 2019 has been time-apportioned to reflect the period he was Chief Executive.
Total shareholder return (TSR) performance:
1
1 January 2012 to 31 December 2021
 

Note:
 
1.
Performance and pay chart:
this shows the performance of a hypothetical investment of £100 in ordinary shares (as measured by the TSR for the Company) against a broad equity market index (the FTSE 100 Index) over a period of 10 financial years starting from 1 January 2012 through to 31 December 2021 based on
30-trading-day
average values. The FTSE 100 has been selected by the Committee as an appropriate comparator group due to BAT’s position within the FTSE. A local currency basis is used for the purposes of the TSR calculation making it consistent with the approach to TSR measurement for the LTIP.
 
140


Table of Contents
BAT Annual Report and Form 20-F 2021    
 
Strategic Report        
 
Governance Report        
  
Financial Statements        
  
Other Information        


Annual change in remuneration of Directors’ and employees
The following table shows the percentage change in the Directors’ remuneration measured against a comparator group comprising the UK employee population across all UK entities. This comparator group is considered to be the most appropriate group due to the limited number of employees employed under BAT p.l.c. contracts outside of the Director group. In addition, using a more widely-drawn group encompassing the worldwide nature of the Group’s business would also present practical difficulties in collation and a less relevant comparator, given the significant variations in employee pay across the Group, the differing economic conditions and wide variations in gross domestic product per capita.
 
    
% change in salary/fees


% change in taxable benefits
1


% change in STI


        2020 to

2021


        2019 to

2020


        2020 to

2021


        2019 to
2020


        2020 to
2021


        2019 to
2020
 
 
Executive Directors
                     
Jack Bowles
  
 
5%


7%


(37%)


84%


26%


(21%)
 
Tadeu Marroco
2
  
 
4%


5%


(33%)


22%


25%


(24%)
 
Chairman
                     
Richard Burrows
3
  
 
2%


3%


8%


(44%)


Luc Jobin
4
  
 
334%


2%


24%


(79%)


Non-Executive
Directors
                     
Sue Farr
  
 
1%


2%


0%


(100%)


Dr Marion Helmes
  
 
1%


2%


(72%)


(77%)


Jerry Fowden
5
  
 
2%


2%


(98%)


14%


Holly Koeppel
  
 
1%


3%


(99%)


(82%)


Savio Kwan
  
 
1%


2%


(97%)


(84%)


Dimitri Panayotopoulos
6
  
 
9%


21%


(78%)


(88%)


Karen Guerra
7
  
 
0%


n/a


0%


n/a


Darrell Thomas
8
  
 
n/a


n/a


n/a


n/a


Average
UK-based
employee
9
  
 
6%


3%


(1%)


1%


20%


(5%)
 
Notes:
 
1.
Changes in taxable benefit values for 2019 to 2020 and for 2020 to 2021 for
Non-Executive
Directors were primarily a result of a reduction in travel and subsistence costs associated with business functions due to COVID-related travel restrictions throughout 2020 and 2021. Further details of the taxable benefits figures can be found in the table on page 144.
 
2.
Tadeu Marroco was appointed as an Executive Director from 5 August 2019. For the period 5 August 2019 to 31 December 2019, annualised figures have been used to calculate the
year-on-year
change.
 
3.
Richard Burrows departed the Company 28 April 2021. For the period 1 January to 28 April 2021, annualised figures have been used to calculate the
year-on-year
change.
 
4.
Luc Jobin was appointed Chairman from 28 April 2021. The change in fees from 2020 to 2021 is due to the increase in fees received following the appointment.
 
5.
Jerry Fowden was appointed to the Board on 1 September 2019 and departed the Company on 31 March 2021. For the periods 1 September to 31 December 2019 and 1 January to 31 March 2021, annualised figures have been used to calculate the
year-on-year
change.
 
6.
Dimitri Panayotopoulos started receiving the Senior Independent Director fee with effect from 1 May 2020.
 
7.
Karen Guerra was appointed to the Board on 14 September 2020. For the period 14 September 2020 to 31 December 2020, annualised figures have been used to calculate the
year-on-year
change.
 
8.
Darrell Thomas was appointed to the Board on 7 December 2020, receiving no fees or taxable benefits in 2020. Accordingly, no
year-on-year
change figures have been included.
 
9.
The data for the
UK-based
employees comparator group are made up as follows as at 1 November 2021: (1) the weighted average base salaries; (2) the average taxable benefits per grade; and (3) the weighted average bonus result based on that population as at that date.
 
141


Table of Contents
BAT Annual Report and Form 20-F 2021
 
Remuneration Report
Annual Statement on Remuneration
Continued


Chief Executive Pay Ratio Disclosure
The below table reflects the Chief Executive pay ratio when compared to employees at the 25th percentile, median and 75th percentile of the Group’s UK workforce for years 2019, 2020 and 2021. The table also includes the salary and total remuneration figures for the employees at each percentile for 2021.
 
Year
  
Method
    
25th percentile pay ratio
    
Median pay ratio
    
75th percentile pay ratio
 
2019
  
 
Option A


144:1


86:1


36:1
 
2020
  
 
Option A


103:1


66:1


29:1
 
2021
  
 
Option A


138:1


90:1


37:1
 
Employees remuneration for 2021
          
25th percentile
    
Median
    
75th percentile
 
Salary


£36,010


£55,849


£98,777
 
Total Remuneration


£53,980


£83,438


£202,314
 
Notes:
 
1.
Option A uses the total full-time equivalent remuneration for all UK employees for the financial year ended 31 December 2021 and has been used to calculate the ratio as this is viewed to be the most robust and comprehensive means of assessment and is also reflective of shareholder preferences.
 
2.
Total pay and benefits are based on the workforce as at 1 November 2021 and include the annualised income for the earnings period 1 January 2021 to 31 December 2021.
 
3.
Total pay and benefits for the Chief Executive are based on the single figure calculation on page 135.
 
4.
Total pay and benefits for the workforce is calculated as far as possible on the same basis as the Chief Executive single figure calculation. This includes salary, taxable benefits, short-term incentive, long-term incentive, dividends, pension benefits and any other remuneration receivable. For the purposes of this analysis, the following has been assumed:


For all employees that are eligible for a car benefit, the applicable car allowance amounts have been used;


For all employees that participate in the global International Executive Incentive Scheme or equivalent corporate incentive scheme, incentive
pay-outs
are calculated based on the same metrics; and


For all employees that participate in the UK DC scheme, Company contributions of 15% of salary have been used.
 
5.
For the calculation of the total pay and benefits for employees, employees on international assignment into and out of the UK have been included; however, assignment benefits, such as housing support, education support, home leave allowance or relocation costs, have not been included as these are not consistent with the benefits included in the Chief Executive single figure calculation.
 
6.
For hourly paid employees who are not full time, total pay and benefits have been
pro-rated
based on full-time employee hours.
The figures above show that following the decrease from 2019 to 2020, there has been an increase in the Chief Executive pay ratio across all quartiles from 2020 to 2021.
The increase in pay ratio from 2020 to 2021 is due to the 2019 LTIP award being the first award made to Jack Bowles at Chief Executive award levels.
Fixed remuneration remained aligned with that of the wider
UK-based
workforce, with salary increasing in line with the wider workforce increase range, pension contribution percentage remaining aligned with the wider workforce at 15% and taxable benefits reducing significantly.
The CEO pay ratio is likely to continue to vary over time, with variances being attributable to the CEO variable pay opportunity which accounts for 80% to 90% of the total remuneration.
The Company believes the median pay ratio for 2021 reflects the diversity of our business footprint and employee population across the UK. The Group’s remuneration policies and practices are founded on a high degree of alignment and consistency, with total remuneration at all levels providing competitive compensation that enables the attraction and retention of talent while also providing equitable differentiated remuneration based on grade, performance and experience. Further details on
all-employee
rewards at BAT can be found on pages 163 and 164.
 
142


Table of Contents
BAT Annual Report and Form 20-F 2021    
 
Strategic Report        
 
Governance Report        
  
Financial Statements        
  
Other Information        


4 Executive Directors’ Remuneration for the Upcoming Year
Base salary for 2022
The Remuneration Committee has determined the following salaries for the Executive Directors.
 
Executive Directors – salaries
  
Base
salary from
1 Apr 2022
£
    
Percentage
change
%
    
Base
salary from
1 Apr 2021
£
 
Jack Bowles
  
 
1,325,610


n/a


1,325,610
 
Tadeu Marroco
  
 
803,400


n/a


803,400
 
Benefits and pension
No changes have been made to the provision of benefits or pension for 2022.
Short-term incentives for 2022
STI opportunity levels for Executive Directors will be in line with those set out in our Directors’ Remuneration Policy. STI metrics and weightings are as follows:
 
2022 STI metrics & weightings
        
Volume share growth (Incl THP)
1
  
 
10%
 
New Categories revenue
2
  
 
15%
 
Adjusted profit from operations
  
 
25%
 
New Categories contribution
3
  
 
20%
 
Adjusted cash generated from operations
4
  
 
30%
 
Total
  
 
100%
 
Notes:
 
1.
Group share of key markets will include THP performance for all major markets (markets included are Japan, South Korea, Italy, the Czech Republic, Ukraine, Russia, Poland, Greece and Hungary).
 
2.
New Categories Revenue is the revenue derived from the Vapour, THP and Modern Oral product categories. This measure is assessed at constant rates of exchange. Further details of the metric can be found on page 305.
 
3.
New Categories Contribution is the contribution to APFO from Vapour, THP and Modern Oral products. It is stated after deduction of directly attributable costs and allocated cross-category shared costs, before the deduction of administrative overheads and excluding the impact of adjusting items. The measure is assessed at constant rates of exchange.
 
4.
Net cash generated from operating activities, less net finance costs, net capital expenditure, dividends from associates and dividends paid to
non-controlling
interests and before cash paid/ received in respect of litigation. Adjusted CGFO is measured at constant rates of exchange.
Due to the commercial sensitivity of the targets, details for the year ending 31 December 2022 will be disclosed retrospectively in the Annual Report on remuneration for the year ending 31 December 2022.
 
143


Table of Contents
BAT Annual Report and Form 20-F 2021
 
Remuneration Report
Annual Statement on Remuneration
Continued


Long-term incentives for 2022
The Chief Executive and Finance and Transformation Director will be granted an LTIP award equal to a maximum of 500% of salary and 400% of salary, respectively. The measures and targets for 2022 LTIP awards are set out below.
 
LTIP measures and performance ranges
            
% of award
vesting
at maximum
    
% of award
vesting
at threshold
 
Relative TSR


20


3
 
Median performance vs. FMCG peer group to upper quartile.


The current constituents of the FMCG peer group as part of the new remuneration policy will be:
 
     
Altria Group
  
 
Coca-Cola


Imperial Brands


Pernod Ricard


Reckitt Benckiser
 
     
Anheuser-Busch InBev
  
 
Diageo


Japan Tobacco


Philip Morris International


Swedish Match
 
     
Carlsberg
  
 
Heineken


PepsiCo


Procter & Gamble


Unilever


EPS growth (15% current and 15% constant rates of exchange)


30


4.5
 
5%–10% compound annual growth in adjusted diluted EPS over the performance period
 
Adjusted revenue growth


15


2.25
 
3%–5% compound annual growth over the performance period
 
Growth in New Categories revenue


15


2.25
 
20%–30% compound annual growth over the performance period
 
Adjusted operating cash flow conversion ratio


20


3
 
Ratio of 85%–95% over the performance period at current rates of exchange
 
Total


100


15
 
5 Chairman and
Non-Executive
Directors’ Remuneration for the Year Ended 31 December 2021
The following table shows a single figure of remuneration for the Chairman and
Non-Executive
Directors in respect of qualifying services for the year ended 31 December 2021 together with comparative figures for 2020.
 
    
Base fee
1

£’000 
    
Chair/Committee 

membership fees
1

£’000 
    
Taxable benefits
2

£’000 
    
Total remuneration

£’000
 
     
            2021
    
            2020
    
            2021
    
            2020
    
            2021
    
            2020
    
            2021
    
            2020
 
Chairman
                       
Luc Jobin
3
(from 28 April 2021)
  
 
523


96


9


26


20


16


552


138
 
Richard Burrows (up to 28 April 2021)
  
 
234


714


36


77


270


791
 
Non-Executive
Directors
                       
Sue Farr
  
 
97


96


27


26


124


122
 
Karen Guerra
  
 
97


29


27


8


124


37
 
Dr Marion Helmes
  
 
97


96


27


26


1


3


125


125
 
Holly Keller Koeppel
4
  
 
97


96


54


53


23


152


172
 
Savio Kwan
  
 
97


96


27


26


10


124


132
 
Dimitri Panayotopoulos
  
 
138


124


54


53


1


3


193


180
 
Darrell Thomas
5
  
 
104


29


133


Jerry Fowden (up to 31 March 2021)
  
 
25


96


7


26


3


32


139
 
Total
  
 
1,509


1,443


261


244


58


135


1,829


1,836
 
Notes:
 
1.
Committee memberships:
are shown, together with changes during the year, in the reports of the respective committees in the Governance sections of the Directors’ Report.
 
2.
Benefits:
the Chairman’s benefits in respect of Richard Burrows in 2021 comprised: health insurance and
‘walk-in’
medical services £15,000 (2020: £16,000); the use of a Company driver £11,000 (2020: £48,000); home and personal security in the UK and Ireland £10,000 (2020: £11,000); and commuting flights to London (2020: £2,000). The Chairman’s benefits in respect of Luc Jobin in 2021 comprised: health insurance and
‘walk-in’
medical services £8,000; the use of a Company driver £1,000; and commuting flights to London £3,000. The benefits for the other
Non-Executive
Directors principally comprised travel-related expenses incurred in connection with individual and/or accompanied attendance at certain business functions and/or events and
‘walk-in’
medical services. The figures shown are
grossed-up
amounts (as appropriate) as, in line with the UK market, it is the normal practice for the Company to pay the tax that may be due on any benefits.
 
3.
Pension:
Luc Jobin receives a pension in respect of prior service to Imasco Limited (acquired in 2000 by the Group) and Imperial Tobacco Canada Limited, a subsidiary of BAT. In 2021 this amount was CAD$150,228.00 (£87,139.21) (2020: CAD$151,395.00 (£86,112.85)).
 
4.
Deferred Compensation Plan for Directors of Reynolds American Inc. (DCP):
as a former outside director of Reynolds American Inc. Holly Keller Koeppel participated in the DCP under which she elected to defer payment of a portion of her Reynolds American retainers and meeting attendance fees to a Reynolds American stock account. Following the acquisition of Reynolds American by BAT, amounts deferred to a stock account (Deferred Stock Units or DSUs) mirror the performance of, and receive dividend equivalents based on, BAT American Depository Shares (ADSs). The DSUs of Holly Keller Koeppel are disclosed as a note to ‘Summary of Directors’ share interests’ below. DSUs deferred under the DCP will be paid in accordance with the terms of the DCP, section 409A of the US Internal Revenue Code of 1986, as amended, and the Director’s existing deferral elections.
 
5.
Darrell Thomas was appointed to the Board on 7 December 2020, with the first fee being paid to him in January 2021.
 
6.
The
Non-Executive
Directors’ fees structure 2021 is set out in the table overleaf.
 
144


Table of Contents
BAT Annual Report and Form 20-F 2021    
 
Strategic Report        
 
Governance Report        
  
Financial Statements        
  
Other Information        


Fees from 1 May 2021
£
    
            Fees to 30 April 2021
£
 
Base fee
  
 
96,850


96,850
 
Senior Independent Director – supplement
  
 
41,500


41,500
 
Audit Committee: Chairman
  
 
42,000


40,950
 
Audit Committee: Member
  
 
14,400


14,100
 
Nominations Committee: Chairman


Nominations Committee: Member
  
 
12,800


12,500
 
Remuneration Committee: Chairman
  
 
42,000


40,950
 
Remuneration Committee: Member
  
 
14,400


14,100
 
Chairman and
Non-Executive
Directors’ fees and remuneration for the upcoming year
As described in the Annual Report on Remuneration for the year ended 31 December 2020, the Chairman’s fee was £670,000 from 28 April 2021.
The Chairman’s fee and the fees for
Non-Executive
Directors will be maintained at their current levels, with no increases to apply in May 2022.
6 Directors’ Share Interests
Summary of Directors’ share interests
 
           
Outstanding scheme interests 31 Dec 2021
        
     
Ordinary shares
held at
31 Dec 2021
    
Unvested awards
subject to performance
measures and
continued employment
(LTIP)
    
 
Unvested awards
subject to
continued
employment only
(DSBS)
    
Unvested
interests
(Sharesave)
    
Total ordinary
shares subject
to outstanding
scheme interests
    
Total of all interests
in ordinary shares at
31 Dec 2021
 
Executive Directors
                 
Jack Bowles
1,2
  
 
239,214


629,975


119,862


749,837


989,051
 
Tadeu Marroco
2,3
  
 
78,126


265,012


56,348


890


322,250


400,376
 
Chairman
                 
Richard Burrows (up to 28 April 2021)
  
 
19,000


19,000
 
Luc Jobin
4
  
 
90,236


90,236
 
Non-Executive
Directors
                 
Sue Farr


Jerry Fowden (up to 31 March 2021)
4
  
 
10,000


10,000
 
Karen Guerra
  
 
5,000


5,000
 
Dr Marion Helmes
  
 
4,500


4,500
 
Holly Keller Koeppel
5


Savio Kwan
  
 
8,238


8,238
 
Dimitri Panayotopoulos
  
 
3,300


3,300
 
Darrell Thomas
4
  
 
2,600


2,600
 
Notes:
 
1.
Jack Bowles:
ordinary shares held include 822 held by the trustees of the BAT Share Incentive Plan (SIP).
 
2.
Changes from 31
 December 2021:
Tadeu Marroco: purchases of five ordinary shares on 5 January 2022 and five ordinary shares on 2 February 2022 under the SIP. There were no changes in the interests of the Chairman and the other
Non-Executive
Directors.
 
3.
Tadeu Marroco:
ordinary shares held include 1,347 held by the trustees of the SIP.
 
4.
American Depositary Shares (ADSs):
each of the interests in ordinary shares held by Luc Jobin, Jerry Fowden and Darrell Thomas consists of an equivalent number of BAT ADSs each of which represents one ordinary share in the Company.
 
5.
Deferred Stock Units (DSUs):
at the date of this report Holly Keller Koeppel, being a former director of Reynolds American Inc. and a participant in the Deferred Compensation Plan for Directors of Reynolds American (DCP), holds DSUs which were granted prior to becoming a Director of BAT. Each DSU entitles the holder to receive a cash payment upon ceasing to be a Director equal to the value of one BAT ADS. The number of DSUs increases on each dividend date by reference to the value of dividends declared on the ADSs underlying the DSUs. Ms Koeppel currently holds 26,660.09 DSUs (31 December 2020: 25,125.91 DSUs).
 
145


Table of Contents
BAT Annual Report and Form 20-F 2021
 
Remuneration Report
Annual Statement on Remuneration
Continued


Executive Directors’ shareholding guidelines
Executive Directors are encouraged to build up a high level of personal shareholding to ensure a continuing alignment of interests with shareholders. The shareholding guidelines require Executive Directors to hold ordinary shares equal to the value of a percentage of salary as set out in the table below.
 
     
No. of eligible
ordinary shares
held at
31 Dec 2021
    
Value of eligible
ordinary shares
held at
31 Dec 2021
1
£m
    
Actual
percentage (%)
of base salary at
31 Dec 2021
    
Shareholding
requirements
(% of base salary
31 Dec 2021)
   
Compliant
with shareholding
requirement
 
Jack Bowles
  
 
301,919


8,255


623%


500%


Yes
 
Tadeu Marroco
  
 
106,653


2,916


363%


400%
2


See note 2
 
Executive Directors are required to hold shares equivalent to 100% of current shareholding requirements for two full years following the date of their departure with a sale restriction mechanism in place for this period. More detail on Executive Director shareholding requirements can be found in the Directors Remuneration policy on page 157.
Ben Stevens was compliant with the post-employment shareholding requirement up to the end of the two year post employment shareholding period which ended on 4 August 2021.
Eligibility of shares: (a) unvested ordinary shares under the DSBS, which represent deferral of earned bonus, are eligible and count towards the requirement on a
net-of-tax
basis; (b) unvested ordinary shares under the LTIP are not eligible and do not count towards the requirement during the performance period, but the estimated notional net number of ordinary shares held during the LTIP Extended Vesting Period are eligible and will count towards the requirement; and (c) ordinary shares held in trust under the
all-employee
share ownership plan (SIP) are not eligible and do not count towards the shareholding requirement.
Non-Executive
Directors are not subject to any formal shareholding requirements although they are encouraged to build a small interest in ordinary shares during, the term of their appointment. As noted in the Directors’ Remuneration policy on page 162, future fees for
Non-Executive
Directors may be paid in cash or a combination of cash and shares, with the proportion to be paid in shares in a year to be disclosed in the relevant Directors’ Remunerations Report.
Notes:
 
1.
Value of ordinary shares shown above:
this is based on the closing
mid-market
share price on 31 December 2021 of 2,734p.
 
2.
Tadeu Marroco was appointed as an Executive Director on 5 August 2019, prior to which the shareholding requirement for Mr Marroco was set at a lower percentage of salary with Mr Marroco being compliant with required percentage. Under the Directors’ Remuneration Policy, Executive Directors may generally sell a maximum of up to 50% of any shares vesting (after tax) under the Company’s share plans until the threshold for shareholding requirements has been met and Mr Marroco is compliant with this policy requirement. In line with the Directors’ Remuneration Policy, the shareholding requirement is equal to the value of the same multiple of salary at which LTIP awards are made to that Director, as such the shareholding requirement for Mr Marroco increased to 400% in 2020.
 
3.
Meeting the guidelines:
if an Executive Director does not at any time, meet the requirements of the shareholding guidelines, the individual may, generally, only sell a maximum of up to 50% of any ordinary shares vesting (after tax) under the Company share plans until the threshold required under the shareholding guidelines has been met.
 
4.
Waiver of compliance with guidelines:
this is permitted with the approval of the Remuneration Committee in circumstances where a restriction on a requested share sale could cause undue hardship. No such applications were received from the Executive Directors during 2021.
 
146


Table of Contents
BAT Annual Report and Form 20-F 2021    
 
Strategic Report        
 
Governance Report        
  
Financial Statements        
  
Other Information        


Executive Directors’ outstanding scheme interests
 
     
Plan
   
At 1 Jan 2021
    
Awarded
in 2021
    
Lapsed
in 2021
    
Exercised/
released
in 2021
    
At
31 Dec 2021
    
Exercise
price
(p)
    
End of
performance
period
    
Date from which
exercisable or
shares released
 
Jack Bowles
  
 
LTIP
1


43,785


20,054


23,731


2,802


31 Dec 20


26 Mar 21


LTIP
2


176,532


176,532


31 Dec 21


28 Mar 24


LTIP
3


223,129


223,129


31 Dec 22


30 Mar 25


LTIP
3


230,314


230,314


31 Dec 23


29 Mar 26


DSBS


12,064


12,064


31 Dec 20


26 Mar 21


DSBS


26,192


26,192


31 Dec 21


28 Mar 22


DSBS


53,618


53,618


31 Dec 22


30 Mar 23


DSBS


40,052


40,052


31 Dec 23


29 Mar 24


Sharesave


Sharesave


Tadeu Marroco
  
 
LTIP
1


28,248


12,938


15,310


2,787


31 Dec 20


26 Mar 21


LTIP
2


36,057


36,057


31 Dec 21


28 Mar 22


LTIP
3


113,938


113,938


31 Dec 22


30 Mar 25


LTIP
3


115,017


115,017


31 Dec 23


29 Mar 26


DSBS


7,783


7,783


31 Dec 20


26 Mar 21


DSBS


13,233


13,233


31 Dec 21


28 Mar 22


DSBS


24,388


24,388


31 Dec 22


30 Mar 23


DSBS


18,727


18,727


31 Dec 23


29 Mar 24


Sharesave


266


266


1 May 21


1 May 21


Sharesave


433


433


1 May 24


1 May 24


Sharesave


624


624


1 May 25


1 May 25
 
Notes:
 
1.
Details of the performance condition for the LTIP awards granted in 2018 (which vested during 2021), and of achievement against that condition in the period to 31 December 2020, were set out in the Annual Report on Remuneration for the year ended 31 December 2020.
 
2.
Details of the performance condition attached to 2019 LTIP awards, and of achievement against that condition in the period to 31 December 2021, are set out on page 138.
 
3.
Details of the performance condition attached to 2020 and 2021 LTIP awards are set out on page 148.
Further details in relation to scheme interests granted during the year ended 31 December 2021
 
             
Plan
    
Ordinary
shares awarded
    
Price per
ordinary share
at award
1
    
Face value
of award
£’000
    
Proportion of award vesting
for threshold performance
(%)
    
Performance
period
    
Date from which
exercisable or
shares released
 
Jack Bowles
     
 
LTIP
2


230,314


2,794p


6,435


15


2021–2023


29 Mar 26


DSBS


40,052


n/a


n/a


29 Mar 24
 
Tadeu Marroco
     
 
LTIP
2


115,017


2,794p


3,214


15


2021-2023


29 Mar 26


DSBS


18,727


n/a


n/a


29 Mar 24
 
Notes:
 
1.
The price per ordinary share is the price used to determine the number of ordinary shares subject to the awards, which is calculated as the average of the closing
mid-market
price of an ordinary share over the three dealing days preceding the date of grant.
 
2.
Details of the performance condition attached to these LTIP awards are set out on page 148.
 
147


Table of Contents
BAT Annual Report and Form 20-F 2021
Remuneration Report
Annual Statement on Remuneration
Continued
 
Further details in relation to performance conditions attaching to outstanding scheme interests
 
   
LTIP awards granted in 2020
         
LTIP awards granted in 2021
 
   
1 January 2020–31 December 2022
         
1 January 2021–31 December 2023
 
    
        Weighting
   
Threshold
   
Maximum
         
        Weighting
   
Threshold
   
Maximum
 
Relative TSR
 
Ranking against a peer group of international FMCG companies
 
 
20%


At median,
3% of
award vests


At upper

quartile, 20% of
award vests


20%


At median,
3% of
award vests


At upper
quartile, 20% of
award vests


EPS growth at current rates of exchange
 
Compound annual growth in adjusted diluted EPS measured at current rates of exchange
 
 
20%


At 5%
CAGR, 3% of
award vests


At 10%

CAGR, 20% of
award vests


20%


At 5%

CAGR, 3% of
award vests


At 10% CAGR,
20% of

award vests


EPS growth at constant rates of exchange
 
Compound annual growth in adjusted diluted EPS measured at constant rates of exchange
 
 
20%


At 5%
CAGR, 3% of
award vests


At 10%

CAGR, 20% of
award vests


20%


At 5%

CAGR, 3% of
award vests


At 10% CAGR,
20% of

award vests


Adjusted revenue growth
 
Compound annual growth measured at constant rates of exchange
 
 
20%


At 3%
CAGR, 3% of
award vests


At 5%

CAGR, 20% of
award vests


20%


At 3%

CAGR, 3% of
award vests


At 5% CAGR,

20% of
award vests


Adjusted operating cash flow conversion ratio
 
Measured at current rates of exchange, as a percentage of APFO
 
 
20%


At 85%,

3% of
award vests


At 95%,

20% of
award vests


20%


At 85%,

3% of
award vests


At 95%,

20% of
award vests


7 Other Disclosures
Payments to past directors or for loss of office
There were no payments to past Directors or for loss of office.
Relative importance of spend on pay
To illustrate the relative importance of the remuneration of the Directors in the context of the Group’s finances overall, the Remuneration Committee makes the following disclosure:
 
Item
  
 
2021
                        £m


2020
                        £m


            % change   
Remuneration of Group employees
1
  
 
2,717


2,744
 
  
(1%) 
Remuneration of Executive Directors
  
 
10


8
 
  
25%  
Remuneration of Chairman and
Non-Executive
Directors
  
 
2


2
 
  
-      
Total dividends
2
  
 
4,904


4,745
 
  
3%  
Notes:
 
1.
Total remuneration of Group employees:
this represents the total employee remuneration costs for the Group, set out on page 193 within note 3(a) in the Notes on the Accounts.
 
2.
Total dividends:
this represents the total dividends paid in 2021. For further details please refer to pages 79, 354 and 355.
Shareholder dilution – options and awards outstanding
 
Satisfaction of Company share plan awards in accordance with the Investment
Association’s Principles of Remuneration
  
New ordinary shares issued by the Company during the year ended
31 December 2021
–  by the issue of new ordinary shares;
 
–  ordinary shares issued from treasury only up to a maximum of 10% of the Company’s issued share capital in a rolling
10-year
period;
 
–  within this 10% limit, the Company can only issue (as newly issued ordinary shares or from treasury) 5% of its issued share capital to satisfy awards under discretionary or executive plans; and
 
–  the rules of the Company’s Deferred Share Bonus Scheme do not allow for the satisfaction of awards by the issue of new ordinary shares.
  
–  26,191 ordinary shares issued by the Company in relation to the Sharesave Scheme;
 
–  a total of 956,857 Sharesave Scheme options over ordinary shares in the Company were outstanding at 31 December 2021, representing 0.04% of the Company’s issued share capital (excluding shares held in treasury); and
 
–  options outstanding under the Sharesave Scheme are exercisable until 1 March 2027 at option prices ranging from 2,076p to 4,056p.
 
148


Table of Contents
BAT Annual Report and Form 20-F 2021    
 
Strategic Report        
 
Governance Report        
  
Financial Statements        
  
Other Information        


8 The Remuneration Committee and Shareholder Engagement
 
 
Remuneration Committee current members
Dimitri Panayotopoulos (Chairman)
Sue Farr
Dr Marion Helmes
Savio Kwan
Role
As set out in the Terms of Reference, the Remuneration Committee is responsible for:
 
 
determining and proposing the Directors’ Remuneration Policy (covering salary, benefits, performance-based variable rewards and retirement benefits) for shareholder approval;
 
 
determining, within the terms of the approved Directors’ Remuneration Policy, the specific remuneration packages for the Chairman and the Executive Directors, on appointment, on review and, if appropriate, any compensation payment due on termination of appointment;
 
 
the setting of targets applicable for the Company’s performance-based variable reward schemes and determining achievement against those targets, exercising discretion where appropriate and as provided by the applicable scheme rules and the Directors’ Remuneration Policy;
 
 
reviewing Group workforce remuneration and related policies, and the alignment of incentives and rewards with Group culture, taking these into account when setting the policy for Executive Director remuneration. Providing feedback to the Board on workforce reward, incentives and conditions applicable across the Group and supporting the Board’s monitoring of the Group’s culture and its alignment with the Group’s purpose, values and strategy;
 
 
setting remuneration for members of the Management Board and the Company Secretary; and
 
 
monitoring and advising the Board on any major changes to the policy on employee benefit structures for the Group.
Remuneration Committee terms of reference
The Committee’s terms of reference align with the requirements of the UK Corporate Governance Code 2018. No changes were made to the Remuneration Committee’s terms of reference in 2021.


For the Remuneration Committee’s terms of reference see:
 
www.bat.com/governance
Attendance at meetings in 2021
1
 
Name
  
Member
since
    
Attendance/
    Eligible to attend
Scheduled
    
Attendance/
    Eligible to attend
Ad Hoc
 
Dimitri Panayotopoulos
1(b)
  
 
2015


4/4


2/3
 
Sue Farr
  
 
2016


4/4


3/3
 
Karen Guerra
2(b)
  
 
2020 – 2021


1/1


2/2
 
Marion Helmes
  
 
2019


4/4


3/3
 
Savio Kwan
  
 
2016


4/4


3/3
 
Notes:
 
1.
Number of meetings in 2021:
(a) the Committee held seven meetings in 2021, three of which were ad hoc: (b) Dimitri Panayotopoulos did not attend the ad hoc meeting in February 2021 due to a scheduled medical appointment. That ad hoc meeting was chaired by a member of the Remuneration Committee in accordance with the Committee’s Terms of Reference.
 
2.
Membership:
(a) all members of the Committee are independent
Non-Executive
Directors in accordance with the UK Corporate Governance Code 2018 Provisions 10 and 32 and applicable NYSE listing standards; and (b) Karen Guerra stepped down from the Committee with effect from 1 April 2021.
 
3.
Other attendees:
the Chairman, the Chief Executive, the Director, Talent, Culture and Inclusion, the Group Head of Reward and other senior management, including the Company Secretary, may be consulted and provide advice, guidance and assistance to the Remuneration Committee. They may also attend Committee meetings (or parts thereof) by invitation. Neither the Chairman, any Executive Director nor member of senior management plays any part in determining their own respective remuneration.
 
4.
PwC LLP:
Appointed in January 2020 as one of the Remuneration Committee’s remuneration consultants, representatives of PwC LLP attended meetings of the Remuneration Committee in 2021. PwC LLP agrees to the Remuneration Consultants Group (RCG) Code of Conduct which seeks to clarify the scope and conduct of the role of executive remuneration consultants when advising UK listed companies and is one of the founding members of the RCG. The Committee is satisfied that the advice received is independent and objective.
 
5.
Meridian Compensation Partners:
Appointed in January 2020 as one of the Remuneration Committee’s remuneration consultants, a representative of Meridian Compensation Partners attended meetings of the Remuneration Committee in 2021.
 
149


Table of Contents
BAT Annual Report and Form 20-F 2021
Remuneration Report
Annual Statement on Remuneration
Continued
 
Remuneration Committee advisers during 2021
 
Independent
external advisers
  
Services provided to the Remuneration Committee
  
Fees
  
Other services provided
to the Company                                        
PwC LLP
1,2
  
General advice on remuneration matters including: market trends and comparator group analysis; policy review and shareholder engagement perspectives; and independent measurement of the relative TSR performance conditions.
 
  
2021: £165,946
 
2020: £126,013
  
Tax, corporate finance and consulting services to Group companies worldwide excluding the US.
Meridian
2
  
General advice on remuneration matters including market trends, shareholder engagement perspectives and comparator group analysis.
 
  
2021: $72,974
 
2020: $49,537
  
Consulting services to Group companies in the US.
Herbert Smith Freehills LLP
  
Advice in respect of share plan regulations is provided to the Company and is available to the Remuneration Committee.
  
Fees relate to advice given to the Company.
 
  
General corporate legal and tax advice principally in the UK.
KPMG LLP
  
Specified procedures to assist in the assessment of the calculations of the STI bonus and LTI outcomes and future targets.
 
  
2021: £29,000
2020: £28,000
  
Audit and tax services and other
non-audit
services.
Notes:
 
1.
PwC LLP also provides other international services and international tax advice such as tax return services including for certain globally mobile directors. The Remuneration Committee advisory team is not involved in any other services PwC provides to the Group.
 
 
2.
The fees payable to PwC and Meridian are based on annual fixed fees for specified services with anything outside this scope being charged on a time and material basis.
Regular work programme 2021
The Remuneration Committee:
 
 
reviewed salaries for the Executive Directors to take effect from 1 April 2021, taking into account market positioning and the level of salary increases awarded to UK employees. A programme of shareholder engagement on executive remuneration was conducted, led by the Committee Chairman, and the Committee considered feedback from shareholders (discussed at page 131);
 
 
reviewed salaries for members of the Management Board and the Company Secretary from 1 April 2021, taking into account market positioning and the level of salary increases awarded to UK employees;
 
 
assessed the achievement against the targets for the 2020 STI award and set the STI targets for 2021;
 
 
reviewed updates on performance against the 2021 STI target measures and for outstanding LTIP awards;
 
 
assessed the achievement against the performance conditions for the vesting of the 2018 LTIP award, determined the contingent level of LTIP awards for March 2021 and reviewed the associated performance conditions;
 
 
assessed the achievement against the targets for the 2020 Share Reward Scheme and set the targets for the 2021 award;
 
 
reviewed and assessed the target ranges across STI and LTI plans to ensure there is an appropriate level of stretch within the target range to drive performance for the benefit of shareholders;
 
 
reviewed the Annual Statement and the Annual Report on Remuneration for the year ended 31 December 2020 prior to its approval by the Board and subsequent proposal to shareholders at the Company’s AGM on 28 April 2021;
 
 
reviewed the 2021 AGM voting results relating to remuneration resolutions, market trends in the context of that annual general meeting season and corporate governance developments in the UK and the US;
 
 
monitored the continued application of the Company’s shareholding guidelines for the Executive Directors and members of the Management Board; and
 
 
reviewed the Remuneration Committee’s effectiveness following the Board and Committee evaluation process, discussed further on pages 114 to 115.
Directors’ Remuneration Policy
The Committee conducted an
in-depth
assessment of proposed changes to the current Directors’ Remuneration Policy and an associated programme of shareholder engagement led by the Committee Chairman.
In determining the revised Directors’ Remuneration Policy to be proposed to shareholders at the Company’s AGM on 28 April 2022, the Committee has taken into account shareholder feedback, remuneration and related policies applicable to the wider workforce, the alignment of incentives and rewards with the Group’s culture, the application of the UK Corporate Governance Code and applicable regulations.
 
150


Table of Contents
BAT Annual Report and Form 20-F 2021    
 
Strategic Report        
 
Governance Report        
  
Financial Statements        
  
Other Information        


Other activities in 2021
The Remuneration Committee
 
 
reviewed the terms of appointment and associated remuneration, and terms of termination of employment, in connection with Management Board changes during the year;
 
 
reviewed elements of the Group’s workforce remuneration strategy and their alignment with Executive Directors’ remuneration and their alignment with the Group’s culture, with specific focus on the reward architecture for management grade employees across the Group;
 
 
approved changes to the methodology for calculating the share of market read for the STI volume share metric in a limited number of markets, based on the local market environment and reporting capabilities; and
 
 
reviewed the UK gender pay report for 2020 for applicable UK Group companies, prior to publication in March 2021.
Voting on Remuneration and Engagement with Shareholders
At the AGM on 28 April 2021, shareholders considered and voted on the 2020 Directors’ Remuneration Report as set out on the table below. No other resolutions in respect of Directors’ remuneration or incentives were considered at the 2021 AGM. Further information regarding shareholder engagement in relation to remuneration matters is set out in the Annual Statement on Remuneration on page 128 and in the discussion of Board engagement with shareholders on pages 106 to 107.
Approval of Directors’ Remuneration Report¹
 
     
2021 AGM
 
Percentage for
  
 
61.71
 
Votes for (including discretionary)
  
 
1,091,216,857
 
Percentage against
  
 
38.29
 
Votes against
  
 
676,947,189
 
Total votes cast excluding votes withheld
  
 
1,768,164,046
 
Votes withheld
³
  
 
16,119,810
 
Total votes cast including votes withheld
  
 
1,784,283,856
 
The Directors’ Remuneration Policy was approved by shareholders at the 2019 AGM. A summary of this Policy is on pages 133 to 134.
Approval of Directors’ Remuneration Policy²
 
     
2019 AGM
 
Percentage for
  
 
92.63
 
Votes for (including discretionary)
  
 
1,641,331,721
 
Percentage against
  
 
7.37
 
Votes against
  
 
130,661,885
 
Total votes cast excluding votes withheld
  
 
1,771,993,606
 
Votes withheld
³
  
 
1,820,757
 
Total votes cast including votes withheld
  
 
1,773,814,363
 
Notes:
 
1.
Directors’ Remuneration Report:
does not include the part of the Remuneration Report containing the Remuneration Policy (see note 2 below).
 
2.
Directors’ Remuneration Policy:
was approved by shareholders at the 2019 AGM held on 25 April 2019 and is set out in full in the 2018 Annual Report on Remuneration.
 
3.
Votes withheld:
these are not included in the final proxy figures as they are not recognised as a vote in law.
The Directors’ Remuneration Report has been approved by the Board on 10 February 2022 and signed on its behalf by:
Dimitri Panayotopoulos
Chairman, Remuneration Committee
10 February 2022
 
151


Table of Contents
BAT Annual Report and Form 20-F 2021
Remuneration Report
Annual Statement on Remuneration
Continued
 
Policy Report
Introduction
This policy section of the Remuneration Report (the Policy Report) sets out a proposed new Remuneration Policy for the Executive Directors and the
Non-Executive
Directors.
This new Remuneration Policy, which is intended to replace the current remuneration policy approved by shareholders at the 2019 AGM, is subject to a binding vote by shareholders at the AGM on 28 April 2022 and, if approved, will come into effect from 29 April 2022. The new Remuneration Policy is set out in full on the following pages with changes from the current remuneration policy identified for reference.
Principles of remuneration
The Committee’s remuneration principles are to:
 
 
reward, as an overriding objective, the delivery of the Group’s long-term strategy in a manner which is simple, straightforward and understandable and which is aligned with shareholders’ interests;
 
 
structure a remuneration package that is appropriately positioned relative to the market and comprises core fixed elements and performance-based variable elements;
 
 
design the fixed elements of pay (comprising base salary, pension and other benefits) to recognise the skills and experience of our Executive Directors and to ensure current and future market competitiveness in attracting talent;
 
 
design the variable elements of pay (provided via two performance-based incentive schemes: a short-term incentive scheme delivered through a combination of a cash element and a deferral element, and a long-term incentive scheme), to be both transparent and stretching and to support, motivate and reward the successful delivery of the Group’s long-term strategy and growth for shareholders on a sustainable basis;
 
 
ensure that reputational, behavioural and other risks that can arise from target-based incentive plans are identified and mitigated;
 
 
maintain an appropriate balance between fixed pay and the opportunity to earn performance-related remuneration with immediate and deferred elements, such that the majority of the Executive Directors’ total remuneration package is delivered in BAT shares;
 
 
ensure that the performance-based elements form, at maximum opportunity, between 80% and 90% of the Executive Directors’ total remuneration packages;
 
 
ensure, through its annual review, that the Remuneration Policy is both rigorously applied and remains aligned with the Company’s purpose, values and strategy and the need to promote the long-term success of the Company; and
 
 
ensure that remuneration arrangements are transparent and promote effective engagement with shareholders and the workforce.
Our remuneration principles and the key elements of the Directors’ Remuneration Policy align with the UK Corporate Governance Code 2018 requirements, as follows:
Clarity and simplicity
Our policy provides an overall remuneration package that is transparent for our Executive Directors and shareholders alike; its simple structure has a clear and straightforward link to the delivery of the Group’s long-term strategy. Principles driving fixed remuneration (salary, benefits, pension) are closely aligned with the wider workforce and variable remuneration (STI and LTI) rewards delivery of financial and strategic objectives both in the short and long-term.
Risk
The combination of performance target setting for the STI and LTI, the inclusion of provisions for discretionary adjustments and malus and clawback provisions ensure that we remunerate our Executive Directors in accordance with high standards of governance while mitigating, as far as possible, reputational and other risks arising from remuneration that are not proportionate to outcomes.
Predictability and proportionality
There is a clear link between the operation of our short and long-term incentive plan awards and the delivery of our strategy and long-term performance. Variable remuneration at the Company accounts for between
80%-90%
of an Executive Directors’ total remuneration, ensuring that poor performance is not rewarded. Further detail on short and long-term incentive plan awards are detailed on pages 155 and 156.
Alignment to culture
The Remuneration Committee has worked extensively to develop a policy that closely aligns the Executive Directors to the wider workforce and rewards long-term sustainable performance. The Remuneration Committee continually reviews the Policy, taking into account any feedback received from engagement with the wider workforce and shareholders, to ensure it is aligned to the Company’s purpose and values, and promotes the long-term success of the Company.
Summary of key changes
The background and explanation of the proposed key changes from the current remuneration policy are given in the Annual Statement from the Chairman of the Remuneration Committee starting on page 128 of this Remuneration Report. Those key changes have been further explained in relevant sections of the Policy Report as summarised below:
 
Policy Element
  
Change in Policy
  
Page Number    
 
Short-Term Incentive (STI),
performance measures


Underlying policy is unchanged, however alternative measures and weightings have been selected for awards to be made in 2022.


155  
 
Long-Term Incentive
Plan (LTIP),
performance measures


Underlying policy is unchanged, however alternative measures and weightings have been selected for awards to be made in 2022.
  
 
156  
Malus and clawback


Updated and expanded to reflect market best practice


157  
 
 
152


Table of Contents
BAT Annual Report and Form 20-F 2021    
 
Strategic Report        
 
Governance Report        
  
Financial Statements        
  
Other Information        


Future Policy Table – Executive Directors
 
Base salary
    
      
How the element supports the
Company’s strategic objectives
  
To attract and retain high-calibre individuals to deliver the Company’s strategic plans and to offer market-competitive levels of guaranteed cash to reflect an individual’s skills, experience and role within the Company.
 
Operation of the element
2022 Policy:
no change in policy
  
Base salary
is normally paid in 12 equal monthly instalments during the year. Salaries are normally reviewed annually in February (with salary changes effective from April) or subject to an ad hoc review on a significant change of responsibilities.
 
Salaries are reviewed taking into account factors including individual performance as well as appropriate market data including general UK pay trends and a company size and complexity model based on a Pay Comparator Group*.
 
The Committee will review and potentially amend the constituents of the Pay Comparator Group from time to time.
 
*  Current constituents of the pay comparator group are: Accenture, Altria Group, Anheuser-Busch Inbev, AstraZeneca, Bayer, Coca-Cola Company, Colgate-Palmolive, Danone, Diageo, GlaxoSmithKline, Heineken, Imperial Brands, Johnson & Johnson, Kraft Heinz, L’Oréal, LVMH, Microsoft, Mondelēz International, Nestlé, Nike, Novartis, PepsiCo, Philip Morris International, Procter & Gamble, Reckitt Benckiser, salesforce, Siemens, Unilever, Vodafone.
 
Maximum potential value
2022 Policy:
no change in policy
  
Annual increases for Executive Directors’ base salaries in the normal course will generally be in the range of the increases in the base pay of other
UK-based
employees in the Group and will not exceed 10% per annum.
 
The salary of a recently appointed Executive Director as he or she progresses in a role may exceed the top of the range of the salary increases for
UK-based
employees where the Committee considers it appropriate to reflect the accrual of experience. A significant change in responsibilities or material change in role may be reflected in an above average increase (which may exceed 10%) in salary.
 
  
Benefits
    
      
How the element supports the Company’s strategic objectives
  
To provide market-competitive benefits consistent with the role which:
 
–  attract and retain high-calibre individuals to deliver the Company’s strategic plans; and
 
–  recognise that such talent is global in source and that the availability of certain benefits (e.g. relocation, repatriation, taxation compliance advice) will from time to time be necessary to avoid such factors being an inhibitor to accepting the role.
 
Operation of the element
2022 Policy:
no change in policy
  
The Company currently offers the following contractual benefits to Executive Directors:
a car
or car allowance
; the
use of a car and driver for personal and business use; employment
tax advice
(including in instances where multi-jurisdictional tax authorities are involved);
tax
equalisation payments
(where appropriate);
private medical insurance,
including
general
practitioner
‘walk-in’
medical services
;
personal life and accident insurance
; and
housing
and
education
allowances or similar arrangements as appropriate to family circumstances (anticipated to be provided for Executive Directors who relocate internationally).
 
Other benefits may include the Executive Directors’ and their partners’ attendance at hospitality or similar functions, and the provision of services and benefits which may be treated as benefits for tax purposes, such as the provision of home security and the reimbursement of expenses incurred in connection with their duties.
 
Other benefits not identified above may be offered if, in the Committee’s view, these are necessary in order to remain aligned with market practice.
 
With the exception of the car or car allowance, in line with the UK market and the practice followed for all the Group’s other UK employees, it is also practice to pay the tax that may be due on benefits.
 
The Company provides Directors and Officers liability insurance (D&O) and an indemnity to Directors to cover costs and liabilities incurred in the execution of their duties.
 
 
153


Table of Contents
BAT Annual Report and Form 20-F 2021
Remuneration Report
Annual Statement on Remuneration
Continued
 
 
Maximum potential value
2022 Policy:
no change in policy
  
The maximum potential values are based on market practice for individuals of this level of seniority, with any tax on benefits paid by the Company in addition.
 
The maximum annual value (subject to periodic inflation-related increases where applicable) that can be offered for the following benefits is:
 
–  
car allowance
: £20,000;
 
–  
use of a car and company driver for personal and business use
: cost is dependent on the miles driven in any year;
 
–  the cost of
private medical insurance
is dependent on an individual’s circumstances and is provided on a family basis;
 
–  
GP
‘walk-in’
medical services located close to the Group’s headquarters in London
: £5,000 per annum;
 
–  
personal life and accident insurance
designed to pay out at a multiple of four and five times base salary, respectively;
 
–  
employment tax advice
as required, but not exceeding £30,000 and
tax equalisation
payments
as agreed by the Committee from time to time; and
 
–  
housing and education allowances
or other similar arrangements, as appropriate to the individual’s family circumstances.
  
Pensions
    
      
How the element supports the
Company’s strategic objectives
  
To provide competitive post-retirement benefit arrangements which are aligned to the wider workforce whilst also recognising the external environment in the context of attracting and retaining senior high calibre individuals to deliver the Group’s long-term strategy.
 
Operation of the element
2022 Policy:
no change in policy
  
Defined contribution benefits
 
Executive Directors are eligible to receive a pension benefit equivalent to 15% of base salary, which the Committee may determine to provide as a contribution into the British American Tobacco UK Pension Plan (the “Plan”) (or a similar defined contribution arrangement from time to time) or as a gross cash sum paid in lieu thereof.
 
The level of contribution in the Plan is restricted to take into account the annual allowance, and the individual may elect to accumulate any balance in the Defined Contribution Unfunded Unapproved Retirement Benefits Scheme (“DC UURBS”) or receive the balance as a gross cash sum. The DC UURBS closed to new entrants on 31 March 2021.
 
Operation
 
The pension arrangements operate in accordance with the rules of the applicable scheme, including in respect of any benefits payable in the event of death or on early retirement. Details of the Executive Directors’ accrued pension benefits are provided in the Annual Report on Remuneration on page 139.
 
Maximum potential value
  
The maximum annual contribution in the defined contribution section of the Pension Fund is 15% of base salary in alignment with the wider workforce. Excess benefits (whether accrued in the DC UURBS or paid as a cash sum) are subject to this same limit.
 
 
154


Table of Contents
BAT Annual Report and Form 20-F 2021    
 
Strategic Report        
 
Governance Report        
  
Financial Statements        
  
Other Information        


Short-term incentives: International Executive Incentive Scheme (IEIS)
      
How the element supports the
Company’s strategic objectives
  
To incentivise the attainment of corporate targets aligned to the Group’s strategic objectives on an annual basis, with a deferred element to ensure alignment with shareholders’ interests.
 
To ensure, overall, a market-competitive package to attract and retain high-calibre individuals to deliver the Group’s long-term strategy.
Operation of the element
2022 Policy:
no change in policy
  
The IEIS is awarded
50% in cash
and
50% in shares
through the
Deferred Share Bonus Scheme
(DSBS)
.
 
The deferred shares normally
vest after three years
and attract
additional dividend
equivalent shares.
 
IEIS cash payments are subject to clawback provisions, and the deferred shares element of the IEIS is subject to updated malus and clawback provisions, as described on page 157.
Performance assessment
2022 Policy:
underlying policy is unchanged, however alternative measures / weightings have been selected for awards to be made in 2022
  
The IEIS is assessed against a range of performance measures.
 
The Committee determines performance measures, weightings and targets annually each year.
 
The Remuneration Committee will review the formulaic outcome of the incentive measures to ensure it reflects the underlying performance of the business and the experience of shareholders over the performance period. The Committee retains the ability to adjust any formulaic outcomes if considered appropriate. Any such adjustments will be fully disclosed in the relevant Directors’ Remuneration Report.
 
In cases of identified poor individual performance, the corporate result may be reduced by up to 50%.
 
Performance measures for 2021 can be found on page 137 and for 2022 on page 143.
Maximum potential value and
payment and threshold
2022 Policy:
no change in policy
  
Chief Executive – Maximum 250% of salary;
on-target
125% of salary.
 
Other Executive Directors – Maximum 190% of salary;
on-target
95% of salary.
 
The payout at threshold is 0% for each performance measure.
 
155


Table of Contents
BAT Annual Report and Form 20-F 2021
Remuneration Report
Annual Statement on Remuneration
Continued
 
 
Long-term incentives: Long-Term Incentive Plan (LTIP)
      
How the element supports the Company’s strategic objectives
  
To incentivise individuals to deliver the Group’s long-term strategy and promote the long-term success of the Company, and facilitate the appointment and retention of senior high-calibre talent.
 
To put in place a combination of measures with appropriately stretching targets around the long-term plan that provides a balance relevant to the Company’s business and market conditions as well as providing alignment between Executive Directors’ and shareholders’ interests.
 
Operation of the element
2022 Policy:
no change in policy
  
LTIP awards are annual awards over shares that vest only to the extent that:
 
1. the performance condition is satisfied at the end of the
three-year performance period
; and
 
2. 
an additional vesting period of two years
from the date of the third anniversary of the date of grant has been completed –
the LTIP Extended Vesting Period
.
 
Participants may receive a dividend equivalent which is delivered in additional shares on vesting at the end of the LTIP Extended Vesting Period to the extent to which awards vest.
 
LTIP awards may be delivered in any form provided under the LTIP rules as approved by shareholders. Awards are subject to updated malus and clawback provisions, as described on page 157.
 
Performance assessment,
measures and weighting
2022 Policy:
underlying policy is unchanged, however alternative measures / weightings have been selected and the TSR comparator group has been updated for awards to be made in 2022
  
The Committee sets performance measures and targets for each LTIP grant. Measures, weightings and performance conditions will be selected based on the strategic priorities for BAT at that time.
 
The performance measures and weightings for the LTIP grant in 2022 will be:
 
1. 
Relative total shareholder return (TSR) (20%)
.
 
2. 
Growth in New Categories revenue (15%)
.
 
3. 
Adjusted diluted earnings per share (ESP) growth (30%)
 
at current rates (15%)
 
at constant rates (15%)
 
4. 
Adjusted revenue growth (15%)
.
 
5. 
Adjusted operating cash flow conversion ratio (20%)
.
 
The Remuneration Committee will engage with shareholders in advance if it proposes significant changes to the LTIP performance measures.
 
The Remuneration Committee will review the formulaic outcome of the incentive measures to ensure it reflects the underlying performance of the business and the experience of shareholders over the performance period. The Committee retains the ability to adjust any formulaic outcomes if considered appropriate. Any such adjustments will be fully disclosed in the relevant Directors’ Remuneration report.
 
Maximum potential value and payment at threshold
  
Maximum award of shares
permitted is 500% of salary for Executive Directors.
 
The payout for
threshold performance
is 15% of maximum for each measure.
 
 
156


Table of Contents
BAT Annual Report and Form 20-F 2021    
 
Strategic Report        
 
Governance Report        
  
Financial Statements        
  
Other Information        


All-employee
share schemes
      
How the element supports the Company’s strategic objectives
  
Executive Directors are eligible to participate in the Company’s
all-employee
share schemes, in the same way as the wider workforce, which are designed to incentivise employees by giving them an opportunity to build shareholdings in the Company.
 
Operation of the element
2022 Policy:
no change in policy
  
The Company currently operates two
all-employee
share schemes: the
Sharesave Scheme
, an HM Revenue & Customs (HMRC)
tax-advantaged
savings-related share option scheme, and the
Share Incentive Plan (SIP)
– an HMRC
tax-advantaged
plan operated by the Company to allow eligible employees to purchase shares in the Company (the
Partnership Plan
) and to make an annual award of free shares of a level based on performance in the previous financial year (the
Share Reward Scheme
).
 
Maximum potential value
2022 Policy:
no change in policy
  
Executive Directors are subject to the same limits on participation as other employees, as defined by the applicable statutory provisions. Currently, these limits are monthly savings under the Sharesave Scheme of £500 per month, and annual share purchases under the Partnership Plan of £1,800 and annual share awards under the Share Reward Scheme of £3,600.
 
  
Shareholding requirements
      
How the element supports the Company’s strategic objectives
  
To strengthen the alignment between the interests of the Executive Directors and those of the shareholders by requiring Executive Directors to build up a high level of personal shareholding in the Company.
 
To ensure long-term alignment through the operation of post-employment shareholding requirements.
 
Operation of the element and
performance metrics used 2022
Policy:
no change in policy
  
Executive Directors are required to hold shares in the Company:
 
–  during service as a Director, equal to the value of the same multiple of salary at which LTIP awards are made to that Director; and
 
–  after ceasing service as a Director during the period until the second anniversary of cessation of employment with the Group, of a value equal to 100% of the shareholding requirement that applied whilst a Director. In order to monitor and enforce the above provisions, former Executive Directors are required to hold their shares in a nominee account in respect of which a sale restriction applies to shares held to comply with the requirements.
 
Those Executive Directors who do not meet the shareholding requirements may generally sell a maximum of up to 50% of any shares vesting (after tax) until the threshold for the shareholding requirements has been met. The estimated notional
net-of-tax
number of shares held subject to unvested awards under the DSBS element, and LTIP Awards during the LTIP Extended Vesting Period, will count towards the respective shareholding requirements.
 
A waiver of compliance with the shareholding requirements is permitted at the discretion of the
Committee in circumstances which the Committee considers to be exceptional.
Additional notes to the Future Policy Table:
 
1.
The Committee reserves the right to make any remuneration payments where the terms were agreed prior to an individual being appointed an Executive Director of the Company or prior to the approval and implementation of the Remuneration Policy (including, for the avoidance of doubt, pursuant to the current Remuneration Policy). This includes the achievement of the applicable performance conditions for Executive Directors who are eligible to receive payment from any award made prior to the approval and implementation of the Remuneration Policy.
 
2.
The Company recognises the opportunities and benefits that accrue to the Company and its Executive Directors who undertake
non-executive
roles. Consequently, an Executive Director may, with the permission of the Board, undertake a single external appointment and the Executive Director may retain the fees from such appointment.
 
3.
Malus and clawback
: Bonus amounts paid under the IEIS are subject to clawback provisions, and awards made under the DSBS and the LTIP are subject to malus and clawback provisions. Malus and clawback provisions apply to DSBS awards and the cash portion of the IEIS respectively for the duration of three years from the date of the award and to LTIP awards for the duration of five years from the date of award if: (1) there has been a material misrepresentation in relation to the performance of any Group company, relevant business unit and/or the participant; (2) an erroneous calculation was made in assessing the extent to which an award vested or bonus was paid, which in either case resulted in the value of the award or payment being more than it should have been; or (3) there is an insolvency event or corporate failure.
 
 
Malus and Clawback provisions apply to DSBS and LTIP awards at any time before or after the vesting of a share award or at any time after the payment of IEIS cash element where it is determined that the participant: (1) committed misconduct; (2) caused a material loss for any Group company as a result of (a) reckless, negligent or wilful actions or (b) inappropriate behaviour or behaviour that is not aligned with corporate values; (3) contributed to serious reputational damage of any Group company or one of its business units, in each case prior to the vesting of the relevant award or payment of the bonus.
 
 
Where the Committee determines that these provisions are to be applied, the participant may be required to repay up to the excess value which was paid or vested. This repayment may also be effected by the number of shares subject to the award being reduced and/or by a reduction in other cash or share-based awards held by the participant.
 
4.
The operation of the remuneration policy for employees below Board level is discussed on pages 163 and 164.
 
157


Table of Contents
BAT Annual Report and Form 20-F 2021
Remuneration Report
Annual Statement on Remuneration
Continued
 
Illustrations of the Application of the Remuneration Policy
The levels of remuneration to be received by Jack Bowles and Tadeu Marroco as Executive Directors for the first complete year in which
the Remuneration Policy will apply are shown as the hypothetical values of their remuneration packages under different performance
scenarios in the charts below.
 
 
Remuneration outcomes for varying levels of performance
Chief Executive
 

Finance and Transformation Director
 

The following assumptions have been applied in the chart above.


Chief Executive
  
Finance and Transformation Director
Fixed remuneration
     
Salary: £1,325,610 (effective 1 Jan 2022)
  
Salary: £803,400 (effective 1 Jan 2022)
     
Pension: 15% of salary
  
Pension: 15% of salary
     
Benefits: £320,000 (illustrative based
  
Benefits: £100,000 (illustrative based on


on 2021 figure)
  
2021 figure)
STI (IEIS)


250%
  
190%
LTI (LTIP)


500%
  
400%
Minimum
  
Fixed remuneration only:
  
No IEIS payout; no vesting under LTIP
  
 
On-target
  
Fixed remuneration, plus:
  
50% IEIS payout; threshold vesting under the LTIP
Maximum
  
Fixed remuneration, plus:
  
100% IEIS payout; 100% vesting under the LTIP
Maximum plus 50% share price growth
  
Fixed remuneration, plus:
  
All elements are the same as the maximum but assuming 50% share price appreciation during relevant performance period of LTIP
 
158


Table of Contents
BAT Annual Report and Form 20-F 2021    
 
Strategic Report        
 
Governance Report        
  
Financial Statements        
  
Other Information        


Other Policy Provisions in Relation to Directors’ Pay
Flexibility, judgement and discretion
As the Remuneration Policy needs to be capable of operating over a three-year period, the Committee has built in a degree of flexibility to enable the practical implementation of the Remuneration Policy over that prospective lifetime, including as set out in the Future Policy Table above. The key discretions and areas of flexibility and judgement under the STI (cash and deferred shares) and LTI are summarised as follows:
 
 
to determine performance measures, weightings and targets annually for the STI and to set performance measures and targets for each LTIP grant based on the strategic priorities of BAT at that time.
 
 
to alter performance conditions if events happen which cause the Committee to determine that the performance conditions are no longer a fair measure of the Company’s performance, or to take account of legal changes or to obtain or retain favourable tax, regulatory or exchange control treatment or in the event that it considers it fair and reasonable to do so, provided that the revised target is, in the opinion of the Committee, not materially less challenging than was intended in setting the original condition.
 
 
to exercise available discretions in connection with any termination of employment or change of control or similar event.
 
 
to determine whether awards under the LTIP are delivered as options or under any other form permitted under the LTIP rules as approved by shareholders, and in respect of operational matters not otherwise covered by this Policy, to operate the IEIS, DSBS and LTIP in accordance with their terms.
 
 
to operate the malus and clawback provisions.
Approach to Remuneration of Directors on Recruitment
 
Principles
 
In making an Executive Director appointment (whether an internal promotion or external appointee) the Committee will follow these principles.
 
2022 Policy:
no change in policy
  
–  British American Tobacco seeks to appoint senior, high-calibre managers. Many of its competitors for talent are based outside the UK.
 
–  To offer a package (both fixed salary, pension and performance-related remuneration) which is sufficiently competitive (but not excessively so) so that senior, high-calibre candidates can be appointed, and which is designed to promote the long-term success of the Company.
 
–  The Committee will consider the market, including the Pay Comparator Group, and by reference to other companies of equivalent size and complexity to ensure that it does not overpay.
 
–  Consideration will be given to relevant factors, such as the candidate’s skills, knowledge and experience and his or her current package and current location in determining the overall package.
 
–  Internal pay relativities and the terms and conditions of employment of the new and existing Executive Directors will be considered to ensure fairness between Executive Directors.
 
External appointment to
role of Executive Director –
additional considerations
 
2022 Policy:
no change in policy
  
–  Maximum incentive opportunities will be set in line with the Policy set out in the policy table.
 
–  The Committee will consider matching up to the maximum of the expected value of lost short or long-term incentive awards in order to facilitate the recruitment of that individual.
 
–  A replacement award would generally take the form of either a
one-off
award with a vesting period similar to the award given up (and, in the case of a replacement of a performance-based award, appropriate performance conditions) or a cash replacement payment in respect of an award that is within three months of vesting, although in either case the Committee may make other arrangements as it deems to be necessary.
 
–  Where appropriate, a replacement award will also be made subject to malus and clawback provisions.
Relocation
 
British American Tobacco
may provide appropriate
relocation support.
 
2022 Policy:
no change in policy
  
Relocation support of up to £200,000 may be provided in connection with recruitment. Examples of this support may include: shipment of goods; temporary accommodation; assistance to find accommodation; tax support services; and spouse or partner career counselling.
 
Inbound relocation and shipment expenses are subject to clawback provisions.
 
159


Table of Contents
BAT Annual Report and Form 20-F 2021
Remuneration Report
Annual Statement on Remuneration
Continued
 
Service Contracts – Executive Directors
The following table describes the provisions of the service contracts of Jack Bowles and Tadeu Marroco. It is currently anticipated that service contracts for newly-appointed Executive Directors will not contain terms differing materially from these provisions (provided that other arrangements may be entered into in connection with the recruitment of Executive Directors, as described in the ‘Approach to remuneration of Directors on recruitment’ section on page 159).
 
Notice period –
no change in policy
 
A period of notice to be given by either the Executive Director or the Company of 12 months.
Employed on a permanent contract, terminable by either party on
one-year’s
notice.
 
The Company may require the Executive Director to be on garden leave during all or any part of the period of notice (whether given by the Executive Director or the Company).
Contractual terms –
no change in policy
 
The contract includes obligations which could give rise to, or impact upon, remuneration and/or payments for loss of office.
 
The provisions of the Company’s incentive arrangements applicable on a termination of employment are set out separately below.
 
The primary obligations under the contract which may give rise to remuneration or payments for loss of office are as follows:
 
–  to terminate the contract only on the expiry of 12 months’ written notice or to make a payment in lieu of notice in respect of all, or the unexpired part, of the 12 months’ notice calculated based on: (1) salary at then current base pay; and (2) the cost to the Company of providing private medical expenses insurance and personal accident insurance (or the Company may, at its option, continue those benefits for the unexpired period of the notice). In determining the value of a payment in lieu of notice the Company shall not be required to reward failure on the part of the Executive Director and shall have regard to corporate governance standards at the termination date. The Company may, at its reasonable discretion, make the payment in lieu of notice in phased monthly or quarterly instalments and may determine that it should be reduced in accordance with the duty on the part of the Executive Director to mitigate their loss; and
 
–  to continue to pay the Executive Director’s salary and contractual benefits during any garden leave period.
   
In addition to the contractual rights to a payment on loss of office, the Executive Director may have statutory and/or common law rights to certain additional payments depending on the circumstances of the termination.
Inspection of service contracts
 
The dates of the latest service contracts are shown below:
Copies may be inspected at the
Company’s registered office; these
contracts are amended annually
following the salary review.
 
 
Executive Director
  
Execution date of current service contract


Jack Bowles
  
11 December 2018 (appointment as an Executive Director commenced
    
1 January 2019)
 
   
Tadeu Marroco
  
5 August 2019
 
160


Table of Contents
BAT Annual Report and Form 20-F 2021    
 
Strategic Report        
 
Governance Report        
  
Financial Statements        
  
Other Information        


Policy on Payment for Loss of Office
 
Treatment of awards under the share incentive schemes:
no change in policy
 
International Executive Incentive Scheme (IEIS)/Deferred Share Bonus Scheme (DSBS)
 
Long-Term Incentive Plan (LTIP)
All-employee
scheme
 
The release of awards is dependent on ‘leaver’ status and is at the discretion of the Committee.
  
Plan
  
‘Good leaver’
  
‘Other’ leaver scenarios


IEIS and DSBS
2022 Policy:
no change in policy
  
‘Good leavers’ are eligible for a bonus
pro-rated
for the period of employment during the year. Payments made during a notice period or after cessation may, at the discretion of the Committee, be made in cash only.
 
Bonuses are assessed based on actual full-year performance and paid at the normal time.
 
Deferred awards under the DSBS will vest upon termination of employment.
  
No entitlement to a bonus but the Committee has the discretion to treat ‘other’ leavers in the same manner as ‘good leavers’; this discretion is not exercisable in the case of summary dismissal.
 
Deferred awards under the DSBS will lapse unless the Committee, in its absolute discretion, decides otherwise.


LTIP
2022 Policy:
no change in policy.
  
Vesting occurs at the end of the LTIP Extended Vesting Period, subject to performance over the normal performance period and, where applicable,
pro-rated
for the period of employment during the performance period.
  
Unvested awards, including any awards which are still subject to the LTIP Extended Vesting Period, will lapse unless the Committee, in its absolute discretion, decides otherwise.


All-employee
share schemes
  
Directors are treated in accordance with the scheme rules, in the same manner as applies to all employees.
 
 
The Committee retains discretion in deciding ‘good leaver’ status other than in cases of automatic ‘good leavers’ as set out in the applicable provisions of the DSBS and LTIP rules. The discretionary powers are intended to provide flexibility as Executive Directors may leave employment for a broad variety of reasons which may not necessarily fall within the prescribed category of ‘good leaver’. The Committee exercises its discretion by reference to guidelines which set out its agreed relevant factors to assist in the determination of a leaver’s status.
   
 
Guidelines


Factors which may indicate that discretion may be exercised to treat as a ‘good leaver’
 
Resignation intending to cease work altogether.
 
Resignation intending to take up a different occupation, such as a portfolio career.
 
Delayed resignation from the Company to accommodate the Company’s plans or the demands of his or her current workload.
 
Departure at the request of and/or with the agreement of the Company.
 
Factors which may indicate that discretion may not be exercised
 
Resignation from the Company to work for a competitor or to undertake a role otherwise acting in conflict with the interests of the Company.
 
Resignation from the Company notwithstanding the Company’s plans and role demands.
 
Termination or resignation in any circumstance involving factors such as misconduct or poor performance.
 
 
In exercising its discretion, the Committee will also take into account the individual’s overall performance as well as their contribution to the Company during their total period of employment.
 
Other –
no change in policy
 
–  Payment of legal fees incurred by an individual in connection with reviewing a settlement agreement on termination of employment.
 
–  Reimbursement of reasonable relocation costs of up to £200,000 where an Executive Director (and, where relevant, his or her family) had originally relocated to take up the appointment; this may include the shipment of personal goods and
winding-up
his or her affairs in the UK and the incidental costs incurred in doing so.
 
In certain circumstances, the Committee may approve new contractual arrangements with departing Executive Directors, potentially including (but not limited to) settlement, confidentiality, restrictive covenants and/or consultancy arrangements. These arrangements would only be entered into where the Committee believes that it is in the best interests of the Company and its shareholders to do so.


161


Table of Contents
BAT Annual Report and Form 20-F 2021
 
Remuneration Report
Annual Statement on Remuneration
Continued


Terms of Appointment for the Chairman and other
Non-Executive
Directors
Non-Executive
Directors, including the Chairman, are appointed as officeholders, not employees. In any given year, the period of appointment runs from the close of the Company’s last AGM to the close of the Company’s next AGM.
The Chairman may terminate his or her appointment on one month’s written notice, and the Company may give a compensation payment in lieu of all or part of such notice. The Chairman may be removed by the Company prior to the expiry of his or her term of appointment by three months’ written notice or a compensation payment in lieu of all or part of such notice.
A
Non-Executive
Director may terminate his or her appointment at any time in accordance with the Company’s Articles of Association. Alternatively, a
Non-Executive
Director’s appointment will terminate if: (1) the Board requests that he or she not offer himself or herself for
re-election
at the next AGM; (2) the
Non-Executive
Director is not
re-elected
at the next AGM; (3) the
Non-Executive
Director is required to vacate office for any reason pursuant to any of the provisions of the Company’s Articles of Association; or (4) the
Non-Executive
Director is removed as Director or otherwise required to vacate office under any applicable law.
 
Chairman and
Non-Executive
Directors
  
 
Fees
2022 Policy:
policy has been updated
so fees may be delivered in cash or a combination of cash and shares
  
The Chairman receives a single
all-inclusive
fee. Other
Non-Executive
Directors receive a base fee and may also receive additional fees in respect of committee membership and/or chairmanship.
 
  
The Committee considers annually the fee payable to the Chairman and to the other
Non-Executive
Directors. This process may take into account factors including the breadth and demands of the relevant role as well as comparison with fees paid by the same comparator group of companies used for setting the base salary of Executive Directors. The annual review does not necessarily result in a change to the fees.
 
  
Fees may be paid in cash or a combination of cash and shares, with the proportion to be paid in shares in a year to be disclosed in the relevant Directors’ Remuneration Report.
 
  
It is anticipated that any future aggregate increase in fees for the Chairman and other
Non-Executive
Directors will generally be in the range of the increases in the base pay of
UK-based
employees in the Group and will not exceed 10% per annum during the policy period.
1


The Chairman and other
Non-Executive
Directors do not participate in any discussion on their own respective remuneration.
Benefits, travel and related expenses
2022 Policy:
no change in policy
  
Non-Executive
Directors may be reimbursed for the cost of travel, accommodation and related expenses incurred in connection with their duties and are eligible to use general practitioner
‘walk-in’
services. The
Non-Executive
Directors and their partners may attend hospitality or similar functions.
 
  
Benefits for the Chairman may also include: the use of a Company driver; private medical insurance and personal accident insurance benefits; the provision of home and personal security; and assistance in relation to personal tax matters.
 
  
If necessary, the Company will pay for independent professional advice in connection with the performance of duties as
Non-Executive
Directors.
 
  
The Company provides D&O insurance and an indemnity to the
Non-Executive
Directors to cover costs and liabilities incurred in the execution of their duties.


In instances where any benefits, reimbursements or expenses are classified by HMRC as a benefit to the
Non-Executive
Directors, it is also the practice of the Company to pay any tax due on any such benefits.
Other
2022 Policy:
no change in policy
  
There are no formal requirements or guidelines to hold shares in the Company. No
Non-Executive
Director is eligible to participate in the British American Tobacco share schemes, bonus schemes or incentive plans and no
Non-Executive
Director may be a member of any Group pension plan.
Note:
 
1.
Aggregate fees limit: the total annual fees of the Chairman and other
Non-Executive
Directors are limited to the overall aggregate annual limit authorised by shareholders with reference to the Company’s Articles of Association (currently £2,500,000).
 
162


Table of Contents
BAT Annual Report and Form 20-F 2021    
 
Strategic Report        
 
Governance Report        
  
Financial Statements        
  
Other Information        


Principles of Remuneration for Our Wider Workforce
The Group’s remuneration policies and practices are founded on a high degree of alignment and consistency across the organisation. Accordingly, remuneration for senior management is determined considering the remuneration principles that apply to the Executive Directors, and similar principles also form the basis of the remuneration arrangements for the wider workforce.
The reward strategy for all employees is built around the following four strategic pillars and comprises fixed and variable remuneration elements:
 
Competitive yet sustainable


Equitably differentiated
–  Competitive remuneration, able to attract and retain talent.
 
    
–  Differentiated on clear and objective criteria – level, performance and experience.
–  Agility to meet changing generational needs.
 
 
–  Responsible cost structure to support profit delivery.
    
–  Supported by unbiased processes and tools.
Transparent
    
Aligned to shareholder interests
–  Clear and inclusive policies, openly communicated.
 
–  Individual total reward package statements form part of regular annual cycle.
    
–  Competitive employment cost base and incentives that align the interests of employees with those of shareholders.
A globally consistent pay comparator group, derived from the peer group used by the Remuneration Committee for executive pay benchmarking, is utilised across all levels of the organisation for pay benchmarking purposes, with an appropriate level of flexibility provided to the other employing entities.
The approach to annual salary reviews is consistent across the Group, with consideration given to the scope of the role, level of individual experience, responsibility, individual performance and pay levels in the selected peer group.
All
middle-to-senior
managers are eligible to participate in a short-term incentive plan with the same metrics as Executive Directors. Other employees in corporate functions are eligible to participate in annual bonus plans, which mirror the Executive Directors’ performance objectives. Functional incentive schemes are offered to the Group’s employees in
non-corporate
positions such as sales force or manufacturing roles. Opportunities and metrics which apply to those schemes may vary by organisational level with functional performance indicators incorporated where appropriate.
Senior managers are eligible to participate in the long-term incentive schemes, namely the Performance Share Plan (PSP) and the Restricted Share Plan (RSP), with opportunities varying across levels with the most senior managers having a bigger portion of their pay delivered under the long-term incentive schemes. Metrics under the PSP are the same as those for Executive Directors.
In the UK, all employees are encouraged to become shareholders by participating in
all-employee
share plans on the same terms as Executive Directors. Similar
all-employee
share schemes have been adopted for other jurisdictions with the goal of encouraging broader long-term employee ownership.
Retirement benefits, typically in the form of a pension, are provided based on local market practice. Pension contribution rates for Executive Directors under the defined contribution scheme are aligned with those available to the wider UK employee population. Other benefits provided to the wider employee population reflect local market practice and legislative requirements.
The key difference between Executive Directors’ remuneration and the wider employee population is the increased emphasis on long-term performance in respect of Executive Directors, with a greater percentage of their total remuneration being performance-related and delivered in BAT shares. This includes an additional
two-year
holding period on vested LTIPs, and post-employment shareholding requirements which do not apply to other employees other than members of the Management Board.
Fixed remuneration
Salary


Salary is a key element of total remuneration for all employees.
 
 
Salary ranges for each grade are set by reference to external market data, and individual positioning within the set salary ranges will depend on level of experience, responsibility and individual performance.
 
 
Annual salary reviews typically take place in April each year.
In several markets Collective Labour Agreements (CLAs) exist covering some employees, therefore, some of the above principles may not apply.
Benefits and recognition


Benefits provided to employees reflect local market practice and legislative requirements.
 
 
The benefits architecture for the Group includes core benefits (such as medical insurance and life insurance) and local statutory benefits and may be delivered as a combination of benefits in kind, cash allowance and flexible benefits.
 
 
Additional financial and
non-financial
rewards can be made for outstanding contributions to the business in exceptional circumstances.
Pension


Retirement benefits are provided to employees based on local market practice.
 
 
Under the UK Defined Contribution arrangements, the Company contributions for all UK employees is 10% of base salary rising to a maximum of 15% on a matching basis. For managers in senior management roles, the total contribution to the British American Tobacco UK Pension Plan (“Plan”) is automatically restricted to £4,000 per annum in line with the UK Government’s Tapered Annual Allowance. The balance of any Company contributions due above this £4,000 limit is paid as a cash allowance or, alternatively, paid into the Defined Contribution Unapproved Unfunded Retirement Benefits Scheme (DC UURBS). The DC UURBS closed to new entrants on 31 March 2021. Employees can choose to opt out of the restriction and have all the Company contribution paid into the Plan.
 
 
163


Table of Contents
BAT Annual Report and Form 20-F 2021
 
Remuneration Report
Annual Statement on Remuneration
Continued


Variable remuneration
Short-term incentives
 
 
Short-term incentive schemes are designed to reward employees across the business for the delivery of financial, strategic and operational targets. The Group operates various short-term incentive arrangements, as set out below, with participation dependent on role.
International Executive Incentive Scheme (IEIS)
– globally aligned scheme for all managers in senior management roles (c. 1,700 employees), including the Executive Directors.
 
 
Incentive opportunities for the IEIS participants are defined globally for each eligible grade.
 
 
A portion of any award receivable is deferred in BAT shares for three years, with the remaining portion paid in cash during the following year.
 
 
Dividend-equivalent payments on all unvested deferred shares are paid quarterly in cash via payroll.
Corporate annual bonus plans
– in operation for employees in corporate functions who are not eligible to participate in the IEIS (c. 15,000 employees).
 
 
Designed to mirror the basic construct of the IEIS with opportunity levels set locally.
 
 
Performance metrics aligned to those of the IEIS.
Functional incentive schemes
– in operation for employees in
non-corporate
functions, examples include trade marketing or factory incentive schemes.
 
 
Opportunity levels are set locally and vary by grade.
 
 
Functional performance measures are incorporated into each scheme to ensure line of sight for participants.
Long-term incentives
 
 
Long-term incentive schemes are designed to reward and retain our senior talent while aligning the interests of leaders with those of our shareholders. From 2020, we have moved from a single LTI plan to a segmented approach by grade as set out below.
Restricted Share Plan (RSP)
– globally aligned discretionary plan for managers at eligible grades in senior management roles (c. 540 employees), excluding the Executive Directors. Aligns scheme participants with the success of the Group through its share price.
 
 
Opportunity levels are defined globally for each eligible grade.
 
 
No performance conditions apply to awards.
 
 
Awards are typically granted in March of each year, and vest in full following the end of the three-year vesting period provided the participant remains an employee of the Group on the vesting date.
 
 
Dividend-equivalent payments are paid on shares vesting.
Performance Share Plan (PSP)
– discretionary plan for our most senior managers (c. 160 employees), including the Executive Directors, which rewards their contribution to the long-term global performance of the Company.
 
 
Consistent performance measures across all plan participants with opportunity levels defined globally for each eligible grade.
 
 
Awards vest only to the extent that the performance conditions are satisfied at the end of the three-year performance period.
 
 
Awards are typically granted in March of each year, and vest following the end of a three-year performance period.
 
 
Dividend-equivalent payments are paid on any shares vesting.
All-employee
share schemes


In the UK, all employees are eligible to participate in the Company’s
all-employee
share schemes (c. 2,500 employees) – the Partnership Share Scheme, the Sharesave Scheme and the Share Incentive Plan – all of which are HMRC-approved plans, which are designed to incentivise employees by giving them an opportunity to build shareholdings in the Company.
 
164


Table of Contents
BAT Annual Report and Form 20-F 2021    
 
Strategic Report        
 
Governance Report        
  
Financial Statements        
  
Other Information        


Process in setting Executive Directors’ remuneration
The Committee considers the budgeted salary increases for the
UK-based
employee population, the guidance given to managers on the range of salary increases and other remuneration arrangements and employment conditions for all
UK-based
employees when determining remuneration for the Executive Directors.
It is expected that future salary increases for the Executive Directors will be in line with the range set out in the salary review guidelines for the general UK employee population, except in exceptional circumstances, such as where a recently appointed Executive Director’s salary is increased to reflect his or her growth in the role over time or where significant additional responsibilities are added to the role.
As a key principle, management provides the Remuneration Committee with visibility of the potential impact of proposed changes to the Executive Directors’ Remuneration Policy on the wider employee population.
Workforce engagement
The Board keeps up to date with the current views of our workforce and provides the workforce with information, including on how executive pay and the pay of the wider workforce are aligned, through a combination of engagement methods across multiple channels at different levels of our organisation. These include town halls, works councils, webcasts, global independently managed Speak Up channels, our biennial ‘Your Voice’ global employee survey, and direct engagement through Directors’ market and site visits where possible.
Feedback from these channels is collected across the Group and are independently analysed to define the priority themes. The consolidated feedback and themes are reviewed by our Board each year, as part of our Workforce Voice in the Boardroom programme. This focuses on ensuring the Board understands the views of our workforce, and reviews details of the key themes identified and how we have responded.
The views of our workforce are a key consideration for the Remuneration Committee when reviewing the reward priorities of the organisation. In 2021 we conducted our latest ‘Your Voice’ global employee survey, with the results of this survey also serving as a factor in shaping the reward agenda of the organisation. Although employees are not specifically consulted on the policy for Directors’ remuneration, there continues to be an ongoing dialogue with employees, through a variety of channels, about the Company’s broader pay practices.
In addition to the Workforce Voice in the Boardroom programme, the Remuneration Committee also receives updates from management on feedback received during the year where relevant to remuneration matters considered by the Remuneration Committee and takes feedback into account as applicable in determining executive remuneration.
The Remuneration Committee is regularly updated on the pay principles and practices in operation across the Group and considers them in relation to the implementation of the Directors’ Remuneration Policy, and in ensuring there is an appropriate degree of alignment throughout the Group.
 
165


Table of Contents
BAT Annual Report and Form 20-F 2021
 
 
Governance
Responsibility of Directors
 
This page is intentionally left blank


166


Table of Contents
BAT Annual Report and Form 20-F 2021    
 
Strategic Report        
 
Governance Report        
  
Financial Statements        
  
        Other Information        


This page is intentionally left blank


167


Table of Contents
BAT Annual Report and Form 20-F 2021
 
Financial Statements


This page is intentionally left blank


168


Table of Contents
BAT Annual Report and Form 20-F 2021    
 
Strategic Report        
 
Governance Report        
  
Financial Statements        
  
        Other Information        


This page is intentionally left blank


169


Table of Contents
BAT Annual Report and Form 20-F 2021
Financial Statements
 
 
This page is intentionally left blank


170


Table of Contents
BAT Annual Report and Form 20-F 2021    
 
Strategic Report        
 
Governance Report        
  
Financial Statements        
  
        Other Information        


This page is intentionally left blank


171


Table of Contents
BAT Annual Report and Form 20-F 2021
Financial Statements


This page is intentionally left blank


172


Table of Contents
BAT Annual Report and Form 20-F 2021    
 
Strategic Report        
 
Governance Report        
  
Financial Statements        
  
        Other Information        


This page is intentionally left blank


173


Table of Contents
BAT Annual Report and Form 20-F 2021
Financial Statements


This page is intentionally left blank


174


Table of Contents
BAT Annual Report and Form 20-F 2021    
 
Strategic Report        
 
Governance Report        
  
Financial Statements        
  
        Other Information        


This page is intentionally left blank


175


Table of Contents
BAT Annual Report and Form 20-F 2021
 
 
Financial Statements
Report of Independent Registered
Public Accounting Firm
»
To the Shareholders and Board of Directors of British American Tobacco p.l.c.
Opinions on the Consolidated Financial Statements and Internal Control Over Financial Reporting
We have audited the accompanying Group Balance Sheet of British American Tobacco p.l.c. and subsidiaries (the “Group”) as of December 31, 2021 and 2020, the related Group Income Statement, Group Statement of Comprehensive Income, Group Statement of Changes in Equity, and Group Cash Flow Statement for each of the years in the three-year period ended December 31, 2021, and the related notes (collectively, the consolidated financial statements). We also have audited the Group’s internal control over financial reporting as of December 31, 2021, based on criteria established in Internal Control – Integrated Framework (2013) issued by the Committee of Sponsoring Organizations of the Treadway Commission.
In our opinion, the consolidated financial statements referred to above present fairly, in all material respects, the financial position of the Group as of December 31, 2021 and 2020, and the results of its operations and its cash flows for each of the years in the three-year period ended December 31, 2021, in conformity with International Financial Reporting Standards (IFRS) as issued by the International Accounting Standards Board. Also in our opinion, the Group maintained, in all material respects, effective internal control over financial reporting as of December 31, 2021 based on criteria established in Internal Control – Integrated Framework (2013) issued by the Committee of Sponsoring Organizations of the Treadway Commission.
Basis for Opinions
The Group’s management is responsible for these consolidated financial statements, for maintaining effective internal control over financial reporting, and for its assessment of the effectiveness of internal control over financial reporting, included in the accompanying Management’s report on internal control over financial reporting. Our responsibility is to express an opinion on the Group’s consolidated financial statements and an opinion on the Group’s internal control over financial reporting based on our audits. We are a public accounting firm registered with the Public Company Accounting Oversight Board (United States) (PCAOB) and are required to be independent with respect to the Group in accordance with the U.S. federal securities laws and the applicable rules and regulations of the Securities and Exchange Commission and the PCAOB.
We conducted our audits in accordance with the standards of the PCAOB. Those standards require that we plan and perform the audits to obtain reasonable assurance about whether the consolidated financial statements are free of material misstatement, whether due to error or fraud, and whether effective internal control over financial reporting was maintained in all material respects.
Our audits of the consolidated financial statements included performing procedures to assess the risks of material misstatement of the consolidated financial statements, whether due to error or fraud, and performing procedures that respond to those risks. Such procedures included examining, on a test basis, evidence regarding the amounts and disclosures in the consolidated financial statements. Our audits also included evaluating the accounting principles used and significant estimates made by management, as well as evaluating the overall presentation of the consolidated financial statements. Our audit of internal control over financial reporting included obtaining an understanding of internal control over financial reporting, assessing the risk that a material weakness exists, and testing and evaluating the design and operating effectiveness of internal control based on the assessed risk. Our audits also included performing such other procedures as we considered necessary in the circumstances. We believe that our audits provide a reasonable basis for our opinions.
Definition and Limitations of Internal Control Over Financial Reporting
A company’s internal control over financial reporting is a process designed to provide reasonable assurance regarding the reliability of financial reporting and the preparation of financial statements for external purposes in accordance with generally accepted accounting principles. A company’s internal control over financial reporting includes those policies and procedures that (1) pertain to the maintenance of records that, in reasonable detail, accurately and fairly reflect the transactions and dispositions of the assets of the company; (2) provide reasonable assurance that transactions are recorded as necessary to permit preparation of financial statements in accordance with generally accepted accounting principles, and that receipts and expenditures of the company are being made only in accordance with authorizations of management and directors of the company; and (3) provide reasonable assurance regarding prevention or timely detection of unauthorized acquisition, use, or disposition of the company’s assets that could have a material effect on the financial statements.
Because of its inherent limitations, internal control over financial reporting may not prevent or detect misstatements. Also, projections of any evaluation of effectiveness to future periods are subject to the risk that controls may become inadequate because of changes in conditions, or that the degree of compliance with the policies or procedures may deteriorate.
Critical Audit Matters
The critical audit matters communicated below are matters arising from the current period audit of the consolidated financial statements that were communicated or required to be communicated to the audit committee and that: (1) relate to accounts or disclosures that are material to the consolidated financial statements and (2) involved our especially challenging, subjective, or complex judgments. The communication of critical audit matters does not alter in any way our opinion on the consolidated financial statements, taken as a whole, and we are not, by communicating the critical audit matters below, providing separate opinions on the critical audit matters or on the accounts or disclosures to which they relate.
 
176


Table of Contents
BAT Annual Report and Form 20-F 2021    
 
Strategic Report        
 
Governance Report        
  
Financial Statements        
  
        Other Information        


Impairment analysis of goodwill and trademarks with indefinite lives arising from the 2017 acquisition of Reynolds American Inc. (Reynolds American)
As discussed in Note 12 to the consolidated financial statements, the Group, as at December 31, 2021, has goodwill and trademarks with indefinite lives of £33,021 million and £69,475 million, respectively, arising from the 2017 acquisition of Reynolds American.
We identified the evaluation of the impairment analysis of goodwill and trademarks with indefinite lives arising from the 2017 acquisition of Reynolds American as a critical audit matter. There is a high degree of auditor judgment involved in evaluating: (i) the budgeted revenue and discount rates used in the analysis of the recoverability of trademarks with indefinite lives and goodwill allocated to the Reynolds American cash-generating unit; and (ii) the impact of the proposed menthol ban on the terminal growth rates and discount rates for the Newport and Camel indefinite lived trademarks and the goodwill allocated to the Reynolds American cash-generating unit.
The following are the primary procedures we performed to address this critical audit matter. We evaluated the design and tested the operating effectiveness of certain internal controls related to the goodwill and trademarks with indefinite lives impairment testing process including controls related to the development of the budgeted revenue and management’s determination of the applicable discount rates. In addition, we assessed the impairment analysis by:
 
 
-
assessing and challenging Reynolds American’s budgeted revenue by examining externally derived publicly available data, including, broker and analyst reports, industry reports, media reports, macro-economic assumptions, academic and scientific studies, and regulatory changes;
 
 
-
challenging the budgeted revenue by comparing the historical projections to actual results to assess the Group’s ability to accurately forecast;
 
 
-
performing sensitivity analysis on the budgeted revenue to assess its impact on the Group’s determination that the fair values of the Reynolds American goodwill and trademarks with indefinite lives exceed their carrying value;
 
 
-
specifically for the proposed federal menthol ban, critically evaluating the Group’s assessment of the potential timing of the impact based on the FDA rulemaking process and recent litigations;
 
 
-
assessing and challenging the impact of the proposed menthol ban on the terminal growth rates used in the value-in-use based assessment of the recoverability of the goodwill allocated to the Reynolds American cash-generating unit and the Newport and Camel indefinite lived brands by comparing management’s projected brand retention rates against actual brand retention rates in similar markets where a menthol ban has been implemented; and
 
 
-
involving a valuation professional with specialized skills and knowledge, who assisted in independently developing a range of the discount rates using publicly available market data for comparable companies and comparing these rates to those utilized by Reynolds American to assess their reasonableness.
Canadian legal proceedings
As discussed in Note 31 to the consolidated financial statements, the Group’s operating company in Canada, Imperial Tobacco Canada (“Imperial”), has received an unfavorable judgment on the smoking and health class actions certified by the Quebec Superior Court. As a result of this judgment, Imperial has filed for creditor protection under the Companies’ Creditors Arrangement Act (the “CCAA”) and has asked the Ontario Superior Court to stay all pending or contemplated litigation against Imperial in order to resolve all of the outstanding litigation across the country.
We identified the evaluation of the Canadian legal proceedings as a critical audit matter because complex and subjective auditor judgment was required in evaluating the Group’s assessment of the relevant law, historical and pending court rulings, and the Group’s ability to estimate the likelihood and extent of any future economic outflow arising from the ultimate resolution of the Canadian litigation.
The following are the primary procedures we performed to address this critical audit matter. We evaluated the design and tested the operating effectiveness of certain internal controls related to the legal exposure process including controls related to the interpretation of relevant law and related court rulings and estimation of the likelihood and extent of any future economic outflow arising from the ultimate resolution of the Canadian litigation. In addition, we assessed the Canadian legal proceedings by:
 
 
-
reading letters received directly from the Group’s external and internal legal counsel that evaluated the current status of the Canadian legal proceedings. We further inquired of internal legal counsel to evaluate their basis for conclusions in their letter; and
 
 
-
assessing relevant historical and recent judgments passed by the judicial court authorities in relation to the Canadian litigation and read the related Canadian court rulings in order to challenge Imperial’s interpretation of the Canadian legal proceedings.
/s/ KPMG LLP
We have served as the Group’s auditor since 2015.
London, United Kingdom
February 10, 2022
 
177


Table of Contents
BAT Annual Report and Form 20-F 2021
Financial Statements
Group Income Statement


For the years ended 31 December


Notes
  
            2021
£m
   
            2020
£m
   
            2019
£m
 
         
Revenue
1
  
2
  
 
25,684


25,776


25,877
 
         
Raw materials and consumables used
       
 
(4,542
 
 
(4,583
 
 
(4,599
         
Changes in inventories of finished goods and work in progress
       
 
160


445


162
 
         
Employee benefit costs
  
3
  
 
(2,717
 
 
(2,744
 
 
(3,221
         
Depreciation, amortisation and impairment costs
  
4
  
 
(1,076
 
 
(1,450
 
 
(1,512
         
Other operating income
  
5
  
 
196


188


163
 
         
Loss on reclassification from amortised cost to fair value
       
 
(3
 
 
(3
 
 
(3
         
Other operating expenses
  
6
  
 
(7,468
 
 
(7,667
 
 
(7,851
         
Profit from operations
  
2
  
 
10,234


9,962


9,016
 
         
Net finance costs
  
8
  
 
(1,486
 
 
(1,745
 
 
(1,602
         
Share of post-tax results of associates and joint ventures
  
2, 9
  
 
415


455


498
 
         
Profit before taxation
       
 
9,163


8,672


7,912
 
         
Taxation on ordinary activities
  
10
  
 
(2,189
 
 
(2,108
 
 
(2,063
         
Profit for the year


6,974


6,564


5,849
 
         
Attributable to:
                             
         
Owners of the parent
       
 
6,801


6,400


5,704
 
         
Non-controlling interests


173


164


145


6,974


6,564


5,849
 
         
Earnings per share
                             
         
Basic
  
11
  
 
296.9p


280.0p


249.7p
 
         
Diluted
  
11
  
 
295.6p


278.9p


249.0p
 
Note:
 
1.
Revenue is net of duty, excise and other taxes of £38,595 million, £39,172 million and £39,826 million for the years ended 31 December 2021, 2020 and 2019, respectively.
The accompanying notes are an integral part of these consolidated financial statements.
 
178


Table of Contents
BAT Annual Report and Form 20-F 2021    
 
Strategic Report        
 
Governance Report        
  
Financial Statements        
  
        Other Information        


Group Statement of Comprehensive Income


For the years ended 31 December


Notes 
  
            2021
£m
   
            2020
£m
   
            2019
£m
 
         
Profit for the year
       
 
6,974


6,564


5,849
 
         
Other comprehensive income/(expense)
                             
         
Items that may be reclassified subsequently to profit or loss:
       
 
509


(2,997
 
 
(3,216
         
Foreign currency translation and hedges of net investments in foreign operations
                             
         
– differences on exchange from translation of foreign operations
       
 
32


(2,597
 
 
(2,967
         
– reclassified and reported in profit for the year
  
22(c)
  
 
291


– net investment hedges – net fair value gains/(losses) on derivatives
       
 
75


(16
 
 
21
 
         
– net investment hedges – differences on exchange on borrowings
       
 
24


(163
 
 
(18
         
Cash flow hedges
                             
         
– net fair value gains/(losses)
       
 
95


(257
 
 
(246
         
– reclassified and reported in profit for the year
       
 
32


90


53
 
         
– tax on net fair value (gains)/losses in respect of cash flow hedges
  
10(f)
  
 
(32
 
 
44


56
 
         
Investments held at fair value
                             
         
– net fair value gains
  
18 
  
 
9


Associates – share of OCI, net of tax


(17
 
 
(98
 
 
(115
         
Items that will not be reclassified subsequently to profit or loss:
       
 
313


55


(507
         
Retirement benefit schemes
                             
         
– net actuarial gains/(losses)
  
15 
  
 
382


105


(582
         
– surplus recognition
  
15 
  
 
(1
 
 
10


(7
         
– tax on actuarial (gains)/losses in respect of subsidiaries
  
10(f)
  
 
(82
 
 
(26
 
 
75
 
         
Associates – share of OCI, net of tax


14


(34
 
 
7


Total other comprehensive income/(expense) for the year, net of tax
       
 
822


(2,942
 
 
(3,723
         
Total comprehensive income for the year, net of tax
       
 
7,796


3,622


2,126
 
         
Attributable to:
                             
         
Owners of the parent
       
 
7,622


3,474


2,000
 
         
Non-controlling interests
       
 
174


148


126


7,796


3,622


2,126
 
The accompanying notes are an integral part of these consolidated financial statements.
 
179


Table of Contents
BAT Annual Report and Form 20-F 2021
Financial Statements
 
Group Statement of Changes in Equity


Attributable to owners of the parent


Notes 
  
Share
capital
£m
    
Share
premium,
capital
redemption
and merger
reserves
£m
    
Other
reserves
£m
   
Retained
earnings
£m
   
Total
attributable
to owners
of parent
£m
   
Perpetual
hybrid
bonds
£m
    
Non-
controlling
interests
£m
   
Total
equity
£m
 
                   
Balance at 1 January 2021
       
 
614


26,618


(6,600
 
 
42,041


62,673


282


62,955
 
                   
Total comprehensive income for the year comprising:


523


7,099


7,622


174


7,796
 
                   
Profit for the year


6,801


6,801


173


6,974
 
                   
Other comprehensive income for the year


523


298


821


1


822
 
                   
Other changes in equity
                                                                        
                   
Cash flow hedges reclassified and reported in total assets


45


45


45
 
                   
Employee share options
                                                                        
                   
– value of employee services
  
28


76


76


76
 
                   
– treasury shares used for share option schemes


4


(4


Dividends and other appropriations
                                                                        
                   
– ordinary shares
  
22(f)


(4,904
 
 
(4,904


(4,904
                   
– to non-controlling interests


(162
 
 
(162
                   
Purchase of own shares
                                                                        
                   
– held in employee share ownership trusts


(82
 
 
(82


(82
                   
Perpetual hybrid bonds
                                                                        
                   
– proceeds, net of issuance fees
  
22(d)


1,681


1,681
 
                   
– tax on issuance fees


4


4
 
                   
– coupons paid


(6
 
 
(6


(6
                   
– tax on coupons paid


1


1


1
 
                   
Non-controlling interests – acquisitions
  
27(b)


(5
 
 
(5


(5
                   
Other movements – non-controlling interests
  
27(b)


6


6
 
                   
Other movements


(4
 
 
(4


(4
                   
Balance at 31 December 2021


614


26,622


(6,032
 
 
44,212


65,416


1,685


300


67,401
 
The accompanying notes are an integral part of these consolidated financial statements.
 
180


Table of Contents
BAT Annual Report and Form 20-F 2021    
 
Strategic Report        
 
Governance Report        
  
Financial Statements        
  
        Other Information        


Attributable to owners of the parent


Notes 
  
Share
capital
£m
    
Share
premium,
capital
redemption
and merger
reserves
£m
    
Other
reserves
£m
   
Retained
earnings
£m
   
Total
attributable
to owners
of parent
£m
   
Non-
controlling
interests
£m
   
Total
equity
£m
 
                 
Balance at 1 January 2020
       
 
614


26,609


(3,555
 
 
40,234


63,902


258


64,160
 
                 
Total comprehensive income for the year comprising:


(3,012
 
 
6,486


3,474


148


3,622
 
                 
Profit for the year


6,400


6,400


164


6,564
 
                 
Other comprehensive (expense)/income for the year


(3,012
 
 
86


(2,926
 
 
(16
 
 
(2,942
                 
Other changes in equity
                                                               
                 
Cash flow hedges reclassified and reported in total assets


(33


(33


(33
                 
Employee share options
                                                               
                 
– value of employee services
  
28


88


88


88
 
                 
– proceeds from new shares issued


2


2


2
 
                 
– treasury shares used for share option schemes


7


(7


Dividends and other appropriations
                                                               
                 
– ordinary shares
  
22(f)


(4,747
 
 
(4,747


(4,747
                 
– to non-controlling interests


(141
 
 
(141
                 
Purchase of own shares
                                                               
                 
– held in employee share ownership trusts


(17
 
 
(17


(17
                 
Other movements non-controlling interests
  
27(b)


17


17
 
                 
Other movements


4


4


4
 
                 
Balance at 31 December 2020
       
 
614


26,618


(6,600
 
 
42,041


62,673


282


62,955


Attributable to owners of the parent


Notes 
  
Share
capital
£m
    
Share
premium,
capital
redemption
and merger
reserves
£m
    
Other
reserves
£m
   
Retained
earnings
£m
   
Total
attributable
to owners
of parent
£m
   
Non-
controlling
interests
£m
   
Total
equity
£m
 
                 
Balance at 1 January 2019
       
 
614


26,606


(333
 
 
38,557


65,444


244


65,688
 
                 
Total comprehensive income for the year comprising:


(3,190
 
 
5,190


2,000


126


2,126
 
                 
Profit for the year


5,704


5,704


145


5,849
 
                 
Other comprehensive expense for the year


(3,190
 
 
(514
 
 
(3,704
 
 
(19
 
 
(3,723
                 
Other changes in equity
                                                               
                 
Cash flow hedges reclassified and reported in total assets


(32


(32


(32
                 
Employee share options
                                                               
                 
– value of employee services
  
28 


115


115


115
 
                 
– proceeds from shares issued


3


3


3
 
                 
Dividends and other appropriations
                                                               
                 
– ordinary shares


(3,476
 
 
(3,476


(3,476
                 
– to non-controlling interests


(148
 
 
(148
                 
Purchase of own shares
                                                               
                 
– held in employee share ownership trusts


(117
 
 
(117


(117
                 
Other movements non-controlling interests
  
27(a),(b)


36


36
 
                 
Other movements


(35
 
 
(35


(35
                 
Balance at 31 December 2019
       
 
614


26,609


(3,555
 
 
40,234


63,902


258


64,160
 
The accompanying notes are an integral part of these consolidated financial statements.
 
181


Table of Contents
BAT Annual Report and Form 20-F 2021
Financial Statements
Group Balance Sheet


31 December


Notes 
  
            2021
£m
   
            2020
£m
 
       
Assets
                     
       
Intangible assets
  
12 
  
 
    115,625


    115,343
 
       
Property, plant and equipment
  
13 
  
 
4,953


5,060
 
       
Investments in associates and joint ventures
  
14 
  
 
1,948


1,796
 
       
Retirement benefit assets
  
15 
  
 
918


714
 
       
Deferred tax assets
  
16 
  
 
611


534
 
       
Trade and other receivables
  
17 
  
 
210


242
 
       
Investments held at fair value
  
18 
  
 
50


22
 
       
Derivative financial instruments
  
19 
  
 
243


367
 
       
Total non-current assets


124,558


124,078
 
       
Inventories
  
20 
  
 
5,279


5,998
 
       
Income tax receivable
       
 
117


79
 
       
Trade and other receivables
  
17 
  
 
3,951


3,721
 
       
Investments held at fair value
  
18 
  
 
456


242
 
       
Derivative financial instruments
  
19 
  
 
182


430
 
       
Cash and cash equivalents
  
21 
  
 
2,809


3,139


12,794


13,609
 
       
Assets classified as held-for-sale


13


3
 
       
Total current assets


12,807


13,612
 
       
Total assets


137,365


137,690
 
       
Equity – capital and reserves
                     
       
Share capital
  
22(a)
  
 
614


614
 
       
Share premium, capital redemption and merger reserves
  
22(b)
  
 
26,622


26,618
 
       
Other reserves
  
22(c)
  
 
(6,032
 
 
(6,600
       
Retained earnings
  
22(c)
  
 
44,212


42,041
 
       
Owners of the parent
       
 
65,416


62,673
 
       
Perpetual hybrid bonds
  
22(d)
  
 
1,685


Non-controlling interests
  
22(e)
  
 
300


282
 
       
Total equity


67,401


62,955
 
       
Liabilities
                     
       
Borrowings
  
23 
  
 
35,666


39,927
 
       
Retirement benefit liabilities
  
15 
  
 
1,239


1,524
 
       
Deferred tax liabilities
  
16 
  
 
16,462


16,314
 
       
Other provisions for liabilities
  
24 
  
 
392


387
 
       
Trade and other payables
  
25 
  
 
982


1,064
 
       
Derivative financial instruments
  
19 
  
 
79


41
 
       
Total non-current liabilities


54,820


59,257
 
       
Borrowings
  
23 
  
 
3,992


4,041
 
       
Income tax payable
       
 
879


868
 
       
Other provisions for liabilities
  
24 
  
 
461


598
 
       
Trade and other payables
  
25 
  
 
9,577


9,693
 
       
Derivative financial instruments
  
19 
  
 
235


278
 
       
Total current liabilities


15,144


15,478
 
       
Total equity and liabilities


137,365


137,690
 
The accompanying notes are an integral part of these consolidated financial statements.
On behalf of the Board
Luc Jobin
Chairman
10 February 2022
 
182


Table of Contents
BAT Annual Report and Form 20-F 2021    
 
Strategic Report        
 
Governance Report        
  
Financial Statements        
  
        Other Information        


Group Cash Flow Statement
    
           
For the years ended 31 December


Notes 
    
            2021
£m
   
            2020
£m
   
            2019
£m
 
         
Profit for the year
           
 
6,974


6,564


5,849
 
         
Taxation on ordinary activities
           
 
2,189


2,108


2,063
 
         
Share of post-tax results of associates and joint ventures
           
 
(415
 
 
(455
 
 
(498
         
Net finance costs
           
 
1,486


1,745


1,602
 
         
Profit from operations
           
 
10,234


9,962


9,016
 
         
Adjustments for
                                 
         
– depreciation, amortisation and impairment costs
  
 
4


1,076


1,450


1,512
 
         
– decrease/(increase) in inventories
           
 
433


(144
 
 
(371
         
– (increase)/decrease in trade and other receivables
           
 
(393
 
 
300


(699
         
– decrease in receivables related to the charge in respect of the Quebec Class Actions
  
 
24


436
 
         
– (decrease)/increase in Master Settlement Agreement payable
  
 
6


(36
 
 
369


(124
         
– increase/(decrease) in trade and other payables
           
 
183


(320
 
 
730
 
         
– decrease in net retirement benefit liabilities
           
 
(104
 
 
(96
 
 
(40
         
– (decrease)/increase in other provisions for liabilities
           
 
(145


382
 
         
– other non-cash items
  
 
27(d)


430


46


106
 
         
Cash generated from operating activities
           
 
11,678


11,567


10,948
 
         
Dividends received from associates
           
 
353


351


252
 
         
Tax paid
           
 
(2,314
 
 
(2,132
 
 
(2,204
         
Net cash generated from operating activities
           
 
9,717


9,786


8,996
 
         
Cash flows from investing activities
                                 
         
Interest received
           
 
33


48


80
 
         
Purchases of property, plant and equipment
           
 
(527
 
 
(511
 
 
(664
         
Proceeds on disposal of property, plant and equipment
           
 
31


44


34
 
         
Purchases of intangibles
           
 
(218
 
 
(244
 
 
(151
         
Purchases of investments
           
 
(369
 
 
(343
 
 
(191
         
Proceeds on disposals of investments
           
 
141


184


339
 
         
Investment in associates and acquisitions of other subsidiaries net of cash acquired
           
 
(133
 
 
39


(86
         
Disposal of subsidiary, net of cash disposed of
  
 
27(d)


(98


Net cash used in investing activities
           
 
(1,140
 
 
(783
 
 
(639
         
Cash flows from financing activities
                                 
         
Interest paid on borrowings and financing related activities
           
 
(1,479
 
 
(1,737
 
 
(1,601
         
Interest element of lease liabilities
           
 
(23
 
 
(26
 
 
(32
         
Capital element of lease liabilities
           
 
(154
 
 
(164
 
 
(154
         
Proceeds from increases in and new borrowings
           
 
978


9,826


4,247
 
         
Reductions in and repayments of borrowings
           
 
(4,843
 
 
(10,633
 
 
(5,640
         
Inflows/(outflows) relating to derivative financial instruments
           
 
229


(283
 
 
(564
         
Purchases of own shares held in employee share ownership trusts
           
 
(82
 
 
(18
 
 
(117
         
Proceeds from the issue of perpetual hybrid bonds, net of issuance costs
  
 
22(d)


1,681


Coupon paid on perpetual hybrid bonds
           
 
(6


Dividends paid to owners of the parent
           
 
(4,904
 
 
(4,745
 
 
(4,598
         
Capital injection from and purchases of non-controlling interests
  
 
30


1


17


20
 
         
Dividends paid to non-controlling interests
           
 
(150
 
 
(136
 
 
(157
         
Other
           
 
3


2


3
 
         
Net cash used in financing activities
           
 
(8,749
 
 
(7,897
 
 
(8,593
         
Net cash flows (used in)/generated from operating, investing and financing activities
           
 
(172
 
 
1,106


(236
         
Differences on exchange
           
 
(253
 
 
(253
 
 
(57
         
(Decrease)/increase in net cash and cash equivalents in the year
           
 
(425
 
 
853


(293
         
Net cash and cash equivalents at 1 January
           
 
2,888


2,035


2,328
 
         
Net cash and cash equivalents at 31 December
  
 
21


2,463


2,888


2,035
 
The accompanying notes are an integral part of these consolidated financial statements.
 
183


Table of Contents
BAT Annual Report and Form 20-F 2021
Financial Statements
Notes on Accounts


1 Accounting Policies
Basis of preparation
The consolidated financial statements have been prepared in accordance with International Financial Reporting Standards (IFRS) as issued by the International Accounting Standards Board (IASB) and UK-adopted international accounting standards. UK-adopted international accounting standards differ in certain respects from IFRS as issued by the IASB. The differences have no impact on the Group’s consolidated financial statements for the periods presented.
The consolidated financial statements have been prepared on a going concern basis under the historical cost convention except as described in the accounting policy below on financial instruments. In performing its going concern assessment, management considered forecasts and liquidity requirements within the going concern period. This includes the impact of COVID-19, as well as the payments arising from the Master Settlement Agreement due in the U.S. in 2022 and other known liabilities or future payments (including interim dividends), as they fall due.
The preparation of the consolidated financial statements requires management to make estimates and assumptions that affect the reported amounts of revenues, expenses, assets and liabilities, and the disclosure of contingent liabilities at the date of the financial statements. The key estimates and assumptions are set out in the accounting policies below, together with the related notes to the accounts.
The critical accounting judgements include:
 
 
the identification and quantification of adjusting items, which are separately disclosed as memorandum information, is explained below and the impact of these on the calculation of adjusted earnings per share is described in note 11;
 
 
the determination as to whether to recognise provisions and the exposures to contingent liabilities related to pending litigation or other outstanding claims, as well as other contingent liabilities. The accounting policy on contingent liabilities, which are not provided for, is set out below and the contingent liabilities of the Group are explained in note 31. Judgement is necessary to assess the likelihood that a pending claim is probable (more likely than not to succeed), possible or remote;
 
 
the determination as to whether control (subsidiaries), joint control (joint arrangements), or significant influence (associates) exists in relation to the investments held by the Group. This is assessed after taking into account the Group’s ability to appoint Directors to the entity’s Board, its relative shareholding compared with other shareholders, any significant contracts or arrangements with the entity or its other shareholders and other relevant facts and circumstances. The application of these policies to Group subsidiaries in territories including Canada is explained in note 32;
 
 
the review of applicable exchange rates for transactions with and translation of entities in territories where there are restrictions on the free access to foreign currency, or multiple exchange rates; and
 
 
the determination as to whether perpetual hybrid bonds should be classified as equity instead of borrowings (note 22(d)).
The critical accounting estimates include:
 
 
the review of asset values, especially indefinite life assets such as goodwill and certain trademarks and similar intangibles. The key assumptions used in respect of the impairment testing are the determination of cash-generating units, the budgeted and forecast cash flows of these units, the long-term growth rate for cash flow projections and the rate used to discount the cash flow projections. These are described in note 12;
 
 
the estimation of and accounting for retirement benefit costs. The determination of the carrying value of assets and liabilities, as well as the charge for the year, and amounts recognised in other comprehensive income, involves judgements made in conjunction with independent actuaries. These involve estimates about uncertain future events based on the environment in different countries, including life expectancy of scheme members, salary and pension increases, inflation, as well as discount rates and asset values at the year-end. The assumptions used by the Group and sensitivity analysis are described in note 15; and
 
 
the estimation of amounts to be recognised in respect of taxation and legal matters, and the estimation of other provisions for liabilities and charges are subject to uncertain future events, may extend over several years and so the amount and/or timing may differ from current assumptions. The accounting policy for taxation is explained below. The recognised deferred tax assets and liabilities, together with a note of unrecognised amounts, are shown in note 16, and a contingent tax asset is explained in note 10(b). Other provisions for liabilities and charges are as set out in note 24. Litigation related deposits are shown in note 17. The application of these accounting policies to the payments made and credits recognised under the Master Settlement Agreement by Reynolds American Inc. (Reynolds American) is described in note 6(b).
Such estimates and assumptions are based on historical experience and various other factors that are believed to be reasonable in the circumstances and constitute management’s best judgement at the date of the financial statements. In the future, actual experience may deviate from these estimates and assumptions, which could affect the financial statements as the original estimates and assumptions are modified, as appropriate, in the year in which the circumstances change.
These consolidated financial statements were authorised for issue by the Board of Directors on 10 February 2022.
Basis of consolidation
The consolidated financial information includes the financial statements of British American Tobacco p.l.c. and its subsidiary undertakings, collectively ‘the Group’, together with the Group’s share of the results of its associates and joint arrangements.
A subsidiary is an entity controlled by the Group. The Group controls an entity when the Group is exposed to, or has rights to, variable returns from its involvement with the entity and has the ability to affect those returns through its power over the entity. Non-controlling interests represent the share of earnings or equity in subsidiaries that is not attributable, directly or indirectly, to shareholders of the Group.
 
184


Table of Contents
BAT Annual Report and Form 20-F 2021    
 
Strategic Report        
 
Governance Report        
  
Financial Statements        
  
        Other Information        


1 Accounting Policies
Continued
Associates comprise investments in undertakings, which are not subsidiary undertakings or joint arrangements, where the Group’s interest in the equity capital is long-term and over whose operating and financial policies the Group exercises a significant influence. They are accounted for using the equity method.
Joint arrangements comprise contractual arrangements where two or more parties have joint control and where decisions regarding the relevant activities of the entity require unanimous consent.
Joint operations are jointly-controlled arrangements where the parties to the arrangement have rights to the underlying assets and obligations for the underlying liabilities relating to the arrangement. The Group accounts for its share of the assets, liabilities, income and expenses of any such arrangement.
Joint ventures comprise arrangements where the parties to the arrangement have rights to the net assets of the arrangement. They are accounted for using the equity method.
Foreign currencies and hyperinflationary territories
The functional currency of the Parent Company is sterling and this is also the presentation currency of the Group. The income and cash flow statements of Group undertakings expressed in currencies other than sterling are translated to sterling using exchange rates applicable to the dates of the underlying transactions. Average rates of exchange in each year are used where the average rate approximates the relevant exchange rate at the date of the underlying transactions. Assets and liabilities of Group undertakings are translated at the applicable rates of exchange at the end of each year. In territories where there are restrictions on the free access to foreign currency or multiple exchange rates, the applicable rates of exchange are regularly reviewed.
The differences between retained profits translated at average and closing rates of exchange are taken to reserves, as are differences arising on the retranslation to sterling (using closing rates of exchange) of overseas net assets at the beginning of the year, and are presented as a separate component of equity. They are recognised in the income statement when the gain or loss on disposal of a Group undertaking is recognised.
Foreign currency transactions are initially recognised in the functional currency of each entity in the Group using the exchange rate ruling at the date of the transaction. Foreign exchange gains and losses resulting from the settlement of such transactions and from the translation of foreign currency assets and liabilities at year-end rates of exchange are recognised in the income statement, except when deferred in equity as qualifying cash flow hedges, on intercompany net investment loans and qualifying net investment hedges. Foreign exchange gains or losses recognised in the income statement are included in profit from operations or net finance costs depending on the underlying transactions that gave rise to these exchange differences.
In addition, for hyperinflationary countries where the effect on the Group results would be significant, the financial statements in local currency are adjusted to reflect the impact of local inflation prior to translation into sterling, in accordance with IAS 29
Financial
Reporting in Hyperinflationary Economies.
Where applicable, IAS 29 requires all transactions to be indexed by an inflationary factor to the balance sheet date, potentially leading to a monetary gain or loss on indexation. In addition, the Group assesses the carrying value of fixed assets after indexation and applies IAS 36
Impairment of Assets,
where appropriate, to ensure that the carrying value correctly reflects the economic value of such assets.
The results and balance sheets of operations in hyperinflationary territories are translated at the period end rate. In the case of Venezuela, the Group uses an estimated exchange rate calculated by reflecting the development of the general price index since the Group last achieved meaningful repatriation of dividends.
Revenue
Revenue principally comprises sales of cigarettes, other tobacco products, and nicotine products, to external customers. Revenue excludes duty, excise and other taxes related to sales in the period and is stated after deducting rebates, returns and other similar discounts and payments to direct and indirect customers. For vast majority of the Group’s sales, revenue is recognised when control of the goods is transferred to a customer at a point in time; this is usually evidenced by a transfer of the significant risks and rewards of ownership upon delivery to the customer, which in terms of timing is not materially different to the date of shipping.
Retirement benefit costs
The Group operates both defined benefit and defined contribution schemes including post-retirement healthcare schemes.
For defined benefit schemes, the actuarial cost charged to profit from operations consists of current service cost, net interest on the net defined benefit liability or asset, past service cost and the impact of any settlements. The net deficit or surplus for each defined benefit pension scheme is calculated in accordance with IAS 19
Employee Benefits
based on the present value of the defined benefit obligation at the balance sheet date less the fair value of the scheme assets adjusted, where appropriate, for any surplus restrictions or the effect of minimum funding requirements. Some benefits are provided through defined contribution schemes and payments to these are charged as an expense as they fall due.
Share-based payments
The Group has equity-settled and cash-settled share-based compensation plans.
Equity-settled share-based payments are measured at fair value at the date of grant. The fair value determined at the grant date of the equity-settled share-based payments is expensed over the vesting period, based on the Group’s estimate of awards that will eventually vest. For plans where vesting conditions are based on total shareholder returns, the fair value at date of grant reflects these conditions, whereas earnings per share vesting conditions are reflected in the calculation of awards that will eventually vest over the vesting period.
For cash-settled share-based payments, a liability equal to the portion of the services received is recognised at its current fair value determined at each balance sheet date.
Fair value is measured by the use of the Black-Scholes option pricing model, except where vesting is dependent on market conditions when the Monte-Carlo option pricing model is used. The expected life used in the models has been adjusted, based on management’s best estimate, for the effects of non-transferability, exercise restrictions and behavioural considerations.
 
185


Table of Contents
BAT Annual Report and Form 20-F 2021
Financial Statements
Notes on Accounts
Continued
    
 
1 Accounting Policies
Continued
Research and development
Research expenditure is charged to income in the year in which it is incurred. Development expenditure is charged to income in the year it is incurred, unless it meets the recognition criteria of IAS 38
Intangible Assets
to be capitalised as an intangible asset.
Taxation
Taxation is chargeable on the profits for the period, together with deferred taxation. The current income tax charge is calculated on the basis of tax laws enacted or substantively enacted at the balance sheet date in the countries where the Group’s subsidiaries, associates and joint arrangements operate and generate taxable income.
Deferred taxation is provided in full using the liability method for temporary differences between the carrying amount of assets and liabilities for financial reporting purposes and the amount used for taxation purposes. A deferred tax asset is recognised only to the extent that it is probable that future taxable profits will be available against which the asset can be utilised.
Deferred tax is determined using the tax rates that have been enacted or substantively enacted by the balance sheet date and are expected to apply when the related deferred tax asset is realised or deferred tax liability is settled.
Tax is recognised in the income statement except to the extent that it relates to items recognised in other comprehensive income or directly in equity, in which case it is recognised in the statement of other comprehensive income or the statement of changes in equity.
The Group has exposures in respect of the payment or recovery of a number of taxes. With effect from 1 January 2019, the Group adopted the requirements of IFRIC 23
Uncertainty over Income Tax Treatments
which requires that, where there is uncertainty as to whether a particular tax treatment will be accepted by the relevant taxation authority, the financial statements reflect the probable outcome with estimated amounts determined based on the most likely amount or expected value, depending on which method is expected to better predict the resolution of the uncertainty. Prior to 1 January 2019, liabilities or assets for these payments or recoveries were recognised at such time as an outcome became probable and when the amount could reasonably be estimated.
Goodwill
Goodwill arising on acquisitions is capitalised and any impairment of goodwill is recognised immediately in the income statement and is not subsequently reversed.
Goodwill in respect of subsidiaries is included in intangible assets. In respect of associates and joint ventures, goodwill is included in the carrying value of the investment in the associated company or joint venture. On disposal of a subsidiary, associate or joint venture, the attributable amount of goodwill is included in the determination of the profit or loss on disposal.
Intangible assets other than goodwill
The intangible assets shown on the Group balance sheet consist mainly of trademarks and similar intangibles, including certain intellectual property, acquired by the Group’s subsidiary undertakings and computer software.
Acquired trademarks and similar assets are carried at cost less accumulated amortisation and impairment. Trademarks with indefinite lives are not amortised but are reviewed annually for impairment. Other trademarks and similar assets are amortised on a straight-line basis over their remaining useful lives, consistent with the pattern of economic benefits expected to be received, which do not exceed 20 years. Any impairments of trademarks are recognised in the income statement, but increases in trademark values are not recognised.
Computer software is carried at cost less accumulated amortisation and impairment, and, with the exception of global software solutions, is amortised on a straight-line basis over periods ranging from three years to five years. Global software solutions are software assets designed to be implemented on a global basis and used as a standard solution by all of the operating companies in the Group. Prior to 2021, these assets were amortised on a straight-line basis over periods not exceeding 10 years. Since 2021, global software solutions are amortised on a straight-line basis over periods not exceeding 13 years. The revision in useful economic life is a result of ongoing use of global software solutions due to the extension of third-party supplier support. In 2021 and 2022, the estimated impact of this change in accounting estimate is a reduction in annual amortisation expense of £26 million and, in 2023, a reduction in annual amortisation expense of £12 million.
Property, plant and equipment
Property, plant and equipment are stated at cost less accumulated depreciation and impairment. Depreciation is calculated on a straight-line basis to write off the assets over their useful economic life. No depreciation is provided on freehold land or assets classified as held-for-sale. Freehold and leasehold property are depreciated at rates between 2.5% and 4% per annum, and plant and equipment at rates between 3% and 25% per annum.
Capitalised interest
Borrowing costs which are directly attributable to the acquisition, construction or production of intangible assets or property, plant and equipment that takes a substantial period of time to get ready for its intended use or sale, are capitalised as part of the cost of the asset.
Leased assets
With effect from 1 January 2019, the Group has applied IFRS 16
Leases
to contractual arrangements which are, or contain, leases of assets, and consequently recognises right-of-use assets and lease liabilities at the commencement of the leasing arrangement, with the assets included as part of property, plant and equipment in note 13 and the liabilities included as part of borrowings in note 23.
In adopting IFRS 16, the Group applied the modified retrospective approach with no restatement of prior periods, as permitted by the Standard. The Group took advantage of certain practical expedients available under the Standard, including ‘grandfathering’ previously recognised lease arrangements such that contracts were not reassessed at the implementation date as to whether they were, or contained, a lease, and leases previously classified as finance leases under IAS 17
Leases
remained capitalised on the adoption of IFRS 16.
 
186


Table of Contents
BAT Annual Report and Form 20-F 2021    
 
Strategic Report        
 
Governance Report        
  
Financial Statements        
  
        Other Information        


1 Accounting Policies
Continued
For leasing arrangements entered into after 1 January 2019, the Group has also adopted several practical expedients available under the Standard including not applying the requirements of IFRS 16 to leases of intangible assets, applying the portfolio approach where appropriate to do so, and to not apply the recognition and measurement requirements of IFRS 16 to short-term leases (leases of less than 12 months maximum duration) or leases of low-value assets. Except for property-related leases, non-lease components have not been separated from lease components.
Lease liabilities are initially recognised at an amount equal to the present value of estimated contractual lease payments at the inception of the lease, after taking into account any options to extend the term of the lease. Lease commitments are discounted to present value using the interest rate implicit in the lease if this can be readily determined, or the applicable incremental rate of borrowing, as appropriate. Right-of-use lease assets are initially recognised at an amount equal to the lease liability, adjusted for initial direct costs in relation to the assets, then depreciated over the shorter of the lease term and their estimated useful lives.
Prior to 1 January 2019, the Group applied IAS 17
Leases.
Arrangements where the Group had substantially all the risks and rewards of ownership of the leased asset were classified as finance leases and were included as part of property, plant and equipment. Under IAS 17, leases which were not classified as finance leases were classified as operating leases and such arrangements were not capitalised. Rental payments under operating leases were charged to operating profit on a straight-line basis over the lease term.
Impairment of non-financial assets
Assets are reviewed for impairment whenever events indicate that the carrying amount of a cash-generating unit may not be recoverable. In addition, assets that have indefinite useful lives are tested annually for impairment. An impairment loss is recognised to the extent that the carrying value exceeds the higher of the asset’s fair value less costs to sell and its value-in-use.
A cash-generating unit is the smallest identifiable group of assets that generates cash flows which are largely independent of the cash flows from other assets or groups of assets. At the acquisition date, any goodwill acquired is allocated to the relevant cash-generating unit or group of cash-generating units expected to benefit from the acquisition for the purpose of impairment testing of goodwill.
Impairment of financial assets held at amortised cost
Loss allowances for expected credit losses on financial assets which are held at amortised cost are recognised on initial recognition of the underlying asset. As permitted by IFRS 9
Financial Instruments,
loss allowances on trade receivables arising from the recognition of revenue under IFRS 15
Revenue from Contracts with Customers
are initially measured at an amount equal to lifetime expected losses. Allowances in respect of loans and other receivables are initially recognised at an amount equal to 12-month expected credit losses. Allowances are measured at an amount equal to the lifetime expected credit losses where the credit risk on the receivables increases significantly after initial recognition.
Inventories
Inventories are stated at the lower of cost and net realisable value. Cost is based on the weighted average cost incurred in acquiring inventories and bringing them to their existing location and condition, which will include raw materials, direct labour and overheads, where appropriate. Net realisable value is the estimated selling price less costs to completion and sale. Tobacco inventories which have an operating cycle that exceeds 12 months are classified as current assets, consistent with recognised industry practice.
Biological Assets
The investments in associates and joint ventures shown in the Group balance sheet include biological assets held by Organigram Holdings Inc. In accordance with IAS 41
Agriculture,
the Group measures biological assets at fair value less costs to sell up to the point of harvest, at which point this becomes the basis for the cost of finished goods inventories after harvest with subsequent expenditures incurred on these being capitalised, where applicable, in accordance with IAS 2
Inventories.
Unrealised fair value gains and losses arising during the growth of biological assets are recognised immediately in the income statement.
Equity instruments
Instruments are classified as either financial liabilities or as equity in accordance with the substance of the contractual arrangements. Instruments that cannot be settled in the Group’s own equity instruments and that include no contractual obligation to deliver cash or another financial asset are classified as equity. Equity instruments issued by the Group are recognised at the proceeds received, net of issuance costs.
On 27 September 2021, the Group issued two
1 billion perpetual hybrid bonds. As the Group has the unconditional right to avoid transferring cash or another financial asset in relation to these bonds, they are classified as equity instruments in the consolidated financial statements.
Financial instruments
The Group’s business model for managing financial assets is set out in the Group Treasury Manual which notes that the primary objective with regard to the management of cash and investments is to protect against the loss of principal. Additionally, the Group aims: to maximise Group liquidity by concentrating cash at the Centre, to align the maturity profile of external investments with that of the forecast liquidity profile, to wherever practicable, match the interest rate profile of external investments to that of debt maturities or fixings, and to optimise the investment yield within the Group’s investment parameters. The majority of financial assets are held in order to collect contractual cash flows (typically cash and cash equivalents and loans and other receivables), but some assets (typically investments) are held for investment potential.
Financial assets and financial liabilities are recognised when the Group becomes a party to the contractual provisions of the relevant instrument and derecognised when it ceases to be a party to such provisions. Such assets and liabilities are classified as current if they are expected to be realised or settled within 12 months after the balance sheet date. If not, they are classified as non-current. In addition, current liabilities include amounts where the entity does not have an unconditional right to defer settlement of the liability for at least 12 months after the balance sheet date.
 
187


Table of Contents
BAT Annual Report and Form 20-F 2021
Financial Statements
Notes on Accounts
Continued
 
 
1 Accounting Policies
Continued
The Group early adopted the phase one and phase two Amendments to IFRS 9
Financial Instruments
and IFRS 7
Financial Instruments: Disclosures
regarding Interest Rate Benchmark Reform in 2019 and 2020 respectively. The Amendments provide an exemption for certain hedging relationships directly affected by changes in interest rate benchmarks where the reform gives rise to uncertainties regarding the interest rate designated as a hedged risk, or the timing or amount of interest rate cashflows of either the hedged item or of the hedging instrument, such that without the exemption the relationship might not qualify for hedge accounting. In addition, the Amendments provide a practical expedient for financial assets and financial liabilities that are modified or have existing contractual terms activated that change the basis for determining the contractual cash flows as a result of Interest Rate Benchmark Reform, such that the change to the contractual cash flows is applied prospectively by revising the effective interest rate.
Non-derivative financial assets
are classified on initial recognition in accordance with the Group’s business model as investments, loans and receivables, or cash and cash equivalents and accounted for as follows:
 
 
Investments:
these are non-derivative financial assets that cannot be classified as loans and other receivables or cash and cash equivalents. Dividend and interest income on these investments are included within finance income when the Group’s right to receive payments is established. This category includes financial assets at fair value through profit and loss and financial assets at fair value through other comprehensive income.
 
 
Loans and other receivables:
these are non-derivative financial assets with fixed or determinable payments that are solely payments of principal and interest on the principal amount outstanding, that are primarily held in order to collect contractual cash flows. These balances include trade and other receivables, which are measured at amortised cost, using the effective interest rate method, and stated net of allowances for credit losses, and deposits with banks and other financial institutions which cannot be classified as cash and cash equivalents. In addition, as explained in note 17, certain litigation related deposits are recognised as assets within loans and other receivables where management has determined that these payments represent a resource controlled by the entity as a result of past events. These deposits are held at the fair value of consideration transferred less impairment, if applicable, and have not been discounted.
 
 
Cash and cash equivalents:
cash and cash equivalents include cash in hand and deposits held on call, together with other short-term highly liquid investments including investments in certain money market funds. Cash equivalents normally comprise instruments with maturities of three months or less at their date of acquisition. In the cash flow statement, cash and cash equivalents are shown net of bank overdrafts, which are included as current borrowings in the liabilities section on the balance sheet.
Fair values for quoted investments are based on observable market prices. If there is no active market for a financial asset, the fair value is established by using valuation techniques principally involving discounted cash flow analysis.
Non-derivative financial liabilities
, including borrowings and trade payables, are stated at amortised cost using the effective interest method. For borrowings, their carrying value includes accrued interest payable, as well as unamortised issue costs. As shown in note 23, certain borrowings are subject to fair value hedges, as defined below.
Derivative financial assets and liabilities
are initially recognised, and subsequently measured, at fair value, which includes accrued interest receivable and payable where relevant. Changes in their fair values are recognised as follows:
 
 
for derivatives that are designated as cash flow hedges, the changes in their fair values are recognised directly in other comprehensive income, to the extent that they are effective, with the ineffective portion being recognised in the income statement. Where the hedged item results in a non-financial asset, the accumulated gains and losses, previously recognised in other comprehensive income, are included in the initial carrying value of the asset (basis adjustment) and recognised in the income statement in the same periods as the hedged item. Where the underlying transaction does not result in such an asset, the accumulated gains and losses are reclassified to the income statement in the same periods as the hedged item;
 
 
for derivatives that are designated as fair value hedges, the carrying value of the hedged item is adjusted for the fair value changes attributable to the risk being hedged, with the corresponding entry being made in the income statement. The changes in fair value of these derivatives are also recognised in the income statement;
 
 
for derivatives that are designated as hedges of net investments in foreign operations, the changes in their fair values are recognised directly in other comprehensive income, to the extent that they are effective, with the ineffective portion being recognised in the income statement. Where non-derivatives such as foreign currency borrowings are designated as net investment hedges, the relevant exchange differences are similarly recognised. The accumulated gains and losses are reclassified to the income statement when the foreign operation is disposed of; and
 
 
for derivatives that do not qualify for hedge accounting or are not designated as hedges, the changes in their fair values are recognised in the income statement in the period in which they arise. These are referred to as ‘held-for-trading’.
In order to qualify for hedge accounting, the Group is required to document prospectively the economic relationship between the item being hedged and the hedging instrument. The Group is also required to demonstrate an assessment of the economic relationship between the hedged item and the hedging instrument, which shows that the hedge will be highly effective on an ongoing basis. This effectiveness testing is re-performed periodically to ensure that the hedge has remained, and is expected to remain, highly effective.
Hedge accounting is discontinued when a hedging instrument is derecognised (e.g. through expiry or disposal), or no longer qualifies for hedge accounting. Where the hedged item is a highly probable forecast transaction, the related gains and losses remain in equity until the transaction takes place, when they are reclassified to the income statement in the same manner as for cash flow hedges as described above. When a hedged future transaction is no longer expected to occur, any related gains and losses, previously recognised in other comprehensive income, are immediately reclassified to the income statement.
Derivative fair value changes recognised in the income statement are either reflected in arriving at profit from operations (if the hedged item is similarly reflected) or in finance costs.
 
188


Table of Contents
BAT Annual Report and Form 20-F 2021    
 
Strategic Report        
 
Governance Report        
  
Financial Statements        
  
        Other Information        


1 Accounting Policies
Continued
Dividends
The Company pays interim quarterly dividends, and the Group recognises the interim dividend in the period in which it is paid.
Segmental analysis
The Group is organised and managed on the basis of its geographic regions. These are the reportable segments for the Group as they form the focus of the Group’s internal reporting systems and are the basis used by the chief operating decision maker, identified as the Management Board, for assessing performance and allocating resources.
The Group is primarily a single product business providing cigarettes and other tobacco products. While the Group has clearly differentiated brands, global segmentation between a wide portfolio of brands is not part of the regular internally reported financial information. The results of New Category products are reported as part of the results of each geographic region, and currently individually and in aggregate represent less than 10% of the Group’s revenue and operating profit in total.
The prices agreed between Group companies for intra-group sales of materials, manufactured goods, charges for royalties, commissions, services and fees, are based on normal commercial practices which would apply between independent businesses. Royalty income, less related expenditure, is included in the region in which the licensor is based.
Adjusting items
Adjusting items are significant items of income or expense in revenue, profit from operations, net finance costs, taxation and the Group’s share of the post-tax results of associates and joint ventures which individually or, if of a similar type, in aggregate, are relevant to an understanding of the Group’s underlying financial performance because of their size, nature or incidence. In identifying and quantifying adjusting items, the Group consistently applies a policy that defines criteria that are required to be met for an item to be classified as adjusting. These items are separately disclosed in the segmental analyses or in the notes to the accounts as appropriate.
The Group believes that these items are useful to users of the Group financial statements in helping them to understand the underlying business performance and are used to derive the Group’s principal non-GAAP measures of adjusted revenue, adjusted profit from operations and adjusted diluted earnings per share, all of which are before the impact of adjusting items and which are reconciled from revenue, profit from operations and diluted earnings per share.
Provisions
Provisions are recognised when either a legal or constructive obligation as a result of a past event exists at the balance sheet date, it is probable that an outflow of economic resources will be required to settle the obligation and a reasonable estimate can be made of the amount of the obligation.
Contingent liabilities and contingent assets
Subsidiaries and associate companies are defendants in tobacco-related and other litigation. Provision for this litigation (including legal costs) is made at such time as an unfavourable outcome becomes probable and the amount can be reasonably estimated.
Contingent assets are possible assets whose existence will only be confirmed by future events not wholly within the control of the entity and are not recognised as assets until the realisation of income is virtually certain.
Where a provision has not been recognised, the Group records its external legal fees and other external defence costs for tobacco-related and other litigation as these costs are incurred.
As explained in note 17, certain litigation-related deposits are recognised as assets within loans and other receivables where management has determined that these payments represent a resource controlled by the entity. These deposits are held at the fair value of consideration transferred less impairment, if applicable, and have not been discounted.
Repurchase of share capital
When share capital is repurchased, the amount of consideration paid, including directly attributable costs, is recognised as a deduction from equity. Repurchased shares which are not cancelled, or shares purchased for the employee share ownership trusts, are classified as treasury shares and presented as a deduction from total equity.
Future changes to accounting policies
A number of interpretations and revisions to existing standards have been issued which will be applicable to the Group financial statements in future years, but are not expected to have a material effect on reported profit or equity or on the disclosures in the financial statements.
 
189


Table of Contents
BAT Annual Report and Form 20-F 2021
Financial Statements
Notes on Accounts
Continued
    
 
2 Segmental Analyses
The chief operating decision maker, the Management Board, reviews adjusted profit from operations at constant currencies to evaluate segment performance and allocate resources to the overall business on a geographic region basis. The Management Board also reviews at constant currencies adjusted revenues on a geographic region basis, which are included within adjusted profit from operations.
Regional Directors are responsible for delivering the operating and financial results of their Region inclusive of all product categories. Therefore, the results of New Categories (comprising Tobacco Heating Products, Vapour products and Modern Oral products) are reported to the Management Board as part of the results of each geographic region. However, additional information has been provided to disaggregate revenue based on product category to enable investors to better compare the Group’s business performance across periods and by reference to the Group’s investment activity. Interest income, interest expense, share of post-tax results of associates and joint ventures and taxation are centrally managed, and accordingly, such items are not presented by segment as they are excluded from the measure of segment profitability.
The four geographic regions are the reportable segments for the Group as they form the focus of the Group’s internal reporting systems and are the basis used by the Management Board for assessing performance and allocating resources. Transactions between Group subsidiaries are conducted on arm’s length terms in accordance with appropriate transfer pricing rules and Organisation for Economic Cooperation & Development (OECD) principles. The Management Board reviews current and prior year adjusted segmental revenue and adjusted profit from operations at constant rates of exchange. The constant rate comparison provided for reporting segment information is based on a retranslation, at prior year exchange rates, of the current year results of the Group, including intercompany royalties payable in foreign currency to UK entities. However, the Group does not adjust for the normal transactional gains and losses in operations which are generated by movements in exchange rates.
In respect of the U.S. region, all financial statements and financial information provided by or with respect to the U.S. business or RAI (and/or RAI and its subsidiaries (collectively, the ‘Reynolds Group’)) are prepared on the basis of US GAAP and constitute the primary financial statements or financial information of the U.S. business or RAI (and/or the Reynolds Group). Solely for the purpose of consolidation within the results of BAT p.l.c. and the BAT Group, this financial information is then converted to IFRS. To the extent any such financial information provided in these financial statements relates to the U.S. business or RAI (and/or the Reynolds Group), it is provided as an explanation of the U.S. business’s or RAI’s (and/or the Reynolds Group’s) primary US GAAP based financial statements and information.
Effective 1 January 2022, the North African markets of Algeria, Egypt, Libya, Morocco, Sudan and Tunisia, which currently form part of the ENA region, will be moved to the APME region.
The following table shows 2021 revenue and adjusted revenue at current rates, and 2021 adjusted revenue translated using 2020 rates of exchange. The 2020 figures are stated at the 2020 rates of exchange.
 
    
2021
    
2020


        Adjusted
Revenue
Constant
rates
£m
    
Translation
exchange
£m
   
Adjusted
Revenue
Current
rates
£m
    
Adjusting
items
Current
rates
£m
    
Revenue
Current
rates
£m
    
    Adjusted
Revenue
£m
    
Adjusting
items
£m
    
Revenue
£m
 
                 
U.S.
  
 
12,530


(839
 
 
11,691


11,691


11,473


11,473
 
                 
APME
  
 
4,535


(344
 
 
4,191


4,191


4,537


4,537
 
                 
AMSSA
  
 
4,067


(266
 
 
3,801


3,801


3,772


3,772
 
                 
ENA
  
 
6,429


(428
 
 
6,001


6,001


5,994


5,994
 
                 
Revenue
  
 
27,561


(1,877
 
 
25,684


25,684


25,776


25,776
 
Note:
adjusting items in revenue are in respect of excise included in goods acquired from a third party under short-term arrangements and then passed on to customers. This is deemed as adjusting due to the distorting nature to revenue and operating margin. From 2020 onwards, such arrangements have been discontinued or are immaterial such that no adjustments have been made in 2020 and 2021.
The following table shows 2020 revenue and adjusted revenue at current rates, and 2020 adjusted revenue translated using 2019 rates of exchange. The 2019 figures are stated at the 2019 rates of exchange.
 
    
2020
    
2019


        Adjusted
Revenue
Constant
rates
£m
    
    Translation
exchange
£m
   
  Adjusted
Revenue
Current
rates
£m
    
Adjusting
items
Current
rates
£m
    
Revenue
Current
rates
£m
    
      Adjusted
Revenue
£m
    
Adjusting
items
£m
    
Revenue
£m
 
                 
U.S.
  
 
11,536


(63
 
 
11,473


11,473


10,373


10,373
 
                 
APME
  
 
4,644


(107
 
 
4,537


4,537


5,153


5,153
 
                 
AMSSA
  
 
4,321


(549
 
 
3,772


3,772


4,261


4,261
 
                 
ENA
  
 
6,169


(175
 
 
5,994


5,994


6,040


50


6,090
 
                 
Revenue
  
 
26,670


(894
 
 
25,776


25,776


25,827


50


25,877
 
Note:
adjusting items in revenue are in respect of excise included in goods acquired from a third party under short-term arrangements and then passed on to customers. This is deemed as adjusting due to the distorting nature to revenue and operating margin.
 
190


Table of Contents
BAT Annual Report and Form 20-F 2021    
 
Strategic Report        
 
Governance Report        
  
Financial Statements        
  
        Other Information        


2 Segmental Analyses
Continued
The following table shows 2021 profit from operations and adjusted profit from operations at current rates, and 2021 adjusted profit from operations translated using 2020 rates of exchange. The 2020 figures are stated at the 2020 rates of exchange.
 
   
2021
   
2020


Adjusted*
segment 
result 
    Constant 
rates 

£m 


Translation
exchange
£m


    Adjusted*
segment 
result 
Current 
rates 

£m 


Adjusting*
items 

£m 


Segment
result
Current
rates

£m


        Adjusted*
segment 
result 

£m 


  Adjusting*
items 

£m 


  Segment
result

£m


U.S.
 
 
6,343


(456
 
 
5,887


(321
 
 
5,566


5,784


(809
 
 
4,975
 
                 
APME
 
 
1,833


(116
 
 
1,717


(430
 
 
1,287


1,853


(381
 
 
1,472
 
                 
AMSSA
 
 
1,688


(98
 
 
1,590


(94
 
 
1,496


1,618


(65
 
 
1,553
 
                 
ENA
 
 
2,088


(132
 
 
1,956


(71
 
 
1,885


2,110


(148
 
 
1,962
 
                 
Profit from operations
 
 
11,952


(802
 
 
11,150


(916
 
 
10,234


11,365


(1,403
 
 
9,962
 
                 
Net finance costs
                                   
 
(1,486
                  
 
(1,745
                 
Share of post-tax results of associates and joint

ventures


415


455
 
                 
Profit before taxation
                                   
 
9,163


8,672
 
                 
Taxation on ordinary activities
                                   
 
(2,189
                  
 
(2,108
                 
Profit for the year
                                   
 
6,974


6,564
 
 
*
The adjustments to profit from operations are explained in notes 3, 4, 6(d), 6(f), 6(g) and 7.
The following table shows 2020 profit from operations and adjusted profit from operations at current rates, and 2020 adjusted profit from operations translated using 2019 rates of exchange. The 2019 figures are stated at the 2019 rates of exchange.
 
   
2020
   
2019


Adjusted*
segment 
result 
      Constant 
rates 

£m 


Translation
exchange
£m


      Adjusted*
segment 
result 
Current 
rates 

£m 


Adjusting*
items 

£m 


Segment
result
Current
rates

£m


          Adjusted*
segment 
result 

£m 


Adjusting*
items 

£m 


  Segment
result

£m


U.S.
 
 
5,816


(32
 
 
5,784


(809
 
 
4,975


5,036


(626
 
 
4,410
 
                 
APME
 
 
1,909


(56
 
 
1,853


(381
 
 
1,472


2,059


(306
 
 
1,753
 
                 
AMSSA
 
 
1,796


(178
 
 
1,618


(65
 
 
1,553


1,842


(638
 
 
1,204
 
                 
ENA
 
 
2,140


(30
 
 
2,110


(148
 
 
1,962


2,193


(544
 
 
1,649
 
                 
Profit from operations
 
 
11,661


(296
 
 
11,365


(1,403
 
 
9,962


11,130


(2,114
 
 
9,016
 
                 
Net finance costs
                                   
 
(1,745
                  
 
(1,602
                 
Share of post-tax results of associates and joint

ventures


455


498
 
                 
Profit before taxation
                                   
 
8,672


7,912
 
                 
Taxation on ordinary activities
                                   
 
(2,108
                  
 
(2,063
                 
Profit for the year
                                   
 
6,564


5,849
 
 
*
The adjustments to profit from operations are explained in notes 4, 5, 6(d), 6(f), 6(g) and 7.

191 


Table of Contents

BAT Annual Report and Form 20-F 2021
Financial Statements
Notes on Accounts
Continued
 
 
2 Segmental Analyses
Continued
Adjusted profit from operations at constant rates of £11,952 million (2020: £11,661 million; 2019: £11,032 million) excludes adjusting depreciation, amortisation and impairment charges as explained in notes 4 and 7. These are excluded from segmental adjusted profit from operations at constant rates as follows:
 
    
2021
   
2020


Adjusted
depreciation,
amortisation
and
impairment
Constant
rates
£m
    
Translation
exchange
£m
   
Adjusted
depreciation,
amortisation
and
impairment
Current
rates
£m
    
Adjusting
items
£m
    
Depreciation,
amortisation
and
impairment
Current rates
£m
   
Adjusted
depreciation,
amortisation
and
impairment
£m
    
Adjusting
items
£m
    
Depreciation,
amortisation
and
impairment
£m
 
                 
U.S.
  
 
210


(7
 
 
203


276


479


204


272


476
 
                 
APME
  
 
154


(8
 
 
146


20


166


167


274


441
 
                 
AMSSA
  
 
131


(8
 
 
123


56


179


121


34


155
 
                 
ENA
  
 
266


(14
 
 
252


252


259


119


378


761


(37
 
 
724


352


1,076


751


699


1,450


2020
   
2019


Adjusted
depreciation,
amortisation
and
impairment
Constant
rates
£m
    
Translation
exchange
£m
   
Adjusted
    depreciation,
amortisation
and
impairment
Current
rates
£m
    
  Adjusting
items
£m
    
Depreciation,
amortisation
and
impairment
Current
rates
£m
   
Adjusted
depreciation,
amortisation
and
impairment
£m
    
Adjusting
items
£m
    
Depreciation,
amortisation
and
impairment
£m
 
                 
U.S.
  
 
205


(1
 
 
204


272


476


258


391


649
 
                 
APME
  
 
170


(3
 
 
167


274


441


163


182


345
 
                 
AMSSA
  
 
137


(16
 
 
121


34


155


137


35


172
 
                 
ENA
  
 
266


(7
 
 
259


119


378


216


130


346


778


(27
 
 
751


699


1,450


774


738


1,512
 
Additional information by product category
Although the Group’s operations are managed on a Regional basis, additional information for revenue is provided based on product category as follows:
 
Revenue
  
2021
£m
    
2020
£m
    
2019
£m
 
       
Combustibles
  
 
    22,029


    22,752


      23,001
 
       
New Categories
  
 
2,054


1,443


1,255
 
       
Vapour
  
 
927


611


401
 
       
THP
  
 
853


634


728
 
       
Modern Oral
  
 
274


198


126
 
       
Traditional Oral
  
 
1,118


1,160


1,081
 
       
Other
  
 
483


421


540
 
       
Revenue
  
 
25,684


25,776


25,877
 
 
192


Table of Contents
BAT Annual Report and Form 20-F 2021    
 
Strategic Report        
 
Governance Report        
  
Financial Statements        
  
        Other Information        


2 Segmental Analyses
Continued
External revenue and non-current assets other than financial instruments, deferred tax assets and retirement benefit assets are analysed between the UK and all foreign countries at current rates of exchange as follows:
 
    
United Kingdom 
    
All foreign countries 
    
Group 
 
                   
Revenue is based on location of sale
  
2021
£m
    
2020
£m
    
2019 
£m 
    
2021
£m
    
2020
£m
    
2019 
£m 
    
2021
£m
    
2020
£m
    
2019 
£m 
 
                   
External revenue
  
 
        209


        188


        178 


        25,475


    25,588


    25,699 


25,684


    25,776


    25,877 


United Kingdom 
    
All foreign countries 
    
Group


          2021
£m
    
            2020
£m
    
          2021
£m
    
            2020
£m
    
          2021
£m
    
          2020
£m
 
             
Intangible assets
  
 
481


487


115,144


114,856


115,625


115,343
 
             
Property, plant and equipment
  
 
339


344


4,614


4,716


4,953


5,060
 
             
Investments in associates and joint ventures
  
 
8


8


1,940


1,788


1,948


1,796
 
The consolidated results of the Reynolds Group operating in the U.S. met the criteria for separate disclosure under the requirements of IFRS 8
Operating Segments.
Revenue arising from the operations of the Reynolds Group, inclusive of the sales made to fellow Group companies, in 2021, 2020 and 2019 was £11,707 million, £11,481 million and £10,417 million, respectively. The majority of sales are to customers based in the U.S. Non-current assets attributable to the operations of the Reynolds Group were £106,495 million (2020: £105,549 million).
The main acquisitions comprising the goodwill balance of £43,194 million (2020: £43,319 million), included in intangible assets, are provided in note 12. Included in investments in associates and joint ventures are amounts of £1,759 million (2020: £1,724 million) attributable to the investment in ITC Ltd. Further information is provided in notes 9 and 14.
3 Employee Benefit Costs
 
     
2021
£m
    
2020
£m
    
2019
£m
 
       
Wages and salaries
  
 
2,315


        2,277


        2,651
 
       
Social security costs
  
 
185


194


223
 
       
Other pension and retirement benefit costs (note 15)
  
 
139


182


227
 
       
Share-based payments – equity and cash-settled (note 28)
  
 
78


91


120


2,717


2,744


3,221
 
Included within employee benefits costs are expenses in relation to the Group’s restructuring and integration initiatives of £160 million (2020: £91 million; 2019: £364 million), as explained in note 7.
On 7 October 2021, a partial buy-out was concluded in the U.S. with approximately US$1.9 billion (£1.4 billion) of plan liabilities being removed from the balance sheet, resulting in a settlement gain of £35 million, which is reported in the income statement, and recognised as an adjusting item.
4 Depreciation, Amortisation and Impairment Costs
 
           
2021
£m
    
2020
£m
    
2019
£m
 
         
Intangibles
  
–  amortisation and impairment of trademarks and similar intangibles
  
 
333


360


508


–  amortisation and impairment of computer software
  
 
129


129


108


–  impairment of goodwill
  
 
57


209


194
 
       
Property, plant and equipment – depreciation and impairment
  
 
557


752


702


1,076


        1,450


        1,512
 
Enumerated below are movements in costs that have impacted depreciation, amortisation and impairment in 2021, 2020 and 2019. These include changes in our underlying business performance, as well as impact of adjusting items, as defined in note 1.
 
193


Table of Contents
BAT Annual Report and Form 20-F 2021
Financial Statements
Notes on Accounts
Continued
 
 
4 Depreciation, Amortisation and Impairment Costs
Continued
Intangibles – amortisation and impairment of trademarks and similar intangibles
Acquisitions in previous years have resulted in the capitalisation of trademarks and similar intangibles, including those which are amortised over their expected useful lives, which do not exceed 20 years. The amortisation and impairment of these acquired trademarks and similar intangibles are charged to the income statement as adjusting. In 2021, the amortisation and impairment of these acquired trademarks and similar intangibles is £306 million (2020: £339 million; 2019: £481 million). In 2019, the Group incurred an impairment charge of £129 million, which included the partial impairment of the Kodiak brand as a result of declining volumes.
Impairment of goodwill
The impairment of goodwill is charged to the income statement as adjusting, and further information is provided in note 12(e).
During 2021, the Group impaired £3 million of goodwill held in Myanmar as a result of the decision to cease activities in the market. The Group also recognised a goodwill impairment charge of £54 million in 2021 due to continued difficult trading conditions in Peru as a consequence of the COVID-19 pandemic.
During 2020, the Group impaired the goodwill arising from Malaysia amounting to £197 million, goodwill arising from the acquisition of Twisp of £11 million and goodwill arising from the acquisition of Blue Nile of £1 million.
During 2019, the Group impaired the goodwill arising from the Bentoel acquisition, amounting to £172 million, goodwill arising from the VapeWild acquisition of £12 million and goodwill arising from the Highendsmoke acquisition of £10 million.
Property, plant and equipment – depreciation and impairment
The following items are included within depreciation and impairment of property, plant and equipment:
 
 
Restructuring and integration related depreciation and impairment costs and reversals were a net credit of £11 million (2020: £151 million net cost; 2019: £63 million net cost) resulting from obsolete machines in relation to downsizing and factory rationalisation as mentioned in note 7; and
 
 
Gains and losses recognised on disposal of property, plant and equipment.
5 Other Operating Income
Other operating income of £196 million (2020: £188 million; 2019: £163 million) comprises income that is associated with the Group’s normal activities, but which falls outside the definition of turnover and includes one-off capital profits on property sales and one-off disposals of fixed assets.
As explained in note 31, the Group recognised £5 million (2020: £58 million; 2019: £86 million) in respect of a tax case in Brazil. In addition, during 2021, £130 million of the unrecognised contingent asset in respect of historical VAT on social contributions claims was sold to financial institutions for £45 million.
Also, in 2021, R.J. Reynolds Tobacco Company (RJRT) reached an agreement with several Master Settlement Agreement (MSA) states to waive RJRT’s claims under the MSA in connection with a settlement between those MSA states and a non-participating manufacturer, S&M Brands, Inc. (S&M Brands), under which the states released certain claims against S&M Brands in exchange for receiving a portion of the funds S&M Brands had deposited into escrow accounts in those states pursuant to the states’ escrow statutes. In consideration for waiving claims, RJRT, together with Santa Fe Natural Tobacco Company, received approximately £40 million from the escrow funds paid to those MSA states under their settlement with S&M Brands.
In 2019, as discussed in note 7, certain items of operating income have been incurred as part of the Group’s restructuring and integration activities.
 
194


Table of Contents
BAT Annual Report and Form 20-F 2021    
 
Strategic Report        
 
Governance Report        
  
Financial Statements        
  
        Other Information        


6 Other Operating Expenses
(a) Items included within other operating expenses
The following items are included within other operating expenses:
 
     
2021
£m
   
            2020
£m
   
2019
£m
 
       
Other operating expenses
  
 
7,468


7,667


7,851
 
       
The following items are included within other operating expenses:
                        
       
Master settlement agreement (note 6(b),(d))
  
 
2,486


2,783


      2,163
 
       
Marketing expenses in operating profit (note 6(c))
  
 
1,242


1,096


1,149
 
       
Inventory write-offs (note 20)
  
 
215


309


255
 
       
Research and development expenses (excluding employee benefit costs and depreciation) (note 6(e))
  
 
141


121


126
 
       
Loss on disposal of BAT Pars (note 6(f))
  
 
358


Excise, VAT and penalties in respect of disputes in Turkey, South Korea and Russia (note 6(g))
  
 
26


(40
 
 
202
 
       
Judgment in respect of Quebec class actions (note 6(h))


436
 
       
Exchange differences
  
 
19


(29
 
 
22
 
       
Hedge ineffectiveness within operating profit
  
 
(5
 
 
(3
 
 
(5
       
Expenses relating to short-term leases
  
 
8


10


16
 
       
Expenses relating to leases of low-value assets
  
 
1


1


1
 
       
Gains arising from sale and leaseback transactions


(1


Auditor’s remuneration (note 6(i))
  
 
27.1


28.3


25.3
 
(b) Master Settlement Agreement
In 1998, the major U.S. cigarette manufacturers (including the R.J. Reynolds Tobacco Company, Lorillard and Brown & Williamson, businesses which are now part of the Reynolds Group) entered into the Master Settlement Agreement (MSA) with attorneys general representing most U.S. states and territories. The MSA imposes a perpetual stream of future payment obligations on the major U.S. cigarette manufacturers. The amounts of money that the participating manufacturers are required to annually contribute are based upon, amongst other things, the volume of cigarettes sold and market share (based on cigarette shipments in that year).
During 2012, R.J. Reynolds Tobacco Company, Santa Fe Natural Tobacco Company (SFNTC), various other tobacco manufacturers, 17 states, the District of Columbia and Puerto Rico reached an agreement related to the Non-Participating Manufacturer (NPM) adjustment under the MSA, and three more states joined the agreement in 2013. Under this agreement, R.J. Reynolds Tobacco Company has received credits of more than US$1 billion, in respect of its Non-Participating Manufacturer (NPM) Adjustment claims related to the period from 2003 to 2012. These credits have been applied against the companies’ MSA payments over a period of five years from 2013, subject to, and dependent upon, meeting the various ongoing performance obligations. During 2014, two additional states agreed to settle NPM disputes related to claims for the period 2003 to 2012. R.J. Reynolds Tobacco Company has received US$170 million in credits, which has been applied over a five-year period from 2014. During 2015, another state agreed to settle NPM disputes related to claims for the period 2004 to 2014 and included a method to determine future adjustments from 2015 forward. R.J. Reynolds Tobacco Company has received US$285 million in credits, which was applied over a four-year period from 2016. During 2016, no additional states agreed to settle NPM disputes. During 2017, two more states agreed to settle NPM disputes related to claims for the period 2004 to 2014. It is estimated that R.J. Reynolds Tobacco Company will receive US$61 million in credits, which will be applied over a five-year period from 2017. During 2018, nine more states agreed to settle NPM disputes related to claims for the period 2004 to 2019, with an option through 2022, subject to certain conditions. It is estimated that R.J. Reynolds Tobacco Company will receive US$182 million in credits for settled periods through 2017, which will be applied over a five-year period from 2018. Also, in 2018, one additional state agreed to settle NPM disputes related to claims for the period 2004 to 2024, subject to certain conditions. It is estimated that R.J. Reynolds Tobacco Company will receive US$205 million in credits for settled periods through 2017, which will be applied over a five-year period from 2019. In the first quarter of 2020, certain conditions set forth in the 2017 and 2018 agreements were met for those 10 states. In addition, in August 2020, 24 states, the District of Columbia and Puerto Rico agreed to settle NPM disputes related to claims for the period 2018 to 2022. Credits in respect of future years’ payments and the NPM Adjustment claims would be accounted for in the applicable year and will not be treated as adjusting items. Only credits in respect of prior year payments are included as adjusting items.
In 2020, R.J. Reynolds Tobacco Company recognised additional expenses under the state settlement agreements in the States of Mississippi, Florida, Texas and Minnesota. R.J. Reynolds Tobacco Company recognised US$241 million of expense for payment obligations to the State of Florida for the ITG Brands, LLC acquired brands from the date of divestiture, June 12, 2015, as a result of an unfavourable judgment. In addition, R.J. Reynolds Tobacco Company recognised US$264 million related to the resolution of claims against it in the States of Texas, Minnesota and Mississippi for payment obligations to those states for the ITG Brands, LLC acquired brands from the date of divestiture. Finally, R.J. Reynolds Tobacco Company settled certain related claims with Phillip Morris USA under the state settlement agreements in the states of Mississippi, Texas and Minnesota for US$8 million. Additional information related to the resolution of these claims is included in notes 6(d) and 31. During 2021, an additional US$17 million expense was recognised in relation to the final resolution of the Texas and Minnesota claims.
The BAT Group is subject to substantial payment obligations under the MSA and the state settlement agreements with the States of Mississippi, Florida, Texas and Minnesota (such settlement agreements, collectively State Settlement Agreements). Reynolds Group’s operating subsidiaries’ expenses and payments under the MSA and the State Settlement Agreements for 2021 amounted to US$3,420 million (2020: US$3,572 million; 2019: US$2,762 million) in respect of settlement expenses and US$3,744 million (2020: US$2,848 million; 2019: US$2,918 million) in respect of settlement cash payments.
 
195


Table of Contents
BAT Annual Report and Form 20-F 2021
Financial Statements
Notes on Accounts
Continued
    
 
6 Other Operating Expenses
Continued
(c) Marketing expenses in operating profit
Certain marketing activities, such as discounts or allowances provided to customers, are required to be deducted from revenue as explained in note 1. Other marketing expenses, such as point of sale and promotional materials, media advertising and sponsorship, and consumer research, are reported as operating expenses and have been shown in the table above.
(d) Litigation costs
Litigation costs included within other operating expenses, and reported as an adjusting item, were £54 million (2020: £87 million; 2019: £236 million) predominantly related to other litigation costs including
Engle
progeny.
In 2020, also included as an adjusting item was a charge of £400 million incurred largely in respect of charges following the development in cases regarding payment obligations under the state settlement agreements with Florida, Texas, Minnesota and Mississippi for brands previously sold to a third party. The Group recognised a charge of £188 million in the period for a final judgment of a case in the Florida court. The Group continues to pursue indemnification remedies in a Delaware court for payments made to Florida as a result of this judgment, as explained in note 31. During 2020, the Group also recognised a provision of £212 million related to the settlement discussions with other manufacturers and the States of Texas, Minnesota and Mississippi for payment obligations related to these brands in prior years. During 2021, an additional £12 million expense was recognised in relation to the final resolution of the Texas and Minnesota claims.
(e) Research and development
Total research and development costs, including employee benefit costs and depreciation, are £304 million (2020: £307 million; 2019: £376 million). Included in the 2019 research and development costs is £65 million of costs primarily related to packages in respect of employee benefit reductions as part of the Group’s 2019 restructuring initiative (Quantum), as discussed in note 7.
(f) Loss on disposal of BAT Pars
On 6 August 2021, the Group disposed of its Iranian subsidiary, B.A.T. Pars Company PJSC (BAT Pars). Included within other operating expenses, and recognised as an adjusting item, is a charge of £358 million comprising £272 million of foreign exchange reclassified from other comprehensive income (note 22(c)(i)) and an impairment charge and associated costs of £88 million. In addition, a credit of £2 million was recognised in relation to a partial unwind of discounting on the deferred proceeds. More information has been provided in note 27(d).
(g) Tax disputes in Turkey, South Korea and Russia
The settlement of tax disputes in Turkey, South Korea and Russia were recognised as adjusting items.
Turkey
As explained in note 31, British American Tobacco Tutun Mamulleri Sanayi ve Ticaret Anonim Sirketi (BAT Tutun) was subject to a series of tax audits mainly on inventory movements for the years 2015, 2016 and 2019. In August 2021, BAT Tutun applied under the relevant tax amnesty law to settle its retrospective tax assessments. Based on the settlement through the tax amnesty procedure, BAT Tutun agreed to pay £47 million in 18 instalments from 1 November 2021 until 31 July 2024. Of the £47 million, £30 million of excise and penalties were recognised and charged to operating profit, £11 million as interest in net finance costs (note 8(b)) and £6 million in taxation.
South Korea
As explained in note 31, on 16 September 2021, Rothmans Far East B.V. Korea Branch Office received £4 million in relation to a VAT case. In line with the treatment of the associated expense incurred in 2016, the cash received was recognised as an adjusting item.
Russia
In August 2019, the Russian tax authority issued a final audit report to JSC British American Tobacco-SPb (BAT SpB) related to the application of legislation introduced in 2017 that prospectively limited the amount of production that could take place prior to excise tax increases, without being subject to higher excise tax rates. The final audit report sought to retrospectively apply the legislation to the years 2015 to 2017. BAT SpB submitted an appeal to the Federal Tax Services (FTS) objecting to the findings. The FTS accepted some of BAT SpB’s arguments and, on 27 January 2020, a final claim was issued by the FTS. As a consequence, the Group recognised a charge of £202 million. The Group also recognised an interest charge of £50 million (note 8(b)).
In 2020, a credit of £40 million was recognised in relation to the 2019 charge discussed above, of which £14 million was offset in the adjusting items included in taxation (note 10(d)).
(h) Quebec class actions
In 2019, a charge of £436 million was incurred in respect of the Quebec class actions, as explained in note 31, and charged as an adjusting item.
 
196


Table of Contents
BAT Annual Report and Form 20-F 2021    
 
Strategic Report        
 
Governance Report        
  
Financial Statements        
  
        Other Information        


6 Other Operating Expenses
Continued
(i) Auditor’s remuneration
 
     
2021
£m
    
            2020
£m
    
            2019
£m
 
       
Auditor’s remuneration
                          
       
Total expense for audit services pursuant to legislation:
                          
       
–  fees to KPMG LLP for Parent Company and Group audit
  
 
8.7


8.7


6.8
 
       
–  fees to KPMG LLP firms and associates for local statutory and Group reporting audits
  
 
9.5


9.9


9.0
 
       
Total audit fees expense – KPMG LLP firms and associates
  
 
18.2


18.6


15.8
 
       
Audit fees expense to other firms
  
 
0.2


0.2


0.1
 
       
Total audit fees expense
  
 
18.4


18.8


15.9
 
       
Fees to KPMG LLP firms and associates for other services:
                          
       
–  audit-related assurance services
  
 
8.0


8.5


8.5
 
       
–  other assurance services
  
 
0.3


0.5


0.5
 
       
–  tax advisory services


–  tax compliance


–  audit of defined benefit schemes of the Company
  
 
0.4


0.5


0.4
 
       
–  other non-audit services


8.7


9.5


9.4
 
The total auditor’s remuneration to KPMG firms and associates included above are £26.9 million (2020: £28.1 million; 2019: £25.2 million).
Under SEC regulations, the remuneration to KPMG firms and associates of £26.9 million in 2021 (2020: £28.1 million; 2019: £25.1 million) is required to be presented as follows: audit fees £26.2 million (2020: £27.5 million; 2019: £24.7 million), audit-related fees £0.4 million (2020: £0.5 million; 2019: £0.4 million), tax fees £nil (2020: £nil; 2019: £nil) and all other fees £0.3 million (2020: £0.1 million; 2019: £0.1 million). Audit-related fees are in respect of services provided to associated pension schemes. All other fees are in respect of other assurance services, including those provided over information derived from the financial information systems subject to audit or over the controls over those systems.
7 Restructuring and Integration Costs
Restructuring costs reflect the costs incurred as a result of initiatives to improve the effectiveness and the efficiency of the Group as a globally integrated enterprise. These costs represent additional expenses incurred that are not related to the normal business and day-to-day activities. These initiatives include the costs associated with Quantum, being a review of the Group’s organisational structure announced in 2019 to simplify the business and create a more efficient, agile and focused company. In 2019 and 2020, these also included a review of the Group’s manufacturing operations. It is expected that such restructuring programmes (related to Quantum) will be substantially complete by the end of 2022.
The costs of the Group’s initiatives are included in profit from operations under the following headings:
 
     
2021
£m
   
            2020
£m
    
            2019
£m
 
       
Employee benefit costs (note 3)
  
 
160


91


364
 
       
Depreciation, amortisation and impairment costs (note 4)
  
 
(11
 
 
151


63
 
       
Other operating income (note 5)


(7
       
Other operating expenses
  
 
1


166


145


150


408


565
 
The adjusting charge in 2021 relates to the cost of employee packages in respect of Quantum and the ongoing costs associated with initiatives to improve the effectiveness and efficiency of the Group as a globally integrated organisation. In addition, Quantum initiatives in certain countries have resulted in the move to above market business models utilising local distributors as importers. As a consequence, with the cessation of a physical presence in these markets, foreign exchange previously recognised in Other Comprehensive Income for these countries has been reclassified to the income statement and reported within other operating expenses (note 22(c)(i)).
Included under the Quantum initiatives above is a charge of £27 million, including £4 million for foreign exchange reclassified from equity (note 22(c)(i)), related to the Group’s withdrawal from Myanmar. In addition, as set out in note 4, goodwill in relation to Myanmar was impaired and charged to the income statement. These costs were recognised in 2021 as an adjusting item.
 
197


Table of Contents
BAT Annual Report and Form 20-F 2021
Financial Statements
Notes on Accounts
Continued
    
 
7 Restructuring and Integration Costs
Continued
The depreciation, amortisation and impairment costs in 2021 include a credit of £25 million due to a partial reversal of previously estimated impairment following the revision of factory rationalisation initiatives.
Included within other operating expenses is a credit of £59 million representing the release of an accrual on the successful conclusion of the dispute with former shareholders of Reynolds American, as explained in note 31.
The adjusting charges in 2020 and 2019 relate to the ongoing restructuring costs associated with the implementation of revisions to the Group’s operating model, mainly in relation to Quantum, including the cost of packages in respect of permanent headcount reduction and permanent employee benefit reductions in the Group. The costs also cover the downsizing and factory rationalisation activities in the Netherlands and Hungary in 2020, Germany in 2019, and Russia and APME in both 2020 and 2019.
Also, in 2020, as a consequence of a reduction in volumes due to the significant increase in excise in Indonesia, the Group announced a restructuring programme which included the partial closure of the factory operations in Indonesia. As a result of this decision, a £69 million impairment was recognised in respect of machinery. This impairment charge related to some of the machinery in use as well as machinery held for future use which, following the significant changes in consumer preferences, is not expected to be brought in to manufacturing in the future.
Also included in other operating income in 2019 are amounts related to cash and reversal of deferred consideration associated with the acquisition of TDR d.o.o. (TDR) (note 27).
8 Net finance Costs
(a) Net finance costs/(income)
 
     
2021
£m
   
            2020
£m
   
            2019
£m
 
       
Interest expense
  
 
1,436


1,605


1,676
 
       
Interest expense on lease liabilities
  
 
24


26


32
 
       
Facility fees
  
 
33


23


10
 
       
Interest and fair value related to early repurchase of bonds (note 8(b))


142


Interest related to adjusting tax payables (note 8(b))
  
 
31


11


80
 
       
Fair value changes on derivative financial instruments and hedged items
  
 
252


(217
 
 
367
 
       
Fair value change on other financial items (note 8(b))
  
 
24


Exchange differences
  
 
(279
 
 
205


(479
       
Finance costs
  
 
1,521


1,795


1,686
 
       
Interest under the effective interest method
  
 
(35
 
 
(50
 
 
(84
       
Finance income
  
 
(35
 
 
(50
 
 
(84
       
Net finance costs
  
 
1,486


1,745


1,602
 
The Group manages foreign exchange gains and losses and fair value changes on a net basis excluding adjusting items, which are explained in note 8(b). The derivatives that generate the fair value changes are explained in note 19.
Facility fees principally relate to the Group’s central banking facilities.
In October 2020, the Group completed a tender offer to repurchase sterling-equivalent £2,653 million of bonds, including £24 million of accrued interest. Following this, in November 2020, the Group also completed a ‘make-whole’ bond redemption exercise of sterling-equivalent £462 million of bonds, including £6 million of accrued interest. Further details on the tender offer and ‘make-whole’ redemption exercise are provided in note 26. Other costs directly associated with the early repurchase of bonds, including the premium paid, were treated as adjusting items, as detailed in note 8(b).
(b) Adjusting items included in net finance costs
Adjusting items are significant items in net finance costs which individually or, if of a similar type, in aggregate, are relevant to an understanding of the Group’s underlying financial performance.
In 2021, as part of the disposal of the Group’s operations in Iran (note 27(d)), a provision of £24 million was charged to net finance costs against non-current investments held at fair value due to the uncertainty around recovery of these funds.
In addition, the Group recognised interest on adjusting tax payables of £31 million (2020: £11 million; 2019: £80 million), which included interest of £20 million (2020: £21 million; 2019: £28 million) in relation to the Franked Investment Income Group Litigation Order (FII GLO) (note 10(b)), an amnesty tax payment in Turkey of £11 million (2020: £nil; 2019: £nil) and £nil (2020: net credit of £10 million; 2019: charge of £50 million) in respect of the excise dispute (note 6(g)) and withholding tax in Russia.
In 2020, the Group incurred additional interest costs of £157 million and fair value gains of £15 million in relation to the early repurchase of bonds.
 
198 


Table of Contents
BAT Annual Report and Form 20-F 2021    
 
Strategic Report        
 
Governance Report        
  
Financial Statements        
  
        Other Information        


9 Associates and Joint Ventures
 
    
2021
    
2020
    
2019


                Total
£m
    
    Group’s
share
£m
    
                Total
£m
    
    Group’s
share
£m
    
                Total
£m
    
    Group’s
share
£m
 
             
Revenue
  
 
7,668


2,164


7,001


1,983


7,581


2,158
 
             
Profit from operations
  
 
1,911


567


2,006


591


2,386


704
 
             
Net finance costs
  
 
13


2


(6
  
 
(2
  
 
(7
  
 
(2
             
Profit on ordinary activities before taxation
  
 
1,924


569


2,000


589


2,379


702
 
             
Taxation on ordinary activities
  
 
(499
  
 
(147
  
 
(421
  
 
(125
  
 
(666
  
 
(196
             
Profit on ordinary activities after taxation
  
 
1,425


422


1,579


464


1,713


506
 
             
Non-controlling interests
  
 
(22
  
 
(7
  
 
(30
  
 
(9
  
 
(27
  
 
(8
             
Post-tax results of associates and joint ventures
  
 
1,403


415


1,549


455


1,686


498
 
Enumerated below are movements that have impacted the post-tax results of associates and joint ventures in 2021, 2020 and 2019. The amounts below were reported as adjusting items under the share of profit from associates in the income statement.
(a) Adjusting items
In 2021, the Group’s interest in ITC Ltd. (ITC) decreased from 29.42% to 29.38% (2020: 29.46% to 29.42%; 2019: 29.57% to 29.46%) as a result of ITC issuing ordinary shares under the ITC Employee Share Option Scheme. The issue of these shares and change in the Group’s share of ITC resulted in a gain of £6 million (2020: £17 million; 2019: £25 million), which is treated as a deemed partial disposal and included in the income statement.
In 2021, due to a challenging operating environment, the investment in Kamaran Industry & Investment Company, one of the Group’s associates in Yemen, was impaired. This resulted in a charge of £18 million to the income statement.
As detailed in note 14, as a result of the liquidation of Tisak d.d., the Group reclassified the foreign exchange previously recognised in other comprehensive income to the income statement. This resulted in a credit of £2 million to the income statement.
Also, in 2021, the Group incurred a £2 million charge in relation to the amortisation of acquired intangibles associated with the acquisition of Organigram in March 2021, as described in note 14.
In 2020, ITC recognised a charge in respect of the cost of leaf tobacco stocks destroyed in a third-party warehouse fire, the Group’s share of which was £4 million.
(b) Other financial information
The Group’s share of the results of associates and joint ventures is shown in the table below.
 
    
2021
    
2020
   
2019


  Group’s
share
£m
    
  Group’s
share
£m
   
  Group’s
share
£m
 
       
Profit on ordinary activities after taxation
                         
       
– attributable to owners of the Parent
  
 
415


455


498
 
       
Other comprehensive income:
                         
       
Items that may be reclassified to profit and loss
  
 
(17
  
 
(98
 
 
(115
       
Items that will not be reclassified to profit and loss
  
 
14


(34
 
 
7
 
       
Total comprehensive income
  
 
412


323


390
 
 
199


Table of Contents
BAT Annual Report and Form 20-F 2021
Financial Statements
Notes on Accounts
Continued
    
 
9 Associates and Joint Ventures
Continued
Summarised financial information of the Group’s associates and joint ventures is shown below.
 
      
2021


ITC
£m
      
    Others
£m
    
    Total
£m
 
       
Revenue
    
 
5,312


2,356


7,668
 
       
Profit on ordinary activities before taxation
    
 
1,931


(7
  
 
1,924
 
       
Post-tax results of associates and joint ventures
    
 
1,427


(24
  
 
1,403
 
       
Other comprehensive income
    
 
(11


(11
       
Total comprehensive income
    
 
1,416


(24
  
 
1,392


2020


ITC
£m
      
    Others
£m
    
    Total
£m
 
       
Revenue
    
 
4,892


2,109


7,001
 
       
Profit on ordinary activities before taxation
    
 
1,930


70


2,000
 
       
Post-tax results of associates and joint ventures
    
 
1,495


54


1,549
 
       
Other comprehensive income
    
 
(450


(450
       
Total comprehensive income
    
 
1,045


54


1,099


2019


ITC
£m
      
    Others
£m
    
    Total
£m
 
       
Revenue
    
 
5,556


2,025


7,581
 
       
Profit on ordinary activities before taxation
    
 
2,322


57


2,379
 
       
Post-tax results of associates and joint ventures
    
 
1,646


40


1,686
 
       
Other comprehensive income
    
 
(365


(365
       
Total comprehensive income
    
 
1,281


40


1,321
 
 
200


Table of Contents
BAT Annual Report and Form 20-F 2021    
 
Strategic Report        
 
Governance Report        
  
Financial Statements        
  
        Other Information        


10 Taxation on Ordinary Activities
(a) Summary of taxation on ordinary activities
 
     
2021
£m
   
2020
£m
   
2019
£m
 
       
UK corporation tax
  
 
(25
 
 
38


8
 
       
Comprising:
                        
       
– current year tax expense
  
 
1


38


41
 
       
– adjustments in respect of prior periods
  
 
(26


(33
       
Overseas tax
  
 
2,401


    2,387


    2,047
 
       
Comprising:
                        
       
– current year tax expense
  
 
2,418


2,369


2,074
 
       
– adjustments in respect of prior periods
  
 
(17
 
 
18


(27
       
Total current tax
  
 
2,376


2,425


2,055
 
       
Deferred tax
  
 
(187
 
 
(317
 
 
8
 
       
Comprising:
                        
       
– deferred tax relating to origination and reversal of temporary differences
  
 
(29
 
 
(184
 
 
55
 
       
– deferred tax relating to changes in tax rates
  
 
(158
 
 
(133
 
 
(47


2,189


2,108


2,063
 
(b) Franked Investment Income Group Litigation Order
The Group is the principal test claimant in an action in the United Kingdom against HM Revenue and Customs (HMRC) in the Franked Investment Income Group Litigation Order (FII GLO). There were 18 corporate groups in the FII GLO as at 31 December 2021. The case concerns the treatment for UK corporate tax purposes of profits earned overseas and distributed to the UK.
The original claim was filed in 2003. The trial of the claim was split broadly into issues of liability and quantification. The main liability issues were heard by the High Court, Court of Appeal and Supreme Court in the UK and the European Court of Justice in the period to November 2012. The detailed technical issues of the quantification mechanics of the claim were heard by the High Court during May and June 2014 and the judgment handed down on 18 December 2014. The High Court determined that in respect of issues concerning the calculation of unlawfully charged corporation tax and advance corporation tax, the law of restitution including the defence on change of position and questions concerning the calculation of overpaid interest, the approach of the Group was broadly preferred. The conclusion reached by the High Court would, if upheld, produce an estimated receivable of £1.2 billion for the Group. Appeals on a majority of the issues were made to the Court of Appeal, which heard the arguments in June 2016. The Court of Appeal determined in November 2016 on the majority of issues that the conclusion reached by the High Court should be upheld. The Supreme Court gave permission for a number of issues to be appealed in two separate hearings. The first, in February 2020, concerned the time limit for bringing claims. HMRC sought to challenge existing case law. In November 2020, the Supreme Court handed down its judgment. The Supreme Court agreed to overturn existing case law partially but introduced a new test for determining whether claims of this type are in time. The case has been remitted to the High Court to apply that new test to the facts. The second hearing was heard in December 2020 and concerned issues relating to the type of claims BAT is entitled to bring. The judgment from the second hearing was handed down in July 2021. Applying that judgment reduces the value of the FII claim to approximately £0.3 billion, mainly as the result of the application of simple interest and the limitation to claims for advance corporation tax offset against lawful corporation tax charges, which is subject to the determination of the timing issue by the High Court and any subsequent appeal.
During 2015, HMRC paid to the Group a gross amount of £1,224 million in two separate payments. The payments made by HMRC have been made without any admission of liability and are subject to refund were HMRC to succeed on appeal. The second payment in November 2015 followed the introduction of a new 45% tax on the interest component of restitution claims against HMRC. HMRC held back £261 million from the second payment contending that it represents the new 45% tax on that payment, leading to total cash received by the Group of £963 million. Actions challenging the legality of the withholding of the 45% tax have been lodged by the Group. The First Tier Tribunal found in favour of HMRC in July 2017 and the Group’s appeal to the Upper Tribunal was heard in July 2018 and judgment has not yet been handed down.
The net £0.9 billion held by the Group is higher than the current value of the claim referred to above. Due to the uncertainty of the amounts and eventual outcome, the Group has not recognised any impact in the Income Statement in the current or prior period. The receipt, net of the deduction by HMRC, is held within trade and other payables as disclosed in note 25. Any future recognition as income will be treated as an adjusting item, due to the size of the amount, with interest of £20 million for the 12 months to 31 December 2021 (2020: £21 million; 2019: £28 million) accruing on the balance, which was also treated as an adjusting item.
The final resolution of all issues in the litigation is likely to take a number of years and the Group intends from 2022 onwards to commence annual interim repayments to HMRC of at least £50 million per annum.
 
201 


Table of Contents

BAT Annual Report and Form 20-F 2021
Financial Statements
Notes on Accounts
Continued
    
 
10 Taxation on Ordinary Activities
Continued
(c) Factors affecting the taxation charge
The taxation charge differs from the standard 19% (2020: 19%; 2019: 19%) rate of corporation tax in the UK. The major causes of this difference are listed below:
 
      
2021
    
2020
    
2019


£m
    
%
    
£m
    
%
    
£m
    
%
 
             
Profit before tax
    
 
    9,163


    8,672


7,912


Less: share of post-tax results of associates and joint ventures (see note 9)
    
 
(415


(455


(498


8,748


8,217


7,414


Tax at 19% (2020 and 2019: 19%) on the above
    
 
  1,662


    19.0


  1,561


    19.0


  1,409


    19.0
 
             
Factors affecting the tax rate:
                                                       
             
Tax at standard rates other than UK corporation tax rate
    
 
319


3.6


368


4.5


353


4.8
 
             
Other national tax charges
    
 
184


2.1


142


1.7


147


2.0
 
             
Permanent differences
    
 
87


1.0


20


0.3


122


1.6
 
             
Overseas withholding taxes
    
 
189


2.2


155


1.9


106


1.4
 
             
Double taxation relief on UK profits
    
 
(23
  
 
(0.3
  
 
(22
  
 
(0.3
  
 
(29
  
 
(0.4
             
(Utilised)/unutilised tax losses
    
 
(10
  
 
(0.1
  
 
5


0.1


16


0.2
 
             
Adjustments in respect of prior periods
    
 
(43
  
 
(0.5
  
 
18


0.2


(60
  
 
(0.8
             
Deferred tax relating to changes in tax rates
    
 
(158
  
 
(1.8
  
 
(133
  
 
(1.6
  
 
(47
  
 
(0.6
             
Additional net deferred tax (credits)/charges
    
 
(18
  
 
(0.2
  
 
(6
  
 
(0.1
  
 
46


0.6


2,189


25.0


2,108


25.7


2,063


27.8
 
(d) Adjusting items included in taxation
In 2021, adjusting items in taxation included a net credit of £91 million mainly relating to the revaluation of deferred tax liabilities arising on trademarks recognised in the Reynolds American acquisition in 2017 due to changes in U.S. state tax rates.
In 2020, adjusting items in taxation included a net credit of £35 million mainly relating to the release of a provision regarding the application of overseas withholding tax, the revaluation of deferred tax liabilities arising on trademarks recognised in the Reynolds American acquisition in 2017 due to changes in U.S. state tax rates and the excise dispute in Russia (note 6(g)).
In 2019, adjusting items in taxation total a credit of £65 million relating primarily to changes in U.S. state tax rates, relating to the revaluation of deferred tax liabilities arising on trademarks recognised in the Reynolds American acquisition in 2017.
(e) Tax on adjusting items
In addition, the tax on adjusting items, separated between the different categories, as per note 11, amounted to £119 million (2020: £287 million; 2019: £373 million). The adjustment to the adjusted earnings per share (note 11) also includes £6 million (2020: £8 million; 2019: £17 million) in respect of the non-controlling interests’ share of the adjusting items net of tax.
(f) Tax on items recognised directly in other comprehensive income
 
       
      2021
£m
    
      2020
£m
    
      2019
£m
 
       
Current tax
    
 
(4
  
 
(5
  
 
(7
       
Deferred tax
    
 
(110
  
 
23


138
 
       
(Charged)/credited to other comprehensive income
    
 
(114
  
 
18


131
 
(g) Tax on items recognised directly in equity
In relation to the perpetual hybrid bonds issued on 27 September 2021 (note 22(d)), tax relief of £5 million has been recognised on the issuance costs and coupon incurred.
 
202 


Table of Contents
BAT Annual Report and Form 20-F 2021    
 
Strategic Report        
 
Governance Report        
  
Financial Statements        
  
        Other Information        


11 Earnings Per Share
Earnings used in the basic, diluted and headline earnings per share calculation represent the profit attributable to the ordinary equity shareholders after deducting amounts representing the coupon on perpetual hybrid bonds on a pro-rata basis regardless of whether coupons have been deferred or paid in the period. Below is a reconciliation of the earnings used to calculate earnings per share:
 
       
2021
£m
    
2020
£m
      
2019
£m
 
       
Earnings attributable to owners of the parent
    
 
6,801


6,400


5,704
 
       
Coupon on perpetual hybrid bonds
    
 
(15


Tax on coupon on perpetual hybrid bonds
    
 
3


Earnings
    
 
    6,789


    6,400


    5,704
 
Below is a reconciliation from basic to diluted earnings per share:
 
    
2021
   
2020
   
2019


Earnings
£m
    
Weighted
average
number of
shares
m
    
Earnings
per share
pence
   
Earnings
£m
    
Weighted
average
number of
shares
m
    
Earnings
per share
pence
   
Earnings
£m
    
Weighted
average
number of
shares
m
    
Earnings
per share
pence
 
                   
Basic earnings per share (ordinary shares of 25p each)
  
 
6,789


2,287


296.9


6,400


2,286


280.0


5,704


2,284


249.7
 
                   
Share options


10


(1.3


9


(1.1


7


(0.7
                   
Diluted earnings per share
  
 
6,789


2,297


295.6


6,400


2,295


278.9


5,704


2,291


249.0
 
Adjusted earnings per share calculation
Earnings have been affected by a number of adjusting items, which are described in notes 3 to 10. Adjusting items are significant items in the profit from operations, net finance costs, taxation and the Group’s share of the post-tax results of associates and joint ventures which individually or, if of a similar type, in aggregate, are relevant to an understanding of the Group’s underlying financial performance. The Group believes that these items are useful to users of the Group financial statements in helping them to understand the underlying business performance. To illustrate the impact of these items, an adjusted earnings per share calculation is shown below.
 
          
Basic


2021
   
2020
   
2019


Notes
   
        Earnings
£m
   
Earnings
  per share
pence
   
        Earnings
£m
   
Earnings
  per share
pence
   
          Earnings
£m
   
Earnings
  per share
pence
 
               
Basic earnings per share
          
 
6,789


296.9


6,400


280.0


5,704


249.7
 
               
Effect of restructuring and integration costs
  
 
7


150


6.5


408


17.8


565


24.7
 
               
Tax and non-controlling interests on restructuring and integration costs
          
 
(39
 
 
(1.7
 
 
(64
 
 
(2.8
 
 
(101
 
 
(4.4
               
Effect of amortisation and impairment of goodwill, trademarks and similar intangibles
  
 
4


363


15.9


548


24.0


675


29.6
 
               
Tax and non-controlling interests on amortisation and impairment of goodwill, trademarks and similar intangibles
          
 
(71
 
 
(3.1
 
 
(77
 
 
(3.4
 
 
(115
 
 
(5.0
               
Effect of associates’ adjusting items net of tax
  
 
9(a
 
 
12


0.5


(13
 
 
(0.6
 
 
(25
 
 
(1.1
               
Effect of Quebec class action
  
 
6(h


436


19.1
 
               
Tax on Quebec class action


(124
 
 
(5.4
               
Effect of excise and VAT disputes
  
 
6(g
 
 
26


1.1


(40
 
 
(1.7
 
 
202


8.9
 
               
Tax on excise and VAT disputes
  
 
10(d
 
 
(3
 
 
(0.1
 
 
14


0.6


(16
 
 
(0.7
               
Effect of disposal of BAT Pars
  
 
6(f
 
 
358


15.7


Other adjusting items
  
 
3,6(d
 
 
19


0.8


487


21.2


236


10.3
 
               
Tax effect on other adjusting items
          
 
(5
 
 
(0.2
 
 
(104
 
 
(4.5
 
 
(50
 
 
(2.2
               
Deferred tax relating to changes in tax rates
  
 
10


(98
 
 
(4.3
 
 
(21
 
 
(0.9
 
 
(49
 
 
(2.2
               
Effect of early repurchase of bonds
  
 
8(b


142


6.2


Tax effect of early repurchase of bonds


(32
 
 
(1.4


Effect of interest on FII GLO settlement and other
  
 
8(b
 
 
55


2.4


11


0.5


80


3.5
 
               
Tax effect of interest on FII GLO settlement and other


(4
 
 
(0.2


Effect of retrospective guidance on WHT
  
 
10(d


(42
 
 
(1.8


Adjusted earnings per share (basic)
          
 
7,556


330.4


7,613


333.0


7,418


324.8
 
 
203


Table of Contents
BAT Annual Report and Form 20-F 2021
Financial Statements
Notes on Accounts
Continued
    
 
11 Earnings Per Share
Continued
 
          
Diluted
 
          
2021
   
2020
   
2019


Notes
   
        Earnings
£m
   
Earnings
per share
pence
   
        Earnings
£m
   
Earnings
per share
pence
   
        Earnings
£m
   
Earnings
per share
pence
 
               
Diluted earnings per share
          
 
6,789


295.6


6,400


278.9


5,704


249.0
 
               
Effect of restructuring and integration costs
  
 
7


150


6.6


408


17.7


565


24.7
 
               
Tax and non-controlling interests on restructuring and integration costs
          
 
(39
 
 
(1.7
 
 
(64
 
 
(2.8
 
 
(101
 
 
(4.4
               
Effect of amortisation and impairment of goodwill, trademarks and similar intangibles
  
 
4


363


15.8


548


23.9


675


29.5
 
               
Tax and non-controlling interests on amortisation and impairment of goodwill, trademarks and similar intangibles
          
 
(71
 
 
(3.1
 
 
(77
 
 
(3.4
 
 
(115
 
 
(5.0
               
Effect of associates’ adjusting items net of tax
  
 
9(a
 
 
12


0.5


(13
 
 
(0.6
 
 
(25
 
 
(1.1
               
Effect of Quebec class action
  
 
6(h


436


19.0
 
               
Tax on Quebec class action


(124
 
 
(5.4
               
Effect of excise and VAT disputes
  
 
6(g
 
 
26


1.1


(40
 
 
(1.7
 
 
202


8.8
 
               
Tax on excise and VAT disputes
  
 
10(d
 
 
(3
 
 
(0.1
 
 
14


0.6


(16
 
 
(0.7
               
Effect of disposal of BAT Pars
  
 
6(f
 
 
358


15.6


Other adjusting items
  
 
3,6(d
 
 
19


0.8


487


21.2


236


10.3
 
               
Tax effect on other adjusting items
          
 
(5
 
 
(0.2
 
 
(104
 
 
(4.5
 
 
(50
 
 
(2.2
               
Deferred tax relating to changes in tax rates
  
 
10


(98
 
 
(4.3
 
 
(21
 
 
(0.9
 
 
(49
 
 
(2.2
               
Effect of early repurchase of bonds
  
 
8(b


142


6.2


Tax effect of early repurchase of bonds


(32
 
 
(1.4


Effect of interest on FII GLO settlement and other
  
 
8(b
 
 
55


2.4


11


0.5


80


3.5
 
               
Tax effect of interest on FII GLO settlement and other


(4
 
 
(0.2


Effect of retrospective guidance on WHT
  
 
10(d


(42
 
 
(1.8


Adjusted earnings per share (diluted)


7,556


329.0


7,613


331.7


7,418


323.8
 
 
204


Table of Contents
BAT Annual Report and Form 20-F 2021    
 
Strategic Report        
 
Governance Report        
  
Financial Statements        
  
        Other Information        


11 Earnings Per Share
Continued
Headline earnings per share as required by the JSE Limited
The presentation of headline earnings per share, as an alternative measure of earnings per share, is mandated under the JSE Listing Requirements. It is calculated in accordance with Circular 1/2021 ‘Headline Earnings’, as issued by the South African Institute of Chartered Accountants.
 
      
Basic


2021
    
2020
    
2019


        Earnings
£m
    
Earnings
per share
pence
    
        Earnings
£m
    
Earnings
per share
pence
    
        Earnings
£m
    
Earnings
per share
pence
 
             
Basic earnings per share
    
 
6,789


296.9


6,400


280.0


5,704


249.7
 
             
Effect of impairment of intangibles, property, plant and equipment and assets held-for-sale
    
 
138


6.0


465


20.3


518


22.7
 
             
Tax and non-controlling interests on impairment of intangibles and property, plant and equipment
    
 
(42
  
 
(1.8
  
 
(74
  
 
(3.3
  
 
(79
  
 
(3.5
             
Effect of (gains)/losses on disposal of property, plant and equipment, held-for-sale assets, partial/full termination of IFRS 16 leases, and sale and leaseback
    
 
(10
  
 
(0.4
  
 
(26
  
 
(1.1
  
 
7


0.3
 
             
Tax and non-controlling interests on disposal of property, plant and equipment, held-for-sale assets, partial/full termination of IFRS 16 leases, and sale and leaseback
    
 
2


0.1


8


0.3


(1


Effect of impairment of BAT Pars
    
 
83


3.6


Tax on impairment of BAT Pars


Effect of foreign exchange reclassification from reserves to the income statement
                                                       
             
– Subsidiaries
    
 
291


12.7


– Associates
    
 
(2
  
 
(0.1


Issue of shares and change in shareholding in associate
    
 
(6
  
 
(0.3
  
 
(17
  
 
(0.7
  
 
(25
  
 
(1.1
             
Headline earnings per share (basic)
    
 
7,243


316.7


6,756


295.5


6,124


268.1


Diluted


2021
    
2020
    
2019


        Earnings
£m
    
Earnings
per share
pence
    
        Earnings
£m
    
Earnings
per share
pence
    
        Earnings
£m
    
Earnings
per share
pence
 
             
Diluted earnings per share
    
 
6,789


295.6


6,400


278.9


5,704


249.0
 
             
Effect of impairment of intangibles, property, plant and equipment and assets held-for-sale
    
 
138


6.0


465


20.3


518


22.5
 
             
Tax and non-controlling interests on impairment of intangibles and property, plant and equipment
    
 
(42
  
 
(1.8
  
 
(74
  
 
(3.3
  
 
(79
  
 
(3.4
             
Effect of (gains)/losses on disposal of property, plant and equipment, held-for-sale assets, partial/full termination of IFRS 16 leases, and sale and leaseback
    
 
(10
  
 
(0.4
  
 
(26
  
 
(1.1
  
 
7


0.3
 
             
Tax and non-controlling interests on disposal of property, plant and equipment, held-for-sale assets, partial/full termination of IFRS 16 leases, and sale and leaseback
    
 
2


0.1


8


0.3


(1


Effect of impairment of BAT Pars
    
 
83


3.6


Tax on impairment of BAT Pars


Effect of foreign exchange reclassification from reserves to the income statement
                                                       
             
– Subsidiaries
    
 
291


12.6


– Associates
    
 
(2
  
 
(0.1


Issue of shares and change in shareholding in associate
    
 
(6
  
 
(0.3
  
 
(17
  
 
(0.7
  
 
(25
  
 
(1.1
             
Headline earnings per share (diluted)
    
 
7,243


315.3


6,756


294.4


6,124


267.3
 
 
205


Table of Contents
BAT Annual Report and Form 20-F 2021
Financial Statements
Notes on Accounts
Continued
    
 
12 Intangible Assets
(a) Overview of intangible assets
 
    
2021


        Goodwill
£m
   
Computer
software
£m
   
Trademarks
and
similar
intangibles
£m
   
Assets in
the course of
development
£m
   
Total
£m
 
           
1 January
                                        
           
Cost
  
 
43,319


1,307


73,598


120


118,344
 
           
Accumulated amortisation and impairment


(885
 
 
(2,116


(3,001
           
Net book value at 1 January
  
 
43,319


422


71,482


120


115,343
 
           
Differences on exchange
  
 
(68
 
 
(3
 
 
640


569
 
           
Additions
                                        
           
– internal development


139


139
 
           
– separately acquired


60


33


93
 
           
Reallocations


118


18


(136


Amortisation charge


(116
 
 
(319


(435
           
Impairment
  
 
(57
 
 
(13
 
 
(14


(84
           
31 December
                                        
           
Cost
  
 
43,194


1,266


74,227


156


118,843
 
           
Accumulated amortisation and impairment


(858
 
 
(2,360


(3,218
           
Net book value at 31 December
  
 
43,194


408


71,867


156


115,625


2020


        Goodwill
£m
   
Computer
software
£m
   
    Trademarks
and
similar
intangibles
£m
   
Assets in
the course of
development
£m
   
Total
£m
 
           
1 January
                                        
           
Cost
  
 
44,316


1,207


75,726


115


121,364
 
           
Accumulated amortisation and impairment


(780
 
 
(1,797


(2,577
           
Net book value at 1 January
  
 
44,316


427


73,929


115


118,787
 
           
Differences on exchange
  
 
(824
 
 
(3
 
 
(2,252


(3,079
           
Additions
                                        
           
– internal development


142


142
 
           
– acquisitions (note 27)
  
 
36


39


75
 
           
– separately acquired


103


13


116
 
           
Reallocations


127


23


(150


Amortisation charge


(121
 
 
(338


(459
           
Impairment
  
 
(209
 
 
(8
 
 
(22


(239
           
31 December
                                        
           
Cost
  
 
43,319


1,307


73,598


120


118,344
 
           
Accumulated amortisation and impairment


(885
 
 
(2,116


(3,001
           
Net book value at 31 December
  
 
43,319


422


71,482


120


115,343
 
(b) Goodwill
Goodwill of £43,194 million (2020: £43,319 million) is included in intangible assets in the balance sheet of which the following are the significant acquisitions: Reynolds American £33,021 million (2020: £32,719 million); Rothmans Group £4,408 million (2020: £4,591 million); Imperial Tobacco Canada £2,345 million (2020: £2,304 million); ETI (Italy) £1,384 million (2020: £1,474 million) and ST (principally Scandinavia) £1,043 million (2020: £1,111 million). The principal allocations of goodwill in the Rothmans’ acquisition are to the cash-generating units of Europe and South Africa, with the remainder mainly relating to operations in APME.
During 2021, the Group recognised a goodwill impairment charge of £57 million (2020: £209 million) as explained in note 12(e)(iv) below.
 
206


Table of Contents
BAT Annual Report and Form 20-F 2021    
 
Strategic Report        
 
Governance Report        
  
Financial Statements        
  
        Other Information        


12 Intangible Assets
Continued
(c) Trademarks and similar intangibles
Trademarks and similar intangibles with indefinite lives
The net book value of trademarks and similar intangibles with indefinite lives is £69,475 million (2020: £68,839 million) and relates to the acquisition of Reynolds American. The trademarks acquired, including Newport, Camel, Natural American Spirit, Grizzly and Pall Mall, all of which are part of the Group’s Strategic Portfolio of key brands, form the core focus of the U.S. business and receive significant support in the form of dedicated internal resources, forecasting and, where appropriate, marketing investment. These trademarks have significant market share and positive cashflow growth expectations. There are no regulatory or contractual restrictions on the use of the trademarks, and there are no plans by management to significantly redirect resources elsewhere. Consequently, in the view of management, these trademarks do not have a foreseeable and definite end to their ability to generate future cash flows and hence are not amortised.
Trademarks and similar intangibles with definite lives
The majority of trademarks and similar intangibles with definite lives relate to trademarks acquired in previous years. These trademarks are amortised over their expected useful lives, which do not exceed 20 years. Included in the net book value of trademarks and similar intangibles are trademarks relating to the acquisition of Reynolds American £2,038 million (2020: £2,260 million). In 2020, the Group acquired the formulations, brands, associated know-how and other relevant assets owned by Dryft Sciences, LLC, relating to its white nicotine pouch products. These have been accounted as trademarks with a value of £103 million (see note 27(c)).
Also, in 2020, due to the migration to Vuse and difficult trading conditions in South Africa and the delisting of certain brands in Belize, the Group recognised an impairment charge of £18 million.
(d) Computer software and assets in the course of development
Included in computer software and assets in the course of development are internally developed assets with a carrying value of £517 million (2020: £513 million). The costs of internally developed assets include capitalised expenses of employees working full time on software development projects, third-party consultants and software licence fees from third-party suppliers.
The Group has £2 million of future contractual commitments (2020: £6 million) related to intangible assets.
(e) Impairment testing
(i) Overview
a. Estimation uncertainty
As described in note 1, the critical accounting estimates used in the preparation of the consolidated financial statements include the review of asset values, especially indefinite life assets such as goodwill and certain trademarks and similar intangibles.
There is significant judgement with regard to assumptions and estimates involved in the forecasting of future cash flows, which form the basis of the assessment of the recoverability of these assets, with the effect that the value-in-use of calculations incorporate estimation uncertainty, particularly for certain assets held in relation to the Canadian, U.S., Malaysian, Peruvian and South African markets and the Global Travel Retail (GTR) business.
b. Impact of climate change
The impact of climate change on the future cash flows has been considered for scenarios analysed in terms of future access to tobacco and nicotine. The climate change scenario analyses – conducted in line with TCFD recommendations – undertaken this year did not identify any material financial impact.
(ii) Impairment testing – Trademarks and similar intangibles with indefinite lives (brands)
The trademarks and similar intangibles with indefinite lives (brands) have been tested for impairment on a value-in-use basis. The value-in-use calculations use cash flows based on detailed brand budgets prepared by management using projected sales volumes, revenues and projected brand profitability covering a five-year horizon and, thereafter, grown into perpetuity. Corporate costs are allocated to the brand budgets based on either specific allocations, where appropriate, or based on volumes. The pre-tax discount rates, ranging between 8.71% and 9.94%, and long-term growth rates of between 0.75% and 1%, applied to the brand value-in-use calculations have been determined by local management based on experience, specific market and brand trends and pricing and cost expectations. Following the application of a reasonable range of sensitivities, there was no indication of impairment.
Refer to note 12(e)(v) for further information on the Newport and Camel brand impairment testing. As the trademarks and similar intangibles with indefinite lives relate to the acquisition of Reynolds American, the brand budgets used in the value-in-use calculations have also been incorporated into the budget information used in the impairment testing of the Reynolds American goodwill.
 
207


Table of Contents
BAT Annual Report and Form 20-F 2021
Financial Statements
Notes on Accounts
Continued
    
 
12 Intangible Assets
Continued
(iii) Cash-generating units and information on goodwill impairment testing
In 2021, goodwill was allocated for impairment testing purposes to 17 (2020: 19) individual cash-generating units – one in the U.S. (2020: one), six in APME (2020: six), six in AMSSA (2020: seven) and four in ENA (2020: five).
The number of cash-generating units in AMSSA and ENA reduced by one as a result of the 2020 impairment of goodwill in Twisp and Blue Nile (note 12(e)(iv)).
 
    
2021
   
2020


        Carrying
amount
£m
    
Pre-tax
discount
rate
%
   
        Carrying
amount
£m
    
Pre-tax
discount rate
%
 
         
Cash-generating unit
                                  
         
Reynolds American
  
 
33,021


8.4


32,719


7.6
 
         
Europe
  
 
5,362


6.1


5,639


6.2
 
         
Canada
  
 
2,345


19.3


2,304


19.1
 
         
Australia
  
 
719


6.8


756


7.9
 
         
South Africa
  
 
512


14.6


552


11.5
 
         
Singapore
  
 
352


8.2


356


9.6
 
         
GTR
  
 
233


7.7


241


6.5
 
         
Malaysia
  
 
226


11.2


232


10.3
 
         
Peru
  
 
91


10.7


145


9.5
 
         
Other
  
 
333


6.8


375


7.8
 
         
Total
  
 
43,194


43,319


Included within ‘Other’ above is goodwill arising on various acquisitions that have been allocated to eight cash-generating units which are, individually, insignificant. The pre-tax discount rate represents the weighted average pre-tax discount rate.
The recoverable amounts of all cash-generating units have been determined on a value-in-use basis. The key assumptions for the recoverable amounts of all units are the budgeted volumes, revenues, operating margins and terminal growth rates, which directly impact the cash flows, and the discount rates used in the calculation. The long-term growth rate is used purely for the impairment testing of goodwill under IAS 36
Impairment of Assets
and does not reflect long-term planning assumptions used by the Group for investment proposals or for any other assessments.
Pre-tax discount rates, as shown above, were used in the impairment testing, based on the Group’s weighted average cost of capital, taking into account the cost of capital and borrowings, to which specific market-related premium adjustments are made. These adjustments are derived from external sources and are based on the spread between bonds (or credit default swaps, or similar indicators) issued by the U.S. or comparable governments and by the relevant local government, adjusted for the Group’s own credit market risk. For ease of use and consistency in application, these results are periodically calibrated into bands based on internationally recognised credit ratings. The long-term growth rates and discount rates have been applied to the budgeted cash flows of each cash-generating unit. These cash flows have been determined by local management based on experience, specific market and brand trends, as well as pricing and cost expectations. These have been endorsed by Group management as part of the consolidated Group’s budget.
(iv) Impairment testing – Goodwill (excluding Reynolds American and Canada)
The value-in-use calculations use cash flows based on detailed financial budgets prepared by management covering a one-year period extrapolated over a
10-year
horizon with growth of 3% (2020: 3%) in years 2 to 10 having been assumed as the long-term volume decline is more than offset by pricing to drive revenue growth.
A 10-year horizon is considered appropriate based on the Group’s history of profit and cash growth, its well-balanced portfolio of brands and the industry in which it operates. For recent acquisitions and start-up ventures the detailed financial budget is expanded to reflect the medium-term plan of the country or market management spanning five years or beyond.
As a result of difficult trading conditions, the above assumptions were amended to reflect the short- to medium-term plans of the country or area management spanning up to a period of five years for the Malaysian, GTR, South African and Peruvian cash-generating units.
Having recognised an impairment charge in 2020 due to difficult trading conditions in Malaysia (£197 million), including high incidence of illicit trade and downtrading, the Malaysian CGU assessment was amended to reflect the short- to medium-term country plans. As a result of the assessment, in 2021, no further deterioration in performance was identified requiring further impairment consideration. The Group will continue to monitor Malaysia’s performance going forward to identify if any impairment triggers materialise.
During 2021, GTR continued to experience difficult trading conditions as a consequence of the COVID-19 pandemic, as global travel continued to be significantly constrained. As a result, management prepared forecasted cashflows assuming a phased recovery, alongside maintaining the long-term growth rate at 0%. Following the application of a reasonable range of sensitivities, there was no indication of impairment. For the GTR cash-generating unit headroom to reduce to £nil, the forecast cash flows would need to reduce by a further 79% in each forecast year or the pre-tax discount rate would need to increase to 29.7%. Management believes that the duty-free business will recover and therefore both scenarios are not considered, at this stage, to be reasonably possible.
 
208


Table of Contents
BAT Annual Report and Form 20-F 2021    
 
Strategic Report        
 
Governance Report        
  
Financial Statements        
  
        Other Information        


12 Intangible Assets
Continued
South Africa continues to recover from a five-month sales ban in 2020, with the forecasted cashflows prepared to reflect the continued expected recovery. Following the application of a reasonable range of sensitivities, there was no indication of impairment. For the South African cash-generating unit headroom to reduce to £nil, the forecast cash flows would need to reduce by a further 23% in each forecast year or the pre-tax discount rate would need to increase to 18.9%. Management believes that the post-ban recovery will continue in South Africa and therefore both scenarios are not considered by management, at this stage, to be reasonably possible.
In Peru, due to continued difficult trading conditions as a consequence of the COVID-19 pandemic and its impact on the forecasted operating cashflows, the Group had recognised an impairment charge of £54 million in 2021. This partial impairment reduces the carrying value of goodwill to £91 million. Also, in 2021, the Group impaired in full the goodwill of Myanmar resulting in an impairment charge of £3 million.
The table below shows the headroom and the impairment charge that would be recognised if the assumptions used in the value-in-use calculation were changed:
 
    
Carrying
           
Increase in
         
Increase in
 
    
amount of
           
discount
   
Decrease in
   
terminal


CGU


Headroom


rate
1


cash flows
1


value
1
 
    
£m
    
£m
    
£m
   
£m
   
£m


Change in headroom/impairment charge
 
           
Cash-generating unit
                                          
           
Peru
1
  
 
91


(14
 
 
(10
 
 
(11
Note:
 
1.
Peru: reasonably possible changes in key assumptions that would result in additional impairment would be a 1.6% increase in the pre-tax discount rate, a 10% decrease in forecast cash flows reflecting a permanent loss in volumes arising from the COVID-19 pandemic or a 1% increase in terminal decline.
With the exception of the Peruvian cash-generating unit, following the application of a reasonable range of sensitivities to all the cash-generating units, and after reflecting the impairments above, there was no indication of any further impairment.
In 2020, the Group also impaired in full the goodwill arising from the acquisitions of Twisp in South Africa and Blue Nile in Sudan due to difficult trading conditions in these markets. This resulted in the recognition of impairment charges of £11 million and £1 million, respectively.
(v) Impairment testing – Reynolds American
Goodwill relating to Reynolds American and the Newport and Camel trademarks
On 29 April 2021, the FDA reconfirmed its intention to issue a proposed product standard to ban menthol as a characterising flavour in cigarettes. Management notes that the FDA announcement does not itself constitute a ban on menthol in cigarettes, and any proposed regulation of menthol in cigarettes would need to be introduced through the established U.S. comprehensive rule-making process, the timetable and outcome for which was, and remains, uncertain. Management continues to believe that any ban, given the mechanisms and processes required to be followed in the U.S., is unlikely to be implemented within the next five years. In addition, it is unclear how any such potential U.S. regulation might affect the manufacture and marketing of Group combustible brands containing menthol. The base case scenario used in the impairment model therefore does not include any potential impact of changes in regulation in relation to menthol flavourings in combustibles within the five-year discrete forecast period. Any potential impacts have been captured within the terminal growth rate and discount rates applied.
The Group has a long-standing track record of managing regulatory shifts and, in the event of regulatory change, the Group remains confident in its ability to navigate that environment successfully.
Since 2018, having considered the combination of the risk of implementation and impact of any change in regulations, the Group has not recognised any impairment on either the Newport or Camel brands or the Reynolds American goodwill, as management concluded that there would not be a significant impact to the value-in-use.
The carrying amounts for Reynolds American goodwill, Newport and Camel brands intangibles were £33,021 million, £29,517 million and £12,485 million, respectively (2020: £32,719 million, £29,248 million and £12,371 million). The value-in-use calculations for brands, as described in note 12(e)(ii) above, have been incorporated in the base case scenario used in the Reynolds American goodwill model. The value-in-use calculations have been prepared based on a five-year cash flow forecast which assumes long-term volume decline of cigarettes. This decline is more than offset by pricing. After this forecast, a growth rate of 1% has been assumed for Reynolds American goodwill, 0.75% for Newport and 0.85% for Camel and a pre-tax discount rate of 8.4% (2020: 7.6%), 9.9% (2020: 8.3%) and 9.4% (2020: 8.3%), respectively.
 
209


Table of Contents
BAT Annual Report and Form 20-F 2021
Financial Statements
Notes on Accounts
Continued
    
 
12 Intangible Assets
Continued
The excess of value-in-use earnings over the carrying values (headroom) of the Reynolds American goodwill and the Newport and Camel brands intangibles would be reduced to nil if the following individual changes, none of which are considered reasonably possible by management, were made to the key assumptions used in the impairment model.
 
     
Reynolds
American
goodwill
%
    
    Newport
%
    
        Camel
%
 
       
Assumptions
                          
       
Decrease in revenue by
  
 
7.2


15.1


15.2
 
       
Increase in pre-tax discount rate by
  
 
1.6


2.5


2.9
 
       
Decrease in terminal value rate by
  
 
1.4


5.1


5.6
 
For Reynolds American goodwill, the change in revenue assumption is based on combustibles revenue in the five-year forecast reducing by 7.2% in each year and assumes that other assumptions are not changed. For Newport and Camel, the change in revenue assumption is based on the revenue in the five-year forecast reducing by 15.1% and 15.2%, respectively in each year and assumes that other assumptions are not changed.
(vi) Impairment testing – Canada
Goodwill relating to Imperial Tobacco Canada Ltd (ITCAN)
In March 2019, ITCAN obtained an Initial Order from the Ontario Superior Court of Justice granting it protection under the Companies’ Creditors Arrangement Act (CCAA). If the CCAA bankruptcy protection were to end, significant liabilities might crystallise. As a consequence, to reflect the risk to future operating cash flows, the value-in-use calculations have been prepared based on a five-year cash flow forecast, after which a growth rate of -2.5% and a pre-tax discount rate of 19.3% (2020: 19.1%) have been assumed. Further information on the Quebec Class Actions and CCAA can be found in note 31.
In addition to the increase in discount rate, a reasonable range of sensitivities was applied to the value-in-use calculation, and there was no indication of impairment.
The excess of value-in-use earnings over the carrying values (headroom) of the ITCAN goodwill would be reduced to nil if the following individual changes, none of which are considered reasonably possible by management, were made to the key assumptions used in the impairment model. The change in revenue assumption is based on combustibles revenue in the five-year forecast reducing by 27.4% in each year and assumes that other assumptions are not changed.
 
     
Canada
goodwill
%
 
   
Assumptions
        
   
Decrease in revenue by
  
 
27.4
 
   
Increase in pre-tax discount rate by
  
 
14.7
 
The £2,345 million of goodwill relating to ITCAN on the Group’s balance sheet at 31 December 2021 will continue to be reviewed on a regular basis. Any future impairment charge would result in a non-cash charge to the income statement that will be treated as an adjusting item.
 
210


Table of Contents
BAT Annual Report and Form 20-F 2021    
 
Strategic Report        
 
Governance Report        
  
Financial Statements        
  
        Other Information        


13 Property, Plant and Equipment
(a) Overview of property, plant and equipment, including right-of-use assets
 
    
2021


        Freehold
property
£m
   
Leasehold
property
£m
   
Plant,
equipment
and other
owned
£m
   
Plant,
equipment
and other
leased
£m
   
Assets in the
course of
construction
£m
   
Total
£m
 
             
1 January
                                                
             
Cost
  
 
1,518


798


5,807


217


764


9,104
 
             
Accumulated depreciation and impairment
  
 
(444
 
 
(315
 
 
(3,175
 
 
(110
         
 
(4,044
             
Net book value at 1 January
  
 
1,074


483


2,632


107


764


5,060
 
             
Differences on exchange
  
 
(23
 
 
(22
 
 
(135
 
 
(5
 
 
(18
 
 
(203
             
Additions
                                                
             
– right-of-use assets


88


76


164
 
             
– separately acquired


1


45


508


554
 
             
Reallocations
  
 
44


51


441


1


(537


Depreciation
  
 
(35
 
 
(110
 
 
(303
 
 
(57


(505
             
Impairment
  
 
(4
 
 
(2
 
 
(37


(11
 
 
(54
             
Right-of-use assets – reassessments, modifications and terminations


(11


(5


(16
             
Disposals
  
 
(7
 
 
(1
 
 
(12


(20
             
Net reclassifications as held-for-sale
  
 
(16


(11


(27
             
31 December
                                                
             
Cost
  
 
1,421


847


5,750


247


706


8,971
 
             
Accumulated depreciation and impairment
  
 
(388
 
 
(370
 
 
(3,130
 
 
(130
         
 
(4,018
             
Net book value at 31 December
  
 
1,033


477


2,620


117


706


4,953


2020


        Freehold
property
£m
   
Leasehold
property
£m
   
Plant,
equipment
and other
owned
£m
   
Plant,
  equipment
and other
leased
£m
   
Assets in the
course of
construction
£m
   
Total
£m
 
             
1 January
                                                
             
Cost
  
 
1,503


785


5,795


215


921


9,219
 
             
Accumulated depreciation and impairment
  
 
(427
 
 
(229
 
 
(2,974
 
 
(71
         
 
(3,701
             
Net book value at 1 January
  
 
1,076


556


2,821


144


921


5,518
 
             
Differences on exchange
  
 
(38
 
 
(25
 
 
(150
 
 
(4
 
 
(55
 
 
(272
             
Additions
                                                
             
– right-of-use assets


67


36


103
 
             
– separately acquired
  
 
2


40


459


501
 
             
– acquisition of subsidiaries (note 27(a))


1


1
 
             
Reallocations
  
 
84


14


427


(525


Depreciation
  
 
(38
 
 
(118
 
 
(313
 
 
(62


(531
             
Impairment
  
 
(5
 
 
(1
 
 
(184


(36
 
 
(226
             
Right-of-use assets – reassessments, modifications and terminations


(11


(7


(18
             
Disposals
  
 
(7


(9


(16
             
Net reclassifications as held-for-sale


31 December
                                                
             
Cost
  
 
1,518


798


5,807


217


764


9,104
 
             
Accumulated depreciation and impairment
  
 
(444
 
 
(315
 
 
(3,175
 
 
(110
         
 
(4,044
             
Net book value at 31 December
  
 
1,074


483


2,632


107


764


5,060
 
Refer to notes 4 and 7 for more information on property, plant and equipment impairments. The £27 million (2020: £nil) of assets reclassified as held-for-sale primarily relates to the disposal of the Iranian subsidiary, BAT Pars, as disclosed on note 27(d).
The Group has £90 million of future contractual commitments (2020: £110 million) related to property, plant and equipment.
 
211 


Table of Contents
BAT Annual Report and Form 20-F 2021
Financial Statements
Notes on Accounts
Continued
    
 
13 Property, Plant and Equipment
Continued
(b) Right-of-use assets
In accordance with IFRS 16
Leases,
the right-of-use assets related to leased properties have been included in the asset class ‘Leasehold Property’ (note 13(c)) and other right-of-use assets have been reported under ‘Plant, equipment and other leased’.
The Group leases various offices, warehouses, retail spaces, equipment and vehicles through its subsidiaries across the globe. Arrangements are entered into in the course of ordinary business, and lease terms are negotiated on an individual basis and contain a wide range of different terms and conditions reflecting local commercial practice. The lease agreements do not impose any covenants other than the security interests in the leased assets that are held by the lessor. Leased assets may not be used as security for borrowing purposes.
Assets representing ‘plant, equipment and other’ relate to leases of various assets including tobacco vending machines, industrial equipment and distribution vehicles in Brazil, Japan, Pakistan, Poland, Romania, Switzerland, U.S. and other countries.
(c) Leasehold property
As of 31 December 2021, the Group holds £165 million (2020: £132 million) of leasehold properties acquired and another £312 million (2020: £351 million) of right-of-use leased properties.
Assets representing ‘leasehold property’ relate to leases in respect of offices, retail space, warehouses and manufacturing facilities occupied by Group subsidiaries and include property leases with lease terms of more than five years in Brazil, Bangladesh, Germany, Mexico, Romania, Singapore and Vietnam, amongst other countries. In addition, capitalised expenditure representing leasehold improvements is included in this asset class.
 
     
2021
£m
    
                2020
£m
 
     
Leasehold land and property comprises


– net book value of long leasehold
  
 
14


17
 
     
– net book value of short leasehold
  
 
463


466


477


483


2021
 
           
Leasehold property net book value movements for the year
ended 31 December 2021
  
        Net book
value at
1 January
£m
    
Differences
on exchange
£m
   
Depreciation and
impairment
£m
   
Other net 
movements*
£m 
    
Net book
value at
31 December
£m
 
           
– Property acquired (IAS16)
  
 
132


(8
 
 
(13
 
 
54


165
 
           
– Right-of-use properties (IFRS16)
  
 
351


(14
 
 
(99
 
 
74


312


483


(22
 
 
(112
 
 
128


477


2020
 
           
Leasehold property net book value movements for the year
ended 31 December 2020
  
        Net book
value at
1 January
£m
    
Differences on
exchange
£m
   
Depreciation and
impairment
£m
   
Other net 
movements*
£m 
   
Net book value
at 31 December
£m
 
           
– Property acquired (IAS16)
  
 
135


(6
 
 
(11
 
 
14


132
 
           
– Right-of-use properties (IFRS16)
  
 
421


(19
 
 
(108
 
 
57


351


556


(25
 
 
(119
 
 
71


483
 
 
*
Property acquired (IAS 16
Property, plant and equipment
) other net movements represent additions (directly acquired and/or transferred from assets in the course of construction) net of disposals, whereas the right-of-use properties (IFRS 16) other net movements relates to new leases net of reassessments, modifications and terminations as reported in the Property, plant and equipment movement table in note 13(a). Other net movements also includes £nil (2020: £1 million) in relation to acquired companies.
(d) Freehold property
As of 31 December 2021, the Group owns freehold property amounting to £1,033 million (2020: £1,074 million), representing factories, warehouses and office buildings together with adjoining land, mainly in the U.S., UK, Bangladesh, Indonesia and South Korea.
 
     
2021
£m
    
            2020
£m
 
     
Cost of freehold land within freehold property on which no depreciation is provided
  
 
242


251
 
 
212


Table of Contents
BAT Annual Report and Form 20-F 2021    
 
Strategic Report        
 
Governance Report        
  
Financial Statements        
  
        Other Information        


14 Investments in Associates and Joint Ventures
 
     
2021
£m
   
            2020
£m
 
     
1 January
  
 
1,796


1,860
 
     
Total comprehensive income (note 9)
  
 
412


323
 
     
Dividends
  
 
(392
 
 
(394
     
Additions (note 27(c))
  
 
130


5
 
     
Other equity movements
  
 
2


2
 
     
31 December
  
 
1,948


1,796
 
     
Non-current assets
  
 
1,286


1,021
 
     
Current assets
  
 
1,144


1,155
 
     
Non-current liabilities
  
 
(83
 
 
(61
     
Current liabilities
  
 
(399
 
 
(319


1,948


1,796
 
     
ITC Ltd. (Group’s share of the market value is £7,839 million (2020: £7,574 million))
  
 
1,759


1,724
 
     
Other listed associates (Group’s share of the market value is £232 million (2020: £184 million))
  
 
154


26
 
     
Unlisted associates
  
 
35


46


1,948


1,796
 
The principal associate undertaking of the Group is ITC Ltd. (ITC). Included within the dividends amount of £392 million (2020: £394 million) are £383 million (2020: £386 million) attributable to dividends declared by ITC.
Organigram Inc.
On 11 March 2021, the Group announced a strategic collaboration agreement with Organigram Inc., a wholly owned subsidiary of publicly traded Organigram Holdings Inc. (collectively, Organigram). Under the terms of the transaction, a Group subsidiary acquired a 19.9% equity stake in Organigram Holdings Inc. (listed on both the Nasdaq and Toronto Stock Exchange under the symbol ‘OGI’) to become its largest shareholder.
The Group’s share of the fair value of net assets acquired included £49 million of intangibles and £30 million of goodwill, representing a strategic premium to enter the legal cannabis market in North America.
The carrying value of the investment at 31 December 2021 is £125 million, which is higher than the value implied by the market price of individual shares at that date. Due to the likelihood of short-term volatility in the share price, third-party valuations were considered which indicate a valuation for the Group’s investment in excess of the current carrying value. Any potential impairment of the investment would be immaterial to the Group. Management will continue to monitor the carrying value, in line with IAS 36, over the course of future periods.
Tisak d.d.
The Group’s investment in Tisak d.d. (Tisak) was acquired as part of the TDR transaction (note 27). During 2016, the Group entered into an agreement with Tisak’s parent Agrokor d.d. (Agrokor) to convert certain outstanding trading balances into long-term loans and an additional shareholding in Tisak. As part of the agreement, Agrokor had the right to reacquire the additional shareholding in Tisak. As a consequence of this, while the Group had legal ownership of the additional shareholding, it did not consider that the shares provided any additional equity interest and continued to account for 26% of the equity of Tisak. In 2017, due to the financial difficulties of Agrokor and Tisak, the Group fully impaired this investment resulting in a charge of £27 million to the income statement in that year that was reported as an adjusting item. In July 2018, Agrokor’s creditors approved a settlement plan proposed by Agrokor’s administrators. The settlement plan has not returned any value to the Group, and Tisak was liquidated on 21 September 2021.
 
213


Table of Contents
 
BAT Annual Report and Form 20-F 2021
Financial Statements
Notes on Accounts
Continued
    
 
14 Investments in Associates and Joint Ventures
Continued
ITC Ltd.
ITC is an Indian conglomerate based in Kolkata and maintains a presence in cigarettes, hotels, paper and packaging, agri-business and other fast-moving goods (e.g. confectionery, branded apparel, personal care, stationery and safety matches). BAT’s interest in ITC is 29.38%.
ITC prepares accounts on a quarterly basis with a 31 March year-end. As permitted by IAS 28
Investments in associates and joint ventures,
results up to 30 September 2021 have been used in applying the equity method. This is driven by the availability of information at the half-year, to be consistent with the treatment in the Group’s interim accounts. Any further information available after the date used for reporting purposes is reviewed and any material items adjusted for in the final results. The latest published information available is at 31 December 2021.
 
     
2021
£m
   
            2020
£m
 
     
Non-current assets
  
 
3,889


3,399
 
     
Current assets
  
 
3,391


3,513
 
     
Non-current liabilities
  
 
(231
 
 
(194
     
Current liabilities
  
 
(1,061
 
 
(858


5,988


5,860


Group’s share of ITC Ltd. (2021: 29.38%; 2020: 29.42%)
  
 
1,759


1,724
 
15 Retirement Benefit Schemes
The Group operates various funded and unfunded defined benefit schemes, including pension and post-retirement healthcare schemes, and defined contribution pension schemes through its subsidiary undertakings in multiple jurisdictions, with its most significant arrangements being in the U.S., UK, Canada, Germany, Switzerland and the Netherlands. Together, schemes in these territories account for over 90% of the total underlying obligations of the Group’s defined benefit arrangements and over 70% of the defined benefit net costs charged to adjusted profit.
Pension obligations consist mainly of final salary pension schemes which provide benefits to members in the form of a guaranteed level of pension payable for life. The level of benefits provided depends on members’ length of service and their salary in the final years leading up to retirement. In addition, the Group operates several healthcare benefit schemes, of which the most significant are in the U.S. and Canada. The majority of defined benefit schemes allow for the future accrual of benefits. With the exception of arrangements required under local regulations, most of the Group’s arrangements are closed to new entrants.
Benefits provided through defined contribution schemes are charged as an expense as payments fall due. The liabilities arising in respect of defined benefit schemes are determined in accordance with the advice of independent, professionally qualified actuaries, using the projected unit credit method. It is Group policy that all schemes are formally valued at least every three years.
Through its defined benefit pension schemes and healthcare benefit schemes, the Group is exposed to a number of risks, including:
 
Asset volatility:
The scheme liabilities are calculated using discount rates set by reference to bond yields. If scheme assets underperform this yield, e.g. due to stock market volatility, this will create a deficit. However, most funded schemes hold a proportion of assets which are expected to outperform bonds in the long term, and the majority of schemes by value are subject to local regulation regarding funding deficits.
 
Changes in bond yields:
A decrease in corporate bond yields will increase scheme liabilities, although this will be partially offset by an increase in the value of the schemes’ bond holdings, ‘buy-in’ insurance assets or other hedging instruments.
 
Inflation risk:
Some of the Group’s pension obligations are linked to inflation, and higher inflation will lead to higher liabilities, although in most cases, caps on the level of inflationary increases are in place in the scheme rules, while some assets and derivatives provide specific inflation protection.
 
Life expectancy:
The majority of the schemes’ obligations are to provide benefits for the life of the member, so increases in life expectancy will result in an increase in the plans’ liabilities. Assumptions regarding mortality and mortality improvements are regularly reviewed in line with actuarial tables and scheme specific experience.
The Group has an internal body, the Pensions Executive Committee (PEC), that is chaired by the Finance and Transformation Director. The PEC sets and oversees a set of philosophies, policies and practices in respect of post-employment benefits including, but not limited to, design, funding, investment strategy, risk management and governance. It also reviews significant changes to defined benefit schemes in the countries with the most significant liabilities, and defined contribution schemes in the countries with the most significant costs. Significant changes to defined benefit arrangements include scheme closures to future accrual and risk management exercises such as the ‘buy-in’ and ‘buy-out’ transactions referred to below.
A ‘buy-out’ transaction is where a pension scheme derecognises all (or part) of its liabilities, removing it from the balance sheet, by permanently transferring those obligations from the sponsoring employer to a third-party provider and eliminating all further legal or constructive obligation to the pension scheme or to the sponsoring employer. By contrast, with a ‘buy-in’ transaction the scheme liabilities remain on the balance sheet and the sponsoring employer remains responsible for the fulfilment of the pension obligations. However, these obligations are de-risked through the purchase of an insurance product designed to match the underlying cash flows of the pension liability reducing the risks associated with improved longevity and interest and discount rate movements. The Group consequently benefits from the ‘buy-in’ as it reduces the individual scheme’s reliance on the Group for future cash funding requirements.
 
214 


Table of Contents
BAT Annual Report and Form 20-F 2021    
 
Strategic Report        
 
Governance Report        
  
Financial Statements        
  
        Other Information        


15 Retirement Benefit Schemes
Continued
All of the Group’s arrangements, including funded schemes where formal trusts or equivalents are required, have been developed and are operated in accordance with local practices and regulations where applicable in the countries concerned. Responsibility for the governance of these schemes, including specific investment decisions and funding contribution schedules, generally lies with the trustees, or equivalent bodies, of each arrangement. The trustees will usually consist of representatives appointed by both the sponsoring company and the beneficiaries.
The funded arrangements in the Group have policies on investment management, including strategies over a preferred long-term investment profile, and schemes in certain territories including Canada and the Netherlands manage their bond portfolios to match the weighted average duration of scheme liabilities. In addition, as noted below, certain arrangements in the UK and Canada have been de-risked through the purchase of insurance policies. The majority of funded schemes are subject to local regulations regarding funding requirements. Contributions to defined benefit schemes are determined after consultation with the respective trustees and actuaries of the individual externally funded schemes, and after taking into account regulatory requirements in each territory. The Group’s contributions to funded defined benefit schemes in 2022 in total are expected to be £83 million compared to £74 million in 2021.
U.S.
In the U.S., the main funded pension plans are the
Reynolds American Retirement Plan
(PEP) and the
Retirement Income Plan for Certain RAI Affiliates
(Affiliates), and the only funded healthcare scheme is the
Brown & Williamson Tobacco Corporation Welfare & Fringe Benefit
Plan
, all of which are established with corporate trustees that are required to run the plans in accordance with the plan’s rules and to comply with all relevant legislation, including the Employee Retirement Income Security Act of 1974.
The corporate trustees act as custodians with a committee of local management acting in a fiduciary capacity with regard to investment decisions, risk mitigation and administration of the arrangements. Contributions to the various funded plans are agreed with the named fiduciary, scheme actuaries and the committee of local management after taking account of statutory requirements including the Pension Protection Act of 2006, as amended. Through its U.S. subsidiaries, the Group may make significant contributions, either as required by statutory requirements or at the discretion of the Group, with the aim of maintaining a funding status of at least 90% and remaining fully funded in the long term. During 2021, the Group did not contribute to its funded pension and post-retirement plans in the U.S. and does not expect to do so in 2022.
For funded plans in the U.S., the trustees employ a risk mitigation strategy which seeks to balance pension plan returns with a reasonable level of funded status volatility. Based on this framework, the asset allocation has two primary components. The first component is the hedging portfolio, which uses extended duration fixed income holdings (typically U.S. Government and investment grade corporate bonds) and, to a lesser extent, derivatives to match a portion of the interest rate risk associated with the benefit obligations, thereby reducing expected funded status volatility. The second component is the return-seeking portfolio, which is designed to enhance portfolio returns. The return-seeking portfolio is broadly diversified across asset classes.
On 7 October 2021, the Group concluded a transaction affecting portions of the membership of the PEP and the Affiliates plans referred to above, allowing the Group to fully settle portions of its liability by transferring the obligations to the Metropolitan Tower Life Insurance Company in a buy-out. Approximately US$1.9 billion (£1.4 billion) of plan liabilities have been removed from the balance sheet, resulting in a settlement gain of £35 million.
At 31 December 2021, the PEP and Affiliates plans referred to above were reporting surpluses under IAS 19 totalling £463 million (2020: £232 million). Under the rules of these plans, after assuming the gradual settlement of the plan liabilities over the lives of the arrangements, any surplus would be returnable to the Group in the event of a termination or could otherwise be repurposed for other existing or replacement benefit plans, and accordingly, no surplus restrictions have been recognised.
United Kingdom
In the UK, the main pension arrangement is the
British American Tobacco UK Pension Fund
(UKPF), which is established under trust law and has a corporate trustee that is required to run the scheme in accordance with the UKPF’s Trust Deed and Rules and to comply with the Pension Scheme Act 1993, Pensions Act 1995, Pensions Act 2004 and all other relevant legislation. With effect from 1 July 2020, UKPF was closed to further accrual of benefits with all active members becoming deferred members. A past service credit was recognised on the difference between the salary increase assumption for active members and the inflation assumption for deferred members at the date of the plan amendment and curtailment of benefits.
The formal triennial actuarial valuation of the UKPF was last carried out with an effective date of 31 March 2020. This showed that UKPF had a surplus of £139 million on a Technical Provisions basis, in accordance with the statutory funding objective. The Trustee also has a Long-Term Funding Target to be fully funded on a Solvency Liabilities basis by 2026, and on this basis UKPF had a surplus of £7 million at the valuation date. Under IAS 19, this was reported as a net retirement benefit asset of £293 million (2020: £389 million).
Following the completion of the valuation noted above, the Trustee and the Group agreed a new Schedule of Contributions with an effective date of 5 October 2020. This schedule was subsequently replaced with a new Schedule with an effective date of 30 March 2021, such that the Group made no contributions in 2021 but is committed to pay £18 million in July 2022 and £18 million in July 2023 as contributions towards further de-risking of UKPF’s assets and securing members’ benefits. Contributions were £21 million in 2020 and £30 million in 2019.
Under the UKPF scheme rules, the Trustee does not have a unilateral power to commence a wind up of UKPF, and the Group has recognised a surplus as an unconditional right to a refund assuming the gradual settlement of the UKPF liabilities over the life of the scheme with any future surplus returnable to the Group at the end of the life of the scheme. The funding commitment is not considered onerous and no additional liabilities or surplus restrictions have been recognised.
 
215


Table of Contents

BAT Annual Report and Form 20-F 2021
Financial Statements
Notes on Accounts
Continued
    
 
15 Retirement Benefit Schemes
Continued
As part of its risk management strategy, on 31 May 2019, the UK Trustee entered into a buy-in agreement with Pension Insurance Corporation plc (‘PIC’) to acquire an insurance policy with the intent of matching a specific part of UKPF’s future cash flows arising from the accrued pension liabilities of retired and deferred members and improving the security to the UKPF and its members. On an IAS 19 basis, the subsequent fair value of the insurance policy matches the present value of the liabilities being insured. On 19 May 2021, the Trustee entered into an agreement with PIC to acquire a second buy-in policy which involved the transfer of £383 million of assets held by UKPF to PIC. As a result of these transactions, approximately 84% of the assets held by UKPF (2020: 75%) are represented by the buy-in contracts, covering 91% of UKPF’s liabilities (2020: 83%).
For the residual assets held by UKPF, the current allocation is broadly split as 75% in risk reducing assets and 25% in return seeking assets. The return seeking portfolio is invested in illiquid assets which, in the normal course of events, will wind down naturally over time, with their value being realised as the investments mature. This is consistent with the Trustee’s ultimate target which is to be 100% invested in risk reducing assets or matching assets. Given the strong funding position of UKPF as shown in the 31 March 2020 Actuarial valuation, the Trustee will continue to review the investment strategy and may look to increase the proportion of risk-reducing or matching assets, commensurate with their ultimate target to further reduce UKPF’s exposure to asset volatility.
Other territories
Payments made to pensioners by the operating companies in Germany, net of income on scheme assets, are deemed to be company contributions to the Contractual Trust Arrangements and are anticipated to be around £37 million in 2022 and £33 million per annum for the four years after that. Contributions to pension schemes in Canada, Netherlands and Switzerland in total are anticipated to be around £11 million in 2022 and then also around £11 million per annum for the four years after that.
For schemes in the Netherlands reporting surpluses of £77 million (2020: £26 million), these surpluses have been recognised as an unconditional right to a refund assuming the gradual settlement of the pension liabilities over the life of the scheme, with any future surplus returnable to the Group at the end of the life of the scheme. For schemes in surplus in Canada of £27 million (2020: £19 million), the economic benefit has been calculated as a combination of the expected level of administration expenses which may be charged to the plan assets in accordance with the plan rules, which economically represents a potential surplus refund, and the value of the employer reserve account as defined in legislation, which represents a potential reduction in contributions on an ongoing basis or a surplus refund at the end of the life of the scheme.
On 2 September 2021, the Group through its Canadian subsidiaries entered into a buy-in agreement with five insurers to acquire insurance policies that operate as assets of its largest Canadian scheme, the Imasco Pension Fund Society Plan (Society Plan), by transferring plan assets of CAD $766 million (£451 million). The transaction was met entirely from the pension plan assets with no further funding required from the Group. The buy-in covered all the Society Plan’s liabilities in relation to pensioners and deferred members as well as the pensions accrued up to 31 December 2020 for active members. The Group consequently benefits from the buy-in as it reduces the Society Plan’s reliance on the Group for future cash funding requirements. For the residual assets, the Society Plan is 100% invested in risk reducing assets, consistent with the Canadian subsidiary’s ultimate de-risking target.
Unfunded arrangements
The majority of benefit payments are from trustee administered funds, however, there are also a number of unfunded schemes where the sponsoring company meets the benefit payment obligation as it falls due, including UK-based Defined Benefit and Defined Contribution Unapproved Unfunded Retirement Benefit Schemes (DB UURBS and DC UURBS respectively). The DC UURBS credits accrued in the year are increased in line with the Company’s Weighted Average Cost of Debt and the scheme is therefore treated as a defined benefit scheme under IAS 19. For unfunded pension schemes in the U.S. and UK, 38% of the liabilities reported at year-end are expected to be settled by the Group within 10 years, 28% between 10 and 20 years, 19% between 20 and 30 years, and 15% thereafter. For unfunded healthcare schemes in the U.S. and Canada, 63% of the liabilities reported at year-end are expected to be settled by the Group within 10 years, 27% between 10 and 20 years, 8% between 20 and 30 years, and 2% thereafter.
The amounts recognised in the balance sheet are determined as follows:


Pension schemes


Healthcare schemes


Total


                2021
£m
   
2020
£m
   
                2021
£m
   
    2020
£m
   
                2021
£m
   
2020
£m
 
             
Present value of funded scheme liabilities
  
 
(9,859
 
 
(11,970
 
 
(225
 
 
(253
 
 
(10,084
 
 
(12,223
             
Fair value of funded scheme assets
  
 
10,644


12,403


172


173


10,816


12,576


785


433


(53
 
 
(80
 
 
732


353
 
             
Unrecognised funded scheme surpluses
  
 
(16
 
 
(16


(16
 
 
(16


769


417


(53
 
 
(80
 
 
716


337
 
             
Present value of unfunded scheme liabilities
  
 
(555
 
 
(602
 
 
(482
 
 
(545
 
 
(1,037
 
 
(1,147


214


(185
 
 
(535
 
 
(625
 
 
(321
 
 
(810
             
The above net (liability)/asset is recognised in the balance sheet as follows:
                                                
             
– retirement benefit scheme liabilities
  
 
(702
 
 
(897
 
 
(537
 
 
(627
 
 
(1,239
 
 
(1,524
             
– retirement benefit scheme assets
  
 
916


712


2


2


918


714


214


(185
 
 
(535
 
 
(625
 
 
(321
 
 
(810
 
216


Table of Contents
BAT Annual Report and Form 20-F 2021    
 
Strategic Report        
 
Governance Report        
  
Financial Statements        
  
        Other Information        


15 Retirement Benefit Schemes
Continued
The net liabilities of funded pension schemes by territory are as follows:
 
    
Liabilities
   
Assets
    
Total


                  2021
£m
   
                  2020
£m
   
                  2021
£m
    
                  2020
£m
    
                  2021
£m
   
                  2020
£m
 
             
– U.S.
  
 
(3,378
 
 
(5,012
 
 
3,748


5,144


370


132
 
             
– UK
  
 
(3,357
 
 
(3,485
 
 
3,645


3,866


288


381
 
             
– Germany
  
 
(913
 
 
(1,035
 
 
896


918


(17
 
 
(117
             
– Canada
  
 
(706
 
 
(756
 
 
724


758


18


2
 
             
– Netherlands
  
 
(769
 
 
(873
 
 
846


893


77


20
 
             
– Switzerland
  
 
(317
 
 
(348
 
 
311


312


(6
 
 
(36
             
– Rest of Group
  
 
(419
 
 
(461
 
 
474


512


55


51
 
             
Funded schemes
  
 
(9,859
 
 
(11,970
 
 
10,644


12,403


785


433
 
Of the Group’s unfunded pension schemes, 57% (2020: 54%) relate to arrangements in the UK and 32% (2020: 32%) relate to arrangements in the U.S., while 85% (2020: 85%) of the Group’s unfunded healthcare arrangements relate to arrangements in the U.S.
The amounts recognised in the income statement are as follows:
 
    
Pension schemes
   
Healthcare schemes
   
Total


                2021
£m
   
                2020
£m
   
                2021
£m
   
                2020
£m
   
                2021
£m
   
                2020
£m
 
             
Defined benefit schemes
                                                
             
Service cost
                                                
             
– current service cost
  
 
60


72


2


2


62


74
 
             
– past service credit, curtailments and settlements
  
 
(29
 
 
(12


(29
 
 
(12
             
Net interest on the net defined benefit liability
                                                
             
– interest on scheme liabilities
  
 
226


300


19


27


245


327
 
             
– interest on scheme assets
  
 
(226
 
 
(289
 
 
(5
 
 
(7
 
 
(231
 
 
(296
             
– interest on unrecognised funded scheme surpluses
  
 
1


1


1


1


32


72


16


22


48


94
 
             
Defined contribution schemes
  
 
91


88


91


88
 
             
Total amount recognised in the income statement (note 3)
  
 
123


160


16


22


139


182
 
The above charges are recognised within employee benefit costs in note 3 and include a credit of £23 million in 2021 (2020: charge of £10 million) in respect of settlements, past service costs and defined contribution costs reported as part of the restructuring costs and other adjusting items charged in arriving at profit from operations (note 7). Included in current service cost in 2021 is £15 million (2020: £16 million) of administration costs. Current service cost is stated after netting employee contributions, where applicable.
The movements in scheme liabilities are as follows:
 
    
Pension schemes
   
Healthcare schemes
   
Total


                  2021
£m


                  2020
£m


                        2021
£m


                  2020
£m


                  2021
£m


                  2020
£m


Present value at 1 January
  
 
12,572


12,032


798


829


13,370


12,861
 
             
Differences on exchange
  
 
(122
 
 
(106
 
 
5


(23
 
 
(117
 
 
(129
             
Current service cost
  
 
60


72


2


2


62


74
 
             
Past service credit and settlements
  
 
(1,426
 
 
(58


(1,426
 
 
(58
             
Interest on scheme liabilities
  
 
226


300


19


27


245


327
 
             
Contributions by scheme members
  
 
3


1


3


1
 
             
Benefits paid
  
 
(705
 
 
(737
 
 
(55
 
 
(58
 
 
(760
 
 
(795
             
Actuarial losses/(gains)
                                                
             
– arising from changes in demographic assumptions
  
 
147


26


3


(7
 
 
150


19
 
             
– arising from changes in financial assumptions
  
 
(394
 
 
1,032


(18
 
 
59


(412
 
 
1,091
 
             
Experience losses/(gains)
  
 
53


10


(47
 
 
(31
 
 
6


(21
             
Present value at 31 December
  
 
10,414


12,572


707


798


11,121


13,370
 
Changes in financial assumptions principally relate to discount rate movements in both years. Past service and settlements in the table above includes amounts relating to the U.S. buy-out transaction during the year.
 
217


Table of Contents
BAT Annual Report and Form 20-F 2021
Financial Statements
Notes on Accounts
Continued
    
 
15 Retirement Benefit Schemes
Continued
Scheme liabilities by scheme membership:
 
    
Pension schemes
    
Healthcare schemes
    
Total


                2021
£m
    
                 2020
£m
    
                2021
£m
    
                 2020
£m
    
                2021
£m
    
                 2020
£m
 
             
Active members
  
 
1,090


1,305


41


54


1,131


1,359
 
             
Deferred members
  
 
1,750


1,897


1


2


1,751


1,899
 
             
Retired members
  
 
7,574


9,370


665


742


8,239


10,112
 
             
Present value at 31 December
  
 
10,414


12,572


707


798


11,121


13,370
 
Approximately 95% of scheme liabilities in both years relate to guaranteed benefits.
The movements in funded scheme assets are as follows:
 
    
Pension schemes
   
Healthcare schemes
   
Total


                2021
£m
   
                2020
£m
   
                2021
£m
   
                2020
£m
   
                2021
£m
   
                2020
£m
 
             
Fair value of scheme assets at 1 January
  
 
12,403


11,682


173


178


12,576


11,860
 
             
Differences on exchange
  
 
(116
 
 
(117


(7
 
 
(116
 
 
(124
             
Settlements
  
 
(1,397
 
 
(45


(1,397
 
 
(45
             
Interest on scheme assets
  
 
226


289


5


7


231


296
 
             
Company contributions
  
 
74


103


74


103
 
             
Contributions by scheme members
  
 
3


3


3


3
 
             
Benefits paid
  
 
(668
 
 
(696
 
 
(13
 
 
(15
 
 
(681
 
 
(711
             
Actuarial gains
  
 
119


1,184


7


10


126


1,194
 
             
Fair value of scheme assets at 31 December
  
 
10,644


12,403


172


173


10,816


12,576
 
The actuarial gains and losses in both years principally relate to movements in the fair values of scheme assets including revaluations on initial recognition and subsequent remeasurement of insurance assets acquired in the buy-in transactions referred to above. Actual returns are stated net of applicable taxes and fund management fees. Past service and settlements in the table above includes amounts relating to the U.S. buy-out transaction during the year.
Scheme assets have been diversified into equities, bonds and other assets and are typically invested via fund investment managers into both pooled and segregated mandates of listed and unlisted equities and bonds.
 
    
Pension schemes
    
Healthcare schemes
    
Total


                2021
£m
    
                 2020
£m
    
                2021
£m
    
                 2020
£m
    
                2021
£m
    
                 2020
£m
 
             
Equities – listed
  
 
741


1,259


6


5


747


1,264
 
             
Equities – unlisted
  
 
892


992


65


68


957


1,060
 
             
Bonds – listed
  
 
1,929


2,432


5


5


1,934


2,437
 
             
Bonds – unlisted
  
 
1,924


3,163


72


73


1,996


3,236
 
             
Other assets – listed
  
 
543


202


15


13


558


215
 
             
Other assets – unlisted
  
 
4,615


4,355


9


9


4,624


4,364
 
             
Fair value of scheme assets at 31 December
  
 
10,644


12,403


172


173


10,816


12,576
 
In the above analysis, investments via equity-based investment funds are shown under listed equities, and investments via bond-based investment funds are shown under listed bonds. Other assets include insurance contracts, cash and other deposits, derivatives and other hedges, recoverable taxes, infrastructure investments and investment property.
In the U.S., pension plan assets are invested using active investment strategies and multiple investment management firms. Managers within each asset class cover a range of investment styles and approaches. Allowable investment types include global equity, fixed income, real assets, private equity and absolute return. The range of allowable investment types utilised for pension assets provides enhanced returns and more widely diversifies the plan.
As noted above, during 2021 and 2019, the UKPF Trustee acquired insurance policies that operate as a UK Fund investment asset in a buy-in transaction. The residual assets now predominantly consist of liability driven investments and absolute return funds as well as a proportion of illiquid investments, such as private equity and infrastructure investments. Insurance policies acquired in buy-in transactions in the UK and Canada are included within ‘other assets-unlisted’ in the table above.
 
218 


Table of Contents
BAT Annual Report and Form 20-F 2021    
 
Strategic Report        
 
Governance Report        
  
Financial Statements        
  
        Other Information        


15 Retirement Benefit Schemes
Continued
The fair values of listed scheme assets were derived from observable data including quoted market prices and other market data, including market values of individual segregated investments and of pooled investment funds where quoted. The fair value of buy-in insurance products was estimated as the present value of the underlying obligations covered by the insurance policy. The fair values of other unlisted assets were derived from cash flow projections of estimated future income after taking into account the estimated recoverable value of these assets.
The recognition of retirement benefit surpluses on the balance sheet is restricted where the economic benefit, in the form of a potential refund or reduction in future contributions, has a present value which is less than the net assets of the scheme. The movements in the unrecognised scheme surpluses, recognised in other comprehensive income, are as follows:
 
    
Pension schemes
   
Healthcare schemes
    
Total


        2021
£m
   
        2020
£m
   
        2019
£m
   
        2021
£m
    
        2020
£m
    
        2019
£m
    
        2021
£m
   
        2020
£m
   
        2019
£m
 
                   
Unrecognised funded scheme
surpluses at 1 January
  
 
(16
 
 
(28
 
 
(20


(16
 
 
(28
 
 
(20
                   
Differences on exchange
  
 
2


3


(1


2


3


(1
                   
Interest on unrecognised funded
scheme surpluses
  
 
(1
 
 
(1


(1
 
 
(1


Movement in year (note 22)
  
 
(1
 
 
10


(7


(1
 
 
10


(7
                   
Unrecognised funded scheme
surpluses at 31 December
  
 
(16
 
 
(16
 
 
(28


(16
 
 
(16
 
 
(28
The principal actuarial assumptions (weighted to reflect individual scheme differences) used in the following territories are shown below. In both years, discount rates are determined by reference to normal yields on high quality corporate bonds at the balance sheet date.
 
   
2021
   
2020


U.S.
   
UK
   
Germany
   
Canada
   
Netherlands
   
Switzerland
   
U.S.
   
UK
   
Germany
   
Canada
   
Netherlands
   
Switzerland
 
                         
Rate of increase in salaries (%)
 
 
3.4


2.5


2.5


1.4


1.2


3.4


2.5


3.0


2.1


1.1
 
                         
Rate of increase in pensions in payment (%)
 
 
2.5


3.4


1.8


Nil


1.1


Nil


2.5


3.0


1.5


Nil


0.9


Nil
 
                         
Rate of increase in deferred pensions (%)
 
 
0.1


3.0


1.8


Nil


1.1


2.2


1.5


Nil


0.9


Discount rate (%)
 
 
3.0


1.8


1.3


2.8


1.0


0.2


2.6


1.4


0.9


2.3


0.5


General inflation (%)
 
 
  2.5


  3.4


  1.8


  2.0


  2.0


  1.0


  2.5


  3.0


  1.5


2.0


  2.0


  0.9


2021
   
2020


U.S.
   
UK
   
Germany
   
Canada
   
Netherlands
   
Switzerland
   
U.S.
   
UK
   
Germany
   
Canada
   
Netherlands
   
Switzerland
 
                         
Weighted average duration of liabilities (years)
 
 
12.3


16.7


13.6


11.0


17.1


13.3


11.6


17.0


14.0


11.0


18.0


13.4
 
 
219


Table of Contents
BAT Annual Report and Form 20-F 2021
Financial Statements
Notes on Accounts
Continued
    
 
15 Retirement Benefit Schemes
Continued
For healthcare inflation in the U.S., the assumption is 7.0% for 2021 (2020: 6.0%) and in Canada, the assumption is 5.0% for both years.
Mortality assumptions are subject to regular review. The principal schemes used the following tables:
 
U.S.
  
PRI-2012 mortality tables without collar or amount, projected with MP-2021 generational projection (2020: PRI-2012 mortality tables without collar or amount, projected with MP-2020 generational projection)
   
UK
  
S2PA (YOB) with the CMI (2020) improvement model with a 1.25% long-term improvement rate (2020: S2PA (YOB) with the CMI (2019) improvement model with a 1.25% long-term improvement rate)
   
Germany
  
RT Heubeck 2018 G (both years)
   
Canada
  
CPM-2014 Private Table (both years)
   
Netherlands
  
AG Prognosetafel 2020 (both years)
   
Switzerland
  
LPP/BVG 2020 base table with CMI projection factors for mortality improvements with a 1.5% long-term improvement rate (2020: LPP/BVG 2015 base table with CMI projection factors for mortality improvements with a 1.5% long-term improvement rate)
Based on the above, the weighted average life expectancy, in years, for mortality tables used to determine benefit obligations is as follows:
 
    
U.S.
    
UK
    
Germany
    
Canada
    
Netherlands
    
Switzerland


        Male
    
Female
    
        Male
    
Female
    
        Male
    
Female
    
        Male
    
Female
    
        Male
    
Female
    
        Male
    
Female
 
                         
31 December
2021
                                                                                                           
                         
Member age 65
(current life expectancy)
  
 
21.6


23.5


22.9


24.2


20.5


23.9


22.0


24.3


20.7


24.1


21.9


23.6
 
                         
Member age 45
(life expectancy at age 65)
  
 
22.1


24.0


24.5


25.9


23.2


26.2


23.0


25.3


22.8


25.8


23.8


25.5
 
                         
31 December 2020
                                                                                                           
                         
Member age 65
(current life expectancy)
  
 
20.4


22.4


22.8


24.1


18.3


23.8


21.6


24.0


20.6


24.0


21.9


23.9
 
                         
Member age 45
(life expectancy at age 65)
  
 
21.9


23.8


24.5


25.9


23.1


26.0


22.6


24.9


22.7


25.7


23.8


25.8
 
For the remaining territories, typical assumptions are that real salary increases will be from 0% to 8.0% (2020: 0% to 9.0%) per annum and discount rates will be from 0% to 11.0% (2020: 0% to 12.0%) above inflation. Pension increases, where allowed for, are generally assumed to be in line with inflation. Assumptions of life expectancy are in line with best practice in each territory. For countries where there is not a deep market in such corporate bonds, the yield on government bonds is used.
The valuation of retirement benefit schemes involves judgements about uncertain future events. Sensitivities in respect of the key assumptions used to measure the principal pension schemes as at 31 December 2021 are set out below. These sensitivities show the hypothetical impact of a change in each of the listed assumptions in isolation, with the exception of the sensitivity to inflation which incorporates the impact of certain correlating assumptions such as salary increases. While each of these sensitivities holds all other assumptions constant, in practice such assumptions rarely change in isolation, while asset values also change, and the impacts may offset to some extent.
 
     
1 year
increase
£m
    
1 year
decrease
£m
   
0.25
percentage
point
increase
£m
   
0.25
percentage
point
decrease
£m
 
         
Average life expectancy – increase/(decrease) of scheme liabilities
  
 
271


(267
               
         
Rate of inflation – increase/(decrease) of scheme liabilities
                   
 
182


(175
         
Discount rate – (decrease)/increase of scheme liabilities


(327
 
 
346
 
A one percentage point increase in healthcare inflation would increase healthcare scheme liabilities by £33 million, and a one percentage point decrease would decrease liabilities by £25 million. The income statement effect of this change in assumption is not material.
 
220


Table of Contents
BAT Annual Report and Form 20-F 2021    
 
Strategic Report        
 
Governance Report        
  
Financial Statements        
  
        Other Information        


16 Deferred Tax
Net deferred tax (liabilities)/assets comprise:
 
     
Stock
relief
£m
   
Excess of
capital
allowances
over
depreciation
£m
   
Tax
    losses
£m
   
Undistributed
earnings of
associates and
subsidiaries
£m
   
Retirement
benefits
£m
   
Trademarks
£m
   
Other
temporary
differences
£m
   
Total
£m
 
                 
1 January 2021
  
 
(13
 
 
(189
 
 
58


(231
 
 
246


(16,784
 
 
1,133


(15,780
                 
Differences on exchange
  
 
(3
 
 
5


(3
 
 
2


(4
 
 
(149
 
 
4


(148
                 
Credited/(charged) to the income statement
  
 
12


(16
 
 
34


8


(22
 
 
63


(50
 
 
29
 
                 
Credited/(charged) relating to changes in tax rates


49


5


(3
 
 
91


16


158
 
                 
Charged to other comprehensive income


(78


(32
 
 
(110
                 
31 December 2021
  
 
(4
 
 
(151
 
 
94


(221
 
 
139


(16,779
 
 
1,071


(15,851
                 
1 January 2020
  
 
(45
 
 
(208
 
 
79


(318
 
 
279


(17,408
 
 
995


(16,626
                 
Differences on exchange
  
 
4


13


(3
 
 
8


528


(44
 
 
506
 
                 
Credited/(charged) to the income statement
  
 
28


(6
 
 
(21
 
 
(18
 
 
(12
 
 
75


138


184
 
                 
Credited relating to changes in tax rates


12


3


97


21


133
 
                 
(Charged)/credited to other comprehensive income


(21


44


23
 
                 
31 December 2020
  
 
(13
 
 
(189
 
 
58


(231
 
 
246


(16,784
 
 
1,133


(15,780
The net deferred tax liabilities are reflected in the Group balance sheet as follows: deferred tax asset of £611 million and deferred tax liability of £16,462 million (2020: deferred tax asset of £534 million and deferred tax liability of £16,314 million), after offsetting assets and liabilities where there is a legally enforceable right to offset current tax assets and liabilities and where the deferred income taxes relate to the same fiscal authority.
At the balance sheet date, the Group has not recognised a deferred tax asset in respect of unused tax losses of £342 million (2020: £342 million) which have no expiry date and unused tax losses of £452 million (2020: £458 million) which will expire within the next 20 years.
In 2021 and 2020 the Group has not recognised any deferred tax asset in respect of deductible temporary differences which have no expiry date and has not recognised £148 million (2020: £173 million) in respect of deductible temporary differences which will expire within the next 10 years.
At the balance sheet date, the Group has unused tax credits of £80 million (2020: £80 million) which have no expiry date. No amount of deferred tax has been recognised in respect of these unused tax credits.
At the balance sheet date, the aggregate amount of undistributed earnings of subsidiaries which would be subject to dividend withholding tax and for which no withholding tax liability has been recognised was £0.9 billion (2020: £0.6 billion).
 
221


Table of Contents

BAT Annual Report and Form 20-F 2021
Financial Statements
Notes on Accounts
Continued
    
 
17 Trade and Other Receivables
 
     
2021
£m
    
            2020
£m
 
     
Trade receivables
  
 
2,998


2,763
 
     
Loans and other receivables
  
 
755


696
 
     
Prepayments and accrued income
  
 
408


504


4,161


3,963
 
     
Current
  
 
3,951


3,721
 
     
Non-current
  
 
210


242


4,161


3,963
 
The majority of receivables are held in order to collect contractual cash flows, in accordance with the Group’s business model for managing financial assets, and hence are measured at amortised cost. In certain countries, however, the Group has entered into factoring arrangements and periodically sells certain trade receivables to banks and other financial institutions, without recourse, for cash. These trade receivables have been derecognised from the statement of financial position to reflect the transfer by the Group of substantially all of the risks and rewards of the receivables, including credit risk. Consequently, the cash inflows have been recognised within operating cash flows. Typically in these arrangements, the Group also acts as a collection agent for the bank. At 31 December 2021, the value of trade receivables derecognised through the factoring arrangements where the Group acts as a collection agent was £562 million (2020: £600 million) and where the Group does not act as a collection agent was £8 million (2020: £25 million). Included in trade receivables above is £110 million (2020: £205 million) of trade debtor balances which were available for factoring under these arrangements. In addition, the Group participates in certain supply chain finance programmes utilised by our customers allowing us to receive payment for invoices earlier than the agreed due date at a discounted value. At 31 December 2021, the value of trade receivables derecognised through these arrangements was £171 million (2020: £131 million).
Included in loans and other receivables are £84 million of litigation related deposits (2020: £78 million). Management has determined that these payments represent a resource controlled by the entity, as a result of past events and from which future economic benefits are expected to flow to the entity either by being recoverable on conclusion of ongoing appeal processes or by reducing amounts potentially payable should the appeal process fail. These deposits are held at the fair value of consideration transferred less impairment, if applicable. The effect of discounting would be immaterial.
Also included in loans and other receivables are deposits that do not meet the definition of cash and cash equivalents as well as loans provided to farmers. The cash flows arising from these transactions are included in investing activities and have been reconciled to the cash flow statement in note 18.
Prepayments and accrued income include £24 million (2020: £8 million) of accrued income primarily in relation to rebates.
Amounts receivable from related parties including associated undertakings are shown in note 30.
 
222


Table of Contents
BAT Annual Report and Form 20-F 2021    
 
Strategic Report        
 
Governance Report        
  
Financial Statements        
  
        Other Information        


17 Trade and Other Receivables
Continued
Trade and other receivables have been reported in the balance sheet net of allowances as follows:
 
     
2021
£m
   
            2020
£m
 
     
Trade receivables – gross
  
 
3,035


2,804
 
     
Trade receivables – allowance
  
 
(37
 
 
(41
     
Loans and other receivables – gross
  
 
755


696
 
     
Loans and other receivables – allowance


Prepayments and accrued income
  
 
408


504
 
     
Net trade and other receivables per balance sheet
  
 
4,161


3,963
 
The movements in the allowance account are as follows:
 
    
2021
   
2020


Trade
receivables
£m
   
Loans
and other
receivables
£m
    
    Total
£m
   
Trade
receivables
£m
   
Loans
and other
receivables
£m
   
        Total
£m
 
             
1 January
  
 
41


41


27


10


37
 
             
Differences on exchange
  
 
(2


(2
 
 
(2


(2
             
Provided in the year
  
 
7


7


31


31
 
             
Released
  
 
(9


(9
 
 
(15
 
 
(10
 
 
(25
             
31 December
  
 
37


37


41


41
 
As permitted by IFRS 9, the loss allowance on trade receivables arising from the recognition of revenue under IFRS 15 is initially measured at an amount equal to lifetime expected losses. Allowances in respect of loans and other receivables are initially recognised at an amount equal to 12-month expected credit losses. Allowances are measured at an amount equal to the lifetime expected credit losses where the credit risk on the receivables increases significantly after initial recognition.
The Group holds bank guarantees, other guarantees and credit insurance in respect of some of the past due debtor balances.
Trade and other receivables are predominantly denominated in the functional currencies of subsidiary undertakings apart from the following: U.S. dollar: 2.2% (2020: 2.6%), UK sterling: 0.1% (2020: 0.1%), Euro: 3.6% (2020: 0.4%) and other currencies: 0.9% (2020: 1.7%).
There is no material difference between the above amounts for trade and other receivables and their fair value due to the short-term duration of the majority of trade and other receivables as determined using discounted cash flow analysis. There is no concentration of credit risk with respect to trade receivables as the Group has a large number of internationally dispersed customers.
 
223 


Table of Contents
BAT Annual Report and Form 20-F 2021
Financial Statements
Notes on Accounts
Continued
    
 
18 Investments Held at Fair Value
 
    
2021
   
2020


Fair value
through P&L
   
Fair value
through OCI
    
    Total
£m
   
Fair value
through P&L
   
Fair value
through OCI
    
Total
£m
 
             
1 January
  
 
255


9


264


127


8


135
 
             
Difference on exchange
  
 
3


1


4


(23


(23
             
Additions
  
 
327


18


345


247


1


248
 
             
Disposals
  
 
(98


(98
 
 
(111


(111
             
Provisions
  
 
(24


(24


Fair value movements
  
 
6


9


15


15


15
 
             
31 December
  
 
469


37


506


255


9


264
 
             
Current
  
 
456


456


242


242
 
             
Non-current
  
 
13


37


50


13


9


22


469


37


506


255


9


264
 
The Group’s investments principally consist of non-derivative financial assets that cannot be classified as loans and other receivables or cash and cash equivalents, as well as investments made by the Group’s corporate venture capital unit, Btomorrow Ventures.
Investments held at fair value through profit and loss principally consist of government securities, indexed deposits, treasury bills or other treasury products with maturities of more than three months which, if held for less than 12 months, form part of the Group’s definition of net debt. Investments held at fair value through other comprehensive income (OCI) include equity investments in various start-up businesses which are held for their strategic value.
Investments held at fair value through profit and loss above include restricted amounts of £351 million (2020: £115 million) due to investments held by subsidiaries in CCAA protection (note 32), as well as £61 million (2020: £97 million) subject to potential exchange control restrictions.
In 2021, as part of the disposal of the Group’s operations in Iran (note 27(d)), a provision of £24 million (2020: £nil) against non-current investments held at fair value was charged to net finance costs as recoverability of these funds is not certain.
Investments held at fair value are predominantly denominated in the functional currencies of subsidiary undertakings with less than 4% in other currencies (2020: less than 2% in other currencies).
The classification of these investments under the IFRS 13
Fair value measurement
fair value hierarchy is given in note 26.
There is no material difference between the investments held at fair value and their gross contractual values.
Below is a reconciliation of the fair value investments cash flows to the cash flow statement – investing activities:
 
     
2021
£m
   
    2020
£m
 
     
Cash outflow from investments held at fair value
  
 
345


248
 
     
Cash outflow from loans and other receivables
  
 
24


95
 
     
Cash outflows from investments per cash flow statement
  
 
369


343
 
     
Cash inflow from investments held at fair value
  
 
(98
 
 
(111
     
Cash inflow from loans and other receivables
  
 
(43
 
 
(73
     
Cash inflows from investments per cash flow statement
  
 
(141
 
 
(184
 
224


Table of Contents
BAT Annual Report and Form 20-F 2021    
 
Strategic Report        
 
Governance Report        
  
Financial Statements        
  
        Other Information        


19 Derivative Financial Instruments
The fair values of derivatives are determined based on market data (primarily yield curves, implied volatilities and exchange rates) to calculate the present value of all estimated flows associated with each derivative at the balance sheet date. In the absence of sufficient market data, fair values would be based on the quoted market price of similar derivatives. The classification of these derivative assets and liabilities under the IFRS 13 fair value hierarchy is given in note 26.
 
    
2021
    
2020


            Assets
£m
    
Liabilities
£m
    
            Assets
£m
    
Liabilities
£m
 
         
Fair value hedges
                                   
         
– interest rate swaps
  
 
5


2


20


– cross-currency swaps
  
 
114


255


Cash flow hedges
                                   
         
– cross-currency swaps
  
 
107


35


189


– forward foreign currency contracts
  
 
81


35


62


100
 
         
Net investment hedges
                                   
         
– forward foreign currency contracts
  
 
62


81


211


43
 
         
Held-for-trading*
                                   
         
– interest rate swaps
  
 
28


34


45


53
 
         
– forward foreign currency contracts
  
 
28


127


15


123
 
         
Total
  
 
425


314


797


319
 
         
Current
  
 
182


235


430


278
 
         
Non-current
  
 
243


79


367


41


425


314


797


319
 
         
Derivatives
                                   
         
– in respect of net debt**
  
 
273


182


518


172
 
         
– other
  
 
152


132


279


147


425


314


797


319
 
 
*
Derivatives which do not meet the tests for hedge accounting under IFRS 9 or which are not designated as hedging instruments are referred to as ‘held-for-trading’. These derivatives principally consist of interest rate swaps and forward foreign currency contracts which have not been designated as hedges due to their value changes offsetting with other components of net finance costs relating to financial assets and financial liabilities. The Group does not use derivatives for speculative purposes. All derivatives are undertaken for risk management purposes.
 
**
Derivatives in respect of net debt are in a net asset position of £91 million as at 31 December 2021 (2020: net asset position of £346 million). The Group’s net debt is presented in note 23.
For cash flow hedges, the timing of expected cash flows is as follows: assets of £188 million (2020: £251 million) of which £78 million (2020: £98 million) is expected within one year and £107 million (2020: £143 million) beyond five years and liabilities of £70 million (2020: £100 million) of which £33 million (2020: £94 million) is expected within
one year
and £nil (2020: £nil) beyond
five years
.
The Group’s cash flow hedges are principally in respect of sales or purchases of inventory and certain debt instruments. A certain number of forward foreign currency contracts were used to manage the currency profile of external borrowings and are reflected in the currency table in note 23. Interest rate swaps have been used to manage the interest rate profile of external borrowings and are reflected in the re-pricing table in note 23.
 
225


Table of Contents
BAT Annual Report and Form 20-F 2021
Financial Statements
Notes on Accounts
Continued
    
 
19 Derivative Financial Instruments
Continued
The tables below set out the maturities of the Group’s derivative financial instruments on an undiscounted contractual basis, based on spot rates.
The maturity dates of all gross-settled derivative financial instruments are as follows:
 
    
2021
   
2020


Assets
   
Liabilities
   
Assets
   
Liabilities


            Inflow
£m
    
Outflow
£m
   
            Inflow
£m
    
Outflow
£m
   
            Inflow
£m
    
Outflow
£m
   
            Inflow
£m
    
Outflow
£m
 
                 
Within one year
                                                                    
                 
– forward foreign currency contracts
  
 
5,743


(4,727
 
 
12,407


(12,096
 
 
7,345


(6,567
 
 
10,661


(10,185
                 
– cross-currency swaps
  
 
14


(22
 
 
17


(36
 
 
1,756


(1,655


Between one and two years
                                                                    
                 
– forward foreign currency contracts
  
 
807


(779
 
 
143


(113
 
 
522


(498
 
 
285


(266
                 
– cross-currency swaps
  
 
705


(592
 
 
665


(689
 
 
33


(54


Between two and three years
                                                                    
                 
– cross-currency swaps
  
 
9


(15
 
 
10


(15
 
 
1,446


(1,261


Between three and four years
                                                                    
                 
– cross-currency swaps
  
 
9


(15
 
 
460


(445
 
 
19


(29


Between four and five years
                                                                    
                 
– cross-currency swaps
  
 
9


(15


469


(451


Beyond five years
                                                                    
                 
– cross-currency swaps
  
 
726


(579


767


(594


8,022


(6,744
 
 
13,702


(13,394
 
 
12,357


(11,109
 
 
10,946


(10,451
The maturity dates of net-settled derivative financial instruments, which primarily relate to interest rate swaps, are as follows:
 
    
2021
   
2020


Assets
Inflow/
        (outflow)
£m
   
        Liabilities
Outflow/
(inflow)
£m
   
Assets
Inflow/
        (outflow)
£m
    
        Liabilities
Outflow/
(inflow)
£m
 
         
Within one year
  
 
127


225


296


263
 
         
Between one and two years
  
 
25


19


26


21
 
         
Between two and three years
  
 
23


11


16


18
 
         
Between three and four years
  
 
(2
 
 
11


Between four and five years


12


Beyond five years


(17


173


261


338


302
 
 
226


Table of Contents
BAT Annual Report and Form 20-F 2021    
 
Strategic Report        
 
Governance Report        
  
Financial Statements        
  
        Other Information        


19 Derivative Financial Instruments
Continued
The items designated as hedging instruments are as follows:
 
    
2021
   
2020


Nominal amount
of hedging
instrument
£m
    
Changes in fair
value used for
calculating
hedge
ineffectiveness
£m
   
Nominal amount
of hedging
instrument
£m
    
Changes in fair
value used for
calculating
hedge
ineffectiveness
£m
 
         
Interest rate risk exposure:
                                  
         
Fair value hedges
                                  
         
– interest rate swaps
  
 
4,413


(35
 
 
757


(5
         
– cross-currency swaps
  
 
672


(52
 
 
1,428


66
 
         
Cash flow hedges
                                  
         
– cross-currency swaps
  
 
1,751


69


2,822


(155
         
Foreign currency risk exposure:
                                  
         
Cash flow hedges
                                  
         
– forward foreign currency contracts
  
 
3,573


49


3,279


(36
         
Net investment hedges (derivative related)
                                  
         
– forward foreign currency contracts
  
 
6,120


(27
 
 
5,922


156
 
         
Net investment hedges (non-derivative related)
                                  
         
– debt (carrying value) in borrowings designated as net investment hedges of net assets
  
 
368


(24
 
 
392


21
 
20 Inventories
 
     
2021
£m
    
            2020
£m
 
     
Raw materials and consumables
  
 
2,100


2,362
 
     
Finished goods and work in progress
  
 
3,046


3,549
 
     
Goods purchased for resale
  
 
133


87


5,279


5,998
 
Inventories pledged as security for liabilities amount to £nil (2020: £2 million). Write-offs taken to other operating expenses in the Group income statement were £215 million (2020: £309 million; 2019: £255 million). In 2020, this included £24 million in relation to the restructuring in Indonesia (refer to note 7) and £47 million as a result of the decision to withdraw glo Sens from Japan. Goods purchased for resale include Group brands produced under third-party contract manufacturing arrangements.
 
227


Table of Contents
BAT Annual Report and Form 20-F 2021
Financial Statements
Notes on Accounts
Continued
    
 
21 Cash and Cash Equivalents
 
     
2021
£m
    
2020
£m
 
     
Cash and bank balances
  
 
2,529


        2,940
 
     
Cash equivalents
  
 
280


199


2,809


3,139
 
The carrying value of cash and cash equivalents approximates their fair value.
Cash and cash equivalents are denominated in the functional currency of the subsidiary undertaking or other currencies as shown below:
 
     
2021
£m
    
2020
£m
 
     
Functional currency
  
 
2,422


2,597
 
     
U.S. dollar
  
 
170


197
 
     
Euro
  
 
92


170
 
     
Other currencies
  
 
125


175


2,809


          3,139
 
In the Group cash flow statement, net cash and cash equivalents are shown after deducting bank overdrafts and accrued interest where applicable, as follows:
 
     
2021
£m
   
2020
£m
 
     
Cash and cash equivalents as above
  
 
2,809


3,139
 
     
Less overdrafts and accrued interest
  
 
(346
 
 
(251
     
Net cash and cash equivalents
  
 
2,463


        2,888
 
Cash and cash equivalents also include £42 million (2020: £48 million) of cash that is held as a hedging instrument.
Restricted cash
Cash and cash equivalents include restricted amounts of £1,024 million (2020: £878 million) due to subsidiaries in CCAA protection (note 32), as well as £305 million (2020: £455 million) principally due to exchange control restrictions, including amounts of £92 million (2020: £141 million) where the underlying restrictions are expected to be short-term in nature.
22 Capital and Reserves
(a) Share capital
 
     
Ordinary
shares of 25p each
Number of shares
    
£m
 
     
Allotted and fully paid
                 
     
1 January 2021
  
 
2,456,591,597


614.14
 
     
Changes during the year
                 
     
– share option schemes
  
 
26,191


0.01
 
     
31 December 2021
  
 
2,456,617,788


614.15
 
     
Allotted and fully paid
                 
     
1 January 2020
  
 
2,456,520,738


        614.12
 
     
Changes during the year
                 
     
– share option schemes
  
 
70,859


0.02
 
     
31 December 2020
  
 
2,456,591,597


614.14
 
     
Allotted and fully paid
                 
     
1 January 2019
  
 
2,456,415,884


614.09
 
     
Changes during the year
                 
     
– share option schemes
  
 
104,854


0.03
 
     
31 December 2019
  
 
2,456,520,738


614.12
 
 
228


Table of Contents
BAT Annual Report and Form 20-F 2021    
 
Strategic Report        
 
Governance Report        
  
Financial Statements        
  
        Other Information        


22 Capital and Reserves
Continued
Share capital
The Company’s ordinary shares are fully paid and no further contribution of capital may be required by the Company from the shareholders. All ordinary shares rank equally with regard to participation in dividends and to share in the proceeds of the Company’s residual assets upon a winding up of the Company. Shareholders may, by ordinary resolution, declare final dividends, but not in excess of the amount recommended by the Directors. Holders of ordinary shares have no pre-emptive rights.
On a show of hands every shareholder who is present in person at a general meeting is entitled to one vote regardless of the number of shares held by the shareholder, unless a poll is demanded. On a poll, every shareholder who is present in person or by proxy has one vote for every share held by the shareholder. The Company’s Annual General Meeting voting is undertaken by way of a poll.
All rights attached to the Company’s shares held by the Group as treasury shares are suspended until those shares are reissued.
(b) Share premium account, capital redemption reserves and merger reserves comprise:
 
     
Share
premium
account
£m
    
Capital
redemption
reserves
£m
    
Merger
reserves
£m
    
Total
£m
 
         
31 December 2021
  
 
107


101


26,414


26,622
 
         
31 December 2020
  
 
103


101


26,414


26,618
 
         
31 December 2019
  
 
94


101


26,414


26,609
 
Share premium account
The share premium account includes the difference between the value of shares issued and their nominal value. The share premium increase includes £nil (2020: £2 million; 2019: £3 million) in respect of ordinary shares issued under the Company’s share option schemes. A further £4 million (2020: £7 million; 2019: £nil) increase in share premium is related to shares repurchased and not cancelled that have been transferred from the Company to other Group undertakings, to be granted to certain employees on vesting of awards, and represents the excess of transfer price of the share over the original weighted average cost of shares.
Capital redemption account
On the purchase of own shares as part of the share buy-back programme for shares which are cancelled, a transfer is made from retained earnings to the capital redemption reserve equivalent to the nominal value of shares purchased. Purchased shares which are not cancelled are classified as treasury shares and presented as a deduction from total equity.
Merger reserve account
The merger reserve comprises:
 
a.
In 1999, shares were issued for the acquisition of the Rothmans International B.V. Group and the difference between the fair value of shares issued and their nominal value of £3,748 million was credited to merger reserves; and
 
b.
On 25 July 2017, the Group announced the completion of the acquisition of the remaining 57.8% of RAI not already owned by the Group. Shares were issued for the acquisition and the difference between the fair value of shares issued and their nominal value of £22,666 million was credited to merger reserves.
 
229


Table of Contents
BAT Annual Report and Form 20-F 2021
Financial Statements
Notes on Accounts
Continued
    
 
22 Capital and Reserves
Continued
(c) Equity attributed to owners of the parent – movements in other reserves and retained earnings (which are after deducting treasury shares) comprise:
 
                                          
Retained earnings


Translation
reserve
(i)
£m
   
Hedging
reserve
(ii)
£m
   
Fair value
reserve
(iii)
£m
   
Revaluation
reserve
(iv)
£m
    
        Other
(v)
£m
    
Total other
reserves
£m
   
      Treasury
shares
(vi)
£m
   
Other
£m
 
                 
1 January 2021
  
 
(6,830
 
 
(504
 
 
(18
 
 
179


573


(6,600
 
 
(5,150
 
 
47,191
 
                 
Comprehensive income and expense
                                                                  
                 
Profit for the year


6,801
 
                 
Foreign currency translation and hedges of net investments in foreign operations
                                                                  
                 
– differences on exchange from translation of foreign operations
  
 
31


31


– reclassified and reported in profit for the year
  
 
291


291


– net investment hedges – net fair value gains on derivatives
  
 
75


75


– net investment hedges – differences on exchange on borrowings
  
 
24


24


Cash flow hedges
                                                                  
                 
– net fair value gains


95


95


– reclassified and reported in profit for the year


32


32


– tax on net fair value gains in respect of cash flow hedges (note 10(f))


(32


(32


Investments held at fair value
                                                                  
                 
– net fair value gains


9


9


Associates – share of OCI, net of tax (note 9)
  
 
(18
 
 
1


(17


Retirement benefit schemes
                                                                  
                 
– net actuarial gains (note 15)


382
 
                 
– surplus recognition (note 15)


(1
                 
– tax on actuarial gains in respect of subsidiaries (note 10(f))


(82
                 
Associates – share of OCI, net of tax (note 9)


15


15


(1
                 
Other changes in equity
                                                                  
                 
Cash flow hedges reclassified and reported in total assets


45


45


Employee share options
                                                                  
                 
– value of employee services


76
 
                 
– treasury shares used for share option schemes


13


(17
                 
Dividends and other appropriations
                                                                  
                 
– ordinary shares


(4,904
                 
Purchase of own shares
                                                                  
                 
– held in employee share ownership trusts


(82


Perpetual hybrid bonds
                                                                  
                 
– coupons paid


(6
                 
– tax on coupons paid


1
 
                 
Non-controlling interests – acquisitions (note 27(b))


(5
                 
Other movements


97


(101
                 
31 December 2021
  
 
(6,427
 
 
(363
 
 
6


179


573


(6,032
 
 
(5,122
 
 
49,334
 
 
230


Table of Contents
BAT Annual Report and Form 20-F 2021    
 
Strategic Report        
 
Governance Report        
  
Financial Statements        
  
        Other Information        


22 Capital and Reserves
Continued
 
                                          
Retained earnings


Translation
reserve
(i)
£m
   
Hedging
reserve
(ii)
£m
   
Fair value
reserve
(iii)
£m
   
Revaluation
reserve
(iv)
£m
    
        Other
(v)
£m
    
Total other
reserves
£m
   
      Treasury
shares
(vi)
£m
   
Other
£m
 
                 
1 January 2020
  
 
(3,974
 
 
(346
 
 
13


179


573


(3,555
 
 
(5,261
 
 
45,495
 
                 
Comprehensive income and expense
                                                                  
                 
Profit for the year


6,400
 
                 
Foreign currency translation and hedges of net investments in foreign operations
                                                                  
                 
– differences on exchange from translation of foreign operations
  
 
(2,582


(2,582


– net investment hedges – net fair value losses on derivatives
  
 
(16


(16


– net investment hedges – differences on exchange on borrowings
  
 
(163


(163


Cash flow hedges
                                                          
                 
– net fair value losses


(256


(256


– reclassified and reported in profit for the year


90


90


– tax on net fair value losses in respect of cash flow hedges (note 10(f))


44


44


Associates – share of OCI, net of tax (note 9)
  
 
(95
 
 
(3


(98


Retirement benefit schemes
                                                          
                 
– net actuarial gains (note 15)


105
 
                 
– surplus recognition (note 15)


10
 
                 
– tax on actuarial gains in respect of subsidiaries (note 10(f))


(26
                 
Associates – share of OCI, net of tax (note 9)


(31


(31


(3
               
Other changes in equity
                                                          
                 
Cash flow hedges reclassified and reported in total assets


(33


(33


Employee share options
                                                          
                 
– value of employee services


88
 
                 
– treasury shares used for share option schemes


9


(16
               
Dividends and other appropriations
                                                          
                 
– ordinary shares


(4,747
               
Purchase of own shares
                                                          
                 
– held in employee share ownership trusts


(17


Other movements


119


(115
                 
31 December 2020
  
 
(6,830
 
 
(504
 
 
(18
 
 
179


573


(6,600
 
 
(5,150
 
 
47,191
 
 
231


Table of Contents
BAT Annual Report and Form 20-F 2021
Financial Statements
Notes on Accounts
Continued
    
 
22 Capital and Reserves
Continued
 
                                           
Retained earnings


Translation
reserve
(i)
£m
   
Hedging
reserve
(ii)
£m
   
Fair value
reserve
(iii)
£m
    
Revaluation
reserve
(iv)
£m
    
        Other
(v)
£m
    
Total other
reserves
£m
   
      Treasury
shares
(vi)
£m
   
Other
£m
 
                 
1 January 2019
  
 
(914
 
 
(177
 
 
6


179


573


(333
 
 
(5,242
 
 
43,799
 
                 
Comprehensive income and expense
                                                                   
                 
Profit for the year


5,704
 
                 
Foreign currency translation and hedges of net investments in foreign operations
                                                                   
                 
– differences on exchange from translation of foreign operations
  
 
(2,948


(2,948


– net investment hedges – net fair value gains on derivatives
  
 
21


21


– net investment hedges – differences on exchange on borrowings
  
 
(18


(18


Cash flow hedges
                                                                   
                 
– net fair value losses


(246


(246


– reclassified and reported in profit for the year


53


53


– tax on net fair value losses in respect of cash flow hedges (note 10(f))


56


56


Associates – share of OCI, net of tax (note 9)
  
 
(115


(115


Retirement benefit schemes
                                                                   
                 
– net actuarial losses (note 15)


(582
                 
– surplus recognition (note 15)


(7
                 
– tax on actuarial losses in respect of subsidiaries (note 10(f))


75
 
                 
Associates – share of OCI, net of tax (note 9)


7


7


Other changes in equity
                                                                   
                 
Cash flow hedges reclassified and reported in total assets


(32


(32


Employee share options
                                                                   
                 
– value of employee services


115
 
               
Dividends and other appropriations
                                                           
                 
– ordinary shares


(3,476
               
Purchase of own shares
                                                           
                 
– held in employee share ownership trusts


(117


Other movements


98


(133
                 
31 December 2019
  
 
(3,974
 
 
(346
 
 
13


179


573


(3,555
 
 
(5,261
 
 
45,495
 
i. Translation reserve:
The translation reserve is explained in the accounting policy on foreign currencies in note 1.
In 2021, included within the differences on exchange from translation of foreign operations is £291 million which has been reclassified from reserves to the income statement and recognised in other operating expenses as an adjusting item. The £291 million comprises £272 million in respect of the disposal of BAT Pars (note 27(d)) and £19 million from the Group exiting certain countries. As a result of Quantum initiatives, the Group has withdrawn its operations from Myanmar and, in certain countries, the Group has moved to above market business models utilising local distributors as importers. As a consequence, with the cessation of a physical presence in these markets, foreign exchange previously recognised in other comprehensive income for these countries has been reclassified to the income statement.
As detailed in note 14, as a result of the liquidation of Tisak d.d., the Group reclassified to the income statement the foreign exchange previously recognised in associates other comprehensive income. This resulted in a credit of £2 million to the income statement.
 
232


Table of Contents
BAT Annual Report and Form 20-F 2021    
 
Strategic Report        
 
Governance Report        
  
Financial Statements        
  
        Other Information        


22 Capital and Reserves
Continued
ii. Hedging reserve:
The hedging reserve is explained in the accounting policy on financial instruments in note 1.
Of the amounts reclassified from the hedging reserve and reported in profit for the year, a loss of £29 million (2020: £16 million gain; 2019: £12 million gain) and a gain of £6 million (2020: £19 million gain; 2019: £3 million gain) were reported within revenue and raw materials and consumables, respectively, together with a loss of £4 million (2020: £2 million loss; 2019: £11 million gain) reported in other operating expenses, and a gain of £59 million (2020: £57 million gain; 2019: £27 million gain) reported within net finance costs.
The Group hedges certain foreign currency denominated borrowings with cross-currency interest rate swaps. As permitted by IFRS 9
Financial Instruments,
the foreign currency basis spreads have been separated from the hedging instrument and are recognised in reserves as a ‘cost of hedging’ and are reclassified to the income statement in the same period in which profit and loss is affected by the hedged expected cashflows as a component of the associated interest expense. The basis spreads are disclosed within hedging reserves as they are not material. Included within the balance of hedging reserves at 31 December 2021 is an accumulated gain of £4 million (2020: £9 million; 2019: £14 million) in respect of the cost of hedging.
iii. Fair value reserve:
The fair value reserve is explained in the accounting policy on financial instruments in note 1. Fair value gains and losses arising from investments held at fair value through other comprehensive income are recognised in this reserve.
iv. Revaluation reserve:
The revaluation reserve relates to the acquisition of the cigarette and snus business of ST in 2008.
v. Other reserves:
Other reserves comprise:
 
(a)
£483 million which arose in 1998 from merger accounting in a Scheme of Arrangement and Reconstruction whereby British American Tobacco p.l.c. acquired the entire share capital of B.A.T Industries p.l.c. and the share capital of that company’s principal financial services subsidiaries was distributed, so effectively demerging them; and
 
(b)
In the 1999 Rothmans transaction, convertible redeemable preference shares were issued as part of the consideration. The discount on these shares was amortised by crediting other reserves and charging retained earnings. The £90 million balance in other reserves comprises the accumulated balance in respect of the preference shares converted during 2004.
vi. Treasury shares:
Total equity attributable to owners of the parent is stated after deducting the cost of treasury shares which include £4,823 million (2020: £4,836 million; 2019: £4,845 million) for shares repurchased and not cancelled and £299 million (2020: £314 million; 2019: £416 million) in respect of the cost of own shares held in employee share ownership trusts. The reduction in the shares repurchased and not cancelled is primarily due to shares reissued to satisfy the vesting of U.S. share options.
The previous share buy-back programme was suspended from 30 July 2014. As at 31 December 2021, treasury shares include 6,269,959 (2020: 6,053,158; 2019: 8,275,677) shares held in trust and 161,930,217 (2020: 162,347,246; 2019: 162,645,590) shares repurchased and not cancelled as part of the Company’s share buy-back programme. From March 2020, the Company has utilised shares acquired in the share buy-back programme to satisfy shared-based payment awards made to certain employees. On 10 February 2022, the Board approved a proposed £2 billion share repurchase programme for 2022.
(d) Perpetual hybrid bonds
On 27 September 2021, the Group issued two
1 billion perpetual hybrid bonds amounting to £1,703 million, which have been classified as equity. Issuance costs of these bonds, amounting to
26 million (£22 million), have been recognised within equity.
These bonds include redemption options exercisable at the Group’s discretion from September 2026 to December 2026 (the 3% perpetual hybrid bond) and June 2029 to September 2029 (the 3.75% perpetual hybrid bond), on specified dates thereafter, or in the event of specific circumstances (such as a change in IFRS or tax regime) as set out in the individual terms of each issue.
The coupons associated with these perpetual hybrid bonds are fixed at 3% until 2026 and 3.75% until 2029, respectively, and would reset to rates determined by the contractual terms of each instrument on certain dates thereafter. The bonds are perpetual in nature and do not have maturity dates for the repayment of principal. The contractual terms of the perpetual hybrid bonds allow the Group to defer coupon payments, however certain contingent events could trigger mandatory payments of such deferred coupons, including the payment of dividends on and the repurchase of ordinary shares, subject to certain exceptions in each case. The full terms and conditions of such events can be found in the prospectus dated 27 September 2021 which is available under the debt facilities section of the Group’s debt microsite (bat.com/debt). As the Group has the unconditional right to avoid transferring cash or another financial asset in relation to these bonds, they are classified as equity instruments in the consolidated financial statements.
During the year, the Group did not defer any eligible coupon payments and in December 2021 paid a coupon of £6 million on the 3% December 2026 bond which has been recognised within equity. The fair value of these bonds at 31 December 2021 is £1,651 million.
(e) Non-controlling interests
Movements in non-controlling interests primarily relate to profit for the year and dividends (reported as a movement in retained earnings) and differences on exchange arising from the translation into sterling (reported as a movement in other reserves). Information on subsidiaries with material non-controlling interests is provided in note 32.
 
233


Table of Contents
BAT Annual Report and Form 20-F 2021
Financial Statements
Notes on Accounts
Continued
    
 
22 Capital and Reserves
Continued
(f) Dividends and other appropriations
The interim quarterly dividend payment for the year ended 31 December 2020 of 215.6p per ordinary share (31 December 2019: 210.4p per ordinary share) was payable in four equal instalments: amounts payable in May 2021 of £1,241 million (May 2020: £1,185 million), August 2021 of £1,228 million (August 2020: £1,195 million), November 2021 of £1,232 million (November 2020: £1,206 million) and £1,236 million in February 2022 (February 2021: £1,203 million) respectively. The total dividends recognised as an appropriation from reserves in 2021 was £4,904 million (2020: £4,747 million).
The Board has declared an interim dividend of 217.8p per ordinary share of
25
p, for the year ended 31 December 2021, payable in four equal quarterly instalments of 54.45p per ordinary share in May 2022, August 2022, November 2022 and February 2023. These payments will be recognised as appropriations from reserves in 2022 and 2023. The total amount payable is estimated to be £5,003 million based on the number of shares outstanding at the date of these accounts.
23 Borrowings
 
     
Currency
  
Maturity dates
  
Interest rates
  
2021
£m
    
2020
£m
 
           
Eurobonds
   Euro   
2022 to 2045
  
0.9% to 3.1%
  
 
7,316


8,875
 
           
     Euro*             


984
 
           
     UK sterling   
2022 to 2055
  
2.1% to 7.3%
  
 
4,086


4,590
 
           
     Swiss franc   
2026
  
1.4%
  
 
203


540
 
           
Bonds issued pursuant to Rules under the U.S. Securities Act (as amended)
   U.S. dollar   
2022 to 2050
  
1.7% to 8.1%
  
 
25,625


25,461


   U.S. dollar   
2022
  
USD 3m LIBOR + 88bps
  
 
554


548
 
           
Bonds and notes
                 
 
37,784


40,998
 
           
Commercial paper
                 
 
269


Other loans
                 
 
500


1,929
 
           
Bank loans
                 
 
313


317
 
           
Bank overdrafts
                 
 
346


249
 
           
Lease liabilities


446


475


39,658


    43,968
 
* As at 31 December 2021, there were no outstanding floating Eurobonds in euro currency (2020: £984 million, 3M EURIBOR + 50bps).
Perpetual hybrid bonds issued by the Group have been classified as equity (note 22(d)) and therefore excluded from borrowings.
Other loans comprise £500 million (2020: £nil) relating to a bilateral facility and £nil (2020: £1,929 million) relating to a term loan. Commercial paper is issued at competitive rates to meet short-term borrowing requirements as and when needed.
Current borrowings per the balance sheet include interest payable of £460 million at 31 December 2021 (2020: £499 million).
Included within borrowings are £9,197 million (2020: £5,356 million) of borrowings subject to fair value hedges where their amortised cost has been increased by £101 million (2020: £173 million).
The fair value of borrowings is estimated to be £40,557 million (2020: £47,029 million) of which £38,683 million (2020: £44,059 million) has been calculated using quoted market prices and is within level 1 of the fair value hierarchy and £1,874 million (2020: £2,970 million) has been calculated based on discounted cash flow analysis and is within level 3 of the fair value hierarchy.
Amounts secured on Group assets including property, plant and equipment, inventory and receivables as at 31 December 2021 are £10 million (2020: £21 million). The majority of lease liabilities are also secured against the associated assets.
Borrowings are repayable as follows:
 
    
Per balance sheet
        
        Contractual gross maturities


2021
£m
    
2020
£m
         
2021
£m
    
2020
£m
 
           
Within one year
  
 
3,992


4,041


4,860


4,901
 
           
Between one and two years
  
 
2,484


4,049


3,740


5,355
 
           
Between two and three years
  
 
3,853


2,587


5,092


3,829
 
           
Between three and four years
  
 
4,090


3,854


5,034


5,095
 
           
Between four and five years
  
 
2,739


4,108


3,675


5,025
 
           
Beyond five years
  
 
22,500


25,329


32,203


35,848


39,658


      43,968


54,604


60,053
 
The contractual gross maturities in each year include the borrowings maturing in that year together with forecast interest payments on all borrowings which are outstanding for all or part of that year.
 
234


Table of Contents
BAT Annual Report and Form 20-F 2021    
 
Strategic Report        
 
Governance Report        
  
Financial Statements        
  
        Other Information        


23 Borrowings
Continued
Borrowings are denominated in the functional currency of the subsidiary undertaking or other currencies as shown below:
 
     
Functional
currency
£m
    
U.S.
dollar
£m
    
UK
    sterling
£m
    
Euro
£m
   
Other
currencies
£m
   
Total
£m
 
             
31 December 2021
                                                   
             
Total borrowings
  
 
30,363


2,837


453


5,775


230


39,658
 
             
Effect of derivative financial instruments
                                                   
             
– cross-currency swaps
  
 
2,219


(450
  
 
(1,973


(204
             
– forward foreign currency contracts
  
 
(24
  
 
(464


58


432


2


    32,558


    2,373


3


    3,860


    662


    39,456
 
             
31 December 2020
                                                   
             
Total borrowings
  
 
32,000


2,700


452


8,221


595


43,968
 
             
Effect of derivative financial instruments
                                                   
             
– cross-currency swaps
  
 
3,795


(450
  
 
(3,536
 
 
(265
 
 
(456
             
– forward foreign currency contracts
  
 
593


(460


(520
 
 
394


7


36,388


2,240


2


4,165


724


43,519
 
The exposure to interest rate changes when borrowings are re-priced is as follows:
 
    
Within
1 year
£m
   
Between
1-2 years
£m
   
Between
2-3 years
£m
   
Between
3-4 years
£m
   
Between
4-5 years
£m
   
Beyond
5 years
£m
   
Total
£m
 
               
31 December 2021
                                                       
               
Total borrowings
 
 
3,999


2,477


3,853


4,090


2,739


22,500


39,658
 
               
Effect of derivative financial instruments
                                                       
               
– interest rate swaps
 
 
4,192


(500
 
 
(1,107


(2,585


– cross-currency swaps
 
 
566


(652


(19


(99
 
 
(204


8,757


    1,825


    3,353


    2,964


  2,739


  19,816


    39,454
 
               
31 December 2020
                                                       
               
Total borrowings
 
 
6,519


1,568


2,594


3,855


4,108


25,324


43,968
 
               
Effect of derivative financial instruments
                                                       
               
– interest rate swaps
 
 
219


(219


– cross-currency swaps
 
 
454


(744


(23
 
 
(143
 
 
(456


7,192


1,349


1,850


3,855


4,085


25,181


43,512
 
Lease liabilities are repayable as follows:
 
    
                    Per balance sheet
   
        Contractual gross maturities


2021
£m
   
2020
£m
   
2021
£m
   
2020
£m
 
         
Within one year
  
 
126


137


142


156
 
         
Between one and two years
  
 
93


98


106


114
 
         
Between two and three years
  
 
66


71


76


80
 
         
Between three and four years
  
 
49


47


56


55
 
         
Between four and five years
  
 
38


35


43


41
 
         
Beyond five years
  
 
74


87


103


104


446


475


526


550
 
For more information on leasing arrangements, refer to note 13(b).
As at 31 December 2021, the Group’s undrawn committed borrowing facilities (note 26) amount to £7,850 million (2020: £9,366 million) with £4,850 million maturing within one year (2020: £6,366 million maturing within one year), £150 million maturing between three and four years and with £2,850 million maturing between four and five years (2020: £3,000 million maturing between four to five years).
 
235


Table of Contents
BAT Annual Report and Form 20-F 2021
Financial Statements
Notes on Accounts
Continued
    
 
23 Borrowings
Continued
The Group’s composition and movements in net debt are presented below along with a reconciliation to the financing activities in the Group Cash Flow Statement:
 
    
2021

£m


Opening
balance
   
Cash flow
   
Foreign
exchange
   
Fair value,
accrued
interest
and other
   
Closing
balance
 
           
Borrowings (excluding lease liabilities)*
  
 
43,493


(3,768
 
 
(387
 
 
(126
 
 
39,212
 
           
Lease liabilities
  
 
475


(154
 
 
(22
 
 
147


446
 
           
Derivatives in respect of net debt (note 19)
  
 
(346
 
 
(22
 
 
277


(91
           
Cash and cash equivalents (note 21)
  
 
(3,139
 
 
75


258


(3
 
 
(2,809
           
Current investments held at fair value (note 18)
  
 
(242
 
 
(205
 
 
(2
 
 
(7
 
 
(456


    40,241


(4,074
 
 
124


11


36,302


2020

£m


Opening
balance
   
Subsidiaries
acquired
   
Cash flow
   
Foreign
exchange
   
Fair value,
accrued
interest
and other
   
Closing
balance
 
             
Borrowings (excluding lease liabilities)*
  
 
44,787


(1,049
 
 
(195
 
 
(50
 
 
43,493
 
             
Lease liabilities
  
 
579


1


(164
 
 
(24
 
 
83


475
 
             
Derivatives in respect of net debt (note 19)
  
 
(143


(240
 
 
(134
 
 
171


(346
             
Cash and cash equivalents (note 21)
  
 
(2,526
 
 
(96
 
 
(768
 
 
264


(13
 
 
(3,139
             
Current investments held at fair value (note 18)
  
 
(123


(119
 
 
20


(20
 
 
(242


42,574


(95
 
 
(2,340
 
 
(69
 
 
171


40,241
 
* Borrowings as at 31 December 2021 include £754 million (2020: £790 million) in respect of the purchase price adjustments relating to the acquisition of Reynolds American.
‘Fair value, accrued interest and other’ movements in lease liabilities in 2021 mainly comprise additions of £147 million (2020: £85 million) (net of reassessments, modifications and terminations), see note 13(a). The movement of £7 million (2020: £20 million) in current investments held at fair value represents the fair value gains for these investments.
 
     
2021
£m
   
2020
£m
 
     
Cash flows per net debt statement
  
 
(4,074
 
 
(2,340
     
Non-financing cash flows included in net debt
  
 
33


    1,129
 
     
Interest paid
  
 
(1,479
 
 
(1,737
     
Interest element of lease liabilities
  
 
(23
 
 
(26
     
Remaining cash flows relating to derivative financial instruments
  
 
251


(43
     
Purchases of own shares held in employee share ownership trusts
  
 
(82
 
 
(18
     
Proceeds from issue of perpetual hybrid bonds
  
 
1,681


Coupon paid on perpetual hybrid bonds
  
 
(6


Dividends paid to owners of the parent
  
 
(4,904
 
 
(4,745
     
Capital injection from and purchase of non-controlling interests
  
 
1


17
 
     
Dividends paid to non-controlling interests
  
 
(150
 
 
(136
     
Other
  
 
3


2
 
     
Net cash used in financing activities per cash flow statement
  
 
(8,749
 
 
(7,897
 
236


Table of Contents
BAT Annual Report and Form 20-F 2021    
 
Strategic Report        
 
Governance Report        
  
Financial Statements        
  
        Other Information        


24 Provisions for Liabilities
 
     
Restructuring
of existing
businesses
£m
   
Employee-
related
benefits
£m
   
Fox River
£m
   
Other
provisions
£m
   
Total
£m
 
1 January 2021
  
 
241


38


70


636


985
 
           
Differences on exchange
  
 
(13
 
 
(3


(23
 
 
(39
           
Provided in respect of the year (*)
  
 
32


27


199


258
 
           
Utilised during the year
  
 
(81
 
 
(21
 
 
(8
 
 
(241
 
 
(351
           
– in respect of MSA litigation (Texas, Minnesota, Mississippi)


(199
 
 
(199
           
– in respect of other
  
 
(81
 
 
(21
 
 
(8
 
 
(42
 
 
(152
           
31 December 2021
  
 
179


41


62


571


853
 
Analysed on the balance sheet as
                                        
           
– current
  
 
123


14


8


316


461
 
           
– non-current
  
 
56


27


54


255


392


179


41


62


571


853


Restructuring
of existing
businesses
£m
   
Employee-
related
benefits
£m
   
  Fox River
£m
   
Other
provisions
£m
   
Total
£m
 
1 January 2020
  
 
298


28


73


659


1,058
 
           
Differences on exchange
  
 
5


(2


(57
 
 
(54
           
Subsidiaries acquired


6


6
 
           
Provided in respect of the year (*)
  
 
60


19


312


391
 
           
– in respect of MSA litigation (Texas, Minnesota, Mississippi)


212


212
 
           
– in respect of other
  
 
60


19


100


179
 
           
Utilised during the year
  
 
(122
 
 
(7
 
 
(3
 
 
(284
 
 
(416
           
– in respect of excise dispute in Russia


(226
 
 
(226
           
– in respect of other
  
 
(122
 
 
(7
 
 
(3
 
 
(58
 
 
(190
           
31 December 2020
  
 
241


38


70


636


985
 
Analysed on the balance sheet as
                                        
           
– current
  
 
165


23


1


409


598
 
           
– non-current
  
 
76


15


69


227


387


241


38


70


636


985
 
 
*
Amounts provided above are shown net of reversals of unused provisions which include reversals of £20 million (2020: £72 million) for restructuring of existing businesses, £1 million (2020: £4 million) for employee benefits and £147 million (2020: £125 million) for other provisions, of which £34 million (2020: £4 million) was reclassified to trade and other payables.
The restructuring provisions relate to the restructuring and integration costs incurred and are reported as adjusting items. The principal restructuring activities in 2021 and 2020 are as described in note 7 and primarily include the cost of employee packages and long-term social plans associated with redundancy programmes from previous years. Provisions associated with redundancy packages are determined based on termination packages offered in each country. The long-term social plans primarily relate to social plans in Germany, which span over several years and are based on actuarial calculations. These are discounted to present value using Central Bank rates. We do not consider the effect of discounting to be material. While some elements of the non-current provisions of £56 million will unwind over several years, as termination payments are made over extended periods in some countries, it is estimated that approximately 97% of these non-current provisions will unwind within five years.
Employee-related benefits mainly relate to employee benefits other than post-employment benefits. The principal components of these provisions are gratuity and termination awards, ‘jubilee’ payments due after a certain service period and expected payments associated with long-term disability. The majority of these provisions are calculated by actuaries. It is estimated that approximately 84% of the non-current provisions of £27 million will unwind within five years.
A provision of £274 million was made in 2011 for a potential claim under a 1998 settlement agreement entered into by a Group subsidiary in respect of the clean-up of sediment in the Fox River. On 30 September 2014, the Group, NCR, Appvion and Windward Prospects entered into a funding agreement; the details of this agreement are explained in note 31. This agreement led to payments of £2 million in 2021 (2020: £2 million). In addition, the Group incurred legal costs of £6 million (2020: £1 million), which were also charged against the provision. It is expected that the non-current provision will unwind within five years.
 
237


Table of Contents
BAT Annual Report and Form 20-F 2021
Financial Statements
Notes on Accounts
Continued
    
 
24 Provisions for Liabilities
Continued
Other provisions comprise balances set up in the ordinary course of general business that cannot be classified within the other categories, such as sales returns and onerous contracts, together with amounts in respect of supplier, excise and other disputes. The nature of the amounts provided in respect of disputes is such that the extent and timing of cash flows are difficult to estimate and the ultimate liability may vary from the amounts provided. Other provisions also include a provision for interest of £150 million in relation to the Franked Investment Income Group Litigation Order (FII GLO), as mentioned in notes 8(b) and 10(b). The provision is calculated based on the UK central bank base rate plus 2% and has been charged to net finance costs. As there is uncertainty over the potential timing of the utilisation, as explained in note 10(b), the provision has been reported as a non-current provision.
In 2020, the Group recognised a provision of US$272 million (£212 million) in relation to the ITG Brands, LLC MSA litigation agreements with the States of Texas, Minnesota and Mississippi which was utilised in 2021. Further details are provided in note 31.
On 1 March 2019, the Quebec Court of Appeal in Montreal upheld the Superior Court’s decision of May 2015 (reducing ITCAN’s share of the judgment due to a change in interest computation to a maximum of CAD$9.2 billion). The Court of Appeal also upheld the previously stated requirements for the defendants to deposit CAD$1.1 billion into an escrow account. The Board of Directors of ITCAN reassessed the recoverability of the litigation related deposit and, accordingly, the Group recognised a charge against the income statement of CAD$758 million (£436 million) in 2019, reflecting the amount of the judgment that is considered to be probable and estimable in line with IAS 37
Provisions, Contingent Liabilities and Contingent Assets.
Consequently, the Group utilised the litigation related deposit which was shown as a receivable at 31 December 2018 (within trade and other receivables) against the current estimate of the liability and both the provision and litigation related deposit were reduced accordingly. Further details are provided in note 31.
In 2019, the Group recognised a provision of £252 million in relation to the Russia excise dispute. The provision was utilised in January 2020, when the tax claim was paid.
25 Trade and Other Payables
 
     
2021
£m
    
2020
£m
 
Trade payables
  
 
3,923


3,722
 
     
Duty, excise and other taxes
  
 
3,148


3,410
 
     
Accrued charges and deferred income
  
 
2,095


2,228
 
     
FII GLO (note 10(b))
  
 
963


963
 
     
Social security and other taxation
  
 
55


53
 
     
Sundry payables
  
 
375


381


10,559


10,757
 
Current
  
 
9,577


9,693
 
     
Non-current
  
 
982


1,064


10,559


    10,757
 
As explained in note 17, the Group acts as a collection agent for banks and other financial institutions in certain debt factoring arrangements. The cash collected in respect of these arrangements that has not yet been remitted amounts to £137 million (2020: £128 million) and is included in sundry payables.
In addition, the Group has certain Supply Chain Financing (SCF) or ‘reverse factoring’ arrangements in place. The principal purpose of these arrangements is to provide the supplier with the option to access liquidity earlier through the sale of its receivables due from the Group to a bank or other financial institution prior to their due date. Management has determined that the Group’s payables to these suppliers have neither been extinguished nor have the liabilities been significantly modified by these arrangements. The value of amounts payable, invoice due dates and other terms and conditions applicable, from the Group’s perspective, remain unaltered, with only the ultimate payee being changed. At 31 December 2021, the value of amounts payable under the SCF programmes was £251 million (2020: £48 million). The cash outflows in respect of these arrangements have been recognised within operating cash flows. Included in this amount is £156 million of leaf payables where the standard payment terms with the vendor is 150 days, consistent with credit terms normally available in certain markets.
Accrued charges and deferred income include £1 million of deferred income (2020: £nil) and £58 million (2020: £55 million) in respect of interest payable mainly related to tax matters. FII GLO of £963 million relates to receipts in 2015, in respect of the Franked Investment Income Government Litigation Order (note 10(b)). Amounts payable to related parties including associated undertakings are shown in note 30.
There is no material difference between the above amounts for trade and other payables and their fair value due to the short-term duration of the majority of trade and other payables, as determined using discounted cash flow analysis.
Trade and other payables are predominantly denominated in the functional currencies of subsidiary undertakings with less than 6% in other currencies (2020: less than 5% in other currencies).
 
238


Table of Contents
BAT Annual Report and Form 20-F 2021    
 
Strategic Report        
 
Governance Report        
  
Financial Statements        
  
        Other Information        


26 Financial Instruments and Risk Management
Management of financial risks
One of the principal responsibilities of Treasury is to manage the financial risks arising from the Group’s underlying operations. Specifically, Treasury manages, within an overall policy framework set by the Group’s Main Board and Corporate Finance Committee (CFC), the Group’s exposure to funding and liquidity, interest rate, foreign exchange and counterparty risks. The Group’s treasury position is monitored by the CFC which meets regularly throughout the year and is chaired by the Group Finance Director. The approach is one of risk reduction within an overall framework of delivering total shareholder return.
The Group defines capital as net debt (note 23) and equity (note 22). There are no externally imposed capital requirements for the Group. Group policies include a set of financing principles that provide a framework within which the Group’s capital base is managed and, in particular, the policies on dividends (as a percentage of long-term sustainable earnings) and share buy-back are decided. The key objective of the financing principles is to appropriately balance the interests of equity and debt holders in driving an efficient financing mix for the Group. The Group’s average cost of debt in 2021 is 3.5% (2020: 3.6%).
The Group manages its financial risks in line with the classification of its financial assets and liabilities in the Group’s balance sheet and related notes. The Group’s management of specific risks is dealt with as follows:
Liquidity risk
It is the policy of the Group to maximise financial flexibility and minimise refinancing risk by issuing debt with a range of maturities, generally matching the projected cash flows of the Group and obtaining this financing from a wide range of sources. The Group has a target average centrally managed debt maturity of at least five years with no more than 20% of centrally managed debt maturing in a single rolling year. As at 31 December 2021, the average centrally managed debt maturity was 10.1 years (2020: 9.9 years) and the highest proportion of centrally managed debt maturing in a single rolling year was 18.6.% (2020: 16.4%). Perpetual hybrid bonds are treated as equity (note 22 (d)) and therefore not included within the debt maturity analysis.
The Group utilises cash pooling and zero balancing bank account structures in addition to intercompany loans and borrowings to mobilise cash efficiently within the Group. The key objectives of Treasury in respect of cash and cash equivalents are to protect their principal value, to concentrate cash at the centre, to minimise the required debt issuance and to optimise the yield earned. The amount of debt issued by the Group is determined by forecasting the net debt requirement after the mobilisation of cash.
The Group continues to target a solid investment-grade credit rating. In January 2017, Moody’s and S&P revised the Group’s rating to Baa2 and BBB+ with stable outlook, respectively, following the announcement of the Reynolds American acquisition. The Group’s strategy is to continue deleveraging and is seeking to recover to Baa1/BBB+ in the medium term. The Group is confident of its continued ability to successfully access the debt capital markets for future refinancing requirements.
As part of its short-term cash management, the Group invests in a range of cash and cash equivalents, including money market funds, which are regarded as highly liquid and are not exposed to significant changes in fair value. These are kept under continuous review as described in the credit risk section below. At 31 December 2021, the Group does not have any investments in money market funds (2020: £nil).
As part of its working capital management, in certain countries, the Group has entered into factoring arrangements and supply chain financing arrangements. These are explained in further detail in note 17 and note 25.
Subsidiary companies are funded by share capital and retained earnings, loans from the central finance companies on commercial terms, or through local borrowings by the subsidiaries in appropriate currencies to predominantly fund short- to medium-term working capital requirements.
Available facilities in current year:
It is Group policy that short-term sources of funds (including drawings under both the Group US$4 billion U.S. commercial paper (U.S. CP) programme and the Group £3 billion euro commercial paper (ECP) programme) are backed by undrawn committed lines of credit and cash. Commercial paper is issued by B.A.T. International Finance p.l.c, B.A.T. Netherlands Finance B.V. and B.A.T Capital Corporation and guaranteed by British American Tobacco p.l.c. At 31 December 2021, commercial paper of £269 million was outstanding (2020: £nil). Cashflows relating to commercial paper that have maturity periods of three months or less are presented on a net basis in Group’s cash flow statement.
At 31 December 2021, the Group had access to a £5.85 billion revolving credit facility. This facility was undrawn at 31 December 2021. In 2021, the Group exercised the first of the
one-yea
r
extension options on both tranches of the revolving credit facility with the second one-year extension subsequently exercised in February 2022. Effective March 2022, therefore, the £2.85 billion 364-day tranche will be extended to March 2023 at the reduced amount of £2.7 billion and £2.5 billion of the
five-year
tranche will be extended from March 2026 to March 2027 (with £3.0 billion of this tranche remaining available until March 2025 and £2.85 billion remaining available from March 2025 to March 2026).
During 2021, the Group extended short-term bilateral facilities totalling £2.5 billion until March or April 2022, some with extension options to extend for further periods. As at 31 December 2021, £500 million was drawn on a short-term basis. Of such short-term bilateral facilities, in December 2021, the Group amended and extended a total of £500 million until December 2022 and subsequent to year end, the Group amended and extended a further £500 million until January 2023 and effective April 2022, an additional £350 million was agreed to be extended until October 2022 and £500 million until April 2023. Cashflows relating to bilateral facilities that have maturity periods of three months or less are presented on a net basis in the Group’s cash flow statement.
 
239


Table of Contents
BAT Annual Report and Form 20-F 2021
Financial Statements
Notes on Accounts
Continued
    
 
26 Financial Instruments and Risk Management
Continued
Issuance, drawdowns and repayments in current year:
 
In February 2021, the Group repaid a
650 million bond at maturity;
 
In June 2021, the Group repaid £500 million of the £1,929 million term loan that has a maturity date in January 2022; the remaining £1,429 million was repaid in September 2021;
 
In July, August, September and November 2021, the Group repaid £500 million,
1,100 million, CHF 400 million and
500 million of bonds at maturity, respectively; and
 
The Group issued perpetual hybrid bonds totalling
2 billion in September 2021. Please refer to note 22(d) for further details.
Available facilities in prior year:
In March 2020, the Group refinanced its £6 billion revolving credit facility consisting of a £3 billion 364-day tranche (with two one-year extension options and a one-year term-out option), and a £3 billion five-year tranche (with two one-year extension options). The facility no longer contains a financial covenant. As at 31 December 2020, the facility was undrawn.
In March and April 2020, the Group arranged short-term bilateral facilities with core relationship banks for a total amount of approximately £4.8 billion, strengthening the Group’s liquidity position and further mitigating liquidity risks during the COVID-19 crisis. The bilateral facilities have since been reduced to a total amount of approximately £3.4 billion. At 31 December 2020, these facilities were undrawn.
Issuance, drawdowns and repayments in prior year:
 
In April 2020, the Group accessed the U.S. dollar market under its SEC Shelf Programme, raising a total of US$2.4 billion across three tranches. Additionally, the Group accessed the European market under its EMTN programme, raising a total of
1.7 billion across two tranches;
 
In May and June 2020, the Group repaid US$750 million and US$770.8 million bonds at maturity, respectively. Additionally, in June 2020, the Group raised £500 million in the sterling market under its EMTN Programme;
 
In July 2020, the Group repaid a
600 million bond and a £1.9 billion term loan at maturity, and in August 2020, the Group repaid a US$1 billion bond at maturity;
 
In September 2020, the Group accessed the U.S. dollar market under its SEC Shelf programme, raising a total of US$6.25 billion across five tranches. The Group also made a tender offer to repurchase portions of seven series of bonds prior to their maturities. The tender offer was completed in October 2020, totalling US$3.2 billion under five series of bonds, £70 million and
100 million under two separate series of bonds, all of which would have otherwise matured in 2021 and 2022; and
 
In October 2020, the Group exercised the make whole redemption provision to fully redeem the remaining amounts outstanding following the tender offer on three series of bonds that would have otherwise matured in 2022. In November 2020, the balance outstanding on these bonds was repurchased, totalling US$597.6 million.
Currency risk
The Group is subject to exposure on the translation of the net assets of foreign currency subsidiaries and associates into its reporting currency, sterling. The Group’s primary balance sheet translation exposures are to the U.S. dollar, Canadian dollar, euro, Danish krone, Swiss franc, South African rand, Russian rouble, Brazilian real, Australian dollar, Malaysian ringgit, Singaporean dollar and Indian rupee. These exposures are kept under continuous review. The Group’s policy on borrowings is to broadly match the currency of these borrowings with the currency of cash flows arising from the Group’s underlying operations. Within this overall policy, the Group aims to minimise all balance sheet translation exposure where it is practicable and cost-effective to do so through matching currency assets with currency borrowings. The main objective of these policies is to protect shareholder value by increasing certainty and minimising volatility in earnings per share. At 31 December 2021, the currency profile of the Group’s gross debt, after taking into account derivative contracts, was 68% U.S. dollar (2020: 63%), 13% euro (2020: 13%), 13% sterling (2020: 19%) and 6% other currencies (2020: 5% other currencies).
The Group faces currency exposures arising from the translation of profits earned in foreign currency subsidiaries and associates and joint arrangements; these exposures are not normally hedged. Exposures also arise from:
(i) foreign currency denominated trading transactions undertaken by subsidiaries. These exposures comprise committed and highly probable forecast sales and purchases, which are offset wherever possible. The remaining exposures are hedged within the Treasury policies and procedures with forward foreign exchange contracts and options, which are designated as hedges of the foreign exchange risk of the identified future transactions; and
(ii) forecast dividend flows from subsidiaries to the centre. To ensure cash flow certainty, the Group enters into forward foreign exchange contracts which are designated as net investment hedges of the foreign exchange risk arising from the investments in these subsidiaries.
IFRS 7 requires a sensitivity analysis that shows the impact on the income statement and on items recognised directly in other comprehensive income of hypothetical changes of exchange rates in respect of non-functional currency financial assets and liabilities held across the Group. All other variables are held constant although, in practice, market rates rarely change in isolation. Financial assets and liabilities held in the functional currency of the Group’s subsidiaries, as well as non-financial assets and liabilities and translation risk, are not included in the analysis. The Group considers a 10% strengthening or weakening of the functional currency against the non-functional currency of its subsidiaries as a reasonably possible change. The impact is calculated with reference to the financial asset or liability held as at the year-end, unless this is unrepresentative of the position during the year.
 
240


Table of Contents
BAT Annual Report and Form 20-F 2021    
 
Strategic Report        
 
Governance Report        
  
Financial Statements        
  
        Other Information        


26 Financial Instruments and Risk Management
Continued
A 10% strengthening of functional currencies against non-functional currencies would result in pre-tax profit being £53 million lower (2020: £61 million lower; 2019: £16 million lower) and items recognised directly in other comprehensive income being £144 million higher (2020: £57 million higher; 2019: £22 million lower). A 10% weakening of functional currencies against non-functional currencies would result in pre-tax profit being £65 million higher (2020: £74 million higher; 2019: £20 million higher) and items recognised directly in other comprehensive income being £177 million lower (2020: £70 million lower; 2019: £27 million higher).
The exchange sensitivities on items recognised directly in other comprehensive income relate to hedging of certain net asset currency positions in the Group, as well as on cash flow hedges in respect of future transactions, but do not include sensitivities in respect of exchange on non-financial assets or liabilities.
Interest rate risk
The objectives of the Group’s interest rate risk management policy are to lessen the impact of adverse interest rate movements on the earnings, cash flow and economic value of the Group. Additional objectives are to minimise the cost of hedging and the associated counterparty risk.
During 2020, the Group financial covenant, being gross interest cover, was removed from the centrally managed banking facilities.
In order to manage its interest rate risk, the Group maintains both floating rate and fixed rate debt. The Group sets targets (within overall guidelines) for the desired ratio of floating to fixed rate debt on a net basis (at least 50% fixed on a net basis in the short to medium term) as a result of regular reviews of market conditions and strategy by the Corporate Finance Committee and the board of the main central finance company. At 31 December 2021, the relevant ratios of floating to fixed rate borrowings were 10:90 (2020: 7:93) on a net basis. Underlying borrowings are arranged on both a fixed rate and a floating rate basis and, where appropriate, the Group uses derivatives, primarily interest rate swaps to vary the fixed and floating mix, or forward starting swaps to manage the refinancing risk. The interest rate profile of liquid assets is taken into account in determining the net interest rate exposure.
IFRS 7 requires a sensitivity analysis that shows the impact on the income statement and on items recognised directly in other comprehensive income of hypothetical changes of interest rates in respect of financial assets and liabilities of the Group. All other variables are held constant although, in practice, market rates rarely change in isolation. For the purposes of this sensitivity analysis, financial assets and liabilities with fixed interest rates are not included. The Group considers a 100 basis point change in interest rates a reasonably possible change except where rates are less than 100 basis points. In these instances, it is assumed that the interest rates increase by 100 basis points and decrease to zero for the purpose of performing the sensitivity analysis. The impact is calculated with reference to the financial asset or liability held as at the year-end, unless this is unrepresentative of the position during the year.
A 100 basis point increase in interest rates would result in pre-tax profit being £44 million lower (2020: £31 million lower; 2019: £143 million lower). A 100 basis point decrease in interest rates, or less where applicable, would result in pre-tax profit being £47 million higher (2020: £29 million higher; 2019: £108 million higher). The effect of these interest rate changes on items recognised directly in other comprehensive income is not material in either year.
 
In accordance with the UK Financial Conduct Authority’s announcement on 27 July 2017, and following the decision taken by global regulators in 2018 to replace Interbank Offered Rates with alternative nearly risk-free rates, such benchmark rates are expected to be largely discontinued after 2021. The IASB addressed the effects of interest rate benchmark reform on financial reporting, with two phases of Amendments to IFRS 9
Financial Instruments
(and other Standards) which the Group adopted in its Year End 2019 and 2020 accounts, respectively, as explained in the accounting policies (note 1). The impact on the Group’s profit or equity from the application of these amendments was not material.
In January 2021, the Group confirmed adherence to the ISDA 2020 IBOR Fallbacks Protocol as published by the International Swaps and Derivatives Association, Inc. (ISDA) on 23 October 2020 (the Protocol), ensuring that appropriate fallback rates can apply to derivatives in the event of LIBOR discontinuation.
As at 31 December 2021, the Group has a floating rate bond with a nominal value US$750 million (£554 million) (2020: US$750 million (£549 million)) that is due to mature in August 2022 before USD LIBOR ceases. £1,929 million of floating rate borrowings outstanding at 31 December 2020 were repaid during the year. In addition, the Group has bilateral facilities totalling £2.5 billion of which £500 million was drawn down at 31 December 2021. The contractual language on these facilities was updated during 2021 such that all drawings are based on SONIA with effect from the end of November 2021. The Group’s syndicated revolving credit facility (undrawn at 31 December 2021 and 2020) has historically had references to USD LIBOR, EURIBOR and GBP LIBOR. This facility includes market standard LIBOR replacement language, and with effect from June 2021 the agreement has adopted SOFR and SONIA as the alternative benchmark rates in respect of USD LIBOR and GBP LIBOR, respectively.
Following announcements by the respective regulators, EURIBOR and USD LIBOR are now expected to continue for the foreseeable future, with USD LIBOR rates potentially discontinued after June 2023.
The Group has a total of nine derivatives that may be impacted by an interest rate benchmark reform of which two are free-standing derivatives (EUR interest rate swaps) maturing in January 2023 with nominal values of
750 million (£630 million). There are three derivatives (USD interest rate swaps) in fair value hedge relationship with nominal value US$300 million (£221 million) maturing in June 2022 (before USD LIBOR cessation) and therefore no further exposure arises.
The remaining four impacted derivatives (cross currency interest rate swaps) with nominal values totalling
800 million (£672 million) maturing in October 2023 are in fair value hedge relationships which are indexed to the sterling LIBOR interest rates. The Group is party to the ISDA fallback protocol and in January 2022, it automatically replaced the GBP LIBOR with an economically equivalent interest rate derivatives referencing SONIA on their reset date. The Group has updated the respective hedge documentation accordingly since the uncertainty regarding the transition for these four derivatives has ceased. The hedge relationship on these derivatives will continue with any resulting ineffectiveness likely to be immaterial.
 
241


Table of Contents
BAT Annual Report and Form 20-F 2021
Financial Statements
Notes on Accounts
Continued
    
 
26 Financial Instruments and Risk Management
Continued
The Group therefore believes that any outstanding contracts on 1 January 2022 with interest rates based on LIBOR or similar benchmarks will adequately provide for alternate calculations of interest in the event that they are unavailable.
Credit risk
The Group has no significant concentrations of customer credit risk. Subsidiaries have policies in place requiring appropriate credit checks on potential customers before sales commence. The process for monitoring and managing credit risk once sales to customers have been made varies depending on local practice in the countries concerned.
Certain territories have bank guarantees, other guarantees or credit insurance provided in the Group’s favour in respect of Group trade receivables, the issuance and terms of which are dependent on local practices in the countries concerned. All derivatives are subject to ISDA agreements or equivalent documentation.
Cash deposits and other financial instruments give rise to credit risk on the amounts due from the related counterparties. Generally, the Group aims to transact with counterparties with strong investment grade credit ratings. However, the Group recognises that due to the need to operate over a large geographic footprint, this will not always be possible. Counterparty credit risk is managed on a global basis by limiting the aggregate amount and duration of exposure to any one counterparty, taking into account its credit rating. The credit ratings of all counterparties are reviewed regularly.
The Group ensures that it has sufficient counterparty credit capacity of requisite quality to undertake all anticipated transactions throughout its geographic footprint, while at the same time ensuring that there is no geographic concentration in the location of counterparties.
With the following exceptions, the maximum exposure to the credit risk of financial assets at the balance sheet date is reflected by the carrying values included in the Group’s balance sheet. The Group has entered into short-term risk participation agreements in relation to certain leaf supply arrangements and the maximum exposure under these would be £89 million (2020: £88 million). In addition, the Group has entered into a guarantee arrangement to support a short-term bank credit facility with distribution and supply chain partner. The maximum exposure under the arrangement would be £1 million (2020: £36 million).
Price risk
The Group is exposed to price risk on investments held by the Group, which are included in investments held at fair value on the consolidated balance sheet, but the quantum of such is not material.
Hedge accounting
In order to qualify for hedge accounting, the Group is required to document prospectively the economic relationship between the item being hedged and the hedging instrument. The Group is also required to demonstrate an assessment of the economic relationship between the hedged item and the hedging instrument, which shows that the hedge will be highly effective on an ongoing basis. This effectiveness testing is repeated periodically to ensure that the hedge has remained, and is expected to remain, highly effective. The prospective effectiveness testing determines that an economic relationship between the hedged item and the hedging instrument exists.
In accordance with the Group Treasury Policy, the exact hedge ratios and profile of a hedge relationship will depend on several factors, including the desired degree of certainty and reduced volatility of net interest costs and market conditions, trends and expectations in the relevant markets. The sources of ineffectiveness include spot and forward differences, impact of time value and timing differences between periods in the hedged item and hedging instrument.
The Group’s risk management strategy has been explained in further detail under the interest rate risk and currency risk sections of this note.
Fair value estimation
The fair values of financial assets and liabilities with maturities of less than one year, other than derivatives, are assumed to approximate their book values. For other financial instruments which are measured at fair value in the balance sheet, the basis for fair values is described below.
 
242


Table of Contents
BAT Annual Report and Form 20-F 2021    
 
Strategic Report        
 
Governance Report        
  
Financial Statements        
  
        Other Information        


26 Financial Instruments and Risk Management
Continued
 
Fair value hierarchy
The following table presents the Group’s financial assets and liabilities that are measured at fair value in accordance with IFRS 13 classification hierarchy:
 
    
2021
    
2020


            Level 1
£m
    
        Level 2
£m
    
        Level 3
£m
    
        Total
£m
    
            Level 1
£m
    
        Level 2
£m
    
        Level 3
£m
    
        Total
£m
 
                 
Assets at fair value
                                                                       
                 
Investment held at fair value (note 18)
  
 
405


101


506


171


93


264
 
                 
Derivatives relating to
                                                                       
                 
– interest rate swaps (note 19)


33


33


65


65
 
                 
– cross-currency swaps (note 19)


221


221


444


444
 
                 
– forward foreign currency contracts (note 19)


171


171


288


288
 
                 
Assets at fair value
  
 
405


425


101


931


171


797


93


1,061
 
                 
Liabilities at fair value
                                                                       
                 
Derivatives relating to
                                                                       
                 
– interest rate swaps (note 19)


36


36


53


53
 
                 
– cross-currency swaps (note 19)


35


35


– forward foreign currency contracts (note 19)


243


243


266


266
 
                 
Liabilities at fair value


314


314


319


319
 
Level 2 financial instruments are not traded in an active market, but the fair values are based on quoted market prices, broker/dealer quotations, or alternative pricing sources with reasonable levels of price transparency. The Group’s level 2 financial instruments include OTC derivatives.
Netting arrangements of derivative financial instruments
The gross fair value of derivative financial instruments as presented in the Group balance sheet, together with the Group’s rights of offset associated with recognised financial assets and recognised financial liabilities subject to enforceable master netting arrangements and similar agreements, is summarised as follows:
 
    
2021
          
2020


Amount 
presented in 
the Group 
balance 
sheet*
£m 
   
Related
amounts
not offset in
the Group
balance
sheet
£m
   
Net
    amount
£m
           
Amount 
presented in
the Group
balance 
sheet*
£m 
   
Related
amounts
not offset in
the Group
balance
sheet
£m
   
Net
amount
£m
 
             
Financial assets
                                                 
               
– Derivative financial instruments (note 19)
  
 
425


(184
 
 
241


797


(237
 
 
560
 
             
Financial liabilities
                                                 
               
– Derivative financial instruments (note 19)
  
 
(314
 
 
184


(130
          
 
(319
 
 
237


(82


111


111


478


478
 
 
*
No financial instruments have been offset in the Group balance sheet.
The Group is subject to master netting arrangements in force with financial counterparties with whom the Group trades derivatives.
The master netting arrangements determine the proceedings should either party default on their obligations. In case of any event of default, the non-defaulting party will calculate the sum of the replacement cost of outstanding transactions and amounts owed to it by the defaulting party. If that sum exceeds the amounts owed to the defaulting party, the defaulting party will pay the balance to the non-defaulting party. If the sum is less than the amounts owed to the defaulting party, the non-defaulting party will pay the balance to the defaulting party.
 
243


Table of Contents
BAT Annual Report and Form 20-F 2021
Financial Statements
Notes on Accounts
Continued
    
26 Financial Instruments and Risk Management
Continued
 
The hedged items by risk category are presented below:
 
    
2021


Carrying
amount of the
hedged item
£m
    
Accumulated
amount of fair
value hedge
adjustments
on the hedged
item included
in the carrying
amount of the
hedged item
£m
    
Line item in
the statement
of financial
position where
the hedged item
is included
    
Changes in fair
value used for
calculating
hedge
ineffectiveness
£m
   
Cash flow
hedge reserve
(gross of tax)
£m
 
           
Fair value hedges
                                           
           
Interest rate risk
                                           
           
– borrowings (liabilities)
  
 
9,197


101


Borrowings


87


Cash flow hedges
                                           
           
Interest rate risk
                                           
           
– borrowings (liabilities)
  
 
2,132


Borrowings


(69
 
 
(538
 
    
2020


Carrying
amount of the
hedged item
£m
    
Accumulated
amount of fair
value hedge
adjustments
on the hedged
item included
in the carrying
amount of the
hedged item
£m
    
Line item in
the statement
of financial
position where
the hedged item
is included
    
Changes in fair
value used for
calculating
hedge
ineffectiveness
£m
   
Cash flow
hedge reserve
(gross of tax)
£m
 
           
Fair value hedges
                                           
           
Interest rate risk
                                           
           
– borrowings (liabilities)
  
 
5,356


173


Borrowings


(57
       
           
Cash flow hedges
                                           
           
Interest rate risk
                                           
           
– borrowings (liabilities)
  
 
2,816


Borrowings


155


(628
£368 million (2020: £392 million) of the Group’s borrowings are designated as net investment hedge instruments of the Group’s net investments in foreign operations. In line with the Group’s risk management policies, the net investment hedge relationships are reviewed periodically. A number of these relationships had matured in 2019. The change in the value used for calculating hedge ineffectiveness for hedged items designated under net investment hedge relationships is £24 million (2020: £21 million).
As at 31 December 2021, the accumulated balance of the cash flow hedge reserve was a loss of £363 million (2020: loss of £504 million) including an accumulated loss of £538 million (2020: loss of £628 million) in relation to interest rate exposure and foreign currency exposure arising from borrowings held by the Group, and an accumulated gain of £116 million (2020: gain of £139 million) in relation to deferred tax arising from cash flow hedges. The remainder related to the Group’s foreign currency exposure on forecasted transactions and cost of hedging (note 22(c)(ii)).
 
244


Table of Contents
BAT Annual Report and Form 20-F 2021    
 
Strategic Report        
 
Governance Report        
  
Financial Statements        
  
        Other Information        


27 Changes in the Group
(a) Acquisitions
The Group acquired certain businesses and other tobacco assets as noted below. The financial impact of these transactions to the Group were immaterial individually and in aggregate. Except as noted, there were no material differences between the fair value and book values of net assets acquired in business combinations.
On 12 November 2020, the Group acquired 100% of the share capital in
Eastern Tobacco Company for Trading
, formerly known as Rafique Mohammed Sudki Jad Establishment for Trading when acting as BAT’s distributor in Saudi Arabia (KSA), for £50 million (SAR 246 million). Goodwill of £36 million, representing anticipated synergies, and trademarks and similar intangibles of £39 million, as well as £96 million of cash and cash equivalents, were recognised on acquisition.
On 8 April 2019, the Group via its U.S. subsidiary R.J. Reynolds Vapor Company (RJR Vapor), acquired a 45% stake in
VapeWild Holdings LLC
,
a vertically integrated vapour manufacturer and retailer for US$40 million. This was followed by a further acquisition of 15% on 24 June 2019 for US$8 million, giving the Group a 60% interest for US$48 million (£36 million). The Group consolidated VapeWild as a subsidiary from the date of the first investment. Goodwill of £11 million, representing a strategic premium to enter this segment of the U.S. vapour market, and trademarks and similar intangibles of £39 million were recognised on acquisition. Following the announcements with regard to flavours in vapour in the U.S., goodwill was impaired in full in 2019. The business was subsequently discontinued and liquidation proceedings commenced in December 2020.
On
21 December 2017
, the Group signed an agreement to acquire 100% of the share capital of
Twisp Proprietary Limited
, a South African e-cigarette/nicotine vapour company with a market share of circa 70% within South Africa and a leading presence in shopping malls via its branded kiosks outlets. Completion of the proposed acquisition was conditional upon South African anti-trust clearance, which was given in the second half of 2019 and BAT acquired control on 30 September 2019 for a purchase price of £25 million of which £6 million was deferred and contingent upon future performance in the market. Goodwill of £12 million, representing a strategic premium to enter this segment of the South African vapour market, and trademarks and similar intangibles of £15 million were recognised on acquisition. Due to difficult trading conditions, the goodwill and intangibles were fully impaired in 2020 and deferred consideration adjusted by £3 million. The final payment of deferred consideration of £3 million was paid in 2021.
On 5 May 2017, the Group acquired certain tobacco assets, including a distribution company,
Express Logistic and Distribution EOOD (ELD)
, from Bulgartabac Holding AD in Bulgaria. The assets acquired, including brands and other intangibles of £117 million, were purchased for a total consideration of £110 million, of which £28 million was contingent upon future performance in the market. £14 million of this was paid during 2018 and £13 million of this was paid during 2019. Subsequently, ELD was disposed of in 2019 at carrying value.
On 4 January 2017, the Group completed the acquisition of 100% of
Winnington Holding AB
, a Swedish manufacturer of ‘white’ snus, for a purchase price of £31 million. Goodwill of £8 million and brands and similar intangibles of £28 million were recognised. £8 million of the consideration was contingent on post-acquisition targets being met and was substantially settled in January 2019.
On 17 November 2015, the Group acquired 100% of
Blue Nile Cigarette Company Limited
from a private shareholder. The fair value of the consideration payable was £45 million of which £8 million was contingent on achievement of certain post-acquisition targets. Subsequent payments in respect of this were £1 million in 2016, £5 million in 2017, £1 million in 2018 and £1 million in 2019.
On 30 September 2015, the Group acquired
TDR
and other tobacco and retail assets from Adris Grupa d.d. (Adris) for a total enterprise value of
550 million. Part of the consideration was contingent upon certain targets being met post-acquisition, and £5 million of this was paid in January 2017. In 2019, the Group reached an agreement with Adris regarding the level of contingent consideration such that any remaining amounts would not be paid by the Group and the Group received
3 million in full and final settlement of all claims between Adris and the Group. Consequently,
9 million of cash and deferred consideration was recognised as other income (note 7).
(b) Non-controlling interests
In 2021, the Group made a capital contribution to
Brascuba Cigarrillos S.A.
at a cost of £6 million (2020: £17 million; 2019: £20 million). This contribution was in proportion to a capital contribution made by the non-controlling interest to the company and as such, the Group’s shareholding remains unchanged.
In addition, in 2021, as part of a Voluntary Tender Offer for the non-controlling interests of the Group’s Indonesian subsidiary, the Group acquired 0.2% additional shares at a cost of £4 million as explained in note 30.
Also in 2021, the Group acquired a further 2.7% in
Hrvatski Duhani d.d. Tobacco Leaf Processing
at a cost of £1 million.
(c) Other transactions
(i) Organigram
On 11 March 2021, the Group announced a strategic collaboration agreement with Organigram Inc., a wholly owned subsidiary of publicly traded Organigram Holdings Inc. (collectively, Organigram). Under the terms of the transaction, a Group subsidiary acquired a 19.9% equity stake in Organigram Holdings Inc. (listed on both the Nasdaq and Toronto Stock Exchange under the symbol ‘OGI’) to become its largest shareholder, with the ability to appoint two directors to Organigram Holdings Inc.’s board of directors and representation on its investment committee. At closing, one BAT nominee, Mr. Jeyan Heper, was added to the board. A second nominee and a replacement for Mr. Heper, who resigned on 31 October 2021, are expected to be proposed in due course. The Group accounts for the investment as an associate.
The Group’s investment provides a significant injection of capital for Organigram that will enable them to expand and accelerate their R&D and product development activities and support business expansion. The Group’s investment of £129 million has been allocated against the Group’s share of Organigram’s net assets, including the recognition of £49 million of intangibles, and goodwill of £30 million, which represents a strategic premium to enter the legal cannabis market in North America.
During 2021, Organigram acquired all of the issued and outstanding shares of The Edibles & Infusions Corporation (EIC) for an initial consideration of CAD$22 million, payable in shares.
 
245


Table of Contents
BAT Annual Report and Form 20-F 2021
Financial Statements
Notes on Accounts
Continued
    
 
27 Changes in the Group
Continued
Organigram also acquired all of the issued and outstanding shares of Laurentian Organic Inc. for consideration of CAD$36 million, payable in cash and shares. The impact of these transactions on the Group was not material. As a result of these transactions, the Group’s shareholding was reduced to 18.8%. Potential additional shares are payable on both transactions upon the acquired businesses achieving certain earnout milestones. The transactions and results of these changes are immaterial to the Group and organic measures, excluding the results of these acquisitions, are not presented.
(ii) Other acquisitions
During 2021, the Group increased its ownership of a wholesale producer and distributor operating in the agriculture sector based in Uzbekistan,
FE “Samfruit” JSC
to 42.61%, for £1 million. During 2020, the ownership was increased to 38.63%, for £5 million.
On 20 October 2020, the Group acquired the formulations, brands, associated know-how and other relevant assets owned by
Dryft Sciences, LLC
(DSL) relating to its white nicotine pouch products for consideration of up to US$150 million payable in accordance with the achievement of certain milestones. The transaction has been accounted for as an asset acquisition, rather than as a business combination, as the intellectual property and associated assets acquired do not represent an integrated set of activities required by IFRS for business combination accounting. Consequently, the consideration payable has been assigned to the acquired assets by relative fair value.
On 10 January 2019, the Group acquired a minority stake in
AYR Limited
, a vapour technology company based in the UK, for £8 million, with the potential to increase this in the future. The investment terms also provide for the Group and AYR to agree a commercial collaboration agreement under which the Group and AYR will jointly develop future vaping products.
(d) Disposals
On 25 June 2021, the Group agreed to dispose of its Iranian subsidiary,
B.A.T. Pars Company PJSC
(BAT Pars) to DTM ME FZE LLC. Accordingly, BAT Pars was classified as held-for-sale at that date and £152 million of assets, primarily comprised £98 million of cash and cash equivalents, £38 million of inventory and £14 million of property, plant and equipment, were transferred to held-for-sale assets. Also, £24 million of liabilities, primarily comprised £10 million of trade creditors and £8 million of corporation tax payable, were transferred to held-for-sale liabilities. Subsequently an impairment charge and associated costs of £88 million was recognised in the income statement and treated as an adjusting item.
Completion took place on 6 August 2021. The value of the consideration, in Euros, is subject to the finalisation of the completion accounts process, as well as various other matters, with payment deferred until September 2022. Discounted estimated proceeds of £45 million have been recognised as a current receivable. At 31 December 2021, a credit of £2 million was recognised in operating profit in relation to a partial unwind of discounting on the deferred proceeds. In addition, £272 million in respect of foreign exchange previously recognised in other comprehensive income has been reclassified to the income statement. The financial impact of this has also been treated as an adjusting item.
The held-for-sale impairment charge of £83 million and the foreign exchange reclassification of £272 million which were charged to the income statement have been included as non-cash items in the cash flow statement.
In compliance with IAS 7
Statement of cash flows,
the £98 million of cash and cash equivalents held at the date of disposal have been reported as a cash outflow under investing activities.
In addition, £24 million of related investments held at fair value were provided against as a charge to net finance costs given uncertainties regarding recovery of these funds.
28 Share-based Payments
The Group operates a number of share-based payment arrangements of which the two principal ones are:
Long-Term Incentive Plan (LTIP)
Awards granted from 2020 under the Long-Term Incentive Plan are the Performance Share Plan and the Restricted Share Plan with the following conditions:
Performance Share Plan (PSP):
nil-cost options released three years from date of grant. Payout is subject to performance conditions based on earnings per share (40% of grant), operating cash flow (20% of grant), total shareholder return (20% of grant) and net turnover (20% of grant) in 2021, 2020 and 2019. Total shareholder return combines the share price and dividend performance of the Company by reference to one comparator group. Participants are not entitled to dividends prior to the exercise of the options. A cash equivalent dividend accrues through the vesting period and is paid on vesting. Both equity and cash-settled PSP awards are granted in March each year.
Restricted Share Plan (RSP):
Nil-cost options released three years from date of grant and may be subject to forfeit if a participant leaves employment before the end of the three-year holding period.
Participants are not entitled to dividends prior to the exercise of the options.
A cash equivalent dividend accrues through the vesting period and is paid on vesting. Both equity- and cash-settled RSP awards are granted in March.
Awards granted in 2019 are nil-cost options exercisable after three years from date of grant with a contractual life of 10 years. The performance conditions and the dividend entitlement attached to these awards are identical to the PSP award mentioned above. Both equity and cash-settled LTIP awards were granted in March.
Following the acquisition of Reynolds American on 25 July 2017, underlying Reynolds American shares for LTIPs were replaced with BAT American Depositary Shares (ADS). LTIP awards for ADSs are measured against the performance conditions of Reynolds American at the maximum of 150% at the vesting date. Equity-settled LTIPs were granted by Reynolds American in March each year with options exercisable after three years from the date of grant with the payment made no later than 90 days from date of vesting. Participants are not entitled to dividends prior to exercise of the options.
Deferred Share Bonus Scheme (DSBS)
Free ordinary shares released three years from date of grant and may be subject to forfeit if a participant leaves employment before the end of the
three-year
holding period. Participants receive a separate payment equivalent to a proportion of the dividend payment during the holding period. Both equity- and cash-settled deferred shares are granted in March each year.
The Group also has a number of other arrangements which are not material for the Group and these are as follows:
 
246


Table of Contents
BAT Annual Report and Form 20-F 2021    
 
Strategic Report        
 
Governance Report        
  
Financial Statements        
  
        Other Information        


28 Share-based Payments
Continued
Sharesave Scheme (SAYE)
Options granted in March each year from 2011 onwards (previously, November until 2009, and no options were granted during 2010) by invitation at a 20% discount to the market price. Options to this equity-settled scheme are exercisable at the end of a three-year or five-year savings contract. Participants are not entitled to dividends prior to the exercise of the options. The maximum amount that can be saved by a participant in this way is £6,000 in any tax year.
Share Reward Scheme (SRS) and International Share Reward Scheme (ISRS)
Free shares granted in April each year (maximum £3,600 in any year) under the equity-settled schemes are subject to a three-year holding period. Participants receive dividends during the holding period which are reinvested to buy further shares.
Partnership Share Scheme
Open to all eligible employees, where employees can allocate part of their pre-tax salary to purchase shares in British American Tobacco p.l.c. The maximum amount that can be allocated in this way to any individual is £1,800 in any tax year. The shares purchased are held in a UK-based trust and are normally capable of transfer to participants tax-free after a five-year holding period.
Share-based payment expense
The amounts recognised in the income statement in respect of share-based payments were as follows:
 
    
                                        2021
    
                                        2020
    
                                        2019


Equity-
settled
£m
    
Cash-
settled
£m
    
Equity-
settled
£m
    
Cash-
settled
£m
    
Equity-
settled
£m
    
Cash-
settled
£m
 
             
LTIP (note (a))
  
 
30


36


58


1
 
             
DSBS (note (b))
  
 
39


2


44


3


50


4
 
             
Other schemes
  
 
7


8


7


Total recognised in the income statement (note 3)
  
 
76


2


88


3


115


5
 
Share-based payment liability
The Group issues to certain employees cash-settled share-based payments that require the Group to pay the intrinsic value of these share-based payments to the employee at the date of exercise. The Group has recorded liabilities in respect of vested and unvested grants at the end of 2021 and 2020:
 
    
2021
          
2020


Vested
£m
    
Unvested
£m
           
Vested
£m
    
Unvested
£m
 
           
LTIP
  
 
0.1


1.1


0.3


1.5
 
           
DSBS
  
 
0.1


6.4


0.2


5.7
 
           
Total liability
  
 
0.2


7.5


0.5


7.2
 
(a) Long-Term incentive Plan
Details of the movements for the equity- and cash-settled LTIP scheme during the years ended 31 December 2021 and 31 December 2020, were as follows:
 
    
2021
          
2020


Equity-
settled
Number
of options
in thousands
   
Cash-settled
Number
of options
in thousands
           
Equity-
settled
Number
of options
in thousands
   
Cash-settled
Number
of options
in thousands
 
           
Outstanding at start of year
  
 
10,000


274


9,193


318
 
           
Granted during the period
  
 
3,440


81


3,856


109
 
           
Exercised during the period
  
 
(1,639
 
 
(48
          
 
(1,590
 
 
(63
           
Forfeited during the period
  
 
(1,910
 
 
(64
          
 
(1,459
 
 
(90
           
Outstanding at end of year
  
 
9,891


243


10,000


274
 
           
Exercisable at end of year
  
 
611


29


690


27
 
As at 31 December 2021, the Group has 9,891,000 shares (2020: 10,000,000 shares) outstanding which includes 2,650,364 shares (2020: 2,876,738 shares) which are related to Reynolds American LTIP awards from which nil shares (2020: nil shares) are exercisable at the end of the year.
The weighted average British American Tobacco p.l.c. share price at the date of exercise for share options exercised during the period was £27.67 (2020: £29.37; 2019: £28.31) for equity-settled and £27.59 (2020: £28.68; 2019: £30.87) for cash-settled options.
The weighted average British American Tobacco p.l.c. share price for ADS on the New York Stock Exchange at the date of exercise for share options exercised during the period relating to equity-settled Reynolds American LTIP awards was US$35.93 (2020: US$40.04; 2019: US$36.35).
 
247


Table of Contents
BAT Annual Report and Form 20-F 2021
Financial Statements
Notes on Accounts
Continued
    
 
28 Share-based Payments
Continued
The outstanding shares for the year ended 31 December 2021 had a weighted average remaining contractual life of 3.7 years (2020: 8.1 years; 2019: 8.2 years) for the equity-settled scheme, 1.70 years for Reynolds American equity-settled scheme (2020: 1.72 years; 2019: 1.93 years) and 4.1 years (2020: 8.1 years; 2019: 8.3 years) for the cash-settled share-based payment arrangements.
(b) Deferred Share Bonus Scheme
Details of the movements for the equity- and cash-settled DSBS scheme during the years ended 31 December 2021 and 31 December 2020, were as follows:
 
    
2021
          
2020


Equity-
settled
Number
of options
in thousands
   
Cash-settled
Number
of options
in thousands
           
Equity-
settled
Number
of options
in thousands
   
Cash-settled
Number
of options
in thousands
 
           
Outstanding at start of year
  
 
4,141


200


3,748


282
 
           
Granted during the period
  
 
1,562


179


1,829


109
 
           
Exercised during the period
  
 
(1,497
 
 
(142
          
 
(1,368
 
 
(175
           
Forfeited during the period
  
 
(65
 
 
(14


(68
 
 
(16
           
Outstanding at end of year
  
 
4,141


223


4,141


200
 
           
Exercisable at end of year


1


91


4
 
The weighted average British American Tobacco p.l.c. share price at the date of exercise for share options exercised during the financial year was £27.58 (2020: £28.08; 2019: £28.40) for equity-settled and £27.70 (2020: £28.06; 2019: £30.06) for cash-settled options.
The outstanding shares for the year ended 31 December 2021 had a weighted average remaining contractual life of 1.3 years (2020: 1.4 years; 2019: 1.5 years) for the equity-settled scheme and 1.3 years (2020: 1.4 years; 2019: 1.5 years) for the cash-settled scheme.
Valuation assumptions
Assumptions used in the Black-Scholes models to determine the fair value of share options at grant date were as follows:
 
    
                                    2021
          
                                    2020


LTIP
  
DSBS
           
LTIP
    
DSBS
 
           
Expected volatility (%)
  
27.0
  
 
27.0


25.0


25.0
 
           
Average expected term to exercise (years)*
  
3.0
  
 
3.0


3.5 /3.0


3.0
 
           
Risk-free rate (%)
  
0.2
  
 
0.2


0.2


0.2
 
           
Expected dividend yield (%)
  
7.7
  
 
7.7


7.9


7.9
 
           
Share price at date of grant (£)
  
27.94
  
 
27.94


26.33


26.33
 
           
Fair value at grant date (£)*
  
19.87 / 22.20
  
 
22.20


21.23 / 20.76


20.76
 
           
Fair value at grant date (£)* – Management Board
  
    17.35 / 22.20
  
 
    22.20


        21.23 / 20.76


        20.76
 
 
*
Where two figures have been quoted for the Long-Term Incentive Plan, the numbers relate to PSP and RSP awards, respectively.
Market condition features were incorporated into the Monte-Carlo models for the total shareholder return elements of the LTIP, in determining fair value at grant date. Assumptions used in these models were as follows:
 
     
2021
LTIP (PSP)
    
2020
LTIP (PSP)
 
     
Average share price volatility FMCG comparator group (%)
  
 
23


21
 
     
Average correlation FMCG comparator group (%)
  
 
29


31
 
Fair values determined from the Black-Scholes and Monte-Carlo models use assumptions revised at the end of each reporting period for cash-settled share-based payment arrangements.
The expected British American Tobacco p.l.c. share price volatility was determined taking account of the return index (the share price index plus the dividend reinvested) over a five-year period. The FMCG share price volatility and correlation was also determined over the same periods. The average expected term to exercise used in the models has been adjusted, based on management’s best estimate, for the effects of non-transferability, exercise restrictions and behavioural conditions, forfeiture and historical experience.
The risk-free rate has been determined from market yield curves for government gilts with outstanding terms equal to the average expected term to exercise for each relevant grant. The expected dividend yield was determined by calculating the yield from the last two declared dividends divided by the grant share price.
In addition to these valuation assumptions, LTIP awards, excluding RSP, contain earnings per share performance conditions. As these are non-market performance conditions they are not included in the determination of fair value of share options at the grant date, however, they are used to estimate the number of awards expected to vest. This pay-out calculation is based on expectations published in analysts’ forecasts.
 
248


Table of Contents
BAT Annual Report and Form 20-F 2021    
 
Strategic Report        
 
Governance Report        
  
Financial Statements        
  
        Other Information        


29 Group Employees
The average number of persons employed by the Group and its associates during the year, including Directors, was 82,868 (2020: 89,182).
 
     
2021
        Number
    
2020
        Number
 
     
U.S.
  
 
4,789


4,914
 
     
APME
  
 
10,488


12,703
 
     
AMSSA
  
 
16,799


17,869
 
     
ENA
  
 
22,289


23,957
 
     
Subsidiary undertakings
  
 
54,365


59,443
 
     
Associates
  
 
28,503


29,739


82,868


89,182
 
Included within the employee numbers for ENA are certain employees in the UK in respect of central functions. Some of the costs of these employees are allocated or charged to the various regions and markets in the Group.
30 Related Party Disclosures
The Group has a number of transactions and relationships with related parties, as defined in IAS 24
Related Party Disclosures,
all of which are undertaken in the normal course of business. Transactions with CTBAT International Limited (a joint operation) are not included in these disclosures as the results are immaterial to the Group.
Intercompany transactions and balances are eliminated on consolidation and therefore are not disclosed.
Transactions and balances with associates relate mainly to the sale and purchase of cigarettes and tobacco leaf. The Group’s share of dividends from associates, included in other net income in the table below, was £392 million (2020: £394 million; 2019: £239 million).
 
     
    2021
£m
   
    2020
£m
   
    2019
£m
 
       
Transactions
                        
       
–  revenue
  
 
524


495


511
 
       
–  purchases
  
 
(123
 
 
(80
 
 
(79
       
–  other net income
  
 
387


388


248
 
       
Amounts receivable at 31 December
  
 
48


33


42
 
       
Amounts payable at 31 December
  
 
(3
 
 
(5
 
 
(2
On 5 October 2021, PT Bentoel Internasional Investama Tbk (Bentoel) announced its intention to delist from the Indonesia Stock Exchange and go private by conducting a Voluntary Tender Offer (VTO). As part of this, in two phases in November and December 2021, the Group acquired an additional 0.2% of shares in Bentoel from independent shareholders at a cost of £4 million and terminated the total return swap (as explained in note 32).
As set out in note 27, in March 2021, the Group acquired a 19.9% equity stake in Organigram. The Group and Organigram also entered into a Product Development Collaboration Agreement following which a Centre of Excellence has been established to focus on developing the next generation of cannabis products with an initial focus on cannabidiol (CBD). The Centre of Excellence is located at Organigram’s indoor facility in New Brunswick, Canada, which holds the Health Canada licences required to conduct R&D activities with cannabis products. Both the Group and Organigram are contributing scientists, researchers, and product developers to the Centre of Excellence, which is governed and supervised by a steering committee consisting of an equal number of senior members from each company. Both partners share a commitment to continue to maintain the highest regulatory and ethical standards. Furthermore, as part of the transaction, the Group and Organigram have agreed to grant each other a royalty-free licence to certain intellectual property to enable the development of new and potentially disruptive, novel products. Both parties have the ability to independently commercialise any products developed as a result of the collaboration under their own brands.
During 2021, the Group increased its ownership of a wholesale producer and distributor operating in the agriculture sector based in Uzbekistan, FE “Samfruit” JSC to 42.61%, for £1 million. In 2020 the Group increased its ownership to 38.63% for £5 million.
During 2021, the Group made a capital contribution in Brascuba Cigarrillos S.A. at a cost of £6 million (2020: £17 million; 2019: £20 million). There was a capital reduction in CTBAT International Limited of approximately US$171 million with funds remitted prorate to investors in 2021.
Also in 2021, the Group acquired a further 2.7% in Hrvatski Duhani d.d. Tobacco Leaf Processing at a cost of £1 million.
During 2019, the Group acquired 60% of VapeWild Holdings LLC and a minority stake in AYR Limited. Please refer to note 27 for the VapeWild Holdings LLC business that was discontinued and liquidated in 2020.
 
249


Table of Contents
BAT Annual Report and Form 20-F 2021
Financial Statements
Notes on Accounts
Continued
    
 
30 Related Party Disclosures
Continued
The key management personnel of British American Tobacco consist of the members of the Board of Directors of British American Tobacco p.l.c. and the members of the Management Board. No such person had any material interest during the year in a contract of significance (other than a service contract) with the Company or any subsidiary company. The term key management personnel in this context includes their close family members.
 
     
    2021
£m
    
    2020
£m
    
    2019
£m
 
       
The total compensation for key management personnel, including Directors, was:
                          
       
–  salaries and other short-term employee benefits
  
 
18


17


26
 
       
–  post-employment benefits
  
 
1


2


4
 
       
–  share-based payments
  
 
16


13


23


35


32


53
 
The following table, which is not part of IAS 24 disclosures, shows the aggregate emoluments of the Directors of the Company.
 
    
Executive Directors
    
Chairman
    
Non-Executive Directors
    
Total


2021
    £’000
    
2020
£’000
    
2019
£’000
    
2021
    £’000
    
2020
£’000
    
2019
£’000
    
2021
    £’000
    
2020
£’000
    
2019
£’000
    
2021
    £’000
    
2020
£’000
    
2019
£’000
 
                         
Salary; fees; benefits;incentives
                                                                                                           
                         
–  salary
  
 
2,119


2,026


2,356


2,119


2,026


2,356
 
                         
–  fees
                             
 
727


714


695


1,045


1,028


969


1,772


1,742


1,664
 
                         
–  taxable benefits
  
 
420


744


608


55


77


137


2


72


310


477


893


1,055
 
                         
–  short-term incentives
  
 
4,128


3,274


4,791


4,128


3,274


4,791
 
                         
–  long-term incentives
  
 
3,399


1,294


4,420


3,399


1,294


4,420
 
                         
Sub-total
  
 
10,066


7,338


12,175


782


791


832


1,047


1,100


1,279


11,895


9,229


14,286
 
                         
Pension; other emoluments
                                                                                                           
                         
–  pension
  
 
318


304


686


318


304


686
 
                         
–  other emoluments
  
 
6


20


47


6


20


47
 
                         
Sub-total
  
 
324


324


733


324


324


733
 
                         
Total emoluments
  
 
10,390


7,662


12,908


782


791


832


1,047


1,100


1,279


12,219


9,553


15,019
 
Aggregate gains on LTIP shares exercised in the year
 
     
Award
  
      Exercised
LTIP
shares
    
Exercise
date
    
Price per
share
(£)
    
Aggregate
gain
(£)
 
           
Jack Bowles
  
26 March 2018
  
 
23,731


10 May 2021


28.25


670,401
 
           
Tadeu Marroco
  
26 March 2018
  
 
15,310


29 March 2021


28.27


432,737
 
LTIP – Value of awards 2018
 
     
Shares
    
Price per
share
(£)
1
    
Face
value
(£)
 
       
Jack Bowles
  
 
43,785


      38.94


      1,704,988
 
       
Tadeu Marroco
  
 
28,248


38.94


1,099,977
 
Note:
1. For information only as awards are made as nil-cost options.
In 2021, no Sharesave were exercised by Executive Directors.
 
250


Table of Contents
BAT Annual Report and Form 20-F 2021    
 
Strategic Report        
 
Governance Report        
  
Financial Statements        
  
        Other Information        


31 Contingent Liabilities and Financial Commitments
 
1.
The Group is subject to contingencies pursuant to requirements that it complies with relevant laws, regulations and standards.
 
2.
Failure to comply could result in restrictions in operations, damages, fines, increased tax, increased cost of compliance, interest charges, reputational damage or other sanctions. These matters are inherently difficult to quantify. In cases where the Group has an obligation as a result of a past event existing at the balance sheet date, if it is probable that an outflow of economic resources will be required to settle the obligation and if the amount of the obligation can be reliably estimated, a provision will be recognised based on best estimates and management judgement.
 
3.
There are, however, contingent liabilities in respect of litigation, taxes in some countries and guarantees for which no provisions have been made.
General Litigation Overview
 
4.
There are a number of legal and regulatory actions, proceedings and claims against Group companies related to tobacco and New Category products that are pending in a number of jurisdictions. These proceedings include, among other things, claims for personal injury (both individual claims and class actions) and claims for economic loss arising from the treatment of smoking- and health-related diseases (such as medical recoupment claims brought by local governments).
 
5.
The plaintiffs in these cases seek recovery on a variety of legal theories, including negligence, strict liability in tort, design defect, failure to warn, fraud, misrepresentation, violations of unfair and deceptive trade practices statutes, conspiracy, public nuisance, medical monitoring and violations of competition and antitrust laws. The plaintiffs seek various forms of relief, including compensatory and, where available, punitive damages, treble or multiple damages and statutory damages and penalties, creation of medical monitoring and smoking cessation funds, disgorgement of profits, attorneys’ fees, and injunctive and other equitable relief.
 
6.
Although alleged damages often are not determinable from a complaint, and the law governing the pleading and calculation of damages varies from jurisdiction to jurisdiction, compensatory and punitive damages have been specifically pleaded in a number of cases, sometimes in amounts ranging into the hundreds of millions and even hundreds of billions of sterling.
 
7.
With the exception of the
Engle
progeny cases described below, the Group continues to win the majority of tobacco-related litigation claims that reach trial, and a very high percentage of the tobacco-related litigation claims brought against them, including
Engle
progeny cases, continue to be dismissed at or before trial. Based on their experience in tobacco-related litigation and the strength of the defences available to them in such litigation, the Group’s companies believe that their successful defence of tobacco-related litigation in the past will continue in the future.
 
8.
Group companies generally do not settle claims. However, Group companies may enter into settlement discussions in some cases, if they believe it is in their best interests to do so. Exceptions to this general approach include, but are not limited to, actions taken pursuant to ‘offer of judgment’ statutes and Filter Cases, as defined below. An ‘offer of judgment,’ if rejected by the plaintiff, preserves the Group’s right to recover attorneys’ fees under certain statutes in the event of a verdict favourable to the Group. Such offers are sometimes made through court-ordered mediations. Other settlements by Group companies include the State Settlement Agreements (as defined in paragraph 41 below), the funding by various tobacco companies of a US$5.2 billion (approximately £3.8 billion) trust fund contemplated by the Master Settlement Agreement (as described in paragraph 41 below) to benefit tobacco growers, the original
Broin
flight attendant case, and most of the
Engle
progeny cases pending in U.S. federal court, after the initial docket of over 4,000 such cases was reduced to approximately 400 cases. The Group believes that the circumstances surrounding these claims are readily distinguishable from the current categories of tobacco-related litigation claims involving Group companies.
 
9.
Although the Group intends to defend all pending cases vigorously, and believes that the Group’s companies have valid bases for appeals of adverse verdicts and valid defences to all actions, and that an outflow of resources related to any individual case is not considered probable, litigation is subject to many uncertainties, and, generally, it is not possible to predict the outcome of any particular litigation pending against Group companies, or to reasonably estimate the amount or range of any possible loss. Furthermore, a number of political, legislative, regulatory and other developments relating to the tobacco industry and cigarette smoking have received wide media attention. These developments may negatively affect the outcomes of tobacco-related legal actions and encourage the commencement of additional similar litigation. Therefore, the Group does not provide estimates of the financial effect of the contingent liabilities represented by such litigation, as such estimates are not practicable.
 
10.
The following table lists the categories of the tobacco-related actions pending against Group companies as of 31 December 2021 and the increase or decrease from the number of cases pending against Group companies as of 31 December 2020. Details of the quantum of past judgments awarded against Group companies, the majority of which are under appeal, are also identified along with any settlements reached during the relevant period. Given the volume and more active nature of the
Engle
progeny cases and the Filter Cases in the U.S. described below, and the fluctuation in the number of such cases and amounts awarded from year to year, the Group presents judgment or settlement figures for these cases on a three-year basis. Where no quantum is identified, either no judgment has been awarded against a Group company, or where a verdict has been reached no quantification of damages has been given, or no settlement has been entered into. Further details on the judgments, damages quantification and settlements are included within the case narratives below. For a discussion of the non-tobacco related litigation pending against the Group, see note 31, paragraph 83, et seq.
 
251


Table of Contents
BAT Annual Report and Form 20-F 2021
Financial Statements
Notes on Accounts
Continued
    
31 Contingent Liabilities and Financial Commitments
Continued
 
Case Type
  
Case Numbers as at
31 December 2021
    
Case Numbers as at
31 December 2020
(note 1)
    
Change in Number
Increase/(decrease)
 
       
U.S. tobacco-related actions
                          
       
Medical reimbursement cases (note 2)
  
 
2


2


No change
 
       
Class actions (note 3)
  
 
20


20


No change
 
       
Individual smoking and health cases (note 4)
  
 
222


189


33
 
       
Engle
Progeny Cases (note 5)
  
 
1,071


1,400


(329
       
Broin
II Cases (note 6)
  
 
1,200


1,227


(27
       
Filter Cases (note 7)
  
 
46


48


(2
       
State Settlement Agreements – Enforcement and Validity (note 8)
  
 
2


4


(2
       
Non-U.S. tobacco-related actions
                          
       
Medical reimbursement cases
  
 
19


19


No change
 
       
Class actions (note 9)
  
 
12


12


No change
 
       
Individual smoking and health cases (note 10)
  
 
52


68


(16
(Note 1) This includes cases to which the Reynolds American Inc. (Reynolds American) group companies were a party at such date.
(Note 2) This category of cases includes the Department of Justice action. See note 31, paragraphs 20-24.
(Note 3) See note 31, paragraphs 25-38.
(Note 4) This category of cases includes smoking and health cases alleging personal injuries caused by tobacco use or exposure brought by or on behalf of individual plaintiffs based on theories of negligence, strict liability, breach of express or implied warranty and violations of state deceptive trade practices or consumer protection statutes. The plaintiffs seek to recover compensatory damages, attorneys’ fees and costs and punitive damages. Out of the 222 active individual smoking and health cases, six judgments have been returned in the plaintiffs’ favour, awarding damages totalling approximately US$150.1 million (approximately £110.8 million), which are pending post-trial in trial courts or on appeal. For a further description of these cases, see note 31, paragraphs 39-40.
(Note 5) In July 1998, trial began in
Engle v. R.J. Reynolds Tobacco Co.
, a then-certified class action filed in Circuit Court, Miami-Dade County, Florida, against U.S. cigarette manufacturers, including R. J. Reynolds Tobacco Co. (RJRT) (individually, and as successor by merger to Lorillard Tobacco Company (Lorillard Tobacco)) and Brown & Williamson Holdings, Inc. (formerly Brown & Williamson Tobacco Corporation) (B&W). In July 2000, the jury in Phase II awarded the class a total of approximately US$145 billion (approximately £107.1 billion) in punitive damages, apportioned US$36.3 billion (approximately £26.8 billion) to RJRT, US$17.6 billion (approximately £13 billion) to B&W, and US$16.3 billion (approximately £12 billion) to Lorillard Tobacco. This decision was appealed and ultimately resulted in the Florida Supreme Court in December 2006 decertifying the class and allowing judgments entered for only two of the three
Engle
class representatives to stand and setting aside the punitive damages award. Putative
Engle
class members were permitted to file individual lawsuits, deemed ‘
Engle
progeny cases’, against the
Engle
defendants, within one year of the Supreme Court’s decision (subsequently extended to 11 January 2008). Between the period 1 January 2019 and 31 December 2021, 21 judgments have been returned in the plaintiffs’ favour, awarding damages totalling approximately US$225 million (approximately £166.1 million). Certain of these judgments have been appealed by RJRT and in certain other cases, RJRT still had time to appeal, as of 31 December 2021. For a further description of the
Engle
progeny cases, see note 31, paragraphs 29-38 seq.
(Note 6)
Broin v. Philip Morris, Inc.
was a class action filed in Circuit Court in Miami-Dade County, Florida in 1991 and brought on behalf of flight attendants alleged to have suffered from diseases or ailments caused by exposure to Environmental Tobacco Smoke (ETS) in airplane cabins. Group companies and other cigarette manufacturer defendants settled
Broin,
agreeing to pay a total of US$300 million (approximately £221.5 million) to fund research on the detection and cure of tobacco-related diseases and US$49 million (approximately £36.2 million) in plaintiffs’ counsel’s fees and expenses. Group companies’ share of these payments totalled US$174 million (approximately £128.5 million).
Broin
II cases refer to individual cases by class members. There have been no
Broin
II trials since 2007. For a further description of the
Broin
II cases, see note 16 to paragraph 40.
(Note 7) Includes claims brought against Lorillard Tobacco and Lorillard Inc. by individuals who seek damages resulting from their alleged exposure to asbestos fibres that were incorporated into filter material used in one brand of cigarettes manufactured by a predecessor to Lorillard Tobacco for a limited period of time ending more than 50 years ago. Since 1 January 2019, Lorillard Tobacco and RJRT have paid, or have reached agreement to pay, a total of approximately US$25.9 million (approximately £19.1 million) in settlements to resolve 102 Filter Cases. See note 17 to paragraph 40.
(Note 8) Group companies’ expenses and payments under the State Settlement Agreements for 2021 amounted to approximately US$3.4 billion (approximately £2.5 billion) in respect of settlement expenses and US$3.7 billion (approximately £2.7 billion) in respect of settlement cash payments. See note 31, paragraph 43. The pending cases referred to above relate to the enforcement, validity or interpretation of the State Settlement Agreements in which RJRT, B&W or Lorillard Tobacco is a party. See note 31, paragraphs 41-54.
 
252


Table of Contents
BAT Annual Report and Form 20-F 2021    
 
Strategic Report        
 
Governance Report        
  
Financial Statements        
  
        Other Information        


31 Contingent Liabilities and Financial Commitments
Continued
(Note 9) Outside the United States, there are 12 class actions being brought against Group companies as of 31 December 2021. These include class actions in the following jurisdictions: Canada (11) and Venezuela (1). For a description of the Group companies’ class actions, see note 31, paragraphs 70-81. Pursuant to the judgment in 2015 in the two Quebec class actions, the plaintiffs were awarded damages and interest in the amount of CAD$15.6 billion, most of which were on a joint and several basis (approximately £9.1 billion), of which the Group companies’ share was CAD$10.4 billion (approximately £6.1 billion). On 1 March 2019, the Quebec Court of Appeal handed down a judgment which largely upheld and endorsed the lower court’s previous decision in the Quebec Class Actions, as further described below. The share of the judgment for Imperial Tobacco Canada Limited (Imperial), the Group’s operating company in Canada, was reduced to approximately CAD$9.2 billion (approximately £5.4 billion). For a further description of the Quebec Class Actions, see paragraph 76. All of the class actions in Canada are currently stayed pursuant to a court order. See paragraph 58.
(Note 10) As at 31 December 2021, the jurisdictions with the most active individual cases against Group companies were, in descending order: Brazil (23), Italy (11), Canada (5), Argentina (5), Chile (4) and Ireland (2). There were a further two jurisdictions with one active case only. Out of these 52 cases, one case in Argentina (
Baldassare
) returned a first instance judgment on 28 December 2020, in the amount of ARS 685,976 (approximately £5,000) in compensatory damages and ARS 2,500,000 (approximately £18,000) in punitive damages (plus interest), in the plaintiffs’ favour as of 31 December 2021. BAT Argentina filed a notice of appeal of the judgment on 3 February 2021.
 
11.
Certain terms and phrases used in this note 31 may require some explanation.
 
 
a.
‘Judgment’ or ‘final judgment’ refers to the final decision of the court resolving the dispute and determining the rights and obligations of the parties. At the trial court level, for example, a final judgment generally is entered by the court after a jury verdict and after post-verdict motions have been decided. In most cases, the losing party can appeal a verdict only after a final judgment has been entered by the trial court.
 
 
b.
‘Damages’ refers to the amount of money sought by a plaintiff in a complaint, or awarded to a party by a jury or, in some cases, by a judge. ‘Compensatory damages’ are awarded to compensate the prevailing party for actual losses suffered, if liability is proved. In cases in which there is a finding that a defendant has acted wilfully, maliciously or fraudulently, generally based on a higher burden of proof than is required for a finding of liability for compensatory damages, a plaintiff also may be awarded ‘punitive damages’. Although damages may be awarded at the trial court stage, a losing party may be protected from paying any damages until all appellate avenues have been exhausted by posting a supersedeas bond. The amount of such a bond is governed by the law of the relevant jurisdiction and generally is set at the amount of damages plus some measure of statutory interest, modified at the discretion of the appropriate court or subject to limits set by a court or statute.
 
 
c.
‘Settlement’ refers to certain types of cases in which cigarette manufacturers, including RJRT, B&W and Lorillard Tobacco, have agreed to resolve disputes with certain plaintiffs without resolving the cases through trial.
 
d.
All sums set out in note 31 have been converted to GBP and US$ using the following end closing rates: GBP 1 to US$ 1.3545, GBP 1 to CAD$ 1.7109, GBP 1 to EURO 1.1910, GBP 1 to BRL
7.5443
, GBP 1 to AOA 763.1513, GBP 1 to NGN 711.7127, GBP 1 to KRW 1610.1000, GBP 1 to HRK 8.9537, GBP 1 to JPY 155.9717, GBP 1 to QAR 4.9316, GBP 1 to SAR 5.0852 and GBP 1 to ARS 139.0908.
U.S. Tobacco Litigation
 
12.
Group companies, notably RJRT (individually and as successor by merger to Lorillard Tobacco) and B&W as well as other leading cigarette manufacturers, are defendants in a number of product liability cases. In a number of these cases, the amounts of compensatory and punitive damages sought are significant.
 
13.
The total number of U.S. tobacco product liability cases pending at 31 December 2021 involving RJRT, B&W and/or Lorillard Tobacco was approximately 2,573. As at 31 December 2021, British American Tobacco (Investments) Limited (Investments) has been served as a co-defendant in one of those cases (2018:1). No other UK-based Group company has been served as a co-defendant in any U.S. tobacco product liability case pending as at 31 December 2021.
 
14.
Since many of these pending cases seek unspecified damages, it is not possible to quantify the total amounts being claimed, but the aggregate amounts involved in such litigation are significant, possibly totalling billions of U.S. dollars. The cases fall into four broad categories: medical reimbursement cases; class actions; individual cases; and other claims.
 
15.
RJRT (individually and as successor by merger to Lorillard Tobacco), American Snuff Co., Santa Fe Natural Tobacco Company, Inc. (SFNTC), R.J. Reynolds Vapor Company (RJR Vapor), Reynolds American, Lorillard Inc., other Reynolds American affiliates and indemnitees, including but not limited to B&W (collectively, the Reynolds Defendants), believe that they have valid defences to the tobacco-related litigation claims against them, as well as valid bases for appeal of adverse verdicts against them. The Reynolds Defendants have, through their counsel, filed pleadings and memoranda in pending tobacco-related litigation that set forth and discuss a number of grounds and defences that they and their counsel believe have a valid basis in law and fact.
 
16.
Scheduled trials. Trial schedules are subject to change, and many cases are dismissed before trial. In the U.S., there are 57 cases, exclusive of
Engle
progeny cases, scheduled for trial as of 31 December 2021 through 31 December 2022, for the Reynolds Defendants: 39 individual smoking and health cases, 15 Filter Cases, and 3 non-smoking and health cases. There are also approximately 151
Engle
progeny cases against RJRT (individually and as successor to Lorillard Tobacco) and B&W scheduled for trial through 31 December 2022. It is not known how many of these cases will actually be tried.
 
17.
Trial results. From 1 January 2019 through 31 December 2021, 53 trials occurred in individual smoking and health,
Engle
progeny, and Filter Cases in which the Reynolds Defendants were defendants, including five where mistrials were declared. Verdicts in favour of the Reynolds Defendants and, in some cases, other defendants, were returned in 15 cases, tried in Florida (11), Oregon (1), and Massachusetts (3). Verdicts in favour of the plaintiffs were returned in 24 cases, which were tried in Florida (21), Massachusetts (2) and New Mexico (1). Six of the cases (four in Florida, one in New York, and one in Connecticut) were dismissed during trial. Two cases were punitive damages retrials. One case in Massachusetts is awaiting a decision.
 
253


Table of Contents
BAT Annual Report and Form 20-F 2021
Financial Statements
Notes on Accounts
Continued
    
 
31 Contingent Liabilities and Financial Commitments
Continued
 
(a) Medical Reimbursement Cases
 
18.
These civil actions seek to recover amounts spent by government entities and other third-party providers on healthcare and welfare costs claimed to result from illnesses associated with smoking.
 
19.
At 31 December 2021, one U.S. medical reimbursement suit (
Crow
Creek Sioux Tribe v. American Tobacco Co.
) was pending against RJRT, B&W and Lorillard Tobacco in a Native American tribal court in South Dakota. The plaintiffs seek to recover actual and punitive damages, restitution, funding of a clinical cessation programme, funding of a corrective public education programme, and disgorgement of unjust profits from sales to minors. No other medical reimbursement suits are pending against these companies by county or other political subdivisions of the states.
U.S. Department of Justice Action
 
20.
On 22 September 1999, the U.S. Department of Justice brought an action in the U.S. District Court for the District of Columbia against various industry members, including RJRT, B&W, Lorillard Tobacco, B.A.T Industries p.l.c. (Industries) and Investments (
United States v. Philip Morris USA Inc.
). The U.S. Department of Justice initially sought (1) recovery of federal funds expended in providing health care to smokers who developed alleged smoking-related diseases pursuant to the Medical Care Recovery Act and Medicare Secondary Payer provisions of the Social Security Act and (2) equitable relief under the civil provisions of the Racketeer Influenced and Corrupt Organizations Act (RICO), including disgorgement of roughly US$280 billion (approximately £206.7 billion) in profits the government contended were earned as a consequence of a purported racketeering ‘enterprise’ along with certain ‘corrective communications’. In September 2000, the district court dismissed the government’s Medical Care Recovery Act and Medicare Secondary Payer claims. In February 2005, the U.S. Court of Appeals for the DC Circuit (the DC Circuit) ruled that disgorgement was not an available remedy.
 
21.
Industries was dismissed for lack of personal jurisdiction on 28 September 2000. In addition, Investments was a defendant at the trial, but intervening changes in controlling law post-trial led to a 28 March 2011 court ruling that the court’s Final Judgment and Remedial Order no longer applied to Investments prospectively, and for this reason, Investments would not have to comply with any of the remaining injunctive remedies being sought by the government. As the government did not appeal the 28 March 2011 ruling, this means that Investments is no longer in the case and is not subject to any injunctive relief that the court is expected to order against the remaining defendants. As the case continued as against RJRT and Lorillard Tobacco with respect to injunctive relief and related matters, the following is noted.
22.
The non-jury trial of the RICO portion of the claim began on 21 September 2004 and ended on 9 June 2005. On 17 August 2006, the federal district court issued its Final Judgment and Remedial Order, which found certain defendants, including RJRT, B&W, Lorillard Tobacco and Investments, had violated RICO, but did not impose any direct financial penalties. The district court instead enjoined the defendants from committing future racketeering acts, participating in certain trade organisations, making misrepresentations concerning smoking and health and youth marketing, and using certain brand descriptors such as ‘low tar’, ‘light’, ‘ultra-light’, ‘mild’ and ‘natural’. The district court also ordered the defendants to issue ‘corrective communications’ on five subjects, including smoking and health and addiction, and to comply with further undertakings, including maintaining websites of historical corporate documents and disseminating certain marketing information on a confidential basis to the government. In addition, the district court placed restrictions on the defendants’ ability to dispose of certain assets for use in the United States, unless the transferee agrees to abide by the terms of the district court’s order, and ordered certain defendants to reimburse the U.S. Department of Justice its taxable costs incurred in connection with the case.
 
23.
Defendants, including RJRT, B&W, Lorillard Tobacco and Investments, appealed, and the U.S. government cross-appealed to the DC Circuit. On 22 May 2009, the DC Circuit affirmed the federal district court’s RICO liability judgment, but vacated the order and remanded for further factual findings and clarification as to whether liability should be imposed against B&W, based on changes in the nature of B&W’s business operations (including the extent of B&W’s control over tobacco operations). The court also remanded on three other discrete issues relating to the injunctive remedies, including for the district court ‘to reformulate’ the injunction on the use of low-tar descriptors ‘to exempt foreign activities that have no substantial, direct, and foreseeable domestic effects,’ and for the district court to evaluate whether corrective communications could be required at point-of-sale displays (which requirement the DC Circuit vacated). On 28 June 2010, the U.S. Supreme Court denied the parties’ petitions for further review.
 
24.
On 22 December 2010, the district court dismissed B&W from the litigation. In November 2012, the trial court entered an order setting forth the text of the corrective statements and directed the parties to engage in discussions with the Special Master to implement them. After various proceedings and appeals, the federal district court in October 2017 ordered RJRT and the other U.S. tobacco company defendants to fund the publishing of compelled public statements in various U.S. media outlets, including in newspapers, on television, on the companies’ websites, and in onserts on cigarette packaging. The compelled public statements in newspapers and on television were completed in 2018 and in package onserts were completed in mid-2020. Also, the compelled public statements now appear on RJRT websites. The district court is considering mandating the display of the compelled public statements at retail point of sale; an evidentiary hearing is scheduled to begin on 13 June 2022.
 
254


Table of Contents
BAT Annual Report and Form 20-F 2021    
 
Strategic Report        
 
Governance Report        
  
Financial Statements        
  
        Other Information        


31 Contingent Liabilities and Financial Commitments
Continued
(b) Class Actions
 
25.
At 31 December 2021, RJRT, B&W and Lorillard Tobacco were named as defendants in two separate actions attempting to assert claims on behalf of classes of persons allegedly injured or financially impacted by their smoking, one asserting claims of violation of the Americans With Disabilities Act of 1990, and SFNTC was named in 16 separate cases relating to the use of the words ‘natural,’ ‘100% additive-free,’ or ‘organic’ in Natural American Spirit advertising and promotional materials. If the classes are or remain certified, separate trials may be needed to assess individual plaintiffs’ damages. Among the pending class actions, 16 specified the amount of the claim in the complaint and alleged that the plaintiffs were seeking in excess of US$5 million (approximately £3.7 million) and one that alleged that the plaintiffs were seeking less than US$75,000 (approximately £55,370) per class member plus unspecified punitive damages.
No Additive/Natural/Organic Claim Cases
 
26.
A total of 16 pending putative class actions were filed in nine U.S. federal district courts against SFNTC, a subsidiary of Reynolds American, which cases generally allege, in various combinations, violations of state deceptive and unfair trade practice statutes, and claim state common law fraud, negligent misrepresentation, and unjust enrichment based on the use of descriptors such as ‘natural’, ‘organic’ and ‘100% additive-free’ in the marketing, labelling, advertising, and promotion of SFNTC’s Natural American Spirit brand cigarettes. In these actions, the plaintiffs allege that the use of these terms suggests that Natural American Spirit brand cigarettes are less harmful than other cigarettes and, for that reason, violated state consumer protection statutes or amounted to fraud or a negligent or intentional misrepresentation. The actions seek various categories of recovery, including economic damages, injunctive relief (including medical monitoring and cessation programmes), interest, restitution, disgorgement, treble and punitive damages, and attorneys’ fees and costs. In April 2016, in response to a motion by the various plaintiffs, the U.S. Judicial Panel on Multidistrict Litigation (JPML) consolidated these cases for pre-trial purposes before a federal court in New Mexico. On 21 December 2017, that court granted the defendants’ motion to dismiss in part, dismissing a number of claims with prejudice, and denied it in part. The district court conducted a five-day hearing on the motion for class certification and on the motion challenging the admissibility of expert opinion testimony in December 2020. The parties filed post-hearing briefs in January 2021 and filed proposed findings of fact and conclusions of law in February 2021. A decision is pending.
Other Putative Class Actions
 
27.
Jones v. American Tobacco Co.
is a putative class action filed in December 1998 in the Circuit Court, Jackson County, Missouri. The action was brought by a plaintiff on behalf of a putative class of Missouri tobacco product users and purchasers against various defendants, including RJRT, B&W and Lorillard Tobacco alleging that the plaintiffs’ use of the defendants’ tobacco products has caused them to become addicted to nicotine, and seeking an unspecified amount of compensatory and punitive damages. There is currently no activity in this case.
28.
Young v. American Tobacco Co.
is a case filed in November 1997 in the Circuit Court, Orleans Parish, Louisiana against various U.S. cigarette manufacturers, including RJRT and B&W, and parent companies of such manufacturers. This putative ETS class action was brought on behalf of a putative class of Louisiana residents who, though not themselves cigarette smokers, have been exposed to second-hand smoke from cigarettes manufactured by the defendants, and who allegedly suffered injury as a result of that exposure, and seeks an unspecified amount of compensatory and punitive damages. In March 2016, the court entered an order staying the case, including all discovery, pending the completion of an ongoing smoking cessation programme ordered by the court in a now-concluded Louisiana state court certified class action,
Scott v. American Tobacco Co.
Engle
Class Action and
Engle
Progeny Cases (Florida)
 
29.
In July 1998, trial began in
Engle v. R. J. Reynolds Tobacco Co.
, a then-certified class action filed in Circuit Court, Miami-Dade County, Florida, against U.S. cigarette manufacturers, including RJRT, B&W and Lorillard Tobacco. The then-certified class consisted of Florida citizens and residents, and their survivors, who suffered from smoking-related diseases that first manifested between 5 May 1990, and 21 November 1996, and were caused by an addiction to cigarettes. In July 1999, the jury in this Phase I found against RJRT, B&W, Lorillard Tobacco and the other defendants on common issues relating to the defendants’ conduct, general causation, the addictiveness of cigarettes, and entitlement to punitive damages.
 
30.
In July 2000, the jury in Phase II awarded the class a total of approximately US$145 billion (approximately £107.1 billion) in punitive damages, apportioned US$36.3 billion (approximately £26.8 billion) to RJRT, US$17.6 billion (approximately £13 billion) to B&W, and US$16.3 billion (approximately £12 billion) to Lorillard Tobacco. The three class representatives in the
Engle
class action were awarded US$13 million (approximately £9.6 million) in compensatory damages.
 
31.
This decision was appealed and ultimately resulted in the Florida Supreme Court in December 2006 decertifying the class and allowing judgments entered for only two of the three
Engle
class representatives to stand and setting aside the punitive damages award. The court preserved certain of the jury’s Phase I findings, including that cigarettes can cause certain diseases, nicotine is addictive, and defendants placed defective cigarettes on the market, breached duties of care, concealed health-related information and conspired. Putative
Engle
class members were permitted to file individual lawsuits, deemed ‘
Engle
progeny cases’, against the
Engle
defendants, within one year of the Supreme Court’s decision (subsequently extended to 11 January 2008).
 
32.
During 2015, RJRT and Lorillard Tobacco, together with Philip Morris USA Inc. (PM USA), settled virtually all of the
Engle
progeny cases then pending against them in federal district court. The total amount of the settlement was US$100 million (approximately £73.8 million) divided as follows: RJRT US$42.5 million (approximately £31.4 million); PM USA US$42.5 million (approximately £31.4 million); and Lorillard Tobacco US$15 million (approximately £11.1 million). The settlement covered more than 400 federal
Engle
progeny cases but did not cover 12 federal progeny cases previously tried to verdict and then pending on post-trial motions or appeal, and two federal progeny cases filed by different lawyers from the ones who negotiated the settlement for the plaintiffs.
 
255


Table of Contents
BAT Annual Report and Form 20-F 2021
Financial Statements
Notes on Accounts
Continued
    
 
31 Contingent Liabilities and Financial Commitments
Continued
 
33.
As at 31 December 2021, there were approximately 1,071
Engle
progeny cases pending in which RJRT, B&W and/or Lorillard Tobacco have all been named as defendants and served. These cases include claims by or on behalf of 1,304 plaintiffs. In addition, as of 31 December 2021, RJRT was aware of four additional
Engle
progeny cases that have been filed but not served. The number of pending cases fluctuates for a variety of reasons, including voluntary and involuntary dismissals. Voluntary dismissals include cases in which a plaintiff accepts an ‘offer of judgment’ from RJRT, Lorillard Tobacco and/or RJRT’s affiliates and indemnitees. An offer of judgment, if rejected by the plaintiff, preserves RJRT’s and Lorillard Tobacco’s right to recover attorneys’ fees under Florida law in the event of a verdict favourable to RJRT or Lorillard Tobacco, or affiliates of such entities. Such offers are sometimes made through court-ordered mediations.
 
34.
41 trials occurred in
Engle
progeny cases in Florida state and federal courts against RJRT, B&W and/or Lorillard Tobacco from 1 January 2019 through 31 December 2021, and additional state court trials are scheduled for 2022.
 
35.
The following chart identifies the number of trials in
Engle
progeny cases as at 31 December 2021 and additional information about the adverse judgments entered:
Trials/verdicts/judgments of individual
Engle
progeny cases from 1 January 2019 through 31 December 2021:


Total number of trials
  
41
   
Number of trials resulting in plaintiffs’ verdicts
  
21**
   
Total damages awarded in final judgments against RJRT
  
US$224,990,000 (approximately
   
    
£166 million)
   
Amount of overall damages comprising ‘compensatory damages’ (approximately)
  
US$65,440,000 (of overall
   
    
US$224,990,000) (approximately
   
    
£48 million of £166 million)
   
Amount of overall damages comprising ‘punitive damages’ (approximately)
  
US$159,550,000 (of overall
   
    
US$224,990,000) (approximately


£118 million of £166 million)
** Of the 21 trials resulting in plaintiffs’ verdicts 1 January 2019 to 31 December 2021 (note 11):


Number of adverse judgments appealed by RJRT
  
13 (note 12)
   
Number of adverse judgments, in which RJRT still has time to file an appeal
  
4
   
Number of adverse judgments in which an appeal was not, and can no longer be, sought
  
3
   
Appeals of individual
Engle
progeny cases 1 January 2019 to 31 December 2021:


Number of adverse judgments appealed by RJRT
  
15 (note 13)
Note 11:
the 21 trials include two cases that were tried twice (
Gloger v. R.J. Reynolds Tobacco Co. and Bessent-Dixon v. R.J. Reynolds Tobacco Co
.) and one case (
Robert Miller v. R.J. Reynolds Tobacco Co.
) where plaintiff moved for a mistrial following a plaintiff’s verdict where the jury awarded no compensatory or punitive damages, and an adverse judgment has not yet been entered. Plaintiff’s motion for new trial on compensatory damages was granted and RJRT appealed.
Note 12:
of the 13 adverse verdicts appealed by RJRT as a result of judgments arising in the period 1 January 2019 to 31 December 2021:
 
 
a.
5 appeals remain undecided in the District Courts of Appeal; and
 
 
b.
8 appeals were decided and/or closed in the District Court of Appeals. Of these 8 appeals, 4 were affirmed in favour of plaintiff (review of by the Florida Supreme Court has been sought in 3 of the 4 cases), 3 were reversed for a new trial, and 1 was voluntarily dismissed and judgment paid.
Note 13:
of the 15 adverse judgments appealed by RJRT (during the period 1 January 2019 to 31 December 2021):
 
 
a.
5 appeals remain undecided in the District Courts of Appeal;
 
 
b.
9 appeals were decided and/or closed in the District Courts of Appeal, and 1 appeal was reversed by the Eleventh Circuit. Of these appeals, 5 were affirmed in favour of plaintiff, 3 in which review of Florida Supreme Court was sought, 1 was voluntarily dismissed and judgment paid, 1 in which the Eleventh Circuit reversed the district court’s denial of Defendants’ motion for judgment in accordance with the verdict, and 3 were reversed for a new trial; and
 
 
c
does not include four cases that were appealed prior to the relevant time period but which remain pending before the Florida Supreme Court.
 
36.
By statute, Florida applies a US$200 million (approximately £147.7 million) bond cap to all
Engle
progeny cases in the aggregate. Individual bond caps for any given
Engle
progeny case vary depending on the number of judgments in effect at a given time. Judicial attempts by several plaintiffs in the
Engle
progeny cases to challenge the bond cap as violating the Florida Constitution have failed. In addition, bills have been introduced in sessions of the Florida legislature that would eliminate the
Engle
progeny bond cap, but those bills have not been enacted as of 31 December 2021.
 
37.
In 2021, RJRT or Lorillard Tobacco paid judgments in five
Engle
progeny cases. Those payments totalled US$15.14 million (approximately £11.2 million) in compensatory or punitive damages. Additional costs were paid in respect of attorneys’ fees and statutory interest.
 
38.
In addition, accruals for damages and attorneys’ fees and statutory interest for two cases (
Starr-Blundell v. R. J. Reynolds Tobacco Co.
and
Hardin v. R. J. Reynolds Tobacco Co.
) was recorded in Reynolds American’s consolidated balance sheet as of 31 December 2021 to the value of US$208,400 (approximately £153,860).
 
256


Table of Contents
BAT Annual Report and Form 20-F 2021    
 
Strategic Report        
 
Governance Report        
  
Financial Statements        
  
        Other Information        


31 Contingent Liabilities and Financial Commitments
Continued
(c) Individual Cases
 
39.
As of 31 December 2021, 222 individual cases were pending in the United States against RJRT, B&W and/or Lorillard Tobacco. This category of cases includes smoking and health cases alleging personal injuries caused by tobacco use or exposure brought by or on behalf of individual plaintiffs based on theories of negligence, strict liability, breach of express or implied warranty, and violations of state deceptive trade practices or consumer protection statutes. The plaintiffs seek to recover compensatory damages, attorneys’ fees and costs, and punitive damages. The category does not include the
Engle
progeny cases,
Broin
II cases, and Filter Cases discussed above and below. One of the individual cases is brought by or on behalf of an individual or his/her survivors alleging personal injury as a result of exposure to ETS.
 
40.
The following chart identifies the number of individual cases pending as of 31 December 2021 as against the number pending as of 31 December 2020, along with the number of
Engle
progeny cases,
Broin
II cases, and Filter Cases, which are discussed further below.
 
    
U.S. 
    
U.S. 
    
Change in 
 
    
Case Numbers 
    
Case Numbers 
    
Number 
 
    
31 December 
    
31 December 
    
Increase/ 
 
Case Type
  
2021 
    
2020 
    
(Decrease) 
 
       
Individual Smoking and Health Cases (note 14)
  
 
222 


189 


33 
 
       
Engle
Progeny Cases (Number of Plaintiffs) (note 15)
  
 
1,071 (1,304)


1,400 (1,725)


(329) (421)
 
       
Broin
II Cases (note 16)
  
 
1,200 


1,227


(27)
 
       
Filter Cases (note 17)
  
 
46 


48 


(2)
 
(Note 14) Out of the 222 pending individual smoking and health cases, six have received adverse verdicts or judgments in the court of first instance or on appeal, and the total amount of those verdicts or judgments is approximately US$150.1 million (approximately £110.8 million).
(Note 15) The number of
Engle
progeny cases will fluctuate as cases are dismissed or if any of the dismissed cases are appealed. Please see earlier table in paragraph 35.
(Note 16)
Broin v. Philip Morris, Inc.
was a class action filed in Circuit Court in Miami-Dade County, Florida in 1991 and brought on behalf of flight attendants alleged to have suffered from diseases or ailments caused by exposure to ETS in airplane cabins. In October 1997, RJRT, B&W, Lorillard Tobacco and other cigarette manufacturer defendants settled
Broin,
agreeing to pay a total of US$300 million (approximately £221.5 million) in three annual US$100 million (approximately £73.8 million) instalments, allocated among the companies by market share, to fund research on the early detection and cure of diseases associated with tobacco smoke. It also required those companies to pay a total of US$49 million (approximately £36.2 million) for the plaintiffs’ counsel’s fees and expenses. RJRT’s portion of these payments was approximately US$86 million (approximately £63.5 million); B&W’s was approximately US$57 million (approximately £42.1 million); and Lorillard Tobacco’s was approximately US$31 million (approximately £22.9 million). The settlement agreement, among other things, limits the types of claims class members may bring and eliminates claims for punitive damages. The settlement agreement also provides that, in individual cases by class members that are referred to as
Broin
II lawsuits, the defendants will bear the burden of proof with respect to whether ETS can cause certain specifically enumerated diseases, referred to as ‘general causation’. With respect to all other liability issues, including whether an individual plaintiff’s disease was caused by his or her exposure to ETS in airplane cabins, referred to as ‘specific causation’, individual plaintiffs will bear the burden of proof. On 7 September 1999, the Florida Supreme Court approved the settlement. There have been no
Broin
II trials since 2007. There have been periodic efforts to activate cases and the Group expects this to continue over time.
(Note 17) Includes claims brought against Lorillard Tobacco and Lorillard Inc. by individuals who seek damages resulting from their alleged exposure to asbestos fibres that were incorporated into filter material used in one brand of cigarettes manufactured by a predecessor to Lorillard Tobacco for a limited period of time ending more than 50 years ago. Pursuant to the terms of a 1952 agreement between P. Lorillard Company and H&V Specialties Co., Inc. (the manufacturer of the filter material), Lorillard Tobacco is required to indemnify Hollingsworth & Vose for legal fees, expenses, judgments and resolutions in cases and claims alleging injury from finished products sold by P. Lorillard Company that contained the filter material. As of 31 December 2021, Lorillard Tobacco and/or Lorillard Inc. was a defendant in 46 Filter Cases. Since 1 January 2019, Lorillard Tobacco and RJRT have paid, or have reached agreement to pay, a total of approximately US$25.9 million (approximately £19.1 million) in settlements to resolve 102 Filter Cases.
(d) State Settlement Agreements
 
41.
In November 1998, the major U.S. cigarette manufacturers, including RJRT, B&W and Lorillard Tobacco, entered into the Master Settlement Agreement (MSA) with attorneys general representing 46 U.S. states, the District of Columbia and certain U.S. territories and possessions. These cigarette manufacturers previously settled four other cases, brought on behalf of Mississippi, Florida, Texas and Minnesota, by separate agreements with each state (collectively and with the MSA, the ‘State Settlement Agreements’).
 
42.
These State Settlement Agreements settled all health care cost recovery actions brought by, or on behalf of, the settling jurisdictions; released the defending major U.S. cigarette manufacturers from various additional present and potential future claims; imposed future payment obligations in perpetuity on RJRT, B&W, Lorillard Tobacco and other major U.S. cigarette manufacturers; and placed significant restrictions on their ability to market and sell cigarettes and smokeless tobacco products. In accordance with the MSA, various tobacco companies agreed to fund a US$5.2 billion (approximately £3.8 billion) trust fund to be used to address the possible adverse economic impact of the MSA on tobacco growers.
 
257


Table of Contents
BAT Annual Report and Form 20-F 2021
Financial Statements
Notes on Accounts
Continued
    
 
31 Contingent Liabilities and Financial Commitments
Continued
 
43.
RJRT and SFNTC are subject to the substantial payment obligations under the State Settlement Agreements. Payments under the State Settlement Agreements are subject to various adjustments for, among other things, the volume of cigarettes sold, relative market share, operating profit and inflation. Reynolds American’s operating subsidiaries’ expenses and payments under the State Settlement Agreements for 2018, 2019, 2020 and 2021 and the projected expenses and payments for 2022 and onwards are set forth below (in millions of U.S. dollars)*:
 
                                       
2023 and
 
     
2018
    
          2019
    
          2020
    
          2021
    
          2022
    
        thereafter
 
             
Settlement expenses
  
 
$2,741


$2,762


$3,572


$3,420


Settlement cash payments
  
 
$917


$2,918


$2,848


$3,744


Projected settlement expenses
                                      
 
$>3,300


$>3,200
 
             
Projected settlement cash payments


$>3,100


$>3,200
 
 
*
Subject to adjustments for changes in sales volume, inflation, operating profit and other factors. Payments are allocated among the companies on the basis of relative market share or other methods.
 
44.
The State Settlement Agreements have materially adversely affected RJRT’s shipment volumes. Reynolds American believes that these settlement obligations may materially adversely affect the results of operations, cash flows or financial position of Reynolds American and RJRT in future periods. The degree of the adverse impact will depend, among other things, on the rate of decline in U.S. cigarette sales in the premium and value categories, RJRT’s share of the domestic premium and value cigarette categories, and the effect of any resulting cost advantage of manufacturers not subject to the State Settlement Agreements.
 
45.
In addition, the MSA includes an adjustment that potentially reduces the annual payment obligations of RJRT, Lorillard Tobacco and the other signatories to the MSA, known as ‘Participating Manufacturers’ (PMs). Certain requirements, collectively referred to as the ‘Adjustment Requirements’, must be satisfied before the Non-Participating Manufacturers (NPM) Adjustment for a given year is available: (i) an Independent Auditor must determine that the PMs have experienced a market share loss, beyond a triggering threshold, to those manufacturers that do not participate in the MSA (such non-participating manufacturers being referred to as NPMs); and (ii) in a binding arbitration proceeding, a firm of independent economic consultants must find that the disadvantages of the MSA were a significant factor contributing to the loss of market share. This finding is known as a significant factor determination.
 
46.
When the Adjustment Requirements are satisfied, the MSA provides that the NPM Adjustment applies to reduce the annual payment obligation of the PMs. However, an individual settling state may avoid its share of the NPM Adjustment if it had in place and diligently enforced during the entirety of the relevant year a ‘Qualifying Statute’ that imposes escrow obligations on NPMs that are comparable to what the NPMs would have owed if they had joined the MSA. In such event, the state’s share of the NPM Adjustment is reallocated to other settling states, if any, that did not have in place and diligently enforce a Qualifying Statute.
 
47.
RJRT and Lorillard Tobacco are or were involved in NPM Adjustment proceedings concerning the years 2003 to 2019. In 2012, RJRT, Lorillard Tobacco, and SFNTC entered into an agreement (the Term Sheet) with certain settling states that resolved accrued and potential NPM adjustments for the years 2003 through 2012 and, as a result, RJRT and SFNTC collectively received, or are to receive, more than US$1.1 billion (approximately £812.1 million) in credits that, in substantial part, were applied to MSA payments in 2014 through 2017. After an arbitration panel ruled in September 2013 that six states had not diligently enforced their qualifying statutes in the year 2003, additional states joined the Term Sheet. RJRT executed the NPM Adjustment Settlement Agreement on 25 September 2017 (which incorporated the Term Sheet). Since the NPM Adjustment Settlement Agreement was executed, an additional 10 states have joined. NPM proceedings are ongoing and could result in further reductions of the companies’ MSA-related payments.
 
48.
On 18 January 2017, the State of Florida filed a motion to join Imperial Tobacco Group, PLC (ITG) as a defendant and to enforce the Florida State Settlement Agreement, which motion sought payment under the Florida State Settlement Agreement of approximately US$45 million (approximately £33.2 million) with respect to the four brands (Winston, Salem, Kool and Maverick) that were sold to ITG in the divestiture of certain assets, on 12 June 2015, by subsidiaries or affiliates of Reynolds American and Lorillard, together with the transfer of certain employees and certain liabilities, to a wholly owned subsidiary of Imperial Brands plc (the Divestiture), referred to as the ‘Acquired Brands’. The motion also claimed future annual losses of approximately US$30 million per year (approximately £22.1 million) absent the court’s enforcement of the Florida State Settlement Agreement. The State’s motion sought, among other things, an order declaring that RJRT and ITG are in breach of the Florida Settlement Agreement and are required, jointly and severally, to make annual payments to the State under the Florida State Settlement Agreement with respect to the Acquired Brands. In addition, on 18 January 2017, PM USA filed a motion to enforce the Florida State Settlement Agreement, asserting among other things that RJRT and ITG breached that agreement by failing to make settlement payments as to the Acquired Brands, which PM USA asserts has improperly shifted settlement payment obligations to PM USA. On 27 January 2017, RJRT sought leave to file a supplemental pleading for breach by ITG of its obligations regarding joinder into the Florida State Settlement Agreement. The Florida court, on 30 March 2017, ruled that ITG should be joined into the enforcement action.
 
258


Table of Contents
BAT Annual Report and Form 20-F 2021    
 
Strategic Report        
 
Governance Report        
  
Financial Statements        
  
        Other Information        


31 Contingent Liabilities and Financial Commitments
Continued
49.
After a bench trial, on 27 December 2017 the court entered an order holding that RJRT (not ITG) is liable for annual settlement payments for the Acquired Brands, finding that ITG did not assume liability for annual settlement payments under the terms of the asset purchase agreement relating to the Divestiture and RJRT remained liable for payments under the Florida State Settlement Agreement as to the Acquired Brands. In January 2018, the auditor of the Florida State Settlement Agreement adjusted the final 2017 invoice for the annual payment and amended the 2015 and 2016 invoices for the respective annual payment and the net operating profit penalty for each of those years under the Florida Settlement Agreement, based on the auditor’s interpretation of the court’s order. The adjusted invoices reflected amounts due to both the State of Florida and PM USA. In total, the estimated additional amounts due were US$99 million (approximately £73.1 million) with US$84 million (approximately £62 million) to the State of Florida and US$16 million (approximately £11.8 million) to PM USA. RJRT advised the auditor that it disputed these amounts, and therefore no further amounts were due or would be paid for those years pending the final resolution of RJRT’s appeal of the court’s order. On 23 January 2018, RJRT filed a notice of appeal, and on 25 January 2018, RJRT filed an amended notice of appeal, and PM USA filed a notice of appeal as to the court’s ruling as to ITG. On 26 January 2018, the State moved for recovery of its attorneys’ fees and costs from RJRT. The State and PM USA filed a joint motion for the entry of final judgment on 1 February 2018. The court declined to enter a final judgment until after resolution of the dispute between RJRT and PM USA regarding PM USA’s assertion that settlement payment obligations have been improperly shifted to PM USA. On 15 August 2018, the court entered a final judgment in the action (the Final Judgment). As a result of the Final Judgment, PM USA’s challenge to RJRT’s accounting assumptions related to the Acquired Brands was rendered moot, subject to reinstatement if ITG joins the Florida State Settlement Agreement or if judgment is reversed. On 29 August 2018, RJRT filed a notice of appeal on the Final Judgment. On 7 September 2018, PM USA filed a notice of appeal with respect to the court’s ruling as to ITG. On 12 September 2018, RJRT filed a motion to consolidate RJRT’s appeal with the appeal filed by PM USA, which was granted on 1 October 2018. Appellate briefing was completed on 6 February 2020. Oral argument, originally scheduled for 7 April 2020, was conducted through video conference on 9 June 2020. On 29 July 2020, Florida’s Fourth District Court of Appeal affirmed the Final Judgement. On 12 August 2020, RJRT filed a motion for rehearing or for certification to the Florida Supreme Court of the 29 July 2020 decision. On 10 June 2020, RJRT posted an additional bond in the amount of US$84,102,984.75 (approximately £62.1 million), over the US$103,694,155.08 (approximately £76.6 million) bond initially posted, to cover additional disputed amounts plus two years of statutory interest. The total amount RJRT bonded for its appeal was US$187,797,139.83 (approximately £138.6 million). RJRT’s motion for rehearing or certification to the Florida Supreme Court was denied on 18 September 2020 and its motion for review was denied by the Florida Supreme Court on 18 December 2020. On 5 October 2020, RJRT satisfied the Final Judgment (approximately US$192,869,589.86 (approximately £
142,400,000)
) and paid approximately US$3.2 million (approximately £2.4 million) of Florida’s attorneys’ fees. RJRT’s appellate bonds were released to RJRT by order dated 5 November 2020. RJRT is seeking indemnification from ITG in the Delaware action, as described below.
50.
On 17 February 2017, ITG filed an action in the Court of Chancery of the State of Delaware seeking declaratory relief against Reynolds American and RJRT. In its complaint, ITG asked the court to declare various matters related to its rights and obligations under the asset purchase agreement (and related documents) relating to the Divestiture with respect to the subject of the Florida enforcement litigation. On 24 March 2017, Reynolds American and RJRT answered the ITG complaint and counterclaimed. Cross-motions for partial judgment on the pleadings were filed focusing on whether ITG’s obligation to use ‘reasonable best efforts’ to join the Florida State Settlement Agreement continued after the 12 June 2015 closing. On 30 November 2017, following argument, the Delaware court ruled in favour of RJRT, holding that ITG’s obligation to use its reasonable best efforts to join the Florida Settlement Agreement did not terminate due to the closing of the asset purchase agreement relating to the Divestiture. On 4 January 2019, RJRT filed another motion for partial judgment on the pleadings seeking to resolve two contract-interpretation questions under the asset purchase agreement: first, to the extent RJRT is held liable for any settlement payments based on post-closing sales of the Acquired Brands, ITG assumed this liability, and second, that the asset purchase agreement does not entitle ITG to a unique protection from an equity-fee law that does not yet exist in a Previously Settled State. Argument on RJRT’s motion for partial judgment was heard on 4 June 2019. On 23 September 2019, the Delaware Chancery Court declined to resolve, at that time, the first issue, whether ITG had assumed any liability imposed on RJRT for making settlement payments on ITG’s brands. The court concluded that both sides had presented reasonable interpretations of the asset purchase agreement, which was therefore ambiguous, so the court would receive any parole evidence that may exist to help interpret the intent of the asset purchase agreement on assumed liabilities. The court granted RJRT’s motion on the second issue and ruled that ITG could not refuse to join the Florida State Settlement Agreement unless a joinder exempted it from a future equity-fee statute. On 11 October 2019, ITG filed in the Chancery Court a motion to seek interlocutory appeal in the Delaware Supreme Court on the second issue, which was denied on 31 October 2019. On 31 October 2019, ITG filed a notice of interlocutory appeal directly to the Delaware Supreme Court, which was denied on 7 November 2019. Following the settlement of the Minnesota and Texas enforcement litigation, as described below, claims in the Delaware litigation with respect to those states were voluntarily dismissed by orders entered, respectively, on 7 April 2021 and 2 June 2021. On 20 August 2021, Reynolds American and RJRT amended their counterclaims to account for those settlements, as well as the resolution of the Florida enforcement litigation, described above, which included adding a claim for indemnification for the Final Judgment in Florida. Discovery is ongoing and scheduled to end in early 2022. A hearing on summary judgment motions is scheduled to follow, and trial is scheduled to begin on 8 September 2022.
 
51.
On 26 March 2018, the State of Minnesota filed a motion against RJRT to enforce the Minnesota State Settlement Agreement, which motion sought payments under the Minnesota State Settlement Agreement of approximately US$40 million (approximately £29.5 million) with respect to the Acquired Brands. The motion also claimed future annual losses of approximately US$15 million (approximately £11.1 million) absent the court’s enforcement of the Minnesota State Settlement Agreement.
 
259


Table of Contents
BAT Annual Report and Form 20-F 2021
Financial Statements
Notes on Accounts
Continued
    
 
31 Contingent Liabilities and Financial Commitments
Continued
  
The State of Minnesota also filed a separate complaint against ITG, which complaint sought the same payments. The State’s motion against RJRT and complaint against ITG sought, among other things, an order declaring that RJRT and ITG were in breach of the Minnesota State Settlement Agreement and were jointly and severally liable to make annual payments to the State of Minnesota under the Minnesota State Settlement Agreement with respect to the Acquired Brands. In addition, on 28 March 2018, PM USA filed a motion to enforce the Minnesota State Settlement Agreement, asserting, among other things, that RJRT and ITG breached the Minnesota State Settlement Agreement by failing to make settlement payments as to the Acquired Brands, which PM USA asserted had improperly shifted settlement payment obligations to PM USA. On 27 March 2018, the Minnesota court consolidated the motions to enforce and separate complaint against ITG into one proceeding captioned
In re Petition of the State of Minnesota for an Order Compelling Payments of Settlement Proceeds Related to ITG Brands LLC,
Court File No. 62-CV-18-1912. On 11 June 2018, the court held a scheduling conference in the case and by order dated 21 June 2018, set a discovery schedule for the case, under which discovery is complete. A hearing on the motions to enforce to determine if RJRT and/ or ITG are liable to make payments on the Acquired Brands was held on 26 June 2019. On 24 September 2019, the Minnesota District Court issued an Order and Memorandum, holding RJRT liable for settlement payments on the Acquired Brands, and determining the issue of whether ITG is a ‘successor or assign’ of RJRT under the Minnesota State Settlement Agreement is unresolved, reasoning ITG’s status depends on whether it satisfied its post-closing obligation to expend its reasonable best efforts to join the Minnesota State Settlement Agreement. On 23 December 2019, ITG filed a motion in the Minnesota District Court seeking certification of an appeal of certain questions arising from the 24 September 2019 order. On 21 January 2020, a hearing was held on ITG’s motion seeking certification of an appeal. On 19 February 2020, the Minnesota District Court entered an Order and Memorandum denying ITG’s motion for certification. A multi-day hearing to determine whether ITG is liable for settlement payments was completed on 9 September 2020. The parties filed post-hearing briefs on 13 November 2020. A status conference was held on 3 March 2021, during which the parties agreed to notify the Court of the status of settlement discussions by 15 March 2021. On 15 March 2021, the parties resolved all claims and an order of dismissal was entered by the Minnesota district court on 17 March 2021.
 
52.
On 28 January 2019, the State of Texas filed motions in the original Texas health care reimbursement case, brought against the tobacco industry that led to the Texas State Settlement Agreement, to join ITG as a defendant and to enforce the Texas State Settlement Agreement against RJRT and ITG, seeking payment under the Texas State Settlement Agreement of approximately US$125 million (approximately £92.3 million) with respect to the Acquired Brands that were sold to ITG in the Divestiture. The motion also claimed future annual losses of an unspecified amount absent the court’s enforcement of the Texas State Settlement Agreement. The State’s motion sought, among other things, an order declaring that RJRT, or in the alternative, ITG, is in breach of the Texas Settlement Agreement and is required to make annual payments to the State under the Texas State Settlement Agreement with respect to the Acquired Brands. In addition, on 29 January 2019,
 
PM USA filed a motion to enforce the Texas State Settlement Agreement, asserting among other things that RJRT and ITG breached that agreement by failing to make settlement payments as to the Acquired Brands, which PM USA asserts has improperly shifted settlement payment obligations to PM USA. After completion of discovery, a hearing on the motions to enforce was held on 30 October 2019. On 25 February 2020, the Court entered a Memorandum Opinion and Order holding that RJRT remains liable for settlement payments on the Acquired Brands under the Texas Settlement Agreement. The Court further held that, although ITG is unambiguously an assign within the meaning of the Texas Settlement Agreement, a final determination of the scope of ITG’s obligations under the asset purchase agreement is to be determined in the litigation pending before the Delaware Court. Pursuant to the Court’s direction, on 9 March 2020 the parties submitted a status report indicating the remaining issues before the Court include RJRT’s position that the Court should subtract the equity fee payments made on the Acquired Brands by ITG’s distributors from the settlement payments due by RJRT after including the Acquired Brands in calculating damages, whether a final judgment should be entered in favour of ITG, whether a partial final judgment should be entered against RJRT and the State’s request for an award of attorneys’ fees and costs against RJRT and/or ITG. On 5 May 2020 the Court entered final judgment (later clarified in a 14 August 2020 amended judgment) on the State’s motion, ordering RJRT to pay all settlement amounts due on the Acquired Brands under the Texas Settlement Agreement; granting RJRT a full dollar-for-dollar set-off for all equity fee payments made on the Acquired Brands by ITG or its distributors, but holding RJRT liable for any equity fee payments that are lawfully refunded; and ordering the case closed, to be reopened after ITG’s liability under the asset purchase agreement is determined by the Delaware Court. ITG’s equity fee payments to Texas for the Acquired Brands currently equal approximately 90% of the annual Texas settlement payments for those brands. Thus, the settlement payments for those Acquired Brands exceed ITG’s equity fee payments by approximately US$3 million (approximately £2.2 million) per year. As such, RJRT would owe approximately US$3 million (approximately £2.2 million) a year after an equity fee credit. Due to how the profit penalty is allocated, RJRT will pay approximately US$10 million (approximately £7.4 million) less in 2019 in Texas payments than it would have paid had ITG joined, with that trend continuing in future years. However, because ITG made equity fee payments at a substantially lower rate before 2019, and because of how the profit penalty was calculated before now, RJRT owed approximately US$260.4 million (before interest) (approximately £192.2 million) in past payments under the judgment through 2020. On 3 and 4 June 2020, respectively, RJRT and ITG filed notices of appeal of the 5 May 2020 judgment. In August 2020, RJRT filed a notice of appeal, and in September 2020, the State and ITG filed notices of appeal from the portion of the judgment denying the motion to remove the equity fee set-off. RJRT moved to dismiss ITG’s appeal for lack of jurisdiction, which motion was ordered by the Fifth Circuit Court of Appeals to be argued with ITG’s appeal. On 2 November 2020 RJRT filed its appellate brief. On 19 January 2021 the parties filed responses. On 21 May 2021, the parties entered into a settlement agreement resolving all claims. On 27 May 2021, the parties filed a stipulation dismissing all claims, and on 28 May 2021, the Fifth Circuit dismissed the parties’ appeals.
 
260


Table of Contents
BAT Annual Report and Form 20-F 2021    
 
Strategic Report        
 
Governance Report        
  
Financial Statements        
  
        Other Information        


31 Contingent Liabilities and Financial Commitments
Continued
53.
In June 2015, ITG joined the Mississippi Settlement Agreement. On 26 December 2018, PM USA filed a Motion to Enforce Settlement Agreement against RJRT and ITG alleging RJRT and ITG failed to act in good faith in calculating the base-year net operating profits for the Acquired Brands, claiming damages of approximately US$6 million (approximately £4.4 million) through 2017. On 21 February 2019, the Chancery Court of Jackson County, Mississippi held a scheduling conference and issued a discovery schedule order. A hearing on PM USA’s Motion to Enforce Settlement Agreement originally scheduled for 3-6 May 2021 was adjourned on consent of the parties to 11-12 August 2021. On 8 June 2021, PM USA and RJRT entered into a settlement agreement resolving the outstanding payment calculation issues. On 11 June 2021, the Mississippi Chancery Court entered an order withdrawing PM USA’s motion to enforce. On 3 December 2019, the State of Mississippi filed a Notice of Violation and Motion to Enforce the Settlement Agreement in the Chancery Court of Jackson County, Mississippi against RJRT, PM USA and ITG, seeking a declaration that the base year 1997 net operating profit to be used in calculating the Net Operating Profit Adjustment was not affected by the change in the federal corporate tax rate in 2018 from 35% to 21%, and an order requiring RJRT to pay the approximately US$5 million (approximately £3.7 million) difference in its 2018 payment because of this issue. Determination of this issue may affect RJRT’s annual payment thereafter. A hearing on Mississippi’s Motion to Enforce Settlement Agreement occurred on 6-7 October 2021.
 
54.
In January 2021, RJRT reached an agreement with several MSA states to waive RJRT’s claims under the MSA in connection with a settlement between those MSA states and a non-participating manufacturer, S&M Brands, Inc. (S&M Brands), under which the states released certain claims against S&M Brands in exchange for receiving a portion of the funds S&M Brands had deposited into escrow accounts in those states pursuant to the states’ escrow statutes. In consideration for waiving claims, RJRT, together with SFNTC, received approximately $55.4 million from the escrow funds paid to those MSA states under their settlement with S&M Brands.
Tobacco-Related Litigation Outside the U.S.
 
55.
As at 31 December 2021:
 
 
a.
medical reimbursement actions are being brought in Angola, Brazil, Canada, Nigeria and South Korea;
 
 
b.
class actions are being brought in Canada and Venezuela; and
 
 
c.
active tobacco product liability claims against the Group’s companies existed in 12 markets outside the U.S. The only markets with five or more claims were Argentina, Brazil, Canada, Nigeria and Italy.
(a) Medical reimbursement cases
Angola
 
56.
In or about November 2016, BAT Angola affiliate Sociedade Unificada de Tabacos de Angola (SUT) was served with a collective action filed in the Provincial Court of Luanda, 2nd Civil Section, by the consumer association Associação Angolana dos Direitos do Consumidor (AADIC). The lawsuit seeks damages of AOA 800,000,000 (approximately £1,000,000) allegedly incurred by the Angolan Instituto Nacional do Controlo do Cancro (INCC) for the cost of treating tobacco-related disease, non-material damages allegedly suffered by certain individual smokers on the rolls of INCC, and the mandating of certain cigarette package warnings. SUT filed its answer to the claim on or about 5 December 2016. The case remains pending.
Argentina
 
57.
In 2007, the non-governmental organisation the Argentina Tort Law Association (ATLA) and Emma Mendoza Voguet brought a reimbursement action against Nobleza Piccardo S.A.I.C.y.F. (Nobleza) and Massalín Particulares. The case is being heard in the Contentious Administrative Court. The parties filed conclusive briefs on 20 May 2019. On 11 May 2021, the Court dismissed the case on the basis of plaintiffs’ lack of legal standing to bring the suit. Plaintiffs did not appeal within the applicable deadline and accordingly the judgment dismissing the case has become final.
Canada
 
58.
On 1 March 2019, the Quebec Court of Appeal handed down a judgment which largely upheld and endorsed the lower court’s previous decision in two Quebec class actions (the Quebec Class Actions), as further described below. The share of the judgment for Imperial, the Group’s operating company in Canada, is approximately CAD $9.2 billion (approximately £5.4 billion). As a result of this judgment, there were attempts by the Quebec plaintiffs to obtain payment out of the CAD $758 million (approximately £443 million) on deposit with the court. JTI-MacDonald Corp (a co-defendant in the cases) filed for creditor protection under the Companies’ Creditors Arrangement Act (the CCAA) on 8 March 2019. A court order to stay all tobacco litigation in Canada against all defendants (including RJRT and its affiliate R.J. Reynolds Tobacco International Inc. (collectively, the RJR Companies)) until 4 April 2019 was obtained, and the need for a mediation process to resolve all the outstanding litigation across the country was recognised. On 12 March 2019 Imperial filed for creditor protection under the CCAA. In its application Imperial asked the Ontario Superior Court to stay all pending or contemplated litigation against Imperial, certain of its subsidiaries and all other Group companies that were defendants in the Canadian tobacco litigation, including British American Tobacco p.l.c. (the Company), Investments, Industries and Carreras Rothmans Limited (collectively, the UK Companies). On 22 March 2019, Rothmans, Benson & Hedges Inc. also filed for CCAA protection and obtained a stay of proceedings (together with the other two stays, the Stays). The Stays are currently in place until 31 March 2022. While the Stays are in place, no steps are to be taken in connection with the Canadian tobacco litigation with respect to any of the defendants.
 
59.
The below represents the state of the referenced litigation as at the advent of the Stays.
 
60.
Following the implementation of legislation enabling provincial governments to recover health-care costs directly from tobacco manufacturers, 10 actions for recovery of health-care costs arising from the treatment of smoking- and health-related diseases have been brought. These proceedings name various Group companies as defendants, including the UK Companies and Imperial as well as the RJR Companies. Pursuant to the terms of the 1999 sale of RJRT’s international tobacco business to Japan Tobacco Incorporated (JTI), JTI has agreed to indemnify RJRT for all liabilities and obligations (including litigation costs) arising in respect of the Canadian recoupment actions. Subject to a reservation of rights, JTI has assumed the defence of the RJR Companies in these actions.
 
61.
The 10 cases were proceeding in British Columbia, New Brunswick, Newfoundland and Labrador, Ontario, Quebec, Manitoba, Alberta, Saskatchewan, Nova Scotia and Prince Edward Island. The enabling legislation is in force in all 10 provinces. In addition, legislation has received Royal Assent in two of the three territories in Canada, but has yet to be proclaimed into force.
 
261


Table of Contents
BAT Annual Report and Form 20-F 2021
Financial Statements
Notes on Accounts
Continued
    
 
31 Contingent Liabilities and Financial Commitments
Continued
 
Canadian province
 
Act pursuant to which
Claim was brought
 
Companies named as
Defendants
 
Current stage
       
British Columbia
 
Tobacco Damages and Health Care Costs Recovery Act 2000
 
Imperial, Investments, Industries, Carreras Rothmans Limited, the RJR Companies and other former Rothmans Group companies have been named as defendants and served.
 
The defences of Imperial, Investments, Industries, Carreras Rothmans Limited and the RJR Companies have been filed, and document production and discoveries were ongoing. On 13 February 2017 the Province delivered an expert report dated October 2016, quantifying its damages in the amount of CAD$118 billion (approximately £69 billion). No trial date has been set. The federal government is seeking CAD$5 million (approximately £2.9 million) jointly from all the defendants in respect of costs pertaining to the third-party claim, now dismissed.
       
New Brunswick
 
Tobacco Damages and Health Care Costs Recovery Act 2006
 
Imperial, the UK Companies and the RJR Companies have been named as defendants and served.
 
The defences of Imperial, the UK Companies and the RJR Companies have been filed and document production and discoveries are substantially complete. The most recent expert report filed by the Province estimated a range of damages between CAD $11.1 billion (approximately £6.5 billion) and CAD $23.2 billion (approximately £13.6 billion), including expected future costs. Following a motion to set a trial date, the New Brunswick Court of Queen’s Bench ordered that the trial commence on 4 November 2019. On 7 March 2019, the New Brunswick Court of Queen’s Bench released a decision which requires the Province to produce a substantial amount of additional documentation and data to the defendants. As a result, the original trial date of 4 November 2019 would have been delayed. No new trial date has been set.
       
Ontario
 
Tobacco Damages and Health Care Costs Recovery Act 2009
 
Imperial, the UK Companies and the RJR Companies have been named as defendants and served.
 
The defences of Imperial, the UK Companies and the RJR Companies have been filed. The parties completed significant document production in the summer of 2017 and discoveries commenced in the autumn of 2018. On 15 June 2018, the Province delivered an expert report quantifying its damages in the range of CAD$280 billion (approximately £163.7 billion) – CAD$630 billion (approximately £368.2 billion) in 2016/2017 dollars for the period 1954 – 2060, and the Province amended the damages sought in its Statement of Claim to CAD$330 billion (approximately £192.9 billion). On 31 January 2019, the Province delivered a further expert report claiming an additional amount between CAD $9.4 billion (approximately £5.5 billion) and CAD$10.9 billion in damages (approximately £6.4 billion) in respect of ETS. No trial date has been set.
       
Newfoundland and Labrador
 
Tobacco Health Care Costs Recovery Act 2001
 
Imperial, the UK Companies and the RJR Companies have been named as defendants and served.
 
The case is at an early case management stage. The defences of Imperial, the UK Companies and the RJR Companies have been filed and the Province began its document production in March 2018. Damages have not been quantified by the Province. No trial date has been set.
       
Saskatchewan
 
Tobacco Damages and Health Care Costs Recovery Act 2007
 
Imperial, the UK Companies and the RJR Companies have been named as defendants and served.
 
This case is at an early case management stage. The defences of Imperial, the UK Companies and the RJR Companies have been filed and the Province has delivered a test shipment of documents. Damages have not been quantified by the Province. No trial date has been set.
       
Manitoba
 
Tobacco Damages Health Care Costs Recovery Act 2006
 
Imperial, the UK Companies and the RJR Companies have been named as defendants and served.
 
This case is at an early case management stage. The defences of Imperial, the UK Companies and the RJR Companies have been filed and document production commenced. Damages have not been quantified by the Province. No trial date has been set.
       
Alberta
 
Crown’s Right of Recovery Act 2009
 
Imperial, the UK Companies and the RJR Companies have been named as defendants and served.
 
This case is at an early case management stage. The defences of Imperial, the UK Companies and the RJR Companies have been filed and the Province commenced its document production. The Province has stated its claim to be worth CAD$10 billion (approximately £5.8 billion). No trial date has been set.
 
262


Table of Contents
BAT Annual Report and Form 20-F 2021    
 
Strategic Report        
 
Governance Report        
  
Financial Statements        
  
        Other Information        


31 Contingent Liabilities and Financial Commitments
Continued
 
Canadian province
 
Act pursuant to which
Claim was brought
 
Companies named as
Defendants
 
Current stage
       
Quebec
 
Tobacco Related Damages and Health Care Costs Recovery Act 2009
 
Imperial, Investments, Industries, the RJR Companies and Carreras Rothmans Limited have been named as defendants and served.
 
The case is at an early case management stage. The defences of Imperial, Investments, Industries, Carreras Rothmans Limited and the RJR Companies have been filed. Motions over admissibility of documents and damages discovery have been filed but not heard. The Province is seeking CAD$60 billion (approximately £35.1 billion). No trial date has been set.
       
Prince Edward Island
 
Tobacco Damages and Health Care Costs Recovery Act 2009
 
Imperial, the UK Companies and the RJR Companies have been named as defendants and served.
 
This case is at an early case management stage. The defences of Imperial, the UK Companies and the RJR Companies have been filed and the next step was expected to be document production, which the parties deferred for the time being. Damages have not been quantified by the Province. No trial date has been set.
       
Nova Scotia
 
Tobacco Health Care Costs Recovery Act 2005
 
Imperial, the UK Companies and the RJR Companies have been named as defendants and served.
 
This case is at an early case management stage. The defences of Imperial, the UK Companies and the RJR Companies have been filed. The Province provided a test document production in March 2018. Damages have not been quantified by the Province. No trial date has been set.
Nigeria
 
62.
British American Tobacco (Nigeria) Limited (BAT Nigeria), the Company and Investments have been named as defendants in a medical reimbursement action by the federal government of Nigeria, filed on 6 November 2007 in the Federal High Court, and in similar actions filed by the Nigerian states of Kano (9 May 2007), Oyo (30 May 2007), Lagos (13 March 2008), Ogun (26 February 2008), and Gombe (17 October 2008) commenced in their respective High Courts. In the five cases that remain active, the plaintiffs seek a total of approximately 10.6 trillion Nigerian naira (approximately £14.9 billion) in damages, including special, anticipatory and punitive damages, restitution and disgorgement of profits, as well as declaratory and injunctive relief.
 
63.
The suits claim that the state and federal government plaintiffs incurred costs related to the treatment of smoking-related illnesses resulting from allegedly tortious conduct by the defendants in the manufacture, marketing, and sale of tobacco products in Nigeria, and assert that the plaintiffs are entitled to reimbursement for such costs. The plaintiffs assert causes of action for negligence, negligent design, fraud and deceit, fraudulent concealment, breach of express and implied warranty, public nuisance, conspiracy, strict liability, indemnity, restitution, unjust enrichment, voluntary assumption of a special undertaking, and performance of another’s duty to the public.
 
64.
The Company and Investments have made a number of challenges to the jurisdiction of the Nigerian courts. Such challenges are still pending (on appeal) against the federal government and the states of Lagos, Kano, Gombe and Ogun. The underlying cases are stayed or adjourned pending the final outcome of these jurisdictional challenges. In the state of Oyo, on 13 November 2015, and 24 February 2017, respectively, the Company’s and Investments’ jurisdictional challenges were successful in the Court of Appeal and the issuance of the writ of summons was set aside.
South Korea
 
65.
In April 2014, Korea’s National Health Insurance Service (NHIS) filed a healthcare recoupment action against KT&G (a Korean tobacco company), PM Korea and BAT Korea (including BAT Korea Manufacturing). The NHIS is seeking damages of roughly 54 billion Korean Won (approximately £33.5 million) in respect of health care costs allegedly incurred by the NHIS treating patients with lung (small cell and squamous cell) and laryngeal (squamous cell) cancer between 2003 and 2012. Court hearings in the case, which constitute the trial, commenced in September 2014. On 20 November 2020, the court issued a judgment in favour of the defendants and dismissing all of the plaintiff’s claims. The NHIS filed an appeal of the judgment on 11 December 2020. Appellate proceedings commenced in June 2021 and remain ongoing.
 
263


Table of Contents
BAT Annual Report and Form 20-F 2021
Financial Statements
Notes on Accounts
Continued
    
 
31 Contingent Liabilities and Financial Commitments
Continued
Brazil
 
66.
On 21 May 2019, the Federal Attorney’s Office (AGU) in Brazil filed an action in the Federal Court of Rio Grande do Sul against the Company, the BAT Group’s Brazilian subsidiary Souza Cruz LTDA (Souza Cruz), Philip Morris International, Philip Morris Brazil Indústria e Comércio LTDA and Philip Morris Brasil S/A, asserting claims for medical reimbursement for funds allegedly expended by the federal government as public health care expenses to treat 26 tobacco-related diseases over the last five years and that will be expended in perpetuity during future years, including diseases allegedly caused both by cigarette smoking and exposure to ETS. The action includes a claim for moral damages allegedly suffered by Brazilian society to be paid into a public welfare fund. The action is for an unspecified amount of monetary compensation, as the AGU seeks a bifurcated action in which liability would be determined in the first phase followed by an evidentiary phase to ascertain damages.
 
67.
On 19 July 2019, the trial court ordered that service of the action on the Company be effected via service on Souza Cruz. On 6 August 2019, Souza Cruz refused to receive service on behalf of the Company due to Souza Cruz’s lack of power to receive the summons on behalf of the Company and such refusal was attached to the case files on 9 August 2019. On 7 August 2019, Souza Cruz was served with the complaint by the AGU and Souza Cruz’s acknowledgement of service was attached to the case files on 12 August 2019.
 
68.
On 19 August 2019, Souza Cruz filed an interlocutory appeal challenging the 19 July 2019 trial court order permitting the AGU to effect service on the Company by serving Souza Cruz and requesting a stay of the proceedings until the appeal is decided. Souza Cruz also appealed the fact that several documents attached to the AGU’s complaint are in English, without proper translation, and it also appealed the very short term of 30 days for the defendants to prepare their defences.
 
69.
On 20 August 2019, Souza Cruz informed the trial court about the appeal and the trial court entered an order, which ordered the closure of the online system preventing the parties from submitting any petition so that no prejudice would be caused to the defendants and permitted the AGU, within 15 days of its notification, to respond to the argument that the service of a foreign defendant via its Brazilian subsidiary constituted improper service. On 21 August 2019, the substitute reporting judge of the appellate court, having been notified that the trial court judge had in the meantime issued a new decision (thereby revoking the previous decision), ruled that the appeal filed had therefore been rendered moot. The AGU filed its submission in the trial court on 19 September 2019, and Souza Cruz filed a reply submission on 25 September 2019. Souza Cruz reported on 4 February 2020 that the trial court ruled that service of the Company via its Brazilian subsidiary constituted proper service, denied the request for additional time to file defences, denied the request to have the foreign language documents attached to the initial complaint fully translated into Portuguese, and ordered that defences be filed within 30 business days. On 18 February 2020, Souza Cruz filed an interlocutory appeal (including a request to stay the deadline to file defences). On 12 March 2020, the court denied the request for a stay. On 11 May 2020, the Company filed a petition to intervene in Souza Cruz’s interlocutory appeal. On 17 June 2020, AGU filed its opposition to Souza Cruz’s interlocutory appeal. The Company filed a reply submission on 8 July 2020. On 15 July 2020, the court denied the interlocutory appeal.
 
Souza Cruz and the Company submitted on 6 August 2020 requests for clarification of this appellate decision. The court granted the Company’s request to intervene, and rejected Souza Cruz and the Company’s request for clarification of the appellate decision, which decision became final on 6 June 2021. Souza Cruz and the Company filed their respective defences on 12 May 2020. On 19 May 2020, a notice was sent to the Public Prosecutor’s Office (MPF) regarding the AGU’s request that the MPF join the action as a plaintiff. The MPF, in its response filed 10 July 2020, rejected the AGU’s request, and declined to join the action as party, but will act as an ‘inspector of the law’, which enables MPF to express its opinion on matters in the case. The court to date has not opened up the term for the AGU to reply to the defences presented. On 19 February 2021, the Associação de Controle do Tabagismo, Promoção da Saúde (ACT) filed a petition seeking to intervene in the case as
amicus curiae
, which petition remains pending. On 25 March 2021 and 26 March 2021, respectively, Souza Cruz and PMB filed petitions requesting that ACT’s powers be limited should ACT be admitted as
amicus curiae
. On 19 May 2021, ACT filed a brief in further support of its
amicus curiae
petition. On 8 August 2021, the Company responded to ACT’s request to intervene as
amicus
curiae
, arguing that ACT’s request should be rejected or in the alternative that the scope of ACT’s intervention rights should be limited. On 31 August 2021, ACT responded to the Company’s submission. A court ruling on ACT’s petition is pending.
(b) Class Actions
Canada
 
70.
As noted above, on 1 March 2019 the Quebec Court of Appeal handed down a judgment which largely upheld and endorsed the lower court’s previous decision in two Quebec Class Actions, as further described below. Imperial’s share of the judgment is approximately CAD $9.2 billion (approximately £5.4 billion). As a result of this judgment, there were attempts by the Quebec plaintiffs to obtain payment out of the CAD $758 million (approximately £443 million) on deposit with the court. JTI-MacDonald Corp (a co-defendant in the cases) filed for creditor protection under the CCAA on 8 March 2019. A court order to stay all tobacco litigation in Canada against all defendants (including the RJR Companies) until 4 April 2019 was obtained, and the need for a mediation process to resolve all the outstanding litigation across the country was recognized. On 12 March 2019 Imperial filed for protection under the CCAA. In its application Imperial asked the Ontario Superior Court to stay all pending or contemplated litigation against Imperial, certain of its subsidiaries and all other Group companies that were defendants in the Canadian tobacco litigation, including the UK Companies. On 22 March 2019, Rothmans, Benson & Hedges Inc. also filed for CCAA protection and obtained a stay of proceedings (together with the other two stays, the Stays). The Stays are currently in place until 31 March 2022. While the Stays are in place, no steps are to be taken in connection with the Canadian tobacco litigation with respect to any of the defendants.
 
71.
The below represents the state of the referenced litigation as at the advent of the Stays.
 
72.
There are 11 class actions being brought in Canada against Group companies.
 
264


Table of Contents
BAT Annual Report and Form 20-F 2021    
 
Strategic Report        
 
Governance Report        
  
Financial Statements        
  
        Other Information        


31 Contingent Liabilities and Financial Commitments
Continued
73.
Knight Class Action:
the Supreme Court of British Columbia certified a class of all consumers who purchased Imperial cigarettes in British Columbia bearing ‘light’ or ‘mild’ descriptors since 1974. The plaintiff is seeking compensation for amounts spent on ‘light and mild’ products and a disgorgement of profits from Imperial on the basis that the marketing of light and mild cigarettes was deceptive because it conveyed a false and misleading message that those cigarettes are less harmful than regular cigarettes.
 
74.
On appeal, the appellate court confirmed the certification of the class, but limited any financial liability, if proven, to 1997 onward. Imperial’s third-party claim against the federal government was dismissed by the Supreme Court of Canada. The federal government is seeking a cost order of CAD$5 million (approximately £2.9 million) from Imperial relating to its now dismissed third-party claim. After being dormant for several years, the plaintiff delivered a Notice of Intention to Proceed, and Imperial delivered an application to dismiss the action for delay. The application was heard on 23 June 2017 and was dismissed on 23 August 2017. Notice to class members of certification was provided on 14 February 2018. As at the date of the Stays, the next steps were expected to include discovery-related ones.
 
75.
Growers’ Class Action:
in December 2009, Imperial was served with a proposed class action filed by Ontario tobacco farmers and the Ontario Flue-Cured Tobacco Growers’ Marketing Board. The plaintiffs allege that Imperial and the Canadian subsidiaries of Philip Morris International and JTI failed to pay the agreed domestic contract price to the growers used in products manufactured for the export market and which were ultimately smuggled back into Canada. JTI has sought indemnification pursuant to the JTI Indemnities (discussed below at paragraphs 137-138). The plaintiffs seek damages in the amount of CAD$50 million (approximately £29.2 million). Various preliminary challenges have been heard, the last being a motion for summary judgment on a limitation period. The motion was dismissed and ultimately, leave to appeal to the Ontario Court of Appeal was dismissed in November 2016. In December 2017, the plaintiffs proposed that the action proceed by way of individual actions as opposed to a class action. The defendants did not consent. As at the date of the Stays, the claim was in abeyance pending further action from the plaintiffs.
 
76.
Quebec Class Actions:
there are currently two class actions in Quebec. On 21 February 2005, the Quebec Superior Court granted certification in two class actions against Imperial and two other domestic manufacturers. The court certified two classes, with the class definitions being revised in the judgment rendered 27 May 2015. One class consists of residents of Quebec who (a) smoked before 20 November 1998 at least 12 pack years of cigarettes manufactured by the defendants; and (b) were diagnosed before 12 March 2012 with: lung cancer, or cancer (squamous cell carcinoma) of the throat, or emphysema. The group also includes the heirs of persons deceased after 20 November 1998 who meet the criteria described above. The second consists of residents of Quebec who, as of 30 September 1998, were addicted to nicotine contained in cigarettes and who in addition meet the following three criteria: (a) they started smoking before 30 September 1994 by smoking cigarettes manufactured by the defendants; (b) between 1 September and 30 September 1998 they smoked on average at least 15 cigarettes manufactured by the defendants on a daily basis; and (c) they still smoked an average of at least 15 cigarettes manufactured by the defendants as of 21 February 2005, or until their death if it occurred before that date.
  
The group also includes the heirs of members who meet the criteria described above. Pursuant to the judgment, the plaintiffs were awarded damages and interest against Imperial and the Canadian subsidiaries of Philip Morris International and JTI in the amount of CAD$15.6 billion (approximately £9.1 billion), most of which was on a joint and several basis, of which Imperial’s share was CAD$10.4 billion (approximately £6.1 billion). An appeal of the judgment was filed on 26 June 2015. The court also awarded provisional execution pending appeal of CAD$1,131 million (approximately £661.1 million), of which Imperial’s share was approximately CAD$742 million (approximately £433.7 million). This order was subsequently overturned by the Court of Appeal. Following the cancellation of the order for provisional execution, the plaintiffs filed a motion against Imperial and one other manufacturer seeking security in the amount of CAD $5 billion (approximately £2.9 billion) to guarantee, in whole or in part, the payment of costs of the appeal and the judgment. On 27 October 2015, the Court of Appeal ordered the parties to post security in the amount of CAD$984 million (approximately £575.1 million), of which Imperial’s share was CAD$758 million (approximately £443 million). The security was paid in seven equal quarterly instalments of just over CAD$108 million (approximately £63.1 million) between 31 December 2015 and 30 June 2017. The appeal was heard in November 2016. On 1 March 2019, the trial judgment was upheld by a unanimous decision of the five-member panel of the Court of Appeal, with one exception being an amendment to the original interest calculation applied to certain portions of the judgment. The interest adjustment has resulted in the reduction of the total maximum award in the two cases to CAD $13.7 billion (approximately £8 billion) as of 1 March 2019, with Imperial’s share being reduced to approximately CAD $9.2 billion (approximately £5.4 billion). The Court of Appeal also upheld the payment of the initial deposits into the defendants’ solicitors’ trusts account within 60 days, totalling approximately CAD $1.13 billion (approximately £660.5 million), of which Imperial’s share was recalculated by the Court of Appeal as CAD $759 million (approximately £443.6 million). Imperial has already paid CAD $758 million (approximately £443 million) into court as security for the judgment.
 
77.
Other Canadian Smoking and Health Class Actions:
seven putative class actions, described below, have been filed against various Canadian and non-Canadian tobacco-related entities, including the UK Companies, Imperial and the RJR Companies, in various Canadian provinces. In these cases, none of which have quantified their asserted damages, the plaintiffs allege claims based on fraud, fraudulent concealment, breach of warranty of merchantability, and of fitness for a particular purpose, failure to warn, design defects, negligence, breach of a ‘special duty’ to children and adolescents, conspiracy, concert of action, unjust enrichment, market share liability and violations of various trade practices and competition statutes. Pursuant to the terms of the 1999 sale of RJRT’s international tobacco business, and subject to a reservation of rights, JTI has assumed the defence of the RJR Companies in these seven actions (Semple, Kunka, Adams, Dorion, Bourassa, McDermid and Jacklin, discussed below).

265


Table of Contents
BAT Annual Report and Form 20-F 2021
Financial Statements
Notes on Accounts
Continued
    
 
31 Contingent Liabilities and Financial Commitments
Continued
78.
In June 2009, four smoking and health class actions were filed in Nova Scotia (Semple), Manitoba (Kunka), Saskatchewan (Adams) and Alberta (Dorion) against various Canadian and non-Canadian tobacco-related entities, including the UK Companies, Imperial and the RJR Companies. In Saskatchewan, the Company, Carreras Rothmans Limited and Ryesekks p.l.c. have been released from Adams, and the RJR Companies have brought a motion challenging the jurisdiction of the court. There are service issues in relation to Imperial and the UK Companies in Alberta and in relation to the UK Companies in Manitoba. The plaintiffs did not serve their certification motion materials and no dates for certification motions were set.
 
79.
In June 2010, two further smoking and health class actions were filed in British Columbia against various Canadian and non-Canadian tobacco-related entities, including Imperial, the UK Companies and the RJR Companies. The Bourassa claim is allegedly on behalf of all individuals who have suffered chronic respiratory disease and the McDermid claim proposes a class based on heart disease. Both claims state that they have been brought on behalf of those who have ‘smoked a minimum of 25,000 cigarettes’. The UK Companies, Imperial, the RJR Companies and other defendants objected to jurisdiction. Subsequently, the Company, Carreras Rothmans Limited and Ryesekks p.l.c. were released from Bourassa and McDermid. Imperial, Industries, Investments and the RJR Companies remain as defendants in both actions. The plaintiffs did not serve their certification motion materials and no dates for certification motions were set.
 
80.
In June 2012, a smoking and health class action was filed in Ontario (Jacklin) against various Canadian and non-Canadian tobacco-related entities, including the UK Companies, Imperial and the RJR Companies. The claim has been in abeyance.
Venezuela
 
81.
In April 2008, the Venezuelan Federation of Associations of Users and Consumers (FEVACU) and Wolfang Cardozo Espinel and Giorgio Di Muro Di Nunno, acting as individuals, filed a class action against the Venezuelan government. The class action seeks regulatory controls on tobacco and recovery of medical expenses for future expenses of treating smoking-related illnesses in Venezuela. Both C.A Cigarrera Bigott Sucs. (Cigarrera Bigott), a Group subsidiary, and ASUELECTRIC, represented by its president Giorgio Di Muro Di Nunno (who had previously filed as an individual), have been admitted as third parties by the Constitutional Chamber of the Supreme Court of Justice. A hearing date for the action is yet to be scheduled. On 25 April 2017 and on 23 January 2018, Cigarrera Bigott requested the court to declare the lapsing of the class action due to no proceedings taking place in the case in over a year. A ruling on the matter is yet to be issued.
(c) Individual Tobacco-Related Personal Injury Claims
 
82.
As at 31 December 2021, the jurisdictions with the most active individual cases against Group companies were, in descending order: Brazil (23), Italy (11), Canada (5), Argentina (5), Chile (4) and Ireland (2). There were a further two jurisdictions with one active case only. Out of the 52 active individual tobacco related personal injury claims, one case in Argentina (
Baldassare
) received an unfavourable verdict as at 31 December 2021. In that case, a first instance judgment, issued on 28 December 2020, awarded damages to the plaintiff in the amount of ARS 685,976 (approximately £5,000) in compensatory damages and ARS 2,500,000 (approximately £18,000) in punitive damages (plus interest). BAT Argentina filed a notice of appeal of the judgment on 3 February 2021.
Non-Tobacco-Related Litigation
VUSE Litigation
 
83.
On 22 July 2020, Nicholas Bernston filed a personal injury action in the Northern District of Oklahoma against JUUL Labs Inc. (JUUL), Altria Client Services, LLC, RJR Vapor, Reynolds American, and others. The complaint seeks damages for personal injuries (including pneumonia and acute respiratory failure) allegedly resulting from vaping on several theories, including strict liability, negligence, and breach of implied warranty of merchantability. On 24 July 2020, JUUL notified the JPML that this case could be a potential tag-along in the JUUL MDL. On 5 August 2020, the Judicial Panel on Multidistrict Litigation entered a conditional transfer order transferring the case to the Northern District of California. That order became effective on 12 August 2020, and this case now is a member case in the JUUL multidistrict litigation (MDL). On 13 October 2020, RJR Vapor and Reynolds American moved to dismiss the complaint or, in the alternative, for a stay or a suggestion of remand to the Northern District of Oklahoma. On 16 October 2020, the MDL court issued an order staying those motions to dismiss. The case will remain pending against Reynolds American and RJR Vapor, but they will not be subject to discovery or other pretrial obligations absent further order from the court.
Croatian Distributor Dispute
 
84.
BAT Hrvatska d.o.o u likvidaciji and British American Tobacco Investments (Central and Eastern Europe) Limited are named as defendants in a claim by Mr Perica received on 22 August 2017 and brought before the commercial court of Zagreb, Croatia. Mr Perica seeks damages of HRK 408,000,000 (approximately £45.6 million) relating to a BAT Standard Distribution Agreement dating from 2005. BAT Hrvatska d.o.o and British American Tobacco Investments (Central and Eastern Europe) Ltd filed a reply to the statement of claim on 6 October 2017. A hearing had been scheduled to take place on 10 May 2018, but it was postponed due to a change of the judge hearing the case. The Commercial Court in Zagreb declared they do not have jurisdiction and that the competent court to hear this case is the Municipal Court in Zagreb. TDR d.o.o. is also named as the defendant in a claim by Mr Perica received on 30 April 2018 and brought before the commercial court of Zagreb, Croatia. Mr. Perica seeks payment in the amount of HRK 408,000,000 (approximately £45.6 million) claiming that BAT Hrvatska d.o.o. transferred a business unit to TDR d.o.o, thus giving rise to a liability of TDR d.o.o. for the debts incurred by BAT Hrvatska d.o.o, on the basis of the provisions of Croatian civil obligations law. A response to the statement of claim was filed on 30 May 2018. The Commercial Court in Zagreb declared they do not have jurisdiction and that the competent court to hear this case is the Municipal Court in Pula. Mr Perica filed an appeal against this decision which was rejected by the High Commercial Court of The Republic of Croatia confirming therewith that the competent court to hear this case is the Municipal Court in Pula. The Municipal Court in Zagreb has decided that the claims by Mr Perica initiated on 22 August 2017 and 30 April 2018 shall be heard as one case in front of the Municipal Court of Zagreb. After the two hearings have been held, the Municipal Court of Zagreb has appointed the court financial and auditing appraisal to determine the value of Mr Perica’s claim.
 
266


Table of Contents
BAT Annual Report and Form 20-F 2021    
 
Strategic Report        
 
Governance Report        
  
Financial Statements        
  
        Other Information        


31 Contingent Liabilities and Financial Commitments
Continued
BAT/Reynolds American Inc. Shareholder Litigation
 
85.
Following the Company’s acquisition of the remaining 57.8% of Reynolds American in July 2017, pursuant to North Carolina law, under which Reynolds American was incorporated, a number of Reynolds American shareholders dissented and asserted their rights to a judicial appraisal of the value of their Reynolds American stock. On 29 November 2017, Reynolds American filed a Complaint for Judicial Appraisal in state court in North Carolina against 20 dissenting shareholders holding an aggregate of approximately 9.65 million shares. The complaint asked the court to determine the fair value of the dissenting shareholders’ shares in Reynolds American and any accrued interest. A trial was held in June 2019, at which the dissenters sought US$92.17 per share plus interest. On 27 April 2020, the court issued its final judgment upholding Reynolds American’s proposed valuation of $59.64 per share and concluding that no further payment is due to the dissenters for their shares. Dissenting shareholders holding an aggregate of approximately 6.52 million shares filed a notice of appeal to the North Carolina Supreme Court. On 17 December 2021, the North Carolina Supreme Court issued an opinion affirming the Business Court’s determination, and on 21 January 2022 the dissenters’ deadline to seek further review expired, meaning that this matter is now concluded.
Patents Litigation
 
86.
Certain Group companies are party to a number of patent litigation cases and procedural challenges concerning the validity of patents owned by or licensed to them and/or the alleged infringement of third-parties’ patents.
 
87.
On 22 June 2018, an affiliate of Philip Morris International (PMI) commenced proceedings against British American Tobacco Japan, Ltd. (BAT Japan) in the Japanese courts challenging the import, export, sale and offer of sale of the glo device and of the NeoStiks consumable in Japan at the time the claim was brought (and earlier models of the glo device), alleging that the glo devices directly infringe certain claims of two Japanese patents that have been issued to the PMI affiliate and that the NeoStiks indirectly infringe certain claims of those patents. On 17 January 2019, the PMI affiliate introduced new grounds of infringement, alleging that the glo device also infringes some other claims in the two PMI affiliate’s Japanese patents. Damages for the glo device and NeoStik are claimed in the court filing, to the amount of 100 million Yen (approximately £641,000). The PMI affiliate has also filed a request for injunction with respect to the glo device. BAT Japan denies infringement and is challenging the validity of the two PMI affiliate’s Japanese patents.
 
88.
Fuma International LLC (Fuma) filed two separate patent infringement complaints in the U.S. District Court for the Middle District of North Carolina against RJR Vapor on 6 March 2019 and 2 July 2019, each alleging that Vuse Solo and Vuse Ciro products infringe a patent. The two complaints were consolidated into a single proceeding involving both asserted Fuma patents. The parties resolved this matter pursuant to a Confidential Settlement and License Agreement effective 29 November 2021.
 
89.
On 9 April 2020, Nicoventures Trading Limited (Nicoventures) commenced an action in the England and Wales High Court (Patents Court) against Philip Morris Products S.A. (PMP) for revocation against three divisional patents in the same family, of which PMP is the proprietor (a further divisional patent in the same family was added into the revocation action on 9 July 2020). On 12 May 2020 PMP filed its defence
 
together with a counterclaim for patent infringement against Nicoventures and Investments concerning prototype examples or production samples of certain ‘glo’ tobacco heating devices. PMP are seeking an injunction, an order for delivery up or a destruction upon oath of all infringing articles, and either an account of profits or damages on commercial sales (and interest thereon). On 12 June 2020, Nicoventures and Investments filed their defence to the counterclaim. The trial of this action took place between 18-25 May 2021. On 14 July 2021 the England and Wales High Court (Patents Court) handed down its judgment finding that all four divisional patents were invalid for lack of an inventive step and consequently, that PMP’s counterclaim failed. On 2 November 2021, PMP filed a request for permission to appeal.
 
90.
On 28 May 2020 Altria Client Services LLC and U.S. Smokeless Tobacco Company LLC commenced proceedings against RJR Vapor before the U.S. District Court for the Middle District of North Carolina against the vapour products Vuse Vibe and Vuse Alto, and the tin used in the modern oral product Velo. Nine patents in total were asserted: two against Vibe, four against Alto and three against Velo. On 5 January 2021, Altria filed an Amended Complaint adding Modoral Brands Inc. as a defendant with respect to the Velo product claims. The plaintiffs have sought damages but have not to date sought preliminary or permanent injunctions. RJR Vapor has responded to the complaint. The parties conducted a one-day mediation session in August 2021, but were unable to resolve the dispute. A claim construction hearing was held on 28 April 2021, and the court issued its claim construction ruling on 12 May 2021. Fact discovery, expert discovery, and summary judgment briefings are completed. No date has been set for a summary judgment hearing, and no trial date has been set.
 
91.
On 9 April 2020, RAI Strategic Holdings, Inc. and RJR Vapor commenced an action in the U.S. District Court for the Eastern District of Virginia against Altria Client Services LLC, Philip Morris USA, Inc., Altria Group, Inc., Philip Morris International, Inc., and Philip Morris Products S.A. (collectively, Philip Morris) for infringement of six patents based on the importation and commercialization within the United States of IQOS. On 8 May 2020 and 12 June 2020, Philip Morris filed Inter Partes Review (IPR) petitions in the U.S. Patent Office challenging the validity of each of the six patents asserted. On 29 June 2020, Philip Morris asserted counterclaims alleging that RJR Vapor infringes five patents. On 24 November 2020, the court issued a claim construction order that determined that each disputed term would have its plain and ordinary meaning. On 4 December 2020, the magistrate judge issued an order staying RJR Vapor and Philip Morris’s patent claims pending a decision by the U.S. Patent Office regarding whether to proceed with the IPRs. At the time of the stay, fact and expert discovery was ongoing and was scheduled to conclude 26 January 2021. The court lifted the stay, and the parties have substantially completed discovery. On 6 August 2021, the court denied all summary judgment motions. Trial on the Altria and Philip Morris patents was scheduled to have begun on 4 April 2022, but the court postponed the trial and set a new trial date of 6 June 2022; the RJR Vapor offensive patent case remains stayed pending (i) an appeal by Philip Morris to the Federal Circuit in relation an exclusion order granted against Philip Morris by the International Trade Commission based on the relevant patents, and (ii) the decisions in IPRs commenced by Philip Morris against the relevant patents at the U.S. Patent Office.
 
267


Table of Contents
BAT Annual Report and Form 20-F 2021
Financial Statements
Notes on Accounts
Continued
    
 
31 Contingent Liabilities and Financial Commitments
Continued
92.
On 27 November 2020 Philip Morris filed a complaint before the Regional Court Mannheim in Germany against British American Tobacco (Germany) GmbH (BAT Germany) alleging that the sale, offer for sale and importation of Vype ePod products infringes a patent. Philip Morris is seeking an injunction, a recall of product from commercial customers and a declaratory judgment for damages. The trials of this action took place on 15 June 2021 and 9 November 2021. A decision on the matter was promulgated on 30 November 2021. The decision dismissed the complaint in its entirety. On 28 December 2021, Philip Morris lodged an appeal against this decision before the Higher Regional Court Karlsruhe.
 
93.
On 11 December 2020 Philip Morris filed a complaint before the Regional Court Dusseldorf in Germany against BAT Germany alleging that the sale, offer for sale and importation of the glo TABAK HEATER and neo STICK products infringe a patent. Philip Morris is seeking an injunction, a recall of product from commercial customers and a declaratory judgment for damages. The trial of this action took place on 30 November 2021. The court promulgated its decision on 21 December 2021 and decided that the above-mentioned products infringe the patent. The decision is not final and was appealed by BAT Germany on 21 December 2021 to the Higher Regional Court Dusseldorf. On 31 December 2021, BAT Germany also lodged a formal request with the appeal court to suspend the injunction order against the neo STICK products. On 24 January 2022, the appeal court granted this request, subject to providing a security and indicating that the neo STICK products are only suitable for new glo TABAK HEATER devices. BAT Germany is no longer marketing the glo TABAK HEATER, but rather a new glo TABAK HEATER marketed as glo Hyper + New Heating Technology, which is not subject to the patent infringement proceedings. Because the trial court decision only contains a declaratory obligation for BAT Germany to pay damages, Philip Morris would have to file a new separate action for the actual payment of damages, stating the precise amount that is being claimed.
 
94.
On 14 December 2020, Modoral Brands Inc. (Modoral) filed a complaint in the U.S. District Court for the District of Delaware against Pinkerton Tobacco Co., LP, Swedish Match North America LLC, and NYZ AB (collectively Swedish Match) seeking a declaratory judgment that the importation, manufacture, use, and/or sale of Modoral’s Velo product does not infringe U.S. Patent No. 9,161,908 (the ‘908 Patent) or any of Swedish Match’s trade secrets. On 3 June 2021, the case was transferred to the U.S. District Court for the Central District of California. On 13 July 2021, Swedish Match and Helix Innovations GmbH filed counterclaims against Modoral for infringement of the ’908 patent and misappropriation of trade secrets arising out of the manufacture, use, and sale of Modoral’s Velo product. On 15 December 2021, the court entered a Markman Order finding that the ’908 patent distinguishes a nicotine complex from the claimed ‘nicotine salt,’ and more specifically, affirmatively excluding the nicotine polacrilex complex used in the accused Velo product from the claimed invention because it is “not a nicotine salt”. Swedish Match agreed to a joint stipulation and request for entry of judgment of non-infringement for all of the asserted claims of the ’908 patent, which the Court granted on 19 January 2022. Modoral filed a motion to stay Swedish Match’s remaining trade secret misappropriation claims in light of Swedish Match’s intent to appeal the Markman Order to the Federal Circuit. Modoral also filed a Rule 54(b) motion for partial final judgment of the infringement claims. Both motions are scheduled for argument on 4 March 2022.
Mozambican IP Litigation
 
95.
On 19 April 2017, Sociedade Agrícola de Tabacos, Limitada (SAT) (a BAT Group company in Mozambique) filed a complaint to the National Inspectorate for Economic Activities (INAE), the government body under the Ministry of Industry and Trade, regarding alleged infringements of its registered trademark (GT) by GS Tobacco SA (GST). INAE subsequently seized the allegedly infringing products (GS cigarettes) and fined and ordered GST to discontinue manufacturing products that could infringe SAT’s intellectual property rights. Following INAE’s decision, in July 2017 and March 2018, SAT sought damages via the Judicial Court of Nampula, from GST in the amount of and equivalent to £573,000 as well as a permanent restraint order in connection with the manufacturing and selling of the allegedly infringing products. The Judicial Court of Nampula (Tribunal Judicial de Nampula) granted the order on an interim basis on 7 August 2017. After hearing the parties, on 5 September 2017, the court found that no alleged infringement by GST had occurred and removed the interim restraint order, this decision was appealed by SAT and is currently pending a decision. GST filed an application for review against INAE’s initial decision directly to the Minister of Trade and Industry, which reversed the decision of INAE. On 31 December 2018, SAT was notified of GST’s counterclaim against SAT at the Judicial Court of Nampula for damages allegedly sustained as a result of SAT’s complaint to INAE (and INAE’s decision). GST is seeking damages in the amount equivalent to £190 million. On 31 January 2019 SAT filed a formal response to the counterclaim. GST was notified on 28 February 2019 to file a response to our formal response to the counterclaim and the judge scheduled the preliminary hearing for 14 March 2019. This hearing was adjourned and was held on 2 April 2019, when the court heard arguments on the validity of SAT’s counterclaim. On 2 September 2019, SAT received notification of an order which provided that (i) SAT’s claim had been dismissed by the court; and (ii) the GST counterclaim would proceed to trial. On 9 September 2019 SAT responded to the order by appealing the dismissal of the SAT claim. Additionally, SAT made an interlocutory application in the counterclaim proceedings to challenge certain questions posed by the judge, on the basis that the responses may be used as evidence at trial. SAT was notified in December 2021 that the trial of the counterclaim is to take place on 24 February 2022. SAT subsequently submitted a complaint related to that trial to the court, on the basis that prior to any further step being taken in relation to the trial the process should be submitted to the superior court for analysis, as per the appeals previously submitted in the proceedings. SAT’s complaint has not yet been determined.
Malawi Group Action
 
96.
In December 2020, the Company and British American Tobacco (GLP) Limited (GLP) were named as defendants in a claim made in the English High Court by around 7,500 Malawian tobacco farmers and their family members. The claim also names Imperial Brands plc and five affiliates as defendants. The claimants allege they were subjected to unlawful and exploitative working conditions on tobacco farms from which it is alleged that the defendants indirectly acquire tobacco. They seek unquantified damages (including aggravated and exemplary damages) for the torts of negligence and conversion and unquantified personal and proprietary remedies for restitution of unjust enrichment. They also seek an injunction to restrain the commission of further torts of conversion or negligence by the defendants. The defendants had an application to strike out the claims dismissed in a judgment dated 25 June 2021. In January 2022, the Company and GLP were served with a similar claim by around a further 3,500 claimants. The Company and GLP intend vigorously to defend the claims.
 
268


Table of Contents
BAT Annual Report and Form 20-F 2021    
 
Strategic Report        
 
Governance Report        
  
Financial Statements        
  
        Other Information        


31 Contingent Liabilities and Financial Commitments
Continued
Qatar Customs Authority Claims
 
97.
On 12 November 2020, British American Tobacco Middle East W.L.L (formerly British American Tobacco Middle East SPC) (BAT ME), along with its distributor in Qatar, Ali Bin Ali Establishment (ABA), filed a case before the Qatar Court of First Instance which challenges a decision of Qatar General Authority of Customs dated 16 August 2020 ordering ABA to pay two amounts arising from unrelated circumstances, one of which totalled QAR 160,531,588 (approximately £32.6 million) in customs duties and penalties in relation to 27 consignments of cigarettes imported into Qatar by ABA. On 14 February 2021, the General Authority of Customs issued a new order that repeated (and addressed only) its demand that ABA pay QAR 160,531,588 in customs duties and penalties in relation to the same 27 consignments of cigarettes imported into Qatar by ABA. On 19 May 2021, BAT ME and ABA filed a second case before the Qatar Court of First Instance which challenges the decision of Qatar’s General Authority of Customs dated 14 February 2021. On 28 October 2021, the Court of First Instance dismissed both cases filed by BAT ME and ABA on the grounds the cases were not timely filed. In December 2021, BAT ME and ABA appealed the decisions of the Court of First Instance in both cases. It is possible that the two appeals filed by BAT ME and ABA will be consolidated into a single case. In any event, ABA can only have liability under one case not both, so its maximum liability is QAR 160,531,588, not twice that amount. BAT ME’s potential liability in respect of the foregoing amount arises from certain contractual arrangements with ABA. BAT ME and ABA strongly assert that the additional customs duty and penalties imposed by the Qatar Customs Authority are inconsistent with applicable law.
Saudi Arabia Customs Claim
 
98.
On 25 January 2021, Walid Ahmed Mohammed Al Naghi for Trading Establishment (Al Naghi), a former distributor for the Group’s operating companies in the Middle East, filed a claim in the Commercial Court in Jeddah, Saudi Arabia, seeking SAR 2,105,356,121 (approximately £414 million) for reimbursement of funds allegedly due under contract. Al Naghi did not formally name any Group entity as a defendant in the claim. The claim was dismissed orally by the Court on 9 February 2021. On 20 April 2021, Al Naghi filed a new claim in the Jeddah Commercial Court against BAT UKE demanding that BAT UKE reimburse Al Naghi in the amount of SAR 2,105,356,121 allegedly paid by Al Naghi to the customs authorities in customs dues. BAT UKE submitted a response on 27 May 2021 requesting dismissal of the claim on the ground that BAT UKE lacks legal capacity to be sued as it was not a party to any relevant agreement with Al Naghi. On 16 June 2021, the Court of First Instance issued a judgment dismissing the claim against BAT UKE and ruling that BAT UKE lacks legal standing to be named defendant in the proceedings. On 22 August 2021, Al Naghi filed an appeal against the Court of First Instance judgement. BAT UKE was not given an opportunity to respond to Al Naghi’s allegations on appeal. On 15 November 2021, the Appellate Court issued an oral ruling cancelling the Court First Instance judgement and remanding the case to the lower court for further deliberation. In its written judgement dated 12 December 2021, the Appellate Court stated that it was remanding the case in order for the Court of First Instance to join to the proceedings BAT entities in Bahrain and UAE, which Al Naghi had wrongly claimed on appeal to be branches of BAT UKE. The Court of First Instance held a hearing on 19 January 2022 to re-consider the case in light of the Appellate Court judgement.
  
At that hearing, the Court of First Instance set a timetable for the parties to file written submissions setting out their arguments with regard to the legal status of the BAT entities in Bahrain and UAE. A further hearing was held on 2 February 2022. The court is seeking further information from the BAT entities in Bahrain and UAE ahead of a further hearing on 23 February 2022.
Asbestos Litigation
 
99.
On 15 January 2021, plaintiffs in an individual asbestos personal injury action (Rentko), originally filed 5 October 2020 in the New York City Asbestos Litigation court, filed an amended complaint, which named as defendants the Company, BATUS Holdings, Inc., British American Tobacco (Brands) Inc., and RJRT, along with various other defendants. The amended complaint was served 20 January 2021 on BATUS Holdings, Inc. and British American Tobacco (Brands) Inc., and served 22 January 2021 on RJRT. The amended complaint alleges that one of the plaintiffs was exposed to the defendants’ asbestos and asbestos-contaminated talcum powder products, which allegedly caused her to develop mesothelioma, and asserts claims under state law, including for negligence, breach of warranty, product liability, negligent misrepresentation, fraudulent concealment, and civil conspiracy. A further amended complaint was filed on 27 January 2021, which named Reynolds American as a defendant as an alleged successor in interest to the Company, and which was served on Reynolds American on 5 February 2021. Plaintiffs seek unspecified compensatory and punitive damages jointly and severally against the defendants. Reynolds American and RJRT moved to dismiss the amended complaint on 26 March 2021. A notice of discontinuance was filed on 31 March 2021 discontinuing the litigation without prejudice as against the Company, BATUS Holdings, Inc. and British American Tobacco (Brands) Inc. A stipulation of discontinuance was filed on 6 April 2021 discontinuing the litigation without prejudice as against Reynolds American and RJRT.
 
100.
On 23 April 2021, plaintiff in an asbestos personal injury action (Smoltino), originally filed 25 August 2020 in the New York City Asbestos Litigation court, filed an amended complaint, which named as defendants the Company, BATUS Holdings, Inc., British American Tobacco (Brands) Inc., Reynolds American and RJRT, along with various other defendants. The amended complaint was served on BATUS Holdings, Inc., British American Tobacco (Brands) Inc. and RJRT on 23 April 2021 and served on Reynolds American on 26 April 2021. The amended complaint alleged that plaintiff’s decedent was exposed to the defendants’ asbestos and asbestos-contaminated talcum powder products, which allegedly caused her to develop mesothelioma, and asserted claims under state law, including for negligence, breach of warranty, product liability, negligent misrepresentation, fraudulent concealment, wrongful death and civil conspiracy. Plaintiff seeks unspecified compensatory and punitive damages jointly and severally against the defendants. A notice of discontinuance was filed on 19 May 2021 discontinuing the litigation without prejudice as against the Company, BATUS Holdings, Inc. and British American Tobacco (Brands) Inc. Reynolds American and RJRT moved to dismiss the amended complaint on 10 May 2021. A stipulation of discontinuance was filed on 24 May 2021 discontinuing the litigation without prejudice as against Reynolds American and RJRT.
 
269


Table of Contents
BAT Annual Report and Form 20-F 2021
Financial Statements
Notes on Accounts
Continued
    
 
31 Contingent Liabilities and Financial Commitments
Continued
101.
On 11 May 2021, plaintiff in an asbestos personal injury action (Gilbride) filed a complaint in the Superior Court of New Jersey Law Division – Middlesex County, which named as defendants R. J. Reynolds Tobacco Company, individually and as successor-by-merger to British American Cosmetics, along with various other defendants. The complaint was served on RJRT on 26 May 2021. The complaint alleged that plaintiff was exposed to asbestos-containing cosmetic talcum powder products sold and supplied by the Defendants (and/or their predecessors in interest), which allegedly caused her to develop mesothelioma, and asserted claims under state law, including for negligence, breach of warranty, strict liability in tort, marketing an ultra-hazardous product, failure to warn, product liability, negligent misrepresentation, fraudulent concealment, and civil conspiracy. Plaintiff seeks unspecified compensatory and punitive damages jointly and severally against the defendants. A stipulation for voluntary dismissal was filed with the court on 7 July 2021.
Fox River
Background to environmental liabilities arising out of contamination of the Fox River:
 
102.
In Wisconsin, the authorities have identified potentially responsible parties (PRPs) to fund the clean-up of river sediments in the lower Fox River. The pollution was caused by discharges of Polychlorinated Biphenyls (PCBs) from paper mills and other facilities operating close to the river. Among the PRPs is NCR Corporation (NCR).
 
103.
In NCR’s Form 10-K Annual Report for the year ended 31 December 2014, the total clean-up costs for the Fox River were estimated at US$825 million (approximately £609.1 million). This estimate is subject to uncertainties and does not include natural resource damages (NRDs). Total NRDs may range from US$0 to US$246 million (approximately £0 to £181.6 million).
 
104.
Industries’ involvement with the environmental liabilities arises out of indemnity arrangements which it became party to due to a series of transactions that took place from the late-1970s onwards and subsequent litigation brought by NCR against Industries and Appvion Inc. (Appvion) (a former Group subsidiary) in relation to those arrangements which was ultimately settled. U.S. authorities have never identified Industries as a PRP.
 
105.
There has been a substantial amount of litigation in the United States involving NCR and Appvion regarding the responsibility for the costs of the clean-up operations. The U.S. Government also brought enforcement proceedings against NCR and Appvion to ensure compliance with regulatory orders made in relation to the Fox River clean-up. This litigation has been settled through agreements with other PRPs and a form of settlement known as a Consent Decree with the U.S. Government, approved by the District Court of Wisconsin on 23 August 2017.
 
106.
The principal terms of that Consent Decree, in summary, are as follows:
 
 
a.
NCR is obliged to perform and fund all of the remaining Fox River remediation work by itself.
 
 
b.
The U.S. Government enforcement proceedings were settled, with NCR having no liability to meet the U.S. Government’s claim for costs it had incurred in relation to the clean-up to date, a secondary responsibility to meet certain future costs, and no liability to the U.S. Government for NRDs.
 
c.
NCR ceased to pursue its contribution claims against the other PRPs and in return received contribution protection preventing other PRPs from pursuing their contribution claims against NCR and existing claims for contribution being dismissed by order of the Court. NCR does, however, have the right to reinstate its contribution claims if the other PRPs decide to continue to pursue certain contractual claims against NCR.
 
 
d.
Appvion also agreed to cease pursuance of claims against the other PRPs, subject to retention of the right to reinstate its claims if the other PRPs decide to continue to pursue certain claims against Appvion.
 
107.
A Consent Decree between the U.S. Government, P.H. Glatfelter and Georgia Pacific settling the allocation of costs on the Fox River was approved by the District Court in the Eastern District of Wisconsin on 14 March 2019. This Consent Decree concludes all existing litigation on the Fox River, following P.H. Glatfelter’s withdrawal of its appeal against the issuance of the Consent Decree as a term of the settlement.
 
108.
In NCR’s Form 10-K Annual Report for the year ended 31 December 2020 NCR disclosed that, in November 2019, an arbitral tribunal had awarded approximately US$10 million (approximately £7.4 million) to a remediation general contractor engaged by the LLC formed by NCR and Appvion to perform the clean-up operation of the Fox River. NCR further stated that its indemnitors and co-obligors were responsible for the majority of the award, with its own share being approximately 25% of the award.
Industries’ involvement with environmental liabilities arising out of the contamination of the Fox River:
 
109.
NCR has taken the position that, under the terms of a 1998 Settlement Agreement between it, Appvion and Industries, and a 2005 arbitration award, Industries and Appvion generally had a joint and several obligation to bear 60% of the Fox River environmental remediation costs imposed on NCR and of any amounts NCR has to pay in respect of other PRPs’ contribution claims. BAT has not acknowledged any such liability to NCR and has defences to such claims. Further, under the terms of the Funding Agreement (described below), any dispute between Industries and NCR as to the final amount of any NCR claim against Industries in respect of the Fox River (if any) can only be determined at the later of (i) the completion of Fox River remediation works or (ii) the final resolution and exhaustion of all possible appeals in proceedings brought against Sequana, PricewaterhouseCoopers LLP (PwC) and other former advisers.
 
110.
Until May 2012, Appvion and Windward Prospects Limited (Windward) (another former Group subsidiary) had paid a 60% share of the clean-up costs incurred by NCR. Industries was never required to contribute. Around that time, Appvion refused to continue to pay clean-up costs, leading to NCR demanding that Industries pay a 60% share of those costs.
 
111.
Industries commenced proceedings against Windward and Appvion in December 2011 seeking indemnification in respect of any liability it might have to NCR (the English Indemnity Proceedings) pursuant to a 1990 de-merger agreement between those parties.
 
270


Table of Contents
BAT Annual Report and Form 20-F 2021    
 
Strategic Report        
 
Governance Report        
  
Financial Statements        
  
        Other Information        


31 Contingent Liabilities and Financial Commitments
Continued
Funding Agreement of 30 September 2014
 
112.
On 30 September 2014, Industries entered into a Funding Agreement with Windward, Appvion, NCR and BTI 2014 LLC (BTI) (a wholly owned subsidiary of Industries). Pursuant to the Funding Agreement, the English Indemnity Proceedings and a counterclaim Appvion had brought in those proceedings, as well as an NCR-Appvion arbitration concerning Appvion’s indemnity to NCR, were discontinued as part of an overall agreement between the parties providing a framework through which they would together fund the ongoing costs of the Fox River clean-up. Under the agreement, NCR has agreed to accept funding by Industries at the lower level of 50% of the ongoing clean-up related costs of the Fox River (rather than the 60% referenced above). This remains subject to an ability to litigate at a later stage the extent of Industries’ liability (if any) in relation to Fox River clean-up related costs (including in respect of the 50% of costs that Industries has paid under the Funding Agreement to date). In addition, Windward has contributed US$10 million (approximately £7.4 million) of funding and Appvion has contributed US$25 million (approximately £18.5 million) for Fox River and agreed to contribute US$25 million (approximately £18.5 million) for the Kalamazoo River (see further below). Appvion entered Chapter 11 bankruptcy protection on 1 October 2017.
 
113.
The parties also agreed to cooperate in order to maximise recoveries from certain claims made against third parties, including (i) a claim commenced by Windward in the High Court of England & Wales (the High Court) against Sequana and the former Windward directors (the Windward Dividend Claim). That claim was assigned to BTI under the Funding Agreement, and relates to dividend payments made by Windward to Sequana of around
443 million (approximately £372 million) in 2008 and
135 million (approximately £113.4 million) in 2009 (the Dividend Payments) and (ii) a claim commenced by Industries directly against Sequana to recover the value of the Dividend Payments alleging that the dividends were paid for the purpose of putting assets beyond the reach of Windward’s creditors (including Industries) (the BAT section 423 Claim) (together, the Sequana Proceedings).
 
114.
The Windward Dividend Claim and BAT section 423 Claim were heard together in the High Court, with judgment handed down on 11 July 2016. The court upheld the BAT section 423 Claim and, by way of a consequentials judgment dated 10 February 2017, ordered that Sequana pay to BTI an amount up to the full value of the 2009 Dividend plus interest, which equates to around US$185 million (approximately £136.6 million). The Court dismissed the Windward Dividend Claim.
 
115.
The parties pursued cross appeals on the judgment, during which time Sequana was granted a stay in respect of the above payments. That stay was lifted in May 2017, three months after Sequana had entered into an insolvency process in France seeking court protection (the Sauvegarde). On 15 May 2019, the Nanterre Commercial Court made an order placing Sequana into formal liquidation proceedings (
liquidation judiciaire
). To date, Industries has not received any payments from Sequana.
 
116.
On 6 February 2019 the Court of Appeal gave judgment upholding the High Court’s findings, with one immaterial change to the method of calculating the damages awarded. Sequana therefore remains liable to pay approximately US$185 million (approximately £136.6 million). Because of Sequana’s ongoing insolvency process, execution of that judgment is stayed. The Court of Appeal dismissed BTI’s appeal in relation to the Windward Dividend Claim. The Court of Appeal also dismissed Sequana’s application for permission to appeal the High Court’s costs order in favour of Industries. Sequana therefore remains liable to pay around £10 million in costs to Industries.
 
117.
All parties to the appeal sought permission from the Court of Appeal for a further appeal to the UK Supreme Court. On 31 July 2019, BTI was granted permission to appeal to the Supreme Court. On the same day, the Supreme Court refused Sequana permission to appeal. The hearing of BTI’s appeal took place before the UK Supreme Court on 4 and 5 May 2021 and the judgment is awaited.
 
118.
BTI has brought claims against certain of Windward’s former advisers, including Windward’s auditors at the time of the dividend payments, PricewaterhouseCoopers LLP (PwC) (which claims were also assigned to BTI under the Funding Agreement). The claim had been stayed pending the outcome of the Sequana Proceedings. Once that stay was lifted, PwC applied to strike-out BTI’s claim. A hearing of this application took place in October 2019. On 15 November 2019, the court dismissed PwC’s application. The court granted PwC permission to appeal in respect of part of its dismissal of the application and the hearing of that appeal was heard by the Court of Appeal on 27 and 28 October 2020. On 11 January 2021, the Court of Appeal handed down judgment dismissing PwC’s appeal. The Court of Appeal also refused PwC’s application for permission to appeal to the Supreme Court and made an order requiring PwC to file its Defence within two months of 11 January 2021. This deadline was subsequently extended. PwC subsequently applied directly to the Supreme Court for permission to appeal the Court of Appeal’s decision. PwC’s application for permission to appeal to the Supreme Court has yet to be determined. In the meantime, BTI’s claim against PwC is progressing in the High Court. PwC served its Defence on 22 April 2021 and filed it with the Court on 26 April 2021. A Case Management Conference has been listed in a window between 2 March 2022 and 4 March 2022 (inclusive).
 
119.
An agreed stay is in place in respect of BTI’s separate assigned claim against Freshfields Bruckhaus Deringer.
 
120.
The sums Industries has paid under the Funding Agreement are subject to the reservation as set out in paragraph 112 above and ongoing adjustment. Clean-up costs can only be estimated in advance of the work being carried out and certain sums payable are the subject of ongoing U.S. litigation. In 2019, Industries paid £32 million in respect of clean-up costs. In 2020, Industries paid £2 million in respect of clean-up costs. In 2021, Industries paid a further £1.8 million in respect of clean-up costs. Industries is potentially liable for further costs associated with the clean-up. Industries has a provision of £62.3 million which represents the current best estimate of its exposure – see note 24.
 
271 


Table of Contents
BAT Annual Report and Form 20-F 2021
Financial Statements
Notes on Accounts
Continued
    
 
31 Contingent Liabilities and Financial Commitments
Continued
Kalamazoo
 
121.
NCR is also being pursued by Georgia-Pacific, a designated PRP in respect of the Kalamazoo River in Michigan, in relation to remediation costs caused by PCBs released into that river.
 
122.
On 26 September 2013, the Michigan Court held that NCR was liable as a PRP on the basis that it had arranged for the disposal of hazardous material for the purposes of the Comprehensive Environmental Response, Compensation and Liability Act (CERCLA).
 
123.
The second phase of the Kalamazoo trial to determine the apportionment of liability amongst PRPs took place between September and December 2015. On 29 March 2018, Judge Jonker ordered that NCR pay 40% of Georgia-Pacific past costs (around US$22 million (approximately £16.2 million)). The question of future remediation costs was not determined.
 
124.
The parties commenced appeal proceedings against the judgment in July 2018. NCR also agreed an appeal bond with Georgia-Pacific to prevent enforcement of the judgment while it remained subject to appeal.
 
125.
On 11 December 2019, NCR announced that it had entered into a Consent Decree with the U.S. Government and the State of Michigan, pursuant to which it assumed liability for certain remediation work at the Kalamazoo River. This Consent Decree was approved by the District Court for the Western District of Michigan on 2 December 2020. The payments to be made on the face of the Consent Decree in respect of such work total approximately US$245 million (approximately £181 million). The Consent Decree also provides for the withdrawal of NCR’s appeal against Georgia-Pacific, and payment by NCR of the outstanding judgment against it of approximately US$20 million (approximately £14.8 million) to Georgia-Pacific.
 
126.
The quantum of the clean-up costs for the Kalamazoo River is presently unclear. It may well exceed the amounts which are payable on the face of the Consent Decree.
 
127.
It is anticipated that NCR will look to Industries to pay 60% of any sums NCR becomes liable to pay pursuant to the Consent Decree on the basis, it would be asserted, that the river constitutes a ‘Future Site’ for the purposes of the Settlement Agreement. The Funding Agreement described above does not resolve any such claims, but does provide an agreed mechanism pursuant to which any surplus from the valuable recoveries of any third-party claims that remains after all Fox River-related clean-up costs have been paid and Industries and NCR have been made whole may be applied towards Kalamazoo clean-up costs, in the event that NCR were to be successful in any claim for a portion of them from Industries or Appvion (subject to Appvion’s cap, described below). Industries has defences to any claims made by NCR in relation to the Kalamazoo River. No such claims have been made against Industries.
 
128.
Industries also anticipates that NCR may seek to recover from Appvion (subject to a cap of US$25 million (approximately £18.5 million)) for ‘Future Sites’ under the Funding Agreement. The basis of the recovery would be the same as any demand NCR may make on Industries. Appvion entered Chapter 11 bankruptcy protection on 1 October 2017. The effect of the Chapter 11 proceedings on Appvion’s liability for Future Sites payments under the Funding Agreement is currently uncertain.
 
129.
As detailed above, Industries is taking active steps to protect its interests, including seeking to procure the repayment of the Windward dividends, pursuing the other valuable claims that are now within its control, and working with the other parties to the Funding Agreement to maximise recoveries from third parties with a view to ensuring that amounts funded towards clean-up related costs are later recouped under the agreed repayment mechanisms under the Funding Agreement.
Other environmental matters
 
130.
Reynolds American and its subsidiaries are subject to federal, state and local environmental laws and regulations concerning the discharge, storage, handling and disposal of hazardous or toxic substances. Such laws and regulations provide for significant fines, penalties and liabilities, sometimes without regard to whether the owner or operator of the property or facility knew of, or was responsible for, the release or presence of hazardous or toxic substances. In addition, third parties may make claims against owners or operators of properties for personal injuries and property damage associated with releases of hazardous or toxic substances. In the past, RJRT has been named a PRP with third parties under CERCLA with respect to several superfund sites. Reynolds American and its subsidiaries are not aware of any current environmental matters that are expected to have a material adverse effect on the business, results of operations or financial position of Reynolds American or its subsidiaries.
Criminal investigations
 
131.
From time to time, the Group investigates, and becomes aware of governmental authorities’ investigations into, allegations of misconduct against Group companies. The Group cooperates with the authorities’ investigations, where appropriate, including with the DOJ and OFAC in the United States, which are conducting an investigation into suspicions of breach of sanctions.
 
132.
Potential fines, penalties or other consequences cannot currently be assessed. As the investigations are ongoing, it is not possible to identify the timescale in which these matters might be resolved.
 
272


Table of Contents
BAT Annual Report and Form 20-F 2021    
 
Strategic Report        
 
Governance Report        
  
Financial Statements        
  
        Other Information        


31 Contingent Liabilities and Financial Commitments
Continued
Closed litigation matters
 
133.
The following matters on which the Company reported in the contingent liabilities and financial commitments note 27 to the Company’s 2020 financial statements have been dismissed, concluded or resolved as noted below:
 
Matter
  
Jurisdiction
  
Companies named as Defendants
  
Description
  
Disposition
         
Vuse Litigation (Illinois School Districts)
  
U.S.
  
Reynolds American, RJR Vapor, the Company, Lorillard LLC and LOEC Inc.
  
Public Nuisance
  
Voluntary dismissal by plaintiff
         
Brazil Associação de Defesa da Saúde do Fumante class action
  
Brazil
  
Souza Cruz
  
Class action
  
Superior Court of Justice certified decision in favour of defendants
         
UK Serious Fraud Office (SFO) investigation
  
UK
  
The Company, its subsidiaries, and associated persons
  
Investigation
  
SFO’s announcement that the investigation had been closed
         
Perry
  
U.S.
  
Investments
  
Individual case
  
Dormant/closed
         
Antimonopoly Committee of Ukraine
  
Ukraine
  
British American Tobacco Sales & Marketing Ukraine Limited Liability Company
  
Competition investigation
  
Judgment of Supreme Court of Ukraine
General Litigation Conclusion
 
134.
While it is impossible to be certain of the outcome of any particular case or of the amount of any possible adverse verdict, the Group believes that the defences of the Group’s companies to all these various claims are meritorious on both the law and the facts, and a vigorous defence is being made everywhere.
 
135.
As indicated above, on 1 March 2019 the Quebec Court of Appeal released its appeal judgment. The trial judgment was largely upheld by a unanimous decision of the five-member panel including the requirement that the defendants deposit the initial deposits in their solicitors’ trust accounts within 60 days. This is the only executory aspect of the judgment. In these circumstances we are of the view that it is more likely than not that there will be an outlay and it is reasonably estimable at CAD $758 million (approximately £443 million), the amount of the initial deposit paid into court. If further adverse judgments are entered against any of the Group’s companies in any case, avenues of appeal will be pursued. Such appeals could require the appellants to post appeal bonds or substitute security (as has been necessary in Quebec) in amounts which could in some cases equal or exceed the amount of the judgment. At least in the aggregate, and despite the quality of defences available to the Group, it is not impossible that the Group’s results of operations or cash flows in any particular period could be materially adversely affected by the impact of a significant increase in litigation, difficulties in obtaining the bonding required to stay execution of judgments on appeal, or any final outcome of any particular litigation.
 
136.
Having regard to all these matters, with the exception of the Quebec Class Actions, Fox River and certain
Engle
progeny cases identified above, the Group does not consider it appropriate to make any provision in respect of any pending litigation because the likelihood of any resulting material loss, on an individual case basis, is not considered probable and/or the amount of any such loss cannot be reasonably estimated. Notwithstanding the negative decision in the Quebec Class Actions, the Group does not believe that the ultimate outcome of this litigation will significantly impair the Group’s financial condition. If the facts and circumstances change and result in further unfavourable outcomes in the pending litigation, then there could be a material impact on the financial statements of the Group.
Other contingencies
 
137.
JTI Indemnities.
By a purchase agreement dated 9 March 1999, amended and restated as of 11 May 1999, referred to as the 1999 Purchase Agreement, R.J. Reynolds Tobacco Holdings, Inc. (RJR) and RJRT sold their international tobacco business to JTI. Under the 1999 Purchase Agreement, RJR and RJRT retained certain liabilities relating to the international tobacco business sold to JTI, and agreed to indemnify JTI against: (i) any liabilities, costs and expenses arising out of the imposition or assessment of any tax with respect to the international tobacco business arising prior to the sale, other than as reflected on the closing balance sheet; (ii) any liabilities, costs and expenses that JTI or any of its affiliates, including the acquired entities, may incur after the sale with respect to any of RJR’s or RJRT’s employee benefit and welfare plans; and (iii) any liabilities, costs and expenses incurred by JTI or any of its affiliates arising out of certain activities of Northern Brands.
 
138.
RJRT has received claims for indemnification from JTI, and several of these have been resolved. Although RJR and RJRT recognise that, under certain circumstances, they may have other unresolved indemnification obligations to JTI under the 1999 Purchase Agreement, RJR and RJRT disagree what circumstances described in such claims give rise to any indemnification obligations by RJR and RJRT and the nature and extent of any such obligation. RJR and RJRT have conveyed their position to JTI, and the parties have agreed to resolve their differences at a later date.
 
273


Table of Contents
BAT Annual Report and Form 20-F 2021
Financial Statements
Notes on Accounts
Continued
    
 
31 Contingent Liabilities and Financial Commitments
Continued
139.
ITG Indemnity.
In the Divestiture, Reynolds American agreed to defend and indemnify, subject to certain conditions and limitations, ITG in connection with claims relating to the purchase or use of one or more of the Winston, Kool, Salem or Maverick cigarette brands on or before 12 June 2015, as well as in actions filed before 13 June 2023, relating to the purchase or use of one or more of the Winston, Kool, Salem or Maverick cigarette brands. In the purchase agreement relating to the Divestiture, ITG agreed to defend and indemnify, subject to certain conditions and limitations, Reynolds American and its affiliates in connection with claims relating to the purchase or use of ‘blu’ brand e-cigarettes. ITG also agreed to defend and indemnify, subject to certain conditions and limitations, Reynolds American and its affiliates in actions filed after 12 June 2023, relating to the purchase or use of one or more of the Winston, Kool, Salem or Maverick cigarette brands after 12 June 2015. ITG has tendered a number of actions to Reynolds American under the terms of this indemnity, and Reynolds American has, subject to a reservation of rights, agreed to defend and indemnify ITG pursuant to the terms of the indemnity. Reynolds American has tendered an action to ITG under the terms of this indemnity, and ITG has, subject to a reservation of rights, agreed to defend and indemnify Reynolds American and its affiliates pursuant to the terms of the indemnity. These claims are substantially similar in nature and extent to claims asserted directly against RJRT in similar actions.
 
140.
Loews Indemnity.
In 2008, Loews Corporation (Loews), entered into an agreement with Lorillard Inc., Lorillard Tobacco, and certain of their affiliates, which agreement is referred to as the ‘Separation Agreement’. In the Separation Agreement, Lorillard agreed to indemnify Loews and its officers, directors, employees and agents against all costs and expenses arising out of third-party claims (including, without limitation, attorneys’ fees, interest, penalties and costs of investigation or preparation of defence), judgments, fines, losses, claims, damages, liabilities, taxes, demands, assessments, and amounts paid in settlement based on, arising out of or resulting from, among other things, Loews’ ownership of or the operation of Lorillard and its assets and properties, and its operation or conduct of its businesses at any time prior to or following the separation of Lorillard and Loews (including with respect to any product liability claims). Loews is a defendant in three pending product liability actions, each of which is a putative class action. Pursuant to the Separation Agreement, Lorillard is required to indemnify Loews for the amount of any losses and any legal or other fees with respect to such cases. Following the closing of the Lorillard merger, RJRT assumed Lorillard’s obligations under the Separation Agreement as was required under the Separation Agreement.
 
141.
SFRTI Indemnity.
In connection with the 13 January 2016 sale by Reynolds American of the international rights to the Natural American Spirit brand name and associated trademarks, along with SFR Tobacco International GmbH (SFRTI) and other international companies that distributed and marketed the brand outside the United States, to JT International Holding BV (JTI Holding), each of SFNTC, R. J. Reynolds Global Products, Inc., and R. J. Reynolds Tobacco B.V. agreed to indemnify JTI Holding against, among other things, any liabilities, costs, and expenses relating to actions (i) commenced on or
  
before (a) 13 January 2019, to the extent relating to alleged personal injuries, and (b) in all other cases, 13 January 2021; (ii) brought by (a) a governmental authority to enforce legislation implementing European Union Directive 2001/37/EC or European Directive 2014/40/EU or (b) consumers or a consumer association; and (iii) arising out of any statement or claim (a) made on or before 13 January 2016, (b) by any company sold to JTI Holding in the transaction, (c) concerning Natural American Spirit brand products consumed or intended to be consumed outside of the United States and (d) that the Natural American Spirit brand product is natural, organic, or additive-free. Under the terms of this indemnity, JTI has requested indemnification from Santa Fe Natural Tobacco Company Germany GmbH (SFNTCG) in connection with an audit of SFNTCG relating to transfer pricing for the tax years 2007 to 2010 and 2012 to 2015. SFNTCG contests the audit results. The amount in dispute is approximately
21 million plus interest (approximately £17.6 million).
 
142.
Indemnification of Distributors and Retailers. RJRT, Lorillard Tobacco, SFNTC, American Snuff Co. and RJR Vapor have entered into agreements to indemnify certain distributors and retailers from liability and related defence costs arising out of the sale or distribution of their products. Additionally, SFNTC has entered into an agreement to indemnify a supplier from liability and related defence costs arising out of the sale or use of SFNTC’s products. The cost has been, and is expected to be, insignificant. RJRT, SFNTC, American Snuff Co. and RJR Vapor believe that the indemnified claims are substantially similar in nature and extent to the claims that they are already exposed to by virtue of their having manufactured those products.
 
143.
Except as otherwise noted above, Reynolds American is not able to estimate the maximum potential of future payments, if any, related to these indemnification obligations.
 
144.
Competition Investigations. There are instances where Group companies are cooperating with relevant national competition authorities in relation to ongoing competition law investigations and/or engaged in legal proceedings at the appellate level, including (amongst others) in the Netherlands.
Tax disputes
The Group has exposures in respect of the payment or recovery of a number of taxes. The Group is and has been subject to a number of tax audits covering, amongst others, excise tax, value added taxes, sales taxes, corporate taxes, withholding taxes and payroll taxes.
The estimated costs of known tax obligations have been provided in these accounts in accordance with the Group’s accounting policies. In some countries, tax law requires that full or part payment of disputed tax assessments be made pending resolution of the dispute. To the extent that such payments exceed the estimated obligation, they would not be recognised as an expense. While the amounts that may be payable or receivable in relation to tax disputes could be material to the results or cash flows of the Group in the period in which they are recognised, the Board does not expect these amounts to have a material effect on the Group’s financial condition.
 
274 


Table of Contents
BAT Annual Report and Form 20-F 2021    
 
Strategic Report        
 
Governance Report        
  
Financial Statements        
  
        Other Information        


31 Contingent Liabilities and Financial Commitments
Continued
The following matters are in or may proceed to litigation:
Corporate taxes
Brazil
The Brazilian Federal Tax Authority has filed claims against Souza Cruz seeking to reassess the profits of overseas subsidiaries to corporate income tax and social contribution tax. The reassessments are for the years 2004 until and including 2012 for a total amount of BRL1,813 million (£240 million) to cover tax, interest and penalties.
Souza Cruz appealed all reassessments. Regarding the first assessments (2004-2006), Souza Cruz’s appeals were rejected by the ultimate Administrative Court after which Souza Cruz filed two lawsuits with the Judicial Court to appeal the reassessments. The judgment in respect of the reassessment of corporate income tax has been decided in favour of Souza Cruz by the first level of the Judicial Court and Souza Cruz is waiting to see whether the Brazilian Tax Authorities will appeal the judgment. The lawsuit appealing the social contribution tax is pending judgment in the first level of the Judicial Court. The appeal against the second assessments (2007 and 2008) was upheld at the second tier tribunal and was closed. In 2015, a further reassessment for the same period (2007 and 2008) was raised after the five-year statute of limitation which has been appealed against.
Souza Cruz received further reassessments in 2014 for the 2009 calendar year and in 2015 an assessment for the 2010 calendar year. Souza Cruz appealed both the reassessments in full. In December 2016, assessments were received for the calendar years 2011 and 2012 which have also been appealed.
Netherlands
The Dutch tax authority has issued a number of assessments on various issues across the years 2003-2016 in relation to various intra-group transactions. The assessments amount to an aggregate net liability across these periods of £1,146 million covering tax, interest and penalties. The Group has appealed against the assessments in full.
The Group believes that its companies have meritorious defences in law and fact in each of the above matters and intends to pursue each dispute through the judicial system as necessary. The Group does not consider it appropriate to make provision for these amounts nor for any potential further amounts which may be assessed in relation to these matters in subsequent years.
Indirect and other taxes
Bangladesh
On 25 July 2018, the Appellate Division of the Supreme Court of Bangladesh has reversed the decision of the High Court Division against British American Tobacco Bangladesh Company Limited (BATB) in respect of the retrospective demands for VAT and Supplementary Duty amounting to approximately £154 million. On 3 February 2020, the certified Court Order was received. The Government filed a Review Petition on 25 March 2020 in the Appellate Division of the Supreme Court of Bangladesh against the judgment. On 9 December 2021, the review petitions were heard and the Appellate Division of the Supreme Court of Bangladesh dismissed the review petitions filed by the National Board of Revenue (NBR) which resulted in BATB wining the cases against the NBR.
In addition, in 2017, NBR passed a discriminatory special order fixing BDT 27 for local brands and BDT 35 for foreign brand cigarettes. After NBR passed the special order, it was highlighted to the Government that it was against the principles of foreign direct investment and against WTO practice. Subsequently, the Finance Minister directed that no action should be taken in this regard until the different issues raised were finalised. Later in 2018, the special order itself was repealed. AKTC (a local Bangladeshi tobacco manufacturer) filed a case against NBR to get a direction from the Court to implement the special order and reserve low segment for local industries. The judgment in the AKTC case was passed by the High Court Division verbally on 21 September 2020. The judgment revived the discriminatory regime of VAT and Supplementary Duty (SD) between local and international/imported brands for the fiscal year 2017 – 2018. In light of the judgment, the Large Taxpayers’ Unit (LTU) of National Board of Revenue by a notice asked BATB to show cause as to why BATB believed it should not be liable to pay £210 million as unpaid VAT and SD. Challenging the judgment, BATB filed and moved an appeal (known as the Civil Miscellaneous Petition for Leave to Appeal) before the Appellate Division of the Supreme Court of Bangladesh. On a preliminary hearing on 4 October 2020, the Appellate Division Judge in Chamber stayed operation of the judgment for eight weeks as an interim measure.
Since the judgment has been stayed, the operation of the show cause notice shall also be deemed to have been stayed. BATB has formally notified LTU of this on 12 October 2020. In the meantime, the judgment will remain stayed.
On 20 December 2020, BATB filed a Civil Petition for Leave to Appeal as directed by the Appellate Division Judge in Chamber. The judgment passed by the High Court Division will continue to remain stayed while the appeal remains pending at the Appellate Division of the Supreme Court of Bangladesh. So far, the appeal has not been listed for hearing.
Egypt
British American Tobacco Egypt LLC (BAT Egypt) is subject to two ongoing civil cases concerning the imposition of sales tax on low-price category brands brought by the Egyptian tax authority for £88 million. Management believes that the tax claims are unfounded and has appealed the tax claims. These cases are under review by the Council of State. During hearings in August 2020, the courts decided, in both cases, to transfer the files to court appointed experts. One case (pertaining to the period from May 2008 to February 2009) was referred to a court-appointed expert who filed a report in January 2022. A hearing date has not yet been set. In the other case (pertaining to the period from March 2009 to June 2010), the expert has concluded his report and filed it with the court. In May 2021, a judgment was issued which acquitted BAT Egypt from all amounts related only to the period from March 2009 to October 2009. An appeal has been submitted to the Supreme Administrative Court to extend the acquittal to the rest of the disputed period. The appeal process is expected to take approximately two years.
 
275


Table of Contents
BAT Annual Report and Form 20-F 2021
Financial Statements
Notes on Accounts
Continued
    
 
31 Contingent Liabilities and Financial Commitments
Continued
South Korea
In 2016, the Board of Audit and Inspection of Korea (BAI) concluded its tax assessment in relation to the 2014 year-end tobacco inventory, and imposed additional national excise, local excise, VAT taxes and penalties. This resulted in the recognition of a KRW 80.7 billion (approximately £50 million) charge by Group subsidiaries, BAT Korea Ltd., Rothmans Far East B.V. Korea Branch Office and BAT Korea Manufacturing Ltd. Management deems the tax and penalties to be unfounded and has appealed to the tax tribunal against the assessment. On grounds of materiality and the likelihood of the tax and penalties being reversed in future, the Group classified the tax and penalties charge as an adjusting item in 2016.
On 23 August 2019, the trial court ruled in favour of Rothmans Far East B.V. Korea Branch Office on KRW 6.7 billion (approximately £4 million), the VAT portion of the assessment; appeals on the other elements of the assessment are still pending at Appeals Court. The Korean government appealed the ruling on 16 September 2019. On 16 April 2021 the Court of Appeals affirmed the ruling of the Trial Court. The government immediately appealed to the Supreme Court and the Supreme Court also affirmed the ruling of the Appeals Court on 26 August 2021. On 16 September 2021, Rothmans Far East B.V. Korea Branch Office duly received the amount litigated (VAT portion) including statutory interests (note 6).
Turkey
In Turkey, British American Tobacco Tutun Mamulleri Sanayi ve Ticaret Anonim Sirketi (BAT Tutun) was subject to a series of tax audits mainly on inventory movements for the years 2015, 2016 and 2019. The final audit reports sought retrospective payment of additional tax with interest and penalties mostly based on alleged illegitimate intra-group forestalling relating to finished goods giving rise to further excise tax. In 2020 and 2021, BAT Tutun received a total tax assessment amounting to TRY
 2.7
billion (approximately
£151
million), of which, TRY
 2.1
billion (approximately
£120
million) related to tax and penalties and TR
Y
 0.6 billion (approximately £31 million) related to late payment interest. In August 2021, BAT Tutun applied under the relevant tax amnesty law to settle its retrospective tax assessments. Based on the settlement through the tax amnesty procedure, BAT Tutun agreed to pay £47 million in 18 instalments from 1 November 2021 until 31 July 2024.
Brazil
On 15 March 2017, the Brazilian Supreme Court ruled that for all taxpayers VAT (ICMS) should not be included in the calculation of social contribution taxes (PIS/Cofins) which are levied based on revenue. On 13 May 2021, the Supreme Court modulated the effects of the first decision handed down in 2017, stating that the taxpayers who filed a lawsuit by 15 March 2017 will be able to recover credits from the past five years.
The Group’s Brazilian subsidiary, Souza Cruz, had filed an individual lawsuit to establish that it had overpaid taxes to the government. Based on favourable court decisions in 2020 and 2019 the Group has recognised £5 million in 2021 (2020: £58 million; 2019: £86 million) in other income representing management’s best estimate of the amounts likely to be recovered at this time with the potential for further amounts in future periods.
If the ruling were to be enacted retrospectively for a period of five years, the potential asset is estimated to be around £480 million. During 2021, £130 million of the unrecognised contingent asset was sold to financial institutions for £45 million.
Commitments in relation to service contracts, non-capitalised leases
The total future minimum payments under non-cancellable service contracts based on when payments fall due:
 
     
2021
£m
    
2020
£m
 
     
Service contracts
                 
     
Within one year
  
 
        41


        63
 
     
Between one and five years
  
 
81


17
 
     
Beyond five years
  
 
5


6


127


86
 
Financial commitments arising from short-term leases and leases of low-value assets that are not capitalised under IFRS 16
Leases
are £7 million (2020: £6 million) for property and £19 million (2020: £3 million) for plant, equipment and other assets.
 
276


Table of Contents
BAT Annual Report and Form 20-F 2021    
 
Strategic Report        
 
Governance Report        
  
Financial Statements        
  
        Other Information        


32 Interests in Subsidiaries
Subsidiaries with material non-controlling interests
Until 2020, non-controlling interests principally arise from the Group’s listed investment in Malaysia (British American Tobacco (Malaysia) Berhad). But due to difficult trading conditions, as mentioned in note 12, the non-controlling interest in Malaysia is no longer material to the Group and is not disclosed anymore.
In 2021, non-controlling interests principally arise from the Group’s listed investment in Bangladesh (British American Tobacco Bangladesh Company Limited) where the Group held 72.91% in 2021, 2020 and 2019. Summarised financial information for Bangladesh is shown below as required by IFRS 12
Disclosure of interest in other entities.
No adjustments have been made to the information below for the elimination of intercompany transactions and balances with the rest of the Group.
 
Summarised financial information
  
2021
£m
   
2020
£m
   
2019
£m
 
       
Revenue
  
 
640


553


        527
 
       
Profit for the year
  
 
    127


        101


86
 
       
– Attributable to non-controlling interests
  
 
34


27


23
 
       
Total comprehensive income
  
 
127


91


70
 
       
– Attributable to non-controlling interests
  
 
34


25


19
 
       
Dividends paid to non-controlling interests
  
 
(28
 
 
(31
 
 
(8
       
Summary net assets:
                        
       
Non-current assets
  
 
303


271


287
 
       
Current assets
  
 
345


271


241
 
       
Non-current liabilities
  
 
70


58


65
 
       
Current liabilities
  
 
262


190


144
 
       
Total equity at the end of the year
  
 
316


294


319
 
       
– Attributable to non-controlling interests
  
 
86


80


86
 
       
Net cash generated from operating activities
  
 
52


137


140
 
       
Net cash used in investing activities
  
 
(26
 
 
(11
 
 
(51
       
Net cash used in financing activities
  
 
(55
 
 
(111
 
 
(75
       
Differences on exchange


(1
 
 
(1
       
(Decrease)/increase in net cash and cash equivalents
  
 
(29
 
 
14


13
 
       
Net cash and cash equivalents at 1 January
  
 
30


16


3
 
       
Net cash and cash equivalents at 31 December
  
 
1


30


16
 
Subsidiaries subject to restrictions:
As a result of the Group’s Canadian subsidiary, Imperial Tobacco Canada (ITCAN), entering CCAA protection, the assets of ITCAN are subject to restrictions. The table below summarises the assets and liabilities of ITCAN:
 
Summarised financial information
  
2021
£m
   
2020
£m
 
     
Non-current assets
  
 
2,403


    2,354
 
     
Current assets
  
 
1,630


1,251
 
     
Non-current liabilities
  
 
(109
 
 
(132
     
Current liabilities
  
 
(479
 
 
(528


3,445


2,945
 
Under the terms of CCAA, the court has appointed FTI Consulting Canada Inc. to act as a monitor. This monitor has no operational input and is not involved in the management of the business. The Group considers that ITCAN continues to meet the requirements of IFRS 10
Consolidated Financial Statements,
and, until such requirements are not met, the Group will continue to consolidate the results of ITCAN.
 
277 


Table of Contents
BAT Annual Report and Form 20-F 2021
Financial Statements
Notes on Accounts
Continued
    
 
32 Interests in Subsidiaries
Continued
Whilst the Group continues to control the operations of its Canadian subsidiary, there are restrictions over the ability to access or use certain assets including the ability to remit dividends. Included in non-current assets for 2021 and 2020 is goodwill of £2.3 billion subject to impairment reviews (note 12). Included in current liabilities are trade and other payables of £341 million (2020: £284 million), the majority of which are amounts payable in respect of duties and excise. A breakdown of current assets has been provided below.
 
     
2021
£m
    
2020
£m
 
     
Cash and cash equivalents *
  
 
1,114


        992
 
     
Inventory
  
 
126


114
 
     
Investments held at fair value
  
 
351


115
 
     
Other
  
 
39


30


1,630


1,251
 
 
*
Cash and cash equivalents above include £1,024 million (2020: £878 million) of restricted cash and cash equivalents. The Group defines restricted cash and cash equivalents as where there are significant restrictions on its ability to access or use the assets and settle the liabilities of the Group, but excludes cash and cash equivalents where there are also outstanding local currency borrowings or where there is an outstanding excise liability. In addition, dividends payable would also be excluded from restricted cash and cash equivalents if the dividend has been approved by the necessary regulatory channels.
Refer to note 31 for information on the Quebec Class Actions.
Other shareholdings
At 31 December 2021, the Group holds almost 100% (2020: 92%) of the equity shares of PT Bentoel Internasional Investama Tbk (Bentoel). In 2011, the Group sold 984 million shares, representing approximately 14% of Bentoel’s share capital, for the purposes of fulfilling certain obligations pursuant to Bapepam LK (Indonesia) takeover regulations. The Group simultaneously entered into a total return swap on 971 million of the shares. In June 2016, the Group and other investors participated in a rights issue by Bentoel, with the Group increasing its stake in Bentoel to 92%. Simultaneously, the Group amended the total return swap to take account of an additional 1,684 million shares with the shares subject to the total return swap representing 7% of Bentoel’s issued capital. While the Group did not have legal ownership of these shares, it retained the risks and rewards associated with them which resulted in the Group continuing to recognise an effective interest in 99% of Bentoel’s net assets and results. As explained in note 30, on 5 October 2021, Bentoel announced its intention to delist from the Indonesia Stock Exchange and go private by conducting a Voluntary Tender Offer (VTO). As part of this process, the Group terminated the total return swap, with legal ownership of the shares being reacquired by the Group. The process is on-going and is expected to conclude in the early part of 2022, with no material impact to the Group.
Refer to note 14 for information on the Group’s 42% investment in Tisak d.d.
33 Summarised Financial Information
The following summarised financial information is required by the rules of the Securities and Exchange Commission and has been prepared as a requirement of the Regulation S-X 3-10 in respect of the guarantees of:
The financial information relates to the guarantees of:
 
 
US$12.35 billion of outstanding bonds issued by B.A.T Capital Corporation (BATCAP) in connection with the acquisition of Reynolds American Inc. (Reynolds American), including registered bonds issued in exchange for the initially issued bonds (the 2017 Bonds);
 
 
US$10.65 billion of outstanding bonds issued by BATCAP pursuant to the Shelf Registration Statement on Form F-3 filed on July 17, 2019, pursuant to which BATCAP or BATIF may issue an indefinite amount of debt securities; and
 
 
US$1.50 billion of outstanding bonds issued by BATIF pursuant to the Shelf Registration Statement on Form F-3 filed on July 17, 2019, pursuant to which BATCAP or BATIF may issue an indefinite amount of debt securities.
As of July 28, 2020, all relevant Group entities suspended their reporting obligations with respect to the US$7.7 billion (2020: US$7.7 billion) of Reynolds American unsecured notes and US$40.9 million (2020: US$40.9 million) of Lorillard unsecured notes. As such, no summarised financial information is provided with respect to these securities.
As described below, Reynolds American is a subsidiary guarantor of all outstanding series of BATCAP and BATIF bonds. Under the terms of the indentures governing such notes, any subsidiary guarantor (including Reynolds American) other than BATCAP or BATIF, as applicable, BATNF and BATHTN, will automatically and unconditionally be released from all obligations under its guarantee, and such guarantee shall thereupon terminate and be discharged and of no further force or effect, in the event that (1) its guarantee of all then outstanding notes issued under the Group’s EMTN Programme is released or (2) at substantially the same time its guarantee of the debt securities is terminated, such subsidiary guarantor is released from all obligations in respect of indebtedness for borrowed money for which such subsidiary guarantor is an obligor (as a guarantor or borrower). Under the EMTN Programme, Reynolds American’s guarantee is released if at any time the aggregate amount of indebtedness for borrowed money, subject to certain exceptions, for which Reynolds American is an obligor does not exceed 10% of the outstanding long-term debt of BAT as reflected in the balance sheet included in BAT’s most recent publicly released interim or annual consolidated financial statements.
 
278 


Table of Contents
BAT Annual Report and Form 20-F 2021    
 
Strategic Report        
 
Governance Report        
  
Financial Statements        
  
        Other Information        


33 Summarised Financial Information
Continued
Reynolds American’s guarantee may be released notwithstanding Reynolds American guaranteeing other indebtedness, provided Reynolds American’s guarantee of outstanding notes issued under the EMTN Programme is released. If Reynolds American’s guarantee is released, BAT is not required to replace such guarantee, and the debt securities will have the benefit of fewer subsidiary guarantees for the remaining maturity of the debt securities.
Note: The following summarised financial information report the unconsolidated contribution of each applicable company to the Group’s consolidated results and not the separate financial statements for each applicable company as local financial statements are prepared in accordance with local legislative requirements and may differ from the financial information provided below. In particular, in respect of the U.S. region, all financial statements and financial information provided by or with respect to the U.S. business or RAI (and/or RAI and its subsidiaries (collectively, the Reynolds Group)) are prepared on the basis of US GAAP and constitute the primary financial statements or financial information of the U.S. business or RAI (and/or the Reynolds Group). Solely for the purpose of consolidation within the results of BAT p.l.c. and the BAT Group, this financial information is then converted to IFRS. To the extent any such financial information provided in these financial statements relates to the U.S. business or RAI (and/or the Reynolds Group), it is provided as an explanation of the U.S. business’s or RAI’s (and/or the Reynolds Group’s) primary US GAAP based financial statements and information.
The subsidiaries disclosed below are wholly-owned and the guarantees provided are full and unconditional, and joint and several:
 
 
a.
British American Tobacco p.l.c. (as the parent guarantor), referred to as ‘BAT p.l.c.’ in the financials below;
 
 
b.
B.A.T Capital Corporation (as an issuer or a subsidiary guarantor, as the case may be), referred to as ‘BATCAP’ in the financials below;
 
 
c.
B.A.T. International Finance p.l.c. (as an issuer or a subsidiary guarantor, as the case may be), referred to as ‘BATIF’ in the financials below;
 
 
d.
B.A.T. Netherlands Finance B.V. (as a subsidiary guarantor), referred to as ‘BATNF’ in the financials below;
 
 
e.
Reynolds American Inc. (as a subsidiary guarantor), referred to as ‘RAI’ in the financials below; and
 
 
f.
British American Tobacco Holdings (The Netherlands) B.V. (as a subsidiary guarantor of the 2017 Bonds only), referred to as ‘BATHTN’ in the financials below.
In accordance with Regulation S-X 13-01, information in respect of investments in subsidiaries that are not issuers or guarantors has been excluded from non-current assets as shown in the balance sheet table below. The ‘BATHTN’ column in the summarised financial information is only applicable in the context of the 2017 Bonds. British American Tobacco Holdings (The Netherlands) B.V. (BATHTN) is not an issuer nor guarantor of any of the other securities referenced in this note. None of the issuers or other guarantors has material balances with or an investment in BATHTN. Investments in subsidiaries represents share capital acquired in relation to or issued by subsidiary undertakings.


Summarised Financial Information
 
             
Year ended 31 December 2021
  
    BAT p.l.c.
£m
   
      BATCAP
£m
   
          BATIF
£m
    
      BATNF
£m
   
        RAI
£m
    
  BATHTN
£m
 
             
Income Statement
                                                  
             
Revenue


(Loss)/profit from operations
  
 
(111
 
 
(1
 
 
(2


3


Dividend income
  
 
6,200


4,827


164
 
             
Net finance income/(costs)
  
 
170


(43
 
 
63


1


(421


Profit/(loss) before taxation
  
 
6,259


(44
 
 
61


1


      4,409


164
 
             
Taxation on ordinary activities
  
 
5


19


1


97


Profit/(loss) for the year
  
 
6,264


(25
 
 
62


1


4,506


164
 
             
Intercompany Transactions – Income Statement
                                                  
             
Transactions with non-issuer/non-guarantor subsidiaries (expense)/income
  
 
(111
 
 
(1
 
 
(2


36


Transactions with non-issuer/non-guarantor subsidiaries net finance (cost)/income
  
 
(2
 
 
709


370


28


Dividend income from non-issuer/non-guarantor subsidiaries
  
 
6,200


4,827


164
 
 
279 


Table of Contents
BAT Annual Report and Form 20-F 2021
Financial Statements
Notes on Accounts
Continued
    
 
33 Summarised Financial Information
Continued


Summarised Financial Information
 
             
Year ended 31 December 2020
  
        BAT p.l.c.
£m
   
      BATCAP
£m
   
      BATIF
£m
    
BATNF
£m
   
RAI
£m
    
    BATHTN
£m
 
             
Income Statement
                                                  
             
Revenue


Loss from operations
  
 
(112
 
 
(1
 
 
(2


(5


Dividend income
  
 
5,050


4,845


224
 
             
Net finance income/(costs)
  
 
131


417


174


(758
  
 
1
 
             
Profit before taxation
  
 
5,069


416


172


4,082


225
 
             
Taxation on ordinary activities
  
 
(14
 
 
(101
 
 
4


170


Profit for the year
  
 
5,055


315


176


4,252


225
 
             
Intercompany Transactions – Income Statement
                                                  
             
Transactions with non-issuer/non-guarantor subsidiaries (expense)/income
  
 
(118
 
 
(1
 
 
4


22


Transactions with non-issuer/non-guarantor subsidiaries net finance income
  
 
5


996


747


32


Dividend income from non-issuer/non-guarantor subsidiaries
  
 
5,050


      –


          –


      –


      4,845


224


Summarised Financial Information
 
             
As at 31 December 2021
  
        BAT p.l.c.
£m
    
BATCAP
£m
   
BATIF
£m
    
BATNF
£m
   
RAI
£m
    
BATHTN
£m
 
             
Balance Sheet
                                                   
             
Non-current assets
  
 
1,916


    18,192


4,986


1,417


357


75
 
             
Current assets
  
 
8,443


3,583


      35,772


21


1,033


19
 
             
Non-current liabilities
  
 
9


17,024


13,667


1,417


8,778


19
 
             
Non-current borrowings


16,965


13,560


1,417


8,719


Other non-current liabilities
  
 
9


59


107


59


19
 
             
Current liabilities
  
 
1,607


4,633


25,451


20


882


10
 
             
Current borrowings
  
 
1,580


4,602


25,081


20


263


10
 
             
Other current liabilities
  
 
27


31


370


619


Intercompany Transactions – Balance Sheet
                                                   
             
Amounts due from non-issuer/non-guarantor subsidiaries
  
 
8,405


14,999


38,539


1,360


19
 
             
Amounts due to non-issuer/non-guarantor subsidiaries


3,006


20,422


48


9
 
             
Investment in subsidiaries (that are not issuers or guarantors)
  
 
27,234


718


      23,643


1,488


Summarised Financial Information
 
             
As at 31 December 2020
  
        BAT p.l.c
£m.
    
BATCAP
£m
   
BATIF
£m
    
BATNF
£m
   
RAI
£m
    
BATHTN
£m
 
             
Balance Sheet
                                                   
             
Non-current assets
  
 
236


    18,991


      10,332


1,509


402


26
 
             
Current assets
  
 
7,070


3,404


30,601


22


268


15
 
             
Non-current liabilities
  
 
1,580


17,867


15,326


1,509


8,885


6
 
             
Non-current borrowings
  
 
1,571


17,867


15,243


1,509


8,823


Other non-current liabilities
  
 
9


83


62


6
 
             
Current liabilities
  
 
52


4,444


24,038


22


972


2
 
             
Current borrowings
  
 
9


4,329


23,478


22


200


1
 
             
Other current liabilities
  
 
43


115


560


772


1
 
             
Intercompany Transactions – Balance Sheet
                                                   
             
Amounts due from non-issuer/non-guarantor subsidiaries
  
 
7,031


16,088


38,761


620


15
 
             
Amounts due to non-issuer/non-guarantor subsidiaries
  
 
3


3,139


19,550


62


1
 
             
Investment in subsidiaries (that are not issuers or guarantors)
  
 
27,234


718


      23,820


1,580
 
 
280


Table of Contents
BAT Annual Report and Form 20-F 2021    
 
Strategic Report        
 
Governance Report        
  
Financial Statements        
  
        Other Information        


33 Summarised Financial Information
Continued
Perpetual hybrid bonds
BAT p.l.c. has issued two
1 billion of perpetual hybrid bonds which have been classified as equity as there is no contractual obligation to either repay the principal or make payments of interest (note 22(d)).
BAT p.l.c.’s unconsolidated contribution to the Group’s consolidated equity results is shown below:
BAT p.l.c.
 
As at 31 December
  
2021
£m
    
2020
£m
 
     
Total equity
  
 
35,977


        32,908
 
     
Share capital
  
 
614


614
 
     
Share premium
  
 
107


103
 
     
Perpetual hybrid bonds
  
 
1,685


Other equity
  
 
33,571


32,191
 
 
281


Table of Contents
BAT Annual Report and Form 20-F 2021
Financial Statements
Group Companies and Undertakings


This disclosure is made in accordance with Section 409 of the Companies Act 2006 and The Large and
Medium-sized
Companies and Groups (Accounts and Reports) Regulations 2008, as amended by The Companies, Partnerships and Groups (Accounts and Reports) Regulations 2015. A full list of subsidiary undertakings, associates and joint ventures and joint operations as defined by IFRS (showing the country of incorporation, effective percentage of equity shares held and full registered office addresses) as at 31 December 2021 is disclosed below.
The subsidiary undertakings that are held directly by British American Tobacco p.l.c. (the ultimate Parent Company) are indicated thus*; all others are held by
sub-holding
companies.
Unless otherwise stated, the equity shares held are in the form of ordinary shares or common stock, except for those indicated thus
#
, which include preference shares. The effective percentage of equity shares held in subsidiary undertakings is 100% unless otherwise stated. Further, where the effective percentage of equity shares held by the
sub-holding
company is different from that held by British American Tobacco p.l.c., the percentage of equity shares held by British American Tobacco p.l.c. is indicated thus^ and is shown after the percentage interest held by the
sub-holding
company.
The results of a number of these subsidiary undertakings principally affect the financial statements of the Group. These principal subsidiary undertakings are highlighted in grey and are considered to be the main corporate entities in those countries which, in aggregate, contributed 89% of the Group revenue and 100% of profit from operations.
Subsidiary Undertakings
 
Albania
Rruga e Kavajes, Ish Kombinati Ushqimor, Tirana, Albania
British American Tobacco – Albania SH.P.K.
Algeria
Zone d’activité El Omran, Route de Ouled Fayet, Ilot
789-
Lot 04,
Cheraga, Alger, Algerié
British American Tobacco (Algérie) S.P.A. (51%)
Angola
Viana Park, Polo Industrial, Viana, Luanda, Angola
British American Tobacco – B.A.T. Angola, Limitada
1
Sociedade Geral de Distribuição e Comércio, Limitada
Sociedade Industrial Tabacos Angola LDA (77.60%)
Sociedade Unificada Tabacos Angola LDA (76.39%)
Argentina
San Martín 140, Floor 14, City of Buenos Aires, Argentina
BAT Operaciones S.A.U.
British American Tobacco Argentina S.A.I.C.y F. (99.98%)
Australia
166 William Street, Woolloomooloo, NSW 2011, Australia
British American Tobacco South East Asia Pty Limited
British American Tobacco Australasia Limited
British American Tobacco Australia Limited
British American Tobacco Australia Overseas Pty Limited
British American Tobacco Australia Services Limited
Rothmans Asia Pacific Limited
#
The Benson & Hedges Company Pty. Limited
W.D. & H.O. Wills Holdings Limited
Austria
Dr. Karl Lueger Platz 5, 1010, Wien, Austria
British American Tobacco (Austria) GmbH
Bahrain
Flat 2115, Building 2504, Road 2832, Block 428 Al Seef Area,
Kingdom of Bahrain
British American Tobacco Middle East W.L.L
Bangladesh
New DOHS Road, Mohakhali, Dhaka 1206, Bangladesh
British American Tobacco Bangladesh Company Limited (72.91%)
Barbados
Chancery Chambers, Chancery House, High Street, Bridgetown,
Barbados
Southward Insurance Ltd.
Belarus
7th Floor, 3 Kuprevicha Str., Minsk, 220141, Belarus
British-American Tobacco Trading Company Foreign Trade
Unitary Enterprise
Belgium
Globe House, 4 Temple Place, London, WC2R 2PG, United Kingdom
British American Tobacco Holdings Belgium N.V.
Nieuwe Gentsesteenweg 21, 1702 Groot-Bijgaarden, Belgium
British American Tobacco Belgium N.V.
Benin
Cotonou, Lot Numbero H19, Quartiers Les Cocotiers, 01 BP 2520,
Benin
British American Tobacco Benin SA
Bolivia
Av. Ballivian entre calles 11 y 12 No. 555, Edificio El Dorial, Piso 19,
Oficina E, Zona de Calacoto, La Paz, Bolivia
BAT Bolivia S.R.L.
 
282
 

Table of Contents
BAT Annual Report and Form 20-F 2021    
 
Strategic Report        
 
Governance Report        
  
Financial Statements        
  
        Other Information        


Bosnia and Herzegovina
Fra Dominka Mandica 24 A, 88220 Široki Brijeg, Bosnia and Herzegovina
IPRESS d.o.o.
ul. Azize Ša´cirbegovi´c 1, 71000 Sarajevo-Novo Sarajevo, Bosnia and Herzegovina
TDR d.o.o. Sarajevo
ul. Kolodvorska 12, 71000 Sarajevo-Novo Sarajevo, Bosnia and Herzegovina
iNovine BH d.o.o.
Botswana
Plot 20774 Broadhurst Industrial Estate, Gaborone, Botswana
British American Tobacco Botswana (Pty) Limited
Business Venture Investments Botswana 6773 (Pty) Ltd.
Brazil
Avenida República do Chile, nº 330, Bloco 1, Torre Leste, 30º andar, Centro, Rio de Janeiro/RJ - CEP
20.031-170,
Brazil
Souza Cruz LTDA
Yolanda Participacoes S.A.
Brunei Darussalam
6th Floor, Bang Hj Ahmad Laksamana Othman,
38-39,
Jalan Sultan, Bandar Seri Begawan BS8811, Brunei Darussalam
Commercial Marketers and Distributors Sdn. Bhd. (100%) (50%)^
(In Liquidation)
Bulgaria
115 M, Tsarigradsko Shose Blvd., Building D, Floor 5, Sofia, Mladost Municipality, 1784, Bulgaria
British American Tobacco Trading EOOD
Burkina Faso
Ouagadougou, Avenue Yennega, BP: 882, Ouagadougou, Burkina Faso
Tobacco Marketing Consultant Burkina Faso SARL
Burundi
Avenue de L’Uprina a Bujumbura, BP 345, Burundi
Tabarundi SARL
Cambodia
1121 National Road 2, Prek Tanou Village, Sangkat Chak Ang Re Leu, Khan Mean Chey, Phnom Penh, Kingdom of Cambodia
British American Tobacco (Cambodia) Limited (71%)
British American Tobacco (Cambodge) International Limited
Cameroon
Rue Njo Njo, Bonapriso – B.P. 259, Douala, Cameroon
British American Tobacco Cameroun S.A. (99.76%)
Canada
30 Pedigree Court, Brampton, Ontario, L6T 5T8, Canada
Imperial Tobacco Canada Limited
Imperial Tobacco Company Limited
3711
St-Antoine
West, Montreal, Quebec, H4C 3P6, Canada
Allan Ramsay and Company Limited
Cameo Inc.
Genstar Corporation
2
Imperial Brands Limited
Imperial Tobacco Products Limited
Imperial Tobacco Services Inc.
John Player & Sons Ltd
Liggett & Myers Tobacco Company of Canada Limited (70%) (50%)^
3
Marlboro Canada Limited
Medaillon Inc.
45 O’Connor Street, Suite 1500, Ottawa, Ontario, K1P 1A4, Canada
2004969 Ontario Inc.
Cayman Islands
Trident Trust Company (Cayman) Ltd., One Capital Place, PO Box 847, Grand Cayman
KY1-1103,
Cayman Islands
R.J. Reynolds Tobacco (CI), Co.
Chile
Isidora Goyenechea 3000, Piso 15, of 1501, Las Condes, Santiago, Chile
BAT Chile S.A.
British American Tobacco Chile Operaciones S.A. (99.51%)
Inversiones Casablanca S.A.
China (People’s Republic of)
607, Floor 6, China Resources Tower, No. 2666 South Keyuan Road, Zhuhai Community, Yuehai Street, Nanshan District, Shenzhen, People’s Republic of China
Nicoventures Business Consulting (Shenzhen) Co., Ltd
Room 436, No. 1000, Zenchen Road, Baoshan District, Shanghai, People’s Republic of China
British American (Shanghai) Enterprise Development Co., Ltd
British American Nico Business Consulting (Shanghai) Co., Ltd
Unit 1001 in 901, 9/F, Building 3, No.8 Guanghuadongli, Chaoyang District, Beijing, People’s Republic of China
British American Consulting (Beijing) Co., Ltd
Colombia
Av. Cra. 72 #
80-94
Piso 10. Bogotá, Colombia
British American Tobacco Colombia S.A.S.
Vype Colombia S.A.S.
Congo (Democratic Republic of)
1er étage, Immeuble du Centenaire, Gombe, Kinshasa, Democratic Republic of Congo
British American Tobacco Congo SARL (In Liquidation)
BAT Distribution SARL (In Liquidation)
1st floor Immeuble L’horizon sis avenue Colonel Lukusa n.50, Gombe, Kinshasa, Democratic Republic of Congo
British American Tobacco Services Congo SARL
British American Tobacco Import SARL
Costa Rica
325 Metros este del Puente de la Firestone, Llorente, Flores, Heredia, Costa Rica
BASS Americas S.A.
BATCCA Park Inversiones Immobiliarias, S.A.
BATCCA Servicios S.A.
 
283


Table of Contents
BAT Annual Report and Form 20-F 2021
Financial Statements
Group Companies and Undertakings
Continued
    
 
Croatia
Draškovi´ceva 27, 10000 Zagreb, Croatia
Inovine d.d. (93.42%)
Ivana Lu  ci´ca 2/a, 10000 Zagreb, Croatia
BAT HRVATSKA d.o.o. u likvidaciji
Obala V. Nazora 1, 52210 Rovinj, Croatia
TDR d.o.o.
Osje  cka 2, 33000 Virovitica, Croatia
Hrvatski Duhani d.d. Tobacco Leaf Processing (89.55%) (95.25%)^
Cuba
Parcela nº 2 a noroeste do terminal de contêineres de Mariel, a 2,2 km do vértice nº 4, Município de Mariel, Província de Artemisa, na República de Cuba.
Brascuba Cigarrillos S.A. (50%)
Cyprus
Photiades Business Centre, 5th Floor, 8 Stasinou Avenue, Nicosia, CY-1060, Cyprus
B.A.T (Cyprus) Limited
Rothmans (Middle East) Limited
Czech Republic
Karolinská 654/2, Prague 8 – Karlín, 186 00, Czech Republic
British American Tobacco (Czech Republic), s.r.o.
Denmark
Bernstorffsgade 50, 1577 Copenhagen, Denmark
British American Tobacco Denmark A/S (House of Prince A/S)
Precis (1789) Denmark A/S
Djibouti
Rue de Magadiscio, Lot No. 133, Djibouti City, Djibouti
British American Tobacco Djibouti SARL
Egypt
Administrative unit no.1, 5th Floor, Building S2B, Sector A, Downtown Mall Katameya, 5th settlement, New Cairo, Egypt
BETCO for General Services and Marketing LLC
BETCO for Trade and Distribution LLC
British American Tobacco Egypt LLC
British American Tobacco North Africa LLC
English American Company for Importation and Trade LLC
(In Liquidation)
Eritrea
P.O. Box 749, 62 Fel Ket Street, Asmara, Eritrea
British American Tobacco (Eritrea) Share Company
#
Estonia
Tornimäe 7-10, 10145 Tallinn, Estonia
British American Tobacco Estonia AS
Fiji
Lady Maria Road, Nabua, Suva, Fiji
British American Tobacco (Fiji) Marketing Pte Limited
Central Manufacturing Company Pte Limited
Rothmans of Pall Mall (Fiji) Pte Limited
Finland
c/o Retail 24, Olarinluoma 7, 02200 Espoo, Finland
British American Tobacco Finland Oy
France
111 Avenue Victor Hugo, Paris, 75016, France
Carreras France SAS
Tour Légende, 20 place de la Défense, CS 80289, 92050 Paris La Défense Cedex, France
British American Tobacco France SAS
Germany
Alsterufer 4, 20354 Hamburg, Germany
BATIG Gesellschaft fur Beteiligungen m.b.H.
British American Tobacco (Germany) GmbH
British American Tobacco (Industrie) GmbH
Schutterwalder Straße. 23, 01458 Ottendorf-Okrilla, Germany
Quantus Beteiligungs – und Beratungsgesellschaft mbH
Ghana
4th Floor, Volta Place, Airport Residence Area, Patrice Lumumba Street, Accra, Ghana
British American Tobacco Ghana Limited (97.09%)
Greece
27, Ag. Thoma Street, Maroussi, 151 24, Greece
British American Tobacco Hellas S.A.
Guernsey
St. Martin’s House, Le Bordage, St. Peter’s Port, GY1 4AU, Guernsey
Belaire Insurance Company Limited
Guyana
Lot 122 Parade Street, Kingston, Georgetown, Guyana
Demerara Tobacco Company Limited (70.25%)
Honduras
Boulevard del Sur, Zona El Cacao, San Pedro Sula, Depart.de Cortés, Honduras
Tabacalera Hondureña S.A. (83.64%)
Hong Kong
11/F, One Pacific Place, 88 Queensway, Hong Kong
British American Tobacco China Investments Limited
LEHMAN, LEE & XU CORPORATE SERVICES, Suite 3313, Tower One, Times Square, 1 Matheson Street, Causeway Bay, Hong Kong
Reynolds Asia-Pacific Limited
Level 30, Three Pacific Place, 1 Queen’s Road East, Wanchai, Hong Kong
British American Tobacco Asia-Pacific Region Limited
British-American Tobacco Company (Hong Kong) Limited
Level 24, Suites 2407 - 09, 3 Pacific Place, 1 Queen’s Road East, Wanchai, Hong Kong
BAT Global Travel Retail Limited
Hungary
H-1124, Budapest, Csörsz utca 49-51. 3. em., Hungary
BAT Pécsi Dohánygyár Korlátolt Felelosségu Társaság
 
284
 

Table of Contents
BAT Annual Report and Form 20-F 2021    
 
Strategic Report        
 
Governance Report        
  
Financial Statements        
  
        Other Information        


Indonesia
Capital Place Office Tower, 6th Floor, Jl. Gatot Subroto Kav. 18, Jakarta 12710 Indonesia
PT Bentoel Internasional Investama, Tbk (99.96%)
Jl. Raya Karanglo, 1 Desa Banjararum, Kecamatan Singosari, Jawa Timur 65153 Indonesia
PT Bentoel Prima
4
(100%) (99.99%)^
Jl. Susanto No. 2B, Ciptomulyo, Sukun, Malang, Jawa Timur 65148 Indonesia
PT Bentoel Distribusi Utama (100%) (99.8%)^
Iraq
Empire Business Tower, Building C5, 2nd Floor, Erbil, Kurdistan Region of Iraq
B.A.T. Iraqia Company for Tobacco Trading Limited
Ireland
Suite D, 2nd Floor, The Apex Building, Blackthorn Road, Sandyford Industrial Estate, Dublin 18, Republic of Ireland
Carroll Group Distributors Limited
P.J. Carroll & Company Limited
Rothmans of Pall Mall (Ireland) Limited
5
Isle of Man
2nd Floor, St Mary’s Court, 20 Hill Street, Douglas, IM1 1EU, Isle of Man
Abbey Investment Company Limited
The Raleigh Investment Company Limited
Tobacco Manufacturers (India) Limited
Italy
Via Amsterdam 147, 00144 Rome, Italy
British American Tobacco Italia S.p.A.
Ivory Coast
Rue des Jardins -Immeuble Sayegh-Mezzanine, Abidjan, Cocody 2 plateaux, Côte d’Ivoire
British American Tobacco RCI SARL
Jamaica
13A Ripon Road, Kingston 5, Jamaica
Carreras Limited (50.40%)
9
Sans Souci Development Limited (100%) (50.40%) ^
9
Sans Souci Limited (100%) (50.40%) ^
9
Japan
Midtown Tower 20F, 9-7-1 Akasaka, Minato-ku, Tokyo, Japan
British American Tobacco Japan, Ltd.
Jersey
22 Grenville Street, St Helier, JE4 8PX, Jersey
Pathway 5 (Jersey) Limited
Jordan
Airport Road, Al Qastal Industrial Area, Air Cargo Road, Amman, Jordan
British American Tobacco – Jordan Private Shareholding Company Limited
Kazakhstan
240G, Nursultan Nazarbayev avenue, A26F8D4 Almaty, Republic of Kazakhstan
British American Tobacco Kazakhstan Trading LLP
Kenya
8 Likoni Road, Industrial Area, P.O. Box 30000-00100, Nairobi, Kenya
BAT Kenya Tobacco Company Limited (100%) (60%)^
British American Tobacco Area Limited
British American Tobacco Kenya plc (60%)
East African Tobacco Company (Kenya) Limited (100%) (60%)^ (In Liquidation)
Korea, Republic of
141, Gongdan1-ro, Sanam-Myun, Sacheon City, Kyungsangnamdo, Korea (the Republic of)
British American Tobacco Korea Manufacturing Limited
42FI Gangnam Finance Center, 152 Teheran-ro, Gangnam-gu, Seoul, Korea (the Republic of)
British American Tobacco Korea Limited
Kosovo, Republic of
Llapllaselle p.n., 10500 Gracanicë, Republic of Kosovo
British American Tobacco Kosovo SH.P.K.
Latvia
Mukusalas iela 101, Riga LV-1004, Latvia
British American Tobacco Latvia SIA
Lithuania
J. Galvydžio g. 11-7, LT-08236 Vilnius, Lithuania
UAB British American Tobacco Lietuva
Luxembourg
1, Rue Jean Piret, 2350 Luxembourg, Grand Duchy of Luxembourg
British American Tobacco Brands (Switzerland) Limited
Malawi
Northgate Arcade Complex, Masauko Chipembere Highway, Blantyre, Malawi
British American Tobacco (Malawi) Limited
Malaysia
12th Floor, Menara Symphony, No. 5, Jalan Prof Khoo Kay Kim, Seksyen 13, 46200, Petaling Jaya, Selangor Darul Ehsan, Malaysia
British American Tobacco GSD (Kuala Lumpur) Sdn Bhd
Level 11, Sunway Geo Tower, Jalan Lagoon Selatan, Sunway South Quay, Bandar Sunway, 47500 Subang Jaya, Selangor Darul Ehsan, Malaysia
BAT Aspac Service Centre Sdn Bhd
Level 19, Guoco Tower, Damansara City, No. 6 Jalan Damanlela, Bukit Damansara, 50490 Kuala Lumpur, Malaysia
British American Tobacco Malaysia Foundation
8
British American Tobacco (Malaysia) Berhad (50%)
Commercial Marketers and Distributors Sdn. Bhd. (100%) (50%)^
Rothmans Brands Sdn. Bhd. (100%) (50%)^ (In Liquidation)
Tobacco Importers and Manufacturers Sdn. Bhd. (100%) (50%)^
 
285


Table of Contents
BAT Annual Report and Form 20-F 2021
Financial Statements
Group Companies and Undertakings
Continued
    
 
Mali
DJELIBOUGOU-Immeuble BASSARO- BP 2065, Bamako -Mali
British American Tobacco (Mali) Sarl
Malta
PM Building, Level 2, Bone Street, Zone 1, Central Business District, Birkirkara, CBD 1060, Malta
British American Tobacco (Malta) Limited
Central Cigarette Company Limited
Rothmans of Pall Mall (Malta) Limited
Mexico
Francisco I Madero 2750 Poniente, Colonia Centro, Monterrey, Nuevo León, C.P. 64000, Mexico
BAT DBS Mexico S.A. de C.V.
4
British American Tobacco Mexico Comercial, S.A. de C.V.
British American Tobacco Mexico, S.A. de C.V.
4
British American Tobacco Servicios S.A. de C.V.
Cigarrera La Moderna, S.A. de C.V.
Predio Los Sauces Sin número, Colonia Los Sauces, C.P. 63197, Tepic, Nayarit, Mexico
Procesadora de Tabacos de Mexico, S.A. de C.V. (93%)
Moldova, Republic of
65, Stephan cel Mare Str., off. 416, Chisinau, MD2001, Republic of Moldova
British American Tobacco – Moldova S.R.L.
Mozambique
2289 Avenida de Angola, Maputo, Mozambique
British American Tobacco Mozambique Limitada (95%)
Myanmar
Min Aye Yar Street, Plot No. (55, 56), Survey Ward No. (14) Shwe Than Lwin Industrial Zone, Hlaing Tharyar Township Yangon Region, Myanmar
British American Tobacco Myanmar Limited (95%)
9
British American Tobacco Myanmar Services Limited
9
Namibia
24 Orban Street, Klein Windhoek, Namibia
Twisp (Pty) Limited
Shop 48, Second Floor Old Power Station Complex, Armstrong Street, Windhoek, Namibia
British American Tobacco Namibia (Pty) Limited
Netherlands
Handelsweg 53 A, 1181 ZA, Amstelveen, Netherlands
Aruba Properties B.V.
B.A.T. Netherlands Finance B.V.
British American Tobacco European Operations Centre B.V.
British American Tobacco Exports B.V.
British American Tobacco Holdings (Australia) B.V.
British American Tobacco Holdings (Malaysia) B.V.
British American Tobacco Holdings (South Africa) B.V.
British American Tobacco Holdings (The Netherlands) B.V.
British American Tobacco Holdings (Venezuela) B.V.
British American Tobacco Holdings (Vietnam) B.V.
British American Tobacco International (Holdings) B.V.
Molensteegh Invest B.V.
Precis (1790) B.V.
Rothmans Far East B.V.
Rothmans International Holdings B.V.
Rothmans Tobacco Investments B.V.
Rothmans UK Holdings B.V.
New Zealand
2 Watt Street, Parnell, Auckland, 1052, New Zealand
BAT (New Zealand) Limited
BAT Holdings (New Zealand) Limited
Mint Advisory Limited, Suite 6, 8 Turua Street, St Heliers, Auckland, 1071, New Zealand
New Zealand (UK Finance) Limited
#
Nigeria
1, Tobacco Road, Oluyole Local Government Area, Ibadan, Oyo State, Nigeria
British American Tobacco (Nigeria) Limited
2 Olumegbon Road, Ikoyi, Lagos, Nigeria
British American Tobacco Marketing Nigeria Limited
 
286
 

Table of Contents
BAT Annual Report and Form 20-F 2021    
 
Strategic Report        
 
Governance Report        
  
Financial Statements        
  
        Other Information        


North Macedonia, Republic of
Blvd. 8-mi SEPTEMVRI No. 18, 1000 Skopje, Republic of Macedonia
TDR SKOPJE DOOEL Skopje
Norway
Dronning Eufemias Gate 42. 0191 Oslo, Norway
British American Tobacco Norway AS
Pakistan
Serena Business Complex. Khayaban-e-Suhrwardy, Islamabad, Pakistan
British American Tobacco SAA Services (Private) Ltd
Pakistan Tobacco Company Limited (94.65%)
Bun Khurma Chichian Road, Mirpur Azad Jammu & Kashmir, Pakistan
Phoenix (Private) Limited (100%) (94.65%)^
Panama
Calle 54, Obarrio, PH Twist Tower, Piso 22, Oficina E-22, Corregimiento Bella Vista, Ciudad de Panama, Panama
British American Tobacco Central America S.A. (87.65%)
British American Tobacco Panama S.A.
Tabacalera Istmeña S.A.
Via Fernandez de Cordoba, Corregimiento of Pueblo Nuevo, Panama City, Panama
BAT Caribbean, S.A.
Papua New Guinea
Ashurst Png, Level 11 Mrdc Haus, Cnr Of Musgrave Street and Champion Parade, Port Moresby, National Capital District, Papua New Guinea
British American Tobacco (PNG) Limited
Papua New Guinea Tobacco Co. Ltd
Paradise Tobacco Co. Limited
Rothmans of Pall Mall (P.N.G) Limited
Paraguay
Roque Centurion Miranda 1635, AYMAC II, Piso 2, Asunción, Paraguay
British American Tobacco Productora de Cigarrillos S.A.
Peru
Av. El Derby No 055, Torre 3, Oficinas 405-406-407-408, Urb. Lima Polo and Hunt Club, Santiago de Surco, Lima, Perú
British American Tobacco del Peru Holdings S.A. (98.55%)
6
British American Tobacco del Peru, S.A.C.
Philippines
31 Tayuman Street, Tondo, Manila, Philippines
Alhambra Industries Inc.
#
Poland
Aleja Wojska Polskiego 23c, 63-500, Ostrzeszow, Poland
CHIC sp.zo.o
Chic Holding sp.zo.o (In Liquidation)
ESMOKING LIQUIDS SP. Z O.O
Krakowiakow 48, 02-255, Warszawa, Poland
British American Tobacco Polska Trading sp. zo.o.
Rubiez 46, 61-612, Poznan, Poland
eSMOKING INSITUTE sp.zo
ul. IŁZECKA 26E, 02-135, Warszawa, Poland
Nicoventures Poland sp. Z.o.o.
Ul. Tytoniowa 16, 16-300, Augustow, Poland
British-American Tobacco Polska S.A.
Portugal
Edificio Amoreiras Square, Rua Carlos Alberto da Mota Pinto 17, 3e A, 1070-313, Amoreiras, Lisboa, Portugal
COTAPO Empreendimentos Commerciais e Industriais S.A.
Sociedade Unificada de Tabacos Limitada (76.4%)
Qatar
P.O. Box 6689, 41 Floor, Tornado Tower, West Bay, Doha, Qatar
British American Tobacco Q LLC
Réunion
5, Immeuble Cap, Avenue Théodore Drouhet, ZAC Horizon 2000, Le Port, 97420, IIe de la Réunion
B.A.T. La Reunion SAS
Romania
319 Splaiul Independentei, Sema Parc ‘City Building’, 1st Floor, 6th Sector, Bucharest, Romania
British American Shared Services (Europe) S.R.L.
319 Splaiul Independentei, Sema Parc ‘City Building’, 6th Floor, 6th Sector, Bucharest, Romania
BRITISH American GBS Recruitment S.R.L.
Ploiesti, 17-19 Laboratorului Street, Prahova County, Romania
British-American Tobacco (Romania) Investment S.R.L.
Bucharest Business Park, Building A (3rd floor) and Building B2 (floors 3-4), 1A Bucuresti – Ploiesti (DN1) Road, Sector 1, Bucharest 013681, Romania
British American Tobacco (Romania) Trading SRL
Russia
38, 3rd Konnaya lakhta, Saint Petersburg, 197229 Russia
JSC ‘British American Tobacco-SPb’
#
Building 2, 17 Krylatskaya Street, Moscow, 121614 Russia
JSC ‘International Tobacco Marketing Services’
Rwanda
SORAS Building, Boulevard de la Revolution P.O Box 650 Kigali, Rwanda
British American Tobacco Rwanda Limited
Saint Lucia
c/o ADCO Incorporated, 10 Manoel Street, Castries, Saint Lucia
Carisma Marketing Services Ltd
Pointe Seraphine, Castries, Saint Lucia
Rothmans Holdings (Caricom) Limited
Samoa
Vaitele Estate, Vaitele, Samoa
British American Tobacco Company (Samoa) Limited
Saudi Arabia, Kingdom Of
7051 Al Amir Sultan-Al Salamah District, Unit 1302. Jeddah 23525 - 2661, Saudi Arabia
BAT Saudia for Trading
BAT Arabia for Trading
Senegal
Almadies, Route Hôtel Méridien en Face Club Med, Dakar, Senegal BP 3174
Tobacco Marketing Consultant TMC S.A.R.L. (In Liquidation)
 
287


Table of Contents
BAT Annual Report and Form 20-F 2021
Financial Statements
Group Companies and Undertakings
Continued
    
 
Serbia
Bulevar Milutina Milankovica 1ž, Belgrade, 11070, Serbia
British American Tobacco South – East Europe d.o.o. Beograd
Kralja Stefana Provencanog 209, Vranje, 17500, Serbia
British American Tobacco Vranje a.d. Vranja
Singapore
15 Senoko Loop, Singapore, 758168
British-American Tobacco (Singapore) Private Limited
British-American Tobacco Marketing (Singapore) Private Limited
18 Ah Hood Road #12-51, Hiap Hoe Bldg at Zhongshan Park, Singapore, 329983
British American Tobacco Sales & Marketing Singapore Pte. Ltd.
Shenton Way, #33-00 OUE Downtown, Singapore 068809
RHL Investments Pte Limited
#
(In Liquidation)
Slovenia
Bravni  carjeva ulica 13, 1000 Ljubljana, Slovenia
British American Tobacco d.o.o.
Solomon Islands
Kukum Highway, Ranadi, Honiara, Honiara, Solomon Islands
Solomon Islands Tobacco Company Limited
South Africa
Waterway House South, 3 Dock Road, V&A Waterfront, Cape Town, Western Cape 8002, South Africa
Agrega EEMEA (Pty) Ltd
Amalgamated Tobacco Corporation (South Africa) (Pty) Ltd
American Cigarette Company (Overseas) (Pty) Ltd
Benson and Hedges (Pty) Ltd
British American Shared Services Africa Middle East (Pty) Ltd
British American Tobacco GSD (South Africa) (Pty) Ltd
British American Tobacco Holdings South Africa (Pty) Ltd
#
British American Tobacco Properties South Africa (Pty) Ltd.
British American Tobacco Services South Africa (Pty) Ltd
British American Tobacco South Africa (Pty) Ltd
British American Tobacco East and Southern Africa (Pty) Ltd
Brown & Williamson Tobacco Corporation (Pty) Ltd
Business Venture Investments No 216 (Pty) Ltd
Carlton Cigarette Company (Pty) Ltd
John Chapman (Pty) Ltd
John Player & Sons (Pty) Ltd
Kentucky Tobacco Corporation (Pty) Ltd
Martins of London (Pty) Ltd
Rembrandt Tobacco Corporation (Overseas) (Pty) Ltd
Riggio Tobacco Corporation of New York (Pty) Ltd
Rothmans of Pall Mall London (Pty) Ltd
St Regis Tobacco Corporation (Pty) Ltd
Thomas Bear’s Son and Company (Pty) Ltd
Tobacco Research and Development Institute (Pty) Ltd
Twisp (Pty) Ltd
WD and HO Wills (Pty) Ltd
Westminster Tobacco Company (Cape Town and London) (Pty) Ltd
Winfield Tobacco Corporation (Pty) Ltd
Winston Tobacco Company (Pty) Ltd
Spain
Torreo Espacio, Paseo de la Castellana, 259D, 28046 Madrid, Spain
British American Tobacco España, S.A.
Sri Lanka
178 Srimath Ramanathan Mawatha, Colombo, 15, Sri Lanka
Ceylon Tobacco Company Plc (84.13%)
Sudan
Byblos Tower, Al-Muk Nemer Street, Postal Code 11111, P.O. Box 1381, Khartoum, Sudan
Blue Nile Cigarette Company Limited
Swaziland
213 King Mswati III Avenue West, Matsapha Industrial Site, Mutsapha, eSwatini
British American Tobacco Swaziland (Pty) Limited
Sweden
Hyllie Boulevard 32, 215 32 Malmö, Sweden
Niconovum AB
Stenåldersgatan 23, 213 76 Malmö, Sweden
Fiedler & Lundgren AB
Winnington AB
Västra Trädgårdsgatan 15, 11153 Stockholm, Sweden
British American Tobacco Sweden AB
Switzerland
c/o British American Tobacco Switzerland S.A., Route de France 17, 2926 Boncourt, Switzerland
American-Cigarette Company (Overseas) Limited
British American Tobacco Switzerland SA
BAT Switzerland Vending SA
Rothmans of Pall Mall Limited
Route de France 17, 2926 Boncourt, Switzerland
Nicoventures Communications (Switzerland) SA
c/o NBA Fiduciaire S.A., Route de la Glâne 107, c/o NBA Fiduciaire S.A. 1752 Villars-sur-Glâne, Switzerland
Intertab S.A. (50%)
c/o Bright Law AG, Bundesplatz, 6302 Zug, Switzerland
British American Tobacco International Limited (In Liquidation)
Tanzania
Acacia Estate Building, Kinondoni Road, P.O Box 288, Dar es Salaam, Tanzania
BAT Distribution Tanzania Limited
British American Tobacco (Tanzania) Limited (In Liquidation)
International Cigarette Distributors Limited (99%) (In Liquidation)
Zanzibar Distribution Company Limited (99%) (In Liquidation)
Trinidad and Tobago
Corner Eastern Main Road and Mt. D’or Road, Champs Fleurs, Trinidad and Tobago
The West Indian Tobacco Company Limited (50.13%)
Turkey
Orjin Maslak İş Merkezi, Eski Büyükdere Caddesi, Kat 9-10, Maslak, Sarıyer, İstanbul
British American Tobacco Tütün Mamulleri Sanayi ve Ticaret Anonim Sirketi
 
288
 

Table of Contents
BAT Annual Report and Form 20-F 2021    
 
Strategic Report        
 
Governance Report        
  
Financial Statements        
  
        Other Information        


Uganda
10th Floor, Lotis Towers, Plot 16 Mackinnon Road, Nakasero, Kampala, Uganda
British American Tobacco Uganda Limited (90%)
Ukraine
13-15 Bolsunovska Str, Kyiv, 01014 Ukraine
LLC ‘British American Tobacco Sales and Marketing Ukraine’
21 Nezalezhnosti Str, Chernihiv Oblast, Prylucky, 17502, Ukraine
PJSC ‘A/T B.A.T. – Prilucky Tobacco Company’
United Arab Emirates
Jumeriah Business Centre 3, 37th Floor, Jumeirah Lake Towers, Dubai, P.O. Box 337222, United Arab Emirates
British American Tobacco GCC DMCC
British American Tobacco ME DMCC
Unit # 2680, DMCC Business Center- Level # 1, Jewellery & Gemplex 3 Dubai, United Arab Emirates
British American Tobacco International DMCC
United Kingdom
212-218 Upper Newtownards Road, Belfast, BT4 3ET, Northern Ireland
Murray, Sons & Company, Limited
7 More London, Riverside, London, SE1 2RT, United Kingdom
Ryesekks P.L.C. (50%) (In Liquidation)
Building 7, Chiswick Business Park, 566 Chiswick High Road, London, W4 5YG, United Kingdom
British American Tobacco UK Limited
Ten Motives Limited
10 Motives Limited
Globe House, 1 Water Street, London, WC2R 3LA, United Kingdom
Advanced Technologies (Cambridge) Limited
Allen & Ginter (UK) Limited
B.A.T (U.K. and Export) Limited
B.A.T Cambodia (Investments) Limited
B.A.T Far East Holding Limited
B.A.T Far East Leaf Limited
B.A.T Services Limited
B.A.T Uzbekistan (Investments) Limited
B.A.T Vietnam Limited
B.A.T. (Westminster House) Limited
B.A.T. China Limited
BAT Finance COP Limited
BATIF Dollar Limited
BATUS Limited
Big Ben Tobacco Company Limited
British American Shared Services (GSD) Limited
British American Shared Services Limited
British American Tobacco (AIT) Limited
British American Tobacco (GLP) Limited
British American Tobacco (Investments) Limited
British American Tobacco (Philippines) Limited
British American Tobacco (Serbia) Limited
British American Tobacco (South America) Limited
British American Tobacco China Holdings Limited
British American Tobacco Exports Limited
British American Tobacco Georgia Limited
British American Tobacco Global Travel Retail Limited
British American Tobacco International Holdings (UK) Limited
British American Tobacco Investments (Central & Eastern Europe) Limited
British American Tobacco Italy Investments Limited
British American Tobacco Italy Limited
British American Tobacco Korea (Investments) Limited
British American Tobacco Malaysia (Investments) Limited
British American Tobacco Peru Holdings Limited
British American Tobacco UK Pension Fund Trustee Limited
9
British-American Tobacco (Mauritius) p.l.c.
Carreras Rothmans Limited
#
Chelwood Trading & Investment Company Limited
East African Tobacco Company (U.K.) Limited
Kbio Holdings Limited
Lord Extra Limited
Myddleton Investment Company Limited
Nicovations Limited
Nicoventures Holdings Limited
Nicoventures Retail (UK) Limited
Nicoventures Trading Limited
Powhattan Limited
Precis (2396) Limited
Ridirectors Limited
Rothmans Exports Limited
Rothmans International Limited
Rothmans International Services Limited
Rothmans International Tobacco (UK) Limited
Rothmans of Pall Mall (Overseas) Limited
Rothmans Trading Limited
Ryservs (1995) Limited
Ryservs (No.3) Limited
Tobacco Exporters International Limited
Tobacco Marketing Consultants Limited
Venezuela Property Company Limited
Westanley Trading & Investment Company Limited
Westminster Tobacco Company Limited
Globe House, 2 Milford Lane, London, WC2R 3LN, United Kingdom
World Investment Company Limited
 
289


Table of Contents
BAT Annual Report and Form 20-F 2021
Financial Statements
Group Companies and Undertakings
Continued
    
 
Globe House, 4 Temple Place, London, WC2R 2PG, United Kingdom
Amalgamated Tobacco Company Limited
American Cigarette Company (Overseas) Limited
Ardath Tobacco Company Limited
B.A.T Additional Retirement Benefit Scheme Trustee Limited
B.A.T Industries p.l.c.
B.A.T. International Finance p.l.c.*
B.A.T. Operating Finance Limited
BATLaw Limited
BATMark Limited*
Benson & Hedges (Overseas) Limited
British American Global Shared Services Limited
British American Tobacco (1998) Limited*
British American Tobacco (2009) Limited
British American Tobacco (2009 PCA) Limited
British American Tobacco (2012) Limited
British American Tobacco (Brands) Limited
British American Tobacco (Corby) Limited
British American Tobacco (NGP) Limited
British American Tobacco Healthcare Trustee Limited
British American Tobacco Taiwan Logistics Limited
British-American Tobacco (Holdings) Limited
Brown & Williamson Tobacco Corporation (Export) Limited
Btomorrow Ventures Limited
Carreras Limited
Courtleigh of London Limited
Dunhill Tobacco of London Limited
John Sinclair Limited
Louisville Securities Limited
Moorgate Tobacco Co. Limited
Peter Jackson (Overseas) Limited
Precis (1789) Limited
Precis (1814) Limited
Rothmans International Enterprises Limited
Rothmans of Pall Mall Limited
Senior Service (Overseas) Limited
South Western Nominees Limited
The London Tobacco Company Limited
Tobacco Insurance Company Limited
Weston (2009) Limited
Weston Investment Company Limited
United States
CSC-Lawyers Incorporating Service, 2710 Gateway Oaks Drive, Suite 150N, Sacramento CA 95833-3505, United States
Genstar Pacific Corporation
251 Little Falls Drive, Wilmington, DE 19808, United States
B.A.T Capital Corporation
BATUS Holdings Inc.
BATUS Japan, Inc.
BATUS Retail Services, Inc.
British American Tobacco (Brands), Inc.
Brown & Williamson Holdings, Inc.
BT DE Investments Inc.
Btomorrow Innovation Hub Inc.
BTI 2014 LLC
Imasco Holdings Group, Inc.
Imasco Holdings, Inc.
ITL (USA) Limited
Louisville Corporate Services, Inc.
Nicoventures U.S. Limited
Farmers Bank Building, Suite 1402, 301 N. Market Street, Wilmington, DE 19801, United States
Reynolds Finance Company
3700 Airpark Drive, Owensboro, KY 42301, United States
KBio, Inc.
401 N. Main Street, Winston-Salem, NC 27101, United States
Conwood Holdings, Inc.
EXP Homes, LLC
Lorillard Licensing Company LLC
Lorillard, LLC
Modoral Brands Inc.
Northern Brands International, Inc.
R.J. Reynolds Global Products, Inc.
R.J. Reynolds Tobacco Company
R.J. Reynolds Tobacco International, Inc
R.J. Reynolds Vapor Company
R.J. Reynolds Tobacco Co.
R.J. Reynolds Tobacco Holdings, Inc.
RAI Innovations Company
RAI International, Inc.
RAI Services Company
RAI Strategic Holdings, Inc.
Reynolds American Inc.
Reynolds Brands Inc.
Reynolds Marketing Services Company
Reynolds Technologies, Inc.
RJR Realty Relocation Services, Inc.
RJR Vapor Co., LLC
Rosswil LLC
S.F. Imports, Inc.
Spot You More, Inc.
Vuse Stores LLC
 
290
 

Table of Contents
BAT Annual Report and Form 20-F 2021    
 
Strategic Report        
 
Governance Report        
  
Financial Statements        
  
        Other Information        


3220 Knotts Grove Road, Oxford, NC 27565, United States
Santa Fe Natural Tobacco Company, Inc.
5106, Tradeport Dr., Memphis, TN 38141, United States
American Snuff Company, LLC
Uruguay
Juncal 1392, Montevideo, Uruguay
Kellian S.A.
Uzbekistan
77 Minor Passage, Tashkent, 100084, Uzbekistan
JSC JV “UZBAT A.O.” (97.38%)
Venezuela
Registro Mecantil Primero de la Circunscripción, Judical des Distrito, Capital y Estado, Miranda, Venezuela
Agrega de Venezuela, Agreven, C.A. (50%) (In Liquidation)
Avenida Francisco de Miranda, Edificio Bigott, Los Ruices, Caracas – Estado Miranda, 1010, Venezuela
Agrobigott, C.A.
Compania Anonima Cigarrera Bigott Sucesores
Distribuidora Bigott, C.A.
Avenida Francisco de Miranda, Torre Regelfall, Municipio Chacao, Estado, Miranda, Caracas, Venezuela
Proyectos de Inversion BAT 1902 C.A.
Vietnam
20/F Mplaza Saigon, 39 Le Duan Street, Ben Nghe Ward, District 1, Ho Chi Minh City, Vietnam
East Asia Area Services Company Limited
7
Area 8, Long Binh Ward, Bien Hoa City, Dong Nai Province, Vietnam
British American Tobacco – Vinataba (JV) (70%)
7
Lot 45C/I, Road #7, Vinh Loc Industrial Park, Binh Chanh District, Ho Chi Minh City, Vietnam
VINA-BAT Joint Venture Company Limited (49%)
7
Zambia
Plot No. PH1 IND & 53 & 54, LS-MFEZ, Chifwema Road, Lusaka, Zambia
British American Tobacco (Zambia) plc (78.08%)
Zimbabwe
Manchester Road 1, Southerton, Harare, Zimbabwe
American-Cigarette Company (Overseas) (Private) Ltd
British American Tobacco Zimbabwe (Holdings) Limited (63.74%)
House of Raleigh Limited
Rothmans Limited
Associated Undertakings and Joint Ventures
 
Canada
35 English Drive, Moncton, New Brunswick, E1E 3X3, Canada
Organigram Holdings Inc. (18.8%)
France
88 Avenue des Ternes, 75017, Paris, France
Alcome SAS (24%)
Hungary
H-6800 Hódmezóvásárhely, Erzsébeti út 5/b, Hungary
Országos Dohányboltellátó Korlátolt Felelosségu Társaság (49%)
India
Virginia House, 37, J.L. Nehru Road, Kolkata, 700071, India
ITC Limited (29.37%)
9
Azamabad, Andhra Pradesh, Hyderabad, 500 020, India
VST Industries Limited (32.16%)
9
United Kingdom
4a Station Parade, Uxbridge Road, London, W5 3LD, United Kingdom
AYR LTD (13.14%)
10
Uzbekistan
Gulobod Village, Samarkand Region, 140100, Uzbekistan
FE “Samfruit” JSC (42.61%)
Yemen
P.O. Box 14, Sanna, Yemen
Kamaran Industry and Investment Company (31%)
P.O. Box 5302, Hoban, Taiz, Yemen
United Industries Company Limited (32%)
Joint Operations
 
Hong Kong
29/F, Oxford House, 979 King’s Road, Taikoo Place, Quarry Bay, Hong Kong
CTBAT International Co. Limited (50%)
Notes:
1. Ownership held in the class of US Dollar 100 (100%) (76.30%)^ and US Dollar 49,900 (100%).
2. Ownership held in the class of Series F and 2nd Preferred shares.
3. Ownership held in the class of A shares (50%) and class of B shares (100%).
4. Ownership held in class of A shares and B shares.
5. Ownership held solely in class of preference shares.
6. Ownership held in class of Investment stock (98.98%) and Ordinary shares (98.35%).
7. Ownership held in the class of Charter Capital Contribution Units.
8. Company limited by guarantee.
9. 31 March year-end.
10. 31 May year-end.


291


Table of Contents
BAT Annual Report and Form 20-F 2021
Financial Statements


This page is intentionally left blank


292
 

Table of Contents
BAT Annual Report and Form 20-F 2021    
 
Strategic Report        
 
Governance Report        
  
Financial Statements        
  
        Other Information        


This page is intentionally left blank


293


Table of Contents
BAT Annual Report and Form 20-F 2021
Financial Statements


This page is intentionally left blank


294
 

Table of Contents
                 
BAT Annual Report and Form 20-F 2021    
 
Strategic Report        
 
Governance Report        
  
Financial Statements        
  
        Other Information        


This page is intentionally left blank


295


Table of Contents
BAT Annual Report and Form 20-F 2021
Financial Statements


This page is intentionally left blank


296
 

Table of Contents
BAT Annual Report and Form 20-F 2021    
 
Strategic Report        
 
Governance Report        
  
Financial Statements        
  
        Other Information        


This page is intentionally left blank


297


Table of Contents
BAT Annual Report and Form 20-F 2021
Financial Statements


This page is intentionally left blank


298
 

Table of Contents
                 
BAT Annual Report and Form 20-F 2021    
 
Strategic Report        
 
Governance Report        
  
Financial Statements        
  
Other Information        


Other Information
Additional Disclosures


300


301


302


304


314


315


317


318


340


345


346


348


348


349


350


350


351


352
 
 
Shareholder Information


353


354


356


360


373


376


377


378


379


380


382


383


299


Table of Contents
BAT Annual Report and Form 20-F 2021
Other Information
Information on the Group


Overview
British American Tobacco p.l.c. is the parent holding company of the Group, a leading consumer-centric, multi-category consumer goods company that provides tobacco and nicotine products to millions of consumers around the world. According to the Group’s internal estimates, the BAT Group is a market leader by volume in more than 50 countries, producing the cigarette chosen by one in eight of the world’s one billion smokers.
The Group, excluding the Group’s associated undertakings, is organised into four regions:
 
 
the United States (U.S. – Reynolds American Inc.);
 
 
Asia-Pacific and the Middle East (APME);
 
 
Americas and
Sub-Saharan
Africa (AmSSA); and
 
 
Europe and North Africa (ENA).
The Group’s range of combustible products covers all segments, from
value-for-money
to premium with a portfolio of international, regional and local tobacco brands to meet a broad array of adult tobacco consumer preferences wherever the Group operates. The Group is investing in building a portfolio of potentially less harmful tobacco and nicotine products alongside its traditional tobacco business – including vapour products, tobacco heating products (THPs) and Modern Oral products, which are collectively termed the New Categories, as well as Traditional Oral products.
The Group manages a globally-integrated supply chain and its products are distributed to retail outlets worldwide.
History and development of BAT
The Group has had a significant global presence in the tobacco industry for over 100 years. BAT Ltd. was incorporated in 1902, when the Imperial Tobacco Company and the American Tobacco Company agreed to form a joint venture company. BAT Ltd. inherited companies and quickly expanded into major markets, including India and Ceylon, Egypt, Malaya, Northern Europe and East Africa. In 1927, BAT Ltd. expanded into the U.S. market through its acquisition of B&W.
During the 1960s, 1970s and 1980s, the Group diversified its business under the umbrella of B.A.T Industries p.l.c., with acquisitions in the paper, cosmetics, retail and financial services industries, among others. Various business reorganisations followed as the business was eventually refocused on the Group’s core cigarette, cigars and tobacco products businesses with BAT becoming a separately listed entity on the LSE in 1998.
The following is a summary of the significant mergers, acquisitions and disposals undertaken since 1998:
 
 
1999 - global merger with Rothmans International;
 
 
2000 - acquisition of Imperial Tobacco Canada;
 
 
2003 - acquisition of Ente Tabacchi Italiani S.p.A., Italy’s state-owned tobacco company, Tabacalera Nacional in Peru and Duvanska Industrija Vranje in Serbia;
 
 
2004 - the U.S. assets, liabilities and operations, other than certain specified assets and liabilities, of BAT’s wholly-owned subsidiary, B&W, were combined with RJR Tobacco Company to form Reynolds American Inc. As a result of the B&W business combination, B&W acquired beneficial ownership of approximately 42% of the Reynolds American Inc. shares;
 
 
2008 - acquisition of Tekel, the Turkish state-owned tobacco company and the cigarette and snus business of Skandinavisk Tobakskompagni A/S;
 
 
2009 - acquisition of an effective 99% interest in Bentoel in Indonesia;
 
 
2011 - acquisition of Protabaco in Colombia;  
 
2012 - acquisition of CN Creative Limited in the UK;
 
 
2013 - entered into joint operations in China;
 
 
2015 - acquisition of the shares not already owned by the Group in Souza Cruz in Brazil, the acquisition of the CHIC Group in Poland, the acquisition of TDR d.o.o., a cigarette manufacturer in Central Europe. Also in 2015, the Group increased its investment in Reynolds American Inc. by US$4.7 billion to maintain the Group’s approximate 42% equity position following Reynolds American Inc.’s purchase of Lorillard Inc.;
 
 
2016 - acquisition of Ten Motives in the UK;
 
 
2017 - acquisition of the remaining 57.8% of Reynolds American Inc. the Group did not already own. Following completion of the acquisition, Reynolds American Inc. became an indirect, wholly-owned subsidiary of BAT and is no longer a publicly-held corporation. In 2017, the Group also acquired certain tobacco assets from Bulgartabac Holding AD in Bulgaria and Fabrika Duhana Sarajevo (FDS) in Bosnia, acquired Winnington Holdings AB in Sweden and acquired certain assets from Must Have Limited in the UK, including the electronic cigarette brand ViP.
 
 
2018 - acquisition of Quantus Beteiligungs-und Beratungsgesellschaft mbH in Germany;
 
 
2019 - acquisition of the Twisp Propriety Limited in South African and 60% of VapeWild Holdings LLC in the US;
 
 
2020 - acquisition of the nicotine pouch product assets of Dryft Sciences, LLC (Dryft) in the U.S. and the acquisition of Eastern Tobacco Company for Trading in Saudi Arabia;
 
 
2021 - entered into a strategic collaboration agreement with Organigram Inc., a wholly-owned subsidiary of publicly-traded Organigram Holdings Inc., as part of which a Group subsidiary acquired a 19.9% equity stake in Organigram Holdings Inc., being a company focused on research and product development activities of next generation adult cannabis products, with an initial focus on cannabidiol; and
 
 
2021 - disposed of BAT Pars Company PJSC, the Group’s Iranian subsidiary.
British American Tobacco p.l.c. was incorporated in July 1997 under the laws of England and Wales as a public limited company and is domiciled in the United Kingdom.
Seasonality
The Group’s business segments are not significantly affected by seasonality although in certain markets cigarette consumption trends rise during summer months due to longer daylight time and tourism.
Patents and trademarks
Our trademarks, which include the brand names under which our products are sold, are key assets which we consider, in the aggregate, to be important to the business as a whole. As well as protecting our brand names by way of trademark registration, we also protect our innovations by means of patents and designs in key global jurisdictions.
Board oversight of M&A transactions
The Company’s Board has strategic oversight of significant M&A transactions (determined by value or strategic nature of transaction), which are referred to it for noting under the Group Statement of Delegated Authorities (SoDA).
Other M&A transactions are referred for strategic oversight to the Management Board or other applicable senior forum or persons, under the Group SoDA. Those referral requirements under the Group SoDA apply alongside any requirement for corporate approval of M&A transactions by or within a Group company.
 
300
 

Table of Contents
BAT Annual Report and Form 20-F 2021    
 
Strategic Report        
 
Governance Report        
  
Financial Statements        
  
Other Information        


Selected Financial Information
This information set out below has been derived from, in part, the audited consolidated financial statements of the Group commencing on page 178. This selected financial information should be read in conjunction with the consolidated financial statements and the Strategic Report.
 
    
As of and for the Year Ended 31 December
 
All items shown in £m except per share information
  
2021
   
2020
   
2019
   
2018
   
2017
 
Income statement data
          
Revenue
2
  
 
25,684


25,776


25,877


24,492


19,564
 
Raw materials and consumables used
  
 
(4,542
 
 
(4,583
 
 
(4,599
 
 
(4,664
 
 
(4,520
Changes in inventories of finished goods and work in progress
  
 
160


445


162


114


(513
Employee benefit costs
  
 
(2,717
 
 
(2,744
 
 
(3,221
 
 
(3,005
 
 
(2,679
Depreciation, amortisation and impairment costs
  
 
(1,076
 
 
(1,450
 
 
(1,512
 
 
(1,038
 
 
(902
Other operating income
  
 
196


188


163


85


144
 
Loss on reclassification from amortised cost to fair value
  
 
(3
 
 
(3
 
 
(3
 
 
(3


Other operating expenses
  
 
(7,468
 
 
(7,667
 
 
(7,851
 
 
(6,668
 
 
(4,682
Profit from operations
  
 
10,234


9,962


9,016


9,313


6,412
 
Net finance costs
  
 
(1,486
 
 
(1,745
 
 
(1,602
 
 
(1,381
 
 
(1,094
Share of
post-tax
results of associates and joint ventures
  
 
415


455


498


419


24,209
 
Profit before taxation
  
 
9,163


8,672


7,912


8,351


29,527
 
Taxation on ordinary activities
  
 
(2,189
 
 
(2,108
 
 
(2,063
 
 
(2,141
 
 
8,129
 
Profit for the year
  
 
(6,974
 
 
6,564


5,849


6,210


37,656
 
Per share data
          
Basic weighted average number of ordinary shares, in millions
  
 
2,287


2,286


2,284


2,285


2,044
 
Diluted weighted average number of ordinary shares, in millions
  
 
2,297


2,295


2,291


2,292


2,051
 
Earnings per share-basic (pence)
  
 
296.9p


280.0p


249.7p


264.0p


1,833.9p
 
Earnings per share-diluted (pence)
  
 
295.6p


278.9p


249.0p


263.2p


1,827.6p
 
Dividends per share (pence)
3
  
 
217.8p


215.6p


210.4p


203.0p


195.2p
 
Dividends per share (US dollars)
3
  
 
$2.94


$2.99


$2.69


$2.71


$2.54
 
Balance sheet data
          
Assets
          
Non-current
assets
  
 
124,558


124,078


127,731


133,687


127,088
 
Current assets
  
 
12,807


13,612


13,274


12,655


13,966
 
Total assets
  
 
137,365


137,690


141,005


146,342


141,054
 
Liabilities
          
Non-current
liabilities
  
 
54,820


59,257


58,022


64,325


64,468
 
Current liabilities
  
 
15,144


15,478


18,823


16,329


15,605
 
Total borrowings
  
 
39,658


43,968


45,366


47,509


49,450
 
Equity
          
Share capital
  
 
614


614


614


614


614
 
Total equity
  
 
67,401


62,955


64,160


65,688


60,981
 
Cash flow data
          
Net cash generated from operating activities
  
 
9,717


9,786


8,996


10,295


5,347
 
Net cash used in investing activities
  
 
(1,140
 
 
(783
 
 
(639
 
 
(1,021
 
 
(18,544
Net cash (used in)/generated from financing activities
  
 
(8,749
 
 
(7,897
 
 
(8,593
 
 
(9,630
 
 
14,759
 
Notes:
 
1.
All of the information above is in respect of continuing operations, revised for the fully retrospective adoption of IFRS 15.
 
2.
Revenue is net of duty, excise and other taxes of £38,595 million, £39,172 million, £39,826 million, £38,553 million and £37,780 million for the years ended 31 December 2021, 2020, 2019, 2018, and 2017, respectively.
 
3.
In February 2022, the BAT Directors declared an interim dividend of 217.8 pence per share for the year ended 31 December 2021, payable in four equal instalments of 54.45 pence per ordinary share. The interim dividend will be paid to BAT shareholders in May 2022, August 2022, November 2022 and February 2023. The equivalent quarterly dividends receivable by holders of ADSs in US dollars will be calculated based on the exchange rate on the applicable payment date.
 
301


Table of Contents
BAT Annual Report and Form 20-F 2021
Other Information
Non-Financial
Measures


Volume
Volume is defined as the number of units sold. Units may vary between categories. This can be summarised for the principal metrics as follows:
 
 
Factory made cigarettes (FMC) – sticks, regardless of weight or dimensions;
 
 
Roll-Your-Own/Make-Your-Own
– kilos, converted to a stick equivalent based upon 0.8 grams (per stick equivalent) for
Roll-Your-Own
and between 0.5 and 0.7 grams (per stick equivalent) for
Make-Your-Own;
 
 
Traditional oral – pouches (being 1:1 conversion to stick equivalent) and kilos, converted to a stick equivalent based upon 2.8 grams (per stick equivalent) for Moist Snuff, 2.0 grams (per stick equivalent) for Dry Snuff and 7.1 grams (per stick equivalent) for other oral;
 
 
Modern Oral – pouches, being 1:1 conversion to stick equivalent;
 
 
Tobacco Heat sticks – sticks, being 1:1 conversion to stick equivalent; and
 
 
Vapour - pods and 10 millilitre bottles. There is no conversion to a stick equivalent.
Volume is recognised in line with IFRS 15
Revenue from Contracts with Customers
, based upon transfer of control. It is assumed that there is no material difference, in line with the Group’s recognition of revenue, between the transfer of control and shipment date.
Volume is used by management and investors to assess the relative performance of the Group and its brands within categories, given volume is a principal determinant of revenue.
Volume Share
Volume share is the number of units bought by consumers of a specific brand or combination of brands, as a proportion of the total units bought by consumers in the industry, category or other
sub-categorisation.
Sub-categories
include, but are not limited to, the total nicotine category, modern oral, vapour, traditional oral, total oral or cigarette. Except when referencing particular markets, volume share is based on our key markets (representing around 85% of the Group’s cigarette and THP volume).
Where possible, the Group utilises data provided by third-party organisations, including AC Nielsen, based upon retail audit of sales to consumers. In certain markets, where such data is not available, other measures are employed which assess volume share based upon other movements within the supply chain, such as sales to retailers. This may depend on the provision of data to the industry by the customers including distributors/wholesalers.
Volume share is used by management to assess the relative performance to the Group and its brands against the performance of its competitors in the categories and geographies in which the Group operates. This measure is also useful to understand the Group’s performance when seeking to grow scale within a market or category from which future financial returns can be realised. The Group’s management believes that this measure is useful to investors to understand the relative performance of the Group and its brands against the performance of its competitors in the categories and geographies in which the Group operates.
Volume share in each year compares the average volume share in the year with the average volume share in the prior year. This is a more robust measure of performance, removing short-term volatility that may arise at a point in time.
However, in certain circumstances, related to periods of introduction to a market, in order to illustrate the latest performance, data may be provided as at the end of the period rather than the average in that period. In these instances the Group states these are at a specific date (for instance, December 2021).
Value Share
Value share is the retail value of units bought by consumers of a particular brand or combination of brands, as a proportion of the total retail value of units bought by consumers in the industry, category or other
sub-categorisation
in discussion. Except when referencing particular markets, value share is based on our key markets (representing around 90% of the Group’s cigarette and THP value).
Where possible, the Group utilises data provided by third-party organisations, including AC Nielsen, based upon retail audit of sales to consumers. In certain markets, where such data is not available, other measures are employed which assess value share based upon other movements within the supply chain, such as sales to retailers. This may depend on the provision of data to the industry by the customers (including distributors and wholesalers).
Value share is used by management to assess the relative performance of the Group and its brands against the performance of its competitors in the categories and geographies in which the Group operates, specifically indicating the Group’s ability to realise value relative to the market. The measure is particularly useful when the Group’s products and/or the relevant category in the market in which they are sold has developed or achieved scale from which value can be realised. The Group’s management believes that this measure is useful to investors to apprehend the relative performance of the Group and its brands against the performance of its competitors in the categories and geographies in which the Group operates, specifically indicating the Group’s ability to realise value relative to the market.
Value share in each year compares the average value share in the year with the average value share in the prior period. This is a more robust measure of performance, removing short-term volatility that may arise at a point of time. However, in certain circumstances, related to periods of introduction to a market, in order to illustrate the latest performance, data may be provided that is as at the end of the period rather than the average in that period. In these instances the Group states these are at a specific date (for instance, December 2021).
 
302
 

Table of Contents
                 
BAT Annual Report and Form 20-F 2021    
 
Strategic Report        
 
Governance Report        
  
Financial Statements        
  
Other Information        


Price Mix
Price mix is a term used by management and investors to explain the movement in revenue between periods. Revenue is affected by the volume (how many units are sold) and the value (how much is each unit sold for). Price mix is used to explain the value component of the sales as the Group sells each unit for a value (price) but may also achieve a movement in revenue due to the relative proportions of higher value volume sold compared to lower value volume sold (mix).
This term is used to explain the Group’s relative performance between periods only. It is calculated as the difference between the movement in revenue (between periods) and volume (between periods). For instance, the growth in combustibles revenue (excluding translational foreign exchange movements) of 4.0% in 2021, with a decline in combustibles volume of 0.3% in 2021, leads to a price mix of 4.3% in 2021. No assumptions underlie this metric as it utilises the Group’s own data.
Non-Combustible
Consumers
The number of consumers of
Non-Combustible
products is defined as the estimated number of Legal Age (minimum 18 years) consumers of the Group’s
Non-Combustible
products. In markets where regular consumer tracking is in place, this estimate is obtained from adult consumer tracking studies conducted by third parties (including Kantar). In markets where regular consumer tracking is not in place, the number of consumers of
Non-Combustible
products is derived from volume sales of consumables and devices in such markets, using consumption patterns obtained from other similar markets with consumer tracking (utilising studies conducted by third parties including Kantar).
The number of
Non-Combustible
products consumers is used by management to assess the number of consumers regularly using the Group’s New Categories products as the increase in
Non-Combustible
products is a key pillar of the Group’s ESG Ambition and is integral to the sustainability of our business.
The Group’s management believes that this measure is useful to investors given the Group’s ESG ambition and alignment to the sustainability of the business with respect to the
Non-Combustibles
portfolio.
Total weight of unnecessary single use plastics in our packaging
This measure covers packaging for all Group products. We use the definition developed by the UK Plastics Pact for unnecessary
single-use
plastics: “items where consumption could be avoided through elimination, reuse or replacement and items that, post-consumption, commonly do not enter recycling and composting systems, or where they do, are not recycled due to their format, composition or size”. We began reporting on this metric in 2020, so 2019 data is not available.
% of operations sites at zero waste to landfill
Operations sites refers to all
BAT-owned
cigarette manufacturing factories, sites manufacturing other tobacco products, Snus, Modern Oral and liquids and green leaf threshing (GLT) tobacco processing sites. We began reporting on this metric in 2020, so 2019 data is not available.
% of farms monitored for child labour; % of farms with incidents of child labour identified; Number of child labour incidents identified; % reported as resolved by end of the growing season
Data for these measures are collected for our contracted farmers by BAT field technicians (FTs) based on farmer and worker interviews and observations during monthly farm visits. These are recorded and tracked in our FSM system. All child labour data refers to hazardous child labour as defined by the ILO Convention No. 138 on Minimum Age and ILO Convention No. 182 on the Worst Forms of Child Labour. For child labour incidents identified, our leaf operations and third-party suppliers work with the farmer to implement a remediation plan that considers the individual circumstances. Wherever possible, this plan involves local community or school support. Remediation is verified in
follow-up
visits to the farm. If there is a repeat instance, a formal written warning is given to the farmer. In a small number of cases, where there is persistent
non-compliance,
the farmer’s contract is not renewed for the next growing season.
 
303


Table of Contents
BAT Annual Report and Form 20-F 2021
Other Information
Non-GAAP
Measures
 
 
To supplement the presentation of the Group’s results of operations and financial condition in accordance with IFRS, we also present several
non-GAAP
measures used by management to monitor the Group’s performance. The Group’s management regularly reviews the measures used to assess and present the financial performance of the Group and, as relevant, its geographic segments.
Changes to
Non-GAAP
measures in 2021
As reported in 2020, Change in Revenue from Strategic Portfolio at constant rates of exchange ceased to be a KPI and has accordingly been removed as a
non-GAAP
measure. This was replaced as a KPI by Revenue from New Categories at constant rates of exchange, which has already been provided as a
non-GAAP
measure in previous reports.
Adjusted Revenue
Definition – revenue before the impact of adjusting items.
To supplement BAT’s revenue presented in accordance with IFRS, the Group’s Management Board, as the chief operating decision-maker, reviews adjusted revenue to evaluate the underlying business performance of the Group and its geographic segments. The Group’s Management Board defines adjusted revenue as revenue before the impact of adjusting items (specifically the excise on
bought-in
goods that the Group acquired and sold which, for the period 2017 to 2019, has been recorded in accordance with IFRS as a cost of sale and within revenue, with a dilutive effect on operating margin).
In 2021 and 2020, as the short-term arrangements ceased or were immaterial, the goods are manufactured by the Group, and the excise, in accordance with Group policy, is not included in cost of sales or revenue. In 2019, this excise included in revenue led to a reduction in revenue and improvement in operating margin that did not represent the underlying performance of the Group. As such, the excise on
bought-in
goods in 2019 met the Group’s definition of an adjusting item, as defined in note 1 in the Notes on the Accounts.
The Group’s Management Board also believes that adjusted revenue provides information that enables investors to better compare the Group’s business performance across periods. Adjusted revenue has limitations as an analytical tool. The most directly comparable IFRS measure to adjusted revenue is revenue. Adjusted revenue is not a presentation made in accordance with IFRS, and is not a measure of financial condition or liquidity and should not be considered as an alternative to revenue as determined in accordance with IFRS. Adjusted revenue is not necessarily comparable to similarly titled measures used by other companies. As a result, you should not consider this performance measure in isolation from, or as a substitute analysis for, BAT’s results as determined in accordance with IFRS.
The table below reconciles the Group’s revenue to adjusted revenue for the periods presented and to adjusted revenue at constant rates based on a
re-translation
of adjusted revenue for each year at the previous year’s exchange rates. Refer to note 2 in the Notes on the Accounts for further discussion of the segmental results and for the reconciliation of adjusted revenue at current and constant rates of exchange to segmental revenue and to Group revenue for the years ended 31 December 2021, 2020 and 2019.
 
    
For the year ended 31 December (£m)
 
     
2021
    
2020
    
2019
 
Revenue
  
 
25,684


25,776


25,877
 
Less: Excise on goods
bought-in
on short-term arrangements


(50
Adjusted revenue
  
 
25,684


25,776


25,827
 
Impact of translational foreign exchange
  
 
1,877


894


(144
2021 adjusted revenue
re-translated
at 2020 exchange rates
  
 
27,561
 
     
2020 adjusted revenue
re-translated
at 2019 exchange rates
     
 
26,670
 
  
2019 adjusted revenue
re-translated
at 2018 exchange rates


25,683
 
Change in adjusted revenue at prior year’s exchange rates (constant rates)
  
 
+6.9%


+3.3%


+5.6%
 
 
304
 

Table of Contents
BAT Annual Report and Form 20-F 2021    
 
Strategic Report        
 
Governance Report        
  
Financial Statements        
  
Other Information        


Adjusted Revenue by Product Category or Geographic Segment – Including Revenue From New Categories
Definition – revenue by product category, before the impact of adjusting items and at the prior year’s prevailing exchange rate, derived from the principal product categories of Combustibles, New Categories (being comprised of revenue from Vapour, THP and Modern Oral), and Traditional Oral, including by the geographic segments of the United States, Europe and North Africa, Americas and
Sub-Saharan
Africa and Asia-Pacific and Middle East.
To supplement BAT’s revenue presented in accordance with IFRS, the Group’s Management Board, as the chief operating decision-maker, reviews adjusted revenue growth from the principal product categories of combustibles, New Categories and Traditional Oral, including from the geographic segments of the United States, Europe and North Africa, Americas and
Sub-Saharan
Africa and Asia-Pacific and Middle East, to evaluate the underlying business performance of the Group reflecting the focus of the Group’s investment activity. The Group’s Management Board assesses adjusted revenue by product category, including by geographic segment, at constant rates of exchange, as revenue before the impact of adjusting items and translated to the Group’s reporting currency at the prior period’s prevailing exchange rate, derived from the Group’s combustible portfolio (including but not limited to Kent, Dunhill, Lucky Strike, Pall Mall, Rothmans, Camel (U.S.), Newport (U.S.), Natural American Spirit (U.S.)), the Group’s New Category portfolio (being Vapour, THP and Modern Oral) and the Group’s Traditional Oral portfolio and the Group’s operations in the United States, Europe and North Africa, Americas and
Sub-Saharan
Africa and Asia-Pacific and Middle East.
The Group’s Management Board also believes that the adjusted revenue performance by product category, including by geographic segment provides information that enables investors to better compare the Group’s business performance across periods and by reference to the Group’s investment activity. Adjusted revenue by product category, including by geographic segment have limitations as analytical tools. The most directly comparable IFRS measure to adjusted revenue by product category, including by geographic segment, is revenue. Adjusted revenue by product category, including by geographic segment, are not presentations made in accordance with IFRS, are not measures of financial condition or liquidity and should not be considered as alternatives to revenue as determined in accordance with IFRS. Adjusted revenue by product category, including by geographic segment, are not necessarily comparable to similarly titled measures used by other companies. As a result, you should not consider these performance measures in isolation from, or as a substitute analysis for, BAT’s results as determined in accordance with IFRS.
Reconciliation of revenue by product category to adjusted revenue by product category at constant rates
of exchange – 2021- 2020
 
                                                    
2021
                       
2020
 
                                              
Adjusted
                         
                  
   Adjusting
           
Impact of
    
Adjusted
    
   at constant
              
     Adjusting
        
    
Reported
    
   vs 2020
    
items
    
   Adjusted
    
   exchange
    
   at constant
    
vs 2020
       
     Reported
    
items
    
     Adjusted
 
     
£m
    
%
    
£m
    
£m
    
£m
    
£m
    
%
        
£m
    
£m
    
£m
 
Combustible
  
 
22,029


-3.2%


22,029


1,640


23,669


+4.0%


22,752


22,752
 
Vapour
  
 
927


+51.8%


927


46


973


+59.3%


611


611
 
THP
  
 
853


+34.4%


853


74


927


+46.1%


634


634
 
Modern Oral
  
 
274


+38.8%


274


4


278


+40.6%


198


198
 
New Categories
  
 
2,054


+42.4%


2,054


124


2,178


+50.9%


1,443


1,443
 
Traditional Oral
  
 
1,118


-3.6%


1,118


77


1,195


+3.0%


1,160


1,160
 
Other
  
 
483


+14.7%


483


36


519


+23.1%


421


421
 
Revenue
  
 
25,684


-0.4%


25,684


1,877


27,561


+6.9%


25,776


25,776
 
Reconciliation of revenue by product category to adjusted revenue by product category at constant rates
of exchange – 2020- 2019
 
                                                    
2020
                         
2019
 
                                              
Adjusted
                           
                  
    Adjusting
           
Impact of
    
Adjusted
    
  at constant
                 
     Adjusting
       
    
Reported
    
  vs 2019
    
items
    
    Adjusted
    
    exchange
    
   at constant
    
vs 2019
          
    Reported
    
items
   
     Adjusted
 
     
£m
    
%
    
£m
    
£m
    
£m
    
£m
    
%
           
£m
    
£m
   
£m
 
Combustible
  
 
22,752


-1.1%


22,752


842


23,594


+2.8%


23,001


(50
 
 
22,951
 
Vapour
  
 
611


+52.3%


611


4


615


+53.4%


401


401
 
THP
  
 
634


-12.9%


634


2


636


-12.7%


728


728
 
Modern Oral
  
 
198


  +57.1%


198


198


+57.1%


126


126
 
New Categories
  
 
1,443


+14.9%


1,443


6


1,449


+15.4%


1,255


1,255
 
Traditional Oral
  
 
1,160


+7.2%


1,160


5


1,165


+7.7%


1,081


1,081
 
Other
  
 
421


-21.7%


421


41


462


-14.4%


540


540
 
Revenue
  
 
25,776


-0.4%


25,776


894


26,670


+3.3%


25,877


(50
 
 
25,827
 
 
305


Table of Contents
BAT Annual Report and Form 20-F 2021
Other Information
Non-GAAP
Measures
Continued
    
 
Reconciliation of revenue by product category to adjusted revenue by product category at constant rates of exchange
 
                                                    
2021
                          
2020
 
                                              
Adjusted
                            
                  
  Adjusting
           
Impact of
    
Adjusted
    
  at constant
                 
     Adjusting
        
    
Reported
    
  vs 2020
    
items
    
  Adjusted
    
  exchange
    
  at constant
    
vs 2020
          
    Reported
    
items
    
     Adjusted
 
U.S.
  
£m
    
%
    
£m
    
£m
    
£m
    
£m
    
%
           
£m
    
£m
    
£m
 
Combustible
  
 
10,015


+0.9%


10,015


719


10,734


+8.1%


9,926


9,926
 
Vapour
  
 
561


+46.4%


561


40


601


+56.9%


383


383
 
THP
  
 
1


-21.8%


1


1


-16.2%


1


1
 
Modern Oral
  
 
2


-81.5%


2


2


-80.1%


10


10
 
New Categories
  
 
564


+43.0%


564


40


604


+53.3%


394


394
 
Traditional Oral
  
 
1,077


-4.3%


1,077


78


1,155


+2.6%


1,126


1,126
 
Other
  
 
35


+26.9%


35


2


37


+36.0%


27


27
 
Revenue
  
 
11,691


+1.9%


11,691


839


12,530


+9.2%


11,473


11,473


2020
                          
2019
 
                                              
Adjusted


 Adjusting
           
Impact of
    
Adjusted
    
    at constant
                 
     Adjusting
        
    
Reported
    
   vs 2019
    
items
    
   Adjusted
    
   exchange
    
   at constant
    
vs 2019
          
    Reported
    
items
    
     Adjusted
 
U.S.
  
£m
    
%
    
£m
    
£m
    
£m
    
£m
    
%
           
£m
    
£m
    
£m
 
Combustible
  
 
9,926


+9.3%


9,926


54


9,980


+9.9%


9,078


9,078
 
Vapour
  
 
383


+85.1%


383


2


385


+86.1%


207


207
 
THP
  
 
1


+0.0%


1


1


+0.5%


1


1
 
Modern Oral
  
 
10


+13.5%


10


10


+14.1%


9


9
 
New Categories
  
 
394


+81.9%


394


2


396


+82.9%


217


217
 
Traditional Oral
  
 
1,126


+7.0%


1,126


5


1,131


+7.6%


1,052


1,052
 
Other
  
 
27


+4.6%


27


2


29


+5.1%


26


26
 
Revenue
  
 
11,473


+10.6%


11,473


63


11,536


+11.2%


10,373


10,373


2021
                          
2020
 
                                              
Adjusted
                            
                  
  Adjusting
           
Impact of
    
Adjusted
    
  at constant
                 
     Adjusting
        
    
Reported
    
  vs 2020
    
items
    
  Adjusted
    
  exchange
    
  at constant
    
vs 2020
          
    Reported
    
items
    
     Adjusted
 
AMSSA
  
£m
    
%
    
£m
    
£m
    
£m
    
£m
    
%
           
£m
    
£m
    
£m
 
Combustible
  
 
3,435


-2.8%


3,435


244


3,679


+4.1%


3,535


3,535
 
Vapour
  
 
141


+115%


141


141


+115%


65


65
 
THP


Modern Oral


-100%


-100%


1


1
 
New Categories
  
 
141


+114%


141


141


+114%


66


66
 
Traditional Oral


Other
  
 
225


+32.3%


225


22


247


+44.7%


171


171
 
Revenue
  
 
3,801


+0.8%


3,801


266


4,067


+7.8%


3,772


3,772


2020
                          
2019
 
                                             
Adjusted


 Adjusting
           
Impact of
   
Adjusted
    
    at constant
                 
     Adjusting
        
    
Reported
    
   vs 2019
    
items
    
    Adjusted
    
   exchange
   
   at constant
    
vs 2019
          
    Reported
    
items
    
     Adjusted
 
AMSSA
  
£m
    
%
    
£m
    
£m
    
£m
   
£m
    
%
           
£m
    
£m
    
£m
 
Combustible
  
 
3,535


-11.4%


3,535


508


4,043


+1.3%


3,992


3,992
 
Vapour
  
 
65


+52.8%


65


3


68


+58.6%


43


43
 
THP


Modern Oral
  
 
1


-49.8%


1


(1


-47.3%


1


1
 
New Categories
  
 
66


+51.3%


66


2


68


+57.1%


44


44
 
Traditional Oral


Other
  
 
171


-24.3%


171


39


210


-7.2%


225


225
 
Revenue
  
 
3,772


-11.5%


3,772


549


4,321


+1.4%


4,261


4,261
 
 
306
 

Table of Contents
BAT Annual Report and Form 20-F 2021    
 
Strategic Report        
 
Governance Report        
  
Financial Statements        
  
Other Information        


Reconciliation of revenue by product category to adjusted revenue by product category at constant rates of exchange
 
                                                    
2021
                          
2020
 
                                              
Adjusted
                            
                  
Adjusting
           
Impact of
    
Adjusted
    
at constant
                 
Adjusting
        
    
Reported
    
vs 2020
    
items
    
Adjusted
    
exchange
    
at constant
    
vs 2020
          
Reported
    
items
    
Adjusted
 
APME
  
£m
    
%
    
£m
    
£m
    
£m
    
£m
    
%
           
£m
    
£m
    
£m
 
Combustible
  
 
3,555


-9.6%


3,555


287


3,842


-2.3%


3,935


3,935
 
Vapour
  
 
18


+26.0%


18


1


19


+27.5%


15


15
 
THP
  
 
511


+2.8%


511


51


562


+13.0%


497


497
 
Modern Oral
  
 
6


+179%


6


1


7


+199%


2


2
 
New Categories
  
 
535


+4.2%


535


53


588


+14.2%


514


514
 
Traditional Oral


Other
  
 
101


+13.0%


101


4


105


+20.1%


88


88
 
Revenue
  
 
4,191


-7.6%


4,191


344


4,535


0.0%


4,537


4,537


2020
                          
2019
 
                                             
Adjusted
                            
                  
  Adjusting
           
Impact of
   
Adjusted
    
at constant
                 
Adjusting
        
    
Reported
    
  vs 2019
    
items
    
  Adjusted
    
exchange
   
    at constant
    
vs 2019
          
Reported
    
items
    
Adjusted
 
APME
  
£m
    
%
    
£m
    
£m
    
£m
   
£m
    
%
           
£m
    
£m
    
£m
 
Combustible
  
 
3,935


-10.3%


3,935


113


4,048


-7.7%


4,387


4,387
 
Vapour
  
 
15


+255%


15


15


+260%


4


4
 
THP
  
 
497


-26.0%


497


(7
 
 
490


-27.1%


671


671
 
Modern Oral
  
 
2


n/m


2


2


n/m


New Categories
  
 
514


-24.0%


514


(7
 
 
507


-25.0%


675


675
 
Traditional Oral


Other
  
 
88


-1.3%


88


1


89


-0.4%


91


91
 
Revenue
  
 
4,537


-11.9%


4,537


107


4,644


-9.9%


5,153


5,153


2021
                          
2020
 
                                             
Adjusted
                            
                  
Adjusting
           
Impact of
   
Adjusted
    
at constant
                 
Adjusting
        
    
Reported
    
vs 2020
    
items
    
Adjusted
    
exchange
   
at constant
    
vs 2020
          
Reported
    
items
    
Adjusted
 
ENA
  
£m
    
%
    
£m
    
£m
    
£m
   
£m
    
%
           
£m
    
£m
    
£m
 
Combustible
  
 
5,024


-6.2%


5,024


390


5,414


+1.1%


5,356


5,356
 
Vapour
  
 
207


+40.2%


207


5


212


+43.8%


148


148
 
THP
  
 
341


+150%


341


23


364


+167%


136


136
 
Modern Oral
  
 
266


+43.9%


266


3


269


+45.6%


185


185
 
New Categories
  
 
814


+73.6%


814


31


845


+80.3%


469


469
 
Traditional Oral
  
 
41


+18.2%


41


(1
 
 
40


+18.1%


34


34
 
Other
  
 
122


-8.9%


122


8


130


-4.9%


135


135
 
Revenue
  
 
6,001


+0.1%


6,001


428


6,429


+7.3%


5,994


5,994


2020
                         
2019
 
                                             
Adjusted
                           
                  
  Adjusting
           
Impact of
   
Adjusted
    
at constant
                 
Adjusting
       
    
Reported
    
  vs 2019
    
items
    
Adjusted
    
exchange
   
    at constant
    
vs 2019
          
Reported
    
items
   
Adjusted
 
ENA
  
£m
    
%
    
£m
    
£m
    
£m
   
£m
    
%
           
£m
    
£m
   
£m
 
Combustible
  
 
5,356


-3.4%


5,356


167


5,523


+0.5%


5,544


(50
 
 
5,494
 
Vapour
  
 
148


+0.4%


148


(1
 
 
147


+0.2%


147


147
 
THP
  
 
136


+143%


136


9


145


+159%


56


56
 
Modern Oral
  
 
185


+58.5%


185


1


186


+59.3%


116


116
 
New Categories
  
 
469


+46.7%


469


9


478


+49.6%


319


319
 
Traditional Oral
  
 
34


+16.2%


34


34


+14.2%


29


29
 
Other
  
 
135


-31.6%


135


(1
 
 
134


-31.7%


198


198
 
Revenue
  
 
5,994


-1.6%


5,994


175


6,169


+2.1%


6,090


(50
 
 
6,040
 
 
307


Table of Contents
BAT Annual Report and Form 20-F 2021
Other Information
Non-GAAP
Measures
Continued
    
 
Adjusted Profit From Operations and Adjusted Operating Margin
Definition – profit from operations before the impact of adjusting items and adjusted profit from operations as a percentage of adjusted revenue.
To supplement BAT’s results from operations presented in accordance with IFRS, the Group’s Management Board, as the chief operating decision-maker, reviews adjusted profit from operations to evaluate the underlying business performance of the Group and its geographic segments, to allocate resources to the overall business and to communicate financial performance to investors. The Group also presents adjusted operating margin, which is defined as adjusted profit from operations as a percentage of adjusted revenue, as defined previously. Adjusted profit from operations and adjusted operating margin are not measures defined by IFRS. The most directly comparable IFRS measure to adjusted profit from operations is profit from operations.
Adjusting items, as identified in accordance with the Group’s accounting policies, represent certain items of income and expense which the Group considers distinctive based on their size, nature or incidence. In identifying and quantifying adjusting items, the Group consistently applies a policy that defines criteria that are required to be met for an item to be classified as adjusting and provides details of items that are specifically excluded from being classified as adjusting items. Adjusting items in profit from operations include restructuring and integration costs, amortisation of trademarks and similar intangibles, impairment of goodwill and charges in respect of certain litigation. The definition of adjusting items is explained in note 1 in the Notes on the Accounts.
The Group’s Management Board believes that these additional measures are useful to investors and are used by the Group’s Management Board as described above, because they exclude the impact of adjusting items which have less bearing on the routine ongoing operating activities of the Group, thereby enhancing users’ understanding of underlying business performance. The Group’s Management Board also believes that adjusted profit from operations provides information that enables investors to better compare the Group’s business performance across periods. Additionally, the Group’s Management Board believes that similar measures are frequently used by securities analysts, investors and other interested parties in their evaluation of companies comparable to the Group, many of which present an adjusted operating profit-related performance measure when reporting their results. Adjusted profit from operations and adjusted operating margin have limitations as analytical tools. They are not presentations made in accordance with IFRS, are not measures of financial condition or liquidity and should not be considered as alternatives to profit for the year, profit from operations or operating margin as determined in accordance with IFRS. Adjusted profit from operations and adjusted operating margin are not necessarily comparable to similarly titled measures used by other companies. As a result, you should not consider these performance measures in isolation from, or as a substitute analysis for, BAT’s results of operations as determined in accordance with IFRS.
The table below reconciles the Group’s profit from operations to adjusted profit from operations, and to adjusted profit from operations at constant rates based on a
re-translation
of adjusted profit from operations for each year, at the previous year’s exchange rates, and provides adjusted operating margin for the periods presented. Refer to note 2 in the Notes on the Accounts for further discussion of the segmental results and for the reconciliation of adjusted profit from operations at current and constant rates of exchange to segmental profit from operations and to Group profit for the years ended 31 December 2021, 2020 and 2019.


For the year ended 31 December (£m)
 
     
2021
   
2020
   
2019
 
Profit from operations
  
 
10,234


9,962


9,016
 
Add:
      
Restructuring and integration costs
  
 
150


408


565
 
Amortisation and impairment of trademarks and similar intangibles
  
 
306


339


481
 
Impairment of goodwill
  
 
57


209


194
 
(Income)/charge in respect of an excise tax dispute in Russia


(40
 
 
202
 
Charge in respect of Canada class action


436
 
Charge in respect of MSA liabilities related to brands sold to a third party


400


Credit in respect of the partial
buy-out
of the pension fund in the U.S.
  
 
(35


Charge in respect of the sale of the Group’s operations in Iran
  
 
358


Other, including litigation
  
 
80


87


236
 
Adjusted profit from operations
  
 
11,150


11,365


11,130
 
Operating margin
  
 
39.8%


38.6%


34.8%
 
Adjusted operating margin*
  
 
43.4%


44.1%


43.1%
 
Impact of translational foreign exchange
  
 
802


296


(98
2021 adjusted profit from operations
re-translated
at 2020 exchange rates
  
 
11,952
 
   
2020 adjusted profit from operations
re-translated
at 2019 exchange rates
    
 
11,661
 
 
2019 adjusted profit from operations
re-translated
at 2018 exchange rates
      
 
11,032
 
Change in adjusted profit from operations at prior year’s exchange rates (constant rates)
  
 
+5.2%


+4.8%


+6.6%
 
 
*
Adjusted profit from operations as a percentage of adjusted revenue.
 
308
 

Table of Contents
                 
BAT Annual Report and Form 20-F 2021    
 
Strategic Report        
 
Governance Report        
  
Financial Statements        
  
Other Information        


Adjusted Share of
Post-Tax
Results of Associates and Joint Ventures
Definition – share of
post-tax
results of associates and joint ventures before the impact of adjusting items.
To supplement BAT’s performance presented in accordance with IFRS, the Group’s share of
post-tax
results of associates and joint ventures is also presented before adjusting items (as defined in note 1 in the Notes on the Accounts). The Group’s Management Board believes that adjusted share of
post-tax
results of associates and joint ventures provides information that enables investors to better compare the Group’s business performance across periods. The Group’s Management Board uses adjusted share of
post-tax
results from associates and joint ventures as part of the total assessment of the underlying performance of all the Group’s business interests. Adjusted share of
post-tax
results of associates and joint ventures has limitations as an analytical tool. It is not a presentation made in accordance with IFRS, is not a measure of financial condition or liquidity, and should not be considered as an alternative to the Group’s share of
post-tax
results of associates and joint ventures as determined in accordance with IFRS. Adjusted share of
post-tax
results of associates and joint ventures is not necessarily comparable to similarly titled measures used by other companies. As a result, you should not consider this performance measure in isolation from, or as a substitute analysis for, BAT’s results of operations as determined in accordance with IFRS.
The most directly comparable IFRS measure to adjusted share of
post-tax
results of associates and joint ventures is share of
post-tax
results of associates and joint ventures.


For the year ended 31 December (£m)
 
     
2021
   
2020
   
2019
 
Group’s share of
post-tax
results of associates and joint ventures
  
 
415


455


498
 
Issue of shares and changes in shareholding
  
 
(6
 
 
(17
 
 
(25
Impairment of the Group’s associate in Yemen
  
 
18


Other


4


Adjusted Group’s share of
post-tax
results of associates and joint ventures
  
 
427


442


473
 
Underlying Tax Rate
Definition – Tax rate incurred before the impact of adjusting items and to adjust for the inclusion of the Group’s share of
post-tax
results of associates and joint ventures within the Group’s
pre-tax
results.
BAT management monitors the Group’s underlying tax rate to assess the tax rate applicable to the Group’s underlying operations, excluding the Group’s share of
post-tax
results of associates and joint ventures in BAT’s
pre-tax
results and adjusting items (as defined in note 1 in the Notes on the Accounts). Underlying tax rate is not a measure defined by IFRS. The table below provides the calculation of the Group’s effective tax rate as determined in accordance with IFRS with underlying tax rate for the periods presented. The Group’s Management Board believes that this additional measure is useful to investors, and is used by BAT management as described above, because it excludes the contribution from the Group’s associates, recognised after tax but within the Group’s
pre-tax
profits, and adjusting items, thereby enhancing users’ understanding of underlying business performance.
Underlying tax rate has limitations as an analytical tool. It is not a presentation made in accordance with IFRS and should not be considered as an alternative to the effective tax rate as determined in accordance with IFRS. Underlying tax rate is not necessarily comparable to similarly titled measures used by other companies. As a result, you should not consider this measure in isolation from, or as a substitute analysis for, the Group’s effective tax rate as determined in accordance with IFRS. The table below provides the calculation of the Group’s underlying tax rate for the periods presented.


            For the year ended 31 December (£m)
 
     
2021
   
2020
   
2019
 
Profit before taxation
  
 
9,163


8,672


7,912
 
Less: Share of
post-tax
results of associates and joint ventures
  
 
(415
 
 
(455
 
 
(498
Adjusting items within profit from operations
  
 
916


1,403


2,114
 
Adjusting items within finance costs
  
 
55


153


80
 
Adjusted profit before taxation, excluding associates and joint ventures
  
 
9,719


9,773


9,608
 
Taxation on ordinary activities
  
 
(2,189
 
 
(2,108
 
 
(2,063
Adjusting items in taxation
  
 
(91
 
 
(35
 
 
(65
Taxation on adjusting items
  
 
(119
 
 
(287
 
 
(373
Adjusted taxation
  
 
(2,399
 
 
     (2,430
 
 
     (2,501
Effective tax rate
  
 
23.9%


24.3%


26.1%
 
Underlying tax rate
  
 
24.7%


24.9%


26.0%


309


Table of Contents
BAT Annual Report and Form 20-F 2021
Other Information
Non-GAAP
Measures
Continued
    
 
Adjusted Diluted Earnings Per Share
Definition – diluted earnings per share before the impact of adjusting items.
BAT management monitors adjusted diluted earnings per share, a measure which removes the impact of adjusting items, (as defined in note 1 in the Notes on the Accounts), from diluted earnings per share. Adjusted diluted earnings per share is used by management within the Group’s incentive schemes, as reported within the Remuneration Report beginning on page 128 and reported in note 11 in the Notes on the Accounts. The Group’s Management Board believes that this additional measure is useful to investors, and is used by BAT management as described above, as an indicator of diluted earnings per share before adjusting items. Adjusted diluted earnings per share has limitations as an analytical tool and should not be used in isolation from, or as a substitute for, diluted earnings per share as determined in accordance with IFRS. The most directly comparable IFRS measure to adjusted diluted earnings per share is diluted earnings per share and a reconciliation is provided in note 11 in the Notes on the Accounts. The definition of adjusting items is provided in note 1 in the Notes on the Accounts.
Operating Cash Flow Conversion Ratio
Definition – net cash generated from operating activities before the impact of adjusting items and dividends from associates and excluding trading loans to third parties, pension short fall funding, taxes paid and net capital expenditure, as a proportion of adjusted profit from operations.
 
310
 

Table of Contents
BAT Annual Report and Form 20-F 2021    
 
Strategic Report        
 
Governance Report        
  
Financial Statements        
  
Other Information        


Net Debt
Definition – total borrowings, including related derivatives, less cash and cash equivalents and current investments held at fair value.
The Group uses net debt to assess its financial capacity. Net debt is not a measure defined by IFRS. The most directly comparable IFRS measure to net debt is total borrowings. The Group’s Management Board believes that this additional measure, which is used internally to assess the Group’s financial capacity, is useful to the users of the financial statements in helping them to see how business financing has changed over the year. Net debt has limitations as an analytical tool. It is not a presentation made in accordance with IFRS and should not be considered as an alternative to total borrowings or total liabilities determined in accordance with IFRS. Net debt is not necessarily comparable to similarly titled measures used by other companies. In addition, it does not exclude restricted cash (as set out in note 21 in the Notes on the Accounts) in the calculation. As a result, you should not consider this measure in isolation from, or as a substitute analysis for, the Group’s measures of financial position or liquidity as determined in accordance with IFRS. A reconciliation of borrowings to net debt is provided in note 23 in the Notes on the Accounts.
 
311


Table of Contents
BAT Annual Report and Form 20-F 2021
Other Information
Non-GAAP
Measures
Continued
 
Adjusted Net Debt to Adjusted Earnings Before Interest, Tax, Depreciation and Amortisation (Adjusted EBITDA)
Definition – net debt excluding the impact of the revaluation of Reynolds American Inc. acquired debt arising as part of the purchase price allocation process, as a proportion of profit for the year (earnings) before net finance costs/income, taxation on ordinary activities, depreciation, amortisation, impairment costs, the Group’s share of
post-tax
results of associates and joint ventures, and other adjusting items.
 
312
 

Table of Contents
BAT Annual Report and Form 20-F 2021    
 
Strategic Report        
 
Governance Report        
  
Financial Statements        
  
Other Information        


Results on a Constant Translational Currency Basis
Movements in foreign exchange rates have impacted the Group’s financial results. The Group’s Management Board reviews certain of its results, including adjusted revenue, revenue growth from New Categories, adjusted profit from operations and adjusted diluted earnings per share, at constant rates of exchange. The Group calculates these financial measures at constant rates of exchange based on a
re-translation,
at prior year exchange rates, of the current year’s results of the Group and, where applicable, its geographic segments. The Group does not adjust for the normal transactional gains and losses in profit from operations that are generated by exchange movements. Although the Group does not believe that these measures are a substitute for IFRS measures, the Group’s Management Board does believe that such results excluding the impact of currency fluctuations
year-on-year
provide additional useful information to investors regarding the Group’s operating performance on a local currency basis. Accordingly, the constant rates of exchange financial measures appearing in the discussion of the Group results of operations (beginning on page 74) should be read in conjunction with the information provided in note 2 in the Notes on the Accounts.
In 2021, 2020 and 2019, results were affected by translational exchange rate movements. In 2021, at the prevailing exchange rates, adjusted revenue declined by 0.4%, revenue growth from New Categories increased 42.4% and adjusted profit from operations declined by 1.9% versus 2020. At constant rates of exchange, adjusted revenue would have increased by 6.9%, revenue from New Categories would have increased by 50.9% and adjusted profit from operations would have increased by 5.2%. This lower growth rate at prevailing exchange rates reflects the negative translational impact as a result of the relative strengthening of the pound sterling. In 2020, at the prevailing exchange rates, adjusted revenue declined by 0.4%, adjusted profit from operations increased by 2.1%, adjusted revenue from the strategic portfolio increased by 4.0% and adjusted revenue from New Categories increased by 14.9% versus 2019. At constant rates of exchange, adjusted revenue would have increased by 3.3%, adjusted profit from operations would have increased by 4.8%, adjusted revenue from the strategic portfolio would have increased by 7.0% and adjusted revenue from New Categories would have increased by 15.4%. This lower growth rate at prevailing exchange rates reflects the negative translational impact as a result of the relative strengthening of the pound sterling.
In 2021, 2020 and 2019, adjusted diluted earnings per share was affected by translational exchange rate movements. In 2021, the adjusted diluted earnings per share of 329.0p, a decrease of 0.8%, would, when translated at 2020 exchange rates, have been 353.5p, an increase of 6.6%. This lower growth rate, in 2021, at prevailing exchange rates, reflects the negative translational impact as a result of the relative strength of the pound sterling. In 2020, the adjusted diluted earnings per share of 331.7p, an increase of 2.4%, would, when translated at 2019 exchange rates, have been 341.4p, an increase of 5.5%. This lower growth rate, in 2020, at prevailing exchange rates, reflects the negative translational impact as a result of the relative strength of the pound sterling.
 
313


Table of Contents
BAT Annual Report and Form 20-F 2021
Other Information
Employees


As at 31 December 2021, the number of persons employed by the Group was 52,050 worldwide. The Group believes that its labour relations are good.
Certain temporary employees are included in the below figures. The number of such temporary employees is approximately 241 in 2021 and largely relates to seasonal workers within operations.
The following table sets forth the number of Group employees by region in 2021, 2020 and 2019.
 
    
As of 31 December
 
Region (number of employees worldwide)
  
2021
    
2020
    
2019
 
U.S.
  
 
4,405


4,921


5,020
 
APME
  
 
9,747


10,750


13,465
 
AmSSA
  
 
15,565


15,873


16,862
 
ENA
1
  
 
22,333


23,785


24,642
 
Total employees
  
 
    52,050


    55,329


    59,989
 
Note:
 
1.
Included within the employee numbers for ENA are certain employees in different locations in respect of central functions. Some of the costs of these employees are allocated or charged to the various regions and markets in the Group.
 
314
 

Table of Contents
BAT Annual Report and Form 20-F 2021    
 
Strategic Report        
 
Governance Report        
  
Financial Statements        
  
Other Information        


Additional Disclosures on
Liquidity and Capital Resources
The Group’s cash inflows derive principally from its operating activities. They are supplemented when required by cash flows from financing activities, typically to support general corporate requirements but also, from time to time, to support acquisitions. The principal sources of liquidity for the Group are cash flows generated from the operating business and proceeds from issuances of debt securities described below under ‘capital resources’.
The Board reviews and agrees the overall treasury policies and procedures, delegating appropriate oversight to the Finance and Transformation Director and the treasury function. The treasury policies include a set of financing principles and key performance indicators. The Group’s treasury position is monitored by a Corporate Finance Committee chaired by the Finance and Transformation Director. Treasury operations are subject to periodic independent reviews and audits, both internal and external.
In 2021, 2020 and 2019, all contractual borrowing covenants were met and none are expected to inhibit the Group’s operations or funding plans. In 2020, the Group’s financial covenant (interest cover) was removed from the terms of the revolving credit facility and syndicated term loan.
Capital Expenditure
Gross capital expenditures include purchases of property, plant and equipment and purchases of certain intangibles. The Group’s gross capital expenditures for 2021, 2020 and 2019 were £664 million, £648 million and £807 million, respectively, representing investment in the Group’s global operational infrastructure (including, but not limited to, the manufacturing network, trade marketing and IT systems). The Group expects gross capital expenditures in 2022 of approximately £750 million, representing the ongoing investment in the Group’s operational infrastructure, including the continued investment into New Categories. This is expected to be funded by the Group’s cash flows and existing facilities.
Hedging Instruments
As discussed in note 23 in the Notes on the Accounts, the Group hedges its exposure to interest rate movements and currency movements. BAT’s cash flow hedges are principally in respect of sales or purchases of inventory and certain debt instruments. A certain number of forward foreign currency contracts were used to manage the currency profile of external borrowings. Interest rate swaps have been used to manage the interest rate profile of external borrowings, while cross-currency swaps have been used to manage the currency profile of external borrowings.
Capital Resources
Policy
The Group utilises cash pooling and zero balancing bank account structures in addition to intercompany loans and borrowings to ensure that there is the maximum mobilisation of cash within the Group. The key objectives of treasury in respect of cash and cash equivalents are to protect the principal value of the Group’s cash and cash equivalents, to concentrate cash at the centre to minimise the required long-term debt issuance, including perpetual hybrid debt treated as an equity instrument, and to optimise the yield earned. The amount of debt the Group issues is determined by forecasting the net debt requirement after the mobilisation of cash. Subsidiary companies are funded by share capital and retained earnings, loans from the central finance companies on commercial terms or through local borrowings by the subsidiaries in appropriate currencies. All contractual borrowing covenants have been met and none are expected to inhibit the Group’s operations or funding plans.
Borrowings
The following table sets out the Group’s long- and short-term borrowings as of the dates indicated:
 
                   
As of 31 December (£m)
1
 
     
Currency
  
Maturity dates
  
Interest rates at 31 December 2021
  
2021
    
2020
    
2019
 
Eurobonds
2
  
Euro
  
2022 to 2045        
  
0.9% to 3.1%
  
 
7,316


8,875


7,591
 
  
Euro
  
2021
  
3m EURIBOR +50bps


984


931
 
  
UK pound sterling        
  
2022 to 2055
  
2.1% to 7.3%
  
 
4,086


4,590


4,161
 
  
Swiss franc
  
2026
  
1.4%
  
 
203


540


510
 
Bonds issued pursuant to rules under the
                 
U.S. Securities Act (as amended)
2
  
US dollar
  
2022 to 2050
  
1.7% to 8.1%
  
 
25,625


25,461


23,805
 
  
US dollar
  
2022
  
USD 3m LIBOR + 88bps
  
 
554


548


1,325
 
Commercial Paper
2
           
 
269


1,056
 
Other loans
           
 
500


1,929


4,624
 
Bank loans
           
 
313


317


293
 
Bank overdrafts
           
 
346


249


491
 
Finance leases
                 
 
446


475


579
 
Total
                 
 
39,658


43,968


45,366
 
Notes
:
 
1.
The financial data above has been extracted from the Group’s consolidated financial statements.
 
2.
The issuers of these debt securities are B.A.T. International Finance p.l.c., B.A.T Capital Corporation, Reynolds American Inc., or R.J. Reynolds Tobacco Company, as applicable. British American Tobacco p.l.c. is the ultimate guarantor in each case.
Perpetual hybrid bonds issued by the Company have been classified as equity and therefore excluded from borrowings.
 
315


Table of Contents
BAT Annual Report and Form 20-F 2021
Other Information
Additional Disclosures on
Liquidity and Capital Resources
Continued


Off-Balance
Sheet Arrangements and Contractual Obligations
The Group has no significant
off-balance
sheet arrangements. The Group has contractual obligations to make future payments on debt agreements. In the normal course of business, the Group enters into contractual arrangements where the Group commits to future purchases of services from unaffiliated parties and related parties.
The Group’s undiscounted contractual obligations as of 31 December 2021 were as follows:


Payments due by period (£m)
 
     
Total
    
Less than
1 Year
    
1–3 Years
    
3–5 Years
    
Thereafter
 
Long-term notes and other borrowings, exclusive of interest
1
  
 
38,752


3,406


6,178


6,742


22,426
 
Interest payments related to long-term notes
1
  
 
460


460


Lease liabilities
  
 
446


126


159


87


74
 
Purchase obligations
2
  
 
1,160


943


207


10


Total cash obligations
  
 
40,818


4,935


6,544


6,839


22,500
 
Notes:
 
1.
For more information about the Group’s long-term debt, see note 23 in the Notes on the Accounts.
 
2.
Purchase obligations primarily include commitments to acquire tobacco leaf. Purchase orders for the purchase of other raw materials and other goods and services are not included in the table, as the Group’s operating subsidiaries are not able to determine the aggregate amount of such purchase orders that represent contractual obligations, as purchase orders typically represent authorisations to purchase rather than binding agreements.
The table above does not include any amounts that the Group may pay to fund its retirement benefit plans as the timing and amount of any such future funding are unknown and dependent on, among other things, the future performance of defined benefit pension plan assets, interest rate assumptions and other factors. The net retirement benefit scheme liabilities totalled £321 million as of 31 December 2021, which is net of pension assets of £10,816 million. The Group expects to be required to contribute £83 million to its defined benefit plans during 2022. See note 15 in the Notes on the Accounts for further information.
The above table also excludes any amounts in relation to service contracts which are disclosed in note 31 in the Notes on the Accounts.
 
316
 

Table of Contents
                 
BAT Annual Report and Form 20-F 2021    
 
Strategic Report        
 
Governance Report        
  
Financial Statements        
  
Other Information        
         
 
Other Information
Summary of Group Risk Factors


The following is a summary of some of the risks and uncertainties, the occurrence of any one of which, alone or in combination with other events or circumstances, may materially adversely affect the Group’s results of operations and financial condition. You should read this summary together with the ‘Group Principal Risks’ section on pages 84 to 88 and the more detailed description of each risk factor contained below.
Business execution and supply chain risks


Competition from illicit trade.
 
 
Geopolitical tensions that have the potential to disrupt the Group’s business in multiple markets.
 
 
Disruption to the Group’s data and information technology systems, including by cyber attack or the malicious manipulation or disclosure of confidential or sensitive information.
 
 
Failure to meet current or future New Categories demand.
 
 
Failure of a financial counterparty.
 
 
Exposure to unavailability of, and price volatility, in raw materials and increased costs of employment.
 
 
Failure to retain key personnel or to attract and retain skilled talent.
 
 
Disruption to the supply chain and distribution channels.
 
 
Failure to deliver digital innovation and drive digital transformation.
 
 
Exposure to product contamination.
 
 
Inability to obtain adequate supplies of tobacco leaf.
 
 
Failure to successfully design, implement and sustain an integrated operating model.
 
 
Failure to uphold the high standard of ESG management.
 
 
Failure to manage the Group’s climate change risk.
 
 
Impact of a pandemic on the performance of the Group.
 
 
Legal, regulatory and compliance risks
 
 
Exposure to, the enactment of, proposals for, or rumours of regulation that significantly impairs the Group’s ability to communicate, differentiate, market or launch its products and/or the lack of appropriate regulation for New Categories.
 
 
Adverse implications of proposed EU legislation on
single-use
plastics that will result in
on-pack
environmental warnings and financial implications relating to the Extended Producer Responsibility (EPR).
 
 
Exposure to litigation on tobacco, nicotine, New Categories and other issues.
 
 
Significant and/or unexpected increases or structural changes in tobacco and nicotine-related taxes.
 
 
Failure to comply with health and safety and environmental laws.
 
 
Exposure to unfavourable tax rulings.
 
 
Unexpected legislative changes to corporate income tax laws.
 
 
Exposure to potential liability under competition or antitrust laws.
 
 
Failure to establish and maintain adequate controls and procedures to comply with applicable securities, corporate governance and compliance regulations.
 
 
Loss of confidential information, including through manipulation of data by employees and system failure.
 
 
Failure to comply with product regulations due to uncertainty surrounding the proper interpretation and application of those regulations.
 
 
Failure to uphold high standards of corporate behaviour, including through unintended or malicious breach of anti-bribery and anti-corruption and other anti-financial crime laws.
 
 
Imposition of sanctions under sanctions regimes or similar international, regional or national measures.
 
 
Loss or misuse of personal data through a failure to comply with the European General Data Protection Regulation, the UK Data Protection Act 2018,
e-Privacy
laws and other privacy legislation governing the processing of personal data.
 
 
Failure to uphold New Categories marketing practices.
 
 
Economic and financial risks
 
 
Foreign exchange rate exposures.
 
 
Inability to obtain price increases and exposure to risks from excessive price increases and value chain erosion.
 
 
Effects of declining consumption of legitimate tobacco products and a tough competitive environment.
 
 
Funding, liquidity and interest rate risks.
 
 
Failure to achieve growth through mergers, acquisitions and joint ventures.
 
 
Unforeseen underperformance in key global markets.
 
 
Increases in net liabilities under the Group’s retirement benefit schemes.
 
 
Product pipeline, commercialisation and Intellectual Property risks
 
 
Inability to predict consumers’ changing behaviours and launch innovative products that offer adult tobacco and nicotine consumers meaningful value-added differentiation.
 
 
Exposure to risks associated with intellectual property rights, including the failure to identify, protect and prevent infringement of the Group’s intellectual property rights and potential infringement of, or the failure to retain licences to use, third-party intellectual property rights.


317


Table of Contents
BAT Annual Report and Form 20-F 2021
Other Information
Group Risk Factors


Business Execution and Supply Chain Risks
Risk: Competition from illicit trade.
 
Description
 
Illicit trade, illegal products and tobacco trafficking in the form of counterfeit products, smuggled genuine products (product diversion), and locally manufactured products, which do not comply with applicable regulations and/or in which applicable taxes are evaded, represent a significant and growing threat to the legitimate tobacco industry and New Categories products. Factors such as increasing levels of taxation, price increases, economic downturn, lack of law enforcement, appropriate penalties and weak border control are encouraging more adult tobacco and New Categories consumers to switch to illegal cheaper tobacco and New Categories products and are providing greater rewards for counterfeiters and smugglers. Regulatory restrictions such as plain packaging or graphic health warnings, display bans, flavour or ingredient restrictions and increased compliance costs further disadvantage legitimate industry participants by providing competitive advantages to illicit manufacturers and distributors of illicit tobacco and New Categories products.
In addition, third parties may seek to divert product when there is an arbitrage opportunity for them between lower and higher excise countries.
 
Impact
 
Illicit trade has an adverse effect on the Group’s overall sales volume and may restrict the ability to increase selling prices. Illicit trade can also damage brand equity and reputation, which could undermine the Group’s investment in Trade Marketing and Distribution. Operational costs (e.g. track and trace costs) can increase and the product may become commoditised.
These factors in turn could reduce profits and have an adverse effect on the Group’s results of operations and financial conditions and cause the Group to fail to deliver on its strategic growth plans. Further, counterfeit products (especially New Categories) and other illicit products could harm consumers, damaging goodwill and/or the category (with lower volumes and reduced profits), and potentially leading to misplaced claims against BAT and further regulation and also lead to a failure to deliver our corporate harm reduction objective. In addition, as the Group has contractual and legislative obligations to prevent the diversion of our products into illicit channels, actual and perceived breaches of the obligations to prevent product diversion into illicit channels can lead to substantial fines in the forms of seizure payments and legislative penalties (including financial penalties), as well as the risk of reputational damage (including negative perceptions of our governance and our ESG credentials) from Group products being found in illicit channels.
 
Risk: Geopolitical tensions that have the potential to disrupt the Group’s business in multiple markets.
 
Description
 
The Group’s operations and financial condition are influenced by the economic and political situations in the markets and regions in which it has operations, which are often unpredictable and outside of its control. Some markets in which the Group operates face the threat of civil unrest and can be subject to frequent changes in regime. In others, there is a risk of terrorism, conflict, global health crisis, war, organised crime or other criminal activity. The Group is also exposed to economic policy changes in jurisdictions in which it operates. In addition, some markets maintain trade barriers or adopt policies that favour domestic producers, preventing or restricting the Group’s sales.
 
Impact
 
Deterioration of socio-economic or political conditions could lead to injury or loss of life, restricted mobility, loss of assets and/or denial of access to BAT sites that reduce the Group’s access to particular markets or may disrupt the Group’s operations, such as supply chain, or manufacturing or distribution capabilities. Such disruption may result in increased taxes and/or other costs due to the need for more complex supply chain and security arrangements, to build new facilities or to maintain inefficient facilities, or in a reduction of the Group’s sales volume. Further, there may be reputational damage, including negative perceptions of our governance and protection of our people and our ESG credentials.
 
Risk: Disruption to the Group’s data and information technology systems, including by cyber attack or the malicious manipulation or disclosure of confidential or sensitive information.
 
Description
 
The Group increasingly relies on data and information technology systems for its daily business operations, internal communications, controls, reporting and relations with customers and suppliers. Some of these systems are managed by third-party service providers. A significant disruption of the Group’s systems, including those managed by third-party service providers, due to computer viruses, cyber threats, malicious intrusions or unintended or malicious behaviour by employees, contractors or services providers could affect the Group’s communications and operations. Computer viruses and cyber attacks are becoming more sophisticated and coordinated. In addition, such disruption may compromise the integrity of information and result in the inappropriate disclosure of confidential information, or may lead to false or misleading statements being made about the Group.
 
 
318
 

Table of Contents
BAT Annual Report and Form 20-F 2021    
 
Strategic Report        
 
Governance Report        
  
Financial Statements        
  
Other Information        


Risk: Disruption to the Group’s data and information technology systems, including by cyber attack or the malicious manipulation or disclosure of confidential or sensitive information
continued.
 
Impact
 
Any disruption to technology systems related to the Group’s operations could adversely affect its business and result in financial and reputational losses. Any delays or failure to rapidly detect or respond to attempts to gain unauthorised access to the Group’s information technology systems through a cyber attack can lead to a loss of access to systems or information being corrupted or lost, resulting in significantly increased costs for remediation and reputational consequences. Any delay in response will also impact the outcome.
Security breaches and the loss of data or operational capacity may disrupt relationships throughout the supply chain, expose the Group or our consumers to a risk of loss or misuse of information, which could further expose the Group to liability, impact the Group’s reputation and lead to increased costs.
The disclosure of trade secrets or other commercially sensitive information may provide competitors with a competitive advantage resulting in competitive or operational damage to the Group. The disclosure of confidential and sensitive information about the Group’s employees, customers, consumers, suppliers or other third parties could compromise data privacy and expose the Group to liability.
Failure to effectively prevent or respond to a major breach or cyber attack may also subject the Group to significant reputational damage.
 
Risk: Failure to meet current or future New Categories demand.
 
Description
 
The New Categories supply chain is a multi-tiered and complex environment with reliance on multiple factors, such as third-party suppliers’ ability to upscale production in order to meet demand while maintaining product quality, dependency on single suppliers at various points in the chain and the Group’s ability to build adequate consumables production capacity in line with product demand. The geographical spread of suppliers and customers exposes the Group to political and economic conflicts such as Brexit and trade wars which may compromise the New Categories supply chain. Given the developing nature of the New Categories portfolio, there is also an enhanced risk that some products may not meet product quality and safety standards or may be subject to regulatory changes, leading to product recalls, which we have experienced in the past, or bans of certain ingredients or products. In addition, the New Categories supply chain may be vulnerable to changes in local legislation related to liquid nicotine that could increase import duties. Furthermore, the New Categories supply chain includes the development of sensitive trade secrets jointly with external design partners, which carries the risk of exposure of innovations to competitors.
 
Impact
 
Vulnerabilities in the New Categories supply chain may impact the Group’s ability to maintain supply and meet the current and future demand requirements across the New Categories portfolio, potentially resulting in significant reputational harm and financial impact that may negatively affect the Group’s results of operations and financial condition and cause the Group to fail to deliver on its strategic growth plans. Over-forecasting may also lead to
write-off
and negatively impact working capital. The design of New Categories devices may also prevent the scaling of commercial manufacturing, which will either restrict supply or increase the costs of production.
Further, there may be loss of investors’ confidence in ESG performance, including failure to deliver our corporate purpose of harm reduction.
In addition, changes in local legislation related to liquid nicotine import duties may increase New Categories production costs, which may increase end market pricing and reduce demand. Furthermore, the exposure of sensitive trade secrets can lead to competitive disadvantages and further negatively impact the Group’s results of operations and financial condition and cause the Group to fail to deliver on its strategic growth plans.
 
Risk: Failure of a financial counterparty.
 
Description
 
The Group relies on transactions with a variety of financial counterparties to manage the Group’s business and financial risks. In the event that any of these counterparties fails, payments due from such counterparties, such as under hedging or insurance contracts, may not be recovered. In addition, failure of a transactional banking party may lead to the loss of cash balances and disruption to payment systems involving such counterparty.
 
Impact
 
The inability to recover payments due from one or more failed financial counterparties or the loss of cash balances may cause significant financial loss and have an adverse impact on the Group’s results of operations, financial condition and financial risk profile. In addition, the loss of cash balances or a disruption to payment systems may cause disruption to the Group’s ongoing operations and ability to pay its creditors and suppliers.
 
 
319


Table of Contents
BAT Annual Report and Form 20-F 2021
Other Information
Group Risk Factors
Continued
    
 
Business Execution and Supply Chain Risks
Continued
Risk: Exposure to unavailability of, and price volatility, in raw materials and increased costs of employment.
 
Description
 
The availability and price of various commodities required in the manufacture of the Group’s products fluctuate. Raw materials and other inputs used in the Group’s business, such as wood pulp and energy, are commodities that are subject to price volatility caused by numerous factors, including political influence, market fluctuations and natural disasters.
Similarly, the Group is exposed to the risk of an increase above inflation in employment costs, including due to governmental action to introduce or increase minimum wages. Employment and health care law changes may also increase the cost of provided health care and other employment benefits expenses.
 
Impact
 
Restricted availability and price volatility of commodities may result in supply shortages and unexpected increases in costs for raw materials and packaging for the Group’s products, which may affect the Group’s results of operations and financial condition.
Similarly, the Group’s profitability may be affected by increases in overall employment costs.
The Group may not be able to increase prices to offset increased costs without suffering reduced sales volume and revenue. In the absence of compensating for increased costs through pricing, significant increases in raw material, packaging and employment costs above inflation will impact product margins, leading to lower profits and negatively affecting the Group’s results of operations and financial condition and cause the Group to fail to deliver on its strategic growth plans.
 
Risk: Failure to retain key personnel or to attract and retain skilled talent.
 
Description
 
The Group relies on a number of highly experienced employees with detailed knowledge of the tobacco industry, other areas of focus for the Group (including New Categories and Beyond Nicotine) and the Group’s business. Similarly, the Group is dependent on its ability to identify, attract, develop and retain such qualified personnel in the future. The Group is also dependent on external hires to ensure that there are the right new business critical capabilities and knowledge to accelerate transformation. BAT anticipates that this trend will continue and therefore the ability to continue to build awareness, increase reach and ultimately attract the new target audience remains a primary focus.
The shift in career development expectations from new hires are leading to shorter tenures. Although the Group is increasing its effort on retaining critical capabilities and knowledge, following any departure of new external hires, there can be no assurance that this effort will be successful. Furthermore, broader economic and ESG trends may impact the Group’s ability to retain key employees and may increase competition for highly talented employees, potentially resulting in the loss of experienced employees.
 
Impact
 
If the Group is unable to retain its existing key employees or to attract and retain skilled talent in the future, critical positions may be left vacant, which could adversely impact the delivery of strategic objectives, which could ultimately impact the Group’s results of operations, financial condition and achieving its ESG related ambitions.
High voluntary employee turnover may also reduce organisational performance and productivity, which may have a further adverse impact on the Group’s results of operations and financial condition.
 
Risk: Disruption to the supply chain and distribution channels.
 
Description
 
The Group has an increasingly global approach to managing its supply chain and distribution channels and is exposed to the risk of disruption to any aspect of the Group’s supply chain, to suppliers’ operations or to distribution channels, and the deterioration in the financial condition of a trading partner. This is especially so in our New Categories Supply Chain which is a multi-tiered and complex environment.
Such disruption may be caused by a cyber event, global health crisis, major fire, violent weather conditions or other natural disasters that affect manufacturing or other facilities of the Group’s operating subsidiaries or those of their suppliers and distributors. In certain geographic areas where the Group operates, insurance coverage may not be obtainable on commercially reasonable terms, if at all. Coverage may be subject to limitations or the Group may be unable to recover damages from its insurers.
Disruption may also be caused by spread of infectious disease (such as the
COVID-19
pandemic) or by a deterioration/shortage in labour or union relations, disputes or work stoppages or other labour-related developments within the Group or its suppliers and distributors.
In addition, the Group’s operating subsidiaries may not be able to establish or maintain relationships on favourable commercial terms with their suppliers and distributors. In some markets, distribution of the Group’s products is through third-party monopoly channels, often licensed by governments. The Group may be unable to renew these third-party supplier and distribution agreements on satisfactory terms for numerous reasons, including government regulations or ESG considerations.
Furthermore, there are some product categories for which the Group does not have spare production capacity or where substitution between different production plants is very difficult. Consolidation of global suppliers and certain distributors that control large geographies may reduce the Group’s availability of alternatives and negatively impact the Group’s negotiating power with key suppliers and distributors.
These risks are particularly relevant in jurisdictions where the Group’s manufacturing facilities are more concentrated or for certain product categories where production is more centralised.
 
 
320
 

Table of Contents
                 
BAT Annual Report and Form 20-F 2021    
 
Strategic Report        
 
Governance Report        
  
Financial Statements        
  
Other Information        


Risk: Disruption to the supply chain and distribution channels
continued.
 
Impact
 
Any disruption to the Group’s supply chain and distribution channels could have an adverse effect on the results of operations and financial conditions of the Group through failures to meet shipment demand, contract disputes, increased costs, loss of market share and inability to reinvest into New Category and support harm reduction agenda and cause the Group to fail to deliver on its strategic growth plans.
 
Risk: Failure to deliver digital innovation and drive digital transformation.
 
Description
 
The Group’s strategy in areas of further growth and increasing profitability depends to a large extent on digital transformation and innovation. Digital transformation and innovation are key drivers of the Group’s ethos and Quest, which includes new and modern categories of products, increased interaction with customers, data-driven decision making and cost optimisation efforts driven by automated and modernised processes. Examples of the Group’s ambitions that depend on digital transformation include:
 
 
the ability to leverage our data assets to generate insights and foresights as a key driver of revenue growth;
 
 
the expansion and flexibility of technology solutions to streamline the market realisation of new products and marketing campaigns; and
 
 
the ability to build new solutions and the flexibility to react to market disruptions.
The Group must effectively implement new ways of working and supporting technologies to fully develop the digital agenda defined by the Board (e.g. digital channels, data and analytics, automation, etc.).
The Group may see stalled progress in the pace of digital transformation and hampered strategy goals realisation if the necessary information and digital technology is not ready to support the business implementation of global functional transformations (e.g. direct relationship with consumers, integrated planning, demand forecasting and revenue growth management). The unavailability of the necessary digital technology may be due to missing technology capabilities, lack of scalability or poor data quality. Shortage of skills and ineffective ways of working may slow down the pace of the Group’s digital transformation and hamper its value realisation processes. In addition,
sub-optimal
design of the global digital platforms implemented by BAT may lead to the fragmentation and under-utilisation of such platforms and slow down the Group’s digital transformation.
 
Impact
 
The Group’s multi-category strategy requires dealing with different consumer needs and behaviours as well as complying with various regulations, which increasingly require the expansion and flexibility of technology solutions. This may lead to the fragmentation and under-utilisation of existing and future technology solutions. Similarly, increased control and centralisation of the technology solutions and delivery mechanisms may slow down the effective delivery of the Group’s digital transformation and innovation.
The Group’s inability to adapt to the ever-changing digital space and fully exploit the value expected from digital transformation may have an adverse impact on its competitive edge, market share and profitability, and may prevent the Group from reaching its medium and long-term financial targets.
 
Risk: Exposure to product contamination.
 
Description
 
The Group may experience product contamination, whether by accident or deliberate malicious intent, during supply chain or manufacturing processes, or may otherwise fail to comply with the Group’s quality standards. The Group may also receive threats of malicious tampering.
 
Impact
 
Product contamination or threats of contamination may expose the Group to significant costs associated with recalling products from the market or temporarily ceasing production. In addition, adult tobacco consumers may lose confidence in the specific brand affected by the contamination, resulting in reputational damage and a loss of sales volume and market share. The Group could be subject to liability and costs associated with civil and criminal actions as well as regulatory sanctions brought in connection with a contamination of the Group’s products. Each of these results may in turn have an adverse effect on the Group’s results of operations, financial condition and reputation and cause the Group to fail to deliver on its strategic growth plans.
 
 
321


Table of Contents
BAT Annual Report and Form 20-F 2021
Other Information
Group Risk Factors
Continued
    
 
Business Execution and Supply Chain Risks
Continued
Risk: Inability to obtain adequate supplies of tobacco leaf.
 
Description
 
The Group purchases significant volumes of packed leaf each year. Tobacco leaf supplies are impacted by a variety of factors, including weather conditions, drought, flood and other natural disasters, growing conditions, diseases causing crop failure, climate change and local planting decisions. Tobacco production in certain countries is also subject to a variety of controls, including regulation affecting farming and production control programmes, and competition for land use from other agriculture products. Such controls and competition can further constrain the production of tobacco leaf, raising prices and reducing supply.
Human rights issues may arise in connection with our tobacco leaf supply chain. Due to the large number of casual and temporary workers, the use of family labour in small-scale farming and high levels of rural poverty, the agricultural sector as a whole is vulnerable to human rights issues. The Group recognises that child labour is a risk to our tobacco leaf supply chain. The aforementioned issues could also threaten the next generation of farmers as young people move away from the rural areas to the cities.
 
Impact
 
Restricted availability of tobacco leaf may impact the quality of the Group’s products to a level that may prevent the Group accessing sufficient tobacco leaf that meets volume, quality and the Group’s ESG compliance impacting the Group’s ability to deliver on consumer needs. Accordingly, the reduction of tobacco leaf supply may impact supply and demand of the Group’s products and have a negative impact on results of operations. The Group’s commitment to ESG may result in higher tobacco leaf prices. Higher tobacco leaf prices may also increase the Group’s costs for raw materials and have an adverse effect on its results of operations and financial condition. The Group may also experience reputation damage from failing to manage human rights issues in our leaf supply chain, which may impact availability of suppliers willing to do business with us.
 
Risk: Failure to successfully design, implement and sustain an integrated operating model.
 
Description
 
The Group aims to improve profitability and productivity through supply chain improvements and the implementation of an integrated operating model and organisational structure, including standardisation of processes, centralised back-office services and a common IT platform. The Group undertakes transformation initiatives periodically which aim to simplify the organisation and facilitate growth. The Group’s efforts to achieve these goals are driven and enabled through use of our TaO (central SAP ERP system) global template – a standardised process used by all BAT entities globally with the use of a central SAP instance common for BAT subsidiaries (excluding Reynolds American Inc. and its subsidiaries). These processes include, among others, core back-office global processes, procurement, warehouse management, accounting and controlling.
 
Impact
 
Failure by the Group to successfully design, implement and sustain the integrated operating model, organisational structure and transformation initiatives could lead to the failure to realise anticipated benefits, increased costs, disruption to operations, decreased trading performance, disgruntled employees, loss of institutional knowledge and reduced market share. These results could in turn reduce profitability and funds available for investment by the Group in long-term growth opportunities. Lack of adherence to the TaO template, as well as template degradation over time, may result in the failure to maintain achieved productivity gains and capture additional productivity gains which may in turn have an adverse effect on the Group’s results of operations and financial condition and cause the Group to fail to deliver on its strategic growth plans.
 
Risk: Failure to uphold the high standard of ESG management.
 
Description
 
Stakeholder expectations of Group’s ESG performance are continually evolving. The Group may fail to have the appropriate internal standards, strategic plans and governance, monitoring and reporting mechanisms in place to ensure it can identify emerging issues, meet external expectations and align with recognised international standards.
 
Impact
 
Failure to uphold high standards of ESG management or provide transparent and consistent reporting could seriously impact Group reputation and reduce investor confidence. In addition, poor performance across any aspect of ESG, such as a failure to address climate change or human rights impacts across the Group’s business and supply chain, could result in increased regulation, difficulty in attracting and retaining talent, criminal or civil prosecution, or decreases in consumer demand for our products. As well as resulting in our failure to deliver our ESG targets.
 
 
322
 

Table of Contents
BAT Annual Report and Form 20-F 2021    
 
Strategic Report        
 
Governance Report        
  
Financial Statements        
  
Other Information        


Risk: Failure to manage the Group’s climate change risk
 
Description
 
The Group is currently exposed to violent weather conditions or other natural disasters in locations across the Group, further climate changes may lead to acute risks such as more frequent and severe weather events or chronic risks such as events relating to longer-term shifts in climate patterns and higher temperatures, which, among other things, could lead to reductions in the supply and quality of tobacco leaf and other supplies and cause other disruptions in our supply chains.
The Group will also experience transitional risks associated to low carbon economy. The TCFD was introduced by the Financial Sustainability Board (FSB) for companies, investors and other financial stakeholders to disclose climate-related financial risk. As climate change legislation is evolving rapidly, companies are required to adapt quickly to identify, assess, monitor and mitigate climate change related transitional risks, failure to adapt could lead to BAT scoring lower in sustainability benchmarking indices, such as CDP and DJSI.
As consumer behaviours and expectations evolve, the Group may fail to adapt its product portfolio and marketing strategy in response to stakeholders’ increasing environmental expectations. Factors such as emerging climate-change, product sustainability and circularity related aspects of the products may result in the potential rejection of the Group’s products as well as reputational risk in relation to business performance and sustainability in comparison to peers.
 
Impact
 
Any disruption to the Group’s supply chain (including agricultural supply chain) and distribution channels could have an adverse effect on the results of operations and financial conditions of the Group through failures to meet shipment demand, contract disputes, increased costs, reduced production capacity and loss of market share.
Consumer behaviours and expectations related to environmental issues and the Group’s sustainability credentials are rapidly starting to influence their purchasing choices which may lead to consumers seeking alternative sustainable products. The inability to timely develop and roll out sustainable innovations or products in line with consumer demand, including any failure to predict changes in consumer and societal behaviour and expectations and to fill gaps in the product portfolio, as well as the risk of poor product quality, could lead to missed opportunities, under- or over-supply, loss of competitive advantage, loss of market share, unrecoverable costs and/or the erosion of the Group’s consumer base or brand equity. There are also further financial implications from having to fund Extended Producer Responsibility schemes.
Lower ESG rating by investors, investor-owned platforms or other commonly used indices (e.g. CDP, DJSI) may impact perceived business resilience, sustainability and share price. Investors are becoming increasingly interested in the environmental sustainability of listed companies and their resilience in overall ESG matters is influencing their investment decisions.
Employees are also becoming increasingly aware of the climate change impact and have higher expectations of the effect that the Group has on the environment which has bearings on employee retention and the Group’s attractiveness to future employees.
Non-compliance
with the TCFD could reduce BAT’s ability to attract investors and result in reputational damage and potentially other sanctions.
 
 
323


Table of Contents
BAT Annual Report and Form 20-F 2021
Other Information
Group Risk Factors
Continued
    
 
Business Execution and Supply Chain Risks
Continued
Risk: Impact of a pandemic on the performance of the Group.
 
Description
 
The Group continues to closely monitor the development and disruption of the present coronavirus (the
“COVID-19
pandemic”) and current and further waves seen in some countries across the Group. The consequences of
COVID-19
may include significant logistical challenges for staff and their ability to perform their duties, potential loss of lives or significant level of illness in the workforce, inability to deliver revenue stream and market share targets impacting profits and cash flows, disruption to supply chain and third parties unable to deliver contractual goods and services. In addition, some countries in which the Group operates have adopted regulations restricting the ability to manufacture, distribute, market and sell products.
 
Impact
 
The
COVID-19
pandemic’s impact on the Group’s results of operations and financial condition is uncertain and cannot be predicted as the pandemic evolves.
The long-term impacts of the
COVID-19
pandemic to the Group’s business will depend on a range of factors which we are not able to accurately predict, including the duration and scope of the pandemic, the geographies impacted, the impact of the pandemic on economic activity and the nature and severity of measures adopted by governments. These factors include, but are not limited to:
 
 
Reductions or volatility in consumer demand for one or more of our products due to illness, retail closures, quarantine or other travel restrictions, health consciousness (quitting use of tobacco and nicotine products), government restrictions, the deterioration of socio-economic conditions, economic hardship and customer-downtrading (switching to a cheaper brand), which may impact the Group’s market share.
 
 
Disruptions to the Group’s operations, such as its supply chain, or manufacturing or distribution capabilities, which may result in increased costs due to the need for more complex supply chain arrangements, to expand existing facilities or to maintain inefficient facilities, a reduction of the Group’s sales volumes or an increase in bad debts from customers.
 
 
Disruption to the Group’s operations resulting from a significant number of the Group’s employees, including employees performing key functions, working remotely for extended periods of time or becoming ill, which may reduce the employees’ efficiency and productivity and cause product development delays, hamper new product innovation and have other adverse effects on the Group’s business.
 
 
Significant volatility in financial markets (including exchange rate volatility) and measures adopted by governments and central banks that further restrict liquidity, which may limit the Group’s access to funds, lead to shortages of cash and cash equivalents needed to operate the Group’s business, and impact the Group’s ability to refinance its existing debt.
 
 
Regulations restricting the ability to manufacture, distribute, market and sell products, and potentially increasing illicit trade.
 
 
Governments seeking to increase revenues through increased corporate taxes and excise in combustible and/or New Category products, increasing the cost and prices of our products – which could reduce volumes and margins, and/or increase illicit trade.
All of these factors may have material adverse effects on the Group’s results of operations and financial condition and cause the Group to fail to deliver on its strategic growth plans.
 
 
324
 

Table of Contents
                 
BAT Annual Report and Form 20-F 2021    
 
Strategic Report        
 
Governance Report        
  
Financial Statements        
  
Other Information        


Legal, Regulatory and Compliance Risks
Risk: Exposure to, the enactment of, proposals for, or rumours of regulation that significantly impairs the Group’s ability to communicate, differentiate, market or launch its products and/or the lack of appropriate regulation for New Categories.
 
Description
 
Tobacco control measures are in place in nearly all markets in which we operate and specific regulations for
non-tobacco
nicotine products and Beyond Nicotine products (including CBD) are gaining momentum. Such restrictions are introduced by legislation, regulations and/or voluntary agreements. Most tobacco and nicotine control measures can be categorised as follows:
 
 
Category Bans: including regulations that ban the sale, import, possession, or use of certain product categories, entirely (e.g. New Categories);
 
 
Place: including regulations restricting consumption in private and public spaces (e.g. public place smoking or vaping bans, including restaurants and bars);
 
 
Product: including regulations on the use of or testing for ingredients, product design and attributes (e.g. tar/ nicotine / carbon monoxide ceilings) flavours bans (including menthol); product safety (e.g. reduced cigarette ignition propensity standards); product disclosure (e.g. ingredients and emissions) and environmental impact (e.g. Extended Producer Responsibility (EPR) requirements for cigarette filters);
 
 
Packaging and labelling: including regulations on health warnings and other government-mandated messages; restrictions on the use of certain descriptors and brand names; requirements on pack shape, size, weight and colour; and mandatory plain packaging;
 
 
Advertising, promotion and sponsorship: including partial or total bans on advertising, promotions and sponsorship, and online and direct engagement communication;
 
 
Purchase: including regulations on where the products are sold, such as type of outlet (e.g. supermarkets and vending machines), radius or distance restrictions (e.g. 300 meters from a school), online sales bans, regulation regarding how they are sold and displayed (e.g. above the counter or under the counter) and minimum purchase age and increases thereto; and
 
 
Price: including regulations that have implications on prices and margins (e.g. excise taxes, minimum prices and import/export duties).
The Group believes that further tobacco control and nicotine regulation is expected over the medium term in many of the Group’s markets. Irresponsible behaviour or marketing practices of competitors (for example where there is a lack of appropriate regulation) or actions contrary to the regulations in certain markets, may cause reputational harm to the industry as a whole and may result in additional regulation or bans. Further, there is pressure on governments from international organisations and agencies, tobacco control NGOs, vanguard regulators and the private sector (including philanthropists, pharmaceutical and security technology companies and social justice groups) to pursue regulatory policies and implement tobacco or nicotine product-related regulation which is not science or evidence based and is aimed at increasing the complexity and cost burden on the tobacco or nicotine industry, limiting the commercial viability of tobacco and nicotine products or prohibiting the products completely. Regulators may be lacking in understanding of New Categories products and their role in tobacco harm reduction due to their novelty. These factors can lead to a lack of adequate or existing regulatory regimes or clear and appropriate product classifications.
In addition, the Group may fail to implement the right level of control measures or to maintain adequate standards of compliance with regulatory measures. For example, the Group’s marketing activities may fail to comply with the relevant law and regulations or with the Group’s International Marketing Principles.
Insufficient information, instruction and training in the relevant areas and a lack of knowledge of the existence and/or requirements of relevant regulations including tobacco and nicotine as well as other relevant regulations, such as battery regulation, or a failure to monitor, assess and implement the requirements of new or modified regulation, may increase these risks.
There may also be negative and disproportionate societal responses to consumer abuse or misuse of tobacco and/or nicotine products (e.g. in New Categories) or to certain categories of products.
Traditional Tobacco Products
With respect to tobacco and combustible products, many of the measures outlined in the FCTC have been or are in the process of being implemented through national legislation in many markets in which the Group operates, including recommendations for plain packaging and flavour bans (e.g. menthol bans – in effect in the European Union since 20 May 2020). In April 2021, the U.S. Food and Drug Administration (“FDA”) announced that it will issue proposed product standards to ban menthol as a characterising flavour in cigarettes in the U.S. In December 2021, a regulatory agenda released in the U.S. confirmed the FDA’s plans to publish a Notice of Proposed Rulemaking for a menthol cigarette ban in April 2022. Further, various national or international regulatory regimes may seek to require the reduction of nicotine levels in tobacco products.
In March 2018, the FDA published its Advanced Notice of Proposed Rulemaking titled “Tobacco Product Standard for Nicotine Level of Combusted Cigarettes” and invited interested parties to submit comments on, among other issues, maximum nicotine limits and whether any maximum nicotine level should apply to combustible tobacco products. In October 2019, the FDA withdrew the Advanced Notice of Proposed Rulemaking without explanation.
In the U.S., manufacturers of all tobacco products deemed to be under the authority of the FDA as of 2016 (which includes vapour and Modern Oral products that contain or can be used with tobacco-derived nicotine) must submit information to the FDA seeking formal marketing authorisation of such products.
In 2021, New Zealand published its Smokefree 2025 Action Plan, considering the implementation of drastic measures, such as a ban on tobacco sales to those born after a certain date and very low nicotine cigarettes.
Finally, the FCTC COP10 and the EU Tobacco Product Directive 2, post-implementation review which is currently ongoing, are likely to result in calls for further regulation for tobacco products.
 
325


Table of Contents
BAT Annual Report and Form 20-F 2021
Other Information
Group Risk Factors
Continued
    
 
Legal, Regulatory and Compliance Risks
Continued
Risk: Exposure to, the enactment of, proposals for, or rumours of regulation that significantly impairs the Group’s ability to communicate, differentiate, market or launch its products and/or the lack of appropriate regulation for New Categories.
continued
.
 
New Categories
With respect to New Categories, regulation is still evolving and frameworks for regulation and taxation vary from country to country. Some regulators have applied or are considering applying combustible tobacco products’ restrictive regulatory framework to New Categories. Some jurisdictions have banned or are considering banning certain New Category products altogether.
Following reports of individuals experiencing acute respiratory injury in suspected association with vaping certain
e-liquids
(EVALI) and reports regarding vaping youth usage in the U.S., stricter regulatory views gained momentum and were publicly supported by the World Health Organization (WHO) which continues to call on countries to ban or regulate novel nicotine products as tobacco. The U.S., the EU and Canada are playing a leading role across all identified regulatory risks, including: bans on flavours, sales channel bans, advertising restrictions and nicotine limits, among others.
The U.S. is expected to issue additional decisions on the marketing authorisation of BAT and competitor vapour products in the near-term, which could result in further restrictions on our ability to offer flavoured vapour products, including menthol.
The FDA granted marketing authorisation for the Vuse Solo device and its tobacco (“original”) flavour in October 2021, but denied authorisation for Vuse Solo flavours other than menthol (which were not on the market). That denial is being appealed with the FDA. The FDA has not issued a decision on the authorisation of the Vuse Solo menthol flavour, which remains on the market pending FDA decision. There can be no assurance that the Vuse Solo menthol authorisation will be granted, or that the other flavours appeal will succeed. Additionally, the continued marketing authorisation of Vuse Solo original flavour is contingent on continued compliance with regulatory requirements; the marketing authorisation may be suspended or withdrawn if the FDA determines that the continued marketing of the product is no longer appropriate for the protection of the public health. The FDA has not issued marketing authorisations for Vuse Alto and its associated flavours, including menthol, with FDA decisions still pending. Although the Vuse Alto menthol and tobacco flavoured products remain on the market pending FDA decisions there can be no assurance that these authorisations (or the other Vuse Alto flavours) will be granted. Similarly, the Group’s Velo products remain on the market in the U.S., again pending FDA decisions on their marketing authorisations, and there can be no assurance these will be granted. If the FDA denies a marketing authorisation then the relevant product(s) would need to be withdrawn from the market (unless a court intervenes or the FDA).
With respect to Modern Oral and other New Categories, regulatory frameworks currently follow divergent approaches. In certain markets, where there is an absence of adequate regulation, actions of irresponsible competitors may cause reputational harm to the category and result in outright bans or adverse regulation, as has been the case with Modern Oral in Russia with allegations regarding youth usage. In markets where there is a likelihood of tobacco, pharmaceutical or food regulatory classification, the category can be at risk of severe regulation or total ban.
The Group believes that Tobacco Heated Products are likely to be regulated as traditional tobacco products, driven by the decision of WHO’s 7th Conference of Parties to the Framework Convention on Tobacco Control, and Reports from the WHO submitted to the COP9 for Noting, to apply tobacco control regulations to these products including recommendations for plain packaging and flavour bans.
Beyond Nicotine
As the Group also looks to Beyond Nicotine products including CBD (in connection with its investment in Organigram), it may be subject to additional regulation and these products might not be scalable on a global basis given varying degrees of regulation.
Please refer to pages 340 to 344 for details of tobacco and nicotine regulatory regimes under which the Group’s businesses operate.
 
 
326
 

Table of Contents
BAT Annual Report and Form 20-F 2021    
 
Strategic Report        
 
Governance Report        
  
Financial Statements        
  
Other Information        


Risk: Exposure to, the enactment of, proposals for, or rumours of regulation that significantly impairs the Group’s ability to communicate, differentiate, market or launch its products and/or the lack of appropriate regulation for New Categories.
continued.
 
Impact
 
Existing and future regulatory measures impacting one or more New Categories and/or Beyond Nicotine traditional tobacco products could adversely affect volume, revenue and profits, as a result of: restrictions on the Group’s ability to sell and differentiate its products or brands, leverage price, innovate, make scientific claims, compete in future product categories and make new market entries; regulations (e.g. pharma or food) or total bans of tobacco and/or New Categories products in certain markets; reduced margins due to increased operating costs; impediments to building or maintaining brand equity; and restrictions on the Group’s ability to deliver, market and sell existing or new products responding to consumers’ preferences. In addition, new (and changes to existing) regulation could lead to greater complexity, as well as higher production and compliance costs.
As an example, through the acquisition of Reynolds American Inc., the Group acquired the Newport brand, the leading menthol cigarette brand in the U.S., the Group’s largest single market. The sales of Newport, together with the other menthol brands of the Group’s operating subsidiaries, represent a significant portion of the Group’s total net sales. Any action by the FDA or any other governmental authority banning or materially restricting the use of menthol in tobacco products could have a significant negative impact on sales volumes which would, in turn, have an adverse effect on the results of operations and financial position of the Group.
Regulations can also have an adverse impact on the Group’s ability to compete within the legitimate tobacco, nicotine or New Categories industry and with illicit traders or legal operators exploiting legal and regulatory loop holes. Regulations could also lead to reduced consumer acceptability of new product specifications, leading to consumers seeking alternatives in illicit markets.
Unclear or inadequate regulations can lead to legal uncertainty, impacting the Group’s position in the marketplace.
In the specific case of New Categories, our corporate harm reduction ambition, including of revenue of £5 billion by 2025 and 50 million New Categories consumers of
non-combustible
products by 2030 could be at risk if stricter regulatory views are imposed at a global scale, or if appropriate regulation is lacking or there is a lack of acceptance of tobacco harm reduction as a tobacco control policy (preventing a balanced regulatory framework for New Categories). Any action by the FDA or any government authority restricting the use of New Category products could also have an adverse effect on the operation and financial position of the Group and the possible failure of the Group’s harm reduction objective and loss of confidence in the Group’s ESG performance.
As a reflection of the real or perceived impact of stricter regulation in our business, the Group’s share price has also experienced, and could in the future experience, shocks upon the announcement, rumour of or enactment of restrictive regulation. All these effects may have an adverse effect on the Group’s results of operations and financial conditions and cause the Group to fail to deliver on its strategic growth plans.
In addition, considering the significant number of regulations that may apply to the Group’s businesses across the world, the Group is and may in the future be subject to claims for breach of such regulations. Government authorities (such as the FDA), organisations or even individuals may allege that our marketing activities do not comply with the relevant law s and regulations, or with our International Marketing Principles. As such, the Group could be subject to liability and costs associated with civil and criminal actions as well as regulatory sanctions, fines and penalties brought in connection with these allegations. Even when proven untrue, there are often financial costs and reputational impacts in defending against such claims and allegations (including potential adverse impact on the treatment by the FDA of the Group ‘s PMTAs in the U.S.). Each of these results may in turn have an adverse effect on the Group’s results of operations and financial condition and cause the Group to fail to deliver on its strategic growth plans.
 
 
327


Table of Contents
BAT Annual Report and Form 20-F 2021
Other Information
Group Risk Factors
Continued
    
 
Legal, Regulatory and Compliance Risks
Continued
Risk: Adverse implications of EU legislation on single-use plastics that will result in on-pack environmental warnings and financial implications relating to the Extended Producer Responsibility (EPR).
 
Description
 
The EU adopted a Directive on
single-use
plastics in July 2019 which, among other products, targets tobacco products with filters containing plastic. The Cellulose Acetate in our filters is defined as a
single-use
plastic under the Directive and, as such, the Directive will have an impact on the Group’s cigarettes, filters for other tobacco products and consumables for THPs.
Under the Directive, the Group will be subject to (and in some cases already is subject to) Extended Producer Responsibility (“EPR”) schemes, requiring the Group to cover the costs of collecting, transporting, treating and
cleaning-up
of filters containing plastic. The Directive also imposes on tobacco manufacturers the obligation to finance consumer awareness campaigns and to place environmental markings on packs of products with filters containing plastic.
Prior to the anticipated implementation deadline for EPR schemes on 5 January 2023, the European Commission is expected to issue guidelines on the criteria for the costs of cleaning up litter in the first half of 2022. In addition, in December 2020 the European Commission adopted and published an Implementing Act harmonising specifications for required product markings with a compliance deadline of July 2021. When transposing the Directive into national law, EU member states could decide to expand the scope of EPR systems under their respective national laws, which may expose the Group to additional regulations and financial obligations. This is the case in France, where EPR implementation has already occurred with an expansion of the scope to include
non-plastic
filters for RYO products. Although Sweden’s government has abandoned plans to extend its national EPR system to Snus and modern oral pouches, other markets are still at risk of extension, such as in Spain (tobacco manufacturers would be mandated to financially contribute to the cost of cleaning of parts of the general sewage system), the Czech Republic (tobacco manufacturers would be mandated to contribute to the cost of managing household waste costs), and Poland and Romania (manufacturers’ financial contribution would also cover paper filters, although they are not plastic items). Proposed regulations are still being discussed in these countries.
It is noted that there is a growing level of scrutiny on the use of
single-use
plastic across the world and a number of other markets in which the Group operates are considering ways to restrict (or ban) the use of filters made of plastic and/or introduce EPR schemes covering other plastic elements in our products beyond filters for traditional products and/or New Categories products.
 
Impact
 
The financial implications of existing and future EPR schemes will increase administrative burdens and operating costs and may have an adverse effect on the Group’s results of operations and financial condition and cause the Group to fail to deliver on its strategic growth plans. If significant space is appropriated on the packaging of some of the Group’s products, this may also be an impediment to maintaining or building brand equity of the Group’s products which may, in turn, have a negative impact on the Group’s sales volume.
 
Risk: Exposure to litigation on tobacco, nicotine, New Categories and other issues.
 
Description
 
The Group is involved in litigation related to its tobacco and nicotine products, including legal, regulatory and patent actions, proceedings and claims, brought against it in a number of jurisdictions. Claims brought against the Group may be based on personal injury (both individual claims and class actions), economic loss arising from the treatment of smoking and health-related diseases (such as medical recoupment claims brought by local governments), patent infringement (please refer to the risk factor under “Product pipeline, commercialisation and Intellectual Property risks, Exposure to risks associated with intellectual property rights, including the failure to identify, protect and prevent infringement of the Group’s intellectual property rights and potential infringement of, or the failure to retain licences to use, third-party intellectual property rights” below), negligence, strict tort liability, design defect, failure to warn, fraud, misrepresentation, deceptive/unfair trade practices, conspiracy, medical monitoring and violations of antitrust/racketeering laws.
Certain actions, such as those in the U.S. and Canada, involve claims in the tens or hundreds of billions of pounds sterling. The Group is also involved in proceedings that are not directly related to its tobacco and nicotine products, including proceedings based on environmental pollution claims.
Additional legal and regulatory actions, proceedings and claims may be brought against the Group in the future.
 
 
328
 

Table of Contents
                 
BAT Annual Report and Form 20-F 2021    
 
Strategic Report        
 
Governance Report        
  
Financial Statements        
  
Other Information        


Risk: Exposure to litigation on tobacco, nicotine, New Categories and other issues
continued.
 
Impact
 
The Group’s consolidated results of operations and financial position could be materially affected by any unfavourable outcome of certain pending or future litigation. The Group could be exposed to substantial liability, which may take the form of ongoing payments. Whether successful or not, the costs of the Group’s involvement in litigation could materially increase due to costs associated with bringing proceedings and defending claims, which may also cause operational and strategic disruption by diverting management time away from business matters. Liabilities and costs in connection with litigation could result in bankruptcy of one or more Group entities, which, in turn, could cause a material reduction in the Group’s sales volume and profits. Any negative publicity resulting from these claims may also adversely affect the Group’s reputation.
The occurrence of any of the above effects could in turn have an adverse effect on the Group’s results of operations and financial condition and cause the Group to fail to deliver on its strategic growth plans.
Please refer to note 31 in the Notes on the Accounts for details of contingent liabilities applicable to the Group.
 
Risk: Significant and/or unexpected increases or structural changes in tobacco and nicotine-related taxes.
 
Description
 
Tobacco and nicotine products are subject to high levels of taxation, including excise taxes, sales taxes, import duties and levies in most markets in which the Group operates. In many of these markets, taxes are generally increasing, but the rate of increase varies between markets and between different types of tobacco and nicotine products. Increases in, or the introduction of new, tobacco and nicotine-related taxes may be caused by a number of factors, including fiscal pressures, health policy objectives and increased lobbying pressure from anti-tobacco advocates.
With respect to New Categories, although a common framework for regulation and taxation has yet to emerge, the manufacture, sale, packaging and advertising of such products are increasingly being regulated and taxed.
 
Impact
 
Significant or unexpected increases in, or the introduction of new, tobacco-related taxes or minimum retail selling prices, changes in relative tax rates for different tobacco and nicotine products or adjustments to excise have in the past resulted, and may in the future result in, the need for the Group to absorb such tax increases due to limits in its ability to increase prices, an alteration in the sales mix in favour of
value-for-money
brands or products, or growth in illicit trade, each of which could impact pricing, sales volume and profit for the Group’s products. Significant or unexpected increases of tobacco-related taxes could also impact BAT’s ability to deliver the corporate purpose of harm reduction.
 
Risk: Failure to comply with health and safety and environmental laws.
 
Description
 
The Group is subject to a variety of laws, regulations and operational standards relating to health and safety and the environment.
The Group may fail to assess certain risks and implement the right level of control measures or to maintain adequate standards of health and safety or environmental compliance, which could cause injury, ill health, disability or loss of life to employees, contractors or members of the public, or harm to the natural environment and local communities in which the Group operates. As a result of the outcomes of the recent COP26, further future regulation is anticipated as governments look to meet their climate change ambitions.
Insufficient information, instruction and training in the relevant areas and a lack of knowledge of the existence and/or requirements of relevant regulations, or a failure to monitor, assess and implement the requirements of new or modified legislation, may increase these risks.
 
Impact
 
Any failure by the Group to comply with applicable health and safety or environmental laws, or the exposure to the consequences of a perceived failure, could result in business disruption, reputational damage, difficulties in recruiting and retaining staff, increased insurance costs, consequential losses, the obligation to install or upgrade costly pollution control equipment, loss of value of the Group’s assets, remedial costs and damages, fines and penalties as well as civil or criminal liability. Each of these results could in turn adversely impact the Group’s results of operations and financial condition and cause the Group to fail to deliver on its strategic growth plans.
 
 
329


Table of Contents
BAT Annual Report and Form 20-F 2021
Other Information
Group Risk Factors
Continued
    
 
Legal, Regulatory and Compliance Risks
Continued
Risk: Exposure to unfavourable tax rulings.
 
Description
 
The Group is subject to tax laws in a variety of jurisdictions. The Group‘s interpretation and application of the tax laws could differ from those of the relevant tax authority, which may subject the Group to claims for breach of such laws, including for late or incorrect filings or for misinterpretation of rules. Tax authorities in a variety of jurisdictions, such as the Netherlands and Russia, have assessed, and may in the future assess, the Group for historical tax claims, including interest and penalties, arising from disputed areas of tax law. The Group is currently party to tax disputes in a number of jurisdictions, some of which involve claims for amounts in the hundreds of millions of pounds sterling.
Please refer to note 31 in the Notes on the Accounts for details of contingent liabilities applicable to the Group.
 
Impact
 
The Group’s failure to comply with the relevant tax authority’s interpretation and application of the tax laws could result in significant financial and legal penalties, including the payment of additional taxes, fines and interest in the event of an unfavourable ruling by a tax authority in a disputed area, as well as the payment of dispute costs. Disruption to the business could occur as a result of management’s time being diverted away from business matters. Each of these results could negatively affect the Group’s results of operations and financial condition and cause the Group to fail to deliver on its strategic growth plans.
 
Risk: Unexpected legislative changes to corporate income tax laws.
 
Description
 
The Group is subject to corporate income tax laws in the jurisdictions in which it operates. These laws frequently change on a prospective or retroactive basis.
 
Impact
 
Legislative changes to corporate income tax laws and regulations may have an adverse impact on the Group’s corporate income tax liabilities and may lead to a material increase of the Group’s overall tax rate. This could, in turn, negatively affect the Group’s results of operations and financial condition and cause the Group to fail to deliver on its strategic growth plans.
 
Risk: Exposure to potential liability under competition or antitrust laws.
 
Description
 
According to the Group’s internal estimates, the Group is a market leader by volume and/or value in certain categories in a number of countries in which it operates and/or is one of a small number of tobacco and /or New Categories companies in certain other markets in which it operates. The Group has had antitrust infringement decisions against it in the past and is subject to ongoing investigations (please refer to note 31 in the Notes on the Accounts for details of contingent liabilities applicable to the Group). The Group may fail to comply with competition or antitrust laws and may be subject to investigation and/or litigation for alleged abuse of its position in markets in which it has significant market share or for alleged collusion/anti-competitive arrangements with other market participants. Competition / antitrust laws continue to evolve globally with increasingly aggressive enforcement.
 
Impact
 
Failure by the Group to comply with competition or antitrust laws and investigations (and/or litigation) for violation of such laws may result in significant legal liability, fines, penalties and/or damages actions; criminal sanctions against the Group, its officers and employees; increased costs, prohibitions on conduct of the Group’s business; forced changes in business practices, forced divestment of brands and businesses (or parts of businesses) to competitors or other buyers; director disqualifications; commercial agreements being held void; and operational and strategic disruption (including by diverting management time away from business matters). The Group may face increased public scrutiny and the investigation or imposition of sanctions by antitrust regulation agencies and/or courts for violations of competition regimes which may subject the Group to reputational damage and loss of goodwill, including negative perceptions of the Group’s governance and our ESG credentials.
The occurrence of any of the above effects could in turn have an adverse effect on the Group’s results of operations and financial condition and cause the Group to fail to deliver on its strategic growth plans.
 
 
330
 

Table of Contents
BAT Annual Report and Form 20-F 2021    
 
Strategic Report        
 
Governance Report        
  
Financial Statements        
  
Other Information        


Risk: Failure to establish and maintain adequate controls and procedures to comply with applicable securities, corporate governance and compliance regulations.
 
Description
 
The Group’s operations are subject to a range of rules and regulations around the world. These include U.S. securities, corporate governance and compliance laws and regulations such as the Sarbanes-Oxley Act of 2002 and the U.S. Foreign Corrupt Practices Act of 1977, which applies to the Group’s worldwide activities. While the Group continuously seeks to improve its systems of internal controls and to remedy any weaknesses identified, there can be no assurance that the policies and procedures will be followed at all times or effectively detect and prevent violations of applicable laws. In addition, the Group is subject to increasingly stringent reporting obligations under UK corporate reporting regulations.
 
Impact
 
The increased scope and complexity of applicable regulations to which the Group is subject may lead to higher costs for compliance. Failure to comply with laws and regulations may result in significant legal liability, fines, penalties, and/or damages actions, criminal sanctions against the Group, its officers and employees, and damage to the Group’s reputation.
Non-compliance
with such regulations could also lead to a loss of the Group’s listing on one or more stock exchanges or a loss of investor confidence with a subsequent reduction in share price.
 
Risk: Loss of confidential information, including through manipulation of data by employees and system failure.
 
Description
 
Unintended or inappropriate behaviour by employees, contractors, service providers and others using or managing the Group’s confidential information especially given the increased use of third parties (including sensitive or confidential information of third parties) or personal data (including sensitive consumer personal data) may affect the Group’s communications and operations which may result in the unauthorised disclosure of such information. Increased remote working has and may increase this risk.
In addition, flaws in our IT systems and/or those of our suppliers, a lack of infrastructure or application resilience, slow or insufficient disaster recovery service levels or the installation of new systems may increase the possibility that data, including confidential, personal or other sensitive information, stored or communicated by IT systems may be corrupted, lost or disclosed. There may be malicious ‘bad actor’ activity (e.g. cyber attack) or ‘insider threat’ (e.g. activists or disgruntled employees).
 
Impact
 
The loss of confidential information may result in civil or criminal legal liability and prosecution by enforcement bodies and/or claims from third parties, which may subject the Group to the imposition of material fines, damages and/or penalties and the costs associated with defending these claims. It could also lead to a competitive disadvantage through the loss of trade secrets. There could also be potential exposure from extortion attempts and costs from business continuity situations.
Inappropriate disclosure of confidential information or violation of the GDPR or other privacy laws (please refer to the risk factor under “Loss or misuse of personal data through a failure to comply with the European General Data Protection Regulation, the UK Data Protection Act 2018,
e-Privacy
Laws and other privacy legislation governing the processing of personal data” below) may also result in significant reputational harm and public scrutiny which could create negative perceptions of the Group’s governance and our ESG credentials, a loss of investor confidence (including a possible share price impact) and reduced third-party reliance on the Group’s information technology systems or other data handling practices. In addition, restoration and remediation of disclosed confidential information or personal data may be costly, difficult or even impossible.
The occurrence of any of the above effects could in turn have an adverse effect on the Group’s results of operations and financial condition and cause the Group to fail to deliver on its strategic growth plans.
 
 
331


Table of Contents
BAT Annual Report and Form 20-F 2021
Other Information
Group Risk Factors
Continued
    
 
Legal, Regulatory and Compliance Risks
Continued
Risk: Failure to comply with product regulations due to uncertainty surrounding the proper interpretation and application of those regulations.
 
Description
 
The interpretation and application of regulations concerning the Group’s products, such as the Tobacco and Related Products Directive (TPD2), may be subject to debate and uncertainty. This includes uncertainty over product classifications and restrictions on advertising. In particular with respect to the developing category of New Categories, which has grown in size and complexity in a relatively short period of time, a consensus framework for the interpretation and application of existing regulation, such as the rules concerning nicotine-containing liquids used in vapour products, has yet to emerge.
The continuously changing and evolving landscape of regulation concerning the Group’s products contributes to the uncertainty surrounding interpretation and application and creates a risk that the Group may misinterpret or fail to comply with developing regulations in the various jurisdictions in which it operates, or becomes subject to enforcement actions from regulators. With the continuous changing of product cycle plans and expansion to new markets and innovations, there is a risk that such changes and launches fail to comply with the relevant regulations, including
pre-approval
and/or
pre-registration
requirements. For example, some governments have intentionally banned or are seeking to ban novel tobacco products and products containing nicotine, while others would need to amend their existing legislation to permit their sale. Even in countries where the sale of such products is currently permitted, some governments have adopted, or are seeking to adopt, bans on New Categories or restrictions on certain flavours.
 
Impact
 
The significant number of emerging regulations and the uncertainty surrounding their interpretation and application may subject the Group to claims for breach of such regulations. Financial costs of such enforcement actions include financial penalties, product recalls and litigation costs, and entail a significant risk of adverse publicity and damage to the Group’s reputation and goodwill.
 
Risk: Failure to uphold high standards of corporate behaviour, including through unintended or malicious breach of anti-bribery and anti-corruption and other anti-financial crime laws.
 
Description
 
The Group is subject to various anti-corruption laws and regulations and other anti-financial crime laws including but not limited to failure to prevent facilitation of tax evasion, money laundering and terrorist financing (Anti-Corruption Laws). All employees of BAT, its subsidiaries and joint ventures which it controls are expected to uphold a high standard of corporate behaviour and comply with the Group Standards of Business Conduct (SoBC) which includes a requirement to comply with Anti-Corruption Laws. Employees, associates, suppliers, distributors and agents are prohibited from engaging in improper conduct to obtain or retain business or to improperly influence (directly or indirectly) a person working in an official capacity to decide in the Group’s favour. The Group’s employees, contractors and service providers may fail to comply with our SoBC and/or may violate applicable Anti-Corruption Laws.
From
time-to-time,
the Group investigates, and becomes aware of governmental authorities’ investigations into, and allegations of misconduct against Group companies. The Group cooperates with the authorities’ investigations, where appropriate, including with the DOJ and OFAC in the United States, which are conducting an investigation into suspicions of breach of sanctions. Potential fines, penalties or other consequences cannot currently be assessed. As the investigations are ongoing, it is not possible to identify the timescale in which these matters might be resolved.
Please refer to note 31 in the Notes on the Accounts for details of contingent liabilities applicable to the Group.
 
Impact
 
Failure of the Group to comply with Anti-Corruption Laws or to deploy and maintain robust internal policies, procedures and controls could result in significant fines and penalties (reducing the Group’s ability to reinvest in the future), a share price impact, criminal and/or civil sanctions against the Group and its officers and employees, increased costs, prohibitions or other limitations or requirements (e.g. compliance requirements) on the conduct of the Group’s business and reputational harm (including negative perceptions of the Group’s governance and our ESG credentials), it may subject the Group to claims for breach of such regulations and it could in turn have an adverse effect on the Group’s results of operations and financial condition and cause the Group to fail to deliver on its strategic growth plans.
Even when proven untrue, there are often financial costs, time demands and reputational impacts associated with investigating and defending against such claims.
 
 
332
 

Table of Contents
                 
BAT Annual Report and Form 20-F 2021    
 
Strategic Report        
 
Governance Report        
  
Financial Statements        
  
Other Information        


Risk: Imposition of sanctions under sanctions regimes or similar international, regional or national measures.
 
Description
 
National, international and supra-national sanctions regimes or similar international, regional or national measures are complex and dynamic and may affect territories in which the Group operates or third parties with which it may have commercial relationships. There may be unintended or malicious breaches of sanctions due to inappropriate or negligent behaviour by BAT employees, contractors, customers, suppliers or service providers.
In particular, the Group has operations in a number of territories that are subject to various sanctions, including Cuba and Belarus. Operations in these territories expose the Group to the risk of significant financial costs and disruption in operations that may be difficult or impossible to predict or avoid or the activities could become commercially and/or operationally unviable. Sanctions can be imposed quickly (as happened recently in Belarus) with the possibility of further territories the Group operates in becoming subject to sanctions at short notice.
National, international and supra-national sanctions regimes may also affect third parties with which the Group has commercial relationships (including possible risk aversion to being associated with a sanctioned territory) and could lead to supply and payment chain disruptions.
From
time-to-time,
the Group investigates, and becomes aware of governmental authorities’ investigations into, allegations of misconduct against Group companies. The Group cooperates with the authorities’ investigations, where appropriate, including with the DOJ and OFAC in the United States, which are conducting an investigation into suspicions of breach of sanctions. Potential fines, penalties or other consequences cannot currently be assessed. As the investigations are ongoing, it is not possible to identify the timescale in which these matters might be resolved.
Please refer to note 31 in the Notes on the Accounts for details of contingent liabilities applicable to the Group.
 
Impact
 
As a result of the limitations imposed by sanctions, it may become commercially and/or operationally unviable for the Group and/or its critical business partners to operate in certain territories or execute transactions related to them and the Group may be required to exit existing operations in such territories. The Group may also experience difficulty in sourcing materials or importing products, repatriating currency from a sanctioned country and finding financial institutions willing to transact with it, any of which may expose the Group to increased costs. In addition, the costs of complying with sanctions may increase as a result of new, or changes to existing, sanctions regimes.
Any failure to comply with sanctions regimes or similar international, regional, or national or supra-national measures may result in significant legal liability, fines (reducing the Group’s ability to reinvest in the future) and/or penalties, criminal and/or civil sanctions against the Group, its officers and employees, damage to commercial or banking relationships and reputational harm. Reputational harm (including negative perceptions of the Group’s governance and our ESG credentials) may result regardless of whether the Group complies with imposed sanctions.
The occurrence of any of the above effects could in turn have an adverse effect on the Group’s results of operations and financial condition and cause the Group to fail to deliver on its strategic growth plans.
 
 
333


Table of Contents
BAT Annual Report and Form 20-F 2021
Other Information
Group Risk Factors
Continued
    
 
Legal, Regulatory and Compliance Risks
Continued
Risk: Loss or misuse of personal data through a failure to comply with the European General Data Protection Regulation, the UK Data Protection Act 2018, e-Privacy Laws and other privacy legislation governing the processing of personal data.
 
Description
 
Personal data is a subset of data (which is likely to be confidential) which attracts different risks and treatment under applicable law. Breaches of data privacy laws include misuse of information which may not be confidential in nature. These include, for example, unsolicited marketing calls to a publicly available number, or using an individual’s personal data in a way which was not authorised or in a way that the individual did not reasonably expect through technologies such as online tracking or monitoring.
Various privacy laws, including the European General Data Protection Regulation (“GDPR”), UK Data Protection Act 2018 (“UKDPA”) and
e-Privacy
Directive
(“e-Privacy
Laws”) / EU Regulatory guidances, govern the way in which organisations (comprising employees, contractors, service providers and other authorised persons) handle individuals’ personal data including how such organisations, including the Group, track or monitor their online behaviour.
Unintended or malicious breaches of data privacy laws may occur through inappropriate or negligent behaviour by BAT employees, contractors, service providers or others. In particular:
– in the event of:
– an unauthorised disclosure of personal data as a result of a bad actor (e.g. cyber attack); or
– flaws in our IT systems, or application resilience, slow or insufficient disaster recovery service levels or the installation failure of a new system (which result in personal data stored or communicated by IT systems being corrupted, lost or disclosed).
– Depending on the risk to the individuals concerned, such personal data breaches (including mass personal data unavailability) must be reported to the local data protection supervisory authority which could subject Group companies to not only regulatory scrutiny but also individual claims or even class action suits; and
– ePrivacy Laws state that any misuse of consumer personal data or lack of transparency provided to consumers on how we use their data or track their online behaviours are subject to regulatory scrutiny.
Legal requirements relating to the collection, storage, handling, and transfer of personal data continue to evolve. Following the entry into force of the GDPR in May 2018, other jurisdictions in which the Group operates have enacted similar local legislation such as the California Consumer Privacy Act U.S. and the “LGPD” in Brazil which further increases the risks surrounding the processing of personal data especially in the consumer space. As part of the Group’s digital transformation initiative, it has an enhanced focus on consumer data, especially regarding New Categories, which increases these risks.
 
Impact
 
Failure to comply with existing or future
e-Privacy
Laws and privacy legislation governing the processing of personal data may adversely impact the Group’s results of operations and financial condition.
Loss or misuse of personal data may result in civil or criminal legal liability and prosecution by enforcement bodies, which may subject the Group to the imposition of material fines (currently up to 4% of Group worldwide turnover in the context of GDPR) and/or penalties and/ or claims and costs associated with defending these claims (which could include class action suits brought by consumers). The Group’s officers and employees may also be subject to personal criminal sanctions.
Reputational damage could also potentially cause significant harm to the Group, including negative perceptions of the Group’s governance and our ESG credentials.
Relevant data protection supervisory authority could also order certain Group legal entities to cease processing activities, which could result in a significant operational disruption. Regulatory interest may also prompt interest from other compliance authorities/ governments, leading to further regulation or proceedings.
The occurrence of any of the above effects could in turn have an adverse effect on the Group’s results of operations and financial condition and cause the Group to fail to deliver on its strategic growth plans.
 
Risk: Failure to uphold New Categories marketing practices.
 
Description
 
The regulatory landscape is constantly evolving with marketing practices being different in key New Categories markets. The Group’s marketing activities may be alleged to be
non-compliant
laws and regulations, or with the International Marketing Principles (“IMPs”) on the marketing and sale of tobacco products to consumers such as age verification measures with allegations of this in the media. Online activities can also be wrongly considered to be aimed at consumers in a country where such activities are not permitted.
 
Impact
The Group is and may in the future be subject to claims for breach of marketing practices. In particular, national authorities (such as the FDA), organisations or even individuals may allege that our marketing activities do not comply with the relevant laws and regulations, or with our IMPs. As such, the Group could be subject to liability and costs as well as regulatory sanctions, fines and penalties brought in connection with these allegations. Even when proven untrue, there are often financial costs and reputational impacts in defending against such claims and allegations.
Future breaches may lead to a loss of investor confidence in ESG performance and inability to meet our responsible marketing focus area if our IMPs are not followed, impacting our corporate purpose of delivering harm reduction.
 
 
334
 

Table of Contents
BAT Annual Report and Form 20-F 2021    
 
Strategic Report        
 
Governance Report        
  
Financial Statements        
  
Other Information        


Economic and Financial Risks
Risk: Foreign exchange rate exposures.
 
Description
 
 
The Group’s reporting currency is the pound sterling. The Group is exposed to the risk of fluctuations in exchange rates affecting the translation of net assets and earned profits of overseas subsidiaries into the Group’s reporting currency. These translational exposures are not normally hedged.
Exposures also arise from the foreign currency denominated trading transactions undertaken by subsidiaries and dividend flows. Where not offset by opposing flows, these exposures are generally hedged according to internal policies, but hedging of exposure to certain currencies might not be possible due to exchange controls, limited currency availability or prohibitive costs, and errors in hedging may occur. Fiscal policy divergence in relation to interest rates between key markets may also increase these risks.
 
 
Impact
 
 
During periods of exchange rate volatility, the impact of exchange rates on the Group’s results of operations and financial condition can be significant. Fluctuations in exchange rates of key currencies against the pound sterling may result in volatility in the Group’s reported earnings per share, cash flow and balance sheet. Furthermore, the dividend paid by the Group may be impacted if the payout ratio is not adjusted. Differences in translation between earnings and net debt may also affect key ratios used by credit rating agencies, which may have an adverse effect on the Group’s credit ratings.
In addition, volatility and/or increased costs in the Group’s business due to transactional foreign exchange rate exposures may adversely affect operating margins and profitability and attempts to increase prices to offset such increases could adversely impact sales volumes.
 
Risk: Inability to obtain price increases and exposure to risks from excessive price increases and value chain erosion.
 
Description
 
 
Annual price increases by the Group are among the key drivers in increasing market profitability. However, the Group has in the past been, and may in the future be, unable to obtain such price increases as a result of increased regulation; increased competition from illicit trade; stretched consumer affordability arising from deteriorating political and economic conditions and rising prices; sharp increases or changes in excise structures; and competitors’ pricing.
As the New Category market continues to develop, the Group may face erosion in the value chain for New Categories through lower market prices, excise taxes, high retail trade margins or high production costs that make New Categories less competitive versus combustible tobacco products. As an example, excise on Tobacco Heated Products in Japan is increasing and will align closer to FMC following a five year (2018-2022) phased excise plan.
In addition, the Group faces the risk that price increases it has conducted in the past, and may conduct in the future, may be excessive and not find adequate adult tobacco consumer acceptance.
 
 
Impact
 
 
If the Group is unable to obtain price increases or is adversely affected by impacts of excessive price increases, it may be unable to achieve its strategic growth metrics, have fewer funds to invest in growth opportunities, and, in the case of excessive price increases, be faced with quicker reductions in sales volumes than anticipated due to accelerated market decline, down-trading (switching to a cheaper brand) and increased illicit trade. These in turn impact the Group’s market share, results of operations and financial condition and cause the Group to fail to deliver on its strategic growth plans.
In addition, erosion in the value chain for New Categories could have a negative impact on the Group’s sales volume or pricing for these products. High excise could dampen demand for New Categories or result in lower profit margins. Lower market prices, high retail trade margins or increases in production costs could also negatively impact profit margins or lead to uncompetitive pricing.
 
 
335


Table of Contents
BAT Annual Report and Form 20-F 2021
Other Information
Group Risk Factors
Continued
    
 
Economic and Financial Risks
Continued
Risk: Effects of declining consumption of legitimate tobacco products and a tough competitive environment.
 
Description
 
 
Evidence of market contraction and the growth of illicit trade of tobacco products is apparent in several key global markets in which the Group operates. This decline is due to multiple factors, including increases in excise taxes leading to continuous above-inflation price rises, changes in the regulatory environment, the continuing difficult economic environment in many countries impacting consumers’ disposable incomes, the increase in the trade of illicit tobacco products, rising health concerns, a decline in the social acceptability of smoking and an increase in New Category uptake.
The Group competes based on the strength of its strategic brand portfolio, product quality and taste, brand recognition, brand loyalty, taste, innovation, packaging, service, marketing, advertising and price. The Group is subject to highly competitive environments in all aspects of its business, and its competitive position can be significantly influenced by the prevailing economic climate, consumers’ disposable income, regulation, competitors’ introduction of lower-price or innovative products, higher tobacco product taxes, higher absolute prices, governmental action to increase minimum wages, employment costs, interest rates and increase in raw material costs.
Furthermore, the Group is subject to substantial payment obligations under the State Settlement Agreements, which adversely affect the ability of the Group to compete in the U.S. with manufacturers of deep-discount cigarettes that are not subject to such substantial obligations.
 
 
Impact
 
Any future decline in the demand for legitimate tobacco products could have an adverse effect on the Group’s results of operations and financial conditions and cause the Group to fail to deliver on its strategic growth plans.
In a tough competitive environment, factors such as market size reduction, customer down-trading, illicit trade and competitors aggressively taking market share through price
re-positioning
or price wars generally reduce the overall profit pool of the market and may impact delivery of the Group’s profits. This may also lead to a decline in sales volume, loss of market share, impact delivery of the Group’s ESG agenda, erosion of its portfolio mix and reduction of funds available for investment in growth opportunities.
 
Risk: Funding, liquidity and interest rate risks.
 
Description
 
The Group cannot be certain that it will have access to bank financing or to the debt and equity capital markets at all times and is therefore subject to funding and liquidity risks. In addition, the Group’s access to funding may be affected by restrictive covenants to which it is subject under some of its credit facilities. Furthermore, broader ESG trends may impact the Group’s access to funding.
The Group is also exposed to increases in interest rates in connection with both existing floating rate debt and future debt refinancings. The current economic environment, with historically low interest rates, increases the likelihood of higher interest rates in the future. The phaseout of LIBOR and uncertainty regarding the appropriate benchmark replacement similarly increases uncertainty with respect to the interest rates applicable to the Group’s floating rate debt.
Furthermore, the Group operates in several markets closely regulated by governmental bodies that intervene in foreign exchange markets by imposing limitations on the ability to transfer local currency into foreign currency and introducing other currency controls that expose cash balances to devaluation risks or that increase costs to obtain hard currency. As a result, the Group’s operational entities in these markets may be restricted from using
end-market
cash resources to pay for imported goods, dividend remittances, interest payments and royalties. The inability to access
end-market
cash resources in certain markets contributes to the Group’s funding and liquidity risks.
 
Impact
 
Adverse developments in the Group’s funding, liquidity and interest rate environment may lead to shortages of cash and cash equivalents needed to operate the Group’s business and to refinance its existing debt. Inability to fund the business under the Group’s current capital structure, failure to access funding and foreign exchange or increases in interest rates may also have an adverse effect on the Group’s credit rating, which would in turn result in further increased funding costs and may require the Group to issue equity or seek new sources of capital.
Non-compliance
with the Group’s covenants under certain credit facilities could lead to an acceleration of its debt. The phaseout of LIBOR may result in the Group being subject to higher or uncertain interest rates with respect to future floating rate debt.
All these factors may have material adverse effects on the Group’s results of operations and financial conditions and cause the Group to fail to deliver on its strategic growth plans. These conditions could also lead to underperforming bond prices and increased yields.
In the case of funding or liquidity constraints, the Group may also suffer reputational damage due to its perceived failure to manage the financial risk profile of its business, which may result in an erosion of shareholder value reflected in an underperforming share price, and/ or underperforming bond prices and higher yields. In addition, the Group’s ability to finance strategic opportunities or respond to threats may be impacted by limited access to funds.
 
 
336
 

Table of Contents
                 
BAT Annual Report and Form 20-F 2021    
 
Strategic Report        
 
Governance Report        
  
Financial Statements        
  
Other Information        


Risk: Failure to achieve growth through mergers, acquisitions and joint ventures.
 
Description
 
 
The Group’s growth strategy includes a combination of organic growth as well as mergers, acquisitions and joint ventures. The Group may be unable to acquire attractive businesses on favourable terms and may inappropriately value or otherwise fail to identify or capitalise on growth opportunities. The Group may not be able to deliver strategic objectives and revenue improvements from business combinations, successfully integrate businesses it acquires or establishes, or obtain appropriate regulatory approvals for business combinations. Risks from integration of businesses also include the risk that the integration may divert the Group’s focus and resources from its other strategic goals.
Additionally, the Group could be exposed to financial, legal or reputational risks if it fails to appropriately consider any compliance, antitrust or ESG aspects of a transaction. Further, the Group has certain uncapped indemnification obligations in connection with divestitures and could incur similar obligations in the future.
 
Impact
 
 
Any of the foregoing risks could result in increased costs, decreased revenues or a loss of opportunities and have an adverse effect on the Group’s results of operations and financial condition, and in the case of a breach of compliance or antitrust regulation, could lead to reputational damage, fines and potentially criminal sanctions.
The Group may become liable for claims arising in respect of conduct prior to any merger or acquisition of businesses if deemed to be a successor to the liabilities of the acquired company or indemnification claims relating to divestitures, and any resulting adverse judgment against the Group may adversely affect its results of operations and financial condition and cause the Group to fail to deliver on its strategic growth plans.
Please refer to note 31 in the Notes on the Accounts for details of contingent liabilities applicable to the Group.
 
Risk: Unforeseen underperformance in key global markets.
 
Description
 
 
A substantial majority of the Group’s profit from operations is based on its operations in certain key markets, including the US. A number of these markets are declining for a variety of factors, including price increases, restrictions on advertising and promotions, smoking prevention campaigns, increased pressure from anti-tobacco groups, migration to smokeless products and private businesses adopting policies that prohibit or restrict, or are intended to discourage, smoking and tobacco use.
Economic and political factors affecting the Group’s key markets include the prevailing economic climate, governmental austerity measures, levels of employment, inflation, governmental action to increase minimum wages, employment costs, interest rates, raw material costs, consumer confidence and consumer pricing.
 
Impact
 
 
Any change to the economic and political factors in any of the key markets in which the Group operates could affect consumer behaviour and have an impact on the Group’s results of operations and financial condition and cause the Group to fail to deliver on its strategic growth plans.
 
 
Risk: Increases in net liabilities under the Group’s retirement benefit schemes.
 
Description
 
 
The Group currently maintains and contributes to defined benefit pension plans and other post-retirement benefit plans that cover various categories of employees and retirees worldwide. The Group’s obligations to make contributions under these arrangements may increase in the case of increases in pension liabilities, decreases in asset returns, salary increases, inflation, decreases in long-term interest rates, increases in life expectancies, changes in population trends and other actuarial assumptions.
Please refer to the information under the caption ‘Retirement benefit schemes’ on page 215 and to note 15 in the Notes on the Accounts for details of the Group’s retirement benefit schemes.
 
Impact
 
 
Higher contributions to the Group’s retirement benefit schemes could have an adverse impact on the Group’s results of operations, financial condition and ability to raise funds and cause the Group to fail to deliver on its strategic growth plans.
 
 
337


Table of Contents
BAT Annual Report and Form 20-F 2021
Other Information
Group Risk Factors
Continued
    
 
Product Pipeline, Commercialisation and Intellectual Property
Risks
Risk: Inability to predict consumers’ changing behaviours and launch innovative products that offer adult tobacco and nicotine consumers meaningful value-added differentiation.
 
Description
 
 
The Group focuses its research and development activities on both creating new products, including New Category and Beyond Nicotine products, whilst maintaining and improving the quality of its existing products. In a competitive market, the Group believes that innovation is key to growth. The Group considers that one of its key challenges in the medium and long term is to provide adult tobacco and nicotine consumers with high-quality products that take into account their changing preferences and expectations, including those in relation to ESG, while complying with evolving regulation.
The Group continues to develop and
roll-out
its New Category portfolio which requires significant investment. The Group may be unsuccessful in developing and launching innovative products or maintaining and improving the quality of existing products across Combustibles, New Categories and Beyond Nicotine that offer consumers meaningful value-added differentiation. The Group may fail to keep pace with innovation in its sector or changes in consumer expectations and is also exposed to the risk of an inability to build a strong enough brand equity through social media and other technological tools to compete with its competitors. There are potential bans and restrictions in key markets when using social media to advertise and communicate. Competitors may be more successful in predicting changing consumer behaviour, developing and rolling out consumer-relevant products and may be able to do so more quickly and at a lower cost.
In addition, the Group devotes considerable resources to the research and development of innovative products that may have the potential to reduce the risks of smoking-related diseases. The complex nature of research and development programmes necessary to satisfy emerging regulatory and scientific requirements creates a substantial risk that these programmes will fail to demonstrate health-related claims regarding New Categories and Beyond Nicotine or to achieve adult tobacco consumer, regulatory and scientific acceptance.
Furthermore, the regulatory environment impacting
non-combustible
tobacco products, vapour products and other
non-tobacco
nicotine products and Beyond Nicotine, including classification of products for regulatory and excise purposes, is still developing and it cannot be predicted whether regulations will permit the marketing of such products in any given market in the future. Categorisation as medicines, for example, and restrictions on advertising could stifle innovation, increase complexity and costs and significantly undermine the commercial viability of these products.
Alternatively, categorisation of any New Categories, as tobacco products for instance, could result in the application of onerous regulation, which could further stifle uptake.
 
Impact
 
 
The inability to timely develop and roll out innovations or products in line with consumer demand, including any failure to predict changes in adult tobacco consumer and societal behaviour and expectations and to fill gaps in the product portfolio, as well as the risk of poor product quality, could lead to missed opportunities, under- or over-supply, loss of competitive advantage, unrecoverable costs and/or the erosion of the Group’s consumer base or brand equity.
Restrictions on packaging and labelling or on promotion and advertising could impact the Group’s ability to communicate its innovations and product differences to adult tobacco consumers, leading to unsuccessful product launches. An inability to provide robust scientific results sufficient to substantiate health-related product claims poses a significant threat to the ability to launch innovative products and comply with emerging regulatory and legal regimes.
The occurrence of any of the above effects could in turn have an adverse effect on the Group’s results of operations and financial condition and cause the Group to fail to deliver on its strategic growth plans.
In addition, there may be loss of investors’ confidence in ESG performance, including failure to deliver our corporate purpose of harm reduction.
 
 
338
 

Table of Contents
BAT Annual Report and Form 20-F 2021    
 
Strategic Report        
 
Governance Report        
  
Financial Statements        
  
Other Information        


Risk: Exposure to risks associated with intellectual property rights, including the failure to identify, protect and prevent infringement of the Group’s intellectual property rights and potential infringement of, or the failure to retain licences to use, third-party intellectual property rights.
 
Description
 
 
The Group relies on trademarks, patents, registered designs, copyrights, domain names and trade secrets. The brand names under which the Group’s products are sold are key assets of its business. The protection and maintenance of these brand names and of the reputation of these brands is important to the Group’s success. Protection of intellectual property rights is also important in connection with the Group’s innovative products, including New Categories.
The Group is exposed to the risk of infringements of its intellectual property rights by third parties due to limitations in judicial protection, failure to identify, protect and register its innovations and/or inadequate enforceability of these rights in some markets in which the Group operates.
The Group currently is involved in various patent infringement litigation proceedings in several countries related to the Group’s New Category inventions and products. This litigation involves both claims by the Group that competitors are infringing the Group’s patents and claims by competitors that the Group is infringing competitors’ patents. Please refer to note 31 in the Notes on the Accounts for details of contingent liabilities relating to patent litigation applicable to the Group.
Some brands and trademarks under which the Group’s products are sold are licensed for a fixed period of time in certain markets. If any of these licences are terminated or not renewed after the end of the applicable term, the Group would no longer have the right to use, and to sell products under, those brand(s) and trademark(s).
In addition, as third party rights are not always identifiable, the Group may be subject to claims for infringement of third party intellectual property rights.
 
Impact
 
 
Any erosion in the value of the Group’s brands or innovations, or failure to obtain or maintain adequate protection of intellectual property rights for any reason, or the loss of brands, trademarks or other intellectual property rights under licence to Group companies, may have a material adverse effect on the Group‘s market share, results of operations and financial condition. Any inability to appropriately protect the Group’s products and key innovations will also limit its growth and affect competitiveness and return on innovation investment.
Any infringement of third-party intellectual property rights could result in interim or final injunctions, product recalls, legal liability and the payment of damages, any of which may disrupt operations, negatively impact the Group’s reputation and have an adverse effect on its results of operations and financial condition and cause the Group to fail to deliver on its strategic growth plans.
 
 
339


Table of Contents
BAT Annual Report and Form 20-F 2021
Other Information
Regulation of the Group’s Business


Overview
The Group’s businesses operate under increasingly stringent regulatory regimes worldwide. The tobacco industry is one of the most highly regulated in the world, with manufacturers required to comply with a variety of different regulatory regimes across the globe. The Group continues to respond to these regimes and engages with governments and other regulatory bodies to find solutions to changing regulatory landscapes. Restrictions on the manufacture, sale, marketing and packaging of tobacco and
non-tobacco
nicotine products are in place in nearly all countries and markets.
Regulation can typically be categorised as follows:
Place:
including regulations restricting smoking in private, public and work places (e.g. public place smoking bans);
Product:
including regulations on the use of ingredients, product design and attributes (e.g. ceilings regarding tar, nicotine and carbon monoxide yields, as well as restrictions on flavours); product safety regulations (e.g. the EU’s General Product Safety Directive (2001/95/EC), electrical safety regulations and reduced ignition propensity standards for cigarettes); regulatory product disclosure requirements (e.g. in relation to ingredients and emissions); and bans of entire product categories (e.g. bans on the manufacture, import, export, sale, and advertisement of novel tobacco products or
non-tobacco
nicotine products);
Packaging and labelling:
including regulations on health warnings and other government-mandated messages (e.g. in respect of content, positioning, size and rotation); restrictions on the use of certain descriptors and brand names; requirements on pack shape, size, weight and colour and mandatory plain packaging;
Sponsorship, promotion and advertising:
including partial or total bans on tobacco and/or
non-tobacco
nicotine product advertising, marketing, promotions and sponsorship and restrictions on brand sharing and stretching (the latter refers to the creation of an association between a tobacco product and a
non-tobacco
product by the use of tobacco branding on the
non-tobacco
product);
Purchase:
including regulations on the manner in which tobacco products and
non-tobacco
nicotine products are sold, such as type of outlet (e.g. supermarkets and vending machines) and how they are sold (e.g.
above-the-counter
versus
beneath-the-counter);
Price:
including regulations which have implications for the prices that manufacturers can charge for their tobacco products and
non-tobacco
nicotine products (e.g. excise taxes and minimum prices); and
Responsibility:
including regulations introducing Extended Producer Responsibility schemes on cigarette manufacturers to cover the cost to clean up cigarette waste (see Single Use Plastics Directive (EU) 2019/904).
In addition, the Group operates a number of global policies, and in some cases its businesses have also entered into voluntary agreements, which may impose more onerous obligations or standards than those imposed by local legislation.
World Health Organization Framework Convention on Tobacco Control
Much of the recent development in regulation at a global level has been driven by the World Health Organization Framework Convention on Tobacco Control (FCTC). The FCTC came into force in 2005 and contains provisions aimed at, among other things, reducing tobacco consumption and toxicity. The original treaty is supplemented by protocols and guidelines. While the guidelines are not legally binding, they provide a framework of recommendations for parties to the guidelines.
To date, the FCTC has been ratified by 182 countries, not including the U.S. The FCTC has led to increased efforts by tobacco-control advocates and public health organisations to reduce the supply of, and demand for, tobacco products, and to encourage governments to further regulate the tobacco industry. As national regulations increasingly reflect global influences, the scope of areas regulated will likely further expand. The guidelines on advertising, promotion and sponsorship, for example, seek to broaden the definition of tobacco advertising to include product display, the use of vending machines as well as the design of the pack itself. Where adopted by contracting parties, a number of the measures referred to in the guidelines may result in either additional costs for the tobacco industry or restrictions on a manufacturer’s ability to differentiate its products and communicate those differences to adult smokers. The World Health Organization and other public health organisations have recently focused their efforts on attempting to widen the scope of the FCTC to include Reduced Risk Products (RRPs), mostly indirectly by adopting decisions and working groups concerning these products. Given that these organisations are reluctant to acknowledge the harm reduction properties of RRPs, this approach risks to result in a further push for stricter regulations of RRPs or the application of existing tobacco regulations to RRPs. All engagement efforts of the tobacco industry are being closely monitored by these organisations and often (incorrectly) labelled as unlawful industry interference. In turn, this has an impact on the willingness of Parties to engage with the industry, which limits the opportunity of the industry to mitigate these risks.
The biannual session of the Conference of the Parties to the FCTC took place in November 2021 (COP9). Due to the virtual nature of the meetings most substantive discussions have however been postponed to COP10, which will take place in 2023 in Panama.
EU Tobacco and Related Products Directive (2014/40/EU)
Other developments in regulation have been driven by tobacco control activities undertaken outside the FCTC process. For example, the EU Tobacco Products Directive (2001/37/EC), referred to as TPD1, was adopted by the EU in May 2001 for transposition into EU member states’ laws by September 2002. TPD1 included provisions that set maximum tar, nicotine and carbon monoxide yields, introduced larger health warnings and banned descriptors such as ‘light’ and ‘mild’.
A revised TPD1, the EU Tobacco and Related Products Directive (2014/40/EU), referred to as TPD2, was adopted in April 2014 for transposition into EU member states’ law by May 2016. Provisions of TPD2 include: larger combined pictorial and textual health warnings covering 65% of the two main pack surfaces (front and back) for cigarettes; restrictions on pack shape and size, including minimum pack sizes of 20 sticks for cigarettes and 30g for
roll-your-own
and
make-your-own
tobacco; increased ingredients reporting; ‘tracking and tracing’ requirements; and for
e-cigarettes:
nicotine limits,
pre-market
notification, ingredients reporting and advertising bans. Among other things, TPD2 bans the sale of cigarettes and
roll-your-own
tobacco with a characterising flavour. Menthol-flavoured cigarettes were exempted from the ban until May 2020, which has since been applied also to menthol cigarettes. (See ‘The U.S.’ for information pertaining to the regulation of menthol in that market).
 
340
 

Table of Contents
BAT Annual Report and Form 20-F 2021    
 
Strategic Report        
 
Governance Report        
  
Financial Statements        
  
Other Information        


TPD2 also purports to leave open to EU Member States the possibility of further standardising the packaging of tobacco products and to apply some of its provisions in different ways. For example, it provides, among other things, that the labelling, packaging and the tobacco product itself shall not include any element or feature that suggests that a particular tobacco product has vitalising, energetic, healing, rejuvenating, natural or organic properties or has other health or lifestyle benefits. On 26 April 2019, Belgium adopted a Royal Decree that allows the Minister of Health to establish a procedure to put brands on a prohibited list and to draw up such a list. To date, such a procedure has not yet been established by the Belgian Minister of Health. BAT’s request for annulment is still pending.
The European Commission published its Article 28 report on the application of TPD2 on 20 May 2021. The report concluded that TPD2 helped decrease smoking rates and tobacco use but that more efforts are needed, particularly in relation to enforcement at national level and new market developments, such as novel tobacco products. Currently, the preparations of a revised TPD2 are progressing, with estimated adoption in 2025. TPD2 might be replaced with a directly applicable regulation instead of a directive, following which transposition in Member States would no longer be required. It is anticipated that this new regulation will include the following provisions: plain packaging for combustibles; more regulation of ingredients, including menthol ban, for combustibles at EU level; regulation of flavours and nicotine-free liquids for
e-cigarettes
at EU level; tightening of advertising restrictions for
e-cigarettes;
stricter regulations for THPs; regulation of modern oral at EU level.
Single-Use
Plastics
The Single Use Plastics Directive (EU) 2019/904 (the SUP Directive) entered into force on 2 July 2019. The Directive requires that EU Member States introduce Extended Producer Responsibility (EPR) schemes covering the cost to clean up litter and the application of
on-pack
marking requirements for tobacco product filters. Member States must transpose the SUP Directive into national law by 3 July 2021, with an implementation deadline of 3 July 2021 for pack marking requirements and of 5 January 2023 for EPR schemes. France was the only Member State to not await this deadline and already implemented in December 2020 and February 2021 EPR schemes for, among others, cigarette manufacturers. These regulations are currently being challenged before the French Council of State. Other governments have passed or are considering similar legislation including Canada, Russia, South Korea and various levels of government in the U.S.
Restrictions on Smoking in Private, Public and Workplaces
The Group operates in a number of markets which have in place restrictions on smoking in certain private, public and work places, including restaurants, bars and nightclubs. While these restrictions vary in scope and severity, extensive public and work place smoking bans have been enacted in markets including the U.S., Canada, the UK, Spain, New Zealand and Australia. Restrictions on smoking in private have also been adopted or proposed, and typically take the form of prohibitions on smoking in cars or residential homes when children are present, or smoking within a certain distance from specified public places (such as primary schools).
Regulation of Ingredients, Including Flavoured Tobacco Products
A number of countries have restricted, and others are seeking to restrict or ban, the use of certain flavours or ingredients in cigarettes and other tobacco products, on the basis that such products are alleged to appeal disproportionally to minors, act as a catalyst for young people taking up smoking and/or increase the addictiveness or toxicity of the relevant product. To the extent flavours are permitted, this is often restricted to tobacco and/or menthol flavours only.
Such restrictions have been enacted in markets including the U.S., Canada, Australia, Turkey and Iran. An ingredients ban in Brazil, which would ban the use of certain ingredients with flavouring or aromatic properties, including menthol, is not currently in force due to ongoing legal challenges. TPD2 similarly bans in the EU the manufacture and sale of cigarettes and
roll-your-own
tobacco with a characterising flavour other than tobacco. A number of the above regulations are subject to ongoing legal challenges (See ‘The U.S.’ for information pertaining to the regulation of menthol in that market).
Currently, European regulators are increasingly seeking to restrict, and even ban, the use of flavours or ingredients in vapour products and other RRPs (see “Reduced Risk Products”). For example, Hungary, Finland, the Netherlands, Denmark, Sweden and Norway have adopted, or are considering to adopt, bills banning flavours in vapour products. This is partially based on a scientific opinion on
e-cigarettes
commissioned by the EU (the SCHEER report), which was published on 16 April 2021 and which alleges that flavours have a relevant contribution for attractiveness of use of electronic cigarettes. Legal challenges are expected to be filed against these new regulations, which will be supported by credible and contrary scientific evidence.
Further legislation on ingredients, both for FMCs and RRPs, is to be expected. The Conference of Parties to the FCTC has tasked a working group to further elaborate the partial guidelines on the regulation of the contents of tobacco products and tobacco product disclosures. The substantive discussions by the Conference of Parties to the FCTC on this report have been postponed to COP10 (see ‘World Health Organization Framework Convention on Tobacco Control’). Furthermore, certain industry players have avoided the menthol characterising flavour ban that came into force in the EU on 20 May 2020 by introducing several low menthol/WS3 products. This has resulted in several regulators in Member States taking action to ban these products from the market. In Belgium, the regulator has on this basis banned all cigarettes and other tobacco products that include components with cooling and/or analgesic effects. This movement is spurred forward by the EU JATC Report on priority additives that was published on 3 December 2020. According to this report, even a small amount of menthol, when added to cigarettes, allegedly facilitates inhalation or nicotine uptake. Many reputable public and private scientific agencies, however, have concluded the opposite.
 
341


Table of Contents
BAT Annual Report and Form 20-F 2021
Other Information
Regulation of the Group’s Business
Continued
    
 
Plain and Standardised Packaging
Plain (or ‘standardised’) packaging generally refers to a ban on the use of trademarks, logos and colours on packaging other than the use of a single colour and the presentation of brand name and variant in a specified font and location(s). The presentation of individual cigarettes may be similarly restricted. Plain packaging is high on the agenda of tobacco control groups, and the
non-binding
FCTC guidelines recommend that contracting parties consider introducing plain packaging. To date, 22 countries (including Australia, Belgium, Canada, Denmark, France, Ireland, New Zealand, the Netherlands, Saudi Arabia, Singapore, Turkey, and the UK) have adopted plain packaging legislation, with the measure being implemented in 18 of those countries. Countries, territories and states that are currently considering adopting plain packaging legislation include, but are not limited to Argentina, India, Ecuador, Panama, Brazil, Chile, Spain and South Africa. Others, such as South Korea, Ukraine and Colombia, are considering implementing increased graphic health warnings. Also RRPs are increasingly facing plain packaging regulations (see “Reduced Risk Products”), such as in Denmark where a bill was adopted on 15 December 2020, which introduces plain packaging for vapour products and THPs.
Product Display Bans at Point of Sale and Licensing Regimes
Product display bans at point of sale and licensing regimes have become relatively commonplace and have been implemented for several years in a number of countries both at national and state levels, including in Norway, Iceland, Finland, New Zealand, Thailand, Canada, Australia, and the UK. The Danish bill (referenced above) also introduces a product display ban for RRPs. A large number of countries, such as Hungary, Finland and Spain, have also sought to restrict the supply of tobacco products, including through the adoption of licensing regimes limiting the number of retail outlets from which it is possible to purchase tobacco products and/or by prohibiting the sale of tobacco products within a certain distance of specified public places.
Illicit Trade
The illegal market for tobacco products is an increasingly important issue for governments and the industry across the world.
Euromonitor International estimates that approximately 400 billion cigarettes per year are smuggled, manufactured illegally or counterfeited. A number of governments, regulators and organisations have or are considering adopting regulation to support anti-illicit trade activities. Among other forms, such regulation may comprise mandatory ‘tracking and tracing’ requirements, enabling regulators to identify the point at which any seized product left the legal supply chain, security features to combat counterfeiting and inspection and authentication obligations in respect of seized product. The TPD2, for example, requires that all unit packets of tobacco are marked with a unique and irremovable identifier, which when scanned provides various information about that product’s
route-to-market.
In November 2012, the FCTC adopted the Protocol to Eliminate Illicit Trade in Tobacco Products which includes a raft of supply chain control measures, including the implementation of ‘tracking and tracing’ technologies. The Protocol entered into force on 25 September 2018 and was considered at the first session of the Meeting of the Parties to the Protocol in October 2018. As at 1 January 2021, 62 parties have ratified the Protocol. The second session of the Meeting of the Parties to the Protocol in took place in November 2021.
Reduced Risk Products (“RRPs”)
More recently, significant debate has been generated regarding the appropriate regulation of vapour products, including regulation of the nicotine liquids used in them. As the nascent vapour category has grown in size and complexity in a relatively short period of time, a consensus framework for regulation and taxation has yet to emerge. The TPD2, for example, establishes frameworks for the regulation of novel tobacco products and
e-cigarettes,
introducing nicotine limits, health warnings requirements, advertising bans and
pre-market
notification and post-market disclosure obligations. The Conference of the Parties to the FCTC is also contemplating to redefine the scope of the FCTC to include novel tobacco products and products containing nicotine.
In countries where the sale of vapour products is permitted, governments are seeking to more strictly regulate these products, including by adopting or seeking to adopt bans on vaping in public places, bans or restrictions on flavours or other restrictions such as plain packaging and retail display and advertising bans. Conversely, some governments have intentionally banned or are seeking to ban novel tobacco products and products containing nicotine, such as Hong Kong, while others would need to amend their existing legislation in order to permit their sale. For example, in Australia nicotine is currently classified as poison, meaning that the importation of vaping products or nicotine refill liquids is illegal in every state and territory, as is the possession and use of these products. While Australia’s Therapeutic Goods Administration
re-classified
nicotine as a prescription-only medication as of 1 October 2021, the effect will be that a doctor’s prescription will be required to legally access nicotine vapour products and liquid nicotine. Recent reports in North America of individuals experiencing acute respiratory injury in suspected association with vaping certain
e-liquids
(EVALI) and youth usage have led to an increase in scrutiny of vapour products, especially at State and Provincial levels in the U.S. and Canada.
Also, other RRPs, such as nicotine pouches and THPs, are facing increasing scrutiny by regulators. In countries such as Belgium, Germany, the Netherlands, modern oral products have sought to be classified as food stuff or medicinal products to ban these products from the market. In Germany and Hungary, THPs have faced being classified in the same way as traditional tobacco products, with the potential consequence of facing the same restrictions or excise categories. These might be temporary measures until the countries have amended their existing tobacco legislation to include these products under its scope.
The U.S.
Through the RAI subsidiaries, the Group is subject to U.S. federal, state, and local laws and regulations. The Family Smoking Prevention and Tobacco Control Act (FSPTCA), which was enacted in 2009, grants the U.S. Food & Drug Administration (FDA) broad authority over the manufacture, sale, marketing and packaging of tobacco products but at the outset limited the agency’s authority to cigarettes, smokeless tobacco products, cigarette tobacco and
roll-your-own
tobacco products. Key elements of the FSPTCA include: filing of facility registrations, product listing, constituent testing and ingredient information; obtaining FDA clearance for all new products and product modifications; banning all characterising flavours other than tobacco or menthol in cigarettes; establishing ‘user fees’ to fund the FDA’s regulation of tobacco products; increasing the health warning size on cigarette packs with the option to introduce pictorial health warnings; implementing good manufacturing practices; revising the labelling and advertising requirements for smokeless tobacco products; and requiring the study of menthol. The U.S. Congress did limit the FDA’s authority in two areas, prohibiting it from:
 
 
banning categories of tobacco products; and
 
 
requiring the reduction of nicotine yields of a tobacco product to zero.
 
342
 

Table of Contents
BAT Annual Report and Form 20-F 2021    
 
Strategic Report        
 
Governance Report        
  
Financial Statements        
  
Other Information        


On 10 May 2016, the FDA issued a final regulation, referred to as the Deeming Rule, deeming all remaining products that are ‘made or derived from tobacco’ to be subject to the FDA’s regulatory authority under the FSPTCA. The Final Rule became effective as of 8 August 2016, though each requirement of the Final Rule had its own compliance date. Such ‘deemed’ tobacco products subject to the FSPTCA include, among others, electronic nicotine delivery systems (including
e-cigarettes,
e-hookah,
e-cigars,
vape pens, advanced refillable personal vapourisers, electronic pipes and
e-liquids
mixed in vape shops), certain dissolvable tobacco products, cigars and pipe tobacco.
The ‘grandfathered’ date under the Final Rule for newly deemed products remained the same as the ‘grandfathered’ date for those tobacco products already subject to the FSPTCA – 15 February 2007. Any tobacco product that was not legally marketed as of 15 February 2007 is considered a new tobacco product subject to premarket review by the FDA. The FDA has recognised that few, if any,
e-cigarettes
were on the market as of 15 February 2007, but thousands of such products (including R. J. Reynolds Vapor Company’s Vuse products) subsequently have entered into commerce. To address this issue, the FDA established a compliance policy regarding the premarket review requirements for all newly deemed tobacco products that are not grandfathered products but were on the market as of 8 August 2016. The FDA allowed such products to remain on the market so long as the manufacturer filed the appropriate Premarket Tobacco Product Application (PMTA) by a specific deadline.
The Final Rule established staggered initial compliance periods based on the expected complexity of the applications to be submitted. On 28 July 2017, as part of the FDA’s announcement of a comprehensive regulatory plan for nicotine and tobacco, the FDA extended the deadline for submission of PMTAs for newly deemed products by several years (for
e-cigarettes,
the new deadline was August 2022). However, as a result of legal action, in July 2019 a federal court ultimately brought forward the filing deadline for
non-combustible
products to 12 May 2020. In October 2019, R. J. Reynolds Vapour Company filed PMTAs for Vuse Solo. Based upon requirements of the FSPTCA that must be addressed in PMTAs, and the FDA’s Guidance regarding the type of evidence required for such applications, the costs of preparing a PMTA are significant.
In January 2020, the FDA reinforced the filing deadline of 12 May 2020 in its Guidance related to vapour but reversed its previous compliance policy that allowed products to remain on the market pending the submission of a PMTA. The Guidance announced the agency’s intent to enforce (as of February 2020) the PMTA requirements on certain products as follows: 1) Flavoured, cartridge-based vapour products except for tobacco- or menthol-flavoured products; 2) All other vapour products for which the manufacturer has failed to take (or is failing to take) adequate measures to prevent minors’ access; 3) Any vapour products that targets or whose marketing is likely to promote use by minors; and 4) Any vapour product that is offered for sale in the U.S. after 12 May 2020, and for which the manufacturer has not submitted a premarket application. Flavoured disposable vapour products and flavoured open systems would remain available for sale unless 1) the manufacturer has failed to take adequate measures to prevent minors’ access, 2) product that targets or whose marketing is likely to promote use by minors, or 3) fails to file a PMTA by 12 May 2020.
In April 2020, the federal court extended the PMTA deadline by 120 days to 9 September 2020 to address the FDA’s concerns regarding delays caused by the
COVID-19
pandemic. R. J. Reynolds Vapor Company filed PMTAs for the remaining Vuse products (Vibe, Ciro, and Alto) and the Velo products (pouch and lozenge) by the September 2020 deadline. Certain additional data from ongoing research relevant to the Alto and Velo applications were submitted as amendments to the PMTAs during the FDA review process.
The FDA granted marketing authorisation for the Vuse Solo device and its tobacco (‘original’) flavour in October 2021, but denied authorisation for Vuse Solo flavours other than menthol (which were not on the market). That denial is being appealed with the FDA. The FDA has not issued a decision on the authorisation of the Vuse Solo menthol flavour, which remains on the market pending FDA decision. There can be no assurance that the Vuse Solo menthol authorisation will be granted, or that the other flavours appeal will succeed.
Additionally, the continued marketing authorisation of Vuse Solo original flavour is contingent on continued compliance with regulatory requirements; the marketing authorisation may be suspended or withdrawn if the FDA determines that the continued marketing of the product is no longer appropriate for the protection of the public health. The FDA has not issued marketing authorisations for Vuse Alto and its associated flavours, including menthol, with FDA decisions still pending. Although the Vuse Alto menthol and tobacco flavoured products remain on the market pending FDA decisions there can be no assurance that these authorisations (or the other Vuse Alto flavours) will be granted. Similarly, the Group’s Velo products remain on the market in the U.S., again pending FDA decisions on their marketing authorisations and there can be no assurance these will be granted. If the FDA denies a marketing authorisation then the relevant product(s) would need to be withdrawn from the market (unless a court intervenes).
Comprehensive plan for tobacco and nicotine regulation
On 28 July 2017, the FDA announced its intent to develop a comprehensive plan for tobacco and nicotine regulation that recognises the continuum of risk for nicotine delivery. As part of that plan, the FDA planned to publish an Advance Notice of Proposed Rulemaking (ANPRM) to seek public input regarding the potential health benefits and possible adverse effects of lowering the level of nicotine in combustible cigarettes.
The ANPRM would request comments from interested stakeholders regarding the potential impact of a nicotine product standard on, among other things:
 
 
the likelihood that existing users of tobacco products will stop using cigarettes;
 
 
the likelihood that those who do not use tobacco products will start using such products; and
 
 
the illicit trade of cigarettes containing nicotine at levels higher than a
non-addictive
nicotine threshold.
In addition, the Center for Tobacco Products (CTP), which was established within the FDA in 2009, will coordinate with the FDA Center for Drug Evaluation and Research regarding medicinal nicotine and other therapeutic products as part of an agency-wide nicotine framework. As part of the comprehensive plan, the FDA also announced its intent to issue ANPRMs requesting public stakeholder input on the impact of flavours (including menthol) in increased initiation among youth and young adults as well as assisting adult smokers to switch to potentially less harmful forms of nicotine delivery, and the patterns of use and public health impact of premium cigars.
 
343


Table of Contents
BAT Annual Report and Form 20-F 2021
Other Information
Regulation of the Group’s Business
Continued
    
 
This follows on from the FDA’s decision to issue its own preliminary scientific evaluation regarding menthol cigarettes in 2013, which concluded that menthol cigarettes adversely affect initiation, addiction and cessation compared to
non-menthol
cigarettes. In 2018, the FDA took several steps to further this plan. Firstly, in January 2018, the FDA held a public hearing to obtain input from a broad group of stakeholders on ways to streamline the regulatory process for the issuance of therapeutic claims for nicotine products. Secondly, in March 2018, the agency issued three ANPRMs, seeking information on (1) the lowering of nicotine levels to
non-addictive
or minimally addictive levels, (2) the impact of flavours (including menthol) in increased initiation among youth and young adults as well as assisting adult smokers to switch to potentially less harmful forms of nicotine delivery, and (3) the patterns of use and public health impact of premium cigars. In April 2021, the FDA announced that it will issue proposed product standards to ban menthol as a characterising flavour in cigarettes in the U.S. In December 2021, a regulatory agenda released in the U.S. confirmed the FDA’s plans to publish a Notice of Proposed Rulemaking for a menthol cigarette ban in April 2022.
Additional regulation
In addition to the ANPRMs on reduced nicotine products and flavours, the FDA, in April 2019, issued a proposed rule on the format and content of reports to demonstrate substantial equivalence. This follows on the FDA’s previous statements regarding the development of foundational rules so as to provide clarity and predictability to the tobacco product submission process, including not only substantial equivalence applications but new product applications as well as MRTP applications. In September 2019, FDA published a proposed rule on the format and content of PMTAs. The final foundations rules for substantial equivalence and PMTAs were published on 5 October 2021 and became effective on 4 November 2021. Notably, in each rule, FDA changed the term “grandfathered tobacco product” to
“Pre-Existing
Tobacco Product,” indicating that the latter term more appropriately describes those products that were commercially marketed in the U.S. as of 15 February 2007. The FDA has not yet promulgated its proposed rule for MRTP applications, though the most recent FDA semi-annual regulatory agenda — which details the regulatory activities that the FDA expects to undertake in the foreseeable future — targeted November 2021 for the issuance of a proposed rule.
Under the FSPTCA, for a manufacturer to launch a new tobacco product or modify an existing tobacco product after 22 March 2011, the manufacturer must obtain an order from the FDA allowing the new or modified product to be marketed. Similarly, a manufacturer that introduced a cigarette or smokeless tobacco product between 15 February 2007 and 22 March 2011 was required to file a substantial equivalence report with the FDA demonstrating either (1) that the new or modified product had the same characteristics as a product commercially available as at 15 February 2007, referred to as a predicate product, or (2) if the new or modified product had different characteristics than the predicate product, that it did not raise different questions of public health. A product subject to such report is referred to as a provisional product. A manufacturer may continue to market a provisional product unless and until the FDA issues an order that the provisional product is not substantially equivalent (NSE), in which case the FDA could then require the manufacturer to remove the provisional product from the market. Many of the RAI subsidiaries’ cigarette and smokeless tobacco products currently on the market are provisional products.
In January 2017, the FDA issued its first proposed product standard just prior to President Trump’s inauguration whereby the agency would require the reduction, over a three-year period, of the levels of
N-nitrosonornicotine
(NNN) contained in smokeless tobacco products.
Since issuing this proposal, the agency has simply stated that it is evaluating submitted comments. The FDA’s semi-annual regulatory agenda has not listed the NNN proposal since its publication. Thus, it is not known whether or when this proposed rule will be finalised, and, if adopted, whether the final rule will be the same as or similar to the proposed rule. On 18 December 2017, the FDA accepted for review MRTP applications for six Camel Snus smokeless tobacco products. In 2018, the FDA began its review of these applications, which included facility inspections and a public meeting held
13-14
September 2018 before the Tobacco Product Scientific Advisory Committee to obtain its review and recommendation. The FDA is completing its independent review of the applications with no announced deadline for completion.
On 18 March 2020, FDA issued a rule mandating the incorporation on cigarettes packages of graphic health warnings. The rule requires eleven new textual warnings, each accompanied by a specific graphic image, on the top 50% of the front and back of all cigarette packages, on the left 50% of the front and back of cigarette cartons, and the top 20% of all cigarette advertising, beginning 18 June 2021. On 3 April 2020, RAI subsidiaries R. J. Reynolds Tobacco Company and Santa Fe Natural Tobacco Company, in conjunction with several cigarette manufacturers and retailers, filed a lawsuit seeking to permanently enjoin implementation of the rule. The court has on multiple occasions entered orders delaying the implementation of the rule, which currently is delayed until 9 January 2023. All briefing and oral argument in the case has been completed, and the parties await a ruling from the court as to whether the final rule will be enjoined permanently. Irrespective of the court’s decision, once issued it is expected to be appealed to the federal court of appeals. If the industry challenge is unsuccessful, the RAI companies are prepared to implement the rule’s requirements by the January 2023 deadline, having created compliant packaging and obtained approval from the FDA for the required warning rotation plans.
Cigarettes and other tobacco products are subject to substantial taxes in the U.S. All states and the District of Columbia currently impose cigarette excise taxes. Certain city and county governments, such as those of New York, Philadelphia and Chicago, also impose substantial excise taxes on cigarettes sold in those jurisdictions. Also, all states and the District of Columbia currently subject smokeless tobacco products to excise taxes. Various states and the District of Columbia impose a tax on vapour products, such as
e-cigarettes,
and many other states have proposed taxes on vapour products. Currently, there is no federal tax on vapour products.
State and local governments also consider and implement other legislation and regulation regarding the sale of tobacco products. Measures include, among others, limiting or prohibiting the sale of flavours in tobacco products, restricting where tobacco products may be sold and increasing the minimum age to purchase tobacco products. The Group believes that, as a responsible business, it can contribute through information, ideas and practical steps, to help regulators address the key issues regarding its products, including underage access, illicit trade, product information, product design, involuntary exposure to smoke and the development of potentially less harmful products, while maintaining a competitive market that accommodates the significant percentage of adults who choose to be tobacco consumers. The Group is committed to working with national governments and multilateral organisations and welcomes opportunities to participate in good faith to achieve sensible and balanced regulation of traditional tobacco and potentially reduced-risk products.
 
344
 

Table of Contents
BAT Annual Report and Form 20-F 2021    
 
Strategic Report        
 
Governance Report        
  
Financial Statements        
  
Other Information        


Disclosure Pursuant to Section 219 of the Iran Threat Reduction and Syria Human Rights Act of 2012 (ITRA)
Section 219 of the Iran Threat Reduction and Syria Human Rights Act of 2012 added Section 13(r) to the Exchange Act. Section 13(r) requires an issuer to disclose in its annual or quarterly reports, as applicable, whether it or any of its affiliates knowingly engaged in certain activities, transactions or dealings relating to Iran or with designated natural persons or entities sanctioned under programmes relating to terrorism or the proliferation of weapons of mass destruction. Disclosure is required even where the activities, transactions or dealings are conducted outside the U.S. by
non-U.S.
affiliates in compliance with applicable law, and whether or not the activities are sanctionable under U.S. law.
As of the date of this report, BAT is not aware of any activity, transaction or dealing by the Group or any of its affiliates during the financial year ended 31 December 2021 that is disclosable under Section 219 of the Iran Threat Reduction and Syria Human Rights Act of 2012 and Section 13(r) of the Exchange Act, except as set forth below. This information is to the best of BAT’s knowledge.
Until 6 August 2021, BAT had a local operation in Iran, established on 18 October 2003, through its wholly-owned
non-U.S.
subsidiary, B.A.T. Pars Company (Private Joint Stock) (BAT Pars). BAT Pars produced its products, which include Kent, Pall Mall and Montana brands, in its own factory in Eshtehard, which is in the Alborz province of Iran. As at 6 August 2021, BAT Pars distributed its product via 54 sub-agents with national and provincial distribution licences, who sell products to wholesalers and retailers with the support of BAT Pars’ sales representatives. BAT Pars had 326 direct employees and an additional 1,192 contract workers supplied by a private company.
On 25 June 2021, the Group agreed to dispose of BAT Pars to DTM ME FZE LLC. Consideration is subject to the completion accounts process, with payment deferred until September 2022. The transaction was subject to the approval by State Centre of Tobacco Planning and Supervision of the Ministry of Industry of Iran and was successfully completed on 6 August 2021.
Concerning the business of BAT Pars during its period of ownership within the Group, various elements such as income tax, payroll, social security, other taxes, excise, monopoly fees, duties and other fees, including for utilities, licences and judicial fees to commence litigation, were payable to the Government of Iran and affiliated entities regarding BAT Pars’ operation. BAT Pars maintained bank accounts in Iran with various banks to facilitate its operations in the country and to make any required payments, as described above, to the Government of Iran and affiliated entities regarding its operations.
During the year ended 31 December 2021, BAT did not have any gross revenues or net profits derived from transactions with the Government of Iran or affiliated entities.
BAT maintains policies and procedures designed to ensure that its former activities in Iran and elsewhere comply in all material aspects with the applicable and relevant trade sanctions laws and regulations, including U.S. and other international trade sanctions and/or embargoes. BAT’s sanctions policies and procedures have been designed to be as robust as possible. However, there can be no absolute assurance that these policies and procedures will be effective. Were they to be ineffective, penalties or sanctions could be imposed against BAT, which could be material. Following completion of the disposal of BAT Pars, the above-described activities in Iran have ceased.
 
345


Table of Contents
BAT Annual Report and Form 20-F 2021
 
Other Information
Material Contracts
The Master Settlement Agreement & State Settlement Agreements
In 1998, the major U.S. cigarette manufacturers (including R.J. Reynolds Tobacco Company, Lorillard and Brown & Williamson, businesses which are now part of Reynolds American) entered into the Master Settlement Agreement (“MSA”) with attorneys general representing most U.S. states and territories. The MSA imposes a perpetual stream of future payment obligations on the major US cigarette manufacturers. The amounts of money that the participating manufacturers are required to annually contribute are based upon, among other things, the volume of cigarettes sold and market share (based on cigarette shipments in that year).
During 2012, R.J. Reynolds Tobacco Company, various other tobacco manufacturers, 17 states, the District of Columbia and Puerto Rico reached a final agreement related to Reynolds American’s 2003 MSA activities, and three more states joined the agreement in 2013. Under this agreement, R.J. Reynolds Tobacco Company has received credits of more than US$1 billion in respect of its
Non-Participating
Manufacturer (“NPM”) Adjustment claims related to the period from 2003 to 2012. These credits have been applied against the company’s MSA payments over a period of five years from 2013, subject to, and dependent upon, meeting the various ongoing performance obligations. During 2014, two additional states agreed to settle NPM disputes related to claims for the period 2003 to 2012. R.J. Reynolds Tobacco Company received US$170 million in credits, which have been applied over a five-year period from 2014. During 2015, another state agreed to settle NPM disputes related to claims for the period 2004 to 2014. R.J. Reynolds Tobacco Company received US$285 million in credits, which have been applied over a four-year period from 2016. During 2016, no additional states agreed to settle NPM disputes. During 2017, two more states agreed to settle NPM disputes related to claims for the period 2004 to 2014. It is estimated that R.J. Reynolds Tobacco Company will receive US$61 million in credits, which will be applied over a five-year period from 2017. During 2018, nine more states agreed to settle NPM disputes related to claims for the period 2004 to 2019, with an option through 2022, subject to certain conditions. It is estimated that R.J. Reynolds Tobacco Company will receive US$182 million in credits for settled periods through 2017, which will be applied over a five-year period from 2018. Also in 2018, a 10th additional state agreed to settle NPM disputes related to claims for the period 2004 to 2024, subject to certain conditions. It is estimated that R.J. Reynolds Tobacco Company will receive US$205 million in credits for settled periods through 2017, which will be applied over a five-year period from 2019. In the first quarter of 2020, certain conditions set forth in the 2018 agreements were met for those 10 states. In addition, in August 2020, 24 states, the District of Columbia and Puerto Rico agreed to settle NPM disputes related to claims for the period 2018-2022. Credits in respect of future years’ payments and the NPM Adjustment claims would be accounted for in the applicable year and will not be treated as adjusting items. Only credits in respect of prior year payments are included as adjusting items.
The BAT Group is subject to substantial payment obligations under the MSA and the state settlement agreements with the states of Mississippi, Florida, Texas and Minnesota (such settlement agreements, collectively “State Settlement Agreements”). Reynolds American Inc.’s operating subsidiaries’ expenses and payments under the MSA and the State Settlement Agreements for 2021 amounted to US$3,420 million in respect of settlement expenses and US$3,744 million in respect of settlement cash payments. Reynolds American Inc.’s operating subsidiaries’ expenses and payments under the MSA and the State Settlement Agreements for 2020 amounted to US$3,572 million in respect of settlement expenses and US$2,848 million in respect of settlement cash payments. Reynolds American Inc.’s operating subsidiaries’ expenses and payments under the MSA and the State Settlement Agreements for 2019 amounted to US$2,762 million in respect of settlement expenses and US$2,918 million in respect of settlement cash payments.
R.J. Reynolds Tobacco Company divested certain brands to Imperial Tobacco Group (ITG) in 2015. In 2020, R.J. Reynolds Tobacco Company recognised additional expenses, included above, under the state settlement agreements in the states of Mississippi, Florida, Texas and Minnesota related to these divested brands. R.J. Reynolds Tobacco Company recognised US$241 million of expense for payment obligations to the state of Florida for the ITG acquired brands from the date of divestiture, 12 June 2015, as a result of an unfavourable judgment. In addition, R.J. Reynolds Tobacco Company recognised US$264 million related to the resolution of claims against it in the states of Texas, Minnesota and Mississippi for payment obligations to those states for the ITG acquired brands from the date of divestiture. Finally, R.J. Reynolds Tobacco Company settled certain related claims with Phillip Morris USA under the state settlement agreements in the states of Mississippi, Texas and Minnesota for US$8 million.
Reynolds American Inc.: Transfer of Pension Obligations
On October 7 2021, Reynolds American Inc. entered into a ‘buy out’ transaction with Metropolitan Tower Life Insurance Company to transfer $1.9 billion of pension obligations (and eliminating all further legal or constructive obligation to the pension scheme or to the sponsoring employer) through the purchase of annuities for retirees receiving benefit payments of less than a threshold amount per month. The transaction was funded with plan assets (see note 15 in the Notes on the Accounts on page 215).
 
346


Table of Contents
                 
BAT Annual Report and Form 20-F 2021    
 
Strategic Report        
 
Governance Report        
  
Financial Statements        
  
Other Information        


Change of Control Provisions as at 31 December 2021
Significant agreements
 
     
Nature of agreement
  
Key provisions
The revolving credit facilities agreement, effective 12 March 2020, entered into between the Company, B.A.T. International Finance p.l.c., B.A.T. Netherlands Finance B.V. and B.A.T Capital Corporation (as borrowers and, in the case of the Company, as a guarantor) and HSBC Bank plc (as agent) and certain financial institutions (as lenders), pursuant to which the lenders agreed to make available to the borrowers £5.85 billion for general corporate purposes (the Facility).
  
–  should a borrower (other than the Company) cease to be a direct or indirect subsidiary of the Company, such borrower shall immediately repay any outstanding advances made to it and shall cease to be a borrower under the Facility; and
 
–  where there is a change of control in respect of the Company, the lenders can require all amounts outstanding under the Facility to be repaid.
In March and December 2021, the Group extended short-term bilateral facilities with core relationship banks for a total amount of £2.5 billion. B.A.T. International Finance p.l.c. is the borrower under these facilities and the Company as the guarantor. As at 31 December 2021, £500 million was drawn on a short-term basis.
  
–  should the borrower cease to be a direct or indirect subsidiary of the Company, the borrower shall immediately repay any outstanding advances made to it under these facilities; and
 
–  where there is a change of control in respect of the Company, the lenders can require all amounts outstanding under these facilities to be repaid.
Packaging Materials Agreement dated 8 April 2015, between Souza Cruz S.A. and Amcor Group GmbH for the production and supply of packaging for a value of R$1.5 billion.
  
–  either party may terminate the agreement in the event of any direct or indirect acquisition of at least 25% of the voting shares of the supplier and/or its affiliates by directly or indirectly a competitor of Souza Cruz S.A., importer or distributor.
Global Framework Agreement dated 1 January 2014, between British American Tobacco (Investments) Limited and Papierfabrik Wattens GmbH & Co for the supply of direct materials, cigarette and plug-wrap paper.
  
–  Either party may terminate the agreement in the event of a change of control of the other party (or certain of its affiliated companies) in specified circumstances and which, in relation to British American Tobacco (Investments) Limited, would trigger a right for the other party to terminate the agreement on a change of control of British American Tobacco (Investments) Limited (or any holding company), where the new controlling entity is a customer or competitor of the other party.
On 25 July 2017, the Company acceded as a guarantor under the indenture of its indirect, wholly-owned subsidiary Reynolds American Inc. The securities issued under the indenture include approximately US$7.7 billion aggregate principal amount of unsecured Reynolds American Inc debt securities.
  
–  with respect to each series of debt securities issued under the indenture, upon a change of control event, combined with a credit ratings downgrade of the series to below investment-grade level (such downgrade occurring on any date from the date of the public notice of an arrangement that could result in a change of control event until the end of the 60-day period following public notice of the occurrence of a change of control event), Reynolds American Inc. is obligated to make an offer to repurchase all debt securities from each holder of debt securities. As a guarantor under the indenture, the Company guarantees such payments.
Rules of the long-term incentive plans 2007 and 2016 (“LTIPs”).
  
–  in the event of a change of control of the Company as a result of a takeover, reconstruction or winding-up of the Company (not being an internal reorganisation), LTIP awards will become exercisable for a limited period based on the period of time that has elapsed since the date of the award and the achievement of the performance conditions at that date, unless the Remuneration Committee determines this not to be appropriate in the circumstances; and
 
–  the rules of the LTIPs allow (as an alternative to early release) that participants may, if permitted, exchange their LTIP awards for new awards of shares in the acquiring company on a comparable basis.
 
347


Table of Contents
BAT Annual Report and Form 20-F 2021
 
Other Information
Property, Plant and Equipment
The Group uses a combination of
in-house
and contract manufacturers to manufacture its products.
BAT-owned
manufacturing facilities
1
 
     
United States
    
            APME
    
            AmSSA
    
            ENA
    
            Total
 
Fully integrated cigarette manufacturing
  
 
2


14


15


11


42
 
Sites processing tobacco only
  
 
1


6


9


2


18
 
Site manufacturing other tobacco products, Snus, Modern Oral and Liquids
  
 
3


5


8
 
R&D facilities and Product Centres
  
 
1


1


3


2


7
 
Total
  
 
7


21


27


20


75
 
Note:
1. As of 31 December 2021.
The plants and properties owned or leased and operated by the Group’s subsidiaries are maintained in good condition and are believed to be suitable and adequate for the Group’s present needs.
The technology employed in the Group’s factories is sophisticated, especially in the area of cigarette-making and packing where throughputs can reach between 500 and 1,000 packs per minute. The Group can produce many different pack formats (e.g., the number of cigarettes per packet) and configurations (e.g., bevel edge, round corner, international) to suit marketing and consumer requirements. New technology machines are sourced from the leading machinery suppliers to the industry. Close cooperation with these organisations helps the Group support its marketing strategy by driving its product innovations, which are brought to the market on a regular basis. The Group utilises quality standards, processes and procedures covering the entire
end-to-end
value chain to help to ensure quality products are provided to its customers and adult tobacco consumers according to the Group’s requirements and end market regulatory requirements.
The Group has several improvement initiatives which it is currently managing. For example, the Group is continuing to realise the benefits of its Integrated Work System Programme launched in 2014, which is centrally led with an aim to improve the performance of the Group’s factories globally by focusing on manufacturing standards, continuous improvement, assessment and benchmarking, and organisational development. The Group also utilises a survey process in the factories with an aim to improve factory productivity and reduce costs in the manufacturing environment. This process, known as ‘Bulls Eye’, has been in existence for a number of years and highlights productivity opportunities by benchmarking.
In 2021, the Group manufactured cigarettes in 42 cigarette factories in 40 countries. These plants and properties are owned or leased and operated by the Group’s subsidiaries. The Group’s factory outputs and establishments vary significantly in size and production capacity. Also in 2021, the Group used third-party manufacturers to manufacture the components required, including the devices, related to New Categories. The Group also used third-party manufacturers to supplement the Group’s own production facilities in the US and Poland to bottle the liquids used in the vapour products.
For more information on property, plant and equipment, see note 13 in the Notes on the Accounts.
Raw Materials
While the Group does not own tobacco farms or directly employ farmers, it sources tobacco leaf directly from over 75,000 contracted farmers and through third-party suppliers mainly in developing countries and emerging markets. In respect of farmers we contract, we continually strive to improve farmer sustainability and viability with a focus on improved quality and resistance of seed, tailored mechanisation to reduce costs of production and increased yield, with similar expectation on our third-party suppliers in respect of their farmer contracts. We review our contracts on an annual basis considering Group requirements over the medium term
(2-3
years) to promote the stability of demand and supply on production volumes. The Group also purchases a small amount of tobacco leaf from India where the tobacco is bought over an auction floor. The price of tobacco in US dollars varies from
year-to-year
driven by domestic inflationary pressures, economic and political factors, as well as climatic conditions which impact supply, demand and quality of tobacco grown.
While
COVID-19
impacted tobacco supply chains across most markets and required process enhancements to minimise transmission risks within communities, prices and availability of tobacco were not significantly impacted. The Group believes there is an adequate supply of tobacco leaf in the world markets to satisfy its current and anticipated production requirements.
We also source a number of other materials required as part of our production requirements, covering areas that include wrapping materials and filters for our combustibles business and liquids and batteries for our New Categories products. We work closely with our suppliers to ensure a robust supply chain, with contingency sourcing in place. Contracts and sourcing agreements are reviewed regularly, to ensure competitive trading terms while recognising that prices may be impacted by external factors that affect our third-party supply partners.
COVID-19
has led to some short-term disruption in the supply of certain materials (due to local lockdowns and travel restrictions), yet this has been proactively managed to mitigate the impact.
 
348


Table of Contents
BAT Annual Report and Form 20-F 2021    
 
Strategic Report        
 
Governance Report        
  
Financial Statements        
  
Other Information        


Other Information
US Corporate Governance Practices
Principles
In the U.S., ADSs of the Company are listed on the New York Stock Exchange (NYSE). The significant differences between the Company’s corporate governance practices as a UK company and those required by NYSE listing standards for U.S. companies are discussed below.
The Company has applied a robust set of board governance principles, which reflect the UK Corporate Governance Code 2018 and its principles-based approach to corporate governance. NYSE rules require U.S. companies to adopt and disclose on their websites corporate governance guidelines. The Company complies with UK requirements, including a statement in this report of how the Company has applied the principles of the UK Corporate Governance Code 2018 and that the Company has complied with the provisions of the UK Corporate Governance Code 2018.
Independence
The Company’s Board governance principles require that all
Non-Executive
Directors be determined by the Board to be independent in character and judgement and free from any business or other relationships that could interfere materially with, or appear to affect, their judgement. The Board also has formal procedures for managing conflicts of interest. The Board has determined that, in its judgement, all of the
Non-Executive
Directors are independent. In doing so, the Board has taken into consideration the independence requirements outlined in the NYSE’s listing standards and considers these to be met by the Chairman and all of its
Non-Executive
Directors.
Committees
The Company has a number of Board Committees that are broadly comparable in purpose and composition to those required by NYSE rules for domestic U.S. companies. For instance, the Company has a Nominations (rather than nominating/corporate governance) Committee and a Remuneration (rather than compensation) Committee. The Company also has an Audit Committee, which NYSE rules require for both US companies and foreign private issuers.
These Committees are composed solely of
Non-Executive
Directors and, in the case of the Nominations Committee, the Chairman whom the Board has determined to be independent in the manner described above.
Each Board Committee has its own terms of reference, which prescribe the composition, main tasks and requirements of each of the Committees (see the Board Committee reports on pages 116, 120 and 128).
Under U.S. securities law and the listing standards of the NYSE, the Company is required to have an audit committee that satisfies the requirements of Rule
10A-3
under the Exchange Act and Section 303A.06 of the NYSE Listed Company Manual. The Company’s Audit Committee complies with these requirements. The Company’s Audit Committee does not have direct responsibility for the appointment, reappointment or removal of the independent auditors. Instead, it follows the UK Companies Act 2006 by making recommendations to the Board on these matters for it to put forward for shareholder approval at the AGM.
One of the NYSE’s additional requirements for the audit committee states that at least one member of the audit committee is to have ‘accounting or related financial management expertise’. The Board has determined that Holly Keller Koeppel and Darrell Thomas possess such expertise and also possess the financial and audit committee experiences set forth in both the UK Corporate Governance Code 2018 and SEC rules (see the Audit Committee report on page 120). Ms Keller Koeppel and Mr Thomas have also each been designated as an Audit Committee financial expert as defined in Item 16.A. of Form
20-F.
The Board has also determined that each Audit Committee member meets the financial literacy requirements applicable under NYSE listing standards.
Shareholder Approval of Equity Compensation Plans
The NYSE rules for U.S. companies require that shareholders must be given the opportunity to vote on all equity-compensation plans and material revisions to those plans. The Company complies with UK requirements that are similar to the NYSE rules. The Board, however, does not explicitly take into consideration the NYSE’s detailed definition of what are considered ‘material revisions’.
Codes of Business Conduct and Ethics
The NYSE rules require US companies to adopt and disclose a code of business conduct and ethics for all directors, officers and employees and promptly disclose any waivers of the code for directors or executive officers. The Group Standards of Business Conduct (the “SoBC”) described on pages 56 and 57 apply to all staff in the Group, including senior management and the Board, and satisfy the NYSE requirements. All Group companies have adopted the SoBC (or localised versions). The SoBC also set out the Group’s whistleblowing policy, enabling staff, in confidence and anonymously, to raise concerns without fear of reprisal, including concerns regarding questionable accounting or auditing matters. The SoBC is available at bat.com/sobc.
The Company has also adopted a code of ethics for its Chief Executive, Finance and Transformation Director, Group Financial Controller and Group Chief Accountant as required by the provisions of Section 406 of the Sarbanes-Oxley Act of 2002 and the rules issued by the SEC. No waivers or exceptions to the Code of Ethics were granted in 2021. The Code of Ethics includes requirements in relation to confidentiality, conflicts of interest and corporate opportunities, and obligations for those senior financial officers to act with honesty and integrity in the performance of their duties and to promote full, fair, accurate, timely and understandable disclosures in all reports and other documents submitted to the SEC, the UK Financial Conduct Authority, and any other regulatory agency.
The Company considers that these codes and policies address the matters specified in the NYSE rules for U.S. companies.
Independent Director Contact
Interested parties may communicate directly with the independent directors, individually or as a group, by sending written correspondence addressed to the independent director(s) to the attention of the Company Secretary at the following address: c/o Paul McCrory, Company Secretary, British American Tobacco p.l.c., Globe House, 4 Temple Place, London WC2R 2PG.
 
349


Table of Contents
BAT Annual Report and Form 20-F 2021
 
Other Information
Controls and Procedures
Evaluation of Disclosure Controls and Procedures
Disclosure controls and procedures
The Group maintains ‘disclosure controls and procedures’ (as such term is defined in Exchange Act Rule
13a-15(e)),
that are designed to ensure that information required to be disclosed in reports the Group files or submits under the Exchange Act is recorded, processed, summarised and reported within the time periods specified in the SEC rules and forms, and that such information is accumulated and communicated to management, including the Chief Executive and Finance and Transformation Director, as appropriate, to allow timely decisions regarding required disclosure.
In designing and evaluating our disclosure controls and procedures, our management, including the Chief Executive and Finance and Transformation Director, recognise that any controls and procedures, no matter how well designed and operated, can provide only reasonable, not absolute, assurance that the objectives of the disclosure controls and procedures are met. Due to the inherent limitations in all control systems, no evaluation of controls can provide absolute assurance that all control issues and instances of fraud, if any, within the Group have been detected. The Group’s disclosure controls and procedures have been designed to meet, and management believes that they meet, reasonable assurance standards.
Management, with the participation of the Chief Executive and Finance and Transformation Director, has evaluated the effectiveness of the Group disclosure controls and procedures pursuant to Exchange Act Rule
13a-15(b)
as of the end of the period covered by this annual report. Based on that evaluation, the Chief Executive and Finance and Transformation Director have concluded that the Group disclosure controls and procedures were effective at a reasonable assurance level.
Management’s report on internal control over financial reporting
Management, under the oversight of the Chief Executive and the Finance and Transformation Director, is responsible for establishing and maintaining adequate internal control over financial reporting for the Group. The Group’s internal control over financial reporting consists of processes which are designed to: provide reasonable assurance regarding the reliability of financial reporting and the preparation of the Group’s financial statements for external reporting purposes in accordance with IFRS as issued by the IASB and
UK-adopted
international accounting standards; provide reasonable assurance that receipts and expenditure are made only in accordance with the authorisation of management; and provide reasonable assurance regarding the prevention or timely detection of any unauthorised acquisition, use or disposal of assets that could have a material effect on the consolidated financial statements.
As required by Section 404 of the Sarbanes-Oxley Act of 2002, management has assessed the effectiveness of the internal control over financial reporting (as defined in Rules
13(a)-13(f)
and
15(d)-15(f)
under the US Securities Exchange Act of 1934) based on the updated Internal Control-Integrated Framework issued by the Committee of Sponsoring Organisations of the Treadway Commission (COSO) (2013). Based on that assessment, management has determined that the Group’s internal control over financial reporting was effective as at 31 December 2021.
Any internal control framework, no matter how well designed, has inherent limitations, including the possibility of human error and the circumvention or overriding of controls and procedures and may not prevent or detect misstatements. Also, projections of any evaluation of effectiveness to future periods are subject to the risk that controls may become inadequate because of changes in conditions or because the degree of compliance with the policies or procedures may deteriorate.
»KPMG LLP, an independent registered public accounting firm, who also audit the Group’s consolidated financial statements, has audited the effectiveness of the Group’s internal control over financial reporting as at 31 December 2021, which is included in this document.»
Changes in internal control over financial reporting
During the period covered by this report, there were no changes in the Group’s internal control over financial reporting that have materially affected or are reasonably likely to materially affect the effectiveness of internal control over financial reporting.
Statements Regarding
Competitive Position
Statements referring to the competitive position of BAT and its subsidiaries are based on the Group’s belief and best estimates. In certain cases, such statements and figures rely on a range of sources, including investment analyst reports, independent market surveys, and the Group’s own internal assessments of market share.
 
350


Table of Contents
BAT Annual Report and Form 20-F 2021    
 
Strategic Report        
 
Governance Report        
  
Financial Statements        
  
Other Information        


Directors’ Report Information
This Other Information section of the British American Tobacco Annual Report and Form
20-F,
which includes Additional Disclosures and Shareholder Information, forms part of, and includes certain disclosures which are required by law to be included in, the Directors’ Report.
Strategic Report Disclosures
 
Section 414C(11) of the Companies Act 2006 allows the Board to include in the Strategic Report information that it considers to be of strategic importance that would otherwise need to be disclosed in the Directors’ Report. The Board has chosen to take advantage of this provision and accordingly, the information set out below, which would otherwise be required to be contained in the Directors’ Report, has been included in the Strategic Report.
Information required in the Directors’ Report
  
Section in the Strategic Report
Information on dividends
  
Financial review
Certain risk information about the use of financial instruments
  
Financial review
An indication of likely future developments in the business of the Group
  
A strategy for accelerated growth
An indication of the activities of the Group in the field of research and development
  
Accelerating the Enterprise of the Future
    
Tobacco Harm Reduction Through World-class Science
A statement describing the Group’s policy regarding the hiring, continuing employment and training, career development and promotion of disabled persons
  
People and Culture
Details of employee engagement: information, consultation, regard to employee interests, share scheme participation and the achievement of a common awareness of the financial and economic factors affecting the performance of the Group
  
Engaging with our stakeholders
 
People and Culture
 
Principles of Remuneration for Our Wider Workforce
Details of business relationships: Directors’ regard to business relationships with customers, suppliers and other external stakeholders
  
Engaging with our stakeholders
Disclosures concerning greenhouse gas emissions and energy consumption
  
Excellence in Environmental Management
Shareholder Information Disclosures
  
 
Information required in the Directors’ Report
  
Section in Other Information
Change of control provisions
  
Material contracts
Information on dividends
  
Dividends
Share capital – structure and voting rights; restrictions on transfers of shares
  
Articles of Association
Directors – appointment and retirement
  
Articles of Association
Amendment of Articles of Association
  
Articles of Association
Branch outside of the UK - Representative Office in South Africa
  
Inside page of the back cover
Major shareholders
  
Share capital and security ownership
Directors – share issuance and
buy-back
powers
  
Share capital and security ownership


Purchases of shares
Listing Rules (LRs) Disclosures
 
  
For the purpose of LR 9.8.4C R the applicable information
required to be disclosed by LR 9.8.4 R
  
Section in Other Information
Section (12) – shareholder waivers of dividends
  
Group Employee Trust
Section (13) – shareholder waivers of future dividends
  
Group Employee Trust
 
Directors: Interests and Indemnities
   
Interests
  
–  details of Directors’ remuneration and emoluments, and their interests in the Company’s shares (including share options and deferred shares) as at 31 December 2021 are given in the Remuneration Report; and
 
–  no Director had any material interest in a contract of significance (other than a service contract) with the Company or any subsidiary company during the year.
Insurance
  
–  appropriate cover provided in the event of legal action against the Company’s Directors.
Indemnities
  
–  provision of indemnities to Directors in accordance with the Company’s Articles of Association and to the maximum extent permitted by law; and
 
–  as at the date of this report, such indemnities are in force covering any costs, charges, expenses or liabilities that they may incur in or about the execution of their duties to the Company or to any entity which is an associated company (as defined in Section 256 of the Companies Act 2006), or as a result of duties performed by them on behalf of the Company or any such associated company.
 
Directors’ Report Approval and Signature
 
The Directors’ Report comprises the information on pages 98 to 127 and pages 299 to 379. The Directors’ Report was approved by the Board of Directors on 10 February 2022 and signed on its behalf by Paul McCrory, Company Secretary.
 
351


Table of Contents
BAT Annual Report and Form 20-F 2021
 
Other Information
Cautionary Statement
This document contains certain forward-looking statements, including “forward-looking” statements made within the meaning of the U.S. Private Securities Litigation Reform Act of 1995. These statements are often, but not always, made through the use of words or phrases such as “believe,” “anticipate,” “could,” “may,” “would,” “should,” “intend,” “plan,” “potential,” “predict,” “will,” “expect,” “estimate,” “project,” “positioned,” “strategy,” “outlook”, “target” and similar expressions. These include statements regarding our intentions, beliefs or current expectations concerning, amongst other things, our results of operations, financial condition, liquidity, prospects, growth, strategies and the economic and business circumstances occurring from time to time in the countries and markets in which the Group operates, including the projected future financial and operating impacts of the
COVID-19
pandemic.
In particular, these forward-looking statements include, among other statements, statements regarding the Group’s future financial performance, planned product launches and future regulatory developments, as well as: (i) certain statements in the Overview section (pages 2 to 11, including the Chairman’s Introduction, Chief Executive’s Review and Finance and Transformation Director’s Overview; (ii) certain statements in the Strategic Management section (pages 12 to 32), including Our Global Business section; (iii) certain statements in the Financial Review section (pages 75 to 83), including the Treasury and Cash Flow section and going concern discussions; and (iv) certain statements in the Other Information section (pages 299 to 382), including the Additional Disclosures and Shareholder Information sections.
All such forward-looking statements involve estimates and assumptions that are subject to risks, uncertainties and other factors. It is believed that the expectations reflected in this document are reasonable but they may be affected by a wide range of variables that could cause actual results to differ materially from those currently anticipated.
Among the key factors that could cause actual results to differ materially from those projected in the forward-looking statements are uncertainties related to the following: the impact of competition from illicit trade; the impact of adverse domestic or international legislation and regulation; the inability to develop, commercialise and deliver the Group’s New Categories strategy; adverse litigation and dispute outcomes and the effect of such outcomes on the Group’s financial condition; the impact of significant increases or structural changes in tobacco, nicotine and New Categories related taxes; translational and transactional foreign exchange rate exposure; changes or differences in domestic or international economic or political conditions; the ability to maintain credit ratings and to fund the business under the current capital structure; the impact of serious injury, illness or death in the workplace; adverse decisions by domestic or international regulatory bodies; and changes in the market position, businesses, financial condition, results of operations or prospects of the Group. Further details on the principal risks that may affect the Group can be found in the ‘Group Principal Risks’ section of the Strategic Report on pages 92 to 97 of this document. A summary of all the risk factors (including the principal risks) which are monitored by the Board through the Group’s risk register is set out in the Additional Disclosures section under the heading ‘Group Risk Factors’ on pages 317 to 339.
Past performance is no guide to future performance and persons needing advice should consult an independent financial adviser. The forward-looking statements reflect knowledge and information available at the date of preparation of this document and the Group undertakes no obligation to update or revise these forward-looking statements, whether as a result of new information, future events or otherwise. Readers are cautioned not to place undue reliance on such forward-looking statements.
No statement in this document is intended to be a profit forecast and no statement in this document should be interpreted to mean that earnings per share of BAT for the current or future financial years would necessarily match or exceed the historical published earnings per share of BAT.
 
352


Table of Contents
                 
BAT Annual Report and Form 20-F 2021    
 
Strategic Report        
 
Governance Report        
  
Financial Statements        
  
Other Information        


Share Prices and Listing
Premium Listing – London Stock Exchange (LSE)
The primary market for BAT’s ordinary shares is the LSE (Share Code: BATS; ISIN: GB0002875804). BAT’s ordinary shares have been listed on the LSE main market since 8 September 1998 and are a constituent element of the FTSE 100 Index.
Secondary Listing – Johannesburg Stock Exchange (JSE Limited), South Africa
BAT’s ordinary shares have a secondary listing and are traded in South African rand on the Main Board of the JSE in South Africa (Abbreviated name: BATS; Trading code: BTI). BAT’s ordinary shares have been listed on the JSE since 28 October 2008 and are a constituent element of the JSE Top 40 Index.
American Depositary Shares (ADSs) – New York Stock Exchange (NYSE)
BAT ordinary shares trade in the form of BAT ADSs in the United States under the symbol BTI (CUSIP Number: 110448107). The BAT ADSs have been listed on the NYSE since 25 July 2017 as a Sponsored Level III ADS programme for which Citibank, N.A. is the depositary (the ‘Depositary’) and transfer agent. Each ADS represents one ordinary share. ADSs are evidenced by American Depositary Receipts (ADRs).
Share Prices
The high and low prices at which the Company’s ordinary shares and ADSs are recorded as having traded during the year on each of the LSE, JSE and NYSE are as follows:


High
    
Low
 
LSE
  
 
£29.14


£24.85
 
JSE
  
 
R590.95


R513.00
 
NYSE
  
 
US$40.51


US$33.65
 
 
353


Table of Contents
BAT Annual Report and Form 20-F 2021
 
Other Information
Dividends
Policy
The Group’s policy is to pay dividends of 65% of long-term sustainable earnings, calculated with reference to adjusted diluted earnings per share, as defined on page 308, and reconciled from earnings per share in note 11 in the Notes on the Accounts. Please see page 79 of this Annual Report and Form
20-F
2021 for further discussion on the Group’s dividend.
Currencies and Exchange Rates
Details of foreign exchange rates are set out in the Financial Review section of the Strategic Report on page 83 of this Annual Report and
Form 20-F
2021. There are currently no UK foreign exchange controls or restrictions on remittance of dividends on the ordinary shares other than restrictions applicable to certain countries and persons subject to UK economic sanctions.
American Depositary Shares – Dividends
The following table shows the dividends paid by British American Tobacco p.l.c. in the years ended 31 December 2019 to 31 December 2021 inclusive.
 
Announcement
Year
  
Payment
  
Dividend Period
  
        Dividend Per BAT Ordinary Share
GBP
    
        Dividend Per BAT ADS
ADS ratio 1:1
USD
1
 
2019
  
May
  
Quarterly Interim 2019
  
 
0.5075


0.6596990
 
  
August
  
Quarterly Interim 2019
  
 
0.5075


0.6155970
 
  
November
  
Quarterly Interim 2019
  
 
0.5075


0.6521370


February 2020            
  
Quarterly Interim 2019
  
 
0.5075


0.6571610
 
     
Total
  
 
2.0300


2.5845940
 
                             
2020
  
May
  
Quarterly Interim 2020
  
 
0.526


0.6424030
 
  
August
  
Quarterly Interim 2020
  
 
0.526


0.6889020
 
  
November
  
Quarterly Interim 2020
  
 
0.526


0.6895860


February 2021
  
Quarterly Interim 2020
  
 
0.526


0.7178320
 
     
Total
  
 
2.104


2.738723
 
                             
2021
  
May
  
Quarterly Interim 2021
  
 
0.539


0.7576180
 
  
August
  
Quarterly Interim 2021
  
 
0.539


0.7345300
 
  
November
  
Quarterly Interim 2021
  
 
0.539


0.7217210


February 2022
  
Quarterly Interim 2021
  
 
0.539


0.7298860


Total
  
 
2.156


2.943755
 
Note:
1.
Holders of BAT ADSs:
dividends are receivable in US dollars based on the £ sterling/US dollar exchange rate on the applicable ADS payment date, being three business days after the payment date for the BAT ordinary shares.
 
354


Table of Contents
BAT Annual Report and Form 20-F 2021    
 
Strategic Report        
 
Governance Report        
  
Financial Statements        
  
Other Information        


Quarterly Dividends for the Year Ended 31 December 2021
The Group pays quarterly dividends. The Board has declared an interim dividend of 217.8p per ordinary share of 25p which is payable in four equal quarterly instalments of 54.45p per ordinary share in May 2022, August 2022, November 2022 and February 2023. This represents an increase of 1.0% on 2020 (2020: 215.6p per share), and a payout ratio, on 2021 adjusted diluted earnings per share, of 66.2%.
The quarterly dividends will be paid to shareholders registered on either the UK main register or the South Africa branch register and to ADS holders, each on the applicable record dates set out under the heading ‘Key dates’ below.
Holders of American Depositary Shares (ADSs)
For holders of ADSs listed on the NYSE, the record dates and payment dates are set out below. The equivalent quarterly dividends receivable by holders of ADSs in US dollars will be calculated based on the exchange rate on the applicable payment date.
South Africa branch register
In accordance with the JSE Listing Requirements, the finalisation information relating to shareholders registered on the South Africa branch register (comprising the amount of the dividend in South African rand, the exchange rate and the associated conversion date) will be published on the dates stated below, together with South Africa dividends tax information.
The quarterly dividends are regarded as ‘foreign dividends’ for the purposes of the South Africa Dividends Tax. For the purposes of South Africa Dividends Tax reporting, the source of income for the payment of the quarterly dividends is the United Kingdom.
 
  Key dates
 
In compliance with the requirements of the LSE, the NYSE and Strate, the electronic settlement and custody system used by the JSE, the following are the salient dates for the quarterly dividend payments. All dates are 2022 unless otherwise stated.
 
 
Event
  
Payment No. 1        
  
Payment No. 2        
 
Payment No. 3        
 
Payment No. 4            
Preliminary announcement (includes
declaration data required for JSE purposes)
 
       
11 February
 
   
Publication of finalisation information (JSE)
  
14 March
  
28 June
 
20 September
 
12 December
No removal requests (in either direction)
permitted between the UK main register
and the South Africa branch register
  
14 March–

28 March
 
(inclusive)
  
28 June–

11 July
 
(inclusive)
 
20 September–

3 October
 
(inclusive)
 
12 December–

27 December
 
(inclusive)
Last day to trade (LDT)
cum-dividend
(JSE)
  
22 March
  
5 July
 
27 September
 
20 December
Shares commence trading
ex-dividend
(JSE)
  
23 March
  
6 July
 
28 September
 
21 December
No transfers permitted between the UK
main register and the South Africa
branch register
 
  
23 March–

28 March
 
(inclusive)
  
6 July–

11 July
 
(inclusive)
 
28 September –

3 October
 
(inclusive)
 
21 December–

27 December
 
(inclusive)
No shares to be dematerialised or
rematerialised on the South Africa
branch register
 
  
23 March–
28 March
 
(inclusive)
  
6 July–

11 July
 
(inclusive)
 
28 September–

3 October
 
(inclusive)
 
21 December–

27 December
 
(inclusive)
Shares commence trading
ex-dividend
(LSE)
  
24 March
  
7 July
 
29 September
 
22 December
Shares commence trading
ex-dividend
(NYSE)
  
24 March
  
7 July
 
29 September
 
22 December
Record date (LSE, JSE and NYSE)
  
25 March
  
8 July
 
30 September
 
23 December
Last date for receipt of Dividend
Reinvestment Plan (DRIP) elections (LSE)
  
8 April
  
27 July
 
20 October
 
12 January 2023
Payment date (LSE and JSE)
  
4 May
  
17 August
 
10 November
 
2 February 2023
ADS payment date (NYSE)
  
9 May
  
22 August
 
15 November
 
6 February 2023
 
355


Table of Contents
BAT Annual Report and Form 20-F 2021
 
Other Information
Shareholder Taxation Information
The following discussion summarises material US federal income tax consequences and UK taxation consequences to US holders of owning and disposing of ordinary shares or ADSs, this information is accurate as at
>>
8 March 2022
>>
. This discussion does not address any tax consequences arising under the laws of any state, local or foreign jurisdiction or under any US federal laws other than those pertaining to income tax. This discussion is based upon the US Internal Revenue Code of 1986 (the ‘US Tax Code’), the Treasury regulations promulgated under the US Tax Code and court and administrative rulings and decisions, all as in effect on the date hereof. These laws may change, possibly retroactively, and any change could affect the accuracy of the statements and conclusions set forth in this discussion.
This discussion addresses only those US holders of ordinary shares or ADSs who hold such equity interests as capital assets within the meaning of Section 1221 of the US Tax Code. Further, this discussion does not address all aspects of US federal income taxation that may be relevant to US holders in light of their particular circumstances or that may be applicable to them if they are subject to special treatment under the US federal income tax laws, including, without limitation:
 
 
a bank or other financial institution;
 
 
a tax-exempt organisation;
 
 
an S corporation or other pass-through entity and an investor therein;
 
 
an insurance company;
 
 
a mutual fund;
 
 
a regulated investment company or real estate investment trust;
 
 
a dealer or broker in stocks and securities, or currencies;
 
 
a trader in securities that elects mark-to-market treatment;
 
 
a US holder subject to the alternative minimum tax provisions of the US Tax Code;
 
 
a US holder that received ordinary shares or ADSs through the exercise of an employee stock option, pursuant to a tax qualified retirement plan or otherwise as compensation;
 
a US holder that is a tax-qualified retirement plan or a participant or a beneficiary under such a plan;
 
 
a person that is not a US holder (as defined below);
 
 
a person that has a functional currency other than the US dollar;
 
 
a person required to recognise any item of gross income as a result of such income being recognised on an applicable financial statement;
 
 
a US holder of ordinary shares or ADSs that holds such equity interest as part of a hedge, straddle, constructive sale, conversion or other integrated transaction;
 
 
a US holder that owns (directly, indirectly or constructively) 10% or more of ordinary shares or ADSs by vote or by value; or
 
 
a US expatriate.
 
The determination of the actual tax consequences to a US holder will depend on the US holder’s specific situation. US holders of ordinary shares or ADSs should consult their own tax advisers as to the tax consequences of owning and disposing of ordinary shares or ADSs, in each case, including the applicability and effect of the alternative minimum tax and any state, local, foreign or other tax laws and of changes in those laws.
For purposes of this discussion, the term US holder means a beneficial owner of ordinary shares or ADSs (as the case may be) that:
 
 
is for US federal income tax purposes: (i) an individual citizen or resident of the United States; (ii) a corporation, including any entity treated as a corporation for US federal income tax purposes, created or organised in or under the laws of the United States, any state thereof or the District of Columbia; (iii) a trust if a US court is able to exercise primary supervision over the trust’s administration and one or more US persons are authorised to control all substantial decisions of the trust or it has a valid election in effect under applicable Treasury regulations to be treated as a US person; or (iv) an estate that is subject to US federal income tax on its income regardless of its source; and
 
 
is not resident in the UK for UK tax purposes.
The US federal income tax consequences to a partner in an entity or arrangement treated as a partnership for US federal income tax purposes that holds ordinary shares or ADSs generally will depend on the status of the partner and the activities of the partnership. Partners in a partnership holding any such equity interest should consult their own tax advisers.
Material US Federal Income Tax Consequences Relating to the Ownership and Disposition of Ordinary Shares or ADSs
The following is a discussion of the material US federal income tax consequences of the ownership and disposition by US holders of ordinary shares or ADSs. This discussion assumes that BAT is not, and will not become, a passive foreign investment company for US federal income tax purposes, as described below.
ADSs
A US holder of ADSs, for US federal income tax purposes, generally will be treated as the owner of the underlying ordinary shares that are represented by such ADSs. Accordingly, deposits or withdrawals of ordinary shares for or from ADSs will not be subject to US federal income tax.
Taxation of Dividends
The gross amount of distributions on the ordinary shares or ADSs will be taxable as dividends to the extent paid out of BAT’s current or accumulated earnings and profits, as determined under US federal income tax principles. Such income will be includable in a US holder’s gross income as ordinary income on the day actually or constructively received by the US holder. Such dividends will be treated as foreign source income and will not be eligible for the dividends received deduction allowed to corporations under the US Tax Code.
 
356


Table of Contents
                 
BAT Annual Report and Form 20-F 2021    
 
Strategic Report        
 
Governance Report        
  
Financial Statements        
  
Other Information        


With respect to
non-corporate
US investors, certain dividends received from a qualified foreign corporation may be subject to reduced rates of taxation. A qualified foreign corporation includes a foreign corporation that is eligible for the benefits of a comprehensive income tax treaty with the United States that the Treasury determines to be satisfactory for these purposes and that includes an exchange of information provision. The Treasury has determined that the treaty between the United States and the United Kingdom meets these requirements, and BAT believes that it is eligible for the benefits of the treaty. However,
non-corporate
holders that do not meet a minimum holding period requirement during which they are not protected from the risk of loss or that elect to treat the dividend income as ‘investment income’ pursuant to Section 163(d)(4) of the US Tax Code will not be eligible for the reduced rates of taxation. In addition, the rate reduction will not apply to dividends if the recipient of a dividend is obligated to make related payments with respect to positions in substantially similar or related property. This disallowance applies even if the minimum holding period has been met. US holders should consult their own tax advisers regarding the application of these rules to their particular circumstances.
The amount of any dividend paid by BAT in £ sterling (including any such amount in respect of ADSs that is converted into US dollars by the depositary bank) will equal the US dollar value of the £ sterling actually or constructively received, calculated by reference to the exchange rate in effect on the date the dividend is so received by the US holder, regardless of whether the £ sterling are converted into US dollars. If the £ sterling received as a dividend are converted into US dollars on the date received, the US holder generally will not be required to recognise foreign currency exchange gain or loss in respect of the dividend income. If the £ sterling received as a dividend are not converted into US dollars on the date of receipt, the US holder will have a basis in £ sterling equal to their US dollar value on the date of receipt. Any gain or loss realised on a subsequent conversion or other disposition of £ sterling will be treated as US source ordinary income or loss. US holders of ADSs should consult their own tax advisers regarding the application of these rules to the amount of any dividend paid by BAT in £ sterling that is converted into US dollars by the depositary bank.
To the extent that the amount of any distribution exceeds BAT’s current and accumulated earnings and profits for a taxable year, as determined under US federal income tax principles, the distribution will first be treated as a
tax-free
return of capital, causing a reduction in the US holder’s adjusted basis of the ordinary shares or ADSs, and to the extent the amount of the distribution exceeds the US holder’s tax basis, the excess will be taxed as capital gain recognised on a sale or exchange, as described below. BAT does not expect to determine earnings and profits in accordance with US federal income tax principles. Therefore, notwithstanding the foregoing, US holders should expect that distributions generally will be reported as dividend income for US information reporting purposes.
Distributions by BAT of additional ordinary shares (which may be distributed by the depositary bank to a holder of ADSs in the form of ADSs) to a US holder that is made as part of a pro rata distribution to all holders of ordinary shares and ADSs in respect of their ordinary shares or ADSs, and for which there is no option to receive other property (not including ADSs), generally will not be subject to US federal income tax. The basis of any new ordinary shares (or ADSs representing new ordinary shares) so received will be determined by allocating the US holder’s basis in the previously held ordinary shares or ADSs between the previously held ordinary shares or ADSs and the new ordinary shares or ADSs, based on their relative fair market values on the date of distribution.
Passive foreign investment company
A passive foreign investment company (“PFIC”), is any foreign corporation if, after the application of certain ‘look-through’ rules: (1) at least 75% of its gross income is ‘passive income’ as that term is defined in the relevant provisions of the US Tax Code; or (2) at least 50% of the average value of its assets produce ‘passive income’ or are held for the production of ‘passive income.’ The determination as to PFIC status is made annually.
BAT does not believe that it is, for US federal income tax purposes, a PFIC, and BAT expects to operate in such a manner so as not to become a PFIC. If, however, BAT is or becomes a PFIC, US holders could be subject to additional US federal income taxes on gain recognised with respect to the ordinary shares or ADSs and on certain distributions, plus an interest charge on certain taxes treated as having been deferred under the PFIC rules.
Non-corporate
US holders will not be eligible for reduced rates of taxation on any dividends received from BAT if it is a PFIC in the taxable year in which such dividends are paid or in the preceding taxable year. BAT’s US counsel expresses no opinion with respect to BAT’s PFIC status.
Taxation of capital gains
Upon a sale, exchange or other taxable disposition of ordinary shares or ADSs, a US holder will generally recognise capital gain or loss for US federal income tax purposes in an amount equal to the difference between the US dollar value of the amount realised on the disposition and the US holder’s adjusted tax basis in the ordinary shares or ADSs as determined in US dollars. Such gain or loss generally will be US source gain or loss, and will be long-term capital gain or loss if the US holder has held the ordinary shares or ADSs for more than one year. Certain
non-corporate
US holders may be eligible for preferential rates of US federal income tax in respect of net long-term capital gains. The deductibility of capital losses is subject to limitations.
The amount realised on a sale, exchange or other taxable disposition of ordinary shares for an amount in foreign currency will be the US dollar value of that amount on the date of sale or disposition. On the settlement date, the US holder will recognise US source foreign currency exchange gain or loss (taxable as ordinary income or loss) equal to the difference (if any) between the US dollar value of the amount received based on the exchange rates in effect on the date of sale, exchange or other disposition and the settlement date. However, in the case of ordinary shares traded on an established securities market that are sold by a cash-basis US holder (or an accrual-basis US holder that so elects), the amount realised will be based on the exchange rate in effect on the settlement date for the sale, and no foreign currency exchange gain or loss will be recognised at that time.
A US holder’s tax basis in ordinary shares or ADSs will generally equal the US dollar cost of the ordinary shares or ADSs. The US dollar cost of ordinary shares purchased with foreign currency will generally be the US dollar value of the purchase price on the date of purchase, or the settlement date for the purchase in the case of ordinary shares traded on an established securities market that are purchased by a cash-basis US holder (or an accrual-basis US holder that so elects).
 
357


Table of Contents
BAT Annual Report and Form 20-F 2021
Other Information
Shareholder Taxation Information
Continued
    
 
Information with respect to foreign financial assets
Individuals and certain entities that own ‘specified foreign financial assets’ with an aggregate value in excess of US$50,000 are generally required to file information reports with respect to such assets with their US federal income tax returns. Depending on the individual’s circumstances, higher threshold amounts may apply. Specified foreign financial assets include any financial accounts maintained by foreign financial institutions, as well as any of the following, but only if they are not held in accounts maintained by financial institutions: (1) stocks and securities issued by
non-US
persons; (2) financial instruments and contracts held for investment that have
non-US
issuers or counterparties; and (3) interests in
non-US
entities. If a US holder is subject to this information reporting regime, the failure to file information reports may subject the US holder to penalties. US holders are urged to consult their own tax advisers regarding their obligations to file information reports with respect to ordinary shares or ADSs.
Medicare net investment tax
Certain persons who are individuals (other than
non-resident
aliens), estates or trusts are required to pay an additional 3.8% tax on the lesser of (1) their ‘net investment income’ (in the case of individuals) or ‘undistributed net investment income’ (in the case of estates and trusts) (which includes dividend income in respect of, and gain recognised on the disposition of, ordinary shares or ADSs) for the relevant taxable year; and (2) the excess of their modified adjusted gross income (in the case of individuals) or adjusted gross income (in the case of estates and trusts) for the taxable year over specified dollar amounts. US holders are urged to consult their tax advisers regarding the applicability of this provision to their ownership of ordinary shares or ADSs.
Credits or deductions for UK taxes
As indicated under ‘Material UK tax consequences’ below, dividends in respect of, and gains on the disposition of, ordinary shares or ADSs may be subject to UK taxation in certain circumstances. A US holder may be eligible to claim a credit or deduction in respect of UK taxes attributable to such income or gain for purposes of computing the US holder’s US federal income tax liability, subject to certain limitations. The US foreign tax credit rules are complex, and US holders should consult their own tax advisers regarding the availability of US foreign tax credits and the application of the US foreign tax credit rules to their particular situation.
Information reporting and backup withholding
Information reporting and backup withholding may apply to dividend payments and proceeds from the sale, exchange or other taxable disposition of ordinary shares or ADSs. Backup withholding will not apply, however, to a US holder that: (1) furnishes a correct taxpayer identification number (TIN), certifies that such holder is not subject to backup withholding on Internal Revenue Service Form
W-9
(or appropriate successor form) and otherwise complies with all applicable requirements of the backup withholding rules; or (2) provides proof that such holder is otherwise exempt from backup withholding. Backup withholding is not an additional tax, and any amounts withheld under the backup withholding rules may be refunded or credited against a holder’s US federal income tax liability, if any, provided that such holder furnishes the required information to the Internal Revenue Service in a timely manner. The Internal Revenue Service may impose a penalty upon any taxpayer that fails to provide the correct TIN.
This summary of material US federal income tax consequences is not tax advice. The determination of the actual tax consequences for a US holder will depend on the US holder’s specific situation. US holders of ordinary shares or ADSs, in each case, should consult their own tax advisers as to the tax consequences of owning and disposing of ordinary shares or ADSs, including the applicability and effect of the alternative minimum tax and any state, local, foreign or other tax laws and of changes in those laws.
Material UK Tax Consequences
The following paragraphs summarise material aspects of the UK tax treatment of US holders of ordinary shares or ADSs and do not purport to be either a complete analysis of all tax considerations relating to holding ordinary shares or ADSs or an analysis of the tax position of BAT. They are based on current UK legislation and what is understood to be current HMRC practice, both of which are subject to change, possibly with retrospective effect.
The comments are intended as a general guide and (otherwise than where expressly stated to the contrary) apply only to US holders of ordinary shares or ADSs (other than under a personal equity plan or individual savings account) and who are the absolute beneficial owners of such shares. These comments do not deal with certain types of shareholders such as charities, dealers in securities, persons holding or acquiring shares in the course of a trade, persons who have or could be treated for tax purposes as having acquired their ordinary shares or ADSs by reason of their employment, collective investment schemes, persons subject to UK tax on the remittance basis and insurance companies. You are encouraged to consult an appropriate independent professional tax adviser with respect to your tax position.
Tax on chargeable gains as a result of disposals of ordinary shares or ADSs
Subject to the below, US holders will not generally be subject to UK tax on chargeable gains on a disposal of ordinary shares or ADSs provided that they do not carry on a trade, profession or vocation in the United Kingdom through a branch, agency or permanent establishment in connection with which the ordinary shares or ADSs are held.
A US holder who is an individual, who has ceased to be resident for tax purposes in the United Kingdom for a period of less than five years and who disposes of ordinary shares or ADSs during that period may be liable for UK tax on capital gains (in the absence of any available exemptions or reliefs). If applicable, the tax charge will arise in the tax year that the individual returns to the United Kingdom.
 
358
 

Table of Contents
BAT Annual Report and Form 20-F 2021    
 
Strategic Report        
 
Governance Report        
  
Financial Statements        
  
Other Information        


Tax on dividends
BAT is not required to withhold UK tax at source from dividends paid on ordinary shares or ADSs.
US holders will not generally be subject to UK tax on dividends received from BAT provided that they do not carry on a trade, profession or vocation in the United Kingdom through a branch, agency or permanent establishment in connection with which the ordinary shares or ADSs are held.
Stamp duty and stamp duty reserve tax (SDRT)
Based on current published HMRC practice and recent case law, transfers of ADSs should not be subject to SDRT or stamp duty. The transfer of an underlying ordinary share to the ADS holder in exchange for the cancellation of an ADS should also not give rise to a stamp duty or SDRT charge.
Transfers of ordinary shares outside of the depositary bank, including the repurchase of ordinary shares by BAT, will generally be subject to stamp duty or SDRT at the rate of 0.5% of the amount or value of the consideration given, except as described above in connection with the cancellation of an ADS. If ordinary shares are redeposited into a clearance service or depositary system, the redeposit will attract stamp duty or SDRT at the higher rate of 1.5%.
The purchaser or the transferee of the ordinary shares or ADSs will generally be responsible for paying any stamp duty or SDRT payable. Where stamp duty or SDRT is payable, it is payable regardless of the residence position of the purchaser.
Inheritance tax
A gift or settlement of ordinary shares or ADSs by, or on the death of, an individual shareholder may give rise to a liability to UK inheritance tax even if the shareholder is not a resident of, or domiciled in, the United Kingdom.
A charge to inheritance tax may arise in certain circumstances where ordinary shares or ADSs are held by close companies and trustees of settlements.
However, pursuant to the Estate and Gift Tax Treaty 1980 (the “Treaty”) entered into between the United Kingdom and the United States, a gift or settlement of ordinary shares or ADSs by shareholders who are domiciled in the United States for the purposes of the Treaty may be exempt from any liability to UK inheritance tax.
 
359


Table of Contents
BAT Annual Report and Form 20-F 2021
 
Other Information
Share Capital and Security Ownership
 
Share Capital
 
Share capital
      
Ordinary shares of 25p each
  
31 December 2021
 
Issued ordinary shares
  
(excluding treasury shares)
  
 
2,294,687,571
 
Treasury shares
  
 
161,930,217
 
Total allotted and fully paid
ordinary shares
1
  
 
2,456,617,788
 
Aggregate nominal value £m
  
 
614.2
 
Note:
1. Includes treasury shares and shares owned by employee share trusts.
Authority to allot shares
This authority (granted at the 2021 AGM) will expire at the 2022 AGM and provides the Company authority to allot relevant securities up to the amount representing
two-thirds
of the Company’s then issued ordinary share capital (excluding treasury shares), of which approximately
one-third
can only be allotted pursuant to a rights issue. Although the Directors have no present intention of exercising this authority, it provides them with an appropriate level of authority for
on-going
purposes and the Directors consider it appropriate to maintain the flexibility that this authority provides.
Analyses of Shareholders
Ordinary Shares
At 31 December 2021, there was a total of 2,456,617,788 ordinary shares in issue held by 108,467 shareholders. These shareholdings are analysed as follows:
(a) by listing as at 31 December 2021:
 
Register
  
Total number
of shares
  
Number of
holders
  
% of issued
share capital
UK
  
2,201,910,356
  
35,134
  
89.63
South Africa
  
254,707,432
  
69,124
  
10.37
Total
  
2,456,617,788
  
104,258
  
100.00
(b) by size of shareholding as at 31 December 2021:
UK Register
 
     
Number of
holders
    
% of
UK ordinary
share capital
 
1–1,999
  
 
30,072


0.58
 
2,000–9,999
  
 
3,650


0.63
 
10,000–199,999
  
 
1,011


2.38
 
200,000–499,999
  
 
138


2.04
 
500,000 and over
  
 
262


87.01
 
Treasury shares (UK)
  
 
1


7.36
 
Total
  
 
35,134


100.00
 
South Africa Register
 
     
Number of
holders
    
% of
SA ordinary
share capital
 
1–1,999
  
 
63,837


6.44
 
2,000–9,999
  
 
3,557


5.69
 
10,000–199,999
  
 
1,592


25.43
 
200,000–499,999
  
 
78


9.89
 
500,000 and over
  
 
60


52.55
 
Total
  
 
69,124


100.00
 
Combined registers
     
     
Number of
holders
    
% of issued
ordinary
share capital
 
1–1,999
  
 
93,909


1.19
 
2,000–9,999
  
 
7,207


1.15
 
10,000–199,999
  
 
2,603


4.77
 
200,000–499,999
  
 
216


2.85
 
500,000 and over
  
 
322


83.43
 
Treasury shares (UK)
  
 
1


6.61
 
Total
  
 
104,258


100.00
 
American Depositary Shares (ADSs)
At 31 December 2021, there was a total of 247,266,515 ADSs outstanding held by 8,909 registered holders. The ADS register is analysed by size of shareholding as at 31 December 2021 as follows:
 
     
Number of
holders
    
% of
total ADSs
 
1–1,999
  
 
8,721


0.69
 
2,000–9,999
  
 
166


0.22
 
10,000–199,999
  
 
20


0.16
 
200,000–499,999
  
 
1


0.09
 
500,000 and over
1
  
 
1


98.84
 
Total
  
 
8,909


100.00
 
Note:
1. One registered holder of ADSs represents 513,342 underlying shareholders.
Security Ownership of Ordinary Shares
As at 8 February 2022, there were 35,086 record holders of ordinary shares listed on the LSE (including Citibank as the depositary bank for the ADSs) and 2,196,967,436 of such ordinary shares outstanding. As at that date, to BAT’s knowledge, 299 record holders, representing 0.01% of the ordinary shares listed on the LSE, had a registered address in the US. As at 8 February 2022, there were 723 record holders of ordinary shares listed on the JSE (including PLC Nominees (Proprietary) Limited as the nominee for the dematerialised ordinary shares listed on the JSE) and 259,652,752 of such ordinary shares outstanding. As at such date, to BAT’s knowledge, no record holders of the ordinary shares listed on the JSE had a registered address in the US. As at 8 February 2022, based on information received from Citibank, there were 8,883 record holders of ADSs and 259,359,198 ADSs outstanding. As at that date, based on information received from Citibank, 8,820 record holders, representing 99.94% of ADSs representing ordinary shares, had a registered address in the US.
Security Ownership – Major Shareholders
 
At 31 December 2021, the following substantial interests (3% or more) in the Company’s ordinary share capital (voting securities) had been notified to the Company in accordance with Section 5.1.2 of the Disclosure Guidance and Transparency Rules (DTRs).
 
Name
  
Number of
ordinary shares
    
% of issued 
share capital

 
The Capital Group Companies, Inc.
2
  
 
251,653,679


10.96 
 
Spring Mountain Investments Ltd.
3
  
 
187,023,731


8.15 
 
BlackRock, Inc.
  
 
132,891,526


5.79 
 
Notes:
1. The latest percentage of issued share capital excludes treasury shares.
2. Includes 18,902,551 ordinary shares represented by ADRs.
3. Includes 5,807,274 ordinary shares represented by ADRs.
 
360


Table of Contents
BAT Annual Report and Form 20-F 2021    
 
Strategic Report        
 
Governance Report        
  
Financial Statements        
  
Other Information        


On 25 January 2022, The Capital Group Companies, Inc. notified the Company that, on 24 January 2022, its interest in ordinary shares had decreased to 249,908,259 (10.89% of issued share capital), including 14,025,662 ordinary shares represented by ADRs. Its total voting rights interest increased to a total of 253,881,130 voting rights consisting of 249,908,259 ordinary shares and 3,972,871 of equivalent financial instruments (rights to recall lent shares of Common Stock and rights to recall ADRs which represents 11.06% of the Company’s outstanding shares).
On 26 January 2022, The Capital Group Companies, Inc. notified the Company that, on 25 January 2022, its interest in ordinary shares had increased to 253,762,060 (11.06% of issued share capital) including 13,652,301 ordinary shares represented by ADRs. Its total voting rights interest increased to a total of 258,127,131 voting rights consisting of 253,762,060 ordinary shares and 4,365,071 of equivalent financial instruments (rights to recall lent shares of Common Stock and rights to recall ADRs which represents 11.25% of the Company’s outstanding shares).
All shares held by the significant shareholders represent the Company’s ordinary shares. These significant shareholders have no special voting rights compared with other holders of the Company’s ordinary shares.
Additional Significant Shareholding Disclosure
>>
Portfolio Services Ltd filed with the SEC an amendment to Schedule 13G under the Exchange Act on 10 February 2022 disclosing that as of 31 December 2021 it and Kenneth B. Dart, who is the beneficial owner of all of the outstanding shares of Portfolio Services Ltd., beneficially owned 187,023,731 ordinary shares representing 8.2% of the Company’s ordinary shares outstanding as of 31 December 2021.
>>
Portfolio Services Ltd filed with the SEC a statement on Schedule 13G under the Exchange Act on 22 January 2021 disclosing that as of 31 December 2020 Kenneth B. Dart, who is the beneficial owner of all the outstanding shares of Portfolio Services Ltd., beneficially owned 114,819,555 ordinary shares representing 5.0% of the Company’s ordinary shares outstanding as of 31 December 2020.
BlackRock, Inc. filed with the SEC an amendment to Schedule 13G under the Exchange Act on 3 February 2022 disclosing that as of 31 December 2021 it beneficially owned 184,921,039 ordinary shares representing 8.1% of the Company’s ordinary shares outstanding as of 31 December 2021. BlackRock, Inc. filed with the SEC a statement on Schedule 13G under the Exchange Act on 29 January 2021 disclosing that as of 31 December 2020 it beneficially owned 178,392,857 ordinary shares representing 7.8% of the Company’s ordinary shares outstanding as of 31 December 2020. BlackRock, Inc. filed with the SEC an amendment to Schedule 13G under the Exchange Act on 7 February 2020 disclosing that as of 31 December 2019 it beneficially owned 170,313,722 ordinary shares representing 7.4% of the Company’s ordinary shares outstanding as of 31 December 2019.
>>
Capital International Investors, a division of Capital Research and Management Company, filed with the SEC an amendment to Schedule 13G under the Exchange Act on 11 February 2022 disclosing that as of 31 December 2021 it beneficially owned 110,680,543 ordinary shares representing 4.8% of the Company’s ordinary shares outstanding as of 31 December 2021.
>>
Capital Research Global Investors, a division of Capital Research and Management Company, filed with the SEC an amendment to Schedule 13G under the Exchange Act on 16 February 2021 disclosing that as of 31 December 2020 it beneficially owned 42,749,672 ordinary shares representing 1.9% of the Company’s ordinary shares outstanding as of 31 December 2020. Capital International Investors, a division of Capital Research and Management Company, filed with the SEC a statement on Schedule 13G under the Exchange Act on 16 February 2021, disclosing that as of 31 December 2020 it beneficially owned 122,341,746 ordinary shares representing 5.3% of the Company’s ordinary shares outstanding as of 31 December 2020. Capital Research Global Investors, a division of Capital Research and Management Company, filed with the SEC an amendment to Schedule 13G under the Exchange Act on 14 February 2020 disclosing that as of 31 December 2019 it beneficially owned 120,959,021 ordinary shares representing 5.2% of the Company’s ordinary shares outstanding as of 31 December 2019. The notifications regarding the holdings by The Capital Group Companies, Inc., listed below, indicate that Capital Research and Management Company is part of a chain of controlled undertakings with The Capital Group Companies, Inc.
In accordance with the DTRs, shareholders must notify the Company if their shareholding reaches, exceeds or falls below 3% of total voting rights and each 1% threshold thereafter. The notifications received by the Company during the past three years to the best of the Company’s knowledge are set out below.
The Capital Group Companies, Inc. notified the Company on: 8 March 2019 that its interest had increased above 11% to 253,390,697 ordinary shares on 7 March 2019; 11 April 2019 that its interest had decreased below 11% to 252,158,534 ordinary shares on 10 April 2019; 15 April 2019 that its interest had increased above 11% to 252,776,216 ordinary shares on 11 April 2019; 16 April 2019 that its interest had decreased below 11% to 251,780,072 ordinary shares on 15 April 2019; 19 November 2019 that its interest had increased above 11% to 253,543,406 ordinary shares on 18 November 2019; 6 January 2020 that its interest had increased above 12% to 275,376,579 ordinary shares on 3 January 2020; 26 March 2020 that its interest had decreased below 12% to 274,639,101 ordinary shares on 25 March 2020; 8 April that its interest had increased above 12% to 276,394,237 ordinary shares on 7 April 2020; 22 July 2020 that its interest had decreased below 12% to 243,800,405 ordinary shares on 20 July 2020; 6 August 2020 that its interest had decreased below 11% to 246,222,696 ordinary shares on 4 August 2020; 1 October 2020 that its interest had increased above 11% to 256,821,004 ordinary shares on 29 September 2020; 29 March 2021 that its interest had decreased to 252,372,180 ordinary shares on 26 March 2021; 20 April 2021 that its interest had increased above 11% to 253,881,408 ordinary shares on 19 April 2021; and 15 October 2021 that its interest had decreased below 11% to 251,829,230 ordinary shares on 14 October 2021.
Spring Mountain Investments Ltd notified the Company on: 22 October 2020 that its interest had increased above the notifiable threshold of 3% to 69,295,724 ordinary shares on 20 October 2020; 11 December 2020 that its interest had increased above 4% to 92,462,558 ordinary shares on 9 December 2020; 14 January 2021 that its interest had increased above 5% to 115,596,737 ordinary shares on 12 January 2021; 19 February 2021 that its interest had increased above 6% to 138,342,092 ordinary shares on 23 February 2021; 22 April 2021 that its interest had increased above 7% to 161,977,731 ordinary shares on 20 April 2021; 17 August 2021 that its interest had increased above 8% to 184,360,731 ordinary shares on 16 August 2021; and 12 November 2021 that its interest had increased to 187,023,731 ordinary shares on 11 November 2021.
To the extent known by BAT, BAT is not directly or indirectly owned or controlled by another corporation, any foreign government or by any other natural or legal person, severally or jointly. BAT is not aware of any arrangements, the operation of which may at a subsequent date result in a change of control of the Group.
 
361


Table of Contents
BAT Annual Report and Form 20-F 2021
Other Information
Share Capital and Security Ownership
Continued
    
 
Security Ownership of the Board of Directors and the Management Board
The following table presents information regarding the total amount of ordinary shares beneficially owned (outright, by their family or by connected persons) by each current Director of BAT, each member of the Management Board and all Directors and the Management Board as a group, as of 9 February 2022. Unless otherwise indicated, the address for each Director and member of the Management Board listed is: c/o British American Tobacco p.l.c., Globe House, 4 Temple Place, London, WC2R 2PG, United Kingdom. The address for Michael Dijanosic is Level 30, Three Pacific Place, 1 Queen’s Road East, Hong Kong. The address for Guy Meldrum is 401 North Main Street, Winston-Salem, NC 27101, United States of America.


Number of Ordinary Shares


            Percentage of Class
10
 
 
Directors
     
Luc Jobin
1
  
 
90,236


0.0039
 
Jack Bowles
2,3
  
 
239,214


0.0104
 
Tadeu Marroco
2,3,4
  
 
78,136


0.0034
 
Sue Farr


Karen Guerra
  
 
5,000


0.0002
 
Dr Marion Helmes
  
 
4,500


0.0002
 
Holly Keller Koeppel
5


Savio Kwan
  
 
8,238


0.0004
 
Dimitri Panayotopoulos
  
 
3,300


0.0001
 
Darrell Thomas
1
  
 
2,600


0.0001
 
Management Board
     
Jerome Abelman
6,7,8
  
 
102,664


0.0045
 
Marina Bellini
6
  
 
2,551


0.0001
 
Luciano Comin
6,7,8
  
 
30,523


0.0013
 
Michael Dijanosic
6,7,8
  
 
28,876


0.0013
 
Zafar Khan
6,7,8
  
 
415


0.0000
 
Hae In Kim
6,7,8]
  
 
18,294


0.0008
 
Paul Lageweg
6,7,8,9
  
 
150,447


0.0066
 
Guy Meldrum
6,7,8
  
 
25,299


0.0011
 
David O’Reilly
6,7,8
  
 
77,822


0.0034
 
Johan Vandermeulen
6,7,8
  
 
77,506


0.0034
 
Kingsley Wheaton
6,7,8
  
 
61,992


0.0027
 
     
All Directors and Management Board as a group (21 persons)
  
 
1,007,613


0.0260
 
Notes:
1.
The ordinary shares beneficially owned by Mr Jobin and Mr Thomas are represented by ADSs, each of which represents one ordinary share.
 
2.
The number of ordinary shares beneficially owned by the Executive Directors include ordinary shares awarded and required to be held for a period of at least three years in a
UK-based
trust under the SIP. Ordinary shares cannot be sold or transferred out of the trust until the end of the three-year holding period. The amounts next to the corresponding Executive Director include the following ordinary shares held in the trust under the SIP: (a) 822 ordinary shares for Mr Bowles, of which 451 have been held for less than three years; (b) 1,347 ordinary shares for Mr Marroco, of which 529 have been held for less than three years. In all cases, the beneficial owner of ordinary shares under the SIP may direct the trust to exercise its voting rights in accordance with his instructions. See footnote (5) to the table below under the heading ‘Outstanding Share-based Awards and Options-based Awards of the Board of Directors and the Management Board’ for additional details regarding the SIP and the ordinary shares held thereunder.
 
3.
The number of ordinary shares beneficially owned by the Executive Directors include the following number of awards of restricted ordinary shares granted under the DSBS that are scheduled to vest within 60 days of 9 February 2022: (a) 26,192 ordinary shares for Mr Bowles; (b) 13,233 ordinary shares for Mr Marroco. Until awards of ordinary shares under the DSBS vest, they are held in trust and the recipient of such award does not have the ability to transfer, sell or direct the voting of the applicable ordinary shares. See footnote (4) to the table below under the heading ‘Outstanding Share-based Awards and Options-based Awards of the Board of Directors and the Management Board’ for additional details regarding the DSBS.
 
4.
The number of ordinary shares beneficially owned by Mr Marroco includes 36,057 options granted under the LTIP that are scheduled to vest and may be exercised within 60 days of 9 February 2022. Each option is convertible into one ordinary share upon exercise. See footnote (1) to the table below under the heading ‘Outstanding Share-based Awards and Options-based Awards of the Board of Directors and the Management Board’ for additional details regarding the LTIP.
 
5.
Ms Koeppel, being a former director of Reynolds American Inc. and a participant in the Deferred Compensation Plan for Directors of Reynolds American Inc. (DCP), holds DSUs which were granted prior to becoming a Director of BAT. Each DSU entitles the holder to receive a cash payment upon ceasing to be a Director equal to the value of one BAT ADS. The number of DSUs increases on each dividend date by reference to the value of dividends declared on the ADSs underlying the DSUs. Ms Koeppel currently holds 26,660.09 DSUs.
 
6.
The number of ordinary shares beneficially owned by the members of the Management Board include ordinary shares awarded and required to be held for a period of at least three years in a
UK-based
trust under the SIP. Ordinary shares cannot be sold or transferred out of the trust until the end of the three-year holding period. The amounts next to the corresponding Management Board member include the following ordinary shares held in the trust under the SIP: (a) 1,159 ordinary shares for Mr Abelman, of which 498 have been held for less than three years; (b) 551 ordinary shares for Ms Bellini, of which 371 have been held for less than three years; (c) 1,199 ordinary shares for Mr Comin, of which 502 have been held for less than three years; (d) 30 ordinary shares for Mr Dijanosic, all of which 30 have been held for less than three years; (e) 359 ordinary shares for Mr Khan, all of which 207 have been held for less than three years; (f) 460 ordinary shares for Ms Kim, all of which 387 have been held for less than three years; (g) 601 ordinary shares for Mr Lageweg, 382 of which have been held for less than three years; (h) 400 ordinary shares for Mr Meldrum, 329 of which have been held for less than three years; (i) 2,517 ordinary shares for Dr O’Reilly, of which 760 have been held for less than three years; (j) 1,162 ordinary shares for Mr Vandermeulen, of which 492 have been held for less than three years; and (k) 1,278 ordinary shares for Mr Wheaton, of which 535 have been held for less than three years. In all cases, the beneficial owner of ordinary shares under the SIP may direct the trust to exercise its voting rights in accordance with their instructions. See footnote (5) to the table below under the heading ‘Outstanding Share-based Awards and Options-based Awards of the Board of Directors and the Management Board’ for additional details regarding the SIP and the ordinary shares held thereunder.
 
7.
The number of ordinary shares beneficially owned by the members of the Management Board include the following number of options granted under the LTIP that are scheduled to vest and may be exercised within 60 days of 9 February 2022: (a) 37,560 options under the LTIP for Mr Abelman; (b) 29,296 options under the LTIP for Ms Bellini; (c) 31,550 options under the LTIP for Mr Comin; (d) 8,862 options under the LTIP for Mr Khan; (e) 30,048 options under the LTIP for Ms Kim; (f) 29,296 options under the LTIP for Mr Lageweg; (g) 31,550 options under the LTIP for Mr Meldrum; (h) 30,048 options under the LTIP for Dr O’Reilly; (i) 8,299 options under the LTIP for Mr Dijanosic; (j) 39,438 options under the LTIP for Mr Vandermeulen; (k) 43,194 options under the LTIP for Mr Wheaton. Each option is convertible into one ordinary share upon exercise. See footnote (1) to the table below under the heading ‘Outstanding Share-based Awards and Options-based Awards of the Board of Directors and the Management Board’ for additional details regarding the LTIP.
 
 
362
 

Table of Contents
BAT Annual Report and Form 20-F 2021    
 
Strategic Report        
 
Governance Report        
  
Financial Statements        
  
Other Information        


Notes
continued:
8.
The number of ordinary shares beneficially owned by the members of the Management Board include the following number of awards of restricted ordinary shares granted under the DSBS that are scheduled to vest within 60 days of 9 February 2022: (a) 13,785 ordinary shares for Mr Abelman; (b) 5,084 ordinary shares for Mr Comin; (c) 2,981 ordinary shares for Mr Khan; (d) 3,798 ordinary shares for Ms Kim; (e) 5,265 ordinary shares for Mr Lageweg; (f) 5,651 ordinary shares for Mr Meldrum; (g) 11,028 ordinary shares for Dr O’Reilly; (h) 2,827 ordinary shares for Mr Dijanosic; (i) 13,785 ordinary shares for Mr Vandermeulen; (j) 13,785 ordinary shares for Mr Wheaton; and (k) 5,525 ordinary shares for Ms Bellini. Until awards of ordinary shares under the DSBS vest, they are held in trust and the recipient of such award does not have the ability to transfer, sell or direct the voting of the applicable ordinary shares. See footnote (4) to the table below under the heading ‘Outstanding Share-based Awards and Options-based Awards of the Board of Directors and the Management Board’ for additional details regarding the DSBS.
 
9.
The number of ordinary shares beneficially owned by Mr Lageweg includes 109,558 ADSs, each of which represents one ordinary share.
 
10.
The information in this column is based on 2,294,690,625 ordinary shares outstanding (excluding treasury shares) as of 9 February 2022. Any securities not outstanding subject to options, warrants, rights or conversion privileges that give the beneficial owner the right to acquire the securities within 60 days are deemed to be outstanding for the purpose of computing the percentage of outstanding securities of the class owned by such person but are not deemed to be outstanding for the purpose of computing the percentage of the class by any other person.
Outstanding Share-Based Awards and Options-Based Awards of the Board of Directors and the Management Board
The following table presents information regarding the options and the restricted share awards held by the Directors and the Management Board as of 9 February 2022. The following Directors (being the Chairman and the
Non-Executive
Directors) have not been granted share-based Awards or Options-based Awards over ordinary shares: Mr Jobin, Ms Farr, Ms Guerra, Dr Helmes, Ms Koeppel, Mr Kwan, Mr Panayotopoulos and Mr Thomas.
 
     
Number of
Options Held
    
Date of
Grant/Award
    
Options
Exercise Price
£
    
Market Price
at Date of Grant
of Option
£
    
Number of
Shares
Awarded
    
Exercisable (LTIP/Sharesave)
Vesting (DSBS/SIP)
 
Directors
 
Jack Bowles
 
LTIP
1
  
 
176,532


28 Mar 2019


0.00


33.28


28 Mar 2024 – 27 Mar 2029


223,129


30 Mar 2020


0.00


26.33


30 Mar 2025 – 29 Mar 2030


230,314


29 Mar 2021


0.00


27.94


29 Mar 2026 – 28 Mar 2031
 
Total Options
3
  
 
629,975
 
                                            
DSBS
4


28 Mar 2019


26,192


28 Mar 2022


30 Mar 2020


53,618


30 Mar 2023


29 Mar 2021


40,052


29 Mar 2024
 
SIP
5


1 Apr 2019


112


1 Apr 2022


8 May 2019


6


8 May 2022


8 Aug 2019


8


8 Aug 2022


14 Nov 2019


9


14 Nov 2022


6 Feb 2020


7


6 Feb 2023


1 Apr 2020


125


1 Apr 2023


13 May 2020


9


13 May 2023


19 Aug 2020


13


19 Aug 2023


12 Nov 2020


12


12 Nov 2023


5 Feb 2021


13


5 Feb 2024


1 Apr 2021


92


1 Apr 2024


12 May 2021


13


12 May 2024


20 Aug 2021


16


20 Aug 2024


11 Nov 2021


16


11 Nov 2024
 
Total Restricted Share Awards
6
                                      
 
120,313


363


Table of Contents
BAT Annual Report and Form 20-F 2021
Other Information
Share Capital and Security Ownership
Continued


Number of
Options Held
    
Date of
Grant/Award
    
Options
Exercise Price
£
    
Market Price
at Date of Grant
of Option
£
    
Number of
Shares
Awarded
    
Exercisable (LTIP/Sharesave)
Vesting (DSBS/SIP)
 
 
Tadeu Marroco
 
LTIP
1
  
 
36,057


28 Mar 2019


0.00


33.28


28 Mar 2022 – 27 Mar 2029


113,938


30 Mar 2020


0.00


26.33


30 Mar 2025 – 29 Mar 2030


115,017


29 Mar 2021


0.00


27.94


29 Mar 2026 – 28 Mar 2031
 
Sharesave
2
  
 
624


30 Mar 2020


24.01


26.35


1 May 2025 – 31 Oct 2025
 
Total Options
3
  
 
265,636


DSBS
4


28 Mar 2019


13,233


28 Mar 2022


30 Mar 2020


24,388


30 Mar 2023


29 Mar 2021


18,727


29 Mar 2024
 
SIP
5


1 Apr 2019


112


1 Apr 2022


8 May 2019


11


8 May 2022


8 Aug 2019


13


8 Aug 2022


14 Nov 2019


14


14 Nov 2022


6 Feb 2020


12


6 Feb 2023


1 Apr 2020


125


1 Apr 2023


13 May 2020


14


13 May 2023


19 Aug 2020


21


19 Aug 2023


12 Nov 2020


20


12 Nov 2023


5 Feb 2021


21


5 Feb 2024


1 Apr 2021


92


1 Apr 2024


14 May 2021


22


14 May 2024


20 Aug 2021


25


20 Aug 2024


11 Nov 2021


27


11 Nov 2024
 
Total Restricted Share Awards
6


56,877


364
 

Table of Contents
                 
BAT Annual Report and Form 20-F 2021    
 
Strategic Report        
 
Governance Report        
  
Financial Statements        
  
Other Information        


Number of
Options Held
    
Date of
Grant/Award
    
Options
Exercise Price
£
    
Market Price
at Date of Grant
of Option
£
    
Number of
Shares
Awarded
    
Exercisable (LTIP/Sharesave)
Vesting (DSBS/SIP)
 
Management Board
 
Jerome Abelman
 
LTIP
1
  
 
37,560


28 Mar 2019


0.00


33.28


28 Mar 2022 – 27 Mar 2029


40,676


30 Mar 2020


0.00


26.33


30 Mar 2023 – 29 Mar 2030


38,715


29 Mar 2021


0.00


27.94


29 Mar 2024 – 28 Mar 2031
 
Restricted Share Plan
7
  
 
10,653


30 Mar 2020


0.00


26.33


30 Mar 2023


10,139


29 Mar 2021


0.00


27.94


29 Mar 2024
 
Total Options
3
  
 
137,743
 
                                            
DSBS
4


28 Mar 2019


13,785


28 Mar 2022


30 Mar 2020


15,824


30 Mar 2023


29 Mar 2021


11,114


29 Mar 2024
 
SIP
5


1 Apr 2019


112


1 Apr 2022


8 May 2019


9


8 May 2022


8 Aug 2019


10


8 Aug 2022


14 Nov 2019


11


14 Nov 2022


6 Feb 2020


10


6 Feb 2023


1 Apr 2020


125


1 Apr 2023


13 May 2020


12


13 May 2023


19 Aug 2020


18


19 Aug 2023


12 Nov 2020


17


12 Nov 2023


5 Feb 2021


18


5 Feb 2024


1 Apr 2021


92


1 Apr 2024


12 May 2021


18


12 May 2024


20 Aug 2021


22


20 Aug 2024


11 Nov 2021


24


11 Nov 2024
 
Total Restricted Share Awards
6
                                      
 
41,221


365


Table of Contents
BAT Annual Report and Form 20-F 2021
Other Information
Share Capital and Security Ownership
Continued


Number of
Options Held
    
Date of
Grant/Award
    
Options
Exercise Price
£
    
Market Price
at Date of Grant
of Option
£
    
Number of
Shares
Awarded
    
Exercisable (LTIP/Sharesave)
Vesting (DSBS/SIP)
 
 
Marina Bellini


LTIP
1
  
 
29,296


28 Mar 2019


0.00


33.28


28 Mar 2022 – 27 Mar 2029


31,105


30 Mar 2020


0.00


26.33


30 Mar 2023 – 29 Mar 2030


39,835


29 Mar 2021


0.00


27.94


29 Mar 2024 – 28 Mar 2031
 
Restricted Share Plan
7
  
 
8,146


30 Mar 2020


0.00


26.33


30 Mar 2023


10,433


29 Mar 2021


0.00


27.94


29 Mar 2024
 
Sharesave
2
  
 
785


28 Mar 2019


22.91


28.63


1 May 2022 – 31 Oct 2022
 
Total Options
3
  
 
119,600


DSBS
4


28 Mar 2019


5,525


28 Mar 2022


30 Mar 2020


12,101


30 Mar 2023


29 Mar 2021


10,711


29 Mar 2024
 
SIP
5


1 Apr 2019


99


1 Apr 2022


8 Aug 2019


1


8 Aug 2022


14 Nov 2019


3


14 Nov 2022


6 Feb 2020


2


6 Feb 2023


1 Apr 2020


125


1 Apr 2023


13 May 2020


2


13 May 2023


19 Aug 2020


7


19 Aug 2023


12 Nov 2020


6


12 Nov 2023


5 Feb 2021


7


5 Feb 2024


1 Apr 2021


92


1 Apr 2024


12 May 2021


7


14 May 2024


20 Aug 2021


10


20 Aug 2024


11 Nov 2021


10


11 Nov 2024
 
Total Restricted Share Awards
6


28,708


366
 

Table of Contents
BAT Annual Report and Form 20-F 2021    
 
Strategic Report        
 
Governance Report        
  
Financial Statements        
  
Other Information        


Number of
Options Held
    
Date of
Grant/Award
    
Options
Exercise Price
£
    
Market Price
at Date of Grant
of Option
£
    
Number of
Shares
Awarded
    
Exercisable (LTIP/Sharesave)
Vesting (DSBS/SIP)
 
 
Luciano Comin
                                                     
LTIP
1
  
 
31,550


28 Mar 2019


0.00


33.28


28 Mar 2022 – 27 Mar 2029


5,299


30 Mar 2020


0.00


25.52


30 Mar 2023 – 29 Mar 2030


36,077


29 Mar 2021


0.00


27.94


29 Mar 2024 – 28 Mar 2031
 
Restricted Share Plan
7
  
 
8,773


30 Mar 2020


0.00


26.33


30 Mar 2023


9,448


29 Mar 2021


0.00


27.94


29 Mar 2024
 
Total Options
3
  
 
91,147
 
                                            
DSBS
4


28 Mar 2019


5,084


28 Mar 2022


30 Mar 2020


13,032


30 Mar 2023


29 Mar 2021


10,059


29 Mar 2024
 
SIP
5


1 Apr 2019


112


1 Apr 2022


8 May 2019


9


8 May 2022


8 Aug 2019


11


8 Aug 2022


14 Nov 2019


12


14 Nov 2022


6 Feb 2020


10


6 Feb 2023


1 Apr 2020


125


1 Apr 2023


13 May 2020


13


13 May 2023


19 Aug 2020


18


19 Aug 2023


12 Nov 2020


17


12 Nov 2023


5 Feb 2021


18


5 Feb 2024


1 Apr 2021


92


1 Apr 2024


12 May 2021


19


14 May 2024


20 Aug 2021


22


20 Aug 2024


11 Nov 2021


24


11 Nov 2024
 
Total Restricted Share Awards
6
                                      
 
28,677


Michael Dijanosic
                                                     
LTIP
1
  
 
8,299


28 Mar 2019


0.00


33.28


28 Mar 2022 – 27 Mar 2029


7,739


30 Mar 2020


0.00


26.33


30 Mar 2023 – 29 Mar 2030


31,567


29 Mar 2021


0.00


27.94


29 Mar 2024 – 28 Mar 2031
 
Restricted Share Plan
7
  
 
2,149


30 Mar 2020


0.00


26.33


30 Mar 2023


8,267


29 Mar 2021


0.00


27.94


29 Mar 2024
 
Total Options
3
  
 
58,021
 
                                            
DSBS
4


28 Mar 2019


2,827


28 Mar 2022


30 Mar 2020


2,746


30 Mar 2023


29 Mar 2021


4,873


29 Mar 2024
 
SIP
5


1 Apr 2021


30


1 Apr 2024
 
Total Restricted Share Awards
6
                                      
 
10,476


367


Table of Contents
BAT Annual Report and Form 20-F 2021
Other Information
Share Capital and Security Ownership
Continued


Number of
Options Held
    
Date of
Grant/Award
    
Options
Exercise Price
£
    
Market Price
at Date of Grant
of Option
£
    
Number of
Shares
Awarded
    
Exercisable (LTIP/Sharesave)
Vesting (DSBS/SIP)
 
Zafar Khan


LTIP
1
  
 
8,862


28 Mar 2019


0.00


33.28


28 Mar 2022 – 27 Mar 2029


8,855


30 Mar 2020


0.00


25.52


30 Mar 2023 – 29 Mar 2030


31,567


29 Mar 2021
  
 
0.00


27.94


29 Mar 2024 – 28 Mar 2031
 
Restricted Share Plan
7
  
 
2,459


30 Mar 2020


0.00


26.33


30 Mar 2023


8,043


29 Mar 2021


0.00


27.94


29 Mar 2024
 
Total Options
3
  
 
59,786


DSBS
4


28 Mar 2019


2,981


28 Mar 2022


30 Mar 2020


3,062


30 Mar 2023


29 Mar 2021


2,992


29 Mar 2024
 
SIP
5


1 Apr 2019


112


1 Apr 2022


1 Apr 2021


92


1 Apr 2024


20 Aug 2021


1


20 Aug 2024


11 Nov 2021


2


11 Nov 2024
 
Total Restricted Share Awards
6


9,242


Hae In Kim


LTIP
1
  
 
30,048


28 Mar 2019


0.00


33.28


28 Mar 2022 – 27 Mar 2029


2,802


6 Apr 2020


0.00


29.50


6 Apr 2023 – 5 Apr 2030


35,325


29 Mar 2021


0.00


27.94


29 Mar 2024 – 28 Mar 2031
 
Restricted Share Plan
7
  
 
8,355


30 Mar 2020


0.00


26.33


30 Mar 2023


9,251


29 Mar 2021


0.00


27.94


29 Mar 2024
 
Total Options
3
  
 
85,781


DSBS
4


28 Mar 2019


3,798


28 Mar 2022


30 Mar 2020


12,411


30 Mar 2023


29 Mar 2021


9,789


29 Mar 2024
 
SIP
5


1 Apr 2019


112


1 Apr 2022


8 May 2019


1


8 May 2022


8 Aug 2019


3


8 Aug 2022


14 Nov 2019


4


14 Nov 2022


6 Feb 2020


3


6 Feb 2023


1 Apr 2020


125


1 Apr 2023


13 May 2020


3


13 May 2023


19 Aug 2020


7


19 Aug 2023


12 Nov 2020


6


12 Nov 2023


5 Feb 2021


6


5 Feb 2024


1 Apr 2021


92


1 Apr 2024


12 May 2021


7


14 May 2024


20 Aug 2021


9


20 Aug 2024


11 Nov 2021


9


11 Nov 2024
 
Total Restricted Share Awards
6


26,385


368
 

Table of Contents
BAT Annual Report and Form 20-F 2021    
 
Strategic Report        
 
Governance Report        
  
Financial Statements        
  
Other Information        


Number of
Options Held
    
Date of
Grant/Award
    
Options
Exercise Price
£
    
Market Price
at Date of Grant
of Option
£
    
Number of
Shares
Awarded
    
Exercisable (LTIP/Sharesave)
Vesting (DSBS/SIP)
 
Paul Lageweg
                                                     
LTIP
1
  
 
29,296


28 Mar 2019


0.00


33.28


28 Mar 2022 – 27 Mar 2029


31,105


30 Mar 2020


0.00


26.33


30 Mar 2023 – 29 Mar 2030


36,159


29 Mar 2021


0.00


27.94


29 Mar 2024 – 28 Mar 2031
 
Restricted Share Plan
7
  
 
8,146


30 Mar 2020


0.00


26.33


30 Mar 2023


9,470


29 Mar 2021


0.00


27.94


29 Mar 2024
 
Sharesave
2
  
 
1,309


28 Mar 2019


22.91


28.63


1 May 2024 – 31 Oct 2024
 
Total Options
3
  
 
115,485
 
                                            
DSBS
4


28 Mar 2019


5,265


28 Mar 2022


30 Mar 2020


12,101


30 Mar 2023


29 Mar 2021


9,580


29 Mar 2024
 
SIP
5


1 Apr 2019


112


1 Apr 2022


8 May 2019


1


8 May 2022


8 Aug 2019


2


8 Aug 2022


14 Nov 2019


3


14 Nov 2022


6 Feb 2020


2


6 Feb 2023


1 Apr 2020


125


1 Apr 2023


13 May 2020


3


13 May 2023


19 Aug 2020


6


19 Aug 2023


12 Nov 2020


5


12 Nov 2023


5 Feb 2021


6


5 Feb 2024


1 Apr 2021


92


1 Apr 2024


12 May 2021


6


14 May 2024


20 Aug 2021


9


20 Aug 2024


11 Nov 2021


10


11 Nov 2024
 
Total Restricted Share Awards
6
                                      
 
27,328
 
        
Guy Meldrum
                                                     
LTIP
1
  
 
31,550


28 Mar 2019


0.00


33.28


28 Mar 2022 – 27 Mar 2029


5,633


12 Aug 2020


0.00


26.36


12 Aug 2023 – 11 Aug 2030


43,593


29 Mar 2021


0.00


27.94


29 Mar 2024 – 28 Mar 2031
 
Restricted Share Plan
7
  
 
8,773


30 Mar 2020


0.00


26.33


30 Mar 2023


11,417


29 Mar 2021


0.00


27.94


29 Mar 2024
 
Total Options
3
  
 
100,966
 
                                            
DSBS
4


28 Mar 2019


5,651


28 Mar 2022


30 Mar 2020


13,032


30 Mar 2023


29 Mar 2021


10,780


29 Mar 2024
 
SIP
5


1 Apr 2019


112


1 Apr 2022


1 Apr 2020


125


1 Apr 2023


1 Apr 2021


92


1 Apr 2024
 
Total Restricted Share Awards
6
                                      
 
29,792


369


Table of Contents
BAT Annual Report and Form 20-F 2021
Other Information
Share Capital and Security Ownership
Continued


Number of
Options Held
    
Date of
Grant/Award
    
Options
Exercise Price
£
    
Market Price
at Date of Grant
of Option
£
    
Number of
Shares
Awarded
    
Exercisable (LTIP/Sharesave)
Vesting (DSBS/SIP)
 
Dr David O’Reilly


LTIP
1
  
 
30,048


28 Mar 2019


0.00


33.28


28 Mar 2022 – 27 Mar 2029


12,354


2 Apr 2020


0.00


25.52


2 Apr 2023 – 1 Apr 2030
  
 
31,282


29 Mar 2021


0.00


27.94


29 Mar 2024 – 28 Mar 2031
 
Restricted Share Plan
7
  
 
8,522


30 Mar 2020


0.00


26.33


30 Mar 2023


8,192


29 Mar 2021


0.00


27.94


29 Mar 2024
 
Total Options
3
  
 
90,398


DSBS
4


28 Mar 2019


11,028


28 Mar 2022


30 Mar 2020


12,659


30 Mar 2023


29 Mar 2021


8,958


29 Mar 2024
 
SIP
5


1 Apr 2019


112


1 Apr 2022


8 May 2019


31


8 May 2022


8 Aug 2019


32


8 Aug 2022


14 Nov 2019


33


14 Nov 2022


6 Feb 2020


29


6 Feb 2023


1 Apr 2020


125


1 Apr 2023


13 May 2020


34


13 May 2023


19 Aug 2020


44


19 Aug 2023


12 Nov 2020


42


12 Nov 2023


5 Feb 2021


43


5 Feb 2024


1 Apr 2021


92


1 Apr 2024


12 May 2021


44


14 May 2024


20 Aug 2021


48


20 Aug 2024


11 Nov 2021


51


11 Nov 2024
 
Total Restricted Share Awards
6


33,405


370
 

Table of Contents
                 
BAT Annual Report and Form 20-F 2021    
 
Strategic Report        
 
Governance Report        
  
Financial Statements        
  
Other Information        


Number of
Options Held
    
Date of
Grant/Award
    
Options
Exercise Price
£
    
Market Price
at Date of Grant
of Option
£
    
Number of
Shares
Awarded
    
Exercisable (LTIP/Sharesave)
Vesting (DSBS/SIP)
 
Johan Vandermeulen
                                                     
LTIP
1
  
 
39,438


28 Mar 2019


0.00


33.28


28 Mar 2022 – 27 Mar 2029


41,872


30 Mar 2020


0.00


26.33


30 Mar 2023 – 29 Mar 2030


40,662


29 Mar 2021


0.00


27.94


29 Mar 2024 – 28 Mar 2031
 
Restricted Share Plan
7
  
 
10,966


30 Mar 2020


0.00


26.33


30 Mar 2023


10,649


29 Mar 2021


0.00


27.94


29 Mar 2024
 
Total Options
3
  
 
143,587
 
                                            
DSBS
4


28 Mar 2019


13,785


28 Mar 2022


30 Mar 2020


16,290


30 Mar 2023


29 Mar 2021


11,615


29 Mar 2024
 
SIP
5


1 Apr 2019


112


1 Apr 2022


8 May 2019


8


8 May 2022


8 Aug 2019


10


8 Aug 2022


14 Nov 2019


11


14 Nov 2022


6 Feb 2020


10


6 Feb 2023


1 Apr 2020


125


1 Apr 2023


13 May 2020


11


13 May 2023


19 Aug 2020


18


19 Aug 2023


12 Nov 2020


16


12 Nov 2023


5 Feb 2021


17


5 Feb 2024


1 Apr 2021


92


1 Apr 2024


12 May 2021


18


14 May 2024


20 Aug 2021


21


20 Aug 2024


11 Nov 2021


23


11 Nov 2024
 
Total Restricted Share Awards
6
                                      
 
42,182


371


Table of Contents
BAT Annual Report and Form 20-F 2021
Other Information
Share Capital and Security Ownership
Continued


Number of
Options Held
    
Date of
Grant/Award
    
Options
Exercise Price
£
    
Market Price
at Date of Grant
of Option
£
    
Number of
Shares
Awarded
    
Exercisable (LTIP/Sharesave)
Vesting (DSBS/SIP)
 
Kingsley Wheaton


LTIP
1
  
 
43,194


28 Mar 2019


0.00


33.28


28 Mar 2022 – 27 Mar 2029


46,777


30 Mar 2020


0.00


26.33


30 Mar 2023 – 29 Mar 2030


48,578


29 Mar 2021


0.00


27.94


29 Mar 2024 – 28 Mar 2031
 
Restricted Share Plan
7
  
 
12,251


30 Mar 2020


0.00


26.33


30 Mar 2023


12,722


29 Mar 2021


0.00


27.94


29 Mar 2024
 
Sharesave
2
  
 
1,309


28 Mar 2019


22.91


28.63


1 May 2024 – 31 Oct 2024
 
Total Options
3
  
 
164,831


DSBS
4


28 Mar 2019


13,785


28 Mar 2022


30 Mar 2020


18,198


30 Mar 2023


29 Mar 2021


13,454


29 Mar 2024
 
SIP
5


1 Apr 2019


112


1 Apr 2022


8 May 2019


13


8 May 2022


8 Aug 2019


14


8 Aug 2022


14 Nov 2019


16


14 Nov 2022


6 Feb 2020


13


6 Feb 2023


1 Apr 2020


125


1 Apr 2023


13 May 2020


15


13 May 2023


19 Aug 2020


22


19 Aug 2023


12 Nov 2020


20


12 Nov 2023


5 Feb 2021


22


5 Feb 2024


1 Apr 2021


92


1 Apr 2024


12 May 2021


21


14 May 2024


20 Aug 2021


24


20 Aug 2024


11 Nov 2021


26


11 Nov 2024
 
Total Restricted Share Awards
6


45,972


Notes:
Options
 
1.
LTIP: grants or awards of ordinary shares under the LTIP are for nil consideration. The number of options shown is the maximum that may be exercised subject to the completion of the applicable performance period and conditions under the rules of the LTIP. The number of options which may vest and become exercisable may be less than the number of ordinary shares shown in the table.
 
2.
Sharesave Scheme: grants of options under the Sharesave Scheme are: (a) normally granted at a discount of 20% to the market price of ordinary shares at the time of invitation, as permitted by the rules of the Sharesave Scheme; and (b) are exercisable at the end of a three-year or five-year savings contract up to a monthly limit of £500.
 
3.
Each of the LTIP and Sharesave Scheme contains provisions which permit the Board of Directors or a duly authorised committee of the Board of Directors to establish further plans for the benefit of overseas employees based on the relevant share plan but modified as necessary or desirable to take account of overseas tax, exchange control or applicable securities laws. Any new ordinary shares issued under such plans would not count towards any applicable plan limits under the LTIP or the Sharesave Scheme.
Restricted Share Awards
 
4.
DSBS: a portion of annual bonus is deferred into a grant of ordinary shares which vests after a three year period. No further performance conditions apply in that period. Participants have no ownership over the shares until vesting and the shares carry no rights to vote in that period. Dividend equivalent payments are paid quarterly during the vesting period.
 
5.
SIP: the SIP is an
all-employee
plan which includes the SRS under which eligible employees receive an award of ordinary shares (Free Shares) in April of each year in which the plan operates in respect of performance in the previous financial year. The Free Shares are held in a
UK-based
trust from the date of the award for a minimum period of three years. During that time the SIP participant is entitled to receive dividends on those ordinary shares which are
re-invested
by such trust to buy further ordinary shares (Dividend Shares) on behalf of the SIP participant. The Dividend Shares are also held in the trust from the date of acquisition for a minimum period of three years. During the three-year holding periods, the SIP participant may not remove the Free Shares or the Dividend Shares from the trust, but may direct the trust to exercise its voting rights in accordance with his or her instructions. In addition to the Free Shares and Dividend Shares, participants in the SIP are also eligible to purchase additional ordinary shares from their
pre-tax
salary up to an annual statutory limit (Partnership Shares). The SIP also provides that BAT has the right to offer additional ordinary shares to a participant at no cost for each Partnership Share the participant purchases, at a ratio of two such ordinary shares for each Partnership Share purchased (Matching Shares). BAT does not currently provide any Matching Shares.
 
6.
BAT has established similar plans to the SIP for
non-UK
employees and specific plans for employees in Germany, Belgium and the Netherlands. Each of these plans has been modified to take account of overseas tax, exchange control and applicable securities laws.
 
7.
Restricted Share Plan: grant of ordinary shares which vests after a three year period. No performance conditions apply in that period. Participants have no ownership over the shares until vesting and the shares carry no rights to vote in that period. Dividend equivalent payments are paid on shares vesting.
 
372
 

Table of Contents
BAT Annual Report and Form 20-F 2021    
 
Strategic Report        
 
Governance Report        
  
Financial Statements        
  
Other Information        


Articles of Association
 
The Company is incorporated under the name of British American Tobacco p.l.c. and is registered in England and Wales under registered number 3407696. Under the Companies Act 2006 (the “Companies Act”), the Company’s objects are unrestricted. The following descriptions summarise certain provisions of the Company’s current Articles of Association (the “Articles”) (as adopted by special resolution at the AGM on 28 April 2010), applicable English and Welsh law and the Companies Act. This summary is qualified in its entirety by reference to the Companies Act and the Articles, available on bat.com. The Articles may be altered or added to, or completely new articles may be adopted, by a special resolution of the shareholders of the Company, subject to the provisions of the Companies Act.
Share capital – structure
Ordinary shares
–  all of the Company’s ordinary shares are fully paid
–  no further contribution of capital may be required by the Company from the holders of such shares
Alteration of share capital – the Company by ordinary resolution may:
–  consolidate and divide all or any of its shares into shares of a larger amount than its existing shares
–  divide or
sub-divide
any of its shares into shares of smaller amount than its existing shares
–  determine that, as between the shares resulting from such a
sub-division,
any of them may have any preference or advantage as compared with the others
Alteration of share capital – the Company, subject to the provisions of the Companies Act, may:
–  reduce its share capital, its capital redemption reserve and any share premium account in any way
–  purchase its own shares, including redeemable shares, and may hold such shares as treasury shares or cancel them
Dividend rights
–  shareholders may, by ordinary resolution, declare dividends but not in excess of the amount recommended by the Directors
–  the Directors may pay interim dividends out of distributable profits
–  no dividend shall be paid otherwise than out of the profits available for distribution as specified under the provisions of the Companies Act
–  the Directors may, with the authority of an ordinary resolution of the shareholders, pay scrip dividends or satisfy the payment of a dividend by the distribution of specific assets
–  unclaimed dividends for a period of 12 years may be forfeited and cease to be owed by the Company
–  specific provisions enable the Directors to elect to pay dividends by bank or electronic transfer only
Share capital – voting rights
Voting at general meetings
–  by a show of hands, unless a poll is demanded, and on a show of hands, every shareholder who is present in person at a general meeting has one vote regardless of the number of shares held by that shareholder
–  every proxy appointed by a shareholder and present at a general meeting has one vote except that if the proxy has been duly appointed by more than one shareholder entitled to vote on the resolution and is instructed by one or more of those shareholders to vote for the resolution and by one or more others to vote against it, or is instructed by one or more of those shareholders to vote in one way and is given discretion as to how to vote by one or more others (and wishes to use that discretion to vote in the other way), he has one vote for and one vote against the resolution
–  on a poll, every shareholder who is present in person or by proxy has one vote for every share held by the shareholder
–  a shareholder (or his duly appointed proxy) entitled to more than one vote need not use all his votes or cast all the votes he uses in the same way
–  a poll may be demanded by any of the following:
(1) the Chairman of the meeting;
(2) the Directors;
(3) not less than five shareholders having the right to vote at the meeting;
(4) a shareholder or shareholders representing not less than
one-tenth
of the total voting rights of all shareholders having the right to vote at the meeting (excluding any voting rights attached to treasury shares); or
(5) a shareholder or shareholders holding shares which confer a right to vote on the resolution at the meeting being shares on which an aggregate sum has been paid up equal to not less than
one-tenth
of the total sum paid up on all shares conferring that right (excluding any voting rights attached to treasury shares)
Matters transacted at general meetings
–  ordinary resolutions can include resolutions for the appointment, reappointment and removal of Directors, the receiving of the Annual Report, the declaration of final dividends, the appointment and reappointment of the external auditor, the authority for the Company to purchase its own shares and the grant of authority to allot shares
–  an ordinary resolution is passed when a simple majority of the votes cast at a meeting at which there is a quorum vote in favour of the resolution
–  special resolutions can include resolutions amending the Company’s Articles and resolutions relating to certain matters concerning
a winding-up
of the Company
–  a special resolution is passed when not less than three-quarters of the votes cast at a meeting at which there is a quorum vote in favour of the resolution
–  quorum for a meeting of the Company is a minimum of two shareholders present in person or by proxy or by a duly authorised representative(s) of a corporation which is a shareholder and entitled to vote
–  convening a meeting: the Company may specify a time not more than 48 hours before the time of the meeting (excluding any part of a day that is not a working day) by which a person must be entered on the register of members in order to have the right to attend or vote at the meeting
 
373


Table of Contents
BAT Annual Report and Form 20-F 2021
Other Information
Articles of Association
Continued


Share capital –
pre-emptive
rights and new issues of shares
–  holders of ordinary shares have no
pre-emptive
rights under the Articles – the ability of the Directors to cause the Company to issue shares, securities convertible into shares or rights to shares, otherwise than pursuant to an employee share scheme, is restricted
–  under the Companies Act, the directors of a company are, with certain exceptions, unable to allot any equity securities without express authorisation, which may be contained in a company’s articles of association or given by its shareholders in a general meeting, but which in either event cannot last for more than five years
–  under the Companies Act, a company may also not allot shares for cash (otherwise than pursuant to an employee share scheme) without first making an offer to existing shareholders to allot such shares to them on the same or more favourable terms in proportion to their respective shareholdings, unless this requirement is waived by a special resolution of the shareholders
Restrictions on transfers of shares
–  Directors can, in their absolute discretion, refuse to register the transfer of a share in certificated form which is not fully paid, provided that such a refusal would not prevent dealings in shares in certificated form which are not fully paid from taking place on a proper basis
–  the Directors may also refuse to register a transfer of a share in certificated form (whether fully paid or not) unless the instrument of transfer: (1) is lodged, duly stamped, and is deposited at the registered office of the Company or such other place as the Directors may appoint and is accompanied by a certificate for the shares to which it relates and such other evidence as the Directors may reasonably require to show the right of the transferor to make the transfer; (2) is in respect of only one class of share; and (3) is in favour of not more than four transferees
–  for uncertificated shares, transfers shall be registered only in accordance with the terms of the Uncertificated Securities Regulations 2001 so that Directors may refuse to register a transfer which would require shares to be held jointly by more than four persons
–  if the Directors refuse to register a share transfer, they must give the transferee notice of this refusal as soon as practicable and in any event within two months of the instrument of transfer being lodged with the Company
Repurchase of shares
–  subject to authorisation by shareholder resolution, the Company may purchase its own shares in accordance with the Companies Act
–  any shares which have been bought back may be held as treasury shares or, if not so held, must be cancelled immediately upon completion of the purchase, thereby reducing the amount of the Company’s issued share capital
Directors
Appointment and retirement
–  a Board of Directors of not fewer than five Directors and not subject to any maximum (unless otherwise determined by ordinary resolution of shareholders)
–  Directors and the Company (by ordinary resolution) may appoint a person who is willing to act as a Director
–  the Articles govern the minimum number of Directors who must be subject to retirement at each AGM and who may seek
re-election
–  notwithstanding the Articles, all of the Directors of the Company will be subject to
re-election
at the forthcoming AGM to be held on 28 April 2022 in accordance with the UK Corporate Governance Code
–  fees for
Non-Executive
Directors and the Chairman are determined by the Directors but cannot currently exceed in aggregate an annual sum of £2,500,000, unless determined otherwise by ordinary resolution of the shareholders
–  the remuneration of the Executive Directors is determined by the Remuneration Committee, which comprises independent
Non-Executive Directors
Disclosure of interests
–  the Articles require disclosure, subject to certain limited exceptions, of Directors’ interests in transactions that may result in a conflict of interest, including those which may arise as a result of the Director’s office or employment or persons connected with such Director, and identify procedures to resolve such conflicts of interest
Meetings and voting
–  the quorum for a meeting of Directors is two Directors
–  the Directors may delegate any of their powers to a person or a committee
–  the Articles place a general prohibition on a Director voting at a Board meeting on any matter in which he has an interest other than by virtue of his interest in shares in the Company
–  the Articles restrict a Director’s ability to vote on any resolution concerning a matter in which such Director has a material interest, unless such Director’s interest arises only because the resolution relates to the giving of guarantees; the provision of indemnities; insurance proposals; retirement benefits; and other specified transactions or arrangements with a company in which the Director may have an indirect interest
Borrowing powers
–  the Directors may exercise all the powers of the Company to borrow money and to mortgage or charge its undertaking, property, assets (present and future) and uncalled capital
–  the Directors may also issue debentures, debenture stock and other securities
 
374
 

Table of Contents
                 
BAT Annual Report and Form 20-F 2021    
 
Strategic Report        
 
Governance Report        
  
Financial Statements        
  
Other Information        


Additional disclosures
Disclosure of ownership of shares
–  there are no provisions in the Articles whereby persons acquiring, holding or disposing of a certain percentage of the Company’s ordinary shares are required to make disclosure of their ownership percentage, although there are such requirements under statute and regulation
Director retirement
–  there is no requirement for a Director to retire on reaching any age
Sinking funds
–  there is no sinking fund provision in the Articles applicable to the Company’s ordinary shares
Limitations on voting and shareholding
–  there are no limitations under the Articles restricting the right of
non-resident
or foreign owners to hold or vote ordinary shares in the Company
Distribution of assets on a winding up
–  if the Company is wound up, the liquidator may, with the sanction of a special resolution and any other sanction required by law, divide among the members in specie the whole or any part of the assets of the Company and may, for that purpose, value any assets and determine how the division shall be carried out as between the members or different classes of members
–  the liquidator may, with the like sanction, vest the whole or any part of the assets in trustees upon such trusts for the benefit of the members as he may with the like sanction determine, but no member shall be compelled to accept any assets upon which there is a liability
Anti-takeover devices and change of control
–  there are no provisions in the Articles that would have the effect of delaying, deferring or preventing a takeover, or change of control, of the Company
–  under English law, the Company’s Directors have a fiduciary duty to take only those actions that are in the interests of the Company and any anti-takeover devices employed by the Directors in the future, if any, must accordingly be in the interests of the Company
–  the Company is also subject to the City Code on Takeovers and Mergers (the "City Code”), which governs the conduct of mergers and takeovers in the UK. Any takeover of the Company would have to be in accordance with the City Code
 
375


Table of Contents
BAT Annual Report and Form 20-F 2021
 
Other Information
Purchase of Shares
 
Renewal of Authority for Company to Purchase Own Shares
   
Current authority to purchase shares
 
–  this authority (granted at the 2021 AGM) will expire at the 2022 AGM; and
 
–  renewed authority to purchase the Company’s ordinary shares in order that the appropriate mechanisms are in place to enable the share
buy-back
programme to be reinstated at any time and authority would be exercised when, in the opinion of the Directors, the exercise of the authority would result in an increase in the Company’s earnings per share and would be in the interest of its shareholders generally.
   
Proposed authority to purchase shares
 
–  the minimum price that may be paid for such shares is 25p, and the maximum price is the higher of: (i) an amount equal to 105% of the average of the middle-market prices shown in the quotation for an ordinary share as derived from the LSE Daily Official List for the five business days immediately preceding the day on which the ordinary share is contracted to be purchased; and (ii) the higher of the price of the last independent trade and the highest current independent bid for an ordinary share in the Company on the trading venues where the market purchases by the Company will be carried out;
 
–  in the absence of the necessary practical arrangements, the proposed authority has not been extended to enable BAT to purchase its own ordinary shares on the JSE in South Africa or the NYSE in the form of ADSs; and
 
–  further details are set out in the Notice of Annual General Meeting 2022 which is made available to all shareholders and is published on bat.com.
   
Treasury shares
 
–  in accordance with the Company’s policy, any repurchased shares are expected to be held as treasury shares; at 31 December 2021, the number of treasury shares was 161,930,217 (2020: 162,347,246); no dividends are paid on treasury shares; treasury shares have no voting rights; and treasury shares may be resold at a later date.
Purchases of Equity Securities by the Issuer and Affiliated Purchasers
At the AGM on 28 April 2021, authorisation was given to the Company to repurchase up to 229.4 million ordinary shares for the period until the next AGM in 2022. This authorisation is renewed annually at the AGM. No ordinary shares were repurchased by the Company during 2021. The following table provides details of ordinary share purchases made by the trustees of employee share ownership plans (“ESOPs”) and other purchases of ordinary shares and ADSs made to satisfy the commitments to deliver shares under certain employee share-based payment plans.


Total number of

ordinary
shares purchased
by ESOPs or certain
employee share-
based plans


Average price
paid per
        ordinary share
£


Total number of
ADSs purchased
    by ESOPs or certain
employee share-
based plans


        Average price
paid per
ADS
US$


Total number of
ordinary shares
    purchased as
part of a publicly
announced plan
1


Maximum number of
shares that may
yet be purchased as
part of a publicly
announced plan
1


2021
                 
7 January
  
 
3,046


28.118500


3 February
  
 
3,187


27.188100


3 February
  
 
21,151


27.127600


3 March
  
 
3,407


25.498700


31 March
  
 
1,783,215


27.709844


1 April
  
 
322,326


27.239586


1 April
  
 
177,289


27.320552


1 April
  
 
7,041


27.290000


1 April
  
 
8,292


27.320552


7 April
  
 
3,270


27.772500


7 April
  
 
7,487


27.982000


7 April
  
 
2,770


27.605000


28 April
  
 
80,120


27.046770


5 May
  
 
3,440


27.176900


12 May
  
 
20,286


28.130600


3 June
  
 
3,482


27.226300


7 July
  
 
3,221


28.091500


4 August
  
 
3,208


27.060000


20 August
  
 
23,208


27.142953


1 September
  
 
177,690


27.286770


1 September
  
 
2,752


27.151700


6 October
  
 
3,925


25.149800


4 November
  
 
3,415


25.202000


11 November
  
 
23,881


25.912700


1 December
  
 
3,255


25.643500


2,694,364


27.055777


Notes:
 
1.
There was no publicly announced plan for BAT to purchase its own ordinary shares or ADSs during the year ended 31 December 2021.
 
2.
All the purchases of ordinary shares were made on open market transactions.
 
376


Table of Contents
BAT Annual Report and Form 20-F 2021    
 
Strategic Report        
 
Governance Report        
  
Financial Statements        
  
Other Information        


Group Employee Trust
 
The British American Tobacco Group Employee Trust (BATGET)
Function
  
–  used to satisfy the vesting and exercise of awards of ordinary shares under the BAT Deferred Share Bonus Scheme and Long-Term Incentive Plans; and
 
–  a committee of senior management reporting to the Board’s Share Schemes Committee monitors the number of ordinary shares held in BATGET to satisfy outstanding awards.
Funding
  
–  funded by interest-free loan facilities from the Company totalling £1 billion;
 
–  this enables BATGET to facilitate the purchase of ordinary shares to satisfy the future vesting or exercise of options and awards;
 
–  loan to BATGET: £300.00 million at 31 December 2021 (2020: £795.02 million);
 
–  the loan is either repaid from the proceeds of the exercise of options or, in the case of ordinary shares acquired by BATGET to satisfy the vesting and exercise of awards, the Company will subsequently waive the loan provided over the life of the awards; and
 
–  if any options lapse, ordinary shares may be sold by BATGET to cover the loan repayment.
           
1 Jan 2021               
    
31 Dec 2021
 
Ordinary shares
held in BATGET
  
     Number of ordinary shares
  
 
5,787,154             


5,995,678


     Market value of ordinary shares


£156.7m             


£163.9m


     % of issued share capital of Company
  
 
0.24             


0.24
 
Dividends paid
 
in 2021
  
–  BATGET currently waives dividends on the ordinary shares held by it; and
 
–  quarterly interim dividends 2021: £12.63 million across 2021.
Voting rights
  
–  the trustee does not exercise any voting rights while ordinary shares are held in BATGET; and
 
–  share scheme participants may exercise the voting rights attaching to those ordinary shares once the ordinary shares have been transferred out of BATGET.
Notes:
 
1.
Company share – based payment arrangements:
details of the material equity share-based and cash-settled share-based arrangements are set out in note 28 in the Notes on the Accounts.
 
2.
The values of ordinary shares shown are based on the closing
mid-market
share price on 31 December 2021: 2,733p (31 December 2020: 2,708p).
 
3.
In addition to the ordinary shares held in BATGET, the trust held the following American Depositary Shares (ADSs) which relate to the vesting and exercise of certain employee stock awards formerly granted by Reynolds American Inc. over Reynolds American Inc. common stock and which were assumed by BAT to be satisfied by the delivery of ADSs following the merger with Reynolds American Inc. on 25 July 2017.
 
     
1 Jan 2021              
    
31 Dec 2021
 
Number of ADSs
  
 
15,197            


15,197
 
Market value of ADSs
(a)
  
 
US$0.6m            


US$0.6m
 
% of issued share capital
  
 
0.0006            


0.0006
 
Note:
(a) The value of the ADSs shown is based on the closing price of ADSs on 31 December 2021 of US$37.41
 
377


Table of Contents
BAT Annual Report and Form 20-F 2021
 
Other Information
American Depositary Shares
Fees and Charges Payable by ADS Holders
Citibank, N.A. (Citibank) was appointed as the depositary bank (the “Depositary”) for BAT’s ADS programme pursuant to the Amended and Restated Deposit Agreement dated 1 December 2008 and amended as of 14 February 2017 and 14 June 2017 between BAT, the Depositary and the owners and holders of ADSs (the “Deposit Agreement”). Citibank was reappointed as the Depositary pursuant to the Second Amended and Restated Deposit Agreement dated 26 November 2018 (the “Restated Deposit Agreement”).
The Restated Deposit Agreement provides that ADS holders may be required to pay various fees to the Depositary, and the Depositary may refuse to provide any service for which a fee is assessed until the applicable fee has been paid.
 
     
Service
 
Fees
Issuance of ADSs upon deposit of ordinary shares (excluding issuances as a result of distributions of shares described below)
 
Up to US$0.05 per ADS issued
1
Cancellation of ADSs
 
Up to US$0.05 per ADS surrendered
1
Distribution of cash dividends or other cash distributions (i.e., sale of rights and other entitlements)
 
Up to US$0.05 per ADS held
2
Distribution of ADSs pursuant to: (1) stock dividends or other free stock distributions; or (2) exercise of rights to purchase additional BAT ADSs
 
Up to US$0.05 per ADS held
Distribution of securities other than ADSs or rights to purchase additional ADSs (i.e., spinoff shares)
 
Up to US$0.05 per ADS held
Depositary bank services
 
Up to US$0.05 per ADS held
Notes:
 
1.
Under the terms of a separate agreement between BAT and the Depositary, the Depositary has agreed to waive the fees that would otherwise be payable in connection with the issuance of ADSs upon deposit of ordinary shares and the cancellation of ADSs and corresponding withdrawal of ordinary shares, in each case by BAT or any of its affiliates, officers, directors or employees. The terms of this separate agreement may be amended at any time by BAT and the Depositary.
 
2.
While under the Restated Deposit Agreement cash dividends paid in respect of ADSs are subject to a fee of up to US$0.05 per ADS payable to the Depositary, under the terms of the separate agreement between BAT and the Depositary referred to above, such dividends are instead subject to a fee of up to US$0.02 per ADS per year (a fee of US$0.005 per dividend based on the distribution of four quarterly cash dividends per year). Under the separate agreement, this dividend fee may not be varied by the Depositary without the consent of BAT.
Contact details for Citibank Shareholder Services are on page 377.
In addition, ADS holders may be required under the Restated Deposit Agreement to pay the Depositary: (a) taxes (including applicable interest and penalties) and other governmental charges; (b) registration fees; (c) certain cable, telex and facsimile transmission and delivery expenses; (d) the expenses and charges incurred by the Depositary in the conversion of foreign currency; (e) such fees and expenses as are incurred by the Depositary in connection with compliance with applicable exchange control regulations and other regulatory requirements; and (f) the fees and expenses incurred by the Depositary, the custodian or any nominee in connection with the servicing or delivery of deposited securities. The Depositary may: (a) withhold dividends or other distributions or sell for the account of any ADS holder any or all of the shares underlying the ADSs in order to satisfy any tax or governmental charge; and (b) deduct from any cash distribution the applicable fees and charges of, and expenses incurred by, the Depositary and any taxes, duties or other governmental charges on account.
Fees and Payments Made by the Depositary to BAT
Under the terms of the contractual arrangements set out in the separate agreement between BAT and the Depositary referred to above, BAT received a total of approximately US$6.1 million from the Depositary, comprising fees charged in respect of dividends and a contribution to BAT’s ADS programme administration costs for the year ended 31 December 2021.
In 2021, these programme administration costs principally included those associated with AGM proxy mailings, exchange listing and regulatory fees, foreign private issuer analysis, legal fees, share registration fees and other expenses incurred by BAT in relation to the ADS programme.
Under these contractual arrangements, the Depositary has also agreed to waive certain standard fees associated with the administration of the ADS programme.
 
378


Table of Contents
                 
BAT Annual Report and Form 20-F 2021    
 
Strategic Report        
 
Governance Report        
  
Financial Statements        
  
Other Information        


Shareholding Administration
and Services
 
Ordinary Shareholder Enquiries
United Kingdom Registrar
Computershare Investor Services PLC
The Pavilions, Bridgwater Road, Bristol BS99 6ZZ
tel: 0800 408 0094 or +44 370 889 3159
online: www.investorcentre.co.uk/contactus
South African Registrar
Computershare Investor Services Proprietary Limited
Private Bag X9000, Saxonwold, 2132, South Africa
tel: 0861 100 634; +27 11 870 8216
email: web.queries@computershare.co.za
American Depositary Shares Enquiries
All enquiries regarding ADS holder accounts and payment of dividends should be addressed to:
Citibank Shareholder Services
PO Box 43077, Providence, Rhode Island 02940-3077, USA
tel: +1 888 985 2055 (toll-free) or +1 781 575 4555
email: citibank@shareholders-online.com
website: www.citi.com/dr
Manage Your Shareholding Online
Computershare Investor Services PLC (Computershare) operates an online service, Investor Centre, for holders of shares on the Company’s UK share register. Investor Centre allows shareholders to manage their shareholding online, enabling shareholders to:
 
 
update personal details and provide address changes;
 
 
update dividend bank mandate instructions and review dividend payment history;
 
 
register for the Dividend Reinvestment Plan (“DRIP”); and
 
 
register to receive Company communications electronically.
To register for Investor Centre, go to www.computershare.com/uk/ investor/bri.
Shareholders with any queries regarding their holding should contact Computershare using the above contact details.
Share dealing
Computershare also offers a share dealing service to existing shareholders. For full details on how to trade British American Tobacco shares traded on the London Stock Exchange, go to www.computershare.com/dealing/uk. Please note that this service is only available in certain countries.
Dividends
Comprehensive information on dividend payments is available on pages 352 and 353.
DRIP
We offer a DRIP to our UK shareholders. The DRIP allows eligible shareholders to use their cash dividends to acquire additional shares in the Company. The DRIP shares are purchased by Computershare through a
low-cost
dealing arrangement. Contact Computershare in the UK for details and exclusions of this service.
Taxation of dividends
See pages 354 and 357 for details on dividend taxation.
A fact sheet detailing historical UK capital gains tax information is available at bat.com/cgt. Alternatively, contact the British American Tobacco Company Secretarial Department on +44 20 7845 1000.
Share Fraud
The practice of share fraud (also known as ‘boiler room’ scams) unfortunately continues with many companies’ shareholders receiving unsolicited phone calls or mail from people offering to sell them what often turn out to be worthless or high risk shares in US
 
or UK investments, or to buy shares at an inflated price in return for an upfront payment.
If you suspect that you have been approached by fraudsters, please tell the FCA using the share fraud reporting form at www.fca.org.uk/scams, where you can find out more about investment scams. You can also call the FCA Consumer Helpline on 0800 111 6768. If you have lost money to investment fraud, you should report it to Action Fraud on 0300 123 2040 or online at www.actionfraud.police.uk.
Documents on Display and Publications
This Annual Report and Form
20-F
2021 is available online at bat.com/ annualreport. Copies of current and past Annual Reports are available on request from:
British American Tobacco Publications
Unit 80, London Industrial Park, Roding Road, London E6 6LS
tel: +44 20 7511 7797 email: bat@team365.co.uk
Holders of shares held on the South Africa register can contact the Company’s Representative office in South Africa using the contact details shown at the end of this Annual Report and Form
20-F
2021.
ADS holders can contact Citibank Shareholder Services in the United States using the contact details shown opposite.
Highlights from the current and past Annual Reports can be produced in alternative formats such as Braille, audio tape and large print.
Documents referred to in this Annual Report and Form
20-F
2021 do not form part of this Annual Report unless specifically incorporated by reference.
The Company is subject to the information requirements of the US Securities Exchange Act of 1934 applicable to foreign private issuers. In accordance with these requirements, the Company files its Annual Report on Form
20-F
and other documents with the SEC. BAT’s SEC filings are available to the public, together with the public filings of other issuers, at the SEC’s website, www.sec.gov or by calling the SEC on +1
800-SEC-0330.
The Company’s agent for service in the United States for the purposes of the registration statement on Form
F-3
(333-232691)
is Brian T. Harrison, Secretary, B.A.T Capital Corporation, C/O Corporation Service Company, 251 Little Falls Drive, Wilmington, Delaware 19808 U.S.A.
Our Website
Comprehensive information about British American Tobacco is available from our website: bat.com. Within the Investors section you will find valuation and charting tools, dividend and share price data and you can download shareholder publications and subscribe for email alert services. You can also download our Investor Relations app to access all the latest financial information on your iPad, iPhone or Android device.
 
     
Calendar 2022
Thur 28 April
at
11:30am
 
Annual General Meeting
 
Details of the venue and business to be proposed at the meeting are set out in the Notice of Annual General Meeting, which is made available to all shareholders and is published on bat.com.
 
BAT provides for the vote on each resolution to be by poll rather than by a show of hands. This provides for greater transparency and allows the votes of all shareholders to be counted, including those cast by proxy. The voting results will be released on the same day in accordance with regulatory requirements and made available on bat.com.
   
Wed
27 July
 
Half-Year Report
 
379


Table of Contents
BAT Annual Report and Form 20-F 2021
 
Other Information
Exhibits
The following documents are filed in the SEC EDGAR system, as part of this Annual Report on Form
20-F,
and can be viewed on the SEC’s website, www.sec.gov:
 
Exhibit
Number
  
Description
1
  
2.1
  
2.2
  
2.3
  
2.4
  
2.5
  
2.6
  
2.7
  
2.8
  
2.9
  
2.10
  
2.11
  
2.12
  
2.13
  
2.14
  
2.15
  
2.16
  
2.17
  
2.18
  
2.19
  
4.1
  
4.2
  
4.3
  
4.4
  
4.5
  
4.6
  
4.7
  
4.8
  
4.9
  
4.10
  
4.11
  
4.12
  
4.13
  
4.14
  
4.15
  
4.16
  
4.17
  
4.18
  
 
380


Table of Contents
BAT Annual Report and Form 20-F 2021    
 
Strategic Report        
 
Governance Report        
  
Financial Statements        
  
Other Information        


Exhibit
Number
  
Description
4.19
  
4.20
  
8
  
11
  
12
  
13
  
15
  
17
  
101
  
Interactive Data Files (formatted in XBRL (Extensible Business Reporting Language) and furnished electronically).
Notes:
1. Incorporated by reference to Exhibit 3.1 to BAT’s Registration Statement on Form
F-4
(Reg.
No. 333-217939)
filed on 12 May 2017.
2. Incorporated by reference to Exhibit 4.1 to BAT’s Registration Statement on Form
S-8
(Reg.
No. 333-237186)
filed on 16 March 2020.
3. Incorporated by reference to Exhibit 2.4 to BAT’s Annual Report on Form
20-F
for the year ended 31 December 2017 filed on 15 March 2018.
4. Incorporated by reference to Exhibit 4.2 to BAT’s Registration Statement on Form
F-4
(Reg.
No. 333-227658)
filed on 2 October 2018.
5. Incorporated by reference to Exhibit 4.1 to British American Tobacco p.l.c.’s Form
6-K
filed on 6 September 2019.
6. Incorporated by reference to Exhibit 4.2 to British American Tobacco p.l.c.’s Form
6-K
filed on 6 September 2019.
7. Incorporated by reference to Exhibit 4.3 to British American Tobacco p.l.c.’s Form
6-K
filed on 6 September 2019.
8. Incorporated by reference to Exhibit 4.4 to British American Tobacco p.l.c.’s Form
6-K
filed on 6 September 2019.
9. Incorporated by reference to Exhibit 4.5 to British American Tobacco p.l.c.’s Form
6-K
filed on 6 September 2019.
10. Incorporated by reference to Exhibit 4.6 to British American Tobacco p.l.c.’s Form
6-K
filed on 2 April 2020.
11. Incorporated by reference to Exhibit 4.7 to British American Tobacco p.l.c.’s Form
6-K
filed on 2 April 2020.
12. Incorporated by reference to Exhibit 4.8 to British American Tobacco p.l.c.’s Form
6-K
filed on 2 April 2020.
13. Incorporated by reference to Exhibit 4.9 to British American Tobacco p.l.c.’s Form
6-K
filed on 25 September 2020.
14. Incorporated by reference to Exhibit 4.10 to British American Tobacco p.l.c.’s Form
6-K
filed on 25 September 2020.
15. Incorporated by reference to Exhibit 4.11 to British American Tobacco p.l.c.’s Form
6-K
filed on 25 September 2020.
16. Incorporated by reference to Exhibit 4.12 to British American Tobacco p.l.c.’s Form
6-K
filed on 25 September 2020.
17. Incorporated by reference to Exhibit 4.13 to British American Tobacco p.l.c.’s Form
6-K
filed on 25 September 2020.
18. Incorporated by reference to Exhibit 4.14 to British American Tobacco p.l.c.’s Form
6-K
filed on 25 September 2020.
19. Incorporated by reference to Exhibit 10.6 to BAT’s Registration Statement on Form
F-4
(Reg.
No. 333-217939)
filed on 12 May 2017.
20. Incorporated by reference to Exhibit 10.8 to BAT’s Registration Statement on Form
F-4
(Reg.
No. 333-217939)
filed on 12 May 2017.
21. Incorporated by reference to Exhibit 4.6 to BAT’s Annual Report on Form
20-F
for the year ended 31 December 2018 filed on 15 March 2019.
22. Incorporated by reference to Exhibit 10.43 to Reynolds American Inc.’s Annual Report on Form
10-K
for the fiscal year ended 31 December 2007 filed on 27 February 2008.
23. Incorporated by reference to Exhibit 4.11 to BAT’s Annual Report on Form
20-F
for the year ended 31 December 2018 filed on 15 March 2019.
24. Incorporated by reference to Exhibit 4.14 to BAT’s Annual Report on Form
20-F
for the year ended 31 December 2019 filed on 26 March 2020.
25. Incorporated by reference to Exhibit 4 to R.J. Reynolds Tobacco Holdings, Inc.’s Form
8-K
dated 24 November 1998.
26. Incorporated by reference to Exhibit 2 to R.J. Reynolds Tobacco Holdings, Inc.’s Form
8-K
dated 5 September 1997.
27. Incorporated by reference to Exhibit 2 to R.J. Reynolds Tobacco Holdings, Inc.’s Form
8-K
dated 27 January 1998.
28. Incorporated by reference to Exhibit 99.1 to R.J. Reynolds Tobacco Holdings, Inc.’s Quarterly Report on Form
10-Q
for the quarter ended 30 March 1998 filed on 15 May 1998.
29. Incorporated by reference to Exhibit 99.2 to R.J. Reynolds Tobacco Holdings, Inc.’s Quarterly Report on Form
10-Q
for the quarter ended 30 March 1998 filed on 15 May 1998.
30. Incorporated by reference to Exhibit 99.3 to R.J. Reynolds Tobacco Holdings, Inc.’s Quarterly Report on Form
10-Q
for the quarter ended 30 March 1998 filed on 15 May 1998.
31. Incorporated by reference to Exhibit 99.2 to R.J. Reynolds Tobacco Holdings, Inc.’s Quarterly Report on Form
10-Q
for the quarter ended 30 June 1998 filed on 14 August 1998.
32. Incorporated by reference to Exhibit 99.4 to R.J. Reynolds Tobacco Holdings, Inc.’s Quarterly Report on Form
10-Q
for the quarter ended 30 June 1998 filed on 14 August 1998.
33. Incorporated by reference to Exhibit 99.1 to R.J. Reynolds Tobacco Holdings, Inc.’s Quarterly Report on Form
10-Q
for the quarter ended 30 September 1998 filed on 12 November 1998.
34. Incorporated by reference to Exhibit 10.1 to Reynolds American Inc.’s Form
8-K
dated 12 March 2013.
35. Incorporated by reference to Exhibit 4.25 to BAT’s Annual Report on Form
20-F
for the year ended 31 December 2019 filed on 26 March 2020.
36. These certifications are furnished only and are not filed as part of BAT’s Annual Report on Form
20-F
for the year ended 31 December 2021.
Certain instruments which define the rights of holders of long-term debt issued by BAT and its subsidiaries are not being filed because the total amount of securities authorised under each such instrument does not exceed 10% of the total consolidated assets of BAT and its subsidiaries. BAT agrees to furnish copies of any or all such instruments to the SEC on request.
 
381


Table of Contents
BAT Annual Report and Form 20-F 2021
 
Other Information
Glossary
 
   
ADR
  
American Depositary Receipt
ADS
  
American Depositary Share – 1 ADS is equivalent to 1 BAT ordinary share
AGM
  
Annual General Meeting
AmSSA
  
Americas (excluding US) and Sub- Saharan Africa
APFO
  
Adjusted profit from operations
APME
  
Asia-Pacific and Middle East
BATGET
  
British American Tobacco Group Employee Trust
bps
  
Basis points
CC
  
Constant currency
CGFO
  
Cash generated from operations
CO
2
e
  
Carbon dioxide equivalent
Code
  
UK Corporate Governance Code, July 2018 version
CSR
  
Corporate Social Responsibility
DSBS
  
Deferred share bonus scheme
EMTN
  
European Medium Term Notes
ENA
  
Europe and North Africa
EPS
  
Earnings per share
ESG
  
Environmental, Social and Governance
EU
  
European Union
FII GLO
  
Franked Investment Income Group Litigation Order
FCTC
  
Framework Convention on Tobacco Control
FMCG
  
Fast Moving Consumer Goods
GAAP
  
Generally Accepted Accounting Practice
GDB
  
Global Drive Brands, being Kent, Dunhill, Pall Mall, Lucky Strike and Rothmans
GDPR
  
EU General Data Protection Regulation
GDSB
  
Global Drive and Key Strategic Brands, being the GDBs, plus Shuang Xi and State Express 555
GJ
  
Gigajoules (of energy use)
IASB
  
International Accounting Standards Board
IEIS
  
International Executive Incentive Scheme
IFRS
  
International Financial Reporting Standards as issued by the IASB and as adopted by the EU
ISA
  
International Standards on Auditing
JSE
  
Johannesburg Stock Exchange
KPI
  
Key performance indicator
LIBOR
  
London Interbank Offered Rate
LSE
  
London Stock Exchange
LR
  
Listing Rules
LTIP
  
Long-Term Incentive Plan
   
MCE
  
Million cigarettes equivalent
MSA
  
Master Settlement Agreement
NGP
  
Next Generation Product
NRT
  
Nicotine Replacement Therapy
NTO
  
Net turnover or revenue
NYSE
  
New York Stock Exchange
OCF
  
Operating cash flow
OECD
  
Organisation for Economic
Co-operation
and Development
OTP
  
Other tobacco products, including but not limited to
roll-your-own,
make-your-own
and cigars
Parker Report
  
The Parker Review Committee’s final report on ethnic diversity in UK boards published on 12 October 2017
PCAOB
  
Public Company Accounting Oversight Board
Reynolds American
  
Reynolds American Inc.
Reynolds American Companies
  
Reynolds American Inc. and its
subsidiary companies
SAFL
  
Sustainable Agriculture and Farmer Livelihoods
SEC
  
United States Securities and Exchange Commission
SIP
  
Share incentive plan
SoBC
  
Group Standards of Business Conduct
SOx
  
United States Sarbanes-Oxley Act of 2002
SRS
  
Share reward scheme
TaO
  
Programme to implement the new operating model, including one instance of SAP
TCFD
  
Taskforce on Climate-related Financial Disclosures
TDR
  
TDR d.o.o
THP
  
Tobacco Heating Products (i.e. the devices) or Tobacco Heated Products (i.e. the consumables used by such devices)
TPD1
  
European Tobacco Products Directive
(directive 2001/37/EC)
TPD2
  
European Tobacco and Related Products Directive (directive 2014/40/EU)
TSR
  
Total shareholder return
US
  
United States of America
UURBS
  
Unfunded unapproved retirement benefit scheme
WHO
  
World Health Organization
 
 
382


Table of Contents
BAT Annual Report and Form 20-F 2021    
 
Strategic Report        
 
Governance Report        
  
Financial Statements        
  
Other Information        


Cross-Reference to Form
20-F
 
Item            
  
Form
20-F
caption
  
Location in this document
1
  
Identity of Directors, Senior Management and Advisers
  
N/A
2
  
Offer Statistics and Expected Timetable
  
N/A
3
  
Key Information
    
A
       
N/A
B
  
Capitalisation and indebtedness
  
N/A
C
  
Reasons for the offer and use of proceeds
  
N/A
D
  
Risk factors
  
92-97,
317-339
>>, Developments in Ukraine page >>
4
  
Information on the Company
    
A
  
History and development of the Company
  
3, 77, 81,
211-214,
245-246,
300, 315, 379
B
  
Business overview
  
2-73,
76,
84-91,
106-109,
190,
192-193,
300, 302, 320, 322, 340- 344,
347-348,
350
C
  
Organisational structure
  
280-289,
298
D
  
Property, plants and equipment
  
211-212,
348
4a
  
Unresolved staff comments
  
N/A
5
  
Operating and Financial Review and Prospects
    
A
  
Operating results
  
3,
7-9,
22-23,
36, 38,
40-43,
75, 83, 85,
87-89,
91, 97,
225-227,
240-241,
313, 315,
325-329,
340-344
B
  
Liquidity and capital resources
  
80-81,
183, 228,
239-244,
315-316,
336
C
  
Research and development, patent and licences
  
3-5,
11-13,
16-19,
31,
50-51,
76, 196, 300
D
  
Trend information
  
2-73,
75-97,
340-344
>>, Developments in Ukraine page >>
E
  
Critical Accounting Estimates
  
N/A
6
  
Directors, Senior Management and Employees
    
A
  
Directors and senior management
  
100-102,
113
B
  
Compensation
  
128-165,
214-220,
250,
360-372
C
  
Board practices
  
100-102,
116-128,
133-134,
149-151,
250, 351,
374-375
D
  
Employees
  
249, 314
E
  
Share ownership
  
73,
163-165,
246-248,
361-372,
377
7
  
Major Shareholders and Related Party Transactions
    
A
  
Major shareholders
  
360-361
B
  
Related party transactions
  
249-250
C
  
Interests of experts and counsel
  
N/A
8
  
Financial Information
    
A
  
Consolidated statements and other financial information
  
79, 95, 122,
178-281,
318-339,
354-355
B
  
Significant changes
  
N/A
9
  
The Offer and Listing
    
A
  
Offer and listing details
  
353
B
  
Plan of distribution
  
N/A
C
  
Markets
  
353
D
  
Selling shareholders
  
N/A
E
  
Dilution
  
N/A
F
  
Expenses of the issue
  
N/A
10
  
Additional Information
    
A
  
Share capital
  
N/A
B
  
Memorandum and Articles of Association
  
146,
373-375
C
  
Material contracts
  
215, 276,
346-347
D
  
Exchange controls
  
354
E
  
Taxation
  
356-359
F
  
Dividends and paying agents
  
N/A
G
  
Statements by experts
  
N/A
H
  
Documents on display
  
379
I
  
Subsidiary information
  
N/A
11
  
Quantitative and Qualitative Disclosures about Market Risk
  
239-244
 
383


Table of Contents
BAT Annual Report and Form 20-F 2021
 
    
Cross-Reference to Form
20-F
Continued
    
 
Item            
  
Form
20-F
caption
  
Location in this document
12
  
Description of Securities Other Than Equity Securities
  
 
A
  
Debt securities
  
N/A
B
  
Warrants and rights
  
N/A
C
  
Other securities
  
N/A
D
  
American Depositary Shares
  
378
13
  
Defaults, Dividend Arrearages and Delinquencies
  
N/A
14
  
Material Modifications to the Rights of Security Holders and Use of Proceeds
  
N/A
15
  
Controls and Procedures
  
350
16A
  
Audit Committee Financial Expert
  
120, 349
16B
  
Code of Ethics
  
127, 349
16C
  
Principal Accountant Fees and Services
  
123-124,
197
16D
  
Exemptions from the Listing Standards for Audit Committees
  
N/A
16E
  
Purchases of Equity Securities by the Issuer and Affiliated Purchasers
  
376
16F
  
Change in Registrant’s Certifying Accountant
  
N/A
16G
  
Corporate Governance
  
349
16H
  
Mine Safety Disclosure
  
N/A
16I
  
Disclosure Regarding Foreign Jurisdictions that Prevent Inspections
  
N/A
17
  
Financial Statements
  
N/A
18
  
Financial Statements
  
176-281
19
  
Exhibits
  
380-381
 
384
 

Table of Contents

Registered office Globe House, 4 Temple Place, London WC2R 2PG tel: +44 20 7845 1000, facsimile: +44 20 7240 0555 Incorporated in England and Wales No. 3407696 Representative Office in South Africa Waterway House South, No 3 Dock Road, V&A Waterfront, Cape Town 8000, South Africa PO Box 631, Cape Town 8000, South Africa tel: +27 21 003 6712 Secretary Paul McCrory Investor relations Enquiries should be directed to Mike Nightingale, Victoria Buxton, William Houston or John Harney tel: +44 20 7845 1180 Press office Enquiries should be directed to Anna Vickerstaff tel: +44 20 7845 2888 email: press_office@bat.com Auditors KPMG LLP 15 Canada Square, Canary Wharf, London E14 5GL References in this publication to ‘British American Tobacco’, ‘BAT’, ‘we’, ‘us’, and ‘our’ when denoting opinion refer to British American Tobacco p.l.c. (the Company) (No. 3407696) and when denoting tobacco business activity refer to British American Tobacco Group operating companies, collectively or individually as the case may be. Design and production: Radley Yeldar www.ry.com Printed in the UK by Pureprint Group on Revive 100% recycled papers, made entirely from post-consumer waste. All pulps used are Elemental Chlorine Free. The manufacturing mills hold the ISO14001 and EU Ecolabel (EMAS) certificates for environmental management.

Table of Contents

Go online Explore the story of our year www.bat.com Featuring downloadable versions of this report, along with our @BATplc sustainability summary report and other content – all accessible on youtube.com/welcometobat desktop, tablet and mobile. www.bat.com/reporting

Table of Contents
Developments related to Ukraine >>
Subsequent to the approval of the Annual Report 2021 by the Board of the Company on 10 February 2022 and the date of British American Tobacco p.l.c.’s consolidated financial statements for the years ended 31 December 2021, 2020 and 2019, management are monitoring the military conflict involving Russia and Ukraine. In 2021, Russia and Ukraine accounted for 3% of Group revenue and a slightly lower proportion of adjusted profit from operations. Our primary focus is on the safety and wellbeing of our employees, with the Group employing approximately 3,500 people in total across the two countries. The Group manufactures cigarettes and glo consumables domestically in both Russia and Ukraine. Whilst it is too early to determine the impact on the Group’s operations, we will continue to monitor and revisit our contingency plans in light of developments, including in response to any further sanctions.
Please refer to page 333 for the identified risk in relation to the imposition of sanctions. Following the developments in Ukraine, this risk will be extended to include Russia and disputed territories.

Table of Contents
SIGNATURE
The registrant hereby certifies that it meets all of the requirements for filing on Form
20-F
and that it has duly caused and authorized the undersigned to sign this annual report on its behalf.
Date: 8 March 2022
British American Tobacco p.l.c.
(Registrant)
 
By:  
/s/ Paul McCrory
  Paul McCrory
Company Secretary