UNITED STATES
SECURITIES AND EXCHANGE COMMISSION
Washington, D.C. 20549
FORM N-CSR
CERTIFIED SHAREHOLDER REPORT OF REGISTERED
MANAGEMENT INVESTMENT COMPANIES
Investment Company Act file number 811-21667
Fidelity Central Investment Portfolios LLC
(Exact name of registrant as specified in charter)
82 Devonshire St., Boston, Massachusetts 02109
(Address of principal executive offices) (Zip code)
Scott C. Goebel, Secretary
82 Devonshire St.
Boston, Massachusetts 02109
(Name and address of agent for service)
Registrant's telephone number, including area code: 617-563-7000
|
Date of fiscal year end: |
August 31 |
|
|
|
|
Date of reporting period: |
August 31, 2012 |
Item 1. Reports to Stockholders
Fidelity® High Income
Central Fund 2
Annual Report
August 31, 2012
To view a fund's proxy voting guidelines and proxy voting record for the 12-month period ended June 30, visit http://www.fidelity.com/proxyvotingresults or visit the Securities and Exchange Commission's (SEC) web site at http://www.sec.gov. You may also call 1-800-544-8544 to request a free copy of the proxy voting guidelines.
Standard & Poor's, S&P and S&P 500 are registered service marks of The McGraw-Hill Companies, Inc. and have been licensed for use by Fidelity Distributors Corporation.
Other third party marks appearing herein are the property of their respective owners.
All other marks appearing herein are the registered or unregistered trademarks or service marks of FMR LLC or an affiliated company. © 2012 FMR LLC. All rights reserved.
A fund files its complete schedule of portfolio holdings with the SEC for the first and third quarters of each fiscal year on Form N-Q. Forms N-Q are available on the SEC's web site at http://www.sec.gov. A fund's Forms N-Q may be reviewed and copied at the SEC's Public Reference Room in Washington, DC. Information regarding the operation of the SEC's Public Reference Room may be obtained by calling 1-800-SEC-0330.
HICII-ANN-1012
1.861961.104
Performance: The Bottom Line
Average annual total return reflects the change in the value of an investment, assuming reinvestment of the fund's distributions from dividend income and capital gains (the profits earned upon the sale of securities that have grown in value, if any) and assuming a constant rate of performance each year. The $10,000 table and the fund's returns do not reflect the deduction of taxes that a shareholder would pay on fund distributions or the redemption of fund shares. During periods of reimbursement by Fidelity, a fund's total return will be greater than it would be had the reimbursement not occurred. How a fund did yesterday is no guarantee of how it will do tomorrow.
Average Annual Total Returns
|
Periods ended August 31, 2012 |
Past 1 |
Life of |
|
Fidelity® High Income Central Fund 2 |
15.22% |
11.22% |
A From March 31, 2008.
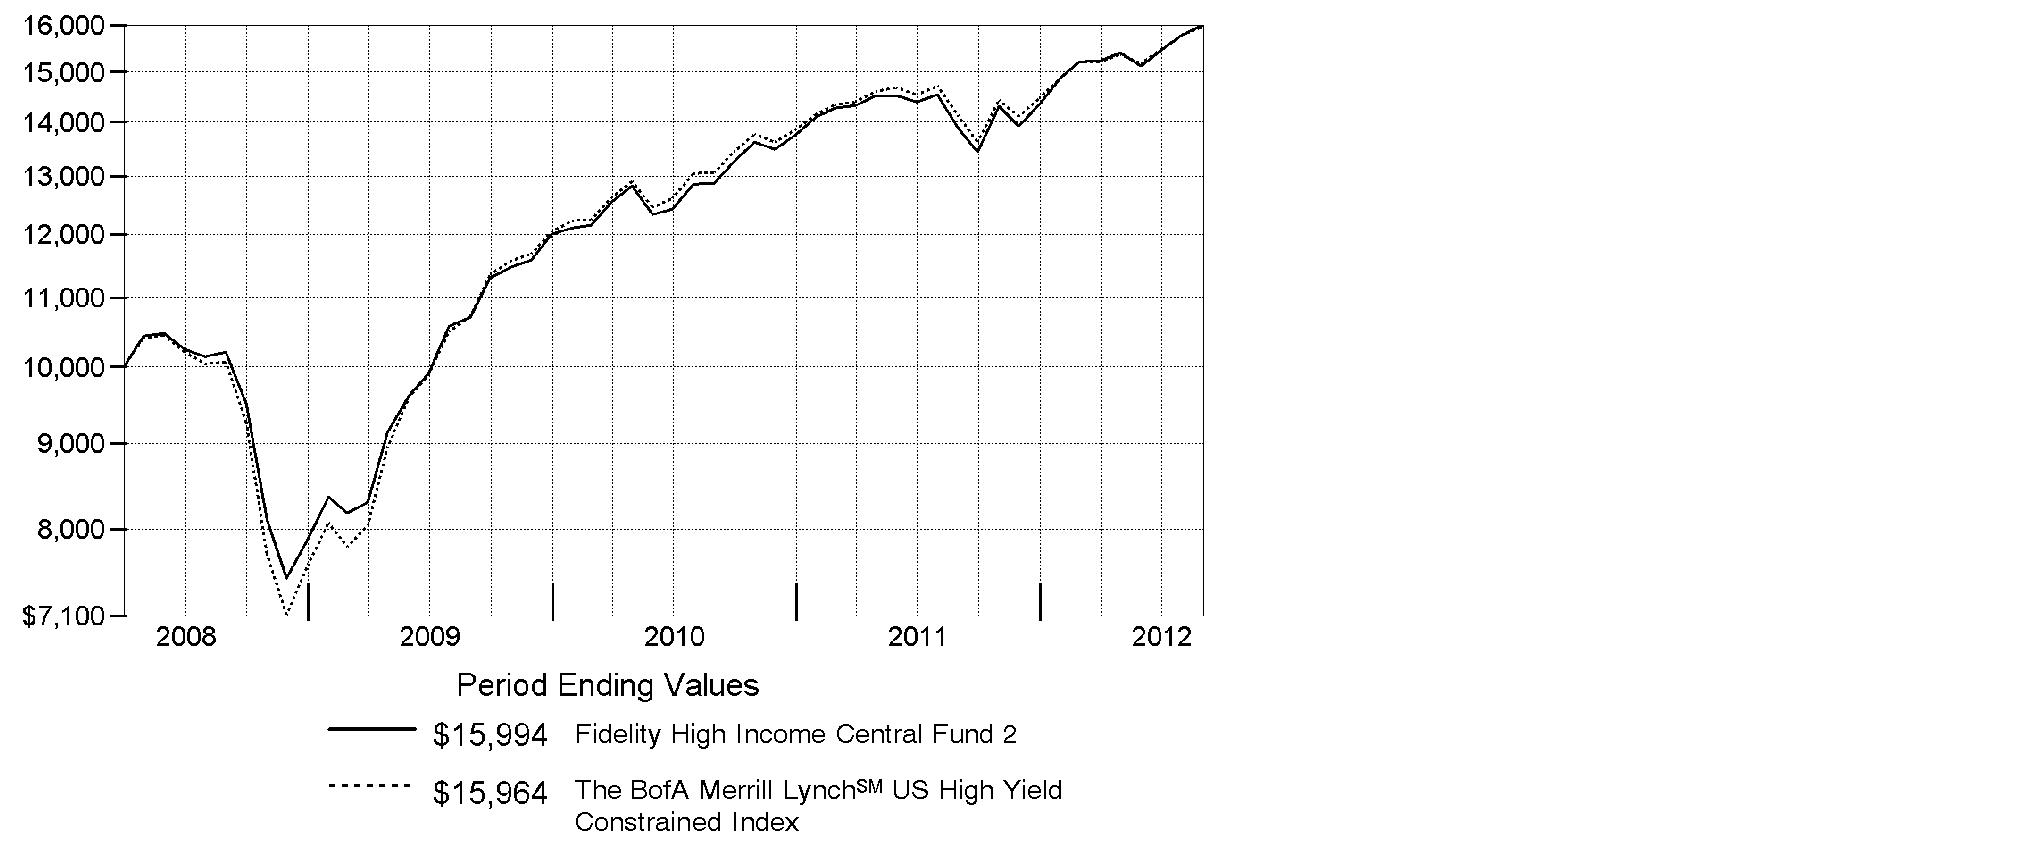
$10,000 Over Life of Fund
Let's say hypothetically that $10,000 was invested in Fidelity® High Income Central Fund 2 on March 31, 2008, when the fund started. The chart shows how the value of your investment would have changed, and also shows how The BofA Merrill LynchSM US High Yield Constrained Index performed over the same period.
Annual Report
Management's Discussion of Fund Performance
Market Recap: High-yield bonds produced a strong return for the year ending August 31, 2012, with The BofA Merrill LynchSM US High Yield Constrained Index advancing 13.01%. Worry about sovereign debt issues in the eurozone and weak global economic growth failed to restrain the asset class amid favorable supply/demand technicals - with investors attracted to its higher yields in a very low interest rate environment - accommodative Federal Reserve monetary policy, plentiful liquidity and a low default rate. High-yield bonds started the period off wracked by volatility, but rebounded in October 2011 to one of its largest monthly increases ever, before stalling once again in November. The market posted positive returns from December through February, then declined modestly from March through May. The tide shifted in June, though, as Greece elected a pro-euro, pro-bailout government and the Fed implemented a second round of "Operation Twist," a program designed to help buoy economic growth. In July, soft corporate earnings and weak economic data were a concern, but the market was supported by comments late in the month by European Central Bank (ECB) President Mario Draghi, who said the ECB would do "whatever it takes" to protect the eurozone from collapsing. In August, hopes of further monetary response in the U.S. and abroad outweighed weak global economic growth, further boosting the asset class.
Comments from Frederick Hoff, Portfolio Manager of Fidelity® High Income Central Fund 2: For the year, the fund returned 15.22%, well ahead of the BofA Merrill Lynch index. In a very strong market environment, the fund benefited from favorable security selection among B-rated bonds - which we regularly emphasize as part of our long-term strategy - and BB-rated issues. However, the fund's positioning among debt securities rated BBB or higher hurt, albeit to a much smaller extent, as did a 3% cash stake. On an industry basis, good security selection in building materials was helpful, most notably bond positions in global cement producer CEMEX and an equity stake in Nortek, which manufactures building products. Bond picking in energy also added value, as it did in banks/thrifts, where not owning poor-performing BTA Bank - a Kazakhstan-based financial institution removed from the benchmark during the period - was helpful. Other noteworthy individual contributors were International Lease Finance and CDW, an aircraft leasing company and technology distributor, respectively. In contrast, selection of paper company bonds was subpar, especially a position in NewPage. Other individual detractors included energy company ATP Oil & Gas and securities clearing firm Penson Worldwide.
The views expressed above reflect those of the portfolio manager(s) only through the end of the period as stated on the cover of this report and do not necessarily represent the views of Fidelity or any other person in the Fidelity organization. Any such views are subject to change at any time based upon market or other conditions and Fidelity disclaims any responsibility to update such views. These views may not be relied on as investment advice and, because investment decisions for a Fidelity fund are based on numerous factors, may not be relied on as an indication of trading intent on behalf of any Fidelity fund.
Annual Report
Shareholder Expense Example
As a shareholder of the Fund, you incur two types of costs: (1) transaction costs, and (2) ongoing costs, including other Fund expenses. This Example is intended to help you understand your ongoing costs (in dollars) of investing in the Fund and to compare these costs with the ongoing costs of investing in other mutual funds.
The Example is based on an investment of $1,000 invested at the beginning of the period and held for the entire period (March 1, 2012 to August 31, 2012).
Actual Expenses
The first line of the accompanying table provides information about actual account values and actual expenses. You may use the information in this line, together with the amount you invested, to estimate the expenses that you paid over the period. Simply divide your account value by $1,000.00 (for example, an $8,600 account value divided by $1,000.00 = 8.6), then multiply the result by the number in the first line under the heading entitled "Expenses Paid During Period" to estimate the expenses you paid on your account during this period. In addition, the Fund, as a shareholder in the underlying Fidelity Central Funds, will indirectly bear its pro-rata share of the fees and expenses incurred by the underlying Fidelity Central Funds. These fees and expenses are not included in the Fund's annualized expense ratio used to calculate the expense estimate in the table below.
Hypothetical Example for Comparison Purposes
The second line of the accompanying table provides information about hypothetical account values and hypothetical expenses based on the Fund's actual expense ratio and an assumed rate of return of 5% per year before expenses, which is not the Fund's actual return. The hypothetical account values and expenses may not be used to estimate the actual ending account balance or expenses you paid for the period. You may use this information to compare the ongoing costs of investing in the Fund and other funds. To do so, compare this 5% hypothetical example with the 5% hypothetical examples that appear in the shareholder reports of the other funds. In addition, the Fund, as a shareholder in the underlying Fidelity Central Funds, will indirectly bear its pro-rata share of the fees and expenses incurred by the underlying Fidelity Central Funds. These fees and expenses are not included in the Fund's annualized expense ratio used to calculate the expense estimate in the table below.
Please note that the expenses shown in the table are meant to highlight your ongoing costs only and do not reflect any transaction costs. Therefore, the second line of the table is useful in comparing ongoing costs only, and will not help you determine the relative total costs of owning different funds.
|
|
Annualized Expense Ratio |
Beginning |
Ending |
Expenses Paid |
|
Actual |
.0016% |
$ 1,000.00 |
$ 1,051.60 |
$ .01 |
|
Hypothetical (5% return per year before expenses) |
|
$ 1,000.00 |
$ 1,025.13 |
$ .01 |
* Expenses are equal to the Fund's annualized expense ratio, multiplied by the average account value over the period, multiplied by 184/366 (to reflect the one-half year period).
Semiannual Report
Investment Changes (Unaudited)
|
Top Five Holdings as of August 31, 2012 |
||
|
(by issuer, excluding cash equivalents) |
% of fund's |
% of fund's net assets |
|
Avaya, Inc. |
3.1 |
3.5 |
|
International Lease Finance Corp. |
3.0 |
3.5 |
|
CIT Group, Inc. |
2.2 |
2.1 |
|
Calpine Corp. |
1.8 |
1.9 |
|
Rite Aid Corp. |
1.8 |
1.3 |
|
|
11.9 |
|
|
Top Five Market Sectors as of August 31, 2012 |
||
|
|
% of fund's |
% of fund's net assets |
|
Energy |
9.2 |
9.7 |
|
Healthcare |
9.0 |
8.7 |
|
Technology |
8.0 |
8.7 |
|
Electric Utilities |
8.0 |
7.1 |
|
Diversified Financial Services |
7.3 |
8.5 |
|
Quality Diversification (% of fund's net assets) |
|||||||
|
As of August 31, 2012 |
As of February 29, 2012 |
||||||
 |
BBB 2.0% |
|
|
BBB 0.1% |
|
||
 |
BB 25.1% |
|
|
BB 23.8% |
|
||
 |
B 49.4% |
|
|
B 56.2% |
|
||
 |
CCC,CC,C 10.4% |
|
|
CCC,CC,C 11.9% |
|
||
 |
D 0.3% |
|
 |
D 0.0% |
|
||
 |
Not Rated 1.1% |
|
|
Not Rated 0.7% |
|
||
 |
Equities 2.4% |
|
|
Equities 2.1% |
|
||
 |
Short-Term |
|
|
Short-Term |
|
||

|
We have used ratings from Moody's Investors Service, Inc. Where Moody's® ratings are not available, we have used S&P® ratings. All ratings are as of the date indicated and do not reflect subsequent changes. |
|
Asset Allocation (% of fund's net assets) |
|||||||
|
As of August 31, 2012 * |
As of February 29, 2012 ** |
||||||
|
Nonconvertible |
|
|
Nonconvertible |
|
||
|
Convertible Bonds, Preferred Stocks 2.6% |
|
|
Convertible Bonds, Preferred Stocks 2.0% |
|
||
|
Common Stocks 0.3% |
|
|
Common Stocks 0.3% |
|
||
|
Floating Rate Loans 9.8% |
|
|
Floating Rate Loans 11.4% |
|
||
|
Preferred Securities 0.2% |
|
|
Preferred Securities 0.4% |
|
||
|
Short-Term |
|
|
Short-Term |
|
||
|
* Foreign investments |
10.7% |
|
** Foreign investments |
10.4% |
|
||

Annual Report
Investments August 31, 2012
Showing Percentage of Net Assets
|
Corporate Bonds - 78.3% |
||||
|
|
Principal Amount |
Value |
||
|
Convertible Bonds - 0.5% |
||||
|
Capital Goods - 0.1% |
||||
|
General Cable Corp.: |
|
|
|
|
|
0.875% 11/15/13 |
|
$ 340,000 |
$ 332,350 |
|
|
4.5% 11/15/29 (d) |
|
388,000 |
393,160 |
|
|
|
725,510 |
|||
|
Metals/Mining - 0.4% |
||||
|
Massey Energy Co. 3.25% 8/1/15 |
|
1,140,000 |
1,023,150 |
|
|
Peabody Energy Corp. 4.75% 12/15/66 |
|
2,850,000 |
2,408,250 |
|
|
|
3,431,400 |
|||
|
TOTAL CONVERTIBLE BONDS |
4,156,910 |
|||
|
Nonconvertible Bonds - 77.8% |
||||
|
Aerospace - 0.5% |
||||
|
Alliant Techsystems, Inc. 6.875% 9/15/20 |
|
945,000 |
1,015,875 |
|
|
Esterline Technologies Corp. 7% 8/1/20 |
|
620,000 |
680,450 |
|
|
Huntington Ingalls Industries, Inc.: |
|
|
|
|
|
6.875% 3/15/18 |
|
770,000 |
823,900 |
|
|
7.125% 3/15/21 |
|
1,185,000 |
1,282,763 |
|
|
|
3,802,988 |
|||
|
Air Transportation - 0.0% |
||||
|
Delta Air Lines, Inc. pass-thru trust certificates 10.06% 1/2/16 (a) |
|
31,995 |
0 |
|
|
Automotive - 3.4% |
||||
|
ArvinMeritor, Inc.: |
|
|
|
|
|
8.125% 9/15/15 |
|
140,000 |
144,550 |
|
|
10.625% 3/15/18 |
|
330,000 |
341,550 |
|
|
Chrysler Group LLC/CG Co-Issuer, Inc.: |
|
|
|
|
|
8% 6/15/19 |
|
845,000 |
891,475 |
|
|
8.25% 6/15/21 |
|
930,000 |
976,500 |
|
|
Dana Holding Corp.: |
|
|
|
|
|
6.5% 2/15/19 |
|
330,000 |
351,450 |
|
|
6.75% 2/15/21 |
|
360,000 |
387,000 |
|
|
Delphi Corp.: |
|
|
|
|
|
5.875% 5/15/19 |
|
1,745,000 |
1,871,513 |
|
|
6.125% 5/15/21 |
|
1,165,000 |
1,281,500 |
|
|
Exide Technologies 8.625% 2/1/18 |
|
495,000 |
405,900 |
|
|
Ford Motor Co.: |
|
|
|
|
|
6.375% 2/1/29 |
|
330,000 |
356,560 |
|
|
6.625% 2/15/28 |
|
230,000 |
252,465 |
|
|
Corporate Bonds - continued |
||||
|
|
Principal Amount |
Value |
||
|
Nonconvertible Bonds - continued |
||||
|
Automotive - continued |
||||
|
Ford Motor Co.: - continued |
|
|
|
|
|
6.625% 10/1/28 |
|
$ 85,000 |
$ 94,947 |
|
|
7.125% 11/15/25 |
|
15,000 |
16,875 |
|
|
7.45% 7/16/31 |
|
285,000 |
351,975 |
|
|
Ford Motor Credit Co. LLC: |
|
|
|
|
|
5% 5/15/18 |
|
2,330,000 |
2,507,739 |
|
|
5.75% 2/1/21 |
|
500,000 |
542,500 |
|
|
5.875% 8/2/21 |
|
3,675,000 |
4,058,696 |
|
|
8% 12/15/16 |
|
1,050,000 |
1,255,090 |
|
|
8.125% 1/15/20 |
|
1,750,000 |
2,166,773 |
|
|
General Motors Acceptance Corp. 8% 11/1/31 |
|
2,150,000 |
2,552,037 |
|
|
International Automotive Components Group SA 9.125% 6/1/18 (e) |
|
615,000 |
590,400 |
|
|
Navistar International Corp. 8.25% 11/1/21 |
|
744,000 |
708,660 |
|
|
Stoneridge, Inc. 9.5% 10/15/17 (e) |
|
330,000 |
346,500 |
|
|
Tenneco, Inc. 7.75% 8/15/18 |
|
330,000 |
358,050 |
|
|
Tomkins LLC/Tomkins, Inc. 9.25% 10/1/18 |
|
369,000 |
412,358 |
|
|
Tower Automotive Holdings USA LLC / TA Holdings Finance, Inc. 10.625% 9/1/17 (e) |
|
1,488,000 |
1,584,720 |
|
|
|
24,807,783 |
|||
|
Banks & Thrifts - 1.3% |
||||
|
Ally Financial, Inc.: |
|
|
|
|
|
3.6375% 2/11/14 (g) |
|
585,000 |
587,194 |
|
|
4.5% 2/11/14 |
|
585,000 |
599,625 |
|
|
5.5% 2/15/17 |
|
1,180,000 |
1,221,300 |
|
|
6.25% 12/1/17 |
|
610,000 |
655,750 |
|
|
7.5% 9/15/20 |
|
1,720,000 |
1,969,400 |
|
|
8% 3/15/20 |
|
1,735,000 |
2,029,950 |
|
|
GMAC LLC: |
|
|
|
|
|
6.75% 12/1/14 |
|
1,878,000 |
2,018,850 |
|
|
8% 11/1/31 |
|
320,000 |
377,600 |
|
|
|
9,459,669 |
|||
|
Broadcasting - 0.4% |
||||
|
Clear Channel Communications, Inc. 10.75% 8/1/16 |
|
405,000 |
255,150 |
|
|
Nexstar Broadcasting, Inc.: |
|
|
|
|
|
7% 1/15/14 |
|
52,000 |
51,480 |
|
|
7% 1/15/14 pay-in-kind |
|
1,588,997 |
1,573,107 |
|
|
Univision Communications, Inc. 6.875% 5/15/19 (e) |
|
1,175,000 |
1,210,250 |
|
|
|
3,089,987 |
|||
|
Corporate Bonds - continued |
||||
|
|
Principal Amount |
Value |
||
|
Nonconvertible Bonds - continued |
||||
|
Building Materials - 3.5% |
||||
|
Associated Materials LLC 9.125% 11/1/17 |
|
$ 3,190,000 |
$ 3,086,325 |
|
|
Building Materials Corp. of America 6.75% 5/1/21 (e) |
|
565,000 |
617,263 |
|
|
CEMEX Espana SA (Luxembourg) 9.875% 4/30/19 (e) |
|
1,350,000 |
1,350,000 |
|
|
CEMEX SA de CV: |
|
|
|
|
|
5.4606% 9/30/15 (e)(g) |
|
3,720,000 |
3,534,000 |
|
|
9% 1/11/18 (e) |
|
2,400,000 |
2,382,000 |
|
|
General Cable Corp.: |
|
|
|
|
|
2.8356% 4/1/15 (g) |
|
1,240,000 |
1,162,500 |
|
|
7.125% 4/1/17 |
|
1,805,000 |
1,868,175 |
|
|
Headwaters, Inc. 7.625% 4/1/19 |
|
2,190,000 |
2,190,000 |
|
|
Interline Brands, Inc. 7.5% 11/15/18 |
|
345,000 |
370,875 |
|
|
Isabelle Acquisition Sub, Inc. 10% 11/15/18 pay-in-kind (e)(g) |
|
195,000 |
205,725 |
|
|
Masco Corp.: |
|
|
|
|
|
5.95% 3/15/22 |
|
1,450,000 |
1,565,672 |
|
|
6.125% 10/3/16 |
|
210,000 |
228,794 |
|
|
7.125% 3/15/20 |
|
875,000 |
980,000 |
|
|
Masonite International Corp. 8.25% 4/15/21 (e) |
|
310,000 |
327,050 |
|
|
Ply Gem Industries, Inc. 8.25% 2/15/18 |
|
3,070,000 |
3,139,075 |
|
|
Summit Materials LLC/Summit Materials Finance Corp. 10.5% 1/31/20 (e) |
|
825,000 |
858,000 |
|
|
USG Corp.: |
|
|
|
|
|
7.875% 3/30/20 (e) |
|
750,000 |
797,813 |
|
|
8.375% 10/15/18 (e) |
|
1,265,000 |
1,366,200 |
|
|
|
26,029,467 |
|||
|
Cable TV - 2.9% |
||||
|
CCO Holdings LLC/CCO Holdings Capital Corp.: |
|
|
|
|
|
6.5% 4/30/21 |
|
2,970,000 |
3,185,325 |
|
|
6.625% 1/31/22 |
|
1,305,000 |
1,407,769 |
|
|
7% 1/15/19 |
|
3,460,000 |
3,745,450 |
|
|
7.375% 6/1/20 |
|
900,000 |
999,000 |
|
|
7.875% 4/30/18 |
|
240,000 |
260,400 |
|
|
CSC Holdings LLC: |
|
|
|
|
|
6.75% 11/15/21 (e) |
|
705,000 |
764,009 |
|
|
8.625% 2/15/19 |
|
785,000 |
918,450 |
|
|
DISH DBS Corp. 6.75% 6/1/21 |
|
1,425,000 |
1,521,188 |
|
|
EchoStar Communications Corp. 7.125% 2/1/16 |
|
660,000 |
721,050 |
|
|
Harron Communications LP/Harron Finance Corp. 9.125% 4/1/20 (e) |
|
275,000 |
297,688 |
|
|
Corporate Bonds - continued |
||||
|
|
Principal Amount |
Value |
||
|
Nonconvertible Bonds - continued |
||||
|
Cable TV - continued |
||||
|
Unitymedia Hessen GmbH & Co. KG/Unitymedia NRW GmbH: |
|
|
|
|
|
7.5% 3/15/19 (e) |
|
$ 210,000 |
$ 229,950 |
|
|
8.125% 12/1/17 (e) |
|
420,000 |
455,700 |
|
|
UPCB Finance III Ltd. 6.625% 7/1/20 (e) |
|
4,415,000 |
4,602,638 |
|
|
UPCB Finance V Ltd. 7.25% 11/15/21 (e) |
|
880,000 |
944,856 |
|
|
UPCB Finance VI Ltd. 6.875% 1/15/22 (e) |
|
450,000 |
474,750 |
|
|
WaveDivision Escrow LLC/WaveDivision Escrow Corp. 8.125% 9/1/20 (e) |
|
615,000 |
634,988 |
|
|
|
21,163,211 |
|||
|
Capital Goods - 0.7% |
||||
|
Amsted Industries, Inc. 8.125% 3/15/18 (e) |
|
1,145,000 |
1,236,600 |
|
|
Briggs & Stratton Corp. 6.875% 12/15/20 |
|
325,000 |
351,000 |
|
|
CNH Capital LLC 6.25% 11/1/16 (e) |
|
705,000 |
754,350 |
|
|
Coleman Cable, Inc. 9% 2/15/18 |
|
2,075,000 |
2,204,688 |
|
|
SPL Logistics Escrow LLC/SPL Logistics Finance Corp. 8.875% 8/1/20 (e) |
|
905,000 |
934,413 |
|
|
|
5,481,051 |
|||
|
Chemicals - 1.6% |
||||
|
Celanese US Holdings LLC: |
|
|
|
|
|
5.875% 6/15/21 |
|
430,000 |
474,075 |
|
|
6.625% 10/15/18 |
|
660,000 |
727,650 |
|
|
Chemtura Corp. 7.875% 9/1/18 |
|
1,310,000 |
1,411,525 |
|
|
Hexion US Finance Corp. 6.625% 4/15/20 |
|
225,000 |
227,813 |
|
|
INEOS Finance PLC: |
|
|
|
|
|
7.5% 5/1/20 (e) |
|
1,005,000 |
1,022,588 |
|
|
8.375% 2/15/19 (e) |
|
455,000 |
478,888 |
|
|
INEOS Group Holdings PLC 8.5% 2/15/16 (e) |
|
1,675,000 |
1,578,688 |
|
|
Kinove German Bondco GmbH 9.625% 6/15/18 (e) |
|
352,000 |
371,360 |
|
|
Kraton Polymers LLC/Kraton Polymers Capital Corp. 6.75% 3/1/19 |
|
410,000 |
420,250 |
|
|
LyondellBasell Industries NV: |
|
|
|
|
|
5% 4/15/19 |
|
2,275,000 |
2,411,500 |
|
|
5.75% 4/15/24 |
|
905,000 |
1,027,175 |
|
|
6% 11/15/21 |
|
520,000 |
591,500 |
|
|
NOVA Chemicals Corp. 8.625% 11/1/19 |
|
335,000 |
381,900 |
|
|
Olin Corp. 5.5% 8/15/22 |
|
315,000 |
316,985 |
|
|
Taminco Global Chemical Corp. 9.75% 3/31/20 (e) |
|
195,000 |
205,725 |
|
|
|
11,647,622 |
|||
|
Corporate Bonds - continued |
||||
|
|
Principal Amount |
Value |
||
|
Nonconvertible Bonds - continued |
||||
|
Consumer Products - 0.2% |
||||
|
Elizabeth Arden, Inc. 7.375% 3/15/21 |
|
$ 220,000 |
$ 245,300 |
|
|
Libbey Glass, Inc. 6.875% 5/15/20 (e) |
|
780,000 |
834,600 |
|
|
Prestige Brands, Inc. 8.125% 2/1/20 |
|
120,000 |
132,300 |
|
|
|
1,212,200 |
|||
|
Containers - 3.1% |
||||
|
Ardagh Packaging Finance PLC: |
|
|
|
|
|
7.375% 10/15/17 (e) |
|
550,000 |
589,875 |
|
|
9.125% 10/15/20 (e) |
|
465,000 |
485,925 |
|
|
Ardagh Packaging Finance PLC / Ardagh MP Holdings USA, Inc.: |
|
|
|
|
|
7.375% 10/15/17 (e) |
|
200,000 |
214,500 |
|
|
9.125% 10/15/20 (e) |
|
1,425,000 |
1,478,438 |
|
|
9.125% 10/15/20 (e) |
|
370,000 |
386,650 |
|
|
Berry Plastics Corp. 5.2051% 2/15/15 (g) |
|
3,800,000 |
3,800,000 |
|
|
Consolidated Container Co. LLC/Consolidated Container Capital, Inc. 10.125% 7/15/20 (e) |
|
330,000 |
343,200 |
|
|
Graphic Packaging International, Inc. 7.875% 10/1/18 |
|
425,000 |
471,750 |
|
|
Reynolds Group Issuer, Inc./Reynolds Group Issuer LLC/Reynolds Group Issuer (Luxembourg) SA: |
|
|
|
|
|
6.875% 2/15/21 |
|
2,115,000 |
2,289,488 |
|
|
7.125% 4/15/19 |
|
535,000 |
576,463 |
|
|
7.875% 8/15/19 |
|
1,940,000 |
2,158,250 |
|
|
8.25% 2/15/21 |
|
3,225,000 |
3,168,563 |
|
|
9% 4/15/19 |
|
1,050,000 |
1,067,063 |
|
|
9.875% 8/15/19 |
|
1,585,000 |
1,676,138 |
|
|
Sealed Air Corp.: |
|
|
|
|
|
8.125% 9/15/19 (e) |
|
1,405,000 |
1,559,550 |
|
|
8.375% 9/15/21 (e) |
|
1,560,000 |
1,743,300 |
|
|
Tekni-Plex, Inc. 9.75% 6/1/19 (e) |
|
1,120,000 |
1,164,800 |
|
|
|
23,173,953 |
|||
|
Diversified Financial Services - 6.8% |
||||
|
Aircastle Ltd. 9.75% 8/1/18 |
|
900,000 |
1,031,625 |
|
|
CIT Group, Inc.: |
|
|
|
|
|
4.25% 8/15/17 |
|
675,000 |
680,063 |
|
|
5% 5/15/17 |
|
2,370,000 |
2,458,875 |
|
|
5% 8/15/22 |
|
675,000 |
676,688 |
|
|
5.25% 3/15/18 |
|
1,815,000 |
1,892,138 |
|
|
5.375% 5/15/20 |
|
1,600,000 |
1,652,000 |
|
|
5.5% 2/15/19 (e) |
|
915,000 |
953,888 |
|
|
7% 5/2/16 (e) |
|
5,601,563 |
5,601,563 |
|
|
Corporate Bonds - continued |
||||
|
|
Principal Amount |
Value |
||
|
Nonconvertible Bonds - continued |
||||
|
Diversified Financial Services - continued |
||||
|
CIT Group, Inc.: - continued |
|
|
|
|
|
7% 5/2/17 (e) |
|
$ 1,256,924 |
$ 1,256,924 |
|
|
Icahn Enterprises LP/Icahn Enterprises Finance Corp. 8% 1/15/18 |
|
5,095,000 |
5,426,175 |
|
|
International Lease Finance Corp.: |
|
|
|
|
|
5.625% 9/20/13 |
|
910,000 |
940,713 |
|
|
5.75% 5/15/16 |
|
835,000 |
866,313 |
|
|
5.875% 5/1/13 |
|
705,000 |
719,981 |
|
|
6.25% 5/15/19 |
|
1,620,000 |
1,692,900 |
|
|
6.625% 11/15/13 |
|
1,450,000 |
1,515,250 |
|
|
7.125% 9/1/18 (e) |
|
2,680,000 |
3,061,900 |
|
|
8.625% 9/15/15 |
|
4,430,000 |
4,961,600 |
|
|
8.625% 1/15/22 |
|
1,080,000 |
1,271,700 |
|
|
8.75% 3/15/17 |
|
3,975,000 |
4,581,188 |
|
|
8.875% 9/1/17 |
|
2,640,000 |
3,062,400 |
|
|
Penson Worldwide, Inc. 12.5% 5/15/17 (e) |
|
1,840,000 |
368,000 |
|
|
SLM Corp.: |
|
|
|
|
|
6% 1/25/17 |
|
700,000 |
742,000 |
|
|
6.25% 1/25/16 |
|
735,000 |
784,613 |
|
|
7.25% 1/25/22 |
|
615,000 |
659,588 |
|
|
8% 3/25/20 |
|
2,405,000 |
2,705,625 |
|
|
8.45% 6/15/18 |
|
965,000 |
1,114,575 |
|
|
|
50,678,285 |
|||
|
Diversified Media - 0.4% |
||||
|
Clear Channel Worldwide Holdings, Inc.: |
|
|
|
|
|
7.625% 3/15/20 |
|
115,000 |
109,825 |
|
|
7.625% 3/15/20 |
|
935,000 |
906,950 |
|
|
Entravision Communication Corp. 8.75% 8/1/17 |
|
583,000 |
622,353 |
|
|
Lamar Media Corp. 5.875% 2/1/22 |
|
290,000 |
307,400 |
|
|
Nielsen Finance LLC/Nielsen Finance Co. 7.75% 10/15/18 |
|
1,125,000 |
1,257,188 |
|
|
|
3,203,716 |
|||
|
Electric Utilities - 7.4% |
||||
|
Atlantic Power Corp. 9% 11/15/18 |
|
1,960,000 |
2,048,200 |
|
|
Calpine Corp.: |
|
|
|
|
|
7.5% 2/15/21 (e) |
|
7,415,000 |
8,230,605 |
|
|
7.875% 7/31/20 (e) |
|
4,870,000 |
5,442,225 |
|
|
7.875% 1/15/23 (e) |
|
140,000 |
156,100 |
|
|
CMS Energy Corp. 8.75% 6/15/19 |
|
340,000 |
426,700 |
|
|
Dolphin Subsidiary II, Inc. 7.25% 10/15/21 (e) |
|
1,165,000 |
1,328,100 |
|
|
Corporate Bonds - continued |
||||
|
|
Principal Amount |
Value |
||
|
Nonconvertible Bonds - continued |
||||
|
Electric Utilities - continued |
||||
|
Energy Future Holdings Corp. 10% 1/15/20 |
|
$ 365,000 |
$ 404,238 |
|
|
Energy Future Intermediate Holding Co. LLC/Energy Future Intermediate Holding Finance, Inc.: |
|
|
|
|
|
6.875% 8/15/17 (e) |
|
300,000 |
306,375 |
|
|
10% 12/1/20 |
|
1,625,000 |
1,830,156 |
|
|
11% 10/1/21 |
|
172,000 |
169,420 |
|
|
11.75% 3/1/22 (e) |
|
3,455,000 |
3,679,575 |
|
|
Everest Acquisition LLC / Everest Acquisition Finance, Inc.: |
|
|
|
|
|
6.875% 5/1/19 (e) |
|
865,000 |
929,875 |
|
|
9.375% 5/1/20 (e) |
|
1,795,000 |
1,947,575 |
|
|
GenOn Energy, Inc.: |
|
|
|
|
|
9.5% 10/15/18 |
|
2,155,000 |
2,375,888 |
|
|
9.875% 10/15/20 |
|
3,205,000 |
3,513,481 |
|
|
InterGen NV 9% 6/30/17 (e) |
|
6,190,000 |
6,035,250 |
|
|
Mirant Americas Generation LLC: |
|
|
|
|
|
8.5% 10/1/21 |
|
2,825,000 |
2,980,375 |
|
|
9.125% 5/1/31 |
|
1,684,000 |
1,742,940 |
|
|
NRG Energy, Inc.: |
|
|
|
|
|
7.625% 5/15/19 |
|
415,000 |
432,638 |
|
|
7.875% 5/15/21 |
|
465,000 |
494,063 |
|
|
NSG Holdings II, LLC 7.75% 12/15/25 (e) |
|
946,000 |
964,920 |
|
|
Puget Energy, Inc.: |
|
|
|
|
|
5.625% 7/15/22 (e) |
|
585,000 |
613,490 |
|
|
6% 9/1/21 |
|
960,000 |
1,056,547 |
|
|
RRI Energy, Inc. 7.875% 6/15/17 |
|
1,970,000 |
2,080,813 |
|
|
The AES Corp.: |
|
|
|
|
|
7.375% 7/1/21 |
|
1,245,000 |
1,425,525 |
|
|
8% 10/15/17 |
|
2,940,000 |
3,425,100 |
|
|
9.75% 4/15/16 |
|
660,000 |
788,700 |
|
|
TXU Corp. 6.5% 11/15/24 |
|
350,000 |
199,500 |
|
|
|
55,028,374 |
|||
|
Energy - 8.8% |
||||
|
AmeriGas Finance LLC/AmeriGas Finance Corp.: |
|
|
|
|
|
6.75% 5/20/20 |
|
460,000 |
488,750 |
|
|
7% 5/20/22 |
|
985,000 |
1,051,488 |
|
|
AmeriGas Partners LP/AmeriGas Finance Corp.: |
|
|
|
|
|
6.25% 8/20/19 |
|
695,000 |
722,800 |
|
|
6.5% 5/20/21 |
|
289,000 |
302,728 |
|
|
Antero Resources Finance Corp. 7.25% 8/1/19 |
|
1,390,000 |
1,483,825 |
|
|
Corporate Bonds - continued |
||||
|
|
Principal Amount |
Value |
||
|
Nonconvertible Bonds - continued |
||||
|
Energy - continued |
||||
|
ATP Oil & Gas Corp. 11.875% 5/1/15 (c) |
|
$ 2,030,000 |
$ 527,800 |
|
|
Atwood Oceanics, Inc. 6.5% 2/1/20 |
|
175,000 |
186,813 |
|
|
Calumet Specialty Products Partners LP/Calumet Finance Corp. 9.375% 5/1/19 |
|
435,000 |
456,750 |
|
|
Chesapeake Energy Corp.: |
|
|
|
|
|
6.125% 2/15/21 |
|
3,040,000 |
3,017,200 |
|
|
6.625% 8/15/20 |
|
900,000 |
921,420 |
|
|
6.875% 11/15/20 |
|
1,340,000 |
1,390,250 |
|
|
7.25% 12/15/18 |
|
535,000 |
557,738 |
|
|
9.5% 2/15/15 |
|
2,290,000 |
2,513,275 |
|
|
Chesapeake Midstream Partners LP/CHKM Finance Corp. 6.125% 7/15/22 |
|
925,000 |
962,000 |
|
|
Chesapeake Oilfield Operating LLC 6.625% 11/15/19 (e) |
|
695,000 |
667,200 |
|
|
Continental Resources, Inc.: |
|
|
|
|
|
5% 9/15/22 (e) |
|
1,800,000 |
1,876,500 |
|
|
7.125% 4/1/21 |
|
380,000 |
426,550 |
|
|
7.375% 10/1/20 |
|
550,000 |
613,250 |
|
|
Crestwood Midstream Partners LP / Finance Corp. 7.75% 4/1/19 |
|
1,300,000 |
1,319,500 |
|
|
Denbury Resources, Inc. 8.25% 2/15/20 |
|
743,000 |
843,305 |
|
|
Edgen Murray Corp. 12.25% 1/15/15 |
|
2,550,000 |
2,709,375 |
|
|
Energy Transfer Equity LP 7.5% 10/15/20 |
|
3,685,000 |
4,237,750 |
|
|
EP Energy LLC/Everest Acquisition Finance, Inc. 7.75% 9/1/22 (e) |
|
535,000 |
535,000 |
|
|
Expro Finance Luxembourg SCA 8.5% 12/15/16 (e) |
|
2,896,000 |
2,896,000 |
|
|
Ferrellgas LP/Ferrellgas Finance Corp. 6.5% 5/1/21 |
|
1,010,000 |
984,750 |
|
|
Forest Oil Corp. 7.25% 6/15/19 |
|
2,675,000 |
2,621,500 |
|
|
Frontier Oil Corp. 6.875% 11/15/18 |
|
530,000 |
563,125 |
|
|
Gulfmark Offshore, Inc. 6.375% 3/15/22 (e) |
|
205,000 |
209,613 |
|
|
Hornbeck Offshore Services, Inc. 5.875% 4/1/20 |
|
725,000 |
735,875 |
|
|
LINN Energy LLC/LINN Energy Finance Corp.: |
|
|
|
|
|
6.25% 11/1/19 (e) |
|
2,750,000 |
2,715,625 |
|
|
6.5% 5/15/19 (e) |
|
1,325,000 |
1,321,688 |
|
|
7.75% 2/1/21 |
|
650,000 |
676,000 |
|
|
8.625% 4/15/20 |
|
1,490,000 |
1,609,200 |
|
|
Markwest Energy Partners LP/Markwest Energy Finance Corp.: |
|
|
|
|
|
5.5% 2/15/23 |
|
370,000 |
378,325 |
|
|
6.25% 6/15/22 |
|
1,565,000 |
1,662,813 |
|
|
MRC Global, Inc. 9.5% 12/15/16 |
|
3,020,000 |
3,291,800 |
|
|
Corporate Bonds - continued |
||||
|
|
Principal Amount |
Value |
||
|
Nonconvertible Bonds - continued |
||||
|
Energy - continued |
||||
|
Offshore Group Investment Ltd. 11.5% 8/1/15 |
|
$ 450,000 |
$ 498,375 |
|
|
Oil States International, Inc. 6.5% 6/1/19 |
|
885,000 |
940,313 |
|
|
PBF Holding Co. LLC/PBF Finance Corp. 8.25% 2/15/20 (e) |
|
1,710,000 |
1,795,500 |
|
|
Pioneer Drilling Co. 9.875% 3/15/18 |
|
535,000 |
561,750 |
|
|
Plains Exploration & Production Co.: |
|
|
|
|
|
6.75% 2/1/22 |
|
930,000 |
997,425 |
|
|
7.625% 4/1/20 |
|
960,000 |
1,057,152 |
|
|
Precision Drilling Corp. 6.5% 12/15/21 |
|
155,000 |
162,750 |
|
|
Regency Energy Partners LP/Regency Energy Finance Corp. 6.875% 12/1/18 |
|
890,000 |
952,300 |
|
|
Samson Investment Co. 9.75% 2/15/20 (e) |
|
970,000 |
999,100 |
|
|
SandRidge Energy, Inc. 7.5% 3/15/21 (e) |
|
450,000 |
453,375 |
|
|
SESI LLC 6.375% 5/1/19 |
|
1,165,000 |
1,236,298 |
|
|
Star Gas Partners LP/Star Gas Finance Co. 8.875% 12/1/17 |
|
465,000 |
467,325 |
|
|
Suburban Propane Partners LP/Suburban Energy Finance Corp.: |
|
|
|
|
|
7.375% 8/1/21 (e) |
|
2,297,000 |
2,423,335 |
|
|
7.5% 10/1/18 (e) |
|
1,089,000 |
1,173,398 |
|
|
Targa Resources Partners LP/Targa Resources Partners Finance Corp.: |
|
|
|
|
|
6.375% 8/1/22 (e) |
|
415,000 |
432,638 |
|
|
6.875% 2/1/21 |
|
440,000 |
473,000 |
|
|
7.875% 10/15/18 |
|
1,235,000 |
1,346,150 |
|
|
WPX Energy, Inc.: |
|
|
|
|
|
5.25% 1/15/17 |
|
725,000 |
763,063 |
|
|
6% 1/15/22 |
|
885,000 |
935,888 |
|
|
|
65,146,716 |
|||
|
Environmental - 0.3% |
||||
|
Clean Harbors, Inc. 5.25% 8/1/20 (e) |
|
540,000 |
554,175 |
|
|
Covanta Holding Corp.: |
|
|
|
|
|
6.375% 10/1/22 |
|
720,000 |
784,800 |
|
|
7.25% 12/1/20 |
|
825,000 |
920,780 |
|
|
|
2,259,755 |
|||
|
Food & Drug Retail - 1.8% |
||||
|
Bi-Lo LLC/Bi-Lo Finance Corp. 9.25% 2/15/19 (e) |
|
1,690,000 |
1,812,525 |
|
|
Rite Aid Corp.: |
|
|
|
|
|
7.5% 3/1/17 |
|
1,145,000 |
1,176,488 |
|
|
9.25% 3/15/20 |
|
3,280,000 |
3,370,200 |
|
|
Corporate Bonds - continued |
||||
|
|
Principal Amount |
Value |
||
|
Nonconvertible Bonds - continued |
||||
|
Food & Drug Retail - continued |
||||
|
Rite Aid Corp.: - continued |
|
|
|
|
|
9.5% 6/15/17 |
|
$ 4,520,000 |
$ 4,655,600 |
|
|
10.375% 7/15/16 |
|
2,140,000 |
2,257,700 |
|
|
Tops Markets LLC 10.125% 10/15/15 |
|
375,000 |
398,438 |
|
|
|
13,670,951 |
|||
|
Food/Beverage/Tobacco - 1.5% |
||||
|
Bumble Bee Acquisition Corp. 9% 12/15/17 (e) |
|
2,826,000 |
2,868,390 |
|
|
C&S Group Enterprises LLC 8.375% 5/1/17 (e) |
|
2,781,000 |
2,892,240 |
|
|
Constellation Brands, Inc. 4.625% 3/1/23 |
|
410,000 |
416,683 |
|
|
Dean Foods Co. 7% 6/1/16 |
|
827,413 |
878,092 |
|
|
JBS Finance II Ltd. 8.25% 1/29/18 (e) |
|
580,000 |
580,000 |
|
|
JBS USA LLC/JBS USA Finance, Inc.: |
|
|
|
|
|
7.25% 6/1/21 (e) |
|
45,000 |
40,950 |
|
|
8.25% 2/1/20 (e) |
|
2,380,000 |
2,278,850 |
|
|
Smithfield Foods, Inc. 6.625% 8/15/22 |
|
750,000 |
768,750 |
|
|
|
10,723,955 |
|||
|
Gaming - 2.3% |
||||
|
Ameristar Casinos, Inc. 7.5% 4/15/21 |
|
1,245,000 |
1,332,150 |
|
|
Boyd Acquisition Sub LLC/Boyd Acquisition Finance Corp. 8.375% 2/15/18 (e) |
|
195,000 |
199,388 |
|
|
Caesars Operating Escrow LLC/Caesars Escrow Corp.: |
|
|
|
|
|
8.5% 2/15/20 (e) |
|
2,770,000 |
2,721,525 |
|
|
9% 2/15/20 (e) |
|
1,575,000 |
1,569,094 |
|
|
Chester Downs & Marina LLC 9.25% 2/1/20 (e) |
|
240,000 |
243,600 |
|
|
Graton Economic Development Authority 9.625% 9/1/19 (e) |
|
450,000 |
464,625 |
|
|
MGM Mirage, Inc.: |
|
|
|
|
|
7.5% 6/1/16 |
|
470,000 |
491,150 |
|
|
7.625% 1/15/17 |
|
1,725,000 |
1,781,063 |
|
|
7.75% 3/15/22 |
|
1,200,000 |
1,200,000 |
|
|
8.625% 2/1/19 (e) |
|
2,610,000 |
2,766,600 |
|
|
Pinnacle Entertainment, Inc. 7.75% 4/1/22 |
|
250,000 |
269,375 |
|
|
Wynn Las Vegas LLC/Wynn Las Vegas Capital Corp.: |
|
|
|
|
|
5.375% 3/15/22 (e) |
|
2,965,000 |
3,024,300 |
|
|
7.75% 8/15/20 |
|
805,000 |
896,569 |
|
|
|
16,959,439 |
|||
|
Healthcare - 8.3% |
||||
|
Alere, Inc. 9% 5/15/16 |
|
1,140,000 |
1,179,900 |
|
|
Carriage Services, Inc. 7.875% 1/15/15 |
|
705,000 |
714,253 |
|
|
Corporate Bonds - continued |
||||
|
|
Principal Amount |
Value |
||
|
Nonconvertible Bonds - continued |
||||
|
Healthcare - continued |
||||
|
Community Health Systems, Inc.: |
|
|
|
|
|
5.125% 8/15/18 |
|
$ 775,000 |
$ 799,219 |
|
|
7.125% 7/15/20 |
|
780,000 |
815,100 |
|
|
8% 11/15/19 |
|
6,090,000 |
6,569,588 |
|
|
Emergency Medical Services Corp. 8.125% 6/1/19 |
|
1,690,000 |
1,804,075 |
|
|
Endo Pharmaceuticals Holdings, Inc. 7% 12/15/20 |
|
920,000 |
995,900 |
|
|
Fresenius Medical Care US Finance II, Inc. 6.5% 9/15/18 (e) |
|
335,000 |
371,013 |
|
|
Grifols, Inc. 8.25% 2/1/18 |
|
375,000 |
409,688 |
|
|
HCA, Inc.: |
|
|
|
|
|
6.5% 2/15/20 |
|
2,455,000 |
2,688,225 |
|
|
7.25% 9/15/20 |
|
1,025,000 |
1,132,625 |
|
|
7.875% 2/15/20 |
|
2,290,000 |
2,547,625 |
|
|
8% 10/1/18 |
|
2,000,000 |
2,280,000 |
|
|
8.5% 4/15/19 |
|
1,420,000 |
1,593,950 |
|
|
Hologic, Inc. 6.25% 8/1/20 (e) |
|
895,000 |
947,581 |
|
|
IASIS Healthcare LLC/IASIS Capital Corp. 8.375% 5/15/19 |
|
1,800,000 |
1,710,000 |
|
|
Inverness Medical Innovations, Inc. 7.875% 2/1/16 |
|
2,415,000 |
2,517,638 |
|
|
Jaguar Holding Co. II/Jaguar Merger Sub, Inc. 9.5% 12/1/19 (e) |
|
260,000 |
289,900 |
|
|
Kindred Healthcare, Inc. 8.25% 6/1/19 |
|
300,000 |
289,500 |
|
|
Legend Acquisition Sub, Inc. 10.75% 8/15/20 (e) |
|
450,000 |
444,375 |
|
|
Mylan, Inc. 6% 11/15/18 (e) |
|
1,290,000 |
1,373,850 |
|
|
Omega Healthcare Investors, Inc.: |
|
|
|
|
|
5.875% 3/15/24 (e) |
|
2,155,000 |
2,305,850 |
|
|
6.75% 10/15/22 |
|
2,335,000 |
2,574,338 |
|
|
7.5% 2/15/20 |
|
1,430,000 |
1,594,450 |
|
|
Radiation Therapy Services, Inc. 8.875% 1/15/17 |
|
940,000 |
897,700 |
|
|
Rotech Healthcare, Inc. 10.75% 10/15/15 |
|
500,000 |
485,000 |
|
|
Sabra Health Care LP/Sabra Capital Corp.: |
|
|
|
|
|
8.125% 11/1/18 |
|
975,000 |
1,060,313 |
|
|
8.125% 11/1/18 (e) |
|
450,000 |
489,375 |
|
|
Stewart Enterprises, Inc. 6.5% 4/15/19 |
|
485,000 |
515,943 |
|
|
Tenet Healthcare Corp.: |
|
|
|
|
|
6.25% 11/1/18 |
|
935,000 |
1,015,691 |
|
|
8.875% 7/1/19 |
|
1,335,000 |
1,513,623 |
|
|
Valeant Pharmaceuticals International: |
|
|
|
|
|
6.5% 7/15/16 (e) |
|
1,020,000 |
1,076,100 |
|
|
6.75% 8/15/21 (e) |
|
1,035,000 |
1,050,525 |
|
|
Corporate Bonds - continued |
||||
|
|
Principal Amount |
Value |
||
|
Nonconvertible Bonds - continued |
||||
|
Healthcare - continued |
||||
|
Valeant Pharmaceuticals International: - continued |
|
|
|
|
|
6.875% 12/1/18 (e) |
|
$ 3,535,000 |
$ 3,720,588 |
|
|
7% 10/1/20 (e) |
|
715,000 |
740,025 |
|
|
7.25% 7/15/22 (e) |
|
1,100,000 |
1,135,750 |
|
|
Vanguard Health Holding Co. II LLC / Vanguard Holding Co. II, Inc.: |
|
|
|
|
|
7.75% 2/1/19 |
|
1,280,000 |
1,328,000 |
|
|
7.75% 2/1/19 (e) |
|
1,135,000 |
1,177,563 |
|
|
8% 2/1/18 |
|
1,520,000 |
1,592,200 |
|
|
VWR Funding, Inc. 10.25% 7/15/15 pay-in-kind (g) |
|
4,816,531 |
4,964,037 |
|
|
WP Rocket Merger Sub, Inc. 10.125% 7/15/19 (e) |
|
560,000 |
558,600 |
|
|
|
61,269,676 |
|||
|
Homebuilders/Real Estate - 1.4% |
||||
|
CB Richard Ellis Services, Inc.: |
|
|
|
|
|
6.625% 10/15/20 |
|
710,000 |
773,900 |
|
|
11.625% 6/15/17 |
|
1,620,000 |
1,824,606 |
|
|
KB Home: |
|
|
|
|
|
7.25% 6/15/18 |
|
600,000 |
606,000 |
|
|
8% 3/15/20 |
|
1,225,000 |
1,321,469 |
|
|
Realogy Corp.: |
|
|
|
|
|
7.625% 1/15/20 (e) |
|
625,000 |
675,750 |
|
|
7.875% 2/15/19 (e) |
|
295,000 |
303,850 |
|
|
11.5% 4/15/17 |
|
1,030,000 |
1,096,950 |
|
|
Standard Pacific Corp.: |
|
|
|
|
|
8.375% 5/15/18 |
|
1,385,000 |
1,537,350 |
|
|
8.375% 1/15/21 |
|
1,935,000 |
2,152,688 |
|
|
|
10,292,563 |
|||
|
Hotels - 0.7% |
||||
|
Choice Hotels International, Inc. 5.75% 7/1/22 |
|
230,000 |
246,100 |
|
|
FelCor Lodging LP 6.75% 6/1/19 |
|
2,595,000 |
2,783,138 |
|
|
Host Hotels & Resorts LP: |
|
|
|
|
|
5.875% 6/15/19 |
|
1,400,000 |
1,536,500 |
|
|
6% 10/1/21 |
|
610,000 |
683,200 |
|
|
|
5,248,938 |
|||
|
Leisure - 0.7% |
||||
|
Dave & Buster's Parent, Inc. 0% 2/15/16 (e) |
|
1,600,000 |
1,160,000 |
|
|
GWR Operating Partnership LLP/Great Wolf Finance Corp. 10.875% 4/1/17 |
|
850,000 |
956,250 |
|
|
NCL Corp. Ltd. 11.75% 11/15/16 |
|
765,000 |
877,838 |
|
|
Corporate Bonds - continued |
||||
|
|
Principal Amount |
Value |
||
|
Nonconvertible Bonds - continued |
||||
|
Leisure - continued |
||||
|
Royal Caribbean Cruises Ltd.: |
|
|
|
|
|
11.875% 7/15/15 |
|
$ 1,590,000 |
$ 1,967,625 |
|
|
yankee 7.25% 6/15/16 |
|
205,000 |
226,525 |
|
|
|
5,188,238 |
|||
|
Metals/Mining - 2.1% |
||||
|
Aleris International, Inc. 7.625% 2/15/18 |
|
485,000 |
510,463 |
|
|
Alpha Natural Resources, Inc.: |
|
|
|
|
|
6% 6/1/19 |
|
1,965,000 |
1,763,588 |
|
|
6.25% 6/1/21 |
|
1,305,000 |
1,171,238 |
|
|
American Rock Salt Co. LLC/American Rock Capital Corp. 8.25% 5/1/18 (e) |
|
230,000 |
205,850 |
|
|
Calcipar SA 6.875% 5/1/18 (e) |
|
235,000 |
230,888 |
|
|
CONSOL Energy, Inc.: |
|
|
|
|
|
8% 4/1/17 |
|
3,445,000 |
3,703,375 |
|
|
8.25% 4/1/20 |
|
1,675,000 |
1,800,625 |
|
|
FMG Resources (August 2006) Pty Ltd.: |
|
|
|
|
|
7% 11/1/15 (e) |
|
1,970,000 |
1,935,525 |
|
|
8.25% 11/1/19 (e) |
|
1,485,000 |
1,470,150 |
|
|
Peabody Energy Corp.: |
|
|
|
|
|
6% 11/15/18 (e) |
|
940,000 |
958,800 |
|
|
7.375% 11/1/16 |
|
360,000 |
402,300 |
|
|
Penn Virginia Resource Partners LP/Penn Virginia Finance Corp. 8.375% 6/1/20 (e) |
|
590,000 |
600,325 |
|
|
SunCoke Energy, Inc. 7.625% 8/1/19 |
|
440,000 |
444,400 |
|
|
|
15,197,527 |
|||
|
Paper - 1.0% |
||||
|
AbitibiBowater, Inc. 10.25% 10/15/18 |
|
69,000 |
79,005 |
|
|
Mercer International, Inc. 9.5% 12/1/17 |
|
970,000 |
1,025,775 |
|
|
NewPage Corp. 11.375% 12/31/14 (c) |
|
5,306,000 |
3,594,815 |
|
|
Sappi Papier Holding GmbH 6.625% 4/15/21 (e) |
|
415,000 |
383,875 |
|
|
Xerium Technologies, Inc. 8.875% 6/15/18 |
|
2,510,000 |
2,171,150 |
|
|
|
7,254,620 |
|||
|
Publishing/Printing - 0.1% |
||||
|
Cengage Learning Acquisitions, Inc. 11.5% 4/15/20 (e) |
|
125,000 |
130,938 |
|
|
Cenveo Corp. 7.875% 12/1/13 |
|
345,000 |
343,275 |
|
|
TL Acquisitions, Inc. 10.5% 1/15/15 (e) |
|
200,000 |
146,000 |
|
|
|
620,213 |
|||
|
Restaurants - 0.5% |
||||
|
DineEquity, Inc. 9.5% 10/30/18 |
|
2,030,000 |
2,263,450 |
|
|
Corporate Bonds - continued |
||||
|
|
Principal Amount |
Value |
||
|
Nonconvertible Bonds - continued |
||||
|
Restaurants - continued |
||||
|
Landry's Acquisition Co. 9.375% 5/1/20 (e) |
|
$ 490,000 |
$ 514,500 |
|
|
Roadhouse Financing, Inc. 10.75% 10/15/17 |
|
735,000 |
711,113 |
|
|
Wok Acquisition Corp. 10.25% 6/30/20 (e) |
|
410,000 |
429,475 |
|
|
|
3,918,538 |
|||
|
Services - 0.9% |
||||
|
ARAMARK Corp. 3.9446% 2/1/15 (g) |
|
1,955,000 |
1,950,113 |
|
|
Avis Budget Car Rental LLC/Avis Budget Finance, Inc.: |
|
|
|
|
|
2.9345% 5/15/14 (g) |
|
950,000 |
938,125 |
|
|
7.75% 5/15/16 |
|
1,065,000 |
1,092,903 |
|
|
ServiceMaster Co. 10.75% 7/15/15 pay-in-kind (e)(g) |
|
1,829,930 |
1,877,966 |
|
|
The Geo Group, Inc.: |
|
|
|
|
|
6.625% 2/15/21 |
|
235,000 |
249,100 |
|
|
7.75% 10/15/17 |
|
240,000 |
259,200 |
|
|
UR Financing Escrow Corp. 5.75% 7/15/18 (e) |
|
455,000 |
478,888 |
|
|
|
6,846,295 |
|||
|
Shipping - 1.7% |
||||
|
Navios Maritime Acquisition Corp./Navios Acquisition Finance US, Inc. 8.625% 11/1/17 |
|
3,675,000 |
3,417,750 |
|
|
Navios Maritime Holdings, Inc.: |
|
|
|
|
|
8.125% 2/15/19 |
|
3,165,000 |
2,753,550 |
|
|
8.875% 11/1/17 |
|
1,870,000 |
1,898,050 |
|
|
Navios Maritime Holdings, Inc./Navios Maritime Finance US, Inc. 8.875% 11/1/17 (e) |
|
455,000 |
453,863 |
|
|
Navios South American Logisitcs, Inc./Navios Logistics Finance U.S., Inc. 9.25% 4/15/19 |
|
225,000 |
209,250 |
|
|
Ship Finance International Ltd. 8.5% 12/15/13 |
|
2,310,000 |
2,304,225 |
|
|
Teekay Corp. 8.5% 1/15/20 |
|
710,000 |
736,625 |
|
|
Ultrapetrol (Bahamas) Ltd. 9% 11/24/14 |
|
690,000 |
558,900 |
|
|
|
12,332,213 |
|||
|
Steel - 0.5% |
||||
|
Essar Steel Algoma, Inc. 9.375% 3/15/15 (e) |
|
1,520,000 |
1,474,400 |
|
|
JMC Steel Group, Inc. 8.25% 3/15/18 (e) |
|
2,090,000 |
2,137,025 |
|
|
|
3,611,425 |
|||
|
Super Retail - 1.9% |
||||
|
Asbury Automotive Group, Inc. 7.625% 3/15/17 |
|
3,436,000 |
3,564,850 |
|
|
Claire's Stores, Inc.: |
|
|
|
|
|
8.875% 3/15/19 |
|
195,000 |
168,188 |
|
|
9% 3/15/19 (e) |
|
3,890,000 |
4,045,600 |
|
|
J. Crew Group, Inc. 8.125% 3/1/19 |
|
1,505,000 |
1,574,606 |
|
|
Corporate Bonds - continued |
||||
|
|
Principal Amount |
Value |
||
|
Nonconvertible Bonds - continued |
||||
|
Super Retail - continued |
||||
|
Limited Brands, Inc.: |
|
|
|
|
|
6.625% 4/1/21 |
|
$ 1,675,000 |
$ 1,867,625 |
|
|
7% 5/1/20 |
|
605,000 |
683,650 |
|
|
Office Depot, Inc. 9.75% 3/15/19 (e) |
|
670,000 |
613,050 |
|
|
Sally Holdings LLC 6.875% 11/15/19 |
|
540,000 |
602,100 |
|
|
The Bon-Ton Department Stores, Inc. 10.625% 7/15/17 (e) |
|
1,270,000 |
1,041,400 |
|
|
|
14,161,069 |
|||
|
Technology - 5.1% |
||||
|
Avaya, Inc.: |
|
|
|
|
|
7% 4/1/19 (e) |
|
7,925,000 |
7,231,563 |
|
|
9.75% 11/1/15 |
|
5,385,000 |
4,658,025 |
|
|
10.125% 11/1/15 pay-in-kind (g) |
|
6,388,138 |
5,541,710 |
|
|
CDW LLC/CDW Finance Corp.: |
|
|
|
|
|
8% 12/15/18 |
|
555,000 |
616,050 |
|
|
8.5% 4/1/19 |
|
2,040,000 |
2,228,700 |
|
|
Ceridian Corp.: |
|
|
|
|
|
8.875% 7/15/19 (e) |
|
655,000 |
702,488 |
|
|
11.25% 11/15/15 |
|
180,000 |
175,950 |
|
|
CommScope, Inc. 8.25% 1/15/19 (e) |
|
855,000 |
916,988 |
|
|
First Data Corp.: |
|
|
|
|
|
7.375% 6/15/19 (e) |
|
470,000 |
486,450 |
|
|
8.25% 1/15/21 (e) |
|
1,212,000 |
1,201,395 |
|
|
8.75% 1/15/22 pay-in-kind (e)(g) |
|
975,000 |
972,563 |
|
|
10.55% 9/24/15 pay-in-kind (g) |
|
327,398 |
335,583 |
|
|
12.625% 1/15/21 |
|
1,305,000 |
1,321,313 |
|
|
Freescale Semiconductor, Inc.: |
|
|
|
|
|
8.05% 2/1/20 |
|
500,000 |
490,000 |
|
|
9.25% 4/15/18 (e) |
|
1,545,000 |
1,668,600 |
|
|
10.125% 3/15/18 (e) |
|
1,680,000 |
1,839,600 |
|
|
Jabil Circuit, Inc. 5.625% 12/15/20 |
|
390,000 |
420,693 |
|
|
Lawson Software, Inc. 9.375% 4/1/19 (e) |
|
415,000 |
450,275 |
|
|
Lucent Technologies, Inc. 6.45% 3/15/29 |
|
375,000 |
241,875 |
|
|
Nuance Communications, Inc. 5.375% 8/15/20 (e) |
|
390,000 |
399,263 |
|
|
Sanmina-SCI Corp. 7% 5/15/19 (e) |
|
1,535,000 |
1,531,163 |
|
|
Serena Software, Inc. 10.375% 3/15/16 |
|
210,000 |
215,250 |
|
|
Spansion LLC 7.875% 11/15/17 |
|
965,000 |
940,875 |
|
|
Viasystems, Inc. 7.875% 5/1/19 (e) |
|
895,000 |
879,338 |
|
|
Corporate Bonds - continued |
||||
|
|
Principal Amount |
Value |
||
|
Nonconvertible Bonds - continued |
||||
|
Technology - continued |
||||
|
WideOpenWest Finance LLC/WideOpenWest Capital Corp.: |
|
|
|
|
|
10.25% 7/15/19 (e) |
|
$ 1,960,000 |
$ 2,038,400 |
|
|
13.375% 10/15/19 (e) |
|
385,000 |
383,075 |
|
|
|
37,887,185 |
|||
|
Telecommunications - 5.5% |
||||
|
Broadview Networks Holdings, Inc. 11.375% 9/1/49 (c) |
|
2,400,000 |
1,620,000 |
|
|
Clearwire Communications LLC/Clearwire Finance, Inc. 12% 12/1/15 (e) |
|
770,000 |
762,300 |
|
|
Clearwire Escrow Corp. 12% 12/1/15 (e) |
|
930,000 |
916,050 |
|
|
Cricket Communications, Inc. 7.75% 10/15/20 |
|
3,395,000 |
3,293,150 |
|
|
Digicel Group Ltd. 9.125% 1/15/15 pay-in-kind (e)(g) |
|
281,000 |
286,620 |
|
|
Dycom Investments, Inc. 7.125% 1/15/21 |
|
535,000 |
583,150 |
|
|
Frontier Communications Corp.: |
|
|
|
|
|
8.25% 4/15/17 |
|
935,000 |
1,044,863 |
|
|
8.5% 4/15/20 |
|
2,240,000 |
2,508,800 |
|
|
Intelsat Jackson Holdings SA: |
|
|
|
|
|
7.25% 4/1/19 |
|
1,710,000 |
1,842,525 |
|
|
7.5% 4/1/21 |
|
2,310,000 |
2,500,575 |
|
|
Intelsat Luxembourg SA: |
|
|
|
|
|
11.25% 2/4/17 |
|
380,000 |
399,475 |
|
|
11.5% 2/4/17 pay-in-kind (g) |
|
4,591,391 |
4,820,961 |
|
|
Level 3 Communications, Inc. 8.875% 6/1/19 (e) |
|
485,000 |
494,700 |
|
|
Level 3 Financing, Inc. 7% 6/1/20 (e) |
|
675,000 |
669,938 |
|
|
MetroPCS Wireless, Inc. 6.625% 11/15/20 |
|
1,705,000 |
1,768,938 |
|
|
Nextel Communications, Inc. 7.375% 8/1/15 |
|
2,926,000 |
2,940,630 |
|
|
NII Capital Corp. 7.625% 4/1/21 |
|
520,000 |
401,700 |
|
|
Sprint Capital Corp. 6.9% 5/1/19 |
|
7,580,000 |
7,760,025 |
|
|
Sprint Nextel Corp. 9% 11/15/18 (e) |
|
465,000 |
548,700 |
|
|
Telesat Canada/Telesat LLC 6% 5/15/17 (e) |
|
1,120,000 |
1,164,800 |
|
|
Wind Acquisition Finance SA: |
|
|
|
|
|
7.25% 2/15/18 (e) |
|
1,270,000 |
1,168,400 |
|
|
11.75% 7/15/17 (e) |
|
1,770,000 |
1,619,550 |
|
|
Wind Acquisition Holdings Finance SA 12.25% 7/15/17 pay-in-kind (e)(g) |
|
2,016,730 |
1,380,144 |
|
|
Windstream Corp. 7% 3/15/19 |
|
570,000 |
577,125 |
|
|
|
41,073,119 |
|||
|
Corporate Bonds - continued |
||||
|
|
Principal Amount |
Value |
||
|
Nonconvertible Bonds - continued |
||||
|
Textiles & Apparel - 0.5% |
||||
|
Hanesbrands, Inc. 6.375% 12/15/20 |
|
$ 3,240,000 |
$ 3,515,400 |
|
|
TOTAL NONCONVERTIBLE BONDS |
575,956,141 |
|||
|
TOTAL CORPORATE BONDS (Cost $549,459,686) |
|
|||
|
Commercial Mortgage Securities - 0.0% |
||||
|
|
||||
|
Berkeley Federal Bank & Trust FSB Series 1994-1 |
|
138,879 |
|
|
|
Common Stocks - 0.3% |
|||
|
Shares |
|
||
|
Banks & Thrifts - 0.1% |
|||
|
CIT Group, Inc. (a) |
16,491 |
622,700 |
|
|
Building Materials - 0.2% |
|||
|
Nortek, Inc. (a) |
34,442 |
1,772,730 |
|
|
Publishing/Printing - 0.0% |
|||
|
RDA Holding Co. warrants 2/19/14 (a)(h) |
6,468 |
0 |
|
|
Services - 0.0% |
|||
|
Penhall Acquisition Co.: |
|
|
|
|
Class A (a) |
763 |
61,040 |
|
|
Class B (a) |
254 |
20,320 |
|
|
|
81,360 |
||
|
TOTAL COMMON STOCKS (Cost $3,754,213) |
|
||
|
Preferred Stocks - 2.1% |
|||
|
|
|
|
|
|
Convertible Preferred Stocks - 1.3% |
|||
|
Banks & Thrifts - 1.0% |
|||
|
Bank of America Corp. Series L, 7.25% |
3,566 |
3,769,262 |
|
|
Huntington Bancshares, Inc. 8.50% |
3,170 |
3,848,380 |
|
|
|
7,617,642 |
||
|
Electric Utilities - 0.1% |
|||
|
PPL Corp. 8.75% |
6,900 |
379,017 |
|
|
Preferred Stocks - continued |
|||
|
Shares |
Value |
||
|
Convertible Preferred Stocks - continued |
|||
|
Energy - 0.2% |
|||
|
Chesapeake Energy Corp. Series A, 5.75% (e) |
1,300 |
$ 1,189,500 |
|
|
TOTAL CONVERTIBLE PREFERRED STOCKS |
9,186,159 |
||
|
Nonconvertible Preferred Stocks - 0.8% |
|||
|
Banks & Thrifts - 0.3% |
|||
|
Ally Financial, Inc. 7.00% (e) |
2,830 |
2,554,075 |
|
|
Diversified Financial Services - 0.5% |
|||
|
Citigroup Capital XIII 7.875% |
28,064 |
774,005 |
|
|
GMAC Capital Trust I Series 2, 8.125% |
103,471 |
2,568,150 |
|
|
|
3,342,155 |
||
|
TOTAL NONCONVERTIBLE PREFERRED STOCKS |
5,896,230 |
||
|
TOTAL PREFERRED STOCKS (Cost $13,110,376) |
|
||
|
Floating Rate Loans - 9.8% |
||||
|
|
Principal Amount |
|
||
|
Aerospace - 0.1% |
||||
|
Sequa Corp. term loan 3.7181% 12/3/14 (g) |
|
$ 1,065,091 |
1,057,102 |
|
|
Air Transportation - 0.7% |
||||
|
US Airways Group, Inc. term loan 2.7355% 3/23/14 (g) |
|
5,412,774 |
5,263,922 |
|
|
Automotive - 0.3% |
||||
|
Delphi Corp. Tranche B, term loan 3.5% 3/31/17 (g) |
|
199,353 |
199,602 |
|
|
Federal-Mogul Corp.: |
|
|
|
|
|
Tranche B, term loan 2.1775% 12/27/14 (g) |
|
1,612,662 |
1,542,108 |
|
|
Tranche C, term loan 2.1775% 12/27/15 (g) |
|
822,787 |
786,790 |
|
|
|
2,528,500 |
|||
|
Broadcasting - 0.5% |
||||
|
Univision Communications, Inc. term loan 4.4815% 3/31/17 (g) |
|
2,883,625 |
2,789,907 |
|
|
VNU, Inc. Tranche C, term loan 3.4913% 5/1/16 (g) |
|
637,101 |
637,101 |
|
|
|
3,427,008 |
|||
|
Floating Rate Loans - continued |
||||
|
|
Principal Amount |
Value |
||
|
Cable TV - 0.5% |
||||
|
Cequel Communications LLC Tranche B, term loan 4% 2/14/19 (g) |
|
$ 3,206,963 |
$ 3,186,919 |
|
|
RCN Telecom Services, LLC Tranche B, term loan 5.25% 8/21/16 (g) |
|
305,000 |
305,381 |
|
|
|
3,492,300 |
|||
|
Capital Goods - 0.1% |
||||
|
SRAM LLC.: |
|
|
|
|
|
2nd LN, term loan 8.5% 12/7/18 (g) |
|
245,000 |
248,675 |
|
|
Tranche B 1LN, term loan 4.7759% 6/7/18 (g) |
|
691,085 |
691,949 |
|
|
|
940,624 |
|||
|
Electric Utilities - 0.5% |
||||
|
Texas Competitive Electric Holdings Co. LLC/Texas Competitive Electric Holdings Finance, Inc. Tranche B, term loan 4.7685% 10/10/17 (g) |
|
5,658,139 |
3,783,881 |
|
|
Energy - 0.2% |
||||
|
CCS, Inc. Tranche B, term loan 3.2315% 11/14/14 (g) |
|
687,042 |
668,148 |
|
|
Chesapeake Energy Corp. term loan 8.5% 12/2/17 (g) |
|
750,000 |
750,938 |
|
|
|
1,419,086 |
|||
|
Food & Drug Retail - 0.2% |
||||
|
Rite Aid Corp. Tranche ABL, term loan 1.9935% 6/4/14 (g) |
|
1,118,343 |
1,093,180 |
|
|
Gaming - 0.1% |
||||
|
Ameristar Casinos, Inc. Tranche B, term loan 4% 4/14/18 (g) |
|
696,110 |
698,720 |
|
|
Healthcare - 0.7% |
||||
|
Community Health Systems, Inc.: |
|
|
|
|
|
term loan 3.9237% 1/25/17 (g) |
|
381,766 |
381,766 |
|
|
Tranche B, term loan 2.623% 7/25/14 (g) |
|
50,646 |
50,646 |
|
|
Emergency Medical Services Corp. Tranche B, term loan 5.25% 5/25/18 (g) |
|
848,874 |
849,935 |
|
|
HCA, Inc.: |
|
|
|
|
|
Tranche B2, term loan 3.7106% 3/31/17 (g) |
|
504,058 |
497,758 |
|
|
Tranche B3, term loan 3.4815% 5/1/18 (g) |
|
1,493,935 |
1,473,468 |
|
|
IASIS Healthcare LLC Tranche B, term loan 5% 5/3/18 (g) |
|
760,077 |
748,676 |
|
|
VWR Funding, Inc. term loan 2.7315% 6/29/14 (g) |
|
1,378,103 |
1,374,658 |
|
|
|
5,376,907 |
|||
|
Publishing/Printing - 0.4% |
||||
|
Thomson Learning Tranche B, term loan 2.49% 7/5/14 (g) |
|
2,875,299 |
2,652,463 |
|
|
Floating Rate Loans - continued |
||||
|
|
Principal Amount |
Value |
||
|
Restaurants - 0.5% |
||||
|
OSI Restaurant Partners, Inc.: |
|
|
|
|
|
Credit-Linked Deposit 2.5079% 6/14/13 (g) |
|
$ 322,095 |
$ 319,680 |
|
|
term loan 2.5625% 6/14/14 (g) |
|
3,246,240 |
3,221,893 |
|
|
|
3,541,573 |
|||
|
Services - 0.2% |
||||
|
ServiceMaster Co.: |
|
|
|
|
|
term loan 2.7981% 7/24/14 (g) |
|
1,005,485 |
999,200 |
|
|
Tranche DD, term loan 2.75% 7/24/14 (g) |
|
100,128 |
99,502 |
|
|
|
1,098,702 |
|||
|
Super Retail - 0.6% |
||||
|
Neiman Marcus Group, Inc. Tranche B, term loan 4.75% 5/16/18 (g) |
|
4,505,000 |
4,499,369 |
|
|
Technology - 2.9% |
||||
|
Avaya, Inc.: |
|
|
|
|
|
term loan 3.1769% 10/27/14 (g) |
|
2,102,657 |
2,013,294 |
|
|
Tranche B 3LN, term loan 4.9269% 10/26/17 (g) |
|
4,223,620 |
3,780,140 |
|
|
CDW Corp. Tranche B, term loan 4% 7/15/17 (g) |
|
3,930,234 |
3,881,106 |
|
|
First Data Corp. term loan 4.2365% 3/24/18 (g) |
|
8,179,895 |
7,730,001 |
|
|
Freescale Semiconductor, Inc. term loan 4.4957% 12/1/16 (g) |
|
2,198,298 |
2,110,366 |
|
|
Lawson Software, Inc. Tranche B, term loan 6.25% 4/5/18 (g) |
|
1,576,050 |
1,595,751 |
|
|
SunGard Data Systems, Inc. Tranche C, term loan 3.9943% 2/28/17 (g) |
|
431,240 |
431,240 |
|
|
|
21,541,898 |
|||
|
Telecommunications - 1.3% |
||||
|
Crown Castle Operating Co. Tranche B, term loan 4% 1/31/19 (g) |
|
781,075 |
782,090 |
|
|
FairPoint Communications, Inc. term loan 6.5% 1/24/16 (g) |
|
6,812,889 |
6,335,986 |
|
|
Intelsat Jackson Holdings SA: |
|
|
|
|
|
term loan 3.2385% 2/1/14 (g) |
|
1,250,000 |
1,231,250 |
|
|
Tranche B, term loan 5.25% 4/2/18 (g) |
|
1,528,482 |
1,536,124 |
|
|
|
9,885,450 |
|||
|
TOTAL FLOATING RATE LOANS (Cost $70,602,918) |
|
|||
|
Preferred Securities - 0.2% |
|||
|
Principal Amount |
Value |
||
|
Banks & Thrifts - 0.2% |
|||
|
Bank of America Corp.: |
|
|
|
|
8% (f)(g) |
$ 365,000 |
$ 393,168 |
|
|
8.125% (f)(g) |
1,170,000 |
1,284,737 |
|
|
TOTAL PREFERRED SECURITIES (Cost $1,508,233) |
|
||
|
Money Market Funds - 7.6% |
|||
|
Shares |
|
||
|
Fidelity Cash Central Fund, 0.17% (b) |
56,404,694 |
|
|
|
TOTAL INVESTMENT PORTFOLIO - 98.3% (Cost $694,937,499) |
728,130,564 |
||
|
NET OTHER ASSETS (LIABILITIES) - 1.7% |
12,463,805 |
||
|
NET ASSETS - 100% |
$ 740,594,369 |
||
|
Legend |
|
(a) Non-income producing |
|
(b) Affiliated fund that is available only to investment companies and other accounts managed by Fidelity Investments. The rate quoted is the annualized seven-day yield of the fund at period end. A complete unaudited listing of the fund's holdings as of its most recent quarter end is available upon request. In addition, each Fidelity Central Fund's financial statements, which are not covered by the Fund's Report of Independent Registered Public Accounting Firm, are available on the SEC's website or upon request. |
|
(c) Non-income producing - Security is in default. |
|
(d) Security initially issued at one coupon which converts to a higher coupon at a specified date. The rate shown is the rate at period end. |
|
(e) Security exempt from registration under Rule 144A of the Securities Act of 1933. These securities may be resold in transactions exempt from registration, normally to qualified institutional buyers. At the end of the period, the value of these securities amounted to $189,829,750 or 25.6% of net assets. |
|
(f) Security is perpetual in nature with no stated maturity date. |
|
(g) Coupon rates for floating and adjustable rate securities reflect the rates in effect at period end. |
|
(h) Restricted securities - Investment in securities not registered under the Securities Act of 1933 (excluding 144A issues). At the end of the period, the value of restricted securities (excluding 144A issues) amounted to $0 or 0.0% of net assets. |
|
Additional information on each restricted holding is as follows: |
|
Security |
Acquisition Date |
Acquisition Cost |
|
RDA Holding Co. warrants 2/19/14 |
2/27/07 - 3/7/07 |
$ 2,004,800 |
|
Affiliated Central Funds |
|
Information regarding fiscal year to date income earned by the Fund from investments in Fidelity Central Funds is as follows: |
|
Fund |
Income earned |
|
Fidelity Cash Central Fund |
$ 40,329 |
|
Other Information |
|
The following is a summary of the inputs used, as of August 31, 2012, involving the Fund's assets and liabilities carried at fair value. The inputs or methodology used for valuing securities may not be an indication of the risk associated with investing in those securities. For more information on valuation inputs, and their aggregation into the levels used in the table below, please refer to the Security Valuation section in the accompanying Notes to Financial Statements. |
|
Valuation Inputs at Reporting Date: |
||||
|
Description |
Total |
Level 1 |
Level 2 |
Level 3 |
|
Investments in Securities: |
||||
|
Equities: |
||||
|
Consumer Discretionary |
$ - |
$ - |
$ - |
$ - |
|
Energy |
1,189,500 |
- |
1,189,500 |
- |
|
Financials |
14,136,572 |
11,582,497 |
2,554,075 |
- |
|
Industrials |
1,854,090 |
1,772,730 |
- |
81,360 |
|
Utilities |
379,017 |
- |
379,017 |
- |
|
Corporate Bonds |
580,113,051 |
- |
580,113,051 |
- |
|
Commercial Mortgage Securities |
75,050 |
- |
- |
75,050 |
|
Floating Rate Loans |
72,300,685 |
- |
72,300,685 |
- |
|
Preferred Securities |
1,677,905 |
- |
1,677,905 |
- |
|
Money Market Funds |
56,404,694 |
56,404,694 |
- |
- |
|
Total Investments in Securities: |
$ 728,130,564 |
$ 69,759,921 |
$ 658,214,233 |
$ 156,410 |
|
Distribution of investments by country or territory of incorporation, as a percentage of total net assets, is as follows. (Unaudited) |
|
United States of America |
89.3% |
|
Luxembourg |
2.4% |
|
Netherlands |
1.3% |
|
Marshall Islands |
1.3% |
|
Cayman Islands |
1.0% |
|
Others (Individually Less Than 1%) |
4.7% |
|
|
100.0% |
See accompanying notes which are an integral part of the financial statements.
Annual Report
Financial Statements
Statement of Assets and Liabilities
|
|
August 31, 2012 |
|
|
|
|
|
|
Assets |
|
|
|
Investment in securities, at value - See accompanying schedule: Unaffiliated issuers (cost $638,532,805) |
$ 671,725,870 |
|
|
Fidelity Central Funds (cost $56,404,694) |
56,404,694 |
|
|
Total Investments (cost $694,937,499) |
|
$ 728,130,564 |
|
Cash |
|
42,329 |
|
Receivable for investments sold |
|
1,085,300 |
|
Interest receivable |
|
11,636,886 |
|
Distributions receivable from Fidelity Central Funds |
|
6,443 |
|
Total assets |
|
740,901,522 |
|
|
|
|
|
Liabilities |
|
|
|
Payable for investments purchased |
$ 303,475 |
|
|
Distributions payable |
78 |
|
|
Other payables and accrued expenses |
3,600 |
|
|
Total liabilities |
|
307,153 |
|
|
|
|
|
Net Assets |
|
$ 740,594,369 |
|
Net Assets consist of: |
|
|
|
Paid in capital |
|
$ 707,401,304 |
|
Net unrealized appreciation (depreciation) on investments |
|
33,193,065 |
|
Net Assets, for 6,501,075 shares outstanding |
|
$ 740,594,369 |
|
Net Asset Value, offering price and redemption price per share ($740,594,369 ÷ 6,501,075 shares) |
|
$ 113.92 |
See accompanying notes which are an integral part of the financial statements.
Annual Report
Financial Statements - continued
Statement of Operations
|
|
Year ended August 31, 2012 |
|
|
|
|
|
|
Investment Income |
|
|
|
Dividends |
|
$ 1,186,763 |
|
Interest |
|
53,047,949 |
|
Income from Fidelity Central Funds |
|
40,329 |
|
Total income |
|
54,275,041 |
|
|
|
|
|
Expenses |
|
|
|
Custodian fees and expenses |
$ 11,027 |
|
|
Independent directors' compensation |
4,483 |
|
|
Total expenses before reductions |
15,510 |
|
|
Expense reductions |
(4,667) |
10,843 |
|
Net investment income (loss) |
|
54,264,198 |
|
Realized and Unrealized Gain (Loss) Net realized gain (loss) on: |
|
|
|
Investment securities: |
|
|
|
Unaffiliated issuers |
|
9,160,717 |
|
Change in net unrealized appreciation (depreciation) on investment securities |
|
34,359,292 |
|
Net gain (loss) |
|
43,520,009 |
|
Net increase (decrease) in net assets resulting from operations |
|
$ 97,784,207 |
See accompanying notes which are an integral part of the financial statements.
Annual Report
Statement of Changes in Net Assets
|
|
Year ended |
Year ended |
|
Increase (Decrease) in Net Assets |
|
|
|
Operations |
|
|
|
Net investment income (loss) |
$ 54,264,198 |
$ 49,184,660 |
|
Net realized gain (loss) |
9,160,717 |
21,653,408 |
|
Change in net unrealized appreciation (depreciation) |
34,359,292 |
(33,048,931) |
|
Net increase (decrease) in net assets resulting |
97,784,207 |
37,789,137 |
|
Distributions to partners from net investment income |
(48,164,874) |
(41,924,291) |
|
Affiliated share transactions |
- |
104,443,965 |
|
Reinvestment of distributions |
48,163,887 |
41,923,298 |
|
Cost of shares redeemed |
- |
(31,017,155) |
|
Net increase (decrease) in net assets resulting from share transactions |
48,163,887 |
115,350,108 |
|
Total increase (decrease) in net assets |
97,783,220 |
111,214,954 |
|
|
|
|
|
Net Assets |
|
|
|
Beginning of period |
642,811,149 |
531,596,195 |
|
End of period |
$ 740,594,369 |
$ 642,811,149 |
|
Other Affiliated Information Shares |
|
|
|
Sold |
- |
927,403 |
|
Issued in reinvestment of distributions |
439,904 |
378,642 |
|
Redeemed |
- |
(288,588) |
|
Net increase (decrease) |
439,904 |
1,017,457 |
See accompanying notes which are an integral part of the financial statements.
Annual Report
Financial Highlights
|
Years ended August 31, |
2012 |
2011 |
2010 |
2009 |
2008 H |
|
Selected Per-Share Data |
|
|
|
|
|
|
Net asset value, beginning of period |
$ 106.05 |
$ 105.40 |
$ 94.45 |
$ 98.62 |
$ 100.00 |
|
Income from Investment Operations |
|
|
|
|
|
|
Net investment income (loss) D |
8.659 |
9.048 |
9.362 |
8.623 |
3.708 |
|
Net realized and unrealized gain (loss) |
6.901 |
(.660) |
9.337 |
(5.390) |
(1.658) |
|
Total from investment operations |
15.560 |
8.388 |
18.699 |
3.233 |
2.050 |
|
Distributions to partners from net investment income |
(7.690) |
(7.738) |
(7.749) |
(7.403) |
(3.430) |
|
Net asset value, end of period |
$ 113.92 |
$ 106.05 |
$ 105.40 |
$ 94.45 |
$ 98.62 |
|
Total Return B,C |
15.22% |
7.88% |
20.25% |
4.83% |
2.09% |
|
Ratios to Average Net Assets E,I |
|
|
|
|
|
|
Expenses before reductions G |
-% |
-% |
-% |
-% |
-% A |
|
Expenses net of fee waivers, if any G |
-% |
-% |
-% |
-% |
-% A |
|
Expenses net of all reductions G |
-% |
-% |
-% |
-% |
-% A |
|
Net investment income (loss) |
7.93% |
8.18% |
9.08% |
10.53% |
8.73% A |
|
Supplemental Data |
|
|
|
|
|
|
Net assets, end of period (000 omitted) |
$ 740,594 |
$ 642,811 |
$ 531,596 |
$ 465,555 |
$ 435,837 |
|
Portfolio turnover rate F |
36% |
43% |
65% |
57% |
35% A,J |
A Annualized
B Total returns for periods of less than one year are not annualized.
C Total returns would have been lower if certain expenses had not been reduced during the applicable periods shown.
D Calculated based on average shares outstanding during the period.
E Fees and expenses of any underlying Fidelity Central Funds are not included in the Fund's expense ratio. The Fund indirectly bears its proportionate share of the expenses of any underlying Fidelity Central Funds.
F Amount does not include the portfolio activity of any underlying Fidelity Central Funds.
G Amount represents less than .01%.
H For the period March 31, 2008 (commencement of operations) to August 31, 2008.
I Expense ratios reflect operating expenses of the Fund. Expenses before reductions do not reflect amounts reimbursed by the investment adviser or reductions from expense offset arrangements and do not represent the amount paid by the Fund during periods when reimbursements or reductions occur. Expense ratios before reductions for start-up periods may not be representative of longer term operating periods. Expenses net of fee waivers reflect expenses after reimbursement by the investment adviser but prior to reductions from expense offset arrangements. Expenses net of all reductions represent the net expenses paid by the Fund.
J Portfolio turnover rate excludes securities received or delivered in-kind.
See accompanying notes which are an integral part of the financial statements.
Annual Report
Notes to Financial Statements
For the period ended August 31, 2012
1. Organization.
Fidelity High Income Central Fund 2 (the Fund) is a fund of Fidelity Central Investment Portfolios LLC (the LLC) and is authorized to issue an unlimited number of shares. The LLC is registered under the Investment Company Act of 1940, as amended (the 1940 Act), as an open-end management investment company organized as a Delaware Limited Liability Company. Each fund in the LLC is a separate partnership for tax purposes. Shares of the Fund are only offered to other investment companies and accounts managed by Fidelity Management & Research Company (FMR), or its affiliates (the Investing Funds). The Board of Directors may permit the purchase of shares (for cash, securities or other consideration) and admit new Eligible Accredited Investors into each fund, in accordance with the Partnership Agreement.
2. Investments in Fidelity Central Funds.
The Fund invests in Fidelity Central Funds, which are open-end investment companies available only to other investment companies and accounts managed by FMR and its affiliates. The Fund's Schedule of Investments lists each of the Fidelity Central Funds held as of period end, if any, as an investment of the Fund, but does not include the underlying holdings of each Fidelity Central Fund. As an Investing Fund, the Fund indirectly bears its proportionate share of the expenses of the underlying Fidelity Central Funds.
The Money Market Central Funds seek preservation of capital and current income and are managed by Fidelity Investments Money Management, Inc. (FIMM), an affiliate of FMR.
A complete unaudited list of holdings for each Fidelity Central Fund is available upon request or at the Securities and Exchange Commission (the SEC) web site at www.sec.gov. In addition, the financial statements of the Fidelity Central Funds, which are not covered by the Fund's Report of Independent Registered Public Accounting Firm, are available on the SEC web site or upon request.
3. Significant Accounting Policies.
The financial statements have been prepared in conformity with accounting principles generally accepted in the United States of America (GAAP), which require management to make certain estimates and assumptions at the date of the financial statements. Actual results could differ from those estimates. Subsequent events, if any, through the date that the financial statements were issued have been evaluated in the preparation of the financial statements. The following summarizes the significant accounting policies of the Fund:
Annual Report
3. Significant Accounting Policies - continued
Security Valuation. Investments are valued as of 4:00 p.m. Eastern time on the last calendar day of the period. In accordance with valuation policies and procedures approved by the Board of Directors (the Board), the Fund attempts to obtain prices from one or more third party pricing vendor or broker to value its investments. When current market prices, quotations or rates are not readily available or reliable, securities will be fair valued in good faith by the FMR Fair Value Committee (the Committee), in accordance with procedures adopted by the Board. Factors used in determining fair value vary by security type and may include market or security specific events, changes in interest rates and credit quality. The frequency with which these procedures are used cannot be predicted and they may be utilized to a significant extent. The Committee oversees the Fund's valuation policies and procedures and is responsible for approving and reporting to the Board all fair value determinations.
The Fund categorizes the inputs to valuation techniques used to value its investments into a disclosure hierarchy consisting of three levels as shown below:
Level 1 - quoted prices in active markets for identical investments
Level 2 - other significant observable inputs (including quoted prices for similar investments, interest rates, prepayment speeds, etc.)
Level 3 - unobservable inputs (including the Fund's own assumptions based on the best information available)
Valuation techniques used to value the Fund's investments by major category are as follows:
Debt securities, including restricted securities, are valued based on evaluated prices received from third party pricing vendors or from brokers who make markets in such securities. For corporate bonds, floating rate loans and preferred securities, pricing vendors utilize matrix pricing which considers yield or price of bonds of comparable quality, coupon, maturity and type as well as broker-supplied prices and are generally categorized as Level 2 in the hierarchy. For commercial mortgage securities, pricing vendors utilize matrix pricing which considers prepayment speed assumptions, attributes of the collateral, yield or price of bonds of comparable quality, coupon, maturity and type as well as broker-supplied prices and, accordingly, such securities are generally categorized as Level 2 in the hierarchy. When independent prices are unavailable or unreliable, debt securities may be valued utilizing pricing methodologies which consider similar factors that would be used by third party pricing vendors. These are generally categorized as Level 2 in the hierarchy but may be Level 3 depending on the circumstances. The Fund invests a significant portion of its assets in below investment grade securities. The value of these securities can be more volatile due to changes in the credit quality of the issuer and is sensitive to changes in economic, market and regulatory conditions.
Annual Report
Notes to Financial Statements - continued
3. Significant Accounting Policies - continued
Security Valuation - continued
Equity securities, including restricted securities, for which market quotations are readily available, are valued at the last reported sale price or official closing price as reported by a third party pricing vendor on the primary market or exchange on which they are traded and are categorized as Level 1 in the hierarchy. In the event there were no sales during the day or closing prices are not available, securities are valued at the last quoted bid price or may be valued using the last available price and are generally categorized as Level 2 in the hierarchy. Utilizing these techniques may result in transfers between Level 1 and Level 2. For restricted securities and private placements where observable inputs are limited, assumptions about market activity and risk are used and these securities are categorized as Level 3 in the hierarchy.
Investments in open-end mutual funds, including the Fidelity Central Funds, are valued at their closing net asset value each business day and are categorized as Level 1 in the hierarchy.
Changes in valuation techniques may result in transfers in or out of an assigned level within the disclosure hierarchy. The aggregate value of investments by input level, as of August 31, 2012, for the Fund's investments is included at the end of the Fund's Schedule of Investments.
Investment Transactions and Income. For financial reporting purposes, the Fund's investment holdings and NAV include trades executed through the end of the last business day of the period. The NAV per share for processing shareholder transactions is calculated as of the close of business of the New York Stock Exchange (NYSE), normally 4:00 p.m. Eastern time and includes trades executed through the end of the prior business day. Gains and losses on securities sold are determined on the basis of identified cost. Dividend income is recorded on the ex-dividend date, except for certain dividends from foreign securities where the ex-dividend date may have passed, which are recorded as soon as the Fund is informed of the ex-dividend date. Non-cash dividends included in dividend income, if any, are recorded at the fair market value of the securities received. Distributions received on securities that represent a return of capital or capital gain are recorded as a reduction of cost of investments and/or as a realized gain. The Fund estimates the components of distributions received that may be considered return of capital distributions or capital gain distributions. Interest income and distributions from other Fidelity Central Funds are accrued as earned. Interest income includes coupon interest and amortization of premium and accretion of discount on debt securities. Debt obligations may be placed on non-accrual status and related interest income may be
Annual Report
3. Significant Accounting Policies - continued
Investment Transactions and Income - continued
reduced by ceasing current accruals and writing off interest receivables when the collection of all or a portion of interest has become doubtful based on consistently applied procedures. A debt obligation is removed from non-accrual status when the issuer resumes interest payments or when collectability of interest is reasonably assured.
Expenses. Expenses directly attributable to a fund are charged to that fund. Expenses attributable to more than one fund are allocated among the respective funds on the basis of relative net assets or other appropriate methods. Expense estimates are accrued in the period to which they relate and adjustments are made when actual amounts are known.
Income Tax Information and Distributions to Partners. No provision has been made for federal income taxes because the Fund allocates, at least annually among its partners, each partner's share of the Fund's income and expenses and capital gains and losses as determined by income tax regulations for inclusion in each partner's tax return.
Distributions are declared daily and paid monthly from net investment income on a book basis, except for certain items such as market discount, equity-debt classifications, and term loan fee income which are deemed distributed based on allocations to the partners and are reclassified to paid in capital. Due to the Fund's partnership structure, paid in capital includes any accumulated net investment income/(loss) and net realized gain/(loss) on investments.
There are no unrecognized tax benefits in the accompanying financial statements in connection with the tax positions taken by the Fund; nor is the Fund aware of any tax positions for which it is reasonably possible that the total amounts of unrecognized tax benefits will significantly change in the next twelve months. The Fund files a U.S. federal tax return, in addition to state and local tax returns as required. A fund's federal income tax returns are subject to examination by the Internal Revenue Service (IRS) for a period of three fiscal years after they are filed. State and local tax returns may be subject to examination for an additional fiscal year depending on the jurisdiction. The federal tax cost of investment securities and unrealized appreciation (depreciation) as of period end were as follows:
Annual Report
Notes to Financial Statements - continued
3. Significant Accounting Policies - continued
Income Tax Information and Distributions to Partners - continued
|
Gross unrealized appreciation |
$ 56,361,970 |
|
Gross unrealized depreciation |
(13,221,353) |
|
Net unrealized appreciation (depreciation) on securities and other investments |
$ 43,140,617 |
|
|
|
|
Tax Cost |
$ 684,989,947 |
4. Operating Policies.
Restricted Securities. The Fund may invest in securities that are subject to legal or contractual restrictions on resale. These securities generally may be resold in transactions exempt from registration or to the public if the securities are registered. Disposal of these securities may involve time-consuming negotiations and expense, and prompt sale at an acceptable price may be difficult. Information regarding restricted securities is included at the end of the Fund's Schedule of Investments.
Loans and Other Direct Debt Instruments. The Fund invests in direct debt instruments which are interests in amounts owed to lenders by corporate or other borrowers. These instruments may be in the form of loans, trade claims or other receivables and may include standby financing commitments such as revolving credit facilities that obligate the Fund to supply additional cash to the borrower on demand. Loans may be acquired through assignment or participation, or may be made directly to a borrower. The Fund may be contractually obligated to receive approval from the agent bank and/or borrower prior to the sale of these loans.
5. Purchases and Sales of Investments.
Purchases and sales of securities, other than short-term securities, aggregated $250,331,208 and $230,982,367, respectively.
6. Fees and Other Transactions with Affiliates.
Management Fee and Expense Contract. FMR Co., Inc. (FMRC), an affiliate of FMR, provides the Fund with investment management services. The Fund does not pay any fees for these services. Pursuant to the Fund's management contract with FMRC, FMR pays FMRC a portion of the management fees it receives from the Investing Funds. In addition, under an expense contract, FMR also pays all other expenses of the Fund, excluding custody fees, the compensation of the independent Directors, and certain exceptions such as interest expense.
Annual Report
7. Expense Reductions.
FMR has voluntarily agreed to reimburse a portion of the Fund's operating expenses. For the period, the reimbursement reduced the expenses by $4,483.
In addition, through arrangements with the Fund's custodian, credits realized as a result of uninvested cash balances were used to reduce the Fund's expenses. During the period, these credits reduced the Fund's custody expenses by $184.
8. Other.
The Fund's organizational documents provide former and current directors and officers with a limited indemnification against liabilities arising in connection with the performance of their duties to the Fund. In the normal course of business, the Fund may also enter into contracts that provide general indemnifications. The Fund's maximum exposure under these arrangements is unknown as this would be dependent on future claims that may be made against the Fund. The risk of material loss from such claims is considered remote.
At the end of the period, mutual funds managed by FMR or an FMR affiliate were the owners of record of all of the outstanding shares of the Fund.
Annual Report
Report of Independent Registered Public Accounting Firm
To the Directors of Fidelity Central Investment Portfolios LLC and Partners of Fidelity High Income Central Fund 2:
We have audited the accompanying statement of assets and liabilities of Fidelity High Income Central Fund 2 (the Fund), a fund of Fidelity Central Investment Portfolios LLC, including the schedule of investments, as of August 31, 2012, and the related statement of operations for the year then ended, the statement of changes in net assets for each of the two years in the period then ended, and the financial highlights for each of the four years in the period then ended and for the period from March 31, 2008 (commencement of operations) to August 31, 2008. These financial statements and financial highlights are the responsibility of the Fund's management. Our responsibility is to express an opinion on these financial statements and financial highlights based on our audits.
We conducted our audits in accordance with the standards of the Public Company Accounting Oversight Board (United States). Those standards require that we plan and perform the audit to obtain reasonable assurance about whether the financial statements and financial highlights are free of material misstatement. The Fund is not required to have, nor were we engaged to perform, an audit of its internal control over financial reporting. Our audits included consideration of internal control over financial reporting as a basis for designing audit procedures that are appropriate in the circumstances, but not for the purpose of expressing an opinion on the effectiveness of the Fund's internal control over financial reporting. Accordingly, we express no such opinion. An audit also includes examining, on a test basis, evidence supporting the amounts and disclosures in the financial statements, assessing the accounting principles used and significant estimates made by management, as well as evaluating the overall financial statement presentation. Our procedures included confirmation of securities owned as of August 31, 2012, by correspondence with the custodians, agent banks and brokers; where replies were not received from brokers, we performed other auditing procedures. We believe that our audits provide a reasonable basis for our opinion.
In our opinion, the financial statements and financial highlights referred to above present fairly, in all material respects, the financial position of Fidelity High Income Central Fund 2 as of August 31, 2012, the results of its operations for the year then ended, the changes in its net assets for each of the two years in the period then ended, and the financial highlights for each of the four years in the period then ended and for the period from March 31, 2008 (commencement of operations) to August 31, 2008, in conformity with accounting principles generally accepted in the United States of America.
DELOITTE & TOUCHE LLP
Boston, Massachusetts
October 16, 2012
Annual Report
Directors and Officers (Trustees and Officers)
The Trustees, Members of the Advisory Board, and executive officers of the Fidelity Central Investment Portfolios LLC and fund, as applicable, are listed below. The Board of Trustees governs the fund and is responsible for protecting the interests of shareholders. The Trustees are experienced executives who meet periodically throughout the year to oversee the fund's activities, review contractual arrangements with companies that provide services to the fund, oversee management of the risks associated with such activities and contractual arrangements, and review the fund's performance. Except for James C. Curvey, each of the Trustees oversees 228 funds advised by FMR or an affiliate. Mr. Curvey oversees 435 funds advised by FMR or an affiliate.
The Trustees hold office without limit in time except that (a) any Trustee may resign; (b) any Trustee may be removed by written instrument, signed by at least two-thirds of the number of Trustees prior to such removal; (c) any Trustee who requests to be retired or who has become incapacitated by illness or injury may be retired by written instrument signed by a majority of the other Trustees; and (d) any Trustee may be removed at any special meeting of shareholders by a two-thirds vote of the outstanding voting securities of the trust. Each Trustee who is not an interested person (as defined in the 1940 Act) (Independent Trustee), shall retire not later than the last day of the calendar year in which his or her 75th birthday occurs. The Independent Trustees may waive this mandatory retirement age policy with respect to individual Trustees. The executive officers and Advisory Board Members hold office without limit in time, except that any officer and Advisory Board Member may resign or may be removed by a vote of a majority of the Trustees at any regular meeting or any special meeting of the Trustees. Except as indicated, each individual has held the office shown or other offices in the same company for the past five years.
Experience, Skills, Attributes, and Qualifications of the Fund's Trustees. The Governance and Nominating Committee has adopted a statement of policy that describes the experience, qualifications, attributes, and skills that are necessary and desirable for potential Independent Trustee candidates (Statement of Policy). The Board believes that each Trustee satisfied at the time he or she was initially elected or appointed a Trustee, and continues to satisfy, the standards contemplated by the Statement of Policy. The Governance and Nominating Committee also engages professional search firms to help identify potential Independent Trustee candidates who have the experience, qualifications, attributes, and skills consistent with the Statement of Policy. From time to time, additional criteria based on the composition and skills of the current Independent Trustees, as well as experience or skills that may be appropriate in light of future changes to board composition, business conditions, and regulatory or other developments, have also been considered by the professional search firms and the Governance and Nominating Committee. In addition, the Board takes into account the Trustees' commitment and participation in Board and committee meetings, as well as their leadership of standing and ad hoc committees throughout their tenure.
In determining that a particular Trustee was and continues to be qualified to serve as a Trustee, the Board has considered a variety of criteria, none of which, in isolation, was controlling. The Board believes that, collectively, the Trustees have balanced and diverse experience, qualifications, attributes, and skills, which allow the Board to operate effectively in governing the fund and protecting the interests of shareholders. Information about the specific experience, skills, attributes, and qualifications of each Trustee, which in each case led to the Board's conclusion that the Trustee should serve (or continue to serve) as a trustee of the fund, is provided below.
Annual Report
Board Structure and Oversight Function. James C. Curvey is an interested person (as defined in the 1940 Act) and currently serves as Chairman. The Trustees have determined that an interested Chairman is appropriate and benefits shareholders because an interested Chairman has a personal and professional stake in the quality and continuity of services provided to the fund. Independent Trustees exercise their informed business judgment to appoint an individual of their choosing to serve as Chairman, regardless of whether the Trustee happens to be independent or a member of management. The Independent Trustees have determined that they can act independently and effectively without having an Independent Trustee serve as Chairman and that a key structural component for assuring that they are in a position to do so is for the Independent Trustees to constitute a substantial majority for the Board. The Independent Trustees also regularly meet in executive session. Ned C. Lautenbach serves as Chairman of the Independent Trustees and as such (i) acts as a liaison between the Independent Trustees and management with respect to matters important to the Independent Trustees and (ii) with management prepares agendas for Board meetings.
Fidelity funds are overseen by different Boards of Trustees. The fund's Board oversees Fidelity's equity and high income funds and another Board oversees Fidelity's investment-grade bond, money market, and asset allocation funds. The asset allocation funds may invest in Fidelity funds overseen by the fund's Board. The use of separate Boards, each with its own committee structure, allows the Trustees of each group of Fidelity funds to focus on the unique issues of the funds they oversee, including common research, investment, and operational issues. On occasion, the separate Boards establish joint committees to address issues of overlapping consequences for the Fidelity funds overseen by each Board.
The Trustees operate using a system of committees to facilitate the timely and efficient consideration of all matters of importance to the Trustees, the fund, and fund shareholders and to facilitate compliance with legal and regulatory requirements and oversight of the fund's activities and associated risks. The Board, acting through its committees, has charged FMR and its affiliates with (i) identifying events or circumstances the occurrence of which could have demonstrably adverse effects on the fund's business and/or reputation; (ii) implementing processes and controls to lessen the possibility that such events or circumstances occur or to mitigate the effects of such events or circumstances if they do occur; and (iii) creating and maintaining a system designed to evaluate continuously business and market conditions in order to facilitate the identification and implementation processes described in (i) and (ii) above. Because the day-to-day operations and activities of the fund are carried out by or through FMR, its affiliates and other service providers, the fund's exposure to risks is mitigated but not eliminated by the processes overseen by the Trustees. While each of the Board's committees has responsibility for overseeing different aspects of the fund's activities, oversight is exercised primarily through the Operations, Audit, and Compliance Committees. In addition, the Independent Trustees have worked with FMR to enhance the Board's oversight of investment and financial risks, legal and regulatory risks, technology risks, and operational risks, including the development of additional risk reporting to the Board. For example, a working group comprised of Independent Trustees and FMR has worked and continues to work to review the Fidelity funds' valuation-related activities, reporting and risk management. Appropriate personnel, including but not limited to the fund's Chief Compliance Officer (CCO), FMR's internal auditor, the independent accountants, the fund's Treasurer and portfolio management personnel, make periodic reports to the Board's committees, as appropriate, including an annual review of FMR's risk management program for the Fidelity funds. The responsibilities of each standing committee, including their oversight responsibilities, are described further under "Standing Committees of the Fund's Trustees."
Annual Report
Directors and Officers (Trustees and Officers) - continued
The fund's Statement of Additional Information (SAI) includes more information about the Trustees. To request a free copy, call Fidelity at 1-800-544-8544.
Interested Trustees*:
Correspondence intended for each Trustee who is an interested person may be sent to Fidelity Investments, 82 Devonshire Street, Boston, Massachusetts 02109.
|
Name, Age; Principal Occupations and Other Relevant Experience+ |
|
|
James C. Curvey (77) |
|
|
|
Year of Election or Appointment: 2007 Mr. Curvey is Trustee and Chairman of the Board of Trustees of certain Trusts. Mr. Curvey also serves as Trustee (2007-present) of other investment companies advised by FMR. Mr. Curvey is a Director of Fidelity Investments Money Management, Inc. (2009-present), Director of Fidelity Research & Analysis Co. (2009-present) and Director of FMR and FMR Co., Inc. (2007-present). Mr. Curvey is also Vice Chairman (2007-present) and Director of FMR LLC. In addition, Mr. Curvey serves as an Overseer for the Boston Symphony Orchestra and a member of the Trustees of Villanova University. Previously, Mr. Curvey was the Vice Chairman (2006-2007) and Director (2000-2007) of FMR Corp. |
|
Ronald P. O'Hanley (55) |
|
|
|
Year of Election or Appointment: 2011 Mr. O'Hanley is Director of FMR Co., Inc. (2010-present), Director of Fidelity Investments Money Management, Inc. (2010-present), Director of Fidelity Research & Analysis Company (2010-present), President of Fidelity Asset Management and Corporate Services and a member of Fidelity's Executive Committee (2010-present). Previously, Mr. O'Hanley served as President and Chief Executive Officer of BNY Mellon Asset Management (2007-2010). Mr. O'Hanley also served as Vice Chairman of Bank New York Mellon Corp. and a member of that firm's Executive Committee. Prior to the 2007 merger of The Bank of New York and Mellon Financial Corporation, he was Vice Chairman of Mellon Financial Corporation and President and Chief Executive Officer of Mellon Asset Management. He joined Mellon in February 1997. Mr. O'Hanley currently serves as Chairman of the Boston Public Library Foundation Board of Directors and sits on the Board of Directors of Beth Israel Deaconess Medical Center, the Board of Trustees of the Marine Biological Laboratory and the Advisory Board of the Maxwell School of Citizenship and Public Administration at Syracuse University. Mr. O'Hanley also chairs the Council on Asset Management for the Financial Services Roundtable and is a member of the Board of Directors of Institutional Investor's U.S. Institute. |
* Trustees have been determined to be "Interested Trustees" by virtue of, among other things, their affiliation with the Fidelity Central Investment Portfolios LLC or various entities under common control with FMR.
+ The information above includes each Trustee's principal occupation during the last five years and other information relating to the experience, attributes, and skills relevant to each Trustee's qualifications to serve as a Trustee, which led to the conclusion that each Trustee should serve as a Trustee for the fund.
Annual Report
Directors and Officers (Trustees and Officers) - continued
Independent Trustees:
Correspondence intended for each Independent Trustee (that is, the Trustees other than the Interested Trustees) may be sent to Fidelity Investments, P.O. Box 55235, Boston, Massachusetts 02205-5235.
|
Name, Age; Principal Occupations and Other Relevant Experience+ |
|
|
Dennis J. Dirks (64) |
|
|
|
Year of Election or Appointment: 2005 Prior to his retirement in May 2003, Mr. Dirks was Chief Operating Officer and a member of the Board of The Depository Trust & Clearing Corporation (DTCC). He also served as President, Chief Operating Officer, and Board member of The Depository Trust Company (DTC) and President and Board member of the National Securities Clearing Corporation (NSCC). In addition, Mr. Dirks served as Chief Executive Officer and Board member of the Government Securities Clearing Corporation, Chief Executive Officer and Board member of the Mortgage-Backed Securities Clearing Corporation, as a Trustee and a member of the Finance Committee of Manhattan College (2005-2008), and as a Trustee and a member of the Finance Committee of AHRC of Nassau County (2006-2008). Mr. Dirks is a member of the Independent Directors Council (IDC) Governing Council (2010-present) and Board of Directors for The Brookville Center for Children's Services, Inc. (2009-present). |
|
Alan J. Lacy (58) |
|
|
|
Year of Election or Appointment: 2008 Mr. Lacy serves as Senior Adviser (2007-present) of Oak Hill Capital Partners, L.P. (private equity). Mr. Lacy also served as Chief Executive Officer (2000-2005) and Vice Chairman (2005-2006) of Sears Holdings Corporation and Sears, Roebuck and Co. (retail). In addition, Mr. Lacy serves as a member of the Board of Directors of Dave & Buster's Entertainment, Inc. (restaurant and entertainment complexes, 2010-present), Earth Fare, Inc. (retail grocery, 2012-present), The Hillman Companies, Inc. (hardware wholesalers, 2010-present), and Bristol-Myers Squibb Company (global pharmaceuticals, 2008-present). Mr. Lacy is a member of the Board of Trustees of The National Parks Conservation Association (2006-present). Previously, Mr. Lacy served as Chairman of the Board of Trustees of the National Parks Conservation Association (2008-2011) and as a member of the Board of Directors for the Western Union Company (global money transfer, 2006-2011). |
|
Ned C. Lautenbach (68) |
|
|
|
Year of Election or Appointment: 2004 Mr. Lautenbach is Chairman of the Independent Trustees of the Equity and High Income Funds (2006-present). Mr. Lautenbach currently serves as the Lead Director of the Eaton Corporation Board of Directors (diversified industrial, 1997-present). Mr. Lautenbach is Chairman of the Board of Directors of the Philharmonic Center for the Arts in Naples, Florida (2012-present) and a member of the Council on Foreign Relations (1994-present). Previously, Mr. Lautenbach was a Partner/Advisory Partner at Clayton, Dubilier & Rice, LLC (private equity investment, 1998-2010), as well as a Director of Sony Corporation (2006-2007). |
|
Joseph Mauriello (67) |
|
|
|
Year of Election or Appointment: 2008 Prior to his retirement in January 2006, Mr. Mauriello served in numerous senior management positions including Deputy Chairman and Chief Operating Officer (2004-2005), and Vice Chairman of Financial Services (2002-2004) of KPMG LLP US (professional services, 1965-2005). Mr. Mauriello currently serves as a member of the Board of Directors of XL Group plc. (global insurance and re-insurance, 2006-present). Previously, Mr. Mauriello served as a Director of the Hamilton Funds of the Bank of New York (2006-2007) and of Arcadia Resources Inc. (health care services and products, 2007-2012). |
|
Robert W. Selander (61) |
|
|
|
Year of Election or Appointment: 2011 Previously, Mr. Selander served as a Member of the Advisory Board of Fidelity's Equity and High Income Funds (2011), Executive Vice Chairman (2010), Chief Executive Officer (2009-2010), and President and Chief Executive Officer (1997-2009) of Mastercard, Inc. |
|
Cornelia M. Small (68) |
|
|
|
Year of Election or Appointment: 2005 Ms. Small is a member of the Board of Directors (2009-present) and Chair of the Investment Committee (2010-present) of the Teagle Foundation. Ms. Small also serves on the Investment Committee of the Berkshire Taconic Community Foundation (2008-present). Previously, Ms. Small served as Chairperson (2002-2008) and a member of the Investment Committee and Chairperson (2008-2012) and a member of the Board of Trustees of Smith College. In addition, Ms. Small served as Chief Investment Officer, Director of Global Equity Investments, and a member of the Board of Directors of Scudder, Stevens & Clark and Scudder Kemper Investments. |
|
William S. Stavropoulos (73) |
|
|
|
Year of Election or Appointment: 2004 Mr. Stavropoulos is Vice Chairman of the Independent Trustees of the Equity and High Income Funds (2006-present). Mr. Stavropoulos serves as President and Founder of the Michigan Baseball Foundation, the Great Lakes Loons (2007-present). Mr. Stavropoulos is Chairman Emeritus of the Board of Directors of The Dow Chemical Company, where he previously served in numerous senior management positions, including President, CEO (1995-2000; 2002-2004), Chairman of the Executive Committee (2000-2006), and as a member of the Board of Directors (1990-2006). Currently, Mr. Stavropoulos is a Director of Univar Inc. (global distributor of commodity and specialty chemicals, Chairman from 2010-May 2012 and Lead Director from May 2012-present), Teradata Corporation (data warehousing and technology solutions, 2008-present), Maersk Inc. (industrial conglomerate), and Tyco International, Ltd. (multinational manufacturing and services, 2007-present), and a member of the Advisory Board for Metalmark Capital LLC (private equity investment, 2005-present). Mr. Stavropoulos is an operating advisor to Clayton, Dubilier & Rice, LLC (private equity investment). In addition, Mr. Stavropoulos is a member of the University of Notre Dame Advisory Council for the College of Science, a Trustee of the Rollin L. Gerstacker Foundation, and a Director of the Naples Philharmonic Center for the Arts. Previously, Mr. Stavropoulos served as a Director of Chemical Financial Corporation (bank holding company, 1993-2012). |
|
David M. Thomas (63) |
|
|
|
Year of Election or Appointment: 2008 Previously, Mr. Thomas served as Executive Chairman (2005-2006) and Chairman and Chief Executive Officer (2000-2005) of IMS Health, Inc. (pharmaceutical and healthcare information solutions), and a Director of Fortune Brands, Inc. (consumer products, 2000-2011). In addition, Mr. Thomas serves as Non-Executive Chairman of the Board of Directors of Fortune Brands Home and Security (home and security products, 2011-present), and as a member of the Board of Directors of Interpublic Group of Companies, Inc. (marketing communication, 2004-present). |
|
Michael E. Wiley (61) |
|
|
|
Year of Election or Appointment: 2008 Mr. Wiley also serves as a Director of Asia Pacific Exploration Consolidated (international oil and gas exploration and production, 2008-present). Mr. Wiley serves as a Director of Tesoro Corporation (independent oil refiner and marketer, 2005-present), and a Director of Bill Barrett Corporation (exploration and production, 2005-present). In addition, Mr. Wiley also serves as a Director of Post Oak Bank (privately-held bank, 2004-present). Previously, Mr. Wiley served as a member of the Board of Trustees of the University of Tulsa (2000-2006; 2007-2010), as a Senior Energy Advisor of Katzenbach Partners, LLC (consulting, 2006-2007), as an Advisory Director of Riverstone Holdings (private investment), Chairman, President, and CEO of Baker Hughes, Inc. (oilfield services, 2000-2004), and as Director of Spinnaker Exploration Company (exploration and production, 2001-2005). |
+ The information above includes each Trustee's principal occupation during the last five years and other information relating to the experience, attributes, and skills relevant to each Trustee's qualifications to serve as a Trustee, which led to the conclusion that each Trustee should serve as a Trustee for the fund.
Advisory Board Members and Executive Officers:
Correspondence intended for David A. Rosow and Garnett A. Smith may be sent to Fidelity Investments, P.O. Box 55235, Boston, Massachusetts 02205-5235. Correspondence intended for each executive officer, Edward C. Johnson 3d, and Peter S. Lynch may be sent to Fidelity Investments, 82 Devonshire Street, Boston, Massachusetts 02109.
|
Name, Age; Principal Occupation |
|
|
Edward C. Johnson 3d (82) |
|
|
|
Year of Election or Appointment: 2011 Member of the Advisory Board of Fidelity's Equity and High Income Funds. Mr. Johnson serves as Chief Executive Officer, Chairman, and a Director of FMR LLC, and also serves as Chairman and Director of FIL Limited. Previously, Mr. Johnson served as a Trustee and Chairman of the Board of certain Fidelity Trusts, Chairman and a Director of FMR, Chairman and a Director of FMR Co., Inc., and President of FMR LLC (2006-2007). |
|
Peter S. Lynch (68) |
|
|
|
Year of Election or Appointment: 2003 Member of the Advisory Board of Fidelity's Equity and High Income Funds. Mr. Lynch is Vice Chairman and a Director of FMR and FMR Co., Inc. In addition, Mr. Lynch serves as a Trustee of Boston College and as the Chairman of the Inner-City Scholarship Fund. Previously, Mr. Lynch served on the Special Olympics International Board of Directors (1997-2006). |
|
David A. Rosow (69) |
|
|
|
Year of Election or Appointment: 2012 Member of the Advisory Board of Fidelity's Equity and High Income Funds. Chairman and Chief Executive Officer of International Golf Group, Inc. (golf course development, 1989-present). Previously, Mr. Rosow served as Chairman and Chief Executive Officer of Rosow & Company, Inc. (private investment company, 1989-2011), a Lead Director of Hudson United Bancorp (2001-2006) and as a Director of TD Banknorth (1996-2006). In addition, Mr. Rosow is a member (2008-present) and President (2009-present) of the Town Council of Palm Beach, Florida. |
|
Garnett A. Smith (64) |
|
|
|
Year of Election or Appointment: 2012 Member of the Advisory Board of Fidelity's Equity and High Income Funds. Prior to Mr. Smith's retirement, he served as Chairman and Chief Executive Officer of Inbrand Corp. (manufacturer of personal absorbent products, 1990-1997). He also served as President (1986-1990) of Inbrand Corp. Prior to his employment with Inbrand Corp., he was employed by a retail fabric chain and North Carolina National Bank. In addition, Mr. Smith is a board member of the Jackson Hole Land Trust (2009-present). |
|
Kenneth B. Robins (43) |
|
|
|
Year of Election or Appointment: 2008 President and Treasurer of Fidelity's Equity and High Income Funds. Mr. Robins also serves as President and Treasurer (2010-present) and Assistant Treasurer (2009-present) of other Fidelity funds and is an employee of Fidelity Investments (2004-present). Previously, Mr. Robins served as Deputy Treasurer of the Fidelity funds (2005-2008) and Treasurer and Chief Financial Officer of The North Carolina Capital Management Trust: Cash and Term Portfolios (2006-2008). |
|
Brian B. Hogan (47) |
|
|
|
Year of Election or Appointment: 2009 Vice President of Equity and High Income Funds. Mr. Hogan also serves as President of FMR's Equity Division (2009-present). Previously, Mr. Hogan served as Senior Vice President, Equity Research of FMR (2006-2009) and as a portfolio manager. |
|
Thomas C. Hense (48) |
|
|
|
Year of Election or Appointment: 2008 or 2010 Vice President of Fidelity's High Income (2008), Small Cap (2008), and Value (2010) Funds. Previously, Mr. Hense served as a portfolio manager for Fidelity's Institutional Money Management Group (Pyramis) (2003-2008). |
|
Scott C. Goebel (44) |
|
|
|
Year of Election or Appointment: 2008 Secretary and Chief Legal Officer (CLO) of the Fidelity funds. Mr. Goebel also serves as Secretary of Fidelity Investments Money Management, Inc. (FIMM) (2010-present) and Fidelity Research and Analysis Company (FRAC) (2010-present); Secretary and CLO of The North Carolina Capital Management Trust: Cash and Term Portfolios (2008-present); General Counsel, Secretary, and Senior Vice President of FMR (2008-present) and FMR Co., Inc. (2008-present); employed by FMR LLC or an affiliate (2001-present); Chief Legal Officer of Fidelity Management & Research (Hong Kong) Limited (2008-present) and Assistant Secretary of Fidelity Management & Research (Japan) Inc. (2008-present), and Fidelity Management & Research (U.K.) Inc. (2008-present). Previously, Mr. Goebel served as Assistant Secretary of FIMM (2008-2010), FRAC (2008-2010), and the Funds (2007-2008) and as Vice President and Secretary of Fidelity Distributors Corporation (FDC) (2005-2007). |
|
William C. Coffey (43) |
|
|
|
Year of Election or Appointment: 2009 Assistant Secretary of Fidelity's Equity and High Income Funds. Mr. Coffey also serves as Senior Vice President and Deputy General Counsel of FMR LLC (2010-present), and is an employee of Fidelity Investments. Previously, Mr. Coffey served as Vice President and Associate General Counsel of FMR LLC (2005-2009). |
|
Elizabeth Paige Baumann (44) |
|
|
|
Year of Election or Appointment: 2012 Anti-Money Laundering (AML) Officer of the Fidelity funds. Ms. Baumann also serves as AML Officer of The North Carolina Capital Management Trust: Cash and Term Portfolios (2012-present), Chief AML Officer of FMR LLC (2012-present), and is an employee of Fidelity Investments. Previously, Ms. Baumann served as Vice President and Deputy Anti-Money Laundering Officer (2007-2012). |
|
Christine Reynolds (53) |
|
|
|
Year of Election or Appointment: 2008 Chief Financial Officer of the Fidelity funds. Ms. Reynolds became President of Fidelity Pricing and Cash Management Services (FPCMS) in August 2008. Ms. Reynolds served as Chief Operating Officer of FPCMS (2007-2008). Previously, Ms. Reynolds served as President, Treasurer, and Anti-Money Laundering officer of the Fidelity funds (2004-2007). |
|
Joseph A. Hanlon (44) |
|
|
|
Year of Election or Appointment: 2012 Chief Compliance Officer of Fidelity's Equity and High Income Funds. Mr. Hanlon serves as Compliance Officer of FMR, FMR Co., Inc., Fidelity Investments Money Management, Inc. (FIMM), Fidelity Research and Analysis Company (FRAC), Fidelity Management & Research (Japan) Inc., Fidelity Management & Research (U.K.) Inc., Fidelity Management & Research (Hong Kong), and Strategic Advisers, Inc. (2009-present), as Senior Vice President of the Fidelity Asset Management Division (2009-present), and is an employee of Fidelity Investments. |
|
Joseph F. Zambello (55) |
|
|
|
Year of Election or Appointment: 2011 Deputy Treasurer of the Fidelity funds. Mr. Zambello is an employee of Fidelity Investments. Previously, Mr. Zambello served as Vice President of FMR's Program Management Group (2009-2011) and Vice President of the Transfer Agent Oversight Group (2005-2009). |
|
Adrien E. Deberghes (45) |
|
|
|
Year of Election or Appointment: 2008 Deputy Treasurer of Fidelity's Equity and High Income Funds. Mr. Deberghes also serves as Vice President (2011-present) and Assistant Treasurer (2010-present) of other Fidelity funds, and is an employee of Fidelity Investments (2008-present). Previously, Mr. Deberghes served as Senior Vice President of Mutual Fund Administration at State Street Corporation (2007-2008), Senior Director of Mutual Fund Administration at Investors Bank & Trust (2005-2007), and Director of Finance for Dunkin' Brands (2000-2005). |
|
Stephanie J. Dorsey (43) |
|
|
|
Year of Election or Appointment: 2010 Assistant Treasurer of Fidelity's Equity and High Income Funds. Ms. Dorsey also serves as Deputy Treasurer of other Fidelity funds (2008-present) and is an employee of Fidelity Investments (2008-present). Previously, Ms. Dorsey served as Treasurer (2004-2008) of the JPMorgan Mutual Funds and Vice President (2004-2008) of JPMorgan Chase Bank. |
|
John R. Hebble (54) |
|
|
|
Year of Election or Appointment: 2009 Assistant Treasurer of Fidelity's Equity and High Income Funds. Mr. Hebble also serves as President (2011-present), Treasurer, and Chief Financial Officer of The North Carolina Capital Management Trust: Cash and Term Portfolios (2008-present), President and Treasurer of other Fidelity funds (2008-present) and is an employee of Fidelity Investments. |
|
Gary W. Ryan (54) |
|
|
|
Year of Election or Appointment: 2005 Assistant Treasurer of the Fidelity funds. Mr. Ryan is an employee of Fidelity Investments. Previously, Mr. Ryan served as Vice President of Fund Reporting in Fidelity Pricing and Cash Management Services (FPCMS) (1999-2005). |
|
Jonathan Davis (44) |
|
|
|
Year of Election or Appointment: 2010 Assistant Treasurer of the Fidelity funds. Mr. Davis is also Assistant Treasurer of Fidelity Rutland Square Trust II and Fidelity Commonwealth Trust II. Mr. Davis is an employee of Fidelity Investments. Previously, Mr. Davis served as Vice President and Associate General Counsel of FMR LLC (2003-2010). |
Annual Report
Board Approval of Investment Advisory Contracts and Management Fees
Fidelity High Income Central Fund 2
Each year, the Board of Directors, including the Independent Directors (together, the Board), votes on the renewal of the management contract and sub-advisory agreements (together, the Advisory Contracts) for the fund. The Board, assisted by the advice of fund counsel and Independent Directors' counsel, requests and considers a broad range of information relevant to the renewal of the Advisory Contracts throughout the year.
The Board meets regularly and, at each of its meetings, considers factors that are relevant to its annual consideration of the renewal of the fund's Advisory Contracts, including the services and support provided to the fund and its shareholders. The Board has established various standing committees, each composed of and chaired by Independent Directors with varying backgrounds, to which the Board has assigned specific subject matter responsibilities in order to enhance effective decision-making by the Board. The Board, acting directly and through its Committees, requests and receives information concerning the annual consideration of the renewal of the fund's Advisory Contracts. The Board also meets as needed to consider matters specifically related to the Board's annual consideration of the renewal of Advisory Contracts. Members of the Board may also meet with trustees of other Fidelity funds through ad hoc joint committees to discuss certain matters relevant to the Fidelity funds.
At its July 2012 meeting, the Board of Directors, including the Independent Directors, unanimously determined to renew the fund's Advisory Contracts. In reaching its determination, the Board considered all factors it believed relevant and reached a determination, with the assistance of fund counsel and Independent Directors' counsel and through the exercise of its business judgment, that the renewal of the Advisory Contracts is in the best interests of the fund and its shareholders and that the lack of compensation payable under the management contract is fair and reasonable.
Nature, Extent, and Quality of Services Provided. The Board considered the staffing within the investment adviser, FMR Co., Inc., and the sub-advisers (together, the Investment Advisers), including the backgrounds of the fund's investment personnel, and also considered the fund's investment objective, strategies, and related investment philosophy. The Independent Directors also had discussions with senior management of Fidelity's investment operations and investment groups. The Board considered the structure of the portfolio manager compensation program and whether this structure provides appropriate incentives to act in the best interests of the fund.
Resources Dedicated to Investment Management and Support Services. The Board and the Fund Oversight and Research Committees reviewed the general qualifications and capabilities of the Investment Advisers' investment staff, including its size, education, experience, and resources, as well as the Investment Advisers' approach to recruiting, training, managing, and compensating investment personnel. The Board also noted that FMR has continued to increase the resources devoted to non-U.S. offices, including expansion of Fidelity's global investment organization. The Board noted that Fidelity's analysts have extensive resources, tools and capabilities that allow them to conduct sophisticated quantitative and fundamental analysis, as well as credit analysis of issuers, counterparties and guarantors. The Board also believes that Fidelity's investment professionals have sufficient access to global information and data so as to provide competitive investment results over time, and that those professionals also have access to sophisticated tools that permit them to assess portfolio construction and risk and performance attribution characteristics continuously, as well as to transmit new information and research conclusions rapidly around the world. Additionally, in its deliberations, the Board considered the Investment Advisers' trading and risk management capabilities and resources, which are an integral part of the investment management process.
Annual Report
Administrative Services. The Board considered (i) the nature, extent, quality, and cost of advisory and administrative services performed by the Investment Advisers and their affiliates under the Advisory Contracts and under separate agreements covering transfer agency, pricing and bookkeeping, and securities lending services for the fund; (ii) the nature and extent of the supervision of third party service providers, principally custodians and subcustodians; and (iii) the resources devoted to, and the record of compliance with, the fund's compliance policies and procedures. The Board also reviewed the allocation of fund brokerage, including allocations to brokers affiliated with the Investment Advisers, and the use of "soft" commission dollars to pay for research services.
Investment Performance. The Board considered whether the fund has operated in accordance with its investment objective, as well as its record of compliance with its investment restrictions. The Board reviewed the fund's absolute investment performance, as well as the fund's relative investment performance, but did not consider performance to be a material factor in its decision to renew the fund's Advisory Contracts, as the fund is not publicly offered as a stand-alone investment product. In this regard, the Board noted that the fund is designed to offer a liquid investment option for other investment companies managed by Fidelity Management & Research Company (FMR) or its affiliates and ultimately to enhance the performance of those investment companies.
Based on its review, the Board concluded that the nature, extent, and quality of services provided to the fund under the Advisory Contracts should benefit the fund's shareholders.
Competitiveness of Management Fee and Total Expense Ratio. The Board considered that while the fund does not pay a management fee, FMR pays a management fee on behalf of the fund and receives fees for providing services to funds that invest in the fund. The Board also noted that FMR bears all expenses of the fund, except expenses related to the fund's investment activities (primarily custody expenses). Based on its review, the Board concluded that the management fee paid on behalf of the fund and the fund's total expense ratio was reasonable in light of the services that the fund and its shareholders receive and the other factors considered.
Annual Report
Board Approval of Investment Advisory Contracts and
Management Fees - continued
Costs of the Services and Profitability. The Board considered the level of Fidelity's profits in respect of all the Fidelity funds, as well as the profitability of each fund that invests in this fund.
PricewaterhouseCoopers LLP (PwC), independent registered public accounting firm and auditor to Fidelity and certain Fidelity funds, has been engaged annually by the Board as part of the Board's assessment of Fidelity's profitability analysis. PwC's engagement includes the review and assessment of Fidelity's methodologies used in determining the revenues and expenses attributable to Fidelity's mutual fund business, and completion of agreed-upon procedures surrounding the mathematical accuracy of fund profitability and its conformity to allocation methodologies. After considering PwC's reports issued under the engagement and information provided by Fidelity, the Board concluded that while other allocation methods may also be reasonable, Fidelity's profitability methodologies are reasonable in all material respects.
The Board also reviewed Fidelity's non-fund businesses and fall-out benefits related to the mutual fund business as well as cases where Fidelity's affiliates may benefit from or be related to the fund's business.
The Board concluded that the costs of the services provided by and the profits realized by Fidelity in connection with the operation of the fund were not relevant to the renewal of the Advisory Contracts because the fund pays no advisory fees and FMR bears all expenses of the fund, except expenses related to the fund's investment activities.
Economies of Scale. The Board concluded that because the fund pays no advisory fees and FMR bears all expenses of the fund, except expenses related to the fund's investment activities, economies of scale cannot be realized by the fund.
Additional Information Requested by the Board. In order to develop fully the factual basis for consideration of the Fidelity funds' Advisory Contracts, the Board requested and received additional information on certain topics, including (i) fund performance trends, actions to be taken by FMR to improve certain funds' overall performance, and Fidelity's long-term strategies for certain funds; (ii) the potential to further rationalize the Fidelity fund lineup with the possibility of achieving savings for the funds and Fidelity; (iii) Fidelity's compensation structure for portfolio managers and other key investment personnel; (iv) the amount of the investment that each portfolio manager has made in the Fidelity fund(s) that he or she manages; (v) the realization of fall-out benefits in certain Fidelity business units; (vi) Fidelity's group fee structures, the potential impact of regulatory changes on such structures, and the rationale for the individual fee rates of certain funds; (vii) fund profitability methodology, including Fidelity's cost allocation methodology, and the impact of certain factors on fund profitability results; (viii) trends regarding industry use of performance fee structures and the possibility of implementing performance fee structures for additional funds; and (ix) the impact of net redemptions from the Fidelity funds.
Annual Report
Based on its evaluation of all of the conclusions noted above, and after considering all factors it believed relevant, the Board ultimately concluded that the advisory fee structures are fair and reasonable, and that the fund's Advisory Contracts should be renewed.
Annual Report
Fidelity® Specialized High Income
Central Fund
Annual Report
August 31, 2012
To view a fund's proxy voting guidelines and proxy voting record for the 12-month period ended June 30, visit http://www.fidelity.com/proxyvotingresults or visit the Securities and Exchange Commission's (SEC) web site at http://www.sec.gov. You may also call 1-800-544-8544 to request a free copy of the proxy voting guidelines.
Standard & Poor's, S&P and S&P 500 are registered service marks of The McGraw-Hill Companies, Inc. and have been licensed for use by Fidelity Distributors Corporation.
Other third party marks appearing herein are the property of their respective owners.
All other marks appearing herein are registered or unregistered trademarks or service marks of FMR LLC or an affiliated company. © 2012 FMR LLC. All rights reserved.
A fund files its complete schedule of portfolio holdings with the SEC for the first and third quarters of each fiscal year on Form N-Q. Forms N-Q are available on the SEC's web site at http://www.sec.gov. A fund's Forms N-Q may be reviewed and copied at the SEC's Public Reference Room in Washington, DC. Information regarding the operation of the SEC's Public Reference Room may be obtained by calling 1-800-SEC-0330.
SHI-ANN-1012
1.820817.107
Performance: The Bottom Line
Average annual total return reflects the change in the value of an investment, assuming reinvestment of the fund's distributions from dividend income and capital gains (the profits earned upon the sale of securities that have grown in value, if any) and assuming a constant rate of performance each year. The $10,000 table and the fund's returns do not reflect the deduction of taxes that a shareholder would pay on fund distributions or the redemption of fund shares. During periods of reimbursement by Fidelity, a fund's total return will be greater than it would be had the reimbursement not occurred. How a fund did yesterday is no guarantee of how it will do tomorrow.
Average Annual Total Returns
|
Periods ended August 31, 2012 |
Past 1 |
Past 5 |
Life of |
|
Fidelity® Specialized High Income Central |
13.31% |
9.15% |
8.07% |
A From September 20, 2005.
$10,000 Over Life of Fund
Let's say hypothetically that $10,000 was invested in Fidelity® Specialized High Income Central Fund on September 20, 2005, when the fund started. The chart shows how the value of your investment would have changed, and also shows how The BofA Merrill LynchSM BB US High Yield Constrained Index performed over the same period.

Annual Report
Management's Discussion of Fund Performance
Market Recap: High-yield bonds produced a strong return for the year ending August 31, 2012, with The BofA Merrill LynchSM US High Yield Constrained Index advancing 13.01%. Worry about sovereign debt issues in the eurozone and weak global economic growth failed to restrain the asset class amid favorable supply/demand technicals - with investors attracted to its higher yields in a very low interest rate environment - accommodative Federal Reserve monetary policy, plentiful liquidity and a low default rate. High-yield bonds started the period off wracked by volatility, but rebounded in October 2011 to one of its largest monthly increases ever, before stalling once again in November. The market posted positive returns from December through February, then declined modestly from March through May. The tide shifted in June, though, as Greece elected a pro-euro, pro-bailout government and the Fed implemented a second round of "Operation Twist," a program designed to help buoy economic growth. In July, soft corporate earnings and weak economic data were a concern, but the market was supported by comments late in the month by European Central Bank (ECB) President Mario Draghi, who said the ECB would do "whatever it takes" to protect the eurozone from collapsing. In August, hopes of further monetary response in the U.S. and abroad outweighed weak global economic growth, further boosting the asset class.
Comments from Matthew Conti, Portfolio Manager of Fidelity® Specialized High Income Central Fund: For the year, the fund returned 13.31%, outperforming The BofA Merrill LynchSM BB US High Yield Constrained Index, which gained 12.42%. An overweighting in diversified financial services helped the fund's performance the most relative to the index, including an investment in International Lease Finance. We also benefited from positioning in homebuilders/real estate and metals/mining, and from security selection in energy. Other top relative contributors included wireless telecommunications company Sprint Nextel, waste management firm Covanta Holding, drug company Valeant Pharmaceuticals International, an underweighting in independent oil and gas producer Chesapeake Energy and auto parts supplier Delphi. Conversely, an underweighting and unfavorable security selection in banks/thrifts detracted, including an underweighting in and untimely ownership of Ally Financial. Out-of-benchmark positions in Latin American oil and gas producer Pan American Energy and shipping company Overseas Shipholding Group also hurt, as did untimely ownership of phone company Frontier Communications and not owning paper company and index component Georgia-Pacific. Some of the securities mentioned were not held by the fund at period end.
The views expressed above reflect those of the portfolio manager(s) only through the end of the period as stated on the cover of this report and do not necessarily represent the views of Fidelity or any other person in the Fidelity organization. Any such views are subject to change at any time based upon market or other conditions and Fidelity disclaims any responsibility to update such views. These views may not be relied on as investment advice and, because investment decisions for a Fidelity fund are based on numerous factors, may not be relied on as an indication of trading intent on behalf of any Fidelity fund.
Annual Report
Shareholder Expense Example
As a shareholder of the Fund, you incur two types of costs: (1) transaction costs, and (2) ongoing costs, including other Fund expenses. This Example is intended to help you understand your ongoing costs (in dollars) of investing in the Fund and to compare these costs with the ongoing costs of investing in other mutual funds.
The Example is based on an investment of $1,000 invested at the beginning of the period and held for the entire period (March 1, 2012 to August 31, 2012).
Actual Expenses
The first line of the accompanying table provides information about actual account values and actual expenses. You may use the information in this line, together with the amount you invested, to estimate the expenses that you paid over the period. Simply divide your account value by $1,000.00 (for example, an $8,600 account value divided by $1,000.00 = 8.6), then multiply the result by the number in the first line under the heading entitled "Expenses Paid During Period" to estimate the expenses you paid on your account during this period. In addition, the Fund, as a shareholder in the underlying Fidelity Central Funds, will indirectly bear its pro-rata share of the fees and expenses incurred by the underlying Fidelity Central Funds. These fees and expenses are not included in the Fund's annualized expense ratio used to calculate the expense estimate in the table below.
Hypothetical Example for Comparison Purposes
The second line of the accompanying table provides information about hypothetical account values and hypothetical expenses based on the Fund's actual expense ratio and an assumed rate of return of 5% per year before expenses, which is not the Fund's actual return. The hypothetical account values and expenses may not be used to estimate the actual ending account balance or expenses you paid for the period. You may use this information to compare the ongoing costs of investing in the Fund and other funds. To do so, compare this 5% hypothetical example with the 5% hypothetical examples that appear in the shareholder reports of the other funds. In addition, the Fund, as a shareholder in the underlying Fidelity Central Funds, will indirectly bear its pro-rata share of the fees and expenses incurred by the underlying Fidelity Central Funds. These fees and expenses are not included in the Fund's annualized expense ratio used to calculate the expense estimate in the table below.
Please note that the expenses shown in the table are meant to highlight your ongoing costs only and do not reflect any transaction costs. Therefore, the second line of the table is useful in comparing ongoing costs only, and will not help you determine the relative total costs of owning different funds.
Annual Report
|
|
Annualized |
Beginning |
Ending |
Expenses Paid |
|
Actual |
.0016% |
$ 1,000.00 |
$ 1,041.60 |
$ .01 |
|
Hypothetical (5% return per year before expenses) |
|
$ 1,000.00 |
$ 1,025.13 |
$ .01 |
* Expenses are equal to the Fund's annualized expense ratio, multiplied by the average account value over the period, multiplied by 184/366 (to reflect the one-half year period).
Annual Report
Investment Changes (Unaudited)
|
Top Five Holdings as of August 31, 2012 |
||
|
(by issuer, excluding cash equivalents) |
% of fund's |
% of fund's net assets |
|
International Lease Finance Corp. |
4.8 |
4.8 |
|
Ford Motor Credit Co. LLC |
4.1 |
4.2 |
|
Icahn Enterprises LP/Icahn Enterprises Finance Corp. |
3.9 |
3.9 |
|
CCO Holdings LLC/CCO Holdings Capital Corp. |
3.5 |
2.5 |
|
The AES Corp. |
2.4 |
2.5 |
|
|
18.7 |
|
|
Top Five Market Sectors as of August 31, 2012 |
||
|
|
% of fund's |
% of fund's net assets |
|
Energy |
13.8 |
13.8 |
|
Diversified Financial Services |
11.4 |
11.1 |
|
Automotive |
10.0 |
10.4 |
|
Electric Utilities |
9.9 |
9.8 |
|
Cable TV |
8.4 |
5.6 |
|
Quality Diversification (% of fund's net assets) |
|||||||
|
As of August 31, 2012 |
As of February 29, 2012 |
||||||
|
BBB 7.0% |
|
|
BBB 3.0% |
|
||
 |
BB 67.5% |
|
|
BB 71.5% |
|
||
 |
B 18.1% |
|
|
B 21.6% |
|
||
 |
CCC,CC,C 0.0% |
|
 |
CCC,CC,C 0.3% |
|
||
|
Not Rated 0.2% |
|
|
Not Rated 0.1% |
|
||
|
Short-Term |
|
|
Short-Term |
|
||

|
We have used ratings from Moody's Investors Service, Inc. Where Moody's® ratings are not available, we have used S&P® ratings. All ratings are as of the date indicated and do not reflect subsequent changes. |
|
Asset Allocation (% of fund's net assets) |
|||||||
|
As of August 31, 2012* |
As of February 29, 2012** |
||||||
|
Nonconvertible |
|
|
Nonconvertible |
|
||
|
Floating Rate |
|
|
Floating Rate |
|
||
|
Short-Term |
|
|
Short-Term |
|
||
|
* Foreign investments |
13.6% |
|
** Foreign investments |
13.8% |
|
||

Annual Report
Investments August 31, 2012
Showing Percentage of Net Assets
|
Nonconvertible Bonds - 88.0% |
||||
|
|
Principal |
Value |
||
|
Aerospace - 0.5% |
||||
|
Huntington Ingalls Industries, Inc. 6.875% 3/15/18 |
|
$ 2,030,000 |
$ 2,172,100 |
|
|
Air Transportation - 2.9% |
||||
|
Continental Airlines, Inc.: |
|
|
|
|
|
pass-thru trust certificates 9.798% 4/1/21 |
|
678,581 |
729,475 |
|
|
6.75% 9/15/15 (b) |
|
2,535,000 |
2,611,050 |
|
|
Continental Airlines, Inc. 9.25% 5/10/17 |
|
316,703 |
346,790 |
|
|
Delta 2012-1B Pass Through Trust 6.875% 5/7/19 (b) |
|
1,320,000 |
1,333,200 |
|
|
Delta Air Lines, Inc. pass-thru trust certificates: |
|
|
|
|
|
6.375% 1/2/16 |
|
690,000 |
690,000 |
|
|
6.75% 11/23/15 |
|
690,000 |
702,075 |
|
|
8.021% 8/10/22 |
|
2,233,226 |
2,300,223 |
|
|
8.954% 8/10/14 |
|
326,443 |
332,156 |
|
|
Northwest Airlines, Inc. pass-thru trust certificates 8.028% 11/1/17 |
|
1,195,173 |
1,238,558 |
|
|
United Air Lines, Inc. pass-thru trust certificates: |
|
|
|
|
|
Class B, 7.336% 7/2/19 |
|
1,174,733 |
1,133,617 |
|
|
9.75% 1/15/17 |
|
1,487,025 |
1,706,361 |
|
|
12% 1/15/16 (b) |
|
220,928 |
240,259 |
|
|
|
13,363,764 |
|||
|
Automotive - 8.0% |
||||
|
Dana Holding Corp.: |
|
|
|
|
|
6.5% 2/15/19 |
|
3,285,000 |
3,498,525 |
|
|
6.75% 2/15/21 |
|
1,035,000 |
1,112,625 |
|
|
Delphi Corp.: |
|
|
|
|
|
5.875% 5/15/19 |
|
4,170,000 |
4,472,325 |
|
|
6.125% 5/15/21 |
|
3,970,000 |
4,367,000 |
|
|
Ford Motor Co. 7.45% 7/16/31 |
|
2,620,000 |
3,235,700 |
|
|
Ford Motor Credit Co. LLC: |
|
|
|
|
|
3.875% 1/15/15 |
|
2,730,000 |
2,840,680 |
|
|
5% 5/15/18 |
|
2,305,000 |
2,480,832 |
|
|
5.625% 9/15/15 |
|
1,310,000 |
1,424,625 |
|
|
5.875% 8/2/21 |
|
1,305,000 |
1,441,251 |
|
|
6.625% 8/15/17 |
|
5,835,000 |
6,666,488 |
|
|
7% 4/15/15 |
|
1,630,000 |
1,816,146 |
|
|
8% 12/15/16 |
|
2,350,000 |
2,809,011 |
|
|
General Motors Financial Co., Inc. 4.75% 8/15/17 (b) |
|
1,095,000 |
1,097,738 |
|
|
|
37,262,946 |
|||
|
Banks & Thrifts - 0.2% |
||||
|
Ally Financial, Inc. 5.5% 2/15/17 |
|
745,000 |
771,075 |
|
|
Nonconvertible Bonds - continued |
||||
|
|
Principal |
Value |
||
|
Building Materials - 2.7% |
||||
|
Building Materials Corp. of America: |
|
|
|
|
|
6.75% 5/1/21 (b) |
|
$ 2,690,000 |
$ 2,938,825 |
|
|
6.875% 8/15/18 (b) |
|
4,960,000 |
5,369,200 |
|
|
Griffon Corp. 7.125% 4/1/18 |
|
1,765,000 |
1,848,838 |
|
|
Masco Corp. 5.95% 3/15/22 |
|
1,175,000 |
1,268,734 |
|
|
USG Corp. 7.875% 3/30/20 (b) |
|
1,270,000 |
1,350,963 |
|
|
|
12,776,560 |
|||
|
Cable TV - 8.3% |
||||
|
CCO Holdings LLC/CCO Holdings Capital Corp.: |
|
|
|
|
|
5.25% 9/30/22 |
|
1,835,000 |
1,821,238 |
|
|
6.5% 4/30/21 |
|
4,000,000 |
4,290,000 |
|
|
6.625% 1/31/22 |
|
1,030,000 |
1,111,113 |
|
|
7% 1/15/19 |
|
6,130,000 |
6,635,725 |
|
|
7.25% 10/30/17 |
|
2,420,000 |
2,643,850 |
|
|
CSC Holdings LLC: |
|
|
|
|
|
6.75% 11/15/21 (b) |
|
2,680,000 |
2,904,316 |
|
|
8.625% 2/15/19 |
|
2,185,000 |
2,556,450 |
|
|
DISH DBS Corp.: |
|
|
|
|
|
4.625% 7/15/17 (b) |
|
3,355,000 |
3,388,550 |
|
|
5.875% 7/15/22 (b) |
|
1,600,000 |
1,612,000 |
|
|
Unitymedia Hessen GmbH & Co. KG/Unitymedia NRW GmbH 8.125% 12/1/17 (b) |
|
3,610,000 |
3,916,850 |
|
|
UPCB Finance III Ltd. 6.625% 7/1/20 (b) |
|
5,240,000 |
5,462,700 |
|
|
UPCB Finance V Ltd. 7.25% 11/15/21 (b) |
|
1,940,000 |
2,082,978 |
|
|
|
38,425,770 |
|||
|
Capital Goods - 0.5% |
||||
|
Amsted Industries, Inc. 8.125% 3/15/18 (b) |
|
1,150,000 |
1,242,000 |
|
|
Terex Corp. 6.5% 4/1/20 |
|
1,245,000 |
1,304,138 |
|
|
|
2,546,138 |
|||
|
Chemicals - 1.7% |
||||
|
Celanese US Holdings LLC 6.625% 10/15/18 |
|
2,615,000 |
2,883,038 |
|
|
LyondellBasell Industries NV: |
|
|
|
|
|
5% 4/15/19 |
|
1,625,000 |
1,722,500 |
|
|
5.75% 4/15/24 |
|
2,680,000 |
3,041,800 |
|
|
6% 11/15/21 |
|
330,000 |
375,375 |
|
|
|
8,022,713 |
|||
|
Containers - 3.0% |
||||
|
Ardagh Packaging Finance PLC 7.375% 10/15/17 (b) |
|
2,420,000 |
2,595,450 |
|
|
Ardagh Packaging Finance PLC / Ardagh MP Holdings USA, Inc. 7.375% 10/15/17 (b) |
|
200,000 |
214,500 |
|
|
Nonconvertible Bonds - continued |
||||
|
|
Principal |
Value |
||
|
Containers - continued |
||||
|
Reynolds Group Issuer, Inc./Reynolds Group Issuer LLC/Reynolds Group Issuer (Luxembourg) SA: |
|
|
|
|
|
7.75% 10/15/16 |
|
$ 1,995,000 |
$ 2,084,775 |
|
|
7.875% 8/15/19 |
|
5,855,000 |
6,513,688 |
|
|
Sealed Air Corp.: |
|
|
|
|
|
8.125% 9/15/19 (b) |
|
1,450,000 |
1,609,500 |
|
|
8.375% 9/15/21 (b) |
|
770,000 |
860,475 |
|
|
|
13,878,388 |
|||
|
Diversified Financial Services - 11.4% |
||||
|
Aircastle Ltd.: |
|
|
|
|
|
6.75% 4/15/17 |
|
660,000 |
712,800 |
|
|
9.75% 8/1/18 |
|
3,135,000 |
3,593,494 |
|
|
CIT Group, Inc.: |
|
|
|
|
|
4.25% 8/15/17 |
|
1,050,000 |
1,057,875 |
|
|
5% 5/15/17 |
|
2,670,000 |
2,770,125 |
|
|
5% 8/15/22 |
|
835,000 |
837,088 |
|
|
5.25% 3/15/18 |
|
1,625,000 |
1,694,063 |
|
|
5.375% 5/15/20 |
|
1,315,000 |
1,357,738 |
|
|
Icahn Enterprises LP/Icahn Enterprises Finance Corp.: |
|
|
|
|
|
7.75% 1/15/16 |
|
10,005,000 |
10,505,233 |
|
|
8% 1/15/18 |
|
6,630,000 |
7,060,950 |
|
|
8% 1/15/18 (b) |
|
380,000 |
403,750 |
|
|
ILFC E-Capital Trust II 6.25% 12/21/65 (b)(c) |
|
460,000 |
322,000 |
|
|
International Lease Finance Corp.: |
|
|
|
|
|
5.65% 6/1/14 |
|
4,040,000 |
4,181,400 |
|
|
5.75% 5/15/16 |
|
560,000 |
581,000 |
|
|
5.875% 4/1/19 |
|
485,000 |
500,096 |
|
|
6.25% 5/15/19 |
|
1,815,000 |
1,896,675 |
|
|
6.75% 9/1/16 (b) |
|
745,000 |
832,538 |
|
|
7.125% 9/1/18 (b) |
|
1,560,000 |
1,782,300 |
|
|
8.625% 9/15/15 |
|
5,280,000 |
5,913,600 |
|
|
8.75% 3/15/17 |
|
4,135,000 |
4,765,588 |
|
|
8.875% 9/1/17 |
|
1,820,000 |
2,111,200 |
|
|
|
52,879,513 |
|||
|
Electric Utilities - 9.9% |
||||
|
Atlantic Power Corp. 9% 11/15/18 |
|
1,715,000 |
1,792,175 |
|
|
Calpine Construction Finance Co. LP 8% 6/1/16 (b) |
|
4,140,000 |
4,471,200 |
|
|
Dolphin Subsidiary II, Inc. 6.5% 10/15/16 (b) |
|
2,295,000 |
2,513,025 |
|
|
Everest Acquisition LLC / Everest Acquisition Finance, Inc. 6.875% 5/1/19 (b) |
|
1,905,000 |
2,047,875 |
|
|
InterGen NV 9% 6/30/17 (b) |
|
3,780,000 |
3,685,500 |
|
|
Nonconvertible Bonds - continued |
||||
|
|
Principal |
Value |
||
|
Electric Utilities - continued |
||||
|
IPALCO Enterprises, Inc.: |
|
|
|
|
|
5% 5/1/18 |
|
$ 1,280,000 |
$ 1,334,400 |
|
|
7.25% 4/1/16 (b) |
|
2,175,000 |
2,436,000 |
|
|
Mirant Mid-Atlantic LLC 10.06% 12/30/28 |
|
1,558,871 |
1,734,244 |
|
|
NSG Holdings II, LLC 7.75% 12/15/25 (b) |
|
6,535,000 |
6,665,700 |
|
|
NV Energy, Inc. 6.25% 11/15/20 |
|
1,855,000 |
2,142,280 |
|
|
Otter Tail Corp. 9% 12/15/16 |
|
1,300,000 |
1,410,500 |
|
|
Puget Energy, Inc.: |
|
|
|
|
|
5.625% 7/15/22 (b) |
|
375,000 |
393,263 |
|
|
6.5% 12/15/20 |
|
3,605,000 |
3,965,500 |
|
|
The AES Corp.: |
|
|
|
|
|
7.375% 7/1/21 |
|
4,070,000 |
4,660,150 |
|
|
7.75% 10/15/15 |
|
3,020,000 |
3,397,500 |
|
|
8% 10/15/17 |
|
1,710,000 |
1,992,150 |
|
|
9.75% 4/15/16 |
|
1,305,000 |
1,559,475 |
|
|
|
46,200,937 |
|||
|
Energy - 13.3% |
||||
|
AmeriGas Partners LP/AmeriGas Finance Corp.: |
|
|
|
|
|
6.25% 8/20/19 |
|
580,000 |
603,200 |
|
|
6.5% 5/20/21 |
|
148,000 |
155,030 |
|
|
Chesapeake Energy Corp.: |
|
|
|
|
|
6.125% 2/15/21 |
|
2,360,000 |
2,342,300 |
|
|
6.5% 8/15/17 |
|
965,000 |
993,950 |
|
|
6.775% 3/15/19 |
|
655,000 |
659,913 |
|
|
6.875% 11/15/20 |
|
3,450,000 |
3,579,375 |
|
|
Chesapeake Midstream Partners LP/CHKM Finance Corp.: |
|
|
|
|
|
5.875% 4/15/21 |
|
525,000 |
536,813 |
|
|
6.125% 7/15/22 |
|
1,195,000 |
1,242,800 |
|
|
Chesapeake Oilfield Operating LLC 6.625% 11/15/19 (b) |
|
595,000 |
571,200 |
|
|
Denbury Resources, Inc. 6.375% 8/15/21 |
|
4,025,000 |
4,306,750 |
|
|
Energy Transfer Equity LP 7.5% 10/15/20 |
|
3,050,000 |
3,507,500 |
|
|
Exterran Holdings, Inc. 7.25% 12/1/18 |
|
6,395,000 |
6,395,000 |
|
|
Ferrellgas LP/Ferrellgas Finance Corp. 6.5% 5/1/21 |
|
2,156,000 |
2,102,100 |
|
|
Frontier Oil Corp.: |
|
|
|
|
|
6.875% 11/15/18 |
|
3,625,000 |
3,851,563 |
|
|
8.5% 9/15/16 |
|
3,320,000 |
3,465,416 |
|
|
Hornbeck Offshore Services, Inc.: |
|
|
|
|
|
5.875% 4/1/20 |
|
460,000 |
466,900 |
|
|
8% 9/1/17 |
|
930,000 |
1,004,400 |
|
|
Nonconvertible Bonds - continued |
||||
|
|
Principal |
Value |
||
|
Energy - continued |
||||
|
Kinder Morgan Finance Co. LLC 6% 1/15/18 (b) |
|
$ 3,085,000 |
$ 3,308,663 |
|
|
Markwest Energy Partners LP/Markwest Energy Finance Corp. 5.5% 2/15/23 |
|
235,000 |
240,288 |
|
|
Newfield Exploration Co. 5.625% 7/1/24 |
|
525,000 |
569,625 |
|
|
Oil States International, Inc. 6.5% 6/1/19 |
|
3,145,000 |
3,341,563 |
|
|
Pan American Energy LLC 7.875% 5/7/21 (b) |
|
1,520,000 |
1,314,800 |
|
|
PBF Holding Co. LLC/PBF Finance Corp. 8.25% 2/15/20 (b) |
|
1,530,000 |
1,606,500 |
|
|
Petroleum Geo-Services ASA 7.375% 12/15/18 (b) |
|
1,065,000 |
1,136,888 |
|
|
Plains Exploration & Production Co. 6.125% 6/15/19 |
|
2,455,000 |
2,590,025 |
|
|
Precision Drilling Corp.: |
|
|
|
|
|
6.5% 12/15/21 |
|
100,000 |
105,000 |
|
|
6.625% 11/15/20 |
|
3,830,000 |
4,031,075 |
|
|
SESI LLC 7.125% 12/15/21 |
|
1,790,000 |
1,989,048 |
|
|
Suburban Propane Partners LP/Suburban Energy Finance Corp.: |
|
|
|
|
|
7.375% 8/1/21 (b) |
|
204,000 |
215,220 |
|
|
7.5% 10/1/18 (b) |
|
1,566,000 |
1,687,365 |
|
|
Targa Resources Partners LP/Targa Resources Partners Finance Corp. 6.375% 8/1/22 (b) |
|
1,855,000 |
1,933,838 |
|
|
WPX Energy, Inc.: |
|
|
|
|
|
5.25% 1/15/17 |
|
730,000 |
768,325 |
|
|
6% 1/15/22 |
|
1,055,000 |
1,115,663 |
|
|
|
61,738,096 |
|||
|
Environmental - 2.5% |
||||
|
Clean Harbors, Inc. 5.25% 8/1/20 (b) |
|
1,305,000 |
1,339,256 |
|
|
Covanta Holding Corp.: |
|
|
|
|
|
6.375% 10/1/22 |
|
640,000 |
697,600 |
|
|
7.25% 12/1/20 |
|
8,555,000 |
9,548,210 |
|
|
|
11,585,066 |
|||
|
Food/Beverage/Tobacco - 0.4% |
||||
|
Constellation Brands, Inc. 4.625% 3/1/23 |
|
260,000 |
264,238 |
|
|
JBS USA LLC/JBS USA Finance, Inc. 8.25% 2/1/20 (b) |
|
1,645,000 |
1,575,088 |
|
|
|
1,839,326 |
|||
|
Gaming - 1.1% |
||||
|
Wynn Las Vegas LLC/Wynn Las Vegas Capital Corp.: |
|
|
|
|
|
5.375% 3/15/22 (b) |
|
1,670,000 |
1,703,400 |
|
|
7.75% 8/15/20 |
|
3,285,000 |
3,658,669 |
|
|
|
5,362,069 |
|||
|
Nonconvertible Bonds - continued |
||||
|
|
Principal |
Value |
||
|
Healthcare - 5.1% |
||||
|
Community Health Systems, Inc. 5.125% 8/15/18 |
|
$ 805,000 |
$ 830,156 |
|
|
Fresenius Medical Care US Finance II, Inc. 5.625% 7/31/19 (b) |
|
2,030,000 |
2,172,100 |
|
|
HCA, Inc.: |
|
|
|
|
|
8.5% 4/15/19 |
|
770,000 |
864,325 |
|
|
9.875% 2/15/17 |
|
172,000 |
185,760 |
|
|
MPT Operating Partnership LP/MPT Finance Corp. 6.875% 5/1/21 |
|
1,635,000 |
1,778,063 |
|
|
Mylan, Inc.: |
|
|
|
|
|
6% 11/15/18 (b) |
|
510,000 |
543,150 |
|
|
7.625% 7/15/17 (b) |
|
660,000 |
732,600 |
|
|
Omega Healthcare Investors, Inc.: |
|
|
|
|
|
6.75% 10/15/22 |
|
575,000 |
633,938 |
|
|
7.5% 2/15/20 |
|
645,000 |
719,175 |
|
|
Sabra Health Care LP/Sabra Capital Corp. 8.125% 11/1/18 |
|
2,015,000 |
2,191,313 |
|
|
Senior Housing Properties Trust 6.75% 4/15/20 |
|
3,060,000 |
3,403,011 |
|
|
Valeant Pharmaceuticals International: |
|
|
|
|
|
6.5% 7/15/16 (b) |
|
3,890,000 |
4,103,950 |
|
|
6.75% 8/15/21 (b) |
|
460,000 |
466,900 |
|
|
6.875% 12/1/18 (b) |
|
4,790,000 |
5,041,475 |
|
|
7% 10/1/20 (b) |
|
130,000 |
134,550 |
|
|
|
23,800,466 |
|||
|
Homebuilders/Real Estate - 1.3% |
||||
|
CB Richard Ellis Services, Inc. 6.625% 10/15/20 |
|
3,540,000 |
3,858,600 |
|
|
D.R. Horton, Inc. 4.75% 5/15/17 |
|
2,140,000 |
2,255,025 |
|
|
|
6,113,625 |
|||
|
Hotels - 0.4% |
||||
|
Host Hotels & Resorts LP: |
|
|
|
|
|
4.75% 3/1/23 |
|
495,000 |
507,375 |
|
|
5.875% 6/15/19 |
|
750,000 |
823,125 |
|
|
9% 5/15/17 |
|
485,000 |
528,650 |
|
|
|
1,859,150 |
|||
|
Leisure - 2.4% |
||||
|
GWR Operating Partnership LLP/Great Wolf Finance Corp. 10.875% 4/1/17 |
|
2,770,000 |
3,116,250 |
|
|
Royal Caribbean Cruises Ltd.: |
|
|
|
|
|
7.25% 3/15/18 |
|
500,000 |
552,500 |
|
|
7.5% 10/15/27 |
|
1,415,000 |
1,475,138 |
|
|
yankee 7.25% 6/15/16 |
|
5,305,000 |
5,862,025 |
|
|
|
11,005,913 |
|||
|
Nonconvertible Bonds - continued |
||||
|
|
Principal |
Value |
||
|
Metals/Mining - 2.6% |
||||
|
Boart Longyear Management Pty Ltd. 7% 4/1/21 (b) |
|
$ 1,370,000 |
$ 1,421,375 |
|
|
CONSOL Energy, Inc. 8% 4/1/17 |
|
2,630,000 |
2,827,250 |
|
|
FMG Resources (August 2006) Pty Ltd.: |
|
|
|
|
|
6.375% 2/1/16 (b) |
|
4,115,000 |
3,929,825 |
|
|
7% 11/1/15 (b) |
|
3,770,000 |
3,704,025 |
|
|
|
11,882,475 |
|||
|
Paper - 0.9% |
||||
|
Louisiana-Pacific Corp. 7.5% 6/1/20 |
|
1,055,000 |
1,144,675 |
|
|
Sappi Papier Holding GmbH: |
|
|
|
|
|
7.75% 7/15/17 (b) |
|
2,670,000 |
2,790,150 |
|
|
8.375% 6/15/19 (b) |
|
355,000 |
373,638 |
|
|
|
4,308,463 |
|||
|
Services - 0.7% |
||||
|
Audatex North America, Inc. 6.75% 6/15/18 (b) |
|
140,000 |
150,150 |
|
|
FTI Consulting, Inc.: |
|
|
|
|
|
6.75% 10/1/20 |
|
1,610,000 |
1,718,675 |
|
|
7.75% 10/1/16 |
|
1,475,000 |
1,519,250 |
|
|
|
3,388,075 |
|||
|
Shipping - 0.7% |
||||
|
Navios Maritime Holdings, Inc. 8.875% 11/1/17 |
|
3,280,000 |
3,329,200 |
|
|
Steel - 1.7% |
||||
|
Steel Dynamics, Inc.: |
|
|
|
|
|
6.125% 8/15/19 (b) |
|
425,000 |
439,875 |
|
|
6.75% 4/1/15 |
|
3,100,000 |
3,162,000 |
|
|
7.625% 3/15/20 |
|
3,925,000 |
4,239,000 |
|
|
|
7,840,875 |
|||
|
Technology - 1.7% |
||||
|
Amkor Technology, Inc. 7.375% 5/1/18 |
|
2,565,000 |
2,677,219 |
|
|
Jabil Circuit, Inc. 4.7% 9/15/22 |
|
475,000 |
477,375 |
|
|
Nuance Communications, Inc. 5.375% 8/15/20 (b) |
|
1,050,000 |
1,074,938 |
|
|
Seagate HDD Cayman 7.75% 12/15/18 |
|
855,000 |
934,088 |
|
|
Seagate Technology HDD Holdings 6.8% 10/1/16 |
|
1,300,000 |
1,430,000 |
|
|
Viasystems, Inc. 7.875% 5/1/19 (b) |
|
1,510,000 |
1,483,575 |
|
|
|
8,077,195 |
|||
|
Telecommunications - 3.6% |
||||
|
Equinix, Inc. 8.125% 3/1/18 |
|
1,395,000 |
1,544,963 |
|
|
Nextel Communications, Inc.: |
|
|
|
|
|
5.95% 3/15/14 |
|
710,000 |
711,775 |
|
|
7.375% 8/1/15 |
|
3,059,000 |
3,074,295 |
|
|
Nonconvertible Bonds - continued |
||||
|
|
Principal |
Value |
||
|
Telecommunications - continued |
||||
|
Qwest Communications International, Inc.: |
|
|
|
|
|
7.125% 4/1/18 |
|
$ 1,220,000 |
$ 1,299,300 |
|
|
8% 10/1/15 |
|
2,330,000 |
2,438,345 |
|
|
Sprint Nextel Corp.: |
|
|
|
|
|
6% 12/1/16 |
|
3,123,000 |
3,185,460 |
|
|
7% 3/1/20 (b) |
|
2,630,000 |
2,886,425 |
|
|
9% 11/15/18 (b) |
|
1,190,000 |
1,404,200 |
|
|
|
16,544,763 |
|||
|
Textiles & Apparel - 0.5% |
||||
|
Hanesbrands, Inc. 6.375% 12/15/20 |
|
1,995,000 |
2,164,575 |
|
|
TOTAL NONCONVERTIBLE BONDS (Cost $383,527,275) |
|
|||
|
Floating Rate Loans - 4.8% |
||||
|
|
||||
|
Automotive - 2.0% |
||||
|
Chrysler Group LLC Tranche B, term loan 6% 5/24/17 (c) |
|
2,074,050 |
2,110,346 |
|
|
Federal-Mogul Corp.: |
|
|
|
|
|
Tranche B, term loan 2.1775% 12/27/14 (c) |
|
4,763,071 |
4,554,687 |
|
|
Tranche C, term loan 2.1775% 12/27/15 (c) |
|
2,642,397 |
2,526,792 |
|
|
|
9,191,825 |
|||
|
Cable TV - 0.1% |
||||
|
UPC Broadband Holding BV Tranche AB, term loan 4.75% 12/31/17 (c) |
|
595,000 |
595,000 |
|
|
Capital Goods - 0.3% |
||||
|
Husky Intermediate, Inc. Tranche B, term loan 5.75% 6/30/18 (c) |
|
1,355,340 |
1,358,729 |
|
|
Chemicals - 0.2% |
||||
|
Kronos Worldwide, Inc. term loan 5.75% 6/13/18 (c) |
|
690,000 |
693,450 |
|
|
Consumer Products - 0.2% |
||||
|
Visant Corp. Tranche B, term loan 5.25% 12/22/16 (c) |
|
974,845 |
940,726 |
|
|
Energy - 0.5% |
||||
|
Chesapeake Energy Corp. term loan 8.5% 12/2/17 (c) |
|
1,350,000 |
1,351,688 |
|
|
Energy Transfer Equity LP Tranche B, term loan 3.75% 3/23/17 (c) |
|
870,000 |
860,213 |
|
|
|
2,211,901 |
|||
|
Insurance - 0.7% |
||||
|
Asurion Corp. Tranche 1st LN, term loan 5.5% 5/24/18 (c) |
|
3,200,000 |
3,208,000 |
|
|
Floating Rate Loans - continued |
||||
|
|
Principal |
Value |
||
|
Metals/Mining - 0.3% |
||||
|
Arch Coal, Inc. Tranche B, term loan 5.75% 5/16/18 (c) |
|
$ 1,275,000 |
$ 1,275,000 |
|
|
Publishing/Printing - 0.3% |
||||
|
Newsday LLC term loan 10.5% 8/1/13 |
|
1,535,000 |
1,536,996 |
|
|
Super Retail - 0.2% |
||||
|
Neiman Marcus Group, Inc. Tranche B, term loan 4.75% 5/16/18 (c) |
|
1,155,000 |
1,153,556 |
|
|
TOTAL FLOATING RATE LOANS (Cost $21,462,357) |
|
|||
|
Money Market Funds - 5.3% |
|||
|
Shares |
|
||
|
Fidelity Cash Central Fund, 0.17% (a) |
24,589,213 |
|
|
|
TOTAL INVESTMENT PORTFOLIO - 98.1% (Cost $429,578,845) |
455,893,632 |
||
|
NET OTHER ASSETS (LIABILITIES) - 1.9% |
9,023,776 |
||
|
NET ASSETS - 100% |
$ 464,917,408 |
||
|
Legend |
|
(a) Affiliated fund that is available only to investment companies and other accounts managed by Fidelity Investments. The rate quoted is the annualized seven-day yield of the fund at period end. A complete unaudited listing of the fund's holdings as of its most recent quarter end is available upon request. In addition, each Fidelity Central Fund's financial statements, which are not covered by the Fund's Report of Independent Registered Public Accounting Firm, are available on the SEC's website or upon request. |
|
(b) Security exempt from registration under Rule 144A of the Securities Act of 1933. These securities may be resold in transactions exempt from registration, normally to qualified institutional buyers. At the end of the period, the value of these securities amounted to $115,628,824 or 24.9% of net assets. |
|
(c) Coupon rates for floating and adjustable rate securities reflect the rates in effect at period end. |
|
Affiliated Central Funds |
|
Information regarding fiscal year to date income earned by the Fund from investments in Fidelity Central Funds is as follows: |
|
Fund |
Income earned |
|
Fidelity Cash Central Fund |
$ 19,323 |
|
Other Information |
|
The following is a summary of the inputs used, as of August 31, 2012, involving the Fund's assets and liabilities carried at fair value. The inputs or methodology used for valuing securities may not be an indication of the risk associated with investing in those securities. For more information on valuation inputs, and their aggregation into the levels used in the table below, please refer to the Security Valuation section in the accompanying Notes to Financial Statements. |
|
Valuation Inputs at Reporting Date: |
||||
|
Description |
Total |
Level 1 |
Level 2 |
Level 3 |
|
Investments in Securities: |
||||
|
Corporate Bonds |
$ 409,139,236 |
$ - |
$ 409,139,236 |
$ - |
|
Floating Rate Loans |
22,165,183 |
- |
22,165,183 |
- |
|
Money Market Funds |
24,589,213 |
24,589,213 |
- |
- |
|
Total Investments in Securities: |
$ 455,893,632 |
$ 24,589,213 |
$ 431,304,419 |
$ - |
|
Distribution of investments by country or territory of incorporation, as a percentage of total net assets, is as follows. (Unaudited) |
|
United States of America |
86.4% |
|
Cayman Islands |
2.2% |
|
Australia |
2.0% |
|
Netherlands |
1.9% |
|
Liberia |
1.7% |
|
Canada |
1.6% |
|
Others (Individually Less Than 1%) |
4.2% |
|
|
100.0% |
See accompanying notes which are an integral part of the financial statements.
Annual Report
Financial Statements
Statement of Assets and Liabilities
|
|
August 31, 2012 |
|
|
|
|
|
|
Assets |
|
|
|
Investment in securities, at value - See accompanying schedule: Unaffiliated issuers (cost $404,989,632) |
$ 431,304,419 |
|
|
Fidelity Central Funds (cost $24,589,213) |
24,589,213 |
|
|
Total Investments (cost $429,578,845) |
|
$ 455,893,632 |
|
Cash |
|
459 |
|
Receivable for investments sold |
|
4,035,393 |
|
Interest receivable |
|
7,109,207 |
|
Distributions receivable from Fidelity Central Funds |
|
3,261 |
|
Total assets |
|
467,041,952 |
|
|
|
|
|
Liabilities |
|
|
|
Payable for investments purchased |
$ 2,122,100 |
|
|
Distributions payable |
68 |
|
|
Other payables and accrued expenses |
2,376 |
|
|
Total liabilities |
|
2,124,544 |
|
|
|
|
|
Net Assets |
|
$ 464,917,408 |
|
Net Assets consist of: |
|
|
|
Paid in capital |
|
$ 438,602,621 |
|
Net unrealized appreciation (depreciation) on investments |
|
26,314,787 |
|
Net Assets, for 4,433,680 shares outstanding |
|
$ 464,917,408 |
|
Net Asset Value, offering price and redemption price per share ($464,917,408 ÷ 4,433,680 shares) |
|
$ 104.86 |
See accompanying notes which are an integral part of the financial statements.
Annual Report
Financial Statements - continued
Statement of Operations
|
|
Year ended August 31, 2012 |
|
|
|
|
|
|
Investment Income |
|
|
|
Dividends |
|
$ 48,600 |
|
Interest (including $4,293 from affiliated interfund lending) |
|
29,699,952 |
|
Income from Fidelity Central Funds |
|
19,323 |
|
Total income |
|
29,767,875 |
|
|
|
|
|
Expenses |
|
|
|
Custodian fees and expenses |
$ 6,244 |
|
|
Independent directors' compensation |
2,866 |
|
|
Total expenses before reductions |
9,110 |
|
|
Expense reductions |
(3,392) |
5,718 |
|
Net investment income (loss) |
|
29,762,157 |
|
Realized and Unrealized Gain (Loss) Net realized gain (loss) on: |
|
|
|
Investment securities: |
|
|
|
Unaffiliated issuers |
|
3,912,442 |
|
Change in net unrealized appreciation (depreciation) on investment securities |
|
20,919,497 |
|
Net gain (loss) |
|
24,831,939 |
|
Net increase (decrease) in net assets resulting from operations |
|
$ 54,594,096 |
See accompanying notes which are an integral part of the financial statements.
Annual Report
Statement of Changes in Net Assets
|
|
Year ended |
Year ended |
|
Increase (Decrease) in Net Assets |
|
|
|
Operations |
|
|
|
Net investment income (loss) |
$ 29,762,157 |
$ 32,379,126 |
|
Net realized gain (loss) |
3,912,442 |
18,470,771 |
|
Change in net unrealized appreciation (depreciation) |
20,919,497 |
(17,255,608) |
|
Net increase (decrease) in net assets resulting |
54,594,096 |
33,594,289 |
|
Distributions to partners from net investment income |
(28,015,990) |
(30,240,648) |
|
Affiliated share transactions Proceeds from sale of shares |
- |
- |
|
Reinvestment of distributions |
28,015,164 |
30,234,444 |
|
Cost of shares redeemed |
(10,001,076) |
(50,847,009) |
|
Net increase (decrease) in net assets resulting from share transactions |
18,014,088 |
(20,612,565) |
|
Total increase (decrease) in net assets |
44,592,194 |
(17,258,924) |
|
|
|
|
|
Net Assets |
|
|
|
Beginning of period |
420,325,214 |
437,584,138 |
|
End of period |
$ 464,917,408 |
$ 420,325,214 |
|
Other Information Shares |
|
|
|
Sold |
- |
- |
|
Issued in reinvestment of distributions |
274,941 |
298,656 |
|
Redeemed |
(101,730) |
(498,998) |
|
Net increase (decrease) |
173,211 |
(200,342) |
See accompanying notes which are an integral part of the financial statements.
Annual Report
Financial Highlights
|
Years ended August 31, |
2012 |
2011 |
2010 |
2009 |
2008 |
|
Selected Per-Share Data |
|
|
|
|
|
|
Net asset value, beginning of period |
$ 98.66 |
$ 98.10 |
$ 89.24 |
$ 92.46 |
$ 97.00 |
|
Income from Investment Operations |
|
|
|
|
|
|
Net investment income (loss) B |
6.937 |
7.354 |
7.729 |
7.598 |
7.134 |
|
Net realized and unrealized gain (loss) |
5.796 |
.073 |
8.103 |
(4.053) |
(4.802) |
|
Total from investment operations |
12.733 |
7.427 |
15.832 |
3.545 |
2.332 |
|
Distributions to partners from net investment income |
(6.533) |
(6.867) |
(6.972) |
(6.765) |
(6.872) |
|
Net asset value, end of period |
$ 104.86 |
$ 98.66 |
$ 98.10 |
$ 89.24 |
$ 92.46 |
|
Total Return A |
13.31% |
7.61% |
18.23% |
4.96% |
2.39% |
|
Ratios to Average Net Assets C, F |
|
|
|
|
|
|
Expenses before reductions E |
.00% |
.00% |
.00% |
.00% |
.00% |
|
Expenses net of fee waivers, if any E |
.00% |
.00% |
.00% |
.00% |
.00% |
|
Expenses net of all reductions E |
.00% |
.00% |
.00% |
.00% |
.00% |
|
Net investment income (loss) |
6.82% |
7.27% |
8.12% |
9.40% |
7.45% |
|
Supplemental Data |
|
|
|
|
|
|
Net assets, end of period (000 omitted) |
$ 464,917 |
$ 420,325 |
$ 437,584 |
$ 409,729 |
$ 410,834 |
|
Portfolio turnover rate D |
41% |
60% |
70% |
73% |
50% |
A Total returns would have been lower if certain expenses had not been reduced during the applicable periods shown.
B Calculated based on average shares outstanding during the period.
C Fees and expenses of any underlying Fidelity Central Funds are not included in the Fund's expense ratio. The Fund indirectly bears its proportionate share of the expenses of any underlying Fidelity Central Funds.
D Amount does not include the portfolio activity of any underlying Fidelity Central Funds.
E Amount represents less than .01%.
F Expense ratios reflect operating expenses of the Fund. Expenses before reductions do not reflect amounts reimbursed by the investment adviser or reductions from expense offset arrangements and do not represent the amount paid by the Fund during periods when reimbursements or reductions occur. Expenses net of fee waivers reflect expenses after reimbursement by the investment adviser but prior to reductions from expense offset arrangements. Expenses net of all reductions represent the net expenses paid by the Fund.
See accompanying notes which are an integral part of the financial statements.
Annual Report
Notes to Financial Statements
For the period ended August 31, 2012
1. Organization.
Fidelity Specialized High Income Central Fund (the Fund) is a fund of Fidelity Central Investment Portfolios LLC (the LLC) and is authorized to issue an unlimited number of shares. The LLC is registered under the Investment Company Act of 1940, as amended (the 1940 Act), as an open-end management investment company organized as a Delaware Limited Liability Company. Each fund in the LLC is a separate partnership for tax purposes. Shares of the Fund are only offered to other investment companies and accounts managed by Fidelity Management & Research Company (FMR), or its affiliates (the Investing Funds). The Board of Directors may permit the purchase of shares (for cash, securities or other consideration) and admit new Eligible Accredited Investors into each fund, in accordance with the Partnership Agreement.
2. Investments in Fidelity Central Funds.
The Fund invests in Fidelity Central Funds, which are open-end investment companies available only to other investment companies and accounts managed by FMR and its affiliates. The Fund's Schedule of Investments lists each of the Fidelity Central Funds held as of period end, if any, as an investment of the Fund, but does not include the underlying holdings of each Fidelity Central Fund. As an Investing Fund, the Fund indirectly bears its proportionate share of the expenses of the underlying Fidelity Central Funds.
The Money Market Central Funds seek preservation of capital and current income and are managed by Fidelity Investments Money Management, Inc. (FIMM), an affiliate of FMR.
A complete unaudited list of holdings for each Fidelity Central Fund is available upon request or at the Securities and Exchange Commission (the SEC) web site at www.sec.gov. In addition, the financial statements of the Fidelity Central Funds, which are not covered by the Fund's Report of Independent Registered Public Accounting Firm, are available on the SEC web site or upon request.
3. Significant Accounting Policies.
The financial statements have been prepared in conformity with accounting principles generally accepted in the United States of America (GAAP), which require management to make certain estimates and assumptions at the date of the financial statements. Actual results could differ from those estimates. Subsequent events, if any, through the date that the financial statements were issued have been evaluated in the preparation of the financial statements. The following summarizes the significant accounting policies of the Fund:
Annual Report
Notes to Financial Statements - continued
3. Significant Accounting Policies - continued
Security Valuation. Investments are valued as of 4:00 p.m. Eastern time on the last calendar day of the period. In accordance with valuation policies and procedures approved by the Board of Directors (the Board), the Fund attempts to obtain prices from one or more third party pricing vendor or broker to value its investments. When current market prices, quotations or rates are not readily available or reliable, securities will be fair valued in good faith by the FMR Fair Value Committee (the Committee), in accordance with procedures adopted by the Board. Factors used in determining fair value vary by security type and may include market or security specific events, changes in interest rates and credit quality. The frequency with which these procedures are used cannot be predicted and they may be utilized to a significant extent. The Committee oversees the Fund's valuation policies and procedures and is responsible for approving and reporting to the Board all fair value determinations.
The Fund categorizes the inputs to valuation techniques used to value its investments into a disclosure hierarchy consisting of three levels as shown below:
Level 1 - quoted prices in active markets for identical investments
Level 2 - other significant observable inputs (including quoted prices for similar investments, interest rates, prepayment speeds, etc.)
Level 3 - unobservable inputs (including the Fund's own assumptions based on the best information available)
Valuation techniques used to value the Fund's investments by major category are as follows:
Debt securities, including restricted securities, are valued based on evaluated prices received from third party pricing vendors or from brokers who make markets in such securities. For corporate bonds and floating rate loans, pricing vendors utilize matrix pricing which considers yield or price of bonds of comparable quality, coupon, maturity and type as well as broker-supplied prices and are generally categorized as Level 2 in the hierarchy. When independent prices are unavailable or unreliable, debt securities may be valued utilizing pricing methodologies which consider similar factors that would be used by third party pricing vendors. These are generally categorized as Level 2 in the hierarchy but may be Level 3 depending on the circumstances. The Fund invests a significant portion of its assets in below investment grade securities. The value of these securities can be more volatile due to changes in the credit quality of the issuer and is sensitive to changes in economic, market and regulatory conditions.
Investments in open-end mutual funds, including the Fidelity Central Funds, are valued at their closing net asset value each business day and are categorized as Level 1 in the hierarchy.
Annual Report
3. Significant Accounting Policies - continued
Security Valuation - continued
Changes in valuation techniques may result in transfers in or out of an assigned level within the disclosure hierarchy. The aggregate value of investments by input level, as of August 31, 2012 for the Fund's investments is included at the end of the Fund's Schedule of Investments.
Investment Transactions and Income. For financial reporting purposes, the Fund's investment holdings and NAV include trades executed through the end of the last business day of the period. The NAV per share for processing shareholder transactions is calculated as of the close of business of the New York Stock Exchange (NYSE), normally 4:00 p.m. Eastern time and includes trades executed through the end of the prior business day. Gains and losses on securities sold are determined on the basis of identified cost. Dividend income is recorded on the ex-dividend date. Interest income and distributions from other Fidelity Central Funds are accrued as earned. Interest income includes coupon interest and amortization of premium and accretion of discount on debt securities.
Expenses. Expenses directly attributable to a fund are charged to that fund. Expenses attributable to more than one fund are allocated among the respective funds on the basis of relative net assets or other appropriate methods. Expense estimates are accrued in the period to which they relate and adjustments are made when actual amounts are known.
Income Tax Information and Distributions to Partners. No provision has been made for federal income taxes because the Fund allocates, at least annually among its partners, each partner's share of the Fund's income and expenses and capital gains and losses as determined by income tax regulations for inclusion in each partner's tax return.
Distributions are declared daily and paid monthly from net investment income on a book basis, except for certain items such as market discount and term loan fee income which are deemed distributed based on allocations to the partners and are reclassified to paid in capital. Due to the Fund's partnership structure, paid in capital includes any accumulated net investment income/(loss) and net realized gain/(loss) on investments.
There are no unrecognized tax benefits in the accompanying financial statements in connection with the tax positions taken by the Fund; nor is the Fund aware of any tax positions for which it is reasonably possible that the total amounts of unrecognized tax benefits will significantly change in the next twelve months. The Fund files a U.S. federal tax return, in addition to state and local tax returns as required. A fund's federal income tax returns are subject to examination by the Internal Revenue Service (IRS) for a period of three fiscal years after they are filed. State and local tax returns may be subject to examination for an additional fiscal year depending on the jurisdiction. The federal
Annual Report
Notes to Financial Statements - continued
3. Significant Accounting Policies - continued
Income Tax Information and Distributions to Partners - continued
tax cost of investment securities and unrealized appreciation (depreciation) as of period end were as follows:
|
Gross unrealized appreciation |
$ 29,980,696 |
|
Gross unrealized depreciation |
(1,039,169) |
|
Net unrealized appreciation (depreciation) on securities and other investments |
$ 28,941,527 |
|
|
|
|
Tax Cost |
$ 426,952,105 |
4. Operating Policies.
Restricted Securities. The Fund may invest in securities that are subject to legal or contractual restrictions on resale. These securities generally may be resold in transactions exempt from registration or to the public if the securities are registered. Disposal of these securities may involve time-consuming negotiations and expense, and prompt sale at an acceptable price may be difficult. Information regarding restricted securities is included at the end of the Fund's Schedule of Investments.
Loans and Other Direct Debt Instruments. The Fund invests in direct debt instruments which are interests in amounts owed to lenders by corporate or other borrowers. These instruments may be in the form of loans, trade claims or other receivables and may include standby financing commitments such as revolving credit facilities that obligate the Fund to supply additional cash to the borrower on demand. Loans may be acquired through assignment or participation, or may be made directly to a borrower. The Fund may be contractually obligated to receive approval from the agent bank and/or borrower prior to the sale of these loans.
5. Purchases and Sales of Investments.
Purchases and sales of securities, other than short-term securities, aggregated $190,088,368 and $167,942,161, respectively.
6. Fees and Other Transactions with Affiliates.
Management Fee and Expense Contract. FMR Co., Inc. (FMRC), an affiliate of FMR, provides the Fund with investment management services. The Fund does not pay any fees for these services. Pursuant to the Fund's management contract with FMRC, FMR pays FMRC a portion of the management fees it receives from the Investing Funds. In addition, under an expense contract, FMR also pays all other expenses of the Fund,
Annual Report
6. Fees and Other Transactions with Affiliates - continued
Management Fee and Expense Contract - continued
excluding custody fees, the compensation of the independent Directors, and certain exceptions such as interest expense.
Interfund Lending Program. Pursuant to an Exemptive Order issued by the SEC, the Fund, along with other registered investment companies having management contracts with FMR, may participate in an interfund lending program. This program provides an alternative credit facility allowing the funds to borrow from, or lend money to, other participating affiliated funds. At period end, there were no interfund loans outstanding. The Fund's activity in this program during the period for which loans were outstanding was as follows:
|
Borrower or Lender |
Average |
Weighted Average |
|
Lender |
$ 6,676,275 |
.34% |
7. Expense Reductions.
FMR has voluntarily agreed to reimburse a portion of the Fund's operating expenses. For the period, the reimbursement reduced the expenses by $2,866.
In addition, through arrangements with the Fund's custodian, credits realized as a result of uninvested cash balances were used to reduce the Fund's expenses. During the period, these credits reduced the Fund's custody expenses by $526.
8. Other.
The Fund's organizational documents provide former and current directors and officers with a limited indemnification against liabilities arising in connection with the performance of their duties to the Fund. In the normal course of business, the Fund may also enter into contracts that provide general indemnifications. The Fund's maximum exposure under these arrangements is unknown as this would be dependent on future claims that may be made against the Fund. The risk of material loss from such claims is considered remote.
At the end of the period, mutual funds managed by FMR or an FMR affiliate were the owners of record of all of the outstanding shares of the Fund.
Annual Report
Report of Independent Registered Public Accounting Firm
To the Directors of Fidelity Central Investment Portfolios LLC and Partners of Fidelity Specialized High Income Central Fund:
We have audited the accompanying statement of assets and liabilities of Fidelity Specialized High Income Central Fund (the Fund), a fund of Fidelity Central Investment Portfolios LLC, including the schedule of investments, as of August 31, 2012, and the related statement of operations for the year then ended, the statement of changes in net assets for each of the two years in the period then ended, and the financial highlights for each of the five years in the period then ended. These financial statements and financial highlights are the responsibility of the Fund's management. Our responsibility is to express an opinion on these financial statements and financial highlights based on our audits.
We conducted our audits in accordance with the standards of the Public Company Accounting Oversight Board (United States). Those standards require that we plan and perform the audit to obtain reasonable assurance about whether the financial statements and financial highlights are free of material misstatement. The Fund is not required to have, nor were we engaged to perform, an audit of its internal control over financial reporting. Our audits included consideration of internal control over financial reporting as a basis for designing audit procedures that are appropriate in the circumstances, but not for the purpose of expressing an opinion on the effectiveness of the Fund's internal control over financial reporting. Accordingly, we express no such opinion. An audit also includes examining, on a test basis, evidence supporting the amounts and disclosures in the financial statements, assessing the accounting principles used and significant estimates made by management, as well as evaluating the overall financial statement presentation. Our procedures included confirmation of securities owned as of August 31, 2012, by correspondence with the custodian, agent banks, and brokers; where replies were not received from brokers, we performed other auditing procedures. We believe that our audits provide a reasonable basis for our opinion.
In our opinion, the financial statements and financial highlights referred to above present fairly, in all material respects, the financial position of Fidelity Specialized High Income Central Fund as of August 31, 2012, the results of its operations for the year then ended, the changes in its net assets for each of the two years in the period then ended, and the financial highlights for each of the five years in the period then ended, in conformity with accounting principles generally accepted in the United States of America.
DELOITTE & TOUCHE LLP
Boston, Massachusetts
October 17, 2012
Annual Report
Directors and Officers (Trustees and Officers)
The Trustees, Members of the Advisory Board, and executive officers of the Fidelity Central Investment Portfolios LLC and fund, as applicable, are listed below. The Board of Trustees governs the fund and is responsible for protecting the interests of shareholders. The Trustees are experienced executives who meet periodically throughout the year to oversee the fund's activities, review contractual arrangements with companies that provide services to the fund, oversee management of the risks associated with such activities and contractual arrangements, and review the fund's performance. Except for James C. Curvey, each of the Trustees oversees 228 funds advised by FMR or an affiliate. Mr. Curvey oversees 435 funds advised by FMR or an affiliate.
The Trustees hold office without limit in time except that (a) any Trustee may resign; (b) any Trustee may be removed by written instrument, signed by at least two-thirds of the number of Trustees prior to such removal; (c) any Trustee who requests to be retired or who has become incapacitated by illness or injury may be retired by written instrument signed by a majority of the other Trustees; and (d) any Trustee may be removed at any special meeting of shareholders by a two-thirds vote of the outstanding voting securities of the trust. Each Trustee who is not an interested person (as defined in the 1940 Act) (Independent Trustee), shall retire not later than the last day of the calendar year in which his or her 75th birthday occurs. The Independent Trustees may waive this mandatory retirement age policy with respect to individual Trustees. The executive officers and Advisory Board Members hold office without limit in time, except that any officer and Advisory Board Member may resign or may be removed by a vote of a majority of the Trustees at any regular meeting or any special meeting of the Trustees. Except as indicated, each individual has held the office shown or other offices in the same company for the past five years.
Experience, Skills, Attributes, and Qualifications of the Fund's Trustees. The Governance and Nominating Committee has adopted a statement of policy that describes the experience, qualifications, attributes, and skills that are necessary and desirable for potential Independent Trustee candidates (Statement of Policy). The Board believes that each Trustee satisfied at the time he or she was initially elected or appointed a Trustee, and continues to satisfy, the standards contemplated by the Statement of Policy. The Governance and Nominating Committee also engages professional search firms to help identify potential Independent Trustee candidates who have the experience, qualifications, attributes, and skills consistent with the Statement of Policy. From time to time, additional criteria based on the composition and skills of the current Independent Trustees, as well as experience or skills that may be appropriate in light of future changes to board composition, business conditions, and regulatory or other developments, have also been considered by the professional search firms and the Governance and Nominating Committee. In addition, the Board takes into account the Trustees' commitment and participation in Board and committee meetings, as well as their leadership of standing and ad hoc committees throughout their tenure.
In determining that a particular Trustee was and continues to be qualified to serve as a Trustee, the Board has considered a variety of criteria, none of which, in isolation, was controlling. The Board believes that, collectively, the Trustees have balanced and diverse experience, qualifications, attributes, and skills, which allow the Board to operate effectively in governing the fund and protecting the interests of shareholders. Information about the specific experience, skills, attributes, and qualifications of each Trustee, which in each case led to the Board's conclusion that the Trustee should serve (or continue to serve) as a trustee of the fund, is provided below.
Annual Report
Board Structure and Oversight Function. James C. Curvey is an interested person (as defined in the 1940 Act) and currently serves as Chairman. The Trustees have determined that an interested Chairman is appropriate and benefits shareholders because an interested Chairman has a personal and professional stake in the quality and continuity of services provided to the fund. Independent Trustees exercise their informed business judgment to appoint an individual of their choosing to serve as Chairman, regardless of whether the Trustee happens to be independent or a member of management. The Independent Trustees have determined that they can act independently and effectively without having an Independent Trustee serve as Chairman and that a key structural component for assuring that they are in a position to do so is for the Independent Trustees to constitute a substantial majority for the Board. The Independent Trustees also regularly meet in executive session. Ned C. Lautenbach serves as Chairman of the Independent Trustees and as such (i) acts as a liaison between the Independent Trustees and management with respect to matters important to the Independent Trustees and (ii) with management prepares agendas for Board meetings.
Fidelity funds are overseen by different Boards of Trustees. The fund's Board oversees Fidelity's equity and high income funds and another Board oversees Fidelity's investment-grade bond, money market, and asset allocation funds. The asset allocation funds may invest in Fidelity funds overseen by the fund's Board. The use of separate Boards, each with its own committee structure, allows the Trustees of each group of Fidelity funds to focus on the unique issues of the funds they oversee, including common research, investment, and operational issues. On occasion, the separate Boards establish joint committees to address issues of overlapping consequences for the Fidelity funds overseen by each Board.
The Trustees operate using a system of committees to facilitate the timely and efficient consideration of all matters of importance to the Trustees, the fund, and fund shareholders and to facilitate compliance with legal and regulatory requirements and oversight of the fund's activities and associated risks. The Board, acting through its committees, has charged FMR and its affiliates with (i) identifying events or circumstances the occurrence of which could have demonstrably adverse effects on the fund's business and/or reputation; (ii) implementing processes and controls to lessen the possibility that such events or circumstances occur or to mitigate the effects of such events or circumstances if they do occur; and (iii) creating and maintaining a system designed to evaluate continuously business and market conditions in order to facilitate the identification and implementation processes described in (i) and (ii) above. Because the day-to-day operations and activities of the fund are carried out by or through FMR, its affiliates and other service providers, the fund's exposure to risks is mitigated but not eliminated by the processes overseen by the Trustees. While each of the Board's committees has responsibility for overseeing different aspects of the fund's activities, oversight is exercised primarily through the Operations, Audit, and Compliance Committees. In addition, the Independent Trustees have worked with FMR to enhance the Board's oversight of investment and financial risks, legal and regulatory risks, technology risks, and operational risks, including the development of additional risk reporting to the Board. For example, a working group comprised of Independent Trustees and FMR has worked and continues to work to review the Fidelity funds' valuation-related activities, reporting and risk management. Appropriate personnel, including but not limited to the fund's Chief Compliance Officer (CCO), FMR's internal auditor, the independent accountants, the fund's Treasurer and portfolio management personnel, make periodic reports to the Board's committees, as appropriate, including an annual review of FMR's risk management program for the Fidelity funds. The responsibilities of each standing committee, including their oversight responsibilities, are described further under "Standing Committees of the Fund's Trustees."
Annual Report
Directors and Officers (Trustees and Officers) - continued
The fund's Statement of Additional Information (SAI) includes more information about the Trustees. To request a free copy, call Fidelity at 1-800-544-8544.
Interested Trustees*:
Correspondence intended for each Trustee who is an interested person may be sent to Fidelity Investments, 82 Devonshire Street, Boston, Massachusetts 02109.
|
Name, Age; Principal Occupations and Other Relevant Experience+ |
|
|
James C. Curvey (77) |
|
|
|
Year of Election or Appointment: 2007 Mr. Curvey is Trustee and Chairman of the Board of Trustees of certain Trusts. Mr. Curvey also serves as Trustee (2007-present) of other investment companies advised by FMR. Mr. Curvey is a Director of Fidelity Investments Money Management, Inc. (2009-present), Director of Fidelity Research & Analysis Co. (2009-present) and Director of FMR and FMR Co., Inc. (2007-present). Mr. Curvey is also Vice Chairman (2007-present) and Director of FMR LLC. In addition, Mr. Curvey serves as an Overseer for the Boston Symphony Orchestra and a member of the Trustees of Villanova University. Previously, Mr. Curvey was the Vice Chairman (2006-2007) and Director (2000-2007) of FMR Corp. |
|
Ronald P. O'Hanley (55) |
|
|
|
Year of Election or Appointment: 2011 Mr. O'Hanley is Director of FMR Co., Inc. (2010-present), Director of Fidelity Investments Money Management, Inc. (2010-present), Director of Fidelity Research & Analysis Company (2010-present), President of Fidelity Asset Management and Corporate Services and a member of Fidelity's Executive Committee (2010-present). Previously, Mr. O'Hanley served as President and Chief Executive Officer of BNY Mellon Asset Management (2007-2010). Mr. O'Hanley also served as Vice Chairman of Bank New York Mellon Corp. and a member of that firm's Executive Committee. Prior to the 2007 merger of The Bank of New York and Mellon Financial Corporation, he was Vice Chairman of Mellon Financial Corporation and President and Chief Executive Officer of Mellon Asset Management. He joined Mellon in February 1997. Mr. O'Hanley currently serves as Chairman of the Boston Public Library Foundation Board of Directors and sits on the Board of Directors of Beth Israel Deaconess Medical Center, the Board of Trustees of the Marine Biological Laboratory and the Advisory Board of the Maxwell School of Citizenship and Public Administration at Syracuse University. Mr. O'Hanley also chairs the Council on Asset Management for the Financial Services Roundtable and is a member of the Board of Directors of Institutional Investor's U.S. Institute. |
* Trustees have been determined to be "Interested Trustees" by virtue of, among other things, their affiliation with the Fidelity Central Investment Portfolios LLC or various entities under common control with FMR.
+ The information above includes each Trustee's principal occupation during the last five years and other information relating to the experience, attributes, and skills relevant to each Trustee's qualifications to serve as a Trustee, which led to the conclusion that each Trustee should serve as a Trustee for the fund.
Annual Report
Directors and Officers (Trustees and Officers) - continued
Independent Trustees:
Correspondence intended for each Independent Trustee (that is, the Trustees other than the Interested Trustees) may be sent to Fidelity Investments, P.O. Box 55235, Boston, Massachusetts 02205-5235.
|
Name, Age; Principal Occupations and Other Relevant Experience+ |
|
|
Dennis J. Dirks (64) |
|
|
|
Year of Election or Appointment: 2005 Prior to his retirement in May 2003, Mr. Dirks was Chief Operating Officer and a member of the Board of The Depository Trust & Clearing Corporation (DTCC). He also served as President, Chief Operating Officer, and Board member of The Depository Trust Company (DTC) and President and Board member of the National Securities Clearing Corporation (NSCC). In addition, Mr. Dirks served as Chief Executive Officer and Board member of the Government Securities Clearing Corporation, Chief Executive Officer and Board member of the Mortgage-Backed Securities Clearing Corporation, as a Trustee and a member of the Finance Committee of Manhattan College (2005-2008), and as a Trustee and a member of the Finance Committee of AHRC of Nassau County (2006-2008). Mr. Dirks is a member of the Independent Directors Council (IDC) Governing Council (2010-present) and Board of Directors for The Brookville Center for Children's Services, Inc. (2009-present). |
|
Alan J. Lacy (58) |
|
|
|
Year of Election or Appointment: 2008 Mr. Lacy serves as Senior Adviser (2007-present) of Oak Hill Capital Partners, L.P. (private equity). Mr. Lacy also served as Chief Executive Officer (2000-2005) and Vice Chairman (2005-2006) of Sears Holdings Corporation and Sears, Roebuck and Co. (retail). In addition, Mr. Lacy serves as a member of the Board of Directors of Dave & Buster's Entertainment, Inc. (restaurant and entertainment complexes, 2010-present), Earth Fare, Inc. (retail grocery, 2012-present), The Hillman Companies, Inc. (hardware wholesalers, 2010-present), and Bristol-Myers Squibb Company (global pharmaceuticals, 2008-present). Mr. Lacy is a member of the Board of Trustees of The National Parks Conservation Association (2006-present). Previously, Mr. Lacy served as Chairman of the Board of Trustees of the National Parks Conservation Association (2008-2011) and as a member of the Board of Directors for the Western Union Company (global money transfer, 2006-2011). |
|
Ned C. Lautenbach (68) |
|
|
|
Year of Election or Appointment: 2004 Mr. Lautenbach is Chairman of the Independent Trustees of the Equity and High Income Funds (2006-present). Mr. Lautenbach currently serves as the Lead Director of the Eaton Corporation Board of Directors (diversified industrial, 1997-present). Mr. Lautenbach is Chairman of the Board of Directors of the Philharmonic Center for the Arts in Naples, Florida (2012-present) and a member of the Council on Foreign Relations (1994-present). Previously, Mr. Lautenbach was a Partner/Advisory Partner at Clayton, Dubilier & Rice, LLC (private equity investment, 1998-2010), as well as a Director of Sony Corporation (2006-2007). |
|
Joseph Mauriello (67) |
|
|
|
Year of Election or Appointment: 2008 Prior to his retirement in January 2006, Mr. Mauriello served in numerous senior management positions including Deputy Chairman and Chief Operating Officer (2004-2005), and Vice Chairman of Financial Services (2002-2004) of KPMG LLP US (professional services, 1965-2005). Mr. Mauriello currently serves as a member of the Board of Directors of XL Group plc. (global insurance and re-insurance, 2006-present). Previously, Mr. Mauriello served as a Director of the Hamilton Funds of the Bank of New York (2006-2007) and of Arcadia Resources Inc. (health care services and products, 2007-2012). |
|
Robert W. Selander (61) |
|
|
|
Year of Election or Appointment: 2011 Previously, Mr. Selander served as a Member of the Advisory Board of Fidelity's Equity and High Income Funds (2011), Executive Vice Chairman (2010), Chief Executive Officer (2009-2010), and President and Chief Executive Officer (1997-2009) of Mastercard, Inc. |
|
Cornelia M. Small (68) |
|
|
|
Year of Election or Appointment: 2005 Ms. Small is a member of the Board of Directors (2009-present) and Chair of the Investment Committee (2010-present) of the Teagle Foundation. Ms. Small also serves on the Investment Committee of the Berkshire Taconic Community Foundation (2008-present). Previously, Ms. Small served as Chairperson (2002-2008) and a member of the Investment Committee and Chairperson (2008-2012) and a member of the Board of Trustees of Smith College. In addition, Ms. Small served as Chief Investment Officer, Director of Global Equity Investments, and a member of the Board of Directors of Scudder, Stevens & Clark and Scudder Kemper Investments. |
|
William S. Stavropoulos (73) |
|
|
|
Year of Election or Appointment: 2004 Mr. Stavropoulos is Vice Chairman of the Independent Trustees of the Equity and High Income Funds (2006-present). Mr. Stavropoulos serves as President and Founder of the Michigan Baseball Foundation, the Great Lakes Loons (2007-present). Mr. Stavropoulos is Chairman Emeritus of the Board of Directors of The Dow Chemical Company, where he previously served in numerous senior management positions, including President, CEO (1995-2000; 2002-2004), Chairman of the Executive Committee (2000-2006), and as a member of the Board of Directors (1990-2006). Currently, Mr. Stavropoulos is a Director of Univar Inc. (global distributor of commodity and specialty chemicals, Chairman from 2010-May 2012 and Lead Director from May 2012-present), Teradata Corporation (data warehousing and technology solutions, 2008-present), Maersk Inc. (industrial conglomerate), and Tyco International, Ltd. (multinational manufacturing and services, 2007-present), and a member of the Advisory Board for Metalmark Capital LLC (private equity investment, 2005-present). Mr. Stavropoulos is an operating advisor to Clayton, Dubilier & Rice, LLC (private equity investment). In addition, Mr. Stavropoulos is a member of the University of Notre Dame Advisory Council for the College of Science, a Trustee of the Rollin L. Gerstacker Foundation, and a Director of the Naples Philharmonic Center for the Arts. Previously, Mr. Stavropoulos served as a Director of Chemical Financial Corporation (bank holding company, 1993-2012). |
|
David M. Thomas (63) |
|
|
|
Year of Election or Appointment: 2008 Previously, Mr. Thomas served as Executive Chairman (2005-2006) and Chairman and Chief Executive Officer (2000-2005) of IMS Health, Inc. (pharmaceutical and healthcare information solutions), and a Director of Fortune Brands, Inc. (consumer products, 2000-2011). In addition, Mr. Thomas serves as Non-Executive Chairman of the Board of Directors of Fortune Brands Home and Security (home and security products, 2011-present), and as a member of the Board of Directors of Interpublic Group of Companies, Inc. (marketing communication, 2004-present). |
|
Michael E. Wiley (61) |
|
|
|
Year of Election or Appointment: 2008 Mr. Wiley also serves as a Director of Asia Pacific Exploration Consolidated (international oil and gas exploration and production, 2008-present). Mr. Wiley serves as a Director of Tesoro Corporation (independent oil refiner and marketer, 2005-present), and a Director of Bill Barrett Corporation (exploration and production, 2005-present). In addition, Mr. Wiley also serves as a Director of Post Oak Bank (privately-held bank, 2004-present). Previously, Mr. Wiley served as a member of the Board of Trustees of the University of Tulsa (2000-2006; 2007-2010), as a Senior Energy Advisor of Katzenbach Partners, LLC (consulting, 2006-2007), as an Advisory Director of Riverstone Holdings (private investment), Chairman, President, and CEO of Baker Hughes, Inc. (oilfield services, 2000-2004), and as Director of Spinnaker Exploration Company (exploration and production, 2001-2005). |
+ The information above includes each Trustee's principal occupation during the last five years and other information relating to the experience, attributes, and skills relevant to each Trustee's qualifications to serve as a Trustee, which led to the conclusion that each Trustee should serve as a Trustee for the fund.
Advisory Board Members and Executive Officers:
Correspondence intended for David A. Rosow and Garnett A. Smith may be sent to Fidelity Investments, P.O. Box 55235, Boston, Massachusetts 02205-5235. Correspondence intended for each executive officer, Edward C. Johnson 3d, and Peter S. Lynch may be sent to Fidelity Investments, 82 Devonshire Street, Boston, Massachusetts 02109.
|
Name, Age; Principal Occupation |
|
|
Edward C. Johnson 3d (82) |
|
|
|
Year of Election or Appointment: 2011 Member of the Advisory Board of Fidelity's Equity and High Income Funds. Mr. Johnson serves as Chief Executive Officer, Chairman, and a Director of FMR LLC, and also serves as Chairman and Director of FIL Limited. Previously, Mr. Johnson served as a Trustee and Chairman of the Board of certain Fidelity Trusts, Chairman and a Director of FMR, Chairman and a Director of FMR Co., Inc., and President of FMR LLC (2006-2007). |
|
Peter S. Lynch (68) |
|
|
|
Year of Election or Appointment: 2003 Member of the Advisory Board of Fidelity's Equity and High Income Funds. Mr. Lynch is Vice Chairman and a Director of FMR and FMR Co., Inc. In addition, Mr. Lynch serves as a Trustee of Boston College and as the Chairman of the Inner-City Scholarship Fund. Previously, Mr. Lynch served on the Special Olympics International Board of Directors (1997-2006). |
|
David A. Rosow (69) |
|
|
|
Year of Election or Appointment: 2012 Member of the Advisory Board of Fidelity's Equity and High Income Funds. Chairman and Chief Executive Officer of International Golf Group, Inc. (golf course development, 1989-present). Previously, Mr. Rosow served as Chairman and Chief Executive Officer of Rosow & Company, Inc. (private investment company, 1989-2011), a Lead Director of Hudson United Bancorp (2001-2006) and as a Director of TD Banknorth (1996-2006). In addition, Mr. Rosow is a member (2008-present) and President (2009-present) of the Town Council of Palm Beach, Florida. |
|
Garnett A. Smith (64) |
|
|
|
Year of Election or Appointment: 2012 Member of the Advisory Board of Fidelity's Equity and High Income Funds. Prior to Mr. Smith's retirement, he served as Chairman and Chief Executive Officer of Inbrand Corp. (manufacturer of personal absorbent products, 1990-1997). He also served as President (1986-1990) of Inbrand Corp. Prior to his employment with Inbrand Corp., he was employed by a retail fabric chain and North Carolina National Bank. In addition, Mr. Smith is a board member of the Jackson Hole Land Trust (2009-present). |
|
Kenneth B. Robins (43) |
|
|
|
Year of Election or Appointment: 2008 President and Treasurer of Fidelity's Equity and High Income Funds. Mr. Robins also serves as President and Treasurer (2010-present) and Assistant Treasurer (2009-present) of other Fidelity funds and is an employee of Fidelity Investments (2004-present). Previously, Mr. Robins served as Deputy Treasurer of the Fidelity funds (2005-2008) and Treasurer and Chief Financial Officer of The North Carolina Capital Management Trust: Cash and Term Portfolios (2006-2008). |
|
Brian B. Hogan (47) |
|
|
|
Year of Election or Appointment: 2009 Vice President of Equity and High Income Funds. Mr. Hogan also serves as President of FMR's Equity Division (2009-present). Previously, Mr. Hogan served as Senior Vice President, Equity Research of FMR (2006-2009) and as a portfolio manager. |
|
Thomas C. Hense (48) |
|
|
|
Year of Election or Appointment: 2008 or 2010 Vice President of Fidelity's High Income (2008), Small Cap (2008), and Value (2010) Funds. Previously, Mr. Hense served as a portfolio manager for Fidelity's Institutional Money Management Group (Pyramis) (2003-2008). |
|
Scott C. Goebel (44) |
|
|
|
Year of Election or Appointment: 2008 Secretary and Chief Legal Officer (CLO) of the Fidelity funds. Mr. Goebel also serves as Secretary of Fidelity Investments Money Management, Inc. (FIMM) (2010-present) and Fidelity Research and Analysis Company (FRAC) (2010-present); Secretary and CLO of The North Carolina Capital Management Trust: Cash and Term Portfolios (2008-present); General Counsel, Secretary, and Senior Vice President of FMR (2008-present) and FMR Co., Inc. (2008-present); employed by FMR LLC or an affiliate (2001-present); Chief Legal Officer of Fidelity Management & Research (Hong Kong) Limited (2008-present) and Assistant Secretary of Fidelity Management & Research (Japan) Inc. (2008-present), and Fidelity Management & Research (U.K.) Inc. (2008-present). Previously, Mr. Goebel served as Assistant Secretary of FIMM (2008-2010), FRAC (2008-2010), and the Funds (2007-2008) and as Vice President and Secretary of Fidelity Distributors Corporation (FDC) (2005-2007). |
|
William C. Coffey (43) |
|
|
|
Year of Election or Appointment: 2009 Assistant Secretary of Fidelity's Equity and High Income Funds. Mr. Coffey also serves as Senior Vice President and Deputy General Counsel of FMR LLC (2010-present), and is an employee of Fidelity Investments. Previously, Mr. Coffey served as Vice President and Associate General Counsel of FMR LLC (2005-2009). |
|
Elizabeth Paige Baumann (44) |
|
|
|
Year of Election or Appointment: 2012 Anti-Money Laundering (AML) Officer of the Fidelity funds. Ms. Baumann also serves as AML Officer of The North Carolina Capital Management Trust: Cash and Term Portfolios (2012-present), Chief AML Officer of FMR LLC (2012-present), and is an employee of Fidelity Investments. Previously, Ms. Baumann served as Vice President and Deputy Anti-Money Laundering Officer (2007-2012). |
|
Christine Reynolds (53) |
|
|
|
Year of Election or Appointment: 2008 Chief Financial Officer of the Fidelity funds. Ms. Reynolds became President of Fidelity Pricing and Cash Management Services (FPCMS) in August 2008. Ms. Reynolds served as Chief Operating Officer of FPCMS (2007-2008). Previously, Ms. Reynolds served as President, Treasurer, and Anti-Money Laundering officer of the Fidelity funds (2004-2007). |
|
Joseph A. Hanlon (44) |
|
|
|
Year of Election or Appointment: 2012 Chief Compliance Officer of Fidelity's Equity and High Income Funds. Mr. Hanlon serves as Compliance Officer of FMR, FMR Co., Inc., Fidelity Investments Money Management, Inc. (FIMM), Fidelity Research and Analysis Company (FRAC), Fidelity Management & Research (Japan) Inc., Fidelity Management & Research (U.K.) Inc., Fidelity Management & Research (Hong Kong), and Strategic Advisers, Inc. (2009-present), as Senior Vice President of the Fidelity Asset Management Division (2009-present), and is an employee of Fidelity Investments. |
|
Joseph F. Zambello (55) |
|
|
|
Year of Election or Appointment: 2011 Deputy Treasurer of the Fidelity funds. Mr. Zambello is an employee of Fidelity Investments. Previously, Mr. Zambello served as Vice President of FMR's Program Management Group (2009-2011) and Vice President of the Transfer Agent Oversight Group (2005-2009). |
|
Adrien E. Deberghes (45) |
|
|
|
Year of Election or Appointment: 2008 Deputy Treasurer of Fidelity's Equity and High Income Funds. Mr. Deberghes also serves as Vice President (2011-present) and Assistant Treasurer (2010-present) of other Fidelity funds, and is an employee of Fidelity Investments (2008-present). Previously, Mr. Deberghes served as Senior Vice President of Mutual Fund Administration at State Street Corporation (2007-2008), Senior Director of Mutual Fund Administration at Investors Bank & Trust (2005-2007), and Director of Finance for Dunkin' Brands (2000-2005). |
|
Stephanie J. Dorsey (43) |
|
|
|
Year of Election or Appointment: 2010 Assistant Treasurer of Fidelity's Equity and High Income Funds. Ms. Dorsey also serves as Deputy Treasurer of other Fidelity funds (2008-present) and is an employee of Fidelity Investments (2008-present). Previously, Ms. Dorsey served as Treasurer (2004-2008) of the JPMorgan Mutual Funds and Vice President (2004-2008) of JPMorgan Chase Bank. |
|
John R. Hebble (54) |
|
|
|
Year of Election or Appointment: 2009 Assistant Treasurer of Fidelity's Equity and High Income Funds. Mr. Hebble also serves as President (2011-present), Treasurer, and Chief Financial Officer of The North Carolina Capital Management Trust: Cash and Term Portfolios (2008-present), President and Treasurer of other Fidelity funds (2008-present) and is an employee of Fidelity Investments. |
|
Gary W. Ryan (54) |
|
|
|
Year of Election or Appointment: 2005 Assistant Treasurer of the Fidelity funds. Mr. Ryan is an employee of Fidelity Investments. Previously, Mr. Ryan served as Vice President of Fund Reporting in Fidelity Pricing and Cash Management Services (FPCMS) (1999-2005). |
|
Jonathan Davis (44) |
|
|
|
Year of Election or Appointment: 2010 Assistant Treasurer of the Fidelity funds. Mr. Davis is also Assistant Treasurer of Fidelity Rutland Square Trust II and Fidelity Commonwealth Trust II. Mr. Davis is an employee of Fidelity Investments. Previously, Mr. Davis served as Vice President and Associate General Counsel of FMR LLC (2003-2010). |
Annual Report
Board Approval of Investment Advisory Contracts and Management Fees
Fidelity Specialized High Income Central Fund
Each year, the Board of Directors, including the Independent Directors (together, the Board), votes on the renewal of the management contract and sub-advisory agreements (together, the Advisory Contracts) for the fund. The Board, assisted by the advice of fund counsel and Independent Directors' counsel, requests and considers a broad range of information relevant to the renewal of the Advisory Contracts throughout the year.
The Board meets regularly and, at each of its meetings, considers factors that are relevant to its annual consideration of the renewal of the fund's Advisory Contracts, including the services and support provided to the fund and its shareholders. The Board has established various standing committees, each composed of and chaired by Independent Directors with varying backgrounds, to which the Board has assigned specific subject matter responsibilities in order to enhance effective decision-making by the Board. The Board, acting directly and through its Committees, requests and receives information concerning the annual consideration of the renewal of the fund's Advisory Contracts. The Board also meets as needed to consider matters specifically related to the Board's annual consideration of the renewal of Advisory Contracts. Members of the Board may also meet with trustees of other Fidelity funds through ad hoc joint committees to discuss certain matters relevant to the Fidelity funds.
At its July 2012 meeting, the Board of Directors, including the Independent Directors, unanimously determined to renew the fund's Advisory Contracts. In reaching its determination, the Board considered all factors it believed relevant and reached a determination, with the assistance of fund counsel and Independent Directors' counsel and through the exercise of its business judgment, that the renewal of the Advisory Contracts is in the best interests of the fund and its shareholders and that the lack of compensation payable under the management contract is fair and reasonable.
Nature, Extent, and Quality of Services Provided. The Board considered the staffing within the investment adviser, FMR Co., Inc., and the sub-advisers (together, the Investment Advisers), including the backgrounds of the fund's investment personnel, and also considered the fund's investment objective, strategies, and related investment philosophy. The Independent Directors also had discussions with senior management of Fidelity's investment operations and investment groups. The Board considered the structure of the portfolio manager compensation program and whether this structure provides appropriate incentives to act in the best interests of the fund.
Resources Dedicated to Investment Management and Support Services. The Board and the Fund Oversight and Research Committees reviewed the general qualifications and capabilities of the Investment Advisers' investment staff, including its size, education, experience, and resources, as well as the Investment Advisers' approach to recruiting, training, managing, and compensating investment personnel. The Board also noted that FMR has continued to increase the resources devoted to non-U.S. offices, including expansion of Fidelity's global investment organization. The Board noted that Fidelity's analysts have extensive resources, tools and capabilities that allow them to conduct sophisticated quantitative and fundamental analysis, as well as credit analysis of issuers, counterparties and guarantors. The Board also believes that Fidelity's investment professionals have sufficient access to global information and data so as to provide competitive investment results over time, and that those professionals also have access to sophisticated tools that permit them to assess portfolio construction and risk and performance attribution characteristics continuously, as well as to transmit new information and research conclusions rapidly around the world. Additionally, in its deliberations, the Board considered the Investment Advisers' trading and risk management capabilities and resources, which are an integral part of the investment management process.
Annual Report
Administrative Services. The Board considered (i) the nature, extent, quality, and cost of advisory and administrative services performed by the Investment Advisers and their affiliates under the Advisory Contracts and under separate agreements covering transfer agency, pricing and bookkeeping, and securities lending services for the fund; (ii) the nature and extent of the supervision of third party service providers, principally custodians and subcustodians; and (iii) the resources devoted to, and the record of compliance with, the fund's compliance policies and procedures. The Board also reviewed the allocation of fund brokerage, including allocations to brokers affiliated with the Investment Advisers, and the use of "soft" commission dollars to pay for research services.
Investment Performance. The Board considered whether the fund has operated in accordance with its investment objective, as well as its record of compliance with its investment restrictions. The Board reviewed the fund's absolute investment performance, as well as the fund's relative investment performance, but did not consider performance to be a material factor in its decision to renew the fund's Advisory Contracts, as the fund is not publicly offered as a stand-alone investment product. In this regard, the Board noted that the fund is designed to offer a liquid investment option for other investment companies managed by Fidelity Management & Research Company (FMR) or its affiliates and ultimately to enhance the performance of those investment companies.
Based on its review, the Board concluded that the nature, extent, and quality of services provided to the fund under the Advisory Contracts should benefit the fund's shareholders.
Competitiveness of Management Fee and Total Expense Ratio. The Board considered that while the fund does not pay a management fee, FMR pays a management fee on behalf of the fund and receives fees for providing services to funds that invest in the fund. The Board also noted that FMR bears all expenses of the fund, except expenses related to the fund's investment activities (primarily custody expenses). Based on its review, the Board concluded that the management fee paid on behalf of the fund and the fund's total expense ratio was reasonable in light of the services that the fund and its shareholders receive and the other factors considered.
Annual Report
Board Approval of Investment Advisory Contracts and
Management Fees - continued
Costs of the Services and Profitability. The Board considered the level of Fidelity's profits in respect of all the Fidelity funds, as well as the profitability of each fund that invests in this fund.
PricewaterhouseCoopers LLP (PwC), independent registered public accounting firm and auditor to Fidelity and certain Fidelity funds, has been engaged annually by the Board as part of the Board's assessment of Fidelity's profitability analysis. PwC's engagement includes the review and assessment of Fidelity's methodologies used in determining the revenues and expenses attributable to Fidelity's mutual fund business, and completion of agreed-upon procedures surrounding the mathematical accuracy of fund profitability and its conformity to allocation methodologies. After considering PwC's reports issued under the engagement and information provided by Fidelity, the Board concluded that while other allocation methods may also be reasonable, Fidelity's profitability methodologies are reasonable in all material respects.
The Board also reviewed Fidelity's non-fund businesses and fall-out benefits related to the mutual fund business as well as cases where Fidelity's affiliates may benefit from or be related to the fund's business.
The Board concluded that the costs of the services provided by and the profits realized by Fidelity in connection with the operation of the fund were not relevant to the renewal of the Advisory Contracts because the fund pays no advisory fees and FMR bears all expenses of the fund, except expenses related to the fund's investment activities.
Economies of Scale. The Board concluded that because the fund pays no advisory fees and FMR bears all expenses of the fund, except expenses related to the fund's investment activities, economies of scale cannot be realized by the fund.
Additional Information Requested by the Board. In order to develop fully the factual basis for consideration of the Fidelity funds' Advisory Contracts, the Board requested and received additional information on certain topics, including (i) fund performance trends, actions to be taken by FMR to improve certain funds' overall performance, and Fidelity's long-term strategies for certain funds; (ii) the potential to further rationalize the Fidelity fund lineup with the possibility of achieving savings for the funds and Fidelity; (iii) Fidelity's compensation structure for portfolio managers and other key investment personnel; (iv) the amount of the investment that each portfolio manager has made in the Fidelity fund(s) that he or she manages; (v) the realization of fall-out benefits in certain Fidelity business units; (vi) Fidelity's group fee structures, the potential impact of regulatory changes on such structures, and the rationale for the individual fee rates of certain funds; (vii) fund profitability methodology, including Fidelity's cost allocation methodology, and the impact of certain factors on fund profitability results; (viii) trends regarding industry use of performance fee structures and the possibility of implementing performance fee structures for additional funds; and (ix) the impact of net redemptions from the Fidelity funds.
Annual Report
Based on its evaluation of all of the conclusions noted above, and after considering all factors it believed relevant, the Board ultimately concluded that the advisory fee structures are fair and reasonable, and that the fund's Advisory Contracts should be renewed.
Annual Report
Item 2. Code of Ethics
As of the end of the period, August 31, 2012, Fidelity Central Investment Portfolios LLC (the trust) has adopted a code of ethics, as defined in Item 2 of Form N-CSR, that applies to its President and Treasurer and its Chief Financial Officer. A copy of the code of ethics is filed as an exhibit to this Form N-CSR.
Item 3. Audit Committee Financial Expert
The Board of Trustees of the trust has determined that Joseph Mauriello is an audit committee financial expert, as defined in Item 3 of Form N-CSR. Mr. Mauriello is independent for purposes of Item 3 of Form N-CSR.
Item 4. Principal Accountant Fees and Services
Fees and Services
The following table presents fees billed by Deloitte & Touche LLP, the member firms of Deloitte Touche Tohmatsu, and their respective affiliates (collectively, "Deloitte Entities") in each of the last two fiscal years for services rendered to Fidelity High Income Central Fund 2 and Fidelity Specialized High Income Central Fund (the "Funds"):
Services Billed by Deloitte Entities
August 31, 2012 FeesA
|
|
Audit Fees |
Audit-Related Fees |
Tax Fees |
All Other Fees |
|
Fidelity High Income Central Fund 2 |
$47,000 |
$- |
$6,100 |
$400 |
|
Fidelity Specialized High Income Central Fund |
$55,000 |
$- |
$8,200 |
$400 |
August 31, 2011 FeesA
|
|
Audit Fees |
Audit-Related Fees |
Tax Fees |
All Other Fees |
|
Fidelity High Income Central Fund 2 |
$47,000 |
$- |
$6,100 |
$200 |
|
Fidelity Specialized High Income Central Fund |
$54,000 |
$- |
$8,200 |
$200 |
A Amounts may reflect rounding.
The following table presents fees billed by Deloitte Entities that were required to be approved by the Audit Committee for services that relate directly to the operations and financial reporting of the Funds and that are rendered on behalf of Fidelity Management & Research Company ("FMR") and entities controlling, controlled by, or under common control with FMR (not including any sub-adviser whose role is primarily portfolio management and is subcontracted with or overseen by another investment adviser) that provide ongoing services to the Funds ("Fund Service Providers"):
Services Billed by Deloitte Entities
|
|
August 31, 2012A |
August 31, 2011A |
|
Audit-Related Fees |
$615,000 |
$645,000 |
|
Tax Fees |
$- |
$- |
|
All Other Fees |
$1,115,000 |
$730,000 |
A Amounts may reflect rounding.
"Audit-Related Fees" represent fees billed for assurance and related services that are reasonably related to the performance of the fund audit or the review of the fund's financial statements and that are not reported under Audit Fees.
"Tax Fees" represent fees billed for tax compliance, tax advice or tax planning that relate directly to the operations and financial reporting of the fund.
"All Other Fees" represent fees billed for services provided to the fund or Fund Service Provider, a significant portion of which are assurance related, that relate directly to the operations and financial reporting of the fund, excluding those services that are reported under Audit Fees, Audit-Related Fees or Tax Fees.
Assurance services must be performed by an independent public accountant.
* * *
The aggregate non-audit fees billed by Deloitte Entities for services rendered to the Funds, FMR (not including any sub-adviser whose role is primarily portfolio management and is subcontracted with or overseen by another investment adviser), and any Fund Service Provider for each of the last two fiscal years of the Funds are as follows:
|
Billed By |
August 31, 2012 A |
August 31, 2011 A |
|
Deloitte Entities |
$1,830,000 |
$1,490,000 |
A Amounts may reflect rounding.
The trust's Audit Committee has considered non-audit services that were not pre-approved that were provided by Deloitte Entities to Fund Service Providers to be compatible with maintaining the independence of Deloitte Entities in its audit of the Funds, taking into account representations from Deloitte Entities, in accordance with Public Company Accounting Oversight Board rules, regarding its independence from the Funds and their related entities and FMR's review of the appropriateness and permissibility under applicable law of such non-audit services prior to their provision to the Fund Service Providers.
Audit Committee Pre-Approval Policies and Procedures
The trust's Audit Committee must pre-approve all audit and non-audit services provided by a fund's independent registered public accounting firm relating to the operations or financial reporting of the fund. Prior to the commencement of any audit or non-audit services to a fund, the Audit Committee reviews the services to determine whether they are appropriate and permissible under applicable law.
The Audit Committee has adopted policies and procedures to, among other purposes, provide a framework for the Committee's consideration of non-audit services by the audit firms that audit the Fidelity funds. The policies and procedures require that any non-audit service provided by a fund audit firm to a Fidelity fund and any non-audit service provided by a fund auditor to a Fund Service Provider that relates directly to the operations and financial reporting of a Fidelity fund ("Covered Service") are subject to approval by the Audit Committee before such service is provided.
All Covered Services must be approved in advance of provision of the service either: (i) by formal resolution of the Audit Committee, or (ii) by oral or written approval of the service by the Chair of the Audit Committee (or if the Chair is unavailable, such other member of the Audit Committee as may be designated by the Chair to act in the Chair's absence). The approval contemplated by (ii) above is permitted where the Treasurer determines that action on such an engagement is necessary before the next meeting of the Audit Committee.
Non-audit services provided by a fund audit firm to a Fund Service Provider that do not relate directly to the operations and financial reporting of a Fidelity fund are reported to the Audit Committee on a periodic basis.
Non-Audit Services Approved Pursuant to Rule 2-01(c)(7)(i)(C) and (ii) of Regulation S-X ("De Minimis Exception")
There were no non-audit services approved or required to be approved by the Audit Committee pursuant to the De Minimis Exception during the Funds' last two fiscal years relating to services provided to (i) the Funds or (ii) any Fund Service Provider that relate directly to the operations and financial reporting of the Funds.
Item 5. Audit Committee of Listed Registrants
Not applicable.
Item 6. Investments
(a) Not applicable.
(b) Not applicable
Item 7. Disclosure of Proxy Voting Policies and Procedures for Closed-End Management Investment Companies
Not applicable.
Item 8. Portfolio Managers of Closed-End Management Investment Companies
Not applicable.
Item 9. Purchase of Equity Securities by Closed-End Management Investment Company and Affiliated Purchasers
Not applicable.
Item 10. Submission of Matters to a Vote of Security Holders
There were no material changes to the procedures by which shareholders may recommend nominees to the trust's Board of Trustees.
Item 11. Controls and Procedures
(a)(i) The President and Treasurer and the Chief Financial Officer have concluded that the trust's disclosure controls and procedures (as defined in Rule 30a-3(c) under the Investment Company Act) provide reasonable assurances that material information relating to the trust is made known to them by the appropriate persons, based on their evaluation of these controls and procedures as of a date within 90 days of the filing date of this report.
(a)(ii) There was no change in the trust's internal control over financial reporting (as defined in Rule 30a-3(d) under the Investment Company Act) that occurred during the second fiscal quarter of the period covered by this report that has materially affected, or is reasonably likely to materially affect, the trust's internal control over financial reporting.
Item 12. Exhibits
|
(a) |
(1) |
Code of Ethics pursuant to Item 2 of Form N-CSR is filed and attached hereto as EX-99.CODE ETH. |
|
(a) |
(2) |
Certification pursuant to Rule 30a-2(a) under the Investment Company Act of 1940 (17 CFR 270.30a-2(a)) is filed and attached hereto as Exhibit 99.CERT. |
|
(a) |
(3) |
Not applicable. |
|
(b) |
|
Certification pursuant to Rule 30a-2(b) under the Investment Company Act of 1940 (17 CFR 270.30a-2(b)) is furnished and attached hereto as Exhibit 99.906CERT. |
SIGNATURES
Pursuant to the requirements of the Securities Exchange Act of 1934 and the Investment Company Act of 1940, the registrant has duly caused this report to be signed on its behalf by the undersigned, thereunto duly authorized.
Fidelity Central Investment Portfolios LLC
|
By: |
/s/Kenneth B. Robins |
|
|
Kenneth B. Robins |
|
|
President and Treasurer |
|
|
|
|
Date: |
October 26, 2012 |
Pursuant to the requirements of the Securities Exchange Act of 1934 and the Investment Company Act of 1940, this report has been signed below by the following persons on behalf of the registrant and in the capacities and on the dates indicated.
|
By: |
/s/Kenneth B. Robins |
|
|
Kenneth B. Robins |
|
|
President and Treasurer |
|
|
|
|
Date: |
October 26, 2012 |
|
By: |
/s/Christine Reynolds |
|
|
Christine Reynolds |
|
|
Chief Financial Officer |
|
|
|
|
Date: |
October 26, 2012 |