UNITED STATES
SECURITIES AND EXCHANGE COMMISSION
Washington, D.C. 20549
_____________________
Form 8-K
_____________________
CURRENT REPORT
Pursuant to Section 13 or 15(d) of the Securities Exchange Act of 1934
Date of Report (Date of earliest event Reported): May 8, 2019
LHC GROUP, INC.
(Exact Name of Registrant as Specified in Charter)
Delaware | 001-33989 | 71-0918189 |
(State or Other Jurisdiction of Incorporation) | (Commission File Number) | (I.R.S. Employer Identification Number) |
901 Hugh Wallis Road South, Lafayette, LA 70508 |
(Address of Principal Executive Offices) (Zip Code) |
(337) 233-1307
(Registrant's telephone number, including area code)
(Former name or former address, if changed since last report)
Check the appropriate box below if the Form 8-K filing is intended to simultaneously satisfy the filing obligation of the registrant under any of the following provisions: | ||
[ ] | Written communications pursuant to Rule 425 under the Securities Act (17 CFR 230.425) | |
[ ] | Soliciting material pursuant to Rule 14a-12 under the Exchange Act (17 CFR 240.14a-12) | |
[ ] | Pre-commencement communications pursuant to Rule 14d-2(b) under the Exchange Act (17 CFR 240.14d-2(b)) | |
[ ] | Pre-commencement communications pursuant to Rule 13e-4(c) under the Exchange Act (17 CFR 240.13e-4(c)) |
Indicate by check mark whether the registrant is an emerging growth company as defined in Rule 405 of the Securities Act of 1933 (17 CFR §230.405) or Rule 12b-2 of the Securities Exchange Act of 1934 (17 CFR §240.12b-2). Emerging growth company [ ]
If an emerging growth company, indicate by check mark if the registrant has elected not to use the extended transition period for complying with any new or revised financial accounting standards provided pursuant to Section 13(a) of the Exchange Act. [ ]
Title of each class | Trading Symbol(s) | Name of each exchange on which registered |
Common Stock, par value $0.01 per share | LHCG | NASDAQ Global Select Market |
Item 2.02. Results of Operations and Financial Condition.
On May 8, 2019, the Company issued a press release announcing its financial results for the first quarter ended March 31, 2019. A copy of the press release is furnished with this Current Report on Form 8-K as Exhibit 99.1 and is incorporated herein by reference. The information furnished pursuant to Item 2.02 and Exhibit 99.1 of this Current Report on Form 8-K shall not be deemed “filed” for purposes of Section 18 of the Securities Exchange Act of 1934, as amended (the “Exchange Act”), or otherwise subject to the liabilities of that Section, nor shall it be deemed incorporated by reference in any filing under the Securities Act of 1933, as amended, or the Exchange Act, whether made before or after the date of this Current Report, regardless of any general incorporation language in the filing, except as shall be expressly set forth by specific reference in such filing.
Item 9.01. Financial Statements and Exhibits.
(d) Exhibits The following exhibits are furnished with this Current Report on Form 8-K:
SIGNATURE
Pursuant to the requirements of the Securities Exchange Act of 1934, the registrant has duly caused this report to be signed on its behalf by the undersigned hereunto duly authorized.
LHC GROUP, INC. | ||
Date: May 8, 2019 | By: | /s/ JOSHUA L. PROFFITT |
Joshua L. Proffitt | ||
Chief Financial Officer | ||
EXHIBIT 99.1
LHC Group Announces First Quarter 2019 Financial Results
Increases 2019 Guidance; Maintains Active M&A Pipeline
LAFAYETTE, La., May 08, 2019 (GLOBE NEWSWIRE) -- LHC Group, Inc. (NASDAQ: LHCG) announced its financial results for the quarter ended March 31, 2019. Unless otherwise noted, all results for the first quarter ended March 31, 2019 are compared with the first quarter ended March 31, 2018.
First Quarter of 2019 Financial Results – Strong Start to the Year
Operational and Strategic Highlights
Commenting on the results, Keith G. Myers, LHC Group’s Chairman and Chief Executive Officer, said, “We remain at the forefront of value-based initiatives to deliver better care, better outcomes and better value for patients and payors. As a clinically driven company, we have a long track record of tightly controlling non-patient expenses that enables us to reinvest in our people, technology and education. This commitment to reinvesting in those directly responsible for care has led to industry leading quality and patient satisfaction, long tenured and highly qualified clinicians and leaders and the lowest turnover in our history.
“We have outlined a number of growth opportunities for the next several years that build on our leadership position, expand our national in-home healthcare platform and enhance our relationships with hospitals and health systems as well as managed care providers. Early results in 2019 demonstrate strong progress on each one of our growth priorities and the increasing recognition that LHC Group is creating a model for the future in healthcare.”
Joint Venture Strategy – Accelerating Momentum after Record Year in 2018
On January 31, 2019, LHC Group and Unity Health finalized an equity partnership agreement to purchase and share ownership of two home health providers in Arkansas: Unity Health – White County Medical Center Home Health in Searcy and Unity Health – Harris Medical Center Home Health in Newport. These agencies, which serve their local communities and the Northeast Arkansas region, represent annualized revenue of approximately $4.0 million.
On February 26, 2019, LHC Group and Geisinger Home Health and Hospice, and AtlantiCare Home Health and Hospice entered into a definitive agreement for a joint venture partnership to enhance home health and hospice services at Geisinger locations in Pennsylvania and at AtlantiCare – a Member of Geisinger in Atlantic County, New Jersey. The joint venture for the Pennsylvania locations was completed on April 1, and the joint venture for the New Jersey locations, subject to customary closing conditions, is expected to close by June 1. These agencies, which serve their local communities in the states of Pennsylvania and New Jersey, represent annualized revenue of approximately $35.0 million.
On May 2, 2019, LHC Group and Capital Regional Medical Center (CRMC) entered into a definitive agreement for a joint venture to purchase from SSM Health the assets of three home health and hospice locations in Jefferson City and Mexico, Missouri. The purchase agreement is expected to be completed by June 1, subject to customary closing conditions, at which time the partnership will assume management responsibility. These agencies, which serve their local communities in the state of Missouri, represent annualized revenue of approximately $5.0 million.
Full Year 2019 Guidance Increased – 21.1% Year-over-Year Adjusted Earnings Growth at the Midpoint is Expected to be Fueled by Strong Organic Growth and Acquisition Accretion
Based on strong organic growth, a lower estimated effective tax rate, and an intense focus on achieving non-patient care cost efficiencies and growth synergies, the Company increased its guidance for full year 2019 of net service revenue to a range of $2.09 billion to $2.14 billion from a range of $2.08 billion to $2.13 billion; increased adjusted earnings per diluted share to a range of $4.25 to $4.35 from $4.15 to $4.25; and increased Adjusted EBITDA, less non-controlling interest, to a range of $214 million to $220 million from $212 million to $218 million. The guidance assumes the following:
The Company’s guidance ranges do not take into account the impact of future reimbursement changes, if any, future acquisitions, if made, de novo locations, if opened, location closures, if any, or future legal expenses, if necessary. The adjusted earnings guidance for 2019 is presented on a non-GAAP basis, as it does not include the impact of transaction related costs, integration related expenses or other expenses related to the acquisition of Almost Family or other acquisitions. Given the difficulty in predicting the future amount and timing of these expenses, the Company cannot reasonably provide a full reconciliation of its fiscal year 2019 adjusted earnings per share guidance to GAAP earnings per share.
Conference Call
LHC Group will host a conference call on Thursday, May 9, 2019, at 9:00 a.m. Eastern time to discuss its first quarter 2019 results. The toll-free number to call for this interactive teleconference is (866) 393‑1608 (international callers: (973) 890-8327). A telephonic replay of the conference call will be available through midnight on May 16, 2019, by dialing (855) 859‑2056 (international callers: (404) 537-3406) and entering confirmation number 4068459. The Company posted supplemental financial information on the first quarter results that it will reference during the conference call. The supplemental information can be found under Quarterly Results on the Company’s Investor Relations page.
A live webcast of LHC Group’s conference call will be available under the Investor Relations section of the Company’s website, www.LHCGroup.com. A one-year online replay will be available approximately one hour following the conclusion of the live broadcast.
About LHC Group, Inc.
LHC Group, Inc. is a national provider of in-home healthcare services and innovations, providing quality, value-based healthcare to patients primarily within the comfort and privacy of their home or place of residence. LHC Group’s services cover a wide range of healthcare needs for patients and families dealing with illness, injury, or chronic conditions. The company’s 32,000 employees deliver home health, hospice, home and community based services, and facility-based care in 35 states and the District of Columbia – reaching 60 percent of the U.S. population aged 65 and older. LHC Group is the preferred in-home healthcare partner for 350 leading hospitals around the country.
Forward-looking Statements
This press release contains “forward-looking statements” (as defined in the Securities Litigation Reform Act of 1995) regarding, among other things, future events or the future financial performance of the Company, or anticipated benefits of the transaction. Words such as “anticipate,” “expect,” “project,” “intend,” “believe,” “will,” “estimates,” “may,” “could,” “should” and words and terms of similar substance used in connection with any discussion of future plans, actions or events identify forward-looking statements. Forward-looking statements contained in this press release include, but are not limited to: our 2019 revenue and earnings guidance, statements about the benefits of the acquisition, including anticipated earnings accretion, synergies and cost savings and the timing thereof; the Company’s plans, objectives, expectations, projections and intentions; and other statements relating to the transaction that are not historical facts. Forward-looking statements are based on information currently available to the Company and involve estimates, expectations and projections. Investors are cautioned that all such forward-looking statements are subject to risks and uncertainties, and important factors could cause actual events or results to differ materially from those indicated by such forward-looking statements. With respect to the acquisition, these risks, uncertainties and factors include, but are not limited to: the risk that the businesses will not be integrated successfully; the risk that the cost savings, synergies and growth from the transaction may not be fully realized or may take longer to realize than expected; the diversion of management time on integration-related issues; and the risk that costs associated with the integration of the businesses are higher than anticipated. With respect to the Company’s businesses, these risks, uncertainties and factors include, but are not limited to: changes in, or failure to comply with, existing government regulations that impact the Company’s businesses; legislative proposals for healthcare reform; the impact of changes in future interpretations of fraud, anti-kickback, or other laws; changes in Medicare and Medicaid reimbursement levels; changes in laws and regulations with respect to Accountable Care Organizations; changes in the marketplace and regulatory environment for Health Risk Assessments; decrease in demand for the Company’s services; the potential impact of the transaction on relationships with customers, joint venture and other partners, competitors, management and other employees, including the loss of significant contracts or reduction in revenues associated with major payor sources; ability of customers to pay for services; risks related to any current or future litigation proceedings; potential audits and investigations by government and regulatory agencies, including the impact of any negative publicity or litigation; the ability to attract new customers and retain existing customers in the manner anticipated; the ability to hire and retain key personnel; increased competition from other entities offering similar services as offered by the Company; reliance on and integration of information technology systems; ability to protect intellectual property rights; impact of security breaches, cyber-attacks or fraudulent activity on the Company’s reputation; the risks associated with assumptions the parties make in connection with the parties’ critical accounting estimates and legal proceedings; the risks associated with the Company’s expansion strategy, the successful integration of recent acquisitions, and if necessary, the ability to relocate or restructure current facilities; and the potential impact of an economic downturn or effects of tax assessments or tax positions taken, risks related to goodwill and other intangible asset impairment, tax adjustments, anticipated tax rates, benefit or retirement plan costs, or other regulatory compliance costs.
Many of these risks, uncertainties and assumptions are beyond the Company’s ability to control or predict. Because of these risks, uncertainties and assumptions, you should not place undue reliance on these forward-looking statements. Furthermore, forward-looking statements speak only as of the information currently available to the Company on the date they are made, and the Company does not undertake any obligation to update publicly or revise any forward-looking statements to reflect events or circumstances that may arise after the date of this press release. The Company does not give any assurance (1) that the Company will achieve its guidance or expectations, or (2) concerning any result or the timing thereof. All subsequent written and oral forward-looking statements concerning the transaction or other matters and attributable to the Company or any person acting on their behalf are expressly qualified in their entirety by the cautionary statements above.
LHC GROUP, INC. AND SUBSIDIARIES | |||||||
CONDENSED CONSOLIDATED BALANCE SHEETS | |||||||
(Amounts in thousands, except share data) | |||||||
March 31, 2019 | December 31, 2018 | ||||||
(Unaudited) | |||||||
ASSETS | |||||||
Current assets: | |||||||
Cash | $ | 38,520 | $ | 49,363 | |||
Receivables: | |||||||
Patient accounts receivable | 268,559 | 252,592 | |||||
Other receivables | 5,517 | 6,658 | |||||
Amounts due from governmental entities | 1,010 | 830 | |||||
Total receivables | 275,086 | 260,080 | |||||
Prepaid income taxes | 7,690 | 11,788 | |||||
Prepaid expenses | 25,604 | 24,775 | |||||
Other current assets | 19,422 | 20,899 | |||||
Total current assets | 366,322 | 366,905 | |||||
Property, building and equipment, net of accumulated depreciation of $58,932 and $55,253, respectively | 83,040 | 79,563 | |||||
Goodwill | 1,164,999 | 1,161,717 | |||||
Intangible assets, net of accumulated amortization of $15,549 and $15,176, respectively | 291,954 | 297,379 | |||||
Assets held for sale | 2,500 | 2,850 | |||||
Operating lease right of use asset | 84,805 | — | |||||
Other assets | 20,237 | 20,301 | |||||
Total assets | $ | 2,013,857 | $ | 1,928,715 | |||
LIABILITIES AND STOCKHOLDERS’ EQUITY | |||||||
Current liabilities: | |||||||
Accounts payable and other accrued liabilities | $ | 70,698 | $ | 77,135 | |||
Salaries, wages, and benefits payable | 102,500 | 84,254 | |||||
Self-insurance reserves | 31,899 | 32,776 | |||||
Current operating lease liabilities | 24,454 | — | |||||
Current portion of long-term debt | — | 7,773 | |||||
Amounts due to governmental entities | 4,475 | 4,174 | |||||
Total current liabilities | 234,026 | 206,112 | |||||
Deferred income taxes | 43,676 | 43,306 | |||||
Income taxes payable | 4,481 | 4,297 | |||||
Revolving credit facility | 239,000 | 235,000 | |||||
Long term notes payable | — | 930 | |||||
Operating lease payable | 61,985 | — | |||||
Total liabilities | 583,168 | 489,645 | |||||
Noncontrolling interest — redeemable | 15,060 | 14,596 | |||||
Stockholders’ equity: | |||||||
LHC Group, Inc. stockholders’ equity: | |||||||
Preferred stock — $0.01 par value; 5,000,000 shares authorized; none issued or outstanding | — | — | |||||
Common stock — $0.01 par value; 60,000,000 shares authorized in 2019 and 2018; 35,816,333 and 35,636,414 shares issued in 2019 and 2018, respectively | 358 | 356 | |||||
Treasury stock — 5,044,230 and 4,958,721shares at cost, respectively | (56,951 | ) | (49,374 | ) | |||
Additional paid-in capital | 940,135 | 937,968 | |||||
Retained earnings | 446,831 | 427,975 | |||||
Total LHC Group, Inc. stockholders’ equity | 1,330,373 | 1,316,925 | |||||
Noncontrolling interest — non-redeemable | 85,256 | 107,549 | |||||
Total equity | 1,415,629 | 1,424,474 | |||||
Total liabilities and equity | $ | 2,013,857 | $ | 1,928,715 |
LHC GROUP, INC. AND SUBSIDIARIES | |||||||
CONDENSED CONSOLIDATED STATEMENTS OF INCOME | |||||||
(Amounts in thousands, except per share data) | |||||||
(Unaudited) | |||||||
Three Months Ended March 31, | |||||||
2019 | 2018 | ||||||
Net service revenue | $ | 502,585 | $ | 291,054 | |||
Cost of service revenue | 320,992 | 188,618 | |||||
Gross margin | 181,593 | 102,436 | |||||
General and administrative expenses | 145,221 | 92,031 | |||||
Other intangible impairment charge | 6,319 | — | |||||
Operating income | 30,053 | 10,405 | |||||
Interest expense | (3,052 | ) | (1,450 | ) | |||
Income before income taxes and noncontrolling interest | 27,001 | 8,955 | |||||
Income tax expense | 3,600 | 977 | |||||
Net income | 23,401 | 7,978 | |||||
Less net income attributable to noncontrolling interests | 4,545 | 2,983 | |||||
Net income attributable to LHC Group, Inc.’s common stockholders | $ | 18,856 | $ | 4,995 | |||
Earnings per share attributable to LHC Group, Inc.’s common stockholders: | |||||||
Basic | $ | 0.61 | $ | 0.28 | |||
Diluted | $ | 0.60 | $ | 0.28 | |||
Weighted average shares outstanding: | |||||||
Basic | 30,837 | 17,790 | |||||
Diluted | 31,187 | 18,039 |
LHC GROUP, INC. AND SUBSIDIARIES | |||||||
CONDENSED CONSOLIDATED STATEMENTS OF CASH FLOWS | |||||||
(Amounts in thousands, Unaudited) | |||||||
Three Months Ended March 31, | |||||||
2019 | 2018 | ||||||
Operating activities: | |||||||
Net income | $ | 23,401 | $ | 7,978 | |||
Adjustments to reconcile net income to net cash provided by operating activities: | |||||||
Depreciation and amortization expense | 4,202 | 3,293 | |||||
Amortization of operating lease right of use asset | 7,399 | — | |||||
Stock-based compensation expense | 1,804 | 1,601 | |||||
Deferred income taxes | 1,578 | (1,926 | ) | ||||
(Gain) loss on disposal of assets | 56 | (187 | ) | ||||
Impairment of intangibles and other | 6,319 | — | |||||
Changes in operating assets and liabilities, net of acquisitions: | |||||||
Receivables | (16,284 | ) | (7,111 | ) | |||
Prepaid expenses and other assets | 470 | 3,881 | |||||
Prepaid income taxes | 1,883 | 2,458 | |||||
Accounts payable and accrued expenses | 471 | 24,859 | |||||
Income taxes payable | 184 | — | |||||
Net amounts due to/from governmental entities | (55 | ) | (1,011 | ) | |||
Net cash provided by operating activities | 31,428 | 33,835 | |||||
Investing activities: | |||||||
Purchases of property, building and equipment | (2,801 | ) | (2,551 | ) | |||
Cash payments for business combinations | (1,413 | ) | (2,770 | ) | |||
Net cash used in investing activities | (4,214 | ) | (5,321 | ) | |||
Financing activities: | |||||||
Proceeds from line of credit | 17,000 | 13,000 | |||||
Payments on line of credit | (13,000 | ) | (32,000 | ) | |||
Proceeds from employee stock purchase plan | 478 | 332 | |||||
Payments on debt | (7,650 | ) | (64 | ) | |||
Noncontrolling interest distributions | (9,194 | ) | (3,086 | ) | |||
Withholding taxes paid on stock-based compensation | (7,577 | ) | (3,467 | ) | |||
Purchase of additional controlling interest | (18,000 | ) | (55 | ) | |||
Proceeds from exercise of options | (114 | ) | — | ||||
Sale of noncontrolling interest | — | 3,322 | |||||
Net cash provided by (used in) financing activities | (38,057 | ) | (22,018 | ) | |||
Change in cash | (10,843 | ) | 6,496 | ||||
Cash at beginning of period | 49,363 | 2,849 | |||||
Cash at end of period | $ | 38,520 | $ | 9,345 | |||
Supplemental disclosures of cash flow information: | |||||||
Interest paid | $ | 2,855 | $ | 1,397 | |||
Income taxes paid | $ | 318 | $ | 792 | |||
Non-cash operating activity: The Company recorded $91.2 million in operating lease right of use assets in exchange for lease obligations.
Non-cash financing activity: The Company accrued $4.6 million for capital expenditures primarily related to the home office expansion project during the three months ended March 31, 2019.
LHC GROUP, INC. AND SUBSIDIARIES | |||||||||||||||||||||||
SEGMENT INFORMATION | |||||||||||||||||||||||
(Amounts in thousands, Unaudited) | |||||||||||||||||||||||
Three Months Ended March 31, 2019 | |||||||||||||||||||||||
Home health services | Hospice services | Home and community- based services | Facility- based services | HCI | Total | ||||||||||||||||||
Net service revenue | $ | 363,035 | $ | 51,736 | $ | 51,785 | $ | 27,701 | $ | 8,328 | $ | 502,585 | |||||||||||
Cost of service revenue | 226,123 | 33,176 | 39,855 | 17,732 | 4,106 | 320,992 | |||||||||||||||||
General and administrative expenses | 104,839 | 14,853 | 10,982 | 9,177 | 5,370 | 145,221 | |||||||||||||||||
Other intangible impairment charge | 6,318 | 1 | — | — | — | 6,319 | |||||||||||||||||
Operating income (loss) | 25,755 | 3,706 | 948 | 792 | (1,148 | ) | 30,053 | ||||||||||||||||
Interest expense | (2,138 | ) | (343 | ) | (301 | ) | (180 | ) | (90 | ) | (3,052 | ) | |||||||||||
Income (loss) before income taxes and noncontrolling interest | 23,617 | 3,363 | 647 | 612 | (1,238 | ) | 27,001 | ||||||||||||||||
Income tax expense (benefit) | 3,208 | 446 | 151 | 5 | (210 | ) | 3,600 | ||||||||||||||||
Net income (loss) | 20,409 | 2,917 | 496 | 607 | (1,028 | ) | 23,401 | ||||||||||||||||
Less net income (loss) attributable to noncontrolling interests | 3,780 | 601 | (310 | ) | 481 | (7 | ) | 4,545 | |||||||||||||||
Net income (loss) attributable to LHC Group, Inc.’s common stockholders | $ | 16,629 | $ | 2,316 | $ | 806 | $ | 126 | $ | (1,021 | ) | $ | 18,856 | ||||||||||
Total assets | $ | 1,421,000 | $ | 220,347 | $ | 226,991 | $ | 79,257 | $ | 66,262 | $ | 2,013,857 |
Three Months Ended March 31, 2018 | |||||||||||||||||||||||
Home health services | Hospice services | Home and community- based services | Facility- based services | HCI | Total | ||||||||||||||||||
Net service revenue | $ | 204,187 | $ | 42,626 | $ | 14,091 | $ | 30,150 | $ | — | $ | 291,054 | |||||||||||
Cost of service revenue | 130,161 | 28,018 | 10,790 | 19,649 | — | 188,618 | |||||||||||||||||
General and administrative expenses | 66,289 | 13,298 | 3,298 | 9,146 | — | 92,031 | |||||||||||||||||
Operating income | 7,737 | 1,310 | 3 | 1,355 | — | 10,405 | |||||||||||||||||
Interest expense | (1,088 | ) | (218 | ) | (72 | ) | (72 | ) | — | (1,450 | ) | ||||||||||||
Income (loss) before income taxes and noncontrolling interest | 6,649 | 1,092 | (69 | ) | 1,283 | — | 8,955 | ||||||||||||||||
Income tax expense | 722 | 111 | (15 | ) | 159 | — | 977 | ||||||||||||||||
Net income (loss) | 5,927 | 981 | (54 | ) | 1,124 | — | 7,978 | ||||||||||||||||
Less net income attributable to noncontrolling interests | 2,236 | 417 | 21 | 309 | — | 2,983 | |||||||||||||||||
Net income (loss) attributable to LHC Group, Inc.’s common stockholders | $ | 3,691 | $ | 564 | $ | (75 | ) | $ | 815 | $ | — | $ | 4,995 | ||||||||||
Total assets | $ | 530,197 | $ | 157,338 | $ | 47,819 | $ | 69,969 | $ | — | $ | 805,323 |
LHC GROUP, INC. AND SUBSIDIARIES | |||||||
SELECT CONSOLIDATED KEY STATISTICAL AND FINANCIAL DATA | |||||||
(Unaudited) | |||||||
Three Months Ended | |||||||
March 31, | |||||||
2019 | 2018 | ||||||
Key Data: | |||||||
Home-Health Services: | |||||||
Locations | 540 | 319 | |||||
Acquired | 3 | 1 | |||||
De novo | – | – | |||||
Divested/Consolidated | (6 | ) | (1 | ) | |||
Total new admissions | 93,674 | 53,123 | |||||
Medicare new admissions | 57,456 | 33,028 | |||||
Average daily census | 75,675 | 45,156 | |||||
Average Medicare daily census | 49,411 | 30,362 | |||||
Medicare completed and billed episodes | 90,971 | 54,320 | |||||
Average Medicare case mix for completed and billed Medicare episodes | 1.08 | 1.09 | |||||
Average reimbursement per completed and billed Medicare episodes | $ | 3,038 | $ | 2,811 | |||
Total visits | 2,521,009 | 1,495,118 | |||||
Total Medicare visits | 1,666,907 | 1,009,425 | |||||
Average visits per completed and billed Medicare episodes | 18.3 | 18.6 | |||||
Organic growth:(1) | |||||||
Net revenue | 7.0 | % | 9.0 | % | |||
Net Medicare revenue | 1.7 | % | 4.8 | % | |||
Total new admissions | 5.7 | % | 6.7 | % | |||
Medicare new admissions | 0.2 | % | 4.3 | % | |||
Average daily census | 3.6 | % | 3.4 | % | |||
Average Medicare daily census | -1.8 | % | -0.6 | % | |||
Medicare completed and billed episodes | -0.7 | % | -0.2 | % | |||
Home and Community-Based Services: | |||||||
Locations | 80 | 16 | |||||
Acquired | – | – | |||||
De novo | – | 4 | |||||
Divested/Consolidated | (1 | ) | – | ||||
Average daily census | 14,692 | 2,102 | |||||
Billable hours | 2,271,894 | 478,952 | |||||
Revenue per billable hour | $ | 23.43 | $ | 29.87 | |||
Hospice-Based Services: | |||||||
Locations | 103 | 91 | |||||
Acquired | – | – | |||||
De novo | – | – | |||||
Divested/Consolidated | (1 | ) | – | ||||
Admissions | 4,587 | 4,054 | |||||
Average daily census | 3,752 | 3,144 | |||||
Patient days | 337,649 | 282,993 | |||||
Average revenue per patient day | $ | 156.51 | $ | 153.25 | |||
Facility-Based Services: | |||||||
Long-term Acute Care | |||||||
Locations | 12 | 14 | |||||
Acquired | – | – | |||||
Divested/Consolidated | – | – | |||||
Patient days | 19,636 | 22,560 | |||||
Average revenue per patient day | $ | 1,287 | $ | 1,248 | |||
Occupancy rate | 70.4 | % | 80.9 | % | |||
(1) Organic growth is calculated as the sum of same store plus de novo for the period divided by total from the same period in the prior year. |
LHC GROUP, INC. AND SUBSIDIARIES | |||||||
RECONCILIATION OF REVENUE AFTER ADOPTION OF ASU 2014-09 | |||||||
(Amounts in thousands, Unaudited) | |||||||
Three Months Ended | |||||||
March 31, | |||||||
2019 | 2018 | ||||||
Net Service Revenue, pre-adoption | $ | 510,937 | $ | 295,980 | |||
Less: Implicit price concession (1) | 8,352 | 4,926 | |||||
Net Service Revenue, post-adoption | $ | 502,585 | $ | 291,054 | |||
RECONCILIATION OF ADJUSTED NET INCOME ATTRIBUTABLE TO LHC GROUP, INC. | |||||||
(Amounts in thousands, Unaudited) | |||||||
Three Months Ended | |||||||
March 31, | |||||||
2019 | 2018 | ||||||
Net income attributable to LHC Group, Inc.’s common stockholders | $ | 18,856 | $ | 4,995 | |||
Add (net of tax): | |||||||
AFAM and other acquisition expenses (2) | 5,268 | 6,311 | |||||
Closures/relocations/consolidations (3) | 2,244 | ─ | |||||
Provider moratorium impairment (4) | 4,332 | ─ | |||||
Adjusted net income attributable to LHC Group, Inc.'s common stockholders | $ | 30,700 | $ | 11,306 | |||
RECONCILIATION OF ADJUSTED NET INCOME ATTRIBUTABLE | |||||||
TO LHC GROUP, INC. PER DILUTED SHARE | |||||||
(Unaudited) | |||||||
Three Months Ended | |||||||
March 31, | |||||||
2019 | 2018 | ||||||
Diluted earnings per share attributable to LHC Group, Inc.’s common stockholders | $ | 0.60 | $ | 0.28 | |||
Add (net of tax): | |||||||
AFAM and other acquisition expenses (2) | 0.17 | 0.35 | |||||
Closures/relocations/consolidations (3) | 0.07 | ─ | |||||
Provider moratorium impairment (4) | 0.14 | ─ | |||||
Adjusted diluted earnings per share attributable to LHC Group, Inc.’s common stockholders | $ | 0.98 | $ | 0.63 | |||
(1) Provision for bad debts are classified as implicit price concessions in determining the transaction price of the Company's net service revenue. | |||||||
(2) Transition, integration and Homecare Homebase conversion expenses and other costs associated with the acquisition of Almost Family and other recently announced or completed acquisitions. ($7.3 million pre-tax in the three months ended March 31, 2019). | |||||||
(3) Expenses and impairments associated with the closure or consolidation of 8 locations in the first quarter of 2019 along with residual costs and expenses in connection with the closures in the fourth quarter of 2018. ($3.1 million pre-tax in the three months ended March 31, 2019). | |||||||
(4) During the first quarter of 2019, the Company recorded $6.0 million of moratoria fair value impairment as a result of the Centers for Medicare and Medicaid Services (“CMS”) action to remove all federal moratoria with regard to Medicare provider enrollment. In assigning fair value acquired in acquisitions as required by ASC 805, Business Combinations, the Company had assigned fair value to Certificates of need or license moratoria, as applicable, in certain states. | |||||||
We have included certain financial measures in this press release, including adjusted net income attributable to LHC Group and adjusted net income attributable to LHC Group per diluted share, which are “non-GAAP financial measures” as defined under the rules and regulations promulgated by the SEC. We define adjusted net income attributable to LHC Group as net income attributable to LHC Group adjusted for the AFAM acquisition and other closure costs. We define adjusted net income attributable to LHC Group per diluted share as net income attributable to LHC Group adjusted for the AFAM acquisition and other closure costs divided by weighted average diluted shares outstanding.
Adjusted net income attributable to LHC Group and adjusted net income attributable to LHC Group per diluted share are supplemental measures of our performance and are not required by, or presented in accordance with, generally accepted accounting principles in the United States (“GAAP”). Adjusted net income attributable to LHC Group and adjusted net income attributable to LHC Group per diluted share are not measures of our financial performance under GAAP and should not be considered as alternatives to net income attributable to LHC Group, net income attributable to LHC Group per diluted share or any other performance measures derived in accordance with GAAP. Our measurements of adjusted net income attributable to LHC Group and adjusted net income attributable to LHC Group per diluted share may not be comparable to similarly titled measures of other companies. We have included information concerning adjusted net income attributable to LHC Group and adjusted net income attributable to LHC Group per diluted share in this press release because we believe that such information is used by certain investors as measures of a company’s historical performance. We believe these measures are frequently used by securities analysts, investors and other interested parties in the evaluation of issuers of equity securities, many of which present adjusted net income and adjusted net income per diluted share when reporting their results. Our presentation of adjusted net income attributable to LHC Group and adjusted net income attributable to LHC Group per diluted share should not be construed as an inference that our future results will be unaffected by unusual or nonrecurring items.
Contact: | Eric Elliott | |
Senior Vice President of Finance | ||
(337) 233-1307 | ||
eric.elliott@lhcgroup.com | ||
Exhibit 99.2
Supplemental Financial Information First Quarter Ended March 31, 2019 May 8, 2019
Forward - Looking Statements This presentation contains “forward - looking statements” (as defined in the Securities Litigation Reform Act of 1995 ) regarding, among other things, future events or the future financial performance of the Company . Words such as “anticipate,” “expect,” “project,” “intend,” “believe,” “will,” “estimate,” “may,” “could,” “should,” “outlook,” and “guidance” and words and terms of similar substance used in connection with any discussion of future plans, actions, events or results identify forward - looking statements . Forward - looking statements are based on information currently available to the Company and involve estimates, expectations and projections . Investors are cautioned that all such forward - looking statements are subject to risks and uncertainties that could cause actual events or results to differ materially from the events or results described in the forward - looking statements, including, but not limited to, the risks and uncertainties described in our filings with the Securities and Exchange Commission, including our most recent Annual Report on Form 10 - K and subsequent Quarterly Reports on Form 10 - Q and Current Reports on Form 8 - K . Many of these risks, uncertainties and assumptions are beyond the Company’s ability to control or predict . Because of these risks, uncertainties and assumptions, investors should not place undue reliance on these forward - looking statements . Furthermore, forward - looking statements speak only as of the information currently available to the Company on the date they are made, and the Company does not undertake any obligation to update publicly or revise any forward - looking statements to reflect events or circumstances that may arise after the date of this presentation . The Company does not give any assurance ( 1 ) that the Company will achieve its guidance or expectations, or ( 2 ) concerning any result or the timing thereof . All subsequent written and oral forward - looking statements concerning the Company and attributable to the Company or any person acting on their behalf are expressly qualified in their entirety by the cautionary statements above . ” Non - GAAP Financial Information This presentation includes certain financial measures that were not prepared in accordance with U . S . generally accepted accounting principles (“GAAP”), including EBITDA and Adjusted EBITDA . The company uses these non - GAAP financial measures in operating its business because management believes they are less susceptible to variances in actual operating performance that can result from the excluded items . The company presents these financial measures to investors because they believe they are useful to investors in evaluating the primary factors that drive the company's operating performance . The items excluded from these non - GAAP measures are important in understanding LHC Group’s financial performance, and any non - GAAP measures presented should not be considered in isolation of, or as an alternative to, GAAP financial measures . Since these non - GAAP financial measures are not measures determined in accordance with GAAP, have no standardized meaning prescribed by GAAP and are susceptible to varying calculations, these measures, as presented, may not be comparable to other similarly titled measures of other companies . EBITDA of LHC Group is defined as net income (loss) before income tax benefit (expense), interest expense, and depreciation and amortization expense . Adjusted EBITDA of LHC Group is defined as net income (loss) before income tax expense benefit (expense), depreciation and amortization expense, and transaction costs related to previous transactions . 2 Please visit the Investors section on our website at Investor.LHCgroup.com for additional information on LHC Group and the industry. Nasdaq: LHCG
Table of Contents 3 Company overview ………………………………………………………………………… .................... … 4 - 6 Select key segment statistical and financial data ……………… .. ……………………… ............. 7 Consolidated results ……………………………………………………………… ........................ ……… 8 - 9 Adjustments to net income …………………………………………………………………………… ... …… 10 Segment results …………………………………………………………………………………………… ..... 11 - 15 2019 guidance ………………………………………………………………………………………………… .. 16 - 17 Almost Family update ………………………………………………………………………………………… ... 18 Accelerated joint venture momentum…………………. …………………………..…………………..19 Quality data………………………………………………………………………………………………….……….20 Debt and liquidity metrics………………………………………………………………………………….....21 Focus for 2019………………………………………………………………………………………………….……22 Non - GAAP reconciliations…………………………………………………………………………….....23 - 25
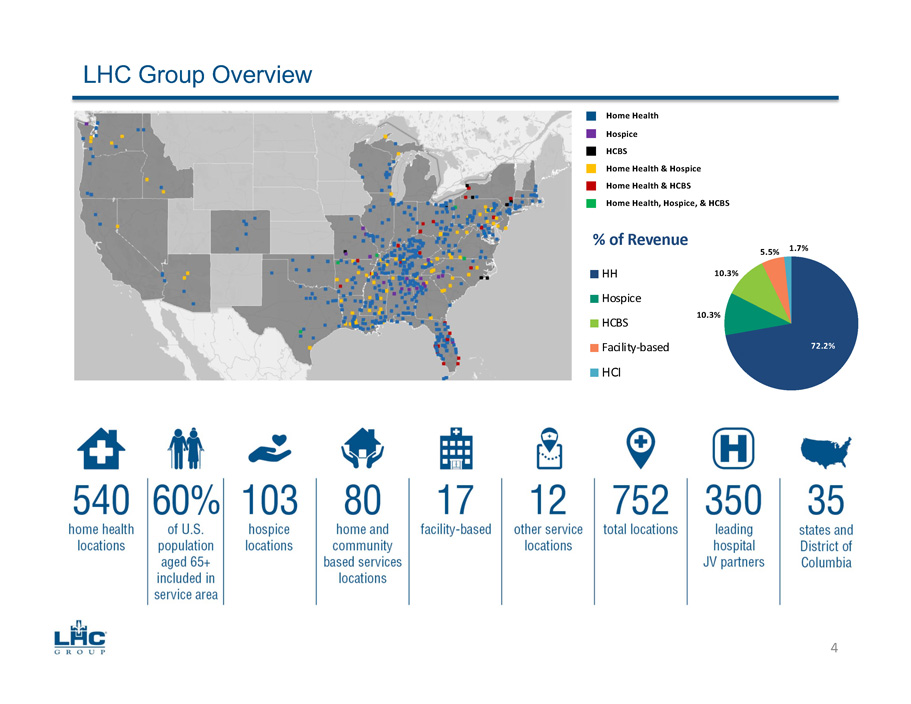
Home Health Hospice HCBS Home Health & Hospice Home Health & HCBS Home Health, Hospice, & HCBS LHC Group Overview 72.2% 10.3% 10.3% 5.5% 1.7% % of Revenue HH Hospice HCBS Facility-based HCI 4
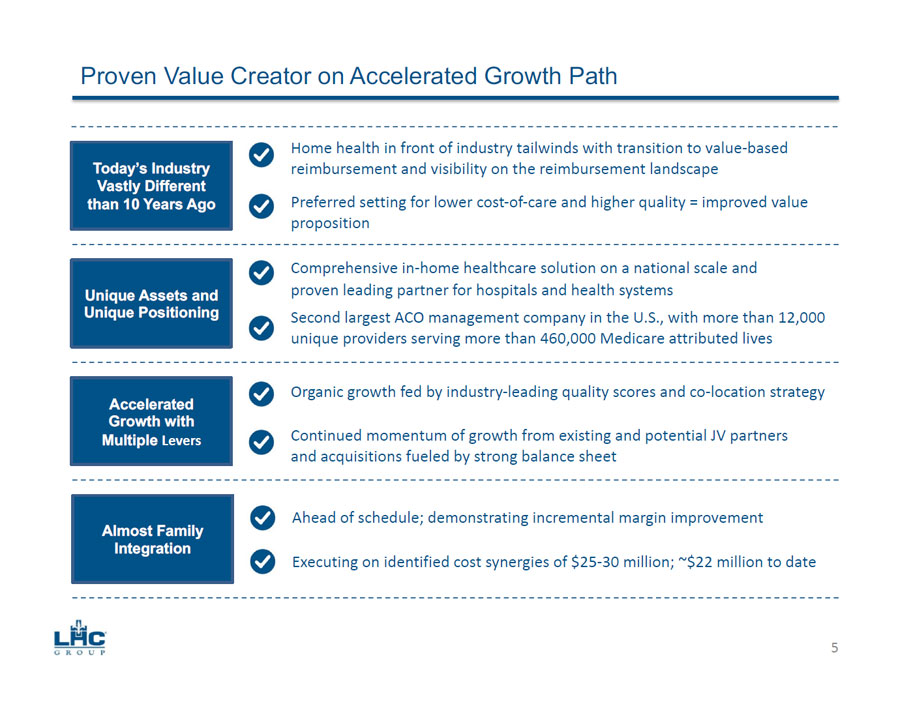
Proven Value Creator on Accelerated Growth Path Unique Assets and Unique Positioning Second largest ACO management company in the U.S., with more than 12,000 unique providers serving more than 460,000 Medicare attributed lives Today’s Industry Vastly Different than 10 Years Ago Home health in front of industry tailwinds with transition to value - based reimbursement and visibility on the reimbursement landscape Preferred setting for lower cost - of - care and higher quality = improved value proposition Accelerated Growth with Multiple Levers Organic growth fed by industry - leading quality scores and co - location strategy Continued momentum of growth from existing and potential JV partners and acquisitions fueled by strong balance sheet Comprehensive in - home healthcare solution on a national scale and the proven leading partner for hospitals and health systems Almost Family Integration Ahead of schedule; demonstrating incremental margin improvement Executing on identified cost synergies of $25 - 30 million; ~$22 million to date 5
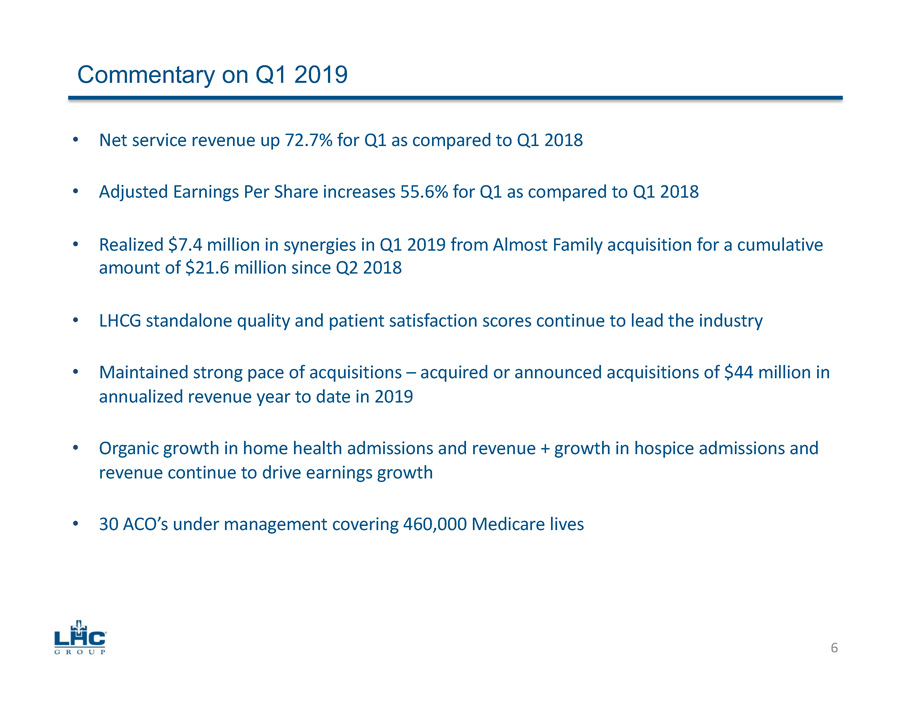
• Net service revenue up 72.7% for Q1 as compared to Q1 2018 • Adjusted Earnings Per Share increases 55.6% for Q1 as compared to Q1 2018 • Realized $7.4 million in synergies in Q1 2019 from Almost Family acquisition for a cumulative amount of $21.6 million since Q2 2018 • LHCG standalone quality and patient satisfaction scores continue to lead the industry • Maintained strong pace of acquisitions – acquired or announced acquisitions of $44 million in annualized revenue year to date in 2019 • Organic growth in home health admissions and revenue + growth in hospice admissions and revenue continue to drive earnings growth • 30 ACO’s under management covering 460,000 Medicare lives Commentary on Q1 2019 6
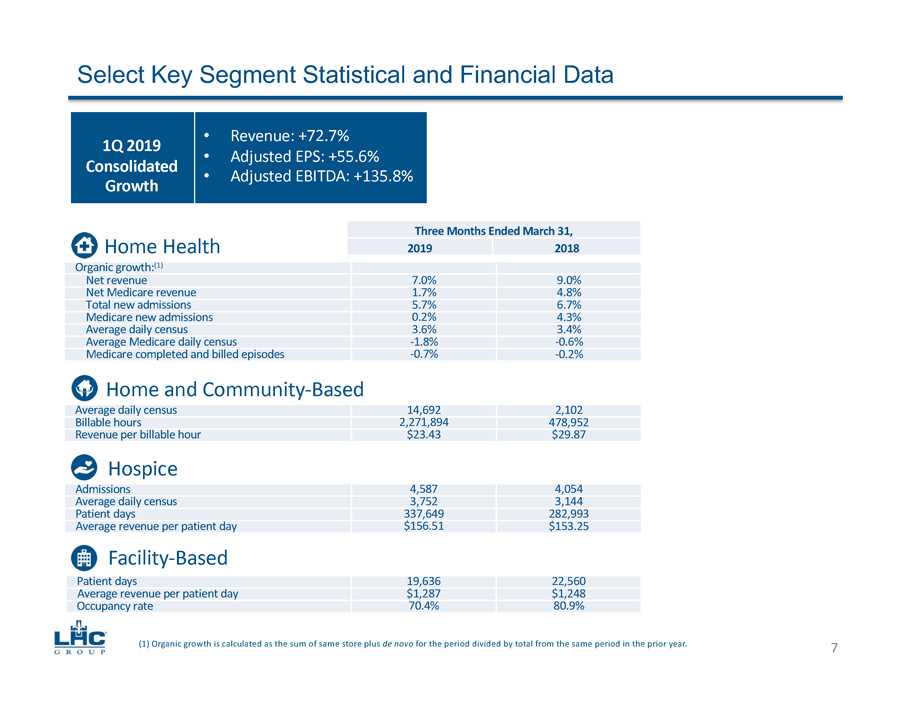
Select Key Segment Statistical and Financial Data Organic growth: (1) Net revenue 7.0% 9.0% Net Medicare revenue 1.7% 4.8% Total new admissions 5.7% 6.7% Medicare new admissions 0.2% 4.3% Average daily census 3.6% 3.4% Average Medicare daily census - 1.8% - 0.6% Medicare completed and billed episodes - 0.7% - 0.2% Three Months Ended March 31, 2019 2018 Home Health Average daily census 14,692 2,102 Billable hours 2,271,894 478,952 Revenue per billable hour $23.43 $29.87 Home and Community - Based Admissions 4,587 4,054 Average daily census 3,752 3,144 Patient days 337,649 282,993 Average revenue per patient day $156.51 $153.25 Hospice Patient days 19,636 22,560 Average revenue per patient day $1,287 $1,248 Occupancy rate 70.4% 80.9% Facility - Based (1) Organic growth is calculated as the sum of same store plus de novo for the period divided by total from the same period in the prior year. 1Q 2019 Consolidated Growth 7 • Revenue: +72.7% • Adjusted EPS: +55.6% • Adjusted EBITDA: +135.8% • Revenue: +70.3% • Adjusted EPS: +46.7% • Adjusted EBITDA: +84.5%
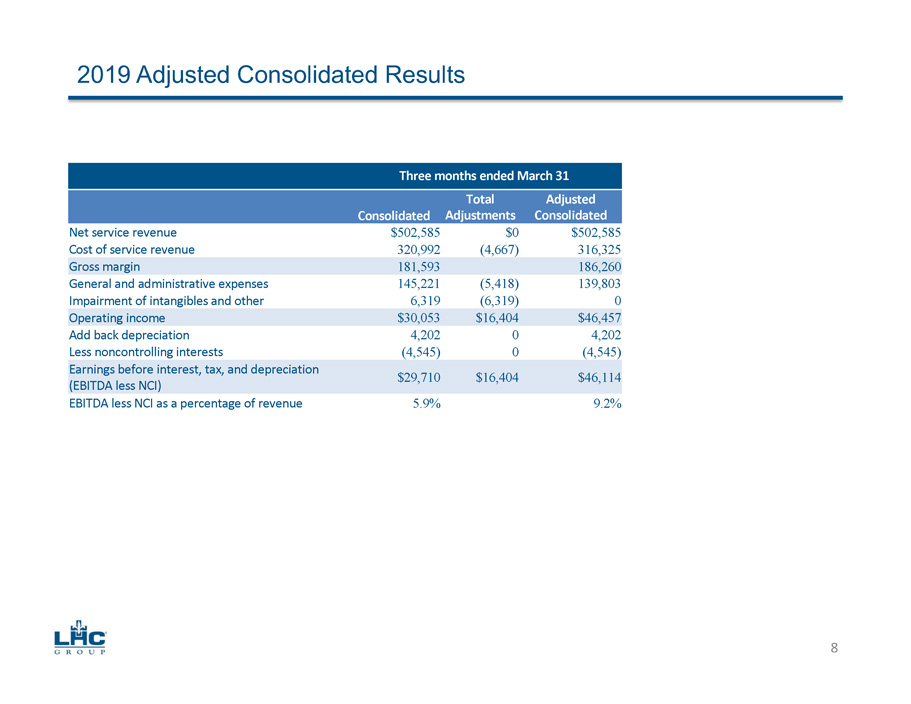
2019 Adjusted Consolidated Results Three months ended March 31 Consolidated Total Adjustments Adjusted Consolidated Net service revenue $502,585 $0 $502,585 Cost of service revenue 320,992 (4,667) 316,325 Gross margin 181,593 186,260 General and administrative expenses 145,221 (5,418) 139,803 Impairment of intangibles and other 6,319 (6,319) 0 Operating income $30,053 $16,404 $46,457 Add back depreciation 4,202 0 4,202 Less noncontrolling interests (4,545) 0 (4,545) Earnings before interest, tax, and depreciation (EBITDA less NCI) $29,710 $16,404 $46,114 EBITDA less NCI as a percentage of revenue 5.9% 9.2% 8
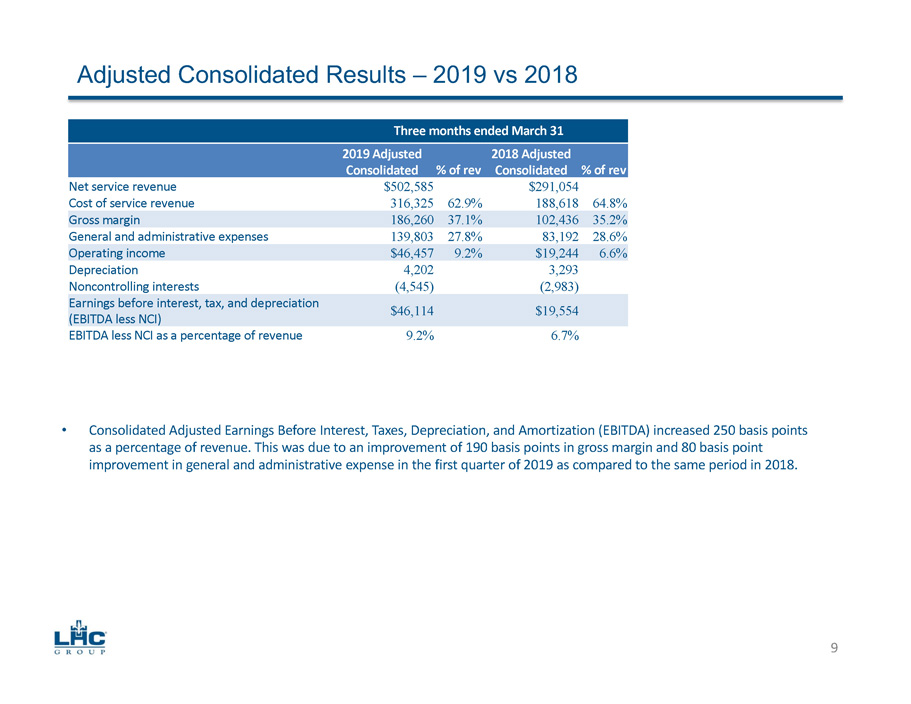
Adjusted Consolidated Results – 2019 vs 2018 Three months ended March 31 2019 Adjusted Consolidated % of rev 2018 Adjusted Consolidated % of rev Net service revenue $502,585 $291,054 Cost of service revenue 316,325 62.9% 188,618 64.8% Gross margin 186,260 37.1% 102,436 35.2% General and administrative expenses 139,803 27.8% 83,192 28.6% Operating income $46,457 9.2% $19,244 6.6% Depreciation 4,202 3,293 Noncontrolling interests (4,545) (2,983) Earnings before interest, tax, and depreciation (EBITDA less NCI) $46,114 $19,554 EBITDA less NCI as a percentage of revenue 9.2% 6.7% • Consolidated Adjusted Earnings Before Interest, Taxes, Depreciation, and Amortization (EBITDA) increased 250 basis points as a percentage of revenue. This was due to an improvement of 190 basis points in gross margin and 80 basis point improvement in general and administrative expense in the first quarter of 2019 as compared to the same period in 2018. 9
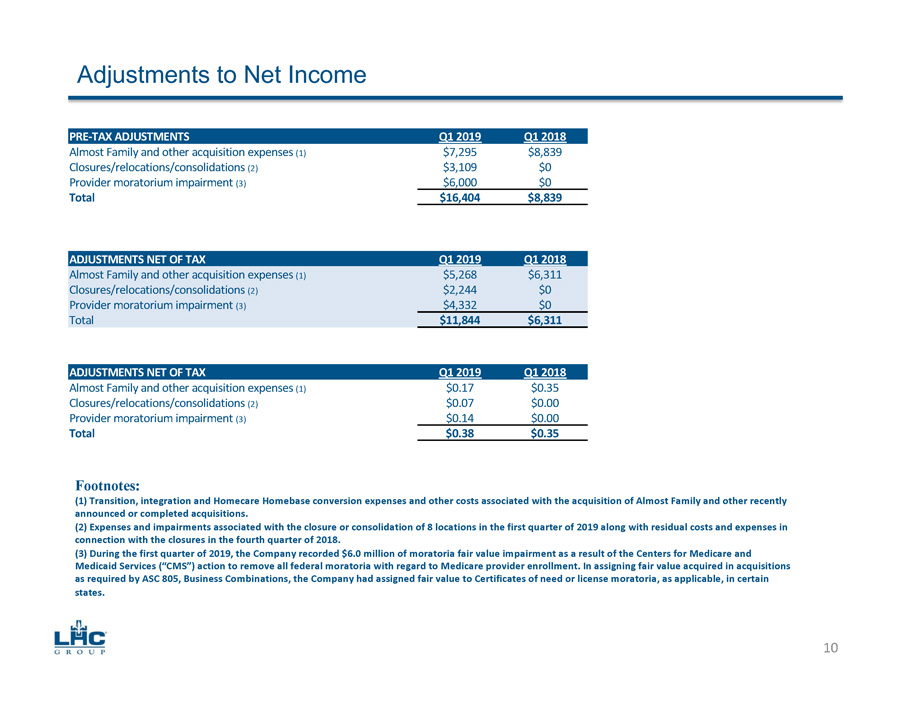
Adjustments to Net Income PRE - TAX ADJUSTMENTS Q1 2019 Q1 2018 Almost Family and other acquisition expenses (1) $7,295 $8,839 Closures/relocations/consolidations (2) $3,109 $0 Provider moratorium impairment (3) $6,000 $0 Total $16,404 $8,839 ADJUSTMENTS NET OF TAX Q1 2019 Q1 2018 Almost Family and other acquisition expenses (1) $5,268 $6,311 Closures/relocations/consolidations (2) $2,244 $0 Provider moratorium impairment (3) $4,332 $0 Total $11,844 $6,311 ADJUSTMENTS NET OF TAX Q1 2019 Q1 2018 Almost Family and other acquisition expenses (1) $0.17 $0.35 Closures/relocations/consolidations (2) $0.07 $0.00 Provider moratorium impairment (3) $0.14 $0.00 Total $0.38 $0.35 10 Footnotes: (1) Transition, integration and Homecare Homebase conversion expenses and other costs associated with the acquisition of Almost Family and other recently announced or completed acquisitions . (2) Expenses and impairments associated with the closure or consolidation of 8 locations in the first quarter of 2019 along w ith residual costs and expenses in connection with the closures in the fourth quarter of 2018. (3) During the first quarter of 2019, the Company recorded $6.0 million of moratoria fair value impairment as a result of the Ce nters for Medicare and Medicaid Services (“CMS”) action to remove all federal moratoria with regard to Medicare provider enrollment. In assigning fa ir value acquired in acquisitions as required by ASC 805, Business Combinations, the Company had assigned fair value to Certificates of need or license morator ia, as applicable, in certain states.
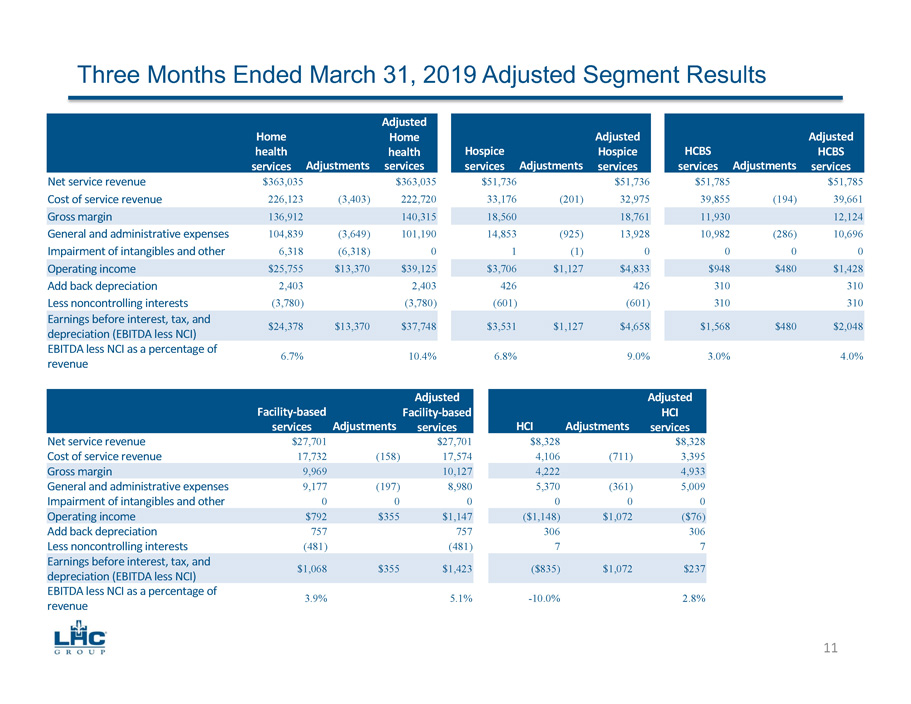
Three Months Ended March 31, 2019 Adjusted Segment Results Home health services Adjustments Adjusted Home health services Hospice services Adjustments Adjusted Hospice services HCBS services Adjustments Adjusted HCBS services Net service revenue $363,035 $363,035 $51,736 $51,736 $51,785 $51,785 Cost of service revenue 226,123 (3,403) 222,720 33,176 (201) 32,975 39,855 (194) 39,661 Gross margin 136,912 140,315 18,560 18,761 11,930 12,124 General and administrative expenses 104,839 (3,649) 101,190 14,853 (925) 13,928 10,982 (286) 10,696 Impairment of intangibles and other 6,318 (6,318) 0 1 (1) 0 0 0 0 Operating income $25,755 $13,370 $39,125 $3,706 $1,127 $4,833 $948 $480 $1,428 Add back depreciation 2,403 2,403 426 426 310 310 Less noncontrolling interests (3,780) (3,780) (601) (601) 310 310 Earnings before interest, tax, and depreciation (EBITDA less NCI) $24,378 $13,370 $37,748 $3,531 $1,127 $4,658 $1,568 $480 $2,048 EBITDA less NCI as a percentage of revenue 6.7% 10.4% 6.8% 9.0% 3.0% 4.0% Facility - based services Adjustments Adjusted Facility - based services HCI Adjustments Adjusted HCI services Net service revenue $27,701 $27,701 $8,328 $8,328 Cost of service revenue 17,732 (158) 17,574 4,106 (711) 3,395 Gross margin 9,969 10,127 4,222 4,933 General and administrative expenses 9,177 (197) 8,980 5,370 (361) 5,009 Impairment of intangibles and other 0 0 0 0 0 0 Operating income $792 $355 $1,147 ($1,148) $1,072 ($76) Add back depreciation 757 757 306 306 Less noncontrolling interests (481) (481) 7 7 Earnings before interest, tax, and depreciation (EBITDA less NCI) $1,068 $355 $1,423 ($835) $1,072 $237 EBITDA less NCI as a percentage of revenue 3.9% 5.1% - 10.0% 2.8% 11
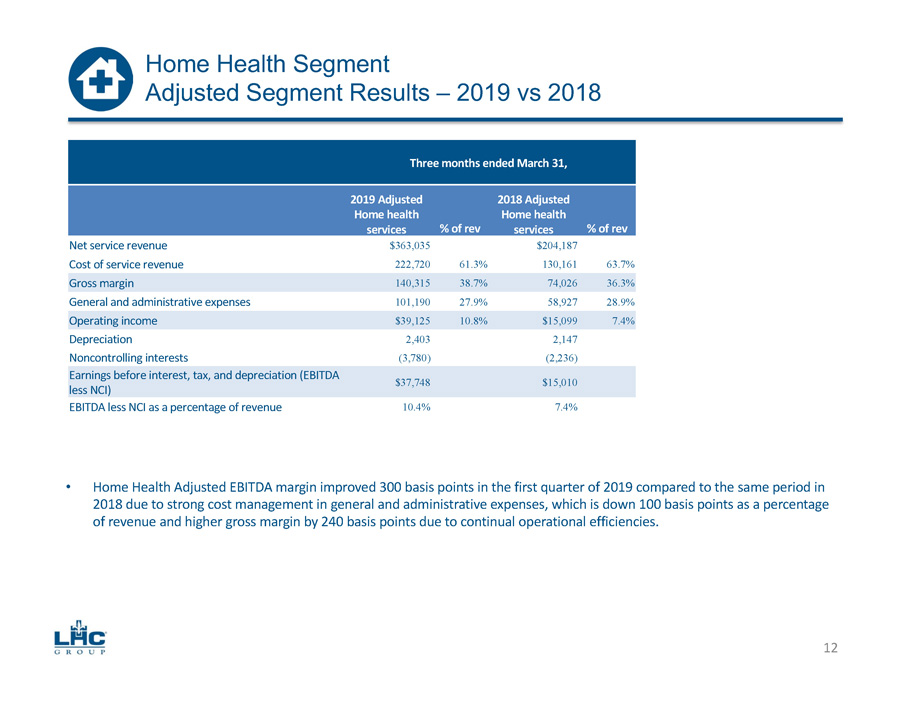
Three months ended March 31, 2019 Adjusted Home health services % of rev 2018 Adjusted Home health services % of rev Net service revenue $363,035 $204,187 Cost of service revenue 222,720 61.3% 130,161 63.7% Gross margin 140,315 38.7% 74,026 36.3% General and administrative expenses 101,190 27.9% 58,927 28.9% Operating income $39,125 10.8% $15,099 7.4% Depreciation 2,403 2,147 Noncontrolling interests (3,780) (2,236) Earnings before interest, tax, and depreciation (EBITDA less NCI) $37,748 $15,010 EBITDA less NCI as a percentage of revenue 10.4% 7.4% • Home Health Adjusted EBITDA margin improved 300 basis points in the first quarter of 2019 compared to the same period in 2018 due to strong cost management in general and administrative expenses, which is down 100 basis points as a percentage of revenue and higher gross margin by 240 basis points due to continual operational efficiencies. 12 Home Health Segment Adjusted Segment Results – 2019 vs 2018
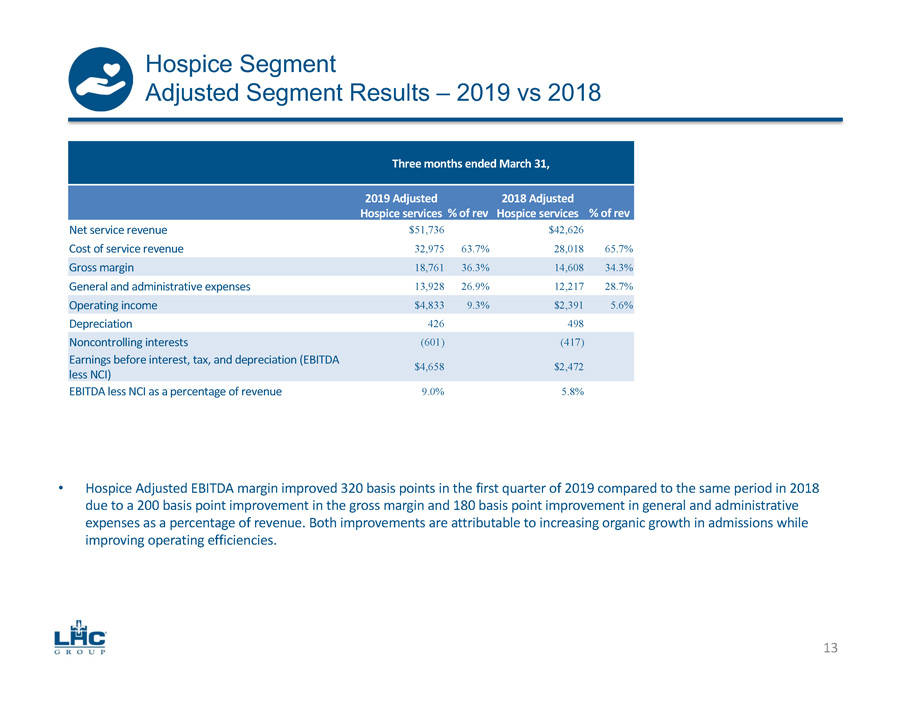
Three months ended March 31, 2019 Adjusted Hospice services % of rev 2018 Adjusted Hospice services % of rev Net service revenue $51,736 $42,626 Cost of service revenue 32,975 63.7% 28,018 65.7% Gross margin 18,761 36.3% 14,608 34.3% General and administrative expenses 13,928 26.9% 12,217 28.7% Operating income $4,833 9.3% $2,391 5.6% Depreciation 426 498 Noncontrolling interests (601) (417) Earnings before interest, tax, and depreciation (EBITDA less NCI) $4,658 $2,472 EBITDA less NCI as a percentage of revenue 9.0% 5.8% • Hospice Adjusted EBITDA margin improved 320 basis points in the first quarter of 2019 compared to the same period in 2018 due to a 200 basis point improvement in the gross margin and 180 basis point improvement in general and administrative expenses as a percentage of revenue. Both improvements are attributable to increasing organic growth in admissions while improving operating efficiencies. 13 Hospice Segment Adjusted Segment Results – 2019 vs 2018
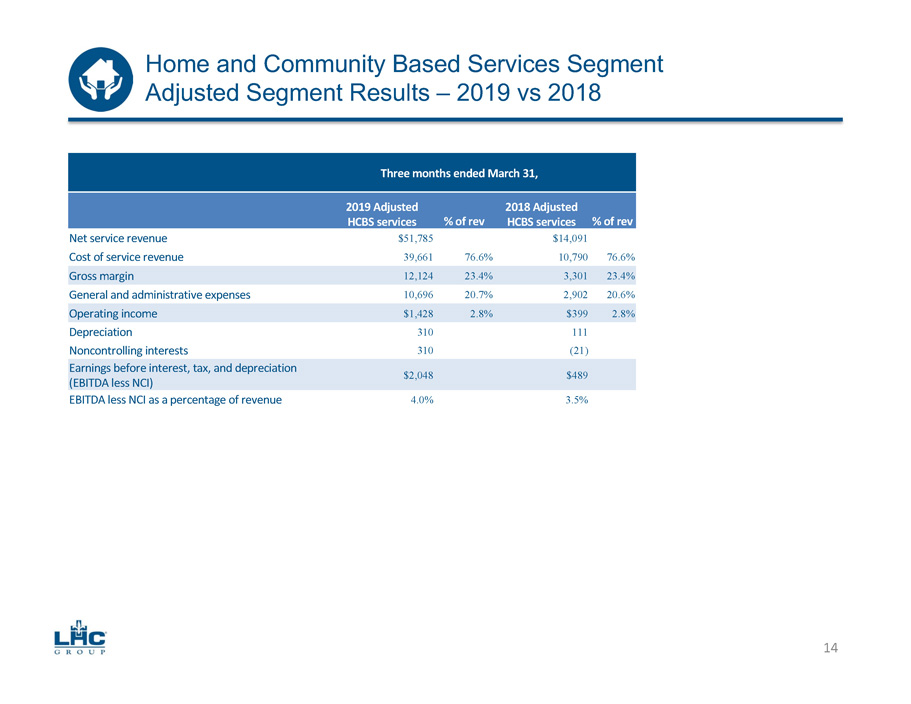
Three months ended March 31, 2019 Adjusted HCBS services % of rev 2018 Adjusted HCBS services % of rev Net service revenue $51,785 $14,091 Cost of service revenue 39,661 76.6% 10,790 76.6% Gross margin 12,124 23.4% 3,301 23.4% General and administrative expenses 10,696 20.7% 2,902 20.6% Operating income $1,428 2.8% $399 2.8% Depreciation 310 111 Noncontrolling interests 310 (21) Earnings before interest, tax, and depreciation (EBITDA less NCI) $2,048 $489 EBITDA less NCI as a percentage of revenue 4.0% 3.5% 14 Home and Community Based Services Segment Adjusted Segment Results – 2019 vs 2018
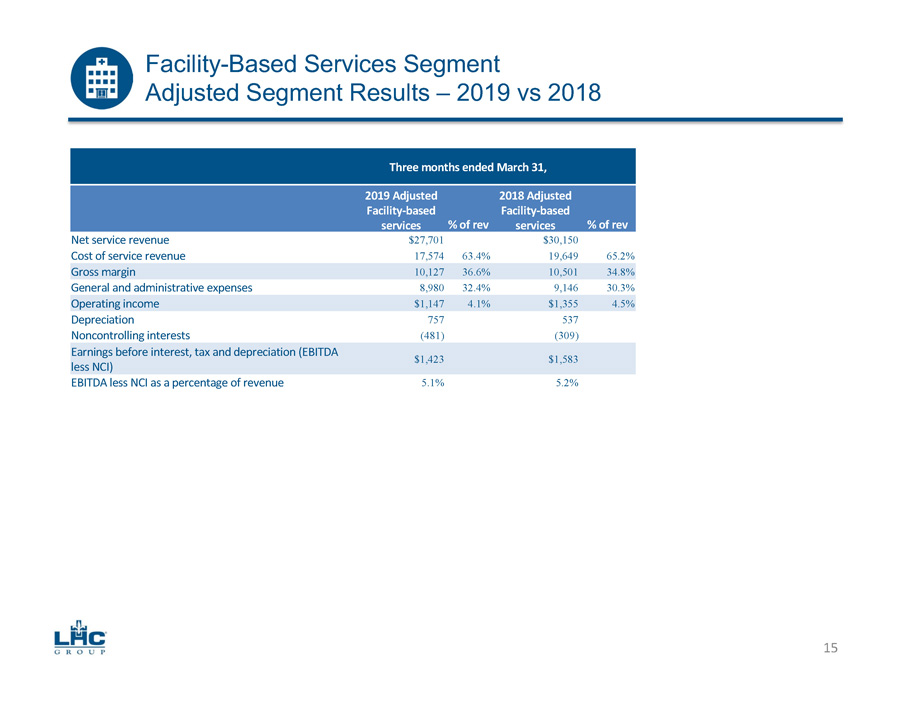
Facility - Based Services Segment Adjusted Segment Results – 2019 vs 2018 Three months ended March 31, 2019 Adjusted Facility - based services % of rev 2018 Adjusted Facility - based services % of rev Net service revenue $27,701 $30,150 Cost of service revenue 17,574 63.4% 19,649 65.2% Gross margin 10,127 36.6% 10,501 34.8% General and administrative expenses 8,980 32.4% 9,146 30.3% Operating income $1,147 4.1% $1,355 4.5% Depreciation 757 537 Noncontrolling interests (481) (309) Earnings before interest, tax and depreciation (EBITDA less NCI) $1,423 $1,583 EBITDA less NCI as a percentage of revenue 5.1% 5.2% 15
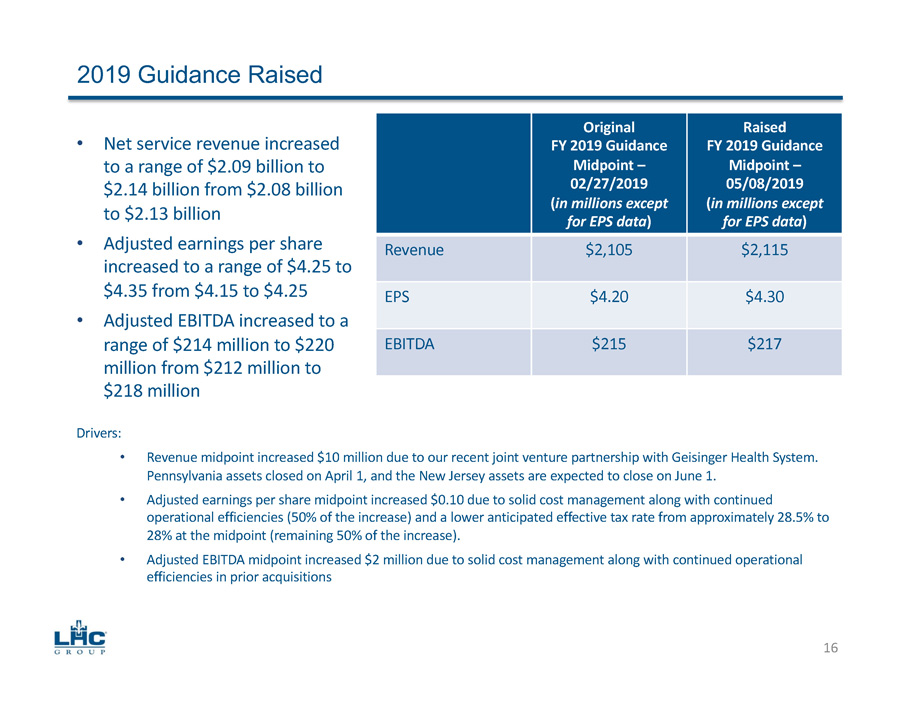
Drivers: • Revenue midpoint increased $10 million due to our recent joint venture partnership with Geisinger Health System. Pennsylvania assets closed on April 1, and the New Jersey assets are expected to close on June 1. • Adjusted earnings per share midpoint increased $0.10 due to solid cost management along with continued operational efficiencies (50% of the increase) and a lower anticipated effective tax rate from approximately 28.5% to 28% at the midpoint (remaining 50% of the increase). • Adjusted EBITDA midpoint increased $2 million due to solid cost management along with continued operational efficiencies in prior acquisitions 2019 Guidance Raised Original FY 2019 Guidance Midpoint – 02/27/2019 ( in millions except for EPS data ) Raised FY 2019 Guidance Midpoint – 05/08/2019 ( in millions except for EPS data ) Revenue $2,105 $2,115 EPS $4.20 $4.30 EBITDA $215 $217 • Net service revenue increased to a range of $2.09 billion to $2.14 billion from $2.08 billion to $2.13 billion • Adjusted earnings per share increased to a range of $4.25 to $4.35 from $4.15 to $4.25 • Adjusted EBITDA increased to a range of $214 million to $220 million from $212 million to $218 million 16
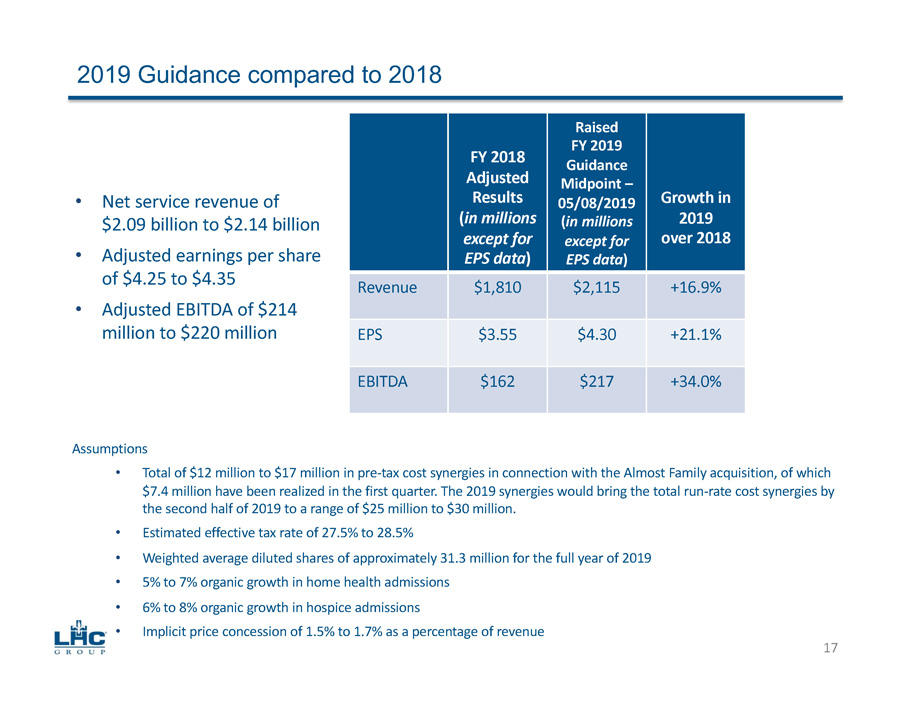
Assumptions • Total of $12 million to $17 million in pre - tax cost synergies in connection with the Almost Family acquisition , of which $7.4 million have been realized in the first quarter. The 2019 synergies would bring the total run - rate cost synergies by the second half of 2019 to a range of $25 million to $30 million. • Estimated effective tax rate of 27.5% to 28.5% • Weighted average diluted shares of approximately 31.3 million for the full year of 2019 • 5% to 7% organic growth in home health admissions • 6% to 8% organic growth in hospice admissions • Implicit price concession of 1.5% to 1.7% as a percentage of revenue 2019 Guidance compared to 2018 FY 2018 Adjusted Results ( in millions except for EPS data ) Raised FY 2019 Guidance Midpoint – 05/08/2019 ( in millions except for EPS data ) Growth in 2019 over 2018 Revenue $1,810 $2,115 +16.9% EPS $3.55 $4.30 +21.1% EBITDA $162 $217 +34.0% • Net service revenue of $2.09 billion to $2.14 billion • Adjusted earnings per share of $4.25 to $4.35 • Adjusted EBITDA of $214 million to $220 million 17
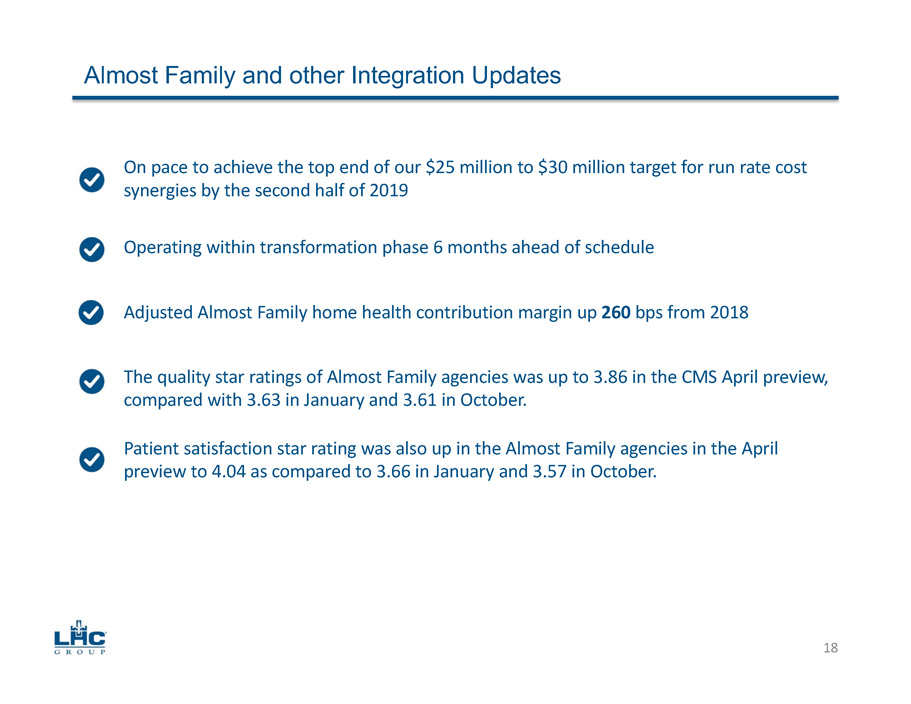
Almost Family and other Integration Updates On pace to achieve the top end of our $25 million to $30 million target for run rate cost synergies by the second half of 2019 Adjusted Almost Family home health contribution margin up 260 bps from 2018 The quality star ratings of Almost Family agencies was up to 3.86 in the CMS April preview, compared with 3.63 in January and 3.61 in October. Operating within transformation phase 6 months ahead of schedule 18 Patient satisfaction star rating was also up in the Almost Family agencies in the April preview to 4.04 as compared to 3.66 in January and 3.57 in October.
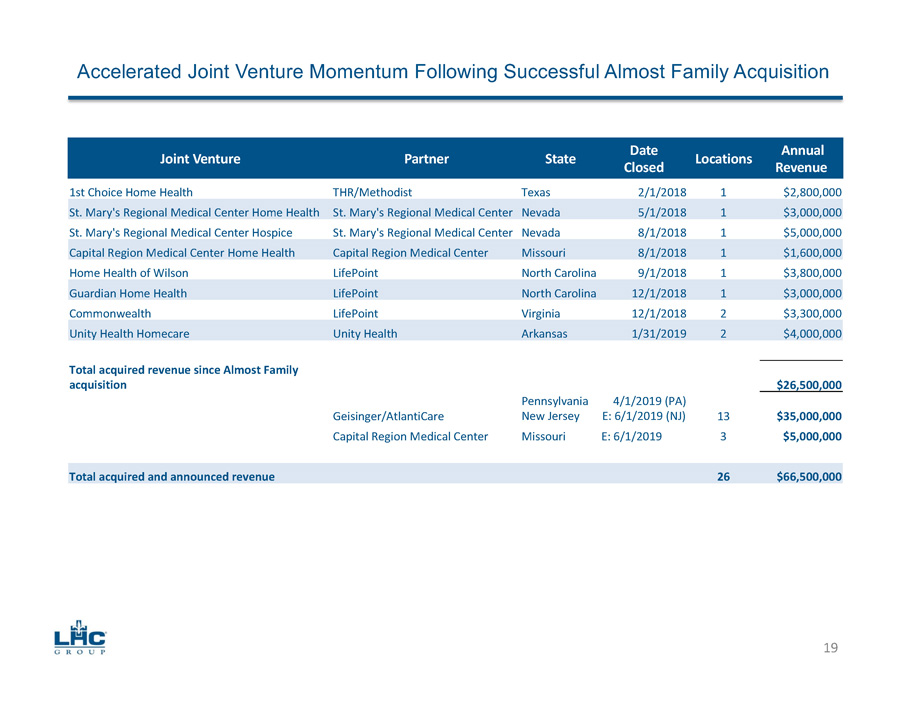
Accelerated Joint Venture Momentum Following Successful Almost Family Acquisition Joint Venture Partner State Date Closed Locations Annual Revenue 1st Choice Home Health THR/Methodist Texas 2/1/2018 1 $2,800,000 St. Mary's Regional Medical Center Home Health St. Mary's Regional Medical Center Nevada 5/1/2018 1 $3,000,000 St. Mary's Regional Medical Center Hospice St. Mary's Regional Medical Center Nevada 8/1/2018 1 $5,000,000 Capital Region Medical Center Home Health Capital Region Medical Center Missouri 8/1/2018 1 $1,600,000 Home Health of Wilson LifePoint North Carolina 9/1/2018 1 $3,800,000 Guardian Home Health LifePoint North Carolina 12/1/2018 1 $3,000,000 Commonwealth LifePoint Virginia 12/1/2018 2 $3,300,000 Unity Health Homecare Unity Health Arkansas 1/31/2019 2 $4,000,000 Total acquired revenue since Almost Family acquisition $26,500,000 Geisinger/ AtlantiCare Pennsylvania New Jersey 4/1/2019 (PA) E: 6/1/2019 (NJ) 13 $35,000,000 Capital Region Medical Center Missouri E: 6/1/2019 3 $5,000,000 Total acquired and announced revenue 26 $66,500,000 19
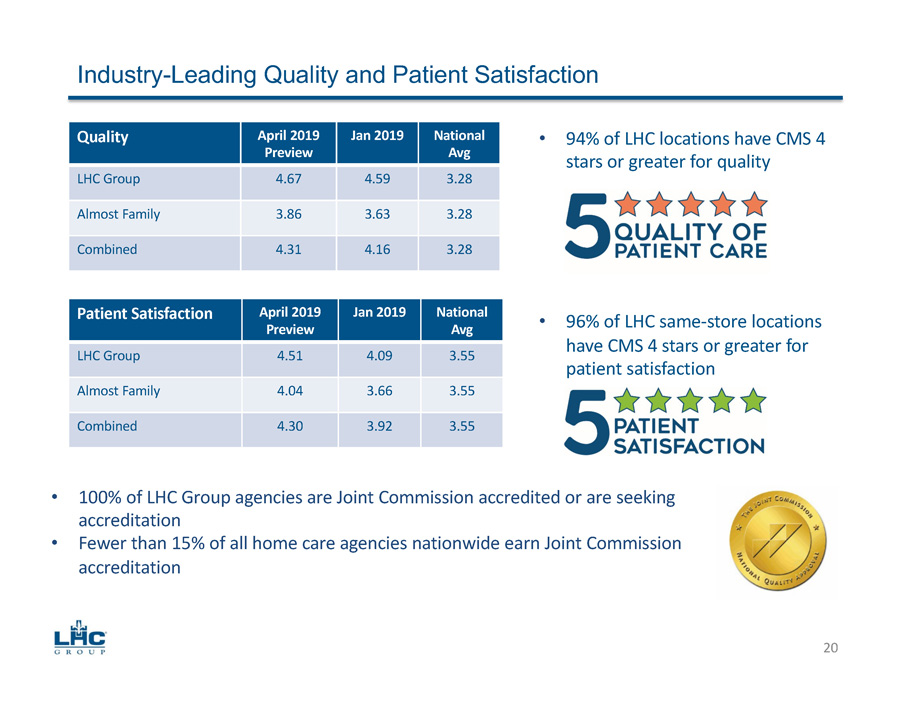
Industry - Leading Quality and Patient Satisfaction • 94% of LHC locations have CMS 4 stars or greater for quality • 96% of LHC same - store locations have CMS 4 stars or greater for patient satisfaction 20 Quality April 2019 Preview Jan 2019 National Avg LHC Group 4.67 4.59 3.28 Almost Family 3.86 3.63 3.28 Combined 4.31 4.16 3.28 Patient Satisfaction April 2019 Preview Jan 2019 National Avg LHC Group 4.51 4.09 3.55 Almost Family 4.04 3.66 3.55 Combined 4.30 3.92 3.55 • 100% of LHC Group agencies are Joint Commission accredited or are seeking accreditation • Fewer than 15% of all home care agencies nationwide earn Joint Commission accreditation
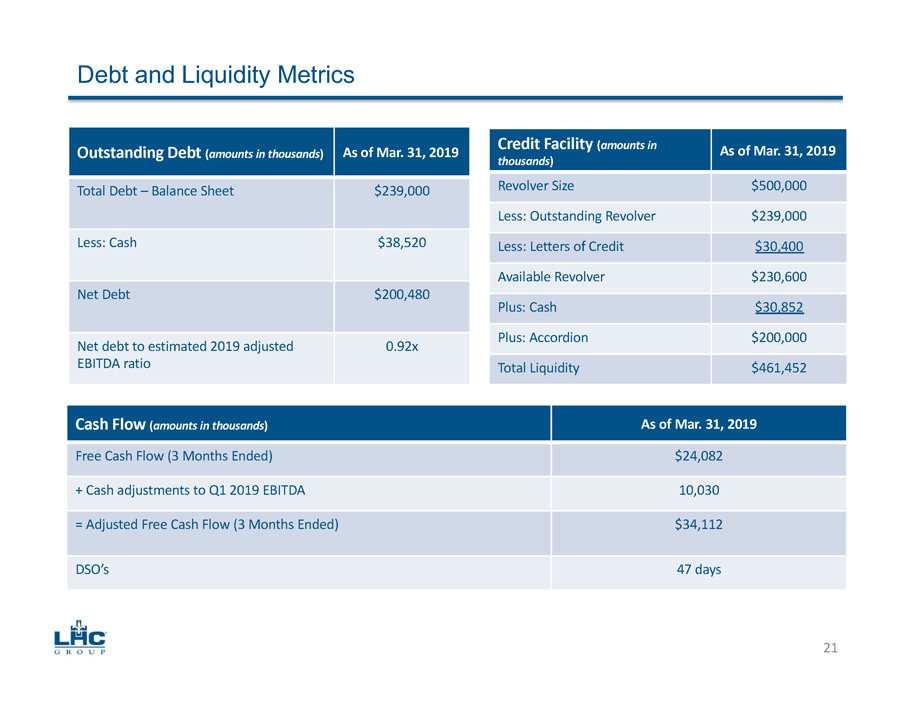
Debt and Liquidity Metrics Outstanding Debt ( amounts in thousands ) As of Mar. 31, 2019 Total Debt – Balance Sheet $239,000 Less: Cash $38,520 Net Debt $200,480 Net debt to estimated 2019 adjusted EBITDA ratio 0.92x Credit Facility ( amounts in thousands ) As of Mar. 31, 2019 Revolver Size $500,000 Less: Outstanding Revolver $239,000 Less: Letters of Credit $30,400 Available Revolver $230,600 Plus: Cash $30,852 Plus: Accordion $200,000 Total Liquidity $461,452 Cash Flow ( amounts in thousands ) As of Mar. 31, 2019 Free Cash Flow (3 Months Ended) $24,082 + Cash adjustments to Q1 2019 EBITDA 10,030 = Adjusted Free Cash Flow (3 Months Ended) $34,112 DSO’s 47 days 21
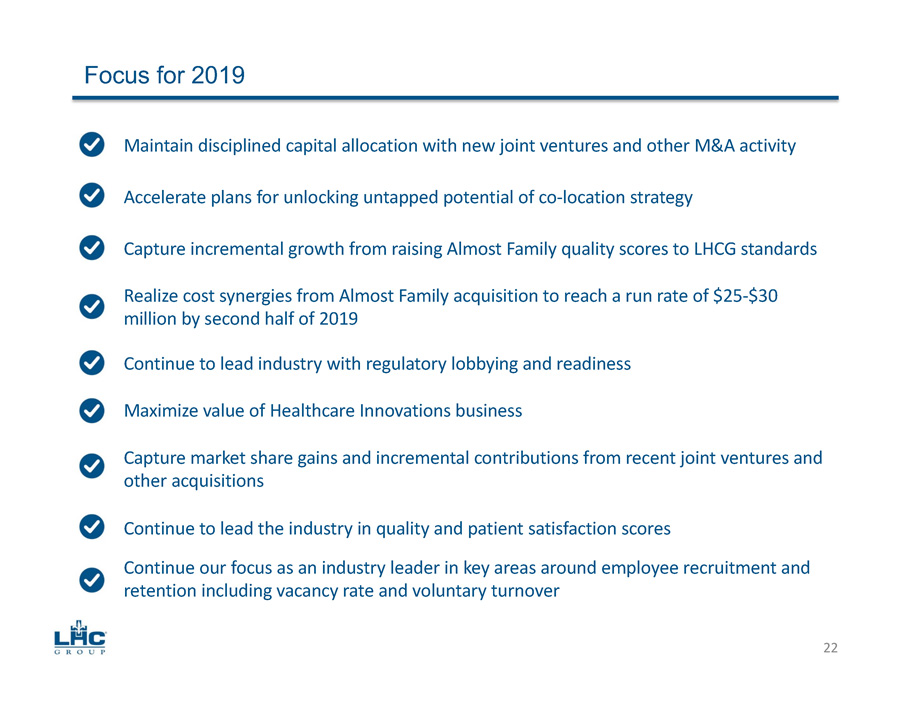
Focus for 2019 Maintain disciplined capital allocation with new joint ventures and other M&A activity Realize cost synergies from Almost Family acquisition to reach a run rate of $25 - $30 million by second half of 2019 Continue to lead industry with regulatory lobbying and readiness Maximize value of Healthcare Innovations business Capture incremental growth from raising Almost Family quality scores to LHCG standards Accelerate plans for unlocking untapped potential of co - location strategy Capture market share gains and incremental contributions from recent joint ventures and other acquisitions 22 Continue to lead the industry in quality and patient satisfaction scores Continue our focus as an industry leader in key areas around employee recruitment and retention including vacancy rate and voluntary turnover
Non - GAAP Reconciliations (Amounts in thousands, unaudited) RECONCILIATION OF REVENUE AFTER ADOPTION OF ASU 2014 - 09 RECONCILIATION OF ADJUSTED NET INCOME ATTRIBUTABLE TO LHC GROUP Three Months Ended March 31, 2019 2018 Net Service Revenue, pre - adoption $510,937 $295,980 Less: Implicit price concession (1) 8,352 4,926 Net Service Revenue, post - adoption $502,585 $291,054 Three Months Ended March 31, 2019 2018 Net income attributable to LHC Group, Inc.’s common stockholders $18,856 $4,995 Add (net of tax): Almost Family and other acquisition expenses (2) 5,268 6,311 Closures/relocations/consolidations (3) 2,244 ─ Provider moratorium impairment (4) 4,332 ─ Adjusted net income attributable to LHC Group, Inc.’s common stockholders $30,700 $11,306 23 Footnotes are on page 26
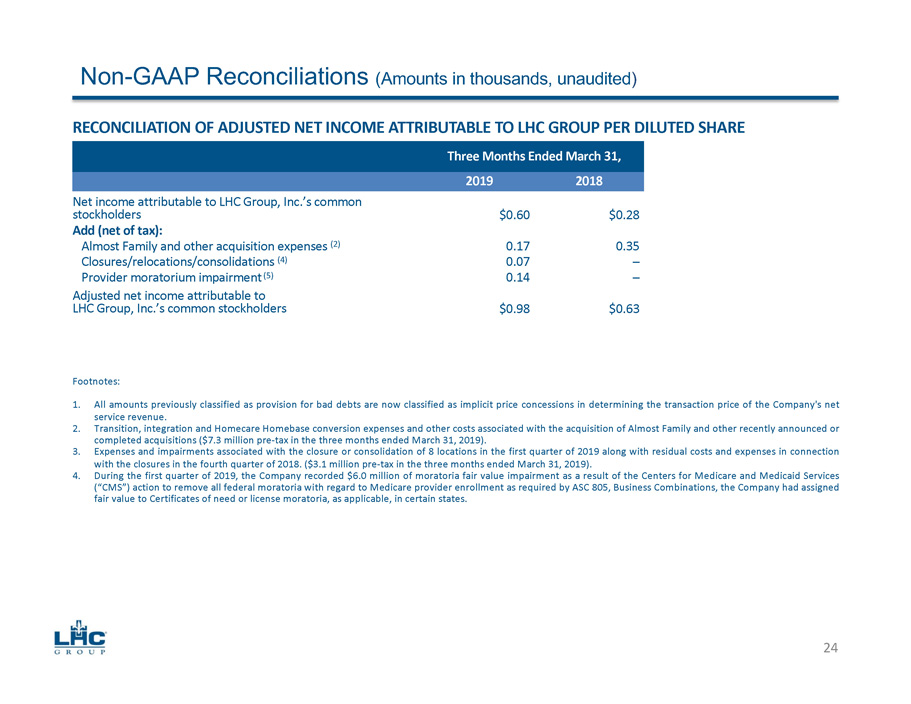
Non - GAAP Reconciliations (Amounts in thousands, unaudited ) RECONCILIATION OF ADJUSTED NET INCOME ATTRIBUTABLE TO LHC GROUP PER DILUTED SHARE Three Months Ended March 31, 2019 2018 Net income attributable to LHC Group, Inc.’s common stockholders $0.60 $0.28 Add (net of tax): Almost Family and other acquisition expenses (2) 0.17 0.35 Closures/relocations/consolidations (4) 0.07 ─ Provider moratorium impairment (5) 0.14 ─ Adjusted net income attributable to LHC Group, Inc.’s common stockholders $0.98 $0.63 Footnotes : 1. All amounts previously classified as provision for bad debts are now classified as implicit price concessions in determining the transaction price of the Company's net service revenue . 2. Transition, integration and Homecare Homebase conversion expenses and other costs associated with the acquisition of Almost Family and other recently announced or completed acquisitions ( $ 7 . 3 million pre - tax in the three months ended March 31 , 2019 ) . 3. Expenses and impairments associated with the closure or consolidation of 8 locations in the first quarter of 2019 along with residual costs and expenses in connection with the closures in the fourth quarter of 2018 . ( $ 3 . 1 million pre - tax in the three months ended March 31 , 2019 ) . 4. During the first quarter of 2019 , the Company recorded $ 6 . 0 million of moratoria fair value impairment as a result of the Centers for Medicare and Medicaid Services (“CMS”) action to remove all federal moratoria with regard to Medicare provider enrollment as required by ASC 805 , Business Combinations, the Company had assigned fair value to Certificates of need or license moratoria, as applicable, in certain states . 24
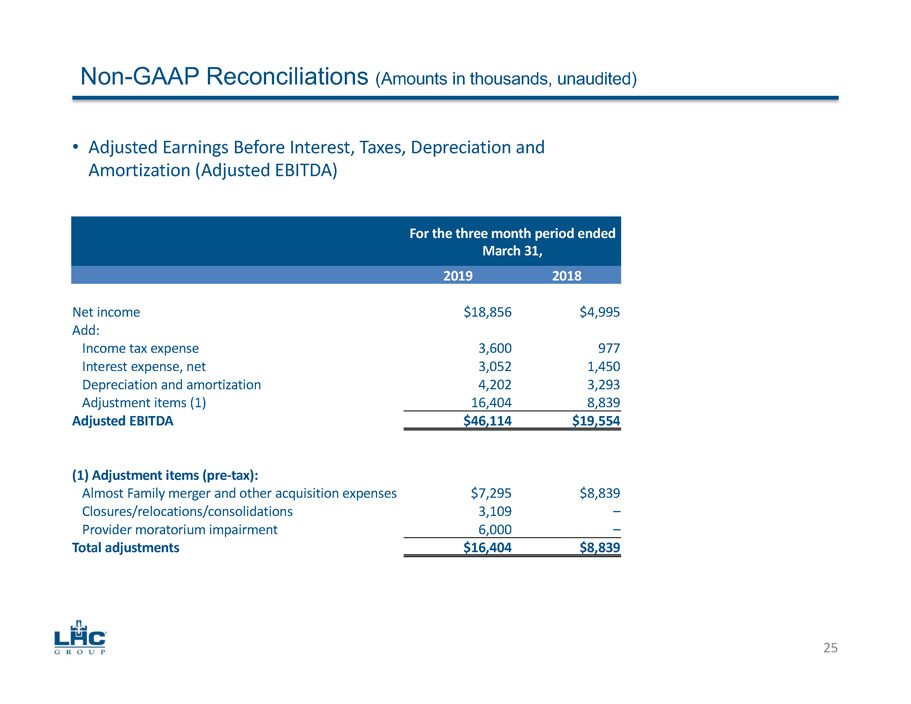
• Adjusted Earnings Before Interest, Taxes, Depreciation and Amortization (Adjusted EBITDA) For the three month period ended March 31, 2019 2018 Net income $18,856 $4,995 Add: Income tax expense 3,600 977 Interest expense, net 3,052 1,450 Depreciation and amortization 4,202 3,293 Adjustment items (1) 16,404 8,839 Adjusted EBITDA $46,114 $19,554 (1) Adjustment items (pre - tax): Almost Family merger and other acquisition expenses $7,295 $8,839 Closures/relocations/consolidations 3,109 ─ Provider moratorium impairment 6,000 ─ Total adjustments $16,404 $8,839 Non - GAAP Reconciliations (Amounts in thousands, unaudited) 25
G-:W&KZ:
M!3EU#UJ2QC2&MMJZ>ZO)IC8ZNJNSV^ZQCZ:+/237Y_3F=0^SU=/9E.):]MU0
MK,NL'VT>YP;^D?9C49&_?L_1_:?5_0+=20XAV_%/">_X.7TEV!E/R+*L!N*^
MK(]0N-;076OK:YV3N:/Y_P!.]U5EG\Y_U"M?LOIFW9]DHV !H;Z;(VAKZFMC
M;]'TKKJ_^+MM_P!(K22:9:Z:?5W_"
M[&>I^^I-Z;TYKWV-Q:198_U;'BMH+K(