Exhibit 99.1

MANITEX INTERNATIONAL REPORTS FOURTH QUARTER
AND FULL-YEAR 2022 RESULTS
Delivers strong year-over-year growth in revenue, Adjusted EBITDA and profitability
Introduces “Elevating Excellence” value creation strategy
Introduces 2025 revenue, Adjusted EBITDA and Adjusted EBITDA margin targets
Bridgeview, IL, March 8, 2023 – Manitex International, Inc. (Nasdaq: MNTX) (“Manitex” or the “Company”), a leading international provider of truck cranes, specialized industrial equipment, and construction equipment rental solutions to infrastructure and construction markets, today reported financial results for the three months and full-year ended December 31, 2022.
FOURTH QUARTER 2022 RESULTS
(all comparisons versus the prior year period unless otherwise noted)
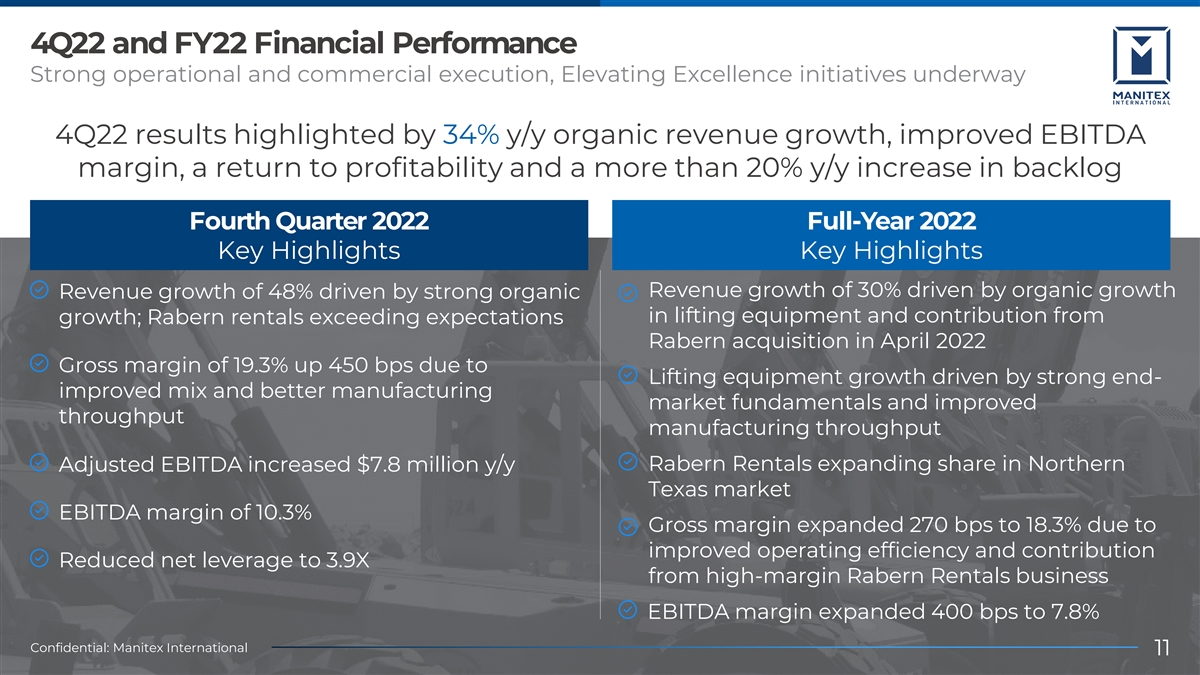
| • | Net revenue of $78.8 million, +47.6%, including +33.8% organic growth in lifting equipment |
| • | Backlog increased to $230.2 million, +21.8%, on strong North American and European demand |
| • | Net Income of $0.7 million, or $0.04 per diluted share |
| • | Gross profit of $15.2 million; gross margin of 19.3%, +450 basis points, excluding non-recurring adjustments related to the disposition of the Badger business unit in the fourth quarter of 2021 |
| • | Adjusted Net Income of $2.0 million, or $0.10 per diluted share |
| • | Adjusted EBITDA of $8.1 million, or 10.3% of net revenue |
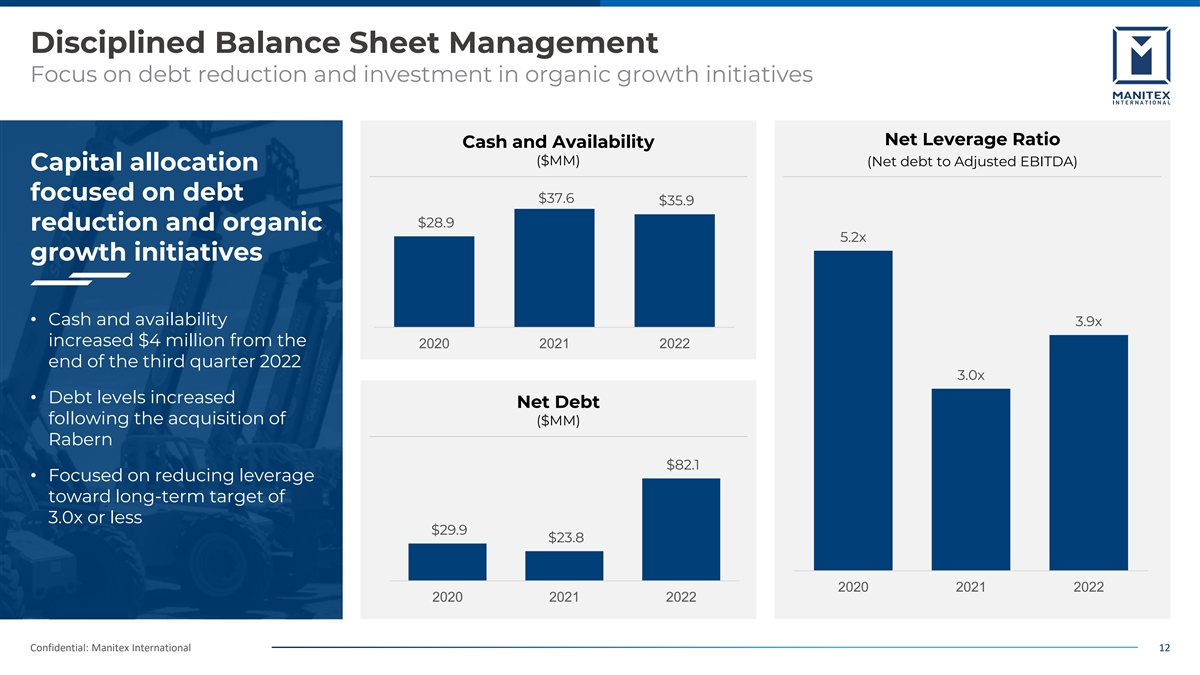
| • | Net leverage of 3.9x; total liquidity increased by nearly $4 million to $36 million versus the third quarter of 2022 |
FULL-YEAR 2022 RESULTS
(all comparisons versus the prior year period unless otherwise noted)
| • | Net Revenue of $273.9 million, +29.5%, including +19.4% organic growth |
| • | Net Loss of $4.3 million, or ($0.21) per diluted share |
| • | Gross Profit of $50.0 million; gross margin of 18.3%, +120 basis points, excluding non-recurring adjustments related to the disposition of the Badger business unit in the fourth quarter of 2021 |
| • | Adjusted Net Income of $5.0 million, or $0.25 per diluted share |
| • | Adjusted EBITDA of $21.3 million, +165% |
| • | Adjusted EBITDA margin of 7.8%, +400 basis points |
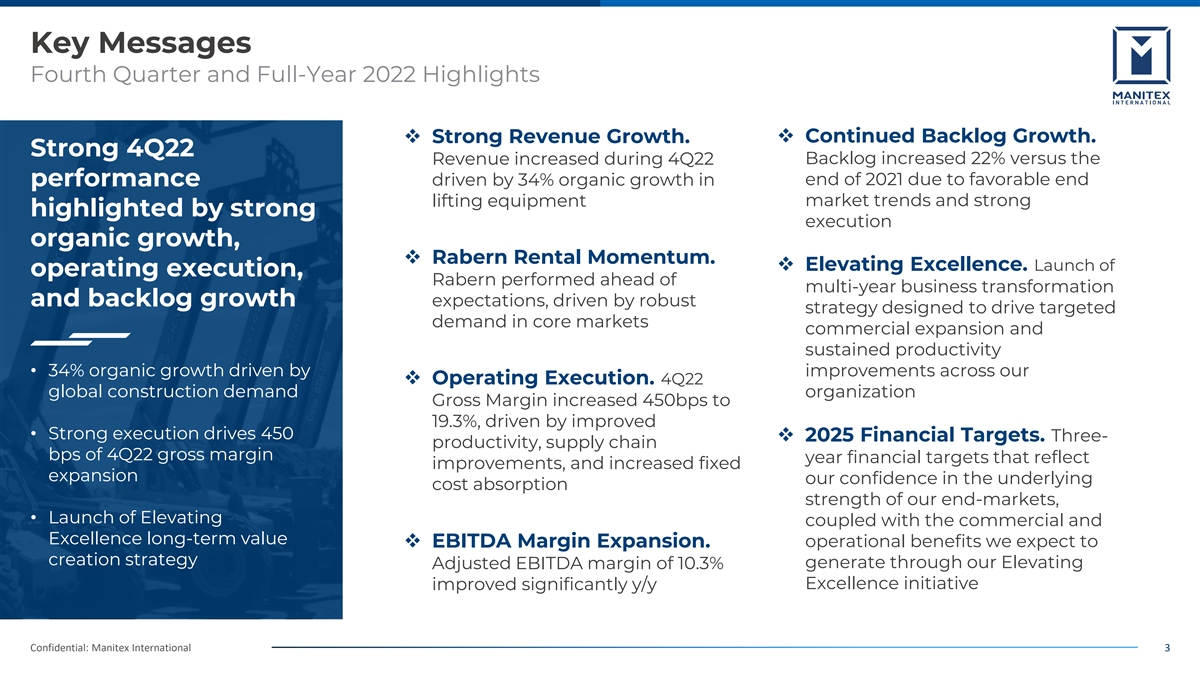
“We delivered strong fourth quarter results, highlighted by significant organic revenue growth across our lifting equipment and rental segments, sustained margin expansion, and our fourth consecutive quarter of improved profitability,” stated Michael Coffey, CEO of Manitex. “Early progress on our operational excellence initiatives, which include targeted improvements in capacity utilization, supply chain optimization and fixed cost absorption, contributed to our improved quarterly EBITDA margins that exceeded 10%. Customer demand was robust across our North American and European markets during the fourth quarter, culminating in 22% year-over-year growth in total backlog.”
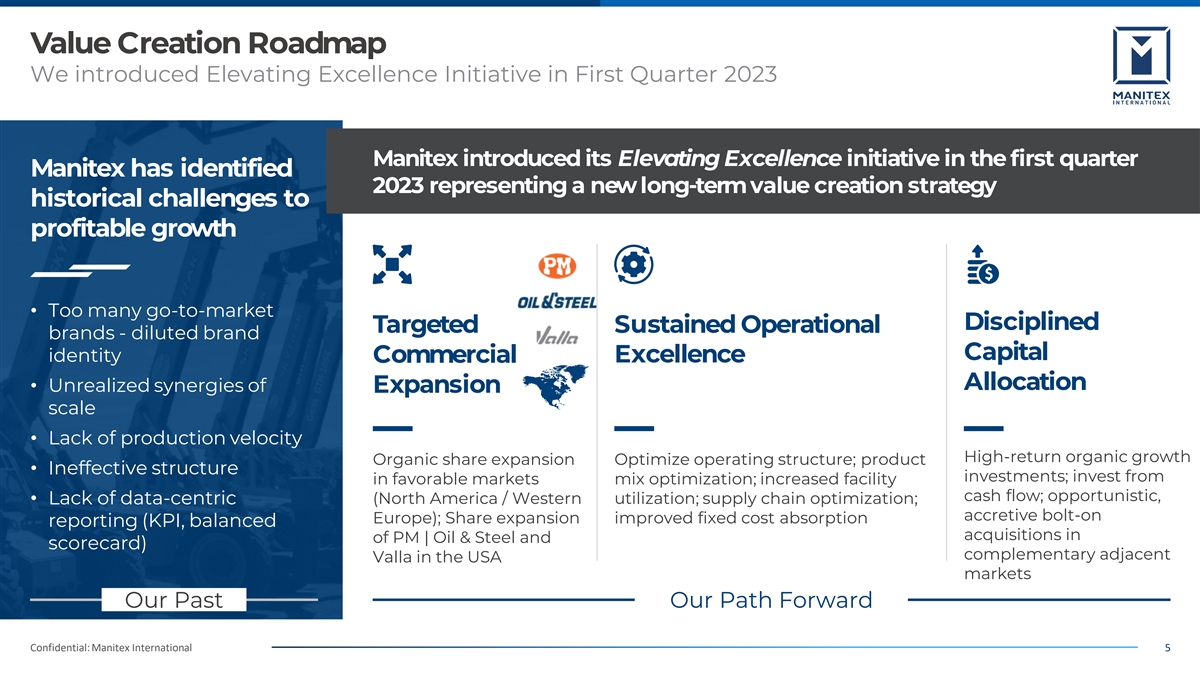
“In early 2023, we formally launched Elevating Excellence, a multi-year business transformation strategy designed to drive targeted commercial expansion and sustained productivity improvements across our organization,” continued Coffey. “In application, Elevating Excellence is designed to refine our go-to-market strategy, further optimize our resource base, enhance our sourcing and procurement, and ensure a disciplined approach to capital allocation, with an initial emphasis on debt reduction. We are working to build a strong platform for sustained, profitable growth, positioning Manitex to elevate its position within the global lifting solutions market, consistent with our long-term focus on shareholder value creation.”
“Today we introduced three-year financial targets that reflect our confidence in the underlying strength of our end-markets, coupled with the commercial and operational benefits we aim to generate through our Elevating Excellence initiative,” continued Coffey. “ The initiative is outlined in this release and will be discussed in further detail during our fourth quarter 2022 conference call.”
“We ended the fourth quarter with nearly $36 million in cash and available liquidity, a sequential increase of $4 million,” stated Joseph Doolan, Chief Financial Officer of Manitex. “In 2023, our capital allocation priorities will include debt reduction and select investments in organic growth. We intend to reduce our net leverage ratio closer toward our long-term target of at-or-below 3.0x, driven by a combination of improved operating cash flow and a planned decline in maintenance capital expenditures.”
“While our team made measurable progress on our strategic initiatives during 2022, we remain in the early stages of a multi-year business transformation,” noted Coffey. “Entering 2023, our focus will turn toward market share growth in key product categories across North America; further expansion of our rental footprint; optimization of our manufacturing operations and supply chain; and further reduction in net leverage, ensuring that we maintain balance sheet flexibility. Given our more than 20% year-over-year growth in backlog exiting the fourth quarter, a more favorably priced backlog to current production costs, and stable end-market fundamentals, we believe that Manitex is on-pace to deliver a low double-digit Adjusted EBITDA growth rate in 2023.”
FOURTH QUARTER 2022 PERFORMANCE
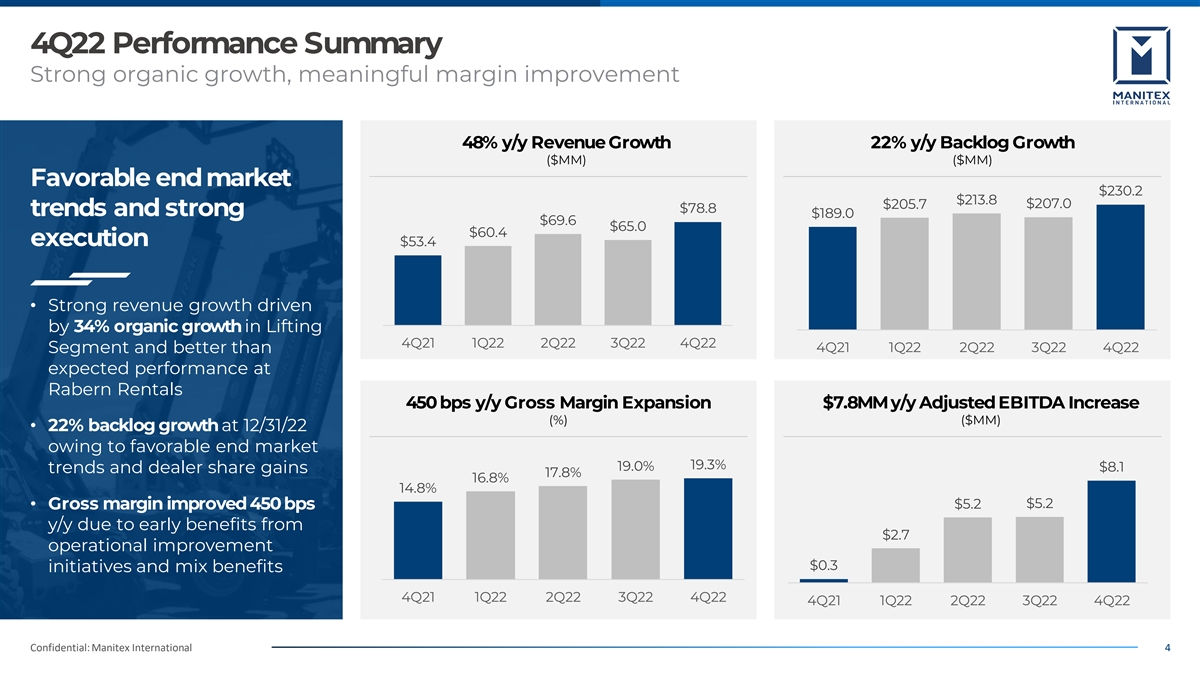
The Company reported net revenue of $78.8 million in the fourth quarter 2022, an increase of 47.6% versus the prior-year period, driven by organic growth in Lifting Equipment and contributions from the Rabern Rentals acquisition completed in April 2022.
Lifting Equipment Segment revenue was $71.5 million in the fourth quarter, an increase of 33.8%, versus the prior-year period. Lifting Equipment revenue growth was driven by both strong demand trends in domestic and international markets, coupled with improved throughput in manufacturing facilities owing to production velocity initiatives, better coordination with suppliers and related benefits from recent efficiency gains.
Rental Equipment Segment revenue was $7.3 million in fourth quarter 2022, supported by strong end-market demand in key North Texas markets. The Rabern business performed ahead of expectations in the fourth quarter, due to the deployment of new rental fleet acquired in 2022 and preliminary market share gains in Lubbock, Texas, ahead of the new branch soft opening scheduled for March 2023.
Gross profit was $15.2 million in the fourth quarter, an increase from $4.7 million in the prior year period. Excluding an inventory write-down of $3.2 million taken during the fourth quarter 2021, gross profit during the fourth quarter 2022 increased 93% over the prior-year period due to strong revenue growth, benefits from the Company’s operational improvement initiatives, and improved mix due to the contributions from Rabern Rentals. As a results of these factors, gross profit margin increased 450 basis points to 19.3% during the fourth quarter 2022, after adjusting for the inventory write-down during the fourth quarter 2021.
Operating income was $4.2 million for the fourth quarter, compared to an operating loss of ($7.1) million for the same period last year. Operating margin in the fourth quarter 2022 was 5.3%. The year-over-year improvement in operating income was driven by the strong gross margin performance and disciplined cost control.
Net income was $0.7 million, or $0.04 per diluted share, for the fourth quarter 2022, compared to a net loss of ($8.1) million, or ($0.40) per diluted share, for the same period last year. Adjusted net income was $2.0 million, or $0.10 per diluted share in the fourth quarter 2022, a significant increase compared to a net loss of ($1.7) million, or ($0.08) per diluted share, for the same period last year. Adjusted net income excludes $0.6 million of stock compensation expense and approximately $0.8 million of other non-recurring expenses in the fourth quarter of 2022.
Adjusted EBITDA was $8.1 million for the fourth quarter 2022, or 10.3% of sales, compared to $0.3 million, or 0.6% of sales, for the same period last year. See Non-GAAP reconciliations in the appendix of this release.
As of December 31, 2022, total backlog was $230.2 million, up 22% from the end of 2021 and up 11% from the end of the third quarter 2022, driven by continued favorable trends in key end markets in both North America and International regions. In addition, the Company continued to gain share with key North American dealers and added an important new dealer in the Midwest.
BALANCE SHEET AND LIQUIDITY
As of December 31, 2022, total debt was $90.3 million, compared to $97.5 million at the end of third quarter 2022. Cash and cash equivalents as of December 31, 2022 were $8.2 million, resulting in net debt of $82.1 million, compared to $85.6 million at the end of third quarter 2022 and $23.8 million at the end of fourth quarter 2021. Net leverage was 3.9x at the end of fourth quarter 2022, compared to 6.4x at the end of third quarter 2022. As of December 31, 2022, Manitex had total cash and availability of $36 million.
ELEVATING EXCELLENCE INITIATIVE 2023 - 2025
The Elevating Excellence Initiative aims to drive sustained commercial growth and improved operating performance, ultimately resulting in long-term value creation for our shareholders. The Initiative builds on the Company’s core values of Customer Focus, Innovation, Dedication, Teamwork, Accountability, Excellence and Integrity.
Key pillars of the Initiative are as follows:
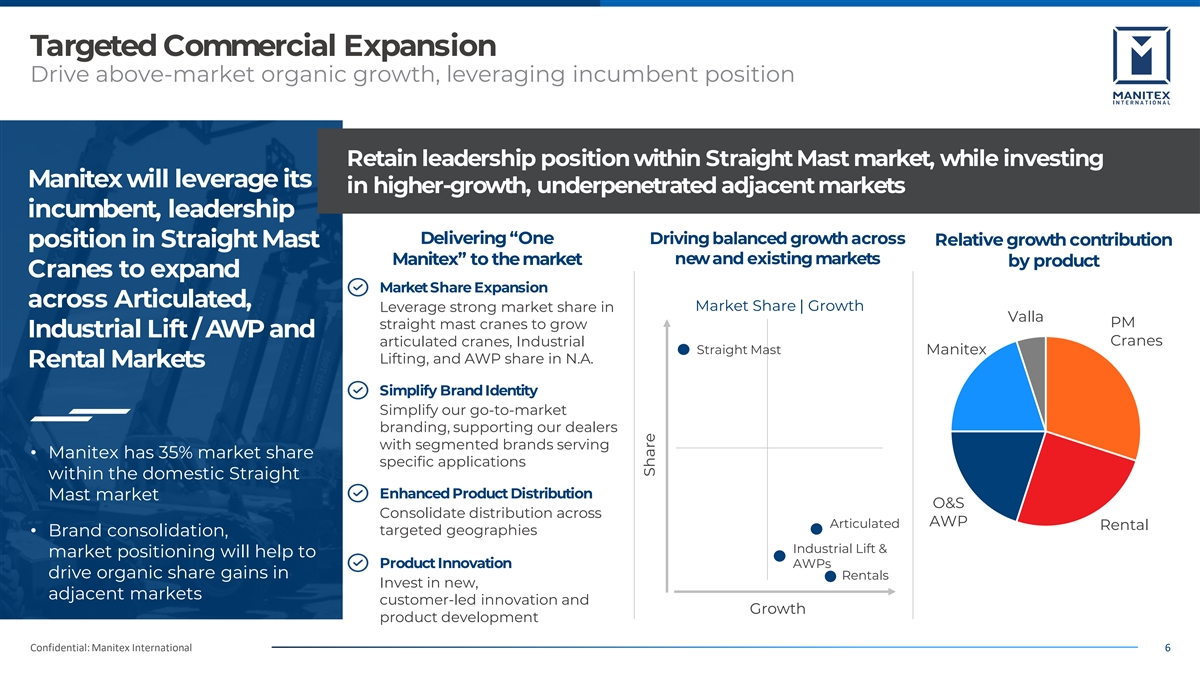
| • | Organic Market Share Expansion. Manitex currently holds a leading market share position for Straight Mast Cranes under its Manitex brand in North America. The Company believes there is a significant opportunity to leverage this position and expand its share in the high-growth Articulated Crane, Industrial Lifting Equipment and Aerial Work Platform markets in North America. The Company has implemented an enhanced distribution model, using North American resources to sell and support products traditionally supported from Europe. This new operating structure enables improved sales, support and upfitting of our PM branded truck cranes in North America. We will support current and new dealers with upfitting capabilities to further expand the PM truck crane product offering in North America. Management is working toward common goals to meaningfully increase share. |
| • | Refreshed Global Brand Identity. Manitex has consolidated and refreshed its global branding across all product lines, streamlining its go-to-market offering within five brand core categories: Manufactured Lifting Solutions, under the Manitex and PM brands; Aerial Work Platforms, under the Oil & Steel brand; Electric Industrial Cranes, under the Valla brand; and Rental Solutions, under the Rabern Rentals brand, which Manitex acquired in 2022. As previously disclosed, the consolidated and uniform branding initiative will play a key role in supporting the Company’s global distribution model. The rebranding is also expected to aid the Company’s dealers by representing a more cohesive and clear brand with their customers. Manitex has discontinued the MAC product brand, choosing to sell its articulated truck cranes under the global PM brand, going forward. |
| • | New Product Innovation. Manitex is committed to bringing new, more efficient, practical innovations to the global market in an effort to maintain and grow its market share. New product innovation is focused on its core lifting equipment product categories that the Company can market in both North America and Europe, with an emphasis on expanding profitability. Set to release in March, the company developed a first of its kind electric boom truck crane. The Electric Crane System (ECSY) is an optional module enabling Manitex TC cranes the ability to operate on electric power, not diesel. The innovation represents a practical step toward efficiency and lowering emmissions for mobile truck cranes. The Company also recently released its TC850, an 85 ton truck crane designed for energy, infrastructure and heavy industrial applications. Both products will be on display next week at ConExpo, Las Vegas. |
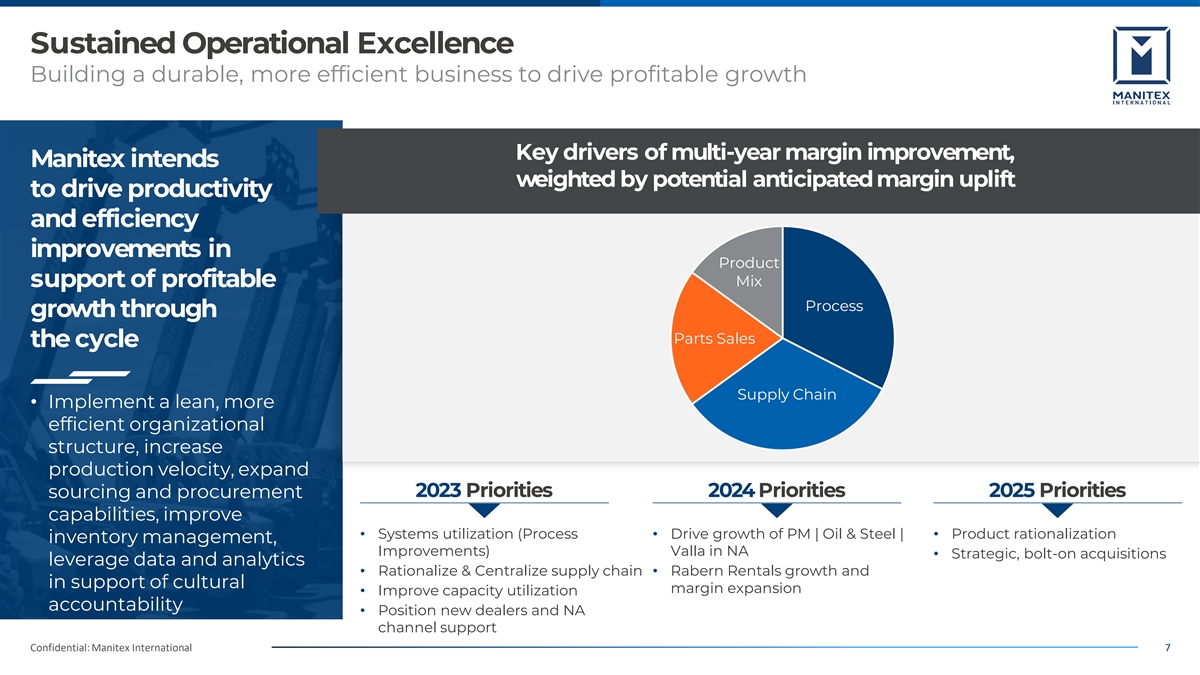
| • | Purpose-Driven Operating Structure. The Company has consolidated its operating structure with dedicated leaders in each of its Italian and North American manufacturing operations, as well as within its Rabern Rentals business. The new organizational structure allows for common goals across the Company, designed to improve resource utilization, salesforce alignment, a more leveraged supply chain and improved working capital management. Manitex completed initial organizational actions in 2022 and began to implement process and systems improvements in early 2023. These improvements are designed for short-term efficiency gains and longer-term capacity growth initiatives. |
| • | Product Mix Optimization and Aftermarket Focus. Manitex has a broad global portfolio of lifting equipment and solutions. Over time, as it introduces new, innovative and more efficient product lines, the Company plans to optimize its portfolio to focus on the highest growth and most profitable areas of its business. Additionally, the Company will continue to focus on driving high-value aftermarket parts sales which typically respresents between 10 – 15% of total revenues. The Company is targeting a 10 percent improvement to aftermarket products sales. |
| • | Disciplined Capital Allocation. Manitex intends to prioritize debt reduction and organic growth investments. As of December 31, 2022, Manitex’s net leverage ratio was 3.9x. The Company continues to target a net leverage ratio of at-or-below 3.0x, consistent with its mandate to optimize balance sheet flexibility. |
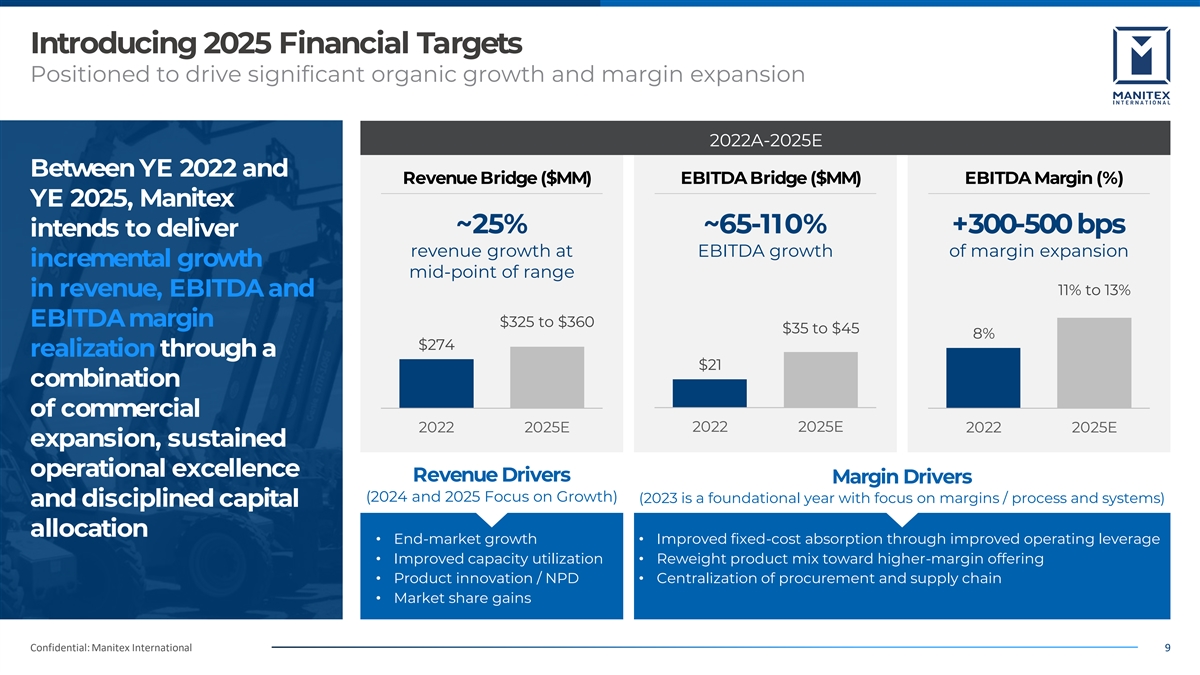
LONG-TERM FINANCIAL TARGETS
Today, Manitex introduced 2025 financial targets, as supported by its Elevating Excellence initiative and continued, perceived strength in its core end-markets.
| Full-Year | Full Year 2025 | |||||||||||||||
| ($ in millions) | 2022 Actual | Low-Case | Base-Case | High-Case | ||||||||||||
| Total Revenue |
$ | 273.9 | $ | 325 | $ | 342 | $ | 360 | ||||||||
| Total Adjusted EBITDA |
$ | 21.3 | $ | 35 | $ | 40 | $ | 45 | ||||||||
| Total Adjusted EBITDA Margin |
7.8 | % | 10.8 | % | 11.8 | % | 12.8 | % | ||||||||
These targets are current as of the time provided and subject to change, given markets conditions.
FOURTH QUARTER AND FULL-YEAR 2022 RESULTS CONFERENCE CALL
Manitex will host a conference call today at 9:00 AM ET to discuss the Company’s fourth quarter and full-year 2022 results and updated corporate strategy.
A webcast of the conference call and accompanying presentation materials will be available in the Investor Relations section of the Manitex website at https://www.manitexinternational.com/eventspresentations.aspx, and a replay of the webcast will be available at the same time shortly after the webcast is complete.
To participate in the live teleconference:
| Domestic Live: | (877) 407-0792 | |
| International Live: | (201) 689-8263 | |
| Passcode: | 13736090 |
To listen to a replay of the teleconference, which will be available through March 15, 2023:
| Domestic Replay: | (844) 512-2921 | |
| International Replay: | (412) 317-6671 | |
| Passcode: | 13736090 |
NON-GAAP FINANCIAL MEASURES AND OTHER ITEMS
In this press release, we refer to various non-GAAP (U.S. generally accepted accounting principles) financial measures which management uses to evaluate operating performance, to establish internal budgets and targets, and to compare the Company’s financial performance against such budgets and targets. These non-GAAP measures, as defined by the Company, may not be comparable to similarly titled measures being disclosed by other companies. While adjusted financial measures are not intended to replace any presentation included in our consolidated financial statements under generally accepted accounting principles (GAAP) and should not be considered an alternative to operating performance or an alternative to cash flow as a measure of liquidity, we believe these measures are useful to investors in assessing our operating results, capital expenditure and working capital requirements and the ongoing performance of its underlying businesses. A reconciliation of Adjusted GAAP financial measures is included with this press release. All per share amounts are on a fully diluted basis. The quarterly amounts described below are unaudited, are reported in thousands of U.S. dollars, and are as of the dates indicated.
ABOUT MANITEX INTERNATIONAL
Manitex International is a leading provider of mobile truck cranes, industrial lifting solutions, aerial work platforms, construction equipment and rental solutions that serve general construction, crane companies, and heavy industry. The company engineers and manufactures its products in North America and Europe, distributing through independent dealers worldwide. Our brands include Manitex, PM, Oil & Steel, Valla, and Rabern Rentals.
FORWARD-LOOKING STATEMENTS
Safe Harbor Statement under the U.S. Private Securities Litigation Reform Act of 1995: This release contains statements that are forward-looking in nature which express the beliefs and expectations of management including statements regarding the Company’s expected results of operations or liquidity; statements concerning projections, predictions, expectations, estimates or forecasts as to our business, financial and operational results and future economic performance; and statements of management’s goals and objectives and other similar expressions concerning matters that are not historical facts. In some cases, you can identify forward-looking statements by terminology such as “anticipate,” “estimate,” “plan,” “project,” “continuing,” “ongoing,” “expect,” “we believe,” “we intend,” “may,” “will,” “should,” “could,” and similar expressions. Such statements are based on current plans, estimates and expectations and involve a number of known and unknown risks, uncertainties and other factors that could cause the Company’s future results, performance or achievements to differ significantly from the results, performance or achievements expressed or implied by such forward-looking statements. These factors and additional information are discussed in the Company’s filings with the Securities and Exchange Commission and statements in this release should be evaluated in light of these important factors. Although we believe that these statements are based upon reasonable assumptions, we cannot guarantee future results. Forward-looking statements speak only as of the date on which they are made, and the Company undertakes no obligation to update publicly or revise any forward-looking statement, whether as a result of new information, future developments or otherwise.
IR CONTACT
Paul Bartolai or Noel Ryan
MNTX@val-adv.com
MANITEX INTERNATIONAL, INC. AND SUBSIDIARIES
CONDENSED CONSOLIDATED BALANCE SHEETS
(In thousands, except share and per share data)
(Unaudited)
| December 31, 2022 | December 31, 2021 | |||||||
| ASSETS |
||||||||
| Current assets |
||||||||
| Cash |
$ | 7,973 | $ | 21,359 | ||||
| Cash – restricted |
217 | 222 | ||||||
| Trade receivables (net) |
43,856 | 30,515 | ||||||
| Other receivables |
1,750 | 2,039 | ||||||
| Inventory (net) |
69,801 | 64,965 | ||||||
| Prepaid expense and other current assets |
3,832 | 2,436 | ||||||
| Assets held for sale |
75 | — | ||||||
|
|
|
|
|
|||||
| Total current assets |
127,504 | 121,536 | ||||||
|
|
|
|
|
|||||
| Total fixed assets, net of accumulated depreciation of $22,441 and $18,662 |
51,697 | 16,460 | ||||||
| Operating lease assets |
5,667 | 3,563 | ||||||
| Intangible assets (net) |
14,367 | 11,946 | ||||||
| Goodwill |
36,916 | 24,949 | ||||||
| Other long-term assets |
— | 1,143 | ||||||
| Deferred tax assets |
452 | 178 | ||||||
|
|
|
|
|
|||||
| Total assets |
$ | 236,603 | $ | 179,775 | ||||
|
|
|
|
|
|||||
| LIABILITIES AND EQUITY |
||||||||
| Current liabilities |
||||||||
| Accounts payable |
$ | 45,682 | $ | 44,136 | ||||
| Accrued expenses |
12,379 | 10,539 | ||||||
| Related party payables (net) |
60 | 203 | ||||||
| Notes payable |
22,666 | 18,401 | ||||||
| Current portion of finance lease obligations |
509 | 399 | ||||||
| Current portion of operating lease obligations |
1,758 | 1,064 | ||||||
| Customer deposits |
3,407 | 7,121 | ||||||
|
|
|
|
|
|||||
| Total current liabilities |
86,461 | 81,863 | ||||||
|
|
|
|
|
|||||
| Long-term liabilities |
||||||||
| Revolving term credit facilities (net) |
41,479 | 12,717 | ||||||
| Notes payable (net) |
22,261 | 10,089 | ||||||
| Finance lease obligations (net of current portion) |
3,382 | 3,822 | ||||||
| Non-current operating lease obligations |
3,909 | 2,499 | ||||||
| Deferred gain on sale of property |
427 | 507 | ||||||
| Deferred tax liability |
5,151 | 1,074 | ||||||
| Other long-term liabilities |
5,572 | 4,389 | ||||||
|
|
|
|
|
|||||
| Total long-term liabilities |
82,181 | 35,097 | ||||||
|
|
|
|
|
|||||
| Total liabilities |
168,642 | 116,960 | ||||||
|
|
|
|
|
|||||
| Commitments and contingencies |
||||||||
| Equity |
||||||||
| Preferred Stock—Authorized 150,000 shares, no shares issued or outstanding at
|
— | — | ||||||
| Common Stock—no par value 25,000,000 shares authorized, 20,107,014 and 19,940,487 |
133,289 | 132,206 | ||||||
| Paid-in capital |
4,266 | 3,264 | ||||||
| Retained deficit |
(73,338 | ) | (68,436 | ) | ||||
| Accumulated other comprehensive loss |
(5,822 | ) | (4,219 | ) | ||||
|
|
|
|
|
|||||
| Equity attributable to shareholders of Manitex International |
58,395 | 62,815 | ||||||
| Equity attributed to noncontrolling interest |
9,566 | — | ||||||
|
|
|
|
|
|||||
| Total equity |
67,961 | 62,815 | ||||||
|
|
|
|
|
|||||
| Total liabilities and equity |
$ | 236,603 | $ | 179,775 | ||||
|
|
|
|
|
|||||
MANITEX INTERNATIONAL, INC.
CONSOLIDATED STATEMENTS OF OPERATIONS
(In thousands, except for share and per share amounts)
| Three Months Ended December 31, |
Year Ended December 31, |
|||||||||||||||
| 2022 | 2021 | 2022 | 2021 | |||||||||||||
| Net revenues |
$ | 78,820 | $ | 53,391 | $ | 273,854 | $ | 211,539 | ||||||||
| Cost of sales |
63,637 | 45,510 | 223,835 | 175,377 | ||||||||||||
| Cost of sales - inventory write-down |
— | 3,226 | — | 3,226 | ||||||||||||
|
|
|
|
|
|
|
|
|
|||||||||
| Gross profit |
15,183 | 4,655 | 50,019 | 32,936 | ||||||||||||
| Operating expenses |
||||||||||||||||
| Research and development costs |
894 | 975 | 2,989 | 3,332 | ||||||||||||
| Selling, general and administrative expenses |
10,100 | 8,716 | 40,417 | 31,948 | ||||||||||||
| Transaction costs |
— | — | 2,236 | — | ||||||||||||
| Impairment of intangibles and fixed assets |
— | 2,078 | — | 2,078 | ||||||||||||
|
|
|
|
|
|
|
|
|
|||||||||
| Total operating expenses |
10,994 | 11,769 | 45,642 | 37,358 | ||||||||||||
|
|
|
|
|
|
|
|
|
|||||||||
| Operating income (loss) |
4,189 | (7,114 | ) | 4,377 | (4,422 | ) | ||||||||||
| Other income (expense) |
||||||||||||||||
| Interest expense |
(1,655 | ) | (511 | ) | (4,637 | ) | (2,084 | ) | ||||||||
| Interest income |
(1 | ) | 36 | 2 | 43 | |||||||||||
| Gain on Paycheck Protection Program loan forgiveness |
— | — | — | 3,747 | ||||||||||||
| Foreign currency transaction loss |
(376 | ) | (122 | ) | (108 | ) | (543 | ) | ||||||||
| Other income (expense) |
46 | 20 | (1,818 | ) | (97 | ) | ||||||||||
|
|
|
|
|
|
|
|
|
|||||||||
| Total other income (expense) |
(1,986 | ) | (577 | ) | (6,561 | ) | 1,066 | |||||||||
|
|
|
|
|
|
|
|
|
|||||||||
| Income (loss) before income taxes |
2,203 | (7,691 | ) | (2,184 | ) | (3,356 | ) | |||||||||
| Income tax expense |
1,544 | 374 | 2,114 | 1,217 | ||||||||||||
|
|
|
|
|
|
|
|
|
|||||||||
| Net income (loss) |
$ | 659 | $ | (8,065 | ) | (4,298 | ) | (4,573 | ) | |||||||
|
|
|
|
|
|
|
|
|
|||||||||
| Net income attributable to noncontrolling interest |
161 | — | 603 | — | ||||||||||||
|
|
|
|
|
|
|
|
|
|||||||||
| Net (loss) income attributable to shareholders of Manitex International, Inc. |
$ | 498 | $ | (8,065 | ) | $ | (4,901 | ) | $ | (4,573 | ) | |||||
|
|
|
|
|
|
|
|
|
|||||||||
| Income (loss) per share |
||||||||||||||||
| Basic |
$ | 0.04 | $ | (0.40 | ) | $ | (0.21 | ) | $ | (0.23 | ) | |||||
| Diluted |
$ | 0.04 | $ | (0.40 | ) | $ | (0.21 | ) | $ | (0.23 | ) | |||||
| Weighted average common shares outstanding |
||||||||||||||||
| Basic |
20,103,398 | 19,935,512 | 20,055,836 | 19,900,117 | ||||||||||||
| Diluted |
20,103,398 | 19,935,512 | 20,055,836 | 19,900,117 | ||||||||||||
Net Sales and Gross Margin
| Three Months Ended | ||||||||||||||||||||||||
| December 31, 2022 | September 30, 2022 | December 31, 2021 | ||||||||||||||||||||||
| As Reported |
As Adjusted |
As Reported |
As Adjusted |
As Reported |
As Adjusted |
|||||||||||||||||||
| Net sales |
$ | 78,820 | $ | 78,820 | $ | 65,037 | $ | 65,037 | $ | 53,391 | $ | 53,391 | ||||||||||||
| % change Vs Q3 2022 |
21.2 | % | 21.2 | % | ||||||||||||||||||||
| % change Vs Q4 2021 |
47.6 | % | 47.6 | % | ||||||||||||||||||||
| Gross margin |
15,183 | 15,355 | 12,344 | 12,354 | 4,655 | 7,881 | ||||||||||||||||||
| Gross margin % of net sales |
19.3 | % | 19.5 | % | 19.0 | % | 19.0 | % | 8.7 | % | 14.8 | % | ||||||||||||
| Year Ended | ||||||||||||||||
| December 31, 2022 | December 31, 2021 | |||||||||||||||
| As Reported | As Adjusted | As Reported | As Adjusted | |||||||||||||
| Net sales |
$ | 273,854 | $ | 273,854 | $ | 211,539 | $ | 211,539 | ||||||||
| % change Vs prior year |
29.5 | % | 29.5 | % | ||||||||||||
| Gross margin |
50,019 | 50,201 | 32,936 | 36,231 | ||||||||||||
| Gross margin % of net sales |
18.3 | % | 18.3 | % | 15.6 | % | 17.1 | % | ||||||||
| Operating Income (loss) |
4,377 | 11,722 | (4,422 | ) | 3,586 | |||||||||||
Backlog
| Dec 31, 2022 | Sept 30, 2022 | June 30, 2022 | Mar 31, 2022 | Dec 31, 2021 | ||||||||||||||||
| Backlog from continuing operations |
$ | 230,206 | $ | 207,032 | $ | 213,810 | $ | 205,682 | $ | 188,981 | ||||||||||
| Change Versus Current Period |
11.2 | % | 7.7 | % | 11.9 | % | 21.8 | % | ||||||||||||
Backlog is defined as orders for equipment which have not yet shipped as well as orders by foreign subsidiaries for international deliveries.. The disclosure of backlog aids in the analysis the Company’s customers’ demand for product, as well as the ability of the Company to meet that demand.
Backlog is not necessarily indicative of sales to be recognized in a specified future period.
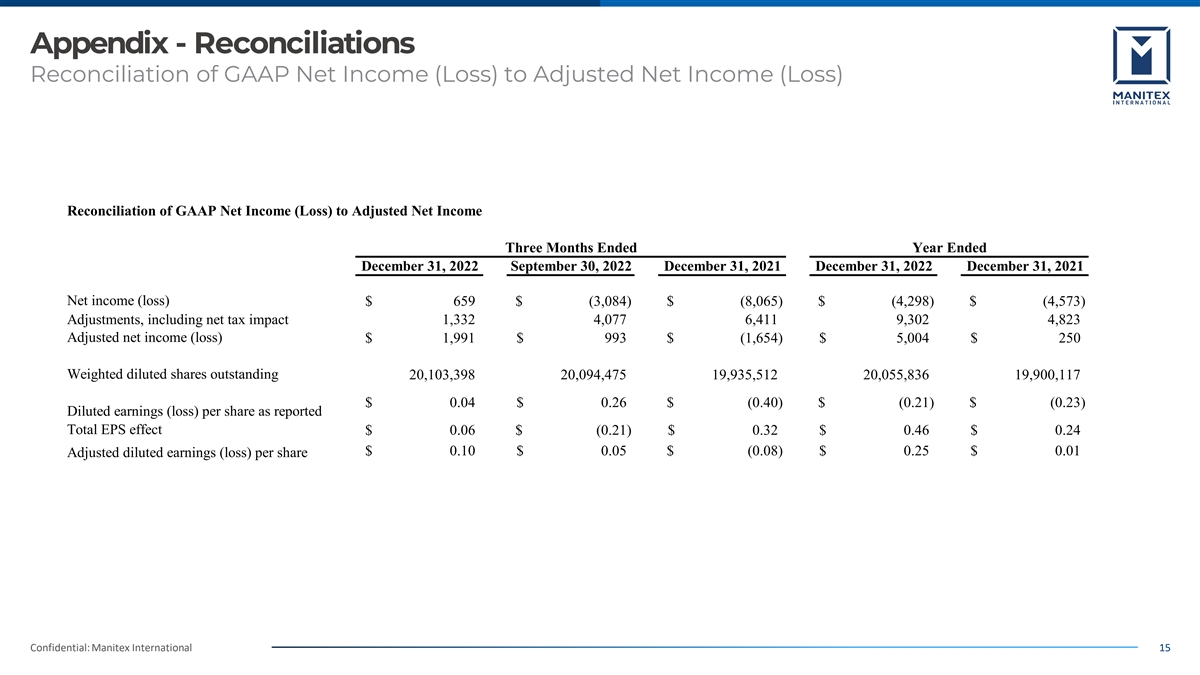
Reconciliation of GAAP Net Income(Loss) to Adjusted Net Income
| Three Months Ended | Year Ended | |||||||||||||||||||
| December 31, 2022 |
September 30, 2022 |
December 31, 2021 |
December 31, 2022 |
December 31, 2021 |
||||||||||||||||
| Net income (loss) |
$ | 659 | $ | (3,084 | ) | $ | (8,065 | ) | $ | (4,298 | ) | $ | (4,573 | ) | ||||||
| Adjustments, including net tax impact |
1,332 | 4,077 | 6,411 | 9,302 | 4,823 | |||||||||||||||
| Adjusted net income (loss) |
$ | 1,991 | $ | 993 | $ | (1,654 | ) | $ | 5,004 | $ | 250 | |||||||||
| Weighted diluted shares outstanding |
20,103,398 | 20,094,475 | 19,935,512 | 20,055,836 | 19,900,117 | |||||||||||||||
| Diluted earnings (loss) per share as reported |
$ | 0.04 | $ | 0.26 | $ | (0.40 | ) | $ | (0.21 | ) | $ | (0.23 | ) | |||||||
| Total EPS effect |
$ | 0.06 | $ | (0.21 | ) | $ | 0.32 | $ | 0.46 | $ | 0.24 | |||||||||
| Adjusted diluted earnings (loss) per share |
$ | 0.10 | $ | 0.05 | $ | (0.08 | ) | $ | 0.25 | $ | 0.01 | |||||||||
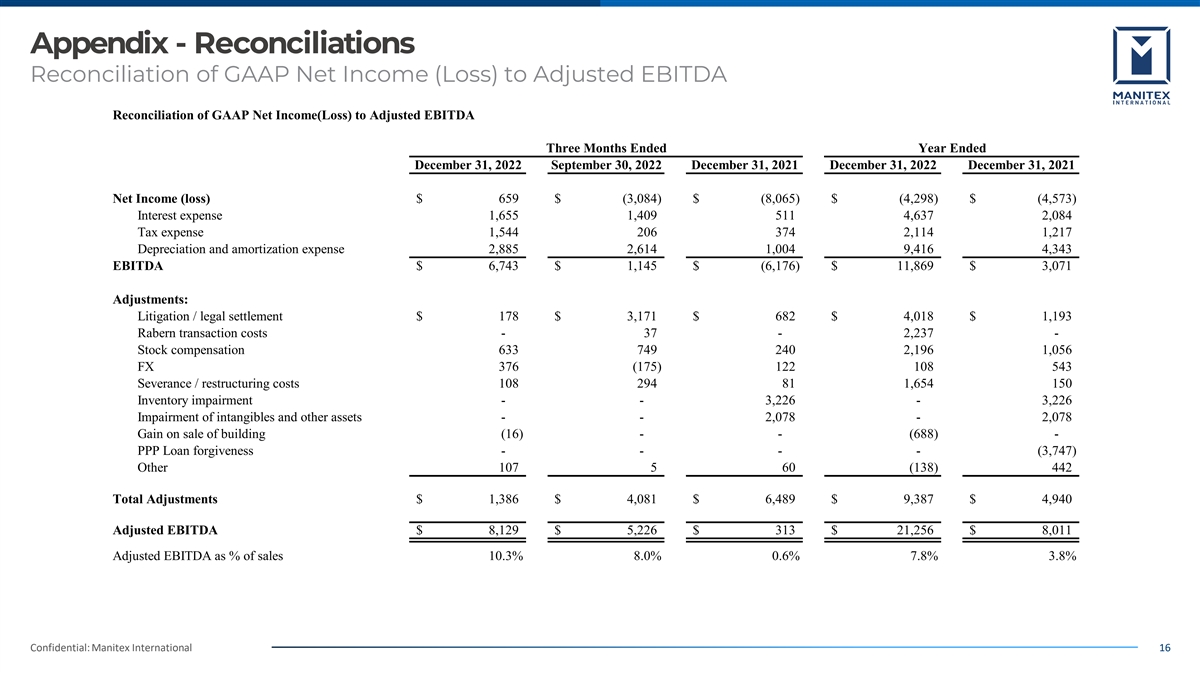
Reconciliation of GAAP Net Income(Loss) to Adjusted EBITDA
| Three Months Ended | Year Ended | |||||||||||||||||||
| December 31, 2022 |
September 30, 2022 |
December 31, 2021 |
December 31, 2022 |
December 31, 2021 |
||||||||||||||||
| Net Income (loss) |
$ | 659 | $ | (3,084 | ) | $ | (8,065 | ) | $ | (4,298 | ) | $ | (4,573 | ) | ||||||
| Interest expense |
1,655 | 1,409 | 511 | 4,637 | 2,084 | |||||||||||||||
| Tax expense |
1,544 | 206 | 374 | 2,114 | 1,217 | |||||||||||||||
| Depreciation and amortization expense |
2,885 | 2,614 | 1,004 | 9,416 | 4,343 | |||||||||||||||
|
|
|
|
|
|
|
|
|
|
|
|||||||||||
| EBITDA |
$ | 6,743 | $ | 1,145 | $ | (6,176 | ) | $ | 11,869 | $ | 3,071 | |||||||||
| Adjustments: |
||||||||||||||||||||
| Litigation / legal settlement |
$ | 178 | $ | 3,171 | $ | 682 | $ | 4,018 | $ | 1,193 | ||||||||||
| Rabern transaction costs |
— | 37 | — | 2,237 | — | |||||||||||||||
| Stock compensation |
633 | 749 | 240 | 2,196 | 1,056 | |||||||||||||||
| FX |
376 | (175 | ) | 122 | 108 | 543 | ||||||||||||||
| Severance / restructuring costs |
108 | 294 | 81 | 1,654 | 150 | |||||||||||||||
| Inventory impairment |
— | — | 3,226 | — | 3,226 | |||||||||||||||
| Impairment of intangibles and other assets |
— | — | 2,078 | — | 2,078 | |||||||||||||||
| Gain on sale of building |
(16 | ) | — | — | (688 | ) | — | |||||||||||||
| PPP Loan forgiveness |
— | — | — | — | (3,747 | ) | ||||||||||||||
| Other |
107 | 5 | 60 | (138 | ) | 442 | ||||||||||||||
|
|
|
|
|
|
|
|
|
|
|
|||||||||||
| Total Adjustments |
$ | 1,386 | $ | 4,081 | $ | 6,489 | $ | 9,387 | $ | 4,940 | ||||||||||
|
|
|
|
|
|
|
|
|
|
|
|||||||||||
| Adjusted EBITDA |
$ | 8,129 | $ | 5,226 | $ | 313 | $ | 21,256 | $ | 8,011 | ||||||||||
|
|
|
|
|
|
|
|
|
|
|
|||||||||||
| Adjusted EBITDA as % of sales |
10.3 | % | 8.0 | % | 0.6 | % | 7.8 | % | 3.8 | % | ||||||||||
Net Debt
| December 31, 2022 |
September 30, 2022 |
December 31, 2021 |
||||||||||
| Total cash & cash equivalents |
$ | 8,190 | $ | 11,865 | $ | 21,581 | ||||||
| Notes payable - short term |
$ | 22,666 | $ | 16,486 | $ | 18,401 | ||||||
| Current portion of finance leases |
509 | 487 | 399 | |||||||||
| Notes payable - long term |
22,261 | 23,829 | 10,089 | |||||||||
| Finance lease obligations - LT |
3,382 | 3,518 | 3,822 | |||||||||
| Revolver, net |
41,479 | 53,152 | 12,717 | |||||||||
|
|
|
|
|
|
|
|||||||
| Total debt |
$ | 90,297 | $ | 97,472 | $ | 45,428 | ||||||
|
|
|
|
|
|
|
|||||||
| Net debt |
$ | 82,107 | $ | 85,607 | $ | 23,847 | ||||||
|
|
|
|
|
|
|
|||||||
Net debt is calculated using the Consolidated Balance Sheet amounts for current and long term portion of long term debt, capital lease obligations, notes payable, and revolving credit facilities minus cash and cash equivalents.