Exhibit 99.1

4300 Wildwood Parkway
Atlanta, GA 30339
1-888-502-BLUE
www.BlueLinxCo.com
| Doug Goforth, CFO & Treasurer | Investor Relations: |
| BlueLinx Holdings Inc. | Maryon Davis, Director Finance & IR |
| (770) 953-7505 | (770) 221-2666 |
FOR IMMEDIATE RELEASE
BLUELINX ANNOUNCES FIRST-QUARTER RESULTS
– Revenue Rises 10.9% to $503.2 Million for the Quarter –
ATLANTA – May 1, 2013 – BlueLinx Holdings Inc. (NYSE:BXC), a leading distributor of building products in North America, today reported financial results for the first quarter ended March 30, 2013.
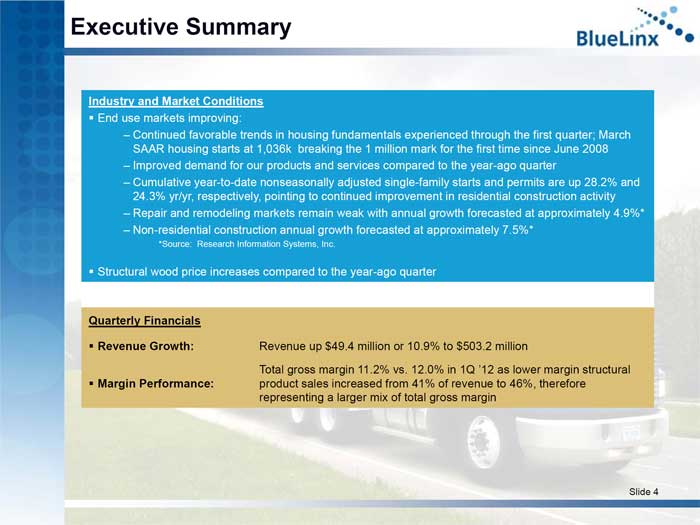
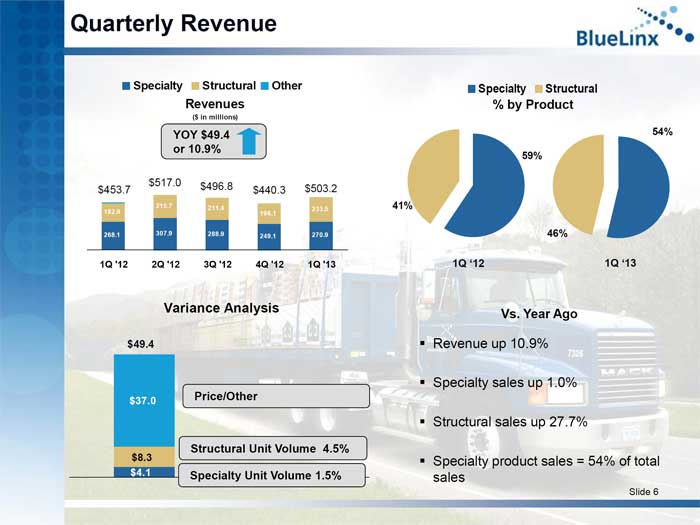
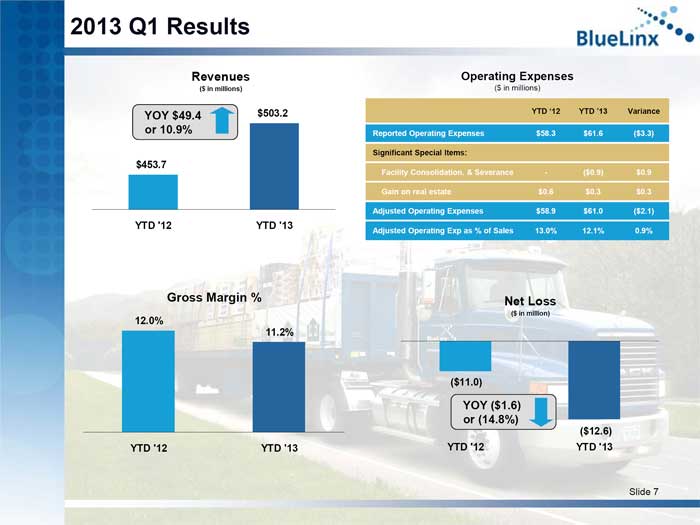
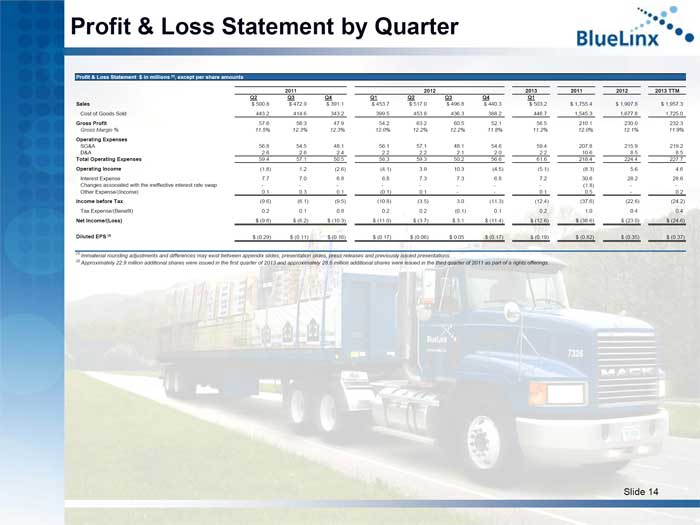
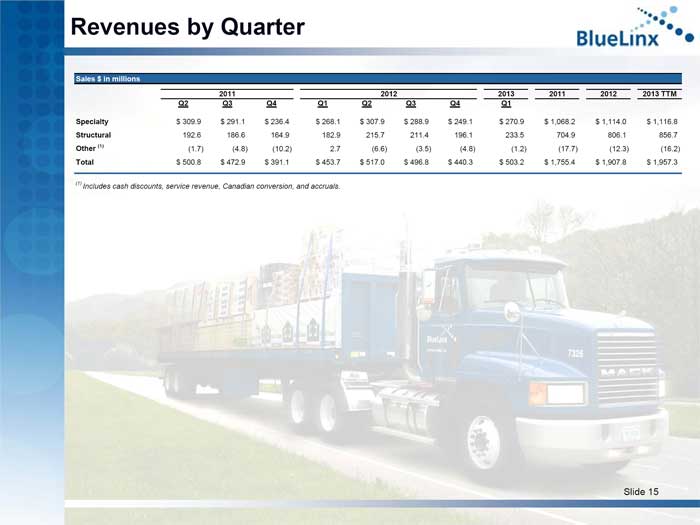
Revenues increased 10.9% to $503.2 million from $453.7 million for the same period a year ago. The Company incurred a net loss of $12.6 million, or $0.19 per diluted share for the first quarter of 2013, compared with a net loss of $11.0 million, or $0.17 per diluted share, for the first quarter of 2012.
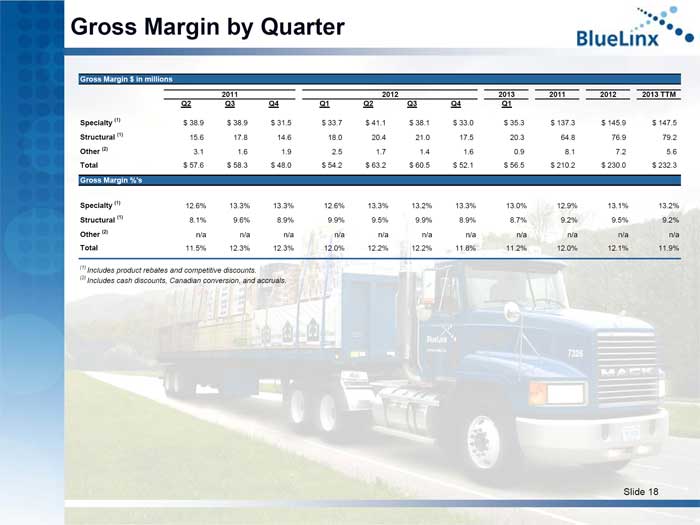
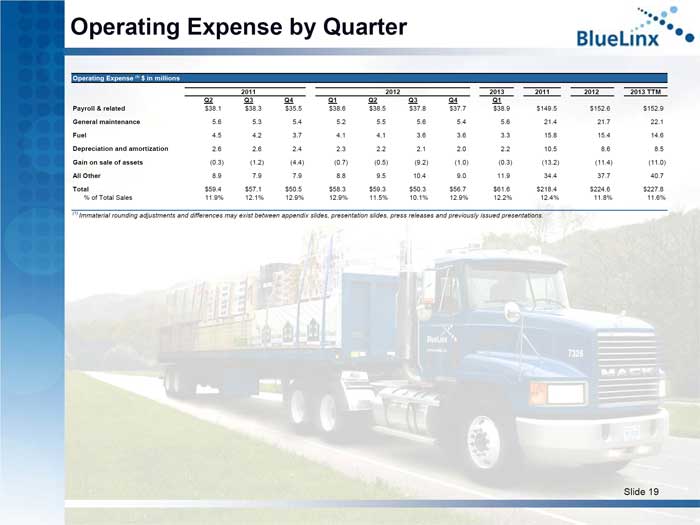
Gross profit for the first quarter totaled $56.5 million, up 4.1% from $54.2 million in the year-ago period. Gross margins were 11.2% compared to 12.0% a year ago. First-quarter operating expenses of $61.6 million increased $3.3 million compared to the same period a year ago, and included $0.6 million in net expenses from significant special items in 2013 and $0.6 million in net gains from significant special items in 2012. Reported operating loss for the quarter was $5.1 million, compared to an operating loss of $4.1 million a year ago.
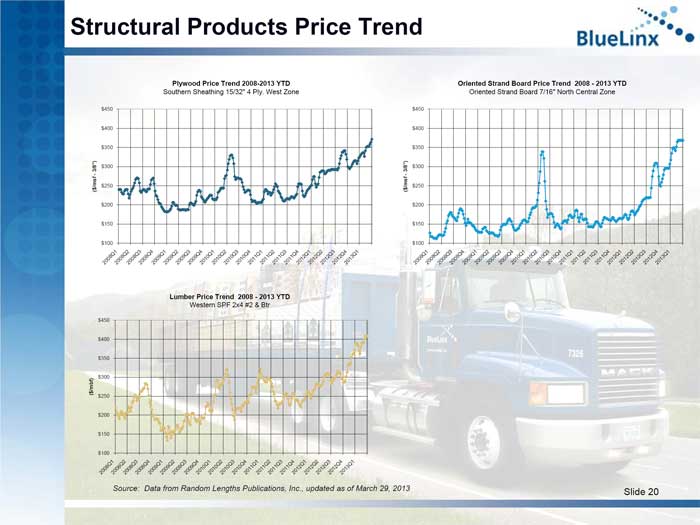
“While our business is off to a good start in several parts of the country, our specialty sales declined in two of our largest regions, both of which greatly benefited from last year’s early spring. Wood-based structural product prices have risen significantly and we experienced increased demand in regions with less severe winters,” said George Judd, president and chief executive officer. “We believe that the sustained growth in both housing starts and permits will continue, which will in turn drive growth in other areas such as repair and remodeling. BlueLinx is well positioned to grow in all regions as we move into the spring.”
The Company’s operating results for the first quarter of 2013 and 2012, adjusted for significant special items, are shown in the following table (see accompanying financial schedules for full financial details and reconciliations of non-GAAP financial measures to their GAAP equivalents):
BlueLinx 1Q ’13 Press Release
Page 2 of 8
|
in millions, except per share amounts
(unaudited)
|
Quarters Ended
|
|||||||
|
March 30,
2013 |
March 31,
2012 |
|||||||
|
Pretax loss
|
($12.4 | ) | ($10.8 | ) | ||||
|
Gain from sale of certain properties
|
(0.3 | ) | (0.6 | ) | ||||
|
Facility restructuring and severance related costs
|
0.9 | - | ||||||
|
Adjusted pretax loss
|
(11.8 | ) | (11.4 | ) | ||||
|
Adjusted benefit from income taxes
|
(4.3 | ) | (4.2 | ) | ||||
|
Adjusted net loss
|
($7.5 | ) | ($7.2 | ) | ||||
|
Diluted weighted average shares
|
66.7 | 65.4 | ||||||
|
Adjusted diluted net loss per share applicable to common shares
|
($0.11 | ) | ($0.11 | ) | ||||
For the quarter ended March 30, 2013, the above table reflects the following events: (i) a gain recorded by the Company from the sale of certain properties; and (ii) certain facility restructuring and severance related costs recorded by the Company. The adjusted benefit from income taxes reflected in the table is comprised of the Company’s effective tax rate excluding the valuation allowance related to its deferred tax assets and the tax effect of the significant special items. The adjusted benefit from income taxes assumes that the Company’s deferred tax assets will be realized.
For the quarter ended March 31, 2012, the above table reflects a gain recorded by the Company from the sale of certain properties. The adjusted benefit from income taxes reflected in the table is comprised of the Company’s effective tax rate excluding the valuation allowance related to its deferred tax assets and the tax effect of the significant special item. The adjusted benefit from income taxes assumes that the Company’s deferred tax assets will be realized.
Successful Completion of Rights Offering
As previously announced, on March 27, 2013, the Company completed a $40 million rights offering. The Company used the net proceeds of the rights offering of approximately $38.6 million to reduce the outstanding balance of its U.S. revolving credit facility. Following the issuance of the newly subscribed shares BlueLinx has approximately 86.6 million total shares outstanding. After giving effect to the offering, Cerberus ABP Investor LLC beneficially owns approximately 54.4% of BlueLinx’ common stock.
Extension to Credit Agreement
As previously announced, concurrent with the completion of the rights offering, the Company amended and extended its U.S. revolving credit facility. As a result of the amendment and extension, the Company’s existing $400 million credit facility was increased by $22.5 million to $422.5 million and the maturity date was extended to April 15, 2016. Further details concerning the amendment are contained in the Company’s Current Report on Form 8-K, which was filed with the Securities and Exchange Commission on March 29, 2013. Wells Fargo Capital Finance acted as sole lead arranger for the transaction. The bank group also includes Regions Bank, Bank of America, N.A., JPMorgan Chase Bank, N.A., and TD Bank, N.A.
BlueLinx 1Q ’13 Press Release
Page 3 of 8
Conference Call
BlueLinx will host a conference call today at 10:00 a.m. Eastern Time, accompanied by a supporting slide presentation. Investors can listen to the conference call and view the accompanying slide presentation by going to the BlueLinx web site, www.BlueLinxCo.com, and selecting the conference link on the Investor Relations page. Investors will be able to access an archived recording of the conference call for one week by calling 404-537-3406, Conference ID# 45692480. The recording will be available two hours after the conference call has concluded. Investors also can access a recording of this call on the BlueLinx web site, where a replay of the webcast will be available for 90 days.
Use of Non-GAAP Measures
BlueLinx reports its financial results in accordance with U.S. generally accepted accounting principles (GAAP). The Company also believes that presentation of certain non-GAAP measures, i.e., results excluding certain charges or other nonrecurring events, when appropriate, provides useful information for the understanding of its ongoing operations and enables investors to focus on period-over-period operating performance, without the impact of significant special items, and thereby enhances the user’s overall understanding of the Company’s current financial performance relative to past performance and provides a better baseline for modeling future earnings expectations. Any non-GAAP measures used herein are reconciled in the financial tables accompanying this news release. The Company cautions that non-GAAP measures should be considered in addition to, but not as a substitute for, the Company’s reported GAAP results.
About BlueLinx Holdings Inc.
Headquartered in Atlanta, Georgia, BlueLinx Holdings Inc., operating through its wholly owned subsidiary BlueLinx Corporation, is a leading distributor of building products in North America. Employing approximately 1,900 people, BlueLinx offers greater than 10,000 products from over 750 suppliers to service approximately 11,500 customers nationwide, including dealers, industrial manufacturers, manufactured housing producers and home improvement retailers. The Company operates its distribution business from sales centers in Atlanta and Denver, and its network of approximately 55 distribution centers. BlueLinx is traded on the New York Stock Exchange under the symbol BXC. Additional information about BlueLinx can be found on its Web site at www.BlueLinxCo.com.
BlueLinx 1Q ’13 Press Release
Page 4 of 8
Forward-looking Statements
This press release includes “forward-looking statements” within the meaning of the Private Securities Litigation Reform Act of 1995, including statements relating to our ability to return to profitability and our outlook on the housing industry. All of these forward-looking statements are based on estimates and assumptions made by our management that, although believed by BlueLinx to be reasonable, are inherently uncertain. Forward-looking statements involve risks and uncertainties, including, but not limited to, economic, competitive, governmental and technological factors outside of BlueLinx’ control that may cause its business, strategy or actual results to differ materially from the forward-looking statements. These risks and uncertainties may include, among other things: changes in the supply and/or demand for products that it distributes, especially as a result of conditions in the residential housing market; general economic and business conditions in the United States; the activities of competitors; changes in significant operating expenses; changes in the availability of capital, including the availability of residential mortgages; the ability to identify acquisition opportunities and effectively and cost-efficiently integrate acquisitions; adverse weather patterns or conditions; acts of war or terrorist activities; variations in the performance of the financial markets; and other factors described in the “Risk Factors” section in the Company’s Annual Report on Form 10-K for the year ended December 29, 2012 and in its periodic reports filed with the Securities and Exchange Commission from time to time. Given these risks and uncertainties, you are cautioned not to place undue reliance on forward-looking statements. BlueLinx undertakes no obligation to publicly update or revise any forward-looking statement as a result of new information, future events, changes in expectation or otherwise, except as required by law.
- Tables Follow -
BlueLinx 1Q ’13 Press Release
Page 5 of 8
BlueLinx Holdings Inc.
Statements of Operations
Statements of Operations
in thousands, except per share data
|
Quarters Ended
|
||||||||
|
March 30,
|
March 31,
|
|||||||
|
2013
|
2012
|
|||||||
|
(unaudited)
|
(unaudited)
|
|||||||
|
Net sales
|
$ | 503,153 | $ | 453,708 | ||||
|
Cost of sales
|
446,695 | 399,476 | ||||||
|
Gross profit
|
56,458 | 54,232 | ||||||
|
Operating expenses:
|
||||||||
|
Selling, general, and administrative
|
59,419 | 56,066 | ||||||
|
Depreciation and amortization
|
2,173 | 2,260 | ||||||
|
Total operating expenses
|
61,592 | 58,326 | ||||||
|
Operating loss
|
(5,134 | ) | (4,094 | ) | ||||
|
Non-operating expenses:
|
||||||||
|
Interest expense
|
7,192 | 6,782 | ||||||
|
Other expense (income), net
|
110 | (62 | ) | |||||
|
Loss before provision for income taxes
|
(12,436 | ) | (10,814 | ) | ||||
|
Provision for income taxes
|
213 | 205 | ||||||
|
Net loss
|
$ | (12,649 | ) | $ | (11,019 | ) | ||
|
Basic weighted average number of common shares outstanding
|
66,714 | 65,368 | ||||||
|
Basic net loss per share applicable to common shares
|
$ | (0.19 | ) | $ | (0.17 | ) | ||
|
Diluted weighted average number of common shares outstanding
|
66,714 | 65,368 | ||||||
|
Diluted loss per share applicable to common shares
|
$ | (0.19 | ) | $ | (0.17 | ) | ||
BlueLinx 1Q ’13 Press Release
Page 6 of 8
BlueLinx Holdings Inc.
Balance Sheets
Balance Sheets
in thousands
|
March 30,
|
December 29,
|
|||||||
|
2013
|
2012
|
|||||||
|
(unaudited)
|
||||||||
|
Assets:
|
||||||||
|
Current assets:
|
||||||||
|
Cash and cash equivalents
|
$ | 5,285 | $ | 5,188 | ||||
|
Receivables, net
|
218,861 | 157,465 | ||||||
|
Inventories, net
|
319,654 | 230,059 | ||||||
|
Other current assets
|
23,304 | 19,427 | ||||||
|
Total current assets
|
567,104 | 412,139 | ||||||
|
Property, plant, and equipment:
|
||||||||
|
Land and improvements
|
43,149 | 43,120 | ||||||
|
Buildings
|
94,098 | 94,070 | ||||||
|
Machinery and equipment
|
78,946 | 78,674 | ||||||
|
Construction in progress
|
1,210 | 1,173 | ||||||
|
Property, plant, and equipment, at cost
|
217,403 | 217,037 | ||||||
|
Accumulated depreciation
|
(103,565 | ) | (101,684 | ) | ||||
|
Property, plant, and equipment, net
|
113,838 | 115,353 | ||||||
|
Non-current deferred income tax assets, net
|
445 | 445 | ||||||
|
Other non-current assets
|
18,197 | 16,799 | ||||||
|
Total assets
|
$ | 699,584 | $ | 544,736 | ||||
|
Liabilities:
|
||||||||
|
Current liabilities:
|
||||||||
|
Accounts payable
|
$ | 143,197 | $ | 77,850 | ||||
|
Bank overdrafts
|
29,086 | 35,384 | ||||||
|
Accrued compensation
|
4,510 | 6,170 | ||||||
|
Current maturities of long-term debt
|
67,699 | 8,946 | ||||||
|
Deferred income taxes, net
|
449 | 449 | ||||||
|
Other current liabilities
|
11,800 | 10,937 | ||||||
|
Total current liabilities
|
256,741 | 139,736 | ||||||
|
Non-current liabilities:
|
||||||||
|
Long-term debt
|
380,039 | 368,446 | ||||||
|
Other non-current liabilities
|
57,168 | 57,146 | ||||||
|
Total liabilities
|
693,948 | 565,328 | ||||||
|
Stockholders’ Equity (Deficit):
|
||||||||
|
Common stock
|
867 | 637 | ||||||
|
Additional paid in capital
|
247,853 | 209,815 | ||||||
|
Accumulated other comprehensive loss
|
(29,433 | ) | (30,042 | ) | ||||
|
Accumulated deficit
|
(213,651 | ) | (201,002 | ) | ||||
|
Total stockholders’ equity (deficit)
|
5,636 | (20,592 | ) | |||||
|
Total liabilities and stockholders’ equity (deficit)
|
$ | 699,584 | $ | 544,736 | ||||
BlueLinx 1Q ’13 Press Release
Page 7 of 8
BlueLinx Holdings Inc.
Statements of Cash Flows
in thousands
|
Periods Ended
|
||||||||
|
March 30,
|
March 31,
|
|||||||
|
2013
|
2012
|
|||||||
|
(unaudited)
|
(unaudited)
|
|||||||
|
Cash flows from operating activities:
|
||||||||
|
Net loss
|
$ | (12,649 | ) | $ | (11,019 | ) | ||
|
Adjustments to reconcile net loss to cash used in operations:
|
||||||||
|
Depreciation and amortization
|
2,173 | 2,260 | ||||||
|
Amortization of debt issuance costs
|
946 | 933 | ||||||
|
Write-off of debt issuance costs
|
119 | - | ||||||
|
Gain from sale of properties
|
(238 | ) | (578 | ) | ||||
|
Payments on modification on lease agreement
|
- | (5,000 | ) | |||||
|
Deferred income tax benefit
|
- | (24 | ) | |||||
|
Share-based compensation expense
|
824 | 743 | ||||||
|
Increase in restricted cash related to the swap, insurance, and other
|
(361 | ) | (308 | ) | ||||
|
Other
|
254 | 1,826 | ||||||
| (8,932 | ) | (11,167 | ) | |||||
|
Changes in primary working capital components:
|
||||||||
|
Receivables
|
(61,396 | ) | (59,078 | ) | ||||
|
Inventories
|
(89,595 | ) | (64,983 | ) | ||||
|
Accounts payable
|
64,084 | 46,726 | ||||||
|
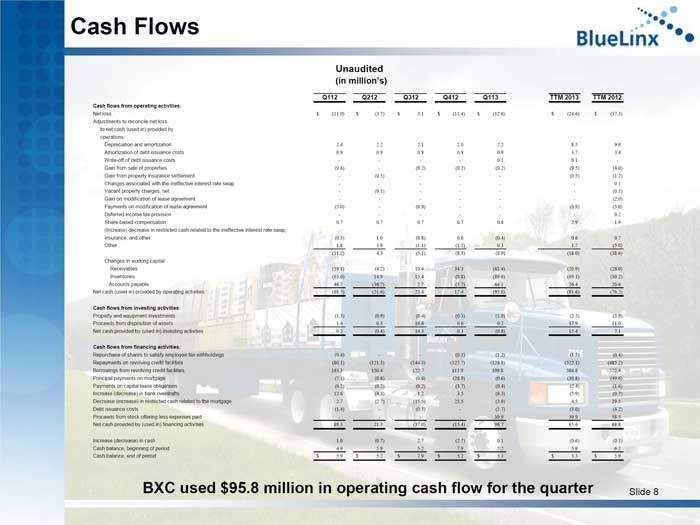
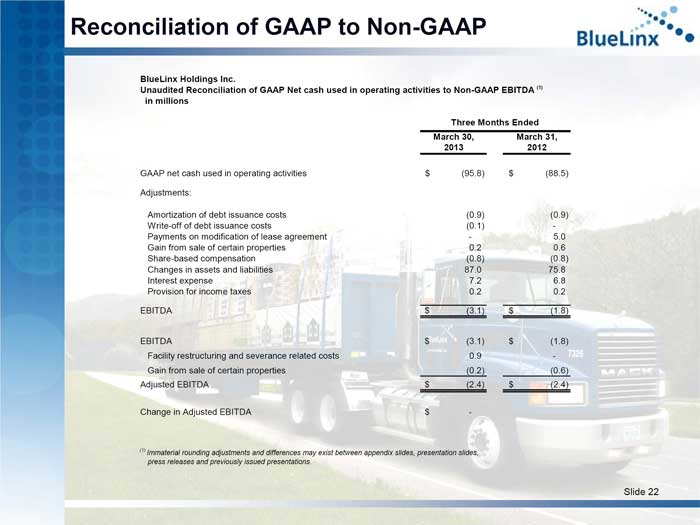
Net cash used in operating activities
|
(95,839 | ) | (88,502 | ) | ||||
|
Cash flows from investing activities:
|
||||||||
|
Property, plant, and equipment investments
|
(955 | ) | (1,278 | ) | ||||
|
Proceeds from disposition of assets
|
195 | 1,439 | ||||||
|
Net cash (used in) provided by investing activities
|
(760 | ) | 161 | |||||
|
Cash flows from financing activities:
|
||||||||
|
Excess tax benefits from share-based compensation arrangements
|
16 | - | ||||||
|
Repurchase of shares to satisfy employee tax withholdings
|
(1,206 | ) | (424 | ) | ||||
|
Repayments on the revolving credit facilities
|
(128,836 | ) | (80,055 | ) | ||||
|
Borrowings from the revolving credit facilities
|
199,828 | 163,268 | ||||||
|
Payment of principal on mortgage
|
(646 | ) | (7,134 | ) | ||||
|
Payments on capital lease obligations
|
(384 | ) | (213 | ) | ||||
|
(Decrease) increase in bank overdrafts
|
(6,298 | ) | 12,591 | |||||
|
(Increase) decrease in restricted cash related to the mortgage
|
(2,955 | ) | 2,707 | |||||
|
Debt issuance costs
|
(2,715 | ) | (1,433 | ) | ||||
|
Proceeds from stock offering less expenses paid
|
39,892 | - | ||||||
|
Net cash provided by financing activities
|
96,696 | 89,307 | ||||||
|
Increase in cash
|
97 | 966 | ||||||
|
Balance, beginning of period
|
5,188 | 4,898 | ||||||
|
Balance, end of period
|
$ | 5,285 | $ | 5,864 | ||||
|
Non Cash Transactions:
|
||||||||
|
Capital leases
|
$ | - | $ | 32 | ||||
BlueLinx 1Q ’13 Press Release
Page 8 of 8
BlueLinx Holdings Inc.
Adjusted Pre-Tax Loss
Adjusted Pre-Tax Loss
in thousands, except for per share amounts
|
Quarters Ended
|
||||||||
|
March 30,
|
March 31,
|
|||||||
|
2013
|
2012
|
|||||||
|
(unaudited)
|
(unaudited)
|
|||||||
|
Pretax loss
|
$ | (12,436 | ) | $ | (10,814 | ) | ||
|
Gain from sale of certain properties
|
(238 | ) | (578 | ) | ||||
|
Facility restructuring and severance related costs
|
889 | - | ||||||
|
Adjusted pretax loss
|
(11,785 | ) | (11,392 | ) | ||||
|
Adjusted benefit from income taxes
|
(4,336 | ) | (4,192 | ) | ||||
|
Adjusted net loss
|
$ | (7,449 | ) | $ | (7,200 | ) | ||
|
Diluted weighted average shares
|
66,714 | 65,368 | ||||||
|
Adjusted diluted net loss per share applicable to common shares
|
$ | (0.11 | ) | $ | (0.11 | ) | ||
BlueLinx Holdings Inc.
Reconciliation of GAAP Net Loss to Adjusted Net Loss
in thousands
|
Quarters Ended
|
||||||||
|
March 30,
|
March 31,
|
|||||||
|
2013
|
2012
|
|||||||
|
(unaudited)
|
(unaudited)
|
|||||||
|
GAAP net loss
|
$ | (12,649 | ) | $ | (11,019 | ) | ||
|
Gain from sale of certain properties
|
(238 | ) | (578 | ) | ||||
|
Facility restructuring and severance related costs
|
889 | - | ||||||
|
Tax effect of selected charges
|
(251 | ) | 223 | |||||
|
Valuation allowance
|
4,800 | 4,174 | ||||||
|
Adjusted net loss
|
$ | (7,449 | ) | $ | (7,200 | ) | ||
###