Exhibit 99.1
|
|
Investor Presentation August 2013 |
|
|
2 The forward-looking statements contained in this presentation are subject to various risks and uncertainties. Although the Company believes the expectations reflected in such forward-looking statements are based on reasonable assumptions, there can be no assurance that its expectations will be achieved. You should not rely on our forward-looking statements because the matters they describe are subject to known and unknown risks and uncertainties that could cause the Company’s future results, performance, or achievements to differ significantly from the results, performance, or achievements expressed or implied by such statements. Such risks are set forth under the captions “Item 1A. Risk Factors” and “Forward-Looking Statements” in our annual report on Form 10-K and under the caption “Item 2. Management’s Discussion and Analysis of Financial Condition and Results of Operations” (or similar captions) in our quarterly reports on Form 10-Q, and described from time to time in the Company’s filings with the SEC. Forward-looking statements are not guarantees of performance. For forward-looking statements herein, the Company claims the protection of the safe harbor for forward-looking statements contained in the Private Securities Litigation Reform Act of 1995. The Company assumes no obligation to update or supplement forward-looking statements that become untrue because of subsequent events. |
|
|
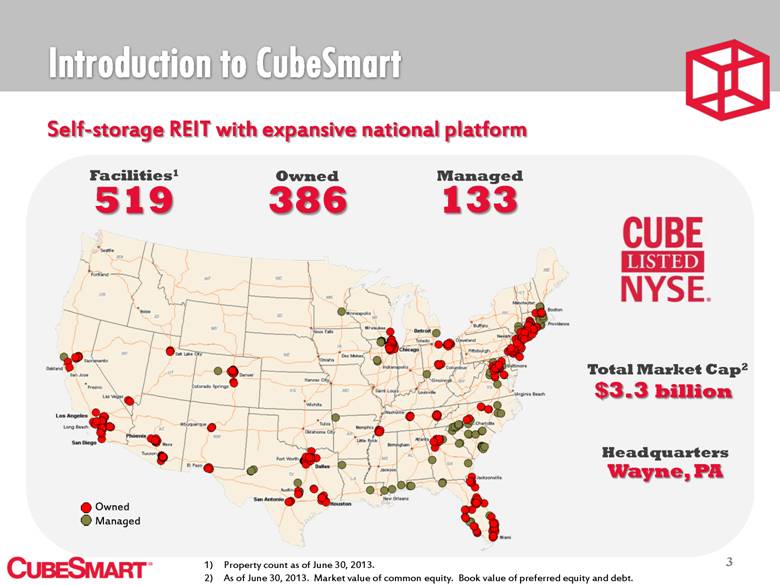
Wayne, PA 3 Owned Managed Self-storage REIT with expansive national platform Property count as of June 30, 2013. As of June 30, 2013. Market value of common equity. Book value of preferred equity and debt. 386 519 133 Facilities1 Owned Managed Headquarters $3.3 billion Total Market Cap2 1) 2) |
|
|
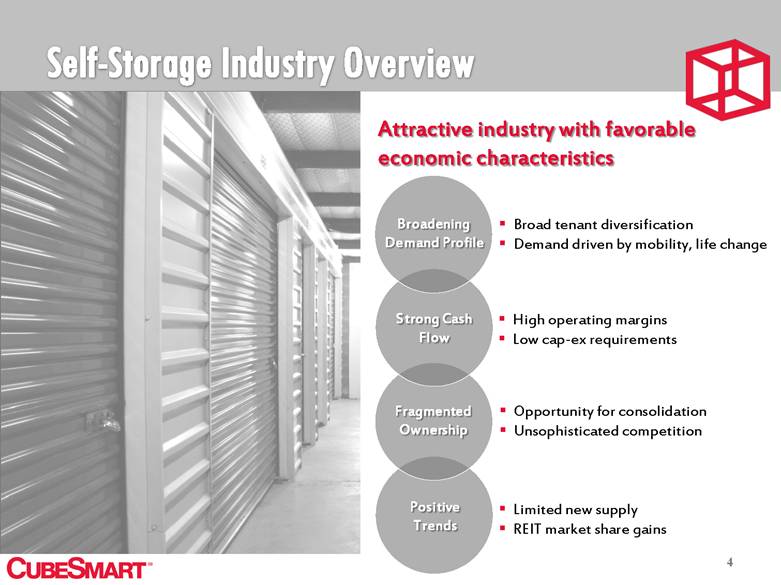
4 Broad tenant diversification Demand driven by mobility, life change Opportunity for consolidation Unsophisticated competition High operating margins Low cap-ex requirements Attractive industry with favorable economic characteristics Limited new supply REIT market share gains Positive Trends Strong Cash Flow Fragmented Ownership Broadening Demand Profile |
|
|
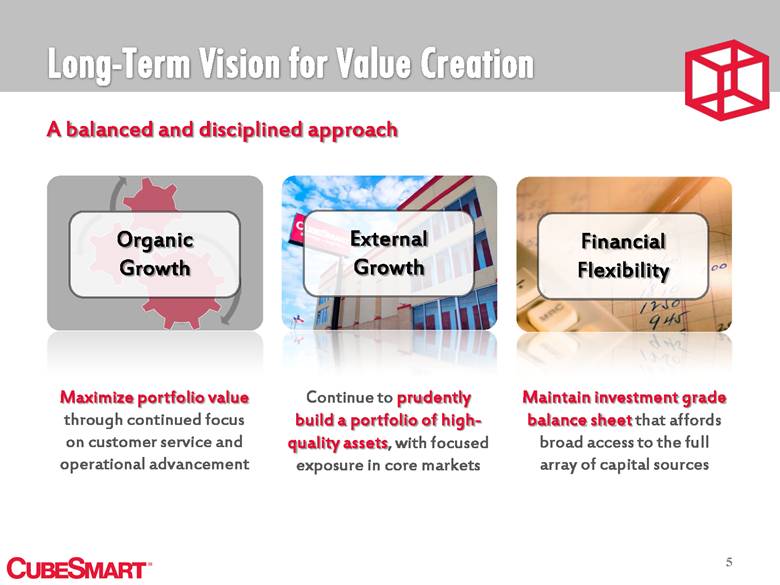
5 A balanced and disciplined approach Maximize portfolio value through continued focus on customer service and operational advancement Continue to prudently build a portfolio of high-quality assets, with focused exposure in core markets Maintain investment grade balance sheet that affords broad access to the full array of capital sources External Growth Financial Flexibility Organic Growth |
|
|
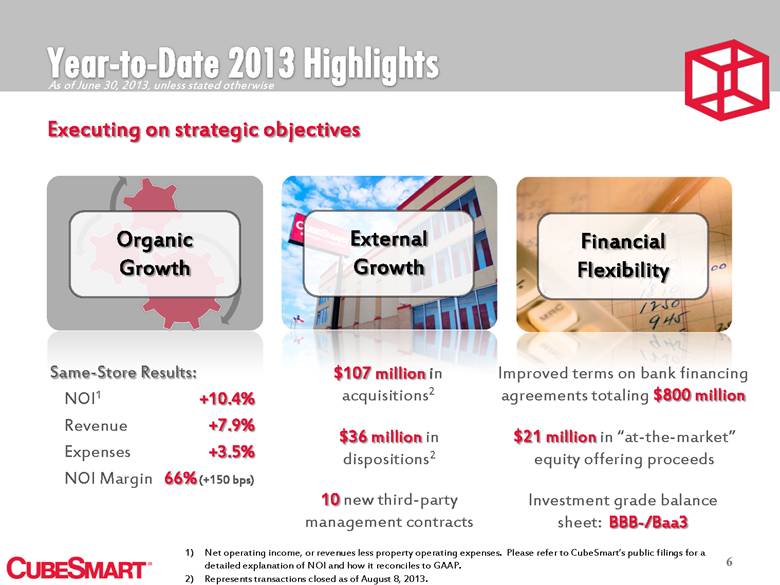
6 Executing on strategic objectives Same-Store Results: NOI1 +10.4% Revenue +7.9% Expenses +3.5% NOI Margin 66% (+150 bps) $107 million in acquisitions2 Improved terms on bank financing agreements totaling $800 million 10 new third-party management contracts $36 million in dispositions2 $21 million in “at-the-market” equity offering proceeds Investment grade balance sheet: BBB-/Baa3 Net operating income, or revenues less property operating expenses. Please refer to CubeSmart’s public filings for a detailed explanation of NOI and how it reconciles to GAAP. Represents transactions closed as of August 8, 2013. External Growth Financial Flexibility Organic Growth As of June 30, 2013, unless stated otherwise 1) 2) |
|
|
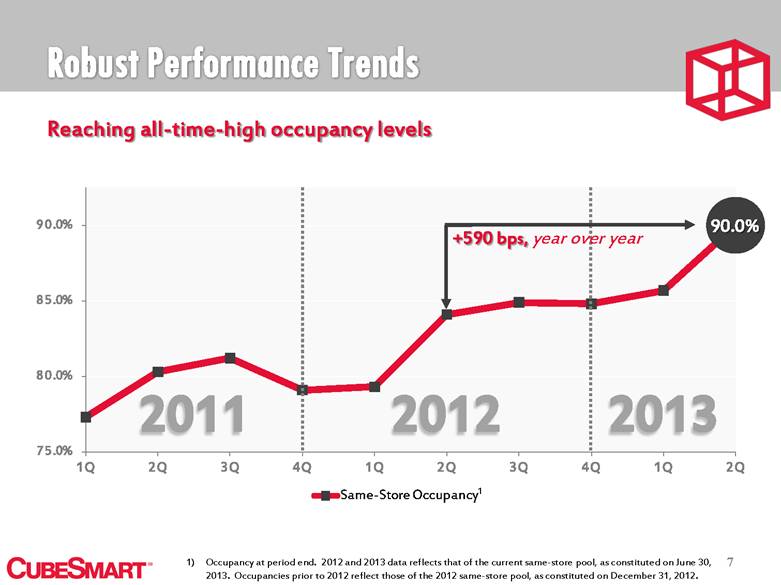
7 Reaching all-time-high occupancy levels Occupancy at period end. 2012 and 2013 data reflects that of the current same-store pool, as constituted on June 30, 2013. Occupancies prior to 2012 reflect those of the 2012 same-store pool, as constituted on December 31, 2012. 90.0% +590 bps, year over year 1 75.0% 80.0% 85.0% 90.0% 1Q 2Q 3Q 4Q 1Q 2Q 3Q 4Q 1Q 2Q Same - Store Occupancy 1) |
|
|
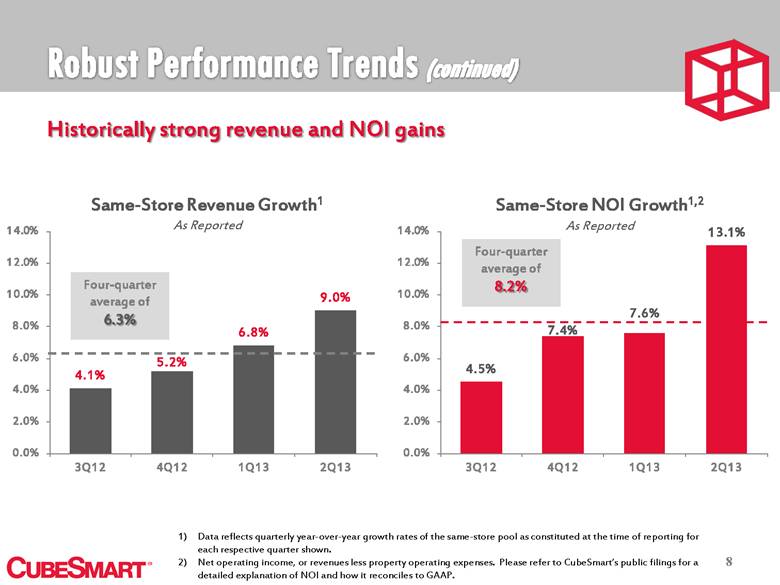
8 Historically strong revenue and NOI gains Same-Store Revenue Growth1 As Reported Four-quarter average of 6.3% Same-Store NOI Growth1,2 As Reported Data reflects quarterly year-over-year growth rates of the same-store pool as constituted at the time of reporting for each respective quarter shown. Net operating income, or revenues less property operating expenses. Please refer to CubeSmart’s public filings for a detailed explanation of NOI and how it reconciles to GAAP. Four-quarter average of 8.2% 4.1% 5.2% 6.8% 9.0% 0.0% 2.0% 4.0% 6.0% 8.0% 10.0% 12.0% 14.0% 3Q12 4Q12 1Q13 2Q13 4.5% 7.4% 7.6% 13.1% 0.0% 2.0% 4.0% 6.0% 8.0% 10.0% 12.0% 14.0% 3Q12 4Q12 1Q13 2Q13 1) 2) |
|
|
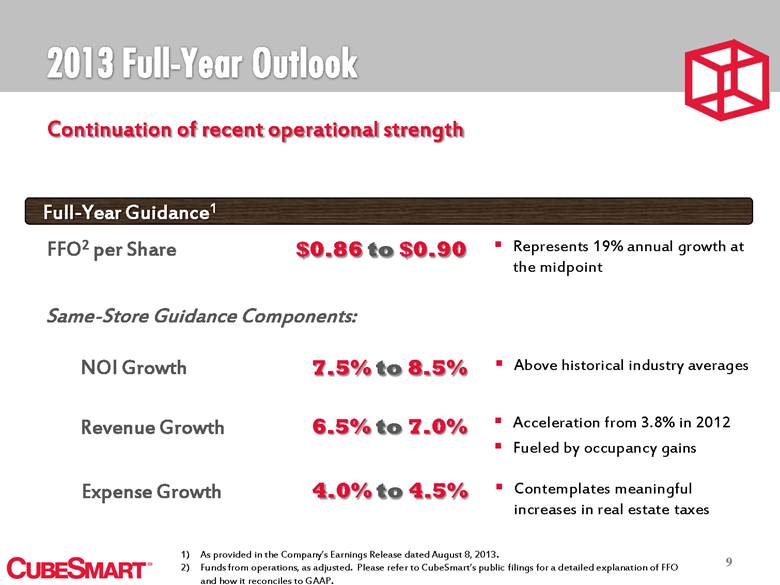
Continuation of recent operational strength Full-Year Guidance1 $0.86 to $0.90 FFO2 per Share 7.5% to 8.5% NOI Growth 6.5% to 7.0% Revenue Growth 4.0% to 4.5% Expense Growth Same-Store Guidance Components: Represents 19% annual growth at the midpoint Acceleration from 3.8% in 2012 Fueled by occupancy gains Contemplates meaningful increases in real estate taxes Above historical industry averages As provided in the Company’s Earnings Release dated August 8, 2013. Funds from operations, as adjusted. Please refer to CubeSmart’s public filings for a detailed explanation of FFO and how it reconciles to GAAP. 9 |
|
|
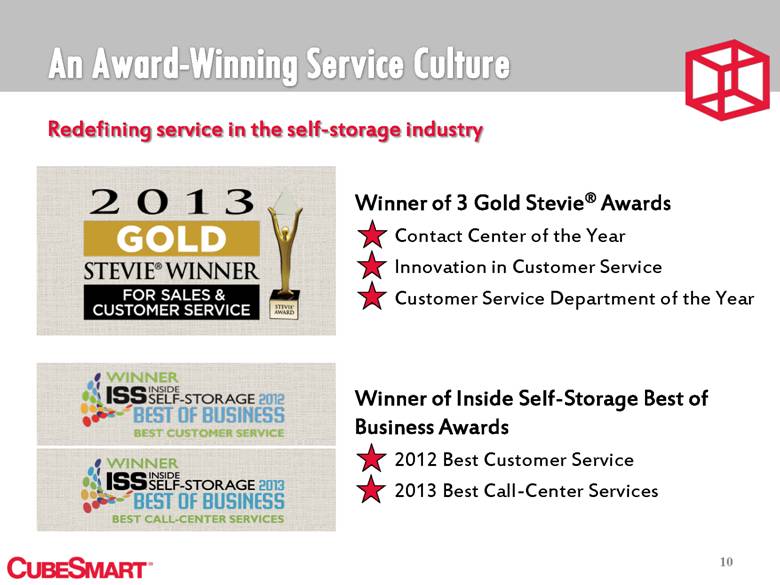
10 Winner of 3 Gold Stevie® Awards Contact Center of the Year Innovation in Customer Service Customer Service Department of the Year Winner of Inside Self-Storage Best of Business Awards 2012 Best Customer Service 2013 Redefining service in the self-storage industry |
|
|
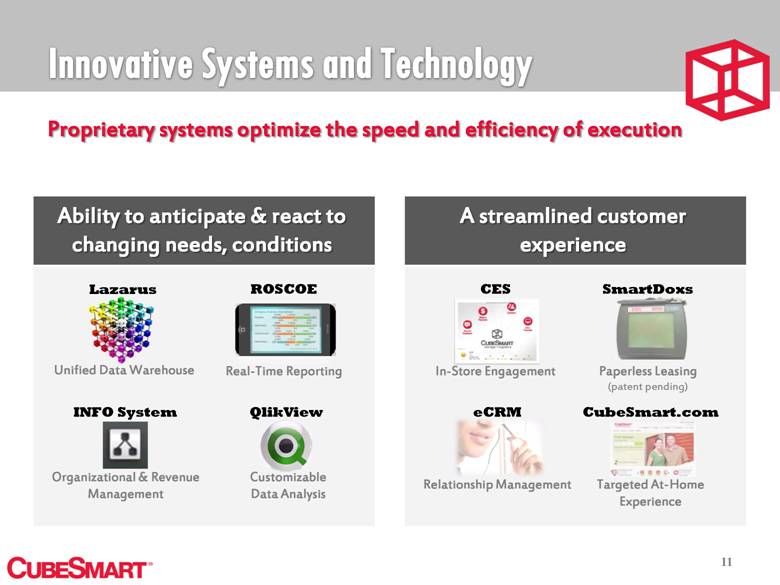
ROSCOE Real-Time Reporting eCRM Relationship Management CubeSmart.com Targeted At-Home Experience 11 Proprietary systems optimize the speed and efficiency of execution Ability to anticipate & react to changing needs, conditions Lazarus Organizational & Revenue Management Unified Data Warehouse INFO System QlikView Customizable Data Analysis A streamlined customer experience CES In-Store Engagement SmartDoxs Paperless Leasing (patent pending) |
|
|
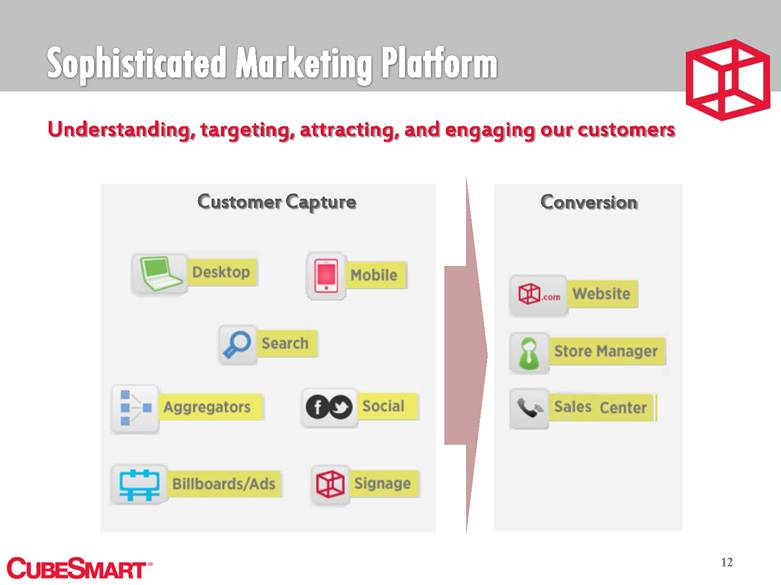
12 Understanding, targeting, attracting, and engaging our customers Customer Capture Conversion |
|
|
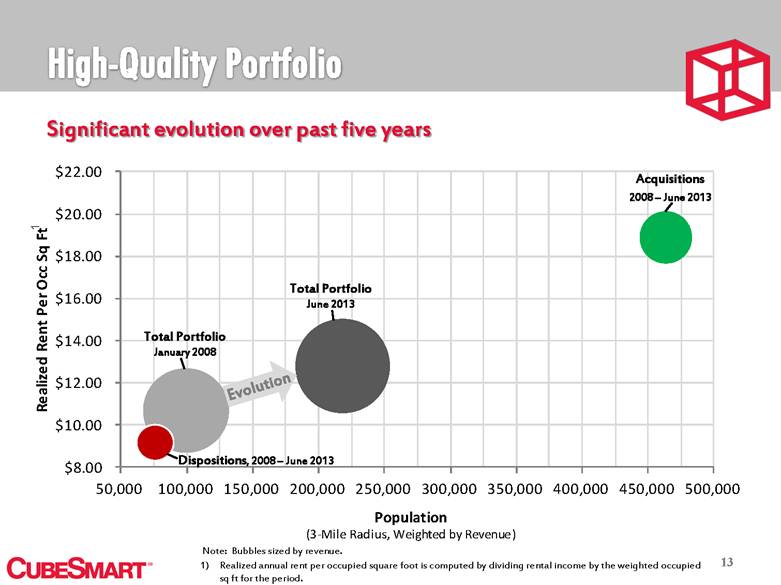
13 Significant evolution over past five years Note: Bubbles sized by revenue. Realized annual rent per occupied square foot is computed by dividing rental income by the weighted occupied sq ft for the period. Evolution Total Portfolio January 2008 Total Portfolio June 2013 Acquisitions 2008 – June 2013 Dispositions, 2008 – June 2013 1 $8.00 $10.00 $12.00 $14.00 $16.00 $18.00 $20.00 $22.00 50,000 100,000 150,000 200,000 250,000 300,000 350,000 400,000 450,000 500,000 Realized Rent Per Occ Sq Ft Population (3 - Mile Radius, Weighted by Revenue) |
|
|
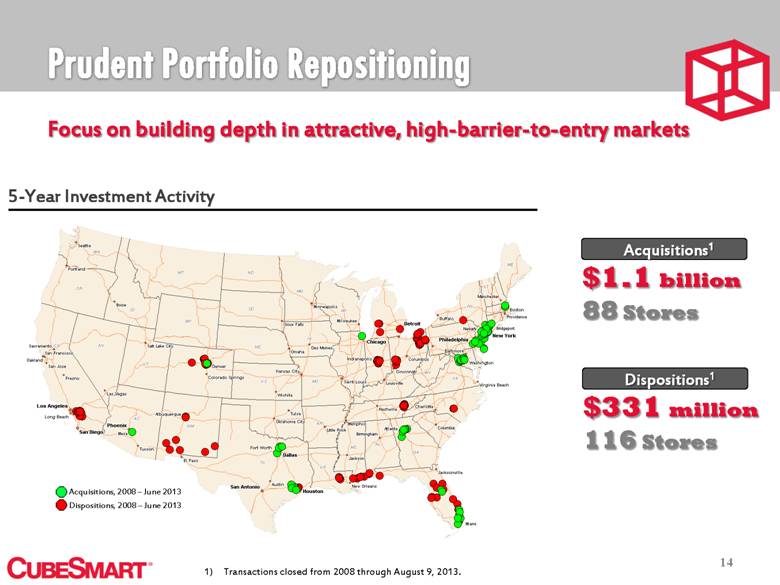
Acquisitions1 14 Focus on building depth in attractive, high-barrier-to-entry markets 5-Year Investment Activity $1.1 billion 88 Stores Transactions closed from 2008 through August 9, 2013. Dispositions1 $331 million 116 Stores Acquisitions, 2008 – June 2013 Dispositions, 2008 – June 2013 |
|
|
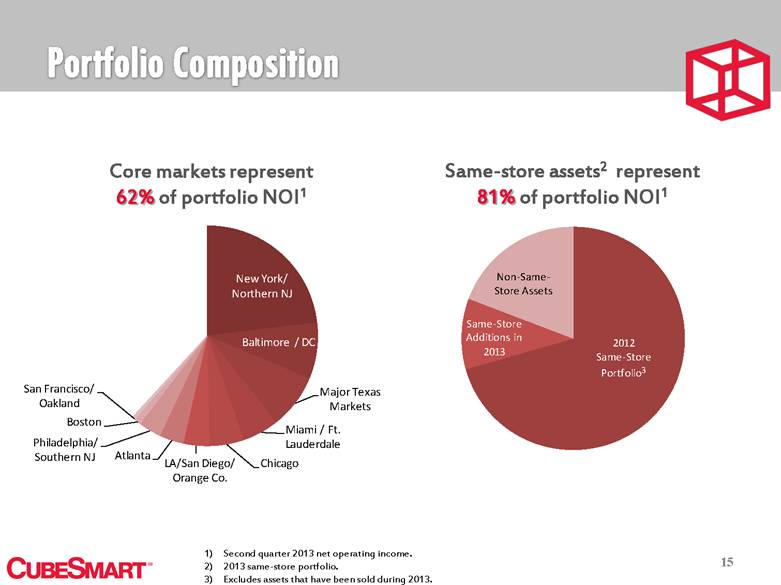
Core markets represent 62% of portfolio NOI1 Same-store assets2 represent 81% of portfolio NOI1 Second quarter 2013 net operating income. 2013 same-store portfolio. Excludes assets that have been sold during 2013. 15 2012 Same - Store Portfolio 3 Same - Store Additions in 2013 Non - Same - Store Assets New York/ Northern NJ Baltimore / DC Major Texas Markets Miami / Ft. Lauderdale Chicago LA/San Diego/ Orange Co. Atlanta Philadelphia/ Southern NJ Boston San Francisco/ Oakland |
|
|
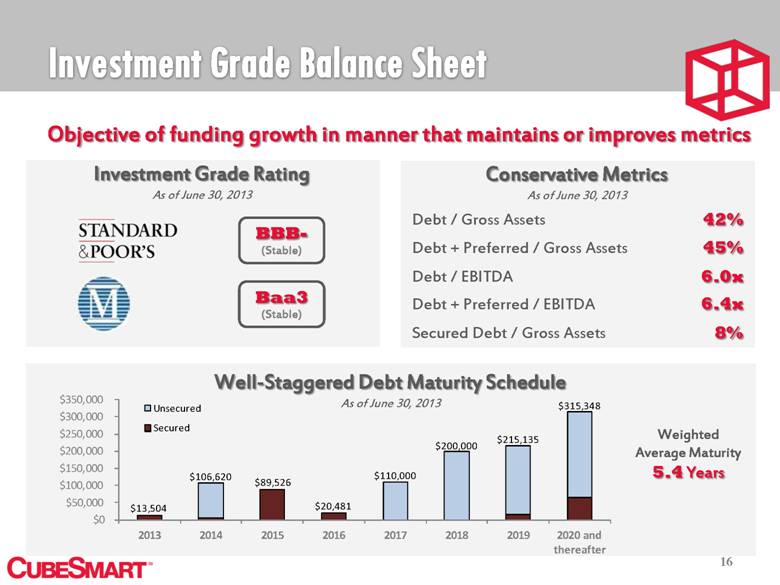
16 Objective of funding growth in manner that maintains or improves metrics Investment Grade Rating As of June 30, 2013 Conservative Metrics 42% Debt / Gross Assets 45% Debt + Preferred / Gross Assets 6.0x Debt / EBITDA 6.4x Debt + Preferred / EBITDA 8% Secured Debt / Gross Assets As of June 30, 2013 BBB- (Stable) Baa3 (Stable) Well-Staggered Debt Maturity Schedule As of June 30, 2013 Weighted Average Maturity 5.4 Years $13,504 $89,526 $20,481 $106,620 $110,000 $200,000 $215,135 $315,348 $0 $50,000 $100,000 $150,000 $200,000 $250,000 $300,000 $350,000 2013 2014 2015 2016 2017 2018 2019 2020 and thereafter Unsecured Secured |
|
|
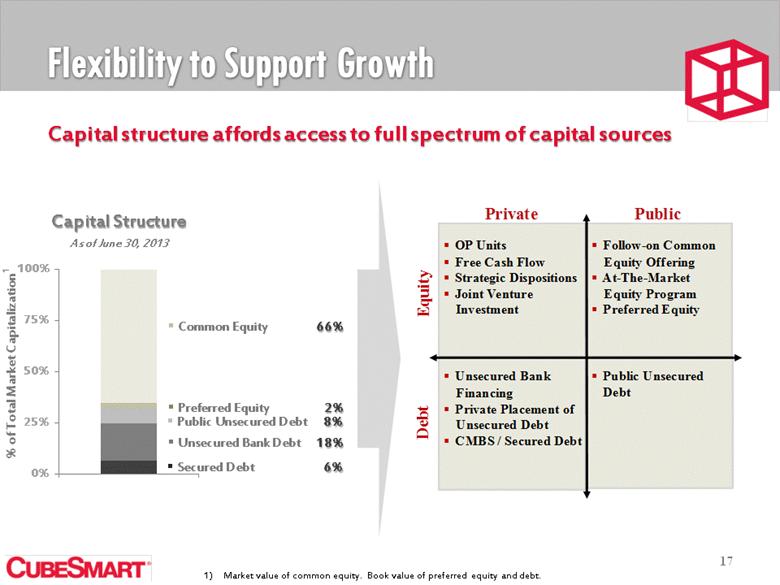
17 Capital structure affords access to full spectrum of capital sources Capital Structure As of June 30, 2013 Common Equity 66% Preferred Equity 2% Unsecured Bank Debt 18% Secured Debt 6% Public Unsecured Debt 8% % of Total Market Capitalization 1 Market value of common equity. Book value of preferred equity and debt. Free Cash Flow Private Public Equity Debt § OP Units § Free Cash Flow § Strategic Dispositions § Joint Venture Investment § Unsecured Bank Financing § Private Placement of Unsecured Debt § CMBS / Secured Debt § Follow - on Common Equity Offering § At - The - Market Equity Program § Preferred Equity § Public Unsecured Debt |
|
|
Limited new supply, a widening competitive divide between large and small operators, and continuing industry consolidation Accelerating organic growth fueled by a focus on customer service and continued enhancement of operational infrastructure Meaningful external growth through a disciplined investment process and a competitive and expanding third party management platform Strategic growth objectives are supported by a healthy balance sheet and access to a broad array of capital sources 18 |
|
|
Investor Relations Contact Daniel Ruble, CFA Vice President, Finance 460 E. Swedesford Rd. Suite 3000 Wayne, PA 19087 610.293.5700 druble@cubesmart.com |
