Overview | PAGE |
| |
3 | |
| |
5 | |
| |
6 | |
| |
Consolidated Statements of Operations | |
| |
8 | |
| |
11 | |
| |
13 | |
| |
14 | |
| |
15 | |
| |
Balance Sheet Information | |
| |
16 | |
| |
17 | |
| |
18 | |
| |
19 | |
| |
Internal Growth | |
| |
20 | |
| |
21 | |
| |
22 | |
| |
23 | |
| |
24 | |
| |
25 | |
| |
External Growth | |
| |
26 | |
| |
27 | |
| |
Historical Capital Expenditures and Investments in Real Estate | 28 |
| |
29 | |
| |
30 | |
| |
31 | |
| |
Additional Information | |
| |
Reconciliation of Earnings Before Interest, Taxes, Depreciation & Amortization and Financial Ratios | 32 |
| |
33 | |
| |
35 |
Corporate Profile
Digital Realty owns, acquires, develops and operates data centers. The company is focused on providing data center, colocation and interconnection solutions for domestic and international customers across a variety of industry verticals ranging from cloud and information technology services, communications and social networking to financial services, manufacturing, energy, healthcare, and consumer products. As of June 30, 2022, the company’s 297 data centers, including 51 data centers held as investments in unconsolidated joint ventures, contain applications and operations critical to the day-to-day operations of technology industry and corporate enterprise data center customers. Digital Realty’s portfolio is comprised of approximately 36.8 million square feet, excluding approximately 8.3 million square feet of space under active development and 2.7 million square feet of space held for future development, located throughout North America, Europe, South America, Asia, Australia and Africa. For additional information, please visit the company’s website at https://www.digitalrealty.com/.
Corporate Headquarters
5707 Southwest Parkway, Building 1, Suite 275
Austin, TX 78735
Telephone: (737) 281-0101
Website: https://www.digitalrealty.com/.
Senior Management
Chief Executive Officer: A. William Stein
President & Chief Financial Officer: Andrew P. Power
Chief Investment Officer: Gregory S. Wright
Chief Technology Officer: Christopher L. Sharp
Chief Revenue Officer: Corey J. Dyer
Chief Operating Officer: Erich J. Sanchack
Investor Relations
To request more information or to be added to our e-mail distribution list, please visit the Investor Relations section of our website at https://investor.digitalrealty.com/
| Bank of America | | BMO Capital | | Cowen & | |||||||
Argus Research | | Merrill Lynch | | Barclays | | Markets | | Citigroup | | Company | | Credit Suisse |
Marie Ferguson | | David Barden | | Brendan Lynch | | Ari Klein | | Michael Rollins | | Michael Elias | | Sami Badri |
(212) 425-7500 | | (646) 855-1320 | | (212) 526-9428 | | (212) 885-4103 | | (212) 816-1116 | | (646) 562-1358 | | (212) 538-1727 |
| | | | | | | | | | | | |
Deutsche Bank | | Edward Jones | | Evercore ISI | | Green Street Advisors | | J.P. Morgan | | Jefferies | | MoffettNathanson |
Matthew Niknam | | Kyle Sanders | | Irvin Liu | | David Guarino | | Richard Choe | | Jonathan Petersen | | Nick Del Deo |
(212) 250-4711 | | (314) 515-0198 | | (415) 800-0183 | | (949) 640-8780 | | (212) 662-6708 | | (212) 284-1705 | | (212) 519-0025 |
| | | | | | | | | | | | |
Morgan Stanley | | Morningstar | | New Street Research | | Raymond James | | RBC Capital Markets | | Stifel | | TD Securities |
Simon Flannery | | Matthew Dolgin | | Jonathan Chaplin | | Frank Louthan | | Jonathan Atkin | | Erik Rasmussen | | Jonathan Kelcher |
(212) 761-6432 | | (312) 696-6783 | | (212) 921-9876 | | (404) 442-5867 | | (415) 633-8589 | | (212) 271-3461 | | (416) 307-9931 |
| | | | | | | | | | | | |
Truist Securities | | UBS | | Wells Fargo | | William Blair | | Wolfe Research | | | | |
Gregory Miller | | John Hodulik | | Eric Luebchow | | James Breen | | Andrew Rosivach | | | | |
(212) 303-4169 | | (212) 713-4226 | | (312) 630-2386 | | (617) 235-7513 | | (646) 582-9250 | | | | |
This Earnings Press Release and Supplemental Information package supplements the information provided in our quarterly and annual reports filed with the U.S. Securities and Exchange Commission. Additional information about Digital Realty and our business is also available on our website at www.digitalrealty.com.
3
Stock Listing Information
The stock of Digital Realty Trust, Inc. is traded primarily on the New York Stock Exchange under the following symbols:
Common Stock: | | DLR |
Series J Preferred Stock: | | DLRPRJ |
Series K Preferred Stock: | | DLRPRK |
Series L Preferred Stock: | | DLRPRL |
Symbols may vary by stock quote provider.
Credit Ratings
Standard & Poor’s | | | |
Corporate Credit Rating: | | BBB | (Stable Outlook) |
Preferred Stock: | | BB+ | |
| | | |
Moody’s | | | |
Issuer Rating: | | Baa2 | (Stable Outlook) |
Preferred Stock: | | Baa3 | |
| | | |
Fitch | | | |
Issuer Default Rating: | | BBB | (Stable Outlook) |
Preferred Stock: | | BB+ | |
These credit ratings may not reflect the potential impact of risks relating to the structure or trading of the company’s securities and are provided solely for informational purposes. Credit ratings are not recommendations to buy, hold or sell any security, and may be revised or withdrawn at any time by the issuing rating agency at its sole discretion. The company does not undertake any obligation to maintain the ratings or to advise of any change in ratings. Each agency’s rating should be evaluated independently of any other agency’s rating. An explanation of the significance of the ratings may be obtained from each of the rating agencies.
Common Stock Price Performance
The following summarizes recent activity of Digital Realty’s common stock (DLR):
| | Three Months Ended |
| |||||||||||||
| | 30-Jun-22 | | 31-Mar-22 | | 31-Dec-21 | | 30-Sep-21 | | 30-Jun-21 | | |||||
High price | |
| $153.50 | |
| $177.15 | |
| $178.22 | |
| $168.30 | |
| $164.04 |
|
Low price |
| | $124.00 |
| | $130.10 |
| | $139.31 |
| | $143.01 |
| | $140.29 | |
Closing price, end of quarter | | | $129.83 | | | $141.80 | | | $176.87 | | | $144.45 | | | $150.46 | |
Average daily trading volume | | | 1,580,520 | | | 1,661,700 | | | 1,242,203 | | | 1,239,685 | | | 1,293,054 | |
Indicated dividend per common share (1) | | | $4.88 | | | $4.88 | | | $4.64 | | | $4.64 | | | $4.64 | |
Closing annual dividend yield, end of quarter | | | 3.8% | | | 3.4% | | | 2.6% | | | 3.2% | | | 3.1% | |
Shares and units outstanding, end of quarter (2) | | | 291,033,400 | | | 290,956,547 | | | 290,346,784 | | | 290,340,867 | | | 289,658,561 | |
Closing market value of shares and units outstanding (3) | | | $37,784,866 | | | $41,257,638 | | | $51,353,636 | | | $41,939,738 | | | $43,582,029 | |
| (1) | On an annualized basis. |
| (2) | As of June 30, 2022, the total number of shares and units includes 284,733,922 shares of common stock, 4,386,944 common units held by third parties and 1,912,534 common units and vested and unvested long-term incentive units held by directors, officers and others and excludes all shares of common stock potentially issuable upon conversion of our series J, series K and series L cumulative redeemable preferred stock upon certain change of control transactions and upon physical settlement of our September 2021 forward sale agreements. |
| (3) | Dollars in thousands as of the end of the quarter. |
This Earnings Press Release and Supplemental Information package supplements the information provided in our quarterly and annual reports filed with the U.S. Securities and Exchange Commission. Additional information about us and our data centers is also available on our website at www.digitalrealty.com.
4

Partner |
| # of Units (2) |
| % Ownership |
Digital Realty Trust, Inc. |
| 284,733,922 |
| 97.8% |
Third-Party Unitholders |
| 4,386,944 |
| 1.5% |
Directors, Officers and Others (3) |
| 1,912,534 |
| 0.7% |
Total |
| 291,033,400 |
| 100.0% |
| (1) | Includes properties owned by joint ventures. |
| (2) | The total number of units includes 284,733,922 general partnership common units, 4,386,944 common units held by third parties and 1,912,534 common units and vested and unvested long-term incentive units held by directors, officers and others, and excludes all common units potentially issuable upon conversion of our series J, series K and series L cumulative redeemable preferred units upon certain change of control transactions and upon physical settlement of our September 2021 forward sale agreements. |
| (3) | Reflects limited partnership interests held by our directors, officers and others in the form of common units, and vested and unvested long-term incentive units. |
5
Key Quarterly Financial Data |
| Financial Supplement |
|---|---|---|
Unaudited and Dollars in Thousands, Except Per Share Data | Second Quarter 2022 |
Shares and Units at End of Quarter |
| 30-Jun-22 |
| 31-Mar-22 |
| 31-Dec-21 |
| 30-Sep-21 |
| 30-Jun-21 | |||||
Common shares outstanding |
| | 284,733,922 |
| | 284,666,082 |
| | 284,415,013 |
| | 283,846,802 |
| | 282,603,152 |
Common units outstanding |
| | 6,299,478 |
| | 6,290,465 |
| | 5,931,771 |
| | 6,494,065 |
| | 7,055,409 |
Total Shares and Partnership Units |
| | 291,033,400 |
| | 290,956,547 |
| | 290,346,784 |
| | 290,340,867 |
| | 289,658,561 |
| | | | | | | | | | | | | | | |
Enterprise Value |
| |
|
| |
|
| |
|
| |
|
| |
|
Market value of common equity (1) | | | $37,784,866 | | | $41,257,638 | | | $51,353,636 | | | $41,939,738 | | | $43,582,029 |
Liquidation value of preferred equity | |
| 755,000 | |
| 755,000 | |
| 755,000 | |
| 755,000 | |
| 755,000 |
Total debt at balance sheet carrying value | |
| 14,294,307 | |
| 14,388,215 | |
| 13,448,210 | |
| 14,087,539 | |
| 13,927,821 |
Total Enterprise Value | | | $52,834,174 | | | $56,400,853 | | | $65,556,846 | | | $56,782,277 | | | $58,264,850 |
Total debt / total enterprise value | |
| 27.1% | |
| 25.5% | |
| 20.5% | |
| 24.8% | |
| 23.9% |
Debt-plus-preferred-to-total-enterprise-value | | | 28.5% | | | 26.8% | | | 21.7% | | | 26.1% | | | 25.2% |
| | | | | | | | | | | | | | | |
Selected Balance Sheet Data | |
|
| |
|
| |
|
| |
|
| |
|
|
Investments in real estate (before depreciation) | | | $29,408,055 | | | $29,444,273 | | | $28,780,211 | | | $28,033,614 | | | $27,821,024 |
Total Assets | |
| 35,956,057 | |
| 36,680,546 | |
| 36,369,560 | |
| 35,847,648 | |
| 36,151,220 |
Total Liabilities | |
| 18,284,791 | |
| 18,429,107 | |
| 17,845,778 | |
| 18,040,369 | |
| 17,945,483 |
| | | | | | | | | | | | | | | |
Selected Operating Data | |
|
| |
|
| |
|
| |
|
| |
|
|
Total operating revenues | | | $1,139,321 | | | $1,127,323 | | | $1,111,168 | | | $1,133,136 | | | $1,093,188 |
Total operating expenses | |
| 968,950 | |
| 986,087 | |
| 979,671 | |
| 948,769 | |
| 907,561 |
Interest expense | |
| 69,023 | |
| 66,725 | |
| 71,762 | |
| 71,417 | |
| 75,014 |
Net income | |
| 63,862 | |
| 76,911 | |
| 1,090,397 | |
| 136,543 | |
| 125,797 |
Net income available to common stockholders | |
| 53,245 | |
| 63,101 | |
| 1,057,629 | |
| 124,096 | |
| 127,368 |
| | | | | | | | | | | | | | | |
Financial Ratios | |
|
| |
|
| |
|
| |
|
| |
|
|
EBITDA (2) | | | $515,642 | | | $576,337 | | | $1,512,560 | | | $578,257 | | | $618,945 |
Adjusted EBITDA (3) | |
| 610,994 | |
| 602,994 | |
| 583,712 | |
| 610,076 | |
| 602,684 |
Net Debt to Adjusted EBITDA (4) | |
| 6.2x | |
| 6.3x | |
| 6.1x | |
| 6.0x | |
| 6.0x |
Interest expense | |
| 69,023 | |
| 66,725 | |
| 71,762 | |
| 71,417 | |
| 75,014 |
Fixed charges (5) | |
| 93,335 | |
| 91,657 | |
| 97,271 | |
| 96,740 | |
| 98,457 |
Interest coverage ratio (6) | |
| 6.6x | |
| 6.1x | |
| 6.0x | |
| 6.5x | |
| 6.1x |
Fixed charge coverage ratio (7) | |
| 6.0x | |
| 5.5x | |
| 5.4x | |
| 5.8x | |
| 5.4x |
| | | | | | | | | | | | | | | |
Profitability Measures | |
|
| |
|
| |
|
| |
|
| |
|
|
Net income per common share - basic | | | $0.19 | | | $0.22 | | | $3.73 | | | $0.44 | | | $0.45 |
Net income per common share - diluted | | | $0.19 | | | $0.22 | | | $3.71 | | | $0.44 | | | $0.45 |
Funds from operations (FFO) / diluted share and unit (8) | | | $1.55 | | | $1.60 | | | $1.54 | | | $1.54 | | | $1.78 |
Core funds from operations (Core FFO) / diluted share and unit (8) | | | $1.72 | | | $1.67 | | | $1.67 | | | $1.65 | | | $1.54 |
Adjusted funds from operations (AFFO) / diluted share and unit (9) | | | $1.63 | | | $1.59 | | | $1.41 | | | $1.60 | | | $1.63 |
Dividends per share and common unit | | | $1.22 | | | $1.22 | | | $1.16 | | | $1.16 | | | $1.16 |
Diluted FFO payout ratio (8) (10) | |
| 78.7% | |
| 76.3% | |
| 75.3% | |
| 75.3% | |
| 65.2% |
Diluted Core FFO payout ratio (8) (11) | |
| 71.1% | |
| 73.2% | |
| 69.4% | |
| 70.3% | |
| 75.3% |
Diluted AFFO payout ratio (9) (12) | |
| 75.0% | |
| 76.7% | |
| 82.1% | |
| 72.4% | |
| 71.2% |
| | | | | | | | | | | | | | | |
Portfolio Statistics | |
|
| |
|
| |
|
| |
|
| |
|
|
Buildings (13) | | | 309 | | | 303 | | | 300 | | | 295 | | | 305 |
Data Centers (13) | |
| 297 | |
| 291 | |
| 287 | |
| 282 | |
| 291 |
Cross-connects (13)(14) | |
| 185,000 | |
| 181,500 | |
| 178,000 | |
| 174,000 | |
| 170,000 |
Net rentable square feet, excluding development space (13) | |
| 36,802,807 | |
| 35,786,973 | |
| 35,630,828 | |
| 34,988,250 | |
| 35,837,908 |
Occupancy at end of quarter (15) | |
| 83.9% | |
| 83.3% | |
| 83.6% | |
| 84.2% | |
| 84.7% |
Occupied square footage (13) | |
| 30,866,495 | |
| 29,801,451 | |
| 29,774,698 | |
| 29,471,445 | |
| 30,352,404 |
Space under active development (16) | |
| 8,289,404 | |
| 8,086,565 | |
| 7,230,460 | |
| 7,464,633 | |
| 7,617,837 |
Space held for development (17) | |
| 2,660,692 | |
| 2,646,137 | |
| 2,682,456 | |
| 2,088,701 | |
| 1,958,306 |
Weighted average remaining lease term (years) (18) | |
| 4.8 | |
| 4.8 | |
| 4.7 | |
| 4.8 | |
| 4.7 |
Same-capital occupancy at end of quarter (15) (19) | |
| 83.0% | |
| 82.8% | |
| 83.7% | |
| 83.8% | |
| 84.4% |
6
Key Quarterly Financial Data |
| Financial Supplement |
|---|---|---|
Unaudited and Dollars in Thousands, Except Per Share Data | Second Quarter 2022 |
| (2) | EBITDA is calculated as earnings before interest expense, loss from early extinguishment of debt, tax expense, and depreciation and amortization. For a discussion of EBITDA, see page 33. For a reconciliation of net income available to common stockholders to EBITDA, see page 32. |
| (3) | Adjusted EBITDA is EBITDA excluding unconsolidated joint venture real estate related depreciation & amortization, unconsolidated joint venture interest and tax expense, severance, equity acceleration, and legal expenses, transaction and integration expenses, gain on sale / deconsolidation, impairment of investments in real estate, other non-core adjustments, net, non-controlling interests, preferred stock dividends, including undeclared dividends, and issuance costs associated with redeemed preferred stock. For a discussion of Adjusted EBITDA, see page 33. For a reconciliation of net income available to common stockholders to Adjusted EBITDA, see page 32. |
| (4) | Net Debt to Adjusted EBITDA is calculated as total debt at balance sheet carrying value (see page 6), plus capital lease obligations, plus our share of joint venture debt at carrying value, less cash and cash equivalents (including JV share of cash), divided by the product of Adjusted EBITDA (including our share of joint venture EBITDA), multiplied by four. |
| (5) | Fixed charges consist of GAAP interest expense, capitalized interest, scheduled debt principal payments and preferred dividends. |
| (6) | Interest coverage ratio is Adjusted EBITDA divided by GAAP interest expense plus capitalized interest (including our pro rata share of unconsolidated joint venture interest expense). |
| (7) | Fixed charge coverage ratio is Adjusted EBITDA divided by fixed charges (including our pro rata share of unconsolidated joint venture fixed charges). |
| (8) | For definitions and discussion of FFO and core FFO, see page 33. For reconciliations of net income available to common stockholders to FFO and core FFO, see page 14. |
| (9) | For a definition and discussion of AFFO, see page 33. For a reconciliation of core FFO to AFFO, see page 15. |
| (10) | Diluted FFO payout ratio is dividends declared per common share and unit divided by diluted FFO per share and unit. |
| (11) | Diluted core FFO payout ratio is dividends declared per common share and unit divided by diluted core FFO per share and unit. |
| (12) | Diluted AFFO payout ratio is dividends declared per common share and unit divided by diluted AFFO per share and unit. |
| (13) | Includes buildings held as investments in unconsolidated entities. Excludes buildings held-for-sale. |
| (14) | Represents approximate amounts. |
| (15) | Occupancy and same-capital occupancy exclude space under active development and space held for development. Occupancy represents our consolidated portfolio in addition to our managed portfolio of unconsolidated joint ventures and non-managed unconsolidated joint ventures. For some of our buildings, we calculate occupancy based on factors in addition to contractually leased square feet, including available power, required support space and common area. Excludes buildings held-for-sale. |
| (16) | Space under active development includes current Base Building and Data Centers projects in progress (see page 26). Excludes buildings held-for-sale. |
| (17) | Space held for development includes space held for future Data Center development, and excludes space under active development (see page 29). Excludes buildings held-for-sale. |
| (18) | Weighted average remaining lease term excludes renewal options and is weighted by net rentable square feet. |
| (19) | Represents buildings owned as of December 31, 2020 with less than 5% of total rentable square feet under development. Excludes buildings that were undergoing, or were expected to undergo, development activities in 2021-2022, buildings classified as held-for-sale, and buildings sold or contributed to joint ventures for all periods presented. Prior period results have been adjusted to reflect current same-capital pool. |
Explanatory Note: Certain portfolio information regarding Medallion is excluded from the portfolio statistics included in this Earnings Press Release and Supplemental Information package, as indicated in the footnotes, where applicable. Specifically, we have excluded the following related to Medallion: two new metropolitan areas, two data centers, square footage, occupancy percentage and lease terms. Medallion’s financial results are included in our condensed consolidated financial information.
7
DIGITAL REALTY REPORTS SECOND QUARTER 2022 RESULTS
Austin, TX — July 28, 2022 — Digital Realty (NYSE: DLR), the largest global provider of cloud- and carrier-neutral data center, colocation and interconnection solutions, announced today financial results for the second quarter of 2022. All per share results are presented on a fully diluted basis.
Highlights
| ◾ | Reported net income available to common stockholders of $0.19 per share in 2Q22, compared to $0.45 in 2Q21 |
| ◾ | Reported FFO per share of $1.55 in 2Q22, compared to $1.78 in 2Q21 |
| ◾ | Reported core FFO per share of $1.72 in 2Q22, compared to $1.54 in 2Q21 |
| ◾ | Signed total bookings during 2Q22 expected to generate $113 million of annualized GAAP rental revenue, including a $12 million contribution from interconnection |
| ◾ | Updated 2022 core FFO per share outlook to $6.75 - $6.85; Reiterated 2022 constant-currency core FFO per share outlook of $6.95 - $7.05 |
Financial Results
Digital Realty reported revenues for the second quarter of 2022 of $1.1 billion, a 1% increase from the previous quarter and a 4% increase from the same quarter last year.
The company delivered second quarter of 2022 net income of $63.9 million, and net income available to common stockholders of $53.2 million, or $0.19 per diluted share, compared to $0.22 per diluted share in the previous quarter and $0.45 per diluted share in the same quarter last year.
Digital Realty generated second quarter of 2022 Adjusted EBITDA of $611 million, a 1% increase from the previous quarter and a 1% increase over the same quarter last year.
The company reported second quarter of 2022 funds from operations of $452 million, or $1.55 per share, compared to $1.60 per share in the previous quarter and $1.78 per share in the same quarter last year.
Excluding certain items that do not represent core expenses or revenue streams, Digital Realty delivered second quarter of 2022 core FFO per share of $1.72, compared to $1.67 per share in the previous quarter, and $1.54 per share in the same quarter last year.
Leasing Activity
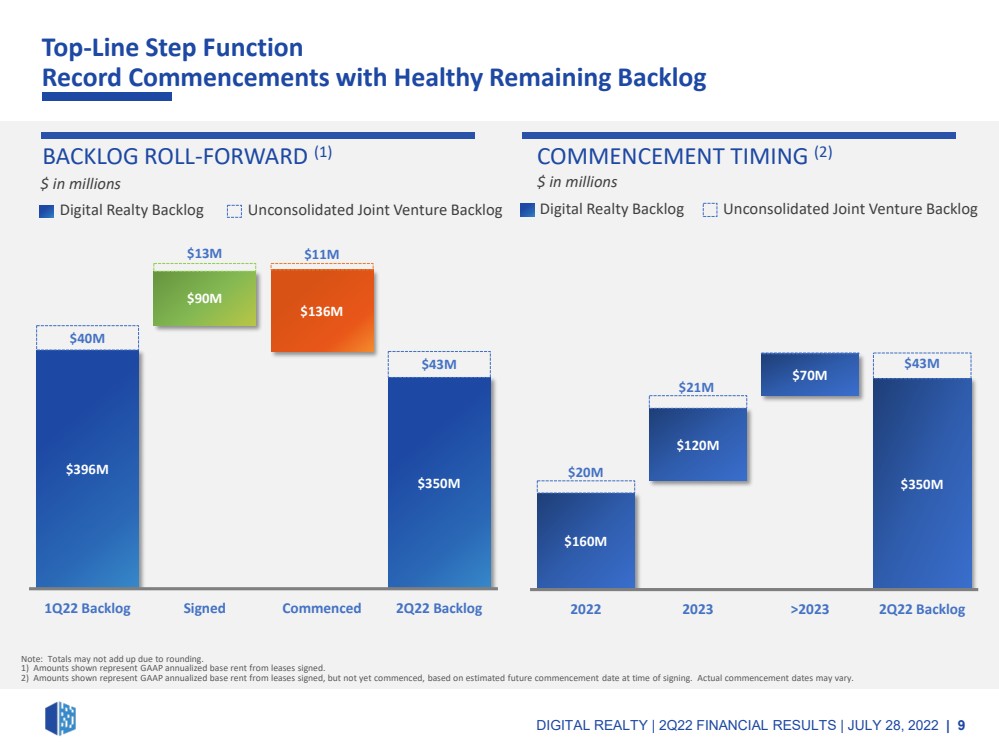
In the second quarter, Digital Realty signed total bookings expected to generate $113 million of annualized GAAP rental revenue, including a $12 million contribution from interconnection.
“Demand for data center solutions continued to be strong through the second quarter, with healthy contributions from both hyperscale and enterprise segments,” said Digital Realty Chief Executive Officer A. William Stein. “Customers are seeking to secure the capacity they require in advance of availability, as over half of our record development schedule is pre-leased, and tight conditions in many markets around the world are resulting in an improving pricing environment and rising occupancy.”
The weighted-average lag between new leases signed during the second quarter of 2022 and the contractual commencement date was thirteen months.
In addition to new leases signed, Digital Realty also signed renewal leases representing $173 million of annualized GAAP rental revenue during the quarter. Rental rates on renewal leases signed during the second quarter of 2022 rolled up 3.4% on a cash basis and up 5.3% on a GAAP basis.
8
New leases signed during the second quarter of 2022 are summarized by region as follows:
|
| Annualized GAAP |
| |
| | |
|
|
| | | |
| | Base Rent | | | | GAAP Base Rent | | | | GAAP Base Rent | |||
The Americas | | (in thousands) | | Square Feet | | per Square Foot | | Megawatts | | per Kilowatt | |||
0-1 MW | | | $15,583 |
| 63,303 | | | $246 |
| 6.0 | | | $217 |
> 1 MW | | | 15,537 |
| 137,937 | | | 113 |
| 14.1 | | | 92 |
Other (1) | | | 1,566 |
| 63,467 | | | 25 |
| — | | | — |
Total | | | $32,686 |
| 264,707 | | | $123 |
| 20.1 | | | $129 |
| | | | | | | | | | | | | |
EMEA (2) | | |
|
|
| | |
|
|
| | |
|
0-1 MW | | | $18,301 |
| 71,568 | | | $256 |
| 6.4 | | | $238 |
> 1 MW | | | 43,760 |
| 347,280 | | | 126 |
| 34.0 | | | 107 |
Other (1) | | | 171 |
| 2,409 | | | 71 |
| — | | | — |
Total | | | $62,232 |
| 421,257 | | | $148 |
| 40.4 | | | $128 |
| | | | | | | | | | | | | |
Asia Pacific (2) | | |
|
|
| | |
|
|
| | |
|
0-1 MW | | | $1,544 |
| 8,591 | | | $180 |
| 0.4 | | | $322 |
> 1 MW | | | 5,399 | | 27,157 | | | 199 | | 3.0 | | | 150 |
Other (1) | | | 25 |
| 327 | | | 78 |
| — | | | — |
Total | | | $6,968 |
| 36,075 | | | $193 |
| 3.4 | | | $170 |
| | | | | | | | | | | | | |
All Regions (2) | | |
|
|
| | |
|
|
| | |
|
0-1 MW | | | $35,428 |
| 143,461 | | | $247 |
| 12.8 | | | $231 |
> 1 MW | | | 64,695 | | 512,374 | | | 126 | | 51.1 | | | 105 |
Other (1) | | | 1,763 |
| 66,203 | | | 27 |
| — | | | — |
Total | | | $101,886 |
| 722,038 | | | $141 |
| 63.9 | | | $131 |
| | | | | | | | | | | | | |
Interconnection | | | $11,515 |
| N/A | | | N/A |
| N/A | | | N/A |
| | | | | | | | | | | | | |
Grand Total | | | $113,401 |
| 722,038 | | | $141 |
| 63.9 | | | $131 |
Note: Totals may not foot due to rounding differences.
| (1) | Other includes Powered Base Building® shell capacity as well as storage and office space within fully improved data center facilities. |
| (2) | Based on quarterly average exchange rates during the three months ended June 30, 2022. |
Investment Activity
During the second quarter, Digital Realty acquired an 8-acre parcel in Dublin for $6 million, which can support up to 40 megawatts of IT load. Digital Realty also acquired 2.4 acres in Barcelona for $11 million, which can support up to 15 megawatts of IT load. Lastly, Digital Realty acquired 34 acres in Frankfurt for $60 million, which can support up to 70 megawatts of IT load.
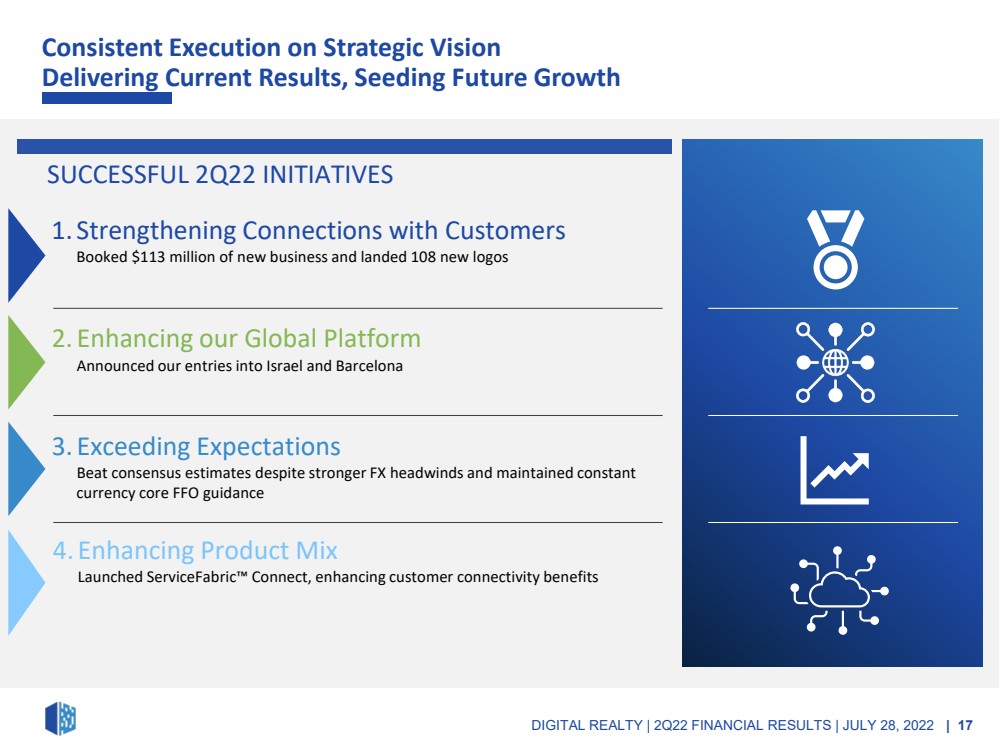
Also during the second quarter, Digital Realty announced a joint venture with Mivne Real Estate (K.D.) (TASE: MVNE) for entry into the Israeli market. The joint venture, which will operate under the brand name Digital Realty Mivne, will serve as a strategic partnership between Digital Realty and Mivne, a market leading real estate developer, owner and operator that has developed many large-scale projects across Israel and has an extensive land bank. Digital Realty Mivne expects to develop a multi-tenant data center campus in Petah Tikvah, the primary connectivity hub in Israel. The data center campus will support the development of up to 20 megawatts of IT load. Delivery of the initial phase is anticipated in 2023, subject to customer demand.
Subsequent to the close of the second quarter, Digital Realty acquired 38 acres in Paris for $11 million and 9 acres in Stockholm for $43 million.
9
Digital Realty had approximately $14.3 billion of total debt outstanding as of June 30, 2022, comprised of $14.1 billion of unsecured debt and approximately $0.2 billion of secured debt. At the end of the second quarter of 2022, net debt-to-Adjusted EBITDA was 6.2x, debt-plus-preferred-to-total enterprise value was 28.5% and fixed charge coverage was 6.0x. Pro forma for settlement of the $1 billion forward equity offering, net debt-to-adjusted EBITDA was 5.8x and fixed charge coverage was 6.2x.
During the second quarter of 2022, Digital Realty completed the following financing transactions.
| ◾ | Amended its Global Senior Credit Agreement to increase the size from $3.0 billion to $3.75 billion. |
| ◾ | Entered into an at-the-market (ATM) equity offering agreement of up to $1.5 billion. The prior program which had $577.6 million remaining was terminated. |
10
Digital Realty updated its 2022 core FFO per share outlook of $6.75-$6.85 and reiterated its 2022 constant-currency core FFO per share outlook of $6.95 - $7.05. The assumptions underlying the outlook are summarized in the following table.
|
| As of | | As of | | As of |
Top-Line and Cost Structure | | February 17, 2022 | | April 28, 2022 | | July 28, 2022 |
Total revenue | | $4.700 - $4.800 billion | | $4.700 - $4.800 billion | | $4.650 - $4.750 billion |
Net non-cash rent adjustments (1) | | ($35 - $40 million) | | ($45 - $50 million) | | ($50 - $55 million) |
Adjusted EBITDA | | $2.475 - $2.525 billion | | $2.475 - $2.525 billion | | $2.450 - $2.500 billion |
G&A | | $410 - $420 million | | $410 - $420 million | | $405 - $415 million |
| | | | | | |
Internal Growth | | | | | | |
Rental rates on renewal leases | | | | | | |
Cash basis | | Flat | | Slightly Positive | | Slightly Positive |
GAAP basis | | Slightly positive | | Up low-single-digits | | Up low-single-digits |
Year-end portfolio occupancy | | 83.0% - 84.0% | | 83.0% - 84.0% | | 83.0% - 84.0% |
"Same-capital" cash NOI growth (2) | | (2.5% - 3.5%) | | (2.5% - 3.5%) | | (3.5% - 4.5%) |
| | | | | | |
Foreign Exchange Rates | | | | | | |
U.S. Dollar / Pound Sterling | | $1.30 - $1.38 | | $1.25 - $1.35 | | $1.15 - $1.25 |
U.S. Dollar / Euro | | $1.10 - $1.15 | | $1.05 - $1.10 | | $1.00 - $1.05 |
| | | | | | |
External Growth | | | | | | |
Dispositions | | | | | | |
Dollar volume | | $0.5 - $1.0 billion | | $0.5 - $1.0 billion | | $0.5 - $1.0 billion |
Cap rate | | 0.0% - 10.0% | | 0.0% - 10.0% | | 0.0% - 10.0% |
Development | | | | | | |
CapEx (3) | | $2.3 - $2.5 billion | | $2.3 - $2.5 billion | | $2.2 - $2.4 billion |
Average stabilized yields | | 9.0% - 15.0% | | 9.0% - 15.0% | | 9.0% - 15.0% |
Enhancements and other non-recurring CapEx (4) | | $5 - $10 million | | $5 - $10 million | | $5 - $10 million |
Recurring CapEx + capitalized leasing costs (5) | | $210 - $220 million | | $200 - $210 million | | $200 - $210 million |
| | | | | | |
Balance Sheet | | | | | | |
Long-term debt issuance | | | | | | |
Dollar amount | | $1.8 - $2.0 billion | | $1.8 - $2.0 billion | | $1.8 - $2.0 billion |
Pricing | | 1.5% - 2.0% | | 1.5% - 2.0% | | 2.0% - 2.5% |
Timing | | Early & Late 2022 | | Early & Late 2022 | | Early & Late 2022 |
| | | | | | |
Net income per diluted share | | $1.05 - $1.10 | | $1.05 - $1.10 | | $1.00 - $1.05 |
Real estate depreciation and (gain) / loss on sale | | $5.35 - $5.35 | | $5.35 - $5.35 | | $5.35 - $5.35 |
Funds From Operations / share (NAREIT-Defined) | | $6.40 - $6.45 | | $6.40 - $6.45 | | $6.35 - $6.40 |
Non-core expenses and revenue streams | | $0.40 - $0.45 | | $0.40 - $0.45 | | $0.40 - $0.45 |
Core Funds From Operations / share | | $6.80 - $6.90 | | $6.80 - $6.90 | | $6.75 - $6.85 |
Foreign currency translation adjustments | | $0.10 - $0.10 | | $0.15 - $0.15 | | $0.20 - $0.20 |
Constant-Currency Core Funds From Operations / share | | $6.90 - $7.00 | | $6.95 - $7.05 | | $6.95 - $7.05 |
| (1) | Net non-cash rent adjustments represent the sum of straight-line rental revenue and straight-line rent expense, as well as the amortization of above- and below-market leases (i.e., ASC 805 adjustments). |
| (2) | The “same-capital” pool includes properties owned as of December 31, 2020 with less than 5% of total rentable square feet under development. It excludes properties that were undergoing, or were expected to undergo, development activities in 2021-2022, properties classified as held for sale, and properties sold or contributed to joint ventures for all periods presented. |
| (3) | Includes land acquisitions. |
| (4) | Other non-recurring CapEx represents costs incurred to enhance the capacity or marketability of operating properties, such as network fiber initiatives and software development costs. |
| (5) | Recurring CapEx represents non-incremental improvements required to maintain current revenues, including second-generation tenant improvements and leasing commissions. |
11
Non-GAAP Financial Measures
This document contains non-GAAP financial measures, including FFO, core FFO and Adjusted EBITDA. A reconciliation from U.S. GAAP net income available to common stockholders to FFO, a reconciliation from FFO to core FFO, and definitions of FFO and core FFO are included as an attachment to this document. A reconciliation from U.S. GAAP net income available to common stockholders to Adjusted EBITDA, a definition of Adjusted EBITDA and definitions of net debt-to-Adjusted EBITDA, debt-plus-preferred-to-total enterprise value, cash NOI, and fixed charge coverage ratio are included as an attachment to this document.
Investor Conference Call
Prior to Digital Realty’s investor conference call at 5:30 p.m. EDT / 2:30 p.m. PDT on July 28, 2022, a presentation will be posted to the Investors section of the company’s website at https://investor.digitalrealty.com/. The presentation is designed to accompany the discussion of the company’s second quarter 2022 financial results and operating performance. The conference call will feature Chief Executive Officer A. William Stein and President & Chief Financial Officer Andrew P. Power.
To participate in the live call, investors are invited to dial (888) 317-6003 (for domestic callers) or (412) 317-6061 (for international callers) and reference the conference ID# 6453950 at least five minutes prior to start time. A live webcast of the call will be available via the Investors section of Digital Realty’s website at https://investor.digitalrealty.com/.
Telephone and webcast replays will be available after the call until August 28, 2022. The telephone replay can be accessed by dialing (877) 344-7529 (for domestic callers) or (412) 317-0088 (for international callers) and providing the conference ID# 1684177. The webcast replay can be accessed on Digital Realty’s website.
About Digital Realty
Digital Realty brings companies and data together by delivering the full spectrum of data center, colocation and interconnection solutions. PlatformDIGITAL®, the company’s global data center platform, provides customers with a secure data “meeting place” and a proven Pervasive Datacenter Architecture (PDx™) solution methodology for powering innovation and efficiently managing Data Gravity challenges. Digital Realty gives its customers access to the connected communities that matter to them with a global data center footprint of 290+ facilities in 50+ metros across 26 countries on six continents. To learn more about Digital Realty, please visit digitalrealty.com or follow us on LinkedIn and Twitter.
Contact Information
Andrew P. Power
President & Chief Financial Officer
Digital Realty
(737) 281-0101
Jordan Sadler / Jim Huseby
Investor Relations
Digital Realty
(737) 281-0101
12
Consolidated Quarterly Statements of Operations |
| Financial Supplement |
|---|---|---|
Unaudited and Dollars in Thousands, Except Per Share Data | Second Quarter 2022 |
| | | Three Months Ended | | | Six Months Ended | ||||||||||||||||
| | | 30-Jun-22 | | | 31-Mar-22 | | | 31-Dec-21 | | | 30-Sep-21 | | | 30-Jun-21 | | | | 30-Jun-22 | | | 30-Jun-21 |
Rental revenues | | | $767,313 | | | $751,962 | | | $763,117 | | | $773,195 | | | $768,826 | | | | $1,519,275 | | | $1,523,370 |
Tenant reimbursements - Utilities | | | 218,198 | | | 224,547 | | | 195,340 | | | 189,060 | | | 169,743 | | | | 442,745 | | | 354,716 |
Tenant reimbursements - Other | | | 52,688 | | | 51,511 | | | 58,528 | | | 57,666 | | | 60,261 | | | | 104,198 | | | 119,589 |
Interconnection & other | | | 93,338 | | | 93,530 | | | 89,850 | | | 90,983 | | | 90,565 | | | | 186,868 | | | 179,626 |
Fee income | | | 5,072 | | | 5,757 | | | 4,133 | | | 3,255 | | | 3,628 | | | | 10,829 | | | 6,054 |
Other | | | 2,713 | | | 15 | | | 200 | | | 18,977 | | | 165 | | | | 2,728 | | | 224 |
Total Operating Revenues | | | $1,139,321 | | | $1,127,323 | | | $1,111,167 | | | $1,133,135 | | | $1,093,189 | | | | $2,266,644 | | | $2,183,580 |
| | | | | | | | | | | | | | | | | | | | | | |
Utilities | | | $223,426 | | | $241,239 | | | $213,933 | | | $209,585 | | | $185,010 | | | | $464,665 | | | $361,057 |
Rental property operating | | | 198,076 | | | 194,354 | | | 205,250 | | | 196,743 | | | 198,206 | | | | 392,430 | | | 383,939 |
Property taxes | | | 47,213 | | | 46,526 | | | 42,673 | | | 55,915 | | | 42,795 | | | | 93,738 | | | 91,800 |
Insurance | | | 3,836 | | | 3,698 | | | 3,507 | | | 4,718 | | | 5,703 | | | | 7,534 | | | 9,201 |
Depreciation & amortization | | | 376,967 | | | 382,132 | | | 378,883 | | | 369,035 | | | 368,981 | | | | 759,099 | | | 738,714 |
General & administration | | | 101,991 | | | 96,435 | | | 103,705 | | | 97,082 | | | 94,956 | | | | 198,426 | | | 192,524 |
Severance, equity acceleration, and legal expenses | | | 3,786 | | | 2,077 | | | 1,003 | | | 1,377 | | | 2,536 | | | | 5,863 | | | 4,963 |
Transaction and integration expenses | | | 13,586 | | | 11,968 | | | 12,427 | | | 13,804 | | | 7,075 | | | | 25,554 | | | 21,195 |
Impairment of investments in real estate | | | — | | | — | | | 18,291 | | | — | | | — | | | | — | | | — |
Other expenses | | | 70 | | | 7,657 | | | (1) | | | 510 | | | 2,298 | | | | 7,727 | | | 2,041 |
Total Operating Expenses | | | $968,950 | | | $986,087 | | | $979,669 | | | $948,770 | | | $907,561 | | | | $1,955,037 | | | $1,805,433 |
| | | | | | | | | | | | | | | | | | | | | | |
Operating Income | | | $170,371 | | | $141,236 | | | $131,498 | | | $184,365 | | | $185,627 | | | | $311,607 | | | $378,146 |
| | | | | | | | | | | | | | | | | | | | | | |
Equity in earnings (loss) of unconsolidated joint ventures | | | (34,088) | | | 60,958 | | | (7,714) | | | 40,884 | | | 52,143 | | | | 26,870 | | | 29,112 |
Gain / (loss) on sale of investments | | | — | | | 2,770 | | | 1,047,011 | | | (635) | | | 499 | | | | 2,770 | | | 334,420 |
Interest and other income (expense), net | | | 13,008 | | | 3,051 | | | (4,349) | | | (2,947) | | | 10,124 | | | | 16,059 | | | 2,938 |
Interest (expense) | | | (69,023) | | | (66,725) | | | (71,762) | | | (71,417) | | | (75,014) | | | | (135,748) | | | (150,667) |
Income tax (expense) | | | (16,406) | | | (13,244) | | | (3,961) | | | (13,709) | | | (47,582) | | | | (29,650) | | | (55,129) |
Loss from early extinguishment of debt | | | — | | | (51,135) | | | (325) | | | — | | | — | | | | (51,135) | | | (18,347) |
Net Income | | | $63,862 | | | $76,911 | | | $1,090,397 | | | $136,541 | | | $125,799 | | | | $140,773 | | | $520,474 |
| | | | | | | | | | | | | | | | | | | | | | |
Net (income) attributable to noncontrolling interests | | | (436) | | | (3,629) | | | (22,587) | | | (2,266) | | | (4,544) | | | | (4,065) | | | (13,298) |
Net Income Attributable to Digital Realty Trust, Inc. | | | $63,426 | | | $73,282 | | | $1,067,811 | | | $134,275 | | | $121,255 | | | | $136,708 | | | $507,177 |
| | | | | | | | | | | | | | | | | | | | | | |
Preferred stock dividends, including undeclared dividends | | | (10,181) | | | (10,181) | | | (10,181) | | | (10,181) | | | (11,885) | | | | (20,363) | | | (25,399) |
Gain on / (Issuance costs associated with) redeemed preferred stock | | | — | | | — | | | — | | | — | | | 18,000 | | | | — | | | 18,000 |
Net Income Available to Common Stockholders | | | $53,245 | | | $63,101 | | | $1,057,630 | | | $124,094 | | | $127,371 | | | | $116,346 | | | $499,777 |
| | | | | | | | | | | | | | | | | | | | | | |
Weighted-average shares outstanding - basic | | | 284,694,064 | | | 284,525,992 | | | 283,869,662 | | | 283,105,966 | | | 281,791,855 | | | | 284,610,492 | | | 281,445,252 |
Weighted-average shares outstanding - diluted | | | 285,109,903 | | | 285,025,099 | | | 284,868,184 | | | 283,799,538 | | | 282,433,857 | | | | 284,979,709 | | | 282,075,611 |
Weighted-average fully diluted shares and units | | | 290,944,163 | | | 290,662,421 | | | 290,893,110 | | | 290,228,785 | | | 289,484,805 | | | | 290,716,197 | | | 289,218,609 |
| | | | | | | | | | | | | | | | | | | | | | |
Net income per share - basic | | | $0.19 | | | $0.22 | | | $3.73 | | | $0.44 | | | $0.45 | | | | $0.41 | | | $1.78 |
Net income per share - diluted | | | $0.19 | | | $0.22 | | | $3.71 | | | $0.44 | | | $0.45 | | | | $0.41 | | | $1.77 |
13
Funds From Operations and Core Funds From Operations |
| Financial Supplement |
|---|---|---|
Unaudited and in Thousands, Except Per Share Data | Second Quarter 2022 |
| | Three Months Ended | | | Six Months Ended | |||||||||||||||||
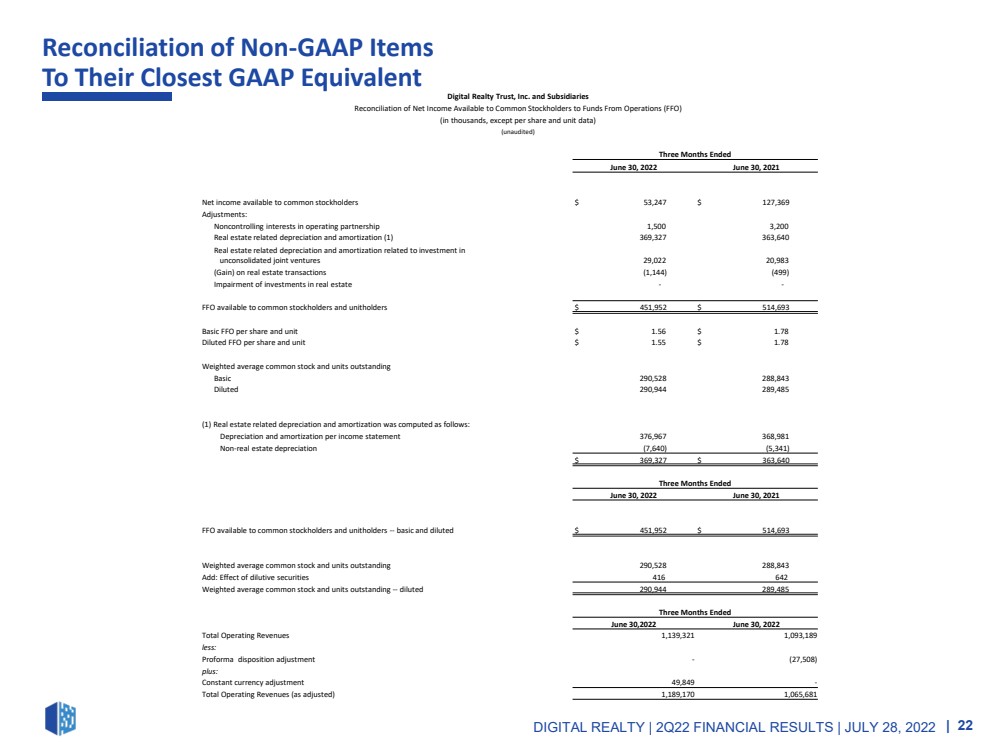
Reconciliation of Net Income to Funds From Operations (FFO) | | | 30-Jun-22 | | | 31-Mar-22 | | | 31-Dec-21 | | | 30-Sep-21 | | | 30-Jun-21 | | | | 30-Jun-22 | | | 30-Jun-21 |
| | | | | | | | | | | | | | | | | | | | | | |
Net Income Available to Common Stockholders | | | $53,245 | | | $63,101 | | | $1,057,630 | | | $124,094 | | | $127,371 | | | | $116,346 | | | $499,777 |
Adjustments: | | | | | | | | | | | | | | | | | | | | | | |
Non-controlling interest in operating partnership | | | 1,500 | | | 1,600 | | | 23,100 | | | 3,000 | | | 3,200 | | | | 3,100 | | | 13,000 |
Real estate related depreciation & amortization (1) | | | 369,327 | | | 374,162 | | | 372,447 | | | 362,728 | | | 363,640 | | | | 743,489 | | | 728,336 |
Unconsolidated JV real estate related depreciation & amortization | | | 29,022 | | | 29,320 | | | 24,146 | | | 21,293 | | | 20,983 | | | | 58,341 | | | 40,361 |
(Gain) on real estate transactions (2) | | | (1,144) | | | (2,770) | | | (1,047,010) | | | (63,798) | | | (499) | | | | (3,914) | | | (334,420) |
Impairment of investments in real estate | | | - | | | - | | | 18,291 | | | - | | | - | | | | - | | | - |
Funds From Operations - diluted | | | $451,949 | | | $465,412 | | | $448,602 | | | $447,317 | | | $514,695 | | | | $917,362 | | | $947,055 |
| | | | | | | | | | | | | | | | | | | | | | |
Weighted-average shares and units outstanding - basic | | | 290,528 | | | 290,163 | | | 289,895 | | | 289,542 | | | 288,843 | | | | 290,346 | | | 288,588 |
Weighted-average shares and units outstanding - diluted (3) | | | 290,944 | | | 290,662 | | | 290,893 | | | 290,228 | | | 289,485 | | | | 290,716 | | | 289,219 |
| | | | | | | | | | | | | | | | | | | | | | |
Funds From Operations per share - basic | | | $1.56 | | | $1.60 | | | $1.55 | | | $1.54 | | | $1.78 | | | | $3.16 | | | $3.28 |
| | | | | | | | | | | | | | | | | | | | | | |
Funds From Operations per share - diluted (3) | | | $1.55 | | | $1.60 | | | $1.54 | | | $1.54 | | | $1.78 | | | | $3.16 | | | $3.27 |
| | Three Months Ended | | | Six Months Ended | |||||||||||||||||
Reconciliation of FFO to Core FFO | | | 30-Jun-22 | | | 31-Mar-22 | | | 31-Dec-21 | | | 30-Sep-21 | | | 30-Jun-21 | | | | 30-Jun-22 | | | 30-Jun-21 |
| | | | | | | | | | | | | | | | | | | | | | |
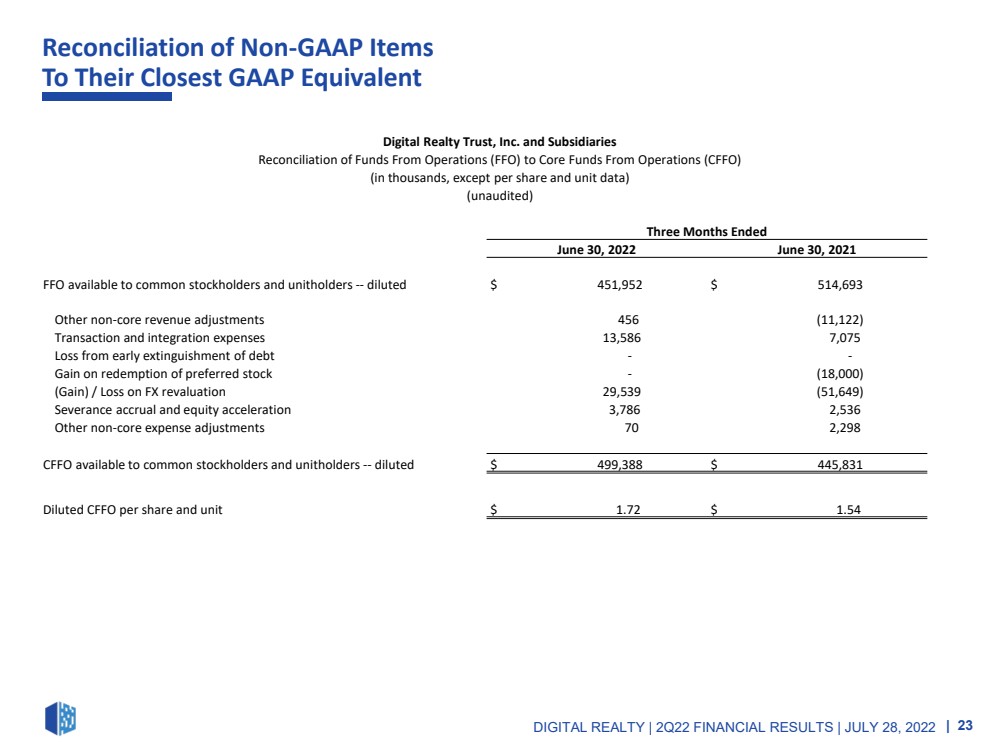
Funds From Operations - diluted | | | $451,949 | | | $465,412 | | | $448,602 | | | $447,317 | | | $514,695 | | | | $917,362 | | | $947,055 |
Other non-core revenue adjustments (4) | | | 456 | | | 13,916 | | | 9,859 | | | (18,066) | | | (11,122) | | | | 14,372 | | | (11,181) |
Transaction and integration expenses | | | 13,586 | | | 11,968 | | | 12,427 | | | 13,804 | | | 7,075 | | | | 25,554 | | | 21,195 |
Loss from early extinguishment of debt | | | - | | | 51,135 | | | 325 | | | - | | | - | | | | 51,135 | | | 18,347 |
(Gain on) / Issuance costs associated with redeemed preferred stock | | | - | | | - | | | - | | | - | | | (18,000) | | | | - | | | (18,000) |
Severance, equity acceleration, and legal expenses (5) | | | 3,786 | | | 2,077 | | | 1,003 | | | 1,377 | | | 2,536 | | | | 5,863 | | | 4,963 |
(Gain) / Loss on FX revaluation | | | 29,539 | | | (67,676) | | | 14,308 | | | 33,773 | | | (51,649) | | | | (38,137) | | | (17,577) |
Other non-core expense adjustments | | | 70 | | | 7,657 | | | (1) | | | 1,004 | | | 2,298 | | | | 7,727 | | | (16,942) |
Core Funds From Operations - diluted | | | $499,386 | | | $484,490 | | | $486,525 | | | $479,209 | | | $445,833 | | | | $983,875 | | | $927,859 |
| | | | | | | | | | | | | | | | | | | | | | |
Weighted-average shares and units outstanding - diluted (3) | | | 290,944 | | | 290,662 | | | 290,893 | | | 290,228 | | | 289,485 | | | | 290,716 | | | 289,219 |
| | | | | | | | | | | | | | | | | | | | | | |
Core Funds From Operations per share - diluted (3) | | | $1.72 | | | $1.67 | | | $1.67 | | | $1.65 | | | $1.54 | | | | $3.38 | | | $3.21 |
(1) Real Estate Related Depreciation & Amortization | | Three Months Ended | | | Six Months Ended | |||||||||||||||||
| | | 30-Jun-22 | | | 31-Mar-22 | | | 31-Dec-21 | | | 30-Sep-21 | | | 30-Jun-21 | | | | 30-Jun-22 | | | 30-Jun-21 |
| | | | | | | | | | | | | | | | | | | | | | |
Depreciation & amortization per income statement | | | $376,967 | | | $382,132 | | | $378,883 | | | $369,035 | | | $368,981 | | | | 759,099 | | | 738,714 |
Non-real estate depreciation | | | (7,640) | | | (7,970) | | | (6,436) | | | (6,307) | | | (5,341) | | | | (15,610) | | | (10,377) |
Real Estate Related Depreciation & Amortization | | | $369,327 | | | $374,162 | | | $372,447 | | | $362,728 | | | $363,640 | | | | $743,489 | | | $728,336 |
| (3) | For all periods presented, we have excluded the effect of dilutive series C, series J, series K and series L preferred stock, as applicable, that may be converted into common stock upon the occurrence of specified change in control transactions as described in the articles supplementary governing the series C, series J, series K and series L preferred stock, as applicable, which we consider highly improbable, and the effect of the physical settlement of our September 2021 forward sales agreements. See above for calculations of diluted FFO and the share count detail section that follows the reconciliation of core FFO to AFFO for calculations of weighted average common stock and units outstanding. For definitions and discussion of FFO and core FFO, see the definitions section. |
| (4) | Includes lease termination fees and certain other adjustments that are not core to our business. For the third quarter 2021, includes a $19 million promote received related to a sale of portfolio of assets within an unconsolidated joint venture. The promote is included in Other revenue in our consolidated income statement. |
| (5) | Relates to severance and other charges related to the departure of company executives and integration-related severance. |
14
Adjusted Funds From Operations (AFFO) |
| Financial Supplement |
|---|---|---|
Unaudited and in Thousands, Except Per Share Data | Second Quarter 2022 |
| | Three Months Ended | | | Six Months Ended | |||||||||||||||||
Reconciliation of Core FFO to AFFO | | | 30-Jun-22 | | | 31-Mar-22 | | | 31-Dec-21 | | | 30-Sep-21 | | | 30-Jun-21 | | | | 30-Jun-22 | | | 30-Jun-21 |
| | | | | | | | | | | | | | | | | | | | | | |
Core FFO available to common stockholders and unitholders | | | $499,386 | | | $484,490 | | | $486,525 | | | $479,209 | | | $445,833 | | | | $983,875 | | | $927,859 |
Adjustments: | | | | | | | | | | | | | | | | | | | | | | |
Non-real estate depreciation | | | 7,640 | | | 7,970 | | | 6,436 | | | 6,307 | | | 5,341 | | | | 15,610 | | | 10,377 |
Amortization of deferred financing costs | | | 3,330 | | | 3,634 | | | 3,515 | | | 3,625 | | | 3,718 | | | | 6,964 | | | 7,256 |
Amortization of debt discount/premium | | | 1,193 | | | 1,214 | | | 1,107 | | | 1,138 | | | 1,166 | | | | 2,407 | | | 2,300 |
Non-cash stock-based compensation expense | | | 15,799 | | | 14,453 | | | 15,097 | | | 15,082 | | | 15,578 | | | | 30,253 | | | 31,675 |
Straight-line rental revenue | | | (17,278) | | | (18,810) | | | (16,497) | | | (11,969) | | | (16,139) | | | | (36,089) | | | (34,631) |
Straight-line rental expense | | | (2,237) | | | 4,168 | | | 5,753 | | | 7,862 | | | 7,175 | | | | 1,931 | | | 13,884 |
Above- and below-market rent amortization | | | 196 | | | 335 | | | 910 | | | 1,165 | | | 1,857 | | | | 531 | | | 3,994 |
Deferred tax expense / (benefit) | | | (769) | | | (1,604) | | | (13,731) | | | 2,112 | | | 35,522 | | | | (2,372) | | | 31,013 |
Leasing compensation & internal lease commissions | | | 9,411 | | | 13,261 | | | 9,564 | | | 11,142 | | | 11,078 | | | | 22,672 | | | 22,120 |
Recurring capital expenditures (1) | | | (43,497) | | | (46,770) | | | (87,550) | | | (50,800) | | | (39,231) | | | | (90,267) | | | (78,753) |
| | | | | | | | | | | | | | | | | | | | | | |
AFFO available to common stockholders and unitholders (2) | | | $473,173 | | | $462,341 | | | $411,130 | | | $464,872 | | | $471,899 | | | | $935,514 | | | $937,095 |
| | | | | | | | | | | | | | | | | | | | | | |
Weighted-average shares and units outstanding - basic | | | 290,528 | | | 290,163 | | | 289,895 | | | 289,542 | | | 288,843 | | | | 290,346 | | | 288,588 |
Weighted-average shares and units outstanding - diluted (3) | | | 290,944 | | | 290,662 | | | 290,893 | | | 290,228 | | | 289,485 | | | | 290,716 | | | 289,219 |
| | | | | | | | | | | | | | | | | | | | | | |
AFFO per share - diluted (3) | | | $1.63 | | | $1.59 | | | $1.41 | | | $1.60 | | | $1.63 | | | | $3.22 | | | $3.24 |
| | | | | | | | | | | | | | | | | | | | | | |
Dividends per share and common unit | | | $1.22 | | | $1.22 | | | $1.16 | | | $1.16 | | | $1.16 | | | | $2.44 | | | $2.32 |
| | | | | | | | | | | | | | | | | | | | | | |
Diluted AFFO Payout Ratio | | | 75.0% | | | 76.7% | | | 82.1% | | | 72.4% | | | 71.2% | | | | 75.8% | | | 71.6% |
| | Three Months Ended | | | Six Months Ended | |||||||||||||||||
Share Count Detail | | | 30-Jun-22 | | | 31-Mar-22 | | | 31-Dec-21 | | | 30-Sep-21 | | | 30-Jun-21 | | | | 30-Jun-22 | | | 30-Jun-21 |
| | | | | | | | | | | | | | | | | | | | | | |
Weighted Average Common Stock and Units Outstanding | | | 290,528 | | | 290,163 | | | 289,895 | | | 289,542 | | | 288,843 | | | | 290,346 | | | 288,588 |
Add: Effect of dilutive securities | | | 416 | | | 499 | | | 998 | | | 686 | | | 642 | | | | 370 | | | 631 |
Weighted Avg. Common Stock and Units Outstanding - diluted | | | 290,944 | | | 290,662 | | | 290,893 | | | 290,228 | | | 289,485 | | | | 290,716 | | | 289,219 |
| (1) | Recurring capital expenditures represent non-incremental building improvements required to maintain current revenues, including second-generation tenant improvements and external leasing commissions. Recurring capital expenditures do not include acquisition costs contemplated when underwriting the purchase of a building, costs which are incurred to bring a building up to Digital Realty’s operating standards, or internal leasing commissions. |
| (2) | For a definition and discussion of AFFO, see the definitions section. For a reconciliation of net income available to common stockholders to FFO and core FFO, see above. |
| (3) | For all periods presented, we have excluded the effect of dilutive series C, series J, series K and series L preferred stock, as applicable, that may be converted into common stock upon the occurrence of specified change in control transactions as described in the articles supplementary governing the series C, series J, series K and series L preferred stock, as applicable, which we consider highly improbable, and the effect of the physical settlement of our September 2021 forward sales agreements. See above for calculations of diluted FFO available to common stockholders and unitholders and for calculations of weighted average common stock and units outstanding. |
15
Consolidated Balance Sheets |
| Financial Supplement |
|---|---|---|
Unaudited and in Thousands, Except Share and Per Share Data | Second Quarter 2022 |
| | | | | | | 30-Jun-22 | | 31-Mar-22 | | 31-Dec-21 | | 30-Sep-21 | | 30-Jun-21 | |||||
Assets | | | | | | | | | | | | | | | | | | | | |
Investments in real estate: | | | | | | | | | | | | | | | | |||||
Real estate | | | $24,065,933 | | | $23,769,712 | | | $23,625,451 | | | $23,384,809 | | | $23,287,853 | |||||
Construction in progress | | | 3,362,114 | | | 3,523,484 | | | 3,213,387 | | | 3,238,388 | | | 3,270,570 | |||||
Land held for future development | | | 37,460 | | | 107,003 | | | 133,683 | | | 118,091 | | | 143,575 | |||||
Investments in real estate | | | $27,465,507 | | | $27,400,199 | | | $26,972,522 | | | $26,741,289 | | | $26,701,998 | |||||
Accumulated depreciation and amortization | | | (6,665,118) | | | (6,467,233) | | | (6,210,281) | | | (6,159,294) | | | (5,919,650) | |||||
Net Investments in Properties | | | $20,800,389 | | | $20,932,966 | | | $20,762,241 | | | $20,581,995 | | | $20,782,348 | |||||
Investment in unconsolidated joint ventures | | | 1,942,549 | | | 2,044,074 | | | 1,807,689 | | | 1,292,325 | | | 1,119,026 | |||||
Net Investments in Real Estate | | | $22,742,937 | | | $22,977,040 | | | $22,569,930 | | | $21,874,320 | | | $21,901,374 | |||||
| | | | | | | | | | | | | | | | |||||
Cash and cash equivalents | | | $99,226 | | | $157,964 | | | $142,698 | | | $116,002 | | | $120,482 | |||||
Accounts and other receivables (1) | | | 797,208 | | | 774,579 | | | 671,721 | | | 610,416 | | | 630,086 | |||||
Deferred rent | | | 554,016 | | | 545,666 | | | 547,385 | | | 552,850 | | | 539,379 | |||||
Customer relationship value, deferred leasing costs & other intangibles, net | | | 2,521,390 | | | 2,640,795 | | | 2,735,486 | | | 2,871,622 | | | 2,956,027 | |||||
Goodwill | | | 7,545,107 | | | 7,802,440 | | | 7,937,440 | | | 8,062,914 | | | 8,185,931 | |||||
Operating lease right-of-use assets | | | 1,310,970 | | | 1,361,942 | | | 1,405,441 | | | 1,442,661 | | | 1,452,633 | |||||
Other assets | | | 385,202 | | | 420,119 | | | 359,459 | | | 316,863 | | | 365,308 | |||||
Total Assets | | | $35,956,057 | | | $36,680,546 | | | $36,369,560 | | | $35,847,648 | | | $36,151,220 | |||||
| | | | | | | | | | | | | | | | |||||
Liabilities and Equity | | | | | | | | | | | | | | | | |||||
Global unsecured revolving credit facilities | | | $1,440,040 | | | $943,325 | | | $398,172 | | | $832,322 | | | $1,026,368 | |||||
Unsecured senior notes, net of discount | | | 12,695,568 | | | 13,284,650 | | | 12,903,370 | | | 13,012,790 | | | 12,659,043 | |||||
Secured debt and other, net of premiums | | | 158,699 | | | 160,240 | | | 146,668 | | | 242,427 | | | 242,410 | |||||
Operating lease liabilities | | | 1,418,540 | | | 1,472,510 | | | 1,512,187 | | | 1,543,231 | | | 1,545,689 | |||||
Accounts payable and other accrued liabilities | | | 1,619,222 | | | 1,572,359 | | | 1,543,623 | | | 1,341,866 | | | 1,367,240 | |||||
Deferred tax liabilities, net | | | 611,582 | | | 649,112 | | | 666,451 | | | 725,955 | | | 742,127 | |||||
Accrued dividends and distributions | | | — | | | — | | | 338,729 | | | — | | | — | |||||
Security deposits and prepaid rent | | | 341,140 | | | 346,911 | | | 336,578 | | | 341,778 | | | 362,606 | |||||
Total Liabilities | | | $18,284,791 | | | $18,429,107 | | | $17,845,778 | | | $18,040,369 | | | $17,945,483 | |||||
| | | | | | | | | | | | | | | | |||||
Redeemable non-controlling interests - operating partnership | | | 41,047 | | | 42,734 | | | 46,995 | | | 40,920 | | | 41,490 | |||||
| | | | | | | | | | | | | | | | |||||
Equity | | | | | | | | | | | | | | | | |||||
Preferred Stock: $0.01 par value per share, 110,000,000 shares authorized: | | | | | | | | | | | | | | | | |||||
Series J Cumulative Redeemable Preferred Stock (2) | | | $193,540 | | | $193,540 | | | $193,540 | | | $193,540 | | | $193,540 | |||||
Series K Cumulative Redeemable Preferred Stock (3) | | | 203,264 | | | 203,264 | | | 203,264 | | | 203,264 | | | 203,264 | |||||
Series L Cumulative Redeemable Preferred Stock (4) | | | 334,886 | | | 334,886 | | | 334,886 | | | 334,886 | | | 334,886 | |||||
Common Stock: $0.01 par value per share, 392,000,000 shares authorized (5) | | | 2,824 | | | 2,824 | | | 2,824 | | | 2,818 | | | 2,806 | |||||
Additional paid-in capital | | | 21,091,364 | | | 21,069,391 | | | 21,075,863 | | | 21,010,202 | | | 20,844,834 | |||||
Dividends in excess of earnings | | | (4,211,685) | | | (3,916,854) | | | (3,631,929) | | | (4,359,033) | | | (4,153,407) | |||||
Accumulated other comprehensive income (loss), net | | | (475,561) | | | (188,844) | | | (173,880) | | | (111,560) | | | 31,733 | |||||
Total Stockholders' Equity | | | $17,138,632 | | | $17,698,207 | | | $18,004,568 | | | $17,274,117 | | | $17,457,656 | |||||
| | | | | | | | | | | | | | | | |||||
Noncontrolling Interests | | | | | | | | | | | | | | | | |||||
Noncontrolling interest in operating partnership | | | $432,213 | | | $444,029 | | | $425,337 | | | $459,918 | | | $513,897 | |||||
Noncontrolling interest in consolidated joint ventures | | | 59,374 | | | 66,470 | | | 46,882 | | | 32,324 | | | 192,694 | |||||
| | | | | | | | | | | | | | | | |||||
Total Noncontrolling Interests | | | $491,587 | | | $510,499 | | | $472,219 | | | $492,242 | | | $706,591 | |||||
| | | | | | | | | | | | | | | | |||||
Total Equity | | | $17,630,219 | | | $18,208,706 | | | $18,476,787 | | | $17,766,359 | | | $18,164,247 | |||||
| | | | | | | | | | | | | | | | |||||
Total Liabilities and Equity | | | $35,956,057 | | | $36,680,546 | | | $36,369,560 | | | $35,847,648 | | | $36,151,220 | |||||
| (1) | Net of allowance for doubtful accounts of $37,799 and $28,574 as of June 30, 2022 and December 31, 2021, respectively. |
| (2) | Series J Cumulative Redeemable Preferred Stock, 5.250%, $200,000 and $200,000 liquidation preference, respectively ($25.00 per share), 8,000,000 and 8,000,000 shares issued and outstanding as of June 30, 2022 and December 31, 2021, respectively. |
| (3) | Series K Cumulative Redeemable Preferred Stock, 5.850%, $210,000 and $210,000 liquidation preference, respectively ($25.00 per share), 8,400,000 and 8,400,000 shares issued and outstanding as of June 30, 2022 and December 31, 2021, respectively. |
| (4) | Series L Cumulative Redeemable Preferred Stock, 5.200%, $345,000 and $345,000 liquidation preference, respectively ($25.00 per share), 13,800,000 and 13,800,000 shares issued and outstanding as of June 30, 2022 and December 31, 2021, respectively. |
| (5) | Common Stock: 284,733,922 and 284,415,013 shares issued and outstanding as of June 30, 2022 and December 31, 2021, respectively. |
16
Components of Net Asset Value (NAV) (1) |
| Financial Supplement |
|---|---|---|
Unaudited and in Thousands | Second Quarter 2022 |
Consolidated Properties Cash Net Operating Income (NOI)(2), Annualized (3) | | | |
Network-Dense | | | $883,999 |
Campus | | | 1,519,006 |
Other (4) | | | 166,866 |
Total Cash NOI, Annualized | | | $2,569,871 |
less: Partners' share of consolidated JVs | | | (1,207) |
Acquisitions / dispositions / expirations | | | (35,881) |
FY 2022 backlog cash NOI and 2Q22 carry-over (stabilized) (5) | | | 127,762 |
Total Consolidated Cash NOI, Annualized | | | $2,660,545 |
| | | |
Digital Realty's Pro Rata Share of Unconsolidated Joint Venture Cash NOI (3)(6) | | | $160,572 |
| | | |
Other Income | | | |
Development and Management Fees (net), Annualized | | | $20,289 |
| | | |
Other Assets | | | |
Pre-stabilized inventory, at cost (7) | | | $263,140 |
Land held for development | | | 37,460 |
Development CIP (8) | | | 3,362,114 |
less: Investment associated with FY22 Backlog NOI | | | (378,234) |
Cash and cash equivalents | | | 99,226 |
Accounts and other receivables, net | | | 797,208 |
Other assets | | | 385,202 |
less: Partners' share of consolidated JV assets | | | 707 |
Total Other Assets | | | $4,566,823 |
| | | |
Liabilities | | | |
Global unsecured revolving credit facilities | | | $1,458,730 |
Unsecured senior notes | | | 12,792,421 |
Secured debt, excluding premiums | | | 159,023 |
Accounts payable and other accrued liabilities | | | 1,619,222 |
Deferred tax liabilities, net | | | 611,582 |
Security deposits and prepaid rents | | | 341,140 |
Backlog NOI cost to complete (9) | | | 168,963 |
Preferred stock | | | 755,000 |
Digital Realty's share of unconsolidated JV debt | | | 788,838 |
Total Liabilities | | | $18,694,919 |
| | | |
Diluted Shares and Units Outstanding | | | 291,449 |
| (1) | Includes Digital Realty’s share of backlog leasing at unconsolidated joint venture buildings. Excludes Mitsubishi Corporation Digital Realty (MCDR) and Ascenty joint venture. |
| (2) | For definitions and discussion of NOI and cash NOI and a reconciliation of operating income to NOI and cash NOI, see page 34. |
| (3) | Annualized cash NOI is calculated by multiplying results for the most recent quarter by four. Annualized results may not be indicative of any four-quarter period and do not take into account scheduled lease expirations, among other things. Annualized data is presented for illustrative purposes only. Reflects annualized 2Q22 Cash NOI of $2.6 billion. NOI is allocated based on management’s best estimates derived using contractual ABR and stabilized margins. |
| (4) | Other includes Powered Base Building shell capacity as well as storage and office space within fully improved data center facilities. |
| (5) | Estimated cash NOI related to signed leasing expected to commence through June 30, 2022. Includes Digital Realty’s share of signed leases at unconsolidated joint venture buildings. Excludes MCDR and Ascenty joint venture. |
| (6) | For a reconciliation of Digital Realty’s pro rata share of unconsolidated joint venture operating income to cash NOI, see page 31. |
| (7) | Includes Digital Realty’s share of cost at unconsolidated joint venture buildings. Excludes MCDR and Ascenty joint venture. |
| (8) | See page 27 for further details on the breakdown of the construction in progress balance. |
| (9) | Includes Digital Realty’s share of expected cost to complete at unconsolidated joint venture buildings. Excludes MCDR and Ascenty joint venture. |
17
Debt Maturities |
| Financial Supplement |
|---|---|---|
Unaudited and Dollars in Thousands | Second Quarter 2022 |
| | As of June 30, 2022 | |||||||||||||||||||||||
| | | | Interest Rate | | | | | | | | | | | | | | | | | | | | | |
| | Interest | | Including | | | | | | | | | | | | | | | | | | | | | |
| | Rate | | Swaps | | | 2022 | | | 2023 | | | 2024 | | | 2025 | | | 2026 | | | Thereafter | | | Total |
Global Unsecured Revolving Credit Facilities (1) | | | | | | | | | | | | | | | | | | | | | | | | | |
Global unsecured revolving credit facility - Unhedged | | 2.029% | | 2.029% | | | — | | | — | | | — | | | — | | | — | | | $1,378,061 | | | $1,378,061 |
Yen revolving credit facility | | 0.590% | | 0.590% | | | — | | | — | | | — | | | — | | | — | | | 80,669 | | | 80,669 |
Deferred financing costs, net | | — | | — | | | — | | | — | | | — | | | — | | | — | | | — | | | (18,689) |
Total Global Unsecured Revolving Credit Facilities | | 1.949% | | 1.949% | | | — | | | — | | | — | | | — | | | — | | | $1,458,730 | | | $1,440,040 |
| | | | | | | | | | | | | | | | | | | | | | | | | |
Senior Notes | | | | | | | | | | | | | | | | | | | | | | | | | |
€300 million Floating Rate Notes due 2022 | | 0.317% | | 0.317% | | | $314,520 | | | — | | | — | | | — | | | — | | | — | | | $314,520 |
€300 million 0.125% Notes due 2022 | | 0.125% | | 0.125% | | | 314,520 | | | — | | | — | | | — | | | — | | | — | | | 314,520 |
₣100 million 0.600% Notes due 2023 | | 0.600% | | 0.600% | | | — | | | $104,725 | | | — | | | — | | | — | | | — | | | 104,725 |
€600 million 2.625% Notes due 2024 | | 2.625% | | 2.625% | | | — | | | — | | | $629,040 | | | — | | | — | | | — | | | 629,040 |
£250 million 2.750% Notes due 2024 | | 2.750% | | 2.750% | | | — | | | — | | | 304,450 | | | — | | | — | | | — | | | 304,450 |
£400 million 4.250% Notes due 2025 | | 4.250% | | 4.250% | | | — | | | — | | | — | | | $487,120 | | | — | | | — | | | 487,120 |
€650 million 0.625% Notes due 2025 | | 0.625% | | 0.625% | | | — | | | — | | | — | | | 681,460 | | | — | | | — | | | 681,460 |
€1.08 billion 2.500% Notes due 2026 | | 2.500% | | 2.500% | | | — | | | — | | | — | | | — | | | $1,127,030 | | | — | | | 1,127,030 |
₣275 million 0.200% Notes due 2026 | | 0.200% | | 0.200% | | | — | | | — | | | — | | | — | | | 287,993 | | | — | | | 287,993 |
₣150 million 1.700% Notes due 2027 | | 1.700% | | 1.700% | | | — | | | — | | | — | | | — | | | — | | | $157,087 | | | 157,087 |
$1.00 billion 3.700% notes due 2027 | | 3.700% | | 3.700% | | | — | | | — | | | — | | | — | | | — | | | 1,000,000 | | | 1,000,000 |
€500 million 1.125% Notes due 2028 | | 1.125% | | 1.125% | | | — | | | — | | | — | | | — | | | — | | | 524,200 | | | 524,200 |
$650 million 4.450% Notes due 2028 | | 4.450% | | 4.450% | | | — | | | — | | | — | | | — | | | — | | | 650,000 | | | 650,000 |
₣270 million 0.550% Notes due 2029 | | 0.550% | | 0.550% | | | — | | | — | | | — | | | — | | | — | | | 282,757 | | | 282,757 |
$900 million 3.600% Notes due 2029 | | 3.600% | | 3.600% | | | — | | | — | | | — | | | — | | | — | | | 900,000 | | | 900,000 |
£350 million 3.300% Notes due 2029 | | 3.300% | | 3.300% | | | — | | | — | | | — | | | — | | | — | | | 426,230 | | | 426,230 |
€750 million 1.500% Notes due 2030 | | 1.500% | | 1.500% | | | — | | | — | | | — | | | — | | | — | | | 786,300 | | | 786,300 |
£550 million 3.750% Notes due 2030 | | 3.750% | | 3.750% | | | — | | | — | | | — | | | — | | | — | | | 669,790 | | | 669,790 |
€500 million 1.250% Notes due 2031 | | 1.250% | | 1.250% | | | — | | | — | | | — | | | — | | | — | | | 524,200 | | | 524,200 |
€1.00 billion 0.625% Notes due 2031 | | 0.625% | | 0.625% | | | — | | | — | | | — | | | — | | | — | | | 1,048,400 | | | 1,048,400 |
€750 million 1.000% Notes due 2032 | | 1.000% | | 1.000% | | | — | | | — | | | — | | | — | | | — | | | 786,300 | | | 786,300 |
€750 million 1.375% Notes due 2032 | | 1.375% | | 1.375% | | | — | | | — | | | — | | | — | | | — | | | 786,300 | | | 786,300 |
Unamortized discounts | | — | | — | | | — | | | — | | | — | | | — | | | — | | | — | | | (36,026) |
Deferred financing costs | | — | | — | | | — | | | — | | | — | | | — | | | — | | | — | | | (60,827) |
Total Senior Notes | | 2.125% | | 2.125% | | | $629,040 | | | 104,725 | | | $933,490 | | | $1,168,580 | | | $1,415,023 | | | $8,541,564 | | | $12,695,568 |
| | | | | | | | | | | | | | | | | | | | | | | | | |
Secured Debt | | | | | | | | | | | | | | | | | | | | | | | | | |
ICN10 Facilities | | 2.402% | | 2.784% | | | — | | | — | | | — | | | — | | | — | | | $13,121 | | | $13,121 |
Westin | | 3.290% | | 3.290% | | | — | | | — | | | — | | | — | | | — | | | 135,000 | | | 135,000 |
Deferred financing costs | | — | | — | | | — | | | — | | | — | | | — | | | — | | | — | | | (325) |
Total Secured Debt | | 3.211% | | 3.245% | | | — | | | — | | | — | | | — | | | — | | | $148,121 | | | $147,796 |
| | | | | | | | | | | | | | | | | | | | | | | | | |
Other Debt | | | | | | | | | | | | | | | | | | | | | | | | | |
Digital Jubilee | | 2.595% | | 2.595% | | | — | | | $3,081 | | | — | | | — | | | — | | | — | | | $3,081 |
Icolo loan | | 11.650% | | 11.650% | | | — | | | — | | | — | | | — | | | — | | | $7,821 | | | 7,821 |
Total Other Debt | | 9.091% | | 9.091% | | | — | | | $3,081 | | | — | | | — | | | — | | | $7,821 | | | $10,902 |
| | | | | | | | | | | | | | | | | | | | | | | | | |
Total unhedged variable rate debt | | — | | — | | | $314,520 | | | $3,081 | | | — | | | — | | | — | | | $1,464,136 | | | $1,781,737 |
Total fixed rate / hedged variable rate debt | | — | | — | | | 314,520 | | | 104,725 | | | $933,490 | | | $1,168,580 | | | $1,415,023 | | | 8,692,100 | | | 12,628,437 |
Total Debt | | 2.124% | | 2.124% | | | $629,040 | | | $107,806 | | | $933,490 | | | $1,168,580 | | | $1,415,023 | | | $10,156,235 | | | $14,410,174 |
| | | | | | | | | | | | | | | | | | | | | | | | | |
Weighted Average Interest Rate | | | | | | | 0.221% | | | 0.657% | | | 2.666% | | | 2.136% | | | 2.032% | | | 2.219% | | | 2.124% |
| | | | | | | | | | | | | | | | | | | | | | | | | |
Summary | | | | | | | | | | | | | | | | | | | | | | | | | |
| | | | | | | | | | | | | | | | | | | | | | | | | |
Weighted Average Term to Initial Maturity | | | | | | | | | | | | | | | | | | | | | | | | | 5.7 Years |
| | | | | | | | | | | | | | | | | | | | | | | | | |
Weighted Average Maturity (assuming exercise of extension options) | | | | | | | | | | | | | | | | | | | | | | | | | 5.8 Years |
Global Unsecured Revolving Credit Facility Detail As of June 30, 2022 | | | | | | | | | | | | |
| | |
|
|
|
|
|
|
|
|
|
|
| | | Maximum Available | | Existing Capacity (2) | | Currently Drawn | |||||
| | | | | | | | | | | | |
Global Unsecured Revolving Credit Facility | $3,942,097 | | $2,394,543 | | $1,458,730 | |||||||
| (1) | Assumes all extensions will be exercised. |
| (2) | Net of letters of credit issued of $88.8 million. |
18
Debt Analysis and Covenant Compliance |
| Financial Supplement |
|---|---|---|
Unaudited | Second Quarter 2022 |
| | As of June 30, 2022 | ||||||||
| | | | | | | | | | |
|
| |
| |
| |
| Global Unsecured | ||
| | Unsecured Senior Notes | | Credit Facilities | ||||||
Debt Covenant Ratios (1) |
| Required | | Actual (2) | | Actual (3) | | Required | | Actual |
Total outstanding debt / total assets (4) |
| Less than 60% | | 42% | | 38% | | Less than 60% (5) |
| 37% |
Secured debt / total assets (6) |
| Less than 40% | | < 1% | | < 1% | | Less than 40% | | 1% |
Total unencumbered assets / unsecured debt |
| Greater than 150% | | 212% | | 236% | | N/A |
| N/A |
Consolidated EBITDA / interest expense (7) |
| Greater than 1.5x |
| 6.8x |
| 6.8x |
| N/A |
| N/A |
Fixed charge coverage |
| |
| N/A |
| N/A |
| Greater than 1.5x |
| 5.9x |
Unsecured debt / total unencumbered asset value (8) |
| |
| N/A | | N/A | | Less than 60% | | 38% |
Unencumbered assets debt service coverage ratio |
| |
| N/A |
| N/A |
| Greater than 1.5x |
| 8.3x |
| (1) | For definitions of the terms used in the table above and related footnotes, please refer to the indentures which govern the notes, the Second Amended and Restated Global Senior Credit Agreement dated as of November 18, 2021 and the Amended and Restated Yen facility Credit Agreement dated as of November 18, 2021, each as amended and which are filed as exhibits to our reports filed with the U.S. Securities and Exchange Commission. |
| (2) | Ratios for the Unsecured Senior Notes listed on page 18 except for the floating rate notes due 2022, 0.60% notes due 2023, 0.20% notes due 2026, 1.70% notes due 2027, 0.55% notes due 2029, 1.250% notes due 2031, 0.625% notes due 2031, 1.00% notes due 2032 and 1.375% notes due 2032. |
| (3) | Ratios for the floating rate notes due 2022, 0.60% notes due 2023, 0.20% notes due 2026, 1.70% notes due 2027, 0.55% notes due 2029, 1.250% notes due 2031, 0.625% notes due 2031, 1.00% notes due 2032 and 1.375% notes due 2032. |
| (4) | This ratio is referred to as the Leverage Ratio, defined as Consolidated Debt / Total Asset Value, under the global unsecured revolving credit facility and the Yen facility. For the calculation of Total Assets, please refer to the indentures which govern the notes, the Second Amended and Restated Global Senior Credit Agreement dated as of November 18, 2021 and the Amended and Restated Yen facility Credit Agreement dated as of November 18, 2021, each as amended and which are filed as exhibits to our reports filed with the U.S. Securities and Exchange Commission. |
| (5) | The company has the right to maintain a Leverage Ratio of greater than 60.0% but less than or equal to 65.0% for up to four consecutive fiscal quarters during the term of the facility following an acquisition of one or more Assets. |
| (6) | This ratio is referred to as the Secured Debt Leverage Ratio, defined as Secured Debt / Total Asset Value, under the global unsecured revolving credit facility and the Yen facility. |
| (7) | Calculated as current quarter annualized consolidated EBITDA to current quarter annualized Interest Expense (including capitalized interest and debt discounts). |
| (8) | Assets must satisfy certain conditions to qualify for inclusion as an Unencumbered Asset under the global unsecured revolving credit facility and the Yen facility. |
19
| Financial Supplement | |
|---|---|---|
Unaudited and in Thousands | Second Quarter 2022 |
Stabilized (“Same-Capital”) Portfolio (1)
| | Three Months Ended | | | Six Months Ended | | ||||||||||||||||||||
| | 30-Jun-22 | | 30-Jun-21 | | % Change | | 31-Mar-22 | | % Change | | | 30-Jun-22 | | 30-Jun-21 | | % Change | | ||||||||
Rental revenues | | | $581,213 | | | $618,895 | | | (6.1%) | | | $582,399 | | | (0.2%) | | | | $1,163,612 | | | $1,224,757 | | | (5.0%) | |
Tenant reimbursements - Utilities | | | 155,853 | | | 142,485 | | | 9.4% | | | 165,022 | | | (5.6%) | | | | 320,876 | | | 300,477 | | | 6.8% | |
Tenant reimbursements - Other | | | 45,766 | | | 47,193 | | | (3.0%) | | | 43,726 | | | 4.7% | | | | 89,492 | | | 94,745 | | | (5.5%) | |
Interconnection & other | | | 80,355 | | | 79,087 | | | 1.6% | | | 80,779 | | | (0.5%) | | | | 161,134 | | | 159,596 | | | 1.0% | |
Total Revenue | | | $863,188 | | | $887,660 | | | (2.8%) | | | $871,926 | | | (1.0%) | | | | $1,735,114 | | | $1,779,575 | | | (2.5%) | |
| | | | | | | | | | | | | | | | | | | | | | | | | | |
Utilities | | | $171,602 | | | $154,030 | | | 11.4% | | | $180,262 | | | (4.8%) | | | | $351,864 | | | $325,124 | | | 8.2% | |
Rental property operating | | | 146,023 | | | 158,220 | | | (7.7%) | | | 146,102 | | | (0.1%) | | | | 292,125 | | | 307,924 | | | (5.1%) | |
Property taxes | | | 37,440 | | | 34,753 | | | 7.7% | | | 37,273 | | | 0.4% | | | | 74,712 | | | 72,862 | | | 2.5% | |
Insurance | | | 3,428 | | | 3,939 | | | (13.0%) | | | 3,198 | | | 7.2% | | | | 6,625 | | | 6,460 | | | 2.6% | |
Total Expenses | | | $358,492 | | | $350,942 | | | 2.2% | | | $366,835 | | | (2.3%) | | | | $725,327 | | | $712,370 | | | 1.8% | |
| | | | | | | | | | | | | | | | | | | | | | | | | | |
Net Operating Income (2) | | | $504,696 | | | $536,718 | | | (6.0%) | | | $505,092 | | | (0.1%) | | | | $1,009,787 | | | $1,067,205 | | | (5.4%) | |
Less: | | | | | | | | | | | | | | | | | | | | | | | | | | |
Stabilized straight-line rent | | | ($6,401) | | | ($2,782) | | | 130.1% | | | ($11,143) | | | (42.6%) | | | | ($17,543) | | | ($4,776) | | | 267.4% | |
Above- and below-market rent | | | 791 | | | (630) | | | (225.6%) | | | 697 | | | 13.4% | | | | 1,489 | | | (1,799) | | | (182.7%) | |
Cash Net Operating Income (3) | | | $510,305 | | | $540,131 | | | (5.5%) | | | $515,537 | | | (1.0%) | | | | $1,025,842 | | | $1,073,780 | | | (4.5%) | |
| | | | | | | | | | | | | | | | | | | | | | | | | | |
Stabilized Portfolio occupancy at period end (4) | | | 83.0% | | | 84.4% | | | (1.4%) | | | 82.8% | | | 0.3% | | | | 83.0% | | | 84.4% | | | (1.4%) | |
| (1) | Represents buildings owned as of December 31, 2020 with less than 5% of total rentable square feet under development. Excludes buildings that were undergoing, or were expected to undergo, development activities in 2021-2022, buildings classified as held for sale, and buildings sold or contributed to joint ventures for all periods presented. Prior period numbers adjusted to reflect current same-capital pool. |
| (2) | For a definition and discussion of net operating income and a reconciliation of operating income to NOI, see page 34. |
| (3) | For a definition and discussion of cash net operating income and a reconciliation of operating income to cash NOI, see page 34. |
| (4) | Occupancy excludes space under active development and space held for development. For some of our buildings, we calculate occupancy based on factors in addition to contractually leased square feet, including available power, required support space and common areas. |
20
Summary of Leasing Activity |
| Financial Supplement |
|---|---|---|
Leases Signed in the Quarter Ended June 30, 2022 | Second Quarter 2022 |
| | 0-1 MW | | > 1 MW | | Other (3) | | Total | ||||||||||||||||
Leasing Activity - New (1) (2) |
| 2Q22 |
| LTM |
| 2Q22 |
| LTM |
| 2Q22 |
| LTM |
| 2Q22 |
| LTM | ||||||||
| | | | | | | | | | | | | | | | | | | | | | | | |
Annualized GAAP Rent |
| | $35,428 |
| | $146,290 |
| | $64,695 |
| | $348,906 |
| | $1,763 |
| | $9,788 |
| | $101,886 |
| | $504,985 |
| | | | | | | | | | | | | | | | | | | | | | | | |
Kilowatt leased | | | 12,767 | | | 53,471 | | | 51,135 | | | 287,806 | | | — | | | — | | | 63,902 | | | 341,277 |
NRSF | | | 143,461 | | | 618,138 | | | 512,374 | | | 2,633,104 | | | 66,203 | | | 354,972 | | | 722,038 | | | 3,606,213 |
| | | | | | | | | | | | | | | | | | | | | | | | |
Weighted Average Lease Term (years) | | | 3.5 | | | 3.4 | |
| 9.4 | | | 8.2 | | | 2.8 | | | 12.0 | | | 7.6 | | | 7.7 |
| | | | | | | | | | | | | | | | | | | | | | | | |
Initial stabilized cash rent per Kilowatt | | | $232 | | | $226 | | | $102 | | | $98 | | | — | | | — | | | $138 | | | $125 |
GAAP rent per Kilowatt | | | $231 | | | $228 | | | $105 | | | $101 | | | — | | | — | | | $131 | | | $121 |
Leasing cost per Kilowatt | | | $22 | | | $25 | | | $8 | | | $14 | | | — | | | — | | | $11 | | | $15 |
| | | | | | | | | | | | | | | | | | | | | | | | |
Net Effective Economics by Kilowatt (4) | | | | | | | | | | | | | | | | | | | | | | | | |
| | | | | | | | | | | | | | | | | | | | | | | | |
Base rent by Kilowatt | | | $234 | | | $231 | |
| $106 | | | $103 | | | — | | | — | | | $138 | | | $125 |
Rental concessions by Kilowatt | | | $4 | | | $4 | |
| $1 | | | $3 | | | — | | | — | | | $1 | | | $2 |
Estimated operating expense by Kilowatt | | | $108 | | | $96 | |
| $41 | | | $33 | | | — | | | — | | | $54 | | | $43 |
| | | | | | | | | | | | | | | | | | | | | | | | |
Net rent per Kilowatt | | | $122 | | | $130 | | | $64 | | | $67 | | | — | | | — | | | $82 | | | $80 |
| | | | | | | | | | | | | | | | | | | | | | | | |
Tenant improvements by Kilowatt | | | $0 | | | $0 | | | $0 | | | $1 | | | — | | | — | | | $0 | | | $1 |
Leasing commissions by Kilowatt | | | $10 | | | $12 | | | $1 | | | $1 | | | — | | | — | | | $3 | | | $2 |
| | | | | | | | | | | | | | | | | | | | | | | | |
Net effective rent per Kilowatt | | | $112 | | | $118 | | | $63 | | | $65 | | | — | | | — | | | $79 | | | $77 |
| | | | | | | | | | | | | | | | | | | | | | | | |
Initial stabilized cash rent per NRSF | | | $248 | | | $235 | | | $122 | | | $129 | | | $26 | | | $25 | | | $138 | | | $137 |
GAAP rent per NRSF | | | $247 | | | $237 | | | $126 | | | $133 | | | $24 | | | $26 | | | $141 | | | $140 |
Leasing cost per NRSF | | | $24 | | | $26 | | | $9 | | | $18 | | | $7 | | | $2 | | | $12 | | | $18 |
| | | | | | | | | | | | | | | | | | | | | | | | |
Net Effective Economics by NRSF (4) | | | | | | | | | | | | | | | | | | | | | | | | |
| | | | | | | | | | | | | | | | | | | | | | | | |
Base rent by NRSF | | | $250 | | | $239 | |
| $127 | | | $135 | | | $27 | | | $28 | | | $142 | | | $111 |
Rental concessions by NRSF | | | $3 | | | $3 | | | $1 | | | $3 | | | $0 | | | $0 | | | $2 | | | $3 |
Estimated operating expense by NRSF | | | $89 | | | $89 | | | $27 | | | $25 | | | $8 | | | $2 | | | $37 | | | $33 |
| | | | | | | | | | | | | | | | | | | | | | | | |
Net rent per NRSF | | | $158 | | | $148 | | | $100 | | | $107 | | | $19 | | | $26 | | | $103 | | | $75 |
| | | | | | | | | | | | | | | | | | | | | | | | |
Tenant improvements by NRSF | | | $0 | | | $0 | | | $0 | | | $1 | | | $0 | | | $0 | | | $0 | | | $1 |
Leasing commissions by NRSF | | | $10 | | | $12 | | | $1 | | | $1 | | | $2 | | | $1 | | | $3 | | | $3 |
| | | | | | | | | | | | | | | | | | | | | | | | |
Net effective rent per NRSF | | | $148 | | | $135 | | | $98 | | | $105 | | | $16 | | | $25 | | | $100 | | | $71 |
| (1) | Excludes short-term, roof, storage and garage leases. |
| (2) | Includes leases for new and re-leased space. |
| (3) | Other includes Powered Base Building shell capacity as well as storage and office space within fully improved data center facilities. |
| (4) | All dollar amounts are per square foot averaged over lease term. Per Kilowatt metrics are presented in monthly values. Per NRSF are presented in yearly values. |
Note: LTM is last twelve months, including current quarter. Weighted average remaining lease term excludes renewal options and is weighted by net rentable square feet.
21
Summary of Leasing Activity |
| Financial Supplement |
|---|---|---|
Leases Renewed in the Quarter Ended June 30, 2022 | Second Quarter 2022 |
| | 0-1 MW | | > 1 MW | | Other (4) | | Total | ||||||||||||||||
Leasing Activity - Renewals (1) (2) (3) |
| 2Q22 |
| LTM |
| 2Q22 |
| LTM |
| 2Q22 |
| LTM |
| 2Q22 |
| LTM | ||||||||
| | | | | | | | | | | | | | | | | | | | | | | | |
Leases renewed (Kilowatt) | | | 39,290 | | | 129,631 | | | 14,345 | | | 107,657 | | | — | | | — | | | 53,635 | | | 237,288 |
Leases renewed (NRSF) | | | 569,911 | | | 1,841,717 | |
| 157,775 | | | 1,174,796 | | | 132,950 | | | 1,481,855 | | | 860,635 | | | 4,498,368 |
Leasing cost per Kilowatt | | | $1 | | | $0 | |
| — | |
| $13 | | | — | | | — | | | $1 | | | $11 |
Leasing cost per NRSF | | | $1 | | | $0 | |
| — | |
| $14 | | | $5 | | | $9 | | | $1 | | | $7 |
| | | | | | | | | | | | | | | | | | | | | | | | |
Weighted Term (years) | | | 1.5 | | | 1.5 | | | 2.8 | | | 4.6 | | | 8.4 | | | 7.8 | | | 2.8 | | | 4.4 |
| | | | | | | | | | | | | | | | | | | | | | | | |
Cash Rent | | | | | | | | | | | | | | | | | | | | | | | | |
| | | | | | | | | | | | | | | | | | | | | | | | |
Expiring cash rent per Kilowatt |
| | $286 | | | $308 | |
| $137 | |
| $158 | | | — | | | — | | | $246 | | | $240 |
Renewed cash rent per Kilowatt |
| | $295 | | | $314 | |
| $139 | |
| $143 | | | — | | | — | | | $253 | | | $236 |
| | | | | | | | | | | | | | | | | | | | | | | | |
% Change Cash Rent Per Kilowatt |
| | 3.0% | | | 1.9% | |
| 1.1% | |
| (9.9%) | | | — | | | — | | | 2.7% | | | (1.7%) |
| | | | | | | | | | | | | | | | | | | | | | | | |
Expiring cash rent per NRSF | | | $236 | | | $260 | |
| $150 | |
| $174 | | | $58 | | | $33 | | | $193 | | | $163 |
Renewed cash rent per NRSF | | | $244 | | | $265 | |
| $152 | |
| $157 | | | $68 | | | $35 | | | $200 | | | $161 |
| | | | | | | | | | | | | | | | | | | | | | | | |
% Change Cash Rent Per NRSF | | | 3.0% | | | 1.9% | |
| 1.1% | |
| (9.9%) | |
| 17.0% | |
| 6.8% | |
| 3.4% | |
| (1.1%) |
| | | | | | | | | | | | | | | | | | | | | | | | |
GAAP Rent | | | | | | | | | | | | | | | | | | | | | | | | |
| | | | | | | | | | | | | | | | | | | | | | | | |
Expiring GAAP rent per Kilowatt |
| | $285 |
| | $307 | |
| $130 | |
| $149 | |
| — | |
| — | |
| $244 | | | $235 |
Renewed GAAP rent per Kilowatt |
| | $295 |
| | $314 | |
| $141 | |
| $141 | |
| — | |
| — | |
| $254 | | | $236 |
| | | | | | | | | | | | | | | | | | | | | | | | |
% Change GAAP Rent Per Kilowatt |
| | 3.5% |
| | 2.4% | |
| 8.7% | | | (5.5%) | | | — | | | — | | | 4.3% | | | 0.3% |
| | | | | | | | | | | | | | | | | | | | | | | | |
Expiring GAAP rent per NRSF | | | $236 | | | $259 | |
| $142 | | | $164 | | | $52 | | | $30 | | | $190 | | | $159 |
Renewed GAAP rent per NRSF | | | $244 | | | $265 | |
| $154 | | | $155 | | | $67 | | | $35 | | | $200 | | | $161 |
| | | | | | | | | | | | | | | | | | | | | | | | |
% Change GAAP Rent Per NRSF | | | 3.5% |
| | 2.4% | |
| 8.7% | | | (5.5%) | | | 28.2% | | | 17.1% | | | 5.3% | | | 1.2% |
| | | | | | | | | | | | | | | | | | | | | | | | |
Retention ratio (5) | | | 90.9% | | | 84.3% | | | 43.9% | | | 67.7% | | | 92.8% | | | 75.9% | | | 76.2% | | | 76.6% |
| | | | | | | | | | | | | | | | | | | | | | | | |
Churn (6) | | | 1.9% | | | 8.0% | | | 2.7% | | | 6.2% | | | 0.2% | | | 5.0% | | | 2.2% | | | 6.8% |
| (1) | Excludes short-term, roof, storage and garage leases. |
| (2) | Rental rates represent annual estimated cash rent per kilowatt, adjusted for straight-line rents in accordance with GAAP. |
| (3) | Per Kilowatt metrics are presented in monthly values. Per NRSF metrics are presented in yearly values. |
| (4) | Other includes Powered Base Building shell capacity as well as storage and office space within fully improved data center facilities. |
| (5) | Based on square feet. |
| (6) | Churn is defined as recurring revenue lost during the period due to leases terminated or not renewed during the period, divided by recurring revenue at the beginning of the period. |
Note: LTM is last twelve months, including current quarter. Weighted average remaining lease term excludes renewal options and is weighted by net rentable square feet.
22
Lease Expirations - By Size |
| Financial Supplement |
|---|---|---|
Dollars in Thousands, Except Per Square Foot | Second Quarter 2022 |
|
| |
| | |
| % of |
| Annualized Rent Per |
| Annualized Rent Per |
| |
| | |
| |
| Rent Per kW |
| |||||
| | Square Footage of | | Annualized | | Annualized | | Occupied | | Occupied Square | | Annualized Rent | | kW of Expiring | | Rent per kW | | Per Month at |
| |||||||
Year | | Expiring Leases (1) | | Rent (2) | | Rent | | Square Foot | | Foot at Expiration | | at Expiration | | Leases | | Per Month | | Expiration |
| |||||||
0 - 1 MW |
|
|
|
|
|
|
|
|
|
|
|
|
|
|
|
|
|
|
|
|
|
|
|
|
|
|
Available |
| 1,837,782 |
| | — |
| — |
| | — |
| | — |
| | — |
| | — |
| | — |
| | — | |
Month to Month (3) |
| 130,087 | | | $37,286 |
| 1.2% | | | $287 | | | $288 | | | $37,510 | | | 8,987 | | | $346 | | | $348 | |
2022 |
| 850,149 | | | 254,711 |
| 8.2% | | | 300 | | | 299 | | | 254,443 | | | 65,250 | | | 325 | | | 325 | |
2023 |
| 1,529,530 | | | 381,593 |
| 12.3% | | | 249 | | | 252 | | | 385,973 | | | 110,233 | | | 288 | | | 292 | |
2024 |
| 743,649 | | | 136,212 |
| 4.4% | | | 183 | | | 186 | | | 138,521 | | | 51,496 | | | 220 | | | 224 | |
2025 |
| 553,717 | | | 101,806 |
| 3.3% | | | 184 | | | 189 | | | 104,518 | | | 35,478 | | | 239 | | | 245 | |
2026 |
| 259,124 | | | 50,068 |
| 1.6% | | | 193 | | | 199 | | | 51,512 | | | 18,432 | | | 226 | | | 233 | |
2027 |
| 287,683 | | | 41,872 |
| 1.3% | | | 146 | | | 153 | | | 43,958 | | | 18,307 | | | 191 | | | 200 | |
2028 |
| 73,352 | | | 7,425 |
| 0.2% | | | 101 | | | 112 | | | 8,200 | | | 3,041 | | | 203 | | | 225 | |
2029 |
| 45,448 | | | 5,937 |
| 0.2% | | | 131 | | | 143 | | | 6,515 | | | 3,183 | | | 155 | | | 171 | |
2030 |
| 66,021 | | | 11,564 |
| 0.4% | | | 175 | | | 176 | | | 11,625 | | | 3,959 | | | 243 | | | 245 | |
2031 |
| 47,439 | | | 8,585 |
| 0.3% | | | 181 | | | 196 | | | 9,281 | | | 2,880 | | | 248 | | | 269 | |
Thereafter |
| 244,814 | | | 6,649 |
| 0.2% | | | 27 | | | 26 | | | 6,250 | | | 2,517 | | | 220 | | | 207 | |
| | | | | | | | | | | | | | | | | | | | | | | | | | |
Total / Wtd. Avg. |
| 6,668,797 | | | $1,043,707 |
| 33.6% | | | $216 | | | $219 | | | $1,058,307 | | | 323,764 | | | $269 | | | $272 | |
| | | | | | | | | | | | | | | | | | | | | | | | | | |
> 1 MW |
| Expiring Leases (1) | | Annualized |
| Annualized | Annualized Rent Per | | Annualized Rent Per | | Annualized Rent Per | | kW of Expiring | | Annualized | | Rent Per kW |
| ||||||||
Available |
| 2,007,313 |
| | — |
| — |
| | — |
| | — |
| | — |
| | — |
| | — |
| | — | |
Month to Month (3) |
| 245,339 | | | $36,624 |
| 1.2% | | | $149 | | | $149 | | | $36,624 | | | 23,028 | | | $133 | | | $133 | |
2022 |
| 615,500 | | | 96,015 |
| 3.1% | | | 156 | | | 156 | | | 95,889 | | | 57,749 | | | 139 | | | 138 | |
2023 |
| 1,903,076 | | | 266,660 |
| 8.6% | | | 140 | | | 138 | | | 262,732 | | | 158,579 | | | 140 | | | 138 | |
2024 |
| 1,262,809 | | | 187,391 |
| 6.0% | | | 148 | | | 154 | | | 194,591 | | | 116,709 | | | 134 | | | 139 | |
2025 |
| 1,638,537 | | | 220,307 |
| 7.1% | | | 134 | | | 141 | | | 231,657 | | | 148,829 | | | 123 | | | 130 | |
2026 |
| 1,703,963 | | | 224,312 |
| 7.2% | | | 132 | | | 142 | | | 241,730 | | | 157,905 | | | 118 | | | 128 | |
2027 |
| 1,476,320 | | | 198,734 |
| 6.4% | | | 135 | | | 147 | | | 217,240 | | | 144,905 | | | 114 | | | 125 | |
2028 |
| 500,911 | | | 55,965 |
| 1.8% | | | 112 | | | 126 | | | 63,006 | | | 47,963 | | | 97 | | | 109 | |
2029 |
| 810,029 | | | 108,180 |
| 3.5% | | | 134 | | | 154 | | | 124,783 | | | 100,530 | | | 90 | | | 103 | |
2030 |
| 540,604 | | | 70,409 |
| 2.3% | | | 130 | | | 145 | | | 78,371 | | | 52,662 | | | 111 | | | 124 | |
2031 |
| 956,708 | | | 111,245 |
| 3.6% | | | 116 | | | 133 | | | 127,628 | | | 97,253 | | | 95 | | | 109 | |
Thereafter |
| 1,892,070 | | | 209,015 |
| 6.7% | | | 110 | | | 130 | | | 246,207 | | | 188,751 | | | 92 | | | 109 | |
| | | | | | | | | | | | | | | | | | | | | | | | | | |
Total / Wtd. Avg. |
| 15,553,179 | | | $1,784,857 |
| 57.5% | | | $132 | | | $142 | | | $1,920,457 | | | 1,294,862 | | | $115 | | | $124 | |
| | | | | | | | | | | | | | | | | | | | | | | | | | |
Other (4) |
| Expiring Leases (1) | | Annualized |
| Annualized | Annualized Rent Per | | Annualized Rent Per | | Annualized Rent Per | | kW of Expiring | | Annualized | | Rent Per kW | | ||||||||
Available |
| 1,610,372 |
| | — |
| — |
| | — |
| | — |
| | — |
| | — |
| | — |
| | — | |
Month to Month (3) |
| 36,570 | | | $1,366 |
| 0.0% | | | $37 | | | $37 | | | $1,366 | | | — | | | — | | | — | |
2022 |
| 283,045 | | | 8,086 |
| 0.3% | | | 29 | | | 26 | | | 7,496 | | | — | | | — | | | — | |
2023 |
| 1,104,130 | | | 25,596 |
| 0.8% | | | 23 | | | 23 | | | 25,789 | | | — | | | — | | | — | |
2024 |
| 377,334 | | | 17,102 |
| 0.6% | | | 45 | | | 47 | | | 17,821 | | | — | | | — | | | — | |
2025 |
| 957,180 | | | 42,133 |
| 1.4% | | | 44 | | | 47 | | | 44,560 | | | — | | | — | | | — | |
2026 |
| 749,058 | | | 24,018 |
| 0.8% | | | 32 | | | 37 | | | 27,853 | | | — | | | — | | | — | |
2027 |
| 328,752 | | | 13,186 |
| 0.4% | | | 40 | | | 45 | | | 14,952 | | | — | | | — | | | — | |
2028 |
| 197,162 | | | 10,340 |
| 0.3% | | | 52 | | | 61 | | | 11,949 | | | — | | | — | | | — | |
2029 |
| 754,541 | | | 27,626 |
| 0.9% | | | 37 | | | 43 | | | 32,820 | | | — | | | — | | | — | |
2030 |
| 638,077 | | | 26,166 |
| 0.8% | | | 41 | | | 50 | | | 31,946 | | | — | | | — | | | — | |
2031 |
| 68,509 | | | 2,191 |
| 0.1% | | | 32 | | | 40 | | | 2,729 | | | — | | | — | | | — | |
Thereafter |
| 3,069,306 | | | 78,007 |
| 2.5% | | | 25 | | | 33 | | | 101,740 | | | — | | | — | | | — | |
| | | | | | | | | | | | | | | | | | | | | | | | | | |
Total / Wtd. Avg. |
| 10,174,036 | | | $275,817 |
| 8.9% | | | $32 | | | $37 | | | $321,022 | | | — | | | — | | | — | |
| | | | | | | | | | | | | | | | | | | | | | | | | | |
Total |
| Expiring Leases (1) | | Annualized |
| Annualized | Annualized Rent Per | | Annualized Rent Per | | Annualized Rent Per | | kW of Expiring | | Annualized | | Rent Per kW |
| ||||||||
Available |
| 5,455,467 |
| | — |
| — |
| | — |
| | — |
| | — |
| | — |
| | — |
| | — | |
Month to Month (3) |
| 411,996 | | | $75,276 |
| 2.4% | | | $183 | | | $183 | | | $75,500 | | | — | | | — | | | — | |
2022 |
| 1,748,694 | | | 358,811 |
| 11.6% | | | 205 | | | 205 | | | 357,829 | | | — | | | — | | | — | |
2023 |
| 4,536,736 | | | 673,849 |
| 21.7% | | | 149 | | | 149 | | | 674,494 | | | — | | | — | | | — | |
2024 |
| 2,383,792 | | | 340,705 |
| 11.0% | | | 143 | | | 147 | | | 350,933 | | | — | | | — | | | — | |
2025 |
| 3,149,435 | | | 364,246 |
| 11.7% | | | 116 | | | 121 | | | 380,735 | | | — | | | — | | | — | |
2026 |
| 2,712,145 | | | 298,398 |
| 9.6% | | | 110 | | | 118 | | | 321,095 | | | — | | | — | | | — | |
2027 |
| 2,092,754 | | | 253,792 |
| 8.2% | | | 121 | | | 132 | | | 276,149 | | | — | | | — | | | — | |
2028 |
| 771,425 | | | 73,730 |
| 2.4% | | | 96 | | | 108 | | | 83,155 | | | — | | | — | | | — | |
2029 |
| 1,610,019 | | | 141,743 |
| 4.6% | | | 88 | | | 102 | | | 164,119 | | | — | | | — | | | — | |
2030 |
| 1,244,702 | | | 108,139 |
| 3.5% | | | 87 | | | 98 | | | 121,943 | | | — | | | — | | | — | |
2031 |
| 1,072,656 | | | 122,020 |
| 3.9% | | | 114 | | | 130 | | | 139,638 | | | — | | | — | | | — | |
Thereafter |
| 5,206,190 | | | 293,671 |
| 9.5% | | | 56 | | | 68 | | | 354,196 | | | — | | | — | | | — | |
| | | | | | | | | | | | | | | | | | | | | | | | | | |
Total / Wtd. Avg. |
| 32,396,011 | | | $3,104,380 |
| 100.0% | | | $115 | | | $122 | | | $3,299,785 | | | — | | | — | | | — | |
| (1) | For some buildings, we calculate square footage based on factors in addition to contractually leased square feet, including available power, required support space and common areas. We estimate the total net rentable square feet available for lease based on a number of factors in addition to contractually leased square feet, including available power, required support space and common areas. |
| (2) | Annualized rent represents the monthly contractual base rent (defined as cash base rent before abatements) under existing leases as of June 30, 2022, multiplied by 12. |
| (3) | Includes leases, licenses and similar agreements that upon expiration have been automatically renewed on a month-to-month basis. |
| (4) | Other includes unimproved building shell capacity as well as storage and office space within fully improved data center facilities |
Note: Represents consolidated portfolio in addition to our managed portfolio of unconsolidated joint ventures based on our ownership percentage. Certain portfolio information regarding Medallion is excluded from the portfolio statistics included in this Earnings Press Release and Supplemental Information package, as indicated in the footnotes, where applicable. Specifically, we have excluded the following related to Medallion: two new metropolitan areas, two data centers, square footage, occupancy percentage and lease terms. Medallion’s financial results are included in our condensed consolidated financial information.
23
Top 20 Customers by Annualized Rent |
| Financial Supplement |
|---|---|---|
Dollars in Thousands | Second Quarter 2022 |
| | |
| |
| | |
| |
| Weighted |
| | | | | | | | | | | Average |
| | | | | | Annualized | | % of Annualized | | Remaining | |
| | | | Number of | | Recurring | | Recurring | | Lease Term in | |
| | Customer | | Locations | | Revenue (1) | | Revenue | | Years | |
1 |
| Fortune 50 Software Company |
| 62 | |
| $346,647 |
| 10.0% | | 8.7 |
2 | | IBM |
| 39 | |
| 137,028 |
| 3.9% | | 2.0 |
3 | | Oracle Corporation |
| 30 | |
| 119,300 |
| 3.4% | | 3.2 |
4 | | Global Cloud Provider |
| 53 | |
| 119,193 |
| 3.4% | | 3.0 |
5 | | Social Content Platform |
| 17 | |
| 115,952 |
| 3.3% | | 5.2 |
6 | | Fortune 25 Investment Grade-Rated Company |
| 26 | |
| 97,713 |
| 2.8% | | 4.2 |
7 | | Equinix |
| 20 | |
| 88,067 |
| 2.5% | | 7.5 |
8 | | Facebook, Inc. |
| 37 | |
| 72,074 |
| 2.1% | | 4.5 |
9 | | LinkedIn Corporation |
| 7 | |
| 69,206 |
| 2.0% | | 2.3 |
10 | | Fortune 500 SaaS Provider |
| 15 | |
| 66,007 |
| 1.9% | | 3.7 |
11 | | Fortune 25 Tech Company |
| 45 | |
| 62,253 |
| 1.8% | | 4.2 |
12 | | Cyxtera |
| 15 | |
| 61,922 |
| 1.8% | | 9.9 |
13 | | Social Media Platform |
| 8 | |
| 60,705 |
| 1.7% | | 8.9 |
14 | | Rackspace |
| 22 | |
| 53,640 |
| 1.5% | | 10.2 |
15 | | Lumen Technologies, Inc. |
| 130 | |
| 51,954 |
| 1.5% | | 10.5 |
16 | | Comcast Corporation |
| 38 | |
| 43,123 |
| 1.2% | | 3.8 |
17 | | JPMorgan Chase & Co. |
| 17 | |
| 42,196 |
| 1.2% | | 2.1 |
18 | | Verizon |
| 99 | |
| 40,154 |
| 1.2% | | 3.9 |
19 | | AT&T |
| 74 | |
| 38,705 |
| 1.1% | | 2.6 |
20 | | Zayo |
| 126 | |
| 35,317 |
| 1.0% | | 2.0 |
| | Total / Weighted Average | | | | | $1,721,156 |
| 49.4% | | 6.1 |
| (1) | Annualized recurring revenue represents the monthly contractual base rent (defined as cash base rent before abatements), and interconnection revenue under existing leases as of June 30, 2022, multiplied by 12. |
Note: Represents consolidated portfolio in addition to our managed portfolio of unconsolidated joint ventures based on ownership percentage. Our direct customers may be the entities named in the table above or their subsidiaries or affiliates. Certain portfolio information regarding Medallion is excluded from the portfolio statistics included in this Earnings Press Release and Supplemental Information package, as indicated in the footnotes, where applicable. Specifically, we have excluded the following related to Medallion: two new metropolitan areas, two data centers, square footage, occupancy percentage and lease terms. Medallion’s financial results are included in our condensed consolidated financial information.
24
| | Net Rentable | | Space Under Active | | Space Held for | | Annualized | | Occupancy (5) | | White Space | | Data Center | |||
Metropolitan Area |
| Square Feet (1) |
| Development (2) |
| Development (3) |
| Rent (4) |
| 30-Jun-22 |
| 31-Mar-22 |
| IT Load (6) |
| Count | |
North America |
|
|
|
|
|
|
| |
|
|
|
|
|
|
|
|
|
| | | | | | | | | | | | | | | | | |
Northern Virginia |
| 5,445,521 |
| 1,536,065 |
| 118,937 | | | $556,419 |
| 91.4% | | 91.2% | | 470.9 | | 23 |
Chicago |
| 3,427,745 |
| 34,679 |
| 113,422 | | | 318,925 |
| 91.2% | | 88.6% | | 162.7 | | 10 |
New York |
| 2,214,496 |
| 68,806 |
| 72,928 | | | 216,675 |
| 80.4% | | 79.0% | | 55.8 | | 13 |
Dallas |
| 3,557,842 |
| 136,445 |
| 1,000 | | | 191,741 |
| 79.2% | | 79.2% | | 101.2 | | 21 |
Silicon Valley |
| 1,591,835 |
| — |
| 130,752 | | | 173,489 |
| 94.7% | | 96.3% | | 94.6 | | 15 |
San Francisco |
| 843,339 |
| — |
| — | | | 67,401 |
| 66.4% | | 65.6% | | 31.5 | | 4 |
Portland |
| 602,716 |
| 552,862 |
| — | | | 64,287 |
| 97.3% | | 96.6% | | 58.5 | | 3 |
Phoenix |
| 795,697 |
| — |
| — | | | 64,080 |
| 67.1% | | 68.0% | | 42.5 | | 2 |
Atlanta |
| 525,413 |
| 41,661 |
| 313,581 | | | 53,491 |
| 94.2% | | 94.3% | | 7.1 | | 4 |
Seattle |
| 398,649 |
| — |
| — | | | 39,718 |
| 80.4% | | 82.8% | | 19.5 | | 1 |
Los Angeles |
| 584,248 |
| 17,805 |
| — | | | 38,533 |
| 78.4% | | 78.3% | | 15.0 | | 2 |
Toronto |
| 325,466 |
| 401,890 |
| — | | | 29,074 |
| 86.8% | | 85.7% | | 29.0 | | 2 |
Boston |
| 437,121 |
| — |
| 50,649 | | | 21,501 |
| 51.0% | | 51.5% | | 19.0 | | 3 |
Houston |
| 392,816 |
| — |
| 13,969 | | | 18,585 |
| 70.4% | | 70.4% | | 13.0 | | 6 |
Miami |
| 226,314 |
| — |
| — | | | 7,907 |
| 83.2% | | 84.6% | | 1.3 | | 2 |
Minneapolis/St. Paul |
| 328,765 |
| — |
| — | | | 7,141 |
| 100.0% | | 100.0% | | — | | 1 |
Austin |
| 85,688 |
| — |
| — | | | 6,352 |
| 52.5% | | 52.5% | | 4.3 | | 1 |
Charlotte |
| 95,499 |
| — |
| — | | | 5,188 |
| 89.8% | | 89.5% | | 1.5 | | 3 |
North America Total/Weighted Average |
| 21,879,170 |
| 2,790,213 |
| 815,238 | | | $1,880,507 |
| 85.0% | | 84.5% | | 1,127.4 | | 116 |
| | | | | | | | | | | | | | | | | |
EMEA | |
|
|
|
|
| |
|
|
|
|
|
|
|
|
|
|
| | | | | | | | | | | | | | | | | |
London |
| 1,432,546 |
| 64,272 |
| 95,832 | | | $204,622 |
| 67.9% | | 67.5% | | 103.9 | | 16 |
Frankfurt |
| 1,982,387 |
| 1,686,979 |
| — | | | 202,934 |
| 85.8% | | 84.6% | | 124.0 | | 29 |
Amsterdam | | 1,224,498 |
| 46,258 |
| 92,321 | | | 142,947 |
| 74.9% | | 71.0% | | 112.8 | | 13 |
Paris |
| 761,400 |
| 797,633 |
| — | | | 76,068 |
| 79.7% | | 79.0% | | 60.3 | | 12 |
Dublin |
| 475,100 |
| 78,029 |
| — | | | 51,895 |
| 79.8% | | 76.4% | | 32.5 | | 9 |
Marseille |
| 392,501 |
| 165,495 |
| — | | | 47,981 |
| 79.6% | | 79.8% | | 31.8 | | 4 |
Vienna |
| 354,174 |
| 133,214 |
| — | | | 43,055 |
| 79.9% | | 81.4% | | 25.6 | | 3 |
Zurich |
| 284,775 |
| 313,509 |
| — | | | 38,318 |
| 80.3% | | 79.8% | | 17.0 | | 3 |
Madrid |
| 220,714 |
| 225,000 |
| — | | | 35,358 |
| 79.4% | | 77.2% | | 11.8 | | 4 |
Brussels |
| 183,228 |
| 174,835 |
| — | | | 23,828 |
| 70.3% | | 73.0% | | 7.6 | | 4 |
Stockholm |
| 192,907 |
| 53,417 |
| — | | | 20,911 |
| 70.6% | | 66.9% | | 14.2 | | 6 |
Copenhagen |
| 175,871 |
| 150,834 |
| — | | | 17,121 |
| 74.9% | | 78.2% | | 8.1 | | 3 |
Dusseldorf |
| 116,197 |
| 106,261 |
| — | | | 14,824 |
| 61.5% | | 60.9% | | 11.0 | | 3 |
Athens |
| 55,187 |
| 159,306 |
| — | | | 7,837 |
| 76.6% | | 69.2% | | 1.7 | | 4 |
Zagreb |
| 20,980 |
| 8,584 |
| — | | | 2,442 |
| 52.5% | | 55.3% | | 0.9 | | 1 |
Nairobi |
| 15,715 |
| — |
| — | | | 1,720 |
| 62.8% | | 62.8% | | 0.5 | | 1 |
Mombasa |
| 10,119 |
| 37,039 |
| — | | | 1,100 |
| 53.2% | | 53.2% | | 0.3 | | 2 |
Maputo |
| — |
| 6,837 |
| — | | | — |
| — | | — | | 0.7 | | 1 |
EMEA Total/Weighted Average |
| 7,898,298 |
| 4,207,502 |
| 188,153 | | | $932,961 |
| 77.4% | | 76.0% | | 564.7 | | 118 |
| | | | | | | | | | | | | | | | | |
Asia Pacific |
|
|
|
|
|
| |
|
|
|
|
|
|
|
|
|
|
| | | | | | | | | | | | | | | | | |
Singapore |
| 882,847 |
| — |
| — | | | $187,416 |
| 94.3% | | 93.1% | | 77.5 | | 3 |
Sydney |
| 361,875 |
| — |
| 87,660 | | | 32,900 |
| 91.5% | | 86.4% | | 22.1 | | 4 |
Melbourne |
| 146,570 |
| — |
| — | | | 15,341 |
| 62.8% | | 62.8% | | 9.6 | | 2 |
Seoul |
| 87,494 |
| 74,766 |
| — | | | 254 |
| 3.1% | | — | | 6.0 | | 1 |
Hong Kong |
| 99,129 |
| 185,622 |
| — | | | 157 |
| 0.3% | | 0.1% | | 7.5 | | 1 |
Osaka |
| — |
| 235,532 |
| — | | | — |
| — | | — | | — | | 1 |
Asia Pacific Total/Weighted Average |
| 1,577,915 |
| 495,920 |
| 87,660 | | | $236,068 |
| 79.7% | | 81.9% | | 122.7 | | 12 |
| | | | | | | | | | | | | | | | | |
Non-Data Center Properties |
| 263,668 |
| — |
| — | | | $1,068 |
| 83.1% | | 83.1% | | — | | — |
| | | | | | | | | | | | | | | | | |
Consolidated Portfolio Total/Weighted Average |
| 31,619,051 |
| 7,493,635 |
| 1,091,051 | | | $3,050,604 |
| 82.8% | | 82.3% | | 1,814.7 | | 246 |
| | | | | | | | | | | | | | | | | |
Managed Unconsolidated Joint Ventures |
|
|
|
|
|
| |
|
|
| |
| | |
| |
|
| | | | | | | | | | | | | | | | | |
Northern Virginia |
| 1,482,337 |
| — |
| — | | | $101,446 |
| 93.8% | | 93.8% | | 98.7 | | 8 |
Silicon Valley |
| 414,267 |
| — |
| — | | | 25,175 |
| 100.0% | | 100.0% | | 10.9 | | 4 |
Hong Kong |
| 186,300 |
| — |
| — | | | 20,367 |
| 87.3% | | 87.3% | | 11.0 | | 1 |
Toronto |
| 104,308 |
| — |
| — | | | 13,278 |
| 100.0% | | 100.0% | | 6.8 | | 1 |
Los Angeles |
| 196,517 |
| — |
| — | | | 5,207 |
| 100.0% | | 100.0% | | — | | 2 |
Managed Unconsolidated Portfolio Total/Weighted Average (7) |
| 2,383,729 |
| — |
| — | | | $165,473 |
| 95.2% | | 95.2% | | 127.3 | | 16 |
| | | | | | | | | | | | | | | | | |
Managed Portfolio Total/Weighted Average |
| 34,002,780 |
| 7,493,635 |
| 1,091,051 | | | $3,216,076 |
| 83.7% | | 83.2% | | 1,942.0 | | 262 |
| | | | | | | | | | | | | | | | | |
Digital Realty Share Total/Weighted Average (8) |
| 32,396,011 |
| 7,644,511 |
| 1,091,051 | | | $3,104,380 |
| 83.2% | | 82.5% | | 1,969.1 | | |
| | | | | | | | | | | | | | | | | |
Non-Managed Unconsolidated Joint Ventures |
|
|
|
|
|
| |
|
|
| |
| |
|
|
|
|
| | | | | | | | | | | | | | | | | |
Sao Paulo |
| 1,043,614 |
| 262,075 |
| 1,012,604 | | | 156,961 |
| 97.3% | | 96.9% | | 89.4 | | 21 |
Tokyo |
| 1,059,436 |
| 239,895 |
| — | | | 51,152 |
| 69.6% | | 66.8% | | 34.5 | | 3 |
Osaka |
| 277,031 |
| 248,590 |
| — | | | 47,131 |
| 94.6% | | 94.6% | | 28.5 | | 3 |
Rio De Janeiro |
| 99,223 |
| — |
| — | | | 12,081 |
| 100.0% | | 100.0% | | 8.0 | | 2 |
Queretaro |
| 108,178 |
| — |
| 376,202 | | | 12,039 |
| 100.0% | | — | | 8.0 | | 2 |
Fortaleza |
| 94,205 |
| — |
| — | | | 10,299 |
| 100.0% | | 100.0% | | 6.2 | | 1 |
Seattle |
| 51,000 |
| — |
| — | | | 7,770 |
| 100.0% | | 100.0% | | 9.0 | | 1 |
Santiago |
| 67,340 |
| 45,209 |
| 180,835 | | | 6,650 |
| 68.7% | | 68.7% | | 6.3 | | 2 |
Non-Managed Portfolio Total/Weighted Average |
| 2,800,027 |
| 795,769 |
| 1,569,641 | | | $304,082 |
| 86.2% | | 84.4% | | 189.8 | | 35 |
| | | | | | | | | | | | | | | | | |
Portfolio Total/Weighted Average |
| 36,802,807 |
| 8,289,404 |
| 2,660,692 | | | $3,520,159 |
| 83.9% | | 83.3% | | 2,131.8 | | 297 |
| (1) | We estimate the total net rentable square feet available for lease based on a number of factors in addition to contractually leased square feet, including available power, required support space and common areas. |
| (2) | Space under active development includes current Base Building and Data Center projects in progress (see page 26). |
| (3) | Space held for development includes space held for future Data Center development, and excludes space under active development (see page 29). |
| (4) | Annualized base rent represents the monthly contractual base rent (defined as cash base rent before abatements) under existing leases as of June 30, 2022, multiplied by 12. |
| (5) | Occupancy excludes space under active development and space held for development. For some of our buildings, we calculate occupancy based on factors in addition to contractually leased square feet, including available power, required support space and common areas. |
| (6) | White Space IT Load represents UPS-backed utility power dedicated to Digital Realty’s operated data center space |
| (7) | Certain portfolio information regarding Medallion is excluded from the portfolio statistics included in this Earnings Press Release and Supplemental Information package, as indicated in the footnotes, where applicable. Specifically, we have excluded the following related to Medallion: two new metropolitan areas, two data centers, square footage, occupancy percentage and lease terms. Medallion’s financial results are included in our condensed consolidated financial information. |
| (8) | Represents consolidated portfolio plus our managed portfolio of unconsolidated joint ventures based on our ownership percentage. |
25
Development Lifecycle - Committed Active Development |
| Financial Supplement |
|---|---|---|
Dollars in Thousands | Second Quarter 2022 |
| | Base Building Construction | | Data Center Construction | | Total Active Development | |||||||||||||||||||||||||||||||||||||||||
| | | | | | | | | | | | | | | | | | | | | | | | | | | | | | | | | | | | | | | | | | | | | | | |
|
|
|
|
|
| A |
| B |
| A + B |
|
|
|
|
|
|
| A |
| B |
| A + B |
|
|
|
|
|
|
|
|
|
|
| A |
| B |
| A + B | |||||||||
| | | | | | | | | | | | | | | | | | | | | | | | | | | | | | | | Average | | Pre-tax | | | | | | | | | | | | | |
| | | | Total | | Current | | Future | | Total | | | | Total | | | | Current | | Future | | Total | | | | Expected | | Est. | | | | Total | | Current | | Future | | Total | |||||||||
| | # of | | Square | | Investment | | Funding | | Expected | | # of | | Square | | | | Investment | | Funding | | Expected | | % | | Completion | | Stabilized | | # of | | Square | | Investment | | Funding | | Expected | |||||||||
Metropolitan Area | | Locations | | Feet | | (1) | | Req. (2) | | Investment (3) | | Locations | | Feet | | kW | | (1) | | Req. (2) | | Investment (3) | | Leased | | Period | | Cash Yield (4) | | Locations | | Feet | | (1) | | Req. (2) | | Investment (3) | |||||||||
Atlanta | | — |
| — | | | — | | | — | | | — |
| 1 |
| 41,661 |
| 2,000 | | | $27,944 | | | $8,356 | | | $36,301 |
| — | | 3Q22 |
| |
| 1 |
| 41,661 | | | $27,944 | | | $8,356 | | | $36,301 |
Chicago | | — |
| — | | | — | | | — | | | — |
| 1 |
| 34,679 |
| 4,000 | | | 15,095 | | | 27,018 | | | 42,113 |
| — | | 1Q23 |
| |
| 1 |
| 34,679 | | | 15,095 | | | 27,018 | | | 42,113 |
Dallas | | — |
| — | | | — | | | — | | | — |
| 2 |
| 136,445 |
| 11,501 | | | 56,921 | | | 61,254 | | | 118,175 |
| 86.9% | | 4Q22 |
| |
| 2 |
| 136,445 | | | 56,921 | | | 61,254 | | | 118,175 |
Los Angeles | | — |
| — | | | — | | | — | | | — |
| 1 |
| 17,805 |
| 1,200 | | | 3,247 | | | 34,189 | | | 37,435 |
| — | | 3Q23 |
| |
| 1 |
| 17,805 | | | 3,247 | | | 34,189 | | | 37,435 |
New York | | — |
| — | | | — | | | — | | | — |
| 2 |
| 68,806 |
| 6,000 | | | 2,790 | | | 97,495 | | | 100,286 |
| 40.0% | | 2Q23 |
| |
| 2 |
| 68,806 | | | 2,790 | | | 97,495 | | | 100,286 |
Northern Virginia (5) | | 3 |
| 934,118 | | | $102,750 | | | $147,349 | | | $250,099 |
| 4 |
| 601,948 |
| 78,000 | | | 172,777 | | | 392,166 | | | 564,942 |
| 79.5% | | 1Q23 |
| |
| 5 |
| 1,536,065 | | | 275,527 | | | 539,514 | | | 815,041 |
Portland | | 1 |
| 414,647 | | | 101,490 | | | 79,824 | | | 181,314 |
| 1 |
| 138,216 |
| 16,000 | | | 37,687 | | | 123,918 | | | 161,606 |
| — | | 3Q23 |
| |
| 1 |
| 552,862 | | | 139,177 | | | 203,742 | | | 342,920 |
Toronto | | 1 |
| 140,512 | | | 18,964 | | | 41,051 | | | 60,015 |
| 2 |
| 261,378 |
| 14,800 | | | 36,023 | | | 100,640 | | | 136,663 |
| 94.6% | | 3Q23 |
| |
| 2 |
| 401,890 | | | 54,987 | | | 141,691 | | | 196,678 |
North America |
| 5 |
| 1,489,276 | | | $223,204 | | | $268,223 | | | $491,428 |
| 14 |
| 1,300,937 |
| 133,501 | | | $352,484 | | | $845,036 | | | $1,197,521 |
| 66.2% | | | | 9.1% | | 15 |
| 2,790,213 | | | $575,688 | | | $1,113,260 | | | $1,688,948 |
| | | | | | | | | | | | | | | | | | | | | | | | | | | | | | | | | | | | | | | | | | | | | | | |
Amsterdam |
| — |
| — | | | — | | | — | | | — |
| 1 |
| 46,258 |
| 4,000 | | | $33,807 | | | $3,507 | | | $37,314 |
| 100.0% | | 4Q22 |
| |
| 1 |
| 46,258 | | | $33,807 | | | $3,507 | | | $37,314 |
Athens |
| — |
| — | | | — | | | — | | | — |
| 2 |
| 159,306 |
| 13,600 | | | 19,624 | | | 128,048 | | | 147,672 |
| 29.4% | | 4Q23 |
| |
| 2 |
| 159,306 | | | 19,624 | | | 128,048 | | | 147,672 |
Brussels |
| 1 |
| 79,551 | | | $6,455 | | | $29,590 | | | $36,045 |
| 2 |
| 95,285 |
| 8,250 | | | 38,232 | | | 75,227 | | | 113,458 |
| 48.5% | | 4Q22 |
| |
| 2 |
| 174,835 | | | 44,687 | | | 104,816 | | | 149,503 |
Copenhagen |
| 1 |
| 100,556 | | | 35,488 | | | 15,675 | | | 51,163 |
| 1 |
| 50,278 |
| 4,800 | | | 36,969 | | | 51,892 | | | 88,861 |
| — | | 1Q23 |
| |
| 1 |
| 150,834 | | | 72,457 | | | 67,567 | | | 140,024 |
Dublin | | — |
| — | | | — | | | — | | | — |
| 1 |
| 78,029 |
| 6,840 | | | 11,437 | | | 80,279 | | | 91,716 |
| — | | 3Q23 |
| |
| 1 |
| 78,029 | | | 11,437 | | | 80,279 | | | 91,716 |
Dusseldorf |
| 1 |
| 72,290 | | | 12,715 | | | 1,451 | | | 14,167 |
| 1 |
| 33,971 |
| 3,133 | | | 37,723 | | | 13,291 | | | 51,014 |
| 25.2% | | 3Q22 |
| |
| 1 |
| 106,261 | | | 50,439 | | | 14,742 | | | 65,181 |
Frankfurt |
| 5 |
| 1,053,645 | | | 127,437 | | | 238,701 | | | 366,138 |
| 4 |
| 633,334 |
| 61,560 | | | 211,584 | | | 577,159 | | | 788,743 |
| 69.7% | | 1Q23 |
| |
| 8 |
| 1,686,979 | | | 339,021 | | | 815,861 | | | 1,154,881 |
London |
| — |
| — | | | — | | | — | | | — |
| 1 |
| 64,272 |
| 3,066 | | | 19,947 | | | 18,842 | | | 38,789 |
| — | | 1Q23 |
| |
| 1 |
| 64,272 | | | 19,947 | | | 18,842 | | | 38,789 |
Madrid | | 1 |
| 150,000 | | | 33,325 | | | 8,786 | | | 42,112 |
| 1 |
| 75,000 |
| 5,000 | | | 43,935 | | | 21,106 | | | 65,041 |
| 100.0% | | 4Q22 |
| |
| 1 |
| 225,000 | | | 77,260 | | | 29,892 | | | 107,152 |
Maputo |
| — |
| — | | | — | | | — | | | — |
| 1 |
| 6,837 |
| 370 | | | 6,380 | | | 3,398 | | | 9,778 |
| — | | 3Q22 |
| |
| 1 |
| 6,837 | | | 6,380 | | | 3,398 | | | 9,778 |
Marseille | | — |
| — | | | — | | | — | | | — |
| 1 |
| 165,495 |
| 13,600 | | | 112,173 | | | 59,687 | | | 171,860 |
| 40.4% | | 4Q22 |
| |
| 1 |
| 165,495 | | | 112,173 | | | 59,687 | | | 171,860 |
Mombasa |
| 1 |
| 18,520 | | | 1,347 | | | 244 | | | 1,591 |
| 1 |
| 18,520 |
| 855 | | | 7,419 | | | 1,246 | | | 8,664 |
| — | | 3Q22 |
| |
| 1 |
| 37,039 | | | 8,766 | | | 1,490 | | | 10,256 |
Paris | | — |
| — | | | — | | | — | | | — |
| 4 |
| 797,633 |
| 63,600 | | | 233,323 | | | 632,766 | | | 866,089 |
| 19.5% | | 4Q23 |
| |
| 4 |
| 797,633 | | | 233,323 | | | 632,766 | | | 866,089 |
Stockholm |
| — |
| — | | | — | | | — | | | — |
| 1 |
| 53,417 |
| 2,625 | | | 16,150 | | | 11,560 | | | 27,710 |
| — | | 3Q22 |
| |
| 1 |
| 53,417 | | | 16,150 | | | 11,560 | | | 27,710 |
Vienna | | 1 |
| 66,607 | | | 11,684 | | | 49,054 | | | 60,738 |
| 1 |
| 66,607 |
| 5,000 | | | 11,891 | | | 87,119 | | | 99,009 |
| — | | 4Q24 |
| |
| 1 |
| 133,214 | | | 23,575 | | | 136,173 | | | 159,748 |
Zagreb |
| — |
| — | | | — | | | — | | | — |
| 1 |
| 8,584 |
| 700 | | | 881 | | | 6,248 | | | 7,129 |
| — | | 2Q23 |
| |
| 1 |
| 8,584 | | | 881 | | | 6,248 | | | 7,129 |
Zurich |
| — |
| — | | | — | | | — | | | — |
| 1 |
| 313,509 |
| 24,000 | | | 220,801 | | | 156,044 | | | 376,844 |
| 79.3% | | 1Q23 |
| |
| 1 |
| 313,509 | | | 220,801 | | | 156,044 | | | 376,844 |
EMEA |
| 11 |
| 1,541,169 | | | $228,452 | | | $343,502 | | | $571,954 |
| 25 |
| 2,666,333 |
| 220,999 | | | $1,062,275 | | | $1,927,418 | | | $2,989,693 |
| 44.2% | | | | 10.3% | | 29 |
| 4,207,502 | | | $1,290,727 | | | $2,270,920 | | | $3,561,647 |
| | | | | | | | | | | | | | | | | | | | | | | | | | | | | | | | | | | | | | | | | | | | | | | |
Hong Kong |
| 1 |
| 185,622 | | | $28,551 | | | $840 | | | $29,390 |
| — |
| — |
| — | | | — | | | — | | | — |
| | | — |
| |
| 1 |
| 185,622 | | | $28,551 | | | $840 | | | $29,390 |
Osaka |
| 1 |
| 168,237 | | | 30,505 | | | 21,294 | | | 51,799 |
| 1 |
| 67,295 |
| 6,000 | | | $24,636 | | | $57,147 | | | $81,783 |
| — | | 2Q23 |
| |
| 1 |
| 235,532 | | | 55,140 | | | 78,441 | | | 133,581 |
Seoul | | — |
| — | | | — | | | — | | | — |
| 1 |
| 74,766 |
| 6,000 | | | 54,051 | | | 5,264 | | | 59,314 |
| — | | 3Q22 |
| |
| 1 |
| 74,766 | | | 54,051 | | | 5,264 | | | 59,314 |
Asia Pacific |
| 2 |
| 353,859 | | | $59,055 | | | $22,134 | | | $81,189 |
| 2 |
| 142,061 |
| 12,000 | | | $78,686 | | | $62,410 | | | $141,097 |
| 0.0% | | | | 10.6% | | 3 |
| 495,920 | | | $137,742 | | | $84,544 | | | $222,286 |
| | | | | | | | | | | | | | | | | | | | | | | | | | | | | | | | | | | | | | | | | | | | | | | |
Total |
| 18 |
| 3,384,304 | | | $510,711 | | | $633,859 | | | $1,144,570 |
| 41 |
| 4,109,331 | | 366,500 | | | $1,493,446 | | | $2,834,864 | | | $4,328,310 |
| 50.8% | | | | 10.0% | | 47 |
| 7,493,635 | | | $2,004,157 | | | $3,468,724 | | | $5,472,881 |
| (1) | Represents costs incurred through June 30, 2022. |
| (2) | Represents estimated cost to complete specific scope of work pursuant to contract, budget or approved capital plan. |
| (3) | For Base Building Construction, represents the pro rata share of the acquisition and infrastructure costs related to the specific Base Building project. For Data Center Construction, represents the pro rata share of the acquisition and infrastructure costs, or Base Building Construction costs, applicable to the specific Data Center project, plus the total direct investment in the specific Data Center project. |
| (4) | Estimated yields are based on total expected investment amounts and anticipated net operating income from leases signed or other assumptions based on market conditions. |
| (5) | Northern Virginia includes 263,202 square feet of pre-leased Base Building. |
Note: Square footage is based on current estimates and project plans, and may change upon completion of the project or due to remeasurement.
26
Construction Projects in Progress |
| Financial Supplement |
|---|---|---|
Dollars in Thousands, Except Per Square Foot | Second Quarter 2022 |
|
| | |
| | |
| | |
| | |
| | |
| Total Cost/ | |
| | Net Rentable | | | | | Current | | Future | | Total | | Net Rentable | |||||
Construction Projects in Progress | | Square Feet (5) | | Acreage | | Investment (6) | | Investment (7) | | Investment | | Square Foot | ||||||
Development Lifecycle |
|
|
|
|
|
|
|
|
|
|
|
|
|
|
|
|
|
|
Land - Held for Development (1) |
| | N/A |
| | 12.6 | | | $37,460 | | | — |
| | $37,460 |
| |
|
Development Construction in Progress |
| |
|
| |
| | |
| | |
|
| |
|
| |
|
Land - Current Development (1) |
| | N/A |
| | 790.7 | | | $1,036,470 | | | — | | | $1,036,470 |
| |
|
Space Held for Development (1) |
| | 1,091,051 |
| | N/A | | | 232,514 | | | — | | | 232,514 | | | $213 |
Base Building Construction (2) |
| | 3,384,304 |
| | N/A | | | 510,711 | | | $633,859 | | | 1,144,570 | |
| 338 |
Data Center Construction |
| | 4,109,331 |
| | N/A | | | 1,493,446 | | | 2,834,864 | | | 4,328,310 | |
| 1,053 |
Equipment Pool & Other Inventory (3) |
| | N/A |
| | N/A | | | 14,926 | | | — | | | 14,926 | |
|
|
Campus, Tenant Improvements & Other (4) |
| | N/A |
| | N/A | | | 74,047 | | | 136,184 | | | 210,231 | |
|
|
Total Development Construction in Progress |
| | 8,584,686 |
| | 790.7 | | | $3,362,114 | | | $3,604,908 | | | $6,967,021 | |
|
|
| | | | | | | | | | | | | | | | | | |
Enhancement & Other | | | | | | | | | $13,119 | | | $17,153 | | | $30,272 | |
|
|
Recurring | | | | | | | | | 13,248 | | | 35,951 | | | 49,199 | |
|
|
Total Construction in Progress | |
| | | | 803.3 | | | $3,425,941 | | | $3,658,012 | | | $7,083,953 | |
|
|
| (1) | Land and Space Held for Development reflect cumulative cost spent to date pending future development. Excludes square footage and cost incurred on unconsolidated joint ventures. |
| (2) | Base Building Construction consists of ongoing improvements to building infrastructure in preparation for future data center fit-out. |
| (3) | Represents long-lead time equipment and materials required for timely deployment and delivery of data center fit-out. |
| (4) | Represents improvements in progress as of June 30, 2022 which benefit space recently converted to our operating portfolio and is composed primarily of shared infrastructure projects and first-generation tenant improvements. |
| (5) | We estimate the total net rentable square feet available for lease based on a number of factors in addition to contractually leased square feet, including available power, required support space and common areas. Excludes square footage of properties held in unconsolidated joint ventures. |
| (6) | Represents costs incurred through June 30, 2022. Excludes costs incurred by unconsolidated joint ventures. |
| (7) | Represents estimated cost to complete specific scope of work pursuant to contract, budget or approved capital plan. |
Note: We capitalize interest on active construction work. Base Building Construction, Data Center Construction, Equipment Pool, Campus Improvements, Enhancements and Recurring are considered active construction work. Square footage is based on current estimates and project plans and may change upon completion of the project or due to remeasurement.
27
Historical Capital Expenditures and Investments in Real Estate |
| Financial Supplement |
|---|---|---|
Dollars in Thousands | Second Quarter 2022 |
| | Three Months Ended | | | Six Months Ended | |||||||||||||||||
|
| 30-Jun-22 |
| 31-Mar-22 |
| 31-Dec-21 |
| 30-Sep-21 |
| 30-Jun-21 |
|
| 30-Jun-22 |
| 30-Jun-21 | |||||||
| | | | | | | | | | | | | | | | | | | | | | |
Non-Recurring Capital Expenditures (1) |
|
|
|
|
|
|
|
|
|
|
|
|
|
|
| |
|
|
|
|
|
|
| | | | | | | | | | | | | | | | | | | | | | |
Development | | | $466,304 | | | $430,947 | | | $648,615 | | | $581,853 | | | $505,942 | | | | $897,251 | | | $945,735 |
| | | | | | | | | | | | | | | | | | | | | | |
Enhancements and Other Non-Recurring | | | 3,310 | | | 5,387 | | | 2,241 | | | 411 | | | 102 | | | | 8,697 | | | 160 |
| | | | | | | | | | | | | | | | | | | | | | |
Total Non-Recurring Capital Expenditures | | | $469,614 | | | $436,334 | | | $650,856 | | | $582,264 | | | $506,044 | | | | $905,948 | | | $945,895 |
| | | | | | | | | | | | | | | | | | | | | | |
Recurring Capital Expenditures (2) | | | $43,497 | | | $46,770 | | | $87,550 | | | $50,800 | | | $39,231 | | | | $90,267 | | | $78,753 |
| | | | | | | | | | | | | | | | | | | | | | |
Total Direct Capital Expenditures | | | $513,111 | | | $483,104 | | | $738,406 | | | $633,064 | | | $545,275 | | | | $996,215 | | | $1,024,648 |
| | | | | | | | | | | | | | | | | | | | | | |
Indirect Capital Expenditures | | |
| | |
| | |
| | |
| | |
| | | |
| | |
|
| | | | | | | | | | | | | | | | | | | | | | |
Capitalized Interest | | | $14,131 | | | $14,751 | | | $15,328 | | | $15,142 | | | $11,558 | | | | $28,882 | | | $22,992 |
| | | | | | | | | | | | | | | | | | | | | | |
Capitalized Overhead | | | 21,051 | | | 20,879 | | | 18,963 | | | 18,423 | | | 16,090 | | | | 41,930 | | | 33,806 |
| | | | | | | | | | | | | | | | | | | | | | |
Total Indirect Capital Expenditures | | | $35,182 | | | $35,630 | | | $34,291 | | | $33,565 | | | $27,648 | | | | $70,812 | | | $56,798 |
| | | | | | | | | | | | | | | | | | | | | | |
Total Improvements to and Advances for Investment in Real Estate | | | $548,293 | | | $518,734 | | | $772,697 | | | $666,629 | | | $572,923 | | | | $1,067,027 | | | $1,081,446 |
| | | | | | | | | | | | | | | | | | | | | | |
Consolidated Portfolio Net Rentable Square Feet (3) | |
| 32,396,011 | |
| 31,551,302 | |
| 31,457,664 | |
| 31,620,833 | |
| 31,753,051 | | |
| 32,396,011 | |
| 31,753,051 |
| (1) | Non-recurring capital expenditures are primarily for development of space and land, excluding acquisition costs. |
| (2) | Recurring capital expenditures represent non-incremental building improvements required to maintain current revenues, including second-generation tenant improvements and external leasing commissions. Recurring capital expenditures do not include acquisition costs contemplated when underwriting the purchase of a building, costs which are incurred to bring a building up to Digital Realty’s operating standards, or internal leasing commissions. |
| (3) | For some of our buildings, we calculate square footage based on factors in addition to contractually leased square feet, including available power, required support space and common areas. |
28
Development Lifecycle – Held for Development |
| Financial Supplement |
|---|---|---|
Dollars in Thousands | Second Quarter 2022 |
| | Land Inventory (1) | | Space Held for Development | |||||||||||||
| | | | | | | | | | | | | | | | | |
|
| |
| |
| Land - |
| Land - |
| |
| Total |
| | | ||
| | # of | | | | Held for | | Current | | # of | | Square | | Current | |||
Metropolitan Area | | Locations | | Acres | | Development | | Development | | Locations | | Feet | | Investment (2) | |||
Atlanta |
| — |
| — |
|
| — |
|
| — |
| 1 |
| 313,581 | |
| $25,621 |
Boston |
| — |
| — |
| | — |
| | — |
| 1 |
| 50,649 | | | 23,623 |
Chicago |
| 1 |
| 1.4 | | | — |
| | $26,266 |
| 5 |
| 113,422 | | | 37,938 |
Dallas |
| 3 |
| 114.0 | | | — |
| | 33,838 |
| 2 |
| 1,000 | | | 3,133 |
Houston |
| — |
| — | | | — |
| | — |
| 1 |
| 13,969 | | | 2,726 |
New York |
| 1 |
| 21.5 | | | — |
| | 44,089 |
| 4 |
| 72,928 | | | 17,034 |
Northern Virginia |
| 7 |
| 576.3 | | | — |
| | 481,404 |
| 4 |
| 118,937 | | | 2,128 |
Silicon Valley |
| 1 |
| 13.0 | | | — | | | 72,146 |
| 1 |
| 130,752 | | | 14,499 |
North America |
| 13 |
| 726.2 | | | — | | | $657,743 |
| 19 |
| 815,238 | | | $126,700 |
| | | | | | | | | | | | | | | | | |
Amsterdam |
| 1 |
| 4.4 | | | — | | | $29,744 |
| 2 |
| 92,321 | | | $33,265 |
Barcelona |
| 1 |
| 2.4 | | | — | | | 12,327 |
| — |
| — | | | — |
Dublin |
| 2 |
| 5.0 | | | — | | | 15,406 |
| — |
| — | | | — |
Frankfurt |
| 2 |
| 26.6 | | | — | | | 163,860 |
| — |
| — | | | — |
London |
| 1 |
| 6.7 | | | $15,642 | | | — |
| 3 |
| 95,832 | | | 28,636 |
Madrid |
| 1 |
| 1.8 | | | 17,656 | | | — |
| — |
| — | | | — |
Paris |
| — |
| — | | | — | | | 134 |
| — |
| — | | | — |
Zurich |
| 1 |
| 2.6 | | | — | | | 19,765 |
| — |
| — | | | — |
EMEA |
| 9 |
| 49.6 | | | $33,299 | | | $241,235 |
| 5 |
| 188,153 | | | $61,901 |
| | | | | | | | | | | | | | | | | |
Melbourne |
| 1 |
| 4.1 | | | $4,161 | | | — |
| — |
| — | | | — |
Seoul |
| 1 |
| 4.9 | | | — | | | $67,920 |
| — |
| — | | | — |
Sydney |
| 1 |
| 18.5 | | | — | | | 69,572 |
| 1 |
| 87,660 | | | $43,913 |
Asia Pacific |
| 3 |
| 27.5 | | | 4,161 | | | $137,492 |
| 1 |
| 87,660 | | | $43,913 |
| | | | | | | | | | | | | | | | | |
Consolidated Portfolio |
| 25 |
| 803.3 | | | $37,460 | | | $1,036,470 |
| 25 |
| 1,091,051 | | | $232,514 |
| (1) | Represents locations acquired to support ground-up development. |
| (2) | Represents costs incurred through June 30, 2022. Includes the cost of acquisition as well as cost of improvements since acquisition to prepare for future building construction. |
Note: Square footage is based on current estimates and project plans and may change upon completion of the project or due to remeasurement.
29
Acquisitions / Dipositions/ Joint Ventures |
| Financial Supplement |
|---|---|---|
Dollars in Thousands | Second Quarter 2022 |
|
| |
| |
| |
| |
|
|
| Net |
| |
| |
| |
| | | | | | | | | | | | Rentable | | Square Feet | | Square Feet | | % of Total Net |
| | Acquisition | | Metropolitan | | Date | | Purchase | | Cap | | Square | | Under | | Held For | | Rentable Square |
Property | | Type | | Area | | Acquired | | Price (1) | | Rate (2) | | Feet (3) | | Development | | Development | | Feet Occupied (4) |
FRA33/34 (Hattersheim) (5) | | Land | | Frankfurt | | 4/8/2022 | | $59,700 | | — | | — | | — | | — | | — |
DUB15/16 (Profile Park) (5) | | Land | | Ireland | | 4/6/2022 | | 6,100 | | — | | — | | — | | — | | — |
BCN1 (Barcelona) (5) | | Land | | Barcelona | | 4/8/2022 | | 11,300 | | — | | — | | — | | — | | — |
Total | | — | | — | | — | | $77,100 |
| — |
| — |
| — |
| — |
| — |
Closed Dispositions:
|
| |
| |
| |
| |
| |
| Net |
| |
| |
| |
| | | | | | | | | | | | Rentable | | Square Feet | | Square Feet | | % of Total Net |
| | Disposition | | Metropolitan | | Date | | Sale | | Cap | | Square | | Under | | Held For | | Rentable Square |
Property | | Type | | Area | | Disposed | | Price (1) | | Rate (2) | | Feet (3) | | Development | | Development | | Feet Occupied (4) |
| | — | | — | | — | | — | | — | | — | | — | | — | | — |
Total | | — | | — | | — | | — | | — | | — | | — | | — | | — |
Closed Joint Venture Contributions:
|
| |
| |
| |
| |
| Net |
| |
| |
| |
| | | | | | | | | | Rentable | | Square Feet | | Square Feet | | % of Total Net |
| | Metropolitan | | | | Contribution | | Cap | | Square | | Under | | Held For | | Rentable Square |
Property | | Area | | Date | | Price | | Rate (2) | | Feet (3) | | Development | | Development | | Feet Occupied (4) |
Mivne JV | | Israel | | 6/13/2022 | | — | | — | | — | | — | | — | | — |
Total |
| — |
| — |
| — |
| — | | — |
| — |
| — |
| — |
| (1) | Represents the purchase price or sale price, as applicable, before contractual adjustments, transaction expenses, and taxes. |
| (2) | We calculate the cash capitalization rate on acquisitions, dispositions and joint venture contributions by dividing anticipated annual net operating income by the purchase/sale/contribution price, including assumed debt and related pre-payment penalties. Net operating income represents rental revenue and tenant reimbursement revenue from in-place leases, less rental property operating and maintenance expenses, property taxes and insurance expenses, and is not a financial measure calculated in accordance with GAAP. We caution you not to place undue reliance on our cash capitalization rates because they are based solely on data made available to us in the diligence process in connection with the relevant acquisitions and are calculated on a non-GAAP basis. Our calculation of the cash capitalization rate on acquisitions may change, based on our experience operating the data centers subsequent to closing of the acquisitions. In addition, the actual cash capitalization rates may differ from our expectations based on numerous other factors, including the results of our final purchase price allocation, difficulties collecting anticipated rental revenues, customer bankruptcies, property tax reassessments and unanticipated expenses at the data centers that we cannot pass on to customers. |
| (3) | We estimate the total net rentable square feet available for lease based on a number of factors in addition to contractually leased square feet, including available power, required support space and common area. |
| (4) | Occupancy excludes space under development and space held for development. |
| (5) | Based on a spot rate of 1.045x USD to EUR as of June 30, 2022. |
30
Unconsolidated Joint Ventures |
| Financial Supplement |
|---|---|---|
Dollars in Thousands | Second Quarter 2022 |
Summary Balance Sheet - | | As of June 30, 2022 | |||||||||||||||||||
at the JV's 100% Share | | | Ascenty | | | Mitsubishi | | | Digital Core REIT | | | Lumen (1) | | | Mapletree | | | Other (2) | | | Total |
| | | | | | | | | | | | | | | | | | | | | |
Undepreciated book value of operating real estate |
|
| $1,186,699 |
|
| $1,049,636 |
|
| $1,288,715 |
|
| $183,789 |
|
| $782,372 |
|
| $476,511 |
|
| $4,967,722 |
Accumulated depreciation & amortization | | | (226,649) | | | (82,535) | | | (20,580) | | | (55,597) | | | (111,166) | | | (22,164) | | | (518,689) |
Net Book Value of Operating Real Estate | | | $960,050 | | | $967,100 | | | $1,268,136 | | | $128,192 | | | $671,207 | | | $454,347 | | | $4,449,032 |
Cash | | | 86,361 | | | $220,259 | | | $37,787 | | | $9,008 | | | 32,581 | | | 16,046 | | | 402,041 |
Other assets | | | 1,231,994 | | | 126,868 | | | 209,117 | | | 11,977 | | | 189,918 | | | 100,178 | | | 1,870,053 |
Total Assets | | | $2,278,405 | | | $1,314,227 | | | $1,515,040 | | | $149,177 | | | $893,706 | | | $570,571 | | | $6,721,126 |
| | | | | | | | | | | | | | | | | | | | | |
Debt | | | 890,290 | | | 318,254 | | | 347,313 | | | — | | | — | | | 119,630 | | | 1,675,488 |
Other liabilities | | | 169,813 | | | 158,043 | | | 67,512 | | | 10,889 | | | 23,173 | | | 270,676 | | | 700,106 |
Equity / (deficit) | | | 1,218,301 | | | 837,930 | | | 1,100,215 | | | 138,288 | | | 870,533 | | | 180,265 | | | 4,345,532 |
Total Liabilities and Equity | | | $2,278,405 | | | $1,314,227 | | | $1,515,040 | | | $149,177 | | | $893,706 | | | $570,571 | | | $6,721,126 |
| | | | | | | | | | | | | | | | | | | | | |
Digital Realty's ownership percentage | | | 49% (3) | | | 50% | | | 41% (4) | | | 50% | | | 20% | | | Various | | | |
| | | | | | | | | | | | | | | | | | | | | |
Digital Realty's Pro Rata Share of Unconsolidated JV Debt | | | $454,048 | | | $159,127 | | | $143,444 | | | — | | | — | | | $32,219 | | | $788,838 |
Summary Statement of Operations - | | Three Months Ended June 30, 2022 | |||||||||||||||||||
at the JV's 100% Share | | | Ascenty | | | Mitsubishi | | | Digital Core REIT | | | Lumen (1) | | | Mapletree | | | Other (2) | | | Total |
| | | | | | | | | | | | | | | | | | | | | |
Total revenues |
|
| $63,029 |
|
| $41,805 |
|
| $28,690 |
|
| $6,472 |
|
| $28,149 |
|
| $7,340 |
|
| $175,486 |
Operating expenses | | | (25,584) | | | (23,280) | | | (9,146) | | | (2,588) | | | (11,681) | | | (4,543) | | | (76,822) |
Net Operating Income (NOI) | | | $37,445 | | | $18,525 | | | $19,544 | | | $3,884 | | | $16,468 | | | $2,797 | | | $98,664 |
| | | | | | | | | | | | | | | | | | | | | |
Straight-line rent | | | — | | | (2,388) | | | (2,426) | | | 133 | | | (523) | | | (54) | | | (5,259) |
Above and below market rent | | | — | | | — | | | (952) | | | — | | | 178 | | | — | | | (774) |
Cash Net Operating Income (NOI) | | | $37,445 | | | $16,137 | | | $16,165 | | | $4,016 | | | $16,124 | | | $2,743 | | | $92,631 |
| | | | | | | | | | | | | | | | | | | | | |
Interest expense | | | ($10,955) | | | ($696) | | | ($2,200) | | | ($0) | | | ($4) | | | ($3,311) | | | ($17,165) |
Depreciation & amortization | | | (24,766) | | | (10,021) | | | (17,017) | | | (2,276) | | | (17,368) | | | (1,453) | | | (72,900) |
Other income / (expense) | | | 9,294 | | | (2,291) | | | (1,197) | | | (282) | | | (1,342) | | | (704) | | | 3,477 |
FX remeasurement on USD debt | | | (83,903) | | | — | | | — | | | — | | | — | | | — | | | (83,903) |
Total Non-Operating Expenses | | | ($110,329) | | | ($13,008) | | | ($20,413) | | | ($2,558) | | | ($18,714) | | | ($5,467) | | | ($170,490) |
| | | | | | | | | | | | | | | | | | | | | |
Net Income / (Loss) | | | ($72,884) | | | $5,517 | | | ($869) | | | $1,326 | | | ($2,246) | | | ($2,671) | | | ($71,827) |
| | | | | | | | | | | | | | | | | | | | | |
Digital Realty's ownership percentage | | | 49% (3) | | | 50% | | | 41% (4) | | | 50% | | | 20% | | | Various | | | |
| | | | | | | | | | | | | | | | | | | | | |
Digital Realty's Pro Rata Share of Unconsolidated JV NOI | | | $19,097 | | | $9,263 | | | $8,072 | | | $1,942 | | | $3,294 | | | $1,078 | | | $42,746 |
| | | | | | | | | | | | | | | | | | | | | |
Digital Realty's Pro Rata Share of Unconsolidated JV Cash NOI | | | $19,097 | | | $8,068 | | | $6,676 | | | $2,008 | | | $3,225 | | | $1,069 | | | $40,143 |
| | | | | | | | | | | | | | | | | | | | | |
Digital Realty's Earnings (loss) income from unconsolidated joint ventures | | | ($37,036) | | | $2,759 | | | ($334) | | | $663 | | | ($462) | | | $322 | | | ($34,088) |
| | | | | | | | | | | | | | | | | | | | | |
Digital Realty's Pro Rata Share of core FFO (5) | | | $18,385 | | | $7,769 | | | $6,694 | | | $1,801 | | | $3,012 | | | ($488) | | | $37,173 |
| | | | | | | | | | | | | | | | | | | | | |
Digital Realty's Fee Income from Joint Ventures | | | — | | | $46 | | | $3,279 | | | $159 | | | $771 | | | $71 | | | $4,326 |
| (1) | Formerly known as 33 Chun Choi Street. |
| (2) | Includes Medallion, Clise, Colovore, Menlo, Starwood, Walsh, and BAM Digital Realty joint ventures. |
| (3) | Equity in income pick-up comprised of 49% owned by Digital Realty and 2% owned by management, with a corresponding offset for the 2% in minority interest. |
| (4) | As of June 30, 2022 Digital Realty owns approximately 35% of Digital Core REIT and separately owns 10% retained interest in the underlying operating properties. |
| (5) | For a definition of core FFO, see page 33. |
31
Reconciliation of Earnings Before Interest, Taxes, Depreciation & Amortization and Financial Ratios |
| Financial Supplement |
|---|---|---|
Unaudited and Dollars in Thousands | Second Quarter 2022 |
| | Three Months Ended | |||||||||||||
Reconciliation of Earnings Before Interest, Taxes, Depreciation & Amortization (EBITDA) (1) | | | 30-Jun-22 | | | 31-Mar-22 | | | 31-Dec-21 | | | 30-Sep-21 | | | 30-Jun-21 |
| | | | | | | | | | | | | | | |
Net Income Available to Common Stockholders | | | $53,245 | | | $63,101 | | | $1,057,630 | | | $124,094 | | | $127,371 |
Interest |
|
| 69,023 |
|
| 66,725 |
|
| 71,762 |
|
| 71,417 |
|
| 75,014 |
Loss from early extinguishment of debt | | | — | | | 51,135 | | | 325 | | | — | | | — |
Income tax expense (benefit) | | | 16,406 | | | 13,244 | | | 3,961 | | | 13,709 | | | 47,582 |
Depreciation & amortization | | | 376,967 | | | 382,132 | | | 378,883 | | | 369,035 | | | 368,981 |
EBITDA | | | $515,642 | | | $576,337 | | | $1,512,561 | | | $578,255 | | | $618,947 |
Unconsolidated JV real estate related depreciation & amortization | | | 29,023 | | | 29,319 | | | 24,146 | | | 21,293 | | | 20,983 |
Unconsolidated JV interest expense and tax expense | | | 6,708 | | | 21,111 | | | 15,222 | | | 11,008 | | | 15,523 |
Severance, equity acceleration, and legal expenses | | | 3,786 | | | 2,077 | | | 1,003 | | | 1,377 | | | 2,536 |
Transaction and integration expenses | | | 13,586 | | | 11,968 | | | 12,427 | | | 13,804 | | | 7,075 |
(Gain) / loss on sale of investments | | | — | | | (2,770) | | | (1,047,011) | | | 635 | | | (499) |
Impairment of investments in real estate | | | — | | | — | | | 18,291 | | | — | | | — |
Other non-core adjustments, net | | | 31,633 | | | (48,858) | | | 14,307 | | | (28,745) | | | (60,308) |
Non-controlling interests | | | 436 | | | 3,629 | | | 22,587 | | | 2,266 | | | 4,544 |
Preferred stock dividends, including undeclared dividends | | | 10,181 | | | 10,181 | | | 10,181 | | | 10,181 | | | 11,885 |
(Gain on) / Issuance costs associated with redeemed preferred stock | | | — | | | — | | | — | | | — | | | (18,000) |
Adjusted EBITDA | | | $610,994 | | | $602,994 | | | $583,713 | | | $610,074 | | | $602,686 |
| (1) | For definitions and discussion of EBITDA and Adjusted EBITDA, see the definitions section. |
| | Three Months Ended | |||||||||||||
Financial Ratios | | | 30-Jun-22 | | | 31-Mar-22 | | | 31-Dec-21 | | | 30-Sep-21 | | | 30-Jun-21 |
| | | | | | | | | | | | | | | |
Total GAAP interest expense |
|
| $69,023 |
|
| $66,725 |
|
| $71,762 |
|
| $71,417 |
|
| $75,014 |
Capitalized interest | | | 14,131 | | | 14,751 | | | 15,328 | | | 15,142 | | | 11,558 |
Change in accrued interest and other non-cash amounts | | | (43,952) | | | 52,324 | | | (37,974) | | | 17,820 | | | (43,604) |
Cash Interest Expense (2) | | | $39,202 | | | $133,800 | | | $49,116 | | | $104,379 | | | $42,968 |
| | | | | | | | | | | | | | | |
Preferred dividends | | | 10,181 | | | 10,181 | | | 10,181 | | | 10,181 | | | 11,885 |
Total Fixed Charges (3) | | | $93,335 | | | $91,657 | | | $97,271 | | | $96,740 | | | $98,457 |
| | | | | | | | | | | | | | | |
| | | | | | | | | | | | | | | |
Coverage | | | | | | | | | | | | | | | |
Interest coverage ratio (4) | | | 6.6x | | | 6.1x | | | 6.0x | | | 6.5x | | | 6.1x |
Cash interest coverage ratio (5) | | | 12.6x | | | 4.0x | | | 9.8x | | | 5.4x | | | 10.9x |
Fixed charge coverage ratio (6) | | | 6.0x | | | 5.5x | | | 5.4x | | | 5.8x | | | 5.4x |
Cash fixed charge coverage ratio (7) | | | 10.4x | | | 3.7x | | | 8.3x | | | 5.0x | | | 9.0x |
| | | | | | | | | | | | | | | |
Leverage | | | | | | | | | | | | | | | |
Debt to total enterprise value (8) (9) | | | 27.1% | | | 25.5% | | | 20.5% | | | 24.8% | | | 23.9% |
Debt plus preferred stock to total enterprise value (10) | | | 28.5% | | | 26.8% | | | 21.7% | | | 26.1% | | | 25.2% |
Pre-tax income to interest expense (11) | | | 1.9x | | | 2.2x | | | 16.2x | | | 2.9x | | | 2.7x |
Net Debt to Adjusted EBITDA (12) | | | 6.2x | | | 6.3x | | | 6.1x | | | 6.0x | | | 6.0x |
| (2) | Cash interest expense is interest expense less amortization of debt discount and deferred financing fees and includes interest that we capitalized. We consider cash interest expense to be a useful measure of interest as it excludes non-cash based interest expense. |
| (3) | Fixed charges consist of GAAP interest expense, capitalized interest, and preferred dividends. |
| (4) | Adjusted EBITDA divided by GAAP interest expense plus capitalized interest (including our pro rata share of unconsolidated joint venture interest expense). |
| (5) | Adjusted EBITDA divided by cash interest expense (including our pro rata share of unconsolidated joint venture interest expense). |
| (6) | Adjusted EBITDA divided by fixed charges (including our pro rata share of unconsolidated joint venture fixed charges). |
| (7) | Adjusted EBITDA divided by the sum of cash interest expense, and preferred dividends (including our pro rata share of unconsolidated joint venture cash fixed charges). |
| (8) | Mortgage debt and other loans divided by market value of common equity plus debt plus preferred stock. |
| (9) | Total enterprise value defined as market value of common equity plus debt plus preferred stock. |
| (10) | Same as (8), except numerator includes preferred stock. |
| (11) | Calculated as net income plus interest expense divided by GAAP interest expense. |
| (12) | Calculated as total debt at balance sheet carrying value, plus capital lease obligations, plus Digital Realty’s pro rata share of unconsolidated of joint venture debt, less cash and cash equivalents (including Digital Realty’s pro rata share of unconsolidated joint venture cash) divided by the product of Adjusted EBITDA (including Digital Realty’s pro rata share of unconsolidated joint venture EBITDA), multiplied by four. |
32
Funds From Operations (FFO):
We calculate funds from operations, or FFO, in accordance with the standards established by the National Association of Real Estate Investment Trusts, or Nareit, in the Nareit Funds From Operations White Paper - 2018 Restatement. FFO represents net income (loss) (computed in accordance with GAAP), excluding gains (or losses) from real estate transactions, impairment of investment in real estate, real estate related depreciation and amortization (excluding amortization of deferred financing costs), unconsolidated JV real estate related depreciation & amortization, non-controlling interests in operating partnership and after adjustments for unconsolidated partnerships and joint ventures. Management uses FFO as a supplemental performance measure because, in excluding real estate related depreciation and amortization and gains and losses from property dispositions and after adjustments for unconsolidated partnerships and joint ventures, it provides a performance measure that, when compared year over year, captures trends in occupancy rates, rental rates and operating costs. We also believe that, as a widely recognized measure of the performance of REITs, FFO will be used by investors as a basis to compare our operating performance with that of other REITs. However, because FFO excludes depreciation and amortization and captures neither the changes in the value of our data centers that result from use or market conditions, nor the level of capital expenditures and capitalized leasing commissions necessary to maintain the operating performance of our data centers, all of which have real economic effect and could materially impact our financial condition and results from operations, the utility of FFO as a measure of our performance is limited. Other REITs may not calculate FFO in accordance with the NAREIT definition and, accordingly, our FFO may not be comparable to other REITs’ FFO. FFO should be considered only as a supplement to net income computed in accordance with GAAP as a measure of our performance.
Core Funds from Operations (Core FFO):
We present core funds from operations, or core FFO, as a supplemental operating measure because, in excluding certain items that do not reflect core revenue or expense streams, it provides a performance measure that, when compared year over year, captures trends in our core business operating performance. We calculate core FFO by adding to or subtracting from FFO (i) other non-core revenue adjustments, (ii) transaction and integration expenses, (iii) loss from early extinguishment of debt, (iv) gain on / issuance costs associated with redeemed preferred stock, (v) severance, equity acceleration, and legal expenses, (vi) gain/loss on FX revaluation, and (vii) other non-core expense adjustments. Because certain of these adjustments have a real economic impact on our financial condition and results from operations, the utility of core FFO as a measure of our performance is limited. Other REITs may calculate core FFO differently than we do and accordingly, our core FFO may not be comparable to other REITs’ core FFO. Core FFO should be considered only as a supplement to net income computed in accordance with GAAP as a measure of our performance.
Adjusted Funds from Operations (AFFO):
We present adjusted funds from operations, or AFFO, as a supplemental operating measure because, when compared year over year, it assesses our ability to fund dividend and distribution requirements from our operating activities. We also believe that, as a widely recognized measure of the operations of REITs, AFFO will be used by investors as a basis to assess our ability to fund dividend payments in comparison to other REITs, including on a per share and unit basis. We calculate AFFO by adding to or subtracting from core FFO (i) non-real estate depreciation, (ii) amortization of deferred financing costs, (iii) amortization of debt discount/premium, (iv) non-cash stock-based compensation expense, (v) straight-line rental revenue, (vi) straight-line rental expense, (vii) above- and below-market rent amortization, (viii) deferred tax expense / (benefit), (ix) leasing compensation and internal lease commissions, and (x) recurring capital expenditures. Other REITs may calculate AFFO differently than we do and, accordingly, our AFFO may not be comparable to other REITs’ AFFO. AFFO should be considered only as a supplement to net income computed in accordance with GAAP as a measure of our performance.
We believe that earnings before interest, loss from early extinguishment of debt, income taxes, and depreciation and amortization, or EBITDA, and Adjusted EBITDA (as defined below), are useful supplemental performance measures because they allow investors to view our performance without the impact of non-cash depreciation and amortization or the cost of debt and, with respect to Adjusted EBITDA, unconsolidated joint venture real estate related depreciation & amortization, unconsolidated joint venture interest expense and tax, severance, equity acceleration, and legal expenses, transaction and integration expenses, gain on sale / deconsolidation, impairment of investments in real estate, other non-core adjustments, net, non-controlling interests, preferred stock dividends, including undeclared dividends, and issuance costs associated with redeemed preferred stock. Adjusted EBITDA is EBITDA excluding unconsolidated joint venture real estate related depreciation & amortization, unconsolidated joint venture interest expense and tax, severance, equity acceleration, and legal expenses, transaction and integration expenses, gain on sale / deconsolidation, impairment of investments in real estate, other non-core adjustments, net, non-controlling interests, preferred stock dividends, including undeclared dividends, and gain on / issuance costs associated with redeemed preferred stock. In addition, we believe EBITDA and Adjusted EBITDA are frequently used by securities analysts, investors and other interested parties in the evaluation of REITs. Because EBITDA and Adjusted EBITDA are calculated before recurring cash charges including interest expense and income taxes, exclude capitalized costs, such as leasing commissions, and are not adjusted for capital expenditures or other recurring cash requirements of our business, their utility as a measure of our performance is limited. Other REITs may calculate EBITDA and Adjusted EBITDA differently than we do and, accordingly, our EBITDA and Adjusted EBITDA may not be comparable to other REITs’ EBITDA and Adjusted EBITDA. Accordingly, EBITDA and Adjusted EBITDA should be considered only as supplements to net income computed in accordance with GAAP as a measure of our financial performance.
33
Net Operating Income (NOI) and Cash NOI:
Net operating income, or NOI, represents rental revenue, tenant reimbursement revenue and interconnection revenue less utilities expense, rental property operating expenses, property taxes and insurance expenses (as reflected in the statement of operations). NOI is commonly used by stockholders, company management and industry analysts as a measurement of operating performance of the company’s rental portfolio. Cash NOI is NOI less straight-line rents and above- and below-market rent amortization. Cash NOI is commonly used by stockholders, company management and industry analysts as a measure of property operating performance on a cash basis. However, because NOI and cash NOI exclude depreciation and amortization and capture neither the changes in the value of our data centers that result from use or market conditions, nor the level of capital expenditures and capitalized leasing commissions necessary to maintain the operating performance of our data centers, all of which have real economic effect and could materially impact our results from operations, the utility of NOI and cash NOI as measures of our performance is limited. Other REITs may calculate NOI and cash NOI differently than we do and, accordingly, our NOI and cash NOI may not be comparable to other REITs’ NOI and cash NOI. NOI and cash NOI should be considered only as supplements to net income computed in accordance with GAAP as measures of our performance.
Additional Definitions
Net debt-to-Adjusted EBITDA ratio is calculated using total debt at balance sheet carrying value, plus capital lease obligations, plus our share of unconsolidated JV debt, less unrestricted cash and cash equivalents (including our share of unconsolidated JV cash) divided by the product of Adjusted EBITDA (inclusive of our share of unconsolidated JV EBITDA) multiplied by four.
Debt-plus-preferred-to-total enterprise value is mortgage debt and other loans plus preferred stock divided by mortgage debt and other loans plus the liquidation value of preferred stock and the market value of outstanding Digital Realty Trust, Inc. common stock and Digital Realty Trust, L.P. units, assuming the redemption of Digital Realty Trust, L.P. units for shares of Digital Realty Trust, Inc. common stock.
Fixed charge coverage ratio is Adjusted EBITDA divided by the sum of GAAP interest expense, capitalized interest, scheduled debt principal payments and preferred dividends. For the quarter ended June 30, 2022, GAAP interest expense was $69 million, capitalized interest was $14 million and scheduled debt principal payments and preferred dividends was $10 million.
Reconciliation of Net Operating Income (NOI) | | Three Months Ended | | | Six Months Ended | |||||||||||
(in thousands) |
| 30-Jun-22 |
| 31-Mar-21 |
| 30-Jun-21 |
|
| 30-Jun-22 |
| 30-Jun-21 | |||||
| |
| | |
| | |
| | | |
| | |
| |
Operating income | | | $170,371 | | | $141,236 | | | $185,627 | | | | $311,607 | | | $378,146 |
| | | | | | | | | | | | | | | | |
Fee income | | | (5,072) | | | (5,757) | | | (3,628) | | | | (10,829) | | | (6,054) |
Other income | | | (2,713) | | | (15) | | | (165) | | | | (2,728) | | | (224) |
Depreciation and amortization | | | 376,967 | | | 382,132 | | | 368,981 | | | | 759,099 | | | 738,714 |
General and administrative | | | 101,991 | | | 96,435 | | | 94,956 | | | | 198,426 | | | 192,524 |
Severance, equity acceleration, and legal expenses | | | 3,786 | | | 2,077 | | | 2,536 | | | | 5,863 | | | 4,963 |
Transaction expenses | | | 13,586 | | | 11,968 | | | 7,075 | | | | 25,554 | | | 21,195 |
Other expenses | | | 70 | | | 7,657 | | | 2,298 | | | | 7,727 | | | 2,041 |
| | | | | | | | | | | | | | | | |
Net Operating Income | | | $658,986 | | | $635,734 | | | $657,680 | | | | $1,294,720 | | | $1,331,304 |
| | | | | | | | | | | | | | | | |
| | | | | | | | | | | | | | | | |
Cash Net Operating Income (Cash NOI) | | |
| | |
| | |
| | | |
| | |
|
| | | | | | | | | | | | | | | | |
Net Operating Income | | | $658,986 | | | $635,734 | | | $657,680 | | | | $1,294,720 | | | $1,331,304 |
| | | | | | | | | | | | | | | | |
Straight-line rental revenue | | | (14,105) | | | (6,530) | | | (17,127) | | | | (20,635) | | | (35,734) |
Straight-line rental expense | | | (2,609) | | | 3,646 | | | 7,069 | | | | 1,037 | | | 13,819 |
Above- and below-market rent amortization | | | 196 | | | 335 | | | 1,857 | | | | 531 | | | 3,994 |
| | | | | | | | | | | | | | | | |
Cash Net Operating Income | | | $642,468 | | | $633,185 | | | $649,480 | | | | $1,275,653 | | | $1,313,383 |
34
This document contains forward-looking statements within the meaning of the federal securities laws, which are based on current expectations, forecasts and assumptions that involve risks and uncertainties that could cause actual outcomes and results to differ materially. Such forward-looking statements include statements relating to: our economic outlook, our expected investment and expansion activity, our expected physical settlement of the forward sale agreements and use of proceeds from any such settlement, our liquidity, our joint ventures, supply and demand for data center and colocation space, our acquisition and disposition activity, pricing and net effective leasing economics, market dynamics and data center fundamentals, our strategic priorities, our product offerings, available inventory rent from leases that have been signed but have not yet commenced and other contracted rent to be received in future periods, rental rates on future leases, lag between signing and commencement, cap rates and yields, investment activity, the company’s FFO, core FFO and net income, 2022 outlook and underlying assumptions, information related to trends, our strategy and plans, leasing expectations, weighted average lease terms, the exercise of lease extensions, lease expirations, debt maturities, annualized rent at expiration of leases, the effect new leases and increases in rental rates will have on our rental revenue, our credit ratings, construction and development activity and plans, projected construction costs, estimated yields on investment, expected occupancy, expected square footage and IT load capacity upon completion of development projects, 2022 backlog NOI, NAV components, and other forward-looking financial data. Such statements are based on management’s beliefs and assumptions made based on information currently available to management. Such statements are subject to risks, uncertainties and assumptions and are not guarantees of future performance and may be affected by known and unknown risks, trends, uncertainties and factors that are beyond our control. Should one or more of these risks or uncertainties materialize, or should underlying assumptions prove incorrect, actual results may vary materially from those anticipated, estimated or projected. Some of the risks and uncertainties that may cause our actual results, performance or achievements to differ materially from those expressed or implied by forward-looking statements include, among others, the following:
| ● | reduced demand for data centers or decreases in information technology spending; |
| ● | increased competition or available supply of data center space; |
| ● | decreased rental rates, increased operating costs or increased vacancy rates; |
| ● | the suitability of our data centers and data center infrastructure, delays or disruptions in connectivity or availability of power, or failures or breaches of our physical and information security infrastructure or services; |
| ● | our dependence upon significant customers, bankruptcy or insolvency of a major customer or a significant number of smaller customers, or defaults on or non-renewal of leases by customers; |
| ● | our ability to attract and retain customers; |
| ● | breaches of our obligations or restrictions under our contracts with our customers; |
| ● | our inability to successfully develop and lease new properties and development space, and delays or unexpected costs in development of properties; |
| ● | the impact of current global and local economic, credit and market conditions; |
| ● | our inability to retain data center space that we lease or sublease from third parties; |
| ● | global supply chain or procurement disruptions, or increased supply chain costs; |
| ● | information security and data privacy breaches; |
| ● | difficulty managing an international business and acquiring or operating properties in foreign jurisdictions and unfamiliar metropolitan areas; |
| ● | our failure to realize the intended benefits from, or disruptions to our plans and operations or unknown or contingent liabilities related to, our recent acquisitions; |
| ● | our failure to successfully integrate and operate acquired or developed properties or businesses; |
| ● | difficulties in identifying properties to acquire and completing acquisitions; |
| ● | risks related to joint venture investments, including as a result of our lack of control of such investments; |
| ● | risks associated with using debt to fund our business activities, including re-financing and interest rate risks, our failure to repay debt when due, adverse changes in our credit ratings or our breach of covenants or other terms contained in our loan facilities and agreements; |
| ● | our failure to obtain necessary debt and equity financing, and our dependence on external sources of capital; |
| ● | financial market fluctuations and changes in foreign currency exchange rates; |
| ● | adverse economic or real estate developments in our industry or the industry sectors that we sell to, including risks relating to decreasing real estate valuations and impairment charges and goodwill and other intangible asset impairment charges; |
| ● | our inability to manage our growth effectively; |
| ● | losses in excess of our insurance coverage; |
| ● | our inability to attract and retain talent; |
| ● | impact on our operations and on the operations of our customers, suppliers and business partners during a pandemic, such as COVID-19; |
| ● | environmental liabilities, risks related to natural disasters and our inability to achieve our sustainability goals; |
| ● | our inability to comply with rules and regulations applicable to our company; |
| ● | Digital Realty Trust, Inc.’s failure to maintain its status as a REIT for federal income tax purposes; |
| ● | Digital Realty Trust, L.P.’s failure to qualify as a partnership for federal income tax purposes; |
| ● | restrictions on our ability to engage in certain business activities; |
| ● | changes in local, state, federal and international laws and regulations, including related to taxation, real estate and zoning laws, and increases in real property tax rates; and |
| ● | the impact of any financial, accounting, legal or regulatory issues or litigation that may affect us. |
The risks included here are not exhaustive, and additional factors could adversely affect our business and financial performance. Several additional material risks are discussed in our annual report on Form 10-K for the year ended December 31, 2021 and other filings with the U.S. Securities and Exchange Commission. Those risks continue to be relevant to our performance and financial condition. Moreover, we operate in a very competitive and rapidly changing environment. New risk factors emerge from time to time and it is not possible for management to predict all such risk factors, nor can it assess the impact of all such risk factors on the business or the extent to which any factor, or combination of factors, may cause actual results to differ materially from those contained in any forward-looking statements. We expressly disclaim any responsibility to update forward-looking statements, whether as a result of new information, future events or otherwise. Digital Realty, Digital Realty Trust, the Digital Realty logo, Interxion, Turn-Key Flex, Powered Base Building, and PlatformDIGITAL, Data Gravity Index and Data Gravity Index DGx are registered trademarks and service marks of Digital Realty Trust, Inc. in the United States and/or other countries. All other names, trademarks and service marks are the property of their respective owners.
35