0001295947-14-000019.txt : 20140807 0001295947-14-000019.hdr.sgml : 20140807 20140807060618 ACCESSION NUMBER: 0001295947-14-000019 CONFORMED SUBMISSION TYPE: 8-K PUBLIC DOCUMENT COUNT: 30 CONFORMED PERIOD OF REPORT: 20140807 ITEM INFORMATION: Results of Operations and Financial Condition ITEM INFORMATION: Regulation FD Disclosure ITEM INFORMATION: Financial Statements and Exhibits FILED AS OF DATE: 20140807 DATE AS OF CHANGE: 20140807 FILER: COMPANY DATA: COMPANY CONFORMED NAME: Prestige Brands Holdings, Inc. CENTRAL INDEX KEY: 0001295947 STANDARD INDUSTRIAL CLASSIFICATION: PHARMACEUTICAL PREPARATIONS [2834] IRS NUMBER: 201297589 FISCAL YEAR END: 0331 FILING VALUES: FORM TYPE: 8-K SEC ACT: 1934 Act SEC FILE NUMBER: 001-32433 FILM NUMBER: 141021633 BUSINESS ADDRESS: STREET 1: 660 WHITE PLAINS RD. CITY: TARRYTOWN STATE: NY ZIP: 10591 BUSINESS PHONE: (914) 524-6800 MAIL ADDRESS: STREET 1: 660 WHITE PLAINS RD. CITY: TARRYTOWN STATE: NY ZIP: 10591 FORMER COMPANY: FORMER CONFORMED NAME: Prestige Household Brands, Inc. DATE OF NAME CHANGE: 20040630 8-K 1 a8-kpressreleaseaugust72014.htm 8-K 8-K Press Release August 7, 2014


UNITED STATES
SECURITIES AND EXCHANGE COMMISSION
Washington, D.C. 20549
_______________________
 
FORM 8-K
 
CURRENT REPORT
 
Pursuant to Section 13 or 15(d) of the Securities Exchange Act of 1934
 
Date of Report (Date of earliest event reported): August 7, 2014

 
PRESTIGE BRANDS HOLDINGS, INC.
(Exact name of registrant as specified in its charter)
 
Delaware
 
001-32433
 
20-1297589
(State or other jurisdiction of incorporation)
 
(Commission File Number)
 
(IRS Employer Identification No.)

 
660 White Plains Road, Tarrytown, New York 10591
(Address of principal executive offices, including Zip Code)
 
(914) 524-6800
(Registrant's telephone number, including area code)
 
Check the appropriate box below if the Form 8-K filing is intended to simultaneously satisfy the filing obligation of the registrant under any of the following provisions:
 
[ ] Written communications pursuant to Rule 425 under the Securities Act (17 CFR 230.425)
 
[ ] Soliciting material pursuant to Rule 14a-12 under the Exchange Act (17 CFR 240.14a-12)
 
[ ] Pre-commencement communications pursuant to Rule 14d-2(b) under the Exchange Act (17 CFR 240.14d-2(b))
 
[ ] Pre-commencement communications pursuant to Rule 13e-4(c) under the Exchange Act (17 CFR 240.13e-4(c))


Item 2.02 Results of Operations and Financial Condition.
 
On August 7, 2014, Prestige Brands Holdings, Inc. (the “Company”) announced financial results for the fiscal quarter ended June 30, 2014. A copy of the press release announcing the Company's earnings results for the fiscal quarter ended June 30, 2014 is attached hereto as Exhibit 99.1 and incorporated herein by reference.
 

Item 7.01. Regulation FD Disclosure.
 
The information set forth in Item 2.02 above is incorporated by reference as if fully set forth herein.

On August 7, 2014, representatives of the Company began making presentations to investors regarding the Company's financial results for the quarter ended June 30, 2014 using slides containing the information attached to this Current Report on Form 8-K as Exhibit 99.2 (the “Investor Presentation”) and incorporated herein by reference.  The Company expects to use the Investor Presentation, in whole or in part, and possibly with modifications, in connection with presentations to investors, analysts and others during the fiscal year ended March 31, 2015.
 
By filing this Current Report on Form 8-K and furnishing the information contained herein, the Company makes no admission as to the materiality of any information in this report that is required to be disclosed solely by reason of Regulation FD.
 
The information contained in the Investor Presentation is summary information that is intended to be considered in the context of the Company's Securities and Exchange Commission (“SEC”) filings and other public announcements that the Company may make, by press release or otherwise, from time to time.  The Company undertakes no duty or obligation to publicly update or revise the information contained in this report, although it may do so from time to time as its management believes is warranted.  Any such updating may be made through the filing of other reports or documents with the SEC, through press releases or through other public disclosure.

The information presented in Items 2.02 and 7.01 of this Current Report on Form 8-K and Exhibits 99.1 and 99.2 shall not be deemed to be “filed” for purposes of Section 18 of the Securities Exchange Act of 1934, as amended (the “Exchange Act”), or otherwise subject to the liabilities of that section, unless the Company specifically states that the information is to be considered “filed” under the Exchange Act or specifically incorporates it by reference into a filing under the Securities Act of 1933, as amended, or the Exchange Act.


Item 9.01 Financial Statements and Exhibits.
 
(d)    Exhibits.
 
See Exhibit Index immediately following the signature page.


SIGNATURES
 
Pursuant to the requirements of the Securities Exchange Act of 1934, the registrant has duly caused this report to be signed on its behalf by the undersigned hereunto duly authorized.
 
 
Dated: August 7, 2014
PRESTIGE BRANDS HOLDINGS, INC.


By:
/s/ Ronald M. Lombardi


Name: Ronald M. Lombardi


Title: Chief Financial Officer


EXHIBIT INDEX
 
Exhibit
 
Description


99.1
 
Press Release dated August 7, 2014 announcing the Company's financial results for the fiscal quarter ended June 30, 2014 (furnished only).
99.2
 
Investor Relations Slideshow in use beginning August 7, 2014 (furnished only).


EX-99.1 2 exhibit991fy15-q1earningsr.htm PRESS RELEASE Exhibit 99.1 FY15-Q1 Earnings Release Exhibit


Exhibit 99.1


Prestige Brands Holdings, Inc. Reports First Quarter Fiscal 2015 Revenues of $145.7 Million Up 2.2%: Outlook Reaffirmed for Fiscal Year 2015


Tarrytown, NY-(Business Wire)-August 7, 2014-Prestige Brands Holdings, Inc. (NYSE-PBH) today announced results for the first quarter of fiscal year 2015, which ended June 30, 2014, and reconfirmed the outlook for the fiscal year previously provided for revenues, adjusted earnings per share and free cash flow.

Revenues for the first quarter of fiscal 2015 were $145.7 million, an increase of 2.2% over the prior year comparable quarter’s revenues of $142.5 million. Reported net income for the first quarter of fiscal 2015 was $16.7 million, or $0.32 per diluted share, which was 19.1% lower than the prior year comparable quarter’s results of $20.7 million, or $0.40 per diluted share. Net income for the first quarter of fiscal 2015 would have been $21.5, million or $0.41 per diluted share, excluding adjustments of $4.8 million related to the acquisitions of Care Pharmaceuticals and the Hydralyte brand. Net income for the first quarter of fiscal 2014 would have been $21.1 million, excluding $0.4 million of adjustments related to the acquisition of Care Pharmaceuticals, with no effect on diluted earnings per share.

Revenues for the combined North American and International Over-The-Counter Healthcare (OTC) segments were $124.2 million for the first quarter of fiscal 2015, which was 1.3% higher than the prior year comparable quarter's revenues of $122.5 million. Revenues for the Household Cleaning segment, which represent approximately 14.8% of overall Company revenues and 7.5% of contribution margin, were $21.5 million for the first quarter of fiscal 2015, an increase of 7.7% over the prior year comparable quarter's revenues of $20.0 million.


Commentary & Outlook
“We are very pleased with our financial performance, highlighted by first quarter net revenue growth of 2.2% in a challenging retail environment,” said Matthew M. Mannelly, President and CEO. “Strengthening consumption trends in the first quarter have positioned the Company well to meet our financial goals for the full fiscal year. The acquisition of Hydralyte closed on April 30th, and our team is now integrating that brand into Care Pharmaceuticals' growing portfolio.”

“The acquisition of Insight Pharmaceuticals announced in April is proceeding as planned with an anticipated closing by the end of the second fiscal quarter, pending regulatory approval,” he said. “This strategic acquisition will be the largest in our history, and we believe it will add meaningfully to long-term value creation for our shareholders. The acquisition of Insight will add a compelling platform of scale in the feminine care category to the Prestige portfolio, led by Monistat, a $100 million brand with the leading market position.”

Mr. Mannelly continued, “With one quarter of results under our belt, we believe the Company is on track to meet the outlook previously provided. For the full fiscal year, we are reconfirming our revenue growth projection to be in the range of 15% to 18%. In addition, we expect fiscal 2015 adjusted earnings per share in the range of $1.75 to $1.85. Our industry-leading free cash flow is expected to be very strong for the fiscal year, totaling approximately $150 million, which will enable the Company to rapidly de-lever and to provide flexibility in brand building,” he said.
 
Free Cash Flow & Debt
The Company's record free cash flow for the quarter ended June 30, 2014 was $29.2 million, an increase of $7.8 million over the prior year comparable quarter's free cash flow of $21.4 million. On a per share


basis, free cash flow for the quarter ended June 30, 2014 was $0.56 per diluted share compared to $0.41 per diluted share for the quarter ended June 30, 2013.

The Company's net debt at June 30, 2014 was approximately $956.8 million, an increase of $47.7 million compared to March 31, 2014, primarily as a result of the net borrowing associated with the acquisition of the Hydralyte brand, which was completed on April 30, 2014. At June 30, 2014, the Company's covenant-defined leverage ratio was approximately 4.6.

The Company also announced that it will initiate financing on August 7, 2014 in connection with its anticipated acquisition of Insight Pharmaceuticals. The transaction is expected to close by the end of the second quarter, pending regulatory approval. As part of the process of obtaining the necessary regulatory approval and in connection with the closing of the acquisition of Insight Pharmaceuticals, the Company expects to divest a small gastrointestinal brand owned by Insight.

Q1 Conference Call & Accompanying Slide Presentation
The Company will host a conference call to review its first quarter results on August 7, 2014 at 8:30 am EDT. The toll-free dial-in numbers are 866-383-8009 within North America and 617-597-5342 outside of North America. The conference pass code is "prestige". The Company will provide a live Internet webcast, a slide presentation to accompany the call, as well as an archived replay, all of which can be accessed from the Investor Relations page of the Company's website at http://prestigebrands.com. The slide presentation can be accessed just before the call from the Investor Relations page of the website by clicking on Webcasts and Presentations. Telephonic replays will be available for two weeks following the completion of the call and can be accessed at 888-286-8010 within North America and at 617-801-6888 from outside North America. The pass code is 77378443.


Non-GAAP Financial Information
In addition to financial results reported in accordance with generally accepted accounting principles (GAAP), we have provided certain non-GAAP financial information in this release to aid investors in understanding the Company's performance. Each non-GAAP financial measure is defined and reconciled to its most closely related GAAP financial measure in the “About Non-GAAP Financial Measures” section at the end of this earnings release.

About Prestige Brands Holdings, Inc.
The Company markets and distributes brand name over-the-counter and household cleaning products throughout the U.S., Canada, Australia and in certain other international markets. Core brands include Chloraseptic® sore throat treatments, Clear Eyes® eye care products, Compound W® wart treatments, The Doctor's® NightGuard® dental protector, the Little Remedies® and PediaCare® lines of pediatric over-the-counter products, Efferdent® denture care products, Luden's® throat drops, Dramamine® motion sickness treatment, BC® and Goody's® pain relievers, Beano® gas prevention, Debrox® earwax remover, and Gaviscon® antacid in Canada. Visit the Company's website at www.prestigebrands.com.

Note Regarding Forward-Looking Statements
This news release contains "forward-looking statements" within the meaning of the federal securities laws that are intended to qualify for the safe harbor from liability established by the Private Securities Litigation Reform Act of 1995. "Forward-looking statements" generally can be identified by the use of forward-looking terminology such as "outlook," "goals," "projection," "may," "will," "would," "expect," or "believe”, (or the negative or other derivatives of each of these terms) or similar terminology. The "forward-looking statements" include, without limitation, statements regarding the integration of the Hydralyte brand into Care Pharmaceuticals and the growth of the Care portfolio, the expected closing of the acquisition of Insight Pharmaceuticals, including the related financing and the anticipated results from the acquisition, as well as the expected divestiture of a small brand, the Company's expectations regarding


future operating results including our revenues, adjusted earnings per share, free cash flow and gross margins, the success of our marketing initiatives, and our expectations of rapid de-levering and flexibility in brand building. These statements are based on management's estimates and assumptions with respect to future events and financial performance and are believed to be reasonable, though are inherently uncertain and difficult to predict. Actual results could differ materially from those expected as a result of a variety of factors, including the impact of our advertising and promotional initiatives, general economic and business conditions, competition in our industry, the difficulty of the regulatory approval process or failure to satisfy other closing conditions in connection with the acquisition of Insight Pharmaceuticals and the success of our new product introductions and integration of newly acquired products. A discussion of other factors that could cause results to vary is included in the Company's Annual Report on Form 10-K for the year ended March 31, 2014 and other periodic reports filed with the Securities and Exchange Commission.
Contact: Dean Siegal
914-524-6819


Prestige Brands Holdings, Inc.
Consolidated Statements of Income and Comprehensive Income
(Unaudited)
 
Three Months Ended June 30,
(In thousands, except per share data)
2014
 
2013
Revenues


Net sales
$
144,541

 
$
141,642

Other revenues
1,161

 
870

Total revenues
145,702

 
142,512


Cost of Sales


Cost of sales (exclusive of depreciation shown below)
63,836

 
59,488

Gross profit
81,866

 
83,024


Operating Expenses


Advertising and promotion
19,096

 
18,681

General and administrative
17,006

 
11,634

Depreciation and amortization
2,961

 
3,268

Total operating expenses
39,063

 
33,583

Operating income
42,803

 
49,441


Other (income) expense


Interest income
(32
)
 
(3
)
Interest expense
14,685

 
15,908

Total other expense
14,653

 
15,905

Income before income taxes
28,150

 
33,536

Provision for income taxes
11,418

 
12,844

Net income
$
16,732

 
$
20,692


Earnings per share:


Basic
$
0.32

 
$
0.40

Diluted
$
0.32

 
$
0.40


Weighted average shares outstanding:


Basic
51,956

 
51,222

Diluted
52,533

 
52,040


Comprehensive income, net of tax:


Currency translation adjustments
$
2,726

 
$
1

Total other comprehensive income
2,726

 
1

Comprehensive income
$
19,458

 
$
20,693


Prestige Brands Holdings, Inc.
Consolidated Balance Sheets
(Unaudited)

(In thousands)
Assets
June 30,
2014
 
March 31,
2014
Current assets


Cash and cash equivalents
$
15,675

 
$
28,331

Accounts receivable, net
58,238

 
65,050

Inventories
66,171

 
65,586

Deferred income tax assets
6,118

 
6,544

Prepaid expenses and other current assets
13,895

 
11,674

Total current assets
160,097

 
177,185


Property and equipment, net
10,673

 
9,597

Goodwill
192,632

 
190,911

Intangible assets, net
1,468,172

 
1,394,817

Other long-term assets
22,376

 
23,153

Total Assets
$
1,853,950

 
$
1,795,663


Liabilities and Stockholders' Equity


Current liabilities


Accounts payable
$
45,279

 
$
48,286

Accrued interest payable
9,449

 
9,626

Other accrued liabilities
23,591

 
26,446

Total current liabilities
78,319

 
84,358


Long-term debt


Principal amount
972,500

 
937,500

Less unamortized discount
(2,942
)
 
(3,086
)
Long-term debt, net of unamortized discount
969,558

 
934,414


Deferred income tax liabilities
219,908

 
213,204

Other long-term liabilities
358

 
327

Total Liabilities
1,268,143

 
1,232,303


Stockholders' Equity


Preferred stock - $0.01 par value


Authorized - 5,000 shares


Issued and outstanding - None


Common stock - $0.01 par value


Authorized - 250,000 shares


Issued - 52,209 shares at June 30, 2014 and 52,021 shares at March 31, 2014
522

 
520

Additional paid-in capital
418,488

 
414,387

Treasury stock, at cost - 240 shares at June 30, 2014 and 206 shares at March 31, 2014
(2,545
)
 
(1,431
)
Accumulated other comprehensive loss, net of tax
3,465

 
739

Retained earnings
165,877

 
149,145

Total Stockholders' Equity
585,807

 
563,360

Total Liabilities and Stockholders' Equity
$
1,853,950

 
$
1,795,663


Prestige Brands Holdings, Inc.
Consolidated Statements of Cash Flows
(Unaudited)
 
Three Months Ended June 30,
(In thousands)
2014
 
2013
Operating Activities


Net income
$
16,732

 
$
20,692

Adjustments to reconcile net income to net cash provided by operating activities:


Depreciation and amortization
2,961

 
3,268

Deferred income taxes
7,140

 
6,797

Amortization of deferred financing costs
851

 
892

Stock-based compensation costs
1,858

 
1,193

Amortization of debt discount
144

 
345

(Gain) on sale or disposal of equipment

 
(2
)
Changes in operating assets and liabilities, net of effects of acquisitions


Accounts receivable
6,956

 
11,070

Inventories
1,540

 
(6,716
)
Prepaid expenses and other current assets
(2,203
)
 
187

Accounts payable
(3,096
)
 
(9,147
)
Accrued liabilities
(3,212
)
 
(5,781
)
Net cash provided by operating activities
29,671

 
22,798


Investing Activities


Purchases of property and equipment
(496
)
 
(1,364
)
Proceeds from sale of property and equipment

 
2

Acquisition of the Hydralyte brand
(77,991
)
 

Net cash used in investing activities
(78,487
)
 
(1,362
)


Financing Activities


Repayments under revolving credit agreement
(30,000
)
 
(18,000
)
Borrowings under revolving credit agreement
65,000


Payment of deferred financing costs
(74
)
 
(280
)
Proceeds from exercise of stock options
1,294

 
309

Proceeds from restricted stock exercises
57


Excess tax benefits from share-based awards
950

 
452

Fair value of shares surrendered as payment of tax withholding
(1,171
)
 
(278
)
Net cash provided by (used in) financing activities
36,056

 
(17,797
)


Effects of exchange rate changes on cash and cash equivalents
104

 
(3
)
(Decrease) increase in cash and cash equivalents
(12,656
)
 
3,636

Cash and cash equivalents - beginning of period
28,331

 
15,670

Cash and cash equivalents - end of period
$
15,675

 
$
19,306


Interest paid
$
13,867

 
$
14,826

Income taxes paid
$
707

 
$
657


Prestige Brands Holdings, Inc.
Consolidated Statements of Income
Business Segments
(Unaudited)


Three Months Ended June 30, 2014
(In thousands)
North American OTC
Healthcare
 
International OTC
Healthcare
 
Household
Cleaning
 
Consolidated
Gross segment revenues
$
110,973

 
$
13,692

 
$
20,593

 
$
145,258

Elimination of intersegment revenues
(717
)


(717
)
Third-party segment revenues
110,256

 
13,692

 
20,593

 
144,541

Other revenues
177

 
35

 
949

 
1,161

Total revenues
110,433

 
13,727

 
21,542

 
145,702

Cost of sales
42,340

 
5,078

 
16,418

 
63,836

Gross profit
68,093

 
8,649

 
5,124

 
81,866

Advertising and promotion
16,353

 
2,339

 
404

 
19,096

Contribution margin
$
51,740

 
$
6,310

 
$
4,720

 
62,770

Other operating expenses


19,967

Operating income


42,803

Other expense


14,653

Income before income taxes


28,150

Provision for income taxes


11,418

Net income


$
16,732


Three Months Ended June 30, 2013
(In thousands)
North American OTC
Healthcare
 
International OTC
Healthcare
 
Household
Cleaning
 
Consolidated
Gross segment revenues
$
118,936

 
$
3,414

 
$
19,292

 
$
141,642

Elimination of intersegment revenues


Third-party segment revenues
118,936

 
3,414

 
19,292

 
141,642

Other revenues
150

 
7

 
713

 
870

Total revenues
119,086

 
3,421

 
20,005

 
142,512

Cost of sales
43,546

 
1,465

 
14,477

 
59,488

Gross profit
75,540

 
1,956

 
5,528

 
83,024

Advertising and promotion
17,551

 
263

 
867

 
18,681

Contribution margin
$
57,989

 
$
1,693

 
$
4,661

 
64,343

Other operating expenses


14,902

Operating income


49,441

Other expense


15,905

Income before income taxes


33,536

Provision for income taxes


12,844

Net income


$
20,692


About Non-GAAP Financial Measures
We define Non-GAAP Total Revenues excluding acquisitions and divestitures as Total Revenues excluding revenues associated with products acquired or divested in the periods presented. We define Non-GAAP EBITDA as earnings before interest expense (income), income taxes, depreciation and amortization and Non-GAAP Adjusted EBITDA as earnings before interest expense (income), income taxes, depreciation and amortization, certain other legal and professional fees, and other acquisition-related costs. We define Non-GAAP Adjusted Gross Margin as Gross Profit before inventory step up charges and certain other acquisition and integration-related costs.We define Non-GAAP Adjusted Operating Income as Operating Income minus certain other legal and professional fees, acquisition and other integration costs. We define Non-GAAP Adjusted Net Income as Net Income before inventory step-up charges, certain other legal and professional fees, other acquisition and integration-related costs, the applicable tax impacts associated with these items and the tax impacts of state tax rate adjustments and other non-deductible items. Non-GAAP Adjusted EPS is calculated based on Non-GAAP Adjusted Net Income, divided by the weighted average number of common and potential common shares outstanding during the period. We define Non-GAAP Free Cash Flow as Net Cash provided by operating activities less cash paid for capital expenditures. Non-GAAP Free Cash Flow per Share is calculated based on Non-GAAP Free Cash Flow, divided by the weighted average number of common and potential common shares outstanding during the period. We define Non-GAAP Contribution Margin as Gross Profit less advertising and promotional expenses. Non-GAAP Total Revenues excluding acquisitions and divestitures, Non-GAAP EBITDA, Non-GAAP Adjusted EBITDA, Non-GAAP Contribution Margin, Non-GAAP Adjusted Operating Income, Non-GAAP Adjusted Net Income, Non-GAAP Adjusted EPS, Non-GAAP Free Cash Flow and Non-GAAP Free Cash Flow per Share may not be comparable to similarly titled measures reported by other companies.
We are presenting Non-GAAP Total Revenues excluding acquisitions and divestitures, Non-GAAP EBITDA, Non-GAAP Adjusted EBITDA, Non-GAAP Adjusted Gross Margin, Non-GAAP Contribution Margin, Non-GAAP Adjusted Operating Income, Non-GAAP Adjusted Net Income, Non-GAAP Adjusted EPS, Non-GAAP Free Cash Flow and Non-GAAP Free Cash Flow per Share because they provide additional ways to view our operations, when considered with both our GAAP results and the reconciliation to net income and net cash provided by operating activities, respectively, which we believe provide a more complete understanding of our business than could be obtained absent this disclosure. Each of Non-GAAP Total Revenues excluding acquisitions and divestitures, Non-GAAP EBITDA, Non-GAAP Adjusted EBITDA, Non-GAAP Adjusted Gross Margin, Non-GAAP Contribution Margin, Non-GAAP Adjusted Operating Income, Non-GAAP Adjusted Net Income, Non-GAAP Adjusted EPS, Non-GAAP Free Cash Flow and Non-GAAP Free Cash Flow per Share is presented solely as a supplemental disclosure because (i) we believe it is a useful tool for investors to assess the operating performance of the business without the effect of these items; (ii) we believe that investors will find this data useful in assessing shareholder value; and (iii) we use Non-GAAP Total Revenues excluding acquisitions and divestitures, Non-GAAP EBITDA, Non-GAAP Adjusted EBITDA, Non-GAAP Adjusted Gross Margin, Non-GAAP Contribution Margin, Non-GAAP Adjusted Operating Income, Non-GAAP Adjusted Net Income, Non-GAAP Adjusted EPS, Non-GAAP Free Cash Flow and Non-GAAP Free Cash Flow per Share internally to evaluate the performance of our personnel and also as a benchmark to evaluate our operating performance or compare our performance to that of our competitors. The use of Non-GAAP Total Revenues excluding acquisitions and divestitures, Non-GAAP EBITDA, Non-GAAP Adjusted EBITDA, Non-GAAP Adjusted Gross Margin, Non-GAAP Contribution Margin, Non-GAAP Adjusted Operating Income, Non-GAAP Adjusted Net Income, Non-GAAP Adjusted EPS, Non-GAAP Free Cash Flow and Non-GAAP Free Cash Flow per Share has limitations, and you should not consider these measures in isolation from or as an alternative to GAAP measures such as Operating income, Net income,


and Net cash flow provided by operating activities, or cash flow statement data prepared in accordance with GAAP, or as a measure of profitability or liquidity.

The following tables set forth the reconciliation of Non-GAAP Total Revenues excluding acquisitions and divestitures, Non-GAAP EBITDA, Non-GAAP Adjusted EBITDA, Non-GAAP Adjusted Gross Margin, Non-GAAP Adjusted Operating Income, Non-GAAP Adjusted Net Income, Non-GAAP Adjusted EPS, Non-GAAP Free Cash Flow and Non-GAAP Free Cash Flow per Share, all of which are non-GAAP financial measures, to GAAP Gross Profit, GAAP Operating Income, GAAP Net Income, GAAP Diluted EPS and GAAP Net cash provided by operating activities, our most directly comparable financial measures presented in accordance with GAAP. Non-GAAP Contribution Margin is reconciled in the Business Segments table immediately preceding this "About Non-GAAP Financial Measures" section,

Reconciliation of GAAP Total Revenues to Non-GAAP Total Revenues excluding acquisitions and divestitures:
 
Three Months Ended June 30,
 
2014
 
2013
(In thousands)


GAAP Total Revenues
$
145,702

 
$
142,512

Adjustments: (1)


Care Pharma and Hydralyte revenues
(7,280
)
 

Total adjustments
(7,280
)
 

Non-GAAP Total Revenues excluding acquisitions and divestitures
$
138,422

 
$
142,512

(1) Revenue adjustments relate to our International OTC Healthcare segment


Reconciliation of GAAP Gross Profit to Non-GAAP Adjusted Gross Margin and related Adjusted Gross Margin percentage:
 
Three Months Ended June 30,
 
2014
 
2013
(In thousands)


GAAP Total Revenues
$
145,702

 
$
142,512


GAAP Gross Profit
$
81,866

 
$
83,024

Adjustments:


Inventory step-up charge associated with acquisitions (1)
130


Total adjustments
130


Non-GAAP Adjusted Gross Margin
$
81,996

 
$
83,024

Non-GAAP Adjusted Gross Margin %
56.3
%
 
58.3
%
(1) Inventory step-up charge relates to our International OTC Healthcare segment


Reconciliation of GAAP Operating Income to Non-GAAP Adjusted Operating Income:
 
Three Months Ended June 30,
 
2014
 
2013
(In thousands)


GAAP Operating Income
$
42,803

 
$
49,441

Adjustments:


Inventory step-up charge associated with acquisitions (1)
130


Legal and professional fees associated with acquisitions (2)
1,799

 
583

Stamp/Duty Tax on Australian acquisition (2)
2,940


Integration, transition and other costs associated with acquisitions (2)
411


Total adjustments
5,280

 
583

Non-GAAP Adjusted Operating Income
$
48,083

 
$
50,024

(1) Adjustments relate to our International OTC Healthcare segment
(2) Adjustments relate to G&A expenses

Reconciliation of GAAP Net Income to Non-GAAP Adjusted EBITDA:
 
Three Months Ended June 30,
 
2014
 
2013
(In thousands)


GAAP Net Income
$
16,732

 
$
20,692

Interest expense, net
14,653

 
15,905

Provision for income taxes
11,418

 
12,844

Depreciation and amortization
2,961

 
3,268

Non-GAAP EBITDA:
45,764

 
52,709

Adjustments:


Inventory step-up charge associated with acquisitions (1)
130


Legal and professional fees associated with acquisitions (2)
1,799

 
583

Stamp/Duty Tax on Australian acquisition (2)
2,940


Integration, transition and other costs associated with acquisitions (2)
411


Total adjustments
5,280

 
583

Non-GAAP Adjusted EBITDA
$
51,044

 
$
53,292

(1) Adjustments relate to our International OTC Healthcare segment
(2) Adjustments relate to G&A expenses


Reconciliation of GAAP Net Income to Non-GAAP Adjusted Net Income and related Adjusted Earnings Per Share:
 
Three Months Ended June 30,
 
2014
2014 Adjusted EPS
 
2013
2013 Adjusted EPS
(In thousands)


GAAP Net Income
$
16,732

$
0.32

 
$
20,692

$
0.40

Adjustments:


Inventory step-up charge associated with acquisitions (1)
130


Legal and professional fees associated with acquisitions (2)
1,799

0.03

 
583


Stamp/Duty Tax on Australian acquisition (2)
2,940

0.06


Integration, transition and other costs associated with acquisitions (2)
411

0.01


Tax impact of adjustments
(528
)
(0.01
)


Impact of state tax adjustments


(223
)

Total adjustments
4,752

0.09

 
360


Non-GAAP Adjusted Net Income and Adjusted EPS
$
21,484

$
0.41

 
$
21,052

$
0.40

(1) Adjustments relate to our International OTC Healthcare segment
(2) Adjustments relate to G&A expenses


Reconciliation of GAAP Net Cash Provided by Operating Activities to Non-GAAP Free Cash Flow:
 
Three Months Ended June 30,
 
2014
 
2013
(In thousands)


GAAP Net cash provided by operating activities
$
29,671

 
$
22,798

Additions to property and equipment for cash
(496
)
 
(1,364
)
Non-GAAP Free Cash Flow
$
29,175

 
$
21,434


Non-GAAP Free Cash Flow per Share
$
0.56

 
$
0.41


Reconciliation of GAAP Net Income and EPS to Non-GAAP Free Cash Flow and Non-GAAP Free Cash Flow per Share:
 
Three Months Ended June 30,
 
2014
2014 Free Cash Flow per Share
 
2013
2013 Free Cash Flow per Share
(In thousands)


GAAP Net Income
$
16,732

$
0.32

 
$
20,692

$
0.40

Adjustments:


Adjustments to reconcile net income to net cash provided by operating activities as shown in the Statement of Cash Flows
12,954

0.25

 
12,493

0.24

Changes in operating assets and liabilities, net of effects from acquisitions as shown in the Statement of Cash Flows
(15
)

 
(10,387
)
(0.20
)
Total adjustments
12,939

0.25

 
2,106

0.04

GAAP Net cash provided by operating activities
29,671

0.57

 
22,798

0.44

Purchases of property and equipment
(496
)
(0.01
)
 
(1,364
)
(0.03
)
Non-GAAP Free Cash Flow
$
29,175

$
0.56

 
$
21,434

$
0.41


Guidance for Fiscal Year 2015:

Reconciliation of Projected GAAP EPS to Projected Non-GAAP Adjusted EPS:
 
2015 Projected EPS(a)
 
Low
 
High
Projected FY'15 GAAP EPS
$
1.45

 
$
1.55

Adjustments:


Integration, transition and other costs associated with acquisitions
0.30

 
0.30

Total Adjustments
0.30

 
0.30

Projected FY'15 Non-GAAP Adjusted EPS
$
1.75

 
$
1.85

(a) Assumes anticipated closing of the Insight Pharmaceuticals transaction at the end of the first half of fiscal year 2015.


Reconciliation of Projected GAAP Net cash provided by operating activities to Projected Non-GAAP Free Cash Flow:
 
2015 Projected Free Cash Flow
(In millions)
 
Projected FY'15 GAAP Net cash provided by operating activities
$
136

Projected integration, transition and other costs associated with acquisitions
20

Additions to property and equipment for cash
(6
)
Projected FY'15 Non-GAAP Free Cash Flow
$
150


EX-99.2 3 exhibit992prestigebrands.htm PRESENTATION exhibit992prestigebrands
P R E S T I G E B R A N D S F i r s t Q u a r t e r F ’ 1 5 R e s u l t s 1 Review of First Quarter F’15 Results Matt Mannelly, CEO & President Ron Lombardi, CFO August 7, 2014 Exhibit 99.2

 
P R E S T I G E B R A N D S F i r s t Q u a r t e r F ’ 1 5 R e s u l t s 2 This presentation contains certain “forward-looking” statements within the meaning of the Private Securities Litigation Reform Act of 1995, such as statements about the Company’s growth strategies, competitive position, product development and acquisitions, business trends, creation of shareholder value, ability to integrate the Insight and Hydralyte acquisitions, the timing of closing and the impact of the Insight acquisition, the growth and market position of the Company’s brands, and the Company’s future financial performance. Words such as “continue,” “will,” “expect,” “anticipate,” “likely,” “estimate,” “may,” “should,” “could,” “would,” and similar expressions identify forward-looking statements. Such forward-looking statements represent the Company’s expectations and beliefs and involve a number of known and unknown risks, uncertainties and other factors that may cause actual results to differ materially from those expressed or implied by such forward-looking statements. These factors include, among others, failure to satisfy the closing conditions for the Insight acquisition, the failure to successfully integrate the Insight or Hydralyte businesses or future acquisitions, the failure to successfully commercialize new and enhanced products, the severity of the cough/cold season, general economic and business conditions, competitive pressures, the effectiveness of the Company’s brand building investments, fluctuating foreign exchange rates, and other risks set forth in Part I, Item 1A. Risk Factors in the Company’s Annual Report on Form 10-K for the year ended March 31, 2014. You are cautioned not to place undue reliance on these forward-looking statements, which speak only as of the date this presentation. Except to the extent required by applicable law, the Company undertakes no obligation to update any forward-looking statement contained in this presentation, whether as a result of new information, future events, or otherwise. Safe Harbor Disclosure

 
P R E S T I G E B R A N D S F i r s t Q u a r t e r F ’ 1 5 R e s u l t s 3 Agenda for Today’s Discussion I. First Quarter FY2015: Performance Highlights II. First Quarter FY2015: Financial Overview III. Updated Perspective on the M&A Market IV. FY2015 Outlook and the Road Ahead

 
P R E S T I G E B R A N D S F i r s t Q u a r t e r F ’ 1 5 R e s u l t s 4 I. First Quarter FY2015: Performance Highlights
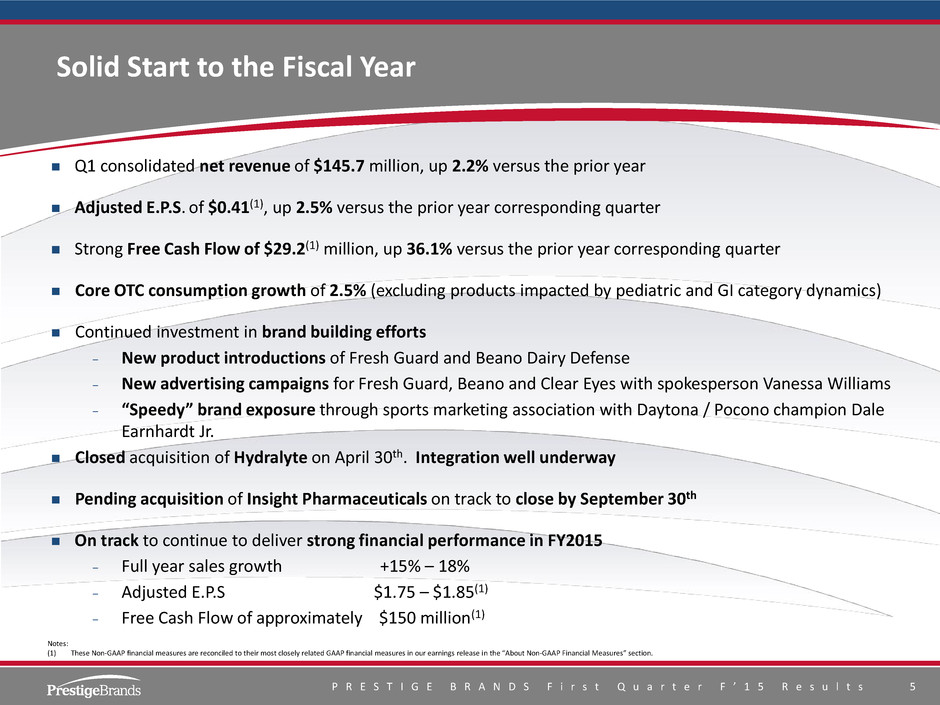

 
P R E S T I G E B R A N D S F i r s t Q u a r t e r F ’ 1 5 R e s u l t s 5 Solid Start to the Fiscal Year  Q1 consolidated net revenue of $145.7 million, up 2.2% versus the prior year  Adjusted E.P.S. of $0.41(1), up 2.5% versus the prior year corresponding quarter  Strong Free Cash Flow of $29.2(1) million, up 36.1% versus the prior year corresponding quarter  Core OTC consumption growth of 2.5% (excluding products impacted by pediatric and GI category dynamics)  Continued investment in brand building efforts − New product introductions of Fresh Guard and Beano Dairy Defense − New advertising campaigns for Fresh Guard, Beano and Clear Eyes with spokesperson Vanessa Williams − “Speedy” brand exposure through sports marketing association with Daytona / Pocono champion Dale Earnhardt Jr.  Closed acquisition of Hydralyte on April 30th. Integration well underway  Pending acquisition of Insight Pharmaceuticals on track to close by September 30th  On track to continue to deliver strong financial performance in FY2015 − Full year sales growth +15% – 18% − Adjusted E.P.S $1.75 – $1.85(1) − Free Cash Flow of approximately $150 million(1) Notes: (1) These Non-GAAP financial measures are reconciled to their most closely related GAAP financial measures in our earnings release in the “About Non-GAAP Financial Measures” section.
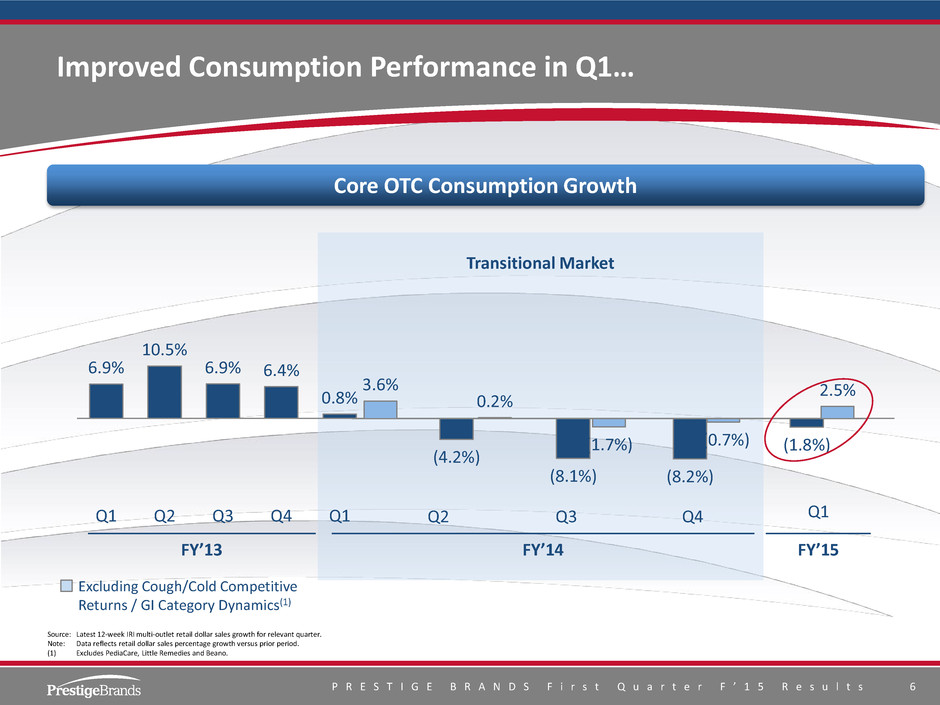

 
P R E S T I G E B R A N D S F i r s t Q u a r t e r F ’ 1 5 R e s u l t s 6 Transitional Market 6.9% 10.5% 6.9% 6.4% 0.8% (4.2%) (8.1%) (8.2%) (1.8%) Q1 Q2 Q3 Q4 Q1 3.6% 0.2% (1.7%) (0.7%) 2.5% Core OTC Consumption Growth Source: Latest 12-week IRI multi-outlet retail dollar sales growth for relevant quarter. Note: Data reflects retail dollar sales percentage growth versus prior period. (1) Excludes PediaCare, Little Remedies and Beano. Excluding Cough/Cold Competitive Returns / GI Category Dynamics(1) FY’13 FY’14 Q2 Q3 Improved Consumption Performance in Q1… FY’15 Q4 Q1
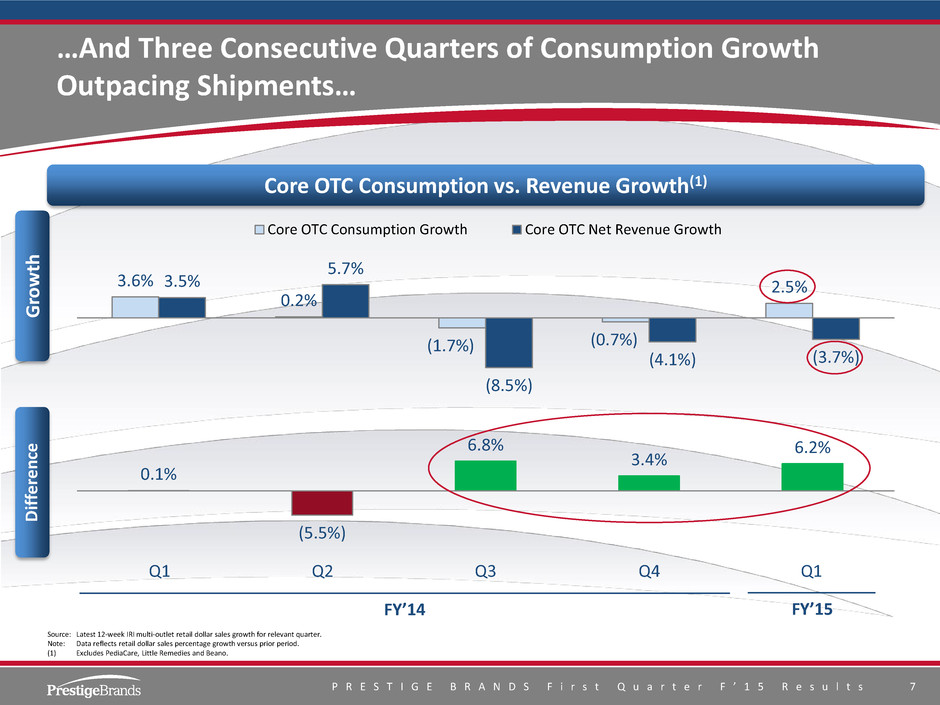

 
P R E S T I G E B R A N D S F i r s t Q u a r t e r F ’ 1 5 R e s u l t s 7 …And Three Consecutive Quarters of Consumption Growth Outpacing Shipments… Source: Latest 12-week IRI multi-outlet retail dollar sales growth for relevant quarter. Note: Data reflects retail dollar sales percentage growth versus prior period. (1) Excludes PediaCare, Little Remedies and Beano. Core OTC Consumption vs. Revenue Growth(1) 3.6% 0.2% (1.7%) (0.7%) 2.5%3.5% 5.7% (8.5%) (4.1%) (3.7%) Core OTC Consumption Growth Core OTC Net Revenue Growth FY’14 FY’15 Q1 Q2 Q3 Q4 Q1 0.1% (5.5%) 6.8% 3.4% 6.2% G rowt h Dif fe ren ce
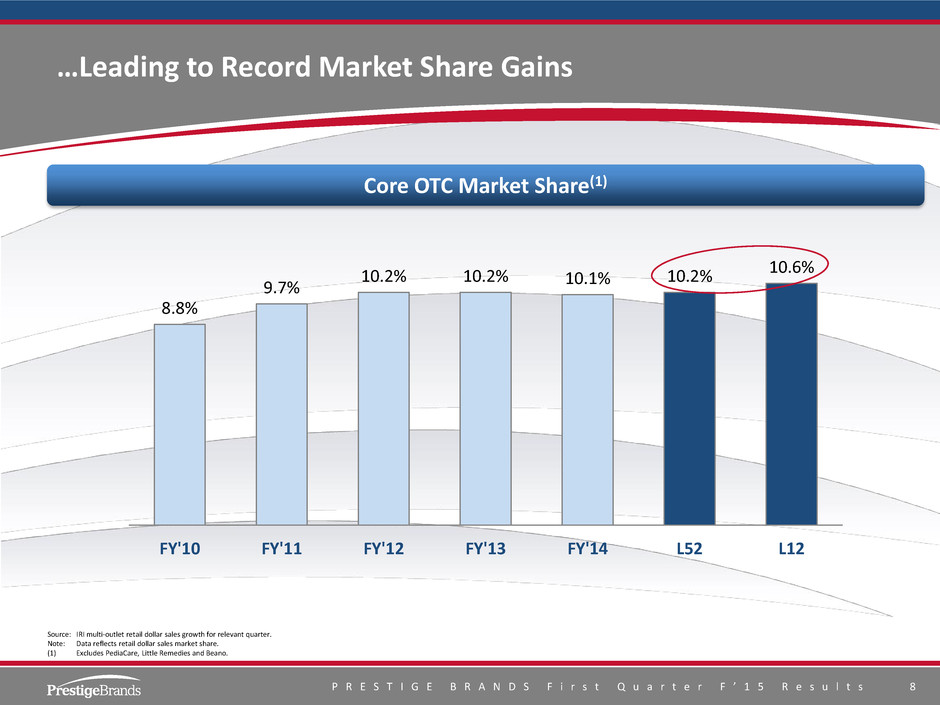

 
P R E S T I G E B R A N D S F i r s t Q u a r t e r F ’ 1 5 R e s u l t s 8 Core OTC Market Share(1) Source: IRI multi-outlet retail dollar sales growth for relevant quarter. Note: Data reflects retail dollar sales market share. (1) Excludes PediaCare, Little Remedies and Beano. …Leading to Record Market Share Gains 8.8% 9.7% 10.2% 10.2% 10.1% 10.2% 10.6% FY'10 FY'11 FY'12 FY'13 FY'14 L52 L12
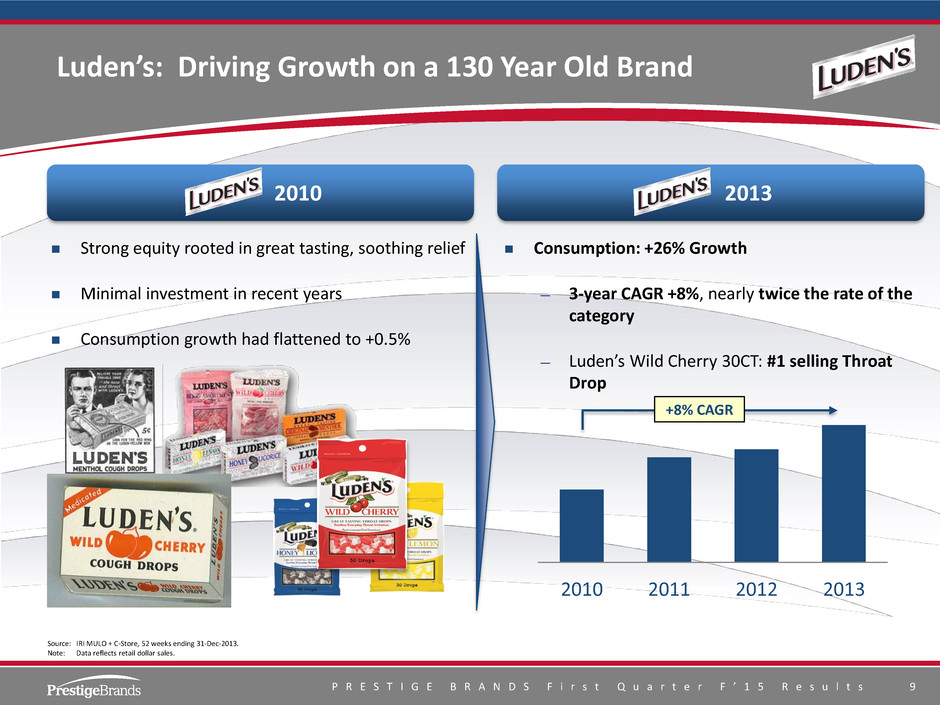

 
P R E S T I G E B R A N D S F i r s t Q u a r t e r F ’ 1 5 R e s u l t s 9 Luden’s: Driving Growth on a 130 Year Old Brand 2010 2013 Source: IRI MULO + C-Store, 52 weeks ending 31-Dec-2013. Note: Data reflects retail dollar sales.  Strong equity rooted in great tasting, soothing relief  Minimal investment in recent years  Consumption growth had flattened to +0.5%  Consumption: +26% Growth — 3-year CAGR +8%, nearly twice the rate of the category — Luden’s Wild Cherry 30CT: #1 selling Throat Drop 2010 2011 2012 2013 +8% CAGR
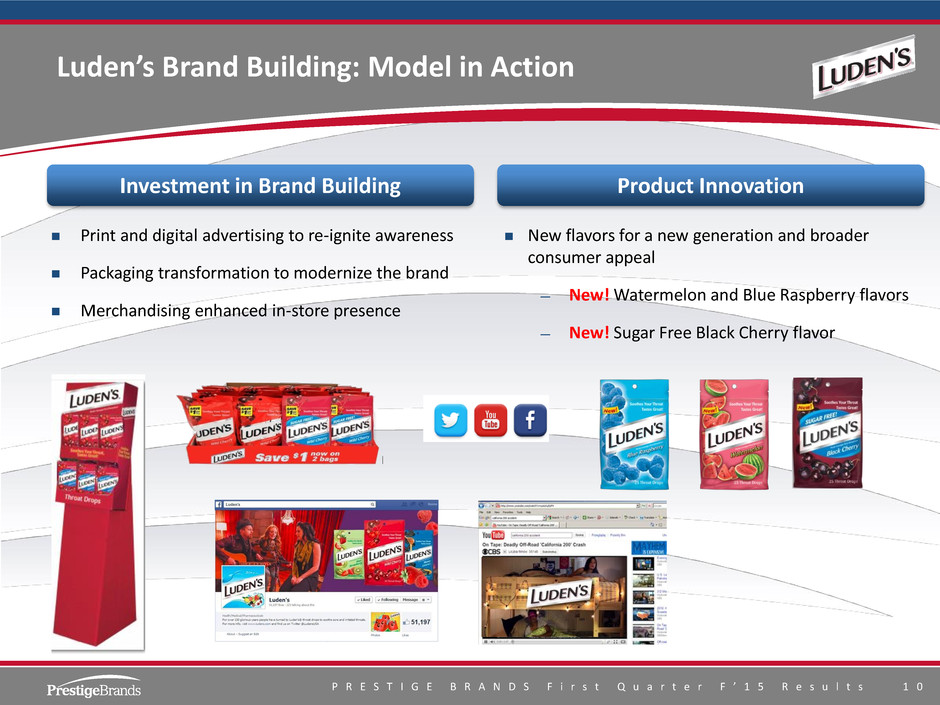

 
P R E S T I G E B R A N D S F i r s t Q u a r t e r F ’ 1 5 R e s u l t s 1 0 Luden’s Brand Building: Model in Action Investment in Brand Building Product Innovation  Print and digital advertising to re-ignite awareness  Packaging transformation to modernize the brand  Merchandising enhanced in-store presence  New flavors for a new generation and broader consumer appeal — New! Watermelon and Blue Raspberry flavors — New! Sugar Free Black Cherry flavor
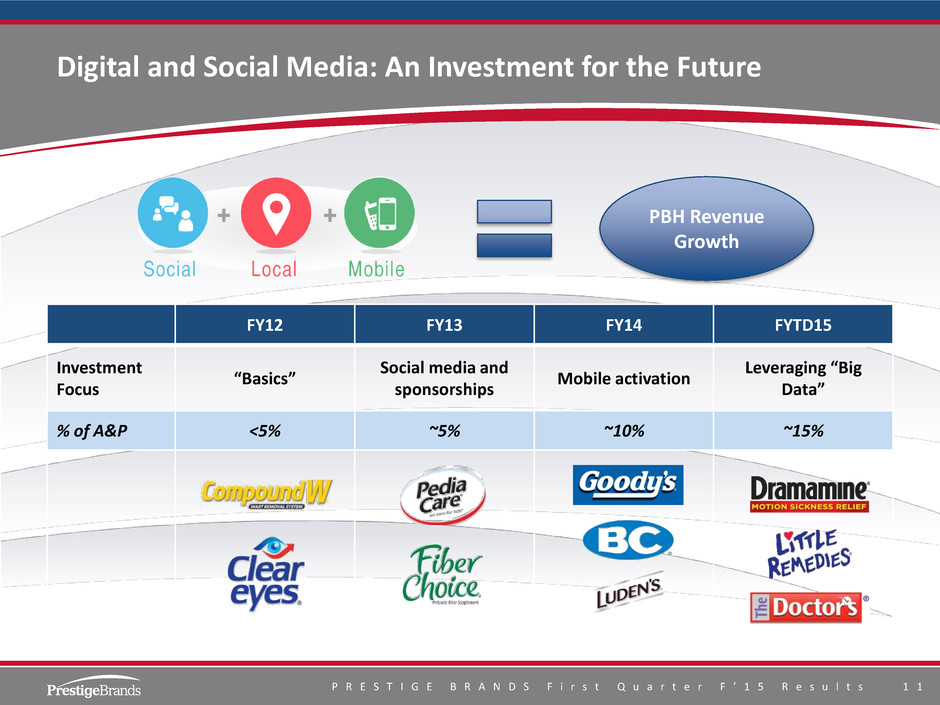

 
P R E S T I G E B R A N D S F i r s t Q u a r t e r F ’ 1 5 R e s u l t s 1 1 FY12 FY13 FY14 FYTD15 Investment Focus “Basics” Social media and sponsorships Mobile activation Leveraging “Big Data” % of A&P <5% ~5% ~10% ~15% PBH Revenue Growth Digital and Social Media: An Investment for the Future
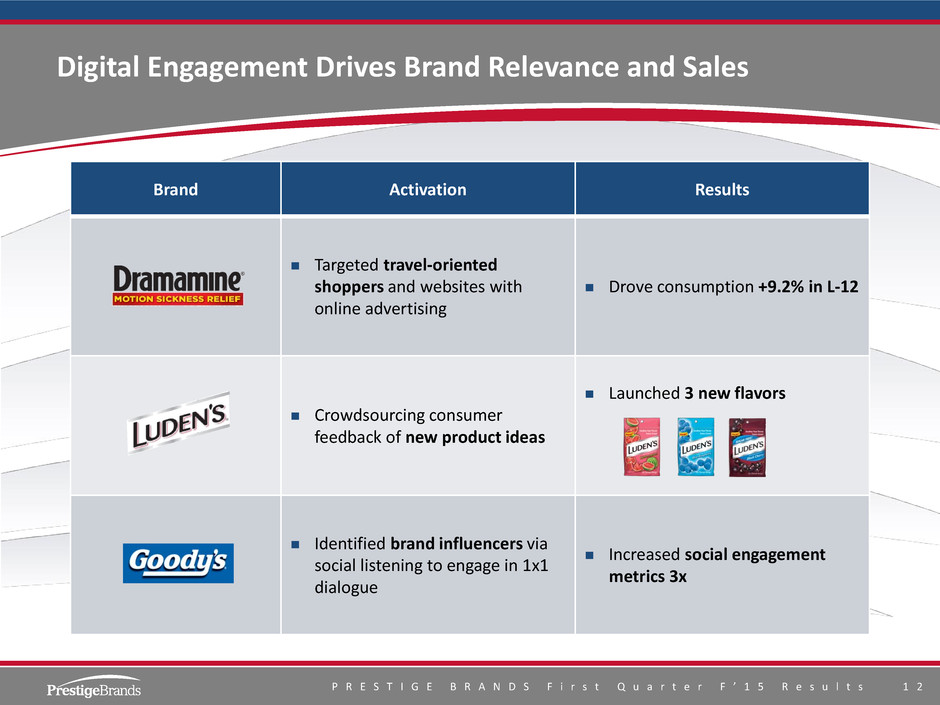

 
P R E S T I G E B R A N D S F i r s t Q u a r t e r F ’ 1 5 R e s u l t s 1 2 Brand Activation Results  Targeted travel-oriented shoppers and websites with online advertising  Drove consumption +9.2% in L-12  Crowdsourcing consumer feedback of new product ideas  Launched 3 new flavors  Identified brand influencers via social listening to engage in 1x1 dialogue  Increased social engagement metrics 3x Digital Engagement Drives Brand Relevance and Sales
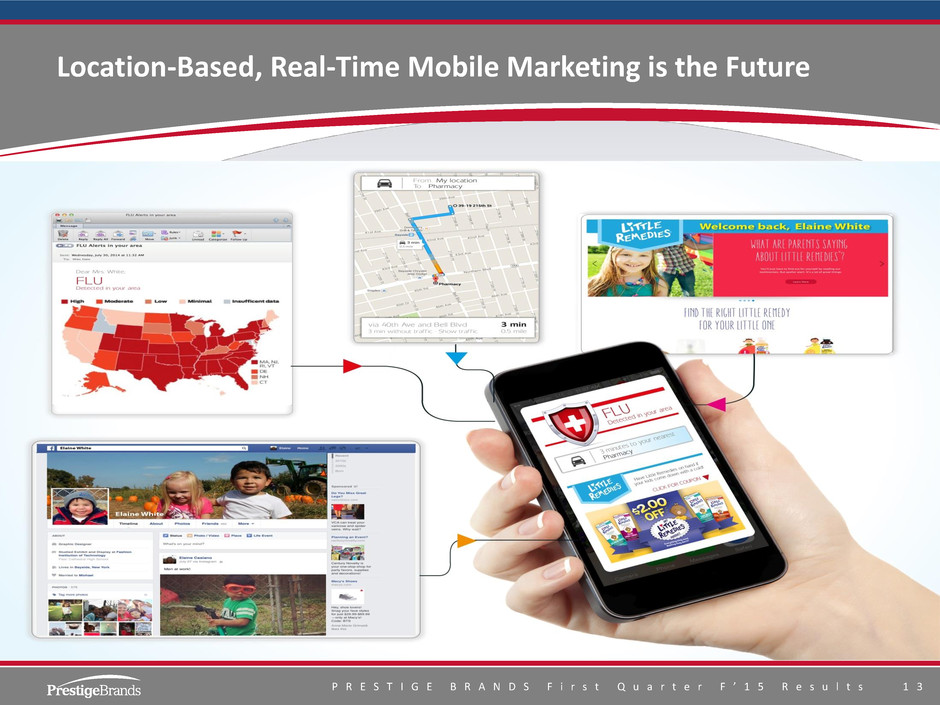

 
P R E S T I G E B R A N D S F i r s t Q u a r t e r F ’ 1 5 R e s u l t s 1 3 Location-Based, Real-Time Mobile Marketing is the Future
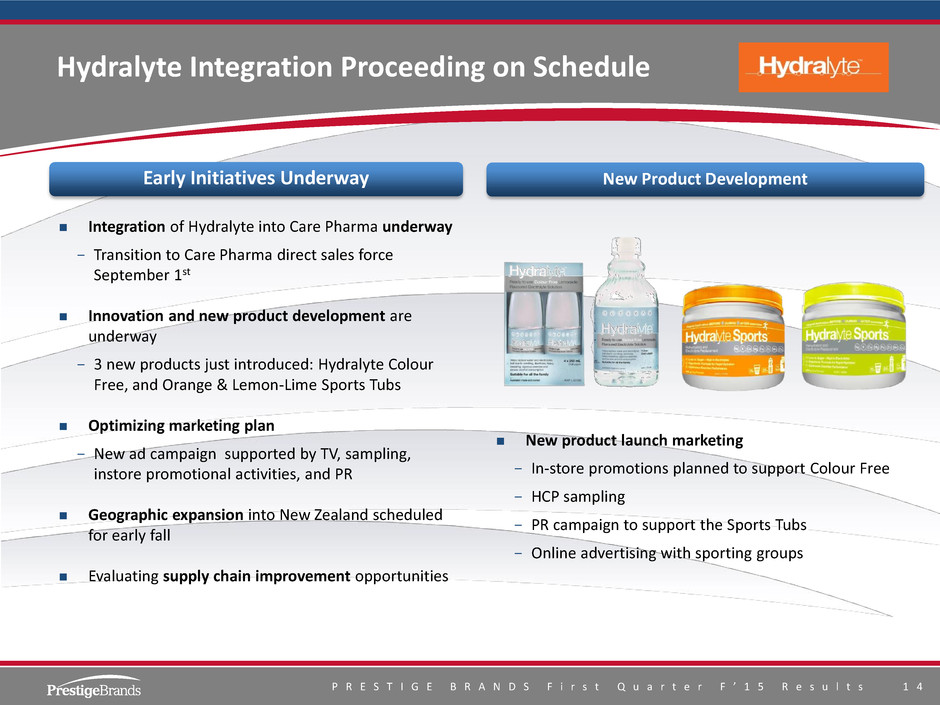

 
P R E S T I G E B R A N D S F i r s t Q u a r t e r F ’ 1 5 R e s u l t s 1 4 Hydralyte Integration Proceeding on Schedule  Integration of Hydralyte into Care Pharma underway − Transition to Care Pharma direct sales force September 1st  Innovation and new product development are underway − 3 new products just introduced: Hydralyte Colour Free, and Orange & Lemon-Lime Sports Tubs  Optimizing marketing plan − New ad campaign supported by TV, sampling, instore promotional activities, and PR  Geographic expansion into New Zealand scheduled for early fall  Evaluating supply chain improvement opportunities Early Initiatives Underway New Product Development  New product launch marketing − In-store promotions planned to support Colour Free − HCP sampling − PR campaign to support the Sports Tubs − Online advertising with sporting groups
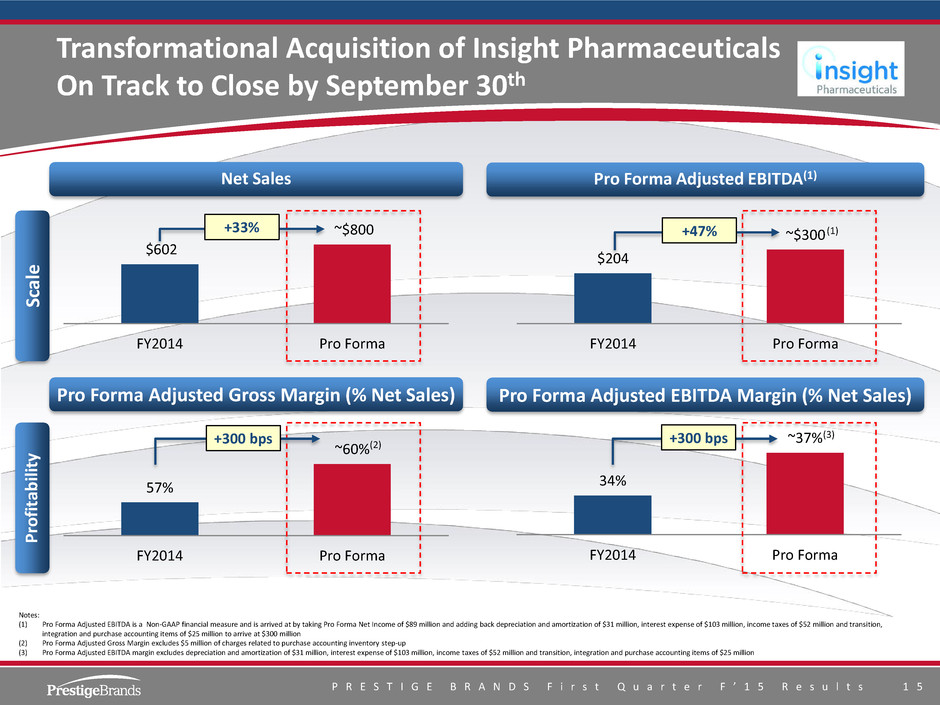

 
P R E S T I G E B R A N D S F i r s t Q u a r t e r F ’ 1 5 R e s u l t s 1 5 Net Sales Pro Forma Adjusted EBITDA(1) Sc al e P rofi ta b ili ty Pro Forma Adjusted Gross Margin (% Net Sales) Pro Forma Adjusted EBITDA Margin (% Net Sales) $602 ~$800 FY2014 Pro Forma 57% ~60% FY2014 Pro Forma 34% ~37% FY2014 Pro Forma +33% $204 ~$300 FY2014 Pro Forma +47% +300 bps +300 bps Notes: (1) Pro Forma Adjusted EBITDA is a Non-GAAP financial measure and is arrived at by taking Pro Forma Net Income of $89 million and adding back depreciation and amortization of $31 million, interest expense of $103 million, income taxes of $52 million and transition, integration and purchase accounting items of $25 million to arrive at $300 million (2) Pro Forma Adjusted Gross Margin excludes $5 million of charges related to purchase accounting inventory step-up (3) Pro Forma Adjusted EBITDA margin excludes depreciation and amortization of $31 million, interest expense of $103 million, income taxes of $52 million and transition, integration and purchase accounting items of $25 million (1) (2) (3) Transformational Acquisition of Insight Pharmaceuticals On Track to Close by September 30th

 
P R E S T I G E B R A N D S F i r s t Q u a r t e r F ’ 1 5 R e s u l t s 1 6 II. First Quarter FY2015: Financial Overview
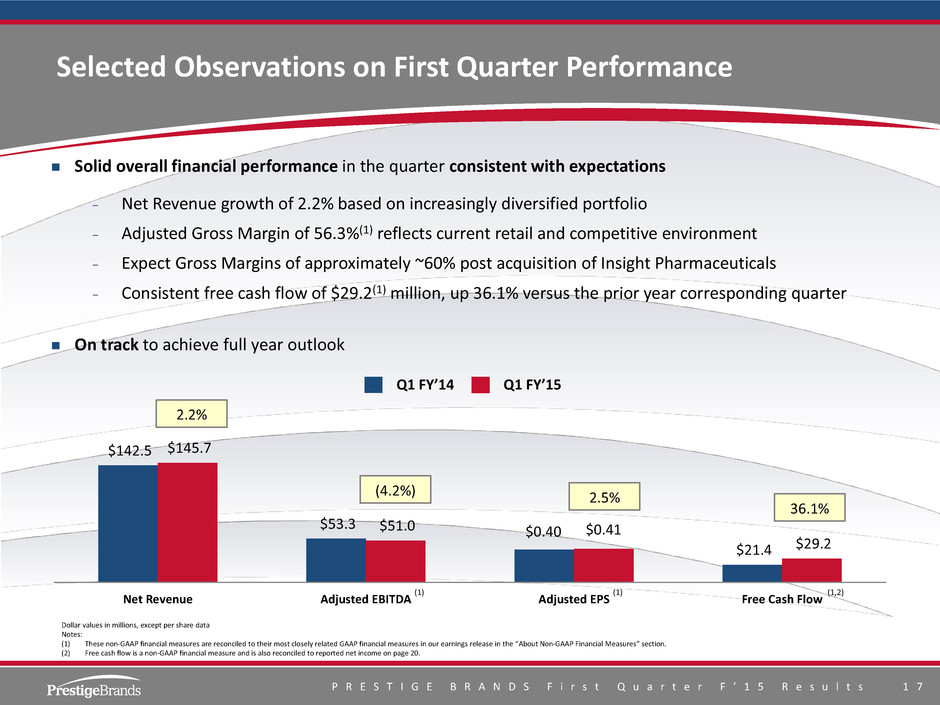

 
P R E S T I G E B R A N D S F i r s t Q u a r t e r F ’ 1 5 R e s u l t s 1 7 Selected Observations on First Quarter Performance  Solid overall financial performance in the quarter consistent with expectations − Net Revenue growth of 2.2% based on increasingly diversified portfolio − Adjusted Gross Margin of 56.3%(1) reflects current retail and competitive environment − Expect Gross Margins of approximately ~60% post acquisition of Insight Pharmaceuticals − Consistent free cash flow of $29.2(1) million, up 36.1% versus the prior year corresponding quarter  On track to achieve full year outlook $142.5 $53.3 $21.4 $145.7 $51.0 $29.2 Net Revenue Adjusted EBITDA Adjusted EPS Free Cash Flow Q1 FY’15Q1 FY’14 2.2% (4.2%) 2.5% 36.1% $0.40 $0.41 (1) (1) (1,2) Dollar values in millions, except per share data Notes: (1) These non-GAAP financial measures are reconciled to their most closely related GAAP financial measures in our earnings release in the “About Non-GAAP Financial Measures” section. (2) Free cash flow is a non-GAAP financial measure and is also reconciled to reported net income on page 20.

 
P R E S T I G E B R A N D S F i r s t Q u a r t e r F ’ 1 5 R e s u l t s 1 8 Selected Observations on First Quarter Performance (Cont’d)  Company announced today its plan to launch financing for the acquisition of Insight Pharmaceuticals − Continue to expect to close transaction by September 30th − Single, minor brand divestiture expected to be required from the FTC and expected to be completed concurrent with closing − Transaction expected to be funded under Term Loan accordion. Pro forma leverage of 5.7x − Rapid deleveraging expected due to unique high free cash flow generation model − Capital structure allows for flexibility to pursue additional acquisition opportunities
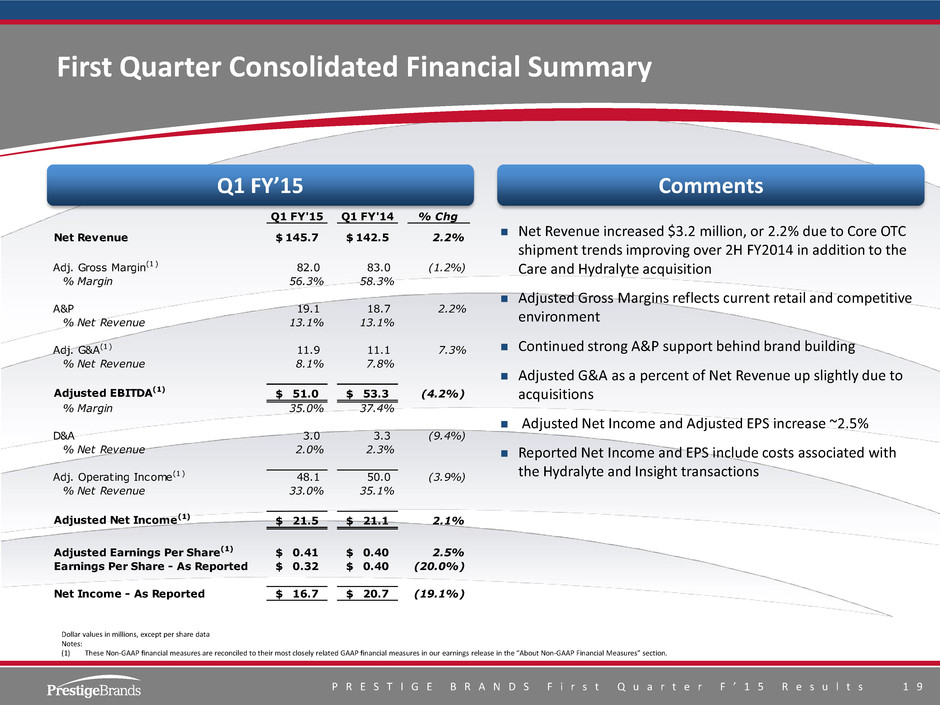

 
P R E S T I G E B R A N D S F i r s t Q u a r t e r F ’ 1 5 R e s u l t s 1 9 Q1 FY'15 Q1 FY'14 % Chg Net Revenue 145.7$ 142.5$ 2.2% Adj. Gross Margin(1) 82.0 83.0 (1.2%) % Margin 56.3% 58.3% A&P 19.1 18.7 2.2% % Net Revenue 13.1% 13.1% Adj. G&A(1) 11.9 11.1 7.3% % Net Revenue 8.1% 7.8% Adjusted EBITDA(1) 51.0$ 53.3$ (4.2%) % Margin 35.0% 37.4% D&A 3.0 3.3 (9.4%) % Net Revenue 2.0% 2.3% Adj. Operating Income(1) 48.1 50.0 (3.9%) % Net Revenue 33.0% 35.1% Adjusted Net Income(1) 21.5$ 21.1$ 2.1% Adjusted Earnings Per Share(1) 0.41$ 0.40$ 2.5% Earnings Per Share - As Reported 0.32$ 0.40$ (20.0%) Net Income - As Reported 16.7$ 20.7$ (19.1%)  Net Revenue increased $3.2 million, or 2.2% due to Core OTC shipment trends improving over 2H FY2014 in addition to the Care and Hydralyte acquisition  Adjusted Gross Margins reflects current retail and competitive environment  Continued strong A&P support behind brand building  Adjusted G&A as a percent of Net Revenue up slightly due to acquisitions  Adjusted Net Income and Adjusted EPS increase ~2.5%  Reported Net Income and EPS include costs associated with the Hydralyte and Insight transactions First Quarter Consolidated Financial Summary Dollar values in millions, except per share data Notes: (1) These Non-GAAP financial measures are reconciled to their most closely related GAAP financial measures in our earnings release in the “About Non-GAAP Financial Measures” section. Q1 FY’15 Comments
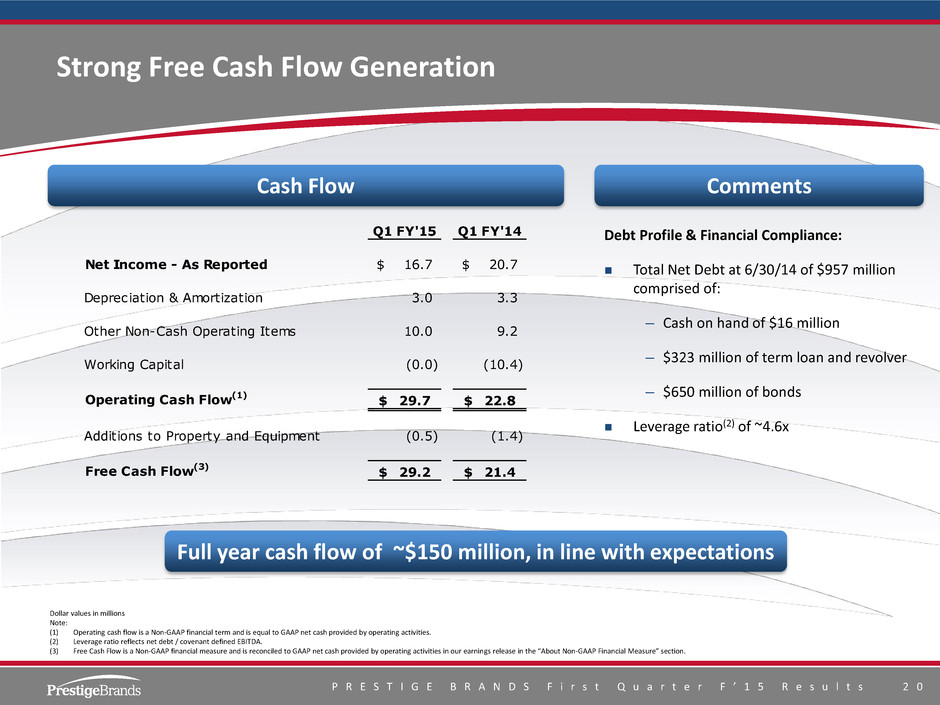

 
P R E S T I G E B R A N D S F i r s t Q u a r t e r F ’ 1 5 R e s u l t s 2 0 Debt Profile & Financial Compliance:  Total Net Debt at 6/30/14 of $957 million comprised of: – Cash on hand of $16 million – $323 million of term loan and revolver – $650 million of bonds  Leverage ratio(2) of ~4.6x Strong Free Cash Flow Generation Dollar values in millions Note: (1) Operating cash flow is a Non-GAAP financial term and is equal to GAAP net cash provided by operating activities. (2) Leverage ratio reflects net debt / covenant defined EBITDA. (3) Free Cash Flow is a Non-GAAP financial measure and is reconciled to GAAP net cash provided by operating activities in our earnings release in the “About Non-GAAP Financial Measure” section. Cash Flow Comments Q1 FY'15 Q1 FY'14 Net Income - As Reported 16.7$ 20.7$ Depreciation & Amortization 3.0 3.3 Other Non-Cash Operating Items 10.0 9.2 Working Capital (0.0) (10.4) Operating Cash Flow(1) 29.7$ 22.8$ Additions to Property a Equipment (0.5) (1.4) Free Cash Flow(3) 29.2$ 21.4$ Full year cash flow of ~$150 million, in line with expectations

 
P R E S T I G E B R A N D S F i r s t Q u a r t e r F ’ 1 5 R e s u l t s 2 1 III. Updated Perspective on the M&A Market
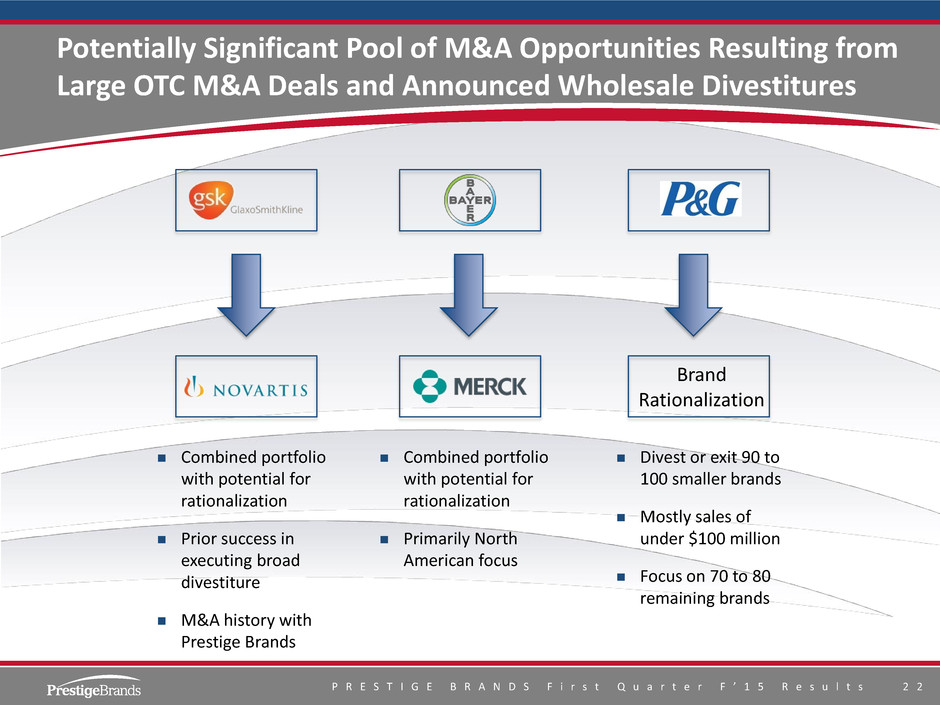

 
P R E S T I G E B R A N D S F i r s t Q u a r t e r F ’ 1 5 R e s u l t s 2 2 Potentially Significant Pool of M&A Opportunities Resulting from Large OTC M&A Deals and Announced Wholesale Divestitures  Divest or exit 90 to 100 smaller brands  Mostly sales of under $100 million  Focus on 70 to 80 remaining brands  Combined portfolio with potential for rationalization  Prior success in executing broad divestiture  M&A history with Prestige Brands  Combined portfolio with potential for rationalization  Primarily North American focus Brand Rationalization
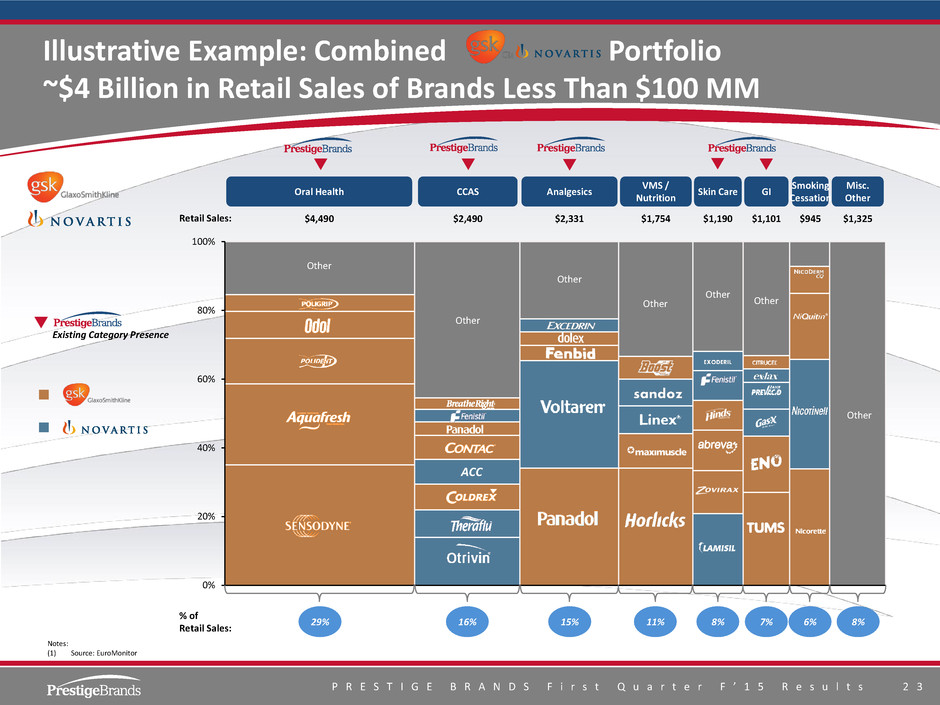

 
P R E S T I G E B R A N D S F i r s t Q u a r t e r F ’ 1 5 R e s u l t s 2 3 Dollar values in millions Source: Euromonitor (2013) 0% 20% 40% 60% 80% 100% Retail Sales: % of Retail Sales: 29% 16% 15% 11% 8% 7% 6% 8% Oral Health CCAS $4,490 Analgesics $1,754 $1,325 VMS / Nutrition Skin Care GI Smoking Cessation Misc. Other $2,490 $2,331 $1,190 $1,101 $945 Other Other Other Other Other Other Other ACC Existing Category Presence Illustrative Example: Combined Portfolio ~$4 Billion in Retail Sales of Brands Less Than $100 MM Notes: (1) Source: EuroMonitor
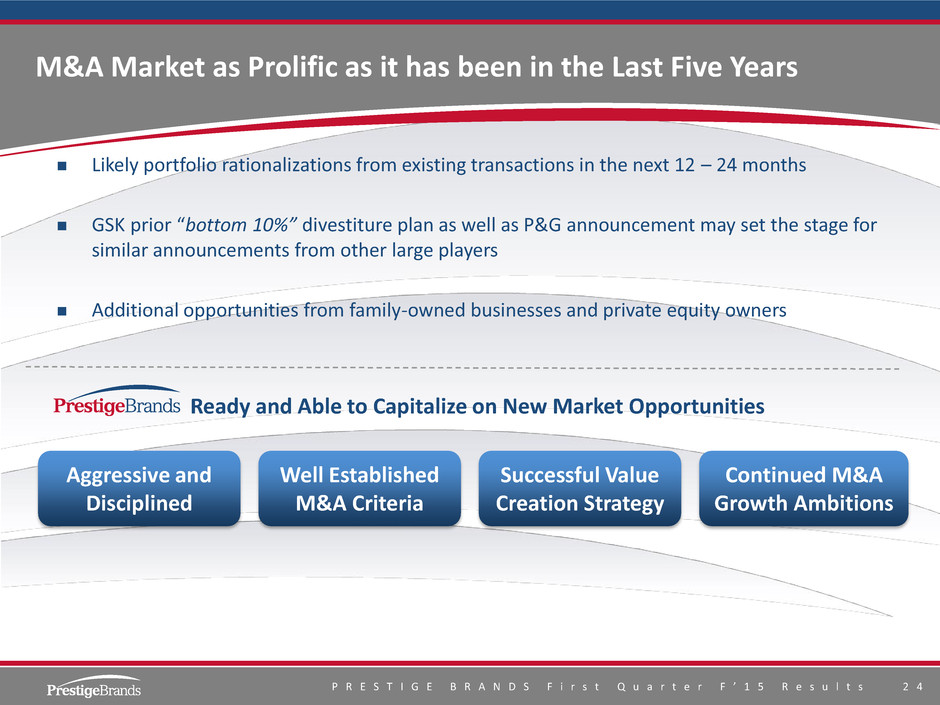

 
P R E S T I G E B R A N D S F i r s t Q u a r t e r F ’ 1 5 R e s u l t s 2 4 M&A Market as Prolific as it has been in the Last Five Years  Likely portfolio rationalizations from existing transactions in the next 12 – 24 months  GSK prior “bottom 10%” divestiture plan as well as P&G announcement may set the stage for similar announcements from other large players  Additional opportunities from family-owned businesses and private equity owners Ready and Able to Capitalize on New Market Opportunities Aggressive and Disciplined Well Established M&A Criteria Successful Value Creation Strategy Continued M&A Growth Ambitions


 
P R E S T I G E B R A N D S F i r s t Q u a r t e r F ’ 1 5 R e s u l t s 2 5 IV. FY2015 Outlook and the Road Ahead
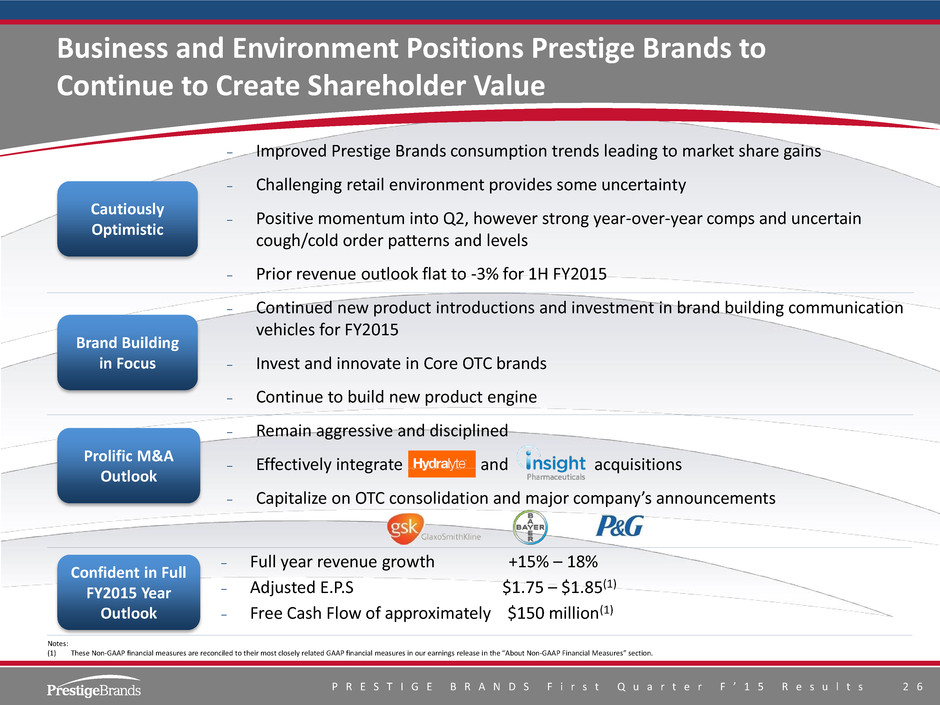

 
P R E S T I G E B R A N D S F i r s t Q u a r t e r F ’ 1 5 R e s u l t s 2 6 Business and Environment Positions Prestige Brands to Continue to Create Shareholder Value − Improved Prestige Brands consumption trends leading to market share gains − Challenging retail environment provides some uncertainty − Positive momentum into Q2, however strong year-over-year comps and uncertain cough/cold order patterns and levels − Prior revenue outlook flat to -3% for 1H FY2015 − Continued new product introductions and investment in brand building communication vehicles for FY2015 − Invest and innovate in Core OTC brands − Continue to build new product engine − Remain aggressive and disciplined − Effectively integrate and acquisitions − Capitalize on OTC consolidation and major company’s announcements − Full year revenue growth +15% – 18% − Adjusted E.P.S $1.75 – $1.85(1) − Free Cash Flow of approximately $150 million(1) Cautiously Optimistic Brand Building in Focus Prolific M&A Outlook Confident in Full FY2015 Year Outlook Notes: (1) These Non-GAAP financial measures are reconciled to their most closely related GAAP financial measures in our earnings release in the “About Non-GAAP Financial Measures” section.


 
P R E S T I G E B R A N D S F i r s t Q u a r t e r F ’ 1 5 R e s u l t s 2 7


GRAPHIC 4 exhibit992prestigebrands001.jpg begin 644 exhibit992prestigebrands001.jpg M_]C_X``02D9)1@`!`0(`E`"4``#_VP!#``,"`@,"`@,#`P,$`P,$!0@%!00$ M!0H'!P8(#`H,#`L*"PL-#A(0#0X1#@L+$!80$1,4%145#`\7&!84&!(4%13_ MVP!#`0,$!`4$!0D%!0D4#0L-%!04%!04%!04%!04%!04%!04%!04%!04%!04 M%!04%!04%!04%!04%!04%!04%!04%!3_P``1"`+!`ZP#`1$``A$!`Q$!_\0` M'0`!```'`0$```````````````$"`P0%!@<("?_$`'`0``$#`P($`P0%!@@' M"`L'%0$"`P0`!1$&$@<3(3$(05$4(F%Q"3*!D=,5(T)7E*$6&3-25F)RL1%AK7$ M1D=49<+#U/_$`!P!`0`"`P$!`0`````````````!`@,$!08'"/_$`$P1``(! M`P$$!`H'!@4#!`("`P`!`@,$$2$%$C%!$U%QD084(C)A@:&QP=$64E-4HM+P M%1A2>A%,M:H&->T=8I-K:MCMG@N6]M"6T151D%I M*4G*4A.,``@$#R-1)M\0D`VSKNHI MVM1**26[EQCY&=UM:MM-[W'5\3D+;-6EI7I\/B7-MU*+VW'N"[>XW;YB$2G! M&4M1Y+DCVAPGID%>UI`!(QYD"O*5O\/-I6L%#?C4W-%HM=V$HP6F5I*3>7UF M[3VW0J8;6[G7XLVW3ET1J2=9;<]+D29F- MH\ZXNS/!NZV9M.G6NZ>(45)J>=<1I[L8XY:[W:=)WE.O2\B7G8]_R+Z[K6A_ M4J&DAU##\>Y27%G&5Y0L,#X\ME/VN"OF.SW7D[*YQJW.G!=;EG,N^7L.M-); M\8^A]QV+A]87--Z4@PY)W3E),B6O^<^X2MP_\91`^`%?KFSMJ=E;T[6EYL$H MKU(\\VY/+,R_<(\>6Q%HZ5,HRCC>7$B%6G4RHRSAX?:7>1ZBJ9 M,PS0`XQU[4!0A369[/-86'$;BG(]0<$?NJ$T^!+3CQ+BI(%`*`4!"@,?+L<" MGHZE@I4M!]L$T]220?45$FI/7&&>DE MY3UQJ(LF>X_$*Y!C&0!*1SG4I:VN.*)"P>JNF``.U2U'73).B1NFD)4J2RZF M9)YLAG"5-:6=#/NJ*4=,9/09]:Q&,T-6M;C. M=*K;:Y+K'M/(:DEP%#A"L*W)\AC.*D&XB[L)*0X>5G&%*(*3DX[CIWZ5`*;F MH8#,]$-;X2^O&T>1SY9J"=UXWC)5)`H!0"@%`*`4`H#7).EE84IIT+4HDK"Q MC?[V>_\`U[5G57K*X*0AW2$K``^X$FIS!\1J2F_RPV`I#*7 M7#@*(P1U`VX\R,_=4[D1EE6TW.'#6ZK>\A*P#L4,I!SV&/F*QNFT;%2OTJ2: MX%Q=TQGW4K&5+<2-JD^1STS6'6+R8MW>6#+1GE.(2%HV.;1N&F/O\`C0&1H!0"@%`*`I+C-.*"E-I*AU!(ZU.6B,(J8`.<=:@DL_8EI>"\ M@@$'[<]3]U3DC`;RGE-%)"VR23CIC!ZY^-`4V5J::"`2-K14GY'&/]=207(< M<+ZT@IZ#HD]/MS4$D42N*@%1+J%**0H%0[C/6A)/0$`0>QH M"-`*`I+C-N9RD9/F.E`4S%V]4*ZYSA0S\J`E*%H))02>F2D]Z`F8_2A.2;O0D%0!J,DX`.:D@C0"@%`*`4`H!0"@%`*` M4`H!0"@%`*`4`H!0"@%`*`4`H!0"@%`*`4`H!0"@%`*`4`H!0"@%`*`4`H!0 M"@%`0R/6A&2-"10$.]`6\N#'FH*)##;Z#W2X@*'[ZI**D\M9(>'HS5;CPATG MX1Z M<5%:C1HKUOC(D>U*9AOJ;0ZO*#[Z[=:^)VB3,FL1-B)BE*?6$)2E M382#D].I&*[]E1J5;.NH)OS>':>1VG=QX:K0TN?JB]2-;-IM4 M6+(::U"Z&5H<#:'LQ@0E6WZY*=Q"CGJ`*ZT+2A&US5;3<$WG7'E<5U=AYVK? MW;ODK>*:5626-$_)X/KZ\DUAXAW.-+@3KLF9%MK$^XJ<4\Z%*<2$*5RE('F@ MX`\L]JK<6-&490I--N,.7-\_63:[5N:A\#:)/'-BW6Y M#\C3UT5*5,;AB)&"'5;W$;V\D'`*ATV]\UQ*VSW3DDIIIKCJNWNZSWFR;S]J M*>([KAQ3:>CU3RC88NKY-\L;4E^S3[('W3'4S<6PEQ)\B0"?=/K7(N*,M80> M>P[U.$5+.P`_U5R+55(2>]P-JXBII8XFUMJ"T MA0.0>H-=A:K)RN!-4@4!#-`1H!0"@%`6=VMC=XMLB$ZM:&WT[%*;.#CSJT7N MO*)3W7D.6F&]R.9%9<+`VME:`2@8Q@9J%*2X,G>:X%&TV&)95OF*A2.;C(4L MJ"0.R1GL!D]*M*3EQ#DY<2\E,J?CK0A?+<(RE>,[3Y&J%32&X5Y@/NH_([#, M++CCJK>YA;BE)*=R0KL1G.*`L6;FS#6[NM\A,*/$9:CQGT8)=2LD9(Z'J
2@1CYS;S%U:P0ZXEI2E'&U/7IT].]5()K7!A+!VK2.F21^>"]Y(&2$_&A!2=C+6VE`4!C)SWZ^7]]3 MD$X0'7UE0!PM0PD9P34KB26R7EM.*PD(23V4,'OCO4X#; M?$N(TD/I/3!'?TJ&L$%>H)(`Y[4!!:MHH"`6?,4!-0$"A)STZGSH1@AR^HZT M&"`20H>0^%",$5?6JKXF1<"&V@R1!-!@FJQ4C0"@%`*`4`H!0"@%`*`4`H!0 M"@%`*`4`H!0"@%`*`4`H!0"@%`*`4`H!0"@%`*`4`H!0"@%`*`4`H!0'DBS? M2+Z)*@WJ;36HM+.]BI^,'FQ]H*3^ZN5N_`[;MDFZEK)I;AZU)@ MR-P]:$C(H"-`*`4!872QV^]H"+A!CS4`8`D-)7C[Q66G6J4GFG)KL-:O;T;F M.[6@I+TF(;X?62-(ANQ8289BR_;4)C^ZDNF/A6?QNLTU)YRL>K.3 M26R[6$HRIQW=U[VG7C!@+SPA8N,9##4U:&S<)$QP.("LH?!2X@8Q@@'(/KWK M?I;4G3>\XZJ*2_X\#EW.P*=>"A&6%O2E_P!7$TCB#PREV+0,1DR)D]B+>(\M MQ%FC!EQMD92M82C)4H#WL]P>U7\=C7K[ZCAXQJ\GN3L^WZ><9L,:])L>IMED:3>W5"2R^'.CR0HYVK0I?;&"FJ1492S/&8ZZ<, M=1Z)14GY;65KIPP4H,K44V^73V6YF%=&'I<<-7&8T&%\O"6FV65=>8``KF*' M]=+`J3)NIHD!2#U&,8&>_0U;`.W0]?-QK>PJX!IQQ"% MID/07T/(0ZTG<\D@'(*<$D5&`4=2<7M/Z;L<2[K>YS\Z`A-4Y[5<6_9W5NR$I::(3[NW'?/S)JII2SF2QJRU5(F.15M[ MR4G+!25#`ZA(Z=\_[:C4Q[TW'#["_;O3D=Q<=;*5\DD*6V"[:O[*OY1"D?$=166-S%\48)6DUP>2\:N$ M=[ZKR<^A.#6Q&I"7!FNZ4X\47&01G-93$1H!0%*0SSD8SA0Z@^AJ4\`MG5!Y M&QT;%^H'>IP"9AH!7N;MOH22*@%2=%,R,6@OEJR%!6,X(((Z?94`P\FPOI;4 M&U\\KP59.TJ/O$G[SVH"SY$FW)40EQGQST^.?OH"NW?);(*EJ0ZG M^:I.".I\Q\J`R,.]ID.-M+:*'%'!VG('F*`R#KP:(Z$D^E8I2W7@DG"@>QS5 ME)/@R"-7`H!0"@%`*`MY493Y200-OD?.K)X(*'^,M=\K'H1G-3HP2F0DI*2@ M(W=24FF"8O#R7*'4.,E)7DXZDC%5:&4WH1C'"2.N,]":@!]SEK'3/D*`BF4A M6.A&<4!.VL.)RDY%`3T`H!0$JD[JC!.27:148)R1'QH";R%6*@=J`C0"@%`* M`4`H!0"@%`*`4`H!0"@%`*`4`H!0"@%`*`4`H!0"@%`*`4`H!0"@%`*`4`H! M0"@%`*`4`H#YUZ'EV^7HW@/:KE9V)CFMWKA!G71+CB)32D/A#+B,'8=N\92I M)!`\JY$=U4X)KSG@_1.U5=PVIM25O5W86T8S4&LIK"RNM9.=ZBX47:)'GR+I MI2PW'D)FR&V6'4-3Y,.*\6G92&DX46P1D][%R6D&^&?_!:Z+X.W6[3K,K3]BUCI9Z\)+D"5'>6TPZ`@KW!: MQ@#:DD$D`^51&E4>-U/O-_:&U[2VIU5<7%.HJ?G)XDURX>_!GM-<;^)6G7`S M9>+KLOEDI$._L!P]/(E6XU:-><'A2[SG7/@YLR\IJ=79\=5G,,QT>N='AG;- M*^*#CC&M:ITW15DU=;FOY25:G^4O'KC/3_BUNQN:N,[N4?/KSP6\'.EZ*G<3 MHSZGB2^#-_X=^-RR:JU*Q8K_`*;N>D9SC:W5.S5I5'0E*2HJ*NA`]TC.#UK8 MIW2J/=QAGF]L>!-79MI4O:%Q&I3AC.C4M7A=9Z4C2F9D9J0PXEYAU(6AQ!RE M22,@@^8(-;9\U*FX4`R*`9H"-`*`@1F@->O6C8]]U-8KO)?=5^2"ZXS&Z'VG+U(F2)EFAOR9C7(??4T.8M'H5 M=_3KWZ"H56<5NIZ!5)Q6$RMI+2,/1UO>BPW)+X>>4^X[+>+KBU$`=5'J<``? M92I4=1Y:(G-S>69"[05W&W/1VWE1GE)_-O)&2VL=4J'R(%8D4.&-63B)8-2\ MZ/H[3JH?MAGSI-K6IEVX*"%H!PHD)7[Y5Y^]5LD&H6F[-6346E(@TQ>['I>S M1+D;@S/:YJWB\#N65H^NH_NS4Y),AIS64Z_6:5O1#B)N\N-%M.F9DH,-(MS& M5D8/3+@&S/F3CM0&WW:_7"P.WJYVR-_"22W*9M[<"">4F.E:>:I3_)R"M(.S M<.F`/C0@S,;75PAOW"T-NR)-WM\%-R=4Z$JCIYB@41MWUE'"@`KSQF@-B?XB M1K?*0AYYJ2P;E^2G7&D*067RG<$D'HH>1([5#)-S)P#4`P=FU?"O$A+*$O,K M7N+7.1@.A)P2D]CVJJDF:=*YA5>%_P"3-+>0T`5K2@$@`J..I["K&VVEQ)Z$ MB@%`0S0$:`4`H"&*`H.06'5%2V4*4>ZBGK]]"C@GQ1;FR1@VZA`4@+;+9ZY\ M\Y^>:C!3HHXPBTEV23(2Z5/H<*@.FW&=O8?`4P8Y4I2SJ9AM(0V`$A'3L/*I M-E:&NQG&B@-*&XDJ'GGKCM7+@X^:_2=>HI)[Z]!.J$SRW-I4=N/>Z')R0>E3 MT4SS'2<$X``R2:[48N3PC@RENEG'U+"?(!66S_7%7=*7(KTBYK! MD&I+3XRVXE?R-4<6N)=23X,J%(/<"JE@`!T'2@(T`H!0%!^"Q(&'&DJ^..M` M4F;6S'DI>:RD@$$'KD?ZJ`KO-%SL0.F#D>58I0WBF[[Z8J0&4RI[0M:>F`<$YJ'4ES)P567%.%6>PK-2DY++(95K,0*`4 M`H!0$JD)7]9(/S%`2".A.<`C(QW[5.0$MEM*$@YQYU`(.M[UIZ[3Y'XT!1+: MBM0[#=D9^%`7#"2EM((P0*`D0_CHOY@@4!5"TJ[$&@)J`4`H!0"@%`*`4`H! M0"@%`*`4`H!0"@)'G4L-+=6<(0DJ4<9Z#J>U`:'8^/?#_4JK:+9JNWS47*28 M4-UI9+;[X*@6D+QM*\H6-NWWTQH[CRPM2$)*R&T%:B`,]$I!)/P M`)-`8+A_KZR<3]'6O5&G9:IMDN;7.BR%LK9*T;BG)0L!2>J3T(!H#%JXRZ.5 M>-+VV->V;@]J:5)A6MZ`A4B-(>CH=4^WST`MI4@,.Y2I0.4*&,@T!LMRU#:[ M/,ML2?@4DGIT!!/0B@$+6M@N5^D62+>H$B\1TJ4[` M:DH4^@)("B4`YZ%20?0J&<9%`4-7<0]+:`3"5J?4=IT\F<[R(INLUJ,'W.GN M(WJ&X]1T'J/6@-AH!0"@%`*`4`H!0"@%`*`4`H!0"@%`*`4`H!0"@/C+I7Q0 M:NT):-.VQ.G;%,=TN7S99MQ@+=D0%NDE:TE+@"CDY&Y)Q@5PH5MV*B^7`_76 MT_!5;1N*]U&I.G&LDIJ.)*26.>IGM,^+&+:[+;W[O:)ESU=:K'<+%`N"Y*$1 MWD2U%1I*$GO>=%QZ MGZ3>]+\;]$7KQ`:'XBR-6/6C$>-!N=HDQWTMPRW$6R5I=3EM3)5M5CN"LY'2 MLF^ND4^6#G5-AW%IL>^V8K7?DW*<:BP\K*>.O>QGM-DL\K3]XT)%;N-WL=RT MY"TQ=QJ*89;#K[E\#NYB0'58><4OW.6I.002/A65;LL9_3.'.M<[/N75I.I" MKOTNB7E8W'YT<<--**=!3+<-.66/$8W3FGU!M;DB(VLH>&#M M82M0/F4G*L@9!S*O&DW1QQ-%[#VKM>SGMZ,]^4');NF=)//:TCG'"*PRO]V) M`L.H+;RFT%]E=OD/IE)Y2F'%##@2D+0H*W)5@9!'G6E3CNUTNT]MM>M"Z\#I MUJ;3S&.<+&JGC7T]9](8T-F!!:C1FDL1V6PVVTV,)0D#``'D``*[!^9GJ