Exhibit 99.1
|
|
|
Morningstar 2011 Shareholders’ Meeting |
|
|
|
Call to Order and Introductions Business of Annual Meeting Management Presentations Break Questions and Answers |

|
|
|
Today’s presentations contain forward-looking statements. All statements made that are not historical facts are subject to a number of risks and uncertainties, and actual results may differ materially. Please refer to our most recent earnings release and our most recent Form 10-Q or 10-K for more information on the factors that could cause actual results to differ. Today’s presentations also contain non-GAAP financial measures. Please refer to the slides at the end of the presentation for a reconciliation to the applicable GAAP measures. |
Please carefully read the legal disclaimer above.
Please refer to the slides at the end of this presentation for reconciliations of non-GAAP financial measures to the applicable GAAP measures.
|
|
|
Morningstar Update Joe Mansueto Chairman and Chief Executive Officer |
|
|
|
2010 Highlights Industry Landscape Update on 2010 Initiatives 2011 Initiatives |
My talk today will cover four major areas:
· 2010 highlights
· Industry landscape
· Follow up on major initiatives from 2010
· Major initiatives for 2011
|
|
|
3,235 Employees |
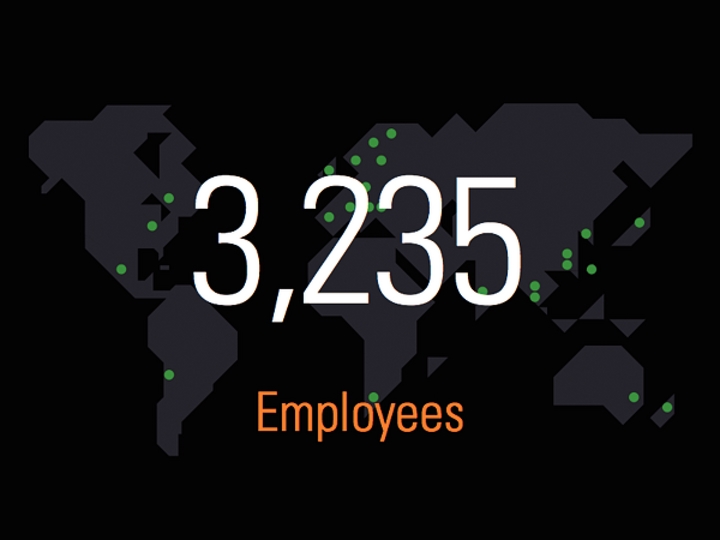
Here’s a snapshot of our operations today. We have more than 3,200 employees around the world and have operations in 26 countries.
|
|
|
Our mission is to create great products that help investors reach their financial goals. |

Our mission is to create great products that help investors reach their financial goals. We take this mission very seriously, and it frames everything we do as a company.
|
|
|
7.4 mil Individual Investors |
We currently reach about 7.4 million individual investors around the world through our websites and other products.
|
|
|
270,000 Advisors |

Another major audience for us is financial advisors. We currently reach about 270,000 advisors globally—about a 10% increase from 2009.
|
|
|
4,300 Institutions |
We also have relationships with about 4,300 institutions around the world, primarily through our Investment Consulting and software businesses.
|
|
|
Revenue |
Our business rebounded nicely in 2010, with revenue up 15.9% as the markets steadily improved.
We had about $48 million in revenue from acquisitions in 2010, and organic growth also contributed to the increase.
|
|
|
Operating Income |
However, our operating income was down 2.9% because we restored some of the compensation costs we reduced during the downturn.
|
|
|
Free Cash Flow |
Free cash flow rose 22.2% to about $109 million in 2010. We’re fortunate to be in a business that generates healthy cash levels and doesn’t require much capital.
|
|
|
Industry Landscape |

|
|
|
VSS Communications Industry Forecast 2010-2014 $13.3 bil Financial & Economic Industry 2011 Forecast |
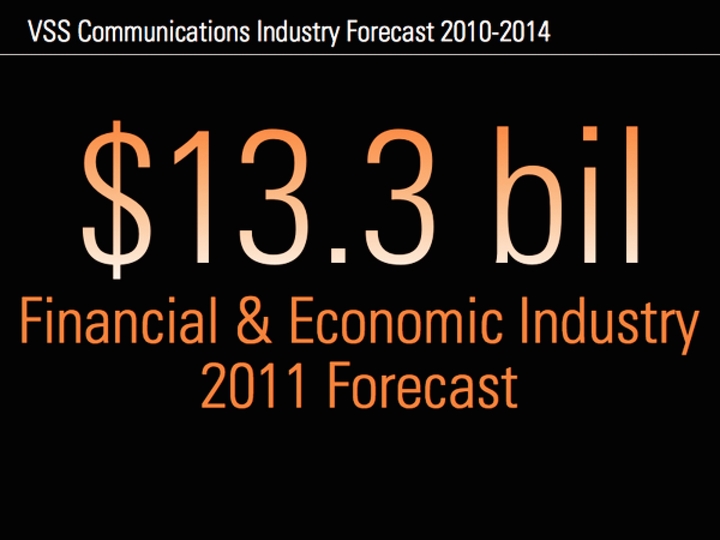
Next I’ll turn to the industry landscape. Veronis Suhler Stevenson estimates that spending on economic and financial information totaled about $13 billion in 2011, so we have a small, 4% share of this market.
|
|
|
VSS Communications Industry Forecast 2010-2014 $11.9 bil Credit & Risk Industry 2011 Forecast |
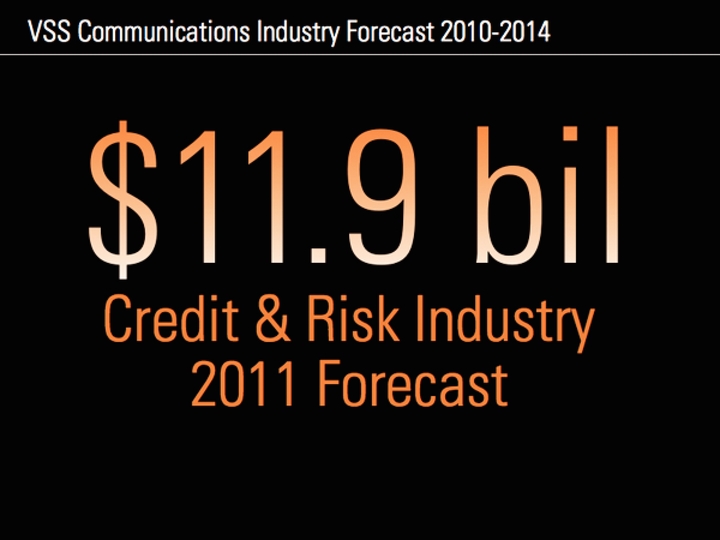
The credit and risk information industry has an additional $12 billion in total spending, based on Veronis Suhler’s estimates.
We had about $555 million in company-wide revenue in 2010, so we’re a small player addressing large markets.
|
|
|
Morningstar U.S. Market Index 28.5% 16.8% 9.11% 07 –0.43 –5.52 –8.15 8.64 1.95 –5.43 12.34 19.70 11.06 08 –36.17 –35.95 –31.67 -31.47 -38.73 –36.19 -41.87 -46.28 -39.92 09 11.38 36.05 40.28 21.52 38.94 39.86 44.37 42.05 32.98 YTD 05.10.11 10 14.69 20.61 25.96 12.93 26.46 27.77 12.91 27.67 31.26 10.10 8.22 6.16 10.14 8.53 12.19 12.77 11.56 12.46 5.9% –37.0% |
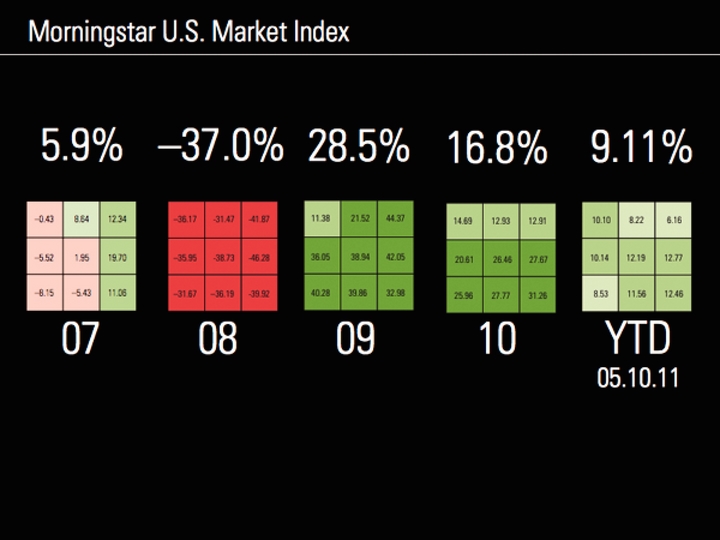
This page shows Morningstar’s market barometer, a heat map of total returns for different areas of the Morningstar Style Box, a nine-square grid that provides a graphical representation of nine different investment styles. We saw another strong year for the market in 2010, and returns for the Morningstar U.S. Market index were up 9% for the year to date through May 10, 2011.
The more positive market environment has helped our business recently, especially on the asset management side.
|
|
|
Growth Strategies |

|
|
|
Growth Strategies Focus on three platforms |
Next I’ll turn to our five key growth strategies. The first of our five strategies is to focus our product offerings on our three major platforms, which are geared toward individuals, advisors, and institutions. The three platforms are:
· Morningstar.com for individual investors, which includes Premium Membership services and Internet advertising sales. We had about 139,000 paid Premium Members as of March 31, 2011.
· Morningstar Advisor Workstation, which is our web-based planning system for financial advisors. U.S. licenses totaled about 155,000 as of the same date.
· Morningstar Direct, which is our institutional research platform that provides access to the full range of our global data, research, and tools. We had about 5,100 licenses for Morningstar Direct globally as of March 31.
|
|
|
Growth Strategies Create premier global database |
Our second major strategy is to create a premier global investment database. Our data is the foundation for all of our products and services, and we continuously invest in both depth and breadth of data coverage.
|
|
|
Growth Strategies Build thought leadership |

We also want to continue building thought leadership in independent investment research. We currently have about 90 fund analysts and 120 equity and credit analysts globally.
|
|
|
Growth Strategies Become a global leader in funds of funds |

Our fourth growth strategy is to become a global leader in fund-of-funds investment management. We think assembling and evaluating funds of funds is a natural extension of our expertise in understanding managed investment products.
We offer three main investment management services: Investment Consulting, Retirement Advice, and Morningstar Managed Portfolios.
|
|
|
Growth Strategies Expand internationally |
Finally, we’re focusing on expanding our international brand presence, products, and services. Our operations outside of the United States generated $157.1 million in revenue in 2010 compared with $129.2 million in 2009 and represent an increasing percentage of our consolidated revenue.
Last year I highlighted five major initiatives. Here’s a brief report on the progress we made on those.
|
|
|
Update on 2010 Initiatives |

|
|
|
Invest in data manufacturing 390,000 Global Investments |
We continued to invest aggressively in our data manufacturing capabilities, focusing on quality and process improvements.
We currently have comprehensive data on about 390,000 investments globally, as well as real-time market data on an additional 5 million securities. We’re expanding our databases and using LEAN and Six Sigma processes to drive quality.
|
|
|
Measurement Tools Research and Response Audits Process Dashboards Invest in data manufacturing |
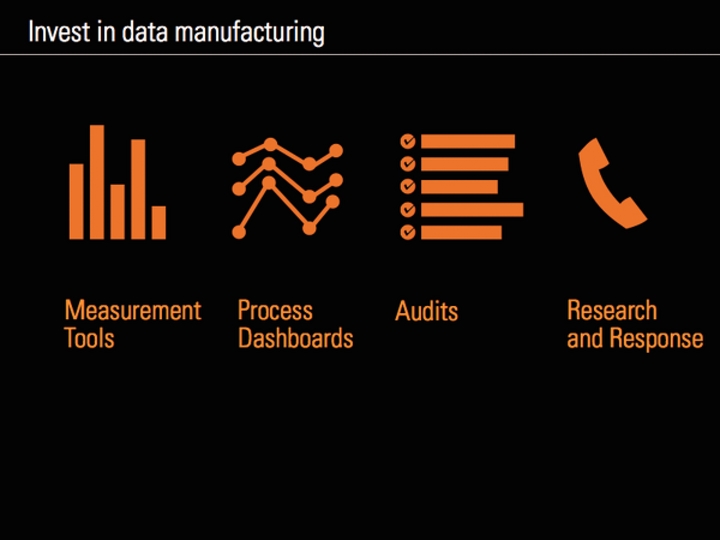
We invest significantly not only in data analysts to keep up with the ever-expanding number of securities, but also in quality control. These efforts are deeply embedded in our data operations and give us a level of accuracy, timeliness, and completeness that’s become a competitive advantage.
To continuously raise the bar on quality, we have dozens of quality measurements in place. We’ve also developed process dashboards to monitor trends in our operations across the organization and make quality visible to all. We have a quality dashboard on our intranet site, available to all employees and managers, updated daily. We also have team of independent quality auditors as a complement to our operations and day-to-day measurements.
The Six Sigma methods we’re implementing help us identify the root causes of data errors instead of just fixing the errors. LEAN is focused on streamlining processes.
In the end, quality is defined by the user. We have to listen to our customers and stay alert and responsive. We’ve made great progress on our capabilities and are continuing to raise the bar to deliver best in class customer service.
|
|
|
Invest in data manufacturing Total Cost and Risk |
We added some key data sets, including several proprietary data points that help investors assess total cost and risk for exchange-traded funds (ETFs).
|
|
|
Invest in data manufacturing 1,300 Conference Call Transcripts |
We’ve also added conference call transcripts. We’re now transcribing earnings conference calls for about 1,300 companies each quarter and have some of the fastest turnaround times in the industry.
|
|
|
Invest in data manufacturing |
We made a capital investment in a new office space for our facility in Shenzhen, China. We have about 810 employees working from this location.
|
|
|
Invest in development team 820 2010 Programmers/Tech/Infrastructure |
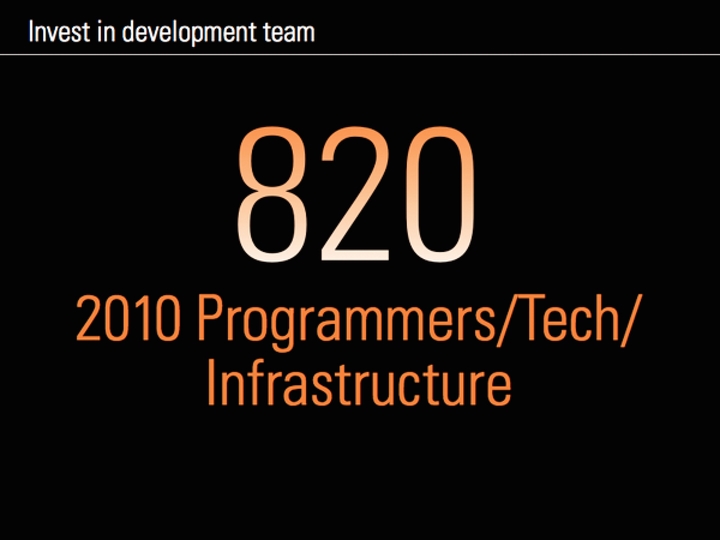
We have a large development team that works on enhancing our three major platforms. We significantly expanded this team to about 820 in 2010, a 25% increase from the year before. These folks have been working on a number of key initiatives, including third-party data, middle and back office capabilities, our real-time terminal offering, other real-time news and data aggregation, mobile devices, and web delivery for Morningstar Direct and Morningstar Office.
|
|
|
Invest in development team 25% 2010 Programmers/Tech/Infrastructure |
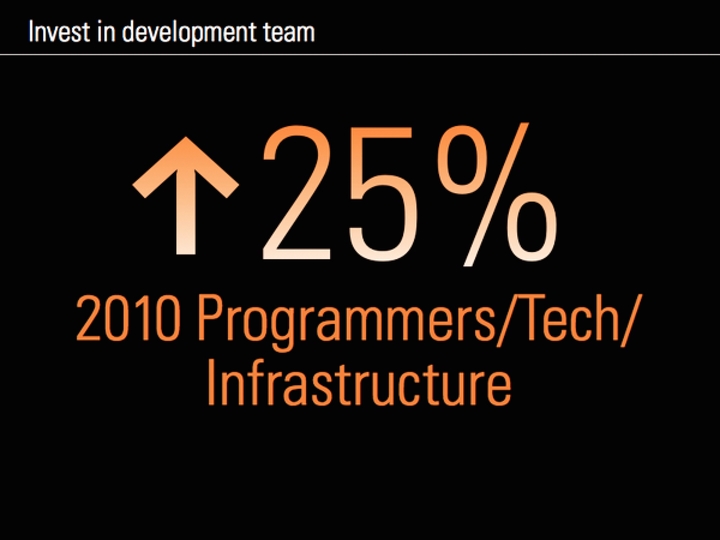
We have a large development team that works on enhancing our three major platforms. We significantly expanded this team to about 820 in 2010, a 25% increase from the year before. These folks have been working on a number of key initiatives, including third-party data, middle and back office capabilities, our real-time terminal offering, other real-time news and data aggregation, mobile devices, and web delivery for Morningstar Direct and Morningstar Office.
|
|
|
Expand sales team 520 2010 Sales and Marketing |
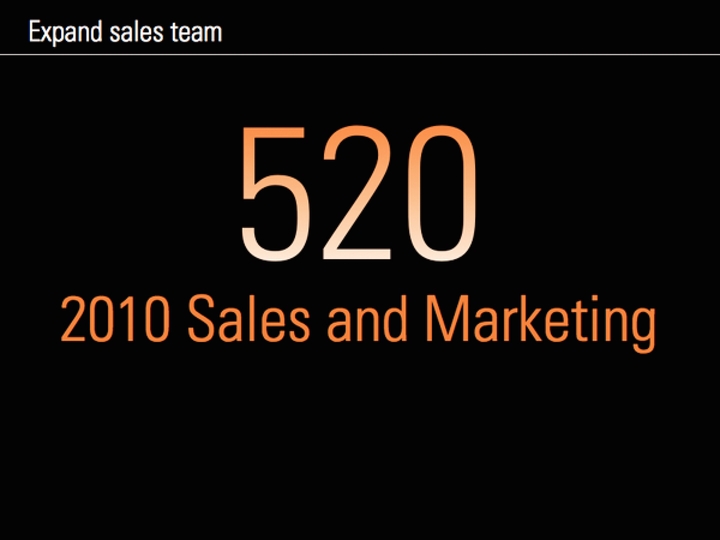
We’ve also been investing in our sales staff, particularly for key platforms such as Morningstar Office and Morningstar Direct. We now have about 520 sales and marketing employees globally, which is a 30% increase from 2009.
|
|
|
Expand sales team 30% 2010 Sales and Marketing |
We’ve also been investing in our sales staff, particularly for key platforms such as Morningstar Office and Morningstar Direct. We now have about 520 sales and marketing employees globally, which is a 30% increase from 2009.
|
|
|
Build out credit ratings and research 700+ Independent Credit Ratings |
We began our corporate credit rating business in 2009 and now provide credit ratings on more than 700 companies. Our work in this area leverages the work of our equity analysts, who build discounted cash-flow models that can be used to evaluate a company’s ability to pay off debt. In mid-2010, we entered into our first credit research agreement with a major financial services firm to provide credit ratings and research to its 18,000 financial advisors.
|
|
|
Build out credit ratings and research 5/16 New CMBS Deals in 2010 |
Building on our credit ratings initiative, in 2010 we also acquired Realpoint, LLC, a Nationally Recognized Statistical Rating Organization (NRSRO) that specializes in structured finance. We believe there’s strong demand for unbiased ratings and research in the structured credit market, and we think the time is ripe to bring more competition to this market.
Realpoint rates commercial mortgage-backed securities (CMBS)—an area that had significant problems during the financial crisis. The CMBS market is recovering, though, and new issue volume is rebounding. Realpoint was chosen to rate 5 of the 16 new CMBS deals that came to market in 2010, plus 5 of the 10 new CMBS deals for the first quarter of 2011.
|
|
|
Build out credit ratings and research 5/10 New CMBS Deals in Q1/2011 |
|
|
|
Globalize consulting capabilities |
We’ve continued to build our global consulting capabilities. We expanded our UK consulting business through our acquisition of Old Broad Street Research (OBSR) in April 2010, and in July 2010 we purchased Seeds Group, an up-and-coming research and consulting firm in France.
In 2009, we acquired Intech Pty Ltd, a leading provider of multi-manager and investment portfolio solutions in Sydney, Australia.
|
|
|
Major Initiatives for 2011 |

|
|
|
Transition core products to 4.0 platform |
The technology landscape is rapidly changing, and we’re re-designing our core software platforms to stay ahead of the curve. We plan to introduce major upgrades to Morningstar Office and Morningstar Direct (4.0 versions) and redesign the software architecture for Morningstar.com. This will make it easier for customers to access our products and services and provide us with more flexibility in how we deliver software to customers.
Today, Morningstar Direct is a downloadable application, and we’re making it fully web-based. We currently have 5,100 users, and we sell Direct at about $9,000 per seat. If we take the total to 10,000 seats, that would be $90 million in revenue, which would represent significant growth for Morningstar.
|
|
|
Expand mobile capabilities |
We’re continuing to expand our mobile capabilities for individual investors and advisors. We currently have applications for the iPhone, BlackBerry, and Android platforms. We plan to keep rolling out more mobile applications, including an iPad app for Morningstar.com and an iPad version of our hypothetical tool for advisors and wholesalers.
|
|
|
Expand sales/support teams for Direct and Office |
We’ve seen strong sales momentum with Morningstar Direct and Office, and we want to build on that by expanding our sales and support teams. We’re seeing positive ROIs with these new hires. We need to market these products more aggressively, as well as taking client feedback and folding it back into our development efforts.
|
|
|
Expand portfolio management /back-office capabilities |
We’ve been investing in capabilities for portfolio management, portfolio importing, aggregating performance data, and other back-office functionality. These capabilities feed into our key software platforms for advisors as well as Morningstar.com. Also, this past year we started providing Portfolio Management Services for Primerica Financial, which has 22,000 registered reps. Every night we download client positions from the custodians so these reps can present holistic reports to their clients.
|
|
|
Widen moat around managed investment product data |
Our managed investment product data is the core of our Licensed Data business. This is a solid business for us that typically has very high renewal rates. We want to continue building out our moat, or sustainable competitive advantage, here by continuously improving the depth and breadth of our databases. In 2011, we’re focusing on expanding our operations data for funds based in Europe. We’re also working on making our data easier for clients to access. One example is our new Morningstar Essentials website (shown above), which has been well-received by clients and helped increase Licensed Data revenue.
|
|
|
Build out equity data coverage 30,300 |
This is currently a smaller area for us, but we have big ambitions and see potential for our equity data business to be much larger. We added fundamental equity data on more about 2,000 companies in 2010 and currently have data coverage on more than 30,000 global equities. We plan to continue building out fundamental equity data and adding to our information on earnings estimates, conference call transcripts, management bios, and executive compensation. We want our clients to view us as a leading equity data provider.
|
|
|
Harmonize global qualitative fund rating methodologies |
We’ve had great success with our qualitative fund ratings in Europe, Asia, and Australia. With OBSR, we’ve added additional capabilities in fund ratings and research for the UK market. We’re focusing on pulling together all of these capabilities and harmonizing our rating systems globally.
|
|
|
Expand analyst research on industry growth areas CEF Weekly CEF Industry Roundtable: A Discussion of Income CEF executives weigh in on viable opportunities in emerging markets, why some are shying away from muni markets in developed economies, and more. Print Comment Recommend (0) SHARE Like AAA By Care Esser 05-05-11 08:44 AM E-mail Article About the Author Cara Esser is a closed-end fund analyst at Morningstar. Contact Author Meet other investing specialists For investors seeking high-income opportunities, CEFs can fit the bill. The first quarter of 2011 brought many surprising events whose impacts will reverberate throughout the world for many years. Most Active Stocks Ticker Price($) Change(%) Morningstar Rating Morningstar Analyst Report BAC 11.94 -2.17 YHOO 16.55 -3.61 CSCO 16.88 -0.3 SIRI 2.24 -1.75 MSFT 25.02 -1.18 NVDA 18.25 -10.95 INTC 23.43 -1.18 F 15.07 -1.25 C 41.51 -2.15 S 5.11 -1.16 With Morningstar Analyst reports you can get our expert Buy/Sell opinions on over 3,900 Stock and Funds |
We’re well-known for our research expertise on actively managed mutual funds but we’re also aligning our research with industry growth areas. We’re doing more work on ETFs, closed-end funds, alternative investments, 529 plans, and target-date funds. We’ve quadrupled our ETF analyst staff and invested in areas that complement our core mutual fund competency.
|
|
|
Launch residential mortgage-backed securities research RMBS $1.7 trillion CMBS $820 billion Source: Intex Solutions, Inc. |
We’re working on this initiative with our Realpoint subsidiary, which we acquired in May 2010. We currently cover commercial mortgage-backed securities (CMBS), but the residential mortgage-backed securities market (RMBS) is even larger ($1.7 trillion in underlying collateral vs. $820 billion for CMBS).
Investors are looking for better research and analytics on RMBS, and we’re excited about stepping up to meet this need.
|
|
|
Unify Investment Management capabilities/operating platforms Advisors Institutions International Retirement |
We recently combined our investment management operations — all of our registered investment advisor operations globally — under one leader, Peng Chen. Peng and his team are working on unifying our capabilities and operations so our clients can get the best combination of solutions and capabilities from across the Investment Management division to meet their needs. We’re focusing on four key growth areas: retirement advice, discretionary asset management programs for financial advisors, fund-of-fund consulting for institutions, and international.
|
|
|
Continue expanding internationally and globalizing operations |
We continued building out our global operations with new locations in Brazil, Chile, and Mexico in 2011. We’re interested in exploring other areas, such as South America, Eastern Europe, and the Middle East. We’re also working on integrating our international operations much more closely with all of our products and services, and we’ve built this into our incentive structure for key managers in 2011.
|
|
|
Further integrate acquisitions |
We’ve made numerous acquisitions over the past several years and acquired a lot of great capabilities. Now, I want to take a step back so we can focus on putting all these capabilities together to maximize our potential. You’ll probably see us complete fewer acquisitions in 2011. We’ll still consider acquisitions that fit in with our growth strategies, but we’re setting the bar higher in terms of size and potential return.
|
|
|
FORTUNE is a registered trademark of Time Inc. and is used under license. From FORTUNE Magazine, February 7, 2011 © 2011 Time Inc. FORTUNE and Time Inc. are not affiliated with, and do not endorse products or services of, Licensee. Continue making Morningstar a great place to work |
We were recently recognized in FORTUNE magazine as one of the 100 Best Companies to Work For, and it was exciting to have our efforts recognized there. But there’s always more we can do. We want to continue making Morningstar a great place to work and build a career, and we have a team of employees working across the organization to spark ideas to keep us moving in the right direction.
|
|
|
[LOGO] |

We have 3,200 bright, talented people here and a strong balance sheet. We’re excited about the opportunities we see to expand our business and continue our mission of helping investors in the years ahead. We see many opportunities ahead and feel good about our capabilities.
With that, let me turn things over to Scott Cooley, our Chief Financial Officer.
|
|
|
Financial Highlights Scott Cooley Chief Financial Officer |

|
|
|
2010 Highlights First-Quarter 2011 Capital Allocation |
My talk today will cover three main areas:
· 2010 Highlights
· First-Quarter 2011
· Capital Allocation
|
|
|
2010 Highlights |

|
|
|
2010 Key Metrics Operating Income ($mil) Free Cash Flow* ($mil) Revenue ($mil) $124.7 $121.1 – 2.9% 10 09 $108.6 $88.9 + 22.2% *Free Cash Flow is considered a non-GAAP financial measure under SEC regulations. 10 09 + 15.9% $479.0 $555.4 10 09 |
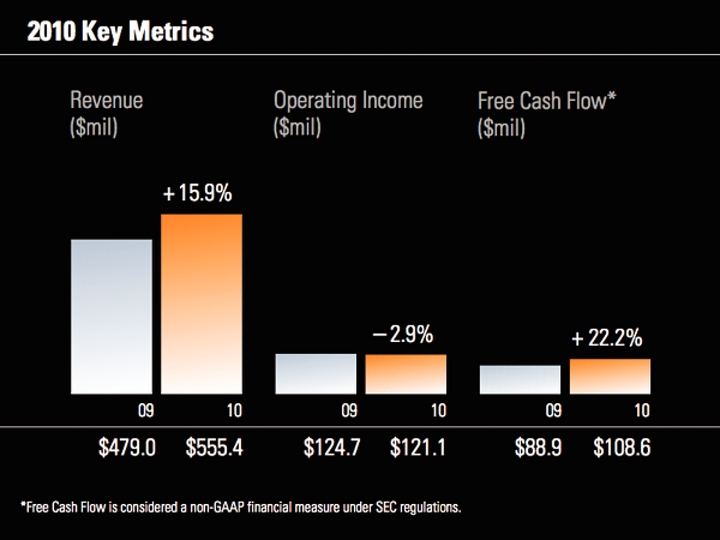
We have three key metrics that we use to measure our results, and two of the three improved in 2010.
Revenue was up about 16% to $555 million, operating income was down slightly to $121 million, and free cash flow rose 22% to $109 million.
|
|
|
84 85 86 87 88 89 90 91 92 93 94 95 96 97 98 99 00 01 02 03 04 05 06 07 08 10 09 Morningstar Revenue 5-YR Compound Annual Growth Rate 19.6% |
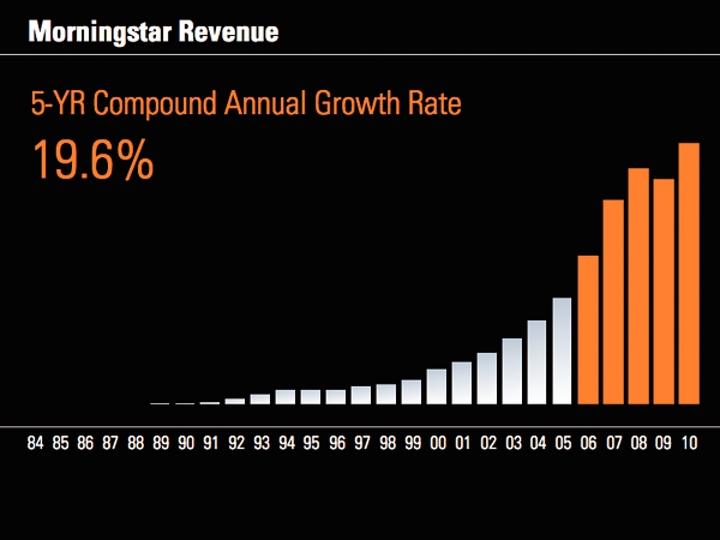
Taking a longer-term view of revenue over our 27-year history, we’ve had a consistent history of solid revenue growth, except for small dips in 2009 and 1995.
Over the past five years, we’ve compounded revenue at close to 20% per year, on average.
|
|
|
84 85 86 87 88 89 90 91 92 93 94 95 96 97 98 99 00 01 02 03 04 05 06 07 08 10 09 Morningstar Revenue 10-YR Compound Annual Growth Rate 22.2% |
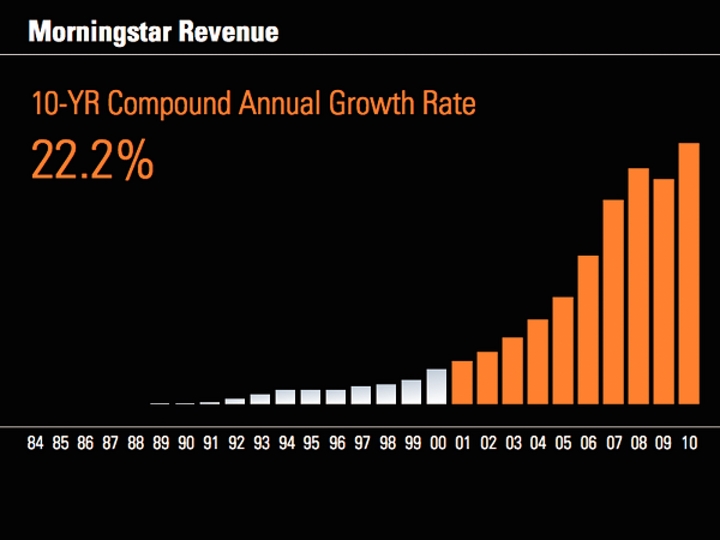
The compound annual growth rate over the past 10 years is about 22%.
|
|
|
Investment Information Segment Operating Income ($mil) Share of Consolidated Revenue Revenue ($mil) $138.4 $127.7 –7.7% 09 10 80.1% $386.6 $445.0 +15.1% 09 10 |
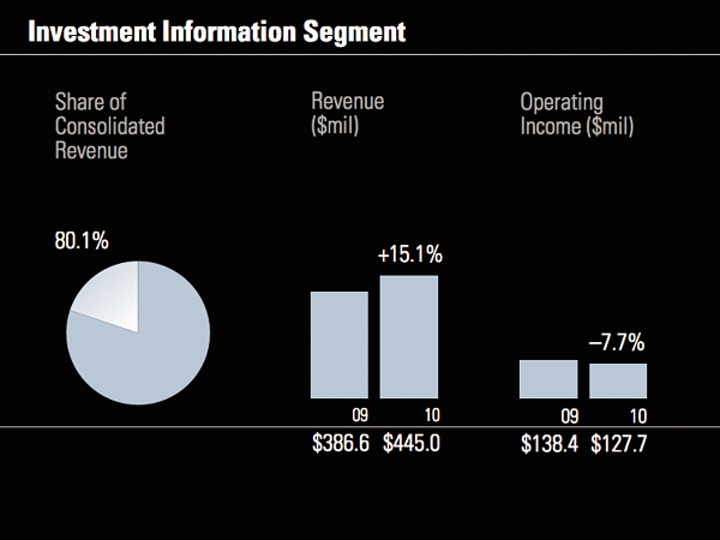
Revenue for our Investment Information segment, which accounts for about 80% of company-wide revenue, increased by 15% in 2010. We had $40.4 million of revenue from acquisitions in this segment, primarily from LIM, Realpoint, OBSR, and CPMS. However, we also had higher revenue in our software, data, and investment research products and services.
In 2010, operating income for the Investment Information segment was $127.7 million, down about 8% from 2009, as operating expense increased more than revenue.
|
|
|
Investment Management Segment Operating Income ($mil) Share of Consolidated Revenue Revenue ($mil) $52.9 $56.8 09 10 19.9% $92.4 110.4 +19.5% 09 10 +7.4% |
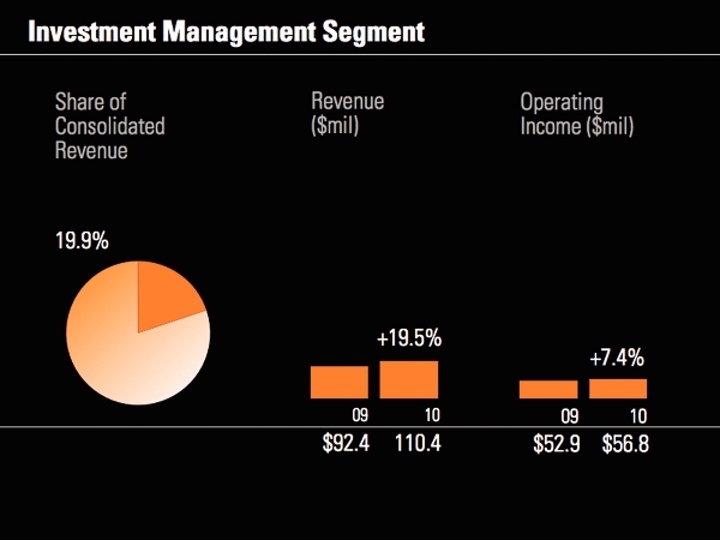
Investment Management segment revenue increased 19.5% in 2010. Acquisitions contributed $7.5 million to the segment, and we also had strong organic growth from Retirement Advice, Investment Consulting, and Managed Portfolios.
Operating income was up about 7% because our expense base increased, but at a lower rate than revenue.
|
|
|
Corporate Items Year ended Dec. 31 ($000) 2010 2009 % change Operating expense excluding stock-based compensation, depreciation and amortization $27,752 $36,372 (23.7%) Stock-based compensation $3,651 $3,924 (7.0%) Depreciation and amortization $32,094 $26,349 21.8% Operating loss ($63,497) ($66,645) (4.7%) |
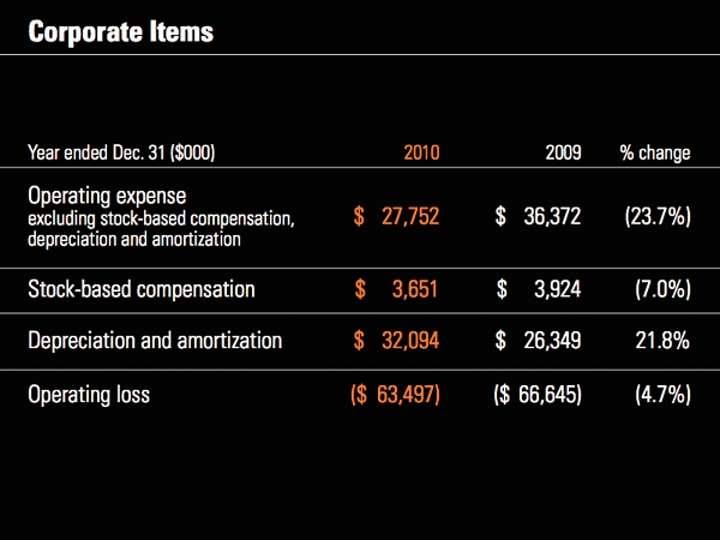
Although depreciation and amortization expense was up about 22% in 2010, corporate operating expense declined. As a result, the operating loss for the corporate segment was slightly smaller in 2010 versus 2009.
|
|
|
Australia Japan Europe Asia Canada 07 09 10 06 08 14.0% 20.6% 24.2% 27.0% 28.3% Revenue by Region % of total |
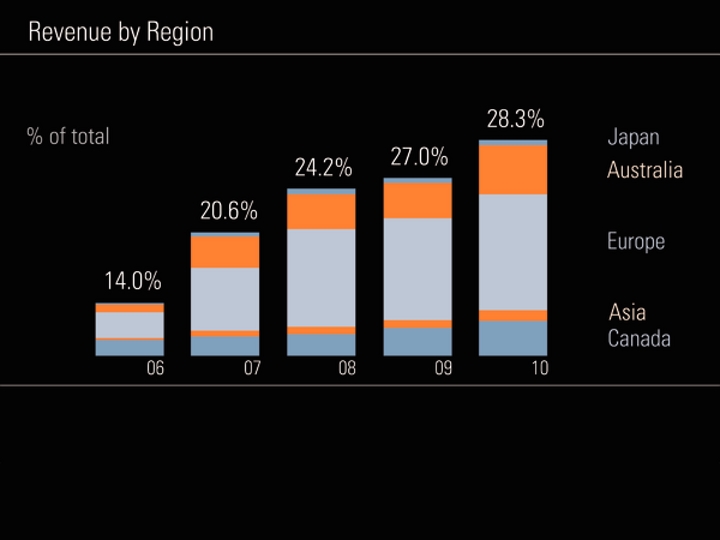
Revenue from international operations has continued edging up. The majority of our international revenue is from Europe, Australia, and Canada.
|
|
|
Quarterly Organic Revenue Growth % Q2 Q3 Q4 –1.3 –7.1 –10.9 –10.2 –6.6 –1.6 2.7 6.6 13.3 7.7 12.2 08 Q1 Q2 Q3 Q4 09 Q1 Q2 Q3 Q4 10 11 Q1 10.0 |
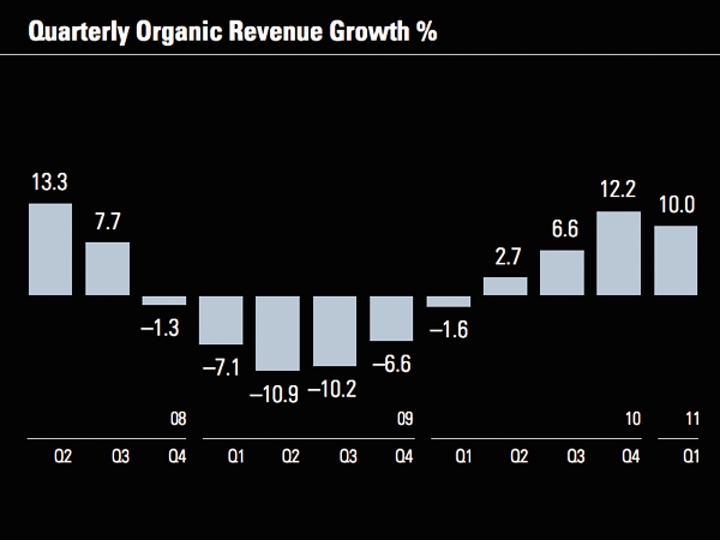
We saw consistent improvement in our quarterly organic revenue growth rates in 2010. Organic revenue growth was 12.2% in the fourth quarter and just a bit below that level at 10.0% for the first quarter of 2011.
Organic revenue growth bottomed out in the second quarter of 2009 and has improved nearly every quarter since then.
The main reason organic growth was slightly lower sequentially in the first quarter of 2011 was a reduction in the growth rate for Morningstar.com ad sales. We continued to see strong performance there, but slightly lower growth in percentage terms because of a tough comparison to the previous-year period.
|
|
|
Renewal Rates 06 95–100% 80–85% 07 08 09 10 90–95% 95–100% 90–95% |
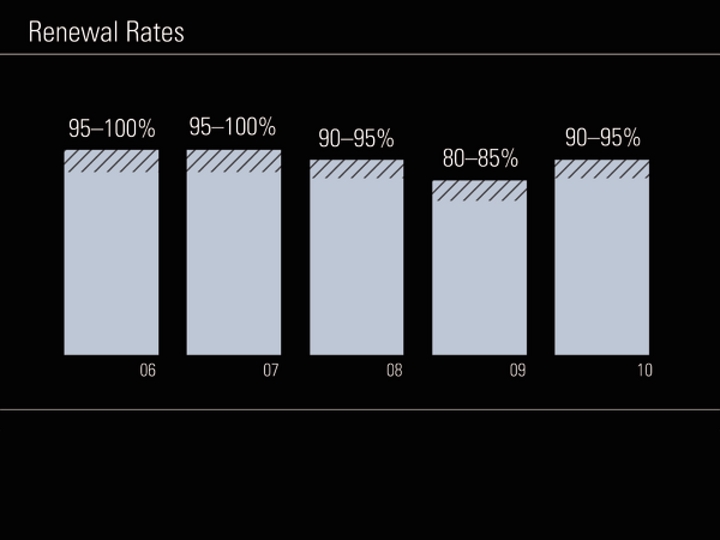
We were encouraged to see improvements in both renewal and retention rates in 2010, reflecting improved business conditions and healthier sales trends across most of our product lines.
For contract-based products and services (such as Licensed Data, Investment Consulting, Morningstar Direct, and Morningstar Advisor Workstation), we estimate that our weighted average renewal rate was between 90% and 95% and increased about 13 percentage points from 2009. The 2009 renewal rate was depressed partly because of the end of the Global Analyst Research Settlement period. Excluding this factor, the 2010 renewal rate rose about 6 percentage points.
|
|
|
Retention Rates 06 60–65% 55–60% 07 08 09 10 60–65% 95–100% 65–70% |
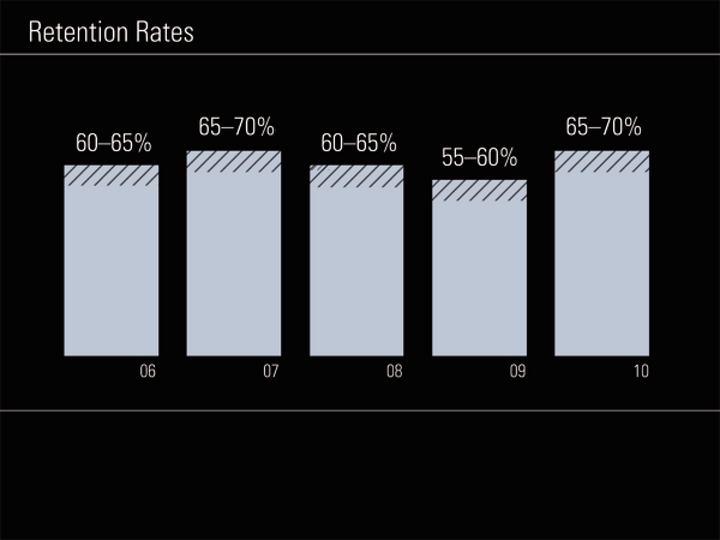
In 2010, we estimate that our retention rate for subscription-based products, such as Principia, Morningstar.com Premium Membership service, and print and online newsletters, was on the higher end of the range between 65% and 70%, up from 55% to 60% in 2009.
|
|
|
Top Five Products 2010 Revenue ($000) % Change (Organic) Licensed Data $ 98,186 7.3% Morningstar Advisor Workstation $ 69,321 5.6% Investment Consulting $ 66,114 17.3% Morningstar.com $ 49,673 25.9% Morningstar Direct $ 38,069 27.0% |
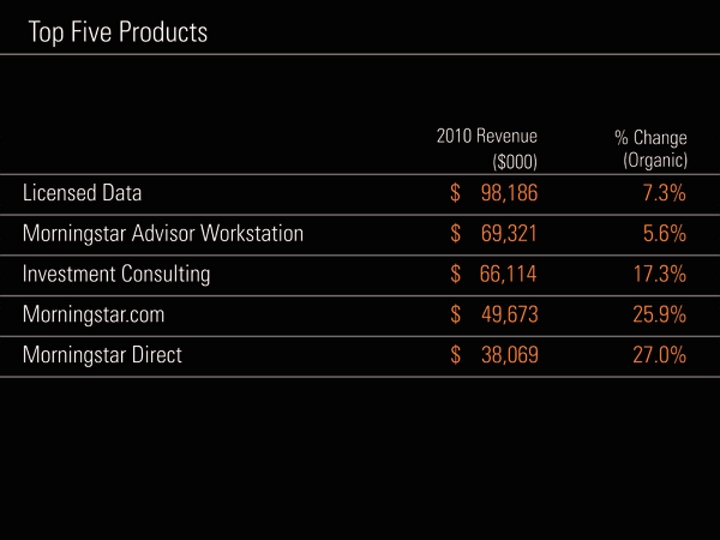
Licensed Data remained our largest product in 2010 because of strong organic growth as well as additional revenue from acquisitions. Overall, we had relatively strong growth rates in most of our key products in 2010. Morningstar.com was a key contributor because of strong trends in ad sales, and Morningstar Direct also drove growth.
|
|
|
Significant Operating Leverage 07 08 09 10 06 Operating margin % 26.9% 27.6% 26.0% 21.8% 24.6% |
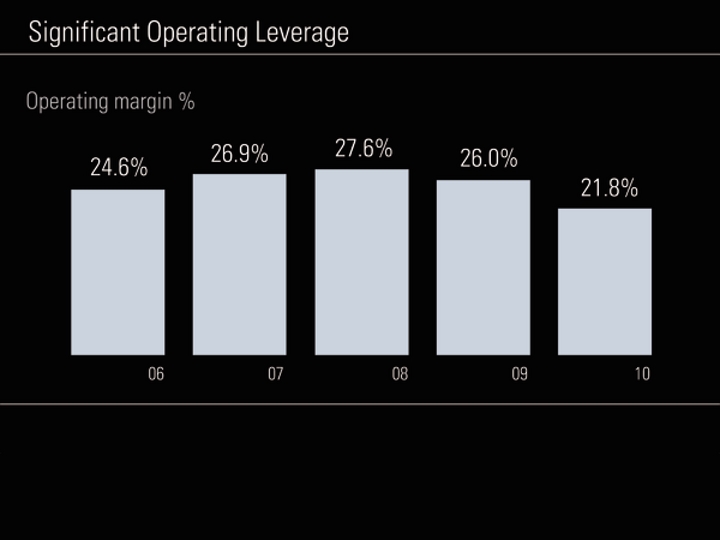
Because we restored some of the compensation expense we reduced in the market downturn, we saw some compression in our operating margin in 2010.
Fundamentally, we still think operating leverage is a core characteristic of our business. As we see additional revenue growth, we shoud realize operating leverage over time.
|
|
|
07 08 09 10 06 $93,523 $99,691 $100,820 $88,884 $108,645 ($11,346) ($48,519) ($12,372) ($14,771) ($4,722) $111,037 $149,339 $101,256 $123,416 $98,245 *Free Cash Flow is considered a non-GAAP financial measure under SEC regulations. Free Cash Flow* Capital expenditures Cash provided by operating activities ($000) |
Free cash flow in 2010 increased about 22% versus 2009, mainly because of higher cash provided by operating activities.
|
|
|
Solid Balance Sheet Consolidated balance sheet data ($000) as of Dec. 31, 2010 Cash, cash equivalents, and investments $365,416 Total assets $1,086,302 Deferred revenue $146,267 Long-term liabilities $52,153 |
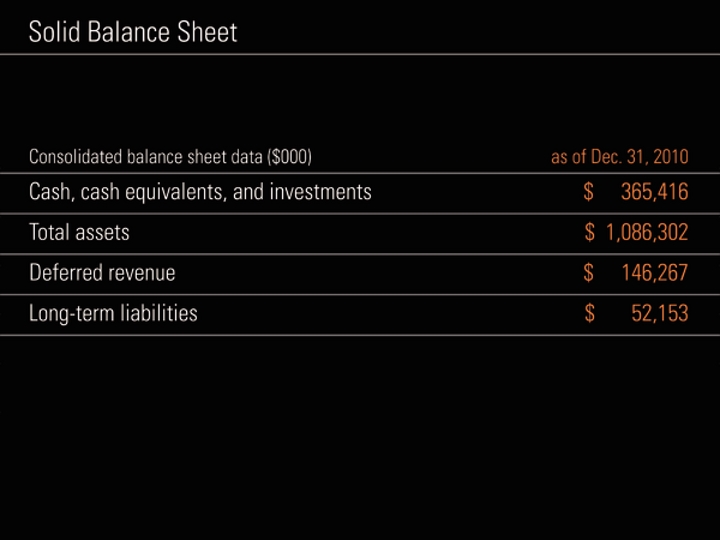
We had about $365 million in cash, cash equivalents, and investments as of December 31, 2010 and no bank debt.
|
|
|
First-Quarter 2011 |

|
|
|
First-Quarter 2011 Key Metrics Operating Income ($mil) Free Cash Flow* ($mil) Revenue ($mil) 11 10 $30.9 $31.8 +2.8% *Free Cash Flow is considered a non-GAAP financial measure under SEC regulations. 11 10 $9.3 $12.8 –27.3% 11 10 $128.3 $151.8 +18.3% |
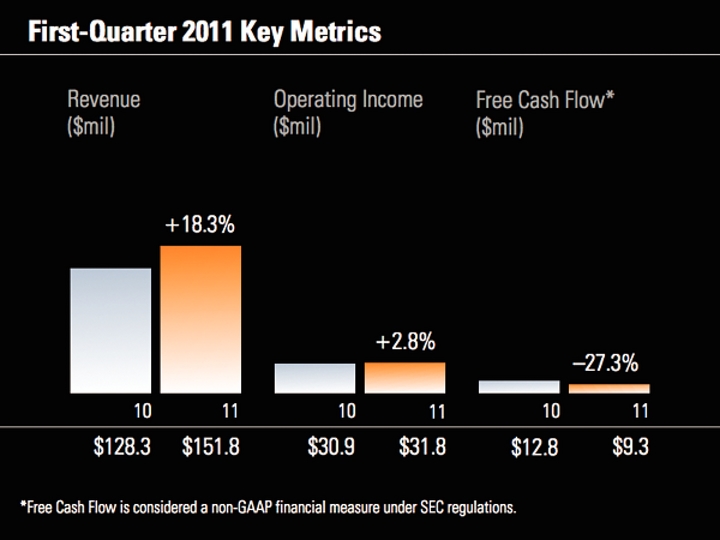
Here’s a snapshot of our key metrics in the first quarter of 2011. Revenue increased about 18%, operating income rose about 3%, and free cash flow declined to $9.3 million. Operating income increased at a lower rate partly because of payments we made related to a separation agreement with Tao Huang, our former chief operating officer. Free cash flow was down because we had higher capital expenditures (a $3.4 million increase) for our new development center in China. In addition, we made bonus payments of $37.5 million in the first quarter of 2011, compared with $21.4 million in the first quarter of 2010.
|
|
|
First-Quarter 2011 Balance Sheet Consolidated balance sheet data ($000) as of March 31, 2011 Cash, cash equivalents, and investments $385,260 Total assets $1,110,228 Deferred revenue $157,660 Long-term liabilities $50,042 |
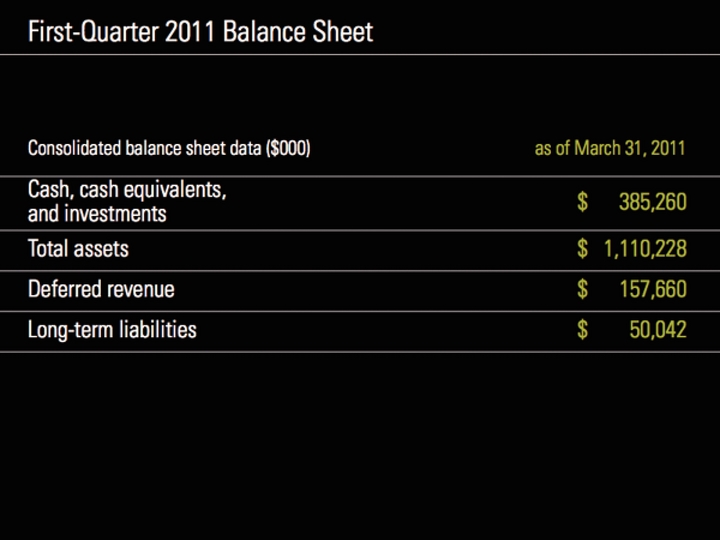
Despite paying out more in bonuses in the first quarter, we had cash, cash equivalents, and investments of $385.3 million as of March 31, 2011.
Deferred revenue—which in some ways is a good measure of future revenue trends because it includes revenue we expect to recognize in future periods—rose about 8% during the first quarter.
|
|
|
Capital Allocation |

|
|
|
Free Cash Flow and Acquisitions Acquisition Spending as a % of FCF 06 09 10 07 08 125.5% 60.7% 104.6% 83.5% 94.2% $93.5 $117.3 $99.7 $60.5 $100.8 $105.4 $88.9 $74.2 $108.6 $102.3 ($mil) FCF Acq. |
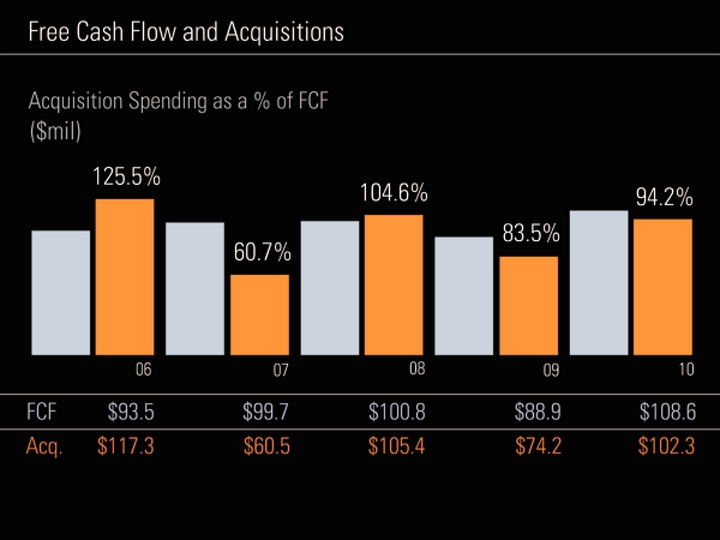
This graph shows our free cash flow and acquisition spending over time. Our acquisition spending worked out to about 94% of free cash flow in 2010.
|
|
|
Potential Uses of Cash Balance sheet strength acquisitions organic expansion dividend stock buyback |
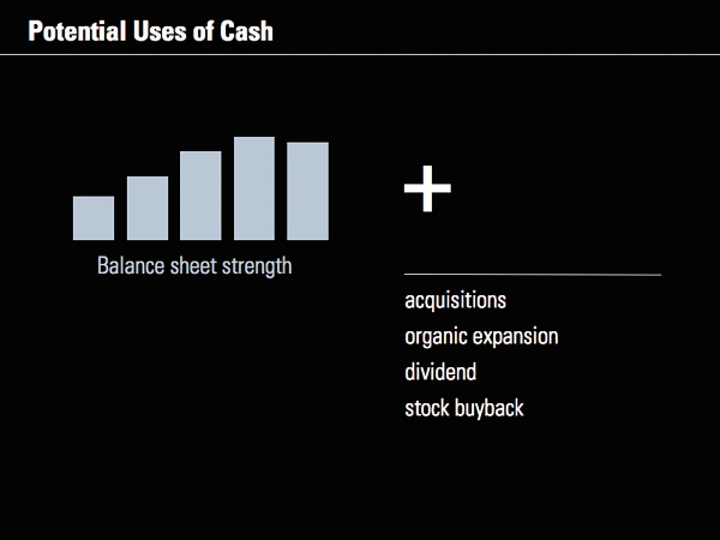
We try to use our cash balance in ways that will maximize returns over the long term. In addition to maintaining a strong balance sheet, there are several other potential areas we could deploy cash. We like to live within our means and use our cash flow to enhance the company’s value by making acquisitions or for organic expansion. As you know, our board of directors has also approved a $0.05 per share quarterly dividend and a $100 million stock repurchase program.
|
|
|
Repurchase Activity to Date Period Total shares purchased Average price per share * Through Dec. 31, 2010 76,218 $49.64 Q1 2011 0 na |
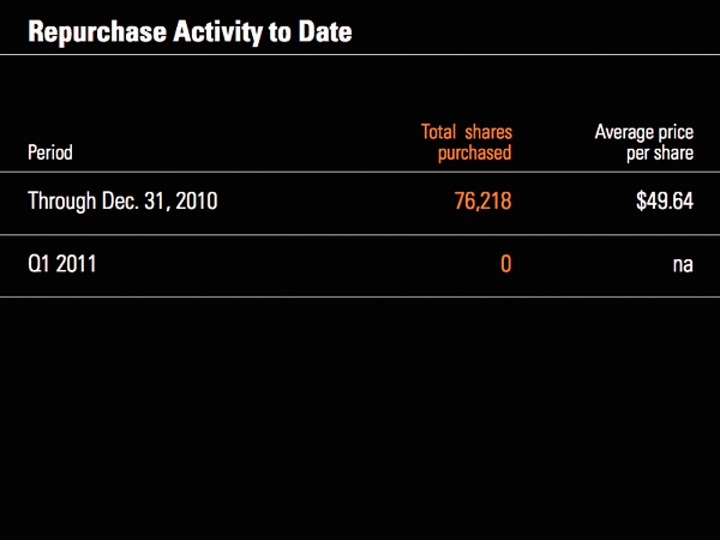
We repurchased a small number of shares, for a total of about $3.4 million in 2010. We look at stock repurchases like any other investment, and we want to be opportunistic about it. Our intent is to buy shares when they’re trading at discount to our intrinsic value estimate. We expect to continue monitoring changes in market valuations as well as any changes to our intrinsic value estimate.
|
|
|
Dividends Paid Date Amount Jan. 14, 2011 $2.5 mil April 29, 2011 $2.5 mil |
We’ve also paid out about $5 million in dividends so far.
|
|
|
Organic revenue (illustrated in a previous slide) is considered a non-GAAP measure. The tables below reconcile consolidated revenue with organic revenue (revenue excluding acquisitions and the favorable impact of foreign currency translations): ($000) 2010 Consolidated revenue $ 555,351 Less: acquisitions (47,850) Favorable impact of foreign currency translations (4,362) Organic revenue $ 503,139 Three months ended March 31 ($000) 2011 Consolidated revenue $ 151,767 Less: acquisitions (9,015) Favorable impact of foreign currency (1,680) Organic revenue $ 141,072 Reconciliation of Non-GAAP Measures with the Nearest Comparable GAAP Measure |
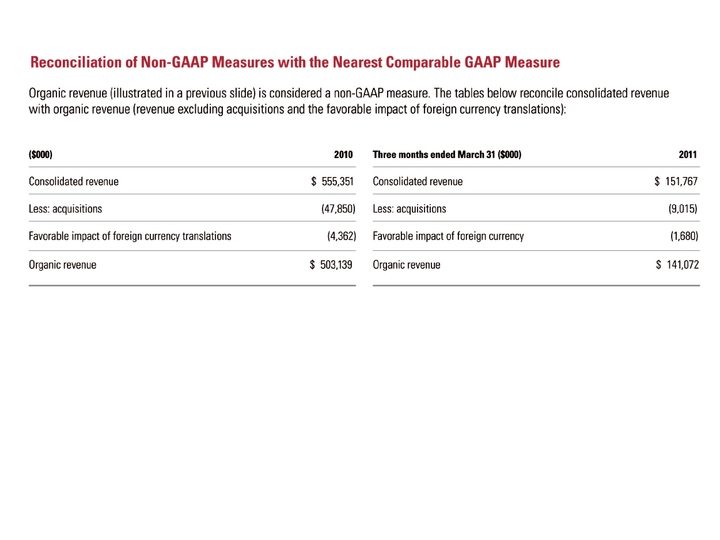
These slides reconciles the organic growth rates shown earlier (a non-GAAP measure) to consolidated revenue.
|
|
|
Reconciliation of Non-GAAP Measure with the Nearest Comparable GAAP Measure Organic revenue (illustrated in a previous slide) is considered a non-GAAP measure. Reconciliation from consolidated revenue to revenue excluding acquisitions and foreign currency translations (organic revenue) 2008 2009 2010 $000 Q2 Q3 Q4 Q1 Q2 Q3 Q4 Q1 Q2 Q3 Q4 Consolidated revenue $132,237 $125,505 $119,271 $116,732 $119,533 $120,088 $122,643 $128,290 $136,091 $139,817 $151,153 Less: acquisitions (4,876) (4,732) (6,419) (5,928) (6,732) (9,342) (7,588) (9,704) (12,718) (11,964) (13,464) (Favorable)/unfavorable (3,085) (271) 3,787 5,697 5,031 1,969 (3,710) (3,731) (671) 183 (143) impact of foreign currency translations Revenue excluding $124,276 $120,502 $116,639 $116,501 $117,832 $112,715 111,345 $114,855 $122,702 $128,036 $137,546 acquisitions and foreign currency translations Consolidated revenue 21% 12% 1% -7% -10% -4% 3% 10% 14% 16% 23% growth Less: acquisitions -4% -4% -5% -5% -5% -7% -6% -8% -11% -10% -11% Less: impact of -3% 0% 3% 5% 4% 2% -3% -3% -1% 0% 0% foreign currency Revenue growth 13% 8% -1% -7% -11% -10% -7% 2011 Q1 $151,767 (9,015) (1,680) $141,072 18% -7% -1% 10% -2% 3% 7% 12% excluding acquisitions and foreign currency translations (1) (1) Sum of percentages may not match total because of rounding. |
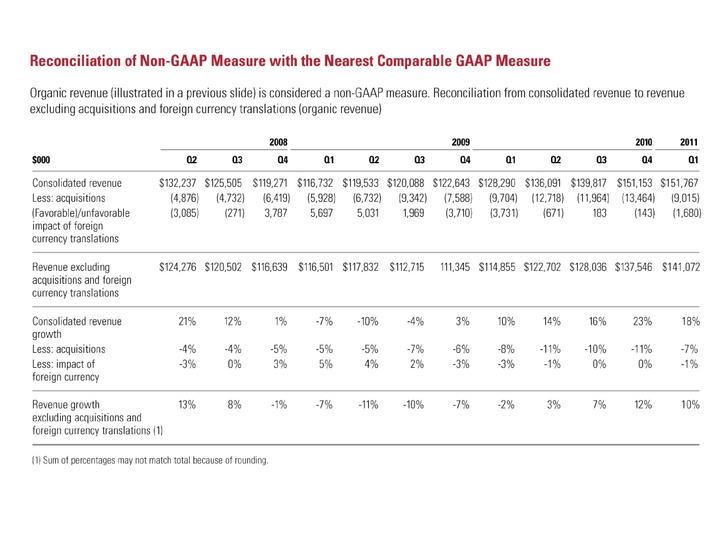
These slides reconciles the organic growth rates shown earlier (a non-GAAP measure) to consolidated revenue.
|
|
|
Reconciliation of Non-GAAP Measures with the Nearest Comparable GAAP Measure Free Cash Flow (illustrated in a previous slide) is considered a non-GAAP measure. The tables below reconcile cash provided by operating activities with free cash flow: Three months ended March 31 ($000) 2011 Cash provided by operating activities $14,346 Less: Capital expenditures (5,037) Free Cash Flow $9,309 Three months ended March 31 ($000) 2010 Cash provided by operating activities $14,450 Less: Capital expenditures (1,650) Free Cash Flow $12,800 |
This slide reconciles free cash flow (a non-GAAP measure) to the nearest comparable GAAP measure.