UNITED STATES
SECURITIES AND EXCHANGE COMMISSION
Washington, D.C. 20549
_____________________
Form 8-K
_____________________
CURRENT REPORT
Pursuant to Section 13 or 15(d) of the Securities Exchange Act of 1934
Date of Report (Date of earliest event Reported): March 4, 2019
Otelco Inc.
(Exact Name of Registrant as Specified in Charter)
Delaware | 1-32362 | 52-2126395 |
(State or Other Jurisdiction of Incorporation) | (Commission File Number) | (I.R.S. Employer Identification Number) |
505 Third Avenue East, Oneonta, AL 35121 |
(Address of Principal Executive Offices) (Zip Code) |
(205) 625-3580
(Registrant's telephone number, including area code)
(Former name or former address, if changed since last report)
Check the appropriate box below if the Form 8-K filing is intended to simultaneously satisfy the filing obligation of the registrant under any of the following provisions: | ||
[ ] | Written communications pursuant to Rule 425 under the Securities Act (17 CFR 230.425) | |
[ ] | Soliciting material pursuant to Rule 14a-12 under the Exchange Act (17 CFR 240.14a-12) | |
[ ] | Pre-commencement communications pursuant to Rule 14d-2(b) under the Exchange Act (17 CFR 240.14d-2(b)) | |
[ ] | Pre-commencement communications pursuant to Rule 13e-4(c) under the Exchange Act (17 CFR 240.13e-4(c)) |
Indicate by check mark whether the registrant is an emerging growth company as defined in Rule 405 of the Securities Act of 1933 (17 CFR §230.405) or Rule 12b-2 of the Securities Exchange Act of 1934 (17 CFR §240.12b-2). Emerging growth company [ ]
If an emerging growth company, indicate by check mark if the registrant has elected not to use the extended transition period for complying with any new or revised financial accounting standards provided pursuant to Section 13(a) of the Exchange Act. [ ]
Item 2.02. Results of Operations and Financial Condition.
On March 4, 2019, Otelco Inc. announced its results of operations for its fourth quarter and year ended December 31, 2018. A copy of the press release is attached hereto as Exhibit 99.1 and is incorporated herein by reference. In addition, the Company posted a fourth quarter and year ended December 31, 2018, investor presentation to the Investor Relations section of its website at www.Otelco.com. A copy of the presentation is attached hereto as Exhibit 99.2 and is incorporated herein by reference. Other information contained on Otelco Inc.’s website does not constitute a part of this Current Report on Form 8-K.”
Item 9.01. Financial Statements and Exhibits.
(d) Exhibits.99.1 Press Release dated March 4, 2019 99.2 Earnings Presentation Dated March 4, 2019
SIGNATURE
Pursuant to the requirements of the Securities Exchange Act of 1934, the registrant has duly caused this report to be signed on its behalf by the undersigned hereunto duly authorized.
Otelco Inc. | ||
(Registrant) | ||
Date: March 4, 2019 | By: | /s/ Curtis L. Garner, Jr. |
Curtis L. Garner, Jr. | ||
Chief Financial Officer | ||
EXHIBIT INDEX
Exhibit Number | Description of Exhibit(s) | |||
99.1 | Press Release dated March 4, 2019 | |||
99.2 | Earnings Presentation Dated March 4, 2019 |
EXHIBIT 99.1
Otelco Reports Fourth Quarter and 2018 Operational and Financial Results
ONEONTA, Ala., March 04, 2019 (GLOBE NEWSWIRE) -- Otelco Inc. (NASDAQ: OTEL), a wireline telecommunications services provider in Alabama, Maine, Massachusetts, Missouri, New Hampshire, Vermont and West Virginia, today announced operational and financial results for its fourth quarter and year ended December 31, 2018. Key operational and financial highlights for Otelco include:
FOURTH QUARTER RESULTS
The Company continued to execute on its strategy of fiber deployment and debt reduction in fourth quarter 2018. The impact of the Tax Cuts and Jobs Act significantly reduced the provision for income taxes due to the reduction of deferred taxes in fourth quarter 2017. The Company’s new credit agreement with CoBank in fourth quarter 2017 increased interest expense associated with the extinguishment of its former debt. Both changes limit the comparability of net income for fourth quarter and the year. Net income was $2.2 million in fourth quarter 2018, compared to $7.4 million in fourth quarter 2017. Revenues declined $0.6 million, or 3.7%, primarily from a reduction in residential customers and access fees, while expenses declined $0.1 million, or 0.6%, compared with the prior year period. Interest expense declined $4.0 million reflecting the write-off of unamortized loan costs in 2017 and lower interest expense associated with the reduction in principal under the Company’s new credit agreement. The Company invested $2.3 million in its network and operations. Consolidated EBITDA (as defined below) was $6.0 million for fourth quarter 2018, compared to $6.5 million for the same period in the previous year. The ratio of debt, net of cash, to Consolidated EBITDA was 2.72, reflecting the mandatory payments and voluntary prepayments made on the debt during the year. Basic net income per share was $0.61 per share for fourth quarter 2018, compared to $2.21 per share in the same period of 2017.
CONNECT AMERICA FUND II AND RURAL MUNICIPALITIES
Otelco was awarded just over $0.9 million over a ten-year period from the FCC’s reverse auction for three census blocks in Western Massachusetts. The funding will support the construction of a fixed wireless network to provide improved data services to four targeted communities. Approximately 1,000 locations in Hawley, Monroe, Florida and Savoy (Massachusetts) will have access to the network. The Company is partnering with another firm to build and operate the network, with construction expected to begin in second quarter 2019 once final contract negotiations are completed with the municipalities. The Company is working with the FCC staff to update its application information and be confirmed for grant release.
“We look forward to bringing improved broadband services to four more communities in New England,” commented Robert J. Souza, President and Chief Executive of Otelco. “The new network will enhance the residents’ voice and data service options with service levels not currently available in their markets. A number of other municipalities are exploring options with Otelco to improve digital service availability in their jurisdictions, based on our previous work with the town of Leverett, Massachusetts.”
NETWORK INVESTMENT
Otelco invested $8.0 million in 2018 to grow its fiber distribution network and improve its support systems, including the $2.3 million invested during fourth quarter 2018. Fiber-to-the-premise (“FTTP”) will be the primary vehicle to increase data capacity for Otelco’s customers, with fiber-to-the-node (“FTTN”) and fixed wireless options being employed in more sparsely populated areas. During 2018, Otelco added 135 miles of fiber in its service territories, an increase of 12% from 2017, and now passes approximately 7,250 discrete locations with fiber. The Company has over 2,200 miles of distribution and transport fiber in its network. During 2019, the Company plans to increase its investment in the business by 12% to $9.0 million, which is expected to expand the reach of its broadband network. In addition, the Company is evaluating the FCC’s revised Alternative Connect America Model (“A-CAM”) program which includes approximately $440,000 per year of additional funding and extends the program through 2028, representing two additional years of funding.
BALANCE SHEET
At the end of 2018, the Company reported cash of $4.7 million, an increase of $1.1 million from the end of 2017. During fourth quarter 2018, the Company reduced the outstanding principal on its credit facility by $2.1 million, including a $1.0 million voluntary prepayment. Otelco made more than $11.4 million in scheduled and voluntary payments on its debt during 2018. The remaining balance on the loan at the end of 2018 was $74.6 million, excluding loan origination costs, down 14.3% since the origination of the $87.0 million loan on November 2, 2017. At current interest rates, the payments made during 2018 will lower annual interest expense by just under $0.8 million. The interest rate on the loan reflects a reduction in the interest rate margin from 4.50% to 4.25%, which occurred when the Company brought its ratio of consolidated indebtedness to Consolidated EBITDA below 3.0 at the end of third quarter 2018. The lower margin will save the Company approximately $0.2 million in interest expense on an annual basis.
RICHARD CLARK JOINS OTELCO AS CHIEF OPERATING OFFICER
On October 15, 2018, Richard Clark joined the Company as Chief Operating Officer. Clark formerly was Executive Vice President and Chief Financial Officer of TVC Albany, Inc., which does business as FirstLight Fiber. Since joining Otelco, Clark has worked closely with the Company’s technical and engineering teams in determining a short and long-term broadband and fiber deployment strategy to optimize the use of A-CAM funding.
BILLING/OPERATIONS SUPPORT SYSTEM REPLACEMENT
During 2018, Otelco completed the conversion of three billing systems into a single new billing and operations support system. All carrier and end user activity - from ordering to provisioning to billing to collecting – is being handled in the new system. The next stage of the implementation will be the completion of geocoded maps that will improve Otelco’s ability to serve its customers and deploy capital as effectively as possible. Implementation of the system has reduced annual maintenance costs and, through consolidation of work groups, eliminated the need to backfill open positions within the organization, representing over $0.7 million in expense reductions.
SUMMARY
“The flexibility provided by our new debt agreement and completion of the billing system conversion, coupled with Otelco’s participation in the FCC’s A-CAM program with its focus on broadband and fiber deployment, provides a solid foundation for our business,” noted Souza. “Our marketing, sales and customer service teams are targeted in their approach to offering fiber-based Lightwave services to every location we pass with each new mile of fiber. With these improvements, we are well positioned to enhance our customers’ experience, improve available data speeds and product offerings, and add new customers to the Otelco family of companies. Focusing on both cost management and our revenue trajectory should continue to serve our employees, customers and stockholders well as we move into 2019.”
FOURTH QUARTER EARNINGS CONFERENCE CALL
Otelco has scheduled a conference call, which will be broadcast live over the internet, on Tuesday, March 5, 2019, at 11:30 a.m. (Eastern Time). To participate in the call, participants should dial (334) 323-0522 and ask for the Otelco call 10 minutes prior to the start time. Investors, analysts and the general public will also have the opportunity to listen to the conference call free over the internet by visiting the Company’s website at www.Otelco.com. To listen to the live call online, please visit the website at least 15 minutes early to register, download and install any necessary audio software. For those who cannot listen to the live webcast, a replay of the webcast will be available on the Company's website at www.Otelco.com for 30 days. A two-week telephonic replay may also be accessed by calling (719) 457-0820 and entering the Confirmation Code 2948716.
ABOUT OTELCO
Otelco Inc. provides wireline telecommunications services in Alabama, Maine, Massachusetts, Missouri, New Hampshire, Vermont and West Virginia. The Company’s services include local and long distance telephone, digital high-speed data lines, transport services, network access, cable television and other related services. Otelco is among the top 20 largest local exchange carriers in the United States. Otelco operates eleven incumbent telephone companies serving rural markets, or rural local exchange carriers. It also provides competitive retail and wholesale communications services and technology consulting, managed services and private/hybrid cloud hosting services through several subsidiaries. For more information, visit the Company’s website at www.Otelco.com.
FORWARD LOOKING STATEMENTS
Statements in this press release that are not statements of historical or current fact constitute forward-looking statements. Such forward-looking statements involve known and unknown risks, uncertainties, and other unknown factors that could cause the actual results of the Company to be materially different from the historical results or from any future results expressed or implied by such forward-looking statements. In addition to statements which explicitly describe such risks and uncertainties, readers are urged to consider statements labeled with the terms “believes,” “belief,” “expects,” “intends,” “anticipates,” “plans,” or similar terms to be uncertain and forward-looking. The forward-looking statements contained herein are also subject generally to other risks and uncertainties that are described from time to time in the Company’s filings with the Securities and Exchange Commission. The Company assumes no obligation to update or revise any forward-looking statements, whether as a result of new information, future events or otherwise, except as required by applicable law.
OTELCO INC. | ||||||||||||||||
CONSOLIDATED BALANCE SHEETS | ||||||||||||||||
(in thousands, except share par value and share amounts) | ||||||||||||||||
As of December 31, | ||||||||||||||||
2018 | 2017 | |||||||||||||||
Assets | ||||||||||||||||
Current assets | ||||||||||||||||
Cash and cash equivalents | $ | 4,657 | $ | 3,570 | ||||||||||||
Accounts receivable: | ||||||||||||||||
Due from subscribers, net of allowance for doubtful | ||||||||||||||||
accounts of $577 and $226, respectively | 4,183 | 4,647 | ||||||||||||||
Other | 1,899 | 1,875 | ||||||||||||||
Materials and supplies | 2,802 | 2,700 | ||||||||||||||
Prepaid expenses | 1,198 | 3,122 | ||||||||||||||
Total current assets | 14,739 | 15,914 | ||||||||||||||
Property and equipment, net | 52,073 | 50,888 | ||||||||||||||
Goodwill | 44,976 | 44,976 | ||||||||||||||
Intangible assets, net | 919 | 1,328 | ||||||||||||||
Investments | 1,498 | 1,632 | ||||||||||||||
Interest rate cap | 4 | - | ||||||||||||||
Other assets | 143 | 201 | ||||||||||||||
Total assets | $ | 114,352 | $ | 114,939 | ||||||||||||
Liabilities and Stockholders' Equity | ||||||||||||||||
Current liabilities | ||||||||||||||||
Accounts payable | $ | 1,331 | $ | 1,619 | ||||||||||||
Accrued expenses | 5,054 | 4,803 | ||||||||||||||
Advance billings and payments | 1,614 | 1,684 | ||||||||||||||
Customer deposits | 48 | 58 | ||||||||||||||
Current maturity of long-term notes payable, net of debt issuance costs | 3,904 | 3,891 | ||||||||||||||
Total current liabilities | 11,951 | 12,055 | ||||||||||||||
Deferred income taxes | 20,145 | 18,939 | ||||||||||||||
Advance billings and payments | 2,234 | 2,367 | ||||||||||||||
Other liabilities | 13 | 13 | ||||||||||||||
Long-term notes payable, less current maturities and debt issuance costs | 69,107 | 80,058 | ||||||||||||||
Total liabilities | 103,450 | 113,432 | ||||||||||||||
Stockholders' equity | ||||||||||||||||
Class A Common Stock, $.01 par value-authorized 10,000,000 shares; | ||||||||||||||||
issued and outstanding 3,388,624 and 3,346,689 shares, respectively | 34 | 34 | ||||||||||||||
Additional paid in capital | 4,213 | 4,285 | ||||||||||||||
Retained earnings (accumulated deficit) | 6,655 | (2,812 | ) | |||||||||||||
Total stockholders' equity | 10,902 | 1,507 | ||||||||||||||
Total liabilities and stockholders' equity | $ | 114,352 | $ | 114,939 | ||||||||||||
OTELCO INC. AND SUBSIDIARIES | ||||||||||||||||||||||
CONSOLIDATED STATEMENTS OF OPERATIONS | ||||||||||||||||||||||
(in thousands, except share and per share amounts) | ||||||||||||||||||||||
Three Months Ended December 31, | Twelve Months Ended December 31, | |||||||||||||||||||||
2018 | 2017 | 2018 | 2017 | |||||||||||||||||||
Revenues | $ | 16,200 | $ | 16,793 | $ | 66,068 | $ | 68,526 | ||||||||||||||
Operating expenses | ||||||||||||||||||||||
Cost of services | 7,567 | 7,927 | 30,592 | 31,395 | ||||||||||||||||||
Selling, general and administrative expenses | 2,759 | 2,461 | 10,451 | 10,147 | ||||||||||||||||||
Depreciation and amortization | 1,850 | 1,861 | 7,232 | 7,377 | ||||||||||||||||||
Total operating expenses | 12,176 | 12,249 | 48,275 | 48,919 | ||||||||||||||||||
Income from operations | 4,024 | 4,544 | 17,793 | 19,607 | ||||||||||||||||||
Other income (expense) | ||||||||||||||||||||||
Interest expense | (1,460 | ) | (5,500 | ) | (5,844 | ) | (13,249 | ) | ||||||||||||||
Loss on debt prepayment penalty | - | (2,228 | ) | - | (2,303 | ) | ||||||||||||||||
Other income | 11 | 1 | 263 | 204 | ||||||||||||||||||
Total other expenses | (1,449 | ) | (7,727 | ) | (5,581 | ) | (15,348 | ) | ||||||||||||||
Income (loss) before income tax (expense) benefit | 2,575 | (3,183 | ) | 12,212 | 4,259 | |||||||||||||||||
Income tax (expense) benefit | (338 | ) | 10,565 | (2,745 | ) | 7,856 | ||||||||||||||||
Net income | $ | 2,237 | $ | 7,382 | $ | 9,467 | $ | 12,115 | ||||||||||||||
Weighted average number of common shares outstanding: | ||||||||||||||||||||||
Basic | 3,388,624 | 3,346,689 | 3,388,624 | 3,346,689 | ||||||||||||||||||
Diluted | 3,443,119 | 3,445,632 | 3,434,862 | 3,445,632 | ||||||||||||||||||
Basic net income per common share | $ | 0.66 | $ | 2.21 | $ | 2.79 | $ | 3.62 | ||||||||||||||
Diluted net income per common share | $ | 0.65 | $ | 2.14 | $ | 2.76 | $ | 3.52 | ||||||||||||||
OTELCO INC. AND SUBSIDIARIES | ||||||||||||||||
CONSOLIDATED STATEMENTS OF CASH FLOWS | ||||||||||||||||
(in thousands) | ||||||||||||||||
Years Ended December 31, | ||||||||||||||||
2018 | 2017 | |||||||||||||||
Cash flows from operating activities: | ||||||||||||||||
Net income | $ | 9,467 | $ | 12,115 | ||||||||||||
Adjustments to reconcile net income to cash flows provided by operating activities: | ||||||||||||||||
Depreciation | 6,906 | 7,001 | ||||||||||||||
Amortization | 326 | 376 | ||||||||||||||
Amortization of loan costs | 476 | 4,823 | ||||||||||||||
Loss on debt prepayment penalty | - | 2,303 | ||||||||||||||
Provision (benefit) for deferred income taxes | 1,062 | (9,393 | ) | |||||||||||||
Excess tax benefit from stock-based compensation | 144 | 52 | ||||||||||||||
Provision for uncollectible accounts receivable | 553 | 357 | ||||||||||||||
Stock-based compensation | 308 | 308 | ||||||||||||||
Payment in kind interest - subordinated debt | - | 266 | ||||||||||||||
Changes in operating assets and liabilities | ||||||||||||||||
Accounts receivable | (113 | ) | (316 | ) | ||||||||||||
Materials and supplies | (102 | ) | (516 | ) | ||||||||||||
Prepaid expenses and other assets | 1,982 | (189 | ) | |||||||||||||
Accounts payable and accrued expenses | (37 | ) | 215 | |||||||||||||
Advance billings and payments | (203 | ) | 577 | |||||||||||||
Other liabilities | (9 | ) | (17 | ) | ||||||||||||
Net cash from operating activities | 20,760 | 17,962 | ||||||||||||||
Cash flows used in investing activities: | ||||||||||||||||
Acquisition and construction of property and equipment | (7,983 | ) | (8,510 | ) | ||||||||||||
Retirement of investment | (11 | ) | (1 | ) | ||||||||||||
Net cash used in investing activities | (7,994 | ) | (8,511 | ) | ||||||||||||
Cash flows used in financing activities: | ||||||||||||||||
Loan origination costs | (64 | ) | (2,144 | ) | ||||||||||||
Principal repayment of long-term notes payable | (11,350 | ) | (98,927 | ) | ||||||||||||
Proceeds from loan refinancing | - | 87,000 | ||||||||||||||
Debt prepayment penalty fees | - | (2,303 | ) | |||||||||||||
Interest rate cap | (4 | ) | - | |||||||||||||
CoBank equity account retirement | 119 | 164 | ||||||||||||||
Tax withholdings paid on behalf of employees for restricted stock units | (380 | ) | (209 | ) | ||||||||||||
Net cash used in financing activities | (11,679 | ) | (16,419 | ) | ||||||||||||
Net increase (decrease) in cash and cash equivalents | 1,087 | (6,968 | ) | |||||||||||||
Cash and cash equivalents, beginning of period | 3,570 | 10,538 | ||||||||||||||
Cash and cash equivalents, end of period | $ | 4,657 | $ | 3,570 | ||||||||||||
Supplemental disclosures of cash flow information: | ||||||||||||||||
Interest paid | $ | 5,383 | $ | 9,287 | ||||||||||||
Income taxes (refund) paid | $ | (502 | ) | $ | 1,802 | |||||||||||
Issuance of Class A common stock | $ | - | $ | 1 | ||||||||||||
CONSOLIDATED EBITDA – Consolidated EBITDA is defined as consolidated net income plus consolidated net interest expense, depreciation and amortization, income taxes and certain other fees, expenses and non-cash charges reducing consolidated net income. Consolidated EBITDA is a supplemental measure of the Company’s performance that is not required by, or presented in accordance with, accounting principles generally accepted in the United States (“GAAP”). Consolidated EBITDA corresponds to the definition of Consolidated EBITDA in the Company’s credit facility. The lenders under the Company’s credit facility utilize this measure to determine compliance with credit facility requirements. The Company uses Consolidated EBITDA as an operational performance measurement to focus attention on the operational generation of cash, which is used for reinvestment into the business; to repay its debt and to pay interest on its debt; to pay income taxes; and for other corporate requirements. The Company reports Consolidated EBITDA to allow current and potential investors to understand this performance metric and because the Company believes that it provides current and potential investors with helpful information with respect to the Company’s operating performance. However, Consolidated EBITDA should not be considered as an alternative to net income or any other performance measures derived in accordance with GAAP. The Company’s presentation of Consolidated EBITDA may not be comparable to similarly titled measures used by other companies.
Reconciliation of Consolidated EBITDA to Net Income | |||||||||||||||||
Three Months Ended December 31, | Twelve Months Ended December 31, | ||||||||||||||||
2018 | 2017 | 2018 | 2017 | ||||||||||||||
Net income | $ | 2,237 | $ | 7,382 | $ | 9,467 | $ | 12,115 | |||||||||
Add: | Depreciation | 1,771 | 1,776 | 6,906 | 7,001 | ||||||||||||
Interest expense less interest income | 1,339 | 1,605 | 5,368 | 8,426 | |||||||||||||
Interest expense - amortize loan cost | 122 | 3,896 | 476 | 4,823 | |||||||||||||
Loan termination fees | - | 2,228 | - | 2,303 | |||||||||||||
Income tax expense (benefit) | 338 | (10,565 | ) | 2,745 | (7,856 | ) | |||||||||||
Amortization - intangibles | 79 | 85 | 326 | 376 | |||||||||||||
Stock-based compensation | 100 | 71 | 308 | 308 | |||||||||||||
Loan fees | 18 | 26 | 74 | 144 | |||||||||||||
Consolidated EBITDA | $ | 6,004 | $ | 6,504 | $ | 25,670 | $ | 27,640 | |||||||||
LEVERAGE RATIO – The Company uses the ratio of debt, net of cash, to Consolidated EBITDA for the last twelve months as an operational performance measurement of Otelco’s leverage. Such ratio is a supplemental measure of the Company’s performance that is not required by, or presented in accordance with, GAAP. The Company reports such ratio to allow current and potential investors to understand this performance metric. The Company also believes that it provides current and potential investors with helpful information with respect to the Company’s operating performance, including the Company’s ability to generate earnings sufficient to service its debt, and enhances understanding of the Company’s financial performance and highlights operational trends. However, such ratio should not be considered as an alternative to net income or any other performance measures derived in accordance with GAAP. The Company’s presentation of such ratio may not be comparable to similarly titled ratios used by other companies. The table below provides the calculation of such ratio as of December 31, 2018.
Ratio of Debt, Net of Cash, to Consolidated EBITDA | ||||||
as of December 31, 2018 | ||||||
($ 000) | ||||||
Notes payable | $ | 73,011 | ||||
Debt issuance costs | 1,551 | |||||
Notes outstanding | 74,562 | |||||
Less cash | (4,657 | ) | ||||
Notes outstanding, net of cash | $ | 69,905 | ||||
Consolidated EBITDA for the | ||||||
last twelve months | $ | 25,670 | ||||
Leverage ratio | 2.72 |
Contact: Curtis Garner
Chief Financial Officer
Otelco Inc.
205-625-3580
Curtis.Garner@Otelco.com
Exhibit 99.2
OTELCO Inc. OTEL (Nasdaq) www.otelco.com March 4, 2019
Forward Looking Statements This presentation contains forward - looking statements that are subject to risks and uncertainties . Forward - looking statements give our current expectations relating to our financial condition, results of operations, plans, objectives, future performance and business . These statements may include words such as “anticipate,” “estimate,” “expect,” “project,” “plan,” “intend,” “believe” and other words and terms of similar meaning in connection with any discussion of the timing or nature of future operating or financial performance or other events . These forward - looking statements are based on assumptions that we have made in light of our experience in the industry in which we operate, as well as our perceptions of historical trends, current conditions, expected future developments and other factors we believe are appropriate under the circumstances . Although we believe that these forward - looking statements are based on reasonable assumptions, you should be aware that many factors could affect our actual financial condition or results of operations, or cause our actual results to differ materially from those in the forward - looking statements 1
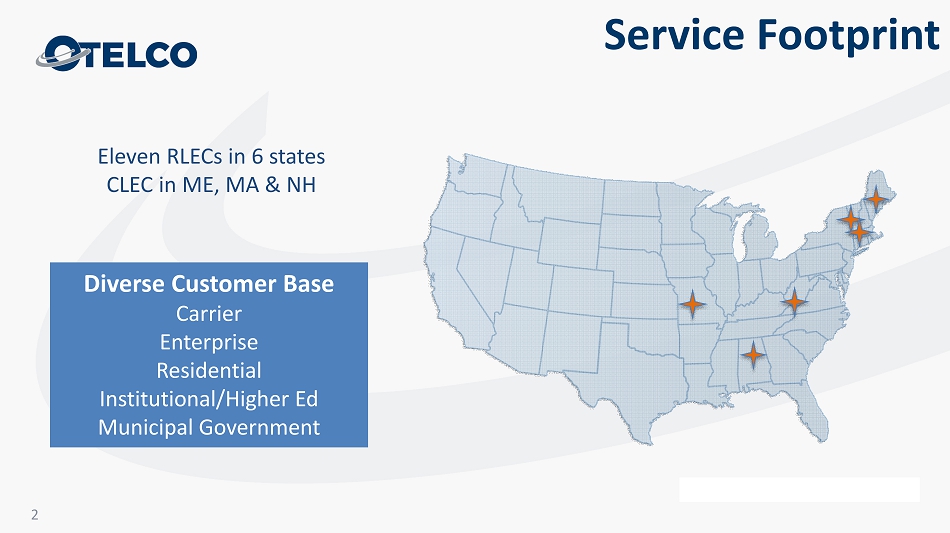
Diverse Customer Base Carrier Enterprise Residential Institutional/Higher Ed Municipal Government Eleven RLECs in 6 states CLEC in ME, MA & NH 2 Service Footprint
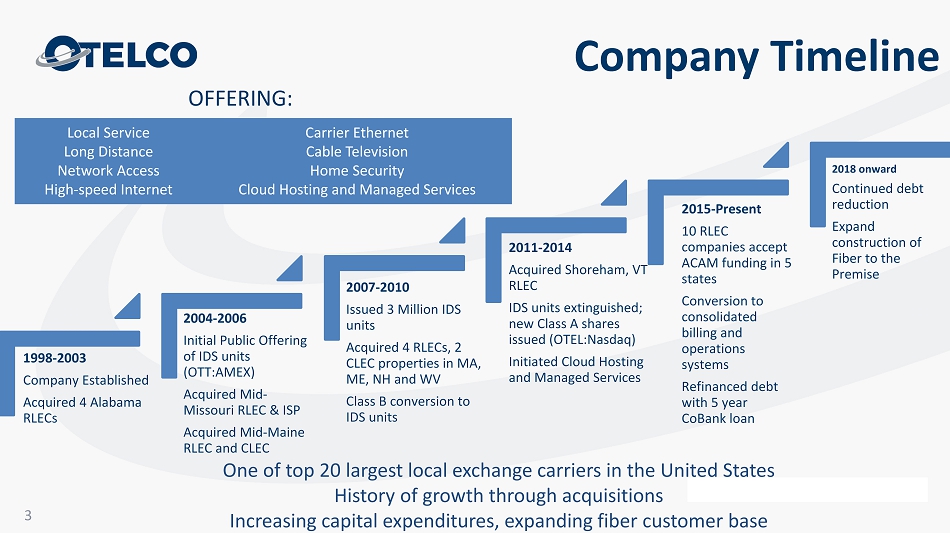
1998 - 2003 Company Established Acquired 4 Alabama RLECs 2004 - 2006 Initial Public Offering of IDS units (OTT:AMEX) Acquired Mid - Missouri RLEC & ISP Acquired Mid - Maine RLEC and CLEC 2007 - 2010 Issued 3 Million IDS units Acquired 4 RLECs, 2 CLEC properties in MA, ME, NH and WV Class B conversion to IDS units 2011 - 2014 Acquired Shoreham, VT RLEC IDS units extinguished; new Class A shares issued ( OTEL:Nasdaq ) Initiated Cloud Hosting and Managed Services 2015 - Present 10 RLEC companies accept ACAM funding in 5 states Conversion to consolidated billing and operations systems Refinanced debt with 5 year CoBank loan 2018 onward Continued debt reduction Expand construction of Fiber to the Premise Company Timeline One of top 20 largest local exchange carriers in the United States History of growth through acquisitions Increasing capital expenditures, expanding fiber customer base Local Service Long Distance Network Access High - speed Internet OFFERING: Carrier Ethernet Cable Television Home Security Cloud Hosting and Managed Services 3
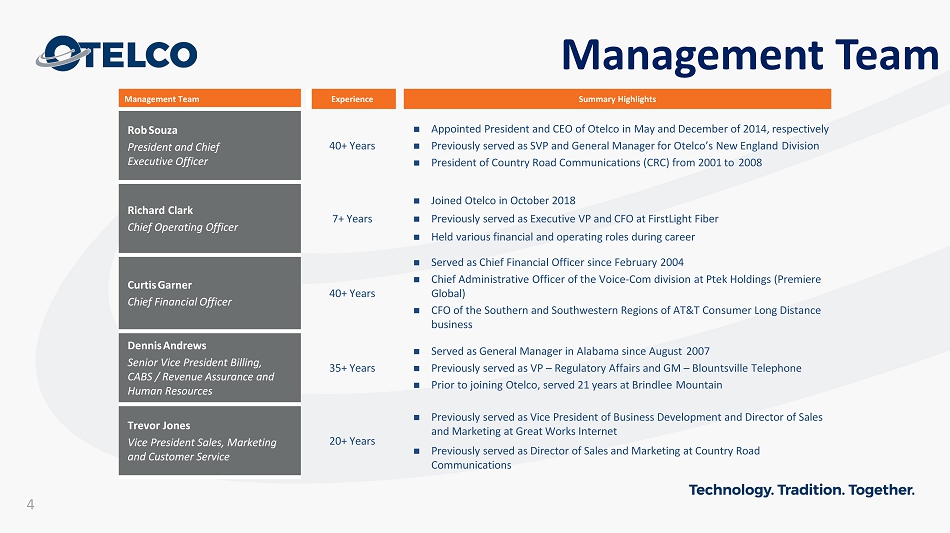
Management Team Management Team Experience Summary Highlights Rob Souza President and Chief Executive O fficer 40+ Years Appointed President and CEO of Otelco in May and December of 2014, respectively Previously served as SVP and General Manager for Otelco’s New England Division President of Country Road Communications (CRC) from 2001 to 2008 Richard Clark Chief Operating Officer 7 + Years Joined Otelco in October 2018 Previously served as Executive VP and CFO at FirstLight Fiber Held various financial and operating roles during career Curtis Garner Chief Financial Officer 40+ Years Served as Chief Financial Officer since February 2004 Chief Administrative Officer of the Voice - Com division at Ptek Holdings (Premiere Global) CFO of the Southern and Southwestern Regions of AT&T Consumer Long Distance business Dennis Andrews Senior Vice President Billing, CABS / Revenue Assurance and Human Resources 35+ Years Served as General Manager in Alabama since August 2007 Previously served as VP – Regulatory Affairs and GM – Blountsville Telephone Prior to joining Otelco, served 21 years at Brindlee Mountain Trevor Jones Vice President Sales, Marketing and Customer Service 20+ Years Previously served as Vice President of Business Development and Director of Sales and Marketing at Great Works Internet Previously served as Director of Sales and Marketing at Country Road Communications 4
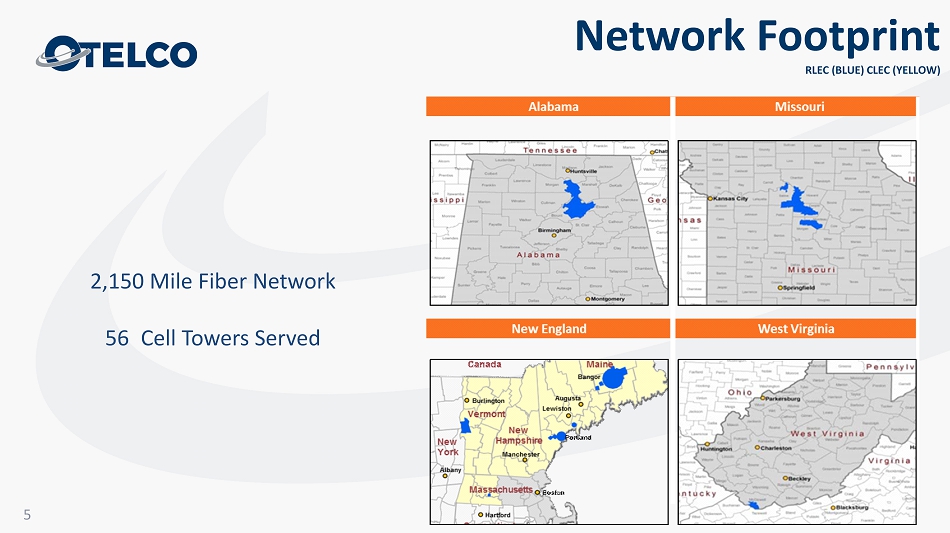
Network Footprint RLEC (BLUE) CLEC (YELLOW) 2,150 Mile Fiber Network 56 Cell Towers Served 5
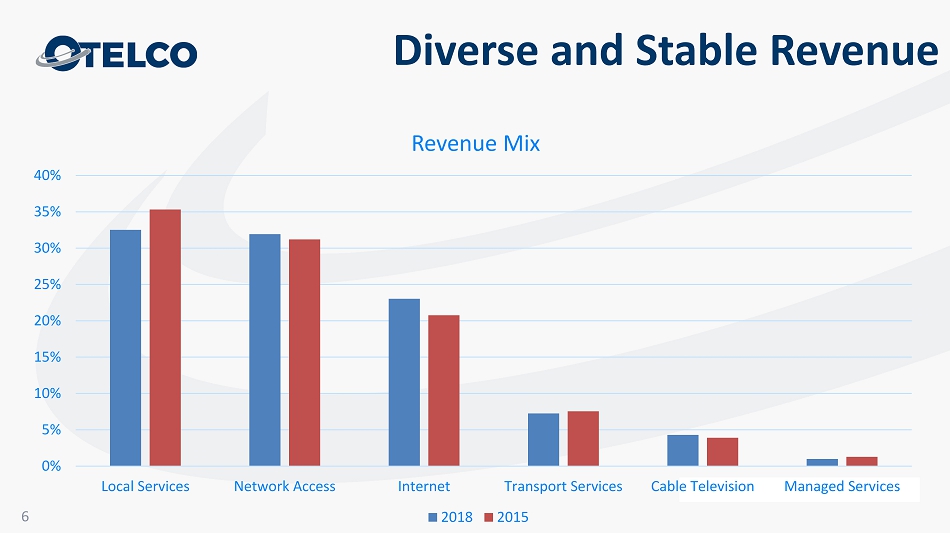
Diverse and Stable Revenue 0% 5% 10% 15% 20% 25% 30% 35% 40% Local Services Network Access Internet Transport Services Cable Television Managed Services Revenue Mix 2018 2015 6
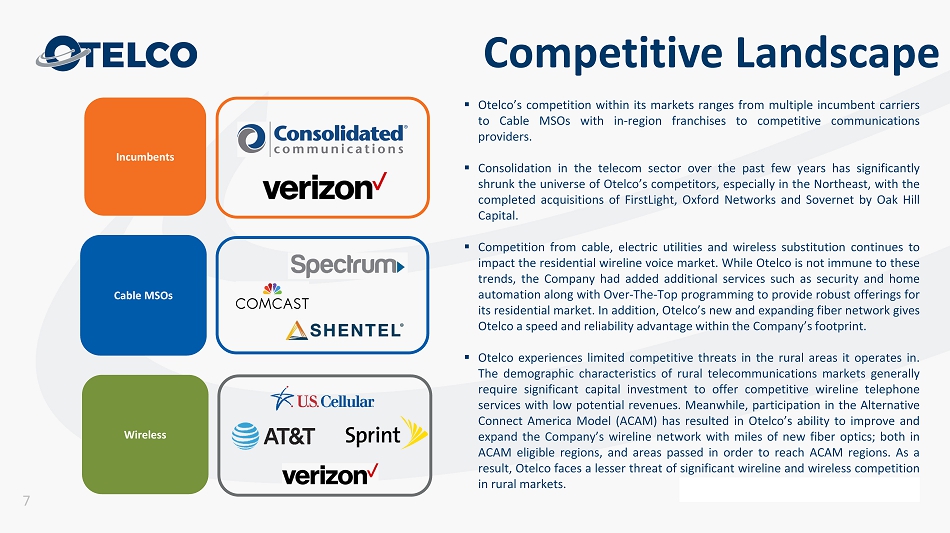
Incumbents Cable MSOs Competitive Landscape ▪ Otelco’s competition within its markets ranges from multiple incumbent carriers to Cable MSOs with in - region franchises to competitive communications providers . ▪ Consolidation in the telecom sector over the past few years has significantly shrunk the universe of Otelco’s competitors, especially in the Northeast, with the completed acquisitions of FirstLight, Oxford Networks and Sovernet by Oak Hill Capital . ▪ Competition from cable, electric utilities and wireless substitution continues to impact the residential wireline voice market . While Otelco is not immune to these trends, the Company had added additional services such as security and home automation along with Over - The - Top programming to provide robust offerings for its residential market . In addition, Otelco’s new and expanding fiber network gives Otelco a speed and reliability advantage within the Company’s footprint . ▪ Otelco experiences limited competitive threats in the rural areas it operates in . The demographic characteristics of rural telecommunications markets generally require significant capital investment to offer competitive wireline telephone services with low potential revenues . Meanwhile, participation in the Alternative Connect America Model (ACAM) has resulted in Otelco’s ability to improve and expand the Company’s wireline network with miles of new fiber optics ; both in ACAM eligible regions, and areas passed in order to reach ACAM regions . As a result, Otelco faces a lesser threat of significant wireline and wireless competition in rural markets . Wireless 7
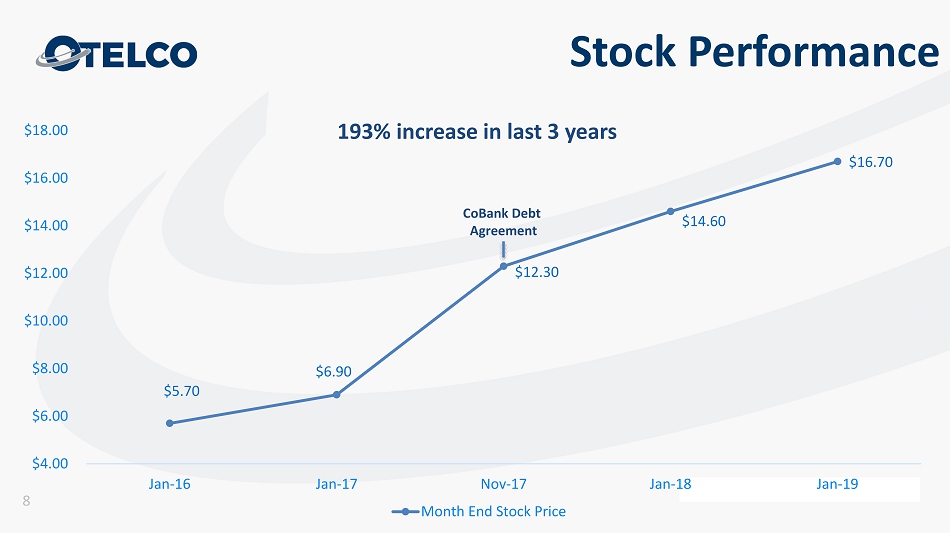
Stock Performance $5.70 $6.90 $12.30 $14.60 $16.70 $4.00 $6.00 $8.00 $10.00 $12.00 $14.00 $16.00 $18.00 Jan-16 Jan-17 Nov-17 Jan-18 Jan-19 Month End Stock Price CoBank Debt Agreement 193% increase in last 3 years 8
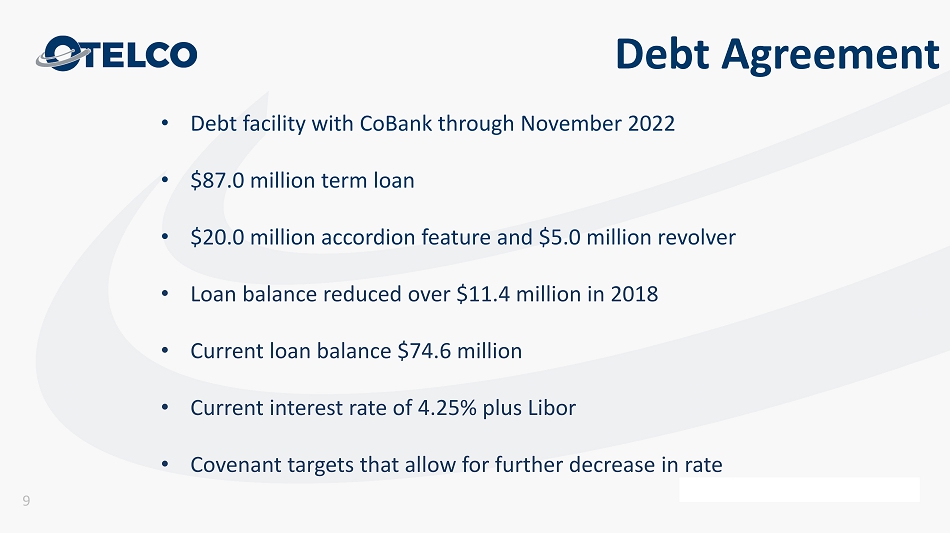
Debt Agreement • Debt facility with CoBank through November 2022 • $87.0 million term loan • $20.0 million accordion feature and $5.0 million revolver • Loan balance reduced over $11.4 million in 2018 • Current loan balance $74.6 million • Current interest rate of 4.25% plus Libor • Covenant targets that allow for further decrease in rate 9
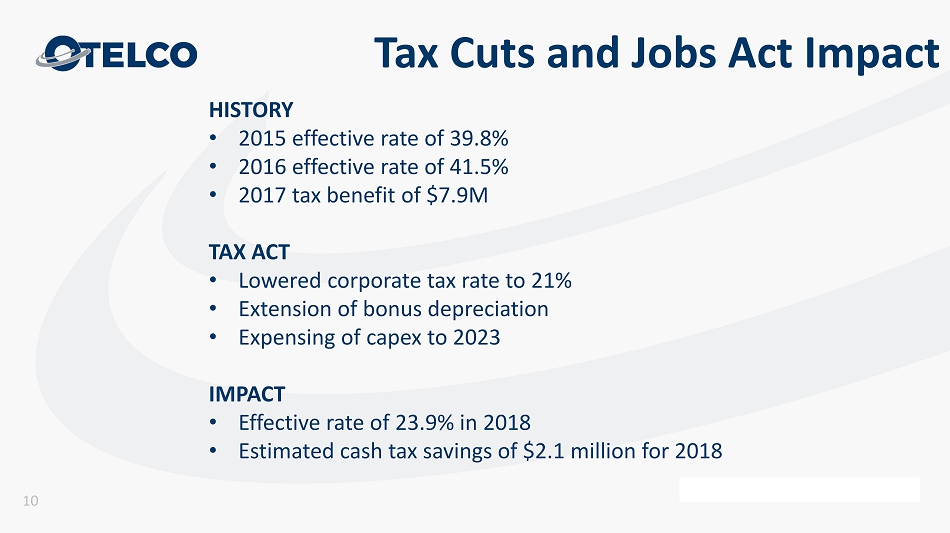
Tax Cuts and Jobs Act Impact HISTORY • 2015 effective rate of 39.8% • 2016 effective rate of 41.5% • 2017 tax benefit of $7.9M TAX ACT • Lowered corporate tax rate to 21% • Extension of bonus depreciation • Expensing of capex to 2023 IMPACT • Effective rate of 23.9% in 2018 • Estimated cash tax savings of $2.1 million for 2018 10
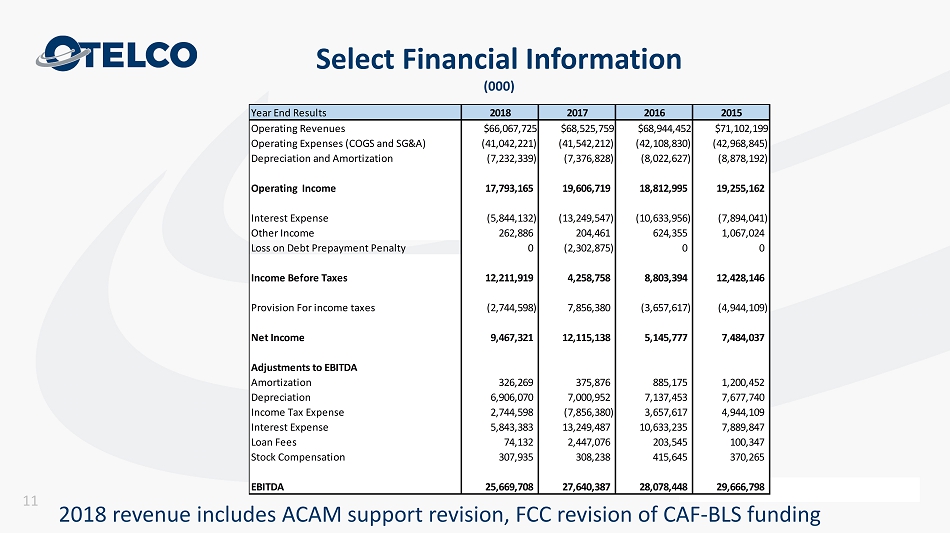
Select Financial Information (000) 2018 revenue includes ACAM support revision, FCC revision of CAF - BLS funding 11 Year End Results 2018 2017 2016 2015 Operating Revenues $66,067,725 $68,525,759 $68,944,452 $71,102,199 Operating Expenses (COGS and SG&A) (41,042,221) (41,542,212) (42,108,830) (42,968,845) Depreciation and Amortization (7,232,339) (7,376,828) (8,022,627) (8,878,192) Operating Income 17,793,165 19,606,719 18,812,995 19,255,162 Interest Expense (5,844,132) (13,249,547) (10,633,956) (7,894,041) Other Income 262,886 204,461 624,355 1,067,024 Loss on Debt Prepayment Penalty 0 (2,302,875) 0 0 Income Before Taxes 12,211,919 4,258,758 8,803,394 12,428,146 Provision For income taxes (2,744,598) 7,856,380 (3,657,617) (4,944,109) Net Income 9,467,321 12,115,138 5,145,777 7,484,037 Adjustments to EBITDA Amortization 326,269 375,876 885,175 1,200,452 Depreciation 6,906,070 7,000,952 7,137,453 7,677,740 Income Tax Expense 2,744,598 (7,856,380) 3,657,617 4,944,109 Interest Expense 5,843,383 13,249,487 10,633,235 7,889,847 Loan Fees 74,132 2,447,076 203,545 100,347 Stock Compensation 307,935 308,238 415,645 370,265 EBITDA 25,669,708 27,640,387 28,078,448 29,666,798
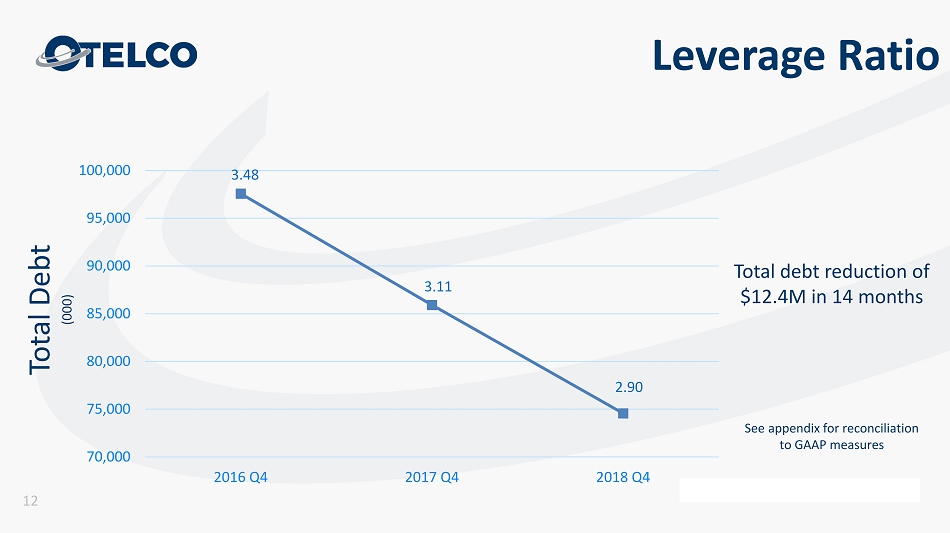
*S Leverage Ratio Total Debt (000) Total debt reduction of $12.4M in 14 months 12 See appendix for reconciliation to GAAP measures 3.48 3.11 2.90 70,000 75,000 80,000 85,000 90,000 95,000 100,000 2016 Q4 2017 Q4 2018 Q4
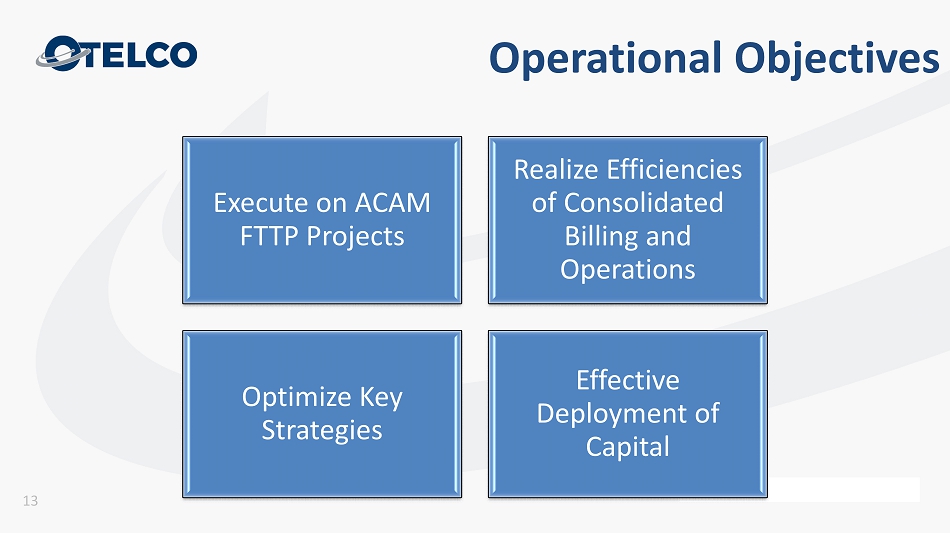
Operational Objectives Execute on ACAM FTTP Projects Realize Efficiencies of Consolidated Billing and Operations Optimize Key Strategies Effective Deployment of Capital 13
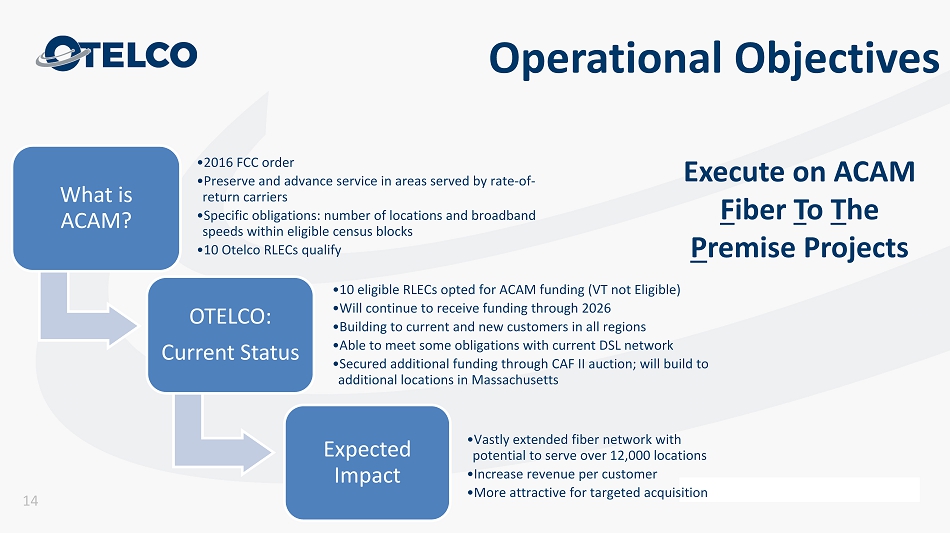
Operational Objectives What is ACAM? • 2016 FCC order • Preserve and advance service in areas served by rate - of - return carriers • Specific obligations: number of locations and broadband speeds within eligible census blocks • 10 Otelco RLECs qualify OTELCO: Current Status • 10 eligible RLECs opted for ACAM funding (VT not Eligible) • Will continue to receive funding through 2026 • Building to current and new customers in all regions • Able to meet some obligations with current DSL network • Secured additional funding through CAF II auction; will build to additional locations in Massachusetts Expected Impact • Vastly extended fiber network with potential to serve over 12,000 locations • Increase revenue per customer • More attractive for targeted acquisition Execute on ACAM F iber T o T he P remise Projects 14
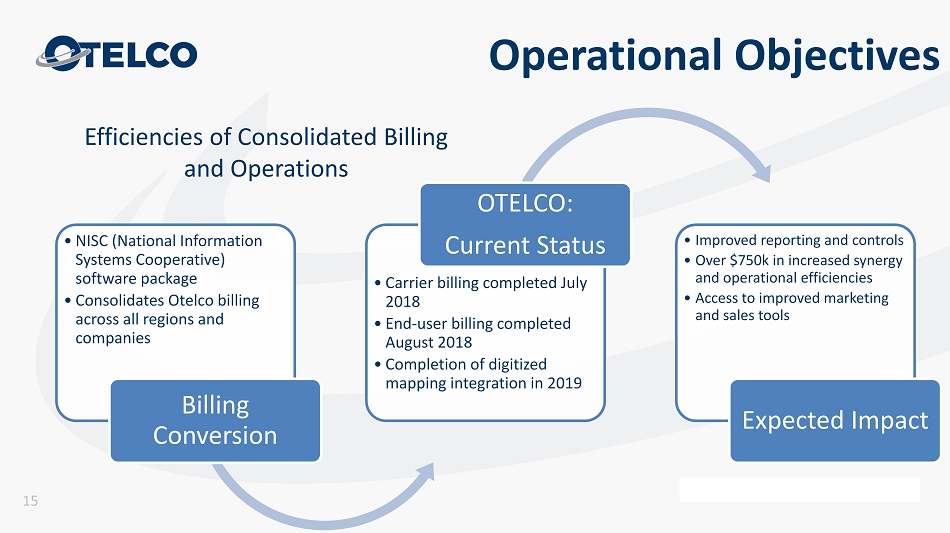
Operational Objectives • NISC (National Information Systems Cooperative) software package • Consolidates Otelco billing across all regions and companies Billing Conversion • Carrier billing completed July 2018 • End - user billing completed August 2018 • Completion of digitized mapping integration in 2019 OTELCO: Current Status • Improved reporting and controls • Over $750k in increased synergy and operational efficiencies • Access to improved marketing and sales tools Expected Impact Efficiencies of Consolidated Billing and Operations 15
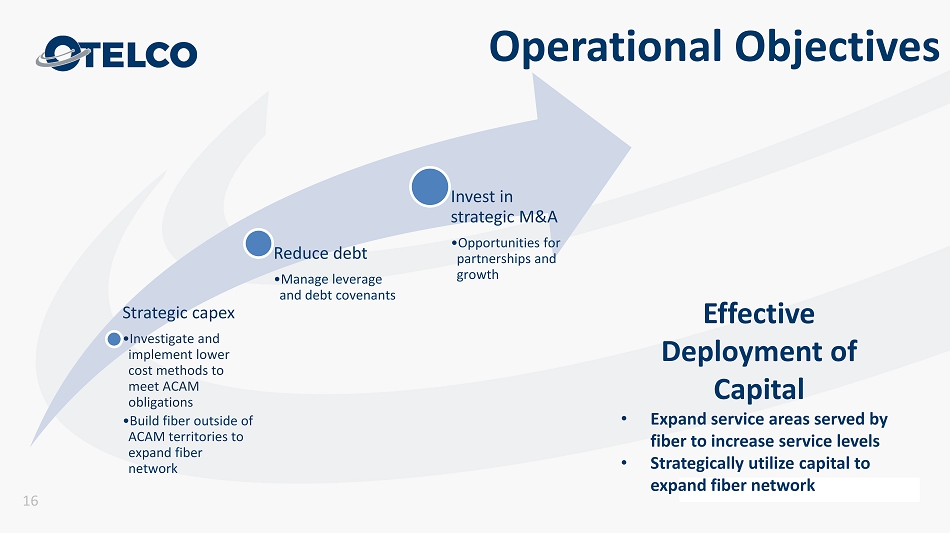
Operational Objectives Strategic capex • Investigate and implement lower cost methods to meet ACAM obligations • Build fiber outside of ACAM territories to expand fiber network Reduce debt • Manage leverage and debt covenants Invest in strategic M&A • Opportunities for partnerships and growth Effective Deployment of Capital • Expand service areas served by fiber to increase service levels • Strategically utilize capital to expand fiber network 16
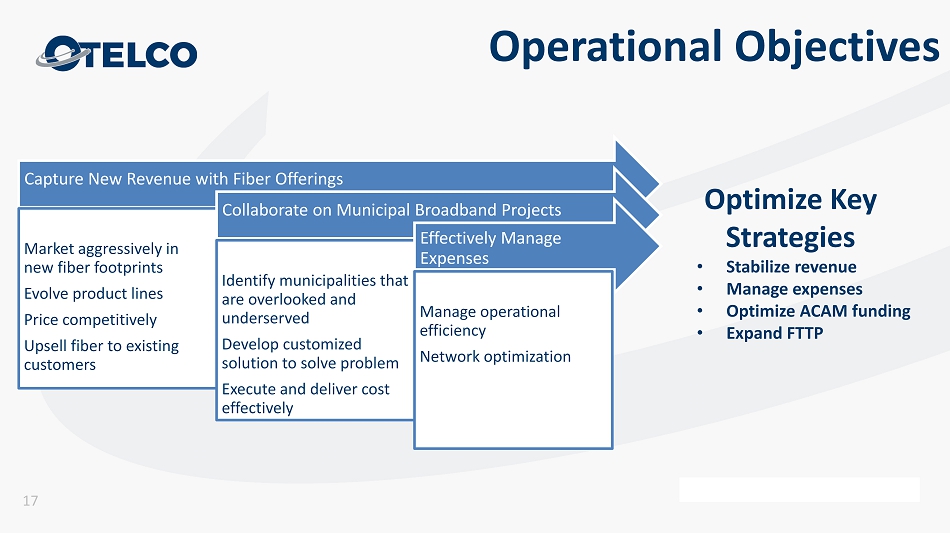
Capture New Revenue with Fiber Offerings Market aggressively in new fiber footprints Evolve product lines Price competitively Upsell fiber to existing customers Collaborate on Municipal Broadband Projects Identify municipalities that are overlooked and underserved Develop customized solution to solve problem Execute and deliver cost effectively Effectively Manage Expenses Manage operational efficiency Network optimization Optimize Key Strategies • Stabilize revenue • Manage expenses • Optimize ACAM funding • Expand FTTP 17 Operational Objectives
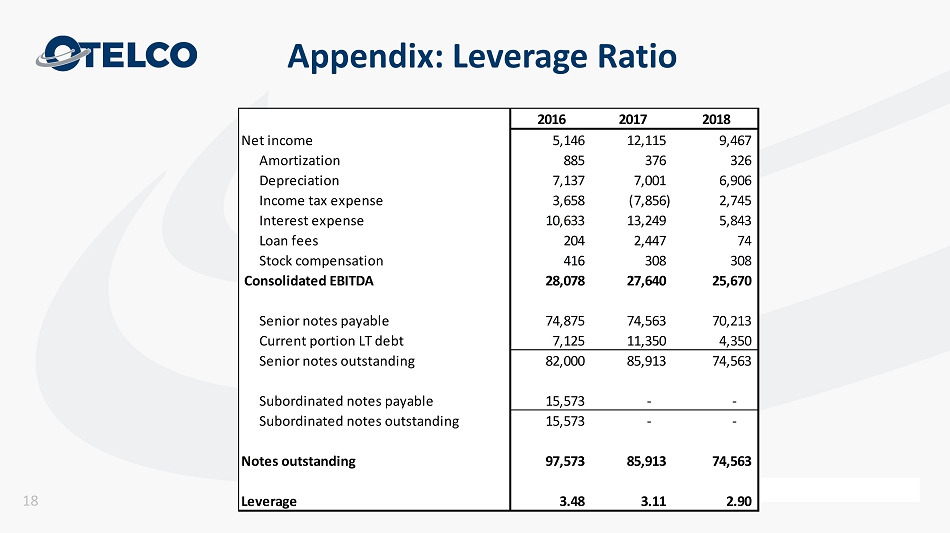
Appendix: Leverage Ratio 18 2016 2017 2018 Net income 5,146 12,115 9,467 Amortization 885 376 326 Depreciation 7,137 7,001 6,906 Income tax expense 3,658 (7,856) 2,745 Interest expense 10,633 13,249 5,843 Loan fees 204 2,447 74 Stock compensation 416 308 308 Consolidated EBITDA 28,078 27,640 25,670 Senior notes payable 74,875 74,563 70,213 Current portion LT debt 7,125 11,350 4,350 Senior notes outstanding 82,000 85,913 74,563 Subordinated notes payable 15,573 - - Subordinated notes outstanding 15,573 - - Notes outstanding 97,573 85,913 74,563 Leverage 3.48 3.11 2.90
www.Otelco.com 19
)[^*WNM<\+^$M=O;6/5/#GPMT"_C72O#'AC3!IE
MOJ%IIT'B+Q);:AXJU+5=2G_0#XK_ G^&'QW\#ZM\-/C7\/?!OQ9^'^NJHU7
MP=\0_#NF>+?#]U)&KK!=C3]9M[N*UU*S,CRZ=JUE]FU33+C;=:=>6MRB3+X&
M-\;\%0S*I0P>2U<;EE*JZ7UV6-6'Q.(A";BZ^'PSP\Z4*>(=1UGQ_\ %74K
M"X:2[TO_ (3WQ-K&B>&;F:X7P1H7A/3I$TZ+RGXO?M2_LF_L\27EE\8_V@/"
M]QXHL/.$_P *O@*FF?M!?%,7,#&&73=0/A3Q!I?P:\$:K;7"B#4M#^)7QI\&
M>*M,)9SX6O)()K4?7?\ P1'^/6J_MT_M"_%3Q]X6_9T\,?#C]EWX ^&+;3XO
M%?Q%U!_BO\8/'GQM\87\