UNITED STATES
SECURITIES AND EXCHANGE COMMISSION
WASHINGTON, D.C. 20549
FORM 8-K
CURRENT REPORT
PURSUANT TO SECTION 13 OR 15(d)
OF THE SECURITIES EXCHANGE ACT OF 1934
Date of report (Date of earliest event reported): August 9, 2017
MEDICAL PROPERTIES TRUST, INC.
(Exact Name of Registrant as Specified in Charter)
Commission File Number 001-32559
Maryland | 20-0191742 | |
(State or other jurisdiction of incorporation or organization) |
(I.R.S. Employer Identification No.) | |
1000 Urban Center Drive, Suite 501 Birmingham, AL |
35242 | |
(Address of principal executive offices) | (Zip Code) |
Registrants telephone number, including area code
(205) 969-3755
Check the appropriate box below if the Form 8-K filing is intended to simultaneously satisfy the filing obligation of the Registrant under any of the following provisions:
☐ | Written communications pursuant to Rule 425 under the Securities Act (17 CFR 230.425) |
☐ | Soliciting material pursuant to Rule 14a-12 under the Exchange Act (17 CFR 240.14a-12) |
☐ | Pre-commencement communications pursuant to Rule 14d-2(b) under the Exchange Act (17 CFR 240.14d-2(b)) |
☐ | Pre-commencement communications pursuant to Rule 13e-4(c) under the Exchange Act (17 CFR 240.13e-4(c)) |
Indicate by check mark whether the registrant is an emerging growth company as defined in Rule 405 of the Securities Act of 1933 (§ 230.405 of this chapter) or Rule 12b-2 of the Securities Exchange Act of 1934 (§ 240.12b-2 of this chapter).
Emerging growth company ☐
If an emerging growth company, indicate by check mark if the registrant has elected not to use the extended transition period for complying with any new or revised financial accounting standards provided pursuant to Section 13(a) of the Exchange Act. ☐
Item 2.02. | Results of Operations and Financial Condition. |
On August 9, 2017, Medical Properties Trust, Inc. issued a press release announcing its financial results for the three and six months ended June 30, 2017. A copy of the press release is attached as Exhibit 99.1 to this Current Report on Form 8-K and is incorporated herein by reference. The information in this Current Report on Form 8-K, including the information set forth in Exhibit 99.1 and Exhibit 99.2 attached hereto, shall not be deemed filed for purposes of Section 18 of the Securities Exchange Act of 1934, as amended, or otherwise subject to the liability of that section or Sections 11 and 12(a)(2) of the Securities Act of 1933, as amended. In addition, this information shall not be deemed incorporated by reference in any filing of Medical Properties Trust, Inc. with the Securities and Exchange Commission, except as expressly set forth by specific reference in any such filing.
The Company disclosed certain non-GAAP financial measures in the attached press release for the three and six months ended June 30, 2017, including Funds from operations, Normalized funds from operations and Adjusted funds from operations. The most directly comparable GAAP financial measure to each of these non-GAAP financial measures is net income, which was $73.4 million, or $0.21 per diluted share for the three months ended June 30, 2017 compared to $53.7 million, or $0.22 per diluted share for the three months ended June 30, 2016. For the six months ended June 30, 2017, net income was $141.4 million, or $0.42 per diluted share compared to $111.7 million, or $0.47 per diluted share for the six months ended June 30, 2016. In the attached press release, the Company disclosed Funds from operations of $103.3 million and $191.9 million for the three and six months ended June 30, 2017, respectively, and Normalized funds from operations of $113.6 million and $219.6 million for three and six months ended June 30, 2017, respectively. Adjusted funds from operations were disclosed in the press release as $98.6 million and $191.6 million for the three and six months ended June 30, 2017, respectively.
A reconciliation of the non-GAAP financial measures to net income as well as a statement disclosing the reasons why the Companys management believes that presentation of these non-GAAP financial measures provides useful information to investors regarding the Companys financial condition and results of operations are included in Exhibits 99.1 and 99.2.
Item 5.07. | Submission of Matters to a Vote of Security Holders. |
At the 2017 Annual Meeting, the Companys stockholders voted, among other matters, on an advisory basis, as to the frequency with which executive compensation will be subject to future advisory stockholder votes. As previously reported, the greatest number of votes was cast in favor of every 1 Year. In accordance with the Boards recommendation as set forth in the Companys proxy statement for the Annual Meeting and consistent with the stated preference of the Companys stockholders, the Company has determined that future advisory stockholder votes on executive compensation will be conducted on an annual basis, until the next advisory vote on this matter is held.
Item 9.01. | Financial Statements and Exhibits. |
(d) Exhibits.
Exhibit Number |
Description | |
99.1 | Press release dated August 9, 2017 reporting financial results for the three and six months ended June 30, 2017 | |
99.2 | Medical Properties Trust, Inc. 2nd Quarter 2017 Supplemental Information |
2
SIGNATURES
Pursuant to the requirements of the Securities Exchange Act of 1934, as amended, the registrant has duly caused this report to be signed on its behalf by the undersigned hereunder duly authorized.
MEDICAL PROPERTIES TRUST, INC. | ||
By: | /s/ R. Steven Hamner | |
Name: | R. Steven Hamner | |
Title: | Executive Vice President and Chief Financial Officer |
Date: August 9, 2017
3
INDEX TO EXHIBITS
Exhibit Number |
Description | |
99.1 | Press release dated August 9, 2017 reporting financial results for the three and six months ended June 30, 2017 | |
99.2 | Medical Properties Trust, Inc. 2nd Quarter 2017 Supplemental Information |
4
Exhibit 99.1
Contact: Tim Berryman | ||
Director Investor Relations | ||
Medical Properties Trust, Inc. | ||
(205) 969-3755 | ||
tberryman@medicalpropertiestrust.com |
MEDICAL PROPERTIES TRUST, INC. REPORTS SECOND QUARTER RESULTS;
PROVIDES NET INCOME AND FFO ESTIMATES FOR 2017 AND 2018
| Per Share Net Income of $0.21 and Normalized FFO of $0.32 |
| Reinstates 2017 Per Share Estimates of Net Income of $0.87 to $0.89 and Normalized FFO of $1.29 to $1.31 |
| Introduces 2018 Per Share Estimates of Net Income of $1.02 to $1.06 and Normalized FFO of $1.42 to $1.46 |
Birmingham, AL August 9, 2017 Medical Properties Trust, Inc. (the Company or MPT) (NYSE: MPW) today announced financial and operating results for the second quarter ended June 30, 2017 and recent highlights, including approximately $1.9 billion in announced acquisitions year to date.
For the past three calendar years, MPT has grown its normalized FFO per share at a compounded annual rate of more than ten percent, significantly exceeding our peers, said Edward K. Aldag, Jr., MPTs Chairman, President and Chief Executive Officer. Our outstanding growth so far in 2017 sets the stage for continued outperformance in FFO per share and dividend growth. The hospital real estate market remains very active and MPT is continuing to pursue opportunities to acquire high-quality hospitals located in strong markets with the objective of further creating long-term value for our shareholders.
SECOND QUARTER AND RECENT HIGHLIGHTS
| Net income of $0.21 and normalized funds from operations (FFO) of $0.32 in the second quarter both on a per diluted share basis; |
| Entered into previously announced binding agreements to acquire the real estate interests of ten acute care hospitals and a behavioral health facility to be operated by Steward Health Care LLC (Steward) for $1.4 billion, along with a $100 million investment in Steward; acquisitions expected to close in the fourth quarter of 2017; |
| Completed previously announced sale and leaseback transactions aggregating approximately $429 million with Steward, RCCH Healthcare Partners and Alecto Healthcare; and 19.4 million with German acute operator ATOS; |
1
| Previously announced funding commitment with Circle Health Group and commencement of development of an acute care hospital in Birmingham, England for an estimated total cost of approximately £33 million; |
| Completed sale leaseback transactions of 13 rehabilitation hospitals in the second quarter and July for 166.2 million to affiliates of MEDIAN, which combined with previous acquisitions of seven hospitals in the fourth quarter of 2016 for 49.5 million finalizes the acquisition of 20 hospitals for 215.7 million announced in 2016; |
| Previously announced completion of a public offering of 43.1 million shares of common stock (including underwriters overallotment) resulting in net proceeds of $548 million; |
| FTSE Russell added MPW with its equity market capitalization of approximately $4.8 billion to the Russell 1000 Index on June 23. |
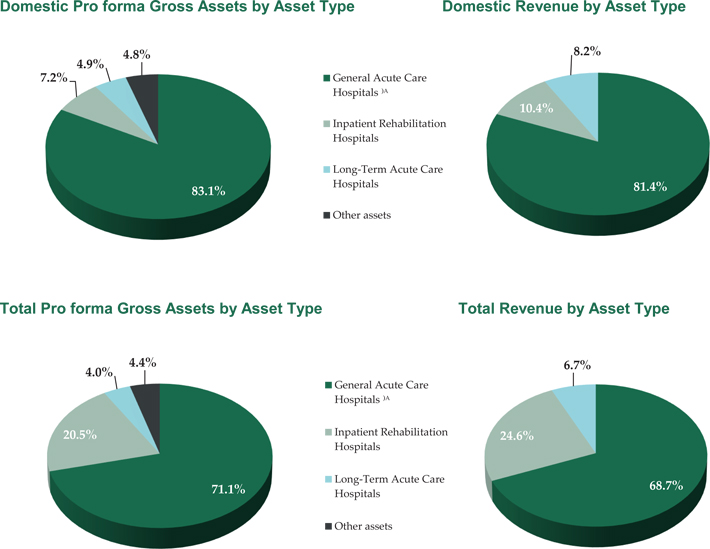
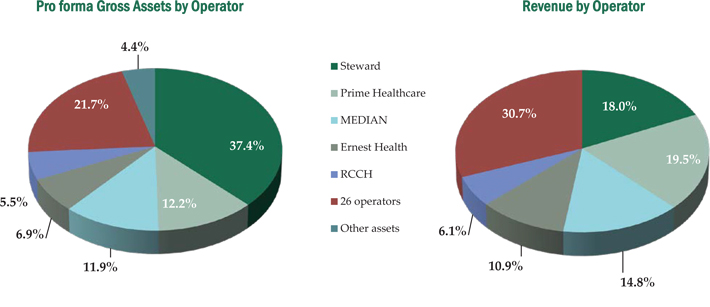
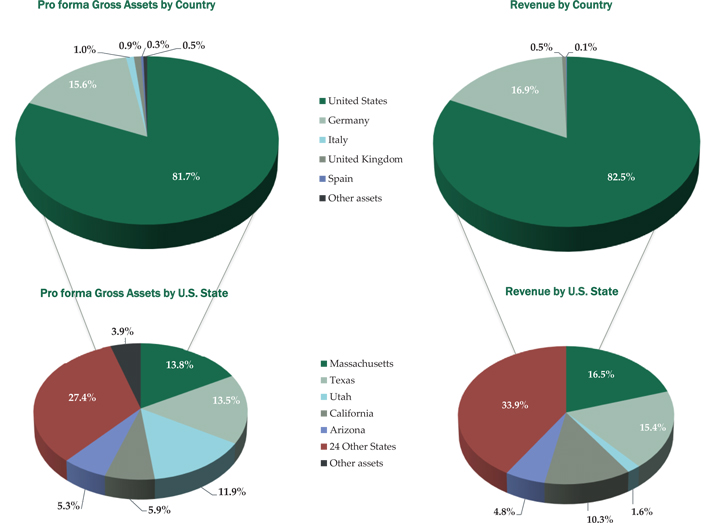
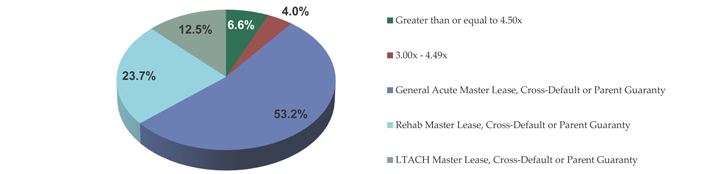
After closing of the pending transactions, the Company expects to have pro forma total gross assets of approximately $9.1 billion, including $6.5 billion in general acute care hospitals, $1.9 billion in inpatient rehabilitation hospitals, and $0.4 billion in long-term acute care hospitals. This pro forma portfolio includes 270 properties representing more than 31,000 licensed beds in 29 states and in Germany, the United Kingdom, Italy and Spain. The properties are leased to or mortgaged by 31 hospital operating companies.
Included in the financial tables accompanying this press release is information about the Companys assets and liabilities, net income and reconciliations of net income to FFO and Adjusted Funds from Operations (AFFO), all on a basis comparable to 2016 results. In addition, a reconciliation of pro forma total gross assets to total assets is included in the financial tables accompanying this press release.
OPERATING RESULTS AND OUTLOOK
Net income for the second quarter of 2017 was $73.4 million (or $0.21 per diluted share), compared to $53.7 million (or $0.22 per diluted share) in the second quarter of 2016. Normalized FFO for the second quarter increased 50% to $113.6 million compared with $75.5 million in the second quarter of 2016. Normalized FFO was $0.32 per diluted share in the second quarter compared with $0.32 per diluted share in the second quarter of 2016.
Based on managements present investment, capital and operating strategies, and the expected timing of each, management estimates 2017 net income as a range of between $0.87 and $0.89 per diluted share and 2017 Normalized FFO between $1.29 and $1.31 per diluted share. This range is based on managements estimate of the likely timing of closing of the $1.4 billion Steward investment and the timing and interest rate related to the anticipated debt financing of such investment.
The Company today is also introducing its estimate of 2018 net income as a range of between $1.02 and $1.06 per diluted share and 2018 Normalized FFO between $1.42 and $1.46 per diluted share. This estimate assumes no additional acquisitions or investments and no asset sales.
A reconciliation of Normalized FFO guidance to net income is included with the financial tables accompanying this press release.
2
These estimates do not include the effects, if any, of unexpected real estate operating costs, changes in accounting pronouncements, litigation costs, debt refinancing costs, acquisition costs, currency exchange rate movements, interest rate hedging activities, write-offs of straight-line rent or other non-recurring or unplanned transactions. These estimates may change if the Company acquires or sells assets, market interest rates change, debt is refinanced, new shares are issued, additional debt is incurred, other operating expenses vary, income from investments in tenant operations vary from expectations, or existing leases do not perform in accordance with their terms.
CONFERENCE CALL AND WEBCAST
The Company has scheduled a conference call and webcast for Wednesday, August 9, 2017 at 11:00 a.m. Eastern Time to present the Companys financial and operating results for the quarter ended June 30, 2017. The dial-in numbers for the conference call are 855-365-5214 (U.S.) and 440-996-5721 (international); both numbers require passcode 53420810. The conference call will also be available via webcast in the Investor Relations section of the Companys website, www.medicalpropertiestrust.com.
A telephone and webcast replay of the call will be available beginning shortly after the calls completion through August 23, 2017. Dial-in numbers for the replay are 855-859-2056 and 404-537-3406 for U.S. and International callers, respectively. The replay passcode for both U.S. and international callers is 53420810.
The Companys supplemental information package for the current period will also be available on the Companys website under the Investor Relations section.
About Medical Properties Trust, Inc.
Medical Properties Trust, Inc. is a self-advised real estate investment trust formed to capitalize on the changing trends in healthcare delivery by acquiring and developing net-leased healthcare facilities. MPTs financing model allows hospitals and other healthcare facilities to unlock the value of their underlying real estate in order to fund facility improvements, technology upgrades, staff additions and new construction. Facilities include acute care hospitals, inpatient rehabilitation hospitals, long-term acute care hospitals, and other medical and surgical facilities. For more information, please visit the Companys website at www.medicalpropertiestrust.com.
The statements in this press release that are forward looking are based on current expectations and actual results or future events may differ materially. Words such as expects, believes, anticipates, intends, will, should and variations of such words and similar expressions are intended to identify such forward-looking statements. Forward-looking statements involve known and unknown risks, uncertainties and other factors that may cause the actual results of the Company or future events to differ materially from those expressed in or underlying such forward-looking statements, including without limitation: the satisfaction of all conditions to, and the timely closing (if at all) of pending transactions including the recently announced Steward transactions; net income per share for 2017 and 2018; Normalized FFO per share for 2017 and 2018; the amount of acquisitions of healthcare real estate, if any; results from the potential sales, if any, of assets; capital markets conditions; estimated leverage metrics; the repayment of debt arrangements; statements concerning the additional income to the Company
3
as a result of ownership interests in certain hospital operations and the timing of such income; the payment of future dividends, if any; completion of additional debt arrangements, and additional investments; national and international economic, business, real estate and other market conditions; the competitive environment in which the Company operates; the execution of the Companys business plan; financing risks; the Companys ability to maintain its status as a REIT for income tax purposes; acquisition and development risks; potential environmental and other liabilities; and other factors affecting the real estate industry generally or healthcare real estate in particular. For further discussion of the factors that could affect outcomes, please refer to the Risk factors section of the Companys Annual Report on Form 10-K for the year ended December 31, 2016 and as updated by the Companys subsequently filed Quarterly Reports on Form 10-Q and other SEC filings. Except as otherwise required by the federal securities laws, the Company undertakes no obligation to update the information in this press release.
# # #
4
MEDICAL PROPERTIES TRUST, INC. AND SUBSIDIARIES
Consolidated Balance Sheets
(Amounts in thousands, except for per share data) | June 30, 2017 | December 31, 2016 | ||||||
(Unaudited) | (A) | |||||||
Assets |
||||||||
Real estate assets |
||||||||
Land, buildings and improvements, intangible lease assets, and other |
$ | 4,976,129 | $ | 4,317,866 | ||||
Mortgage loans |
1,062,558 | 1,060,400 | ||||||
Net investment in direct financing leases |
693,243 | 648,102 | ||||||
|
|
|
|
|||||
Gross investment in real estate assets |
6,731,930 | 6,026,368 | ||||||
Accumulated depreciation and amortization |
(384,826 | ) | (325,125 | ) | ||||
|
|
|
|
|||||
Net investment in real estate assets |
6,347,104 | 5,701,243 | ||||||
Cash and cash equivalents |
236,364 | 83,240 | ||||||
Interest and rent receivables |
68,537 | 57,698 | ||||||
Straight-line rent receivables |
147,755 | 116,861 | ||||||
Other assets |
528,077 | 459,494 | ||||||
|
|
|
|
|||||
Total Assets |
$ | 7,327,837 | $ | 6,418,536 | ||||
|
|
|
|
|||||
Liabilities and Equity |
||||||||
Liabilities |
||||||||
Debt, net |
$ | 3,221,054 | $ | 2,909,341 | ||||
Accounts payable and accrued expenses |
219,527 | 207,711 | ||||||
Deferred revenue |
20,108 | 19,933 | ||||||
Lease deposits and other obligations to tenants |
34,943 | 28,323 | ||||||
|
|
|
|
|||||
Total Liabilities |
3,495,632 | 3,165,308 | ||||||
Equity |
||||||||
Preferred stock, $0.001 par value. Authorized 10,000 shares; no shares outstanding |
| | ||||||
Common stock, $0.001 par value. Authorized 500,000 shares; issued and outstanding - 364,020 shares at June 30, 2017 and 320,514 shares at December 31, 2016 |
364 | 321 | ||||||
Additional paid in capital |
4,327,733 | 3,775,336 | ||||||
Distributions in excess of net income |
(457,419 | ) | (434,114 | ) | ||||
Accumulated other comprehensive loss |
(52,591 | ) | (92,903 | ) | ||||
Treasury shares, at cost |
(777 | ) | (262 | ) | ||||
|
|
|
|
|||||
Total Medical Properties Trust, Inc. Stockholders Equity |
3,817,310 | 3,248,378 | ||||||
|
|
|
|
|||||
Non-controlling interests |
14,895 | 4,850 | ||||||
|
|
|
|
|||||
Total Equity |
3,832,205 | 3,253,228 | ||||||
|
|
|
|
|||||
Total Liabilities and Equity |
$ | 7,327,837 | $ | 6,418,536 | ||||
|
|
|
|
(A) | Financials have been derived from the prior year audited financial statements. |
MEDICAL PROPERTIES TRUST, INC. AND SUBSIDIARIES
Consolidated Statements of Income
(Unaudited)
(Amounts in thousands, except for per share data) | For the Three Months Ended | For the Six Months Ended | ||||||||||||||
June 30, 2017 | June 30, 2016 | June 30, 2017 | June 30, 2016 | |||||||||||||
Revenues |
||||||||||||||||
Rent billed |
$ | 103,447 | $ | 77,960 | $ | 200,210 | $ | 152,021 | ||||||||
Straight-line rent |
16,277 | 8,551 | 29,056 | 16,768 | ||||||||||||
Income from direct financing leases |
18,312 | 13,552 | 36,192 | 32,503 | ||||||||||||
Interest and fee income |
28,771 | 26,237 | 57,746 | 60,007 | ||||||||||||
|
|
|
|
|
|
|
|
|||||||||
Total revenues |
166,807 | 126,300 | 323,204 | 261,299 | ||||||||||||
Expenses |
||||||||||||||||
Real estate depreciation and amortization |
29,493 | 22,832 | 57,079 | 43,974 | ||||||||||||
Impairment charges |
| 7,375 | | 7,375 | ||||||||||||
Property-related |
1,153 | 784 | 2,481 | 1,685 | ||||||||||||
Acquisition expenses |
10,806 | 4,767 | 13,562 | 3,702 | ||||||||||||
General and administrative |
15,079 | 12,045 | 28,276 | 23,516 | ||||||||||||
|
|
|
|
|
|
|
|
|||||||||
Total operating expenses |
56,531 | 47,803 | 101,398 | 80,252 | ||||||||||||
|
|
|
|
|
|
|
|
|||||||||
Operating income |
110,276 | 78,497 | 221,806 | 181,047 | ||||||||||||
Interest expense |
(39,710 | ) | (41,501 | ) | (77,739 | ) | (80,870 | ) | ||||||||
Gain on sale of real estate and other asset dispositions, net |
| 16,638 | 7,413 | 16,678 | ||||||||||||
Unutilized financing fees/debt refinancing costs |
(751 | ) | | (14,380 | ) | (4 | ) | |||||||||
Other income (expense) |
3,367 | 654 | 5,134 | (4,018 | ) | |||||||||||
Income tax benefit (expense) |
614 | (364 | ) | (253 | ) | (683 | ) | |||||||||
|
|
|
|
|
|
|
|
|||||||||
Income from continuing operations |
73,796 | 53,924 | 141,981 | 112,150 | ||||||||||||
Loss from discontinued operations |
| | | (1 | ) | |||||||||||
|
|
|
|
|
|
|
|
|||||||||
Net income |
73,796 | 53,924 | 141,981 | 112,149 | ||||||||||||
Net income attributable to non-controlling interests |
(381 | ) | (200 | ) | (596 | ) | (498 | ) | ||||||||
|
|
|
|
|
|
|
|
|||||||||
Net income attributable to MPT common stockholders |
$ | 73,415 | $ | 53,724 | $ | 141,385 | $ | 111,651 | ||||||||
|
|
|
|
|
|
|
|
|||||||||
Earnings per common share - basic: |
||||||||||||||||
Income from continuing operations |
$ | 0.21 | $ | 0.23 | $ | 0.42 | $ | 0.47 | ||||||||
Loss from discontinued operations |
| | | | ||||||||||||
|
|
|
|
|
|
|
|
|||||||||
Net income attributable to MPT common stockholders |
$ | 0.21 | $ | 0.23 | $ | 0.42 | $ | 0.47 | ||||||||
|
|
|
|
|
|
|
|
|||||||||
Earnings per common share - diluted: |
||||||||||||||||
Income from continuing operations |
$ | 0.21 | $ | 0.22 | $ | 0.42 | $ | 0.47 | ||||||||
Loss from discontinued operations |
| | | | ||||||||||||
|
|
|
|
|
|
|
|
|||||||||
Net income attributable to MPT common stockholders |
$ | 0.21 | $ | 0.22 | $ | 0.42 | $ | 0.47 | ||||||||
|
|
|
|
|
|
|
|
|||||||||
Weighted average shares outstanding - basic |
349,856 | 238,082 | 335,456 | 237,796 | ||||||||||||
Weighted average shares outstanding - diluted |
350,319 | 239,008 | 335,871 | 238,413 | ||||||||||||
Dividends declared per common share |
$ | 0.24 | $ | 0.23 | $ | 0.48 | $ | 0.45 |
MEDICAL PROPERTIES TRUST, INC. AND SUBSIDIARIES
Reconciliation of Net Income to Funds From Operations
(Unaudited)
(Amounts in thousands, except for per share data) | For the Three Months Ended | For the Six Months Ended | ||||||||||||||
June 30, 2017 | June 30, 2016 | June 30, 2017 | June 30, 2016 | |||||||||||||
FFO information: |
||||||||||||||||
Net income attributable to MPT common stockholders |
$ | 73,415 | $ | 53,724 | $ | 141,385 | $ | 111,651 | ||||||||
Participating securities share in earnings |
(100 | ) | (132 | ) | (225 | ) | (276 | ) | ||||||||
|
|
|
|
|
|
|
|
|||||||||
Net income, less participating securities share in earnings |
$ | 73,315 | $ | 53,592 | $ | 141,160 | $ | 111,375 | ||||||||
Depreciation and amortization (A) |
30,027 | 23,335 | 58,126 | 44,807 | ||||||||||||
Gain on sale of real estate |
| (22,613 | ) | (7,413 | ) | (22,653 | ) | |||||||||
|
|
|
|
|
|
|
|
|||||||||
Funds from operations |
$ | 103,342 | $ | 54,314 | $ | 191,873 | $ | 133,529 | ||||||||
Write-off of straight line rent and other |
| 3,063 | 1,117 | 3,063 | ||||||||||||
Transaction costs from non-real estate dispositions |
| 5,975 | | 5,975 | ||||||||||||
Acquisition expenses, net of tax benefit (A) |
9,539 | 4,801 | 12,184 | 9,034 | ||||||||||||
Impairment charges |
| 7,375 | | 7,375 | ||||||||||||
Unutilized financing fees / debt refinancing costs |
751 | | 14,380 | 4 | ||||||||||||
|
|
|
|
|
|
|
|
|||||||||
Normalized funds from operations |
$ | 113,632 | $ | 75,528 | $ | 219,554 | $ | 158,980 | ||||||||
Share-based compensation |
2,406 | 1,814 | 4,377 | 3,509 | ||||||||||||
Debt costs amortization |
1,522 | 2,062 | 3,139 | 3,897 | ||||||||||||
Additional rent received in advance (B) |
(300 | ) | (300 | ) | (600 | ) | (600 | ) | ||||||||
Straight-line rent revenue and other |
(18,681 | ) | (11,204 | ) | (34,863 | ) | (22,033 | ) | ||||||||
|
|
|
|
|
|
|
|
|||||||||
Adjusted funds from operations |
$ | 98,579 | $ | 67,900 | $ | 191,607 | $ | 143,753 | ||||||||
|
|
|
|
|
|
|
|
|||||||||
Per diluted share data: |
||||||||||||||||
Net income, less participating securities share in earnings |
$ | 0.21 | $ | 0.22 | $ | 0.42 | $ | 0.47 | ||||||||
Depreciation and amortization (A) |
0.08 | 0.10 | 0.17 | 0.18 | ||||||||||||
Gain on sale of real estate |
| (0.09 | ) | (0.02 | ) | (0.09 | ) | |||||||||
|
|
|
|
|
|
|
|
|||||||||
Funds from operations |
$ | 0.29 | $ | 0.23 | $ | 0.57 | $ | 0.56 | ||||||||
Write-off of straight line rent and other |
| 0.01 | | 0.01 | ||||||||||||
Transaction costs from non-real estate dispositions |
| 0.03 | | 0.03 | ||||||||||||
Acquisition expenses, net of tax benefit (A) |
0.03 | 0.02 | 0.04 | 0.04 | ||||||||||||
Impairment charges |
| 0.03 | | 0.03 | ||||||||||||
Unutilized financing fees / debt refinancing costs |
| | 0.04 | | ||||||||||||
|
|
|
|
|
|
|
|
|||||||||
Normalized funds from operations |
$ | 0.32 | $ | 0.32 | $ | 0.65 | $ | 0.67 | ||||||||
Share-based compensation |
0.01 | 0.01 | 0.01 | 0.01 | ||||||||||||
Debt costs amortization |
| 0.01 | 0.01 | 0.01 | ||||||||||||
Additional rent received in advance (B) |
| | | | ||||||||||||
Straight-line rent revenue and other |
(0.05 | ) | (0.06 | ) | (0.10 | ) | (0.09 | ) | ||||||||
|
|
|
|
|
|
|
|
|||||||||
Adjusted funds from operations |
$ | 0.28 | $ | 0.28 | $ | 0.57 | $ | 0.60 | ||||||||
|
|
|
|
|
|
|
|
(A) | Includes our share of real estate depreciation and acquisition expenses from unconsolidated joint ventures. These amounts are included with the activity of all of our equity interests in the Other income (expense) line on the consolidated statements of income. |
(B) | Represents additional rent received from one tenant in advance of when we can recognize as revenue for accounting purposes. This additional rent is being recorded to revenue on a straight-line basis over the lease life. |
Investors and analysts following the real estate industry utilize funds from operations, or FFO, as a supplemental performance measure. FFO, reflecting the assumption that real estate asset values rise or fall with market conditions, principally adjusts for the effects of GAAP depreciation and amortization of real estate assets, which assumes that the value of real estate diminishes predictably over time. We compute FFO in accordance with the definition provided by the National Association of Real Estate Investment Trusts, or NAREIT, which represents net income (loss) (computed in accordance with GAAP), excluding gains (losses) on sales of real estate and impairment charges on real estate assets, plus real estate depreciation and amortization and after adjustments for unconsolidated partnerships and joint ventures.
In addition to presenting FFO in accordance with the NAREIT definition, we also disclose normalized FFO, which adjusts FFO for items that relate to unanticipated or non-core events or activities or accounting changes that, if not noted, would make comparison to prior period results and market expectations less meaningful to investors and analysts. We believe that the use of FFO, combined with the required GAAP presentations, improves the understanding of our operating results among investors and the use of normalized FFO makes comparisons of our operating results with prior periods and other companies more meaningful. While FFO and normalized FFO are relevant and widely used supplemental measures of operating and financial performance of REITs, they should not be viewed as a substitute measure of our operating performance since the measures do not reflect either depreciation and amortization costs or the level of capital expenditures and leasing costs necessary to maintain the operating performance of our properties, which can be significant economic costs that could materially impact our results of operations. FFO and normalized FFO should not be considered an alternative to net income (loss) (computed in accordance with GAAP) as indicators of our financial performance or to cash flow from operating activities (computed in accordance with GAAP) as an indicator of our liquidity.
We calculate adjusted funds from operations, or AFFO, by subtracting from or adding to normalized FFO (i) unbilled rent revenue, (ii) non-cash share-based compensation expense, and (iii) amortization of deferred financing costs. AFFO is an operating measurement that we use to analyze our results of operations based on the receipt, rather than the accrual, of our rental revenue and on certain other adjustments. We believe that this is an important measurement because our leases generally have significant contractual escalations of base rents and therefore result in recognition of rental income that is not collected until future periods, and costs that are deferred or are non-cash charges. Our calculation of AFFO may not be comparable to AFFO or similarly titled measures reported by other REITs. AFFO should not be considered as an alternative to net income (calculated pursuant to GAAP) as an indicator of our results of operations or to cash flow from operating activities (calculated pursuant to GAAP) as an indicator of our liquidity.
MEDICAL PROPERTIES TRUST, INC. AND SUBSIDIARIES
Fiscal Years 2017 and 2018 Guidance Reconciliation
(Unaudited)
Fiscal Year 2017 Guidance -Per Share(1) | ||||||||
Low | High | |||||||
Net income attributable to MPT common stockholders |
$ | 0.87 | $ | 0.89 | ||||
Participating securities share in earnings |
| | ||||||
|
|
|
|
|||||
Net income, less participating securities share in earnings |
$ | 0.87 | $ | 0.89 | ||||
Depreciation and amortization |
0.34 | 0.34 | ||||||
Gain on sale of real estate |
(0.02 | ) | (0.02 | ) | ||||
|
|
|
|
|||||
Funds from operations |
$ | 1.19 | $ | 1.21 | ||||
Other adjustments(2) |
0.10 | 0.10 | ||||||
|
|
|
|
|||||
Normalized funds from operations |
$ | 1.29 | $ | 1.31 | ||||
|
|
|
|
|||||
Fiscal Year 2018 Guidance - Per Share(1) | ||||||||
Low | High | |||||||
Net income attributable to MPT common stockholders |
$ | 1.02 | $ | 1.06 | ||||
Participating securities share in earnings |
| | ||||||
|
|
|
|
|||||
Net income, less participating securities share in earnings |
$ | 1.02 | $ | 1.06 | ||||
Depreciation and amortization |
0.40 | 0.40 | ||||||
|
|
|
|
|||||
Funds from operations |
$ | 1.42 | $ | 1.46 | ||||
Other adjustments(2) |
| | ||||||
|
|
|
|
|||||
Normalized funds from operations |
$ | 1.42 | $ | 1.46 | ||||
|
|
|
|
(1) | The 2017 and 2018 guidance is based on current expectations and actual results or future events may differ materially from those expressed in this table, which is a forward-looking statement within the meaning of the federal securities laws. Please refer to the forward-looking statement included in this press release and our filings with the Securities and Exchange Commission for a discussion of risk factors that affect our performance. |
(2) | Includes acquisition expenses, write-off of straight line rent, transaction costs from non-real estate dispositions, impairment charges, unutilized fees/debt refinancing costs, and other. |
Pro Forma Total Gross Assets
(Unaudited)
June 30, 2017 | ||||
Total Assets |
$ | 7,327,837 | ||
Add: |
||||
Binding real estate commitments on new investments(3) |
1,562,290 | |||
Unfunded amounts on development deals and commenced capital improvement projects(4) |
91,189 | |||
Accumulated depreciation and amortization |
384,826 | |||
Less: |
||||
Cash and cash equivalents |
(236,364 | ) | ||
|
|
|||
Pro Forma Total Gross Assets(5) |
$ | 9,129,778 | ||
|
|
(3) | Reflects post June 30, 2017 transactions and commitments, including 11 Steward facilities, one RCCH facility, and two facilities in Germany. |
(4) | Includes $51.6 million unfunded amounts on ongoing development projects and $39.6 million unfunded amounts on capital improvement projects and development projects that have commenced rent. |
(5) | Pro forma total gross assets is total assets before accumulated depreciation/amortization, assumes all real estate binding commitments on new investments and unfunded amounts on development deals and commenced capital improvement projects are fully funded, and assumes cash on hand is fully used in these transactions. We believe pro forma total gross assets is useful to investors as it provides a more current view of our portfolio and allows for a better understanding of our concentration levels as our binding commitments close and our other commitments are fully funded. |
Exhibit 99.2
SECOND QUARTER 2017
Supplemental Information
MEDICALPROPERTIESTRUST.COM
TABLE OF CONTENTS
COMPANY OVERVIEW
Company Information 3
FINANCIAL INFORMATION
Reconciliation of Net Income to Funds from Operations 5
Debt Summary 6
Debt Maturity Schedule 7
Pro Forma Net Debt /Annualized Adjusted EBITDA 8
PORTFOLIO INFORMATION
Lease and Mortgage Loan Maturity Schedule 9
Pro Forma Gross Assets and Revenue
by Asset Type, Operator, State and Country 10
EBITDAR to Rent Coverage 13
Summary of Acquisitions and Development Projects 14
FINANCIAL STATEMENTS
Consolidated Statements of Income 15
Consolidated Balance Sheets 16
Other Income Generating Assets 17
FORWARD-LOOKING STATEMENT Forward-looking statements involve
known and unknown risks, uncertainties and other factors that may cause the actual results of the Company or future events to differ materially from those expressed in or underlying such forward-looking statements, including without limitation:
Normalized FFO per share; expected payout ratio, the amount of acquisitions of healthcare real estate, if any; estimated debt metrics, portfolio diversification, capital markets conditions, the repayment of debt arrangements; statements concerning
the additional income to the Company as a result of ownership interests in certain hospital operations and the timing of such income; the payment of future dividends, if any; completion of additional debt arrangement, and additional investments;
national and international economic, business, real estate and other market conditions; the competitive environment in which the Company operates; the execution of the Companys business plan; financing risks; the Companys ability to
maintain its status as a REIT for federal income tax purposes; acquisition and development risks; potential environmental and other liabilities; and other factors affecting the real estate industry generally or healthcare real estate in particular.
For further discussion of the factors that could affect outcomes, please refer to the Risk Factors section of the Companys Annual Report on Form 10-K for the year ended December 31,
2016, and as updated by the Companys subsequently filed Quarterly Reports on Form 10-Q and other SEC filings. Except as otherwise required by the federal securities laws, the Company undertakes no
obligation to update the information in this report.
On the Cover: Holy Family Hospital, an acute care hospital in Haverhill, Massachusetts operated by Steward
Health Care.
MEDICALPROPERTIESTRUST.COM
COMPANY OVERVIEW
Medical Properties Trust, Inc. is a Birmingham, Alabama based self-advised real estate investment trust formed to capitalize on the changing trends in healthcare
delivery by acquiring and developing net-leased healthcare facilities. MPTs financing model allows hospitals and other healthcare facilities to unlock the value of their underlying real estate in order
to fund facility improvements, technology upgrades, staff additions and new construction. Facilities include acute care hospitals, inpatient rehabilitation hospitals, long-term acute care hospitals, and other medical and surgical facilities.
OFFICERS
Edward K. Aldag, Jr. R. Steven Hamner Emmett E. McLean J. Kevin
Hanna
BOARD OF DIRECTORS
Edward K. Aldag, Jr. G.
Steven Dawson R. Steven Hamner William G. McKenzie D. Paul Sparks, Jr. Michael G. Stewart C. Reynolds Thompson, III
CORPORATE HEADQUARTERS
Medical Properties Trust, Inc.
1000 Urban Center Drive, Suite 501 Birmingham, AL 35242
(205) 969-3755 (205) 969-3756 (fax) www.medicalpropertiestrust.com
Chairman, President and
Chief Executive Officer Executive Vice President and Chief Financial Of?cer
Executive Vice President, Chief Operating Officer, Treasurer and Secretary Vice
President, Controller and Chief Accounting Of?cer
MEDICALPROPERTIESTRUST.COM
COMPANY
OVERVIEW(continued)
INVESTOR RELATIONS CAPITAL MARKETS
Tim Berryman | DirectorInvestor Relations Charles Lambert | Managing DirectorCapital Markets
(205) 397-8589 (205) 397-8897
tberryman@medicalpropertiestrust.com clambert@medicalpropertiestrust.com
TRANSFER AGENT STOCK EXCHANGE SENIOR UNSECURED
American Stock Transfer LISTING AND DEBT RATINGS
and
Trust Company TRADING SYMBOL Moodys Ba1
6201 15th Avenue New York Stock Exchange Standard &
Poors BBB-
Brooklyn, NY 11219 (NYSE): MPW
CONTINUUM OF CARE
E MEDICAL PROPERTIES TRUST FOCUSES ON THE MOST
H I G CRITICAL COMPONENTS OF HEALTHCARE DELIVERY.
ACUTE HOSPITALS CARE
ACUTE CARE HOSPITALS & FREE STANDING EMERGENCY ROOMS INPATIENT REHABILITATION FACILITIES
LONG-TERM ACUTE CARE HOSPITALS NURSING HOMES
REHABILITATION
INPATIENT ASSISTED LIVING
FACILITIES HOME HEALTH CARE
MPT facility types shown in green.
HEALTH HOME ACUTE LONG- TERM
CARE CARE
MEDICALPROPERTIESTRUST.COM
FINANCIAL INFORMATION
RECONCILIATION OF NET INCOME TO FUNDS FROM OPERATIONS
(Unaudited)
(Amounts in thousands except per share data)
For the Three Months Ended | For the Six Months Ended | |||||||||||||||
June 30, 2017 | June 30, 2016 | June 30, 2017 | June 30, 2016 | |||||||||||||
FFO INFORMATION: |
||||||||||||||||
Net income attributable to MPT common stockholders |
$ | 73,415 | $ | 53,724 | $ | 141,385 | $ | 111,651 | ||||||||
Participating securities share in earnings |
(100 | ) | (132 | ) | (225 | ) | (276 | ) | ||||||||
|
|
|
|
|
|
|
|
|||||||||
Net income, less participating securities share in earnings |
$ | 73,315 | $ | 53,592 | $ | 141,160 | $ | 111,375 | ||||||||
Depreciation and amortization(A) |
30,027 | 23,335 | 58,126 | 44,807 | ||||||||||||
Gain on sale of real estate |
| (22,613 | ) | (7,413 | ) | (22,653 | ) | |||||||||
|
|
|
|
|
|
|
|
|||||||||
Funds from operations |
$ | 103,342 | $ | 54,314 | $ | 191,873 | $ | 133,529 | ||||||||
Write-off of straight line rent and other |
| 3,063 | 1,117 | 3,063 | ||||||||||||
Transaction costs from non-real estate dispositions |
| 5,975 | | 5,975 | ||||||||||||
Acquisition expenses, net of tax benefit (A) |
9,539 | 4,801 | 12,184 | 9,034 | ||||||||||||
Impairment charges |
| 7,375 | | 7,375 | ||||||||||||
Unutilized financing fees / debt refinancing costs |
751 | | 14,380 | 4 | ||||||||||||
|
|
|
|
|
|
|
|
|||||||||
Normalized funds from operations |
$ | 113,632 | $ | 75,528 | $ | 219,554 | $ | 158,980 | ||||||||
|
|
|
|
|
|
|
|
|||||||||
Share-based compensation |
2,406 | 1,814 | 4,377 | 3,509 | ||||||||||||
Debt costs amortization |
1,522 | 2,062 | 3,139 | 3,897 | ||||||||||||
Additional rent received in advance (B) |
(300 | ) | (300 | ) | (600 | ) | (600 | ) | ||||||||
Straight-line rent revenue and other |
(18,681 | ) | (11,204 | ) | (34,863 | ) | (22,033 | ) | ||||||||
|
|
|
|
|
|
|
|
|||||||||
Adjusted funds from operations |
$ | 98,579 | $ | 67,900 | $ | 191,607 | $ | 143,753 | ||||||||
|
|
|
|
|
|
|
|
|||||||||
PER DILUTED SHARE DATA: |
||||||||||||||||
Net income, less participating securities share in earnings |
$ | 0.21 | $ | 0.22 | $ | 0.42 | $ | 0.47 | ||||||||
Depreciation and amortization(A) |
0.08 | 0.10 | 0.17 | 0.18 | ||||||||||||
Gain on sale of real estate |
| (0.09 | ) | (0.02 | ) | (0.09 | ) | |||||||||
|
|
|
|
|
|
|
|
|||||||||
Funds from operations |
$ | 0.29 | $ | 0.23 | $ | 0.57 | $ | 0.56 | ||||||||
Write-off of straight line rent and other |
| 0.01 | | 0.01 | ||||||||||||
Transaction costs from non-real estate dispositions |
| 0.03 | | 0.03 | ||||||||||||
Acquisition expenses, net of tax benefit (A) |
0.03 | 0.02 | 0.04 | 0.04 | ||||||||||||
Impairment charges |
| 0.03 | | 0.03 | ||||||||||||
Unutilized financing fees / debt refinancing costs |
| | 0.04 | | ||||||||||||
|
|
|
|
|
|
|
|
|||||||||
Normalized funds from operations |
$ | 0.32 | $ | 0.32 | $ | 0.65 | $ | 0.67 | ||||||||
|
|
|
|
|
|
|
|
|||||||||
Share-based compensation |
0.01 | 0.01 | 0.01 | 0.01 | ||||||||||||
Debt costs amortization |
| 0.01 | 0.01 | 0.01 | ||||||||||||
Additional rent received in advance (B) |
| | | | ||||||||||||
Straight-line rent revenue and other |
(0.05 | ) | (0.06 | ) | (0.10 | ) | (0.09 | ) | ||||||||
|
|
|
|
|
|
|
|
|||||||||
Adjusted funds from operations |
$ | 0.28 | $ | 0.28 | $ | 0.57 | $ | 0.60 | ||||||||
|
|
|
|
|
|
|
|
(A) | Includes our share of real estate depreciation and acquisition expenses from unconsolidated joint ventures. These amounts are included with the activity of all of our equity interests in the Other income (expense) line on the consolidated statements of income. |
(B) | Represents additional rent received from one tenant in advance of when we can recognize as revenue for accounting purposes. This additional rent is being recorded to revenue on a straight-line basis over the lease life. |
Investors and analysts following the real estate industry utilize funds from operations, or FFO, as a supplemental performance measure. FFO, reflecting the assumption that real estate asset values rise or fall with market conditions, principally adjusts for the effects of GAAP depreciation and amortization of real estate assets, which assumes that the value of real estate diminishes predictably over time. We compute FFO in accordance with the definition provided by the National Association of Real Estate Investment Trusts, or NAREIT, which represents net income (loss) (computed in accordance with GAAP), excluding gains (losses) on sales of real estate and impairment charges on real estate assets, plus real estate depreciation and amortization and after adjustments for unconsolidated partnerships and joint ventures.
In addition to presenting FFO in accordance with the NAREIT definition, we also disclose normalized FFO, which adjusts FFO for items that relate to unanticipated or non-core events or activities or accounting changes that, if not noted, would make comparison to prior period results and market expectations less meaningful to investors and analysts. We believe that the use of FFO, combined with the required GAAP presentations, improves the understanding of our operating results among investors and the use of normalized FFO makes comparisons of our operating results with prior periods and other companies more meaningful. While FFO and normalized FFO are relevant and widely used supplemental measures of operating and financial performance of REITs, they should not be viewed as a substitute measure of our operating performance since the measures do not reflect either depreciation and amortization costs or the level of capital expenditures and leasing costs necessary to maintain the operating performance of our properties, which can be significant economic costs that could materially impact our results of operations. FFO and normalized FFO should not be considered an alternative to net income (loss) (computed in accordance with GAAP) as indicators of our financial performance or to cash flow from operating activities (computed in accordance with GAAP) as an indicator of our liquidity.
We calculate adjusted funds from operations, or AFFO, by subtracting from or adding to normalized FFO (i) unbilled rent revenue, (ii) non-cash share-based compensation expense, and (iii) amortization of deferred financing costs. AFFO is an operating measurement that we use to analyze our results of operations based on the receipt, rather than the accrual, of our rental revenue and on certain other adjustments. We believe that this is an important measurement because our leases generally have significant contractual escalations of base rents and therefore result in recognition of rental income that is not collected until future periods, and costs that are deferred or are non-cash charges. Our calculation of AFFO may not be comparable to AFFO or similarly titled measures reported by other REITs. AFFO should not be considered as an alternative to net income (calculated pursuant to GAAP) as an indicator of our results of operations or to cash flow from operating activities (calculated pursuant to GAAP) as an indicator of our liquidity.
Q2 2017 | SUPPLEMENTAL INFORMATION 5
MEDICALPROPERTIESTRUST.COM
FINANCIAL INFORMATION
DEBT SUMMARY
(as of June 30, 2017)
($ amounts in thousands)
Debt Instrument |
Rate Type | Rate | Balance | |||||||||
Northland Mortgage Capital Term Loan |
Fixed | 6.20 | % | $ | 12,943 | |||||||
2021 Credit Facility Revolver |
Variable | 2.47 | % | 245,000 | ||||||||
2021 Credit Facility Revolver (GBP) (A) |
Variable | 1.51 | % | 5,210 | ||||||||
2022 Term Loan |
Variable | 2.72 | % | 200,000 | ||||||||
4.000% Notes Due 2022 (Euro) (B) |
Fixed | 4.00 | % | 571,300 | ||||||||
6.375% Notes Due 2022 |
Fixed | 6.38 | % | 350,000 | ||||||||
6.375% Notes Due 2024 |
Fixed | 6.38 | % | 500,000 | ||||||||
5.500% Notes Due 2024 |
Fixed | 5.50 | % | 300,000 | ||||||||
3.325% Notes Due 2025 (Euro) (B) |
Fixed | 3.33 | % | 571,300 | ||||||||
5.250% Notes Due 2026 |
Fixed | 5.25 | % | 500,000 | ||||||||
|
|
|||||||||||
$3,255,753 | ||||||||||||
Debt premium |
1,636 | |||||||||||
Debt issuance costs |
(36,335 | ) | ||||||||||
|
|
|
|
|||||||||
Weighted average rate | 4.64 | % | $ | 3,221,054 | ||||||||
|
|
|
|
(A) | Represents credit facility borrowings in pound sterling and converted to U.S. dollars at June 30, 2017. |
(B) | Represents bonds issued in euros and converted to U.S. dollars at June 30, 2017. |
Q2 2017 | SUPPLEMENTAL INFORMATION 6
MEDICALPROPERTIESTRUST.COM
FINANCIAL INFORMATION
DEBT MATURITY SCHEDULE
($ amounts in thousands)
Debt Instrument |
2017 | 2018 | 2019 | 2020 | 2021 | 2022 | 2023 | 2024 | 2025 | 2026 | ||||||||||||||||||||||||||||||
Northland Mortgage Capital Term Loan |
$ | 162 | $ | 12,781 | $ | | $ | | $ | | $ | | $ | | $ | | $ | | $ | | ||||||||||||||||||||
2021 Credit Facility Revolver |
| | | | 245,000 | | | | | | ||||||||||||||||||||||||||||||
2021 Credit Facility Revolver (GBP) |
| | | | 5,210 | | | | | | ||||||||||||||||||||||||||||||
2022 Term Loan |
| | | | | 200,000 | | | | | ||||||||||||||||||||||||||||||
4.000% Notes Due 2022 (Euro) |
| | | | | 571,300 | | | | | ||||||||||||||||||||||||||||||
6.375% Notes Due 2022 |
| | | | | 350,000 | | | | | ||||||||||||||||||||||||||||||
6.375% Notes Due 2024 |
| | | | | | | 500,000 | | | ||||||||||||||||||||||||||||||
5.500% Notes Due 2024 |
| | | | | | | 300,000 | | | ||||||||||||||||||||||||||||||
3.325% Notes Due 2025 (Euro) |
| | | | | | | | 571,300 | | ||||||||||||||||||||||||||||||
5.250% Notes Due 2026 |
| | | | | | | | | 500,000 | ||||||||||||||||||||||||||||||
|
|
|
|
|
|
|
|
|
|
|
|
|
|
|
|
|
|
|
|
|||||||||||||||||||||
$ | 162 | $ | 12,781 | $ | | $ | | $ | 250,210 | $ | 1,121,300 | $ | | $ | 800,000 | $ | 571,300 | $ | 500,000 | |||||||||||||||||||||
|
|
|
|
|
|
|
|
|
|
|
|
|
|
|
|
|
|
|
|
Q2 2017 | SUPPLEMENTAL INFORMATION 7
MEDICALPROPERTIESTRUST.COM
FINANCIAL INFORMATION
PRO FORMA NET DEBT / ANNUALIZED ADJUSTED EBITDA
(Unaudited)
(Amounts in thousands)
For the Three Months Ended | ||||
June 30, 2017 | ||||
Net income attributable to MPT common stockholders |
$ | 73,415 | ||
Pro forma adjustments for capital transactions and acquisitions that occurred after the period (A) |
34,374 | |||
|
|
|||
Pro forma net income |
$ | 107,789 | ||
Add back: |
||||
Interest expense |
39,710 | |||
Unutilized financing fees / debt refinancing costs |
751 | |||
Depreciation and amortization |
31,405 | |||
Stock-based compensation |
2,406 | |||
Mid-quarter acquisitions / divestitures |
6,445 | |||
Acquisition expenses |
10,818 | |||
Income tax benefit |
(614 | ) | ||
|
|
|||
2Q 2017 Pro forma Adjusted EBITDA |
$ | 198,710 | ||
|
|
|||
Annualization |
$ | 794,840 | ||
|
|
|||
Total debt |
$ | 3,221,054 | ||
Pro forma changes to cash and debt balance after June 30, 2017(A) |
1,327,790 | |||
|
|
|||
Pro forma Net Debt |
$ | 4,548,844 | ||
|
|
|||
Pro forma Net Debt / Annualized Adjusted EBITDA |
5.7x |
(A) | The schedule reflects post June 30, 2017 transactions and commitments, including the acquisition of 11 Steward facilities, one RCCH facility, and two remaining facilities in Germany. |
Investors and analysts following the real estate industry utilize net debt (debt less cash) to EBITDA (net income before interest expense, income taxes, depreciation and amortization) as a measurement of leverage that shows how many years it would take for us to pay back our debt, assuming net debt and EBITDA are held constant. The table above considers the pro forma effects on net debt and EBITDA from investments and capital transactions that were either completed during the period or disclosed as firm commitments, assuming such transactions were consummated/fully funded as of the beginning of the period. In addition, we show EBITDA adjusted to exclude stock compensation expense, gains or losses on real estate and other dispositions, unutilized financing fees / debt refinancing costs, impairment charges, and acquisition expenses to derive Pro forma Annualized Adjusted EBITDA, which is a non-GAAP measure. We believe Pro forma Net Debt and Pro forma Annualized Adjusted EBITDA are useful to investors and analysts as they allow for a more current view of our credit quality and allow for the comparison of our credit strength between periods and to other real estate companies without the effect of items that by their nature are not comparable from period to period.
Q2 2017 | SUPPLEMENTAL INFORMATION 8
MEDICALPROPERTIESTRUST.COM
PORTFOLIO INFORMATION
LEASE AND MORTGAGE LOAN MATURITY SCHEDULE
(as of June 30, 2017)
($ amounts in thousands)
Years of Maturities (A) (B) |
Total Properties | Base Rent/Interest (C) | Percent of Total Base Rent/Interest |
|||||||||
2017 |
| $ | | | ||||||||
2018 |
| | | |||||||||
2019 |
3 | 5,437 | 0.8 | % | ||||||||
2020 |
1 | 2,032 | 0.3 | % | ||||||||
2021 |
3 | 13,397 | 1.9 | % | ||||||||
2022 |
15 | 74,275 | 10.5 | % | ||||||||
2023 |
4 | 12,885 | 1.8 | % | ||||||||
2024 |
1 | 2,273 | 0.3 | % | ||||||||
2025 |
7 | 22,952 | 3.2 | % | ||||||||
2026 |
6 | 26,430 | 3.7 | % | ||||||||
Thereafter |
218 | 549,592 | 77.5 | % | ||||||||
|
|
|
|
|
|
|||||||
258 | $ | 709,273 | 100.0 | % | ||||||||
|
|
|
|
|
|
(A) | Excludes two of our facilities that are under development, our Twelve Oaks facility that is not fully occupied, and the nine properties that we own through joint venture arrangements. In addition, the schedule reflects post June 30, 2017 transactions and commitments, including the the acquisition of 11 Steward facilities, one RCCH facility and two facilities in Germany. |
(B) | Lease/Loan expiration is based on the fixed term of the lease/loan and does not factor in potential renewal options provided for in our agreements. |
(C) | Represents base rent/interest income on an annualized basis but does not include tenant recoveries, additional rents and other lease-related adjustments to revenue (i.e., straight-line rents and deferred revenues). |
Q2 2017 | SUPPLEMENTAL INFORMATION 9
MEDICALPROPERTIESTRUST.COM
PORTFOLIO INFORMATION
PRO FORMA GROSS ASSETS AND REVENUE BY ASSET TYPE
(June 30, 2017)
($ amounts in thousands)
Asset Types |
Total Pro foma Gross Assets (B) |
Percentage of Pro forma Gross Assets |
YTD Revenue |
Percentage of Total Revenue |
||||||||||||
General Acute Care Hospitals (A) |
$ | 6,488,910 | 71.1 | % | $ | 222,068 | 68.7 | % | ||||||||
Inpatient Rehabilitation Hospitals |
1,870,480 | 20.5 | % | 79,344 | 24.6 | % | ||||||||||
Long-Term Acute Care Hospitals |
368,719 | 4.0 | % | 21,792 | 6.7 | % | ||||||||||
Other assets |
401,669 | 4.4 | % | | | |||||||||||
|
|
|
|
|
|
|
|
|||||||||
Total |
$ | 9,129,778 | 100.0 | % | $ | 323,204 | 100.0 | % | ||||||||
|
|
|
|
|
|
|
|
(A) | Includes three medical office buildings. |
(B) | Represents investment concentration as a percentage of gross real estate assets, other loans, and equity investments, assuming all binding real estate commitments on new investments and unfunded amounts on development deals and commenced capital improvement projects are fully funded. See press release dated August 9, 2017, for reconciliation of total assets to pro forma total gross assets at June 30, 2017. |
Q2 2017 | SUPPLEMENTAL INFORMATION 10
MEDICALPROPERTIESTRUST.COM
PORTFOLIO INFORMATION
PRO FORMA GROSS ASSETS AND REVENUE BY OPERATOR
(June 30, 2017)
($ amounts in thousands)
Operators |
Total Pro forma Gross Assets (A) |
Percentage of Pro forma Gross Assets |
YTD Revenue |
Percentage of Total Revenue |
||||||||||||
Steward |
$ | 3,410,874 | 37.4 | % | $ | 58,278 | 18.0 | % | ||||||||
Prime Healthcare |
1,116,694 | 12.2 | % | 63,059 | 19.5 | % | ||||||||||
MEDIAN |
1,086,109 | 11.9 | % | 47,744 | 14.8 | % | ||||||||||
Ernest Health |
630,811 | 6.9 | % | 35,269 | 10.9 | % | ||||||||||
RCCH |
506,265 | 5.5 | % | 19,632 | 6.1 | % | ||||||||||
26 operators |
1,977,356 | 21.7 | % | 99,222 | 30.7 | % | ||||||||||
Other assets |
401,669 | 4.4 | % | | | |||||||||||
|
|
|
|
|
|
|
|
|||||||||
Total |
$ | 9,129,778 | 100.0 | % | $ | 323,204 | 100.0 | % | ||||||||
|
|
|
|
|
|
|
|
(A) | Represents investment concentration as a percentage of gross real estate assets, other loans, and equity investments, assuming all binding real estate commitments on new investments and unfunded amounts on development deals and commenced capital improvement projects are fully funded. See press release dated August 9, 2017, for reconciliation of total assets to pro forma total gross assets at June 30, 2017. |
Q2 2017 | SUPPLEMENTAL INFORMATION 11
MEDICALPROPERTIESTRUST.COM
PORTFOLIO INFORMATION
PRO FORMA GROSS ASSETS AND REVENUE BY U.S. STATE AND COUNTRY
(June 30, 2017)
($ amounts in thousands)
U.S. States and Other Countries |
Total Pro forma Gross Assets (A) |
Percentage of Pro forma Gross Assets |
YTD Revenue |
Percentage of Total Revenue |
||||||||||||
Massachusetts |
$ | 1,262,041 | 13.8 | % | $ | 53,159 | 16.5 | % | ||||||||
Texas |
1,230,945 | 13.5 | % | 49,851 | 15.4 | % | ||||||||||
Utah |
1,083,152 | 11.9 | % | 5,057 | 1.6 | % | ||||||||||
California |
542,883 | 5.9 | % | 33,123 | 10.3 | % | ||||||||||
Arizona |
486,547 | 5.3 | % | 15,542 | 4.8 | % | ||||||||||
24 Other States |
2,502,791 | 27.4 | % | 109,875 | 33.9 | % | ||||||||||
Other assets |
352,748 | 3.9 | % | | | |||||||||||
|
|
|
|
|
|
|
|
|||||||||
United States |
$ | 7,461,107 | 81.7 | % | $ | 266,607 | 82.5 | % | ||||||||
Germany |
$ | 1,421,350 | 15.6 | % | $ | 54,576 | 16.9 | % | ||||||||
Italy |
95,507 | 1.0 | % | | | |||||||||||
United Kingdom |
78,813 | 0.9 | % | 1,799 | 0.5 | % | ||||||||||
Spain |
24,080 | 0.3 | % | 222 | 0.1 | % | ||||||||||
Other assets |
48,921 | 0.5 | % | | | |||||||||||
|
|
|
|
|
|
|
|
|||||||||
International |
$ | 1,668,671 | 18.3 | % | $ | 56,597 | 17.5 | % | ||||||||
|
|
|
|
|
|
|
|
|||||||||
Total |
$ | 9,129,778 | 100.0 | % | $ | 323,204 | 100.0 | % | ||||||||
|
|
|
|
|
|
|
|
(A) | Represents investment concentration as a percentage of gross real estate assets, other loans, and equity investments, assuming all binding real estate commitments on new investments and unfunded amounts on development deals and commenced capital improvement projects are fully funded. See press release dated August 9, 2017, for reconciliation of total assets to pro forma total gross assets at June 30, 2017. |
Q2 2017 | SUPPLEMENTAL INFORMATION 12
MEDICALPROPERTIESTRUST.COM
PORTFOLIO INFORMATION
Same Store EBITDAR(1) Rent Coverage
YOY and Sequential Quarter Comparisons by Property Type
Stratification of Portfolio EBITDAR Rent Coverage
EBITDAR Rent Coverage TTM |
Investment (in thousands) |
No. of Facilities | Percentage of Investment |
|||||||||
Greater than or equal to 4.50x |
$ | 192,388 | 4 | 6.6 | % | |||||||
3.00x - 4.49x |
$ | 115,000 | 1 | 4.0 | % | |||||||
Total Master Leased, Cross-Defaulted and/or with Parent Guaranty: 2.0x |
$ | 2,583,757 | 81 | 89.4 | % | |||||||
General Acute Master Leased, Cross-Defaulted and/or with Parent Guaranty: 2.3x |
$ | 1,539,821 | 32 | 53.2 | % | |||||||
Inpatient Rehabilitation Facilities Master Leased, Cross- Defaulted and/or with
Parent |
$ | 683,856 | 32 | 23.7 | % | |||||||
Long-Term Acute Care Hospitals Master Leased, Cross- Defaulted and/or with Parent Guaranty: 1.3x |
$ | 360,080 | 17 | 12.5 | % |
Notes:
Same Store represents properties with at least 24 months of financial reporting data. Properties that do not provide financial reporting and disposed assets are not included. Adeptus facilities excluded until Bankruptcy proceedings are resolved and operations stabilize.
All data presented is on a trailing twelve month basis.
(1) | EBITDAR adjusted for non-recurring items. |
Q2 2017 | SUPPLEMENTAL INFORMATION 13
MEDICALPROPERTIESTRUST.COM
PORTFOLIO INFORMATION
SUMMARY OF COMPLETED ACQUISITIONS / DEVELOPMENT PROJECTS FOR THE SIX MONTHS ENDED JUNE 30, 2017
($ amounts in thousands)
Operator |
Location | Costs Incurred as of 06/30/2017 |
Rent Commencement Date |
Acquisition/ Development |
||||||||||||
Adeptus Health |
Mesa, Arizona | $ | 52,000 | 2/10/2017 | Development | |||||||||||
Adeptus Health |
Austin, Texas | 5,264 | 3/2/2017 | Development | ||||||||||||
Adeptus Health |
San Tan Valley, Arizona | 6,372 | 4/13/2017 | Development | ||||||||||||
Steward |
Florida, Ohio & Pennsylvania | 301,292 | 5/1/2017 | Acquisition | ||||||||||||
RCCH |
Lewiston, Idaho | 87,500 | 5/1/2017 | Acquisition | ||||||||||||
Adeptus Health |
Cypress, Texas | 4,670 | 5/8/2017 | Development | ||||||||||||
MEDIAN & Affiliates |
Germany | 171,538 | Various | Acquisition | ||||||||||||
Alecto |
Ohio & West Virginia | 40,451 | 6/1/2017 | Acquisition | ||||||||||||
|
|
|||||||||||||||
$ | 669,087 | |||||||||||||||
|
|
SUMMARY OF CURRENT INVESTMENT COMMITMENTS AS OF JUNE 30, 2017
($ amounts in thousands)
Operator |
Location | Commitment | Acquisition/ Development |
|||||||||
MEDIAN & Affiliates |
Germany | $ | 44,790 | Acquisition | ||||||||
RCCH |
Washington | 17,500 | Acquisition | |||||||||
Steward |
Utah, Arizona, Texas & Arkansas | 1,500,000 | Acquisition | |||||||||
|
|
|||||||||||
$ | 1,562,290 | |||||||||||
|
|
SUMMARY OF CURRENT DEVELOPMENT PROJECTS AS OF JUNE 30, 2017
($ amounts in thousands)
Operator |
Location | Commitment | Cost Incurred as of 6/30/2017 |
Estimated Completion Date |
||||||||||||
Ernest Health |
Flagstaff, Arizona | $ | 28,067 | $ | 11,351 | Q1 2018 | ||||||||||
Circle Health |
United Kingdom | 42,017 | 7,088 | Q4 2018 | ||||||||||||
|
|
|
|
|||||||||||||
$ | 70,084 | $ | 18,439 | |||||||||||||
|
|
|
|
Q2 2017 | SUPPLEMENTAL INFORMATION 14
MEDICALPROPERTIESTRUST.COM
FINANCIAL STATEMENTS
MEDICAL PROPERTIES TRUST, INC. AND SUBSIDIARIES
Consolidated Statements of Income
(Unaudited)
(Amounts in thousands, except per share data)
For the Three Months Ended | For the Six Months Ended | |||||||||||||||
June 30, 2017 | June 30, 2016 | June 30, 2017 | June 30, 2016 | |||||||||||||
Revenues |
||||||||||||||||
Rent billed |
$ | 103,447 | $ | 77,960 | $ | 200,210 | $ | 152,021 | ||||||||
Straight-line rent |
16,277 | 8,551 | 29,056 | 16,768 | ||||||||||||
Income from direct financing leases |
18,312 | 13,552 | 36,192 | 32,503 | ||||||||||||
Interest and fee income |
28,771 | 26,237 | 57,746 | 60,007 | ||||||||||||
|
|
|
|
|
|
|
|
|||||||||
Total revenues |
166,807 | 126,300 | 323,204 | 261,299 | ||||||||||||
Expenses |
||||||||||||||||
Real estate depreciation and amortization |
29,493 | 22,832 | 57,079 | 43,974 | ||||||||||||
Impairment charges |
| 7,375 | | 7,375 | ||||||||||||
Property-related |
1,153 | 784 | 2,481 | 1,685 | ||||||||||||
Acquisition expenses |
10,806 | 4,767 | 13,562 | 3,702 | ||||||||||||
General and administrative |
15,079 | 12,045 | 28,276 | 23,516 | ||||||||||||
|
|
|
|
|
|
|
|
|||||||||
Total operating expenses |
56,531 | 47,803 | 101,398 | 80,252 | ||||||||||||
|
|
|
|
|
|
|
|
|||||||||
Operating income |
110,276 | 78,497 | 221,806 | 181,047 | ||||||||||||
Interest expense |
(39,710 | ) | (41,501 | ) | (77,739 | ) | (80,870 | ) | ||||||||
Gain on sale of real estate and other asset dispositions, net |
| 16,638 | 7,413 | 16,678 | ||||||||||||
Unutilized financing fees / debt refinancing costs |
(751 | ) | | (14,380 | ) | (4 | ) | |||||||||
Other income (expense) |
3,367 | 654 | 5,134 | (4,018 | ) | |||||||||||
Income tax benefit (expense) |
614 | (364 | ) | (253 | ) | (683 | ) | |||||||||
|
|
|
|
|
|
|
|
|||||||||
Income from continuing operations |
73,796 | 53,924 | 141,981 | 112,150 | ||||||||||||
Loss from discontinued operations |
| | | (1 | ) | |||||||||||
|
|
|
|
|
|
|
|
|||||||||
Net income |
73,796 | 53,924 | 141,981 | 112,149 | ||||||||||||
Net income attributable to non-controlling interests |
(381 | ) | (200 | ) | (596 | ) | (498 | ) | ||||||||
|
|
|
|
|
|
|
|
|||||||||
Net income attributable to MPT common stockholders |
$ | 73,415 | $ | 53,724 | $ | 141,385 | $ | 111,651 | ||||||||
|
|
|
|
|
|
|
|
|||||||||
Earnings per common share basic: |
||||||||||||||||
Income from continuing operations |
$ | 0.21 | $ | 0.23 | $ | 0.42 | $ | 0.47 | ||||||||
Loss from discontinued operations |
| | | | ||||||||||||
|
|
|
|
|
|
|
|
|||||||||
Net income attributable to MPT common stockholders |
$ | 0.21 | $ | 0.23 | $ | 0.42 | $ | 0.47 | ||||||||
|
|
|
|
|
|
|
|
|||||||||
Earnings per common share diluted: |
||||||||||||||||
Income from continuing operations |
$ | 0.21 | $ | 0.22 | $ | 0.42 | $ | 0.47 | ||||||||
Loss from discontinued operations |
| | | | ||||||||||||
|
|
|
|
|
|
|
|
|||||||||
Net income attributable to MPT common stockholders |
$ | 0.21 | $ | 0.22 | $ | 0.42 | $ | 0.47 | ||||||||
|
|
|
|
|
|
|
|
|||||||||
Weighted average shares outstanding basic |
349,856 | 238,082 | 335,456 | 237,796 | ||||||||||||
Weighted average shares outstanding diluted |
350,319 | 239,008 | 335,871 | 238,413 | ||||||||||||
Dividends declared per common share |
$ | 0.24 | $ | 0.23 | $ | 0.48 | $ | 0.45 |
Q2 2017 | SUPPLEMENTAL INFORMATION 15
MEDICALPROPERTIESTRUST.COM
FINANCIAL STATEMENTS
MEDICAL PROPERTIES TRUST, INC. AND SUBSIDIARIES
Consolidated Balance Sheets
(Amounts in thousands, except per share data)
June 30, 2017 | December 31, 2016 | |||||||
(Unaudited) | (A) | |||||||
ASSETS |
||||||||
Real estate assets |
||||||||
Land, buildings and improvements, intangible lease assets, and other |
$ | 4,976,129 | $ | 4,317,866 | ||||
Mortgage loans |
1,062,558 | 1,060,400 | ||||||
Net investment in direct financing leases |
693,243 | 648,102 | ||||||
|
|
|
|
|||||
Gross investment in real estate assets |
6,731,930 | 6,026,368 | ||||||
Accumulated depreciation and amortization |
(384,826 | ) | (325,125 | ) | ||||
|
|
|
|
|||||
Net investment in real estate assets |
6,347,104 | 5,701,243 | ||||||
Cash and cash equivalents |
236,364 | 83,240 | ||||||
Interest and rent receivables |
68,537 | 57,698 | ||||||
Straight-line rent receivables |
147,755 | 116,861 | ||||||
Other assets |
528,077 | 459,494 | ||||||
|
|
|
|
|||||
Total Assets |
$ | 7,327,837 | $ | 6,418,536 | ||||
|
|
|
|
|||||
LIABILITIES AND EQUITY |
||||||||
Liabilities |
||||||||
Debt, net |
$ | 3,221,054 | $ | 2,909,341 | ||||
Accounts payable and accrued expenses |
219,527 | 207,711 | ||||||
Deferred revenue |
20,108 | 19,933 | ||||||
Lease deposits and other obligations to tenants |
34,943 | 28,323 | ||||||
|
|
|
|
|||||
Total Liabilities |
3,495,632 | 3,165,308 | ||||||
Equity |
||||||||
Preferred stock, $0.001 par value. Authorized 10,000 shares; no shares outstanding |
| | ||||||
Common stock, $0.001 par value. Authorized 500,000 shares; issued and outstanding -364,020 shares at June 30, 2017 and 320,514 shares at December 31, 2016 |
364 | 321 | ||||||
Additional paid in capital |
4,327,733 | 3,775,336 | ||||||
Distributions in excess of net income |
(457,419 | ) | (434,114 | ) | ||||
Accumulated other comprehensive loss |
(52,591 | ) | (92,903 | ) | ||||
Treasury shares, at cost |
(777 | ) | (262 | ) | ||||
|
|
|
|
|||||
Total Medical Properties Trust, Inc. Stockholders Equity |
3,817,310 | 3,248,378 | ||||||
Non-controlling interests |
14,895 | 4,850 | ||||||
|
|
|
|
|||||
Total Equity |
3,832,205 | 3,253,228 | ||||||
|
|
|
|
|||||
Total Liabilities and Equity |
$ | 7,327,837 | $ | 6,418,536 | ||||
|
|
|
|
(A) | Financials have been derived from the prior year audited financial statements. |
Q2 2017 | SUPPLEMENTAL INFORMATION 16
MEDICALPROPERTIESTRUST.COM
FINANCIAL STATEMENTS
OTHER INCOME GENERATING ASSETS AS OF JUNE 30, 2017
($ amounts in thousands)
Operator |
Investment | Annual Interest Rate |
YTD RIDEA Income (A) |
Security / Credit Enhancements | ||||||||||
Non-Operating Loans |
||||||||||||||
Vibra Healthcare acquisition loan (B) |
$ | 5,432 | 10.25 | % | Secured and cross-defaulted with real estate, other agreements and guaranteed by Parent | |||||||||
Alecto working capital |
12,500 | 11.44 | % | Secured and cross-defaulted with real estate and guaranteed by Parent | ||||||||||
IKJG/HUMC working capital |
4,640 | 10.40 | % | Secured and cross-defaulted with real estate and guaranteed by Parent | ||||||||||
Ernest Health |
22,542 | 9.37 | % | Secured and cross-defaulted with real estate and guaranteed by Parent | ||||||||||
Other |
14,654 | |||||||||||||
|
|
|||||||||||||
$ | 59,768 | |||||||||||||
Operating Loans |
||||||||||||||
Ernest Health (C) |
$ | 93,200 | 15.00 | % | $ | 7,783 | Secured and cross-defaulted with real estate and guaranteed by Parent | |||||||
|
|
|
|
|||||||||||
$ | 93,200 | 7,783 | ||||||||||||
Equity investments(D) |
||||||||||||||
Domestic |
$ | 63,953 | $ | 2,771 | ||||||||||
International(E) |
$ | 125,779 | $ | 2,814 | (F) |
(A) | Income earned on operating loans is reflected in the interest income line of the income statement. |
(B) | Original amortizing acquisition loan was $41 million; loan matures in 2019. |
(C) | Due to compounding, effective interest rate is 16.7%. |
(D) | All earnings in income from equity investments are reported on a one quarter lag basis. |
(E) | Includes equity investments in Spain, Italy, and Germany. |
(F) | Excludes our share of real estate depreciation and acquisition expenses of certain unconsolidated joint ventures. |
Q2 2017 | SUPPLEMENTAL INFORMATION 17
1000 Urban Center Drive, Suite 501 Birmingham, AL 35242 (205) 969-3755 NYSE: MPW
www.medicalpropertiestrust.com
Contact:
Tim Berryman, DirectorInvestor
Relations
(205) 397-8589 or tberryman@medicalpropertiestrust.com or Charles Lambert, Managing DirectorCapital Markets
(205) 397-8897 or clambert@medicalpropertiestrust.com
At the Very heart of healthcare®.
"L% BE0;RUFC*VW- /$+BH8I#1J+@JC< [C%]1JYLC3);,),' >]6
MBDNE14W&HI=(TRFP!YPP[OP)UR64JJ$.YLQ(U\:!;6%Z_C8!>8!DN+
M!&;D8MC)R3"*4= 4'"S=NNNFD)C$3.8 :2 & R5V;'2-6<%"(?RA\FDN>Z/
MCV/Q]T/_ %/53 2WO^L^Q0U^)QU8&U@3_F:B+9S?^'_[7O!F)1=_01+U'*KY
M?^7KB80BK Z]5'XB+8&-Q,(XY
G(W)$*VQ2B#A?-KK+\Z9<'4M -QK;RA#C.W!)I3[WCSMRD^
MNP@UY6H=0R->-?';D7[&W8[R]R5Q^RZN'A6"RK'9[U)MMHB7UW%+18#.NB'$SQ<;R
MVOTDS"6;9$0D(-/(+#':(=3\6\!\E=YY:OW[;R5]I[X_XBQ5(XRUKM(#M :I
M55 PX/3NAT_AE72O#ZYEDV2[BW7NG X_9^32 I15WP^/[.VBBJ4KT_ BA33C?\
M9&EH\>J%"HH"#Y@D:OLGAD"QO:Y>@@^PU@I;2[MGEEQ#(PC-6N'I4!/)5H!/
M;:>QZ*2>_P 17RGZ-2YA:@!'5Z0?3T>>C:#W-.H2/ %2C0)!^)\/CINO%*70
MN/110#\O\-/WM*30 !E1MZTIU^&C50@K=V''KGDMQ:M-I9:=F/(==)D2HT*+
M'881O>D2Y B6FT)Z?0-;
MJS2S^* :SH 3V5RZ1\\S?YT]\DO2YSG'RJ36-]I:DI0%+HDU":E(I7J/+J9L
MF..-4Y;=K@$ 4$>VDX8!)\:=@22:[>IJ?'2* ,14P5Q#6G'#'C78'LNBEK/\
MV40-OZA-@^/F.56'P/6M#W^&N;>);FG:( W_ ,2?Y-_[M=I\&XI&[Y=.EQ'P
M@'E)D9CZ$%<4O,J5ZJ@!_9E*)(Z5WK[ #Z== L=(MXL,>Z:/X(KFN]ZSN5PX
M)V;F0X_ENK IM52442>YI0=>QH*]R/'5X-"=I:U]UP7.(;I49HBUK)K(]5A:
MZ)HLM4.U)<4ZH;2%D5"D&GY"=*Z
FEX84PE2M90.@(IT33KVH-0G,CKJ\W!H/!*RQH3TU]+4=.
M]QRE#7RI22!4T'4;NU.IU'-@\>BDI0KTTC:M(W?RB?J(Z>&I0UJJH
MJI\7+H TG2O35T>*%$E(/0?QA\?#KN'8:CD=H;CD:MV;/BI48N'3Z?DKN5L!
MCV/VD!1&_,*55W6#R?>"JIH:] ->(?O'$&"Z7+XNV_1?7TE^Z>TBZV_B1;7F
M)SQT^VN,7:$T'F!.[QJ.W3KKR$)1E7OX1DXFL6S<$@4\M*@=JU/57C0@^'72
M@N<4J32&=HT%)20 I5"".Y [@ #L*]]60R-H4G&F"1[L ,*M4@_;4FFX%!Z
M=JUZ^%3\">@T&8$(VE;&0=7&K%^0'IL0*?:-5J)Z;JGL#](^K0TH%)I3T4EH
MH&@"AW6D= I2":E:BH^2OT]3X:4;3FZ6MQSJS:/3W[O3;!J:D(('2I!57
M8"32IJH^ U, F=,<\NRRI.ZM#(05)4%U4$!2: 5JK?M5N -$_:551^&G!X:,
M,Z:CG9^[21IN0\?4=5L235M)'56W:?(%*"J=R5J_)I!&Z4JD$H2H[R04A-233QZ=?+\3T&FM:7>]3U#0@K'O6^I8&Y02**
M*5';N\$NO5J0H?Q4T U('QGLTUS)&]H"DSA":#:I9W52#YOAT2CP'2E3J.1B
MA!1&]K2KB*Q>JIQ+A