PRESS RELEASE
Contact Information: Investors/Media:
Kite Realty Group Trust Kite Realty Group Trust
Dan Sink, Chief Financial Officer Adam Basch, Investor Relations
(317) 577-5609 (317) 578-5161
dsink@kiterealty.com abasch@kiterealty.com
Kite Realty Group Trust Reports
Second Quarter 2014 Results
Indianapolis, Ind., July 31, 2014 – Kite Realty Group Trust (NYSE: KRG) (the “Company”) announced today its operating results for the second quarter ended June 30, 2014. Financial statements and exhibits attached to this release include results for the three and six months ended June 30, 2014 and 2013.
“We continue to execute on our strategic plan as evidenced by another quarter of excellent operating results,” said John A. Kite, Chairman and CEO. “Our portfolio fundamentals and operating metrics continue to be among the leaders in the shopping center sector. We achieved 30% year-over-year as adjusted FFO per share growth in the quarter, posted strong same property net operating income growth of 4.4% and generated cash spreads on lease renewals of 7.7%. We also closed on our merger with Inland Diversified earlier this month which strengthens our balance sheet and considerably bolsters our liquidity position to approximately $400 million. We also expect to significantly increase our cash flow from combined operations in the second half of 2014 and beyond.”
Second Quarter Financial Results
|
·
|
As adjusted for $3.3 million of merger and acquisition costs, Funds From Operations (FFO), was $17.4 million, or $0.13 per diluted common share, for the second quarter of 2014 which represents a 30% per share increase over the second quarter of last year.
|
|
·
|
Revenue from recurring property operations increased 40% in the second quarter of 2014 over the second quarter of 2013.
|
For the three months ended June 30, 2014, FFO was $14.1 million, or $0.10 per diluted common share for Kite Realty Group, L.P.’s real estate properties in which the Company owns an interest (the “Kite Portfolio”), compared to $10.1 million, or $0.10 per diluted common share, for the same period in the prior year. As adjusted for costs associated with our recently completed merger with Inland Diversified Real Estate Trust (“Inland Diversified”), FFO for the three months ended June 30, 2014 was $17.4 million, or $0.13 per diluted common share for the Kite Portfolio, compared to $10.1 million, or $0.10 per diluted common share, for the same period in the prior year.
For the six months ended June 30, 2014, FFO was $27.1 million, or $0.20 per diluted common share for the Kite Portfolio, compared to $21.5 million, or $0.24 per diluted common share for the same period of the prior year. As adjusted for merger and acquisition costs of $7.8 million, FFO for the six months ended June 30, 2014 was $34.9 million, or $0.25 per diluted common share for the Kite Portfolio, compared to $21.7 million, or $0.24 per diluted common share, in the same period of the prior year.
Net loss attributable to common shareholders for the three months ended June 30, 2014 was $5.1 million compared to a net loss of $8.7 million for the same period in 2013. Net loss attributable to common shareholders during the three months ended June 30, 2014 included merger and acquisition costs of $3.3 million while the three months ended June 30, 2013 included a $5.4 million impairment charge.
Net loss attributable to common shareholders was $2.9 million for the first six months of 2014 compared to an $8.8 million net loss in the same period of the prior year. Net loss in the current year includes gains on sales of operating properties totaling $6.7 million, offset by merger and acquisition costs of $7.8 million. The prior year includes a $5.4 million impairment charge.
Total revenue from property operations for the three months ended June 30, 2014 increased 40% over the same period in the prior year and reflects the effects of acquisition of the nine-property portfolio in November of 2013, the delivery of development and redevelopment properties into operations, and the completion of anchor tenant renovations.
Total revenue from property operations for the six months ended June 30, 2014 increased 47% over the same period in 2013, mainly due to the acquisition of operating properties and the transition of development properties to operating status.
Portfolio Operations
|
·
|
Same property net operating income increased 4.4% in the second quarter of 2014 over the same period in the prior year.
|
|
·
|
The total portfolio was 95.2% leased at the end of the second quarter of 2014.
|
|
·
|
Executed 45 new and renewal leases for 174,450 square feet during the second quarter of 2014 for an aggregate cash rent spread on comparable leases of 13.9%.
|
As of June 30, 2014, the Company owned interests in 66 operating properties totaling approximately 11.7 million square feet. The owned GLA in the Company’s retail operating portfolio was 95.2 % leased as of June 30, 2014, compared to 95.4% leased as of June 30, 2013.
Same property net operating income, which includes 50 operating properties, increased 4.4% in the second quarter of 2014 compared to the same period in the prior year. The leased percentage of these properties increased to 96.3% at June 30, 2014 from 95.9% at June 30, 2013.
The Company executed 45 new and renewal leases during the second quarter of 2014 totaling 174,450 square feet. Cash spreads on new leases executed in the quarter were up 32.0% while cash spreads on renewals were up 7.7% for a blended spread of 13.9%.
As previously announced, several new anchor and national tenants, representing 151,000 square feet of GLA, opened for business during the second quarter of 2014. These tenants include Publix Supermarkets at King’s Lake Square in Naples, Florida; Harris Teeter, Massage Envy, and Sleepy’s at Parkside Town Commons in Raleigh, North Carolina; Total Wine & More at International Speedway Square in Daytona Beach, Florida; Panera Bread at Bolton Plaza in Jacksonville, Florida; and Walgreens at Four Corner Square in Maple Valley, Washington.
Investments in Properties
|
·
|
Substantially completed the redevelopment of Kings Lake Square, a retail shopping center in Naples, Florida, that was 88% leased at quarter-end, and transitioned the property into the operating portfolio.
|
Development
As of June 30, 2014, the Company owned interests in three development projects under construction which include Phase II of Holly Springs Towne Center and Phases I and II of Parkside Town Commons, all near Raleigh, North Carolina. Phase II of Holly Springs Towne Center is anchored by Target, Frank Theatres, Bed Bath & Beyond and DSW while Parkside Town Commons Phase I and II is anchored by Target, Frank Theatres, Harris Teeter, PETCO, Golf Galaxy and Field & Stream. These projects were in aggregate 73.6% pre-leased or committed as of June 30, 2014 with a total estimated cost of approximately $158.0 million, of which approximately $95.5 million had been incurred as of June 30, 2014.
Redevelopment
The Company substantially completed the King’s Lake Square redevelopment in Naples, Florida with a new 20-year Publix lease as well as an updated Starbucks and other national and regional tenants. Publix reopened for business on April 24.
The Company owns two additional redevelopment properties under construction that were in the aggregate 83.5% pre-leased or committed as of June 30, 2014. Gainesville Plaza in Gainesville, Florida will be anchored by Burlington Coat Factory and Ross Dress for Less and Bolton Plaza in Jacksonville, Florida is anchored by LA Fitness and Academy Sports & Outdoors. We expect Gainesville to open for operations in late 2014 and Bolton Plaza to be substantially complete in September 2014.
During the second quarter, the Company commenced redevelopment of its Hamilton Crossing operating property in Carmel, Indiana as the Company allowed its lease with Office Depot to expire. The Company intends to re-tenant and refurbish the center and revise the layout.
Merger with Inland Diversified
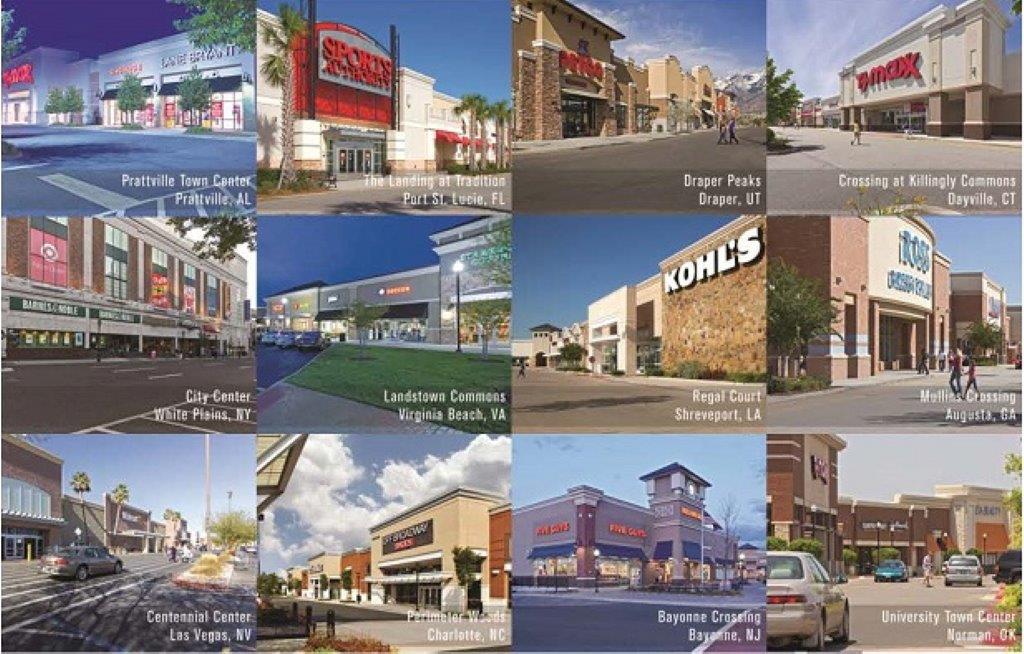
The Company closed on the $2.1 billion merger with Inland Diversified Real Estate Trust on July 1, 2014. The Company now owns 133 properties containing approximately 20.6 million square feet of owned GLA in 26 states. As of June 30, 2014, the pro forma combined portfolio was 95.5% leased. With the closing of the merger, the Company has properties in new attractive markets such as Westchester, NY; Bayonne, NJ; Las Vegas, NV; Virginia Beach, VA; and Salt Lake City, UT.
Capital Markets Activities
|
·
|
On July 1, 2014, the Company amended and restated its unsecured revolving credit facility, increasing the credit capacity to $500 million.
|
|
·
|
Total cash and available credit was approximately $400 million after the closing of the amended unsecured revolving credit facility.
|
On July 1, 2014, the Company amended its unsecured revolving credit facility (the “Revolver”) and its unsecured term loan (the “Term Loan”). Borrowing capacity on the Revolver was increased from $200 million to $500 million. The maturity date of the amended Revolver is July 1, 2019, including a twelve-month extension option and the LIBOR-based interest rate was reduced to LIBOR plus 140 to 200 basis points, depending on the Company’s leverage ratio, a decrease of between 25 to 50 basis points across the leverage grid. The Term Loan principal amount remains at $230 million. The maturity date of the amended Term Loan is January 1, 2020, including a six-month extension option and the LIBOR-based interest rate was reduced to LIBOR plus 135 to 190 basis points, depending on the Company’s leverage ratio, a decrease of between 10 to 55 basis points across the leverage grid.
Distributions and Shareholders’ Equity
On June 13, 2014, the Board of Trustees declared a quarterly common share distribution of $0.065 per common share for the quarter ended June 30, 2014 payable to shareholders of record as of June 24, 2014. This distribution was paid on July 1, 2014.
On May 9, 2014, the Board of Trustees declared a quarterly preferred share cash distribution of $0.515625 per preferred share covering the distribution period from March 2, 2014 to June 1, 2014 payable to shareholders of record as of May 21, 2014. This distribution was paid on May 30, 2014.
On July 18, the Board of Trustees approved a reverse share split at a ratio of 1-for-4. The reverse share split is expected to take effect at about 5:00 p.m. Eastern time on August 11, 2014. As a result of the reverse share split, the number of outstanding common shares of the Company will be reduced from approximately 332.7 million to approximately 83.2 million. The Company expects that a corresponding adjustment will be made to its quarterly share dividend.
2014 Earnings Guidance
The Company is increasing its as adjusted FFO guidance for the year ending December 31, 2014 to be within a range of $0.49 to $0.52 per diluted common share and net loss to be within a range of $(0.14) to $(0.11) per diluted common share. Guidance assumptions include the effects of the merger with Inland Diversified and exclude merger and acquisition costs. Following is a reconciliation of the earnings guidance range from net loss per diluted common share to FFO per diluted common share and adjusted FFO per diluted common share.
|
Guidance Range for Full Year 2014
|
Low
|
High
|
||||||
|
Net loss per diluted common share
|
$ | (0.14 | ) | $ | (0.11 | ) | ||
|
Less: Dividends on preferred shares
|
(0.06 | ) | (0.06 | ) | ||||
|
Less: Gain on sales of operating properties
|
(0.05 | ) | (0.05 | ) | ||||
|
Add: Depreciation and amortization
|
0.54 | 0.54 | ||||||
|
FFO per diluted common share
|
0.29 | 0.32 | ||||||
|
Add: Merger and acquisition costs
|
0.20 | 0.20 | ||||||
|
FFO per diluted common share, as adjusted
|
$ | 0.49 | $ | 0.52 | ||||
Reflecting the effects of the Company’s announced 1-for-4 share split, which is expected to become effective on August 11, 2014, the guidance range for FFO per diluted common share, as adjusted would be $1.96 to $2.08.
Non-GAAP Financial Measures
Given the nature of the Company’s business as a real estate owner and operator, the Company believes that FFO and FFO, as adjusted, are helpful to investors when measuring operating performance because they exclude various items included in net income or loss that do not relate to or are not indicative of operating performance, such as gains or losses from sales and impairments of operating properties, and depreciation and amortization, which can make periodic and peer analyses of operating performance more difficult. For informational purposes, we have also provided FFO adjusted for first and second quarter 2014 costs associated with our merger with Inland Diversified and the first quarter 2013 write-off of deferred loan costs. We believe this supplemental information provides a more meaningful measure of our operating performance. The Company believes presenting FFO and adjusted FFO in this manner allows investors and other interested parties to form a more meaningful assessment of the Company’s operating results. Reconciliations of net income to FFO and adjusted FFO are included in the attached table.
Earnings Conference Call
The Company will conduct a conference call to discuss its financial results on Friday, August 1st at 1:00 p.m. Eastern time. A live webcast of the conference call will be available online on the Company’s corporate website at www.kiterealty.com. The dial-in numbers are (877) 703-6107 for domestic callers and (857) 244-7306 for international callers (passcode 54259352). In addition, a webcast replay of the call will be available until September 30, 2014.
About Kite Realty Group Trust
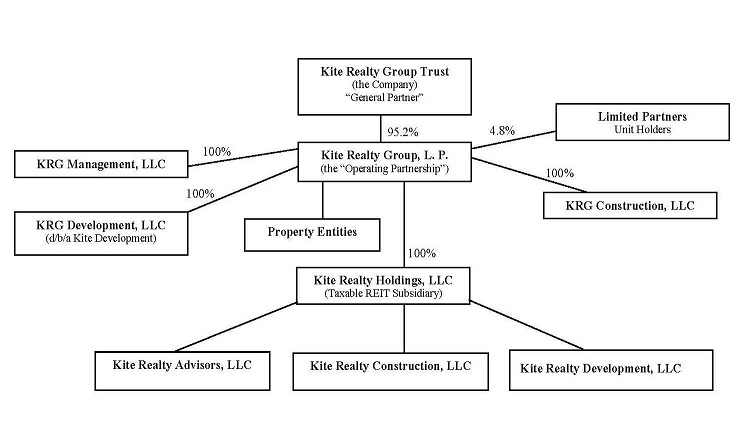
Kite Realty Group Trust is a full-service, vertically integrated real estate investment trust engaged in the ownership, operation, management, leasing, acquisition, construction, redevelopment and development of neighborhood and community shopping centers in selected markets in the United States. At July 1, 2014 and after giving effect to the merger with Inland Diversified Real Estate Trust, Inc., the Company owned interests in a portfolio of 133 operating, development and redevelopment properties totaling approximately 20.6 million owned square feet across 26 states. For more information, please visit the Company’s website at www.kiterealty.com.
Safe Harbor
This press release contains certain forward-looking statements within the meaning of Section 27A of the Securities Act of 1933 and Section 21E of the Securities Exchange Act of 1934. Such statements are based on assumptions and expectations that may not be realized and are inherently subject to risks, uncertainties and other factors, many of which cannot be predicted with accuracy and some of which might not even be anticipated. Future events and actual results, performance, transactions or achievements, financial or otherwise, may differ materially from the results, performance, transactions or achievements, financial or otherwise, expressed or implied by the forward-looking statements. Risks, uncertainties and other factors that might cause such differences, some of which could be material, include, but are not limited to: national and local economic, business, real estate and other market conditions, particularly in light of low growth in the U.S. economy, financing risks, including the availability of and costs associated with sources of liquidity, the Company’s ability to refinance, or extend the maturity dates of, its indebtedness, the level and volatility of interest rates, the financial stability of tenants, including their ability to pay rent and the risk of tenant bankruptcies, the competitive environment in which the Company operates, acquisition, disposition, development and joint venture risks (including the Company’s ability to successfully integrate the operations of the properties acquired in connection with the merger with Inland Diversified Real Estate Trust, Inc.), property ownership and management risks, the Company’s ability to maintain its status as a real estate investment trust for federal income tax purposes, potential environmental and other liabilities, impairment in the value of real estate property the Company owns, risks related to the geographical concentration of our properties in Indiana, Florida and Texas, the dilutive effects of future offerings of issuing additional securities, and other factors affecting the real estate industry generally. The Company refers you to the documents filed by the Company from time to time with the Securities and Exchange Commission, specifically the section titled “Risk Factors” in the Company’s Annual Report on Form 10-K for the year ended December 31, 2013, which discuss these and other factors that could adversely affect the Company’s results. The Company undertakes no obligation to publicly update or revise these forward-looking statements, whether as a result of new information, future events or otherwise.
Kite Realty Group Trust
Consolidated Balance Sheets
(Unaudited)
|
June 30,
2014
|
December 31,
2013
|
|||||||
|
Assets:
|
||||||||
|
Investment properties, at cost:
|
||||||||
|
Land
|
$ | 343,372,841 | $ | 333,458,070 | ||||
|
Land held for development
|
55,943,799 | 56,078,488 | ||||||
|
Buildings and improvements
|
1,384,322,981 | 1,351,641,925 | ||||||
|
Furniture, equipment and other
|
5,889,005 | 4,970,310 | ||||||
|
Construction in progress
|
88,111,081 | 130,909,478 | ||||||
| 1,877,639,707 | 1,877,058,271 | |||||||
|
Less: accumulated depreciation
|
(251,414,868 | ) | (232,580,267 | ) | ||||
| 1,626,224,839 | 1,644,478,004 | |||||||
|
Cash and cash equivalents
|
22,628,414 | 18,134,320 | ||||||
|
Tenant receivables, including accrued straight-line rent of $15,673,299 and $14,490,070, respectively, net of allowance for uncollectible accounts
|
27,608,726 | 24,767,556 | ||||||
|
Other receivables
|
3,807,369 | 4,566,679 | ||||||
|
Escrow deposits
|
9,925,188 | 11,046,133 | ||||||
|
Deferred costs, net
|
53,579,731 | 56,387,586 | ||||||
|
Prepaid and other assets
|
3,704,711 | 4,546,752 | ||||||
|
Total Assets
|
$ | 1,747,478,978 | $ | 1,763,927,030 | ||||
|
Liabilities and Equity:
|
||||||||
|
Mortgage and other indebtedness
|
$ | 874,516,933 | $ | 857,144,074 | ||||
|
Accounts payable and accrued expenses
|
54,995,861 | 61,437,187 | ||||||
|
Deferred revenue and other liabilities
|
40,462,089 | 44,313,402 | ||||||
|
Total Liabilities
|
969,974,883 | 962,894,663 | ||||||
|
Commitments and contingencies
|
||||||||
|
Redeemable noncontrolling interests in the Operating Partnership
|
40,781,994 | 43,927,540 | ||||||
|
Equity:
|
||||||||
|
Kite Realty Group Trust Shareholders’ Equity:
|
||||||||
|
Preferred Shares, $.01 par value, 40,000,000 shares authorized, 4,100,000 shares issued and outstanding.
|
102,500,000 | 102,500,000 | ||||||
|
Common Shares, $.01 par value, 450,000,000 shares authorized, 131,547,538 shares and 130,826,217 shares issued and outstanding, respectively
|
1,315,475 | 1,308,262 | ||||||
|
Additional paid in capital
|
824,073,343 | 821,526,172 | ||||||
|
Accumulated other comprehensive (loss) income
|
(1,424,608 | ) | 1,352,850 | |||||
|
Accumulated deficit
|
(193,105,408 | ) | (173,130,113 | ) | ||||
|
Total Kite Realty Group Trust Shareholders’ Equity
|
733,358,802 | 753,557,171 | ||||||
|
Noncontrolling Interests
|
3,363,299 | 3,547,656 | ||||||
|
Total Equity
|
736,722,101 | 757,104,827 | ||||||
|
Total Liabilities and Equity
|
$ | 1,747,478,978 | $ | 1,763,927,030 | ||||
Kite Realty Group Trust
Consolidated Statements of Operations
For the Three and Six Months Ended June 30, 2014 and 2013
(Unaudited)
|
Three Months Ended
June 30,
|
Six Months Ended
June 30,
|
|||||||||||||||
|
2014
|
2013
|
2014
|
2013
|
|||||||||||||
|
Revenue:
|
||||||||||||||||
|
Minimum rent
|
$ | 31,221,687 | $ | 22,652,292 | $ | 62,481,723 | $ | 43,132,499 | ||||||||
|
Tenant reimbursements
|
8,315,228 | 5,537,062 | 17,478,089 | 11,092,810 | ||||||||||||
|
Other property related revenue
|
1,306,140 | 1,726,628 | 3,543,155 | 6,731,666 | ||||||||||||
|
Total revenue
|
40,843,055 | 29,915,982 | 83,502,967 | 60,956,975 | ||||||||||||
|
Expenses:
|
||||||||||||||||
|
Property operating
|
6,890,778 | 5,032,725 | 14,206,034 | 10,133,563 | ||||||||||||
|
Real estate taxes
|
4,303,135 | 3,449,818 | 9,416,158 | 6,960,778 | ||||||||||||
|
General, administrative and other
|
2,313,358 | 1,814,287 | 5,419,460 | 3,954,236 | ||||||||||||
|
Merger and acquisition costs
|
3,280,098 | 236,613 | 7,760,487 | 413,512 | ||||||||||||
|
Impairment charge
|
— | 5,371,428 | — | 5,371,428 | ||||||||||||
|
Depreciation and amortization
|
19,737,108 | 13,807,431 | 37,176,713 | 25,192,395 | ||||||||||||
|
Total expenses
|
36,524,477 | 29,712,302 | 73,978,852 | 52,025,912 | ||||||||||||
|
Operating income
|
4,318,578 | 203,680 | 9,524,115 | 8,931,063 | ||||||||||||
|
Interest expense
|
(7,521,991 | ) | (6,942,818 | ) | (14,904,836 | ) | (13,270,926 | ) | ||||||||
|
Income tax expense of taxable REIT subsidiary
|
(75,614 | ) | (104,833 | ) | (22,468 | ) | (75,881 | ) | ||||||||
|
Other income (expense)
|
83,323 | (39,045 | ) | (9,621 | ) | 7,863 | ||||||||||
|
Loss from continuing operations
|
(3,195,704 | ) | (6,883,016 | ) | (5,412,810 | ) | (4,407,881 | ) | ||||||||
|
Discontinued operations1:
|
||||||||||||||||
|
Income from operations
|
— | (370,796 | ) | — | (789,163 | ) | ||||||||||
|
Gain on sale of operating property, net
|
— | — | 3,198,772 | — | ||||||||||||
|
(Loss) income from discontinued operations
|
— | (370,796 | ) | 3,198,772 | (789,163 | ) | ||||||||||
|
Loss before gain on sale of operating properties
|
(3,195,704 | ) | (7,253,812 | ) | (2,214,038 | ) | (5,197,044 | ) | ||||||||
|
Gain on sale of operating properties1
|
— | — | 3,489,338 | — | ||||||||||||
|
Consolidated net (loss) income
|
(3,195,704 | ) | (7,253,812 | ) | 1,275,300 | (5,197,044 | ) | |||||||||
|
Net loss attributable to noncontrolling interests
|
219,502 | 661,009 | 80,590 | 636,154 | ||||||||||||
|
Net (loss) income attributable to Kite Realty Group Trust
|
(2,976,202 | ) | (6,592,803 | ) | 1,355,890 | (4,560,890 | ) | |||||||||
|
Dividends on preferred shares
|
(2,114,063 | ) | (2,114,063 | ) | (4,228,125 | ) | (4,228,125 | ) | ||||||||
|
Net loss attributable to common shareholders
|
$ | (5,090,265 | ) | $ | (8,706,866 | ) | $ | (2,872,235 | ) | $ | (8,789,015 | ) | ||||
|
Net (loss) income per common share attributable to Kite Realty Group Trust common shareholders – basic and diluted
|
||||||||||||||||
|
Loss from continuing operations attributable to common shareholders
|
$ | (0.04 | ) | $ | (0.09 | ) | $ | (0.04 | ) | $ | (0.10 | ) | ||||
|
Income from discontinued operations attributable to common shareholders
|
0.00 | (0.01 | ) | 0.02 | (0.00 | ) | ||||||||||
|
Net loss attributable to common shareholders
|
$ | (0.04 | ) | $ | (0.10 | ) | $ | (0.02 | ) | $ | (0.10 | ) | ||||
|
Weighted average common shares outstanding – basic and diluted
|
131,537,866 | 91,066,817 | 131,282,150 | 84,486,979 | ||||||||||||
|
Dividends declared per common share
|
$ | 0.065 | $ | 0.06 | $ | 0.125 | $ | 0.12 | ||||||||
|
Loss attributable to Kite Realty Group Trust common shareholders:
|
||||||||||||||||
|
Loss from continuing operations
|
$ | (5,090,265 | ) | $ | (8,361,511 | ) | $ | (5,917,227 | ) | $ | (8,057,908 | ) | ||||
|
(Loss) income from discontinued operations
|
— | (345,355 | ) | 3,044,992 | (731,107 | ) | ||||||||||
|
Net loss attributable to Kite Realty Group Trust common shareholders
|
$ | (5,090,265 | ) | $ | (8,706,886 | ) | $ | (2,872,235 | ) | $ | (8,789,015 | ) | ||||
|
____________________
|
|
|
1
|
The Financial Accounting Standards Board (“FASB”) has issued ASU 2014-08 regarding the criteria for reporting discontinued operations. The Company has elected to early adopt this standard. Therefore, beginning in the first quarter of 2014, activity related to individual properties sold or held for sale will no longer be included as discontinued operations on the consolidated statements of operations unless such activity represents a strategic shift that has or will have a major effect on the Company’s operations and financial results or unless the asset was held for sale at the end of a prior reporting period..
|
Kite Realty Group Trust
Funds From Operations
For the Three and Six Months Ended June 30, 2014 and 2013
(Unaudited)
|
Three Months Ended
June 30,
|
Six Months Ended
June 30,
|
|||||||||||||||
|
2014
|
2013
|
2014
|
2013
|
|||||||||||||
|
Funds From Operations
|
||||||||||||||||
|
Consolidated net (loss) income
|
$ | (3,195,704 | ) | $ | (7,253,812 | ) | $ | 1,275,300 | $ | (5,197,044 | ) | |||||
|
Less dividends on preferred shares
|
(2,114,063 | ) | (2,114,063 | ) | (4,228,125 | ) | (4,228,125 | ) | ||||||||
|
Less net income attributable to noncontrolling interests in properties
|
(49,842 | ) | (29,795 | ) | (76,475 | ) | (61,772 | ) | ||||||||
|
Less gain on sale of operating properties
|
— | — | (6,784,887 | ) | — | |||||||||||
|
Add impairment charge
|
— | 5,371,428 | — | 5,371,428 | ||||||||||||
|
Add depreciation and amortization, net of noncontrolling interests
|
19,511,682 | 14,078,520 | 36,950,890 | 25,639,803 | ||||||||||||
|
Funds From Operations of the Kite Portfolio1
|
14,152,073 | 10,052,278 | 27,136,703 | 21,524,290 | ||||||||||||
|
Less redeemable noncontrolling interests in Funds From Operations
|
(679,739 | ) | (673,452 | ) | (1,304,591 | ) | (1,583,477 | ) | ||||||||
|
Funds From Operations allocable to the Company1
|
$ | 13,472,334 | $ | 9,378,826 | $ | 25,832,112 | $ | 19,940,813 | ||||||||
|
Basic and Diluted FFO per share of the Kite Portfolio
|
$ | 0.10 | $ | 0.10 | $ | 0.20 | $ | 0.24 | ||||||||
|
Funds From Operations of the Kite Portfolio
|
$ | 14,152,073 | $ | 10,052,278 | $ | 27,136,703 | $ | 21,524,290 | ||||||||
|
Add back: merger and acquisition costs
|
3,280,098 | — | 7,760,487 | — | ||||||||||||
|
Add back: accelerated amortization of deferred financing fees
|
— | — | — | 171,572 | ||||||||||||
|
Funds From Operations of the Kite Portfolio, as adjusted
|
$ | 17,432,171 | $ | 10,052,278 | $ | 34,897,190 | $ | 21,695,862 | ||||||||
|
Basic and Diluted FFO per share of the Kite Portfolio, as adjusted
|
$ | 0.13 | $ | 0.10 | $ | 0.25 | $ | 0.24 | ||||||||
|
Basic weighted average Common Shares outstanding
|
131,537,866 | 91,066,817 | 131,282,150 | 84,486,979 | ||||||||||||
|
Diluted weighted average Common Shares outstanding
|
131,745,088 | 91,391,141 | 131,483,282 | 84,801,949 | ||||||||||||
|
Basic weighted average Common Shares and Units outstanding
|
138,175,595 | 97,799,238 | 137,922,409 | 91,221,006 | ||||||||||||
|
Diluted weighted average Common Shares and Units outstanding
|
138,382,817 | 98,123,563 | 138,123,542 | 91,535,976 | ||||||||||||
Kite Realty Group Trust
Same Property Net Operating Income
For the Three and Six Months Ended June 30, 2014 and 2013
(Unaudited)
|
Three Months Ended
June 30,
|
Six Months Ended
June 30,
|
||||||||||||||||
|
2014
|
2013
|
% Change
|
2014
|
2013
|
% Change
|
||||||||||||
|
Number of properties at period end1
|
50
|
50
|
50
|
50
|
|||||||||||||
|
Leased percentage at period end
|
96.3%
|
95.9%
|
96.3%
|
95.9%
|
|||||||||||||
|
Minimum rent
|
$
|
18,369,497
|
$
|
17,535,330
|
$
|
37,142,381
|
$
|
35,517,475
|
|||||||||
|
Tenant recoveries
|
5,355,566
|
5,027,093
|
11,535,599
|
10,657,285
|
|||||||||||||
|
Other income
|
481,290
|
438,707
|
1,257,988
|
1,122,386
|
|||||||||||||
|
24,206,353
|
23,001,130
|
49,935,968
|
47,297,146
|
||||||||||||||
|
Property operating expenses
|
4,963,143
|
4,583,604
|
10,813,951
|
9,908,342
|
|||||||||||||
|
Real estate taxes
|
3,332,223
|
3,180,526
|
6,894,578
|
6,567,139
|
|||||||||||||
|
8,295,366
|
7,764,130
|
17,708,529
|
16,475,481
|
||||||||||||||
|
Net operating income – same properties (50 properties)2
|
$
|
15,910,987
|
$
|
15,237,000
|
4.4%
|
|
$
|
32,227,439
|
$
|
30,821,665
|
4.6%
|
|
|||||
|
Reconciliation to Most Directly Comparable GAAP Measure:
|
|||||||||||||||||
|
Net operating income - same properties
|
$
|
15,910,987
|
$
|
15,237,000
|
$
|
32,227,439
|
$
|
30,821,665
|
|||||||||
|
Net operating income - non-same activity
|
13,738,155
|
6,196,439
|
27,653,336
|
13,040,969
|
|||||||||||||
|
Other income (expense), net
|
7,709
|
(143,878
|
)
|
(32,089
|
)
|
(68,018
|
)
|
||||||||||
|
General and administrative expense
|
(2,313,358
|
)
|
(1,814,287
|
)
|
(5,419,460
|
)
|
(3,954,236
|
)
|
|||||||||
|
Merger and acquisition costs
|
(3,280,098
|
)
|
(236,613
|
)
|
(7,760,487
|
)
|
(413,512
|
)
|
|||||||||
|
Impairment charge
|
-
|
(5,371,428
|
)
|
-
|
(5,371,428
|
)
|
|||||||||||
|
Depreciation expense
|
(19,737,108
|
)
|
(13,807,431
|
)
|
(37,176,713
|
)
|
(25,192,395
|
)
|
|||||||||
|
Interest expense
|
(7,521,991
|
)
|
(6,942,818
|
)
|
(14,904,836
|
)
|
(13,270,926
|
)
|
|||||||||
|
Discontinued operations
|
-
|
(370,796
|
)
|
-
|
(789,163
|
)
|
|||||||||||
|
Gain on sales of operating properties
|
-
|
-
|
6,688,110
|
-
|
|||||||||||||
|
Net loss attributable to noncontrolling interests
|
219,502
|
661,009
|
80,590
|
636,154
|
|||||||||||||
|
Dividends on preferred shares
|
(2,114,063
|
)
|
(2,114,063
|
)
|
(4,228,125
|
)
|
(4,228,125
|
)
|
|||||||||
|
Net loss attributable to common shareholders
|
$
|
(5,090,265
|
)
|
$
|
(8,706,866
|
)
|
$
|
(2,872,235
|
)
|
$
|
(8,789,015
|
)
|
|||||
|
____________________
|
|
|
1
|
Same Property analysis excludes operating properties in redevelopment
|
|
2
|
Same Property net operating income excludes net gains from outlot sales, straight-line rent revenue bad debt expense and recoveries, lease termination fees, amortization of lease intangibles and significant prior year expense recoveries and adjustments, if any.
|
The Company believes that Net Operating Income is helpful to investors as a measure of its operating performance because it excludes various items included in net income that do not relate to or are not indicative of its operating performance, such as depreciation and amortization, interest expense, and impairment, if any. The Company believes that Same Property NOI is helpful to investors as a measure of its operating performance because it includes only the NOI of properties that have been owned for the full period presented, which eliminates disparities in net income due to the redevelopment, acquisition or disposition of properties during the particular period presented, and thus provides a more consistent metric for the comparison of the Company's properties. NOI and Same Property NOI should not, however, be considered as alternatives to net income (calculated in accordance with GAAP) as indicators of the Company's financial performance.