Item 1. Reports to Stockholders
Eaton Vance
Tax-Advantaged Global Dividend Opportunities Fund (ETO)
Semi-Annual Report
April 30, 2024

Commodity Futures Trading Commission Registration
.
The Commodity Futures Trading Commission (“CFTC”) has adopted regulations that subject registered investment companies and advisers to regulation by the CFTC if a fund invests more than a prescribed level of its assets in certain CFTC-regulated instruments (including futures, certain options and swap agreements) or markets itself as providing investment exposure to such instruments. The investment adviser has claimed an exclusion from the definition of “commodity pool operator” under the Commodity Exchange Act with respect to its management of the Fund. Accordingly, neither the Fund nor the adviser with respect to the operation of the Fund is subject to CFTC regulation. Because of its management of other strategies, the Fund’s adviser is registered with the CFTC as a commodity pool operator. The adviser is also registered as a commodity trading advisor.
Managed Distribution Plan.
Pursuant to an exemptive order issued by the Securities and Exchange Commission (Order), the Fund is authorized to distribute long-term capital gains to shareholders more frequently than once per year. Pursuant to the Order, the Fund’s Board of Trustees approved a Managed Distribution Plan (MDP) pursuant to which the Fund makes monthly cash distributions to common shareholders, stated in terms of a fixed amount per common share.
The Fund currently distributes monthly cash distributions equal to $0.1733 ($0.1374 prior to April 2024) per share in accordance with the MDP. You should not draw any conclusions about the Fund’s investment performance from the amount of these distributions or from the terms of the MDP. The MDP will be subject to regular periodic review by the Fund’s Board of Trustees and the Board may amend or terminate the MDP at any time without prior notice to Fund shareholders. However, at this time there are no reasonably foreseeable circumstances that might cause the termination of the MDP.
The Fund may distribute more than its net investment income and net realized capital gains and, therefore, a distribution may include a return of capital. A return of capital distribution does not necessarily reflect the Fund’s investment performance and should not be confused with “yield” or “income.” With each distribution, the Fund will issue a notice to shareholders and a press release containing information about the amount and sources of the distribution and other related information. The amounts and sources of distributions contained in the notice and press release are only estimates and are not provided for tax purposes. The amounts and sources of the Fund’s distributions for tax purposes will be reported to shareholders on Form 1099-DIV for each calendar year.
Fund shares are not insured by the FDIC and are not deposits or other obligations of, or guaranteed by, any depository institution. Shares are subject to investment risks, including possible loss of principal invested.
Eaton Vance
Tax-Advantaged Global Dividend Opportunities Fund
April 30, 2024
Performance
Portfolio Manager(s)
Derek J.V. DiGregorio and Joseph Mehlman, CFA of Eaton Vance Management; Christopher M. Dyer, CFA of Eaton Vance Advisers International Ltd.
% Average Annual Total Returns 1,2 |
Inception Date |
Six Months |
One Year |
Five Years |
Ten Years |
| Fund at NAV | 04/30/2004 | 21.39% | 17.92% | 10.67% | 9.35% |
| Fund at Market Price | — | 24.28 | 16.55 | 7.80 | 9.21 |
| MSCI World Index | — | 20.29% | 18.39% | 10.44% | 8.86% |
| ICE BofA Fixed Rate Preferred Securities Index | — | 12.17 | 6.76 | 2.32 | 4.20 |
| Blended Index | — | 18.65 | 16.03 | 8.90 | 8.02 |
% Premium/Discount to NAV 3 |
|
| As of period end | ( |
Distributions 4 |
|
| Total Distributions per share for the period | $0.860 |
| Distribution Rate at NAV | 7.82% |
| Distribution Rate at Market Price | 8.60 |
% Total Leverage 5 |
|
| Borrowings | 19.12% |
See Endnotes and Additional Disclosures in this report.
Past performance is no guarantee of future results. Returns are historical and are calculated net of management fees and other expenses by determining the percentage change in net asset value (NAV) or market price (as applicable) with all distributions reinvested in accordance with the Fund’s Dividend Reinvestment Plan. Furthermore, returns do not reflect the deduction of taxes that shareholders may have to pay on Fund distributions or upon the sale of Fund shares. Performance at market price will differ from performance at NAV due to variations in the Fund’s market price versus NAV, which may reflect factors such as fluctuations in supply and demand for Fund shares, changes in Fund distributions, shifting market expectations for the Fund’s future returns and distribution rates, and other considerations affecting the trading prices of closed-end funds. Investment return and principal value will fluctuate so that shares, when sold, may be worth more or less than their original cost. Performance for periods less than or equal to one year is cumulative. Performance is for the stated time period only; due to market volatility, current Fund performance may be lower or higher than the quoted return. For performance as of the most recent month-end, please refer to eatonvance.com.
2
Eaton Vance
Tax-Advantaged Global Dividend Opportunities Fund
April 30, 2024
Fund Profile
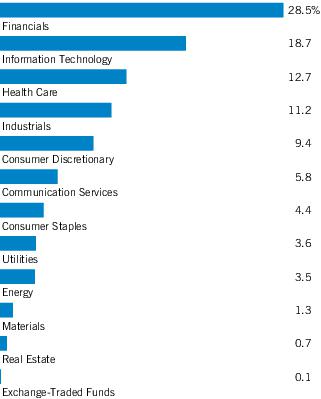
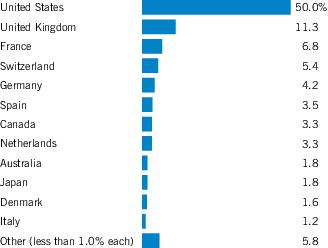
Footnotes:
1 |
Excludes cash and cash equivalents. |
3
Eaton Vance
Tax-Advantaged Global Dividend Opportunities Fund
April 30, 2024
Endnotes and Additional Disclosures
4