Exhibit 99.1

| Media Contact: | Investor Relations Contact: | |
| Tim Deighton | List Underwood | |
| (205) 264-4551 | (205) 801-0265 |
Regions Reports Earnings for First Quarter 2012
Successful execution of business plans, capital actions and broad based improvement in asset quality bolster financial strength and position the company for profitable growth
BIRMINGHAM, Ala. – (BUSINESS WIRE) – April 24, 2012 – Regions Financial Corporation (NYSE:RF) today reported earnings for the quarter ending March 31, 2012.
Key points:
| — | Reported net income available to common shareholders of $0.11 per diluted share and $0.14 per diluted share from continuing operations reflecting solid business performance and broad-based improvement in asset quality metrics; a net loss from discontinued operations of $0.03 per diluted share is attributable to an increase in professional and legal fees |
| — | Successful completion of an approximate $900 million common equity offering |
| — | Completed the sale of Morgan Keegan & Company, Inc. and related affiliates on April 2, 2012 resulting in total proceeds of approximately $1.2 billion |
| — | Repurchased $3.5 billion of Series A Preferred Stock issued to the U.S. Treasury on April 4, 2012 |
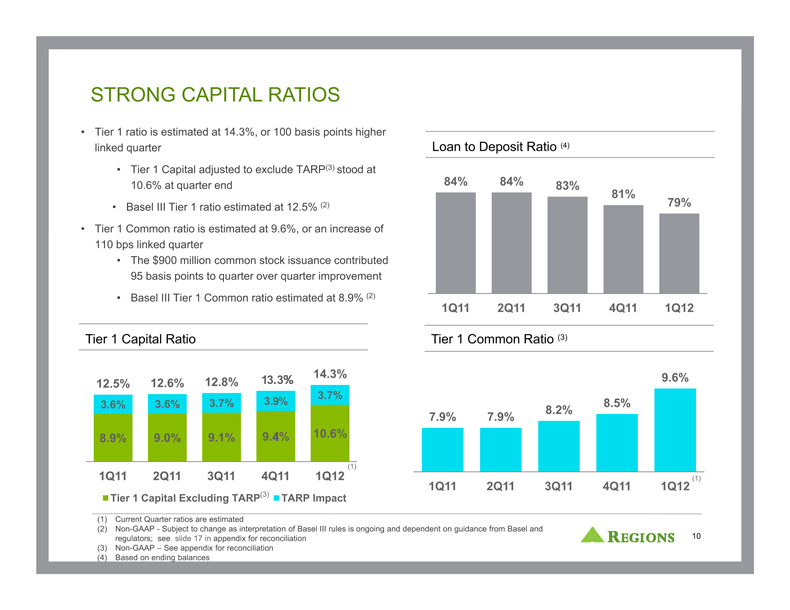
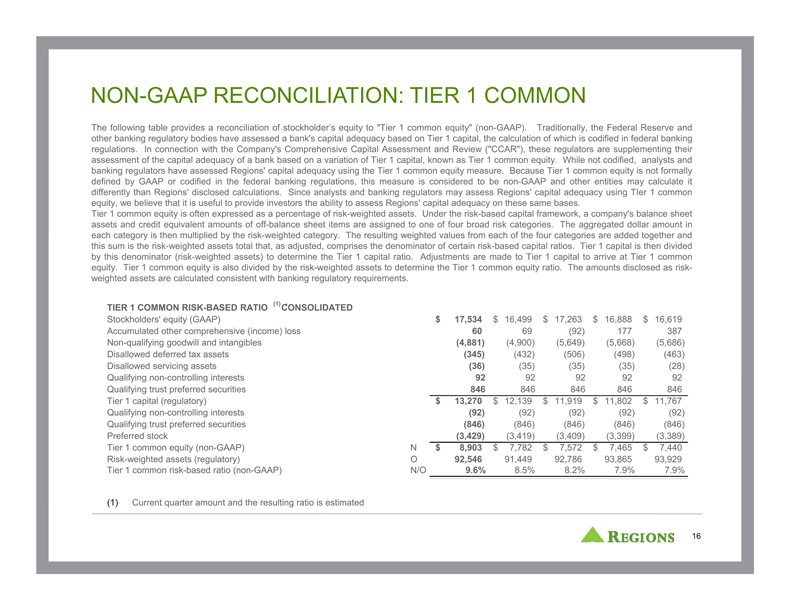
| — | Strong capital position with an estimated Tier 1 ratio of 14.3 percent and Tier 1 Common ratio1 of 9.6 percent at March 31, 2012; adjusted for the redemption of Series A Preferred Stock the Tier 1 ratio is 10.6 percent1 |
| — | Liquidity position remains solid with a loan-to-deposit ratio of 79 percent |
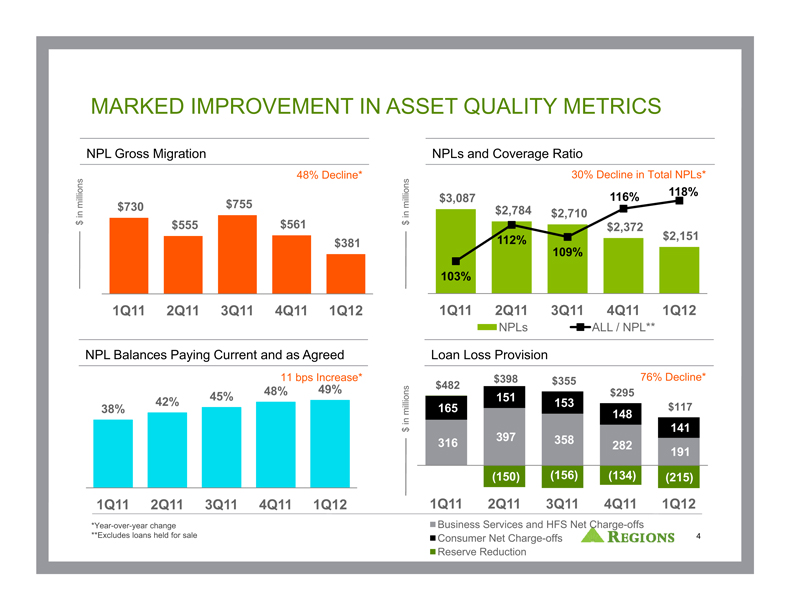
| — | Non-performing loans, excluding loans held for sale, declined $221 million or 9 percent linked quarter; inflows of non-performing loans declined to $381million from $561 million or 32 percent from the fourth quarter |
| — | Net charge-offs declined $98 million or 23 percent linked quarter; loan loss provision of $117 million was $215 million less than net charge-offs in the quarter |
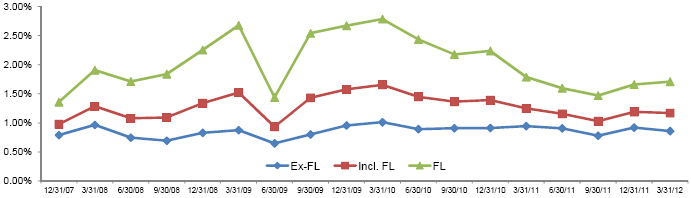
| — | Allowance for loan losses as a percentage of loans declined 24 basis points linked quarter to 3.30 percent, while the coverage ratio of non-performing loans increased 2 basis points to 1.18x |
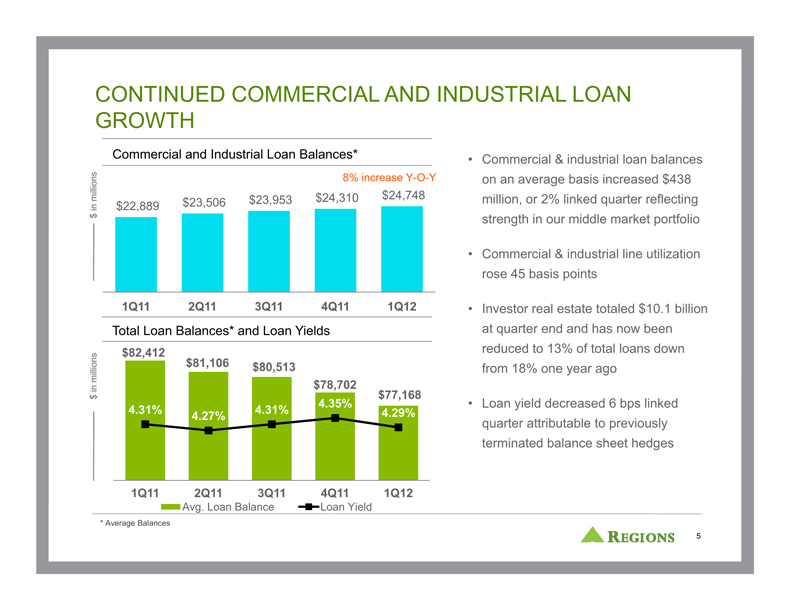
| — | Loan growth in the middle market commercial and industrial loan portfolio continued, with ending loans up 2.3 percent linked quarter, while consumer loans declined 1.8 percent |
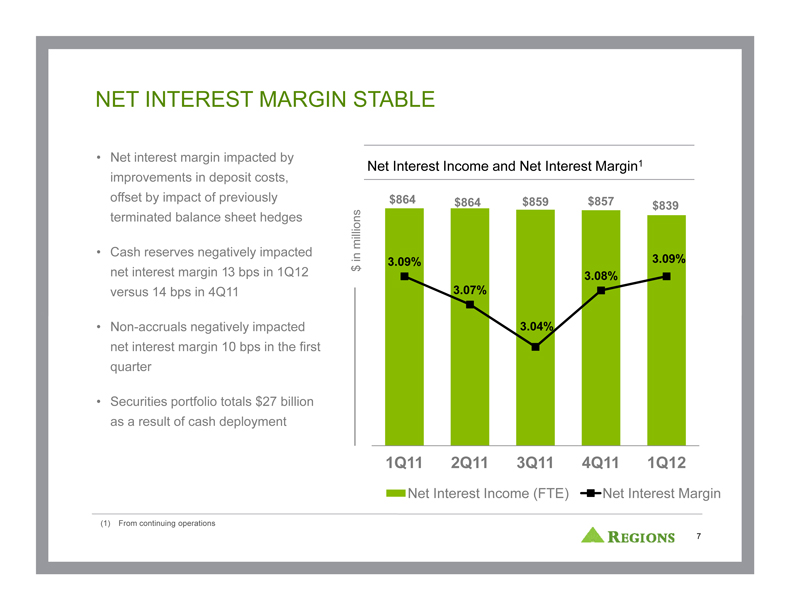
| — | Net interest income was down $22 million linked quarter and totaled $827 million, while the net interest margin increased 1 basis point to 3.09 percent |
| — | Loan yields declined 6 basis points linked quarter to 4.29 percent primarily attributable to previously terminated balance sheet hedges |
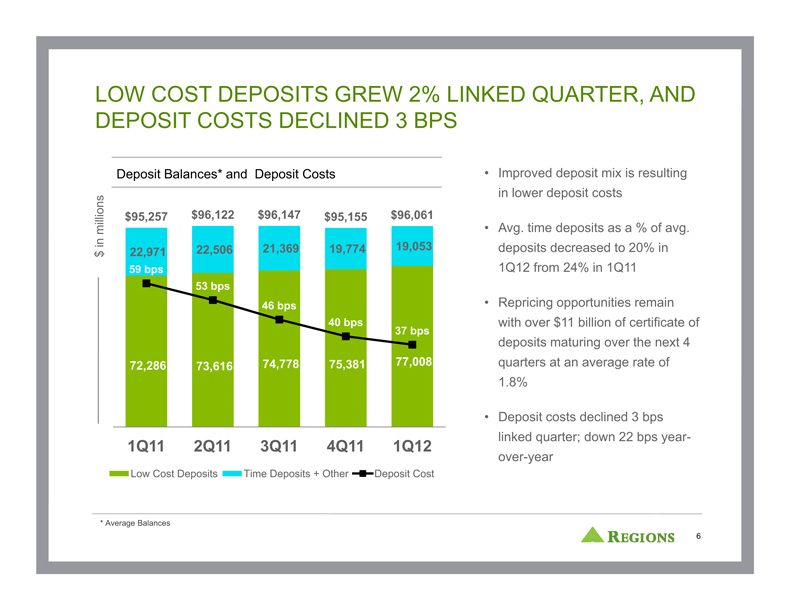
| — | Funding mix continued to improve while deposit costs declined to 37 basis points down 3 basis points from fourth quarter and down 22 basis points from the prior year |
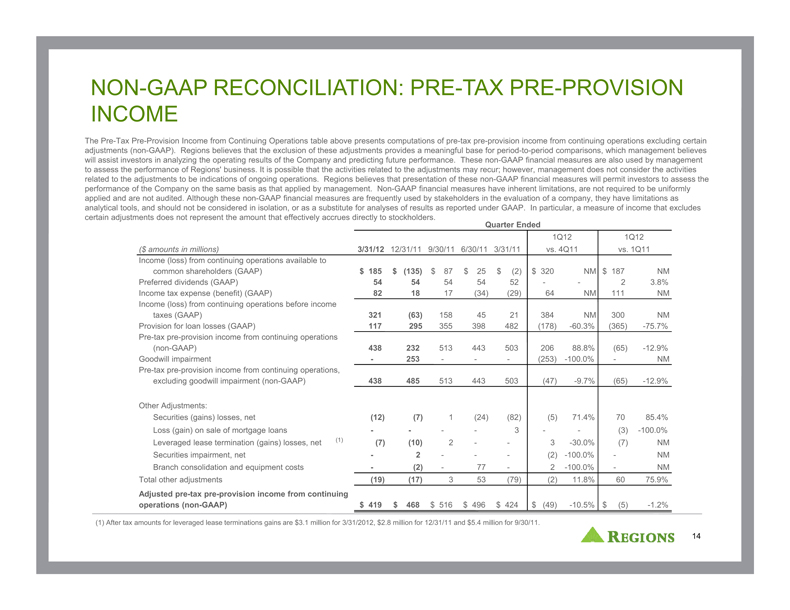
| — | Adjusted pre-tax pre-provision income2 (“PPI”) from continuing operations totaled $419 million, an 11 percent decline from the prior quarter reflecting an expected seasonal increase in expenses from payroll taxes and a subsidiary’s annual dividend payment |
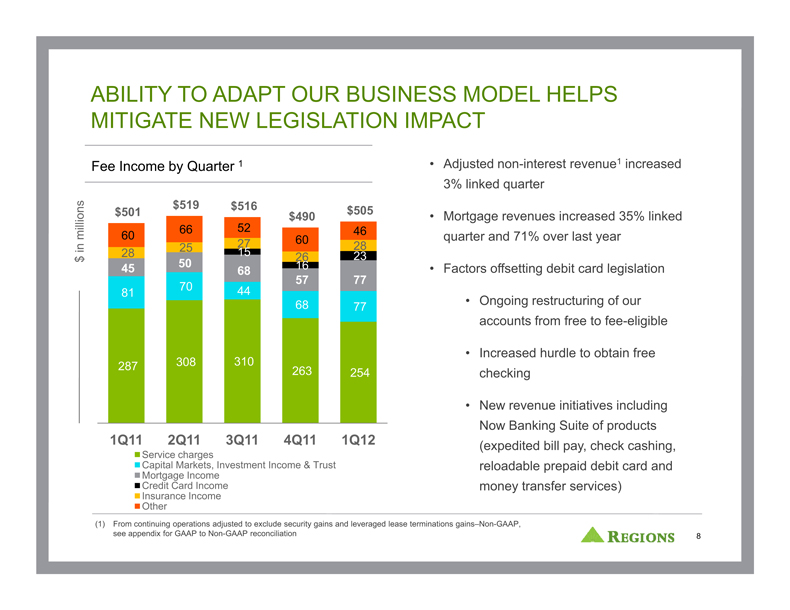
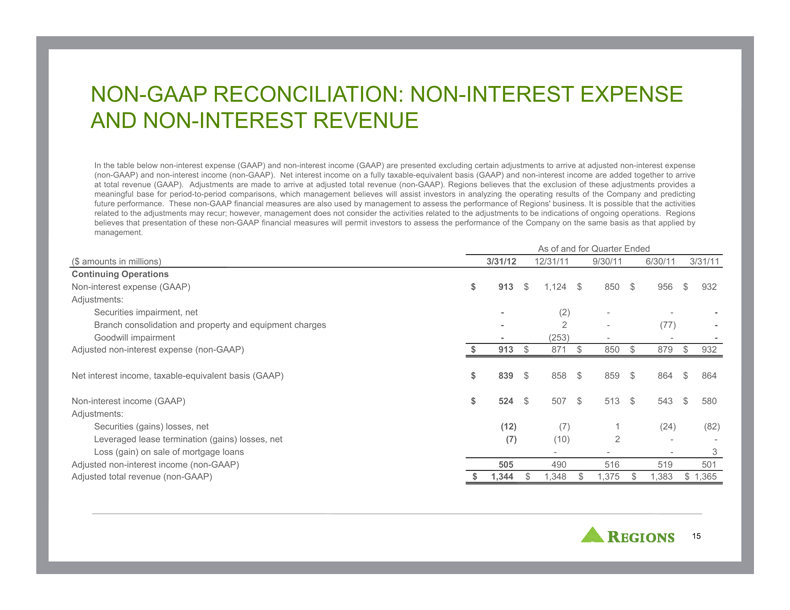
| — | Non-interest revenue from continuing operations was $524 million, a 3 percent improvement on a linked quarter basis as growth in mortgage income more than offset the slight reduction in service charges |
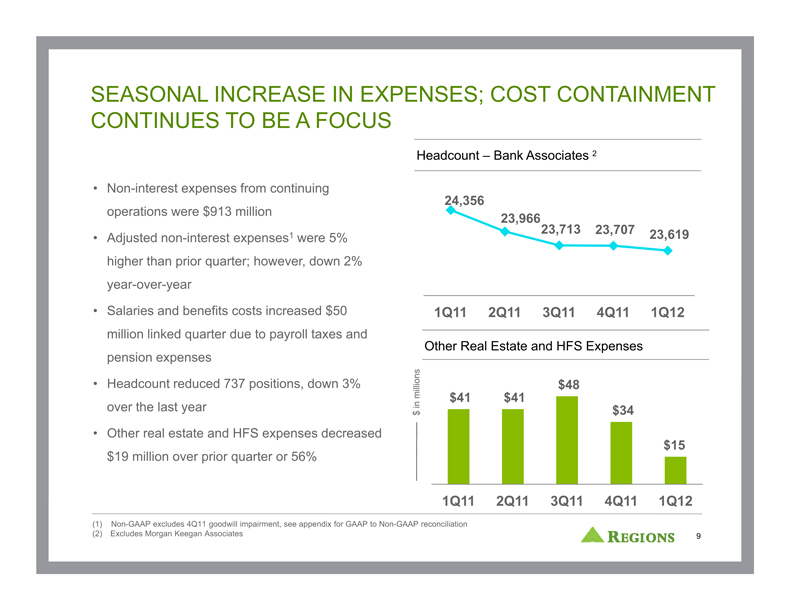
| — | Non-interest expenses from continuing operations totaled $913 million; excluding last quarter’s $253 million goodwill impairment charge, non-interest expenses1 increased 5 percent linked quarter reflecting higher salaries and benefits offset by lower other real estate expense |
1 Non-GAAP, refer to pages 17-19 of the financial supplement to this earnings release
2 Non-GAAP, refer to page 8 of the financial supplement to this earnings release
| Highlights | Three months ended: | |||||||||||
| (In millions, except per share data) | March 31, 2012 | December 31, 2011 | March 31, 2011 | |||||||||
| Amount | Amount | Amount | ||||||||||
| Net Income (Loss) |
||||||||||||
| Net interest income |
$827 | $849 | $855 | |||||||||
| Provision for loan losses |
117 | 295 | 482 | |||||||||
| Securities gains, net |
12 | 7 | 82 | |||||||||
| Non-interest income, excluding securities gains |
512 | 500 | 498 | |||||||||
| Goodwill impairment |
- | 253 | - | |||||||||
| Non-interest expense, excluding goodwill impairment |
913 | 871 | 932 | |||||||||
|
|
|
|
|
|
|
|||||||
| Pre-tax income (loss) |
321 | (63 | ) | 21 | ||||||||
| Income tax expense (benefit) |
82 | 18 | (29 | ) | ||||||||
|
|
|
|
|
|
|
|||||||
| Income (loss) from continuing operations (A) |
239 | (81 | ) | 50 | ||||||||
| Income (loss) from discontinued operations, net of tax |
(40 | ) | (467 | ) | 19 | |||||||
|
|
|
|
|
|
|
|||||||
| Net income (loss) |
199 | (548 | ) | 69 | ||||||||
| Preferred dividends and accretion (B) |
54 | 54 | 52 | |||||||||
|
|
|
|
|
|
|
|||||||
| Net income (loss) available to common shareholders |
$145 | ($602 | ) | $17 | ||||||||
|
|
|
|
|
|
|
|||||||
| Income (loss) from continuing operations available to common shareholders (A) – (B) |
$185 | ($135 | ) | ($2 | ) | |||||||
|
|
|
|
|
|
|
|||||||
| Three Months Ended |
||||||||||||
| March 31, 2012 | December 31, 2011 | March 31, 2011 | ||||||||||
| Amount/Dil. EPS | Amount/ Dil. EPS | Amount/Dil. EPS | ||||||||||
| Pre-tax Pre-Provision Income (non-GAAP) |
||||||||||||
| Income (loss) from continuing operations available to common shareholders (GAAP) (A) – (B) |
$185 | ($135 | ) | ($2 | ) | |||||||
| Plus: Preferred dividends and accretion (GAAP) |
54 | 54 | 52 | |||||||||
| Plus: Income tax expense (benefit) (GAAP) |
82 | 18 | (29 | ) | ||||||||
|
|
|
|
|
|
|
|||||||
| Pre-tax income (loss) from continuing operations (GAAP) |
321 | (63 | ) | 21 | ||||||||
| Plus: Provision for loan losses (GAAP) |
117 | 295 | 482 | |||||||||
|
|
|
|
|
|
|
|||||||
| Pre-tax pre-provision income from continuing operations (non-GAAP) |
438 | 232 | 503 | |||||||||
| Plus: Goodwill impairment from continuing operations |
- | 253 | - | |||||||||
|
|
|
|
|
|
|
|||||||
| Pre-tax pre-provision income from continuing operations, excluding goodwill impairment (non-GAAP) |
$438 | $485 | $503 | |||||||||
|
|
|
|
|
|
|
|||||||
| GAAP to non-GAAP EPS Reconciliation |
||||||||||||
| Earnings (loss) per share (GAAP) |
$0.11 | ($0.48 | ) | $0.01 | ||||||||
| Earnings (loss) per share from discontinued operations (GAAP) |
(0.03 | ) | (0.37 | ) | 0.01 | |||||||
|
|
|
|
|
|
|
|||||||
| Earnings (loss) per share from continuing operations (GAAP) |
0.14 | (0.11 | ) | (0.00 | ) | |||||||
| Goodwill impairment from continuing operations |
- | (0.20 | ) | - | ||||||||
|
|
|
|
|
|
|
|||||||
| Adjusted earnings per share from continuing operations, excluding goodwill impairment (non-GAAP) |
$0.14 | $0.09 | ($0.00 | ) | ||||||||
|
|
|
|
|
|
|
|||||||
| Three Months Ended |
||||||||||||
| March 31, 2012 | December 31, 2011 | March 31, 2011 | ||||||||||
| Key ratios* |
||||||||||||
| Net interest margin (FTE) |
3.09 | % | 3.08 | % | 3.09 | % | ||||||
| Tier 1 capital |
14.3 | % | 13.3 | % | 12.5 | % | ||||||
| Tier 1 common1 risk-based ratio (non-GAAP) |
9.6 | % | 8.5 | % | 7.9 | % | ||||||
| Tangible common stockholders’ equity to tangible assets1 (non-GAAP) |
7.35 | % | 6.57 | % | 5.98 | % | ||||||
| Tangible common book value per share1 (non-GAAP) |
$6.42 | $6.37 | $6.00 | |||||||||
| Asset quality |
||||||||||||
| Allowance for loan losses as % of net loans |
3.30 | % | 3.54 | % | 3.92 | % | ||||||
| Net charge-offs as % of average net loans~ |
1.73 | % | 2.16 | % | 2.37 | % | ||||||
| Non-accrual loans, excluding loans held for sale, as % of loans |
2.80 | % | 3.06 | % | 3.79 | % | ||||||
| Non-performing assets as % of loans, foreclosed properties and non-performing loans held for sale |
3.42 | % | 3.83 | % | 4.78 | % | ||||||
| Non-performing assets (including 90+ past due) as % of loans, foreclosed properties and non-performing loans held for sale |
3.97 | % | 4.40 | % | 5.42 | % | ||||||
*Tier 1 Common and Tier 1 Capital ratios for the
current quarter are estimated.
~ Annualized
Disciplined execution of business plans
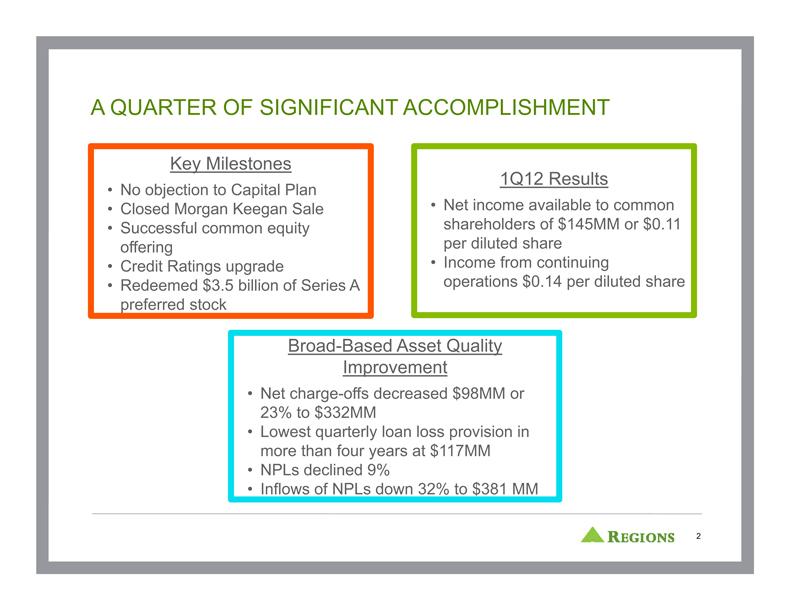
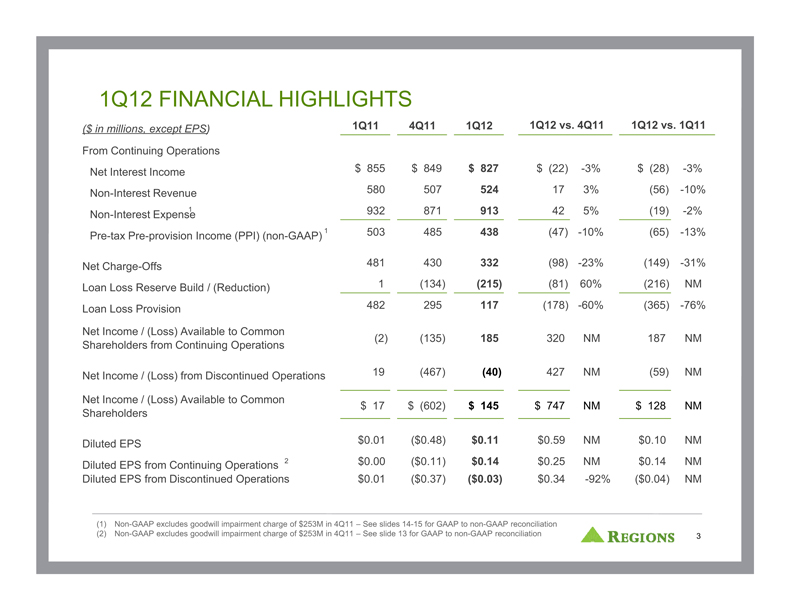
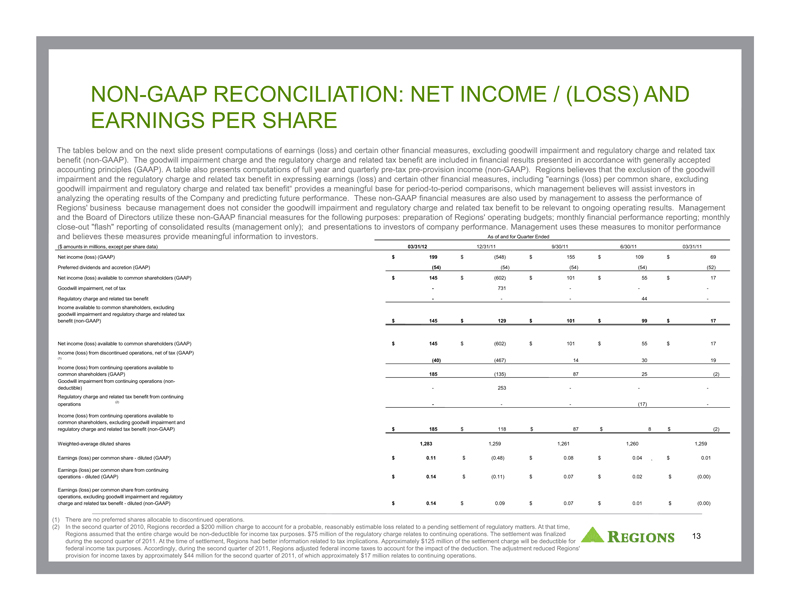
Regions reported first quarter net income available to common shareholders of $145 million or $0.11 per diluted share, driven by continued execution of the company’s business plans. First quarter income from continuing operations was $185 million or $0.14 per diluted share. From discontinued operations, Regions reported a net loss of $40 million or $0.03 per share attributable to an increase in professional and legal fees. Pre-tax pre-provision income totaled $438 million as compared to $485 million in the prior quarter. Excluding fourth quarter’s goodwill impairment of $253 million1, first quarter pre-tax pre-provision income declined $47 million due to lower net interest income and higher expected seasonal expenses partially offset by an increase in mortgage income.
“During the first quarter, we achieved several important milestones that position us well to continue growing profitable customer relationships, expanding our market share and helping our customers become more successful financially,” said Grayson Hall, president and chief executive officer. “We are poised to build on Regions’ strong foundation to benefit our shareholders, customers and associates.”
Key milestones position the company for profitable growth
On January 9, 2012, the company submitted a capital plan to the Federal Reserve as part of the comprehensive capital analysis and review. After review by the Federal Reserve, Regions received permission to execute on its plan which demonstrates the strength of the company’s capital plan and process. As the analysis shows, execution of the company’s capital plan – including the sale of Morgan Keegan and the capital raise – positions
Regions among the top large U.S. banks in terms of key capital ratios under the stress scenario. In executing the plan, the company has already taken several important steps to ensure its long term financial strength:
| — | March 13 – completed a highly successful approximate $900 million common equity raise, yielding $875 million in net proceeds |
| — | April 2 – completed the sale of Morgan Keegan to Raymond James Financial resulting in proceeds of approximately $1.2 billion |
| — | April 4 – repaid the U.S. Treasury Department’s $3.5 billion preferred stock investment |
Strong capital and solid liquidity
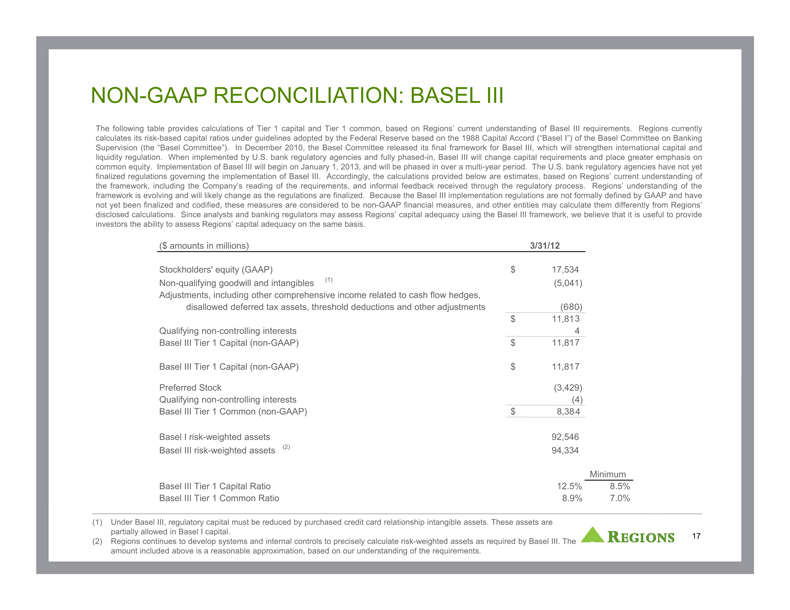
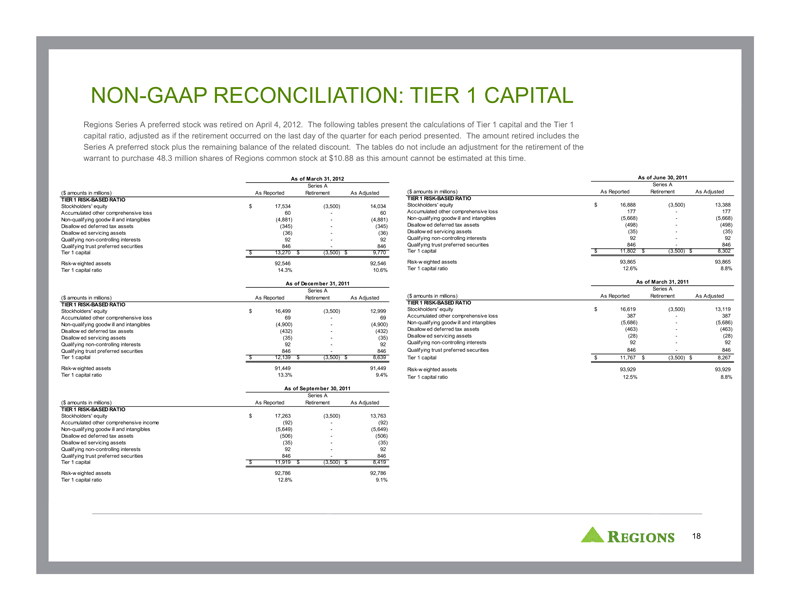
Tier 1 and Tier 1 common1 capital ratios remained strong, ending the first quarter at an estimated 14.3 percent and 9.6 percent, respectively. On a Basel III basis1, they were estimated to be 12.5 percent and 8.9 percent, which are above the 8.5 percent and 7 percent minimum requirements, respectively. Adjusted to exclude the government’s preferred stock investment, which was repaid shortly after the quarter’s end, the Tier 1 ratio stood at 10.6 percent1. The company’s liquidity position at both the bank and the holding company remains solid as well. As of March 31, 2012, the company’s loan-to-deposit ratio was 79 percent.
Asset quality improvement continues
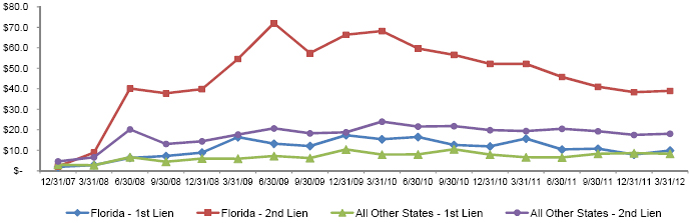
First quarter resulted in significant asset quality improvement. The provision for loan losses totaled $117 million or $215 million less than net charge-offs; the lowest quarterly loan loss provision in more than four years. Total net charge-offs declined $98 million or 23 percent linked quarter. The company’s loan loss allowance to non-performing loan coverage ratio increased from 1.03x to 1.18x year-over-year and the allowance for loan losses as a percent of loans was 3.30 percent as of March 31, 2012.
Non-performing loans, excluding loans held for sale, were down $221 million or 9 percent linked quarter. Inflows of non-performing loans declined to $381 million or 32 percent from the fourth quarter. In addition, 49 percent or nearly half of ending Business Services’ non-performing loans were current and paying as agreed as of March 31, 2012, up from 38 percent in the prior year. Business Services criticized loans also declined 6 percent in the quarter and are down 35 percent year-over-year.
Focused on growing profitable customer relationships
With a strong financial and customer service foundation in place, Regions is focused on profitable growth across all lines of business to advance its strategic priorities and improve its performance.
Total loan production for the quarter was $12.6 billion. Commercial loan production (including renewals) constituted the majority of that total at $10.3 billion, of which $4 billion was new loan production. Growth in lending to middle market commercial and industrial customers continued,
with average loans in this category up 8.1 percent compared to prior year. Total commercial and industrial commitments grew $872 million, or 3 percent linked quarter. This growth was driven primarily by broad based geographic growth and continued momentum in our specialized industries. Consumer loan production totaled $2.3 billion in first quarter 2012, which reflected strength in mortgage and indirect auto.
Overall, ending loans declined 1 percent linked quarter reflecting a further $616 million decline in the investor real estate portfolio. The company’s aggregate loan yield decreased 6 basis points linked quarter to 4.29 percent, primarily due to the impact of previously terminated balance sheet hedges. Ending earning assets increased 2 percent attributable to growth in the securities portfolio.
Improving funding mix
The company’s funding mix continued to improve during the quarter, as average low-cost deposits as a percentage of total deposits rose to 80 percent compared to 76 percent last year. This positive mix shift resulted in deposit costs declining to 37 basis points for the quarter, down 3 basis points from fourth quarter and a 3 basis points decline in total funding costs to 65 basis points.
Net interest income from continuing operations was $827 million, a $22 million decline linked quarter, driven by a $1.2 billion decline in average earning assets and higher mortgage prepayments. The net interest margin was up slightly linked quarter at 3.09 percent. The net interest margin benefited from lower deposit costs and a $530 million decrease in average cash reserves at the Federal Reserve as well as lower non-accrual levels. These benefits were partially offset by the impact of previously terminated balance sheet hedges.
The securities portfolio increased $2.7 billion during the quarter and now totals $27 billion as part of the strategic decision to deploy excess cash into earning assets.
Growing fee income and expanding services
Non-interest revenues from continuing operations totaled $524 million, up 3 percent linked quarter as a result of higher mortgage income. Excluding security gains and leveraged lease termination gains, adjusted non-interest revenue1 increased $15 million or 3 percent reflecting higher mortgage income partially offset by lower service charges. Mortgage revenue increased 35 percent linked quarter or $20 million, as customers took advantage of the extended Home Affordable Refinance Program, or HARP II.
Improving productivity and reducing non-interest expenses
Non-interest expenses from continuing operations declined $211 million linked quarter due to fourth quarter’s goodwill impairment charge. Excluding the $253 million goodwill impairment1, non-interest expenses increased 5 percent linked quarter, reflecting a $50 million increase in salaries and benefits related to payroll taxes and pension costs as well as a $13 million annual subsidiary dividend.
1Non-GAAP, refer to the following pages of the financial supplement to this earnings release:
| — | Pre-tax pre-provision income from continuing operations on page 8 |
| — | Non-interest revenue from continuing operations and non-interest expense from continuing operations before goodwill impairment on page 17 |
| — | Reconciliation to GAAP Financial Measures on pages 16-20 |
About Regions Financial Corporation
Regions Financial Corporation, with $128 billion in assets, is a member of the S&P 500 Index and is one of the nation’s largest full-service providers of consumer and commercial banking, wealth management, mortgage, and insurance products and services. Regions serves customers in 16 states across the South, Midwest and Texas, and through its subsidiary, Regions Bank, operates approximately 1,700 banking offices and 2,100 ATMs. Additional information about Regions and its full line of products and services can be found at www.regions.com.
Forward-looking statements
This presentation may include forward-looking statements which reflect Regions’ current views with respect to future events and financial performance. The Private Securities Litigation Reform Act of 1995 (“the Act”) provides a “safe harbor” for forward-looking statements that are identified as such and are accompanied by the identification of important factors that could cause actual results to differ materially from the forward-looking statements. For these statements, we, together with our subsidiaries, claim the protection afforded by the safe harbor in the Act. Forward-looking statements are not based on historical information, but rather are related to future operations, strategies, financial results or other developments. Forward-looking statements are based on management’s expectations as well as certain assumptions and estimates made by, and information available to, management at the time the statements are made. Those statements are based on general assumptions and are subject to various risks, uncertainties and other factors that may cause actual results to differ materially from the views, beliefs and projections expressed in such statements. These risks, uncertainties and other factors include, but are not limited to, those described below:
| — | The Dodd-Frank Wall Street Reform and Consumer Protection Act (the “Dodd-Frank Act”) became law in July 2010, but a number of legislative and regulatory proposals remain pending. Additionally, the Treasury Department and federal banking regulators continue to implement, but are also beginning to wind down, a number of programs to address capital and liquidity in the banking system. Future and proposed rules, including those that are related to the various regulatory capital and liquidity proposals and standards, referred to as “Basel III,” adopted by the Basel Committee on Banking Supervision, could require banking institutions to increase levels of capital and to satisfy liquidity requirements. All of the foregoing may have significant effects on Regions and the financial services industry, the exact nature and extent of which cannot be fully determined at this time. |
| — | Regions’ ability to mitigate the impact of the Dodd-Frank Act on debit interchange fees through revenue enhancements and other revenue measures, which will depend on various factors, including the acceptance by our customers of modified fee structures for Regions’ products and services. |
| — | Possible additional loan losses, impairment of goodwill and other intangibles, and adjustment of valuation allowances on deferred tax assets and the impact on earnings and capital. |
| — | Possible changes in interest rates may increase funding costs and reduce earning asset yields, thus reducing margins. Increases in benchmark interest rates would also increase debt service requirements for customers whose terms include a variable interest rate, which may negatively impact the ability of borrowers to pay as contractually obligated. |
| — | Possible changes in general economic and business conditions in the United States in general and in the communities Regions serves in particular, including any prolonging or worsening of the current unfavorable economic conditions including unemployment levels. |
| — | Possible changes in the creditworthiness of customers and the possible impairment of the collectability of loans. |
| — | Possible changes in trade, monetary and fiscal policies, laws and regulations and other activities of governments, agencies, and similar organizations, may have an adverse effect on business. |
| — | Possible stresses in the financial and real estate markets, including possible continued deterioration in property values. |
| — | Regions’ ability to manage fluctuations in the value of assets and liabilities and off-balance sheet exposure so as to maintain sufficient capital and liquidity to support Regions’ business. |
| — | Regions’ ability to expand into new markets and to maintain profit margins in the face of competitive pressures. |
| — | Regions’ ability to develop competitive new products and services in a timely manner and the acceptance of such products and services by Regions’ customers and potential customers. |
| — | Regions’ ability to keep pace with technological changes. |
| — | Regions’ ability to effectively manage credit risk, interest rate risk, market risk, operational risk, legal risk, liquidity risk, reputational risk and regulatory and compliance risk. |
| — | Regions’ ability to ensure adequate capitalization which is impacted by inherent uncertainties in forecasting credit losses. |
| — | The cost and other effects of material contingencies, including litigation contingencies, and any adverse judicial, administrative or arbitral rulings or proceedings. |
| — | The effects of increased competition from both banks and non-banks. |
| — | The effects of geopolitical instability and risks such as terrorist attacks. |
| — | Possible changes in consumer and business spending and saving habits could affect Regions’ ability to increase assets and to attract deposits. |
| — | The effects of weather and natural disasters such as floods, droughts, wind, tornados and hurricanes, and the effects of man-made disasters. |
| — | Possible downgrades in ratings issued by rating agencies. |
| — | Potential dilution of holders of shares of Regions’ common stock resulting from the U.S. Treasury’s ownership of a warrant to purchase up to 48,253,677 shares of common stock. |
| — | Potential dilution of holders of shares of common stock resulting from any future efforts by Regions to raise additional capital. |
| — | Possible changes in the speed of loan prepayments by Regions’ customers and loan origination or sales volumes. |
| — | Possible acceleration of prepayments on mortgage-backed securities due to low interest rates and the related acceleration of premium amortization on those securities. |
| — | The effects of problems encountered by larger or similar financial institutions that adversely affect Regions or the banking industry generally. |
| — | Regions’ ability to receive dividends from its subsidiaries. |
| — | The effects of the failure of any component of Regions’ business infrastructure which is provided by a third party. |
| — | Changes in accounting policies or procedures as may be required by the Financial Accounting Standards Board or other regulatory agencies. |
| — | With regard to the sale of Morgan Keegan the possibility of business disruption following the transaction; reputational risks and the reaction of customers and counterparties to the transaction; and occurrences which could cause post-closing adjustments to the purchase price. |
| — | The foregoing list of factors is not exhaustive. For discussion of these and other factors that may cause actual results to differ from expectations, look under the captions “Forward-Looking Statements” and “Risk Factors” in Regions’ Annual Report on Form 10-K for the year ended December 31, 2011. |
The words “believe,” “expect,” “anticipate,” “project,” and similar expressions often signify forward-looking statements. You should not place undue reliance on any forward-looking statements, which speak only as of the date made. We assume no obligation to update or revise any forward-looking statements that are made from time to time.
Use of non-GAAP financial measures
Pages two and three of this earnings release present computations of earnings and certain other financial measures excluding goodwill impairment (non-GAAP), Tier 1 common risk-based ratio (non-GAAP) and tangible common ratios (non-GAAP). Page three of the financial supplement shows additional ratios based on return on average assets, tangible common stockholders’ equity, efficiency ratio, as well as the Tier 1 common risk-based ratio and computations of earnings and certain other financial measures excluding goodwill impairment (non-GAAP), the regulatory charge and the federal income tax benefit related to the regulatory charge (non-GAAP). Tangible common stockholders’ equity ratios have become a focus of some investors and management believes they may assist investors in analyzing the capital position of the Company absent the effects of intangible assets and preferred stock. Traditionally, the Federal Reserve and other banking regulatory bodies have assessed a bank’s capital adequacy based on Tier 1 capital, the calculation of which is codified in federal banking regulations. In connection with the Company’s Comprehensive Capital Assessment and Review process, these regulators supplement their assessment of the capital adequacy of a bank based on a variation of Tier 1 capital, known as Tier 1 common equity. While not codified, analysts and banking regulators have assessed Regions’ capital adequacy using the tangible common stockholders’ equity and/or the Tier 1 common equity measure. Because tangible common stockholders’ equity and Tier 1 common equity are not formally defined by GAAP or codified in the federal banking regulations, these measures are considered to be non-GAAP financial measures and other entities may calculate them differently than Regions’ disclosed calculations. Since analysts and banking regulators may assess Regions’ capital adequacy using tangible common stockholders’ equity and Tier 1 common equity, we believe that it is useful to provide investors the ability to assess Regions’ capital adequacy on these same bases.
Tier 1 common equity is often expressed as a percentage of risk-weighted assets. Under the risk-based capital framework, a company’s balance sheet assets and credit equivalent amounts of off-balance sheet items are assigned to one of four broad risk categories. The aggregated dollar amount in each category is then multiplied by the risk-weighted category. The resulting weighted values from each of the four categories are added together and this sum is the risk-weighted assets total that, as adjusted, comprises the denominator of certain risk-based capital ratios. Tier 1 capital is then divided by this denominator (risk-weighted assets) to determine the Tier 1 capital ratio. Adjustments are made to Tier 1 capital to arrive at Tier 1 common equity. Tier 1 common equity is also divided by the risk-weighted assets to determine the Tier 1 common equity ratio. The amounts disclosed as risk-weighted assets are calculated consistent with banking regulatory requirements.
Regions currently calculates its risk-based capital ratios under guidelines adopted by the Federal Reserve based on the 1988 Capital Accord (“Basel I”) of the Basel Committee on Banking Supervision (the “Basel Committee”). In December 2010, the Basel Committee released its final framework for Basel III, which will strengthen international capital and liquidity regulation. When implemented by U.S. bank regulatory agencies and fully phased-in, Basel III will change capital requirements and place greater emphasis on common equity. Implementation of Basel III will begin on January 1, 2013, and will be phased in over a multi-year period. The U.S. bank regulatory agencies have not yet finalized regulations governing the implementation of Basel III. Accordingly, the calculations provided on page 20 are estimates, based on Regions’ current understanding of the framework, including the Company’s reading of the requirements, and informal feedback received through the regulatory process. Regions’ understanding of the framework is evolving and will likely change as the regulations are finalized. Because the Basel III implementation regulations are not formally defined by GAAP and have not yet been finalized and codified, these measures are considered to be non-GAAP financial measures, and other entities may calculate them differently from Regions’ disclosed calculations. Since analysts and banking regulators may assess Regions’ capital adequacy using the Basel III framework, we believe that it is useful to provide investors the ability to assess Regions’ capital adequacy on the same basis.
Non-GAAP financial measures have inherent limitations, are not required to be uniformly applied and are not audited. To mitigate these limitations, Regions has policies and procedures in place to identify and address expenses that qualify for non-GAAP presentation, including authorization and system controls to ensure accurate period to period comparisons. Although these non-GAAP financial measures are frequently used by stakeholders in the evaluation of a company, they have limitations as analytical tools, and should not be considered in isolation, or as a substitute for analyses of results as reported under GAAP. In particular, a measure of earnings that excludes goodwill impairment, the regulatory charge and the federal income tax benefit related to the regulatory charge does not represent the amount that effectively accrues directly to stockholders (i.e. goodwill impairment and the regulatory charge is a reduction in earnings and stockholders’ equity).
Management and the Board of Directors utilize non-GAAP measures as follows:
| — | Preparation of Regions’ operating budgets |
| — | Calculation of performance-based annual incentive bonuses for certain executives |
| — | Monthly financial performance reporting |
| — | Monthly close-out “flash” reporting of consolidated results (management only) |
| — | Presentation to investors of Company performance |
See page 8 of the supplement to this earnings release for the computation of income (loss) from continuing operations available to common shareholders (GAAP) to pre-tax pre-provision income (non-GAAP) to adjusted pre-tax pre-provision income (non-GAAP). See page 9 of the supplement to this earnings release for the computation of non-interest expense from continuing operations (GAAP) to non-interest expense from continuing operations excluding goodwill impairment (non-GAAP). See pages 16,17,18, 19 and 20 of the supplement to this earnings release for 1) computation of GAAP net income (loss) available to common shareholders, earnings (loss) per common share and return on average assets to non-GAAP financial measures, 2) income (loss) and earnings per common share from continuing operations (GAAP) to continuing operations excluding goodwill impairment, regulatory charge and related tax benefit (non-GAAP), 3) a reconciliation of average and ending stockholders’ equity (GAAP) to average and ending tangible common stockholders’ equity (non-GAAP), 4) a reconciliation of stockholders’ equity (GAAP) to Tier 1 capital (regulatory) and to Tier 1 common equity (non-GAAP), 5) a reconciliation of ending stockholder’ equity (GAAP) to Tier 1 capital(regulatory) excluding series A preferred stock 6) a reconciliation of non-interest expense (GAAP) to adjusted non-interest expense (non-GAAP), 7) a reconciliation of non-interest income (GAAP) to adjusted non-interest income (non-GAAP), 8) a computation of the efficiency ratio and fee ratio (non-GAAP), and 9) a reconciliation of stockholders’ equity (GAAP) to Basel III Tier 1 capital (non-GAAP) and Basel III Tier 1 common (non-GAAP).