UNITED STATES
SECURITIES AND EXCHANGE COMMISSION
Washington, D.C. 20549
FORM N-CSR
CERTIFIED SHAREHOLDER REPORT OF REGISTERED MANAGEMENT
INVESTMENT COMPANIES
Investment Company Act file number 811-21504
Advent/Claymore Enhanced Growth & Income Fund
(Exact name of registrant as specified in charter)
1271 Avenue of the Americas, 45th Floor, New York, NY 10020
(Address of principal executive offices) (Zip code)
Robert White, Treasurer
1271 Avenue of the Americas, 45th Floor, New York, NY 10020
(Name and address of agent for service)
Registrant's telephone number, including area code: (212) 482-1600
Date of fiscal year end: October 31
Date of reporting period: November 1, 2014 - April 30, 2015
Item 1. Reports to Stockholders.
The registrant's semi-annual report transmitted to shareholders pursuant to Rule 30e-1 under the Investment Company Act of 1940, as amended (the “Investment Company Act”), is as follows:
GUGGENHEIMINVESTMENTS.COM/LCM
...YOUR BRIDGE TO THE LATEST, MOST UP-TO-DATE
INFORMATION ABOUT THE ADVENT/CLAYMORE
ENHANCED GROWTH & INCOME FUND
The shareholder report you are reading right now is just the beginning of the story. Online at guggenheiminvestments.com/lcm, you will find:
|
• Daily, weekly and monthly data on share prices, net asset values, dividends and more
|
|
• Portfolio overviews and performance analyses
|
|
• Announcements, press releases and special notices
|
|
• Fund and adviser contact information
|
Advent Capital Management and Guggenheim Investments are continually updating and expanding shareholder information services on the Fund’s website in an ongoing effort to provide you with the most current information about how your Fund’s assets are managed, and the results of our efforts. It is just one more small way we are working to keep you better informed about your investment in the Fund.
|
April 30, 2015
|
DEAR SHAREHOLDER

Tracy V. Maitland
President and Chief Executive Officer
We thank you for your investment in the Advent/Claymore Enhanced Growth & Income Fund (the “Fund”). This report covers the Fund’s performance for the six months ended April 30, 2015.
Advent Capital Management, LLC (“Advent” or the “Investment Manager”), serves as the Fund’s Investment Manager. Based in New York, New York, with additional investment personnel in London, England, Advent is a credit-oriented firm specializing in the management of global convertible, high-yield, and equity securities across three lines of business—long-only strategies, hedge funds, and closed-end funds. As of April 30, 2015, Advent managed approximately $8.5 billion in assets.
Guggenheim Funds Investment Advisors, LLC (the “Investment Adviser”), serves as the Investment Adviser to the Fund. The Investment Adviser is an affiliate of Guggenheim Partners, LLC, a global diversified financial services firm.
The Fund’s primary investment objective is to seek current income and current gains from trading in securities, with a secondary objective of long-term capital appreciation. Under normal market conditions, the Fund invests at least 40% of its managed assets in a diversified portfolio of equity securities and convertible securities of U.S. and non-U.S. issuers, and may invest up to 60% of its managed assets in non-convertible high-yield securities. Additionally, the Fund engages in a strategy of writing (selling) covered call options on a portion of the securities held in the Fund’s portfolio, thus generating option writing premiums. The Fund’s non-fundamental investment policies were changed during the period and took effect in January 2015. Please see the Questions & Answers section following for more information.
Advent seeks international investment opportunities in each asset class, with an emphasis on large multinational companies. Appreciation potential is provided by investments in convertibles and common stock, while the allocation to high-yield securities is primarily a source of income. The balance between convertible securities, equities, and high-yield securities, and the degree to which the Fund engages in a covered call strategy, will vary from time to time based on security valuations, interest rates, equity market volatility, and other economic and market factors.
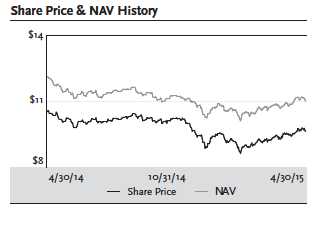
All Fund returns cited—whether based on net asset value (NAV) or market price—assume the reinvestment of all distributions. For the six-month period ended April 30, 2015, the Fund generated a total return based on market price of 5.78% and a return of 5.09% based on NAV. As of April 30, 2015, the Fund’s market price of $9.62 represented a discount of 12.47% to NAV of $10.99.
|
April 30, 2015
|
Past performance is not a guarantee of future results. The Fund’s NAV performance data reflect fees and expenses of the Fund. The market price of the Fund’s shares fluctuates from time to time, and it may be higher or lower than the Fund’s NAV.
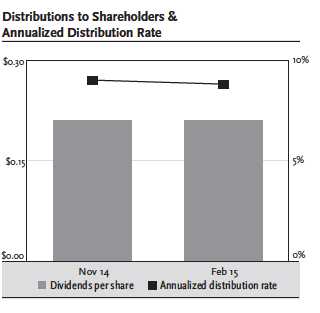
The Fund paid quarterly distributions of $0.210 in November 2014 and February 2015. The most recent dividend represents an annualized distribution rate of 8.73% based on the Fund’s market price on April 30, 2015. There is no guarantee of any future distributions or that the current returns and distribution rate will be maintained. Please see Note 2(l) on page 42 for more information on distributions for the period.
We encourage shareholders to consider the opportunity to reinvest their distributions from the Fund through the Dividend Reinvestment Plan (“DRIP”), which is described in detail on page 56 of this report. When shares trade at a discount to NAV, the DRIP takes advantage of the discount by reinvesting the quarterly dividend distribution in common shares of the Fund purchased in the market at a price less than NAV. Conversely, when the market price of the Fund’s common shares is at a premium above NAV, the DRIP reinvests participants’ dividends in newly-issued common shares at the greater of NAV per share or 95% of the market price per share. The DRIP provides a cost-effective means to accumulate additional shares and enjoy the benefits of compounding returns over time.
The Fund is managed by a team of experienced and seasoned professionals led by myself in my capacity as Chief Investment Officer (as well as President and Founder) of Advent Capital Management, LLC. We encourage you to read the following Questions & Answers section, which provides additional information regarding the factors that influenced the Fund’s performance.
We thank you for your investment in the Fund and we are honored that you have chosen the Advent/Claymore Enhanced Growth & Income Fund as part of your investment portfolio. For the most up-to-date information regarding your investment, including related investment risks, please visit the Fund’s website at guggenheiminvestments.com/lcm.
Sincerely,

Tracy V. Maitland
President and Chief Executive Officer of the Advent/Claymore Enhanced
Growth & Income Fund
May 31, 2015
|
QUESTIONS & ANSWERS
|
April 30, 2015
|
Advent/Claymore Enhanced Growth & Income Fund (the “Fund”) is managed by a team of seasoned professionals at Advent Capital Management, LLC (“Advent” or the “Investment Manager”), led by Tracy V. Maitland, Advent’s Founder, President, and Chief Investment Officer. In the following interview, the management team discusses the equity, convertible securities, and high-yield markets and Fund performance for the six-month period ended April 30, 2015.
Please describe the Fund’s objective and management strategies.
The Fund’s primary investment objective is to seek current income and current gains from trading in securities, with a secondary objective of long-term capital appreciation. Under normal market conditions, the Fund invests at least 40% of its managed assets in equity securities and convertible securities of U.S. and non-U.S. issuers and may invest up to 60% of its managed assets in non-convertible high yield securities. Prior to January 12, 2015, the Fund invested at least 70% of its managed assets in a diversified portfolio of equity securities and convertible securities of U.S. and non-U.S. issuers, and up to 30% of its managed assets in non-convertible high-yield securities.
Advent seeks international investment opportunities in each asset class, with an emphasis on large multinational companies. The Fund’s investments in convertibles and common stock provide capital appreciation potential, while the allocation to high-yield securities is primarily a source of income.
The Fund also uses a strategy of writing (selling) covered call options, but the percentage of positions to be written against can vary. As the percentage increases, the risks associated with covered call option writing also increase, and the Fund may also limit its ability to benefit from capital appreciation in holdings on which options have been written. In addition, the Fund may invest in other derivatives, such as foreign exchange currency contracts, futures contracts, and swaps.
The Fund uses financial leverage to finance the purchase of additional securities. Although financial leverage may create an opportunity for increased return for shareholders, it also results in additional risks and can magnify the effect of any losses. There is no assurance that the strategy will be successful. If income and gains earned on securities purchased with the financial leverage proceeds are greater than the cost of the financial leverage, shareholders’ return will be greater than if financial leverage had not been used. Conversely, if the income or gains from the securities purchased with the proceeds of financial leverage are less than the cost of the financial leverage, shareholders’ return will be less than if financial leverage had not been used.
Discuss the recent changes to Advent’s non-fundamental investment policies.
Modifications to non-fundamental investment policies approved by the Board of Trustees of the Fund and Advent’s other closed-end funds took effect on January 12, 2015. These modifications were designed to expand the portfolio management flexibility of the Funds and may provide an opportunity to enhance shareholder value through the Investment Manager’s expanded investment capabilities and ability to manage risk.
|
QUESTIONS & ANSWERS continued
|
April 30, 2015
|
Advent’s institutional strategies, which invest in the same asset classes as the Fund, have provided superior performance relative to applicable benchmarks. Accordingly, Advent has reallocated the Fund’s portfolio to establish a core portfolio of convertible bonds that is managed, subject to the Fund’s investment policies and restrictions, in a manner similar to that of Advent’s Global Balanced Convertible Strategy. Advent’s Global Balanced Convertible Strategy seeks a high total return by investing in a portfolio of global convertible securities that provide equity-like returns while seeking to limit downside risk.
This core portfolio is supplemented by investments in high yield securities selected in a manner similar to that of Advent’s High Yield Strategy. Advent’s High Yield Strategy seeks income and total return by investing primarily in high yielding corporate credit using fundamental and relative value analysis to identify undervalued securities.
Advent now uses a separate portion of the Fund’s portfolio to increase or decrease relative overall exposure to convertible securities, high yield securities, and equities. This portion of the Fund’s portfolio incorporates leverage and operates as an asset allocation tool reflecting Advent’s conservative management philosophy and its views on the relative value of these three asset classes under changing market conditions.
Please describe the economic and market environment over the last six months.
World securities markets generally advanced in the six months ended April 30, 2015, spurred by healthy monetary conditions in the U.S. and direct injections of quantitative easing or other monetary support in various foreign geographies. In the U.S., various equity indices returned roughly mid-single-digits in the period, led by the health care sector, merger and acquisitions activity, and reasonable strength in the overall U.S. economy. Later in the period, however, slowing corporate earnings growth from falling commodity prices, the strong dollar, and a weaker economy in the first quarter of 2015 led to small corrections in the mid- and small-cap markets. Risk-free Treasury rates fell, and prices rose, continuing a trend from earlier in 2014 as the U.S. Federal Reserve (Fed) kept pushing out the normalization of short-term monetary policy. However, high-yield bonds, a key asset class for the Fund, returned less as spreads widened on exposure to the oil & gas sector and lower liquidity from dealer participants from regulatory changes.
Convertible bond returns were satisfactory, compared to equity indices, as the asset class piggybacked off the higher returns from the highly represented sectors of health care and technology and lower risk-free rates to come to returns that mimicked the equity indices. Exposure to foreign convertibles also helped as overseas securities benefitted from much higher equity returns and even more pronounced declines in bond yields and corporate bond spreads than the U.S. The announcement of a large asset purchase program by the European Central Bank (ECB) and expansion of the existing program by the Bank of Japan led to large advances in equity and bond markets there as well as large declines in the respective currencies. The Fund’s policy to hedge foreign currency exposure helped it take advantage of asset price increases without suffering the related currency depreciation.
6 l LCM l ADVENT/CLAYMORE ENHANCED GROWTH & INCOME FUND SEMIANNUAL REPORT
|
QUESTIONS & ANSWERS continued
|
April 30, 2015
|
How did the Fund perform in this environment?
All Fund returns cited—whether based on net asset value (NAV) or market price—assume the reinvestment of all distributions. For the six-month period ended April 30, 2015, the Fund generated a total return based on market price of 5.78% and a return of 5.09% based on NAV. As of April 30, 2015, the Fund’s market price of $9.62 represented a discount of 12.47% to NAV of $10.99. As of October 31, 2014, the Fund’s market price of $9.51 represented a discount of 12.51% to NAV of $10.87.
Past performance is not a guarantee of future results. The Fund’s NAV performance data reflect fees and expenses of the Fund. The market price of the Fund’s shares fluctuates from time to time, and it may be higher or lower than the Fund’s NAV.
How has the Fund’s leverage strategy affected performance?
As part of its investment strategy, the Fund utilizes leverage to finance the purchase of additional securities that provide increased income and potentially greater appreciation potential to common shareholders than could be achieved from a portfolio that is not leveraged.
The Fund’s leverage outstanding as of April 30, 2015, including borrowing and reverse repurchase agreements or the issuance of commercial paper or other forms of debt, was $50 million, approximately 25% of the Fund’s total managed assets.
There is no guarantee that the Fund’s leverage strategy will be successful, and the Fund’s use of leverage may cause the Fund’s NAV and market price of common shares to be more volatile.
The Fund’s use of leverage remained unchanged in absolute dollars as the fiscal half-year progressed. The Fund’s total return, defined as the return inclusive of reinvested dividends, was above that of the cost of that leverage for the fiscal half-year. Therefore, on a simple comparison, the use of leverage had an additive effect on shareholder returns for the period.
What was the impact of the Fund’s covered call strategy?
The Fund continues to seek income from occasionally overwriting equity positions and convertibles with call options. Equity allocations in the Fund declined in the six months ended April 30, 2015, as the Investment Manager sought out greater income and better relative value in the high-yield market. That plus a continued low-volatility environment led to lower opportunities to generate call option income than previous years. The CBOE SPX Volatility Index (VIX) averaged 15.5 for the six-month period, slightly higher than the 14.0 of the previous fiscal year, but both are quite low by historical averages, and the figure had dropped again to 12.5 as of this writing in mid-May. While there is a reasonable forecast of higher volatility as the Fed embarks on a rate hike strategy, neither the hikes nor higher volatility have occurred yet, and the Fund will remain in a monitoring state for better opportunities to write option contracts for income in the near future.
How did related market measures perform in this environment?
For the six-month period ended April 30, 2015, the return of the Bank of America Merrill Lynch Global 300 Convertible Index was 6.99% (local currency).
|
QUESTIONS & ANSWERS continued
|
April 30, 2015
|
The return of the Bank of America Merrill Lynch High Yield Master II Index was 1.51%.
The CBOE S&P 500 2% OTM BuyWrite Index (BXY) returned 1.68%.
The Fund’s mandate differs materially from each of the individual indices. The Fund also maintains leverage and incurs transaction costs, advisory fees, and other expenses, while these indices do not.
Please discuss the Fund’s distributions.
The Fund paid a quarterly distribution of $0.210 in November 2014 and February 2015. The most recent dividend represents an annualized distribution rate of 8.73% based on the Fund’s market price on April 30, 2015. There is no guarantee of any future distributions or that the current returns and distribution rate will be maintained. Please see Note 2(l) on page 42 for more information on distributions for the period.
How was the Fund’s portfolio allocated among asset classes during the six months ended April 30, 2015, and what did this mean for performance?
At April 30, 2015, the Fund’s assets were invested approximately 68.5% in convertible bonds, convertible preferred securities, and mandatory convertibles; 21.4% in corporate bonds; 6.7% in equities; 3.3% in cash and cash equivalents; and 0.1% in senior floating rate interests. At the previous report, on October 31, 2014, the Fund’s assets were invested 70.9% in convertible bonds, convertible preferred securities, and mandatory convertibles; 20.3% in corporate bonds; 8.4% in equities; and 0.4% in senior floating rate interests.
The change in asset allocation, primarily from a slightly higher proportion invested in corporate bonds and slightly lower one in convertibles, reflects changes in the high-yield bond market over the past six months: the sell-off and cheapening that occurred late in calendar year 2014 in this market, as regulation and capital constraints reduced market-making and liquidity by dealers, and richening due to improved credit conditions as 2015 progressed. Foreign securities represented 36% of assets at period end compared to 30% at the start, reflecting greater opportunities in foreign markets, with aggressive quantitative easing occurring in many overseas countries and regions.
Which investment decisions had the greatest effect on the Fund’s performance?
Among the large winners for the Fund over the period were holdings related to Cemex SAB de CV, Omnicare, Inc., and Hologic, Inc.
The stock of global cement producer Cemex SAB de CV rose after two competitors announced plans to merge, and Cemex’s newly issued contingent convertible contract (0.7% of long-term investments at period end) richened.
Two of the Fund’s health care holdings continued to contribute to performance, based on their strong growth and a robust merger/acquisition environment. Convertibles in Omnicare, Inc. (1.4% of long-term investments at period end), a provider of nursing and assisted home services, rose as speculation about a potential sale occurred in late April, speculation that was realized when a merger with CVS
|
QUESTIONS & ANSWERS continued
|
April 30, 2015
|
Health Corp. was announced in May. Convertibles in Hologic, Inc. (1.0% of long-term investments at period end), a developer and supplier of diagnostic and medical imaging systems, advanced after the company reported strong demand for its mammography and assay test systems.
Among the leading detractors for the Fund over the last year were holdings of Wynn Resorts Ltd., American Airlines Group, Inc., Iconix Brand Group, Inc., and Alcatel-Lucent.
Equity held in casino operator Wynn Resorts Ltd. (0.2% of long-term investments at period end) performed poorly, as the company struggled with a region-wide decline in gaming from corruption crackdowns and a slowing economy in China.
Equity in air carrier American Airlines Group, Inc. (0.3% of long-term investments at period end), declined after concerns percolated about rising domestic capacity as well as rebounding oil prices.
Convertibles in Iconix Brand Group, Inc. (0.5% of long-term investments at period end), a retail brand licensor, declined with the stock after the company reported weaker earnings and suffered the resignation of both its chief financial officer and chief operating officer. The Fund has retained its position anticipating a resumption of earnings growth and the possibility of profiting from a restructured convertible.
Late in the period, a relatively new position in convertibles in Alcatel-Lucent (0.9% of long-term investments at period end), a networking and broadband company, declined after merger suitor Nokia reported its own quarter with declining margins, which sent stocks of both companies lower. We continue with the Alcatel-Lucent position on the back of positive fundamentals at Alcatel and believing the merger’s closure will result in realization of the convertible’s valuable make-whole payment to holders.
Do you have any other comments about the markets and the Fund?
Markets seem to have taken an aware but thus far unbothered attitude toward the specter of the first Fed short-term monetary policy rate increases since 2004. While there is general consensus there will be some level of increases in the Fed funds rate in the second half of 2015, the Open Market Committee’s attitude toward near-term economic data as determining future moves has introduced much uncertainty and debate over the slope and timing of rate increases into 2016. Further increasing uncertainty has been the slowdown in the U.S. economy in the first half of 2015. Foreign bond markets are generally highly priced from the liquidity injections from various central banks but will have that continued support through 2015 or longer with the potential of economic recovery aiding the balance sheets and leverage levels of corporate issuers. Prices of some select commodities have begun to rebound, perhaps reflecting a stronger foreign growth outlook than in the previous months.
Index Definitions
Indices are unmanaged, do not use leverage, and do not experience fees, expenses or transaction costs and it is not possible to invest directly in an index.
Bank of America Merrill Lynch Global 300 Convertible Index measures the performance of convertible securities of issuers throughout the world.
|
QUESTIONS & ANSWERS continued
|
April 30, 2015
|
Bank of America Merrill Lynch High Yield Master II Index is a commonly used benchmark index for high yield corporate bonds. It is a measure of the broad high yield market.
The CBOE S&P 500 2% OTM BuyWrite Index (BXY) uses the same methodology as the widely accepted CBOE S&P 500 BuyWrite Index (BXM), but the BXY Index is calculated using out-of-the-money S&P 500 Index (SPX) call options, rather than at-the-money SPX call options. The BXY strategy diversifies the buy-write opportunities currently provided by the BXM. The BXY Index yields lower monthly premiums in return for a greater participation in the upside moves of the S&P 500. S&P 500 Index is a capitalization-weighted index of 500 stocks. The index is designed to measure performance of the broad domestic economy through changes in the aggregate market value of 500 stocks representing all major industries.
VIX is the ticker symbol for the Chicago Board Options Exchange Volatility Index, a popular measure of the implied volatility of S&P 500 index options. It is a weighted blend of prices for a range of options on the S&P 500 index.
LCM Risks and Other Considerations
The views expressed in this report reflect those of the Portfolio Managers only through the report period as stated on the cover. These views are subject to change at any time, based on market and other conditions and should not be construed as a recommendation of any kind. The material may also contain forward-looking statements that involve risk and uncertainty, and there is no guarantee they will come to pass. There can be no assurance that the Fund will achieve its investment objectives. The value of the Fund will fluctuate with the value of the underlying securities. Historically, closed-end funds often trade at a discount to their net asset value. Past performance does not guarantee future results. The Fund is subject to investment risk, including the possible loss of the entire amount that you invest.
Please see guggenheiminvestments.com/lcm for a detailed discussion of the Fund’s risks and considerations.
|
FUND SUMMARY (Unaudited)
|
April 30, 2015
|
|
Fund Statistics
|
|
|
Share Price
|
$9.62
|
|
Net Asset Value
|
$10.99
|
|
Discount to NAV
|
-12.47%
|
|
Net Assets ($000)
|
$149,447
|
|
AVERAGE ANNUAL TOTAL RETURNS
|
||||||
|
FOR THE PERIOD ENDED APRIL 30, 2015
|
||||||
|
Six Month
|
Since
|
|||||
|
(non-
|
One
|
Three
|
Five
|
Ten
|
Inception
|
|
|
annualized)
|
Year
|
Year
|
Year
|
Year
|
(1/31/05)
|
|
|
Advent/Claymore Enhanced
|
||||||
|
Growth & Income Fund
|
||||||
|
NAV
|
5.09%
|
4.33%
|
8.40%
|
5.52%
|
3.77%
|
3.05%
|
|
Market
|
5.78%
|
4.79%
|
8.24%
|
4.58%
|
3.58%
|
2.21%
|
|
Portfolio Breakdown
|
% of Net Assets
|
|
Investments:
|
|
|
Convertible Bonds
|
83.1%
|
|
Corporate Bonds
|
28.7%
|
|
Common Stocks
|
8.9%
|
|
Convertible Preferred Stocks
|
8.8%
|
|
Short Term Investments
|
4.4%
|
|
Senior Floating Rate Interests
|
0.2%
|
|
Total Investments
|
134.1%
|
|
Other Assets & Liabilities, net
|
-34.1%
|
|
Net Assets
|
100.0%
|
Past performance does not guarantee future results and does not reflect the deductions of taxes that a shareholder would pay on fund distributions. NAV performance data reflects fees and expenses of the Fund. All portfolio data is subject to change daily. For more current information, please visit guggenheiminvestments.com/lcm. The above summaries are provided for informational purposes only and should not be viewed as recommendations.
|
FUND SUMMARY (Unaudited) continued
|
April 30, 2015
|
|
FUND SUMMARY (Unaudited) continued
|
April 30, 2015
|
|
Country Breakdown
|
% of Long-Term Investments
|
|
United States
|
64.0%
|
|
Cayman Islands
|
4.8%
|
|
Japan
|
4.3%
|
|
France
|
3.9%
|
|
Netherlands
|
3.6%
|
|
Austria
|
2.7%
|
|
Bermuda
|
1.7%
|
|
United Kingdom
|
1.6%
|
|
Spain
|
1.4%
|
|
Germany
|
1.4%
|
|
Italy
|
1.2%
|
|
Ireland
|
1.1%
|
|
United Arab Emirates
|
1.1%
|
|
Virgin Islands
|
1.1%
|
|
Jersey
|
0.8%
|
|
Canada
|
0.8%
|
|
Luxembourg
|
0.7%
|
|
Mexico
|
0.7%
|
|
Honk Kong
|
0.6%
|
|
Hungary
|
0.6%
|
|
India
|
0.5%
|
|
Taiwan
|
0.4%
|
|
Australia
|
0.4%
|
|
Marshall Island
|
0.3%
|
|
Liberia
|
0.2%
|
|
Greece
|
0.1%
|
|
Subject to change daily.
|
|
PORTFOLIO OF INVESTMENTS (Unaudited)
|
April 30, 2015
|
|
Shares
|
Value
|
|||||||
|
COMMON STOCKS† – 8.9%
|
||||||||
|
Consumer, Non-cyclical – 1.9%
|
||||||||
|
GlaxoSmithKline plc ADR1
|
30,000 | $ | 1,384,499 | |||||
|
Gilead Sciences, Inc.1
|
5,100 | 512,601 | ||||||
|
Pfizer, Inc.1
|
14,150 | 480,110 | ||||||
|
Mylan N.V.*
|
5,600 | 404,656 | ||||||
|
Total Consumer, Non-cyclical
|
2,781,866 | |||||||
|
Financial – 1.7%
|
||||||||
|
NorthStar Realty Finance Corp.1
|
59,250 | 1,111,530 | ||||||
|
Hospitality Properties Trust1
|
30,300 | 911,424 | ||||||
|
Citigroup, Inc.1
|
11,000 | 586,520 | ||||||
|
Total Financial
|
2,609,474 | |||||||
|
Energy – 1.5%
|
||||||||
|
Occidental Petroleum Corp.1
|
20,000 | 1,602,000 | ||||||
|
Royal Dutch Shell plc — Class B ADR1
|
9,800 | 632,982 | ||||||
|
Total Energy
|
2,234,982 | |||||||
|
Industrial – 1.3%
|
||||||||
|
Greenbrier Companies, Inc.
|
19,943 | 1,150,512 | ||||||
|
Koninklijke Philips N.V.
|
30,000 | 862,431 | ||||||
|
Total Industrial
|
2,012,943 | |||||||
|
Basic Materials – 1.0%
|
||||||||
|
Freeport-McMoRan, Inc.1
|
31,500 | 733,005 | ||||||
|
Dow Chemical Co.1
|
14,200 | 724,200 | ||||||
|
Total Basic Materials
|
1,457,205 | |||||||
|
Communications – 0.8%
|
||||||||
|
Lamar Advertising Co. — Class A1
|
20,000 | 1,159,200 | ||||||
|
Consumer, Cyclical – 0.7%
|
||||||||
|
American Airlines Group, Inc.1
|
12,800 | 618,048 | ||||||
|
Wynn Resorts Ltd.1
|
4,200 | 466,494 | ||||||
|
Total Consumer, Cyclical
|
1,084,542 | |||||||
|
Total Common Stocks
|
||||||||
|
(Cost $12,966,782)
|
13,340,212 | |||||||
|
CONVERTIBLE PREFERRED STOCKS† – 8.8%
|
||||||||
|
Consumer, Non-cyclical – 3.1%
|
||||||||
|
Actavis plc 5.50% due 03/01/18
|
2,189 | 2,198,576 | ||||||
|
Tyson Foods, Inc. 4.75% due 07/15/171
|
38,314 | 1,884,665 | ||||||
|
Kindred Healthcare, Inc. 7.50% due 12/01/17
|
496 | 572,769 | ||||||
|
Total Consumer, Non-cyclical
|
4,656,010 | |||||||
See notes to financial statements.
|
PORTFOLIO OF INVESTMENTS (Unaudited) continued
|
April 30, 2015
|
|
Shares
|
Value
|
|||||||
|
CONVERTIBLE PREFERRED STOCKS† – 8.8% (continued)
|
||||||||
|
Financial – 3.0%
|
||||||||
|
Wells Fargo & Co. 7.50%1,9
|
1,949 | $ | 2,375,344 | |||||
|
American Tower Corp. 5.25% due 05/15/171
|
11,938 | 1,237,732 | ||||||
|
American Tower Corp. 5.50% due 02/15/18
|
8,267 | 848,194 | ||||||
|
Total Financial
|
4,461,270 | |||||||
|
Utilities – 0.9%
|
||||||||
|
Dominion Resources, Inc. 6.38% due 07/01/171
|
20,979 | 1,041,607 | ||||||
|
Exelon Corp. 6.50% due 06/01/171
|
6,050 | 298,810 | ||||||
|
Total Utilities
|
1,340,417 | |||||||
|
Basic Materials – 0.7%
|
||||||||
|
Alcoa, Inc. 5.38% due 10/01/171
|
24,014 | 1,095,519 | ||||||
|
Total Basic Materials
|
1,095,519 | |||||||
|
Energy – 0.6%
|
||||||||
|
Southwestern Energy Co. 6.25% due 01/15/18
|
10,200 | 605,064 | ||||||
|
Chesapeake Energy Corp. 5.75%1,9
|
386 | 339,680 | ||||||
|
Total Energy
|
944,744 | |||||||
|
Industrial – 0.5%
|
||||||||
|
Stanley Black & Decker, Inc. 4.75% due 11/17/152
|
3,960 | 544,758 | ||||||
|
United Technologies Corp. 7.50% due 08/01/151
|
2,443 | 143,697 | ||||||
|
Total Industrial
|
688,455 | |||||||
|
Total Convertible Preferred Stocks
|
||||||||
|
(Cost $13,253,867)
|
13,186,415 | |||||||
|
SHORT TERM INVESTMENTS† – 4.4%
|
||||||||
|
Goldman Sachs Financial Prime Obligations – Administration Share Class2
|
6,609,461 | 6,609,461 | ||||||
|
Total Short Term Investments
|
||||||||
|
(Cost $6,609,461)
|
6,609,461 | |||||||
|
Face
|
||||||||
|
Amount~
|
Value
|
|||||||
|
CONVERTIBLE BONDS†† – 83.1%
|
||||||||
|
Financial – 18.5%
|
||||||||
|
IMMOFINANZ AG
|
||||||||
|
1.50% due 09/11/19
|
1,600,000 EUR
|
$ | 2,072,927 | |||||
|
4.25% due 03/08/18
|
96,000 EUR
|
514,951 | ||||||
|
Forest City Enterprises, Inc.
|
||||||||
|
3.63% due 08/15/201
|
1,496,000 | 1,691,415 | ||||||
|
Colony Capital, Inc.
|
||||||||
|
3.88% due 01/15/21
|
1,493,000 | 1,632,969 | ||||||
|
Aabar Investments PJSC
|
||||||||
|
1.00% due 03/27/22
|
1,200,000 EUR
|
1,474,211 | ||||||
See notes to financial statements.
|
PORTFOLIO OF INVESTMENTS (Unaudited) continued
|
April 30, 2015
|
|
Face
|
||||||||
|
Amount~
|
Value
|
|||||||
|
CONVERTIBLE BONDS†† – 83.1% (continued)
|
||||||||
|
Financial – 18.5% (continued)
|
||||||||
|
Starwood Property Trust, Inc.
|
||||||||
|
4.00% due 01/15/191
|
1,141,000 | $ | 1,297,174 | |||||
|
Tong Jie Ltd.
|
||||||||
|
0.00% due 02/18/183
|
9,000,000 HKD
|
1,291,743 | ||||||
|
BNP Paribas S.A.
|
||||||||
|
0.25% due 09/21/15
|
1,000,000 EUR
|
1,198,540 | ||||||
|
Conwert Immobilien Invest SE
|
||||||||
|
4.50% due 09/06/18
|
900,000 EUR
|
1,189,217 | ||||||
|
Air Lease Corp.
|
||||||||
|
3.88% due 12/01/181
|
789,000 | 1,156,871 | ||||||
|
Azimut Holding SpA
|
||||||||
|
2.13% due 11/25/20
|
800,000 EUR
|
1,134,624 | ||||||
|
BENI Stabili SpA
|
||||||||
|
3.38% due 01/17/18
|
800,000 EUR
|
1,127,811 | ||||||
|
Magyar Nemzeti Vagyonkezelo Zrt
|
||||||||
|
3.38% due 04/02/19
|
900,000 EUR
|
1,112,975 | ||||||
|
Criteria CaixaHolding S.A.
|
||||||||
|
1.00% due 11/25/17
|
800,000 EUR
|
1,048,924 | ||||||
|
AYC Finance Ltd.
|
||||||||
|
0.50% due 05/02/19
|
870,000 | 988,538 | ||||||
|
Radian Group, Inc.
|
||||||||
|
2.25% due 03/01/191
|
577,000 | 981,621 | ||||||
|
American Realty Capital Properties, Inc.
|
||||||||
|
3.00% due 08/01/18
|
900,000 | 874,125 | ||||||
|
Hansteen Jersey Securities Ltd.
|
||||||||
|
4.00% due 07/15/18
|
500,000 EUR
|
846,744 | ||||||
|
Haitong International Securities Group, Ltd.
|
||||||||
|
1.25% due 11/04/19
|
4,000,000 HKD
|
844,195 | ||||||
|
PRA Group, Inc.
|
||||||||
|
3.00% due 08/01/201
|
728,000 | 790,335 | ||||||
|
Unite Jersey Issuer Ltd.
|
||||||||
|
2.50% due 10/10/18
|
400,000 GBP
|
763,519 | ||||||
|
Element Financial Corp.
|
||||||||
|
5.13% due 06/30/194
|
755,000 CAD
|
758,896 | ||||||
|
Hong Kong Exchanges and Clearing Ltd.
|
||||||||
|
0.50% due 10/23/17
|
350,000 | 657,125 | ||||||
|
Unibail-Rodamco SE
|
||||||||
|
0.00% due 01/01/223
|
1,538 EUR
|
628,526 | ||||||
|
Billion Express Investments Ltd.
|
||||||||
|
0.75% due 10/18/15
|
500,000 | 533,750 | ||||||
|
Fidelity National Financial, Inc.
|
||||||||
|
4.25% due 08/15/181
|
247,000 | 494,772 | ||||||
See notes to financial statements.
|
PORTFOLIO OF INVESTMENTS (Unaudited) continued
|
April 30, 2015
|
|
Face
|
||||||||
|
Amount~
|
Value
|
|||||||
|
CONVERTIBLE BONDS†† – 83.1% (continued)
|
||||||||
|
Financial – 18.5% (continued)
|
||||||||
|
Host Hotels & Resorts, LP
|
||||||||
|
2.50% due 10/15/294
|
294,000 | $ | 462,683 | |||||
|
Total Financial
|
27,569,181 | |||||||
|
Communications – 13.8%
|
||||||||
|
Twitter, Inc.
|
||||||||
|
1.00% due 09/15/211,4
|
2,360,000 | 2,150,551 | ||||||
|
0.25% due 09/15/191,4
|
1,531,000 | 1,406,605 | ||||||
|
Priceline Group, Inc.
|
||||||||
|
0.35% due 06/15/201
|
2,150,000 | 2,545,062 | ||||||
|
0.90% due 09/15/211,4
|
723,000 | 718,481 | ||||||
|
Ciena Corp.
|
||||||||
|
0.88% due 06/15/171
|
2,249,000 | 2,249,000 | ||||||
|
4.00% due 12/15/201
|
468,000 | 624,780 | ||||||
|
Yahoo!, Inc.
|
||||||||
|
0.00% due 12/01/181,3
|
1,991,000 | 2,119,171 | ||||||
|
Ctrip.com International Ltd.
|
||||||||
|
1.25% due 10/15/181
|
1,511,000 | 1,672,489 | ||||||
|
Alcatel Lucent
|
||||||||
|
0.00% due 01/30/193
|
326,000 EUR
|
1,660,650 | ||||||
|
Qihoo 360 Technology Company Ltd.
|
||||||||
|
1.75% due 08/15/211,4
|
1,000,000 | 860,625 | ||||||
|
0.50% due 08/15/201,4
|
722,000 | 647,093 | ||||||
|
Liberty Media Corp.
|
||||||||
|
1.38% due 10/15/231
|
1,060,000 | 1,066,625 | ||||||
|
Web.com Group, Inc.
|
||||||||
|
1.00% due 08/15/18
|
1,000,000 | 921,874 | ||||||
|
Liberty Interactive LLC
|
||||||||
|
0.75% due 03/30/431
|
615,000 | 893,288 | ||||||
|
Yandex N.V.
|
||||||||
|
1.13% due 12/15/181
|
834,000 | 732,878 | ||||||
|
LinkedIn Corp.
|
||||||||
|
0.50% due 11/01/194
|
363,000 | 404,293 | ||||||
|
Total Communications
|
20,673,465 | |||||||
|
Consumer, Non-cyclical – 13.8%
|
||||||||
|
Omnicare, Inc.
|
||||||||
|
3.50% due 02/15/441
|
1,084,000 | 1,462,045 | ||||||
|
3.25% due 12/15/351
|
1,000,000 | 1,198,750 | ||||||
|
Hologic, Inc.
|
||||||||
|
0.00% due 12/15/431,5,6
|
1,700,000 | 1,999,625 | ||||||
|
Anthem, Inc.
|
||||||||
|
2.75% due 10/15/421
|
799,000 | 1,615,478 | ||||||
|
J Sainsbury plc
|
||||||||
|
1.25% due 11/21/19
|
700,000 GBP
|
1,169,635 | ||||||
See notes to financial statements.
|
PORTFOLIO OF INVESTMENTS (Unaudited) continued
|
April 30, 2015
|
|
Face
|
||||||||
|
Amount~
|
Value
|
|||||||
|
CONVERTIBLE BONDS†† – 83.1% (continued)
|
||||||||
|
Consumer, Non-cyclical – 13.8% (continued)
|
||||||||
|
BioMarin Pharmaceutical, Inc.
|
||||||||
|
1.50% due 10/15/201
|
795,000 | $ | 1,119,458 | |||||
|
Molina Healthcare, Inc.
|
||||||||
|
1.63% due 08/15/44
|
575,000 | 682,453 | ||||||
|
1.13% due 01/15/201
|
233,000 | 357,364 | ||||||
|
Brookdale Senior Living, Inc.
|
||||||||
|
2.75% due 06/15/181
|
722,000 | 983,725 | ||||||
|
Gilead Sciences, Inc.
|
||||||||
|
1.63% due 05/01/161
|
213,000 | 940,396 | ||||||
|
Jazz Investments I Ltd.
|
||||||||
|
1.88% due 08/15/211,4
|
750,000 | 900,000 | ||||||
|
HealthSouth Corp.
|
||||||||
|
2.00% due 12/01/43
|
636,000 | 802,553 | ||||||
|
Isis Pharmaceuticals, Inc.
|
||||||||
|
1.00% due 11/15/214
|
699,000 | 759,289 | ||||||
|
Euronet Worldwide, Inc.
|
||||||||
|
1.50% due 10/01/444
|
667,000 | 733,283 | ||||||
|
Wright Medical Group, Inc.
|
||||||||
|
2.00% due 02/15/204
|
689,000 | 725,173 | ||||||
|
DP World Ltd.
|
||||||||
|
1.75% due 06/19/24
|
600,000 | 672,600 | ||||||
|
Qiagen N.V.
|
||||||||
|
0.88% due 03/19/21
|
600,000 | 666,510 | ||||||
|
Illumina, Inc.
|
||||||||
|
0.50% due 06/15/211,4
|
500,000 | 578,750 | ||||||
|
Spectranetics Corp.
|
||||||||
|
2.63% due 06/01/34
|
484,000 | 530,888 | ||||||
|
Temp Holdings, Co.
|
||||||||
|
0.00% due 09/19/183
|
42,000,000 JPY
|
491,263 | ||||||
|
Array BioPharma, Inc.
|
||||||||
|
3.00% due 06/01/201
|
409,000 | 469,839 | ||||||
|
Macquarie Infrastructure Company LLC
|
||||||||
|
2.88% due 07/15/19
|
400,000 | 468,250 | ||||||
|
Ligand Pharmaceuticals, Inc.
|
||||||||
|
0.75% due 08/15/194
|
308,000 | 374,413 | ||||||
|
NuVasive, Inc.
|
||||||||
|
2.75% due 07/01/17
|
270,000 | 333,956 | ||||||
|
Incyte Corp.
|
||||||||
|
0.38% due 11/15/18
|
159,000 | 305,678 | ||||||
|
Medivation, Inc.
|
||||||||
|
2.63% due 04/01/17
|
127,000 | 298,609 | ||||||
|
Total Consumer, Non-cyclical
|
20,639,983 | |||||||
See notes to financial statements.
|
PORTFOLIO OF INVESTMENTS (Unaudited) continued
|
April 30, 2015
|
|
Face
|
||||||||
|
Amount~
|
Value
|
|||||||
|
CONVERTIBLE BONDS†† – 83.1% (continued)
|
||||||||
|
Technology – 11.3%
|
||||||||
|
Microchip Technology, Inc.
|
||||||||
|
1.63% due 02/15/254
|
2,016,000 | $ | 2,071,440 | |||||
|
ServiceNow, Inc.
|
||||||||
|
0.00% due 11/01/182,3
|
1,348,000 | 1,624,341 | ||||||
|
Lam Research Corp.
|
||||||||
|
0.50% due 05/15/161
|
1,208,000 | 1,531,140 | ||||||
|
SanDisk Corp.
|
||||||||
|
0.50% due 10/15/201
|
1,152,000 | 1,190,880 | ||||||
|
Cornerstone OnDemand, Inc.
|
||||||||
|
1.50% due 07/01/181
|
1,139,000 | 1,114,084 | ||||||
|
Proofpoint, Inc.
|
||||||||
|
1.25% due 12/15/181
|
696,000 | 1,037,910 | ||||||
|
Intel Corp.
|
||||||||
|
3.48% due 12/15/351
|
704,000 | 898,480 | ||||||
|
ASM Pacific Technology Ltd.
|
||||||||
|
2.00% due 03/28/19
|
6,000,000 HKD
|
880,514 | ||||||
|
Verint Systems, Inc.
|
||||||||
|
1.50% due 06/01/211
|
703,000 | 822,949 | ||||||
|
Red Hat, Inc.
|
||||||||
|
0.25% due 10/01/191,4
|
647,000 | 795,001 | ||||||
|
Akamai Technologies, Inc.
|
||||||||
|
0.00% due 02/15/193
|
715,000 | 781,141 | ||||||
|
Micron Technology, Inc.
|
||||||||
|
3.00% due 11/15/431
|
674,000 | 765,411 | ||||||
|
NVIDIA Corp.
|
||||||||
|
1.00% due 12/01/181
|
600,000 | 736,500 | ||||||
|
Epistar Corp.
|
||||||||
|
0.00% due 08/07/183
|
700,000 | 728,000 | ||||||
|
Kingsoft Corp. Ltd.
|
||||||||
|
1.25% due 04/11/19
|
5,000,000 HKD
|
674,094 | ||||||
|
Synchronoss Technologies, Inc.
|
||||||||
|
0.75% due 08/15/19
|
522,000 | 604,868 | ||||||
|
PROS Holdings, Inc.
|
||||||||
|
2.00% due 12/01/194
|
600,000 | 593,625 | ||||||
|
Total Technology
|
16,850,378 | |||||||
|
Industrial – 10.0%
|
||||||||
|
Cemex SAB de CV
|
||||||||
|
3.72% due 03/15/201,4
|
1,169,000 | 1,278,593 | ||||||
|
Siemens Financieringsmaatschappij N.V.
|
||||||||
|
1.65% due 08/16/19
|
1,000,000 | 1,160,505 | ||||||
|
OSG Corp.
|
||||||||
|
0.00% due 04/04/223
|
90,000,000 JPY
|
1,151,040 | ||||||
|
Ebara Corp.
|
||||||||
|
0.00% due 03/19/183
|
110,000,000 JPY
|
1,117,281 | ||||||
See notes to financial statements.
LCM l ADVENT/CLAYMORE ENHANCED GROWTH & INCOME FUND SEMIANNUAL REPORT l 19
|
PORTFOLIO OF INVESTMENTS (Unaudited) continued
|
April 30, 2015
|
|
Face
|
||||||||
|
Amount~
|
Value
|
|||||||
|
CONVERTIBLE BONDS†† – 83.1% (continued)
|
||||||||
|
Industrial – 10.0% (continued)
|
||||||||
|
Fluidigm Corp.
|
||||||||
|
2.75% due 02/01/341
|
1,042,000 | $ | 1,058,933 | |||||
|
Larsen & Toubro Ltd.
|
||||||||
|
0.68% due 10/22/19
|
944,000 | 1,028,016 | ||||||
|
Deutsche Post A.G.
|
||||||||
|
0.60% due 12/06/19
|
600,000 EUR
|
951,010 | ||||||
|
MISUMI Group, Inc.
|
||||||||
|
0.00% due 10/22/183
|
800,000 | 917,600 | ||||||
|
BW Group Ltd.
|
||||||||
|
1.75% due 09/10/19
|
1,000,000 | 906,000 | ||||||
|
Zhen Ding Technology Holding Ltd.
|
||||||||
|
0.00% due 06/26/193
|
800,000 | 900,200 | ||||||
|
Greenbrier Companies, Inc.
|
||||||||
|
3.50% due 04/01/18
|
500,000 | 757,813 | ||||||
|
Yaskawa Electric Corp.
|
||||||||
|
0.00% due 03/16/173
|
55,000,000 JPY
|
689,396 | ||||||
|
Mitsui OSK Lines, Ltd.
|
||||||||
|
0.00% due 04/24/203
|
600,000 | 591,450 | ||||||
|
KUKA A.G.
|
||||||||
|
2.00% due 02/12/18
|
300,000 EUR
|
588,490 | ||||||
|
Vishay Intertechnology, Inc.
|
||||||||
|
2.25% due 11/15/40
|
504,000 | 509,355 | ||||||
|
Chart Industries, Inc.
|
||||||||
|
2.00% due 08/01/181
|
429,000 | 453,131 | ||||||
|
Nidec Corp.
|
||||||||
|
0.00% due 09/18/153
|
25,000,000 JPY
|
352,480 | ||||||
|
UTi Worldwide, Inc.
|
||||||||
|
4.50% due 03/01/19
|
286,000 | 285,643 | ||||||
|
Trinity Industries, Inc.
|
||||||||
|
3.88% due 06/01/36
|
215,000 | 280,172 | ||||||
|
Total Industrial
|
14,977,108 | |||||||
|
Consumer, Cyclical – 8.8%
|
||||||||
|
Jarden Corp.
|
||||||||
|
1.13% due 03/15/341
|
1,481,000 | 1,719,811 | ||||||
|
Fiat Chrysler Automobiles N.V.
|
||||||||
|
7.88% due 12/15/16
|
10,400 | 1,341,600 | ||||||
|
Faurecia
|
||||||||
|
3.25% due 01/01/18
|
2,582,000 EUR
|
1,239,021 | ||||||
|
Iconix Brand Group, Inc.
|
||||||||
|
1.50% due 03/15/181
|
585,000 | 606,206 | ||||||
|
2.50% due 06/01/16
|
436,000 | 453,440 | ||||||
|
Resorttrust, Inc.
|
||||||||
|
0.00% due 12/01/213
|
110,000,000 JPY
|
1,059,372 | ||||||
See notes to financial statements.
|
PORTFOLIO OF INVESTMENTS (Unaudited) continued
|
April 30, 2015
|
|
Face
|
||||||||
|
Amount~
|
Value
|
|||||||
|
CONVERTIBLE BONDS†† – 83.1% (continued)
|
||||||||
|
Consumer, Cyclical – 8.8% (continued)
|
||||||||
|
Steinhoff Finance Holding GmbH
|
||||||||
|
4.00% due 01/30/21
|
600,000 EUR
|
$ | 1,014,277 | |||||
|
International Consolidated Airlines Group S.A.
|
||||||||
|
1.75% due 05/31/18
|
500,000 EUR
|
996,897 | ||||||
|
Toray Industries, Inc.
|
||||||||
|
0.00% due 08/30/193
|
80,000,000 JPY
|
833,124 | ||||||
|
Sekisui House Co.
|
||||||||
|
0.00% due 07/05/163
|
40,000,000 JPY
|
627,392 | ||||||
|
Volkswagen International Finance N.V.
|
||||||||
|
5.50% due 11/09/151,4
|
400,000 EUR
|
600,888 | ||||||
|
Adidas A.G.
|
||||||||
|
0.25% due 06/14/19
|
400,000 EUR
|
530,110 | ||||||
|
NHK Spring Co. Ltd.
|
||||||||
|
0.00% due 09/20/193
|
450,000 | 511,425 | ||||||
|
Standard Pacific Corp.
|
||||||||
|
1.25% due 08/01/32
|
429,000 | 503,003 | ||||||
|
Sonae Investments B.V.
|
||||||||
|
1.63% due 06/11/19
|
400,000 EUR
|
456,064 | ||||||
|
Rallye S.A.
|
||||||||
|
1.00% due 10/02/20
|
350,000 EUR
|
442,295 | ||||||
|
LGI Homes, Inc.
|
||||||||
|
4.25% due 11/15/194
|
219,000 | 227,486 | ||||||
|
Total Consumer, Cyclical
|
13,162,411 | |||||||
|
Energy – 2.9%
|
||||||||
|
SunEdison, Inc.
|
||||||||
|
0.25% due 01/15/201,4
|
1,640,000 | 1,851,150 | ||||||
|
Whiting Petroleum Corp.
|
||||||||
|
1.25% due 04/01/201,4
|
1,107,000 | 1,324,249 | ||||||
|
CaixaBank S.A.
|
||||||||
|
4.50% due 11/22/16
|
600,000 EUR
|
666,000 | ||||||
|
Utilities – 2.0%
|
||||||||
|
Helix Energy Solutions Group, Inc.
|
||||||||
|
3.25% due 03/15/32
|
500,000 | 508,750 | ||||||
|
Total Energy
|
4,350,149 | |||||||
|
ENN Energy Holdings Ltd.
|
||||||||
|
0.00% due 02/26/183
|
1,000,000 | 1,260,000 | ||||||
|
CenterPoint Energy, Inc.
|
||||||||
|
3.94% due 09/15/291,5
|
18,995 | 1,256,044 | ||||||
|
China Power International Development Ltd.
|
||||||||
|
2.75% due 09/18/17
|
1,500,000 CNY
|
523,796 | ||||||
|
Total Utilities
|
3,039,840 | |||||||
See notes to financial statements.
|
PORTFOLIO OF INVESTMENTS (Unaudited) continued
|
April 30, 2015
|
|
Face
|
||||||||
|
Amount~
|
Value
|
|||||||
|
CONVERTIBLE BONDS†† – 83.1% (continued)
|
||||||||
|
Diversified – 1.1%
|
||||||||
|
Misarte
|
||||||||
|
3.25% due 01/01/16
|
430,000 EUR
|
$ | 847,959 | |||||
|
Horizon Pharma Investment Ltd.
|
||||||||
|
2.50% due 03/15/224
|
610,000 | 760,213 | ||||||
|
Total Diversified
|
1,608,172 | |||||||
|
Basic Materials – 0.9%
|
||||||||
|
Royal Gold, Inc.
|
||||||||
|
2.88% due 06/15/191
|
1,000,000 | 1,046,250 | ||||||
|
B2Gold Corp.
|
||||||||
|
3.25% due 10/01/18
|
300,000 | 258,938 | ||||||
|
Total Basic Materials
|
1,305,188 | |||||||
|
Total Convertible Bonds
|
||||||||
|
(Cost $119,843,362)
|
124,175,875 | |||||||
|
CORPORATE BONDS†† – 28.7%
|
||||||||
|
Communications – 6.6%
|
||||||||
|
UPCB Finance III Ltd.
|
||||||||
|
6.63% due 07/01/201,4
|
1,400,000 | 1,457,399 | ||||||
|
Alliance Data Systems Corp.
|
||||||||
|
6.38% due 04/01/204
|
1,250,000 | 1,304,688 | ||||||
|
Numericable-SFR SAS
|
||||||||
|
4.88% due 05/15/191,4
|
1,250,000 | 1,265,624 | ||||||
|
Altice S.A.
|
||||||||
|
7.75% due 05/15/221,4
|
1,000,000 | 1,012,510 | ||||||
|
Sprint Communications, Inc.
|
||||||||
|
9.00% due 11/15/184
|
490,000 | 558,752 | ||||||
|
T-Mobile USA, Inc.
|
||||||||
|
6.63% due 04/28/21
|
500,000 | 529,375 | ||||||
|
EarthLink Holdings Corp.
|
||||||||
|
7.38% due 06/01/201
|
500,000 | 522,500 | ||||||
|
LIN Television Corp.
|
||||||||
|
5.88% due 11/15/221,4
|
500,000 | 516,250 | ||||||
|
Radio One, Inc.
|
||||||||
|
7.38% due 04/15/224
|
350,000 | 354,813 | ||||||
|
DISH DBS Corp.
|
||||||||
|
6.75% due 06/01/21
|
300,000 | 318,399 | ||||||
|
Equinix, Inc.
|
||||||||
|
5.75% due 01/01/25
|
300,000 | 317,250 | ||||||
|
Wind Acquisition Finance S.A.
|
||||||||
|
7.00% due 04/23/21
|
240,000 EUR
|
288,042 | ||||||
|
Townsquare Media, Inc.
|
||||||||
|
6.50% due 04/01/234
|
252,000 | 254,205 | ||||||
See notes to financial statements.
|
PORTFOLIO OF INVESTMENTS (Unaudited) continued
|
April 30, 2015
|
|
Face
|
||||||||
|
Amount~
|
Value
|
|||||||
|
CORPORATE BONDS†† – 28.7% (continued)
|
||||||||
|
Communications – 6.6% (continued)
|
||||||||
|
Univision Communications, Inc.
|
||||||||
|
5.13% due 02/15/254
|
250,000 | $ | 252,500 | |||||
|
West Corp.
|
||||||||
|
5.38% due 07/15/224
|
240,000 | 231,900 | ||||||
|
Telesat Canada / Telesat LLC
|
||||||||
|
6.00% due 05/15/174
|
200,000 | 203,600 | ||||||
|
Outfront Media Capital LLC / Outfront Media Capital Corp.
|
||||||||
|
5.63% due 02/15/244
|
120,000 | 124,950 | ||||||
|
GCI, Inc.
|
||||||||
|
6.88% due 04/15/254
|
120,000 | 123,600 | ||||||
|
CenturyLink, Inc.
|
||||||||
|
5.63% due 04/01/254
|
120,000 | 120,450 | ||||||
|
Level 3 Financing, Inc.
|
||||||||
|
5.38% due 05/01/254
|
120,000 | 120,000 | ||||||
|
Total Communications
|
9,876,807 | |||||||
|
Consumer, Non-cyclical – 6.0%
|
||||||||
|
Tenet Healthcare Corp.
|
||||||||
|
6.00% due 10/01/201
|
2,425,000 | 2,594,749 | ||||||
|
8.13% due 04/01/22
|
120,000 | 131,250 | ||||||
|
HCA, Inc.
|
||||||||
|
6.50% due 02/15/201
|
700,000 | 799,750 | ||||||
|
4.75% due 05/01/23
|
500,000 | 526,250 | ||||||
|
United Rentals North America, Inc.
|
||||||||
|
7.38% due 05/15/20
|
600,000 | 649,974 | ||||||
|
5.75% due 11/15/24
|
240,000 | 247,800 | ||||||
|
Prospect Medical Holdings, Inc.
|
||||||||
|
8.38% due 05/01/191,4
|
500,000 | 535,000 | ||||||
|
CHS/Community Health Systems, Inc.
|
||||||||
|
5.13% due 08/15/18
|
500,000 | 520,000 | ||||||
|
Sotheby’s
|
||||||||
|
5.25% due 10/01/221,4
|
500,000 | 501,250 | ||||||
|
Omnicare, Inc.
|
||||||||
|
5.00% due 12/01/24
|
360,000 | 394,200 | ||||||
|
Cott Beverages, Inc.
|
||||||||
|
6.75% due 01/01/204
|
360,000 | 378,000 | ||||||
|
Cenveo Corp.
|
||||||||
|
8.50% due 09/15/224
|
250,000 | 210,625 | ||||||
|
11.50% due 05/15/17
|
120,000 | 122,100 | ||||||
|
HealthSouth Corp.
|
||||||||
|
5.13% due 03/15/23
|
300,000 | 310,500 | ||||||
|
Biomet, Inc.
|
||||||||
|
6.50% due 08/01/20
|
250,000 | 265,313 | ||||||
|
Valeant Pharmaceuticals International
|
||||||||
|
6.38% due 10/15/204
|
240,000 | 253,800 | ||||||
See notes to financial statements
|
PORTFOLIO OF INVESTMENTS (Unaudited) continued
|
April 30, 2015
|
|
Face
|
||||||||
|
Amount~
|
Value
|
|||||||
|
CORPORATE BONDS†† – 28.7% (continued)
|
||||||||
|
Consumer, Non-cyclical – 6.0% (continued)
|
||||||||
|
Novasep Holding SAS
|
||||||||
|
8.00% due 12/15/164
|
270,000 | $ | 247,725 | |||||
|
FAGE Dairy Industry S.A. / FAGE USA Dairy Industry, Inc.
|
||||||||
|
9.88% due 02/01/204
|
100,000 | 105,625 | ||||||
|
Live Nation Entertainment, Inc.
|
||||||||
|
7.00% due 09/01/204
|
70,000 | 74,900 | ||||||
|
Concordia Healthcare Corp.
|
||||||||
|
7.00% due 04/15/234
|
60,000 | 61,050 | ||||||
|
Total Consumer, Non-cyclical
|
8,929,861 | |||||||
|
Basic Materials – 3.6%
|
||||||||
|
Ashland, Inc.
|
||||||||
|
4.75% due 08/15/221
|
1,448,000 | 1,491,440 | ||||||
|
FMG Resources August 2006 Pty Ltd.
|
||||||||
|
8.25% due 11/01/194
|
718,000 | 629,147 | ||||||
|
9.75% due 03/01/224
|
60,000 | 61,988 | ||||||
|
Sappi Papier Holding GmbH
|
||||||||
|
6.63% due 04/15/214
|
500,000 | 525,000 | ||||||
|
Steel Dynamics, Inc.
|
||||||||
|
5.13% due 10/01/214
|
500,000 | 513,750 | ||||||
|
Commercial Metals Co.
|
||||||||
|
4.88% due 05/15/23
|
370,000 | 354,275 | ||||||
|
Appvion, Inc.
|
||||||||
|
9.00% due 06/01/204
|
500,000 | 330,000 | ||||||
|
Verso Paper Holdings LLC / Verso Paper, Inc.
|
||||||||
|
11.75% due 01/15/19
|
360,000 | 316,800 | ||||||
|
Celanese US Holdings LLC
|
||||||||
|
4.63% due 11/15/22
|
300,000 | 308,250 | ||||||
|
First Quantum Minerals Ltd.
|
||||||||
|
7.00% due 02/15/214
|
300,000 | 281,250 | ||||||
|
Compass Minerals International, Inc.
|
||||||||
|
4.88% due 07/15/244
|
240,000 | 243,000 | ||||||
|
HIG BBC Intermediate Holdings LLC / HIG BBC Holdings Corp.
|
||||||||
|
10.50% due 09/15/184,7
|
240,000 | 225,600 | ||||||
|
Hexion, Inc.
|
||||||||
|
8.88% due 02/01/18
|
180,000 | 160,875 | ||||||
|
Total Basic Materials
|
5,441,375 | |||||||
|
Consumer, Cyclical – 3.4%
|
||||||||
|
Hilton Worldwide Finance LLC / Hilton Worldwide Finance Corp.
|
||||||||
|
5.63% due 10/15/211
|
1,000,000 | 1,060,000 | ||||||
|
MGM Resorts International
|
||||||||
|
5.25% due 03/31/201
|
600,000 | 615,000 | ||||||
|
6.00% due 03/15/23
|
300,000 | 312,188 | ||||||
See notes to financial statements.
24 l LCM l ADVENT/CLAYMORE ENHANCED GROWTH & INCOME FUND SEMIANNUAL REPORT
|
PORTFOLIO OF INVESTMENTS (Unaudited) continued
|
April 30, 2015
|
|
Face
|
||||||||
|
Amount~
|
Value
|
|||||||
|
CORPORATE BONDS†† – 28.7% (continued)
|
||||||||
|
Consumer, Cyclical – 3.4% (continued)
|
||||||||
|
FCA US LLC / CG Company-Issuer, Inc.
|
||||||||
|
8.00% due 06/15/191
|
500,000 | $ | 524,400 | |||||
|
Churchill Downs, Inc.
|
||||||||
|
5.38% due 12/15/21
|
385,000 | 394,625 | ||||||
|
Dana Holding Corp.
|
||||||||
|
5.50% due 12/15/24
|
300,000 | 309,750 | ||||||
|
Polymer Group, Inc.
|
||||||||
|
6.88% due 06/01/194
|
300,000 | 286,125 | ||||||
|
Speedway Motorsports, Inc.
|
||||||||
|
5.13% due 02/01/234
|
240,000 | 243,288 | ||||||
|
Wynn Las Vegas LLC / Wynn Las Vegas Capital Corp.
|
||||||||
|
5.50% due 03/01/254
|
240,000 | 242,100 | ||||||
|
Scientific Games International, Inc.
|
||||||||
|
10.00% due 12/01/224
|
240,000 | 223,800 | ||||||
|
Fiat Chrysler Automobiles N.V.
|
||||||||
|
5.25% due 04/15/234
|
200,000 | 202,500 | ||||||
|
First Cash Financial Services, Inc.
|
||||||||
|
6.75% due 04/01/21
|
180,000 | 187,200 | ||||||
|
Global Partners Limited Partnership / GLP Finance Corp.
|
||||||||
|
6.25% due 07/15/22
|
180,000 | 178,200 | ||||||
|
Levi Strauss & Co.
|
||||||||
|
5.00% due 05/01/254
|
161,000 | 161,704 | ||||||
|
Regal Entertainment Group
|
||||||||
|
5.75% due 03/15/22
|
120,000 | 123,750 | ||||||
|
Family Tree Escrow LLC
|
||||||||
|
5.75% due 03/01/234
|
60,000 | 63,300 | ||||||
|
Total Consumer, Cyclical
|
5,127,930 | |||||||
|
Financial – 2.5%
|
||||||||
|
Synovus Financial Corp.
|
||||||||
|
7.88% due 02/15/191
|
669,000 | 759,315 | ||||||
|
5.13% due 06/15/171
|
312,000 | 322,140 | ||||||
|
CIT Group, Inc.
|
||||||||
|
5.50% due 02/15/194
|
860,000 | 901,925 | ||||||
|
Credit Acceptance Corp.
|
||||||||
|
7.38% due 03/15/234
|
360,000 | 359,100 | ||||||
|
Ally Financial, Inc.
|
||||||||
|
5.13% due 09/30/24
|
300,000 | 312,375 | ||||||
|
E*TRADE Financial Corp.
|
||||||||
|
4.63% due 09/15/23
|
300,000 | 307,125 | ||||||
|
Kennedy-Wilson, Inc.
|
||||||||
|
5.88% due 04/01/24
|
300,000 | 304,530 | ||||||
|
Corrections Corporation of America
|
||||||||
|
4.63% due 05/01/23
|
300,000 | 303,750 | ||||||
See notes to financial statements.
|
PORTFOLIO OF INVESTMENTS (Unaudited) continued
|
April 30, 2015
|
|
Face
|
||||||||
|
Amount~
|
Value
|
|||||||
|
CORPORATE BONDS†† – 28.7% (continued)
|
||||||||
|
Financial – 2.5% (continued)
|
||||||||
|
Greystar Real Estate Partners LLC
|
||||||||
|
8.25% due 12/01/224
|
100,000 | $ | 106,250 | |||||
|
Total Financial
|
3,676,510 | |||||||
|
Industrial – 2.4%
|
||||||||
|
Pfleiderer GmbH
|
||||||||
|
7.88% due 08/01/19
|
500,000 EUR
|
579,885 | ||||||
|
Sanmina Corp.
|
||||||||
|
4.38% due 06/01/191,4
|
550,000 | 554,125 | ||||||
|
Reynolds Group Issuer Incorporated / Reynolds Group Issuer LLC / Reynolds Group
|
||||||||
|
Issuer Lu
|
||||||||
|
5.75% due 10/15/20
|
420,000 | 439,950 | ||||||
|
MasTec, Inc.
|
||||||||
|
4.88% due 03/15/231
|
445,000 | 422,750 | ||||||
|
Eletson Holdings
|
||||||||
|
9.63% due 01/15/224
|
360,000 | 353,700 | ||||||
|
Navios Maritime Acquisition Corporation / Navios Acquisition Finance US, Inc.
|
||||||||
|
8.13% due 11/15/214
|
318,000 | 326,745 | ||||||
|
Cleaver-Brooks, Inc.
|
||||||||
|
8.75% due 12/15/194
|
300,000 | 306,000 | ||||||
|
Masco Corp.
|
||||||||
|
4.45% due 04/01/25
|
240,000 | 248,400 | ||||||
|
Navios Maritime Holdings Incorporated / Navios Maritime Finance II US Inc
|
||||||||
|
7.38% due 01/15/224
|
250,000 | 231,250 | ||||||
|
Casella Waste Systems, Inc.
|
||||||||
|
7.75% due 02/15/19
|
120,000 | 123,000 | ||||||
|
KLX, Inc.
|
||||||||
|
5.88% due 12/01/224
|
60,000 | 60,675 | ||||||
|
Total Industrial
|
3,646,480 | |||||||
|
Energy – 2.4%
|
||||||||
|
PBF Holding Company LLC / PBF Finance Corp.
|
||||||||
|
8.25% due 02/15/201
|
1,000,000 | 1,065,000 | ||||||
|
Tesoro Corp.
|
||||||||
|
5.13% due 04/01/24
|
500,000 | 515,000 | ||||||
|
Regency Energy Partners Limited Partnership / Regency Energy Finance Corp.
|
||||||||
|
5.88% due 03/01/22
|
300,000 | 336,750 | ||||||
|
Continental Resources, Inc.
|
||||||||
|
4.50% due 04/15/23
|
300,000 | 302,515 | ||||||
|
Calumet Specialty Products Partners Limited Partnership / Calumet Finance Corp.
|
||||||||
|
6.50% due 04/15/214
|
300,000 | 300,000 | ||||||
|
Genesis Energy Limited Partnership / Genesis Energy Finance Corp.
|
||||||||
|
5.75% due 02/15/211
|
300,000 | 299,250 | ||||||
|
Alta Mesa Holdings Limited Partnership / Alta Mesa Finance Services Corp.
|
||||||||
|
9.63% due 10/15/18
|
300,000 | 251,250 | ||||||
See notes to financial statements.
|
PORTFOLIO OF INVESTMENTS (Unaudited) continued
|
April 30, 2015
|
|
Face
|
||||||||
|
Amount~
|
Value
|
|||||||
|
CORPORATE BONDS†† – 28.7% (continued)
|
||||||||
|
Energy – 2.4% (continued)
|
||||||||
|
CONSOL Energy, Inc.
|
||||||||
|
5.88% due 04/15/22
|
270,000 | $ | 249,075 | |||||
|
BreitBurn Energy Partners Limited Partnership / BreitBurn Finance Corp.
|
||||||||
|
8.63% due 10/15/20
|
180,000 | 153,000 | ||||||
|
Laredo Petroleum, Inc.
|
||||||||
|
6.25% due 03/15/23
|
120,000 | 124,800 | ||||||
|
Western Refining Logistics Limited Partnership / WNRL Finance Corp.
|
||||||||
|
7.50% due 02/15/234
|
24,000 | 25,080 | ||||||
|
Total Energy
|
3,621,720 | |||||||
|
Technology – 1.8%
|
||||||||
|
First Data Corp.
|
||||||||
|
11.75% due 08/15/212
|
500,000 | 576,250 | ||||||
|
12.63% due 01/15/21
|
400,000 | 473,200 | ||||||
|
Nuance Communications, Inc.
|
||||||||
|
5.38% due 08/15/201,4
|
705,000 | 715,575 | ||||||
|
NXP BV / NXP Funding LLC
|
||||||||
|
5.75% due 02/15/214
|
550,000 | 586,438 | ||||||
|
Project Homestake Merger Corp.
|
||||||||
|
8.88% due 03/01/234
|
240,000 | 243,300 | ||||||
|
Total Technology
|
2,594,763 | |||||||
|
Total Corporate Bonds
|
||||||||
|
(Cost $42,694,500)
|
42,915,446 | |||||||
|
SENIOR FLOATING RATE INTERESTS††,8 – 0.2%
|
||||||||
|
Basic Materials – 0.2%
|
||||||||
|
Vertellus Specialties, Inc.
|
||||||||
|
10.50% due 10/30/19
|
298,500 | 262,182 | ||||||
|
Total Senior Floating Rate Interests
|
||||||||
|
(Cost $289,047)
|
262,182 | |||||||
|
Total Investments – 134.1%
|
||||||||
|
(Cost $195,657,019)
|
$ | 200,489,591 | ||||||
|
Other Assets & Liabilities, net – (34.1)%
|
(51,042,202 | ) | ||||||
|
Total Net Assets – 100.0%
|
$ | 149,447,389 | ||||||
|
~
|
The face amount is denominated in U.S. Dollars, unless otherwise noted.
|
|
|
*
|
Non-income producing security.
|
|
|
†
|
Value determined based on Level 1 inputs — See Note 2.
|
|
|
††
|
Value determined based on Level 2 inputs — See Note 2.
|
|
|
1
|
All or a portion of these securities have been physically segregated in connection with borrowings. As
|
|
|
of April 30, 2015, the total value of the positions segregated was $83,468,331.
|
||
|
2
|
All or a portion of these securities are reserved and/or pledged with the custodian for forward foreign
|
|
|
currency exchange contracts. As of April 30, 2015, the total amount segregated was $8,399,243.
|
See notes to financial statements.
|
PORTFOLIO OF INVESTMENTS (Unaudited) continued
|
April 30, 2015
|
|
3
|
Zero coupon rate security.
|
|
|
4
|
Security is a 144A or Section 4(a)(2) security. The total market value of 144A or Section 4(a)(2)
|
|
|
securities is $40,554,711 (cost $39,984,128), or 27.1% of total net assets.
|
||
|
5
|
Security is a step up/step down bond. The coupon increases or decreases at regular intervals until
|
|
|
the bond reaches full maturity.
|
||
|
6
|
Security becomes an accreting bond after December 15, 2017 with a 4.00% principal accretion rate,
|
|
|
and then accretes at a 2.00% principal accretion rate until maturity.
|
||
|
7
|
Payment-In-Kind toggle notes that give the issuer the option to pay 10.50% interest in cash or 11.25%
|
|
|
interest in additional Payment-In-Kind toggle notes.
|
||
|
8
|
Variable rate security. Rate indicated is rate effective at April 30, 2015.
|
|
|
9
|
Perpetual maturity.
|
|
ADR
|
American Depositary Receipt
|
|
B.V.
|
Limited Liability Company
|
|
CAD
|
Canadian Dollar
|
|
CNY
|
Chinese Yuan
|
|
EUR
|
Euro
|
|
GBP
|
British Pound
|
|
GmbH
|
Limited Liability
|
|
HKD
|
Hong Kong Dollar
|
|
JPY
|
Japanese Yen
|
|
N.V.
|
Publicly Traded Company
|
|
plc
|
Public Limited Company
|
|
S.A.
|
Corporation
|
|
SAB de CV
|
Publicly Traded Company
|
|
SpA
|
Limited Share Company
|
See notes to financial statements.
|
STATEMENT OF ASSETS AND LIABILITIES (Unaudited)
|
April 30, 2015
|
|
ASSETS:
|
||||
|
Investments, at value (Cost $195,657,019)
|
$ | 200,489,591 | ||
|
Foreign Currency, at value (Cost $411,018)
|
398,579 | |||
|
Unrealized appreciation on forward foreign currency exchange contracts
|
134,168 | |||
|
Receivables:
|
||||
|
Investments sold
|
2,734,116 | |||
|
Interest
|
1,066,602 | |||
|
Dividends
|
56,810 | |||
|
Tax reclaims
|
11,500 | |||
|
Total assets
|
204,891,366 | |||
|
LIABILITIES:
|
||||
|
Borrowings
|
50,000,000 | |||
|
Unrealized depreciation on forward foreign currency exchange contracts
|
1,534,184 | |||
|
Interest due on borrowings
|
4,158 | |||
|
Payable for:
|
||||
|
Investments purchased
|
3,553,278 | |||
|
Investment management fees
|
84,019 | |||
|
Investment advisory fees
|
80,735 | |||
|
Administration fees
|
4,449 | |||
|
Trustee fees
|
1,667 | |||
|
Other fees
|
181,487 | |||
|
Total liabilities
|
55,443,977 | |||
|
NET ASSETS
|
$ | 149,447,389 | ||
|
NET ASSETS CONSIST OF:
|
||||
|
Common Stock, $0.001 par value per share, unlimited number of shares authorized,
|
||||
|
13,603,025 shares issued and outstanding
|
$ | 13,603 | ||
|
Additional paid-in capital
|
208,387,619 | |||
|
Distributions in excess of net investment income
|
(5,641,275 | ) | ||
|
Accumulated net realized loss on investments, written options and foreign
|
||||
|
currency transactions
|
(56,743,087 | ) | ||
|
Net unrealized appreciation on investments, written options and foreign
|
||||
|
currency translations
|
3,430,529 | |||
|
NET ASSETS
|
$ | 149,447,389 | ||
|
Shares outstanding ($0.001 par value with unlimited amount authorized)
|
13,603,025 | |||
|
Net asset value, offering price and repurchase price per share
|
$ | 10.99 | ||
See notes to financial statements.
LCM l ADVENT/CLAYMORE ENHANCED GROWTH & INCOME FUND SEMIANNUAL REPORT l 29
|
STATEMENT OF OPERATIONS
|
April 30, 2015
|
For the Period Ended April 30, 2015 (Unaudited)
|
INVESTMENT INCOME:
|
||||
|
Interest
|
$ | 2,256,748 | ||
|
Dividends, net of foreign taxes withheld of $930
|
655,227 | |||
|
Total investment income
|
2,911,975 | |||
|
EXPENSES:
|
||||
|
Investment management fees
|
494,500 | |||
|
Investment advisory fees
|
475,108 | |||
|
Interest expense
|
303,174 | |||
|
Professional fees
|
81,488 | |||
|
Trustee fees
|
78,042 | |||
|
Fund accounting fees
|
29,908 | |||
|
Administration fees
|
26,658 | |||
|
Printing fees
|
20,489 | |||
|
Insurance
|
17,204 | |||
|
Custodian fees
|
12,546 | |||
|
NYSE listing fees
|
11,765 | |||
|
Transfer agent fees
|
10,207 | |||
|
Other fees
|
543 | |||
|
Total expenses
|
1,561,632 | |||
|
Net investment income
|
1,350,343 | |||
|
NET REALIZED AND UNREALIZED GAIN (LOSS):
|
||||
|
Net realized gain (loss) on:
|
||||
|
Investments
|
(3,258,777 | ) | ||
|
Foreign currency transactions
|
5,195,996 | |||
|
Written options
|
(7,556 | ) | ||
|
Net realized gain
|
1,929,663 | |||
|
Net change in unrealized appreciation (depreciation) on:
|
||||
|
Investments
|
6,555,756 | |||
|
Foreign currency translations
|
(2,518,384 | ) | ||
|
Written options
|
22,043 | |||
|
Net change in unrealized appreciation
|
4,059,415 | |||
|
Net realized and unrealized gain
|
5,989,078 | |||
|
Net increase in net assets resulting from operations
|
$ | 7,339,421 | ||
See notes to financial statements.
|
STATEMENTS OF CHANGES IN NET ASSETS
|
April 30, 2015
|
|
Period Ended
|
||||||||
|
April 30, 2015
|
Year Ended
|
|||||||
|
(Unaudited)
|
October 31, 2014
|
|||||||
|
INCREASE (DECREASE) IN NET ASSETS FROM OPERATIONS:
|
||||||||
|
Net investment income
|
$ | 1,350,343 | $ | 2,893,637 | ||||
|
Net realized gain on investments, written options and foreign
|
||||||||
|
currency transactions
|
1,929,663 | 7,638,378 | ||||||
|
Net change in unrealized appreciation (depreciation) on
|
||||||||
|
investments, written options and foreign currency translations
|
4,059,415 | (7,671,316 | ) | |||||
|
Net increase in net assets resulting from operations
|
7,339,421 | 2,860,699 | ||||||
|
DISTRIBUTIONS TO SHAREHOLDERS FROM:
|
||||||||
|
Net investment income
|
(5,713,271 | ) | (11,368,513 | ) | ||||
|
Return of capital
|
— | (58,028 | ) | |||||
|
Total distributions
|
(5,713,271 | ) | (11,426,541 | ) | ||||
|
Net increase (decrease) in net assets
|
1,626,150 | (8,565,842 | ) | |||||
|
NET ASSETS:
|
||||||||
|
Beginning of period
|
147,821,239 | 156,387,081 | ||||||
|
End of period
|
$ | 149,447,389 | $ | 147,821,239 | ||||
|
Distributions in excess of net investment income at end of period
|
$ | (5,641,275 | ) | $ | (1,278,347 | ) | ||
See notes to financial statements.
|
STATEMENT OF CASH FLOWS
|
April 30, 2015
|
For the Period Ended April 30, 2015(Unaudited)
|
Cash Flows from Operating Activities:
|
||||
|
Net increase in net assets resulting from operations
|
$ | 7,339,421 | ||
|
Adjustments to Reconcile Net Increase in Net Assets Resulting from Operations to
|
||||
|
Net Cash Used in Operating and Investing Activities:
|
||||
|
Stock dividend received from corporate action
|
(97,855 | ) | ||
|
Net change in unrealized appreciation on investments
|
(6,555,756 | ) | ||
|
Net change in unrealized appreciation on written options
|
(22,043 | ) | ||
|
Net change in unrealized depreciation on foreign currency translations
|
2,518,384 | |||
|
Net realized loss on investments
|
3,258,777 | |||
|
Purchase of long-term investments
|
(130,526,958 | ) | ||
|
Proceeds from sale of long-term investments
|
127,842,197 | |||
|
Net amortization/accretion of premium/discount
|
71,755 | |||
|
Net proceeds (purchases) from sale of short-term investments
|
(6,333,069 | ) | ||
|
Net decrease in premiums received on written options
|
(46,434 | ) | ||
|
Decrease in investments sold receivable
|
1,127,894 | |||
|
Decrease in interest receivable
|
76,290 | |||
|
Decrease in dividends receivable
|
108,735 | |||
|
Decrease in tax reclaims receivable
|
885 | |||
|
Decrease in other assets
|
17,030 | |||
|
Increase in interest due on borrowings
|
72 | |||
|
Decrease in investments purchased payable
|
(5,980,741 | ) | ||
|
Increase in investment management fees payable
|
7 | |||
|
Increase in investment advisory fees payable
|
7 | |||
|
Decrease in administration fees payable
|
(5 | ) | ||
|
Decrease in trustees fees payable
|
(5,267 | ) | ||
|
Decrease in other fees
|
(9,168 | ) | ||
|
Net Cash Used in Operating and Investing Activities
|
(7,215,842 | ) | ||
|
Cash Flows From Financing Activities:
|
||||
|
Distributions to common shareholders
|
(5,713,271 | ) | ||
|
Net Cash Used in Financing Activities
|
(5,713,271 | ) | ||
|
Net decrease in cash
|
(12,929,113 | ) | ||
|
Cash and cash equivalents (including foreign currency) at Beginning of Period
|
13,327,692 | |||
|
Cash and cash equivalents (including foreign currency) at End of Period
|
$ | 398,579 | ||
|
Supplemental Disclosure of Cash Flow Information:
|
||||
|
Cash paid during the period for interest
|
$ | 303,102 | ||
|
Stock dividend received from corporate action
|
$ | 97,855 | ||
See notes to financial statements.
|
FINANCIAL HIGHLIGHTS
|
April 30, 2015
|
|
Period Ended
|
Year Ended
|
Year Ended
|
Year Ended
|
Year Ended
|
Period Ended
|
|||||||||||||||||||
|
April 30, 2015
|
October 31,
|
October 31,
|
October 31,
|
October 31,
|
October 31,
|
|||||||||||||||||||
|
(Unaudited)
|
2014
|
2013
|
2012
|
2011
|
2010
|
|||||||||||||||||||
|
Per Share Data:
|
||||||||||||||||||||||||
|
Net asset value, beginning of period
|
$ | 10.87 | $ | 11.50 | $ | 10.60 | $ | 10.63 | $ | 12.11 | $ | 11.72 | ||||||||||||
|
Income from investment operations:
|
||||||||||||||||||||||||
|
Net investment income(a)
|
0.10 | 0.21 | 0.23 | 0.41 | 0.42 | 0.40 | ||||||||||||||||||
|
Net gain (loss) on investments (realized and unrealized)
|
0.44 | — | * | 1.51 | 0.45 | (0.84 | ) | 1.05 | ||||||||||||||||
|
Total from investment operations
|
0.54 | 0.21 | 1.74 | 0.86 | (0.42 | ) | 1.45 | |||||||||||||||||
|
Less distributions from:
|
||||||||||||||||||||||||
|
Net investment income
|
(0.42 | ) | (0.84 | ) | (0.84 | ) | (0.86 | ) | (0.47 | ) | (1.06 | ) | ||||||||||||
|
Return of capital
|
— | — | * | — | (0.03 | ) | (0.59 | ) | — | |||||||||||||||
|
Total distributions to shareholders
|
(0.42 | ) | (0.84 | ) | (0.84 | ) | (0.89 | ) | (1.06 | ) | (1.06 | ) | ||||||||||||
|
Net asset value, end of period
|
$ | 10.99 | $ | 10.87 | $ | 11.50 | $ | 10.60 | $ | 10.63 | $ | 12.11 | ||||||||||||
|
Market value, end of period
|
$ | 9.62 | $ | 9.51 | $ | 10.03 | $ | 9.46 | $ | 9.73 | $ | 11.38 | ||||||||||||
|
Total Return(b)
|
||||||||||||||||||||||||
|
Net asset value
|
5.09 | % | 1.58 | % | 17.10 | % | 8.59 | % | -4.18 | % | 13.14 | % | ||||||||||||
|
Market value
|
5.78 | % | 2.90 | % | 15.56 | % | 6.78 | % | -6.27 | % | 19.37 | % | ||||||||||||
|
Ratios/Supplemental Data:
|
||||||||||||||||||||||||
|
Net assets, end of period (in thousands)
|
$ | 149,447 | $ | 147,821 | $ | 156,387 | $ | 144,222 | $ | 144,533 | $ | 164,684 | ||||||||||||
|
Ratio to average net assets of:
|
||||||||||||||||||||||||
|
Net investment income
|
1.87 | %(f) | 1.86 | % | 2.05 | % | 3.85 | % | 3.54 | % | 3.43 | % | ||||||||||||
|
Total expenses(c)
|
2.16 | %(f) | 2.10 | %(e) | 2.18 | %(e) | 2.32 | %(e) | 2.11 | % | 2.10 | % | ||||||||||||
|
Portfolio turnover rate
|
68 | % | 344 | % | 321 | % | 141 | % | 121 | % | 127 | % | ||||||||||||
|
Senior Indebtedness
|
||||||||||||||||||||||||
|
Total Borrowings outstanding (in thousands)
|
$ | 50,000 | $ | 50,000 | $ | 50,000 | $ | 50,000 | $ | 50,000 | $ | 50,000 | ||||||||||||
|
Asset Coverage per $1,000 of indebtedness(d)
|
$ | 3,989 | $ | 3,956 | $ | 4,128 | $ | 3,884 | $ | 3,891 | $ | 4,293 | ||||||||||||
See notes to financial statements.
|
FINANCIAL HIGHLIGHTS continued
|
April 30, 2015
|
|
(a)
|
Based on average shares outstanding.
|
|||||
|
(b)
|
Total return is calculated assuming a purchase of a common share at the beginning of the period and a sale on the last day of the period reported either at net asset value (“NAV”) or
|
|||||
|
market price per share. Distributions are assumed to be reinvested at NAV for NAV returns or the prices obtained under the Fund’s Dividend Reinvestment Plan for market value
|
||||||
|
returns. Total return does not reflect brokerage commissions. A return calculated for a period of less than one year is not annualized.
|
||||||
|
(c)
|
Excluding interest expense, the operating expense ratio for the period ended April 30, 2015 and the years ended October 31, would be:
|
|||||
|
April 30
|
|||||||
|
2015
|
2014
|
2013
|
2012
|
2011
|
2010 | ||
|
1.74%
|
1.71%
|
1.76%
|
1.82%
|
1.72%
|
1.71%
|
|
(d)
|
Calculated by subtracting the Fund’s total liabilities (not including the borrowings) from the Fund’s total assets and dividing by the total borrowings.
|
|||||
|
(e)
|
The expense ratio does not reflect fees and expenses incurred by the Fund as a result of its investment in shares of business development companies. If these fees were included in
|
|||||
|
the expense ratio, the increase to the expense ratio would be approximately 0.05%, 0.03% and 0.07% for the years ended October 31, 2014, 2013 and 2012, respectively.
|
||||||
|
(f)
|
Annualized.
|
|||||
|
*
|
Less than $0.01.
|
|||||
See notes to financial statements.
|
NOTES TO FINANCIAL STATEMENTS (Unaudited)
|
April 30, 2015
|
Note 1 – Organization:
Advent/Claymore Enhanced Growth & Income Fund (the “Fund”) was organized as a Delaware statutory trust on January 30, 2004. The Fund is registered as a diversified, closed-end management investment company under the Investment Company Act of 1940, as amended.
The Fund’s primary investment objective is to seek current income and current gains from trading in securities, with a secondary objective of long-term capital appreciation. The Fund will pursue its investment objectives by investing its assets in dividend and interest paying equity securities, convertible securities and nonconvertible high-yield securities. Also, in pursuit of the Fund’s primary investment objective, the Fund intends to engage in an option strategy of writing (selling) covered call options.
Note 2 – Accounting Policies:
The preparation of the financial statements in accordance with U.S. generally accepted accounting principles (“GAAP”) requires management to make estimates and assumptions that affect the reported amounts and disclosures in the financial statements. Actual results could differ from these estimates.
The following is a summary of the significant accounting policies followed by the Fund.
(a) Valuation of Investments
Equity securities listed on an exchange are valued at the last reported sale price on the primary exchange on which they are traded. Equity securities traded on an exchange or on the over-the-counter market and for which there are no transactions on a given day are valued at the mean of the closing bid and ask prices. Securities traded on NASDAQ are valued at the NASDAQ Official Closing Price. Equity securities not listed on a securities exchange or NASDAQ are valued at the mean of the closing bid and ask prices. Debt securities are valued by independent pricing services or dealers using the mean of the closing bid and ask prices for such securities or, if such prices are not available, at prices for securities of comparable maturity, quality and type. If sufficient market activity is limited or does not exist, the pricing providers or broker-dealers may utilize proprietary valuation models which consider market characteristics such as benchmark yield curves, option-adjusted spreads, credit spreads, estimated default rates, coupon rates, anticipated timing of principal repayments, underlying collateral, or other unique security features in order to estimate relevant cash flows, which are then discounted to calculate a security’s fair value. Exchange traded funds and listed closed-end funds are valued at the last sale price or official closing price on the exchange where the security is principally traded. Exchange-traded options are valued at the closing price, if traded that day. If not traded, they are valued at the mean of the bid and ask prices on the primary exchange on which they are traded. Futures contracts are valued using the settlement price established each day on the exchange on which they are traded. Swaps are valued daily by independent pricing services or dealers using the mid price. Forward foreign currency exchange contracts are valued daily at current exchange rates. The Fund values money market funds at net asset value. Short-term securities with remaining maturities of 60 days or less are valued at market price, or if a market price is not available, at amortized cost, provided such amount approximates market value.
For those securities where quotations or prices are not available, the valuations are determined in accordance with procedures established in good faith by management and approved by the Board of
|
NOTES TO FINANCIAL STATEMENTS (Unaudited) continued
|
April 30, 2015
|
Trustees. A valuation committee consisting of representatives from investment management, fund administration, legal and compliance is responsible for the oversight of the valuation process of the Fund and convenes monthly, or more frequently as needed. The valuation committee reviews monthly Level 3 fair valued securities methodology, price overrides, broker quoted securities, price source changes, illiquid securities, unchanged priced securities, halted securities, price challenges, fair valued securities sold and back testing trade prices in relation to prior day closing prices. On a quarterly basis, the valuations and methodologies of all Level 3 fair valued securities are presented to the Fund’s Board of Trustees.
Valuations in accordance with these procedures are intended to reflect each security’s (or asset’s) fair value. Such fair value is the amount that the Fund might reasonably expect to receive for the security (or asset) upon its current sale. Each such determination is based on a consideration of all relevant factors, which are likely to vary from one security to another. Examples of such factors may include, but are not limited to: (i) the type of security, (ii) the initial cost of the security, (iii) the existence of any contractual restrictions on the security’s disposition, (iv) the price and extent of public trading in similar securities of the issuer or of comparable companies, (v) quotations or evaluated prices from broker-dealers and/or pricing services, (vi) information obtained from the issuer, analysts, and/or the appropriate stock exchange (for exchange traded securities), (vii) an analysis of the company’s financial statements, and (viii) an evaluation of the forces that influence the issuer and the market(s) in which the security is purchased and sold (e.g. the existence of pending merger activity, public offerings or tender offers that might affect the value of the security). There were no securities fair valued in accordance with such procedures established by the Board of Trustees as of April 30, 2015.
GAAP requires disclosure of fair valuation measurements as of each measurement date. In compliance with GAAP, the Fund follows a fair value hierarchy that distinguishes between market data obtained from independent sources (observable inputs) and the Fund’s own market assumptions (unobservable inputs). These inputs are used in determining the value of the Fund’s investments and summarized in the following fair value hierarchy:
Level 1 – quoted prices in active markets for identical securities
Level 2 – quoted prices in inactive markets or other significant observable inputs (e.g. quoted prices for similar securities; interest rates; prepayment speed; credit risk; yield curves)
Level 3 – significant unobservable inputs (e.g. discounted cash flow analysis; non-market based methods used to determine fair value)
Observable inputs are those based upon market data obtained from independent sources, and unobservable inputs reflect the Fund’s own assumptions based on the best information available. A financial instrument’s level within the fair value hierarchy is based on the lowest level of any input both individually and in aggregate that is significant to the fair value measurement. The inputs or methodology used for valuing securities are not necessarily an indication of the risk associated with investing in those securities.
|
NOTES TO FINANCIAL STATEMENTS (Unaudited) continued
|
April 30, 2015
|
The following are certain inputs and techniques that are generally utilized to evaluate how to classify each major type of investment in accordance with GAAP.
Equity Securities (Common and Preferred Stock) – Equity securities traded in active markets where market quotations are readily available are categorized as Level 1. Equity securities traded in inactive markets and certain foreign equities are valued using inputs which include broker quotes, prices of securities closely related where the security held is not trading but the related security is trading, and evaluated price quotes received from independent pricing providers. To the extent that these inputs are observable, such securities are categorized as Level 2. To the extent that these inputs are unobservable, such securities are categorized as Level 3.
Convertible Bonds & Notes – Convertible bonds and notes are valued by independent pricing providers who employ matrix pricing models utilizing various inputs such as market prices, broker quotes, prices of securities with comparable maturities and qualities, and closing prices of corresponding underlying securities. To the extent that these inputs are observable, such securities are categorized as Level 2. To the extent that these inputs are unobservable, such securities are categorized as Level 3.
Corporate Bonds & Notes – Corporate bonds and notes are valued by independent pricing providers who employ matrix pricing models utilizing various inputs such as market prices, broker quotes, and prices of securities with comparable maturities and qualities, and closing prices of corresponding underlying securities. To the extent that these inputs are observable, such securities are categorized as Level 2. To the extent that these inputs are unobservable, such securities are categorized as Level 3.
Listed derivatives that are actively traded are valued based on quoted prices from the exchange and categorized in level 1 of the fair value hierarchy. Over-the-counter (OTC) derivative contracts including forward foreign currency exchange contracts and option contracts derive their value from underlying asset prices, indices, reference rates, and other inputs. Depending on the product and terms of the transaction, the fair value of the OTC derivative products can be modeled taking into account the counterparties’ creditworthiness and using a series of techniques, including simulation models. Many pricing models do not entail material subjectivity because the methodologies employed do not necessitate significant judgments, and the pricing inputs are observed from actively quoted markets. These OTC derivatives are categorized within Level 2 of the fair value hierarchy.
The Fund did not hold any Level 3 securities during the six months ended April 30, 2015.
Transfers between valuation levels, if any, are in comparison to the valuation levels at the end of the previous fiscal year, and are effective using the fair value as of the end of the current fiscal period.
There were no transfers between valuation levels during the six months ended April 30, 2015.
|
NOTES TO FINANCIAL STATEMENTS (Unaudited) continued
|
April 30, 2015
|
The following table represents the Fund’s investments carried on the Statement of Assets and Liabilities by caption and by level within the fair value hierarchy as of April 30, 2015:
|
Significant
|
||||||||||||||||
|
Quoted Prices
|
Other
|
Significant
|
||||||||||||||
|
in Active Markets
|
Observable
|
Unobservable
|
||||||||||||||
|
for Identical Assets
|
Inputs
|
Inputs
|
||||||||||||||
|
Description
|
(Level 1)
|
(Level 2)
|
(Level 3)
|
Total
|
||||||||||||
|
Assets:
|
||||||||||||||||
|
Convertible Bonds
|
$ | – | $ | 124,175,875 | $ | – | $ | 124,175,875 | ||||||||
|
Corporate Bonds
|
– | 42,915,446 | – | 42,915,446 | ||||||||||||
|
Common Stocks
|
13,340,212 | – | – | 13,340,212 | ||||||||||||
|
Convertible Preferred Stocks
|
13,186,415 | – | 13,186,415 | |||||||||||||
|
Short Term Investments
|
6,609,461 | – | – | 6,609,461 | ||||||||||||
|
Senior Floating Rate Interests
|
– | 262,182 | – | 262,182 | ||||||||||||
|
Forward Foreign
|
||||||||||||||||
|
Currency Exchange Contracts
|
– | 134,168 | – | 134,168 | ||||||||||||
|
Total
|
$ | 33,136,088 | $ | 167,487,671 | $ | – | $ | 200,623,759 | ||||||||
|
Liabilities:
|
||||||||||||||||
|
Forward Foreign
|
||||||||||||||||
|
Currency Exchange Contracts
|
$ | – | $ | 1,534,184 | $ | – | $ | 1,534,184 | ||||||||
|
Total
|
$ | – | $ | 1,534,184 | $ | – | $ | 1,534,184 | ||||||||
If not referenced in the table, please refer to the Portfolio of Investments for the breakdown of investment type by industry category.
(b) Investment Transactions and Investment Income
Investment transactions are accounted for on the trade date. Realized gains and losses on investments are determined on the identified cost basis. Dividend income is recorded net of applicable withholding taxes on the ex-dividend date and interest income is recorded on an accrual basis. Discounts on debt securities purchased are accreted to interest income over the lives of the respective securities using the effective interest method. Premiums on debt securities purchased are amortized to interest income up to the next call date of the respective securities using the effective interest method.
(c) Cash and Cash Equivalents
The Fund considers all demand deposits to be cash equivalents. Cash and cash equivalents are held at the Bank of New York Mellon.
(d) Restricted Cash
A portion of cash on hand is pledged with a broker for current or potential holdings, which includes options, swaps, forward foreign currency exchange contracts and securities purchased on a when issued or delayed delivery basis.
As of April 30, 2015, there was no restricted cash outstanding.
|
NOTES TO FINANCIAL STATEMENTS (Unaudited) continued
|
April 30, 2015
|
(e) Convertible Securities
The Fund invests in preferred stocks and fixed-income securities which are convertible into common stock. Convertible securities may be converted either at a stated price or rate within a specified period of time into a specified number of shares of common stock. Traditionally, convertible securities have paid dividends or interest greater than on the related common stocks, but less than fixed income non-convertible securities. By investing in a convertible security, the Fund may participate in any capital appreciation or depreciation of a company’s stock, but to a lesser degree than if it had invested in that company’s common stock. Convertible securities rank senior to common stock in a corporation’s capital structure and, therefore, entail less risk than the corporation’s common stock.
(f ) Currency Translation
Assets and liabilities denominated in foreign currencies are translated into U.S. dollars at the mean of the bid and ask price of respective exchange rates on the last day of the period. Purchases and sales of investments denominated in foreign currencies are translated at the mean of the bid and ask price of respective exchange rates on the date of the transaction.
The Fund does not isolate that portion of the results of operations resulting from changes in foreign exchange rates on investments from the fluctuations arising from changes in market prices of securities held. Such fluctuations are included with the net realized and unrealized gain or loss from investments.
Foreign exchange realized gain or loss resulting from holding of a foreign currency, expiration of a currency exchange contract, difference in exchange rates between the trade date and settlement date of an investment purchased or sold, and the difference between dividends actually received compared to the amount shown in the Fund’s accounting records on the date of receipt is shown as net realized gains or losses on foreign currency transactions in the Fund’s Statement of Operations.
Foreign exchange unrealized gain or loss on assets and liabilities, other than investments, is shown as unrealized appreciation (depreciation) on foreign currency translations on the Fund’s Statement of Operations.
(g) Covered Call and Put Options
The Fund will pursue its objective by employing an option strategy of writing (selling) covered call options or put options on up to 25% of the securities held in the portfolio of the Fund. The Fund seeks to generate current gains from option premiums as a means to enhance distributions payable to shareholders.
When an option is written, the premium received is recorded as an asset with an equal liability and is subsequently marked to market to reflect the current market value of the option written. These liabilities are reflected as options written, at value, in the Statement of Assets and Liabilities. Premiums received from writing options which expire unexercised are recorded on the expiration date as a realized gain. The difference between the premium received and the amount paid on effecting a closing purchase transaction, including brokerage commissions, is also treated as a
|
NOTES TO FINANCIAL STATEMENTS (Unaudited) continued
|
April 30, 2015
|
realized gain, or if the premium is less than the amount paid for the closing purchase transactions, as a realized loss. If a call option is exercised, the premium is added to the proceeds from the sale of the underlying security in determining whether there has been a realized gain or loss.
(h) Forward Foreign Currency Exchange Contracts
The Fund entered into forward foreign currency exchange contracts in order to hedge its exposure to the change in foreign currency exchange rates on its foreign portfolio holdings, to hedge certain firm purchases and sales commitments denominated in foreign currencies and for investment purposes. Forward foreign currency exchange contracts are agreements between two parties to buy and sell currencies at a set price on a future date. Fluctuations in the value of open forward foreign currency exchange contracts are recorded for financial reporting purposes as unrealized appreciation and depreciation by the Fund until the contracts are closed. When the contracts are closed, realized gains and losses are recorded, and included on the Statement of Operations.
Forward foreign currency exchange contracts involve elements of both market and credit risk in excess of the amounts reflected on the Statement of Assets and Liabilities.
(i) Senior Floating Rate Interests
Senior floating rate interests, or term loans, in which the Fund typically invests are not listed on a securities exchange or board of trade. Term loans are typically bought and sold by institutional investors in individually negotiated transactions. The market generally has fewer trades and less liquidity than the secondary market for other types of securities. Due to the nature of the market, the actual settlement date may not be certain at the time of purchase or sale. Interest income is not accrued until settlement date. Typically term loans are valued by independent pricing services using broker quotes.
(j) Reverse Repurchase Agreements
In a reverse repurchase agreement, the Fund sells to a counterparty a security that it holds with a contemporaneous agreement to repurchase the same security at an agreed-upon price and date. Reverse repurchase agreements are valued based on the amount of cash received, which represents fair value. Reverse repurchase agreements are reflected as a liability on the Statement of Assets and Liabilities. Interest payments made are recorded as a component of interest expense on the Statement of Operations. The Fund monitors collateral market value for the reverse repurchase agreement, including accrued interest, throughout the life of the agreement, and when necessary, delivers or receives cash or securities in order to manage credit exposure and liquidity. If the counterparty defaults or enters insolvency proceeding, realization or return of the collateral to the Fund may be delayed or limited.
(k) Risks and Other Considerations
In the normal course of business, the Fund trades financial instruments and enters into financial transactions where risk of potential loss exists due to, among other things, changes in the market (market risk) or the potential inability of a counterparty to meet the terms of an agreement (counterparty risk). The Fund is also exposed to other risks such as, but not limited to, concentration, interest rate, credit and financial leverage risks.
|
NOTES TO FINANCIAL STATEMENTS (Unaudited) continued
|
April 30, 2015
|
Concentration of Risk. It is the Fund’s policy to invest a significant portion of its assets in convertible securities. Although convertible securities do derive part of their value from that of the securities into which they are convertible, they are not considered derivative financial instruments. However, certain of the Fund’s investments include features which render them more sensitive to price changes in their underlying securities. Consequently, this exposes the Fund to greater downside risk than traditional convertible securities, but still less than that of the underlying common stock.
Credit Risk. Credit risk is the risk that one or more of the securities in the Fund’s portfolio will decline in price, or fail to pay interest and principal when due, because the issuer of the security experiences a decline in its financial status. The Fund’s investments in income securities involve credit risk. However, in general, lower rated, lower grade and non-investment grade securities carry a greater degree of risk that the issuer will lose its ability to make interest and principal payments, which could have a negative impact on the Fund’s net asset value or dividends.
Interest Rate Risk. Convertible and nonconvertible income-producing securities, including preferred stock and debt securities (collectively, “income securities”) are subject to certain interest rate risks. If interest rates go up, the value of income securities in the Fund’s portfolio generally will decline. These risks may be greater in the current market environment because interest rates are near historically low levels. During periods of rising interest rates, the average life of certain types of income securities may be extended because of slower than expected principal payments. This may lock in a below market interest rate, increase the security’s duration (the estimated period until the security is paid in full) and reduce the value of the security. This is known as extension risk. During periods of declining interest rates, the issuer of a security may exercise its option to prepay principal earlier than scheduled, forcing the Fund to reinvest in lower yielding securities. This is known as call or prepayment risk. Lower grade securities have call features that allow the issuer to repurchase the security prior to its stated maturity. An issuer may redeem a lower grade security if the issuer can refinance the security at a lower cost due to declining interest rates or an improvement in the credit standing of the issuer.
Lower Grade Securities Risk. Investing in lower grade and non-investment grade securities involves additional risks. Securities of below investment grade quality are commonly referred to as “junk bonds” or “high yield securities.” Investment in securities of below investment grade quality involves substantial risk of loss. Securities of below investment grade quality are predominantly speculative with respect to the issuer’s capacity to pay interest and repay principal when due and therefore involve a greater risk of default or decline in market value due to adverse economic and issuer specific developments. Issuers of below investment grade securities are not perceived to be as strong financially as those with higher credit ratings. Issuers of lower grade securities may be highly leveraged and may not have available to them more traditional methods of financing. Therefore, the risks associated with acquiring the securities of such issuers generally are greater than is the case with higher rated securities. These issuers are more vulnerable to financial setbacks and recession than more creditworthy issuers, which may impair their ability to make interest and principal payments. The issuer’s ability to service its debt obligations also may be adversely affected by specific issuer developments, the issuer’s inability to meet specific projected business forecasts or the unavailability of additional financing. Therefore, there can be no assurance that in the future there will not exist a higher default rate relative to the rates currently existing in the market for lower grade securities. The risk of loss due to default by the issuer is significantly greater for the holders of
|
NOTES TO FINANCIAL STATEMENTS (Unaudited) continued
|
April 30, 2015
|
lower grade securities because such securities may be unsecured and may be subordinate to other creditors of the issuer. Securities of below investment grade quality display increased price sensitivity to changing interest rates and to a deteriorating economic environment. The market values for securities of below investment grade quality tend to be more volatile and such securities tend to be less liquid than investment grade debt securities. To the extent that a secondary market does exist for certain below investment grade securities, the market for them may be subject to irregular trading activity, wide bid/ask spreads and extended trade settlement periods.
Structured and Synthetic Convertible Securities Risk. The value of structured convertible securities can be affected by interest rate changes and credit risks of the issuer. Such securities may be structured in ways that limit their potential for capital appreciation and the entire value of the security may be at a risk of loss depending on the performance of the underlying equity security. Structured convertible securities may be less liquid than other convertible securities. The value of a synthetic convertible security will respond differently to market fluctuations than a convertible security because a synthetic convertible security is composed of two or more separate securities, each with its own market value. In addition, if the value of the underlying common stock or the level of the index involved in the convertible component falls below the exercise price of the warrant or option, the warrant or option may lose all value.
Foreign Securities and Emerging Markets Risk. Investing in non-U.S. issuers may involve unique risks, such as currency, political, economic and market risk. In addition, investing in emerging markets entails additional risk including, but not limited to: news and events unique to a country or region; smaller market size, resulting in lack of liquidity and price volatility; and certain national policies which may restrict the Fund’s investment opportunities; less uniformity in accounting and reporting requirements; unreliable securities valuation; and custody risk.
Financial Leverage Risk. Certain risks are associated with the leveraging of common stock, including the risk that both the net asset value and the market value of shares of common stock may be subject to higher volatility and a decline in value.
Counterparty Risk. The Fund is subject to counterparty credit risk, which is the risk that the counterparty fails to perform on agreements with the Fund such as swap and option contracts, and reverse repurchase agreements.
(l) Distributions to Shareholders
The Fund declares and pays quarterly distributions to common shareholders. These distributions consist of investment company taxable income, which generally includes qualified dividend income, ordinary income and short-term capital gains. Any net realized long-term gains are distributed annually to common shareholders.
Distributions to shareholders are recorded on the ex-dividend date. The amount and timing of distributions are determined in accordance with federal income tax regulations, which may differ from GAAP.
|
NOTES TO FINANCIAL STATEMENTS (Unaudited) continued
|
April 30, 2015
|
(m) New Accounting Pronouncements
In June 2014, the FASB issued an ASU that expands secured borrowing accounting for certain repurchase agreements. The ASU also sets forth additional disclosure requirements for certain transactions accounted for as sales, in order to provide financial statement users with information to compare to similar transactions accounted for as secured borrowings. The ASU is effective prospectively during interim or annual periods beginning after December 15, 2014. At this time, management is evaluating the implications of these changes on the financial statements.
Note 3 – Investment Management Agreement, Servicing Agreement and Other Agreements:
Pursuant to an Investment Advisory Agreement (the “Agreement”) between Guggenheim Funds Investment Advisors, LLC (“GFIA” or the “Investment Adviser”) and the Fund, the Investment Adviser furnishes offices, necessary facilities and equipment, provides administrative services to the Fund, oversees the activities of Advent Capital Management, LLC (the “Investment Manager”), provides personnel and compensates the Trustees and Officers of the Fund who are its affiliates. As compensation for these services, the Fund pays the Investment Adviser an annual fee, payable monthly in arrears, at an annual rate equal to 0.49% of the average Managed Assets during such month. Managed Assets means the total assets of the Fund (including any assets attributable to borrowings in the use of financial leverage, if any) minus the sum of accrued liabilities (other than debt representing financial leverage, if any).
Pursuant to an Investment Management Agreement between the Investment Manager and the Fund, the Fund pays the Investment Manager an annual fee, payable monthly in arrears, at an annual rate equal to 0.51% of the average Managed Assets during such month for the services and facilities provided by the Investment Manager to the Fund. These services include the day-to-day management of the Fund’s portfolio of securities, which includes buying and selling securities for the Fund and investment research.
The Bank of New York Mellon (“BNY”) acts as the Fund’s custodian and accounting agent. As custodian, BNY is responsible for the custody of the Fund’s assets. As accounting agent, BNY is responsible for maintaining the books and records of the Fund’s securities and cash.
Rydex Fund Services, LLC (“RFS”), an affiliate of Servicing Agent, provides fund administration services to the Fund. As compensation for these services RFS receives an administration fee payable monthly at the annual rate set forth below as a percentage of the average daily Managed Assets of the Fund:
|
Managed Assets
|
Rate
|
|
First $200,000,000
|
0.0275%
|
|
Next $300,000,000
|
0.0200%
|
|
Next $500,000,000
|
0.0150%
|
|
Over $1,000,000,000
|
0.0100%
|
Certain officers and trustees of the Fund are also officers and directors of the Investment Adviser or Servicing Agent. The Fund does not compensate its officers or trustees who are officers of the aforementioned firms.
|
NOTES TO FINANCIAL STATEMENTS (Unaudited) continued
|
April 30, 2015
|
Note 4 – Federal Income Taxes:
The Fund intends to continue to comply with the requirements of Subchapter M of the Internal Revenue Code of 1986, as amended, applicable to regulated investment companies. Accordingly, no provision for U.S. federal income taxes is required. In addition, by distributing substantially all of its ordinary income and long-term capital gains, if any, during each calendar year, the Fund avoids a 4% federal excise tax that is assessed on the amount of the under distribution.
As of April 30, 2015, the cost of investments and accumulated unrealized appreciation/depreciation on investments for federal income tax purposes were as follows:
|
Net Tax
|
Net Tax
|
|||
|
Cost of
|
Unrealized
|
Unrealized
|
||
|
Investments
|
Gross Tax
|
Gross Tax
|
Appreciation
|
Depreciation on
|
|
for Tax
|
Unrealized
|
Unrealized
|
on
|
Derivatives and
|
|
Purposes
|
Appreciation
|
Depreciation
|
Investments
|
Foreign Currency
|
|
$ 196,506,258
|
$ 9,460,410
|
$ (5,477,077)
|
$ 3,983,333
|
$ (1,400,016)
|
The differences between book basis and tax basis unrealized appreciation/(depreciation) are attributable to the tax deferral of losses on wash sales and income adjustments for tax purposes on certain convertible securities.
As of October 31, 2014 (the most recent fiscal year end for federal income tax purposes), the components of accumulated earnings/losses (excluding paid-in capital) on a tax basis were as follows:
|
Undistributed
|
Undistributed | |
|
Ordinary
|
Long-Term
|
|
|
Income/
|
Gains/
|
|
|
(Accumulated
|
(Accumulated
|
|
|
Ordinary Loss)
|
Capital Loss)
|
|
|
$ —
|
$ (57,670,077)
|
The diffrences between book basis and tax basis undistributed long-term gains/(accumulated capital losses) are attributable to the tax deferral of losses on wash sales and straddles.
At October 31, 2014 (the most recent fiscal year end for federal income tax purposes), the Fund had a capital loss carryforward of $57,670,077 available to offset possible future capital gains. Of the capital loss carryforward, $5,251,357 expires on October 31, 2016 and $52,418,720 expires on October 31, 2017. For the year ended October 31, 2014 (the most recent fiscal year end for federal income tax purposes), the Fund utilized $5,191,215 of capital losses. Per the Regulated Investment Company Modernization Act of 2010, capital loss carryforwards generated in taxable years beginning after December 22, 2010 must be fully used before capital loss carryforwards generated in taxable years prior to December 22, 2010; therefore, under certain circumstances, capital loss carryforwards available as of the report date, if any, may expire unused.
For the year ended October 31, 2014 (the most recent fiscal year end for federal income tax purposes), the tax character of distributions paid, as reflected in the Statements of Changes in Net Assets, was $11,368,513 of ordinary income and $58,028 of return of capital.
|
NOTES TO FINANCIAL STATEMENTS (Unaudited) continued
|
April 30, 2015
|
For all open tax years and all major jurisdictions, management of the Fund has concluded that there are no significant uncertain tax positions that would require recognition in the financial statements. Uncertain tax positions are tax positions taken or expected to be taken in the course of preparing the Fund’s tax returns that would not meet a more-likely-than not threshold of being sustained by the applicable tax authority and would be recorded as a tax expense in the current year. Open tax years are those that are open for examination by taxing authorities (i.e. generally the last four tax year ends and the interim tax period since then). Furthermore, management of the Fund is also not aware of any tax positions for which it is reasonably possible that the total amounts of unrecognized tax benefits will significantly change in the next twelve months.
Note 5 – Investments in Securities:
For the six months ended April 30, 2015, the cost of purchases and proceeds from sales of investments, excluding written options and short-term securities, were $130,526,958 and $127,842,197, respectively.
Note 6 – Derivatives:
(a) Covered Call and Put Options
An option on a security is a contract that gives the holder of the option, in return for a premium, the right to buy from (in the case of a call) or sell to (in the case of a put) the writer of the option the security underlying the option at a specified exercise or “strike” price. The writer of an option on a security has the obligation upon exercise of the option to deliver the underlying security upon payment of the exercise price (in the case of a call) or to pay the exercise price upon delivery of the underlying security (in the case of a put).
The Fund will follow a strategy of writing covered call options, which is a strategy designed to produce income from option premiums and offset a portion of a market decline in the underlying security. This strategy will be the Fund’s principal investment strategy in seeking to pursue its primary investment objective. The Fund will only “sell” or “write” options on securities held in the Fund’s portfolio. It may not sell “naked” call options, i.e., options on securities that are not held by the Fund or on more shares of a security than are held in the Fund’s portfolio. The Fund will consider a call option written with respect to a security underlying a convertible security to be covered so long as (i) the convertible security, pursuant to its terms, grants to the holders of such security the right to convert the convertible security into the underlying security and (ii) the convertible security, upon conversion, will convert into enough shares of the underlying security to cover the call option written by the Fund.
There are several risks associated with transactions in options on securities. As the writer of a covered call option, the Fund forgoes, during the option’s life, the opportunity to profit from increases in the market value of the security covering the call option above the sum of the premium and the strike price of the call, but has retained the risk of loss should the price of the underlying security decline. A writer of a put option is exposed to the risk of loss if the fair value of the underlying security declines, but profits only to the extent of the premium received if the underlying security increases in value. The writer of an option has no control over the time when it may be required to fulfill its obligation as writer of the option. Once an option writer has received an exercise notice, it cannot effect a closing purchase transaction in order to terminate its obligation under the option and must deliver the underlying security at the exercise price.
|
NOTES TO FINANCIAL STATEMENTS (Unaudited) continued
|
April 30, 2015
|
Transactions in written options for the six months ended April 30, 2015 were as follows:
|
Number of
|
Premiums
|
|||||||
|
Contracts
|
Received
|
|||||||
|
Options outstanding, beginning of period
|
331 | $ | 46,434 | |||||
|
Options written during the period
|
1,506 | 168,930 | ||||||
|
Options expired during the period
|
(237 | ) | (16,490 | ) | ||||
|
Options closed during the period
|
(1,600 | ) | (198,874 | ) | ||||
|
Options outstanding, end of period
|
— | $ | — | |||||
(b) Forward Foreign Currency Exchange Contracts
A forward foreign currency exchange contract is a commitment to purchase or sell a foreign currency on a future date at a negotiated forward rate. The gain or loss arising from the difference between the original contracts and the closing of such contracts would be included in net realized gain or loss on foreign currency transactions.
Risk may arise from the potential inability of a counterparty to meet the terms of a contract and from unanticipated movements in the value of a foreign currency relative to the U.S. dollar. The face or contract amount, in U.S. dollars, reflects the total exposure the Fund has in that particular currency contract.
As of April 30, 2015, the following forward foreign currency exchange contracts were outstanding:
|
Settlement
|
Settlement
|
Value as of
|
Net Unrealized
|
|||||||||||||||
|
Contracts to Sell
|
Counterparty
|
Date
|
Value
|
4/30/2015
|
(Depreciation)
|
|||||||||||||
|
CAD
|
890,000 | |||||||||||||||||
|
for USD
|
695,698 |
The Bank of New York Mellon
|
06/19/2015
|
$ | 695,698 | $ | 734,259 | $ | (38,561 | ) | ||||||||
|
EUR
|
680,000 | |||||||||||||||||
|
for USD
|
747,075 |
The Bank of New York Mellon
|
06/19/2015
|
747,075 | 762,485 | (15,410 | ) | |||||||||||
|
EUR
|
18,000,000 | |||||||||||||||||
| for USD |
19,153,620
|
The Bank of New York Mellon
|
06/19/2015
|
19,153,620 | 20,183,416 | (1,029,796 | ) | |||||||||||
|
EUR
|
584,000 | |||||||||||||||||
|
for USD
|
641,880 |
The Bank of New York Mellon
|
06/19/2015
|
641,880 | 654,840 | (12,960 | ) | |||||||||||
|
EUR
|
310,000 | |||||||||||||||||
|
for USD
|
337,552 |
The Bank of New York Mellon
|
06/19/2015
|
337,552 | 347,603 | (10,051 | ) | |||||||||||
|
EUR
|
250,000 | |||||||||||||||||
|
for USD
|
269,538 |
The Bank of New York Mellon
|
06/19/2015
|
269,538 | 280,325 | (10,787 | ) | |||||||||||
|
EUR
|
1,026,000 | |||||||||||||||||
|
for USD
|
1,116,681 |
The Bank of New York Mellon
|
06/19/2015
|
1,116,681 | 1,150,455 | (33,774 | ) | |||||||||||
|
EUR
|
498,000 | |||||||||||||||||
|
for USD
|
542,153 |
The Bank of New York Mellon
|
06/19/2015
|
542,153 | 558,408 | (16,255 | ) | |||||||||||
|
EUR
|
1,587,000 | |||||||||||||||||
|
for USD
|
1,675,905 |
The Bank of New York Mellon
|
06/19/2015
|
1,675,905 | 1,779,504 | (103,599 | ) | |||||||||||
|
EUR
|
372,000 | |||||||||||||||||
|
for USD
|
399,547 |
The Bank of New York Mellon
|
06/19/2015
|
399,547 | 417,124 | (17,577 | ) | |||||||||||
|
EUR
|
138,000 | |||||||||||||||||
|
for USD
|
148,150 |
The Bank of New York Mellon
|
06/19/2015
|
148,150 | 154,739 | (6,589 | ) | |||||||||||
|
NOTES TO FINANCIAL STATEMENTS (Unaudited) continued
|
April 30, 2015
|
|
Settlement
|
Settlement
|
Value as of
|
Net Unrealized
|
|||||||||||||||
|
Contracts to Sell
|
Counterparty
|
Date
|
Value
|
4/30/2015
|
(Depreciation)
|
|||||||||||||
|
EUR
|
222,000 | |||||||||||||||||
|
for USD
|
242,003 |
The Bank of New York Mellon
|
06/19/2015
|
$ | 242,003 | $ | 248,929 | $ | (6,926 | ) | ||||||||
|
EUR
|
500,000 | |||||||||||||||||
|
for USD
|
532,045 |
The Bank of New York Mellon
|
06/19/2015
|
532,045 | 560,650 | (28,605 | ) | |||||||||||
|
EUR
|
818,000 | |||||||||||||||||
|
for USD
|
870,540 |
The Bank of New York Mellon
|
06/19/2015
|
870,540 | 917,224 | (46,684 | ) | |||||||||||
|
GBP
|
120,000 | |||||||||||||||||
|
for USD
|
176,738 |
The Bank of New York Mellon
|
06/19/2015
|
176,738 | 184,345 | (7,607 | ) | |||||||||||
|
GBP
|
796,000 | |||||||||||||||||
|
for USD
|
1,173,626 |
The Bank of New York Mellon
|
06/19/2015
|
1,173,626 | 1,222,821 | (49,195 | ) | |||||||||||
|
GBP
|
318,000 | |||||||||||||||||
|
for USD
|
468,861 |
The Bank of New York Mellon
|
06/19/2015
|
468,861 | 488,514 | (19,653 | ) | |||||||||||
|
HKD
|
25,000 | |||||||||||||||||
|
for USD
|
3,225 |
The Bank of New York Mellon
|
05/04/2015
|
3,225 | 3,225 | — | ||||||||||||
|
JPY
|
764,000,000 |
|
||||||||||||||||
|
for USD
|
6,310,633 |
The Bank of New York Mellon
|
06/19/2015
|
6,310,633 | 6,388,000 | (77,367 | ) | |||||||||||
|
JPY
|
37,000,000 | |||||||||||||||||
|
for USD
|
309,177 |
The Bank of New York Mellon
|
06/19/2015
|
309,177 | 309,366 | (189 | ) | |||||||||||
| $ | (1,531,585 | ) | ||||||||||||||||
|
Net Unrealized
|
||||||||||||||||||
|
Settlement
|
Settlement
|
Value as of
|
Appreciation
|
|||||||||||||||
|
Contracts to Buy
|
Counterparty
|
Date
|
Value
|
4/30/2015
|
(Depreciation)
|
|||||||||||||
|
EUR
|
195,000 | |||||||||||||||||
|
for USD
|
207,854 |
The Bank of New York Mellon
|
06/19/2015
|
$ | 207,854 | $ | 218,654 | $ | 10,800 | |||||||||
|
EUR
|
216,400 | |||||||||||||||||
|
for USD
|
232,424 |
The Bank of New York Mellon
|
06/19/2015
|
232,424 | 242,649 | 10,225 | ||||||||||||
|
EUR
|
370,000 | |||||||||||||||||
|
for USD
|
401,984 |
The Bank of New York Mellon
|
06/19/2015
|
401,984 | 414,881 | 12,897 | ||||||||||||
|
EUR
|
296,000 | |||||||||||||||||
|
for USD
|
313,470 |
The Bank of New York Mellon
|
06/19/2015
|
313,470 | 331,905 | 18,435 | ||||||||||||
|
EUR
|
563,000 | |||||||||||||||||
|
for USD
|
606,020 |
The Bank of New York Mellon
|
06/19/2015
|
606,020 | 631,292 | 25,272 | ||||||||||||
|
EUR
|
170,000 | |||||||||||||||||
|
for USD
|
183,990 |
The Bank of New York Mellon
|
06/19/2015
|
183,990 | 190,621 | 6,631 | ||||||||||||
|
EUR
|
569,000 | |||||||||||||||||
|
for USD
|
609,347 |
The Bank of New York Mellon
|
06/19/2015
|
609,347 | 638,020 | 28,673 | ||||||||||||
|
EUR
|
141,000 | |||||||||||||||||
|
for USD
|
151,445 |
The Bank of New York Mellon
|
06/19/2015
|
151,445 | 158,104 | 6,659 | ||||||||||||
|
EUR
|
530,000 | |||||||||||||||||
|
for USD
|
581,211 |
The Bank of New York Mellon
|
06/19/2015
|
581,211 | 594,289 | 13,078 | ||||||||||||
|
EUR
|
322,087 | |||||||||||||||||
|
for USD
|
359,417 |
The Bank of New York Mellon
|
05/04/2015
|
359,417 | 360,915 | 1,498 | ||||||||||||
|
NOTES TO FINANCIAL STATEMENTS (Unaudited) continued
|
April 30, 2015
|
|
Net Unrealized
|
||||||||||||||||||
|
Settlement
|
Settlement
|
Value as of
|
Appreciation
|
|||||||||||||||
|
Contracts to Buy
|
Counterparty
|
Date
|
Value
|
4/30/2015
|
(Depreciation)
|
|||||||||||||
|
JPY
|
27,000,000 | |||||||||||||||||
|
for USD
|
227,785 |
The Bank of New York Mellon
|
06/19/2015
|
$ | 227,785, | $ | 225,754 | $ | (2,031 | ) | ||||||||
|
JPY
|
15,000,000 | |||||||||||||||||
|
for USD
|
125,987 |
The Bank of New York Mellon
|
06/19/2015
|
125,987 | 125,419 | (568 | ) | |||||||||||
| $ | 131,569 | |||||||||||||||||
|
Total unrealized depreciation on forward foreign currency exchange contracts
|
$ | (1,400,016 | ) | |||||||||||||||
(e) Summary of Derivatives Information
The Fund is required by GAAP to disclose: a) how and why a fund uses derivative instruments, b) how derivatives instruments are accounted for, and c) how derivative instruments affect a fund’s financial position, results of operations and cash flows.
The following table presents the types of derivatives in the Fund by location as presented on the Statement of Assets and Liabilities as of April 30, 2015.
| Statement of Assets and Liabilities | ||||||||||
| Presentation of Fair Values of Derivative Instruments ($000s): | ||||||||||
|
Asset Derivatives
|
Liability Derivatives
|
|||||||||
|
Statement of Assets
|
Statement of Assets
|
|||||||||
|
Primary Risk Exposure
|
and Liabilities Location
|
Fair Value
|
and Liabilities Location
|
Fair Value
|
||||||
|
Foreign exchange risk
|
Unrealized appreciation on
|
Unrealized depreciation on
|
||||||||
|
forward foreign currency
|
forward foreign currency
|
|||||||||
|
exchange contracts
|
$ | 134 |
exchange contracts
|
$ | 1,534 | |||||
|
Total
|
$ | 134 | $ | 1,534 | ||||||
The following table presents the effect of derivative instruments on the Statement of Operations for the period ended April 30, 2015:
|
Effect of Derivative Instruments on the Statement of Operations: ($000s)
|
||||||||||||
|
Amount of Realized Gain/(Loss) on Derivatives
|
||||||||||||
|
Derivatives not
|
||||||||||||
|
accounted for
|
Foreign
|
|||||||||||
|
as hedging
|
Currency
|
|||||||||||
|
instruments
|
Options
|
Transactions
|
Total
|
|||||||||
|
Equity risk
|
$ | (352 | ) | $ | – | $ | (352 | ) | ||||
|
Foreign exchange risk
|
– | 5,670 | 5,670 | |||||||||
|
Total
|
$ | (352 | ) | $ | 5,670 | $ | 5,318 | |||||
|
NOTES TO FINANCIAL STATEMENTS (Unaudited) continued
|
April 30, 2015
|
|
Change in Unrealized Appreciation (Depreciation) on Derivatives
|
||||||||||||
|
Derivatives not
|
||||||||||||
|
accounted for
|
Foreign
|
|||||||||||
|
as hedging
|
Currency
|
|||||||||||
|
instruments
|
Options
|
Translations
|
Total
|
|||||||||
|
Equity risk
|
$ | 255 | $ | – | $ | 255 | ||||||
|
Foreign exchange risk
|
– | (2,518 | ) | (2,518 | ) | |||||||
|
Total
|
$ | 225 | $ | (2,518 | ) | $ | (2,263 | ) | ||||
|
Derivative Volume
|
||||
|
Forward Foreign Currency Exchange Contracts:
|
||||
|
Average Settlement Value Purchased
|
$ | 487,006 | ||
|
Average Settlement Value Sold
|
1,549,740 | |||
|
Ending Settlement Value Purchased
|
4,000,934 | |||
|
Ending Settlement Value Sold
|
35,814,647 | |||
|
Options Contracts:
|
||||
|
Average Number of Contracts Written
|
157 | |||
|
Average Number of Contracts Purchased
|
0 | |||
For financial reporting purposes, the Fund does not offset financial assets and financial liabilities across derivative types that are subject to master netting arrangements or similar agreements on the Statement of Assets and Liabilities. The following table presents the Fund’s derivative asset and liabilities as of April 30, 2015.
|
Gross
|
Net Amounts
|
|||||||
|
Amount
|
of Assets
|
|||||||
|
Gross
|
Offset in the
|
Presented in
|
||||||
|
Amounts
|
Statement
|
the Statement
|
Derivatives
|
|||||
|
Investment
|
of Recognized
|
of Assets &
|
of Assets &
|
Available for
|
Financial
|
Collateral
|
Net
|
|
|
Counterparty
|
Type
|
Assets
|
Liabilities
|
Liabilities
|
Offset
|
Instruments
|
Received
|
Amount
|
|
Bank of
|
Foreign
|
$134,168
|
$ –
|
$134,168
|
$(134,168)
|
$ –
|
$ –
|
$ –
|
|
New York Mellon
|
Exchange
|
|||||||
|
Currency
|
||||||||
|
Contract
|
|
Gross
|
Net Amounts
|
|||||||
|
Amount
|
of Liabilities
|
|||||||
|
Gross
|
Offset in the
|
Presented in
|
||||||
|
Amounts of
|
Statement
|
the Statement
|
Derivatives
|
|||||
|
Investment
|
Recognized
|
of Assets &
|
of Assets &
|
Available for
|
Financial
|
Collateral
|
Net
|
|
|
Counterparty
|
Type
|
Liabilities
|
Liabilities
|
Liabilities
|
Offset |
Instruments
|
Pledged
|
Amount
|
|
Bank of
|
Foreign
|
$1,534,184
|
$ –
|
$1,534,184
|
$(134,168)
|
$ –
|
$(8,399,243)
|
$6,999,227
|
|
New York Mellon
|
Exchange
|
|||||||
|
Currency
|
||||||||
|
Contract
|
In December 2011, the Financial Accounting Standards Board (“FASB”) issued an Accounting Standards Update (“ASU”) No. 2011-11: Disclosures about Offsetting Assets and Liabilities (“netting”) on the Statements of Assets and Liabilities that are subject to master netting
|
NOTES TO FINANCIAL STATEMENTS (Unaudited) continued
|
April 30, 2015
|
arrangements or similar agreements. ASU 2011-11, was amended by ASU No. 2013-01, clarifying which investments and transactions are subject to the netting disclosure. The scope of the disclosure requirements is limited to derivative instruments, repurchase agreements and reverse repurchase agreements, and securities borrowing and securities lending transactions to the extent they are subject to an enforceable master netting arrangement or similar agreement. This information will enable users of the Fund’s financial statements to evaluate the effect or potential effect of netting arrangements on the Fund’s financial position. The ASU is effective for financial statements with fiscal years beginning on or after January 1, 2013, and interim periods within those fiscal years. The Fund adopted the disclosure requirement on netting for the current reporting period.
Note 7 – Capital:
Common Shares
The Fund has an unlimited amount of common shares, $0.001 par value, authorized and 13,603,025 issued and outstanding. In connection with the Fund’s dividend reinvestment plan, the Fund did not issue shares during the period ended April 30, 2015, or the year ended October 31, 2014.
Note 8 – Borrowings:
On December 30, 2009, the Fund entered into a $50,000,000 committed credit facility agreement whereby the lender has agreed to provide secured financing to the Fund and the Fund will provide pledged collateral to the lender. Interest on the amount borrowed is based on the 3-month LIBOR plus 0.95%. An unused commitment fee of 0.85% is charged on the difference between the $50,000,000 credit agreement and the amount borrowed, which is included in Interest Expense on the Statement of Operations. As of April 30, 2015, there was $50,000,000 outstanding in connection with the Fund’s credit facility. The average daily amount of the borrowings on the credit facility during the six months ended April 30, 2015 was $50,000,000 with a related average interest rate of 1.21%. The maximum amount outstanding during the period was $50,000,000. As of April 30, 2015, the total amount of securities segregated in connection with borrowings was $83,468,331.
The Fund’s use of leverage creates special risks that may adversely affect the total return of the Fund. The risks include but are not limited to: greater volatility of the Fund’s net asset value and market price; fluctuations in the interest rates on the leverage; and the possibility that increased costs associated with the leverage, which would be borne entirely by the holder’s of the Fund, may reduce the Fund’s total return. The Fund will pay interest expense on the leverage, thus reducing the Fund’s total return. This expense may be greater than the Fund’s return on the underlying investment.
The committed credit facility agreement governing the loan facility includes usual and customary covenants. These covenants impose on the Fund asset coverage requirements, collateral requirements, investment strategy requirements, and certain financial obligations. These covenants place limits or restrictions on the Fund’s ability to (i) enter into additional indebtedness with a party other than the lender, (ii) change its fundamental investment policy, or (iii) pledge to any other party, other than to the lender, securities owned or held by the Fund over which the lender has a lien. In addition, the Fund is required to deliver financial information to the lender within established deadlines, maintain an asset coverage ratio (as defined in Section 18(g) of the 1940 Act) greater than
|
NOTES TO FINANCIAL STATEMENTS (Unaudited) continued
|
April 30, 2015
|
300%, comply with the rules of the stock exchange on which its shares are listed, and maintain its classification as a “closed-end fund company” as defined in the 1940 Act.
Note 9 – Indemnifications:
In the normal course of business, the Fund enters into contracts that contain a variety of representations, which provide general indemnifications. The Fund’s maximum exposure under these arrangements is unknown, as this would involve future claims that may be made against the Fund that have not yet occurred. However, the Fund expects the risk of loss to be remote.
Note 10 – Subsequent Event:
Subsequent to April 30, 2015, the Fund declared on May 1, 2015 a quarterly distribution of $0.2100 per common share. The distribution is payable on May 29, 2015, to shareholders of record on May 15, 2015.
The Fund has performed an evaluation of subsequent events through the date of issuance of this report and has determined that there are no material events that would require disclosure other than the event disclosed above.
|
SUPPLEMENTAL INFORMATION (Unaudited)
|
April 30, 2015
|
|
Federal Income Tax Information
|
|||||
|
In January 2016, you will be advised on IRS Form 1099 DIV or substitute 1099 DIV as to the federal tax status of the distributions received by you in the calendar year 2015.
|
|||||
|
Trustees
|
|||||
|
The Trustees of the Advent Claymore Enhanced Growth & Income Fund and their principal occupations during the past five years:
|
|||||
|
Number
|
|||||
|
of Funds
|
|||||
|
Term of
|
in Fund | ||||
|
Position(s)
|
Office* and
|
Complex**
|
|||
|
Name, Address,
|
Held with
|
Length of
|
Principal Occupation(s) During
|
Overseen
|
Other Directorships
|
|
Year of Birth
|
Registrant
|
Time Served
|
the Past Five Years
|
by Trustee
|
Held by Trustee
|
|
Independent Trustees:
|
|||||
| Randall C. Barnes++ |
Trustee
|
Since 2005
|
Current: Private Investor (2001-present).
|
91
|
Current: Trustee, Purpose
|
|
Year of birth: 1951
|
Investments Funds (2014-present).
|
||||
|
Former: Senior Vice President and Treasurer, PepsiCo. Inc. (1993-1997), President, Pizza Hut International (1991-1993); Senior Vice President, Strategic Planning and New Business
Development of Pepsico, Inc. (1987-1990).
|
|||||
|
Daniel L. Black+
Year of birth: 1960
|
Trustee
|
Since 2005
|
Current: Managing Partner, the Wicks Group of Cos., (2003-present).
Former: Managing Director and Co-head of the Merchant Banking Group at BNY Capital Markets, a division of BNY Mellon (1998-2003); and Co-Head of U.S. Corporate Banking at BNY Mellon (1995-1998).
|
3
|
Current: Bendon Publishing
International (2012-Present);
Antenna International, Inc.
(2010-present); Bonded (2011-present).
Former: Penn Foster Education
Group, Inc. (2007-2009).
|
|
Derek Medina +
Year of birth: 1966
|
Trustee
|
Since 2004
|
Current: Senior Vice President, Business Affairs at ABC News (2008-present).
Former: Vice President, Business Affairs and News Planing at ABC News (2003-2008). Executive Director, Office of the President at ABC News (2000-2003). Former Associate at Cleary Gottlieb Steen & Hamilton (law firm) (1995-1998). Former associate in Corporate Finance at J.P. Morgan/Morgan Guaranty (1988-1990).
|
3
|
Current: Young Scholar’s Institute. (2005-present); Olive
Scholars (2011-present).
|
|
SUPPLEMENTAL INFORMATION (Unaudited) continued
|
April 30, 2015
|
|
Number
|
|||||
|
of Funds
|
|||||
|
Term of
|
in Fund | ||||
|
Position(s)
|
Office* and
|
Complex**
|
|||
|
Name, Address,
|
Held with
|
Length of
|
Principal Occupation(s) During
|
Overseen
|
Other Directorships
|
|
Year of Birth
|
Registrant
|
Time Served
|
the Past Five Years
|
by Trustee
|
Held by Trustee
|
|
Independent Trustees continued:
|
|||||
|
Ronald A. Nyberg++
Year of birth: 1953
|
Trustee and
Chairman of
the
Nominating
and
Governance
Committee
|
Since 2004
|
Current: Partner, Nyberg & Cassioppi, LLC (2000-present).
Former: Executive Vice President, General Counsel and Corporate Secretary, Van Kampen Investments (1982-1999).
|
93
|
Current: Edward-Elmhurst Healthcare System (2012-present).
|
|
Gerald L. Seizert,
CFA, CIC+
Year of birth: 1952
|
Trustee
|
Since 2004
|
Current: Chief Executive Officer of Seizert Capital Partners, LLC, where he directs the equity disciplines of the firm and serves as a co-manager of the firm’s hedge fund, Prosper Long Short (2000-present).
Former: Co-Chief Executive (1998-1999) and a Managing Partner and Chief Investment Officer-Equities of Munder Capital Management, LLC (1995-1999). Former Vice President and Portfolio Manager of Loomis, Sayles & Co., L.P. (asset manager) (1984-1995). Former Vice President and Portfolio Manager at First of America Bank (1978-1984).
|
3
|
Current: Beaumont Hospital
(2012-present).
|
|
Michael A. Smart+
Year of birth: 1960
|
Trustee
|
Since 2004
|
Current: Managing Partner, Herndon Equity Partners (2014-present), Managing Partner, Cordova, Smart & Williams, LLC (2003-present).
Former: Managing Director in Investment Banking-the Private Equity Group (1995-2001) and a Vice President in Investment Banking-Corporate Finance (1992-1995) at Merrill Lynch & Co.; Founding Partner of The Carpediem Group, a private placement firm (1991-1992); Associate at Dillon, Read and Co. (investment bank) (1988-1990).
|
3
|
Current: President & Chairman, Board of Directors, Berkshire Blanket Holdings, Inc. (2006-present); President and Chairman, Board of Directors, Sqwincher Holdings (2006-present); Board of Directors, Sprint Industrial Holdings (2007-present); Vice Chairman, Board of Directors, National Association of Investment Companies (“NAIC”) (2010-present). Trustee, The Mead School (2014-Present).
|
|
SUPPLEMENTAL INFORMATION (Unaudited) continued
|
April 30, 2015
|
|
Number
|
|||||
|
of Funds
|
|||||
|
Term of
|
in Fund | ||||
|
Position(s)
|
Office* and
|
Complex**
|
|||
|
Name, Address,
|
Held with
|
Length of
|
Principal Occupation(s) During
|
Overseen
|
Other Directorships
|
|
Year of Birth
|
Registrant
|
Time Served
|
the Past Five Years
|
by Trustee
|
Held by Trustee
|
|
Interested Trustees:
|
|||||
|
Tracy V. Maitland+ø
Year of birth: 1960
|
Trustee,
Chairman,
President
and Chief
Executive
Officer
|
Since 2004
|
Current: President of Advent Capital Management, LLC, which he founded in June 2001.
Former: Prior to June 2001 President, Advent Capital Management, a division of Utendahl Capital.
|
3
|
None.
|
|
+
|
Address for all Trustees noted: 1271 Avenue of the Americas, 45th Floor, New York, NY 10020
|
|||
|
++
|
Address for all Trustees noted: 227 West Monroe Street, Chicago, IL 60606.
|
|||
|
*
|
After a Trustee’s initial term, each Trustee is expected to serve a three-year term concurrent with the class of Trustees for which he serves:
|
|||
|
- Mr. Michael A. Smart and Mr. Daniel L. Black are the Class I Trustees. Mr. Smart and Mr. Black are standing for re-election at the Annual Meeting.
|
||||
|
- Mr. Tracy V. Maitland and Mr. Ronald A. Nyberg are the Class II Trustees. The term of the Class II Trustees will continue until the 2015 annual meeting of
|
||||
|
shareholders or until successors shall have been elected and qualified.
|
||||
|
- Mr. Gerald L. Seizert, Mr. Derek Medina and Mr. Randall C. Barnes are the Class III Trustees. The term of the Class III Trustees will continue until the 2016
|
||||
|
annual meeting of shareholders or until successors shall have been elected and qualified.
|
||||
|
**
|
As of period end. The Guggenheim Investments Fund Complex consists of U.S. registered investment companies advised or serviced by Guggenheim Funds
|
|||
|
Investment Advisors, LLC and/or Guggenheim Funds Distributors, LLC and/or affiliates of such entities. The Guggenheim Investments Fund Complex is
|
||||
|
overseen by multiple Boards of Trustees.
|
||||
|
ø
|
Mr. Maitland is an “interested person” (as defined in section 2(a)(19) of the 1940 Act) of the Fund because of his position as an officer of Advent Capital
|
|||
|
Management, LLC, the Fund’s Investment Adviser.
|
||||
|
SUPPLEMENTAL INFORMATION (Unaudited) continued
|
April 30, 2015
|
Officers
The Officers of the Advent/Claymore Enhanced Growth & Income Fund and their principal occupations during the past five years:
|
Name, Address*
|
Position(s)
|
Term of Office
|
|
|
and Year of Birth
|
held with
|
and Length of
|
|
|
Officers:
|
the Trust
|
Time Served**
|
Principal Occupations During Past Five Years
|
|
Edward C. Delk
(1968)
|
Secretary and
Chief
Compliance
Officer
|
Since 2012
|
Current: General Counsel and Chief Compliance Officer, Advent Capital Management, LLC (2012-present).
Former: Assistant General Counsel and Chief Compliance Officer, Insight Venture Management, LLC (2009-2012); Associate General Counsel, TIAA-CREF (2008-2009); Principal, Legal Department, The Vanguard Group, Inc. (2000-2008).
|
|
Tony Huang
(1976)
|
Vice President
and Assistant
Secretary
|
Since 2014
|
Current: Vice-President, Co-Portfolio Manager and Analyst, Advent Capital Management, LLC (2007-present).
Former: Senior Vice President, Portfolio Manager and Analyst, Essex Investment Management (2001-2006); Vice President, Analyst, Abacus Investments (2001); Vice President, Portfolio Manager, M/C Venture Partners (2000-2001); Associate, Fidelity Investments (1996-2000).
|
|
Robert White
(1965)
|
Treasurer and
Chief
Financial
Officer
|
Since 2005
|
Current: Chief Financial Officer, Advent Capital Management, LLC (2005-present).
Former: Vice President, Client Service Manager, Goldman Sachs Prime Brokerage (1997-2005).
|
|
*
|
Address for all Officers: 1271 Avenue of the Americas, 45th Floor, New York, NY 10020
|
|||
|
**
|
Officers serve at the pleasure of the Board of Trustees and until his or her successor is appointed and qualified or until his or her earlier resignation or removal.
|
|||
|
DIVIDEND REINVESTMENT PLAN (Unaudited)
|
April 30, 2015
|
Unless the registered owner of common shares elects to receive cash by contacting Computershare Shareowner Services LLC, (the “Plan Administrator”), all dividends declared on common shares of the Fund will be automatically reinvested by the Plan Administrator for shareholders in the Fund’s Dividend Reinvestment Plan (the “Plan”), in additional common shares of the Fund. Participation in the Plan is completely voluntary and may be terminated or resumed at any time without penalty by notice if received and processed by the Plan Administrator prior to the dividend record date; otherwise such termination or resumption will be effective with respect to any subsequently declared dividend or other distribution. Some brokers may automatically elect to receive cash on your behalf and may re-invest that cash in additional common shares of the Fund for you. If you wish for all dividends declared on your common shares of the Fund to be automatically reinvested pursuant to the Plan, please contact your broker.
The Plan Administrator will open an account for each common shareholder under the Plan in the same name in which such common shareholder’s common shares are registered. Whenever the Fund declares a dividend or other distribution (together, a “Dividend”) payable in cash, non-participants in the Plan will receive cash and participants in the Plan will receive the equivalent in common shares. The common shares will be acquired by the Plan Administrator for the participants’ accounts, depending upon the circumstances described below, either (i) through receipt of additional unissued but authorized common shares from the Fund (“Newly Issued Common Shares”) or (ii) by purchase of outstanding common shares on the open market (“Open-Market Purchases”) on the New York Stock Exchange or elsewhere. If, on the payment date for any Dividend, the closing market price plus estimated brokerage commission per common share is equal to or greater than the net asset value per common share, the Plan Administrator will invest the Dividend amount in Newly Issued Common Shares on behalf of the participants. The number of Newly Issued Common Shares to be credited to each participant’s account will be determined by dividing the dollar amount of the Dividend by the net asset value per common share on the payment date; provided that, if the net asset value is less than or equal to 95% of the closing market value on the payment date, the dollar amount of the Dividend will be divided by 95% of the closing market price per common share on the payment date. If, on the payment date for any Dividend, the net asset value per common share is greater than the closing market value plus estimated brokerage commission, the Plan Administrator will invest the Dividend amount in common shares acquired on behalf of the participants in Open- Market Purchases.
If, before the Plan Administrator has completed its Open-Market Purchases, the market price per common share exceeds the net asset value per common share, the average per common share purchase price paid by the Plan Administrator may exceed the net asset value of the common shares, resulting in the acquisition of fewer common shares than if the Dividend had been paid in Newly Issued Common Shares on the Dividend payment date. Because of the foregoing difficulty with respect to Open-Market Purchases, the Plan provides that if the Plan Administrator is unable to invest the full Dividend amount in Open-Market Purchases during the purchase period or if the market discount shifts to a market premium during the purchase period, the Plan Administrator may cease making Open-Market Purchases and may invest the uninvested portion of the Dividend amount in Newly Issued Common Shares at net asset value per common share at the close of business on the Last Purchase Date provided that, if the net asset value is less than or equal to 95% of the then current market price per common share; the dollar amount of the Dividend will be divided by 95% of the market price on the payment date.
|
DIVIDEND REINVESTMENT PLAN (Unaudited) continued
|
April 30, 2015
|
The Plan Administrator maintains all shareholders’ accounts in the Plan and furnishes written confirmation of all transactions in the accounts, including information needed by shareholders for tax records. Common shares in the account of each Plan participant will be held by the Plan Administrator on behalf of the Plan participant, and each shareholder proxy will include those shares purchased or received pursuant to the Plan. The Plan Administrator will forward all proxy solicitation materials to participants and vote proxies for shares held under the Plan in accordance with the instruction of the participants.
There will be no brokerage charges with respect to common shares issued directly by the Fund. However, each participant will pay a pro rata share of brokerage commission incurred in connection with Open-Market Purchases. The automatic reinvestment of Dividends will not relieve participants of any Federal, state or local income tax that may be payable (or required to be withheld) on such Dividends.
The Fund reserves the right to amend or terminate the Plan. There is no direct service charge to participants with regard to purchases in the Plan; however, the Fund reserves the right to amend the Plan to include a service charge payable by the participants.
All correspondence or questions concerning the Plan should be directed to the Plan Administrator, Computershare Shareowner Services, LLC, P.O. Box 30170 College Station, TX 77842-3170; Attention: Shareowner Services Department, Phone Number: (866) 488-3559.
|
FUND INFORMATION
|
April 30, 2015
|
|
Board of Trustees
|
Investment Manager
|
|
Randall C. Barnes
|
Advent Capital Management, LLC
|
|
New York, NY
|
|
|
Daniel L. Black
|
|
|
Investment Adviser
|
|
|
Tracy V. Maitland*
|
Guggenheim Funds Distributors, LLC
|
|
Chairman
|
Chicago, IL
|
|
Derek Medina
|
Accounting Agent and Custodian
|
|
The Bank of New York Mellon
|
|
|
Ronald A. Nyberg
|
New York, NY
|
|
Gerald L. Seizert
|
Administrator
|
|
Rydex Fund Services, LLC
|
|
|
Michael A. Smart
|
Rockville, MD
|
|
* Trustee is an “interested person” of the Fund
|
Transfer Agent
|
|
as defined in the Investment Company Act of
|
Computershare Shareowner
|
|
1940, as amended.
|
Services, LLC
|
|
Jersey City, NJ
|
|
|
Officers
|
|
| Legal Counsel | |
|
Tracy V. Maitland
|
Skadden, Arps, Slate, |
|
President and Chief Executive Officer
|
Meagher & Flom LLP
|
|
New York, NY
|
|
|
Robert White
|
|
|
Treasurer and Chief Financial Officer
|
Independent Registered Public
|
|
Accounting Firm
|
|
|
Edward C. Delk
|
PricewaterhouseCoopers LLP
|
|
Secretary and Chief Compliance Officer
|
New York, NY
|
|
Tony Huang
|
|
|
Vice President and Assistant Secretary
|
|
FUND INFORMATION continued
|
April 30, 2015
|
Portfolio Managers of the Fund
The portfolio managers of the Fund are Tracy Maitland (Chief Investment Officer of Advent), Paul Latronica (Managing Director of Advent), David Hulme (Managing Director of Advent), Hart Woodson (Managing Director of Advent), Michael Brown (Managing Director of Advent) and Tony Huang (Vice President of Advent).
Privacy Principles of the Fund
The Fund is committed to maintaining the privacy of its shareholders and to safeguarding their non-public personal information. The following information is provided to help you understand what personal information the Fund collects, how the Fund protects that information and why, in certain cases, the Fund may share information with select other parties.
Generally, the Fund does not receive any non-public personal information relating to its shareholders, although certain non-public personal information of its shareholders may become available to the Fund. The Fund does not disclose any non-public personal information about its shareholders or former shareholders to anyone, except as permitted by law or as is necessary in order to service shareholder accounts (for example, to a transfer agent or third party administrator).
The Fund restricts access to non-public personal information about its shareholders to employees of the Fund’s Investment Adviser and its affiliates with a legitimate business need for the information. The Fund maintains physical, electronic and procedural safeguards designed to protect the non-public personal information of its shareholders.
Questions concerning your shares of Advent/Claymore Enhanced Growth & Income Fund?
|
·
|
If your shares are held in a Brokerage Account, contact your Broker.
|
|
·
|
If you have physical possession of your shares in certificate form, contact the Fund’s Transfer Agent:
|
|
|
Computershare Shareowner Services LLC, P.O. Box 30170, College Station, TX 77842-3170; (866) 488-3559.
|
This report is sent to shareholders of Advent/Claymore Enhanced Growth and Income Fund for their information. It is not a Prospectus, circular or representation intended for use in the purchase or sale of shares of the Fund or of any securities mentioned in this report.
A description of the Fund’s proxy voting policies and procedures related to portfolio securities is available without charge, upon request, by calling the Fund at (866) 274-2227. Information regarding how the Fund voted proxies for portfolio securities, if applicable, during the most recent 12-month period ended June 30, is also available, without charge and upon request by calling the Fund at (866) 274-2227 or by accessing the Fund’s Form N-PX on the U.S. Securities & Exchange Commission’s (“SEC”) website at www.sec.gov or guggenheiminvestments.com/lcm or by accessing the Fund’s Form N-PX on the U.S. Securities & Exchange Commission’s (“SEC”) website at www.sec.gov.
The Fund files its complete schedule of portfolio holdings with the SEC for the first and third quarters of each fiscal year on Form N-Q. The Fund’s Form N-Q is available on the SEC website at www.sec.gov or by visiting the Fund’s website at www.guggenheiminvestments.com/lcm. The Fund’s Form N-Q may also be viewed and copied at the SEC’s Public Reference Room in Washington, DC; information on the operation of the Public Reference Room may be obtained by calling (800) SEC-0330 or at www.sec.gov.
Notice to Shareholders
Notice is hereby given in accordance with Section 23(c) of the Investment Company Act of 1940, as amended, that the Fund from time to time may purchase shares of its common stock in the open market or in private transactions.
|
ABOUT THE FUND MANAGER
|
Advent Capital Management, LLC
Advent Capital Management, LLC (“Advent”) is a registered investment adviser, based in New York, which specializes in convertible and high-yield securities for institutional and individual investors. The firm was established by Tracy V. Maitland, a former Director in the Convertible Securities sales and trading division of Merrill Lynch. Advent’s investment discipline emphasizes capital structure research, encompassing equity fundamentals as well as credit research, with a focus on cash flow and asset values while seeking to maximize total return.
Investment Philosophy
Advent believes that superior returns can be achieved while reducing risk by investing in a diversified portfolio of global equity, convertible and high-yield securities. Advent seeks securities with attractive risk/reward characteristics. Advent employs a bottom-up security selection process across all of the strategies it manages. Securities are chosen from those that Advent believes have stable-to-improving fundamentals and attractive valuations.
Investment Process
Advent manages securities by using a strict four-step process:
|
1
|
Screen the convertible and high-yield markets for securities with attractive risk/reward characteristics and favorable cash flows;
|
|
2
|
Analyze the quality of issues to help manage downside risk;
|
|
3
|
Analyze fundamentals to identify catalysts for favorable performance; and
|
|
4
|
Continually monitor the portfolio for improving or deteriorating trends in the financials of each investment.
|
|
Advent Capital Management, LLC
|
Guggenheim Funds Distributors, LLC
|
|
1271 Avenue of the Americas, 45th Floor
|
227 West Monroe Street
|
|
New York, NY 10020
|
Chicago, IL 60606
|
|
Member FINRA/SIPC
|
|
|
(06/15)
|
NOT FDIC-INSURED l NOT BANK-GUARANTEED l MAY LOSE VALUE
CEF-LCM-SAR-0415
Item 2. Code of Ethics.
Not applicable for a semi-annual reporting period.
Item 3. Audit Committee Financial Expert.
Not applicable for a semi-annual reporting period.
Item 4. Principal Accountant Fees and Services.
Not applicable for a semi-annual reporting period.
Item 5. Audit Committee of Listed Registrants.
Not applicable for a semi-annual reporting period.
Item 6. Schedule of Investments.
The Schedule of Investments is included as part of Item 1.
Item 7. Disclosure of Proxy Voting Policies and Procedures for Closed-End Management Investment Companies.
Not applicable for a semi-annual reporting period.
Item 8. Portfolio Managers of Closed-End Management Investment Companies.
(a) Not applicable for a semi-annual reporting period.
(b) There has been no change, as of the date of this filing, in the Portfolio Managers identified in response to paragraph (a)(1) of this Item in the registrant’s most recent annual report on Form N-CSR.
Item 9. Purchases of Equity Securities by Closed-End Management Investment Company and Affiliated Purchasers.
None.
Item 10. Submission of Matters to a Vote of Security Holders.
The registrant has not made any material changes to the procedures by which shareholders may recommend nominees to the registrant’s Board of Trustees.
Item 11. Controls and Procedures.
(a) The registrant's principal executive officer and principal financial officer have evaluated the registrant's disclosure controls and procedures (as defined in Rule 30a-3(c) under the Investment Company Act) as of a date within 90 days of this filing and have concluded based on such evaluation, as required by Rule 30a – 3(b) under the Investment Company Act, that the registrant's disclosure controls and procedures were effective, as of that date, in ensuring that information required to be disclosed by the registrant in this Form N-CSR was recorded, processed, summarized, and reported within the time periods specified in the Securities and Exchange Commission’s rules and forms.
(b) There were no changes in the registrant's internal control over financial reporting (as defined in Rule 30a-3(d) under the Investment Company Act) that occurred during the registrant's second fiscal quarter of the period covered by this report that have materially affected, or are reasonably likely to materially affect, the registrant's internal control over financial reporting.
Item 12. Exhibits.
(a)(1) Not applicable.
(a)(2) Certification of principal executive officer and principal financial officer pursuant to Rule 30a-2(a) of the Investment Company Act.
(a)(3) Not applicable.
(b) Certification of principal executive officer and principal financial officer pursuant to Rule 30a-2(b) of the Investment Company Act and Section 906 of the Sarbanes-Oxley Act of 2002.
SIGNATURES
Pursuant to the requirements of the Securities Exchange Act of 1934 and the Investment Company Act of 1940, the registrant has duly caused this report to be signed on its behalf by the undersigned, thereunto duly authorized.
(Registrant) Advent/Claymore Enhanced Growth & Income Fund
By: /s/ Tracy V. Maitland
Name: Tracy V. Maitland
Title: President and Chief Executive Officer
Date: July 8, 2015
Pursuant to the requirements of the Securities Exchange Act of 1934 and the Investment Company Act of 1940, this report has been signed by the following persons on behalf of the registrant and in the capacities and on the dates indicated.
By: /s/ Tracy V. Maitland
Name: Tracy V. Maitland
Title: President and Chief Executive Officer
Date: July 8, 2015
By: /s/ Robert White
Name: Robert White
Title: Treasurer and Chief Financial Officer
Date: July 8, 2015