UNITED STATES
SECURITIES AND EXCHANGE COMMISSION
WASHINGTON, D.C. 20549
FORM 10-K
x | ANNUAL REPORT PURSUANT TO SECTION 13 OR 15(d) OF THE SECURITIES EXCHANGE ACT OF 1934 |
For the fiscal year ended December 29, 2015
or
¨ | TRANSITION REPORT PURSUANT TO SECTION 13 OR 15(d) OF THE SECURITIES EXCHANGE ACT OF 1934 |
For the transition period from to
Commission File Number: 001-35987
NOODLES & COMPANY
(Exact name of registrant as specified in its charter)
Delaware | 84-1303469 | |
(State or other jurisdiction of incorporation or organization) | (IRS Employer Identification No.) | |
520 Zang Street, Suite D | 80021 | |
Broomfield, CO | ||
(Address of Principal Executive Offices) | (Zip Code) | |
Registrant’s telephone number, including area code: (720) 214-1900
Securities registered pursuant to Section 12(b) of the Act:
Title of each class | Name of each exchange on which registered | |
Common stock, par value $0.01 per share | NASDAQ (Global Select Market) | |
Securities registered pursuant to Section 12(g) of the Act: None
Indicate by check mark if the registrant is a well-known seasoned issuer, as defined in Rule 405 of the Securities Act. Yes ¨ No x
Indicate by check mark if the registrant is not required to file reports pursuant to Section 13 or Section 15(d) of the Act. Yes ¨ No x
Indicate by check mark whether the registrant: (1) has filed all reports required to be filed by Section 13 or 15(d) of the Securities Exchange Act of 1934 during the preceding 12 months (or for such shorter period that the registrant was required to file such reports), and (2) has been subject to such filing requirements for the past 90 days. Yes x No ¨
Indicate by check mark whether the registrant has submitted electronically and posted on its corporate Web site, if any, every Interactive Data File required to be submitted and posted pursuant to Rule 405 of Regulation S-T (§232.405 of this chapter) during the preceding 12 months (or for such shorter period that the registrant was required to submit and post such files). x Yes ¨ No
Indicate by check mark if disclosure of delinquent filers pursuant to Item 405 of Regulation S-K (§229.405 of this chapter) is not contained herein, and will not be contained, to the best of registrant’s knowledge, in definitive proxy or information statements incorporated by reference in Part III of this Form 10-K or any amendment to this Form 10-K. ¨
Indicate by check mark whether the registrant is a large accelerated filer, an accelerated filer, a non-accelerated filer, or a smaller reporting company. See the definitions of "large accelerated filer," "accelerated filer," and "smaller reporting company" in Rule 12b-2 of the Exchange Act (check one):
¨ Large accelerated filer | x Accelerated filer | ¨ Non-accelerated filer (do not check if a smaller reporting company) | ¨ Smaller reporting company | |||
Indicate by check mark whether the registrant is a shell company (as defined in Rule 12b-2 of the Act). Yes ¨ No x
The aggregate market value of the voting and non-voting common stock held by non-affiliates as of June 30, 2015, the last business day of the registrant's most recently completed second fiscal quarter, was $210.1 million. This amount was calculated based on the closing price of the common stock on June 30, 2015 on the NASDAQ Global Select Market. All executive officers and directors of the registrant have been deemed, solely for the purpose of the foregoing calculation, to be "affiliates" of the registrant.
As of February 25, 2016, there were 26,202,466 shares of the registrant’s Class A common stock, par value of $0.01 per share, and 1,522,098 shares of the registrant's Class B common stock, par value $0.01 per share, outstanding.
DOCUMENTS INCORPORATED BY REFERENCE
Portions of the registrant's proxy statement relating to its 2016 Annual Meeting of Stockholders, to be held on or about May 5, 2016, are incorporated by reference into Part III of this Annual Report on Form 10-K, where so indicated. Such proxy statement will be filed with the U.S. Securities and Exchange Commission within 120 days after the fiscal year end to which this report relates.
TABLE OF CONTENTS
Page | ||
PART I | ||
ITEM 1. | ||
ITEM 1A. | ||
ITEM 1B. | ||
ITEM 2. | ||
ITEM 3. | ||
ITEM 4. | ||
PART II | ||
ITEM 5. | ||
ITEM 6. | ||
ITEM 7. | ||
ITEM 7A. | ||
ITEM 8. | ||
ITEM 9. | ||
ITEM 9A. | ||
ITEM 9B. | ||
PART III | ||
ITEM 10. | ||
ITEM 11. | ||
ITEM 12. | ||
ITEM 13. | ||
ITEM 14. | ||
PART IV | ||
ITEM 15. | ||
SIGNATURES | ||
EXHIBITS | ||
i
PART I
ITEM 1. Business
General
Noodles & Company is a growing, fast casual restaurant concept offering lunch and dinner within the fast casual segment of the restaurant industry. We opened our first location in Denver, Colorado in 1995, offering noodle and pasta dishes, staples of many cuisines, with the goal of delivering fresh ingredients and flavors from around the world under one roof. Today, our globally inspired menu includes a wide variety of high quality, cooked-to-order dishes, including noodles and pasta, soups, salads, sandwiches and appetizers, which are served on china by our friendly team members. In conjunction with our 20th Anniversary in October 2015, we built on our commitment to provide our customers high quality dishes and announced our Made. Different. brand positioning, detailing our Real Food, Real Cooking and Real Flavors initiatives. As part of this brand positioning, we also announced the removal of all artificial colors, flavors, preservatives and sweeteners from our core menu, including noodles, sauces, soups, condiments, bread and dressings, but excluding beverages, cookies and rice crispies. We also committed to offer meat and poultry never given antibiotics or hormones by 2017. We believe that we offer our customers value, with per person spend of $8.55 for the fiscal year ended December 29, 2015. We have 492 restaurants, comprised of 422 company-owned and 70 franchised locations, across 35 states, the District of Columbia and one Canadian province as of December 29, 2015.
We offer more than 25 globally inspired Asian, Mediterranean and American dishes together on a single menu. We believe we will continue to benefit from trends in consumer preferences, wider availability of international cuisines and increasingly adventurous consumer tastes. At many restaurants, people are limited to a particular ethnic cuisine or type of dish, such as a sandwich, burrito or burger. At Noodles & Company, we aim to eliminate the "veto vote" by satisfying the preferences of a wide range of customers, whether a mother with kids, a group of coworkers, an individual or a large party.
We believe that we are the only national fast casual restaurant concept offering a menu with a wide variety of noodle and pasta dishes, soups, salads, sandwiches and appetizers inspired by global flavors. We believe our attributes—global flavors, variety, dishes prepared-to-order and fast service—allow us to compete against multiple segments throughout the restaurant industry and provide us a larger addressable market for lunch and dinner than competitors who focus on a single cuisine. We believe we provide a pleasant dining experience by quickly delivering fresh food with friendly service at a price point we believe is attractive to our customers.
Noodles & Company is a Delaware corporation that was organized in 2002. Noodles & Company and its subsidiaries are sometimes referred to as "we," "us," "our," and the "Company" in this report.
Our Concept and Business Strengths
Variety. We have purposefully chosen a range of healthy to indulgent dishes to satisfy carnivores and vegetarians. Our menu encourages customers to customize their meals to meet their tastes and nutritional preferences with our selection of 14 fresh vegetables and six proteins–marinated steak, naturally raised pork, chicken, meatballs, shrimp and organic tofu.
All of our dishes are cooked-to-order with fresh, high quality ingredients sourced from our carefully selected suppliers. Our commitment to the freshness of our ingredients is further demonstrated by our use of seasonal ingredients and healthy add-in options (such as organic tofu). Our culinary team strives to develop new dishes and limited time offerings ("LTOs") to further reinforce our Made. Different. brand positioning and regularly provide our customers additional options. For example, in Spring of 2015 we introduced BUFF Bowls: four of Noodles & Company's most popular pasta bowls—Japanese Pan, Whole Grain Tuscan Fresca, Pesto Cavatappi and Bangkok Curry—in the buff—to showcase the customization available to customers designing dishes to their dietary or nutritional preferences. Each BUFF Bowl features a double portion of veggies, topped with protein and served on a bed of spinach in place of the noodles, for a low-carb dish that is full of flavor and under 400 calories. This focus on culinary innovation, combined with our commitment to Real cooking, allows us to prepare and serve high quality food.
Value. The value we offer, the quality of our food and the welcoming ambiance of our restaurants creates an overall customer experience that we believe is second-to-none. Our per person spend of $8.55 for the twelve months ended December 29, 2015 is competitive not only within the fast casual segment, but also within the quick-service segment. We deliver value by combining a family-friendly dining environment with the opportunity to enjoy many dishes containing ingredients like our award-winning slow-braised, naturally raised pork. In October of 2015 we also introduced Kids Meals which, at a fixed low price, offers the opportunity
1
for parents to feed their children a balanced meal which includes sides such as broccoli, carrots, fruit, applesauce, and a smaller portion of our housemade rice crispy treat.
Our Restaurant Experience. We design each location individually, which we believe creates an inviting restaurant environment. We believe the ambiance is warm and welcoming, with muted lighting and colors, comfortable seating and our own custom music mix, which is intended to make our customers feel relaxed and at home. We also enhance the experience by featuring Coca-Cola Freestyle® machines in all our restaurants, offering our customers over 100 drink choices to complement their meal—again putting control in the customers’ hands, so that they can create or match their drink to their meal.
We believe we deliver an exceptional overall dining experience. We think that our customers should expect not only great food from our restaurants, but also warm hospitality and attentive service. Whether you are a mother with kids or a businessperson with a laptop, you simply order your food, grab a drink and take a seat. We cook each dish to order in approximately five minutes and bring the food right to your table. Our customers may enjoy a relaxed meal or just eat and run.
Consistent with our culture of enhanced customer service, we seek to hire individuals who will deliver prompt, attentive service by engaging customers the moment they enter our restaurants. Our training philosophy empowers both our restaurant managers and team members to add a personal touch when serving our customers, such as coming out from behind the counter to explain our menu and guide customers to the right dish. Our restaurant managers are critical to our success, as we believe that their entrepreneurial spirit and outreach efforts build our brand in our communities. We call our cashiers "Noodle Ambassadors" to highlight their role in helping our customers explore our global menu.
After our customers order at the counter, their food is served on china and delivered to their table by our friendly team members. To further enhance our customers’ dining experience, we check on them throughout their meal. We offer them drink refills, a glass of wine or dessert, so they do not have to leave their seats. No trash cans are visible to our customers in our restaurants: following the meal, our team quickly clears the table.
Restaurant Unit Growth
We believe we have significant growth potential because of our brand positioning, strong unit economics, financial results and broad customer appeal. We have more than doubled our restaurant base in the last six years to 492 locations in 35 states, the District of Columbia and one Canadian province as of December 29, 2015, including the 51 company-owned restaurants and 19 franchise restaurants opened in 2015. During 2015 we also purchased one restaurant from a franchisee and closed 16 company-owned restaurants and one franchise restaurant. We believe we are at an early stage of nationwide expansion, and that we can grow up to 2,500 restaurants over the next 15 to 20 years across the United States based on our scalable infrastructure, broad appeal and flexible and portable real estate model, but this growth rate is not guaranteed. Our restaurants are typically 2,600 to 2,700 square feet and are located in end-cap, inline or free-standing locations across a variety of urban and suburban markets. Our near-term growth strategy will involve opening units primarily in existing markets.
Although we expect the majority of our expansion to continue to be from company-owned restaurants, we are strategically expanding our base of franchise restaurants. Our franchise program is a low-cost and high-return model that allows us to expand our footprint and build brand awareness in markets that we do not plan to enter with company-owned restaurants in the short to medium term. As of December 29, 2015, we have 70 franchise units in 15 states operated by 12 franchisees. We look for experienced, well-capitalized franchise partners who are able to leverage their existing infrastructure and local knowledge in a manner that benefits both our franchisees and ourselves. As of December 29, 2015, a total of`11 area developers have signed development agreements providing for the opening of 145 restaurants in their respective territories.
Site Development and Expansion
We consider our site selection and development process critical to our long-term success. We use a combination of our own development team and outside real estate consultants to locate, evaluate and negotiate new sites using various criteria. In addition, because we offer a mix of dishes and a dining experience that differs from many other restaurant concepts, we believe our restaurants are highly sought after by real estate owners and developers. Also, we learn of opportunities early in their development process, allowing us to secure optimal locations.
2
In making site selection decisions, we also use several analytical tools designed to uncover the key site, demographic, business, retail, competitive and traffic characteristics that drive successful locations. These tools have been customized to leverage existing real estate information to project sales at a potential location and to assist in the development of local marketing plans.
Our ability to succeed in several different kinds of trade areas and real estate types has allowed us flexibility in our market development strategy. While we typically target end-cap or freestanding locations, we also have seen success in inline locations. Moreover, we perform well in various market sizes, from smaller markets to suburbs to central business districts. This flexibility also allows us to manage risk in our development portfolio by balancing higher cost locations—typically seen in urban areas—with those that are lower cost—typically seen in smaller markets.
Once a location has been approved by our executive-level selection committee, we begin a design process to match the characteristics and feel of the location to the trade area. For example, in a trade area with a high percentage of families we will utilize additional booth seating in the dining room, and in an urban location we will typically alter our kitchen design to enhance throughput for the busy lunch hours.
Restaurant Management and Operations
Friendly People. We believe our genuine, nice people separate us from our competitors. We value the individuality of our team members, which we believe results in a management, operations and training philosophy distinct from that of our competitors. We make an effort to hire team members who share a passion for food, have a competitive spirit and will operate our restaurants in a way that is consistent with our high standards. We seek to hire individuals who will deliver prompt, attentive service by engaging customers the moment they enter our restaurants. We empower our team members to enrich the experience of our customers and directly address any concerns that may arise in a manner that contributes to the success of our business.
Restaurant Management and Employees. Each restaurant typically has a restaurant manager, an assistant manager and as many as 15 to 25 team members. We cross-train our employees in an effort to create a depth of competency in our critical restaurant functions. Consistent with our emphasis on customer interaction, we encourage our restaurant managers and team members to welcome and interact with customers throughout the day. To lead our restaurant management teams, we have area managers (each of whom is responsible for between five and 12 restaurants), as well as market directors (each of whom is responsible for between 50 and 80 restaurants).
Training and Career Development. We believe that our training efforts create a culture of continuous learning and professional growth that allows our team members to continue their career development with us. Within each restaurant, two to four team members are designated to lead the training efforts and ensure a consistent approach to team member development. We produce training materials that encourage individual contributions and participation from our team members, rather than providing rote, step-by-step scripts or rigid and extensively detailed policy manuals.
Food Preparation and Quality. Our teams use classic professional cooking methods, including hand-chopping, par boiling and sautéing many of our vegetables, in full kitchens resembling those of full service restaurants. All team members, including our restaurant managers, spend their first several days working solely with food and learning these techniques, and we spend a significant amount of time ensuring that each team member learns how to prepare and cook our food properly. Despite our more labor-intensive method of food preparation, we believe that we produce food with an efficiency that enables us to compete effectively.
The majority of our restaurants have exhibition-style kitchens. This design demonstrates our commitment to cooking fresh food in an accessible manner. We provide each customer with individual attention and make every effort to respond to customer suggestions and concerns in a personal and hospitable way.
We do real cooking in our restaurants, which requires that all of our dishes are cooked to order at food safe temperatures or, in the case of salads, subject to our produce washing protocols, which helps us to ensure that the food that we serve to our customers is safe. We have designed our food safety and quality assurance programs to maintain high standards for our food and food preparation procedures. Our quality assurance manager oversees comprehensive restaurant and supplier audits based upon the potential food safety risk of each food. We also consider food safety and quality assurance when selecting our distributors and suppliers. Our suppliers are inspected by federal, state and local regulators or other reputable, qualified inspection services, which helps ensure their compliance with all federal food safety and quality guidelines. We regularly inspect our suppliers to ensure that the ingredients we buy conform to our quality standards and that the prices we pay are competitive. We also rely on our own recipes, specifications and protocols to ensure that our food is consistently the best quality possible when served, including a physical examination of
3
ingredients when they arrive at our restaurants. We train our employees to pay detailed attention to food quality at every stage of the food preparation cycle, and we have developed a daily checklist that our employees use to assess the freshness and quality of food supplies. Finally, we encourage our customers to provide feedback regarding our food quality so that we can identify and resolve problems or concerns as quickly as possible.
Restaurant Marketing
Our marketing efforts seek to increase sales through a variety of channels and initiatives. Community-based restaurant marketing, as well as online, social and other media tools, highlight our competitive strengths, including our varied and healthy menu offerings and the value we offer our customers.
• | Local Relationship Marketing. We differentiate our business through an innovative, community-based approach to building brand awareness and customer loyalty. We use a wide range of local marketing initiatives to increase the frequency of and occasions for visits, and to encourage people to get to know us better, try our food and bring their friends. We empower our local restaurant managers to selectively organize events to bring new customers into our restaurants. For example, we offer fundraising nights to build our partnerships with our community organizations and schools, and we hold "Appreciation Days" for our customers to showcase our menu offerings. |
• | Outdoor, Radio, and Digital Advertising. In select markets where we have economies of scale, we utilize traditional advertising methods such as outdoor billboards and transit stations, as well as radio placement. Additionally, we use targeted digital advertising in many of our markets. We believe these efforts help to increase top of mind awareness with potential customers and drive both frequency and trial. In addition, digital advertising provides us with the opportunity to promote specific product platforms and offerings such as online ordering. |
• | Our Menu Offerings. We focus some of our marketing efforts on new menu offerings to broaden our appeal to our customers. We promote these items through a variety of formats including market-wide public relations events, social media marketing, radio promotions, tastings and email blasts to our e-club. In addition to increasing brand awareness, these promotions also encourage prompt consumer action, resulting in more immediate increases in our customer traffic. |
• | Online, Social and Other Media Tools. We rely on our website, www.noodles.com, to promote our business and increase brand awareness. The information on or available through our website is not, and should not be considered, a part of this report. Our customers are encouraged to sign up to receive email communication or Noodlegrams, updating them on new menu offerings and promotional opportunities. As of December 29, 2015, more than 1,300,000 of our customers have signed up to receive Noodlegrams. We also communicate with our customers using social media, such as our Facebook and Instagram pages, our YouTube channel and our Twitter feed. Our media tools also include editorial placements in local, regional and national print/online media. |
• | Creating New Meal Occasions. We also focus on ways Noodles & Company can serve customers at different times and in new places. For example, with our core demographic target being the career-minded millennial parent, we introduced a new Kids Meal menu in fall of 2015. Created for the future foodies of the world, children aged ten and under are invited to design their own meal made fresh-to-order, with quality ingredients, by choosing their entrée, two sides and a drink for just $5. Customers who want to feed a large group can enjoy our three catering options: NoodlesBar, serving buffet style meals for 20 or more people comprised of main entrées, sides and desserts; A La Carte individual pans that serve up to 10 people each and are great for adding variety to larger spreads or feeding a small get together; and Square Bowls, which are family-style take-out offerings of our noodles, pastas and salads that generally feed up to four people. We market these offerings in a variety of ways, including through in-restaurant posters, email Noodlegrams, Facebook posts and other communications outside of our restaurants. |
• | Making Noodles & Company Easier to Use. Some of our marketing efforts focus on making our restaurants easier to use. We seek to deliver superior customer service at every opportunity, generating consumer awareness of menu offerings with in-restaurant communications by providing displays of our menu offerings and beer and wine selection that are visible upon entry, chalkboards featuring new menu offerings and fresh ingredients and table top cards that highlight healthy food offerings. By providing multiple points of access to our wide variety of menu offerings, we seek to optimize our customers’ in-restaurant experience to increase the frequency of our customers’ visits. Our efforts also utilize tools like online ordering. |
4
Suppliers
Maintaining a high degree of quality in our restaurants depends in part on our ability to acquire fresh ingredients and other necessary supplies that meet our specifications from reliable suppliers. We carefully select suppliers based on quality and their understanding of our brand, and we seek to develop mutually beneficial long-term relationships with them. We work closely with our suppliers and use a mix of forward, fixed and formula pricing protocols. We have tried to increase, in some cases, the number of suppliers for our ingredients, which we believe can help mitigate pricing volatility, and we monitor industry news, trade issues, weather, crises and other world events that may affect supply prices.
Seasonality
Seasonal factors and the timing of holidays cause our revenue to fluctuate from quarter to quarter. Our revenue per restaurant is typically lower in the first and fourth quarters due to reduced winter and holiday traffic and higher in the second and third quarters.
Competition
We face competition from the casual dining, quick-service and fast casual segments of the restaurant industry. These segments are highly competitive with respect to taste, price, food quality and presentation, service, location and the ambience and condition of each restaurant, among other things. Our competition includes a variety of locally owned restaurants and national and regional chains who offer dine-in, carry-out and delivery services. Many of our competitors have existed longer and have a more established market presence with substantially greater financial, marketing, personnel and other resources than we have. Among our competitors are a number of multi-unit, multi-market fast casual restaurant concepts, some of which are expanding nationally. As we expand, we will face competition from these concepts and new competitors that strive to compete with our market segments.
We believe we are the only national fast casual restaurant concept offering a menu with a wide variety of noodle and pasta dishes, soups, salads and sandwiches inspired by global flavors. We believe our attributes—global flavors, variety and fast service—allow us to compete against multiple segments throughout the restaurant industry and provide us a larger addressable market for lunch and dinner than competitors who focus on a single cuisine. We believe we provide a pleasant dining experience by quickly delivering fresh food with friendly service at a price point we believe is attractive to our customer.
Franchising
We had 12 franchisees who operated 70 franchise restaurants in 15 states as of December 29, 2015. A total of 11 area developers have signed area development agreements as of December 29, 2015, providing for the opening of 145 additional restaurants in their respective territories. We expect to continue to offer development rights in markets where we do not intend to build company-owned restaurants. We may offer such rights to larger developers who commit to open 10 or more units, or to smaller developers who may commit to open significantly fewer restaurants. We do not currently intend to offer single-unit franchises. We believe the strength and attractiveness of our brand and unit growth opportunities in attractive undeveloped markets will attract experienced and well-capitalized area developers.
Intellectual Property and Trademarks
We own a number of trademarks and service marks registered or pending with the U.S. Patent and Trademark Office ("PTO"). We have registered the following marks with the PTO: Noodles & Company, the Noodles & Company logo, Your World Kitchen, Square Bowl, Noodlegram, Crave Card and Wisconsin Mac & Cheese. We also have certain trademarks registered or pending in certain foreign countries. In addition, we have registered the Internet domain name www.noodles.com. The information on, or that can be accessed through, our website is not part of this report. We believe that our trademarks, service marks and other intellectual property rights have significant value and are important to the marketing of our brand, and it is our policy to protect and defend vigorously our rights to such intellectual property.
Governmental Regulation and Environmental Matters
We are subject to extensive and varied federal, state and local government regulation, including regulations relating to public and occupational health and safety, sanitation and fire prevention. We operate each of our restaurants in accordance with standards and procedures designed to comply with applicable codes and regulations. However, an inability to obtain or retain health department or other licenses could adversely affect our operations. Although we have not experienced, and do not anticipate, any significant
5
difficulties, delays or failures in obtaining required licenses, permits or approvals, any such problem could delay or prevent the opening of, or adversely impact the viability of, a particular restaurant or group of restaurants.
In addition, in order to develop and construct restaurants, we need to comply with applicable zoning, land use and environmental regulations. Federal and state environmental regulations have not had a material effect on our operations to date, but more stringent and varied requirements of local governmental bodies with respect to zoning, land use and environmental factors could delay or even prevent construction and increase development costs for new restaurants. We are also required to comply with the accessibility standards mandated by the U.S. Americans with Disabilities Act ("ADA"), which generally prohibits discrimination in accommodation or employment based on disability. We may in the future have to modify restaurants, for example by adding access ramps or redesigning certain architectural fixtures, to provide service to or make reasonable accommodations for disabled persons. While these expenses could be material, our current expectation is that any such actions will not require us to expend substantial funds.
A small percentage of our revenues is attributable to the sale of alcoholic beverages. Alcoholic beverage control regulations require each of our restaurants to apply to a state authority and, in certain locations, county or municipal authorities for a license that must be renewed annually and may be revoked or suspended for cause at any time. Alcoholic beverage control regulations relate to numerous aspects of daily operations of our restaurants, including the minimum age of patrons and employees, hours of operation, advertising, trade practices, wholesale purchasing, other relationships with alcohol manufacturers, wholesalers and distributors, inventory control and handling and storage and dispensing of alcoholic beverages. We are also subject in certain states to "dram shop" statutes, which generally provide a person injured by an intoxicated person the right to recover damages from an establishment that wrongfully served alcoholic beverages to the intoxicated person. We carry liquor liability coverage as part of our existing comprehensive general liability insurance. A small number of our restaurants do not have liquor licenses, typically because of the cost of a liquor license in jurisdictions having liquor license quotas.
In addition, we are subject to the U.S. Fair Labor Standards Act, the U.S. Immigration Reform and Control Act of 1986, the Occupational Safety and Health Act and various other federal and state laws governing similar matters including minimum wages, overtime, workplace safety and other working conditions. Our failure to fully comply with these laws could subject us to potential litigation and liability. We are also subject to various laws and regulations relating to our current and any future franchise operations.
We are subject to federal, state and local environmental laws and regulations concerning waste disposal, pollution, protection of the environment, and the presence, discharge, storage, handling, release and disposal of, or exposure to, hazardous or toxic substances ("environmental laws"). These environmental laws can provide for significant fines and penalties for non-compliance and liabilities for remediation, sometimes without regard to whether the owner or operator of the property knew of, or was responsible for, the release or presence of the hazardous or toxic substances. Third parties may also make claims against owners or operators of properties for personal injuries and property damage associated with releases of, or actual or alleged exposure to, such substances. We are not aware of any environmental laws that will materially affect our earnings or competitive position, or result in material capital expenditures relating to our restaurants. However, we cannot predict what environmental laws will be enacted in the future, how existing or future environmental laws will be administered, interpreted or enforced, or the amount of future expenditures that we may need to make to comply with, or to satisfy claims relating to, environmental laws. It is possible that we will become subject to environmental liabilities at our properties, and any such liabilities could materially affect our business, financial condition or results of operations.
Management Information Systems
All of our restaurants use computerized management information systems, which we believe are scalable to support our future growth plans. We use point-of-sale computers designed specifically for the restaurant industry. The system provides a touch screen interface, a graphical order confirmation display and integrated, high-speed credit card and gift card processing. The point-of-sale system is used to collect daily transaction data, which generates information about daily sales, product mix and average check that we actively analyze. All products sold and prices at our company-owned restaurants are programmed into the system from our central support office.
Our in-restaurant back office computer system is designed to assist in the management of our restaurants and provide labor and food cost management tools. These tools provide corporate and restaurant operations management quick access to detailed business data and reduces restaurant managers’ administrative time. The system provides our restaurant managers the ability to submit orders electronically with our distribution network. The system also supplies sales, bank deposit and variance data to our accounting department on a daily basis. We use this data to generate daily sales information and weekly consolidated reports regarding sales
6
and other key measures, as well as preliminary weekly detailed profit and loss statements for each location with final reports following the end of each period.
Franchisees use similar point of sale systems and are required to report sales on a daily basis through an on-line reporting network and submit their restaurant-level financial statements on a quarterly or annual basis.
Financial Information About Segments
We operate as a single accounting segment. Financial information related to our business is included in Item 8 of this Annual Report on Form 10-K.
Employees
As of December 29, 2015, we had approximately 10,600 employees, including approximately 1,000 salaried employees and approximately 9,600 hourly employees. None of our employees are unionized or covered by a collective bargaining agreement, and we consider our current employee relations to be good.
Available Information
We maintain a website at www.noodles.com, including an investor relations section at investor.noodles.com, on which we routinely post important information, such as webcasts of quarterly earnings calls, and any related materials. You may access our Annual Reports on Form 10-K, Quarterly Reports on Form 10-Q, Current Reports on Form 8-K, amendments to those reports and other reports relating to us that are filed with or furnished to the SEC, free of charge in the investor relations section of our website as soon as reasonably practicable after such material is electronically filed with or furnished to the SEC. The public may also read and copy materials we file with the SEC at the SEC’s Public Reference Room, which is located at 100 F Street, NE, Room 1580, Washington, DC 20549. You can obtain information on the operation of the Public Reference Room by calling the SEC at 1-800-SEC-0330. The SEC also maintains a website that contains reports, proxy and information statements and other information regarding issuers that file electronically with the SEC at www.sec.gov.
The contents of the websites mentioned above are not incorporated into and should not be considered a part of this report. The references to the URLs for these websites are intended to be inactive textual references only.
Executive Officers of the Registrant
Name | Age(1) | Position | ||
Kevin Reddy | 58 | Chairman and Chief Executive Officer | ||
Dave Boennighausen | 38 | Chief Financial Officer | ||
Mark Mears | 54 | Executive Vice President and Chief Marketing Officer | ||
Phil Petrilli | 46 | Executive Vice President of Operations | ||
Paul Strasen | 59 | Executive Vice President, General Counsel and Secretary | ||
Kathy Lockhart | 51 | Vice President and Controller | ||
(1) | As of March 1, 2016 |
Kevin Reddy has served as our Chief Executive Officer since April 2006. He became a member of our board of directors in May 2006, and Chairman of the Board in May 2008. Mr. Reddy was our President and Chief Operating Officer from April 2005 to April 2006, continuing to serve as our President until July 2012. Prior to joining us, he was the Chief Operating Officer, Chief Operations Officer and Restaurant Support Officer for Chipotle Mexican Grill. Mr. Reddy began his professional career with McDonald’s Corporation in 1983 as a regional controller and progressed into positions of escalating responsibility. Mr. Reddy has received a number of awards in connection with his role as our Chief Executive Officer, including being named "Entrepreneur of the Year" by Restaurant Business Magazine in 2009 and was most recently included on the Nation's Restaurant News 2014 Builders List, created to feature people who are taking restaurant brands to the next level. He currently serves on the executive advisory board to the Daniels School of Business at the University of Denver. He received a BS degree in Accounting from Duquesne University.
7
Dave Boennighausen has served as our Chief Financial Officer since July 2012. He became a member of our board of directors in August 2015. Mr. Boennighausen has been with the Company since 2004, and served as our Vice President of Finance from October 2007 to March 2011, and as our Executive Vice President of Finance from April 2011 to June 2012. He began his career with May Department Stores. He received a BS degree in Finance and Marketing from Truman State University and holds an MBA from the Stanford Graduate School of Business.
Mark Mears has served as our Executive Vice President and Chief Marketing Officer since July 2015. Prior to joining us, Mr. Mears was Chief Marketing Officer for Schlotzsky's Bakery-Café, an international sandwich restaurant chain, from January 2014 to July 2015. Prior to that time, he served as the President and Chief Concept Officer for Mimi's Café, a US restaurant company, from April 2011 to February 2013, and he served as the Chief Marketing Officer for The Cheesecake Factory, Inc., a US restaurant company, from July 2008 to March 2011. He received a BS degree in Journalism from the University of Kansas and an MS degree in Advertising from Northwestern University.
Phil Petrilli has served as our Executive Vice President of Operations since May 2012. Prior to joining us, he worked for Chipotle Mexican Grill, an international restaurant chain, in multiple operations positions from June 1999 to May 2012, most recently as Regional Director-Northeast Region from 2008 to 2012, where he led a region of 268 restaurants. He received a BA degree in Psychology from the University of Illinois-Chicago.
Paul Strasen has served as our Executive Vice President, Secretary and General Counsel since January 2008. Prior to joining our company, Mr. Strasen was the Vice President, General Counsel and Secretary of Houlihan’s Restaurants, Inc. and served as the General Counsel of Einstein/Noah Bagel Corp. He began his career at Bell Boyd & Lloyd, now part of K & L Gates. Mr. Strasen received a BA degree in Humanities and Political Science from Valparaiso University and received a JD from The University of Chicago Law School.
Kathy Lockhart has served as our Vice President and Controller since August 2006. Prior to joining us, Ms. Lockhart served as the Vice President and Controller of several public and private restaurant and retail companies, including Einstein/Noah Bagel Corp., Boston Market, VICORP (parent company of Village Inn and Bakers Square restaurants) and Ultimate Electronics. She received a BA degree in Business Administration and Political Science from Western State College, and she is a Certified Public Accountant and a member of the American Institute of Certified Public Accountants.
ITEM 1A. Risk Factors
Special Note Regarding Forward-Looking Statements
This report contains forward-looking statements within the meaning of the Private Securities Litigation Reform Act of 1995 that involve risks and uncertainties, including but not limited to the risks and uncertainties discussed under Item 1A. "Risk Factors," Item 7. "Management’s Discussion and Analysis of Financial Condition and Results of Operations" and Item 1. "Business." In some cases, you can identify forward-looking statements by terms such as "may," "might," "will," "objective," "intend," "should," "could," "can," "would," "expect," "believe," "design," "estimate," "predict," "potential," "plan" or the negative of these terms, and similar expressions intended to identify forward-looking statements. These statements involve known and unknown risks, uncertainties and other factors that may cause our actual results, performance or achievements to be materially different from any future results, performances or achievements expressed or implied by the forward-looking statements. We discuss these risks, uncertainties and other factors in greater detail below. These statements reflect our current views with respect to future events and are based on currently available operating, financial and competitive information. Unless required by United States federal securities laws, we do not intend to update any of these forward-looking statements to reflect circumstances or events that occur after the statement is made.
Risks Related to Our Business and Industry
Our sales growth rate depends on our ability to open new restaurants and increase comparable restaurant sales, both of which are subject to many unpredictable factors.
One of the key means of achieving our growth strategy will be through opening new restaurants and operating those restaurants on a profitable basis. We expect this to be the case for the foreseeable future. In 2015, we opened 51 company-owned restaurants, and 19 franchise restaurants, while we closed 16 company-owned restaurants and one franchise restaurant. We expect to open approximately 50 restaurants system-wide in 2016. We may not be able to open new restaurants as quickly as planned. In the past, we have experienced delays in opening some restaurants and that could happen again. Delays or failures in opening new restaurants
8
could materially and adversely affect our growth strategy and our expected results. As we operate more restaurants, our rate of expansion relative to the size of our restaurant base will decline.
The level of comparable restaurant sales, which represent the change in year-over-year sales for restaurants open for at least 18 full periods, will also affect our sales growth and will continue to be a critical factor affecting profit growth because the profit margin on comparable restaurant sales growth is generally higher than the profit margin on new restaurant sales. Our ability to increase comparable restaurant sales depends in part on our ability to successfully implement our initiatives to build sales. It is possible that such initiatives will not be successful, that we will not achieve our target comparable restaurant sales growth or that the change in comparable restaurant sales could be negative, which may cause a decrease in sales and profit growth that could materially adversely affect our business, financial condition or results of operations.
Our ability to open new restaurants also depends on other factors, including:
• | site selection; |
• | negotiating leases with acceptable terms; |
• | identifying, hiring and training qualified employees in each local market; |
• | the state of the labor market in each local market and the presence of heightened minimum wage or enhanced healthcare regulations; |
• | timely delivery of leased premises to use from our landlords and punctual commencement of our build-out construction activities; |
• | managing construction and development costs of new restaurants, particularly in competitive markets; |
• | avoiding the impact of inclement weather, natural disasters and other calamities; |
• | obtaining construction materials and labor at acceptable costs, particularly in urban markets; |
• | securing required governmental approvals, permits and licenses (including construction and other permits) in a timely manner and responding effectively to any changes in local, state or federal laws and regulations that could adversely affect our costs or ability to open new restaurants; and |
• | accessing sufficient capital, which is expected to come from cash flow from operations and third party funding. |
Our progress in opening new restaurants from quarter to quarter may occur at an uneven rate. If we do not open new restaurants in the future according to our current plans, the delay could materially adversely affect our business, financial condition or results of operations.
Our long-term success is highly dependent on our ability to effectively identify appropriate new markets and secure appropriate sites for new restaurants.
We intend to develop new restaurants in our existing markets, expand our footprint into adjacent markets and selectively enter into new markets. In order to build new restaurants, we must first identify target markets where we can enter or expand our footprint, taking into account numerous factors, including the location of our current restaurants, local economic trends, population density, area demographics and geography. The selection of target markets is challenging, and we have had to close restaurants in some markets that we had previously believed would be successful. We also must locate and secure appropriate sites for new restaurants, which is one of our biggest challenges. There are numerous factors involved in identifying and securing an appropriate site, including:
• | identification and availability of locations with the appropriate size, traffic patterns, local retail and business attractions and infrastructure that will drive high levels of customer traffic and sales per unit; |
• | demographics of the populations surrounding the restaurant sites; |
• | competition in new markets, including competition for restaurant sites; |
9
• | financial conditions affecting developers and potential landlords, such as the effects of macro-economic conditions and the credit market, which could lead to these parties delaying or canceling development projects (or renovations of existing projects), in turn reducing the number of appropriate locations available; |
• | developers and potential landlords obtaining licenses or permits for development projects on a timely basis; |
• | proximity of potential development sites to an existing location; |
• | anticipated commercial, residential and infrastructure development near our new restaurants; and |
• | availability of acceptable lease arrangements. |
We may not be able to successfully develop critical market presence for our brand in new geographical markets, as we may be unable to find and secure attractive locations, build name recognition or attract new customers. If we are unable to fully implement our development plan, our business, financial condition or results of operations could be materially adversely affected.
Our expansion into new markets may present increased risks.
We plan to open restaurants in markets where we have little or no operating experience. Restaurants we open in new markets may take longer to reach expected sales and profit levels on a consistent basis, if ever, and may have higher construction, occupancy or operating costs than restaurants we open in existing markets, thereby affecting our overall profitability. New markets may have competitive conditions, consumer tastes and discretionary spending patterns that are more difficult to predict or satisfy than our existing markets. We may need to make greater investments than we originally planned in advertising and promotional activity in new markets to build brand awareness. We may find it more difficult in new markets to hire, motivate and keep qualified employees who share our vision, passion and business culture. We may not be able to successfully develop critical market presence for our brand in new geographical markets, as we may be unable to find and secure attractive locations, build name recognition or attract new customers. We may also incur higher costs from entering new markets, if, for example, we assign area managers to manage comparatively fewer restaurants than we assign in more developed markets. As a result, these new restaurants may be less successful or may achieve target average unit volumes ("AUVs") at a slower rate. In the event that we encounter these types of challenges, some or all of the restaurants we opened in a new market may be closed. If we do not successfully execute our plans to enter new markets, our business, financial condition or results of operations could be materially adversely affected.
New restaurants, once opened, may not be profitable, and the increases in average restaurant sales and comparable restaurant sales that we have experienced in the past may not be indicative of future results.
Our new restaurants typically open with above–average volumes, which then decline after the initial sales surge that comes with interest in a restaurant’s grand opening. Historically openings have stabilized in sales after approximately 32 to 36 weeks of operation, at which time the restaurant’s sales typically begin to grow on a consistent basis. In new markets, the length of time before average sales for new restaurants stabilize is less predictable and can be longer as a result of our limited knowledge of these markets and consumers’ limited awareness of our brand. New restaurants may not be profitable and their sales performance may not follow historical patterns. In addition, our average restaurant sales and comparable restaurant sales may not increase at the rates achieved over the past several years. Our ability to operate new restaurants profitably and increase average restaurant sales and comparable restaurant sales will depend on many factors, some of which are beyond our control, including:
• | consumer awareness, understanding and support of our brand; |
• | general economic conditions, which can affect restaurant traffic, local labor costs and prices we pay for the food products and other supplies we use; |
• | changes in consumer preferences, including the types of food that are popular and concerns about healthy eating, and discretionary spending; |
• | competition, either from our competitors in the restaurant industry or our own restaurants; |
• | temporary and permanent site characteristics of new restaurants; and |
• | changes in government regulation. |
10
If our new restaurants do not perform as planned, our business and future prospects could be harmed. In addition, if we are unable to achieve our expected average restaurant sales, our business, financial condition or results of operations could be materially adversely affected.
Our strategies and initiatives to increase comparable restaurant sales may not be successful.
The level of comparable restaurant sales we achieve will affect our sales growth and will continue to be a critical factor affecting profit growth. We have implemented strategies such as introducing catering options and enhanced marketing efforts in an effort to increase overall sales. For example, catering introduces new operating procedures to our restaurants, and we may not successfully execute these procedures, which could adversely impact the customer experience in our restaurants and thereby harm our sales and customer perception of our brand. In addition, our catering program or our enhanced marketing efforts may not increase our sales to the degree we expect, and these programs and efforts may require the time and attention of our management and require substantial funding. In 2015, we did not achieve comparable restaurant sales growth and we may not do so in the future.
We believe our culture—from the restaurant level up through management—is an important contributor to our success. As we grow and as time passes, however, we may have difficulty maintaining our culture or adapting it sufficiently to meet the needs of our operations. Among other important factors, our culture depends on our ability to attract, retain and motivate employees who share our enthusiasm and dedication to our concept. Our comparable restaurant sales, and more broadly, our business, financial condition or results of operations, could be materially adversely affected if we do not maintain our infrastructure and culture as we grow.
It is possible that our initiatives will not be successful, and that we will not achieve our target comparable restaurant sales growth or that the change in comparable restaurant sales could be negative, which may cause a decrease in sales and profit growth that could materially adversely affect our business, financial condition or results of operations.
We rely heavily on information technology, and any material failure, weakness, interruption or breach of security could prevent us from effectively operating our business.
We rely heavily on information systems, including point-of-sale processing in our restaurants, for management of our supply chain, payment of obligations, collection of cash, credit and debit card transactions and other processes and procedures. Our ability to efficiently and effectively manage our business and its growth depends significantly on the reliability and capacity of these systems. Our operations depend upon our ability to protect our computer equipment and systems against damage from physical theft, fire, power loss, telecommunications failure or other catastrophic events, as well as from internal and external security breaches, viruses and other disruptive problems. In addition, managing our growth effectively will require us to continue to enhance these systems, procedures and controls and to hire, train and retain managers and team members. The failure of these systems to operate effectively, maintenance problems, upgrading or transitioning to new platforms, or a breach in security of these systems could result in delays in customer service and reduce efficiency in our operations. Remediation of such problems could result in significant, unplanned capital investments and harm our business, financial condition or results of operations.
Opening new restaurants in existing markets may negatively affect sales at our existing restaurants.
The consumer target area of our restaurants varies by location, depending on a number of factors, including population density, other local retail and business attractions, area demographics and geography. As a result, opening a new restaurant in or near markets in which we already have restaurants could adversely affect the sales of these existing restaurants. Existing restaurants could also make it more difficult to build our consumer base for a new restaurant in the same market. Our core business strategy does not entail opening new restaurants that we believe will materially affect sales at our existing restaurants, but we may selectively open new restaurants in and around areas of existing restaurants that are operating at or near capacity to effectively serve our customers. Sales cannibalization between our restaurants may become significant in the future as we continue to expand our operations and could affect our sales growth, which could, in turn, materially adversely affect our business, financial condition or results of operations.
Competition from other restaurant companies could adversely affect us.
We face competition from the casual dining, quick-service and fast casual segments of the restaurant industry. These segments are highly competitive with respect to taste, price, food quality and presentation, service, location and the ambience and condition of each restaurant, among other things. Our competition includes a variety of locally owned restaurants and national and regional chains who offer dine-in, carry-out and delivery services. Many of our competitors have existed longer and have a more established
11
market presence with substantially greater financial, marketing, personnel and other resources than we have. Among our competitors are a number of multi-unit, multi-market fast casual restaurant concepts, some of which are expanding nationally. As we expand, we will face competition from these concepts and new competitors that strive to compete with our market segments. For example, additional competitive pressures come from the deli sections and in-store cafés of grocery store chains, as well as from convenience stores and online meal preparation sites. These competitors may have, among other things, lower operating costs, food offerings more responsive to consumer preferences, better locations, better facilities, better management, more effective marketing and more efficient operations.
Several of our competitors compete by offering menu items that are specifically identified as low in carbohydrates, gluten-free, rich in protein or healthier for consumers. In addition, many of our competitors emphasize lower-cost value options or meal packages or have loyalty programs, strategies we do not currently pursue. Any of these competitive factors may materially adversely affect our business, financial condition or results of operations.
Negative publicity relating to one of our restaurants, including our franchised restaurants, could reduce sales at some or all of our other restaurants.
Our success is dependent in part upon our ability to maintain and enhance the value of our brand, consumers’ connection to our brand and positive relationships with our franchisees. We may, from time to time, be faced with negative publicity relating to food quality, restaurant facilities, customer complaints or litigation alleging illness or injury, health inspection scores, integrity of our or our suppliers’ food processing, employee relationships or other matters, regardless of whether the allegations are valid or whether we are held to be responsible. The negative impact of adverse publicity relating to one restaurant may extend far beyond the restaurant or franchise involved to affect some or all of our other restaurants. The risk of negative publicity is particularly great with respect to our franchised restaurants because we are limited in the manner in which we can regulate them, especially on a real-time basis. Negative publicity generated by such incidents may be amplified by the use of social media. A similar risk exists with respect to unrelated food service businesses, if consumers associate those businesses with our own operations or are concerned with the food safety of the broader restaurant industry.
Additionally, employee claims against us based on, among other things, wage and hour violations, discrimination, harassment or wrongful termination may also create negative publicity that could adversely affect us and divert our financial and management resources that would otherwise be used to benefit the future performance of our operations. A significant increase in the number of these claims or an increase in the number or scope of successful claims could materially adversely affect our business, financial condition or results of operations. Consumer demand for our products and our brand’s value could diminish significantly if any such incidents or other matters create negative publicity or otherwise erode consumer confidence in us or our products, or in the restaurant industry as a whole, which would likely result in lower sales and could materially adversely affect our business, financial condition or results of operations.
Food safety and foodborne illness concerns could have an adverse effect on our business.
We cannot guarantee that our internal controls and training will be fully effective in preventing all food safety issues at our restaurants, including any occurrences of foodborne illnesses such as salmonella, E. coli, listeria and Hepatitis A. The risk of illnesses associated with our food might also increase in connection with the expansion of our catering business or other situations in which our food is served in conditions that we cannot control. Furthermore, we and our franchisees rely on third-party vendors, making it difficult to monitor food safety compliance and increasing the risk that foodborne illness would affect multiple locations rather than a single restaurant. Some foodborne illness incidents could be caused by third-party vendors and transporters outside of our control. New illnesses resistant to our current precautions may develop in the future, or diseases with long incubation periods could arise, that could give rise to claims or allegations on a retroactive basis. One or more instances of foodborne illness in any of our restaurants or markets or related to food products we sell could negatively affect our restaurant sales nationwide if highly publicized on national media outlets or through social media. This risk exists even if it were later determined that the illness was wrongly attributed to us or one of our restaurants.
A number of other restaurant chains have experienced incidents related to foodborne illnesses that have had a material adverse effect on their operations, including the recent E. coli and listeria outbreaks at other fast casual concepts. These incidents at other restaurants could cause some customers to have a negative perception of fast casual concepts generally, which can negatively affect our restaurants. The occurrence of a similar incident at one or more of our restaurants, or negative publicity or public speculation about an incident, could materially adversely affect our business, financial condition or results of operations.
12
Adverse weather conditions could affect our sales.
Adverse weather conditions, such as regional winter storms, floods and hurricanes, could affect our sales at restaurants in locations that experience these weather conditions, which could materially adversely affect our business, financial condition or results of operations. It is possible that weather conditions may impact our business more than other businesses in our industry because of the significant concentration of our restaurants in the Upper Midwest, Rocky Mountain and Mid-Atlantic states.
Governmental regulation may adversely affect our ability to open new restaurants or otherwise adversely affect our business, financial condition or results of operations.
We are subject to various federal, state and local regulations, including those relating to building and zoning requirements and those relating to the preparation and sale of food. Our restaurants are also subject to state and local licensing and regulation by health, alcoholic beverage, sanitation, food and occupational safety and other agencies. We may experience material difficulties or failures in obtaining the necessary licenses, approvals or permits for our restaurants, which could delay planned restaurant openings or affect the operations at our existing restaurants. In addition, stringent and varied requirements of local regulators with respect to zoning, land use and environmental factors could delay or prevent development of new restaurants in particular locations.
We are subject to the ADA and similar state laws that give civil rights protections to individuals with disabilities in the context of employment, public accommodations and other areas, including our restaurants. We may in the future have to modify restaurants, for example, by adding access ramps or redesigning certain architectural fixtures, to provide service to or make reasonable accommodations for disabled persons. The expenses associated with these modifications could be material.
Our operations are also subject to the U.S. Occupational Safety and Health Act, which governs worker health and safety, the U.S. Fair Labor Standards Act, which governs such matters as minimum wages and overtime, and a variety of similar federal, state and local laws that govern these and other employment law matters. In addition, federal, state and local proposals related to paid sick leave or similar matters could, if implemented, materially adversely affect our business, financial condition or results of operations.
Changes in employment laws may adversely affect our business.
Various federal and state labor laws govern the relationship with our employees and affect operating costs. These laws include employee classification as exempt/non-exempt for overtime and other purposes, minimum wage requirements, unemployment tax rates, workers’ compensation rates, mandatory health benefits, immigration status and other wage and benefit requirements. Some jurisdictions, including some of those in which we operate, have recently increased their minimum wage by a significant amount, and other jurisdictions are considering similar actions. Significant additional government-imposed increases in the following areas could materially affect our business, financial condition, operating results or cash flow:
• | overtime rules; |
• | mandatory health benefits; |
• | vacation accruals; |
• | paid leaves of absence, including paid sick leave; and |
• | tax reporting. |
In addition, various states in which we operate are considering or have already adopted new immigration laws or enforcement programs, and the U.S. Congress and Department of Homeland Security from time to time may consider and implement changes to federal immigration laws, regulations or enforcement programs as well. Some of these changes may increase our obligations for compliance and oversight, which could subject us to additional costs and make our hiring process more cumbersome, or reduce the availability of potential employees. Although we require all workers to provide us with government-specified documentation evidencing their employment eligibility, some of our employees may, without our knowledge, be unauthorized workers. We currently participate in the "E-Verify" program, an Internet-based, free program run by the United States government to verify employment eligibility, in all of our restaurants and in our corporate support office. However, use of the "E-Verify" program does not guarantee that we will properly identify all applicants who are ineligible for employment. Unauthorized workers are subject to deportation and may subject us to fines or penalties, and if any of our workers are found to be unauthorized we could experience adverse publicity
13
that negatively impacts our brand and may make it more difficult to hire and keep qualified employees. Termination of a significant number of employees who were unauthorized employees may disrupt our operations, cause temporary increases in our labor costs as we train new employees and result in additional adverse publicity. We could also become subject to fines, penalties and other costs related to claims that we did not fully comply with all recordkeeping obligations of federal and state immigration compliance laws. These factors could materially adversely affect our business, financial condition or results of operations.
Compliance with environmental laws may negatively affect our business.
We are subject to federal, state and local laws and regulations concerning waste disposal, pollution, protection of the environment, and the presence, discharge, storage, handling, release and disposal of, and exposure to, hazardous or toxic substances. These environmental laws provide for significant fines and penalties for noncompliance and liabilities for remediation, sometimes without regard to whether the owner or operator of the property knew of, or was responsible for, the release or presence of hazardous toxic substances. Third parties may also make claims against owners or operators of properties for personal injuries and property damage associated with releases of, or actual or alleged exposure to, such hazardous or toxic substances at, on or from our restaurants. Environmental conditions relating to releases of hazardous substances at prior, existing or future restaurant sites could materially adversely affect our business, financial condition or results of operations. Further, environmental laws, and the administration, interpretation and enforcement thereof, are subject to change and may become more stringent in the future, each of which could materially adversely affect our business, financial condition or results of operations.
We rely heavily on certain vendors, suppliers and distributors, which could adversely affect our business.
Our ability to maintain consistent price, quality and safety throughout our restaurants depends in part upon our ability to acquire specified food products and supplies in sufficient quantities from third-party vendors, suppliers and distributors at a reasonable cost. We do not control the businesses of our vendors, suppliers and distributors and our efforts to specify and monitor the standards under which they perform may not be successful. Furthermore, certain food items are perishable, and we have limited control over whether these items will be delivered to us in appropriate condition for use in our restaurants
If any of our distributors or suppliers performs inadequately, or our distribution or supply relationships are disrupted for any reason, our business, financial condition, results of operations or cash flows could be adversely affected. Although we often enter into contracts for the purchase of food products and supplies, we do not have long-term contracts for the purchase of all of such food products and supplies. As a result, we may not be able to anticipate or react to changing food costs by adjusting our purchasing practices or menu prices, which could cause our operating results to deteriorate. If we cannot replace or engage distributors or suppliers who meet our specifications in a short period of time, that could increase our expenses and cause shortages of food and other items at our restaurants, which could cause a restaurant to remove items from its menu. If that were to happen, affected restaurants could experience significant reductions in sales during the shortage or thereafter, if customers change their dining habits as a result. Our focus on a limited menu would make the consequences of a shortage of a key ingredient more severe. In addition, because we provide moderately priced food, we may choose not to, or may be unable to, pass along commodity price increases to consumers. These potential changes in food and supply costs could materially adversely affect our business, financial condition or results of operations.
In addition, we use various third-party vendors to provide, support and maintain most of our management information systems. We also outsource certain accounting, payroll and human resource functions to business process service providers. The failure of such vendors to fulfill their obligations could disrupt our operations. Additionally, any changes we may make to the services we obtain from our vendors, or new vendors we employ, may disrupt our operations. These disruptions could materially adversely affect our business, financial condition or results of operations.
The effect of changes to healthcare laws in the United States increased the number of employees who have elected to participate in our healthcare plans, which increased our healthcare costs, and may further significantly increase our healthcare costs and negatively impact our financial results in future periods.
The Patient Protection and Affordable Care Act of 2010 (the "PPACA") requires health care coverage for many previously uninsured individuals and expands coverage for those already insured. We began offering such benefits in July 2015, and as a consequence we are incurring additional expenses for employee healthcare. If we fail to continue to offer such benefits, or the benefits we elect to offer do not meet the applicable requirements, we may incur penalties. Since the PPACA also requires individuals to obtain coverage or face individual penalties, employees who are currently eligible for but elect not to participate in our healthcare plans may find it advantageous to do so in the future, particularly as the level of individual penalties increases over time. It is also
14
possible that by making changes or failing to make changes in the healthcare plans we offer, we will become less competitive in the market for our labor. Finally, continuing to implement the requirements of the PPACA is likely to impose additional administrative costs. The future costs and other effects of these new healthcare requirements cannot be determined with certainty, but they may continue to significantly increase our healthcare coverage costs and could materially adversely affect our, business, financial condition or results of operations.
Unionization activities or labor disputes may disrupt our operations and affect our profitability.
Although none of our employees are currently covered under collective bargaining agreements, our employees may elect to be represented by labor unions in the future. If a significant number of our employees were to become unionized and collective bargaining agreement terms were significantly different from our current compensation arrangements, it could adversely affect our business, financial condition or results of operations. In addition, a labor dispute involving some or all of our employees may harm our reputation, disrupt our operations and reduce our revenues, and resolution of disputes may increase our costs. Potential changes in labor laws, including the possible passage of legislation designed to make it easier for employees to unionize, could increase the likelihood of some or all of our employees being subjected to greater organized labor influence, and could have an adverse effect on our business and financial results by imposing requirements that could potentially increase our costs, reduce our flexibility and impact our employee culture.
As an employer, we may be subject to various employment-related claims, such as individual, class action or government enforcement actions relating to alleged employment discrimination, employee classification and related withholding, wage-hour, labor standards or healthcare and benefit issues. Such actions, if brought against us and successful in whole or in part, may affect our ability to compete or could materially adversely affect our business, financial condition or results of operations.
We rely in part on our franchisees, and if our franchisees cannot develop or finance new restaurants, build them on suitable sites or open them on schedule, our growth and success may be affected.
We rely in part on our franchisees and the manner in which they operate their locations to develop and promote our business. Although we have developed criteria to evaluate and screen prospective franchisees, we cannot be certain that our franchisees will have the business acumen or financial resources necessary to operate successful franchises in their franchise areas and state franchise laws may limit our ability to terminate or modify these franchise arrangements. Moreover, despite our training, support and monitoring, franchisees may not successfully operate restaurants in a manner consistent with our standards and requirements, or may not hire and train qualified managers and other restaurant personnel. The failure of our franchisees to operate their franchises successfully could have a material adverse effect on us, our reputation, our brand and our ability to attract prospective franchisees and could materially adversely affect our business, financial condition or results of operations.
Franchisees may not have access to the financial or management resources that they need to open the restaurants contemplated by their agreements with us, or be able to find suitable sites on which to develop them, or they may elect to cease development for other reasons. Franchisees may not be able to negotiate acceptable lease or purchase terms for the sites, obtain the necessary permits and government approvals or meet construction schedules. Any of these problems could slow our growth and reduce our franchise revenues. Additionally, our franchisees typically depend on financing from banks and other financial institutions, which may not always be available to them, in order to construct and open new restaurants. The lack of adequate financing could adversely affect the number and rate of new restaurant openings by our franchisees and could materially adversely affect our future franchise revenues.
A franchisee bankruptcy could have a substantial negative impact on our ability to collect payments due under such franchisee’s franchise arrangements. In a franchisee bankruptcy, the bankruptcy trustee may reject its franchise arrangements pursuant to Section 365 under the United States bankruptcy code, in which case there would be no further royalty payments from such franchisee, and there can be no assurance as to the proceeds, if any, that may ultimately be recovered in a bankruptcy proceeding of such franchisee in connection with a damage claim resulting from such rejection.
Failure to support our expanding franchise system could have a material adverse effect on our business, financial condition or results of operations.
Our strategy depends in part on our franchise network, which requires enhanced business support systems, management information systems, financial controls and other systems and procedures as well as additional management, franchise support and financial resources. We may not be able to manage our franchise system effectively. Failure to provide our franchisees with adequate support and resources could materially adversely affect both our new and existing franchisees as well as cause disputes between us
15
and our franchisees and potentially lead to material liabilities. Any of the foregoing could materially adversely affect our business, financial condition or results of operations.
We have limited control over our franchisees and our franchisees could take actions that could harm our business.
Franchisees are independent contractors and are not our employees, and we do not exercise control over their day-to-day operations. We provide training and support to franchisees, but the quality of franchised restaurant operations may be diminished by any number of factors beyond our control. Consequently, franchisees may not successfully operate restaurants in a manner consistent with our standards and requirements, or may not hire and train qualified managers and other restaurant personnel. If franchisees do not meet our standards and requirements, our image and reputation, and the image and reputation of other franchisees, may suffer materially and system-wide sales could decline significantly.
Franchisees, as independent business operators, may from time to time disagree with us and our strategies regarding the business or our interpretation of our, and their, rights and obligations under franchise and development agreements. This may lead to disputes with our franchisees in the future. These disputes may divert the attention of our management and our franchisees from operating our restaurants and affect our image and reputation and our ability to attract franchisees in the future, which could materially adversely affect our business, financial condition or results of operations.
If we or our franchisees face labor shortages or increased labor costs, our growth and operating results could be adversely affected.
Labor is a primary component in the cost of operating our restaurants. If we or our franchisees face labor shortages or increased labor costs because of increased competition for employees, higher employee turnover rates, increases in the federal, state or local minimum wage or other employee benefits costs (including costs associated with health insurance coverage), our operating expenses could increase and our growth could be adversely affected. In addition, our success depends in part upon our and our franchisees’ ability to attract, motivate and retain a sufficient number of well-qualified restaurant operators and management personnel, as well as a sufficient number of other qualified employees, including customer service and kitchen staff, to keep pace with our expansion schedule. Qualified individuals needed to fill these positions are in short supply in some geographic areas, and the national unemployment rate, as well as the unemployment rates in many of the areas in which we operate, has continued to fall over the past few years. In addition, restaurants have traditionally experienced relatively high employee turnover rates. Although we have not yet experienced significant problems in recruiting or retaining employees, our and our franchisees’ ability to recruit and retain such individuals may delay the planned openings of new restaurants or result in higher employee turnover in existing restaurants, which could have a material adverse effect on our business, financial condition or results of operations.
If we or our franchisees are unable to continue to recruit and retain sufficiently qualified individuals at wages comparable to those we currently pay, our business and our growth could be adversely affected. Competition for these employees could require us or our franchisees to pay higher wages, which could result in higher labor costs. In addition increases in the minimum wage, which have become more common and more material in size in recent years, would increase our labor costs. Additionally, costs associated with workers’ compensation are rising, and these costs may continue to rise in the future. We may be unable to increase our menu prices in order to pass these increased labor costs on to consumers, in which case our margins would be negatively affected, which could materially adversely affect our business, financial condition or results of operations.
We might require additional capital, and this capital might be senior to existing equity holders, dilute existing equity holders or include unfavorable restrictions.
In the future we might require additional funds to operate our business. Accordingly, we might need to engage in equity or debt financings to secure additional funds. If we raise additional funds through future issuances of equity or convertible debt securities, our existing stockholders could suffer significant dilution, and any new equity securities we issue could have rights, preferences and privileges superior to those of holders of our Class A common stock. Any debt financing we secure in the future could involve restrictive covenants relating to our capital-raising activities and other financial and operational matters, which might make it more difficult for us to obtain additional capital and to pursue business opportunities. Moreover, if we issue new debt securities, the debt holders would have rights senior to Class A common stockholders to make claims on our assets.
We may not be able to raise capital on acceptable terms.
Operating and developing our business requires significant capital. To meet our capital needs, we rely and expect to continue to rely on our cash flow from operations and third-party financing. Third-party financing in the future may not, however, be available
16
on terms favorable to us, or at all. Our ability to obtain additional funding will be subject to various factors, including market conditions, our operating performance and liquidity, lender sentiment and our ability to incur additional debt in compliance with other contractual restrictions such as financial covenants under our credit facility or other debt documents. These factors may make the timing, amount, terms and conditions of additional financings unattractive. Our inability to raise or access capital could impede our growth and could materially adversely affect our business, financial condition or results of operations.
We depend on the services of key executives, the loss of which could materially harm our business.
Our senior executives have been instrumental in setting our strategic direction, operating our business, identifying, recruiting and training key personnel, identifying expansion opportunities and arranging necessary financing. Losing the services of any of these individuals could materially adversely affect our business until a suitable replacement is found. We believe that these individuals cannot easily be replaced with executives of equal experience and capabilities. Although we have an employment agreement with our Chief Executive Officer, we cannot prevent him from terminating his employment with us.
Changes in economic conditions could materially affect our ability to maintain or increase sales at our restaurants or open new restaurants.
The restaurant industry depends on consumer discretionary spending. The United States in general or the specific markets in which we operate may suffer from depressed economic activity, recessionary economic cycles, higher fuel or energy costs, low consumer confidence as a result of stock market volatility and other reasons, high levels of unemployment, reduced home values, increases in home foreclosures, investment losses, personal bankruptcies, reduced access to credit or other economic factors that may affect consumers' discretionary spending. Economic conditions may remain volatile and may depress consumer confidence and discretionary spending. Traffic in our restaurants could decline if consumers choose to dine out less frequently or reduce the amount they spend on meals while dining out. Negative economic conditions (including negative economic conditions resulting from war, terrorist activities, global economic occurrences or trends or other geo-political events) might cause consumers to make long-term changes to their discretionary spending behavior, including dining out less frequently or at lower priced restaurants on a permanent basis. If restaurant sales decrease, our profitability would decline as we spread fixed costs across a lower level of sales. Reductions in staff levels, additional asset impairment charges and additional restaurant closures could result from prolonged negative restaurant sales, which could materially adversely affect our business, financial condition or results of operations.
Changes to estimates related to our property, fixtures and equipment or operating results that are lower than our current estimates at certain restaurant locations may cause us to incur impairment charges on certain long-lived assets, which may materially adversely affect our results of operations.
In accordance with accounting guidance as it relates to the impairment of long-lived assets, we make certain estimates and projections with regard to individual restaurant operations, as well as our overall performance, in connection with our impairment analyses for long-lived assets. When impairment triggers are deemed to exist for any location, the estimated undiscounted future cash flows are compared to its carrying value. If the carrying value exceeds the undiscounted cash flows, an impairment charge equal to the difference between the carrying value and the fair value is recorded. The projections of future cash flows used in these analyses require the use of judgment and a number of estimates and projections of future operating results. If actual results differ from our estimates, additional charges for asset impairments may be required in the future. If future impairment charges are significant, this could have a material adverse effect on our results of operations.
Health concerns arising from outbreaks of viruses may have an adverse effect on our business.
The United States and other countries have experienced, or may experience in the future, outbreaks of neurological diseases or other diseases or viruses, such as norovirus, influenza, H1N1 and Ebola. If a virus is transmitted by human contact, our employees or customers could become infected, or could choose, or be advised, to avoid gathering in public places, any one of which could materially adversely affect our business, financial condition or results of operations.
Changes in food and supply costs could adversely affect our results of operations.
Our profitability depends in part on our ability to anticipate and react to changes in food and supply costs. Shortages or interruptions in the availability of certain supplies caused by seasonal fluctuations, unanticipated demand, problems in production or distribution, food contamination, product recalls, government regulations, inclement weather or other conditions could adversely affect the availability, quality and cost of our ingredients, which could harm our operations. Weather related issues, such as freezes, heavy rains
17
or drought, may also lead to temporary spikes in the prices of some ingredients such as produce or meats. Increasing weather volatility or other long-term changes in global weather patterns, including any changes associated with global climate change, could have a significant impact on the price, availability and timing of delivery of some of our ingredients. Any increase in the prices of the food products most critical to our menu, such as pasta, beef, chicken, wheat flour, cheese and other dairy products, tofu and vegetables, could adversely affect our operating results. Although we try to manage the impact that these fluctuations have on our operating results, we remain susceptible to increases in food costs as a result of factors beyond our control, such as general economic conditions, seasonal fluctuations, weather conditions, demand, food safety concerns, generalized infectious diseases, product recalls and government regulations. For example, when fuel prices were higher, surcharges on the delivery of commodities to our distributors were sometimes imposed, and generally passed on to us to the extent permitted under our arrangements with them.
Failure to receive frequent deliveries of fresh food ingredients and other supplies could harm our operations.
Our ability to maintain our menu depends in part on our ability to acquire ingredients that meet our specifications from reliable suppliers. We currently import ingredients from many different countries. Shortages or interruptions in the supply of ingredients caused by unanticipated demand, problems in production or distribution, food contamination, inclement weather or other conditions could adversely affect the availability, quality and cost of our ingredients, which could harm our operations. If any of our distributors or suppliers performs inadequately, or our distribution or supply relationships are disrupted for any reason, our business, financial condition or results of operations could be adversely affected. If we cannot replace or engage distributors or suppliers who meet our specifications in a short period of time, that could increase our expenses and cause shortages of food and other items at our restaurants, which could cause a restaurant to remove items from its menu. If that were to happen, affected restaurants could experience significant reductions in sales during the shortage or thereafter, if customers change their dining habits as a result. Our focus on a limited menu would make the consequences of a shortage of a key ingredient more severe. This reduction in sales could materially adversely affect our business, financial condition or results of operations.
New information or attitudes regarding diet and health could result in changes in regulations and consumer consumption habits that could adversely affect our results of operations.
Regulations and consumer eating habits may change as a result of new information or attitudes regarding diet, health and safety. Such changes may include federal, state and local regulations and recommendations from medical and diet professionals pertaining to the ingredients and nutritional content of the food and beverages we offer. The success of our restaurant operations is dependent, in part, upon our ability to effectively respond to changes in any consumer health regulations and our ability to adapt our menu offerings to trends in food consumption. If consumer health regulations or consumer eating habits change significantly, we may choose or be required to modify or delete certain menu items, which may adversely affect the attractiveness of our restaurants to new or returning customers. To the extent we are unwilling or unable to respond with appropriate changes to our menu offerings, it could materially affect consumer demand and could have an adverse impact on our business, financial condition or results of operations.
Government regulation and consumer eating habits may impact our business as a result of changes in attitudes regarding diet and health or new information regarding the adverse health effects of consuming certain menu offerings. These changes have resulted in, and may continue to result in, laws and regulations requiring us to disclose the nutritional content of our food offerings, and they have resulted, and may continue to result in, laws and regulations affecting permissible ingredients and menu offerings. For example, a number of states, counties and cities have enacted menu labeling laws requiring multi-unit restaurant operators to disclose to consumers certain nutritional information, or have enacted legislation restricting the use of certain types of ingredients in restaurants. These requirements may be different or inconsistent with requirements under the PPACA, which establishes a uniform, federal requirement for certain restaurants to post nutritional information on their menus. Specifically, the PPACA requires chain restaurants with 20 or more locations operating under the same name and offering substantially the same menus to publish the total number of calories of standard menu items on menus and menu boards, along with a statement that puts this calorie information in the context of a total daily calorie intake. Inconsistencies among state laws with respect to presentation of nutritional content could be challenging for us to comply with in an efficient manner. The PPACA also requires covered restaurants to provide to consumers, upon request, a written summary of detailed nutritional information for each standard menu item, and to provide a statement on menus and menu boards about the availability of this information upon request. An unfavorable report on, or reaction to, our menu ingredients, the size of our portions or the nutritional content of our menu items could negatively influence the demand for our offerings.
Compliance with current and future laws and regulations regarding the ingredients and nutritional content of our menu items may be costly and time-consuming. Additionally, if consumer health regulations or consumer eating habits change significantly, we may be required to modify or discontinue certain menu items, and we may experience higher costs associated with the implementation of those changes. The risks and costs associated with nutritional disclosures on our menus could also impact our operations, particularly
18
given differences among applicable legal requirements and practices within the restaurant industry with respect to testing and disclosure, ordinary variations in food preparation among our own restaurants, and the need to rely on the accuracy and completeness of nutritional information obtained from third-party suppliers.
We may not be able to effectively respond to changes in consumer health and safety perceptions or to successfully implement the nutrient content disclosure requirements and adapt our menu offerings to trends in eating habits. The imposition of additional menu labeling laws could materially adversely affect our business, financial condition or results of operations, as well as our position within the restaurant industry in general.
We are subject to all of the risks associated with leasing space subject to long-term non-cancelable leases.
We do not own any real property. Payments under our operating leases account for a significant portion of our operating expenses and we expect the new restaurants we open in the future will similarly be leased. Our leases generally have an initial term of ten years and generally can be extended only in five-year increments (at increased rates). All of our leases require a fixed annual rent, although some require the payment of additional rent if restaurant sales exceed a negotiated amount. Generally, our leases are "net" leases, which require us to pay all of the cost of insurance, taxes, maintenance and utilities. We generally cannot cancel these leases. Additional sites that we lease are likely to be subject to similar long-term non-cancelable leases. If an existing or future restaurant is not profitable, and we decide to close it, we may nonetheless be committed to perform our obligations under the applicable lease including, among other things, paying the base rent for the balance of the lease term. In addition, as each of our leases expires, we may fail to negotiate renewals, either on commercially acceptable terms or at all, which could cause us to pay increased occupancy costs or to close restaurants in desirable locations. These potential increased occupancy costs and closed restaurants could materially adversely affect our business, financial condition or results of operations.
We may not be able to adequately protect our intellectual property, which could harm the value of our brand and could adversely affect our business.
Our intellectual property is material to the conduct of our business and our marketing efforts. Our ability to implement our business plan successfully depends in part on our ability to further build brand recognition using our trademarks, service marks, trade dress and other proprietary intellectual property, including our name and logos and the unique ambience of our restaurants. While it is our policy to protect and defend vigorously our rights to our intellectual property, we cannot predict whether steps taken by us to protect our intellectual property rights will be adequate to prevent misappropriation of these rights or the use by others of restaurant features based upon, or otherwise similar to, our concept. It may be difficult for us to prevent others from copying elements of our concept and any litigation to enforce our rights will likely be costly and may not be successful. Although we believe that we have sufficient rights to all of our trademarks and service marks, we may face claims of infringement that could interfere with our ability to market our restaurants and promote our brand. Any such litigation may be costly and divert resources from our business. Moreover, if we are unable to successfully defend against such claims, we may be prevented from using our trademarks or service marks in the future, may be liable for damages and may have to change our marketing efforts, which in turn could materially adversely affect our business, financial condition or results of operations.
We may incur costs resulting from breaches of security of confidential consumer information related to our electronic processing of credit and debit card transactions.
The majority of our restaurant sales are by credit or debit cards. Other restaurants and retailers have experienced security breaches in which credit and debit card information has been stolen. We may in the future become subject to claims for purportedly fraudulent transactions arising out of the actual or alleged theft of credit or debit card information, and we may also be subject to lawsuits or other proceedings relating to these types of incidents. In addition, most states have enacted legislation requiring notification of security breaches involving personal information, including credit and debit card information. Any such claim or proceeding could cause us to incur significant unplanned expenses, which could have an adverse impact on our financial condition and results of operations. Further, adverse publicity resulting from these allegations may have a material adverse effect on us and our restaurants.
We could be party to litigation that could adversely affect us by distracting management, increasing our expenses or subjecting us to material money damages and other remedies.
Our customers occasionally file complaints or lawsuits against us alleging we caused an illness or injury they suffered at or after a visit to our restaurants, or that we have problems with food quality or operations. These kinds of complaints or lawsuits may be more common in a period in which the public is focused on health safety issues, as it has been recently as a result of the extensive
19
media coverage of an E. coli outbreak at another fast casual restaurant brand. We are also subject to a variety of other claims arising in the ordinary course of our business, including personal injury claims, contract claims and claims alleging violations of federal and state law regarding workplace and employment matters, equal opportunity, discrimination and similar matters, and we could become subject to class action or other lawsuits related to these or different matters in the future. Regardless of whether any claims against us are valid, or whether we are ultimately held liable, claims may be expensive to defend and may divert time and money away from our operations and hurt our performance. A judgment in excess of our insurance coverage for any claims could materially and adversely affect our financial condition or results of operations. Any adverse publicity resulting from these allegations, even if proven to be false, may also materially and adversely affect our reputation or prospects, which in turn could materially adversely affect our business, financial condition or results of operations.
We are subject to state and local "dram shop" statutes, which may subject us to uninsured liabilities. These statutes generally allow a person injured by an intoxicated person to recover damages from an establishment that wrongfully served alcoholic beverages to the intoxicated person. Because a plaintiff may seek punitive damages, which may not be fully covered by insurance, this type of action could have an adverse impact on our financial condition or results of operations. A judgment in such an action significantly in excess of, or not covered by, our insurance coverage could adversely affect our business, financial condition or results of operations. Further, adverse publicity resulting from any such allegations may adversely affect us and our restaurants taken as a whole.
In addition, the restaurant industry has been subject to a growing number of claims based on the nutritional content of food products sold and disclosure and advertising practices. We may in the future also be subject to this type of proceeding or to publicity about these matters (particularly those directed at the quick-service or fast casual segments of the industry) may harm our reputation and could materially adversely affect our business, financial condition or results of operations.
Our current insurance may not provide adequate levels of coverage against claims.
There are types of losses we may incur that cannot be insured against or that we believe are not economically reasonable to insure against. Such losses could have a material adverse effect on our business and results of operations. In addition, we self-insure a significant portion of expected losses under our workers’ compensation, general liability, employee health and property insurance programs. Unanticipated changes in the actuarial assumptions and management estimates underlying our reserves for these losses could result in materially different amounts of expense under these programs, which could have a material adverse effect on our financial condition, results of operations and liquidity. Failure to obtain and maintain adequate directors’ and officers’ insurance could materially adversely affect our ability to attract and retain qualified officers and directors.
The Company is subject to the risks presented by acquisitions.
As part of our expansion efforts, the Company has acquired some of its franchised restaurants in the past. In the future, the Company may, from time to time, consider opportunistic acquisitions of restaurants operated by franchisees or other operators. Any future acquisitions will be accompanied by the risks commonly encountered in acquisitions. These risks include among other things:
• | the difficulty of integrating operations and personnel; |
• | the potential disruption to our ongoing business; |
• | the potential distraction of management, the inability to maintain uniform standards, controls procedures and policies; and |
• | the impairment of relations with team members and customers as a result of changes in ownership and management. |
These impacts could materially adversely affect our business, financial condition or results of operation.
Failure to obtain and maintain required licenses and permits or to comply with alcoholic beverage or food control regulations could lead to the loss of our liquor and food service licenses and, thereby, harm our business.
The restaurant industry is subject to various federal, state and local government regulations, including those relating to the sale of food and alcoholic beverages. Such regulations are subject to change from time to time. The failure to obtain and maintain these licenses, permits and approvals could adversely affect our operating results. Typically, licenses must be renewed annually and may be revoked, suspended or denied renewal for cause at any time if governmental authorities determine that our conduct violates
20
applicable regulations. Difficulties or failure to maintain or obtain the required licenses and approvals could adversely affect our existing restaurants and delay or result in our decision to cancel the opening of new restaurants, which could adversely affect our business.
Alcoholic beverage control regulations generally require our restaurants to apply to a state authority and, in certain locations, county or municipal authorities for a license that must be renewed annually and may be revoked or suspended for cause at any time. Alcoholic beverage control regulations relate to numerous aspects of daily operations of our restaurants, including the minimum age of patrons and employees, hours of operation, advertising, trade practices, wholesale purchasing, other relationships with alcohol manufacturers, wholesalers and distributors, inventory control and handling and storage and dispensing of alcoholic beverages. Any future failure to comply with these regulations and obtain or retain liquor licenses could adversely affect our business, financial condition or results of operations.
Changes to accounting rules or regulations may adversely affect our results of operations.
Changes to existing accounting rules or regulations may impact our future results of operations or cause the perception that we are more highly leveraged. Other new accounting rules or regulations and varying interpretations of existing accounting rules or regulations have occurred and may occur in the future. For instance, accounting regulatory authorities have implemented a requirement that lessees will capitalize operating leases in their financial statements beginning in 2019. Such change will require us to record significant capital lease obligations on our balance sheet and make other changes to our financial statements. This and other future changes to accounting rules or regulations could materially adversely affect our financial condition or results of operations.
Failure of our internal control over financial reporting could adversely affect our business and financial results.
Our management is responsible for establishing and maintaining effective internal control over financial reporting under Section 404 of the Sarbanes-Oxley Act of 2002. Internal control over financial reporting is a process to provide reasonable assurance regarding the reliability of financial reporting for external purposes in accordance with GAAP. Because of its inherent limitations, internal control over financial reporting is not intended to provide absolute assurance that we would prevent or detect a misstatement of our financial statements or fraud. Any failure to maintain an effective system of internal control over financial reporting could limit our ability to report our financial results accurately and timely or to detect and prevent fraud. The identification of a material weakness could indicate a lack of controls adequate to generate accurate financial statements that, in turn, could cause a loss of investor confidence and decline in the market price of our common stock. We cannot assure you that we will be able to timely remediate any material weaknesses that may be identified in future periods or maintain all of the controls necessary for continued compliance. Likewise, we cannot assure you that we will be able to retain sufficient skilled finance and accounting personnel, especially in light of the increased demand for such personnel among publicly traded companies.
Under the JOBS Act, our independent registered public accounting firm will not be required to attest to the effectiveness of our internal control over financial reporting pursuant to Section 404 of the Sarbanes-Oxley Act until we are no longer an "emerging growth company." We could be an "emerging growth company" until the end of our 2018 fiscal year.
Our principal stockholders and their affiliates own a substantial portion of our outstanding equity, and their interests may not always coincide with the interests of the other holders.
As of December 29, 2015, L Catterton, certain of its affiliates and Argentia Private Investments, Inc. ("Argentia," and together with L Catterton, our "Equity Sponsors") beneficially owned in the aggregate shares representing approximately 51.8% of our outstanding voting power, assuming no conversion of Class B common stock into common stock. Persons associated with L Catterton currently serve on our board of directors. L Catterton and certain of its affiliates beneficially own, in the aggregate, shares representing approximately 24.7% of our outstanding equity interests and approximately 26.1% of our outstanding voting power as of December 29, 2015. Argentia beneficially owns shares representing approximately 29.8% of our outstanding equity interests and approximately 25.7% of our outstanding voting power as of December 29, 2015. As a result, L Catterton, certain of its affiliates and Argentia could continue to potentially have significant influence over all matters presented to our stockholders for approval, including election and removal of our directors and change in control transactions. The interests of L Catterton, certain of its affiliates and Argentia may not always coincide with the interests of the other holders of our common stock.
21
Our stock price is subject to volatility.
The stock market in general is highly volatile. As a result, the market price of our common stock is similarly volatile. The price of our Class A common stock could be subject to wide fluctuations in response to a number of factors, some of which may be beyond our control. These factors include actual or anticipated fluctuations in our operating results, changes in, or our ability to achieve, estimates of our operating results by analysts, investors or management, analysts’ recommendations regarding our stock or our competitors’ stock, actions or announcements by us or our competitors, the maintenance and growth of the value of our brand, litigation, legislation or other regulatory developments affecting us or our industry, natural disasters, terrorist acts, war or other calamities and changes in general market and economic conditions.
We do not intend to pay dividends for the foreseeable future.
We have never declared or paid any cash dividends on our common stock, except for the Class C common stock dividend paid to Argentia, the previous holder of the one outstanding share of our Class C common stock, which was redeemed in connection with our initial public offering ("IPO"). For the foreseeable future, we intend to retain any earnings to finance the development and expansion of our business, and we do not anticipate paying any cash dividends on our common stock. See Item 5. "Market for the Registrant's Common Equity, Related Stockholder Matters and Issuer Purchases of Equity Securities-Dividends."
Provisions in our charter documents and Delaware law may delay or prevent our acquisition by a third party.
Our amended and restated certificate of incorporation and second amended and restated bylaws, and Delaware law, contain several provisions that may make it more difficult for a third party to acquire control of us without the approval of our board of directors. For example, we have a classified board of directors with three-year staggered terms, which could delay the ability of stockholders to change membership of a majority of our board of directors. These provisions may make it more difficult or expensive for a third party to acquire a majority of our outstanding equity interests. These provisions also may delay, prevent or deter a merger, acquisition, tender offer, proxy contest or other transaction that might otherwise result in our stockholders receiving a premium over the market price for their common stock.
ITEM 1B. Unresolved Staff Comments
None.
22
ITEM 2. Properties
As of December 29, 2015, we and our franchisees operated 492 restaurants in 35 states, the District of Columbia and one Canadian province. Our restaurants are typically 2,600 to 2,700 square feet and are located in a variety of suburban, urban and small markets. We lease the property for our central support office and all of the properties on which we operate restaurants. The chart below shows the locations of our company-owned and franchised restaurants as of December 29, 2015.
State | Company- owned | Franchised | Total | ||||||
Arizona | 2 | — | 2 | ||||||
California | 22 | — | 22 | ||||||
Colorado | 60 | — | 60 | ||||||
Connecticut | — | 3 | 3 | ||||||
Delaware | 3 | — | 3 | ||||||
District of Columbia | 1 | — | 1 | ||||||
Florida | 5 | — | 5 | ||||||
Idaho | 5 | — | 5 | ||||||
Illinois | 53 | 5 | 58 | ||||||
Indiana | 21 | — | 21 | ||||||
Iowa | 10 | 1 | 11 | ||||||
Kansas | 9 | — | 9 | ||||||
Kentucky | 2 | 4 | 6 | ||||||
Maryland | 27 | — | 27 | ||||||
Massachusetts | — | 6 | 6 | ||||||
Michigan | — | 19 | 19 | ||||||
Minnesota | 44 | 1 | 45 | ||||||
Missouri | 4 | 8 | 12 | ||||||
Montana | — | 2 | 2 | ||||||
Nebraska | — | 6 | 6 | ||||||
New Hampshire | — | 2 | 2 | ||||||
New Jersey | 4 | — | 4 | ||||||
New York | 1 | 5 | 6 | ||||||
North Carolina | 16 | — | 16 | ||||||
North Dakota | — | 3 | 3 | ||||||
Ohio | 19 | — | 19 | ||||||
Oklahoma | 2 | — | 2 | ||||||
Oregon | 8 | — | 8 | ||||||
Pennsylvania | 12 | — | 12 | ||||||
South Dakota | — | 2 | 2 | ||||||
Tennessee | 5 | — | 5 | ||||||
Texas | 3 | — | 3 | ||||||
Utah | 14 | — | 14 | ||||||
Virginia | 32 | — | 32 | ||||||
Washington | 1 | — | 1 | ||||||
Wisconsin | 36 | 3 | 39 | ||||||
Canada | 1 | — | 1 | ||||||
422 | 70 | 492 | |||||||
We are obligated under non-cancelable leases for our restaurants and our central support office. Our restaurant leases generally have initial terms of 10 years with two or more five-year extensions. Our restaurant leases generally have renewal options and may require us to pay a proportionate share of real estate taxes, insurance, common area maintenance charges and other operating costs. Some restaurant leases provide for contingent rental payments based on sales thresholds, although we generally do not expect to pay significant contingent rent on these properties based on the thresholds in those leases.
ITEM 3. Legal Proceedings
As previously disclosed in prior reports filed with the SEC, the Company is named as a defendant in an action filed in the Superior Court of Delaware in New Castle County (the "Court"), entitled The State of Delaware, William French v. Card Compliant, LLC, et. al. The case was filed under seal in June 2013 and was unsealed on March 26, 2014. The complaint in this case alleges that a number of large retailers and restaurant companies, including the Company, knowingly refused to fulfill obligations under Delaware's Abandoned Property Law by failing to report and deliver "unclaimed gift card funds" to the State of Delaware, and knowingly made, used or caused to be made or used, false statements and records to conceal, avoid or decrease an obligation to pay or transmit money to Delaware in violation of the Delaware False Claims and Reporting Act. The complaint seeks an order that we cease and desist from violating the Delaware Abandoned Property Law, monetary damages (including treble damages under the False Claims and Reporting Act), penalties, and attorneys' fees and costs. On November 23, 2015, the Court ruled on a motion to dismiss the complaint that the defendants—including the Company—had filed. While the Court granted the motion to dismiss with respect to a claim alleging that the defendants intended to defraud the government or willfully concealed property owed to the government and for which a certificate or receipt was provided, it did not dismiss the other claims alleging that the defendants knowingly made false statements to avoid transmitting money to the government. The trial date with respect to this matter is set for January 8, 2018. We have recorded a loss contingency accrual based on a reasonable estimate of the probable losses that might arise from this matter; this loss contingency accrual did not have a material effect on our results of operation. We intend to continue to vigorously defend this action.
On February 10, 2016, Tammie Carter, a former employee of the Company, filed a purported collective and class action lawsuit against the Company alleging violations of the Fair Labor Standards Act and the Colorado Wage Order (the "Labor Laws") in the United States District Court for the District of Colorado. The plaintiff filed the case on her behalf and on behalf of all assistant general managers employed by us during the past three years whom we classified as exempt employees, and she alleges that we violated the Labor Laws by not paying overtime compensation to our assistant general managers. The plaintiff is seeking, on behalf of herself and members of the putative class, unpaid overtime compensation, damages (including liquidated and/or punitive damages), a declaratory judgment, an injunction, and attorneys’ fees and costs. This case is at an early stage, and we are therefore unable to make a reasonable estimate of the probable loss or range of losses, if any, that might arise from this matter. We intend to vigorously defend this action.
In the normal course of business, we are subject to other proceedings, lawsuits and claims. Such matters are subject to many uncertainties, and outcomes are not predictable with assurance. Consequently, we are unable to ascertain the ultimate aggregate amount of monetary liability or financial impact with respect to these matters as of December 29, 2015. These matters could affect the operating results of any one financial reporting period when resolved in future periods. We believe that an unfavorable outcome with respect to these matters is remote or a potential range of loss is not material to our consolidated financial statements. Significant increases in the number of these claims, or one or more successful claims that result in greater liabilities than they currently anticipate, could materially adversely affect our business, financial condition, results of operations or cash flows.
ITEM 4. Mine Safety Disclosures
Not applicable.
23
PART II
ITEM 5. | Market for the Registrant's Common Equity, Related Stockholder Matters and Issuer Purchases of Equity Securities |
Our common stock has traded on the Nasdaq Global Select Market under the symbol NDLS since it began trading on June 28, 2013, the date of our IPO. The following table sets forth, for the periods indicated, the high and low sales prices per share of our common stock as reported on the Nasdaq Global Select Market.
High | Low | |||||||
Fiscal Year 2015 | ||||||||
First quarter (December 31, 2014 - March 31, 2015) | $ | 28.02 | $ | 17.18 | ||||
Second quarter (April 1, 2015 - June 30, 2015) | $ | 21.41 | $ | 14.28 | ||||
Third quarter (July 1, 2015 - September 29, 2015) | $ | 15.88 | $ | 11.20 | ||||
Fourth quarter (September 30, 2015 - December 29, 2015) | $ | 14.95 | $ | 10.02 | ||||
Fiscal Year 2014 | ||||||||
First quarter (January 1, 2014 - April 1, 2014) | $ | 41.54 | $ | 33.40 | ||||
Second quarter (April 2, 2014 - July 1, 2014) | $ | 39.30 | $ | 30.28 | ||||
Third quarter (July 2, 2014 - September 30, 2014) | $ | 34.32 | $ | 17.15 | ||||
Fourth quarter (October 1, 2014 - December 30, 2014) | $ | 27.00 | $ | 18.58 | ||||
As of February 25, 2016, there were approximately 45 holders of record of our common stock. The number of holders of record is based upon the actual numbers of holders registered at such date and does not include holders of shares in "street name" or persons, partnerships, associates, corporations or other entities in security position listings maintained by depositories.
Purchases of Equity Securities by the Issuer
We had no share repurchases during the fourth quarter of 2015.
Sales of Unregistered Securities by the Issuer
None.
Stock Performance Graph
The following graph compares the cumulative total shareholder return on our common stock from June 28, 2013 (using the price of which our shares of common stock were initially sold to the public) to December 29, 2015 to that of the total return of the Nasdaq Composite and the S&P 600 Restaurants Index. The comparison assumes $100 was invested in our common stock on June 28, 2013 and in each of the forgoing indices on June 28, 2013 and assumes the reinvestment of dividends. This graph is furnished and not "filed" with the Securities and Exchange Commission or "soliciting material" under the Securities Exchange Act of 1934 and shall not be incorporated by reference into any such filings, irrespective of any general incorporation contained in such filing.
24
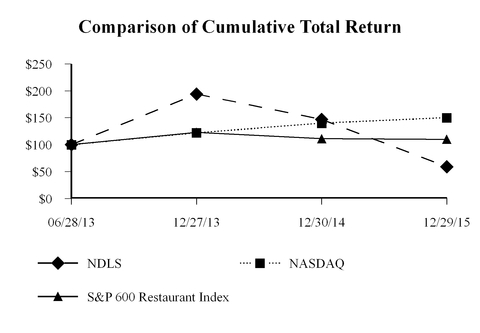
The stock price performance included in this graph is not necessarily indicative of future stock price performance.
Dividends
No dividends have been declared or paid on our shares of equity interests, except for the Class C common stock dividend paid to the previous holder of the one outstanding share of our Class C common stock, which we redeemed upon our IPO. We do not anticipate paying any cash dividends on any of our shares of common stock in the foreseeable future. We currently intend to retain any earnings to finance the development and expansion of our business. Any future determination to pay dividends will be at the discretion of our board of directors and will be dependent upon then-existing conditions, including our earnings, capital requirements, results of operations, financial condition, business prospects and other factors that our board of directors considers relevant. Further, the Company's credit facility contains provisions that limit its ability to pay dividends on its common stock. See "Management’s Discussion and Analysis of Financial Condition and Results of Operations" and "Certain Relationships and Related Transactions, and Director Independence" for additional information regarding our financial condition.
ITEM 6. Selected Financial Data
The following table summarizes the consolidated historical financial and operating data for the periods indicated. The statements of income data for the fiscal years ended December 29, 2015, December 30, 2014 and December 31, 2013, and the balance sheet data as of December 29, 2015 and December 30, 2014 have been derived from our audited consolidated financial statements included in Item 8. "Financial Statements and Supplementary Data," and the statements of income data from the fiscal years ended January 1, 2013 and January 3, 2012, and the balance sheet data as of December 31, 2013, January 1, 2013 and January 3, 2012 have been derived from our audited consolidated financial statements not included in this report.
The historical results presented below are not necessarily indicative of the results to be expected for any future period. This information should be read in conjunction with "Risk Factors," "Management’s Discussion and Analysis of Financial Condition and Results of Operations" and our audited consolidated financial statements and the related notes included elsewhere in this report.
We operate on a 52- or 53-week fiscal year ending on the Tuesday closest to December 31. Fiscal year 2011, which ended on January 3, 2012, contained 53 weeks, and all other fiscal years presented below contained 52 weeks. We refer to our fiscal years as 2015, 2014, 2013, 2012 and 2011. Our fiscal quarters each contain thirteen weeks, with the exception of the fourth quarter of a 53-week fiscal year, which contains fourteen weeks.
25
Fiscal Year Ended | ||||||||||||||||||||
December 29, 2015 | December 30, 2014 | December 31, 2013 | January 1, 2013 | January 3, 2012 | ||||||||||||||||
(dollars in thousands) | ||||||||||||||||||||
Statements of Income Data: | ||||||||||||||||||||
Revenue: | ||||||||||||||||||||
Restaurant revenue | $ | 450,482 | $ | 398,993 | $ | 347,140 | $ | 297,264 | $ | 253,467 | ||||||||||
Franchising royalties and fees | 4,969 | 4,748 | 3,784 | 3,146 | 2,599 | |||||||||||||||
Total revenue | 455,451 | 403,741 | 350,924 | 300,410 | 256,066 | |||||||||||||||
Costs and Expenses: | ||||||||||||||||||||
Restaurant operating costs (exclusive of depreciation and amortization, shown separately below): | ||||||||||||||||||||
Cost of sales | 120,455 | 107,217 | 91,892 | 78,997 | 66,419 | |||||||||||||||
Labor | 143,145 | 120,492 | 104,040 | 89,435 | 75,472 | |||||||||||||||
Occupancy | 50,300 | 42,540 | 35,173 | 29,323 | 25,208 | |||||||||||||||
Other restaurant operating costs | 63,549 | 52,580 | 44,078 | 36,380 | 32,031 | |||||||||||||||
General and administrative(1) | 37,244 | 31,394 | 35,893 | 29,081 | 26,463 | |||||||||||||||
Depreciation and amortization | 27,802 | 24,787 | 20,623 | 16,719 | 14,501 | |||||||||||||||
Pre-opening | 4,407 | 4,425 | 3,809 | 3,145 | 2,327 | |||||||||||||||
Restaurant impairments, closure costs and asset disposals | 29,616 | 1,391 | 1,164 | 1,278 | 1,629 | |||||||||||||||
Total costs and expenses | 476,518 | 384,826 | 336,672 | 284,358 | 244,050 | |||||||||||||||
(Loss) income from operations | (21,067 | ) | 18,915 | 14,252 | 16,052 | 12,016 | ||||||||||||||
Debt extinguishment expense | — | — | 624 | 2,646 | 275 | |||||||||||||||
Interest expense | 1,432 | 365 | 2,196 | 5,028 | 6,132 | |||||||||||||||
(Loss) income before income taxes | (22,499 | ) | 18,550 | 11,432 | 8,378 | 5,609 | ||||||||||||||
(Benefit) provision for income taxes | (8,734 | ) | 7,122 | 4,767 | 3,215 | 1,780 | ||||||||||||||
Net (loss) income | $ | (13,765 | ) | $ | 11,428 | $ | 6,665 | $ | 5,163 | $ | 3,829 | |||||||||
_____________
(1) | 2013 included $0.5 million, and 2012 and 2011 each included $1.0 million of management fee expense, respectively, in accordance with our management services agreement and through the Class C common stock dividend paid to the holder of the one outstanding share of our Class C common stock. In connection with our IPO, the management services agreement expired, and the one share of Class C common stock was redeemed. In the second quarter of 2013, we incurred $5.7 million of IPO-related expenses: $2.0 million of stock-based compensation related to accelerated vesting of outstanding stock options, $1.2 million of stock-based compensation related to stock options granted to our Chief Executive Officer and then-President and Chief Operating Officer of which 50% were vested at grant, $1.7 million of transaction bonuses and related payroll taxes and $0.8 million in transaction payments to our Equity Sponsors. Additionally, we incurred $0.7 million of expenses related to our follow-on offering which closed in December of 2013. |
26
Fiscal Year Ended | ||||||||||||||||||||
December 29, 2015 | December 30, 2014 | December 31, 2013 | January 1, 2013 | January 3, 2012 | ||||||||||||||||
(in thousands, except share and per share data and restaurants) | ||||||||||||||||||||
(Loss) earnings per Class A and Class B common share, combined: | ||||||||||||||||||||
Basic | $ | (0.48 | ) | $ | 0.38 | $ | 0.25 | $ | 0.22 | $ | 0.16 | |||||||||
Diluted | $ | (0.48 | ) | $ | 0.37 | $ | 0.24 | $ | 0.22 | $ | 0.16 | |||||||||
Weighted average Class A and Class B common shares outstanding, combined: | ||||||||||||||||||||
Basic | 28,938,901 | 29,717,304 | 26,406,904 | 23,238,984 | 23,237,698 | |||||||||||||||
Diluted | 28,938,901 | 31,001,099 | 27,688,629 | 23,265,542 | 23,237,698 | |||||||||||||||
Selected Operating Data: | ||||||||||||||||||||
Company-owned restaurants at end of period | 422 | 386 | 318 | 276 | 239 | |||||||||||||||
Franchise-owned restaurants at end of period | 70 | 53 | 62 | 51 | 45 | |||||||||||||||
Company-owned: | ||||||||||||||||||||
Average unit volumes(1) | $ | 1,103 | $ | 1,147 | $ | 1,179 | $ | 1,178 | $ | 1,147 | ||||||||||
Comparable restaurant sales(2) | (0.2 | )% | 0.3 | % | 3.4 | % | 5.2 | % | 4.2 | % | ||||||||||
Restaurant contribution(3) | $ | 73,032 | $ | 76,165 | $ | 71,957 | $ | 63,129 | $ | 54,337 | ||||||||||
as a percentage of restaurant revenue | 16.2 | % | 19.1 | % | 20.7 | % | 21.2 | % | 21.4 | % | ||||||||||
As of | ||||||||||||||||||||
December 29, 2015 | December 30, 2014 | December 31, 2013 | January 1, 2013 | January 3, 2012 | ||||||||||||||||
(in thousands) | ||||||||||||||||||||
Balance Sheet Data: | ||||||||||||||||||||
Total current assets | $ | 25,401 | $ | 22,776 | $ | 18,333 | $ | 16,154 | $ | 12,879 | ||||||||||
Total assets(4) | 239,961 | 238,539 | 187,350 | 155,957 | 122,814 | |||||||||||||||
Total current liabilities | 32,914 | 25,831 | 24,165 | 23,760 | 20,557 | |||||||||||||||
Total long-term debt(4) | 67,732 | 27,136 | 5,860 | 92,693 | 74,012 | |||||||||||||||
Total liabilities(4) | 146,189 | 98,424 | 62,877 | 141,949 | 115,291 | |||||||||||||||
Temporary equity | — | — | — | 3,601 | 2,572 | |||||||||||||||
Total stockholders' equity | 93,772 | 140,115 | 124,473 | 10,407 | 4,951 | |||||||||||||||
_____________
(1) | AUVs consist of average annualized sales of all company-owned restaurants over the trailing 12 periods in a typical operating year. |
(2) | Comparable restaurant sales represent year-over-year sales for restaurants open for at least 18 full periods. |
(3) | Restaurant contribution represents restaurant revenue less restaurant operating costs which are cost of sales, labor, occupancy and other restaurant operating costs. |
(4) | As of December 29, 2015, the Company early adopted Accounting Standards Update ("ASU") 2015-03 "Interest-Imputation of Interest (Subtopic 835-30)." The adoption was retrospective to all prior periods presented. Total assets, long-term debt and total liabilities have been reduced by $0.4 million, $0.5 million, $1.0 million and $3.5 million as of December 30, 2014, December 31, 2013, January 1, 2013 and January 3, 2012, respectively. |
27
ITEM 7. Management's Discussion and Analysis of Financial Condition and Results of Operations
The following discussion and analysis of our financial condition and results of operations should be read in conjunction with Item 6. "Selected Financial Data" and our consolidated financial statements and related notes included in Item 8. "Financial Statements and Supplementary Data." In addition to historical information, this discussion and analysis contains forward-looking statements that involve risks and uncertainties. Our actual results may differ materially from those anticipated in these forward-looking statements as a result of certain factors including, but not limited to, those discussed in Item 1A. "Risk Factors" and elsewhere in this report.
We operate on a 52- or 53-week fiscal year ending on the Tuesday closest to December 31. Fiscal years 2015 and 2014, which ended on December 29, 2015 and December 30, 2014, respectively, each contained 52 weeks. Fiscal year 2011, which ended on January 3, 2012, contained 53 weeks. We refer to our fiscal years as 2015, 2014 and 2013. Our fiscal quarters each contained 13 operating weeks, with the exception of the fourth quarter of 2011, which had 14 operating weeks.
NOODLES & COMPANY
World Kitchen
Overview
Noodles & Company is a high growth, fast casual restaurant concept offering lunch and dinner within a fast growing segment of the restaurant industry. We opened our first location in 1995, offering noodle and pasta dishes, staples of many cuisines, with the goal of delivering fresh ingredients and flavors from around the world under one roof. Today, our globally inspired menu includes a wide variety of high quality, cooked-to-order dishes, including noodles and pasta, soups, salads and sandwiches, which are served on china by our friendly team members. We believe we offer our customers value with per person spend of approximately $8.55 in 2015.
2015 Highlights and Trends
Restaurant Development. New restaurants have contributed substantially to our revenue growth. In 2015, we opened 51 company-owned restaurants and 19 franchise restaurants for a total of 70 restaurants opened system-wide. We also purchased from franchisees 19 restaurants in 2014 and one restaurant from a franchise in 2015, and we closed 16 company-owned restaurants and one franchise restaurant in 2015. As of December 29, 2015, we had 422 company-owned restaurants and 70 franchise restaurants in 35 states, the District of Columbia and one Canadian province. In 2016, we expect to open approximately 50 restaurants system-wide.
Comparable Restaurant Sales. Comparable restaurant sales decreased by 0.3% system-wide in 2015. Comparable restaurant sales represent year-over-year sales comparisons for restaurants open for at least 18 full periods.
Brand positioning. During the fall of 2015, we launched a new brand positioning and food platform — "Made.Different. — Real Food. Real Cooking. Real Flavors." We also announced the removal of all artificial colors, flavors, preservatives and sweeteners from our core menu, including noodles, sauces, soups, condiments, bread and dressings, but excluding beverages, cookies and rice crispies.
Key Measures We Use to Evaluate Our Performance
To evaluate the performance of our business, we utilize a variety of financial and performance measures. These key measures include revenue, average unit volumes ("AUVs"), comparable restaurant sales, restaurant contribution, EBITDA and adjusted EBITDA.
Revenue
Restaurant revenue represents sales of food and beverages in company-owned restaurants. Several factors affect our restaurant revenue in any period, including the number of restaurants in operation and per restaurant sales.
Franchise royalties and fees represent royalty income and initial franchise fees. While we expect that the majority of our revenue and net income growth will be driven by company-owned restaurants, our franchise restaurants remain an important part of our financial success.
28
Seasonal factors cause our revenue to fluctuate from quarter to quarter. Our revenue per restaurant is typically lower in the first and fourth quarters due to reduced winter and holiday traffic and higher in the second and third quarters. As a result of these factors, our quarterly and annual operating results and comparable restaurant sales may fluctuate significantly.
Average Unit Volumes ("AUVs")
AUVs consist of the average annualized sales of all company-owned restaurants for the trailing 12 periods. AUVs are calculated by dividing restaurant revenue by the number of operating days within each time period and multiplying by 361, which is equal to the number of operating days we have in a typical year. This measurement allows management to assess changes in consumer traffic and per person spending patterns at our restaurants.
Comparable Restaurant Sales
Comparable restaurant sales refer to year-over-year sales comparisons for the comparable restaurant base. We define the comparable restaurant base to include restaurants open for at least 18 full periods. As of the end of 2015, 2014 and 2013, there were 322, 295 and 248 restaurants, respectively, in our comparable restaurant base for company-owned locations. This measure highlights performance of existing restaurants, as the impact of new restaurant openings is excluded. Changes in comparable restaurant sales are generated by changes in traffic, which we calculate as the number of entrées sold, or changes in per person spend, calculated as sales divided by traffic. Per person spend can be influenced by changes in menu prices and the mix and number of items sold per person.
Measuring our comparable restaurant sales allows us to evaluate the performance of our existing restaurant base. Various factors impact comparable restaurant sales, including:
• | consumer recognition of our brand and our ability to respond to changing consumer preferences; |
• | overall economic trends, particularly those related to consumer spending; |
• | our ability to operate restaurants effectively and efficiently to meet consumer expectations; |
• | pricing; |
• | per person spend and average check amount; |
• | marketing and promotional efforts; |
• | local competition; |
• | trade area dynamics; |
• | introduction of new and seasonal menu items and limited time offerings; and |
• | opening of new restaurants in the vicinity of existing locations. |
As a result of the 53-week fiscal year 2011, our fiscal year 2012 began one week later than our fiscal year 2011. Consistent with common industry practice, we present comparable restaurant sales on a calendar-adjusted basis that aligns current year sales weeks with comparable periods in the prior year, regardless of whether they belong to the same fiscal period or not. Since opening new company-owned and franchise restaurants will be a significant component of our revenue growth, comparable restaurant sales are only one measure of how we evaluate our performance.
Restaurant Contribution
Restaurant contribution is defined as restaurant revenue less restaurant operating costs which are cost of sales, labor, occupancy and other restaurant operating costs. We expect restaurant contribution to increase in proportion to the number of new restaurants we open and our comparable restaurant sales growth. Fluctuations in restaurant contribution margin can also be attributed to those factors discussed above for the components of restaurant operating costs.
29
EBITDA and Adjusted EBITDA
We define EBITDA as net (loss) income before interest expense, (benefit) provision for income taxes and depreciation and amortization. We define Adjusted EBITDA as net (loss) income before interest expense, debt extinguishment expense, (benefit)provision for income taxes, restaurant impairments, closure costs and asset disposals, depreciation and amortization, stock-based compensation, management fees, IPO-related expenses, follow-on offering expenses, transaction costs and litigation reserves.
EBITDA and Adjusted EBITDA provide clear pictures of our operating results by eliminating certain atypical and non-cash expenses that are not reflective of the underlying business performance. We use these metrics to facilitate a comparison of our operating performance on a consistent basis from period to period and to analyze the factors and trends affecting our business. In addition, we use these measures to monitor compliance with our bank covenants.
The following table presents a reconciliation of net (loss) income to EBITDA and Adjusted EBITDA:
Fiscal Year Ended | ||||||||||||||||||||
December 29, 2015 | December 30, 2014 | December 31, 2013 | January 1, 2013 | January 3, 2012 | ||||||||||||||||
(in thousands) | ||||||||||||||||||||
Net (loss) income | $ | (13,765 | ) | $ | 11,428 | $ | 6,665 | $ | 5,163 | $ | 3,829 | |||||||||
Depreciation and amortization | 27,802 | 24,787 | 20,623 | 16,719 | 14,501 | |||||||||||||||
Interest expense | 1,432 | 365 | 2,196 | 5,028 | 6,132 | |||||||||||||||
(Benefit) provision for income taxes | (8,734 | ) | 7,122 | 4,767 | 3,215 | 1,780 | ||||||||||||||
EBITDA | $ | 6,735 | $ | 43,702 | $ | 34,251 | $ | 30,125 | $ | 26,242 | ||||||||||
Debt extinguishment expense | — | — | 624 | 2,646 | 275 | |||||||||||||||
Restaurant impairments, closure costs and asset disposals | 29,616 | 1,391 | 1,164 | 1,278 | 1,629 | |||||||||||||||
Management fees(a) | — | — | 500 | 1,000 | 1,014 | |||||||||||||||
Stock-based compensation expense | 1,469 | 1,330 | 1,127 | 1,234 | 1,328 | |||||||||||||||
IPO-related expenses(b) | — | — | 5,667 | — | — | |||||||||||||||
Follow-on offering expenses(c) | — | — | 696 | — | — | |||||||||||||||
Transaction costs(d) | — | 100 | — | — | — | |||||||||||||||
Litigation reserves | 200 | — | — | — | — | |||||||||||||||
Adjusted EBITDA | $ | 38,020 | $ | 46,523 | $ | 44,029 | $ | 36,283 | $ | 30,488 | ||||||||||
_____________
(a) | Fiscal year 2013 included $0.5 million in management fee expense, and fiscal years 2012 and 2011 each included $1.0 million of management fee expense, in accordance with our management services agreement and through the Class C common stock dividend paid to the holder of the one outstanding share of our Class C common stock. In connection with our IPO, the management services agreement expired and the one share of Class C common stock was redeemed. |
(b) | Reflects certain expenses incurred in conjunction with the closing of our IPO. This amount includes $2.0 million of stock-based compensation related to accelerated vesting of outstanding stock options, $1.2 million of stock-based compensation related to stock options granted to our Chief Executive Officer and then-President and Chief Operating Officer of which 50% were vested at grant, $1.7 million of transaction bonuses and related payroll tax and $0.8 million in transaction payments to our Equity Sponsors. |
(c) | Reflects $0.7 million of offering expenses related to our follow-on offering completed in December of 2013. |
(d) | Expenses related to the purchase of 19 franchise restaurants. See Note 2-Business Combinations in the consolidated financial statements. |
30
Key Financial Definitions
Cost of Sales
Cost of sales includes the direct costs associated with the food, beverage and packaging of our menu items. Cost of sales also includes any costs related to discounted menu items. Cost of sales is a substantial expense and can be expected to grow proportionally as our restaurant revenue grows. Fluctuations in cost of sales are caused primarily by volatility in the cost of commodity food items and related contracts for such items. Other important factors causing fluctuations in cost of sales include seasonality, discounting activity and restaurant level management of food waste.
Labor Costs
Labor costs include wages, payroll taxes, workers' compensation expense, benefits and bonuses paid to our management teams. Like other expense items, we expect labor costs to grow proportionally as our restaurant revenue grows. Factors that influence fluctuations in our labor costs include minimum wage and payroll tax legislation, the frequency and severity of workers' compensation claims, health care costs and the performance of our restaurants.
Occupancy Costs
Occupancy costs include rent, common area maintenance and real estate tax expense related to our restaurants and is expected to grow proportionally as we open new restaurants.
Other Restaurant Operating Costs
Other restaurant operating costs include the costs of utilities, restaurant-level marketing, credit card processing fees, restaurant supplies, repairs and maintenance and other restaurant operating costs. Like other costs, it is expected to grow proportionally as restaurant revenue grows.
General and Administrative Expense
General and administrative expense is composed of payroll, other compensation, travel, marketing, accounting fees, legal fees and other expenses related to the infrastructure required to support our restaurants. General and administrative expense also includes the non-cash stock compensation expense related to our employee stock incentive plan. General and administrative expense can be expected to grow as we grow, including incremental legal, accounting, insurance and other expenses incurred as a public company.
Depreciation and Amortization
Our principal depreciation and amortization charges relate to depreciation of fixed assets, including leasehold improvements and equipment, from restaurant construction and ongoing maintenance.
Pre-Opening Costs
Pre-opening costs relate to the costs incurred prior to the opening of a restaurant. These include management labor costs, staff labor costs during training, food and supplies utilized during training, marketing costs and other related pre-opening costs. Pre-opening costs also include rent recorded between date of possession and opening date for our restaurants.
Restaurant impairments, closure costs and asset disposals
Restaurant impairments, closure costs and asset disposals include the loss on disposal of assets related to retirements and replacement of leasehold improvements or equipment, restaurant closure and impairment charges.
Debt Extinguishment
In 2013, we amended our credit facility to extend the maturity date and to reduce interest rates on borrowings. As a result of these amendments, a portion of the existing and new fees were treated as debt extinguishment.
31
Interest Expense
Interest expense consists primarily of interest on our outstanding indebtedness and amortization of debt issuance costs over the life of the related debt reduced by capitalized interest.
(Benefit) Provision for Income Taxes
(Benefit) provision for income taxes consists of federal, foreign, state and local taxes on our income.
Restaurant Openings, Closures and Relocations
The following table shows restaurants opened, closed or relocated in the years indicated.
Fiscal Year Ended | |||||||||
December 29, 2015 | December 30, 2014 | December 31, 2013 | |||||||
Company-Owned Restaurant Activity | |||||||||
Beginning of period | 386 | 318 | 276 | ||||||
Openings | 51 | 49 | 43 | ||||||
Acquisitions(1) | 1 | 19 | — | ||||||
Closures and relocations(2) | (16 | ) | — | (1 | ) | ||||
Restaurants at end of period | 422 | 386 | 318 | ||||||
Franchise Restaurant Activity | |||||||||
Beginning of period | 53 | 62 | 51 | ||||||
Openings | 19 | 10 | 11 | ||||||
Divestitures(1) | (1 | ) | (19 | ) | — | ||||
Closures and relocations(2) | (1 | ) | — | — | |||||
Restaurants at end of period | 70 | 53 | 62 | ||||||
Total restaurants | 492 | 439 | 380 | ||||||
_____________
(1) | Represents franchise restaurants acquired by the Company. |
(2) | We account for relocated restaurants under both restaurant openings and closures and relocations. |
32
Results of Operations
The following table summarizes key components of our results of operations for the periods indicated as a percentage of our total revenue, except for the components of restaurant operating costs, which are expressed as a percentage of restaurant revenue. Fiscal years 2015, 2014 and 2013 each contained 52 operating weeks.
Fiscal Year Ended | |||||||||
December 29, 2015 | December 30, 2014 | December 31, 2013 | |||||||
Revenue: | |||||||||
Restaurant revenue | 98.9 | % | 98.8 | % | 98.9 | % | |||
Franching royalties and fees | 1.1 | 1.2 | 1.1 | ||||||
Total revenue | 100.0 | 100.0 | 100.0 | ||||||
Costs and expenses: | |||||||||
Restaurant operating costs (exclusive of depreciation and amortization, shown separately below):(1) | |||||||||
Cost of sales | 26.7 | 26.9 | 26.5 | ||||||
Labor | 31.8 | 30.2 | 30.0 | ||||||
Occupancy | 11.2 | 10.7 | 10.1 | ||||||
Other restaurant operating costs | 14.1 | 13.2 | 12.7 | ||||||
General and administrative(2) | 8.2 | 7.8 | 10.2 | ||||||
Depreciation and amortization | 6.1 | 6.1 | 5.9 | ||||||
Pre-opening | 1.0 | 1.1 | 1.1 | ||||||
Restaurant impairments, closure costs and asset disposals | 6.5 | 0.3 | 0.3 | ||||||
Total costs and expenses | 104.6 | 95.3 | 95.9 | ||||||
(Loss) income from operations | (4.6 | ) | 4.7 | 4.1 | |||||
Debt extinguishment expense | — | — | 0.2 | ||||||
Interest expense | 0.3 | 0.1 | 0.6 | ||||||
(Loss) income before income taxes | (4.9 | ) | 4.6 | 3.3 | |||||
(Benefit) provision for income taxes | (1.9 | ) | 1.8 | 1.4 | |||||
Net (loss) income | (3.0 | )% | 2.8 | % | 1.9 | % | |||
_____________
(1) | As a percentage of restaurant revenue. |
(2) | Fiscal year 2013 included $500,000 of management fee expense, in accordance with our management services agreement and through the Class C common stock dividend paid to the holder of the one outstanding share of our Class C common stock. In connection with our IPO, the management services agreement expired, and the one share of Class C common stock was redeemed. Additionally, we incurred $0.7 million of expenses related to our follow-on offering which closed in December of 2013. |
33
Fiscal Year Ended December 29, 2015 compared to Fiscal Year Ended December 30, 2014
Fiscal years 2015 and 2014 contained 52 operating weeks. The table below presents our operating results for 2015 and 2014, and the related year-over-year changes:
Fiscal Year Ended | Increase / (Decrease) | ||||||||||||||
December 29, 2015 | December 30, 2014 | $ | % | ||||||||||||
(dollars in thousands) | |||||||||||||||
Statements of Income Data: | |||||||||||||||
Revenue: | |||||||||||||||
Restaurant revenue | $ | 450,482 | $ | 398,993 | $ | 51,489 | 12.9 | % | |||||||
Franchising royalties and fees | 4,969 | 4,748 | 221 | 4.7 | |||||||||||
Total revenue | 455,451 | 403,741 | 51,710 | 12.8 | |||||||||||
Costs and Expenses: | |||||||||||||||
Restaurant operating costs (exclusive of depreciation and amortization, shown separately below): | |||||||||||||||
Cost of sales | 120,455 | 107,217 | 13,238 | 12.3 | |||||||||||
Labor | 143,145 | 120,492 | 22,653 | 18.8 | |||||||||||
Occupancy | 50,300 | 42,540 | 7,760 | 18.2 | |||||||||||
Other restaurant operating costs | 63,549 | 52,580 | 10,969 | 20.9 | |||||||||||
General and administrative | 37,244 | 31,394 | 5,850 | 18.6 | |||||||||||
Depreciation and amortization | 27,802 | 24,787 | 3,015 | 12.2 | |||||||||||
Pre-opening | 4,407 | 4,425 | (18 | ) | (0.4 | ) | |||||||||
Restaurant impairments, closure costs and asset disposals | 29,616 | 1,391 | 28,225 | * | |||||||||||
Total costs and expenses | 476,518 | 384,826 | 91,692 | 23.8 | |||||||||||
(Loss) income from operations | (21,067 | ) | 18,915 | (39,982 | ) | * | |||||||||
Interest expense | 1,432 | 365 | 1,067 | * | |||||||||||
(Loss) income before income taxes | (22,499 | ) | 18,550 | (41,049 | ) | * | |||||||||
(Benefit) provision for income taxes | (8,734 | ) | 7,122 | (15,856 | ) | * | |||||||||
Net (loss) income | $ | (13,765 | ) | $ | 11,428 | $ | (25,193 | ) | * | ||||||
_____________
* | Not meaningful. |
Revenue
Restaurant revenue increased by $51.5 million in 2015 compared to 2014. Restaurants not in the comparable restaurant base accounted for $52.3 million of this increase, partially offset by a slight decline in comparable restaurant sales, as well as the impact of closing 16 restaurants in the fourth quarter of 2015. Comparable restaurant sales decreased by $0.8 million or 0.2% in 2015 due to a decrease in traffic, offset by a modest price increase. AUV's decreased to $1.103 million from $1.147 million in the prior year.
Franchise royalties and fees increased by $0.2 million in 2015 due to 19 new restaurant openings, the cancellation of an area development agreement offset by decreased comparable restaurant sales of 0.9% and the loss of royalties and fees from franchise restaurants purchased by the Company during 2014.
Cost of Sales
Cost of sales increased by $13.2 million in 2015 compared to 2014, due primarily to the increase in restaurant revenue in 2015. As a percentage of restaurant revenue, cost of sales decreased to 26.7% in 2015 from 26.9% in 2014. This decrease as a percentage of restaurant revenue was primarily the result of price increases partially offset by modest commodity inflation.
34
Labor Costs
Labor costs increased by $22.7 million in 2015 compared to 2014, due primarily to the increase in restaurant revenue in 2015. As a percentage of restaurant revenue, labor costs increased to 31.8% in 2015 from 30.2% in 2014. The increase as a percentage of restaurant revenue was primarily due to deleverage on lower average unit volumes, wage inflation and the implementation of the PPACA.
Occupancy Costs
Occupancy costs increased by $7.8 million in 2015 compared to 2014, due primarily to new restaurants. As a percentage of restaurant revenue, occupancy costs increased to 11.2% in 2015, from 10.7% in 2014. The increase was due to deleverage on lower average unit volumes.
Other Restaurant Operating Costs
Other restaurant operating costs increased by $11.0 million in 2015 compared to 2014, due primarily to the increase in restaurant revenue in 2015. As a percentage of restaurant revenue, other restaurant operating costs increased to 14.1% in 2015 from 13.2% in 2014. The increase in other restaurant operating cost percentage was primarily due to deleverage on lower average unit volumes, as well as increased marketing initiative costs in 2015.
General and Administrative Expense
General and administrative expense increased by $5.9 million in 2015 compared to 2014, primarily due to the support of additional restaurants, particularly in new markets, and marketing initiatives. As a percentage of revenue, general and administrative expense increased to 8.2% in 2015 from 7.8% in 2014.
Depreciation and Amortization
Depreciation and amortization increased by $3.0 million in 2015 compared to 2014, due primarily to an increased number of restaurants offset by the impairment of 39 restaurants throughout 2015. As a percentage of revenue, depreciation and amortization remained flat at 6.1% in 2015 and 2014.
Pre-Opening Costs
Pre-opening costs decreased by $18,000 in 2015 compared to 2014. As a percentage of revenue, pre-opening costs decreased to 1.0% in 2015 from 1.1% in 2014.
Restaurant Impairments, Closure Costs and Asset Disposals
Restaurant impairments, closure costs and asset disposals increased by $28.2 million in 2015 compared to 2014 due primarily to the impairment of 39 restaurants in 2015, including six restaurants in the fourth quarter, as a result of our current assessment of expected future cash flows. The under performance of these 39 restaurants, compounded by the higher than average construction costs of some of these restaurants, resulted in the recording of an impairment of the fixed assets. Additionally, 16 restaurants were closed in the fourth quarter of 2015, of which 15 were previously impaired during 2015. The majority of the $3.1 million in closing costs were related to the non-cash reserves for lease obligations.
Each quarter we evaluate possible impairment of fixed assets at the restaurant level and record an impairment loss whenever we determine that the fair value of these assets is less than their carrying value. There can be no assurance that such evaluations will not result in additional impairment costs in future periods.
Interest Expense
Interest expense increased by $1.1 million in 2015 compared to 2014. The increase was the result of higher average borrowings used to fund our share repurchase program, and an increase in the interest rate on our credit facility during 2015 compared to 2014.
(Benefit) Provision for Income Taxes
In 2015, we had a benefit for income taxes of $8.7 million in 2015 compared to a provision for income taxes of $7.1 million in 2014, due to a shift from pre-tax net income in 2014 to a pre-tax loss in 2015, as well as an increase in our effective income tax rate. The effective tax rate increased to 38.8% in 2015 from 38.4% in 2014 primarily due to an increase in employment credits, which causes an increase to the effective tax rate when applied to a period with a pre-tax book loss.
35
Fiscal Year Ended December 30, 2014 compared to Fiscal Year Ended December 31, 2013
Fiscal year 2014 and 2013 each contained 52 operating weeks. The table below presents our operating results for 2014 and 2013, and the related year-over-year changes:
Fiscal Year Ended | Increase / (Decrease) | ||||||||||||||
December 30, 2014 | December 31, 2013 | $ | % | ||||||||||||
(dollars in thousands) | |||||||||||||||
Statements of Income Data: | |||||||||||||||
Revenue: | |||||||||||||||
Restaurant revenue | $ | 398,993 | $ | 347,140 | $ | 51,853 | 14.9 | % | |||||||
Franchising royalties and fees | 4,748 | 3,784 | 964 | 25.5 | |||||||||||
Total revenue | 403,741 | 350,924 | 52,817 | 15.1 | |||||||||||
Costs and Expenses: | |||||||||||||||
Restaurant operating costs (exclusive of depreciation and amortization, shown separately below): | |||||||||||||||
Cost of sales | 107,217 | 91,892 | 15,325 | 16.7 | |||||||||||
Labor | 120,492 | 104,040 | 16,452 | 15.8 | |||||||||||
Occupancy | 42,540 | 35,173 | 7,367 | 20.9 | |||||||||||
Other restaurant operating costs | 52,580 | 44,078 | 8,502 | 19.3 | |||||||||||
General and administrative(1) | 31,394 | 35,893 | (4,499 | ) | (12.5 | ) | |||||||||
Depreciation and amortization | 24,787 | 20,623 | 4,164 | 20.2 | |||||||||||
Pre-opening | 4,425 | 3,809 | 616 | 16.2 | |||||||||||
Restaurant impairments, closure costs and asset disposals | 1,391 | 1,164 | 227 | 19.5 | |||||||||||
Total costs and expenses | 384,826 | 336,672 | 48,154 | 14.3 | |||||||||||
Income from operations | 18,915 | 14,252 | 4,663 | 32.7 | |||||||||||
Debt extinguishment expense | — | 624 | (624 | ) | * | ||||||||||
Interest expense | 365 | 2,196 | (1,831 | ) | (83.4 | ) | |||||||||
Income before income taxes | 18,550 | 11,432 | 7,118 | 62.3 | |||||||||||
Provision for income taxes | 7,122 | 4,767 | 2,355 | 49.4 | |||||||||||
Net income | $ | 11,428 | $ | 6,665 | $ | 4,763 | 71.5 | % | |||||||
_____________
* | Not meaningful. |
(1) | Fiscal year 2013 included $500,000 of management fee expense, in accordance with our management services agreement and through the Class C common stock dividend paid to the holder of the one outstanding share of our Class C common stock. In connection with our IPO, the management services agreement expired and the one share of Class C common stock was redeemed. Additionally, we incurred $0.7 million of expenses related to our follow-on offering which closed in December of 2013. |
Revenue
Restaurant revenue increased by $51.9 million in 2014 compared to 2013. Restaurants not in the comparable restaurant base accounted for $51.0 million of this increase, with the balance attributed to growth in comparable restaurant sales. Comparable restaurant sales increased by $0.9 million or 0.3% in 2014, composed of an increase in price and product mix, offset by a decrease in traffic partially attributable to abnormally severe weather in the first quarter of 2014.
Franchise royalties and fees increased by $1.0 million in 2014 due to 10 new restaurant openings, the cancellation of an area development agreement and an increase in marketing administrative fees from 0.5% in 2013 to 1.0% in 2014, offset by decreased comparable restaurant sales of 0.4% and the loss of royalties and fees from franchise restaurants purchased by the Company.
36
Cost of Sales
Cost of sales increased by $15.3 million in 2014 compared to 2013, due primarily to the increase in restaurant revenue in 2014. As a percentage of restaurant revenue, cost of sales increased to 26.9% in 2014 from 26.5% in 2013. This increase as a percentage of restaurant revenue was the result of increased promotional activity and an increase in ingredient costs.
Labor Costs
Labor costs increased by $16.5 million in 2014 compared to 2013, due primarily to the increase in restaurant revenue in 2014. As a percentage of restaurant revenue, labor costs increased to 30.2% in 2014 from 30.0% in 2013. The increase as a percentage of restaurant revenue was the result of an increased percentage of non-comparable base restaurants, which on average have higher labor costs as a percentage of revenue.
Occupancy Costs
Occupancy costs increased by $7.4 million in 2014 compared to 2013, due primarily to new restaurants. As a percentage of restaurant revenue, occupancy costs increased to 10.7% in 2014, from 10.1% in 2013. The increase was due to an increase in the percentage of restaurants not in the comparable base which, due to not reaching mature volumes, on average have higher occupancy costs as a percentage of revenue.
Other Restaurant Operating Costs
Other restaurant operating costs increased by $8.5 million in 2014 compared to 2013, due primarily to the increase in restaurant revenue in 2014. As a percentage of restaurant revenue, other restaurant operating costs increased to 13.2% in 2014 from 12.7% in 2013. The increase in other restaurant operating cost percentage was due to costs of restaurants not in the comparable base, as well as increased utility and maintenance costs in 2014.
General and Administrative Expense
General and administrative expense decreased by $4.5 million in 2014 compared to 2013, due primarily to $5.7 million of expenses related to the closing of our IPO in the second quarter of 2013 and $0.7 million of expenses related to the closing of our follow-on offering in the fourth quarter of 2013, offset by our biennial All Managers Conference, which was held during 2014, as well as increased spend in 2014 due to inflation and the support of additional restaurants. The $5.7 million of expenses related to the closing of our IPO was comprised of $2.0 million of stock-based compensation related to accelerated vesting of outstanding stock options, $1.2 million of stock-based compensation related to stock options granted to our Chief Executive Officer and then-President and Chief Operating Officer, of which 50% were vested at grant, $1.7 million of transaction bonuses and related payroll taxes and $0.8 million in transaction payments to our Equity Sponsors.
Excluding the impact of the $5.7 million of IPO-related expense and $0.7 million of follow-on offering costs, general and administrative expense as a percentage of revenue decreased to 8.4% in 2013. The decrease to 7.8% in 2014 from 8.4% in 2013 was due to increasing revenue without proportionate increases in general and administrative costs or administrative personnel as well as a decrease in incentive compensation in 2014. General and administrative expense included $1.5 million and $4.3 million of stock-based compensation expense in 2014 and 2013, respectively, and $500,000 of management fees in 2013.
Depreciation and Amortization
Depreciation and amortization increased by $4.2 million in 2014 compared to 2013, due primarily to an increased number of restaurants. As a percentage of revenue, depreciation and amortization increased to 6.1% in 2014 from 5.9% in 2013, due to depreciation on restaurants not in the comparable base that, on average, have a higher cost basis of assets, as well as investments in technology.
Pre-Opening Costs
Pre-opening costs increased by $0.6 million in 2014 compared to 2013, due to 49 restaurant openings in 2014 compared to 43 in 2013. As a percentage of revenue, pre-opening costs remained flat at 1.1% in 2014 and 2013.
37
Restaurant Impairments, Closure Costs and Asset Disposals
Restaurant impairments, closure costs and asset disposals increased by $0.2 million in 2014 compared to 2013 due primarily to a $0.5 million expense for the disposal of furniture and fixture inventory related to the dissolving of a relationship with an overseas vendor, offset by decreased disposals of other assets.
Debt Extinguishment
In 2013, debt extinguishment expense was $0.6 million as a result the November 2013 amendment to our credit facility that extended the maturity date and reduced the interest rates on borrowings. A portion of the existing and new fees were treated as debt extinguishment expense.
Interest Expense
Interest expense decreased by $1.8 million in 2014 compared to 2013. The decrease was primarily due to lower average borrowings in 2014 due to the payoff of the majority of our outstanding debt in conjunction with our IPO in 2013.
Provision for Income Taxes
Provision for income taxes increased by $2.4 million in 2014 compared to 2013, due to an increase in pre-tax net income in 2014, offset by a decrease to our effective income tax rate. Our effective tax rate decreased to 38.4% in 2014 from 41.7% in 2013 primarily due to the impact of non-deductible follow-on offering transaction costs in 2013, offset by increased employment credits in 2014.
Quarterly Financial Data
The following table presents select historical quarterly consolidated statements of operations data and other operations data for fiscal years 2015 and 2014. The operating results for any quarter are not necessarily indicative of the results for any subsequent quarter. Results from the quarters ended March 31, 2015, September 29, 2015 and December 29, 2015 include the impact of significant impairments described elsewhere in this report and these impairments may or may not impact our results in future quarters. Each fiscal quarter contained 13 weeks.
Quarter Ended | |||||||||||||||||||||||
December 29, 2015 | September 29, 2015 | June 30, 2015 | March 31, 2015 | December 30, 2014 | September 30, 2014 | July 1, 2014 | April 1, 2014 | ||||||||||||||||
(dollars in thousands, unaudited) | |||||||||||||||||||||||
Total revenue | $117,128 | $117,328 | $115,233 | $105,761 | $108,546 | $106,216 | $99,459 | $89,519 | |||||||||||||||
Net (loss) income | (4,254 | ) | (9,821 | ) | 3,062 | (2,752 | ) | 3,535 | 2,943 | 3,527 | 1,424 | ||||||||||||
Selected Operating Data: | |||||||||||||||||||||||
Company-owned restaurants at end of period | 422 | 424 | 411 | 399 | 386 | 370 | 343 | 331 | |||||||||||||||
Franchise-owned restaurants at end of period | 70 | 64 | 61 | 56 | 53 | 55 | 67 | 63 | |||||||||||||||
Company-owned: | |||||||||||||||||||||||
Average unit volumes | 1,103 | 1,111 | 1,123 | 1,136 | 1,147 | 1,152 | 1,156 | 1,163 | |||||||||||||||
Comparable restaurant sales | (0.9 | )% | (0.7 | )% | 0.1 | % | 0.8 | % | 1.3 | % | 1.6 | % | (0.6 | )% | (1.4 | )% | |||||||
Restaurant contribution as a percentage of restaurant revenue(1) | 14.9 | % | 15.2 | % | 18.6 | % | 16.2 | % | 20.0 | % | 18.6 | % | 20.4 | % | 17.3 | % | |||||||
_____________
(1) | Restaurant contribution represents restaurant revenue less restaurant operating costs which are cost of sales, labor, occupancy and other restaurant operating costs. |
38
Liquidity and Capital Resources
Our primary sources of liquidity and cash flows are operating cash flows and borrowings on our revolving line of credit. We use this cash to fund capital expenditures for new restaurant openings, reinvest in our existing restaurants, invest in infrastructure and information technology and maintain working capital. Our working capital position benefits from the fact that we generally collect cash from sales to customers the same day, or in the case of credit or debit card transactions, within several days of the related sale, and we typically have at least 30 days to pay our vendors. We believe that expected cash flow from operations and planned borrowing capacity are adequate to fund debt service requirements, operating lease obligations, capital expenditures and working capital obligations for the next year.
While operations continue to provide cash, our primary use of cash is new restaurant development. Our total capital expenditures for 2015 were $50.1 million, and we expect to incur capital expenditures of between $45 million and $50 million in 2016, of which $35 million to $40 million relates to our construction of new restaurants before any reductions for landlord reimbursements, and the remainder relates primarily to reinvestment in existing restaurants and investments in technology. In 2015, excluding two atypical freestanding sites, we spent on average $757,000 in development and construction costs per restaurant, net of landlord reimbursements. For new restaurants to be opened in 2016, we anticipate average development costs per restaurant of between $750,000 and $775,000, net of landlord reimbursements. Additionally, we anticipate using cash from operations and our credit facility to support the costs associated with the 16 restaurants closed in 2015, primarily consisting of payments to landlords to terminate leases.
Cash flows from operating, investing and financing activities are shown in the following table:
Fiscal Year Ended | ||||||||||||
December 29, 2015 | December 30, 2014 | December 31, 2013 | ||||||||||
(in thousands) | ||||||||||||
Net cash provided by operating activities | $ | 44,506 | $ | 49,027 | $ | 43,634 | ||||||
Net cash used in investing activities | (50,721 | ) | (72,060 | ) | (54,429 | ) | ||||||
Net cash provided by financing activities | 6,355 | 23,971 | 11,182 | |||||||||
Effect of exchange rate changes on cash | (134 | ) | — | — | ||||||||
Net increase in cash and cash equivalents | $ | 6 | $ | 938 | $ | 387 | ||||||
Operating Activities
Net cash provided by operating activities of $44.5 million for 2015 resulted primarily from net income, adjusted for non-cash items such as depreciation and amortization, impairments and stock-based compensation expense. The $4.5 million decrease in 2015 over 2014 was primarily driven by the decrease in net income adjusted for taxes and impairments, partially offset by increases in working capital changes.
Net cash provided by operating activities increased in 2014 from 2013 primarily due to increased net income, adjusted for items such as depreciation and amortization and stock-based compensation expense. The increase was primarily driven by an increase in net income and the timing of payments in accounts payable, offset by the timing of accrued incentive compensation payments as well as investments in inventory items for catering.
Investing Activities
Net cash used in investing activities was primarily related to new restaurant capital expenditures for the opening of 51, 49 and 43 restaurants in 2015, 2014 and 2013, respectively, as well as infrastructure improvements. The decrease in investing activities from 2015 to 2014 was due to the purchase of 19 franchise restaurants in 2014 and lower average constructions costs in 2015. We used approximately $15.7 million of cash flows for acquisitions in 2014, when we acquired substantially all of the assets of 16 restaurants from our Indiana franchisee and an additional three restaurants from our New Jersey franchisee. See Note 2-Business Combinations to the consolidated financial statements for further information with respect to our acquisition activity in 2014.
39
Financing Activities
Net cash provided by financing activities was $6.4 million and $24.0 million in 2015 and 2014, respectively. The decrease over the prior year is primarily due to the borrowings in 2014 we used to fund the acquisition of 19 franchise locations.
On July 2, 2013, we closed our IPO in which we sold 6,160,714 shares of Class A common stock at $18.00 per share and received net proceeds of approximately $100.2 million (after underwriting discounts, commissions and offering expenses). These net proceeds were used to pay off our outstanding term loan and repay all but $0.2 million of our revolving line of credit.
Share Repurchase Program
In June 2015, the Company announced a share repurchase program of up to $35.0 million of the Company's Class A common stock. Under this program, the Company purchased shares of the Company's Class A common stock in the open market (including in pre-arranged stock trading plans in accordance with the guidelines specified in Rule 10b5-1 under the Securities Exchange Act of 1934, as amended ("the Exchange Act")) or in privately negotiated transactions. During fiscal year 2015, the Company repurchased 2,423,871 shares of its common stock for $35.0 million in open market transactions and completed the repurchase program. Repurchased shares are included as treasury stock in the consolidated balance sheets.
Credit Facility
We maintain a $100.0 million revolving line of credit under our credit facility. The revolving line of credit includes a swing line loan of $10.0 million used to fund working capital requirements. On June 4, 2015, we amended our credit facility to increase our borrowing capacity on the revolving line of credit from $45.0 million to $75.0 million and extended its term from November 2018 to June 2020. All other material terms and covenants remained the same. The revolving line of credit of $10.0 million remained in place. On November 24, 2015, we entered into a second amendment and restatement to our credit facility to extend borrowing capacity from $75.0 million to $100.0 million and to make certain favorable changes to the covenants. We had $68.2 million of outstanding indebtedness, $2.8 million of outstanding letters of credit and $29.0 million available for borrowing under our revolving line of credit as of December 29, 2015. Borrowings under our amended and restated credit facility bear interest, at our option, at either (i) LIBOR plus 1.00 to 2.00%, based on the lease-adjusted leverage ratio or (ii) the highest of the following rates plus zero to 1.00%: (a) the federal funds rate plus 0.50%; (b) the Bank of America prime rate or (c) the one month LIBOR plus 1.00%. The facility includes a commitment fee of 0.125 to 0.30%, based on the lease-adjusted leverage ratio, per year on any unused portion of the facility. We also maintain outstanding letters of credit to secure obligations under our workers’ compensation program and certain lease obligations.
Availability of borrowings under the revolving line of credit is conditioned on our compliance with specified covenants, including a maximum lease-adjusted leverage ratio and a minimum consolidated fixed charge coverage ratio. We are subject to a number of other customary covenants, including limitations on additional borrowings, acquisitions, dividend payments and lease commitments. As of December 29, 2015, we were in compliance with all of our debt covenants.
Our credit facility is secured by a pledge of stock of substantially all of our subsidiaries and a lien on substantially all of the personal property assets of the Company and its subsidiaries.
Contractual Obligations
Our contractual obligations at December 29, 2015 were as follows:
Payments Due by Period | ||||||||||||||||||||
Total | 1 Year | 2 - 3 Years | 4 - 5 Years | After 5 Years | ||||||||||||||||
(in thousands) | ||||||||||||||||||||
Lease obligations(1) | $ | 512,019 | $ | 49,555 | $ | 91,766 | $ | 84,382 | $ | 286,316 | ||||||||||
Purchase obligations(2) | 41,148 | 24,856 | 8,544 | 7,748 | — | |||||||||||||||
Long-term debt(3) | 68,246 | — | — | 68,246 | — | |||||||||||||||
Other liabilities(4) | 1,600 | 458 | 223 | 419 | 500 | |||||||||||||||
Total contractual obligations | $ | 623,013 | $ | 74,869 | $ | 100,533 | $ | 160,795 | $ | 286,816 | ||||||||||
40
_____________
(1) | We are obligated under non-cancelable leases for our restaurants, administrative offices and equipment. Some restaurant leases provide for contingent rental payments based on sales thresholds, which are excluded from this table. We also include capital leases for computer equipment of approximately $400,000. |
(2) | We enter into various purchase obligations in the ordinary course of business. Our binding purchase obligations relate to volume commitments for beverage and food products, as well as binding commitments for the construction of new restaurants. |
(3) | Reflects full payment of our long-term debt at maturity of our credit facility in 2020. Amounts related to interest expense on our revolving credit facility are not included in the table above because the interest rate is variable. See "Liquidity and Capital Resources” for a discussion of the terms of the revolving credit facility. |
(4) | Reflects the expected payments associated with our commitment under our non-qualified deferred compensation plan. |
Off-Balance Sheet Arrangements
We had no off-balance sheet arrangements or obligations as of December 29, 2015.
Critical Accounting Policies and Estimates
Our consolidated financial statements and accompanying notes are prepared in accordance with US GAAP. Preparing consolidated financial statements requires us to make estimates and assumptions that affect the reported amounts of assets, liabilities, revenue and expenses. These estimates and assumptions are affected by the application of our accounting policies. Our significant accounting policies are described in Note 1 to our consolidated financial statements. Critical accounting estimates are those that require application of management’s most difficult, subjective or complex judgments, often as a result of matters that are inherently uncertain and may change in subsequent periods. While we apply our judgment based on assumptions believed to be reasonable under the circumstances, actual results could vary from these assumptions. It is possible that materially different amounts would be reported using different assumptions. We believe the critical accounting policies described below affect our more significant judgments and estimates used in the preparation of our financial statements.
Impairment of Long-Lived Assets
We review long-lived assets, such as property and equipment and intangibles, subject to amortization, for impairment when events or circumstances indicate the carrying value of the assets may not be recoverable. In determining the recoverability of the asset value, an analysis is performed at the individual restaurant level and primarily includes an assessment of historical cash flows and other relevant factors and circumstances. The other factors and circumstances include changes in the economic environment, changes in the manner in which assets are used, unfavorable changes in legal factors or business climate, incurring excess costs in construction of the asset, overall restaurant operating performance and projections for future performance. These estimates result in a wide range of variability on a year to year basis due to the nature of the criteria. Negative restaurant-level cash flow over the previous 24 to 36 periods is considered a potential impairment indicator. In such situations, we evaluate future undiscounted cash flow projections in conjunction with qualitative factors and future operating plans. Our impairment assessment process requires the use of estimates and assumptions regarding the future undiscounted cash flows and operating outcomes, which are based upon a significant degree of management's judgment.
In performing our impairment testing, we forecast our future undiscounted cash flows by looking at recent restaurant level performance, restaurant level operating plans, sales trends and cost trends for cost of sales, labor and operating expenses. We believe that this combination of information gives us a fair benchmark to estimate future undiscounted cash flows. We compare this cash flow forecast to the asset's carrying value at the restaurant. Based on this analysis, if the carrying amount of the assets is greater than the estimated future undiscounted cash flows, an impairment charge is recognized by the amount by which the carrying amount exceeds the fair value.
Business Combinations and Intangible Assets Including Goodwill
We account for acquisitions using the purchase method of accounting. Accordingly, assets acquired and liabilities assumed are recorded at their estimated fair values at the acquisition date. The excess of purchase price over fair value of net assets acquired, including the amount assigned to identifiable intangible assets, is recorded as goodwill. Given the time it takes to obtain pertinent information to finalize the acquired company's balance sheet, it may be several quarters before we are able to finalize those initial fair value estimates. Accordingly, it is not uncommon for the initial estimates to be subsequently revised. The results of operations of acquired businesses are included in the consolidated financial statements from the acquisition date. Our recorded identifiable intangible assets primarily include the estimated value assigned to certain contract‑based assets, primarily favorable or unfavorable lease arrangements, which are amortized on a straight-line basis over the remaining lease terms. At December 29, 2015, we had
41
goodwill recorded in conjunction with franchise acquisitions of $6.4 million. Under the accounting rules, goodwill is not amortized. Instead, goodwill is subject to annual reviews for impairment on the first day of the fourth fiscal quarter.
Self-Insurance Programs
We are self-insured for health, workers' compensation, general and liability and property damage. Predetermined loss limits have been arranged with insurance companies to limit our per occurrence cash outlay. Estimated costs to settle reported claims and incurred but unreported claims for health and workers' compensation self-insured plans are recorded in accrued payroll and benefits and for general and liability and property damage in accrued expenses and other liabilities.
Restaurant Closing Costs
We record restaurant closing costs consisting of future lease commitments, net of anticipated sublease rentals and expected ancillary costs. We record a liability for the net present value of any remaining lease obligations, net of estimated sublease income, at the date we cease using a property. Subsequent adjustments to the liability as a result of changes in estimates of sublease income or lease terminations are recorded in the period incurred. The estimates we make related to sublease income are subject to a high degree of judgment and may differ from actual sublease income due to changes in economic conditions, desirability of the sites and other factors.
Rent
We record rent expense for our leases, which generally have escalating rentals over the term of the lease, on a straight-line basis over the lease term. The lease term includes renewal options that are reasonably assured. Rent expense begins when we have the right to control the use of the property, which is typically before rent payments are due under the lease. We record the difference between the rent expense and rent paid as deferred rent in the consolidated balance sheet. Rent expense for the period prior to the restaurant opening is reported as pre-opening expense in the consolidated statements of income. Tenant incentives used to fund leasehold improvements are recorded in deferred rent and amortized as reductions of rent expense over the term of the lease.
Certain of our operating leases contain clauses that provide additional contingent rent based on a percentage of sales greater than certain specified target amounts. We recognize contingent rent expense when the achievement of specified targets is considered probable.
Recently Issued Accounting Pronouncements
In May 2014, the Financial Accounting Standards Board ("FASB") issued Accounting Standards Updated ("ASU")No. 2014-09, "Revenue from Contracts with Customers." The pronouncement was issued to clarify the principles for recognizing revenue and to develop a common revenue standard and disclosure requirements for U.S. GAAP and International Financial Reporting Standards. The pronouncement is effective for reporting periods beginning after December 15, 2016. The adoption of ASU 2014-09 is not expected to significantly affect the Company’s consolidated financial position or results of operations.
In August 2014, the FASB issued ASU, "Presentation of Financial Statements - Going Concern (Subtopic 205-40): Disclosure of Uncertainties about an Entity’s Ability to Continue as a Going Concern." This update requires management of the Company to evaluate whether there is substantial doubt about the Company’s ability to continue as a going concern. This update is effective for the annual period ending after December 15, 2016, and for annual and interim periods thereafter. Early adoption is permitted. The Company does not expect this standard to have an impact on the Company’s consolidated financial position or results of operations.
In April 2015, the FASB issued ASU No. 2015-05, "Intangibles - Goodwill and Other-Internal-Use Software (Subtopic 350-40): Customer's Accounting for Fees Paid in a Cloud Computing Arrangement." The pronouncement was issued to provide guidance concerning accounting for fees in a cloud computing arrangement. The update is effective for reporting periods beginning after December 15, 2015. The adoption of this standard is not expected to have a material effect on the Company's consolidated financial statements.
In July 2015, the FASB issued ASU No. 2015-11, "Inventory (Topic 330)." The pronouncement was issued to simplify the measurement of inventory and changes the measurement from lower of cost or market to lower of cost and net realizable value. This pronouncement is effective for reporting periods beginning after December 15, 2016. The adoption of ASU 2015-11 is not expected to have a significant impact on the Company's consolidated financial statements.
In February 2016, the FASB issued ASU No. 2016-06, "Leases." The pronouncement amends the existing accounting standards for lease accounting, including requiring lessees to recognize most leases on their balance sheet and making targeted changes to lessor accounting. The pronouncement will be effective beginning in the first quarter of 2019, with early adoption permitted. The new leases standard requires a modified retrospective transition approach for all leases existing at, or entered into after, the date of
42
initial application, with an option to use certain transition relief. We are currently evaluating the impact of adopting the new leases standard on our consolidated financial statements.
Recently Adopted Accounting Pronouncements
In April 2015, the FASB issued ASU No. 2015-03, "Interest-Imputation of Interest (Subtopic 835-50): Simplifying the Presentation of Debt Issuance Costs." This pronouncement requires debt issuance costs related to a recognized debt liability to be presented in the balance sheet as a direct deduction from the carrying value of that debt liability, consistent with debt discounts. The pronouncement is effective retrospectively for fiscal years, and interim periods within those years, beginning after December 15, 2015. Early adoption is permitted, and the Company adopted this standard effective December 29, 2015. As a result, the Company has presented debt issuance costs related to long-term debt liabilities as a direct deduction from its related liability in the consolidated balance sheets. The effects of the standard were applied retrospectively to all prior interim and annual periods within this annual report. The effect of the change in accounting principle was a reduction of other assets, net and long-term debt by approximately $0.5 million and $0.4 million for the fiscal years ended December 29, 2015 and December 30, 2014, respectively.
In November 2015, The FASB issued ASU No. 2015-17, "Income Taxes." The pronouncement requires that deferred tax liabilities and assets be classified as noncurrent in a classified balance sheet. Prior to the issuance of the standard, deferred tax liabilities and assets were required to be separately classified into a current amount and a noncurrent in the balance sheet. The new accounting guidance represents a change in accounting principle, and the standard is required to be adopted in annual periods beginning after December 15, 2016. Early adoption is permitted and the Company elected to early adopt this guidance as of December 29, 2015 and to apply the guidance prospectively. Because the application of this guidance affects classification only, such reclassifications did not have a material effect on the Company's consolidated financial position or results of operations.
JOBS Act
We qualify as an "emerging growth company" pursuant to the provisions of the JOBS Act. For as long as we are an "emerging growth company," we may take advantage of certain exemptions from various reporting requirements that are applicable to other public companies that are not "emerging growth companies," including, but not limited to, not being required to comply with the auditor attestation requirements of Section 404(b) of the Sarbanes-Oxley Act, reduced disclosure obligations regarding executive compensation in our periodic reports and proxy statements, exemptions from the requirements of holding advisory "say-on-pay" votes on executive compensation, shareholder advisory votes on golden parachute compensation and the extended transition period for complying with the new or revised accounting standards.
In addition, Section 107 of the JOBS Act also provides that an "emerging growth company" can take advantage of the extended transition period provided in Section 7(a)(2)(B) of the Securities Act for complying with new or revised accounting standards. An "emerging growth company" can therefore delay the adoption of certain accounting standards until those standards would otherwise apply to private companies. However, we have chosen to "opt out" of such extended transition period and, as a result, we will comply with new or revised accounting standards on the relevant dates on which adoption of such standards is required for non-emerging growth companies. Section 107 of the JOBS Act provides that our decision to opt out of the extended transition period for complying with new or revised accounting standards is irrevocable.
ITEM 7A. Quantitative and Qualitative Disclosure about Market Risk
Interest Rate Risk
We are exposed to market risk from changes in interest rates on debt. Our exposure to interest rate fluctuations is limited to our outstanding bank debt, which bears interest at variable rates. As of December 29, 2015 there was $68.2 million in outstanding borrowings under our credit facility. A plus or minus 1.0% in the effective interest rate applied on these loans would have resulted in a pre-tax interest expense fluctuation of approximately $682,000 on an annualized basis.
Commodity Price Risk
We purchase certain products that are affected by commodity prices and are, therefore, subject to price volatility caused by weather, market conditions and other factors which are not considered predictable or within our control. Although these products are subject to changes in commodity prices, certain purchasing contracts or pricing arrangements contain risk management techniques designed to minimize price volatility. The purchasing contracts and pricing arrangements we use may result in unconditional purchase obligations, which are not reflected in our consolidated balance sheets. Typically, we use these types of purchasing techniques to control costs as an alternative to directly managing financial instruments to hedge commodity prices. In many cases, we believe we will be able to address material commodity cost increases by adjusting our menu pricing or changing our product delivery strategy.
43
However, increases in commodity prices, without adjustments to our menu prices, could increase restaurant operating costs as a percentage of company-owned restaurant revenue.
Inflation
The primary inflationary factors affecting our operations are food, labor costs, energy costs and materials used in the construction of new restaurants. Increases in the minimum wage directly affect our labor costs. Many of our leases require us to pay taxes, maintenance, repairs, insurance and utilities, all of which are generally subject to inflationary increases. Finally, the cost of constructing our restaurants is subject to inflationary increases in the costs of labor and material. Over the past five years, inflation has not significantly affected our operating results with the exception of increased wage inflation that affected our results in 2015. We expect wage inflation to continue to effect our results in the near future.
44
ITEM 8. | Financial Statements and Supplementary Data |
Noodles & Company
INDEX TO CONSOLIDATED FINANCIAL STATEMENTS
Consolidated Financial Statements | |
See accompanying notes to consolidated financial statements.
45
Noodles & Company
Consolidated Balance Sheets
(in thousands, except share and per share data)
December 29, 2015 | December 30, 2014 | |||||||
Assets | ||||||||
Current assets: | ||||||||
Cash and cash equivalents | $ | 1,912 | $ | 1,906 | ||||
Accounts receivable | 4,990 | 4,557 | ||||||
Inventories | 10,494 | 9,415 | ||||||
Prepaid expenses and other assets | 7,185 | 6,271 | ||||||
Income tax receivable | 820 | 627 | ||||||
Total current assets | 25,401 | 22,776 | ||||||
Property and equipment, net | 203,713 | 205,573 | ||||||
Deferred tax assets, net | 664 | — | ||||||
Goodwill | 6,400 | 6,400 | ||||||
Intangibles, net | 1,809 | 1,927 | ||||||
Other assets, net | 1,974 | 1,863 | ||||||
Total long-term assets | 214,560 | 215,763 | ||||||
Total assets | $ | 239,961 | $ | 238,539 | ||||
Liabilities and Stockholders' Equity | ||||||||
Current liabilities: | ||||||||
Accounts payable | $ | 15,073 | $ | 10,865 | ||||
Accrued payroll and benefits | 5,417 | 4,704 | ||||||
Accrued expenses and other current liabilities | 12,424 | 8,560 | ||||||
Deferred tax liabilities, net | — | 1,702 | ||||||
Total current liabilities | 32,914 | 25,831 | ||||||
Long-term debt | 67,732 | 27,136 | ||||||
Deferred rent | 39,597 | 35,498 | ||||||
Deferred tax liabilities, net | — | 6,512 | ||||||
Other long-term liabilities | 5,946 | 3,447 | ||||||
Total liabilities | 146,189 | 98,424 | ||||||
Commitments and contingencies | ||||||||
Stockholders' equity: | ||||||||
Preferred stock—$0.01 par value, authorized 1,000,000 shares as of December 29, 2015 and December 30, 2014; no shares issued or outstanding | — | — | ||||||
Common stock—$0.01 par value, authorized 180,000,000 shares as of December 29, 2015 and December 30, 2014; 30,138,672 issued and 27,714,801 outstanding as of December 29, 2015 and 29,820,340 issued and outstanding as of December 30, 2014 | 301 | 298 | ||||||
Treasury stock, at cost, 2,423,871 and 67,586 shares as of December 29, 2015 and December 30, 2014, respectively | (35,000 | ) | (2,848 | ) | ||||
Additional paid-in capital | 120,634 | 120,929 | ||||||
Accumulated other comprehensive loss | (134 | ) | — | |||||
Retained earnings | 7,971 | 21,736 | ||||||
Total stockholders' equity | 93,772 | 140,115 | ||||||
Total liabilities and stockholders' equity | $ | 239,961 | $ | 238,539 | ||||
46
Noodles & Company
Consolidated Statements of Income
(in thousands, except share and per share data)
Fiscal Year Ended | ||||||||||||
December 29, 2015 | December 30, 2014 | December 31, 2013 | ||||||||||
Revenue: | ||||||||||||
Restaurant revenue | $ | 450,482 | $ | 398,993 | $ | 347,140 | ||||||
Franchising royalties and fees | 4,969 | 4,748 | 3,784 | |||||||||
Total revenue | 455,451 | 403,741 | 350,924 | |||||||||
Costs and expenses: | ||||||||||||
Restaurant operating costs (exclusive of depreciation and amortization shown separately below): | ||||||||||||
Cost of sales | 120,455 | 107,217 | 91,892 | |||||||||
Labor | 143,145 | 120,492 | 104,040 | |||||||||
Occupancy | 50,300 | 42,540 | 35,173 | |||||||||
Other restaurant operating costs | 63,549 | 52,580 | 44,078 | |||||||||
General and administrative | 37,244 | 31,394 | 35,893 | |||||||||
Depreciation and amortization | 27,802 | 24,787 | 20,623 | |||||||||
Pre-opening | 4,407 | 4,425 | 3,809 | |||||||||
Restaurant impairments, closure costs and asset disposals | 29,616 | 1,391 | 1,164 | |||||||||
Total costs and expenses | 476,518 | 384,826 | 336,672 | |||||||||
(Loss) income from operations | (21,067 | ) | 18,915 | 14,252 | ||||||||
Debt extinguishment expense | — | — | 624 | |||||||||
Interest expense | 1,432 | 365 | 2,196 | |||||||||
(Loss) income before income taxes | (22,499 | ) | 18,550 | 11,432 | ||||||||
(Benefit) provision for income taxes | (8,734 | ) | 7,122 | 4,767 | ||||||||
Net (loss) income | $ | (13,765 | ) | $ | 11,428 | $ | 6,665 | |||||
(Loss) earnings per Class A and Class B common stock, combined | ||||||||||||
Basic | $ | (0.48 | ) | $ | 0.38 | $ | 0.25 | |||||
Diluted | $ | (0.48 | ) | $ | 0.37 | $ | 0.24 | |||||
Weighted average Class A and Class B common stock outstanding, combined | ||||||||||||
Basic | 28,938,901 | 29,717,304 | 26,406,904 | |||||||||
Diluted | 28,938,901 | 31,001,099 | 27,688,629 | |||||||||
See accompanying notes to consolidated financial statements.
47
Fiscal Year Ended | ||||||||||||
December 29, 2015 | December 30, 2014 | December 31, 2013 | ||||||||||
Net (loss) income | $ | (13,765 | ) | $ | 11,428 | $ | 6,665 | |||||
Other comprehensive loss: | ||||||||||||
Foreign currency translation adjustments | (134 | ) | — | — | ||||||||
Other comprehensive loss | (134 | ) | — | — | ||||||||
Comprehensive (loss) income | $ | (13,899 | ) | $ | 11,428 | $ | 6,665 | |||||
See accompanying notes to consolidated financial statements.
48
Noodles & Company
Consolidated Statements of Equity
(in thousands, except share data)
Common Stock(1) | Treasury | Additional Paid-In Capital | Accumulated Other Comprehensive Loss | Retained Earnings (Accumulated Deficit) | Total Stockholders' Equity | Temporary Equity | ||||||||||||||||||||||||||||
Shares | Amount | Shares | Amount | |||||||||||||||||||||||||||||||
Balance—January 1, 2013 | 23,238,984 | $ | 232 | (2) | — | $ | — | $ | 7,585 | $ | (24 | ) | $ | 2,614 | $ | 10,407 | $ | 3,601 | ||||||||||||||||
Issuance of common stock in connection with IPO, net of transaction expenses | 6,160,714 | 62 | — | — | 100,007 | — | — | 100,069 | — | |||||||||||||||||||||||||
Elimination of temporary equity at IPO | — | — | — | — | 2,572 | — | 1,029 | 3,601 | (3,601 | ) | ||||||||||||||||||||||||
Proceeds from exercise of stock options, warrants and employee stock purchase plan | 144,907 | 1 | — | — | 1,981 | — | — | 1,982 | — | |||||||||||||||||||||||||
Treasury shares acquired | — | — | 65,478 | (2,777 | ) | — | — | — | (2,777 | ) | — | |||||||||||||||||||||||
Tax benefit on exercise of stock options | — | — | — | — | 201 | — | — | 201 | — | |||||||||||||||||||||||||
Stock-based compensation expense | — | — | — | 1,098 | — | — | 1,098 | — | ||||||||||||||||||||||||||
Stock-based compensation expense related to acceleration of vesting | — | — | — | — | 3,203 | — | — | 3,203 | — | |||||||||||||||||||||||||
Other | (48 | ) | — | — | — | — | 24 | — | 24 | — | ||||||||||||||||||||||||
Net Income | — | — | — | — | — | — | 6,665 | 6,665 | — | |||||||||||||||||||||||||
Balance—December 31, 2013 | 29,544,557 | 295 | (2) | 65,478 | (2,777 | ) | 116,647 | — | 10,308 | 124,473 | — | |||||||||||||||||||||||
Proceeds from exercise of stock options, warrants and employee stock purchase plan | 275,783 | 3 | — | — | 2,673 | — | — | 2,676 | — | |||||||||||||||||||||||||
Treasury shares acquired | — | — | 2,108 | (71 | ) | — | — | — | (71 | ) | — | |||||||||||||||||||||||
Tax benefit on exercise of stock options | — | — | — | — | 253 | — | — | 253 | — | |||||||||||||||||||||||||
Stock-based compensation expense | — | — | — | — | 1,418 | — | — | 1,418 | — | |||||||||||||||||||||||||
Other | — | — | — | — | (62 | ) | — | — | (62 | ) | — | |||||||||||||||||||||||
Net Income | — | — | — | — | — | — | 11,428 | 11,428 | — | |||||||||||||||||||||||||
Balance—December 30, 2014 | 29,820,340 | 298 | (2) | 67,586 | (2,848 | ) | 120,929 | — | 21,736 | 140,115 | — | |||||||||||||||||||||||
Proceeds from exercise of stock options, warrants and employee stock purchase plan | 318,332 | 3 | — | — | 949 | — | — | 952 | — | |||||||||||||||||||||||||
Treasury shares acquired, net | — | — | 2,356,285 | (32,152 | ) | (2,848 | ) | — | — | (35,000 | ) | — | ||||||||||||||||||||||
Stock-based compensation expense | — | — | — | — | 1,698 | — | — | 1,698 | — | |||||||||||||||||||||||||
Other | — | — | — | — | (94 | ) | — | — | (94 | ) | — | |||||||||||||||||||||||
Net loss | — | — | — | — | — | — | (13,765 | ) | (13,765 | ) | — | |||||||||||||||||||||||
Other comprehensive loss | — | — | — | — | — | (134 | ) | — | (134 | ) | — | |||||||||||||||||||||||
Balance—December 29, 2015 | 30,138,672 | $ | 301 | (2) | 2,423,871 | $ | (35,000 | ) | $ | 120,634 | $ | (134 | ) | $ | 7,971 | $ | 93,772 | $ | — | |||||||||||||||
_____________
(1) | Unless otherwise noted, activity relates to Class A common stock |
(2) | Includes 1,522,098 shares of Class B common stock as of December 29, 2015 and December 30, 2014 and 6,292,640 shares of Class B common stock as of December 31, 2013. |
See accompanying notes to consolidated financial statements.
49
Fiscal Year Ended | ||||||||||||
December 29, 2015 | December 30, 2014 | December 31, 2013 | ||||||||||
Operating activities | ||||||||||||
Net (loss) income | $ | (13,765 | ) | $ | 11,428 | $ | 6,665 | |||||
Adjustments to reconcile net income to net cash provided by operating activities: | ||||||||||||
Depreciation and amortization | 27,802 | 24,787 | 20,623 | |||||||||
(Benefit) provision for income taxes | (8,878 | ) | 6,330 | 4,206 | ||||||||
Excess tax benefit on stock-based compensation | — | (253 | ) | (201 | ) | |||||||
Restaurant impairments, closure costs and asset disposals | 28,927 | 1,391 | 1,164 | |||||||||
Amortization of debt issuance costs and debt | ||||||||||||
extinguishment expense | 98 | 101 | 710 | |||||||||
Stock-based compensation | 1,469 | 1,330 | 4,230 | |||||||||
Other noncash | — | — | (248 | ) | ||||||||
Changes in operating assets and liabilities: | ||||||||||||
Accounts receivable | (437 | ) | (75 | ) | 538 | |||||||
Inventories | (1,058 | ) | (1,840 | ) | (1,181 | ) | ||||||
Prepaid expenses and other assets | (1,025 | ) | (1,768 | ) | (1,518 | ) | ||||||
Accounts payable | 2,794 | 2,661 | (230 | ) | ||||||||
Deferred rent | 7,143 | 6,390 | 5,833 | |||||||||
Income taxes | (193 | ) | (24 | ) | 392 | |||||||
Accrued expenses and other liabilities | 1,629 | (1,431 | ) | 2,651 | ||||||||
Net cash provided by operating activities | 44,506 | 49,027 | 43,634 | |||||||||
Investing activities | ||||||||||||
Purchases of property and equipment | (50,093 | ) | (56,352 | ) | (54,429 | ) | ||||||
Acquisition of franchise restaurants | (628 | ) | (15,708 | ) | — | |||||||
Net cash used in investing activities | (50,721 | ) | (72,060 | ) | (54,429 | ) | ||||||
Financing activities | ||||||||||||
Proceeds from issuances of long-term debt | 425,517 | 310,479 | 136,357 | |||||||||
Payments on long-term debt | (384,771 | ) | (289,292 | ) | (224,526 | ) | ||||||
Debt issuance costs | (249 | ) | — | (124 | ) | |||||||
Acquisition of treasury stock | (35,000 | ) | (71 | ) | (2,777 | ) | ||||||
Issuance of common stock, net of transaction expenses | — | — | 100,069 | |||||||||
Proceeds from exercise of stock options, warrants and employee stock purchase plan | 952 | 2,676 | 1,982 | |||||||||
Excess tax benefit on stock-based compensation | — | 253 | 201 | |||||||||
Other financing activities | (94 | ) | (74 | ) | — | |||||||
Net cash provided by financing activities | 6,355 | 23,971 | 11,182 | |||||||||
Effect of exchange rate changes on cash | (134 | ) | — | — | ||||||||
Net increase in cash and cash equivalents | 6 | 938 | 387 | |||||||||
Cash and cash equivalents | ||||||||||||
Beginning of year | 1,906 | 968 | 581 | |||||||||
End of year | $ | 1,912 | $ | 1,906 | $ | 968 | ||||||
See accompanying notes to consolidated financial statements.
50
1. Business and Summary of Significant Accounting Policies
Business
Noodles & Company (the "Company" or "Noodles & Company"), a Delaware corporation, develops and operates fast casual restaurants that serve globally inspired noodle and pasta dishes, soups, salads and sandwiches. As of December 29, 2015, we had 422 company-owned restaurants and 70 franchise restaurants in 35 states, the District of Columbia and one Canadian province. The Company operates its business as one operating and reportable segment.
On July 2, 2013, the Company completed an initial public offering ("IPO") of shares of Class A common stock at $18.00 per share. The Company issued 6,160,714 shares of Class A common stock, $0.01 par value, including 803,571 shares sold to the underwriters in the IPO pursuant to their over-allotment option. After underwriter discounts and commissions and estimated offering expenses, the Company received net proceeds from the offering of approximately $100.2 million. These proceeds were used to repay all but $0.2 million of outstanding debt under the Company's credit facility.
On December 5, 2013, the Company completed a follow-on offering of 4,500,000 shares of Class A common stock at a price of $39.50 per share. All of the shares in the offering were offered by selling stockholders, except for 108,267 shares offered by the Company, the proceeds of which were used to repurchase the same number of shares from certain officers at the same net price per share. The Company did not receive any net proceeds from the offering. The selling stockholders paid all of the underwriting discounts and commissions associated with the sale of the shares; however, the Company incurred approximately $696,000 in costs and expenses related to this offering.
Principles of Consolidation
The accompanying consolidated financial statements include the accounts of Noodles & Company and its subsidiaries. All intercompany balances and transactions are eliminated in consolidation.
Fiscal Year
The Company operates on a 52- or 53-week fiscal year ending on the Tuesday closest to December 31. Fiscal years 2015, 2014 and 2013, which ended on December 29, 2015, December 30, 2014 and December 31, 2013, respectively, each contained 52 weeks.
Estimates
The preparation of financial statements in conformity with accounting principles generally accepted in the United States requires management to make estimates and assumptions that affect the reported amounts of assets and liabilities and disclosure of contingent assets and liabilities as of the date of the financial statements and the reported amounts of revenue and expenses during the reporting period. Actual results could differ from those estimates.
Cash and Cash Equivalents
The Company considers all highly liquid investment instruments with an initial maturity of three months or less when purchased to be cash equivalents. Amounts receivable from credit card processors are converted to cash shortly after the related sales transaction and are considered to be cash equivalents because they are both short-term and highly liquid in nature. Amounts receivable from credit card processors are considered cash equivalents, and as of December 29, 2015 and December 30, 2014 were $1.3 million and $1.2 million, respectively, and were offset on the consolidated balance sheets by outstanding checks. Book overdrafts, which are outstanding checks in excess of cash and cash equivalents, are recorded within accounts payable in the accompanying consolidated balance sheets and within operating activities in the accompanying statements of cash flows.
51
1. Business and Summary of Significant Accounting Policies (continued)
Accounts Receivable
Accounts receivable consist primarily of tenant improvement receivables and vendor rebates receivable, as well as amounts due from franchisees and other miscellaneous receivables. The Company believes all amounts to be collectible. Accordingly, no allowance for doubtful accounts has been recorded as of December 29, 2015 or December 30, 2014.
Inventories
Inventories consist of food, beverages, supplies, and smallwares, and are stated at the lower of cost (first-in, first-out method) or market. Smallwares inventory, which consist of the plates, silverware, and cooking utensils used in the restaurants, are frequently replaced and are considered current assets. Replacement costs of smallwares inventory are recorded as other restaurant operating costs and are expensed as incurred. As of December 29, 2015 and December 30, 2014, smallwares inventory of $6.7 million and $6.2 million, respectively, were included on the consolidated balance sheets.
Property and Equipment
Property and equipment are stated at cost, less accumulated depreciation. Expenditures for major renewals and improvements are capitalized, while expenditures for minor replacements and maintenance and repairs are expensed as incurred. Upon retirement or disposal of assets, the accounts are relieved of cost and accumulated depreciation and the related gain or loss is reflected in earnings. Depreciation is calculated using the straight-line method over the estimated useful lives of the assets. Leasehold improvements are amortized over the shorter of the estimated useful life or the lease term, which generally includes option periods that are reasonably assured to be exercised. Depreciation and amortization expense on property and equipment, including assets under capital lease, was $27.8 million in 2015, $24.8 million in 2014 and $20.6 million in 2013.
The estimated useful lives for property and equipment are:
Property and Equipment | Estimated Useful Lives | |
Leasehold improvements | Shorter of lease term or estimated useful life, not to exceed 20 years | |
Furniture and fixtures | 3 to 15 years | |
Equipment | 3 to 7 years | |
The Company capitalizes internal payroll and payroll related costs directly related to the successful acquisition, development, design and construction of its new restaurants. Capitalized internal costs were $3.0 million, $2.9 million and $2.6 million in 2015, 2014 and 2013, respectively. Interest incurred on funds used to construct company-owned restaurants is capitalized and amortized over the estimated useful life of the related assets. Capitalized interest totaled $0.4 million in both 2015 and 2014 and $0.3 million in 2013.
Goodwill
Goodwill represents the excess of purchase price over the fair value of identifiable net assets acquired and is not subject to amortization. The Company evaluates goodwill annually, on the first day of the Company's fourth fiscal quarter, to determine if there have been any events or circumstances that would trigger a more-likely-than-not reduction in the fair value of a reporting unit below its carrying amount.
Goodwill is evaluated for impairment annually or more frequently if indicators of impairment are present. The Company performed step one of the impairment test on the first day of the Company's fourth fiscal quarter in 2015. Step one of the impairment test is based upon a comparison of the carrying value of net assets, including goodwill balances, to the fair value of net assets. Fair value is measured using a combination of the income approach and the market approach. The income approach consists of utilizing the discounted cash flow method that incorporates the Company's estimates of future revenues and costs, discounted using a risk-adjusted discount rate. The Company's estimates used in the income approach are consistent with the plans and estimates used to manage operations. The market approach utilizes multiples of profit measures to estimate the fair value of the assets. The company evaluates all methods to ensure reasonably consistent results. Additionally, the Company evaluates the key input factors in the model used to determine whether a moderate change in any input factor or combination of factors would significantly change the results of the tests. Based on the completion of the step one test, it was determined that goodwill was not impaired as of September 30, 2015. However, an impairment charge may be triggered in the future if the value of the Company's stock declines, sales in the
52
1. Business and Summary of Significant Accounting Policies (continued)
Company's restaurants decline significantly, or if there are significant adverse changes in the operating environment of the restaurant industry. There was no goodwill impairment recorded during fiscal years 2015 and 2014.
Intangibles, net
Intangible, net consist primarily of reacquired franchise rights, favorable lease agreements, trademarks and transferable liquor licenses. The Company amortizes the fair value of reacquired franchise rights over the remaining contractual terms of the reacquired franchise area development agreements at the time of acquisition, which ranged from approximately 10 years to 18 years as of December 29, 2015. The Company amortizes the fair value of favorable lease agreements over the remaining related lease terms at the time of the acquisition, which ranged from approximately four years to 13 years as of December 29, 2015. Trademark rights are considered indefinite lived intangibles, the carrying value of which is analyzed for impairment at least annually. Transferable liquor licenses are carried at the lower of fair value or cost and are reviewed annually for impairment or changes in circumstances that indicate that the carrying amount may not be recoverable.
Impairment of Long-Lived Assets
Long-lived assets are reviewed for impairment whenever events or changes in circumstances indicate that the carrying amount of an asset may not be recoverable. Recoverability of assets is measured by a comparison of the carrying amount of the assets to the future undiscounted net cash flows expected to be generated by the assets. Identifiable cash flows are measured at the lowest level for which they are largely independent of the cash flows of other groups of assets and liabilities, generally at the restaurant level. If the assets are determined to be impaired, the amount of impairment recognized is the amount by which the carrying amount of the assets exceeds their fair value. Estimates of future cash flows are based on the Company's experience and knowledge of local operations. During 2015, 2014 and 2013, the Company recorded impairment charges of certain long-lived assets which are included in restaurant impairments, closure costs and asset disposals in the consolidated statements of income. See Note 7-Impairment and Closed Restaurant Reserve. Fair value of the restaurants was determined using Level 3 inputs (as described in Note 6-Fair Value Measurements) based on a discounted cash flows method through the estimated date of closure.
Long-term Debt
Effective December 29, 2015, we adopted ASU 2015-03, Simplifying the Presentation of Debt Issuance Costs. The ASU requires debt issuance costs related to a recognized liability to be presented in the balance sheet as a direct deduction from the carrying amount of the debt liability. The effects of this standard were applied retrospectively.
Debt issuance costs include fees and costs incurred to obtain long-term financing. These costs are amortized to Interest Expense over the term of the related loan. Debt issuance costs of $0.5 million and $0.4 million, net of accumulated amortization of $0.4 million and $0.3 million, as of December 29, 2015 and December 30, 2014, respectively. In 2013, the Company amended and restated its credit facility. The Company wrote off $0.6 million of debt issuance costs, net of accumulated amortization of $0.3 million in 2013.
Self-Insurance Programs
The Company self-insures for health, workers' compensation, general liability and property damage. Predetermined loss limits have been arranged with insurance companies to limit the Company's per occurrence cash outlay. Estimated costs to settle reported claims and incurred but unreported claims for health and workers' compensation self-insured plans are recorded in accrued payroll and benefits and for general liability and property damage in accrued expenses and other liabilities.
Concentrations of Credit Risk
Financial instruments that potentially subject the Company to concentrations of credit risk consist primarily of cash and cash equivalents and accounts receivable. The Company's cash balances may exceed federally insured limits. Credit card transactions at the Company's restaurants are processed by one service provider. Concentration of credit risk related to accounts receivable are limited, as the Company's receivables are primarily amounts due from landlords for the reimbursement of tenant improvements and the Company generally has the right to offset rent due for tenant improvement receivables.
Revenue Recognition
Revenue consists of sales from restaurant operations and franchise royalties and fees. Revenue from the operation of company-owned restaurants are recognized when sales occur. The Company reports revenue net of sales and use taxes collected from customers and remitted to governmental taxing authorities.
53
1. Business and Summary of Significant Accounting Policies (continued)
The Company sells gift cards which do not have an expiration date, and it does not deduct non-usage fees from outstanding gift card balances. The Company recognizes revenue from gift cards when the gift card is redeemed by the customer or the Company determines the likelihood of the gift card being redeemed by the customer is remote ("gift card breakage"). The determination of the gift card breakage rate is based upon Company-specific historical redemption patterns. The Company has determined that approximately 6% of gift cards will not be redeemed, which is recognized ratably over the estimated redemption period of the gift card, approximately 18 months. The Company recognized gift card breakage in restaurant revenue of $0.3 million in 2015 and $0.2 million in both 2014 and 2013.
Royalties from franchise restaurants are based on a percentage of restaurant revenues and are recognized in the period the related franchised restaurants' sales occur. Development fees and franchise fees, portions of which are collected in advance, are nonrefundable and are recognized in income when all material services or conditions relating to the sale of the franchise have been substantially performed or satisfied by the Company. Both franchise fees and development fees will generally be recognized upon the opening of a franchise restaurant or upon termination of the agreement(s) between the Company and the franchisee.
As of December 29, 2015, December 30, 2014 and December 31, 2013, there were 70, 53 and 62 franchise restaurants in operation, respectively. Franchisees opened 19, 10 and 11 restaurants in 2015, 2014 and 2013, respectively. The Company purchased from franchisees 19 restaurants in 2014 (see Note 2-Business Combinations) and one in 2015.
Pre-Opening Costs
Pre-opening costs, including rent, wages, benefits and travel for the training and opening teams, food, beverage and other restaurant operating costs, are expensed as incurred prior to a restaurant opening for business.
Advertising and Marketing Costs
Advertising and marketing costs are expensed as incurred and aggregated $8.0 million, $4.4 million and $3.9 million in 2015, 2014 and 2013, respectively. These costs are included in restaurant operating costs, general and administrative expenses and pre-opening costs based on the nature of the advertising and marketing costs incurred.
Rent
Rent expense for the Company's leases, which generally have escalating rentals over the term of the lease, is recorded on a straight-line basis over the lease term. The lease term includes renewal options which are reasonably assured of being exercised and begins when the Company has control and possession of the leased property, which is typically before rent payments are due under the lease. The difference between the rent expense and rent paid is recorded as deferred rent in the consolidated balance sheets. Rent expense for the period prior to the restaurant opening is reported in pre-opening costs in the consolidated statements of income. Tenant incentives used to fund leasehold improvements are recorded in deferred rent and amortized as a reduction of rent expense over the term of the lease. Certain leases contain rental provisions based on the sales of the underlying restaurants; the Company has determined that the amount of these provisions is immaterial.
(Benefit) Provision for Income Taxes
Provision (benefit) for income taxes is accounted for under the asset and liability method. Deferred tax assets and liabilities are recognized for the future tax consequences attributable to differences between the financial statement carrying amounts of existing assets and liabilities and their respective tax bases and operating loss and tax credit carry forwards. Deferred tax assets and liabilities are measured using enacted tax rates expected to apply to taxable income in the years in which those deferred amounts are expected to be recovered or settled. Valuation allowances are recorded for deferred tax assets that more likely than not will not be realized. The effect on deferred tax assets and liabilities of a change in tax rates is recognized in income in the period that includes the enactment date. The Company's policy is to recognize interest to be paid on an underpayment of income taxes in interest expense and any related statutory penalties in provision (benefit) for income taxes in the consolidated statement of income.
Comprehensive (Loss) Income
Comprehensive (loss) income consists of the net (loss) income and other gains and losses affecting stockholders' equity that, under accounting principles generally accepted in the United States, are excluded from net (loss) income. Other comprehensive (loss) income, presented in the consolidated statements of comprehensive income for 2015 consisted of the foreign currency translation adjustment.
54
1. Business and Summary of Significant Accounting Policies (continued)
Stock Compensation Expense
The Company recognizes stock-based compensation using fair value measurement guidance for all share-based payments, including stock options and warrants. For option awards, expense is recognized ratably over the vesting period in an amount equal to the fair value of the stock-based awards on the date of grant determined using the Black-Scholes option pricing model. See Note 10-Stock-Based Compensation.
Foreign Currency Translation
The Canadian dollar is the functional currency for our Canadian restaurant operations. Assets and liabilities denominated in Canadian dollars are translated into U.S. dollars at exchange rates in effect as of the balance sheet date. Income and expense accounts are translated using the average exchange rates prevailing throughout the period. The resulting translation adjustment is recorded as a separate component of other comprehensive income (loss). Gain or loss from foreign currency transactions is recognized in our consolidated statements of income.
(Loss) Earnings Per Share
Basic (loss) earnings per share ("EPS") are calculated by dividing income available to common shareholders by the weighted-average number of shares of common stock outstanding during each period. Diluted (loss) earnings per share is calculated using income available to common shareholders divided by diluted weighted-average shares of common stock outstanding during each period. Potentially dilutive securities include shares of common stock underlying stock options and restricted stock. Diluted EPS considers the impact of potentially dilutive securities except in periods in which there is a loss because the inclusion of the potential common shares would have an anti-dilutive effect. See Note 11-(Loss) Earnings Per Share.
Reclassification
Certain amounts in the prior period financial statements have been reclassified to conform to the current period presentation. These reclassifications had no effect on reported net (loss) income.
Recently Issued Accounting Pronouncements
In May 2014, the Financial Accounting Standards Board ("FASB") issued Accounting Standards Update ("ASU") No. 2014-09, "Revenue from Contracts with Customers (Topic 606)." The pronouncement was issued to clarify the principles for recognizing revenue and to develop a common revenue standard and disclosure requirements for U.S. GAAP and International Financial Reporting Standards. The pronouncement is effective for annual and interim periods beginning after December 15, 2017, which will require the Company to adopt these provisions in the first quarter of fiscal 2018. Early adoption is not permitted. This pronouncement permits the use of either the retrospective or cumulative effect transition method. The Company is evaluating the effect this guidance will have on the Company's consolidated financial statements and related disclosures. The Company has not yet selected a transition method nor has it determined the effect of the standard on its ongoing financial reporting.
In August 2014, the FASB issued ASU No. 2014-15, "Presentation of Financial Statements - Going Concern (Subtopic 205-40): Disclosure of Uncertainties about an Entity’s Ability to Continue as a Going Concern." This update requires management of the Company to evaluate whether there is substantial doubt about the Company’s ability to continue as a going concern. This update is effective for the annual period ending after December 15, 2016 and for annual and interim periods thereafter. Early adoption is permitted. The Company does not expect this standard to have an impact on the Company’s consolidated financial statements.
In April 2015, the FASB issued ASU No. 2015-05, "Intangibles - Goodwill and Other-Internal-Use Software (Subtopic 350-40): Customer's Accounting for Fees Paid in a Cloud Computing Arrangement." The pronouncement was issued to provide guidance concerning accounting for fees in a cloud computing arrangement. The update is effective for reporting periods beginning after December 15, 2015. The adoption of this standard is not expected to have a material effect on the Company's consolidated financial statements.
In July 2015, the FASB issued ASU No. 2015-11, "Inventory (Topic 330)." The pronouncement was issued to simplify the measurement of inventory and changes the measurement from lower of cost or market to lower of cost and net realizable value. This pronouncement is effective for reporting periods beginning after December 15, 2016. The adoption of ASU 2015-11 is not expected to have a significant impact on the Company's consolidated financial statements.
55
1. Business and Summary of Significant Accounting Policies (continued)
In February 2016, the FASB issued ASU No. 2016-06, "Leases." The pronouncement amends the existing accounting standards for lease accounting, including requiring lessees to recognize most leases on their balance sheet and making targeted changes to lessor accounting. The pronouncement will be effective beginning in the first quarter of 2019, with early adoption permitted. The initial application, with an option to use certain transition relief. The Company is currently evaluating the impact of adopting the new leases standard on its consolidated financial statements.
Recently Adopted Accounting Pronouncements
In April 2015, the FASB issued ASU No. 2015-03, "Interest-Imputation of Interest (Subtopic 835-50): Simplifying the Presentation of Debt Issuance Costs." This pronouncement requires debt issuance costs related to a recognized debt liability to be presented in the balance sheet as a direct deduction from the carrying value of that debt liability, consistent with debt discounts. The pronouncement is effective retrospectively for fiscal years, and interim periods within those years, beginning after December 15, 2015. Early adoption is permitted, and the Company adopted this standard effective December 29, 2015. As a result, the Company has presented debt issuance costs related to long-term debt liabilities as a direct deduction from its related liability in the consolidated balance sheets. The effects of the standard were applied retrospectively to all prior interim and annual periods within this annual report. The effect of the change in accounting principle was a reduction of other assets, net and long-term debt by approximately $0.5 million and $0.4 million for the fiscal years ended December 29, 2015 and December 30, 2014, respectively.
In November 2015, The FASB issued ASU No. 2015-17, "Income Taxes." The pronouncement requires that deferred tax liabilities and assets be classified as noncurrent in a classified balance sheet. Prior to the issuance of the standard, deferred tax liabilities and assets were required to be separately classified into a current amount and a noncurrent in the balance sheet. The new accounting guidance represents a change in accounting principle and the standard is required to be adopted in annual periods beginning after December 15, 2016. Early adoption is permitted and the Company elected to early adopt this guidance as of December 29, 2015 and to apply the guidance prospectively. As such, prior year balances were not adjusted retrospectively. Because the application of this guidance affects classification only, such reclassifications did not have a material effect on the Company's consolidated financial position or results of operations.
2. Business Combinations
During 2014, the Company acquired 19 restaurants from its franchisees, through two separate transactions. The total cash purchase price was $15.7 million and the Company incurred acquisition costs related to the transactions of $0.1 million reflected in General and Administrative expense for the year ended December 30, 2014. The consolidated statements of income include the results of operations for the restaurants from the date of acquisition. The pro forma impact of the acquisitions is not presented as the impact was not material to reported results.
The acquisition of the 19 restaurants was accounted for using the purchase method as defined in ASC 805, Business Combination. The goodwill generated by the acquisitions is not amortizable for book purposes but is amortizable and deductible for tax purposes. The assets acquired and liabilities assumed were recorded based on their fair values at the time of the acquisitions, as detailed below (in thousands):
Fair Value at December 30, 2014 | ||||
Inventories | $ | 352 | ||
Prepaid expenses and other assets | 33 | |||
Deferred tax asset | 142 | |||
Property and equipment | 7,564 | |||
Intangibles | 1,567 | |||
Goodwill | 6,400 | |||
Deferred rent and other liabilities | (319 | ) | ||
Total purchase price | $ | 15,739 | ||
56
2. Business Combinations (continued)
Of the $1.6 million of intangible assets, $1.4 million are related to reacquired franchise rights, which will be amortized on a straight-line basis over an average life of approximately 16 years and $0.2 million are related to favorable leases, which will be amortized on a straight-line basis over an average life of nine years. The unfavorable leases, which were included in deferred rent in the accompanying condensed consolidated balance sheets, will be amortized on a straight-line basis over an average period of 11 years. The fair value measurement of tangible and intangible assets and liabilities as of the acquisition date is based on significant inputs not observed in the market and thus represents a Level 3 measurement that is subject to change.
3. Supplemental Financial Information
Accounts receivable consist of the following (in thousands):
2015 | 2014 | |||||||
Tenant improvement receivables | $ | 2,705 | $ | 2,588 | ||||
Vendor rebate receivables | 840 | 983 | ||||||
Franchise and other receivables | 1,445 | 986 | ||||||
$ | 4,990 | $ | 4,557 | |||||
Prepaid expenses and other assets consist of the following (in thousands):
2015 | 2014 | |||||||
Prepaid occupancy related costs | $ | 4,947 | $ | 4,135 | ||||
Other prepaid expenses | 2,019 | 1,997 | ||||||
Other current assets | 219 | 139 | ||||||
$ | 7,185 | $ | 6,271 | |||||
Property and equipment, net, consist of the following (in thousands):
2015 | 2014 | |||||||
Leasehold improvements | $ | 216,474 | $ | 208,678 | ||||
Furniture, fixtures and equipment | 120,132 | 114,148 | ||||||
Construction in progress | 11,485 | 12,074 | ||||||
348,091 | 334,900 | |||||||
Accumulated depreciation and amortization | (144,378 | ) | (129,327 | ) | ||||
$ | 203,713 | $ | 205,573 | |||||
Accrued payroll and benefits consist of the following (in thousands):
2015 | 2014 | |||||||
Accrued payroll and related liabilities | $ | 3,211 | $ | 3,022 | ||||
Accrued bonus | 774 | 803 | ||||||
Insurance liabilities | 1,432 | 879 | ||||||
$ | 5,417 | $ | 4,704 | |||||
Accrued expense and other current liabilities consist of the following (in thousands):
2015 | 2014 | |||||||
Gift card liability | $ | 3,348 | $ | 2,701 | ||||
Occupancy related | 3,446 | 1,477 | ||||||
Utilities | 1,462 | 1,523 | ||||||
Other accrued expenses | 4,168 | 2,859 | ||||||
$ | 12,424 | $ | 8,560 | |||||
57
4. Goodwill and Intangible Assets
The following table presents goodwill as of December 29, 2015 and December 30, 2014, (in thousands).
2015 | 2014 | |||||||
Balance at beginning of year | $ | 6,400 | $ | — | ||||
Acquisitions | — | 6,400 | ||||||
Balance at end of year | $ | 6,400 | $ | 6,400 | ||||
The Company has had no goodwill impairment losses in the periods presented in the above table.
The following table presents intangible assets subject to amortization as of December 29, 2015 and December 30, 2014, (in thousands).
2015 | 2014 | |||||||
Amortized intangible assets: | ||||||||
Reacquired franchise rights | $ | 1,306 | $ | 1,376 | ||||
Favorable leases | 185 | 190 | ||||||
Less accumulated amortization | (164 | ) | (45 | ) | ||||
1,327 | 1,521 | |||||||
Non-amortized intangible assets: | ||||||||
Trademark rights and transferable liquor licenses | 482 | 406 | ||||||
$ | 1,809 | $ | 1,927 | |||||
The estimated aggregate future amortization expense as of December 29, 2015 is as follows, (in thousands):
2016 | $ | 113 | ||
2017 | 111 | |||
2018 | 111 | |||
2019 | 110 | |||
2020 | 108 | |||
Thereafter | 774 | |||
$ | 1,327 | |||
There was approximately $76,000 of impairments to reacquired franchise rights and favorable leases related to two restaurants impaired in fiscal year 2015 which are discussed in Note 7-Impairments and Closed Restaurant Reserve. No impairment charges were recorded related to non-amortized intangible assets in fiscal years 2015, 2014 or 2013.
5. Long-Term Debt
Credit Facility
On June 4, 2015, the Company amended its credit facility to increase borrowing capacity on the revolving line of credit from $45.0 million to $75.0 million and extended its term from November 2018 to June 2020. All other material terms and covenants remained the same. The revolving line of credit of $10.0 million remained in place. On November 24, 2015, the Company entered into a second amendment and restatement to the credit facility to extend borrowing capacity on the revolving line of credit from $75.0 million to $100.0 million and to make certain favorable changes to the covenants.
As of December 29, 2015, the Company had $68.2 million outstanding and $29.0 million available for borrowing under the credit facility, which is net of outstanding letters of credit aggregating $2.8 million reduce the amount available to borrow. Borrowings under our amended and restated credit facility bear interest, at our option, at either (i) LIBOR plus 1.00 to 2.00%, based on the lease-adjusted leverage ratio or (ii) the highest of the following rates plus zero to 1.00%: (a) the federal funds rate plus 0.50%; (b) the
58
5. Long-Term Debt (continued)
Bank of America prime rate or (c) the one month LIBOR plus 1.00%. The facility includes a commitment fee of 0.125 to 0.30%, based on the lease-adjusted leverage ratio, per year on any unused portion of the facility. The credit facility bore interest at a range of 3.50% to 4.25% during 2015.
Availability of borrowings under the revolving line of credit is conditioned on compliance with specified covenants, including a maximum lease-adjusted leverage ratio and a minimum consolidated fixed charge coverage ratio. We are subject to a number of other customary covenants, including limitations on additional borrowings, acquisitions, dividend payments and lease commitments. As of December 29, 2015, the Company was in compliance with all of its debt covenants.
The credit facility is secured by a pledge of stock of substantially all of the Company's subsidiaries and a lien on substantially all of the personal property assets of the Company and its subsidiaries.
6. Fair Value Measurements
The carrying amounts of cash and cash equivalents, accounts receivable, accounts payable and all other current liabilities approximate fair values due to the short maturities of these instruments. The carrying amounts of borrowings approximate fair value as the line of credit and term borrowings vary with market interest rates and negotiated terms and conditions are consistent with current market rates. Asset impairment charges are recorded at fair value on a nonrecurring basis.
Assets and Liabilities Measured at Fair Value
The fair values are assigned a level within the fair value hierarchy, depending on the source of the inputs into the calculation.
Level 1—Unadjusted quoted prices in active markets that are accessible at the measurement date for identical, unrestricted assets or liabilities.
Level 2—Quoted prices in markets that are not active or inputs that are observable, either directly or indirectly, for substantially the full term of the asset or liability.
Level 3—Prices or valuation techniques which require inputs that are both significant to the fair value measurement and unobservable (i.e., supported by little or no market activity).
7. Impairment and Closed Restaurant Reserve
The following table presents restaurant impairments, closure costs and asset disposals for fiscal years 2015, 2014 and 2013 (in thousands):
2015 | 2014 | 2013 | |||||||||
Restaurant impairments(1) | $ | 25,436 | $ | 57 | $ | 54 | |||||
Closure costs(1) | 3,076 | 91 | 129 | ||||||||
Loss on disposal of assets and other | 1,104 | 1,243 | 981 | ||||||||
$ | 29,616 | $ | 1,391 | $ | 1,164 | ||||||
_____________________________
(1) | Restaurant impairments and closure costs can include expenditures related to restaurants previously impaired or closed. |
Restaurant Impairments
During fiscal year 2015, the Company recognized restaurant impairment expense, primarily related to management's current assessment of the expected future cash flows of various restaurants based on recent results. During fiscal year 2015, 39 restaurants were identified as impaired. Fifteen of the 39 restaurants impaired in fiscal year 2015 were also closed in that year. Impairment expense is a Level 3 fair value measure and was determined by comparing the carrying value of restaurant assets to the estimated fair value of the restaurant assets at resale value. These expenses are included in the "Restaurant impairments, closure costs and asset disposals" line in the consolidated statements of income.
59
7. Impairment and Closed Restaurant Reserve (continued)
Restaurant Closures
During fiscal year 2015, the Company closed 16 restaurants that operated below acceptable profitability levels. The Company did not close any restaurants in fiscal year 2014. In fiscal year 2013, one restaurant was closed at the end of its lease term. The Company recorded minimal closure costs in fiscal years 2014 and 2013 related to previously closed restaurants.
The Company provides for closed property operating lease liabilities using a discount rate of 4.45% to calculate the present value of the remaining non-cancelable lease payments after the closing date, net of estimated subtenant income. The following table contains a summary of the changes in the liability for closed properties as of December 29, 2015 and December 30, 2014 (in thousands):
2015 | 2014 | |||||||
Closed restaurant reserves, beginning of period | $ | 444 | $ | 583 | ||||
Additions—store closing costs recognized and accretion | 4,518 | 77 | ||||||
Decreases—payments | (216 | ) | (216 | ) | ||||
Closed restaurant reserves, end of period | $ | 4,746 | $ | 444 | ||||
The current portion of the liability, $2.4 million and $0.2 million as of December 29, 2015 and December 30, 2014, respectively, is recorded in accrued expenses and other liabilities, and the long-term portion is reported in other noncurrent liabilities in the Company's consolidated balance sheets.
8. Income Taxes
The following table presents the domestic and foreign components of (loss) income before income taxes (in thousands):
2015 | 2014 | 2013 | ||||||||||
Domestic(loss) income | $ | (21,674 | ) | $ | 18,586 | $ | 11,531 | |||||
Foreign (loss) income | (825 | ) | (36 | ) | (99 | ) | ||||||
$ | (22,499 | ) | $ | 18,550 | $ | 11,432 | ||||||
The components of the (benefit) provision for income taxes are as follows for 2015, 2014 and 2013 (in thousands):
2015 | 2014 | 2013 | ||||||||||
Current tax provision: | ||||||||||||
Federal | $ | — | $ | — | $ | — | ||||||
State | 144 | 792 | 561 | |||||||||
Foreign | — | — | — | |||||||||
144 | 792 | 561 | ||||||||||
Deferred tax (benefit) provision: | ||||||||||||
Federal | (7,169 | ) | 5,662 | 3,923 | ||||||||
State | (1,495 | ) | 668 | 283 | ||||||||
Foreign | (214 | ) | — | — | ||||||||
(8,878 | ) | 6,330 | 4,206 | |||||||||
Total (benefit) provision for income taxes | $ | (8,734 | ) | $ | 7,122 | $ | 4,767 | |||||
60
8. Income Taxes (continued)
The reconciliation of income tax provision (benefit) that would result from applying the federal statutory rate to pre-tax income as shown in the accompanying consolidated statements of income is as follows for 2015, 2014 and 2013 (in thousands):
2015 | 2014 | 2013 | ||||||||||
Federal income tax (benefit) expense at federal rate | $ | (7,650 | ) | $ | 6,299 | $ | 3,887 | |||||
State income tax (benefit) expense, net of federal tax | (960 | ) | 972 | 653 | ||||||||
Other permanent differences | 378 | 170 | 374 | |||||||||
Foreign rate differential | 66 | 6 | 26 | |||||||||
Tax credits | (423 | ) | (241 | ) | (149 | ) | ||||||
Other items, net | (145 | ) | (84 | ) | (24 | ) | ||||||
(Benefit) provision for income taxes | $ | (8,734 | ) | $ | 7,122 | $ | 4,767 | |||||
Effective income tax rate | 38.8 | % | 38.4 | % | 41.7 | % | ||||||
In 2015, 2014 and 2013 the Company recognized tax benefits on option exercises at fair value in excess of those utilized to record stock-based compensation for book purposes, totaling $0, $253,000 and $201,000, respectively, as a credit to additional paid-in capital.
The company's total deferred tax assets and liabilities are as follows (in thousands):
2015 | 2014 | |||||
Deferred tax assets | 30,748 | 23,001 | ||||
Deferred tax liabilities | (30,084 | ) | (31,216 | ) | ||
Total deferred tax assets (liabilities), net | 664 | (8,215 | ) | |||
Deferred income taxes arise because of the differences in the book and tax bases of certain assets and liabilities. Deferred income tax liabilities and assets consist of the following (in thousands):
2015 | 2014 | |||||||
Noncurrent deferred tax assets (liabilities): | ||||||||
Loss carry forwards | $ | 4,234 | $ | 743 | ||||
Deferred rent and franchise revenue | 15,802 | 14,454 | ||||||
Property, equipment and intangible assets | (24,950 | ) | (26,514 | ) | ||||
Stock-based compensation | 2,833 | 2,847 | ||||||
Tax credit carry forwards | 1,609 | 897 | ||||||
Inventory smallwares | (2,589 | ) | — | |||||
Other accrued expenses | 2,124 | 440 | ||||||
Other | 1,601 | 621 | ||||||
Total noncurrent net deferred tax assets (liabilities) | 664 | (6,512 | ) | |||||
Current deferred tax assets (liabilities): | ||||||||
Inventory smallwares | — | (2,405 | ) | |||||
Other | — | 702 | ||||||
Total current deferred tax assets (liabilities) | — | (1,703 | ) | |||||
Net deferred tax assets (liability) | $ | 664 | $ | (8,215 | ) | |||
61
8. Income Taxes (continued)
At December 29, 2015 and December 30, 2014, net operating loss carry forwards for federal income tax purposes of approximately $34.4 million and $22.5 million, respectively, were available to offset future taxable income through the year 2035 and 2034, respectively. The net operating loss carry forwards are primarily composed of excess tax deductions for equity compensation. Although Internal Revenue Code Section 382 generally limits the utilization of net operating losses when there is an ownership change, the net operating losses as of December 29, 2015 related to prior ownership changes are generally no longer subject to limitation because the cumulative annual loss limitation plus annual realized built-in-gain now exceeds the original net operating loss that was subject to limitation. However, before any net operating losses are used in the future, a Section 382 study will be completed to ensure that no other ownership changes have occurred that cause any limitations in addition to the limitations that we are aware of as of December 29, 2015. As a result of certain realization requirements of ASC 718, the deferred tax assets shown above include only realized tax deductions related to equity compensation equal to the equity compensation recognized for financial reporting during the years ended December 29, 2015 and December 30, 2014. Equity will be increased by up to $7.9 million if and when the net operating loss is ultimately realized.
Uncertain tax positions are recognized if it is more likely than not that the Company will be able to sustain the tax position taken, and the measurement of the benefit is calculated as the largest amount that is more than 50% likely to be realized upon resolution of the benefit. The Company has analyzed filing positions in all of the federal and state jurisdictions where it is required to file income tax returns, as well as all open tax years in these jurisdictions. There were no uncertain tax positions for the years ended December 29, 2015 or December 30, 2014. The only periods subject to examination for the Company's federal and state returns are 2011 through 2014.
9. Stockholders' Equity
On June 4, 2015, the Company announced a share repurchase program of up to $35.0 million of the Company's Class A common stock. Under this program, the Company purchased shares of the Company's Class A common stock in the open market (including in pre-arranged stock trading plans in accordance with the guidelines specified in Rule 10b5-1 under the Securities Exchange Act of 1934, as amended ) or in privately negotiated transactions. During fiscal year 2015, the Company repurchased 2,423,871 shares of its common stock for approximately $35.0 million in open market transactions, thereby completing the repurchase program. Repurchased shares are included as treasury stock in the Condensed consolidated balance sheets.
The Company has 181,000,000 shares of stock authorized, consisting of 150,000,000 shares of Class A common stock, par value $0.01 per share; 30,000,000 shares of Class B common stock, par value $0.01 and 1,000,000 shares of preferred stock, par value $0.01 per share. Preferred stock rights will be determined by the Company's Board of Directors in the event that preferred shares are issued. The following summarizes the rights of common stock:
Voting—Shares of Class A common stock and Class B common stock are entitled to one vote per share in all voting matters, with the exception that Class B common stock does not vote on the election or removal of directors.
Conversion—Each share of Class A common stock held by either one of L Catterton Partners or Argentia Private Investments Inc. or their affiliates the (“Equity Sponsors”) is convertible, at the option of the holder, into one share of Class B common stock. Each share of Class B common stock is convertible, at the option of the holder, into one share of Class A common stock.
Dividends—A Class C dividend agreement was entered in connection with the Merger Agreement between one of the Equity Sponsors and the Company, which provided that the new investor would receive, in the form of a dividend, an amount equal to the compensation payable to the other new investor under a management services agreement. In connection with the IPO, the management services agreement expired, and the one share of Class C common stock was redeemed. See additional information in Note 16-Related-Party Transactions. Class A common stock and Class B common stock share equally if a dividend is declared or paid to either class, but they do not have rights to any special dividend.
Liquidation, Dissolution or Winding Up—Class A common stock and Class B common stock share equally in distributions in liquidation, dissolution or winding up of the corporation.
Registration Rights—The Equity Sponsors have the right to demand registration of 10% or more of the shares of the Company's common stock held by them. A few shareholders who are also Executive Officers of the Company or members of the Company's Board of Directors have piggyback registration rights, but they are not required to exercise these rights.
62
10. Stock-Based Compensation
The Company's Stock Incentive Plan, as amended and restated in May of 2013, authorizes the grant of nonqualified stock options, incentive stock options, stock appreciation rights ("SARs"), restricted stock, restricted stock units ("RSUs") and incentive bonuses
to employees, officers, nonemployee directors and other service providers. The number of shares of common stock available for issuance pursuant to awards granted under the Stock Incentive Plan on or after the IPO shall not exceed 3,750,500 shares. The Plan
is administered by the Compensation Committee of the Company's board of directors (the "Board") or another committee designated by the Board, or in the absence of any such committee, the Board itself (the "administrator"). Stock options are granted at a price determined by the administrator at an exercise price that is not less than the fair market value of the underlying stock on the date of option is grant. The administrator may also grant SARs and RSUs with terms determined by the administrator in accordance with the Plan. The fair market value of shares prior to the IPO was determined by the Compensation Committee of the Board, or the Board using historical or current transactions, comparable public company valuations, historical transactions, third-party valuations and other factors. Stock options generally have a 10-year term and vest equally over four years from the date of grant.
Stock-based compensation expense is generally recognized on a straight-line basis over the service period of the options. In 2015, 2014 and 2013, non-cash stock-based compensation expense of $1.7 million, $1.4 million and $4.3 million, respectively, was included in general and administrative expense. Stock-based compensation of approximately $229,000, $88,000 and $71,000 was included in capitalized internal costs in 2015, 2014 and 2013, respectively. Stock-based compensation expense also includes $45,803 related to the Employee Stock Purchase Plan, see Note 12-Employee Benefit Plans.
At December 29, 2015, options available for future share grants totaled 2,360,084. The intrinsic value associated with options exercised was $4.2 million and $6.0 million for the fiscal years ended December 29, 2015 and December 30, 2014, respectively.
The estimated fair value of each option granted is calculated using the Black-Scholes option-pricing model. Expected volatilities are based on the historical Company volatility, as well as volatilities from publicly traded companies operating in the Company's industry. The Company uses historical data to estimate expected employee forfeiture of stock options. The expected life of options granted is management's best estimate using recent and expected transactions. The risk-free rate for periods within the expected life of the option is based on the U.S. Treasury yield curve in effect at the time of grant.
The weighted-average assumptions used in the model were as follows:
2015 | 2014 | 2013 | ||||||||||
Risk-free interest | 1.6 | % | 1.7 | % | 1.1 | % | ||||||
Expected life (years) | 5.0 | 5.0 | 4.3 | |||||||||
Expected dividend yield | — | — | — | |||||||||
Volatility | 36.8 | % | 36.5 | % | 39.7 | % | ||||||
Weighted-average Black-Scholes fair value per share at date of grant | $ | 5.04 | $ | 10.52 | $ | 6.04 | ||||||
The tables below summarize the option activity under the Plan:
Shares | Weighted- Average Exercise Price | ||||||
Outstanding—December 30, 2014 | 3,245,264 | $ | 12.17 | ||||
Granted | 921,825 | $ | 14.55 | ||||
Forfeited | (307,318 | ) | $ | 18.76 | |||
Exercised | (792,363 | ) | $ | 8.86 | |||
Outstanding—December 29, 2015 | 3,067,408 | $ | 13.08 | ||||
63
10. Stock-Based Compensation (continued)
Shares | Weighted- Average Exercise Price | Weighted- Average Remaining Years of Contractual Life | Aggregate Intrinsic Value(1) (in thousands) | ||||||||||
Outstanding as of December 29, 2015 | 3,067,408 | $ | 13.08 | 7.00 | $ | 2,587 | |||||||
Vested and expected to vest | 2,978,704 | 12.96 | 6.93 | 2,587 | |||||||||
Exercisable as of December 29, 2015 | 1,940,770 | 10.93 | 5.72 | 2,586 | |||||||||
_____________
(1) | Aggregate intrinsic value represents the amount by which fair value of the Company's stock exceeds the exercise price of the option as of December 29, 2015. |
As of December 29, 2015, there was $5.0 million of unrecognized compensation cost related to nonvested share-based compensation arrangements granted under the Stock Incentive Plan, which is expected to be recognized over 2.95 years.
11. (Loss) Earnings Per Share
EPS is calculated by dividing (loss) income available to common shareholders by the weighted-average number of shares of common stock outstanding during each period. Diluted (loss) earnings per share ("diluted EPS") is calculated using (loss) income available to common shareholders divided by diluted weighted-average shares of common stock outstanding during each period. Potentially dilutive securities include shares of common stock underlying stock options and restricted common stock. Diluted EPS considers the impact of potentially dilutive securities except in periods in which there is a loss because the inclusion of the potential common shares would have an anti-dilutive effect.
The following table sets forth the computations of basic and dilutive (loss) earnings per share:
2015 | 2014 | 2013 | ||||||||||
Net (loss) income (in thousands) | $ | (13,765 | ) | $ | 11,428 | $ | 6,665 | |||||
Shares: | ||||||||||||
Basic weighted average shares outstanding | 28,938,901 | 29,717,304 | 26,406,904 | |||||||||
Dilutive stock options and warrants | — | 1,283,795 | 1,281,725 | |||||||||
Diluted weighted average number of shares outstanding | 28,938,901 | 31,001,099 | 27,688,629 | |||||||||
(Loss) earnings per share: | ||||||||||||
Basic (loss) earnings per share | $ | (0.48 | ) | $ | 0.38 | $ | 0.25 | |||||
Diluted (loss) earnings per share | $ | (0.48 | ) | $ | 0.37 | $ | 0.24 | |||||
Potential common shares are excluded from the computation of diluted (loss) earnings per share when the effect would be anti-dilutive. All potential common shares are anti-dilutive in periods of net loss. The Company excluded 3,184,949; 247,427 and 17,000 outstanding options from the diluted (loss) earnings per share calculation for 2015, 2014 and 2013, respectively, as the options were anti-dilutive.
12. Employee Benefit Plans
Defined Contribution Plan
In October 2003, the Company adopted a defined contribution plan, The Noodles & Company 401(k) Plan (the "401(k) Plan"). Company employees with six months of service, aged 21 or older, are eligible to participate in the 401(k) Plan. Under the provisions of the plan, the Company may, at its discretion, make contributions to the 401(k) Plan. Participants are 100% vested in their own contributions. The Company made no contributions during 2015, 2014 and 2013.
Deferred Compensation Plan
The Company's deferred compensation plan, under which compensation deferrals began in 2013, is a non-qualified deferred compensation plan which allows highly compensated employees to defer a portion of their base salary and variable compensation
64
12. Employee Benefit Plans (continued)
each plan year. To offset its obligation, the Company purchases Company-owned whole-life insurance contracts on certain team members. As of December 29, 2015, $1.5 million was included in other assets, net, which represents the cash surrender value of the associated life insurance policy, and $1.6 million was included in other long-term liabilities, which represents the carrying value of the liability for deferred compensation.
Employee Stock Purchase Plan
In 2013, the Company adopted an Employee Stock Purchase Plan under which eligible team members may voluntarily contribute up to 15% of their salaries, subject to limitations, to purchase common stock at a price equal to 85% of the fair market value of a share of the Company's common stock on the first day of each offering period or 85% of the fair market value of a share of the Company's common stock on the last day of each offering period, whichever amount is less. In general, all of the Company's officers and team members who have been employed by the Company for at least thirty days prior to the offering period and who are regularly scheduled to work more than 20 hours per week and for more than five months in any calendar year, are eligible to participate in this plan which operates in-line with the Company's fiscal quarters. A total of 750,000 shares of common stock are available for issuance under this plan. The Company has issued a total of 54,224 shares under this plan, of which 18,464 shares were issued during 2015. A total of 695,776 shares remain available for future issuance. For 2015, in accordance with the guidance for accounting for stock compensation, the Company estimated the fair value of the stock purchase plan using the Black-Scholes multiple-option pricing model. The average assumptions used in the model included a 0.080% risk-free interest rate; .25 month expected life; expected volatility of 17.7%; and a zero percent dividend yield. The weighted average fair value per share at grant date was $2.17. In 2015, the Company recognized $45,803 of compensation expense related to this plan.
13. Leases
The Company leases restaurant facilities, office space and certain equipment under operating leases that expire on various dates through September 2035. Lease terms for traditional shopping centers generally include a base term of 10 years, with options to extend these leases for additional periods of five to 15 years. Typically, the lease includes rent escalations, which are expensed on a straight-line basis over the expected lease term. The difference between rent expense and cash paid for rent is recognized as deferred rent. Rent expense for 2015, 2014 and 2013 was approximately $41.8 million, $35.7 million and $29.5 million, respectively.
Future minimum lease payments required under existing leases as of December 29, 2015 are as follows (in thousands):
2016 | $ | 49,555 | |
2017 | 47,678 | ||
2018 | 44,088 | ||
2019 | 42,149 | ||
2020 | 42,233 | ||
Thereafter | 286,316 | ||
$ | 512,019 | ||
14. Supplemental Disclosures to Consolidated Statements of Cash Flows
The following table presents the supplemental disclosures to the consolidated statements of cash flows (in thousands) for fiscal years 2015, 2014 and 2013:
2015 | 2014 | 2013 | ||||||||||
Interest paid (net of amounts capitalized) | $ | 839 | $ | — | $ | 2,506 | ||||||
Income taxes paid (net of refunds) | 354 | 811 | 137 | |||||||||
Purchases of property and equipment accrued in accounts payable | 1,414 | 37 | 996 | |||||||||
65
15. Commitments and Contingencies
As previously disclosed in prior reports filed with the SEC, the Company is named as a defendant in an action filed in the Superior Court of Delaware in New Castle County (the “Court”), entitled The State of Delaware, William French v. Card Compliant, LLC, et. al. The case was filed under seal in June 2013 and was unsealed on March 26, 2014. The complaint in this case alleges that
a number of large retailers and restaurant companies, including the Company, knowingly refused to fulfill obligations under Delaware's Abandoned Property Law by failing to report and deliver "unclaimed gift card funds" to the State of Delaware, and knowingly made, used or caused to be made or used, false statements and records to conceal, avoid or decrease an obligation to pay or transmit money to Delaware in violation of the Delaware False Claims and Reporting Act. The complaint seeks an order that the Company cease and desist from violating the Delaware Abandoned Property Law, monetary damages (including treble damages under the False Claims and Reporting Act), penalties, and attorneys' fees and costs. On November 23, 2015, the Court ruled on a motion to dismiss the complaint that the defendants—including the Company—had filed. While the Court granted the motion to dismiss with respect to a claim alleging that the defendants intended to defraud the government or willfully concealed property owed to the government and for which a certificate or receipt was provided, it did not dismiss the other claims alleging that the defendants knowingly made false statements to avoid transmitting money to the government. The trial date with respect to this matter is set for January 8, 2018. The Company has recorded a loss contingency accrual based on a reasonable estimate of the probable losses that might arise from this matter; this loss contingency accrual did not have a material effect on our results of operation. The Company intends to continue to vigorously defend this action.
On February 10, 2016, Tammie Carter, a former employee of the Company, filed a purported collective and class action lawsuit against the Company alleging violations of the Fair Labor Standards Act and the Colorado Wage Order (the “Labor Laws”) in the United States District Court for the District of Colorado. The plaintiff filed the case on her behalf and on behalf of all assistant general managers employed by the Company during the past three years whom the Company classified as exempt employees, and she alleges that the Company violated the Labor Laws by not paying overtime compensation to its assistant general managers. The plaintiff is seeking, on behalf of herself and members of the putative class, unpaid overtime compensation, damages (including liquidated and/or punitive damages), a declaratory judgment, an injunction, and attorneys’ fees and costs. This case is at an early stage, and the
Company is therefore unable to make a reasonable estimate of the probable loss or range of losses, if any, that might arise from this matter. The Company intends to vigorously defend this action.
In the normal course of business, the Company is subject to other proceedings, lawsuits and claims. Such matters are subject to many uncertainties, and outcomes are not predictable with assurance. Consequently, the Company is unable to ascertain the ultimate aggregate amount of monetary liability or financial impact with respect to these matters as of December 29, 2015. These matters could affect the operating results of any one financial reporting period when resolved in future periods. The Company believes that an unfavorable outcome with respect to these matters is remote or a potential range of loss is not material to its consolidated financial statements. Significant increases in the number of these claims, or one or more successful claims that result in greater liabilities than they currently anticipate, could materially and adversely affect our business, financial condition, results of operations or cash flows.
The Company entered into an employment agreement with its Chief Executive Officer in connection with the IPO superseding the previous employment agreement with this executive. The agreement has an initial term of three years and automatically renews annually unless canceled by either party within 90 days of the end of the initial term or anniversaries thereof. Under the Employment Agreement, if the executive’s employment is terminated by the Company without "cause" or by the executive with "good reason," (as such terms are defined in the applicable employment agreement) the executive is entitled to receive compensation equal to 18 months of the executive’s then-current base salary, payable in equal installments over 18 months, a pro rata bonus for the year of termination and reimbursement of "COBRA" premiums for up to 18 months for the executive and his dependents. The severance payments are conditioned upon the executive entering into a mutual release of claims with the Company.
16. Related-Party Transactions
During 2013, the Company paid $375,000 to the Equity Sponsors for management service fees and Class C Dividends pursuant to a management services agreement and an agreement to pay dividends on its Class C common stock. In connection with the IPO, the management services agreement expired and one share of Class C common stock was redeemed. Management service fees and Class C dividends paid in each fiscal year vary due to the timing of payments. No such payments were made during fiscal years 2014 and 2015.
66
16. Related-Party Transactions (continued)
In connection with the IPO during the second quarter of 2013, the Company paid $1.7 million of transaction bonuses and related payroll taxes to employees of the Company, and $0.8 million in transaction payments to the Equity Sponsors.
In connection with the follow-on offering in the fourth quarter of 2013, the Company purchased 108,267 shares of common stock from certain of its officers at the net offering price per share in such follow-on offering. The Company did not receive any of the proceeds from the offering.
Stockholders Agreement. In connection with the IPO, the Company entered into a new stockholders agreement with the Equity Sponsors (the "2013 Stockholders Agreement"). The 2013 Stockholders Agreement contains restrictions on sale, issuance or transfer of shares for each Equity Sponsor without the consent of the the other Equity Sponsor except in a tag along sale under the Registration Rights Agreement or the earlier of the second anniversary of the offering and time at which such Sponsor holds less than 25% of the Company's outstanding stock and Class B stock. The 2013 Stockholders Agreement also grants the Equity Sponsors the right to nominate representatives to the Company's board of directors and committees of the board. L Catterton and Argentia each have the right to designate two members to the Company's board of directors and the Equity Sponsors will agree to vote to elect such director designees. If at any time an Equity Sponsor owns more than 10% and less than 20% of outstanding Class A and Class B common stock, such Equity Sponsor has the right to designate one nominee for election to the Company's board of directors. If an Equity Sponsor’s ownership level falls below 10% of outstanding Class A and Class B common stock, such Equity Sponsor will no longer have a right to designate a nominee. In addition, for so long as L Catterton and Argentia hold at least 35% of the voting power of outstanding common stock, certain actions may not be taken without the approval of L Catterton and Argentia.
17. Selected Quarterly Financial Data (unaudited)
The following table presents selected unaudited quarterly financial data for the periods indicated. Each fiscal quarter contained 13 weeks (in thousands, except per share data):
2015 | |||||||||||||||
December 29, | September 29, | June 30, | March 31, | ||||||||||||
Revenue | $ | 117,128 | $ | 117,328 | $ | 115,233 | $ | 105,761 | |||||||
Operating (loss) income | (6,464 | ) | (15,302 | ) | 5,016 | (4,318 | ) | ||||||||
Net (loss) income | (4,254 | ) | (9,821 | ) | 3,062 | (2,752 | ) | ||||||||
Basic (loss) earnings per share | $ | (0.15 | ) | $ | (0.35 | ) | $ | 0.10 | $ | (0.09 | ) | ||||
Diluted (loss) earnings per share | $ | (0.15 | ) | $ | (0.35 | ) | $ | 0.10 | $ | (0.09 | ) | ||||
2014 | |||||||||||||||
December 30, | September 30, | July 1, | April 1, | ||||||||||||
Revenue | $ | 108,546 | $ | 106,216 | $ | 99,459 | $ | 89,519 | |||||||
Operating income | 5,474 | 5,045 | 5,941 | 2,456 | |||||||||||
Net income | 3,535 | 2,943 | 3,527 | 1,424 | |||||||||||
Basic earnings per share | $ | 0.12 | $ | 0.10 | $ | 0.12 | $ | 0.05 | |||||||
Diluted earnings per share | $ | 0.11 | $ | 0.10 | $ | 0.11 | $ | 0.05 | |||||||
67
Report of Independent Registered Public Accounting Firm
The Board of Directors and Stockholders
Noodles & Company
We have audited the accompanying consolidated balance sheets of Noodles & Company (the Company) as of December 29, 2015 and December 30, 2014, and the related consolidated statements of income, comprehensive income, equity, and cash flows for each of the three years in the period ended December 29, 2015. These financial statements are the responsibility of the Company's management. Our responsibility is to express an opinion on these financial statements based on our audits.
We conducted our audits in accordance with the standards of the Public Company Accounting Oversight Board (United States). Those standards require that we plan and perform the audit to obtain reasonable assurance about whether the consolidated financial statements are free of material misstatement. We were not engaged to perform an audit of the Company's internal control over financial reporting. Our audits included consideration of internal control over financial reporting as a basis for designing audit procedures that are appropriate in the circumstances, but not for the purpose of expressing an opinion on the effectiveness of the Company's internal control over financial reporting. Accordingly, we express no such opinion. An audit also includes examining, on a test basis, evidence supporting the amounts and disclosures in the financial statements, assessing the accounting principles used and significant estimates made by management, and evaluating the overall financial statement presentation. We believe that our audits provide a reasonable basis for our opinion.
In our opinion, the financial statements referred to above present fairly, in all material respects, the consolidated financial position of Noodles & Company at December 29, 2015 and December 30, 2014, and the consolidated results of its operations and its cash flows for each of the three years in the period ended December 29, 2015, in conformity with U.S. generally accepted accounting principles.
/s/ Ernst & Young LLP | ||
Denver, Colorado
March 1, 2016
68
ITEM 9. Changes in and Disagreements with Accountants on Accounting and Financial Disclosure
None.
ITEM 9A. Controls and Procedures
Evaluation of Disclosure Controls and Procedures
Our management carried out an evaluation, under the supervision and with the participation of our chief executive officer and chief financial officer, of the effectiveness of the design and operation of our disclosure controls and procedures (as defined in Rule 13a-15(e) of the Exchange Act) as of the end of the period covered by this report. Based on this evaluation, our chief executive officer and chief financial officer concluded that our disclosure controls and procedures were effective as of the end of the period covered by this annual report.
Management’s Annual Report on Internal Control Over Financial Reporting
The management of Noodles & Company is responsible for establishing and maintaining adequate internal control over financial reporting. Our internal control over financial reporting is a process designed to provide reasonable assurance regarding the reliability of financial reporting and the preparation of financial statements for external purposes in accordance with accounting principles generally accepted in the United States of America. Our internal control over financial reporting includes those policies and procedures that (i) pertain to the maintenance of records that, in reasonable detail, accurately and fairly reflect the transactions and dispositions of our assets; (ii) provide reasonable assurance that transactions are recorded as necessary to permit preparation of financial statements in accordance with accounting principles generally accepted in the United State of America, and that our receipts and expenditures are being made only in accordance with authorizations of our management and directors; and (iii) provide reasonable assurance regarding prevention or timely detection of unauthorized acquisition, use, or disposition of assets that could have a material effect on our financial statements.
Under the supervision and with the participation of our management, including our chief executive officer and chief financial officer, we carried out an evaluation of the effectiveness of our internal control over financial reporting as of December 29, 2015 based on the criteria in "Internal Control - Integrated Framework (the 2013 framework)" issued by the Committee of Sponsoring Organizations of the Treadway Commission ("COSO"). Based on this evaluation, our management concluded that our internal control over financial reporting was effective as of December 29, 2015.
This Annual Report on Form 10-K does not include an attestation report of our independent registered public accounting firm, because as an "emerging growth company" under the JOBS Act our independent registered public accounting firm is not required to issue such an attestation report.
Changes in Internal Control over Financial Reporting
There have been no changes in our internal control over financial reporting that occurred during our most recent fiscal quarter that have materially affected, or are reasonably likely to materially affect, our internal control over financial reporting.
ITEM 9B. Other Information
None.
69
PART III
ITEM 10. Directors, Executive Officers and Corporate Governance
Information regarding our executive officers is set forth in Item 1. of Part 1 of this Report under the caption "Executive Officers of the Registrant."
We have adopted a Code of Business Conduct and Ethics that applies to our directors and a Code of Business Conduct and Ethics that applies to our officers and employees (collectively, the "Codes"), including our principal executive, financial and accounting officers, or persons performing similar functions. These Codes are published on our corporate governance website located at investor.noodles.com/corporate-governance.cfm. We intend to disclose future amendments to certain provisions of our Codes, or waivers of provisions of the Codes granted to executive officers and directors, on the website within four business days following the date of such amendment or waiver.
The remaining information required by this item is incorporated herein by reference to the sections entitled "Proposal No. 1 - Election of Directors," "Section 16(a) Beneficial Ownership Reporting Compliance," "Board Committees—Policy Regarding Stockholder Nominations" and "Board Committees—Audit Committee" in our definitive Proxy Statement for the Annual Meeting of Shareholders to be held on May 5, 2016 (the "Proxy Statement").
70
ITEM 11. Executive Compensation
The information required by this item is incorporated by reference to the sections entitled "Executive Compensation," "Director Compensation" and "Board Committees—Compensation Committee Interlocks and Insider Participation" in the Proxy Statement.
71
ITEM 12. | Security Ownership of Certain Beneficial Owners and Management and Related Stockholder Matters |
The information required by this item is incorporated by reference to the section entitled "Security Ownership of Certain Beneficial Owners and Management" in the Proxy Statement.
Equity Compensation Plan Information
The following table summarizes information as of December 29, 2015, about shares of common stock that may be issued under our equity compensation plans.
Plan Category | Number of securities to be issued upon exercise of outstanding options and warrants (a) | Weighted-average exercise price of outstanding options and warrants (b) | Number of securities remaining available for future issuance under equity compensation plans (excluding securities reflected in column (a)) (c) | |||||||
Equity compensation plans approved by security holders(1) | 3,125,108 | $ | 13.08 | 3,055,860 | ||||||
Equity compensation plans not approved by security holders | — | — | — | |||||||
Total | 3,125,108 | $ | 13.08 | 3,055,860 | ||||||
______________________________
(1) | Includes in column (a) 3,067,408 shares of Class A common stock issuable upon exercise of options outstanding under the Company’s Stock Incentive Plan and 57,700 shares of Class B common stock issuable upon exercise of a warrant granted to a consultant. Includes in column (c) 2,360,084 shares of Class A common stock available for issuance upon exercise of future grants under the Company’s Stock Incentive Plan and 695,776 shares of Class A common stock available for future issuance under the Company’s Employee Stock Purchase Plan. Material features of the Company's Stock Incentive Plan and Employee Stock Purchase Plan are set forth in Note 10-Stock-Based Compensation and Note 12-Employee Benefit Plans. |
ITEM 13. Certain Relationships and Related Transactions, and Director Independence
The information required by this item is incorporated by reference to the sections entitled "Transactions with Related Persons" and "Directors and Corporate Governance—Board Independence" in the Proxy Statement.
72
ITEM 14. | Principal Accounting Fees and Services |
The information required by this item is incorporated by reference to the section entitled "Proposal No. 2 - Ratification of Appointment of Independent Registered Public Accounting Firm" in the Proxy Statement.
73
PART IV
ITEM 15. | Exhibits, Financial Statement Schedules |
1. | Our Consolidated Financial Statements and Notes thereto are included in Item 8, "Financial Statements and supplementary Data," of this Annual Report on Form 10-K. |
2. | All financial schedules have been omitted either because they are not applicable or because the required information is provided in our Consolidated Financial Statements and Notes thereto, included in Item 8 of this Annual Report on Form 10-K. |
3. | The Index to Exhibits, which appears immediately following the signature page and is incorporated herein by reference, is filed as part of this 10-K. |
74
SIGNATURES
Pursuant to the requirements of Section 13 or 15(d) of the Securities Exchange Act of 1934, the registrant has duly caused this report to be signed on its behalf by the undersigned, thereunto duly authorized, on March 1, 2016.
NOODLES & COMPANY | |
By: /s/ Dave Boennighausen | |
Dave Boennighausen | |
Chief Financial Officer | |
POWER OF ATTORNEY
Know all persons by these presents, that each person whose signature appears below constitutes and appoints Dave Boennighausen or Paul Strasen, or any of them, as such person’s true and lawful attorney-in-fact and agent, with full power of substitution and resubstitution, for such person and in such person’s name, place and stead, in any and all capacities, to sign any and all amendments to this Report, and to file the same, with all exhibits thereto, and other documents in connection therewith, with the Securities and Exchange Commission, granting unto said attorney-in-fact and agent, and each of them, full power and authority to do and perform each and every act and thing requisite and necessary to be done in connection therewith, as fully to all intents and purposes as such person might or could do in person, hereby ratifying and confirming all that said attorney-in-fact and agent, or any of them or their or such person’s substitute or substitutes, may lawfully do or cause to be done by virtue thereof.
Pursuant to the requirements of the Securities Act of 1934, this report has been signed below by the following persons on behalf of the registrant and in the capacities and on the dates indicated.
75
Signature | Title | Date |
/s/ KEVIN REDDY | ||
Kevin Reddy | Chairman and Chief Executive Officer (principal executive officer) | March 1, 2016 |
/s/ DAVE BOENNIGHAUSEN | ||
Dave Boennighausen | Chief Financial Officer and Director (principal financial officer) | March 1, 2016 |
/s/ KATHY LOCKHART | ||
Kathy Lockhart | Vice President and Controller (principal accounting officer) | March 1, 2016 |
/s/ SCOTT DAHNKE | ||
Scott A. Dahnke | Director | March 1, 2016 |
/s/ JEFFREY JONES | ||
Jeffrey Jones | Director | March 1, 2016 |
/s/ JAMES RAND | ||
James Rand | Director | March 1, 2016 |
/s/ ANDREW TAUB | ||
Andrew Taub | Director | March 1, 2016 |
/s/ JOHANNA MURPHY | ||
Johanna Murphy | Director | March 1, 2016 |
76
EXHIBITS
Description of Exhibit Incorporated Herein by Reference | ||||||||||||
Exhibit Number | Exhibit Description | Form | File No. | Filing Date | Exhibit Number | Filed Herewith | ||||||
3.1 | Amended and Restated Certificate of Incorporation | S-1 | 333-192402 | November 19, 2013 | 3.1 | |||||||
3.2 | Second Amended and Restated Bylaws | 8-K | 001-35987 | August 24, 2015 | 3.1 | |||||||
4.1 | Specimen Stock Certificate | S-1/A | 333-188783 | June 17, 2013 | 4.1 | |||||||
10.1 | Noodles & Company Amended and Restated 2010 Stock Incentive Plan | S-1/A | 333-188783 | June 17, 2013 | 10.1 | |||||||
10.2 | Noodles & Company 2013 Employee Stock Purchase Plan | S-1/A | 333-188783 | June 17, 2013 | 10.2 | |||||||
10.3 | Registration Rights Agreement, dated December 27, 2010, by and among Noodles & Company and certain of its stockholders | S-1/A | 333-188783 | June 17, 2013 | 10.3 | |||||||
10.4 | Amendment No. 1 to Registration Rights Agreement, dated as of July 8, 2014, among Noodles & Company and certain of its stockholders | 10-Q | 001-35987 | November 6, 2014 | 10.1 | |||||||
10.5 | Amended and Restated Credit Agreement, dated as of November 22, 2013, among Noodles & Company, the other Loan Parties thereto, Bank of America, N.A., as Administrative Agent, L/C Issuer and Swing Line Lender and the other lenders party thereto | 8-K | 001-35987 | November 26, 2013 | 10.1 | |||||||
10.6 | Amendment No.1 to the Amended and Restated Credit Agreement, dated as of June 4, 2015, among Noodles & Company, the other Loan Parties party thereto, the lenders thereto and Bank of America, N.A., as Administrative Agent, L/C Issuer and Swingline Lender | 8-K | 001-35987 | June 5, 2015 | 10.10 | |||||||
10.7 | Amendment No.2 to the Amended and Restated Credit Agreement, dated as of November 24, 2015, by and among Noodles & Company, each of the Guarantors signatory thereto, Bank of America, N.A., as administrative agent and the lenders signatory thereto | 8-K | 001-35987 | November 24, 2015 | 10.10 | |||||||
77
10.8 | Security Agreement, dated February 28, 2011, by and between Noodles & Company and Bank of America, N.A., as administrative agent | S-1 | 333-188783 | May 23, 2013 | 10.13 | |||||||
10.9 | Pledge Agreement, dated February 28, 2011, by and between Noodles & Company and Bank of America, N.A., as administrative agent | S-1 | 333-188783 | May 23, 2013 | 10.14 | |||||||
10.10 | Form of Indemnification Agreement by and between Noodles & Company and each of its directors and executive officers | S-1/A | 333-188783 | June 17, 2013 | 10.15 | |||||||
10.11 | Form of Area Development Agreement | 10-K | 001-35987 | February 24, 2015 | 10.9 | |||||||
10.12 | Form of Franchise Agreement | 10-K | 001-35987 | February 24, 2015 | 10.10 | |||||||
10.13 | Severance Agreement with Dave Boennighausen, dated December 19, 2012 | 10-K | 001-35987 | March 7, 2014 | 10.1 | |||||||
10.14 | Employment Agreement, dated June 7, 2013, by and between Noodles & Company and Kevin Reddy | S-1/A | 333-188783 | June 17, 2013 | 10.20 | |||||||
10.15 | Employment Agreement, dated June 7, 2013, by and between Noodles & Company and Keith Kinsey | S-1/A | 333-188783 | June 17, 2013 | 10.21 | |||||||
10.16 | Noodles & Company Compensation Plan For Non-Employee Directors | S-1 | 333-192402 | November 19, 2013 | 10.16 | |||||||
10.17 | The Executive Nonqualified "Excess" Plan Adoption Agreement, adopted by Noodles & Company on May 16, 2013 | S-1/A | 333-188783 | June 17, 2013 | 10.22 | |||||||
10.18 | Amended and Restated Stockholders Agreement, dated as of July 2, 2013, among Noodles & Company, L Catterton-Noodles, LLC and Argentia Private Investments Inc. | S-1 | 333-192402 | November 19, 2013 | 10.18 | |||||||
10.19 | Letter agreement dated March 9, 2015 between Noodles & Company and Dan Fogarty | 10-Q | 001-35987 | May 7, 2015 | 10.10 | |||||||
10.20 | Severance Agreement with Paul Strasen, dated January 24, 2011 | X | ||||||||||
78
21.1 | List of Subsidiaries of Noodles & Company | X | ||||||||||
23.1 | Consent of Ernst & Young LLP | X | ||||||||||
24.1 | Power of Attorney (included on signature page of this report) | X | ||||||||||
31.1 | Certification of Principal Executive Officer pursuant to Section 302 of the Sarbanes-Oxley Act of 2002 | X | ||||||||||
31.2 | Certification of Principal Financial Officer pursuant to Section 302 of the Sarbanes-Oxley Act of 2002 | X | ||||||||||
32.1 | Certification of Chief Executive Officer and Chief Financial Officer Section 302 of the Sarbanes-Oxley Act of 2002 | X | ||||||||||
101.CAL | XBRL Taxonomy Extension Calculation Linkbase Document | X | ||||||||||
101.DEF | XBRL Taxonomy Extension Definition Linkbase Document | X | ||||||||||
101.LAB | XBRL Taxonomy Extension Label Linkbase Document | X | ||||||||||
101.PRE | XBRL Taxonomy Extension Presentation Linkbase Document | X | ||||||||||
79