000127344112/312021Q3trueGran Tierra Energy Inc. (the “Company”) is filing this Amendment No. 1 (“Amendment”) to its Form 10-Q for the quarter ended September 30, 2021, originally filed with the Securities and Exchange Commission (“SEC”) on November 2, 2021 (the “Original 10-Q”). This Amendment is being filed solely for the purpose of correcting an incorrect date in the certification by the Company's Chief Executive Officer and Chief Financial Officer pursuant to Section 906 of the Sarbanes-Oxley Act of 2002 filed as Exhibit 32.1 to the Original 10-Q. In accordance with Compliance and Disclosure Interpretations published by the SEC Staff, the entire periodic report for the quarter ended September 30, 2021 is included in this Amendment. Other than the correction described above, no other statement or amount has been changed from those presented in the Original 10-Q.13.61.15.1nil135,31953,14200012734412021-01-012021-09-30xbrli:shares00012734412021-10-29iso4217:USD00012734412021-07-012021-09-3000012734412020-07-012020-09-3000012734412020-01-012020-09-30iso4217:USDxbrli:shares00012734412019-01-012019-09-3000012734412021-09-3000012734412020-12-3100012734412019-12-3100012734412020-09-300001273441us-gaap:CommonStockMember2021-06-300001273441us-gaap:CommonStockMember2020-06-300001273441us-gaap:CommonStockMember2020-12-310001273441us-gaap:CommonStockMember2019-12-310001273441us-gaap:CommonStockMember2021-09-300001273441us-gaap:CommonStockMember2020-09-300001273441us-gaap:AdditionalPaidInCapitalMember2021-06-300001273441us-gaap:AdditionalPaidInCapitalMember2020-06-300001273441us-gaap:AdditionalPaidInCapitalMember2020-12-310001273441us-gaap:AdditionalPaidInCapitalMember2019-12-310001273441us-gaap:AdditionalPaidInCapitalMember2021-07-012021-09-300001273441us-gaap:AdditionalPaidInCapitalMember2020-07-012020-09-300001273441us-gaap:AdditionalPaidInCapitalMember2021-01-012021-09-300001273441us-gaap:AdditionalPaidInCapitalMember2020-01-012020-09-300001273441us-gaap:AdditionalPaidInCapitalMember2021-09-300001273441us-gaap:AdditionalPaidInCapitalMember2020-09-300001273441us-gaap:RetainedEarningsMember2021-06-300001273441us-gaap:RetainedEarningsMember2020-06-300001273441us-gaap:RetainedEarningsMember2020-12-310001273441us-gaap:RetainedEarningsMember2019-12-310001273441us-gaap:RetainedEarningsMember2021-07-012021-09-300001273441us-gaap:RetainedEarningsMember2020-07-012020-09-300001273441us-gaap:RetainedEarningsMember2021-01-012021-09-300001273441us-gaap:RetainedEarningsMember2020-01-012020-09-300001273441us-gaap:RetainedEarningsMember2021-09-300001273441us-gaap:RetainedEarningsMember2020-09-30xbrli:pure0001273441country:CO2021-01-012021-09-300001273441gte:ProvedOilandGasPropertiesMember2021-09-300001273441gte:ProvedOilandGasPropertiesMember2020-12-310001273441gte:UnprovedOilAndGasPropertiesMember2021-09-300001273441gte:UnprovedOilAndGasPropertiesMember2020-12-310001273441us-gaap:OilAndGasPropertiesMember2021-09-300001273441us-gaap:OilAndGasPropertiesMember2020-12-310001273441us-gaap:PropertyPlantAndEquipmentOtherTypesMember2021-09-300001273441us-gaap:PropertyPlantAndEquipmentOtherTypesMember2020-12-31iso4217:USDutr:bbl0001273441srt:CrudeOilAndNGLPerBarrelMember2021-01-012021-09-300001273441srt:CrudeOilAndNGLPerBarrelMember2020-01-012020-09-300001273441gte:SixPointTwoFivePercentSeniorNotesdue2025Memberus-gaap:SeniorNotesMember2021-09-300001273441gte:SixPointTwoFivePercentSeniorNotesdue2025Memberus-gaap:SeniorNotesMember2020-12-310001273441gte:SevenPointSevenFivePercentSeniorNotesdue2027Memberus-gaap:SeniorNotesMember2021-09-300001273441gte:SevenPointSevenFivePercentSeniorNotesdue2027Memberus-gaap:SeniorNotesMember2020-12-310001273441us-gaap:LineOfCreditMemberus-gaap:RevolvingCreditFacilityMember2021-09-300001273441us-gaap:LineOfCreditMemberus-gaap:RevolvingCreditFacilityMember2020-12-310001273441us-gaap:CapitalLeaseObligationsMemberus-gaap:AccountsPayableMember2021-09-300001273441us-gaap:CapitalLeaseObligationsMemberus-gaap:AccountsPayableMember2020-12-310001273441us-gaap:LineOfCreditMemberus-gaap:RevolvingCreditFacilityMembersrt:MinimumMember2020-06-010001273441us-gaap:LineOfCreditMemberus-gaap:RevolvingCreditFacilityMembersrt:MaximumMember2020-06-010001273441us-gaap:LineOfCreditMemberus-gaap:RevolvingCreditFacilityMembersrt:MinimumMember2021-07-012021-09-300001273441us-gaap:LineOfCreditMemberus-gaap:RevolvingCreditFacilityMemberus-gaap:SubsequentEventMembersrt:MaximumMember2021-10-010001273441us-gaap:LineOfCreditMemberus-gaap:RevolvingCreditFacilityMemberus-gaap:SubsequentEventMembersrt:MinimumMember2021-10-010001273441us-gaap:LineOfCreditMemberus-gaap:RevolvingCreditFacilityMembersrt:MinimumMemberus-gaap:LondonInterbankOfferedRateLIBORMember2021-07-012021-09-300001273441us-gaap:LineOfCreditMemberus-gaap:RevolvingCreditFacilityMembersrt:MaximumMemberus-gaap:LondonInterbankOfferedRateLIBORMember2021-07-012021-09-300001273441us-gaap:LineOfCreditMemberus-gaap:RevolvingCreditFacilityMembersrt:MinimumMemberus-gaap:BaseRateMember2021-07-012021-09-300001273441us-gaap:LineOfCreditMemberus-gaap:RevolvingCreditFacilityMembersrt:MaximumMemberus-gaap:BaseRateMember2021-07-012021-09-300001273441us-gaap:LineOfCreditMemberus-gaap:RevolvingCreditFacilityMembersrt:MinimumMember2021-01-012021-09-300001273441us-gaap:LineOfCreditMemberus-gaap:RevolvingCreditFacilityMembersrt:MaximumMember2021-01-012021-09-300001273441us-gaap:CommonStockMember2021-01-012021-09-300001273441gte:PerformanceShareUnitsMember2020-12-310001273441gte:DeferredShareUnitsMember2020-12-310001273441gte:PerformanceShareUnitsMember2021-01-012021-09-300001273441gte:DeferredShareUnitsMember2021-01-012021-09-300001273441gte:PerformanceShareUnitsMember2021-09-300001273441gte:DeferredShareUnitsMember2021-09-300001273441gte:VestedOnDecember312020Membergte:PerformanceShareUnitsMember2021-01-012021-09-300001273441gte:VestedOnDecember312019Membergte:PerformanceShareUnitsMember2020-01-012020-09-300001273441us-gaap:EmployeeStockOptionMember2021-07-012021-09-300001273441us-gaap:ProductConcentrationRiskMemberus-gaap:RevenueFromContractWithCustomerMember2021-01-012021-09-300001273441us-gaap:ProductConcentrationRiskMemberus-gaap:RevenueFromContractWithCustomerMember2021-07-012021-09-300001273441us-gaap:ProductConcentrationRiskMemberus-gaap:RevenueFromContractWithCustomerMember2020-01-012020-09-300001273441us-gaap:ProductConcentrationRiskMemberus-gaap:RevenueFromContractWithCustomerMember2020-07-012020-09-300001273441gte:PetroTalCorp.Member2021-09-300001273441country:CO2020-01-012020-09-300001273441gte:PetroTalCorp.Member2020-09-300001273441gte:PetroTalCorp.Member2021-09-30iso4217:CADxbrli:shares0001273441gte:PetroTalCorp.Member2020-12-310001273441gte:PetroTalMember2021-01-012021-09-300001273441us-gaap:EstimateOfFairValueFairValueDisclosureMembergte:PetroTalCorp.Member2021-09-300001273441us-gaap:CommodityContractMember2021-07-012021-09-300001273441us-gaap:CommodityContractMember2020-07-012020-09-300001273441us-gaap:CommodityContractMember2021-01-012021-09-300001273441us-gaap:CommodityContractMember2020-01-012020-09-300001273441us-gaap:ForeignExchangeContractMember2021-07-012021-09-300001273441us-gaap:ForeignExchangeContractMember2020-07-012020-09-300001273441us-gaap:ForeignExchangeContractMember2021-01-012021-09-300001273441us-gaap:ForeignExchangeContractMember2020-01-012020-09-300001273441gte:PetroTalMember2020-01-012020-09-300001273441gte:SixPointTwoFivePercentSeniorNotesdue2025Memberus-gaap:SeniorNotesMemberus-gaap:CarryingReportedAmountFairValueDisclosureMember2021-09-300001273441gte:SevenPointSevenFivePercentSeniorNotesdue2027Memberus-gaap:SeniorNotesMemberus-gaap:CarryingReportedAmountFairValueDisclosureMember2021-09-300001273441gte:SixPointTwoFivePercentSeniorNotesdue2025Memberus-gaap:EstimateOfFairValueFairValueDisclosureMemberus-gaap:SeniorNotesMember2021-09-300001273441gte:SevenPointSevenFivePercentSeniorNotesdue2027Memberus-gaap:EstimateOfFairValueFairValueDisclosureMemberus-gaap:SeniorNotesMember2021-09-30utr:bbl0001273441gte:CommodityHedgeMembersrt:ScenarioForecastMembergte:ThreeWayCollarsOctober1ToDecember312021Member2021-07-012021-12-310001273441gte:CommodityHedgeMembersrt:ScenarioForecastMemberus-gaap:ShortMembergte:ThreeWayCollarsOctober1ToDecember312021Memberus-gaap:PutOptionMember2021-12-310001273441gte:CommodityHedgeMembersrt:ScenarioForecastMemberus-gaap:LongMembergte:ThreeWayCollarsOctober1ToDecember312021Memberus-gaap:PutOptionMember2021-12-310001273441gte:CommodityHedgeMembersrt:ScenarioForecastMemberus-gaap:ShortMembergte:ThreeWayCollarsOctober1ToDecember312021Memberus-gaap:CallOptionMember2021-12-310001273441gte:CommodityHedgeMembersrt:ScenarioForecastMembergte:SwaptionsOctober1ToDecember312021Member2021-07-012021-12-31iso4217:COP0001273441srt:ScenarioForecastMembergte:CollarsOctober1ToDecember312021Member2021-12-31iso4217:COPgte:collar0001273441srt:ScenarioForecastMemberus-gaap:ShortMembergte:CollarsOctober1ToDecember312021Memberus-gaap:PutOptionMember2021-12-310001273441srt:ScenarioForecastMemberus-gaap:LongMembergte:CollarsOctober1ToDecember312021Memberus-gaap:CallOptionMember2021-12-31
UNITED STATES SECURITIES AND EXCHANGE COMMISSION
Washington, D.C. 20549
FORM 10-Q/A
AMENDMENT NO. 1
(Mark One)
| | | | | | | | |
| ☒ | | QUARTERLY REPORT PURSUANT TO SECTION 13 OR 15(d) OF THE SECURITIES EXCHANGE ACT OF 1934 |
For the quarterly period ended September 30, 2021
or
| | | | | | | | |
| ☐ | | TRANSITION REPORT PURSUANT TO SECTION 13 OR 15(d) OF THE SECURITIES EXCHANGE ACT OF 1934 |
For the transition period from __________ to __________
Commission file number 001-34018
GRAN TIERRA ENERGY INC.
(Exact name of registrant as specified in its charter)
| | | | | | | | | | | | | | | | | |
Delaware
| | 98-0479924 |
| (State or other jurisdiction of incorporation or organization) | | (I.R.S. Employer Identification No.) |
| 900, 520 - 3 Avenue SW |
| Calgary, | Alberta | Canada | T2P 0R3 | |
| (Address of principal executive offices, including zip code) |
(403) 265-3221
(Registrant's telephone number, including area code)
Securities registered pursuant to Section 12(b) of the Act:
| | | | | | | | |
| Title of each class | Trading Symbol(s) | Name of each exchange on which registered |
| Common Stock, par value $0.001 per share | GTE | NYSE American |
Toronto Stock Exchange |
London Stock Exchange |
Indicate by check mark whether the registrant (1) has filed all reports required to be filed by Section 13 or 15(d) of the Securities Exchange Act of 1934 during the preceding 12 months (or for such shorter period that the registrant was required to file such reports), and (2) has been subject to such filing requirements for the past 90 days. Yes ☒ No ☐
Indicate by check mark whether the registrant has submitted electronically every Interactive Data File required to be submitted pursuant to Rule 405 of Regulation S-T (§ 232.405 of this chapter) during the preceding 12 months (or for such shorter period that the registrant was required to submit such files).
Yes ☒ No ☐
Indicate by check mark whether the registrant is a large accelerated filer, an accelerated filer, a non-accelerated filer, a smaller reporting company, or an emerging growth company. See the definitions of large accelerated filer, accelerated filer, smaller reporting company, and emerging growth company in Rule 12b-2 of the Exchange Act.
| | | | | | | | | | | |
| Large accelerated filer | ☐ | Accelerated filer | ☒ |
| Non-accelerated filer | ☐ | Smaller reporting company | ☒ |
| | Emerging growth company | ☐ |
If an emerging growth company, indicate by check mark if the registrant has elected not to use the extended transition period for complying with any new or revised financial accounting standards provided pursuant to Section 13(a) of the Exchange Act. ☐
Indicate by check mark whether the registrant is a shell company (as defined in Rule 12b-2 of the Act). Yes ☐ No ☒
On October 29, 2021, 367,144,500 shares of the registrant's Common Stock, $0.001 par value, were issued.
EXPLANATORY NOTE
Gran Tierra Energy Inc. (the “Company”) is filing this Amendment No. 1 (“Amendment”) to its Form 10-Q for the quarter ended September 30, 2021, originally filed with the Securities and Exchange Commission (“SEC”) on November 2, 2021 (the “Original 10-Q”). This Amendment is being filed solely for the purpose of correcting an incorrect date in the certification by the Company's Chief Executive Officer and Chief Financial Officer pursuant to Section 906 of the Sarbanes-Oxley Act of 2002 filed as Exhibit 32.1 to the Original 10-Q. In accordance with Compliance and Disclosure Interpretations published by the SEC Staff, the entire periodic report for the quarter ended September 30, 2021 is included in this Amendment. Other than the correction described above, no other statement or amount has been changed from those presented in the Original 10-Q.
Gran Tierra Energy Inc.
Quarterly Report on Form 10-Q
Quarterly Period Ended September 30, 2021
Table of contents
| | | | | | | | |
| | | Page |
| PART I | Financial Information | |
| Item 1. | Financial Statements | |
| Item 2. | Management's Discussion and Analysis of Financial Condition and Results of Operations | |
| Item 3. | Quantitative and Qualitative Disclosures About Market Risk | |
| Item 4. | Controls and Procedures | |
| | |
| PART II | Other Information | |
| Item 1. | Legal Proceedings | |
| Item 1A. | Risk Factors | |
| | |
| Item 2. | Unregistered Sales of Equity Securities and Use of Proceeds | |
| Item 6. | Exhibits | |
| SIGNATURES | |
| |
CAUTIONARY LANGUAGE REGARDING FORWARD-LOOKING STATEMENTS
This Quarterly Report on Form 10-Q includes forward-looking statements within the meaning of Section 27A of the Securities Act of 1933, as amended (the "Securities Act"), and Section 21E of the Securities Exchange Act of 1934, as amended (the "Exchange Act"). All statements other than statements of historical facts included in this Quarterly Report on Form 10-Q regarding our financial position, estimated quantities and net present values of reserves, business strategy, plans and objectives of our management for future operations, covenant compliance, capital spending plans and benefits of the changes in our capital program or expenditures, our liquidity, the impacts of the coronavirus (COVID-19) pandemic and those statements preceded by, followed by or that otherwise include the words “believe”, “expect”, “anticipate”, “intend”, “estimate”, “project”, “target”, “goal”, “plan”, “budget”, “objective”, “could”, “should”, or similar expressions or variations on these expressions are forward-looking statements. We can give no assurances that the assumptions upon which the forward-looking statements are based will prove to be correct or that, even if correct, intervening circumstances will not occur to cause actual results to be different than expected. Because forward-looking statements are subject to risks and uncertainties, actual results may differ materially from those expressed or implied by the forward-looking statements. There are a number of risks, uncertainties and other important factors that could cause our actual results to differ materially from the forward-looking statements, including, but not limited to, our ability to comply with covenants in our credit agreement and indentures and make borrowings under our credit agreement; our ability to obtain amendments to the covenants in our credit agreement so as to avoid an event of default under our credit agreement and senior notes; a reduction in our borrowing base and our ability to repay any excess borrowings; sustained or future declines in commodity prices and the demand for oil; sustained or future excess supply of oil and natural gas; potential future impairments and reductions in proved reserve quantities and value; continuation of the COVID-19 pandemic and responses thereto, including possible future restrictions against oil and gas activity in Colombia and Ecuador; our current operations are located in South America, and unexpected problems can arise due to guerilla activity and other local conditions; technical difficulties and operational difficulties may arise which impact the production, transport or sale of our products; geographic, political and weather conditions can impact the production, transport or sale of our products; our ability to raise capital; our ability to identify and complete successful acquisitions, including in new countries and basins from our current operations; our ability to execute business plans; unexpected delays and difficulties in developing currently owned properties may occur; the timely receipt of regulatory or other required approvals for our operating activities; the failure of exploratory drilling to result in commercial wells; unexpected delays due to the limited availability of drilling equipment and personnel; current global economic and credit market conditions and the regulatory environment may impact oil prices and oil consumption differently than we currently predict, which could cause us to further modify our strategy and capital spending program; volatility or declines in the trading price of our common stock and the continued listing of our shares on a national stock exchange; and those factors set out in Part II, Item 1A "Risk Factors" in this Quarterly Report on Form 10-Q and Part I, Item 1A “Risk Factors” in our 2020 Annual Report on Form 10-K (the "2020 Annual Report on Form 10-K"), and in our other filings with the Securities and Exchange Commission (“SEC”). The unprecedented nature of the COVID-19 pandemic and volatility in the worldwide economy and oil and gas industry makes, including the unpredictable nature of the resurgence of cases, possible variants and governmental responses, it more difficult to predict the accuracy of forward-looking statements. The information included herein is given as of the filing date of this Quarterly Report on Form 10-Q with the SEC and, except as otherwise required by the federal securities laws, we disclaim any obligation or undertaking to publicly release any updates or revisions to, or to withdraw, any forward-looking statement contained in this Quarterly Report on Form 10-Q to reflect any change in our expectations with regard thereto or any change in events, conditions or circumstances on which any forward-looking statement is based.
GLOSSARY OF OIL AND GAS TERMS
In this document, the abbreviations set forth below have the following meanings:
| | | | | |
| bbl | barrel |
| BOPD | barrels of oil per day |
| NAR | net after royalty |
Sales volumes represent production NAR adjusted for inventory changes. Our oil and gas reserves are reported NAR. Our production is also reported NAR, except as otherwise specifically noted as "working interest production before royalties."
PART I - Financial Information
Item 1. Financial Statements
Gran Tierra Energy Inc.
Condensed Consolidated Statements of Operations (Unaudited)
(Thousands of U.S. Dollars, Except Share and Per Share Amounts) | | | | | | | | | | | | | | | | | | | | | | | |
| Three Months Ended September 30, | | Nine Months Ended September 30, |
| | 2021 | | 2020 | | 2021 | | 2020 |
OIL SALES (Note 8) | $ | 135,319 | | | $ | 53,142 | | | $ | 327,435 | | | $ | 173,045 | |
| | | | | | | | |
| EXPENSES | | | | | | | |
| Operating | 37,567 | | | 20,721 | | | 92,623 | | | 84,673 | |
| Transportation | 3,021 | | | 1,286 | | | 8,448 | | | 8,549 | |
COVID-19 related costs (Note 9) | 990 | | | 1,108 | | | 3,026 | | | 1,529 | |
| Depletion, depreciation and accretion | 38,055 | | | 31,340 | | | 98,300 | | | 131,118 | |
Goodwill impairment (Note 5) | — | | | — | | | — | | | 102,581 | |
Asset impairment (Note 5) | — | | | 104,731 | | | — | | | 507,093 | |
| General and administrative | 6,497 | | | 4,562 | | | 25,072 | | | 16,476 | |
| Severance | — | | | 122 | | | 919 | | | 1,469 | |
| Foreign exchange loss | 2,650 | | | 4,275 | | | 15,824 | | | 20,094 | |
Derivative instruments loss (gain) (Note 12) | 2,603 | | | (2,173) | | | 47,540 | | | (9,417) | |
Other financial instruments (gain) loss (Note 12) | (13,634) | | | 1,460 | | | (12,425) | | | 61,286 | |
| Other loss | — | | | 67 | | | — | | | 67 | |
Interest expense (Note 6) | 13,608 | | | 14,029 | | | 41,355 | | | 40,204 | |
| | 91,357 | | | 181,528 | | | 320,682 | | | 965,722 | |
| | | | | | | |
| INTEREST INCOME | — | | | — | | | — | | | 345 | |
| INCOME (LOSS) BEFORE INCOME TAXES | 43,962 | | | (128,386) | | | 6,753 | | | (792,332) | |
| | | | | | | |
| INCOME TAX EXPENSE (RECOVERY) | | | | | | | |
Current (Note 10) | — | | | 637 | | | (14) | | | 560 | |
Deferred (Note 10) | 8,955 | | | (21,202) | | | 26,809 | | | (62,796) | |
| 8,955 | | | (20,565) | | | 26,795 | | | (62,236) | |
| NET AND COMPREHENSIVE INCOME (LOSS) | $ | 35,007 | | | $ | (107,821) | | | $ | (20,042) | | | $ | (730,096) | |
| | | | | | | |
| NET INCOME (LOSS) PER SHARE | | | | | | | |
| | | | | | | |
| BASIC AND DILUTED | $ | 0.10 | | | $ | (0.29) | | | $ | (0.05) | | | $ | (1.99) | |
| | | | | | | |
WEIGHTED AVERAGE SHARES OUTSTANDING - BASIC (Note 7) | 366,992,802 | | | 366,981,556 | | | 366,985,646 | | | 366,981,556 | |
WEIGHTED AVERAGE SHARES OUTSTANDING - DILUTED (Note 7) | 367,740,722 | | | 366,981,556 | | | 366,985,646 | | | 366,981,556 | |
(See notes to the condensed consolidated financial statements)
Gran Tierra Energy Inc.
Condensed Consolidated Balance Sheets (Unaudited)
(Thousands of U.S. Dollars, Except Share and Per Share Amounts)
| | | | | | | | | | | |
| | As at September 30, 2021 | | As at December 31, 2020 |
| | | |
| ASSETS | | | |
| Current Assets | | | |
Cash and cash equivalents (Note 13) | $ | 16,600 | | | $ | 14,114 | |
| | | |
| Accounts receivable | 26,431 | | | 8,044 | |
Investment (Note 12) | 44,116 | | | 48,323 | |
| | | |
| | | |
| | | |
Taxes receivable (Note 3) | 47,772 | | | 49,925 | |
| Other current assets | 17,141 | | | 13,459 | |
| Total Current Assets | 152,060 | | | 133,865 | |
| | | |
| Oil and Gas Properties | | | |
| Proved | 833,069 | | | 797,355 | |
| Unproved | 158,483 | | | 161,763 | |
| Total Oil and Gas Properties | 991,552 | | | 959,118 | |
| Other capital assets | 3,085 | | | 5,364 | |
Total Property, Plant and Equipment (Note 4) | 994,637 | | | 964,482 | |
| | | |
| Other Long-Term Assets | | | |
| Deferred tax assets | 13,349 | | | 57,318 | |
Taxes receivable (Note 3) | 14,447 | | | 42,635 | |
Restricted cash and cash equivalents (Note 13) | 3,532 | | | 3,409 | |
| Other | 3,233 | | | 16 | |
| Total Other Long-Term Assets | 34,561 | | | 103,378 | |
| Total Assets | $ | 1,181,258 | | | $ | 1,201,725 | |
| | | |
| LIABILITIES AND SHAREHOLDERS' EQUITY | | | |
| Current Liabilities | | | |
| Accounts payable and accrued liabilities | $ | 114,785 | | | $ | 100,784 | |
Derivatives (Note 12) | 14,737 | | | 12,050 | |
Taxes payable (Note 3) | 5,938 | | | — | |
Equity compensation award liability (Note 7 and 12) | 2,132 | | | 805 | |
| Total Current Liabilities | 137,592 | | | 113,639 | |
| | | |
| Long-Term Liabilities | | | |
Long-term debt (Notes 6 and 12) | 735,411 | | | 774,770 | |
| | | |
| Asset retirement obligation | 54,356 | | | 48,214 | |
Equity compensation award liability (Note 7 and 12) | 11,469 | | | 3,955 | |
| Other long-term liabilities | 3,563 | | | 4,113 | |
| Total Long-Term Liabilities | 804,799 | | | 831,052 | |
| | | |
Contingencies (Note 11) | | | |
| | | |
| Shareholders' Equity | | | |
Common Stock (Note 7) (367,038,454 and 366,981,556 shares issued and outstanding of Common Stock, par value $0.001 per share, as at September 30, 2021, and December 31, 2020, respectively) | 10,270 | | | 10,270 | |
| Additional paid-in capital | 1,286,893 | | | 1,285,018 | |
| Deficit | (1,058,296) | | | (1,038,254) | |
| Total Shareholders' Equity | 238,867 | | | 257,034 | |
| Total Liabilities and Shareholders’ Equity | $ | 1,181,258 | | | $ | 1,201,725 | |
(See notes to the condensed consolidated financial statements)
Gran Tierra Energy Inc.
Condensed Consolidated Statements of Cash Flows (Unaudited)
(Thousands of U.S. Dollars)
| | | | | | | | | | | |
| | Nine Months Ended September 30, |
| | 2021 | | 2020 |
| Operating Activities | | | |
| Net loss | $ | (20,042) | | | $ | (730,096) | |
| Adjustments to reconcile net loss to net cash provided by operating activities: | | | |
| Depletion, depreciation and accretion | 98,300 | | | 131,118 | |
Goodwill impairment (Note 5) | — | | | 102,581 | |
Asset impairment (Note 5) | — | | | 507,093 | |
| Deferred tax expense (recovery) | 26,809 | | | (62,796) | |
Stock-based compensation expense (recovery) (Note 7) | 6,597 | | | (707) | |
Amortization of debt issuance costs (Note 6) | 2,682 | | | 2,774 | |
| Unrealized foreign exchange loss | 16,945 | | | 22,335 | |
Derivative instruments loss (gain) (Note 12) | 47,540 | | | (9,417) | |
| Cash settlements on derivatives instruments | (45,041) | | | 9,970 | |
Other financial instruments (gain) loss (Note 12) | (12,425) | | | 61,286 | |
| Other non-cash loss | — | | | 2,026 | |
| Cash settlement of asset retirement obligation | (483) | | | (199) | |
| Non-cash lease expenses | 1,222 | | | 1,494 | |
| Lease payments | (1,239) | | | (1,404) | |
Net change in assets and liabilities from operating activities (Note 13) | 17,956 | | | 23,288 | |
| Net cash provided by operating activities | 138,821 | | | 59,346 | |
| | | |
| Investing Activities | | | |
| Additions to property, plant and equipment | (109,650) | | | (56,378) | |
Proceeds on disposition of investment, net of transaction costs (Note 12) | 14,632 | | | — | |
Changes in non-cash investing working capital (Note 13) | 709 | | | (69,549) | |
| Net cash used in investing activities | (94,309) | | | (125,927) | |
| | | |
| Financing Activities | | | |
Proceeds from debt, net of issuance costs (Note 6) | (125) | | | 88,382 | |
Repayment of debt (Note 6) | (40,000) | | | (7,000) | |
| | | |
| Proceeds from exercise of stock options | 19 | | | — | |
| Lease payments | (1,269) | | | (307) | |
| Net cash (used in) provided by financing activities | (41,375) | | | 81,075 | |
| | | |
| Foreign exchange loss on cash, cash equivalents and restricted cash and cash equivalents | (528) | | | (754) | |
| | | |
| Net increase in cash, cash equivalents and restricted cash and cash equivalents | 2,609 | | | 13,740 | |
Cash, cash equivalents and restricted cash and cash equivalents, beginning of period (Note 13) | 17,523 | | | 11,075 | |
Cash, cash equivalents and restricted cash and cash equivalents, end of period (Note 13) | $ | 20,132 | | | $ | 24,815 | |
| | | |
Supplemental cash flow disclosures (Note 13) | | | |
(See notes to the condensed consolidated financial statements)
Gran Tierra Energy Inc.
Condensed Consolidated Statements of Shareholders' Equity (Unaudited)
(Thousands of U.S. Dollars)
| | | | | | | | | | | | | | | | | | | | | | | |
| | Three Months Ended September 30, | | Nine Months Ended September 30, |
| | 2021 | | 2020 | | 2021 | | 2020 |
| Share Capital | | | | | | | |
| Balance, beginning of period | $ | 10,270 | | | $ | 10,270 | | | $ | 10,270 | | | $ | 10,270 | |
| | | | | | | |
| Balance, end of period | 10,270 | | | 10,270 | | | 10,270 | | | 10,270 | |
| | | | | | | |
| Additional Paid-in Capital | | | | | | | |
| Balance, beginning of period | 1,286,235 | | | 1,283,798 | | | 1,285,018 | | | 1,282,627 | |
| | | | | | | |
| Exercise of stock options | 10 | | | — | | | 18 | | | — | |
| | | | | | | |
Stock-based compensation (Note 7) | 648 | | | 607 | | | 1,857 | | | 1,778 | |
| Balance, end of period | 1,286,893 | | | 1,284,405 | | | 1,286,893 | | | 1,284,405 | |
| | | | | | | |
| Deficit | | | | | | | |
| Balance, beginning of period | (1,093,303) | | | (882,562) | | | (1,038,254) | | | (260,287) | |
| Net income (loss) | 35,007 | | | (107,821) | | | (20,042) | | | (730,096) | |
| Balance, end of period | (1,058,296) | | | (990,383) | | | (1,058,296) | | | (990,383) | |
| | | | | | | |
| Total Shareholders' Equity | $ | 238,867 | | | $ | 304,292 | | | $ | 238,867 | | | $ | 304,292 | |
(See notes to the condensed consolidated financial statements)
Gran Tierra Energy Inc.
Notes to the Condensed Consolidated Financial Statements (Unaudited)
(Expressed in U.S. Dollars, unless otherwise indicated)
1. Description of Business
Gran Tierra Energy Inc., a Delaware corporation (the "Company" or "Gran Tierra"), is a publicly traded company focused on international oil and natural gas exploration and production with assets currently in Colombia and Ecuador.
2. Significant Accounting Policies
These interim unaudited condensed consolidated financial statements have been prepared in accordance with generally accepted accounting principles in the United States of America ("GAAP"). The information furnished herein reflects all normal recurring adjustments that are, in the opinion of management, necessary for the fair presentation of results for the interim periods.
The note disclosure requirements of annual consolidated financial statements provide additional disclosures to that required for interim unaudited condensed consolidated financial statements. Accordingly, these interim unaudited condensed consolidated financial statements should be read in conjunction with the Company's consolidated financial statements as at and for the year ended December 31, 2020, included in the Company's 2020 Annual Report on Form 10-K.
The Company's significant accounting policies are described in Note 2 of the consolidated financial statements which are included in the Company's 2020 Annual Report on Form 10-K and are the same policies followed in these interim unaudited condensed consolidated financial statements. The Company has evaluated all subsequent events through to the date these interim unaudited condensed consolidated financial statements were issued.
3. Taxes Receivable and Payable
The table below shows the break-down of taxes receivable and payable, which are comprised of value added tax ("VAT") and income tax:
| | | | | | | | | | | |
| (Thousands of U.S. Dollars) | As at September 30, 2021 | | As at December 31, 2020 |
| Taxes Receivable | | | |
| Current | | | |
| VAT Receivable | $ | 31,890 | | | $ | 35,977 | |
| Income Tax Receivable | 15,882 | | | 13,948 | |
| $ | 47,772 | | | $ | 49,925 | |
| Long-Term | | | |
| VAT Receivable | $ | — | | | $ | 28,485 | |
| Income Tax Receivable | 14,447 | | | 14,150 | |
| $ | 14,447 | | | $ | 42,635 | |
| | | |
| Taxes Payable | | | |
| Current | | | |
| VAT Payable | $ | 5,938 | | | $ | — | |
| | | |
| Total Taxes Receivable net of Taxes Payable | $ | 56,281 | | | $ | 92,560 | |
| | | |
The following table shows the movement of VAT and income tax receivables for the period identified below:
| | | | | | | | | | | | | | | | | |
| (Thousands of U.S. Dollars) | Net VAT Receivable | | Income Tax Receivable | | Total Net Taxes Receivable |
Balance, as at December 31, 2020 | $ | 64,462 | | | $ | 28,098 | | | $ | 92,560 | |
| Collected through direct government refunds | (518) | | | (14,228) | | | (14,746) | |
| Collected through sales contracts | (70,881) | | | — | | | (70,881) | |
Taxes paid (1) | 38,278 | | | 19,923 | | | 58,201 | |
| | | | | |
| Foreign exchange loss | (5,389) | | | (3,464) | | | (8,853) | |
Balance, as at September 30, 2021 | $ | 25,952 | | | $ | 30,329 | | | $ | 56,281 | |
(1)VAT is paid on certain goods and services in Colombia at a rate of 19%
4. Property, Plant and Equipment
| | | | | | | | | | | |
| (Thousands of U.S. Dollars) | As at September 30, 2021 | | As at December 31, 2020 |
| Oil and natural gas properties | | | |
| Proved | $ | 4,236,548 | | | $ | 4,106,768 | |
| Unproved | 158,483 | | | 161,763 | |
| | 4,395,031 | | | 4,268,531 | |
Other(1) | 32,779 | | | 32,135 | |
| 4,427,810 | | | 4,300,666 | |
| Accumulated depletion and depreciation and impairment | (3,433,173) | | | (3,336,184) | |
| $ | 994,637 | | | $ | 964,482 | |
(1) The "other" category includes right-of-use assets for operating and finance leases of $11.7 million, which had a net book value of $2.5 million as at September 30, 2021 (December 31, 2020 - $11.4 million which had a net book value of $4.4 million).
5. Impairment
Asset impairment
(i) Oil and gas property impairment
For the three and nine months ended September 30, 2021, the Company had no ceiling test impairment losses. For each of the three and nine months ended September 30, 2020, Gran Tierra had $104.7 million and $502.9 million of ceiling test impairment losses. The Company used an average Brent price of $60.12 and $47.95 per bbl for the September 30, 2021 and 2020, ceiling test calculations, respectively.
(ii) Inventory impairment
For the three and nine months ended September 30, 2021, the Company had no inventory impairment. For the three and nine months ended September 30, 2020, the Company recorded $0.1 million and $4.2 million, respectively, of inventory impairment.
Goodwill impairment
The entire goodwill balance of $102.6 million was impaired during the nine months ended September 30, 2020, due to the reporting unit's carrying value exceeding its fair value due to the impact of lower forecasted commodity prices.
6. Debt and Debt Issuance Costs
The Company's debt at September 30, 2021, and December 31, 2020, was as follows:
| | | | | | | | | | | |
| (Thousands of U.S. Dollars) | As at September 30, 2021 | | As at December 31, 2020 |
6.25% Senior Notes, due February 2025 | $ | 300,000 | | | $ | 300,000 | |
7.75% Senior Notes, due May 2027 | 300,000 | | | 300,000 | |
| Revolving credit facility | 150,000 | | | 190,000 | |
| Unamortized debt issuance costs | (15,566) | | | (18,124) | |
| Long-term debt | 734,434 | | | 771,876 | |
Long-term lease obligation(1) | 977 | | | 2,894 | |
| $ | 735,411 | | | $ | 774,770 | |
(1) The current portion of the lease obligation has been included in accounts payable and accrued liabilities on the Company's balance sheet and totaled $2.9 million as at September 30, 2021 (December 31, 2020 - $3.3 million).
As at September 30, 2021, the borrowing base of the Company's Senior Secured Credit Facility (the "revolving credit facility") was $215 million. The maturity date of the revolving credit facility is October 2022 and the next re-determination to occur no later than November 2021.
The Company is required to comply with various covenants, which were modified in response to market conditions including the COVID-19 pandemic until October 1, 2021 ("the covenant relief period"). During the covenant relief period, the Company's ratio of total debt to Covenant EBITDAX ("EBITDAX") was permitted to be greater than 4.0 to 1.0, Senior Secured Debt to EBITDAX ratio could not exceed 2.5 to 1.0, and EBITDAX to interest expense ratio for the trailing four-quarter periods measured as of the last day of the fiscal quarter ended September 30, 2021, was required to be 2.0 to 1.0. As of September 30, 2021, the Company was in compliance with all applicable covenants in the revolving credit facility.
Commencing on October 1, 2021, the Company must maintain compliance with the following financial covenants: limitations on Company's ratio of debt to EBITDAX to a maximum of 4.0 to 1.0; limitations on Company's ratio of Senior Secured Debt to EBITDAX to a maximum of 3.0 to 1.0; and the maintenance of a ratio of EBITDAX to interest expense of at least 2.5 to 1.0. If the Company fails to comply with these financial covenants, it would result in a default under the terms of the credit agreement, which could result in an acceleration of repayment of all indebtedness under the Company's revolving credit facility.
Amounts drawn down under the revolving credit facility bear interest, at the Company's option, at the USD LIBOR rate plus a
margin ranging from 2.90% to 4.90%, or an alternate base rate plus a margin ranging from 1.90% to 3.90%, in each case based on the borrowing base utilization percentage. The alternate base rate is currently the U.S. prime rate. We pay a commitment fee on undrawn amounts under the revolving credit facility, which ranges from 0.73% to 1.23% per annum, based on the average daily amount of unused commitments.
The Company's revolving credit facility is guaranteed by and secured against the assets of certain of the Company's subsidiaries (the "Credit Facility Group"). Under the terms of the revolving credit facility, the Company is subject to certain restrictions on its ability to distribute funds to entities outside of the Credit Facility Group, including restrictions on the ability to pay dividends to shareholders of the Company.
Interest Expense
The following table presents total interest expense recognized in the accompanying interim unaudited condensed consolidated statements of operations:
| | | | | | | | | | | | | | | | | | | | |
| Three Months Ended September 30, | | Nine Months Ended September 30, |
| (Thousands of U.S. Dollars) | 2021 | | 2020 | | 2021 | 2020 |
| Contractual interest and other financing expenses | $ | 12,701 | | | $ | 13,191 | | | $ | 38,673 | | $ | 37,430 | |
| Amortization of debt issuance costs | 907 | | | 838 | | | 2,682 | | 2,774 | |
| $ | 13,608 | | | $ | 14,029 | | | $ | 41,355 | | $ | 40,204 | |
7. Share Capital
| | | | | |
| Shares of Common Stock |
| Balance, December 31, 2020 | 366,981,556 | |
| Shares issued on option exercise | 56,898 | |
| Balance, September 30, 2021 | 367,038,454 | |
Equity Compensation Awards
The following table provides information about performance stock units (“PSUs”), deferred share units (“DSUs”), and stock option activity for the nine months ended September 30, 2021:
| | | | | | | | | | | | | | | | | |
| PSUs | DSUs | | Stock Options |
| Number of Outstanding Share Units | Number of Outstanding Share Units | | Number of Outstanding Stock Options | Weighted Average Exercise Price/Stock Option ($) |
| Balance, December 31, 2020 | 23,273,404 | | 4,067,897 | | | 15,444,949 | | 1.50 | |
| Granted | 13,428,840 | | 1,310,122 | | | 5,834,014 | | 0.80 | |
| Exercised | (2,733,209) | | — | | | (56,898) | | 0.33 | |
| Forfeited | (3,492,165) | | — | | | (1,628,591) | | 0.90 | |
| Expired | — | | — | | | (1,279,641) | | 3.17 | |
| Balance, September 30, 2021 | 30,476,870 | | 5,378,019 | | | 18,313,833 | | 1.22 | |
For the three and nine months ended September 30, 2021, stock-based compensation expense was $1.1 million and $6.6 million, respectively (three and nine months ended September 30, 2020, expense of $0.1 million and recovery of $0.7 million, respectively).
At September 30, 2021, there was $14.2 million (December 31, 2020 - $5.9 million) of unrecognized compensation costs related to unvested PSUs and stock options, which is expected to be recognized over a weighted-average period of 1.8 years. During the nine months ended September 30, 2021, the Company paid out $0.6 million for PSUs vested on December 31, 2020 (nine months ended September 30, 2020 - $3.2 million for PSUs vested on December 31, 2019).
Net Income (Loss) per Share
Basic net income (loss) per share is calculated by dividing net income (loss) attributable to common shareholders by the weighted average number of shares of common stock issued and outstanding during each period.
Diluted net income (loss) per share is calculated using the treasury stock method for share-based compensation arrangements. The treasury stock method assumes that any proceeds obtained on the exercise of share-based compensation arrangements would be used to purchase common shares at the average market price during the period. The weighted average number of shares is then adjusted by the difference between the number of shares issued from the exercise of share-based compensation arrangements and shares repurchased from the related proceeds. Anti-dilutive shares represent potentially dilutive securities excluded from the computation of diluted income or loss per share as their impact would be anti-dilutive.
Weighted Average Shares Outstanding
| | | | | | | | | | | | | | | | | |
| | Three Months Ended September 30, | Nine Months Ended September 30, |
| | 2021 | 2020 | | 2021 | 2020 |
| Weighted average number of common shares outstanding | 366,992,802 | | 366,981,556 | | | 366,985,646 | | 366,981,556 | |
| Shares issuable pursuant to stock options | 1,574,305 | | — | | | — | | — | |
| Shares assumed to be purchased from proceeds of stock options | (826,385) | | — | | | — | | — | |
| Weighted average number of diluted common shares outstanding | 367,740,722 | | 366,981,556 | | | 366,985,646 | | 366,981,556 | |
For the three months ended September 30, 2021, 16,362,882 options, on a weighted average basis (three months ended September 30, 2020 - all options), were excluded from the diluted income (loss) per share calculation as the options were anti-dilutive. For the nine months ended September 30, 2021 and 2020, all options on a weighted average basis were excluded from the diluted loss per share calculation as the options were anti-dilutive.
8. Revenue
The Company's revenues are generated from oil sales at prices that reflect the blended prices received upon shipment by the purchaser at defined sales points or defined by contract relative to ICE Brent and adjusted for Vasconia or Castilla crude differentials, quality, and transportation discounts each month. For the three and nine months ended September 30, 2021, 100% (three and nine months ended September 30, 2020 - 100%) of the Company's revenue resulted from oil sales. During the three and nine months ended September 30, 2021, quality and transportation discounts were 16% and 15%, respectively, of the average ICE Brent price (three and nine months ended September 30, 2020 - 22% and 27%, respectively). During the three and nine months ended September 30, 2021, the Company's production was sold primarily to two major customers in Colombia (three and nine months ended September 30, 2020 - two).
As at September 30, 2021, accounts receivable included nil of accrued sales revenue related to September 2021 production (December 31, 2020 - $0.1 million related to December 2020 production).
9. COVID-19 Costs
The COVID-19 pandemic has resulted in additional ongoing operating and transportation costs related to COVID-19 health and safety preventative measures, including incremental sanitation requirements and enhanced procedures for trucking barrels and crew changes in the field. Below is a break-down of the costs:
| | | | | | | | | | | | | | | | | | |
| Three Months Ended September 30, | | Nine Months Ended September 30, |
| (Thousands of U.S. Dollars) | 2021 | 2020 | | 2021 | | 2020 |
| Operating expenses | $ | 881 | | $ | 1,012 | | | $ | 2,743 | | | $ | 1,433 | |
| Transportation costs | 109 | | 96 | | | 283 | | | 96 | |
| Total COVID-19 costs | $ | 990 | | $ | 1,108 | | | $ | 3,026 | | | $ | 1,529 | |
10. Taxes
The Company's effective tax rate was 397% for the nine months ended September 30, 2021, compared to 8% in the comparative period of 2020. Current income tax was in a recovery position for the nine months ended September 30, 2021, versus an expense position for the comparative period in 2020, primarily as a result of changes in the previous estimation of presumptive minimum tax. The deferred income tax expense for the nine months ended September 30, 2021, resulted from excess tax depreciation compared to accounting depreciation and the use of tax losses to offset taxable income in Colombia. The deferred income tax recovery in the comparative period of 2020 was mainly the result of a ceiling test impairment loss in Colombia, partially offset by losses incurred in Colombia that are now fully offset by a valuation allowance.
For the nine months ended September 30, 2021, the difference between the effective tax rate of 397% and the 31% Colombian tax rate was primarily due to the non-deductibility of derivative instrument losses and financing costs; foreign currency translation adjustments, and stock based compensation. These were partially offset by a decrease in the valuation allowance and the non-taxable portion (50%) of the unrealized gain on PetroTal Corp. ("PetroTal") shares.
In the third quarter of 2021, Congressional authorities in Colombia enacted a new tax legislation, which includes an increase to the corporate income tax rate to 35% from 31%, effective January 1, 2022. Accordingly, the tax rates applied to the calculation of deferred income taxes, before valuation allowance, have been adjusted to reflect this change.
For the nine months ended September 30, 2020, the difference between the effective tax rate of 8% and the 32% Colombian tax rate was primarily due to an increase in the valuation allowance, the non-deductibility of goodwill impairment for tax purposes, foreign translation adjustments and the non-deductible portion (50%) of the unrealized loss on PetroTal Corp. ("PetroTal") shares.
11. Contingencies
Legal Proceedings
Gran Tierra has a number of lawsuits and claims pending, including a dispute with the Agencia Nacional de Hidrocarburos (National Hydrocarbons Agency) ("ANH") relating to the calculation of high price share royalties. Although the outcome of these lawsuits and disputes cannot be predicted with certainty, Gran Tierra believes the resolution of these matters would not have a material adverse effect on the Company’s consolidated financial position, results of operations or cash flows. Gran Tierra records costs as they are incurred or become probable and determinable.
Letters of credit and other credit support
At September 30, 2021, the Company had provided letters of credit and other credit support totaling $102.4 million (December 31, 2020 - $100.6 million) as security relating to work commitment guarantees in Colombia and Ecuador contained in exploration contracts and other capital or operating requirements.
12. Financial Instruments and Fair Value Measurement
Financial Instruments
At September 30, 2021, the Company’s financial instruments recognized on the balance sheet consisted of cash and cash equivalents, restricted cash and cash equivalents, accounts receivable, investment, other long-term assets, accounts payable and accrued liabilities, derivatives, equity compensation award liability, long-term debt, and other long-term liabilities.
Fair Value Measurement
The fair value of investment, derivatives, and equity compensation award liability is remeasured to the estimated fair value at the end of each reporting period.
Investment in PetroTal
The estimated fair value of the Company's investment in PetroTal was $44.1 million at September 30, 2021 ($48.3 million at December 31, 2020), based on the closing stock price of PetroTal of $0.41 CAD ($0.25 CAD at December 31, 2020) and the foreign exchange rate at that date. During the nine months ended September 30, 2021, the Company sold 44% (109 million common shares) of its interest in PetroTal for cash proceeds net of transaction costs of $14.6 million, resulting in a loss on sale of $5.1 million. PetroTal is a publicly-traded energy company incorporated and domiciled in Canada engaged in exploration, appraisal, and development of crude oil and natural gas in Peru. PetroTal's shares are listed on the Toronto Stock Exchange Venture under the trading symbol 'TAL' and on the London Stock Exchange Alternative Investment Market under the trading symbol 'PTAL'. As at September 30, 2021, Gran Tierra holds approximately 137 million common shares representing approximately 17% of PetroTal's issued and outstanding common shares.
Commodity and Foreign Currency Derivatives
The fair value of commodity price and foreign currency derivatives is estimated based on various factors, including quoted market prices in active markets and quotes from third parties. The Company also performs an internal valuation to ensure the
reasonableness of third party quotes. In consideration of counterparty credit risk, the Company assessed the possibility of whether the counterparty to the derivative would default by failing to make any contractually required payments. Additionally, the Company considers that it is of substantial credit quality and has the financial resources and willingness to meet its potential repayment obligations associated with the derivative transactions.
PSUs and DSUs
The estimated fair value of the PSUs liability is based on a pricing model using inputs such as quoted market prices in an active market and PSUs performance factor. The fair value of DSUs liability is measured using quoted market prices in an active market.
The fair value of investment, derivatives, and PSUs and DSUs liability at September 30, 2021, and December 31, 2020, was as follows:
| | | | | | | | | | | |
| (Thousands of U.S. Dollars) | As at September 30, 2021 | | As at December 31, 2020 |
| Investment | $ | 44,116 | | | $ | 48,323 | |
| | | |
| | | |
| | | |
| Derivative liability | $ | 14,737 | | | $ | 12,050 | |
PSUs and DSUs liability | 13,601 | | | 4,760 | |
| $ | 28,338 | | | $ | 16,810 | |
The following table presents gains or losses on derivatives and other financial instruments recognized in the accompanying interim unaudited condensed consolidated statements of operations:
| | | | | | | | | | | | | | | | | |
| Three Months Ended September 30, | Nine Months Ended September 30, |
| (Thousands of U.S. Dollars) | 2021 | 2020 | | 2021 | 2020 |
| Commodity price derivatives loss (gain) | $ | 2,586 | | $ | (2,206) | | | $ | 47,435 | | $ | (12,983) | |
| Foreign currency derivatives loss | 17 | | 33 | | | 105 | | 3,566 | |
| Derivative instruments loss (gain) | $ | 2,603 | | $ | (2,173) | | | $ | 47,540 | | $ | (9,417) | |
| | | | | |
| Unrealized PetroTal investment (gain) loss | $ | (13,616) | | $ | 1,055 | | | $ | (17,477) | | $ | 60,124 | |
| Loss on sale of PetroTal shares | — | | — | | | 5,070 | | — | |
| Financial instruments (gain) loss | (18) | | 405 | | | (18) | | 1,162 | |
| Other financial instruments (gain) loss | $ | (13,634) | | $ | 1,460 | | | $ | (12,425) | | $ | 61,286 | |
Financial instruments not recorded at fair value include the Company's 6.25% Senior Notes due 2025 (the "6.25% Senior Notes") and 7.75% Senior Notes due 2027 (the "7.75% Senior Notes"). At September 30, 2021, the carrying amounts of the 6.25% Senior Notes and the 7.75% Senior Notes were $293.5 million and $291.7 million, respectively, which represented the aggregate principal amount less unamortized debt issuance costs, and the fair values were $262.6 million and $260.1 million, respectively. The fair value of long-term restricted cash and cash equivalents and the revolving credit facility approximated their carrying value because interest rates are variable and reflective of market rates. The fair values of other financial instruments approximate their carrying amounts due to the short-term maturity of these instruments.
GAAP establishes a fair value hierarchy that prioritizes the inputs to valuation techniques used to measure fair value. This hierarchy consists of three broad levels. Level 1 inputs consist of quoted prices (unadjusted) in active markets for identical assets and liabilities and have the highest priority. Level 2 and 3 inputs are based on significant other observable inputs and significant unobservable inputs, respectively, and have lower priorities. The Company uses appropriate valuation techniques based on the available inputs to measure the fair values of assets and liabilities.
At September 30, 2021, the fair value of the investment and DSUs liability was determined using Level 1 inputs. The fair value of the derivative and PSUs liability was determined using Level 2 inputs.
The Company uses available market data and valuation methodologies to estimate the fair value of debt. The fair value of debt is the estimated amount the Company would have to pay a third party to assume the debt, including a credit spread for the difference between the issue rate and the period-end market rate. The credit spread is the Company’s default or repayment risk. The credit spread (premium or discount) is determined by comparing the Company’s Senior Notes and revolving credit facility to new issuances (secured and unsecured) and secondary trades of similar size and credit statistics for public and private debt. The disclosure in the paragraph above regarding the fair value of cash and restricted cash and cash equivalents and Senior Notes was based on Level 1 inputs, and the fair value of credit facility was based on Level 2 inputs.
The Company’s non-recurring fair value measurements include asset retirement obligations. The fair value of an asset retirement obligation is measured by reference to the expected future cash outflows required to satisfy the retirement obligation discounted at the Company’s credit-adjusted risk-free interest rate.
Commodity Price Derivatives
The Company utilizes commodity price derivatives to manage the variability in cash flows associated with the forecasted sale of its oil production, reduce commodity price risk and provide a base level of cash flows to assure it can execute at least a portion of its planned capital spending.
At September 30, 2021, the Company had outstanding commodity price derivative positions as follows:
| | | | | | | | | | | | | | | | | | | | |
| Period and type of instrument | Volume,
bopd | Reference | Sold Put ($/bbl, Weighted Average) | Purchased Put ($/bbl, Weighted Average) | Sold Call ($/bbl, Weighted Average) | Swap Price ($/bbl, Weighted Average) |
Three-way Collars:
October 1, to December 31, 2021 | 7,000 | | ICE Brent | 47.14 | | 57.14 | | 68.95 | | n/a |
| Swaps: October 1, to December 31, 2021 | 3,000 | | ICE Brent | n/a | n/a | n/a | 56.75 | |
Foreign Currency Derivatives
The Company utilizes foreign currency derivatives to manage the variability in cash flows associated with the Company's forecasted Colombian peso ("COP") denominated expenses. At September 30, 2021, the Company had outstanding foreign currency derivative positions as follows:
| | | | | | | | | | | | | | | | | |
| Period and type of instrument | Amount Hedged
(Millions of COP) | U.S. Dollar Equivalent of Amount Hedged (Thousands of U.S. Dollars)(1) | Reference | Floor Price
(COP, Weighted Average) | Cap Price (COP, Weighted Average) |
| Collars: October 1, to December 31, 2021 | 3,000 | | 782 | | COP | 3,500 | | 3,630 | |
(1) At September 30, 2021 foreign exchange rate.
13. Supplemental Cash Flow Information
The following table provides a reconciliation of cash and cash equivalents and restricted cash and cash equivalents shown as a sum of these amounts in the interim unaudited condensed consolidated statements of cash flows:
| | | | | | | | | | | | | | | | | |
| (Thousands of U.S. Dollars) | As at September 30, | | As at December 31, |
| 2021 | 2020 | | 2020 | 2019 |
| Cash and cash equivalents | $ | 16,600 | | $ | 21,808 | | | $ | 14,114 | | $ | 8,817 | |
| | | | | |
Restricted cash and cash equivalents -
long-term | 3,532 | | 3,007 | | | 3,409 | | 2,258 | |
| $ | 20,132 | | $ | 24,815 | | | $ | 17,523 | | $ | 11,075 | |
Net changes in assets and liabilities from operating activities were as follows:
| | | | | | | | | | | |
| Nine Months Ended September 30, |
| (Thousands of U.S. Dollars) | 2021 | | 2020 |
| Accounts receivable and other long-term assets | $ | (18,582) | | | $ | 31,108 | |
| Derivatives | (2,427) | | | 694 | |
| Inventory | (2,920) | | | (2,377) | |
| Prepaids | 42 | | | (183) | |
| Accounts payable and accrued and other long-term liabilities | 14,417 | | | (57,621) | |
| Taxes receivable and payable | 27,426 | | | 51,667 | |
| Net changes in assets and liabilities from operating activities | $ | 17,956 | | | $ | 23,288 | |
Changes in non-cash investing working capital for the nine months ended September 30, 2021, are comprised of an increase in accounts payable and accrued liabilities of $0.6 million and a decrease in accounts receivable of $0.1 million (nine months ended September 30, 2020, a decrease in accounts payable and accrued liabilities of $69.9 million and a decrease in accounts receivable of $0.3 million).
The following table provides additional supplemental cash flow disclosures:
| | | | | | | | | | | |
| Nine Months Ended September 30, |
| (Thousands of U.S. Dollars) | 2021 | | 2020 |
| Cash paid for income taxes | $ | 20,433 | | | $ | 11,603 | |
| Cash paid for interest | $ | 37,259 | | | $ | 35,408 | |
| | | |
| Non-cash investing activities: | | | |
| Net liabilities related to property, plant and equipment, end of period | $ | 29,420 | | | $ | 7,805 | |
Item 2. Management’s Discussion and Analysis of Financial Condition and Results of Operations
The following discussion of our financial condition and results of operations should be read in conjunction with the "Financial Statements" as set out in Part I, Item 1 of this Quarterly Report on Form 10-Q as well as the "Financial Statements and Supplementary Data" and "Management’s Discussion and Analysis of Financial Condition and Results of Operations" included in Part II, Items 7 and 8, respectively, of our 2020 Annual Report on Form 10-K. Please see the cautionary language at the beginning of this Quarterly Report on Form 10-Q regarding the identification of and risks relating to forward-looking statements and the risk factors described in Part II, Item 1A "Risk Factors" of this Quarterly Report on Form 10-Q, as well as Part I, Item 1A “Risk Factors” in our 2020 Annual Report on Form 10-K.
Financial and Operational Highlights
Key Highlights for the third quarter of 2021
•Net income in the third quarter of 2021 was $35.0 million or $0.10 per share basic and diluted, compared with a net loss of $107.8 million or $(0.29) per share basic and diluted in the third quarter of 2020
•Income before income taxes in the third quarter of 2021 was $44.0 million compared to loss before income taxes of $128.4 million in the third quarter of 2020
•During the third quarter of 2021, we repaid $25.0 million of the amount drawn under the revolving credit facility
•Funds flow from operations(2) increased by 758% to $69.1 million compared to the third quarter of 2020 and increased 197% from the second quarter of 2021
•During the third quarter the Company generated $34.3 million of free cash flow(2) which was used for debt reduction
•Our third quarter of 2021 average production NAR was 23,372 BOPD (sales volumes - 23,833 BOPD), a 37% increase (sales volumes - 40% increase) from 17,051 BOPD (sales volumes - 17,066 BOPD) in the third quarter of 2020, and 23% increase (sales volumes - 29% increase) from the second quarter of 2021 which was impacted by national blockades in Colombia affecting production from major fields
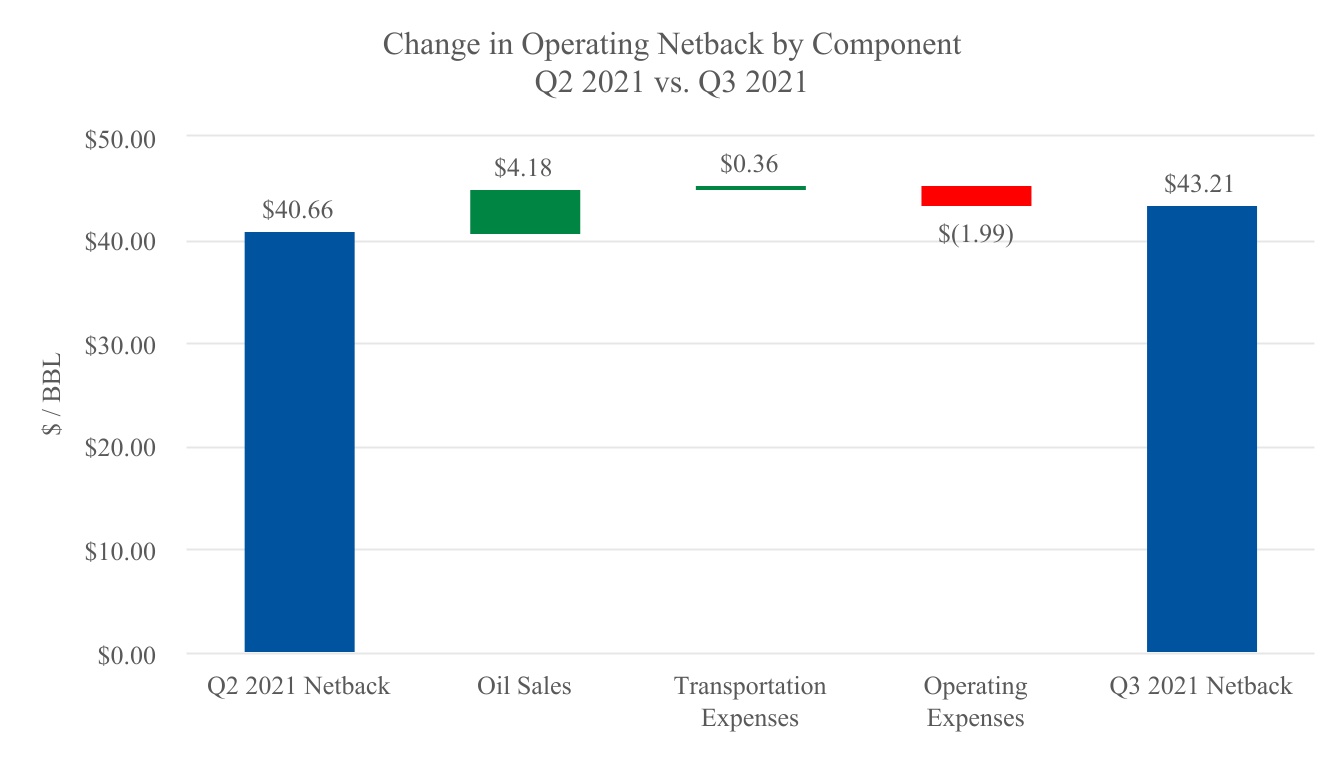
•Oil sales were $135.3 million, 155% higher compared to $53.1 million in the third quarter of 2020 as a result of an increase in Brent price, offset by higher quality and transportation discounts. Oil sales increased by 40% compared with $96.6 million in the second quarter of 2021 as a result of a 6% increase in Brent price and a 29% increase in sales volumes
•Operating expenses increased 30% on a per bbl basis ($3.93 per bbl) compared to the third quarter of 2020 due to higher power generation costs in Acordionero and increased by 13% on a per bbl basis ($1.99 per bbl) compared to the second quarter of 2021 due to power generation and chemical costs
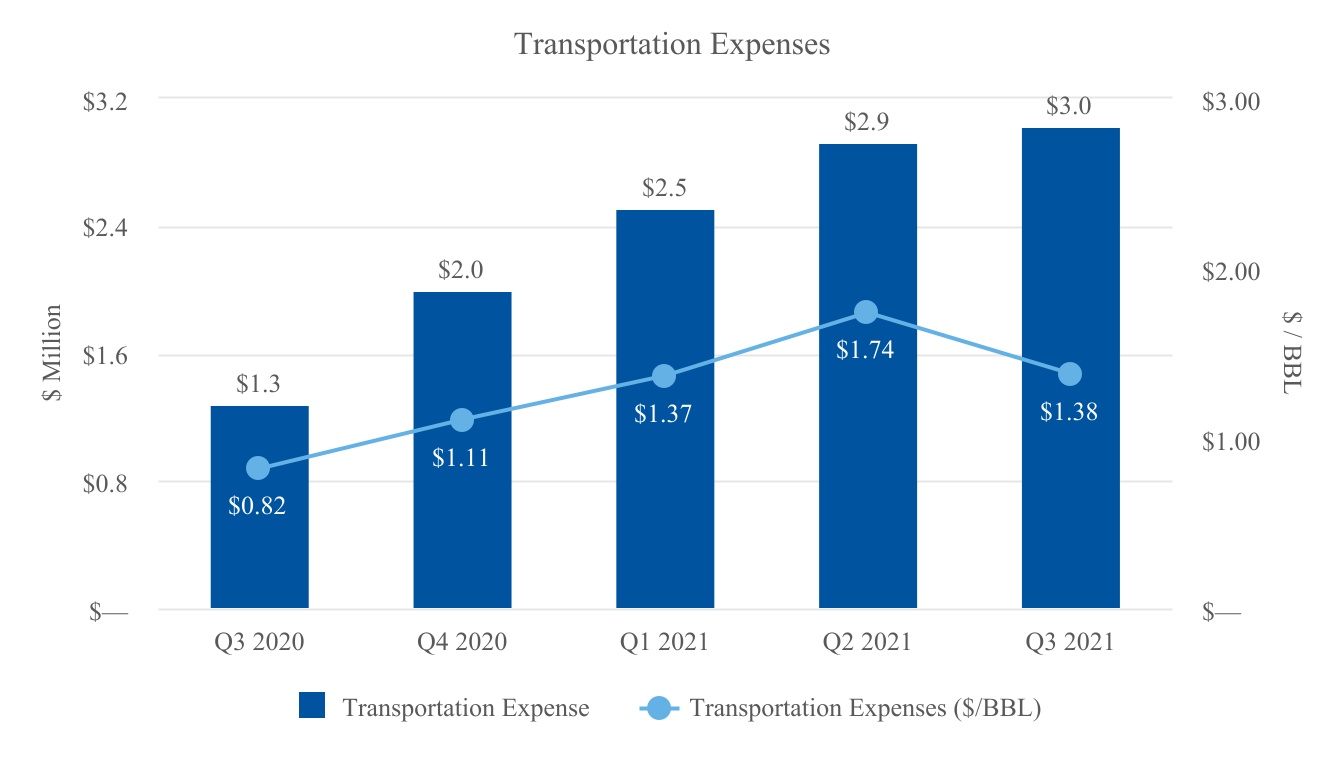
•Transportation expenses increased by 135% compared to the third quarter of 2020 as a result of the national blockades resulting in utilization of more expensive transportation routes and increased 3% compared to the second quarter of 2021
•Operating netback(2) increased by 204% and 39%, respectively, to $94.7 million compared to $31.1 million in the third quarter of 2020 and $68.3 million in the second quarter of 2021
•Adjusted EBITDA(2) increased by 274% and 125%, respectively, to $81.8 million compared to $21.9 million in the third quarter of 2020 and $36.3 million in the second quarter of 2021
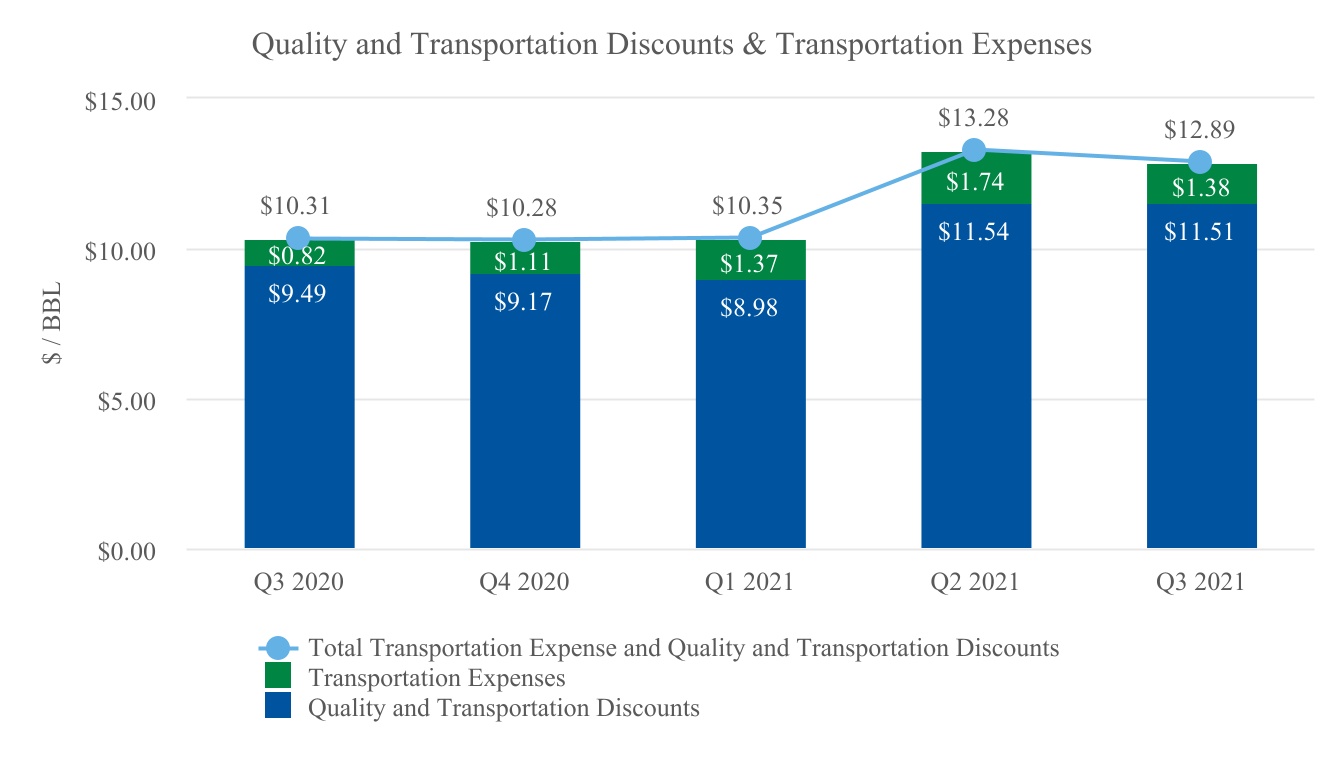
•Quality and transportation discounts for the third quarter of 2021 increased to $11.51 per bbl compared to $9.49 per bbl in the third quarter of 2020 as a result of higher differentials and remained consistent when compared to $11.54 per bbl in the second quarter of 2021
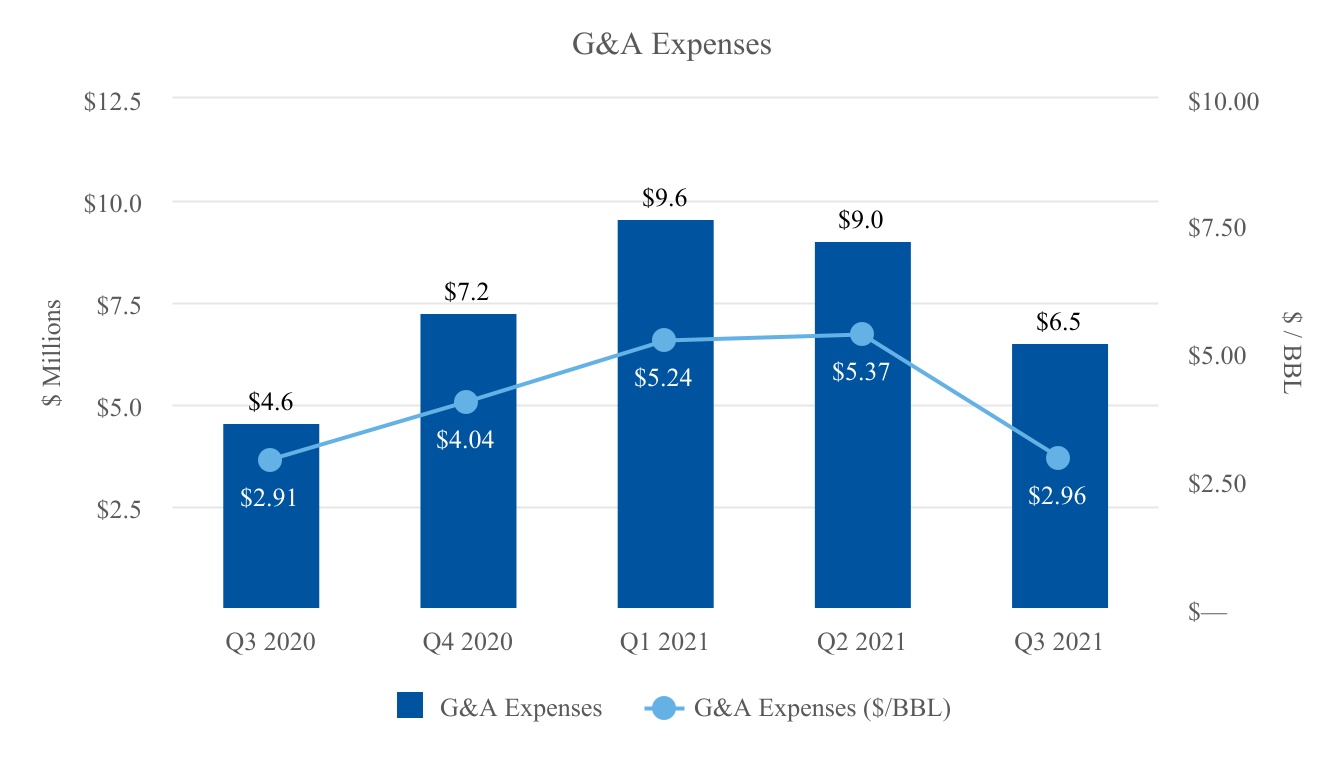
•General and administrative expenses ("G&A") before stock-based compensation increased by 21% compared to the third quarter of 2020, consistent with the increase of operating activities in the current period. When compared to the second quarter of 2021, G&A before stock-based compensation decreased by 24% due to the timing of certain costs incurred and expensed in the prior quarter
•Capital additions for the third quarter of 2021 were $34.8 million, an increase of $27.5 million compared to the third quarter of 2020 and decreased slightly from the $37.4 million incurred in the second quarter of 2021
| | | | | | | | | | | | | | | | | | | | | | | | | | | | | |
| (Thousands of U.S. Dollars, unless otherwise indicated) | Three Months Ended September 30, | | Three Months Ended June 30, | | Nine Months Ended September 30, |
| | 2021 | 2020 | % Change | | 2021 | | 2021 | 2020 | % Change |
| | | | | | | | | |
| | | | | | | | | |
| | | | | | | | | |
| | | | | | | | | |
| | | | | | | | | |
| | | | | | | | | |
| | | | | | | | | |
| Average Daily Volumes (BOPD) | | | | | | | | | |
| Consolidated | | | | | | | | | |
| Working Interest ("WI") Production Before Royalties | 28,957 | | 18,944 | | 53 | | | 23,035 | | | 25,501 | | 22,864 | | 12 | |
| Royalties | (5,585) | | (1,893) | | 195 | | | (4,059) | | | (4,531) | | (2,600) | | 74 | |
| Production NAR | 23,372 | | 17,051 | | 37 | | | 18,976 | | | 20,970 | | 20,264 | | 3 | |
| Decrease (Increase) in Inventory | 461 | | 15 | | 2,973 | | | (522) | | | (105) | | 117 | | (190) | |
Sales(1) | 23,833 | | 17,066 | | 40 | | | 18,454 | | | 20,865 | | 20,381 | | 2 | |
| | | | | | | | | |
| Net Income (Loss) | $ | 35,007 | | $ | (107,821) | | 132 | | | $ | (17,627) | | | $ | (20,042) | | $ | (730,096) | | 97 | |
| | | | | | | | | |
| Operating Netback | | | | | | | | | |
| Oil Sales | $ | 135,319 | | $ | 53,142 | | 155 | | | $ | 96,623 | | | $ | 327,435 | | $ | 173,045 | | 89 | |
| Operating Expenses | (37,567) | | (20,721) | | 81 | | | (25,431) | | | (92,623) | | (84,673) | | 9 | |
| | | | | | | | | |
| Transportation Expenses | (3,021) | | (1,286) | | 135 | | | (2,921) | | | (8,448) | | (8,549) | | (1) | |
Operating Netback(2) | $ | 94,731 | | $ | 31,135 | | 204 | | | $ | 68,271 | | | $ | 226,364 | | $ | 79,823 | | 184 | |
| | | | | | | | | |
| G&A Expenses Before Stock-Based Compensation | $ | 5,444 | | $ | 4,506 | | 21 | | | $ | 7,133 | | | $ | 18,475 | | $ | 17,183 | | 8 | |
| G&A Stock-Based Compensation Expense (Recovery) | 1,053 | | 56 | | 1,780 | | | 1,873 | | | 6,597 | | (707) | | 1,033 | |
| G&A Expenses, Including Stock-Based Compensation | $ | 6,497 | | $ | 4,562 | | 42 | | | $ | 9,006 | | | $ | 25,072 | | $ | 16,476 | | 52 | |
| | | | | | | | | |
Adjusted EBITDA(2) | $ | 81,804 | | $ | 21,884 | | 274 | | | $ | 36,299 | | | $ | 160,007 | | $ | 74,247 | | 116 | |
| | | | | | | | | |
Funds Flow From Operations(2) | $ | 69,103 | | $ | 8,056 | | 758 | | | $ | 23,272 | | | $ | 121,348 | | $ | 36,257 | | 235 | |
| | | | | | | | | |
| Capital Expenditures | $ | 34,839 | | $ | 7,354 | | 374 | | | $ | 37,384 | | | $ | 109,650 | | $ | 56,378 | | 94 | |
(1) Sales volumes represent production NAR adjusted for inventory changes.
(2) Non-GAAP measures
Operating netback, EBITDA, adjusted EBITDA, funds flow from operations and free cash flow are non-GAAP measures which do not have any standardized meaning prescribed under GAAP. Management views these measures as financial performance measures. Investors are cautioned that these measures should not be construed as alternatives to net income (loss) or other measures of financial performance as determined in accordance with GAAP. Our method of calculating these measures may differ from other companies and, accordingly, may not be comparable to similar measures used by other companies. Disclosure of each non-GAAP financial measure is preceded by the corresponding GAAP measure so as not to imply that more emphasis should be placed on the non-GAAP measure.
Operating netback, as presented, is defined as oil sales less operating and transportation expenses. Management believes that operating netback is a useful supplemental measure for management and investors to analyze financial performance and provides an indication of the results generated by our principal business activities prior to the consideration of other income and expenses. A reconciliation from oil sales to operating netback is provided in the table above.
EBITDA, as presented, is defined as net income or loss adjusted for depletion, depreciation and accretion ("DD&A") expenses, interest expense and income tax expense or recovery. Adjusted EBITDA, as presented, is defined as EBITDA adjusted for goodwill impairment, asset impairment, non-cash lease expense, lease payments, unrealized foreign exchange gain or loss, stock-based compensation expense or recovery, other-non cash gain or loss, unrealized derivative instruments gain or loss and other financial instruments gain or loss. Management uses this supplemental measure to analyze performance and income generated by our principal business activities prior to the consideration of how non-cash items affect that income, and believes that this financial measure is
useful supplemental information for investors to analyze our performance and our financial results. A reconciliation from net loss to EBITDA and adjusted EBITDA is as follows:
| | | | | | | | | | | | | | | | | | | | | | | |
| | Three Months Ended September 30, | | Three Months Ended June 30, | | Nine Months Ended September 30, |
| (Thousands of U.S. Dollars) | 2021 | 2020 | | 2021 | | 2021 | 2020 |
| Net income (loss) | $ | 35,007 | | $ | (107,821) | | | $ | (17,627) | | | $ | (20,042) | | $ | (730,096) | |
| Adjustments to reconcile net income (loss) to EBITDA and Adjusted EBITDA | | | | | | | |
| DD&A expenses | 38,055 | | 31,340 | | | 28,927 | | | 98,300 | | 131,118 | |
| Interest expense | 13,608 | | 14,029 | | | 13,935 | | | 41,355 | | 40,204 | |
| Income tax expense (recovery) | 8,955 | | (20,565) | | | 9,189 | | | 26,795 | | (62,236) | |
| EBITDA (non-GAAP) | $ | 95,625 | | $ | (83,017) | | | $ | 34,424 | | | $ | 146,408 | | $ | (621,010) | |
| Goodwill impairment | — | | — | | | — | | | — | | 102,581 | |
| Asset impairment | — | | 104,731 | | | — | | | — | | 507,093 | |
| Non-cash lease expense | 408 | | 523 | | | 370 | | | 1,222 | | 1,494 | |
| Lease payments | (384) | | (429) | | | (393) | | | (1,239) | | (1,404) | |
| Unrealized foreign exchange loss | 3,465 | | 3,080 | | | 477 | | | 16,945 | | 22,335 | |
| Stock-based compensation expense (recovery) | 1,053 | | 56 | | | 1,873 | | | 6,597 | | (707) | |
| Other non-cash loss | — | | 2,026 | | | — | | | — | | 2,026 | |
| Unrealized derivative instruments (gain) loss | (4,729) | | (6,546) | | | (3,066) | | | 2,499 | | 553 | |
| Other financial instruments (gain) loss | (13,634) | | 1,460 | | | 2,614 | | | (12,425) | | 61,286 | |
| Adjusted EBITDA (non-GAAP) | $ | 81,804 | | $ | 21,884 | | | $ | 36,299 | | | $ | 160,007 | | $ | 74,247 | |
| | | | | | | |
| | | | | | | |
| | | | | | | |
| | | | | | | |
| | | | | | | |
Funds flow from operations, as presented, is defined as net income or loss adjusted for DD&A expenses, goodwill and asset impairment, deferred tax expense or recovery, stock-based compensation expense or recovery, amortization of debt issuance costs, non-cash lease expense, lease payments, unrealized foreign exchange gain or loss, derivative instruments gain or loss, cash settlement on derivative instruments, other non-cash gain or loss and other financial instruments gain or loss. Management uses this financial measure to analyze performance and income generated by our principal business activities prior to the consideration of how non-cash items affect that income, and believes that this financial measure is also useful supplemental information for investors to analyze performance and our financial results. Free cash flow, as presented, is defined as funds flow less capital expenditures. Management uses this financial measure to analyze cash flow generated by our principal business activities after capital requirements and believes that this financial measure is also useful supplemental information for investors to analyze performance and our financial results. A reconciliation from net loss to funds flow from operations and free cash flow is as follows:
| | | | | | | | | | | | | | | | | | | | | | | |
| | Three Months Ended September 30, | | Three Months Ended June 30, | | Nine Months Ended September 30, |
| (Thousands of U.S. Dollars) | 2021 | 2020 | | 2021 | | 2021 | 2020 |
| Net income (loss) | $ | 35,007 | | $ | (107,821) | | | $ | (17,627) | | | $ | (20,042) | | $ | (730,096) | |
| Adjustments to reconcile net income (loss) to funds flow from operations | | | | | | | |
| DD&A expenses | 38,055 | | 31,340 | | | 28,927 | | | 98,300 | | 131,118 | |
| Goodwill impairment | — | | — | | | — | | | — | | 102,581 | |
| Asset impairment | — | | 104,731 | | | — | | | — | | 507,093 | |
| Deferred tax expense (recovery) | 8,955 | | (21,202) | | | 9,203 | | | 26,809 | | (62,796) | |
| Stock-based compensation expense (recovery) | 1,053 | | 56 | | | 1,873 | | | 6,597 | | (707) | |
| Amortization of debt issuance costs | 907 | | 838 | | | 894 | | | 2,682 | | 2,774 | |
| Non-cash lease expense | 408 | | 523 | | | 370 | | | 1,222 | | 1,494 | |
| Lease payments | (384) | | (429) | | | (393) | | | (1,239) | | (1,404) | |
| Unrealized foreign exchange loss | 3,465 | | 3,080 | | | 477 | | | 16,945 | | 22,335 | |
| Derivative instruments loss (gain) | 2,603 | | (2,173) | | | 21,239 | | | 47,540 | | (9,417) | |
| Cash settlements on derivative instruments | (7,332) | | (4,373) | | | (24,305) | | | (45,041) | | 9,970 | |
| Other non-cash loss | — | | 2,026 | | | — | | | — | | 2,026 | |
| Other financial instruments (gain) loss | (13,634) | | 1,460 | | | 2,614 | | | (12,425) | | 61,286 | |
| Funds flow from operations (non-GAAP) | $ | 69,103 | | $ | 8,056 | | | $ | 23,272 | | | $ | 121,348 | | $ | 36,257 | |
| Capital expenditures | $ | 34,839 | | $ | 7,354 | | | $ | 37,384 | | | $ | 109,650 | | $ | 56,378 | |
| Free cash flow (non-GAAP) | $ | 34,264 | | $ | 702 | | | $ | (14,112) | | | $ | 11,698 | | $ | (20,121) | |
| | | | | | | |
| | | | | | | |
Additional Operational Results
| | | | | | | | | | | | | | | | | | | | | | | | | | | | | |
| | Three Months Ended September 30, | | Three Months Ended June 30, | | Nine Months Ended September 30, |
| (Thousands of U.S. Dollars) | 2021 | 2020 | % Change | | 2021 | | 2021 | 2020 | % Change |
| Oil sales | $ | 135,319 | | $ | 53,142 | | 155 | | | $ | 96,623 | | | $ | 327,435 | | $ | 173,045 | | 89 | |
| Operating expenses | 37,567 | | 20,721 | | 81 | | | 25,431 | | | 92,623 | | 84,673 | | 9 | |
| | | | | | | | | |
| Transportation expenses | 3,021 | | 1,286 | | 135 | | | 2,921 | | | 8,448 | | 8,549 | | (1) | |
Operating netback(1) | 94,731 | | 31,135 | | 204 | | | 68,271 | | | 226,364 | | 79,823 | | 184 | |
| | | | | | | | | |
| COVID-19 related costs | 990 | | 1,108 | | (11) | | | 897 | | | 3,026 | | 1,529 | | 98 | |
| DD&A expenses | 38,055 | | 31,340 | | 21 | | | 28,927 | | | 98,300 | | 131,118 | | (25) | |
| Goodwill impairment | — | | — | | — | | | — | | | — | | 102,581 | | (100) | |
| Asset impairment | — | | 104,731 | | (100) | | | — | | | — | | 507,093 | | (100) | |
| G&A expenses before stock-based compensation | 5,444 | | 4,506 | | 21 | | | 7,133 | | | 18,475 | | 17,183 | | 8 | |
| G&A stock-based compensation expense (recovery) | 1,053 | | 56 | | 1,780 | | | 1,873 | | | 6,597 | | (707) | | 1,033 | |
| Severance expenses | — | | 122 | | (100) | | | — | | | 919 | | 1,469 | | (37) | |
| Foreign exchange loss | 2,650 | | 4,275 | | (38) | | | 91 | | | 15,824 | | 20,094 | | (21) | |
| Derivative instruments loss (gain) | 2,603 | | (2,173) | | 220 | | | 21,239 | | | 47,540 | | (9,417) | | 605 | |
| Other financial instruments (gain) loss | (13,634) | | 1,460 | | (1,034) | | | 2,614 | | | (12,425) | | 61,286 | | (120) | |
| Other loss | — | | 67 | | (100) | | | — | | | — | | 67 | | (100) | |
| Interest expense | 13,608 | | 14,029 | | (3) | | | 13,935 | | | 41,355 | | 40,204 | | 3 | |
| 50,769 | | 159,521 | | (68) | | | 76,709 | | | 219,611 | | 872,500 | | (75) | |
| | | | | | | | | |
| Interest income | — | | — | | — | | | — | | | — | | 345 | | (100) | |
| | | | | | | | | |
| Income (loss) before income taxes | 43,962 | | (128,386) | | 134 | | | (8,438) | | | 6,753 | | (792,332) | | 101 | |
| | | | | | | | | |
| Current income tax expense (recovery) | — | | 637 | | (100) | | | (14) | | | (14) | | 560 | | (103) | |
| Deferred income tax expense (recovery) | 8,955 | | (21,202) | | 142 | | | 9,203 | | | 26,809 | | (62,796) | | 143 | |
| 8,955 | | (20,565) | | 144 | | | 9,189 | | | 26,795 | | (62,236) | | 143 | |
| Net income (loss) | $ | 35,007 | | $ | (107,821) | | 132 | | | $ | (17,627) | | | $ | (20,042) | | $ | (730,096) | | 97 | |
| | | | | | | | | |
| Sales Volumes (NAR) | | | | | | | | | |
| | | | | | | | | |
| | | | | | | | | |
| Total sales volumes, BOPD | 23,833 | | 17,066 | | 40 | | | 18,454 | | | 20,865 | | 20,381 | | 2 | |
| | | | | | | | | |
| Brent Price per bbl | $ | 73.23 | | $ | 43.34 | | 69 | | | $ | 69.08 | | | $ | 67.97 | | $ | 42.53 | | 60 | |
| | | | | | | | | |
| | | | | | | | | | | | | | | | | | | | | | | | | | | | | |
| Consolidated Results of Operations per bbl Sales Volumes NAR | | | | | | | | | |
| Oil sales | $ | 61.72 | | $ | 33.85 | | 82 | | | $ | 57.54 | | | $ | 57.48 | | $ | 30.99 | | 85 | |
| Operating expenses | 17.13 | | 13.20 | | 30 | | | 15.14 | | | 16.26 | | 15.16 | | 7 | |
| Transportation expenses | 1.38 | | 0.82 | | 68 | | | 1.74 | | | 1.48 | | 1.53 | | (3) | |
Operating netback(1) | 43.21 | | 19.83 | | 118 | | | 40.66 | | | 39.74 | | 14.30 | | 178 | |
| | | | | | | | | |
| COVID-19 related costs | 0.45 | | 0.70 | | (36) | | | 0.53 | | | 0.53 | | 0.27 | | 96 | |
| DD&A expenses | 17.36 | | 19.96 | | (13) | | | 17.23 | | | 17.26 | | 23.48 | | (26) | |
| Goodwill impairment | — | | — | | — | | | — | | | — | | 18.37 | | (100) | |
| Asset impairment | — | | 66.71 | | (100) | | | — | | | — | | 90.80 | | (100) | |
| G&A expenses before stock-based compensation | 2.48 | | 2.87 | | (14) | | | 4.25 | | | 3.24 | | 3.08 | | 5 | |
| G&A stock-based compensation expense (recovery) | 0.48 | | 0.04 | | 1,100 | | | 1.12 | | | 1.16 | | (0.13) | | 992 | |
| Severance expenses | — | | 0.08 | | (100) | | | — | | | 0.16 | | 0.26 | | (38) | |
| Foreign exchange loss | 1.21 | | 2.72 | | (56) | | | 0.05 | | | 2.78 | | 3.60 | | (23) | |
| Derivative instruments loss (gain) | 1.19 | | (1.38) | | 186 | | | 12.65 | | | 8.35 | | (1.69) | | 594 | |
| Other financial instruments (gain) loss | (6.22) | | 0.93 | | (769) | | | 1.56 | | | (2.18) | | 10.97 | | (120) | |
| Other loss | — | | 0.04 | | (100) | | | — | | | — | | 0.01 | | (100) | |
| Interest expense | 6.21 | | 8.94 | | (31) | | | 8.30 | | | 7.26 | | 7.20 | | 1 | |
| 23.16 | | 101.61 | | (77) | | | 45.69 | | | 38.56 | | 156.22 | | (75) | |
| | | | | | | | | |
| | | | | | | | | |
| Interest income | — | | — | | — | | | — | | | — | | 0.06 | | (100) | |
| | | | | | | | | |
| Income (loss) before income taxes | 20.05 | | (81.78) | | 125 | | | (5.03) | | | 1.18 | | (141.86) | | 101 | |
| | | | | | | | | |
| Current income tax expense (recovery) | — | | 0.41 | | (100) | | | (0.01) | | | — | | 0.10 | | (100) | |
| Deferred income tax expense (recovery) | 4.08 | | (13.50) | | 130 | | | 5.48 | | | 4.71 | | (11.24) | | 142 | |
| 4.08 | | (13.09) | | 131 | | | 5.47 | | | 4.71 | | (11.14) | | 142 | |
| Net income (loss) | $ | 15.97 | | $ | (68.69) | | 123 | | | $ | (10.50) | | | $ | (3.53) | | $ | (130.72) | | 97 | |
(1) Operating netback is a non-GAAP measure which does not have any standardized meaning prescribed under GAAP. Refer to "Financial and Operational Highlights—non-GAAP measures" for a definition of this measure.
Oil Production and Sales Volumes, BOPD
| | | | | | | | | | | | | | | | | |
| Three Months Ended September 30, | | Nine Months Ended September 30, |
| 2021 | 2020 | | 2021 | 2020 |
| Average Daily Volumes (BOPD) | | | | | |
| WI Production Before Royalties | 28,957 | | 18,944 | | | 25,501 | | 22,864 | |
| Royalties | (5,585) | | (1,893) | | | (4,531) | | (2,600) | |
| Production NAR | 23,372 | | 17,051 | | | 20,970 | | 20,264 | |
| Decrease (Increase) in Inventory | 461 | | 15 | | | (105) | | 117 | |
| Sales | 23,833 | | 17,066 | | | 20,865 | | 20,381 | |
| | | | | |
| Royalties, % of WI Production Before Royalties | 19 | % | 10 | % | | 18 | % | 11 | % |
Oil production NAR for the three and nine months ended September 30, 2021, increased by 37% and 3%, respectively, compared to the corresponding periods of 2020 due to the successful drilling and workover campaign in all major fields, despite production disruptions during the second quarter of 2021 caused by national blockades in Colombia. Compared to the prior quarter, oil production NAR increased 23% as the national blockades were resolved by the end of the second quarter of 2021.
Royalties as a percentage of production for the three and nine months ended September 30, 2021, increased compared with the corresponding periods of 2020 and the prior quarter commensurate with the increase in benchmark oil prices and the price sensitive royalty regime in Colombia.
The Midas block includes the Acordionero, Mochuelo, and Ayombero oil fields, and the Chaza block includes the Costayaco and Moqueta oil fields.
Operating Netback
| | | | | | | | | | | | | | | | | | | | | | | |
| Three Months Ended September 30, | | Three Months Ended June 30, | | Nine Months Ended September 30, |
| (Thousands of U.S. Dollars) | 2021 | 2020 | | 2021 | | 2021 | 2020 |
| | | | | | | |
| Oil Sales | $ | 135,319 | | $ | 53,142 | | | $ | 96,623 | | | $ | 327,435 | | $ | 173,045 | |
| Transportation Expenses | (3,021) | | (1,286) | | | (2,921) | | | (8,448) | | (8,549) | |
| 132,298 | | 51,856 | | | 93,702 | | | 318,987 | | 164,496 | |
| Operating Expenses | (37,567) | | (20,721) | | | (25,431) | | | (92,623) | | (84,673) | |
Operating Netback(1) | $ | 94,731 | | $ | 31,135 | | | $ | 68,271 | | | $ | 226,364 | | $ | 79,823 | |
| | | | | | | |
| (U.S. Dollars Per bbl Sales Volumes NAR) | | | | | | | |
| Brent | $ | 73.23 | | $ | 43.34 | | | $ | 69.08 | | | $ | 67.97 | | $ | 42.53 | |
| Quality and Transportation Discounts | (11.51) | | (9.49) | | | (11.54) | | | (10.49) | | (11.54) | |
| Average Realized Price | 61.72 | | 33.85 | | | 57.54 | | | 57.48 | | 30.99 | |
| Transportation Expenses | (1.38) | | (0.82) | | | (1.74) | | | (1.48) | | (1.53) | |
| Average Realized Price Net of Transportation Expenses | 60.34 | | 33.03 | | | 55.80 | | | 56.00 | | 29.46 | |
| Operating Expenses | (17.13) | | (13.20) | | | (15.14) | | | (16.26) | | (15.16) | |
Operating Netback(1) | $ | 43.21 | | $ | 19.83 | | | $ | 40.66 | | | $ | 39.74 | | $ | 14.30 | |
(1) Operating netback is a non-GAAP measure which does not have any standardized meaning prescribed under GAAP. Refer to "Financial and Operational Highlights—non-GAAP measures" for a definition of this measure.
Oil sales for the three months ended September 30, 2021, increased by 155% to $135.3 million due to a 69% increase in Brent price and 40% higher sales volumes partially offset by a 21% increase in the quality and transportation discounts as a result of the widening of the Castilla and Vasconia differentials compared to the corresponding period of 2020. Both the Castilla and Vasconia differentials have widened from $4.65 and $3.01 in the third quarter of 2020 to $6.51 and $4.02 in the third quarter of 2021, respectively. For the nine months ended September 30, 2021, oil sales increased by 89% to $327.4 million compared to the corresponding period of 2020 due to a 60% increase in Brent price, higher sales volumes, and lower quality and transportation discounts. Compared with the prior quarter, oil sales increased 40% primarily as a result of a 6% increase in Brent price and a 29% increase in sales volumes.
The following table shows the effect of changes in realized price and sales volumes on our oil sales for the three and nine months ended September 30, 2021, compared to the prior quarter and the corresponding periods of 2020:
| | | | | | | | | | | | | | | | | |
| (Thousands of U.S. Dollars) | Third Quarter 2021 Compared with Second Quarter 2021 | | Third Quarter 2021 Compared with Third Quarter 2020 | | Nine Months Ended September 30, 2021 Compared with Nine Months Ended September 30, 2020 |
| Oil sales for the comparative period | $ | 96,623 | | | $ | 53,142 | | | $ | 173,045 | |
| Realized sales price increase effect | 9,162 | | | 61,106 | | | 150,930 | |
| Sales volumes increase effect | 29,534 | | | 21,071 | | | 3,460 | |
| Oil sales for the three and nine months ended September 30, 2021 | $ | 135,319 | | | $ | 135,319 | | | $ | 327,435 | |
The average realized price for the three and nine months ended September 30, 2021, increased 82% and 85%, respectively, compared to the corresponding periods of 2020. The increases were commensurate with the rise in benchmark oil prices and for the nine month period lower Vasconia and Castilla differentials, but for the three month period were partially offset by higher Vasconia and Castilla differentials. Compared to the prior quarter, the average realized price increased 7% due to higher benchmark oil prices offset by higher differentials.
Operating expenses for the three and nine months ended September 30, 2021, increased $3.93 and $1.10 per bbl to $37.6 million and $92.6 million or $17.13 and $16.26 per bbl primarily due to increased operating activities and higher power generation costs in Acordionero when compared to the corresponding periods of 2020. Lower operating activities during most of 2020 were attributed to the shut-in of higher-cost wells in response to the COVID-19 pandemic. Compared to the prior quarter, operating expenses increased $1.99 per bbl from $25.4 million or $15.14 per bbl due to higher costs associated with power generation and chemical costs in Acordionero and increased workover activity.
We have options to sell our oil through multiple pipelines and trucking routes. Each option has varying effects on realized sales price and transportation expenses. The following table shows the percentage of oil volumes we sold in Colombia using each option for the three and nine months ended September 30, 2021, 2020, and the prior quarter:
| | | | | | | | | | | | | | | | | | | | | | | |
| Three Months Ended September 30, | | Three Months Ended June 30, | | Nine Months Ended September 30, |
| 2021 | 2020 | | 2021 | | 2021 | 2020 |
| Volume transported through pipeline | 9 | % | — | % | | 9 | % | | 6 | % | 5 | % |
| Volume sold at wellhead | 42 | % | 48 | % | | 24 | % | | 55 | % | 45 | % |
Volume transported via truck
to sales point | 49 | % | 52 | % | | 67 | % | | 39 | % | 50 | % |
| 100 | % | 100 | % | | 100 | % | | 100 | % | 100 | % |
Volumes transported through pipeline or via truck receive a higher realized price but incur higher transportation expenses. Conversely, volumes sold at the wellhead have the opposite effect of lower realized price, offset by lower transportation expenses.
Transportation expenses for the three months ended September 30, 2021, increased by 135% to $3.0 million and on a per bbl basis increased by 68% to $1.38 compared to the corresponding period of 2020 due to maintenance on the Impala terminal resulting in utilization of alternative transportation routes which had higher costs per bbl. For the nine months ended September 30, 2021, transportation expenses decreased by 1% to $8.4 million and on a per bbl basis decreased by 3% to $1.48 when compared to the corresponding period of 2020, as a result of higher volumes sold at the wellhead during the current period which resulted in lower transportation costs.
For the three months ended September 30, 2021, transportation expenses increased by 3% compared to $2.9 million in the prior quarter due to increased sales volumes. On a per bbl basis, transportation expenses decreased by 21% from $1.74 in the previous quarter due to the Company utilizing more favorable transportation routes as all blockades were lifted.
COVID-19 Costs
The COVID-19 pandemic has resulted in extra ongoing operating and transportation costs related to COVID-19 health and safety preventative measures, including incremental sanitation requirements and enhanced procedures for trucking barrels and crew changes in the field. For the three and nine months ended September 30, 2021, COVID-19 costs were $1.0 million and $3.0 million, respectively, comprised of $0.9 million and $2.7 million related to operating activities and $0.1 million and $0.3 million related to transportation activities. There were $1.1 million and $1.5 million COVID-19 costs for the three and nine months ended September 30, 2020, respectively, comprised of $1.0 million and $1.4 million related to operating activities and $0.1 million and $0.1 million related to transportation activities. For the prior quarter, COVID-19 costs were $0.9 million, comprised of $0.8 million related to operating and $0.1 million to transportation activities.
DD&A Expenses
| | | | | | | | | | | | | | | | | | | | | | | |
| Three Months Ended September 30, | | Three Months Ended June 30, | | Nine Months Ended September 30, |
| 2021 | 2020 | | 2021 | | 2021 | 2020 |
| DD&A Expenses, thousands of U.S. Dollars | $ | 38,055 | | $ | 31,340 | | | $ | 28,927 | | | $ | 98,300 | | $ | 131,118 | |
| DD&A Expenses, U.S. Dollars per bbl | 17.36 | | 19.96 | | | 17.23 | | | 17.26 | | 23.48 | |
DD&A expenses for the three and nine months ended September 30, 2021, increased 21% and 25%, respectively, due to increased production compared to the corresponding periods of 2020. On a per bbl basis, DD&A expenses decreased by $2.60 and $6.22 per bbl, respectively, due to lower costs in the depletable base as a result of ceiling test impairment losses recorded over the last three quarters of 2020.
For the three months ended September 30, 2021, DD&A expenses increased 32% compared to the prior quarter due to increased production during the current quarter. On a per bbl basis DD&A expenses were comparable to the previous quarter.
Impairment
Asset impairment
(i) Oil and gas property impairment
For the three and nine months ended September 30, 2021, we had no ceiling test impairment losses. For the three and nine months ended September 30, 2020, we had $104.7 million and $502.9 million of ceiling test impairment losses. We used an average Brent price of $60.12 and $47.95 per bbl for September 30, 2021 and 2020, respectively, ceiling test calculations.
(ii) Inventory impairment
For the three and nine months ended September 30, 2021, we had no inventory impairment. For the three and nine months ended September 30, 2020, we recorded $0.1 million and $4.2 million, respectively, of inventory impairment.
Goodwill impairment
The entire goodwill balance of $102.6 million was impaired during the nine months ended September 30, 2020, due to the unit's carrying value exceeding its fair value as a result of the impact of lower forecasted commodity prices.
G&A Expenses
| | | | | | | | | | | | | | | | | | | | | | | | | |
| Three Months Ended September 30, | | Three Months Ended June 30, | | Nine Months Ended September 30, |
| (Thousands of U.S. Dollars) | 2021 | 2020 | | | 2021 | | 2021 | 2020 | |
| G&A Expenses Before Stock-Based Compensation | $ | 5,444 | | $ | 4,506 | | | | $ | 7,133 | | | $ | 18,475 | | $ | 17,183 | | |
| G&A Stock-Based Compensation Expense (Recovery) | 1,053 | | 56 | | | | 1,873 | | | 6,597 | | (707) | | |
| G&A Expenses, Including Stock-Based Compensation | $ | 6,497 | | $ | 4,562 | | | | $ | 9,006 | | | $ | 25,072 | | $ | 16,476 | | |
| (U.S. Dollars Per bbl Sales Volumes NAR) | | | | | | | | | |
| G&A Expenses Before Stock-Based Compensation | $ | 2.48 | | $ | 2.87 | | | | $ | 4.25 | | | $ | 3.24 | | $ | 3.08 | | |
| G&A Stock-Based Compensation Expense (Recovery) | 0.48 | | 0.04 | | | | 1.12 | | | 1.16 | | (0.13) | | |
| G&A Expenses, Including Stock-Based Compensation | $ | 2.96 | | $ | 2.91 | | | | $ | 5.37 | | | $ | 4.40 | | $ | 2.95 | | |
For the three and nine months ended September 30, 2021, G&A expenses before stock-based compensation increased by 21% and 8%, respectively, consistent with an increase of operating activities in 2021 compared to the corresponding periods of 2020. On a per bbl basis, for the three months ended September 30, 2021, G&A expenses before stock-based compensation decreased by 14% to $2.48 as a result of higher sales volumes and increased by 5% to $3.24 for the nine months ended September 30, 2021, as a result of increased operating activities when compared to the corresponding periods of 2020. For the three months ended September 30, 2021, G&A expenses before stock-based compensation decreased by 24% to $5.4 million or 42% to $2.48 on a per bbl basis compared to the prior quarter due to the timing of certain costs incurred and expensed in the prior quarter.
G&A expenses after stock-based compensation for the three and nine months ended September 30, 2021, increased by 42% and 52% (2% and 49% per bbl), respectively, compared to the corresponding periods of 2020, mainly due to higher stock-based compensation resulting from a higher share price. G&A expenses after stock-based compensation for the three months ended September 30, 2021, decreased by 28% or 45% on a per bbl basis, compared with the prior quarter, due to the timing of certain costs incurred and expensed in the prior quarter.
Foreign Exchange Gains and Losses
For the three and nine months ended September 30, 2021, we had a $2.7 million and $15.8 million, respectively, loss on foreign exchange compared to a $4.3 million and a $20.1 million loss for the corresponding periods of 2020. Accounts receivable, taxes receivable, deferred income taxes, accounts payable, and investment are considered monetary items and require translation from local currency to U.S. dollar functional currency at each balance sheet date. This translation was the primary source of the foreign exchange losses in the periods.
The following table presents the change in the U.S. dollar against the Colombian peso and Canadian dollar for the three and nine months ended September 30, 2021, and 2020:
| | | | | | | | | | | | | | | | | |
| Three Months Ended September 30, | | Nine Months Ended September 30, |
| 2021 | 2020 | | 2021 | 2020 |
| Change in the U.S. dollar against the Colombian peso | strengthened by | strengthened by | | strengthened by | strengthened by |
| 2% | 3% | | 12% | 18% |
| Change in the U.S. dollar against the Canadian dollar | strengthened by | weakened by | | strengthened by | strengthened by |
| 3% | 2% | | —% | 3% |
Financial Instrument Gains and Losses
The following table presents the nature of our derivative and other financial instruments gains and losses for the three and nine months ended September 30, 2021, and 2020:
| | | | | | | | | | | | | | | | | |
| Three Months Ended September 30, | | Nine Months Ended September 30, |
| (Thousands of U.S. Dollars) | 2021 | 2020 | | 2021 | 2020 |
| Commodity price derivatives loss (gain) | $ | 2,586 | | $ | (2,206) | | | $ | 47,435 | | $ | (12,983) | |
| Foreign currency derivatives loss | 17 | | 33 | | | 105 | | 3,566 | |
| Derivative instruments loss (gain) | $ | 2,603 | | $ | (2,173) | | | $ | 47,540 | | $ | (9,417) | |
| | | | | |
| Unrealized PetroTal investment (gain) loss | $ | (13,616) | | $ | 1,055 | | | $ | (17,477) | | $ | 60,124 | |
| Loss on sale of PetroTal shares | — | | — | | | 5,070 | | — | |
| Financial instruments (gain) loss | (18) | | 405 | | | (18) | | 1,162 | |
| Other financial instruments (gain) loss | $ | (13,634) | | $ | 1,460 | | | $ | (12,425) | | $ | 61,286 | |
Income Tax Expense
| | | | | | | | | | | | | | | | | |
| Three Months Ended September 30, | | Nine Months Ended September 30, |
| (Thousands of U.S. Dollars) | 2021 | 2020 | | 2021 | 2020 |
| Income (loss) before income tax | $ | 43,962 | | $ | (128,386) | | | $ | 6,753 | | $ | (792,332) | |
| | | | | |
| Current income tax expense (recovery) | $ | — | | $ | 637 | | | $ | (14) | | $ | 560 | |
| Deferred income tax expense (recovery) | 8,955 | | (21,202) | | | 26,809 | | (62,796) | |
| Total income tax expense (recovery) | $ | 8,955 | | $ | (20,565) | | | $ | 26,795 | | $ | (62,236) | |
| | | | | |
| Effective tax rate | 20 | % | 16 | % | | 397 | % | 8 | % |
| | | | | |
| | | | | |
Current income tax was in a recovery position for the nine months ended September 30, 2021, versus an expense position for the comparative period in 2020, primarily due to changes in the previous estimation of presumptive minimum tax. The deferred income tax expense for the nine months ended September 30, 2021, resulted from excess tax depreciation compared with accounting depreciation and the use of tax losses to offset taxable income in Colombia. The deferred income tax recovery in the comparative period of 2020 was mainly the result of a ceiling test impairment loss in Colombia, partially offset by losses incurred in Colombia that are now fully offset by a valuation allowance.
For the nine months ended September 30, 2021, the difference between the effective tax rate of 397% and the 31% Colombian tax rate was primarily due to the non-deductibility of derivative instrument losses and financing costs; foreign currency translation adjustments, and stock based compensation. These were partially offset by a decrease in valuation allowance and the non-taxable portion (50%) of the unrealized gain on PetroTal Corp. ("PetroTal") shares.
In the third quarter of 2021, Congressional authorities in Colombia enacted a new tax legislation, which includes an increase to the corporate income tax rate to 35% from 31%, effective January 1, 2022. Accordingly, the tax rates applied to the calculation of deferred income taxes, before valuation allowances, have been adjusted to reflect this change.
For the nine months ended September 30, 2020, the difference between the effective tax rate of 8% and the 32% Colombian tax rate was primarily due to an increase in the valuation allowance, the non-deductibility of goodwill impairment for tax purposes, foreign translation adjustments and the non-deductible portion (50%) of the unrealized loss on PetroTal shares.
Net Income and Funds Flow from Operations (a Non-GAAP Measure)
| | | | | | | | | | | | | | | | | | | | |
| (Thousands of U.S. Dollars) | Third Quarter 2021 Compared with Second Quarter 2021 | % change | Third Quarter 2021 Compared with Third Quarter 2020 | % change | Nine Months Ended September 30, 2021 Compared with Nine Months Ended September 30, 2020 | % change |
| Net loss for the comparative period | $ | (17,627) | | | $ | (107,821) | | | $ | (730,096) | | |
| Increase (decrease) due to: | | | | | | |
| Sales price | 9,162 | | | 61,106 | | | 150,930 | | |
| Sales volumes | 29,534 | | | 21,071 | | | 3,460 | | |
| Expenses: | | | | | | |
| Operating | (12,136) | | | (16,846) | | | (7,950) | | |
| Transportation | (100) | | | (1,735) | | | 101 | | |
| Cash G&A | 1,689 | | | (938) | | | (1,292) | | |
| Net lease payments | 47 | | | (70) | | | (107) | | |
| Severance | — | | | 122 | | | 550 | | |
Interest, net of amortization of debt
issuance costs | 340 | | | 490 | | | (1,243) | | |
| Realized foreign exchange | 429 | | | 2,010 | | | (1,120) | | |
| Cash settlements on derivative instruments | 16,973 | | | (2,959) | | | (55,011) | | |
| Current taxes | (14) | | | 637 | | | 574 | | |
| Other loss | — | | | (1,959) | | | (1,959) | | |
| COVID-19 related costs | (93) | | | 118 | | | (1,497) | | |
| Interest income | — | | | — | | | (345) | | |
Net change in funds flow from operations(1) from comparative period | 45,831 | | | 61,047 | | | 85,091 | | |
| Expenses: | | | | | | |
| Depletion, depreciation and accretion | (9,128) | | | (6,715) | | | 32,818 | | |
| Goodwill impairment | — | | | — | | | 102,581 | | |
| Asset impairment | — | | | 104,731 | | | 507,093 | | |
| Deferred tax | 248 | | | (30,157) | | | (89,605) | | |
| Amortization of debt issuance costs | (13) | | | (69) | | | 92 | | |
| Stock-based compensation | 820 | | | (997) | | | (7,304) | | |
Derivative instruments gain or loss, net of
settlements on derivative instruments | 1,663 | | | (1,817) | | | (1,946) | | |
| Other financial instruments gain or loss | 16,248 | | | 15,094 | | | 73,711 | | |
| Unrealized foreign exchange | (2,988) | | | (385) | | | 5,390 | | |
| Other Loss | — | | | 2,026 | | | 2,026 | | |
| Net lease payments | (47) | | | 70 | | | 107 | | |
| Net change in net loss | 52,634 | | | 142,828 | | | 710,054 | | |
| Net income (loss) for the current period | $ | 35,007 | | 299% | $ | 35,007 | | 132% | $ | (20,042) | | 97% |
(1)Funds flow from operations is a non-GAAP measure which does not have any standardized meaning prescribed under GAAP. Refer to "Financial and Operational Highlights—non-GAAP measures" for a definition and reconciliation of this measure.
Capital expenditures during the three months ended September 30, 2021 were $34.8 million:
| | | | | |
| (Millions of U.S. Dollars) | |
| Colombia: | |
| Exploration | $ | 6.6 | |
| Development: | |
| Drilling and Completions | 9.6 | |
| Facilities | 6.3 | |
| Other | 11.8 | |
| 34.3 | |
| Corporate & Ecuador | 0.5 | |
| $ | 34.8 | |
During the three months ended September 30, 2021, we commenced drilling the following wells in Colombia:
| | | | | |
| Number of wells (Gross and Net) |
| Development | 2.0 | |
| |
| |
We spud two development wells in the Midas Block, both of which were producing as of September 30, 2021.
Liquidity and Capital Resources
| | | | | | | | | | | | | | | | | |
| | As at |
| (Thousands of U.S. Dollars) | September 30, 2021 | | % Change | | December 31, 2020 |
| Cash and Cash Equivalents | $ | 16,600 | | | 18 | | | $ | 14,114 | |
| | | | | |
| | | | | |
| | | | | |
| Revolving Credit Facility | $ | 150,000 | | | (21) | | | $ | 190,000 | |
| | | | | |
| 6.25% Senior Notes | $ | 300,000 | | | — | | | $ | 300,000 | |
| | | | | |
| 7.75% Senior Notes | $ | 300,000 | | | — | | | $ | 300,000 | |
The outbreak of the COVID-19 virus, which was declared a pandemic by the World Health Organization in March 2020, spread across the globe and impacted worldwide economic activity. In 2020, global commodity prices declined significantly during the first half of 2020 due to disputes between major oil producing countries combined with the impact of the COVID-19 pandemic and associated reductions in global demand for oil. Governments worldwide, including those in Colombia and Ecuador, the countries where we operate, enacted emergency measures to combat the spread of the virus. These measures, which include the implementation of travel bans, self-imposed quarantine periods and social distancing, have caused, and may continue to cause, material disruption to businesses globally resulting in an economic slowdown. While global commodity prices have improved since historic lows during the first half of 2020, the current challenging economic climate had and may continue to have significant adverse impacts on our Company including, but not exclusively:
•material declines in revenue and cash flows as a result of the decline in commodity prices;
•declines in revenue and operating activities due to reduced capital programs and the shut-in of production;
•impairment charges;
•inability to comply with covenants and restrictions in debt agreements;
•inability to access financing sources;
•increased risk of non-performance by our customers and suppliers;
•interruptions in operations as we adjust personnel to the dynamic environment; and
•inability to operate or delay in operations as a result COVID-19 restrictions in the countries in which we operate
Based on current forecasted Brent pricing and production levels, which can change materially in very short time frames, we forecasted to comply with the financial covenants contained in the revolving credit facility for at least the next year from the date of these financial statements. The amount available under our senior secured credit facility is based on the lender's borrowing base determination. The borrowing base is determined, by the lenders, based on our reserves and commodity prices. The next renewal of the borrowing base is in November 2021, and there is a risk that the lenders may reduce the borrowing base. In addition, our ability to borrow under the credit facility may be limited by the terms of the indentures for the 6.25% Senior Notes and 7.75% Senior Notes.
The risk of non-compliance with the covenants in the lending agreements and the risk associated with maintaining the borrowing base is heightened in the current period of volatility coupled with the unprecedented disruption caused by the COVID-19 pandemic. We currently expect to continue to meet the terms of the credit facility or obtain further amendments or waivers if and when required. We also expect to maintain the borrowing base at a level in excess of the amount borrowed. However, there can be no assurances that our liquidity can be maintained at or above current levels during this period of volatility and global economic uncertainty.
The situation is dynamic, and the ultimate duration and magnitude of the impact on the economy and the financial effect on our Company is not known at this time.
As at September 30, 2021, the borrowing base of our Senior Secured Credit Facility (the "revolving credit facility") was $215 million, with the next re-determination to occur no later than November 2021. We are required to comply with various covenants, which have been modified in response to the recent market conditions and the COVID-19 pandemic. We have obtained relief from compliance with certain financial covenants, which expired on October 1, 2021 ("the covenant relief period"). During the covenant relief period, our ratio of total debt to EBITDAX was permitted to be greater than 4.0 to 1.0, our Senior Secured Debt to EBITDAX ratio could not exceed 2.5 to 1.0, and our EBITDAX to interest expense ratio for the trailing four-quarter periods measured as of the last day of the fiscal quarters ending as of the last day of the fiscal quarters ended September 30, 2021, was required to be at least 2.0 to 1.0. We are required to comply with various covenants, which as disclosed above, have been modified in response to the current market conditions and the COVID-19 pandemic. As of September 30, 2021, we were in compliance with all applicable covenants in the revolving credit facility.
After the expiration of the covenant relief period on October 1, 2021, we must maintain compliance with the following financial covenants: limitations on our ratio of debt to EBITDAX to a maximum of 4.0 to 1.0; limitations on our ratio of Senior Secured Debt to EBITDAX to a maximum of 3.0 to 1.0; and the maintenance of a ratio of EBITDAX to interest expense of at least 2.5 to 1.0. If we fail to comply with these financial covenants, it would result in a default under the terms of the credit agreement, which could result in an acceleration of repayment of all indebtedness under the Company's revolving credit facility.
Amounts drawn under the revolving credit facility bear interest, at the borrower's option, USD LIBOR plus a margin ranging from 2.90% to 4.90%, or base rate plus a margin ranging from 1.90% to 3.90%, in each case based on the borrowing base utilization percentage. The alternate base rate is currently the U.S. prime rate. We pay a commitment fee on undrawn amounts under the revolving credit facility, which ranges from 0.73% to 1.23% per annum, based on the average daily amount of unused commitments.
At September 30, 2021, we had $150.0 million drawn under the revolving credit facility. During the third quarter of 2021, we repaid $25.0 million of the amount drawn under the revolving credit facility. Accordingly, we had $65.0 million of availability under the revolving credit facility as of September 30, 2021. As of October 29, 2021, outstanding borrowings under our revolving credit facility were further reduced to $130.0 million.
At September 30, 2021, we had a $300.0 million aggregate principal amount of 6.25% Senior Notes due 2025 and a $300.0 million aggregate principal amount of 7.75% Senior Notes due 2027 outstanding. An event of default under the revolving credit facility would result in a default under the indentures governing the senior notes, which could allow the noteholders to require us to repurchase all of the outstanding Senior Notes.
In accordance with our investment policy, available cash balances are held in our primary cash management banks or invested in U.S. or Canadian government-backed federal, provincial, or state securities or other money market instruments with high credit ratings and short-term liquidity.
Derivative Positions
At September 30, 2021, we had outstanding commodity price derivative positions as follows:
| | | | | | | | | | | | | | | | | | | | |
| Period and type of instrument | Volume,
bopd | Reference | Sold Put ($/bbl, Weighted Average) | Purchased Put ($/bbl, Weighted Average) | Sold Call ($/bbl, Weighted Average) | Swap Price ($/bbl, Weighted Average) |
Three-way Collars:
October 1, to December 31, 2021 | 7,000 | | ICE Brent | 47.14 | | 57.14 | | 68.95 | | n/a |
| Swaps: October 1, to December 31, 2021 | 3,000 | | ICE Brent | n/a | n/a | n/a | 56.75 | |
Foreign Currency Derivatives
At September 30, 2021, we had outstanding foreign currency derivative positions as follows:
| | | | | | | | | | | | | | | | | |
| Period and type of instrument | Amount Hedged
(Millions COP) | U.S. Dollar Equivalent of Amount Hedged (Thousands of U.S. Dollars)(1) | Reference | Floor Price
(COP, Weighted Average) | Cap Price (COP, Weighted Average) |
| Collars: October 1, to December 31, 2021 | 3,000 | 782 | COP | 3,500 | 3,630 |
(1) At September 30, 2021 foreign exchange rate.
At September 30, 2021, our balance sheet included $14.7 million of current liabilities related to the above outstanding commodity price and foreign currency derivative positions.
Cash Flows
The following table presents our primary sources and uses of cash and cash equivalents for the periods presented:
| | | | | | | | |
| Nine Months Ended September 30, |
(Thousands of U.S. Dollars)
| 2021 | 2020 |
| Sources of cash and cash equivalents: | | |
| Net loss | $ | (20,042) | | $ | (730,096) | |
Adjustments to reconcile net loss to Adjusted EBITDA(1) and funds flow from operations(1) | | |
| DD&A expenses | 98,300 | | 131,118 | |
| Interest expense | 41,355 | | 40,204 | |
| Income tax expense (recovery) | 26,795 | | (62,236) | |
| Goodwill impairment | — | | 102,581 | |
| Asset impairment | — | | 507,093 | |
| Other loss | — | | 2,026 | |
| Non-cash lease expenses | 1,222 | | 1,494 | |
| Lease payments | (1,239) | | (1,404) | |
| Unrealized foreign exchange loss | 16,945 | | 22,335 | |
| Stock-based compensation expense (recovery) | 6,597 | | (707) | |
| Unrealized derivative instruments loss | 2,499 | | 553 | |
| Other financial instruments (gain) loss | (12,425) | | 61,286 | |
Adjusted EBITDA(1) | 160,007 | | 74,247 | |
| Current income tax recovery (expense) | 14 | | (560) | |
| Contractual interest and other financing expenses | (38,673) | | (37,430) | |
Funds flow from operations(1) | 121,348 | | 36,257 | |
| Proceeds from debt, net of issuance costs | — | | 88,382 | |
| Proceeds from issuance of Senior Notes, net of issuance costs | — | | — | |
| Proceeds from issuance of exercise of stock options | 19 | | — | |
| Proceeds from disposition of investment, net of transaction costs | 14,632 | | — | |
| Net changes in assets and liabilities from operating activities | 17,956 | | 23,288 | |
| Changes in non-cash investing working capital | 709 | | — | |
| 154,664 | | 147,927 | |
| | |
| Uses of cash and cash equivalents: | | |
| Additions to property, plant and equipment | (109,650) | | (56,378) | |
| | |
| Repayment of debt | (40,000) | | (7,000) | |
| | |
| | |
| Debt issuance costs | (125) | | — | |
| | |
| Changes in non-cash investing working capital | — | | (69,549) | |
| Settlement of asset retirement obligations | (483) | | (199) | |
| Lease payments | (1,269) | | (307) | |
| Foreign exchange loss on cash, cash equivalents and restricted cash and cash equivalents | (528) | | (754) | |
| (152,055) | | (134,187) | |
| Net increase in cash and cash equivalents and restricted cash and cash equivalents | $ | 2,609 | | $ | 13,740 | |
(1) Adjusted EBITDA and funds flow from operations are a non-GAAP measures which do not have any standardized meaning prescribed under GAAP. Refer to “Financial and Operational Highlights - non-GAAP measures” for a definition and reconciliation of this measure.
One of the primary sources of variability in our cash flows from operating activities is the fluctuation in oil prices, the impact of which we partially mitigate by entering into commodity price derivatives. Sales volume changes and costs related to operations and debt service also impact cash flows. Our cash flows from operating activities are also impacted by foreign currency exchange rate changes, the impact of which we partially mitigate by entering into foreign currency derivatives. During the nine months ended September 30, 2021, funds flow from operations increased by 235% compared to the corresponding period of 2020 primarily due to a significant increase in Brent price and increase in production, which were offset by an increase in operating expenses and cash settlements on derivative instruments.
Off-Balance Sheet Arrangements
As at September 30, 2021, we had no off-balance sheet arrangements.
Contractual Obligations
At September 30, 2021, we had $150.0 million drawn under our revolving credit facility.
Except for noted above, as at September 30, 2021, there were no other material changes to our contractual obligations outside of the ordinary course of business from those as at December 31, 2020.
Critical Accounting Policies and Estimates
Our critical accounting policies and estimates are disclosed in Item 7 of our 2020 Annual Report on Form 10-K and have not changed materially since the filing of that document.
Item 3. Quantitative and Qualitative Disclosures About Market Risk
As a Smaller Reporting Company, we are not required to provide information under this Item 3.
Item 4. Controls and Procedures
Disclosure Controls and Procedures
We have established disclosure controls and procedures (as defined in Rules 13a-15(e) and 15d-15(e) under the Securities Exchange Act of 1934, or Exchange Act). Our disclosure controls and procedures are designed to provide reasonable assurance that the information required to be disclosed by Gran Tierra in the reports that it files or submits under the Exchange Act is recorded, processed, summarized, and reported within the time periods specified in the SEC rules and forms and that such information is accumulated and communicated to management, including our Chief Executive Officer and Chief Financial Officer, as appropriate, to allow timely decisions regarding required disclosure. Our management, with the participation of our Chief Executive Officer and Chief Financial Officer, evaluated the effectiveness of the design and operation of our disclosure controls and procedures as of the end of the period covered by this report, as required by Rule l3a-15(b) of the Exchange Act. Based on this evaluation, our Chief Executive Officer and Chief Financial Officer have concluded that Gran Tierra's disclosure controls and procedures were effective as of September 30, 2021.
Changes in Internal Control over Financial Reporting
There were no changes in our internal control over financial reporting during the quarter ended September 30, 2021, that have materially affected, or are reasonably likely to materially affect our internal control over financial reporting.
PART II - Other Information
Item 1. Legal Proceedings
See Note 11 in the Notes to the Condensed Consolidated Financial Statements (Unaudited) in Part I, Item 1 of this Quarterly Report on Form 10-Q, which is incorporated herein by reference, for any material developments with respect to matters previously reported in our Annual Report on Form 10-K for the year ended December 31, 2020, and any material matters that have arisen since the filing of such report.
Item 1A. Risk Factors
There are numerous factors that affect our business and results of operations, many of which are beyond our control. In addition to information set forth in this quarterly report on Form 10-Q, including in Part I, Item 2 "Management's Discussion and Analysis of Financial Condition and Results of Operations", you should carefully read and consider the factors set out in Part I, Item 1A "Risk Factors" in our Annual Report on Form 10-K for the year ended December 31, 2020. These risk factors could materially affect our business, financial condition and results of operations. The unprecedented nature of the current pandemic and downturn in the worldwide economy and oil and gas industry may make it more difficult to identify all the risks to our business, results of operations and financial condition and the ultimate impact of identified risks.
Item 2. Unregistered Sales of Equity Securities and Use of Proceeds
None.
Item 6. Exhibits
| | | | | | | | | | | |
| Exhibit No. | Description | | Reference |
| | | |
| 3.1 | | | Incorporated by reference to Exhibit 3.3 to the Current Report on Form 8-K, filed with the SEC on November 4, 2016 (SEC File No. 001-34018). |
| | | |
| 3.2 | | | Incorporated by reference to Exhibit 3.4 to the Current Report on Form 8-K, filed with the SEC on November 4, 2016 (SEC File No. 001-34018). |
| | | |
| 3.3 | | | Incorporated by reference to Exhibit 3.1 to the Current Report on Form 8-K filed with the SEC on July 9, 2018 (SEC File No. 001-34018). |
| | | |
| 3.4 | | | Incorporated by reference to Exhibit 3.1 to the Current
Report on Form 8-K filed with the SEC on August 4,
2021 (SEC File No. 001-34018). |
| | | |
| 31.1 | | | Filed herewith. |
| | | | |
| 31.2 | | | Filed herewith. |
| | | |
| 32.1 | | | Furnished herewith. |
101.INS XBRL Instance Document - the instance document does not appear in the Interactive Data File because its XBRL tags are embedded within the Inline XBRL document
101.SCH Inline XBRL Taxonomy Extension Schema Document
101.CAL Inline XBRL Taxonomy Extension Calculation Linkbase Document
101.DEF Inline XBRL Taxonomy Extension Definition Linkbase Document
101.LAB Inline XBRL Taxonomy Extension Label Linkbase Document
101.PRE Inline XBRL Taxonomy Extension Presentation Linkbase Document
104.The cover page from Gran Tierra Energy Inc.'s Quarterly Report on Form 10-Q for the quarter ended September 30, 2021, formatted in Inline XBRL (included within the Exhibit 101 attachments).
*Management contract or compensatory plan or arrangement
SIGNATURES
Pursuant to the requirements of the Securities Exchange Act of 1934, the registrant has duly caused this report to be signed on its behalf by the undersigned thereunto duly authorized.
GRAN TIERRA ENERGY INC.
| | | | | | | | |
| Date: November 3, 2021 | | /s/ Gary S. Guidry |
| | | By: Gary S. Guidry |
| | | President and Chief Executive Officer |
| | | (Principal Executive Officer) |
| | | | | | | | |
| Date: November 3, 2021 | | /s/ Ryan Ellson |
| | | By: Ryan Ellson |
| | Executive Vice President and Chief Financial Officer |
| | | (Principal Financial and Accounting Officer) |