UNITED STATES SECURITIES AND EXCHANGE COMMISSION
Washington, D.C. 20549
FORM 10-K
(Mark One)
ANNUAL REPORT PURSUANT TO SECTION 13 OR 15(d) OF THE SECURITIES EXCHANGE ACT OF 1934 | ||
For the fiscal year ended December 31, 2019
or
TRANSITION REPORT PURSUANT TO SECTION 13 OR 15(d) OF THE SECURITIES EXCHANGE ACT OF 1934 | ||
For the transition period from __________ to __________
Commission file number 001-34018
(Exact name of registrant as specified in its charter)
(State or other jurisdiction of incorporation or organization) | (I.R.S. Employer Identification No.) | ||||
(Address of principal executive offices, including zip code) | |||||
(403 ) 265-3221
(Registrant’s telephone number, including area code)
Securities registered pursuant to Section 12(b) of the Act:
Title of each class | Trading Symbol(s) | Name of each exchange on which registered |
Toronto Stock Exchange | ||
London Stock Exchange | ||
Securities Registered Pursuant to Section 12(g) of the Act: None
Indicate by check mark if the registrant is a well-known seasoned issuer, as defined in Rule 405 of the Securities Act.
Yes o No ý
Indicate by check mark if the registrant is not required to file reports pursuant to Section 13 or Section 15(d) of the Act.
Yes o No ý
Indicate by check mark whether the registrant (1) has filed all reports required to be filed by Section 13 or 15(d) of the Securities Exchange Act of 1934 during the preceding 12 months (or for such shorter period that the registrant was required to file such reports), and (2) has been subject to such filing requirements for the past 90 days. Yes ý No o
Indicate by check mark whether the registrant submitted electronically every Interactive Data File required to be submitted pursuant to Rule 405 of Regulation S-T (§ 232.405 of this chapter) during the preceding 12 months (or for such shorter period that the registrant was required to submit such files).
Indicate by check mark whether the registrant is a large accelerated filer, an accelerated filer, a non-accelerated filer, or a smaller reporting company or an emerging growth company. See the definitions of “large accelerated filer,” “accelerated filer”, “smaller reporting company” and “emerging growth company” in Rule 12b-2 of the Exchange Act.
Large accelerated filer | ☐ | ☒ | |
Non-accelerated filer | ☐ | Smaller reporting company | |
Emerging growth company | |||
If an emerging growth company, indicate by check mark if the registrant has elected not to use the extended transition period for complying with any new or revised financial accounting standards provided pursuant to Section 13(a) of the Exchange Act. o
Indicate by check mark whether the registrant is a shell company (as defined in Rule 12b-2 of the Act). Yes ☐ No ý
The aggregate market value of the voting and non-voting common equity held by non-affiliates as of June 30, 2019, the last business day of the registrant’s most recently completed second fiscal quarter, was approximately $0.5 billion.
On February 24, 2020, 366,981,556 shares of the registrant’s Common Stock with $0.001 par value were outstanding.
DOCUMENTS INCORPORATED BY REFERENCE
The information required by Part III of this report, to the extent not set forth herein, is incorporated by reference from the registrant’s definitive proxy statement relating to the 2020 annual meeting of stockholders, which definitive proxy statement will be filed with the Securities and Exchange Commission within 120 days after December 31, 2019.
1
Gran Tierra Energy Inc.
Annual Report on Form 10-K
Year Ended December 31, 2019
Table of Contents
Page | ||
PART I | ||
Items 1 and 2. | Business and Properties | |
Item 1A. | Risk Factors | |
Item 1B. | Unresolved Staff Comments | |
Item 3. | Legal Proceedings | |
Item 4. | Mine Safety Disclosures | |
PART II | ||
Item 5. | Market for Registrant's Common Equity, Related Stockholder Matters and Issuer Purchases of Equity Securities | |
Item 6. | Selected Financial Data | |
Item 7. | Management's Discussion and Analysis of Financial Condition and Results of Operations | |
Item 7A. | Quantitative and Qualitative Disclosures About Market Risk | |
Item 8. | Financial Statements and Supplementary Data | |
Item 9. | Changes in and Disagreements with Accountants on Accounting and Financial Disclosure | |
Item 9A. | Controls and Procedures | |
Item 9B. | Other Information | |
PART III | ||
Item 10. | Directors, Executive Officers and Corporate Governance | |
Item 11. | Executive Compensation | |
Item 12. | Security Ownership of Certain Beneficial Owners and Management and Related Stockholder Matters | |
Item 13. | Certain Relationships and Related Transactions, and Director Independence | |
Item 14. | Principal Accounting Fees and Services | |
PART IV | ||
Item 15. | Exhibits, Financial Statement Schedules | |
Item 16. | Form 10-K Summary | |
SIGNATURES | ||
2
CAUTIONARY LANGUAGE REGARDING FORWARD-LOOKING STATEMENTS
This Annual Report on Form 10-K includes forward-looking statements within the meaning of Section 27A of the Securities Act of 1933, as amended (the “Securities Act”), and Section 21E of the Securities Exchange Act of 1934, as amended (the “Exchange Act”). All statements other than statements of historical facts included in this Annual Report on Form 10-K regarding our financial position, estimated quantities and net present values of reserves, business strategy, plans and objectives of our management for future operations, covenant compliance, capital spending plans and those statements preceded by, followed by or that otherwise include the words “believe”, “expect”, “anticipate”, “intend”, “estimate”, “project”, “target”, “goal”, “plan”, “budget”, “objective”, “should”, or similar expressions or variations on these expressions are forward-looking statements. We can give no assurances that the assumptions upon which the forward-looking statements are based will prove to be correct or that, even if correct, intervening circumstances will not occur to cause actual results to be different than expected. Because forward-looking statements are subject to risks and uncertainties, actual results may differ materially from those expressed or implied by the forward-looking statements. There are a number of risks, uncertainties and other important factors that could cause our actual results to differ materially from the forward-looking statements, including, but not limited to, those set out in Part I, Item 1A. “Risk Factors” in this Annual Report on Form 10-K. The information included herein is given as of the filing date of this Annual Report on Form 10-K with the Securities and Exchange Commission (“SEC”) and, except as otherwise required by the federal securities laws, we disclaim any obligations or undertaking to publicly release any updates or revisions to any forward-looking statement contained in this Annual Report on Form 10-K to reflect any change in our expectations with regard thereto or any change in events, conditions or circumstances on which any forward-looking statement is based.
GLOSSARY OF OIL AND GAS TERMS
In this report, the abbreviations set forth below have the following meanings:
bbl | barrel | Mcf | thousand cubic feet |
Mbbl | thousand barrels | MMcf | million cubic feet |
MMbbl | million barrels | Bcf | billion cubic feet |
BOE | barrels of oil equivalent | bopd | barrels of oil per day |
MMBOE | million barrels of oil equivalent | NAR | net after royalty |
BOEPD | barrels of oil equivalent per day | ||
Sales volumes represent production NAR adjusted for inventory changes and losses. Our oil and gas reserves are reported NAR. Our production is also reported NAR, except as otherwise specifically noted as “working interest production before royalties”. Gas volumes are converted to BOE at the rate of 6 Mcf of gas per bbl of oil, based upon the approximate relative energy content of gas and oil. The rate is not necessarily indicative of the relationship between oil and gas prices. BOEs may be misleading, particularly if used in isolation. A BOE conversion ratio of 6 Mcf:1 bbl is based on an energy equivalency conversion method primarily applicable at the burner tip and does not represent a value equivalency at the wellhead.
Below are explanations of some commonly used terms in the oil and gas business and in this report.
Developed acres. The number of acres that are allocated or assignable to producing wells or wells capable of production.
Development well. A well drilled within the proved area of an oil or gas reservoir to the depth of a stratigraphic horizon known to be productive.
Dry hole. Exploratory or development well that does not produce oil or gas in commercial quantities.
Exploitation activities. The process of the recovery of fluids from reservoirs and drilling and development of oil and gas reserves.
Exploration well. An exploration well is a well drilled to find a new field or new reservoir in a field previously found to be productive of oil or gas in another reservoir. Generally, an exploratory well is any well that is not a development well, an extension well, a service well or a stratigraphic test well.
Field. An area consisting of a single reservoir or multiple reservoirs all grouped on or related to the same individual geological structural feature and/or stratigraphic condition.
Gross acres or gross wells. The total acres or wells in which we own a working interest.
3
Net acres or net wells. The sum of the fractional working interests we own in gross acres or gross wells expressed as whole numbers and fractions of whole numbers.
Possible reserves. Possible reserves are those additional reserves that are less certain to be recovered than probable reserves. The SEC provides a complete definition of possible reserves in Rule 4-10(a)(17) of Regulation S-X.
Probable reserves. Probable reserves are those additional reserves that are less certain to be recovered than proved reserves but that, together with proved reserves, are as likely as not to be recovered. The SEC provides a complete definition of probable reserves in Rule 4-10(a)(18) of Regulation S-X.
Productive well. A well that is found to be capable of producing hydrocarbons in sufficient quantities such that proceeds from the sale of such production exceed production expenses and taxes.
Proved developed reserves. In general, reserves that can be expected to be recovered from existing wells with existing equipment and operating methods. The SEC provides a complete definition of developed oil and gas reserves in Rule 4-10(a)(6) of Regulation S-X.
Proved reserves. Those quantities of oil and natural gas, which, by analysis of geoscience and engineering data, can be estimated with reasonable certainty to be economically producible from a given date forward, from known reservoirs and under existing economic conditions, operating methods and government regulations prior to the time at which contracts providing the right to operate expire, unless evidence indicates that renewal is reasonably certain, regardless of whether deterministic or probabilistic methods are used for the estimation. The project to extract the hydrocarbons must have commenced or the operator must be reasonably certain that it will commence the project within a reasonable time.
(i) The area of the reservoir considered as proved includes:
(A) The area identified by drilling and limited by fluid contacts, if any, and
(B) Adjacent undrilled portions of the reservoir that can, with reasonable certainty, be judged to be continuous with it and to contain economically producible oil or gas on the basis of available geoscience and engineering data.
(ii) In the absence of data on fluid contacts, proved quantities in a reservoir are limited by the lowest known hydrocarbons ("LKH") as seen in a well penetration unless geoscience, engineering, or performance data and reliable technology establishes a lower contact with reasonable certainty.
(iii) Where direct observation from well penetrations has defined a highest known oil ("HKO") elevation and the potential exists for an associated gas cap, proved oil reserves may be assigned in the structurally higher portions of the reservoir only if geoscience, engineering, or performance data and reliable technology establish the higher contact with reasonable certainty.
(iv) Reserves which can be produced economically through application of improved recovery techniques (including, but not limited to, fluid injection) are included in the proved classification when:
(A) Successful testing by a pilot project in an area of the reservoir with properties no more favorable than in the reservoir as a whole, the operation of an installed program in the reservoir or an analogous reservoir, or other evidence using reliable technology establishes the reasonable certainty of the engineering analysis on which the project or program was based; and
(B) The project has been approved for development by all necessary parties and entities, including governmental entities.
(v) Existing economic conditions include prices and costs at which economic producibility from a reservoir is to be determined. The price shall be the average price during the 12-month period prior to the ending date of the period covered by the report, determined as an unweighted arithmetic average of the first-day-of-the-month price for each month within such period, unless prices are defined by contractual arrangements, excluding escalations based upon future conditions.
Proved undeveloped reserves. In general, reserves that are expected to be recovered from new wells on undrilled acreage or from existing wells where a relatively major expenditure is required for recompletion. The SEC provides a complete definition of undeveloped oil and gas reserves in Rule 4-10(a)(31) of Regulation S-X.
Reserves. Reserves are estimated remaining quantities of oil and gas and related substances anticipated to be economically producible, as of a given date, by application of development projects to known accumulations. In addition, there must exist, or there must be a reasonable expectation that there will exist, the legal right to produce or a revenue interest in the production, installed means of delivering oil and gas or related substances to market, and all permits and financing required to implement the project.
Undeveloped acreage. Lease acreage on which wells have not been drilled or completed to a point that would permit the production of economic quantities of oil and gas regardless of whether such acreage contains proved reserves.
4
Working interest. The operating interest that gives the owner the right to drill, produce and conduct operating activities on the property and a share of production and requires the owner to pay a share of the costs of drilling and production operations.
PART I
Items 1 and 2. Business and Properties
General
Gran Tierra Energy Inc., together with its subsidiaries (“Gran Tierra”, “the Company”, “us”, “our”, or “we”), is a company focused on oil and gas exploration and production in Colombia and Ecuador. Our Colombian properties represented 100% of our proved reserves NAR at December 31, 2019. For the year ended December 31, 2019, 100% (year ended December 31, 2018 - 100%, and year ended December 31, 2017 - 98%) of our revenue and other income was generated in Colombia.
We were incorporated under the laws of the State of Nevada in June 2008 and changed our state of incorporation to the State of Delaware in October 2016.
All dollar ($) amounts referred to in this Annual Report on Form 10-K are United States (U.S.) dollars, unless otherwise indicated.
2019 Overview
Acquisitions and Dispositions
On February 20, 2019, we acquired 36.2% working interest ("WI") and operatorship in the Suroriente Block and 100% WI in the Llanos-5 Block for a cash consideration of $79.1 million and a promissory note of $1.5 million. The acquisition increased our WI in Suroriente Block from 16% to 52%. As of December 31, 2019, the Suroriente Block had 6,084 MBOE of proven reserves and 10,390 MBOE of proven plus probable reserves.
On May 22, 2019, we signed participation contracts for the Charapa, Chanangue and Iguana Blocks located in the Oriente Basin in Ecuador and secured 100% WI and operatorship for these blocks. We expect to commence our exploration drilling program in Ecuador during 2020. The blocks added 138,239 acres in a highly prospective basin with access to infrastructure.
During the year ended December 31, 2019, we were awarded four exploration blocks (PUT-21, PUT-33, Llanos-85 and VMM-24) via successful bid rounds in Colombia. The newly awarded blocks added 286,729 acres in highly prospective basins in Colombia, all with access to infrastructure.
2019 Operational Highlights
During the year ended December 31, 2019, we incurred capital expenditures of $379.3 million, the majority of which were incurred in Colombia. In 2019, we drilled six exploration wells, five water injectors, and 25 development wells.
The six exploration wells were drilled in the PUT-1, PUT-7, El Porton, Llanos-10 and Santana Blocks. As at December 31, 2019, three of these wells were producing, two were in-progress and one was a dry well.
We spud five water injector wells, all in the Midas Block.
We spud 25 development wells; 19 in the Midas Block, three in the VMM-2 Block and three in the Chaza Block. As at December 31, 2019, 22 of these wells were producing, two did not achieve economic rates and one was in-progress.
Of the seven wells in-progress in Colombia as at December 31, 2018, three were producing, three were dry and one remained in-progress as at December 31, 2019.
During 2019, we commissioned facilities in the Acordionero Field and continued other facilities work in the Moqueta and Costayaco Fields on the Chaza Block.
5
2020 Outlook
Colombia remains our primary focus and represents 97% of our 2020 capital program with the remainder allocated to exploration activities in Ecuador.
The table below shows break-down of our 2020 capital program:
Number of Wells (Gross) | Number of Wells (Net) | 2020 Capital Budget ($ million) | |
Colombia | |||
Development | 16-19 | 15-18 | 140-160 |
Exploration | 1-2 | 1-2 | 25-35 |
Ecuador | |||
Exploration | 0-1 | 0-1 | 0-10 |
17-22 | 16-21 | 175-195(1) | |
(1) Assumes the mid-point of budgeted amount for exploration
Based on the mid-point of the 2020 guidance, the capital budget is forecasted to be approximately 80% directed to development and 20% to exploration. Approximately 20% of the development activities included in the 2020 capital program are expected to be directed to facilities.
We expect our 2020 capital program to be fully funded by cash flows from operations.
Business Strategy
Our strategy is to profitably grow our portfolio of exploration, development and production opportunities in Colombia and Ecuador in a sustainable manner. We are taking steps to grow cash flows from existing assets by developing reserves and growing reserves through enhanced oil recovery (“EOR”) techniques. We have consolidated sufficient exploration opportunities to commence a three to five year exploration program which we expect will be fully funded through the reinvestment of cash flows from operations.
6
Oil and Gas Properties - Colombia and Ecuador


Acquisitions
On February 20, 2019, we acquired 36.2% WI and operatorship in the Suroriente Block and 100% WI in the Llanos-5 Block for a cash consideration of $79.1 million and a promissory note of $1.5 million. The acquisition increased our WI in Suroriente Block from 16% to 52%.
On May 22, 2019, we signed participation contracts for the Charapa, Chanangue and Iguana Blocks located in the Oriente Basin in Ecuador and secured 100% WI and operatorship for these blocks. We expect to commence our exploration drilling program in Ecuador during 2020.
7
During the year ended December 31, 2019, we were awarded four exploration blocks (PUT-21, PUT-33, Llanos-85 and VMM-24) via successful bid rounds in Colombia.
Excluding blocks subject to relinquishment, we have interests in 29 blocks in Colombia, three blocks in Ecuador and are the operator on 29 of those blocks.
Exploration Blocks & Commitments
The following table provides a summary of our exploration commitments for certain blocks as at December 31, 2019:
Basin | Block | Current Phase | Remaining Commitments, Current Phase |
Colombia | |||
Putumayo | Alea 1848-A | 3 & 4 | 1 exploration well |
Putumayo | Alea 1947-C | 2* | 1 exploration well |
Putumayo | Chaza E&P | Production | 1 exploration well |
Putumayo | PUT-1 | 2* | 2 exploration wells |
Putumayo | PUT-2 | 2** | 3 exploration wells |
Putumayo | PUT-4 | 1 | 1 exploration well |
Putumayo | PUT-7 | 2 | 2 exploration wells |
Putumayo | PUT-10 | 1* | 73 km 2D seismic, 2 exploration wells |
Putumayo | PUT-25 | 1 | 1 exploration well |
Putumayo | PUT-31 | 1 | 200 km2 3D seismic,1.9 km 2D seismic,1 exploration well |
Llanos | LLA-1 | 1** | 97.5 km2 3D seismic, 1 exploration well |
Llanos | LLA-5 | 1** | 133 km2 3D seismic, 1 exploration well |
Llanos | LLA-22 | 1 & 2* | 85 km2 3D seismic, 1 exploration well |
Llanos | LLA-70 | 1** | 163.4 km2 3D seismic, 1 exploration well |
Llanos | LLA-85 | 1 | 50 km2 3D seismic, 451 km2 3D seismic reprocessing |
Caguan-Putumayo | Tinigua | 2* | 1 exploration well |
Ecuador | |||
Oriente | Charapa | 1 | 50 km 2D seismic, 172 points of surface geochemistry, 7 exploration wells |
Oriente | Chanangue | 1 | Reprocess 190 km2 3D seismic, 155 points surface geochemistry, 5 exploration wells |
Oriente | Iguana | 1 | Reprocess 201 km2 3D seismic, 2 exploration wells |
*As of February 24, 2020, suspended due to either licensing restrictions or social reasons
** As of February 24, 2020, suspended due to security issues
Royalties
Colombian royalties are regulated under Colombia Law 756 of 2002, as modified by Law 1530 of 2012. All discoveries made subsequent to the enactment of Law 756 of 2002 have the sliding scale royalty described below. Discoveries made before the enactment of Law 756 of 2002 have a royalty of 20%, and in the case of such discoveries under association contracts reverted to the national government, an additional 12% applies for a total royalty of 32%.
8
The Agencia Nacional de Hidrocarburos (National Hydrocarbons Agency) (“ANH”) contracts have royalties that are based on a sliding scale described in Law 756 of 2002. These royalties work on an individual oil field basis starting with a base royalty rate of 8% for gross production of less than 5,000 bopd, increases in a linear fashion from 8% to 20% for gross production between 5,000 and 125,000 bopd and is stable at 20% for gross production between 125,000 and 400,000 bopd. For gross production between 400,000 and 600,000 bopd the rate increases in a linear fashion from 20% to 25%. For gross production in excess of 600,000 bopd the royalty rate is fixed at 25%. The Santana and Nancy-Burdine-Maxine Blocks have a fixed rate for existing production of 32% and 20%, respectively, and sliding scale for new discoveries or incremental production duly approved by ANH. In addition to the sliding scale royalty, the following blocks have additional x-factor royalties: Llanos-22, Putumayo-2, Putumayo-4 and Putumayo-7: 1%; Sinu-1, VMM-2 and Llanos-10: 3%; Putumayo-1: 5%; Putumayo-31: 12%; Sinu-3: 17%; Putumayo 25: 19%; Llanos-1, Llanos -70: 31%; Llanos-53: 33%.
For gas fields, the royalty is on an individual gas field basis starting with a base royalty rate of 6.4% for gross production of less than 28.5 MMcf of gas per day. The royalty increases in a linear fashion from 6.4% to 16% for gross production between 28.5 MMcf of gas per day and 712.5 MMcf of gas per day and is stable at 16% for gross production between 712.5 to 2,280 MMcf of gas per day, and then increases in a linear fashion from 16% to 20% for gross production between 2.28 to 3.42 Bcf of gas per day. For gross production in excess of 3.42 Bcf of gas per day the royalty rate is fixed at 20%.
An additional royalty (the “HPR royalty”) applies on exploration and production contracts signed under the ANH oil regulatory regime in 2004 and onwards when cumulative gross production from an Exploitation Area is greater than five MMbbl and reference prices exceed the trigger price defined in the contract. For exploration and production contracts awarded in the 2010, 2012 and 2014 Colombia Bid Rounds, the HPR royalty will apply once the production from the area governed by the contract, rather than any particular Exploitation Area designated under the contract, exceeds five MMbbl of cumulative production. At December 31, 2019, our production from the Costayaco and Moqueta Exploitation Areas in the Chaza block and the Acordionero Exploitation Area in the Midas Block were subject to the HPR royalty. The HPR royalty is calculated based on the established percent (S) of the part of the average monthly reference WTI price (P) that exceeds a base price (Po), divided by the average monthly reference price (P).
In addition to these government royalties, our original interests in the Guayuyaco and Chaza Blocks acquired on our entry into Colombia in 2006 are subject to a third party royalty. The additional interests in Guayuyaco and Chaza that we acquired on the acquisition of Solana in 2008 are not subject to this third party royalty. The overriding royalty rights start with a 2% rate on working interest production less government royalties. For new commercial fields discovered within 10 years of the agreement date and after a prescribed threshold is reached, Crosby Capital, LLC (“Crosby”) reserves the right to convert the overriding royalty rights to a net profit interest (“NPI”). This NPI ranges from 7.5% to 10% of working interest production less sliding scale government royalties, as described above, and operating and overhead costs. No adjustment is made for the HPR royalty. On certain pre-existing fields, Crosby does not have the right to convert its overriding royalty rights to an NPI. In addition, there are conditional overriding royalty rights that apply only to the pre-existing fields. Currently, we are subject to a 10% NPI on 50% of our working interest production from the Costayaco and Moqueta Fields in the Chaza Block and 35% of our working interest production from the Juanambu Field in the Guayuyaco Block, and overriding royalties on our working interest production from the Guayuyaco Field in the Guayuyaco Block.
The Putumayo-7 and Putumayo 1 Blocks are also subject to a third party royalty in addition to the government royalties. Putumayo-7: Pursuant to the terms of the agreement by which the interests in the Putumayo-7 Block were acquired, a 10% royalty on production from the Putumayo-7 Block is payable to a third party. The terms of the royalty allow for transportation costs, marketing and handling fees, government royalties (including royalties payable to the ANH pursuant to Section 39 of the contract for the Putumayo-7 Block - the “Rights Due to High Prices”) and taxes (other than taxes measured by the income of any party, and other than VAT or any equivalent) to be paid in cash or kind to the Government of Colombia (or any federal, state, regional or local government agency) and ANH, and a 1% 'X' factor payment to be deducted from production revenue prior to the royalty being paid to a third party. Pursuant to the terms of the agreement by which the interests in the Putumayo-1 Block were acquired, a 3% royalty on production from the Putumayo-1 Block is payable to a third party. The terms of the royalty do not allow for any costs, royalties and taxes to be deducted from production revenue.
Administrative Facilities
Our principal executive offices are located in Calgary, Alberta, Canada. The Calgary office lease will expire on November 29, 2022. We also have office space in Colombia and Ecuador.
9
Estimated Reserves
Our 2019 reserves were independently prepared by McDaniel International Inc. (“McDaniel”), a wholly-owned subsidiary of McDaniel & Associates. McDaniel & Associates was established in 1955 as an independent Canadian consulting firm and has been providing oil and gas reserves evaluation services to the world's petroleum industry for the past 60 years. They have internationally recognized expertise in reserves evaluations, resource assessments, geological studies, and acquisition and disposition advisory services. McDaniel's office is located in Calgary, Canada. The technical person primarily responsible for the preparation of our reserves estimates at McDaniel meets the requirements regarding qualifications, independence, objectivity, and confidentiality set forth in the Standards Pertaining to the Estimating and Auditing of Oil and Gas Reserves Information promulgated by the Society of Petroleum Engineers.
The primary internal technical person in charge of overseeing the preparation of our reserve estimates is the Chief Operating Officer. He has a Bachelor of Science degree in Geological Engineering from the University of Saskatchewan and is a professional engineer and member of the Association of Professional Engineers, Geologists and Geophysicists of Alberta. He is responsible for our engineering activities including reserves reporting, asset evaluation, reservoir management and field development. He has over 20 years of multi-disciplinary upstream oil and gas experience and eight years of executive level leadership experience including leadership project management roles in international oil and gas companies.
We have developed internal controls for estimating and evaluating reserves. Our internal controls over reserve estimates include: 100% of our reserves are evaluated by an independent reservoir engineering firm, at least annually; and review controls are followed, including an independent internal review of assumptions used in the reserve estimates and presentation of the results of this internal review to our reserves committee. Calculations and data are reviewed at several levels of the organization to ensure consistent and appropriate standards and procedures. Our policies are applied by all staff involved in generating and reporting reserve estimates including geological, engineering and finance personnel.
The process of estimating oil and gas reserves is complex and requires significant judgment, as discussed in Item 1A. “Risk Factors”. The reserve estimation process requires us to use significant decisions and assumptions in the evaluation of available geological, geophysical, engineering and economic data for each property. Therefore, the accuracy of the reserve estimate is dependent on the quality of the data, the accuracy of the assumptions based on the data and the interpretations and judgment related to the data.
Proved reserves are reserves which, by analysis of geoscience and engineering data, can be estimated with reasonable certainty to be economically producible from a given date forward from known reservoirs under existing economic conditions, operating methods and government regulations prior to the time at which contracts providing the right to operate expires, unless evidence indicates that renewal is reasonably certain. The term “reasonable certainty” implies a high degree of confidence that the quantities of oil or natural gas actually recovered will equal or exceed the estimate. To achieve reasonable certainty, we and the independent reserve engineers employed technologies that have been demonstrated to yield results with consistency and repeatability. Estimates of proved reserves are generated through the integration of relevant geological, engineering, and production data, utilizing technologies that have been demonstrated in the field to yield repeatable and consistent results as defined in the SEC regulations. Data used in these integrated assessments included information obtained directly from the subsurface through wellbores, such as well logs, reservoir core samples, fluid samples, static and dynamic pressure information, production test data, and surveillance and performance information. The data utilized also included subsurface information obtained through indirect measurements such as seismic data. The tools used to interpret the data included proprietary and commercially available seismic processing software and commercially available reservoir modeling and simulation software. Reservoir parameters from analogous reservoirs were used to increase the quality of and confidence in the reserves estimates when available. The method or combination of methods used to estimate the reserves of each reservoir was based on the unique circumstances of each reservoir and the dataset available at the time of the estimate. Probable reserves are reserves that are less certain to be recovered than proved reserves but which, together with proved reserves, are as likely as not to be recovered. Estimates of probable reserves which may potentially be recoverable through additional drilling or recovery techniques are by nature more uncertain than estimates of proved reserves and accordingly are subject to substantially greater risk of not actually being realized by us. The probable reserves that have been assigned as of December 31, 2019 were based on both the greater percentage of recovery of the hydrocarbons in place than assumed for proved reserves, as well as to areas of a reservoir adjacent to proved reserves where data control or interpretations of available data are less certain.
Possible reserves are reserves that are less certain to be recovered than probable reserves. Estimates of possible reserves are also inherently imprecise. Estimates of probable and possible reserves are also continually subject to revisions based on production history, results of additional exploration and development, price changes and other factors. The possible reserves that have been assigned as of December 31, 2019 were based on both the greater percentage of recovery of the hydrocarbons
10
in place than assumed for probable reserves as well as to areas of a reservoir adjacent to probable reserves where data control or interpretations of available data are less certain.
The following table sets forth our estimated reserves NAR as of December 31, 2019:
Oil | Natural Gas | Oil and Natural Gas | |||||||
Reserves Category | (Mbbl) | (MMcf) | (MBOE) | ||||||
Proved | |||||||||
Total proved developed reserves | 36,465 | 1,008 | 36,633 | ||||||
Total proved undeveloped reserves | 30,864 | 886 | 31,012 | ||||||
Total proved reserves | 67,329 | 1,894 | 67,645 | ||||||
Probable (1) | |||||||||
Total probable developed reserves | 19,896 | 339 | 19,953 | ||||||
Total probable undeveloped reserves | 38,259 | 992 | 38,424 | ||||||
Total probable reserves | 58,155 | 1,331 | 58,377 | ||||||
Possible (1) | |||||||||
Total possible developed reserves | 21,368 | 460 | 21,445 | ||||||
Total possible undeveloped reserves | 16,351 | 1,019 | 16,521 | ||||||
Total possible reserves | 37,719 | 1,479 | 37,966 | ||||||
(1) Estimates of probable and possible reserves are more uncertain than proved reserves, but have not been adjusted for risk due to that uncertainty. Accordingly, estimates of probable and possible reserves are not comparable and have not been, or should not be, summed arithmetically with each other or with estimates of proved reserves.
Product Prices Used In Reserves Estimates
The product prices that were used to determine the future gross revenue for each property reflect adjustments to the benchmark prices for gravity, quality, local conditions and/or distance from market. The average realized prices for reserves in the report are:
Oil ($/bbl) - Colombia | $ | 54.05 | ||
Natural Gas ($/Mcf) - Colombia | $ | 3.67 | ||
ICE Brent - average of the first day of each month price for the 12-month period | $ | 64.20 | ||
These prices should not be interpreted as a prediction of future prices. We do not represent that this data is the fair value of our oil and gas properties, or a fair estimate of the present value of cash flows to be obtained from their development and production.
Proved Undeveloped Reserves
At December 31, 2019, we had total proved undeveloped reserves NAR of 31.0 MMBOE (December 31, 2018 - 17.3 MMBOE), which were 100% in Colombia (December 31, 2018 – 100% in Colombia). Approximately 59%, 11%, 8% and 10% for a total of 88% of proved undeveloped reserves are located in our Acordionero, Cohembi, Costayaco and Moqueta Fields, respectively, in Colombia. None of our proved undeveloped reserves at December 31, 2019 have remained undeveloped for five years or more since initial disclosure as proved reserves and we have adopted a development plan which indicates that the proved undeveloped reserves are scheduled to be drilled within five years of initial disclosure as proved reserves.
Changes in proved undeveloped reserves during the year ended December 31, 2019 are shown in the table below:
11
Colombia - Oil Equivalent (MMBOE) | ||
Balance, December 31, 2018 | 17.3 | |
Acquisitions | 1.5 | |
Converted to proved producing | (8.7 | ) |
Extensions | 6.1 | |
Technical revisions | 14.8 | |
Balance, December 31, 2019 | 31.0 | |
In 2019, we converted 8.7 MMBOE, or 50%, of 2018 proved undeveloped reserves to developed status. In 2019, we made investments, consisting solely of capital expenditures, of $81.3 million in Colombia associated with the development of proved undeveloped reserves.
Changes in proved undeveloped reserves during the year ended December 31, 2019 shown in the table above primarily resulted from the following significant factors:
Acquisitions. During the year ended December 31, 2019, we added 1.5 MMBOE of proved undeveloped reserves as a result of acquisitions of 36.2% WI in the Suroriente Block and 20% WI in the VMM-2 Block.
Converted to Proved Producing. In 2019, we converted 8.7 MMBOE, or 50% of 2018 proved undeveloped reserves to developed status. This was based on drilling 15 wells in the Midas Block, three wells in the Chaza Block and two wells in the PUT-7 Block.
Extensions. Extensions added 6.1 MMBOE of 2019 proved undeveloped reserves during the year ended December 31, 2019 and were attributed to extensions of 4.9 MMBOE in the Acordionero field and 1.2 MMBOE in the Costayaco field.
Technical Revisions. During the year ended December 31, 2019, we experienced revisions of 14.8 MMBOE of 2019 proved undeveloped reserves to proved developed reserves, primarily as a result of positive technical revisions based on well performance in the Acordionero and Cohembi Fields.
Production, Revenue and Price History
Certain information concerning production, prices, revenues and operating expenses for the three years ended December 31, 2019 is set forth in Item 7. “Management’s Discussion and Analysis of Financial Condition and Results of Operations” and in the “Unaudited Supplementary Data” provided following our Financial Statements in Item 8, which information is incorporated by reference here.
The following table presents NAR oil production, average sales prices and operating expenses per NAR oil production from our major Fields Costayaco, Moqueta, Cohembi and Acordionero and from all of our properties for each of the three years ended December 31, 2019:
12
Costayaco(1) | Moqueta(1) | Cohembi(1) | Acordionero(1) | Total for all properties (2) (3) | |||||||||||||
Year Ended December 31, 2019 | |||||||||||||||||
Oil production NAR bbl | 1,966,585 | 1,022,391 | 675,086 | 5,166,430 | 10,590,137 | ||||||||||||
Average sales price of oil per bbl | $ | 56.38 | $ | 55.93 | $ | 54.35 | $ | 54.17 | $ | 53.92 | |||||||
Operating expenses of oil per bbl (4) | $ | 18.95 | $ | 18.88 | $ | 23.94 | $ | 14.60 | $ | 19.23 | |||||||
Year Ended December 31, 2018 | |||||||||||||||||
Oil production NAR bbl | 2,244,497 | 1,020,673 | 324,798 | 5,469,072 | 10,604,197 | ||||||||||||
Average sales price of oil per bbl | $ | 58.19 | $ | 59.87 | $ | 55.06 | $ | 57.64 | $ | 57.85 | |||||||
Operating expenses of oil per bbl (4) | $ | 22.23 | $ | 20.47 | $ | 22.81 | $ | 11.22 | $ | 16.47 | |||||||
Year Ended December 31, 2017 | |||||||||||||||||
Oil production NAR bbl | 3,173,659 | 1,550,344 | 251,618 | 3,131,577 | 9,776,533 | ||||||||||||
Average sales price of oil per bbl | $ | 43.55 | $ | 45.05 | $ | 37.55 | $ | 43.90 | $ | 43.14 | |||||||
Operating expenses of oil per bbl (4) | $ | 11.70 | $ | 15.27 | $ | 24.30 | $ | 10.34 | $ | 13.81 | |||||||
(1) 100% of product sales were oil
(2) Includes de minimis natural gas sales from non-core properties from Colombia of 361,065 mcf (60,178 boe), 208,961 mcf (34,827 boe) and 591,775 mcf (98,629 boe) for each of the years ended December 31, 2019, 2018 and 2017, respectively
(3) In 2019 and 2018, 100% of production was from Colombia and in 2017 total production from all properties included oil and natural gas production from Brazil of 197,841 bbl of oil and 73,325 mcf (12,221 boe) of natural gas
(4) Operating expenses include lifting, workover and transportation
We prepared the estimate of standardized measure of proved reserves in accordance with the Financial Accounting Standards Board (“FASB”) Accounting Standards Codification 932, “Extractive Activities – Oil and Gas”.
Drilling Activities
The following table summarizes the results of our exploration and development drilling activity for the past three years. Wells labeled as “In Progress” for a year were in progress as of December 31, 2019, 2018 or 2017. This information should not be considered indicative of future performance, nor should it be assumed that there was any correlation between the number of productive wells drilled and the oil and gas reserves generated thereby or the costs to Gran Tierra of productive wells compared to the costs of dry holes.
2019 | 2018 | 2017 | ||||||||||||||||
Gross | Net | Gross | Net | Gross | Net | |||||||||||||
Exploration | ||||||||||||||||||
Productive | 3.00 | 2.50 | 1.00 | 1.00 | 2.00 | 1.55 | ||||||||||||
Dry | 1.00 | 1.00 | 1.00 | 0.51 | — | — | ||||||||||||
In Progress | 2.00 | 2.00 | 3.00 | 3.00 | 2.00 | 2.00 | ||||||||||||
Development | ||||||||||||||||||
Productive | 22.00 | 22.00 | 19.00 | 18.16 | 17.00 | 13.63 | ||||||||||||
Dry | 2.00 | 2.00 | — | — | — | — | ||||||||||||
In Progress | 1.00 | 1.00 | 4.00 | 4.00 | 2.00 | 1.70 | ||||||||||||
Service | ||||||||||||||||||
Water injectors | 5.00 | 5.00 | — | — | 2.00 | 2.00 | ||||||||||||
Total Colombia | 36.00 | 35.50 | 28.00 | 26.67 | 25.00 | 20.88 | ||||||||||||
Of the seven wells in progress in Colombia as at December 31, 2018, three were producing, three were dry and one remained in-progress as at December 31, 2019.
13
In 2019, we also continued pressure maintenance projects in the Acordionero, Costayaco, Cohembi, and Moqueta Fields in Colombia.
Well Statistics
The following table sets forth our productive wells as of December 31, 2019:
Oil Wells | |||||
Gross | Net | ||||
Colombia(1) | 216.0 | 180.2 | |||
216.0 | 180.2 | ||||
(1) Includes 37.0 gross and 33.6 net water and gas injector wells and 70.0 gross and 67.1 net wells with multiple completions.
Developed and Undeveloped Acreage
At December 31, 2019, our acreage was located 93% in Colombia and 7% in Ecuador. The following table sets forth our developed and undeveloped oil and gas lease and mineral acreage as of December 31, 2019:
Developed | Undeveloped (2) | Total | |||||||||||||||
Gross | Net | Gross | Net | Gross | Net | ||||||||||||
Colombia(1) | 340,310 | 247,921 | 1,620,955 | 1,548,130 | 1,961,265 | 1,796,051 | |||||||||||
Ecuador | — | — | 138,239 | 138,239 | 138,239 | 138,239 | |||||||||||
Total | 340,310 | 247,921 | 1,759,194 | 1,686,369 | 2,099,504 | 1,934,290 | |||||||||||
(1) Excludes our interest in seven blocks with a total of 0.6 million net acres for which government approval of relinquishments or sale was pending at December 31, 2019.
(2) As of December 31, 2019 the exploration phase for 0.1 million gross and net undeveloped acres expires within next three years with an option to extend exploration phase for 50% of the expired area.
Research and Development
We utilize existing technology, industry best practices and continual process improvement to execute our business plan. We have not expended any resources on pursuing research and development initiatives.
Marketing and Major Customers
Colombia
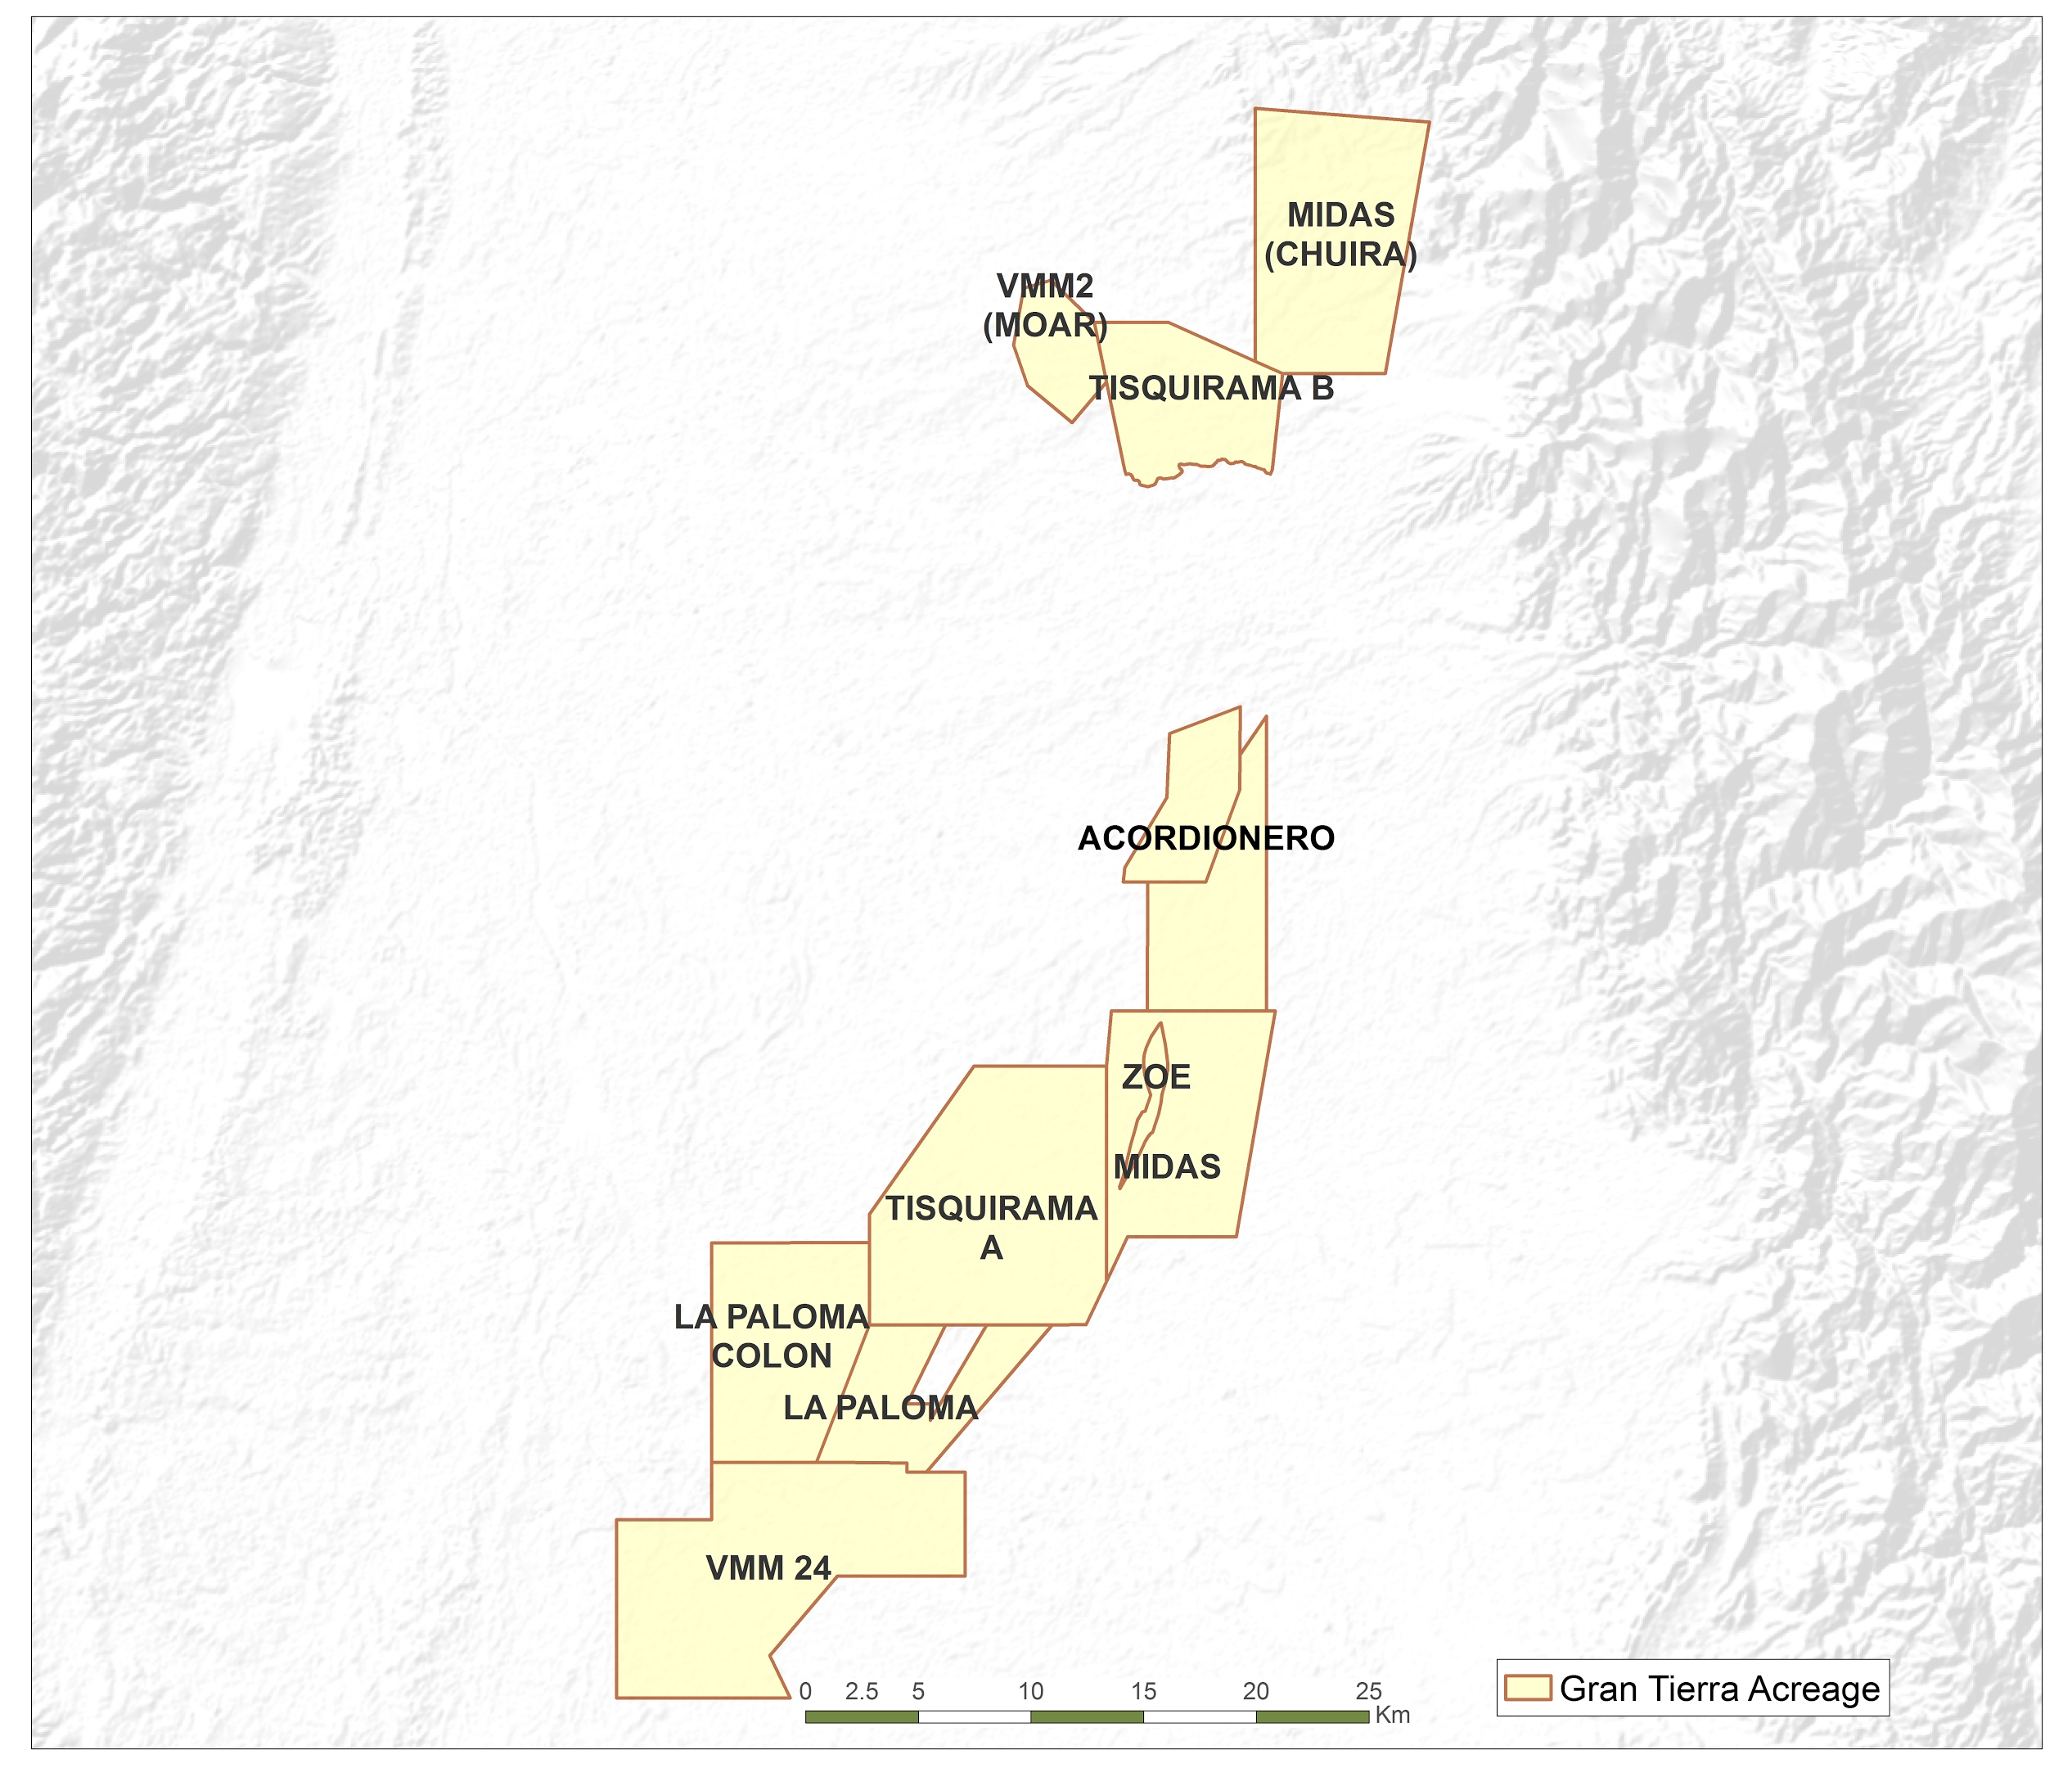
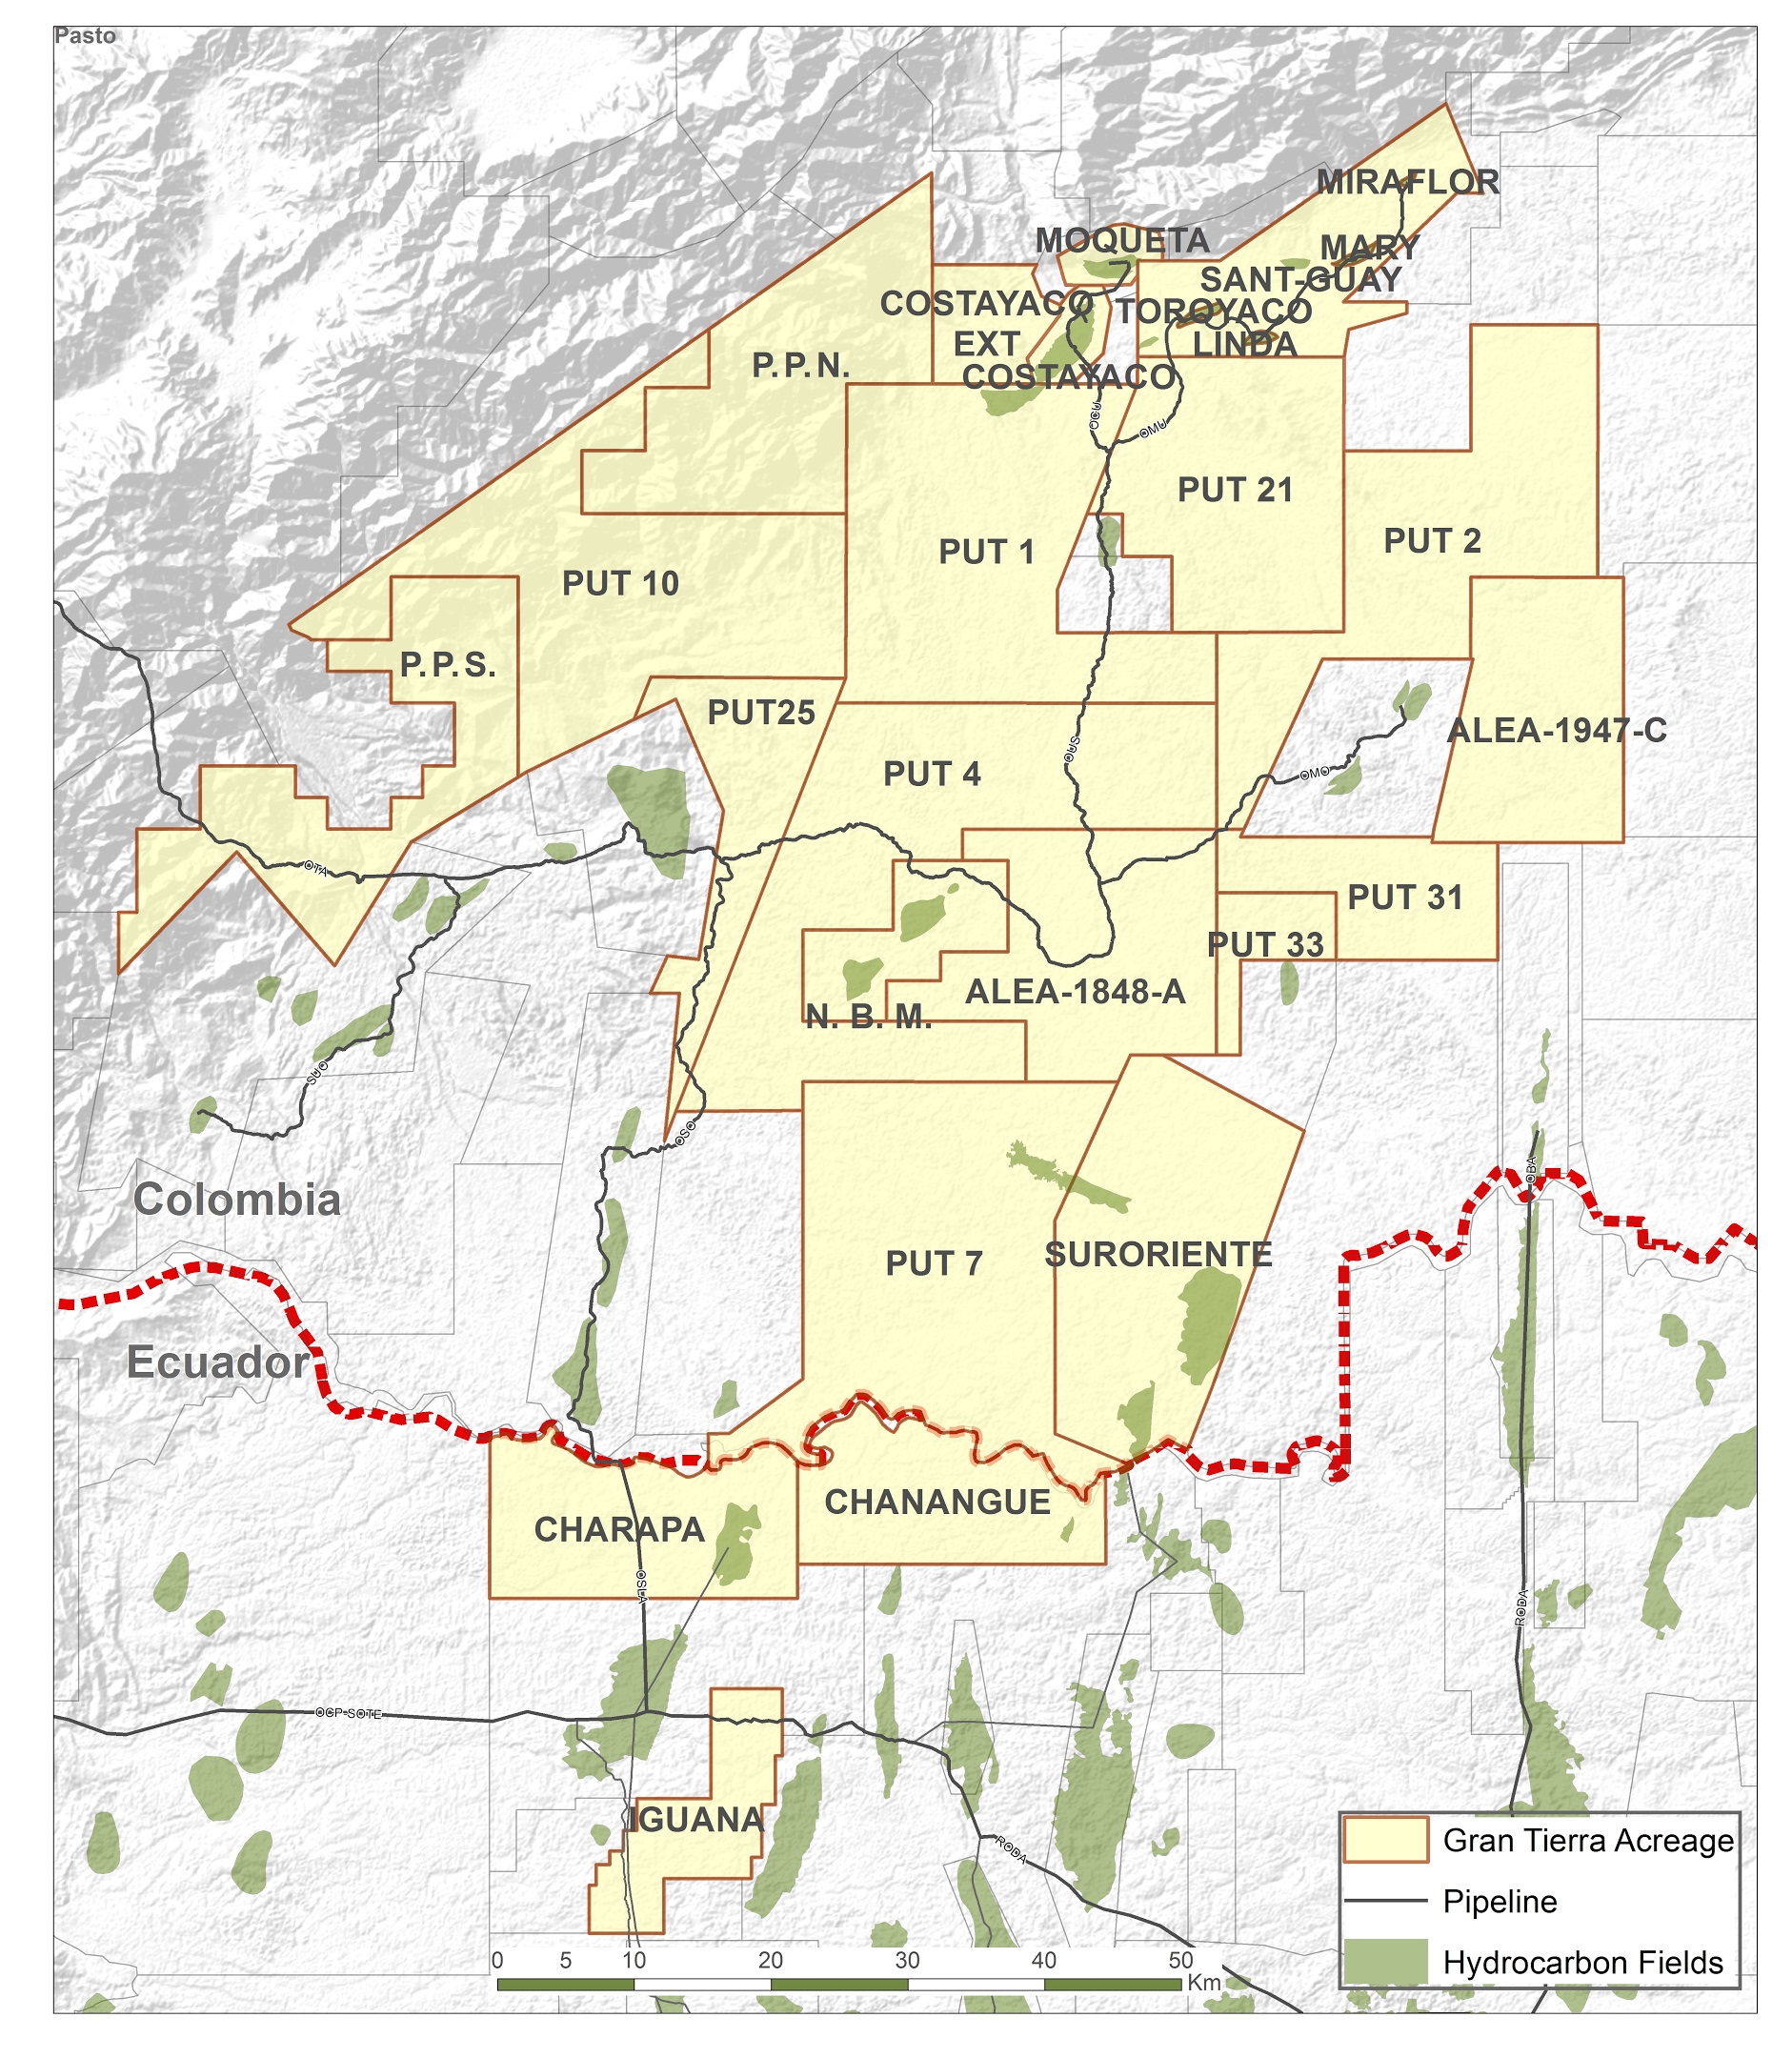
Our oil reserves and production in Colombia are mainly located in the Middle Magdalena Valley (“MMV”) and Putumayo Basin. In MMV, our focus is on the Acordionero Field, where production is approximately 18° API and represented 49% of our production in 2019. The Putumayo production (as defined below) is approximately 28° API and represented 44% of our production in 2019.
We have entered into numerous agreements to sell oil produced in the Chaza and Guayuyaco Blocks (the “Putumayo production”). These agreements are subject to renegotiation for terms between three to twelve months and generally contain mutual termination provisions with 90 days' notice. The volume of crude oil does not include the volume of oil corresponding to royalties taken in kind, but does include volumes relating to HPR royalties.
In 2019, approximately 14% of our Putumayo production was sold to Ecopetrol and with the remainder sold to other parties. The Ecopetrol sales agreement will expire November 30, 2020. We deliver our oil to Ecopetrol through our transportation facilities which include pipelines, gathering systems and through the transportation and logistics assets of Cenit Transporte y Logistica de Hidrocarburos S.A.S (“CENIT”), a wholly-owned subsidiary of Ecopetrol. The point of sale of our Putumayo production to Ecopetrol is the Port of Tumaco on the Pacific coast of Colombia. In the event of pipeline disruptions, the point of sale is the Port of Esmeraldas (Ecuador) where sales are to other third parties. This route is used as a contingency.
We have entered into ship and pay transportation agreements (the “Transportation Agreements”) with CENIT. These agreements will expire October 31, 2020. Pursuant to the Transportation Agreements we pay a transportation tariff and transportation tax for the transportation of the Putumayo production from the Putumayo Basin to the Port of Tumaco. Pursuant to the Transportation
14
Agreements, Gran Tierra Energy Colombia Ltd. has the right to transport up to 10,000 bopd, subject to availability of capacity, (1) from Santana Station to CENIT’s facility at Orito through CENIT’s Mansoya - Orito Pipeline (“OMO”), and (2) from CENIT’s facility at Orito to the Port of Tumaco through CENIT’s Orito - Tumaco Pipeline (“OTA”). Generally, under these agreements, CENIT is liable (subject to specified limitations) for pollution clean-up costs resulting from incidents during transportation. The cost of oil lost during transportation is shared by the parties that ship oil on the pipeline, in proportion to their share of total volumes shipped.
In addition to the ship and pay transportation agreements described above, we have Capacity Transportation Agreements for 6,000 bopd, of which 3,000 bopd are under a ship or pay agreement and 3,000 bopd are under a ship and pay with initial payment agreement. These agreements will expire October 31, 2020.
Putumayo production is also sold to multiple other parties, in addition to Ecopetrol. Other sales in Putumayo are generally delivered at the wellhead. Oil is delivered and sold at the Costayaco battery and Santana station for Putumayo North and at truck loading stations located in Cohembi, Quinde, Quillacinga, Nancy and Cumplidor Fields in Putumayo South.
In MMV, the Acordionero Field production is currently sold to Ecopetrol and other third parties. We truck this volume to Impala Terminals, Barrancabermeja, Petromag, Barranquilla and Ayacucho Station, La Gloria. Production from the minor fields in MMV is sold at the wellhead on a contract which will expire June 30, 2020.
In 2019, 100% of our Llanos production was sold at wellhead. Trucking options for Llanos buyers include: (1) from the Garibay Jilguero Field to facilities at Cusiana Station, a distance of approximately 77 kilometers; and (2) from the Llanos 22 Ramiriqui Field to facilities at Cusiana Station, a distance of approximately 45 kilometers.
We receive revenues for our Colombian oil sales in U.S. dollars. Oil prices for sales of our crude oil are defined by agreements with the purchasers of the oil and are based generally on an average price for crude oil, referenced to ICE Brent, with adjustments for differences in quality, specified fees, transportation fees and transportation tax. Pipeline tariffs are denominated in U.S. dollars and trucking costs are in Colombian Pesos.
Competition
The oil and gas industry is highly competitive. We face competition from both local and international companies. This competition impacts our ability to acquire properties, contract for drilling and other oil field equipment and secure trained personnel. Many competitors, such as Colombia's and Ecuador's national oil companies, have greater financial and technical resources. Our larger or more integrated competitors may be able to absorb the burden of existing, and any changes to, federal, state and local laws and regulations more easily than we can, which could adversely affect our competitive position. Our ability to acquire additional properties and to discover reserves in the future will depend on our ability to evaluate and select suitable properties and to consummate transactions in a highly competitive environment. There is substantial competition for land contracts, prospects and resources in the oil and natural gas industry, and we compete to develop and produce those reserves cost effectively. In addition, we compete to monetize our oil production: for transportation capacity and infrastructure for the delivery of our products, to maintain a skilled workforce and to obtain quality services and materials.
Geographic Information
Based on geographic organization, Colombia is the only reportable segment. During 2019, we signed participation contracts for three blocks in Ecuador. As at and for the year ended December 31, 2019, the Ecuador business unit was not significant and was included in our Colombia reportable segment. Prior to the sale of our Brazil business unit effective June 30, 2017 and our Peru business unit effective December 18, 2017, Brazil and Peru were reportable segments. Long lived assets are Property, Plant and Equipment, which includes all oil and gas assets, furniture and fixtures, automobiles and computer equipment. No long lived assets are held in our country of domicile, which is the United States of America. For the year ended December 31, 2017,“All Other” assets included assets held by our corporate head office in Calgary, Alberta, Canada which were not significant as of December 31, 2019 and 2018 and were included into the Colombia reportable segment. Because all of our exploration and development operations are in Colombia and Ecuador, we face many risks associated with these operations. See Item 1A. “Risk Factors” for risks associated with our foreign operations.
Regulation
The oil and gas industry in both Colombia and Ecuador is heavily regulated. Rights and obligations with regard to exploration, development and production activities are explicit for each project; economics are governed by a royalty/tax regime. Various government approvals are required for property acquisitions and transfers, including, but not limited to, meeting financial and
15
technical qualification criteria in order to be certified as an oil and gas company in the country. Oil and gas concessions are typically granted for fixed terms with opportunity for extension.
Colombia Administration
We operate in Colombia through Colombian branches of the following entities: Gran Tierra Energy Colombia LLC, Gran Tierra Colombia Inc. and Gran Tierra Energy Resources Inc. Gran Tierra Energy Colombia LLC and Gran Tierra Colombia Inc. are currently qualified as operators of oil and gas properties by the ANH.
In Colombia, the ANH is the administrator of the hydrocarbons in the country and therefore is responsible for regulating the Colombian oil and gas industry, including managing all exploration lands. Since 2003, Ecopetrol, the Colombian national oil company, has been a public company owned in majority by the state with the main purpose of exploring and producing hydrocarbons similar to any other oil company. In addition, Ecopetrol is a major purchaser and marketer of oil in Colombia and operates the majority of the oil transportation infrastructure in the country.
The ANH uses an exploration risk contract, or the Exploration and Production Contract, which provides full risk/reward benefits for the contractor. Under the terms of this contract, the successful operator retains the rights to all reserves, production and income from any new exploration block, subject to existing royalty and tax regulations. Each contract contains an exploration phase and a production phase. The exploration phase contains a number of exploration periods and each period has an associated work commitment. The production phase lasts a number of years (usually 24) from the declaration of a commercial hydrocarbon discovery.
When operating under a contract, the contractor is the owner of the hydrocarbons extracted from the contract area during the performance of operations, except for royalty volumes which are collected by the ANH (or its designee). The contractor can market the hydrocarbons in any manner whatsoever, subject to a limitation in the case of natural emergencies where the law specifies the manner of sale.
Ecuador Administration
We operate in Ecuador through the Ecuadorian branch of Gran Tierra Energy Colombia, LLC.
In Ecuador, the Ministry of Energy and Non-Renewable Natural Resources ("MERNNR", for its acronym in Spanish) is the administrator of the hydrocarbons in the country and therefore is responsible for regulating the Ecuadorian oil and gas industry together with the Agency for Hydrocarbons Regulation and Control.
The MERNNR uses the Participation Contract for the Exploration and/or Exploitation of Hydrocarbons, which provides for full risk for the contractor and production sharing with the MERNNR. Each contract contains an exploration phase and an exploitation phase. The exploration phase has an associated work commitment and lasts typically 4 years. The exploitation phase lasts usually 20 years from the approval of the development plan for a commercial hydrocarbon discovery.
When operating under a contract, the contractor is the owner of the hydrocarbons extracted from the contract area during the performance of operations, except for the share of volumes owned by the MERNNR agreed under each contract.
Environmental Compliance
Our activities are subject to laws and regulations governing environmental quality and pollution control in the countries where we maintain operations. Our activities with respect to exploration, drilling, production and facilities, including the operation and construction of pipelines, plants and other facilities for transporting, processing, treating or storing oil and other products, are subject to stringent environmental regulation by regional and federal authorities in Colombia and Ecuador. Such regulations relate to environmental impact studies, the discharge of pollutants into air and water, water use and management, the management of non-hazardous and hazardous waste, including its transportation, storage, and disposal, permitting for the construction of facilities, recycling requirements and reclamation standards, and the protection of certain plants and animal species as well as cultural resources and areas inhabited by indigenous peoples, among others. Risks are inherent in oil and gas exploration, development and production operations. These risks include blowouts, fires, or spills. Significant costs and liabilities may be incurred in connection with environmental compliance issues. Licenses and permits required for our exploration and production activities may not be obtainable on reasonable terms or on a timely basis, which could result in delays and have an adverse effect on our operations. Spills and releases into the environment of petroleum products can result in remediation costs and liability for damages. The costs of remedying such conditions may be significant, and remediation obligations could adversely affect our financial condition, results of operations and prospects. Moreover, violations of environmental laws and regulations can result in the issuance
16
of administrative, civil or criminal fines and penalties, as well as orders or injunctions prohibiting some or all of our operations in affected areas. In addition, indigenous groups or other local organizations could oppose our operations in their communities, potentially resulting in delays which could adversely affect our operations. Governmental or judicial actions may influence the interpretation and enforcement of environmental laws and regulations and may thereby increase compliance costs. We do not expect that the cost of compliance with regional and federal provisions, which have been enacted regulating the discharge of materials into the environment, or otherwise relating to the protection of the environment or natural resources, will be material to us.
We have implemented a company wide web-based reporting system which allows us to track incidents and respective corrective actions and associated costs. We have a Corporate Health, Safety, and Environmental Management Policy and Plan as well as a Corporate Environmental Management Plan ("EMP"). The EMP is based on the environmental performance standards of the World Bank/IFC and reflects best industry practices. We have an Environmental Management System which is ISO14001:2015 certified representing compliance with internationally recognized industry best practice, as well as an environmental risk management program and robust waste management procedures. Air and water testing occur regularly and environmental contingency plans have been prepared for all sites and transportation of oil. We have a regular quarterly comprehensive reporting system, reporting to executive management as well as a committee of the Board of Directors. We have a schedule of internal and external audits and routine checking of practices and procedures and conduct emergency response exercises.
Employees
At December 31, 2019, we had 362 full-time employees (December 31, 2018 - 334): 104 located in the Calgary corporate office, and 258 in Colombia (177 staff in Bogota and 81 field personnel). None of our employees are represented by labor unions, and we consider our employee relations to be good.
Available Information
We file or furnish annual, quarterly and current reports, proxy statements and other documents with the Securities and Exchange
Commission (“SEC”). We make available free of charge through our website at www.grantierra.com our Annual Reports on Form 10-K, Quarterly Reports on Form 10-Q, Current Reports on Form 8-K, and all amendments to those reports as soon as reasonably practicable after such material is electronically filed or furnished with the SEC. Our Code of Business Conduct and Ethics, our Corporate Governance Guidelines, our Audit Committee Charter, our Compensation Committee Charter and our Nominating and Corporate Governance Committee Charter are also posted to the governance section of our website. Our website address is provided solely for informational purposes. Information on our website is not incorporated into this Annual Report or otherwise made part of this Annual Report. We intend to use our website as a means for distributing information to the public for purposes of compliance with Regulation FD.
In addition, the SEC maintains a website (www.sec.gov) that contains reports, proxy and information statements, and other information regarding issuers that file electronically with the SEC, including us.
Item 1A. Risk Factors
Prices and markets for oil and natural gas are unpredictable and tend to fluctuate significantly, which could reduce our profitability, growth and value
Substantially all of our revenues are derived from the sale of oil, the current and forward contract price which is based on world demand, supply, weather, pipeline capacity constraints, inventory storage levels, geopolitical unrest, world health events and other factors, all of which are beyond our control. Historically, the market for oil has been volatile, and for the past several years, the price of oil has been low. The market is likely to continue to be volatile in the future, and oil prices may remain at their current state or decrease further. Furthermore, prices which we receive for our oil sales, while based on international oil prices, are established by contracts with purchasers with prescribed deductions for transportation and quality differentials. These differentials can change over time and have a detrimental impact on realized prices.
Future decreases in the prices of oil or sustained low prices may have a material adverse effect on our financial condition, the future results of our operations (including rendering existing projects unprofitable), financing available to us, and quantities of reserves recoverable on an economic basis, as well as the market price for our securities.
17
Estimates of oil and natural gas reserves may be inaccurate and our actual revenues may be lower than estimated
We make estimates of oil and natural gas reserves, upon which we base our financial projections and capital expenditure plans. We make these reserve estimates using various assumptions, including assumptions as to oil and natural gas prices, drilling and operating expenses, capital expenditures, taxes and availability of funds. Some of these assumptions are inherently subjective, and the accuracy of our reserve estimates relies in part on the ability of our management team, engineers and other advisors to make accurate assumptions. Wells that are drilled may not achieve the results expected. Economic factors beyond our control, such as world oil prices, interest rates, inflation, and exchange rates, will also impact the quantity and value of our reserves.
The process of estimating oil and natural gas reserves is complex, and requires us to use significant decisions and assumptions in the evaluation of available geological, geophysical, engineering and economic data for each property. As a result, our reserves estimates are inherently imprecise. All categories of reserves are continually subject to revisions based on production history, results of additional exploration and development, price changes and other factors. When producing an estimate of the amount of oil that is recoverable from a particular reservoir, probable reserves are those additional reserves that are less certain to be recovered than proved reserves but which, together with proved reserves, are as likely as not to be recovered. Possible reserves are even less certain and generally require only a 10% or greater probability of being recovered. Estimates of probable and possible reserves are by their nature much more speculative than estimates of proved reserves and are subject to greater uncertainties, and accordingly the likelihood of recovering those reserves is subject to substantially greater risk. Actual future production, oil and natural gas prices, revenues, taxes, exploration and development expenditures, operating expenses and quantities of recoverable oil and natural gas reserves may vary substantially from those we estimate. Such changes could materially reduce our revenues and result in the impairment of our oil and natural gas interests.
Unless we are able to replace our reserves and production, and develop and manage oil and natural gas reserves and production on an economically viable basis, our financial condition and results of operations will be adversely impacted
Our future success depends on our ability to find, develop and acquire additional oil and natural gas reserves that are economically recoverable. Producing oil and natural gas reservoirs generally are characterized by declining production rates that vary depending upon reservoir characteristics and other factors. Our future oil and natural gas reserves and production, and therefore our cash flow and results of operations, are highly dependent on our success in efficiently developing and exploiting our current reserves and economically finding or acquiring additional recoverable reserves. The value of our securities and our ability to raise capital will be adversely impacted if we are not able to replace our reserves that are depleted by production. We may not be able to develop, exploit, find or acquire sufficient additional reserves to replace our current and future production.
Exploration, development and production costs (including transportation and workover costs), marketing costs (including distribution costs) and regulatory compliance costs (including taxes) will substantially impact the net revenues we derive from the oil and natural gas that we produce. These costs are subject to fluctuations and variations in the areas in which we operate, and we may not be able to predict or control these costs. If these costs exceed our expectations, this may adversely affect our results of operations.
Our future reserves will depend not only on our ability to develop and effectively manage then-existing properties, but also on our ability to identify and acquire additional suitable producing properties or prospects, to identify and retain responsible service providers and contractors to efficiently drill and complete our wells and to find markets for the oil and natural gas we develop and to effectively distribute our production into our markets.
Exploration for oil and natural gas, and development of new formations, is risky
Oil and natural gas exploration involves a high degree of operational and financial risk. These risks are more acute in the early stages of exploration, appraisal and development. It is difficult to predict the results and project the costs of implementing an exploratory drilling program due to the inherent uncertainties and costs of drilling in unknown formations and encountering various drilling conditions, such as unexpected formations or pressures, premature decline of reservoirs, the invasion of water into producing formations, tools lost in the hole, and changes in drilling plans and locations as a result of prior exploratory wells or additional seismic data and interpretations thereof. Future oil and gas exploration may involve unprofitable efforts, not only from dry wells, but from wells that are productive but do not produce sufficient net revenues to return a profit after drilling, operating and other costs.
Oil and natural gas exploration, development and production operations are subject to the risks and hazards typically associated with such operations, including, but not limited to, fire, explosion, blowouts, cratering, sour gas releases, spills and other environmental hazards. Such risks and hazards could result in substantial damage to oil and natural gas wells, production facilities, other property or the environment, as well as personal injury to our employees, contractors or members of the public.
18
Losses resulting from the occurrence of any of these risks may have a material adverse effect on our business, financial condition, results of operations and prospects.
Although we maintain well control and liability insurance in an amount that we consider prudent and consistent with industry practice, liabilities associated with certain risks could exceed policy limits or not be covered. In either event we could incur significant costs.
Our business requires significant capital expenditures, and we may not have the resources necessary to fund these expenditures
Our base capital program for 2020 is $175 to $195 million for exploration and development based on a mid-point range for budgeted exploration costs. This does not include the cost of any acquisitions. We expect to finance our 2020 capital program primarily through cash flows from operations. Funding this program from cash flow from operations relies in part on Brent oil prices being $60 per barrel.
If cash flows from operations, cash on hand and available capacity under our credit facility are not sufficient to fund our capital program, we may be required to seek external financing or to delay or reduce our exploration and development activities, which could impact production, revenues and reserve growth.
If we require additional capital, we may pursue sources of capital through various financing transactions or arrangements, including joint venturing of projects, debt financing, equity financing or other means. We may not be able to access capital on favorable terms or at all. If we do succeed in raising additional capital, future financings may be dilutive to our shareholders, as we could issue additional shares of common stock or other equity to investors. In addition, debt and other mezzanine financing may involve a pledge of assets, require covenants that would restrict our business activities, and may be senior to interests of equity holders. We may incur substantial costs in pursuing future capital financing, including investment banking fees, legal fees and other costs. We may also be required to recognize non-cash expenses in connection with certain securities we may issue, such as convertibles and warrants, which would adversely impact our financial results.
Our ability to obtain needed financing may be impaired by factors such as weak capital markets (both generally and for the oil and gas industry in particular), the location of our oil and natural gas properties in Colombia and Ecuador, low or declining prices of oil and natural gas on the commodities markets, and the loss of key management. Further, if oil or natural gas prices on the commodities markets decrease, then our revenues will likely decrease, and such decreased revenues may increase our requirements for capital. Some of the contractual arrangements governing our exploration activity may require us to commit to certain capital expenditures, and we may lose our contract rights if we do not have the required capital to fulfill these commitments. If the amount of capital we are able to raise from financing activities, together with our cash flow from operations, is not sufficient to satisfy our capital needs (even to the extent that we reduce our activities), we may be required to curtail our operations.
The borrowing base under our revolving credit facility may be reduced by the lenders, which could prevent us from meeting our future capital needs
The borrowing base under our revolving credit facility is currently $300 million. Our borrowing base is redetermined by the lenders twice per year. Our borrowing base may decrease as a result of a decline in oil or natural gas prices, operating difficulties, declines in reserves, lending requirements or regulations, the issuance of new indebtedness or for any other reason. We cannot be certain that funding will be available if needed, and to the extent required, on acceptable terms. In the event of a decrease in our borrowing base, we could be required to repay any indebtedness in excess of the redetermined borrowing base, which could deplete cash flow from operations or require additional financing. Further, our borrowing base is made available to us subject to the terms and covenants of our revolving credit facility, including compliance with the ratios and other financial covenants of such facility, and a failure to comply with such ratios or covenants could force us to repay a portion of our borrowings and suffer adverse financial impacts.
Our business is subject to local legal, social, political and economic factors that are beyond our control, which could impair or delay our ability to expand our operations or operate profitably
All of our reserves and production are currently located in Colombia; however, we may eventually expand to other countries. Exploration and production operations are subject to legal, social, political and economic uncertainties, including terrorism, military repression, social unrest and activism, blockades, strikes by local or national labor groups, interference with private contract rights, extreme fluctuations in currency exchange rates, high rates of inflation, exchange controls, changes in tax rates, changes in laws or policies affecting environmental issues (including land use and water use), workplace safety, foreign investment, foreign trade, investment or taxation, as well as restrictions imposed on the oil and natural gas industry, such as restrictions on production, price
19
controls and export controls. When such disruptions occur, they may adversely impact our operations and threaten the economic viability of our projects or our ability to meet our production targets.
Both Colombia and Ecuador have experienced and may in the future experience political and economic instability. This instability could result in new governments or the adoption of new policies, laws or regulations that might assume a substantially more hostile attitude toward foreign investment, including but not limited to: the imposition of additional taxes; nationalization; changes in energy or environmental policies or the personnel administering them; changes in oil and natural gas pricing policies; and royalty changes or increases. In an extreme case, such a change could result in termination of contract rights and expropriation of foreign-owned assets or renegotiation or nullification of existing concessions and contracts. Any changes in the oil and gas or investment regulations and policies or a shift in political attitudes in Ecuador or Colombia are beyond our control and may significantly hamper our ability to expand our operations or operate our business at a profit.
We are vulnerable to risks associated with geographically concentrated operations
The vast majority of our production comes from four fields. For the year ended December 31, 2019, the Acordionero, Costayaco, Moqueta and Cohembi Fields collectively generated 83% of our production and at December 31, 2019, these four fields accounted for 85% of our proved reserves. As a result of this concentration, we may be disproportionately exposed to the impact of, among other things, regional supply and demand factors including limitations on our ability to most profitably sell or market our oil and natural gas to a smaller pool of potential buyers, delays or interruptions of production from wells in these areas caused by governmental regulation, community protests, guerrilla activities, processing or transportation capacity constraints, continued authorization by the government to explore and drill in these areas, severe weather events and the availability of drilling rigs and related equipment, facilities, personnel or services. Due to the concentrated nature of our portfolio of properties, a number of our properties could experience any of the same conditions at the same time, resulting in a relatively greater impact on our results of operations than they might have on other companies that have a more diversified portfolio of properties.
We rely on local infrastructure and the availability of transportation for storage and shipment of our products. This infrastructure, including storage and transportation facilities, is less developed than that in North America and may be insufficient for our needs at commercially acceptable terms in the localities in which we operate. Further, we operate in remote areas and may rely on helicopters, boats or other transportation methods. Some of these transport methods may result in increased levels of risk, including the risk of accidents involving serious injury or loss of life, and could lead to operational delays which could affect our ability to add to our reserve base or produce oil and could have a significant impact on our reputation or cash flow. Additionally, some of this equipment is specialized and may be difficult to obtain in our areas of operations, which could hamper or delay operations, and could increase the cost of those operations.
Social disruptions or community disputes in our areas of operations may delay production and result in lost revenue
To enjoy the support and trust of local populations and governments, we must demonstrate a commitment to providing local employment, training and business opportunities; a high level of environmental performance; open and transparent communication; and a willingness to discuss and address community issues including community development investments that are carefully selected, not unduly costly and bring lasting social and economic benefits to the community and the area. Improper management of these relationships could lead to a delay or suspension in operations, loss of license or major impact to our reputation in these communities, which could adversely affect our business. We cannot ensure that such issues or disruptions will not be experienced in the future and we cannot predict their potential impacts, which may include delays or loss of production, standby charges, stranded equipment, or damage to our facilities. We also cannot ensure that we will not experience protests or blockades erected by criminal groups or cultivators of illegal crops, in response to the Colombian government's eradication of such crops, if such crops are grown in proximity to roads required to access our operations. In addition, we must comply with legislative requirements for prior consultation of communities and ethnic groups who are affected by our proposed projects in Colombia and Ecuador. Notwithstanding our compliance with these requirements, we may be sued by such communities through a writ for protection of tutela in the Colombian courts for enhanced consultation, potentially leading to increased costs, operational delays and other impacts. In addition, several areas in Colombia have conducted Popular Consultations, essentially referendums, on extractive industries. The referendums were organized by opponents of the mining or oil and natural gas industries. To this point all have passed with a large majority voting to prohibit extractive industry activity in the particular region, but it remains unclear to what extent such results can impact the exercise of mineral rights conferred by the national government.
We are dependent on obtaining and maintaining permits and licenses from various governmental authorities
Our oil and natural gas exploration and production operations are subject to complex and stringent laws and regulations. In order to conduct our operations in compliance with these laws and regulations, we must obtain and maintain numerous licenses, permits, approvals and certificates, including environmental and other operating permits. We may not be able to obtain, sustain or renew
20
such licenses and permits on a timely basis or at all. We may also have licenses and permits rescinded or may not be able to renew expiring licenses and permits. Failure or delay in obtaining or maintaining regulatory approvals or permits could have a material adverse effect on our ability to develop and explore on our properties, and receipt of drilling permits with onerous conditions could increase our compliance costs. Loss of permits for existing drilling, water injection or other activities necessary for production may result in a decline in our production levels and revenues or damage to the well structure. Regulations and policies relating to these licenses and permits may change, be implemented in a way that we do not currently anticipate or take significantly greater time to obtain. There can be no assurance that future political conditions in Colombia and Ecuador will not result in changes to policies with respect to foreign development and ownership of oil, environmental protection, health and safety or labor relations, which may negatively affect our ability to undertake exploration and development activities in respect of present and future properties, as well as our ability to raise funds to further such activities.
As we are not the operator of all the joint ventures we are currently involved in, we may rely on the operator to obtain all necessary permits and licenses. If we fail to comply with these requirements, we could be prevented from drilling for oil and natural gas, and we could be subject to civil or criminal liability or fines. Revocation or suspension of our environmental and operating permits could have a material adverse effect on our business, financial condition and results of operations.
Security concerns in Colombia or Ecuador may disrupt our operations
Oil pipelines have historically been primary targets of terrorist activity in Colombia. Although a Peace Agreement was ratified by Colombian government in 2016, the result of which was the demobilization and disarmament of the FARC guerilla group, there continue to be examples of violence against pipelines and other infrastructure that has been attributed to such guerilla groups. It is not currently known whether or to what degree violence will continue and whether and to what degree that violence may impact our operations. Notwithstanding the Peace Agreement and the continuing attempts by the Colombian government to reduce or prevent activity of guerrilla dissidents, such efforts may not be successful and such activity may continue to disrupt our operations in the future or cause us higher security costs and could adversely impact our financial condition, results of operations or cash flows.
Colombia and Ecuador also both have a history of security problems. Our efforts to ensure the security of our physical assets may not be successful and there can also be no assurance that we can maintain the safety of our or our contractors' field personnel and our Bogota and Quito head office personnel or operations in Colombia and Ecuador or that this violence will not adversely affect our operations in the future and cause significant loss. If these security problems disrupt our operations, our financial condition and results of operations could be adversely affected.
Environmental regulation and risks may adversely affect our business
Environmental regulation is stringent and the costs and expenses of regulatory compliance are increasing. All phases of the oil and natural gas business present environmental risks and hazards and are subject to environmental regulation pursuant to an extensive suite of international conventions and national and regional laws and regulations. Environmental legislation provides for, among other things, restrictions and prohibitions on spills, releases or emissions of various substances used or produced in association with oil and gas operations. The legislation also requires that wells and facility sites be operated, maintained, abandoned and reclaimed to the satisfaction of applicable regulatory authorities. Compliance with such legislation can require significant expenditures. Failure to comply with these laws and regulations may result in the suspension or termination of operations and subject us to administrative, civil and criminal fines and penalties. Our operations create the risk of significant environmental liabilities to the government or third parties for any unlawful discharge of oil, gas or other pollutants into the air, soil or water or for certain other environmental impacts. There is uncertainty around the impact of environmental laws and regulations, including those presently in force and those expected to be proposed in the future. We cannot predict how future environmental laws will be interpreted, administered or enforced, but more stringent laws or regulations or more vigorous enforcement policies could in the future require material expenditures by us for the installation and operation of compliant systems; therefore it is impossible at this time to predict the nature and impact of those requirements on our company however they may have a material adverse impact on our business.
Given the nature of our business, there are inherent risks of oil spills at drilling or operations sites due to operational failure, accidents, sabotage, pipeline failure or tampering or escape of oil due to the transportation of the oil by truck. All of these may lead to significant potential environmental liabilities, such as damages, litigation costs, clean-up costs or penalties, some of which may be material and for which our insurance coverage maybe inadequate or unavailable.
21
All of our revenue is generated outside of Canada and the United States, and if we determine to, or are required to, repatriate earnings from foreign jurisdictions, we could be subject to taxes
All of our revenue is generated outside of Canada and the United States. The cash generated from operations abroad is generally not available to fund domestic or head office operations unless funds are repatriated. At this time, we do not intend to repatriate further funds, other than to pay head office charges, but if we did, we might have to accrue and pay withholding taxes in certain jurisdictions on the distribution of accumulated earnings. Undistributed earnings of foreign subsidiaries are considered to be permanently reinvested and a determination of the amount of unrecognized deferred tax liability on these undistributed earnings is not practicable.
Foreign currency exchange rate volatility may affect our financial results
We sell our oil and natural gas production under agreements that are denominated mainly in U.S. dollars. Many of the operational and other expenses we incur, including current and deferred tax liabilities in Colombia, are denominated in Colombian pesos. Most of our administration costs in Canada are incurred in Canadian dollars. As a result, we are exposed to translation risk when local currency financial statements are translated to U.S. dollars, our functional currency. An appreciation of local currencies can increase our costs and negatively impact our results from operations. Because our Consolidated Financial Statements are presented in US$, we must translate revenues, expenses and income, as well as assets and liabilities, into US$ at exchange rates in effect during or at the end of each reporting period. We are also exposed to transaction risk on settlement of payables and receivables denominated in foreign currency.
We may be exposed to liabilities under anti-bribery laws and a finding that we violated these laws could have a material adverse effect on our business
We are subject to anti-bribery laws in the United States, Canada, Ecuador and Colombia and will be subject to similar laws in other jurisdictions where we may operate in the future. We may face, directly or indirectly, corrupt demands by officials, tribal or insurgent organizations, international organizations, or private entities. As a result, we face the risk of unauthorized payments or offers of payments by employees, contractors, agents, and partners of ours or our subsidiaries or affiliates, given that these parties are not always subject to our control or direction. It is our policy to prohibit these practices. However, our existing safeguards and any future improvements to those measures may prove to be less than effective or may not be followed, and our employees, contractors, agents, and partners may engage in illegal conduct for which we might be held responsible. A violation of any of these laws, even if prohibited by our policies, may result in criminal or civil sanctions or other penalties (including profit disgorgement) as well as reputational damage and could have a material adverse effect on our business and financial condition.
If the United States imposes sanctions on Colombia or Ecuador in the future, our business may be adversely affected
Colombia is among several nations whose eligibility to receive foreign aid from the United States is dependent on its progress in stemming the production and transit of illegal drugs, which is subject to an annual review by the President of the United States. Although Colombia is currently eligible for such aid, Colombia may not remain eligible in the future. A finding by the President that Colombia has failed demonstrably to meet its obligations under international counter-narcotic agreements may result in the imposition of economic and trade sanctions on Colombia which could result in adverse economic consequences in Colombia including potentially threatening our ability to obtain necessary financing to develop our Colombian properties, and could further heighten the political and economic risks associated with our operations there.
The threat and impact of cyberattacks may adversely impact our operations and could result in information theft, data corruption, operational disruption, and/or financial loss
We use digital technologies and software programs to interpret seismic data, manage drilling rigs, conduct reservoir modeling and reserves estimation, as well as to process and record financial and operating data. We depend on digital technology, including information systems and related infrastructure as well as cloud application and services, to store, transmit, process and record sensitive information (including trade secrets, employee information and financial and operating data), communicate with our employees and business partners, analyze seismic and drilling information, estimate quantities of oil and gas reserves and for many other activities related to our business. The complexities of the technologies needed to explore for and develop oil and gas in increasingly difficult physical environments, and global competition for oil and gas resources make certain information attractive to thieves. Our business processes depend on the availability, capacity, reliability and security of our information technology infrastructure and our ability to expand and continually update this infrastructure in response to our changing needs and therefore it is critical to our business that our facilities and infrastructure remain secure. While we have implemented strategies to mitigate impacts from these types of events, we cannot guarantee that measures taken to defend against cybersecurity threats will be sufficient for this purpose. The ability of the information technology function to support our business in the event of a security
22
breach or a disaster such as fire or flood and our ability to recover key systems and information from unexpected interruptions cannot be fully tested and there is a risk that, if such an event actually occurs, we may not be able to address immediately the repercussions of the breach or disaster. In that event, key information and systems may be unavailable for a number of days or weeks, leading to our inability to conduct business or perform some business processes in a timely manner. Moreover, if any of these events were to materialize, they could lead to losses of sensitive information, critical infrastructure, personnel or capabilities essential to our operations and could have a material adverse effect on our reputation, financial condition or results of operations.
Our employees have been and will continue to be targeted by parties using fraudulent “spoof” and “phishing” emails to misappropriate information or to introduce viruses or other malware through “trojan horse” programs to our computers. These emails appear to be legitimate emails but direct recipients to fake websites operated by the sender of the email or request that the recipient send a password or other confidential information through email or download malware. Despite our efforts to mitigate “spoof” and “phishing” emails through policies and education, “spoof” and “phishing” activities remain a serious problem that may damage our information technology infrastructure.
Regulations related to emissions and the impact of any changes in climate could adversely impact our business
Governments around the world have become increasingly focused on regulating greenhouse gas (“GHG”) emissions and addressing the impacts of climate change in some manner. GHG emissions legislation is emerging and is subject to change. For example, on an international level, in December 2015, almost 200 nations, including Colombia, agreed to an international climate change agreement in Paris, France (the “Paris Agreement”), that calls for countries to set their own GHG emission targets and be transparent about the measures each country will use to achieve its GHG emission targets. Although it is not possible at this time to predict how this legislation or any new regulations that may be adopted to address GHG emissions would impact our business, any such future laws and regulations that limit emissions of GHGs could adversely affect demand for the oil and natural gas that we produce.
Current GHG emissions legislation has not resulted in material compliance costs; however, it is not possible at this time to predict whether proposed legislation or regulations will be adopted, and any such future laws and regulations could result in additional compliance costs or additional operating restrictions. If we are unable to recover a significant amount of our costs related to complying with climate change regulatory requirements imposed on us, it could have a material adverse impact on our business, financial condition and results of operations. Significant restrictions on GHG emissions could result in decreased demand for the oil that we produce, with a resulting decrease in the value of our reserves. Further, there have been efforts in recent years to influence the investment community to consider climate change in how they invest in companies. To the extent financial markets view climate change and GHG emissions as a financial risk; this could negatively impact our cost of or access to capital. Increasing attention to the risks of climate change has resulted in an increased possibility of lawsuits brought by public and private entities against oil and natural gas companies in connection with their GHG emissions. Should we be targeted by any such litigation, we may incur liability, which, to the extent that societal pressures or political or other factors are involved, could be imposed without regard to the company's causation of or contribution to the asserted damage, or to other mitigating factors. Finally, although we strive to operate our business operations to accommodate expected climatic conditions, to the extent there are significant changes in the Earth’s climate, such as more severe or frequent weather conditions in the markets we serve or the areas where our assets reside, we could incur increased expenses, our operations could be materially impacted, and demand for our products could fall.
We hold a minority equity investment in PetroTal Corp. ("PetroTal"), and our inability, or limited ability, to control the operations or management of PetroTal may result in our receiving or retaining less than the amount of benefit we expect
We hold a minority equity investment in PetroTal and our chief executive officer and chief financial officer serve on the board of directors of PetroTal. Even though we are able to exercise influence as a minority equity investor in PetroTal, our influence of PetroTal is limited to our rights under the share purchase agreement and its annexes and PetroTal’s charter and bylaws. Such limitations include a covenant by us not to exercise any voting rights associated with our shares in PetroTal which exceed 30% of the issued and outstanding common shares of PetroTal. As a result, we may be unable to implement or influence PetroTal’s business plan, assure quality control, or set the timing and pace of development. Our inability, or limited ability, to control the operations or management of PetroTal may result in our receiving or retaining less than the amount of benefit we might otherwise expect to receive from such investment. We may also be unable, or limited in our ability, to cause PetroTal to effect significant transactions such as large expenditures or contractual commitments, the development of properties, the construction or acquisition of assets or the borrowing of money. Service on the board of directors by our two senior executive officers will require time commitment and could expose them to liability in such role. If PetroTal or its board of directors were to experience events that exposed them to liability or reputational harm, it could have an adverse effect on us or our senior executives, including a decline in the market price of our equity securities. We may also be limited in our ability to monetize or exit our investment in PetroTal given the limited trading market for its equity securities.
23
Shares of our Common Stock are listed on the NYSE American, the TSX and the London Stock Exchange ("LSE") and investors seeking to take advantage of price differences between such markets may create unexpected volatility in market prices
Shares of our Common Stock are listed on the NYSE American, the TSX and the LSE. While the Common Stock is traded on such markets, the price and volume levels could fluctuate significantly on any market independently of the price or trading volume on other markets. Investors could seek to sell or purchase shares of Common Stock to take advantage of any price differences between the NYSE American, the TSX and the LSE through a practice referred to as arbitrage. Any arbitrage activity could create unexpected volatility in the price of the Common Stock on any of these exchanges or the volume of Common Stock available for trading on any of these markets. In addition, shareholders in any of these jurisdictions will not be able to transfer such shares of Common Stock for trading on another market without effecting necessary procedures with our transfer agent or registrar. This could result in time delays and additional cost for shareholders of the Common Stock.
If we cannot meet the NYSE American continued listing requirements, the NYSE may delist our shares of Common Stock.
Our shares of Common Stock are currently listed on the NYSE, and the continued listing of our shares is subject to our compliance with a number of listing standards. If we fail to maintain compliance with these continued listing standards, including if the price our shares of Common Stock remains at its current low for a substantial period of time and we fail to effect a reverse stock split upon notice from the NYSE, our shares of Common Stock may be delisted. A delisting of our shares could negatively impact us by, among other things reducing the liquidity of our shares and limiting our ability to issue additional securities, obtain additional financing or pursuant strategic transactions.
Item 1B. Unresolved Staff Comments
None.
Item 3. Legal Proceedings
The ANH and Gran Tierra are engaged in discussions regarding the interpretation of whether certain transportation and related costs are eligible to be deducted in the calculation of the HPR royalty. Discussions with the ANH are ongoing. Although the outcome of these discussions cannot be predicted with certainty, Gran Tierra believes the resolution of these matters would not have a material adverse effect on the Company’s consolidated financial position, results of operations or cash flows. Gran Tierra records costs as they are incurred or become probable and determinable.
We have several other lawsuits and claims pending. Although the outcome of these lawsuits and disputes cannot be predicted with certainty, we believe the resolution of these matters would not have a material adverse effect on our consolidated financial position, results of operations or cash flows. We record costs as they are incurred or become probable and determinable.
Item 4. Mine Safety Disclosures
Not applicable.
Information About Our Executive Officers
Set forth below is information regarding our executive officers as of February 24, 2020.
Name | Age | Position | ||
Gary S. Guidry | 64 | President and Chief Executive Officer, Director | ||
Ryan Ellson | 44 | Chief Financial Officer and Executive Vice President, Finance | ||
Tony Berthelet | 49 | Chief Operating Officer | ||
James Evans | 53 | Vice President, Corporate Services | ||
Glen Mah | 62 | Vice President, Exploration Ecuador | ||
Rodger Trimble | 57 | Vice President, Investor Relations | ||
Lawrence West | 62 | Vice President, Exploration | ||
24
• | Gary Guidry, Chief Executive Officer and President. Mr. Guidry has been Gran Tierra's Chief Executive Officer and President since May 7, 2015. Mr. Guidry was the Chief Executive Officer of Onza Energy Inc. from January 2014, until May 2015. From July 2011 to July 2014, Mr. Guidry served as President and Chief Executive Officer of Caracal Energy Inc. Mr. Guidry also served as President and CEO of Orion Oil & Gas Corp. from October 2009 to July 2011, Tanganyika Oil Corp. from May 2005 to January 2009, and Calpine Natural Gas Trust from October 2003 to February 2005. As chief executive officer of these companies, Mr. Guidry was responsible for overseeing all aspects of the respective company’s business. Mr. Guidry currently sits on the board of Africa Oil Corp. (since April 2008) where he also serves as a member of the Audit Committee and the board of PetroTal Corp. (since December 2017). From September 2010 to October 2011, Mr. Guidry served on the board of Zodiac Exploration Corp., from October 2009 to March 2014, he served on the board of TransGlobe Energy Corp., and from February 2007 to May 2018, he served on the board of Shamaran Petroleum Corp. Prior to these positions, Mr. Guidry served as Senior Vice President and subsequently President of Alberta Energy Company International, and President and General Manager of Canadian Occidental Petroleum’s Nigerian operations. Mr. Guidry has directed exploration and production operations in Yemen, Syria and Egypt and has worked for oil and gas companies around the world in the U.S., Colombia, Ecuador, Venezuela, Argentina and Oman. Mr. Guidry is an Alberta-registered professional engineer (P. Eng.) and holds a B.Sc. in petroleum engineering from Texas A&M University. |
• | Ryan Ellson, Chief Financial Officer and Executive Vice President, Finance. Mr. Ellson has been Gran Tierra's Chief Financial Officer since May 2015. Mr. Ellson has 20 years of experience in a broad range of international corporate finance and accounting roles. Mr. Ellson is currently a Director of PetroTal Corp. (since December 2017). Mr. Ellson was CFO of Onza Energy Inc. from January 2015 to May 2015. From July 2014 until December 2014 Mr. Ellson was Head of Finance for Glencore E&P (Canada) Inc. and prior thereto Vice President, Finance at Caracal Energy Inc., a London Stock Exchange ("LSE") listed company with operations in Chad, Africa from August 2011 until July 2014. Prior to Caracal, Mr. Ellson was Vice President of Finance at Sea Dragon Energy from April 2010 until August 2011. In these positions, Mr. Ellson oversaw financial and accounting functions, implemented and oversaw internal financial controls, secured a reserve based lending facility and was involved in multiple capital raises. Mr. Ellson has held management and executive positions with companies operating in Chad, Egypt, India and Canada. Mr. Ellson is a Chartered Professional Accountant and holds a Bachelor of Commerce and a Master of Professional Accounting from the University of Saskatchewan. |
• | Tony Berthelet, Chief Operating Officer. Mr. Berthelet was appointed as Gran Tierra's Chief Operating Officer on October 18, 2019. Mr. Berthelet has over 20 years of multi-disciplinary upstream oil and gas experience and eight years of executive level leadership experience. He has held several senior management roles focused on production, operations and asset development, including the implementation and optimization of secondary and enhanced oil recovery projects. Prior to joining Gran Tierra, Mr. Berthelet was the President and Chief Executive Officer of Strategic Oil and Gas Ltd. since 2018. Prior to joining Strategic, he was Vice President, Development and Operations at Obsidian Energy Ltd. from 2012 to 2014. Earlier in his career, he gained international leadership experience through project management roles focused on enhanced oil recovery evaluation projects at Vermilion Energy in France and Nexen Inc. in Yemen. Mr. Berthelet is a member of the Society of Petroleum Engineers. |
• | James Evans, Vice President, Corporate Services. Mr. Evans has been Gran Tierra's Vice President, Corporate Services, since May 2015. Mr. Evans has over 26 years of experience including working the last 15 years in the international oil and gas industry. Most recently, Mr. Evans was the Head of Compliance & Corporate Services for Glencore E&P (Canada) Inc. from July 2014 to December 2014, and prior thereto Vice President of Compliance & Corporate Services at Caracal Energy Inc. from July 2011 to June 2014 where he oversaw the execution of corporate strategy and goals, developed and implemented a robust corporate compliance program, and managed all aspects of IT, document control, security and administration. Mr. Evans also managed the recruitment, training and retention of staff in both Calgary and Chad. He oversaw the growth of Caracal Energy from seven employees to more than 400 at the time of sale to Glencore. Prior to Caracal, Mr. Evans held senior management and executive positions at Orion Oil and Gas and Tanganyika Oil, with operating experience in Egypt, Syria and Canada. Mr. Evans is a Certified General Accountant and holds a Bachelor of Commerce degree from the University of Calgary. |
25
• | Glen Mah, Vice President, Exploration Ecuador. Mr. Mah was appointed as Vice President, Explorations Ecuador in September 2019 and has been Gran Tierra's Vice President, Business Development since June 2016. He is a Petroleum Geologist with extensive management experience covering the execution of exploration programs, field development and asset management for conventional and unconventional hydrocarbons. He has worked with onshore and offshore projects in various petroleum basins in the Americas, Africa, Middle East and Asia. Mr. Mah was the Chief Geologist with the highly successful Tanganyika Oil Company Ltd. Mr. Mah has Alberta-registered Professional designation with APEGA and holds a Bachelor of Science degree Specialization in Geology from the University of Alberta. |
• | Rodger Trimble, Vice President, Investor Relations. Mr. Trimble has been Gran Tierra's Vice President, Investor Relations since June 2016. He is a Professional Engineer with more than 30 years of experience in domestic and international basins in various management positions. Prior to joining Gran Tierra, Mr. Trimble was Head of Corporate Planning, Budgeting & Finance with Glencore E&P (Canada) Inc. and prior thereto Director Corporate Planning, Budget & Business Development with Caracal Energy Inc. (acquired by Glencore E&P). He has held several senior management positions ranging from Country Manager in Argentina with Canadian Hunter Exploration, Vice President, Exploitation with Esprit Energy Trust, Manager, Reservoir Engineering with Apache Canada Inc. and Manager, Upstream Evaluations - Frontiers & International with Husky Energy. Mr. Trimble is an Alberta-registered Professional Engineer and a member of APEGA. He received a Bachelor of Science in Petroleum Engineering (with Distinction) from Stanford University. |
• | Lawrence West. Vice President, Exploration. Mr. West has been Gran Tierra's Vice President, Exploration, since May 2015. Mr. West has over 35 years of experience as an executive, explorationist, and geologist. Most recently, Mr. West was Vice President, Exploration at Caracal Energy from July 2011 to June 2014. Mr. West built a multi-disciplinary team to assess resources and grow reserves in the interior rift basins within Chad and led a successful exploration program. During his tenure he successfully executed two large 2D/3D seismic shoots in remote frontier basins, on time and on budget. Prior to Caracal he has been involved in starting and growing several public and private companies, including Reserve Royalty Corp., Chariot Energy, Auriga Energy and Orion Oil and Gas. Lawrence worked at Alberta Energy Company (AEC), where he was on the team that merged with Conwest. He built and led the AEC East team to the Rocky Mountain USA basins. His career began with Imperial Oil working on prospect and reservoir characterization, in multi-disciplinary teams, and as a technical mentor to exploration teams. Lawrence has an Honours Bachelor of Science in Geology from McMaster University and an MBA, specializing in economics, from the University of Calgary. |
PART II
Item 5. Market for Registrant's Common Equity, Related Stockholder Matters and Issuer Purchases of Equity Securities
Shares of our Common Stock trade on the NYSE American, the Toronto Stock Exchange (“TSX”) and on the London Stock Exchange (“LSE”) under the symbol “GTE”.
As of February 24, 2020, there were approximately 31 holders of record of shares of our Common Stock and 366,981,556 shares outstanding with $0.001 par value.
Dividend Policy
We have never declared or paid dividends on the shares of Common Stock and we intend to retain future earnings, if any, to support the development of the business and therefore do not anticipate paying cash dividends for the foreseeable future. Payment of future dividends, if any, would be at the discretion of our Board of Directors after taking into account various factors, including current financial condition, the tax impact of repatriating cash, operating results and current and anticipated cash needs. Under the terms of the credit facility, the Company cannot pay any dividends to its shareholders if it is in default under the facility and, if the Company is not in default, it is required to obtain bank approval for dividend payments to shareholders outside of the credit facility group which comprises the Company’s subsidiaries in Colombia, Canada and the United States of America (the “Credit Facility Group”).
Issuer Purchases of Equity Securities
In 2019, the Company implemented a share repurchase program (the “2019 program”) through the facilities of the Toronto Stock Exchange ("TSX") and eligible alternative trading platforms in Canada. Under the 2019 program, the Company is able to purchase at prevailing market prices up to 19,353,951 shares of Common Stock, representing approximately 5% of the issued and outstanding shares of Common Stock as of March 1, 2019. The 2019 program was scheduled to expire on March 12, 2020, or earlier if the 5% share maximum is reached. The 2019 program expired when the 5% share maximum was reached in September 2019.The
26
weighted average price per share under the 2019 program was $1.85 per share. All shares purchased were canceled subsequent to the repurchase.
Performance Graph
The information in this Annual Report on Form 10-K appearing under the heading “Performance Graph” is being “furnished” pursuant to Item 201(e) of Regulation S-K under the Securities Act and shall not be deemed to be “soliciting material” or “filed” with the SEC or subject to Regulation 14A or 14C, other than as provided in Item 201(e) of Regulation S-K, or to the liabilities of Section 18 of the Exchange Act and shall not be deemed incorporated by reference into any filing under the Securities Act or the Exchange Act except to the extent that we specifically incorporate it by reference into such filing.
The performance graph below shows the cumulative total shareholder return on our shares for the period starting on December 31, 2014, and ending on December 31, 2019, which was the end of our fiscal 2019. This is compared with the cumulative total returns over the same period of the S&P 500 Total Return Index and the S&P O&G E&P Select Index Total Return. The graph assumes that, on December 31, 2014, $100 was invested in our shares and $100 was invested in each of the other two indices, with dividends reinvested on the ex-dividend date without payment of any commissions. The performance shown in the graph represents past performance and should not be considered an indication of future performance.
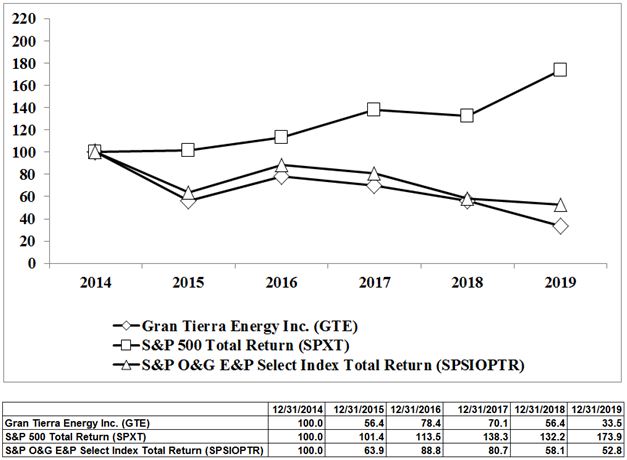
27
Item 6. Selected Financial Data
(Thousands of U.S. Dollars, Except Share and Per Share Amounts)
Statement of Operations Data | |||||||||||||||||||
Year Ended December 31, | |||||||||||||||||||
2019 | 2018 | 2017 | 2016 | 2015 | |||||||||||||||
Oil and natural gas sales | $ | 570,983 | $ | 613,431 | $ | 421,734 | $ | 289,269 | $ | 276,011 | |||||||||
Expenses | |||||||||||||||||||
Operating | 142,086 | 111,272 | 87,855 | 64,173 | 60,756 | ||||||||||||||
Workover | 41,118 | 34,437 | 22,014 | 22,752 | 14,809 | ||||||||||||||
Transportation | 20,400 | 28,993 | 25,107 | 31,776 | 40,204 | ||||||||||||||
Depletion, depreciation and accretion | 225,033 | 197,867 | 131,335 | 139,535 | 176,386 | ||||||||||||||
Asset impairment | — | — | 1,514 | 616,649 | 323,918 | ||||||||||||||
General and administrative | 34,730 | 39,483 | 39,014 | 33,218 | 32,353 | ||||||||||||||
Severance | 1,771 | 2,361 | 1,287 | 1,319 | 8,990 | ||||||||||||||
Transaction | — | — | — | 7,325 | — | ||||||||||||||
Equity tax | — | — | 1,224 | 3,098 | 3,769 | ||||||||||||||
Foreign exchange loss (gain) | 627 | 9,957 | 2,067 | (1,469 | ) | (17,242 | ) | ||||||||||||
Financial instruments (gain) loss | (46,215 | ) | 12,296 | 15,929 | 10,279 | 2,027 | |||||||||||||
Interest expense | 43,268 | 27,364 | 13,882 | 14,145 | — | ||||||||||||||
462,818 | 464,030 | 341,228 | 942,800 | 645,970 | |||||||||||||||
Other (loss) gain | (12,886 | ) | — | (44,385 | ) | 929 | 502 | ||||||||||||
Interest income | 696 | 2,086 | 1,209 | 2,368 | 1,369 | ||||||||||||||
Income (loss) before income taxes | 95,975 | 151,487 | 37,330 | (650,234 | ) | (368,088 | ) | ||||||||||||
Current income tax expense | 17,058 | 43,903 | 24,322 | 20,122 | 15,383 | ||||||||||||||
Deferred income tax expense (recovery) | 40,227 | 4,968 | 44,716 | (204,791 | ) | (115,442 | ) | ||||||||||||
57,285 | 48,871 | 69,038 | (184,669 | ) | (100,059 | ) | |||||||||||||
Net Income (Loss) | $ | 38,690 | $ | 102,616 | $ | (31,708 | ) | $ | (465,565 | ) | $ | (268,029 | ) | ||||||
Income (Loss) per Share | |||||||||||||||||||
Basic | $ | 0.10 | $ | 0.26 | $ | (0.08 | ) | $ | (1.45 | ) | $ | (0.94 | ) | ||||||
Diluted | $ | 0.10 | $ | 0.26 | $ | (0.08 | ) | $ | (1.45 | ) | $ | (0.94 | ) | ||||||
Balance Sheet Data | |||||||||||||||||||
As at December 31, | |||||||||||||||||||
2019 | 2018 | 2017 | 2016 | 2015 | |||||||||||||||
Cash and cash equivalents | $ | 8,301 | $ | 51,040 | $ | 12,326 | $ | 25,175 | $ | 145,342 | |||||||||
Working capital (deficiency) | 91,347 | 33,145 | (11,724 | ) | (23,344 | ) | 160,449 | ||||||||||||
Oil and gas properties | 1,569,743 | 1,310,026 | 1,094,029 | 1,060,093 | 780,360 | ||||||||||||||
28
Deferred tax asset - long-term | 44,003 | 45,437 | 57,310 | 1,611 | 3,241 | ||||||||||||||
Total assets | 2,044,664 | 1,676,584 | 1,429,619 | 1,367,896 | 1,146,118 | ||||||||||||||
Long-term debt | 700,459 | 399,415 | 256,542 | 197,083 | — | ||||||||||||||
Deferred tax liability - long-term | 59,762 | 23,419 | 28,417 | 107,230 | 34,592 | ||||||||||||||
Total long-term liabilities | 812,713 | 477,454 | 336,315 | 353,880 | 70,485 | ||||||||||||||
Shareholders’ equity | 1,032,610 | 1,029,750 | 936,335 | 858,987 | 1,001,642 | ||||||||||||||
During the year ended December 31, 2019, we completed acquisitions in Colombia for cash consideration of $77.8 million. An aggregate of $379.3 million in capital expenditures were incurred for the year, which resulted in a total of 36.0 wells drilled and commissioning of Acordionero facilities.
During the year ended December 31, 2018 we completed acquisitions in Colombia for cash consideration of $53.2 million. During 2018 we incurred of $347.1 million of capital expenditures which resulted in a total of 28.0 wells drilled.
Item 7. Management’s Discussion and Analysis of Financial Condition and Results of Operations
This report, and in particular this Management’s Discussion and Analysis of Financial Condition and Results of Operations, contains forward-looking statements within the meaning of Section 27A of the Securities Act and Section 21E of the Exchange Act. Please see the cautionary language at the very beginning of this Annual Report on Form 10-K regarding the identification of and risks relating to forward-looking statements, as well as Part I, Item 1A. “Risk Factors” in this Annual Report on Form 10-K.
The following discussion of our financial condition and results of operations should be read in conjunction with the “Financial Statements and Supplementary Data” as set out in Part II, Item 8 of this Annual Report on Form 10-K.
Overview
We are a company focused on oil and gas exploration and production in Colombia and Ecuador. Our Colombian properties represented 100% of our proved reserves NAR at December 31, 2019. For the year ended December 31, 2019, 100% of our revenue was generated in Colombia (year ended December 31, 2018- 100%; year ended December 31, 2017 - 98%). We are headquartered in Calgary, Alberta, Canada.
As of December 31, 2019, we had estimated proved reserves NAR of 67.6 MMBOE, of which 54% were proved developed reserves and 100% were oil. During 2019, we replaced 226% of our proved reserves.
As discussed under Items 1 and 2. “Business and Properties,” in 2019, we completed certain asset acquisitions to further enhance our strategy.
Financial and Operational Highlights
Key Highlights
Operational Highlights:
• | Increase proved oil and gas reserves by 26% and achieved a proven reserve replacement ratio of 226% |
• | Announced a new country entry into Ecuador's Oriente Basin by securing 100% WI in three highly prospective exploration blocks via successful bids in a bidding round, creating a contiguous acreage position extending from our existing assets in the Colombian Putumayo Basin |
• | Our total 2019 average production NAR was 29,015 BOEPD, comparable with 2018. Production was negatively impacted by downtime from electrical submersible pump ("ESP") failures in Acordionero and the temporary shut-in of several wells in Acordionero with high gas oil ratio ("GOR"). The successful commissioning of water injection facilities in Acordionero in July 2019 and associated increase in water injection has significantly reduced gas production in Acordionero from a high of 18 mmcf down to the current 8 mmcf per day, all of which is either consumed to generate power or re-injected into the reservoir |
• | Our total 2019 oil and gas sales volumes NAR increased by 1% to 29,140 BOEPD compared with 2018 |
29
Financial Highlights:
• | Net income in 2019 was $38.7 million, or $0.10 per share basic and diluted compared to net income of $102.6 million, or $0.26 per share basic and diluted in 2018 |
• | Net income before taxes in 2019 was $96.0 million compared with $151.5 million in 2018 |
• | EBITDA(1) was $364.3 million compared with $376.7 million in 2018 |
• | Adjusted EBITDA(1) was $325.9 million compared with $375.9 million in 2018 |
• | Returned $37.6 million to shareholders through the repurchase of 20,097,471 common shares |
• | Oil and gas sales for 2019 decreased 7% to $571.0 million compared with $613.4 million in 2018 |
• | Funds flow from operations(1) decreased by 11% to $272.4 million ($0.72 per share basic and diluted) compared with $306.4 million ($0.78 per share basic and diluted) in 2018, consistent with the average Brent price decreasing 11% from 2018 |
• | Oil and gas sales per BOE for 2019 were $53.68, 8% lower compared with 2018 |
• | Operating expenses per BOE for 2019 were $13.36, 26% higher compared with 2018 primarily as a result of higher power generation and rental costs. With the commissioning of the production facilities and the gas to power project in Acordionero both total and per BOE operating costs are expected to decrease in 2020. |
• | Workover expenses per BOE for 2019 increased by 18% to $3.87 compared with 2018 primarily as a result of higher frequency of ESP failures during 2019 due to power outages. With the commissioning of the gas- to-power project which has resulted in more reliable power, we are expecting lower workover costs in 2020. |
• | Quality and transportation discounts per BOE for 2019 was $10.48 compared to $13.16 in 2018. The decrease was due to renegotiation of certain sales contracts which had lower quality and transportation discounts compared to the sales contracts used for in 2018 |
• | Transportation expenses per BOE for 2019 decreased by 31% to $1.92 compared with 2018, due to a higher percentage of volumes being sold at wellhead where transportation is netted against sales price |
• | General and administrative ("G&A") expenses before stock-based compensation per BOE for 2019 increased by 5% to $3.13 per BOE compared to 2018 |
• | On May 20, 2019, we issued $300.0 million of 7.75% Senior Notes due 2027 (“7.75% Senior Notes”) |
• | We purchased and canceled $114,999,000 aggregate principal amount of 5.00% Convertible Senior Notes due 2021 (“Convertible Notes”) |
• | In November, 2019, we extended the maturity of our credit facility to November 10, 2022 |
Environmental, Social and Governance Highlights:
• | In 2019, we achieved our best safety record in terms of Lost Time Injuries ('LTI") and Total Recordable Injuries; our 2019 LTI ratio of 0.02 was 80% below the industry average for Latin American exploration and production companies, which was reported by the International Association of Oil and Gas Producers in 2019 |
• | In partnership with the international non-governmental organization Conservation International, we committed to reforesting 1,000 hectares of land and securing and maintaining 18,000 hectares of forest through the NaturAmazonas project in the Putumayo Basin; our total NaturAmazonas investment in the Andes-Amazon rainforest corridor through this project is forecasted to be $13 million |
• | We planted a total of 560,112 trees and have conserved, preserved or reforested 1,367 hectares of land through all of our environmental efforts |
• | For the last 4 years, we have voluntarily released an assessment of our greenhouse gas ("GHG") emissions |
• | We are reducing GHG emissions at our facilities through gas-to-power projects by converting excess natural gas, that would otherwise be flared, and using it instead for power generation; in 2019, we completed a gas-to-power project at the Acordionero Field, ours single biggest producing asset; previously, gas-to-power projects were completed at the Moqueta field in 2018 and the Costayaco field in 2017 |
• | We are working to eliminate all routine flaring in our operations |
• | We are undertaking the NaturAmazonas project over the course of seven years, commencing in 2017. This project alone is expected to sequester approximately 8.7 million tons of CO2 over its lifetime |
• | We have created almost 16,000 local labor opportunities over the past 3 years |
30
(Thousands of U.S. Dollars, unless otherwise noted) | Year Ended December 31, | |||||||||||||||||
SEC Compliant Reserves, NAR (MMBOE) | 2019 | % Change | 2018 | % Change | 2017 | |||||||||||||
Estimated Proved Oil and Gas Reserves | 68 | 26 | 54 | (8 | ) | 59 | ||||||||||||
Estimated Probable Oil and Gas Reserves | 58 | (6 | ) | 62 | 13 | 55 | ||||||||||||
Estimated Possible Oil and Gas Reserves | 38 | (22 | ) | 49 | (16 | ) | 58 | |||||||||||
Average Consolidated Daily Volumes (BOEPD) | ||||||||||||||||||
Working Interest Production Before Royalties(2) | 34,817 | (4 | ) | 36,209 | 13 | 32,105 | ||||||||||||
Royalties | (5,802 | ) | (19 | ) | (7,156 | ) | 35 | (5,320 | ) | |||||||||
Production NAR | 29,015 | — | 29,053 | 8 | 26,785 | |||||||||||||
Decrease (Increase) in Inventory | 125 | (137 | ) | (336 | ) | 250 | (96 | ) | ||||||||||
Sales(3) | 29,140 | 1 | 28,717 | 8 | 26,689 | |||||||||||||
Net Income (Loss) | $ | 38,690 | (62 | ) | $ | 102,616 | 424 | $ | (31,708 | ) | ||||||||
Operating Netback | ||||||||||||||||||
Oil and Natural Gas Sales | $ | 570,983 | (7 | ) | $ | 613,431 | 45 | $ | 421,734 | |||||||||
Operating Expenses | (142,086 | ) | 28 | (111,272 | ) | 27 | (87,855 | ) | ||||||||||
Workover Expenses | (41,118 | ) | 19 | (34,437 | ) | 56 | (22,014 | ) | ||||||||||
Transportation Expenses | (20,400 | ) | (30 | ) | (28,993 | ) | 15 | (25,107 | ) | |||||||||
Operating Netback(1) | $ | 367,379 | (16 | ) | $ | 438,729 | 53 | $ | 286,758 | |||||||||
G&A Expenses Before Stock-Based Compensation | $ | 33,300 | 6 | $ | 31,369 | 5 | $ | 29,775 | ||||||||||
G&A Stock-Based Compensation | $ | 1,430 | (82 | ) | $ | 8,114 | (12 | ) | $ | 9,239 | ||||||||
EBITDA(1) | $ | 364,276 | (3 | ) | $ | 376,718 | 106 | $ | 182,547 | |||||||||
Funds Flow From Operations(1) | $ | 272,409 | (11 | ) | $ | 306,449 | 39 | $ | 220,197 | |||||||||
Capital Expenditures | $ | 379,314 | 9 | $ | 347,093 | 38 | $ | 251,041 | ||||||||||
Net Cash Received on Dispositions | $ | — | — | $ | — | (100 | ) | $ | 32,968 | |||||||||
Cash Paid for Acquisitions, Net of Cash Acquired | $ | 77,772 | 46 | $ | 53,200 | 55 | $ | 34,410 | ||||||||||
As at December 31, | |||||||||||||||||
(Thousands of U.S. Dollars) | 2019 | % Change | 2018 | % Change | 2017 | ||||||||||||
Cash, Cash Equivalents and Current Restricted Cash and Cash Equivalents | $ | 8,817 | (83 | ) | $ | 52,309 | 117 | $ | 24,113 | ||||||||
Revolving Credit Facility | $ | 118,000 | 100 | $ | — | (100 | ) | $ | 148,000 | ||||||||
Senior Notes | $ | 600,000 | 100 | $ | 300,000 | 100 | $ | — | |||||||||
Convertible Notes | $ | — | (100 | ) | $ | 115,000 | — | $ | 115,000 | ||||||||
(1) Non-GAAP measures
Operating netback, EBITDA, funds flow from operations are non-GAAP measures which do not have any standardized meaning prescribed under GAAP. Management views these measures as financial performance measures. Investors are cautioned that these measures should not be construed as alternatives to net income or loss or other measures of financial performance as determined in accordance with GAAP. Our method of calculating these measures may differ from
31
other companies and, accordingly, may not be comparable to similar measures used by other companies. Each non-GAAP financial measure is presented along with the corresponding GAAP measure so as not to imply that more emphasis should be placed on the non-GAAP measure.
Operating netback, as presented, is defined as oil and natural gas sales less operating, workover and transportation expenses. Management believes that operating netback is a useful supplemental measure for management and investors to analyze financial performance and provides an indication of the results generated by our principal business activities prior to the consideration of other income and expenses. A reconciliation from oil and natural gas sales to operating netback is provided in the table above.
EBITDA, as presented, is defined as net income or loss adjusted for depletion, depreciation and accretion ("DD&A") expenses, interest expense and income tax expense. Adjusted EBITDA, as presented is defined as EBITDA adjusted for loss on redemption of Convertible Notes, investment gains or losses, loss on sale of business units and asset impairment. Management uses this supplemental measure to analyze performance and income generated by our principal business activities prior to the consideration of how non-cash items affect that income, and believes that this financial measure is useful supplemental information for investors to analyze our performance and our financial results. A reconciliation from net income to EBITDA and adjusted EBITDA is as follows:
Year Ended December 31, | ||||||||||||
(Thousands of U.S. Dollars) | 2019 | 2018 | 2017 | |||||||||
Net Income (loss) | $ | 38,690 | $ | 102,616 | $ | (31,708 | ) | |||||
Adjustments to reconcile net income (loss) to EBITDA and adjusted EBITDA | ||||||||||||
DD&A expenses | 225,033 | 197,867 | 131,335 | |||||||||
Interest expense | 43,268 | 27,364 | 13,882 | |||||||||
Income tax expense | 57,285 | 48,871 | 69,038 | |||||||||
EBITDA (non-GAAP) | $ | 364,276 | $ | 376,718 | $ | 182,547 | ||||||
Loss on redemption of Convertible Notes | 11,501 | — | — | |||||||||
Investment gain | (49,884 | ) | (786 | ) | (111 | ) | ||||||
Loss on sale of business units | — | — | 44,385 | |||||||||
Asset impairment | — | — | 1,514 | |||||||||
Adjusted EBITDA (non-GAAP) | $ | 325,893 | $ | 375,932 | $ | 228,335 | ||||||
Funds flow from operations, as presented, is defined as net income or loss adjusted for DD&A expenses, asset impairment, deferred tax expense, stock-based compensation expense, amortization of debt issuance costs, non-cash lease expense, lease payments, cash settlement of RSUs, unrealized foreign exchange gains or losses, financial instruments gains or losses, cash settlement of financial instruments and loss on redemption of Convertible Notes. Management uses this financial measure to analyze performance and income or loss generated by our principal business activities prior to the consideration of how non-cash items affect that income or loss, and believes that this financial measure is also useful supplemental information for investors to analyze performance and our financial results. A reconciliation from net income or loss to funds flow from operations is as follows:
Year Ended December 31, | |||||||||||
(Thousands of U.S. Dollars) | 2019 | 2018 | 2017 | ||||||||
Net Income (loss) | $ | 38,690 | $ | 102,616 | $ | (31,708 | ) | ||||
Adjustments to reconcile net income (loss) to funds flow from operations | |||||||||||
DD&A expenses | 225,033 | 197,867 | 131,335 | ||||||||
Asset impairment | — | — | 1,514 | ||||||||
Deferred tax expense | 40,227 | 4,968 | 44,716 | ||||||||
Stock-based compensation expense | 1,430 | 8,299 | 9,775 | ||||||||
Amortization of debt issuance costs | 3,376 | 3,183 | 2,415 | ||||||||
Non-cash lease expense | 1,806 | — | — | ||||||||
Lease payments | (1,969 | ) | — | — | |||||||
Cash settlement of RSUs | — | (360 | ) | (564 | ) | ||||||
Unrealized foreign exchange loss | 1,803 | 11,511 | 837 | ||||||||
Financial instruments (gain) loss | (46,215 | ) | 12,296 | 15,929 | |||||||
Cash settlement of financial instruments | (3,273 | ) | (33,931 | ) | 1,563 | ||||||
Loss on redemption of Convertible Notes | 11,501 | — | 44,385 | ||||||||
Funds flow from operations (non-GAAP) | $ | 272,409 | $ | 306,449 | $ | 220,197 | |||||
(2)Includes 2017 average WI production of 679 BOEPD respectively, relating to the Brazil operations, which were sold in June 2017.
(3) Sales volumes represent production NAR adjusted for inventory changes. In 2017, Brazil operations contributed 580 BOEPD.
32
Consolidated Results of Operations
Year Ended December 31, | ||||||||||||||||||
2019 | % Change | 2018 | % Change | 2017 | ||||||||||||||
(Thousands of U.S. Dollars) | ||||||||||||||||||
Oil and natural gas sales | $ | 570,983 | (7 | ) | $ | 613,431 | 45 | $ | 421,734 | |||||||||
Operating expenses | 142,086 | 28 | 111,272 | 27 | 87,855 | |||||||||||||
Workover expenses | 41,118 | 19 | 34,437 | 56 | 22,014 | |||||||||||||
Transportation expenses | 20,400 | (30 | ) | 28,993 | 15 | 25,107 | ||||||||||||
Operating netback(1) | 367,379 | (16 | ) | 438,729 | 53 | 286,758 | ||||||||||||
DD&A expenses | 225,033 | 14 | 197,867 | 51 | 131,335 | |||||||||||||
Asset impairment | — | — | — | (100 | ) | 1,514 | ||||||||||||
G&A expenses before stock-based compensation | 33,300 | 6 | 31,369 | 5 | 29,775 | |||||||||||||
G&A stock-based compensation expense | 1,430 | (82 | ) | 8,114 | (12 | ) | 9,239 | |||||||||||
Severance expenses | 1,771 | (25 | ) | 2,361 | 83 | 1,287 | ||||||||||||
Equity tax | — | — | — | (100 | ) | 1,224 | ||||||||||||
Foreign exchange loss | 627 | (94 | ) | 9,957 | 382 | 2,067 | ||||||||||||
Financial instruments (gain) loss | (46,215 | ) | (476 | ) | 12,296 | (23 | ) | 15,929 | ||||||||||
Interest expense | 43,268 | 58 | 27,364 | 97 | 13,882 | |||||||||||||
259,214 | (10 | ) | 289,328 | 40 | 206,252 | |||||||||||||
Other loss | (12,886 | ) | 100 | — | (100 | ) | (44,385 | ) | ||||||||||
Interest income | 696 | (67 | ) | 2,086 | 73 | 1,209 | ||||||||||||
Income before income taxes | 95,975 | (37 | ) | 151,487 | 306 | 37,330 | ||||||||||||
Current income tax expense | 17,058 | (61 | ) | 43,903 | 81 | 24,322 | ||||||||||||
Deferred income tax expense | 40,227 | 710 | 4,968 | (89 | ) | 44,716 | ||||||||||||
Total income tax expense | 57,285 | 17 | 48,871 | (29 | ) | 69,038 | ||||||||||||
Net Income (loss) | $ | 38,690 | (62 | ) | $ | 102,616 | 424 | $ | (31,708 | ) | ||||||||
Sales Volumes (NAR) | ||||||||||||||||||
Total sales volumes, BOEPD | 29,140 | 1 | 28,717 | 8 | 26,689 | |||||||||||||
Brent Price per bbl | $ | 64.16 | (11 | ) | $ | 71.69 | 31 | $ | 54.82 | |||||||||
Consolidated Results of Operations per BOE Sales Volumes (NAR) | ||||||||||||||||||
Oil and natural gas sales | $ | 53.68 | (8 | ) | $ | 58.53 | 35 | $ | 43.29 | |||||||||
Operating expenses | 13.36 | 26 | 10.62 | 18 | 9.02 | |||||||||||||
Workover expenses | 3.87 | 18 | 3.29 | 46 | 2.26 | |||||||||||||
Transportation expenses | 1.92 | (31 | ) | 2.77 | 7 | 2.58 | ||||||||||||
Operating netback(1) | 34.53 | (17 | ) | 41.85 | 42 | 29.43 | ||||||||||||
33
DD&A expenses | 21.16 | 12 | 18.88 | 40 | 13.48 | |||||||||||||
Asset impairment | — | — | — | (100 | ) | 0.16 | ||||||||||||
G&A expenses before stock-based compensation | 3.13 | 5 | 2.99 | (2 | ) | 3.06 | ||||||||||||
G&A stock-based compensation expense | 0.13 | (83 | ) | 0.77 | (19 | ) | 0.95 | |||||||||||
Severance expenses | 0.17 | (26 | ) | 0.23 | 77 | 0.13 | ||||||||||||
Equity tax | — | — | — | (100 | ) | 0.13 | ||||||||||||
Foreign exchange loss | 0.06 | (94 | ) | 0.95 | 352 | 0.21 | ||||||||||||
Financial instruments (gain) loss | (4.35) | (472 | ) | 1.17 | (29 | ) | 1.64 | |||||||||||
Interest expense | 4.07 | 56 | 2.61 | 83 | 1.43 | |||||||||||||
24.37 | (12 | ) | 27.60 | 30 | 21.19 | |||||||||||||
Other loss | (1.21 | ) | 100 | — | (100 | ) | (4.56 | ) | ||||||||||
Interest income | 0.07 | (65 | ) | 0.20 | 67 | 0.12 | ||||||||||||
Income before income taxes | 9.02 | (38 | ) | 14.45 | 280 | 3.80 | ||||||||||||
Current income tax expense | 1.60 | (62 | ) | 4.19 | 68 | 2.50 | ||||||||||||
Deferred income tax expense | 3.78 | 704 | 0.47 | (90 | ) | 4.59 | ||||||||||||
5.38 | 15 | 4.66 | (34 | ) | 7.09 | |||||||||||||
Net Income (loss) | $ | 3.64 | (63 | ) | $ | 9.79 | 398 | $ | (3.29 | ) | ||||||||
(1) Operating netback is a non-GAAP measure which does not have any standardized meaning prescribed under GAAP. Refer to "Financial and Operating Highlights - non-GAAP measures" for a definition and reconciliation of this measure.
Oil and Gas Production and Sales Volumes, BOEPD
Year Ended December 31, | |||||||||
Average Daily Volumes (BOEPD) | 2019 | 2018 | 2017 | ||||||
Working Interest Production Before Royalties | 34,817 | 36,209 | 32,105 | ||||||
Royalties | (5,802 | ) | (7,156 | ) | (5,320 | ) | |||
Production NAR(1) | 29,015 | 29,053 | 26,785 | ||||||
Decrease (Increase) in Inventory | 125 | (336 | ) | (96 | ) | ||||
Sales (1) | 29,140 | 28,717 | 26,689 | ||||||
Royalties, % of Working Interest Production Before Royalties | 17 | % | 20 | % | 17 | % | |||
(1) December 31, 2017 figures include Production NAR of 576 BOEPD and sales volumes of 580 BOEPD, respectively, related to operations in Brazil, which were sold in June 30, 2017
Oil and gas production NAR for the year ended December 31, 2019 of 29,015 BOEPD was consistent with 2018 oil and gas production of 29,053 BOEPD.
Royalties as a percentage of production for the year ended December 31, 2019, decreased compared to prior year commensurate the decrease in benchmark oil prices and the price sensitive royalty regime in Colombia.
Oil and gas production NAR for the year ended December 31, 2018, increased by 8% to 29,053 BOEPD compared with 26,785 BOEPD in 2017. Production increased as a result of a successful drilling and workover campaign in the Acordionero Field. During 2018 we drilled 15 wells in the Acordionero Field.
34
Operating Netbacks
Consolidated | Year Ended December 31, | |||||||||||
(Thousands of U.S. Dollars) | 2019 | 2018 | 2017 | |||||||||
Oil and Gas Sales | $ | 570,983 | $ | 613,431 | $ | 421,734 | ||||||
Transportation Expenses | (20,400 | ) | (28,993 | ) | (25,107 | ) | ||||||
550,583 | 584,438 | 396,627 | ||||||||||
Operating Expenses | (142,086 | ) | (111,272 | ) | (87,855 | ) | ||||||
Workover Expenses | (41,118 | ) | (34,437 | ) | (22,014 | ) | ||||||
Operating Netback(1) | $ | 367,379 | $ | 438,729 | $ | 286,758 | ||||||
(U.S. Dollars per BOE Sales Volumes NAR) | ||||||||||||
Brent | $ | 64.16 | $ | 71.69 | $ | 54.82 | ||||||
Quality and Transportation Discounts | (10.48 | ) | (13.16 | ) | (11.53 | ) | ||||||
Average Realized Price | 53.68 | 58.53 | 43.29 | |||||||||
Transportation Expenses | (1.92 | ) | (2.77 | ) | (2.58 | ) | ||||||
Average Realized Price Net of Transportation Expenses | 51.76 | 55.76 | 40.71 | |||||||||
Operating Expenses | (13.36 | ) | (10.62 | ) | (9.02 | ) | ||||||
Workover Expenses | (3.87 | ) | (3.29 | ) | (2.26 | ) | ||||||
Operating Netback(1) | $ | 34.53 | $ | 41.85 | $ | 29.43 | ||||||
(1) Operating netback is a non-GAAP measure which does not have any standardized meaning prescribed under GAAP. Refer to “Financial and Operating Highlights - non-GAAP measures” for a definition and reconciliation of this measure. 2017 figures include $6,271 of operating netback from operations in Brazil, which were sold in June 2017.
Oil and gas sales for the year ended December 31, 2019, decreased to $571.0 million compared to $613.4 million in 2018, primarily as a result of lower average realized oil prices.
Oil and gas sales for the year ended December 31, 2018, increased compared to $421.7 million in 2017, primarily as a result of increased sales volumes and higher average realized oil prices.
The following table shows the effect of changes in realized price and sales volumes on our oil and gas sales for the three years ended December 31, 2019:
Year Ended December 31, | ||||||||||||
2019 | 2018 | 2017 | ||||||||||
Oil and natural gas sales for the comparative period | $ | 613,431 | $ | 421,734 | $ | 289,269 | ||||||
Realized sales price (decrease) increase effect | (51,485 | ) | 159,653 | 100,304 | ||||||||
Sales volume increase effect | 9,037 | 32,044 | 32,161 | |||||||||
Oil and natural gas sales for the current period | $ | 570,983 | $ | 613,431 | $ | 421,734 | ||||||
On a per BOE basis, average realized prices decreased by 8% to $53.68 for the year ended December 31, 2019 compared to $58.53 in 2018 primarily as a result of the decrease in benchmark oil prices. Average Brent oil prices for the year ended December 31, 2019 decreased by 11% compared to 2018. Brent oil price decreased by $7.53 per bbl but realized prices only decreased by $4.85 per bbl.
On a per BOE basis, average realized price increased by 35% to $58.53 for the year ended December 31, 2018 compared to $43.29 in 2017. The increase in realized prices was consistent with higher benchmark oil prices. Average Brent oil price for the year ended December 31, 2018 increased by 31% compared with 2017.
We have options to sell our oil through multiple pipelines and trucking routes. Each transportation route has varying effects on realized price and transportation expenses. The following table shows the percentage of oil volumes we sold in Colombia using each transportation method for each of the three years ended December 31, 2019:
35
Year Ended December 31, | |||||||||
2019 | 2018 | 2017 | |||||||
Volume transported through pipelines | 1 | % | 8 | % | 16 | % | |||
Volume sold at wellhead | 51 | % | 40 | % | 52 | % | |||
Volume transported via truck to pipelines | 48 | % | 52 | % | 32 | % | |||
100 | % | 100 | % | 100 | % | ||||
Volumes transported through pipelines or via truck receive a higher realized price, but incur higher transportation expenses. Volumes sold at the wellhead have the opposite effect of lower realized price, offset by lower transportation expense. We focus on maximizing operating netback per barrel when choosing a transportation method.
Transportation expenses for the year ended December 31, 2019, decreased by 30% to $20.4 million, compared with $29.0 million in 2018. On a per BOE basis, transportation expenses decreased 31% to $1.92, from $2.77 in 2018. The decrease in transportation expenses per BOE was due to higher volume sold at wellhead where the transportation is netted against sales price and shorter trucking routes to pipelines which lowered the transportation costs.
Transportation expenses for the year ended December 31, 2018, increased 15% to $29.0 million, compared with $25.1 million in 2017. On a per BOE basis, transportation expenses increased 7% to $2.77, from $2.58 in 2017. The increase in transportation expenses per BOE was primarily due to a lower volume sold at wellhead and higher volume sold from the Acordionero field, which is subject to transportation costs.
The following table shows the variance in our average realized price net of transportation expenses in Colombia for each of the three years ended December 31, 2019:
Year Ended December 31, | ||||||||||||
(U.S. Dollars per BOE Sales Volumes NAR) | 2019 | 2018 | 2017 | |||||||||
Average realized price net of transportation expenses for the comparative period | $ | 55.76 | $ | 40.71 | $ | 29.38 | ||||||
(Decrease) increase in benchmark prices | (7.53 | ) | 16.87 | 10.49 | ||||||||
Decrease (increase) in quality and transportation discounts | 2.68 | (1.63 | ) | (0.20 | ) | |||||||
Decrease (increase) in transportation expense | 0.85 | (0.19 | ) | 1.04 | ||||||||
Average realized price net of transportation expenses for the year | $ | 51.76 | $ | 55.76 | $ | 40.71 | ||||||
Operating expenses for the year ended December 31, 2019, increased 28% to $142.1 million compared to $111.3 million in 2018.
On a per BOE basis, operating expenses increased by $2.74 to $13.36 compared to $10.62 in prior year, primarily as a result of higher power generation and rental costs. During 2019, we fully commissioned the Acordionero expansion and gas-to-power facilities. These projects will allow expanded water injection and delivery of enhanced power reliability, which are expected to reduce operating costs and enhance ultimate recovery of oil and gas in the Acordionero field. With the commissioning of the permanent facilities and gas-to-power projects, we are expecting to reduce operating costs by terminating contracts related to rental facilities in the field and generating power through natural gas produced in the field instead of purchased diesel.
Operating expenses for the year ended December 31, 2018, increased 27% to $111.3 million, compared to $87.9 million in 2017.
On a per BOE basis, operating expenses increased by $1.60 to $10.62 compared to $9.02 in 2017. The increase in operating expenses per BOE in 2018 was primarily as a result of higher power generation and equipment rental costs required to manage the capacity limitations in the Acordionero field as a result of rapid production growth.
Workover expenses on a per BOE basis, increased by $0.58 to $3.87 for the year ended December 31, 2019 compared to 2018, due to a higher frequency of ESP failures during 2019 primarily because of power outages. With the gas-to-power facilities fully commissioned in 2019, we expect workover costs per BOE to decrease in 2020.
Workover expenses on a per BOE basis, increased by $1.03 to $3.29 for the year ended December 31, 2018 compared to 2017 due to replacement of ESPs during 2018 resulting from unreliable power.
36
DD&A Expenses
Year Ended December 31, | ||||||||||||
2019 | 2018 | 2017 | ||||||||||
DD&A Expenses, thousands of U.S. Dollars(1) | $ | 225,033 | $ | 197,867 | $ | 131,335 | ||||||
DD&A Expenses, U.S. Dollars per BOE | 21.16 | 18.88 | 13.48 | |||||||||
(1) For the year-ended 2017, Corporate, Brazil and Peru contributed $1.1, $2.3 and $1.5 million, respectively, to DD&A expenses.
DD&A expenses for the year ended December 31, 2019, increased by 14% from 2018 (12% on a per BOE basis), and increased by 51% (40% on a per BOE basis) in 2018 from 2017. On a per BOE basis, DD&A increases in 2019 and 2018 compared to prior years were due to higher costs in the depletable base partially offset by increased proved reserves.
Asset Impairment
Year Ended December 31, | ||||||||||||
(Thousands of U.S. Dollars) | 2019 | 2018 | 2017 | |||||||||
Impairment of oil and gas properties(1) | $ | — | $ | — | $ | 1,514 | ||||||
$ | — | $ | — | $ | 1,514 | |||||||
(1) For the year-ended 2017, Mexico and Peru contributed $0.6 and $0.9 million, respectively, to impairment losses.
We follow the full cost method of accounting for our oil and gas properties. Under this method, the net book value of properties on a country-by-country basis, less related deferred income taxes, may not exceed a calculated “ceiling”. The ceiling is the estimated after tax future net revenues from proved oil and gas properties, discounted at 10% per year. In calculating discounted future net revenues, oil and natural gas prices are determined using the average price during the 12-month period prior to the ending date of the period covered by the balance sheet, calculated as an unweighted arithmetic average of the first-day-of-the month price for each month within such period for that oil and natural gas. That average price is then held constant, except for changes which are fixed and determinable by existing contracts. Therefore, ceiling test estimates are based on historical prices discounted at 10% per year and it should not be assumed that estimates of future net revenues represent the fair market value of our reserves.
For the years ended December 31, 2019, 2018 and 2017, no ceiling test impairment was recorded in our Colombia cost center. In accordance with GAAP, we used an average Brent price of $64.20 per bbl for the purposes of the December 31, 2019 ceiling test calculation (December 31, 2018 - 72.08; December 31, 2017 - 54.19).
G&A Expenses
Year Ended December 31, | |||||||||||||
(Thousands of U.S. Dollars) | 2019 | % change | 2018 | % change | 2017 | ||||||||
G&A Expenses Before Stock-Based Compensation | $ | 33,300 | 6 | $ | 31,369 | 5 | $ | 29,775 | |||||
G&A Stock-Based Compensation | 1,430 | (82 | ) | 8,114 | (12 | ) | 9,239 | ||||||
G&A Expenses, Including Stock-Based Compensation | $ | 34,730 | (12 | ) | $ | 39,483 | 1 | $ | 39,014 | ||||
U.S. Dollars Per BOE Sales Volumes NAR | |||||||||||||
G&A Expenses Before Stock-Based Compensation | $ | 3.13 | 5 | $ | 2.99 | (2 | ) | $ | 3.06 | ||||
G&A Stock-Based Compensation | 0.13 | (83 | ) | 0.77 | (19 | ) | 0.95 | ||||||
G&A Expenses, Including Stock-Based Compensation | $ | 3.26 | (13 | ) | $ | 3.76 | (6 | ) | $ | 4.01 | |||
G&A expenses, on a per BOE basis, after stock-based compensation decreased 13% to $3.26 in 2019 compared to prior year, mainly as a result of decrease in stock-based compensation commensurate with the decrease in stock price during 2019, partially offset by lower recoveries and a reduction of capitalized G&A during 2019.
G&A expenses, on a per BOE basis, after stock-based compensation decreased 6% to $3.76 in 2018 compared to prior year, mainly as a result of production NAR growth and a decrease in stock-based compensation during the fourth quarter of 2018.
37
G&A expenses, on a per BOE basis, before stock-based compensation increased 5% in 2019 compared to 2018 and decreased 2% in 2018 compared to 2017.
Severance Expenses
For the years ended December 31, 2019, 2018 and 2017, severance expenses were $1.8 million, $2.4 million and $1.3 million, respectively, due to headcount optimization.
Equity Tax Expense
For the years ended December 31, 2019, 2018 and 2017, the equity tax expense was nil, nil, and $1.2 million, respectively, and was calculated based on our Colombian legal entities' balance sheet at January 1st of the year. The Equity Tax expense expired as of January 1, 2019, and the modified version re-introduced in the 2018 Colombian Tax Reform is not applicable to our Colombian legal entities.
Foreign Exchange Gains and Losses
For the years ended December 31, 2019, 2018 and 2017, we had foreign exchange losses of $0.6 million, $10.0 million and $2.1 million, respectively. The main sources of the foreign exchange gains and losses are revaluation of taxes receivable and payable, investment in PetroTal shares and deferred tax liabilities. Under GAAP, deferred taxes are considered a monetary liability and require translation from local currency to U.S. dollar functional currency at each balance sheet date.
The following table presents the change in the Colombian peso against the U.S. dollar for each of the three years ended December 31, 2019:
Year Ended December 31, | |||
2019 | 2018 | 2017 | |
Change in the Colombian peso against the U.S. dollar | weakened by | weakened by | strengthened by |
1% | 9% | 1% | |
Change in the U.S. dollar against the Canadian dollar | strengthened by | weakened by | strengthened by |
5% | 9% | 7% | |
Financial Instrument Gains and Losses
The following table presents the nature of our financial instruments gains and losses for each of the three years ended December 31, 2019:
Year Ended December 31, | |||||||||
(Thousands of U.S. Dollars) | 2019 | 2018 | 2017 | ||||||
Commodity price derivative loss | $ | 3,642 | $ | 13,972 | $ | 17,327 | |||
Foreign currency derivative loss (gain) | 27 | (890 | ) | (1,287 | ) | ||||
Investment gain | (49,884 | ) | (786 | ) | (111 | ) | |||
$ | (46,215 | ) | $ | 12,296 | $ | 15,929 | |||
For the year ended December 31, 2019, we had an investment gain of $49.9 million (2018 - $0.8 million) on our investment in PetroTal.
Other Loss
Other loss for the year ended December 31, 2019, was related primarily to the loss on retirement of Convertible notes of $11.5 million. For the year ended December 31, 2017, other loss was related to the loss on sale of our Brazil business unit on June 30, 2017 and our Peru business unit on December 18, 2017.
38
Income Tax Expense and Recovery
Year Ended December 31, | |||||||||
(Thousands of U.S. Dollars) | 2019 | 2018 | 2017 | ||||||
Income before income taxes | $ | 95,975 | $ | 151,487 | $ | 37,330 | |||
Current income tax expense | $ | 17,058 | $ | 43,903 | $ | 24,322 | |||
Deferred income tax expense | 40,227 | 4,968 | 44,716 | ||||||
Total income tax expense | $ | 57,285 | $ | 48,871 | $ | 69,038 | |||
Effective tax rate | 60 | % | 32 | % | 185 | % | |||
Current income tax expense decreased for the year ended December 31, 2019, compared with 2018 and 2017 primarily as a result of lower taxable income in Colombia.
The deferred income tax expense for the year ended December 31, 2019, of $40.2 million was primarily a result of excess tax depreciation compared to accounting depreciation in Colombia. The deferred income tax expense for the year ended December 31, 2018 of $5.0 million was primarily a result of excess tax depreciation compared to accounting depreciation in Colombia, which was partially offset by the impact of the release of the valuation allowance in Colombia. In general, tax depreciation for capital expenditures investments incurred prior to 2017 is on straight-line over five years; and accounting depreciation is based on the unit of production method. The deferred income tax expense in 2017 was the result of tax depreciation being higher than accounting depreciation in Colombia.
Our effective tax rate was 60% for the year ended December 31, 2019, compared with 32% in 2018. The increase in the effective tax rate was primarily due to an increase in the valuation allowance, mainly as a result of the recognition of previously unrecognized tax benefits in Colombia during 2018; and other permanent differences.
Our effective tax rate was 32% for the year ended December 31, 2018, compared with 185% in 2017. The decrease in the effective tax rate was primarily due to a decrease in the valuation allowance, mainly as a result of the recognition of previously unrecognized tax benefits in Colombia during 2018. This was partially offset by an increase in the impact of foreign taxes and other non-deductible expenses.
The difference between our effective tax rate of 60% for the year ended December 31, 2019, and the 33% Colombian statutory rate was primarily due to an increase in foreign currency translation, impact of foreign taxes, increase in valuation allowance and non-deductible third party royalties in Colombia.
The difference between our effective tax rate of 32% for the year ended December 31, 2018, and the 37% Colombian statutory rate was primarily due to a decrease in the valuation allowance and other permanent differences. These are partially offset by an increase in foreign currency translation, the impact of foreign taxes and non-deductible third party royalties in Colombia.
39
Net Loss and Funds Flow From Operations (a Non-GAAP Measure)
(Thousands of U.S. Dollars) | Fourth quarter 2019 compared with third quarter 2019 | % change | Fourth quarter 2019 compared with fourth quarter 2018 | % change | Year ended December 31, 2019 compared with year ended December 31, 2018 | % change | |||||||||
Net (loss) income for the comparative period | $ | (28,833 | ) | $ | (10,840 | ) | $ | 102,616 | |||||||
Increase (decrease) due to: | |||||||||||||||
Sales volumes | 463 | (14,331 | ) | 9,037 | |||||||||||
Prices | (5,020 | ) | 5,627 | (51,485 | ) | ||||||||||
Expenses: | |||||||||||||||
Cash operating expenses, excluding stock-based compensation expense | (2,364 | ) | (4,348 | ) | (30,999 | ) | |||||||||
Workover | (114 | ) | (2,578 | ) | (6,681 | ) | |||||||||
Transportation | (1,054 | ) | 3,736 | 8,593 | |||||||||||
Cash G&A and RSU settlements, excluding stock-based compensation expense | (873 | ) | 5,602 | (1,571 | ) | ||||||||||
Severance | (549 | ) | (343 | ) | 590 | ||||||||||
Interest, net of amortization of debt issuance costs | (447 | ) | (5,575 | ) | (15,711 | ) | |||||||||
Realized foreign exchange loss (gain) | 1,882 | (327 | ) | (378 | ) | ||||||||||
Settlement of financial instruments | (68 | ) | 6,764 | 30,658 | |||||||||||
Other loss | (1,385 | ) | (1,385 | ) | (1,385 | ) | |||||||||
Current taxes | (86 | ) | 4,544 | 26,845 | |||||||||||
Net lease payments | 357 | 74 | (163 | ) | |||||||||||
Interest Income | (94 | ) | 72 | (1,390 | ) | ||||||||||
Net change in funds flow from operations(1) from comparative period | (9,352 | ) | (2,468 | ) | (34,040 | ) | |||||||||
Expenses: | |||||||||||||||
Depletion, depreciation and accretion | (10,791 | ) | (434 | ) | (27,166 | ) | |||||||||
Deferred tax | (3 | ) | (3,389 | ) | (35,259 | ) | |||||||||
Amortization of debt issuance costs | (13 | ) | 52 | (193 | ) | ||||||||||
Loss on convertible notes | 11,109 | (196 | ) | (11,501 | ) | ||||||||||
Net Lease Payments | (357 | ) | (74 | ) | 163 | ||||||||||
Stock-based compensation, net of RSU settlement | (346 | ) | (12,516 | ) | 6,509 | ||||||||||
Financial instruments gain or loss, net of financial instruments settlements | 55,678 | 42,017 | 27,853 | ||||||||||||
Unrealized foreign exchange | 9,912 | 14,852 | 9,708 | ||||||||||||
Net change in net income or loss | 55,837 | 37,844 | (63,926 | ) | |||||||||||
Net income for the current period | $ | 27,004 | (194 | )% | $ | 27,004 | 349 | % | $ | 38,690 | 62 | % | |||
(1) Funds flow from operations is a non-GAAP measure which does not have any standardized meaning prescribed under GAAP. Refer to “Financial and Operating Highlights - non-GAAP measures” for a definition and reconciliation of this measure.
40
2020 Work Program and Capital Expenditures
Colombia remains our primary focus and represents 97% of the 2020 capital program with the remainder allocated to exploration activities in Ecuador.
The table below shows the break-down of our 2020 capital program:
Number of Wells (Gross) | Number of Wells (Net) | 2020 Capital Budget ($ million) | |
Colombia | |||
Development | 16-19 | 15-18 | 140-160 |
Exploration | 1-2 | 1-2 | 25-35 |
Ecuador | |||
Exploration | 0-1 | 0-1 | 0-10 |
17-22 | 16-21 | 175-195(1) | |
(1) Assumes mid-point of budgeted amount for exploration
Based on the mid-point of the 2020 guidance, the capital budget is forecasted to be approximately 80% directed to development and 20% to exploration. Approximately 20% of the development activities included in the 2020 capital program are expected to be directed to facilities.
We expect our 2020 capital program to be fully funded by cash flows from operations.
Capital Program
Capital expenditures during the year ended December 31, 2019, were $379.3 million.
During the year ended December 31, 2019, we spud the following wells in Colombia:
Number of wells (Gross and Net) | ||
Colombia | ||
Development | 25.0 | |
Exploration | 6.0 | |
Service | 5.0 | |
Total | 36.0 | |
We spud six exploration, five service, and 25 development wells in 2019. Approximately 80% of the development wells and all service wells were in the Acordionero Field on the Midas Block. The six exploration wells were spud in the PUT-1, PUT-7, El Porton, Llanos-10 and Santana Blocks.
We also commissioned facilities in the Acordionero Field and continued facilities work in the Moqueta Field on the Chaza Block.
Liquidity and Capital Resources
As at December 31, | |||||||||||||||||
(Thousands of U.S. Dollars) | 2019 | % Change | 2018 | % Change | 2017 | ||||||||||||
Cash and Cash Equivalents | $ | 8,301 | (84 | ) | $ | 51,040 | 314 | $ | 12,326 | ||||||||
Current Restricted Cash and Cash Equivalents | $ | 516 | (59 | ) | $ | 1,269 | (89 | ) | $ | 11,787 | |||||||
Revolving Credit Facility | $ | 118,000 | 100 | $ | — | (100 | ) | $ | 148,000 | ||||||||
Senior Notes | $ | 600,000 | 100 | $ | 300,000 | 100 | $ | — | |||||||||
Convertible Notes | $ | — | (100 | ) | $ | 115,000 | — | $ | 115,000 | ||||||||
41
We believe that our capital resources, including cash on hand, cash generated from operations and available capacity on our credit facility, will provide us with sufficient liquidity to meet our strategic objectives and planned capital program for 2020, given current oil price trends and production levels. In accordance with our investment policy, available cash balances are held in our primary cash management banks or may be invested in U.S. or Canadian government-backed federal, provincial or state securities or other money market instruments with high credit ratings and short-term liquidity. We believe that our current financial position provides us the flexibility to respond to both internal growth opportunities and those available through acquisitions.
On May 20, 2019, we issued $300.0 million of 7.75% Senior Notes. The 7.75% Senior Notes are fully and unconditionally guaranteed by certain of our subsidiaries that guarantee our revolving credit facility. Net proceeds from the issue of the 7.75% Senior Notes were $289.3 million, after deducting the initial purchasers' discounts and commission and the offering expenses payable by us. The 7.75% Senior Notes bear interest at a rate of 7.75% per year, payable semi-annually in arrears on May 23 and November 23 of each year, beginning on November 23, 2019. The 7.75% Senior Notes will mature on May 23, 2027, unless earlier redeemed or repurchased.
During the year, we purchased and canceled $114,999,000 aggregate principal amount of Convertible Notes, including $114,997,000 aggregate principal amount purchased and canceled pursuant to a previously announced offer to purchase for cash all outstanding Convertible Notes.
On February 15, 2018, through our indirect wholly-owned subsidiary, Gran Tierra Energy International Holdings Ltd., we issued $300.0 million aggregate principal amount of 6.25% Senior Notes due 2025 (the "6.25% Senior Notes") in a private placement transaction. The 6.25% Senior Notes bear interest at a rate of 6.25% per year, payable semi-annually in arrears on February 15 and August 15 of each year, beginning on August 15, 2018. The 6.25% Senior Notes will mature on February 15, 2025, unless earlier redeemed or repurchased. The net proceeds of the 6.25% Notes were used to repay the outstanding amount on the revolving credit facility, with the remainder for general corporate purposes.
As at December 31, 2019, we had a fully committed revolving credit facility with a syndicate of lenders with a borrowing base of $300.0 million with $182.0 million of undrawn capacity under the facility. We intentionally apply all excess cash to the facility and minimize cash on the balance to reduce borrowing costs. We can borrow under the facility by providing the lenders with two days notice. Availability under the revolving credit facility is determined by the reserves-based borrowing base determined by the lenders.
Under the terms of our credit facility we are required to maintain compliance with certain financial and operating covenants which include: the maintenance of a ratio of debt, including letters of credit, to net income plus interest, taxes, depreciation, depletion, amortization, exploration expenses and all non-cash charges minus all non-cash income (as defined in our credit agreement, "EBITDAX") not to exceed 4.0 to 1.0; the maintenance of a ratio of EBITDAX to interest expense of at least 2.5 to 1.0. As at December 31, 2019, we were in compliance with all financial and operating covenants in our credit agreement. Under the terms of the credit facility, we are limited in our ability to pay any dividends to our shareholders without bank approval.
Cash and Cash Equivalents Held Outside of Canada and the United States
At December 31, 2019, 92% of our cash and cash equivalents were held by subsidiaries outside of Canada and the United States.
Derivative Positions
At December 31, 2019, we had outstanding commodity price derivative positions as follows:
Period and type of instrument | Volume, bopd | Reference | Purchased Put ($/bbl, Weighted Average) | Sold Call ($/bbl, Weighted Average) | Premium ($/bbl, Weighted Average) | |||
Collars: January 1, to June 30, 2020 | 6,000 | ICE Brent | 55.00 | 69.05 | n/a | |||
A collar limits the range of possible positive and negative returns and provides us downside protection at a lower cost compared to a protective swap.
At December 31, 2019 and subsequent to, we had outstanding foreign currency derivative positions as follows:
42
Period and type of instrument | Amount Hedged (Millions COP) | U.S. Dollar Equivalent of Amount Hedged (Thousands of U.S. Dollars)(1) | Reference | Floor Price (COP, Weighted Average) | Cap Price (COP, Weighted Average) | ||||
Collars: January 1, to December 31, 2020 | 134,500 | 40,994 | COP | 3,305 | 3,423 | ||||
Cash Flows
The following table presents our sources and uses of cash and cash equivalents for the periods presented:
Year Ended December 31, | |||||||||
2019 | 2018 | 2017 | |||||||
Sources of cash and cash equivalents: | |||||||||
Net income (loss) | $ | 38,690 | $ | 102,616 | $ | (31,708 | ) | ||
Adjustments to reconcile net loss to funds flow from operations | |||||||||
DD&A expenses | 225,033 | 197,867 | 131,335 | ||||||
Asset impairment | — | — | 1,514 | ||||||
Deferred tax expense | 40,227 | 4,968 | 44,716 | ||||||
Stock-based compensation expense | 1,430 | 8,299 | 9,775 | ||||||
Amortization of debt issuance costs | 3,376 | 3,183 | 2,415 | ||||||
Cash settlement of RSUs | — | (360 | ) | (564 | ) | ||||
Unrealized foreign exchange loss | 1,803 | 11,511 | 837 | ||||||
Financial instruments (gain) loss | (46,215 | ) | 12,296 | 15,929 | |||||
Non-cash lease expenses | 1,806 | — | — | ||||||
Lease payments | (1,969 | ) | — | — | |||||
Cash settlement of financial instruments | (3,273 | ) | (33,931 | ) | 1,563 | ||||
Loss on redemption of convertible notes | 11,501 | — | — | ||||||
Loss on sale | — | — | 44,385 | ||||||
Funds flow from operations(1) | 272,409 | 306,449 | 220,197 | ||||||
Proceeds from issuance of Senior Notes, net of issuance costs | 289,271 | 288,131 | — | ||||||
Proceeds from other debt, net of issuance costs | 342,575 | 4,560 | 167,043 | ||||||
Changes in non-cash investing working capital | — | 17,704 | 19,680 | ||||||
Proceeds from exercise of stock options | — | 1,429 | — | ||||||
Net proceeds from sale of business units | — | — | 32,968 | ||||||
904,255 | 618,273 | 439,888 | |||||||
Uses of cash and cash equivalents: | |||||||||
Additions to property, plant and equipment - property acquisitions | (77,772 | ) | (53,200 | ) | (34,410 | ) | |||
Additions to property, plant and equipment | (379,314 | ) | (347,093 | ) | (251,041 | ) | |||
Repayment of debt | (349,219 | ) | (153,000 | ) | (110,000 | ) | |||
Cash paid for investments | — | — | (11,000 | ) | |||||
Changes in non-cash operating working capital | (93,874 | ) | (21,421 | ) | (29,217 | ) | |||
Changes in non-cash investing working capital | (7,851 | ) | — | — | |||||
Cash settlement of asset retirement obligation | (870 | ) | (519 | ) | (1,336 | ) | |||
Repurchase of shares of Common Stock | (37,561 | ) | (12,742 | ) | (17,916 | ) | |||
Foreign exchange loss on cash, cash equivalents and restricted cash and cash equivalents | (1,027 | ) | (2,668 | ) | (1,557 | ) | |||
(947,488 | ) | (590,643 | ) | (456,477 | ) | ||||
Net (decrease) increase in cash, cash equivalents and restricted cash and cash equivalents | $ | (43,233 | ) | $ | 27,630 | $ | (16,589 | ) | |
(1) Funds flow from operations is a non-GAAP measure which does not have any standardized meaning prescribed under GAAP. Refer to “Financial and Operating Highlights - non-GAAP measures” for a definition and reconciliation of this measure.
43
Off-Balance Sheet Arrangements
As at December 31, 2019 and 2018, we had no off-balance sheet arrangements.
Contractual Obligations
The following is a schedule by year of purchase obligations, future minimum payments for firm agreements and leases that have initial or remaining non-cancelable terms in excess of one year as of December 31, 2019:
Total | 2020 | 2021-2022 | 2023-2024 | 2025 and beyond | |||||||||||||||
(Thousands of U.S. Dollars) | |||||||||||||||||||
Revolving credit facility | $ | 118,000 | $ | — | $ | 118,000 | $ | — | $ | — | |||||||||
6.25% Senior Notes | 300,000 | — | — | — | 300,000 | ||||||||||||||
7.75% Senior Notes | 300,000 | — | — | — | 300,000 | ||||||||||||||
Total long-term debt | 718,000 | — | 118,000 | — | 600,000 | ||||||||||||||
Interest payments(1) | 289,090 | 46,070 | 91,572 | 84,000 | 67,448 | ||||||||||||||
Oil transportation services | 3,211 | 3,211 | — | — | — | ||||||||||||||
Drilling, completions and seismic | 21,409 | 7,602 | 13,669 | 39 | 99 | ||||||||||||||
Operating leases | 5,679 | 2,708 | 2,971 | — | — | ||||||||||||||
Finance leases | 6,232 | 2,760 | 3,276 | 168 | 28 | ||||||||||||||
Total | $ | 1,043,621 | $ | 62,351 | $ | 229,488 | $ | 84,207 | $ | 667,575 | |||||||||
(1) Interest payments were calculated by assuming that our revolving credit facility outstanding balance at December 31, 2019 of $118 million will be outstanding through the November 2022 maturity date and our 6.25% Senior Notes and 7.75% Senior Notes will be held until their maturity dates of February 2025 and May 2027, respectively. Actual results will differ from these estimates and assumptions.
At December 31, 2019, we had provided promissory notes totaling $120.6 million to support letters of credit or surety bonds relating to work commitment guarantees contained in exploration contracts and other capital or operating requirements. These unsecured letters of credit do not utilize our revolving credit facility capacity because they are backed by local Colombian banks and Export Development Canada.
The above table does not reflect estimated amounts expected to be incurred in the future associated with the abandonment of our oil and gas properties and other long-term liabilities, as we cannot determine with accuracy the timing of such payments. Information regarding our asset retirement obligation can be found in Note 8 to the Consolidated Financial Statements, Asset Retirement Obligation, in Item 8. “Financial Statements and Supplementary Data”.
As is customary in the oil and gas industry, we may at times have commitments in place to reserve or earn certain acreage positions or wells. If we do not meet such commitments, the acreage positions or wells may be lost and associated penalties may be payable.
Critical Accounting Policies and Estimates
The preparation of financial statements under GAAP requires management to make estimates, judgments and assumptions that affect the reported amounts of assets and liabilities as well as the revenues and expenses reported and disclosure of contingent liabilities. Changes in these estimates related to judgments and assumptions will occur as a result of changes in facts and circumstances or discovery of new information, and, accordingly, actual results could differ from amounts estimated.
On a regular basis we evaluate our estimates, judgments and assumptions. We also discuss our critical accounting policies and estimates with the Audit Committee of the Board of Directors.
Certain accounting estimates are considered to be critical if (a) the nature of the estimates and assumptions is material due to the level of subjectivity and judgment necessary to account for highly uncertain matters or the susceptibility of such matters to changes; and (b) the impact of the estimates and assumptions on financial condition or operating performance is material. The areas of accounting and the associated critical estimates and assumptions made are discussed below.
44
Full Cost Method of Accounting, Proved Reserves, DD&A and Impairment of Oil and Gas Properties
We follow the full cost method of accounting for our oil and natural gas properties in accordance with SEC Regulation S-X Rule 4-10, as described in Note 2 to the Consolidated Financial Statements, Significant Accounting Policies, in Item 8. “Financial Statements and Supplementary Data”. Under the full cost method of accounting, all costs incurred in the acquisition, exploration and development of properties are capitalized, including internal costs directly attributable to these activities. The sum of net capitalized costs, including estimated asset retirement obligations ("ARO"), and estimated future development costs to be incurred in developing proved reserves are depleted using the unit-of-production method.
Companies that use the full cost method of accounting for oil and natural gas exploration and development activities are required to perform a ceiling test calculation. The ceiling test limits pooled costs to the aggregate of the discounted estimated after-tax future net revenues from proved oil and gas properties, plus the lower of cost or estimated fair value of unproved properties less any associated tax effects.
If our net book value of oil and gas properties, less related deferred income taxes, is in excess of the calculated ceiling, the excess must be written off as an expense. Any such write-down will reduce earnings in the period of occurrence and result in lower DD&A expenses in future periods. The ceiling limitation is imposed separately for each country in which we have oil and gas properties. An expense recorded in one period may not be reversed in a subsequent period even though higher oil and gas prices may have increased the ceiling applicable to the subsequent period.
Our estimates of proved oil and gas reserves are a major component of the depletion and full cost ceiling calculations. Additionally, our proved reserves represent the element of these calculations that require the most subjective judgments. Estimates of reserves are forecasts based on engineering data, projected future rates of production and the amount and timing of future expenditures. The process of estimating oil and natural gas reserves requires substantial judgment, resulting in imprecise determinations, particularly for new discoveries. Different reserve engineers may make different estimates of reserve quantities based on the same data.
We believe our assumptions are reasonable based on the information available to us at the time we prepare our estimates. However, these estimates may change substantially as additional data from ongoing development activities and production performance becomes available and as economic conditions impacting oil and gas prices and costs change.
Management is responsible for estimating the quantities of proved oil and natural gas reserves and for preparing related disclosures. Estimates and related disclosures are prepared in accordance with SEC requirements and generally accepted industry practices in the United States as prescribed by the Society of Petroleum Engineers. Reserve estimates are evaluated at least annually by independent qualified reserves consultants.
While the quantities of proved reserves require substantial judgment, the associated prices of oil and natural gas and the applicable discount rate, that are used to calculate the discounted present value of the reserves do not require judgment. The ceiling calculation dictates that a 10% discount factor be used and future net revenues are calculated using prices that represent the average of the first day of each month price for the 12-month period. Therefore, the future net revenues associated with the estimated proved reserves are not based on our assessment of future prices or costs, but reflect adjustments for gravity, quality, local conditions, gathering and transportation fees and distance from market. Estimates of standardized measure of our future cash flows from proved reserves for our December 31, 2019, ceiling tests were based on wellhead prices per BOE as of the first day of each month within that twelve month period.
Because the ceiling test calculation dictates the use of prices that are not representative of future prices and requires a 10% discount factor, the resulting value should not be construed as the current market value of the estimated oil and gas reserves attributable to our properties. Historical oil and gas prices for any particular 12-month period can be either higher or lower than our price forecast. Therefore, oil and gas property write-downs that result from applying the full cost ceiling limitation, and that are caused by fluctuations in price as opposed to reductions to the underlying quantities of reserves should not be viewed as absolute indicators of a reduction of the ultimate value of the related reserves.
Our Reserves Committee oversees the annual review of our oil and gas reserves and related disclosures. The Board meets with management periodically to review the reserves process, results and related disclosures and appoints and meets with the independent reserves consultants to review the scope of their work, whether they have had access to sufficient information, the nature and satisfactory resolution of any material differences of opinion, and in the case of the independent reserves consultants, their independence.
45
In the years ended December 31, 2019 and 2018, we had no ceiling test impairment losses. We used an average Brent price of $64.20 per bbl for the purposes of the December 31, 2019 ceiling test calculations (December 31, 2018 - $72.08; December 31, 2017 - $54.19).
It is difficult to predict with reasonable certainty the amount of expected future impairment losses given the many factors impacting the asset base and the cash flows used in the prescribed U.S. GAAP ceiling test calculation. These factors include, but are not limited to, future commodity pricing, royalty rates in different pricing environments, operating costs and negotiated savings, foreign exchange rates, capital expenditures timing and negotiated savings, production and its impact on depletion and cost base, upward or downward reserve revisions as a result of ongoing exploration and development activity, and tax attributes.
Unproved Properties
Unproved properties are not depleted pending the determination of the existence of proved reserves. Costs are transferred into the amortization base on an ongoing basis as the properties are evaluated and proved reserves are established or impairment is determined. Unproved properties are evaluated quarterly to ascertain whether impairment has occurred. Unproved properties, the costs of which are individually significant, are assessed individually by considering seismic data, plans or requirements to relinquish acreage, drilling results and activity, remaining time in the commitment period, remaining capital plans and political, economic and market conditions. Where it is not practicable to individually assess the amount of impairment of properties for which costs are not individually significant, these properties are grouped for purposes of assessing impairment. During any period in which factors indicate an impairment, the cumulative costs incurred to date for such property are transferred to the full cost pool and are then subject to amortization. The transfer of costs into the amortization base involves a significant amount of judgment and may be subject to changes over time based on our drilling plans and results, seismic evaluations, the assignment of proved reserves, availability of capital and other factors. For countries where a reserve base has not yet been established, the impairment is charged to earnings.
Asset Retirement Obligations
We are required to remove or remedy the effect of our activities on the environment at our present and former operating sites by dismantling and removing production facilities and remediating any damage caused. Estimating our future ARO requires us to make estimates and judgments with respect to activities that will occur many years into the future. In addition, the ultimate financial impact of environmental laws and regulations is not always clearly known and cannot be reasonably estimated as standards evolve in the countries in which we operate.
We record ARO in our consolidated financial statements by discounting the present value of the estimated retirement obligations associated with our oil and gas wells and facilities. In arriving at amounts recorded, we make numerous assumptions and judgments with respect to the existence of a legal obligation for an ARO, estimated probabilities, amounts and timing of settlements, inflation factors, credit-adjusted risk-free discount rates and changes in legal, regulatory, environmental and political environments. Because costs typically extend many years into the future, estimating future costs is difficult and requires management to make judgments that are subject to future revisions based upon numerous factors, including changing technology and the political and regulatory environment. In periods subsequent to initial measurement of the ARO, we must recognize period-to-period changes in the liability resulting from the passage of time and revisions to either the timing or the amount of the original estimate of undiscounted cash flows. Increases in the ARO liability due to passage of time impact net income as accretion expense. The related capitalized costs, including revisions thereto, are charged to expense through DD&A.
It is difficult to determine the impact of a change in any one of our assumptions. As a result, we are unable to provide a reasonable sensitivity analysis of the impact a change in our assumptions would have on our financial results.
Equity Method Investment
During December 2017, we acquired an investment in common shares of PetroTal in connection with the sale of our Peru business unit. At December 31, 2019, this investment represented approximately 37% of PetroTal's issued and outstanding common shares. We determined that we did not have a controlling financial interest in PetroTal, but could exert significant influence over PetroTal's operating and financial policies as a result of our ownership interest in PetroTal and the right to nominate two directors to PetroTal's board of directors. Accordingly, we accounted for our investment in the common shares of PetroTal as an equity method investment, but elected the fair value option for this investment.
The fair value of the current portion of the investment was estimated using quoted market prices in active markets. The long-term portion of the investment was estimated based on quoted market prices and valuation technique using observable and one or more unobservable inputs. Information regarding the valuation of the investment can be found in Note 13 to the Consolidated Financial
46
Statements, Financial Instruments, Fair Value Measurement, Credit Risk and Foreign Exchange Risk in Item 8. “Financial Statements and Supplementary Data”, which information is incorporated by reference here.
Goodwill
Goodwill represents the excess of the aggregate of the consideration transferred over net identifiable assets acquired and liabilities assumed. The goodwill on our balance sheet relates entirely to our Colombia reporting unit.
At each reporting date, we assess qualitative factors to determine whether it is more likely than not that the fair value of the reporting unit is less than its carrying amount and whether it is necessary to perform the goodwill impairment test. Changes in our future cash flows, operating results, growth rates, capital expenditures, cost of capital, discount rates, stock price or related market capitalization, could affect the results of our annual goodwill assessment and, accordingly, potentially lead to future goodwill impairment charges. The goodwill impairment test would require a comparison of the fair value of the reporting unit to its net book value. If the estimated fair value of the reporting unit were less than its net book value, including goodwill, we would recognize the goodwill impairment in an amount not exceeding the carrying amount of goodwill through a charge to expense.
The most significant judgments involved in estimating the fair value of our reporting unit would relate to the valuation of our property and equipment. Unfavorable changes in reserves or in our price forecast would increase the likelihood of a goodwill impairment charge. A goodwill impairment charge would have no effect on liquidity or capital resources. However, it would adversely affect our results of operations in that period.
At December 31, 2019, we performed a step 1 test of goodwill and no impairment of goodwill was identified.
Revenue Recognition
Our revenue relates to oil and natural gas sales in Colombia. We recognize revenue when it transfers control of the product to a customer. This generally occurs at the time the customer obtains legal title to the product and when it is physically transferred to the delivery point agreed with the customer. Payment terms are generally within three business days following delivery of an invoice to the customer. Revenue is recognized based on the consideration specified in contracts with customers. Revenue represents our share and is recorded net of royalty payments to governments and other mineral interest owners.
We evaluate our arrangement with third parties and partners to determine if we act as a principal or an agent. In making this evaluation, our management considers if we obtain control of the product delivered, which is indicated by us having the primary responsibility for the delivery of the product, having ability to establish prices or having inventory risk. If we act in the capacity of an agent rather than as a principal in transaction, then the revenue is recognized on a net-basis, only reflecting the fee realized by us from the transaction.
Tariffs, tolls and fees charged to other entities for use of pipelines owned by us are evaluated by management to determine if these originate from contracts with customers or from incidental arrangements.
In the comparative period, revenue from the production of oil and natural gas was recognized when the customer took title and assumed the risks and rewards of ownership, prices were fixed or determinable, the sale was evidenced by a contract and collection of the revenue was reasonably assured.
When determining if we acted as a principal or as an agent in transactions, management determines if we obtain control of the product. As part of this assessment, management considers detailed criteria for revenue recognition set out in ASC 606.
Income Taxes
We follow the liability method of accounting for income taxes whereby we recognize deferred income tax assets and liabilities for the future tax consequences attributable to differences between the financial statement carrying amounts of assets and liabilities and their respective tax bases. Deferred tax assets are also recognized for the future tax benefits attributable to the expected utilization of existing tax net operating loss carryforwards and other types of carryforwards. Deferred tax assets and liabilities are measured using enacted tax rates expected to apply to taxable income in the years in which those temporary differences and carryforwards are expected to be recovered or settled. The effect on deferred tax assets and liabilities of a change in tax rates is recognized in income in the period that includes the enactment date.
We carry on business in several countries and as a result, we are subject to income taxes in numerous jurisdictions. The determination of our income tax provision is inherently complex and we are required to interpret continually changing regulations and make
47
certain judgments. While income tax filings are subject to audits and reassessments, we believe we have made adequate provision for all income tax obligations. However, changes in facts and circumstances as a result of income tax audits, reassessments, jurisprudence and any new legislation may result in an increase or decrease in our provision for income taxes.
To assess the realization of deferred tax assets, we consider whether it is more likely than not that some portion or all of the deferred tax assets will not be realized. The ultimate realization of deferred tax assets is dependent upon the generation of future taxable income during the periods in which those temporary differences become deductible. We consider the scheduled reversal of deferred tax liabilities, projected future taxable income and tax planning strategies in making this assessment.
Our effective tax rate is based on pre-tax income and the tax rates applicable to that income in the various jurisdictions in which we operate. An estimated effective tax rate for the year is applied to our quarterly operating results. In the event that there is a significant unusual or discrete item recognized, or expected to be recognized, in our quarterly operating results, the tax attributable to that item would be separately calculated and recorded at the same time as the unusual or discrete item. We consider the resolution of prior-year tax matters to be such items. Significant judgment is required in determining our effective tax rate and in evaluating our tax positions. We establish reserves when it is more likely than not that we will not realize the full tax benefit of the position. We adjust these reserves in light of changing facts and circumstances.
We routinely assess potential uncertain tax positions and, if required, estimate and establish accruals for such amounts.
Legal and Other Contingencies
A provision for legal and other contingencies is charged to expense when the loss is probable and the cost can be reasonably estimated. Determining when expenses should be recorded for these contingencies and the appropriate amounts for accrual is a complex estimation process that includes the subjective judgment of management. In many cases, management’s judgment is based on interpretation of laws and regulations, which can be interpreted differently by regulators and/or courts of law. Management closely monitors known and potential legal and other contingencies and periodically determines when we should record losses for these items based on information available to us.
Stock-Based Compensation
Our stock-based compensation cost is measured based on the fair value of the awards that are ultimately expected to vest. Fair values are determined using pricing models such as the Black-Scholes simulation stock option-pricing model and/or observable share prices. These estimates depend on certain assumptions, including volatility, risk-free interest rate, the term of the awards, the forfeiture rate and performance factors, which, by their nature, are subject to measurement uncertainty. We use historical data to estimate the expected term used in the Black-Scholes option pricing model, option exercises and employee departure behavior. Expected volatilities used in the fair value estimate are based on the historical volatility of our shares. The risk-free rate for periods within the expected term of the stock options is based on the U.S. Treasury yield curve in effect at the time of grant.
Recently Adopted Accounting Pronouncements
We adopted Accounting Standard Codification ("ASC") 842 Leases with a date of initial application on January 1, 2019 in accordance with the modified retrospective transition approach using the practical expedients available for land easements and short-term leases. We did not elect the "suite" of practical expedients or use the hindsight expedient in our adoption.
At inception of a contract, we assess whether a contract is, or contains, a lease. A contract is, or contains, a lease if the contract conveys the right to control the use of an identified asset for a period of time in exchange for consideration. At inception of a contract that contains a lease component, we allocate the consideration in the contract to each lease and non-lease component on the basis of their relative stand-alone prices. We recognize a right-of-use asset and a lease liability at the lease commencement date. The right-of-use asset is initially measured at cost, and subsequently at cost less any accumulated depreciation and impairment losses, and adjusted for certain remeasurements of the lease liability.
The lease liability is initially measured at the present value of the lease payments that are not paid at the commencement date, discounted using the interest rate implicit in the lease or, if that rate cannot be readily determined, our incremental borrowing rate. Generally, we use our incremental borrowing rate as the discount rate. The lease liability is subsequently increased by the interest cost on the lease liability and decreased by lease payments made. It is remeasured when there is a change in future lease payments arising from a change in an index or rate, a change in the estimate of the amount expected to be payable under a residual value guarantee, or as appropriate, changes in the assessment of whether a purchase or extension option is reasonably certain to be exercised or a termination option is reasonably certain not to be exercised.
48
We have applied judgment to determine the lease term for contracts which include renewal or termination options. The assessment of whether we are reasonably certain to exercise such options impacts the lease term, which significantly affects the amount of lease liabilities and right-of-use assets recognized.
All leases identified as part of the transition relate to office leases.
The transition resulted in the recognition of a right-of-use asset presented in other capital assets of $3.8 million at January 1, 2019, the recognition of lease liabilities of $4.2 million and a $0.4 million impact on retained earnings. When measuring the lease liabilities, our incremental borrowing rate was used. At January 1, 2019 the rates applied ranged between 5.6% and 9.1%.
New Accounting Pronouncements
In June 2016, the FASB issued ASU 2016-13, "Financial Instruments - Credit Losses". This ASU replaces the current incurred loss impairment methodology with a methodology that reflects expected credit losses and requires a broader range of reasonable and supportable information to support credit loss estimates. In December 2019, the FASB issued ASU 2019-10, "Financial Instruments - Credit Losses, Derivatives and Hedging and Leases", which is codification improvement of ASU 2016-13. The ASU will be effective for fiscal years, and interim periods within those years, beginning after December 15, 2019. We have adopted this ASU on January 1, 2020 and applied a current expected credit loss model that has resulted in no impact on our consolidated position, results of operation or cash flows.
Item 7A. Quantitative and Qualitative Disclosures About Market Risk
Commodity Price Risk
Our principal market risk relates to oil prices. Oil prices are volatile and unpredictable and influenced by concerns over world supply and demand imbalance and many other market factors outside of our control. Most of our revenues are from oil sales at Brent and adjusted for quality each month.
During year ended December 31, 2019, we entered into commodity price derivative contracts to manage the variability of cash flows associated with the forecasted sale of our oil production, reduce commodity price risk and provide a base level of cash flow in order to assure we can execute at least a portion of our capital spending. The table below provides the information about our commodity price derivative contracts at December 31, 2019, including the notional amounts and weighted average exchange rates by expected (contractual) maturity dates. Expected cash flows from the forward contract equaled the fair value of the contract. The information is presented in U.S. dollars because that is our reporting currency. We do not hold any of these investments for trading purposes.
Period and type of instrument | Volume, bopd | Reference | Purchased Put ($/bbl, Weighted Average) | Sold Call ($/bbl, Weighted Average) | Premium ($/bbl, Weighted Average) | ||||
Collars: January 1, to June 30, 2020 | 6,000 | ICE Brent | 55.00 | $ | 69.05 | n/a | |||
Foreign Currency Risk
Foreign currency risk is a factor for our company but is ameliorated to a certain degree by the nature of expenditures and revenues in the countries where we operate. Our reporting currency is U.S. dollars and 100% of our revenues are related to the U.S. dollar price of Brent or WTI oil. In Colombia, we receive 100% of our revenues in U.S. dollars and the majority of our capital expenditures are in U.S. dollars or are based on U.S. dollar prices. The majority of income and value added taxes and G&A expenses in all locations are in local currency. While we operate in South America exclusively, the majority of our acquisition expenditures have been valued and paid in U.S. dollars.
Additionally, foreign exchange gains and losses result primarily from the fluctuation of the U.S. dollar to the Colombian peso due to our current and deferred tax liabilities, which are monetary liabilities, denominated in the local currency of the Colombian foreign operations. As a result, a foreign exchange gain or loss must be calculated on conversion to the U.S. dollar functional currency. A strengthening in the Colombian peso against the U.S. dollar results in foreign exchange losses, estimated at approximately $6,000 for each one peso decrease in the exchange rate of the Colombian peso to one U.S. dollar.
During the year ended December 31, 2019, we entered into foreign currency derivative contracts to manage the variability in cash flows associated with our forecasted Colombian peso denominated costs. The table below provides information about our foreign
49
currency forward exchange agreements at December 31, 2019 and subsequent to, including the notional amounts and weighted average exchange rates by expected (contractual) maturity dates. Expected cash flows from the forward contract equaled the fair value of the contract. The information is presented in U.S. dollars because that is our reporting currency. We do not hold any of these investments for trading purposes.
Period and type of instrument | Amount Hedged (Millions COP) | U.S. Dollar Equivalent of Amount Hedged (Thousands of U.S. Dollars)(1) | Reference | Floor Price (COP, Weighted Average) | Cap Price (COP, Weighted Average) | ||||
Collars: January 1, to December 31, 2020 | 134,500 | 40,994 | COP | 3,305 | 3,423 | ||||
(1) At December 31, 2019 foreign exchange rate.
Interest Rate Risk
Interest rate risk is the risk that future cash flows will fluctuate as a result of changes in market interest rates. We are exposed to interest rate fluctuations on our revolving credit facility, which bears floating rates of interest. At December 31, 2019, our outstanding revolving credit facility was $118.0 million (December 31, 2018 - nil). A 10% change in LIBOR would not materially impact our interest expense on debt outstanding at December 31, 2019.
Our investment objectives are focused on preservation of principal and liquidity. By policy, we manage our exposure to market risks by limiting investments to high quality bank issues at overnight rates, or U.S. or Canadian government-backed federal, provincial or state securities or other money market instruments with high credit ratings and short-term liquidity. A 10% change in interest rates would not have a material effect on the value of our investment portfolio. We do not hold any of these investments for trading purposes.
Equity Price Risk
Equity price risk is the risk of loss as a result of changes in equity prices. As at December 31, 2019, we held 246,100,000 common shares of PetroTal. With all other variables held constant, a $0.01 change in the CAD price of PetroTal shares would result in a $1.9 million USD change in the total investment in PetroTal as at December 31, 2019.
50
Item 8. Financial Statements and Supplementary Data
Report of Independent Registered Public Accounting Firm
To the Shareholders and Board of Directors of Gran Tierra Energy Inc.
Opinion on the Consolidated Financial Statements
We have audited the accompanying consolidated balance sheets of Gran Tierra Energy Inc. (the Company) as of December 31, 2019 and 2018, the related consolidated statements of operations, shareholders’ equity, and cash flows for the years then ended, and the related notes (collectively, the consolidated financial statements). In our opinion, the consolidated financial statements present fairly, in all material respects, the financial position of the Company as of December 31, 2019 and 2018, and the results of its operations and its cash flows for each of the years then ended, in conformity with U.S. generally accepted accounting principles.
We also have audited, in accordance with the standards of the Public Company Accounting Oversight Board (United States) (PCAOB), the Company’s internal control over financial reporting as of December 31, 2019, based on criteria established in Internal Control - Integrated Framework (2013) issued by the Committee of Sponsoring Organizations of the Treadway Commission, and our report dated February 26, 2020 expressed an unqualified opinion on the effectiveness of the Company’s internal control over financial reporting.
Basis for Opinion
These consolidated financial statements are the responsibility of the Company’s management. Our responsibility is to express an opinion on these consolidated financial statements based on our audits. We are a public accounting firm registered with the PCAOB and are required to be independent with respect to the Company in accordance with the U.S. federal securities laws and the applicable rules and regulations of the Securities and Exchange Commission and the PCAOB.
We conducted our audits in accordance with the standards of the PCAOB. Those standards require that we plan and perform the audit to obtain reasonable assurance about whether the consolidated financial statements are free of material misstatement, whether due to error or fraud. Our audits included performing procedures to assess the risks of material misstatement of the consolidated financial statements, whether due to error or fraud, and performing procedures that respond to those risks. Such procedures included examining, on a test basis, evidence regarding the amounts and disclosures in the consolidated financial statements. Our audits also included evaluating the accounting principles used and significant estimates made by management, as well as evaluating the overall presentation of the consolidated financial statements. We believe that our audits provide a reasonable basis for our opinion.
Critical Audit Matters
The critical audit matters communicated below are matters arising from the current period audit of the consolidated financial statements that were communicated or required to be communicated to the audit committee and that: (1) relate to accounts or disclosures that are material to the consolidated financial statements and (2) involved our especially challenging, subjective, or complex judgments. The communication of critical audit matters does not alter in any way our opinion on the consolidated financial statements, taken as a whole, and we are not, by communicating the critical audit matters below, providing separate opinions on the critical audit matters or on the accounts or disclosures to which they relate.
Evaluation of the realizability of the Company’s deferred income tax asset.
As discussed in note 10 of the consolidated financial statements, as of December 31, 2019, the Company had recognized a deferred income tax asset of $44,003 thousand. The Company estimated that there was a greater than 50 percent likelihood that the deferred income tax asset will be realized. The determination of the deferred income tax asset involves a number of estimates, including the future cash flows associated with the estimated proved and probable oil and gas reserves (“reserves”). Changes in assumptions regarding future cash flows, which are based on the estimate of the reserves, could have a significant impact on the determination of the Company’s ability to realize the deferred income tax asset and the amount of a valuation allowance, if any. The estimation of the reserves involves the expertise of independent reservoir engineering specialists, who take into consideration assumptions related to its forecasted production, forecasted operating, royalty and capital cost assumptions and forecasted oil prices (“reserve assumptions”). The Company engages independent reservoir engineering specialists to estimate the reserves.
We identified the evaluation of the realizability of the deferred income tax asset as a critical audit matter. Complex auditor judgment was required in evaluating the reserves, which was an input to derive the recognized deferred income tax asset. Auditor judgment was also required to evaluate the reserve assumptions used to estimate the reserves.
The primary procedures we performed to address this critical audit matter included the following. We tested certain internal controls over the Company’s process to evaluate the realizability of the deferred income tax asset, including controls related
51
to the estimation of the reserves. We evaluated the competence, capabilities and objectivity of the independent reservoir engineering specialists engaged by the Company, who estimated the reserves. We evaluated the methodology used by independent reservoir engineering specialists to estimate the reserves for compliance with regulatory standards. We compared the 2019 actual production, operating, royalty and capital costs to those estimates used in the prior year’s estimate of the proved reserves to assess the Company’s ability to accurately forecast. We compared the forecasted commodity prices used in the reserves to those published by other reserve engineering firms. We compared estimates of forecasted production and forecasted operating, royalty and capital cost assumptions used in the reserves to historical results. We involved Canadian and Colombian income tax professionals with specialized skills and knowledge who assisted in evaluating the application of relevant tax laws and regulations used in the determination of the recorded deferred tax asset.
Assessment of the carrying value of goodwill in the Colombian reporting unit
As discussed in note 2 to the consolidated financial statements, the goodwill balance as of December 31, 2019 relates to the Colombian reporting unit. Goodwill at December 31, 2019 amounted to $102,581 thousand. The Company assesses qualitative factors annually, or more frequently if necessary, to determine whether it is more likely than not that the fair value of a reporting unit is less than its carrying amount and whether it is necessary to perform the goodwill impairment test. The estimated fair value of the Colombian reporting unit involves a number of estimates, including the cash flows associated with the estimated reserves and the discount rate. The estimation of the reserves involves the expertise of independent reservoir engineering specialists, who take into consideration reserve assumptions. The Company engages independent reservoir engineering specialists to estimate the reserves.
We identified the assessment of the carrying value of goodwill for the Colombian reporting unit as a critical audit matter. Complex auditor judgment was required in evaluating the Company’s estimate of the reserves and the discount rate, which are inputs to the calculation of the fair value of the Colombian reporting unit. Auditor judgment was also required to evaluate the reserve assumptions used in the reserves.
The primary procedures we performed to address this critical audit matter included the following. We tested certain internal controls over the Company’s determination of the fair value of the Colombian reporting unit, including controls related to the development of the discount rate and the estimation of the reserves. We performed sensitivity analyses over the discount rate used to estimate the fair value of the Colombian reporting unit to assess the impact of a change in the discount rate on the fair value of the Colombian reporting unit. We evaluated the competence, capabilities and objectivity of the independent reservoir engineering specialists engaged by the Company, who estimated the reserves. We evaluated the methodology used by the independent reservoir engineering specialists to estimate the reserves for compliance with regulatory standards. We compared the 2019 actual production, operating, royalty and capital costs of the Colombian reporting unit to those estimates used in the prior year’s estimate of the proved reserves to assess the Company’s ability to accurately forecast. We compared the forecasted commodity prices used in the estimate of the reserves to those published by other reserve engineering firms. We compared estimates of forecasted production and forecasted operating, royalty and capital cost assumptions used in the estimation of the reserves to historical results. We involved a valuation professional with specialized skills and knowledge, who assisted in evaluating the Company’s discount rate, by comparing it against market data and other external data.
Assessment of the impact of estimated proved oil reserves on the calculations of depletion expense and the ceiling test related to oil and gas properties
As discussed in Note 2 to the consolidated financial statements, the Company depletes its oil and gas properties using the unit-of-production method on a country-by-country basis. Under such method, capitalized costs associated with Colombia are depleted over the estimated proved oil and gas reserves associated with Colombia (“proved reserves”). As discussed in Note 5 to the consolidated financial statements, for the year ended December 31, 2019, the Company recorded depletion and depreciation expense of $220.8 million. Additionally, as discussed in Note 2 to the consolidated financial statements, the Company performs a ceiling test calculation each quarter. In performing its quarterly ceiling test, the Company limits, on a country-by-country basis, the capitalized costs of proved oil and natural gas properties, net of accumulated depletion and deferred income taxes, to the estimated future net cash flows from proved reserves discounted at 10 percent, net of related tax effects, plus the lower of cost or fair value of unproved properties included in the costs being amortized. If such capitalized costs exceed the ceiling, the Company will record a write-down to the extent of such excess as a non-cash charge to net income or loss. The estimation of proved reserves, which are used in the calculations of depletion and the ceiling test, involves the expertise of independent reservoir engineering specialists, who take into consideration reserve assumptions. The Company engages independent reservoir engineering specialists to estimate the proved reserves.
We identified the assessment of the impact of estimated proved reserves on the calculations of depletion expense and the ceiling test related to oil and gas properties as a critical audit matter. Complex auditor judgment was required in evaluating the proved reserves, which were an input to the calculations of depletion expense and the ceiling test. Auditor judgment was also required to evaluate the reserve assumptions used to estimate the proved reserves.
The primary procedures we performed to address this critical audit matter included the following. We tested certain internal controls over the calculations of depletion expense and the ceiling test, including controls over the estimation of the proved reserves. We analyzed and assessed the calculations of depletion expense and the ceiling test for compliance with regulatory
52
standards. We evaluated the competence, capabilities and objectivity of the independent reservoir engineering specialists engaged by the Company, who estimated the proved reserves. We evaluated the methodology used by the independent reservoir engineering specialists to estimate the proved reserves for compliance with regulatory standards. We compared the Company’s 2019 actual production, operating, royalty and capital costs to those estimates used in the prior year’s estimate of the proved reserves to assess the Company’s ability to accurately forecast. We compared estimates of forecasted production and forecasted operating, royalty and capital cost assumptions used in the estimate of the proved reserves to historical results.
/s/ KPMG LLP
Chartered Professional Accountants
We have served as the Company's auditor since 2018.
Calgary, Canada
February 26, 2020
53
Report of Independent Registered Public Accounting Firm
To the Shareholders and the Board of Directors of Gran Tierra Energy Inc.
Opinion on the Financial Statements
We have audited the accompanying consolidated financial statements of Gran Tierra Energy Inc. and subsidiaries (the "Company"), which comprise the consolidated statements of operations, shareholders' equity, and cash flows, for the year ended December 31, 2017, and the related notes (collectively referred to as the "financial statements"). In our opinion, the 2017 financial statements present fairly, in all material respects, the results of its operations and its cash flows for the year ended December 31, 2017, in conformity with accounting principles generally accepted in the United States of America.
Basis for Opinion
These financial statements are the responsibility of the Company's management. Our responsibility is to express an opinion on the Company's financial statements based on our audit. We are a public accounting firm registered with the Public Company Accounting Oversight Board (United States) (“PCAOB”) and are required to be independent with respect to the Company in accordance with the U.S. federal securities laws and the applicable rules and regulations of the Securities and Exchange Commission and the PCAOB. Further, we are required to be independent of the Company in accordance with the ethical requirements that are relevant to our audit of the financial statements in Canada and to fulfill our other ethical responsibilities in accordance with these requirements.
We conducted our audit in accordance with the standards of the PCAOB and Canadian generally accepted auditing standards. Those standards require that we plan and perform the audit to obtain reasonable assurance about whether the financial statements are free of material misstatement, whether due to error or fraud. Our audit included performing procedures to assess the risks of material misstatement of the financial statements, whether due to error or fraud, and performing procedures that respond to those risks. Such procedures included examining, on a test basis, evidence regarding the amounts and disclosures in the financial statements. Our audit also included evaluating the accounting principles used and significant estimates made by management, as well as evaluating the overall presentation of the financial statements. We believe that our audit provide a reasonable basis for our opinion.
/s/ Deloitte LLP
Chartered Professional Accountants
Calgary, Canada
February 27, 2018
We began serving as the Company's auditor in 2005. In 2018 we became the predecessor auditor.
54
Gran Tierra Energy Inc.
Consolidated Statements of Operations
(Thousands of U.S. Dollars, Except Share and Per Share Amounts)
Year Ended December 31, | ||||||||||||
2019 | 2018 | 2017 | ||||||||||
OIL AND NATURAL GAS SALES (NOTE 9) | $ | $ | $ | |||||||||
EXPENSES | ||||||||||||
Operating | ||||||||||||
Workover | ||||||||||||
Transportation | ||||||||||||
Depletion, depreciation and accretion (Note 5) | ||||||||||||
Asset impairment (Note 5) | ||||||||||||
General and administrative | ||||||||||||
Severance | ||||||||||||
Equity tax | ||||||||||||
Foreign exchange loss | ||||||||||||
Financial instruments (gain) loss (Note 13) | ( | ) | ||||||||||
Interest expense (Note 6) | ||||||||||||
TOTAL EXPENSES | ||||||||||||
OTHER LOSS (Notes 5, 6 and 10) | ( | ) | ( | ) | ||||||||
INTEREST INCOME | ||||||||||||
INCOME BEFORE INCOME TAXES | ||||||||||||
INCOME TAX EXPENSE | ||||||||||||
Current (Note 10) | ||||||||||||
Deferred (Note 10) | ||||||||||||
NET AND COMPREHENSIVE INCOME (LOSS) | $ | $ | $ | ( | ) | |||||||
NET INCOME (LOSS) PER SHARE | ||||||||||||
– BASIC | $ | $ | $ | ( | ) | |||||||
– DILUTED | $ | $ | $ | ( | ) | |||||||
WEIGHTED AVERAGE SHARES OUTSTANDING - BASIC (Note 7) | ||||||||||||
WEIGHTED AVERAGE SHARES OUTSTANDING - DILUTED (Note 7) | ||||||||||||
(See notes to the consolidated financial statements)
55
Gran Tierra Energy Inc.
Consolidated Balance Sheets
(Thousands of U.S. Dollars, Except Share and Per Share Amounts)
As at December 31, | |||||||
2019 | 2018 | ||||||
ASSETS | |||||||
Current Assets | |||||||
Cash and cash equivalents | $ | $ | |||||
Restricted cash and cash equivalents (Note 8) | |||||||
Accounts receivable (Note 4) | |||||||
Investment (Note 13) | |||||||
Taxes receivable | |||||||
Other current assets | |||||||
Total Current Assets | |||||||
Oil and Gas Properties (using the full cost method of accounting) | |||||||
Proved | |||||||
Unproved | |||||||
Total Oil and Gas Properties | |||||||
Other capital assets | |||||||
Total Property, Plant and Equipment (Notes 5) | |||||||
Other Long-Term Assets | |||||||
Taxes receivable | |||||||
Deferred tax assets (Note 10) | |||||||
Investment (Note 13) | |||||||
Other long-term assets | |||||||
Goodwill | |||||||
Total Other Long-Term Assets | |||||||
Total Assets | $ | $ | |||||
LIABILITIES AND SHAREHOLDERS’ EQUITY | |||||||
Current Liabilities | |||||||
Accounts payable and accrued liabilities (Note 11) | $ | $ | |||||
Derivatives (Note 13) | |||||||
Taxes payable | |||||||
Equity compensation award liability (Note 7 and 13) | |||||||
Total Current Liabilities | |||||||
Long-Term Liabilities | |||||||
Long-term debt (Notes 6) | |||||||
Deferred tax liabilities (Note 10) | |||||||
Asset retirement obligation (Note 8) | |||||||
Equity compensation award liability (Note 7 and 13) | |||||||
Other long-term liabilities | |||||||
Total Long-Term Liabilities | |||||||
Commitments and Contingencies (Note 12) | |||||||
Shareholders’ Equity | |||||||
Common Stock (Note 7) (366,981,556 and 387,079,027 shares of Common Stock, par value $0.001 per share, issued and outstanding as at December 31, 2019 and December 31, 2018, respectively) | |||||||
Additional paid in capital | |||||||
Deficit | ( | ) | ( | ) | |||
Total Shareholders’ Equity | |||||||
Total Liabilities and Shareholders’ Equity | $ | $ | |||||
56
Gran Tierra Energy Inc.
Consolidated Statements of Cash Flows
(Thousands of U.S. Dollars)
Year Ended December 31, | |||||||||||
2019 | 2018 | 2017 | |||||||||
Operating Activities | |||||||||||
Net income (loss) | $ | $ | $ | ( | ) | ||||||
Adjustments to reconcile net income (loss) to net cash provided by operating activities: | |||||||||||
Depletion, depreciation and accretion (Note 5) | |||||||||||
Asset impairment (Note 5) | |||||||||||
Deferred tax expense (Note 10) | |||||||||||
Stock-based compensation (Note 7) | |||||||||||
Amortization of debt issuance costs (Note 6) | |||||||||||
Non-cash lease expenses | — | — | |||||||||
Lease payments | ( | ) | — | — | |||||||
Cash settlement of restricted share units | ( | ) | ( | ) | |||||||
Unrealized foreign exchange loss | |||||||||||
Financial instruments (gain) loss (Note 13) | ( | ) | |||||||||
Cash settlement of financial instruments | ( | ) | ( | ) | |||||||
Cash settlement of asset retirement obligation (Note 8) | ( | ) | ( | ) | ( | ) | |||||
Loss on sale (Note 5) | |||||||||||
Loss on redemption of Convertible Notes (Note 6) | |||||||||||
Net change in assets and liabilities from operating activities (Note 14) | ( | ) | ( | ) | ( | ) | |||||
Net cash provided by operating activities | |||||||||||
Investing Activities | |||||||||||
Additions to property, plant and equipment (Note 5) | ( | ) | ( | ) | ( | ) | |||||
Property acquisitions (Note 5) | ( | ) | ( | ) | ( | ) | |||||
Net proceeds from sale of business units | |||||||||||
Cash paid for investments | ( | ) | |||||||||
Changes in non-cash investing working capital | ( | ) | |||||||||
Net cash used in investing activities | ( | ) | ( | ) | ( | ) | |||||
Financing Activities | |||||||||||
Proceeds from issuance of Senior Notes, net of issuance costs (Note 6) | |||||||||||
Proceeds from bank debt, net of issuance costs | |||||||||||
Repayment of debt | ( | ) | ( | ) | ( | ) | |||||
Proceeds from exercise of stock options | |||||||||||
Repurchase of shares of Common Stock (Note 7) | ( | ) | ( | ) | ( | ) | |||||
Net cash provided by financing activities | |||||||||||
Foreign exchange loss on cash, cash equivalents and restricted cash and cash equivalents | ( | ) | ( | ) | ( | ) | |||||
Net (decrease) increase in cash, cash equivalents and restricted cash and cash equivalents | ( | ) | ( | ) | |||||||
Cash and cash equivalents and restricted cash and cash equivalents, beginning of year (Note 14) | |||||||||||
Cash and cash equivalents and restricted cash and cash equivalents, end of year (Note 14) | $ | $ | $ | ||||||||
Supplemental cash flow disclosures (Note 14) | |||||||||||
57
Gran Tierra Energy Inc.
Consolidated Statements of Shareholders’ Equity
(Thousands of U.S. Dollars)
Year Ended December 31, | |||||||||||
2019 | 2018 | 2017 | |||||||||
Share Capital | |||||||||||
Balance, beginning of year | $ | $ | $ | ||||||||
Repurchase of Common Stock (Note 7) | ( | ) | ( | ) | ( | ) | |||||
Balance, end of year | |||||||||||
Additional Paid in Capital | |||||||||||
Balance, beginning of year | |||||||||||
Exercise of stock options (Note 7) | |||||||||||
Stock-based compensation (Note 7) | |||||||||||
Repurchase of Common Stock (Note 7) | ( | ) | ( | ) | ( | ) | |||||
Balance, end of year | |||||||||||
Deficit | |||||||||||
Balance, beginning of year | ( | ) | ( | ) | ( | ) | |||||
Net income (loss) | ( | ) | |||||||||
Cumulative adjustment for accounting changes related to leases and tax reorganizations (Note 2) | ( | ) | |||||||||
Balance, end of year | ( | ) | ( | ) | ( | ) | |||||
Total Shareholders’ Equity | $ | $ | $ | ||||||||
(See notes to the consolidated financial statements)
58
Gran Tierra Energy Inc.
Notes to the Consolidated Financial Statements
For the Years Ended December 31, 2019, 2018 and 2017
(Expressed in U.S. Dollars, unless otherwise indicated)
1. Description of Business
2. Significant Accounting Policies
The consolidated financial statements have been prepared in accordance with generally accepted accounting principles in the United States of America (“GAAP”).
Significant accounting policies are:
Basis of consolidation
These consolidated financial statements include the accounts of the Company and its controlled subsidiaries. All intercompany accounts and transactions have been eliminated.
Use of estimates
The preparation of financial statements in conformity with GAAP requires management to make estimates and assumptions that affect the reported amounts of assets and liabilities and disclosure of contingent assets and liabilities at the date of the consolidated financial statements and the reported amounts of revenues and expenses during the reporting period. Significant estimates made by management include: oil and natural gas reserves and related present value of future cash flows; depreciation, depletion, amortization and impairment (“DD&A”); impairment assessments of goodwill; timing of transfers from oil and gas properties not subject to depletion to the depletable base; asset retirement obligations; determining the value of the consideration transferred and the net identifiable assets acquired and liabilities assumed in connection with business combinations and determining goodwill; assessments of the likely outcome of legal and other contingencies; income taxes; stock-based compensation; and determining the fair value of derivatives and investment. Although management believes these estimates are reasonable, changes in facts and circumstances or discovery of new information may result in revised estimates and actual results may differ from these estimates.
Cash and cash equivalents
The Company considers all highly liquid investments with an original maturity of three months or less to be cash equivalents.
Restricted cash and cash equivalents
Restricted cash and cash equivalents comprises cash and cash equivalents pledged to secure letters of credit and to settle asset retirement obligations. Letters of credit currently secured by cash relate to work commitment guarantees contained in exploration contracts. Restrictions will lapse when work obligations are satisfied pursuant to the exploration contract or an asset retirement obligation is settled. Cash and claims to cash that are restricted as to withdrawal or use for other than current operations or are designated for expenditure in the acquisition or construction of long-term assets are excluded from the current asset classification. The long-term portion of restricted cash and cash equivalents is included in other long-term assets on the Company's balance sheet.
Allowance for doubtful accounts
Investment in PetroTal Corp.
During December 2017, the Company acquired an investment in common shares of PetroTal Corp. ("PetroTal") in connection with the sale of its Peru business unit. At December 31, 2019, this investment represented approximately 37 % of PetroTal's issued
59
and outstanding common shares. The Company determined that it did not have a controlling financial interest in PetroTal, but could exert significant influence over PetroTal's operating and financial policies as a result of its ownership interest in PetroTal and the right to nominate two directors to PetroTal's board of directors. Accordingly, Gran Tierra accounted for its investment in the common shares of PetroTal as an equity method investment, but elected the fair value option for this investment to reflect the value that market participants would use to value the investment. The fair value of the investment in PetroTal's common shares is recorded in 'Investments' in the consolidated balance sheet, and the change in fair value is recorded in the consolidated statements of operations as financial instruments gains or losses.
Derivatives
The Company records derivative instruments on its balance sheet at fair value as either an asset or liability with changes in fair value recognized in the consolidated statements of operations as financial instruments gains or losses. While the Company utilizes derivative instruments to manage the price risk attributable to its expected oil production and foreign exchange risk, it has elected not to designate its derivative instruments as accounting hedges under the accounting guidance.
Inventory
Income taxes
Income taxes are recognized using the liability method, whereby deferred tax assets and liabilities are recognized for the future tax consequences attributable to differences between the consolidated financial statements carrying amounts of existing assets and liabilities and their respective tax base, and operating loss and tax credit carry forwards. Deferred tax assets and liabilities are measured using enacted tax rates expected to apply to taxable income in the years in which those temporary differences and carryforwards are expected to be recovered or settled. Valuation allowances are provided if, after considering available evidence, it is not more likely than not that some or all of the deferred tax assets will be realized.
The tax benefit from an uncertain tax position is recognized when it is more likely than not, based on the technical merits of the position, that the position will be sustained on examination by the taxing authorities. Additionally, the amount of the tax benefit recognized is the largest amount of benefit that has a greater than 50% likelihood of being realized upon ultimate settlement. In evaluating whether a tax position has met the more-likely-than-not recognition threshold, the Company presumes that the position will be examined by the appropriate taxing authority that has full knowledge of all relevant information. The Company recognizes potential penalties and interest related to unrecognized tax benefits as a component of income tax expense.
In October 2016, the FASB issued ASU 2016-16, "Intra-Entity Transfers of Assets Other than Inventory." This ASU requires companies to recognize the income tax effects of intercompany sales or transfers of assets, other than inventory, in the income statement as income tax expense or benefit in the period the sale or transfer occurs. This ASU is effective for fiscal years beginning after December 15, 2017, and interim periods within those years. Early adoption was permitted as of the beginning of an annual reporting period. The ASU is required to be applied on a modified retrospective basis with a cumulative-effect adjustment directly to retained earnings in the period of adoption. The Company early adopted this ASU on January 1, 2017, and in the three months ending March 31, 2017, wrote off the income tax effects that had been deferred from past intercompany transactions to opening deficit. A total of $124.5 million, representing deferred tax assets of $178.6 million, net of $54.1 million of prepaid tax, was recorded directly to opening deficit at January 1, 2017. Deferred tax assets recorded upon adoption were assessed for realizability under Accounting Standards Codification ("ASC") 740 "Income Taxes", and, valuation allowances were recognized on those deferred tax assets as necessary on the date of adoption. The adoption of ASU 2016-16 did not have any effect on the Company’s cash flows.
Oil and gas properties
The Company uses the full cost method of accounting for its investment in oil and natural gas properties as defined by the Securities and Exchange Commission (“SEC”). Under this method, the Company capitalizes all acquisition, exploration and development costs incurred for the purpose of finding oil and natural gas reserves, including salaries, benefits and other internal costs directly attributable to these activities. Costs associated with production and general corporate activities; however, are expensed as incurred. Separate cost centers are maintained for each country in which the Company incurs costs.
60
The Company computes depletion of oil and natural gas properties on a quarterly basis using the unit-of-production method based upon production and estimates of proved reserve quantities. Future development costs related to properties with proved reserves are also included in the amortization base for computation of depletion. The costs of unproved properties are excluded from the amortization base until the properties are evaluated. The cost of exploratory dry wells is transferred to proved properties, and thus is subject to amortization, immediately upon determination that a well is dry in those countries where proved reserves exist.
The Company performs a ceiling test calculation each quarter in accordance with SEC Regulation S-X Rule 4-10. In performing its quarterly ceiling test, the Company limits, on a country-by-country basis, the capitalized costs of proved oil and natural gas properties, net of accumulated depletion and deferred income taxes, to the estimated future net cash flows from proved oil and natural gas reserves discounted at 10%, net of related tax effects, plus the lower of cost or fair value of unproved properties included in the costs being amortized. If such capitalized costs exceed the ceiling, the Company will record a write-down to the extent of such excess as a non-cash charge to net income or loss. Any such write-down will reduce earnings in the period of occurrence and results in a lower DD&A rate in future periods. A write-down may not be reversed in future periods even though higher oil and natural gas prices may subsequently increase the ceiling.
The Company calculates future net cash flows by applying the unweighted average of prices in effect on the first day of the month for the preceding 12-month period, adjusted for location and quality differentials. Such prices are utilized except where different prices are fixed and determinable from applicable contracts for the remaining term of those contracts.
Unproved properties are not depleted pending the determination of the existence of proved reserves. Costs are transferred into the depletable base on an ongoing basis as the properties are evaluated and proved reserves are established or impairment is determined. Unproved properties are evaluated quarterly to ascertain whether impairment has occurred. This evaluation considers, among other factors, seismic data, requirements to relinquish acreage, drilling results and activity, remaining time in the commitment period, remaining capital plans, and political, economic, and market conditions. During any period in which factors indicate an impairment, the cumulative costs incurred to date for such property are transferred to the full cost pool and are then subject to depletion. For countries where a reserve base has not yet been established, the impairment is charged to earnings.
In exploration areas, related seismic costs are capitalized in unproved property and evaluated as part of the total capitalized costs associated with a property. Seismic costs related to development projects are recorded in proved properties and therefore subject to depletion as incurred.
Gains and losses on the sale or other disposition of oil and natural gas properties are not recognized, unless the gain or loss would significantly alter the relationship between capitalized costs and proved reserves of oil and natural gas attributable to a country.
Asset retirement obligation
The Company records an estimated liability for future costs associated with the abandonment of its oil and gas properties including the costs of reclamation of drilling sites. The Company records the fair value of a liability for a legal obligation to retire an asset in the period in which the liability is incurred with an offsetting increase to the related oil and gas properties. The fair value of an asset retirement obligation is measured by reference to the expected future cash outflows required to satisfy the retirement obligation discounted at the Company’s credit-adjusted risk-free interest rate. Accretion expense is recognized over time as the discounted liabilities are accreted to their expected settlement value, while the asset retirement cost is amortized over the estimated productive life of the related assets. The accretion of the asset retirement obligation and amortization of the asset retirement cost are included in DD&A. If estimated future costs of an asset retirement obligation change, an adjustment is recorded to both the asset retirement obligation and oil and gas properties. Revisions to the estimated asset retirement obligation can result from changes in retirement cost estimates, revisions to estimated inflation rates and changes in the estimated timing of abandonment.
Other capital assets
Other capital assets, including additions and replacements, are recorded at cost upon acquisition and include furniture, fixtures and leasehold improvement, computer equipment and automobiles. Depreciation for furniture and fixtures, computer equipment and automobiles is provided using the straight-line method over the useful life of the asset. Leasehold improvements are depreciated on a straight-line basis over the shorter of the estimated useful life and the term of the related lease. The cost of repairs and maintenance is charged to expense as incurred.
Goodwill
Goodwill represents the excess of the aggregate of the consideration transferred over the net identifiable assets acquired and liabilities assumed. The Company assesses qualitative factors annually, or more frequently if necessary, to determine whether it
61
Convertible Notes
The Company accounted for its 5.00 % Convertible Senior Notes due 2021 (the "Convertible Notes") as a liability in their entirety. The embedded features of the Convertible Notes were assessed for bifurcation from the Convertible Notes under the applicable provisions, including the basic conversion feature, the fundamental change make-whole provision and the put and call options. Based on the assessment, the Company concluded that these embedded features did not meet the criteria to be accounted for separately.
As at December 31, 2019, there were no Convertible Notes outstanding and all debt issuance costs relating to the Convertible Notes were expensed in the period.
Revenue from Contracts with Customers
The Company's revenue relates to oil and natural gas sales in Colombia. The Company recognizes revenue when it transfers control of the product to a customer. This generally occurs at the time the customer obtains legal title to the product and when it is physically transferred to the delivery point agreed with the customer. Payment terms are generally within three business days following delivery of an invoice to the customer. Revenue is recognized based on the consideration specified in contracts with customers. Revenue represents the Company's share and is recorded net of royalty payments to governments and other mineral interest owners.
The Company evaluates its arrangement with third parties and partners to determine if the Company acts as a principal or an agent. In making this evaluation, management considers if the Company obtains control of the product delivered, which is indicated by the Company having the primary responsibility for the delivery of the product, having ability to establish prices or having inventory risk. If the Company acts in the capacity of an agent rather than as a principal in transaction, then the revenue is recognized on a net-basis, only reflecting the fee realized by the Company from the transaction.
Tariffs, tolls and fees charged to other entities for use of pipelines owned by the Company are evaluated by management to determine if these originate from contracts with customers or from incidental arrangements. When determining if the Company acted as a principal or as an agent in transactions, management determines if the Company obtains control of the product. As part of this assessment, management considers detailed criteria for revenue recognition set out in ASC 606.
In 2017, revenue from the production of oil and natural gas was recognized when the customer took title and assumed the risks and rewards of ownership, prices were fixed or determinable, the sale was evidenced by a contract and collection of the revenue was reasonably assured.
Stock-based compensation
The Company records stock-based compensation expense in its consolidated financial statements measured at the fair value of the awards that are ultimately expected to vest. Fair values are determined using pricing models such as the Black-Scholes-Merton or Monte Carlo simulation stock option-pricing models and/or observable share prices. For equity-settled stock-based compensation awards, fair values are determined at the grant date and the expense, net of estimated forfeitures, is recognized using the accelerated method over the requisite service period. An adjustment is made to compensation expense for any difference between the estimated forfeitures and the actual forfeitures. For cash-settled stock-based compensation awards, fair values are determined at each reporting date and periodic changes are recognized as compensation costs, with a corresponding change to liabilities.
The Company uses historical data to estimate the expected term used in the Black-Scholes option pricing model, option exercises and employee departure behavior. Expected volatilities used in the fair value estimate are based on the historical volatility of the
62
Company’s shares. The risk-free rate for periods within the expected term of the stock options is based on the U.S. Treasury yield curve in effect at the time of grant.
Stock-based compensation expense is capitalized as part of oil and natural gas properties or expensed as part of general and administrative (“G&A”) or operating expenses, as appropriate.
Foreign currency translation
The functional currency of the Company, including its subsidiaries, is the United States dollar. Monetary items are translated into the reporting currency at the exchange rate in effect at the balance sheet date and non-monetary items are translated at historical exchange rates. Revenue and expense items are translated in a manner that produces substantially the same reporting currency amounts that would have resulted had the underlying transactions been translated on the dates they occurred.
DD&A expense on assets is translated at the historical exchange rates similar to the assets to which they relate. Gains and losses resulting from foreign currency transactions, which are transactions denominated in a currency other than the entity’s functional currency, are recognized in net income or loss.
Earnings (loss) per share
Basic earnings (loss) per share is calculated by dividing net income or loss attributable to common shareholders by the weighted average number of shares of Common Stock and exchangeable shares issued and outstanding during each period. Diluted net income or loss per share is calculated by adjusting the weighted average number of shares of Common Stock and exchangeable shares outstanding for the dilutive effect, if any, of share equivalents. The Company uses the treasury stock method to determine the dilutive effect. This method assumes that all Common Stock equivalents have been exercised at the beginning of the period (or at the time of issuance, if later), and that the funds obtained thereby were used to purchase shares of Common Stock of the Company at the volume weighted average trading price of shares of Common Stock during the period.
Recently Adopted Accounting Pronouncements
Leases
The Company adopted Accounting Standard Codification ("ASC") 842 Leases with a date of initial application on January 1, 2019 in accordance with the modified retrospective transition approach using the practical expedients available for land easements and short-term leases. The Company did not elect the "suite" of practical expedients or use the hindsight expedient in its adoption.
At inception of a contract, the Company assesses whether a contract is, or contains, a lease. A contract is, or contains, a lease if the contract conveys the right to control the use of an identified asset for a period of time in exchange for consideration. At inception of a contract that contains a lease component, the Company allocates the consideration in the contract to each lease and non-lease component on the basis of their relative stand-alone prices. The Company recognizes a right-of-use asset and a lease liability at the lease commencement date. The right-of-use asset is initially measured at cost, and subsequently at cost less any accumulated depreciation and impairment losses, and adjusted for certain remeasurements of the lease liability.
The lease liability is initially measured at the present value of the lease payments that are not paid at the commencement date, discounted using the interest rate implicit in the lease or, if that rate cannot be readily determined, the Company's incremental borrowing rate. Generally, the Company uses its incremental borrowing rate as the discount rate. The lease liability is subsequently increased by the interest cost on the lease liability and decreased by lease payments made. It is remeasured when there is a change in future lease payments arising from a change in an index or rate, a change in the estimate of the amount expected to be payable under a residual value guarantee, or as appropriate, changes in the assessment of whether a purchase or extension option is reasonably certain to be exercised or a termination option is reasonably certain not to be exercised.
The Company has applied judgment to determine the lease term for contracts which include renewal or termination options. The assessment of whether the Company is reasonably certain to exercise such options impacts the lease term, which significantly affects the amount of lease liabilities and right-of-use assets recognized.
All leases identified as part of the transition relate to office leases.
The transition resulted in the recognition of a right-of-use asset presented in other capital assets of $3.8 million at January 1, 2019, the recognition of lease liabilities of $4.2 million and a $0.4 million impact on retained earnings. When measuring the lease
63
liabilities, the Company's incremental borrowing rate was used. At January 1, 2019 the rates applied ranged between 5.6 % and 9.1 %.
Recently Issued Accounting Pronouncements
Financial Instruments - Credit Losses
In June 2016, the FASB issued ASU 2016-13, "Financial Instruments - Credit Losses". This ASU replaces the current incurred loss impairment methodology with a methodology that reflects expected credit losses and requires a broader range of reasonable and supportable information to support credit loss estimates. In December 2019, the FASB issued ASU 2019-10, "Financial Instruments - Credit Losses, Derivatives and Hedging and Leases", which is codification improvement of ASU 2016-13. The ASU will be effective for fiscal years, and interim periods within those years, beginning after December 15, 2019. The Company has adopted this ASU on January 1, 2020 and applied a current expected credit loss model that has resulted in no impact on Company's consolidated position, results of operation or cash flows.
3. Segment and Geographic Reporting
The Company is primarily engaged in the exploration and production of oil in Colombia. The Company has one reportable segment based on geographic organization, Colombia. For the year ended December 31, 2019, the Ecuador business unit was not significant and was therefore included in the Colombia reportable segment. Prior to the sale of the Company's Brazil business unit effective June 30, 2017, and its Peru business unit effective December 18, 2017, Brazil and Peru were separate reportable segments. The "All Other" category represents the Company’s corporate activities, and the Brazil and Peru activities until the date of sale. The Company evaluates reportable segment performance based on income or loss before income taxes.
The following tables present comparative information on the Company’s reportable segment and other activities for the year ended December 31, 2017:
Year Ended December 31, 2017 | |||||||||||
(Thousands of U.S. Dollars) | Colombia | All Other | Total | ||||||||
Oil and natural gas sales | $ | $ | $ | ||||||||
DD&A expenses | |||||||||||
Asset impairment | |||||||||||
General and administrative expenses | |||||||||||
Interest expense | |||||||||||
Loss on sale | ( | ) | ( | ) | |||||||
Income (loss) before income taxes | ( | ) | |||||||||
Segment capital expenditures | |||||||||||
4. Accounts Receivable
As at December 31, | |||||||
(Thousands of U.S. Dollars) | 2019 | 2018 | |||||
Trade | $ | $ | |||||
Other | |||||||
$ | $ | ||||||
64
5. Property, Plant and Equipment
As at December 31, | |||||||
(Thousands of U.S. Dollars) | 2019 | 2018 | |||||
Oil and natural gas properties | |||||||
Proved | $ | $ | |||||
Unproved | |||||||
Other(1) | |||||||
Accumulated depletion and depreciation | ( | ) | ( | ) | |||
$ | $ | ||||||
(1) Included in other is right-of-use assets for operating and finance leases which totaled $5.7 million as at December 31, 2019 (December 31, 2018 - nil).
Depletion and depreciation expense on property, plant and equipment for the year ended December 31, 2019, was $220.8 million (year ended December 31, 2018 - $197.0 million; year ended December 31, 2017 - $126.8 million). A portion of depletion and depreciation expense was recorded as oil inventory in each year.
Asset impairment for the three years ended December 31, 2019, was as follows:
(Thousands of U.S. Dollars) | Year Ended December 31, | ||||||||||
2019 | 2018 | 2017 | |||||||||
Impairment of oil and gas properties | $ | $ | $ | ||||||||
The Company follows the full cost method of accounting for its oil and gas properties. Under this method, the net book value of properties on a country-by-country basis, less related deferred income taxes, may not exceed a calculated “ceiling”. The ceiling is the estimated after tax future net revenues from proved oil and gas properties, discounted at 10% per year. In calculating discounted future net revenues, oil and natural gas prices are determined using the average price during the 12 months period prior to the ending date of the period covered by the balance sheet, calculated as an unweighted arithmetic average of the first-day-of-the month price for each month within such period for that oil and natural gas. That average price is then held constant, except for changes which are fixed and determinable by existing contracts. Therefore, ceiling test estimates are based on historical prices discounted at 10% per year and it should not be assumed that estimates of future net revenues represent the fair market value of the Company's reserves. In accordance with GAAP, Gran Tierra used an average Brent price of $64.20 per bbl for the purposes of the December 31, 2019 ceiling test calculations (December 31, 2018 - $72.08 ; December 31, 2017 - $54.19 ).
2019 Acquisitions
On February 20, 2019, the Company acquired 36.2 % working interest ("WI") in the Suroriente Block and a 100 % WI of the Llanos-5 Block for cash consideration of $79.1 million and a promissory note of $1.5 million included in current accounts payable on the Company's consolidated balance sheet. The cost of the assets was allocated to proved properties using relative fair values. The entire consideration of $0.3 million for Llanos-5 was allocated to unproved properties.
65
(Thousands of U.S. Dollars) | |||
Cost of asset acquisition: | |||
Cash | $ | ||
Promissory note | |||
$ | |||
Allocation of Consideration Paid: | |||
Oil and gas properties | |||
Proved | $ | ||
Unproved | |||
Net working capital (including cash acquired of $5.3 million) | ( | ) | |
$ | |||
2018 Acquisitions
On October 1, 2018, the Company acquired the remaining 45 % WI in the PUT-1 Block in the Putumayo Basin for cash consideration of $28.1 million, of which $15.2 million was allocated to proved properties.
On August 6, 2018, the Company acquired a WI in the VMM-2 Block in the Middle Magdalena Valley Basin for cash consideration of $17.0 million, of which $6.2 million was allocated to proved properties. On December 1, 2018, the Company acquired a further WI in the VMM-2 Block for cash consideration of $5.0 million, of which $1.6 million was allocated to proved properties. In total, the Company has acquired an 80 % WI in the VMM-2 Block. The Company acquired the remaining 20 % WI in the Block in 2019.
On June 20, 2018, the Company acquired the remaining WI in the Alea 1848-A and 1947-C Blocks in the Putumayo Basin for cash consideration of $3.1 million and was entirely recorded to unproved properties.
2017 Dispositions
In 2017 Gran Tierra completed the sale of its Peru and Brazil business units. The net book value of the Peru business unit was greater than proceeds received and resulted in a $34.1 million loss on sale while the net book value of the Brazil business unit was greater than proceeds received and resulted in a $10.2 million loss on sale. Both losses were included in Other Loss.
Unproved Oil and Natural Gas Properties
At December 31, 2019, unproved oil and natural gas properties consist of exploration lands held in Colombia and Ecuador. Unproved oil and natural gas properties are being held for their exploration value and are not being depleted pending determination of the existence of proved reserves. Gran Tierra will continue to assess the unproved properties over the next several years as proved reserves are established and as exploration warrants whether or not future areas will be developed. The Company expects that approximately 100 % of costs not subject to depletion at December 31, 2019, will be transferred to the depletable base within the next five years .
The following is a summary of Gran Tierra’s oil and natural gas properties not subject to depletion as at December 31, 2019:
Costs Incurred in | |||||||||||||||||||
(Thousands of U.S. Dollars) | 2019 | 2018 | 2017 | Prior to 2017 | Total | ||||||||||||||
Acquisition costs - Colombia | $ | $ | $ | $ | $ | ||||||||||||||
Exploration costs - Colombia | |||||||||||||||||||
Exploration costs - Ecuador | |||||||||||||||||||
$ | $ | $ | $ | $ | |||||||||||||||
66
6. Debt and Debt Issuance Costs
The Company's debt at December 31, 2019 and 2018, was as follows:
As at December 31, | ||||||||
(Thousands of U.S. Dollars) | 2019 | 2018 | ||||||
6.25% Senior Notes | $ | $ | ||||||
7.75% Senior Notes | ||||||||
Convertible Notes (b) | ||||||||
Revolving credit facility (c) | ||||||||
Unamortized debt issuance costs | ( | ) | ( | ) | ||||
Long-term lease obligation(1) | — | |||||||
Long-term debt | $ | $ | ||||||
(1) The current portion of the lease obligation has been included in accounts payable and accrued liabilities on the Company's balance sheet and totaled $3.3 million as at December 31, 2019 (December 31, 2018 - nil).
Senior Notes
On May 20, 2019, the Company, issued $300.0 million of 7.75 % Senior Notes due 2027 (the “7.75 % Senior Notes”). The 7.75 % Senior Notes are fully and unconditionally guaranteed by certain subsidiaries of the Company that guarantee its revolving credit facility. Net proceeds from the issue of the 7.75 % Senior Notes were $289.3 million, after deducting the initial purchasers' discounts and commission and the offering expenses payable by the Company.
The 7.75 % Senior Notes bear interest at a rate of 7.75 % per year, payable semi-annually in arrears on May 23 and November 23 of each year, beginning on November 23, 2019. The 7.75 % Senior Notes will mature on May 23, 2027, unless earlier redeemed or repurchased.
Before May 23, 2023, the Company may, at its option, redeem all or a portion of the 7.75 % Senior Notes at 100 % of the principal amount plus accrued and unpaid interest and a “make-whole” premium. Thereafter, the Company may redeem all or a portion of the 7.75 % Senior Notes plus accrued and unpaid interest applicable to the date of the redemption at the following redemption prices: 2023 - 103.875 %; 2024 - 101.938 %; 2025 and thereafter - 100 %.
On February 15, 2018, Gran Tierra Energy International Holdings Ltd. ("GTEIH"), an indirect, wholly-owned subsidiary of the Company, issued $300.0 million of 6.25 % Senior Notes due 2025 (the “6.25 % Senior Notes” and, together with the 7.75 % Senior Notes, the “Senior Notes”). The 6.25 % Senior Notes are fully and unconditionally guaranteed by the Company and certain subsidiaries of the Company that guarantee its revolving credit facility. Net proceeds from the sale of the 6.25 % Senior Notes were $288.1 million, after deducting the initial purchasers' discounts and commission and the offering expenses payable by the Company.
The 6.25 % Senior Notes bear interest at a rate of 6.25 % per year, payable semi-annually in arrears on February 15 and August 15 of each year, beginning on August 15, 2018. The 6.25 % Senior Notes will mature on February 15, 2025, unless earlier redeemed or repurchased.
Before February 15, 2022, GTEIH may, at its option, redeem all or a portion of the 6.25 % Senior Notes at 100 % of the principal amount plus accrued and unpaid interest and a make-whole premium. Thereafter, the Company may redeem all or a portion of the 6.25 % Senior Notes plus accrued and unpaid interest applicable to the date of the redemption at the following redemption prices: 2022 - 103.125 %; 2023 - 101.563 %; 2024 and thereafter - 100 %.
Convertible Notes
During the year, the Company purchased and canceled $114,999,000 aggregate principal amount of Convertible Notes, including $114,997,000 aggregate principal amount purchased and canceled pursuant to an offer to purchase for cash all outstanding Convertible Notes, at a purchase price of $1,075 in cash per $1,000 principal amount of Convertible Notes plus $1.6 million of accrued and unpaid interest outstanding on such Convertible Notes up to, but not excluding the date of purchase. The Company
67
recorded $11.5 million loss on redemption including the premium paid, transaction costs and the expensing of unamortized deferred financing fees of $2.3 million. At December 31, 2019, the Company had no Convertible Notes outstanding.
Credit Facility
At December 31, 2019, the Company had a revolving credit facility with a syndicate of lenders with a borrowing base of $300.0 million. Availability under the revolving credit facility is determined by the reserves-based borrowing base determined by the lenders. On November 10, 2019, the borrowing base of $300.0 million was reaffirmed and, among other things, the maturity date of the borrowing under the revolving credit facility was extended from November 10, 2021 to November 10, 2022. The next re-determination of the borrowing base is due to occur no later than May 2020.
Amounts drawn down under the revolving credit facility bear interest, at the Company's option, at the USD LIBOR rate plus a margin ranging from 1.65 % to 3.65 % (December 31, 2018 - 1.65 % to 3.65 %), or an alternate base rate plus a margin ranging from 0.65 % to 2.65 % (December 31, 2018 - 0.65 % to 2.65 %), in each case based on the borrowing base utilization percentage. The alternate base rate is currently the U.S. prime rate. Undrawn amounts under the revolving credit facility bear interest from 0.41 % to 0.91 % (December 31, 2018 - 0.41 % to 0.91 %) per annum, based on the average daily amount of unused commitments.
The Company’s revolving credit facility is guaranteed by and secured against the assets of certain of the Company’s subsidiaries (the "Credit Facility Group"). Under the terms of the credit facility, the Company is subject on certain restrictions on its ability to distribute funds to entities outside of the Credit Facility Group, including restrictions on the ability to pay dividends to shareholders of the Company.
d) Interest expense
The following table presents total interest expense recognized in the accompanying consolidated statements of operations:
Year Ended December 31, | |||||||||||
(Thousands of U.S. Dollars) | 2019 | 2018 | 2017 | ||||||||
Contractual interest and other financing expenses | $ | $ | $ | ||||||||
Amortization of debt issuance costs | |||||||||||
$ | $ | $ | |||||||||
7. Share Capital
Shares of Common Stock | Exchangeable Shares of Gran Tierra Exchangeco Inc. | Exchangeable Shares of Gran Tierra Goldstrike Inc. | ||||
Balance, December 31, 2016 | ||||||
Shares repurchased and canceled | ( | ) | ||||
Exchange of exchangeable shares | ( | ) | ( | ) | ||
Balance, December 31, 2017 | ||||||
Options exercised | ||||||
Shares repurchased and canceled | ( | ) | ||||
Exchange of exchangeable shares | ( | ) | ( | ) | ||
Balance, December 31, 2018 | ||||||
Shares repurchased and canceled | ( | ) | ||||
Balance, December 31, 2019 | ||||||
68
The Company’s authorized share capital consists of 595,000,000 shares of capital stock, of which 570,000,000 was designated as Common Stock, par value $0.001 per share and 25,000,000 as Preferred Stock, par value $0.001 per share.
On July 5, 2018, Gran Tierra Exchangeco Inc., a wholly-owned subsidiary of the Company, redeemed all of its outstanding exchangeable shares which were acquired for purchase consideration of one share of Gran Tierra common stock for each exchangeable share. On July 9, 2018, the Company retired and canceled one share of Special A Voting Stock and one share of Special B Voting Stock, which held voting rights in connection with those exchangeable shares. As a result, no shares of Special A Voting Stock and Special B Voting Stock remain outstanding.
The holders of shares of Common Stock are entitled to one vote for each share on all matters submitted to a stockholder vote and are entitled to share in all dividends that the Company’s Board of Directors, in its discretion, declares from legally available funds. The holders of Common Stock have no pre-emptive rights, no conversion rights, and there are no redemption provisions applicable to the shares.
Share Repurchase Program
In 2019, the Company implemented a share repurchase program (the “2019 program”) through the facilities of the Toronto Stock Exchange ("TSX") and eligible alternative trading platforms in Canada. Under the 2019 program, the Company is able to purchase at prevailing market prices up to 19,353,951 shares of Common Stock, representing approximately 5 % of the issued and outstanding shares of Common Stock as of March 1, 2019. The 2019 program was scheduled to expire on March 12, 2020, or earlier if the 5 % share maximum is reached. The 2019 program expired when the 5 % share maximum was reached in September 2019.The weighted average price per share under the 2019 program was $1.85 per share. All shares purchased were canceled subsequent to the repurchase.
During the year ended December 31, 2019, the Company repurchased 20,097,471 shares of Common Stock at a weighted average price of $1.87 per share. Of the shares repurchased, 743,520 shares at a weighted average price of $2.34 per share were repurchased under 2018 share purchase program implemented in 2018 with similar terms to that of the 2019 program.
Equity Compensation Awards
The Company has an equity compensation program in place for its executives, employees and directors. Executives and employees are given equity compensation grants that vest based on a recipient's continued employment and in the case of Performance Share Units (“PSUs”), the number of units that vest is dependent upon the achievement of certain key performance measures. Equity settled awards consist 80 % of PSUs and 20 % of stock options. The Company’s stocked based compensation awards outstanding as at December 31, 2019, include PSUs, deferred share units (“DSUs”), and stock options.
In accordance with the 2007 Equity Incentive Plan, as amended, the Company’s Board of Directors is authorized to issue options or other rights to acquire shares of the Company’s Common Stock. On June 27, 2012, the shareholders of Gran Tierra approved an amendment to the Company’s 2007 Equity Incentive Plan, which increased the Common Stock available for issuance thereunder from 23,306,100 shares to 39,806,100 shares.
The following table provides information about PSU, DSU and stock option activity for the year ended December 31, 2019:
PSUs | DSUs | Stock Options | |||||||||
Number of Outstanding Share Units | Number of Outstanding Share Units | Number of Outstanding Stock Options | Weighted Average Exercise Price /Stock Option ($) | ||||||||
Balance, December 31, 2018 | $ | ||||||||||
Granted | |||||||||||
Exercised | ( | ) | |||||||||
Forfeited | ( | ) | ( | ) | |||||||
Expired | ( | ) | |||||||||
Balance, December 31, 2019 | $ | ||||||||||
Vested and exercisable, at December 31, 2019 | $ | ||||||||||
Vested, or expected to vest, at December 31, 2019 through the life of the options | $ | ||||||||||
69
Stock-based compensation expense for the year ended December 31, 2019, was $1.4 million (December 31, 2018 - $8.3 million; December 31, 2017 - $9.8 million) and was primarily recorded in G&A expenses.
At December 31, 2019, there was $6.7 million (December 31, 2018 - $9.2 million) of unrecognized compensation cost related to unvested PSUs and stock options which is expected to be recognized over a weighted average period of 1.7 years. The weighted-average remaining contractual term of options vested, or expected to vest, at December 31, 2019 was 2.3 years.
PSUs
PSUs entitle the holder to receive, at the option of the Company, either the underlying number of shares of the Company's Common Stock upon vesting of such units or a cash payment equal to the value of the underlying shares. PSUs will cliff vest after three years , subject to the continued employment of the grantee. Upon vesting, the underlying number of Common Shares or the cash payment equivalent to their value may range from zero to 200 % of the number of PSU's vested, based on the Company’s performance with respect to the applicable performance targets. As at December 31, 2019, 2.4 million (December 31, 2018 - 2.7 million) of PSU's had vested and will be settled in cash. The performance targets for the PSUs outstanding as at December 31, 2019, were as follows:
(i) 50 % of the award is subject to targets relating to the total shareholder return (“TSR”) of the Company against a group of
peer companies;
(ii) 25 % of the award is subject to targets relating to net asset value ("NAV") of the Company per share and NAV is based on
before tax net present value discounted at 10 % of proved plus probable reserves; and
(iii) 25 % of the award is subject to targets relating to the execution of corporate strategy.
The compensation cost of PSUs is subject to adjustment based upon the attainability of these performance targets. No settlement will occur with respect to the portion of the PSU award subject to each performance target for results below the applicable minimum threshold for that target. PSUs in excess of the target number granted will vest and be settled if performance exceeds the targeted performance goals. The Company currently intends to settle the PSUs in cash.
DSUs
DSUs entitle the holder to receive, either the underlying number of shares of the Company's Common Stock upon vesting of such units or, at the option of the Company, a cash payment equal to the value of the underlying shares. Once a DSU is vested, it is immediately settled. During the year ended December 31, 2019, DSUs were granted to directors and will vest 100 % at such time the grantee ceases to be a member of the Board of Directors. The Company currently intends to settle the DSUs in cash.
Stock Options
Each stock option permits the holder to purchase one share of Common Stock at the stated exercise price. The exercise price equals the market price of a share of Common Stock at the time of grant. Stock options generally vest over three years . The term of stock options granted starting in May of 2013 is five years or three months after the grantee’s end of service to the Company, whichever occurs first. Stock options granted prior to May of 2013 continue to have a term of ten years or three months after the end of the grantee’s service to the Company, whichever occurs first.
For the year ended December 31, 2019, no stock options were exercised and no cash proceeds were received (2018 – 549,189 options exercised and shares issued; 2017 – no options exercised and no shares issued).
At December 31, 2019, the weighted average remaining contractual term of outstanding stock options was 2.3 years, (exercisable stock options - 1.3 years).
The fair value of each stock option award is estimated on the date of grant using the Black-Scholes option pricing model based on assumptions noted in the following table:
70
Year Ended December 31, | ||||||||
2019 | 2018 | 2017 | ||||||
Dividend yield (per share) | ||||||||
Volatility | 48% to 54% | 51% to 55% | 51% to 53% | |||||
Weighted average volatility | % | % | % | |||||
Risk-free interest rate | 1.49% to 2.54% | 2.18% to 3.00% | 1.75% to 2.10% | |||||
Expected term | 4-5 years | 4-5 years | 4-5 years | |||||
The weighted average grant date fair value for options granted in the year ended December 31, 2019, was $0.89 (2018 - $1.15 ; 2017 - $1.11 ). The weighted average grant date fair value for options vested in the year ended December 31, 2019, was $1.10 (2018 - $1.23 ; 2017 - $1.31 ). The total fair value of stock options vested during year ended December 31, 2019, was $1.9 million (2018 - $2.8 million; 2017 - $2.5 million).
Weighted Average Shares Outstanding
Year Ended December 31, | ||||||||
2019 | 2018 | 2017 | ||||||
Weighted Average number of common and exchangeable shares outstanding | ||||||||
Shares issuable pursuant to stock options | ||||||||
Shares assumed to be purchased from proceeds of stock options | ( | ) | ( | ) | ||||
Shares issuable on conversion of Convertible Notes | ||||||||
Weighted average number of diluted common and exchange shares outstanding | ||||||||
For the year ended December 31, 2019, 9,465,737 options, on a weighted average basis, (2018 - 5,354,545 options; 2017 - 9,681,304 options) were excluded from the diluted loss per share calculation as the options were anti-dilutive.
8. Asset Retirement Obligation
Changes in the carrying amounts of the asset retirement obligation associated with the Company’s oil and natural gas properties were as follows:
Year Ended December 31, | |||||||
(Thousands of U.S. Dollars) | 2019 | 2018 | |||||
Balance, beginning of year | $ | $ | |||||
Liability incurred | |||||||
Settlements | ( | ) | ( | ) | |||
Accretion | |||||||
Revisions in estimated liability | ( | ) | |||||
Liabilities assumed in acquisitions | |||||||
Balance, end of year | $ | $ | |||||
Asset retirement obligation - current | $ | $ | |||||
Asset retirement obligation - long-term | |||||||
Balance, end of year | $ | $ | |||||
Revisions in estimated liabilities relate primarily to changes in estimates of asset retirement costs and include, but are not limited to, revisions of estimated inflation rates, changes in property lives and the expected timing of settling asset retirement obligations. At December 31, 2019, the fair value of assets that were legally restricted for purposes of settling asset retirement obligations was $2.8 million (December 31, 2018 - $2.7 million). These assets were accounted for as restricted cash and cash equivalents on the Company's balance sheet.
71
9. Revenue
Most of the Company's revenue is generated from oil sales at prices which reflect the blended prices received upon shipment by the purchaser at defined sales points or are defined by contract relative to ICE Brent and adjusted for Vasconia or Castilla crude differentials, and quality and transportation discounts each month. For the year ended December 31, 2019, 100 % (year ended December 31, 2018 - 100 %, year-end December 31, 2017 - 99 %) of the Company's revenue resulted from oil sales and quality and transportation discounts were 16 % (year ended December 31, 2018 - 18 %, year ended December 31, 2017 - 21 %) of the ICE Brent price. During the year ended December 31, 2019, the Company's production was sold primarily to three major customers in Colombia (year ended December 31, 2018 - two, year-end December 31, 2017 - three).
10. Taxes
The income tax expense reported differs from the amount computed by applying the statutory rate to loss before income taxes for the following reasons:
Year Ended December 31, | |||||||||||
(Thousands of U.S. Dollars) | 2019 | 2018 | 2017 | ||||||||
Income (loss) before income taxes | |||||||||||
United States | $ | ( | ) | $ | ( | ) | $ | ( | ) | ||
Foreign | |||||||||||
Statutory rate (1) | % | % | % | ||||||||
Income tax expense expected | |||||||||||
Impact of foreign taxes | |||||||||||
Foreign currency translation | ( | ) | |||||||||
Other local taxes | |||||||||||
Stock-based compensation | |||||||||||
Change in valuation allowance | ( | ) | |||||||||
Non-deductible third party royalty in Colombia | |||||||||||
Other permanent differences | ( | ) | ( | ) | ( | ) | |||||
Total income tax expense | $ | $ | $ | ||||||||
Effective tax rate | % | % | % | ||||||||
Current income tax expense | |||||||||||
United States | $ | $ | $ | ||||||||
Foreign | |||||||||||
Deferred income tax expense | |||||||||||
Foreign | |||||||||||
Total income tax expense | $ | $ | $ | ||||||||
(1) The tax rate in 2019 and 2018 is the statutory rate in Colombia. The tax rate in 2017 is the statutory rate in the U.S.
In general, it is the Company's practice and intention to reinvest the earnings of our non-U.S. subsidiaries in such subsidiaries' operations. As of December 31, 2019, the Company has not made a provision for U.S. or additional foreign withholding taxes on the investments in foreign subsidiaries that are indefinitely reinvested. Generally, such amounts become subject to taxation upon the remittance of dividends and under certain other circumstances.
In the fourth quarter of 2019, the Colombia government enacted a new tax reform to replace the 2018 tax reform, which was overturned by the Colombian Constitutional Court. This new tax reform maintains the same corporate tax rates that were approved
72
by Congress in 2018. The enacted corporate tax rates are 32% for 2020, 31% for 2021 and 30% for 2022 and onwards. The tax rates applied to the calculation of deferred income taxes, before valuation allowances, have been adjusted to reflect these changes.
As at December 31, | |||||||
(Thousands of U.S. Dollars) | 2019 | 2018 | |||||
Deferred tax assets | |||||||
Tax benefit of operating loss carryforwards | $ | $ | |||||
Tax basis in excess of book basis | |||||||
Foreign tax credits and other accruals | |||||||
Tax benefit of capital loss carryforwards | |||||||
Deferred tax assets before valuation allowance | |||||||
Valuation allowance | ( | ) | ( | ) | |||
Deferred tax liabilities | |||||||
Net deferred tax (liabilities) assets | $ | ( | ) | $ | |||
At December 31, 2019, the Company has not recognized the benefit of unused non-capital loss carryforwards of $50.5 million (2018 - $22.7 million) for federal purposes in the United States, which expire from 2029 to 2039.
At December 31, 2019, the Company has not recognized the benefit of unused non-capital loss carryforwards of $31.5 million
(2018 - $27.1 million) for federal and provincial purposes in Canada, which expire from 2025 to 2039. The Company has not recognized the benefit of capital loss carry forwards of $197.5 million (2018 - $242.4 million) for federal and provincial purposes in Canada which can be carried forward indefinitely.
At December 31, 2019, the Company has recognized the benefit of unused non-capital loss carryforwards of $140.5 million (2018 - $99.0 million), out of a total of $159.2 million and tax credits of $1.5 million (2018 - $2.2 million), out of a total of $3.3 million, for federal purposes in Colombia. As a result of the 2016 Colombian Tax Reform, Colombian losses can be carryforward for a period of 12 years, and not indefinitely as under the previous tax regime. There is a grandfathering rule for losses incurred prior to 2017, which may continue to be carried forward indefinitely. $75.4 million of the Colombian losses can be carried forward indefinitely and $83.8 million are entitled to a carryforward period of 12 years.
As at December 31, 2019 and 2018, Gran Tierra had no unrecognized tax benefits and related interest and penalties included in its deferred and current tax liabilities in the consolidated balance sheet. The Company does not anticipate any material changes with respect to unrecognized tax benefit within the next twelve months. The Company had no other significant interest or penalties related to taxes included in the consolidated statement of operations for the quarter ended December 31, 2019. The Company and its subsidiaries file income tax returns in the U.S. and certain other foreign jurisdictions. The Company is subject to income tax examinations for the tax years ended 2011 through 2019 in certain jurisdictions.
11. Accounts Payable and Accrued Liabilities
Year Ended December 31, | |||||||
(Thousands of U.S. Dollars) | 2019 | 2018 | |||||
Trade | $ | $ | |||||
Royalties | |||||||
Employee compensation | |||||||
Other | |||||||
$ | $ | ||||||
73
12. Commitments and Contingencies
Purchase Obligations, Firm Agreements and Leases
As at December 31, 2019, future minimum payments under non-cancelable agreements with remaining terms in excess of one year were as follows:
Year ending December 31 | |||||||||||||||||||||||||||
Total | 2020 | 2021 | 2022 | 2023 | 2024 | Thereafter | |||||||||||||||||||||
(Thousands of U.S. Dollars) | |||||||||||||||||||||||||||
Oil transportation services | $ | $ | $ | $ | $ | $ | $ | ||||||||||||||||||||
Drilling, completions and seismic | |||||||||||||||||||||||||||
Operating leases (1) | |||||||||||||||||||||||||||
Finance leases (1) | |||||||||||||||||||||||||||
$ | $ | $ | $ | $ | $ | $ | |||||||||||||||||||||
(1) including maintenance and operating costs
Gran Tierra has operating leases for office spaces and finance leases for water flood facilities and storage tanks and commitments relating to compressors, vehicles, equipment and housing.
Indemnities
Corporate indemnities have been provided by the Company to directors and officers for various items including, but not limited to, all costs to settle suits or actions due to their association with the Company and its subsidiaries and/or affiliates, subject to certain restrictions. The Company has purchased directors’ and officers’ liability insurance to mitigate the cost of any potential future suits or actions. The maximum amount of any potential future payment cannot be reasonably estimated. The Company may provide indemnifications in the normal course of business that are often standard contractual terms to counterparties in certain transactions such as purchase and sale agreements. The terms of these indemnifications will vary based upon the contract, the nature of which prevents the Company from making a reasonable estimate of the maximum potential amounts that may be required to be paid.
Letters of Credit
At December 31, 2019, the Company had provided letters of credit and other credit support totaling $120.6 million (December 31, 2018 - $76.7 million) as security relating to work commitment guarantees contained in exploration contracts in Colombia and Ecuador and other capital or operating requirements.
Contingencies
Gran Tierra has a number of lawsuits and claims pending including a dispute with the ANH relating to the calculation of HPR royalties. Although the outcome of these other lawsuits and disputes cannot be predicted with certainty, Gran Tierra believes the resolution of these matters would not have a material adverse effect on the Company’s consolidated financial position, results of operations or cash flows. Gran Tierra records costs as they are incurred or become probable and determinable.
13. Financial Instruments, Fair Value Measurement, Credit Risk and Foreign Exchange Risk
Financial Instruments
At December 31, 2019, the Company’s financial instruments recognized in the balance sheet consist of cash and cash equivalents, restricted cash and cash equivalents, accounts receivable, investment, derivatives, accounts payable and accrued liabilities, long-term debt, current and long-term equity compensation reward liability and other long-term liabilities.
Fair Value Measurement
The fair value of investment, derivatives and PSU liabilities are being remeasured at the estimated fair value at the end of each reporting period.
74
The fair value of the Company's investment in PetroTal was estimated to be $94.7 million as at December 31, 2019 based on the closing stock price of PetroTal of $0.38 or $0.50 CAD per share as at December 31, 2019 ( December 31, 2018 - $0.17 or $0.24 CAD per share).
The fair value of commodity price and foreign currency derivatives is estimated based on various factors, including quoted market prices in active markets and quotes from third parties. The Company also performs an internal valuation to ensure the reasonableness of third party quotes. In consideration of counterparty credit risk, the Company assessed the possibility of whether the counterparty to the derivative would default by failing to make any contractually required payments. Additionally, the Company considers that it is of substantial credit quality and has the financial resources and willingness to meet its potential repayment obligations associated with the derivative transactions.
The fair value of the PSU liability was estimated based on option pricing model using the inputs, such as quoted market prices in an active market, and PSU performance factor.
The fair value of investments, derivatives, PSU and DSU liabilities at December 31, 2019, and December 31, 2018 were as follows:
As at December 31, | |||||||
(Thousands of U.S. Dollars) | 2019 | 2018 | |||||
Investment - current and long-term assets | $ | $ | |||||
$ | $ | ||||||
Derivative liability | $ | $ | |||||
PSU and DSU liability | |||||||
$ | $ | ||||||
The following table presents gains or losses on financial instruments recognized in the accompanying consolidated statements of operations:
(Thousands of U.S. Dollars) | Year Ended December 31, | ||||||||||
2019 | 2018 | 2017 | |||||||||
Commodity price derivative loss | $ | $ | $ | ||||||||
Foreign currency derivative loss (gain) | ( | ) | ( | ) | |||||||
Investment gain | ( | ) | ( | ) | ( | ) | |||||
$ | ( | ) | $ | $ | |||||||
These gains or losses are presented as financial instruments gains or losses in the consolidated statements of operations and cash flows.
GAAP establishes a fair value hierarchy that prioritizes the inputs to valuation techniques used to measure fair value. This hierarchy consists of three broad levels. Level 1 inputs consist of quoted prices (unadjusted) in active markets for identical assets and liabilities and have the highest priority. Level 2 and 3 inputs are based on significant other observable inputs and significant unobservable inputs, respectively, and have lower priorities. The Company uses appropriate valuation techniques based on the available inputs to measure the fair values of assets and liabilities.
Financial instruments not recorded at fair value at December 31, 2019 include the Senior Notes and the Revolving Credit Facility (Note 6). At December 31, 2019, the carrying amounts of the 6.25 % Senior Notes and 7.75 % Senior Notes were $290.7 million and $289.9 million, respectively, which represents the aggregate principal amount less unamortized debt issuance costs, and the fair values were $272.8 million and $279.1 million. The fair value of the Revolving Credit Facility approximates its carrying value. The fair value of the Senior Notes is determined based on quoted market prices considered Level 1 inputs. The fair value of the Revolving Credit Facility is estimated based on the amount the Company would have to pay a third party to assume the debt, including the credit spread for the difference between the issue rate and the period end market rate. The credit spread is the Company's default or repayment risk. The credit spread (premium or discount) is determined by comparing the debt to new issuances (secured or unsecured) and secondary trades of similar size and credit statistics for both public and private debt. The fair value of the Revolving Credit Facility was estimated using level 2 inputs.
75
The fair value of long-term restricted cash and cash equivalents and the revolving credit facility approximated their carrying value because interest rates are variable and reflective of market rates. The fair values of other financial instruments approximate their carrying amounts due to the short-term maturity of these instruments.
At December 31, 2019, the fair value of current portion of the investment and DSU liability was determined using Level 1 inputs and the fair value of derivatives and PSUs was determined using Level 2 inputs. The fair value of the long-term portion of the investment restricted by escrow conditions was previously determined using Level 3 inputs. The table below presents a roll-forward of the long-term portion of the investment:
Year Ended December 31, | |||||||
(Thousands of U.S. Dollars) | 2019 | 2018 | |||||
Opening balance | $ | $ | |||||
Transfer from long-term (Level 3) to current (Level 1) | ( | ) | ( | ) | |||
Unrealized gain on valuation | |||||||
Unrealized gain (loss) on foreign exchange | ( | ) | |||||
Closing balance | $ | $ | |||||
The Company’s non-recurring fair value measurements include asset retirement obligations. The fair value of an asset retirement obligation is measured by reference to the expected future cash outflows required to satisfy the retirement obligation discounted at the Company’s credit-adjusted risk-free interest rate. The significant level 3 inputs used to calculate such liabilities include estimates of costs to be incurred, the Company’s credit-adjusted risk-free interest rate, inflation rates and estimated dates of abandonment. Accretion expense is recognized over time as the discounted liabilities are accreted to their expected settlement value, while the asset retirement cost is amortized over the estimated productive life of the related assets.
Commodity Price Risk
The Company may at time utilize commodity price derivatives to manage the variability in cash flows associated with the forecasted sale of its oil production, reduce commodity price risk and provide a base level of cash flow in order to assure it can execute at least a portion of its capital spending. As at December 31, 2019, the Company had outstanding commodity price derivative positions as follows:
Period and type of instrument | Volume, bopd | Reference | Purchased Put ($/bbl, Weighted Average) | Sold Call ($/bbl, Weighted Average) | Premium ($/bbl, Weighted Average) | |||
Collars: January 1, to June 30, 2020 | ICE Brent | n/a | ||||||
Foreign Exchange Risk
The Company is exposed to foreign exchange risk in relation to its Colombian operations predominantly in operating costs, general and administrative costs and transportation costs. To mitigate exposure to fluctuations in foreign exchange, the Company may enter into foreign exchange derivatives. As at December 31, 2019 and subsequent to, the Company had outstanding foreign currency derivative positions as follows:
Period and type of instrument | Amount Hedged (Millions COP) | U.S. Dollar Equivalent of Amount Hedged (Thousands of U.S. Dollars)(1) | Reference | Floor Price (COP, Weighted Average) | Cap Price (COP, Weighted Average) | ||||
Collars: January 1, to December 31, 2020 | COP | ||||||||
(1) At December 31, 2019 foreign exchange rate.
Unrealized foreign exchange gains and losses primarily result from fluctuation of the U.S. dollar to the Colombian peso due to Gran Tierra’s current and deferred tax liabilities, which are monetary liabilities mainly denominated in the local currency of the Colombian operations. As a result, foreign exchange gains and losses must be calculated on conversion to the U.S. dollar functional currency. A strengthening in the Colombian peso against the U.S. dollar results in foreign exchange gain, estimated at approximately
76
$6,000 for each one peso decrease in the exchange rate of the Colombian peso to one U.S. dollar. This effect was calculated based on the Company's December 31, 2019, deferred tax balances.
For the year ended December 31, 2019, 100 % (December 31, 2018 - 100 %, December 31, 2017 - 98 %) of the Company's oil and natural gas sales were generated in Colombia. In Colombia, the Company receives 100 % of its revenues in U.S. dollars and the majority of its capital expenditures are in U.S. dollars or are based on U.S. dollar prices.
Credit Risk
Credit risk arises from the potential that the Company may incur a loss if counterparty to a financial instrument fails to meet its obligation in accordance with agreed terms. The Company’s financial instruments that are exposed to concentrations of credit risk consist primarily of cash and cash equivalents, restricted cash and accounts receivable. The carrying value of cash and cash equivalents, restricted cash and accounts receivable reflects management’s assessment of credit risk.
At December 31, 2019, cash and cash equivalents and restricted cash included balances in bank accounts, term deposits and certificates of deposit, placed with financial institutions with investment grade credit ratings.
Most of the Company’s accounts receivable relate to uncollateralized sales to customers in the oil and natural gas industry and are exposed to typical industry credit risks. The concentration of revenues in a single industry affects the Company’s overall exposure to credit risk because customers may be similarly affected by changes in economic and other conditions. The Company manages this credit risk by entering into sales contracts with only credit worthy entities and reviewing its exposure to individual entities on a regular basis. For the year ended December 31, 2019, the Company had three customers which were over 10% of sales.
To reduce the concentration of exposure to any individual counterparty, the Company utilizes a group of investment-grade rated financial institutions, for its derivative transactions. The Company monitors counterparty creditworthiness on an ongoing basis; however, it cannot predict sudden changes in counterparties’ creditworthiness. In addition, even if such changes are not sudden, the Company may be limited in its ability to mitigate an increase in counterparty credit risk. Should one of these counterparties not perform, the Company may not realize the benefit of some of its derivative instruments.
14. Supplemental Cash Flow Information
The following table provides a reconciliation of cash, cash equivalents and restricted cash and cash equivalents with the Company's consolidated balance sheet that sum to the total of the same such amounts shown in the consolidated statements of cash flows:
(Thousands of U.S. Dollars) | Year Ended December 31, | ||||||||||
2019 | 2018 | 2017 | |||||||||
Cash and cash equivalents | $ | $ | $ | ||||||||
Restricted cash and cash equivalents - current | |||||||||||
Restricted cash and cash equivalents - long-term(1) | |||||||||||
$ | $ | $ | |||||||||
(1) The long-term portion of restricted cash is included in other long-term assets on the Company's balance sheet.
Net changes in assets and liabilities from operating activities were as follows:
77
Year Ended December 31, | |||||||||||
2019 | 2018 | 2017 | |||||||||
Accounts receivable and other long-term assets | $ | ( | ) | $ | $ | ( | ) | ||||
Derivatives | ( | ) | |||||||||
Inventory | ( | ) | ( | ) | ( | ) | |||||
Other prepaids | |||||||||||
Accounts payable and accrued and other long-term liabilities | ( | ) | |||||||||
Prepaid tax and taxes receivable and payable | ( | ) | ( | ) | ( | ) | |||||
Net changes in assets and liabilities from operating activities | $ | ( | ) | $ | ( | ) | $ | ( | ) | ||
The following table provides additional supplemental cash flow disclosures:
Year Ended December 31, | |||||||||||
2019 | 2018 | 2017 | |||||||||
Cash paid for income taxes | $ | $ | $ | ||||||||
Cash paid for interest | $ | $ | $ | ||||||||
Non-cash investing activities: | |||||||||||
Net liabilities related to property, plant and equipment, end of year | $ | $ | $ | ||||||||
Supplementary Data (Unaudited)
1) Oil and Gas Producing Activities
In accordance with Financial Accounting Standards Board (FASB) Accounting Standards Codification Topic 932, “Extractive Activities—Oil and Gas”, and regulations of the U.S. Securities and Exchange Commission (SEC), the Company is making certain supplemental disclosures about its oil and gas exploration and production operations.
A. Estimated Proved NAR Reserves
The following table sets forth Gran Tierra's estimated proved NAR reserves and total net proved developed and undeveloped reserves as of December 31, 2016, 2017, 2018 and 2019, and the changes in total net proved reserves during the three-year period ended December 31, 2019.
The net proved reserves represent management’s best estimate of proved oil and natural gas reserves after royalties. Reserve estimates for each property are prepared internally each year and 100% of the reserves at December 31, 2019, have been evaluated by independent qualified reserves consultants, McDaniel & Associates Consultants Ltd.
The reserve estimation process requires us to use significant decisions and assumptions in the evaluation of available geological, geophysical, engineering and economic data for each property, and demonstrate reasonable certainty that they are recoverable from known reservoirs under economic and operating conditions that existed at year end. The determination of oil and natural gas reserves is complex and requires significant judgment. Assumptions used to estimate reserve information may significantly increase or decrease such reserves in future periods. The estimates of reserves are subject to continuing changes and, therefore, an accurate determination of reserves may not be possible for many years because of the time needed for development, drilling, testing, and studies of reservoirs. The process of estimating oil and gas reserves is complex and requires significant judgment, as discussed in Item 1A. “Risk Factors”. See “Critical Accounting Estimates” in Item 7. “Management’s Discussion and Analysis of Financial Condition and Results of Operation” for a description of Gran Tierra’s reserves estimation process.
78
Colombia | ||||||
Liquids (1) | Gas | |||||
(Mbbl) | (MMcf) | |||||
Proved NAR Reserves, December 31, 2016 | 45,878 | 1,595 | ||||
Purchases of reserves in place | 2,041 | — | ||||
Extensions | 9,543 | — | ||||
Improved recoveries | 2,461 | — | ||||
Technical revisions | 7,627 | 1,077 | ||||
Discoveries | 873 | — | ||||
Production | (9,469 | ) | (588 | ) | ||
Proved NAR Reserves, Decemberᅠ 31, 2017 | 58,954 | 2,084 | ||||
Purchases of reserves in place | 1,871 | — | ||||
Extensions | 6,357 | — | ||||
Technical revisions | (3,502 | ) | 307 | |||
Discoveries | 811 | — | ||||
Production | (10,569 | ) | (209 | ) | ||
Proved NAR Reserves, December ᅠ31, 2018 | 53,922 | 2,182 | ||||
Purchases of reserves in place | 4,495 | — | ||||
Extensions | 6,106 | — | ||||
Technical revisions | 13,336 | 73 | ||||
Production | (10,530 | ) | (361 | ) | ||
Proved NAR Reserves, Decemberᅠ 31, 2019 | 67,329 | 1,894 | ||||
Proved Developed Reserves NAR, December 31, 2017 | 39,487 | 1,431 | ||||
Proved Developed Reserves NAR, December 31, 2018 | 36,805 | 1,253 | ||||
Proved Developed Reserves NAR, December 31, 2019 | 36,465 | 1,008 | ||||
Proved Undeveloped Reserves NAR, December 31, 2017 | 19,467 | 653 | ||||
Proved Undeveloped Reserves NAR, December 31, 2018 | 17,117 | 929 | ||||
Proved Undeveloped Reserves NAR, December 31, 2019 | 30,864 | 886 | ||||
(1) At December 31, 2019, 2018, 2017 and 2016, liquids reserves are 100% oil.
Changes in proved reserves during the year ended December 31, 2019 shown in the table above primarily resulted from the following significant factors:
Acquisitions. During the year ended December 31, 2019, we added 4.5 MMBOE of proved reserves as a result of the acquisition of 36.2% WI in the Suroriente Block and 20.0% WI in the VMM-2 Block.
Extensions. Extensions added 6.1 MMBOE of 2019 proved reserves during the year ended December 31, 2019 and were attributed to extensions in the Acordionero and Costayaco Fields.
Technical Revisions. During the year ended December 31, 2019, we added 13.3 MMBOE to proved reserves which primarily relate to positive technical revisions, based on performance and waterflood response, in the Acordionero, Costayaco, Moqueta and Cohembi fields.
79
B. Capitalized Costs
Capitalized costs for Gran Tierra's oil and gas producing activities consisted of the following at the end of each of the years in the two-year period ended December 31, 2019:
(Thousands of U.S. Dollars) | Proved Properties | Unproved Properties | Accumulated Depletion, Depreciation and Impairment | Net Capitalized Costs | |||||||||||
Balance, December 31, 2019 | $ | 3,850,565 | $ | 310,809 | $ | (2,591,631 | ) | $ | 1,569,743 | ||||||
Balance, December 31, 2018 | $ | 3,226,811 | $ | 456,598 | $ | (2,373,383 | ) | $ | 1,310,026 | ||||||
C. Costs Incurred
The following table presents costs incurred for Gran Tierra's oil and gas property acquisitions and exploration and development for the respective years:
(Thousands of U.S. Dollars) | Colombia | Brazil | Peru | Total | ||||||||
Year Ended December 31, 2017 | ||||||||||||
Property acquisition costs | ||||||||||||
Proved | 28,405 | 1,565 | — | 29,970 | ||||||||
Unproved | 8,649 | — | 4,314 | 12,963 | ||||||||
Exploration costs | 64,003 | — | — | 64,003 | ||||||||
Development costs | 171,498 | — | — | 171,498 | ||||||||
Year Ended December 31, 2018 | ||||||||||||
Property acquisition costs | ||||||||||||
Proved | 22,213 | — | — | 22,213 | ||||||||
Unproved | 29,999 | — | — | 29,999 | ||||||||
Exploration costs | 62,997 | — | — | 62,997 | ||||||||
Development costs | 283,120 | — | — | 283,120 | ||||||||
Year Ended December 31, 2019 | ||||||||||||
Property acquisition costs | ||||||||||||
Proved | 53,650 | — | — | 53,650 | ||||||||
Unproved | 48,648 | — | — | 48,648 | ||||||||
Exploration costs | 97,486 | — | — | 97,486 | ||||||||
Development costs | 281,151 | — | — | 281,151 | ||||||||
80
D. Results of Operations for Oil and Gas Producing Activities
(Thousands of U.S. Dollars) | Colombia | ||
December 31, 2019 | |||
Oil and natural gas sales | $ | 570,983 | |
Production costs | (203,604 | ) | |
Exploration expenses | — | ||
DD&A expenses | (224,045 | ) | |
Asset Impairment | — | ||
Income tax expense | (53,989 | ) | |
Results of Operations | $ | 89,345 | |
December 31, 2018 | |||
Oil and natural gas sales | $ | 613,431 | |
Production costs | (174,702 | ) | |
Exploration expenses | — | ||
DD&A expenses | (195,958 | ) | |
Asset Impairment | — | ||
Income tax expense | (45,293 | ) | |
Results of Operations | $ | 197,478 | |
December 31, 2017 | |||
Oil and natural gas sales | $ | 413,316 | |
Production costs | (132,829 | ) | |
Exploration expenses | — | ||
DD&A expenses | (126,453 | ) | |
Asset Impairment | — | ||
Income tax expense | (64,000 | ) | |
Results of Operations | $ | 90,034 | |
E. Standardized Measure of Discounted Future Net Cash Flows and Changes
The following disclosure is based on estimates of net proved reserves and the period during which they are expected to be produced. Future cash inflows are computed by applying the twelve month period unweighted arithmetic average of the price as of the first day of each month within that twelve month period, unless prices are defined by contractual arrangements, excluding escalations based on future conditions to Gran Tierra’s after royalty share of estimated annual future production from proved oil and gas reserves.
Colombia | |||
Twelve month period unweighted arithmetic average of the wellhead price as of the first day of each month within the twelve month period | |||
2019 | $ | 54.05 | |
2018 | $ | 61.16 | |
2017 | $ | 43.00 | |
Weighted average production costs | |||
2019 | $ | 18.67 | |
2018 | $ | 18.18 | |
2017 | $ | 15.73 | |
81
Future development and production costs to be incurred in producing and further developing the proved reserves are based on year end cost indicators. Future income taxes are computed by applying year end statutory tax rates. These rates reflect allowable deductions and tax credits, and are applied to the estimated pre-tax future net cash flows. Discounted future net cash flows are calculated using 10% mid-year discount factors. The calculations assume the continuation of existing economic, operating and contractual conditions. However, such arbitrary assumptions have not proved to be the case in the past. Other assumptions could give rise to substantially different results.
The Company believes this information does not in any way reflect the current economic value of its oil and gas producing properties or the present value of their estimated future cash flows as:
• | no economic value is attributed to probable and possible reserves; |
• | use of a 10% discount rate is arbitrary; and |
• | prices change constantly from the twelve-month period unweighted arithmetic average of the price as of the first day of each month within that twelve-month period. |
The standardized measure of discounted future net cash flows from Gran Tierra's estimated proved oil and gas reserves is as follows:
(Thousands of U.S. Dollars) | Colombia | ||
December 31, 2019 | |||
Future cash inflows | $ | 3,711,517 | |
Future production costs | (1,429,689 | ) | |
Future development costs | (351,750 | ) | |
Future asset retirement obligations | (46,922 | ) | |
Future income tax expense | (288,088 | ) | |
Future net cash flows | 1,595,068 | ||
10% discount | (406,872 | ) | |
Standardized Measure of Discounted Future Net Cash Flows | $ | 1,188,196 | |
December 31, 2018 | |||
Future cash inflows | $ | 3,351,768 | |
Future production costs | (1,225,259 | ) | |
Future development costs | (261,563 | ) | |
Future asset retirement obligations | (45,045 | ) | |
Future income tax expense | (326,856 | ) | |
Future net cash flows | 1,493,045 | ||
10% discount | (298,585 | ) | |
Standardized Measure of Discounted Future Net Cash Flows | $ | 1,194,460 | |
December 31, 2017 | |||
Future cash inflows | $ | 2,570,551 | |
Future production costs | (1,082,651 | ) | |
Future development costs | (212,712 | ) | |
Future asset retirement obligations | (33,796 | ) | |
Future income tax expense | (146,652 | ) | |
Future net cash flows | 1,094,740 | ||
10% discount | (246,692 | ) | |
Standardized Measure of Discounted Future Net Cash Flows | $ | 848,048 | |
82
Changes in the Standardized Measure of Discounted Future Net Cash Flows
The following table summarizes changes in the standardized measure of discounted future net cash flows for Gran Tierra's proved oil and gas reserves during three years ended December 31, 2019:
(Thousands of U.S. Dollars) | 2019 | 2018 | 2017 | ||||||||
Balance, beginning of year | $ | 1,194,460 | $ | 848,048 | $ | 452,705 | |||||
Sales and transfers of oil and gas produced, net of production costs | (595,872 | ) | (368,097 | ) | (193,197 | ) | |||||
Net changes in prices and production costs related to future production | (387,603 | ) | 858,889 | (372,138 | ) | ||||||
Extensions, discoveries and improved recovery, less related costs | 200,486 | 159,529 | 193,672 | ||||||||
Previously estimated development costs incurred during the year | 155,287 | 110,221 | 71,816 | ||||||||
Revisions of previous quantity estimates | 731,352 | (248,735 | ) | 1,128,440 | |||||||
Accretion of discount | 119,446 | 84,804 | (120,231 | ) | |||||||
Purchases of reserves in place | 98,244 | 18,814 | 7,416 | ||||||||
Sales of reserves in place | — | — | (32,847 | ) | |||||||
Net change in income taxes | (92,527 | ) | (170,854 | ) | (112,838 | ) | |||||
Changes in future development costs | (235,077 | ) | (98,159 | ) | (174,750 | ) | |||||
Net (decrease) increase | (6,264 | ) | 346,412 | 395,343 | |||||||
Balance, end of year | $ | 1,188,196 | $ | 1,194,460 | $ | 848,048 | |||||
2) Summarized Quarterly Financial Information
Three Months Ended | Year Ended | |||||||||||||||
(Thousands of U.S. Dollars, Except Per Share Amounts) | March 31, 2019 | June 30, 2019 | September 30, 2019 | December 31, 2019 | December 31, 2019 | |||||||||||
Oil and natural gas sales | $ | 152,565 | $ | 157,993 | $ | 132,491 | $ | 127,934 | $ | 570,983 | ||||||
Net income (loss) | $ | 1,979 | $ | 38,540 | $ | (28,833 | ) | $ | 27,004 | $ | 38,690 | |||||
Net income (loss) per share | ||||||||||||||||
Basic | $ | 0.01 | $ | 0.10 | $ | (0.08 | ) | $ | 0.07 | $ | 0.10 | |||||
Diluted | $ | 0.01 | $ | 0.10 | $ | (0.08 | ) | $ | 0.07 | $ | 0.10 | |||||
Three Months Ended | Year Ended | |||||||||||||||
(Thousands of U.S. Dollars, Except Per Share Amounts) | March 31, 2018 | June 30, 2018 | September 30, 2018 | December 31, 2018 | December 31, 2018 | |||||||||||
Oil and natural gas sales | $ | 138,228 | $ | 163,446 | $ | 175,118 | $ | 136,639 | $ | 613,431 | ||||||
Net income (loss) | 17,861 | 20,300 | 75,295 | (10,840 | ) | 102,616 | ||||||||||
Net income (loss) per share | ||||||||||||||||
Basic | $ | 0.05 | $ | 0.05 | $ | 0.19 | $ | (0.03 | ) | $ | 0.26 | |||||
Diluted | $ | 0.05 | $ | 0.05 | $ | 0.18 | $ | (0.03 | ) | $ | 0.26 | |||||
Item 9. Changes in and Disagreements with Accountants on Accounting and Financial Disclosure
None.
83
Item 9A. Controls and Procedures
Disclosure Controls and Procedures
We have established disclosure controls and procedures (as defined in Rules 13a-15(e) and 15d-15(e) under the Securities Exchange Act of 1934, or Exchange Act). Our management, with the participation of our Chief Executive Officer and Chief Financial Officer, evaluated the effectiveness of the design and operation of our disclosure controls and procedures as of the end of the period covered by this report, as required by Rule 13a-15(b) of the Exchange Act. Based on their evaluation, our Chief Executive Officer and Chief Financial Officer have concluded that Gran Tierra's disclosure controls and procedures were effective as of December 31, 2019, to provide reasonable assurance that the information required to be disclosed by Gran Tierra in the reports that it files or submits under the Exchange Act is recorded, processed, summarized and reported within the time periods specified in the SEC rules and forms and that such information is accumulated and communicated to management, including our Chief Executive Officer and Chief Financial Officer, as appropriate, to allow timely decisions regarding required disclosure.
Management’s Annual Report on Internal Control Over Financial Reporting
Our management is responsible for establishing and maintaining adequate internal control over financial reporting for Gran Tierra, as such term is defined in Rules 13a-15(f) and 15d-15(f) under the Exchange Act. Our management, with the participation of our Chief Executive Officer and Chief Financial Officer, conducted an evaluation of the effectiveness of our internal control over financial reporting as of December 31, 2019 based on the framework in Internal Control — Integrated Framework issued by the Committee of Sponsoring Organizations of the Treadway Commission in 2013 (the “2013 COSO Framework”). Based on this evaluation under the 2013 COSO Framework, management concluded that our internal control over financial reporting was effective as of December 31, 2019. The effectiveness of our internal control over financial reporting as of December 31, 2019 has been audited by KPMG LLP, an independent registered public accounting firm, which audited our financial statements included in this Annual Report on Form 10-K as stated in their report which appears herein.
Changes in Internal Controls over Financial Reporting
There were no changes in our internal controls over financial reporting during the three months ended December 31, 2019, that have materially affected, or are reasonably likely to materially affect our internal controls over financial reporting.
84
Report of Independent Registered Public Accounting Firm
To the Shareholders and Board of Directors of Gran Tierra Energy Inc.:
Opinion on Internal Control Over Financial Reporting
We have audited Gran Tierra Energy Inc.’s (the Company) internal control over financial reporting as of December 31, 2019, based on criteria established in Internal Control - Integrated Framework (2013) issued by the Committee of Sponsoring Organizations of the Treadway Commission. In our opinion, the Company maintained, in all material respects, effective internal control over financial reporting as of December 31, 2019, based on criteria established in Internal Control - Integrated Framework (2013) issued by the Committee of Sponsoring Organizations of the Treadway Commission.
We also have audited, in accordance with the standards of the Public Company Accounting Oversight Board (United States) (PCAOB), the consolidated balance sheets of the Company as of December 31, 2019 and 2018, the related consolidated statements of operations, shareholders’ equity, and cash flows for the years then ended, and the related notes (collectively, the consolidated financial statements), and our report dated February 26, 2020 expressed an unqualified opinion on those consolidated financial statements.
Basis for Opinion
The Company’s management is responsible for maintaining effective internal control over financial reporting and for its assessment of the effectiveness of internal control over financial reporting, included in the accompanying Management’s Annual Report on Internal Control over Financial Reporting. Our responsibility is to express an opinion on the Company’s internal control over financial reporting based on our audit. We are a public accounting firm registered with the PCAOB and are required to be independent with respect to the Company in accordance with the U.S. federal securities laws and the applicable rules and regulations of the Securities and Exchange Commission and the PCAOB.
We conducted our audit in accordance with the standards of the PCAOB. Those standards require that we plan and perform the audit to obtain reasonable assurance about whether effective internal control over financial reporting was maintained in all material respects. Our audit of internal control over financial reporting included obtaining an understanding of internal control over financial reporting, assessing the risk that a material weakness exists, and testing and evaluating the design and operating effectiveness of internal control based on the assessed risk. Our audit also included performing such other procedures as we considered necessary in the circumstances. We believe that our audit provides a reasonable basis for our opinion.
Definition and Limitations of Internal Control Over Financial Reporting
A company’s internal control over financial reporting is a process designed to provide reasonable assurance regarding the reliability of financial reporting and the preparation of financial statements for external purposes in accordance with generally accepted accounting principles. A company’s internal control over financial reporting includes those policies and procedures that (1) pertain to the maintenance of records that, in reasonable detail, accurately and fairly reflect the transactions and dispositions of the assets of the company; (2) provide reasonable assurance that transactions are recorded as necessary to permit preparation of financial statements in accordance with generally accepted accounting principles, and that receipts and expenditures of the company are being made only in accordance with authorizations of management and directors of the company; and (3) provide reasonable assurance regarding prevention or timely detection of unauthorized acquisition, use, or disposition of the company’s assets that could have a material effect on the financial statements.
Because of its inherent limitations, internal control over financial reporting may not prevent or detect misstatements. Also, projections of any evaluation of effectiveness to future periods are subject to the risk that controls may become inadequate because of changes in conditions, or that the degree of compliance with the policies or procedures may deteriorate.
/s/ KPMG LLP
Chartered Professional Accountants
Calgary, Canada
February 26, 2020
85
Item 9B. Other Information
The Board of Directors of Gran Tierra Energy Inc. has established May 6, 2020 as the date of the Company’s 2020 Annual Meeting of Stockholders (the “2020 Annual Meeting”) and March 10, 2020 as the record date for determining stockholders entitled to notice of, and to vote at, the 2020 Annual Meeting. The time and location of the 2020 Annual Meeting will be as set forth in the Company’s proxy materials for the 2020 Annual Meeting.
PART III
Item 10. Directors, Executive Officers and Corporate Governance
The information required regarding our directors is incorporated herein by reference from the information contained in the section entitled “Proposal 1 - Election of Directors” in our definitive Proxy Statement for the 2020 Annual Meeting of Stockholders (our “Proxy Statement”), a copy of which will be filed with the SEC within 120 days after December 31, 2019. For information with respect to our executive officers, see “Information About Our Executive Officers” at the end of Part I of this report, following Item 4. “Mine Safety Disclosure.”
The information required regarding Section 16(a) beneficial ownership reporting compliance, if applicable, is incorporated by reference from the information contained in the section entitled “Delinquent Section 16(a) Reports” in our Proxy Statement.
The information required with respect to procedures by which security holders may recommend nominees to our Board of Directors, the composition of our Audit Committee, and whether we have an “audit committee financial expert”, is incorporated by reference from the information contained in the section entitled “Proposal 1 - Election of Directors” in our Proxy Statement.
Adoption of Code of Ethics
Gran Tierra has adopted a Code of Business Conduct and Ethics (the “Code”) applicable to all of its Board members, employees and executive officers, including its Chief Executive Officer (Principal Executive Officer), and Chief Financial Officer (Principal Financial Officer and Principal Accounting Officer). Gran Tierra has made the Code available on its website at www.grantierra.com.
Gran Tierra intends to satisfy the public disclosure requirements regarding (1) any amendments to the Code, or (2) any waivers under the Code given to Gran Tierra’s Principal Executive Officer, Principal Financial Officer and Principal Accounting Officer by posting such information on its website at http://www.grantierra.com/governance.html within four business days of such amendment or waiver. Information on our website is not incorporated into this Annual Report or otherwise made part of this Annual Report.
Item 11. Executive Compensation
The information required regarding the compensation of our directors and executive officers is incorporated herein by reference from the information contained in the section entitled “Executive Compensation and Related Information” in our Proxy Statement, including under the subheadings “Director Compensation,” “Compensation Committee Report” and “Compensation Committee Interlocks and Insider Participation”.
Item 12. Security Ownership of Certain Beneficial Owners and Management and Related Stockholder Matters
Security Ownership of Certain Beneficial Owners and Management
The information required regarding security ownership of our 10% or greater stockholders and of our directors and management is incorporated herein by reference from the information contained in the section entitled “Security Ownership of Certain Beneficial Owners and Management” in our Proxy Statement.
The following table provides certain information with respect to securities authorized for issuance under Gran Tierra’s equity compensation plans in effect as of the end of December 31, 2019:
86
Equity Compensation Plan Information
Plan category | (a) Number of securities to be issued upon exercise of outstanding options (1) | (b) Weighted average exercise price of outstanding options | (c) Number of securities remaining available for future issuance under equity compensation plans (excluding securities reflected in column (a)(2) | ||||||
Equity compensation plans approved by security holders | 10,612,872 | 2.78 | 15,078,864 | ||||||
Equity compensation plans not approved by security holders | — | — | — | ||||||
10,612,872 | 2.78 | 15,078.864 | |||||||
(1) Includes shares reserved to be issued pursuant to stock options granted pursuant to the 2007 Equity Incentive Plan ("the Plan"), which is an amendment and restatement of our 2005 Equity Incentive Plan. This does not include any shares reserved to be issued relating to performance stock units ("PSU's"), and deferred share units (DSU's"), which may be settled in cash or in shares of our common stock at our election, and for which management's intent to cash settle is reflected in the financial statement classification of these awards as financial liabilities.
(2) In accordance with Item 201(d) of Regulation S-K, the figure in this column represents the total number of shares of our common stock remaining available for issuance under the Plan as of December 31, 2019, minus the awards reported in column (a), above. Note, pursuant to the terms of the Plan, the pool of shares available for grant thereunder is not actually reduced until an award is settled in shares of our common stock (as opposed to reducing the pool at the time of grant). At December 31, 2019, 12,623,361 shares were issued and outstanding relating to PSUs and DSUs and, after application of the fungible factor of 1.55, these outstanding awards would represent a 19,566,210 reduction to the securities remaining available for future issuance under the Plan if such awards were to be equity settled. Consistent with accounting treatment that reflects management's intent to cash settle, these amounts are not included in the above table as a reduction in the securities remaining available for future issuance. Pursuant to the provisions of the Plan, the number of securities remaining available for issuance is reduced by the aggregate balance of (i) stock options exercised and outstanding at a fungible factor of 1.0 shares and (ii) unit based awards at a fungible factor of 1.55 shares for each share of our common stock issued pursuant to any equity settled awards granted under the Plan. Accordingly, the number of shares available for future awards under the Plan may be different than the amount shown in this column.
The only equity compensation plan approved by our stockholders is our 2007 Equity Incentive Plan, which is an amendment and restatement of our 2005 Equity Plan.
Item 13. Certain Relationships and Related Transactions, and Director Independence
The information required regarding related transactions is incorporated herein by reference from the information contained in the section entitled “Certain Relationships and Related Transactions” and, with respect to director independence, the section entitled “Proposal 1 - Election of Directors”, in our Proxy Statement.
Item 14. Principal Accounting Fees and Services
The information required is incorporated herein by reference from the information contained in the sections entitled “Principal Accountant Fees and Services” and “Pre-Approval Policies and Procedures” in the proposal entitled “Ratification of Selection of Independent Auditors” in our Proxy Statement.
PART IV
Item 15. Exhibits, Financial Statement Schedules
(a) The following documents are filed as part of this Annual Report on Form 10-K:
87
(1) Financial Statements
(2) Financial Statement Schedules
None.
(3) Exhibits
Exhibit No. | Description | Reference | |
2.2 | Incorporated by reference to Exhibit 2.1 to the Current Report on Form 8-K, filed with the SEC on November 4, 2016 (SEC File No. 001-34018). | ||
3.1 | Incorporated by reference to Exhibit 3.3 to the Current Report on Form 8-K, filed with the SEC on November 4, 2016 (SEC File No. 001-34018). | ||
3.2 | Incorporated by reference to Exhibit 3.4 to the Current Report on Form 8-K, filed with the SEC on November 4, 2016 (SEC File No. 001-34018). | ||
3.3 | Incorporated by reference to Exhibit 3.1 to the Current Report on Form 8-K, filed with the SEC on July 9, 2018 (SEC File No. 001-34018). | ||
4.1 | Incorporated by reference to Exhibit 4.1 to the Current Report on Form 8-K, filed with the SEC on April 6, 2016 (SEC File No. 001-34018). | ||
4.2 | Incorporated by reference in Exhibit A to Exhibit 4.1 to the Current Report on Form 8-K, filed with the SEC on April 6, 2016 (SEC File No. 001-34018). | ||
4.3 | Incorporated by reference to Exhibit 4.1 to the Current Report on Form 8-K, filed with the SEC on July 14, 2016 (SEC File No. 001-34018). | ||
4.4 | Incorporated by reference to Exhibit 4.2 to the Current Report on Form 8-K, filed with the SEC on July 14, 2016 (SEC File No. 001-34018). | ||
4.5 | Incorporated by reference to Exhibit 4.1 to the Current Report on Form 8-K filed with the SEC on February 16, 2018 (SEC File No. 001-34018). | ||
88
4.6 | Incorporated by reference to Exhibit 10.3 to the Quarterly Report on Form 10-Q, filed with the SEC on August 8, 2019 (SEC File No. 001-34018). | ||
4.7 | Incorporated by reference to Exhibit 4.2 to the Current Report on Form 8-K filed with the SEC on February 16, 2018 (SEC File No. 001-34018). | ||
4.8 | Incorporated by reference to Exhibit 4.1 to the Current Report on Form 8-K filed with the SEC on May 23, 2019 (SEC File No. 001-34018). | ||
4.9 | Incorporated by reference to Exhibit 10.4 to the Quarterly Report on Form 10-Q, filed with the SEC on August 8, 2019 (SEC File No. 001-34018). | ||
4.10 | Incorporated by reference to Exhibit 4.2 to the Current Report on Form 8-K filed with the SEC on May 23, 2019 (SEC File No. 001-34018). | ||
4.11 | Filed herewith. | ||
10.1 | Incorporated by reference to Exhibit 2.1 to the Current Report on Form 8-K, filed with the SEC on July 7, 2016 (SEC File No. 001-34018). | ||
10.2 | Incorporated by reference to Exhibit 2.1 to the Current Report on Form 8-K filed with the SEC on July 6, 2017 (SEC File No. 001-34018). | ||
10.3 | Incorporated by reference to Exhibit 2.2 to the Current Report on Form 8-K filed with the SEC on July 6, 2017 (SEC File No. 001-34018). | ||
10.4 | Incorporated by reference to Exhibit 2.3 to the Current Report on Form 8-K filed with the SEC on July 6, 2017 (SEC File No. 001-34018) | ||
10.5 | Incorporated by reference to Exhibit 2.4 to the Current Report on Form 8-K filed with the SEC on July 6, 2017 (SEC File No. 001-34018). | ||
10.6 | Incorporated by reference to Exhibit 10.2 to the Quarterly Report on Form 10-Q filed with the SEC on November 2, 2017 (SEC File No. 001-34018). | ||
89
10.7 | Incorporated by reference to Exhibit 10.10 to the Annual Report on Form 10-K filed with the SEC on February 27, 2018 (SEC File No. 001-34018). | ||
10.8 | Incorporated by reference to Exhibit 10.11 to the Annual Report on Form 10-K filed with the SEC on February 27, 2018 (SEC File No. 001-34018). | ||
10.9 | Incorporated by reference to Exhibit 10.12 to the Annual Report on Form 10-K filed with the SEC on February 27, 2018 (SEC File No. 001-34018). | ||
10.10 | Incorporated by reference to Exhibit 10.6 to the Quarterly Report on Form 10-Q filed with the SEC on August 7, 2012 (SEC File No. 001-34018). | ||
10.11 | Incorporated by reference to Exhibit 10.1 to the Quarterly Report on Form 10-Q filed with the SEC on August 7, 2013 (SEC File No. 001-34018). | ||
10.12 | Incorporated by reference to Exhibit 10.2 to the Quarterly Report on Form 10-Q filed with the SEC on August 7, 2013 (SEC File No. 001-34018). | ||
10.13 | Incorporated by reference to Exhibit 3.5 to the Current Report on Form 8-K filed with the SEC on November 4, 2016 (SEC File No. 001-34018). | ||
10.14 | Incorporated by reference to Exhibit 10.29 to the Annual Report on Form 10-K, filed with the SEC on February 29, 2016 (SEC File No. 001-34018). | ||
10.15 | Incorporated by reference to Exhibit 10.30 to the Annual Report on Form 10-K, filed with the SEC on February 29, 2016 (SEC File No. 001-34018). | ||
10.16 | Incorporated by reference to Exhibit 10.2 to the Quarterly Report on Form 10-Q, filed with the SEC on November 4, 2015 (SEC File No. 001-34018). | ||
10.17 | Incorporated by reference to Exhibit 10.5 to the Quarterly Report on Form 10-Q, filed with the SEC on November 4, 2015 (SEC File No. 001-34018). | ||
10.18 | Incorporated by reference to Exhibit 10.6 to the Quarterly Report on Form 10-Q, filed with the SEC on November 4, 2015 (SEC File No. 001-34018). | ||
10.19 | Incorporated by reference to Exhibit 10.3 to the Quarterly Report on Form 10-Q, filed with the SEC on May 4, 2016 (SEC File No. 001-34018). | ||
10.20 | Incorporated by reference to Exhibit 10.4 to the Quarterly Report on Form 10-Q, filed with the SEC on May 4, 2016 (SEC File No. 001-34018). | ||
10.21 | Incorporated by reference to Exhibit 10.5 to the Quarterly Report on Form 10-Q, filed with the SEC on May 4, 2016 (SEC File No. 001-34018). | ||
90
10.22 | Incorporated by reference to Exhibit 10.1 to the Current Report on Form 8-K, filed with the SEC on September 21, 2015 (SEC File No. 001-34018). | ||
10.23 | Incorporated by reference to Exhibit 10.2 to the Current Report on Form 8-K, filed with the SEC on April 6, 2016 (SEC File No. 001-34018). | ||
10.24 | Incorporated by reference to Exhibit 10.1 to the Current Report on Form 8-K, filed with the SEC on June 3, 2016 (SEC File No. 001-34018). | ||
10.25 | Incorporated by reference to Exhibit 10.42 to the Annual Report on Form 10-K, filed with the SEC on March 1, 2017 (SEC File No. 001-34018). | ||
10.26 | Incorporated by reference to Exhibit 10.43 to the Annual Report on Form 10-K, filed with the SEC on March 1, 2017 (SEC File No. 001-34018). | ||
10.27 | Incorporated by reference to Exhibit 10.1 to the Current Report on Form 8-K, filed with the SEC on February 15, 2017 (SEC File No. 001-34018). | ||
10.28 | Incorporated by reference to Exhibit 10.1 to the Current Report on Form 8-K, filed with the SEC on May 19, 2017 (SEC File No. 001-34018). | ||
10.29 | Incorporated by reference to Exhibit 10.2 to the Quarterly Report on Form 10-Q, filed with the SEC on August 4, 2017 (SEC File No. 001-34018). | ||
10.30 | Incorporated by reference to Exhibit 10.1 to the Current Report on Form 8-K, filed with the SEC on September 21, 2017 (SEC File No. 001-34018). | ||
10.31 | Incorporated by reference to Exhibit 10.1 to the Current Report on Form 8-K, filed with the SEC on November 14, 2017 (SEC File No. 001-34018). | ||
10.32 | Incorporated by reference to Exhibit 10.1 to the Quarterly Report on Form 10-Q, filed with the SEC on August 2, 2018 (SEC File No. 001-34018) | ||
91
10.33 | Incorporated by reference to Exhibit 10.1 to the Current Report on Form 8-K, filed with the SEC on December 21, 2018 (SEC File No. 001-34018) | ||
10.34 | Incorporated by reference to Exhibit 10.1 to the Current Report on Form 8-K, filed with the SEC on May 15, 2019 (SEC File No. 001-34018) | ||
10.35 | Incorporated by reference to Exhibit 10.1 to the Current Report on Form 8-K, filed with the SEC on December 11, 2019 (SEC File No. 001-34018) | ||
10.36 | Incorporated by reference to Exhibit 10.55 to the Quarterly Report on Form 10-Q, filed with the SEC on August 11, 2008 (SEC File No. 001-34018). | ||
10.37 | Incorporated by reference to Exhibit 10.56 to the Quarterly Report on Form 10-Q, filed with the SEC on August 11, 2008 (SEC File No. 001-34018). | ||
10.38 | Incorporated by reference to Exhibit 10.3 to the Quarterly Report on Form 10-Q/A, filed with the SEC on November 19, 2008 (SEC File No. 001-34018). | ||
10.39 | Incorporated by reference to Exhibit 10.1 to the Current Report on Form 8-K, filed with the SEC on January 7, 2009 (SEC File No. 001-34018). | ||
10.40 | Incorporated by reference to Exhibit 10.1 to the Quarterly Report on Form 10-Q filed with the SEC on May 7, 2012 (SEC File No. 001-34018). | ||
10.41 | Incorporated by reference to Exhibit 10.2 to the Quarterly Report on Form 10-Q filed with the SEC on May 7, 2012 (SEC File No. 001-34018). | ||
10.42 | Incorporated by reference to Exhibit 10.9 to the Quarterly Report on Form 10-Q filed with the SEC on May 7, 2012 (SEC File No. 001-34018). | ||
10.43 | Incorporated by reference to Exhibit 10.1 to the Current Report on Form 8-K filed with the SEC on February 25, 2019 (SEC File No. 001-34018). | ||
10.44 | Incorporated by reference to Exhibit 10.2 to the Current Report on Form 8-K filed with the SEC on February 25, 2019 (SEC File No. 001-34018). | ||
10.45 | Incorporated by reference to Exhibit 10.3 to the Current Report on Form 8-K filed with the SEC on February 25, 2019 (SEC File No. 001-34018). | ||
10.46 | Incorporated by reference to Exhibit 10.4 to the Current Report on Form 8-K filed with the SEC on February 25, 2019 (SEC File No. 001-34018). | ||
92
10.47 | Incorporated by reference to Exhibit 10.1 to the Quarterly Report on Form 10-Q filed with the SEC on November 6, 2019 (SEC File No. 001-34018). | ||
21.1 | Filed herewith. | ||
23.1 | Filed herewith. | ||
23.2 | Filed herewith. | ||
23.3 | Filed herewith. | ||
24.1 | Power of Attorney. | See signature page. | |
31.1 | Filed herewith. | ||
31.2 | Filed herewith. | ||
32.1 | Furnished herewith. | ||
99.1 | Filed herewith. | ||
101.INS XBRL Instance Document - the instance document does not appear in the Interactive Data File because its XBRL tags are embedded within the Inline XBRL document
101.SCH Inline XBRL Taxonomy Extension Schema Document
101.CAL Inline XBRL Taxonomy Extension Calculation Linkbase Document
101.DEF Inline XBRL Taxonomy Extension Definition Linkbase Document
101.LAB Inline XBRL Taxonomy Extension Label Linkbase Document
101.PRE Inline XBRL Taxonomy Extension Presentation Linkbase Document
104. Cover Page Interactive Data File - the cover page XBRL tags are embedded within the Inline XBRL document
* Management contract or compensatory plan or arrangement.
Item 16. Form 10-K Summary
None.
93
SIGNATURES
Pursuant to the requirements of Section 13 or 15(d) of the Securities Exchange Act of 1934, the registrant has duly caused this report to be signed on its behalf by the undersigned, thereunto duly authorized.
GRAN TIERRA ENERGY INC.
Date: February 26, 2020 | /s/ Gary S. Guidry | |
By: Gary S. Guidry | ||
President and Chief Executive Officer, Director | ||
(Principal Executive Officer) | ||
Date: February 26, 2020 | /s/ Ryan Ellson | |
By: Ryan Ellson | ||
Chief Financial Officer | ||
(Principal Financial and Accounting Officer) | ||
94
POWER OF ATTORNEY
KNOW ALL PERSONS BY THESE PRESENTS, that each person whose signature appears below constitutes and appoints Gary S. Guidry and Ryan Ellson, and each of them, as his true and lawful attorneys-in-fact and agents, with full power of substitution and resubstitution, for him and in his name, place and stead, in any and all capacities, to sign any and all amendments (including post-effective amendments) to this Annual Report on Form 10-K, and to file the same, with all exhibits thereto, and other documents in connection therewith, with the Securities and Exchange Commission, granting unto said attorneys-in-fact and agents, and each of them, full power and authority to do and perform each and every act and thing requisite and necessary to be done in connection therewith, as fully to all intents and purposes as he might or could do in person, hereby ratifying and confirming all that said attorneys-in-fact and agents, or any of them, or their or his substitute or substitutes, may lawfully do or cause to be done by virtue hereof.
Pursuant to the requirements of the Securities Exchange Act of 1934, this report has been signed below by the following persons on behalf of the registrant and in the capacities and on the dates indicated:
Name | Title | Date | ||
/s/ Gary S. Guidry | President and Chief Executive Officer, Director | February 26, 2020 | ||
Gary S. Guidry | (Principal Executive Officer) | |||
/s/ Ryan Ellson | Chief Financial Officer | February 26, 2020 | ||
Ryan Ellson | (Principal Financial and Accounting Officer) | |||
/s/ Peter Dey | Director | February 26, 2020 | ||
Peter Dey | ||||
/s/ Evan Hazell | Director | February 26, 2020 | ||
Evan Hazell | ||||
/s/ Robert B. Hodgins | Director | February 26, 2020 | ||
Robert B. Hodgins | ||||
/s/ Ronald Royal | Director | February 26, 2020 | ||
Ronald Royal | ||||
/s/ Sondra Scott | Director | February 26, 2020 | ||
Sondra Scott | ||||
/s/ David P. Smith | Director | February 26, 2020 | ||
David P. Smith | ||||
/s/ Brooke Wade | Director | February 26, 2020 | ||
Brooke Wade | ||||
95