ANNUAL REPORT PURSUANT TO SECTION 13 OR 15(d) OF THE SECURITIES EXCHANGE ACT OF 1934 |
TRANSITION REPORT PURSUANT TO SECTION 13 OR 15(d) OF THE SECURITIES EXCHANGE ACT OF 1934 FOR THE TRANSITION PERIOD FROM |
(State or other jurisdiction of incorporation or organization) |
(I.R.S. Employer Identification No.) | |
|
||
(Address of principal executive offices) |
(Zip Code) |
Title of each class |
Trading Symbol(s) |
Name of each exchange on which registered | ||
Large accelerated filer |
☐ |
Accelerated filer |
☐ | |||
Non-accelerated filer |
☒ |
Smaller reporting company |
||||
Emerging growth company |
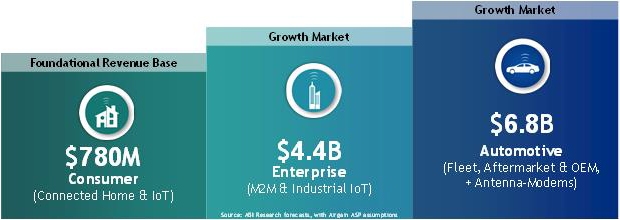
• | Consumer. Wi-Fi Mesh systems and extenders, smart TVs, smart home devices, and set-top boxes. In these applications, our antennas support an array of technologies including WLAN, Wi-Fi, LTE, 5G and LPWAN. These devices facilitate a variety of consumer-oriented applications and services including high-speed wireless internet and wireless video streaming, home automation, smart appliances, home security systems, and smart TV entertainment systems. We estimate that the total addressable market for our antennas in the service provider segment of the consumer market will grow at a compound annual growth rate, or CAGR, of 6%, while the IoT segment will grow at a CAGR of 11% between 2021 and 2024, based on ABI research and our internal estimates of average selling price, or ASP. Furthermore, according to ABI Research, the market for residential gateways, routers and mesh devices shipped worldwide is expected to increase from 229 million device shipments in 2021 to 257 million in 2023. Within the consumer market, the connected home market has seen an explosion of automation services and broadband-connected devices, making the demand for increased bandwidth, high throughput and reliable connectivity more critical than ever before. Between 2021 and 2024, residential Wi-Fi Mesh systems are anticipated to experience some of the highest growth rates within the consumer market, with a CAGR of 16% according to ABI Research. |
• | Enterprise. Wi-Fi systems providers, whereby we often work under a joint development manufacturing (JDM) or ODM model, developing complete external antenna systems, including outdoor enclosure and mounting hardware, to meet demanding technical specifications, often resulting in higher ASP’s when compared to our more traditional embedded antenna business. We estimate that the total addressable market for our antennas in the enterprise market will grow at a CAGR of 13% from 2021 to 2024, based on ABI Research device shipment numbers and our internal estimates of ASP. |
• | Automotive Wi-Fi, 3G, LTE, 5G, and satellite connectivity. The fleet and aftermarket segment of the automotive market consists of applications whereby rugged vehicular wireless routers are paired with external antenna systems to provide connectivity to fixed and mobile assets and includes first responder and public safety vehicle fleets, the targets for our AirgainConnect AC-HPUE antenna-modem. Within the fleet and aftermarket market segment, there has been a rise in the number of antennas per vehicle. This is largely driven by the increasing needs of connectivity across different access technologies that include Wi-Fi, 3G, LTE, 5G, and satellite. We estimate the total addressable market for our antennas (excludes antenna-modems) in the automotive fleet antenna market in North America, will grow at a CAGR of 11% from 2021 and 2024, based on ABI Research device shipment numbers and our internal ASP estimates. |
• | Engineering Review on-board noise and radio interference, as well as identification and housing constraints. We plan to expand awareness of our brand and our offerings throughout the OEM and carrier technical community through participation in industry technical working groups, forums and trade events. |
• | Antenna Selection and Placement |
• | Simulation and Initial Testing |
• | Over-the-Air 802.11-based WLAN devices such as routers, gateways, and set-top boxes. Our benchmark testing provides an accurate assessment of the performance characteristics for devices to enable manufacturers to make informed decisions in selecting the best antenna solution for their needs. This iteration also considers firmware stability, system noise, and interference, as well as antenna performance, to provide a throughput optimized solution. |
• | Final Integration |
• | Validation and Reporting |
• | AirgainConnect. ™ AC-HPUE, the first antenna-modem from our break-through AirgainConnect platform. AirgainConnect AC-HPUE includes an integrated FirstNet Ready™ high-power LTE modem supporting the 3GPP Band 14 High Power UE output power functionality. Band 14 spectrum is the nationwide, high-quality spectrum set aside by the U.S. government specifically for FirstNet. This rugged vehicle antenna-modem solution tightly couples essential LTE radio components to meet the most demanding needs of public safety and fleet vehicles. By integrating an HPUE modem within an antenna assembly, AC-HPUE ensures transmission of the maximum allowable radiated power directly to the LTE antenna elements. Our patented technology supporting the AirgainConnect platform eliminates the signal loss over coax cables that run from mobile routers mounted in vehicle compartments to roof-mounted antennas, which combined with HPUE capability provides up to ten times the transmit power at the antenna when compared to the router’s conventional modem and antenna. The result is a dramatic increase in the coverage area and higher data rates. |
• | Custom Embedded Antenna Solutions. |
• | MaxBeam TM Embedded Antennas |
• | Profile Embedded Antennas |
• | Profile Contour Embedded Antennas two-dimensional shapes making them ideal for integration within curved enclosures and wearable devices. |
• | Ultra Embedded Antennas |
• | SmartMax TM Embedded Antennas. Wi-Fi systems. |
• | MaxBeam Carrier Class Antennas |
• | Antenna Plus Antennas. Wi-Fi 6, Bluetooth, Intelligent Transport Systems, or ITS, and GPS/GNSS. Designed for all environments, our broad range of highly integrated and multi-band products support a variety of applications from kiosk and ATM connectivity to government and public safety vehicular applications. We have over 26 years of experience designing mission critical automotive fleet and mobile antenna applications. As the original inventor of the low-profile cellular antenna, we are known for our market leading performance, quality, and long product life. Our antennas build on the best-in-class |
• | Transition to systems solutions. |
• | Innovate into new products and markets. |
• | Expand our customer base within our core markets. end-customers. Although the customers that pay for our products are often ODMs and distributors, it is primarily the OEMs, carriers, and retail-focused end-customers that drive the selection of our solutions. |
• | Increase our sales to existing customers. |
• | Focus on system performance and products with long lifecycles re-certification of products. This is especially valuable in the service provider market, where product generations generally ship for two to three years before displacement by next-generation devices. |
• | Acquire complementary technologies, assets and companies. |
• | OEM. Wi-Fi access points and repeaters, set-top boxes, video gateways, and other wireless equipment found in homes, schools, businesses, and networks. Typically, these customers work with us to help overcome a specific performance issue, or to improve product performance against internal or external benchmarks. OEMs are also often mandated or encouraged by service providers to select us. |
• | ODM. |
• | Chipset Vendors. time-to-market |
• | Service Providers. |
• | Value Added Reseller (VARs) and Distributors. |
• | Direct Competitors. |
• | In-house Antenna Design and Engineering Teams. |
• | Third-Party Custom Design and Engineering Companies. |
• | Automotive Modem Companies. |
• | Price and total cost of ownership as a result of reliability and performance issues; |
• | Brand awareness and reputation; |
• | Antenna and antenna-modem performance, such as reliability, range, throughput; |
• | Ability to integrate with other technology infrastructures; |
• | Offerings across breadth of in-home wireless products; |
• | Antenna design and testing capabilities; |
• | Lead-time, and flexibility to rapidly customize solutions to individual customer requirements; |
• | Relationships with semiconductor/chipset vendors; and |
• | Intellectual property portfolio. |
• | Methods of determining which antenna pattern to use; |
• | Antenna pattern selection with multiple stations connected to access point; |
• | Dynamically selected antennas for MIMO systems; and |
• | Hardware implementations of switched directional antennas; |
• | Large assortment of antenna designs; |
• | Antenna assemblies and systems for vehicles; and |
• | Compact embedded wireless modems and environmental monitoring assemblies. |
• | The market for our antenna products is developing and may not develop as we expect; |
• | Our operating results may fluctuate significantly, which makes our future operating results difficult to predict and could cause our operating results to fall below expectations or our guidance; |
• | Our products are subject to intense competition, including competition from the customers to whom we sell, and competitive pressures from existing and new companies may harm our business, sales, growth rates and market share; |
• | Our future success depends on our ability to develop and successfully introduce new and enhanced products for the wireless market that meet the needs of our customers; |
• | Our business is characterized by short product development windows and short product lifecycles; |
• | Any delays in our sales cycles could result in customers canceling purchases of our products; |
• | We have a history of losses, including an accumulated deficit of $47.3 million at December 31, 2020, and we may not be profitable in the future; |
• | We sell to customers who are extremely price conscious, and a few customers represent a significant portion of our sales. If we lose any of these customers, our sales could decrease significantly; |
• | We rely on a few contract manufacturers to produce and ship all of our products, a single or limited number of suppliers for some components of our products and channel partners to sell and support our products, and the failure to manage our relationships with these parties successfully could adversely affect our ability to market and sell our products; |
• | If we cannot protect our intellectual property rights, our competitive position could be harmed or we could incur significant expenses to enforce our rights; and |
• | Our international sales and operations subject us to additional risks that can adversely affect our operating results and financial condition. |
• | fluctuations in demand for our products and services; |
• | the inherent complexity, length and associated unpredictability of product development windows and product lifecycles; |
• | the timing and extent of investment in our targeted growth markets and the timing and amount of sales in such markets; |
• | changes in customers’ budgets for technology purchases and delays in their purchasing cycles; |
• | seasonal fluctuations around local holidays in China affecting how customers make purchasing decisions; |
• | delays or difficulties in the integration of the NimbeLink acquisition; |
• | changing market conditions; |
• | any significant changes in the competitive dynamics of our markets, including new entrants, or further consolidation; the timing of product releases or upgrades by us or by our competitors; |
• | our ability to develop, introduce and ship in a timely manner new products and product enhancements and anticipate future market demands that meet our customers’ requirements; |
• | public health crises such as the COVID-19 pandemic; and |
• | increasing uncertainty of international relations and tariffs. |
• | our OEM customers and carriers usually complete a lengthy technical evaluation of our products, over which we have no control, before placing a purchase order; |
• | the commercial introduction of our products by OEM customers and carriers is typically limited during the initial release to evaluate product performance; |
• | the development and commercial introduction of products incorporating new technologies frequently are delayed; and |
• | certain customers of advanced antenna systems and integrated wireless solutions require successful field trials before committing to purchase our solutions, which could delay the customer decision making process. |
• | qualify appropriate component suppliers; |
• | manage capacity during periods of high demand; |
• | meet delivery schedules; |
• | assure the quality of our products; |
• | ensure adequate supplies of materials; |
• | protect our intellectual property; and |
• | deliver finished products at agreed-upon prices. |
• | labor strikes or shortages; |
• | financial problems of either contract manufacturers or component suppliers; |
• | reservation of manufacturing capacity at our contract manufactures by other companies, inside or outside of our industry; |
• | changes or uncertainty in tariffs, economic sanctions, and other trade barriers or political unrest in regions where manufacturers are located, such as recent developments in Myanmar; and |
• | industry consolidation occurring within one or more component supplier markets, such as the semiconductor market. |
• | price and volume fluctuations in the overall stock market from time to time; |
• | volatility in the market prices and trading volumes of technology stocks; |
• | changes in operating performance and stock market valuations of other technology companies generally, or those in our industry in particular; |
• | sales of shares of our common stock by us or our stockholders; |
• | failure of financial analysts to maintain coverage of us, changes in financial estimates by any analysts who follow our company, or our failure to meet these estimates or the expectations of investors; |
• | the financial projections we may provide to the public, any changes in those projections or our failure to meet those projections; |
• | announcements by us or our competitors of new products or new or terminated significant contracts, commercial relationships or capital commitments; |
• | the development and sustainability of an active trading market for our common stock; |
• | the public’s reaction to our press releases, other public announcements and filings with the SEC; |
• | rumors and market speculation involving us or other companies in our industry; |
• | actual or anticipated changes in our operating results or fluctuations in our operating results; |
• | actual or anticipated developments in our business or our competitors’ businesses or the competitive landscape generally; |
• | litigation involving us, our industry or both or investigations by regulators into our operations or those of our competitors; |
• | developments or disputes concerning our intellectual property or other proprietary rights; |
• | announced or completed acquisitions of businesses or technologies by us or our competitors; |
• | new laws or regulations or new interpretations of existing laws or regulations applicable to our business; |
• | changes in accounting standards, policies, guidelines, interpretations or principles; |
• | any major change in our management; |
• | general economic conditions and slow or negative growth of our markets; and |
• | other events or factors, including those resulting from war, incidents of terrorism or responses to these events. |
• | authorize our board of directors to issue, without further action by the stockholders, up to 10,000,000 shares of undesignated preferred stock and up to 200,000,000 shares of authorized common stock; |
• | require that any action to be taken by our stockholders be effected at a duly called annual or special meeting and not by written consent; |
• | specify that special meetings of our stockholders can be called only by our board of directors, the Chairman, the Chief Executive Officer or the President; |
• | establish an advance notice procedure for stockholder approvals to be brought before an annual meeting of our stockholders, including proposed nominations of persons for election to our board of directors; |
• | establish that our board of directors is divided into three classes, Class I, Class II and Class III, with each class serving staggered terms; |
• | provide that our directors may be removed only for cause; and |
• | provide that vacancies on our board of directors may, except as otherwise required by law, be filled only by a majority of directors then in office, even if less than a quorum. |
• | exemption from the auditor attestation requirements under Section 404 of the Sarbanes-Oxley Act; |
• | reduced disclosure obligations regarding executive compensation in our periodic reports and proxy statements; |
• | exemption from the requirements of holding non-binding stockholder votes on executive compensation arrangements; and |
• | exemption from any rules requiring mandatory audit firm rotation and auditor discussion and analysis and, unless the SEC otherwise determines, any future audit rules that may be adopted by the Public Company Accounting Oversight Board. |
• | Sales decreased by 13% in 2020 compared to 2019. The decrease in sales was primarily driven by the impacts from COVID-19 and a product cycle transition for several large volume embedded antenna products. |
• | Gross profit as a percentage of sales increased to 46.6% in 2020 compared to 45.4% in 2019. The increase in gross profit as a percentage of sales was largely due to product cost reductions for the year ended December 31, 2020. |
• | Income from operations decreased by $3.6 million in 2020 compared to 2019. This decrease was primarily due to an increase of $0.8 million in operating expenses along with a $2.7 million decrease in gross profit due to lower sales volumes. |
• | Our effective tax rate was (9.0)% in 2020 compared to 15.0% in 2019. |
• | We ended 2020 with cash, cash equivalents totaling $38.2 million. |
For the year ended December 31, |
||||||||
2020 |
2019 |
|||||||
(calculated as a percentage of associated sales) |
||||||||
Statement of Operations Data: |
||||||||
Sales |
100.0 | % | 100.0 | % | ||||
Cost of goods sold |
53.4 | 54.6 | ||||||
|
|
|
|
|||||
Gross profit |
46.6 | 45.4 | ||||||
Operating expenses: |
||||||||
Research and development |
18.9 | 16.1 | ||||||
Sales and marketing |
12.3 | 12.6 | ||||||
General and administrative |
21.9 | 16.0 | ||||||
|
|
|
|
|||||
Total operating expenses |
53.1 | 44.7 | ||||||
|
|
|
|
|||||
Income (loss) from operations |
(6.5 | ) | 0.7 | |||||
Other income |
(0.4 | ) | (1.3 | ) | ||||
|
|
|
|
|||||
Income (loss) before income taxes |
(6.1 | ) | 2.0 | |||||
Provision for income taxes |
0.6 | 0.3 | ||||||
|
|
|
|
|||||
Net income (loss) |
(6.7 | )% | 1.7 | % | ||||
|
|
|
|
For the year ended December 31, |
||||||||||||||||
2020 |
2019 |
Increase / (Decrease) |
% Change |
|||||||||||||
Sales |
$ | 48,502 | $ | 55,739 | $ | (7,237 | ) | (13.0 | )% |
For the year ended December 31, |
||||||||||||||||
2020 |
2019 |
Increase / (Decrease) |
% Change |
|||||||||||||
Cost of goods sold |
$ | 25,917 | $ | 30,415 | $ | (4,498 | ) | (14.8 | )% |
For the year ended December 31, |
||||||||||||||||
2020 |
2019 |
Increase / (Decrease) |
% Change |
|||||||||||||
Gross profit |
$ | 22,585 | $ | 25,324 | $ | (2,739 | ) | (10.8 | )% | |||||||
Gross profit (percentage of sales) |
46.6 | % | 45.4 | % | 1.2 | % |
For the year ended December 31, |
||||||||||||||||
2020 |
2019 |
Increase / (Decrease) |
% Change |
|||||||||||||
Operating Expenses |
||||||||||||||||
Research and development |
$ | 9,157 | $ | 8,989 | $ | 168 | 1.9 | % | ||||||||
Sales and marketing |
5,976 | 7,036 | (1,060 | ) | (15.1 | )% | ||||||||||
General and administrative |
10,636 | 8,919 | 1,717 | 19.3 | % | |||||||||||
|
|
|
|
|
|
|
|
|||||||||
Total |
$ | 25,769 | $ | 24,944 | $ | 825 | 3.3 | % | ||||||||
|
|
|
|
|
|
|
|
For the year ended December 31, |
||||||||||||||||
2020 |
2019 |
(Increase) / Decrease |
% Change |
|||||||||||||
Other expense (income): |
||||||||||||||||
Interest income, net |
$ | (197 | ) | $ | (709 | ) | $ | 512 | (72.2 | )% | ||||||
Other expense |
19 | — | 19 | — | ||||||||||||
|
|
|
|
|
|
|
|
|||||||||
Total |
$ | (178 | ) | $ | (709 | ) | $ | 531 | (74.9 | )% | ||||||
|
|
|
|
|
|
|
|
For the year ended December 31 |
||||||||
2020 |
2019 |
|||||||
Net cash provided by operating activities |
$ | 3,704 | $ | 2,368 | ||||
Net cash provided by (used in) investing activities |
20,886 | (2,400 | ) | |||||
Net cash used in financing activities |
561 | (392 | ) | |||||
|
|
|
|
|||||
Net increase (decrease) in cash, cash equivalents, and restricted cash |
$ | 25,151 | $ | (424 | ) | |||
|
|
|
|
Payments due by period |
||||||||||||||||||||
Total |
Less than 1 year |
1-3 years |
3-5 years |
More than 5 years |
||||||||||||||||
Office operating leases |
$ | 3,722 | $ | 992 | $ | 2,115 | $ | 615 | $ | — |
• | Fair value of our common stock. |
• | Expected term. |
• | Expected volatility. |
• | Risk-free interest rate. |
• | Expected dividend. |
1. |
Financial Statements. |
2. |
Financial Statement Schedules. |
3. |
Exhibits |
Page | ||||
F-2 | ||||
F-3 | ||||
F-4 | ||||
F-5 | ||||
F-6 | ||||
F-7 | ||||
F-8 |
December 31, |
||||||||
2020 |
2019 |
|||||||
Assets |
||||||||
Current assets: |
||||||||
Cash and cash equivalents |
$ | $ | ||||||
Short-term investments |
— | |||||||
Trade accounts receivable |
||||||||
Inventory |
||||||||
Prepaid expenses and other current assets |
||||||||
|
|
|
|
|||||
Total current assets |
||||||||
Property and equipment, net |
||||||||
Goodwill |
||||||||
Customer relationships, net |
||||||||
Intangible assets, net |
||||||||
Other assets |
||||||||
|
|
|
|
|||||
Total assets |
$ | $ | ||||||
|
|
|
|
|||||
Liabilities and stockholders’ equity |
||||||||
Current liabilities: |
||||||||
Accounts payable |
$ | $ | ||||||
Accrued compensation |
||||||||
Accrued liabilities and other |
||||||||
Current portion of deferred rent obligation under operating lease |
||||||||
|
|
|
|
|||||
Total current liabilities |
||||||||
Deferred tax liability |
||||||||
Deferred rent obligation under operating lease |
||||||||
|
|
|
|
|||||
Total liabilities |
||||||||
|
|
|
|
|||||
Commitments and contingencies (note 11 ) |
||||||||
Stockholders’ equity: |
||||||||
Common stock and additional paid-in capital, par value $ |
||||||||
Treasury stock, at cost; |
( |
) | ( |
) | ||||
Accumulated other comprehensive income |
— | |||||||
Accumulated deficit |
( |
) | ( |
) | ||||
|
|
|
|
|||||
Total stockholders’ equity |
||||||||
|
|
|
|
|||||
Total liabilities and stockholders’ equity |
$ | $ | ||||||
|
|
|
|
For the year ended December 31, |
||||||||
2020 |
2019 |
|||||||
Sales |
$ | $ | ||||||
Cost of goods sold |
||||||||
Gross profit |
||||||||
Operating expenses: |
||||||||
Research and development |
||||||||
Sales and marketing |
||||||||
General and administrative |
||||||||
Total operating expenses |
||||||||
Income (loss) from operations |
( |
) | ||||||
Other (income) expense: |
||||||||
Interest income net |
( |
) | ( |
) | ||||
Other expense |
— | |||||||
Total other income |
( |
) | ( |
) | ||||
Income (loss) before income taxes |
( |
) | ||||||
Provision for income taxes |
||||||||
Net income (loss) |
$ | ( |
) | $ | ||||
Net income (loss) per share: |
||||||||
Basic |
$ | ( |
) | $ | ||||
Diluted |
$ | ( |
) | $ | ||||
Weighted average shares used in calculating income (loss) per share |
||||||||
Basic |
||||||||
Diluted |
For the year ended December 31, |
||||||||
2020 |
2019 |
|||||||
Net income (loss) |
$ | ( |
) | $ | ||||
Unrealized gain (loss) on available-for-sale |
( |
) | ||||||
|
|
|
|
|||||
Total comprehensive income (loss) |
$ | ( |
) | $ | ||||
|
|
|
|
For the year ended December 31, |
||||||||
2020 |
2019 |
|||||||
Total stockholders’ equity, beginning balance |
$ | $ | ||||||
|
|
|
|
|||||
Common stock and additional paid-in capital: |
||||||||
Balance at beginning of period |
||||||||
Stock-based compensation |
||||||||
Issuance of shares for stock purchase plans |
||||||||
|
|
|
|
|||||
Balance at end of period |
||||||||
|
|
|
|
|||||
Treasury stock: |
||||||||
Balance at beginning of period |
( |
) | ( |
) | ||||
Repurchases of common stock |
( |
) | ( |
) | ||||
|
|
|
|
|||||
Balance at end of period |
( |
) | ( |
) | ||||
|
|
|
|
|||||
Accumulated other comprehensive income (loss): |
||||||||
Balance at beginning of period |
( |
) | ||||||
Unrealized gain (loss) on available-for-sale |
( |
) | ||||||
|
|
|
|
|||||
Balance at end of period |
— | |||||||
|
|
|
|
|||||
Accumulated deficit: |
||||||||
Balance at beginning of period |
( |
) | ( |
) | ||||
Net income (loss) |
( |
) | ||||||
|
|
|
|
|||||
Balance at end of period |
( |
) | ( |
) | ||||
|
|
|
|
|||||
Total stockholders’ equity, ending balance |
$ | $ | ||||||
|
|
|
|
For the year ended December 31, |
||||||||
2020 |
2019 |
|||||||
Cash flows from operating activities: |
||||||||
Net income (loss) |
$ | ( |
) | $ | ||||
Adjustments to reconcile net income (loss) to net cash provided by operating activities: |
||||||||
Depreciation |
||||||||
Loss on disposal of property and equipment |
— | |||||||
Amortization of intangibles |
||||||||
Amortization of (discounts) premium on investments, net |
( |
) | ||||||
Stock-based compensation |
||||||||
Deferred tax liability |
||||||||
Changes in operating assets and liabilities: |
||||||||
Trade accounts receivable |
( |
) | ||||||
Inventory |
||||||||
Prepaid expenses and other assets |
( |
) | ( |
) | ||||
Accounts payable |
( |
) | ( |
) | ||||
Accrued compensation |
( |
) | ||||||
Accrued liabilities and other |
||||||||
Deferred obligation under operating lease |
( |
) | ||||||
|
|
|
|
|||||
Net cash provided by operating activities |
||||||||
|
|
|
|
|||||
Cash flows from investing activities: |
||||||||
Purchases of available-for-sale |
( |
) | ( |
) | ||||
Maturities of available-for-sale |
||||||||
Purchases of property and equipment |
( |
) | ( |
) | ||||
|
|
|
|
|||||
Net cash provided by (used in) investing activities |
( |
) | ||||||
|
|
|
|
|||||
Cash flows from financing activities: |
||||||||
Repurchase of common stock |
( |
) | ( |
) | ||||
Proceeds from issuance of common stock |
||||||||
|
|
|
|
|||||
Net cash provided by (used in) financing activities |
( |
) | ||||||
|
|
|
|
|||||
Net increase (decrease) in cash, cash equivalents, and restricted cash |
( |
) | ||||||
Cash, cash equivalents, and restricted cash; beginning of period |
||||||||
|
|
|
|
|||||
Cash, cash equivalents, and restricted cash; end of period |
$ | $ | ||||||
|
|
|
|
|||||
Supplemental disclosure of cash flow information |
||||||||
Interest paid |
$ | — | $ | |||||
Taxes paid |
$ | $ | ||||||
Supplemental disclosure of non-cash investing and financing activities: |
||||||||
Accrual of property and equipment |
$ | $ | ||||||
Cash and cash equivalents |
$ | $ | ||||||
Restricted cash included in other assets |
— | |||||||
|
|
|
|
|||||
Total cash, cash equivalents, and restricted cash |
$ | $ | ||||||
|
|
|
|
(1) |
Significant Accounting Policies |
• |
Fair value of our common stock |
• |
Expected term |
• |
Expected volatility |
• |
Risk-free interest rate |
• |
Expected dividend |
• | Level 1: Quoted prices in active markets for identical assets or liabilities. |
• | Level 2: Quoted prices for similar assets or liabilities in active markets; quoted prices for identical or similar instruments in markets that are not active; and model-derived valuations in which all significant inputs are observable in active markets. |
• | Level 3: Valuations derived from valuation techniques in which one or more significant inputs are unobservable in active markets. |
For the year ended December 31, |
||||||||
2020 |
2019 |
|||||||
Numerator: |
||||||||
Net income (loss) |
$ | ( |
) | $ | ||||
|
|
|
|
|||||
Denominator: |
||||||||
Weighted average common shares outstanding |
||||||||
Basic |
||||||||
Diluted |
||||||||
Net income (loss) per share: |
||||||||
Basic |
$ | ( |
) | $ | ||||
Diluted |
$ | ( |
) | $ |
For the year ended December 31, |
||||||||
2020 |
2019 |
|||||||
Stock options and restricted stock units |
||||||||
Warrants outstanding |
— | |||||||
Total |
$ | $ |
(2) |
Cash, Cash Equivalents and Short-Term Investments |
2020 |
||||||||||||||||||||||||
Amortized Cost |
Gross Unrealized Gains |
Gross Unrealized Losses |
Estimated Fair Value |
Cash and Cash Equivalents |
Short-Term Investments |
|||||||||||||||||||
Cash |
$ | $ | — | $ | — | $ | $ | $ | — | |||||||||||||||
Level 1 (1) : |
||||||||||||||||||||||||
Money market funds |
— | — | — | |||||||||||||||||||||
Total |
$ | $ | — | $ | — | $ | $ | $ | — | |||||||||||||||
2019 |
||||||||||||||||||||||||
Amortized Cost |
Gross Unrealized Gains |
Gross Unrealized Losses |
Estimated Fair Value |
Cash and Cash Equivalents |
Short-Term Investments |
|||||||||||||||||||
Cash |
$ | $ | — | $ | — | $ | $ | $ | — | |||||||||||||||
Level 1 (1) : |
||||||||||||||||||||||||
Money market funds |
— | — | — | |||||||||||||||||||||
U.S. treasury securities |
( |
) | — | |||||||||||||||||||||
Subtotal |
( |
) | ||||||||||||||||||||||
Level 2 (2) : |
||||||||||||||||||||||||
Commercial paper |
— | — | ||||||||||||||||||||||
Corporate debt obligations |
( |
) | — | |||||||||||||||||||||
Repurchase agreements |
— | — | — | |||||||||||||||||||||
Asset-backed securities |
— | — | ||||||||||||||||||||||
Subtotal |
( |
) | ||||||||||||||||||||||
Total |
$ | $ | $ | ( |
) | $ | $ | $ | ||||||||||||||||
(1) | Level 1 fair value estimates are based on quoted prices in active markets for identical assets or liabilities. |
(2) | Level 2 fair value estimates are based on observable inputs other than quoted prices in active markets for identical assets and liabilities, quoted prices for identical or similar assets or liabilities in inactive markets, or other inputs that are observable or can be corroborated by observable market data for substantially the full term of the assets or liabilities. |
Description of securities |
Estimated fair value |
Unrealized losses |
||||||
U.S. treasury securities |
$ | $ | ( |
) | ||||
Corporate debt obligations |
( |
) | ||||||
Asset-backed securities |
||||||||
Total |
$ | $ | ( |
) | ||||
(3) |
Property and Equipment |
2020 |
2019 |
|||||||
Computers and software |
$ | $ | ||||||
Furniture, fixtures, and equipment |
||||||||
Manufacturing and testing equipment |
||||||||
Construction in process |
||||||||
Leasehold improvements |
||||||||
Less accumulated depreciation |
( |
) | ( |
) | ||||
$ | $ | |||||||
(4) |
Goodwill and Intangible Assets |
2020 |
Weighted average amortization period (years) |
Gross carrying amount |
Accumulated amortization |
Intangibles, net |
||||||||||||
Customer relationships |
$ | $ | $ | |||||||||||||
Developed technologies |
$ | |||||||||||||||
Tradename |
$ | — | ||||||||||||||
Total |
$ | $ | $ | |||||||||||||
2019 |
||||||||||||||||
Customer relationships |
$ | $ | $ | |||||||||||||
Developed technologies |
||||||||||||||||
Tradename |
||||||||||||||||
Total |
$ | $ | $ | |||||||||||||
Estimated future amortization |
||||
2021 |
$ | |||
2022 |
||||
2023 |
||||
2024 |
||||
2025 |
||||
Thereafter |
||||
Total |
$ | |||
(5) |
Accrued Liabilities and Other |
2020 |
2019 |
|||||||
Accrued expenses |
$ | $ | ||||||
VAT Payable |
— |
|||||||
Accrued income taxes |
||||||||
Other current liabilities |
||||||||
Total |
$ | $ | ||||||
(6) |
Long-term Note Payable and Line of Credit |
( 7 ) |
Treasury Stock |
( 8 ) |
Income Taxes |
(a) |
Income Taxes |
2020 |
2019 |
|||||||
Current: |
||||||||
U.S. federal |
$ | $ | ||||||
State and local |
( |
) | ||||||
Foreign |
||||||||
Total current provision |
||||||||
Deferred: |
||||||||
U.S. federal |
||||||||
State and local |
( |
) | ||||||
Total deferred provision |
||||||||
Total tax provision |
$ | $ | ||||||
(b) |
Tax Rate Reconciliation |
2020 |
2019 |
|||||||
Income taxes at statutory rates |
$ | ( |
) | $ | ||||
State income tax, net of federal benefit |
( |
) | ||||||
Permanent items |
( |
) | ( |
) | ||||
Meals and entertainment |
||||||||
Equity based compensation |
( |
) | ||||||
Research and development credit |
( |
) | ( |
) | ||||
Federal return to provision |
( |
) | ||||||
Foreign taxes |
|
|
|
|
|
|
|
|
Other |
— | |||||||
Change in federal valuation allowance |
( |
) | ||||||
|
|
|
|
|||||
$ | $ | |||||||
|
|
|
|
(c) |
Significant Components of Current and Deferred Taxes |
2020 |
2019 |
|||||||
Deferred tax assets: |
||||||||
Net operating loss carryforward s |
$ | $ | ||||||
Research and AMT credits |
||||||||
Stock based compensation |
||||||||
Accrued and other |
||||||||
|
|
|
|
|||||
Less valuation allowance |
( |
) | ( |
) | ||||
|
|
|
|
|||||
Deferred tax assets, net of allowance |
||||||||
|
|
|
|
|||||
Deferred tax liabilities: |
||||||||
Fixed assets |
( |
) | ( |
) | ||||
Goodwill |
( |
) | ( |
) | ||||
|
|
|
|
|||||
Deferred tax liabilities |
( |
) | ( |
) | ||||
|
|
|
|
|||||
Total deferred tax liabilities |
$ | ( |
) | $ | ( |
) | ||
|
|
|
|
2020 |
2019 |
|||||||
Beginning unrecognized tax benefits |
$ | $ | ||||||
Decreases related to prior year tax positions |
( |
) | ||||||
Increases related to current year tax positions |
||||||||
|
|
|
|
|||||
Ending unrecognized tax benefits |
$ | $ | ||||||
|
|
|
|
( 9 ) |
Stockholders’ Equity |
2020 |
2019 |
|||||||
Warrants issued and outstanding |
||||||||
Stock option awards issued and outstanding |
||||||||
Authorized for grants under the 2016 Equity Incentive Plan |
(2) |
|||||||
Authorized for grants under the 2016 Employee Stock Purchase Plan |
(3) |
|||||||
|
|
|
|
|||||
|
|
|
|
(1) |
Treasury stock in the amount of |
(2) |
On January 1, 2020, the number of authorized shares in the 2016 Equity Incentive Plan increased by |
(3) |
On January 1, 2020, the number of authorized shares in the 2016 Employee Stock Purchase Plan increased by |
(10) |
Stock Based Compensation |
As of December 31, |
||||||||
2020 |
2019 |
|||||||
Valuation assumptions: |
||||||||
Expected dividend yield |
% | % | ||||||
Expected volatility |
% | % | ||||||
Expected term (years) |
||||||||
Risk-free interest rate |
% | % |
Number of shares |
Weighted average exercise price |
Weighted average remaining contractual term (years) |
||||||||||
Balance at December 31, 2019 |
$ | |||||||||||
Granted |
||||||||||||
Exercised |
( |
) | ||||||||||
Expired/Forfeited |
( |
) | ||||||||||
Balance at December 31, 2020 |
||||||||||||
Vested and exercisable at December 31, 2020 |
$ | |||||||||||
Vested and expected to vest at December 31, 2020 |
$ |
Restricted stock units |
Weighted average grant date fair value |
|||||||
Balance at December 31, 2019 |
$ | |||||||
Grants |
||||||||
Vested |
( |
) | ||||||
Balance at December 31, 2020 |
||||||||
(c) |
Employee Stock Purchase Plan (ESPP) |
(d) |
Stock-based compensation expense |
For the year ended December 31, |
||||||||
2020 |
2019 |
|||||||
Cost of goods sold |
$ |
$ |
||||||
Research and development |
||||||||
Sales and marketing |
||||||||
General and administrative |
||||||||
Total |
||||||||
(11) |
Commitments and Contingencies |
(a) |
Operating Leases |
Year ending: | ||||
2021 |
$ | |||
2022 |
||||
2023 |
||||
2024 |
||||
2025 |
||||
$ | ||||
(b) |
Indemnification |
(c) |
Supply Agreement |
(d) |
Employment Agreements |
(1 2 ) |
Customer and Geographic Information |
(a) |
Concentration of Sales and Accounts Receivable |
For the year ended December 31, |
||||||||
2020 |
2019 |
|||||||
Percentage of net revenue |
||||||||
Customer A |
% | % | ||||||
Customer B |
% | % | ||||||
As of December, 31 |
||||||||
2020 |
2019 |
|||||||
Percentage of gross trade accounts receivable |
||||||||
Customer A |
% | % | ||||||
Customer B |
% | % | ||||||
Customer C |
% | % | ||||||
Customer D |
% |
(b) |
Concentration of Purchases |
(c) |
Concentration of Property and Equipment |
As of December, 31 |
||||||||
2020 |
2019 |
|||||||
North America |
$ | $ | ||||||
China |
||||||||
United Kingdom |
||||||||
Total |
|
$ |
|
|
|
$ |
|
|
(1 3 ) |
Disaggregated Revenues |
By Sales Channel |
For year ended December 31, |
|||||||
2020 |
2019 |
|||||||
Fulfillment distributors |
$ | $ | ||||||
OEM/ODM/CM |
||||||||
Other |
||||||||
|
|
|
|
|||||
Total |
$ | $ | ||||||
|
|
|
|
By Market Group |
For year ended December 31, |
|||||||
2020 |
2019 |
|||||||
Consumer |
$ |
$ |
||||||
Automotive |
||||||||
Enterprise |
||||||||
|
|
|
|
|||||
Total |
$ |
$ |
||||||
|
|
|
|
By Geography |
For year ended December 31, |
|||||||
2020 |
2019 |
|||||||
China |
$ | $ | ||||||
North America |
||||||||
Other |
||||||||
|
|
|
|
|||||
Total |
$ | $ | ||||||
|
|
|
|
(14) |
Employee Benefit Plan |
(1 5 ) |
Subsequent Events |
(1) | Incorporated by reference to the Registrant’s Current Report on Form 8-K, filed with the SEC on August 17, 2016. |
(2) | Incorporated by reference to Amendment No. 1 to the Registrant’s Registration Statement on Form S-1 (Registration No. 333-212542), filed with the SEC on July 29, 2016. |
(3) | Incorporated by reference to the Registrant’s Annual Report on Form 10-K filed with the SEC on February 28, 2020 |
(4) | Incorporated by reference to the Registrant’s Registration Statement on Form S-1 (Registration No. 333-212542), filed with the SEC on July 15, 2016. |
(5) | Incorporated by reference to the Registrant’s Annual Report on Form 10-K, filed with the SEC on March 15, 2019 |
(6) | Incorporated by reference to the Registrant’s Quarterly Report on Form 10-Q, filed with the SEC on May 12, 2017. |
(7) | Incorporated by reference to the Registrant’s Quarterly Report on Form 10-Q, filed with the SEC on November 7, 2019. |
(8) | Incorporated by reference to the Registrant’s Quarterly Report on Form 10-Q, filed with the SEC on May 7, 2020. |
(9) | Incorporated by reference to the Registrant’s Current Report on Form 8-K, filed with the SEC on January 7, 2021. |
# | Indicates management contract or compensatory plan. |
* | These certifications are being furnished solely to accompany this annual report pursuant to 18 U.S.C. Section 1350, and are not being filed for purposes of Section 18 of the Securities Exchange Act of 1934 and are not to be incorporated by reference into any filing of the Registrant, whether made before or after the date hereof, regardless of any general incorporation language in such filing. |
AIRGAIN, INC. |
/s/ Jacob Suen |
Jacob Suen Chief Executive Officer |
Signature |
Title |
Date | ||
/s/ Jacob Suen Jacob Suen |
Chief Executive Officer, President and Director (Principal Executive Officer) |
February 19, 2021 | ||
/s/ David B. Lyle David B. Lyle |
Chief Financial Officer (Principal Financial and Accounting Officer) |
February 19, 2021 | ||
/s/ James K. Sims James K. Sims |
Chairman | February 19, 2021 | ||
/s/ Tzau-Jin ChungTzau-Jin Chung |
Director | February 19, 2021 | ||
/s/ Joan H. Gillman Joan H. Gillman |
Director | February 19, 2021 | ||
/s/ Thomas A. Munro Thomas A. Munro |
Director | February 19, 2021 | ||
/s/ Arthur M. Toscanini Arthur M. Toscanini |
Director | February 19, 2021 |