Exhibit 99.1
Hilltop Holdings Inc. Q3 2015 Earnings Presentation November 3, 2015

Preface 2 200 Crescent Court, Suite 1330 Dallas, TX 75201 Phone: (214) 855-2177 Fax: (817) 887-1687 www.hilltop-holdings.com Please contact: Isabell Novakov Phone: (214) 252-4029 Email: inovakov@plainscapital.com FORWARD-LOOKING STATEMENTS This presentation and statements made by representatives of Hilltop Holdings Inc. (“Hilltop” or the “Company”) during the course of this presentation include “forward-looking statements” within the meaning of the Private Securities Litigation Reform Act of 1995. These forward-looking statements involve known and unknown risks, uncertainties and other factors that may cause our actual results, performance or achievements to be materially different from any future results, performance or achievements anticipated in such statements. Forward-looking statements speak only as of the date they are made and, except as required by law, we do not assume any duty to update forward-looking statements. Such forward-looking statements include, but are not limited to, statements concerning such things as our business strategy, our financial condition, our litigation, our efforts to make strategic acquisitions, our recent acquisition of SWS Group, Inc. (“SWS”) and integration thereof, our revenue, our liquidity and sources of funding, market trends, operations and business, expectations concerning mortgage loan origination volume, expected losses on covered loans and related reimbursements from the Federal Deposit Insurance Corporation (“FDIC”), projected losses on mortgage loans originated, anticipated changes in our revenues or earnings, the effects of government regulation applicable to our operations, the appropriateness of our allowance for loan losses and provision for loan losses, the collectability of loans, our other plans, objectives, strategies, expectations and intentions and other statements that are not statements of historical fact, and may be identified by words such as “anticipates,” “believes,” “could,” “estimates,” “expects,” “forecasts,” “goal,” “intends,” “may,” “might,” “probable,” “projects,” “seeks,” “should,” “view,” or “would” or the negative of these words and phrases or similar words or phrases. The following factors, among others, could cause actual results to differ from those set forth in the forward-looking statements: (i) risks associated with merger and acquisition integration, including the diversion of management time on acquisition-related issues and our ability to promptly and effectively integrate our businesses with those of SWS and achieve the synergies and value creation contemplated by the acquisition; (ii) our ability to estimate loan losses; (iii) changes in the default rate of our loans; (iv) risks associated with concentration in real estate related loans; (v) our ability to obtain reimbursements for losses on acquired loans under loss-share agreements with the FDIC; (vi) changes in general economic, market and business conditions in areas or markets where we compete; (vii) severe catastrophic events in Texas and other areas of the southern United States; (viii) changes in the interest rate environment; (ix) cost and availability of capital; (x) changes in state and federal laws, regulations or policies affecting one or more of the Company’s business segments, including changes in regulatory fees, deposit insurance premiums, capital requirements and the Dodd-Frank Wall Street Reform and Consumer Protection Act; (xi) our ability to use net operating loss carry forwards to reduce future tax payments; (xii) approval of new, or changes in, accounting policies and practices; (xiii) changes in key management; (xiv) competition in our banking, broker-dealer, mortgage origination, and insurance segments from other banks and financial institutions, as well as investment banking and financial advisory firms, mortgage bankers, asset-based non-bank lenders, government agencies and insurance companies; (xv) failure of our insurance segment reinsurers to pay obligations under reinsurance contracts; and (xvi) our ability to use excess cash in an effective manner, including the execution of successful acquisitions. For further discussion of such factors, see the risk factors described in the Hilltop Annual Report on Form 10-K for the year ended December 31, 2014, Quarterly Report on Form 10-Q for the three and nine months ended Sep. 30, 2015, and other reports filed with the Securities and Exchange Commission. All forward-looking statements are qualified in their entirety by this cautionary statement. Corporate Headquarters Additional Information
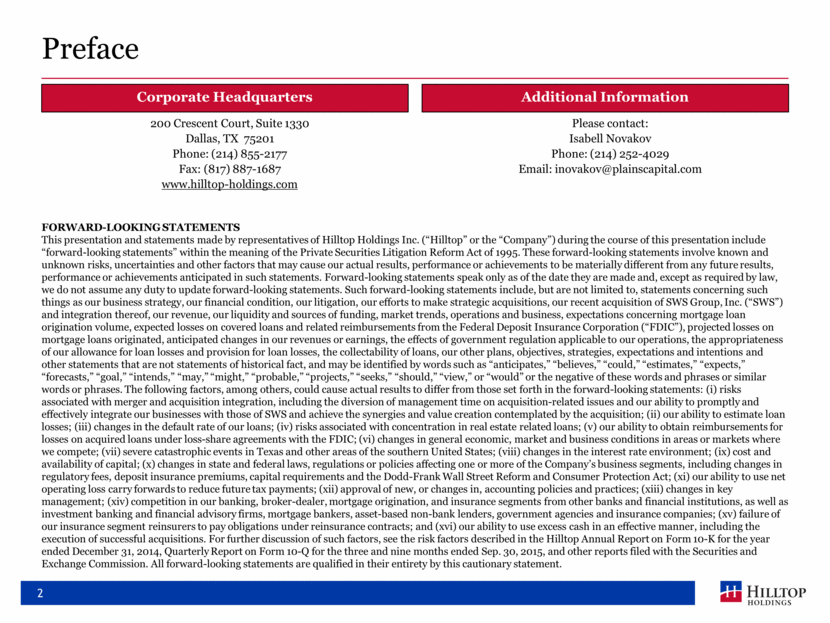
3 Hilltop Holdings – Q3 2015 Highlights For the third quarter of 2015, net income to common stockholders was $46.9 million, or $0.47 per diluted share Third quarter 2015 adjusted net income1 was $49.6 million, or $0.50 per diluted share, when excluding the transaction and integration costs related to the SWS Merger For the third quarter of 2014, net income to common stockholders was $23.4 million, or $0.26 per diluted share ROAA was 1.49% in Q3 2015, relative to 1.03% in Q3 2014 ROAE was 10.97% in Q3 2015, relative to 6.51% in Q3 2014 Hilltop’s four operating segments reported $79.2 million in pre-tax income during Q3 2015 PlainsCapital Bank contributed $53.6 million of pre-tax income PrimeLending contributed $12.1 million of pre-tax income Hilltop Securities Holdings contributed $1.5 million of pre-tax income National Lloyds Corporation contributed $12.0 million of pre-tax income Hilltop common equity increased to $1.7 billion at Sep. 30, 2015, up $41.5 million from June 30, 2015 Hilltop remains well-capitalized with a 12.01% Tier 1 Leverage Ratio2 and a 19.29% Total Risk Based Capital Ratio Hilltop had approximately $41 million of freely usable cash at quarter end and retains excess capital at subsidiaries As of Q3 2015, Hilltop had completed its share repurchase program – Hilltop repurchased an aggregate of 1,390,977 shares, representing a notional amount of $30.0 million and an average price per share of $21.56 All Hilltop operating subsidiaries had a strong and profitable quarter, while the broker-dealer achieved critical milestones as it works toward integration Notes: Certain amounts related to the June 30, 2015 financials, such as common equity, represent revised figures due to the change in the preliminary bargain purchase gain associated with SWS Merger. (1) See appendix for reconciliation of reported net income to adjusted net income as presented (2) Based on the end of period Tier 1 capital divided by total average assets during the respective quarter, excluding goodwill and intangible assets
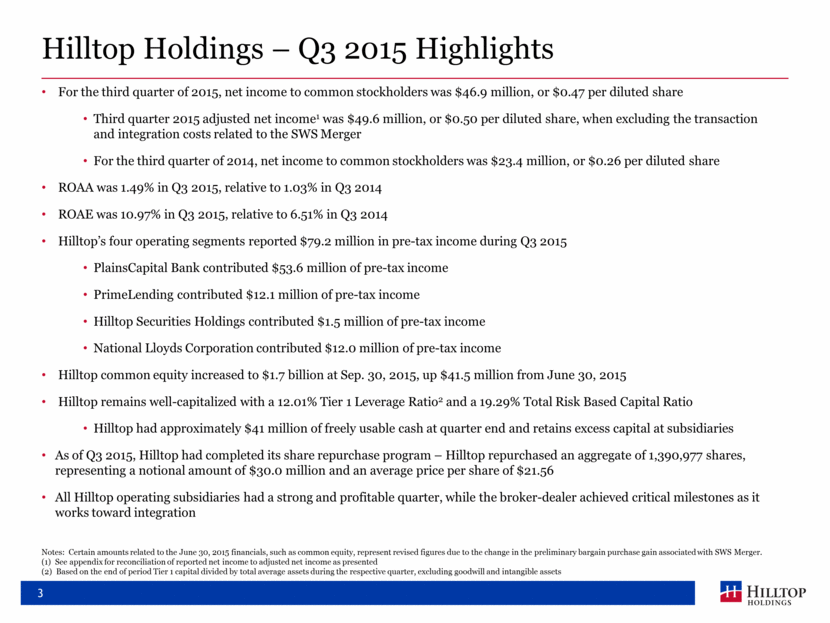
4 Hilltop Holdings – Financial Summary Selected Items Q3 2014 Q2 2015 Q3 2015 Net Income to Common ($000) 23,386 29,622 46,894 EPS - Diluted ($) $0.26 $0.30 $0.47 Book Value Per Share ($) $14.51 $16.82 $17.35 NIM (taxable equivalent) 4.38% 3.75% 4.20% Assets ($000) 9,180,402 12,479,510 12,389,456 Loans HFI, Gross ($000) 4,520,118 5,451,202 5,421,946 Deposits ($000) 6,236,282 6,796,437 6,820,749 Hilltop Common Equity ($000) 1,308,907 1,674,145 1,715,690 NPLs/Total Loans 1 0.48% 0.48% 0.46% NPAs/Total Assets1 0.29% 0.25% 0.24% Tier 1 Leverage Ratio2 13.63% 11.87% 12.01% Total Risk Based Capital Ratio 19.28% 19.29% 19.29% Notes: (1) NPLs, NPAs and Total Loans exclude covered loans and covered OREO (2) Based on the end of period Tier 1 capital divided by total average assets during the quarter, excluding goodwill and intangible assets
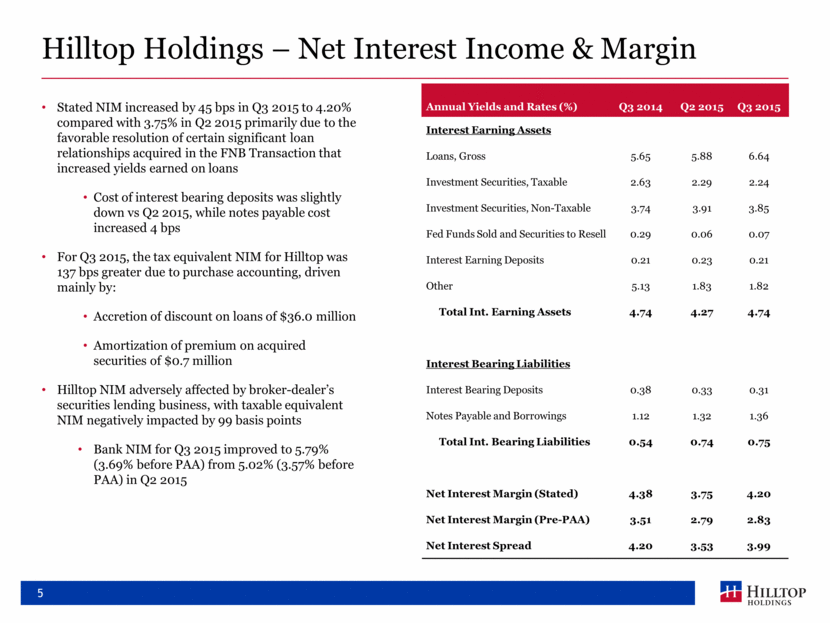
5 Hilltop Holdings – Net Interest Income & Margin Stated NIM increased by 45 bps in Q3 2015 to 4.20% compared with 3.75% in Q2 2015 primarily due to the favorable resolution of certain significant loan relationships acquired in the FNB Transaction that increased yields earned on loans Cost of interest bearing deposits was slightly down vs Q2 2015, while notes payable cost increased 4 bps For Q3 2015, the tax equivalent NIM for Hilltop was 137 bps greater due to purchase accounting, driven mainly by: Accretion of discount on loans of $36.0 million Amortization of premium on acquired securities of $0.7 million Hilltop NIM adversely affected by broker-dealer’s securities lending business, with taxable equivalent NIM negatively impacted by 99 basis points Bank NIM for Q3 2015 improved to 5.79% (3.69% before PAA) from 5.02% (3.57% before PAA) in Q2 2015 Annual Yields and Rates (%) Q3 2014 Q2 2015 Q3 2015 Interest Earning Assets Loans, Gross 5.65 5.88 6.64 Investment Securities, Taxable 2.63 2.29 2.24 Investment Securities, Non-Taxable 3.74 3.91 3.85 Fed Funds Sold and Securities to Resell 0.29 0.06 0.07 Interest Earning Deposits 0.21 0.23 0.21 Other 5.13 1.83 1.82 Total Int. Earning Assets 4.74 4.27 4.74 Interest Bearing Liabilities Interest Bearing Deposits 0.38 0.33 0.31 Notes Payable and Borrowings 1.12 1.32 1.36 Total Int. Bearing Liabilities 0.54 0.74 0.75 Net Interest Margin (Stated) 4.38 3.75 4.20 Net Interest Margin (Pre-PAA) 3.51 2.79 2.83 Net Interest Spread 4.20 3.53 3.99
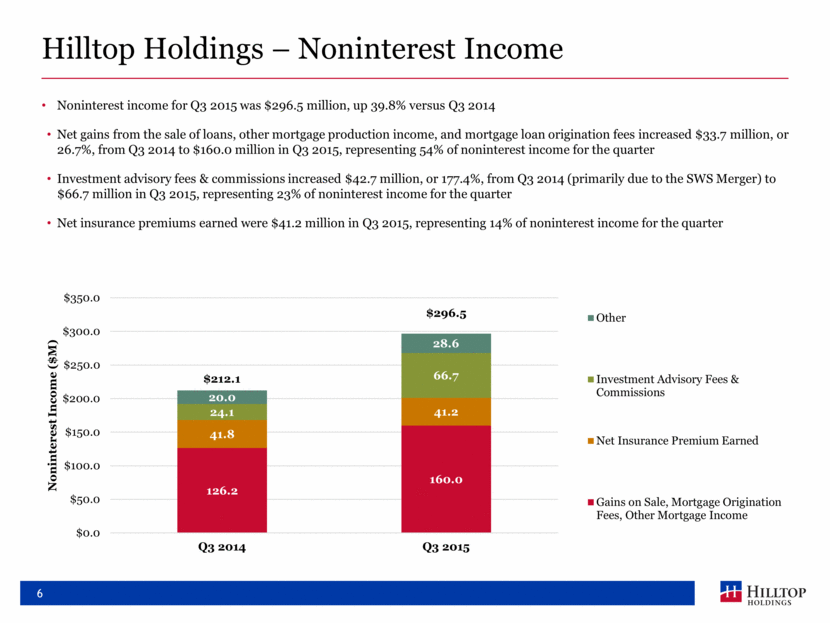
6 Hilltop Holdings – Noninterest Income Noninterest income for Q3 2015 was $296.5 million, up 39.8% versus Q3 2014 Net gains from the sale of loans, other mortgage production income, and mortgage loan origination fees increased $33.7 million, or 26.7%, from Q3 2014 to $160.0 million in Q3 2015, representing 54% of noninterest income for the quarter Investment advisory fees & commissions increased $42.7 million, or 177.4%, from Q3 2014 (primarily due to the SWS Merger) to $66.7 million in Q3 2015, representing 23% of noninterest income for the quarter Net insurance premiums earned were $41.2 million in Q3 2015, representing 14% of noninterest income for the quarter 126.2 160.0 41.8 41.2 24.1 66.7 20.0 28.6 $212.1 $296.5 $0.0 $50.0 $100.0 $150.0 $200.0 $250.0 $300.0 $350.0 Q3 2014 Q3 2015 Noninterest Income ($M) Other Investment Advisory Fees & Commissions Net Insurance Premium Earned Gains on Sale, Mortgage Origination Fees, Other Mortgage Income
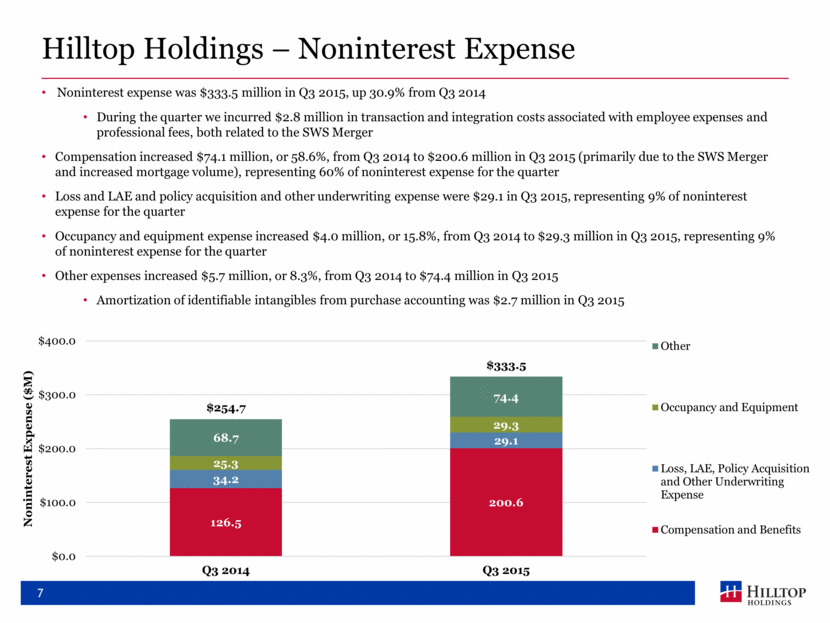
7 Hilltop Holdings – Noninterest Expense Noninterest expense was $333.5 million in Q3 2015, up 30.9% from Q3 2014 During the quarter we incurred $2.8 million in transaction and integration costs associated with employee expenses and professional fees, both related to the SWS Merger Compensation increased $74.1 million, or 58.6%, from Q3 2014 to $200.6 million in Q3 2015 (primarily due to the SWS Merger and increased mortgage volume), representing 60% of noninterest expense for the quarter Loss and LAE and policy acquisition and other underwriting expense were $29.1 in Q3 2015, representing 9% of noninterest expense for the quarter Occupancy and equipment expense increased $4.0 million, or 15.8%, from Q3 2014 to $29.3 million in Q3 2015, representing 9% of noninterest expense for the quarter Other expenses increased $5.7 million, or 8.3%, from Q3 2014 to $74.4 million in Q3 2015 Amortization of identifiable intangibles from purchase accounting was $2.7 million in Q3 2015 126.5 200.6 34.2 29.1 25.3 29.3 68.7 74.4 $254.7 $333.5 $0.0 $100.0 $200.0 $300.0 $400.0 Q3 2014 Q3 2015 Noninterest Expense ($M) Other Occupancy and Equipment Loss, LAE, Policy Acquisition and Other Underwriting Expense Compensation and Benefits
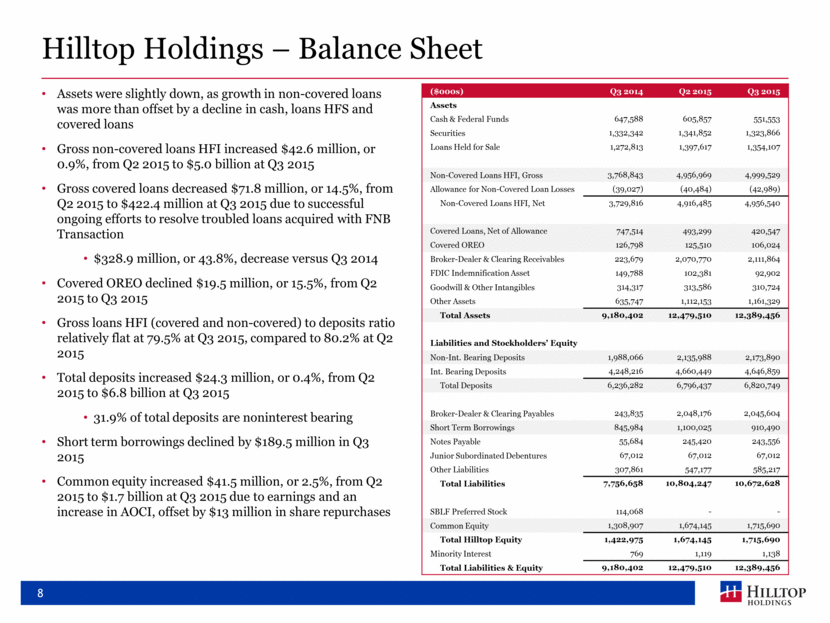
Hilltop Holdings – Balance Sheet Assets were slightly down, as growth in non-covered loans was more than offset by a decline in cash, loans HFS and covered loans Gross non-covered loans HFI increased $42.6 million, or 0.9%, from Q2 2015 to $5.0 billion at Q3 2015 Gross covered loans decreased $71.8 million, or 14.5%, from Q2 2015 to $422.4 million at Q3 2015 due to successful ongoing efforts to resolve troubled loans acquired with FNB Transaction $328.9 million, or 43.8%, decrease versus Q3 2014 Covered OREO declined $19.5 million, or 15.5%, from Q2 2015 to Q3 2015 Gross loans HFI (covered and non-covered) to deposits ratio relatively flat at 79.5% at Q3 2015, compared to 80.2% at Q2 2015 Total deposits increased $24.3 million, or 0.4%, from Q2 2015 to $6.8 billion at Q3 2015 31.9% of total deposits are noninterest bearing Short term borrowings declined by $189.5 million in Q3 2015 Common equity increased $41.5 million, or 2.5%, from Q2 2015 to $1.7 billion at Q3 2015 due to earnings and an increase in AOCI, offset by $13 million in share repurchases 8 ($000s) Q3 2014 Q2 2015 Q3 2015 Assets Cash & Federal Funds 647,588 605,857 551,553 Securities 1,332,342 1,341,852 1,323,866 Loans Held for Sale 1,272,813 1,397,617 1,354,107 Non-Covered Loans HFI, Gross 3,768,843 4,956,969 4,999,529 Allowance for Non-Covered Loan Losses (39,027) (40,484) (42,989) Non-Covered Loans HFI, Net 3,729,816 4,916,485 4,956,540 Covered Loans, Net of Allowance 747,514 493,299 420,547 Covered OREO 126,798 125,510 106,024 Broker-Dealer & Clearing Receivables 223,679 2,070,770 2,111,864 FDIC Indemnification Asset 149,788 102,381 92,902 Goodwill & Other Intangibles 314,317 313,586 310,724 Other Assets 635,747 1,112,153 1,161,329 Total Assets 9,180,402 12,479,510 12,389,456 Liabilities and Stockholders’ Equity Non-Int. Bearing Deposits 1,988,066 2,135,988 2,173,890 Int. Bearing Deposits 4,248,216 4,660,449 4,646,859 Total Deposits 6,236,282 6,796,437 6,820,749 Broker-Dealer & Clearing Payables 243,835 2,048,176 2,045,604 Short Term Borrowings 845,984 1,100,025 910,490 Notes Payable 55,684 245,420 243,556 Junior Subordinated Debentures 67,012 67,012 67,012 Other Liabilities 307,861 547,177 585,217 Total Liabilities 7,756,658 10,804,247 10,672,628 SBLF Preferred Stock 114,068 - - Common Equity 1,308,907 1,674,145 1,715,690 Total Hilltop Equity 1,422,975 1,674,145 1,715,690 Minority Interest 769 1,119 1,138 Total Liabilities & Equity 9,180,402 12,479,510 12,389,456
9 Company Operational Updates PlainsCapital Bank ROAA of 1.64%, driven by strong net interest margin of 5.79% (3.69% Pre-PAA) and improved efficiency ratio (51% vs. 57% for Q2 2015) Healthy non-covered HFI loan (excluding margin loans) growth of 6% annualized for Q3 2015; favorable loan pipeline with $1.6 billion in total unused commitments Credit quality remains sound with non-covered NPAs declining to $30.0 million Energy exposure declined to 4.0% (down ~$40 million in Q3 2015) from 4.9% at Q2 2015; energy portfolio is down ~$122 million YTD in 2015 3.5% reserve on energy portfolio, though only 15.8% of energy loans are classified Operating 66 branches at 9/30/15; continuing to strategically divest non-core and unprofitable branches acquired from FNB while opening new branches in attractive markets 2 unprofitable branches in Corpus Christi were closed in Q3 2015 1 new branch opened during the quarter in downtown Corpus Christi on Shoreline Drive which serves as the headquarters for the Coastal Bend Houston headquarters to now open in Q4 2015 to support growth in that market PrimeLending PrimeLending had a profitable quarter driven by increased loan volume of $3.6 billion, up 24% from Q3 2014 (with only a 6% increase in loan originators) Purchase volume of 81% in Q3 2015 compared to 76% in Q2 2015 and 82% in Q3 2014 Gain on sale margins increased between Q3 2015 and Q2 2015 due to more favorable loan sale pricing Q3 2015 lock volume has grown 24% versus Q3 2014 to $4.2 billion Market share remained steady at 0.96% in Q3 2015; Prime remains focused on purchase business, where it had 1.22% market share in Q3 2015 Mortgage servicing rights retention rate of 25% in Q3 2015, compared to 31% for FY 2014; 100% of all new retained mortgage servicing rights are hedged Note: Market share per Mortgage Bankers Association as of October 20, 2015

10 Company Operational Updates Hilltop Securities Holdings Revenue was relatively flat for most business lines relative to Q2 2015, though stock loan and structured finance had strong results Even with modest overall revenue growth, expenses (excluding integration costs) were down and the comp./net revenue ratio declined to 69.6% from 73.0% in Q2 2015 After adjusting for transaction and integration costs, Hilltop Securities Holdings made $3.6 million1 of pre-tax income On Oct. 5, Southwest Securities, Inc. and SWS Financial Services, Inc. were renamed “Hilltop Securities Inc.” and “Hilltop Securities Independent Network Inc.”, respectively On Oct. 22, the broker-dealers received FINRA regulatory approval to merge, satisfying a critical milestone in the integration process National Lloyds Corporation Revenue was slightly down due to lower new business, but profitability was improved Loss and LAE expense declined year over year, driven by lower claim count Underlying business still fundamentally strong, as exposure management initiatives and improved risk profile demonstrated through lower non-CAT loss ratio YTD relative to 2014 However, continue to proactively increase rates in select markets Note: (1) See appendix for reconciliation of reported pre-tax income to adjusted pre-tax income as presented
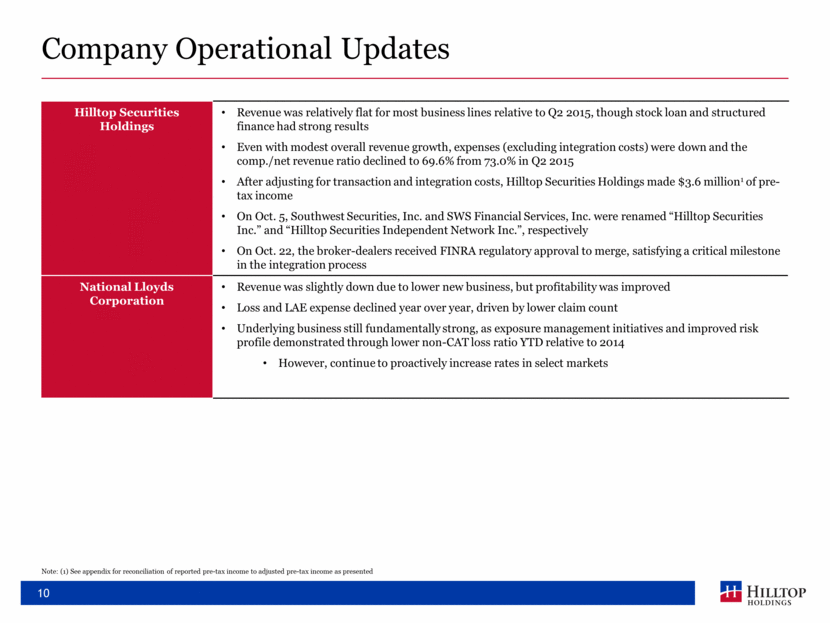
11 Pre-tax income increased to $53.6 million in Q3 2015 versus $24.6 million in Q3 2014 primarily due to a decline in expenses and favorable resolution of significant loan relationships from the FNB Transaction Net interest income was driven by non-covered loan growth and accretion Noninterest income was slightly down compared to Q3 2014 primarily due to decreases in accretion on FDIC indemnification asset, OREO income and service fees Noninterest expense declined compared to Q3 2014 primarily due to reduced write downs on OREO and increased gains on sale of certain OREO from the FNB transaction Bank had OREO write-downs of $14.4 million in Q3 2014 versus $5.4 million in Q3 2015 Noninterest expense reductions were offset by increased comp. and benefits associated with addition of SWS employees PrimeLending funds originations through a $1.5 billion warehouse line from PlainsCapital Bank; $1.2 billion was drawn at Sep. 30, 2015 Tier 1 Leverage Ratio1 increased to 12.77%, up from 12.17% in Q2 2015 PlainsCapital Bank – Q3 2015 Highlights Reported Summary Results ($000) Q3 2014 Q3 2015 Net Interest Income 78,285 105,758 Provision for Loan Losses (4,049) (5,615) Noninterest Income 17,638 13,935 Noninterest Expense (67,236) (60,518) Income Before Taxes 24,638 53,560 Key Highlights Q3 2014 Q3 2015 ROAA (%) 0.77 1.64 NIM (%) 4.62 5.79 Efficiency (%) 70.1 50.6 Fee Income (%) 18.4 11.6 Assets ($000) $7,981,517 $8,299,022 Tier 1 Leverage Ratio1 (%) 9.95 12.77 HTH Consolidated Loans HFI by Type HTH Consolidated Deposit Mix by Type Notes: (1) Based on the end of period Tier 1 capital divided by total average assets during the respective quarter, excluding goodwill and intangible assets (2) Loans and deposits by type represents consolidated balances at Hilltop and, therefore, eliminate intercompany balances; C&I loans include amounts due on margin loans to customers and correspondents of $606.0 million at Q3 2015 Total Deposits2: $6.8 billion Total Loans2: $5.4 billion Non Int. Bearing Demand 32% NOW 15% Money Market 22% Demand 6% Savings 4% Time 21% C&I 39% Real Estate 49% C&D 11% Consumer 1%
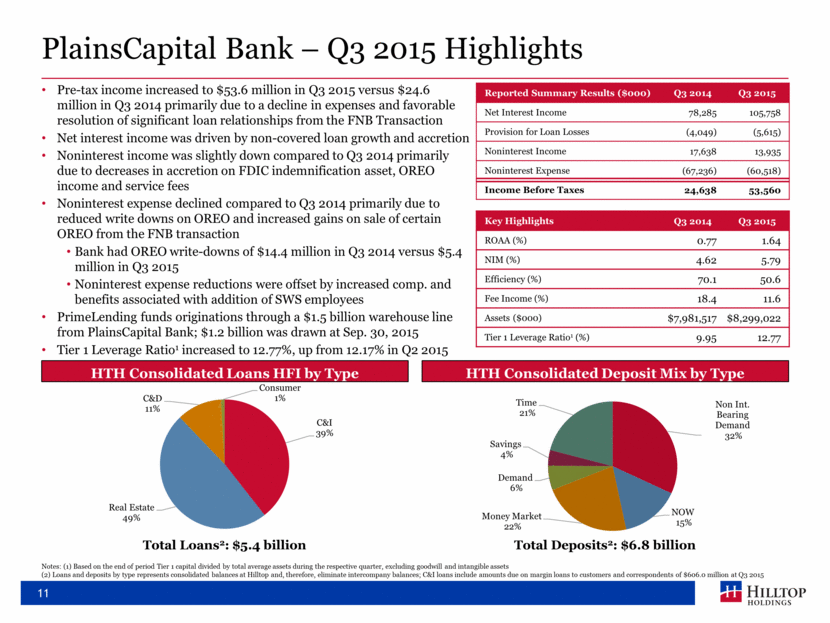
12 PlainsCapital Bank – Credit Quality and Capital Ratios Credit Quality Bank Capital Ratios Note: Tier 1 Leverage Ratio based on the end of period Tier 1 capital divided by total average assets during the respective quarter, excluding goodwill and intangible assets $27.0 $23.2 $32.8 $31.2 $30.0 $0.0 $5.0 $10.0 $15.0 $20.0 $25.0 $30.0 $35.0 $40.0 Q3 2014 Q4 2014 Q1 2015 Q2 2015 Q3 2015 Non - Covered NPAs ($M) 9.95% 10.31% 11.34% 12.17% 12.77% 13.48% 13.74% 16.46% 16.46% 17.36% 14.21% 14.45% 17.19% 17.17% 18.13% 0.00% 2.00% 4.00% 6.00% 8.00% 10.00% 12.00% 14.00% 16.00% 18.00% 20.00% Q3 2014 Q4 2014 Q1 2015 Q2 2015 Q3 2015 Tier 1 Leverage Ratio Tier 1 RBC Ratio Total RBC Ratio
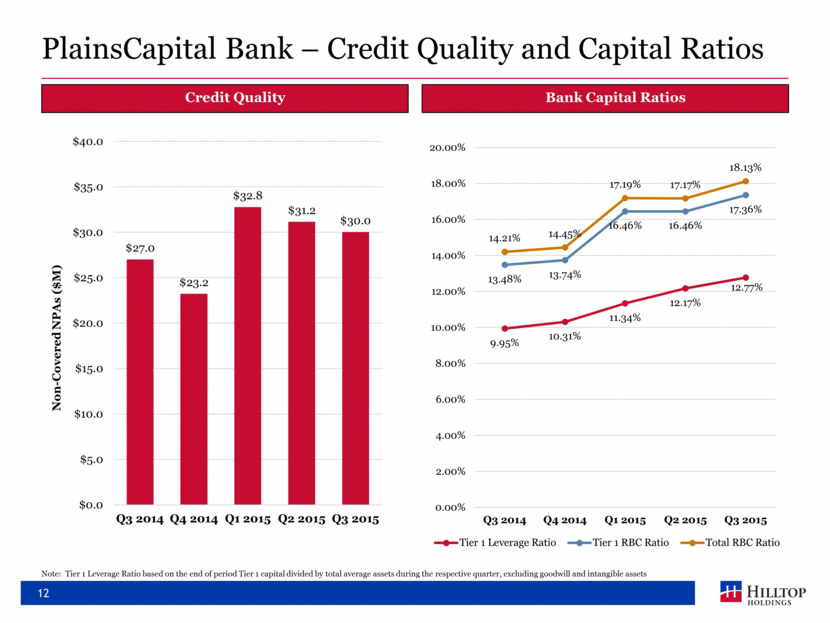
PlainsCapital Bank – Loan Portfolio by Classification 13 Note: PCI stands for Purchased Credit Impaired loans. Loan classification mix represents consolidated balances at Hilltop and, therefore, eliminate intercompany loans. Amounts above equal carrying value, after deductions for discount Covered PCI Loans Covered Non-PCI Loans Non-Covered PCI Loans Non-Covered Non-PCI Loans Q3 2015 Total: $81.2 million Q3 2015 Total: $4,918.4 million Q3 2015 Total: $251.0 million Q3 2015 Total: $171.4 million C&I 43% Real Estate 45% C&D 12% Consumer 1% C&I 4% Real Estate 87% C&D 10% C&I 3% Real Estate 91% C&D 6% C&I 17% Real Estate 75% C&D 7% Consumer 1%
PlainsCapital Bank – PCI Loans at Sep. 30, 2015 14 ($000) Covered PCI Non-Covered PCI Total PCI Outstanding Balance 450,581 104,055 554,636 (Discount) (199,563) (22,894) (222,457) Carrying Amount 251,018 81,161 332,179 Allowance for Loan Loss 1,822 4,599 6,421 Total PCI Loans, Net of Allowance 249,196 76,562 325,758 Carrying Amount (Net of Allowance) / Outstanding Balance 55.3% 73.6% 58.7% Note: Outstanding balance represents unpaid principal balance net of charge-offs and interest applied to principal Purchased Credit Impaired (“PCI”) loans are loans with evidence of credit quality deterioration, for which it is probable that not all contractually required payments will be collected PCI loans include covered and non-covered loans PCI loans had a total discount of $222.5 million $199.6 million of the discount was related to covered loans Weighted average expected loss on PCI loans associated with each of the PlainsCapital Merger, FNB Transaction, and SWS Merger was 28%, 21%, and 20%, respectively
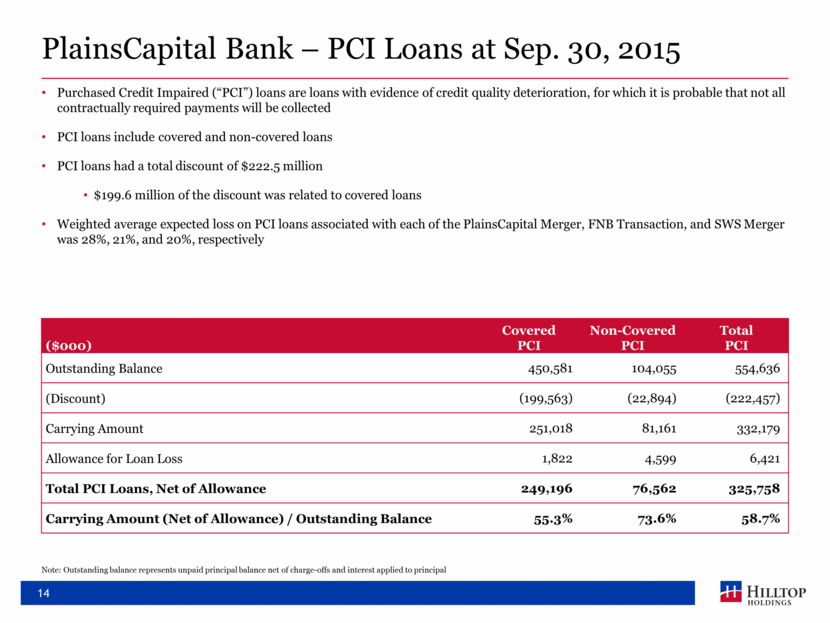
PlainsCapital Bank – Non-PCI Loans at Sep. 30, 2015 15 ($000) Covered Non-PCI Non-Covered Non-PCI Total Non-PCI Outstanding Balance 183,661 4,945,867 5,129,528 (Discount) (12,262) (27,499) (39,761) Carrying Amount 171,399 4,918,368 5,089,767 Allowance for Loan Loss 48 38,390 38,438 Total Non-PCI Loans, Net of Allowance 171,351 4,879,978 5,051,329 Carrying Amount (Net of Allowance) / Outstanding Balance 93.3% 98.7% 98.5% Note: Outstanding balance represents unpaid principal balance net of charge-offs and interest applied to principal Non-PCI loans include newly originated loans, acquired loans without credit impairment at acquisition, and acquired loans that have renewed Non-PCI loans include covered loans and non-covered loans Portfolio on balance sheet at 98.5% unpaid principal balance with a total discount of $39.8 million $27.5 million discount was related to non-covered loans, while covered loans had a $12.3 million discount
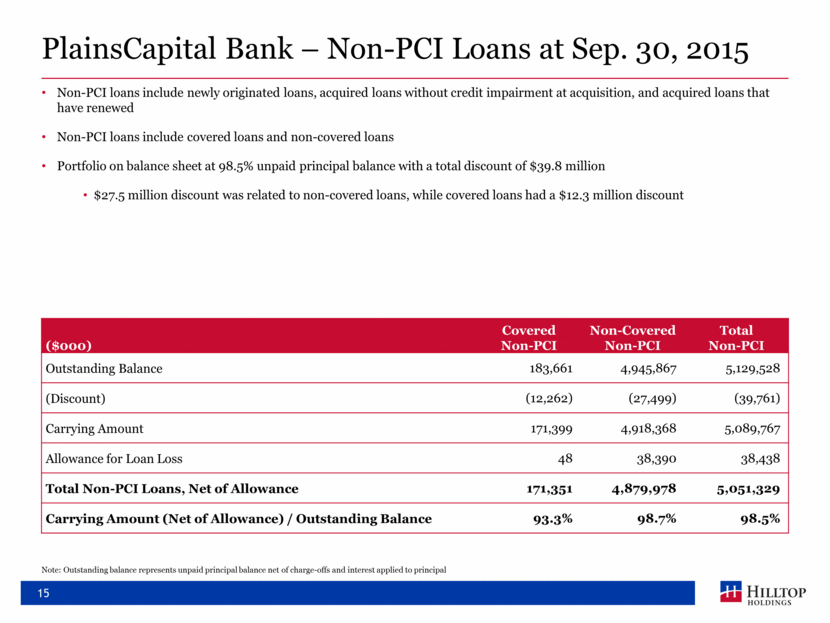
16 PrimeLending – Q3 2015 Highlights Pre-tax income grew to $12.1 million in Q3 2015 versus $11.1 million in Q3 2014 due to higher origination volumes Origination volume of $3.6 billion in Q3 2015 was $693 million greater than Q3 2014 due to growth in both refinance and purchase business Purchase volume (as % of total volume) decreased to 80.9% in Q3 2015 from 81.8% in Q3 2014, although dollar volume was up $536.9 million Refinance volume increased $156.1 million, or 29.0%, from Q3 2014 to $693.6 million in Q3 2015 Noninterest income increased $30.8 million, or 23.9%, from Q3 2014 to $159.8 million in Q3 2015 due to the higher origination volume, higher avg. origination fees and higher servicing income Decline versus Q2 2015 driven primarily by change in fair value of interest rate locks and MSR Noninterest expense increased $30.4 million, or 26.5%, from Q3 2014 to $145.1 million in Q3 2015 due to higher variable compensation and additional headcount to support volumes, technology initiatives and regulatory and compliance needs PrimeLending retained servicing on approximately 25% of loans sold in Q3 2015 Fair value of net MSR decreased $2.9 million during Q3 2015 Given the recent implementation of TILA-RESPA Integrated Disclosures (“TRID”), the impacts of TRID on the mortgage loan origination process, volumes and associated costs beginning in already seasonally lower Q4 2015 are unknown Reported Summary Results ($000) Q3 2014 Q3 2015 Net Interest Income (3,197) (2,538) Provision for Loan Losses - - Noninterest Income 128,989 159,794 Noninterest Expense (114,690) (145,113) Income Before Taxes 11,102 12,143 Key Highlights Q3 2014 Q3 2015 Volume - $M $2,946 $3,639 Volume – Units 13,766 16,672 Volume - % Purchase 81.8% 80.9% Volume - % Conventional 62.1% 61.7% Servicing Asset ($M) $41.9 $47.5 Mortgage Loans Serviced For Others ($M) $3,658 $5,042 Mortgage Origination Volume ($M) 2,409 2,946 537 694 $2,946 $3,639 $0 $500 $1,000 $1,500 $2,000 $2,500 $3,000 $3,500 $4,000 Q3 2014 Q3 2015 Thousands Home Purchases Refinancings

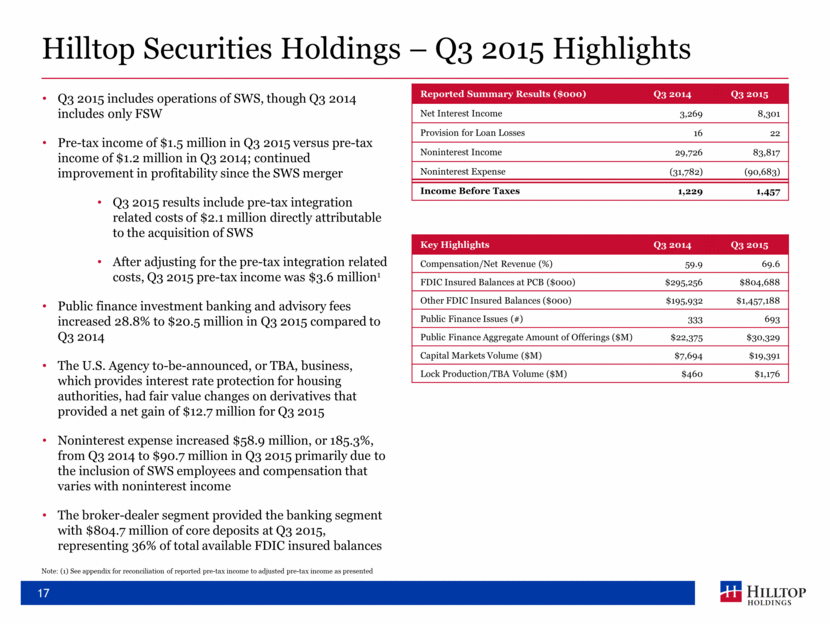
17 Hilltop Securities Holdings – Q3 2015 Highlights Q3 2015 includes operations of SWS, though Q3 2014 includes only FSW Pre-tax income of $1.5 million in Q3 2015 versus pre-tax income of $1.2 million in Q3 2014; continued improvement in profitability since the SWS merger Q3 2015 results include pre-tax integration related costs of $2.1 million directly attributable to the acquisition of SWS After adjusting for the pre-tax integration related costs, Q3 2015 pre-tax income was $3.6 million1 Public finance investment banking and advisory fees increased 28.8% to $20.5 million in Q3 2015 compared to Q3 2014 The U.S. Agency to-be-announced, or TBA, business, which provides interest rate protection for housing authorities, had fair value changes on derivatives that provided a net gain of $12.7 million for Q3 2015 Noninterest expense increased $58.9 million, or 185.3%, from Q3 2014 to $90.7 million in Q3 2015 primarily due to the inclusion of SWS employees and compensation that varies with noninterest income The broker-dealer segment provided the banking segment with $804.7 million of core deposits at Q3 2015, representing 36% of total available FDIC insured balances Reported Summary Results ($000) Q3 2014 Q3 2015 Net Interest Income 3,269 8,301 Provision for Loan Losses 16 22 Noninterest Income 29,726 83,817 Noninterest Expense (31,782) (90,683) Income Before Taxes 1,229 1,457 Key Highlights Q3 2014 Q3 2015 Compensation/Net Revenue (%) 59.9 69.6 FDIC Insured Balances at PCB ($000) $295,256 $804,688 Other FDIC Insured Balances ($000) $195,932 $1,457,188 Public Finance Issues (#) 333 693 Public Finance Aggregate Amount of Offerings ($M) $22,375 $30,329 Capital Markets Volume ($M) $7,694 $19,391 Lock Production/TBA Volume ($M) $460 $1,176 Note: (1) See appendix for reconciliation of reported pre-tax income to adjusted pre-tax income as presented
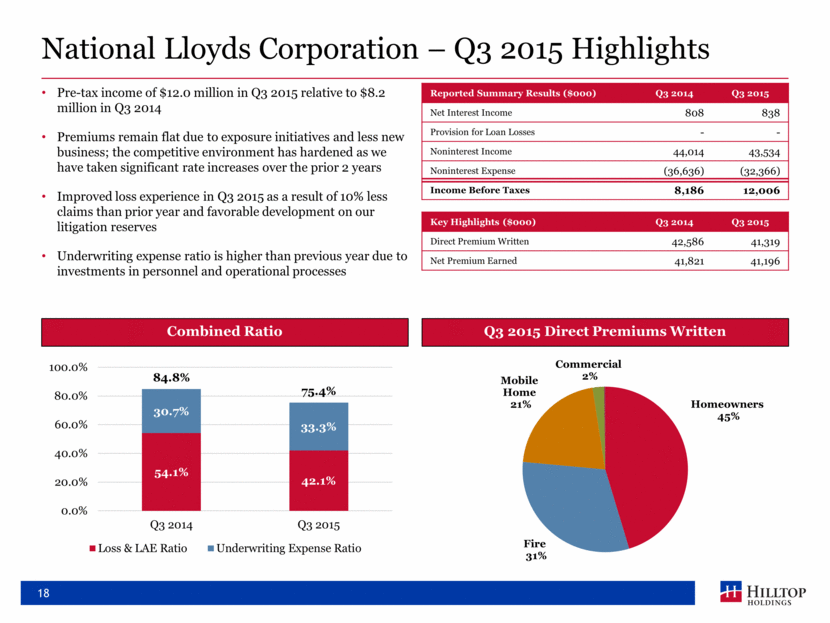
18 National Lloyds Corporation – Q3 2015 Highlights Reported Summary Results ($000) Q3 2014 Q3 2015 Net Interest Income 808 838 Provision for Loan Losses - - Noninterest Income 44,014 43,534 Noninterest Expense (36,636) (32,366) Income Before Taxes 8,186 12,006 Combined Ratio Q3 2015 Direct Premiums Written Key Highlights ($000) Q3 2014 Q3 2015 Direct Premium Written 42,586 41,319 Net Premium Earned 41,821 41,196 Pre-tax income of $12.0 million in Q3 2015 relative to $8.2 million in Q3 2014 Premiums remain flat due to exposure initiatives and less new business; the competitive environment has hardened as we have taken significant rate increases over the prior 2 years Improved loss experience in Q3 2015 as a result of 10% less claims than prior year and favorable development on our litigation reserves Underwriting expense ratio is higher than previous year due to investments in personnel and operational processes Homeowners 45% Fire 31% Mobile Home 21% Commercial 2% 54.1% 42.1% 30.7% 33.3% 84.8% 75.4% 0.0% 20.0% 40.0% 60.0% 80.0% 100.0% Q3 2014 Q3 2015 Loss & LAE Ratio Underwriting Expense Ratio
19 Questions?

20 Appendix

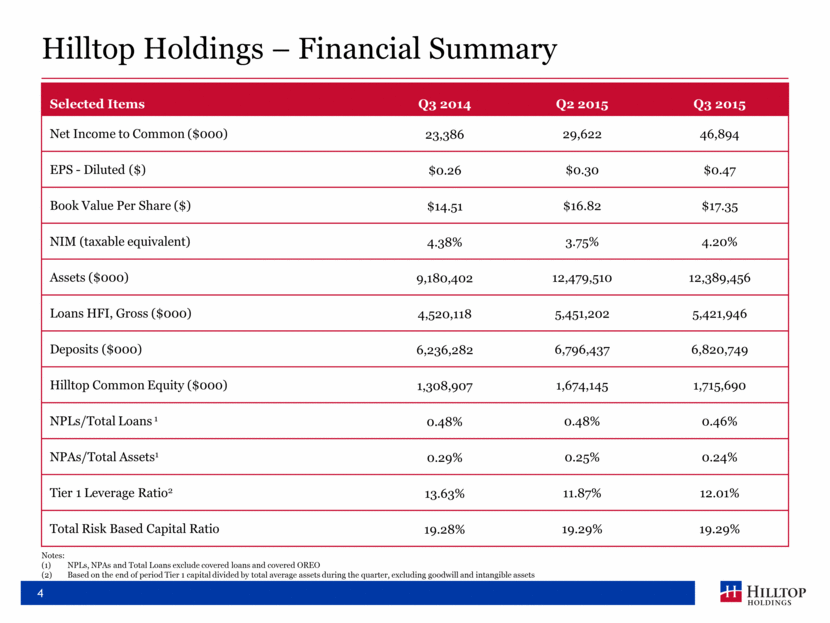
21 Hilltop Non-GAAP to GAAP Reconciliation and Management’s Explanation of Non-GAAP Financial Measures Q3 2015 Reconciliation of Non-GAAP Segment Adjusted Income Before Income Taxes ($M) Broker-Dealer GAAP Income Before Income Taxes 1.5 Add: Transaction and Integration Costs (pre-tax)1 2.1 Non-GAAP Segment Adjusted Income Before Income Taxes 3.6 Note: (1) Includes various transaction and integration costs associated with the SWS Merger, which closed January 1, 2015 Hilltop presents one measure on page ten and seventeen and two measures on page three of this presentation that are not measures of financial performance recognized by generally accepted accounting principles in the United States (“GAAP”). These measures are important to investors interested in changes from period to period in income before taxes, net income and net income per diluted share. For companies, such as Hilltop, business combinations can result in the recording of significant amounts of expenses related to those transactions. You should not view this disclosure as a substitute for results determined in accordance with GAAP, and this disclosure is not necessarily comparable to that of other companies that use non-GAAP measures. The following table reconciles these Hilltop non-GAAP financial measures to the most comparable GAAP financial measures, “segment income before income taxes”, “net income to common shareholders" and “net income per diluted share.” Q3 2015 Reconciliation of Non-GAAP Adjusted Net Income ($M) Diluted EPS ($) GAAP Net Income to HTH Common Shareholders 46.9 0.47 Add: Transaction and Integration Costs (net of tax)1 2.7 0.03 Non-GAAP Adjusted Net Income 49.6 0.50
