UNITED STATES
SECURITIES AND EXCHANGE COMMISSION
Washington, D.C. 20549
FORM N-CSR
CERTIFIED SHAREHOLDER REPORT OF REGISTERED
MANAGEMENT
INVESTMENT COMPANIES
Investment Company Act file number 811-21422
Trust for Advised Portfolios
(Exact name of registrant as specified in charter)
615 East Michigan Street
Milwaukee, Wisconsin 53202
(Address of principal executive offices) (Zip code)
Russell B. Simon, President
Trust for Advised Portfolios
2020 East Financial Way, Suite 100
Glendora, CA 91741
(Name and address of agent for service)
(626) 914-7395
Registrant's telephone number, including area code
Date of fiscal year end: December 31
Date of reporting period: June 30, 2022
Item 1. Reports to Stockholders.
| (a) |

Semi-Annual Report
June 30, 2022
Miller Opportunity Trust
Class A LGOAX
Class C LMOPX
Class FI LMOFX
Class R LMORX
Class I LMNOX
Class IS MVISX
Table of contents
|
Miller Opportunity Trust |
|||||||
|
Manager commentary |
1 |
||||||
|
Fund at a glance |
13 |
||||||
|
Fund expenses |
14 |
||||||
|
Schedule of investments |
16 |
||||||
|
Statement of assets and liabilities |
19 |
||||||
|
Statement of operations |
21 |
||||||
|
Statements of changes in net assets |
22 |
||||||
|
Financial highlights |
24 |
||||||
|
Notes to financial statements |
30 |
||||||
|
Additional information |
44 |
||||||
|
Privacy notice |
45 |
||||||
|
Directory of funds' service providers |
Back Cover |
||||||
Miller Opportunity Trust 2022 Semi-Annual Report
Miller Opportunity Trust manager commentary (unaudited)
An extreme first half of the year capped off a couple years of extremes. Extreme highs, and extreme lows. Extreme changes. The S&P 500 first half loss was the worst in over 50 years, since 1970. The markets challenged even the best managers with many of the best growth investors posting their worst losses in history. Baillie Gifford's US Fund (BGGSX), one of the most exceptional growth managers, was down over 50% in the first half, while other well-known private fund managers were rumored to be down as substantially or more. Value strategies, which generally fared better in the first quarter, ceded to selling pressure in the second quarter, with the Russell 2000 Value index down more than 15%.
Average Annual Total Returns and Expenses (%) as of 6/30/22a
|
Without Sales Charges |
|||||||||||||||||||||||||||||||
|
YTDb |
1 Yr |
3 Yr |
5 Yr |
10 Yr |
Inception* |
Inception Date |
|||||||||||||||||||||||||
|
Class A (LGOAX) |
-34.46 |
-47.75 |
0.79 |
2.20 |
11.41 |
13.21 |
2/3/09 |
||||||||||||||||||||||||
|
Class C (LMOPX) |
-34.69 |
-48.13 |
0.04 |
1.43 |
10.58 |
5.01 |
12/30/99 |
||||||||||||||||||||||||
|
Class FI (LMOFX) |
-34.48 |
-47.81 |
0.73 |
2.13 |
11.36 |
4.71 |
2/13/04 |
||||||||||||||||||||||||
|
Class I (LMNOX) |
-34.37 |
-47.63 |
1.04 |
2.45 |
11.71 |
6.00 |
6/26/00 |
||||||||||||||||||||||||
|
Class IS (MVISX) |
-34.34 |
-47.58 |
1.13 |
— |
— |
-3.52 |
8/22/18 |
||||||||||||||||||||||||
|
Class R (LMORX) |
-34.54 |
-47.90 |
0.54 |
1.92 |
11.06 |
3.19 |
12/28/06 |
||||||||||||||||||||||||
|
S&P 500 |
-19.96 |
-10.62 |
10.60 |
11.31 |
12.96 |
6.32 |
|||||||||||||||||||||||||
|
With Maximum Sales Charges |
|||||||||||||||||||||||||||||||
|
YTD |
1 Yr |
3 Yr |
5 Yr |
10 Yr |
Inception* |
||||||||||||||||||||||||||
|
Class A (LGOAX) |
-38.22 |
-50.76 |
-1.18 |
0.99 |
10.76 |
12.71 |
2/3/09 |
||||||||||||||||||||||||
|
Class C (LMOPX) |
-35.35 |
-48.64 |
0.04 |
1.43 |
10.58 |
5.01 |
12/30/99 |
||||||||||||||||||||||||
|
Class FI (LMOFX) |
-34.48 |
-47.81 |
0.73 |
2.13 |
11.36 |
4.71 |
2/13/04 |
||||||||||||||||||||||||
|
Class I (LMNOX) |
-34.37 |
-47.63 |
1.04 |
2.45 |
11.71 |
6.00 |
6/26/00 |
||||||||||||||||||||||||
|
Class IS (MVISX) |
-34.34 |
-47.58 |
1.13 |
— |
— |
-3.52 |
8/22/18 |
||||||||||||||||||||||||
|
Class R (LMORX) |
-34.54 |
-47.90 |
0.54 |
1.92 |
11.06 |
3.19 |
12/28/06 |
||||||||||||||||||||||||
|
S&P 500 |
-19.96 |
-10.62 |
10.60 |
11.31 |
12.96 |
6.32 |
|||||||||||||||||||||||||
a Performance greater than one year is annualized.
b Performance for the 6 months period ending 6/30/2022 (not annualized).
c S&P 500 since inception return represented from 12/30/99, the Fund's oldest share class.
Gross Expenses (%): Class A 1.21; Class C 1:95; Class FI 1.29; Class I 0.98; Class IS 0.90; Class R 1.47.
Performance shown represents past performance and is no guarantee of future results. Current performance may be higher or lower than the performance shown. Investment return and principal value will fluctuate so shares, when redeemed, may be worth more or less than the original cost. Class A shares have a maximum front-end sales charge of 5.75%. Class C shares have a one-year contingent deferred sales charge (CDSC) of 1.0%. If sales charges were included, performance shown would be lower. Total returns assume the reinvestment of all distributions at net asset value and the deduction of all Fund expenses. Total return figures are based on the NAV per share applied to shareholder subscriptions and redemptions, which may differ from the NAV per share disclosed in Fund shareholder reports. Performance would have been lower if fees had not been waived in various periods. YTD is calculated from January 1 of the reporting year. All classes of shares may not be available to all investors or through all distribution channels. For the most recent month-end information, please call 888-593-5110 or visit millervaluefunds.com.
We faced significant challenges in this environment too. Miller Opportunity Trust I-shares (LMNOX) was down 34.37% in first half vs. the S&P 500's 19.96% decline,
Miller Opportunity Trust 2022 Semi-Annual Report
1
Miller Opportunity Trust manager commentary (unaudited) (cont'd)
most of the loss occurred in the second quarter (Miller Opportunity Trust I-shares (LMNOX) -29.45% vs. SPX -16.10%). Despite the consumer remaining in great shape, knee jerk recession fears pummeled consumer discretionary, where we are overweight, with the MSCI US Investable Market Consumer Discretionary 25/50 Index down more than 25% in the second quarter. We think the market's knee-jerk reaction to simple rules creates opportunities for long-term fundamental investors.
The second quarter was the fourth worst in our 20+ year history, only outdone by Q4 2008, Q1 2020 and Q3 2011. All these periods contained markets in freefall. After prior crashes, the strategy rebounded strongly, averaging 96% returns in the next year.
The markets humble you. It's one of the things I love about markets. Well love-hate really. There's never a dull moment and you're always learning. False bravado gets rooted out quickly. Just when you think you understand something, the world changes.
The extreme economic and market conditions of the past few years are a little short of astounding, reinforcing the notion that forecasting is an exercise in futility. Our expertise lies in analyzing company fundamentals, and how those compare to expectations we believe are baked into stock prices, which is much more straightforward.
To recap: the new decade began on solid footing with early year gains, only to succumb a devastating pandemic. The Covid crash started in February 2020 and culminated in the fastest 30% decline in S&P 500 history. Entire economies shut down. One could hardly imagine a worse economic environment. Unemployment came close to 15%, the highest since the Great Depression. Oil prices went negative. Bill Ackman warned of a Depression era period saying, "Hell is coming." A financial apocalypse to be sure.
Who could be bullish in that environment? Yet that was exactly the right position. Prices were way off the highs. Massive monetary and fiscal stimulus saved the day (over $5T in fiscal spending and a Fed balance sheet expansion nearing $5T). Consumers benefited immensely. We experienced a severe recession with virtually no credit losses, a pairing previously unthinkable.
The world completely changed virtually overnight. Third quarter 2020 GDP growth measured a whopping 33%, the highest since the Bureau of Economic Analysis (BEA) started publishing the data in 1947. Had we finally cracked the nut on how to avoid recessions? Pundits discussed the possibility of another "roaring 20's" with high economic growth and strong markets. People believed elevated spending in areas like ecommerce had experienced a permanent upward shift. It was hard to
Miller Opportunity Trust 2022 Semi-Annual Report
2
find much not to like (in hindsight, the biggest warning sign of all and one we wish we heeded).
Dramatic change happened again when the inflation genie escaped the bottle. At first it was dismissed as transitory, but time made matters worse not better. CPI hit a level not seen in 40 years, yet another extreme. A behind-the-curve Fed has been forced to aggressively play catch up. Meanwhile, a market bubble popped in innovative disruption stocks. At the same time, a normalizing economy faced excess inventories as consumer spend shifted to services. Last but not least, Russia's invasion of Ukraine created the most fraught geopolitical landscape in decades.
This takes us to where we are now: the worst first half market performance since 1970 (SPX down 20.6%), over 50 years ago! Rack up another extreme...enough to give you whiplash. What happens from here? Another dramatic change, or more of the same?
We've eaten enough humble pie on macro thinking to avoid any prognostication. Many questions weigh on investors' minds. Has inflation rolled over? Will we enter a recession or not? Have we entered a new era of geopolitical turmoil and elevated energy costs? Can China sustain its economic recovery while pursing zero-Covid?
No one knows any of these answers. People struggle to understand what a recession is, let alone predict when one will occur. A recession is not two consecutive down GDP quarters as often cited. National Bureau of Economic Research (NBER) defines it as significant decline in economic activity spread across the economy, lasting more than a few months, normally visible in real GDP, real income, employment, industrial production, and wholesale-retail sales.
Here's what we do know. Economic growth has slowed dramatically. GDP growth in the first quarter was negative (mostly due to inventories) and the Atlanta Fed predicts Q2 real GDP growth of -1.2%. The surge in interest rates slammed mortgage demand, which hit the lowest level in 22 years early in June. Refi's are down nearly 80% year-over-year. Housing activity has slowed.
Inflation has remained stubbornly high, but forward indictors of inflation have rolled over. Commodity prices have broken down sharply leading Ned Davis' model to issue a sell signal. Monetary growth has plummeted, and financial conditions have tightened dramatically. Both equities and bonds sold off simultaneously, while credit spreads widened. Inflation breakevens have plummeted. In early July, the 5-year breakeven fell back below 2.5% for the first time since September 2021, down from a high of ~3.8%. The 5-year forward rate in 5 years sits at ~2.1%, not far above the Fed's 2.0% target.
Miller Opportunity Trust 2022 Semi-Annual Report
3
Miller Opportunity Trust manager commentary (unaudited) (cont'd)
Yet employment, a coincident to lagging indicator, remains strong. There has never been a recession without employment deterioration. Consumer balance sheets remain in great shape with approximately $2.3T in excess savings. Demand for services remain strong, and banks remain upbeat about consumer behavior and demand.
Where do we go from here? The cone of uncertainty about the future is always wide, but it currently seems particularly extreme. A return to the low growth, low interest rate environment of the past decade seems quite plausible, as does the emergence of a new, higher inflation regime. The market will likely remain volatile as it figures out the answer.
Yet, a dramatic market decline has lowered expectations across the board. A peak-to-trough S&P 500 drop of 24.5% ranks as the 12th worst in the post-Depression period. Historically, an investor has earned above-average returns buying after a 20% market decline. The market averaged low-to-mid teens annualized returns over 1, 3 and 5 years whether we faced a recession or not. While we could expect more downside to the ultimate low, it hasn't historically taken that much patience (1 year) to be nicely in the green.
Howard Marks, one of the best contrarian value investors, recently said he's seeing good values and buying aggressively. Valuations have come down nicely. The S&P 500 currently trades for 16.7x this year's earnings. The attractiveness of that valuation is highly sensitive to inflation and interest rates. The current multiple is about average for periods when the Fed's favored measure of inflation (core PCE) sits between 3-4%, which happens to be where the 1-year inflation breakeven lies.
If inflation falls below 3%, as suggested by longer term breakevens, there's room for multiple expansion to the historical average multiple of 19x+. The reverse is also true. Higher than expected inflation would continue to weigh on market valuations as multiples averaged 13x with inflation above 4%.
In the low-inflation, low-interest rate environment of the prior decade, high growth stocks led. On the other hand, high inflation periods like the 70s benefit value stocks with pricing power. This dichotomy presents a challenge for investors. We see many compelling opportunities we think can do well irrespective of the macro. We've constructed a diversified portfolio of undervalued securities that we believe can do well over the long term.
Unfortunately, the current price action is all about the macro. When that's happened historically, we've struggled. JP Morgan recently reported that fundamental trading now represents only 10% of trading flows. The other 90% are a combination of passive, systematic and macro discretionary. That means in the
Miller Opportunity Trust 2022 Semi-Annual Report
4
short term, prices can get even more disconnected from fundamentals than they historically did, in our opinion.
While market valuations overall seem reasonable, we believe we are witnessing extreme disconnections in certain areas. Prices can always get more extreme. In the long term, we believe fundamentals will prevail. Based on the fundamentals, we calculate tremendous upside potential for the Fund.
The portfolio sits in four broad buckets: travel, reasonably valued compounders, cash-flowing value companies with good capital allocation and high potential earlier-stage growth companies. The commonalities amongst all our holdings: attractive valuations relative to intrinsic value and an attractive risk-reward skew.
Travel represents the biggest disconnect we see between fundamentals and expectations. Unfortunately, we believe we are early here, as this divergence has only grown. We expected a strong travel recovery would benefit the stocks and close the valuation gap. Despite record revenues at several airlines, cruise lines returning to service with strong bookings and record summer travel, travel stocks uniformly tanked.
Amazingly, some companies like Carnival Cruise Lines (which we don't own) made it back to its March 2020 lows when business was shut down with no sign of return. Carnival already resumed positive operating cash flow generation and disclosed stronger than historical bookings for 2023 at higher prices. The market focused on fear of recession and refinancing risk posed by higher rates.
We do own Norwegian (NCLH $11), which is back to levels not seen since May 2020. Norwegian is the boutique, premium brand. It has guided for a return to positive operating cash flow and adjusted EBITDA in the second half. Management expects to earn record adjusted EBITDA in 2023 and to generate enough cash flow to cover all its capital needs, including debt maturities. It trades at 6x 2023 earnings, well below its historical average of 11.8x.
The market fears weakening demand. So far, we do not see evidence to support this fear in the travel space. There's still significant pent-up demand for leisure, which Rubinson Research estimates to still be over $500B. This provides a cushion for any coming softness. We believe the consumer remains in great shape with excess savings 3x excess inflation (also according to Rubinson). Historically, pricing power has been strong in this group.
Many travel names already seem to have priced in a recession. The airlines are more than 50% off their highs. JP Morgan recently noted that a 40% decline has historically been a good buy signal. Airlines gained more than 70% on average over the next year, subsequently. The legacy US airlines are generating record revenues
Miller Opportunity Trust 2022 Semi-Annual Report
5
Miller Opportunity Trust manager commentary (unaudited) (cont'd)
and significant free cash flow, which can be used to repair their balance sheets. They also have record liquidity.
The market gives airlines no credit for being better businesses than their historical bankruptcy-prone record suggests. Consolidation of US legacy players led to a decade-plus of more capacity discipline and better returns on capital. Pilot shortages will enforce capacity restraint, which should lead to better pricing power...a big deal for profitability given high operating leverage. We already see signs as Delta and United earn attractive margins despite higher fuel costs.
Delta (DAL $30) trades below 4x next year's EV/EBITDAR, the favored industry valuation metric that incorporates aircraft leases and debt balances. That's only happened one other time in the past 20+ years, in June 2016. Delta gained 50% in the following 12 months from that point. United (UAL $38) trades at a similarly depressed multiple, 3.6x. Outside of two months prior to the pandemic, it's also only been below 4x in Jun 2016 as well. It rose ~80% over the next year.
Travel company stock prices seem to be caught in the vortex of simple rules that drive many systematic and macro discretionary strategies. Recession equals sell consumer discretionary. High oil prices mean sell transportation. The facts don't matter, at least in the short term. We believe they absolutely will in the long term, which is why we've added to our exposure.
We bought Expedia (EXPE $89) in the quarter. It's fallen 50% year-to-date despite expectations for record EBITDA this year. Expedia made significant improvements to both its cost structure and its technology infrastructure during the pandemic. This year Expedia's EBITDA margins (21%) are expected to surpass 2019's (16%) by more than 30%.
It's also gushing free cash flow. We believe EXPE could generate ~$16/share this year, which is a ~18% yield on the current $91 stock price. Most of this year's free cash flow stems from working capital, but the prospects for operating free cash flow are also strong. Consensus has Expedia earning ~$11/share next year, a 12% yield. Add in working capital benefits and it should generate more than ~$18/share (20% yield). Barry Diller, who has one of the strongest capital allocation track records around, chairs the Board and recently exercised some options. We expect the company to reach its deleveraging targets later this year, then to deploy its cash flow in value accretive ways, such as share repurchase.
In March 2020, Expedia bottomed at 6.4x 2019 EV/EBITDA. There could hardly be a more dire business outlook than what it faced then. A similar multiple on current year EBITDA would equate to $78, 12% downside, which demonstrates the dire outlook already priced in. We believe the stock is worth more than double the current price, an attractive risk-reward skew. It's unusual to find a company with a
Miller Opportunity Trust 2022 Semi-Annual Report
6
10-20% free cash flow yield that can sustainably grow topline high-single digits, as we believe Expedia can do.
I recall only one other instance where fundamentals diverged so sharply from stock prices. In late 2011, markets sold off on fears that a Eurozone debt crisis would lead the world back into recession. Homebuilders and financials, the worst losers during the Financial Crisis crash, plummeted. Some homebuilders, like Pulte, traded down to half their financial crisis lows despite reporting housing improvements for the first time. Fear ruled in the short term, but fundamentals ultimately prevailed. Homebuilders were top performers in 2012 posting triple-digit increases in some cases. Opportunity Trust was the top performing fund in its category that year: The Fund (Class I) was ranked #1 among 264 Morningstar Mid-Cap Blend Funds.
This raises the question: are we witnessing a once-in-a-decade opportunity?
We started to see this parallel late last year when travel names sold off sharply in the face of a looming travel recovery, which we believed would lead to significant gains. Unfortunately, the disconnect has only grown more extreme, something you can never rule out in markets.
From here, we need to see significant deterioration in fundamentals to justify current prices. That can always happen, but we find it unlikely. We think recency-bias is again rearing its ugly head as the market anchors on pandemic-like outcomes unlikely to recur. As fear recedes, we expect strong gains from these stocks. Sir John Templeton famously advised to invest at the point of maximum pessimism. We may be getting close.
We also like reasonably valued compounders, like Amazon (AMZN $111), Google/Alphabet (GOOGL $2207) and Facebook/ Meta (META $158). GOOGL trades for 16.5x this year's earnings excluding net cash, while META trades for 13x. Given the quality of these businesses, their dominance in online advertising and the great returns on capital, we think these are very attractive valuations.
AMZN looks more expensive on this year's earnings, but we believe it is massively underearning its long run potential. We expect it to close that gap over the coming years. Consensus earnings estimates for 2027 are ~$10 per share so it trades at less than 11x 4.5 year out earnings. Costco trades at close to 39x. A multiple in the low 20's seems conservative in most scenarios, which would imply a doubling. That may understate the potential as you can easily argue that Amazon Web Services (AWS) is currently worth the entire value of the business. Either way, we think these compounders are undervalued. In contrast, there are still many quality companies that appear expensive.
Our cash-flowing value stocks are an eclectic mix of businesses. For much of the past decade, the market ignored value (or worse!) and the stocks languished.
Miller Opportunity Trust 2022 Semi-Annual Report
7
Miller Opportunity Trust manager commentary (unaudited) (cont'd)
When managements allocate capital well by returning it to shareholders, the favorable cash-on-cash returns can take care of themselves. We own some energy companies, like Ovintiv (OVV $40) and Diamondback (FANG $107), with high free cash flow yields that are returning significant amounts of free cash flow to shareholders. Ovintiv, for instance, has a 33% free cash flow yield next year with oil in the $90s, and a cash return of over 20%.
We own OneMain Financial (OMF $38), a subprime consumer credit company, that trades for 4x earnings with a 10% dividend yield, which should be sustainable in a recession. Credit losses are normalizing from abnormal pandemic lows, but it sees no sign of a coming recession. It expects to generate capital through the cycle. It also has enough liquidity to last for 2 years without accessing the capital markets.
We own Teva Pharmaceuticals (TEVA $7), the largest generic pharmaceutical manufacturer, that trades for 3x earnings with a 24% free cash flow yield. Prior management overlevered the balance sheet doing acquisitions. Current management has paid down net debt from $34B to $20B. Assuming it hits its leverage target at the end of next year, that free cash flow can come back to shareholders, or be used for other value accretive purposes.
We own a couple of turnarounds. At Mattel (MAT $22), CEO Ynon Kriez has led a stunning improvement in operations, margins, growth and returns on capital. At 11x next year's earnings, the market isn't yet crediting the company for the magnitude of improvement. For this reason, there's been rumored private equity interest in the company. Later this year, we expect it too will get its balance sheet to a place where it can allocate capital in additional shareholder-friendly ways.
At DXC (DXC $28), CEO Mike Salvino has massively improved the topline, margins and free cash flow. At 7x, the company believes its undervalued (we agree!) so it's buying back a significant amount of stock. Next fiscal year it expects to generate $1.5B in free cash flow, which equates to a 24% yield at the current $6.3B market cap.
I'd be remiss not to mention Alibaba (BABA $104), our largest position. We could place it in the value bucket or the reasonably priced compounders. It got crushed over the past year but was one of only two stocks we had up in the quarter, which is how it ended up at the top spot. With the Chinese government fully committed to zero-Covid, you'd hardly call the operating environment good. It is getting less bad as the economy reopens. With low enough expectations, that's all it takes. A harbinger of what's to come more broadly for markets?
BABA trades for only 12.5x next year's earnings excluding net cash. The perfect storm of malign economic conditions, government pressures and a sizeable investment that weighed on the stock over the past year appears to be dissipating.
Miller Opportunity Trust 2022 Semi-Annual Report
8
It remains an ecommerce and cloud leader with good growth prospects. We think it's significantly undervalued.
The last bucket in the portfolio is high-potential, early-stage growth companies. This group has been slaughtered. Nothing was spared from pain. It's likely some of these companies will prove to be the best values over the next decade. We've concentrated in the names where we have the highest conviction, and exited names where fundamentals have been more challenged.
Here, too, we see some extreme valuations. We've written about the potential we see in Farfetch (FTCH $7), a luxury goods marketplace and aspiring technology platform for luxury. FTCH has also acquired several traditional luxury goods companies over the years, the largest being New Guards Group (NGG), a collection of brands. It also owns Stadium Goods, a stake in Neiman Marcus group, Browns and several other assets. Many of these businesses are already profitable. We calculate their value alone to be worth more than the entire company today! At the current price, we believe it implies you are not paying anything for the option on the whole marketplace and platform services business.
While we are disappointed with our performance, we remain confident about the portfolio's prospects. We wish we'd better foreseen the risks presented by the euphoria of 12-18 months ago. Mr. Market has now reversed that sentiment entirely. We believe the current environment is characterized by extreme pessimism. We maintain high conviction that our securities are mispriced because we see firsthand how deeply disconnected the stock prices are from the underlying fundamentals.
In a market driven by fear rather than fundamentals, we think the rewards for being long term will be outsized. We think extreme times in extreme markets call for extreme patience.
We have a diverse mix of businesses that should help us do well in a variety of environments. We have high confidence in our process, which offers the unique combination of a long-term focus, a flexible approach and valuation-centricity.
We have deep gratitude and appreciation for our supportive clients. As significant investors alongside our clients, we've felt the pain of recent performance. We remain fully committed to seeking to deliver excellent returns going forward.
|
Samantha McLemore, CFA July 18, 2022 |
|||
The S&P 500 Index is a market capitalization-weighted index of 500 widely held common stocks. The MSCI US Investable Market Consumer Discretionary 25/50 Index is a benchmark of large-, mid-, and small-cap U.S. stocks in the
Miller Opportunity Trust 2022 Semi-Annual Report
9
Miller Opportunity Trust manager commentary (unaudited) (cont'd)
consumer discretionary sector. The Russell 2000 Value Index measures the performance of those Russell 2000 Index companies with lower price-to-book ratios and lower forecasted growth values. Unmanaged index returns do not reflect any fees, expenses or sales charges. Active share measures the degree of difference between a fund portfolio and its benchmark index. Basis point is one hundredth of one percent. Compounders are companies with the ability to appreciate over the long term. CPI (Consumer Price Index) is a measure of the average change over time in the prices paid for a market basket of consumer goods and services. Earnings per share (EPS) is the portion of a company's profit allocated to each outstanding share of common stock and serves as an indicator of a company's profitability. EBITDA is earnings before interest, taxes, depreciation and amortization and is a calculation of a company's financial health. EV/EBITDAR compares a company's enterprise value to its earnings before interest, taxes, depreciation, amortization, and restructuring or rent costs and measures a company's financial performance. Free cash flow (FCF) is earnings before depreciation, amortization, and non-cash charges minus maintenance capital expenditures. Net Promoter Score (NPS) is a customer loyalty and satisfaction measurement. Earnings growth is not representative of the Fund's future performance.
Equity securities are subject to price fluctuation and possible loss of principal. Small- and mid-cap stocks involve greater risks and volatility than large-cap stocks. The Fund may focus its investments in certain regions or industries, increasing its vulnerability to market volatility. International investments are subject to special risks, including currency fluctuations and social, economic and political uncertainties, which could increase volatility. Derivatives, such as options and futures, can be illiquid, may disproportionately increase losses, and have a potentially large impact on Fund performance. The manager's investment style may become out of favor and/or the manager's selection process may prove incorrect, which may have a negative impact on the Fund's performance. Short selling is a speculative strategy. Unlike the possible loss on a security that is purchased, there is no limit on the amount of loss on an appreciating security that is sold short.
Morningstar Rankings represent a fund's total return percentile rank relative to all funds in the same Morningstar Category. The highest percentile rank is 1 and the lowest is 100. It is based on Morningstar total return, which includes both income and capital gains or losses and is not adjusted for sales charges or redemption fees. Past performance does not guarantee future results. Ratings shown for Class I shares only: ratings for other share classes may differ. The Fund was ranked 100%, 98% and 9% among 407, 325, and 217 Morningstar Mid-Cap Blend Funds
Miller Opportunity Trust 2022 Semi-Annual Report
10
over the 1-, 5- and 10-year periods as of 6/30/22 based on total returns. ©2022 Morningstar, Inc. All Rights Reserved. The information contained herein: (1) is proprietary to Morningstar; (2) may not be copied or distributed; and (3) is not warranted to be accurate, complete or timely. Neither Morningstar nor its content providers are responsible for any damages or losses arising from any use of this information.
The views expressed are those of the portfolio managers as of the date indicated, are subject to change, and may differ from the views of other portfolio managers or the firm as a whole. These opinions are not intended to be a forecast of future events, a guarantee of future results, or investment advice. All data referenced are from sources deemed to be reliable but cannot be guaranteed. Discussions of individual securities are intended to inform shareholders as to the basis (in whole or in part) for previously made decisions by a portfolio manager to buy, sell or hold a security in a portfolio. References to specific securities are not intended and should not be relied upon as the basis for anyone to buy, sell or hold any security. Portfolio holdings and sector allocations may not be representative of the portfolio manager's current or future investment and are subject to change at any time.
The Miller Value Funds are distributed by Quasar Distributors, LLC.
Before investing, carefully consider a Fund's investment objectives, risks, charges and expenses. You can find this and other information in each prospectus, or summary prospectus if available, which is available at millervaluefunds.com. Please read it carefully.
©2022 Miller Value Partners, LLC
Miller Opportunity Trust 2022 Semi-Annual Report
11
Miller Opportunity Trust manager commentary (unaudited) (cont'd)
Baillie Gifford U.S. Equity Growth Fund
Investment Objective
Baillie Gifford U.S. Equity Growth Fund seeks capital appreciation.
Fees and Expenses
|
Class K |
Institutional Class |
||||||
|
None |
None |
||||||
Annual Fund Operating Expenses
|
Class K |
Institutional Class |
||||||||||
|
Management Feesa |
0.50 |
% |
0.50 |
% |
|||||||
|
Distribution (12b-1) Fees |
None |
None |
|||||||||
|
Other Expenses |
0.18 |
% |
0.28 |
% |
|||||||
|
Total Annual Fund Operating Expenses |
0.68 |
% |
0.78 |
%b |
|||||||
|
Fee Waiver and/or Expense Reimbursementc |
(0.03 |
)% |
(0.03 |
)% |
|||||||
|
Total Annual Fund Operating Expenses After Fee Waiver and/or Expense Reimbursementc |
0.65 |
% |
0.75 |
% |
|||||||
a The Management Fee consists of an Advisory Fee and an Administration and Supervisory Fee paid by the Fund to Baillie
b Gifford Overseas Limited. Total Annual Fund Operating Expenses for the year ended December 31, 2021 do not match the financial statements due to rounding.
c Baillie Gifford Overseas Limited has contractually agreed to waive its fees and/or bear Other Expenses of the Fund until April 30, 2023 to the extent that such Fund's Total Annual Operating Expenses (excluding taxes, sub-accounting expenses and extraordinary expenses) exceed 0.65% for Class K and Institutional Class shares. This contractual agreement may only be terminated by the Board of Trustees of the Trust. Expenses after waiver/ reimbursement exceed 0.65% for Institutional Class due to sub-accounting expenses of 0.10%.
Investments in Baillie Gifford Funds involves the following risks: Investment Style Risk, Growth Stock Risk, Long-Term Investment Strategy Risk, Geographic Focus Risk, Non-Diversification Risk, Conflicts of Interest Risk, Equity Securities Risk, ESG Risk, Focused Investment Risk, Government and Regulatory Risk, Information Technology Risk, IPO Risk, Large-Capitalization Securities Risk, Liquidity Risk, Market Disruption and Geopolitical Risk, Market Risk, New and Smaller-Sized Funds Risk, Service Provider Risk, Small- and Medium-Capitalization Securities Risk, Valuation Risk.
|
Average Annual Total Returns for Periods Ended June 30, 2022 |
1 Year |
5 Year |
Since Fund Inception (12/05/2016) |
||||||||||||
|
Institutional Class Returns Before Taxes1,2 |
-62.05 |
% |
8.80 |
% |
11.73 |
% |
|||||||||
1 Performance for Institutional Class shares prior to their date of inception (April 28, 2017) is derived from the historical performance of Class 1 shares and has been adjusted for the higher total annual operating expenses incurred by Institutional Class.
2 If reimbursement received from the Manager in 2019 were excluded, the total return would be lower.
Miller Opportunity Trust 2022 Semi-Annual Report
12
Fund at a glance+ (unaudited)
Investment breakdown (%) as a percentage of total investments
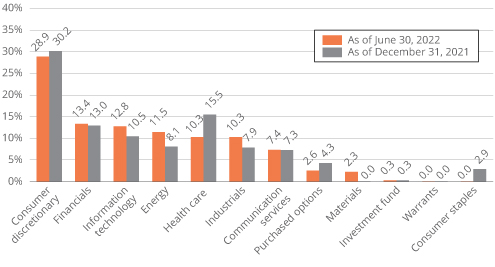
+ The bar graph above represents the composition of the Fund's investment as of June 30, 2022 and December 31, 2021. The Fund is actively managed. As a result, the composition of the Fund's investments is subject to change at any time.
Miller Opportunity Trust 2022 Semi-Annual Report
13
Fund expenses (unaudited)
As a shareholder of the Fund, you may incur two types of costs: (1) transaction costs, including front-end and back-end sales charges (loads) on purchase payments; and (2) ongoing costs, including management fees; service and/or distribution (12b-1) fees; and other Fund expenses. This example is intended to help you understand your ongoing costs (in dollars) of investing in the Fund and to compare these costs with the ongoing costs of investing in other mutual funds.
The example is based on an investment of $1,000 invested on January 1, 2022 and held for the six months ended June 30, 2022.
Actual Expenses
The table below titled "Based on total actual return" provides information about actual account values and actual expenses. You may use the information provided in this table, together with the amount you invested, to estimate the expenses that you paid over the period. To estimate the expenses you paid on your account, divide your ending account value by $1,000 (for example, an $8,600 ending account value divided by $1,000 = 8.6), then multiply the result by the number under the heading entitled "Expenses Paid During the Period".
Hypothetical Example for Comparison Purposes
The table below titled "Based on hypothetical actual return" provides information about hypothetical account values and hypothetical expenses based on the actual expense ratio and an assumed rate of return of 2.48% per year before expenses, which is not the Fund's actual return. The hypothetical account values and expenses may not be used to estimate the actual ending account balance or expenses you paid for the period. You may use this information provided in this table to compare the ongoing costs of investing in the Fund and other funds. To do so, compare the 2.48% hypothetical example relating to the Fund with the 2.48% hypothetical examples that appear in the shareholder reports of the other funds.
Please note that the expenses shown in the table below are meant to highlight your ongoing costs only and do not reflect any transactional costs, such as front-end or back-end sales charges (loads). Therefore, the table is useful in comparing ongoing costs only, and will not help you determine the relative total costs of owning different funds. In addition, if these transactional costs were included, your costs could have been higher.
Miller Opportunity Trust 2022 Semi-Annual Report
14
Based on total actual return1
|
Actual Total Return Without Sales Charges2 |
Beginning Account Value |
Ending Account Value |
Annualized Expense Ratio |
Expenses Paid During the Period3 |
|||||||||||||||||||
|
Class A |
-34.46 |
% |
$ |
1,000.00 |
$ |
655.40 |
1.33 |
% |
$ |
5.48 |
|||||||||||||
|
Class C |
-34.69 |
1,000.00 |
653.10 |
2.08 |
8.53 |
||||||||||||||||||
|
Class FI |
-34.48 |
1,000.00 |
655.20 |
1.42 |
5.83 |
||||||||||||||||||
|
Class R |
-34.54 |
1,000.00 |
654.60 |
1.59 |
6.53 |
||||||||||||||||||
|
Class I |
-34.37 |
1,000.00 |
656.30 |
1.08 |
4.42 |
||||||||||||||||||
|
Class IS |
-34.34 |
1,000.00 |
656.60 |
1.02 |
4.19 |
||||||||||||||||||
Based on hypothetical actual return1
|
Hypothetical Annualized Total Return |
Beginning Account Value |
Ending Account Value |
Annualized Expense Ratio |
Expenses Paid During the Period3 |
|||||||||||||||||||
|
Class A |
2.48 |
% |
$ |
1,000.00 |
$ |
1,018.18 |
1.33 |
% |
$ |
6.68 |
|||||||||||||
|
Class C |
2.48 |
1,000.00 |
1,014.48 |
2.08 |
10.39 |
||||||||||||||||||
|
Class FI |
2.48 |
1,000.00 |
1,017.75 |
1.42 |
7.11 |
||||||||||||||||||
|
Class R |
2.48 |
1,000.00 |
1,016.90 |
1.59 |
7.96 |
||||||||||||||||||
|
Class I |
2.48 |
1,000.00 |
1,019.45 |
1.08 |
5.39 |
||||||||||||||||||
|
Class IS |
2.48 |
1,000.00 |
1,019.73 |
1.02 |
5.11 |
||||||||||||||||||
1 For the six months ended June 30, 2022.
2 Assumes the reinvestment of all distributions, including returns of capital, if any, at net asset value or does not reflect the deduction of the applicable sales charge with respect to Class A shares or the applicable contingent deferred sales charge ("CSDC") with respect to Class C shares. Total return is not annualized, as it may not be representative of the total return for the year. Performance figures may reflect fee waivers and/or expense reimbursements. In the absence of fee waivers and/or expense reimbursements, the total return would have been lower. Past performance is no guarantee of future results.
3 Expenses (net of compensating balance arrangements, fee waivers and/or expense reimbursements) are equal to each class' respective annualized expense ratio multiplied by the average account value over the period, multiplied by the number of days in the most recent fiscal half-year (181), then divided by 365.
Miller Opportunity Trust 2022 Semi-Annual Report
15
Schedule of investments (unaudited)
June 30, 2022
Miller Opportunity Trust
|
Security |
Shares |
Value |
|||||||||
|
Common Stocks — 111.1% |
|||||||||||
|
Communication Services — 8.5% |
|||||||||||
|
Interactive Media & Services — 8.5% |
|||||||||||
|
Alphabet Inc., Class A Shares *(a) |
30,000 |
$ |
65,377,800 |
||||||||
|
Meta Platforms Inc., Class A Shares *(a) |
300,000 |
48,375,000 |
|||||||||
|
Total Interactive Media & Services |
113,752,800 |
||||||||||
|
Total Communication Services |
113,752,800 |
||||||||||
|
Consumer Discretionary — 33.1% |
|||||||||||
|
Automobiles — 3.0% |
|||||||||||
|
General Motors Co. * |
1,250,000 |
39,700,000 |
|||||||||
|
Hotels, Restaurants & Leisure — 6.9% |
|||||||||||
|
Expedia Group, Inc. * |
550,000 |
52,156,500 |
|||||||||
|
Norwegian Cruise Line Holdings Ltd. *(a) |
3,600,000 |
40,032,000 |
|||||||||
|
Total Hotels, Restaurants & Leisure |
92,188,500 |
||||||||||
|
Household Durables — 3.9% |
|||||||||||
|
Taylor Morrison Home Corp. *(a) |
2,250,000 |
52,560,000 |
|||||||||
|
Internet & Direct Marketing Retail — 12.8% |
|||||||||||
|
Alibaba Group Holding Ltd. — ADR * |
725,000 |
82,418,000 |
|||||||||
|
Amazon.com Inc. *(a) |
600,000 |
63,726,000 |
|||||||||
|
Farfetch Ltd., Class A Shares *(a) |
3,400,000 |
24,344,000 |
|||||||||
|
Total Internet & Direct Marketing Retail |
170,488,000 |
||||||||||
|
Leisure Products — 5.4% |
|||||||||||
|
Mattel, Inc. *(a) |
3,250,000 |
72,572,500 |
|||||||||
|
Textiles, Apparel & Luxury Goods — 1.1% |
|||||||||||
|
Canada Goose Holdings Inc. *(a) |
800,000 |
14,408,000 |
|||||||||
|
Total Consumer Discretionary |
441,917,000 |
||||||||||
|
Energy — 13.2% |
|||||||||||
|
Oil, Gas & Consumable Fuels — 13.2% |
|||||||||||
|
Diamondback Energy Inc. |
380,000 |
46,037,000 |
|||||||||
|
Energy Transfer LP |
5,300,000 |
52,894,000 |
|||||||||
|
Ovintiv Inc. (a) |
1,750,000 |
77,332,500 |
|||||||||
|
Total Oil, Gas & Consumable Fuels |
176,263,500 |
||||||||||
|
Total Energy |
176,263,500 |
||||||||||
|
Financials — 15.4% |
|||||||||||
|
Banks — 7.0% |
|||||||||||
|
Bank of America Corp. |
400,000 |
12,452,000 |
|||||||||
|
Citigroup Inc. |
925,000 |
42,540,750 |
|||||||||
|
JPMorgan Chase & Co. (a) |
340,000 |
38,287,400 |
|||||||||
|
Total Banks |
93,280,150 |
||||||||||
|
Capital Markets — 0.9% |
|||||||||||
|
Coinbase Global Inc., Class A Shares * |
260,000 |
12,225,200 |
|||||||||
Miller Opportunity Trust 2022 Semi-Annual Report
16
Miller Opportunity Trust
|
Security |
Shares |
Value |
|||||||||
|
Consumer Finance — 7.5% |
|||||||||||
|
Capital One Financial Corp. |
290,000 |
$ |
30,215,100 |
||||||||
|
OneMain Holdings Inc. (a) |
1,575,000 |
58,873,500 |
|||||||||
|
SoFi Technologies Inc. * |
2,000,000 |
10,540,000 |
|||||||||
|
Total Consumer Finance |
99,628,600 |
||||||||||
|
Total Financials |
205,133,950 |
||||||||||
|
Health Care — 11.8% |
|||||||||||
|
Biotechnology — 3.9% |
|||||||||||
|
Karuna Therapeutics, Inc. * |
200,000 |
25,302,000 |
|||||||||
|
Precigen, Inc. * |
5,263,834 |
7,053,538 |
|||||||||
|
PureTech Health Plc * |
9,500,000 |
19,821,300 |
|||||||||
|
Total Biotechnology |
52,176,838 |
||||||||||
|
Pharmaceuticals — 7.9% |
|||||||||||
|
Bausch Health Cos Inc. *(a) |
2,300,000 |
19,228,000 |
|||||||||
|
Green Thumb Industries Inc. * |
3,100,000 |
24,800,000 |
|||||||||
|
Teva Pharmaceutical Industries Ltd. — ADR * |
8,200,000 |
61,664,000 |
|||||||||
|
Total Pharmaceuticals |
105,692,000 |
||||||||||
|
Total Health Care |
157,868,838 |
||||||||||
|
Industrials — 11.8% |
|||||||||||
|
Airlines — 6.0% |
|||||||||||
|
Delta Air Lines Inc. *(a) |
1,475,000 |
42,730,750 |
|||||||||
|
United Continental Holdings, Inc. * |
1,050,000 |
37,191,000 |
|||||||||
|
Total Airlines |
79,921,750 |
||||||||||
|
Commercial Services & Supplies — 3.7% |
|||||||||||
|
ADT Inc. (a) |
8,000,000 |
49,200,000 |
|||||||||
|
Road & Rail — 2.1% |
|||||||||||
|
Uber Technologies Inc. * |
1,400,000 |
28,644,000 |
|||||||||
|
Total Industrials |
157,765,750 |
||||||||||
|
Information Technology — 14.6% |
|||||||||||
|
Electronic Equipment, Instruments & Components — 3.1% |
|||||||||||
|
Vontier Corp. |
1,800,000 |
41,382,000 |
|||||||||
|
IT Services — 8.7% |
|||||||||||
|
DXC Technology Co. *(a) |
2,300,000 |
69,713,000 |
|||||||||
|
Fiserv, Inc. * |
520,000 |
46,264,400 |
|||||||||
|
Total IT Services |
115,977,400 |
||||||||||
|
Software — 2.8% |
|||||||||||
|
Splunk Inc. * |
430,000 |
38,037,800 |
|||||||||
|
Total Information Technology |
195,397,200 |
||||||||||
Miller Opportunity Trust 2022 Semi-Annual Report
17
Schedule of investments (unaudited) (cont'd)
June 30, 2022
Miller Opportunity Trust
|
Security |
Shares |
Value |
|||||||||||||||||||||
|
Materials — 2.7% |
|||||||||||||||||||||||
|
Metals & Mining — 2.7% |
|||||||||||||||||||||||
|
Cleveland-Cliffs, Inc. * |
2,300,000 |
$ |
35,351,000 |
||||||||||||||||||||
|
Total Materials |
35,351,000 |
||||||||||||||||||||||
|
Total Common Stocks (Cost — $1,865,200,439) |
1,483,450,038 |
||||||||||||||||||||||
|
Investment Fund — 0.3% |
|||||||||||||||||||||||
|
Pangaea One, LP (b)(c)(d) |
4,182,054 |
||||||||||||||||||||||
|
Total Investment Fund (Cost — $28,460,537) |
4,182,054 |
||||||||||||||||||||||
|
Maturity Date |
Strike Price |
Contracts |
Notional ($) |
||||||||||||||||||||
|
Purchased Option — 3.0% |
|||||||||||||||||||||||
|
Put Option — 3.0% |
|||||||||||||||||||||||
|
iShares 20+ Year Treasury Bond ETF |
Jan. 19, 2024 |
$ |
143.00 |
13,000 |
185,900,000 |
39,520,000 |
|||||||||||||||||
|
Total Purchased Option (Premiums Paid — $16,918,613) |
39,520,000 |
||||||||||||||||||||||
|
Expiration Date |
Exercise Price |
Shares |
|||||||||||||||||||||
|
Warrants — 0.0% |
|||||||||||||||||||||||
|
Alaunos Therapeutics, Inc. *(c)(d) |
Jul. 30, 2024 |
$ |
7.00 |
3,787,879 |
615,531 |
||||||||||||||||||
|
Total Warrants (Cost — $1,177,758) |
615,531 |
||||||||||||||||||||||
|
Total Investments — 114.4% (Cost — $1,883,296,810) |
1,527,767,623 |
||||||||||||||||||||||
|
Liabilities in Excess of Other Assets — (14.4)% |
(192,676,220 |
) |
|||||||||||||||||||||
|
Total Net Assets — 100.0% |
$ |
1,335,091,403 |
|||||||||||||||||||||
ADR — American Depositary Receipt
* Non-income producing security.
(a) All or a portion of this security is pledged as collateral pursuant to the loan agreement.
(b) In this instance, as defined in the Investment Company Act of 1940, an "Affiliated Company" represents Fund ownership of at least 5% of the outstanding voting securities of an issuer, or outstanding capital for Pangaea One, LP. At June 30, 2022, the total market value of investments in Affiliated Companies was $4,182,054 and the cost was $28,460,537. (See Note 9).
(c) Security is valued in good faith in accordance with procedures approved by the Board of Trustees (See Note 2).
(d) Restricted security (See Note 10).
The Global Industry Classification Standard (GICS ®) was developed by and/or is the exclusive property of MSCI, Inc. and Standard & Poor's Financial Services LLC ("S&P"). GICS is a service mark of MSCI and S&P and has been licensed for use by U.S. Bancorp Fund Services, LLC.
The Accompanying Notes are an Integral Part of these Financial Statements.
Miller Opportunity Trust 2022 Semi-Annual Report
18
Statement of assets and liabilities (unaudited)
June 30, 2022
|
Assets: |
|||||||
|
Investments in unaffiliated securities, at value (Cost $1,854,836,273) |
$ |
1,523,585,569 |
|||||
|
Investments in affiliated securities, at value (Cost $28,460,537) |
4,182,054 |
||||||
|
Receivable for securities sold |
8,345,842 |
||||||
|
Receivable for Fund shares sold |
582,847 |
||||||
|
Dividends and interest receivable |
318,500 |
||||||
|
Prepaid expenses |
80,410 |
||||||
|
Total Assets |
1,537,095,222 |
||||||
|
Liabilities: |
|||||||
|
Line of credit payable (Note 7) |
194,335,000 |
||||||
|
Payable to Custodian |
30,738 |
||||||
|
Payable for securities purchased |
4,696,448 |
||||||
|
Payable for Fund shares repurchased |
548,168 |
||||||
|
Investment management fee payable |
897,131 |
||||||
|
Distribution and service fees payable |
603,534 |
||||||
|
Interest payable |
317,556 |
||||||
|
Accrued other expenses |
575,244 |
||||||
|
Total Liabilities |
202,003,819 |
||||||
|
Total Net Assets |
$ |
1,335,091,403 |
|||||
|
Net Assets: |
|||||||
|
Paid-in capital |
$ |
1,634,017,038 |
|||||
|
Total accumulated loss |
(298,925,635 |
) |
|||||
|
Total Net Assets |
$ |
1,335,091,403 |
|||||
The Accompanying Notes are an Integral Part of these Financial Statements.
Miller Opportunity Trust 2022 Semi-Annual Report
19
Statement of assets and liabilities (unaudited) (cont'd)
June 30, 2022
|
Net Assets: |
|||||||
|
Class A |
$ |
562,464,412 |
|||||
|
Class C |
$ |
85,550,318 |
|||||
|
Class FI |
$ |
9,357,715 |
|||||
|
Class R |
$ |
4,052,758 |
|||||
|
Class I |
$ |
673,153,486 |
|||||
|
Class IS |
$ |
512,714 |
|||||
|
Shares Outstanding: |
|||||||
|
Class A |
22,432,366 |
||||||
|
Class C |
3,740,957 |
||||||
|
Class FI |
362,671 |
||||||
|
Class R |
162,945 |
||||||
|
Class I |
24,448,934 |
||||||
|
Class IS |
18,572 |
||||||
|
Net Asset Value: |
|||||||
|
Class A (and redemption price) |
$ |
25.07 |
|||||
|
Class C (redemption price* and offering price per share) |
$ |
22.87 |
|||||
|
Class FI (redemption price and offering price per share) |
$ |
25.80 |
|||||
|
Class R (redemption price and offering price per share) |
$ |
24.87 |
|||||
|
Class I (redemption price and offering price per share) |
$ |
27.53 |
|||||
|
Class IS (redemption price and offering price per share) |
$ |
27.61 |
|||||
|
Maximum Public Offering Price Per Share: |
|||||||
|
Class A (based on maximum initial sales charge of 5.75%) |
$ |
26.60 |
|||||
* Redemption price per share of Class C shares is NAV reduced by a 1.00% CDSC if shares are redeemed within one year of purchase (See Note 3)
The Accompanying Notes are an Integral Part of these Financial Statements.
Miller Opportunity Trust 2022 Semi-Annual Report
20
Statement of operations (unaudited)
For the Six Months Ended June 30, 2022
|
Investment Income: |
|||||||
|
Dividends from unaffiliated investments |
$ |
5,879,000 |
|||||
|
Dividends from affiliated investments |
473,018 |
||||||
|
Total Investment Income |
6,352,018 |
||||||
|
Expenses: |
|||||||
|
Investment management fee (Note 3) |
6,932,718 |
||||||
|
Distribution fees (Note 6) |
1,575,726 |
||||||
|
Interest expense (Note 7) |
1,339,061 |
||||||
|
Shareholder servicing fee (Note 6) |
642,128 |
||||||
|
Administration and fund accounting fees (Note 3) |
503,178 |
||||||
|
Transfer agent expenses (Note 3) |
214,304 |
||||||
|
Custody fees (Note 3) |
77,468 |
||||||
|
Registration fees |
73,848 |
||||||
|
Shareholder reports |
53,060 |
||||||
|
Legal fees |
32,218 |
||||||
|
Insurance |
13,674 |
||||||
|
Miscellaneous expenses |
12,127 |
||||||
|
Audit and tax fees |
10,317 |
||||||
|
Trustees' fees (Note 3) |
7,439 |
||||||
|
Compliance fees (Note 3) |
6,697 |
||||||
|
Total Expenses |
11,493,963 |
||||||
|
Less: Expenses Waived and Reimbursed by the Adviser (Note 3) |
(106,121 |
) |
|||||
|
Net Expenses |
11,387,842 |
||||||
|
Net Investment loss |
(5,035,824 |
) |
|||||
|
Realized and Unrealized Gain (Loss) on Investments (Note 2): |
|||||||
|
Net Realized Gain (Loss) From: |
|||||||
|
Investments in unaffiliated securities |
(133,304,460 |
) |
|||||
|
Investments in affiliated securities |
33,906,550 |
||||||
|
Net Realized Loss |
(99,397,910 |
) |
|||||
|
Net Change in Unrealized Appreciation (Depreciation) From: |
|||||||
|
Investments in unaffiliated securities |
(595,446,713 |
) |
|||||
|
Investments in affiliated securities |
(25,015,660 |
) |
|||||
|
Net Change in Unrealized Appreciation (Depreciation) |
(620,462,373 |
) |
|||||
|
Net Loss on Investments |
(719,860,283 |
) |
|||||
|
Decrease in Net Assets from Operations |
$ |
(724,896,107 |
) |
||||
The Accompanying Notes are an Integral Part of these Financial Statements.
Miller Opportunity Trust 2022 Semi-Annual Report
21
Statements of changes in net assets
|
For the Six Months Ended June 30, 2022 (unaudited) and the Year Ended December 31, 2021 |
2022 |
2021 |
|||||||||
|
Operations: |
|||||||||||
|
Net investment loss |
$ |
(5,035,824 |
) |
$ |
(2,938,296 |
) |
|||||
|
Net realized gain (loss) |
(99,397,910 |
) |
163,747,702 |
||||||||
|
Change in unrealized appreciation (depreciation) |
(620,462,373 |
) |
(252,028,172 |
) |
|||||||
|
Decrease in Net Assets from Operations |
(724,896,107 |
) |
(91,218,766 |
) |
|||||||
|
Distributions to shareholders from (Note 11): |
0 |
(25,155,779) |
|||||||||
|
Decrease in Net Assets from Distributions to Shareholders |
0 |
(25,155,779 |
) |
||||||||
|
Fund Share Transactions (Note 8): |
|||||||||||
|
Net proceeds from sale of shares |
127,054,995 |
620,184,408 |
|||||||||
|
Reinvestment of distributions |
— |
23,101,500 |
|||||||||
|
Cost of shares repurchased |
(253,176,067 |
) |
(587,783,169 |
) |
|||||||
|
Increase (Decrease) in Net Assets from Fund Share Transactions |
(126,121,072 |
) |
55,502,739 |
||||||||
|
Decrease in Net Assets |
(851,017,179 |
) |
(60,871,806 |
) |
|||||||
|
Net Assets: |
|||||||||||
|
Beginning of period |
2,186,108,582 |
2,246,980,388 |
|||||||||
|
End of period |
$ |
1,335,091,403 |
$ |
2,186,108,582 |
|||||||
The Accompanying Notes are an Integral Part of these Financial Statements.
Miller Opportunity Trust 2022 Semi-Annual Report
22
Statement of cash flows (unaudited)
For the Six Months Ended June 30, 2022
|
Cash Flow from Operating Activities |
|||||||
|
Net decrease in net assets from operations |
$ |
(724,896,107 |
) |
||||
|
Adjustments to reconcile decrease in net assets resulting from operations to net cash provided by operating activities: |
|||||||
|
Purchases of investment in unaffiliated securities |
(253,675,658 |
) |
|||||
|
Purchases of investment in affiliated securities |
(95,232,040 |
) |
|||||
|
Sales of investments in unaffiliated securities |
447,550,046 |
||||||
|
Sales of investments in affiliated securities |
33,906,550 |
||||||
|
Increase in receivable for securities sold |
(7,282,967 |
) |
|||||
|
Decrease in receivable for fund shares sold |
1,802,449 |
||||||
|
Decrease in dividends receivable |
24,500 |
||||||
|
Increase in payable to custodian |
30,738 |
||||||
|
Increase in prepaid expenses |
(8,407 |
) |
|||||
|
Increase in payable for securities purchased |
2,756,782 |
||||||
|
Decrease in payable for fund shares repurchased |
(2,678,838 |
) |
|||||
|
Decrease in distribution and service fees payable |
(53,339 |
) |
|||||
|
Decrease in investment management fee payable |
(542,303 |
) |
|||||
|
Decrease in accrued other expenses |
(33,293 |
) |
|||||
|
Net realized loss on unaffiliated investments |
133,304,460 |
||||||
|
Net realized gain on affiliated investments |
(33,906,550 |
) |
|||||
|
Partnership distribution from affiliated investment |
744,024 |
||||||
|
Unrealized depreciation on unaffiliated investments |
595,446,713 |
||||||
|
Unrealized depreciation on affiliated investments |
25,015,660 |
||||||
|
Net Cash provided by operating activities |
122,272,420 |
||||||
|
Cash Flow from Financing Activities |
|||||||
|
Increase in loan payable |
1,335,000 |
||||||
|
Increase in interest payable |
198,256 |
||||||
|
Proceeds from shares sold |
127,054,995 |
||||||
|
Payment on shares redeemed |
(253,176,067 |
) |
|||||
|
Net cash provided by financing activities |
(124,587,816 |
) |
|||||
|
Net Decrease in Cash |
(2,315,396 |
) |
|||||
|
Cash at beginning of period |
2,315,396 |
||||||
|
Cash at end of period |
$ |
0 |
|||||
The Accompanying Notes are an Integral Part of these Financial Statements.
Miller Opportunity Trust 2022 Semi-Annual Report
23
Financial highlights
For a share of beneficial interest outstanding throughout each year ended December 31:
|
Class A Shares |
2022* |
2021 |
2020 |
2019 |
2018 |
2017 |
|||||||||||||||||||||
|
Net asset value, beginning of year |
$ |
38.25 |
$ |
39.99 |
$ |
28.85 |
$ |
21.54 |
$ |
23.88 |
$ |
18.96 |
|||||||||||||||
|
Income (loss) from operations: |
|||||||||||||||||||||||||||
|
Net investment income (loss)1 |
(0.10 |
) |
(0.07 |
) |
(0.01 |
) |
—2 |
(0.13 |
) |
(0.14 |
) |
||||||||||||||||
|
Net realized and unrealized gain (loss) |
(13.08 |
) |
(1.22 |
) |
11.15 |
7.31 |
(2.21 |
) |
5.06 |
||||||||||||||||||
|
Total income (loss) from operations |
(13.18 |
) |
(1.29 |
) |
11.14 |
7.31 |
(2.34 |
) |
4.92 |
||||||||||||||||||
|
Less distributions from: |
|||||||||||||||||||||||||||
|
Net realized gain |
— |
(0.45 |
) |
— |
— |
— |
— |
||||||||||||||||||||
|
Total distributions: |
— |
(0.45 |
) |
— |
— |
— |
— |
||||||||||||||||||||
|
Net asset value, end of year |
$ |
25.07 |
$ |
38.25 |
$ |
39.99 |
$ |
28.85 |
$ |
21.54 |
$ |
23.88 |
|||||||||||||||
|
Total return3 |
-34.46 |
% |
-3.24 |
%4 |
38.61 |
%4 |
33.94 |
%4 |
-9.80 |
%4 |
25.95 |
% |
|||||||||||||||
|
Net assets, end of year (000s) |
$ |
562,464 |
$ |
874,473 |
$ |
941,942 |
$ |
705,372 |
$ |
221,842 |
$ |
266,560 |
|||||||||||||||
|
Ratios to average net assets: |
|||||||||||||||||||||||||||
| Gross expenses5 |
1.34 |
%7 |
1.21 |
% |
1.28 |
% |
1.47 |
% |
1.39 |
% |
1.34 |
% |
|||||||||||||||
| Net expenses5 |
1.33 |
6,7 |
1.21 |
6 |
1.28 |
6 |
1.47 |
6 |
1.39 |
6 |
1.34 |
6 |
|||||||||||||||
|
Net investment income (loss) |
(0.63 |
)7 |
(0.17 |
) |
(0.04 |
) |
0.02 |
(0.49 |
) |
(0.64 |
) |
||||||||||||||||
|
Portfolio turnover rate |
17 |
%8 |
55 |
% |
64 |
% |
35 |
% |
30 |
% |
120 |
% |
|||||||||||||||
* For the six months ended June 30, 2022 (unaudited).
1 Per share amounts have been calculated using the average shares method.
2 Amount is less than $0.01 per share.
3 Performance figures, exclusive of sales charges, may reflect fee waivers and/or expense reimbursements. In the absence of fee waivers and/or expense reimbursements, the total return would have been lower. Past performance is no guarantee of future results. Total returns for periods of less than one year are not annualized.
4 The total return includes gains from settlement of security litigations. Without these gains, the total return would have been -3.28%, 38.51%, 33.89%, and -9.84% for the years ended December 31, 2021, 2020, 2019, and 2018, respectively.
5 Does not include fees and expenses of the Underlying Funds in which the Fund invests.
6 Effective April 30, 2020, the Adviser agreed to waive fees and/or reimburse operating expenses, (other than front-end or contingent deferred loads, taxes, interest expense, brokerage commissions, acquired fund fees and expenses, expenses incurred in connection with any merger or reorganization, portfolio transaction expenses, dividends paid on short sales, extraordinary expenses such as litigation, Rule 12b-1 fees, intermediary servicing fees, or any other class-specific expenses) through April 30, 2023, so that such annual operating expenses will not exceed 0.88%. Prior to April 30, 2020, the limit was 1.20% and established at the class level (inclusive of 12b-1 and shareholder servicing fees). Interest expenses were 0.15% (annualized) for the period ended June 30, 2022, and 0.05%, 0.10%, 0.28%, 0.21% and 0.16% for the years ended December 31, 2021, 2020, 2019, 2018 and 2017, respectively. Excluding interest, the net expense ratios were 1.18% (annualized) for the period ended June 30, 2022, and 1.16%, 1.18%, 1.19%, 1.18% and 1.18% for the years ended December 31, 2021, 2020, 2019, 2018 and 2017, respectively (See Note 3).
7 Annualized.
8 Not annualized.
The Accompanying Notes are an Integral Part of these Financial Statements.
Miller Opportunity Trust 2022 Semi-Annual Report
24
For a share of beneficial interest outstanding throughout each year ended December 31:
|
Class C Shares |
2022* |
2021 |
2020 |
2019 |
2018 |
2017 |
|||||||||||||||||||||
|
Net asset value, beginning of year |
$ |
35.02 |
$ |
36.92 |
$ |
26.84 |
$ |
20.19 |
$ |
22.55 |
$ |
18.04 |
|||||||||||||||
|
Income (loss) from operations: |
|||||||||||||||||||||||||||
| Net investment loss1 |
(0.21 |
) |
(0.37 |
) |
(0.23 |
) |
(0.29 |
) |
(0.30 |
) |
(0.29 |
) |
|||||||||||||||
|
Net realized and unrealized gain (loss) |
(11.94 |
) |
(1.08 |
) |
10.31 |
6.94 |
(2.06 |
) |
4.802 |
||||||||||||||||||
|
Total income (loss) from operations |
(12.15 |
) |
(1.45 |
) |
10.08 |
6.65 |
(2.36 |
) |
4.51 |
||||||||||||||||||
|
Less distributions from: |
|||||||||||||||||||||||||||
|
Net realized gain |
— |
(0.45 |
) |
— |
— |
— |
— |
||||||||||||||||||||
|
Total distributions: |
— |
(0.45 |
) |
— |
— |
— |
— |
||||||||||||||||||||
|
Net asset value, end of year |
$ |
22.87 |
$ |
35.02 |
$ |
36.92 |
$ |
26.84 |
$ |
20.19 |
$ |
22.55 |
|||||||||||||||
|
Total return2 |
-34.69 |
% |
-3.95 |
%3 |
37.56 |
%3 |
32.94 |
%3 |
-10.47 |
%3 |
25.00 |
%4 |
|||||||||||||||
|
Net assets, end of year (000s) |
$ |
85,550 |
$ |
152,662 |
$ |
204,214 |
$ |
216,364 |
$ |
559,251 |
$ |
694,001 |
|||||||||||||||
|
Ratios to average net assets: |
|||||||||||||||||||||||||||
| Gross expenses4 |
2.08 |
%6 |
1.95 |
% |
2.03 |
% |
2.22 |
% |
2.13 |
% |
2.11 |
% |
|||||||||||||||
| Net expenses4 |
2.08 |
5,6 |
1.95 |
5 |
2.03 |
5 |
2.22 |
5 |
2.13 |
5 |
2.11 |
5 |
|||||||||||||||
|
Net investment loss |
(1.39 |
)6 |
(0.89 |
) |
(0.88 |
) |
(1.25 |
) |
(1.24 |
) |
(1.42 |
) |
|||||||||||||||
|
Portfolio turnover rate |
17 |
%7 |
55 |
% |
64 |
% |
35 |
% |
30 |
% |
120 |
% |
|||||||||||||||
* For the six months ended June 30, 2022 (unaudited).
1 Per share amounts have been calculated using the average shares method.
2 Performance figures, exclusive of CDSC, may reflect fee waivers and/or expense reimbursements. In the absence of fee waivers and/or expense reimbursements, the total return would have been lower. Past performance is no guarantee of future results. Total returns for periods of less than one year are not annualized.
3 The total return includes gains from settlement of security litigations. Without these gains, the total return would have been -3.98%, 37.44%, 32.69%, and -10.51% for the years ended December 31, 2021, 2020, 2019, and 2018, respectively.
4 Does not include fees and expenses of the Underlying Funds in which the Fund invests.
5 Effective April 30, 2020, the Adviser agreed to waive fees and/or reimburse operating expenses, (other than front-end or contingent deferred loads, taxes, interest expense, brokerage commissions, acquired fund fees and expenses, expenses incurred in connection with any merger or reorganization, portfolio transaction expenses, dividends paid on short sales, extraordinary expenses such as litigation, Rule 12b-1 fees, intermediary servicing fees, or any other class-specific expenses) through April 30, 2023, so that such annual operating expenses will not exceed 0.88%. Prior to April 30, 2020, the limit was 1.97% and established at the class level (inclusive of 12b-1 and shareholder servicing fees). Interest expenses were 0.15% (annualized) for the period ended June 30, 2022, and 0.05%, 0.10%, 0.28%, 0.21% and 0.16% for the years ended December 31, 2021, 2020, 2019, 2018 and 2017, respectively. Excluding interest, the expense ratios were 1.93% (annualized) for the period ended June 30, 2022, and 1.90%, 1.93%, 1.94%, 1.92% and 1.95% for the years ended December 31, 2021, 2020, 2019, 2018 and 2017, respectively (See Note 3).
6 Annualized.
7 Not annualized.
The Accompanying Notes are an Integral Part of these Financial Statements.
Miller Opportunity Trust 2022 Semi-Annual Report
25
Financial highlights (cont'd)
For a share of beneficial interest outstanding throughout each year ended December 31:
|
Class FI Shares |
2022* |
2021 |
2020 |
2019 |
2018 |
2017 |
|||||||||||||||||||||
|
Net asset value, beginning of year |
$ |
39.38 |
$ |
41.19 |
$ |
29.74 |
$ |
22.22 |
$ |
24.64 |
$ |
19.57 |
|||||||||||||||
|
Income (loss) from operations: |
|||||||||||||||||||||||||||
| Net investment loss1 |
(0.12 |
) |
(0.11 |
) |
(0.05 |
) |
(0.09 |
) |
(0.14 |
) |
(0.16 |
) |
|||||||||||||||
|
Net realized and unrealized gain (loss) |
(13.46 |
) |
(1.25 |
) |
11.50 |
7.61 |
(2.28 |
) |
5.23 |
||||||||||||||||||
|
Total income (loss) from operations |
(13.58 |
) |
(1.36 |
) |
11.45 |
7.52 |
(2.42 |
) |
5.07 |
||||||||||||||||||
|
Less distributions from: |
|||||||||||||||||||||||||||
|
Net realized gain |
— |
(0.45 |
) |
— |
— |
— |
— |
||||||||||||||||||||
|
Total distributions: |
— |
(0.45 |
) |
— |
— |
— |
— |
||||||||||||||||||||
|
Net asset value, end of year |
$ |
25.80 |
$ |
39.38 |
$ |
41.19 |
$ |
29.74 |
$ |
22.22 |
$ |
24.64 |
|||||||||||||||
|
Total return2 |
-34.48 |
% |
-3.32 |
%3 |
38.50 |
%3 |
33.84 |
%3 |
-9.82 |
%3 |
25.91 |
% |
|||||||||||||||
|
Net assets, end of year (000s) |
$ |
9,358 |
$ |
14,291 |
$ |
14,458 |
$ |
14,026 |
$ |
13,278 |
$ |
24,394 |
|||||||||||||||
|
Ratios to average net assets: |
|||||||||||||||||||||||||||
| Gross expenses4 |
1.42 |
%6 |
1.29 |
% |
1.35 |
% |
1.53 |
% |
1.41 |
% |
1.39 |
% |
|||||||||||||||
| Net expenses4 |
1.42 |
5,6 |
1.29 |
5 |
1.35 |
5 |
1.53 |
5 |
1.41 |
5 |
1.39 |
5 |
|||||||||||||||
|
Net investment loss |
(0.72 |
)6 |
(0.24 |
) |
(0.19 |
) |
(0.34 |
) |
(0.53 |
) |
(0.70 |
) |
|||||||||||||||
|
Portfolio turnover rate |
17 |
%7 |
55 |
% |
64 |
% |
35 |
% |
30 |
% |
120 |
% |
|||||||||||||||
* For the six months ended June 30, 2022 (unaudited).
1 Per share amounts have been calculated using the average shares method.
2 Performance figures may reflect fee waivers and/or expense reimbursements. In the absence of fee waivers and/or expense reimbursements, the total return would have been lower. Past performance is no guarantee of future results. Total returns for periods of less than one year are not annualized.
3 The total return includes gains from settlement of security litigations. Without these gains, the total return would have been -3.35%, 38.40%, 33.71%, and -9.90% for the years ended December 31, 2021, 2020, 2019, and 2018, respectively.
4 Does not include fees and expenses of the Underlying Funds in which the Fund invests.
5 Effective April 30, 2020, the Adviser agreed to waive fees and/or reimburse operating expenses, (other than front-end or contingent deferred loads, taxes, interest expense, brokerage commissions, acquired fund fees and expenses, expenses incurred in connection with any merger or reorganization, portfolio transaction expenses, dividends paid on short sales, extraordinary expenses such as litigation, Rule 12b-1 fees, intermediary servicing fees, or any other class-specific expenses) through April 30, 2023, so that such annual operating expenses will not exceed 0.88%. Prior to April 30, 2020, the limit was 1.26% and established at the class level (inclusive of 12b-1 and shareholder servicing fees). Interest expenses were 0.15% (annualized) for the period ended June 30, 2022, and 0.05%, 0.10%, 0.28%, 0.21% and 0.16% for the years ended December 31, 2021, 2020, 2019, 2018 and 2017, respectively. Excluding interest, the expense ratios were 1.27%, 1.24%, 1.25%, 1.25%, 1.20% and 1.23% for the period ended June 30, 2022 for the years ended December 31, 2021, 2020, 2019, 2018 and 2017, respectively (See Note 3).
6 Annualized.
7 Not annualized.
The Accompanying Notes are an Integral Part of these Financial Statements.
Miller Opportunity Trust 2022 Semi-Annual Report
26
For a share of beneficial interest outstanding throughout each year ended December 31:
|
Class R Shares |
2022* |
2021 |
2020 |
2019 |
2018 |
2017 |
|||||||||||||||||||||
|
Net asset value, beginning of year |
$ |
37.99 |
$ |
39.82 |
$ |
28.81 |
$ |
21.57 |
$ |
23.98 |
$ |
19.10 |
|||||||||||||||
|
Income (loss) from operations: |
|||||||||||||||||||||||||||
| Net investment loss1 |
(0.15 |
) |
(0.20 |
) |
(0.09 |
) |
(0.14 |
) |
(0.21 |
) |
(0.21 |
) |
|||||||||||||||
|
Net realized and unrealized gain (loss) |
(12.97 |
) |
(1.18 |
) |
11.10 |
7.38 |
(2.20 |
) |
5.09 |
||||||||||||||||||
|
Total income (loss) from operations |
(13.12 |
) |
(1.38 |
) |
11.01 |
7.24 |
(2.41 |
) |
4.88 |
||||||||||||||||||
|
Less distributions from: |
|||||||||||||||||||||||||||
|
Net realized gain |
— |
(0.45 |
) |
— |
— |
— |
— |
||||||||||||||||||||
|
Total distributions: |
— |
(0.45 |
) |
— |
— |
— |
— |
||||||||||||||||||||
|
Net asset value, end of year |
$ |
24.87 |
$ |
37.99 |
$ |
39.82 |
$ |
28.81 |
$ |
21.57 |
$ |
23.98 |
|||||||||||||||
|
Total return2 |
-34.54 |
% |
-3.48 |
%3 |
38.22 |
%3 |
33.57 |
%3 |
-10.05 |
%3 |
25.55 |
% |
|||||||||||||||
|
Net assets, end of year (000s) |
$ |
4,053 |
$ |
8,055 |
$ |
8,195 |
$ |
7,122 |
$ |
5,778 |
$ |
8,367 |
|||||||||||||||
|
Ratios to average net assets: |
|||||||||||||||||||||||||||
| Gross expenses4 |
1.59 |
%6 |
1.47 |
% |
1.53 |
% |
1.76 |
% |
1.67 |
% |
1.66 |
% |
|||||||||||||||
| Net expenses4 |
1.59 |
5,6 |
1.47 |
5 |
1.53 |
5 |
1.76 |
5 |
1.67 |
5 |
1.66 |
5 |
|||||||||||||||
|
Net investment loss |
(0.94 |
)6 |
(0.44 |
) |
(0.32 |
) |
(0.54 |
) |
(0.79 |
) |
(0.97 |
) |
|||||||||||||||
|
Portfolio turnover rate |
17 |
%7 |
55 |
% |
64 |
% |
35 |
% |
30 |
% |
120 |
% |
|||||||||||||||
* For the six months ended June 30, 2022 (unaudited).
1 Per share amounts have been calculated using the average shares method.
2 Performance figures may reflect fee waivers and/or expense reimbursements. In the absence of fee waivers and/or expense reimbursements, the total return would have been lower. Past performance is no guarantee of future results. Total returns for periods of less than one year are not annualized.
3 The total return includes gains from settlement of security litigations. Without these gains, the total return would have been -3.49%, 38.11%, 33.43%, and -10.13% for the years ended December 31, 2021, 2020, 2019, and 2018, respectively.
4 Does not include fees and expenses of the Underlying Funds in which the Fund invests.
5 Effective April 30, 2020, the Adviser agreed to waive fees and/or reimburse operating expenses, (other than front-end or contingent deferred loads, taxes, interest expense, brokerage commissions, acquired fund fees and expenses, expenses incurred in connection with any merger or reorganization, portfolio transaction expenses, dividends paid on short sales, extraordinary expenses such as litigation, Rule 12b-1 fees, intermediary servicing fees, or any other class-specific expenses) through April 30, 2023, so that such annual operating expenses will not exceed 0.88%. Prior to April 30, 2020, the limit was 1.55% and established at the class level (inclusive of 12b-1 and shareholder servicing fees). Interest expenses were 0.15% (annualized) for the period ended June 30, 2022, and 0.05%, 0.10%, 0.28%, 0.21% and 0.16% for the years ended December 31, 2021, 2020, 2019, 2018 and 2017, respectively. Excluding interest, the expense ratios were 1.44% (annualized) for the period ended June 30, 2022, and 1.42%, 1.43%, 1.48%, 1.46% and 1.50% for the years ended December 31, 2021, 2020, 2019, 2018 and 2017, respectively (See Note 3).
6 Annualized.
7 Not annualized.
The Accompanying Notes are an Integral Part of these Financial Statements.
Miller Opportunity Trust 2022 Semi-Annual Report
27
Financial highlights (cont'd)
For a share of beneficial interest outstanding throughout each year ended December 31:
|
Class I Shares |
2022* |
2021 |
2020 |
2019 |
2018 |
2017 |
|||||||||||||||||||||
|
Net asset value, beginning of year |
$ |
41.95 |
$ |
43.73 |
$ |
31.48 |
$ |
23.44 |
$ |
25.91 |
$ |
20.53 |
|||||||||||||||
|
Income (loss) from operations: |
|||||||||||||||||||||||||||
|
Net investment income (loss)1 |
(0.07 |
) |
0.02 |
0.07 |
0.01 |
(0.07 |
) |
(0.09 |
) |
||||||||||||||||||
|
Net realized and unrealized gain (loss) |
(14.35 |
) |
(1.33 |
) |
12.18 |
8.03 |
(2.40 |
) |
5.47 |
||||||||||||||||||
|
Total income (loss) from operations |
(14.42 |
) |
(1.31 |
) |
12.25 |
8.04 |
(2.47 |
) |
5.38 |
||||||||||||||||||
|
Less distributions from: |
|||||||||||||||||||||||||||
|
Net investment income |
— |
(0.02 |
) |
— |
— |
— |
— |
||||||||||||||||||||
|
Net realized gain |
— |
(0.45 |
) |
— |
— |
— |
— |
||||||||||||||||||||
|
Total distributions: |
— |
(0.47 |
) |
— |
— |
— |
— |
||||||||||||||||||||
|
Net asset value, end of year |
$ |
27.53 |
$ |
41.95 |
$ |
43.73 |
$ |
31.48 |
$ |
23.44 |
$ |
25.91 |
|||||||||||||||
|
Total return2 |
-34.37 |
% |
-3.01 |
%3 |
38.91 |
%3 |
34.30 |
%3 |
-9.53 |
%3 |
26.21 |
% |
|||||||||||||||
|
Net assets, end of year (000s) |
$ |
673,153 |
$ |
1,135,832 |
$ |
1,077,438 |
$ |
736,467 |
$ |
517,820 |
$ |
480,451 |
|||||||||||||||
|
Ratios to average net assets: |
|||||||||||||||||||||||||||
| Gross expenses4 |
1.10 |
%6 |
0.98 |
% |
1.04 |
% |
1.23 |
% |
1.15 |
% |
1.12 |
% |
|||||||||||||||
| Net expenses4 |
1.08 |
5,6 |
0.98 |
5 |
1.03 |
5 |
1.21 |
5 |
1.14 |
5 |
1.09 |
5 |
|||||||||||||||
|
Net investment income (loss) |
(0.38 |
)6 |
0.05 |
0.23 |
0.02 |
(0.23 |
) |
(0.39 |
) |
||||||||||||||||||
|
Portfolio turnover rate |
17 |
%7 |
55 |
% |
64 |
% |
35 |
% |
30 |
% |
120 |
% |
|||||||||||||||
* For the six months ended June 30, 2022 (unaudited).
1 Per share amounts have been calculated using the average shares method.
2 Performance figures may reflect fee waivers and/or expense reimbursements. In the absence of fee waivers and/or expense reimbursements, the total return would have been lower. Past performance is no guarantee of future results. Total returns for periods of less than one year are not annualized.
3 The total return includes gains from settlement of security litigations. Without these gains, the total return would have been -3.02%, 38.82%, 34.17% and -9.61% for the years ended December 31, 2021, 2020, 2019 and 2018, respectively.
4 Does not include fees and expenses of the Underlying Funds in which the Fund invests.
5 Effective April 30, 2020, the Adviser agreed to waive fees and/or reimburse operating expenses, (other than front-end or contingent deferred loads, taxes, interest expense, brokerage commissions, acquired fund fees and expenses, expenses incurred in connection with any merger or reorganization, portfolio transaction expenses, dividends paid on short sales, extraordinary expenses such as litigation, Rule 12b-1 fees, intermediary servicing fees, or any other class-specific expenses) through April 30, 2023, so that such annual operating expenses will not exceed 0.88%. Separately, the Adviser has agreed to waive fees and/or reimburse operating expenses such that the previously described annual operating expenses, plus intermediary servicing fees and other class-specific expenses, will not exceed 0.93% for Class I. Interest expenses were 0.15% (annualized) for the period ended June 30, 2022, and 0.05%, 0.10%, 0.28%, 0.21% and 0.16% for the years ended December 31, 2021, 2020, 2019, 2018 and 2017, respectively. Excluding interest, the net expense ratios were 0.93% (annualized) for the period ended June 30, 2022, and 0.93% for the years ended December 31, 2021, 2020, 2019, 2018 and 2017 (See Note 3).
6 Annualized.
7 Not annualized.
The Accompanying Notes are an Integral Part of these Financial Statements.
Miller Opportunity Trust 2022 Semi-Annual Report
28
For a share of beneficial interest outstanding throughout each period ended December 31:
|
Class IS Shares |
2022* |
2021 |
2020 |
2019 |
2018** |
||||||||||||||||||
|
Net asset value, beginning of period |
$ |
42.05 |
$ |
43.82 |
$ |
31.52 |
$ |
23.44 |
$ |
32.06 |
|||||||||||||
|
Income (loss) from operations: |
|||||||||||||||||||||||
| Net investment income (loss)1 |
(0.06 |
) |
0.07 |
0.08 |
0.23 |
0.01 |
|||||||||||||||||
|
Net realized and unrealized gain (loss) |
(14.38 |
) |
(1.35 |
) |
12.22 |
7.85 |
(8.63 |
) |
|||||||||||||||
|
Total gain (loss) from operations |
(14.44 |
) |
(1.28 |
) |
12.30 |
8.08 |
(8.62 |
) |
|||||||||||||||
|
Less distributions from: |
|||||||||||||||||||||||
|
Net investment income |
— |
(0.04 |
) |
— |
— |
— |
|||||||||||||||||
|
Net realized gain |
— |
(0.45 |
) |
— |
— |
— |
|||||||||||||||||
|
Total distributions: |
— |
(0.49 |
) |
— |
— |
— |
|||||||||||||||||
|
Net asset value, end of period |
$ |
27.61 |
$ |
42.05 |
$ |
43.82 |
$ |
31.52 |
$ |
23.44 |
|||||||||||||
|
Total return2 |
-34.34 |
%3 |
-2.93 |
%3 |
39.02 |
%3 |
34.47 |
%3 |
-26.89 |
% |
|||||||||||||
|
Net assets, end of period (000s) |
$ |
513 |
$ |
795 |
$ |
734 |
$ |
605 |
$ |
73 |
|||||||||||||
|
Ratios to average net assets: |
|||||||||||||||||||||||
| Gross expenses4 |
1.02 |
%6 |
0.90 |
% |
0.97 |
% |
1.13 |
% |
1.09 |
%6 | |||||||||||||
| Net expenses4 |
1.02 |
5,6 |
0.90 |
5 |
0.96 |
5 |
1.09 |
5 |
1.05 |
5,6 |
|||||||||||||
|
Net investment income (loss) |
(0.31 |
)6 |
0.14 |
0.25 |
0.81 |
0.09 |
6 |
||||||||||||||||
|
Portfolio turnover rate |
17 |
%7 |
55 |
% |
64 |
% |
35 |
% |
30 |
%7,8 |
|||||||||||||
* For the six months ended June 30, 2022 (unaudited).
** Commenced operations on August 22, 2018.
1 Per share amounts have been calculated using the average shares method.
2 Performance figures may reflect fee waivers and/or expense reimbursements. In the absence of fee waivers and/or expense reimbursements, the total return would have been lower. Past performance is no guarantee of future results. Total returns for periods of less than one year are not annualized.
3 The total return includes gains from settlement of security litigations. Without these gains, the total return would have been -2.81%, 38.93% and 34.39% for the years ended December 31, 2021, 2020 and 2019, respectively.
4 Does not include fees and expenses of the Underlying Funds in which the Fund invests.
5 Effective April 30, 2020, the Adviser agreed to waive fees and/or reimburse operating expenses, (other than front-end or contingent deferred loads, taxes, interest expense, brokerage commissions, acquired fund fees and expenses, expenses incurred in connection with any merger or reorganization, portfolio transaction expenses, dividends paid on short sales, extraordinary expenses such as litigation, Rule 12b-1 fees, intermediary servicing fees, or any other class-specific expenses) through April 30, 2023, so that such annual operating expenses will not exceed 0.88%. Prior to April 30, 2020, the limit was 0.83% and established at the class level (inclusive of 12b-1 and shareholder servicing fees). Interest expenses were 0.15% and 0.22% (annualized) for the periods ended June 30, 2022 and December 31, 2018, and 0.05%, 0.10% and 0.26% for the years ended December 31, 2021, 2020 and 2019, respectively. Excluding interest, the net expense ratios were 0.87% and 0.83% (annualized) for the periods ended June 30, 2022 and December 31, 2018, and 0.85%, 0.86% and 0.83% for the years ended December 31, 2021, 2020 and 2019, respectively (see Note 3).
6 Annualized.
7 Not annualized.
8 Portfolio turnover rate reported is for the fiscal year of the Fund.
The Accompanying Notes are an Integral Part of these Financial Statements.
Miller Opportunity Trust 2022 Semi-Annual Report
29
Notes to financial statements
1. Organization
Miller Opportunity Trust (the "Fund") is a separate diversified investment series of the Trust for Advised Portfolios (the "Trust"), a Delaware Statutory Trust registered under the Investment Company Act of 1940, as amended (the "1940 Act"). The Fund converted to the Trust on February 24, 2017, and was previously organized in the Legg Mason Investment Trust as the Legg Mason Opportunity Trust (the "Predecessor Fund"). The Fund seeks to provide long-term growth of capital.
2. Significant accounting policies
The following is a summary of significant accounting policies consistently followed by the Fund in preparation of its financial statements. These policies are in conformity with U.S. generally accepted accounting principles ("U.S. GAAP") for investment companies. The Fund is considered an investment company under U.S. GAAP and follows the accounting and reporting guidance applicable to investment companies in the Financial Accounting Standards Board Accounting Standards Topic 946. The presentation of financial statement in conformity with U.S. GAAP requires management to make estimates and assumptions that affect the reported amounts of assets and liabilities and disclosure of contingent assets and liabilities at the date of the financial statements and the reported amounts of income and expenses. Actual results may differ from those estimates.
(a) Investment valuation. Investments in securities traded on a national securities exchange are valued at the last reported sales price on the exchange on which the security is principally traded. Securities traded on the NASDAQ exchanges are valued at the NASDAQ Official Closing Price ("NOCP"). Exchange-traded securities for which no sale was reported and NASDAQ securities for which there is no NOCP are valued at the mean of the most recent quoted bid and ask prices quoted. Exchange traded options are valued at the composite mean price, which calculates the mean of the highest bid price and lowest ask price across the exchanges where the option is principally traded. These investments are categorized as Level 1 of the fair value hierarchy. Pricing services may use various valuation methodologies, including matrix pricing and other analytical models as well as market transactions and dealer quotations. Long-term fixed income securities are valued using prices provided by an independent pricing service approved by the Board. Securities for which market quotations are not readily available are valued at their estimated fair value as determined in good faith by Miller Value Partners, LLC (the
Miller Opportunity Trust 2022 Semi-Annual Report
30
"Adviser") under procedures established by and under the general supervision and responsibility of the Board.
Various inputs are used in determining the value of the Funds' investments. These inputs are summarized into three broad levels and described below:
• Level 1 — quoted prices in active markets for identical investments. An active market for a security is a market in which transactions occur with sufficient frequency and volume to provide pricing information on an ongoing basis. A quoted price in an active market provides the most reliable evidence of fair value.
• Level 2 — other significant observable inputs (including quoted prices for similar investments, interest rates, prepayment speeds, credit risk, etc.). Other inputs other than quoted prices included in level 1 that are observable for the asset or liability either directly or indirectly. These inputs may include quoted prices for the identical instrument on an inactive market, prices for similar instruments, interest rates, prepayment speeds, credit risk, yield curves, default rates, and similar data.
• Level 3 — significant unobservable inputs, including the Fund's own assumptions in determining fair value of investments.
The inputs or methodologies used for valuing securities are not necessarily an indication of the risk associated with investing in those securities. The following is a summary of the fair values of the Fund's investments in each category investment type as of June 30, 2022:
| Description |
Quoted Prices (Level 1) |
Other Significant Observable Inputs (Level 2) |
Significant Unobservable Inputs (Level 3) |
Total | |||||||||||||||
|
Investments* |
|||||||||||||||||||
|
Common Stocks |
$ |
1,483,450,038 |
$ |
— |
$ |
— |
$ |
1,483,450,038 |
|||||||||||
|
Investment Fund |
— |
— |
4,182,054 |
4,182,054 |
|||||||||||||||
|
Purchase Options |
— |
39,520,000 |
— |
39,520,000 |
|||||||||||||||
|
Warrant |
— |
— |
615,531 |
615,531 |
|||||||||||||||
|
Total Investments |
$ |
1,483,450,038 |
$ |
39,520,000 |
$ |
4,797,585 |
$ |
1,527,767,623 |
|||||||||||
* See Schedule of Investments for additional detailed categorizations.
Miller Opportunity Trust 2022 Semi-Annual Report
31
Notes to financial statements (cont'd)
The following is a reconciliation of investments in which significant unobservable inputs (Level 3) were used in determining fair value:
| Investments in Securities |
Investment Fund1 |
Warrant1 | |||||||||
|
Balance at December 31, 2021 |
$ |
6,386,791 |
$ |
270,833 |
|||||||
|
Realized gain |
353,9992 |
— |
|||||||||
|
Sales/Partnership distributions |
(744,025 |
) |
— |
||||||||
|
Change in unrealized appreciation (depreciation) |
(1,814,711 |
)1 |
344,698 |
||||||||
|
Balance at June 30, 2022 |
$ |
4,182,054 |
$ |
615,531 |
|||||||
|
Change in unrealized appreciation (depreciation) for Level 3 securities held at June 30, 2022 |
$ |
(1,814,711 |
) |
$ |
344,698 |
||||||
1 This amount is included in the change in net unrealized appreciation (depreciation) in affiliates in the accompanying Statement of Operations. Change in unrealized appreciation (depreciation) includes net unrealized appreciation (depreciation) resulting from changes in investment values during the reporting period and the reversal of previously recorded unrealized appreciation (depreciation) when gains or losses are realized.
2 This amount is included in net realized gain (loss) from investment transactions in affiliates in the accompanying Statement of Operations.
The following table summarizes the valuation techniques and unobservable inputs used to determine the fair value of Level 3 investments:
|
Value at June 30, 2022 |
Valuation Technique(s) |
Unobservable Input(s) |
Range / Weighted Average |
Impact to Valuation from an Increase in Input* |
|||||||||||||||||||
|
Limited Partnership Interests |
$ |
4,182,054 |
NAV of Limited Partnership Interest |
Liquidity Discount |
25 |
% |
Decrease |
||||||||||||||||
| Warrant |
$ |
615,531 |
Black-Scholes Model |
Liquidity Discount |
35 |
% |
Decrease |
||||||||||||||||
* This column represents the directional change in the fair value of the Level 3 investments that would result in an increase from the corresponding unobservable input. A decrease to the unobservable input would have the opposite effect. Significant increases and decreases in these unobservable inputs in isolation could result in significantly higher or lower fair value measurements.
(b) Purchased options. When the Fund purchases an option, an amount equal to the premium paid by the Fund is recorded as an investment on the Statement of Assets and Liabilities, the value of which is marked-to-market to reflect the current market value of the option purchased. If the purchased option expires, the Fund realizes a loss equal to the amount of premium paid. When an instrument is purchased or
Miller Opportunity Trust 2022 Semi-Annual Report
32
sold through the exercise of an option, the related premium paid is added to the basis of the instrument acquired or deducted from the proceeds of the instrument sold. The risk associated with purchasing put and call options is limited to the premium paid.
(c) Security transactions and investment income. Security transactions are accounted for on a trade date basis. Interest income, adjusted for amortization of premium and accretion of discount, is recorded on the accrual basis. Dividend income is recorded on the ex-dividend date. Foreign dividend income is recorded on the ex-dividend date or as soon as practicable after the Fund determines the existence of a dividend declaration after exercising reasonable due diligence. The cost of investments sold is determined by use of the specific identification method.
(d) Distributions to shareholders. Distributions from net investment income and distributions of net realized gains, if any, are declared at least annually. Distributions to shareholders of the Fund are recorded on the ex-dividend date and are determined in accordance with income tax regulations, which may differ from U.S. GAAP.
(e) Share class accounting. Investment income, common expenses and realized/unrealized gains (losses) on investments are allocated to the various classes of the Fund on the basis of daily net assets of each class. Fees relating to a specific class are charged directly to that share class.
(f) Indemnifications. In the normal course of business, the Fund enters into contracts that contain a variety of representations, which provide general indemnifications. The Fund's maximum exposure under these arrangements is unknown as this would involve future claims that may be made against the Fund that have not yet occurred. However, based on experience, the Fund expects the risk of loss to be remote.
(g) Federal and other taxes. It is the Fund's policy to comply with the federal income and excise tax requirements of the Internal Revenue Code of 1986 (the "Code"), as amended, applicable to regulated investment companies. Accordingly, the Fund intends to distribute its taxable income and net realized gains, if any, to shareholders in accordance with timing requirements imposed by the Code. Therefore, no federal or state income tax provision is required in the Fund's financial statements.
Management has analyzed the Fund's tax positions taken on income tax returns for all open tax years and has concluded that as of June 30, 2022, no provision for income tax is required in the Fund's financial statements. The Fund's federal and state income and federal excise tax returns for tax years for which the applicable statutes of limitations have not expired are
Miller Opportunity Trust 2022 Semi-Annual Report
33
Notes to financial statements (cont'd)
subject to examination by the Internal Revenue Service and state departments of revenue.
The Fund was notified in 2017 of a tax lien filed by the Internal Revenue Service related to a previous holding. No liability for the lien has been recorded as it is currently under appeal. If the appeal is unsuccessful, the Fund has also received indemnification from previous management for any tax, penalties, or interest related to the matter.
The Fund holds interests in certain securities that are treated as partnerships for Federal income tax purposes. These entities may be subject to audit by the Internal Revenue Service or other applicable tax authorities. The Fund's taxable income or tax liability for prior taxable years could be adjusted as a result of such an audit. The Fund may be required to pay a fund-level tax as a result of such an adjustment or may pay a "deficiency dividend" to its current shareholders in order to avoid a fund-level tax associated with the adjustment. The Fund could also be required to pay interest and penalties in connection with such an adjustment. Under the applicable foreign tax laws, a withholding tax may be imposed on interest, dividends, and capital gains at various rates.
3. Investment management agreement and other transactions with affiliates
The Trust has an agreement with the Adviser to furnish investment advisory services to the Fund.
Under the investment management agreement, the Fund pays an investment management fee, calculated daily and paid monthly, in accordance with the following breakpoint schedule:
|
Average Daily Net Assets |
Annual Rate |
||||||
|
First $100.0 million |
1.000 |
% |
|||||
|
Next $2.5 billion |
0.750 |
||||||
|
Next $2.5 billion |
0.700 |
||||||
|
Next $2.5 billion |
0.675 |
||||||
|
Over $7.6 billion |
0.650 |
||||||
Effective April 30, 2020, the Adviser has contractually agreed to reduce fees and pay expenses, (other than front-end or contingent deferred loads, taxes, interest expense, brokerage commissions, acquired fund fees and expenses, expenses incurred in connection with any merger or reorganization, portfolio transaction expenses, dividends paid on short sales, extraordinary expenses such as litigation, Rule 12b-1 fees, intermediary servicing fees, or any other class-specific expenses) through April 30, 2023, so that such annual operating expenses will not exceed
Miller Opportunity Trust 2022 Semi-Annual Report
34
0.88%. Separately, with respect to Class I only, the Adviser has agreed to waive fees and/or reimburse operating expenses such that the previously described annual operating expenses, plus intermediary servicing fees and other class-specific expenses, will not exceed 0.93%. These arrangements cannot be terminated prior to May 1, 2023 without the Board of Trustees' consent.
Prior to April 30, 2020, the limit on annual operating expenses was established at a class level and inclusive of 12b-1 fees and shareholder servicing fees and did not exceed the class levels set forth below. The Predecessor Fund did not have expense limitations.
| Class A |
Class C |
Class FI |
Class R |
Class I |
Class IS |
||||||||||||||||||
| 1.20 |
% |
1.97 |
% |
1.26 |
% |
1.55 |
% |
0.93 |
% |
0.83 |
% |
||||||||||||
During the period ended June 30, 2022, fees waived and/or expenses reimbursed amounted to $106,121.
The Adviser is permitted to recapture amounts waived and/or reimbursed to a class within 36 months of the reimbursement date if the class's total annual operating expenses have fallen to a level below the expense limitation ("expense cap") in effect at the time the fees were earned or the expenses incurred. In no case will the Adviser recapture any amount that would result, on any particular business day of the Fund, in the class's total annual operating expenses exceeding the expense cap or any other lower limit then in effect.
Pursuant to these arrangements, at June 30, 2022, the Fund had remaining fee waivers and/or expense reimbursements subject to recapture by the Adviser and respective dates of expiration as follows:
|
Class A |
Class C |
Class FI |
Class R |
Class I |
Class IS |
||||||||||||||||||||||
|
Expires December 31, 2022 |
$ |
— |
$ |
— |
$ |
— |
$ |
— |
$ |
— |
$ |
55 |
|||||||||||||||
|
Expires December 31, 2023 |
— |
— |
— |
— |
71,388 |
83 |
|||||||||||||||||||||
|
Expires December 31, 2024 |
— |
— |
— |
— |
— |
— |
|||||||||||||||||||||
|
Expires June 30, 2025 |
10,498 |
1,468 |
174 |
75 |
93,896 |
10 |
|||||||||||||||||||||
|
Total |
$ |
10,498 |
$ |
1,468 |
$ |
174 |
$ |
75 |
$ |
165,284 |
$ |
148 |
|||||||||||||||
U.S. Bancorp Fund Services, LLC, doing business as U.S. Bank Global Fund Services ("Fund Services") serves as the Fund's administrator & fund accountant and transfer agent. The officers of the Trust are employees of Fund Services. U.S Bank, N.A. serves as the Fund's custodian. For the period ended June 30, 2022, the Fund incurred the following expenses for
Miller Opportunity Trust 2022 Semi-Annual Report
35
Notes to financial statements (cont'd)
administration & fund accounting, transfer agent, custody and compliance fees:
|
Administration & fund accounting |
$ |
503,178 |
|||||
|
Transfer agent |
$ |
214,304 |
|||||
|
Custody |
$ |
77,468 |
|||||
|
Compliance |
$ |
6,697 |
|||||
At June 30, 2022, the Fund had payables due to Fund Services for administration & fund accounting, transfer agent, custody and compliance fees in the following amounts:
|
Administration & fund accounting |
$ |
155,153 |
|||||
|
Transfer agent |
$ |
81,592 |
|||||
|
Custody |
$ |
33,351 |
|||||
|
Compliance |
$ |
2,071 |
|||||
The above payable amounts are included in Accrued other expenses in the Statement of assets and liabilities.
The Independent Trustees were paid $7,439 for their services and reimbursement of travel expenses during the period ended June 30, 2022. The Fund pays no compensation to the Interested Trustee or officers of the Trust.
Quasar Distributors, LLC ("Quasar"), serves as the Fund's distributor and principal underwriter.
There is a maximum initial sales charge of 5.75% for Class A shares. There is a contingent deferred sales charge ("CDSC") of 1.00% on Class C shares, which applies if redemption occurs within 12 months from purchase payment. In certain cases, the Fund's Class A shares have a 1.00% CDSC, which applies if redemption occurs within 18 months from purchase payment. This CDSC only applied to those purchases of Class A shares in excess of $1,000,000 and the initial sales charge is waived. These purchases do not incur an initial sales charge.
For the period ended June 30, 2022, Quasar did not retain sales charges on sales of Class A shares. In addition, period ended June 30, 2022, CDSCs paid to Quasar for Class C shares totaled $1,089.
Miller Opportunity Trust 2022 Semi-Annual Report
36
4. Investments
During the period ended June 30, 2022, the aggregate cost of purchases and proceeds from sales of investments (excluding short-term investments) were as follows:
|
Purchases |
$ |
348,907,698 |
|||||
|
Sales |
$ |
478,173,582 |
|||||
5. Derivative instruments and hedging activities
Below is a table, grouped by derivative type that provides information about the fair value and the location of derivatives within the Assets and Liabilities at June 30, 2022.
ASSET DERIVATIVES
|
Interest Rate Risk |
|||||||
| Purchased options1 |
$ |
39,520,000 |
|||||
1 Market value of purchased options is reported in Investments in unaffiliated securities at value in the Statement of Assets and Liabilities.
The following tables provide information about the effect of derivatives and hedging activities on the Fund's Statement of Operations for the period ended June 30, 2022. The first table provides additional detail about the amounts and sources of gains (losses) realized on derivatives during the period. The second table provides additional information about the change in unrealized appreciation (depreciation) resulting from the Fund's derivatives and hedging activities during the year.
AMOUNT OF REALIZED GAIN (LOSS) ON DERIVIATIVES RECOGNIZED
|
Equity Risk |
Interest Rate Risk |
||||||||||
|
Purchased options1 |
$ |
(23,297,434 |
) |
$ |
12,430,192 |
||||||
1 Net realized gain (loss) from purchased options is reported in net realized gain (loss) from investment transactions in unaffiliated securities in the Statement of Operations.
CHANGE IN UNREALIZED APPRECIATION (DEPRECIATION) ON DERIVATIVES RECOGNIZED
|
Equity Risk |
Interest Rate Risk |
||||||||||
|
Purchased options1 |
$ |
(201,818 |
) |
$ |
20,738,143 |
||||||
1 The change in unrealized appreciation (depreciation) from purchased options is reported in the change in net unrealized appreciation (depreciation) from unaffiliated investments in the Statement of Operations.
Miller Opportunity Trust 2022 Semi-Annual Report
37
Notes to financial statements (cont'd)
For the period ended June 30, 2022, the volume of derivative activity for the Fund was as follows:
|
Average Market Value |
|||||||
|
Purchased options |
$ |
70,563,947 |
|||||
6. Class specific expenses
The Fund has adopted a Rule 12b-1 shareholder services and distribution plan and under that plan the Fund pays service and/or distribution fees with respect to its Class A, Class C, Class FI and Class R shares calculated at the annual rate of 0.25%, 1.00%, 0.25% and 0.50% of the average daily net assets of each class, respectively.
The Fund also has arrangements with various parties to provide ongoing sub-transfer agent services for each share class. Service and/or distribution fees and sub-transfer agent fees are accrued daily and paid monthly or quarterly.
For the period ended June 30, 2022, class specific expenses were as follows:
|
Distribution Fees |
Shareholder Servicing Fees |
||||||||||
|
Class A |
$ |
926,396 |
$ |
236,538 |
|||||||
|
Class C |
618,254 |
39,027 |
|||||||||
|
Class FI |
15,470 |
9,282 |
|||||||||
|
Class R |
15,606 |
2,466 |
|||||||||
|
Class I |
— |
354,815 |
|||||||||
|
Total |
$ |
1,575,726 |
$ |
642,128 |
|||||||
7. Lines of Credit
The Fund may borrow for investment purposes, also known as "leveraging" from a $250,000,000 line of credit ("Leveraging Credit Agreement") with the Bank of Nova Scotia. This Leveraging Credit Agreement renews daily for a 180-day term unless notice to the contrary is given to the Fund. Leverage is the ability to earn a return on a capital base that is larger than the Fund's net assets. Use of leverage can magnify the effects of changes in the value of the Fund's investments and makes such investments more volatile. Leveraging could cause investors to lose more money in adverse environments. The Fund pays a monthly commitment fee at an annual rate of 0.10% on the unutilized portion of the Leveraging Credit Agreement. However, the commitment fee will be waived when 50% of the line of credit is drawn. The interest on the borrowings under this Leveraging Credit Agreement is calculated at
Miller Opportunity Trust 2022 Semi-Annual Report
38
variable rates based on the prevailing LIBOR rate plus a spread. To the extent of the borrowing outstanding, the Fund is required to maintain collateral in a special custody account at the Fund's custodian on behalf of the Bank of Nova Scotia. The Fund's Leveraging Credit Agreement contains customary covenants that, among other things, may limit the Fund's ability to pay distributions in certain circumstances, incur additional debt, change its fundamental investment policies and engage in certain transactions, including mergers and consolidations, and require asset coverage ratios in addition to those required by the 1940 Act. In addition, the Leveraging Credit Agreement may be subject to early termination under certain events and may contain other provisions that could limit the Fund's ability to utilize borrowing under the agreement.
The Fund also has access to a $75 million unsecured line of credit through an agreement with U.S. Bank. The Fund may temporarily draw on the line of credit to satisfy redemption requests or settle investment transactions. Interest is charged to the Fund based on its borrowings at a rate per annum equal to the Prime Rate, to be paid monthly.
|
Bank of Nova Scotia |
U.S. Bank |
||||||||||
|
Maximum available credit |
$ |
250,000,000 |
$ |
75,000,000 |
|||||||
|
Largest amount outstanding on an individual day |
193,000,000 |
34,563,000 |
|||||||||
|
Average daily loan outstanding |
193,000,000 |
4,951,127 |
|||||||||
|
Interest expense |
1,305,845 |
33,216 |
|||||||||
|
Loan outstanding as of June 30, 2022 |
193,000,000 |
— |
|||||||||
|
Average Interest rate |
1.36 |
% |
3.83 |
% |
|||||||
8. Shares of beneficial interest
At June 30, 2022, the Trust had an unlimited number of shares of beneficial interest authorized with no par value. The Fund has the ability to issue multiple classes of shares. Each class of shares represents an identical interest and has the same rights, except that each class bears certain direct expenses, including those specifically related to the distribution of its shares.
Transactions in shares of each class were as follows:
|
Period Ended June 30, 2022 |
Period Ended December 31, 2021 |
||||||||||||||||||
|
Shares |
Amount |
Shares |
Amount |
||||||||||||||||
|
Class A |
|||||||||||||||||||
|
Shares sold |
827,129 |
$ |
27,066,097 |
2,316,685 |
$ |
104,841,882 |
|||||||||||||
|
Shares issued on reinvestment |
— |
— |
249,808 |
9,690,051 |
|||||||||||||||
|
Shares repurchased* |
(1,256,777 |
) |
(41,476,399 |
) |
(3,261,389 |
) |
(145,730,588 |
) |
|||||||||||
|
Net decrease |
(429,648 |
) |
$ |
(14,410,302 |
) |
(694,896 |
) |
$ |
(31,198,655 |
) |
|||||||||
Miller Opportunity Trust 2022 Semi-Annual Report
39
Notes to financial statements (cont'd)
|
Period Ended June 30, 2022 |
Period Ended December 31, 2021 |
||||||||||||||||||
|
Shares |
Amount |
Shares |
Amount |
||||||||||||||||
|
Class C |
|||||||||||||||||||
|
Shares sold |
135,779 |
$ |
4,138,341 |
479,745 |
$ |
19,951,005 |
|||||||||||||
|
Shares issued on reinvestment |
— |
— |
52,235 |
1,855,934 |
|||||||||||||||
|
Shares repurchased* |
(754,496 |
) |
(22,546,367 |
) |
(1,703,848 |
) |
(70,577,168 |
) |
|||||||||||
|
Net decrease |
(618,717 |
) |
$ |
(18,408,026 |
) |
(1,171,868 |
) |
$ |
(48,770,229 |
) |
|||||||||
|
Class FI |
|||||||||||||||||||
|
Shares sold |
26,569 |
$ |
955,986 |
164,551 |
$ |
8,054,870 |
|||||||||||||
|
Shares issued on reinvestment |
— |
— |
3,288 |
131,340 |
|||||||||||||||
|
Shares repurchased |
(26,825 |
) |
(912,608 |
) |
(155,963 |
) |
(7,042,638 |
) |
|||||||||||
|
Net increase (decrease) |
(256 |
) |
$ |
43,378 |
11,876 |
$ |
1,143,572 |
||||||||||||
|
Class R |
|||||||||||||||||||
|
Shares sold |
11,275 |
$ |
395,756 |
27,745 |
$ |
1,282,863 |
|||||||||||||
|
Shares issued on reinvestment |
— |
— |
2,434 |
93,805 |
|||||||||||||||
|
Shares repurchased |
(60,356 |
) |
(1,983,233 |
) |
(23,931 |
) |
(1,067,885 |
) |
|||||||||||
|
Net increase (decrease) |
(49,081 |
) |
$ |
(1,587,477 |
) |
6,248 |
$ |
308,783 |
|||||||||||
|
Class I |
|||||||||||||||||||
|
Shares sold |
2,572,266 |
$ |
94,498,815 |
9,715,420 |
$ |
485,712,748 |
|||||||||||||
|
Shares issued on reinvestment |
— |
— |
266,222 |
11,322,215 |
|||||||||||||||
|
Shares repurchased |
(5,200,276 |
) |
(186,247,460 |
) |
(7,543,291 |
) |
(363,152,574 |
) |
|||||||||||
|
Net increase (decrease) |
(2,628,010 |
) |
$ |
(91,748,645 |
) |
2,438,351 |
$ |
133,882,389 |
|||||||||||
|
Class IS |
|||||||||||||||||||
|
Shares sold |
— |
$ |
— |
6,800 |
$ |
338,840 |
|||||||||||||
|
Shares issued on reinvestment |
— |
— |
191 |
8,155 |
|||||||||||||||
|
Shares repurchased |
(323 |
) |
(10,000 |
) |
(4,855 |
) |
(212,316 |
) |
|||||||||||
|
Net increase (decrease) |
(323 |
) |
$ |
(10,000 |
) |
2,136 |
$ |
134,679 |
|||||||||||
|
Total increase (decrease) |
(3,726,036 |
) |
$ |
(126,121,072 |
) |
591,847 |
$ |
55,502,739 |
|||||||||||
* 33,599 Class C shares converted into 30,718 Class A shares, amounting to $1,088,948, during the period ended June 30, 2022. 61,855 Class C shares converted into 56,541 Class A shares, amounting to $2,652,000, during the year ended December 31, 2021. Class C shares of the Fund automatically convert to Class A shares after they have been held for 8 years.
Miller Opportunity Trust 2022 Semi-Annual Report
40
9. Transactions with affiliated companies
An "Affiliated Company", as defined in the 1940 Act, includes a company in which the Fund owns 5% or more of the company's outstanding voting securities or partnership interests at any time during the period. The following transactions were effected in shares of such companies for the period ended June 30, 2022:
|
Pangaea One, LP |
Shapeways Holdings Inc.1 |
Tivity Health Inc.2 |
Total |
||||||||||||||||
|
Value at December 31, 2021 |
$ |
6,386,791 |
$ |
2,016,637 |
$ |
79,320,000 |
$ |
87,723,428 |
|||||||||||
|
Purchases |
— |
— |
— |
— |
|||||||||||||||
|
Sales / Partnership Distributions |
(744,025 |
) |
(1,554,504 |
) |
(93,552,779 |
) |
(95,851,308 |
) |
|||||||||||
|
Change in Unrealized Gain (Loss) |
(1,814,711 |
) |
3,419,043 |
(23,200,948 |
) |
(21,596,616 |
) |
||||||||||||
|
Realized Gain (Loss) on Sales / Distributions |
353,999 |
(3,881,176 |
) |
37,433,727 |
(33,906,550 |
) |
|||||||||||||
|
Value at June 30, 2022 |
$ |
4,182,054 |
$ |
— |
$ |
— |
$ |
4,182,054 |
|||||||||||
|
Amortization, Dividend, Interest Income |
$ |
473,018 |
$ |
— |
$ |
— |
$ |
473,018 |
|||||||||||
1 Shapeways Holdings Inc. was an affiliated company during the year ended December 31, 2021 and was no longer an affiliated company at June 30, 2022.
2 Tivity Health Inc. was an affiliated company at December 31, 2021 and was no longer an affiliated company at June 30, 2022.
10. Restricted securities
The following Fund investments are restricted as to resale and, in the absence of readily ascertainable market values, are valued in good faith in accordance with procedures approved by the Board of Trustees.
| Security | Cost |
Value at June 30, 2022 |
Percent of Net Assets |
Open Commitments |
|||||||||||||||
|
Pangaea One, LP1 |
$ |
28,460,537 |
$ |
4,182,054 |
0.3 |
% |
$ |
729,3652 |
|||||||||||
|
Alaunos Therapeutics, Inc. (Warrant)3 |
$ |
1,177,758 |
$ |
615,531 |
0.0 |
%4 |
N/A |
||||||||||||
1 Acquisition dates were 5/08, 8/08, 10/08, 12/08, 2/09, 5/09, 8/09, 11/09, 3/10, 7/10, 1/11, 2/11, 4/11, 8/11, 10/11, 1/12,4/12, 5/12, 6/12, 8/12, 12/12, 5/13, 6/13, 9/13, 3/14, 8/14 and 10/14.
2 In the normal course of operations, the Fund makes commitments to invest in businesses. At June 30, 2022, the Fund had open commitment of $729,365.
3 Acquisition date was 7/19.
4 Percentage represents less than 0.05%.
Miller Opportunity Trust 2022 Semi-Annual Report
41
Notes to financial statements (cont'd)
11. Income tax information and distributions to shareholders
The Fund made distributions during the year ended December 31, 2021 and did not make any distributions during the period ended June 30, 2022.
|
Ordinary Income Distributions |
Short-Term Capital Gain Distributions |
||||||||||
|
Class A |
$ |
— |
$ |
10,184,299 |
|||||||
|
Class C |
— |
1,967,573 |
|||||||||
|
Class FI |
— |
161,488 |
|||||||||
|
Class R |
— |
94,516 |
|||||||||
|
Class I |
569,918 |
12,167,457 |
|||||||||
|
Class IS |
781 |
9,747 |
|||||||||
|
Total |
$ |
570,699 |
$ |
24,585,080 |
|||||||
At December 31, 2021, the components of accumulated earnings for income tax purposes were as follows:
|
Tax cost of investments |
$ |
2,119,015,024 |
|||||
|
Unrealized appreciation |
573,199,846 |
||||||
|
Unrealized depreciation |
(311,294,042 |
) |
|||||
|
Net unrealized appreciation |
$ |
261,905,804 |
|||||
|
Other accumulated gain/(loss)(a) |
(190,732 |
) |
|||||
|
Undistributed ordinary income |
2,677,295 |
||||||
|
Undistributed capital gains |
161,578,105 |
||||||
|
Total Distributable Earnings |
164,255,400 |
||||||
|
Total accumulated gain |
$ |
425,970,472 |
|||||
(a) Other book/tax temporary differences are attributable to book/tax differences in the timing of the deductibility of various expenses.
At December 31, 2021, the Fund had no capital loss carryforwards, which reduce the Fund's taxable income arising from future net realized gains on investments, if any, to the extent permitted by the Internal Revenue Code, and thus will reduce the amount of distributions to shareholders which would otherwise be necessary to relieve the Fund of any liability for federal tax.
Miller Opportunity Trust 2022 Semi-Annual Report
42
12. Subsequent Events
Management has evaluated events and transactions that occurred subsequent to June 30, 2022 through the date the financial statements have been issued and has determined that there were no significant subsequent events that would require adjustment to or additional disclosure in these financial statements.
13. COVID-19 Risk
The global outbreak of COVID-19 (commonly referred to as "coronavirus") has disrupted economic markets and the prolonged economic impact is uncertain. The ultimate economic fallout from the pandemic, and the long-term impact on economies, markets, industries and individual issuers, are not known. The operational and financial performance of the issuers of securities in which the Fund invests depends on future developments, including the duration and spread of the outbreak, and such uncertainty may in turn adversely affect the value and liquidity of the Fund's investments, impair the Fund's ability to satisfy redemption requests, and negatively impact the Fund's performance.
14. New Accounting Pronouncements
In December 2020, the SEC adopted a new rule providing a framework for fund valuation practices ("Rule 2a-5"). Rule 2a-5 establishes requirements for determining fair value in good faith for purposes of the 1940 Act. Rule 2a-5 will permit fund boards to designate certain parties to perform fair value determinations, subject to board oversight and certain other conditions. Rule 2a-5 also defines when market quotations are "readily available" for purposes of the 1940 Act and the threshold for determining whether a fund must fair value a security. In connection with Rule 2a-5, the SEC also adopted related recordkeeping requirements and is rescinding previously issued guidance, including with respect to the role of a board in determining fair value and the accounting and auditing of fund investments. The Funds will be required to comply with the rules by September 8, 2022. Management is currently assessing the potential impact of the new rules on the Funds' financial statements.
In June 2022, the FASB issued Accounting Standards Update 2022-03, which amends Fair Value Measurement (Topic 820): Fair Value Measurement of Equity Securities Subject to Contractual Sale Restrictions ("ASU 2022-03"). ASU 2022-03 clarifies guidance for fair value measurement of an equity security subject to a contractual sale restriction and establishes new disclosure requirements for such equity securities. ASU 2022-03 is effective for fiscal years beginning after December 15, 2023 and for interim periods within those fiscal years, with early adoption permitted. Management is currently evaluating the impact of these amendments on the financial statements.
Miller Opportunity Trust 2022 Semi-Annual Report
43
Additional information (unaudited)
June 30, 2022
Proxy Voting Policies and Procedures
You may obtain a description of the Fund's proxy voting policy and voting records, without charge, upon request by contacting the Funds directly at 1-888-593-5110 or on the EDGAR Database on the SEC's website at www.sec.gov. The Fund files its proxy voting records annually as of June 30, with the SEC on Form N-PX. The Fund's Form N-PX is available without charge by visiting the SEC's website at www.sec.gov and may be reviewed and copied at the SEC's Public Reference Room in Washington D.C. You may obtain information on the operation of the Public Reference Room by calling 1-800-SEC-0330.
Quarterly Portfolio Schedule
The Fund files its complete schedule of portfolio holdings for the first and third quarters of each fiscal year with the SEC as an exhibit to its reports on Form N-PORT. The Fund's Form N-PORT reports are available without charge by visiting the SEC's website at www.sec.gov and may be reviewed and copied at the SEC's Public Reference Room in Washington D.C. You may obtain information on the operation of the Public Reference Room by calling (800) SEC-0330.
Statement Regarding Liquidity Risk Management Program
The Fund has adopted a liquidity risk management program. The Fund's Board has designated a committee of the Adviser to serve as the administrator of the program. Personnel of the Adviser conducts the day-to-day operation of the program pursuant to policies and procedures administered by the committee.
Under the program, the committee manages the Fund's liquidity risk, which is the risk that the Fund could not meet shareholder redemption requests without significant dilution of remaining shareholders' interests in the Fund. This risk is managed by monitoring the degree of liquidity of the Fund's investments, limiting the amount of the Fund's illiquid investments, and utilizing various risk management tools and facilities available to the Fund for meeting shareholder redemptions, among other means. The committee's process of determining the degree of liquidity of the Fund's investments is supported by one or more third-party liquidity assessment vendors.
The Fund's Board reviewed a report prepared by the committee regarding the operation and effectiveness of the program for the period January 1, 2021 through December 31, 2021. No liquidity events impacting the Fund were noted in the report. In addition, the committee provided its assessment that the program had been effective in managing the Fund's liquidity risk.
Miller Opportunity Trust 2022 Semi-Annual Report
44
Privacy notice (unaudited)
The Fund collects non-public information about you from the following sources:
• Information we receive about you on applications or other forms;
• Information you give us orally; and/or
• Information about your transactions with us or others.
We do not disclose any non-public personal information about our customers or former customers without the customer's authorization, except as permitted by law or in response to inquiries from governmental authorities. We may share information with affiliated and unaffiliated third parties with whom we have contracts for servicing the Fund. We will provide unaffiliated third parties with only the information necessary to carry out their assigned responsibilities. We maintain physical, electronic and procedural safeguards to guard your non-public personal information and require third parties to treat your personal information with the same high degree of confidentiality.
In the event that you hold shares of the Fund through a financial intermediary, including, but not limited to, a broker-dealer, bank, or trust company, the privacy policy of your financial intermediary would govern how your non-public personal information would be shared by those entities with unaffiliated third parties.
Miller Opportunity Trust 2022 Semi-Annual Report
45
Investment Adviser
Miller Value Partners, LLC
One South Street
Suite 2550
Baltimore, MD 21202
Distributor
Quasar Distributors, LLC
111 East Kilbourn Ave.
Suite 2200
Milwaukee, Wisconsin 53202
Custodian
U.S. Bank National Association
Custody Operations
1555 North River Center Drive,
Suite 302
Milwaukee, Wisconsin 53212
Transfer Agent
U.S. Bancorp Fund Services, LLC
615 East Michigan Street
Milwaukee, Wisconsin 53202
Independent Registered Public Accounting Firm
BBD, LLP
1835 Market Street,
3rd Floor
Philadelphia, PA 19103
Legal Counsel
Morgan, Lewis & Bockius, LLP
1111 Pennsylvania Avenue, NW
Washington, DC 20004
This report has been prepared for shareholders and may be distributed to others only if preceded or accompanied by a current prospectus.
Miller Value Funds
888.593.5110
millervaluefunds.com

| (b) | Not applicable. |
Item 2. Code of Ethics.
Not applicable for semi-annual reports.
Item 3. Audit Committee Financial Expert.
Not applicable for semi-annual reports.
Item 4. Principal Accountant Fees and Services.
Not applicable for semi-annual reports.
Item 5. Audit Committee of Listed Registrants.
Not applicable to registrants who are not listed issuers (as defined in Rule 10A-3 under the Securities Exchange Act of 1934).
Item 6. Investments.
| (a) | Schedule of Investments is included as part of the report to shareholders filed under Item 1 of this Form. |
| (b) | Not Applicable |
Item 7. Disclosure of Proxy Voting Policies and Procedures for Closed-End Management Investment Companies.
Not applicable to open-end investment companies.
Item 8. Portfolio Managers of Closed-End Management Investment Companies.
Not applicable to open-end investment companies.
Item 9. Purchases of Equity Securities by Closed-End Management Investment Company and Affiliated Purchasers.
Not applicable to open-end investment companies.
Item 10. Submission of Matters to a Vote of Security Holders.
There have been no material changes to the procedures by which shareholders may recommend nominees to the registrant’s board of trustees.
Item 11. Controls and Procedures.
| (a) | The Registrant’s President and Treasurer have reviewed the Registrant's disclosure controls and procedures (as defined in Rule 30a-3(c) under the Investment Company Act of 1940 (the “Act”)) as of a date within 90 days of the filing of this report, as required by Rule 30a-3(b) under the Act and Rules 13a-15(b) or 15d-15(b) under the Securities Exchange Act of 1934. Based on their review, such officers have concluded that the disclosure controls and procedures are effective in ensuring that information required to be disclosed in this report is appropriately recorded, processed, summarized and reported and made known to them by others within the Registrant and by the Registrant’s service provider. |
| (b) | There were no changes in the Registrant's internal control over financial reporting (as defined in Rule 30a-3(d) under the Act) that occurred during the second fiscal quarter of the period covered by this report that has materially affected, or is reasonably likely to materially affect, the Registrant's internal control over financial reporting. |
Item 12. Disclosure of Securities Lending Activities for Closed-End Management Investment Companies
Not applicable to open-end investment companies.
Item 13. Exhibits.
| (a) | (1) Any code of ethics or amendment thereto, that is the subject of the disclosure required by Item 2, to the extent that the registrant intends to satisfy Item 2 requirements through filing an exhibit. Not applicable for semi-annual reports. |
(3) Any written solicitation to purchase securities under Rule 23c-1 under the Act sent or given during the period covered by the report by or on behalf of the registrant to 10 or more persons. Not applicable to open-end investment companies.
(4) Change in the registrant’s independent public accountant. There was no change in the registrant’s independent public accountant for the period covered by this report.
| (b) | Certifications pursuant to Section 906 of the Sarbanes-Oxley Act of 2002. Furnished herewith. |
SIGNATURES
Pursuant to the requirements of the Securities Exchange Act of 1934 and the Investment Company Act of 1940, the registrant has duly caused this report to be signed on its behalf by the undersigned, thereunto duly authorized.
| Trust for Advised Portfolios | ||
| By | /s/ Russell B. Simon | |
| Russell B. Simon, President | ||
| Date | 09/07/22 | |
Pursuant to the requirements of the Securities Exchange Act of 1934 and the Investment Company Act of 1940, this report has been signed below by the following persons on behalf of the registrant and in the capacities and on the dates indicated.
| By | /s/ Russell B. Simon | |
| Russell B. Simon, President | ||
| Date | 09/07/22 | |
| By | /s/ Eric T. McCormick | |
| Eric T. McCormick, Treasurer | ||
| Date | 09/07/22 | |