0001258623falseN-CSRSCalculated by subtracting the Trust’s total liabilities (not including the notes payable and preferred shares) from the Trust’s total assets, and dividing the result by the notes payable balance in thousands.Calculated by subtracting the Trust’s total liabilities (not including the notes payable and preferred shares) from the Trust’s total assets, dividing the result by the sum of the values of the notes payable and liquidation value of the preferred shares, and multiplying the result by the liquidation value of one preferred share. Such amount equates to 294%, 301%, 272%, 306%, 266% and 282% at April 30, 2024 and October 31, 2023, 2022, 2021, 2020 and 2019, respectively.Plus accumulated and unpaid dividends.The shares of the Fund often trade at a discount or premium to their net asset value. The discount or premium may vary over time and may be higher or lower than what is quoted in this report. For up-to-date premium/discount information, please refer to https://funds.eatonvance.com/closed-end-fund-prices.php. 0001258623 2023-11-01 2024-04-30 0001258623 cik0001258623:CommonSharesMember 2023-11-01 2024-04-30 0001258623 cik0001258623:SeriessAMember 2023-11-01 2024-04-30 0001258623 cik0001258623:SeriessBMember 2023-11-01 2024-04-30 0001258623 cik0001258623:SeriesCMember 2023-11-01 2024-04-30 0001258623 cik0001258623:SeriesDMember 2023-11-01 2024-04-30 0001258623 cik0001258623:RisksAssociatedWithForeignInvestmentsMember 2023-11-01 2024-04-30 0001258623 cik0001258623:CreditRisksMember 2023-11-01 2024-04-30 0001258623 cik0001258623:PreferredSharesMember 2023-11-01 2024-04-30 0001258623 cik0001258623:PreferredSharesMember 2024-04-30 0001258623 cik0001258623:NotesPayableMember 2024-04-30 0001258623 cik0001258623:PreferredSharesMember 2022-11-01 2023-10-31 0001258623 cik0001258623:PreferredSharesMember 2021-11-01 2022-10-31 0001258623 cik0001258623:PreferredSharesMember 2020-11-01 2021-10-31 0001258623 cik0001258623:PreferredSharesMember 2019-11-01 2020-10-31 0001258623 cik0001258623:PreferredSharesMember 2018-11-01 2019-10-31 0001258623 cik0001258623:PreferredSharesMember 2023-10-31 0001258623 cik0001258623:NotesPayableMember 2023-10-31 0001258623 cik0001258623:PreferredSharesMember 2021-10-31 0001258623 cik0001258623:NotesPayableMember 2021-10-31 0001258623 cik0001258623:PreferredSharesMember 2020-10-31 0001258623 cik0001258623:NotesPayableMember 2020-10-31 0001258623 cik0001258623:PreferredSharesMember 2019-10-31 0001258623 cik0001258623:NotesPayableMember 2019-10-31 0001258623 cik0001258623:PreferredSharesMember 2022-10-31 0001258623 cik0001258623:NotesPayableMember 2022-10-31 xbrli:shares iso4217:USD xbrli:pure iso4217:USD xbrli:shares
 
 
UNITED STATES
SECURITIES AND EXCHANGE COMMISSION
Washington, D.C. 20549
 
 
Form
N-CSR
 
 
CERTIFIED SHAREHOLDER REPORT OF REGISTERED
MANAGEMENT INVESTMENT COMPANIES
Investment Company Act File Number:
811-21411
 
 
Eaton Vance Senior Floating-Rate Trust
(Exact Name of Registrant as Specified in Charter)
 
 
One Post Office Square, Boston, Massachusetts 02109
(Address of Principal Executive Offices)
 
 
Deidre E. Walsh
One Post Office Square, Boston, Massachusetts 02109
(Name and Address of Agent for Services)
 
 
(617)
482-8260
(Registrant’s Telephone Number)
 
 
October 31
Date of Fiscal Year End
April 30, 2024
Date of Reporting Period


Item 1.
Reports to Stockholders


Eaton Vance
Senior Floating-Rate Trust (EFR)
Semi-Annual Report
April 30, 2024


Commodity Futures Trading Commission Registration.
The Commodity Futures Trading Commission (“CFTC”) has adopted regulations that subject registered investment companies and advisers to regulation by the CFTC if a fund invests more than a prescribed level of its assets in certain CFTC-regulated instruments (including futures, certain options and swap agreements) or markets itself as providing investment exposure to such instruments. The investment adviser has claimed an exclusion from the definition of “commodity pool operator” under the Commodity Exchange Act with respect to its management of the Fund. Accordingly, neither the Fund nor the adviser with respect to the operation of the Fund is subject to CFTC regulation. Because of its management of other strategies, the Fund's adviser is registered with the CFTC as a commodity pool operator. The adviser is also registered as a commodity trading advisor.
Fund shares are not insured by the FDIC and are not deposits or other obligations of, or guaranteed by, any depository institution. Shares are subject to investment risks, including possible loss of principal invested.


Semi-Annual Report
April 30, 2024
Eaton Vance
Senior Floating-Rate Trust


Table of Contents
Eaton Vance
Senior Floating-Rate Trust
April 30, 2024
Performance

Portfolio Manager(s)
Andrew N. Sveen, CFA, Catherine C. McDermott, Daniel P. McElaney, CFA and Sarah A. Choi
% Average Annual Total Returns
1,2
Inception Date
Six Months
One Year
Five Years
Ten Years
Fund at NAV 11/28/2003 7.64% 14.25% 5.35% 5.65%
Fund at Market Price 18.82 26.58 8.06 6.21

Morningstar® LSTA® US Leveraged Loan Index
SM
6.05% 11.97% 5.26% 4.59%
% Premium/Discount to NAV
3
 
As of period end 0.54%
Distributions
4
 
Total Distributions per share for the period $0.723
Distribution Rate at NAV
11.16
%
Distribution Rate at Market Price 11.10
% Total Leverage
5
 
Auction Preferred Shares (APS) 13.16%
Borrowings 20.84
See Endnotes and Additional Disclosures in this report.
Past performance is no guarantee of future results. Returns are historical and are calculated net of management fees and other expenses by determining the percentage change in net asset value (NAV) or market price (as applicable) with all distributions reinvested in accordance with the Fund’s Dividend Reinvestment Plan. Furthermore, returns do not reflect the deduction of taxes that shareholders may have to pay on Fund distributions or upon the sale of Fund shares. Performance at market price will differ from performance at NAV due to variations in the Fund’s market price versus NAV, which may reflect factors such as fluctuations in supply and demand for Fund shares, changes in Fund distributions, shifting market expectations for the Fund’s future returns and distribution rates, and other considerations affecting the trading prices of closed-end funds. Investment return and principal value will fluctuate so that shares, when sold, may be worth more or less than their original cost. Performance for periods less than or equal to one year is cumulative. Performance is for the stated time period only; due to market volatility, current Fund performance may be lower or higher than the quoted return. For performance as of the most recent month-end, please refer to eatonvance.com.
2


Table of Contents
Eaton Vance
Senior Floating-Rate Trust
April 30, 2024
Fund Profile

Top 10 Issuers (% of total investments)
1
 
Asurion, LLC 1.1%
Les Schwab Tire Centers 0.8
Cloud Software Group, Inc. 0.8
UKG Inc. 0.8
Focus Financial Partners, LLC 0.8
Virgin Media Bristol LLC 0.7
Sophia, L.P. 0.7
Banff Merger Sub Inc. 0.7
Aretec Group, Inc. 0.7
Endure Digital Inc. 0.7
Total
7.8%
Top 10 Sectors (% of total investments)
1
Software 12.8%
Health Care Providers & Services 5.6
Machinery 5.5
Chemicals 5.1
Hotels, Restaurants & Leisure 4.3
IT Services 4.3
Capital Markets 4.2
Professional Services 3.9
Commercial Services & Supplies 3.4
Specialty Retail 3.3
Total
52.4%
 
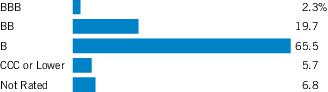
Credit Quality (% of bonds, loans and asset-backed securities)
2
 Footnotes:
1
Excludes cash and cash equivalents.
2
Credit ratings are categorized using S&P Global Ratings (“S&P”). Ratings, which are subject to change, apply to the creditworthiness of the issuers of the underlying securities and not to the Fund or its shares. Credit ratings measure the quality of a bond based on the issuer’s creditworthiness, with ratings ranging from AAA, being the highest, to D, being the lowest based on S&P’s measures. Ratings of BBB or higher by S&P are considered to be investment-grade quality. Credit ratings are based largely on the ratings agency’s analysis at the time of rating. The rating assigned to any particular security is not necessarily a reflection of the issuer’s current financial condition and does not necessarily reflect its assessment of the volatility of a security’s market value or of the liquidity of an investment in the security. Holdings designated as “Not Rated” (if any) are not rated by S&P.
3


Table of Contents
Eaton Vance
Senior Floating-Rate Trust
April 30, 2024
Endnotes and Additional Disclosures

1
Morningstar® LSTA® US Leveraged Loan Index
SM
is an unmanaged index of the institutional leveraged loan market. Morningstar® LSTA® Leveraged Loan indices are a product of Morningstar, Inc. (“Morningstar”) and have been licensed for use. Morningstar® is a registered trademark of Morningstar licensed for certain use. Loan Syndications and Trading Association® and LSTA® are trademarks of the LSTA licensed for certain use by Morningstar, and further sublicensed by Morningstar for certain use. Neither Morningstar nor LSTA guarantees the accuracy and/or completeness of the Morningstar® LSTA® US Leveraged Loan Index
SM
or any data included therein, and shall have no liability for any errors, omissions, or interruptions therein. Unless otherwise stated, index returns do not reflect the effect of any applicable sales charges, commissions, expenses, taxes or leverage, as applicable. It is not possible to invest directly in an index.
2
Performance results reflect the effects of leverage. The Fund’s performance for certain periods reflects the effects of expense reductions. Absent these reductions, performance would have been lower. Included in the average annual total return at NAV for the ten year period is the impact of the tender and repurchase of a portion of the Fund’s APS at 95% of the Fund’s APS per share liquidation preference. Had these transactions not occurred, the total return at NAV would be lower for the Fund.
3
The shares of the Fund often trade at a discount or premium to their net asset value. The discount or premium may vary over time and may be higher or lower than what is quoted in this report. For up-to-date premium/discount information, please refer to https://funds.eatonvance.com/closed-end-fund-prices.php.
4
The Distribution Rate is based on the Fund’s last regular distribution per share in the period (annualized) divided by the Fund’s NAV or market price at the end of the period. The Fund’s distributions may be comprised of amounts characterized for federal income tax purposes as qualified and non-qualified ordinary dividends, capital gains and nondividend distributions, also known as return of capital. For additional information about nondividend distributions, please refer to Eaton Vance Closed-End Fund Distribution Notices (19a) posted on our website, eatonvance.com. The Fund will determine the federal income tax character of distributions paid to a shareholder after the end of the calendar year. This is reported on the IRS form 1099-DIV and provided to the shareholder shortly after each year-end. For information about the tax character of distributions made in prior calendar years, please refer to Performance-Tax Character of Distributions on the Fund’s webpage available at eatonvance.com. The Fund’s distributions are determined by the investment adviser based on its current assessment of the Fund’s long-term return potential. Fund distributions may be affected by numerous factors including changes in Fund performance, the cost of financing for leverage, portfolio holdings, realized and projected returns, and other factors. As portfolio and market conditions change, the rate of distributions paid by the Fund could change.
5
Leverage represents the liquidation value of the Fund’s APS and borrowings outstanding as a percentage of Fund net assets applicable to common shares plus APS and borrowings outstanding. Use of leverage creates an opportunity for income, but creates risks including greater price volatility. The cost of leverage rises and falls with
  changes in short-term interest rates. The Fund may be required to maintain prescribed asset coverage for its leverage and may be required to reduce its leverage at an inopportune time.
  Fund profile subject to change due to active management.
  Important Notice to Shareholders
  On January 26, 2023, the Fund's Board of Trustees voted to exempt, on a going forward basis, all prior and, until further notice, new acquisitions of Fund shares that otherwise might be deemed "Control Share Acquisitions" under the Fund's By-Laws from the Control Share Provisions of the Fund's By-Laws.
 
4


Table of Contents
Eaton Vance
Senior Floating-Rate Trust
April 30, 2024
Portfolio of Investments (Unaudited)

Asset-Backed Securities — 7.6%
Security
Principal
Amount
(000's omitted)
Value
ARES XXXIIR CLO Ltd., Series 2014-32RA, Class D, 11.419%, (3 mo. SOFR + 6.112%), 5/15/30
(1)(2)
$      2,000 $   1,912,860
ARES XXXIV CLO Ltd., Series 2015-2A, Class ER, 12.429%, (3 mo. SOFR + 7.112%), 4/17/33
(1)(2)
       1,150    1,137,459
Benefit Street Partners CLO XIX Ltd., Series 2019-19A, Class E, 12.61%, (3 mo. SOFR + 7.282%), 1/15/33
(1)(2)
         750      758,359
Benefit Street Partners CLO XVIII Ltd., Series 2019-18A, Class ER, 12.34%, (3 mo. SOFR + 7.012%), 10/15/34
(1)(2)
       1,000    1,010,566
Benefit Street Partners CLO XXII Ltd., Series 2020-22A, Class ER, 12.255%, (3 mo. SOFR + 6.93%), 4/20/35
(1)(2)
       1,000    1,003,100
BlueMountain CLO XXVI Ltd., Series 2019-26A, Class ER, 12.716%, (3 mo. SOFR + 7.392%), 10/20/34
(1)(2)
       1,500    1,473,017
Canyon Capital CLO Ltd.:
     
Series 2019-2A, Class ER, 12.34%, (3 mo. SOFR + 7.012%), 10/15/34
(1)(2)
         400      391,538
Series 2022-1A, Class E, 11.728%, (3 mo. SOFR + 6.40%), 4/15/35
(1)(2)
       1,250    1,220,471
Carlyle Global Market Strategies CLO Ltd.:
     
Series 2012-3A, Class DR2, 12.09%, (3 mo. SOFR + 6.762%), 1/14/32
(1)(2)
       1,200    1,183,860
Series 2015-5A, Class DR, 12.286%, (3 mo. SOFR + 6.962%), 1/20/32
(1)(2)
         500      490,014
Cedar Funding X CLO Ltd., Series 2019-10A, Class ER, 12.086%, (3 mo. SOFR + 6.762%), 10/20/32
(1)(2)
       1,000      997,461
Clover CLO Ltd., Series 2019-1A, Class ER, 12.027%, (3 mo. SOFR + 6.70%), 4/18/35
(1)(2)
       1,000      979,501
Galaxy XV CLO Ltd., Series 2013-15A, Class ER, 12.235%, (3 mo. SOFR + 6.907%), 10/15/30
(1)(2)
       1,000      996,512
Galaxy XXI CLO Ltd., Series 2015-21A, Class ER, 10.836%, (3 mo. SOFR + 5.512%), 4/20/31
(1)(2)
       1,000      990,423
Golub Capital Partners CLO 23M Ltd., Series 2015-23A, Class ER, 11.336%, (3 mo. SOFR + 6.012%), 1/20/31
(1)(2)
       1,200    1,205,570
Golub Capital Partners CLO 50B-R Ltd., Series 2020-50A, Class ER, 12.425%, (3 mo. SOFR + 7.10%), 4/20/35
(1)(2)
       1,000    1,002,918
Madison Park Funding XXXVI Ltd., Series 2019-36A, Class ER, 12.379%, (3 mo. SOFR + 7.05%), 4/15/35
(1)(2)
       1,000    1,003,404
Neuberger Berman Loan Advisers CLO Ltd., Series 2022-48A, Class E, 11.824%, (3 mo. SOFR + 6.50%), 4/25/36
(1)(2)
       1,000    1,002,757
Palmer Square CLO Ltd.:
     
Series 2013-2A, Class DRR, 11.429%, (3 mo. SOFR + 6.112%), 10/17/31
(1)(2)
         900       902,391
Security
Principal
Amount
(000's omitted)
Value
Palmer Square CLO Ltd.:
(continued)
     
Series 2014-1A, Class DR2, 11.279%, (3 mo. SOFR + 5.962%), 1/17/31
(1)(2)
$      1,500 $
   1,503,665
Series 2015-1A, Class DR4, 12.076%, (3 mo. SOFR + 6.762%), 5/21/34
(1)(2)
         500      501,303
Series 2019-1A, Class DR, 12.068%, (3 mo. SOFR + 6.762%), 11/14/34
(1)(2)
       1,000    1,004,898
RAD CLO 5 Ltd., Series 2019-5A, Class E, 12.285%, (3 mo. SOFR + 6.962%), 7/24/32
(1)(2)
       1,000      993,503
Regatta XIV Funding Ltd., Series 2018-3A, Class E, 11.535%, (3 mo. SOFR + 6.212%), 10/25/31
(1)(2)
         700      690,460
Regatta XVI Funding Ltd., Series 2019-2A, Class E, 12.59%, (3 mo. SOFR + 7.262%), 1/15/33
(1)(2)
         750      755,267
Vibrant CLO XI Ltd., Series 2019-11A, Class D, 12.356%, (3 mo. SOFR + 7.032%), 7/20/32
(1)(2)
       1,000      972,907
Voya CLO Ltd., Series 2013-1A, Class DR, 12.07%, (3 mo. SOFR + 6.742%), 10/15/30
(1)(2)
       2,000    1,795,460
Wellfleet CLO Ltd., Series 2020-1A, Class D, 12.83%, (3 mo. SOFR + 7.502%), 4/15/33
(1)(2)
       1,150    1,128,350
Total Asset-Backed Securities
(identified cost $29,206,146)
   
$  29,007,994
    
Closed-End Funds — 1.9%
Security
Shares
Value
BlackRock Floating Rate Income Strategies Fund, Inc.       99,936 $
   1,299,168
Invesco Senior Income Trust      361,124    1,549,222
Nuveen Credit Strategies Income Fund      365,228    2,016,059
Nuveen Floating Rate Income Fund      249,983    2,149,854
Total Closed-End Funds
(identified cost $8,822,712)
   
$   7,014,303
    
Common Stocks — 0.8%
Security
Shares
Value
Aerospace and Defense — 0.0%
IAP Worldwide Services LLC
(3)(4)(5)
          55 $
           0
     
$           0
Chemicals — 0.0%
Flint Campfire Topco Ltd., Class A
(3)(4)(5)
     196,320 $
           0
     
$           0
Commercial Services & Supplies — 0.1%
Monitronics International, Inc.
(4)(5)
      18,441 $
     387,261
 
5
See Notes to Financial Statements.


Table of Contents
Eaton Vance
Senior Floating-Rate Trust
April 30, 2024
Portfolio of Investments (Unaudited) — continued

Security
Shares
Value
Commercial Services & Supplies (continued)
Phoenix Services International LLC
(4)(5)
      16,081 $
      82,415
Phoenix Services International LLC
(4)(5)
       1,467        7,519
     
$     477,195
Electronics/Electrical — 0.0%
(6)
Skillsoft Corp.
(4)(5)
       2,650 $
      19,053
     
$      19,053
Entertainment — 0.1%
New Cineworld Ltd.
(4)(5)
      14,009 $
     268,798
     
$     268,798
Health Care — 0.1%
Envision Parent, Inc.
(4)(5)
      44,965 $
     317,565
     
$     317,565
Household Durables — 0.1%
Serta Simmons Bedding, Inc.
(4)(5)
      74,131 $
     525,092
Serta SSB Equipment Co.
(3)(4)(5)
      74,131            0
     
$     525,092
Investment Companies — 0.0%
(6)
Aegletes BV
(4)(5)
      14,087 $
      29,301
     
$      29,301
Pharmaceuticals — 0.4%
Covis Midco 1 SARL, Class A
(4)(5)
         501 $
         255
Covis Midco 1 SARL, Class B
(4)(5)
         501          255
Covis Midco 1 SARL, Class C
(4)(5)
         501          255
Covis Midco 1 SARL, Class D
(4)(5)
         501          256
Covis Midco 1 SARL, Class E
(4)(5)
         501          256
Mallinckrodt International Finance SA
(4)(5)
      27,357    1,443,082
     
$   1,444,359
Retail — 0.0%
Jubilee Enterprise PCL, Class A1
(3)(4)(5)
         458 $
           0
Jubilee Enterprise PCL, Class A2
(3)(4)(5)
     366,665            0
     
$           0
Retailers (Except Food and Drug) — 0.0%
(6)
Phillips Feed Service, Inc.
(3)(4)(5)
         556 $
         796
     
$         796
Security
Shares
Value
Telecommunications — 0.0%
GEE Acquisition Holdings Corp.
(3)(4)(5)
      45,136 $
           0
     
$           0
Total Common Stocks
(identified cost $5,435,344)
   
$   3,082,159
    
Corporate Bonds — 6.2%
Security
Principal
Amount
(000's omitted)
Value
Aerospace and Defense — 0.2%
Bombardier, Inc., 6.00%, 2/15/28
(1)
$        200 $
     195,256
TransDigm, Inc., 4.875%, 5/1/29          625      575,556
     
$     770,812
Automotive — 0.3%
Clarios Global LP/Clarios U.S. Finance Co., 8.50%, 5/15/27
(1)
$      1,000 $
   1,003,193
     
$   1,003,193
Building and Development — 0.3%
Smyrna Ready Mix Concrete LLC, 6.00%, 11/1/28
(1)
$        625 $
     605,184
Standard Industries, Inc., 4.75%, 1/15/28
(1)
         625      590,042
     
$   1,195,226
Business Equipment and Services — 0.4%
GEMS MENASA Cayman Ltd./GEMS Education Delaware LLC, 7.125%, 7/31/26
(1)
$      1,000 $
     994,608
Prime Security Services Borrower LLC/Prime Finance, Inc., 5.75%, 4/15/26
(1)
         700      691,822
     
$   1,686,430
Cable and Satellite Television — 0.1%
CCO Holdings LLC/CCO Holdings Capital Corp., 4.50%, 8/15/30
(1)
$        625 $
     508,370
     
$     508,370
Chemicals — 0.1%
Olympus Water U.S. Holding Corp., 9.75%, 11/15/28
(1)
$        209 $
     222,035
     
$     222,035
 
6
See Notes to Financial Statements.


Table of Contents
Eaton Vance
Senior Floating-Rate Trust
April 30, 2024
Portfolio of Investments (Unaudited) — continued

Security
Principal
Amount
(000's omitted)
Value
Commercial Services — 0.1%
Mavis Tire Express Services Topco Corp., 6.50%, 5/15/29
(1)
$        489 $
     453,499
     
$     453,499
Cosmetics/Toiletries — 0.2%
Edgewell Personal Care Co., 5.50%, 6/1/28
(1)
$        625 $
     603,744
     
$     603,744
Distribution & Wholesale — 0.4%
BCPE Empire Holdings, Inc., 7.625%, 5/1/27
(1)
$        602 $
     586,478
Performance Food Group, Inc., 5.50%, 10/15/27
(1)
       1,000      968,905
     
$   1,555,383
Diversified Financial Services — 0.1%
VistaJet Malta Finance PLC/Vista Management Holding, Inc., 6.375%, 2/1/30
(1)
$        625 $
     484,521
     
$     484,521
Ecological Services and Equipment — 0.1%
GFL Environmental, Inc., 4.375%, 8/15/29
(1)
$        366 $
     330,707
     
$     330,707
Engineering & Construction — 0.2%
TopBuild Corp., 3.625%, 3/15/29
(1)
$        625 $
     561,668
     
$     561,668
Entertainment — 0.3%
Caesars Entertainment, Inc., 8.125%, 7/1/27
(1)
$      1,000 $
   1,014,213
     
$   1,014,213
Food Service — 0.1%
Albertsons Cos., Inc./Safeway, Inc./New Albertsons LP/Albertsons LLC, 3.50%, 3/15/29
(1)
$        625 $
     552,095
     
$     552,095
Health Care — 0.6%
LifePoint Health, Inc., 5.375%, 1/15/29
(1)
$        625 $
     500,343
Medline Borrower LP, 5.25%, 10/1/29
(1)
         241      224,572
Tenet Healthcare Corp., 6.875%, 11/15/31        1,000    1,031,582
U.S. Acute Care Solutions LLC, 6.375%, 3/1/26
(1)
         625      633,447
     
$   2,389,944
Security
Principal
Amount
(000's omitted)
Value
Home Furnishings — 0.2%
Tempur Sealy International, Inc., 4.00%, 4/15/29
(1)
$        625 $
     556,302
     
$     556,302
Insurance — 0.3%
Alliant Holdings Intermediate LLC/Alliant Holdings Co-Issuer, 6.75%, 10/15/27
(1)
$        625 $
     613,402
AmWINS Group, Inc., 4.875%, 6/30/29
(1)
         600      545,983
     
$   1,159,385
Leisure Goods/Activities/Movies — 0.3%
NCL Corp. Ltd., 5.875%, 2/15/27
(1)
$        550 $
     537,677
Viking Cruises Ltd., 5.875%, 9/15/27
(1)
         625      606,469
     
$   1,144,146
Media — 0.0%
(6)
Diamond Sports Group LLC/Diamond Sports Finance Co., 5.375%, 8/15/26
(1)(7)
$          0
(8)
$
           6
iHeartCommunications, Inc., 6.375%, 5/1/26          208      175,659
     
$     175,665
Nonferrous Metals/Minerals — 0.1%
New Gold, Inc., 7.50%, 7/15/27
(1)
$        474 $
     471,532
     
$     471,532
Oil and Gas — 0.3%
Civitas Resources, Inc., 8.375%, 7/1/28
(1)
$        250 $
     261,108
Permian Resources Operating LLC, 5.375%, 1/15/26
(1)
         625      618,143
Vital Energy, Inc., 9.75%, 10/15/30          350      381,646
     
$   1,260,897
Pipelines — 0.1%
Venture Global LNG, Inc., 8.375%, 6/1/31
(1)
$        447 $
     459,012
     
$     459,012
Real Estate Investment Trusts (REITs) — 0.2%
HAT Holdings I LLC/HAT Holdings II LLC, 3.375%, 6/15/26
(1)
$        625 $
     581,580
     
$     581,580
Retail — 0.0%
(6)
Evergreen AcqCo 1 LP/TVI, Inc., 9.75%, 4/26/28
(1)
$         49 $
      51,954
     
$      51,954
 
7
See Notes to Financial Statements.


Table of Contents
Eaton Vance
Senior Floating-Rate Trust
April 30, 2024
Portfolio of Investments (Unaudited) — continued

Security
Principal
Amount
(000's omitted)
Value
Retailers (Except Food and Drug) — 0.2%
Dave & Buster's, Inc., 7.625%, 11/1/25
(1)
$        500 $
     503,702
PetSmart, Inc./PetSmart Finance Corp., 7.75%, 2/15/29
(1)
         355      337,791
     
$     841,493
Surface Transport — 0.1%
Hertz Corp., 4.625%, 12/1/26
(1)
$        252 $
     195,450
     
$     195,450
Technology — 0.2%
athenahealth Group, Inc., 6.50%, 2/15/30
(1)
$        625 $
     563,236
     
$     563,236
Telecommunications — 0.3%
Connect Finco SARL/Connect U.S. Finco LLC, 6.75%, 10/1/26
(1)
$      1,000 $
     969,363
     
$     969,363
Utilities — 0.3%
Calpine Corp., 5.00%, 2/1/31
(1)
$        505 $
     458,153
NRG Energy, Inc., 3.625%, 2/15/31
(1)
       1,000      847,562
     
$   1,305,715
Wireless Telecommunication Services — 0.1%
Digicel Intermediate Holdings Ltd./Digicel International Finance Ltd./DIFL U.S., 10.50%, (9.00% cash, 1.50% PIK), 5/25/27
(9)
$        550 $
     534,072
     
$     534,072
Total Corporate Bonds
(identified cost $23,747,955)
   
$  23,601,642
    
Senior Floating-Rate Loans — 135.3%
(10)
Borrower/Description
Principal

Amount
*

(000's omitted)
Value
Aerospace and Defense — 1.1%
Aernnova Aerospace SAU:
     
Term Loan, 6.902%, (6 mo. EURIBOR + 3.00%), 2/26/27 EUR        102 $     108,444
Term Loan, 6.952%, (3 mo. EURIBOR + 3.00%), 2/26/27 EUR        398      422,933
Dynasty Acquisition Co., Inc.:
     
Term Loan, 8.816%, (SOFR + 3.50%), 8/24/28        2,515    2,529,647
Term Loan, 8.816%, (SOFR + 3.50%), 8/24/28          970       975,367
Borrower/Description
Principal

Amount
*

(000's omitted)
Value
Aerospace and Defense (continued)
IAP Worldwide Services, Inc., Term Loan - Second Lien, 12.152%, (3 mo. USD LIBOR + 6.50%), 7/18/23
(3)
         391 $
     310,307
     
$   4,346,698
Airlines — 0.8%
American Airlines, Inc., Term Loan, 10.336%, (SOFR + 4.75%), 4/20/28        2,420 $
   2,520,236
Mileage Plus Holdings LLC, Term Loan, 10.733%, (SOFR + 5.25%), 6/21/27          488      500,873
     
$   3,021,109
Apparel & Luxury Goods — 0.9%
Gloves Buyer, Inc.:
     
Term Loan, 9.43%, (SOFR + 4.00%), 12/29/27        1,606 $
   1,609,869
Term Loan, 10.43%, (SOFR + 5.00%), 12/29/27          620      621,863
Hanesbrands, Inc., Term Loan, 9.066%, (SOFR + 3.75%), 3/8/30          347      347,366
Touchdown Acquirer, Inc.:
     
Term Loan, 0.00%, 2/21/31
(11)
         175      175,984
Term Loan, 9.314%, (SOFR + 4.00%), 2/21/31          775      779,360
     
$   3,534,442
Auto Components — 3.6%
Adient U.S. LLC, Term Loan, 8.066%, (SOFR + 2.75%), 1/31/31        1,562 $
   1,570,842
Autokiniton U.S. Holdings, Inc., Term Loan, 9.43%, (SOFR + 4.00%), 4/6/28        3,116    3,134,773
Clarios Global LP:
     
Term Loan, 7.098%, (1 mo. EURIBOR + 3.25%), 4/30/26 EUR        630      673,808
Term Loan, 8.316%, (SOFR + 3.00%), 5/6/30        2,070    2,078,609
DexKo Global, Inc.:
     
Term Loan, 7.902%, (3 mo. EURIBOR + 4.00%), 10/4/28 EUR        240      253,186
Term Loan, 7.902%, (3 mo. EURIBOR + 4.00%), 10/4/28 EUR        535      565,210
Term Loan, 9.321%, (SOFR + 3.75%), 10/4/28          686      682,025
Garrett LX I SARL, Term Loan, 8.841%, (SOFR + 3.25%), 4/30/28          707      708,863
Garrett Motion, Inc., Term Loan, 9.83%, (SOFR + 4.50%), 4/30/28          543      545,571
LSF12 Badger Bidco LLC, Term Loan, 11.316%, (SOFR + 6.00%), 8/30/30          299      301,120
LTI Holdings, Inc., Term Loan, 10.18%, (SOFR + 4.75%), 7/24/26          537       531,695
 
8
See Notes to Financial Statements.


Table of Contents
Eaton Vance
Senior Floating-Rate Trust
April 30, 2024
Portfolio of Investments (Unaudited) — continued

Borrower/Description
Principal

Amount
*

(000's omitted)
Value
Auto Components (continued)
RealTruck Group, Inc.:
     
Term Loan, 8.93%, (SOFR + 3.50%), 1/31/28        1,805 $
   1,794,233
Term Loan, 10.43%, (SOFR + 5.00%), 1/31/28          675      673,031
     
$  13,512,966
Automobiles — 0.5%
MajorDrive Holdings IV LLC:
     
Term Loan, 9.571%, (SOFR + 4.00%), 6/1/28          608 $
     611,231
Term Loan, 10.959%, (SOFR + 5.50%), 6/1/29        1,446    1,457,245
     
$   2,068,476
Beverages — 1.3%
Arterra Wines Canada, Inc., Term Loan, 9.071%, (SOFR + 3.50%), 11/24/27          968 $
     891,234
City Brewing Co. LLC:
     
Term Loan, 9.09%, (SOFR + 3.50%), 4/5/28          572      526,165
Term Loan, 11.574%, (SOFR + 6.25%), 4/5/28          185      184,937
Term Loan - Second Lien, 10.59%, (SOFR + 5.00%), 9.09% cash, 1.50% PIK, 4/5/28        1,072      782,501
Triton Water Holdings, Inc., Term Loan, 8.814%, (SOFR + 3.25%), 3/31/28        2,383    2,375,186
     
$   4,760,023
Biotechnology — 0.2%
Alkermes, Inc., Term Loan, 7.93%, (SOFR + 2.50%), 3/12/26          336 $
     337,695
Alltech, Inc., Term Loan, 9.43%, (SOFR + 4.00%), 10/13/28          391      389,045
     
$     726,740
Building Products — 2.4%
Cornerstone Building Brands, Inc., Term Loan, 8.671%, (SOFR + 3.25%), 4/12/28        2,772 $
   2,722,143
LHS Borrower LLC, Term Loan, 10.166%, (SOFR + 4.75%), 2/16/29          998      965,211
MI Windows and Doors LLC, Term Loan, 8.816%, (SOFR + 3.50%), 3/28/31        2,275    2,288,082
Oscar AcquisitionCo LLC, Term Loan, 9.902%, (SOFR + 4.50%), 4/29/29        2,288    2,300,076
Standard Industries, Inc., Term Loan, 7.68%, (SOFR + 2.25%), 9/22/28          911      914,456
     
$   9,189,968
Capital Markets — 6.4%
Advisor Group, Inc.:
     
Term Loan, 9.816%, (SOFR + 4.50%), 8/17/28        2,163 $
   2,177,316
Borrower/Description
Principal

Amount
*

(000's omitted)
Value
Capital Markets (continued)
Advisor Group, Inc.:
(continued)
     
Term Loan, 8/17/28
(12)
         750 $
     754,553
AllSpring Buyer LLC, Term Loan, 8.677%, (SOFR + 3.25%), 11/1/28        1,326    1,323,556
Aretec Group, Inc., Term Loan, 9.916%, (SOFR + 4.50%), 8/9/30        3,926    3,949,699
Citco Funding LLC, Term Loan, 8.422%, (SOFR + 3.25%), 4/27/28          771      774,820
Edelman Financial Center LLC, Term Loan, 8.93%, (SOFR + 3.50%), 4/7/28        2,434    2,437,618
EIG Management Co. LLC, Term Loan, 9.166%, (SOFR + 3.75%), 2/22/25          235      234,853
FinCo I LLC, Term Loan, 8.33%, (SOFR + 3.00%), 6/27/29        1,216    1,220,751
Focus Financial Partners LLC:
     
Term Loan, 7.816%, (SOFR + 2.50%), 6/30/28        2,919    2,919,073
Term Loan, 8.066%, (SOFR + 2.75%), 6/30/28        1,416    1,417,364
Franklin Square Holdings LP, Term Loan, 7.568%, (SOFR + 2.25%), 4/25/31        1,025    1,025,641
HighTower Holdings LLC, Term Loan, 9.586%, (SOFR + 4.00%), 4/21/28        2,248    2,262,332
Kestra Advisor Services Holdings A, Inc., Term Loan, 9.316%, (SOFR + 4.00%), 3/22/31        1,400    1,408,532
Mariner Wealth Advisors LLC, Term Loan, 8.68%, (SOFR + 3.25%), 8/18/28        1,635    1,637,381
Press Ganey Holdings, Inc., Term Loan, 4/24/31
(12)
         650      648,781
     
$  24,192,270
Chemicals — 7.8%
Aruba Investments Holdings LLC:
     
Term Loan, 7.848%, (1 mo. EURIBOR + 4.00%), 11/24/27 EUR        485 $
     494,139
Term Loan, 9.416%, (SOFR + 4.00%), 11/24/27        1,444    1,407,751
Axalta Coating Systems U.S. Holdings, Inc., Term Loan, 7.33%, (SOFR + 2.00%), 12/20/29        1,747    1,753,902
Charter NEX U.S., Inc., Term Loan, 8.816%, (SOFR + 3.50%), 12/1/27        1,180    1,185,369
CPC Acquisition Corp., Term Loan, 9.321%, (SOFR + 3.75%), 12/29/27          674      571,847
Flint Group Midco Ltd., Term Loan, 10.588%, (SOFR + 5.262), 9.838% cash, 0.75% PIK, 12/31/26          346      331,362
Flint Group Topco Ltd.:
     
Term Loan, 12.588%, (SOFR + 7.262), 5.688% cash, 6.90% PIK, 12/31/27          179      148,043
Term Loan - Second Lien, 12.588%, (SOFR + 7.262), 5.688% cash, 6.90% PIK, 12/31/27          235        36,589
 
9
See Notes to Financial Statements.


Table of Contents
Eaton Vance
Senior Floating-Rate Trust
April 30, 2024
Portfolio of Investments (Unaudited) — continued

Borrower/Description
Principal

Amount
*

(000's omitted)
Value
Chemicals (continued)
Gemini HDPE LLC, Term Loan, 8.591%, (SOFR + 3.00%), 12/31/27          647 $
     648,106
Groupe Solmax, Inc., Term Loan, 10.252%, (SOFR + 4.75%), 5/29/28
(13)
       1,459    1,439,604
INEOS Enterprises Holdings II Ltd., Term Loan, 7.952%, (3 mo. EURIBOR + 4.00%), 7/7/30 EUR        175      187,460
INEOS Enterprises Holdings U.S. Finco LLC, Term Loan, 9.193%, (SOFR + 3.75%), 7/8/30        1,047    1,051,303
INEOS Finance PLC:
     
Term Loan, 6.598%, (1 mo. EURIBOR + 2.75%), 11/8/28 EUR        625      664,332
Term Loan, 7.848%, (1 mo. EURIBOR + 4.00%), 11/8/27 EUR          4        4,058
INEOS Quattro Holdings U.K. Ltd.:
     
Term Loan, 7.848%, (1 mo. EURIBOR + 4.00%), 3/14/30 EUR        275      291,384
Term Loan, 9.666%, (SOFR + 4.25%), 4/2/29        1,955    1,952,556
INEOS U.S. Finance LLC:
     
Term Loan, 7.916%, (SOFR + 2.50%), 11/8/28          515      514,259
Term Loan, 8.916%, (SOFR + 3.50%), 2/18/30        1,318    1,322,174
Term Loan, 9.066%, (SOFR + 3.75%), 2/7/31          550      552,406
Term Loan, 9.166%, (SOFR + 3.75%), 11/8/27          598      600,252
Kraton Corp., Term Loan, 8.841%, (SOFR + 3.25%), 3/15/29        1,133    1,089,730
Kraton Polymers Holdings BV, Term Loan, 7.188%, (3 mo. EURIBOR + 3.25%), 3/15/29 EUR        300      310,255
Lonza Group AG, Term Loan, 9.334%, (SOFR + 3.93%), 7/3/28        2,408    2,314,076
Momentive Performance Materials, Inc., Term Loan, 9.817%, (SOFR + 4.50%), 3/29/28        1,784    1,776,674
Olympus Water U.S. Holding Corp.:
     
Term Loan, 9.321%, (SOFR + 3.75%), 11/9/28        1,466    1,471,106
Term Loan, 9.576%, (SOFR + 4.25%), 11/9/28          766      769,893
Orion Engineered Carbons GmbH, Term Loan, 7.559%, (SOFR + 2.15%), 9/24/28          317      316,083
Rohm Holding GmbH, Term Loan, 10.581%, (SOFR + 5.00%), 7/31/26        1,428    1,349,681
SCUR-Alpha 1503 GmbH, Term Loan, 10.83%, (SOFR + 5.50%), 3/29/30          470      436,173
Starfruit Finco BV, Term Loan, 9.423%, (SOFR + 4.00%), 4/3/28          596      597,826
Tronox Finance LLC:
     
Term Loan, 8.816%, (SOFR + 3.50%), 8/16/28          474      475,392
Term Loan, 4/4/29
(12)
       1,000    1,002,812
W.R. Grace & Co.-Conn., Term Loan, 9.321%, (SOFR + 3.75%), 9/22/28        2,395    2,401,930
     
$  29,468,527
Borrower/Description
Principal

Amount
*

(000's omitted)
Value
Commercial Services & Supplies — 4.8%
Albion Financing 3 SARL:
     
Term Loan, 10.575%, (SOFR + 5.25%), 8/17/26        1,320 $
   1,328,698
Term Loan, 10.824%, (SOFR + 5.50%), 8/17/26          272      273,952
Allied Universal Holdco LLC, Term Loan, 9.166%, (SOFR + 3.75%), 5/12/28        3,831    3,835,320
Belfor Holdings, Inc., Term Loan, 9.066%, (SOFR + 3.75%), 11/1/30          587      589,577
EnergySolutions LLC, Term Loan, 9.316%, (SOFR + 4.00%), 9/20/30        1,550    1,558,144
Foundever Worldwide Corp., Term Loan, 9.18%, (SOFR + 3.75%), 8/28/28        2,267    1,763,710
Garda World Security Corp., Term Loan, 9.583%, (SOFR + 4.25%), 2/1/29        2,402    2,416,098
GFL Environmental, Inc., Term Loan, 7.826%, (SOFR + 2.50%), 5/31/27           28       27,775
Heritage-Crystal Clean, Inc., Term Loan, 9.816%, (SOFR + 4.50%), 10/17/30          698      700,977
LABL, Inc., Term Loan, 10.416%, (SOFR + 5.00%), 10/29/28          611      599,355
Monitronics International, Inc., Term Loan, 13.091%, (SOFR + 7.50%), 6/30/28        1,011    1,010,045
Phoenix Services International LLC, Term Loan, 11.418%, (SOFR + 6.10%), 6/30/28          196      183,554
Tempo Acquisition LLC, Term Loan, 8.066%, (SOFR + 2.75%), 8/31/28        1,525    1,531,444
TMF Group Holding BV, Term Loan, 9.306%, (SOFR + 4.00%), 5/3/28          374      375,933
TruGreen LP, Term Loan, 9.416%, (SOFR + 4.00%), 11/2/27        2,015    1,940,809
     
$  18,135,391
Construction Materials — 0.7%
Quikrete Holdings, Inc., Term Loan, 7.569%, (SOFR + 2.25%), 3/19/29        2,450 $
   2,453,572
U.S. Silica Co., Term Loan, 9.316%, (SOFR + 4.00%), 3/25/30          324      324,789
     
$   2,778,361
Consumer Staples Distribution & Retail — 0.5%
Cardenas Markets, Inc., Term Loan, 12.159%, (SOFR + 6.75%), 8/1/29          396 $
     398,667
Peer Holding III BV:
     
Term Loan, 7.652%, (3 mo. EURIBOR + 3.75%), 9/29/28 EUR        525      563,222
Term Loan, 8.559%, (SOFR + 3.25%), 10/28/30        1,100    1,105,271
     
$   2,067,160
 
10
See Notes to Financial Statements.


Table of Contents
Eaton Vance
Senior Floating-Rate Trust
April 30, 2024
Portfolio of Investments (Unaudited) — continued

Borrower/Description
Principal

Amount
*

(000's omitted)
Value
Containers & Packaging — 1.5%
Berlin Packaging LLC, Term Loan, 9.197%, (SOFR + 3.75%), 3/11/28
(13)
       1,766 $
   1,769,447
Clydesdale Acquisition Holdings, Inc., Term Loan, 9.091%, (SOFR + 3.68%), 4/13/29        2,461    2,474,153
Pretium Packaging LLC, Term Loan - Second Lien, 11.309%, (SOFR + 6.00%), 9.906% cash, 1.403% PIK, 10/2/28           35       31,084
Pretium PKG Holdings, Inc., Term Loan - Second Lien, 12.334%, (SOFR + 6.75%), 10/1/29          300      184,875
Proampac PG Borrower LLC, Term Loan, 9.326%, (SOFR + 4.00%), 9/15/28
(13)
       1,122    1,127,565
     
$   5,587,124
Distributors — 0.7%
CD&R Hydra Buyer, Inc., Term Loan, 9.42%, (SOFR + 4.00%), 3/25/31          875 $
     883,067
Parts Europe SA, Term Loan, 7.647%, (3 mo. EURIBOR + 3.75%), 2/3/31 EUR      1,475    1,580,357
Phillips Feed Service, Inc., Term Loan, 12.416%, (SOFR + 7.00%), 11/13/24
(3)
         101       70,394
     
$   2,533,818
Diversified Consumer Services — 1.8%
Ascend Learning LLC, Term Loan, 8.916%, (SOFR + 3.50%), 12/11/28          538 $
     536,491
Belron Finance U.S. LLC, Term Loan, 7.578%, (SOFR + 2.00%), 4/13/28          897      899,867
KUEHG Corp., Term Loan, 9.823%, (SOFR + 4.50%), 6/12/30        2,289    2,298,121
Sotheby's, Term Loan, 10.09%, (SOFR + 4.50%), 1/15/27        1,524    1,491,569
Spring Education Group, Inc., Term Loan, 9.809%, (SOFR + 4.50%), 10/4/30          349      351,002
Wand NewCo 3, Inc., Term Loan, 9.066%, (SOFR + 3.75%), 1/30/31        1,250    1,259,375
     
$   6,836,425
Diversified Financial Services — 0.4%
Concorde Midco Ltd., Term Loan, 7.851%, (6 mo. EURIBOR + 4.00%), 3/1/28 EUR        525 $
     561,448
Sandy BidCo BV, Term Loan, 7.437%, (1 mo. EURIBOR + 3.60%), 8/17/29 EUR        925      988,943
     
$   1,550,391
Diversified Telecommunication Services — 1.9%
Altice France SA, Term Loan, 10.829%, (SOFR + 5.50%), 8/15/28        1,180 $
     885,719
Borrower/Description
Principal

Amount
*

(000's omitted)
Value
Diversified Telecommunication Services (continued)
GEE Holdings 2 LLC:
     
Term Loan, 13.413%, (SOFR + 8.00%), 3/24/25          398 $
     362,483
Term Loan - Second Lien, 13.662%, (SOFR + 8.25%), 5.412% cash, 8.25% PIK, 3/23/26          936      561,493
Virgin Media Bristol LLC, Term Loan, 8.686%, (SOFR + 3.25%), 1/31/29        4,200    4,143,418
Zayo Group Holdings, Inc., Term Loan, 7.098%, (1 mo. EURIBOR + 3.25%), 3/9/27 EUR      1,383    1,280,024
     
$   7,233,137
Electrical Equipment — 1.1%
AZZ, Inc., Term Loan, 8.566%, (SOFR + 3.25%), 5/13/29        1,212 $
   1,219,407
WEC U.S. Holdings Ltd., Term Loan, 8.066%, (SOFR + 2.75%), 1/27/31        3,100    3,105,716
     
$   4,325,123
Electronic Equipment, Instruments & Components — 2.8%
Chamberlain Group, Inc.:
     
Term Loan, 8.666%, (SOFR + 3.25%), 11/3/28        1,295 $
   1,294,956
Term Loan, 9.066%, (SOFR + 3.75%), 11/3/28        1,175    1,178,525
Creation Technologies, Inc., Term Loan, 11.068%, (SOFR + 5.50%), 10/5/28        1,325    1,255,876
Ingram Micro, Inc., Term Loan, 8.571%, (SOFR + 3.00%), 6/30/28        2,236    2,243,341
Mirion Technologies, Inc., Term Loan, 8.314%, (SOFR + 2.75%), 10/20/28          502      503,590
MX Holdings U.S., Inc., Term Loan, 8.18%, (SOFR + 2.75%), 7/31/28          249      249,786
Robertshaw U.S. Holding Corp.:
     
DIP Loan, 6.309%, (SOFR + 1.00%), 9/27/24          312      304,562
Term Loan, 0.00%, 2/28/27
(7)
           0
(8)
         177
Term Loan, 0.00%, 2/28/27
(7)
         999      973,617
Term Loan - Second Lien, 0.00%, 2/28/27
(7)
         919      505,620
Verifone Systems, Inc., Term Loan, 9.585%, (SOFR + 4.00%), 8/20/25        1,088      987,847
Verisure Holding AB:
     
Term Loan, 6.891%, (3 mo. EURIBOR + 3.00%), 8/6/26 EUR        300      320,375
Term Loan, 6.902%, (3 mo. EURIBOR + 3.00%), 3/27/28 EUR        775      825,999
     
$  10,644,271
Energy Equipment & Services — 0.4%
Ameriforge Group, Inc., Term Loan, 12.085%, (SOFR + 8.00%), 12/29/23
(3)(11)
          55 $
      44,195
 
11
See Notes to Financial Statements.


Table of Contents
Eaton Vance
Senior Floating-Rate Trust
April 30, 2024
Portfolio of Investments (Unaudited) — continued

Borrower/Description
Principal

Amount
*

(000's omitted)
Value
Energy Equipment & Services (continued)
GIP Pilot Acquisition Partners LP, Term Loan, 8.308%, (SOFR + 3.00%), 10/4/30          474 $
     476,774
PG Investment Co. 59 SARL, Term Loan, 8.813%, (SOFR + 3.50%), 3/26/31        1,075    1,080,152
     
$   1,601,121
Engineering & Construction — 1.2%
Aegion Corp., Term Loan, 9.566%, (SOFR + 4.25%), 5/17/28        1,253 $
   1,261,659
American Residential Services LLC, Term Loan, 9.071%, (SOFR + 3.50%), 10/15/27          556      557,355
Artera Services LLC, Term Loan, 9.809%, (SOFR + 4.50%), 2/15/31          425      429,144
Northstar Group Services, Inc., Term Loan, 10.93%, (SOFR + 5.50%), 11/12/26        1,348    1,352,887
Platea BC Bidco AB:
     
Term Loan, 4/2/31
(12)
EUR        708      759,241
Term Loan, 4/2/31
(12)
EUR        142      151,848
     
$   4,512,134
Entertainment — 1.7%
City Football Group Ltd., Term Loan, 8.439%, (SOFR + 3.00%), 7/21/28        1,955 $
   1,954,185
Crown Finance U.S., Inc., Term Loan, 13.93%, (SOFR + 8.50%), 6.93% cash, 7.00% PIK, 7/31/28          316      321,909
EP Purchaser LLC, Term Loan, 9.071%, (SOFR + 3.50%), 11/6/28          343      341,464
Renaissance Holding Corp., Term Loan, 9.566%, (SOFR + 4.25%), 4/5/30        1,915    1,920,175
UFC Holdings LLC, Term Loan, 8.336%, (SOFR + 2.75%), 4/29/26        1,715    1,720,124
Vue Entertainment International Ltd., Term Loan, 12.428%, (6 mo. EURIBOR + 8.50%), 4.028% cash, 8.40% PIK, 12/31/27 EUR        252      158,127
Vue International Bidco PLC, Term Loan, 11.844%, (6 mo. EURIBOR + 8.00%), 6/30/27 EUR         69       73,506
     
$   6,489,490
Equity Real Estate Investment Trusts (REITs) — 0.3%
Iron Mountain, Inc., Term Loan, 7.566%, (SOFR + 2.25%), 1/31/31        1,047 $
   1,046,503
     
$   1,046,503
Financial Services — 1.4%
GTCR W Merger Sub LLC, Term Loan, 8.309%, (SOFR + 3.00%), 1/31/31        2,975 $
   2,990,339
Borrower/Description
Principal

Amount
*

(000's omitted)
Value
Financial Services (continued)
NCR Atleos LLC, Term Loan, 10.18%, (SOFR + 4.75%), 3/27/29
(13)
       1,320 $
   1,331,296
Nuvei Technologies Corp., Term Loan, 8.416%, (SOFR + 3.00%), 12/19/30          848      850,313
     
$   5,171,948
Food Products — 1.2%
8th Avenue Food & Provisions, Inc., Term Loan, 10.18%, (SOFR + 4.75%), 10/1/25          488 $
     471,656
Badger Buyer Corp., Term Loan, 8.93%, (SOFR + 3.50%), 9/30/24          327      317,160
CHG PPC Parent LLC, Term Loan, 8.43%, (SOFR + 3.00%), 12/8/28          392      392,928
Del Monte Foods, Inc., Term Loan, 9.668%, (SOFR + 4.25%), 5/16/29          889      760,073
Nomad Foods U.S. LLC, Term Loan, 11/13/29
(12)
       2,000    2,006,718
United Petfood Group BV, Term Loan, 6.583%, (6 mo. EURIBOR + 2.75%), 4/24/28 EUR        700      744,472
     
$   4,693,007
Gas Utilities — 0.7%
CQP Holdco LP, Term Loan, 8.302%, (SOFR + 3.00%), 12/31/30        2,613 $
   2,623,438
     
$   2,623,438
Health Care Equipment & Supplies — 1.6%
Bayou Intermediate II LLC, Term Loan, 10.091%, (SOFR + 4.50%), 8/2/28        1,526 $
   1,520,566
Journey Personal Care Corp., Term Loan, 9.68%, (SOFR + 4.25%), 3/1/28        2,482    2,470,783
Medline Borrower LP, Term Loan, 8.068%, (SOFR + 2.75%), 10/23/28        2,232    2,240,145
     
$   6,231,494
Health Care Providers & Services — 7.8%
AEA International Holdings (Lux) SARL, Term Loan, 8.809%, (SOFR + 3.50%), 9/7/28
(13)
       1,596 $
   1,603,904
Biogroup-LCD, Term Loan, 7.395%, (3 mo. EURIBOR + 3.50%), 2/9/28 EUR        225      227,067
BW NHHC Holdco, Inc., Term Loan - Second Lien, 13.302%, (SOFR + 8.00%), 1/15/26        2,181    1,886,919
Cano Health LLC:
     
DIP Loan, 16.322%, (SOFR + 11.00%), 10/7/24          181      186,479
DIP Loan, 16.322%, (SOFR + 11.00%), 10/7/24          278      285,843
Term Loan, 0.00%, 11/23/27
(7)
       2,443      659,495
CCRR Parent, Inc., Term Loan, 9.18%, (SOFR + 3.75%), 3/6/28        2,538     2,355,322
 
12
See Notes to Financial Statements.


Table of Contents
Eaton Vance
Senior Floating-Rate Trust
April 30, 2024
Portfolio of Investments (Unaudited) — continued

Borrower/Description
Principal

Amount
*

(000's omitted)
Value
Health Care Providers & Services (continued)
Cerba Healthcare SAS:
     
Term Loan, 7.548%, (1 mo. EURIBOR + 3.70%), 6/30/28 EUR        450 $
     414,507
Term Loan, 7.848%, (1 mo. EURIBOR + 4.00%), 2/16/29 EUR        500      463,765
CHG Healthcare Services, Inc.:
     
Term Loan, 8.68%, (SOFR + 3.25%), 9/29/28        1,642    1,648,427
Term Loan, 9.091%, (SOFR + 3.75%), 9/29/28
(13)
         399      401,294
CNT Holdings I Corp., Term Loan, 8.83%, (SOFR + 3.50%), 11/8/27        1,508    1,514,601
Covis Finco SARL, Term Loan, 0.00%, 2/18/27
(7)
         617      257,577
Electron BidCo, Inc., Term Loan, 8.43%, (SOFR + 3.00%), 11/1/28          662      663,360
Ensemble RCM LLC, Term Loan, 8.33%, (SOFR + 3.00%), 8/1/29          330      331,300
IVC Acquisition Ltd.:
     
Term Loan, 9.071%, (6 mo. EURIBOR + 5.00%), 12/12/28 EUR      1,325    1,405,866
Term Loan, 10.809%, (SOFR + 5.50%), 12/12/28        1,047    1,051,629
LSCS Holdings, Inc., Term Loan, 9.931%, (SOFR + 4.61%), 12/16/28          611      604,319
Medical Solutions Holdings, Inc., Term Loan, 8.666%, (SOFR + 3.25%), 11/1/28        2,460    2,187,151
National Mentor Holdings, Inc.:
     
Term Loan, 9.159%, (SOFR + 3.75%), 3/2/28           46       42,360
Term Loan, 9.165%, (SOFR + 3.75%), 3/2/28
(13)
       1,572    1,437,218
Option Care Health, Inc., Term Loan, 8.18%, (SOFR + 2.75%), 10/27/28          342      343,322
Pacific Dental Services LLC, Term Loan, 8.571%, (SOFR + 3.25%), 3/15/31          875      878,145
Phoenix Guarantor, Inc., Term Loan, 8.566%, (SOFR + 3.25%), 2/21/31        1,640    1,629,750
R1 RCM, Inc., Term Loan, 8.327%, (SOFR + 3.00%), 6/21/29          224      225,609
Radnet Management, Inc., Term Loan, 7.823%, (SOFR + 2.50%), 4/18/31          725      725,906
Sound Inpatient Physicians, Term Loan, 8.591%, (SOFR + 3.00%), 6/27/25          424      247,053
Surgery Center Holdings, Inc., Term Loan, 8.815%, (SOFR + 3.50%), 12/19/30        2,203    2,218,911
Synlab Bondco PLC:
     
Term Loan, 6.361%, (6 mo. EURIBOR + 2.50%), 7/1/27 EUR        300      318,639
Term Loan, 12/23/30
(12)
EUR        525      562,385
TTF Holdings LLC, Term Loan, 3/31/28
(12)
       2,000    2,005,834
U.S. Anesthesia Partners, Inc., Term Loan, 9.692%, (SOFR + 4.25%), 10/1/28          902      874,819
     
$  29,658,776
Borrower/Description
Principal

Amount
*

(000's omitted)
Value
Health Care Technology — 3.4%
athenahealth Group, Inc., Term Loan, 8.566%, (SOFR + 3.25%), 2/15/29        1,767 $
   1,763,337
Certara LP, Term Loan, 9.105%, (SOFR + 3.50%), 8/15/26          936      938,844
eResearchTechnology, Inc., Term Loan, 9.93%, (SOFR + 4.50%), 2/4/27          315      316,555
Imprivata, Inc., Term Loan, 9.091%, (SOFR + 3.50%), 12/1/27        2,314    2,328,082
MedAssets Software Intermediate Holdings, Inc.:
     
Term Loan, 9.424%, (SOFR + 4.00%), 12/18/28          931      788,441
Term Loan - Second Lien, 12.18%, (SOFR + 6.75%), 12/17/29          600      416,250
PointClickCare Technologies, Inc., Term Loan, 8.324%, (SOFR + 3.00%), 12/29/27          606      610,797
Project Ruby Ultimate Parent Corp., Term Loan, 8.68%, (SOFR + 3.25%), 3/10/28        1,091    1,091,543
Symplr Software, Inc., Term Loan, 9.93%, (SOFR + 4.50%), 12/22/27        1,691    1,610,237
Verscend Holding Corp., Term Loan, 11.50%, (USD Prime + 3.00%), 8/27/25        1,431    1,432,498
Waystar Technologies, Inc., Term Loan, 9.316%, (SOFR + 4.00%), 10/22/29        1,734    1,745,972
     
$  13,042,556
Hotels, Restaurants & Leisure — 5.9%
Caesars Entertainment, Inc., Term Loan, 8.066%, (SOFR + 2.75%), 2/6/31        2,325 $
   2,331,538
Carnival Corp., Term Loan, 8.067%, (SOFR + 2.75%), 10/18/28        2,512    2,523,169
ClubCorp Holdings, Inc., Term Loan, 10.564%, (SOFR + 5.00%), 9/18/26        1,407    1,411,365
Fertitta Entertainment LLC, Term Loan, 9.069%, (SOFR + 3.75%), 1/27/29        1,980    1,987,099
Flutter Financing BV, Term Loan, 7.559%, (SOFR + 2.25%), 11/25/30        3,142    3,151,944
Great Canadian Gaming Corp., Term Loan, 9.59%, (SOFR + 4.00%), 11/1/26        1,498    1,505,617
IRB Holding Corp., Term Loan, 8.166%, (SOFR + 2.75%), 12/15/27        2,432    2,437,920
Ontario Gaming GTA LP, Term Loan, 9.559%, (SOFR + 4.25%), 8/1/30          998    1,004,108
Oravel Stays Singapore Pte. Ltd., Term Loan, 13.84%, (SOFR + 8.25%), 6/23/26          379      379,114
Playa Resorts Holding BV, Term Loan, 8.565%, (SOFR + 3.25%), 1/5/29        2,024    2,035,236
Scientific Games Holdings LP, Term Loan, 8.556%, (SOFR + 3.25%), 4/4/29        1,975     1,977,406
 
13
See Notes to Financial Statements.


Table of Contents
Eaton Vance
Senior Floating-Rate Trust
April 30, 2024
Portfolio of Investments (Unaudited) — continued

Borrower/Description
Principal

Amount
*

(000's omitted)
Value
Hotels, Restaurants & Leisure (continued)
SeaWorld Parks & Entertainment, Inc., Term Loan, 7.816%, (SOFR + 2.50%), 8/25/28          731 $
     732,024
Wyndham Hotels & Resorts, Inc., Term Loan, 7.666%, (SOFR + 2.25%), 5/24/30          794      797,425
     
$  22,273,965
Household Durables — 1.7%
ACProducts, Inc., Term Loan, 9.814%, (SOFR + 4.25%), 5/17/28        2,721 $
   2,366,461
Libbey Glass, Inc., Term Loan, 11.975%, (SOFR + 6.50%), 11/22/27          660      636,554
Serta Simmons Bedding LLC:
     
Term Loan, 12.924%, (SOFR + 7.50%), 6/29/28        1,432    1,261,971
Term Loan, 6/29/28
(12)
         156      152,788
Solis IV BV, Term Loan, 8.824%, (SOFR + 3.50%), 2/26/29        1,972    1,962,897
     
$   6,380,671
Household Products — 0.7%
Kronos Acquisition Holdings, Inc.:
     
Term Loan, 9.314%, (SOFR + 3.75%), 12/22/26        1,753 $
   1,756,140
Term Loan, 11.493%, (SOFR + 6.00%), 12/22/26          783      787,101
     
$   2,543,241
Industrial Conglomerates — 0.6%
Kohler Energy Co. LLC, Term Loan, 1/30/31
(12)
       2,325 $
   2,332,993
     
$   2,332,993
Insurance — 1.3%
Alliant Holdings Intermediate LLC, Term Loan, 8.819%, (SOFR + 3.50%), 11/6/30          884 $
     888,147
AmWINS Group, Inc., Term Loan, 8.18%, (SOFR + 2.75%), 2/19/28          642      644,132
Financiere CEP SAS, Term Loan, 7.885%, (6 mo. EURIBOR + 4.00%), 6/18/27 EUR        500      535,128
Ryan Specialty Group LLC, Term Loan, 8.066%, (SOFR + 2.75%), 9/1/27        2,917    2,925,992
     
$   4,993,399
Interactive Media & Services — 1.5%
Adevinta ASA:
     
Term Loan, 6.348%, (1 mo. EURIBOR + 2.50%), 6/26/28 EUR        684 $
     731,192
Term Loan, 8.332%, (SOFR + 2.75%), 6/26/28          123      123,547
Arches Buyer, Inc., Term Loan, 8.666%, (SOFR + 3.25%), 12/6/27        1,974     1,910,627
Borrower/Description
Principal

Amount
*

(000's omitted)
Value
Interactive Media & Services (continued)
Buzz Finco LLC, Term Loan, 8.166%, (SOFR + 2.75%), 1/29/27          528 $
     529,815
Foundational Education Group, Inc., Term Loan, 9.341%, (SOFR + 3.75%), 8/31/28        1,442    1,432,801
Getty Images, Inc., Term Loan, 9.909%, (SOFR + 4.50%), 2/19/26          991      993,728
     
$   5,721,710
IT Services — 6.2%
Asurion LLC:
     
Term Loan, 8.68%, (SOFR + 3.25%), 12/23/26        1,142 $
   1,118,014
Term Loan, 8.68%, (SOFR + 3.25%), 7/31/27        1,459    1,420,357
Term Loan, 9.416%, (SOFR + 4.00%), 8/19/28        1,092    1,063,943
Term Loan - Second Lien, 10.68%, (SOFR + 5.25%), 1/31/28        1,830    1,673,469
Term Loan - Second Lien, 10.68%, (SOFR + 5.25%), 1/20/29        1,400    1,266,016
Endure Digital, Inc., Term Loan, 8.939%, (SOFR + 3.50%), 2/10/28        3,975    3,860,339
Gainwell Acquisition Corp., Term Loan, 9.409%, (SOFR + 4.00%), 10/1/27        2,795    2,674,047
Go Daddy Operating Co. LLC, Term Loan, 7.316%, (SOFR + 2.00%), 11/9/29        2,155    2,157,215
Indy U.S. Bidco LLC, Term Loan, 7.598%, (1 mo. EURIBOR + 3.75%), 3/6/28 EUR        583      617,176
NAB Holdings LLC, Term Loan, 8.209%, (SOFR + 2.75%), 11/23/28        3,133    3,134,603
Rackspace Technology Global, Inc.:
     
Term Loan, 11.552%, (SOFR + 6.25%), 5/15/28        1,740    1,757,621
Term Loan - Second Lien, 8.186%, (SOFR + 2.75%), 5/15/28        3,710    1,780,889
Sedgwick Claims Management Services, Inc., Term Loan, 9.066%, (SOFR + 3.75%), 2/24/28        1,121    1,126,590
     
$  23,650,279
Leisure Products — 0.3%
Fender Musical Instruments Corp., Term Loan, 9.418%, (SOFR + 4.00%), 12/1/28          269 $
     266,541
Recess Holdings, Inc., Term Loan, 9.843%, (SOFR + 4.50%), 2/20/30          800      803,000
     
$   1,069,541
Life Sciences Tools & Services — 1.8%
Cambrex Corp., Term Loan, 8.916%, (SOFR + 3.50%), 12/4/26          289 $
     279,191
Catalent Pharma Solutions, Inc., Term Loan, 8.315%, (SOFR + 3.00%), 2/22/28          275       276,547
 
14
See Notes to Financial Statements.


Table of Contents
Eaton Vance
Senior Floating-Rate Trust
April 30, 2024
Portfolio of Investments (Unaudited) — continued

Borrower/Description
Principal

Amount
*

(000's omitted)
Value
Life Sciences Tools & Services (continued)
Curia Global, Inc., Term Loan, 9.18%, (SOFR + 3.75%), 8/30/26
(13)
       1,817 $
   1,730,873
IQVIA, Inc., Term Loan, 7.309%, (SOFR + 2.00%), 1/2/31        1,347    1,354,200
LGC Group Holdings Ltd., Term Loan, 7.098%, (1 mo. EURIBOR + 3.25%), 4/21/27 EUR        475      501,893
Loire Finco Luxembourg SARL, Term Loan, 8.916%, (SOFR + 3.50%), 4/21/27          313      307,800
Packaging Coordinators Midco, Inc., Term Loan, 9.071%, (SOFR + 3.50%), 11/30/27        1,341    1,346,651
Sotera Health Holdings LLC:
     
Term Loan, 8.18%, (SOFR + 2.75%), 12/11/26          625      624,805
Term Loan, 12/11/26
(12)
         500      502,500
     
$   6,924,460
Machinery — 8.5%
AI Aqua Merger Sub, Inc., Term Loan, 9.324%, (SOFR + 4.00%), 7/31/28        2,162 $
   2,170,619
Alliance Laundry Systems LLC, Term Loan, 8.90%, (SOFR + 3.50%), 10/8/27
(13)
       1,864    1,872,471
American Trailer World Corp., Term Loan, 9.166%, (SOFR + 3.75%), 3/3/28        1,261    1,238,577
Apex Tool Group LLC:
     
Term Loan, 15.315%, (SOFR + 10.00%), 2/8/30        1,155    1,120,206
Term Loan - Second Lien, 12.566%, (SOFR + 7.25%), 8.566% cash, 4.00% PIK, 2/8/29          495      489,987
Barnes Group, Inc., Term Loan, 7.816%, (SOFR + 2.50%), 9/3/30          522      524,116
Clark Equipment Co., Term Loan, 7.902%, (SOFR + 2.50%), 4/20/29          869      872,671
Conair Holdings LLC, Term Loan, 9.18%, (SOFR + 3.75%), 5/17/28        2,145    2,131,403
CPM Holdings, Inc., Term Loan, 9.827%, (SOFR + 4.50%), 9/28/28        1,904    1,910,956
EMRLD Borrower LP, Term Loan, 7.816%, (SOFR + 2.50%), 5/31/30          733      734,952
Engineered Machinery Holdings, Inc., Term Loan, 9.321%, (SOFR + 3.75%), 5/19/28        3,425    3,430,540
Filtration Group Corp., Term Loan, 8.93%, (SOFR + 3.50%), 10/21/28          634      635,862
Gates Global LLC, Term Loan, 7.916%, (SOFR + 2.50%), 3/31/27        2,316    2,325,088
Icebox Holdco III, Inc., Term Loan, 9.321%, (SOFR + 3.75%), 12/22/28          711      710,609
Madison IAQ LLC, Term Loan, 8.68%, (SOFR + 3.25%), 6/21/28        2,431    2,434,456
Pro Mach Group, Inc., Term Loan, 9.066%, (SOFR + 3.75%), 8/31/28        1,489     1,496,477
Borrower/Description
Principal

Amount
*

(000's omitted)
Value
Machinery (continued)
Roper Industrial Products Investment Co. LLC, Term Loan, 9.302%, (SOFR + 4.00%), 11/22/29        1,312 $
   1,322,646
SPX Flow, Inc., Term Loan, 9.916%, (SOFR + 4.50%), 4/5/29        1,917    1,930,049
Titan Acquisition Ltd., Term Loan, 10.317%, (SOFR + 5.00%), 2/1/29          850      855,312
TK Elevator Midco GmbH, Term Loan, 7.926%, (3 mo. EURIBOR + 4.00%), 4/30/30 EUR        900      964,923
TK Elevator Topco GmbH, Term Loan, 7.491%, (6 mo. EURIBOR + 3.63%), 7/30/27 EUR        500      534,082
TK Elevator U.S. Newco, Inc., Term Loan, 8.791%, (SOFR + 3.50%), 4/30/30        2,006    2,014,945
Zephyr German BidCo GmbH, Term Loan, 7.446%, (6 mo. EURIBOR + 3.60%), 3/10/28 EUR        600      633,561
     
$  32,354,508
Media — 1.6%
Aragorn Parent Corp., Term Loan, 9.569%, (SOFR + 4.25%), 12/15/28        1,307 $
   1,316,328
Gray Television, Inc.:
     
Term Loan, 7.942%, (SOFR + 2.50%), 1/2/26          575      568,947
Term Loan, 8.442%, (SOFR + 3.00%), 12/1/28          800      754,485
Hubbard Radio LLC, Term Loan, 9.816%, (SOFR + 4.50%), 3/28/25          460      380,998
MJH Healthcare Holdings LLC, Term Loan, 8.916%, (SOFR + 3.50%), 1/28/29          245      245,306
Sinclair Television Group, Inc., Term Loan, 8.091%, (SOFR + 2.50%), 9/30/26          573      534,975
Univision Communications, Inc., Term Loan, 8.68%, (SOFR + 3.25%), 3/15/26        2,140    2,143,345
     
$   5,944,384
Metals/Mining — 1.0%
Arsenal AIC Parent LLC, Term Loan, 9.066%, (SOFR + 3.75%), 8/18/30        1,496 $
   1,509,347
Dynacast International LLC, Term Loan, 14.443%, (SOFR + 9.00%), 10/22/25          327      243,631
PMHC II, Inc., Term Loan, 9.706%, (SOFR + 4.25%), 4/23/29        1,808    1,785,063
WireCo WorldGroup, Inc., Term Loan, 9.075%, (SOFR + 3.75%), 11/13/28          370      372,327
     
$   3,910,368
Oil, Gas & Consumable Fuels — 2.2%
Freeport LNG Investments LLP, Term Loan, 9.086%, (SOFR + 3.50%), 12/21/28          582 $
     579,541
 
15
See Notes to Financial Statements.


Table of Contents
Eaton Vance
Senior Floating-Rate Trust
April 30, 2024
Portfolio of Investments (Unaudited) — continued

Borrower/Description
Principal

Amount
*

(000's omitted)
Value
Oil, Gas & Consumable Fuels (continued)
ITT Holdings LLC, Term Loan, 8.421%, (SOFR + 3.00%), 10/11/30          821 $
     822,585
Matador Bidco SARL, Term Loan, 9.916%, (SOFR + 4.50%), 10/15/26        3,306    3,317,091
Oryx Midstream Services Permian Basin LLC, Term Loan, 8.436%, (SOFR + 3.00%), 10/5/28          875      879,251
Oxbow Carbon LLC, Term Loan, 9.413%, (SOFR + 4.00%), 5/10/30
(13)
         521      523,668
UGI Energy Services LLC, Term Loan, 8.666%, (SOFR + 3.25%), 2/22/30        2,364    2,380,924
     
$   8,503,060
Passenger Airlines — 0.1%
WestJet Loyalty LP, Term Loan, 9.048%, (SOFR + 3.75%), 2/14/31          500 $
     501,161
     
$     501,161
Personal Products — 0.3%
Olaplex, Inc., Term Loan, 8.918%, (SOFR + 3.50%), 2/23/29        1,287 $
   1,191,351
     
$   1,191,351
Pharmaceuticals — 1.8%
Bausch Health Cos., Inc., Term Loan, 10.668%, (SOFR + 5.25%), 2/1/27        1,565 $
   1,319,057
Ceva Sante Animale, Term Loan, 9.564%, (SOFR + 4.25%), 11/1/30          400      403,125
Jazz Financing Lux SARL, Term Loan, 8.43%, (SOFR + 3.00%), 5/5/28        2,189    2,204,517
Mallinckrodt International Finance SA:
     
Term Loan, 12.819%, (SOFR + 7.50%), 11/14/28          375      420,369
Term Loan - Second Lien, 14.819%, (SOFR + 9.50%), 11/14/28        2,127    2,327,361
PharmaZell GmbH, Term Loan, 7.902%, (3 mo. EURIBOR + 4.00%), 5/12/27 EUR        125      132,455
     
$   6,806,884
Professional Services — 5.9%
AlixPartners LLP:
     
Term Loan, 6.902%, (3 mo. EURIBOR + 3.00%), 2/4/28 EUR        485 $
     518,725
Term Loan, 7.93%, (SOFR + 2.50%), 2/4/28          546      547,868
APFS Staffing Holdings, Inc., Term Loan, 9.316%, (SOFR + 4.00%), 12/29/28          241      240,199
Apleona Holding GmbH, Term Loan, 6.564%, (3 mo. EURIBOR + 2.70%), 4/28/28 EUR        750       792,540
Borrower/Description
Principal

Amount
*

(000's omitted)
Value
Professional Services (continued)
Camelot U.S. Acquisition LLC, Term Loan, 8.066%, (SOFR + 2.75%), 1/31/31        2,807 $
   2,814,658
CoreLogic, Inc., Term Loan, 8.93%, (SOFR + 3.50%), 6/2/28        1,815    1,757,827
Corporation Service Co., Term Loan, 8.066%, (SOFR + 2.75%), 11/2/29          253      253,918
Crisis Prevention Institute, Inc., Term Loan, 10.043%, (SOFR + 4.75%), 4/9/31          325      326,828
Deerfield Dakota Holding LLC, Term Loan, 9.059%, (SOFR + 3.75%), 4/9/27        2,072    2,071,518
EAB Global, Inc., Term Loan, 8.93%, (SOFR + 3.50%), 8/16/28        1,489    1,493,762
Employbridge Holding Co., Term Loan, 10.314%, (SOFR + 4.75%), 7/19/28        1,955    1,590,296
Fleet Midco I Ltd., Term Loan, 8.566%, (SOFR + 3.25%), 2/21/31          750      753,750
Genuine Financial Holdings LLC, Term Loan, 9.316%, (SOFR + 4.00%), 9/27/30          398      397,440
Neptune Bidco U.S., Inc., Term Loan, 10.406%, (SOFR + 5.00%), 4/11/29        1,832    1,724,854
Rockwood Service Corp., Term Loan, 9.68%, (SOFR + 4.25%), 1/23/27        1,050    1,057,663
Techem Verwaltungsgesellschaft 675 mbH, Term Loan, 7.605%, (3 mo. EURIBOR + 3.75%), 7/15/29 EUR      2,339    2,499,999
Teneo Holdings LLC, Term Loan, 10.066%, (SOFR + 4.75%), 3/13/31        1,075    1,084,630
Vaco Holdings LLC, Term Loan, 10.434%, (SOFR + 5.00%), 1/21/29        1,237    1,230,191
Wood Mackenzie Ltd., Term Loan, 8.814%, (SOFR + 3.50%), 2/7/31        1,225    1,231,966
     
$  22,388,632
Real Estate Management & Development — 0.8%
Greystar Real Estate Partners LLC, Term Loan, 8.576%, (SOFR + 3.25%), 8/21/30        2,097 $
   2,104,867
Homeserve USA Holding Corp., Term Loan, 8.319%, (SOFR + 3.00%), 10/21/30          925      929,047
     
$   3,033,914
Road & Rail — 1.6%
First Student Bidco, Inc.:
     
Term Loan, 8.564%, (SOFR + 3.00%), 7/21/28          383 $
     383,822
Term Loan, 8.564%, (SOFR + 3.00%), 7/21/28        1,260    1,261,949
Hertz Corp.:
     
Term Loan, 9.065%, (SOFR + 3.75%), 6/30/28          748      690,457
Term Loan, 6/30/28
(12)
       1,259    1,163,873
Term Loan, 6/30/28
(12)
         241       223,614
 
16
See Notes to Financial Statements.


Table of Contents
Eaton Vance
Senior Floating-Rate Trust
April 30, 2024
Portfolio of Investments (Unaudited) — continued

Borrower/Description
Principal

Amount
*

(000's omitted)
Value
Road & Rail (continued)
Kenan Advantage Group, Inc., Term Loan, 9.066%, (SOFR + 3.75%), 1/25/29        2,352 $
   2,355,191
     
$   6,078,906
Semiconductors & Semiconductor Equipment — 0.6%
Altar Bidco, Inc.:
     
Term Loan, 7.947%, (SOFR + 3.10%), 2/1/29        1,797 $
   1,798,370
Term Loan - Second Lien, 10.914%, (SOFR + 5.60%), 2/1/30          450      446,250
Bright Bidco BV, Term Loan, 14.33%, (SOFR + 9.00%), 6.33% cash, 8.00% PIK, 10/31/27          462      139,701
     
$   2,384,321
Software — 19.4%
Applied Systems, Inc., Term Loan, 8.809%, (SOFR + 3.50%), 2/24/31          645 $
     650,569
AppLovin Corp., Term Loan, 7.816%, (SOFR + 2.50%), 8/16/30        1,798    1,800,530
Astra Acquisition Corp.:
     
Term Loan, 10.578%, (SOFR + 5.25%), 10/25/28          735      375,061
Term Loan, 12.078%, (SOFR + 6.75%), 2/25/28          167      164,402
Term Loan, 2/25/28
(12)
         354      347,140
Term Loan - Second Lien, 14.439%, (SOFR + 8.88%), 10/25/29        1,425      403,652
Banff Merger Sub, Inc.:
     
Term Loan, 8.348%, (1 mo. EURIBOR + 4.50%), 12/29/28 EUR        263      282,806
Term Loan, 9.566%, (SOFR + 4.25%), 12/29/28        3,677    3,704,344
Central Parent, Inc., Term Loan, 9.309%, (SOFR + 4.00%), 7/6/29        2,035    2,044,700
Cloud Software Group, Inc., Term Loan, 9.909%, (SOFR + 4.50%), 3/30/29
(13)
       4,474    4,478,323
Cloudera, Inc.:
     
Term Loan, 9.166%, (SOFR + 3.75%), 10/8/28        2,944    2,932,778
Term Loan - Second Lien, 11.416%, (SOFR + 6.00%), 10/8/29          650      627,250
Cornerstone OnDemand, Inc., Term Loan, 9.18%, (SOFR + 3.75%), 10/16/28        1,127    1,081,216
Delta TopCo, Inc.:
     
Term Loan, 9.121%, (SOFR + 3.75%), 12/1/27        1,398    1,401,451
Term Loan - Second Lien, 12.621%, (SOFR + 7.25%), 12/1/28        2,025    2,038,922
E2open LLC, Term Loan, 8.93%, (SOFR + 3.50%), 2/4/28          851      855,348
ECI Macola Max Holding LLC, Term Loan, 9.052%, (SOFR + 3.75%), 5/31/30        1,409    1,416,524
Epicor Software Corp.:
     
Term Loan, 8.68%, (SOFR + 3.25%), 7/30/27        2,216     2,227,881
Borrower/Description
Principal

Amount
*

(000's omitted)
Value
Software (continued)
Epicor Software Corp.:
(continued)
     
Term Loan, 9.066%, (SOFR + 3.75%), 7/30/27          823 $     828,595
Fiserv Investment Solutions, Inc., Term Loan, 9.319%, (SOFR + 4.00%), 2/18/27        1,486    1,428,583
GoTo Group, Inc.:
     
Term Loan, 10.173%, (SOFR + 4.75%), 4/30/28          976      933,191
Term Loan - Second Lien, 10.173%, (SOFR + 4.75%), 4/30/28          818      623,377
iSolved, Inc., Term Loan, 8.819%, (SOFR + 3.50%), 10/15/30          499      500,309
Ivanti Software, Inc., Term Loan, 9.814%, (SOFR + 4.25%), 12/1/27        1,299    1,207,780
Magenta Buyer LLC, Term Loan, 10.591%, (SOFR + 5.00%), 7/27/28        2,013    1,023,079
Marcel LUX IV SARL, Term Loan, 9.81%, (SOFR + 4.50%), 11/11/30        1,272    1,278,966
Maverick Bidco, Inc., Term Loan, 9.23%, (SOFR + 3.75%), 5/18/28          240      239,901
McAfee LLC, Term Loan, 9.177%, (SOFR + 3.75%), 3/1/29        2,407    2,415,507
Mosel Bidco SE, Term Loan, 10.059%, (SOFR + 4.75%), 9/16/30          250      251,406
OceanKey (U.S.) II Corp., Term Loan, 8.916%, (SOFR + 3.50%), 12/15/28          539      536,080
Open Text Corp., Term Loan, 8.166%, (SOFR + 2.75%), 1/31/30        1,904    1,912,397
Polaris Newco LLC, Term Loan, 9.591%, (SOFR + 4.00%), 6/2/28        2,608    2,593,454
Proofpoint, Inc., Term Loan, 8.68%, (SOFR + 3.25%), 8/31/28        2,933    2,946,796
Quartz Acquireco LLC, Term Loan, 8.809%, (SOFR + 3.50%), 6/28/30        1,496    1,505,913
Quest Software U.S. Holdings, Inc., Term Loan, 9.73%, (SOFR + 4.25%), 2/1/29        1,757    1,243,159
RealPage, Inc., Term Loan, 8.43%, (SOFR + 3.00%), 4/24/28        3,287    3,173,340
Redstone Holdco 2 LP, Term Loan, 10.18%, (SOFR + 4.75%), 4/27/28        1,376    1,084,705
Sabre GLBL, Inc.:
     
Term Loan, 8.93%, (SOFR + 3.50%), 12/17/27        1,472    1,290,339
Term Loan, 8.93%, (SOFR + 3.50%), 12/17/27          940      823,629
Term Loan, 9.666%, (SOFR + 4.25%), 6/30/28          881      776,270
Skillsoft Corp., Term Loan, 10.68%, (SOFR + 5.25%), 7/14/28        1,484    1,195,835
SolarWinds Holdings, Inc., Term Loan, 8.566%, (SOFR + 3.25%), 2/5/27        1,763    1,767,818
Sophia LP, Term Loan, 8.916%, (SOFR + 3.50%), 10/9/29        4,093     4,111,592
 
17
See Notes to Financial Statements.


Table of Contents
Eaton Vance
Senior Floating-Rate Trust
April 30, 2024
Portfolio of Investments (Unaudited) — continued

Borrower/Description
Principal

Amount
*

(000's omitted)
Value
Software (continued)
UKG, Inc., Term Loan, 8.814%, (SOFR + 3.50%), 2/10/31        4,384 $
   4,409,780
Veritas U.S., Inc.:
     
Term Loan, 8.652%, (3 mo. EURIBOR + 4.75%), 9/1/25 EUR        314      304,185
Term Loan, 10.43%, (SOFR + 5.00%), 9/1/25        2,740    2,523,889
Vision Solutions, Inc., Term Loan, 9.841%, (SOFR + 4.25%), 4/24/28        3,829    3,820,774
     
$  73,583,546
Specialty Retail — 4.8%
Boels Topholding BV, Term Loan, 7.139%, (EURIBOR + 3.25%), 2/6/27
(13)
EUR        496 $
     530,227
Great Outdoors Group LLC, Term Loan, 9.18%, (SOFR + 3.75%), 3/6/28        2,613    2,616,675
Harbor Freight Tools USA, Inc., Term Loan, 8.18%, (SOFR + 2.75%), 10/19/27        3,184    3,190,122
Hoya Midco LLC, Term Loan, 8.58%, (SOFR + 3.25%), 2/3/29          926      928,491
Les Schwab Tire Centers, Term Loan, 8.317%, (SOFR + 3.00%), 4/23/31        4,815    4,823,735
LIDS Holdings, Inc., Term Loan, 10.98%, (SOFR + 5.50%), 12/14/26          287      286,719
Mattress Firm, Inc., Term Loan, 9.814%, (SOFR + 4.25%), 9/25/28        3,062    3,073,736
PetSmart, Inc., Term Loan, 9.166%, (SOFR + 3.75%), 2/11/28        2,966    2,926,266
     
$  18,375,971
Trading Companies & Distributors — 3.7%
Beacon Roofing Supply, Inc., Term Loan, 7.316%, (SOFR + 2.00%), 5/19/28          549 $
     550,716
Core & Main LP, Term Loan, 7.568%, (SOFR + 2.25%), 2/9/31          374      375,933
DXP Enterprises, Inc., Term Loan, 10.164%, (SOFR + 4.75%), 10/11/30          697      701,071
Foundation Building Materials Holding Co. LLC, Term Loan, 9.33%, (SOFR + 4.00%), 1/29/31
(13)
       1,275    1,286,156
Patagonia Bidco Ltd., Term Loan, 10.473%, (SONIA + 5.25%), 11/1/28 GBP      1,325    1,462,593
Spin Holdco, Inc., Term Loan, 9.585%, (SOFR + 4.00%), 3/4/28        4,123    3,659,234
SRS Distribution, Inc.:
     
Term Loan, 8.666%, (SOFR + 3.25%), 6/2/28          318      320,110
Term Loan, 8.93%, (SOFR + 3.50%), 6/2/28        2,303     2,321,922
Borrower/Description
Principal

Amount
*

(000's omitted)
Value
Trading Companies & Distributors (continued)
White Cap Buyer LLC, Term Loan, 9.066%, (SOFR + 3.75%), 10/19/27        2,099 $
   2,108,781
Windsor Holdings III LLC, Term Loan, 9.319%, (SOFR + 4.00%), 8/1/30        1,145    1,155,896
     
$  13,942,412
Transportation Infrastructure — 1.1%
Brown Group Holding LLC:
     
Term Loan, 8.166%, (SOFR + 2.75%), 6/7/28        2,136 $
   2,139,280
Term Loan, 8.329%, (SOFR + 3.00%), 7/2/29
(13)
         222      222,720
KKR Apple Bidco LLC, Term Loan, 8.18%, (SOFR + 2.75%), 9/22/28        1,613    1,616,781
     
$   3,978,781
Wireless Telecommunication Services — 1.0%
CCI Buyer, Inc., Term Loan, 9.302%, (SOFR + 4.00%), 12/17/27        1,590 $
   1,590,675
Digicel International Finance Ltd., Term Loan, 12.075%, (SOFR + 6.75%), 5/25/27        1,496    1,430,864
SBA Senior Finance II LLC, Term Loan, 7.32%, (SOFR + 2.00%), 1/25/31          750      753,375
     
$   3,774,914
Total Senior Floating-Rate Loans
(identified cost $524,110,413)
   
$ 514,226,259
    
 
18
See Notes to Financial Statements.


Table of Contents
Eaton Vance
Senior Floating-Rate Trust
April 30, 2024
Portfolio of Investments (Unaudited) — continued

Short-Term Investments — 2.9%
Security
Shares
Value
Morgan Stanley Institutional Liquidity Funds - Government Portfolio, Institutional Class, 5.22%
(14)
  10,949,282 $
  10,949,282
Total Short-Term Investments
(identified cost $10,949,282)
   
$  10,949,282
Total Investments — 154.7%
(identified cost $602,271,852)
   
$ 587,881,639
Less Unfunded Loan Commitments — (0.0)%
(6)
   
$
    (180,061)
Net Investments — 154.7%
(identified cost $602,091,791)
   
$ 587,701,578
Other Assets, Less Liabilities — (34.7)%    
$
(131,697,004)
Auction Preferred Shares Plus Cumulative Unpaid Dividends — (20.0)%    
$
 (75,916,998)
Net Assets Applicable to Common Shares — 100.0%    
$ 380,087,576
The percentage shown for each investment category in the Portfolio of Investments is based on net assets applicable to common shares.
* In U.S. dollars unless otherwise indicated.
(1)
Security exempt from registration under Rule 144A of the Securities Act of 1933, as amended. These securities may be sold in certain transactions in reliance on an exemption from registration (normally to qualified institutional buyers). At April 30, 2024, the aggregate value of these securities is $49,911,121 or 13.1% of the Trust's net assets applicable to common shares.
(2)
Variable rate security. The stated interest rate represents the rate in effect at April 30, 2024.
(3)
For fair value measurement disclosure purposes, security is categorized as Level 3 (see Note 10).
(4)
Non-income producing security.
(5)
Security was acquired in connection with a restructuring of a Senior Loan and may be subject to restrictions on resale.
(6)
Amount is less than 0.05% or (0.05)%, as applicable.
(7)
Issuer is in default with respect to interest and/or principal payments or has declared bankruptcy. For a variable rate security, interest rate has been adjusted to reflect non-accrual status.
(8)
Principal amount is less than $500.
(9)
Represents a payment-in-kind security which may pay interest in additional principal at the issuer’s discretion.
(10)
Senior floating-rate loans (Senior Loans) often require prepayments from excess cash flows or permit the borrowers to repay at their election. The degree to which borrowers repay, whether as a contractual requirement or at their election, cannot be predicted with accuracy. As a result, the actual remaining maturity may be substantially less than the stated maturities shown. However, Senior Loans will typically have an expected average life of approximately two to four years. Senior Loans typically have rates of interest which are redetermined periodically by reference to a base lending rate, plus a spread. These base lending rates are primarily the Secured Overnight Financing Rate (“SOFR”) and secondarily, the prime rate offered by one or more major United States banks (the “Prime Rate”). Base lending rates may be subject to a floor, or minimum rate. Rates for SOFR are generally 1 or 3-month tenors and may also be subject to a credit spread adjustment. Senior Loans are generally subject to contractual restrictions that must be satisfied before they can be bought or sold.
(11)
Unfunded or partially unfunded loan commitments. The stated interest rate reflects the weighted average of the reference rate and spread for the funded portion, if any, and the commitment fees on the portion of the loan that is unfunded. At April 30, 2024, the total value of unfunded loan commitments is $179,958. See Note 1F for description.
(12)
This Senior Loan will settle after April 30, 2024, at which time the interest rate will be determined.
(13)
The stated interest rate represents the weighted average interest rate at April 30, 2024 of contracts within the senior loan facility. Interest rates on contracts are primarily redetermined either monthly or quarterly by reference to the indicated base lending rate and spread and the reset period.
(14)
May be deemed to be an affiliated investment company. The rate shown is the annualized seven-day yield as of April 30, 2024.
 
Forward Foreign Currency Exchange Contracts (OTC)
Currency Purchased
Currency Sold
Counterparty
Settlement
Date
Unrealized
Appreciation
Unrealized
(Depreciation)
USD 9,313,394 EUR 8,613,275 Standard Chartered Bank 5/3/24 $
121,303
$
 —
USD 1,127,796 EUR 1,035,000 Bank of America, N.A. 5/31/24  22,013  —
USD 1,128,832 EUR 1,036,178 Bank of America, N.A. 5/31/24  21,790  —
USD 1,034,872 EUR   950,000 Bank of America, N.A. 5/31/24  19,902  —
USD   958,864 EUR   880,000 Bank of America, N.A. 5/31/24  18,681  —
USD 1,144,212 EUR 1,050,000 State Street Bank and Trust Company 5/31/24  22,403  —
USD 1,129,692 EUR 1,037,000 State Street Bank and Trust Company 5/31/24  21,773  —
USD 1,128,448 EUR 1,036,000 State Street Bank and Trust Company 5/31/24  21,597  —
USD 1,339,042 GBP 1,055,000 HSBC Bank USA, N.A. 5/31/24  20,573  —
19
See Notes to Financial Statements.


Table of Contents
Eaton Vance
Senior Floating-Rate Trust
April 30, 2024
Portfolio of Investments (Unaudited) — continued

Forward Foreign Currency Exchange Contracts (OTC)
(continued)
Currency Purchased
Currency Sold
Counterparty
Settlement
Date
Unrealized
Appreciation
Unrealized
(Depreciation)
USD 1,338,109 GBP 1,053,944 State Street Bank and Trust Company 5/31/24 $
 20,959
$
 —
USD 9,221,392 EUR 8,613,275 Standard Chartered Bank 6/4/24  17,549  —
USD 6,225,999 EUR 5,734,660 State Street Bank and Trust Company 6/28/24  91,601  —
           
$420,144
$
Abbreviations:
DIP – Debtor In Possession
EURIBOR – Euro Interbank Offered Rate
LIBOR – London Interbank Offered Rate
OTC – Over-the-counter
PCL – Public Company Limited
PIK – Payment In Kind
SOFR – Secured Overnight Financing Rate
SONIA – Sterling Overnight Interbank Average
Currency Abbreviations:
EUR – Euro
GBP – British Pound Sterling
USD – United States Dollar
20
See Notes to Financial Statements.


Table of Contents
Eaton Vance
Senior Floating-Rate Trust
April 30, 2024
Statement of Assets and Liabilities (Unaudited)

 
April 30, 2024
Assets  
Unaffiliated investments, at value (identified cost $591,142,509) $
576,752,296
Affiliated investments, at value (identified cost $10,949,282) 10,949,282
Cash 4,326,905
Foreign currency, at value (identified cost $2,375,062) 2,363,391
Interest receivable 3,169,024
Dividends receivable from affiliated investments 47,223
Receivable for investments sold 3,798,574
Receivable for open forward foreign currency exchange contracts 420,144
Prepaid upfront fees on notes payable 79,910
Trustees' deferred compensation plan 160,618
Prepaid expenses 8,479
Total assets
$602,075,846
Liabilities  
Notes payable $
120,000,000
Payable for investments purchased 24,497,528
Payable to affiliates:  
 Investment adviser fee 353,462
Trustees' fees 3,045
Trustees' deferred compensation plan 160,618
Accrued expenses 1,056,619
Total liabilities
$146,071,272
Auction preferred shares (3,032 shares outstanding) at liquidation value plus cumulative unpaid dividends
$
75,916,998
Net assets applicable to common shares
$380,087,576
Sources of Net Assets  
Common shares, $0.01 par value, unlimited number of shares authorized $
292,010
Additional paid-in capital 453,627,069
Accumulated loss (73,831,503)
Net assets applicable to common shares
$380,087,576
Common Shares Issued and Outstanding 29,200,987
Net Asset Value Per Common Share  
Net assets ÷ common shares issued and outstanding
$
13.02
21
See Notes to Financial Statements.


Table of Contents
Eaton Vance
Senior Floating-Rate Trust
April 30, 2024
Statement of Operations (Unaudited)

 
Six Months Ended
 
April 30, 2024
Investment Income  
Dividend income $
412,570
Dividend income from affiliated investments 211,197
Interest income 27,694,691
Other income 648,032
Total investment income
$28,966,490
Expenses  
Investment adviser fee $
2,133,886
Trustees’ fees and expenses 18,296
Custodian fee 93,136
Transfer and dividend disbursing agent fees 6,003
Legal and accounting services 62,065
Printing and postage 92,606
Interest expense and fees 3,909,890
Preferred shares service fee 37,630
Miscellaneous 53,048
Total expenses
$
6,406,560
Deduct:  
Waiver and/or reimbursement of expenses by affiliates $
6,085
Total expense reductions
$
6,085
Net expenses
$
6,400,475
Net investment income
$22,566,015
Realized and Unrealized Gain (Loss)  
Net realized gain (loss):  
Investment transactions $
(6,853,269)
Foreign currency transactions 59,006
Forward foreign currency exchange contracts (33,357)
Net realized loss
$
(6,827,620)
Change in unrealized appreciation (depreciation):  
Investments $
15,903,070
Foreign currency 2,566
Forward foreign currency exchange contracts 1,924
Net change in unrealized appreciation (depreciation)
$15,907,560
Net realized and unrealized gain
$
9,079,940
Distributions to preferred shareholders
$
(3,283,374)
Net increase in net assets from operations
$28,362,581
22
See Notes to Financial Statements.


Table of Contents
Eaton Vance
Senior Floating-Rate Trust
April 30, 2024
Statements of Changes in Net Assets

 
Six Months Ended
April 30, 2024
(Unaudited)
Year Ended
October 31, 2023
Increase (Decrease) in Net Assets    
From operations:    
Net investment income $
22,566,015
$
42,239,681
Net realized loss (6,827,620) (13,003,715)
Net change in unrealized appreciation (depreciation) 15,907,560 25,663,868
Distributions to preferred shareholders (3,283,374) (5,930,706)
Net increase in net assets from operations
$
28,362,581
$
48,969,128
Distributions to common shareholders
$
(21,096,597)
$
(34,893,118)
Capital share transactions:    
Reinvestment of distributions to common shareholders $
340,943
$
Net increase in net assets from capital share transactions
$
340,943
$
Net increase in net assets
$
7,606,927
$
14,076,010
Net Assets Applicable to Common Shares    
At beginning of period $
372,480,649
$
358,404,639
At end of period
$380,087,576
$372,480,649
23
See Notes to Financial Statements.


Table of Contents
Eaton Vance
Senior Floating-Rate Trust
April 30, 2024
Statement of Cash Flows (Unaudited)

 
Six Months Ended
 
April 30, 2024
Cash Flows From Operating Activities  
Net increase in net assets from operations $
28,362,581
Distributions to preferred shareholders 3,283,374
Net increase in net assets from operations excluding distributions to preferred shareholders $
31,645,955
Adjustments to reconcile net increase in net assets from operations to net cash provided by operating activities:  
Investments purchased (79,543,479)
Investments sold and principal repayments 73,866,516
Decrease in short-term investments, net 825,375
Net amortization/accretion of premium (discount) (1,041,708)
Amortization of prepaid upfront fees on notes payable 52,773
Decrease in interest receivable 35,888
Decrease in dividends receivable from affiliated investments 28,249
Increase in Trustees’ deferred compensation plan (19,808)
Decrease in cash collateral due to broker (280,000)
Decrease in payable to affiliate for investment adviser fee (2,565)
Decrease in payable to affiliate for Trustees' fees (40)
Increase in payable to affiliate for Trustees' deferred compensation plan 19,808
Decrease in accrued expenses (941,283)
Increase in unfunded loan commitments 175,000
Net change in unrealized (appreciation) depreciation from investments (15,903,070)
Net change in unrealized (appreciation) depreciation from forward foreign currency exchange contracts (1,924)
Net realized loss from investments 6,853,269
Net cash provided by operating activities
$
15,768,956
Cash Flows From Financing Activities  
Cash distributions paid to common shareholders $
(20,755,654)
Cash distributions paid to preferred shareholders (3,279,423)
Proceeds from notes payable 10,000,000
Payment of prepaid upfront fees on notes payable (92,500)
Net cash used in financing activities
$(14,127,577)
Net increase in cash and restricted cash*
$
1,641,379
Cash and restricted cash at beginning of period (including foreign currency)
$
5,048,917
Cash and restricted cash at end of period (including foreign currency)
$
6,690,296
Supplemental disclosure of cash flow information:  
Noncash financing activities not included herein consist of:  
Reinvestment of dividends and distributions $
340,943
Cash paid for interest and fees on borrowings 4,714,415
* Includes net change in unrealized (appreciation) depreciation on foreign currency of $4,702.
24
See Notes to Financial Statements.


Table of Contents
Eaton Vance
Senior Floating-Rate Trust
April 30, 2024
Financial Highlights

Selected data for a common share outstanding during the periods stated
 
Six Months Ended
April 30, 2024
(Unaudited)
Year Ended October 31,
 
2023
2022
2021
2020
2019
Net asset value — Beginning of period (Common shares) $
12.770
$
12.280
$
14.300
$
13.500
$
14.510
$
15.370
Income (Loss) From Operations            
Net investment income
(1)
$
0.773
$
1.448
$
0.917
$
0.721
$
0.816
$
0.987
Net realized and unrealized gain (loss) 0.313 0.441 (1.934) 0.907 (0.874) (0.796)
Distributions to preferred shareholders:
From net investment income
(1)
(0.113) (0.203) (0.045) (0.003) (0.028) (0.072)
Total income (loss) from operations
$
0.973
$
1.686
$
(1.062)
$
1.625
$
(0.086)
$
0.119
Less Distributions to Common Shareholders            
From net investment income $
(0.723)
$
(1.196)
$
(0.875)
$
(0.806)
$
(0.924)
$
(0.979)
Tax return of capital (0.100) (0.056)
Total distributions to common shareholders
$
(0.723)
$
(1.196)
$
(0.975)
$
(0.862)
$
(0.924)
$
(0.979)
Premium from common shares sold through shelf offering (see Note 6)
(1)
$
$
$
0.017
$
0.001
$
$
Discount on tender offer (see Note 6)
(1)
$
$
$
$
0.036
$
$
Net asset value — End of period (Common shares)
$13.020
$12.770
$12.280
$14.300
$13.500
$14.510
Market value — End of period (Common shares)
$13.080
$11.640
$11.170
$14.900
$11.900
$12.910
Total Investment Return on Net Asset Value
(2)
7.64%
(3)
15.09%
(7.26)%
12.69%
0.42%
1.69%
Total Investment Return on Market Value
(2)
18.82%
(3)
15.34%
(19.10)%
33.21%
(0.52)%
3.55%
25
See Notes to Financial Statements.


Table of Contents
Eaton Vance
Senior Floating-Rate Trust
April 30, 2024
Financial Highlights — continued

Selected data for a common share outstanding during the periods stated
 
Six Months Ended
April 30, 2024
(Unaudited)
Year Ended October 31,
 
2023
2022
2021
2020
2019
Ratios/Supplemental Data            
Net assets applicable to common shares, end of period (000’s omitted) $380,088 $372,481 $358,405 $403,589 $497,341 $534,714
Ratios (as a percentage of average daily net assets applicable to common shares):
(4)†
           
Expenses excluding interest and fees 1.32%
(5)
1.34% 1.37% 1.33% 1.32% 1.28%
Interest and fee expense
(6)
2.07%
(5)
1.95% 0.81% 0.46% 0.78% 1.40%
Total expenses 3.39%
(5)(7)
3.29%
(7)
2.18%
(7)
1.79% 2.10% 2.68%
Net investment income 11.94%
(5)
11.37% 6.83% 5.05% 6.03% 6.64%
Portfolio Turnover 13%
(3)
24% 12% 66% 30% 28%
Senior Securities:            
Total notes payable outstanding (in 000’s) $120,000 $110,000 $133,000 $120,000 $223,000 $218,000
Asset coverage per $1,000 of notes payable
(8)
$
4,800
$
5,076
$
4,265
$
4,995
$
3,570
$
3,801
Total preferred shares outstanding 3,032 3,032 3,032 3,032 3,032 3,032
Asset coverage per preferred share
(9)
$
73,545
$
75,134
$
67,924
$
76,531
$
66,612
$
70,501
Involuntary liquidation preference per preferred share
(10)
$
25,000
$
25,000
$
25,000
$
25,000
$
25,000
$
25,000
Approximate market value per preferred share
(10)
$
25,000
$
25,000
$
25,000
$
25,000
$
25,000
$
25,000
(1)
Computed using average shares outstanding.
(2)
Returns are historical and are calculated by determining the percentage change in net asset value or market value with all distributions reinvested. Distributions are assumed to be reinvested at prices obtained under the Trust’s dividend reinvestment plan.
(3)
Not annualized.
(4)
Ratios do not reflect the effect of dividend payments to preferred shareholders.
(5)
Annualized.
(6)
Interest and fee expense relates to the notes payable incurred to partially redeem the Trust’s APS (see Note 8).
(7)
Includes a reduction by the investment adviser of a portion of its adviser fee due to the Trust’s investment in the Liquidity Fund (equal to less than 0.005% of average daily net assets for the six months ended April 30, 2024 and the years ended October 31, 2023 and 2022).
(8)
Calculated by subtracting the Trust’s total liabilities (not including the notes payable and preferred shares) from the Trust’s total assets, and dividing the result by the notes payable balance in thousands.
(9)
Calculated by subtracting the Trust’s total liabilities (not including the notes payable and preferred shares) from the Trust’s total assets, dividing the result by the sum of the values of the notes payable and liquidation value of the preferred shares, and multiplying the result by the liquidation value of one preferred share. Such amount equates to 294%, 301%, 272%, 306%, 266% and 282% at April 30, 2024 and October 31, 2023, 2022, 2021, 2020 and 2019, respectively.
(10)
Plus accumulated and unpaid dividends.
Ratios based on net assets applicable to common shares plus preferred shares and borrowings are presented below. Ratios do not reflect the effect of dividend payments to preferred shareholders. Ratios for periods less than one year are annualized.
 
Six Months Ended
April 30, 2024
(Unaudited)
Year Ended October 31,
 
2023
2022
2021
2020
2019
Expenses excluding interest and fees     0.88%   0.89%   0.88%   0.87%   0.84%   0.82%
Interest and fee expense     1.37%   1.28%   0.52%   0.31%   0.50%   0.91%
Total expenses     2.25%   2.17%   1.40%   1.18%   1.34%   1.73%
Net investment income 7.93% 7.47% 4.39% 3.34% 3.86% 4.29%
26
See Notes to Financial Statements.


Table of Contents
Eaton Vance
Senior Floating-Rate Trust
April 30, 2024
Notes to Financial Statements (Unaudited)

1  Significant Accounting Policies
Eaton Vance Senior Floating-Rate Trust (the Trust) is a Massachusetts business trust registered under the Investment Company Act of 1940, as amended (the 1940 Act), as a diversified, closed-end management investment company. The Trust’s primary investment objective is to provide a high level of current income. The Trust may, as a secondary objective, also seek preservation of capital to the extent consistent with its primary objective.
The following is a summary of significant accounting policies of the Trust. The policies are in conformity with accounting principles generally accepted in the United States of America (U.S. GAAP). The Trust is an investment company and follows accounting and reporting guidance in the Financial Accounting Standards Board (FASB) Accounting Standards Codification Topic 946.
A  Investment Valuation
The following methodologies are used to determine the market value or fair value of investments.
Senior Floating-Rate Loans.
Interests in senior floating-rate loans (Senior Loans) are valued generally at the average mean of bid and ask quotations obtained from a third party pricing service. Senior Loans, for which a valuation is not available or deemed unreliable, are fair valued by the investment adviser utilizing one or more of the valuation techniques described below to assess the likelihood that the borrower will make a full repayment of the loan underlying such Senior Loan. If the investment adviser believes that there is a reasonable likelihood of full repayment, the investment adviser will determine fair value using a matrix pricing approach that considers the yield on the Senior Loan relative to yields on other Senior Loans issued by companies of comparable credit quality. If the investment adviser believes there is not a reasonable likelihood of full repayment, the investment adviser will determine fair value using analyses that include, but are not limited to: (i) a comparison of the value of the borrower’s outstanding equity and debt to that of comparable public companies; (ii) a discounted cash flow analysis; or (iii) when the investment adviser believes it is likely that a borrower will be liquidated or sold, an analysis of the terms of such liquidation or sale. In certain cases, the investment adviser will use a combination of analytical methods to determine fair value, such as when only a portion of a borrower’s assets are likely to be sold. In conducting its assessment and analyses for purposes of determining fair value of a Senior Loan, the investment adviser will use its discretion and judgment in considering and appraising relevant factors. Junior Loans (i.e., subordinated loans and second lien loans) are valued in the same manner as Senior Loans.
Debt Obligations.
Debt obligations are generally valued on the basis of valuations provided by third party pricing services, as derived from such services’ pricing models. Inputs to the models may include, but are not limited to, reported trades, executable bid and ask prices, broker/dealer quotations, prices or yields of securities with similar characteristics, interest rates, anticipated prepayments, benchmark curves or information pertaining to the issuer, as well as industry and economic events. The pricing services may use a matrix approach, which considers information regarding securities with similar characteristics to determine the valuation for a security. Short-term debt obligations purchased with a remaining maturity of sixty days or less for which a valuation from a third party pricing service is not readily available may be valued at amortized cost, which approximates fair value.
Equity Securities.
Equity securities listed on a U.S. securities exchange generally are valued at the last sale or closing price on the day of valuation or, if no sales took place on such date, at the mean between the closing bid and ask prices on the exchange where such securities are principally traded. Equity securities listed on the NASDAQ National Market System are valued at the NASDAQ official closing price. Unlisted or listed securities for which closing sales prices or closing quotations are not available are valued at the mean between the latest available bid and ask prices or, in the case of preferred equity securities that are not listed or traded in the over-the-counter market, by a third party pricing service that uses various techniques that consider factors including, but not limited to, prices or yields of securities with similar characteristics, benchmark yields, broker/dealer quotes, quotes of underlying common stock, issuer spreads, as well as industry and economic events.
Derivatives.
Forward foreign currency exchange contracts are generally valued at the mean of the average bid and average ask prices that are reported by currency dealers to a third party pricing service at the valuation time. Such third party pricing service valuations are supplied for specific settlement periods and the Trust’s forward foreign currency exchange contracts are valued at an interpolated rate between the closest preceding and subsequent settlement period reported by the third party pricing service.
Foreign Securities and Currencies.
Foreign securities and currencies are valued in U.S. dollars, based on foreign currency exchange rate quotations supplied by a third party pricing service. The pricing service uses a proprietary model to determine the exchange rate. Inputs to the model include reported trades and implied bid/ask spreads.
Other.
Investments in management investment companies (including money market funds) that do not trade on an exchange are valued at the net asset value as of the close of each business day.
Fair Valuation.
In connection with Rule 2a-5 of the 1940 Act, the Trustees have designated the Trust’s investment adviser as its valuation designee. Investments for which valuations or market quotations are not readily available or are deemed unreliable are valued by the investment adviser, as valuation designee, at fair value using methods that most fairly reflect the security’s “fair value”, which is the amount that the Trust might reasonably expect to receive for the security upon its current sale in the ordinary course. Each such determination is based on a consideration of relevant factors, which are likely to vary from one pricing context to another. These factors may include, but are not limited to, the type of security, the existence of any contractual restrictions on the security’s disposition, the price and extent of public trading in similar securities of the issuer or of comparable companies or entities, quotations or relevant information obtained from broker/dealers or other market participants, information obtained from the issuer, analysts, and/or the appropriate stock exchange (for exchange-traded securities), an analysis of the company’s or entity’s financial statements, and an evaluation of the forces that influence the issuer and the market(s) in which the security is purchased and sold.
27


Table of Contents
Eaton Vance
Senior Floating-Rate Trust
April 30, 2024
Notes to Financial Statements (Unaudited) — continued

B  Investment Transactions
Investment transactions for financial statement purposes are accounted for on a trade date basis. Realized gains and losses on investments sold are determined on the basis of identified cost.
C  Income
Interest income is recorded on the basis of interest accrued, adjusted for amortization of premium or accretion of discount. Fees associated with loan amendments are recognized immediately. Dividend income is recorded on the ex-dividend date for dividends received in cash and/or securities. Distributions from investment companies are recorded as dividend income, capital gains or return of capital based on the nature of the distribution.
D  Federal Taxes
The Trust's policy is to comply with the provisions of the Internal Revenue Code applicable to regulated investment companies and to distribute to shareholders each year substantially all of its net investment income, and all or substantially all of its net realized capital gains. Accordingly, no provision for federal income or excise tax is necessary.
As of April 30, 2024, the Trust had no uncertain tax positions that would require financial statement recognition, de-recognition, or disclosure. The Trust files a U.S. federal income tax return annually after its fiscal year-end, which is subject to examination by the Internal Revenue Service for a period of three years from the date of filing.
E  Foreign Currency Translation
Investment valuations, other assets, and liabilities initially expressed in foreign currencies are translated each business day into U.S. dollars based upon current exchange rates. Purchases and sales of foreign investment securities and income and expenses denominated in foreign currencies are translated into U.S. dollars based upon currency exchange rates in effect on the respective dates of such transactions. Recognized gains or losses on investment transactions attributable to changes in foreign currency exchange rates are recorded for financial statement purposes as net realized gains and losses on investments. That portion of unrealized gains and losses on investments that results from fluctuations in foreign currency exchange rates is not separately disclosed.
F  Unfunded Loan Commitments
The Trust may enter into certain loan agreements all or a portion of which may be unfunded. The Trust is obligated to fund these commitments at the borrower's discretion. These commitments, if any, are disclosed in the accompanying Portfolio of Investments. At April 30, 2024, the Trust had sufficient cash and/or securities to cover these commitments.
G  Use of Estimates
The preparation of the financial statements in conformity with U.S. GAAP requires management to make estimates and assumptions that affect the reported amounts of assets and liabilities at the date of the financial statements and the reported amounts of income and expense during the reporting period. Actual results could differ from those estimates.
H  Indemnifications
Under the Trust’s organizational documents, its officers and Trustees may be indemnified against certain liabilities and expenses arising out of the performance of their duties to the Trust. Under Massachusetts law, if certain conditions prevail, shareholders of a Massachusetts business trust (such as the Trust) could be deemed to have personal liability for the obligations of the Trust. However, the Trust’s Declaration of Trust contains an express disclaimer of liability on the part of Trust shareholders and the By-laws provide that the Trust shall assume, upon request by the shareholder, the defense on behalf of any Trust shareholders. Moreover, the By-laws also provide for indemnification out of Trust property of any shareholder held personally liable solely by reason of being or having been a shareholder for all loss or expense arising from such liability. Additionally, in the normal course of business, the Trust enters into agreements with service providers that may contain indemnification clauses. The Trust’s maximum exposure under these arrangements is unknown as this would involve future claims that may be made against the Trust that have not yet occurred.
I  Forward Foreign Currency Exchange Contracts
The Trust may enter into forward foreign currency exchange contracts for the purchase or sale of a specific foreign currency at a fixed price on a future date. The forward foreign currency exchange contracts are adjusted by the daily exchange rate of the underlying currency and any gains or losses are recorded as unrealized until such time as the contracts have been closed. Risks may arise upon entering these contracts from the potential inability of counterparties to meet the terms of their contracts and from movements in the value of a foreign currency relative to the U.S. dollar.
J  Interim Financial Statements
The interim financial statements relating to April 30, 2024 and for the six months then ended have not been audited by an independent registered public accounting firm, but in the opinion of the Trust’s management, reflect all adjustments, consisting only of normal recurring adjustments, necessary for the fair presentation of the financial statements.
2  Auction Preferred Shares
The Trust issued Auction Preferred Shares (APS) on January 26, 2004 in a public offering. Dividends on the APS, which accrue daily, are cumulative at rates which are reset weekly for Series A and Series B, and approximately monthly for Series C and Series D by an auction, unless a special dividend period has been set. Series of APS are identical in all respects except for the reset dates of the dividend rates. If the APS auctions do not successfully clear, the dividend payment rate over the next period for the APS holders is set at a specified maximum applicable rate until such time as the APS auctions are successful. Auctions have not cleared since February 13, 2008 and the rate since that date has been the maximum applicable rate (see Note 3). The maximum applicable rate on the APS is 160% of the “AA” Financial Composite Commercial Paper Rate at the date of the auction. The stated spread over the reference benchmark rate is determined based on the credit rating of the APS.
28


Table of Contents
Eaton Vance
Senior Floating-Rate Trust
April 30, 2024
Notes to Financial Statements (Unaudited) — continued

The number of APS issued and outstanding at April 30, 2024 are as follows:
 
APS Issued and
Outstanding
Series A 739
Series B 763
Series C 738
Series D 792
The APS are redeemable at the option of the Trust at a redemption price equal to $25,000 per share, plus accumulated and unpaid dividends, on any dividend payment date. The APS are also subject to mandatory redemption at a redemption price equal to $25,000 per share, plus accumulated and unpaid dividends, if the Trust is in default for an extended period on its asset maintenance requirements with respect to the APS. If the dividends on the APS remain unpaid in an amount equal to two full years’ dividends, the holders of the APS as a class have the right to elect a majority of the Board of Trustees. In general, the holders of the APS and the common shares have equal voting rights of one vote per share, except that the holders of the APS, as a separate class, have the right to elect at least two members of the Board of Trustees. The APS have a liquidation preference of $25,000 per share, plus accumulated and unpaid dividends. The Trust is required to maintain certain asset coverage with respect to the APS as defined in the Trust's By-Laws and the 1940 Act. The Trust pays an annual fee up to 0.15% of the liquidation value of the APS to broker/dealers as a service fee if the auctions are unsuccessful; otherwise, the annual fee is 0.25%.
3  Distributions to Shareholders and Income Tax Information
The Trust intends to make monthly distributions of net investment income to common shareholders, after payment of any dividends on any outstanding APS. In addition, at least annually, the Trust intends to distribute all or substantially all of its net realized capital gains. Distributions to common shareholders are recorded on the ex-dividend date. Distributions to preferred shareholders are recorded daily and are payable at the end of each dividend period. The dividend rates for the APS at April 30, 2024, and the amount of dividends accrued (including capital gains, if any) to APS shareholders, average APS dividend rates (annualized), and dividend rate ranges for the six months then ended were as follows:
 
APS Dividend
Rates at
April 30, 2024
Dividends
Accrued to
APS
Shareholders
Average
APS
Dividend
Rates
Dividend
Rate
Ranges
(%)
Series A 8.58% $800,794 8.57% 8.49-8.74
Series B 8.58 826,799 8.57 8.49-8.74
Series C 8.58 796,584 8.54 8.49-8.62
Series D 8.57 859,197 8.58 8.55-8.65
Beginning February 13, 2008 and consistent with the patterns in the broader market for auction-rate securities, the Trust's APS auctions were unsuccessful in clearing due to an imbalance of sell orders over bids to buy the APS. As a result, the dividend rates of the APS were reset to the maximum applicable rates. The table above reflects such maximum dividend rate for each series as of April 30, 2024.
Distributions to shareholders are determined in accordance with income tax regulations, which may differ from U.S. GAAP. As required by U.S. GAAP, only distributions in excess of tax basis earnings and profits are reported in the financial statements as a return of capital. Permanent differences between book and tax accounting relating to distributions are reclassified to paid-in capital. For tax purposes, distributions from short-term capital gains are considered to be from ordinary income.
At October 31, 2023, the Trust, for federal income tax purposes, had deferred capital losses of $54,903,704 which would reduce its taxable income arising from future net realized gains on investment transactions, if any, to the extent permitted by the Internal Revenue Code, and thus would reduce the amount of distributions to shareholders, which would otherwise be necessary to relieve the Trust of any liability for federal income or excise tax. The deferred capital losses are treated as arising on the first day of the Trust’s next taxable year and retain the same short-term or long-term character as when originally deferred. Of the deferred capital losses at October 31, 2023, $51,890,008 are long-term and $3,013,696 are short-term.
29


Table of Contents
Eaton Vance
Senior Floating-Rate Trust
April 30, 2024
Notes to Financial Statements (Unaudited) — continued

The cost and unrealized appreciation (depreciation) of investments, including open derivative contracts, of the Trust at April 30, 2024, as determined on a federal income tax basis, were as follows:
Aggregate cost
$
602,420,230
Gross unrealized appreciation $
5,881,574
Gross unrealized depreciation (20,180,082)
Net unrealized depreciation
$
(14,298,508)
4  Investment Adviser Fee and Other Transactions with Affiliates
The investment adviser fee is earned by Eaton Vance Management (EVM), an indirect, wholly-owned subsidiary of Morgan Stanley,  as compensation for investment advisory services rendered to the Trust. The fee is computed at an annual rate of 0.75% of the Trust’s average daily gross assets and is payable monthly. Gross assets, as defined in the Trust's investment advisory agreement, means total assets of the Trust, including any form of investment leverage, minus all accrued expenses incurred in the normal course of operations, but not excluding any liabilities or obligations attributable to investment leverage obtained through (i) indebtedness of any type (including, without limitation, borrowing through a credit facility or the issuance of debt securities), (ii) the issuance of preferred stock or other similar preference securities, (iii) the reinvestment of collateral received for securities loaned in accordance with the Trust’s investment objectives and policies, and/or (iv) any other means. Accrued expenses includes other liabilities other than indebtedness attributable to leverage. For the six months ended April 30, 2024, the Trust’s investment adviser fee amounted to $2,133,886. The Trust may invest in a money market fund, the Institutional Class of the Morgan Stanley Institutional Liquidity Funds - Government Portfolio (the "Liquidity Fund"), an open-end management investment company managed by Morgan Stanley Investment Management Inc., a wholly-owned subsidiary of Morgan Stanley. The investment adviser fee paid by the Trust is reduced by an amount equal to its pro rata share of the advisory and administration fees paid by the Trust due to its investment in the Liquidity Fund. For the six months ended April 30, 2024, the investment adviser fee paid was reduced by $6,085 relating to the Trust's investment in the Liquidity Fund. EVM also serves as administrator of the Trust, but receives no compensation.
Trustees and officers of the Trust who are members of EVM’s organization receive remuneration for their services to the Trust out of the investment adviser fee. Trustees of the Trust who are not affiliated with EVM may elect to defer receipt of all or a percentage of their annual fees in accordance with the terms of the Trustees Deferred Compensation Plan. Certain officers and Trustees of the Fund are officers of EVM.
5  Purchases and Sales of Investments
Purchases and sales of investments, other than short-term obligations and including maturities, paydowns and principal repayments on Senior Loans, aggregated $79,265,731 and $74,668,108, respectively, for the six months ended April 30, 2024.
6  Common Shares of Beneficial Interest and Shelf Offering
The Trust may issue common shares pursuant to its dividend reinvestment plan. Common shares issued by the Trust pursuant to its dividend reinvestment plan for the six months ended April 30, 2024 were 26,139. There were no common shares issued by the Trust for the year ended October 31, 2023.
On May 12, 2021, the Trust announced that it will conduct cash tender offers in the fourth quarter of each of 2022, 2023 and 2024 (each, a “Conditional Tender Offer”) for up to 10% of the Trust’s then-outstanding common shares if, from January to August of the relevant year, the Trust’s shares trade at an average daily discount to NAV of more than 10%, based upon the Trust’s volume-weighted average market price and NAV on each business day during the period. If triggered, common shares tendered and accepted in a Conditional Tender Offer would be repurchased at a price per share equal to 98% of the Trust’s NAV as of the close of regular trading on the New York Stock Exchange on the date such Conditional Tender Offer expires. The condition to trigger a tender offer by the Trust in the fourth quarter of 2023 and 2022 was not met.
Pursuant to a registration statement filed with the SEC, the Trust is authorized to issue up to an additional 3,085,835 common shares through an equity shelf offering program (the “shelf offering”). Under the shelf offering, the Trust, subject to market conditions, may raise additional capital from time to time and in varying amounts and offering methods at a net price at or above the Trust’s net asset value per common share. During the six months ended April 30, 2024 and the year ended October 31, 2023, there were no shares sold by the Trust pursuant to its shelf offering.
In November 2013, the Board of Trustees initially approved a share repurchase program for the Trust. Pursuant to the reauthorization of the share repurchase program by the Board of Trustees in March 2019, the Trust is authorized to repurchase up to 10% of its common shares outstanding as of the last day of the prior calendar year at market prices when shares are trading at a discount to net asset value (NAV). The share repurchase program does not obligate the Trust to purchase a specific amount of shares. There were no repurchases of common shares by the Trust for the six months ended April 30, 2024 and the year ended October 31, 2023.
30


Table of Contents
Eaton Vance
Senior Floating-Rate Trust
April 30, 2024
Notes to Financial Statements (Unaudited) — continued

7  Financial Instruments
The Trust may trade in financial instruments with off-balance sheet risk in the normal course of its investing activities. These financial instruments may include forward foreign currency exchange contracts and may involve, to a varying degree, elements of risk in excess of the amounts recognized for financial statement purposes. The notional or contractual amounts of these instruments represent the investment the Trust has in particular classes of financial instruments and do not necessarily represent the amounts potentially subject to risk. The measurement of the risks associated with these instruments is meaningful only when all related and offsetting transactions are considered. A summary of obligations under these financial instruments at April 30, 2024 is included in the Portfolio of Investments. At April 30, 2024, the Trust had sufficient cash and/or securities to cover commitments under these contracts.
The Trust is subject to foreign exchange risk in the normal course of pursuing its investment objectives. Because the Trust holds foreign currency denominated investments, the value of these investments and related receivables and payables may change due to future changes in foreign currency exchange rates. To hedge against this risk, the Trust enters into forward foreign currency exchange contracts.
The Trust enters into forward foreign currency exchange contracts that may contain provisions whereby the counterparty may terminate the contract under certain conditions, including but not limited to a decline in the Trust’s net assets below a certain level over a certain period of time, which would trigger a payment by the Trust for those derivatives in a net liability position. At April 30, 2024, the Trust had no open derivatives with credit-related contingent features in a net liability position.
The over-the-counter (OTC) derivatives in which the Trust invests are subject to the risk that the counterparty to the contract fails to perform its obligations under the contract. To mitigate this risk, the Trust has entered into an International Swaps and Derivatives Association, Inc. Master Agreement (“ISDA Master Agreement”) or similar agreement with substantially all its derivative counterparties. An ISDA Master Agreement is a bilateral agreement between the Trust and a counterparty that governs certain OTC derivatives and typically contains, among other things, set-off provisions in the event of a default and/or termination event as defined under the relevant ISDA Master Agreement. Under an ISDA Master Agreement, the Trust may, under certain circumstances, offset with the counterparty certain derivative financial instruments’ payables and/or receivables with collateral held and/or posted and create one single net payment. The provisions of the ISDA Master Agreement typically permit a single net payment in the event of default including the bankruptcy or insolvency of the counterparty. However, bankruptcy or insolvency laws of a particular jurisdiction may impose restrictions on or prohibitions against the right of offset in bankruptcy or insolvency. Certain ISDA Master Agreements allow counterparties to OTC derivatives to terminate derivative contracts prior to maturity in the event the Trust’s net assets decline by a stated percentage or the Trust fails to meet the terms of its ISDA Master Agreements, which would cause the counterparty to accelerate payment by the Trust of any net liability owed to it.
The collateral requirements for derivatives traded under an ISDA Master Agreement are governed by a Credit Support Annex to the ISDA Master Agreement. Collateral requirements are determined at the close of business each day and are typically based on changes in market values for each transaction under an ISDA Master Agreement and netted into one amount for such agreement. Generally, the amount of collateral due from or to a counterparty is subject to a minimum transfer threshold amount before a transfer is required, which may vary by counterparty. Collateral pledged for the benefit of the Trust and/or counterparty is held in segregated accounts by the Trust’s custodian and cannot be sold, re-pledged, assigned or otherwise used while pledged. The portion of such collateral representing cash, if any, is reflected as deposits for derivatives collateral and, in the case of cash pledged by a counterparty for the benefit of the Trust, a corresponding liability on the Statement of Assets and Liabilities. Securities pledged by the Trust as collateral, if any, are identified as such in the Portfolio of Investments. 
The fair value of open derivative instruments (not considered to be hedging instruments for accounting disclosure purposes) and whose primary underlying risk exposure is foreign exchange risk at April 30, 2024 was as follows:
 
Fair Value
Derivative
Asset Derivative
(1)
Liability Derivative
Forward foreign currency exchange contracts $420,144 $ —
(1)
Statement of Assets and Liabilities location: Receivable for open forward foreign currency exchange contracts.
31


Table of Contents
Eaton Vance
Senior Floating-Rate Trust
April 30, 2024
Notes to Financial Statements (Unaudited) — continued

The Trust's derivative assets and liabilities at fair value by type, which are reported gross in the Statement of Assets and Liabilities, are presented in the table above. The following table presents the Trust's derivative assets by counterparty, net of amounts available for offset under a master netting agreement and net of the related collateral received by the Trust for such assets as of April 30, 2024.
Counterparty
Derivative
Assets Subject to
Master Netting
Agreement
Derivatives
Available
for Offset
Non-cash
Collateral
Received
(a)
Cash
Collateral
Received
(a)
Net Amount
of Derivative
Assets
(b)
Bank of America, N.A. $
82,386
$
 —
$
 —
$
 —
$
82,386
HSBC Bank USA, N.A. 20,573  —  —  — 20,573
Standard Chartered Bank 138,852  —  —  — 138,852
State Street Bank and Trust Company 178,333  —  —  — 178,333
 
$420,144
$
— 
$
$
$420,144
(a)
In some instances, the total collateral received and/or pledged may be more than the amount shown due to overcollateralization.
(b)
Net amount represents the net amount due from the counterparty in the event of default.
The effect of derivative instruments (not considered to be hedging instruments for accounting disclosure purposes) on the Statement of Operations and whose primary underlying risk exposure is foreign exchange risk for the six months ended April 30, 2024 was as follows:
Derivative
Realized Gain (Loss)
on Derivatives Recognized
in Income
(1)
Change in Unrealized
Appreciation (Depreciation) on
Derivatives Recognized in Income
(2)
Forward foreign currency exchange contracts $(33,357) $1,924
(1)
Statement of Operations location: Net realized gain (loss): Forward foreign currency exchange contracts.
(2)
Statement of Operations location: Change in unrealized appreciation (depreciation): Forward foreign currency exchange contracts.
The average notional amount of forward foreign currency exchange contracts (based on the absolute value of notional amounts of currency purchased and currency sold) outstanding during the six months ended April 30, 2024, which is indicative of the volume of this derivative type, was approximately $37,117,000.
8  Credit Agreement
The Trust has entered into a Credit Agreement, as amended (the Agreement) with a bank to borrow up to a limit of $185 million ($190 million prior to March 12, 2024) pursuant to a revolving line of credit. Borrowings under the Agreement are secured by the assets of the Trust. Interest is generally charged at a rate above the Secured Overnight Financing Rate (SOFR) and is payable monthly. Under the terms of the Agreement, in effect through March 11, 2025, the Trust pays a facility fee of 0.15% on the borrowing limit. In connection with the extension of the Agreement on March 12, 2024, the Trust also paid upfront fees of $92,500, which are being amortized to interest expense to March 11, 2025. The unamortized balance at April 30, 2024 is approximately $80,000 and is included in prepaid upfront fees on notes payable on the Statement of Assets and Liabilities. The Trust is required to maintain certain net asset levels during the term of the Agreement. At April 30, 2024, the Trust had borrowings outstanding under the Agreement of $120,000,000 at an annual interest rate of 6.32%. Based on the short-term nature of the borrowings under the Agreement and the variable interest rate, the carrying amount of the borrowings at April 30, 2024 approximated its fair value. If measured at fair value, borrowings under the Agreement would have been considered as Level 2 in the fair value hierarchy (see Note 10) at April 30, 2024. For the six months ended April 30, 2024, the average borrowings under the Agreement and the average annual interest rate (excluding fees) were $116,510,989 and 6.33%, respectively.
32


Table of Contents
Eaton Vance
Senior Floating-Rate Trust
April 30, 2024
Notes to Financial Statements (Unaudited) — continued

9  Affiliated Investments
At April 30, 2024, the value of the Trust's investment in funds that may be deemed to be affiliated was $10,949,282, which represents 2.9% of the Trust's net assets applicable to common shares. Transactions in such investments by the Trust for the six months ended April 30, 2024 were as follows:
Name
Value,
beginning
of period
Purchases
Sales
proceeds
Net realized
gain (loss)
Change in
unrealized
appreciation
(depreciation)
Value, end
of period
Dividend
income
Shares,
end of period
Short-Term Investments
Liquidity Fund $11,774,657 $90,745,432 $(91,570,807) $ — $ — $10,949,282 $211,197 10,949,282
10  Fair Value Measurements
Under generally accepted accounting principles for fair value measurements, a three-tier hierarchy to prioritize the assumptions, referred to as inputs, is used in valuation techniques to measure fair value. The three-tier hierarchy of inputs is summarized in the three broad levels listed below.
Level 1 – quoted prices in active markets for identical investments
Level 2 – other significant observable inputs (including quoted prices for similar investments, interest rates, prepayment speeds, credit risk, etc.)
Level 3 – significant unobservable inputs (including a fund's own assumptions in determining the fair value of investments)
In cases where the inputs used to measure fair value fall in different levels of the fair value hierarchy, the level disclosed is determined based on the lowest level input that is significant to the fair value measurement in its entirety. The inputs or methodology used for valuing securities are not necessarily an indication of the risk associated with investing in those securities.
At April 30, 2024, the hierarchy of inputs used in valuing the Trust’s investments and open derivative instruments, which are carried at fair value, were as follows:
Asset Description
Level 1
Level 2
Level 3*
Total
Asset-Backed Securities $
        —
$
 29,007,994
$
     —
$
 29,007,994
Closed-End Funds  7,014,303          —      —   7,014,303
Common Stocks     19,053   3,062,310     796   3,082,159
Corporate Bonds         —  23,601,642      —  23,601,642
Senior Floating-Rate Loans (Less Unfunded Loan Commitments)         — 513,621,302 424,896 514,046,198
Short-Term Investments 10,949,282          —      —  10,949,282
Total Investments
$
17,982,638
$
569,293,248
$
425,692
$587,701,578
Forward Foreign Currency Exchange Contracts $
        —
$
    420,144
$
     —
$
    420,144
Total
$
17,982,638
$
569,713,392
$
425,692
$588,121,722
* None of the unobservable inputs for Level 3 assets, individually or collectively, had a material impact on the Trust.
Level 3 investments at the beginning and/or end of the period in relation to net assets were not significant and accordingly, a reconciliation of Level 3 assets for the six months ended April 30, 2024 is not presented.
33


Table of Contents
Eaton Vance
Senior Floating-Rate Trust
April 30, 2024
Notes to Financial Statements (Unaudited) — continued

11  Risks and Uncertainties
Risks Associated with Foreign Investments
Foreign investments can be adversely affected by political, economic and market developments abroad, including the imposition of economic and other sanctions by the United States or another country. There may be less publicly available information about foreign issuers because they may not be subject to reporting practices, requirements or regulations comparable to those to which United States companies are subject. Foreign markets may be smaller, less liquid and more volatile than the major markets in the United States. Trading in foreign markets typically involves higher expense than trading in the United States. The Trust may have difficulties enforcing its legal or contractual rights in a foreign country. Securities that trade or are denominated in currencies other than the U.S. dollar may be adversely affected by fluctuations in currency exchange rates.
Credit Risk
The Trust invests primarily in below investment grade floating-rate loans, which are considered speculative because of the credit risk of their issuers. Changes in economic conditions or other circumstances are more likely to reduce the capacity of issuers of these securities to make principal and interest payments. Such companies are more likely to default on their payments of interest and principal owed than issuers of investment grade bonds. An economic downturn generally leads to a higher non-payment rate, and a loan or other debt obligation may lose significant value before a default occurs. Lower rated investments also may be subject to greater price volatility than higher rated investments. Moreover, the specific collateral used to secure a loan may decline in value or become illiquid, which would adversely affect the loan’s value.
12  Additional Information
On August 27, 2020, the Trust’s Board of Trustees (the “Board”) received a shareholder demand letter from counsel to Saba Capital Master Fund, Ltd., a hedge fund (“Saba”). Saba also filed claims against the Trust in a lawsuit in Suffolk County Superior Court in Massachusetts asserting breach of contract and fiduciary duty by the Trust and certain of its affiliates, the Trust’s adviser, and the Board, following the implementation by the Trust of by-law amendments that (i) require trustee nominees in contested elections to obtain affirmative votes of a majority of eligible shares in order to be elected and (ii) establish certain requirements related to shares obtained in “control share” acquisitions. With respect to the Trust, Saba seeks rescission of these by-law provisions and certain related relief. On March 31, 2021, the court allowed in part and denied in part a motion to dismiss Saba’s claims. Discovery is complete. On January 23, 2023, in ruling on the parties’ cross-motions for partial summary judgment, the court dismissed Saba’s claims for breach of fiduciary duty against the Board, while holding that the control share by-law amendment violated Section 18(i) of the 1940 Act. Additional claims and defenses will be addressed at trial, which is currently scheduled to begin September 9, 2024. While management of the Trust is unable to predict the outcome of this matter, it does not believe the outcome would result in the payment of any monetary damages by the Trust.
34


Table of Contents
Eaton Vance
Senior Floating-Rate Trust
April 30, 2024
Officers and Trustees

Officers
Kenneth A. Topping
President
Nicholas S. Di Lorenzo
Secretary
Deidre E. Walsh
Vice President and Chief Legal Officer
Laura T. Donovan
Chief Compliance Officer
James F. Kirchner
Treasurer
 
Trustees  
George J. Gorman
Chairperson
 
Alan C. Bowser  
Mark R. Fetting  
Cynthia E. Frost  
Valerie A. Mosley  
Anchal Pachnanda*  
Keith Quinton  
Marcus L. Smith  
Susan J. Sutherland  
Scott E. Wennerholm  
Nancy A. Wiser  
 
* Interested Trustee
35


Table of Contents
Eaton Vance Funds
U.S. Customer Privacy Notice March 2024

FACTS
WHAT DOES EATON VANCE DO WITH YOUR PERSONAL INFORMATION?
Why?
Financial companies choose how they share your personal information. Federal law gives consumers the right to limit some but not all sharing. Federal law also requires us to tell you how we collect, share, and protect your personal information. Please read this notice carefully to understand what we do.
What?
The types of personal information we collect and share depend on the product or service you have with us. This information can include:
■ Social Security number and income
■ investment experience and risk tolerance
■ checking account information and wire transfer instructions
How?
All financial companies need to share customers’ personal information to run their everyday business. In the section below, we list the reasons financial companies can share their customers’ personal information; the reasons Eaton Vance chooses to share; and whether you can limit this sharing.
Reasons we can share your personal information
Does Eaton Vance
share?
Can you limit
this sharing?
For our everyday business purposes —
such as to process your transactions, maintain your account(s), respond to court orders and legal investigations, or report to credit bureaus
Yes No
For our marketing purposes —
to offer our products and services to you
Yes No
For joint marketing with other financial companies
No We don’t share
For our affiliates’ everyday business purposes —
information about your transactions and experiences
Yes No*
For our affiliates’ everyday business purposes —
information about your creditworthiness
Yes Yes*
For our affiliates to market to you
Yes Yes*
For nonaffiliates to market to you
No We don’t share
To limit our

sharing
Call toll-free 1-800-262-1122 or email:
EVPrivacy@eatonvance.com
Please note:
If you are a
new
customer, we can begin sharing your information 30 days from the date we sent this notice. When you are
no longer
our customer, we continue to share your information as described in this notice. However, you can contact us at any time to limit our sharing.
Questions?
Call toll-free 1-800-262-1122 or email:
EVPrivacy@eatonvance.com
36


Table of Contents
Eaton Vance Funds
U.S. Customer Privacy Notice — continued March 2024

Page 2
Who we are
Who is providing this notice?
Eaton Vance Management and our investment management affiliates (“Eaton Vance”) (see Affiliates definition below.)
What we do
How does Eaton Vance
protect my personal
information?
To protect your personal information from unauthorized access and use, we use security measures that comply with federal law. These measures include computer safeguards and secured files and buildings. We have policies governing the proper handling of customer information by personnel and requiring third parties that provide support to adhere to appropriate security standards with respect to such information.
How does Eaton Vance
collect my personal
information?
We collect your personal information, for example, when you
■ open an account or make deposits or withdrawals from your account
■ buy securities from us or make a wire transfer
■ give us your contact information
We also collect your personal information from others, such as credit bureaus, affiliates, or other companies.
Why can’t I limit all sharing?
Federal law gives you the right to limit only
■ sharing for affiliates’ everyday business purposes — information about your creditworthiness
■ affiliates from using your information to market to you
■ sharing for nonaffiliates to market to you
State laws and individual companies may give you additional rights to limit sharing. (See below for more on your rights under state law.)
What happens when I limit
sharing for an account I hold
jointly with someone else?
Your choices will apply to everyone on your account.
Definitions
Affiliates
Companies related by common ownership or control. They can be financial and nonfinancial companies.
■ 
Our affiliates include registered investment advisers such as Eaton Vance Management, Eaton Vance Advisers International Ltd., Boston Management and Research, Calvert Research and Management, Parametric Portfolio Associates LLC, Atlanta Capital Management Company LLC, Morgan Stanley Investment Management Inc., Morgan Stanley Investment Management Co.; registered broker-dealers such as Morgan Stanley Distributors Inc. and Eaton Vance Distributors, Inc. (together, the “Investment Management Affiliates”); and companies with a Morgan Stanley name and financial companies such as Morgan Stanley Smith Barney LLC and Morgan Stanley & Co. (the “Morgan Stanley Affiliates”).
Nonaffiliates
Companies not related by common ownership or control. They can be financial and nonfinancial companies.
■ 
Eaton Vance does not share with nonaffiliates so they can market to you.
Joint marketing
A formal agreement between nonaffiliated financial companies that together market financial products or services to you.
■ 
Eaton Vance does not jointly market.
37


Table of Contents
Eaton Vance Funds
U.S. Customer Privacy Notice — continued March 2024

Page 3
Other important information
*PLEASE NOTE: Eaton Vance does not share your creditworthiness information or your transactions and experiences information with the Morgan Stanley Affiliates, nor does Eaton Vance enable the Morgan Stanley Affiliates to market to you. Your opt outs will prevent Eaton Vance from sharing your creditworthiness information with the Investment Management Affiliates and will prevent the Investment Management Affiliates from marketing their products to you.
Vermont:
Except as permitted by law, we will not share personal information we collect about Vermont residents with Nonaffiliates unless you provide us with your written consent to share such information.
California:
Except as permitted by law, we will not share personal information we collect about California residents with Nonaffiliates and we will limit sharing such personal information with our Affiliates to comply with California privacy laws that apply to us.
38


Table of Contents
Eaton Vance Funds
IMPORTANT NOTICES

Delivery of Shareholder Documents.
 
The Securities and Exchange Commission (SEC) permits funds to deliver only one copy of shareholder documents, including prospectuses, proxy statements and shareholder reports, to fund investors with multiple accounts at the same residential or post office box address. This practice is often called “householding” and it helps eliminate duplicate mailings to shareholders.
Equiniti Trust Company, LLC
(“
EQ
”),
the closed-end funds transfer agent, or your financial intermediary, may household the mailing of your documents indefinitely unless you instruct EQ, or your financial intermediary, otherwise.
 If you would prefer that your Eaton Vance documents not be householded, please contact EQ or your financial intermediary. Your instructions that householding not apply to delivery of your Eaton Vance documents will typically be effective within 30 days of receipt by EQ or your financial intermediary.
Portfolio Holdings.
 
Each Eaton Vance Fund and its underlying Portfolio(s) (if applicable) files a schedule of portfolio holdings on Part F to Form N-PORT with the SEC. Certain information filed on Form N-PORT may be viewed on the Eaton Vance website at www.eatonvance.com, by calling Eaton Vance at 1-800-262-1122 or in the EDGAR database on the SEC’s website at www.sec.gov.
Proxy Voting.
 
From time to time, funds are required to vote proxies related to the securities held by the funds. The Eaton Vance Funds or their underlying Portfolios (if applicable) vote proxies according to a set of policies and procedures approved by the Funds’ and Portfolios’ Boards. You may obtain a description of these policies and procedures and information on how the Funds or Portfolios voted proxies relating to portfolio securities during the most recent 12-month period ended June 30, without charge, upon request, by calling 1-800-262-1122 and by accessing the SEC’s website at www.sec.gov.
Share Repurchase Program.
 
The Fund’s Board of Trustees has approved a share repurchase program authorizing the Fund to repurchase up to 10% of its common shares outstanding as of the last day of the prior calendar year in open-market transactions at a discount to net asset value. The repurchase program does not obligate the Fund to purchase a specific amount of shares. The Fund’s repurchase activity, including the number of shares purchased, average price and average discount to net asset value, is disclosed in the Fund’s annual and semi-annual reports to shareholders.
Additional Notice to Shareholders.
 
If applicable, a Fund may also redeem or purchase its outstanding preferred shares in order to maintain compliance with regulatory requirements, borrowing or rating agency requirements or for other purposes as it deems appropriate or necessary.
Closed-End Fund Information.
 
Eaton Vance closed-end funds make fund performance data and certain information about portfolio characteristics available on the Eaton Vance website shortly after the end of each month. Other information about the funds is available on the website. The funds’ net asset value per share is readily accessible on the Eaton Vance website. Portfolio holdings for the most recent month-end are also posted to the website approximately 30 days following the end of the month. This information is available at www.eatonvance.com on the fund information pages under “Closed-End Funds & Term Trusts.”
39


Table of Contents
This Page Intentionally Left Blank


Table of Contents
Investment Adviser and Administrator
Eaton Vance Management
One Post Office Square
Boston, MA 02109
Custodian
State Street Bank and Trust Company
One Congress Street, Suite 1
Boston, MA 02114-2016
Transfer Agent
Equiniti Trust Company, LLC ("EQ")
P.O. Box 500
Newark, NJ 07101
Fund Offices
One Post Office Square
Boston, MA 02109


Table of Contents
7735    4.30.24


Item 2.

Code of Ethics

Not required in this filing. 


Item 3.

Audit Committee Financial Expert

Not required in this filing. 


Item 4.

Principal Accountant Fees and Services

Not required in this filing.


Item 5.

Audit Committee of Listed Registrants

Not required in this filing. 


Item 6.

Schedule of Investments

Please see schedule of investments contained in the Report to Stockholders included under Item 1 of this Form N-CSR.


Item 7.

Disclosure of Proxy Voting Policies and Procedures for Closed-End Management Investment Companies

Not required in this filing.


Item 8.

Portfolio Managers of Closed-End Management Investment Companies

Not required in this filing.


Item 9.

Purchases of Equity Securities by Closed-End Management Investment Company and Affiliated Purchasers

No such purchases this period.


Item 10.

Submission of Matters to a Vote of Security Holders

No material changes.


Item 11.

Controls and Procedures

(a) It is the conclusion of the registrant’s principal executive officer and principal financial officer that the effectiveness of the registrant’s current disclosure controls and procedures (such disclosure controls and procedures having been evaluated within 90 days of the date of this filing) provide reasonable assurance that the information required to be disclosed by the registrant has been recorded, processed, summarized and reported within the time period specified in the Commission’s rules and forms and that the information required to be disclosed by the registrant has been accumulated and communicated to the registrant’s principal executive officer and principal financial officer in order to allow timely decisions regarding required disclosure.

(b) There have been no changes in the registrant’s internal controls over financial reporting during the period covered by this report that has materially affected, or is reasonably likely to materially affect, the registrant’s internal control over financial reporting.


Item 12.

Disclosure of Securities Lending Activities for Closed-End Management Investment Companies

No activity to report for the Registrant’s most recent fiscal year end.


Item 13.

Exhibits


(a)(1)   Registrant’s Code of Ethics – Not applicable (please see Item 2).
(a)(2)(i)   Principal Financial Officer’s Section 302 certification.
(a)(2)(ii)   Principal Executive Officer’s Section 302 certification.
(b)   Combined Section 906 certification.


Signatures

Pursuant to the requirements of the Securities Exchange Act of 1934 and the Investment Company Act of 1940, the registrant has duly caused this report to be signed on its behalf by the undersigned, thereunto duly authorized.

Eaton Vance Senior Floating-Rate Trust


By:  

/s/ Kenneth A. Topping

  Kenneth A. Topping
  Principal Executive Officer
Date:   June 25, 2024

Pursuant to the requirements of the Securities Exchange Act of 1934 and the Investment Company Act of 1940, this report has been signed below by the following persons on behalf of the registrant and in the capacities and on the dates indicated.


By:  

/s/ James F. Kirchner

  James F. Kirchner
  Principal Financial Officer
Date:   June 25, 2024
By:  

/s/ Kenneth A. Topping

  Kenneth A. Topping
  Principal Executive Officer
Date:   June 25, 2024