|
FREE WRITING PROSPECTUS
|
||
|
FILED PURSUANT TO RULE 433
|
||
|
REGISTRATION FILE NO.: 333-166711-02
|
||
|
August 28, 2012
|
Free Writing Prospectus
Citigroup Commercial Mortgage Trust 2012-GC8
The depositor has filed a registration statement (including the prospectus) with the SEC (SEC File No. 333-166711) for the offering to which this communication relates. Before you invest, you should read the prospectus in the registration statement and other documents the depositor has filed with the SEC for more complete information about the depositor, the issuing entity and this offering. You may get these documents for free by visiting EDGAR on the SEC website at www.sec.gov. Alternatively, the depositor or Citigroup Global Markets Inc., any other underwriter, or any dealer participating in this offering will arrange to send to you the prospectus if you request it by calling toll-free 1-877-858-5407.
IMPORTANT NOTICE RELATING TO AUTOMATICALLY GENERATED EMAIL DISCLAIMERS
Any legends, disclaimers or other notices that may appear at the bottom of the email communication to which this free writing prospectus is attached relating to (1) these materials not constituting an offer (or a solicitation of an offer), (2) no representation being made that these materials are accurate or complete and may not be updated or (3) these materials possibly being confidential, are not applicable to these materials and should be disregarded. Such legends, disclaimers or other notices have been automatically generated as a result of these materials having been sent via Bloomberg or another system.
The Securities May Not Be a Suitable Investment for You
The securities offered by this Free Writing Prospectus are not suitable investments for all investors. In particular, you should not purchase any class of securities unless you understand and are able to bear the prepayment, credit, liquidity and market risks associated with that class of securities. For those reasons, among others, the yield to maturity and the aggregate amount and timing of distributions on the offered securities are subject to material variability from period to period and give rise to the potential for significant loss over the life of those securities. The interaction of these factors and their effects are impossible to predict and are likely to change from time to time. As a result, an investment in the offered securities involves substantial risks and uncertainties and should be considered only by sophisticated institutional investors with substantial investment experience with similar types of securities and who have conducted appropriate due diligence on the mortgage loans and the securities.
This Free Writing Prospectus is not to be construed as an offer to sell or the solicitation of any offer to buy any security in any jurisdiction where such an offer or solicitation would be illegal. The information contained in this Free Writing Prospectus may not pertain to any securities that will actually be sold. The information contained in this Free Writing Prospectus may be based on assumptions regarding market conditions and other matters as reflected in this Free Writing Prospectus. We make no representations regarding the reasonableness of such assumptions or the likelihood that any such assumptions will coincide with actual market conditions or events, and this Free Writing Prospectus should not be relied upon for such purposes. We and our affiliates, officers, directors, partners and employees, including persons involved in the preparation or issuance of this Free Writing Prospectus may, from time to time, have long or short positions in, and buy or sell, the securities mentioned in this Free Writing Prospectus or derivatives thereof (including options). Information contained in this Free Writing Prospectus is current as of the date appearing on this Term Sheet only. Information in this Free Writing Prospectus regarding the securities and the mortgage loans backing any securities discussed in this Free Writing Prospectus supersedes all prior information regarding such securities and mortgage loans. Neither Citigroup Global Markets Inc. nor Goldman, Sachs & Co. provides accounting, tax or legal advice.
|
Citigroup
|
Goldman, Sachs & Co.
|
|
COLLATERAL OVERVIEW
|
|
Mortgage Loans by Loan Seller
|
||||||||||||
|
Mortgage Loan Seller
|
Mortgage Loans
|
Mortgaged Properties
|
Aggregate Cut-off
Date Balance |
% of Initial Pool
Balance |
||||||||
|
Citigroup Global Markets Realty Corp.
|
39
|
61
|
$549,462,355
|
52.8
|
% | |||||||
|
Goldman Sachs Mortgage Company
|
14
|
74
|
365,467,451
|
35.1
|
||||||||
|
Natixis Real Estate Capital LLC
|
4
|
4
|
125,280,715
|
12.0
|
||||||||
|
Total
|
57
|
139
|
$1,040,210,521
|
100.0
|
% | |||||||
|
Ten Largest Mortgage Loans
|
|||||||||||||||||||||||
|
Mortgage Loan Name
|
Cut-off Date
Balance |
% of
Initial Pool Balance |
Property
Type |
Property Size
SF / Rooms |
Cut-off Date
Balance Per SF / Room |
UW
NCF DSCR |
UW
NOI Debt
Yield |
Cut-off Date
LTV Ratio |
|||||||||||||||
|
Miami Center
|
$114,765,852
|
11.0
|
% |
Office
|
786,836
|
$219
|
1.41x
|
10.1%
|
64.2%
|
||||||||||||||
|
222 Broadway
|
100,000,000
|
9.6
|
Office
|
786,552
|
$172
|
2.11x
|
11.0%
|
58.7%
|
|||||||||||||||
|
17 Battery Place South
|
91,000,000
|
8.7
|
Office
|
428,450
|
$212
|
1.65x
|
11.0%
|
64.5%
|
|||||||||||||||
|
Pinnacle at Westchase
|
79,827,198
|
7.7
|
Office
|
470,940
|
$170
|
1.57x
|
10.8%
|
67.9%
|
|||||||||||||||
|
Gansevoort Park Avenue
|
75,000,000
|
7.2
|
Hospitality
|
249
|
$562,249
|
1.77x
|
12.5%
|
50.4%
|
|||||||||||||||
|
25 East Oak Street
|
49,938,386
|
4.8
|
Retail
|
38,445
|
$1,299
|
1.33x
|
8.1%
|
67.7%
|
|||||||||||||||
|
Sonora Village
|
33,650,000
|
3.2
|
Retail
|
248,322
|
$136
|
1.38x
|
9.4%
|
71.3%
|
|||||||||||||||
|
Cole Family Dollar Portfolio
|
27,725,000
|
2.7
|
Retail
|
298,858
|
$93
|
2.23x
|
11.1%
|
61.4%
|
|||||||||||||||
|
Hyatt Regency - Buffalo
|
25,461,498
|
2.4
|
Hospitality
|
396
|
$64,297
|
1.77x
|
15.8%
|
65.3%
|
|||||||||||||||
|
Plains Capital Towers
|
23,948,280
|
2.3
|
Office
|
425,040
|
$56
|
1.91x
|
15.4%
|
59.2%
|
|||||||||||||||
|
Top 10 Total / Wtd. Avg.
|
$621,316,214
|
59.7
|
% |
1.68x
|
11.0%
|
62.6%
|
|||||||||||||||||
|
Remaining Total / Wtd. Avg.
|
418,894,307
|
40.3
|
1.81x
|
12.6%
|
63.8%
|
||||||||||||||||||
|
Total / Wtd. Avg.
|
$1,040,210,521
|
100.0
|
% |
1.73x
|
11.7%
|
63.1%
|
|||||||||||||||||
|
Pari Passu Note Loan Summary
|
|||||||||||||||
|
Mortgage Loan Name
|
Mortgage
Loan Seller |
Mortgage
Loan Cut-off Date Balance |
Companion
Loan Cut-off Date Balance |
Whole Loan
Cut-off Date Balance |
Controlling Pooling
& Servicing Agreement |
Master
Servicer |
Special Servicer
|
||||||||
|
Miami Center
|
CGMRC
|
$114,765,852
|
$57,382,926
|
$172,148,778
|
CGCMT 2012-GC8
|
Wells Fargo
|
Midland Loan Services
|
||||||||
|
222 Broadway
|
GSMC
|
$100,000,000
|
$35,000,000
|
$135,000,000
|
CGCMT 2012-GC8
|
Wells Fargo
|
Midland Loan Services
|
||||||||
|
Gansevoort Park Avenue
|
CGMRC
|
$75,000,000
|
$65,000,000
|
$140,000,000
|
CGCMT 2012-GC8
|
Wells Fargo
|
Midland Loan Services
|
||||||||
The securities offered by these materials are being offered when, as and if issued. In particular, you are advised that the offered securities, and the asset pool backing them, are subject to modification or revision (including, among other things, the possibility that one or more classes of securities may be split, combined or eliminated), at any time prior to issuance or availability of a final prospectus. As a result, you may commit to purchase securities that have characteristics that may change, and you are advised that all or a portion of the offered securities may not be issued that have the characteristics described in these materials. Our obligation to sell securities to you is conditioned on the offered securities and the underlying transaction having the characteristics described in these materials. If we determine that condition is not satisfied in any material respect, we will notify you, and neither the issuer nor any of the underwriters will have any obligation to you to deliver all or any portion of the securities which you have committed to purchase, and there will be no liability between us as a consequence of the non-delivery.
The depositor has filed a registration statement (including the prospectus) with the SEC (SEC File No. 333-166711) for the offering to which this communication relates. Before you invest, you should read the prospectus in the registration statement and other documents the depositor has filed with the SEC for more complete information about the depositor, the issuing entity and this offering. You may get these documents for free by visiting EDGAR on the SEC website at www.sec.gov. Alternatively, the depositor or Citigroup Global Markets Inc., any other underwriter, or any dealer participating in this offering will arrange to send to you the prospectus if you request it by calling toll-free 1-877-858-5407.
2
|
COLLATERAL OVERVIEW (continued)
|
|
Previously Securitized Mortgage Loans(1)(2)
|
|||||||||||||||
|
Property Name
|
Mortgage
Loan Seller |
City
|
State
|
Property Type
|
Cut-off Date Balance /
Allocated Cut- off Date Balance |
% of
Initial Pool Balance |
Previous Securitization(s)
|
||||||||
|
Miami Center
|
CGMRC
|
Miami
|
FL
|
Office
|
$114,765,852
|
11.0%
|
GSMS 2003-C1, LBUBS 2007-C7
|
||||||||
|
17 Battery Place South
|
Natixis RE
|
New York
|
NY
|
Office
|
$91,000,000
|
8.7%
|
GMACC 2002-FL1A, WBCMT 2007-C32
|
||||||||
|
Pinnacle at Westchase
|
CGMRC
|
Houston
|
TX
|
Office
|
$79,827,198
|
7.7%
|
JPMCC 2004-CBX
|
||||||||
|
Sonora Village
|
GSMC
|
Scottsdale
|
AZ
|
Retail
|
$33,650,000
|
3.2%
|
DLJCM 2000-CF1
|
||||||||
|
Sutton Place Apartments
|
Natixis RE
|
Southfield
|
MI
|
Multifamily
|
$18,800,000
|
1.8%
|
FULB 1997-C2
|
||||||||
|
290 Madison
|
CGMRC
|
New York
|
NY
|
Mixed Use
|
$14,947,118
|
1.4%
|
COMM 2006-C8
|
||||||||
|
College Point Self Storage
|
CGMRC
|
College Point
|
NY
|
Self Storage
|
$14,410,200
|
1.4%
|
GECMC 2002-2A
|
||||||||
|
Legacy Tower
|
GSMC
|
Durham
|
NC
|
Office
|
$11,697,214
|
1.1%
|
BSCMS 2007-T26
|
||||||||
|
1026-1044 Market Street
|
CGMRC
|
Philadelphia
|
PA
|
Mixed Use
|
$9,988,738
|
1.0%
|
GECMC 2002-1A
|
||||||||
|
Mountain Marketplace
|
CGMRC
|
Pasadena
|
MD
|
Retail
|
$8,980,103
|
0.9%
|
BSCMS 2002-PBW1
|
||||||||
|
Countryside Plaza
|
CGMRC
|
Mt. Pleasant
|
PA
|
Retail
|
$8,133,888
|
0.8%
|
JPMC 2000-C9
|
||||||||
|
Food Lion Mount Airy
|
CGMRC
|
Mount Airy
|
MD
|
Retail
|
$7,825,501
|
0.8%
|
MSDWC 2002-HQ
|
||||||||
|
Holiday Inn Express Fayetteville
|
Natixis RE
|
Fayetteville
|
NC
|
Hospitality
|
$7,476,636
|
0.7%
|
GECMC 2003-C2
|
||||||||
|
Briarlane Apartments
|
CGMRC
|
Grand Rapids
|
MI
|
Multifamily
|
$4,684,631
|
0.5%
|
BSCMS 2005-PWR9
|
||||||||
|
Walgreens and Sports Authority Portfolio (Palm Gardens)
|
CGMRC
|
Palm Beach Gardens
|
FL
|
Retail
|
$4,581,975
|
0.4%
|
JPMCC 2002-C2
|
||||||||
|
Storage Pro - Kalamazoo
|
CGMRC
|
Kalamazoo
|
MI
|
Self Storage
|
$3,671,729
|
0.4%
|
GMACC 2002-C2
|
||||||||
|
Americana Self Storage (SST)
|
CGMRC
|
Chantilly
|
VA
|
Self Storage
|
$3,487,661
|
0.3%
|
MSC 1999-RM1
|
||||||||
|
Walgreens and Sports Authority Portfolio (Marshall)
|
CGMRC
|
Marshall
|
TX
|
Retail
|
$2,910,174
|
0.3%
|
GECMC 2002-2A
|
||||||||
|
Walgreens and Sports Authority Portfolio (Little Rock)
|
CGMRC
|
Little Rock
|
AR
|
Retail
|
$2,662,499
|
0.3%
|
WBCMT 2003-C6
|
||||||||
|
Storage Pro - East Lansing
|
CGMRC
|
East Lansing
|
MI
|
Self Storage
|
$2,460,058
|
0.2%
|
GMACC 2002-C2
|
||||||||
|
Storage Pro - Wyoming
|
CGMRC
|
Wyoming
|
MI
|
Self Storage
|
$2,203,037
|
0.2%
|
GMACC 2002-C2
|
||||||||
|
Storage Kings of South Congress
|
CGMRC
|
Austin
|
TX
|
Self Storage
|
$2,193,360
|
0.2%
|
BACM 2003-1
|
||||||||
|
Gas Lite Manor
|
CGMRC
|
Sioux Falls
|
SD
|
Manufactured Housing
|
$1,577,305
|
0.2%
|
WBCMT 2007-C31
|
||||||||
|
Walgreens and Sports Authority Portfolio (Pasadena)
|
CGMRC
|
Pasadena
|
TX
|
Retail
|
$1,486,046
|
0.1%
|
WBCMT 2003-C6
|
||||||||
|
Winchester Self Storage
|
CGMRC
|
Memphis
|
TN
|
Self Storage
|
$948,954
|
0.1%
|
CSMC 2007-C5
|
||||||||
|
(1)
|
The table above represents the most recent securitization with respect to the mortgaged property securing the related mortgage loan, based on information provided by the related borrower or obtained through searches of a third-party database. The information has not otherwise been confirmed by the mortgage loan sellers.
|
|
(2)
|
Includes mortgaged properties securing mortgage loans for which the most recent prior financing of all or a significant portion of such property was included in a securitization.
|
The securities offered by these materials are being offered when, as and if issued. In particular, you are advised that the offered securities, and the asset pool backing them, are subject to modification or revision (including, among other things, the possibility that one or more classes of securities may be split, combined or eliminated), at any time prior to issuance or availability of a final prospectus. As a result, you may commit to purchase securities that have characteristics that may change, and you are advised that all or a portion of the offered securities may not be issued that have the characteristics described in these materials. Our obligation to sell securities to you is conditioned on the offered securities and the underlying transaction having the characteristics described in these materials. If we determine that condition is not satisfied in any material respect, we will notify you, and neither the issuer nor any of the underwriters will have any obligation to you to deliver all or any portion of the securities which you have committed to purchase, and there will be no liability between us as a consequence of the non-delivery.
The depositor has filed a registration statement (including the prospectus) with the SEC (SEC File No. 333-166711) for the offering to which this communication relates. Before you invest, you should read the prospectus in the registration statement and other documents the depositor has filed with the SEC for more complete information about the depositor, the issuing entity and this offering. You may get these documents for free by visiting EDGAR on the SEC website at www.sec.gov. Alternatively, the depositor or Citigroup Global Markets Inc., any other underwriter, or any dealer participating in this offering will arrange to send to you the prospectus if you request it by calling toll-free 1-877-858-5407.
3
|
COLLATERAL OVERVIEW (continued)
|
|
Mortgage Loans with Existing Secured, Mezzanine and Other Financing
|
||||||||||||||||||
|
Mortgage Loan Name
|
Cut-off Date Balance
|
Pari-Passu
Companion Loan Cut-off Date Balance |
Mezzanine Debt Cut-
off Date Balance |
Cut-off Date Total Debt Balance
|
Total
Debt Interest Rate |
Cut-off
Date Mortgage Loan LTV |
Cut-off
Date Total Debt LTV |
Mortgage Loan DSCR
|
Total Debt DSCR
|
|||||||||
|
17 Battery Place South
|
$91,000,000
|
NA
|
$14,000,000
|
$105,000,000
|
5.7000%
|
64.5%
|
74.5%
|
1.65x
|
1.29x
|
|||||||||
|
Gansevoort Park Avenue
|
$75,000,000
|
$65,000,000
|
$20,000,000
|
$160,000,000
|
5.7050%
|
50.4%
|
57.6%
|
1.77x
|
1.43x
|
|||||||||
Property Types
|
Property Type / Detail
|
Number of Mortgaged Properties
|
Aggregate Cut-off
Date Balance(1) |
% of Initial Pool Balance
|
Wtd. Avg. Underwritten
NCF DSCR(2) |
Wtd. Avg.
Cut-off Date LTV Ratio(2) |
Wtd. Avg.
Debt Yield on Underwritten NOI(2)
|
||||||||||
|
Retail
|
77
|
$204,030,725
|
19.6
|
% |
1.85x
|
63.6%
|
10.9%
|
|||||||||
|
Unanchored
|
4
|
61,892,289
|
5.9
|
1.39x
|
66.5%
|
8.8%
|
||||||||||
|
Anchored
|
6
|
56,852,742
|
5.5
|
1.84x
|
62.3%
|
11.9%
|
||||||||||
|
Single Tenant Retail
|
66
|
51,635,694
|
5.0
|
2.73x
|
56.7%
|
13.3%
|
||||||||||
|
Power Center / Big Box
|
1
|
33,650,000
|
3.2
|
1.38x
|
71.3%
|
9.4%
|
||||||||||
|
Office
|
9
|
$459,313,184
|
44.2
|
% |
1.68x
|
63.6%
|
11.0%
|
|||||||||
|
CBD
|
6
|
407,752,058
|
39.2
|
1.68x
|
63.8%
|
10.8%
|
||||||||||
|
General Suburban
|
3
|
51,561,125
|
5.0
|
1.64x
|
62.3%
|
12.8%
|
||||||||||
|
Multifamily
|
13
|
$88,395,609
|
8.5
|
% |
1.76x
|
66.2%
|
12.7%
|
|||||||||
|
Student Housing
|
1
|
12,444,665
|
1.2
|
1.34x
|
67.3%
|
11.0%
|
||||||||||
|
Garden
|
8
|
63,658,203
|
6.1
|
1.90x
|
64.7%
|
13.6%
|
||||||||||
|
Mid Rise
|
3
|
6,000,000
|
0.6
|
1.44x
|
71.1%
|
9.4%
|
||||||||||
|
High Rise
|
1
|
6,292,741
|
0.6
|
1.47x
|
74.6%
|
9.6%
|
||||||||||
|
Hospitality
|
10
|
$180,731,054
|
17.4
|
% |
1.84x
|
56.7%
|
14.3%
|
|||||||||
|
Full Service
|
4
|
121,599,912
|
11.7
|
1.80x
|
55.3%
|
13.8%
|
||||||||||
|
Limited Service
|
5
|
49,027,252
|
4.7
|
1.96x
|
57.4%
|
15.6%
|
||||||||||
|
Extended Stay
|
1
|
10,103,889
|
1.0
|
1.81x
|
69.7%
|
14.7%
|
||||||||||
|
Mixed Use
|
2
|
$24,935,856
|
2.4
|
% |
1.54x
|
59.3%
|
10.4%
|
|||||||||
|
Office / Retail
|
1
|
14,947,118
|
1.4
|
1.36x
|
55.2%
|
9.0%
|
||||||||||
|
Retail / Office
|
1
|
9,988,738
|
1.0
|
1.81x
|
65.4%
|
12.5%
|
||||||||||
|
Self Storage
|
16
|
$55,254,581
|
5.3
|
% |
1.59x
|
70.2%
|
10.6%
|
|||||||||
|
Parking
|
1
|
$ 2,589,978
|
0.2
|
% |
1.58x
|
74.0%
|
11.1%
|
|||||||||
|
Manufactured Housing
|
11
|
$24,959,533
|
2.4
|
% |
1.49x
|
70.0%
|
11.0%
|
|||||||||
|
Total / Wtd. Avg.
|
139
|
$1,040,210,521
|
100.0
|
% |
1.73x
|
63.1%
|
11.7%
|
|||||||||
|
|
(1)
|
Calculated based on the mortgaged property’s allocated loan amount for mortgage loans secured by more than one mortgaged property.
|
|
|
(2)
|
Weighted average based on the mortgaged property’s allocated loan amount for mortgage loans secured by more than one mortgaged property.
|
The securities offered by these materials are being offered when, as and if issued. In particular, you are advised that the offered securities, and the asset pool backing them, are subject to modification or revision (including, among other things, the possibility that one or more classes of securities may be split, combined or eliminated), at any time prior to issuance or availability of a final prospectus. As a result, you may commit to purchase securities that have characteristics that may change, and you are advised that all or a portion of the offered securities may not be issued that have the characteristics described in these materials. Our obligation to sell securities to you is conditioned on the offered securities and the underlying transaction having the characteristics described in these materials. If we determine that condition is not satisfied in any material respect, we will notify you, and neither the issuer nor any of the underwriters will have any obligation to you to deliver all or any portion of the securities which you have committed to purchase, and there will be no liability between us as a consequence of the non-delivery.
The depositor has filed a registration statement (including the prospectus) with the SEC (SEC File No. 333-166711) for the offering to which this communication relates. Before you invest, you should read the prospectus in the registration statement and other documents the depositor has filed with the SEC for more complete information about the depositor, the issuing entity and this offering. You may get these documents for free by visiting EDGAR on the SEC website at www.sec.gov. Alternatively, the depositor or Citigroup Global Markets Inc., any other underwriter, or any dealer participating in this offering will arrange to send to you the prospectus if you request it by calling toll-free 1-877-858-5407.
4
|
COLLATERAL OVERVIEW (continued)
|
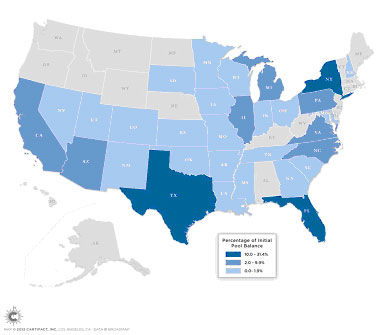
Geographic Distribution
|
Property Location
|
Number of Mortgaged Properties
|
Aggregate Cut-off
Date Balance(1) |
% of Initial Pool Balance
|
Aggregate
Appraised Value |
% of Total
Appraised Value |
Underwritten
NOI |
% of Total Underwritten NOI
|
||||||||||||||
|
New York
|
7
|
$326,294,384
|
31.4
|
% |
$743,900,000
|
38.2
|
% |
$49,750,834
|
35.7
|
% | |||||||||||
|
Texas
|
20
|
154,878,737
|
14.9
|
238,870,000
|
12.3
|
18,555,843
|
13.3
|
||||||||||||||
|
Florida
|
15
|
137,897,771
|
13.3
|
303,370,000
|
15.6
|
20,115,371
|
14.4
|
||||||||||||||
|
Illinois
|
11
|
98,841,924
|
9.5
|
144,050,000
|
7.4
|
9,138,255
|
6.6
|
||||||||||||||
|
Michigan
|
17
|
50,531,289
|
4.9
|
81,490,000
|
4.2
|
7,302,328
|
5.2
|
||||||||||||||
|
Pennsylvania
|
4
|
47,506,145
|
4.6
|
79,075,000
|
4.1
|
6,778,253
|
4.9
|
||||||||||||||
|
Arizona
|
4
|
36,267,492
|
3.5
|
51,210,000
|
2.6
|
3,452,657
|
2.5
|
||||||||||||||
|
North Carolina
|
4
|
35,441,825
|
3.4
|
56,325,000
|
2.9
|
5,476,785
|
3.9
|
||||||||||||||
|
Virginia
|
4
|
24,100,627
|
2.3
|
40,975,000
|
2.1
|
3,102,423
|
2.2
|
||||||||||||||
|
California
|
1
|
23,400,000
|
2.2
|
38,000,000
|
1.9
|
2,408,702
|
1.7
|
||||||||||||||
|
Ohio
|
5
|
19,293,285
|
1.9
|
29,190,000
|
1.5
|
2,193,483
|
1.6
|
||||||||||||||
|
Georgia
|
2
|
18,397,246
|
1.8
|
29,600,000
|
1.5
|
2,426,711
|
1.7
|
||||||||||||||
|
Maryland
|
2
|
16,805,605
|
1.6
|
26,600,000
|
1.4
|
2,061,547
|
1.5
|
||||||||||||||
|
Mississippi
|
8
|
8,177,540
|
0.8
|
13,245,000
|
0.7
|
1,028,933
|
0.7
|
||||||||||||||
|
Oklahoma
|
7
|
6,535,969
|
0.6
|
10,530,000
|
0.5
|
788,687
|
0.6
|
||||||||||||||
|
Utah
|
2
|
6,483,228
|
0.6
|
9,250,000
|
0.5
|
695,436
|
0.5
|
||||||||||||||
|
New Hampshire
|
1
|
5,445,000
|
0.5
|
11,800,000
|
0.6
|
920,640
|
0.7
|
||||||||||||||
|
Wisconsin
|
1
|
4,386,720
|
0.4
|
7,200,000
|
0.4
|
465,404
|
0.3
|
||||||||||||||
|
Tennessee
|
3
|
4,333,677
|
0.4
|
5,850,000
|
0.3
|
465,968
|
0.3
|
||||||||||||||
|
Arkansas
|
2
|
3,129,917
|
0.3
|
5,040,000
|
0.3
|
376,585
|
0.3
|
||||||||||||||
|
Missouri
|
5
|
2,525,716
|
0.2
|
5,540,000
|
0.3
|
411,250
|
0.3
|
||||||||||||||
|
Colorado
|
3
|
1,996,057
|
0.2
|
3,540,000
|
0.2
|
252,626
|
0.2
|
||||||||||||||
|
South Dakota
|
1
|
1,577,305
|
0.2
|
2,110,000
|
0.1
|
162,181
|
0.1
|
||||||||||||||
|
Nevada
|
3
|
1,342,468
|
0.1
|
3,390,000
|
0.2
|
276,588
|
0.2
|
||||||||||||||
|
New Mexico
|
1
|
1,152,447
|
0.1
|
1,800,000
|
0.1
|
128,090
|
0.1
|
||||||||||||||
|
Kansas
|
1
|
981,830
|
0.1
|
1,610,000
|
0.1
|
109,126
|
0.1
|
||||||||||||||
|
Indiana
|
1
|
801,845
|
0.1
|
1,930,000
|
0.1
|
143,419
|
0.1
|
||||||||||||||
|
Louisiana
|
1
|
456,508
|
0.0
|
1,080,000
|
0.1
|
83,082
|
0.1
|
||||||||||||||
|
South Carolina
|
1
|
411,457
|
0.0
|
975,000
|
0.1
|
76,775
|
0.1
|
||||||||||||||
|
Minnesota
|
1
|
408,698
|
0.0
|
590,000
|
0.0
|
45,425
|
0.0
|
||||||||||||||
|
Iowa
|
1
|
407,809
|
0.0
|
680,000
|
0.0
|
45,326
|
0.0
|
||||||||||||||
|
Total
|
139
|
$1,040,210,521
|
100.0
|
% |
$1,948,815,000
|
100.0
|
% |
$139,238,733
|
100.0
|
% | |||||||||||
|
|
(1)
|
Calculated based on the mortgaged property’s allocated loan amount for mortgage loans secured by more than one mortgaged property.
|
The securities offered by these materials are being offered when, as and if issued. In particular, you are advised that the offered securities, and the asset pool backing them, are subject to modification or revision (including, among other things, the possibility that one or more classes of securities may be split, combined or eliminated), at any time prior to issuance or availability of a final prospectus. As a result, you may commit to purchase securities that have characteristics that may change, and you are advised that all or a portion of the offered securities may not be issued that have the characteristics described in these materials. Our obligation to sell securities to you is conditioned on the offered securities and the underlying transaction having the characteristics described in these materials. If we determine that condition is not satisfied in any material respect, we will notify you, and neither the issuer nor any of the underwriters will have any obligation to you to deliver all or any portion of the securities which you have committed to purchase, and there will be no liability between us as a consequence of the non-delivery.
The depositor has filed a registration statement (including the prospectus) with the SEC (SEC File No. 333-166711) for the offering to which this communication relates. Before you invest, you should read the prospectus in the registration statement and other documents the depositor has filed with the SEC for more complete information about the depositor, the issuing entity and this offering. You may get these documents for free by visiting EDGAR on the SEC website at www.sec.gov. Alternatively, the depositor or Citigroup Global Markets Inc., any other underwriter, or any dealer participating in this offering will arrange to send to you the prospectus if you request it by calling toll-free 1-877-858-5407.
5
|
Distribution of Cut-off Date Balances
|
Distribution of Cut-off Date LTV Ratios
|
|||||||||||||||||||||||
|
% of
|
% of
|
|||||||||||||||||||||||
|
Number of
|
Initial
|
Number of
|
Initial
|
|||||||||||||||||||||
|
Range of Cut-off Date
|
Mortgage
|
Cut-off Date
|
Pool
|
Range of Cut-off
|
Mortgage
|
Pool
|
||||||||||||||||||
|
Balances ($)
|
Loans
|
Balance
|
Balance
|
Date LTV (%)
|
Loans
|
Cut-off Date Balance
|
Balance
|
|||||||||||||||||
|
1,577,305 - 4,999,999
|
12
|
$41,169,572
|
4.0
|
% |
41.0 - 45.9
|
1
|
$12,270,000
|
1.2
|
% | |||||||||||||||
|
5,000,000 - 9,999,999
|
19
|
140,005,079
|
13.5
|
46.0 - 50.9
|
3
|
83,932,661
|
8.1
|
|||||||||||||||||
|
10,000,000 - 14,999,999
|
12
|
151,172,045
|
14.5
|
51.0 - 55.9
|
4
|
45,796,883
|
4.4
|
|||||||||||||||||
|
15,000,000 - 19,999,999
|
1
|
18,800,000
|
1.8
|
56.0 - 60.9
|
8
|
184,796,934
|
17.8
|
|||||||||||||||||
|
20,000,000 - 29,999,999
|
6
|
144,882,389
|
13.9
|
61.0 - 65.9
|
15
|
387,971,508
|
37.3
|
|||||||||||||||||
|
30,000,000 - 49,999,999
|
2
|
83,588,386
|
8.0
|
66.0 - 74.9
|
26
|
325,442,535
|
31.3
|
|||||||||||||||||
|
70,000,000 - 99,999,999
|
3
|
245,827,198
|
23.6
|
Total
|
57
|
$1,040,210,521
|
100.0
|
% | ||||||||||||||||
|
100,000,000 - 114,765,852
|
2 |
214,765,852
|
20.6
|
|||||||||||||||||||||
|
Total
|
57
|
$1,040,210,521
|
100.0
|
% | ||||||||||||||||||||
|
Distribution of Maturity Date/ARD LTV Ratios
|
||||||||||||||||||||||||
|
Distribution of Underwritten DSCRs
|
% of
|
|||||||||||||||||||||||
|
% of
|
Number of
|
Initial
|
||||||||||||||||||||||
|
Number of
|
Initial
|
Range of Maturity
|
Mortgage
|
Pool
|
||||||||||||||||||||
|
Range of UW
|
Mortgage
|
Pool
|
Date/ARD LTV (%)
|
Loans
|
Cut-off Date Balance
|
Balance
|
||||||||||||||||||
|
DSCR (x)
|
Loans |
Cut-off Date Balance
|
Balance
|
32.4 - 39.9
|
4
|
$ 99,186,253
|
9.5
|
% | ||||||||||||||||
|
1.33 - 1.39
|
7
|
$143,220,071
|
13.8
|
% |
40.0 - 44.9
|
7
|
88,280,408
|
8.5
|
||||||||||||||||
|
1.40 - 1.49
|
8
|
165,751,383
|
15.9
|
45.0 - 49.9
|
7
|
68,225,378
|
6.6
|
|||||||||||||||||
|
1.50 - 1.59
|
10
|
161,045,208
|
15.5
|
50.0 - 54.9
|
16
|
415,122,440
|
39.9
|
|||||||||||||||||
|
1.60 - 1.69
|
7
|
125,579,699
|
12.1
|
55.0 - 59.9
|
13
|
273,888,927
|
26.3
|
|||||||||||||||||
|
1.70 - 1.79
|
6
|
142,145,816
|
13.7
|
60.0 - 63.3
|
10
|
95,507,114
|
9.2
|
|||||||||||||||||
|
1.80 - 1.89
|
7
|
64,068,146
|
6.2
|
Total
|
57
|
$1,040,210,521
|
100.0
|
% | ||||||||||||||||
|
1.90 - 1.99
|
2
|
30,112,366
|
2.9
|
|||||||||||||||||||||
|
2.00 - 2.09
|
1
|
3,487,661
|
0.3
|
|||||||||||||||||||||
|
2.10 - 4.78
|
9
|
204,800,172
|
19.7
|
Distribution of Loan Purpose
|
||||||||||||||||||||
|
Total
|
57
|
$1,040,210,521
|
100.0
|
% |
% of
|
|||||||||||||||||||
|
Number of
|
Initial
|
|||||||||||||||||||||||
|
Mortgage
|
Pool
|
|||||||||||||||||||||||
|
Distribution of Amortization Types
|
Loan Purpose
|
Loans
|
Cut-off Date Balance
|
Balance
|
||||||||||||||||||||
|
% of
|
Refinance
|
35
|
$577,250,670
|
55.5
|
% | |||||||||||||||||||
|
Number of
|
Initial
|
Acquisition
|
18
|
392,559,022
|
37.7
|
|||||||||||||||||||
|
Mortgage
|
Cut-off Date
|
Pool
|
Recapitalization
|
3
|
62,400,829
|
6.0
|
||||||||||||||||||
|
Amortization Type
|
Loans
|
Balance
|
Balance
|
Acquisition/Refinance
|
1
|
8,000,000
|
0.8
|
|||||||||||||||||
|
Amortizing (30 Years)
|
31
|
$484,207,315
|
46.5
|
% |
Total
|
57
|
$1,040,210,521
|
100.0
|
% | |||||||||||||||
|
Amortizing (25 Years)
|
17
|
168,713,206
|
16.2
|
|||||||||||||||||||||
|
Interest Only, Then
|
||||||||||||||||||||||||
|
Amortizing
|
5
|
241,850,000
|
23.3
|
Distribution of Mortgage Interest Rates
|
||||||||||||||||||||
|
Interest Only
|
3
|
117,715,000
|
11.3
|
% of
|
||||||||||||||||||||
|
Interest Only - ARD
|
1
|
27,725,000
|
2.7
|
Number of
|
Initial
|
|||||||||||||||||||
|
Total
|
57
|
$1,040,210,521
|
100.0
|
% |
Range of Mortgage
|
Mortgage
|
Pool
|
|||||||||||||||||
|
Interest Rates (%)
|
Loans
|
Cut-off Date Balance
|
Balance
|
|||||||||||||||||||||
|
3.700 - 3.999
|
1
|
$12,270,000
|
1.2
|
% | ||||||||||||||||||||
|
Distribution of Lockboxes
|
4.250 - 4.499
|
2
|
55,383,386
|
5.3
|
||||||||||||||||||||
|
% of
|
4.500 - 4.749
|
8
|
105,789,192
|
10.2
|
||||||||||||||||||||
|
Number of
|
Initial
|
4.750 - 4.999
|
18
|
452,813,924
|
43.5
|
|||||||||||||||||||
|
Mortgage
|
Cut-off Date
|
Pool
|
5.000 - 5.249
|
12
|
282,891,294
|
27.2
|
||||||||||||||||||
|
Lockbox Type
|
Loans
|
Balance
|
Balance
|
5.250 - 5.499
|
11
|
86,617,091
|
8.3
|
|||||||||||||||||
|
Hard
|
25
|
$712,395,194
|
68.5
|
% |
5.500 - 5.749
|
2
|
19,825,865
|
1.9
|
||||||||||||||||
|
Springing
|
26
|
230,971,698
|
22.2
|
5.750 - 5.900
|
3
|
24,619,769
|
2.4
|
|||||||||||||||||
|
Soft
|
6
|
96,843,629
|
9.3
|
Total
|
57
|
$1,040,210,521
|
100.0
|
% | ||||||||||||||||
|
Total
|
57
|
$1,040,210,521
|
100.0
|
% | ||||||||||||||||||||
The securities offered by these materials are being offered when, as and if issued. In particular, you are advised that the offered securities, and the asset pool backing them, are subject to modification or revision (including, among other things, the possibility that one or more classes of securities may be split, combined or eliminated), at any time prior to issuance or availability of a final prospectus. As a result, you may commit to purchase securities that have characteristics that may change, and you are advised that all or a portion of the offered securities may not be issued that have the characteristics described in these materials. Our obligation to sell securities to you is conditioned on the offered securities and the underlying transaction having the characteristics described in these materials. If we determine that condition is not satisfied in any material respect, we will notify you, and neither the issuer nor any of the underwriters will have any obligation to you to deliver all or any portion of the securities which you have committed to purchase, and there will be no liability between us as a consequence of the non-delivery.
The depositor has filed a registration statement (including the prospectus) with the SEC (SEC File No. 333-166711) for the offering to which this communication relates. Before you invest, you should read the prospectus in the registration statement and other documents the depositor has filed with the SEC for more complete information about the depositor, the issuing entity and this offering. You may get these documents for free by visiting EDGAR on the SEC website at www.sec.gov. Alternatively, the depositor or Citigroup Global Markets Inc., any other underwriter, or any dealer participating in this offering will arrange to send to you the prospectus if you request it by calling toll-free 1-877-858-5407.
6
|
Distribution of Debt Yield on Underwritten NOI
|
Distribution of Original Amortization Terms
|
|||||||||||||||||||||||
|
% of
|
% of
|
|||||||||||||||||||||||
|
Range of
|
Number of
|
Initial
|
Original
|
Number of
|
Initial
|
|||||||||||||||||||
|
Debt Yields on
|
Mortgage
|
Pool
|
Amortization
|
Mortgage
|
Pool
|
|||||||||||||||||||
|
Underwritten NOI (%)
|
Loans
|
Cut-off Date Balance
|
Balance
|
Terms (months)
|
Loans
|
Cut-off Date Balance
|
Balance
|
|||||||||||||||||
|
8.1 - 9.9
|
7
|
$128,727,588
|
12.4
|
% |
Interest Only
|
4
|
$145,440,000
|
14.0
|
% | |||||||||||||||
|
10.0 - 10.9
|
16
|
319,765,776
|
30.7
|
300
|
17
|
168,713,206
|
16.2
|
|||||||||||||||||
|
11.0 - 11.9
|
11
|
279,266,095
|
26.8
|
360
|
36
|
726,057,315
|
69.8
|
|||||||||||||||||
|
12.0 - 12.9
|
5
|
110,294,166
|
10.6
|
Total
|
57
|
$1,040,210,521
|
100.0
|
% | ||||||||||||||||
|
13.0 - 13.9
|
4
|
33,469,936
|
3.2
|
|||||||||||||||||||||
|
14.0 - 14.9
|
4
|
43,696,470
|
4.2
|
|||||||||||||||||||||
|
15.0 - 15.9
|
4
|
58,066,489
|
5.6
|
Distribution of Remaining Amortization Terms
|
||||||||||||||||||||
|
16.0 - 19.5
|
6
|
66,924,000
|
6.4
|
Range of
|
% of
|
|||||||||||||||||||
|
Total
|
57
|
$1,040,210,521
|
100.0
|
% |
Remaining
|
Number of
|
Initial
|
|||||||||||||||||
|
Amortization
|
Mortgage
|
Pool
|
||||||||||||||||||||||
|
Terms (months)
|
Loans
|
Cut-off Date Balance
|
Balance
|
|||||||||||||||||||||
|
Distribution of Debt Yield on Underwritten NCF
|
Interest Only
|
4
|
$145,440,000
|
14.0
|
% | |||||||||||||||||||
|
% of
|
296 - 300
|
17
|
168,713,206
|
16.2
|
||||||||||||||||||||
|
Range of
|
Number of
|
Initial
|
301 – 360
|
36
|
726,057,315
|
69.8
|
||||||||||||||||||
|
Debt Yields on
|
Mortgage
|
Pool
|
Total
|
57
|
$1,040,210,521
|
100.0
|
% | |||||||||||||||||
|
Underwritten NCF (%)
|
Loans
|
Cut-off Date Balance
|
Balance
|
|||||||||||||||||||||
|
8.0 - 8.9
|
3
|
98,535,504
|
9.5
|
% |
Distribution of Prepayment Provisions
|
|||||||||||||||||||
|
9.0 - 9.9
|
8
|
201,750,212
|
19.4
|
% of
|
||||||||||||||||||||
|
10.0 - 10.9
|
21
|
413,317,611
|
39.7
|
Number of
|
Initial
|
|||||||||||||||||||
|
11.0 - 11.9
|
10
|
149,756,970
|
14.4
|
Prepayment
|
Mortgage
|
Pool
|
||||||||||||||||||
|
12.0 - 12.9
|
5
|
81,014,452
|
7.8
|
Provision
|
Loans
|
Cut-off Date Balance
|
Balance
|
|||||||||||||||||
|
13.0 - 13.9
|
3
|
22,747,687
|
2.2
|
Defeasance
|
50
|
$708,384,447
|
68.1
|
% | ||||||||||||||||
|
14.0 - 17.9
|
7
|
73,088,086
|
7.0
|
Defeasance or Yield
|
||||||||||||||||||||
|
Total
|
57
|
$1,040,210,521
|
100.0
|
% |
Maintenance
|
3
|
202,593,050
|
19.5
|
||||||||||||||||
|
Yield Maintenance
|
4
|
129,233,024
|
12.4
|
|||||||||||||||||||||
|
Total
|
57
|
$1,040,210,521
|
100.0
|
% | ||||||||||||||||||||
|
Mortgage Loans with Original Partial Interest Only Periods
|
||||||||||||||||||||||||
|
Original Partial
|
Number of
|
% of Initial
|
Distribution of Escrow Types
|
|||||||||||||||||||||
|
Interest Only
|
Mortgage
|
Cut-off Date
|
Pool
|
% of
|
||||||||||||||||||||
|
Period (months)
|
Loans
|
Balance
|
Balance
|
Number of
|
Initial
|
|||||||||||||||||||
|
24
|
4
|
$150,850,000
|
14.5
|
% |
Mortgage
|
Pool
|
||||||||||||||||||
|
36
|
1
|
$91,000,000
|
8.7
|
% |
Escrow Type
|
Loans
|
Cut-off Date Balance
|
Balance
|
||||||||||||||||
|
Real Estate Tax
|
53
|
$983,129,826
|
94.5
|
% | ||||||||||||||||||||
|
Distribution of Original Terms to Maturity/ARD
|
Replacement
|
|||||||||||||||||||||||
|
% of
|
Reserves(1)
|
52
|
$964,573,556
|
92.7
|
||||||||||||||||||||
|
Original Term to
|
Number of
|
Initial
|
Insurance
|
45
|
$766,508,850
|
73.7
|
||||||||||||||||||
|
Maturity/ARD
|
Mortgage
|
Pool
|
TI/LC(2)
|
19
|
$578,177,175
|
84.0
|
||||||||||||||||||
|
(months)
|
Loans
|
Cut-off Date Balance
|
Balance
|
(1) Includes mortgage loans with FF&E reserves.
|
||||||||||||||||||||
|
60
|
7
|
$178,355,149
|
17.1
|
% |
(2) Percentage of total office, retail, and mixed use properties only.
|
|||||||||||||||||||
|
84
|
1
|
27,725,000
|
2.7
|
|||||||||||||||||||||
|
120
|
49
|
834,130,372
|
80.2
|
|||||||||||||||||||||
|
Total
|
57
|
$1,040,210,521
|
100.0
|
% | ||||||||||||||||||||
|
Distribution of Remaining Terms to Maturity/ARD
|
||||||||||||||||||||||||
|
Range of
|
% of
|
|||||||||||||||||||||||
|
Remaining Terms
|
Number of
|
Initial
|
||||||||||||||||||||||
|
to Maturity/ARD
|
Mortgage
|
Pool
|
||||||||||||||||||||||
|
(months)
|
Loans
|
Cut-off Date Balance
|
Balance
|
|||||||||||||||||||||
|
49 - 60
|
7
|
$178,355,149
|
17.1
|
% | ||||||||||||||||||||
|
49 - 84
|
1
|
27,725,000
|
2.7
|
|||||||||||||||||||||
|
85 - 120
|
49
|
834,130,372
|
80.2
|
|||||||||||||||||||||
|
Total
|
57
|
$1,040,210,521
|
100.0
|
% | ||||||||||||||||||||
The securities offered by these materials are being offered when, as and if issued. In particular, you are advised that the offered securities, and the asset pool backing them, are subject to modification or revision (including, among other things, the possibility that one or more classes of securities may be split, combined or eliminated), at any time prior to issuance or availability of a final prospectus. As a result, you may commit to purchase securities that have characteristics that may change, and you are advised that all or a portion of the offered securities may not be issued that have the characteristics described in these materials. Our obligation to sell securities to you is conditioned on the offered securities and the underlying transaction having the characteristics described in these materials. If we determine that condition is not satisfied in any material respect, we will notify you, and neither the issuer nor any of the underwriters will have any obligation to you to deliver all or any portion of the securities which you have committed to purchase, and there will be no liability between us as a consequence of the non-delivery.
The depositor has filed a registration statement (including the prospectus) with the SEC (SEC File No. 333-166711) for the offering to which this communication relates. Before you invest, you should read the prospectus in the registration statement and other documents the depositor has filed with the SEC for more complete information about the depositor, the issuing entity and this offering. You may get these documents for free by visiting EDGAR on the SEC website at www.sec.gov. Alternatively, the depositor or Citigroup Global Markets Inc., any other underwriter, or any dealer participating in this offering will arrange to send to you the prospectus if you request it by calling toll-free 1-877-858-5407.
7