UNITED STATES
SECURITIES AND EXCHANGE COMMISSION
Washington, D.C. 20549
FORM N-CSR
CERTIFIED SHAREHOLDER REPORT OF REGISTERED
MANAGEMENT INVESTMENT COMPANIES
Investment Company Act file number 811-21343
Western Asset Emerging Markets Debt Fund Inc.
(Exact name of registrant as specified in charter)
620 Eighth Avenue, 49th Floor, New York, NY 10018
(Address of principal executive offices) (Zip code)
Robert I. Frenkel, Esq.
Legg Mason & Co., LLC
100 First Stamford Place
Stamford, CT 06902
(Name and address of agent for service)
Registrant’s telephone number, including area code: (888) 777-0102
Date of fiscal year end: December 31
Date of reporting period: June 30, 2018
| ITEM 1. | REPORT TO STOCKHOLDERS. |
The Semi-Annual Report to Stockholders is filed herewith.

| Semi-Annual Report | June 30, 2018 |
WESTERN ASSET
EMERGING MARKETS DEBT FUND INC. (EMD)

| INVESTMENT PRODUCTS: NOT FDIC INSURED • NO BANK GUARANTEE • MAY LOSE VALUE |
Fund objectives
The Fund’s primary investment objective is to seek high current income. As a secondary objective, the Fund seeks capital appreciation.
The Fund invests primarily in U.S. dollar and non-U.S. dollar denominated debt securities of issuers in emerging market countries.

Dear Shareholder,
We are pleased to provide the semi-annual report of Western Asset Emerging Markets Debt Fund Inc. for the six-month reporting period ended June 30, 2018. Please read on for Fund performance information and a detailed look at prevailing economic and market conditions during the Fund’s reporting period.
As always, we remain committed to providing you with excellent service and a full spectrum of investment choices. We also remain committed to supplementing the support you receive from your financial advisor. One way we accomplish this is through our website, www.lmcef.com. Here you can gain immediate access to market and investment information, including:
| • | Fund prices and performance, |
| • | Market insights and commentaries from our portfolio managers, and |
| • | A host of educational resources. |
We look forward to helping you meet your financial goals.
Sincerely,

Jane Trust, CFA
Chairman, President and Chief Executive Officer
July 27, 2018
| II | Western Asset Emerging Markets Debt Fund Inc. |
Economic review
Economic activity in the U.S. was mixed during the six months ended June 30, 2018 (the “reporting period”). Looking back, the U.S. Department of Commerce reported that revised fourth quarter 2017 U.S. gross domestic product (“GDP”)i growth was 2.3%. GDP growth then moderated to a revised 2.2% during the first quarter of 2018. Finally, the U.S. Department of Commerce’s initial reading for second quarter 2018 GDP growth — released after the reporting period ended — was 4.1%. The acceleration in GDP growth in the second quarter reflected positive contributions from personal consumption expenditures (“PCE”), exports, nonresidential fixed investment, federal government spending and state and local government spending. These were partly offset by negative contributions from private inventory investment and residential fixed investment. Imports, which are a subtraction in the calculation of GDP, increased.
Job growth in the U.S. was solid overall and supported the economy during the reporting period. When the reporting period ended on June 30, 2018, the unemployment rate was 4.0%, as reported by the U.S. Department of Labor. While the unemployment rate ticked up from 3.8% to 4.0% in June, the increase was largely attributed to an increase in the workforce participation rate. The percentage of longer-term unemployed moved higher during the reporting period. In June 2018, 23.0% of Americans looking for a job had been out of work for more than six months, versus 21.5% when the period began.
Turning to the global economy, in its July 2018 World Economic Outlook Update — released after the reporting period ended — the International Monetary Fund (“IMF”)ii said, “Global growth is projected to reach 3.9 percent in 2018 and 2019, in line with the forecast of the April 2018 World Economic Outlook, but the expansion is becoming less even, and risks to the outlook are mounting. The rate of expansion appears to have peaked in some major economies and growth has become less synchronized.” From a regional perspective, the IMF projects 2018 growth in the Eurozone will be 2.2%, versus 2.4% in 2017. Japan’s economy is expected to expand 1.0% in 2018, compared to 1.7% in 2017. Elsewhere, the IMF projects that overall growth in emerging market countries will accelerate to 4.9% in 2018, versus 4.7% in 2017.
| Western Asset Emerging Markets Debt Fund Inc. | III |
Investment commentary (cont’d)
Market review
Q. How did the Federal Reserve Board (the “Fed”)iii respond to the economic environment?
A. The Fed increased the federal funds rateiv twice during the reporting period. Looking back, at its meeting that concluded on September 20, 2017 — before the reporting period began — the Fed kept rates on hold, but reiterated its intention to begin reducing its balance sheet. At its meeting that ended on December 13, 2017, the Fed raised rates to a range between 1.25% and 1.50%. As expected, the Fed kept rates on hold at its meeting that concluded on January 31, 2018. However, at its meeting that ended on March 21, 2018, the Fed again raised the federal funds rate, moving it to a range between 1.50% and 1.75%. Finally, at its meeting that concluded on June 13, 2018, the Fed raised the federal funds rate to a range between 1.75% and 2.00%.
Q. What actions did international central banks take during the reporting period?
A. Central banks outside the U.S. largely maintained their accommodative monetary policy stances during the reporting period. Looking back, in December 2016, the European Central Bank (“ECB”)v extended its bond buying program until December 2017. From April 2017 through December 2017, the ECB purchased €60 billion-per-month of bonds. In October 2017, the ECB announced that it would continue to buy bonds through September 2018, but after December 2017 it would pare its purchases to €30 billion-per-month. In June 2018, the ECB announced it would end its bond buying program by the end of the year, but it did not anticipate raising interest rates “at least through the summer of 2019”. In other developed countries, on November 2, 2017, the Bank of Englandvi raised rates from 0.25% to 0.50% — the first increase since July 2007. After holding rates steady at 0.10% for more than five years, in January 2016, the Bank of Japanvii announced that it cut the rate on current accounts that commercial banks hold with it to -0.10% and kept rates on hold during the reporting period. Elsewhere, the People’s Bank of Chinaviii kept rates steady at 4.35% during the reporting period.
Q. Did Treasury yields trend higher or lower during the reporting period?
A. Both short-term and longer-term Treasury yields moved higher during the six-month reporting period ended June 30, 2018. The yield for the two-year Treasury note began the reporting period at 1.89% — the low for the period — and ended the period at 2.52%. The peak for the period of 2.59% occurred on several occasions in May and June 2018. The yield for the ten-year Treasury began the reporting period at 2.40% — the low for the period — and ended the period at 2.85%. The high for the period of 3.11% took place on May 17, 2018.
Q. What factors impacted the spread sectors (non-Treasuries) during the reporting period?
A. Most spread sectors generally posted weak results during the reporting period. Performance fluctuated given changing expectations for global growth, uncertainties regarding future central bank monetary policy and concerns over a global trade war. All told, the broad U.S. bond market, as measured by the Bloomberg Barclays U.S. Aggregate Indexix, returned -1.62% during the six-month reporting period ended June 30, 2018.
| IV | Western Asset Emerging Markets Debt Fund Inc. |
Q. How did the high-yield bond market perform over the reporting period?
A. The U.S. high-yield bond market, as measured by the Bloomberg Barclays U.S. Corporate High Yield — 2% Issuer Cap Indexx, returned 0.16% for the six months ended June 30, 2018. The high-yield market posted a modest gain during the first month of the reporting period. Those gains were then erased in February and March 2018. This turnaround was triggered by a number of factors, including fears that the Fed may take a more aggressive approach to rate hikes, trade war concerns and high-profile issues in the technology industry. However, the high yield market then rallied in April, was relatively flat in May and moved higher in June 2018.
Q. How did the emerging markets debt asset class perform over the reporting period?
A. The JPMorgan Emerging Markets Bond Index Global (“EMBI Global”)xi returned -5.23% during the six months ended June 30, 2018. The asset class produced choppy results during the reporting period. At times it was supported by solid investor demand, less concern over a significant shift in U.S. trade policy and a weakening U.S. dollar. However, at other times it was dragged down by rising U.S. interest rates, periods of investor risk aversion and geopolitical issues. In addition, the U.S. dollar rallied during the second half of the reporting period, negatively impacting the performance of the asset class.
Performance review
For the six months ended June 30, 2018, Western Asset Emerging Markets Debt Fund Inc. returned -9.16% based on its net asset value (“NAV”)xii and -10.99% based on its New York Stock Exchange (“NYSE”) market price per share. The Fund’s unmanaged benchmark, the EMBI Global, returned -5.23% for the same period. The Lipper Emerging Markets Hard Currency Debt Closed-End Funds Category Averagexiii returned -9.81% over the same time frame. Please note that Lipper performance returns are based on each fund’s NAV.
During this six-month period, the Fund made distributions to shareholders totaling $0.60 per share. As of June 30, 2018, the Fund estimates that 77% of the distributions were sourced from net investment income and 23% constituted a return of capital.* The performance table shows the Fund’s six-month total return based on its NAV and market price as of June 30, 2018. Past performance is no guarantee of future results.
| Performance Snapshot as of June 30, 2018 (unaudited) | ||||
| Price Per Share | 6-Month Total Return** |
|||
| $15.41 (NAV) | -9.16 | %† | ||
| $13.27 (Market Price) | -10.99 | %‡ | ||
All figures represent past performance and are not a guarantee of future results. Performance figures for periods shorter than one year represent cumulative figures and are not annualized.
| * | These estimates are not for tax purposes. The Fund will issue a Form 1099 with final composition of the distributions for tax purposes after year-end. A return of capital is not taxable and results in a reduction in the tax basis of a shareholder’s investment. For more information about a distribution’s composition, please refer to the Fund’s distribution press release or, if applicable, the Section 19 notice located in the press release section of our website, www.lmcef.com (click on the name of the Fund). |
| Western Asset Emerging Markets Debt Fund Inc. | V |
Investment commentary (cont’d)
** Total returns are based on changes in NAV or market price, respectively. Returns reflect the deduction of all Fund expenses, including management fees, operating expenses, and other Fund expenses. Returns do not reflect the deduction of brokerage commissions or taxes that investors may pay on distributions or the sale of shares.
† Total return assumes the reinvestment of all distributions, including returns of capital, if any, at NAV.
‡ Total return assumes the reinvestment of all distributions, including returns of capital, if any, in additional shares in accordance with the Fund’s Dividend Reinvestment Plan.
Looking for additional information?
The Fund is traded under the symbol “EMD” and its closing market price is available in most newspapers under the NYSE listings. The daily NAV is available on-line under the symbol “XEMDX” on most financial websites. Barron’s and the Wall Street Journal’s Monday edition both carry closed-end fund tables that provide additional information. In addition, the Fund issues a quarterly press release that can be found on most major financial websites as well as www.lmcef.com (click on the name of the Fund).
In a continuing effort to provide information concerning the Fund, shareholders may call 1-888-777-0102 (toll free), Monday through Friday from 8:00 a.m. to 5:30 p.m. Eastern Time, for the Fund’s current NAV, market price and other information.
Thank you for your investment in Western Asset Emerging Markets Debt Fund Inc. As always, we appreciate that you have chosen us to manage your assets and we remain focused on achieving the Fund’s investment goals.
Sincerely,
Jane Trust, CFA
Chairman, President and
Chief Executive Officer
July 27, 2018
RISKS: The Fund is a non-diversified, closed-end management investment company designed primarily as a long-term investment and not as a trading vehicle. The Fund is not intended to be a complete investment program and, due to the uncertainty inherent in all investments, there can be no assurance that the Fund will achieve its investment objective. The Fund’s common stock is traded on the New York Stock Exchange. Similar to stocks, the Fund’s share price will fluctuate with market conditions and, at the time of sale, may be worth more or less than the original investment. Shares of closed-end funds often trade at a discount to their net asset value. Because the Fund is non-diversified, it may be more susceptible to economic, political or regulatory events than a diversified fund. The Fund’s investments are subject to a number of risks, including credit risk, inflation risk and interest rate risk. As interest rates rise, bond prices fall, reducing the value of the Fund’s fixed-income holdings. Investing in foreign securities is subject to certain risks not associated with domestic investing, such as currency fluctuations, and social, political and economic uncertainties which could result in significant volatility. These risks are magnified in emerging or developing markets. High-yield bonds (commonly known as “junk bonds”) involve greater credit and liquidity risks than investment grade bonds. The Fund may make significant investments in derivative instruments, such as options and futures,
| VI | Western Asset Emerging Markets Debt Fund Inc. |
which can be illiquid, may disproportionately increase losses, and have a potentially large impact on Fund performance. Leverage may result in greater volatility of NAV and the market price of common shares and increases a shareholder’s risk of loss.
All investments are subject to risk including the possible loss of principal. Past performance is no guarantee of future results. All index performance reflects no deduction for fees, expenses or taxes. Please note that an investor cannot invest directly in an index.
The information provided is not intended to be a forecast of future events, a guarantee of future results or investment advice. Views expressed may differ from those of the firm as a whole. Forecasts and predictions are inherently limited and should not be relied upon as an indication of actual or future performance.
| i | Gross domestic product (“GDP”) is the market value of all final goods and services produced within a country in a given period of time. |
| ii | The International Monetary Fund (“IMF”) is an organization of 189 countries, working to foster global monetary cooperation, secure financial stability, facilitate international trade, promote high employment and sustainable economic growth, and reduce poverty around the world. |
| iii | The Federal Reserve Board (the “Fed”) is responsible for the formulation of U.S. policies designed to promote economic growth, full employment, stable prices and a sustainable pattern of international trade and payments. |
| iv | The federal funds rate is the rate charged by one depository institution on an overnight sale of immediately available funds (balances at the Federal Reserve) to another depository institution; the rate may vary from depository institution to depository institution and from day to day. |
| v | The European Central Bank (“ECB”) is responsible for the monetary system of the European Union and the euro currency. |
| vi | The Bank of England (“BoE”), formally the Governor and Company of the BoE, is the central bank of the United Kingdom. The BoE’s purpose is to maintain monetary and financial stability. |
| vii | The Bank of Japan is the central bank of Japan. The bank is responsible for issuing and handling currency and treasury securities, implementing monetary policy, maintaining the stability of the Japanese financial system and the yen currency. |
| viii | The People’s Bank of China is the central bank of the People’s Republic of China with the power to carry out monetary policy and regulate financial institutions in mainland China. |
| ix | The Bloomberg Barclays U.S. Aggregate Index is a broad-based bond index comprised of government, corporate, mortgage- and asset-backed issues, rated investment grade or higher, and having at least one year to maturity. |
| x | The Bloomberg Barclays U.S. Corporate High Yield — 2% Issuer Cap Index is an index of the 2% Issuer Cap component of the Bloomberg Barclays U.S. Corporate High Yield Index, which covers the U.S. dollar-denominated, non-investment grade, fixed-rate, taxable corporate bond market. |
| xi | The JPMorgan Emerging Markets Bond Index Global (“EMBI Global”) tracks total returns for U.S. dollar-denominated debt instruments issued by emerging market sovereign and quasi-sovereign entities: Brady bonds, loans, Eurobonds and local market instruments. |
| xii | Net asset value (“NAV”) is calculated by subtracting total liabilities, including liabilities associated with financial leverage (if any), from the closing value of all securities held by the Fund (plus all other assets) and dividing the result (total net assets) by the total number of the common shares outstanding. The NAV fluctuates with changes in the market prices of securities in which the Fund has invested. However, the price at which an investor may buy or sell shares of the Fund is the Fund’s market price as determined by supply of and demand for the Fund’s shares. |
| xiii | Lipper, Inc., a wholly-owned subsidiary of Reuters, provides independent insight on global collective investments. Returns are based on the six-month period ended June 30, 2018, including the reinvestment of all distributions, including returns of capital, if any, calculated among the 7 funds in the Fund’s Lipper category. |
| Western Asset Emerging Markets Debt Fund Inc. | VII |
Investment breakdown (%) as a percent of total investments
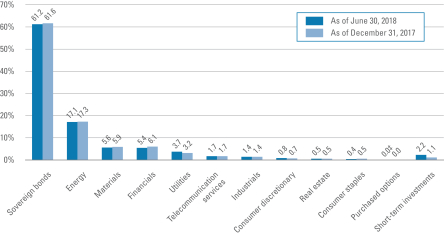
| † | The bar graph above represents the composition of the Fund’s investments as of June 30, 2018 and December 31, 2017 and does not include derivatives such as futures contracts, written options, forward foreign currency contracts and swap contracts. The Fund is actively managed. As a result, the composition of the Fund’s investments is subject to change at anytime. |
| ‡ | Represents less than 0.1%. |
| Western Asset Emerging Markets Debt Fund Inc. 2018 Semi-Annual Report | 1 |
Economic exposure — June 30, 2018
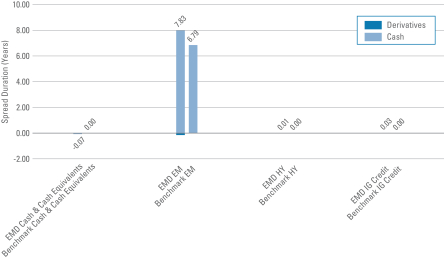
| Total Spread Duration | ||
| EMD | — 7.80 years | |
| Benchmark | — 6.79 years | |
Spread duration measures the sensitivity to changes in spreads. The spread over Treasuries is the annual risk-premium demanded by investors to hold non-Treasury securities. Spread duration is quantified as the % change in price resulting from a 100 basis points change in spreads. For a security with positive spread duration, an increase in spreads would result in a price decline and a decline in spreads would result in a price increase. This chart highlights the market sector exposure of the Fund’s sectors relative to the selected benchmark sectors as of the end of the reporting period.
| Benchmark | — JPMorgan Emerging Markets Bond Index Global | |
| EM | — Emerging Markets | |
| EMD | — Western Asset Emerging Markets Debt Fund Inc. | |
| HY | — High Yield | |
| IG Credit | — Investment Grade Credit |
| 2 | Western Asset Emerging Markets Debt Fund Inc. 2018 Semi-Annual Report |
Effective duration (unaudited)
Interest rate exposure — June 30, 2018
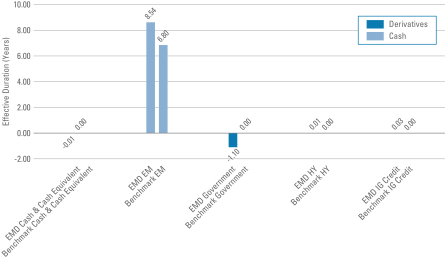
| Total Effective Duration | ||
| EMD | — 7.47 years | |
| Benchmark | — 6.80 years | |
Effective duration measures the sensitivity to changes in relevant interest rates. Effective duration is quantified as the % change in price resulting from a 100 basis points change in interest rates. For a security with positive effective duration, an increase in interest rates would result in a price decline and a decline in interest rates would result in a price increase. This chart highlights the interest rate exposure of the Fund’s sectors relative to the selected benchmark sectors as of the end of the reporting period.
| Benchmark | — JPMorgan Emerging Markets Bond Index Global | |
| EM | — Emerging Markets | |
| EMD | — Western Asset Emerging Markets Debt Fund Inc. | |
| HY | — High Yield | |
| IG Credit | — Investment Grade Credit |
| Western Asset Emerging Markets Debt Fund Inc. 2018 Semi-Annual Report | 3 |
Schedule of investments (unaudited)
June 30, 2018
Western Asset Emerging Markets Debt Fund Inc.
| Security | Rate | Maturity Date |
Face Amount† |
Value | ||||||||||||
| Sovereign Bonds — 84.0% | ||||||||||||||||
| Angola — 0.5% |
||||||||||||||||
| Angolan Government International Bond, Senior Notes |
9.500 | % | 11/12/25 | 1,720,000 | $ | 1,881,723 | (a) | |||||||||
| Angolan Government International Bond, Senior Notes |
8.250 | % | 5/9/28 | 2,500,000 | 2,508,565 | (a) | ||||||||||
| Total Angola |
4,390,288 | |||||||||||||||
| Argentina — 9.1% |
||||||||||||||||
| Argentine Bonar Bonds, Senior Notes (Argentina BADLAR Private Deposit Rate + 2.500%) |
34.194 | % | 3/11/19 | 120,380,000 | ARS | 4,123,218 | (b) | |||||||||
| Argentine Bonos del Tesoro, Bonds |
21.200 | % | 9/19/18 | 140,000 | ARS | 4,651 | ||||||||||
| Argentine Bonos del Tesoro, Bonds |
18.200 | % | 10/3/21 | 3,040,000 | ARS | 90,910 | ||||||||||
| Argentine Bonos del Tesoro, Bonds |
15.500 | % | 10/17/26 | 157,160,000 | ARS | 4,877,502 | ||||||||||
| Argentine POM Politica Monetaria, Bonds (Argentina Central Bank 7 Day Repo Reference Rate) |
40.000 | % | 6/21/20 | 159,070,000 | ARS | 5,695,417 | (b) | |||||||||
| Argentine Republic Government International Bond, Senior Notes |
5.625 | % | 1/26/22 | 3,160,000 | 2,960,920 | (c) | ||||||||||
| Argentine Republic Government International Bond, Senior Notes |
7.500 | % | 4/22/26 | 3,890,000 | 3,603,113 | (c) | ||||||||||
| Argentine Republic Government International Bond, Senior Notes |
8.280 | % | 12/31/33 | 12,590,301 | 11,834,883 | (d) | ||||||||||
| Argentine Republic Government International Bond, Senior Notes |
7.625 | % | 4/22/46 | 8,500,000 | 6,902,000 | (c) | ||||||||||
| Argentine Republic Government International Bond, Senior Notes, Step Bond |
2.500 | % | 12/31/38 | 30,680,000 | 17,510,610 | |||||||||||
| Autonomous City of Buenos Aires Argentina, Senior Notes |
7.500 | % | 6/1/27 | 5,140,000 | 4,669,998 | (a)(c) | ||||||||||
| Bonos de la Nacion Argentina con Ajuste por CER, Bonds |
4.000 | % | 3/6/20 | 57,748,000 | ARS | 2,019,463 | ||||||||||
| Provincia de Buenos Aires, Senior Notes |
9.125 | % | 3/16/24 | 6,230,000 | 6,011,950 | (a) | ||||||||||
| Provincia de Buenos Aires, Senior Notes |
7.875 | % | 6/15/27 | 4,200,000 | 3,696,000 | (a) | ||||||||||
| Provincia de Buenos Aires, Senior Notes |
4.000 | % | 5/15/35 | 1,905,776 | 1,262,367 | (e) | ||||||||||
| Provincia de Cordoba, Senior Notes |
7.450 | % | 9/1/24 | 2,630,000 | 2,368,078 | (a)(c) | ||||||||||
| Provincia de Cordoba, Senior Notes |
7.125 | % | 8/1/27 | 3,800,000 | 3,120,750 | (a) | ||||||||||
| Provincia de Neuquen Argentina, Senior Notes |
7.500 | % | 4/27/25 | 5,400,000 | 4,526,982 | (a)(c) | ||||||||||
| Total Argentina |
85,278,812 | |||||||||||||||
| Armenia — 0.4% |
||||||||||||||||
| Republic of Armenia International Bond, Senior Notes |
6.000 | % | 9/30/20 | 3,850,000 | 3,947,983 | (e) | ||||||||||
| Belarus — 0.6% |
||||||||||||||||
| Republic of Belarus International Bond, Senior Notes |
6.875 | % | 2/28/23 | 5,300,000 | 5,498,353 | (a)(c) | ||||||||||
| Brazil — 2.8% |
||||||||||||||||
| Brazil Notas do Tesouro, Series F, Notes |
10.000 | % | 1/1/21 | 3,007,000 | BRL | 787,386 | ||||||||||
| Brazil Notas do Tesouro, Series F, Notes |
10.000 | % | 1/1/23 | 58,562,000 | BRL | 14,766,405 | ||||||||||
| Brazil Notas do Tesouro, Series F, Notes |
10.000 | % | 1/1/25 | 39,700,000 | BRL | 9,652,871 | ||||||||||
See Notes to Financial Statements.
| 4 | Western Asset Emerging Markets Debt Fund Inc. 2018 Semi-Annual Report |
Western Asset Emerging Markets Debt Fund Inc.
| Security | Rate | Maturity Date |
Face Amount† |
Value | ||||||||||||
| Brazil — continued |
||||||||||||||||
| Brazil Notas do Tesouro, Series F, Notes |
10.000 | % | 1/1/27 | 3,342,000 | BRL | $ | 789,397 | |||||||||
| Total Brazil |
25,996,059 | |||||||||||||||
| Cameroon — 0.1% |
||||||||||||||||
| Republic of Cameroon International Bond, Senior Notes |
9.500 | % | 11/19/25 | 1,200,000 | 1,270,099 | (a) | ||||||||||
| Colombia — 4.6% |
||||||||||||||||
| Colombia Government International Bond, Senior Notes |
7.375 | % | 3/18/19 | 13,279,000 | 13,710,567 | (c) | ||||||||||
| Colombia Government International Bond, Senior Notes |
4.000 | % | 2/26/24 | 6,250,000 | 6,251,563 | (c) | ||||||||||
| Colombia Government International Bond, Senior Notes |
7.375 | % | 9/18/37 | 16,567,000 | 20,708,750 | (c)(d) | ||||||||||
| Colombia Government International Bond, Senior Notes |
6.125 | % | 1/18/41 | 2,080,000 | 2,334,800 | (c) | ||||||||||
| Total Colombia |
43,005,680 | |||||||||||||||
| Costa Rica — 1.1% |
||||||||||||||||
| Costa Rica Government International Bond, Senior Notes |
7.000 | % | 4/4/44 | 10,210,000 | 10,005,800 | (a)(c) | ||||||||||
| Croatia — 1.0% |
||||||||||||||||
| Croatia Government International Bond, Senior Notes |
6.625 | % | 7/14/20 | 3,640,000 | 3,833,764 | (a)(c) | ||||||||||
| Croatia Government International Bond, Senior Notes |
5.500 | % | 4/4/23 | 5,640,000 | 5,939,947 | (e) | ||||||||||
| Total Croatia |
9,773,711 | |||||||||||||||
| Dominican Republic — 1.5% |
||||||||||||||||
| Dominican Republic International Bond, Senior Notes |
5.500 | % | 1/27/25 | 8,210,000 | 8,167,472 | (a)(c) | ||||||||||
| Dominican Republic International Bond, Senior Notes |
6.850 | % | 1/27/45 | 6,300,000 | 6,258,609 | (a)(c) | ||||||||||
| Total Dominican Republic |
14,426,081 | |||||||||||||||
| Ecuador — 3.0% |
||||||||||||||||
| Ecuador Government International Bond, Senior Notes |
10.500 | % | 3/24/20 | 9,980,000 | 10,258,442 | (a) | ||||||||||
| Ecuador Government International Bond, Senior Notes |
10.750 | % | 3/28/22 | 5,270,000 | 5,430,471 | (e) | ||||||||||
| Ecuador Government International Bond, Senior Notes |
10.750 | % | 3/28/22 | 4,210,000 | 4,338,195 | (a) | ||||||||||
| Ecuador Government International Bond, Senior Notes |
7.875 | % | 1/23/28 | 9,400,000 | 7,909,630 | (a) | ||||||||||
| Total Ecuador |
27,936,738 | |||||||||||||||
| Egypt — 2.0% |
||||||||||||||||
| Egypt Government International Bond, Senior Notes |
6.125 | % | 1/31/22 | 2,740,000 | 2,701,492 | (e) | ||||||||||
| Egypt Government International Bond, Senior Notes |
6.125 | % | 1/31/22 | 5,430,000 | 5,353,687 | (a) | ||||||||||
| Egypt Government International Bond, Senior Notes |
5.577 | % | 2/21/23 | 4,990,000 | 4,740,500 | (a) | ||||||||||
| Egypt Government International Bond, Senior Notes |
7.500 | % | 1/31/27 | 800,000 | 788,365 | (a) | ||||||||||
| Egypt Government International Bond, Senior Notes |
8.500 | % | 1/31/47 | 5,100,000 | 4,957,118 | (a) | ||||||||||
| Total Egypt |
18,541,162 | |||||||||||||||
| El Salvador — 0.6% |
||||||||||||||||
| El Salvador Government International Bond, Senior Notes |
6.375 | % | 1/18/27 | 6,380,000 | 5,973,275 | (a)(c) | ||||||||||
| Ethiopia — 0.3% |
||||||||||||||||
| Ethiopia International Bond, Senior Notes |
6.625 | % | 12/11/24 | 2,500,000 | 2,453,763 | (e) | ||||||||||
See Notes to Financial Statements.
| Western Asset Emerging Markets Debt Fund Inc. 2018 Semi-Annual Report | 5 |
Schedule of investments (unaudited) (cont’d)
June 30, 2018
Western Asset Emerging Markets Debt Fund Inc.
| Security | Rate | Maturity Date |
Face Amount† |
Value | ||||||||||||
| Gabon — 0.1% |
||||||||||||||||
| Gabon Government International Bond, Senior Notes |
6.950 | % | 6/16/25 | 1,480,000 | $ | 1,342,974 | (a) | |||||||||
| Georgia — 0.3% |
||||||||||||||||
| Georgia Government International Bond, Bonds |
6.875 | % | 4/12/21 | 2,360,000 | 2,518,026 | (e) | ||||||||||
| Ghana — 1.8% |
||||||||||||||||
| Ghana Government International Bond, Bonds |
10.750 | % | 10/14/30 | 5,270,000 | 6,417,806 | (a)(c) | ||||||||||
| Ghana Government International Bond, Senior Notes |
7.875 | % | 8/7/23 | 5,050,000 | 5,186,759 | (e) | ||||||||||
| Ghana Government International Bond, Senior Notes |
8.125 | % | 1/18/26 | 1,620,000 | 1,664,485 | (a)(c) | ||||||||||
| Ghana Government International Bond, Senior Notes |
7.625 | % | 5/16/29 | 3,350,000 | 3,277,774 | (a) | ||||||||||
| Total Ghana |
16,546,824 | |||||||||||||||
| Guatemala — 0.6% |
||||||||||||||||
| Guatemala Government Bond, Senior Notes |
4.500 | % | 5/3/26 | 2,100,000 | 2,013,375 | (a)(c) | ||||||||||
| Guatemala Government Bond, Senior Notes |
4.375 | % | 6/5/27 | 4,000,000 | 3,720,000 | (a)(c) | ||||||||||
| Total Guatemala |
5,733,375 | |||||||||||||||
| Honduras — 0.5% |
||||||||||||||||
| Honduras Government International Bond, Senior Notes |
7.500 | % | 3/15/24 | 960,000 | 1,028,160 | (e) | ||||||||||
| Honduras Government International Bond, Senior Notes |
6.250 | % | 1/19/27 | 3,500,000 | 3,520,650 | (a) | ||||||||||
| Total Honduras |
4,548,810 | |||||||||||||||
| Hungary — 1.4% |
||||||||||||||||
| Hungary Government International Bond, Senior Notes |
5.750 | % | 11/22/23 | 12,608,000 | 13,592,193 | (c) | ||||||||||
| Indonesia — 9.4% |
||||||||||||||||
| Indonesia Government International Bond, Senior Notes |
4.875 | % | 5/5/21 | 213,000 | 219,443 | (e) | ||||||||||
| Indonesia Government International Bond, Senior Notes |
4.875 | % | 5/5/21 | 1,060,000 | 1,092,063 | (a)(c) | ||||||||||
| Indonesia Government International Bond, Senior Notes |
3.375 | % | 4/15/23 | 4,720,000 | 4,559,907 | (a)(c) | ||||||||||
| Indonesia Government International Bond, Senior Notes |
5.875 | % | 1/15/24 | 7,049,000 | 7,559,517 | (a)(c) | ||||||||||
| Indonesia Government International Bond, Senior Notes |
6.625 | % | 2/17/37 | 3,210,000 | 3,694,598 | (e) | ||||||||||
| Indonesia Government International Bond, Senior Notes |
5.250 | % | 1/17/42 | 2,520,000 | 2,538,343 | (e) | ||||||||||
| Indonesia Government International Bond, Senior Notes |
5.250 | % | 1/17/42 | 20,750,000 | 20,901,039 | (a)(c) | ||||||||||
| Indonesia Government International Bond, Senior Notes |
4.750 | % | 7/18/47 | 20,800,000 | 19,667,918 | (a)(c)(d) | ||||||||||
| Indonesia Treasury Bond, Senior Notes |
7.000 | % | 5/15/22 | 133,900,000,000 | IDR | 9,175,841 | ||||||||||
| Indonesia Treasury Bond, Senior Notes |
8.375 | % | 9/15/26 | 131,422,000,000 | IDR | 9,377,459 | ||||||||||
See Notes to Financial Statements.
| 6 | Western Asset Emerging Markets Debt Fund Inc. 2018 Semi-Annual Report |
Western Asset Emerging Markets Debt Fund Inc.
| Security | Rate | Maturity Date |
Face Amount† |
Value | ||||||||||||
| Indonesia — continued |
||||||||||||||||
| Republic of Indonesia, Senior Notes |
8.375 | % | 3/15/34 | 126,438,000,000 | IDR | $ | 8,845,366 | |||||||||
| Total Indonesia |
87,631,494 | |||||||||||||||
| Ivory Coast — 1.0% |
||||||||||||||||
| Ivory Coast Government International Bond, Senior Notes |
6.375 | % | 3/3/28 | 2,680,000 | 2,533,672 | (a)(c) | ||||||||||
| Ivory Coast Government International Bond, Senior Notes |
6.125 | % | 6/15/33 | 4,940,000 | 4,367,528 | (a) | ||||||||||
| Ivory Coast Government International Bond, Senior Notes, Step Bond |
5.750 | % | 12/31/32 | 2,590,000 | 2,407,941 | (a)(c) | ||||||||||
| Total Ivory Coast |
9,309,141 | |||||||||||||||
| Jamaica — 0.6% |
||||||||||||||||
| Jamaica Government International Bond, Senior Notes |
6.750 | % | 4/28/28 | 3,390,000 | 3,638,589 | (c) | ||||||||||
| Jamaica Government International Bond, Senior Notes |
8.000 | % | 3/15/39 | 1,760,000 | 1,977,976 | (c) | ||||||||||
| Total Jamaica |
5,616,565 | |||||||||||||||
| Jordan — 0.4% |
||||||||||||||||
| Jordan Government International Bond, Senior Notes |
6.125 | % | 1/29/26 | 440,000 | 426,942 | (a) | ||||||||||
| Jordan Government International Bond, Senior Notes |
5.750 | % | 1/31/27 | 2,840,000 | 2,644,863 | (a) | ||||||||||
| Jordan Government International Bond, Senior Notes |
7.375 | % | 10/10/47 | 320,000 | 294,544 | (a) | ||||||||||
| Total Jordan |
3,366,349 | |||||||||||||||
| Kazakhstan — 1.1% |
||||||||||||||||
| Kazakhstan Government International Bond, Senior Notes |
3.875 | % | 10/14/24 | 9,890,000 | 9,950,210 | (e) | ||||||||||
| Kenya — 0.6% |
||||||||||||||||
| Kenya Government International Bond, Senior Notes |
6.875 | % | 6/24/24 | 200,000 | 197,984 | (a)(c) | ||||||||||
| Kenya Government International Bond, Senior Notes |
7.250 | % | 2/28/28 | 5,300,000 | 5,102,151 | (a)(c) | ||||||||||
| Total Kenya |
5,300,135 | |||||||||||||||
| Lebanon — 1.1% |
||||||||||||||||
| Lebanon Government International Bond, Senior Notes |
6.000 | % | 1/27/23 | 12,800,000 | 10,821,965 | (e) | ||||||||||
| Lithuania — 0.7% |
||||||||||||||||
| Lithuania Government International Bond, Senior Notes |
6.125 | % | 3/9/21 | 5,850,000 | 6,265,877 | (a)(c) | ||||||||||
| Mexico — 4.7% |
||||||||||||||||
| Mexican Bonos, Bonds |
6.500 | % | 6/9/22 | 199,640,000 | MXN | 9,652,362 | (c) | |||||||||
| Mexican Bonos, Bonds |
5.750 | % | 3/5/26 | 203,250,000 | MXN | 9,148,284 | (c) | |||||||||
| Mexico Government International Bond, Senior Notes |
4.000 | % | 10/2/23 | 12,776,000 | 12,838,283 | (c)(d) | ||||||||||
| Mexico Government International Bond, Senior Notes |
6.050 | % | 1/11/40 | 1,132,000 | 1,250,860 | (c) | ||||||||||
| Mexico Government International Bond, Senior Notes |
4.600 | % | 2/10/48 | 12,550,000 | 11,558,550 | (c) | ||||||||||
| Total Mexico |
44,448,339 | |||||||||||||||
| Nigeria — 1.2% |
||||||||||||||||
| Nigeria Government International Bond, Senior Notes |
6.500 | % | 11/28/27 | 2,900,000 | 2,705,306 | (a)(c) | ||||||||||
| Nigeria Government International Bond, Senior Notes |
7.875 | % | 2/16/32 | 2,200,000 | 2,163,832 | (e) | ||||||||||
| Nigeria Government International Bond, Senior Notes |
7.875 | % | 2/16/32 | 4,120,000 | 4,052,267 | (a)(c) | ||||||||||
See Notes to Financial Statements.
| Western Asset Emerging Markets Debt Fund Inc. 2018 Semi-Annual Report | 7 |
Schedule of investments (unaudited) (cont’d)
June 30, 2018
Western Asset Emerging Markets Debt Fund Inc.
| Security | Rate | Maturity Date |
Face Amount† |
Value | ||||||||||||
| Nigeria — continued |
||||||||||||||||
| Nigeria Government International Bond, Senior Notes |
7.625 | % | 11/28/47 | 2,970,000 | $ | 2,715,016 | (a)(c) | |||||||||
| Total Nigeria |
11,636,421 | |||||||||||||||
| Oman — 0.9% |
||||||||||||||||
| Oman Government International Bond, Senior Notes |
5.375 | % | 3/8/27 | 830,000 | 783,680 | (a) | ||||||||||
| Oman Government International Bond, Senior Notes |
5.625 | % | 1/17/28 | 7,900,000 | 7,454,598 | (a) | ||||||||||
| Total Oman |
8,238,278 | |||||||||||||||
| Panama — 0.1% |
||||||||||||||||
| Panama Government International Bond, Senior Notes |
9.375 | % | 4/1/29 | 910,000 | 1,278,550 | (c) | ||||||||||
| Panama Government International Bond, Senior Notes |
6.700 | % | 1/26/36 | 159,000 | 195,570 | (c) | ||||||||||
| Total Panama |
1,474,120 | |||||||||||||||
| Paraguay — 0.4% |
||||||||||||||||
| Paraguay Government International Bond, Senior Notes |
5.000 | % | 4/15/26 | 3,500,000 | 3,526,250 | (a)(c) | ||||||||||
| Peru — 5.3% |
||||||||||||||||
| Peruvian Government International Bond, Senior Notes |
7.350 | % | 7/21/25 | 10,300,000 | 12,591,750 | (c) | ||||||||||
| Peruvian Government International Bond, Senior Notes |
8.750 | % | 11/21/33 | 19,998,000 | 29,397,060 | (c)(d) | ||||||||||
| Peruvian Government International Bond, Senior Notes |
6.550 | % | 3/14/37 | 6,189,000 | 7,751,722 | (c) | ||||||||||
| Total Peru |
49,740,532 | |||||||||||||||
| Philippines — 0.5% |
||||||||||||||||
| Philippine Government International Bond, Senior Notes |
3.950 | % | 1/20/40 | 4,600,000 | 4,408,304 | (c) | ||||||||||
| Poland — 2.9% |
||||||||||||||||
| Republic of Poland Government International Bond, Senior Notes |
5.125 | % | 4/21/21 | 10,940,000 | 11,501,878 | (c) | ||||||||||
| Republic of Poland Government International Bond, Senior Notes |
5.000 | % | 3/23/22 | 14,784,000 | 15,611,298 | (c)(d) | ||||||||||
| Total Poland |
27,113,176 | |||||||||||||||
| Qatar — 0.3% |
||||||||||||||||
| Qatar Government International Bond, Senior Notes |
5.103 | % | 4/23/48 | 3,220,000 | 3,217,521 | (a) | ||||||||||
| Romania — 1.0% |
||||||||||||||||
| Romanian Government International Bond, Senior Notes |
4.875 | % | 1/22/24 | 7,370,000 | 7,593,311 | (c)(e) | ||||||||||
| Romanian Government International Bond, Senior Notes |
4.875 | % | 1/22/24 | 1,570,000 | 1,617,571 | (a)(c) | ||||||||||
| Total Romania |
9,210,882 | |||||||||||||||
| Russia — 6.5% |
||||||||||||||||
| Russian Federal Bond, Bonds |
7.000 | % | 1/25/23 | 964,000,000 | RUB | 15,153,287 | ||||||||||
| Russian Federal Bond, Bonds |
8.150 | % | 2/3/27 | 289,580,000 | RUB | 4,789,664 | ||||||||||
| Russian Federal Bond, Bonds |
7.050 | % | 1/19/28 | 83,026,000 | RUB | 1,279,011 | ||||||||||
| Russian Foreign Bond — Eurobond, Senior Notes |
11.000 | % | 7/24/18 | 215,000 | 216,042 | (e) | ||||||||||
| Russian Foreign Bond — Eurobond, Senior Notes |
12.750 | % | 6/24/28 | 790,000 | 1,290,907 | (e) | ||||||||||
| Russian Foreign Bond — Eurobond, Senior Notes |
7.500 | % | 3/31/30 | 23,921,865 | 26,378,617 | (e) | ||||||||||
See Notes to Financial Statements.
| 8 | Western Asset Emerging Markets Debt Fund Inc. 2018 Semi-Annual Report |
Western Asset Emerging Markets Debt Fund Inc.
| Security | Rate | Maturity Date |
Face Amount† |
Value | ||||||||||||
| Russia — continued |
||||||||||||||||
| Russian Foreign Bond — Eurobond, Senior Notes |
5.625 | % | 4/4/42 | 7,400,000 | $ | 7,755,940 | (a)(c) | |||||||||
| Russian Foreign Bond — Eurobond, Senior Notes |
5.875 | % | 9/16/43 | 3,400,000 | 3,662,446 | (a)(c) | ||||||||||
| Total Russia |
60,525,914 | |||||||||||||||
| Senegal — 1.8% |
||||||||||||||||
| Senegal Government International Bond, Bonds |
6.250 | % | 5/23/33 | 8,100,000 | 7,202,925 | (a) | ||||||||||
| Senegal Government International Bond, Senior Notes |
6.250 | % | 7/30/24 | 2,170,000 | 2,133,481 | (e) | ||||||||||
| Senegal Government International Bond, Senior Notes |
4.750 | % | 3/13/28 | 4,800,000 | EUR | 5,239,741 | (a) | |||||||||
| Senegal Government International Bond, Senior Notes |
6.750 | % | 3/13/48 | 2,650,000 | 2,275,727 | (a) | ||||||||||
| Total Senegal |
16,851,874 | |||||||||||||||
| South Africa — 0.5% |
||||||||||||||||
| Republic of South Africa Government International Bond, Senior Notes |
4.875 | % | 4/14/26 | 5,060,000 | 4,878,032 | (c) | ||||||||||
| Sri Lanka — 2.1% |
||||||||||||||||
| Sri Lanka Government International Bond, Senior Notes |
5.125 | % | 4/11/19 | 2,000,000 | 2,001,252 | (e) | ||||||||||
| Sri Lanka Government International Bond, Senior Notes |
6.250 | % | 7/27/21 | 7,660,000 | 7,727,002 | (e) | ||||||||||
| Sri Lanka Government International Bond, Senior Notes |
5.875 | % | 7/25/22 | 3,460,000 | 3,405,754 | (e) | ||||||||||
| Sri Lanka Government International Bond, Senior Notes |
6.825 | % | 7/18/26 | 2,280,000 | 2,189,149 | (a)(c) | ||||||||||
| Sri Lanka Government International Bond, Senior Notes |
6.200 | % | 5/11/27 | 4,900,000 | 4,483,667 | (a)(c) | ||||||||||
| Total Sri Lanka |
19,806,824 | |||||||||||||||
| Turkey — 1.7% |
||||||||||||||||
| Export Credit Bank of Turkey, Senior Notes |
5.875 | % | 4/24/19 | 2,770,000 | 2,775,584 | (a)(c) | ||||||||||
| Export Credit Bank of Turkey, Senior Notes |
4.250 | % | 9/18/22 | 2,410,000 | 2,155,444 | (e) | ||||||||||
| Export Credit Bank of Turkey, Senior Notes |
5.375 | % | 10/24/23 | 5,300,000 | 4,829,021 | (a)(c) | ||||||||||
| Turkey Government International Bond, Senior Notes |
5.625 | % | 3/30/21 | 1,700,000 | 1,693,650 | (c) | ||||||||||
| Turkey Government International Bond, Senior Notes |
3.250 | % | 3/23/23 | 850,000 | 755,668 | (c) | ||||||||||
| Turkey Government International Bond, Senior Notes |
5.750 | % | 3/22/24 | 450,000 | 434,741 | (c) | ||||||||||
| Turkey Government International Bond, Senior Notes |
4.250 | % | 4/14/26 | 2,430,000 | 2,082,070 | |||||||||||
| Turkey Government International Bond, Senior Notes |
6.125 | % | 10/24/28 | 1,000,000 | 939,050 | |||||||||||
| Total Turkey |
15,665,228 | |||||||||||||||
| Ukraine — 2.0% |
||||||||||||||||
| Ukraine Government International Bond, Senior Notes |
7.750 | % | 9/1/20 | 11,470,000 | 11,435,969 | (a)(c) | ||||||||||
| Ukraine Government International Bond, Senior Notes |
7.750 | % | 9/1/21 | 6,000,000 | 5,932,500 | (e) | ||||||||||
| Ukraine Government International Bond, Senior Notes |
7.750 | % | 9/1/24 | 1,500,000 | 1,426,650 | (a) | ||||||||||
| Total Ukraine |
18,795,119 | |||||||||||||||
| United Arab Emirates — 0.5% |
||||||||||||||||
| Abu Dhabi Government International Bond, Senior Notes |
4.125 | % | 10/11/47 | 5,400,000 | 4,955,737 | (a) | ||||||||||
See Notes to Financial Statements.
| Western Asset Emerging Markets Debt Fund Inc. 2018 Semi-Annual Report | 9 |
Schedule of investments (unaudited) (cont’d)
June 30, 2018
Western Asset Emerging Markets Debt Fund Inc.
| Security | Rate | Maturity Date |
Face Amount† |
Value | ||||||||||||
| Uruguay — 2.3% |
||||||||||||||||
| Uruguay Government International Bond, Senior Notes |
9.875 | % | 6/20/22 | 142,400,000 | UYU | $ | 4,509,879 | (a) | ||||||||
| Uruguay Government International Bond, Senior Notes |
9.875 | % | 6/20/22 | 85,770,000 | UYU | 2,716,379 | (e) | |||||||||
| Uruguay Government International Bond, Senior Notes |
4.375 | % | 10/27/27 | 4,943,154 | 5,020,391 | (c) | ||||||||||
| Uruguay Government International Bond, Senior Notes |
5.100 | % | 6/18/50 | 5,760,000 | 5,683,680 | (c) | ||||||||||
| Uruguay Government International Bond, Senior Notes |
4.975 | % | 4/20/55 | 3,700,000 | 3,598,250 | (c) | ||||||||||
| Total Uruguay |
21,528,579 | |||||||||||||||
| Venezuela — 1.0% |
||||||||||||||||
| Venezuela Government International Bond, Senior Notes |
7.750 | % | 10/13/19 | 22,130,000 | 6,123,371 | (e)(f) | ||||||||||
| Venezuela Government International Bond, Senior Notes |
8.250 | % | 10/13/24 | 7,000,000 | 1,936,900 | (e)(f) | ||||||||||
| Venezuela Government International Bond, Senior Notes |
9.250 | % | 9/15/27 | 4,205,000 | 1,205,573 | (f) | ||||||||||
| Total Venezuela |
9,265,844 | |||||||||||||||
| Vietnam — 1.1% |
||||||||||||||||
| Vietnam Government International Bond, Senior Notes |
6.750 | % | 1/29/20 | 1,690,000 | 1,752,598 | (e) | ||||||||||
| Vietnam Government International Bond, Senior Notes |
4.800 | % | 11/19/24 | 8,700,000 | 8,657,770 | (a)(c) | ||||||||||
| Total Vietnam |
10,410,368 | |||||||||||||||
| Total Sovereign Bonds (Cost — $821,278,244) |
786,739,084 | |||||||||||||||
| Corporate Bonds & Notes — 50.3% | ||||||||||||||||
| Consumer Discretionary — 1.0% | ||||||||||||||||
| Hotels, Restaurants & Leisure — 0.3% |
||||||||||||||||
| Gohl Capital, Ltd., Senior Notes |
4.250 | % | 1/24/27 | 3,130,000 | 2,968,301 | (e) | ||||||||||
| Media — 0.7% |
||||||||||||||||
| Grupo Televisa SAB, Senior Notes |
6.625 | % | 1/15/40 | 1,480,000 | 1,610,841 | (c) | ||||||||||
| Myriad International Holdings BV, Senior Notes |
5.500 | % | 7/21/25 | 2,750,000 | 2,835,599 | (a)(c) | ||||||||||
| Myriad International Holdings BV, Senior Notes |
4.850 | % | 7/6/27 | 2,250,000 | 2,207,885 | (a)(c) | ||||||||||
| Total Media |
6,654,325 | |||||||||||||||
| Total Consumer Discretionary |
9,622,626 | |||||||||||||||
| Consumer Staples — 0.5% | ||||||||||||||||
| Food & Staples Retailing — 0.1% |
||||||||||||||||
| Prosperous Ray Ltd., Senior Notes |
4.625 | % | 11/12/23 | 680,000 | 703,818 | (e) | ||||||||||
| Food Products — 0.4% |
||||||||||||||||
| Marfrig Holdings Europe BV, Senior Notes |
8.000 | % | 6/8/23 | 3,700,000 | 3,760,125 | (a)(c) | ||||||||||
| Total Consumer Staples |
4,463,943 | |||||||||||||||
| Energy — 23.6% | ||||||||||||||||
| Oil, Gas & Consumable Fuels — 23.6% |
||||||||||||||||
| Borets Finance DAC, Senior Notes |
6.500 | % | 4/7/22 | 2,000,000 | 1,997,500 | (a)(c) | ||||||||||
| CNOOC Curtis Funding No 1 Pty, Ltd., Senior Notes |
4.500 | % | 10/3/23 | 2,750,000 | 2,837,236 | (e) | ||||||||||
| Dolphin Energy Ltd. LLC, Senior Secured Notes |
5.888 | % | 6/15/19 | 654,192 | 664,169 | (e) | ||||||||||
| Ecopetrol SA, Senior Notes |
7.625 | % | 7/23/19 | 2,550,000 | 2,668,065 | (c) | ||||||||||
See Notes to Financial Statements.
| 10 | Western Asset Emerging Markets Debt Fund Inc. 2018 Semi-Annual Report |
Western Asset Emerging Markets Debt Fund Inc.
| Security | Rate | Maturity Date |
Face Amount† |
Value | ||||||||||||
| Oil, Gas & Consumable Fuels — continued |
||||||||||||||||
| Ecopetrol SA, Senior Notes |
5.875 | % | 9/18/23 | 3,010,000 | $ | 3,198,125 | (c) | |||||||||
| Ecopetrol SA, Senior Notes |
5.875 | % | 5/28/45 | 7,160,000 | 6,817,752 | (c) | ||||||||||
| GNL Quintero SA, Senior Notes |
4.634 | % | 7/31/29 | 1,877,000 | 1,844,153 | (a)(c) | ||||||||||
| KazMunayGas National Co. JSC, Senior Notes |
4.750 | % | 4/19/27 | 5,160,000 | 5,050,670 | (a)(c) | ||||||||||
| KazMunayGas National Co. JSC, Senior Notes |
5.750 | % | 4/19/47 | 4,970,000 | 4,758,775 | (a)(c) | ||||||||||
| KazMunayGas National Co. JSC, Senior Notes |
6.375 | % | 10/24/48 | 5,300,000 | 5,365,587 | (a)(c) | ||||||||||
| KazTransGas JSC, Senior Notes |
4.375 | % | 9/26/27 | 5,900,000 | 5,501,750 | (a)(c) | ||||||||||
| Lukoil International Finance BV, Senior Notes |
6.656 | % | 6/7/22 | 3,524,000 | 3,812,827 | (e) | ||||||||||
| Lukoil International Finance BV, Senior Notes |
4.750 | % | 11/2/26 | 3,500,000 | 3,473,347 | (a)(c) | ||||||||||
| ONGC Videsh Ltd., Senior Notes |
4.625 | % | 7/15/24 | 720,000 | 722,913 | (e) | ||||||||||
| Pertamina Persero PT, Senior Notes |
5.250 | % | 5/23/21 | 6,760,000 | 6,988,143 | (a)(c) | ||||||||||
| Pertamina Persero PT, Senior Notes |
4.875 | % | 5/3/22 | 2,540,000 | 2,585,486 | (a)(c) | ||||||||||
| Pertamina Persero PT, Senior Notes |
4.300 | % | 5/20/23 | 3,250,000 | 3,215,527 | (a)(c) | ||||||||||
| Petrobras Global Finance BV, Senior Notes |
5.375 | % | 1/27/21 | 16,220,000 | 16,378,956 | (c)(d) | ||||||||||
| Petrobras Global Finance BV, Senior Notes |
8.375 | % | 5/23/21 | 1,000,000 | 1,090,250 | (c) | ||||||||||
| Petrobras Global Finance BV, Senior Notes |
6.250 | % | 3/17/24 | 6,300,000 | 6,270,075 | |||||||||||
| Petrobras Global Finance BV, Senior Notes |
7.375 | % | 1/17/27 | 5,600,000 | 5,607,000 | (c) | ||||||||||
| Petrobras Global Finance BV, Senior Notes |
6.850 | % | 6/5/2115 | 16,800,000 | 14,179,200 | (c) | ||||||||||
| Petroleos de Venezuela SA, Senior Notes |
9.000 | % | 11/17/21 | 16,630,000 | 4,074,350 | (e)(f) | ||||||||||
| Petroleos de Venezuela SA, Senior Notes |
6.000 | % | 5/16/24 | 8,145,000 | 1,756,877 | (e)(f) | ||||||||||
| Petroleos del Peru SA, Senior Notes |
4.750 | % | 6/19/32 | 10,800,000 | 10,362,600 | (a)(c) | ||||||||||
| Petroleos Mexicanos, Senior Bonds |
6.625 | % | 6/15/35 | 19,060,000 | 18,702,625 | (c) | ||||||||||
| Petroleos Mexicanos, Senior Notes |
5.500 | % | 1/21/21 | 13,220,000 | 13,626,383 | (c) | ||||||||||
| Petroleos Mexicanos, Senior Notes |
3.500 | % | 1/30/23 | 1,400,000 | 1,328,838 | (c) | ||||||||||
| Petroleos Mexicanos, Senior Notes |
6.875 | % | 8/4/26 | 2,561,000 | 2,698,014 | (c) | ||||||||||
| Petroleos Mexicanos, Senior Notes |
6.350 | % | 2/12/48 | 3,400,000 | 3,085,500 | (a) | ||||||||||
| Petron Corp., Subordinated Notes (7.500% to 8/6/18 then 5 year Treasury Constant Maturity Rate + 9.101%) |
7.500 | % | 8/6/18 | 3,200,000 | 3,224,000 | (b)(e)(g) | ||||||||||
| Petronas Capital Ltd., Senior Notes |
5.250 | % | 8/12/19 | 10,270,000 | 10,518,688 | (a)(c) | ||||||||||
| Petronas Capital Ltd., Senior Notes |
5.250 | % | 8/12/19 | 1,388,000 | 1,421,610 | (e) | ||||||||||
| Ras Laffan Liquefied Natural Gas Co. Ltd. 3, Senior Secured Notes |
6.750 | % | 9/30/19 | 6,218,000 | 6,458,879 | (e) | ||||||||||
| Reliance Holding USA Inc., Senior Notes |
4.500 | % | 10/19/20 | 6,610,000 | 6,721,407 | (a)(c) | ||||||||||
| Sinopec Group Overseas Development 2014 Ltd., Senior Notes |
4.375 | % | 4/10/24 | 3,570,000 | 3,646,427 | (a)(c) | ||||||||||
| Sinopec Group Overseas Development 2017 Ltd., Senior Notes |
4.000 | % | 9/13/47 | 10,060,000 | 9,217,626 | (e) | ||||||||||
| Transportadora de Gas del Peru SA |
4.250 | % | 4/30/28 | 1,080,000 | 1,044,198 | (e) | ||||||||||
| Transportadora de Gas del Peru SA, Senior Notes |
4.250 | % | 4/30/28 | 5,420,000 | 5,240,327 | (a)(c) | ||||||||||
See Notes to Financial Statements.
| Western Asset Emerging Markets Debt Fund Inc. 2018 Semi-Annual Report | 11 |
Schedule of investments (unaudited) (cont’d)
June 30, 2018
Western Asset Emerging Markets Debt Fund Inc.
| Security | Rate | Maturity Date |
Face Amount† |
Value | ||||||||||||
| Oil, Gas & Consumable Fuels — continued |
||||||||||||||||
| Transportadora de Gas del Sur SA, Senior Notes |
6.750 | % | 5/2/25 | 3,000,000 | $ | 2,760,000 | (a)(c) | |||||||||
| Ultrapar International SA, Senior Notes |
5.250 | % | 10/6/26 | 3,190,000 | 2,973,080 | (a)(c) | ||||||||||
| YPF SA, Senior Notes |
8.500 | % | 3/23/21 | 4,700,000 | 4,789,300 | (a)(c) | ||||||||||
| YPF SA, Senior Notes |
16.500 | % | 5/9/22 | 78,563,600 | ARS | 1,988,559 | (a) | |||||||||
| Total Energy |
220,666,794 | |||||||||||||||
| Financials — 7.4% | ||||||||||||||||
| Banks — 6.2% |
||||||||||||||||
| Banco Bilbao Vizcaya Argentaria Colombia SA, Subordinated Notes |
4.875 | % | 4/21/25 | 2,600,000 | 2,574,026 | (a)(c) | ||||||||||
| Banco del Estado de Chile, Senior Notes |
4.125 | % | 10/7/20 | 1,110,000 | 1,123,038 | (a)(c) | ||||||||||
| Banco Mercantil de Norte SA, Junior Subordinated Notes (7.625% to 1/10/28 then 10 year Treasury Constant Maturity Rate + 5.353%) |
7.625 | % | 1/10/28 | 5,900,000 | 5,848,375 | (a)(b)(c)(g) | ||||||||||
| Banco Nacional de Costa Rica, Senior Notes |
5.875 | % | 4/25/21 | 5,090,000 | 5,178,057 | (a)(c) | ||||||||||
| BBVA Banco Continental SA, Subordinated Notes (5.250% to 9/22/24 then 5 year Treasury Constant Maturity Rate + 2.750%) |
5.250 | % | 9/22/29 | 980,000 | 1,008,175 | (a)(b)(c) | ||||||||||
| BBVA Bancomer SA, Subordinated Notes (5.350% to 11/12/24 then 5 year Treasury Constant Maturity Rate + 3.000%) |
5.350 | % | 11/12/29 | 1,350,000 | 1,258,875 | (a)(b) | ||||||||||
| HSBC Holdings PLC, Junior Subordinated Notes (6.250% to 3/23/23 then USD 5 year ICE Swap Rate + 3.453%) |
6.250 | % | 3/23/23 | 1,600,000 | 1,572,000 | (b)(c)(g) | ||||||||||
| HSBC Holdings PLC, Junior Subordinated Notes (6.500% to 3/23/28 then USD 5 year ICE Swap Rate + 3.606%) |
6.500 | % | 3/23/28 | 1,900,000 | 1,826,375 | (b)(c)(g) | ||||||||||
| HSBC Holdings PLC, Senior Notes |
4.300 | % | 3/8/26 | 1,890,000 | 1,896,665 | (c) | ||||||||||
| Itau Unibanco Holding SA, Junior Subordinated Notes (6.125% to 12/12/22 then 5 year Treasury Constant Maturity Rate + 3.981%) |
6.125 | % | 12/12/22 | 7,200,000 | 6,741,000 | (a)(b)(c)(g) | ||||||||||
| Russian Agricultural Bank OJSC Via RSHB Capital SA, Subordinated Notes |
8.500 | % | 10/16/23 | 16,770,000 | 18,027,750 | (e) | ||||||||||
| Shinhan Bank Co. Ltd., Subordinated Notes |
3.875 | % | 3/24/26 | 1,260,000 | 1,195,408 | (a)(c) | ||||||||||
| TC Ziraat Bankasi AS, Senior Notes |
4.250 | % | 7/3/19 | 3,710,000 | 3,665,001 | (e) | ||||||||||
| TC Ziraat Bankasi AS, Senior Notes |
5.125 | % | 5/3/22 | 6,400,000 | 5,951,699 | (a)(c) | ||||||||||
| Total Banks |
57,866,444 | |||||||||||||||
| Diversified Financial Services — 1.2% |
||||||||||||||||
| Banco Nacional de Comercio Exterior SNC, Senior Notes |
4.375 | % | 10/14/25 | 5,760,000 | 5,623,200 | (a)(c) | ||||||||||
| DAE Funding LLC, Senior Notes |
5.000 | % | 8/1/24 | 2,880,000 | 2,773,440 | (a) | ||||||||||
| Park Aerospace Holdings Ltd., Senior Notes |
5.250 | % | 8/15/22 | 1,000,000 | 993,760 | (a)(c) | ||||||||||
| Park Aerospace Holdings Ltd., Senior Notes |
5.500 | % | 2/15/24 | 1,980,000 | 1,959,784 | (a)(c) | ||||||||||
| Total Diversified Financial Services |
11,350,184 | |||||||||||||||
| Total Financials |
69,216,628 | |||||||||||||||
See Notes to Financial Statements.
| 12 | Western Asset Emerging Markets Debt Fund Inc. 2018 Semi-Annual Report |
Western Asset Emerging Markets Debt Fund Inc.
| Security | Rate | Maturity Date |
Face Amount† |
Value | ||||||||||||
| Industrials — 2.0% | ||||||||||||||||
| Industrial Conglomerates — 0.7% |
||||||||||||||||
| Alfa SAB de CV, Senior Notes |
6.875 | % | 3/25/44 | 1,000,000 | $ | 1,023,960 | (a)(c) | |||||||||
| Sinochem Overseas Capital Co. Ltd., Senior Notes |
4.500 | % | 11/12/20 | 5,220,000 | 5,312,947 | (a)(c) | ||||||||||
| Total Industrial Conglomerates |
6,336,907 | |||||||||||||||
| Road & Rail — 0.3% |
||||||||||||||||
| Empresa de Transporte de Pasajeros Metro SA, Senior Notes |
5.000 | % | 1/25/47 | 2,560,000 | 2,534,400 | (a)(c) | ||||||||||
| Transportation Infrastructure — 1.0% |
||||||||||||||||
| Aeropuertos Dominicanos Siglo XXI SA, Senior Secured Notes |
6.750 | % | 3/30/29 | 1,600,000 | 1,670,000 | (a)(c) | ||||||||||
| Mersin Uluslararasi Liman Isletmeciligi AS, Senior Notes |
5.875 | % | 8/12/20 | 2,120,000 | 2,130,238 | (a)(c) | ||||||||||
| Pelabuhan Indonesia II PT, Senior Notes |
4.250 | % | 5/5/25 | 6,300,000 | 6,032,250 | (a)(c) | ||||||||||
| Total Transportation Infrastructure |
9,832,488 | |||||||||||||||
| Total Industrials |
18,703,795 | |||||||||||||||
| Materials — 7.7% | ||||||||||||||||
| Chemicals — 3.7% |
||||||||||||||||
| Alpek SAB de CV, Senior Notes |
4.500 | % | 11/20/22 | 5,878,000 | 5,815,595 | (a)(c) | ||||||||||
| Braskem America Finance Co., Senior Notes |
7.125 | % | 7/22/41 | 210,000 | 236,250 | (e) | ||||||||||
| Braskem Finance Ltd., Senior Notes |
6.450 | % | 2/3/24 | 2,350,000 | 2,469,850 | |||||||||||
| Chandra Asri Petrochemical Tbk PT, Senior Notes |
4.950 | % | 11/8/24 | 2,160,000 | 1,888,706 | (a)(c) | ||||||||||
| Equate Petrochemical BV, Senior Notes |
3.000 | % | 3/3/22 | 492,000 | 472,015 | (e) | ||||||||||
| Equate Petrochemical BV, Senior Notes |
4.250 | % | 11/3/26 | 1,300,000 | 1,263,765 | (a) | ||||||||||
| Mexichem SAB de CV, Senior Notes |
4.875 | % | 9/19/22 | 2,101,000 | 2,134,616 | (a)(c) | ||||||||||
| Mexichem SAB de CV, Senior Notes |
5.875 | % | 9/17/44 | 4,960,000 | 4,588,000 | (a)(c) | ||||||||||
| OCP SA, Senior Notes |
5.625 | % | 4/25/24 | 4,900,000 | 5,023,701 | (a) | ||||||||||
| OCP SA, Senior Notes |
4.500 | % | 10/22/25 | 5,590,000 | 5,336,091 | (a) | ||||||||||
| Phosagro OAO Via Phosagro Bond Funding DAC, Senior Notes |
3.950 | % | 11/3/21 | 5,600,000 | 5,463,058 | (a)(c) | ||||||||||
| Total Chemicals |
34,691,647 | |||||||||||||||
| Construction Materials — 0.6% |
||||||||||||||||
| Cementos Pacasmayo SAA, Senior Notes |
4.500 | % | 2/8/23 | 2,200,000 | 2,161,500 | (a)(c) | ||||||||||
| Cementos Pacasmayo SAA, Senior Notes |
4.500 | % | 2/8/23 | 750,000 | 736,875 | (e) | ||||||||||
| Cemex SAB de CV, Senior Secured Notes |
6.125 | % | 5/5/25 | 2,920,000 | 2,972,005 | (a)(c) | ||||||||||
| Total Construction Materials |
5,870,380 | |||||||||||||||
| Containers & Packaging — 0.6% |
||||||||||||||||
| Suzano Austria GmbH, Senior Notes |
5.750 | % | 7/14/26 | 5,450,000 | 5,526,845 | (a)(c) | ||||||||||
| Metals & Mining — 2.1% |
||||||||||||||||
| Corp. Nacional del Cobre de Chile, Senior Notes |
3.625 | % | 8/1/27 | 7,700,000 | 7,353,731 | (a)(c) | ||||||||||
| Southern Copper Corp., Senior Notes |
7.500 | % | 7/27/35 | 310,000 | 379,452 | (c) | ||||||||||
| Southern Copper Corp., Senior Notes |
6.750 | % | 4/16/40 | 8,490,000 | 9,785,943 | (c) | ||||||||||
| Southern Copper Corp., Senior Notes |
5.250 | % | 11/8/42 | 1,110,000 | 1,102,355 | (c) | ||||||||||
See Notes to Financial Statements.
| Western Asset Emerging Markets Debt Fund Inc. 2018 Semi-Annual Report | 13 |
Schedule of investments (unaudited) (cont’d)
June 30, 2018
Western Asset Emerging Markets Debt Fund Inc.
| Security | Rate | Maturity Date |
Face Amount† |
Value | ||||||||||||
| Metals & Mining — continued |
||||||||||||||||
| Vale Overseas Ltd., Senior Notes |
4.375 | % | 1/11/22 | 737,000 | $ | 747,679 | (c) | |||||||||
| Total Metals & Mining |
19,369,160 | |||||||||||||||
| Paper & Forest Products — 0.7% |
||||||||||||||||
| Inversiones CMPC SA, Senior Notes |
4.500 | % | 4/25/22 | 2,350,000 | 2,376,429 | (a)(c) | ||||||||||
| Inversiones CMPC SA, Senior Notes |
4.375 | % | 5/15/23 | 2,070,000 | 2,066,145 | (a)(c) | ||||||||||
| Klabin Finance SA, Senior Notes |
5.250 | % | 7/16/24 | 1,900,000 | 1,852,500 | (a)(c) | ||||||||||
| Total Paper & Forest Products |
6,295,074 | |||||||||||||||
| Total Materials |
71,753,106 | |||||||||||||||
| Real Estate — 0.7% | ||||||||||||||||
| Real Estate Management & Development — 0.7% |
||||||||||||||||
| China Overseas Finance Cayman III Ltd., Senior Notes |
5.375 | % | 10/29/23 | 2,460,000 | 2,575,290 | (e) | ||||||||||
| Country Garden Holdings Co. Ltd., Senior Secured Notes |
7.250 | % | 4/4/21 | 2,200,000 | 2,207,401 | (e) | ||||||||||
| Yuzhou Properties Co. Ltd., Senior Secured Notes |
6.000 | % | 10/25/23 | 2,000,000 | 1,778,972 | (e) | ||||||||||
| Total Real Estate |
6,561,663 | |||||||||||||||
| Telecommunication Services — 2.3% | ||||||||||||||||
| Diversified Telecommunication Services — 0.3% |
| |||||||||||||||
| Ooredoo International Finance Ltd., Senior Notes |
4.750 | % | 2/16/21 | 2,710,000 | 2,786,769 | (a) | ||||||||||
| Wireless Telecommunication Services — 2.0% |
| |||||||||||||||
| Millicom International Cellular SA, Senior Notes |
5.125 | % | 1/15/28 | 2,650,000 | 2,447,275 | (a)(c) | ||||||||||
| VEON Holdings BV, Senior Notes |
5.950 | % | 2/13/23 | 3,900,000 | 3,940,950 | (a)(c) | ||||||||||
| VEON Holdings BV, Senior Notes |
5.950 | % | 2/13/23 | 11,950,000 | 12,075,475 | (e) | ||||||||||
| Vimpel Communications Via VIP Finance Ireland Ltd. OJSC, Senior Notes |
7.748 | % | 2/2/21 | 440,000 | 472,303 | (a)(c) | ||||||||||
| Total Wireless Telecommunication Services |
|
18,936,003 | ||||||||||||||
| Total Telecommunication Services |
21,722,772 | |||||||||||||||
| Utilities — 5.1% | ||||||||||||||||
| Electric Utilities — 4.2% |
||||||||||||||||
| Abu Dhabi National Energy Co. PJSC, Senior Notes |
4.875 | % | 4/23/30 | 5,100,000 | 5,097,073 | (a) | ||||||||||
| Comision Federal de Electricidad, Senior Notes |
4.875 | % | 1/15/24 | 2,340,000 | 2,360,475 | (a)(c) | ||||||||||
| Enel Chile SA, Senior Notes |
4.875 | % | 6/12/28 | 5,150,000 | 5,194,290 | |||||||||||
| Genneia SA, Senior Notes |
8.750 | % | 1/20/22 | 1,450,000 | 1,402,382 | (a)(c) | ||||||||||
| Kallpa Generacion SA, Senior Notes |
4.875 | % | 5/24/26 | 2,270,000 | 2,207,575 | (e) | ||||||||||
| Pampa Energia SA, Senior Notes |
7.500 | % | 1/24/27 | 4,950,000 | 4,479,750 | (a)(c) | ||||||||||
| Perusahaan Listrik Negara PT, Senior Notes |
5.450 | % | 5/21/28 | 4,810,000 | 4,904,514 | (a) | ||||||||||
| Perusahaan Listrik Negara PT, Senior Notes |
5.250 | % | 5/15/47 | 7,810,000 | 7,093,655 | (e) | ||||||||||
| PT Perusahaan Listrik Negara, Senior Notes |
5.500 | % | 11/22/21 | 6,350,000 | 6,643,751 | (c)(e) | ||||||||||
| Total Electric Utilities |
39,383,465 | |||||||||||||||
See Notes to Financial Statements.
| 14 | Western Asset Emerging Markets Debt Fund Inc. 2018 Semi-Annual Report |
Western Asset Emerging Markets Debt Fund Inc.
| Security | Rate | Maturity Date |
Face Amount† |
Value | ||||||||||||||||
| Independent Power and Renewable Electricity Producers — 0.6% |
| |||||||||||||||||||
| Enel Generacion Chile SA, Senior Notes |
|
4.250 | % | 4/15/24 | 500,000 | $ | 498,347 | (c) | ||||||||||||
| Minejesa Capital BV, Senior Secured Notes |
|
5.625 | % | 8/10/37 | 3,100,000 | 2,808,256 | (a)(c) | |||||||||||||
| Three Gorges Finance I Cayman Islands Ltd., Senior Notes |
|
3.700 | % | 6/10/25 | 2,890,000 | 2,828,121 | (a)(c) | |||||||||||||
| Total Independent Power and Renewable Electricity Producers |
|
6,134,724 | ||||||||||||||||||
| Multi-Utilities — 0.3% |
|
|||||||||||||||||||
| Empresas Publicas de Medellin ESP, Senior Notes |
|
7.625% | 7/29/19 | 2,590,000 | 2,654,750 | (a)(c) | ||||||||||||||
| Total Utilities |
|
48,172,939 | ||||||||||||||||||
| Total Corporate Bonds & Notes (Cost — $483,172,903) |
|
470,884,266 | ||||||||||||||||||
| Counterparty | Expiration Date |
Contracts | Notional Amount† |
|||||||||||||||||
| Purchased Options — 0.1% |
|
|||||||||||||||||||
| OTC Purchased Options — 0.1% |
|
|||||||||||||||||||
| U.S. Dollar/Euro, Put @ $1.19 (Cost — $113,176) |
|
JPMorgan Chase & Co. |
|
8/1/18 | 16,500,000 | 16,500,000 | 389,927 | |||||||||||||
| Total Investments before Short-Term Investments (Cost — $1,304,564,323) |
|
1,258,013,277 | ||||||||||||||||||
| Rate | Maturity Date |
Face Amount† |
||||||||||||||||||
| Short-Term Investments — 3.0% |
|
|||||||||||||||||||
| Sovereign Bonds — 2.4% | ||||||||||||||||||||
| Egypt — 1.2% |
||||||||||||||||||||
| Egypt Treasury Bills |
17.070% | 10/2/18 | 201,500,000 | EGP | 10,757,036 | (h) | ||||||||||||||
| Egypt Treasury Bills |
17.271% | 11/13/18 | 11,300,000 | EGP | 593,103 | (h) | ||||||||||||||
| Total Egypt |
|
11,350,139 | ||||||||||||||||||
| Nigeria — 1.2% |
||||||||||||||||||||
| Federal Republic of Nigeria |
13.229% | 1/31/19 | 4,405,600,000 | NGN | 11,326,962 | (h) | ||||||||||||||
| Total Sovereign Bonds (Cost — $22,815,261) |
|
22,677,101 | ||||||||||||||||||
| Shares | ||||||||||||||||||||
| Money Market Funds — 0.6% | ||||||||||||||||||||
| Dreyfus Government Cash Management, Institutional Shares |
1.242% | 5,353,596 | 5,353,596 | |||||||||||||||||
| Total Short-Term Investments (Cost — $28,168,857) |
|
28,030,697 | ||||||||||||||||||
| Total Investments — 137.4% (Cost — $1,332,733,180) |
|
1,286,043,974 | ||||||||||||||||||
| Liabilities in Excess of Other Assets — (37.4)% |
|
(349,816,902 | ) | |||||||||||||||||
| Total Net Assets — 100.0% |
|
$ | 936,227,072 | |||||||||||||||||
See Notes to Financial Statements.
| Western Asset Emerging Markets Debt Fund Inc. 2018 Semi-Annual Report | 15 |
Schedule of investments (unaudited) (cont’d)
June 30, 2018
Western Asset Emerging Markets Debt Fund Inc.
| † | Face amount denominated in U.S. dollars, unless otherwise noted. |
| (a) | Security is exempt from registration under Rule 144A of the Securities Act of 1933. This security may be resold in transactions that are exempt from registration, normally to qualified institutional buyers. This security has been deemed liquid pursuant to guidelines approved by the Board of Directors. |
| (b) | Variable rate security. Interest rate disclosed is as of the most recent information available. Certain variable rate securities are not based on a published reference rate and spread but are determined by the issuer or agent and are based on current market conditions. These securities do not indicate a reference rate and spread in their description above. |
| (c) | All or a portion of this security is pledged as collateral pursuant to the loan agreement (Note 5). |
| (d) | All or a portion of this security is held by the counterparty as collateral for open reverse repurchase agreements. |
| (e) | Security is exempt from registration under Regulation S of the Securities Act of 1933. Regulation S applies to securities offerings that are made outside of the United States and do not involve direct selling efforts in the United States. This security has been deemed liquid pursuant to guidelines approved by the Board of Directors. |
| (f) | The coupon payment on these securities is currently in default as of June 30, 2018. |
| (g) | Security has no maturity date. The date shown represents the next call date. |
| (h) | Rate shown represents yield-to-maturity. |
| Abbreviations used in this schedule: | ||
| ARS | — Argentine Peso | |
| BRL | — Brazilian Real | |
| CER | — Coeficente de Establilzacion de Referencia | |
| EGP | — Egypt Pound | |
| EUR | — Euro | |
| ICE | — Intercontinental Exchange | |
| IDR | — Indonesian Rupiah | |
| JSC | — Joint Stock Company | |
| MXN | — Mexican Peso | |
| NGN | — Nigerian Naira | |
| OJSC | — Open Joint Stock Company | |
| PJSC | — Private Joint Stock Company | |
| RUB | — Russian Ruble | |
| UYU | — Uruguayan Peso | |
At June 30, 2018, the Fund had the following open reverse repurchase agreements:
| Counterparty | Rate | Effective Date |
Maturity Date |
Face Amount of Reverse Repurchase Agreements |
Asset Class of Collateral* | Collateral Value |
||||||||||||||
| Barclays Bank PLC | 2.350 | % | 6/14/2018 | TBD** | $ | 9,898,388 | Sovereign Bonds | $ | 10,533,046 | |||||||||||
| Cash | 327,708 | |||||||||||||||||||
| Barclays Bank PLC | 2.350 | % | 6/14/2018 | TBD** | 12,465,000 | Sovereign Bonds | 12,645,151 | |||||||||||||
| Cash | 412,682 | |||||||||||||||||||
| Barclays Bank PLC | 2.350 | % | 6/14/2018 | TBD** | 25,132,500 | Sovereign Bonds | 26,457,354 | |||||||||||||
| Cash | 832,068 | |||||||||||||||||||
| Barclays Bank PLC | 2.600 | % | 6/14/2018 | TBD** | 12,642,500 | Corporate Bonds & Notes | 13,103,165 | |||||||||||||
| Cash | 418,558 | |||||||||||||||||||
See Notes to Financial Statements.
| 16 | Western Asset Emerging Markets Debt Fund Inc. 2018 Semi-Annual Report |
Western Asset Emerging Markets Debt Fund Inc.
| Counterparty | Rate | Effective Date |
Maturity Date |
Face Amount of Reverse Repurchase Agreements |
Asset Class of Collateral* | Collateral Value |
||||||||||||||||
| Barclays Bank PLC | 2.600 | % | 6/14/2018 | TBD** | $ | 4,681,250 | Sovereign Bonds | $ | 4,720,300 | |||||||||||||
| Cash | 154,983 | |||||||||||||||||||||
| Barclays Bank PLC | 2.600 | % | 6/14/2018 | TBD** | 11,145,637 | Sovereign Bonds | 12,067,986 | |||||||||||||||
| Cash | 369,001 | |||||||||||||||||||||
| Credit Suisse | 2.600 | % | 6/15/2018 | TBD** | 15,937,500 | Sovereign Bonds | 18,844,963 | |||||||||||||||
| $ | 91,902,775 | $ | 100,886,965 | |||||||||||||||||||
| * | Refer to the Schedule of Investments for positions held at the counterparty as collateral for reverse repurchase agreements. |
| ** | TBD — To Be Determined; These reverse repurchase agreements have no maturity dates because they are renewed daily and can be terminated by either the Fund or the counterparty in accordance with the terms of the agreements. |
| Schedule of Written Options | ||||||||||||||||||||||||
| OTC Written Options |
| |||||||||||||||||||||||
| Security | Counterparty | Expiration Date |
Strike Price |
Contracts | Notional Amount |
Value | ||||||||||||||||||
| U.S. Dollar/Euro, Call | JPMorgan Chase & Co. | 8/1/18 | $ | 1.24 | 16,500,000 | $ | 16,500,000 | $ | 1,281 | |||||||||||||||
| U.S. Dollar/Mexican Peso, Call | JPMorgan Chase & Co. | 7/13/18 | 18.00 | MXN | 10,250,000 | 10,250,000 | 1,004 | |||||||||||||||||
| Total OTC Written Options (Premiums received — $309,845) |
|
$ | 2,285 | |||||||||||||||||||||
At June 30, 2018, the Fund had the following open futures contracts:
| Number of Contracts |
Expiration Date |
Notional Amount |
Market Value |
Unrealized Depreciation |
||||||||||||||||
| Contracts to Sell: |
|
|||||||||||||||||||
| U.S. Treasury 10-Year Notes | 1,423 | 9/18 | $ | 168,961,579 | $ | 171,026,813 | $ | (2,065,234) | ||||||||||||
At June 30, 2018, the Fund had the following open forward foreign currency contracts:
| Currency Purchased |
Currency Sold |
Counterparty | Settlement Date |
Unrealized Appreciation (Depreciation) |
||||||||||||||||
| BRL | 69,822,429 | USD | 18,084,027 | Citibank N.A. | 7/16/18 | $ | (106,082) | |||||||||||||
| MYR | 41,853,000 | USD | 10,825,918 | Goldman Sachs & Co. | 7/16/18 | (468,951) | ||||||||||||||
| USD | 5,281,254 | MYR | 20,890,000 | Goldman Sachs & Co. | 7/16/18 | 111,803 | ||||||||||||||
| BRL | 40,413,000 | USD | 10,466,978 | JPMorgan Chase & Co. | 7/16/18 | (61,400) | ||||||||||||||
| INR | 2,040,557,029 | USD | 31,053,980 | JPMorgan Chase & Co. | 7/16/18 | (1,331,751) | ||||||||||||||
| USD | 7,796,910 | ARS | 204,123,097 | JPMorgan Chase & Co. | 7/16/18 | 872,867 | ||||||||||||||
| USD | 14,024,217 | ARS | 304,606,000 | JPMorgan Chase & Co. | 7/16/18 | 3,691,702 | ||||||||||||||
| USD | 9,550,537 | INR | 658,987,029 | JPMorgan Chase & Co. | 7/16/18 | (48,099) | ||||||||||||||
| USD | 10,915,057 | BRL | 40,413,000 | JPMorgan Chase & Co. | 7/16/18 | 509,480 | ||||||||||||||
| USD | 20,276,588 | BRL | 69,822,429 | Citibank N.A. |
7/16/18 | 2,298,643 | ||||||||||||||
| USD | 14,723,694 | IDR | 209,312,036,494 | Citibank N.A. | 7/16/18 | 150,272 | ||||||||||||||
See Notes to Financial Statements.
| Western Asset Emerging Markets Debt Fund Inc. 2018 Semi-Annual Report | 17 |
Schedule of investments (unaudited) (cont’d)
June 30, 2018
Western Asset Emerging Markets Debt Fund Inc.
| Currency Purchased |
Currency Sold |
Counterparty | Settlement Date |
Unrealized Appreciation (Depreciation) |
||||||||||||||||
| USD | 20,271,000 | INR | 1,381,570,000 | JPMorgan Chase & Co. | 7/16/18 | $ | 147,406 | |||||||||||||
| USD | 5,293,687 | MYR | 20,963,000 | Goldman Sachs & Co. | 7/16/18 | 106,171 | ||||||||||||||
| CAD | 4,000,000 | USD | 3,182,484 | Barclays Bank PLC | 7/19/18 | (138,751) | ||||||||||||||
| USD | 3,119,152 | CAD | 4,000,000 | Barclays Bank PLC | 7/19/18 | 75,419 | ||||||||||||||
| USD | 5,964,072 | EUR | 4,800,000 | Barclays Bank PLC | 7/19/18 | 350,339 | ||||||||||||||
| SAR | 78,665,000 | USD | 20,977,333 | Bank of America N.A. | 8/15/18 | 586 | ||||||||||||||
| USD | 20,954,479 | SAR | 78,665,000 | Bank of America N.A. | 8/15/18 | (23,441) | ||||||||||||||
| CZK | 209,527,597 | USD | 9,877,088 | JPMorgan Chase & Co. | 8/15/18 | (431,099) | ||||||||||||||
| USD | 20,500,852 | PHP | 1,071,118,280 | JPMorgan Chase & Co. | 8/15/18 | 476,195 | ||||||||||||||
| USD | 17,979,198 | MXN | 370,100,000 | JPMorgan Chase & Co. | 9/14/18 | (431,292) | ||||||||||||||
| CNY | 70,598,330 | USD | 10,402,760 | Citibank N.A. | 10/15/18 | 228,084 | ||||||||||||||
| CNY | 132,293,999 | USD | 20,548,928 | Citibank N.A. | 10/15/18 | (627,822) | ||||||||||||||
| USD | 17,933,075 | BRL | 69,822,429 | Citibank N.A. | 10/15/18 | 108,542 | ||||||||||||||
| USD | 9,762,881 | CNY | 65,167,231 | Citibank N.A. | 10/15/18 | (50,137) | ||||||||||||||
| USD | 21,474,249 | CNY | 137,725,098 | Citibank N.A. | 10/15/18 | 735,317 | ||||||||||||||
| INR | 658,987,029 | USD | 9,428,917 | JPMorgan Chase & Co. | 10/15/18 | 67,626 | ||||||||||||||
| USD | 10,380,140 | BRL | 40,413,000 | JPMorgan Chase & Co. | 10/15/18 | 63,357 | ||||||||||||||
| USD | 20,938,862 | SAR | 78,665,000 | Bank of America N.A. | 2/14/19 | (33,072) | ||||||||||||||
| Total | $ | 6,241,912 | ||||||||||||||||||
| Abbreviations used in this table: | ||
| ARS | — Argentine Peso | |
| BRL | — Brazilian Real | |
| CAD | — Canadian Dollar | |
| CNY | — Chinese Yuan Renminbi | |
| CZK | — Czech Koruna | |
| EUR | — Euro | |
| IDR | — Indonesian Rupiah | |
| INR | — Indian Rupee | |
| MXN | — Mexican Peso | |
| MYR | — Malaysian Ringgit | |
| PHP | — Philippine Peso | |
| SAR | — Saudi Arabian Riyal | |
| USD | — United States Dollar | |
See Notes to Financial Statements.
| 18 | Western Asset Emerging Markets Debt Fund Inc. 2018 Semi-Annual Report |
Western Asset Emerging Markets Debt Fund Inc.
At June 30, 2018, the Fund had the following open swap contracts:
| OTC CREDIT DEFAULT SWAPS ON SOVEREIGN ISSUES — BUY PROTECTION1 | ||||||||||||||||||||||||
| Swap Counterparty (Reference Entity) |
Notional Amount2 |
Termination Date |
Implied Credit Spread at June 30, 20183 |
Periodic Payments Made by the Fund† |
Market Value |
Upfront Premiums Paid (Received) |
Unrealized Depreciation |
|||||||||||||||||
| Barclays Bank PLC (Republic of Korea, 7.125%, due 4/16/19) | $ | 11,200,000 | 12/20/22 | 0.46% | 1.000% quarterly | $ | (254,314) | $ | (138,568) | $ | (115,746) | |||||||||||||
| Barclays Bank PLC (Saudi Government International Bond, 2.375%, due 10/26/21) | 21,000,000 | 12/20/22 | 0.82% | 1.000% quarterly | (158,502) | 26,271 | (184,773) | |||||||||||||||||
| Total | $ | 32,200,000 | $ | (412,816) | $ | (112,297) | $ | (300,519) | ||||||||||||||||
| 1 | If the Fund is a buyer of protection and a credit event occurs, as defined under the terms of that particular swap agreement, the Fund will either (i) receive from the seller of protection an amount equal to the notional amount of the swap and deliver the referenced obligation or the underlying securities comprising the referenced index or (ii) receive a net settlement amount in the form of cash or securities equal to the notional amount of the swap less the recovery value of the referenced obligation or the underlying securities comprising the referenced index. |
| 2 | The maximum potential amount the Fund could be required to pay as a seller of credit protection or receive as a buyer of credit protection if a credit event occurs as defined under the terms of that particular swap agreement. |
| 3 | Implied credit spreads, utilized in determining the market value of credit default swap agreements on corporate or sovereign issues as of period end, serve as an indicator of the current status of the payment/performance risk and represent the likelihood or risk of default for the credit derivative. The implied credit spread of a particular referenced entity reflects the cost of buying/selling protection and may include upfront payments required to be made to enter into the agreement. Wider credit spreads represent a deterioration of the referenced entity’s credit soundness and a greater likelihood or risk of default or other credit event occurring as defined under the terms of the agreement. A credit spread identified as “Defaulted” indicates a credit event has occurred for the referenced entity or obligation. |
| † | Percentage shown is an annual percentage rate. |
| Summary of Investments by Country* | ||||
| Indonesia | 10.1 | % | ||
| Mexico | 9.1 | |||
| Argentina | 7.8 | |||
| Brazil | 7.3 | |||
| Russia | 7.3 | |||
| Peru | 6.5 | |||
| Colombia | 4.9 | |||
| Kazakhstan | 2.4 | |||
| China | 2.4 | |||
| Ecuador | 2.2 | |||
| Turkey | 2.1 | |||
See Notes to Financial Statements.
| Western Asset Emerging Markets Debt Fund Inc. 2018 Semi-Annual Report | 19 |
Schedule of investments (unaudited) (cont’d)
June 30, 2018
Western Asset Emerging Markets Debt Fund Inc.
| Summary of Investments by Country* (cont’d) | ||||
| Poland | 2.1 | % | ||
| Chile | 1.8 | |||
| Uruguay | 1.7 | |||
| Sri Lanka | 1.5 | |||
| Ukraine | 1.5 | |||
| Egypt | 1.4 | |||
| Senegal | 1.3 | |||
| Ghana | 1.3 | |||
| Dominican Republic | 1.3 | |||
| Netherlands | 1.2 | |||
| Costa Rica | 1.2 | |||
| Venezuela | 1.2 | |||
| Malaysia | 1.2 | |||
| Hungary | 1.1 | |||
| United Arab Emirates | 1.0 | |||
| Qatar | 1.0 | |||
| Nigeria | 0.9 | |||
| Lebanon | 0.8 | |||
| Vietnam | 0.8 | |||
| Morocco | 0.8 | |||
| South Africa | 0.8 | |||
| Croatia | 0.8 | |||
| Ivory Coast | 0.7 | |||
| Romania | 0.7 | |||
| Oman | 0.6 | |||
| Philippines | 0.6 | |||
| India | 0.6 | |||
| Lithuania | 0.5 | |||
| El Salvador | 0.5 | |||
| Guatemala | 0.4 | |||
| Jamaica | 0.4 | |||
| Belarus | 0.4 | |||
| Kenya | 0.4 | |||
| United Kingdom | 0.4 | |||
| Honduras | 0.4 | |||
| Angola | 0.3 | |||
| Armenia | 0.3 | |||
| Paraguay | 0.3 | |||
| Jordan | 0.3 | |||
See Notes to Financial Statements.
| 20 | Western Asset Emerging Markets Debt Fund Inc. 2018 Semi-Annual Report |
Western Asset Emerging Markets Debt Fund Inc.
| Summary of Investments by Country* (cont’d) | ||||
| Ireland | 0.2 | % | ||
| Georgia | 0.2 | |||
| Ethiopia | 0.2 | |||
| Kuwait | 0.1 | |||
| Panama | 0.1 | |||
| Gabon | 0.1 | |||
| Cameroon | 0.1 | |||
| South Korea | 0.1 | |||
| Hong Kong | 0.1 | |||
| Purchased Options | 0.0 | † | ||
| Short-Term Investments | 2.2 | |||
| 100.0 | % | |||
| * | As a percentage of total investments. Please note that the Fund holdings are as of June 30, 2018 and are subject to change. |
| † | Represents less than 0.1%. |
See Notes to Financial Statements.
| Western Asset Emerging Markets Debt Fund Inc. 2018 Semi-Annual Report | 21 |
Statement of assets and liabilities (unaudited)
June 30, 2018
| Assets: | ||||
| Investments, at value (Cost $1,332,733,180) |
$ | 1,286,043,974 | ||
| Cash |
6,894,785 | |||
| Foreign currency, at value (Cost — $2,976,563) |
2,647,894 | |||
| Interest receivable |
21,538,589 | |||
| Unrealized appreciation on forward foreign currency contracts |
9,993,809 | |||
| Receivable for securities sold |
3,491,403 | |||
| Deposits with brokers for open reverse repurchase agreements |
2,515,000 | |||
| Deposits with brokers for open futures contracts |
1,643,565 | |||
| Deposits with brokers for OTC derivatives |
910,000 | |||
| Prepaid expenses |
23,186 | |||
| Total Assets |
1,335,702,205 | |||
| Liabilities: | ||||
| Loan payable (Note 5) |
295,000,000 | |||
| Payable for open reverse repurchase agreements |
91,902,775 | |||
| Distributions payable |
6,074,601 | |||
| Unrealized depreciation on forward foreign currency contracts |
3,751,897 | |||
| Investment management fee payable |
968,732 | |||
| Interest payable |
873,562 | |||
| OTC swaps, at value (net premiums received — $112,297) |
412,816 | |||
| Foreign currency overdraft, at value (Cost — $313,322) |
313,279 | |||
| Payable for open OTC swap contracts |
9,839 | |||
| Directors’ fees payable |
9,670 | |||
| Written options, at value (premiums received — $309,845) |
2,285 | |||
| Accrued expenses |
155,677 | |||
| Total Liabilities |
399,475,133 | |||
| Total Net Assets | $ | 936,227,072 | ||
| Net Assets: | ||||
| Par value ($0.001 par value; 60,746,012 shares issued and outstanding; 100,000,000 shares authorized) |
$ | 60,746 | ||
| Paid-in capital in excess of par value |
1,118,571,236 | |||
| Overdistributed net investment income |
(5,561,331) | |||
| Accumulated net realized loss on investments, futures contracts, written options, swap contracts, forward foreign currency contracts and foreign currency transactions |
(133,725,228) | |||
| Net unrealized depreciation on investments, futures contracts, written options, swap contracts, forward foreign currency contracts and foreign currencies |
(43,118,351) | |||
| Total Net Assets | $ | 936,227,072 | ||
| Shares Outstanding | 60,746,012 | |||
| Net Asset Value | $15.41 | |||
See Notes to Financial Statements.
| 22 | Western Asset Emerging Markets Debt Fund Inc. 2018 Semi-Annual Report |
Statement of operations (unaudited)
For the Six Months Ended June 30, 2018
| Investment Income: | ||||
| Interest |
$ | 43,234,051 | ||
| Less: Foreign taxes withheld |
(269,466) | |||
| Total Investment Income |
42,964,585 | |||
| Expenses: | ||||
| Investment management fee (Note 2) |
6,039,893 | |||
| Interest expense (Notes 3 and 5) |
4,869,340 | |||
| Transfer agent fees |
145,551 | |||
| Directors’ fees |
137,797 | |||
| Legal fees |
83,675 | |||
| Custody fees |
51,536 | |||
| Fund accounting fees |
47,556 | |||
| Audit and tax fees |
36,018 | |||
| Shareholder reports |
20,357 | |||
| Stock exchange listing fees |
15,438 | |||
| Insurance |
7,177 | |||
| Miscellaneous expenses |
11,180 | |||
| Total Expenses |
11,465,518 | |||
| Less: Fee waivers and/or expense reimbursements (Note 2) |
(213,173) | |||
| Net Expenses |
11,252,345 | |||
| Net Investment Income | 31,712,240 | |||
| Realized and Unrealized Gain (Loss) on Investments, Futures Contracts, Written Options, Swap Contracts, Forward Foreign Currency Contracts and Foreign Currency Transactions (Notes 1, 3 and 4): |
||||
| Net Realized Gain (Loss) From: |
||||
| Investment transactions |
(8,637,499) | |||
| Futures contracts |
5,752,262 | |||
| Written options |
186,353 | |||
| Swap contracts |
(1,405,566) | |||
| Forward foreign currency contracts |
(620,446) | |||
| Foreign currency transactions |
(565,841) | |||
| Net Realized Loss |
(5,290,737) | |||
| Change in Net Unrealized Appreciation (Depreciation) From: |
||||
| Investments |
(126,432,476) | † | ||
| Futures contracts |
(2,623,860) | |||
| Written options |
307,560 | |||
| Swap contracts |
766,544 | |||
| Forward foreign currency contracts |
6,230,877 | |||
| Foreign currencies |
(493,688) | |||
| Change in Net Unrealized Appreciation (Depreciation) |
(122,245,043) | |||
| Net Loss on Investments, Futures Contracts, Written Options, Swap Contracts, Forward Foreign Currency Contracts and Foreign Currency Transactions | (127,535,780) | |||
| Decrease in Net Assets From Operations | $ | (95,823,540) | ||
| † | Net of change in accrued foreign capital gains tax of $(101,848). |
See Notes to Financial Statements.
| Western Asset Emerging Markets Debt Fund Inc. 2018 Semi-Annual Report | 23 |
Statements of changes in net assets
| For the Six Months Ended June 30, 2018 (unaudited) and the Year Ended December 31, 2017 |
2018 | 2017 | ||||||
| Operations: | ||||||||
| Net investment income |
$ | 31,712,240 | $ | 71,332,907 | ||||
| Net realized loss |
(5,290,737) | (6,738,680) | ||||||
| Change in net unrealized appreciation (depreciation) |
(122,245,043) | 38,801,244 | ||||||
| Increase (Decrease) in Net Assets From Operations |
(95,823,540) | 103,395,471 | ||||||
| Distributions to Shareholders From (Note 1): | ||||||||
| Net investment income |
(36,447,607) | (68,461,427) | ||||||
| Return of capital |
— | (5,041,248) | ||||||
| Decrease in Net Assets From Distributions to Shareholders |
(36,447,607) | (73,502,675) | ||||||
| Increase (Decrease) in Net Assets |
(132,271,147) | 29,892,796 | ||||||
| Net Assets: | ||||||||
| Beginning of period |
1,068,498,219 | 1,038,605,423 | ||||||
| End of period* |
$ | 936,227,072 | $ | 1,068,498,219 | ||||
| *Includes overdistributed net investment income of: |
$(5,561,331) | $(825,964) | ||||||
See Notes to Financial Statements.
| 24 | Western Asset Emerging Markets Debt Fund Inc. 2018 Semi-Annual Report |
Statement of cash flows (unaudited)
For the Six Months Ended June 30, 2018
| Increase (Decrease) in Cash: | ||||
| Cash Provided (Used) by Operating Activities: | ||||
| Net decrease in net assets resulting from operations |
$ | (95,823,540) | ||
| Adjustments to reconcile net decrease in net assets resulting from operations |
||||
| Purchases of portfolio securities |
(278,367,395) | |||
| Sales of portfolio securities |
266,813,745 | |||
| Net purchases, sales and maturities of short-term investments |
(10,803,810) | |||
| Realized loss on purchased options |
(278,050) | |||
| Realized gain on options written |
186,353 | |||
| Net amortization of premium (accretion of discount) |
(4,088,092) | |||
| Increase in receivable for securities sold |
(3,491,403) | |||
| Decrease in interest receivable |
2,894,296 | |||
| Increase in prepaid expenses |
(8,517) | |||
| Decrease in principal paydown receivable |
56,000 | |||
| Decrease in payable for securities purchased |
(7,607,861) | |||
| Decrease in investment management fee payable |
(33,157) | |||
| Decrease in Directors’ fee payable |
(27,299) | |||
| Increase in interest payable |
516,749 | |||
| Decrease in accrued expenses |
(52,317) | |||
| Decrease in payable to broker — variation margin on open futures contracts |
(199,875) | |||
| Decrease in payable for open OTC swap contracts |
(894) | |||
| Decrease in net premiums received for OTC swap contracts |
(12,446) | |||
| Increase in premiums received from options written |
309,845 | |||
| Net realized loss on investments |
8,637,499 | |||
| Change in net unrealized appreciation (depreciation) of investments, written options, OTC swap contracts and forward foreign currency transactions |
119,127,495 | |||
| Net Cash Used by Operating Activities* |
(2,252,674) | |||
| Cash Flows From Financing Activities: | ||||
| Distributions paid on common stock |
(30,373,006) | |||
| Increase in payable for reverse repurchase agreements |
35,164,025 | |||
| Due to custodian |
313,279 | |||
| Net Cash Provided in Financing Activities |
5,104,298 | |||
| Net Increase in Cash and Restricted Cash | 2,851,624 | |||
| Cash and restricted cash at beginning of period |
11,759,620 | |||
| Cash and restricted cash at end of period |
$ | 14,611,244 | ||
| * | Included in operating expenses is cash of $4,352,591 paid for interest on borrowings. |
The following table provides a reconciliation of cash and restricted cash reported with the Statement of Assets and Liabilities that sums to the total of the such amounts shown on the Statement of Cash Flows.
| June 30, 2018 | ||||
| Cash |
$9,542,679 | |||
| Restricted cash |
5,068,565 | |||
| Total cash and restricted cash shown in the Statement of Cash Flows |
$14,611,244 | |||
Restricted cash consists of cash that has been segregated to cover the Fund’s collateral or margin obligations under derivative contracts and for reverse repurchase agreements. It is separately reported on the Statement of Assets and Liabilities as Deposits with brokers.
See Notes to Financial Statements.
| Western Asset Emerging Markets Debt Fund Inc. 2018 Semi-Annual Report | 25 |
| For a share of capital stock outstanding throughout each year ended December 31, unless otherwise noted: | ||||||||||||||||||||||||
| 20181,2 | 20171 | 20161 | 20151 | 20141 | 20131 | |||||||||||||||||||
| Net asset value, beginning of period | $17.59 | $17.10 | $16.37 | $18.16 | $19.11 | $22.42 | ||||||||||||||||||
| Income (loss) from operations: | ||||||||||||||||||||||||
| Net investment income |
0.52 | 1.17 | 1.01 | 1.05 | 1.15 | 1.12 | ||||||||||||||||||
| Net realized and unrealized gain (loss) |
(2.10) | 0.53 | 0.98 | (1.53) | (0.68) | (2.99) | ||||||||||||||||||
| Total income (loss) from operations |
(1.58) | 1.70 | 1.99 | (0.48) | 0.47 | (1.87) | ||||||||||||||||||
| Less distributions from: | ||||||||||||||||||||||||
| Net investment income |
(0.60) | 3 | (1.13) | (0.98) | (1.15) | (1.37) | (1.25) | |||||||||||||||||
| Net realized gains |
— | — | — | — | (0.05) | (0.19) | ||||||||||||||||||
| Return of capital |
— | (0.08) | (0.28) | (0.16) | — | — | ||||||||||||||||||
| Total distributions |
(0.60) | (1.21) | (1.26) | (1.31) | (1.42) | (1.44) | ||||||||||||||||||
| Net asset value, end of period | $15.41 | $17.59 | $17.10 | $16.37 | $18.16 | $19.11 | ||||||||||||||||||
| Market price, end of period | $13.27 | $15.55 | $14.71 | $13.73 | $15.76 | $17.20 | ||||||||||||||||||
| Total return, based on NAV4,5 |
(9.16) | % | 10.17 | % | 12.44 | % | (2.83) | % | 2.25 | % | (8.58) | % | ||||||||||||
| Total return, based on Market Price6 |
(10.99) | % | 14.22 | % | 16.56 | % | (4.89) | % | (0.60) | % | (14.89) | % | ||||||||||||
| Net assets, end of period (millions) | $936 | $1,068 | $1,039 | $504 | $559 | $588 | ||||||||||||||||||
| Ratios to average net assets: | ||||||||||||||||||||||||
| Gross expenses |
2.28 | %7 | 1.83 | %8 | 1.60 | %8 | 1.33 | % | 1.25 | % | 1.20 | % | ||||||||||||
| Net expenses |
2.24 | 7,9 | 1.79 | 8,9 | 1.59 | 8,9 | 1.33 | 1.25 | 1.20 | |||||||||||||||
| Net investment income |
6.32 | 7 | 6.66 | 5.92 | 5.97 | 5.91 | 5.43 | |||||||||||||||||
| Portfolio turnover rate | 20 | % | 33 | % | 30 | % | 37 | % | 35 | % | 25 | % | ||||||||||||
| Supplemental data: | ||||||||||||||||||||||||
| Loan Outstanding, End of Period (000s) |
$295,000 | $295,000 | $295,000 | $101,780 | $102,180 | $53,950 | ||||||||||||||||||
| Asset Coverage Ratio for Loan Outstanding10 |
417 | % | 462 | % | 452 | % | 595 | % | 647 | % | 1,191 | % | ||||||||||||
| Asset Coverage, per $1,000 Principal Amount of Loan Outstanding10 |
$4,174 | $4,622 | $4,521 | $5,953 | $6,472 | 11 | $11,907 | 11 | ||||||||||||||||
| Weighted Average Loan (000s) |
$295,000 | $295,000 | $135,366 | $98,076 | $75,780 | $32,807 | ||||||||||||||||||
| Weighted Average Interest Rate on Loan |
2.60 | % | 1.89 | % | 1.29 | % | 0.96 | % | 0.91 | % | 0.94 | % | ||||||||||||
See Notes to Financial Statements.
| 26 | Western Asset Emerging Markets Debt Fund Inc. 2018 Semi-Annual Report |
| 1 | Per share amounts have been calculated using the average shares method. |
| 2 | For the six months ended June 30, 2018 (unaudited). |
| 3 | The actual source of the Fund’s current fiscal year distributions may be from net investment income, return of capital or a combination of both. Shareholders will be informed of the tax characteristics of the distributions after the close of the fiscal year. |
| 4 | Performance figures may reflect compensating balance arrangements, fee waivers and/or expense reimbursements. In the absence of compensating balance arrangements, fee waivers and/or expense reimbursements, the total return would have been lower. Past performance is no guarantee of future results. Total returns for periods of less than one year are not annualized. |
| 5 | The total return calculation assumes that distributions are reinvested at NAV. Past performance is no guarantee of future results. Total returns for periods of less than one year are not annualized. |
| 6 | The total return calculation assumes that distributions are reinvested in accordance with the Fund’s dividend reinvestment plan. Past performance is no guarantee of future results. Total returns for periods of less than one year are not annualized. |
| 7 | Annualized. |
| 8 | Included in the expense ratios are certain non-recurring reorganization fees that were incurred by the Fund during the period. Without these fees, the gross and net expense ratios would have been 1.82% and 1.78%, respectively, for the year ended December 31, 2017 and would both have been 1.52% for the year ended December 31, 2016. |
| 9 | Reflects fee waivers and/or expense reimbursements. |
| 10 | Represents value of net assets plus the loan outstanding at the end of the period divided by the loan outstanding at the end of the period. |
| 11 | Added to conform to current period presentation. |
See Notes to Financial Statements.
| Western Asset Emerging Markets Debt Fund Inc. 2018 Semi-Annual Report | 27 |
Notes to financial statements (unaudited)
1. Organization and significant accounting policies
Western Asset Emerging Markets Debt Fund Inc. (the “Fund”) was incorporated in Maryland on April 16, 2003 and is registered as a non-diversified, closed-end management investment company under the Investment Company Act of 1940, as amended (the “1940 Act”). The Board of Directors authorized 100 million shares of $0.001 par value common stock. The Fund’s primary investment objective is to seek high current income and the Fund’s secondary objective is to seek capital appreciation.
The following are significant accounting policies consistently followed by the Fund and are in conformity with U.S. generally accepted accounting principles (“GAAP”). Estimates and assumptions are required to be made regarding assets, liabilities and changes in net assets resulting from operations when financial statements are prepared. Changes in the economic environment, financial markets and any other parameters used in determining these estimates could cause actual results to differ. Subsequent events have been evaluated through the date the financial statements were issued.
(a) Investment valuation. The valuations for fixed income securities (which may include, but are not limited to, corporate, government, municipal, mortgage-backed, collateralized mortgage obligations and asset-backed securities) and certain derivative instruments are typically the prices supplied by independent third party pricing services, which may use market prices or broker/dealer quotations or a variety of valuation techniques and methodologies. The independent third party pricing services use inputs that are observable such as issuer details, interest rates, yield curves, prepayment speeds, credit risks/spreads, default rates and quoted prices for similar securities. Investments in open-end funds are valued at the closing net asset value per share of each fund on the day of valuation. Futures contracts are valued daily at the settlement price established by the board of trade or exchange on which they are traded. Equity securities for which market quotations are available are valued at the last reported sales price or official closing price on the primary market or exchange on which they trade. When the Fund holds securities or other assets that are denominated in a foreign currency, the Fund will normally use the currency exchange rates as of 4:00 p.m. (Eastern Time). If independent third party pricing services are unable to supply prices for a portfolio investment, or if the prices supplied are deemed by the manager to be unreliable, the market price may be determined by the manager using quotations from one or more broker/dealers or at the transaction price if the security has recently been purchased and no value has yet been obtained from a pricing service or pricing broker. When reliable prices are not readily available, such as when the value of a security has been significantly affected by events after the close of the exchange or market on which the security is principally traded, but before the Fund calculates its net asset value, the Fund values these securities as determined in accordance with procedures approved by the Fund’s Board of Directors.
The Board of Directors is responsible for the valuation process and has delegated the supervision of the daily valuation process to the Legg Mason North Atlantic Fund Valuation Committee (the “Valuation Committee”). The Valuation Committee, pursuant to the policies
| 28 | Western Asset Emerging Markets Debt Fund Inc. 2018 Semi-Annual Report |
adopted by the Board of Directors, is responsible for making fair value determinations, evaluating the effectiveness of the Fund’s pricing policies, and reporting to the Board of Directors. When determining the reliability of third party pricing information for investments owned by the Fund, the Valuation Committee, among other things, conducts due diligence reviews of pricing vendors, monitors the daily change in prices and reviews transactions among market participants.
The Valuation Committee will consider pricing methodologies it deems relevant and appropriate when making fair value determinations. Examples of possible methodologies include, but are not limited to, multiple of earnings; discount from market of a similar freely traded security; discounted cash-flow analysis; book value or a multiple thereof; risk premium/ yield analysis; yield to maturity; and/or fundamental investment analysis. The Valuation Committee will also consider factors it deems relevant and appropriate in light of the facts and circumstances. Examples of possible factors include, but are not limited to, the type of security; the issuer’s financial statements; the purchase price of the security; the discount from market value of unrestricted securities of the same class at the time of purchase; analysts’ research and observations from financial institutions; information regarding any transactions or offers with respect to the security; the existence of merger proposals or tender offers affecting the security; the price and extent of public trading in similar securities of the issuer or comparable companies; and the existence of a shelf registration for restricted securities.
For each portfolio security that has been fair valued pursuant to the policies adopted by the Board of Directors, the fair value price is compared against the last available and next available market quotations. The Valuation Committee reviews the results of such back testing monthly and fair valuation occurrences are reported to the Board of Directors quarterly.
The Fund uses valuation techniques to measure fair value that are consistent with the market approach and/or income approach, depending on the type of security and the particular circumstance. The market approach uses prices and other relevant information generated by market transactions involving identical or comparable securities. The income approach uses valuation techniques to discount estimated future cash flows to present value.
GAAP establishes a disclosure hierarchy that categorizes the inputs to valuation techniques used to value assets and liabilities at measurement date. These inputs are summarized in the three broad levels listed below:
| • | Level 1 — quoted prices in active markets for identical investments |
| • | Level 2 — other significant observable inputs (including quoted prices for similar investments, interest rates, prepayment speeds, credit risk, etc.) |
| • | Level 3 — significant unobservable inputs (including the Fund’s own assumptions in determining the fair value of investments) |
The inputs or methodologies used to value securities are not necessarily an indication of the risk associated with investing in those securities.
| Western Asset Emerging Markets Debt Fund Inc. 2018 Semi-Annual Report | 29 |
Notes to financial statements (unaudited) (cont’d)
The following is a summary of the inputs used in valuing the Fund’s assets and liabilities carried at fair value:
| ASSETS | ||||||||||||||||
| Description | Quoted Prices (Level 1) |
Other Significant Observable Inputs (Level 2) |
Significant Unobservable Inputs (Level 3) |
Total | ||||||||||||
| Long-term investments†: | ||||||||||||||||
| Sovereign bonds |
— | $ | 786,739,084 | — | $ | 786,739,084 | ||||||||||
| Corporate bonds & notes |
— | 470,884,266 | — | 470,884,266 | ||||||||||||
| OTC purchased options |
— | 389,927 | — | 389,927 | ||||||||||||
| Total long-term investments | — | 1,258,013,277 | — | 1,258,013,277 | ||||||||||||
| Short-term investments†: | ||||||||||||||||
| Sovereign bonds |
— | 22,677,101 | — | 22,677,101 | ||||||||||||
| Money market funds |
$ | 5,353,596 | — | — | 5,353,596 | |||||||||||
| Total short-term investments | 5,353,596 | 22,677,101 | — | 28,030,697 | ||||||||||||
| Total investments | $ | 5,353,596 | $ | 1,280,690,378 | — | $ | 1,286,043,974 | |||||||||
| Other financial instruments: | ||||||||||||||||
| Forward foreign currency contracts |
— | 9,993,809 | — | 9,993,809 | ||||||||||||
| Total | $ | 5,353,596 | $ | 1,290,684,187 | — | $ | 1,296,037,783 | |||||||||
| LIABILITIES | ||||||||||||||||
| Description | Quoted Prices (Level 1) |
Other Significant Observable Inputs (Level 2) |
Significant Unobservable Inputs (Level 3) |
Total | ||||||||||||
| Other financial instruments: | ||||||||||||||||
| OTC written options |
— | $ | 2,285 | — | $ | 2,285 | ||||||||||
| Futures contracts |
$ | 2,065,234 | — | — | 2,065,234 | |||||||||||
| Forward foreign currency contracts |
— | 3,751,897 | — | 3,751,897 | ||||||||||||
| OTC credit default swaps on sovereign issues — buy protection‡ |
— | 412,816 | — | 412,816 | ||||||||||||
| Total | $ | 2,065,234 | $ | 4,166,998 | — | $ | 6,232,232 | |||||||||
| † | See Schedule of Investments for additional detailed categorizations. |
| ‡ | Value includes any premium paid or received with respect to swap contracts. |
(b) Purchased options. When the Fund purchases an option, an amount equal to the premium paid by the Fund is recorded as an investment on the Statement of Assets and Liabilities, the value of which is marked-to-market to reflect the current market value of the option purchased. If the purchased option expires, the Fund realizes a loss equal to the amount of premium paid. When an instrument is purchased or sold through the exercise of an option, the related premium paid is added to the basis of the instrument acquired or deducted from the proceeds of the instrument sold. The risk associated with purchasing put and call options is limited to the premium paid.
(c) Written options. When the Fund writes an option, an amount equal to the premium received by the Fund is recorded as a liability, the value of which is marked-to-market daily
| 30 | Western Asset Emerging Markets Debt Fund Inc. 2018 Semi-Annual Report |
to reflect the current market value of the option written. If the option expires, the premium received is recorded as a realized gain. When a written call option is exercised, the difference between the premium received plus the option exercise price and the Fund’s basis in the underlying security (in the case of a covered written call option), or the cost to purchase the underlying security (in the case of an uncovered written call option), including brokerage commission, is recognized as a realized gain or loss. When a written put option is exercised, the amount of the premium received is subtracted from the cost of the security purchased by the Fund from the exercise of the written put option to form the Fund’s basis in the underlying security purchased. The writer or buyer of an option traded on an exchange can liquidate the position before the exercise of the option by entering into a closing transaction. The cost of a closing transaction is deducted from the original premium received resulting in a realized gain or loss to the Fund.
The risk in writing a covered call option is that the Fund may forego the opportunity of profit if the market price of the underlying security increases and the option is exercised. The risk in writing a put option is that the Fund may incur a loss if the market price of the underlying security decreases and the option is exercised. The risk in writing an uncovered call option is that the Fund is exposed to the risk of loss if the market price of the underlying security increases. In addition, there is the risk that the Fund may not be able to enter into a closing transaction because of an illiquid secondary market.
(d) Futures contracts. The Fund uses futures contracts generally to gain exposure to, or hedge against, changes in interest rates or gain exposure to, or hedge against, changes in certain asset classes. A futures contract represents a commitment for the future purchase or sale of an asset at a specified price on a specified date.
Upon entering into a futures contract, the Fund is required to deposit cash or cash equivalents with a broker in an amount equal to a certain percentage of the contract amount. This is known as the ‘‘initial margin’’ and subsequent payments (‘‘variation margin’’) are made or received by the Fund each day, depending on the daily fluctuation in the value of the contract. For certain futures, including foreign denominated futures, variation margin is not settled daily, but is recorded as a net variation margin payable or receivable. The daily changes in contract value are recorded as unrealized gains or losses in the Statement of Operations and the Fund recognizes a realized gain or loss when the contract is closed.
Futures contracts involve, to varying degrees, risk of loss in excess of the amounts reflected in the financial statements. In addition, there is the risk that the Fund may not be able to enter into a closing transaction because of an illiquid secondary market.
(e) Forward foreign currency contracts. The Fund enters into a forward foreign currency contract to hedge against foreign currency exchange rate risk on its non-U.S. dollar denominated securities or to facilitate settlement of a foreign currency denominated portfolio transaction. A forward foreign currency contract is an agreement between two parties to buy and sell a currency at a set price with delivery and settlement at a future date. The contract is marked-to-market daily and the change in value is recorded by the Fund as an unrealized gain or loss. When a forward foreign currency contract is closed, through either
| Western Asset Emerging Markets Debt Fund Inc. 2018 Semi-Annual Report | 31 |
Notes to financial statements (unaudited) (cont’d)
delivery or offset by entering into another forward foreign currency contract, the Fund recognizes a realized gain or loss equal to the difference between the value of the contract at the time it was opened and the value of the contract at the time it is closed.
Non-deliverable forward foreign currency exchange contracts are settled with the counterparty in cash without the delivery of foreign currency.
Forward foreign currency contracts involve elements of market risk in excess of the amounts reflected on the Statement of Assets and Liabilities. The Fund bears the risk of an unfavorable change in the foreign exchange rate underlying the forward foreign currency contract. Risks may also arise upon entering into these contracts from the potential inability of the counterparties to meet the terms of their contracts.
(f) Swap agreements. The Fund invests in swaps for the purpose of managing its exposure to interest rate, credit or market risk, or for other purposes. The use of swaps involves risks that are different from those associated with other portfolio transactions. Swap agreements are privately negotiated in the over-the-counter market and may be entered into as a bilateral contract (“OTC Swaps”) or centrally cleared (“Centrally Cleared Swaps”). Unlike Centrally Cleared Swaps, the Fund has credit exposure to the counterparties of OTC Swaps.
In a Centrally Cleared Swap, immediately following execution of the swap, the swap agreement is submitted to a clearinghouse or central counterparty (the “CCP”) and the CCP becomes the ultimate counterparty of the swap agreement. The Fund is required to interface with the CCP through a broker, acting in an agency capacity. All payments are settled with the CCP through the broker. Upon entering into a Centrally Cleared Swap, the Fund is required to deposit initial margin with the broker in the form of cash or securities.
Swap contracts are marked-to-market daily and changes in value are recorded as unrealized appreciation (depreciation). The daily change in valuation of Centrally Cleared Swaps, if any, is recorded as a receivable or payable for variation margin on the Statement of Assets and Liabilities. Gains or losses are realized upon termination of the swap agreement. Collateral, in the form of restricted cash or securities, may be required to be held in segregated accounts with the Fund’s custodian in compliance with the terms of the swap contracts.
Securities posted as collateral for swap contracts are identified in the Schedule of Investments and restricted cash, if any, is identified on the Statement of Assets and Liabilities. Risks may exceed amounts recorded in the Statement of Assets and Liabilities. These risks include changes in the returns of the underlying instruments, failure of the counterparties to perform under the contracts’ terms, and the possible lack of liquidity with respect to the swap agreements.
OTC swap payments received or made at the beginning of the measurement period are reflected as a premium or deposit, respectively, on the Statement of Assets and Liabilities. These upfront payments are amortized over the life of the swap and are recognized as
| 32 | Western Asset Emerging Markets Debt Fund Inc. 2018 Semi-Annual Report |
realized gain or loss in the Statement of Operations. Net periodic payments received or paid by the Fund are recognized as a realized gain or loss in the Statement of Operations.
The Fund’s maximum exposure in the event of a defined credit event on a credit default swap to sell protection is the notional amount. As of June 30, 2018, the Fund did not hold any credit default swaps to sell protection.
For average notional amounts of swaps held during the six months ended June 30, 2018, see Note 4.
Credit default swaps
The Fund enters into credit default swap (“CDS”) contracts for investment purposes, to manage its credit risk or to add leverage. CDS agreements involve one party making a stream of payments to another party in exchange for the right to receive a specified return in the event of a default by a third party, typically corporate or sovereign issuers, on a specified obligation, or in the event of a write-down, principal shortfall, interest shortfall or default of all or part of the referenced entities comprising a credit index. The Fund may use a CDS to provide protection against defaults of the issuers (i.e., to reduce risk where the Fund has exposure to an issuer) or to take an active long or short position with respect to the likelihood of a particular issuer’s default. As a seller of protection, the Fund generally receives an upfront payment or a stream of payments throughout the term of the swap provided that there is no credit event. If the Fund is a seller of protection and a credit event occurs, as defined under the terms of that particular swap agreement, the maximum potential amount of future payments (undiscounted) that the Fund could be required to make under a credit default swap agreement would be an amount equal to the notional amount of the agreement. These amounts of potential payments will be partially offset by any recovery of values from the respective referenced obligations. As a seller of protection, the Fund effectively adds leverage to its portfolio because, in addition to its total net assets, the Fund is subject to investment exposure on the notional amount of the swap. As a buyer of protection, the Fund generally receives an amount up to the notional value of the swap if a credit event occurs.
Implied spreads are the theoretical prices a lender receives for credit default protection. When spreads rise, market perceived credit risk rises and when spreads fall, market perceived credit risk falls. The implied credit spread of a particular referenced entity reflects the cost of buying/selling protection and may include upfront payments required to enter into the agreement. Wider credit spreads and decreasing market values, when compared to the notional amount of the swap, represent a deterioration of the referenced entity’s credit soundness and a greater likelihood or risk of default or other credit event occurring as defined under the terms of the agreement. Credit spreads utilized in determining the period end market value of credit default swap agreements on corporate or sovereign issues are disclosed in the Schedule of Investments and serve as an indicator of the current status of the payment/performance risk and represent the likelihood or risk of default for credit derivatives. For credit default swap agreements on asset-backed securities and credit indices, the quoted market prices and resulting values, particularly in relation to the
| Western Asset Emerging Markets Debt Fund Inc. 2018 Semi-Annual Report | 33 |
Notes to financial statements (unaudited) (cont’d)
notional amount of the contract as well as the annual payment rate, serve as an indication of the current status of the payment/performance risk.
The Fund’s maximum risk of loss from counterparty risk, as the protection buyer, is the fair value of the contract (this risk is mitigated by the posting of collateral by the counterparty to the Fund to cover the Fund’s exposure to the counterparty). As the protection seller, the Fund’s maximum risk is the notional amount of the contract. Credit default swaps are considered to have credit risk-related contingent features since they require payment by the protection seller to the protection buyer upon the occurrence of a defined credit event.
Entering into a CDS agreement involves, to varying degrees, elements of credit, market and documentation risk in excess of the related amounts recognized on the Statement of Assets and Liabilities. Such risks involve the possibility that there will be no liquid market for these agreements, that the counterparty to the agreement may default on its obligation to perform or disagree as to the meaning of the contractual terms in the agreement, and that there will be unfavorable changes in net interest rates.
Interest rate swaps
The Fund enters into interest rate swap contracts to manage its exposure to interest rate risk. Interest rate swaps are agreements between two parties to exchange cash flows based on a notional principal amount. The Fund may elect to pay a fixed rate and receive a floating rate, receive a fixed rate and pay a floating rate, or pay and receive a floating rate, on a notional principal amount. Interest rate swaps are marked-to-market daily based upon quotations from market makers and the change, if any, is recorded as an unrealized gain or loss in the Statement of Operations. When a swap contract is terminated early, the Fund records a realized gain or loss equal to the difference between the original cost and the settlement amount of the closing transaction.
The risks of interest rate swaps include changes in market conditions that will affect the value of the contract or changes in the present value of the future cash flow streams and the possible inability of the counterparty to fulfill its obligations under the agreement. The Fund’s maximum risk of loss from counterparty credit risk is the discounted net value of the cash flows to be received from the counterparty over the contract’s remaining life, to the extent that amount is positive. This risk is mitigated by the posting of collateral by the counterparty to the Fund to cover the Fund’s exposure to the counterparty.
(g) Reverse repurchase agreements. The Fund may enter into reverse repurchase agreements. Under the terms of a typical reverse repurchase agreement, a fund sells a security subject to an obligation to repurchase the security from the buyer at an agreed upon time and price. In the event the buyer of securities under a reverse repurchase agreement files for bankruptcy or becomes insolvent, the Fund’s use of the proceeds of the agreement may be restricted pending a determination by the counterparty, or its trustee or receiver, whether to enforce the Fund’s obligation to repurchase the securities. In entering into reverse repurchase agreements, the Fund will maintain cash, U.S. government securities or other liquid debt obligations at least equal in value to its obligations with respect
| 34 | Western Asset Emerging Markets Debt Fund Inc. 2018 Semi-Annual Report |
to reverse repurchase agreements or will take other actions permitted by law to cover its obligations. If the market value of the collateral declines during the period, the Fund may be required to post additional collateral to cover its obligation. Cash collateral that has been pledged to cover obligations of the Fund under reverse repurchase agreements, if any, will be reported separately in the Statement of Assets and Liabilities. Securities pledged as collateral are noted in the Schedule of Investments. Interest payments made on reverse repurchase agreements are recognized as a component of “Interest expense” on the Statement of Operations. In periods of increased demand for the security, the Fund may receive a fee for use of the security by the counterparty, which may result in interest income to the Fund.
(h) Cash flow information. The Fund invests in securities and distributes dividends from net investment income and net realized gains, which are paid in cash and may be reinvested at the discretion of shareholders. These activities are reported in the Statement of Changes in Net Assets and additional information on cash receipts and cash payments is presented in the Statement of Cash Flows.
(i) Foreign currency translation. Investment securities and other assets and liabilities denominated in foreign currencies are translated into U.S. dollar amounts based upon prevailing exchange rates on the date of valuation. Purchases and sales of investment securities and income and expense items denominated in foreign currencies are translated into U.S. dollar amounts based upon prevailing exchange rates on the respective dates of such transactions.
The Fund does not isolate that portion of the results of operations resulting from fluctuations in foreign exchange rates on investments from the fluctuations arising from changes in market prices of securities held. Such fluctuations are included with the net realized and unrealized gain or loss on investments.
Net realized foreign exchange gains or losses arise from sales of foreign currencies, including gains and losses on forward foreign currency contracts, currency gains or losses realized between the trade and settlement dates on securities transactions, and the difference between the amounts of dividends, interest, and foreign withholding taxes recorded on the Fund’s books and the U.S. dollar equivalent of the amounts actually received or paid. Net unrealized foreign exchange gains and losses arise from changes in the values of assets and liabilities, other than investments in securities, on the date of valuation, resulting from changes in exchange rates.
Foreign security and currency transactions may involve certain considerations and risks not typically associated with those of U.S. dollar denominated transactions as a result of, among other factors, the possibility of lower levels of governmental supervision and regulation of foreign securities markets and the possibility of political or economic instability.
(j) Credit and market risks. The Fund invests in high-yield and emerging market instruments that are subject to certain credit and market risks. The yields of high-yield and emerging market debt obligations reflect, among other things, perceived credit and market
| Western Asset Emerging Markets Debt Fund Inc. 2018 Semi-Annual Report | 35 |
Notes to financial statements (unaudited) (cont’d)
risks. The Fund’s investments in securities rated below investment grade typically involve risks not associated with higher rated securities including, among others, greater risk related to timely and ultimate payment of interest and principal, greater market price volatility and less liquid secondary market trading. The consequences of political, social, economic or diplomatic changes may have disruptive effects on the market prices of investments held by the Fund. The Fund’s investments in non-U.S. dollar denominated securities may also result in foreign currency losses caused by devaluations and exchange rate fluctuations.
(k) Foreign investment risks. The Fund’s investments in foreign securities may involve risks not present in domestic investments. Since securities may be denominated in foreign currencies, may require settlement in foreign currencies or pay interest or dividends in foreign currencies, changes in the relationship of these foreign currencies to the U.S. dollar can significantly affect the value of the investments and earnings of the Fund. Foreign investments may also subject the Fund to foreign government exchange restrictions, expropriation, taxation or other political, social or economic developments, all of which affect the market and/or credit risk of the investments.
(l) Other risks. Consistent with its objective to seek high current income, the Fund may invest in instruments whose values and interest rates are linked to foreign currencies, interest rates, indices or some other financial indicator. The value at maturity or interest rates for these instruments will increase or decrease according to the change in the indicator to which they are indexed, amongst other factors. These securities are generally more volatile in nature, and the risk of loss of principal may be greater.
(m) Counterparty risk and credit-risk-related contingent features of derivative instruments. The Fund may invest in certain securities or engage in other transactions, where the Fund is exposed to counterparty credit risk in addition to broader market risks. The Fund may invest in securities of issuers, which may also be considered counterparties as trading partners in other transactions. This may increase the risk of loss in the event of default or bankruptcy by the counterparty or if the counterparty otherwise fails to meet its contractual obligations. The Fund’s subadviser attempts to mitigate counterparty risk by (i) periodically assessing the creditworthiness of its trading partners, (ii) monitoring and/or limiting the amount of its net exposure to each individual counterparty based on its assessment and (iii) requiring collateral from the counterparty for certain transactions. Market events and changes in overall economic conditions may impact the assessment of such counterparty risk by the subadviser. In addition, declines in the values of underlying collateral received may expose the Fund to increased risk of loss.
With exchange traded and centrally cleared derivatives, there is less counterparty risk to the Fund since the exchange or clearinghouse, as counterparty to such instruments, guarantees against a possible default. The clearinghouse stands between the buyer and the seller of the contract; therefore, the credit risk is limited to failure of the clearinghouse. While
| 36 | Western Asset Emerging Markets Debt Fund Inc. 2018 Semi-Annual Report |
offset rights may exist under applicable law, the Fund does not have a contractual right of offset against a clearing broker or clearinghouse in the event of a default of the clearing broker or clearinghouse.
The Fund has entered into master agreements, such as an International Swaps and Derivatives Association, Inc. Master Agreement (“ISDA Master Agreement”) or similar agreement, with certain of its derivative counterparties that govern over-the-counter derivatives and provide for general obligations, representations, agreements, collateral posting terms, netting provisions in the event of default or termination and credit related contingent features. The credit related contingent features include, but are not limited to, a percentage decrease in the Fund’s net assets or NAV over a specified period of time. If these credit related contingent features were triggered, the derivatives counterparty could terminate the positions and demand payment or require additional collateral.
Under an ISDA Master Agreement, the Fund may, under certain circumstances, offset with the counterparty certain derivative financial instruments’ payables and/or receivables with collateral held and/or posted and create one single net payment. However, absent an event of default by the counterparty or a termination of the agreement, the terms of the ISDA Master Agreements do not result in an offset of reported amounts of financial assets and financial liabilities in the Statement of Assets and Liabilities across transactions between the Fund and the applicable counterparty. The enforceability of the right to offset may vary by jurisdiction.
Collateral requirements differ by type of derivative. Collateral or margin requirements are set by the broker or exchange clearinghouse for exchange traded derivatives while collateral terms are contract specific for over-the-counter traded derivatives. Cash collateral that has been pledged to cover obligations of the Fund under derivative contracts, if any, will be reported separately in the Statement of Assets and Liabilities. Securities pledged as collateral, if any, for the same purpose are noted in the Schedule of Investments.
As of June 30, 2018, the Fund held forward foreign currency contracts, OTC written options and OTC credit default swaps with credit related contingent features which had a liability position of $4,166,998. If a contingent feature in the master agreements would have been triggered, the Fund would have been required to pay this amount to its derivatives counterparties. As of June 30, 2018, the Fund had posted with its counterparties cash and/or securities as collateral to cover the net liability of these derivatives amounting to $910,000, which could be used to reduce the required payment.
At June 30, 2018, the Fund held non-cash collateral from Citibank N.A. and JPMorgan Chase & Co. in the amounts of $2,645,922 and $4,200,766, respectively. These amounts can be used to reduce the Fund’s exposure to the counterparty in the event of default.
(n) Security transactions and investment income. Security transactions are accounted for on a trade date basis. Interest income (including interest income from payment-in-kind securities), adjusted for amortization of premium and accretion of discount, is recorded on the accrual basis. Dividend income is recorded on the ex-dividend date for
| Western Asset Emerging Markets Debt Fund Inc. 2018 Semi-Annual Report | 37 |
Notes to financial statements (unaudited) (cont’d)
dividends received in cash and/or securities. Foreign dividend income is recorded on the ex-dividend date or as soon as practicable after the Fund determines the existence of a dividend declaration after exercising reasonable due diligence. The cost of investments sold is determined by use of the specific identification method. To the extent any issuer defaults or a credit event occurs that impacts the issuer, the Fund may halt any additional interest income accruals and consider the realizability of interest accrued up to the date of default or credit event.
(o) Distributions to shareholders. Distributions from net investment income of the Fund, if any, are declared quarterly and paid on a monthly basis. The actual source of the Fund’s monthly distributions may be from net investment income, return of capital or a combination of both. Shareholders will be informed of the tax characteristics of the distributions after the close of the fiscal year. Distributions of net realized gains, if any, are declared at least annually. Pursuant to its Managed Distribution Policy, the Fund intends to make regular monthly distributions to shareholders at a fixed rate per common share, which rate may be adjusted from time to time by the Fund’s Board of Directors. Under the Fund’s Managed Distribution Policy, if, for any monthly distribution, the value of the Fund’s net investment income and net realized capital gain is less than the amount of the distribution, the difference will be distributed from the Fund’s net assets (and may constitute a “return of capital”). Shareholders will be informed of the tax characteristics of the distributions after the close of the 2018 fiscal year. The Board of Directors may modify, terminate or suspend the Managed Distribution Policy at any time, including when certain events would make part of the return of capital taxable to shareholders. Any such modification, termination or suspension could have an adverse effect on the market price of the Fund’s shares. Distributions to shareholders of the Fund are recorded on the ex-dividend date and are determined in accordance with income tax regulations, which may differ from GAAP.
(p) Compensating balance arrangements. The Fund has an arrangement with its custodian bank whereby a portion of the custodian’s fees is paid indirectly by credits earned on the Fund’s cash on deposit with the bank.
(q) Federal and other taxes. It is the Fund’s policy to comply with the federal income and excise tax requirements of the Internal Revenue Code of 1986 (the “Code”), as amended, applicable to regulated investment companies. Accordingly, the Fund intends to distribute its taxable income and net realized gains, if any, to shareholders in accordance with timing requirements imposed by the Code. Therefore, no federal or state income tax provision is required in the Fund’s financial statements.
Management has analyzed the Fund’s tax positions taken on income tax returns for all open tax years and has concluded that as of December 31, 2017, no provision for income tax is required in the Fund’s financial statements. The Fund’s federal and state income and federal excise tax returns for tax years for which the applicable statutes of limitations have not expired are subject to examination by the Internal Revenue Service and state departments of revenue.
| 38 | Western Asset Emerging Markets Debt Fund Inc. 2018 Semi-Annual Report |
Under the applicable foreign tax laws, a withholding tax may be imposed on interest, dividends and capital gains at various rates. Realized gains upon disposition of the securities issued in or by certain foreign countries are subject to capital gains tax imposed by those countries. As of June 30, 2018, there were no capital gains tax liabilities accrued on unrealized gains.
(r) Reclassification. GAAP requires that certain components of net assets be reclassified to reflect permanent differences between financial and tax reporting. These reclassifications have no effect on net assets or net asset value per share.
2. Investment management agreement and other transactions with affiliates
Legg Mason Partners Fund Advisor, LLC (“LMPFA”) is the Fund’s investment manager. Western Asset Management Company, LLC (formerly Western Asset Management Company) (“Western Asset”), Western Asset Management Company Limited (“Western Asset Limited”) and Western Asset Management Company Pte. Ltd. (“Western Singapore”) are the Fund’s subadvisers. LMPFA , Western Asset, Western Asset Limited and Western Singapore are wholly-owned subsidiaries of Legg Mason, Inc. (“Legg Mason”).
LMPFA provides administrative and certain oversight services to the Fund. The Fund pays an investment management fee, calculated daily and paid monthly, at an annual rate of 0.85% of the Fund’s average daily net assets plus the proceeds of any outstanding borrowings and issuance of preferred stock. LMPFA implemented a voluntary investment management fee waiver equal to 0.03% of the Fund’s average daily net assets plus the proceeds of any outstanding borrowings effective December 19, 2016 through December 18, 2018.
During the six months ended June 30, 2018, fees waived and/or expenses reimbursed amounted to $213,173.
LMPFA delegates to Western Asset the day-to-day portfolio management of the Fund. Western Asset Limited and Western Singapore provide certain subadvisory services to the Fund relating to currency transactions and investments in non-U.S. dollar denominated securities. Western Asset Limited and Western Singapore do not receive any compensation from the Fund and are compensated by Western Asset for their services to the Fund. For its services, LMPFA pays Western Asset monthly 70% of the net management fee it receives from the Fund. In turn, Western Asset pays Western Asset Limited and Western Singapore a monthly subadvisory fee at an annual rate of 0.30% of the Fund’s assets managed by each subadviser.
During periods in which the Fund utilizes financial leverage, the fees paid to LMPFA will be higher than if the Fund did not utilize leverage because the fees are calculated as a percentage of the Fund’s assets, including those investments purchased with leverage.
All officers and one Director of the Fund are employees of Legg Mason or its affiliates and do not receive compensation from the Fund.
| Western Asset Emerging Markets Debt Fund Inc. 2018 Semi-Annual Report | 39 |
Notes to financial statements (unaudited) (cont’d)
3. Investments
During the six months ended June 30, 2018, the aggregate cost of purchases and proceeds from sales of investments (excluding short-term investments) were as follows:
| Purchases | $ | 278,367,395 | ||
| Sales | 266,813,745 |
At June 30, 2018, the aggregate cost of investments and the aggregate gross unrealized appreciation and depreciation of investments for federal income tax purposes were substantially as follows:
| Cost/Premiums Paid (Received) |
Gross Unrealized Appreciation |
Gross Unrealized Depreciation |
Net Unrealized Appreciation (Depreciation) |
|||||||||||||
| Securities | $ | 1,332,733,180 | $ | 36,276,673 | $ | (82,965,879) | $ | (46,689,206) | ||||||||
| Swap contracts | (112,297) | — | (300,519) | (300,519) | ||||||||||||
| Written options | (309,845) | 307,560 | — | 307,560 | ||||||||||||
| Futures contracts | — | — | (2,065,234) | (2,065,234) | ||||||||||||
| Forward foreign currency contracts | — | 9,993,809 | (3,751,897) | 6,241,912 | ||||||||||||
Transactions in reverse repurchase agreements for the Fund during the six months ended June 30, 2018 were as follows:
| Average Daily Balance* |
Weighted Average Interest Rate* |
Maximum Amount Outstanding | ||
| $103,160,675 | 2.09% | $147,837,775 |
| * | Averages based on the number of days that Fund had reverse repurchase agreements outstanding. |
Interest rates on reverse repurchase agreements ranged from 0.75% to 2.75% during the six months ended June 30, 2018. Interest expense incurred on reverse repurchase agreements totaled $1,070,541.
4. Derivative instruments and hedging activities
Below is a table, grouped by derivative type, that provides information about the fair value and the location of derivatives within the Statement of Assets and Liabilities at June 30, 2018.
| ASSET DERIVATIVES1 | ||||
| Foreign Exchange Risk |
||||
| Purchased options2 | $ | 389,927 | ||
| Forward foreign currency contracts | 9,993,809 | |||
| Total | $ | 10,383,736 | ||
| 40 | Western Asset Emerging Markets Debt Fund Inc. 2018 Semi-Annual Report |
| LIABILITY DERIVATIVES1 | ||||||||||||||||
| Interest Rate Risk |
Foreign Exchange Risk |
Credit Risk |
Total | |||||||||||||
| Written options | — | $ | 2,285 | — | $ | 2,285 | ||||||||||
| Futures contracts3 | $ | 2,065,234 | — | — | 2,065,234 | |||||||||||
| OTC swap contracts4 | — | — | $ | 412,816 | 412,816 | |||||||||||
| Forward foreign currency contracts | — | 3,751,897 | — | 3,751,897 | ||||||||||||
| Total | $ | 2,065,234 | $ | 3,754,182 | $ | 412,816 | $ | 6,232,232 | ||||||||
| 1 | Generally, the balance sheet location for asset derivatives is receivables/net unrealized appreciation (depreciation) and for liability derivatives is payables/net unrealized appreciation (depreciation). |
| 2 | Market value of purchased options is reported in Investments at value in the Statement of Assets and Liabilities. |
| 3 | Includes cumulative appreciation (depreciation) of futures contracts as reported in the Schedule of Investments. Only variation margin is reported within the receivables and/or payables on the Statement of Assets and Liabilities. |
| 4 | Values include premiums paid (received) on swap contracts which are shown separately in the Statement of Assets and Liabilities. |
The following tables provide information about the effect of derivatives and hedging activities on the Fund’s Statement of Operations for the six months ended June 30, 2018. The first table provides additional detail about the amounts and sources of gains (losses) realized on derivatives during the period. The second table provides additional information
about the change in unrealized appreciation (depreciation) resulting from the Fund’s derivatives and hedging activities during the period.
| AMOUNT OF REALIZED GAIN (LOSS) ON DERIVATIVES RECOGNIZED | ||||||||||||||||
| Interest Rate Risk |
Foreign Exchange Risk |
Credit Risk |
Total | |||||||||||||
| Purchased options1 | — | $ | (278,050) | — | $ | (278,050) | ||||||||||
| Written options | — | — | $ | 186,353 | 186,353 | |||||||||||
| Futures contracts | $ | 5,752,262 | — | — | 5,752,262 | |||||||||||
| Swap contracts | (1,256,118) | — | (149,448) | (1,405,566) | ||||||||||||
| Forward foreign currency contracts | — | (620,446) | — | (620,446) | ||||||||||||
| Total | $ | 4,496,144 | $ | (898,496) | $ | 36,905 | $ | 3,634,553 | ||||||||
| 1 | Net realized gain (loss) from purchased options is reported in net realized gain (loss) from investment transactions in the Statement of Operations. |
| CHANGE IN UNREALIZED APPRECIATION (DEPRECIATION) ON DERIVATIVES RECOGNIZED | ||||||||||||||||
| Interest Rate Risk |
Foreign Exchange Risk |
Credit Risk |
Total | |||||||||||||
| Purchased options1 | — | $ | 276,751 | — | $ | 276,751 | ||||||||||
| Written options | — | 307,560 | — | 307,560 | ||||||||||||
| Futures contracts | $ | (2,623,860) | — | — | (2,623,860) | |||||||||||
| Swap contracts | — | — | $ | 766,544 | 766,544 | |||||||||||
| Forward foreign currency contracts | — | 6,230,877 | — | 6,230,877 | ||||||||||||
| Total | $ | (2,623,860) | $ | 6,815,188 | $ | 766,544 | $ | 4,957,872 | ||||||||
| 1 | The change in unrealized appreciation (depreciation) from purchased options is reported in the change in net unrealized appreciation (depreciation) from investments in the Statement of Operations. |
| Western Asset Emerging Markets Debt Fund Inc. 2018 Semi-Annual Report | 41 |
Notes to financial statements (unaudited) (cont’d)
During the six months ended June 30, 2018, the volume of derivative activity for the Fund was as follows:
| Average Market Value |
||||
| Purchased options | $ | 156,944 | ||
| Written options | 214,914 | |||
| Futures contracts (to sell) | 160,995,833 | |||
| Forward foreign currency contracts (to buy) | 130,612,460 | |||
| Forward foreign currency contracts (to sell) | 118,872,793 | |||
| Average Notional Balance |
||||
| Interest rate swap contracts† | $ | 117,463,561 | ||
| Credit default swap contracts (to buy protection) | 32,200,000 | |||
| † | At June 30, 2018, there were no open positions held in this derivative. |
The following table presents the Fund’s OTC derivative assets and liabilities by counterparty net of amounts available for offset under an ISDA Master Agreement and net of the related collateral pledged (received) by the Fund as of June 30, 2018.
| Counterparty | Gross Assets Subject to Master Agreements1 |
Gross Liabilities Subject to Master Agreements1 |
Net Assets (Liabilities) Subject to Master Agreements |
Collateral Pledged (Received)2,3 |
Net Amount4,5 |
|||||||||||||||
| Bank of America N.A. | $ | 586 | $ | (56,513) | $ | (55,927) | — | $ | (55,927) | |||||||||||
| Barclays Bank PLC | 425,758 | (551,567) | (125,809) | $ | 551,567 | 425,758 | ||||||||||||||
| Citibank N.A. | 3,520,858 | (784,041) | 2,736,817 | (2,645,922) | 90,895 | |||||||||||||||
| Goldman Sachs & Co. | 217,974 | (468,951) | (250,977) | 210,000 | (40,977) | |||||||||||||||
| JPMorgan Chase & Co. | 6,218,560 | (2,305,926) | 3,912,634 | (4,200,766) | (288,132) | |||||||||||||||
| Total | $ | 10,383,736 | $ | (4,166,998) | $ | 6,216,738 | $ | (6,085,121) | $ | 131,617 | ||||||||||
| 1 | Absent an event of default or early termination, derivative assets and liabilities are presented gross and not offset in the Statement of Assets and Liabilities. |
| 2 | Gross amounts are not offset in the Statement of Assets and Liabilities. |
| 3 | In some instances, the actual collateral received and/or pledged may be more than the amount shown here due to overcollateralization. |
| 4 | Net amount may also include forward foreign currency exchange contracts that are not required to be collateralized. |
| 5 | Represents the net amount receivable (payable) from (to) the counterparty in the event of default. |
5. Loan
The Fund has a revolving credit agreement with Pershing LLC, which permits the Fund to borrow up to $395,000,000, subject to approval by Pershing LLC, and renews daily for a 180-day term unless notice to the contrary is given to the Fund. Prior to March 28, 2018, the credit agreement permitted the Fund to borrow up to $295,000,000. The interest on the loan outstanding, if any, is calculated at a variable rate based on the one-month LIBOR plus any applicable margin. To the extent of the borrowing outstanding, the Fund is required to maintain collateral in a special custody account at the Fund’s custodian on behalf of
| 42 | Western Asset Emerging Markets Debt Fund Inc. 2018 Semi-Annual Report |
Pershing LLC. The Fund’s credit agreement contains customary covenants that, among other things, may limit the Fund’s ability to pay distributions in certain circumstances, incur additional debt, change its fundamental investment policies and engage in certain transactions, including mergers and consolidations, and require asset coverage ratios in addition to those required by the 1940 Act. In addition, the credit agreement may be subject to early termination under certain conditions and may contain other provisions that could limit the Fund’s ability to utilize borrowing under the agreement. Interest expense related to the loan for the six months ended June 30, 2018 was $3,798,321. For the six months ended June 30, 2018, the Fund did not incur any commitment fee. At June 30, 2018, the Fund had $295,000,000 of borrowings outstanding per this credit agreement. For the six months ended June 30, 2018, the average daily loan balance was $295,000,000 and weighted average interest rate was 2.60%.
6. Distributions subsequent to June 30, 2018
The following distributions have been declared by the Fund’s Board of Directors and are payable subsequent to the period end of this report:
| Record Date | Payable Date | Amount | ||||||
| 6/22/2018 | 7/2/2018 | $ | 0.1000 | |||||
| 7/20/2018 | 8/1/2018 | $ | 0.1000 | |||||
| 8/24/2018 | 9/4/2018 | $ | 0.1000 | |||||
| 9/21/2018 | 10/1/2018 | $ | 0.1000 | |||||
| 10/18/2018 | 11/1/2018 | $ | 0.1000 | |||||
| 11/23/2018 | 12/3/2018 | $ | 0.1000 | |||||
7. Stock repurchase program
On November 16, 2015, the Fund announced that the Fund’s Board of Directors (the “Board”) had authorized the Fund to repurchase in the open market up to approximately 10% of the Fund’s outstanding common stock when the Fund’s shares are trading at a discount to net asset value. The Board has directed management of the Fund to repurchase shares of common stock at such times and in such amounts as management reasonably believes may enhance stockholder value. The Fund is under no obligation to purchase shares at any specific discount levels or in any specific amounts. During the six months ended June 30, 2018, the Fund did not repurchase any shares.
8. Deferred capital losses
As of December 31, 2017, the Fund had deferred capital losses of $119,177,703, which have no expiration date, that will be available to offset future taxable capital losses.
9. Recent accounting pronouncements
The Fund has adopted the disclosure provisions of Financial Accounting Standards Board Accounting Standards Update 2016-18 (“ASU 2016-18”), Statement of Cash Flows (Topic 230) — Restricted Cash. ASU 2016-18 is effective for fiscal years, and interim periods within those fiscal years, beginning after December 15, 2017. ASU 2016-18 requires that a statement of cash flows explain the change during the period in the total of cash,
| Western Asset Emerging Markets Debt Fund Inc. 2018 Semi-Annual Report | 43 |
Notes to financial statements (unaudited) (cont’d)
cash equivalents, and amounts generally described as restricted cash or restricted cash equivalents. Prior to the issuance of ASU 2016-18, GAAP did not include specific guidance on the cash flow classification and presentation of changes in restricted cash or restricted cash equivalents. Upon evaluation, the Fund has concluded that ASU 2016-18 does not materially impact the financial statement amounts; however, as required, additional or enhanced disclosure has been included.
* * *
The Fund has made a change in accounting principle and adopted the provisions of Financial Accounting Standards Board (“FASB”) Accounting Standards Update 2017-08 (“ASU 2017-08”), Premium Amortization on Purchased Callable Debt Securities. ASU 2017-08 shortens the amortization period for certain callable debt securities held at a premium; specifically, requiring the premium to be amortized to the earliest call date. Prior to ASU 2017-08, premiums on callable debt securities were generally amortized to maturity date. ASU 2017-08 is intended to more closely align the amortization period with the expectations incorporated into the market pricing on the underlying security. ASU 2017-08 does not require an accounting change for securities held at discount; the discount continues to be amortized to maturity date. Upon evaluation, the Fund has concluded that the change in accounting principle does not materially impact the financial statement amounts.
| 44 | Western Asset Emerging Markets Debt Fund Inc. 2018 Semi-Annual Report |
Additional shareholder information (unaudited)
Results of annual meeting of shareholders
The Annual Meeting of Shareholders of Western Asset Emerging Markets Debt Fund Inc. was held on April 27, 2018 for the purpose of considering and voting upon the election of Directors. The following table provides information concerning the matter voted upon at the Meeting:
Election of directors
| Nominees | Votes For | Votes Withheld | ||||||
| Carol L. Colman |
47,684,959 | 5,521,803 | ||||||
| Daniel P. Cronin |
47,561,938 | 5,644,824 | ||||||
| Paolo M. Cucchi |
47,400,680 | 5,806,082 | ||||||
At June 30, 2018, in addition to Carol L. Colman, Daniel P. Cronin and Paolo M. Cucchi, the other Directors of the Fund were as follows:
Robert D. Agdern
Leslie H. Gelb
William R. Hutchinson
Eileen A. Kamerick
Riordan Roett
Jane Trust
| Western Asset Emerging Markets Debt Fund Inc. | 45 |
Dividend reinvestment plan (unaudited)
Unless you elect to receive distributions in cash (i.e., opt-out), all dividends, including any capital gain dividends and return of capital distributions, on your Common Stock will be automatically reinvested by Computershare Trust Company, N.A., as agent for the stockholders (the “Plan Agent”), in additional shares of Common Stock under the Fund’s Dividend Reinvestment Plan (the “Plan”). You may elect not to participate in the Plan by contacting the Plan Agent. If you do not participate, you will receive all cash distributions paid by check mailed directly to you by Computershare Trust Company, N.A., as dividend paying agent.
If you participate in the Plan, the number of shares of Common Stock you will receive will be determined as follows:
(1) If the market price of the Common Stock (plus $0.03 per share commission) on the payment date (or, if the payment date is not a NYSE trading day, the immediately preceding trading day) is equal to or exceeds the net asset value per share of the Common Stock at the close of trading on the NYSE on the payment date, the Fund will issue new Common Stock at a price equal to the greater of (a) the net asset value per share at the close of trading on the NYSE on the payment date or (b) 95% of the market price per share of the Common Stock on the payment date.
(2) If the net asset value per share of the Common Stock exceeds the market price of the Common Stock (plus $0.03 per share commission) at the close of trading on the NYSE on the payment date, the Plan Agent will receive the dividend or distribution in cash and will buy Common Stock in the open market, on the NYSE or elsewhere, for your account as soon as practicable commencing on the trading day following the payment date and terminating no later than the earlier of (a) 30 days after the dividend or distribution payment date, or (b) the payment date for the next succeeding dividend or distribution to be made to the stockholders; except when necessary to comply with applicable provisions of the federal securities laws. If during this period: (i) the market price (plus $0.03 per share commission) rises so that it equals or exceeds the net asset value per share of the Common Stock at the close of trading on the NYSE on the payment date before the Plan Agent has completed the open market purchases or (ii) if the Plan Agent is unable to invest the full amount eligible to be reinvested in open market purchases, the Plan Agent will cease purchasing Common Stock in the open market and the Fund shall issue the remaining Common Stock at a price per share equal to the greater of (a) the net asset value per share at the close of trading on the NYSE on the day prior to the issuance of shares for reinvestment or (b) 95% of the then current market price per share.
Common Stock in your account will be held by the Plan Agent in non-certificated form. Any proxy you receive will include all shares of Common Stock you have received under the Plan. You may withdraw from the Plan (i.e., opt-out) by notifying the Plan Agent in writing at 462 South 4th Street, Suite 1600, Louisville, KY 40202 or by calling the Plan Agent at 1-888-888-0151. Such withdrawal will be effective immediately if notice is received by the
| 46 | Western Asset Emerging Markets Debt Fund Inc. |
Plan Agent not less than ten business days prior to any dividend or distribution record date; otherwise such withdrawal will be effective as soon as practicable after the Plan Agent’s investment of the most recently declared dividend or distribution on the Common Stock.
Plan participants who sell their shares will be charged a service charge (currently $5.00 per transaction) and the Plan Agent is authorized to deduct brokerage charges actually incurred from the proceeds (currently $0.05 per share commission). There is no service charge for reinvestment of your dividends or distributions in Common Stock. However, all participants will pay a pro rata share of brokerage commissions incurred by the Plan Agent when it makes open market purchases. Because all dividends and distributions will be automatically reinvested in additional shares of Common Stock, this allows you to add to your investment through dollar cost averaging, which may lower the average cost of your Common Stock over time. Dollar cost averaging is a technique for lowering the average cost per share over time if the Fund’s net asset value declines. While dollar cost averaging has definite advantages, it cannot assure profit or protect against loss in declining markets.
Automatically reinvesting dividends and distributions does not mean that you do not have to pay income taxes due upon receiving dividends and distributions. Investors will be subject to income tax on amounts reinvested under the Plan.
The Fund reserves the right to amend or terminate the Plan if, in the judgment of the Board of Directors, the change is warranted. The Plan may be terminated, amended or supplemented by the Fund upon notice in writing mailed to stockholders at least 30 days prior to the record date for the payment of any dividend or distribution by the Fund for which the termination or amendment is to be effective. Upon any termination, you will be sent cash for any fractional share of Common Stock in your account. You may elect to notify the Plan Agent in advance of such termination to have the Plan Agent sell part or all of your Common Stock on your behalf. Additional information about the Plan and your account may be obtained from the Plan Agent at 462 South 4th Street, Suite 1600, Louisville, KY 40202 or by calling the Plan Agent at 1-888-888-0151.
| Western Asset Emerging Markets Debt Fund Inc. | 47 |
Western Asset
Emerging Markets Debt Fund Inc.
Directors
Robert D. Agdern
Carol L. Colman
Daniel P. Cronin
Paolo M. Cucchi
Leslie H. Gelb
William R. Hutchinson
Eileen A. Kamerick
Riordan Roett
Jane Trust
Chairman
Officers
Jane Trust
President and Chief Executive Officer
Richard F. Sennett
Principal Financial Officer
Todd F. Kuehl
Chief Compliance Officer
Jenna Bailey
Identity Theft Protection Officer
Robert I. Frenkel
Secretary and Chief Legal Officer
Thomas C. Mandia
Assistant Secretary
Jennifer S. Berg
Treasurer
Jeanne M. Kelly
Senior Vice President
Western Asset Emerging Markets Debt Fund Inc.
620 Eighth Avenue
49th Floor
New York, NY 10018
Investment advisers
Western Asset Management Company, LLC*
Western Asset Management Company Limited
Western Asset Management Company Pte. Ltd.
Custodian
The Bank of New York Mellon (“BNY”)**
Transfer agent
Computershare Inc.
462 South 4th Street, Suite 1600
Louisville, KY 40202
| * | Prior to May 2, 2018, known as Western Asset Management Company. |
| ** | Effective May 7, 2018, BNY became custodian. |
Independent registered public accounting firm
PricewaterhouseCoopers LLP
Baltimore, MD 21202
Legal counsel
Simpson Thacher & Bartlett LLP
425 Lexington Avenue
New York, NY 10017
New York Stock Exchange Symbol
EMD
Legg Mason Funds Privacy and Security Notice
Your Privacy and the Security of Your Personal Information is Very Important to the Legg Mason Funds
This Privacy and Security Notice (the “Privacy Notice”) addresses the Legg Mason Funds’ privacy and data protection practices with respect to nonpublic personal information the Funds receive. The Legg Mason Funds include any funds sold by the Funds’ distributor, Legg Mason Investor Services, LLC, as well as Legg Mason-sponsored closed-end funds. The provisions of this Privacy Notice apply to your information both while you are a shareholder and after you are no longer invested with the Funds.
The Type of Nonpublic Personal Information the Funds Collect About You
The Funds collect and maintain nonpublic personal information about you in connection with your shareholder account. Such information may include, but is not limited to:
| • | Personal information included on applications or other forms; |
| • | Account balances, transactions, and mutual fund holdings and positions; |
| • | Bank account information, legal documents, and identity verification documentation; |
| • | Online account access user IDs, passwords, security challenge question responses; and |
| • | Information received from consumer reporting agencies regarding credit history and creditworthiness (such as the amount of an individual’s total debt, payment history, etc.). |
How the Funds Use Nonpublic Personal Information About You
The Funds do not sell or share your nonpublic personal information with third parties or with affiliates for their marketing purposes, or with other financial institutions or affiliates for joint marketing purposes, unless you have authorized the Funds to do so. The Funds do not disclose any nonpublic personal information about you except as may be required to perform transactions or services you have authorized or as permitted or required by law. The Funds may disclose information about you to:
| • | Employees, agents, and affiliates on a “need to know” basis to enable the Funds to conduct ordinary business or to comply with obligations to government regulators; |
| • | Service providers, including the Funds’ affiliates, who assist the Funds as part of the ordinary course of business (such as printing, mailing services, or processing or servicing your account with us) or otherwise perform services on the Funds’ behalf, including companies that may perform statistical analysis, market research and marketing services solely for the Funds; |
| • | Permit access to transfer, whether in the United States or countries outside of the United States to such Funds’ employees, agents and affiliates and service providers as required to enable the Funds to conduct ordinary business, or to comply with obligations to government regulators; |
| • | The Funds’ representatives such as legal counsel, accountants and auditors to enable the Funds to conduct ordinary business, or to comply with obligations to government regulators; |
| NOT PART OF THE SEMI-ANNUAL REPORT |
Legg Mason Funds Privacy and Security Notice (cont’d)
| • | Fiduciaries or representatives acting on your behalf, such as an IRA custodian or trustee of a grantor trust. |
Except as otherwise permitted by applicable law, companies acting on the Funds’ behalf, including those outside the United States, are contractually obligated to keep nonpublic personal information the Funds provide to them confidential and to use the information the Funds share only to provide the services the Funds ask them to perform.
The Funds may disclose nonpublic personal information about you when necessary to enforce their rights or protect against fraud, or as permitted or required by applicable law, such as in connection with a law enforcement or regulatory request, subpoena, or similar legal process. In the event of a corporate action or in the event a Fund service provider changes, the Funds may be required to disclose your nonpublic personal information to third parties. While it is the Funds’ practice to obtain protections for disclosed information in these types of transactions, the Funds cannot guarantee their privacy policy will remain unchanged.
Keeping You Informed of the Funds’ Privacy and Security Practices
The Funds will notify you annually of their privacy policy as required by federal law. While the Funds reserve the right to modify this policy at any time they will notify you promptly if this privacy policy changes.
The Funds’ Security Practices
The Funds maintain appropriate physical, electronic and procedural safeguards designed to guard your nonpublic personal information. The Funds’ internal data security policies restrict access to your nonpublic personal information to authorized employees, who may use your nonpublic personal information for Fund business purposes only.
Although the Funds strive to protect your nonpublic personal information, they cannot ensure or warrant the security of any information you provide or transmit to them, and you do so at your own risk. In the event of a breach of the confidentiality or security of your nonpublic personal information, the Funds will attempt to notify you as necessary so you can take appropriate protective steps. If you have consented to the Funds using electronic communications or electronic delivery of statements, they may notify you under such circumstances using the most current email address you have on record with them.
In order for the Funds to provide effective service to you, keeping your account information accurate is very important. If you believe that your account information is incomplete, not accurate or not current, if you have questions about the Funds’ privacy practices, or our use of your nonpublic personal information, write the Funds using the contact information on your account statements, email the Funds by clicking on the Contact Us section of the Funds’ website at www.leggmason.com, or contact the Funds at 1-888-777-0102.
Revised April 2018
| NOT PART OF THE SEMI-ANNUAL REPORT |
Western Asset Emerging Markets Debt Fund Inc.
Western Asset Emerging Markets Debt Fund Inc.
620 Eighth Avenue
49th Floor
New York, NY 10018
Notice is hereby given in accordance with Section 23(c) of the Investment Company Act of 1940, as amended, that from time to time the Fund may purchase, at market prices, shares of its stock.
The Fund files its complete schedule of portfolio holdings with the Securities and Exchange Commission (“SEC”) for the first and third quarters of each fiscal year on Form N-Q. The Fund’s Forms N-Q are available on the SEC’s website at www.sec.gov. The Fund’s Forms N-Q may be reviewed and copied at the SEC’s Public Reference Room in Washington, D.C., and information on the operation of the Public Reference Room may be obtained by calling 1-800-SEC-0330. To obtain information on Form N-Q from the Fund, shareholders can call 1-888-777-0102.
Information on how the Fund voted proxies relating to portfolio securities during the prior 12-month period ended June 30th of each year and a description of the policies and procedures that the Fund uses to determine how to vote proxies related to portfolio transactions are available (1) without charge, upon request, by calling 1-888-777-0102, (2) at www.lmcef.com and (3) on the SEC’s website at www.sec.gov.
This report is transmitted to the shareholders of Western Asset Emerging Markets Debt Fund Inc. for their information. This is not a prospectus, circular or representation intended for use in the purchase of shares of the Fund or any securities mentioned in this report.
Computershare Inc.
462 South 4th Street, Suite 1600
Louisville, KY 40202
WAS04052 8/18 SR18-3418
| ITEM 2. | CODE OF ETHICS. |
Not applicable.
| ITEM 3. | AUDIT COMMITTEE FINANCIAL EXPERT. |
Not applicable.
| ITEM 4. | PRINCIPAL ACCOUNTANT FEES AND SERVICES. |
Not applicable.
| ITEM 5. | AUDIT COMMITTEE OF LISTED REGISTRANTS. |
Not applicable.
| ITEM 6. | SCHEDULE OF INVESTMENTS. |
Included herein under Item 1.
| ITEM 7. | DISCLOSURE OF PROXY VOTING POLICIES AND PROCEDURES FOR CLOSED-END MANAGEMENT INVESTMENT COMPANIES. |
Not applicable.
| ITEM 8. | INVESTMENT PROFESSIONALS OF CLOSED-END MANAGEMENT INVESTMENT COMPANIES. |
Not applicable.
| ITEM 9. | PURCHASES OF EQUITY SECURITIES BY CLOSED-END MANAGEMENT INVESTMENT COMPANY AND AFFILIATED PURCHASERS. |
Not applicable.
| ITEM 10. | SUBMISSION OF MATTERS TO A VOTE OF SECURITY HOLDERS. |
Not applicable.
| ITEM 11. | CONTROLS AND PROCEDURES. |
| (a) | The registrant’s principal executive officer and principal financial officer have concluded that the registrant’s disclosure controls and procedures (as defined in Rule 30a- 3(c) under the Investment Company Act of 1940, as amended (the “1940 Act”)) are effective as of a date within 90 days of the filing date of this report that includes the disclosure required by this paragraph, based on their evaluation of the disclosure controls and procedures required by Rule 30a-3(b) under the 1940 Act and 15d-15(b) under the Securities Exchange Act of 1934. |
| (b) | There were no changes in the registrant’s internal control over financial reporting (as defined in Rule 30a-3(d) under the 1940 Act) that occurred during the second fiscal quarter of the period covered by this report that have materially affected, or are likely to materially affect the registrant’s internal control over financial reporting. |
| ITEM 12. | EXHIBITS. |
(a) (1) Not applicable.
Exhibit 99.CODE ETH
(a) (2) Certifications pursuant to section 302 of the Sarbanes-Oxley Act of 2002 attached hereto.
Exhibit 99.CERT
(b) Certifications pursuant to Section 906 of the Sarbanes-Oxley Act of 2002 attached hereto.
Exhibit 99.906CERT
SIGNATURES
Pursuant to the requirements of the Securities Exchange Act of 1934 and the Investment Company Act of 1940, the registrant has duly caused this Report to be signed on its behalf by the undersigned, there unto duly authorized.
| Western Asset Emerging Markets Debt Fund Inc. | ||
| By: | /s/ Jane Trust | |
| Jane Trust | ||
| Chief Executive Officer | ||
| Date: | August 27, 2018 | |
Pursuant to the requirements of the Securities Exchange Act of 1934 and the Investment Company Act of 1940, this report has been signed below by the following persons on behalf of the registrant and in the capacities and on the dates indicated.
| By: |
/s/ Jane Trust | |
| Jane Trust | ||
| Chief Executive Officer | ||
| Date: | August 27, 2018 | |
| By: | /s/ Richard F. Sennett | |
| Richard F. Sennett | ||
| Principal Financial Officer | ||
| Date: | August 27, 2018 | |