UNITED STATES SECURITIES AND EXCHANGE COMMISSION
Washington, D.C. 20549
FORM N-CSR
CERTIFIED SHAREHOLDER REPORT OF REGISTERED MANAGEMENT
INVESTMENT COMPANIES
| Investment Company Act file number: | 811-21335 | |
| Exact name of registrant as specified in charter: | Optimum Fund Trust | |
| Address of principal executive offices: | 2005 Market Street | |
| Philadelphia, PA 19103 | ||
| Name and address of agent for service: | David F. Connor, Esq. | |
| 2005 Market Street | ||
| Philadelphia, PA 19103 | ||
| Registrant’s telephone number, including area code: | (800) 523-1918 | |
| Date of fiscal year end: | March 31 | |
| Date of reporting period: | March 31, 2018 |
Item 1. Reports to Stockholders
Table of Contents

Optimum Fixed Income Fund
Optimum International Fund
Optimum Large Cap Growth Fund
Optimum Large Cap Value Fund
Optimum Small-Mid Cap Growth Fund
Optimum Small-Mid Cap Value Fund
March 31, 2018
Carefully consider the Funds’ investment objectives, risk factors, charges, and expenses before investing. This and other information can be found in the Funds’ prospectus and, if available, their summary prospectuses, which may be obtained by visiting optimummutualfunds.com/literature or calling 800 914-0278. Investors should read the prospectus and, if available, the summary prospectus carefully before investing.
Table of Contents
| Portfolio management reviews |
||||
| 1 | ||||
| 5 | ||||
| 8 | ||||
| 11 | ||||
| 14 | ||||
| 17 | ||||
| Performance summaries |
||||
| 20 | ||||
| 23 | ||||
| 26 | ||||
| 29 | ||||
| 32 | ||||
| 35 | ||||
| 38 | ||||
| Security type / sector / country allocations |
40 | |||
| Financial statements |
||||
| 45 | ||||
| 124 | ||||
| 127 | ||||
| 129 | ||||
| 132 | ||||
| 150 | ||||
| 178 | ||||
| 179 | ||||
| 182 | ||||
| 184 | ||||
Other than Macquarie Bank Limited (MBL), none of the entities noted are authorized deposit-taking institutions for the purposes of the Banking Act 1959 (Commonwealth of Australia). The obligations of these entities do not represent deposits or other liabilities of MBL. MBL does not guarantee or otherwise provide assurance in respect of the obligations of these entities, unless noted otherwise. The Funds are governed by US laws and regulations.
Unless otherwise noted, views expressed herein are current as of March 31, 2018, and subject to change for events occurring after such a date.
The Funds are not FDIC insured and are not guaranteed. It is possible to lose the principal amount invested.
Mutual fund advisory services provided by Delaware Management Company, a series of Macquarie Investment Management Business Trust (MIMBT), which is a US registered investment advisor. The Funds are distributed by Delaware Distributors, L.P. (DDLP), an affiliate of Macquarie Investment Management Business Trust and Macquarie Group Limited. Macquarie Investment Management (MIM) is the marketing name for certain companies comprising the asset management division of Macquarie Group Limited and its subsidiaries and affiliates worldwide.
All third-party marks cited are the property of their respective owners.
© 2018 Macquarie Management Holdings, Inc.
Table of Contents
Portfolio management reviews
April 10, 2018 (Unaudited)
Performance review (for the year ended March 31, 2018)
| Optimum Fixed Income Fund (Institutional Class shares) |
1-year return | +1.96 | % | |||
| Optimum Fixed Income Fund (Class A shares) |
1-year return | +1.81 | % | |||
| Bloomberg Barclays US Aggregate Index (benchmark) |
1-year return | +1.20 | % |
Past performance does not guarantee future results.
For complete, annualized performance for Optimum Fixed Income Fund, please see the table on page 20.
Institutional Class shares are not subject to a sales charge and are offered for sale exclusively to certain eligible investors. In addition, Institutional Class shares pay no distribution and service fee.
The performance of Class A shares excludes the applicable sales charge. Both Institutional Class shares and Class A shares reflect the reinvestment of all distributions.
Index performance returns do not reflect any management fees, transaction costs, or expenses. Indices are unmanaged and one cannot invest directly in an index.
| (continues) |
1 |
Table of Contents
Portfolio management reviews
Optimum Fixed Income Fund
2
Table of Contents
| (continues) |
3 |
Table of Contents
Portfolio management reviews
Optimum Fixed Income Fund
4
Table of Contents
April 10, 2018 (Unaudited)
| Performance review (for the year ended March 31, 2018) |
||||||||
| Optimum International Fund (Institutional Class shares)* |
1-year return | +19.42% | ||||||
| Optimum International Fund (Class A shares)* |
1-year return | +19.11% | ||||||
| MSCI ACWI ex USA Index (gross) (current benchmark) |
1-year return | +17.05% | ||||||
| MSCI ACWI ex USA Index (net) (current benchmark) |
1-year return | +16.53% | ||||||
| MSCI EAFE Index (gross) (former benchmark) |
1-year return | +15.32% | ||||||
| MSCI EAFE Index (net) (former benchmark) |
1-year return | +14.80% |
Past performance does not guarantee future results.
For complete, annualized performance for Optimum International Fund, please see the table on page 23.
Institutional Class shares are not subject to a sales charge and are offered for sale exclusively to certain eligible investors. In addition, Institutional Class shares pay no distribution and service fee.
The performance of Class A shares excludes the applicable sales charge. Both Institutional Class shares and Class A shares reflect the reinvestment of all distributions.
Index performance returns do not reflect any management fees, transaction costs, or expenses. Indices are unmanaged and one cannot invest directly in an index.
*Total returns for the report period presented in the table differ from the returns in “Financial highlights.” The total returns presented in the above table are calculated based on the net asset value (NAV) at which shareholder transactions were processed. The total returns presented in “Financial highlights” are calculated in the same manner, but also take into account certain adjustments that are necessary under US generally accepted accounting principles (US GAAP) required in the annual report.
| (continues) |
5 |
Table of Contents
Portfolio management reviews
Optimum International Fund
6
Table of Contents
| (continues) |
7 |
Table of Contents
Portfolio management reviews
April 10, 2018 (Unaudited)
| Performance review (for the year ended March 31, 2018) |
||||||||
| Optimum Large Cap Growth Fund (Institutional Class shares) |
1-year return | +22.50% | ||||||
| Optimum Large Cap Growth Fund (Class A shares) |
1-year return | +22.17% | ||||||
| Russell 1000® Growth Index (benchmark) |
1-year return | +21.25% |
Past performance does not guarantee future results.
For complete, annualized performance for Optimum Large Cap Growth Fund, please see the table on page 26.
Institutional Class shares are not subject to a sales charge and are offered for sale exclusively to certain eligible investors. In addition, Institutional Class shares pay no distribution and service fee.
The performance of Class A shares excludes the applicable sales charge. Both Institutional Class shares and Class A shares reflect the reinvestment of all distributions.
Index performance returns do not reflect any management fees, transaction costs, or expenses. Indices are unmanaged and one cannot invest directly in an index.
8
Table of Contents
| (continues) |
9 |
Table of Contents
Portfolio management reviews
Optimum Large Cap Growth Fund
10
Table of Contents
April 10, 2018 (Unaudited)
| Performance review (for the year ended March 31, 2018) |
||||||||
| Optimum Large Cap Value Fund (Institutional Class shares) |
1-year return | +8.90% | ||||||
| Optimum Large Cap Value Fund (Class A shares) |
1-year return | +8.68% | ||||||
| Russell 1000® Value Index (benchmark) |
1-year return | +6.95% |
Past performance does not guarantee future results.
For complete, annualized performance for Optimum Large Cap Value Fund, please see the table on page 29.
Institutional Class shares are not subject to a sales charge and are offered for sale exclusively to certain eligible investors. In addition, Institutional Class shares pay no distribution and service fee.
The performance of Class A shares excludes the applicable sales charge. Both Institutional Class shares and Class A shares reflect the reinvestment of all distributions.
Index performance returns do not reflect any management fees, transaction costs, or expenses. Indices are unmanaged and one cannot invest directly in an index.
| (continues) |
11 |
Table of Contents
Portfolio management reviews
Optimum Large Cap Value Fund
12
Table of Contents
| (continues) |
13 |
Table of Contents
Portfolio management reviews
Optimum Small-Mid Cap Growth Fund
April 10, 2018 (Unaudited)
| Performance review (for the year ended March 31, 2018) |
| |||||
| Optimum Small-Mid Cap Growth Fund (Institutional Class shares) |
1-year return | +22.22 | % | |||
| Optimum Small-Mid Cap Growth Fund (Class A shares) |
1-year return | +21.88 | % | |||
| Russell 2500™ Growth Index (benchmark) |
1-year return | +19.92 | % | |||
Past performance does not guarantee future results.
For complete, annualized performance for Optimum Small-Mid Cap Growth Fund, please see the table on page 32.
Institutional Class shares are not subject to a sales charge and are offered for sale exclusively to certain eligible investors. In addition, Institutional Class shares pay no distribution and service fee.
The performance of Class A shares excludes the applicable sales charge. Both Institutional Class shares and Class A shares reflect the reinvestment of all distributions.
Index performance returns do not reflect any management fees, transaction costs, or expenses. Indices are unmanaged and one cannot invest directly in an index.
14
Table of Contents
| (continues) |
15 |
Table of Contents
Portfolio management reviews
Optimum Small-Mid Cap Growth Fund
16
Table of Contents
Optimum Small-Mid Cap Value Fund
April 10, 2018 (Unaudited)
Performance review (for the year ended March 31, 2018)
| Optimum Small-Mid Cap Value Fund (Institutional Class shares)* |
1-year return | +4.94 | % | |||
| Optimum Small-Mid Cap Value Fund (Class A shares) |
1-year return | +4.59 | % | |||
| Russell 2500™ Value Index (benchmark) |
1-year return | +5.72 | % |
Past performance does not guarantee future results.
For complete, annualized performance for Optimum Small-Mid Cap Value Fund please see the table on page 35.
Institutional Class shares are not subject to a sales charge and are offered for sale exclusively to certain eligible investors. In addition, Institutional Class shares pay no distribution and service fee.
The performance of Class A shares excludes the applicable sales charge. Both Institutional Class shares and Class A shares reflect the reinvestment of all distributions.
Index performance returns do not reflect any management fees, transaction costs, or expenses. Indices are unmanaged and one cannot invest directly in an index.
*Total returns for the report period presented in the table differ from the returns in “Financial highlights.” The total returns presented in the above table are calculated based on the net asset value (NAV) at which shareholder transactions were processed. The total returns presented in “Financial highlights” are calculated in the same manner, but also take into account certain adjustments that are necessary under US generally accepted accounting principles (US GAAP) required in the annual report.
| (continues) |
17 |
Table of Contents
Portfolio management reviews
Optimum Small-Mid Cap Value Fund
18
Table of Contents
| (continues) |
19 |
Table of Contents
Performance summaries
March 31, 2018
(Unaudited)
The performance quoted represents past performance and does not guarantee future results. Investment return and principal value of an investment will fluctuate so that shares, when redeemed, may be worth more or less than their original cost. Current performance may be lower or higher than the performance quoted. Please obtain the performance data for the most recent month end by calling 800 914-0278 or visiting our website at optimummutualfunds.com/performance.
Fund and benchmark performance1,2
| Average annual total returns through March 31, 2018
|
|
1 year
|
|
|
5 years
|
|
|
10 years
|
|
|||||
| Class A (Est. Aug. 1, 2003) |
||||||||||||||
| Excluding sales charge |
+1.81% | +1.18% | +4.21% | |||||||||||
| Including sales charge |
–2.75% | +0.26% | +3.73% | |||||||||||
| Class C (Est. Aug. 1, 2003) |
||||||||||||||
| Excluding sales charge |
+1.06% | +0.44% | +3.49% | |||||||||||
| Including sales charge |
+0.06% | +0.44% | +3.49% | |||||||||||
| Institutional Class (Est. Aug. 1, 2003) |
||||||||||||||
| Excluding sales charge |
+1.96% | +1.44% | +4.52% | |||||||||||
| Including sales charge |
+1.96% | +1.44% | +4.52% | |||||||||||
| Bloomberg Barclays US Aggregate Index |
+1.20% | +1.82% | +3.63% |
1Returns reflect the reinvestment of all distributions and are presented both with and without the applicable sales charges described below. Returns do not reflect the deduction of taxes the shareholder would pay on Fund distributions or redemptions of Fund shares.
Expense limitations were in effect for certain classes during some or all of the periods shown in the “Fund and benchmark performance” graph. The current expenses for each class are listed on the “Fund expense ratios” table on the next page. Performance would have been lower had expense limitations not been in effect.
Institutional Class shares are not subject to a sales charge and are offered for sale exclusively to certain eligible investors. In addition, Institutional Class shares pay no distribution and service fee.
Class A shares are sold with a maximum front-end sales charge of up to 4.50%, and have an annual distribution and service fee of up to 0.25% of average daily net assets. Performance for Class A shares, excluding sales charges, assumes that no front-end sales charge applied.
Class C shares are sold with a contingent deferred sales charge of 1.00% if redeemed during the first 12 months. They are also subject to an annual distribution and service fee of up to 1.00% of average daily net assets.
Performance for Class C shares, excluding sales charges, assumes either that contingent deferred sales charges did not apply or that the investment was not redeemed.
The “Fund and benchmark performance” table and the “Performance of a $10,000 investment” graph do not reflect the deduction of taxes the shareholder would pay on Fund distributions or redemptions of Fund shares.
20
Table of Contents
2The Fund’s expense ratios, as described in the most recent prospectus, are disclosed in the “Fund expense ratios” table below. Delaware Management Company has agreed to reimburse certain expenses and/or waive certain fees in order to prevent total fund operating expenses (excluding any 12b-1 fees and certain other expenses) from exceeding 0.86% of the Fund’s average daily net assets from July 29, 2017 through March 31, 2018. From April 1, 2017 through July 28, 2017, the expense waiver was 0.92% of the Fund’s average daily net assets.* Please see the most recent prospectus and any applicable supplement(s) for additional information on these fee waivers and/or reimbursements.
| Fund expense ratios |
Class A | Class C | Institutional Class | |||
| Total annual operating expenses (without fee waivers) |
1.11% | 1.86% | 0.86% | |||
| Net Expenses (including fee waivers, if any) |
1.11% | 1.86% | 0.86% | |||
| Type of waiver |
Contractual | Contractual | Contractual |
* The aggregate contractual waiver period covering this report is from July 29, 2016 to July 30, 2018.
Fixed income securities and bond funds can lose value, and investors can lose principal, as interest rates rise. They also may be affected by economic conditions that hinder an issuer’s ability to make interest and principal payments on its debt.
The Fund may also be subject to prepayment risk, the risk that the principal of a bond that is held by a portfolio will be prepaid prior to maturity, at the time when interest rates are lower than what the bond was paying. A portfolio may then have to reinvest that money at a lower interest rate.
Securities in the lowest of the rating categories considered to be investment grade (that is, Baa or BBB) have some speculative characteristics.
High yielding, non-investment-grade bonds (junk bonds) involve higher risk than investment grade bonds.
The high yield secondary market is particularly susceptible to liquidity problems when institutional investors, such as mutual funds and certain other financial institutions, temporarily stop buying bonds for regulatory, financial, or other reasons. In addition, a less liquid secondary market makes it more difficult for the Fund to obtain precise valuations of the high yield securities in its portfolio.
If and when the Fund invests in forward foreign currency contracts or uses other investments to hedge against currency risks, the Fund will be subject to special risks, including counterparty risk.
The Fund may invest in derivatives, which may involve additional expenses and are subject to risk, including the risk that an underlying security or securities index moves in the opposite direction from what the portfolio manager anticipated. A derivatives transaction depends upon the counterparties’ ability to fulfill their contractual obligations.
Portfolio turnover is a measure of how frequently the managers buy and sell assets within a fund over a particular period. It is usually reported for a 12-month time period.
Investments in collateralized loan obligations (CLO) may involve risks. CLOs are securities backed by a pool of debt, often low-rated corporate loans. Investors receive scheduled debt payments from the underlying loans but assume most of the risk in the event that borrowers default.
| (continues) |
21 |
Table of Contents
Performance summaries
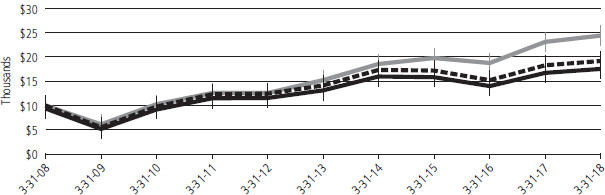
Optimum Fixed Income Fund
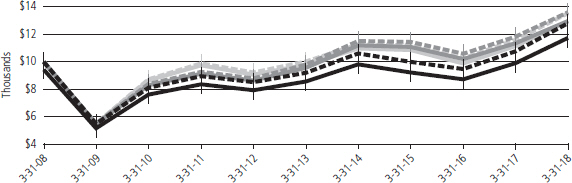
Performance of a $10,000 Investment1
Average annual total returns from March 31, 2008 through March 31, 2018

| Starting value (March 31, 2008) | Ending value (March 31, 2018) | |||||
|
|
Optimum Fixed Income Fund — Institutional Class shares | $10,000 | $15,562 | |||
|
|
Optimum Fixed Income Fund — Class A shares | $9,550 | $14,421 | |||
|
|
Bloomberg Barclays US Aggregate Index | $10,000 | $14,286 |


1The “Performance of $10,000 investment” graph assumes $10,000 invested in Class A and Institutional Class shares of the Fund on March 31, 2008, and includes the effect of a 4.50% front-end sales charge (for Class A shares) and the reinvestment of all distributions. The graph does not reflect the deduction of taxes the shareholders would pay on Fund distributions or redemptions of Fund shares. Expense limitations were in effect for some or all of the periods shown. Performance would have been lower had expense limitations not been in effect. Current expenses are listed in the “Fund expense ratios” table on page 21. Please note additional details on pages 20 through 22.
The graph also assumes $10,000 invested in the Bloomberg Barclays US Aggregate Index as of March 31, 2008. The Bloomberg Barclays US Aggregate Index is a broad composite that tracks the investment grade domestic bond market.
The Bloomberg Barclays US Mortgage-Backed Securities (MBS) Index, mentioned on page 2, measures the performance of agency mortgage-backed pass-through securities (both fixed-rate and hybrid adjustable-rate mortgage) issued by the Federal National Mortgage Association (Fannie Mae), Federal Home Loan Mortgage Association (Freddie Mac), and Government National Mortgage Association (Ginnie Mae).
The ICE BofAML US Dollar 3-Month Deposit Offered Rate Constant Maturity Index (formerly known as the BofA Merrill Lynch US Dollar 3-Month Deposit Offered Rate Constant Maturity Index), mentioned on page 2, represents the London interbank offered rate (Libor) with a constant 3-month average maturity. Libor is a composite of the rates of interest at which banks borrow from one another in the London market, and it is a widely used benchmark for short-term interest rates.
Index performance returns do not reflect any management fees, transaction costs, or expenses. Indices are unmanaged and one cannot invest directly in an index. Past performance is not a guarantee of future results.
Performance of other Fund classes will vary due to different charges and expenses.
Stock symbols and CUSIP numbers
| Nasdaq symbols | CUSIPs | |||||||
| Class A |
OAFIX | 246118681 | ||||||
| Class C |
OCFIX | 246118665 | ||||||
| Institutional Class |
OIFIX | 246118657 | ||||||
22
Table of Contents
March 31, 2018
(Unaudited)
The performance quoted represents past performance and does not guarantee future results. Investment return and principal value of an investment will fluctuate so that shares, when redeemed, may be worth more or less than their original cost. Current performance may be lower or higher than the performance quoted. Please obtain the performance data for the most recent month end by calling 800 914-0278 or visiting our website at optimummutualfunds.com/performance.
Fund and benchmark performance1,2
| Average annual total returns through March 31, 2018
|
1 year
|
5 years
|
10 years
|
|||||||||||
| Class A (Est. Aug. 1, 2003) |
||||||||||||||
| Excluding sales charge |
+19.11% | * | +6.73% | +2.28% | ||||||||||
| Including sales charge |
+12.30% | * | +5.47% | +1.68% | ||||||||||
| Class C (Est. Aug. 1, 2003) |
||||||||||||||
| Excluding sales charge |
+18.28% | * | +5.95% | +1.57% | ||||||||||
| Including sales charge |
+17.28% | * | +5.95% | +1.57% | ||||||||||
| Institutional Class (Est. Aug. 1, 2003) |
||||||||||||||
| Excluding sales charge |
+19.42% | * | +7.02% | +2.59% | ||||||||||
| Including sales charge |
+19.42% | * | +7.02% | +2.59% | ||||||||||
| MSCI ACWI ex USA Index (net) |
+16.53% | +5.89% | +2.70% | |||||||||||
| MSCI ACWI ex USA Index (gross) |
+17.05% | +6.37% | +3.17% | |||||||||||
| MSCI EAFE Index (net) |
+14.80% | +6.50% | +2.74% | |||||||||||
| MSCI EAFE Index (gross) |
+15.32% | +6.98% | +3.22% | |||||||||||
*Total returns for the report period presented in the table differ from the returns in “Financial highlights.” The total returns presented in the above table are calculated based on the net asset value (NAV) at which shareholder transactions were processed. The total returns presented in “Financial highlights” are calculated in the same manner, but also take into account certain adjustments that are necessary under US generally accepted accounting principles (US GAAP) required in the annual report.
1Returns reflect the reinvestment of all distributions and are presented both with and without the applicable sales charges described below. Returns do not reflect the deduction of taxes the shareholder would pay on Fund distributions or redemptions of Fund shares.
Expense limitations were in effect for certain classes during some or all of the periods shown in the “Fund and benchmark performance” graph. The current expenses for each class are listed on the “Fund expense ratios” table on the next page. Performance would have been lower had expense limitations not been in effect.
Institutional Class shares are not subject to a sales charge and are offered for sale exclusively to certain eligible investors. In addition, Institutional Class shares pay no distribution and service fee.
Class A shares are sold with a maximum front-end sales charge of up to 5.75%, and have an annual distribution and service fee of up to 0.25% of average daily net assets. Performance for Class A shares, excluding sales charges, assumes that no front-end sales charge applied.
Class C shares are sold with a contingent deferred sales charge of 1.00% if redeemed during the first 12 months. They are also subject to an annual distribution and service fee of up to 1.00% of average daily net assets.
Performance for Class C shares, excluding sales charges, assumes either that contingent deferred sales charges did not apply or that the investment was not redeemed.
The “Fund and benchmark performance” table and the “Performance of a $10,000 investment” graph do not reflect the deduction of taxes the shareholder would pay on Fund distributions or redemptions of Fund shares.
2 The Fund’s expense ratios, as described in the most recent prospectus, are disclosed in the “Fund expense ratios” table on the next page. Delaware Management Company has agreed to reimburse certain expenses and/or waive certain fees in order to prevent total fund
| (continues) |
23 |
Table of Contents
Performance summaries
Optimum International Fund
operating expenses (excluding any 12b-1 fees and certain other expenses) from exceeding 1.13% of the Fund’s average daily net assets from July 29, 2017, through March 31, 2018. From April 1, 2017 through July 28, 2017, the expense waiver was 1.25% of the Fund’s average daily net assets.* Please see the most recent prospectus and any applicable supplement(s) for additional information on these fee waivers and/or reimbursements.
| Fund expense ratios | Class A | Class C | Institutional Class | |||
| Total annual operating expenses (without fee waivers) |
1.37% | 2.12% | 1.12% | |||
| Net expenses (including fee waivers, if any) |
1.37% | 2.12% | 1.12% | |||
| Type of waiver |
Contractual | Contractual | Contractual |
* The aggregate contractual waiver period covering this report is from July 29, 2016 to July 30, 2018.
International investments entail risks not ordinarily associated with US investments including fluctuation in currency values, differences in accounting principles, or economic or political instability in other nations. Investing in emerging markets can be riskier than investing in established foreign markets due to increased volatility and lower trading volume.
The Fund may invest in derivatives, which may involve additional expenses and are subject to risk, including the risk that an underlying security or securities index moves in the opposite direction from what the portfolio manager anticipated. A derivative transaction depends upon the counterparties’ ability to fulfill their contractual obligations.
There is no guarantee that dividend-paying stocks will continue to pay dividends.
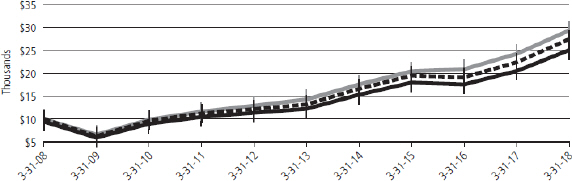
Performance of a $10,000 Investment1
Average annual total returns from March 31, 2008 through March 31, 2018
| Starting value (March 31, 2008) | Ending value (March 31, 2018) | |||||
|
|
MSCI EAFE Index (gross) | $10,000 | $13,735 | |||
|
|
MSCI ACWI ex USA Index (gross) | $10,000 | $13,665 | |||
|
|
MSCI EAFE Index (net) | $10,000 | $13,078 | |||
|
|
MSCI ACWI ex USA Index (net) | $10,000 | $13,053 | |||
|
|
Optimum International Fund — Institutional Class shares | $10,000 | $12,914 | |||
|
|
Optimum International Fund — Class A shares | $9,425 | $11,811 |


1The “Performance of $10,000 investment” graph assumes $10,000 invested in Class A and Institutional Class shares of the Fund on March 31, 2008, and includes the effect of a 5.75% front-end sales charge (for Class A shares) and the reinvestment of all distributions. The graph does not reflect the deduction of taxes the shareholders would pay on Fund distributions or redemptions of Fund shares. Expense
24
Table of Contents
limitations were in effect for some or all of the periods shown. Performance would have been lower had expense limitations not been in effect. Current expenses are listed in the “Fund expense ratios” table on page 24. Please note additional details on pages 23 through 25.
The graph also assumes $10,000 invested in the MSCI EAFE Index and the MSCI ACWI ex USA Index as of March 31, 2008.
The MSCI EAFE (Europe, Australasia, Far East) Index is a free float-adjusted market capitalization weighted index designed to measure equity market performance of developed markets, excluding the United States and Canada. Index “gross” return approximates the maximum possible dividend reinvestment. Index “net” return approximates the minimum possible dividend reinvestment, after deduction of withholding tax at the highest possible rate.
The MSCI ACWI (All Country World Index) ex USA Index is a free float-adjusted market capitalization weighted index that is designed to measure equity market performance across developed and emerging markets worldwide, excluding the United States. Index “gross” return approximates the maximum possible dividend reinvestment. Index “net” return approximates the minimum possible dividend reinvestment, after deduction of withholding tax at the highest possible rate.
Effective Jan. 19, 2018, the MSCI ACWI ex USA Index replaced the MSCI EAFE Index in order to reflect the Fund’s ability to invest in emerging market securities. Please see the supplement to the Fund’s prospectus for more information.
The MSCI Emerging Markets Index, mentioned on page 5, is a free float-adjusted market capitalization index designed to measure equity market performance across emerging market countries worldwide. Index “net” return approximates the minimum possible dividend reinvestment, after deduction of withholding tax at the highest possible rate.
The Russell 1000 Index, mentioned on page 5, measures the performance of the large-cap segment of the US equity universe.
The Russell 2000 Index, mentioned on page 5, measures the performance of the small-cap segment of the US equity universe.
Russell Investment Group is the source and owner of the trademarks, service marks, and copyrights related to the Russell Indexes. Russell® is a trademark of Russell Investment Group.
Index performance returns do not reflect any management fees, transaction costs, or expenses. Indices are unmanaged and one cannot invest directly in an index. Past performance is not a guarantee of future results.
Performance of other Fund classes will vary due to different charges and expenses.
Stock symbols and CUSIP numbers
| Nasdaq symbols | CUSIPs | |||||||
| Class A |
OAIEX | 246118731 | ||||||
| Class C |
OCIEX | 246118715 | ||||||
| Institutional Class |
OIIEX | 246118699 | ||||||
| (continues) |
25 |
Table of Contents
Performance summaries
March 31, 2018
(Unaudited)
The performance quoted represents past performance and does not guarantee future results. Investment return and principal value of an investment will fluctuate so that shares, when redeemed, may be worth more or less than their original cost. Current performance may be lower or higher than the performance quoted. Please obtain the performance data for the most recent month end by calling 800 914-0278 or visiting our website at optimummutualfunds.com/performance.
Fund and benchmark performance1,2
| Average annual total returns through March 31, 2018
|
1 year
|
5 years
|
10 years
|
|||||||||||||
| Class A (Est. Aug. 1, 2003) |
||||||||||||||||
| Excluding sales charge |
+22.17% | +15.41% | +10.24% | |||||||||||||
| Including sales charge |
+15.13% | +14.04% | +9.59% | |||||||||||||
| Class C (Est. Aug. 1, 2003) |
||||||||||||||||
| Excluding sales charge |
+21.30% | +14.56% | +9.48% | |||||||||||||
| Including sales charge |
+20.31% | +14.56% | +9.48% | |||||||||||||
| Institutional Class (Est. Aug. 1, 2003) |
||||||||||||||||
| Excluding sales charge |
+22.50% | +15.71% | +10.58% | |||||||||||||
| Including sales charge |
+22.50% | +15.71% | +10.58% | |||||||||||||
| Russell 1000 Growth Index |
+21.25% | +15.53% | +11.34% | |||||||||||||
1Returns reflect the reinvestment of all distributions and are presented both with and without the applicable sales charges described below. Returns do not reflect the deduction of taxes the shareholder would pay on Fund distributions or redemptions of Fund shares.
Expense limitations were in effect for certain classes during some or all of the periods shown in the “Fund and benchmark performance” graph. The current expenses for each class are listed on the “Fund expense ratios” table on the next page. Performance would have been lower had expense limitations not been in effect.
Institutional Class shares are not subject to a sales charge and are offered for sale exclusively to certain eligible investors. In addition, Institutional Class shares pay no distribution and service fee.
Class A shares are sold with a maximum front-end sales charge of up to 5.75%, and have an annual distribution and service fee of up to 0.25% of average daily net assets. Performance for Class A shares, excluding sales charges, assumes that no front-end sales charge applied.
Class C shares are sold with a contingent deferred sales charge of 1.00% if redeemed during the first 12 months. They are also subject to an annual distribution and service fee of up to 1.00% of average daily net assets.
Performance for Class C shares, excluding sales charges, assumes either that contingent deferred sales charges did not apply or that the investment was not redeemed.
The “Fund and benchmark performance” table and the “Performance of a $10,000 investment” graph do not reflect the deduction of taxes the shareholder would pay on Fund distributions or redemptions of Fund shares.
2 The Fund’s expense ratios, as described in the most recent prospectus, are disclosed in the “Fund expense ratios” table on the next page. Delaware Management Company has agreed to reimburse certain expenses and/or waive certain fees in order to prevent total fund operating expenses (excluding any 12b-1 fees and certain other expenses) from exceeding 1.02% of the Fund’s average daily net assets from July 29, 2017, through March 31, 2018. From April 1, 2017 through July 28, 2017, the expense waiver was 1.10% of the Fund’s average daily net assets.* Please see the most recent prospectus and any applicable supplement(s) for additional information on these fee waivers and/or reimbursements.
26
Table of Contents
| Fund expense ratios | Class A | Class C | Institutional Class | |||
| Total annual operating expenses (without fee waivers) |
1.27% | 2.02% | 1.02% | |||
| Net expenses (including fee waivers, if any) |
1.27% | 2.02% | 1.02% | |||
| Type of waiver |
Contractual | Contractual | Contractual |
* The aggregate contractual waiver period covering this report is from July 29, 2016 to July 29, 2018.
Narrowly focused investments may exhibit higher volatility than investments in multiple industry sectors.
REIT investments are subject to many of the risks associated with direct real estate ownership, including changes in economic conditions, credit risk, and interest rate fluctuations.
Performance of a $10,000 Investment1
Average annual total returns from March 31, 2008 through March 31, 2018
| Starting value (March 31, 2008) | Ending value (March 31, 2018) | |||||
|
|
Russell 1000 Growth Index | $10,000 | $29,278 | |||
|
|
Optimum Large Cap Growth Fund — Institutional Class shares | $10,000 | $27,347 | |||
|
|
Optimum Large Cap Growth Fund — Class A shares | $9,425 | $24,994 |
1The “Performance of $10,000 investment” graph assumes $10,000 invested in Class A and Institutional Class shares of the Fund on March 31, 2008, and includes the effect of a 5.75% front-end sales charge (for Class A shares) and the reinvestment of all distributions. The graph does not reflect the deduction of taxes the shareholders would pay on Fund distributions or redemptions of Fund shares. Expense limitations were in effect for some or all of the periods shown. Performance would have been lower had expense limitations not been in effect. Current expenses are listed in the “Fund expense ratios” table above. Please note additional details on pages 26 through 28.
The graph also assumes $10,000 invested in the Russell 1000 Growth Index as of March 31, 2008. The Russell 1000 Growth Index measures the performance of the large-cap growth segment of the US equity universe. It includes those Russell 1000 companies with higher price-to-book ratios and higher forecasted growth values.
Russell Investment Group is the source and owner of the trademarks, service marks, and copyrights related to the Russell Indexes. Russell® is a trademark of Russell Investment Group.
Index performance returns do not reflect any management fees, transaction costs, or expenses. Indices are unmanaged and one cannot invest directly in an index. Past performance is not a guarantee of future results.
Performance of other Fund classes will vary due to different charges and expenses.
| (continues) | 27 |
Table of Contents
Performance summaries
Optimum Large Cap Growth Fund
Stock symbols and CUSIP numbers
| Nasdaq symbols | CUSIPs | |||||||
| Class A |
OALGX | 246118707 | ||||||
| Class C |
OCLGX | 246118889 | ||||||
| Institutional Class |
OILGX | 246118871 | ||||||
28
Table of Contents
March 31, 2018
(Unaudited)
The performance quoted represents past performance and does not guarantee future results. Investment return and principal value of an investment will fluctuate so that shares, when redeemed, may be worth more or less than their original cost. Current performance may be lower or higher than the performance quoted. Please obtain the performance data for the most recent month end by calling 800 914-0278 or visiting our website at optimummutualfunds.com/performance.
Fund and benchmark performance1,2
| Average annual total returns through March 31, 2018
|
1 year
|
5 years
|
10 years
|
|||||||||||
| Class A (Est. Aug. 1, 2003) |
||||||||||||||
| Excluding sales charge |
+8.68% | +8.56% | +6.59% | |||||||||||
| Including sales charge |
+2.43% | +7.27% | +5.96% | |||||||||||
| Class C (Est. Aug. 1, 2003) |
||||||||||||||
| Excluding sales charge |
+7.82% | +7.76% | +5.85% | |||||||||||
| Including sales charge |
+6.82% | +7.76% | +5.85% | |||||||||||
| Institutional Class (Est. Aug. 1, 2003) |
||||||||||||||
| Excluding sales charge |
+8.90% | +8.83% | +6.91% | |||||||||||
| Including sales charge |
+8.90% | +8.83% | +6.91% | |||||||||||
| Russell 1000 Value Index |
+6.95% | +10.78% | +7.77% | |||||||||||
1Returns reflect the reinvestment of all distributions and are presented both with and without the applicable sales charges described below. Returns do not reflect the deduction of taxes the shareholder would pay on Fund distributions or redemptions of Fund shares.
Expense limitations were in effect for certain classes during some or all of the periods shown in the “Fund and benchmark performance” graph. The current expenses for each class are listed on the “Fund expense ratios” table on the next page. Performance would have been lower had expense limitations not been in effect.
Institutional Class shares are not subject to a sales charge and are offered for sale exclusively to certain eligible investors. In addition, Institutional Class shares pay no distribution and service fee.
Class A shares are sold with a maximum front-end sales charge of up to 5.75%, and have an annual distribution and service fee of up to 0.25% of average daily net assets. Performance for Class A shares, excluding sales charges, assumes that no front-end sales charge applied.
Class C shares are sold with a contingent deferred sales charge of 1.00% if redeemed during the first 12 months. They are also subject to an annual distribution and service fee of up to 1.00% of average daily net assets.
Performance for Class C shares, excluding sales charges, assumes either that contingent deferred sales charges did not apply or that the investment was not redeemed.
The “Fund and benchmark performance” table and the “Performance of a $10,000 investment” graph do not reflect the deduction of taxes the shareholder would pay on Fund distributions or redemptions of Fund shares.
2 The Fund’s expense ratios, as described in the most recent prospectus, are disclosed in the “Fund expense ratios” table on the next page. Delaware Management Company has agreed to reimburse certain expenses and/or waive certain fees in order to prevent total fund operating expenses (excluding any 12b-1 fees and certain other expenses) from exceeding 0.98% of the Fund’s average daily net assets from July 29, 2017 through March 31, 2018. From April 1, 2017 through July 28, 2017, the expense waiver was 1.08% of the Fund’s average daily net assets.* Please see the most recent prospectus and any applicable supplement(s) for additional information on these fee waivers and/or reimbursements.
| (continues) |
29 |
Table of Contents
Performance summaries
Optimum Large Cap Value Fund
| Fund expense ratios | Class A | Class C | Institutional Class | |||
| Total annual operating expenses (without fee waivers) |
1.23% | 1.98% | 0.98% | |||
| Net expenses (including fee waivers, if any) |
1.23% | 1.98% | 0.98% | |||
| Type of waiver |
Contractual | Contractual | Contractual |
*The aggregate contractual waiver period covering this report is from July 29, 2016 to July 30, 2018.
Performance of a $10,000 Investment1
Average annual total returns from March 31, 2008 through March 31, 2018
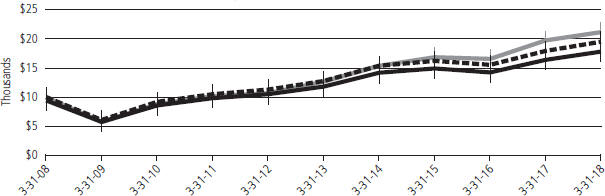
| Starting value (March 31, 2008) | Ending value (March 31, 2018) | |||||||
|
|
Russell 1000 Value Index |
$10,000 | $21,143 | |||||
|
|
Optimum Large Cap Value Fund — Institutional Class shares |
$10,000 | $19,510 | |||||
|
|
Optimum Large Cap Value Fund — Class A shares |
$9,425 | $17,838 | |||||
1The “Performance of $10,000 investment” graph assumes $10,000 invested in Class A and Institutional Class shares of the Fund on March 31, 2008, and includes the effect of a 5.75% front-end sales charge (for Class A shares) and the reinvestment of all distributions. The graph does not reflect the deduction of taxes the shareholders would pay on Fund distributions or redemptions of Fund shares. Expense limitations were in effect for some or all of the periods shown. Performance would have been lower had expense limitations not been in effect. Current expenses are listed in the “Fund expense ratios” table above. Please note additional details on pages 29 through 31.
The graph also assumes $10,000 invested in the Russell 1000 Value Index as of March 31, 2008. The Russell 1000 Value Index measures the performance of the large-cap value segment of the US equity universe. It includes those Russell 1000 companies with lower price-to-book ratios and lower forecasted growth values.
Russell Investment Group is the source and owner of the trademarks, service marks, and copyrights related to the Russell Indexes. Russell® is a trademark of Russell Investment Group.
Index performance returns do not reflect any management fees, transaction costs, or expenses. Indices are unmanaged and one cannot invest directly in an index. Past performance is not a guarantee of future results.
Performance of other Fund classes will vary due to different charges and expenses.
30
Table of Contents
Stock symbols and CUSIP numbers
| Nasdaq symbols | CUSIPs | |||||||||
| Class A |
OALVX | 246118863 | ||||||||
| Class C |
OCLVX | 246118848 | ||||||||
| Institutional Class |
OILVX | 246118830 | ||||||||
| (continues) | 31 |
Table of Contents
Performance summaries
Optimum Small-Mid Cap Growth Fund
| (Unaudited) | March 31, 2018 |
The performance quoted represents past performance and does not guarantee future results. Investment return and principal value of an investment will fluctuate so that shares, when redeemed, may be worth more or less than their original cost. Current performance may be lower or higher than the performance quoted. Please obtain the performance data for the most recent month end by calling 800 914-0278 or visiting our website at optimummutualfunds.com/performance.
Fund and benchmark performance1,2
| Average annual total returns through March 31, 2018
|
1 year
|
5 years
|
10 years
|
|||||||||||||||||
| Class A (Est. Aug. 1, 2003) |
||||||||||||||||||||
| Excluding sales charge |
+21.88% | +10.31% | +8.55% | |||||||||||||||||
| Including sales charge |
+14.89% | +9.02% | +7.91% | |||||||||||||||||
| Class C (Est. Aug. 1, 2003) |
||||||||||||||||||||
| Excluding sales charge |
+21.06% | +9.51% | +7.80% | |||||||||||||||||
| Including sales charge |
+20.06% | +9.51% | +7.80% | |||||||||||||||||
| Institutional Class (Est. Aug. 1, 2003) |
||||||||||||||||||||
| Excluding sales charge |
+22.22% | +10.60% | +8.88% | |||||||||||||||||
| Including sales charge |
+22.22% | +10.60% | +8.88% | |||||||||||||||||
| Russell 2500 Growth Index |
+19.92% | +13.37% | +11.17% | |||||||||||||||||
1Returns reflect the reinvestment of all distributions and are presented both with and without the applicable sales charges described below. Returns do not reflect the deduction of taxes the shareholder would pay on Fund distributions or redemptions of Fund shares.
Expense limitations were in effect for certain classes during some or all of the periods shown in the “Fund and benchmark performance” graph. The current expenses for each class are listed on the “Fund expense ratios” table on the next page. Performance would have been lower had expense limitations not been in effect.
Institutional Class shares are not subject to a sales charge and are offered for sale exclusively to certain eligible investors. In addition, Institutional Class shares pay no distribution and service fee.
Class A shares are sold with a maximum front-end sales charge of up to 5.75%, and have an annual distribution and service fee of up to 0.25% of average daily net assets. Performance for Class A shares, excluding sales charges, assumes that no front-end sales charge applied.
Class C shares are sold with a contingent deferred sales charge of 1.00% if redeemed during the first 12 months. They are also subject to an annual distribution and service fee of up to 1.00% of average daily net assets.
Performance for Class C shares, excluding sales charges, assumes either that contingent deferred sales charges did not apply or that the investment was not redeemed.
The “Fund and benchmark performance” table and the “Performance of a $10,000 investment” graph do not reflect the deduction of taxes the shareholder would pay on Fund distributions or redemptions of Fund shares.
2The Fund’s expense ratios, as described in the most recent prospectus, are disclosed in the “Fund expense ratios” table on the next page. Delaware Management Company has agreed to reimburse certain expenses and/or waive certain fees in order to prevent total fund operating expenses (excluding any 12b-1 fees and certain other expenses) from exceeding 1.29% of the Fund’s average daily net assets from July 29, 2017 through March 31, 2018. From April 1, 2017 through July 28, 2017, the expense waiver was 1.33% of the Fund’s average daily net assets.* Please see the most recent prospectus and any applicable supplement(s) for additional information on these fee waivers and/or reimbursements.
32
Table of Contents
| Fund expense ratios | Class A | Class C | Institutional Class | |||
| Total annual operating expenses (without fee waivers) |
1.66% | 2.41% | 1.41% | |||
| Net expenses (including fee waivers, if any) |
1.54% | 2.29% | 1.29% | |||
| Type of waiver |
Contractual | Contractual | Contractual |
*The aggregate contractual waiver period covering this report is from July 29, 2016 to July 30, 2018.
Investments in small and/or medium-sized companies typically exhibit greater risk and higher volatility than larger, more established companies.
Performance of a $10,000 Investment1
Average annual total returns from March 31, 2008 through March 31, 2018
| Starting value (March 31, 2008) | Ending value (March 31, 2018) | |||||||
|
|
Russell 2500 Growth Index |
$10,000 | $28,843 | |||||
|
|
Optimum Small-Mid Cap Growth Fund — Institutional Class shares |
$10,000 | $23,414 | |||||
|
|
Optimum Small-Mid Cap Growth Fund — Class A shares |
$9,425 | $21,414 | |||||
1The “Performance of $10,000 investment” graph assumes $10,000 invested in Class A and Institutional Class shares of the Fund on March 31, 2008, and includes the effect of a 5.75% front-end sales charge (for Class A shares) and the reinvestment of all distributions. The graph does not reflect the deduction of taxes the shareholders would pay on Fund distributions or redemptions of Fund shares. Expense limitations were in effect for some or all of the periods shown. Performance would have been lower had expense limitations not been in effect. Current expenses are listed in the “Fund expense ratios” table on page 33. Please note additional details on pages 32 through 34.
The graph also assumes $10,000 invested in the Russell 2500 Growth Index as of March 31, 2008. The Russell 2500 Growth Index measures the performance of the small- to mid-cap growth segment of the US equity universe. It includes those Russell 2500 companies with higher price-to-book ratios and higher forecasted growth values.
The Russell 2500 Value Index, mentioned on page 14, measures the performance of the small- to mid-cap value segment of the US equity universe. It includes those Russell 2500 companies with lower price-to-book ratios and lower forecasted growth values.
Russell Investment Group is the source and owner of the trademarks, service marks, and copyrights related to the Russell Indexes. Russell® is a trademark of Russell Investment Group.
Index performance returns do not reflect any management fees, transaction costs, or expenses. Indices are unmanaged and one cannot invest directly in an index. Past performance is not a guarantee of future results.
Performance of other Fund classes will vary due to different charges and expenses.
| (continues) | 33 |
Table of Contents
Performance summaries
Optimum Small-Mid Cap Growth Fund
Stock symbols and CUSIP numbers
| Nasdaq symbols | CUSIPs | |||||
| Class A |
OASGX | 246118822 | ||||
| Class C |
OCSGX | 246118798 | ||||
| Institutional Class |
OISGX | 246118780 | ||||
34
Table of Contents
Optimum Small-Mid Cap Value Fund
| (Unaudited) | March 31, 2018 |
The performance quoted represents past performance and does not guarantee future results. Investment return and principal value of an investment will fluctuate so that shares, when redeemed, may be worth more or less than their original cost. Current performance may be lower or higher than the performance quoted. Please obtain the performance data for the most recent month end by calling 800 914-0278 or visiting our website at optimummutualfunds.com/performance.
Fund and benchmark performance1,2
| Average annual total returns through March 31, 2018
|
|
1 year
|
|
|
5 years
|
|
|
10 years
|
|
|||||||||||
| Class A (Est. Aug. 1, 2003) |
||||||||||||||||||||
| Excluding sales charge |
+4.59% | +5.96% | +6.39% | |||||||||||||||||
| Including sales charge |
–1.42% | +4.71% | +5.77% | |||||||||||||||||
| Class C (Est. Aug. 1, 2003) |
||||||||||||||||||||
| Excluding sales charge |
+3.85% | +5.18% | +5.64% | |||||||||||||||||
| Including sales charge |
+2.87% | +5.18% | +5.64% | |||||||||||||||||
| Institutional Class (Est. Aug. 1, 2003) |
||||||||||||||||||||
| Excluding sales charge |
+4.94%* | +6.24% | +6.72% | |||||||||||||||||
| Including sales charge |
+4.94%* | +6.24% | +6.72% | |||||||||||||||||
| Russell 2500 Value Index |
+5.72% | +9.88% | +9.34% | |||||||||||||||||
*Total returns for the report period presented in the table differ from the returns in “Financial highlights.” The total returns presented in the above table are calculated based on the net asset value (NAV) at which shareholder transactions were processed. The total returns presented in “Financial highlights” are calculated in the same manner, but also take into account certain adjustments that are necessary under US generally accepted accounting principles (US GAAP) required in the annual report.
1Returns reflect the reinvestment of all distributions and are presented both with and without the applicable sales charges described below. Returns do not reflect the deduction of taxes the shareholder would pay on Fund distributions or redemptions of Fund shares.
Expense limitations were in effect for certain classes during some or all of the periods shown in the “Fund and benchmark performance” graph. The current expenses for each class are listed on the “Fund expense ratios” table on the next page. Performance would have been lower had expense limitations not been in effect.
Institutional Class shares are not subject to a sales charge and are offered for sale exclusively to certain eligible investors. In addition, Institutional Class shares pay no distribution and service fee.
Class A shares are sold with a maximum front-end sales charge of up to 5.75%, and have an annual distribution and service fee of up to 0.25% of average daily net assets. Performance for Class A shares, excluding sales charges, assumes that no front-end sales charge applied.
Class C shares are sold with a contingent deferred sales charge of 1.00% if redeemed during the first 12 months. They are also subject to an annual distribution and service fee of up to 1.00% of average daily net assets.
Performance for Class C shares, excluding sales charges, assumes either that contingent deferred sales charges did not apply or that the investment was not redeemed.
The “Fund and benchmark performance” table and the “Performance of a $10,000 investment” graph do not reflect the deduction of taxes the shareholder would pay on Fund distributions or redemptions of Fund shares.
2The Fund’s expense ratios, as described in the most recent prospectus, are disclosed in the “Fund expense ratios” table on the next page. Delaware Management Company has agreed to reimburse certain expenses and/or waive certain fees in order to prevent total fund operating expenses (excluding any 12b-1 fees and certain other expenses) from exceeding 1.22% of the Fund’s average daily net assets from
| (continues) | 35 |
Table of Contents
Performance summaries
Optimum Small-Mid Cap Value Fund
July 29, 2017 through March 31, 2018. From April 1, 2017 through July 28, 2017, the expense waiver was 1.25% of the Fund’s average daily net assets.* Please see the most recent prospectus and any applicable supplement(s) for additional information on these fee waivers and/or reimbursements.
| Fund expense ratios | Class A | Class C | Institutional Class | |||
| Total annual operating expenses (without fee waivers) |
1.56% | 2.31% | 1.31% | |||
| Net expenses (including fee waivers, if any) |
1.47% | 2.22% | 1.22% | |||
| Type of waiver |
Contractual | Contractual | Contractual |
*The aggregate contractual waiver period covering this report is from July 29, 2016 to July 30, 2018.
Investing involves risk, including the possible loss of principal.
Investments in small and/or medium-sized companies typically exhibit greater risk and higher volatility than larger, more established companies.
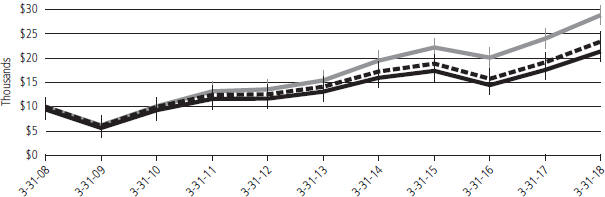
Performance of a $10,000 Investment1
Average annual total returns from March 31, 2008 through March 31, 2018
| Starting value (March 31, 2008) | Ending value (March 31, 2018) | |||||||
|
|
Russell 2500 Value Index |
$10,000 | $24,433 | |||||
|
|
Optimum Small-Mid Cap Value Fund — Institutional Class shares |
$10,000 | $19,164 | |||||
|
|
Optimum Small-Mid Cap Value Fund — Class A shares |
$9,425 | $17,522 | |||||
1The “Performance of $10,000 investment” graph assumes $10,000 invested in Class A and Institutional Class shares of the Fund on March 31, 2008, and includes the effect of a 5.75% front-end sales charge (for Class A shares) and the reinvestment of all distributions. The graph does not reflect the deduction of taxes the shareholders would pay on Fund distributions or redemptions of Fund shares. Expense limitations were in effect for some or all of the periods shown. Performance would have been lower had expense limitations not been in effect. Current expenses are listed in the “Fund expense ratios” table on page 36. Please note additional details on pages 35 through 37.
The graph also assumes $10,000 invested in the Russell 2500 Value Index as of March 31, 2008. The Russell 2500 Value Index measures the performance of the small- to mid-cap value segment of the US equity universe. It includes those Russell 2500 companies with lower price-to-book ratios and lower forecasted growth values.
The Russell 1000 Growth Index, mentioned on page 17, measures the performance of the large-cap growth segment of the US equity universe. It includes those Russell 1000 companies with higher price-to-book ratios and higher forecasted growth values.
The Russell 2000 Value Index, mentioned on page 17, measures the performance of the small-cap value segment of the US equity universe. It includes those Russell 2000 companies with lower price-to-book ratios and lower forecasted growth values.
36
Table of Contents
The Russell 2500 Growth Index, mentioned on page 17, measures the performance of the small- to mid-cap growth segment of the US equity universe. It includes those Russell 2500 companies with higher price-to-book ratios and higher forecasted growth values.
The Russell 2500 Index, mentioned on page 17, measures the performance of the small- to mid-cap segment of the US equity universe. The Russell 2500 Index is a subset of the Russell 3000® Index, representing approximately 2,500 of the smallest securities based on a combination of their market cap and current index membership.
Russell Investment Group is the source and owner of the trademarks, service marks, and copyrights related to the Russell Indexes. Russell® is a trademark of Russell Investment Group.
Index performance returns do not reflect any management fees, transaction costs, or expenses. Indices are unmanaged and one cannot invest directly in an index. Past performance is not a guarantee of future results.
Performance of other Fund classes will vary due to different charges and expenses.
Stock symbols and CUSIP numbers
| Nasdaq symbols | CUSIPs | |||||
| Class A |
OASVX | 246118772 | ||||
| Class C |
OCSVX | 246118756 | ||||
| Institutional Class |
OISVX | 246118749 | ||||
| (continues) | 37 |
Table of Contents
For the six-month period from October 1, 2017 to March 31, 2018 (Unaudited)
38
Table of Contents
| (continues) |
39 |
Table of Contents
Security type / sector allocations
Optimum Fixed Income Fund
As of March 31, 2018 (Unaudited)
Sector designations may be different than the sector designations presented in other Fund materials. The sector designations may represent the investment manager or sub-advisor’s internal sector classifications, which may result in the sector designations for one fund being different than another fund’s sector designations.
40
Table of Contents
Security type / country and sector allocations
Optimum International Fund
As of March 31, 2018 (Unaudited)
Sector designations may be different than the sector designations presented in other Fund materials. The sector designations may represent the investment manager or sub-advisor’s internal sector classifications, which may result in the sector designations for one fund being different than another fund’s sector designations.
| (continues) | 41 |
Table of Contents
Security type / sector allocations and top 10 equity holdings
Sector designations may be different than the sector designations presented in other Fund materials. The sector designations may represent the investment manager or sub-advisor’s internal sector classifications, which may result in the sector designations for one fund being different than another fund’s sector designations.
42
Table of Contents
Sector designations may be different than the sector designations presented in other Fund materials. The sector designations may represent the investment manager or sub-advisor’s internal sector classifications, which may result in the sector designations for one fund being different than another fund’s sector designations.
| (continues) |
43 |
Table of Contents
Security type / sector allocations and top 10 equity holdings
44
Table of Contents
Optimum Fixed Income Fund
March 31, 2018
| (continues) | 45 |
Table of Contents
Schedules of investments
Optimum Fixed Income Fund
46
Table of Contents
| (continues) | 47 |
Table of Contents
Schedules of investments
Optimum Fixed Income Fund
48
Table of Contents
| (continues) | 49 |
Table of Contents
Schedules of investments
Optimum Fixed Income Fund
50
Table of Contents
| (continues) | 51 |
Table of Contents
Schedules of investments
Optimum Fixed Income Fund
52
Table of Contents
| (continues) | 53 |
Table of Contents
Schedules of investments
Optimum Fixed Income Fund
54
Table of Contents
| (continues) |
55 |
Table of Contents
Schedules of investments
Optimum Fixed Income Fund
56
Table of Contents
| (continues) |
57 |
Table of Contents
Schedules of investments
Optimum Fixed Income Fund
58
Table of Contents
| (continues) |
59 |
Table of Contents
Schedules of investments
Optimum Fixed Income Fund
60
Table of Contents
| (continues) |
61 |
Table of Contents
Schedules of investments
Optimum Fixed Income Fund
62
Table of Contents
| (continues) |
63 |
Table of Contents
Schedules of investments
Optimum Fixed Income Fund
64
Table of Contents
| (continues) |
65 |
Table of Contents
Schedules of investments
Optimum Fixed Income Fund
66
Table of Contents
| (continues) |
67 |
Table of Contents
Schedules of investments
Optimum Fixed Income Fund
68
Table of Contents
| (continues) |
69 |
Table of Contents
Schedules of investments
Optimum Fixed Income Fund
70
Table of Contents
| (continues) |
71 |
Table of Contents
Schedules of investments
Optimum Fixed Income Fund
72
Table of Contents
| (continues) |
73 |
Table of Contents
Schedules of investments
Optimum Fixed Income Fund
74
Table of Contents
| (continues) |
75 |
Table of Contents
Schedules of investments
Optimum Fixed Income Fund
76
Table of Contents
| (continues) | 77 |
Table of Contents
Schedules of investments
Optimum Fixed Income Fund
78
Table of Contents
| (continues) | 79 |
Table of Contents
Schedules of investments
Optimum Fixed Income Fund
80
Table of Contents
| (continues) | 81 |
Table of Contents
Schedules of investments
Optimum Fixed Income Fund
82
Table of Contents
| (continues) | 83 |
Table of Contents
Schedules of investments
Optimum Fixed Income Fund
84
Table of Contents
| (continues) |
85 |
Table of Contents
Schedules of investments
Optimum Fixed Income Fund
86
Table of Contents
| (continues) |
87 |
Table of Contents
Schedules of investments
Optimum Fixed Income Fund
88
Table of Contents
| (continues) |
89 |
Table of Contents
Schedules of investments
Optimum Fixed Income Fund
90
Table of Contents
| (continues) | 91 |
Table of Contents
Schedules of investments
Optimum Fixed Income Fund
92
Table of Contents
| (continues) |
93 |
Table of Contents
Schedules of investments
Optimum Fixed Income Fund
94
Table of Contents
The following foreign currency exchange contracts, futures contracts, and swap contracts were outstanding at March 31, 2018:1
Foreign Currency Exchange Contracts
| Counterparty |
Contracts to Receive (Deliver) |
In Exchange For | Settlement Date |
Unrealized Appreciation |
Unrealized Depreciation |
|||||||||||||||||||
| BAML |
AUD | (768,607) | USD | 590,340 | 5/18/18 | $ | — | $ | (27 | ) | ||||||||||||||
| BAML |
BRL | (8,900,000) | USD | 2,624,594 | 7/3/18 | — | (48,397 | ) | ||||||||||||||||
| BAML |
CAD | 6,634,000 | USD | (5,195,761) | 4/4/18 | — | (45,957 | ) | ||||||||||||||||
| BAML |
CAD | (8,400,000) | USD | 6,691,382 | 5/15/18 | 165,607 | — | |||||||||||||||||
| BAML |
CAD | 2,317,394 | USD | (1,796,558) | 5/18/18 | 3,872 | — | |||||||||||||||||
| (continues) | 95 |
Table of Contents
Schedules of investments
Optimum Fixed Income Fund
| Counterparty |
Contracts to Receive (Deliver) |
In Exchange For | Settlement Date |
Unrealized Appreciation |
Unrealized Depreciation |
|||||||||||||||||||
|
BAML |
EUR | (11,229,000 | ) | USD | 13,882,262 | 4/4/18 | $ | 59,767 | $ | — | ||||||||||||||
| BAML |
EUR | (216,069 | ) | USD | 267,011 | 5/18/18 | 188 | — | ||||||||||||||||
| BAML |
EUR | (5,500,000 | ) | USD | 6,807,218 | 8/31/18 | — | (42,613 | ) | |||||||||||||||
| BAML |
GBP | 11,227,000 | USD | (15,875,989 | ) | 4/4/18 | — | (120,563 | ) | |||||||||||||||
| BAML |
GBP | (11,336,000 | ) | USD | 16,045,110 | 5/3/18 | 117,315 | — | ||||||||||||||||
| BAML |
JPY | 264,000,000 | USD | (2,515,399 | ) | 4/4/18 | — | (33,376 | ) | |||||||||||||||
| BAML |
JPY | (2,376,900,000 | ) | USD | 22,432,557 | 4/5/18 | 84,472 | — | ||||||||||||||||
| BAML |
JPY | (730,000,000 | ) | USD | 6,968,208 | 5/2/18 | 92,790 | — | ||||||||||||||||
| BAML |
JPY | (215,379,453 | ) | USD | 2,030,973 | 5/18/18 | 217 | — | ||||||||||||||||
| BAML |
JPY | (3,740,000,000 | ) | USD | 35,014,136 | 5/21/18 | — | (256,602 | ) | |||||||||||||||
| BAML |
NZD | (1,970,489 | ) | USD | 1,420,045 | 5/18/18 | — | (3,785 | ) | |||||||||||||||
| BNP |
AUD | 1,203,000 | USD | (927,239 | ) | 4/4/18 | — | (3,285 | ) | |||||||||||||||
| BNP |
AUD | 225,457 | USD | (173,126 | ) | 5/18/18 | 46 | — | ||||||||||||||||
| BNP |
BRL | 17,054,720 | USD | (5,220,539 | ) | 5/3/18 | — | (69,418 | ) | |||||||||||||||
| BNP |
CAD | (1,800,000 | ) | USD | 1,391,860 | 4/13/18 | — | (5,679 | ) | |||||||||||||||
| BNP |
EUR | 10,189,000 | USD | (12,649,643 | ) | 4/4/18 | — | (107,349 | ) | |||||||||||||||
| BNP |
EUR | (10,189,000 | ) | USD | 12,675,880 | 5/3/18 | 107,401 | — | ||||||||||||||||
| BNP |
EUR | (1,500,000 | ) | USD | 1,863,644 | 5/9/18 | 12,525 | — | ||||||||||||||||
| BNP |
EUR | (1,221,827 | ) | USD | 1,509,603 | 5/18/18 | 771 | — | ||||||||||||||||
| BNP |
IDR | 42,710,845,891 | USD | (3,099,480 | ) | 5/18/18 | 712 | — | ||||||||||||||||
| BNP |
JPY | (264,000,000 | ) | USD | 2,473,109 | 4/4/18 | — | (8,914 | ) | |||||||||||||||
| BNP |
JPY | (837,100,000 | ) | USD | 7,861,192 | 5/14/18 | — | (29,433 | ) | |||||||||||||||
| BNP |
MXN | 3,079,632 | USD | (167,414 | ) | 5/18/18 | 639 | — | ||||||||||||||||
| BNP |
NOK | (3,327,664 | ) | USD | 424,030 | 5/18/18 | — | (1,131 | ) | |||||||||||||||
| BNP |
TWD | (186,760,561 | ) | USD | 6,461,632 | 6/20/18 | — | (9,553 | ) | |||||||||||||||
| BNYM |
AUD | (8,975 | ) | USD | 6,882 | 4/3/18 | — | (10 | ) | |||||||||||||||
| BNYM |
CAD | (4,650 | ) | USD | 3,605 | 4/2/18 | — | (4 | ) | |||||||||||||||
| CITI |
BRL | 5,200,000 | USD | (1,567,823 | ) | 5/3/18 | 2,758 | — | ||||||||||||||||
| CITI |
BRL | (2,700,000 | ) | USD | 803,236 | 7/3/18 | — | (7,671 | ) | |||||||||||||||
| CITI |
CAD | (1,500,000 | ) | USD | 1,146,134 | 4/5/18 | — | (18,299 | ) | |||||||||||||||
| CITI |
CAD | (11,400,000 | ) | USD | 8,733,101 | 4/16/18 | — | (118,500 | ) | |||||||||||||||
| CITI |
EUR | 299,000 | USD | (368,078 | ) | 4/4/18 | — | (20 | ) | |||||||||||||||
| CITI |
EUR | (6,200,000 | ) | USD | 7,696,031 | 4/30/18 | 49,810 | — | ||||||||||||||||
| CITI |
GBP | (11,336,000 | ) | USD | 15,943,069 | 4/4/18 | 34,678 | — | ||||||||||||||||
| CITI |
INR | 23,338,266 | USD | (354,706 | ) | 6/20/18 | 553 | — | ||||||||||||||||
| CITI |
JPY | (6,007,800,000 | ) | USD | 56,841,574 | 4/9/18 | 340,855 | — | ||||||||||||||||
| CITI |
MXN | (1,891,000 | ) | USD | 100,180 | 5/10/18 | — | (3,149 | ) | |||||||||||||||
| CITI |
MXN | (22,965,424 | ) | USD | 1,248,100 | 5/18/18 | — | (5,113 | ) | |||||||||||||||
| CITI |
NZD | (650,000 | ) | USD | 475,419 | 5/15/18 | 5,738 | — | ||||||||||||||||
| DB |
AUD | (2,366,000 | ) | USD | 1,830,067 | 4/4/18 | 12,882 | — | ||||||||||||||||
| DB |
BRL | 7,811,451 | USD | (2,336,449 | ) | 5/18/18 | 19,840 | — | ||||||||||||||||
| DB |
CAD | (26,000,000 | ) | USD | 20,160,493 | 4/2/18 | — | (21,880 | ) | |||||||||||||||
| DB |
GBP | (16,000 | ) | USD | 22,622 | 4/4/18 | 169 | — | ||||||||||||||||
| DB |
KRW | (6,985,745,800 | ) | USD | 6,556,000 | 6/20/18 | — | (34,668 | ) | |||||||||||||||
| DB |
SGD | (9,478,080 | ) | USD | 7,218,638 | 6/20/18 | — | (24,445 | ) | |||||||||||||||
| HSBC |
EUR | (1,295,488 | ) | USD | 1,600,239 | 5/18/18 | 442 | — | ||||||||||||||||
| HSBC |
GBP | (2,122,407 | ) | USD | 2,989,220 | 5/18/18 | 5,364 | — | ||||||||||||||||
| JPMC |
BRL | (5,500,000 | ) | USD | 1,621,466 | 7/3/18 | — | (30,382 | ) | |||||||||||||||
| JPMC |
CAD | (6,634,000 | ) | USD | 5,153,822 | 4/4/18 | 4,018 | — | ||||||||||||||||
| JPMC |
CAD | 6,634,000 | USD | (5,156,627 | ) | 5/3/18 | — | (3,939 | ) | |||||||||||||||
| JPMC |
EUR | (1,800,000 | ) | USD | 2,245,437 | 6/8/18 | 18,890 | — | ||||||||||||||||
96
Table of Contents
| Counterparty |
Contracts to Receive (Deliver) |
In Exchange For |
Settlement Date |
Unrealized Appreciation |
Unrealized Depreciation |
|||||||||||||||||
| JPMC |
JPY |
(975,200,000 | ) | USD |
9,161,890 | 5/21/18 | $ | — | $ | (34,907 | ) | |||||||||||
| JPMC |
KRW |
(1,149,723,270 | ) | USD |
1,082,092 | 5/18/18 | — | (1,496 | ) | |||||||||||||
| JPMC |
KRW |
6,857,306,825 | USD |
(6,452,099 | ) | 6/20/18 | 17,394 | — | ||||||||||||||
| JPMC |
PLN |
(1,265,105 | ) | USD |
370,699 | 5/18/18 | 828 | — | ||||||||||||||
| TD |
JPY |
578,420,753 | USD |
(5,459,883 | ) | 5/18/18 | — | (6,109 | ) | |||||||||||||
| TD |
NZD |
(1,875,000 | ) | USD |
1,352,034 | 5/18/18 | — | (2,797 | ) | |||||||||||||
|
|
|
|
|
|||||||||||||||||||
| Total Foreign Currency Exchange Contracts |
|
$ | 1,160,541 | $ | (1,099,471 | ) | ||||||||||||||||
|
|
|
|
|
|||||||||||||||||||
Futures Contracts
| Contracts to Buy (Sell) |
Notional Amount |
Notional Cost |
Expiration Date |
Value/ Unrealized Appreciation |
Value/ Unrealized Depreciation |
|||||||||||||||||
| (243) |
E-mini S&P 500 Index |
$ | (32,112,450 | ) | $ | (32,256,565 | ) | 6/18/18 | $ | 144,115 | $ | — | ||||||||||
| (235) |
90 Day Euro |
(57,398,750 | ) | (57,914,207 | ) | 6/19/18 | 515,457 | — | ||||||||||||||
| (39) |
90 Day Euro |
(9,518,438 | ) | (9,613,433 | ) | 9/18/18 | 94,995 | — | ||||||||||||||
| (1,002) |
90 Day Euro |
(244,250,025 | ) | (246,727,610 | ) | 12/18/18 | 2,477,585 | — | ||||||||||||||
| 168 |
90 Day Euro |
40,952,100 | 40,969,542 | 12/18/18 | — | (17,442 | ) | |||||||||||||||
| (1,193) |
90 Day Euro |
(290,271,813 | ) | (292,476,275 | ) | 6/18/19 | 2,204,462 | — | ||||||||||||||
| 409 |
90 Day Euro |
99,514,813 | 99,510,531 | 6/18/19 | 4,282 | — | ||||||||||||||||
| (189) |
90 Day Euro |
(45,934,088 | ) | (46,189,555 | ) | 12/17/19 | 255,467 | — | ||||||||||||||
| 26 |
Bankers’ Acceptance |
4,930,434 | 4,936,082 | 3/19/19 | — | (5,648 | ) | |||||||||||||||
| 67 |
Bankers’ Acceptance |
12,694,949 | 12,694,207 | 6/18/19 | 742 | — | ||||||||||||||||
| (185) |
Euro-B.T.P |
(31,593,219 | ) | (30,952,139 | ) | 6/8/18 | — | (641,080 | ) | |||||||||||||
| (42) |
Euro-Bund |
(8,239,167 | ) | (8,080,224 | ) | 6/8/18 | — | (158,943 | ) | |||||||||||||
| (76) |
Long 10 yr Gilt |
(13,096,051 | ) | (12,868,058 | ) | 6/28/18 | — | (227,993 | ) | |||||||||||||
| 1,217 |
US Treasury 10 yr Notes |
147,428,117 | 146,180,562 | 6/20/18 | 1,247,555 | — | ||||||||||||||||
| (246) |
US Treasury 5 yr Notes |
(28,157,391 | ) | (28,043,136 | ) | 7/2/18 | — | (114,255 | ) | |||||||||||||
| 4,043 |
US Treasury 5 yr Notes |
462,765,570 | 460,843,734 | 7/2/18 | 1,921,836 | — | ||||||||||||||||
| 491 |
US Treasury Long Bonds |
71,992,875 | 70,840,239 | 6/21/18 | 1,152,636 | — | ||||||||||||||||
|
|
|
|
|
|
|
|||||||||||||||||
| Total Futures Contracts |
$ | 70,853,695 | $ | 10,019,132 | $ | (1,165,361 | ) | |||||||||||||||
|
|
|
|
|
|
|
|||||||||||||||||
Swap Contracts
CDS Contracts2
| Counterparty/ |
Notional Amount3 |
Annual Protection Payments |
Value | Upfront Payments Paid (Received) |
Unrealized Appreciation4 |
Unrealized Depreciation4 |
Variation Margin Due from (Due to) Brokers |
|||||||||||||||||||||
| Centrally Cleared: |
||||||||||||||||||||||||||||
| Protection Purchased/Moody’s Ratings: |
|
|||||||||||||||||||||||||||
| CDX.EM.295 6/20/23- Quarterly |
4,660,000 | 1.000 | % | $ | 83,689 | $ | 97,915 | $ | — | $ | (14,226 | ) | $ | (55,645 | ) | |||||||||||||
| CDX.NA.HY.296 12/20/22-Quarterly |
13,950,000 | 5.000 | % | (900,843 | ) | (892,283 | ) | — | (8,561 | ) | (8,014 | ) | ||||||||||||||||
| CDX.NA.IG.297 12/20/22-Quarterly |
3,900,000 | 1.000 | % | (72,341 | ) | (91,254 | ) | 18,913 | — | (3,170 | ) | |||||||||||||||||
| CDX.NA.HY.296 12/20/22-Quarterly |
1,300,000 | 5.000 | % | (83,950 | ) | (93,955 | ) | 10,006 | — | (5,117 | ) | |||||||||||||||||
| (continues) | 97 |
Table of Contents
Schedules of investments
Optimum Fixed Income Fund
| Counterparty/ |
Notional Amount3 |
Annual Protection Payments |
Value | Upfront Payments Paid (Received) |
Unrealized Appreciation4 |
Unrealized Depreciation4 |
Variation Margin Due from (Due to) Brokers |
|||||||||||||||||||||
| Protection Sold/Moody’s Ratings: |
|
|||||||||||||||||||||||||||
| Citigroup CDS 6.125% 5/15/18 Baa1 12/20/20-Quarterly |
700,000 | 1.000 | % | $ | 12,339 | $ | 9,981 | $ | 2,358 | $ | — | $ | (3 | ) | ||||||||||||||
| Daimler CDS 0.625% 3/5/20 A2 12/20/20- Quarterly |
EUR800,000 | 1.000 | % | 18,940 | 12,801 | 6,139 | — | (35 | ) | |||||||||||||||||||
|
|
|
|
|
|
|
|
|
|
|
|||||||||||||||||||
| (942,166 | ) | (956,795 | ) | 37,416 | (22,787 | ) | (71,984 | ) | ||||||||||||||||||||
|
|
|
|
|
|
|
|
|
|
|
|||||||||||||||||||
|
Over-The-Counter: |
||||||||||||||||||||||||||||
| Protection Purchased/Moody’s Ratings: |
|
|||||||||||||||||||||||||||
| GSC CDX.EM.295 6/20/23-Quarterly |
4,660,000 | 1.000 | % | 83,689 | 92,298 | — | (8,609 | ) | — | |||||||||||||||||||
| HSBC CDX.EM.295 6/20/23-Quarterly |
2,180,000 | 1.000 | % | 39,151 | 40,120 | — | (969 | ) | — | |||||||||||||||||||
| Protection Sold/Moody’s Ratings: |
|
|||||||||||||||||||||||||||
| BAML Republic of Colombia 10.375% 1/28/33 Baa2 6/20/22-Quarterly |
250,000 | 1.000 | % | 1,844 | (3,213 | ) | 5,057 | — | — | |||||||||||||||||||
| BAML Republic of Colombia 10.375% 1/28/33 /Baa2 6/20/21-Quarterly |
100,000 | 1.000 | % | 1,281 | (2,109 | ) | 3,390 | — | — | |||||||||||||||||||
| BNP Republic of Colombia 10.375% 1/28/33 /Baa2 6/20/21-Quarterly |
200,000 | 1.000 | % | 2,563 | (4,269 | ) | 6,832 | — | — | |||||||||||||||||||
| CITI Republic of Brazil 4.25% 1/7/25 /Ba2 6/20/22-Quarterly |
100,000 | 1.000 | % | (1,238 | ) | (5,343 | ) | 4,105 | — | — | ||||||||||||||||||
| CITI Republic of Colombia 10.375% 1/28/33 /Baa2 12/20/22-Quarterly |
200,000 | 1.000 | % | 407 | (2,325 | ) | 2,732 | — | — | |||||||||||||||||||
| DB CMBX.NA.AAA8 10/17/57-Quarterly |
14,200,000 | 0.500 | % | 54,549 | (910,205 | ) | 964,754 | — | — | |||||||||||||||||||
| DB Republic of Colombia 10.375% 1/28/33 /Baa2 6/20/21-Quarterly |
200,000 | 1.000 | % | 2,563 | (4,216 | ) | 6,779 | — | — | |||||||||||||||||||
| GSC Republic of Brazil 4.25% 1/7/25 /Ba2 6/20/22-Quarterly |
500,000 | 1.000 | % | (6,192 | ) | (27,423 | ) | 21,231 | — | — | ||||||||||||||||||
| GSC Republic of Colombia 10.375% 1/28/33 /Baa2 6/20/21-Quarterly |
3,100,000 | 1.000 | % | 39,720 | (67,080 | ) | 106,800 | — | — | |||||||||||||||||||
98
Table of Contents
| Counterparty/ Reference Obligation/ Termination Date/ Payment Frequency |
Notional Amount3 |
Annual Protection Payments |
Value | Upfront Payments Paid (Received) |
Unrealized Appreciation4 |
Unrealized Depreciation4 |
Variation Margin Due from (Due to) Brokers |
|||||||||||||||||||||
| Protection Sold/Moody’s Ratings (continued): |
|
|||||||||||||||||||||||||||
| JPMC Mexico 5 yr CDS 5.950% 3/19/19 /WR 12/20/19-Quarterly |
7,100,000 | 1.000% | $ | 66,748 | $ | 23,292 | $ | 43,456 | $ | — | $ | — | ||||||||||||||||
| JPMC Republic of Colombia 10.375% 1/28/33 /Baa2 6/20/21-Quarterly |
100,000 | 1.000% | 1,281 | (2,134 | ) | 3,415 | — | — | ||||||||||||||||||||
| MSC CMBX.NA.BBB.68 5/11/63-Quarterly |
5,405,000 | 3.000% | (796,309 | ) | (638,488 | ) | — | (157,821 | ) | — | ||||||||||||||||||
|
|
|
|
|
|
|
|
|
|
|
|||||||||||||||||||
| (509,943 | ) | (1,511,095 | ) | 1,168,551 | (167,399 | ) | — | |||||||||||||||||||||
|
|
|
|
|
|
|
|
|
|
|
|||||||||||||||||||
| Total CDS Contracts |
|
$ (1,452,109 | ) | $ (2,467,890 | ) | $ | 1,205,967 | $ | (190,186 | ) | $ | (71,984 | ) | |||||||||||||||
|
|
|
|
|
|
|
|
|
|
|
|||||||||||||||||||
IRS Contracts9
| Reference Obligation/ Termination Date/ Payment Frequency (Fixed Rate/Floating Rate) |
Notional Amount3 | Fixed/Floating Interest Rate Paid (Received) |
Value | Upfront Payments Paid (Received) |
Unrealized Appreciation4 |
Unrealized Depreciation4 |
Variation Margin Due from (Due to Brokers) |
|||||||||||||||||||||
| Centrally Cleared: |
|
|||||||||||||||||||||||||||
| 1 yr OIS FEDL0110 9/19/18-(Maturity/1 Day) |
93,500,000 | 1.675%/(1.68%) | $ | 46,468 | $ | — | $ | 46,468 | $ | — | $ | (96 | ) | |||||||||||||||
| 1 yr OIS FEDL0110 9/19/18-(Maturity/1 Day) |
112,200,000 | 1.696%/(1.68%) | 49,787 | — | 49,787 | — | (116 | ) | ||||||||||||||||||||
| 1 yr OIS FEDL0110 9/19/18-(Maturity/1 Day) |
34,500,000 | 1.723%/(1.68%) | 12,931 | — | 12,931 | — | (36 | ) | ||||||||||||||||||||
| 1 yr OIS FEDL0110 9/19/18-(Maturity/1 Day) |
86,400,000 | 1.785%/(1.68%) | 18,930 | — | 18,930 | — | (90 | ) | ||||||||||||||||||||
| 2 yr IRS11 12/20/19- (Semiannually/ Quarterly) |
1,100,000 | 2.00%/(2.202%) | 9,760 | (5,967 | ) | 15,727 | — | 191 | ||||||||||||||||||||
| 2 yr IRS11 6/28/21- (Semiannually/ Quarterly) |
30,100,000 | 1.45%/(2.308%) | 770,606 | — | 770,606 | — | (5,577 | ) | ||||||||||||||||||||
| 3 yr IRS11 6/21/20- (Semiannually/ Quarterly) |
32,700,000 | 1.25%/(2.222%) | 952,682 | 494,628 | 458,054 | — | 2,856 | |||||||||||||||||||||
| 3 yr IRS11 6/20/21- (Semiannually/ Quarterly) |
17,800,000 | 1.75%/(2.308%) | 476,865 | 497,557 | — | (20,692 | ) | 811 | ||||||||||||||||||||
| 4 yr IRS11 12/16/19- (Semiannually/ Quarterly) |
1,600,000 | 2.00%/(2.145%) | 13,877 | (2,813 | ) | 16,690 | — | 280 | ||||||||||||||||||||
| (continues) | 99 |
Table of Contents
Schedules of investments
Optimum Fixed Income Fund
| Reference Obligation/ Termination Date/ Payment Frequency (Fixed Rate/Floating Rate) |
Notional Amount3 | Fixed/Floating Interest Rate Paid (Received) |
Value | Upfront Payments Paid (Received) |
Unrealized Appreciation4 |
Unrealized Depreciation4 |
Variation Margin Due from (Due to Brokers) |
|||||||||||||||||||
| Centrally Cleared (continued): |
|
|||||||||||||||||||||||||
| 5 yr
IRS11 |
5,035,000 | 1.199%/(1.704%) | $ | 213,007 | $ | — | $ | 213,007 | $ | — | $ | (91 | ) | |||||||||||||
| 5 yr
IRS11 |
6,220,000 | 1.19%/(1.80%) | 293,907 | — | 293,907 | — | (400 | ) | ||||||||||||||||||
| 5 yr
IRS11 |
2,005,000 | 1.976%/(1.76%) | 54,216 | — | 54,216 | — | (749 | ) | ||||||||||||||||||
| 5 yr IRS USA
3002011 |
1,400,000 | 2.026%/(2.222%) | 36,501 | — | 36,501 | — | (602 | ) | ||||||||||||||||||
| 5 yr IRS11
8/30/22- |
3,035,000 | 1.798%/(1.984%) | 111,863 | — | 111,863 | — | (1,450 | ) | ||||||||||||||||||
| 5 yr IRS11
6/20/23- |
2,500,000 | 2.00%/(2.308%) | 84,632 | 92,590 | — | (7,958 | ) | (1,451 | ) | |||||||||||||||||
| 5 yr IRS
BP0006M12 |
GBP | 26,700,000 | 1.50%/(0.816%) | (153,595 | ) | (16,894 | ) | — | (136,701 | ) | (5,370 | ) | ||||||||||||||
| 5 yr MXIBTIIE14 9/6/21-(28 days) |
MXN | 26,200,000 | (5.797)%/7.841% | (71,131 | ) | (42,029 | ) | — | (29,102 | ) | — | |||||||||||||||
| 5 yr MXIBTIIE14 12/3/21-(28 days) |
MXN | 61,000,000 | (7.199)%/7.841% | (20,845 | ) | (47,746 | ) | 26,901 | — | — | ||||||||||||||||
| 7 yr IRS11
12/16/22- |
42,500,000 | 2.25%/(2.145%) | 835,952 | 262,131 | 573,821 | — | (22,543 | ) | ||||||||||||||||||
| 7 yr
IRS11 |
750,000 | 1.416%/(1.704%) | 46,068 | — | 46,068 | — | (377 | ) | ||||||||||||||||||
| 7 yr IRS11
10/31/24- |
1,750,000 | 2.25%/(1.772%) | 49,568 | — | 49,568 | — | (1,768 | ) | ||||||||||||||||||
| 10 yr
IRS11 |
1,490,000 | 1.686%/(1.696%) | 117,501 | — | 117,501 | — | (1,635 | ) | ||||||||||||||||||
| 10 yr IRS11
6/21/27- |
4,100,000 | 1.50%/(2.222%) | 437,563 | 341,690 | 95,873 | — | (5,119 | ) | ||||||||||||||||||
| 10 yr IRS11
1/30/28- |
1,780,000 | 2.68%/(1.767%) | 13,893 | — | 13,893 | — | (3,275 | ) | ||||||||||||||||||
| 10 yr IRS
JY0006M13 |
JPY | 4,890,000,000 | 0.30%/(0.015%) | (214,103 | ) | 277,544 | — | (491,647 | ) | 19,418 | ||||||||||||||||
100
Table of Contents
| Reference Obligation/ Termination Date/ Payment Frequency (Fixed Rate/Floating Rate) |
Notional Amount3 | Fixed/Floating Interest Rate Paid (Received) |
Value | Upfront Payments Paid (Received) |
Unrealized Appreciation4 |
Unrealized Depreciation4 |
Variation Margin Due from (Due to Brokers) |
|||||||||||||||||||||||||
| Centrally Cleared (continued): |
|
|||||||||||||||||||||||||||||||
| 10 yr IRS JY0006M13 6/18/28-(Semiannually) |
JPY | 200,000,000 | 0.38%/(0.013%) | $ | (21,018 | ) | $ | 121 | $ | — | $ | (21,139 | ) | $ | 875 | |||||||||||||||||
| 30 yr IRS11 6/15/46-(Semiannually/ Quarterly) |
16,600,000 | 2.50%/(2.125%) | 1,107,288 | (1,068,603 | ) | 2,175,891 | — | (71,267 | ) | |||||||||||||||||||||||
| 30 yr IRS11 6/15/46-(Semiannually/ Quarterly) |
500,000 | 2.50%/(2.125%) | 37,714 | (20,007 | ) | 57,721 | — | (2,776 | ) | |||||||||||||||||||||||
| 30 yr IRS11 12/21/46-(Semiannually/ Quarterly) |
900,000 | 2.25%/(2.222%) | 115,023 | (69,196 | ) | 184,219 | — | (4,951 | ) | |||||||||||||||||||||||
| 30 yr IRS11 12/21/46-(Semiannually/ Quarterly) |
1,770,000 | 2.767%/(2.222%) | 37,598 | — | 37,598 | — | (10,390 | ) | ||||||||||||||||||||||||
| 30 yr IRS11 1/27/47-(Semiannually/ Quarterly) |
440,000 | 2.661%/(1.76%) | 14,942 | — | 14,942 | — | (1,952 | ) | ||||||||||||||||||||||||
| 30 yr IRS11 1/30/47-(Semiannually/ Quarterly) |
705,000 | 2.686%/(1.773%) | 20,230 | — | 20,230 | — | (3,141 | ) | ||||||||||||||||||||||||
| 30 yr IRS11 6/20/48-(Semiannually/ Quarterly) |
9,000,000 | 2.50%/(2.308%) | 706,561 | 1,033,449 | — | (326,888 | ) | (54,270 | ) | |||||||||||||||||||||||
| FRA 3-month LIBOR IRS11 9/19/18-(Maturity) |
93,500,000 | 0.50%/(1.89%) | (96,391 | ) | — | — | (96,391 | ) | (3,514 | ) | ||||||||||||||||||||||
| FRA 3-month LIBOR IRS11 9/19/18-(Maturity) |
112,200,000 | 0.50%/(1.91%) | (110,052 | ) | — | — | (110,052 | ) | (4,216 | ) | ||||||||||||||||||||||
| FRA 3-month LIBOR IRS11 9/19/18-(Maturity) |
34,500,000 | 0.50%/(1.945%) | (30,817 | ) | — | — | (30,817 | ) | (1,296 | ) | ||||||||||||||||||||||
| FRA 3-month LIBOR IRS11 9/19/18-(Maturity) |
86,400,000 | 0.50%/(2.13%) | (37,162 | ) | — | — | (37,162 | ) | (3,247 | ) | ||||||||||||||||||||||
|
|
|
|
|
|
|
|
|
|
|
|||||||||||||||||||||||
| Total IRS Contracts |
$ | 5,930,819 | $ | 1,726,455 | $ | 5,512,913 | $ | (1,308,549 | ) | $ | (187,334 | ) | ||||||||||||||||||||
|
|
|
|
|
|
|
|
|
|
|
|||||||||||||||||||||||
The use of foreign currency exchange contracts, futures contracts, and swap contracts involves elements of market risk and risks in excess of the amounts disclosed in these financial statements. The foreign currency exchange contracts and notional amounts presented above represent the Fund’s total exposure in such contracts, whereas only the net unrealized appreciation (depreciation) is reflected in the Fund’s net assets.
| (continues) | 101 |
Table of Contents
Schedules of investments
Optimum Fixed Income Fund
102
Table of Contents
| (continues) | 103 |
Table of Contents
Schedules of investments
Optimum International Fund
March 31, 2018
104
Table of Contents
| (continues) | 105 |
Table of Contents
Schedules of investments
Optimum International Fund
106
Table of Contents
| (continues) | 107 |
Table of Contents
Schedules of investments
Optimum International Fund
108
Table of Contents
The following foreign currency exchange contracts were outstanding at March 31, 2018:1
Foreign Currency Exchange Contracts
| Counterparty | Contracts to Receive (Deliver) |
In Exchange For | Settlement Date |
Unrealized Appreciation |
Unrealized Depreciation |
|||||||||||||||||||
| BBH |
GBP | (1,760,369 | ) | USD | 2,477,786 | 4/3/18 | $ | 7,474 | $ | — | ||||||||||||||
| BBH |
GBP | (2,618,426 | ) | USD | 3,671,481 | 4/4/18 | — | (3,092 | ) | |||||||||||||||
| BNYM |
ILS | (240,999 | ) | USD | 68,670 | 4/2/18 | — | (54 | ) | |||||||||||||||
| BNYM |
KRW | (2,987,731,050 | ) | USD | 2,803,893 | 4/2/18 | — | (4,690 | ) | |||||||||||||||
| NT |
CAD | 899,301 | USD | (698,052 | ) | 4/3/18 | 39 | — | ||||||||||||||||
| NT |
CHF | 160,041 | USD | (167,372 | ) | 4/4/18 | 113 | — | ||||||||||||||||
| NT |
GBP | 90,444 | USD | (126,875 | ) | 4/4/18 | 50 | — | ||||||||||||||||
| SSB |
EUR | 292,198 | USD | (359,549 | ) | 4/4/18 | 136 | — | ||||||||||||||||
| SSB |
HKD | 6,121,315 | USD | (779,974 | ) | 4/4/18 | 182 | — | ||||||||||||||||
|
|
|
|
|
|||||||||||||||||||||
| Total Foreign Currency Exchange Contracts |
|
$ | 7,994 | $ | (7,836 | ) | ||||||||||||||||||
|
|
|
|
|
|||||||||||||||||||||
The use of foreign currency exchange contracts involves elements of market risk and risks in excess of the amounts disclosed in the financial statements. The foreign currency exchange contracts presented above represent the Fund’s total exposure in such contracts, whereas only the net unrealized appreciation (depreciation) is reflected in the Fund’s net assets.
1See Note 7 in “Notes to financial statements.”
Summary of abbreviations:
ADR – American Depositary Receipt
BBH – Brown Brothers Harriman & Co.
BNYM – BNY Mellon
CAD – Canadian Dollar
CHF – Swiss Franc
EUR – Euro
GBP – British Pound Sterling
GDR – Global Depository Receipt
HKD – Hong Kong Dollar
ICE – Intercontinental Exchange
ILS – Israeli Shekel
KRW – South Korean Won
LIBOR – London Interbank Offered Rate
LIBOR01M – ICE LIBOR USD 1 Month
LIBOR03M – ICE LIBOR USD 3 Month
NT – Northern Trust
NVDR – Non-Voting Depositary Receipt
SSB – State Street Bank
USD – US Dollar
See accompanying notes, which are an integral part of the financial statements.
| (continues) | 109 |
Table of Contents
Schedules of investments
Optimum Large Cap Growth Fund
March 31, 2018
110
Table of Contents
| (continues) | 111 |
Table of Contents
Schedules of investments
Optimum Large Cap Growth Fund
112
Table of Contents
Optimum Large Cap Value Fund
March 31, 2018
| (continues) | 113 |
Table of Contents
Schedules of investments
Optimum Large Cap Value Fund
114
Table of Contents
| (continues) | 115 |
Table of Contents
Schedules of investments
Optimum Small-Mid Cap Growth Fund
March 31, 2018
116
Table of Contents
| (continues) | 117 |
Table of Contents
Schedules of investments
Optimum Small-Mid Cap Growth Fund
118
Table of Contents
| (continues) | 119 |
Table of Contents
Schedules of investments
Optimum Small-Mid Cap Value Fund
March 31, 2018
120
Table of Contents
| (continues) | 121 |
Table of Contents
Schedules of investments
Optimum Small-Mid Cap Value Fund
122
Table of Contents
| 123 |
Table of Contents
Statements of assets and liabilities
Optimum Fund Trust
March 31, 2018
| Optimum Fixed Income Fund |
Optimum International Fund |
Optimum Large Cap Growth Fund |
Optimum Large Cap Value Fund |
Optimum Small-Mid Cap Growth Fund |
Optimum Small-Mid Cap Value Fund |
|||||||||||||||||||
| Assets: |
||||||||||||||||||||||||
| Investments, at value1,2 |
$ | 2,387,488,384 | $ | 655,965,068 | $ | 1,741,368,431 | $ | 1,477,735,874 | $517,709,492 | $453,875,931 | ||||||||||||||
| Short-term investments held as collateral for loaned securities, at value3 |
— | 22,105,164 | — | — | — | — | ||||||||||||||||||
| Cash |
8,449,037 | 256,417 | 365,641 | 1,469,937 | — | 170,620 | ||||||||||||||||||
| Foreign currencies, at value4 |
5,235,630 | 1,137,311 | — | 17,963 | — | — | ||||||||||||||||||
| Cash collateral due from brokers |
4,614,129 | — | — | — | — | — | ||||||||||||||||||
| Receivable for securities sold |
138,854,881 | 22,974,196 | 52,178 | — | 2,155,552 | 4,858,779 | ||||||||||||||||||
| Dividends and interest receivable |
13,620,867 | 2,423,284 | 736,157 | 1,942,472 | 164,333 | 598,517 | ||||||||||||||||||
| Receivable for fund shares sold |
3,765,470 | 1,058,734 | 2,574,993 | 2,588,275 | 802,605 | 861,808 | ||||||||||||||||||
| Upfront payments paid on credit default swap contracts |
276,407 | — | — | — | — | — | ||||||||||||||||||
| Upfront payments paid on interest rate swap contracts |
2,999,710 | — | — | — | — | — | ||||||||||||||||||
| Unrealized appreciation of credit default swap contracts |
1,168,551 | — | — | — | — | — | ||||||||||||||||||
| Unrealized appreciation of foreign currency exchange contracts |
1,160,541 | 7,994 | — | — | — | — | ||||||||||||||||||
| Variation margin due from broker on futures contracts |
463,463 | — | — | — | — | — | ||||||||||||||||||
| Swap payments receivable |
190,086 | — | — | — | — | — | ||||||||||||||||||
| Variation margin due from brokers on centrally cleared interest rate swap contracts |
24,431 | — | — | — | — | — | ||||||||||||||||||
| Securities lending income receivable |
— | 19,226 | — | — | — | — | ||||||||||||||||||
| Foreign tax reclaims receivable |
— | 1,219,645 | 22,758 | 503,858 | — | — | ||||||||||||||||||
| Other assets6 |
415,736 | — | — | — | — | — | ||||||||||||||||||
|
|
|
|
|
|
|
|
|
|
|
|
|
|||||||||||||
| Total assets |
2,568,727,323 | 707,167,039 | 1,745,120,158 | 1,484,258,379 | 520,831,982 | 460,365,655 | ||||||||||||||||||
|
|
|
|
|
|
|
|
|
|
|
|
|
|||||||||||||
124
Table of Contents
| Optimum | Optimum | Optimum | Optimum | Optimum | Optimum | |||||||||||||||||||||||||
| Fixed Income | International | Large Cap | Large Cap | Small-Mid Cap | Small-Mid Cap | |||||||||||||||||||||||||
| Fund | Fund | Growth Fund | Value Fund | Growth Fund | Value Fund | |||||||||||||||||||||||||
| Liabilities: |
||||||||||||||||||||||||||||||
| Options written, at value5 |
$ | 194,021 | $ | — | $ | — | $ | — | $ | — | $ | — | ||||||||||||||||||
| Cash due to custodian |
— | — | — | — | 1,832,135 | — | ||||||||||||||||||||||||
| Payable for securities purchased |
536,937,110 | 16,973,226 | 1,456,721 | — | 1,595,387 | 687,929 | ||||||||||||||||||||||||
| Payable for fund shares redeemed |
2,196,088 | 487,782 | 1,604,800 | 1,251,358 | 527,148 | 424,270 | ||||||||||||||||||||||||
| Cash collateral due to brokers |
2,112,000 | — | — | — | — | — | ||||||||||||||||||||||||
| Swap payments payable |
742,927 | — | — | — | — | — | ||||||||||||||||||||||||
| Dividend disbursing and transfer agent fees payable |
306,370 | 102,423 | 273,616 | 229,453 | 80,854 | 70,459 | ||||||||||||||||||||||||
| Variation margin due to brokers on centrally cleared interest rate swap contracts |
211,765 | — | — | — | — | — | ||||||||||||||||||||||||
| Variation margin due to brokers on centrally cleared credit default swap contracts |
71,984 | — | — | — | — | — | ||||||||||||||||||||||||
| Obligation to return securities lending collateral |
— | 22,076,603 | — | — | — | — | ||||||||||||||||||||||||
| Investment management fees payable to affiliates |
893,238 | 421,710 | 1,045,602 | 828,521 | 432,502 | 367,204 | ||||||||||||||||||||||||
| Other accrued expenses |
398,206 | 262,788 | 250,066 | 190,490 | 73,529 | 74,278 | ||||||||||||||||||||||||
| Distribution fees payable to affiliates |
96,272 | 26,158 | 93,626 | 77,876 | 15,174 | 11,236 | ||||||||||||||||||||||||
| Administration expenses payable to affiliates |
89,358 | 29,873 | 79,805 | 66,924 | 23,582 | — | ||||||||||||||||||||||||
| Trustees’ fees and expenses payable to affiliates |
58,303 | 19,147 | 49,980 | 42,376 | 14,901 | 13,043 | ||||||||||||||||||||||||
| Accounting fees payable to affiliates |
11,739 | 4,151 | 10,520 | 8,877 | 3,348 | 23,512 | ||||||||||||||||||||||||
| Upfront payments received on credit default swap contracts |
2,744,297 | — | — | — | — | — | ||||||||||||||||||||||||
| Upfront payments received on interest rate swap contracts |
1,273,255 | — | — | — | — | — | ||||||||||||||||||||||||
| Unrealized depreciation of foreign currency exchange contracts |
1,099,471 | 7,836 | — | — | — | — | ||||||||||||||||||||||||
| Unrealized depreciation of credit default swap contracts |
167,399 | — | — | — | — | — | ||||||||||||||||||||||||
| Contingent liabilities6 |
1,385,788 | — | — | — | — | — | ||||||||||||||||||||||||
| Other liabilities |
80 | 71,573 | — | — | — | — | ||||||||||||||||||||||||
|
|
|
|
|
|
|
|
|
|
|
|
|
|||||||||||||||||||
| Total liabilities |
550,989,671 | 40,483,270 | 4,864,736 | 2,695,875 | 4,598,560 | 1,671,931 | ||||||||||||||||||||||||
|
|
|
|
|
|
|
|
|
|
|
|
|
|||||||||||||||||||
| Total Net Assets |
$ | 2,017,737,652 | $ | 666,683,769 | $ | 1,740,255,422 | $ | 1,481,562,504 | $ | 516,233,422 | $ | 458,693,724 | ||||||||||||||||||
|
|
|
|
|
|
|
|
|
|
|
|
|
|||||||||||||||||||
| Net Assets Consist of: |
||||||||||||||||||||||||||||||
| Paid-in capital |
$ | 2,050,728,322 | $ | 551,003,834 | $ | 1,323,809,728 | $ | 1,200,494,188 | $ | 367,200,531 | $ | 372,155,215 | ||||||||||||||||||
| Undistributed (accumulated) net investment income (loss) |
10,301,910 | 2,168,493 | — | 4,123,503 | — | 1,372,317 | ||||||||||||||||||||||||
| Accumulated net realized gain (loss) |
(54,161,024 | ) | 15,927,791 | 57,598,741 | 17,219,473 | 43,558,557 | 13,101,762 | |||||||||||||||||||||||
| Net unrealized appreciation (depreciation) of investments |
(2,798,343 | ) | 97,557,406 | 358,847,935 | 259,724,095 | 105,474,334 | 72,064,430 | |||||||||||||||||||||||
| Net unrealized appreciation (depreciation) of foreign currencies |
76,633 | 26,087 | (982 | ) | 1,245 | — | — | |||||||||||||||||||||||
| Net unrealized appreciation of foreign currency exchange contracts |
61,070 | 158 | — | — | — | — | ||||||||||||||||||||||||
| Net unrealized appreciation of futures contracts |
8,853,771 | — | — | — | — | — | ||||||||||||||||||||||||
| Net unrealized depreciation of options purchased |
(825,398 | ) | ||||||||||||||||||||||||||||
| Net unrealized appreciation of options written |
778,437 | — | — | — | — | — | ||||||||||||||||||||||||
| Net unrealized appreciation of swap contracts |
4,722,274 | — | — | — | — | — | ||||||||||||||||||||||||
|
|
|
|
|
|
|
|
|
|
|
|
|
|||||||||||||||||||
| Total Net Assets |
$ | 2,017,737,652 | $ | 666,683,769 | $ | 1,740,255,422 | $ | 1,481,562,504 | $ | 516,233,422 | $ | 458,693,724 | ||||||||||||||||||
|
|
|
|
|
|
|
|
|
|
|
|
|
|||||||||||||||||||
| (continues) | 125 |
Table of Contents
Statements of assets and liabilities
Optimum Fund Trust
| Optimum | Optimum | Optimum | Optimum | Optimum | Optimum | |||||||||||||||||||
| Fixed Income | International | Large Cap | Large Cap | Small-Mid Cap | Small-Mid Cap | |||||||||||||||||||
| Fund | Fund | Growth Fund | Value Fund | Growth Fund | Value Fund | |||||||||||||||||||
| Net Asset Value |
||||||||||||||||||||||||
| Class A: |
||||||||||||||||||||||||
| Net assets |
$ | 30,149,594 | $ | 8,703,913 | $ | 32,254,223 | $ | 26,447,591 | $ | 5,414,558 | $ | 3,855,599 | ||||||||||||
| Shares of beneficial interest outstanding, unlimited authorization, no par |
3,224,584 | 603,516 | 1,872,741 | 1,664,151 | 349,068 | 282,270 | ||||||||||||||||||
| Net asset value per share |
$ | 9.35 | $ | 14.42 | $ | 17.22 | $ | 15.89 | $ | 15.51 | $ | 13.66 | ||||||||||||
| Sales charge |
4.50 | % | 5.75 | % | 5.75 | % | 5.75 | % | 5.75 | % | 5.75 | % | ||||||||||||
| Offering price per share, equal to net asset value per share / (1 – sales charge) |
$ | 9.79 | $ | 15.30 | $ | 18.27 | $ | 16.86 | $ | 16.46 | $ | 14.49 | ||||||||||||
| Class C: |
||||||||||||||||||||||||
| Net assets |
$ | 105,193,624 | $ | 28,046,032 | $ | 97,658,456 | $ | 82,610,014 | $ | 15,925,000 | $ | 12,029,566 | ||||||||||||
| Shares of beneficial interest outstanding, unlimited authorization, no par |
11,263,706 | 1,994,627 | 6,678,501 | 5,263,838 | 1,195,996 | 1,001,580 | ||||||||||||||||||
| Net asset value per share |
$ | 9.34 | $ | 14.06 | $ | 14.62 | $ | 15.69 | $ | 13.32 | $ | 12.01 | ||||||||||||
| Institutional Class: |
||||||||||||||||||||||||
| Net assets |
$ | 1,882,394,434 | $ | 629,933,824 | $ | 1,610,342,743 | $ | 1,372,504,899 | $ | 494,893,864 | $ | 442,808,559 | ||||||||||||
| Shares of beneficial interest outstanding, unlimited authorization, no par |
201,445,867 | 43,373,544 | 87,230,355 | 86,141,186 | 29,762,541 | 30,636,012 | ||||||||||||||||||
| Net asset value per share |
$ | 9.34 | $ | 14.52 | $ | 18.46 | $ | 15.93 | $ | 16.63 | $ | 14.45 | ||||||||||||
|
|
||||||||||||||||||||||||
| 1Investments, at cost |
$ | 2,391,112,125 | $ | 558,369,940 | $ | 1,382,520,496 | $ | 1,218,011,779 | $ | 412,235,158 | $ | 381,811,501 | ||||||||||||
| 2Including securities on loan |
— | 23,055,600 | — | — | — | — | ||||||||||||||||||
| 3Short-term investments held as collateral for loaned securities, at cost |
— | 22,105,169 | — | — | — | — | ||||||||||||||||||
| 4Foreign currencies, at cost |
5,173,993 | 1,124,409 | — | 17,905 | — | — | ||||||||||||||||||
| 6Premium received |
(972,458 | ) | — | — | — | — | — | |||||||||||||||||
| 5See Note 12 in “Notes to financial statements.” |
||||||||||||||||||||||||
See accompanying notes, which are an integral part of the financial statements.
126
Table of Contents
Optimum Fund Trust
Year ended March 31, 2018
| Optimum Fixed Income Fund |
Optimum International Fund |
Optimum Large Cap Growth Fund |
Optimum Large Cap Value Fund |
Optimum Small-Mid Cap Growth Fund |
Optimum Small-Mid Cap Value Fund | |||||||||||||||||||||||||
| Investment Income: |
||||||||||||||||||||||||||||||
| Interest |
$ | 65,614,383 | $ | 51,757 | $ | 172,645 | $ | 235,484 | $ | 218,577 | $ | 66,134 | ||||||||||||||||||
| Dividends |
335,118 | 15,696,352 | 15,483,659 | 32,024,378 | 2,065,149 | 8,190,981 | ||||||||||||||||||||||||
| Securities lending income |
— | 194,950 | — | — | — | — | ||||||||||||||||||||||||
| Foreign tax withheld |
(34,316 | ) | (1,680,892 | ) | (54,031 | ) | (86,205 | ) | (5,509 | ) | (613 | ) | ||||||||||||||||||
|
|
|
|
|
|
|
|
|
|
|
|
|
|||||||||||||||||||
| 65,915,185 | 14,262,167 | 15,602,273 | 32,173,657 | 2,278,217 | 8,256,502 | |||||||||||||||||||||||||
|
|
|
|
|
|
|
|
|
|
|
|
|
|||||||||||||||||||
| Expenses: |
||||||||||||||||||||||||||||||
| Management fees |
10,258,511 | 4,687,542 | 11,408,519 | 9,284,706 | 5,029,705 | 4,212,607 | ||||||||||||||||||||||||
| Distribution expenses — Class A |
81,300 | 22,828 | 83,566 | 70,565 | 13,438 | 10,311 | ||||||||||||||||||||||||
| Distribution expenses — Class C |
1,157,083 | 303,902 | 1,054,958 | 912,492 | 164,979 | 133,272 | ||||||||||||||||||||||||
| Dividend disbursing and transfer agent fees and expenses |
3,548,622 | 1,161,541 | 3,005,480 | 2,601,008 | 886,651 | 817,562 | ||||||||||||||||||||||||
| Administration expenses |
1,021,836 | 331,341 | 863,839 | 746,917 | 251,226 | 231,152 | ||||||||||||||||||||||||
| Accounting fees |
518,279 | 181,492 | 438,681 | 382,786 | 142,820 | 133,552 | ||||||||||||||||||||||||
| Trustees’ fees and expenses |
245,555 | 79,514 | 207,021 | 178,493 | 60,297 | 55,123 | ||||||||||||||||||||||||
| Reports and statements to shareholders expenses |
234,666 | 83,708 | 263,100 | 173,756 | 63,772 | 58,902 | ||||||||||||||||||||||||
| Professional fees |
195,816 | 105,496 | 153,827 | 127,155 | 86,720 | 56,896 | ||||||||||||||||||||||||
| Pricing fees |
167,371 | 32,181 | 1,120 | 1,557 | 1,035 | 1,273 | ||||||||||||||||||||||||
| Custodian fees |
116,176 | 241,967 | 82,381 | 63,502 | 510 | 11,533 | ||||||||||||||||||||||||
| Registration fees |
100,227 | 65,292 | 107,615 | 92,472 | 62,368 | 67,060 | ||||||||||||||||||||||||
| Insurance fees |
38,987 | 11,853 | 30,261 | 27,033 | 8,863 | 8,361 | ||||||||||||||||||||||||
| Investment interest expense |
21,236 | — | — | — | — | — | ||||||||||||||||||||||||
| Tax services |
1,771 | 20,031 | 1,197 | 695 | 1,121 | 1,023 | ||||||||||||||||||||||||
| Other |
45,481 | 17,031 | 36,624 | 33,348 | 13,638 | 13,752 | ||||||||||||||||||||||||
|
|
|
|
|
|
|
|
|
|
|
|
|
|||||||||||||||||||
| 17,752,917 | 7,345,719 | 17,738,189 | 14,696,485 | 6,787,143 | 5,812,379 | |||||||||||||||||||||||||
| Less expenses waived |
— | (2,512 | ) | (32 | ) | — | (382,250 | ) | (258,497 | ) | ||||||||||||||||||||
| Less expenses paid indirectly |
(16,552 | ) | (1,439 | ) | (1,647 | ) | (2,615 | ) | (1,502 | ) | (1,234 | ) | ||||||||||||||||||
|
|
|
|
|
|
|
|
|
|
|
|
|
|||||||||||||||||||
| Total operating expenses |
17,736,365 | 7,341,768 | 17,736,510 | 14,693,870 | 6,403,391 | 5,552,648 | ||||||||||||||||||||||||
|
|
|
|
|
|
|
|
|
|
|
|
|
|||||||||||||||||||
| Net Investment Income (Loss) |
48,178,820 | 6,920,399 | (2,134,237 | ) | 17,479,787 | (4,125,174 | ) | 2,703,854 | ||||||||||||||||||||||
|
|
|
|
|
|
|
|
|
|
|
|
|
|||||||||||||||||||
| (continues) | 127 |
Table of Contents
Statements of operations
Optimum Fund Trust
| Optimum | Optimum | Optimum | Optimum | Optimum | Optimum | |||||||||||||||||||||||||
| Fixed Income | International | Large Cap | Large Cap | Small-Mid Cap | Small-Mid Cap | |||||||||||||||||||||||||
| Fund | Fund | Growth Fund | Value Fund | Growth Fund | Value Fund | |||||||||||||||||||||||||
| Net Realized and Unrealized Gain (Loss): |
||||||||||||||||||||||||||||||
| Net realized gain (loss) on: |
||||||||||||||||||||||||||||||
| Investments1 |
$ | (354,923 | ) | $ | 43,764,652 | $ | 275,474,324 | $ | 40,243,084 | $ | 69,241,224 | $ | 26,596,406 | |||||||||||||||||
| Foreign currencies |
2,753,158 | 116,971 | 300 | 42,097 | (28 | ) | — | |||||||||||||||||||||||
| Foreign currency exchange contracts |
(7,163,367 | ) | (164,005 | ) | (4,024 | ) | (38,890 | ) | — | — | ||||||||||||||||||||
| Futures contracts |
(10,929,358 | ) | — | — | — | — | — | |||||||||||||||||||||||
| Options purchased |
(198,214 | ) | — | — | — | — | — | |||||||||||||||||||||||
| Options written |
410,764 | — | — | — | — | — | ||||||||||||||||||||||||
| Swap contracts |
(48,937 | ) | — | — | — | — | — | |||||||||||||||||||||||
|
|
|
|
|
|
|
|
|
|
|
|
|
|||||||||||||||||||
| Net realized gain (loss) |
(15,530,877 | ) | 43,717,618 | 275,470,600 | 40,246,291 | 69,241,196 | 26,596,406 | |||||||||||||||||||||||
|
|
|
|
|
|
|
|
|
|
|
|
|
|||||||||||||||||||
| Net change in unrealized appreciation (depreciation) of: |
||||||||||||||||||||||||||||||
| Investments2 |
(5,333,842 | ) | 59,916,218 | 52,227,344 | 59,983,041 | 31,070,292 | (8,877,449 | ) | ||||||||||||||||||||||
| Foreign currencies |
83,858 | 55,091 | 489 | 21,179 | — | — | ||||||||||||||||||||||||
| Foreign currency exchange contracts |
(204,609 | ) | 688 | — | — | — | — | |||||||||||||||||||||||
| Futures contracts |
6,324,443 | — | — | — | — | — | ||||||||||||||||||||||||
| Options purchased |
(331,942 | ) | — | — | — | — | — | |||||||||||||||||||||||
| Options written |
262,108 | — | — | — | — | — | ||||||||||||||||||||||||
| Swap contracts |
2,593,995 | — | — | — | — | — | ||||||||||||||||||||||||
|
|
|
|
|
|
|
|
|
|
|
|
|
|||||||||||||||||||
| Net change in unrealized appreciation (depreciation) |
3,394,011 | 59,971,997 | 52,227,833 | 60,004,220 | 31,070,292 | (8,877,449 | ) | |||||||||||||||||||||||
|
|
|
|
|
|
|
|
|
|
|
|
|
|||||||||||||||||||
| Net Realized and Unrealized Gain (Loss) |
(12,136,866 | ) | 103,689,615 | 327,698,433 | 100,250,511 | 100,311,488 | 17,718,957 | |||||||||||||||||||||||
|
|
|
|
|
|
|
|
|
|
|
|
|
|||||||||||||||||||
| Net Increase in Net Assets Resulting from Operations |
$ | 36,041,954 | $ | 110,610,014 | $ | 325,564,196 | $ | 117,730,298 | $ | 96,186,314 | $ | 20,422,811 | ||||||||||||||||||
|
|
|
|
|
|
|
|
|
|
|
|
|
|||||||||||||||||||
1Includes $23,655 and $127,826 capital gain taxes paid for Optimum Fixed Income Fund and Optimum International Fund.
2Includes decrease of $11,503 and $81,537 capital gain taxes accrued for Optimum Fixed Income Fund and Optimum International Fund.
See accompanying notes, which are an integral part of the financial statements.
128
Table of Contents
Statements of changes in net assets
Optimum Fund Trust
| Optimum Fixed Income Fund | Optimum International Fund | |||||||||||||||
| Year ended | Year ended | |||||||||||||||
| 3/31/18 | 3/31/17 | 3/31/18 | 3/31/17 | |||||||||||||
| Increase (Decrease) in Net Assets from Operations: |
||||||||||||||||
| Net investment income |
$ | 48,178,820 | $ | 46,326,151 | $ | 6,920,399 | $ | 6,431,141 | ||||||||
| Net realized gain (loss) |
(15,530,877 | ) | (8,445,438 | ) | 43,717,618 | 6,860,569 | ||||||||||
| Net change in unrealized appreciation (depreciation) |
3,394,011 | 8,621,973 | 59,971,997 | 58,119,957 | ||||||||||||
|
|
|
|
|
|
|
|
|
|||||||||
| Net increase in net assets resulting from operations |
36,041,954 | 46,502,686 | 110,610,014 | 71,411,667 | ||||||||||||
|
|
|
|
|
|
|
|
|
|||||||||
| Dividends and Distributions to Shareholders from: |
||||||||||||||||
| Net investment income: |
||||||||||||||||
| Class A |
(700,572 | ) | (676,539 | ) | (71,145 | ) | (80,080 | ) | ||||||||
| Class C |
(1,651,789 | ) | (1,524,429 | ) | (38,744 | ) | (65,461 | ) | ||||||||
| Institutional Class |
(44,780,382 | ) | (37,864,252 | ) | (6,067,099 | ) | (5,899,992 | ) | ||||||||
| Net realized gain: |
||||||||||||||||
| Class A |
— | — | (96,329 | ) | — | |||||||||||
| Class C |
— | — | (329,319 | ) | — | |||||||||||
| Institutional Class |
— | — | (6,357,988 | ) | — | |||||||||||
|
|
|
|
|
|
|
|
|
|||||||||
| (47,132,743 | ) | (40,065,220 | ) | (12,960,624 | ) | (6,045,533 | ) | |||||||||
|
|
|
|
|
|
|
|
|
|||||||||
| Capital Share Transactions: |
||||||||||||||||
| Proceeds from shares sold: |
||||||||||||||||
| Class A |
2,691,823 | 2,615,487 | 425,861 | 626,232 | ||||||||||||
| Class C |
5,853,573 | 7,193,141 | 788,640 | 1,814,846 | ||||||||||||
| Institutional Class |
410,586,301 | 378,540,581 | 118,448,217 | 85,837,495 | ||||||||||||
| Net asset value of shares issued upon reinvestment of dividends and distributions: |
||||||||||||||||
| Class A |
697,909 | 674,466 | 166,852 | 79,845 | ||||||||||||
| Class C |
1,650,329 | 1,523,427 | 367,589 | 65,389 | ||||||||||||
| Institutional Class |
44,744,263 | 37,826,389 | 12,414,824 | 5,894,688 | ||||||||||||
|
|
|
|
|
|
|
|
|
|||||||||
| 466,224,198 | 428,373,491 | 132,611,983 | 94,318,495 | |||||||||||||
|
|
|
|
|
|
|
|
|
|||||||||
| Cost of shares redeemed: |
||||||||||||||||
| Class A |
(6,985,182 | ) | (9,136,395 | ) | (2,050,607 | ) | (2,172,483 | ) | ||||||||
| Class C |
(26,057,224 | ) | (38,409,617 | ) | (7,599,191 | ) | (7,546,843 | ) | ||||||||
| Institutional Class |
(287,504,444 | ) | (589,700,192 | ) | (117,583,144 | ) | (169,259,362 | ) | ||||||||
|
|
|
|
|
|
|
|
|
|||||||||
| (320,546,850 | ) | (637,246,204 | ) | (127,232,942 | ) | (178,978,688 | ) | |||||||||
|
|
|
|
|
|
|
|
|
|||||||||
| Increase (decrease) in net assets derived from capital share transactions |
145,677,348 | (208,872,713 | ) | 5,379,041 | (84,660,193 | ) | ||||||||||
|
|
|
|
|
|
|
|
|
|||||||||
| Net Increase (Decrease) in Net Assets |
134,586,559 | (202,435,247 | ) | 103,028,431 | (19,294,059 | ) | ||||||||||
| Net Assets: |
||||||||||||||||
| Beginning of year |
1,883,151,093 | 2,085,586,340 | 563,655,338 | 582,949,397 | ||||||||||||
|
|
|
|
|
|
|
|
|
|||||||||
| End of year |
$ | 2,017,737,652 | $ | 1,883,151,093 | $ | 666,683,769 | $ | 563,655,338 | ||||||||
|
|
|
|
|
|
|
|
|
|||||||||
| Undistributed net investment income |
$ | 10,301,910 | $ | 13,181,364 | $ | 2,168,493 | $ | 1,599,942 | ||||||||
|
|
|
|
|
|
|
|
|
|||||||||
See accompanying notes, which are an integral part of the financial statements.
| (continues) | 129 |
Table of Contents
Statements of changes in net assets
Optimum Fund Trust
| Optimum Large Cap Growth Fund | Optimum Large Cap Value Fund | |||||||||||||||
| Year ended | Year ended | |||||||||||||||
| 3/31/18 | 3/31/17 | 3/31/18 | 3/31/17 | |||||||||||||
| Increase (Decrease) in Net Assets from Operations: |
||||||||||||||||
| Net investment income (loss) |
$ | (2,134,237 | ) | $ | (2,656,714 | ) | $ | 17,479,787 | $ | 16,818,172 | ||||||
| Net realized gain |
275,470,600 | 102,553,139 | 40,246,291 | 221,643,748 | ||||||||||||
| Net change in unrealized appreciation (depreciation) |
52,227,833 | 131,161,336 | 60,004,220 | (43,657,292 | ) | |||||||||||
|
|
|
|
|
|
|
|
|
|||||||||
| Net increase in net assets resulting from operations |
325,564,196 | 231,057,761 | 117,730,298 | 194,804,628 | ||||||||||||
|
|
|
|
|
|
|
|
|
|||||||||
| Dividends and Distributions to Shareholders from: |
||||||||||||||||
| Net investment income: |
||||||||||||||||
| Class A |
— | — | (273,497 | ) | (322,766 | ) | ||||||||||
| Class C |
— | — | (256,730 | ) | (382,046 | ) | ||||||||||
| Institutional Class |
— | — | (16,122,671 | ) | (16,045,433 | ) | ||||||||||
| Net realized gain: |
||||||||||||||||
| Class A |
(5,495,119 | ) | (1,203,358 | ) | (1,219,830 | ) | (3,180,253 | ) | ||||||||
| Class C |
(19,625,204 | ) | (4,316,642 | ) | (3,971,117 | ) | (10,410,746 | ) | ||||||||
| Institutional Class |
(240,785,863 | ) | (45,828,776 | ) | (58,025,654 | ) | (129,552,015 | ) | ||||||||
|
|
|
|
|
|
|
|
|
|||||||||
| (265,906,186 | ) | (51,348,776 | ) | (79,869,499 | ) | (159,893,259 | ) | |||||||||
|
|
|
|
|
|
|
|
|
|||||||||
| Capital Share Transactions: |
||||||||||||||||
| Proceeds from shares sold: |
||||||||||||||||
| Class A |
1,294,218 | 1,584,659 | 1,327,875 | 1,599,717 | ||||||||||||
| Class C |
1,816,781 | 4,926,393 | 2,091,578 | 5,099,592 | ||||||||||||
| Institutional Class |
259,275,981 | 227,791,648 | 257,769,560 | 320,762,276 | ||||||||||||
| Net asset value of shares issued upon reinvestment of dividends and distributions: |
||||||||||||||||
| Class A |
5,479,590 | 1,200,552 | 1,489,597 | 3,494,971 | ||||||||||||
| Class C |
19,589,493 | 4,311,583 | 4,218,812 | 10,774,076 | ||||||||||||
| Institutional Class |
240,538,379 | 45,764,351 | 74,082,666 | 145,399,962 | ||||||||||||
|
|
|
|
|
|
|
|
|
|||||||||
| 527,994,442 | 285,579,186 | 340,980,088 | 487,130,594 | |||||||||||||
|
|
|
|
|
|
|
|
|
|||||||||
| Cost of shares redeemed: |
||||||||||||||||
| Class A |
(7,970,218 | ) | (8,255,058 | ) | (6,031,113 | ) | (7,586,746 | ) | ||||||||
| Class C |
(29,888,435 | ) | (30,464,822 | ) | (22,154,334 | ) | (26,404,995 | ) | ||||||||
| Institutional Class |
(295,254,850 | ) | (445,881,165 | ) | (211,048,849 | ) | (409,895,778 | ) | ||||||||
|
|
|
|
|
|
|
|
|
|||||||||
| (333,113,503 | ) | (484,601,045 | ) | (239,234,296 | ) | (443,887,519 | ) | |||||||||
|
|
|
|
|
|
|
|
|
|||||||||
| Increase (decrease) in net assets derived from capital share transactions |
194,880,939 | (199,021,859 | ) | 101,745,792 | 43,243,075 | |||||||||||
|
|
|
|
|
|
|
|
|
|||||||||
| Net Increase (Decrease) in Net Assets |
254,538,949 | (19,312,874 | ) | 139,606,591 | 78,154,444 | |||||||||||
| Net Assets: |
||||||||||||||||
| Beginning of year |
1,485,716,473 | 1,505,029,347 | 1,341,955,913 | 1,263,801,469 | ||||||||||||
|
|
|
|
|
|
|
|
|
|||||||||
| End of year |
$ | 1,740,255,422 | $ | 1,485,716,473 | $ | 1,481,562,504 | $ | 1,341,955,913 | ||||||||
|
|
|
|
|
|
|
|
|
|||||||||
| Undistributed net investment income |
$ | — | $ | — | $ | 4,123,503 | $ | 3,293,407 | ||||||||
|
|
|
|
|
|
|
|
|
|||||||||
See accompanying notes, which are an integral part of the financial statements.
130
Table of Contents
| Optimum Small-Mid Cap Growth Fund | Optimum Small-Mid Cap Value Fund | |||||||||||||||
| 3/31/18 | 3/31/17 | 3/31/18 | 3/31/17 | |||||||||||||
| Increase (Decrease) in Net Assets from Operations: |
||||||||||||||||
| Net investment income (loss) |
$ | (4,125,174 | ) | $ | (4,110,057 | ) | $ | 2,703,854 | $ | 3,607,757 | ||||||
| Net realized gain |
69,241,196 | 19,563,168 | 26,596,406 | 34,020,737 | ||||||||||||
| Net change in unrealized appreciation (depreciation) |
31,070,292 | 68,639,917 | (8,877,449 | ) | 38,728,388 | |||||||||||
|
|
|
|
|
|
|
|
|
|||||||||
| Net increase in net assets resulting from operations |
96,186,314 | 84,093,028 | 20,422,811 | 76,356,882 | ||||||||||||
|
|
|
|
|
|
|
|
|
|||||||||
| Dividends and Distributions to Shareholders from: |
||||||||||||||||
| Net investment income: |
||||||||||||||||
| Class A |
— | — | (20,465 | ) | (16,209 | ) | ||||||||||
| Institutional Class |
— | — | (3,036,210 | ) | (2,284,918 | ) | ||||||||||
| Net realized gain: |
||||||||||||||||
| Class A |
(236,782 | ) | — | (194,992 | ) | — | ||||||||||
| Class C |
(835,216 | ) | — | (702,964 | ) | — | ||||||||||
| Institutional Class |
(19,412,135 | ) | — | (19,465,792 | ) | — | ||||||||||
|
|
|
|
|
|
|
|
|
|||||||||
| (20,484,133 | ) | — | (23,420,423 | ) | (2,301,127 | ) | ||||||||||
|
|
|
|
|
|
|
|
|
|||||||||
| Capital Share Transactions: |
||||||||||||||||
| Proceeds from shares sold: |
||||||||||||||||
| Class A |
270,437 | 420,894 | 223,637 | 372,174 | ||||||||||||
| Class C |
348,498 | 1,008,435 | 363,232 | 624,715 | ||||||||||||
| Institutional Class |
80,505,865 | 78,489,396 | 84,337,853 | 76,824,883 | ||||||||||||
| Net asset value of shares issued upon reinvestment of dividends and distributions: |
||||||||||||||||
| Class A |
235,651 | — | 214,986 | 16,178 | ||||||||||||
| Class C |
834,362 | — | 702,150 | — | ||||||||||||
| Institutional Class |
19,396,388 | — | 22,481,400 | 2,282,053 | ||||||||||||
|
|
|
|
|
|
|
|
|
|||||||||
| 101,591,201 | 79,918,725 | 108,323,258 | 80,120,003 | |||||||||||||
|
|
|
|
|
|
|
|
|
|||||||||
| Cost of shares redeemed: |
||||||||||||||||
| Class A |
(1,216,862 | ) | (1,198,557 | ) | (841,912 | ) | (1,195,842 | ) | ||||||||
| Class C |
(4,252,643 | ) | (4,441,565 | ) | (3,124,350 | ) | (4,032,657 | ) | ||||||||
| Institutional Class |
(97,830,534 | ) | (178,827,032 | ) | (67,540,018 | ) | (184,660,997 | ) | ||||||||
|
|
|
|
|
|
|
|
|
|||||||||
| (103,300,039 | ) | (184,467,154 | ) | (71,506,280 | ) | (189,889,496 | ) | |||||||||
|
|
|
|
|
|
|
|
|
|||||||||
| Increase (decrease) in net assets derived from capital share transactions |
(1,708,838 | ) | (104,548,429 | ) | 36,816,978 | (109,769,493 | ) | |||||||||
|
|
|
|
|
|
|
|
|
|||||||||
| Net Increase (Decrease) in Net Assets |
73,993,343 | (20,455,401 | ) | 33,819,366 | (35,713,738 | ) | ||||||||||
| Net Assets: |
||||||||||||||||
| Beginning of year |
442,240,079 | 462,695,480 | 424,874,358 | 460,588,096 | ||||||||||||
|
|
|
|
|
|
|
|
|
|||||||||
| End of year |
$ | 516,233,422 | $ | 442,240,079 | $ | 458,693,724 | $ | 424,874,358 | ||||||||
|
|
|
|
|
|
|
|
|
|||||||||
| Undistributed (accumulated) net investment income (loss) |
$ | — | $ | (1,114,999 | ) | $ | 1,372,317 | $ | 1,701,989 | |||||||
|
|
|
|
|
|
|
|
|
|||||||||
See accompanying notes, which are an integral part of the financial statements.
| (continues) | 131 |
Table of Contents
Optimum Fixed Income Fund Class A
Selected data for each share of the Fund outstanding throughout each period were as follows:
| Year ended | ||||||||||||||||||||
| 3/31/18 | 3/31/17 | 3/31/16 | 3/31/15 | 3/31/14 | ||||||||||||||||
| Net asset value, beginning of period |
$ | 9.39 | $ | 9.37 | $ | 9.72 | $ | 9.54 | $ | 9.85 | ||||||||||
| Income (loss) from investment operations: |
||||||||||||||||||||
| Net investment income1 |
0.22 | 0.20 | 0.20 | 0.20 | 0.21 | |||||||||||||||
| Net realized and unrealized gain (loss) |
(0.05 | ) | — | 2 | (0.28 | ) | 0.20 | (0.35 | ) | |||||||||||
|
|
|
|
|
|
|
|
|
|
|
|||||||||||
| Total from investment operations |
0.17 | 0.20 | (0.08 | ) | 0.40 | (0.14 | ) | |||||||||||||
|
|
|
|
|
|
|
|
|
|
|
|||||||||||
| Less dividends and distributions from: |
||||||||||||||||||||
| Net investment income |
(0.21 | ) | (0.18 | ) | (0.25 | ) | (0.22 | ) | (0.14 | ) | ||||||||||
| Net realized gain |
— | — | (0.02 | ) | — | (0.03 | ) | |||||||||||||
|
|
|
|
|
|
|
|
|
|
|
|||||||||||
| Total dividends and distributions |
(0.21 | ) | (0.18 | ) | (0.27 | ) | (0.22 | ) | (0.17 | ) | ||||||||||
|
|
|
|
|
|
|
|
|
|
|
|||||||||||
| Net asset value, end of period |
$ | 9.35 | 9.39 | 9.37 | 9.72 | 9.54 | ||||||||||||||
|
|
|
|
|
|
|
|
|
|
|
|||||||||||
| Total return3 |
1.81% | 2.03% | (0.63% | ) | 4.21% | (1.40% | ) | |||||||||||||
| Ratios and supplemental data: |
||||||||||||||||||||
| Net assets, end of period (000 omitted) |
$ | 30,150 | $ | 33,838 | $ | 39,545 | $ | 43,144 | $ | 43,241 | ||||||||||
| Ratio of expenses to average net assets |
1.10% | 1.17% | 1.23% | 1.17% | 1.31% | |||||||||||||||
| Ratio of expenses to average net assets prior to fees waived4 |
1.10% | 1.18% | 1.23% | 1.17% | 1.34% | |||||||||||||||
| Ratio of net investment income to average net assets |
2.29% | 2.12% | 2.13% | 2.11% | 2.24% | |||||||||||||||
| Ratio of net investment income to average net assets prior to fees waived4 |
2.29% | 2.11% | 2.13% | 2.11% | 2.21% | |||||||||||||||
| Portfolio turnover |
403% | 419% | 536% | 482% | 5 | 323%5 | ||||||||||||||
| 1 | The average shares outstanding method has been applied for per share information. |
| 2 | Amount is less than $0.005 per share. |
| 3 | Total investment return is based on the change in net asset value of a share during the period and assumes reinvestment of dividends and distributions at net asset value and does not reflect the impact of a sales charge. Total investment return during some of the periods shown reflects a waiver by the manager. Performance would have been lower had the waiver not been in effect. |
| 4 | Expenses paid indirectly were not material and had no impact on the ratios disclosed. Expenses paid indirectly for the year ended March 31,2018 are reflected on the “Statements of operations.” |
| 5 | As a result of the addition of Delaware Management Company’s diversified floating rate investment strategy and Pacific Investment Management Company, LLC’s low-duration investment strategy on Feb. 1, 2014, to the Fund’s principal investment strategy, the Fund’s portfolio turnover rate increased substantially during the years ended March 31, 2015 and 2014. |
See accompanying notes, which are an integral part of the financial statements.
132
Table of Contents
Optimum Fixed Income Fund Class C
Selected data for each share of the Fund outstanding throughout each period were as follows:
| Year ended | ||||||||||||||||||||
| 3/31/18 | 3/31/17 | 3/31/16 | 3/31/15 | 3/31/14 | ||||||||||||||||
| Net asset value, beginning of period |
$ | 9.38 | $ | 9.37 | $ | 9.71 | $ | 9.53 | $ | 9.84 | ||||||||||
| Income (loss) from investment operations: |
||||||||||||||||||||
| Net investment income1 |
0.15 | 0.13 | 0.13 | 0.13 | 0.15 | |||||||||||||||
| Net realized and unrealized gain (loss) |
(0.05 | ) | (0.01 | ) | (0.27 | ) | 0.20 | (0.35 | ) | |||||||||||
|
|
|
|
|
|
|
|
|
|
|
|||||||||||
| Total from investment operations |
0.10 | 0.12 | (0.14 | ) | 0.33 | (0.20 | ) | |||||||||||||
|
|
|
|
|
|
|
|
|
|
|
|||||||||||
| Less dividends and distributions from: |
||||||||||||||||||||
| Net investment income |
(0.14 | ) | (0.11 | ) | (0.18 | ) | (0.15 | ) | (0.08 | ) | ||||||||||
| Net realized gain |
— | — | (0.02 | ) | — | (0.03 | ) | |||||||||||||
|
|
|
|
|
|
|
|
|
|
|
|||||||||||
| Total dividends and distributions |
(0.14 | ) | (0.11 | ) | (0.20 | ) | (0.15 | ) | (0.11 | ) | ||||||||||
|
|
|
|
|
|
|
|
|
|
|
|||||||||||
| Net asset value, end of period |
$ | 9.34 | $ | 9.38 | $ | 9.37 | $ | 9.71 | $ | 9.53 | ||||||||||
|
|
|
|
|
|
|
|
|
|
|
|||||||||||
| Total return2 |
1.06% | 1.27% | (1.39% | ) | 3.44% | (2.06% | ) | |||||||||||||
| Ratios and supplemental data: |
||||||||||||||||||||
| Net assets, end of period (000 omitted) |
$ | 105,194 | $ | 124,024 | $ | 153,266 | $ | 166,154 | $ | 161,353 | ||||||||||
| Ratio of expenses to average net assets |
1.85% | 1.92% | 1.98% | 1.92% | 1.99% | |||||||||||||||
| Ratio of expenses to average net assets prior to fees waived3 |
1.85% | 1.93% | 1.98% | 1.92% | 2.02% | |||||||||||||||
| Ratio of net investment income to average net assets |
1.54% | 1.37% | 1.38% | 1.36% | 1.56% | |||||||||||||||
| Ratio of net investment income to average net assets prior to fees waived3 |
1.54% | 1.36% | 1.38% | 1.36% | 1.53% | |||||||||||||||
| Portfolio turnover |
403% | 419% | 536% | 482%4 | 323%4 | |||||||||||||||
| 1 | The average shares outstanding method has been applied for per share information. |
| 2 | Total investment return is based on the change in net asset value of a share during the period and assumes reinvestment of dividends and distributions at net asset value and does not reflect the impact of a sales charge. Total investment return during some of the periods shown reflects a waiver by the manager. Performance would have been lower had the waiver not been in effect. |
| 3 | Expenses paid indirectly were not material and had no impact on the ratios disclosed. Expenses paid indirectly for the year ended March 31,2018 are reflected on the “Statements of operations.” |
| 4 | As a result of the addition of Delaware Management Company’s diversified floating rate investment strategy and Pacific Investment Management Company, LLC’s low-duration investment strategy on Feb. 1, 2014, to the Fund’s principal investment strategy, the Fund’s portfolio turnover rate increased substantially during the years ended March 31, 2015 and 2014. |
See accompanying notes, which are an integral part of the financial statements.
| (continues) | 133 |
Table of Contents
Financial highlights
Optimum Fixed Income Fund Institutional Class
Selected data for each share of the Fund outstanding throughout each period were as follows:
| Year ended | ||||||||||||||||||||
| 3/31/18 | 3/31/17 | 3/31/16 | 3/31/15 | 3/31/14 | ||||||||||||||||
| Net asset value, beginning of period |
$ | 9.39 | $ | 9.37 | $ | 9.72 | $ | 9.54 | $ | 9.85 | ||||||||||
| Income (loss) from investment operations: |
||||||||||||||||||||
| Net investment income1 |
0.24 | 0.23 | 0.23 | 0.23 | 0.24 | |||||||||||||||
| Net realized and unrealized gain (loss) |
(0.05 | ) | (0.01 | ) | (0.28 | ) | 0.19 | (0.34 | ) | |||||||||||
|
|
|
|
|
|
|
|
|
|
|
|||||||||||
| Total from investment operations |
0.19 | 0.22 | (0.05 | ) | 0.42 | (0.10 | ) | |||||||||||||
|
|
|
|
|
|
|
|
|
|
|
|||||||||||
| Less dividends and distributions from: |
||||||||||||||||||||
| Net investment income |
(0.24 | ) | (0.20 | ) | (0.28 | ) | (0.24 | ) | (0.18 | ) | ||||||||||
| Net realized gain |
— | — | (0.02 | ) | — | (0.03 | ) | |||||||||||||
|
|
|
|
|
|
|
|
|
|
|
|||||||||||
| Total dividends and distributions |
(0.24 | ) | (0.20 | ) | (0.30 | ) | (0.24 | ) | (0.21 | ) | ||||||||||
|
|
|
|
|
|
|
|
|
|
|
|||||||||||
| Net asset value, end of period |
$ | 9.34 | $ | 9.39 | $ | 9.37 | $ | 9.72 | $ | 9.54 | ||||||||||
|
|
|
|
|
|
|
|
|
|
|
|||||||||||
| Total return2 |
1.96% | 2.40% | (0.48% | ) | 4.47% | (1.05% | ) | |||||||||||||
| Ratios and supplemental data: |
||||||||||||||||||||
| Net assets, end of period (000 omitted) |
$ | 1,882,394 | $ | 1,725,289 | $ | 1,892,775 | $ | 1,826,156 | $ | 1,509,156 | ||||||||||
| Ratio of expenses to average net assets |
0.85% | 0.92% | 0.98% | 0.92% | 0.99% | |||||||||||||||
| Ratio of expenses to average net assets prior to fees waived3 |
0.85% | 0.93% | 0.98% | 0.92% | 1.02% | |||||||||||||||
| Ratio of net investment income to average net assets |
2.54% | 2.37% | 2.38% | 2.36% | 2.56% | |||||||||||||||
| Ratio of net investment income to average net assets prior to fees waived3 |
2.54% | 2.36% | 2.38% | 2.36% | 2.53% | |||||||||||||||
| Portfolio turnover |
403% | 419% | 536% | 482%4 | 323%4 | |||||||||||||||
| 1 | The average shares outstanding method has been applied for per share information. |
| 2 | Total investment return is based on the change in net asset value of a share during the period and assumes reinvestment of dividends and distributions at net asset value. Total investment return during some of the periods shown reflects a waiver by the manager. Performance would have been lower had the waiver not been in effect. |
| 3 | Expenses paid indirectly were not material and had no impact on the ratios disclosed. Expenses paid indirectly for the year ended March 31,2018 are reflected on the “Statements of operations.” |
| 4 | As a result of the addition of Delaware Management Company’s diversified floating rate investment strategy and Pacific Investment Management Company, LLC’s low-duration investment strategy on Feb. 1, 2014, to the Fund’s principal investment strategy, the Fund’s portfolio turnover rate increased substantially during the years ended March 31, 2015 and 2014. |
See accompanying notes, which are an integral part of the financial statements.
134
Table of Contents
Optimum International Fund Class A
Selected data for each share of the Fund outstanding throughout each period were as follows:
| Year ended | ||||||||||||||||||||
| 3/31/18 | 3/31/17 | 3/31/16 | 3/31/15 | 3/31/14 | ||||||||||||||||
| Net asset value, beginning of period |
$ | 12.27 | $ | 10.95 | $ | 11.66 | $ | 12.57 | $ | 10.97 | ||||||||||
| Income (loss) from investment operations: |
||||||||||||||||||||
| Net investment income1 |
0.12 | 0.11 | 0.08 | 0.06 | 0.14 | |||||||||||||||
| Net realized and unrealized gain (loss) |
2.29 | 1.31 | (0.73 | ) | (0.84 | ) | 1.54 | |||||||||||||
|
|
|
|
|
|
|
|
|
|
|
|||||||||||
| Total from investment operations |
2.41 | 1.42 | (0.65 | ) | (0.78 | ) | 1.68 | |||||||||||||
|
|
|
|
|
|
|
|
|
|
|
|||||||||||
| Less dividends and distributions from: |
||||||||||||||||||||
| Net investment income |
(0.11 | ) | (0.10 | ) | (0.06 | ) | (0.13 | ) | (0.08 | ) | ||||||||||
| Net realized gain |
(0.15 | ) | — | — | — | — | ||||||||||||||
|
|
|
|
|
|
|
|
|
|
|
|||||||||||
| Total dividends and distributions |
(0.26 | ) | (0.10 | ) | (0.06 | ) | (0.13 | ) | (0.08 | ) | ||||||||||
|
|
|
|
|
|
|
|
|
|
|
|||||||||||
| Net asset value, end of period |
$ | 14.42 | $ | 12.27 | $ | 10.95 | $ | 11.66 | $ | 12.57 | ||||||||||
|
|
|
|
|
|
|
|
|
|
|
|||||||||||
| Total return2 |
19.74% | 13.08% | (5.58% | ) | (6.25% | ) | 15.31% | |||||||||||||
| Ratios and supplemental data: |
||||||||||||||||||||
| Net assets, end of period (000 omitted) |
$ | 8,704 | $ | 8,680 | $ | 9,117 | $ | 10,291 | $ | 11,277 | ||||||||||
| Ratio of expenses to average net assets3 |
1.36% | 1.48% | 1.56% | 1.47% | 1.68% | |||||||||||||||
| Ratio of net investment income to average net assets3 |
0.90% | 0.93% | 0.74% | 0.51% | 1.20% | |||||||||||||||
| Portfolio turnover |
52% | 68% | 47% | 117% | 126% | |||||||||||||||
| 1 | The average shares outstanding method has been applied for per share information. |
| 2 | Total investment return is based on the change in net asset value of a share during the period and assumes reinvestment of dividends and distributions at net asset value and does not reflect the impact of a sales charge. Total investment return during some of the periods shown reflects a waiver by the manager. Performance would have been lower had the waiver not been in effect. |
| 3 | Expenses paid indirectly were not material and had no impact on the ratios disclosed. Expenses paid indirectly for the year ended March 31,2018 are reflected on the “Statements of operations.” |
See accompanying notes, which are an integral part of the financial statements.
| (continues) | 135 |
Table of Contents
Financial highlights
Optimum International Fund Class C
Selected data for each share of the Fund outstanding throughout each period were as follows:
| Year ended | ||||||||||||||||||||
| 3/31/18 | 3/31/17 | 3/31/16 | 3/31/15 | 3/31/14 | ||||||||||||||||
| Net asset value, beginning of period |
$ | 11.98 | $ | 10.69 | $ | 11.41 | $ | 12.29 | $ | 10.76 | ||||||||||
| Income (loss) from investment operations: |
||||||||||||||||||||
| Net investment income (loss)1 |
0.02 | 0.02 | — | 2 | (0.03 | ) | 0.06 | |||||||||||||
| Net realized and unrealized gain (loss) |
2.23 | 1.30 | (0.72 | ) | (0.83 | ) | 1.51 | |||||||||||||
|
|
|
|
|
|
|
|
|
|
|
|||||||||||
| Total from investment operations |
2.25 | 1.32 | (0.72 | ) | (0.86 | ) | 1.57 | |||||||||||||
|
|
|
|
|
|
|
|
|
|
|
|||||||||||
| Less dividends and distributions from: |
||||||||||||||||||||
| Net investment income |
(0.02 | ) | (0.03 | ) | — | (0.02 | ) | (0.04 | ) | |||||||||||
| Net realized gain |
(0.15 | ) | — | — | — | — | ||||||||||||||
|
|
|
|
|
|
|
|
|
|
|
|||||||||||
| Total dividends and distributions |
(0.17 | ) | (0.03 | ) | — | (0.02 | ) | (0.04 | ) | |||||||||||
|
|
|
|
|
|
|
|
|
|
|
|||||||||||
| Net asset value, end of period |
$ | 14.06 | $ | 11.98 | $ | 10.69 | $ | 11.41 | $ | 12.29 | ||||||||||
|
|
|
|
|
|
|
|
|
|
|
|||||||||||
| Total return3 |
18.82% | 12.32% | (6.31% | ) | (7.00% | ) | 14.56% | |||||||||||||
| Ratios and supplemental data: |
||||||||||||||||||||
| Net assets, end of period (000 omitted) |
$ | 28,046 | $ | 29,544 | $ | 31,777 | $ | 35,996 | $ | 37,893 | ||||||||||
| Ratio of expenses to average net assets4 |
2.11% | 2.23% | 2.31% | 2.22% | 2.36% | |||||||||||||||
| Ratio of net investment income (loss) to average net assets4 |
0.15% | 0.18% | (0.01% | ) | (0.24% | ) | 0.52% | |||||||||||||
| Portfolio turnover |
52% | 68% | 47% | 117% | 126% | |||||||||||||||
| 1 | The average shares outstanding method has been applied for per share information. |
| 2 | Amount is less than $(0.005) per share. |
| 3 | Total investment return is based on the change in net asset value of a share during the period and assumes reinvestment of dividends and distributions at net asset value and does not reflect the impact of a sales charge. Total investment return during some of the periods shown reflects a waiver by the manager. Performance would have been lower had the waiver not been in effect. |
| 4 | Expenses paid indirectly were not material and had no impact on the ratios disclosed. Expenses paid indirectly for the year ended March 31,2018 are reflected on the “Statements of operations.” |
See accompanying notes, which are an integral part of the financial statements.
136
Table of Contents
Optimum International Fund Institutional Class
Selected data for each share of the Fund outstanding throughout each period were as follows:
| Year ended | ||||||||||||||||||||
| 3/31/18 | 3/31/17 | 3/31/16 | 3/31/15 | 3/31/14 | ||||||||||||||||
| Net asset value, beginning of period |
$ | 12.35 | $ | 11.02 | $ | 11.74 | $ | 12.66 | $ | 11.05 | ||||||||||
| Income (loss) from investment operations: |
||||||||||||||||||||
| Net investment income1 |
0.16 | 0.14 | 0.11 | 0.09 | 0.18 | |||||||||||||||
| Net realized and unrealized gain (loss) |
2.31 | 1.32 | (0.74 | ) | (0.85 | ) | 1.55 | |||||||||||||
|
|
|
|
|
|
|
|
|
|
|
|||||||||||
| Total from investment operations |
2.47 | 1.46 | (0.63 | ) | (0.76 | ) | 1.73 | |||||||||||||
|
|
|
|
|
|
|
|
|
|
|
|||||||||||
| Less dividends and distributions from: |
||||||||||||||||||||
| Net investment income |
(0.15 | ) | (0.13 | ) | (0.09 | ) | (0.16 | ) | (0.12 | ) | ||||||||||
| Net realized gain |
(0.15 | ) | — | — | — | — | ||||||||||||||
|
|
|
|
|
|
|
|
|
|
|
|||||||||||
| Total dividends and distributions |
(0.30 | ) | (0.13 | ) | (0.09 | ) | (0.16 | ) | (0.12 | ) | ||||||||||
|
|
|
|
|
|
|
|
|
|
|
|||||||||||
| Net asset value, end of period |
$ | 14.52 | $ | 12.35 | $ | 11.02 | $ | 11.74 | $ | 12.66 | ||||||||||
|
|
|
|
|
|
|
|
|
|
|
|||||||||||
| Total return2 |
20.05% | 13.36% | (5.38% | ) | (6.04% | ) | 15.79% | |||||||||||||
| Ratios and supplemental data: |
||||||||||||||||||||
| Net assets, end of period (000 omitted) |
$ | 629,934 | $ | 525,431 | $ | 542,055 | $ | 477,884 | $ | 589,098 | ||||||||||
| Ratio of expenses to average net assets3 |
1.11% | 1.23% | 1.31% | 1.22% | 1.36% | |||||||||||||||
| Ratio of net investment income to average net assets3 |
1.15% | 1.18% | 0.99% | 0.76% | 1.52% | |||||||||||||||
| Portfolio turnover |
52% | 68% | 47% | 117% | 126% | |||||||||||||||
| 1 | The average shares outstanding method has been applied for per share information. |
| 2 | Total investment return is based on the change in net asset value of a share during the period and assumes reinvestment of dividends and distributions at net asset value. Total investment return during some of the periods shown reflects a waiver by the manager. Performance would have been lower had the waiver not been in effect. |
| 3 | Expenses paid indirectly were not material and had no impact on the ratios disclosed. Expenses paid indirectly for the year ended March 31,2018 are reflected on the “Statements of operations.” |
See accompanying notes, which are an integral part of the financial statements.
| (continues) | 137 |
Table of Contents
Financial highlights
Optimum Large Cap Growth Fund Class A
Selected data for each share of the Fund outstanding throughout each period were as follows:
| Year ended | ||||||||||||||||||||
| 3/31/18 | 3/31/17 | 3/31/16 | 3/31/15 | 3/31/14 | ||||||||||||||||
| Net asset value, beginning of period |
$ | 16.84 | $ | 14.97 | $ | 17.00 | $ | 16.39 | $ | 14.53 | ||||||||||
| Income (loss) from investment operations: |
||||||||||||||||||||
| Net investment loss1 |
(0.06 | ) | (0.06 | ) | (0.10 | ) | (0.08 | ) | (0.10 | ) | ||||||||||
| Net realized and unrealized gain (loss) |
3.70 | 2.52 | (0.20 | ) | 2.71 | 3.63 | ||||||||||||||
|
|
|
|
|
|
|
|
|
|
|
|||||||||||
| Total from investment operations |
3.64 | 2.46 | (0.30 | ) | 2.63 | 3.53 | ||||||||||||||
|
|
|
|
|
|
|
|
|
|
|
|||||||||||
| Less dividends and distributions from: |
||||||||||||||||||||
| Net realized gain |
(3.26 | ) | (0.59 | ) | (1.73 | ) | (2.02 | ) | (1.67 | ) | ||||||||||
|
|
|
|
|
|
|
|
|
|
|
|||||||||||
| Total dividends and distributions |
(3.26 | ) | (0.59 | ) | (1.73 | ) | (2.02 | ) | (1.67 | ) | ||||||||||
|
|
|
|
|
|
|
|
|
|
|
|||||||||||
| Net asset value, end of period |
$ | 17.22 | $ | 16.84 | $ | 14.97 | $ | 17.00 | $ | 16.39 | ||||||||||
|
|
|
|
|
|
|
|
|
|
|
|||||||||||
| Total return2 |
22.17% | 16.83% | (2.27% | ) | 17.27% | 25.17% | ||||||||||||||
| Ratios and supplemental data: |
||||||||||||||||||||
| Net assets, end of period (000 omitted) |
$ | 32,254 | $ | 32,215 | $ | 33,787 | $ | 40,790 | $ | 39,044 | ||||||||||
| Ratio of expenses to average net assets |
1.26% | 1.35% | 1.42% | 1.37% | 1.54% | |||||||||||||||
| Ratio of expenses to average net assets prior to fees waived3 |
1.26% | 1.38% | 1.44% | 1.37% | 1.55% | |||||||||||||||
| Ratio of net investment loss to average net assets |
(0.31% | ) | (0.35% | ) | (0.62% | ) | (0.50% | ) | (0.62% | ) | ||||||||||
| Ratio of net investment loss to average net assets prior to fees waived3 |
(0.31% | ) | (0.38% | ) | (0.64% | ) | (0.50% | ) | (0.63% | ) | ||||||||||
| Portfolio turnover |
77% | 4 | 52% | 88% | 86% | 98% | ||||||||||||||
| 1 | The average shares outstanding method has been applied for per share information. |
| 2 | Total investment return is based on the change in net asset value of a share during the period and assumes reinvestment of dividends and distributions at net asset value and does not reflect the impact of a sales charge. Total investment return during some of the periods shown reflects a waiver by the manager. Performance would have been lower had the waiver not been in effect. |
| 3 | Expenses paid indirectly were not material and had no impact on the ratios disclosed. Expenses paid indirectly for the year ended March 31,2018 are reflected on the “Statements of operations.” |
| 4 | As a result of ClearBridge Investment LLC replacing Fred Alger Management Inc. as one of the sub-advisors to Optimum Large Cap Growth Fund during the Fund’s fiscal year ending March 31, 2018, the Fund’s portfolio turnover rate increased during the year ended March 31, 2018. |
See accompanying notes, which are an integral part of the financial statements.
138
Table of Contents
Optimum Large Cap Growth Fund Class C
Selected data for each share of the Fund outstanding throughout each period were as follows:
| Year ended | ||||||||||||||||||||
| 3/31/18 | 3/31/17 | 3/31/16 | 3/31/15 | 3/31/14 | ||||||||||||||||
| Net asset value, beginning of period |
$ | 14.81 | $ | 13.34 | $ | 15.44 | $ | 15.16 | $ | 13.63 | ||||||||||
| Income (loss) from investment operations: |
||||||||||||||||||||
| Net investment loss1 |
(0.17 | ) | (0.15 | ) | (0.20 | ) | (0.19 | ) | (0.19 | ) | ||||||||||
| Net realized and unrealized gain (loss) |
3.24 | 2.21 | (0.17 | ) | 2.49 | 3.39 | ||||||||||||||
|
|
|
|
|
|
|
|
|
|
|
|||||||||||
| Total from investment operations |
3.07 | 2.06 | (0.37 | ) | 2.30 | 3.20 | ||||||||||||||
|
|
|
|
|
|
|
|
|
|
|
|||||||||||
| Less dividends and distributions from: |
||||||||||||||||||||
| Net realized gain |
(3.26 | ) | (0.59 | ) | (1.73 | ) | (2.02 | ) | (1.67 | ) | ||||||||||
|
|
|
|
|
|
|
|
|
|
|
|||||||||||
| Total dividends and distributions |
(3.26 | ) | (0.59 | ) | (1.73 | ) | (2.02 | ) | (1.67 | ) | ||||||||||
|
|
|
|
|
|
|
|
|
|
|
|||||||||||
| Net asset value, end of period |
$ | 14.62 | $ | 14.81 | $ | 13.34 | $ | 15.44 | $ | 15.16 | ||||||||||
|
|
|
|
|
|
|
|
|
|
|
|||||||||||
| Total return2 |
21.30% | 15.88% | (2.98% | ) | 16.44% | 24.27% | ||||||||||||||
| Ratios and supplemental data: |
||||||||||||||||||||
| Net assets, end of period (000 omitted) |
$ | 97,658 | $ | 105,082 | $ | 114,907 | $ | 137,892 | $ | 127,540 | ||||||||||
| Ratio of expenses to average net assets |
2.01% | 2.10% | 2.17% | 2.12% | 2.22% | |||||||||||||||
| Ratio of expenses to average net assets prior to fees waived3 |
2.01% | 2.13% | 2.19% | 2.12% | 2.23% | |||||||||||||||
| Ratio of net investment loss to average net assets |
(1.06% | ) | (1.10% | ) | (1.37% | ) | (1.25% | ) | (1.30% | ) | ||||||||||
| Ratio of net investment loss to average net assets prior to fees waived3 |
(1.06% | ) | (1.13% | ) | (1.39% | ) | (1.25% | ) | (1.31% | ) | ||||||||||
| Portfolio turnover |
77% | 4 | 52% | 88% | 86% | 98% | ||||||||||||||
| 1 | The average shares outstanding method has been applied for per share information. |
| 2 | Total investment return is based on the change in net asset value of a share during the period and assumes reinvestment of dividends and distributions at net asset value and does not reflect the impact of a sales charge. Total investment return during some of the periods shown reflects a waiver by the manager. Performance would have been lower had the waiver not been in effect. |
| 3 | Expenses paid indirectly were not material and had no impact on the ratios disclosed. Expenses paid indirectly for the year ended March 31,2018 are reflected on the “Statements of operations.” |
| 4 | As a result of ClearBridge Investment LLC replacing Fred Alger Management Inc. as one of the sub-advisors to Optimum Large Cap Growth Fund during the Fund’s fiscal year ending March 31, 2018, the Fund’s portfolio turnover rate increased during the year ended March 31, 2018. |
See accompanying notes, which are an integral part of the financial statements.
| (continues) | 139 |
Table of Contents
Financial highlights
Optimum Large Cap Growth Fund Institutional Class
| Selected data for each share of the Fund outstanding throughout each period were as follows: |
| Year ended | ||||||||||||||||||||
| 3/31/18 | 3/31/17 | 3/31/16 | 3/31/15 | 3/31/14 | ||||||||||||||||
| Net asset value, beginning of period |
$ | 17.81 | $ | 15.76 | $ | 17.76 | $ | 17.00 | $ | 14.97 | ||||||||||
| Income (loss) from investment operations: |
||||||||||||||||||||
| Net investment loss1 |
(0.01 | ) | (0.02 | ) | (0.06 | ) | (0.04 | ) | (0.05 | ) | ||||||||||
| Net realized and unrealized gain (loss) |
3.92 | 2.66 | (0.21 | ) | 2.82 | 3.75 | ||||||||||||||
|
|
|
|
|
|
|
|
|
|
|
|||||||||||
| Total from investment operations |
3.91 | 2.64 | (0.27 | ) | 2.78 | 3.70 | ||||||||||||||
|
|
|
|
|
|
|
|
|
|
|
|||||||||||
| Less dividends and distributions from: |
||||||||||||||||||||
| Net investment income |
— | — | — | — | — | 2 | ||||||||||||||
| Net realized gain |
(3.26 | ) | (0.59 | ) | (1.73 | ) | (2.02 | ) | (1.67 | ) | ||||||||||
|
|
|
|
|
|
|
|
|
|
|
|||||||||||
| Total dividends and distributions |
(3.26 | ) | (0.59 | ) | (1.73 | ) | (2.02 | ) | (1.67 | ) | ||||||||||
|
|
|
|
|
|
|
|
|
|
|
|||||||||||
| Net asset value, end of period |
$ | 18.46 | $ | 17.81 | $ | 15.76 | $ | 17.76 | $ | 17.00 | ||||||||||
|
|
|
|
|
|
|
|
|
|
|
|||||||||||
| Total return3 |
22.50% | 17.14% | (2.00% | ) | 17.55% | 25.51% | ||||||||||||||
| Ratios and supplemental data: |
||||||||||||||||||||
| Net assets, end of period (000 omitted) |
$ | 1,610,343 | $ | 1,348,419 | $ | 1,356,335 | $ | 1,413,059 | $ | 1,026,377 | ||||||||||
| Ratio of expenses to average net assets |
1.01% | 1.10% | 1.17% | 1.12% | 1.22% | |||||||||||||||
| Ratio of expenses to average net assets prior to fees waived4 |
1.01% | 1.13% | 1.19% | 1.12% | 1.23% | |||||||||||||||
| Ratio of net investment loss to average net assets |
(0.06% | ) | (0.10% | ) | (0.37% | ) | (0.25% | ) | (0.30% | ) | ||||||||||
| Ratio of net investment loss to average net assets prior to fees waived4 |
(0.06% | ) | (0.13% | ) | (0.39% | ) | (0.25% | ) | (0.31% | ) | ||||||||||
| Portfolio turnover |
77% | 5 | 52% | 88% | 86% | 98% | ||||||||||||||
| 1 | The average shares outstanding method has been applied for per share information. |
| 2 | For the year ended March 31, 2014, net investment income distributions of $149,730 was made by the Fund’s Institutional Class, which calculated to a de minimis amount of $0.00 per share. |
| 3 | Total investment return is based on the change in net asset value of a share during the period and assumes reinvestment of dividends and distributions at net asset value. Total investment return during some of the periods shown reflects a waiver by the manager. Performance would have been lower had the waiver not been in effect. |
| 4 | Expenses paid indirectly were not material and had no impact on the ratios disclosed. Expenses paid indirectly for the year ended March 31,2018 are reflected on the “Statements of operations.” |
| 5 | As a result of ClearBridge Investment LLC replacing Fred Alger Management Inc. as one of the sub-advisors to Optimum Large Cap Growth Fund during the Fund’s fiscal year ending March 31, 2018, the Fund’s portfolio turnover rate increased during the year ended March 31, 2018. |
See accompanying notes, which are an integral part of the financial statements.
140
Table of Contents
Optimum Large Cap Value Fund Class A
Selected data for each share of the Fund outstanding throughout each period were as follows:
| Year ended | ||||||||||||||||||||
| 3/31/18 | 3/31/17 | 3/31/16 | 3/31/15 | 3/31/14 | ||||||||||||||||
| Net asset value, beginning of period |
$ | 15.42 | $ | 15.13 | $ | 16.01 | $ | 15.36 | $ | 12.90 | ||||||||||
| Income (loss) from investment operations: |
||||||||||||||||||||
| Net investment income1 |
0.17 | 0.17 | 0.17 | 0.12 | 0.16 | |||||||||||||||
| Net realized and unrealized gain (loss) |
1.19 | 2.04 | (0.89 | ) | 0.70 | 2.40 | ||||||||||||||
|
|
|
|
|
|
|
|
|
|
|
|||||||||||
| Total from investment operations |
1.36 | 2.21 | (0.72 | ) | 0.82 | 2.56 | ||||||||||||||
|
|
|
|
|
|
|
|
|
|
|
|||||||||||
| Less dividends and distributions from: |
||||||||||||||||||||
| Net investment income |
(0.16 | ) | (0.18 | ) | (0.16 | ) | (0.17 | ) | (0.10 | ) | ||||||||||
| Net realized gain |
(0.73 | ) | (1.74 | ) | — | — | — | |||||||||||||
|
|
|
|
|
|
|
|
|
|
|
|||||||||||
| Total dividends and distributions |
(0.89 | ) | (1.92 | ) | (0.16 | ) | (0.17 | ) | (0.10 | ) | ||||||||||
|
|
|
|
|
|
|
|
|
|
|
|||||||||||
| Net asset value, end of period |
$ | 15.89 | $ | 15.42 | $ | 15.13 | $ | 16.01 | $ | 15.36 | ||||||||||
|
|
|
|
|
|
|
|
|
|
|
|||||||||||
| Total return2 |
8.68% | 14.99% | (4.54% | ) | 5.34% | 19.96% | ||||||||||||||
| Ratios and supplemental data: |
||||||||||||||||||||
| Net assets, end of period (000 omitted) |
$ | 26,448 | $ | 28,739 | $ | 30,502 | $ | 35,952 | $ | 37,299 | ||||||||||
| Ratio of expenses to average net assets |
1.21% | 1.33% | 1.40% | 1.33% | 1.50% | |||||||||||||||
| Ratio of expenses to average net assets prior to fees waived3 |
1.21% | 1.34% | 1.41% | 1.33% | 1.51% | |||||||||||||||
| Ratio of net investment income to average net assets |
1.05% | 1.06% | 1.07% | 0.79% | 1.12% | |||||||||||||||
| Ratio of net investment income to average net assets prior to fees waived3 |
1.05% | 1.05% | 1.06% | 0.79% | 1.11% | |||||||||||||||
| Portfolio turnover |
25% | 82% | 4 | 39% | 35% | 37% | ||||||||||||||
| 1 | The average shares outstanding method has been applied for per share information. |
| 2 | Total investment return is based on the change in net asset value of a share during the period and assumes reinvestment of dividends and distributions at net asset value and does not reflect the impact of a sales charge. Total investment return during some of the periods shown reflects a waiver by the manager. Performance would have been lower had the waiver not been in effect. |
| 3 | Expenses paid indirectly were not material and had no impact on the ratios disclosed. Expenses paid indirectly for the year ended March 31,2018 are reflected on the “Statements of operations.” |
| 4 | As a result of Rothschild Asset Management Inc. replacing Herndon Capital Management, LLC as one of the sub-advisors to Optimum Large Cap Value Fund during the Fund’s fiscal year ending March 31, 2017, the Fund’s portfolio turnover rate increased substantially during the year ended March 31, 2017. |
See accompanying notes, which are an integral part of the financial statements.
| (continues) | 141 |
Table of Contents
Financial highlights
Optimum Large Cap Value Fund Class C
Selected data for each share of the Fund outstanding throughout each period were as follows:
| Year ended | ||||||||||||||||||||
|
3/31/18 |
3/31/17 | 3/31/16 | 3/31/15 | 3/31/14 | ||||||||||||||||
|
Net asset value, beginning of period |
$ | 15.25 | $ | 14.99 | $ | 15.85 | $ | 15.22 | $ | 12.78 | ||||||||||
| Income (loss) from investment operations: |
||||||||||||||||||||
| Net investment income1 |
0.05 | 0.05 | 0.05 | 0.01 | 0.06 | |||||||||||||||
| Net realized and unrealized gain (loss) |
1.17 | 2.01 | (0.87 | ) | 0.67 | 2.39 | ||||||||||||||
|
|
|
|
|
|
|
|
|
|
|
|||||||||||
| Total from investment operations |
1.22 | 2.06 | (0.82 | ) | 0.68 | 2.45 | ||||||||||||||
|
|
|
|
|
|
|
|
|
|
|
|||||||||||
| Less dividends and distributions from: |
||||||||||||||||||||
| Net investment income |
(0.05 | ) | (0.06 | ) | (0.04 | ) | (0.05 | ) | (0.01 | ) | ||||||||||
| Net realized gain |
(0.73 | ) | (1.74 | ) | — | — | — | |||||||||||||
|
|
|
|
|
|
|
|
|
|
|
|||||||||||
| Total dividends and distributions |
(0.78 | ) | (1.80 | ) | (0.04 | ) | (0.05 | ) | (0.01 | ) | ||||||||||
|
|
|
|
|
|
|
|
|
|
|
|||||||||||
| Net asset value, end of period |
$ | 15.69 | $ | 15.25 | $ | 14.99 | $ | 15.85 | $ | 15.22 | ||||||||||
|
|
|
|
|
|
|
|
|
|
|
|||||||||||
| Total return2 |
7.82% | 14.13% | (5.19% | ) | 4.48% | 19.17% | ||||||||||||||
| Ratios and supplemental data: |
||||||||||||||||||||
| Net assets, end of period (000 omitted) |
$ | 82,610 | $ | 95,495 | $ | 103,693 | $ | 122,772 | $ | 123,541 | ||||||||||
| Ratio of expenses to average net assets |
1.96% | 2.08% | 2.15% | 2.08% | 2.18% | |||||||||||||||
| Ratio of expenses to average net assets prior to fees waived3 |
1.96% | 2.09% | 2.16% | 2.08% | 2.19% | |||||||||||||||
| Ratio of net investment income to average net assets |
0.30% | 0.31% | 0.32% | 0.04% | 0.44% | |||||||||||||||
| Ratio of net investment income to average net assets prior to fees waived3 |
0.30% | 0.30% | 0.31% | 0.04% | 0.43% | |||||||||||||||
| Portfolio turnover |
25% | 82% | 4 | 39% | 35% | 37% | ||||||||||||||
| 1 | The average shares outstanding method has been applied for per share information. |
| 2 | Total investment return is based on the change in net asset value of a share during the period and assumes reinvestment of dividends and distributions at net asset value and does not reflect the impact of a sales charge. Total investment return during some of the periods shown reflects a waiver by the manager. Performance would have been lower had the waiver not been in effect. |
| 3 | Expenses paid indirectly were not material and had no impact on the ratios disclosed. Expenses paid indirectly for the year ended March 31,2018 are reflected on the “Statements of operations.” |
| 4 | As a result of Rothschild Asset Management Inc. replacing Herndon Capital Management, LLC as one of the sub-advisors to Optimum Large Cap Value Fund during the Fund’s fiscal year ending March 31, 2017, the Fund’s portfolio turnover rate increased substantially during the year ended March 31, 2017. |
See accompanying notes, which are an integral part of the financial statements.
142
Table of Contents
Optimum Large Cap Value Fund Institutional Class
Selected data for each share of the Fund outstanding throughout each period were as follows:
| Year ended | ||||||||||||||||||||
|
3/31/17 |
3/31/16 | 3/31/15 | 3/31/14 | 3/31/13 | ||||||||||||||||
|
Net asset value, beginning of period |
$ | 15.46 | $ | 15.16 | $ | 16.04 | $ | 15.39 | $ | 12.92 | ||||||||||
| Income (loss) from investment operations: |
||||||||||||||||||||
| Net investment income1 |
0.21 | 0.20 | 0.20 | 0.17 | 0.20 | |||||||||||||||
| Net realized and unrealized gain (loss) |
1.19 | 2.06 | (0.89 | ) | 0.69 | 2.41 | ||||||||||||||
|
|
|
|
|
|
|
|
|
|
|
|||||||||||
| Total from investment operations |
1.40 | 2.26 | (0.69 | ) | 0.86 | 2.61 | ||||||||||||||
|
|
|
|
|
|
|
|
|
|
|
|||||||||||
| Less dividends and distributions from: |
||||||||||||||||||||
| Net investment income |
(0.20 | ) | (0.22 | ) | (0.19 | ) | (0.21 | ) | (0.14 | ) | ||||||||||
| Net realized gain |
(0.73 | ) | (1.74 | ) | — | — | — | |||||||||||||
|
|
|
|
|
|
|
|
|
|
|
|||||||||||
| Total dividends and distributions |
(0.93 | ) | (1.96 | ) | (0.19 | ) | (0.21 | ) | (0.14 | ) | ||||||||||
|
|
|
|
|
|
|
|
|
|
|
|||||||||||
| Net asset value, end of period |
$ | 15.93 | $ | 15.46 | $ | 15.16 | $ | 16.04 | $ | 15.39 | ||||||||||
|
|
|
|
|
|
|
|
|
|
|
|||||||||||
| Total return2 |
8.90% | 15.30% | (4.29% | ) | 5.60% | 20.31% | ||||||||||||||
| Ratios and supplemental data: |
||||||||||||||||||||
| Net assets, end of period (000 omitted) |
$ | 1,372,505 | $ | 1,217,722 | $ | 1,129,606 | $ | 1,146,123 | $ | 1,002,553 | ||||||||||
| Ratio of expenses to average net assets |
0.96% | 1.08% | 1.15% | 1.08% | 1.18% | |||||||||||||||
| Ratio of expenses to average net assets prior to fees waived3 |
0.96% | 1.09% | 1.16% | 1.08% | 1.19% | |||||||||||||||
| Ratio of net investment income to average net assets |
1.30% | 1.31% | 1.32% | 1.04% | 1.44% | |||||||||||||||
| Ratio of net investment income to average net assets prior to fees waived3 |
1.30% | 1.30% | 1.31% | 1.04% | 1.43% | |||||||||||||||
| Portfolio turnover |
25% | 82% | 4 | 39% | 35% | 37% | ||||||||||||||
| 1 | The average shares outstanding method has been applied for per share information. |
| 2 | Total investment return is based on the change in net asset value of a share during the period and assumes reinvestment of dividends and distributions at net asset value. Total investment return during some of the periods shown reflects a waiver by the manager. Performance would have been lower had the waiver not been in effect. |
| 3 | Expenses paid indirectly were not material and had no impact on the ratios disclosed. Expenses paid indirectly for the year ended March 31,2018 are reflected on the “Statements of operations.” |
| 4 | As a result of Rothschild Asset Management Inc. replacing Herndon Capital Management, LLC as one of the sub-advisors to Optimum Large Cap Value Fund during the Fund’s fiscal year ending March 31, 2017, the Fund’s portfolio turnover rate increased substantially during the year ended March 31, 2017. |
See accompanying notes, which are an integral part of the financial statements.
| (continues) | 143 |
Table of Contents
Financial highlights
Optimum Small-Mid Cap Growth Fund Class A
Selected data for each share of the Fund outstanding throughout each period were as follows:
| Year ended | ||||||||||||||||||||
|
3/31/18 |
3/31/17 | 3/31/16 | 3/31/15 | 3/31/14 | ||||||||||||||||
|
Net asset value, beginning of period |
$ | 13.31 | $ | 10.95 | $ | 15.37 | $ | 15.57 | $ | 14.26 | ||||||||||
| Income (loss) from investment operations: |
||||||||||||||||||||
| Net investment loss1 |
(0.16 | ) | (0.14 | ) | (0.15 | ) | (0.16 | ) | (0.19 | ) | ||||||||||
| Net realized and unrealized gain (loss) |
3.03 | 2.50 | (2.26 | ) | 1.44 | 3.07 | ||||||||||||||
|
|
|
|
|
|
|
|
|
|
|
|||||||||||
| Total from investment operations |
2.87 | 2.36 | (2.41 | ) | 1.28 | 2.88 | ||||||||||||||
|
|
|
|
|
|
|
|
|
|
|
|||||||||||
| Less dividends and distributions from: |
||||||||||||||||||||
| Return of capital |
— | — | — | 2 | — | — | ||||||||||||||
| Net realized gain |
(0.67 | ) | — | (2.01 | ) | (1.48 | ) | (1.57 | ) | |||||||||||
|
|
|
|
|
|
|
|
|
|
|
|||||||||||
| Total dividends and distributions |
(0.67 | ) | — | (2.01 | ) | (1.48 | ) | (1.57 | ) | |||||||||||
|
|
|
|
|
|
|
|
|
|
|
|||||||||||
| Net asset value, end of period |
$ | 15.51 | $ | 13.31 | $ | 10.95 | $ | 15.37 | $ | 15.57 | ||||||||||
|
|
|
|
|
|
|
|
|
|
|
|||||||||||
| Total return3 |
21.88% | 21.55% | (16.77% | ) | 8.93% | 21.63% | ||||||||||||||
| Ratios and supplemental data: |
||||||||||||||||||||
| Net assets, end of period (000 omitted) |
$ | 5,414 | $ | 5,293 | $ | 5,040 | $ | 7,050 | $ | 7,158 | ||||||||||
| Ratio of expenses to average net assets |
1.55% | 1.58% | 1.66% | 1.63% | 1.76% | |||||||||||||||
| Ratio of expenses to average net assets prior to fees waived4 |
1.63% | 1.79% | 1.85% | 1.77% | 1.96% | |||||||||||||||
| Ratio of net investment loss to average net assets |
(1.07% | ) | (1.16% | ) | (1.09% | ) | (1.09% | ) | (1.28% | ) | ||||||||||
| Ratio of net investment loss to average net assets prior to fees waived4 |
(1.15% | ) | (1.37% | ) | (1.28% | ) | (1.23% | ) | (1.48% | ) | ||||||||||
| Portfolio turnover |
89% | 180% | 5 | 104% | 72% | 58% | ||||||||||||||
| 1 | The average shares outstanding method has been applied for per share information. |
| 2 | For the year ended March 31, 2016, return of capital distribution of $108 for Class A calculated to a de minimis amount of $0.00 per share. |
| 3 | Total investment return is based on the change in net asset value of a share during the period and assumes reinvestment of dividends and distributions at net asset value and does not reflect the impact of a sales charge. Total investment return during all of the periods shown reflects a waiver by the manager. Performance would have been lower had the waiver not been in effect. |
| 4 | Expenses paid indirectly were not material and had no impact on the ratios disclosed. Expenses paid indirectly for the year ended March 31,2018 are reflected on the “Statements of operations.” |
| 5 | As a result of Peregrine Capital Management, LLC and Columbus Circle Investors replacing Columbia Wanger Asset Management and Wellington Management as the sub-advisors to Optimum Small-Mid Cap Growth Fund during the Fund’s fiscal year ending March 31, 2017, the Fund’s portfolio turnover rate increased substantially during the year ended March 31, 2017. |
See accompanying notes, which are an integral part of the financial statements.
144
Table of Contents
Optimum Small-Mid Cap Growth Fund Class C
Selected data for each share of the Fund outstanding throughout each period were as follows:
| Year ended | ||||||||||||||||||||
|
3/31/18 |
3/31/17 | 3/31/16 | 3/31/15 | 3/31/14 | ||||||||||||||||
|
Net asset value, beginning of period |
$ | 11.59 | $ | 9.61 | $ | 13.86 | $ | 14.29 | $ | 13.28 | ||||||||||
| Income (loss) from investment operations: |
||||||||||||||||||||
| Net investment loss1 |
(0.23 | ) | (0.20 | ) | (0.22 | ) | (0.25 | ) | (0.27 | ) | ||||||||||
| Net realized and unrealized gain (loss) |
2.63 | 2.18 | (2.02 | ) | 1.30 | 2.85 | ||||||||||||||
|
|
|
|
|
|
|
|
|
|
|
|||||||||||
| Total from investment operations |
2.40 | 1.98 | (2.24 | ) | 1.05 | 2.58 | ||||||||||||||
|
|
|
|
|
|
|
|
|
|
|
|||||||||||
| Less dividends and distributions from: |
||||||||||||||||||||
| Return of capital |
— | — | — | 2 | — | — | ||||||||||||||
| Net realized gain |
(0.67 | ) | — | (2.01 | ) | (1.48 | ) | (1.57 | ) | |||||||||||
|
|
|
|
|
|
|
|
|
|
|
|||||||||||
| Total dividends and distributions |
(0.67 | ) | — | (2.01 | ) | (1.48 | ) | (1.57 | ) | |||||||||||
|
|
|
|
|
|
|
|
|
|
|
|||||||||||
| Net asset value, end of period |
$ | 13.32 | $ | 11.59 | $ | 9.61 | $ | 13.86 | $ | 14.29 | ||||||||||
|
|
|
|
|
|
|
|
|
|
|
|||||||||||
| Total return3 |
21.06% | 20.60% | (17.39% | ) | 8.08% | 20.82% | ||||||||||||||
| Ratios and supplemental data: |
||||||||||||||||||||
| Net assets, end of period (000 omitted) |
$ | 15,925 | $ | 16,668 | $ | 16,972 | $ | 23,206 | $ | 22,581 | ||||||||||
| Ratio of expenses to average net assets |
2.30% | 2.33% | 2.41% | 2.38% | 2.45% | |||||||||||||||
| Ratio of expenses to average net assets prior to fees waived4 |
2.38% | 2.54% | 2.60% | 2.52% | 2.65% | |||||||||||||||
| Ratio of net investment loss to average net assets |
(1.82% | ) | (1.91% | ) | (1.84% | ) | (1.84% | ) | (1.97% | ) | ||||||||||
| Ratio of net investment loss to average net assets prior to fees waived4 |
(1.90% | ) | (2.12% | ) | (2.03% | ) | (1.98% | ) | (2.17% | ) | ||||||||||
| Portfolio turnover |
89% | 180% | 5 | 104% | 72% | 58% | ||||||||||||||
| 1 | The average shares outstanding method has been applied for per share information. |
| 2 | For the year ended March 31, 2016, return of capital distribution of $416 for Class C calculated to a de minimis amount of $0.00 per share. |
| 3 | Total investment return is based on the change in net asset value of a share during the period and assumes reinvestment of dividends and distributions at net asset value and does not reflect the impact of a sales charge. Total investment return during all of the periods shown reflects a waiver by the manager. Performance would have been lower had the waiver not been in effect. |
| 4 | Expenses paid indirectly were not material and had no impact on the ratios disclosed. Expenses paid indirectly for the year ended March 31,2018 are reflected on the “Statements of operations.” |
| 5 | As a result of Peregrine Capital Management, LLC and Columbus Circle Investors replacing Columbia Wanger Asset Management and Wellington Management as the sub-advisors to Optimum Small-Mid Cap Growth Fund during the Fund’s fiscal year ending March 31, 2017, the Fund’s portfolio turnover rate increased substantially during the year ended March 31, 2017. |
See accompanying notes, which are an integral part of the financial statements.
| (continues) | 145 |
Table of Contents
Financial highlights
Optimum Small-Mid Cap Growth Fund Institutional Class
Selected data for each share of the Fund outstanding throughout each period were as follows:
| Year ended | ||||||||||||||||||||
|
3/31/18 |
3/31/17 | 3/31/16 | 3/31/15 | 3/31/14 | ||||||||||||||||
|
Net asset value, beginning of period |
$ | 14.19 | $ | 11.65 | $ | 16.17 | $ | 16.27 | $ | 14.78 | ||||||||||
| Income (loss) from investment operations: |
||||||||||||||||||||
| Net investment loss1 |
(0.13 | ) | (0.12 | ) | (0.12 | ) | (0.13 | ) | (0.15 | ) | ||||||||||
| Net realized and unrealized gain (loss) |
3.24 | 2.66 | (2.39 | ) | 1.51 | 3.21 | ||||||||||||||
|
|
|
|
|
|
|
|
|
|
|
|||||||||||
| Total from investment operations |
3.11 | 2.54 | (2.51 | ) | 1.38 | 3.06 | ||||||||||||||
|
|
|
|
|
|
|
|
|
|
|
|||||||||||
| Less dividends and distributions from: |
||||||||||||||||||||
| Return of capital |
— | — | — | 2 | — | — | ||||||||||||||
| Net realized gain |
(0.67 | ) | — | (2.01 | ) | (1.48 | ) | (1.57 | ) | |||||||||||
|
|
|
|
|
|
|
|
|
|
|
|||||||||||
| Total dividends and distributions |
(0.67 | ) | — | (2.01 | ) | (1.48 | ) | (1.57 | ) | |||||||||||
|
|
|
|
|
|
|
|
|
|
|
|||||||||||
| Net asset value, end of period |
$ | 16.63 | $ | 14.19 | $ | 11.65 | $ | 16.17 | $ | 16.27 | ||||||||||
|
|
|
|
|
|
|
|
|
|
|
|||||||||||
| Total return3 |
22.22% | 21.80% | (16.54% | ) | 9.18% | 22.03% | ||||||||||||||
| Ratios and supplemental data: |
||||||||||||||||||||
| Net assets, end of period (000 omitted) |
$ | 494,894 | $ | 420,279 | $ | 440,683 | $ | 527,647 | $ | 436,823 | ||||||||||
| Ratio of expenses to average net assets |
1.30% | 1.33% | 1.41% | 1.38% | 1.45% | |||||||||||||||
| Ratio of expenses to average net assets prior to fees waived4 |
1.38% | 1.54% | 1.60% | 1.52% | 1.65% | |||||||||||||||
| Ratio of net investment loss to average net assets |
(0.82% | ) | (0.91% | ) | (0.84% | ) | (0.84% | ) | (0.97% | ) | ||||||||||
| Ratio of net investment loss to average net assets prior to fees waived4 |
(0.90% | ) | (1.12% | ) | (1.03% | ) | (0.98% | ) | (1.17% | ) | ||||||||||
| Portfolio turnover |
89% | 180% | 5 | 104% | 72% | 58% | ||||||||||||||
| 1 | The average shares outstanding method has been applied for per share information. |
| 2 | For the year ended March 31, 2016, return of capital distribution of $8,916 for Institutional Class calculated to a de minimis amount of $0.00 per share. |
| 3 | Total investment return is based on the change in net asset value of a share during the period and assumes reinvestment of dividends and distributions at net asset value. Total investment return during all of the periods shown reflects a waiver by the manager. Performance would have been lower had the waiver not been in effect. |
| 4 | Expenses paid indirectly were not material and had no impact on the ratios disclosed. Expenses paid indirectly for the year ended March 31,2018 are reflected on the “Statements of operations.” |
| 5 | As a result of Peregrine Capital Management, LLC and Columbus Circle Investors replacing Columbia Wanger Asset Management and Wellington Management as the sub-advisors to Optimum Small-Mid Cap Growth Fund during the Fund’s fiscal year ending March 31, 2017, the Fund’s portfolio turnover rate increased substantially during the year ended March 31, 2017. |
See accompanying notes, which are an integral part of the financial statements.
146
Table of Contents
Optimum Small-Mid Cap Value Fund Class A
Selected data for each share of the Fund outstanding throughout each period were as follows:
| Year ended | ||||||||||||||||||||
|
3/31/18 |
3/31/17 | 3/31/16 | 3/31/15 | 3/31/14 | ||||||||||||||||
|
Net asset value, beginning of period |
$ | 13.77 | $ | 11.53 | $ | 13.64 | $ | 14.88 | $ | 13.74 | ||||||||||
| Income (loss) from investment operations: |
||||||||||||||||||||
| Net investment income (loss)1 |
0.06 | 0.08 | (0.04 | ) | (0.09 | ) | (0.09 | ) | ||||||||||||
| Net realized and unrealized gain (loss) |
0.59 | 2.21 | (1.58 | ) | (0.03 | ) | 2.87 | |||||||||||||
|
|
|
|
|
|
|
|
|
|
|
|||||||||||
| Total from investment operations |
0.65 | 2.29 | (1.62 | ) | (0.12 | ) | 2.78 | |||||||||||||
|
|
|
|
|
|
|
|
|
|
|
|||||||||||
| Less dividends and distributions from: |
||||||||||||||||||||
| Net investment income |
(0.07 | ) | (0.05 | ) | — | — | — | |||||||||||||
| Return of capital |
— | — | — | 2 | — | — | ||||||||||||||
| Net realized gain |
(0.69 | ) | — | (0.49 | ) | (1.12 | ) | (1.64 | ) | |||||||||||
|
|
|
|
|
|
|
|
|
|
|
|||||||||||
| Total dividends and distributions |
(0.76 | ) | (0.05 | ) | (0.49 | ) | (1.12 | ) | (1.64 | ) | ||||||||||
|
|
|
|
|
|
|
|
|
|
|
|||||||||||
| Net asset value, end of period |
$ | 13.66 | $ | 13.77 | $ | 11.53 | $ | 13.64 | $ | 14.88 | ||||||||||
|
|
|
|
|
|
|
|
|
|
|
|||||||||||
| Total return3 |
4.59% | 19.84% | (11.96% | ) | (0.69% | ) | 21.85% | |||||||||||||
| Ratios and supplemental data: |
||||||||||||||||||||
| Net assets, end of period (000 omitted) |
$ | 3,856 | $ | 4,279 | $ | 4,302 | $ | 5,440 | $ | 6,058 | ||||||||||
| Ratio of expenses to average net assets |
1.48% | 1.51% | 1.61% | 1.62% | 1.70% | |||||||||||||||
| Ratio of expenses to average net assets prior to fees waived4 |
1.54% | 1.71% | 1.75% | 1.68% | 1.86% | |||||||||||||||
| Ratio of net investment income (loss) to average net assets |
0.40% | 0.64% | (0.35% | ) | (0.65% | ) | (0.64% | ) | ||||||||||||
| Ratio of net investment income (loss) to average net assets prior to fees waived4 |
0.34% | 0.44% | (0.49% | ) | (0.71% | ) | (0.80% | ) | ||||||||||||
| Portfolio turnover |
31% | 30% | 90% | 5 | 31% | 33% | ||||||||||||||
| 1 | The average shares outstanding method has been applied for per share information. |
| 2 | For the year ended March 31, 2016, return of capital distribution of $325 for Class A calculated to a de minimis amount of $0.001 per share |
| 3 | Total investment return is based on the change in net asset value of a share during the period and assumes reinvestment of dividends and distributions at net asset value and does not reflect the impact of a sales charge. Total investment return during all of the periods shown reflects a waiver by the manager. Performance would have been lower had the waiver not been in effect. |
| 4 | Expenses paid indirectly were not material and had no impact on the ratios disclosed. Expenses paid indirectly for the year ended March 31,2018 are reflected on the “Statements of operations.” |
| 5 | As a result of LSV Asset Management replacing The Delafield Group, a division of Tocqueville Asset Management L.P., and The Killen Group, Inc. as one of the sub-advisors to Optimum Small-Mid Cap Value Fund during the Fund’s fiscal year ending March 31, 2016, the Fund’s portfolio turnover rate increased substantially during the year ended March 31, 2016. |
See accompanying notes, which are an integral part of the financial statements.
| (continues) | 147 |
Table of Contents
Financial highlights
Optimum Small-Mid Cap Value Fund Class A
Selected data for each share of the Fund outstanding throughout each period were as follows:
| Year ended | ||||||||||||||||||||
|
3/31/18 |
3/31/17 | 3/31/16 | 3/31/15 | 3/31/14 | ||||||||||||||||
|
Net asset value, beginning of period |
$ | 12.21 | $ | 10.27 | $ | 12.30 | $ | 13.63 | $ | 12.80 | ||||||||||
| Income (loss) from investment operations: |
||||||||||||||||||||
| Net investment loss1 |
(0.04 | ) | (0.01 | ) | (0.12 | ) | (0.18 | ) | (0.18 | ) | ||||||||||
| Net realized and unrealized gain (loss) |
0.53 | 1.95 | (1.42 | ) | (0.03 | ) | 2.65 | |||||||||||||
|
|
|
|
|
|
|
|
|
|
|
|||||||||||
| Total from investment operations |
0.49 | 1.94 | (1.54 | ) | (0.21 | ) | 2.47 | |||||||||||||
|
|
|
|
|
|
|
|
|
|
|
|||||||||||
| Less dividends and distributions from: |
||||||||||||||||||||
| Return of capital |
— | — | — | 2 | — | — | ||||||||||||||
| Net realized gain |
(0.69 | ) | — | (0.49 | ) | (1.12 | ) | (1.64 | ) | |||||||||||
|
|
|
|
|
|
|
|
|
|
|
|||||||||||
| Total dividends and distributions |
(0.69 | ) | — | (0.49 | ) | (1.12 | ) | (1.64 | ) | |||||||||||
|
|
|
|
|
|
|
|
|
|
|
|||||||||||
| Net asset value, end of period |
$ | 12.01 | $ | 12.21 | $ | 10.27 | $ | 12.30 | $ | 13.63 | ||||||||||
|
|
|
|
|
|
|
|
|
|
|
|||||||||||
| Total return3 |
3.85% | 18.89% | (12.62% | ) | (1.45% | ) | 21.08% | |||||||||||||
| Ratios and supplemental data: |
||||||||||||||||||||
| Net assets, end of period (000 omitted) |
$ | 12,030 | $ | 14,268 | $ | 15,136 | $ | 19,245 | $ | 20,846 | ||||||||||
| Ratio of expenses to average net assets |
2.23% | 2.26% | 2.36% | 2.37% | 2.40% | |||||||||||||||
| Ratio of expenses to average net assets prior to fees waived4 |
2.29% | 2.46% | 2.50% | 2.43% | 2.56% | |||||||||||||||
| Ratio of net investment loss to average net assets |
(0.35% | ) | (0.11% | ) | (1.10% | ) | (1.40% | ) | (1.34% | ) | ||||||||||
| Ratio of net investment loss to average net assets prior to fees waived4 |
(0.41% | ) | (0.31% | ) | (1.24% | ) | (1.46% | ) | (1.50% | ) | ||||||||||
| Portfolio turnover |
31% | 30% | 90% | 5 | 31% | 33% | ||||||||||||||
| 1 | The average shares outstanding method has been applied for per share information. |
| 2 | For the year ended March 31, 2016, return of capital distribution of $1,284 for Class C calculated to a de minimis amount of $0.001 per share. |
| 3 | Total investment return is based on the change in net asset value of a share during the period and assumes reinvestment of dividends and distributions at net asset value and does not reflect the impact of a sales charge. Total investment return during all of the periods shown reflects a waiver by the manager. Performance would have been lower had the waiver not been in effect. |
| 4 | Expenses paid indirectly were not material and had no impact on the ratios disclosed. Expenses paid indirectly for the year ended March 31,2018 are reflected on the “Statements of operations.” |
| 5 | As a result of LSV Asset Management replacing The Delafield Group, a division of Tocqueville Asset Management L.P., and The Killen Group, Inc. as one of the sub-advisors to Optimum Small-Mid Cap Value Fund during the Fund’s fiscal year ending March 31, 2016, the Fund’s portfolio turnover rate increased substantially during the year ended March 31, 2016. |
See accompanying notes, which are an integral part of the financial statements.
148
Table of Contents
Optimum Small-Mid Cap Value Fund Institutional Class
Selected data for each share of the Fund outstanding throughout each period were as follows:
| Year ended | ||||||||||||||||||||
|
3/31/18 |
3/31/17 | 3/31/16 | 3/31/15 | 3/31/14 | ||||||||||||||||
|
Net asset value, beginning of period |
$ | 14.52 | $ | 12.16 | $ | 14.31 | $ | 15.53 | $ | 14.23 | ||||||||||
| Income (loss) from investment operations: |
||||||||||||||||||||
| Net investment income (loss)1 |
0.10 | 0.12 | (0.01 | ) | (0.06 | ) | (0.05 | ) | ||||||||||||
| Net realized and unrealized gain (loss) |
0.63 | 2.32 | (1.65 | ) | (0.04 | ) | 3.00 | |||||||||||||
|
|
|
|
|
|
|
|
|
|
|
|||||||||||
| Total from investment operations |
0.73 | 2.44 | (1.66 | ) | (0.10 | ) | 2.95 | |||||||||||||
|
|
|
|
|
|
|
|
|
|
|
|||||||||||
| Less dividends and distributions from: |
||||||||||||||||||||
| Net investment income |
(0.11 | ) | (0.08 | ) | — | — | (0.01 | ) | ||||||||||||
| Return of capital |
— | — | — | 2 | — | — | ||||||||||||||
| Net realized gain |
(0.69 | ) | — | (0.49 | ) | (1.12 | ) | (1.64 | ) | |||||||||||
|
|
|
|
|
|
|
|
|
|
|
|||||||||||
| Total dividends and distributions |
(0.80 | ) | (0.08 | ) | (0.49 | ) | (1.12 | ) | (1.65 | ) | ||||||||||
|
|
|
|
|
|
|
|
|
|
|
|||||||||||
| Net asset value, end of period |
$ | 14.45 | $ | 14.52 | $ | 12.16 | $ | 14.31 | $ | 15.53 | ||||||||||
|
|
|
|
|
|
|
|
|
|
|
|||||||||||
| Total return3 |
4.87% | 20.05% | (11.67% | ) | (0.53% | ) | 22.29% | |||||||||||||
| Ratios and supplemental data: |
||||||||||||||||||||
| Net assets, end of period (000 omitted) |
$ | 442,808 | $ | 406,327 | $ | 441,150 | $ | 499,578 | $ | 439,417 | ||||||||||
| Ratio of expenses to average net assets |
1.23% | 1.26% | 1.36% | 1.37% | 1.40% | |||||||||||||||
| Ratio of expenses to average net assets prior to fees waived4 |
1.29% | 1.46% | 1.50% | 1.43% | 1.56% | |||||||||||||||
| Ratio of net investment income (loss) to average net assets |
0.65% | 0.89% | (0.10% | ) | (0.40% | ) | (0.34% | ) | ||||||||||||
| Ratio of net investment income (loss) to average net assets prior to fees waived4 |
0.59% | 0.69% | (0.24% | ) | (0.46% | ) | (0.50% | ) | ||||||||||||
| Portfolio turnover |
31% | 30% | 90% | 5 | 31% | 33% | ||||||||||||||
| 1 | The average shares outstanding method has been applied for per share information. |
| 2 | For the year ended March 31, 2016, return of capital distribution of $31,607 for Institutional Class calculated to a de minimis amount of $0.001 per share. |
| 3 | Total investment return is based on the change in net asset value of a share during the period and assumes reinvestment of dividends and distributions at net asset value. Total investment return during all of the periods shown reflects a waiver by the manager. Performance would have been lower had the waiver not been in effect. |
| 4 | Expenses paid indirectly were not material and had no impact on the ratios disclosed. Expenses paid indirectly for the year ended March 31,2018 are reflected on the “Statements of operations.” |
| 5 | As a result of LSV Asset Management replacing The Delafield Group, a division of Tocqueville Asset Management L.P., and The Killen Group, Inc. as one of the sub-advisors to Optimum Small-Mid Cap Value Fund during the Fund’s fiscal year ending March 31, 2016, the Fund’s portfolio turnover rate increased substantially during the year ended March 31, 2016. |
See accompanying notes, which are an integral part of the financial statements.
| (continues) | 149 |
Table of Contents
Optimum Fund Trust
March 31, 2018
Optimum Fund Trust (Trust) is organized as a Delaware statutory trust and offers six series: Optimum Fixed Income Fund, Optimum International Fund, Optimum Large Cap Growth Fund, Optimum Large Cap Value Fund, Optimum Small-Mid Cap Growth Fund, and Optimum Small-Mid Cap Value Fund, (each, a Fund, or collectively, the Funds). The Trust is an open-end investment company. The Funds are considered diversified under the Investment Company Act of 1940, as amended, (1940 Act), and offer Class A, Class C, and Institutional Class shares. Class A shares are sold with a maximum front-end sales charge of 4.50% for Optimum Fixed Income Fund and 5.75% for Optimum International Fund, Optimum Large Cap Growth Fund, Optimum Large Cap Value Fund, Optimum Small-Mid Cap Growth Fund, and Optimum Small-Mid Cap Value Fund. Class A share purchases of $1,000,000 or more will incur a contingent deferred sales charge (CDSC) instead of front-end sales charge of 1.00% if redeemed during the first year and 0.50% during the second year, provided that Delaware Distributors, L.P. (DDLP) paid a financial advisor a commission on the purchase of those shares. Class C shares are sold with a CDSC of 1.00%, if redeemed during the first 12 months.
Institutional Class shares are not subject to a sales charge and are offered for sale exclusively to certain eligible investors.
The investment objective of Optimum Fixed Income Fund is to seek a high level of income. The Fund may also seek growth of capital.
The investment objective of Optimum International Fund is to seek long-term growth of capital. The Fund may also seek income.
The investment objective of Optimum Large Cap Growth Fund is to seek long-term growth of capital.
The investment objective of Optimum Large Cap Value Fund is to seek long-term growth of capital. The Fund may also seek income.
The investment objective of Optimum Small-Mid Cap Growth Fund is to seek long-term growth of capital.
The investment objective of Optimum Small-Mid Cap Value Fund is to seek long-term growth of capital.
1. Significant Accounting Policies
The following accounting policies are in accordance with US generally accepted accounting principles (US GAAP) and are consistently followed by the Funds.
Security Valuation — Equity securities, except those traded on the Nasdaq Stock Market LLC (Nasdaq), are valued at the last quoted sales price as of the time of the regular close of the New York Stock Exchange on the valuation date. Equity securities traded on the Nasdaq are valued in accordance with the Nasdaq Official Closing Price, which may not be the last sales price. If, on a particular day, an equity security does not trade, the mean between the bid and ask prices will be used, which approximates fair value. Equity securities listed on a foreign exchange are normally valued at the last quoted sales price on the valuation date. Open-end investment company securities are valued at net asset value (NAV) per share, as reported by the underlying investment company. US government and agency securities are valued at the mean between the bid and ask prices, which approximates fair value. Other debt securities, credit default swap (CDS) contracts, interest rate swap contracts, CDS and interest rate swap options contracts (swaptions) are valued based upon valuations provided by an independent pricing service or broker/ counterparty and reviewed by management. To the extent current market prices are not available, the pricing service may take into account developments related to the specific security, as well as transactions in comparable securities. Valuations for fixed income securities utilize matrix systems, which reflect such factors as security prices, yields, maturities, and ratings, and are supplemented by dealer and exchange quotations. For asset-backed securities, collateralized mortgage obligations, commercial mortgage securities, and US government agency mortgage securities, pricing vendors utilize matrix pricing which considers prepayment speed, attributes of the collateral, yield or price of bonds of comparable quality, coupon, maturity, and type as well as broker/dealer-supplied prices. Swap prices are derived using daily swap curves and models that incorporate a number of market data factors, such as discounted cash flows, trades, and values of the underlying reference instruments. Foreign currency exchange contracts and foreign cross currency exchange contracts are valued at the mean between the bid and the ask prices, which approximates fair value. Interpolated values are derived when the settlement date of the contract is an interim date for which quotations are not available. Futures contracts and options on futures contracts are valued at the daily quoted settlement prices. Exchange-traded options are valued at the last reported sale price or, if no sales are reported, at the mean between the last reported bid and ask prices, which approximates fair value. Generally, other securities and assets for which market quotations are not readily available are valued at fair value as determined in good faith under the direction of the Trust’s Board of Trustees (Board). In determining whether market quotations are readily available or fair valuation will be used, various factors will be taken into consideration, such as market closures or suspension of trading in a security. Each Fund may use fair value pricing more frequently for securities traded primarily in non-US markets because, among other things, most foreign markets close well before each Fund values its securities, generally as of 4:00pm Eastern time. The earlier close of these foreign markets gives rise to the possibility that significant events, including broad market moves, government actions or pronouncements, aftermarket trading, or news events may have occurred in the interim. Whenever such a significant event occurs, each Fund may value foreign
150
Table of Contents
securities using fair value prices based on third-party vendor modeling tools (international fair value pricing). Restricted securities are valued at fair value using methods approved by the Board.
Federal and Foreign Income Taxes — No provision for federal income taxes has been made as each Fund intends to continue to qualify for federal income tax purposes as a regulated investment company (RIC) under Subchapter M of the Internal Revenue Code of 1986, as amended, and make the requisite distributions to shareholders. The Funds evaluate tax positions taken or expected to be taken in the course of preparing each Fund’s tax returns to determine whether the tax positions are “more-likely-than-not” of being sustained by the applicable tax authority. Tax positions not deemed to meet the “more-likely-than-not” threshold are recorded as a tax benefit or expense in the current year. Management has analyzed each Fund’s tax positions taken or to be taken on each Fund’s federal income tax returns through the year ended March 31, 2018 and for all open federal income tax years (March 31, 2015–March 31, 2017) and has concluded that no provision for federal income tax is required in any Fund’s financial statements. In regard to foreign taxes only, each Fund has open tax years in certain foreign countries in which it invests that may date back to the inception of each Fund. If applicable, the Funds recognize interest accrued in unrecognized tax benefits in interest expense and penalties in other expenses on the “Statements of operations.” During the year ended March 31, 2018, the Funds did not incur any interest or tax penalties.
Class Accounting — Investment income, common expenses, and realized and unrealized gain (loss) on investments are allocated to the various classes of the Funds on the basis of daily net assets of each class. Distribution expenses relating to a specific class are charged directly to that class.
Repurchase Agreements — Each Fund may purchase certain US government securities subject to the counterparty’s agreement to repurchase them at an agreed upon date and price. The counterparty will be required on a daily basis to maintain the value of the collateral subject to the agreement at not less than the repurchase price (including accrued interest). The agreements are conditioned upon the collateral being deposited under the Federal Reserve book-entry system with each Fund’s custodian or a third-party sub-custodian. In the event of default or bankruptcy by the other party to the agreement, retention of the collateral may be subject to legal proceedings. All open repurchase agreements as of the date of this report were entered into on March 29, 2018, and matured on the next business day.
Reverse Repurchase Agreements — Optimum Fixed Income Fund may enter into reverse repurchase agreements. In a reverse repurchase agreement, the Fund sells securities to a bank or broker/dealer and agrees to repurchase the securities at an agreed upon date and price. The Fund will maintain in a segregated account, cash, cash equivalents, or US government securities in an amount sufficient to cover its obligations under reverse repurchase agreements with broker/dealers (but no collateral is required on reverse repurchase agreements with banks). The Fund will subject its investments in reverse repurchase agreements to the borrowing provisions set forth in the 1940 Act. The use of reverse repurchase agreements by the Fund creates leverage, which increases the Fund’s investment risk. If the income and gains on securities purchased with the proceeds of reverse repurchase agreements exceed the costs of the agreements, the Fund’s earnings or NAV will increase faster than otherwise would be the case; conversely, if the income and gains fail to exceed the costs, earnings or NAV would decline faster than otherwise would be the case. For the year ended March 31, 2018, the Fund had average reverse repurchase agreements of $80,547 for which it paid interest at an average rate of 1.19%. At March 31, 2018, there were no open reverse repurchase agreements in the Fund.
To Be Announced Trades (TBA) — Optimum Fixed Income Fund may contract to purchase or sell securities for a fixed price at a transaction date beyond the customary settlement period (examples: when issued, delayed delivery, forward commitment, or TBA transactions) consistent with the Fund’s ability to manage its investment portfolio and meet redemption requests. These transactions involve a commitment by the Fund to purchase or sell securities for a predetermined price or yield with payment and delivery taking place more than three days in the future, or after a period longer than the customary settlement period for that type of security. No interest will be earned by the Fund on such purchases until the securities are delivered or the transaction is completed; however, the market value may change prior to delivery. At March 31, 2018, the Fund received $1,562,000 cash collateral for TBA trades, which is included in “Cash collateral due to brokers” on the “Statements of assets and liabilities.”
Foreign Currency Transactions — Transactions denominated in foreign currencies are recorded at the prevailing exchange rates on the valuation date in accordance with the Funds’ prospectus. The value of all assets and liabilities denominated in foreign currencies is translated daily into US dollars at the exchange rate of such currencies against the US dollar. Transaction gains or losses resulting from changes in exchange rates during the reporting period or upon settlement of the foreign currency transaction are reported in operations for the current period. The Funds generally bifurcate that portion of realized gains and losses on investments in debt securities which is due to changes in foreign exchange rates from that which is due to changes in market prices of debt securities. That portion of gains (losses), which is due to changes in foreign exchange rates is included on the “Statements of operations” under “Net realized gain (loss) on foreign currencies.” For
| (continues) | 151 |
Table of Contents
Notes to financial statements
Optimum Fund Trust
1. Significant Accounting Policies (continued)
foreign equity securities, the realized gains and losses are included on the “Statements of operations” under “Net realized and unrealized gain (loss) on investments.” The Funds report certain foreign currency related transactions as components of realized gains (losses) for financial reporting purposes, whereas such components are treated as ordinary income (loss) for federal income tax purposes.
Use of Estimates — Each Fund is an investment company, whose financial statements are prepared in conformity with US GAAP. Therefore, each Fund follows the accounting and reporting guidelines for investment companies. The preparation of financial statements in conformity with US GAAP requires management to make estimates and assumptions that affect the fair value of investments, the reported amounts of assets and liabilities and disclosure of contingent assets and liabilities at the date of the financial statements, and the reported amounts of revenues and expenses during the reporting period. Actual results could differ from those estimates and the differences could be material.
Other — Expenses directly attributable to a Fund are charged directly to that Fund. Other expenses common to various funds within the Trust are generally allocated among such funds on the basis of average net assets. Management fees and certain other expenses are paid monthly. Security transactions are recorded on the date the securities are purchased or sold (trade date) for financial reporting purposes. Costs used in calculating realized gains and losses on the sale of investment securities are those of the specific securities sold. Dividend income is recorded on the ex-dividend date and interest income is recorded on the accrual basis. Discounts and premiums on debt securities are accreted or amortized to interest income, respectively, over the lives of the respective securities using the effective interest method. Realized gains (losses) on paydowns of asset- and mortgage-backed securities are classified as interest income. Distributions received from investments in real estate investment trusts (REITs) are recorded as dividend income on the ex-dividend date, subject to reclassification upon notice of the character of such distributions by the issuer. Distributions received from investments in master limited partnerships are recorded as return of capital on investments on the ex-dividend date. Foreign dividends are also recorded on the ex-dividend date or as soon after the ex-dividend date that the Funds are aware of such dividends, net of all tax withholdings, a portion of which may be reclaimable. Withholding taxes and reclaims on foreign dividends and interest have been recorded in accordance with the Funds’ understanding of the applicable country’s tax rules and rates. Each Fund may pay foreign capital gains taxes on certain foreign securities held, which are reported as components of realized losses for financial reporting purposes, whereas such components are treated as ordinary loss for federal income tax purposes. Each Fund declares and pays distributions from net investment income and net realized gain on investments, if any, at least annually. The Funds may distribute more frequently, if necessary for tax purposes. Dividends and distributions, if any, are recorded on the ex-dividend date.
Each Fund receives earnings credits from its custodian when positive cash balances are maintained, which may be used to offset custody fees. The expense paid under this agreement is included on the “Statements of operations” under “Custodian fees” with the corresponding offset included under “Less expenses paid indirectly.” For the year ended March 31, 2018, each Fund earned the following amounts under this agreement:
| Optimum Fixed Income Fund |
Optimum International Fund |
Optimum Large Cap Growth Fund |
Optimum Large Cap Value Fund |
Optimum Small-Mid Cap Growth Fund |
Optimum Small-Mid Cap Value Fund | |||||
| $15,688 | $626 | $711 | $1,683 | $588 | $314 |
Each Fund receives earnings credits from its transfer agent when positive cash balances are maintained, which may be used to offset transfer agent fees. If the amount earned is greater than $1, the expense paid under this arrangement is included on the “Statements of operations” under “Dividend disbursing and transfer agent fees and expenses” with the corresponding expense offset included under “Less expenses paid indirectly.” For the year ended March 31, 2018, each Fund earned the following amounts under this agreement:
| Optimum Fixed Income Fund |
Optimum International Fund |
Optimum Large Cap Growth Fund |
Optimum Large Cap Value Fund |
Optimum Small-Mid Cap Growth Fund |
Optimum Small-Mid Cap Value Fund | |||||
| $864 | $813 | $936 | $932 | $914 | $920 |
2. Investment Management, Administration Agreements, and Other Transactions with Affiliates
Delaware Management Company (DMC), a series of Macquarie Investment Management Business Trust, furnishes investment management services to each Fund and has full discretion and responsibility, subject to the overall supervision of the Board, to select and contract with one or more investment sub-advisors to manage the investment operations and composition of each Fund, and to render investment advice for each Fund, including the purchase, retention, and dispositions of investments, securities, and cash contained in each Fund. The investment
152
Table of Contents
management agreement obligates DMC to implement decisions with respect to the allocation or reallocation of each Fund’s assets among one or more current or additional sub-advisors, and to monitor the sub-advisors’ compliance with the relevant Fund’s investment objective, policies and restrictions. DMC pays the sub-advisors out of its fees, which are calculated daily and paid monthly.
In accordance with the terms of its respective investment management agreement, DMC is entitled to receive an annual fee equal to the following percentage rates of the average daily net assets of each Fund, which is calculated daily and paid monthly:
| Optimum Fixed Income Fund | 0.6000% of net assets up to $500 million | |
| 0.5500% of net assets from $500 million to $1 billion | ||
| 0.5000% of net assets from $1 billion to $1.5 billion | ||
| 0.4500% of net assets from $1.5 billion to $2 billion | ||
| 0.4250% of net assets from $2 billion to $2.5 billion | ||
| 0.4000% of net assets from $2.5 billion to $5 billion | ||
| 0.3750% of net assets over $5 billion | ||
| Optimum International Fund | 0.7500% of net assets up to $500 million | |
| 0.7150% of net assets from $500 million to $1 billion | ||
| 0.7000% of net assets from $1 billion to $1.5 billion | ||
| 0.6750% of net assets from $1.5 billion to $2 billion | ||
| 0.6500% of net assets from $2 billion to $2.5 billion | ||
| 0.6000% of net assets over $2.5 billion | ||
| Optimum Large Cap Growth Fund | 0.7500% of net assets up to $500 million | |
| 0.7000% of net assets from $500 million to $1 billion | ||
| 0.6500% of net assets from $1 billion to $1.5 billion | ||
| 0.6250% of net assets from $1.5 billion to $2 billion | ||
| 0.6000% of net assets from $2 billion to $2.5 billion | ||
| 0.5750% of net assets from $2.5 billion to $5 billion | ||
| 0.5500% of net assets over $5 billion | ||
| Optimum Large Cap Value Fund | 0.7000% of net assets up to $500 million | |
| 0.6500% of net assets from $500 million to $1 billion | ||
| 0.6000% of net assets from $1 billion to $1.5 billion | ||
| 0.5750% of net assets from $1.5 billion to $2 billion | ||
| 0.5500% of net assets from $2 billion to $2.5 billion | ||
| 0.5250% of net assets from 2.5 billion to $5 billion | ||
| 0.5000% of net assets over $5 billion | ||
| Optimum Small-Mid Cap Growth Fund | 1.1000% of net assets up to $250 million | |
| 1.0000% of net assets from $250 million to $500 million | ||
| 0.9000% of net assets from $500 million to $750 million | ||
| 0.8000% of net assets from $750 million to $1 billion | ||
| 0.7500% of net assets from $1 billion to $1.5 billion | ||
| 0.7000% of net assets over $1.5 billion | ||
| Optimum Small-Mid Cap Value Fund | 1.0000% of net assets up to $250 million | |
| 0.9000% of net assets from $250 million to $500 million | ||
| 0.8000% of net assets from $500 million to $750 million | ||
| 0.7500% of net assets from $750 million to $1 billion | ||
| 0.7000% of net assets from $1 billion to $1.5 billion | ||
| 0.6500% of net assets over $1.5 billion | ||
| (continues) | 153 |
Table of Contents
Notes to financial statements
Optimum Fund Trust
2. Investment Management, Administration Agreements, and Other Transactions with Affiliates (continued)
DMC has entered into sub-advisory agreements for the Trust as follows: Optimum Fixed Income Fund – Pacific Investment Management Company, LLC (PIMCO); Optimum International Fund – Acadian Asset Management LLC (Acadian), and EARNEST Partners, LLC (EARNEST); Optimum Large Cap Growth Fund –T. Rowe Price Associates, Inc. (T. Rowe Price), and effective Oct. 12, 2017, ClearBridge Investment LLC, (ClearBridge); Optimum Large Cap Value Fund – Massachusetts Financial Services Company (MFS) and Rothschild Asset Management Inc. (Rothschild); Optimum Small-Mid Cap Growth Fund – Columbus Circle Investors (CCI) and Peregrine Capital Management LLC (Peregrine); Optimum Small-Mid Cap Value Fund – LSV Asset Management (LSV) and Westwood Management Corp. (Westwood). Prior to Oct. 12, 2017, Fred Alger Management Inc. was also a sub-advisor for Optimum Large Cap Growth Fund.
For the year ended March 31, 2018, DMC paid the following sub-advisory fees:
| Optimum Fixed Income Fund |
Optimum International Fund |
Optimum Large Cap Growth Fund |
Optimum Large Cap Value Fund |
Optimum Small-Mid Cap Growth Fund |
Optimum Small-Mid Cap Value Fund | |||||
| $2,362,534 | $2,482,317 | $5,630,270 | $4,362,779 | $2,329,793 | $2,281,661 |
DMC has contractually agreed to waive that portion, if any, of its management fee and/or pay/reimburse each Fund to the extent necessary to ensure that total annual fund operating expenses (excluding any distribution and service (12b-1) fees, acquired fund fees and expenses, taxes, interest, short sale and dividend interest expenses, brokerage fees, certain insurance costs, and nonroutine expenses or costs, including, but not limited to, those relating to reorganizations, litigation, conducting shareholder meetings, and liquidations (collectively, nonroutine expenses)) do not exceed the following percentages of each Fund’s average daily net assets. For purposes of these waivers and reimbursements, nonroutine expenses may also include such additional costs and expenses as may be agreed upon from time to time by the Board and DMC. These waivers and reimbursements may be terminated only by agreement of DMC and the Funds.
| Optimum Fixed Income Fund |
Optimum International Fund |
Optimum Large Cap Growth Fund |
Optimum Large Cap Value Fund |
Optimum Small-Mid Cap Growth Fund |
Optimum Small-Mid Cap Value Fund | |||||||
| Operating expense limitation as a percentage of average daily net assets (per annum) for the period July 29, 2017 – July 30, 2018 |
0.86% | 1.13% | 1.02% | 0.98% | 1.29% | 1.22% | ||||||
| Operating expense limitation as a percentage of average daily net assets (per annum) for the period July 29, 2016 – July 29, 2017 |
0.92% | 1.25% | 1.10% | 1.08% | 1.33% | 1.25% |
Delaware Investments Fund Services Company (DIFSC), an affiliate of DMC, provides fund accounting and financial administration oversight services to the Trust. Those services include overseeing the Funds’ pricing process, the calculation and payment of fund expenses, and financial reporting in shareholder reports, registration statements and other regulatory filings. DIFSC also manages the process for the payment of dividends and distributions and the dissemination of Funds’ NAVs and performance data. For these services, the Funds pay DIFSC an asset-based fee, plus certain out-of-pocket expenses and transactional charges. Effective July 1, 2017, DIFSC fees are calculated daily and paid monthly based on the aggregate daily net assets of the Trust at the following annual rate: 0.0075% of the first $3.5 billion; 0.0070% of the next $2 billion; 0.0060% of the next $2 billion; and 0.0050% of aggregate average daily net assets in excess of $7.5 billion. The fees payable
154
Table of Contents
to DIFSC under the service agreement described above are allocated among all funds in the Trust on a relative NAV basis. Prior to July 1, 2017, DIFSC fees were calculated daily and paid monthly based on the aggregate daily net assets of the Trust at the following annual rate: 0.0075% of the first $3 billion; 0.0070% of the next $2 billion; 0.0065% of the next $2.5 billion; 0.0055% of the next $2.5 billion; and 0.0050% of aggregate average daily net assets in excess of $10 billion. These amounts are included on the “Statements of operations” under “Accounting fees.” For the year ended March 31, 2018, each Fund was charged for these services as follows:
| Optimum Fixed Income Fund |
Optimum International Fund |
Optimum Large Cap Growth Fund |
Optimum Large Cap Value Fund |
Optimum Small-Mid Cap Growth Fund |
Optimum Small-Mid Cap Value Fund | |||||
| $136,152 | $45,915 | $115,413 | $100,171 | $35,454 | $32,849 |
DIFSC provides the Trust with administrative services including: preparation, filing and maintaining governing documents; preparation of materials and reports for the Board; and preparation and filing of registration statements and other regulatory filings. For these administrative services, the Trust pays DIFSC the following fee as a percentage of the Trust’s average daily net assets (plus out-of-pocket expenses): 0.0525% of assets up to $7.5 billion; 0.0475% of assets from $7.5 billion to $10 billion; 0.0425% of assets from $10 billion to $12 billion; 0.0375% of assets from $12 billion to $14 billion; and 0.0325% of assets over $14 billion.
DIFSC is also the shareholder servicing, dividend disbursing, and transfer agent for each Fund. For these services, the Trust pays DIFSC a fee at an annual rate of 0.18% of the Trust’s total average daily net assets, subject to a minimum fee of $2,000 per class per fund each month, plus out-of-pocket expenses. The fee is calculated daily and paid monthly. Pursuant to a sub-transfer agency agreement between DIFSC and BNY Mellon Investment Servicing (US) Inc. (BNYMIS), BNYMIS provides certain sub-transfer agency services to the Funds. Sub-transfer agency fees are paid by the Funds and are also included on the “Statements of operations” under “Dividend disbursing and transfer agent fees and expenses.”
DDLP, an affiliate of DMC, serves as the national distributor of each Fund’s shares pursuant to a Distribution Agreement. Pursuant to the Distribution Agreement and Rule 12b-1 plan, each Fund pays DDLP an annual 12b-1 fee of 0.25% of the average daily net assets of the Class A shares and 1.00% of the average daily net assets of the Class C shares. The fees are calculated daily and paid monthly. Institutional Class shares pay no 12b-1 fees.
For the year ended March 31, 2018, DDLP earned commissions on sales of Class A shares for each Fund as follows:
| Optimum Fixed Income Fund |
Optimum International Fund |
Optimum Large Cap Growth Fund |
Optimum Large Cap Value Fund |
Optimum Small-Mid Cap Growth Fund |
Optimum Small-Mid Cap Value Fund | |||||
| $34,918 | $2,284 | $6,771 | $7,040 | $1,541 | $1,102 |
For the year ended March 31, 2018, DDLP received gross CDSC commissions on redemptions of each Fund’s Class C shares, and these commissions were entirely used to offset upfront commissions previously paid by DDLP to broker/dealers on sales of those shares. The amounts received were as follows:
| Optimum Fixed Income Fund |
Optimum International Fund |
Optimum Large Cap Growth Fund |
Optimum Large Cap Value Fund |
Optimum Small-Mid Cap Growth Fund |
Optimum Small-Mid Cap Value Fund | |||||
| $6,303 | $1,617 | $3,609 | $4,230 | $682 | $543 |
| (continues) | 155 |
Table of Contents
Notes to financial statements
Optimum Fund Trust
2. Investment Management, Administration Agreements, and Other Transactions with Affiliates (continued)
DMC, DIFSC and DDLP are indirect, wholly owned subsidiaries of Macquarie Management Holdings, Inc. Certain officers of DMC, DIFSC and DDLP are officers and/or Trustees of the Trust. These officers and Trustees are paid no compensation by the Funds.
Cross trades for the year ended March 31, 2018, were executed by the Funds pursuant to procedures adopted by the Board designed to ensure compliance with Rule 17a-7 under the 1940 Act. Cross trading is the buying or selling of portfolio securities between funds of investment companies, or between a fund of an investment company and another entity, that are or could be considered affiliates by virtue of having a common investment advisor (or affiliated investment advisors), common directors/trustees and/or common officers. At its regularly scheduled meetings, the Board reviews such transactions for compliance with the procedures adopted by the Board. Optimum Large Cap Growth Fund, Optimum Large Cap Value Fund, and Optimum Small Cap Value Fund did not engage in securities cross trades for the year ended March 31, 2018. Pursuant to these procedures, for the year ended March 31, 2018, the following Funds engaged in securities purchases and sales, which resulted in net realized gains (losses) as follows:
| Optimum Fixed Income Fund |
Optimum International Fund |
Optimum Large Cap Growth Fund |
Optimum Small-Mid Cap Growth Fund |
|||||||||||||
| Purchases |
$3,209,659 | $ | — | $5,474,926 | $ | — | ||||||||||
| Sales |
3,189,163 | 1,963,032 | 1,720,850 | 3,791,652 | ||||||||||||
| Net realized gain (loss) |
427 | (103) | 524,495 | (239) | ||||||||||||
3. Investments
For the year ended March 31, 2018, each Fund made purchases and sales of investments securities other than short-term investments as follows:
| Optimum Fixed Income Fund |
Optimum International Fund |
Optimum Large Cap Growth Fund |
Optimum Large Cap Value Fund |
Optimum Small-Mid Cap Growth Fund |
Optimum Small-Mid Cap Value Fund |
|||||||||||||||||||
| Purchases other than US government securities |
$ 989,745,151 | $322,512,767 | $1,252,862,346 | $377,352,069 | $415,471,409 | $143,988,531 | ||||||||||||||||||
| Purchases of US government securities |
7,589,382,270 | — | — | — | — | — | ||||||||||||||||||
| Sales other than US government securities |
1,026,593,675 | 336,383,618 | 1,307,483,223 | 344,849,416 | 442,639,792 | 133,280,501 | ||||||||||||||||||
| Sales of US government securities |
7,400,883,731 | — | — | — | — | — | ||||||||||||||||||
156
Table of Contents
The tax cost of investments includes adjustments to net unrealized appreciation (depreciation) which may not necessarily be final tax cost basis adjustments, but approximate the tax basis unrealized gains and losses that may be realized and distributed to shareholders. At March 31, 2018, the cost and unrealized appreciation (depreciation) of investments and derivatives for federal income tax purposes for each Fund were as follows:
| Optimum Fixed Income Fund |
Optimum International Fund |
Optimum Large Cap Growth Fund |
Optimum Large Cap Value Fund |
Optimum Small-Mid Cap Growth Fund |
Optimum Small-Mid Cap Value Fund |
|||||||||||||||||||
| Cost of investments and derivatives |
$ | 2,410,988,408 | $ | 583,068,288 | $ | 1,389,059,001 | $ | 1,222,951,237 | $ | 414,064,732 | $ | 382,304,751 | ||||||||||||
|
|
|
|
|
|
|
|
|
|
|
|
|
|||||||||||||
| Aggregate unrealized appreciation of investments and derivatives |
$ | 33,687,187 | $ | 123,949,578 | $ | 405,585,548 | $ | 290,718,271 | $ | 116,603,486 | $ | 86,995,930 | ||||||||||||
| Aggregate unrealized depreciation of investments and derivatives |
(43,246,246 | ) | (28,947,476 | ) | (53,276,118 | ) | (35,933,634 | ) | (12,958,726 | ) | (15,424,750 | ) | ||||||||||||
|
|
|
|
|
|
|
|
|
|
|
|
|
|||||||||||||
| Net unrealized appreciation (depreciation) of investments and derivatives |
$ | (9,559,059 | ) | $ | 95,002,102 | $ | 352,309,430 | $ | 254,784,637 | $ | 103,644,760 | $ | 71,571,180 | |||||||||||
|
|
|
|
|
|
|
|
|
|
|
|
|
|||||||||||||
US GAAP defines fair value as the price that each Fund would receive to sell an asset or pay to transfer a liability in an orderly transaction between market participants at the measurement date under current market conditions. A three-level hierarchy for fair value measurements has been established based upon the transparency of inputs to the valuation of an asset or liability. Inputs may be observable or unobservable and refer broadly to the assumptions that market participants would use in pricing the asset or liability. Observable inputs reflect the assumptions market participants would use in pricing the asset or liability based on market data obtained from sources independent of the reporting entity. Unobservable inputs reflect the reporting entity’s own assumptions about the assumptions that market participants would use in pricing the asset or liability based on the best information available under the circumstances. Each Fund’s investment in its entirety is assigned a level based upon the observability of the inputs which are significant to the overall valuation. The three-level hierarchy of inputs is summarized below.
| Level 1 – | Inputs are quoted prices in active markets for identical investments. (Examples: equity securities, open-end investment companies, futures contracts, exchange-traded options contracts) | |
| Level 2 – | Other observable inputs, including, but not limited to: quoted prices for similar assets or liabilities in markets that are active, quoted prices for identical or similar assets or liabilities in markets that are not active, inputs other than quoted prices that are observable for the assets or liabilities (such as interest rates, yield curves, volatilities, prepayment speeds, loss severities, credit risks, and default rates) or other market-corroborated inputs. (Examples: debt securities, government securities, swap contracts, foreign currency exchange contracts, foreign securities utilizing international fair value pricing, broker-quoted securities, fair valued securities) | |
| Level 3 – | Significant unobservable inputs, including each Fund’s own assumptions used to determine the fair value of investments. (Examples: broker-quoted securities, fair valued securities) | |
Level 3 investments are valued using significant unobservable inputs. Each Fund may also use an income-based valuation approach in which the anticipated future cash flows of the investment are discounted to calculate fair value. Discounts may also be applied due to the nature or duration of any restrictions on the disposition of the investments. Valuations may also be based upon current market prices of securities that are comparable in coupon, rating, maturity, and industry. The derived value of a Level 3 investment may not represent the value which is received upon disposition and this could impact the results of operations.
| (continues) | 157 |
Table of Contents
Notes to financial statements
Optimum Fund Trust
3. Investments (continued)
The following tables summarize the valuation of each Fund’s investments by fair value hierarchy levels as of March 31, 2018:
|
Optimum Fixed Income Fund |
||||||||||||||||
|
Level 1 |
Level 2 |
Level 3 |
Total |
|||||||||||||
| Securities |
||||||||||||||||
| Assets: |
||||||||||||||||
| Agency, Asset- & Mortgage-Backed Securities1 |
$ | — | $ | 807,224,725 | $ | — | $ | 807,224,725 | ||||||||
| Corporate Debt |
— | 764,292,757 | — | 764,292,757 | ||||||||||||
| Foreign Debt |
— | 258,595,131 | — | 258,595,131 | ||||||||||||
| Municipal Bonds |
— | 16,521,731 | — | 16,521,731 | ||||||||||||
| Loan Agreements1 |
— | 112,612,531 | 2,718,644 | 115,331,175 | ||||||||||||
| Common Stock |
— | — | — | — | ||||||||||||
| Convertible Preferred Stock1 |
4,765,186 | 2,789,111 | — | 7,554,297 | ||||||||||||
| Preferred Stock |
— | 5,006,897 | — | 5,006,897 | ||||||||||||
| US Treasury Obligations |
— | 302,141,369 | — | 302,141,369 | ||||||||||||
| Short-Term Investments |
— | 110,685,245 | — | 110,685,245 | ||||||||||||
| Options Purchased |
— | 135,057 | — | 135,057 | ||||||||||||
|
|
|
|
|
|
|
|
|
|||||||||
| Total Value of Securities Before Options Written |
$ | 4,765,186 | $ | 2,380,004,554 | $ | 2,718,644 | $ | 2,387,488,384 | ||||||||
|
|
|
|
|
|
|
|
|
|||||||||
| Liabilities: |
||||||||||||||||
| Options Written |
$ | — | $ | (194,021 | ) | $ | — | $ | (194,021 | ) | ||||||
| Derivatives2 |
||||||||||||||||
| Assets: |
||||||||||||||||
| Foreign Currency Exchange Contracts |
$ | — | $ | 1,160,541 | $ | — | $ | 1,160,541 | ||||||||
| Futures Contracts |
10,019,132 | — | — | 10,019,132 | ||||||||||||
| Swap Contracts |
— | 6,718,880 | — | 6,718,880 | ||||||||||||
| Liabilities: |
||||||||||||||||
| Foreign Currency Exchange Contracts |
— | (1,099,471 | ) | — | (1,099,471 | ) | ||||||||||
| Futures Contracts |
(1,165,361 | ) | — | — | (1,165,361 | ) | ||||||||||
| Swap Contracts |
— | (1,498,735 | ) | — | (1,498,735 | ) | ||||||||||
1Security type is valued across multiple levels. Level 1 investments represent exchange-traded investments, Level 2 investments represent investments with observable inputs or matrix-priced investments, and Level 3 investments represent investments without observable inputs. The amounts attributed to Level 1 investments, Level 2 investments, and Level 3 investments represent the following percentages of the total market value of these security types:
| Level 1 |
Level 2 |
Level 3 |
Total |
|||||||||||||
|
Loan Agreements |
— | 98.23 | % | 1.77 | % | 100.00 | % | |||||||||
| Convertible Preferred Stock |
63.08 | % | 36.92 | % | — | 100.00 | % | |||||||||
2Foreign currency exchange contracts, futures contracts, and swap contracts are valued at the unrealized appreciation (depreciation) on the instrument at the year end.
158
Table of Contents
|
Optimum International Fund |
||||||||||||||||
|
Level 1 |
Level 2 |
Level 3 |
Total |
|||||||||||||
| Securities |
||||||||||||||||
| Assets: |
||||||||||||||||
| Common Stock |
||||||||||||||||
| Australia |
$ | 2,865,957 | $ | 7,009,870 | $ | — | $ | 9,875,827 | ||||||||
| Austria |
— | 18,954,632 | — | 18,954,632 | ||||||||||||
| Bermuda |
6,145,446 | — | — | 6,145,446 | ||||||||||||
| Brazil |
8,961,247 | — | — | 8,961,247 | ||||||||||||
| Canada |
25,610,457 | — | — | 25,610,457 | ||||||||||||
| China/Hong Kong |
— | 52,953,161 | — | 52,953,161 | ||||||||||||
| Colombia |
4,199,479 | — | — | 4,199,479 | ||||||||||||
| Czech Republic |
— | 2,717,246 | — | 2,717,246 | ||||||||||||
| Denmark |
— | 8,264,446 | — | 8,264,446 | ||||||||||||
| Finland |
— | 4,268,460 | — | 4,268,460 | ||||||||||||
| France |
1,204,583 | 37,083,094 | — | 38,287,677 | ||||||||||||
| Germany |
— | 33,769,663 | — | 33,769,663 | ||||||||||||
| India |
5,492,806 | 12,483,076 | — | 17,975,882 | ||||||||||||
| Indonesia |
— | 9,419,384 | — | 9,419,384 | ||||||||||||
| Ireland |
12,942,828 | — | — | 12,942,828 | ||||||||||||
| Israel |
4,469,063 | 15,567,872 | — | 20,036,935 | ||||||||||||
| Italy |
— | 8,700,947 | — | 8,700,947 | ||||||||||||
| Japan |
128,664,351 | — | — | 128,664,351 | ||||||||||||
| Macau |
— | 1,174,340 | — | 1,174,340 | ||||||||||||
| Mexico |
4,487,989 | — | — | 4,487,989 | ||||||||||||
| Netherlands |
6,638,637 | 28,275,608 | — | 34,914,245 | ||||||||||||
| New Zealand |
— | 8,317,925 | — | 8,317,925 | ||||||||||||
| Norway |
6,026,351 | 11,962,854 | — | 17,989,205 | ||||||||||||
| Republic of Korea |
19,724,397 | — | — | 19,724,397 | ||||||||||||
| Singapore |
2,610,113 | 7,555,392 | — | 10,165,505 | ||||||||||||
| South Africa |
— | 1,045,557 | — | 1,045,557 | ||||||||||||
| Spain |
8,099,404 | 8,569,045 | — | 16,668,449 | ||||||||||||
| Sweden |
— | 1,807,608 | — | 1,807,608 | ||||||||||||
| Switzerland |
11,764,502 | 21,141,585 | — | 32,906,087 | ||||||||||||
| Taiwan |
17,317,733 | — | — | 17,317,733 | ||||||||||||
| Thailand |
18,219,180 | — | — | 18,219,180 | ||||||||||||
| Turkey |
2,936,187 | — | — | 2,936,187 | ||||||||||||
| United Kingdom |
6,811,921 | 32,525,823 | — | 39,337,744 | ||||||||||||
| United States |
6,777,824 | — | 234,434 | 7,012,258 | ||||||||||||
| Short-Term Investments |
— | 10,192,591 | — | 10,192,591 | ||||||||||||
| Securities Lending Collateral |
— | 22,105,164 | — | 22,105,164 | ||||||||||||
|
|
|
|
|
|
|
|
|
|||||||||
| Total Value of Securities |
$ | 311,970,455 | $ | 365,865,343 | $ | 234,434 | $ | 678,070,232 | ||||||||
|
|
|
|
|
|
|
|
|
|||||||||
| Derivatives:1 |
||||||||||||||||
| Assets: |
||||||||||||||||
| Foreign Currency Exchange Contracts |
$ | — | $ | 7,994 | $ | — | $ | 7,994 | ||||||||
| Liabilities: |
||||||||||||||||
| Foreign Currency Exchange Contracts |
— | (7,836 | ) | — | (7,836 | ) | ||||||||||
1Foreign Currency exchange contracts are valued at the unrealized appreciation (depreciation) on the instrument at the year end.
| (continues) | 159 |
Table of Contents
Notes to financial statements
Optimum Fund Trust
3. Investments (continued)
|
Optimum Large Cap Growth Fund |
||||||||||||||||
| Level 1 |
Level 2 |
Level 3 |
Total |
|||||||||||||
| Securities |
||||||||||||||||
| Assets: |
||||||||||||||||
| Common Stock |
||||||||||||||||
| Consumer Discretionary |
$ | 314,116,076 | $ | — | $ | 1,781,151 | $ | 315,897,227 | ||||||||
| Consumer Staples |
76,369,724 | — | — | 76,369,724 | ||||||||||||
| Energy |
28,888,323 | — | — | 28,888,323 | ||||||||||||
| Financials |
109,427,492 | — | 38,374 | 109,465,866 | ||||||||||||
| Healthcare |
262,671,293 | — | — | 262,671,293 | ||||||||||||
| Industrials |
154,537,375 | — | — | 154,537,375 | ||||||||||||
| Information Technology |
672,160,927 | 12,934,562 | — | 685,095,489 | ||||||||||||
| Materials |
32,246,012 | — | — | 32,246,012 | ||||||||||||
| Real Estate |
32,121,097 | — | — | 32,121,097 | ||||||||||||
| Utilities |
17,672,522 | — | — | 17,672,522 | ||||||||||||
| Convertible Preferred Stock |
— | — | 9,038,809 | 9,038,809 | ||||||||||||
| Corporate Debt |
— | 1,827,680 | — | 1,827,680 | ||||||||||||
| Short-Term Investments |
— | 15,537,014 | — | 15,537,014 | ||||||||||||
|
|
|
|
|
|
|
|
|
|||||||||
| Total Value of Securities |
$ | 1,700,210,841 | $ | 30,299,256 | $ | 10,858,334 | $ | 1,741,368,431 | ||||||||
|
|
|
|
|
|
|
|
|
|||||||||
|
Optimum Large Cap Value Fund |
||||||||||||
| Level 1 |
Level 2 |
Total |
||||||||||
| Securities |
||||||||||||
| Assets: |
||||||||||||
| Common Stock |
||||||||||||
| Consumer Discretionary |
$ | 86,013,292 | $ | — | $ | 86,013,292 | ||||||
| Consumer Staples |
93,257,361 | 26,896,483 | 120,153,844 | |||||||||
| Energy |
115,952,845 | — | 115,952,845 | |||||||||
| Financials |
414,562,878 | — | 414,562,878 | |||||||||
| Healthcare |
214,515,858 | 2,982,442 | 217,498,300 | |||||||||
| Industrials |
192,488,013 | — | 192,488,013 | |||||||||
| Information Technology |
130,326,600 | — | 130,326,600 | |||||||||
| Materials |
55,955,060 | — | 55,955,060 | |||||||||
| Real Estate |
24,276,029 | — | 24,276,029 | |||||||||
| Telecommunication Services |
39,332,359 | — | 39,332,359 | |||||||||
| Utilities |
57,024,275 | — | 57,024,275 | |||||||||
| Short-Term Investments |
— | 24,152,379 | 24,152,379 | |||||||||
|
|
|
|
|
|
|
|||||||
| Total Value of Securities |
$ | 1,423,704,570 | $ | 54,031,304 | $ | 1,477,735,874 | ||||||
|
|
|
|
|
|
|
|||||||
160
Table of Contents
|
Optimum Small-Mid Cap Growth Fund |
||||||||
| Level 1 |
Level 2 |
Level 3 |
Total |
|||||||||||||||||||||||||
| Securities |
||||||||||||||||||||||||||||
| Assets: |
||||||||||||||||||||||||||||
| Common Stock |
$ | 501,652,335 | $ | — | $ | — | $ | 501,652,335 | ||||||||||||||||||||
| Convertible Preferred Stock1 |
1,973,485 | — | 3,762,308 | 5,735,793 | ||||||||||||||||||||||||
| Short-Term Investments |
— | 10,321,364 | — | 10,321,364 | ||||||||||||||||||||||||
|
|
|
|
|
|
|
|
|
|||||||||||||||||||||
| Total Value of Securities |
$ | 503,625,820 | $ | 10,321,364 | $ | 3,762,308 | $ | 517,709,492 | ||||||||||||||||||||
|
|
|
|
|
|
|
|
|
|||||||||||||||||||||
1Security type is valued across multiple levels. Level 1 investments represent exchange-traded investments, Level 2 investments represent investments with observable inputs or matrix-priced investments, and Level 3 investments represent investments without observable inputs. The amounts attributed to Level 1 investments, Level 2 investments, and Level 3 investments represent the following percentages of the total market value of this security type:
| Level 1 |
Level 3 |
Total |
||||||||||
| Convertible Preferred Stock |
34.41 | % | 65.59 | % | 100 | % | ||||||
| Optimum Small-Mid Cap Value Fund | ||||||
| Level 1 |
Level 2 |
Total |
||||||||||||||||||
| Securities |
||||||||||||||||||||
| Assets: |
||||||||||||||||||||
| Common Stock |
$ | 447,365,809 | $ | — | $ | 447,365,809 | ||||||||||||||
| Short-Term Investments |
— | 6,510,122 | 6,510,122 | |||||||||||||||||
|
|
|
|
|
|
|
|||||||||||||||
| Total Value of Securities |
$ | 447,365,809 | $ | 6,510,122 | $ | 453,875,931 | ||||||||||||||
|
|
|
|
|
|
|
|||||||||||||||
Securities valued at zero on the “Schedules of investments” are considered to be Level 3 investments in these tables.
As a result of utilizing international fair value pricing at March 31, 2018, the majority of Optimum International Fund’s common stock investments and a portion of Optimum Large Cap Growth Fund’s and Optimum Large Cap Value Fund’s common stock investments were categorized as Level 2.
During the year ended March 31, 2018, there were no transfers between Level 1 investments, Level 2 investments, or Level 3 investments that had a significant impact to the Funds. This does not include transfers between Level 1 investments and Level 2 investments due to the Funds utilizing international fair value pricing during the year. In accordance with the fair valuation procedures described in Note 1, international fair value pricing of securities in each Fund occurs when market volatility exceeds an established rolling threshold. If the threshold is exceeded on a given date, then prices of international securities (those that traded on exchanges that close at a different time than the time that the Funds’ NAV is determined) are established using a separate pricing feed from a third-party vendor designed to establish a price for each such security as of the time that the Funds’ NAV is determined. Further, international fair value pricing uses other observable market-based inputs in place of the closing exchange price due to the events occurring after the close of the exchange or market on which the investment is principally traded, causing a change in classification between levels. Each Fund’s policy is to recognize transfers between levels based on fair value at the beginning of the reporting period.
A reconciliation of Level 3 investments is presented when each Fund has a significant amount of Level 3 investments at the beginning, interim, or end of the period in relation to each Fund’s net assets. With the exception of Optimum Small-Mid Cap Growth Fund, management has determined not to provide a reconciliation of Level 3 investments as they are not considered significant to each Fund’s net assets at the beginning, interim, or end of the year. Management has determined not to provide additional disclosure on Level 3 inputs since the Level 3 investments are not considered significant to each Fund’s net assets at the end of the year. There were no Level 3 investments during the year ended March 31, 2018 for Optimum Large Cap Value Fund and Optimum Small-Mid Cap Value Fund.
| (continues) | 161 |
Table of Contents
Notes to financial statements
Optimum Fund Trust
3. Investments (continued)
The following is a reconciliation of investments in which significant unobservable inputs (Level 3) were used in determining fair value for Optimum Small-Mid Cap Growth Fund:
| Convertible Preferred Stock |
||||
| Beginning balance March 31, 2017 |
$ | 4,584,960 | ||
| Sales |
(1,065,862 | ) | ||
| Net realized gain |
501,100 | |||
| Transfers into Level 3 |
693,770 | |||
| Transfers out of Level 3 |
(1,134,120 | ) | ||
| Net change in unrealized appreciation (depreciation) |
182,460 | |||
|
|
|
|||
| Ending balance March 31, 2018 |
$ | 3,762,308 | ||
|
|
|
|||
| Net change in unrealized appreciation from investments still held at the end of the year |
$ | 78,542 | ||
4. Dividend and Distribution Information
Income and long-term capital gain distributions are determined in accordance with federal income tax regulations, which may differ from US GAAP. Additionally, distributions from net gains on foreign currency transactions and net short-term gains on sales of investment securities are treated as ordinary income for federal income tax purposes. The tax character of dividends and distributions paid during the years ended March 31, 2018 and 2017 were as follows:
Year ended March 31, 2018
| Optimum | Optimum | Optimum | Optimum | Optimum | Optimum | |||||||||||||||||||
| Fixed Income | International | Large Cap | Large Cap | Small-Mid Cap | Small-Mid Cap | |||||||||||||||||||
| Fund | Fund | Growth Fund | Value Fund | Growth Fund | Value Fund | |||||||||||||||||||
| Ordinary income |
$ | 47,132,743 | $ | 6,176,988 | $ | 33,279,056 | $ | 16,652,898 | $ | — | $ | 3,056,675 | ||||||||||||
| Long-term capital gains |
— | 6,783,636 | 232,627,130 | 63,216,601 | 20,484,133 | 20,363,748 | ||||||||||||||||||
|
|
|
|
|
|
|
|
|
|
|
|
|
|||||||||||||
| Total |
$ | 47,132,743 | $ | 12,960,624 | $ | 265,906,186 | $ | 79,869,499 | $ | 20,484,133 | $ | 23,420,423 | ||||||||||||
|
|
|
|
|
|
|
|
|
|
|
|
|
|||||||||||||
| Year ended March 31, 2017 |
|
|||||||||||||||||||||||
| Optimum | Optimum | Optimum | Optimum | Optimum | Optimum | |||||||||||||||||||
| Fixed Income | International | Large Cap | Large Cap | Small-Mid Cap | Small-Mid Cap | |||||||||||||||||||
| Fund | Fund | Growth Fund | Value Fund | Growth Fund | Value Fund | |||||||||||||||||||
| Ordinary income |
$ | 40,065,220 | $ | 6,045,533 | $ | — | $ | 16,750,245 | $— | $ | 2,301,127 | |||||||||||||
| Long-term capital gains |
— | — | 51,348,776 | 143,143,014 | — | — | ||||||||||||||||||
|
|
|
|
|
|
|
|
|
|
|
|||||||||||||||
| Total |
$ | 40,065,220 | $ | 6,045,533 | $ | 51,348,776 | $ | 159,893,259 | $— | $ | 2,301,127 | |||||||||||||
|
|
|
|
|
|
|
|
|
|
|
|||||||||||||||
162
Table of Contents
5. Components of Net Assets on a Tax Basis
As of March 31, 2018, the components of net assets on a tax basis were as follows:
| Optimum Fixed Income Fund |
Optimum International Fund |
Optimum Large Cap Growth Fund |
||||||||||
| Shares of beneficial interest | $ | 2,050,728,322 | $ | 551,003,834 | $ | 1,323,809,728 | ||||||
| Undistributed ordinary income | 11,954,974 | 5,407,268 | 14,628,115 | |||||||||
| Undistributed long-term capital gains | — | 15,270,565 | 49,508,149 | |||||||||
| Capital loss carryforwards | (34,416,533 | ) | — | — | ||||||||
| Troubled debt litigation* | (970,052 | ) | — | — | ||||||||
| Unrealized appreciation (depreciation) of investments, foreign currencies, and derivatives | (9,559,059 | ) | 95,002,102 | 352,309,430 | ||||||||
|
|
|
|
|
|
|
|||||||
| Net assets | $ | 2,017,737,652 | $ | 666,683,769 | $ | 1,740,255,422 | ||||||
|
|
|
|
|
|
|
|||||||
| Optimum Large Cap Value Fund |
Optimum Small-Mid Cap Growth Fund |
Optimum Small-Mid Cap Value Fund |
||||||||||
| Share of beneficial interest | $ | 1,200,494,188 | $ | 367,200,531 | $ | 372,155,215 | ||||||
| Undistributed ordinary income | 5,837,926 | 9,638,591 | 1,380,524 | |||||||||
| Undistributed long-term capital gains | 20,445,753 | 35,749,540 | 13,586,805 | |||||||||
| Unrealized appreciation of investments and foreign currencies | 254,784,637 | 103,644,760 | 71,571,180 | |||||||||
|
|
|
|
|
|
|
|||||||
| Net assets | $ | 1,481,562,504 | $ | 516,233,422 | $ | 458,693,724 | ||||||
|
|
|
|
|
|
|
|||||||
*See Note 12.
The differences between book basis and tax basis components of net assets are primarily attributable to tax deferral of losses on wash sales, tax deferral of losses on straddles, mark-to-market of foreign currency exchange contracts, mark-to-market of futures contracts, tax recognition of unrealized gain on passive foreign investment companies, tax treatment of swap contracts, contingent payment debt instruments, amortization of premium on convertible securities, trust preferred securities, troubled debt, partnership interest and deemed dividend income.
For financial reporting purposes, capital accounts are adjusted to reflect the tax character of permanent book/tax differences. Reclassifications are primarily due to tax treatment of net operating losses, redesignation of dividends and distributions, gain (loss) on foreign currency transactions, tax treatment of partnerships, amortization of premium on convertible securities, treasury inflation protected securities, swap contracts, foreign capital gain tax, deemed dividend income, contingent payment on debt instruments, sale of passive foreign investment companies, and paydown gains (losses) of asset- and mortgage-backed securities. Results of operations and net assets were not affected by these reclassifications. For the year ended March 31, 2018, the Funds recorded the following reclassifications:
| Optimum Fixed Income Fund |
Optimum International Fund |
Optimum Large Cap Growth Fund |
Optimum Large Cap Value Fund |
Optimum Small-Mid Cap Growth Fund |
Optimum Small-Mid Cap Value Fund | |||||||||||||||||||||||||
| Undistributed (accumulated) net investment income (loss) |
$ | (3,925,531 | ) | $ | (174,860 | ) | $ | 2,134,237 | $ | 3,207 | $ | 5,240,173 | $ | 23,149 | ||||||||||||||||
| Accumulated net realized gain (loss) |
3,925,531 | 174,860 | (2,134,134 | ) | (3,207 | ) | (5,240,173 | ) | (23,149 | ) | ||||||||||||||||||||
| Paid-in capital |
— | — | (103 | ) | — | — | |
— |
||||||||||||||||||||||
For federal income tax purposes, capital loss carryforwards may be carried forward and applied against future capital gains. At March 31, 2018, Optimum International Fund utilized $18,878,375 of capital loss carryforwards.
| (continues) | 163 |
Table of Contents
Notes to financial statements
Optimum Fund Trust
5. Components of Net Assets on a Tax Basis (continued)
Under the Regulated Investment Company Modernization Act of 2010 (Act), net capital losses recognized for tax years beginning after Dec. 22, 2010 may be carried forward indefinitely, and their character is retained as short-term and/or long-term losses. At March 31, 2018, there were no capital loss carryforwards for Optimum International Fund, Optimum Large Cap Growth Fund, Optimum Large Cap Value Fund, Optimum Small-Mid Cap Growth Fund, and Optimum Small-Mid Cap Value Fund. Capital loss carryforwards available to offset future realized capital gains for Optimum Fixed Income Fund at March 31, 2018 were as follows:
| No expiration Post-enactment capital loss character |
|
|||||||||||
| Short-term | Long-term | Total | ||||||||||
| Optimum Fixed Income |
||||||||||||
| Fund |
$13,150,054 | $21,266,479 | $34,416,533 | |||||||||
6. Capital Shares
Transactions in capital shares were as follows:
| Optimum Fixed Income Fund |
Optimum International Fund |
Optimum Large Cap Growth Fund |
||||||||||||||||||||||
| Year ended | Year ended | Year ended | ||||||||||||||||||||||
| 3/31/18 | 3/31/17 | 3/31/18 | 3/31/17 | 3/31/18 | 3/31/17 | |||||||||||||||||||
| Shares sold: |
||||||||||||||||||||||||
| Class A |
282,639 | 277,152 | 32,258 | 55,487 | 72,689 | 102,264 | ||||||||||||||||||
| Class C |
617,287 | 762,019 | 59,224 | 164,385 | 115,858 | 359,119 | ||||||||||||||||||
| Institutional Class |
43,178,438 | 39,990,811 | 8,390,457 | 7,475,950 | 13,467,891 | 13,872,596 | ||||||||||||||||||
| Shares issued upon reinvestment of dividends and distributions: |
||||||||||||||||||||||||
| Class A |
73,931 | 73,073 | 11,816 | 6,992 | 327,335 | 78,519 | ||||||||||||||||||
| Class C |
174,638 | 164,873 | 26,637 | 5,854 | 1,374,702 | 319,613 | ||||||||||||||||||
| Institutional Class |
4,744,885 | 4,107,100 | 873,668 | 513,028 | 13,415,414 | 2,831,952 | ||||||||||||||||||
|
|
|
|
|
|
|
|
|
|
|
|
|
|||||||||||||
| 49,071,818 | 45,375,028 | 9,394,060 | 8,221,696 | 28,773,889 | 17,564,063 | |||||||||||||||||||
|
|
|
|
|
|
|
|
|
|
|
|
|
|||||||||||||
| Shares redeemed: |
||||||||||||||||||||||||
| Class A |
(734,034 | ) | (966,352 | ) | (147,929 | ) | (188,046 | ) | (440,681 | ) | (524,169 | ) | ||||||||||||
| Class C |
(2,744,699 | ) | (4,076,187 | ) | (557,855 | ) | (675,780 | ) | (1,905,871 | ) | (2,200,265 | ) | ||||||||||||
| Institutional Class |
(30,237,929 | ) | (62,330,129 | ) | (8,424,316 | ) | (14,653,443 | ) | (15,378,250 | ) | (27,022,876 | ) | ||||||||||||
|
|
|
|
|
|
|
|
|
|
|
|
|
|||||||||||||
| (33,716,662 | ) | (67,372,668 | ) | (9,130,100 | ) | (15,517,269 | ) | (17,724,802 | ) | (29,747,310 | ) | |||||||||||||
|
|
|
|
|
|
|
|
|
|
|
|
|
|||||||||||||
| Net increase (decrease) |
15,355,156 | (21,997,640 | ) | 263,960 | (7,295,573 | ) | 11,049,087 | (12,183,247 | ) | |||||||||||||||
|
|
|
|
|
|
|
|
|
|
|
|
|
|||||||||||||
164
Table of Contents
| Optimum Large Cap Value Fund |
Optimum Small-Mid Cap Growth Fund |
Optimum Small-Mid Cap Value Fund |
||||||||||||||||||||||
| Year ended | Year ended | Year ended | ||||||||||||||||||||||
| 3/31/18 | 3/31/17 | 3/31/18 | 3/31/17 | 3/31/18 | 3/31/17 | |||||||||||||||||||
| Shares sold: |
||||||||||||||||||||||||
| Class A |
84,253 | 103,359 | 19,248 | 35,937 | 16,085 | 30,413 | ||||||||||||||||||
| Class C |
133,200 | 333,639 | 28,529 | 97,187 | 29,509 | 57,348 | ||||||||||||||||||
| Institutional Class |
15,925,346 | 20,845,005 | 5,180,608 | 6,203,398 | 5,713,301 | 5,847,685 | ||||||||||||||||||
| Shares issued upon reinvestment of dividends and distributions: |
||||||||||||||||||||||||
| Class A |
91,386 | 233,309 | 16,151 | — | 15,411 | 1,195 | ||||||||||||||||||
| Class C |
261,551 | 726,016 | 66,430 | — | 57,132 | — | ||||||||||||||||||
| Institutional Class |
4,536,599 | 9,693,331 | 1,240,971 | — | 1,524,163 | 159,920 | ||||||||||||||||||
|
|
|
|
|
|
|
|
|
|
|
|
|
|||||||||||||
| 21,032,335 | 31,934,659 | 6,551,937 | 6,336,522 | 7,355,601 | 6,096,561 | |||||||||||||||||||
|
|
|
|
|
|
|
|
|
|
|
|
|
|||||||||||||
| Shares redeemed: |
||||||||||||||||||||||||
| Class A |
(374,848 | ) | (489,275 | ) | (84,133 | ) | (98,337 | ) | (60,100 | ) | (93,744 | ) | ||||||||||||
| Class C |
(1,393,295 | ) | (1,716,380 | ) | (337,176 | ) | (425,001 | ) | (253,384 | ) | (362,310 | ) | ||||||||||||
| Institutional Class |
(13,097,979 | ) | (26,278,928 | ) | (6,285,264 | ) | (14,415,539 | ) | (4,580,915 | ) | (14,304,324 | ) | ||||||||||||
|
|
|
|
|
|
|
|
|
|
|
|
|
|||||||||||||
| (14,866,122 | ) | (28,484,583 | ) | (6,706,573 | ) | (14,938,877 | ) | (4,894,399 | ) | (14,760,378 | ) | |||||||||||||
|
|
|
|
|
|
|
|
|
|
|
|
|
|||||||||||||
| Net increase (decrease) |
6,166,213 | 3,450,076 | (154,636 | ) | (8,602,355 | ) | 2,461,202 | (8,663,817 | ) | |||||||||||||||
|
|
|
|
|
|
|
|
|
|
|
|
|
|||||||||||||
Certain shareholders may exchange shares of one class for another class in the same Fund. There were no exchange transactions for the year ended March 31, 2017. For the year ended March 31, 2018, each Fund had the following exchange transactions. These exchange transactions are included as subscriptions and redemptions in the tables above and on the previous page and the “Statements of changes in net assets.”
| Year ended 3/31/18 | |||||||||||||||
| Exchange Redemptions Class A Shares |
Exchange Subscriptions Institutional Class Shares |
Value | |||||||||||||
| Optimum Fixed Income Fund |
12,118 | 12,116 | $ | 115,129 | |||||||||||
| Optimum International Fund |
2,210 | 2,193 | 29,216 | ||||||||||||
| Optimum Large Cap Growth Fund |
6,256 | 5,915 | 111,692 | ||||||||||||
| Optimum Large Cap Value Fund |
6,186 | 6,170 | 96,292 | ||||||||||||
| Optimum Small-Mid Cap Growth Fund |
1,258 | 1,179 | 17,354 | ||||||||||||
| Optimum Small-Mid Cap Value Fund |
845 | 800 | 11,661 | ||||||||||||
7. Derivatives
US GAAP requires disclosures that enable investors to understand: (1) how and why an entity uses derivatives; (2) how they are accounted for; and (3) how they affect an entity’s results of operations and financial position.
Foreign Currency Exchange Contracts — Each Fund may enter into foreign currency exchange contracts and foreign cross currency exchange contracts as a way of managing foreign exchange rate risk. Each Fund may enter into these contracts to fix the US dollar value of a security that it has agreed to buy or sell for the period between the date the trade was entered into and the date the security is delivered and paid for. Each Fund may also enter into these contracts to hedge the US dollar value of securities it already owns that are denominated in foreign currencies. In addition, each Fund may enter into these contracts to facilitate or expedite the settlement of portfolio transactions. The change in value is recorded as an unrealized gain or loss. When the contract is closed, a realized gain or loss is recorded equal to the difference between the value of the contract at the time it was opened and the value at the time it was closed.
The use of foreign currency exchange contracts and foreign cross currency exchange contracts does not eliminate fluctuations in the underlying prices of the securities, but does establish a rate of exchange that can be achieved in the future. Although foreign currency exchange contracts
| (continues) | 165 |
Table of Contents
Notes to financial statements
Optimum Fund Trust
7. Derivatives (continued)
and foreign cross currency exchange contracts limit the risk of loss due to an unfavorable change in the value of the hedged currency, they also limit any potential gain that might result should the value of the currency change favorably. In addition, each Fund could be exposed to risks if the counterparties to the contracts are unable to meet the terms of their contracts. Each Fund’s maximum risk of loss from counterparty credit risk is the value of its currency exchanged with the counterparty. The risk is generally mitigated by having a netting arrangement between the Funds and the counterparty and by the posting of collateral by the counterparty to the Funds to cover the Funds’ exposure to the counterparty. During the year ended March 31, 2018, Optimum Small-Mid Cap Growth Fund and Optimum Small-Mid Cap Value Fund did not use foreign currency exchange contracts.
During the year ended March 31, 2018, Optimum Fixed Income Fund used foreign currency exchange contracts to hedge the US dollar value of securities it already owns that are denominated in foreign currencies.
During the year ended March 31, 2018, Optimum International Fund, Optimum Large Cap Growth Fund, and Optimum Large Cap Value Fund each used foreign currency exchange contracts to facilitate or expedite the settlement of portfolio transactions. Optimum International Fund also used foreign currency exchange contracts to fix the US dollar value of a security between trade date and settlement date.
Futures Contracts — A futures contract is an agreement in which the writer (or seller) of the contract agrees to deliver to the buyer an amount of cash or securities equal to a specific dollar amount times the difference between the value of a specific security or index at the close of the last trading day of the contract and the price at which the agreement is made. Optimum Fixed Income Fund may use futures in the normal course of pursuing its investment objective. Optimum Fixed Income Fund may invest in futures contracts to hedge its existing portfolio securities against fluctuations in fair value caused by changes in interest rates or market conditions. Upon entering into a futures contract, the Fund deposits cash or pledges US government securities to a broker, equal to the minimum “initial margin” requirements of the exchange on which the contract is traded. Subsequent payments are received from the broker or paid to the broker each day, based on the daily fluctuation in the market value of the contract. These receipts or payments are known as “variation margin” and are recorded daily by the Fund as unrealized gains or losses until the contracts are closed. When the contracts are closed, the Fund records a realized gain or loss equal to the difference between the value of the contract at the time it was opened and the value at the time it was closed. Risks of entering into futures contracts include potential imperfect correlation between the futures contracts and the underlying securities and the possibility of an illiquid secondary market for these instruments. When investing in futures, there is reduced counterparty credit risk to the Fund because futures are exchange-traded and the exchange’s clearinghouse, as counterparty to all exchange-traded futures, guarantees against default. The Fund posted $482,934 cash and securities collateral valued at $6,285,780, as margin for open futures contracts. Securities collateral are presented on the “Schedules of investments” and cash collateral is included in “Cash collateral due from brokers” on the “Statements of assets and liabilities.”
During the year ended March 31, 2018, Optimum Fixed Income Fund used futures contracts to hedge the Fund’s existing portfolio securities against fluctuations in value caused by changes in interest rates or market conditions and to facilitate investments in portfolio securities.
Options Contracts — Optimum Fixed Income Fund may enter into options contracts in the normal course of pursuing its investment objective. The Fund may buy or write options contracts for any number of reasons, including without limitation: to manage the Fund’s exposure to changes in securities prices caused by interest rates or market conditions and foreign currencies; as an efficient means of adjusting the Fund’s overall exposure to certain markets; to protect the value of portfolio securities; and as a cash management tool. The Fund may buy or write call or put options on securities, futures, swaps, swaptions, financial indices, and foreign currencies. When the Fund buys an option, a premium is paid and an asset is recorded and adjusted on a daily basis to reflect the current market value of the option purchased. When the Fund writes an option, a premium is received and a liability is recorded and adjusted on a daily basis to reflect the current market value of the option written. Premiums received from writing options that expire unexercised are treated by the Fund on the expiration date as realized gains. The difference between the premium received and the amount paid on effecting a closing purchase transaction, including brokerage commissions, is treated as realized gain or loss. If a call option is exercised, the premium is added to the proceeds from the sale of the underlying security in determining whether the Fund has a realized gain or loss. If a put option is exercised, the premium reduces the cost basis of the securities purchased by the Fund. The Fund, as writer of an option, bears the market risk of an unfavorable change in the price of the security underlying the written option. When writing options, the Fund is subject to minimal counterparty risk because the counterparty is only obligated to pay premiums and does not bear the market risk of an unfavorable market change.
166
Table of Contents
During the year ended March 31, 2018, Optimum Fixed Income Fund used options contracts to manage the Fund’s exposure to changes in securities prices caused by interest rates or market conditions, to adjust the Fund’s overall exposure to certain markets, to receive premiums for writing options, and to manage the Fund’s exposure to changes in foreign currencies.
Swap Contracts — Optimum Fixed Income Fund may enter into currency swap contracts, index swap contracts, inflation swaps, interest rate swap contracts, and CDS contracts in the normal course of pursuing its investment objective. The Fund may invest in interest rate swaps to manage the Fund’s sensitivity to interest rates or to hedge against changes in interest rates. The Fund may use currency swaps to protect against currency fluctuations. The Fund may use inflation swaps to hedge the inflation risk in nominal bonds, thereby creating synthetic inflation-indexed bonds. The Fund may enter into CDS contracts in order to hedge against a credit event, to enhance total return or to gain exposure to certain securities or markets. The Fund will not be permitted to enter into any swap transactions unless, at the time of entering into such transactions, the unsecured long-term debt of the actual counterparty, combined with any credit enhancements, is rated at least BBB- by Standard & Poor’s Financial Services LLC. (S&P) or Baa3 by Moody’s Investors Service Inc. (Moody’s) or is determined to be of equivalent credit quality by DMC.
Interest Rate Swaps. An interest rate swap contract is an exchange of interest rates between counterparties. In one instance, an interest rate swap involves payments received by Optimum Fixed Income Fund from another party based on a variable or floating interest rate, in return for making payments based on a fixed interest rate. An interest rate swap can also work in reverse with the Fund receiving payments based on a fixed interest rate and making payments based on a variable or floating interest rate. Interest rate swaps may be used to adjust the Fund’s sensitivity to interest rates or to hedge against changes in interest rates. Periodic payments on such contracts are accrued daily and recorded as unrealized appreciation (depreciation) on swap contracts. Upon periodic payment (receipt) or termination of the contract, such amounts are recorded as realized gains or losses on swap contracts. The Fund’s maximum risk of loss from counterparty credit risk is the discounted net value of the cash flows to be received from/paid to the counterparty over the interest rate swap contract’s remaining life, to the extent that the amount is positive. This risk is mitigated by (1) for bilateral swap contracts, having a netting arrangement between the Fund and the counterparty and by the posting of collateral by the counterparty to the Fund to cover the Fund’s exposure to the counterparty and (2) for cleared swaps, trading these instruments through a central counterparty.
During the year ended March 31, 2018, Optimum Fixed Income Fund used interest rate swap contracts to manage the Fund’s sensitivity to interest rates or to hedge against changes in interest rates.
Credit Default Swaps. A CDS contract is a risk-transfer instrument through which one party (purchaser of protection) transfers to another party (seller of protection) the financial risk of a credit event (as defined in the CDS agreement), as it relates to a particular reference security or basket of securities (such as an index). In exchange for the protection offered by the seller of protection, the purchaser of protection agrees to pay the seller of protection a periodic amount at a stated rate that is applied to the notional amount of the CDS contract. In addition, an upfront payment may be made or received by the Fund in connection with an unwinding or assignment of a CDS contract. Upon the occurrence of a credit event, the seller of protection would pay the par (or other agreed-upon) value of the reference security (or basket of securities) to the counterparty. Credit events generally include, among others, bankruptcy, failure to pay, and obligation default.
During the year ended March 31, 2018, Optimum Fixed Income Fund entered into CDS contracts as a purchaser and seller of protection, as a hedge against credit events. Periodic payments (receipts) on such contracts are accrued daily and recorded as unrealized losses (gains) on swap contracts. Upon payment (receipt), such amounts are recorded as realized losses (gains) on swap contracts. Upfront payments made or received in connection with CDS contracts are amortized over the expected life of the CDS contracts as unrealized losses (gains) on swap contracts. The change in value of CDS contracts is recorded daily as unrealized appreciation or depreciation. A realized gain or loss is recorded upon a credit event (as defined in the CDS agreement) or the maturity or termination of the agreement. Initial margin and variation margin are posted to central counterparties for centrally cleared CDS basket trades, as determined by the applicable central counterparty.
As disclosed in the footnotes to the “Schedules of investments,” at March 31, 2018, the notional value of the protection sold was EUR800,000 and USD32,155,000, which reflects the maximum potential amount Optimum Fixed Income Fund would have been required to make as a seller of credit protection if a credit event had occurred. In addition to serving as the source of the current value of the securities, the quoted market prices and resulting market values for credit default swap agreements on securities and credit indices serve as an indicator of the current status of the payment/performance risk and represent the likelihood of an expected liability (or profit) for the credit derivative if the swap agreement has been closed/sold as of the period end. Increasing market values, in absolute terms when compared to the notional amount of the swap, represent a deterioration of the reference entity’s credit soundness and a greater likelihood of risk of default or other credit event occurring as defined under the terms of the agreement. At March 31, 2018, there were no recourse provisions with third parties to recover any amounts paid
| (continues) | 167 |
Table of Contents
Notes to financial statements
Optimum Fund Trust
7. Derivatives (continued)
under the credit derivative agreement (including any purchased credit protection) nor was any collateral held by the Fund and other third parties which the Fund can obtain in the event of the occurrence of a credit event. At March 31, 2018, net unrealized appreciation of the protection sold was $1,019,227.
CDS contracts may involve greater risks than if Optimum Fixed Income Fund had invested in the reference obligation directly. CDS contracts are subject to general market risk, liquidity risk, counterparty risk, and credit risk. The Fund’s maximum risk of loss from counterparty credit risk, either as the seller of protection or the buyer of protection, is the fair value of the contract. This risk is mitigated by (1) for bilateral swap contracts, having a netting arrangement between the Fund and the counterparty and by the posting of collateral by the counterparty to the Fund to cover the Fund’s exposure to the counterparty and (2) for cleared swaps, trading these instruments through a central counterparty.
During the year ended March 31, 2018, Optimum Fixed Income Fund used CDS contracts to hedge against credit events, and to gain exposure to certain securities or markets.
Swaps Generally. For centrally cleared swaps, payments are received from the broker or paid to the broker each day, based on the daily fluctuation in the market value of the contract. These receipts or payments are known as “variation margin” and are recorded by Optimum Fixed Income Fund as unrealized gains or losses until the contracts are closed. When the contracts are closed, Optimum Fixed Income Fund records a realized gain or loss equal to the difference between the value of the contract at the time it was opened and the value at the time it was closed. The value of open swaps may differ from that which would be realized in the event Optimum Fixed Income Fund terminated its position in the contract on a given day. Risks of entering into these contracts include the potential inability of the counterparty to meet the terms of the contracts. This type of risk is generally limited to the amount of favorable movement in the value of the underlying security, instrument or basket of instruments, if any, at the day of default. Risks also arise from potential losses from adverse market movements and such losses could exceed the unrealized amounts shown on the “Schedules of investments.”
At March 31, 2018, for bilateral derivative contracts, Optimum Fixed Income Fund posted $990,000 in cash collateral for certain open derivatives, which is included in “Cash collateral due from brokers” on the “Statements of assets and liabilities.” Optimum Fixed Income Fund posted $3,141,195 cash collateral for certain centrally cleared derivatives. The Fund also posted $4,043,196 in securities collateral comprised of US treasury obligations for certain open centrally cleared derivative contracts. Cash collateral is included in “Cash collateral due from brokers” on the “Statements of assets and liabilities” and securities collateral is presented on the “Schedules of investments.” At March 31, 2018, for bilateral derivative contracts, the Fund received $550,000 in cash collateral, which is included in as “Cash collateral due to brokers” on the “Statements of assets and liabilities.”
Fair values of derivative instruments for Optimum Fixed Income Fund as of March 31, 2018 were as follows:
| Asset Derivatives | |||||||||||||||||||||||||
| Fair Value | |||||||||||||||||||||||||
|
|
|
||||||||||||||||||||||||
| Statements of Assets and Liabilities Location |
Currency Contracts |
Equity Contracts |
Interest rate Contracts |
Credit Contracts |
Total | ||||||||||||||||||||
| Unrealized appreciation of foreign currency exchange contracts | $ | 1,160,541 | $ | — | $ | — | $ | — | $ | 1,160,541 | |||||||||||||||
| Variation margin due from broker on futures contracts* | 5,552,248 | 144,115 | 4,322,769 | — | 10,019,132 | ||||||||||||||||||||
| Variation margin due to brokers on centrally cleared credit default swap contracts** | — | — | — | 37,416 | 37,416 | ||||||||||||||||||||
| Variation margin due to brokers on centrally cleared interest rate swap contracts** | — | — | 5,512,913 | — | 5,512,913 | ||||||||||||||||||||
| Unrealized appreciation of credit default swap contracts | — | — | — | 1,168,551 | 1,168,551 | ||||||||||||||||||||
|
|
|
|
|
|
|
|
|
|
|
||||||||||||||||
| Total | $ | 6,712,789 | $ | 144,115 | $ | 9,835,682 | $ | 1,205,967 | $ | 17,898,553 | |||||||||||||||
|
|
|
|
|
|
|
|
|
|
|
||||||||||||||||
168
Table of Contents
| Liability Derivatives Fair Value | |||||||||||||||||||||||
| Statements of Assets and Liabilities Location |
Currency Contracts |
Interest Contracts |
Credit Contracts |
Total |
| ||||||||||||||||||
| Unrealized depreciation of foreign currency exchange contracts | $ | (1,099,471 | ) | $ | — | $ | — | $ | (1,099,471 | ) | |||||||||||||
| Variation margin due from broker on futures contracts* | (17,442 | ) | (1,147,919 | ) | — | (1,165,361 | ) | ||||||||||||||||
| Options written, at value | (3,440 | ) | (185,646 | ) | (4,935 | ) | (194,021 | ) | |||||||||||||||
| Variation margin due to brokers on centrally cleared credit default swap contracts** | — | — | (22,787 | ) | (22,787 | ) | |||||||||||||||||
| Variation margin due to brokers on centrally cleared interest rate swap contracts** | — | (1,308,549 | ) | — | (1,308,549 | ) | |||||||||||||||||
| Unrealized depreciation of credit default swap contracts | — | — | (167,399 | ) | (167,399 | ) | |||||||||||||||||
|
|
|
|
|
|
|
|
|
||||||||||||||||
| Total |
$ | (1,120,353 | ) | $ | (2,642,114 | ) | $ | (195,121 | ) | $ | (3,957,588 | ) | |||||||||||
|
|
|
|
|
|
|
|
|
||||||||||||||||
*Includes cumulative appreciation (depreciation) of futures contracts from the date the contracts were opened through March 31, 2018. Only current day variation margin is reported on Optimum Fixed Income Fund’s “Statements of assets and liabilities.”
**Includes cumulative appreciation (depreciation) of centrally cleared swap contracts from the date the contracts were opened through March 31, 2018. Only current day variation margin is reported on Optimum Fixed Income Fund’s “Statements of assets and liabilities.”
The effect of derivative instruments on Optimum Fixed Income Fund’s “Statements of operations” for the year ended March 31, 2018 was as follows:
| Net Realized Gain (Loss) on: | ||||||||||||||||||||||||||||||
| Foreign | ||||||||||||||||||||||||||||||
| Currency | ||||||||||||||||||||||||||||||
| Exchange | Futures | Options | Options | Swap | ||||||||||||||||||||||||||
| Contracts | Contracts | Purchased | Written | Contracts | Total | |||||||||||||||||||||||||
| Currency contracts |
$ | (7,163,367 | ) | $ | (263,007 | ) | $ | (232,186 | ) | $ | — | $ | — | $ | (7,658,560 | ) | ||||||||||||||
| Equity contracts |
— | (941,173 | ) | — | — | — | (941,173 | ) | ||||||||||||||||||||||
| Interest rate contracts |
— | (9,725,178 | ) | 33,972 | 410,764 | 237,025 | (9,043,417 | ) | ||||||||||||||||||||||
| Credit contracts |
— | — | — | — | (285,962 | ) | (285,962 | ) | ||||||||||||||||||||||
|
|
|
|
|
|
|
|
|
|
|
|
|
|||||||||||||||||||
| Total |
$ | (7,163,367 | ) | $ | (10,929,358 | ) | $ | (198,214 | ) | $ | 410,764 | $ | (48,937 | ) | $ | (17,929,112 | ) | |||||||||||||
|
|
|
|
|
|
|
|
|
|
|
|
|
|||||||||||||||||||
| Net Change in Unrealized Appreciation (Depreciation) of: | ||||||||||||||||||||||||||||||
| Foreign | ||||||||||||||||||||||||||||||
| Currency | ||||||||||||||||||||||||||||||
| Exchange | Futures | Options | Options | Swap | ||||||||||||||||||||||||||
| Contracts | Contracts | Purchased | Written | Contracts | Total | |||||||||||||||||||||||||
| Currency contracts |
$ | (204,609 | ) | $ | 3,946,332 | $ | 13,722 | $ | 1,268 | $ | — | $ | 3,756,713 | |||||||||||||||||
| Equity contracts |
— | 144,115 | — | — | — | 144,115 | ||||||||||||||||||||||||
| Interest rate contracts |
— | 2,233,996 | (345,664 | ) | 260,558 | 2,162,587 | 4,311,477 | |||||||||||||||||||||||
| Credit contracts |
— | — | — | 282 | 431,408 | 431,690 | ||||||||||||||||||||||||
|
|
|
|
|
|
|
|
|
|
|
|
|
|||||||||||||||||||
| Total |
$ | (204,609 | ) | $ | 6,324,443 | $ | (331,942 | ) | $ | 262,108 | $ | 2,593,995 | $ | 8,643,995 | ||||||||||||||||
|
|
|
|
|
|
|
|
|
|
|
|
|
|||||||||||||||||||
During the year ended March 31, 2018, Optimum International Fund, Optimum Large Cap Growth Fund, and Optimum Large Cap Value Fund experienced net realized and unrealized gains or losses attributable to foreign currency holdings, which are disclosed on the “Statements of assets and liabilities” and/or “Statements of operations.”
| (continues) | 169 |
Table of Contents
Notes to financial statements
Optimum Fund Trust
7. Derivatives (continued)
Derivatives Generally. The tables below summarize the average balance of derivative holdings by the Funds during the year ended March 31, 2018:
| Long Derivative Volume | ||||||||||||||||||
| Optimum | Optimum | Optimum | Optimum | |||||||||||||||
| Fixed Income | International | Large Cap | Large Cap | |||||||||||||||
| Fund | Fund | Growth Fund | Value Fund | |||||||||||||||
| Foreign currency exchange contracts (average cost) |
USD | 47,541,910 | USD | 526,999 | USD | 44,950 | USD 19,618 | |||||||||||
| Futures contracts |
561,742,132 | — | — | — | ||||||||||||||
| Options contracts |
360,639 | — | — | — | ||||||||||||||
| CDS contracts |
USD | 12,803,648 | — | — | — | |||||||||||||
| Interest rate swap contracts |
CAD | 7,110,800 | — | — | — | |||||||||||||
| MXN | 77,150,000 | — | — | — | ||||||||||||||
| USD | 107,951,600 | — | — | — | ||||||||||||||
| Short Derivative Volume | ||||||||||||||||||
| Optimum | Optimum | Optimum | Optimum | |||||||||||||||
| Fixed Income | International | Large Cap | Large Cap | |||||||||||||||
| Fund | Fund | Growth Fund | Value Fund | |||||||||||||||
| Foreign currency exchange contracts (average cost) |
USD | 114,807,275 | USD | 479,857 | USD | 60,604 | USD — | |||||||||||
| Futures contracts |
800,782,184 | — | — | — | ||||||||||||||
| Options contracts |
373,481 | — | — | — | ||||||||||||||
| CDS contracts |
EUR | 1,877,200 | — | — | — | |||||||||||||
| USD | 38,830,780 | — | — | — | ||||||||||||||
| Interest rate swap contracts |
GBP | 10,786,800 | — | — | — | |||||||||||||
| JPY | 1,059,880,000 | — | — | — | ||||||||||||||
| USD | 268,849,400 | — | — | — | ||||||||||||||
* Long represents buying protection and short represents selling protection.
** Long represents receiving fixed interest payments and short represents paying fixed interest payments.
8. Offsetting
Each Fund entered into an International Swaps and Derivatives Association, Inc. Master Agreement (ISDA Master Agreement) or a similar agreement with certain of its derivative contract counterparties in order to better define its contractual rights and to secure rights that will help each Fund mitigate its counterparty risk. An ISDA Master Agreement is a bilateral agreement between each Fund and a counterparty that governs certain over-the-counter (OTC) derivatives and foreign exchange contracts and typically contains, among other things, collateral posting items and netting provisions in the event of a default and/or termination event. Under an ISDA Master Agreement, each Fund may, under certain circumstances, offset with the counterparty certain derivative financial instruments’ payables and/or receivables with collateral held and/or posted and create one single net payment. The provisions of the ISDA Master Agreement typically permit a single net payment in the event of default (close-out), including the bankruptcy or insolvency of the counterparty. However, bankruptcy, or insolvency laws of a particular jurisdiction may impose restrictions on or prohibitions against the right of offset in bankruptcy, insolvency, or other events.
170
Table of Contents
For financial reporting purposes, each Fund does not offset derivative assets and derivative liabilities that are subject to netting arrangements on the “Statements of assets and liabilities.”
At March 31, 2018, the Funds had the following assets and liabilities subject to offsetting provisions:
Offsetting of Financial Assets and Liabilities and Derivative Assets and Liabilities
| Optimum Fixed Income Fund | |||||||||||||||
| Gross Value of | Gross Value of | ||||||||||||||
| Counterparty |
Derivative Asset |
Derivative Liability |
Net Position | ||||||||||||
| Bank of America Merrill Lynch |
$ | 532,675 | $ | (551,743 | ) | $ | (19,068 | ) | |||||||
| BNP Paribas |
130,476 | (234,762 | ) | (104,286 | ) | ||||||||||
| BNY Mellon |
— | (14 | ) | (14 | ) | ||||||||||
| Citigroup Global Markets |
441,236 | (152,752 | ) | 288,484 | |||||||||||
| Deutsche Bank |
1,004,569 | (80,993 | ) | 923,576 | |||||||||||
| Goldman Sachs |
128,031 | (8,609 | ) | 119,422 | |||||||||||
| Hong Kong Shanghai Bank |
5,806 | (969 | ) | 4,837 | |||||||||||
| JPMorgan Chase Bank |
88,273 | (70,724 | ) | 17,549 | |||||||||||
| Morgan Stanley Capital |
787,390 | (993,722 | ) | (206,332 | ) | ||||||||||
| Toronto Dominion Bank |
— | (8,906 | ) | (8,906 | ) | ||||||||||
|
|
|
|
|
|
|
||||||||||
| Total |
$ | 3,118,456 | $ | (2,103,194 | ) | $ | 1,015,262 | ||||||||
|
|
|
|
|
|
|
||||||||||
| Counterparty |
Net Position | Fair Value of Non-Cash Collateral Received |
Cash Collateral Received(a) |
Fair Value of Non-Cash Collateral Pledged |
Cash Collateral Pledged |
Net Exposure(b) | ||||||||||||||||||||||||
| Bank of America Merrill Lynch |
$ | (19,068 | ) | $ | — | $ | — | $ | — | $ | — | $ | (19,068 | ) | ||||||||||||||||
| BNP Paribas |
(104,286 | ) | — | — | — | 104,286 | — | |||||||||||||||||||||||
| BNY Mellon |
(14 | ) | — | — | — | — | (14 | ) | ||||||||||||||||||||||
| Citigroup Global Markets |
288,484 | — | — | — | — | 288,484 | ||||||||||||||||||||||||
| Deutsche Bank |
923,576 | — | (90,000 | ) | — | — | 833,576 | |||||||||||||||||||||||
| Goldman Sachs |
119,422 | — | (119,422 | ) | — | — | — | |||||||||||||||||||||||
| Hong Kong Shanghai Bank |
4,837 | — | — | — | — | 4,837 | ||||||||||||||||||||||||
| JPMorgan Chase Bank |
17,549 | — | — | — | — | 17,549 | ||||||||||||||||||||||||
| Morgan Stanley Capital |
(206,332 | ) | — | — | — | 206,332 | — | |||||||||||||||||||||||
| Toronto Dominion Bank |
(8,906 | ) | — | — | — | — | (8,906 | ) | ||||||||||||||||||||||
|
|
|
|
|
|
|
|
|
|
|
|
|
|||||||||||||||||||
| Total |
$ | 1,015,262 | $ | — | $ | (209,422 | ) | $ | — | $ | 310,618 | $ | 1,116,458 | |||||||||||||||||
|
|
|
|
|
|
|
|
|
|
|
|
|
|||||||||||||||||||
| (continues) | 171 |
Table of Contents
Notes to financial statements
Optimum Fund Trust
8. Offsetting (continued)
| Optimum International Fund | |||||||||||||||
| Gross Value of | Gross Value of | ||||||||||||||
| Counterparty |
Derivative Asset |
Derivative Liability |
Net Position | ||||||||||||
| Brown Brothers Harriman |
$ | 7,474 | $ | (3,092 | ) | $ | 4,382 | ||||||||
| BNY Mellon |
— | (4,744 | ) | (4,744 | ) | ||||||||||
| Northern Trust |
202 | — | 202 | ||||||||||||
| State Street Bank |
318 | — | 318 | ||||||||||||
|
|
|
|
|
|
|
||||||||||
| Total |
$ | 7,994 | $ | (7,836 | ) | $ | 158 | ||||||||
|
|
|
|
|
|
|
||||||||||
| Counterparty |
Net Position |
Fair Value of Non-Cash Collateral Received |
Cash Collateral Received |
Fair Value of Non-Cash Collateral Pledged |
Cash Collateral Pledged |
Net Exposure(b) | ||||||||||||||||||||||||
| Brown Brothers Harriman |
$ | 4,382 | $ | — | $ | — | $ | — | $ | — | $ | 4,382 | ||||||||||||||||||
| BNY Mellon |
(4,744 | ) | — | — | — | — | (4,744 | ) | ||||||||||||||||||||||
| Northern Trust |
202 | — | — | — | — | 202 | ||||||||||||||||||||||||
| State Street Bank |
318 | — | — | — | — | 318 | ||||||||||||||||||||||||
|
|
|
|
|
|
|
|
|
|
|
|
|
|||||||||||||||||||
| Total |
$ | 158 | $ | — | $ | — | $ | — | $ | — | $ | 158 | ||||||||||||||||||
|
|
|
|
|
|
|
|
|
|
|
|
|
|||||||||||||||||||
Master Repurchase Agreements
Repurchase agreements are entered into by each Fund under Master Repurchase Agreements (each, an “MRA”). The MRA permits each Fund, under certain circumstances including an event of default (such as bankruptcy or insolvency), to offset payables and/or receivables with collateral held by and/or posted to the counterparty. As a result, one single net payment is created. Bankruptcy or insolvency laws of a particular jurisdiction may impose restrictions on or prohibitions against such a right of offset in the event of the MRA counterparty’s bankruptcy or insolvency. Based on the terms of the MRA, each Fund receives securities as collateral with a market value in excess of the repurchase price at maturity. Upon a bankruptcy or insolvency of the MRA counterparty, each Fund would recognize a liability with respect to such excess collateral. The liability reflects each Fund’s obligation under bankruptcy law to return the excess to the counterparty. As of March 31, 2018, the following table is a summary of each Fund’s repurchase agreements by counterparty which are subject to offset under an MRA:
| Optimum Fixed Income Fund | |||||||||||||||||||||||||
| Counterparty |
Repurchase Agreements |
Fair Value
of Non-Cash Collateral Received(a) |
Cash Collateral Received |
Net Collateral Received |
Net Exposure(b) | ||||||||||||||||||||
| Bank of America Merrill Lynch |
$ | 4,937,085 | $ | (4,937,085 | ) | $ | — | $ | (4,937,085 | ) | $ | — | |||||||||||||
| Bank of Montreal |
14,811,254 | (14,811,254 | ) | — | (14,811,254 | ) | — | ||||||||||||||||||
| BNP Paribas |
14,561,142 | (14,561,142 | ) | — | (14,561,142 | ) | — | ||||||||||||||||||
| Barclays Bank |
20,500,000 | (20,500,000 | ) | — | (20,500,000 | ) | — | ||||||||||||||||||
|
|
|
|
|
|
|
|
|
|
|
||||||||||||||||
| Total |
$ | 54,809,481 | $ | (54,809,481 | ) | $ | — | $ | (54,809,481 | ) | $ | — | |||||||||||||
|
|
|
|
|
|
|
|
|
|
|
||||||||||||||||
| Optimum International Fund | |||||||||||||||||||||||||
| Counterparty |
Repurchase Agreements |
Fair Value of Non-Cash Collateral Received(a) |
Cash Collateral Received |
Net Collateral Received |
Net Exposure(b) | ||||||||||||||||||||
| Bank of America Merrill Lynch |
$ | 1,264,563 | $ | (1,264,563 | ) | $ | — | $(1,264,563) | $ | — | |||||||||||||||
| Bank of Montreal |
3,793,690 | (3,793,690 | ) | — | (3,793,690 | ) | — | ||||||||||||||||||
| BNP Paribas |
3,729,627 | (3,729,627 | ) | — | (3,729,627 | ) | — | ||||||||||||||||||
|
|
|
|
|
|
|
|
|
|
|
||||||||||||||||
| Total |
$ | 8,787,880 | $ | (8,787,880 | ) | $ | — | $(8,787,880) | $ | — | |||||||||||||||
|
|
|
|
|
|
|
|
|
|
|
||||||||||||||||
172
Table of Contents
| Optimum Large Cap Growth Fund | |||||||||||||||||||||||||
| Counterparty |
Repurchase Agreements |
Fair Value of Non-Cash Collateral Received(a) |
Cash Collateral Received |
Net Collateral Received |
Net Exposure(b) | ||||||||||||||||||||
| Bank of America Merrill Lynch |
$ | 2,235,754 | $ | (2,235,754 | ) | $ | — | $ | (2,235,754 | ) | $ | — | |||||||||||||
| Bank of Montreal |
6,707,262 | (6,707,262 | ) | — | (6,707,262 | ) | — | ||||||||||||||||||
| BNP Paribas |
6,593,998 | (6,593,998 | ) | — | (6,593,998 | ) | — | ||||||||||||||||||
|
|
|
|
|
|
|
|
|
|
|
||||||||||||||||
| Total |
$ | 15,537,014 | $ | (15,537,014 | ) | $ | — | $ | (15,537,014 | ) | $ | — | |||||||||||||
|
|
|
|
|
|
|
|
|
|
|
||||||||||||||||
| Optimum Large Cap Value Fund | |||||||||||||||||||||||||
| Counterparty |
Repurchase Agreements |
Fair Value
of Non-Cash Collateral Received(a) |
Cash Collateral Received |
Net Collateral Received |
Net Exposure(b) | ||||||||||||||||||||
| Bank of America Merrill Lynch |
$ | 1,525,317 | $ | (1,525,317 | ) | $ | — | $ | (1,525,317 | ) | $ | — | |||||||||||||
| Bank of Montreal |
4,575,950 | (4,575,950 | ) | — | (4,575,950 | ) | — | ||||||||||||||||||
| BNP Paribas |
4,498,678 | (4,498,678 | ) | — | (4,498,678 | ) | — | ||||||||||||||||||
|
|
|
|
|
|
|
|
|
|
|
||||||||||||||||
| Total |
$ | 10,599,945 | $ | (10,599,945 | ) | $ | — | $ | (10,599,945 | ) | $ | — | |||||||||||||
|
|
|
|
|
|
|
|
|
|
|
||||||||||||||||
| Optimum Small-Mid Cap Growth Fund | |||||||||||||||||||||||||
| Counterparty |
Repurchase Agreements |
Fair Value
of Non-Cash Collateral Received(a) |
Cash Collateral Received |
Net Collateral Received |
Net Exposure(b) | ||||||||||||||||||||
| Bank of America Merrill Lynch |
$ | 575,388 | $ | (575,388 | ) | $ | — | $ | (575,388 | ) | $ | — | |||||||||||||
| Bank of Montreal |
1,726,165 | (1,726,165 | ) | — | (1,726,165 | ) | — | ||||||||||||||||||
| BNP Paribas |
1,697,016 | (1,697,016 | ) | — | (1,697,016 | ) | — | ||||||||||||||||||
|
|
|
|
|
|
|
|
|
|
|
||||||||||||||||
| Total |
$ | 3,998,569 | $ | (3,998,569 | ) | $ | — | $ | (3,998,569 | ) | $ | — | |||||||||||||
|
|
|
|
|
|
|
|
|
|
|
||||||||||||||||
| Optimum Small-Mid Cap Value Fund | |||||||||||||||||||||||||
| Counterparty |
Repurchase Agreements |
Fair Value
of Non-Cash Collateral Received(a) |
Cash Collateral Received |
Net Collateral Received |
Net Exposure(b) | ||||||||||||||||||||
| Bank of America Merrill Lynch |
$ | 646,978 | $ | (646,978 | ) | $ | — | $ | (646,978 | ) | $ | — | |||||||||||||
| Bank of Montreal |
1,940,933 | (1,940,933 | ) | — | (1,940,933 | ) | — | ||||||||||||||||||
| BNP Paribas |
1,908,158 | (1,908,158 | ) | — | (1,908,158 | ) | — | ||||||||||||||||||
|
|
|
|
|
|
|
|
|
|
|
||||||||||||||||
| Total |
$ | 4,496,069 | $ | (4,496,069 | ) | $ | — | $ | (4,496,069 | ) | $ | — | |||||||||||||
|
|
|
|
|
|
|
|
|
|
|
||||||||||||||||
| (continues) | 173 |
Table of Contents
Notes to financial statements
Optimum Fund Trust
8. Offsetting (continued)
Securities Lending
Securities lending transactions are entered into by Optimum International Fund under Master Securities Lending Agreements (each, an MSLA) which provide the right, in the event of default (including bankruptcy or insolvency), for the non-defaulting party to liquidate the collateral and calculate a net exposure to the defaulting party or request additional collateral. In the event that a borrower defaults, the Fund, as lender, would offset the market value of the collateral received against the market value of the securities loaned. When the value of the collateral is greater than that of the market value of the securities loaned, the lender is left with a net amount payable to the defaulting party. However, bankruptcy or insolvency laws of a particular jurisdiction may impose restrictions on or prohibitions against such a right of offset in the event of an MSLA counterparty’s bankruptcy or insolvency. Under the MSLA, the borrower can resell or re-pledge the loaned securities, and the Fund can reinvest cash collateral, or, upon an event of default, resell or re-pledge the collateral (See also Note 9).
As of March 31, 2018, the following table is a summary of Optimum International Fund’s securities lending agreements by counterparty which are subject to offset under an MSLA:
| Fair value of | ||||||||
| Securities Loaned | Cash Collateral | Non-Cash Collateral | ||||||
| Counterparty |
at Value | Received(a) | Received | Net Exposure(b) | ||||
| The Bank of New York Mellon |
$23,055,600 | $(21,759,575) | $(1,296,025) | $— | ||||
(a)The value of the related collateral exceeded the value of the repurchase agreements and securities lending transactions as of March 31, 2018.
(b)Net exposure represents the receivable (payable) that would be due from (to) the counterparty in the event of default.
9. Securities Lending
Each Fund may lend its securities pursuant to a security lending agreement (Lending Agreement) with The Bank of New York Mellon (BNY Mellon). At the time a security is loaned, the borrower must post collateral equal to the required percentage of the market value of the loaned security, including any accrued interest. The required percentage is: (1) 102% with respect to US securities and foreign securities that are denominated and payable in US dollars; and (2) 105% with respect to foreign securities. With respect to each loan, if on any business day the aggregate market value of securities collateral plus cash collateral held is less than the aggregate market value of the securities that are the subject of such loan, the borrower will be notified to provide additional collateral by the end of the following business day, which, together with the collateral already held, will be not less than the applicable initial collateral requirements for such security loan. If the aggregate market value of securities collateral and cash collateral held with respect to a security loan exceeds the applicable initial collateral requirement, upon the request of the borrower, BNY Mellon must return enough collateral to the borrower by the end of the following business day to reduce the value of the remaining collateral to the applicable initial collateral requirement for such security loan. As a result of the foregoing, the value of the collateral held with respect to a loaned security on any particular day may be more or less than the value of the security on loan. The collateral percentage with respect to the market value of the loaned security is determined by the security lending agent.
Cash collateral received by each Fund is generally invested in a series of individual separate accounts, each corresponding to a fund. The investment guidelines permit each separate account to hold certain securities that would be considered eligible securities for a money market fund. Cash collateral received is generally invested in government securities; certain obligations issued by government sponsored enterprises; repurchase agreements collateralized by US Treasury securities; obligations issued by the central government of any Organization for Economic Cooperation and Development (OECD) country or its agencies, instrumentalities, or establishments; obligations of supranational organizations; commercial paper, notes, bonds, and other debt obligations; certificates of deposit, time deposits, and other bank obligations; and asset-backed securities as disclosed on the “Schedules of investments.” Securities purchased with cash collateral are valued at the market value. A Fund can also accept US government securities and letters of credit (non-cash collateral) in connection with securities loans.
In the event of default or bankruptcy by the lending agent, realization and/or retention of the collateral may be subject to legal proceedings. In the event the borrower fails to return loaned securities and the collateral received is insufficient to cover the value of the loaned securities and provided such collateral shortfall is not the result of investment losses, the lending agent has agreed to pay the amount of the shortfall to the Funds or, at the discretion of the lending agent, replace the loaned securities. The Funds continue to record dividends or interest, as applicable,
174
Table of Contents
on the securities loaned and are subject to changes in value of the securities loaned that may occur during the term of the loan. The Funds have the right under the Lending Agreement to recover the securities from the borrower on demand. With respect to security loans collateralized by non-cash collateral, the Funds receive loan premiums paid by the borrower. With respect to security loans collateralized by cash collateral, the earnings from the collateral investments are shared among the Funds, the security lending agent, and the borrower. The Funds record security lending income net of allocations to the security lending agent and the borrower.
Each Fund may incur investment losses as a result of investing securities lending collateral. This could occur if an investment in the collateral investment account defaulted or became impaired. Under those circumstances, the value of a Fund’s cash collateral account may be less than the amount a Fund would be required to return to the borrowers of the securities and that Fund would be required to make up for this shortfall.
During the year ended March 31, 2018, Optimum Fixed Income Fund, Optimum Large Cap Growth Fund, Optimum Large Cap Value Fund, Optimum Small-Mid Cap Growth Fund, and Optimum Small-Mid Cap Value Fund had no securities on loan.
The following table reflects a breakdown of transactions accounted for as secured borrowings, the gross obligation by the type of collateral pledged, and the remaining contractual maturity of those transactions as of March 31, 2018 for Optimum International Fund:
| Overnight | ||||||||||
| and | Under | Between | Over | |||||||
| Securities Lending Transactions |
Continuous | 30 days | 30 & 90 days | 90 days | Total | |||||
| Certificates of Deposit, Repurchase Agreements, and Short-Term Floating Rate Notes |
$22,105,164 | $— | $— | $— | $22,105,164 |
At March 31, 2018, the value of securities on loan for Optimum International Fund was $23,055,600, for which the Fund received cash collateral of $22,076,603 and non-cash collateral with a fair value of $1,296,025. At March 31, 2018, the value of invested collateral was $22,105,164. Investments purchased with cash collateral are presented on the “Schedule of investments” under the caption “Securities Lending Collateral.”
10. Credit and Market Risk
Some countries in which the Funds may invest require governmental approval for the repatriation of investment income, capital, or the proceeds of sales of securities by foreign investors. In addition, if there is deterioration in a country’s balance of payments or for other reasons, a country may impose temporary restrictions on foreign capital remittances abroad.
The securities exchanges of certain foreign markets are substantially smaller, less liquid and more volatile than the major securities markets in the United States. Consequently, acquisition and disposition of securities by the Funds may be inhibited. In addition, a significant portion of the aggregate market value of securities listed on the major securities exchanges in emerging markets is held by a smaller number of investors. This may limit the number of shares available for acquisition or disposition by the Funds.
Optimum Fixed Income Fund invests in high yield fixed income securities, which are securities rated lower than BBB by S&P and lower than Baa3 by Moody’s, or similarly rated by another nationally recognized statistical rating organization. Investments in these higher yielding securities are generally accompanied by a greater degree of credit risk than higher rated securities. Additionally, lower rated securities may be more susceptible to adverse economic and competitive industry conditions than investment grade securities.
Optimum Fixed Income Fund invests in bank loans and other securities that may subject it to direct indebtedness risk, the risk that the Fund will not receive payment of principal, interest and other amounts due in connection with these investments and will depend primarily on the financial condition of the borrower. Loans that are fully secured offer the Fund more protection than unsecured loans in the event of nonpayment of scheduled interest or principal, although there is no assurance that the liquidation of collateral from a secured loan would satisfy the corporate borrower’s obligation, or that the collateral can be liquidated. Some loans or claims may be in default at the time of purchase. Certain of the loans and the other direct indebtedness acquired by the Fund may involve revolving credit facilities or other standby financing commitments that obligate the Fund to pay additional cash on a certain date or on demand. These commitments may require the Fund to increase its investment in a company at a time when the Fund might not otherwise decide to do so (including at a time when the company’s financial condition makes it unlikely that such amounts will be repaid). To the extent that the Fund is committed to advance additional funds, it will at all times hold and maintain cash or other high grade debt obligations in an amount sufficient to meet such commitments. When a loan agreement is purchased, the Fund may pay an assignment fee. On an ongoing basis, the Fund may receive a commitment fee based on the undrawn portion of the underlying line of credit portion of a loan agreement. Prepayment penalty fees are
| (continues) | 175 |
Table of Contents
Notes to financial statements
Optimum Fund Trust
10. Credit and Market Risk (continued)
received upon the prepayment of a loan agreement by the borrower. Prepayment penalty, facility, commitment, consent, and amendment fees are recorded to income as earned or paid. As the Fund may be required to rely upon another lending institution to collect and pass on to the Fund amounts payable with respect to the loan and to enforce the Fund’s rights under the loan and other direct indebtedness, an insolvency, bankruptcy, or reorganization of the lending institution may delay or prevent the Fund from receiving such amounts. The highly leveraged nature of many loans may make them especially vulnerable to adverse changes in economic or market conditions. Investments in such loans and other direct indebtedness may involve additional risk to the Fund.
Optimum Fixed Income Fund invests in certain obligations that may have liquidity protection designed to ensure that the receipt of payments due on the underlying security is timely. Such protection may be provided through guarantees, insurance policies, or letters of credit obtained by the issuer or sponsor through third parties, through various means of structuring the transaction or through a combination of such approaches. The Fund will not pay any additional fees for such credit support, although the existence of credit support may increase the price of a security.
Optimum Fixed Income Fund invests in fixed income securities whose value is derived from an underlying pool of mortgages or consumer loans. The value of these securities is sensitive to changes in economic conditions, including delinquencies and/or defaults, and may be adversely affected by shifts in the market’s perception of the issuers and changes in interest rates. Investors receive principal and interest payments as the underlying mortgages and consumer loans are paid back. Some of these securities are collateralized mortgage obligations (CMOs). CMOs are debt securities issued by US government agencies or by financial institutions and other mortgage lenders, which are collateralized by a pool of mortgages held under an indenture. Prepayment of mortgages may shorten the stated maturity of the obligations and can result in a loss of premium, if any has been paid. Certain of these securities may be stripped (securities which provide only the principal or interest feature of the underlying security). The yield to maturity on an interest-only CMO is extremely sensitive not only to changes in prevailing interest rates, but also to the rate of principal payments (including prepayments) on the related underlying mortgage assets. A rapid rate of principal payments may have a material adverse effect on the Fund’s yield to maturity. If the underlying mortgage assets experience greater than anticipated prepayments of principal, the Fund may fail to fully recoup its initial investment in these securities even if the securities are rated in the highest rating categories.
Optimum Small-Mid Cap Growth Fund and Optimum Small-Mid Cap Value Fund invest a significant portion of their assets in small- and mid-sized companies. Investments in small- and mid-sized companies may be more volatile than investments in larger companies for a number of reasons, which include more limited financial resources or a dependence on narrow product lines.
Optimum Large Cap Growth Fund, Optimum Large Cap Value Fund, Optimum Small-Mid Cap Growth Fund, and Optimum Small-Mid Cap Value Fund may invest in REITs and are subject to the risks associated with that industry. If a Fund holds real estate directly as a result of defaults or receives rental income directly from real estate holdings, its tax status as a regulated investment company may be jeopardized. There were no direct real estate holdings during the year ended March 31, 2018. The Funds’ REIT holdings are also affected by interest rate changes, particularly if the REITs they hold use floating rate debt to finance their ongoing operations. The Funds also invests in real estate acquired as a result of ownership of securities or other instruments, including issuers that invest, deal, or otherwise engage in transactions in real estate or interests therein. These instruments may include interests in private equity limited partnerships or limited liability companies that hold real estate investments (Real Estate Limited Partnerships). The Funds will limit their investments in Real Estate Limited Partnerships to 5% of their total assets at the time of purchase.
Optimum Large Cap Growth Fund, Optimum Large Cap Value Fund and Optimum Small-Mid Cap Growth Fund invested in growth stocks (such as those in the technology sector), which reflect projections of future earnings and revenue. These prices may rise or fall dramatically depending on whether those projections are met. These companies’ stock prices may be more volatile, particularly over the short-term.
Each Fund may invest up to 15% of its net assets in illiquid securities, which may include securities with contractual restrictions on resale, securities exempt from registration under Rule 144A promulgated under the Securities Act of 1933 (the Act), as amended, and other securities which may not be readily marketable. The Funds may also invest in securities exempt from registration under Section 4(a)(2) of the Act, which exempts from registration transactions by an issuer not involving any public offering. The relative illiquidity of these securities may impair the Funds from disposing of them in a timely manner and at a fair price when it is necessary or desirable to do so. While maintaining oversight, the Trust’s Board has delegated to DMC, the day-to-day functions of determining whether individual securities are liquid for purposes of the Funds’ limitation on investments in illiquid securities. Securities eligible for resale pursuant to Rule 144A, which are determined to be liquid, are not subject to the Funds’ 15% limit on investments in illiquid securities. Rule 144A, 4(a)(2) and restricted securities have been identified on the “Schedules of investments.” Restricted securities are valued pursuant to the security valuation procedures noted in Note 1.
176
Table of Contents
11. Contractual Obligations
Each Fund enters into contracts in the normal course of business that contain a variety of indemnifications. Each Fund’s maximum exposure under these arrangements is unknown. However, each Fund has not had prior claims or losses pursuant to these contracts. Management has reviewed the Funds’ existing contracts and expects the risk of loss to be remote.
12. General Motors Term Loan Litigation
Optimum Fixed Income Fund received notice of a litigation proceeding related to a General Motors Corporation (G.M.) term loan participation previously held by the Fund in 2009. We believe the matter subject to the litigation notice will likely lead to a recovery from the Fund of certain amounts received by the Fund because a US Court of Appeals has ruled that the Fund and similarly situated investors were unsecured creditors rather than secured lenders of G.M. as a result of an erroneous Uniform Commercial Code filing made by a third-party. The Fund received the full principal on the loans in 2009 after the G.M. bankruptcy. However, based upon the court ruling the estate is seeking to recover such amounts arguing that, as unsecured creditors, the Fund should not have received payment in full. Based upon currently available information related to the litigation and the Fund’s potential exposure, the Fund recorded a contingent liability of $1,385,788 and an asset of $415,736 based on the expected recoveries to unsecured creditors as of March 31, 2018 that resulted in a net decrease in the Fund’s NAV to reflect this likely recovery.
13. Recent Accounting Pronouncements
In March 2017, the Financial Accounting Standards Board issued an Accounting Standards Update, ASU 2017-08, Receivables — Nonrefundable Fees and Other Costs (Subtopic 310-20), Premium Amortization on Purchased Callable Debt Securities (ASU) which amends the amortization period for certain purchased callable debt securities held at a premium, shortening such period to the earliest call date. The ASU does not require any accounting change for debt securities held at a discount; the discount continues to be amortized to maturity. The ASU is effective for fiscal years, and interim periods within those fiscal years, beginning after Dec. 15, 2018. At this time, management is evaluating the implications of these changes on the financial statements.
14. Subsequent Events
Management has determined that no material events or transactions occurred subsequent to March 31, 2018, that would require recognition or disclosure in the Funds’ financial statements.
| (continues) | 177 |
Table of Contents
registered public accounting firm
To the Board of Trustees of Optimum Fund Trust and Shareholders of Optimum Fixed Income Fund, Optimum International Fund, Optimum Large Cap Growth Fund, Optimum Large Cap Value Fund, Optimum Small-Mid Cap Growth Fund and Optimum Small-Mid Cap Value Fund
Opinions on the Financial Statements
We have audited the accompanying statements of assets and liabilities, including the schedules of investments, of Optimum Fixed Income Fund, Optimum International Fund, Optimum Large Cap Growth Fund, Optimum Large Cap Value Fund, Optimum Small-Mid Cap Growth Fund and Optimum Small-Mid Cap Value Fund (constituting Optimum Fund Trust, hereafter collectively referred to as the “Funds”) as of March 31, 2018, the related statements of operations for the year ended March 31, 2018, the statements of changes in net assets for each of the two years in the period ended March 31, 2018, including the related notes, and the financial highlights for each of the five years in the period ended March 31, 2018 (collectively referred to as the “financial statements”). In our opinion, the financial statements present fairly, in all material respects, the financial position of each of the Funds as of March 31, 2018, the results of each of their operations for the year then ended, the changes in each of their net assets for each of the two years in the period ended March 31, 2018 and each of the financial highlights for each of the five years in the period ended March 31, 2018 in conformity with accounting principles generally accepted in the United States of America.
Basis for Opinions
These financial statements are the responsibility of the Funds’ management. Our responsibility is to express an opinion on the Funds’ financial statements based on our audits. We are a public accounting firm registered with the Public Company Accounting Oversight Board (United States) (“PCAOB”) and are required to be independent with respect to the Funds in accordance with the U.S. federal securities laws and the applicable rules and regulations of the Securities and Exchange Commission and the PCAOB.
We conducted our audits of these financial statements in accordance with the standards of the PCAOB. Those standards require that we plan and perform the audit to obtain reasonable assurance about whether the financial statements are free of material misstatement, whether due to error or fraud.
Our audits included performing procedures to assess the risks of material misstatement of the financial statements, whether due to error or fraud, and performing procedures that respond to those risks. Such procedures included examining, on a test basis, evidence regarding the amounts and disclosures in the financial statements. Our audits also included evaluating the accounting principles used and significant estimates made by management, as well as evaluating the overall presentation of the financial statements. Our procedures included confirmation of securities owned as of March 31, 2018 by correspondence with the custodian and brokers; when replies were not received from brokers, we performed other auditing procedures. We believe that our audits provide a reasonable basis for our opinions.
PricewaterhouseCoopers LLP
Philadelphia, Pennsylvania
May 18, 2018
We have served as the auditor of one or more investment companies in Optimum Fund Trust since 2010.
178
Table of Contents
(Unaudited)
Optimum Fund Trust
Tax Information
The information set forth below is for each Fund’s fiscal year as required by federal income tax laws. Shareholders, however, must report distributions on a calendar year basis for income tax purposes, which may include distributions for portions of two fiscal years of the Funds. Accordingly, the information needed by shareholders for income tax purposes will be sent to them in January of each year. Please consult your tax advisor for proper treatment of this information.
All disclosures are based on financial information available as of the date of this annual report and, accordingly are subject to change. For any and all items requiring reporting, it is the intention of the Funds to report the maximum amount permitted under the Internal Revenue Code and the regulations thereunder.
For the fiscal year ended March 31, 2018, each Fund reports distributions paid during the year as follows:
| (A) Long-Term Capital Gains Distributions (Tax Basis) |
(B) Ordinary Income Distributions* (Tax Basis) |
Total Distributions (Tax Basis) |
(C) Qualifying Dividends1 | |||||||||||||
| Optimum Fixed Income Fund |
— | 100.00 | % | 100.00 | % | — | ||||||||||
| Optimum International Fund |
52.34 | % | 47.66 | % | 100.00 | % | — | |||||||||
| Optimum Large Cap Growth Fund |
87.48 | % | 12.52 | % | 100.00 | % | 30.46 | % | ||||||||
| Optimum Large Cap Value Fund |
79.15 | % | 20.85 | % | 100.00 | % | 100.00 | % | ||||||||
| Optimum Small-Mid Cap Growth Fund |
100.00 | % | — | 100.00 | % | — | ||||||||||
| Optimum Small-Mid Cap Value Fund |
86.95 | % | 13.05 | % | 100.00 | % | 100.00 | % | ||||||||
(A) and (B) are based on a percentage of each Fund’s total distributions.
(C) is based on a percentage of each Fund’s ordinary income distributions.
1Qualifying dividends represent dividends which qualify for the corporate dividends received deduction.
*For the fiscal year ended March 31, 2018, certain dividends paid by the Funds may be subject to a maximum tax rate of 20%. The percentage of dividends paid by the Funds from ordinary income reported as qualified income are as reported in the following table. Complete information will be computed and reported in conjunction with your 2018 Form 1099-DIV.
| Optimum Fixed Income Fund |
Optimum International Fund |
Optimum Large Cap Growth Fund |
Optimum Large Cap Value Fund |
Optimum Small-Mid Cap Growth Fund |
Optimum Small-Mid Cap Value Fund | |||||
| — | 73.65% | 32.93% | 100.00% | — | 100.00% |
For the fiscal year ended March 31, 2018, certain interest income paid by the Funds, determined to be Qualified Interest Income or Qualified Short-Term Capital Gains may be subject to relief from US tax withholding for foreign shareholders, as provided by the American Jobs Creation Act of 2004; the Tax Relief Unemployment Insurance Reauthorization, and Job Creations Act of 2010; and as extended by the American Taxpayer Relief Act of 2012. For the fiscal year ended March 31, 2018, the Funds have reported maximum distributions of Qualified Interest Income and Qualified Short-Term Capital Gains as follows:
| Qualified Interest Income |
Short-Term Capital Gain | |||||||
| Optimum Fixed Income Fund |
$46,395,478 | $ | — | |||||
| Optimum International Fund |
— | 3,158,624 | ||||||
| Optimum Large Cap Growth Fund |
— | 46,985,251 | ||||||
| Optimum Large Cap Value Fund |
— | 1,714,423 | ||||||
Optimum International Fund intends to pass through foreign tax credits in the maximum amount of $1,002,889. The gross foreign source income earned during the fiscal year 2018 by the Fund was $15,696,352.
| (continues) | 179 |
Table of Contents
Other Fund information
(Unaudited)
Optimum Fund Trust
Board Consideration of Optimum Fixed Income Fund Sub-Advisory Agreements at a Meeting Held Dec. 13-14, 2017
At a meeting held on Dec. 13-14, 2017, the Board of Trustees of Optimum Fund Trust, including a majority of non-interested or independent Trustees (the “Independent Trustees”), approved a new Sub Advisory Agreement between Delaware Management Company (“DMC” or “Management”) and each of Macquarie Investment Management Europe Limited (“MIMEL”) and Macquarie Investment Management Global Limited (“MIMGL”) for Optimum Fixed Income Fund (the “Fund” or “Fixed Income Fund”). MIMEL and MIMGL may also be referenced as “Sub-Advisor(s)” below.
In reaching the decision to approve the Sub-Advisory Agreements, the Board considered and reviewed information .about each of MIMEL and MIMGL, including its personnel, operations and financial condition, which had been provided by MIMEL and MIMGL, respectively. The Board also reviewed material furnished by DMC, including: a memorandum from DMC reviewing the Sub-Advisory Agreements and the various services proposed to be rendered by MIMEL and MIMGL; information concerning MIMEL’s and MIMGL’s organizational structure and the experience of their key investment management personnel; copies of MIMEL’s and MIMGL’s Form ADV, financial statements, compliance policies and procedures, and Codes of Ethics; relevant performance information provided with respect to MIMEL and MIMGL; and a copy of the Sub-Advisory Agreements.
In considering such information and materials, the Independent Trustees received assistance and advice from and met separately with independent counsel. The materials prepared by Management in connection with the approval of the Sub-Advisory Agreements were sent to the Independent Trustees in advance of the meeting. While attention was given to all information furnished, the following discusses some primary factors relevant to the Board’s decision. This discussion of the information and factors considered by the Board (as well as the discussion above) is not intended to be exhaustive, but rather summarizes certain factors considered by the Board. In view of the wide variety of factors considered, the Board did not, unless otherwise noted, find it practicable to quantify or otherwise assign relative weights to the following factors. In addition, individual Trustees may have assigned different weights to various factors.
Nature, extent, and quality of services. In considering the nature, extent and quality of the services to be provided by the Sub-Advisors, the Board reviewed the services to be provided by each Sub-Advisor pursuant to each Sub-Advisory Agreement and as described at the meeting. The Board reviewed materials provided by the Sub-Advisors regarding the experience and qualifications of the personnel who will be responsible for providing services to a portion of the Fixed Income Fund. The Board also considered relevant performance information provided with respect to each Sub-Advisor. In discussing the nature of the services proposed to be provided by the Sub-Advisors, it was observed that, unlike traditional sub-advisors who make the investment related decisions with respect to a sub-advised portfolio, the relationship between DMC (the Fund’s investment manager) and the Sub-Advisors as currently contemplated is more of a collaborative effort between DMC and the Sub-Advisors and a cross pollination of investment ideas. Moreover, the Board noted the stated intention that DMC retain the decision-making authority with respect to purchases and sales of securities in the Fixed Income Fund. Based upon these considerations, the Board was satisfied with the nature and quality of the overall services to be provided by the Sub-Advisors to the Fund and its shareholders and was confident in the abilities of the Sub-Advisors to provide quality services to the Fund and its shareholders.
Investment performance. In regards to the appointment of the Sub-Advisors for the Fixed Income Fund, the Board reviewed information on prior performance for the Sub-Advisors. In evaluating performance, the Board considered that the Sub-Advisors would provide investment advice and recommendations, including with respect to specific securities, for consideration and evaluation by DMC’s portfolio managers, but that DMC’s portfolio managers for the Fund would retain final portfolio management discretion.
Sub-advisory fees. The Board considered that DMC would not pay the Sub-Advisors any fees in conjunction with the services that would.be rendered to the Fixed Income Fund. The Board concluded that, in light of the quality and extent of the services to be provided and the business relationships between DMC and the Sub-Advisors, the proposed fee arrangement was understandable and reasonable.
Profitability, economies of scale and fall out benefits. Information about each Sub-Advisor’s profitability from its relationship with the Fixed Income Fund was not available because it had not begun to provide services to the Fund. It was also noted that the Sub-Advisors would be receiving no fees in connection with their services under the Sub-Advisory Agreement. With regard to potential fall-out benefits derived or to be derived by the Sub-Advisors and their affiliates in connection with their relationship to the Fund, the Board considered the potential benefit to DMC and the Sub-Advisors of marketing a global approach on the portfolio management of their fixed income investment strategies. The Trustees also noted that economies of scale are shared with the Fixed Income Fund and its shareholders through investment management fee breakpoints in DMC’s fee schedule for the Fixed Income Fund so that as the Fund grows in size, its effective investment management fee rate declines.
180
Table of Contents
This page intentionally left blank.
Table of Contents
Board of trustees and officers addendum
Optimum Fund Trust
A mutual fund is governed by a Board of Trustees, which has oversight responsibility for the management of a fund’s business affairs. Trustees establish procedures and oversee and review the performance of the investment manager, the distributor and others that perform services for the fund. The independent fund trustees, in particular, are advocates for shareholder interests. The following is a list of the Trustees and Officers of the Trust with certain background and related information.
| Name, Address, and Age |
Position(s) Held with Fund(s) |
Length of Time Served |
Principal Occupation(s) During Past 5 Years |
Number of Portfolios in Fund Complex1 Overseen by Trustee or Officer |
Other Directorships Held by Trustee or Officer | |||||
| INTERESTED TRUSTEES | ||||||||||
| Matt Audette2 2005 Market Street Philadelphia, PA 19103
May 1974 |
Trustee | Dec. 16, 2016 to present |
Chief Financial Officer and Managing Director — LPL Financial LLC (2015-Present)
Chief Financial Officer — E*TRADE Financial Corporation (2011-2015)
|
6 | None | |||||
| Shawn K. Lytle2,4 2005 Market Street Philadelphia, PA 19103
February 1970 |
Trustee, President and Chief Executive Officer |
Trustee since Oct. 14, 2015; President and Chief Executive Officer since June 18, 2015 |
President — Macquarie Investment Management3 (June 2015-Present)
Regional Head of Americas — UBS Global Asset Management (April 2010-May 2015)
|
6 | Trustee — Delaware Funds® by Macquarie (60 funds) (September 2015-Present) | |||||
| INDEPENDENT TRUSTEES | ||||||||||
| Robert J. Christian 2005 Market Street Philadelphia, PA 19103
|
Chairman and Trustee |
Nov. 1, 2007 to present |
Private Investor (2006-Present) |
6 | Trustee — FundVantage Trust (34 mutual funds) (2007-Present) | |||||
| February 1949
|
||||||||||
| Durant Adams Hunter 2005 Market Street Philadelphia, PA 19103
November 1948 |
Trustee | July 17, 2003 to present |
Managing Partner — Ridgeway Partners (Executive recruiting) (2004-Present) |
6 | None | |||||
| Pamela J. Moret 2005 Market Street Philadelphia, PA 19103
February 1956 |
Trustee | Oct. 1, 2013 to present |
Private Investor (2015–Present)
Chief Executive Officer — brightpeak financial (2011-June 2015)
Senior Vice President — Thrivent Financial for Lutherans (2002-2015)
|
6 | Director – Blue Cross Blue Shield of Minnesota (2014-Present) | |||||
| Stephen Paul Mullin | Trustee | July 17, 2003 | President — | 6 | Director – Nasdaq | |||||
| 2005 Market Street | to present | Econsult Solutions, Inc. | Futures, Inc. | |||||||
| Philadelphia, PA 19103 | (Economic Consulting) | (2007-Present) | ||||||||
| (2013-Present) | ||||||||||
| February 1956 | Senior Vice President — Econsult Corp. (Economic consulting) (2000-2012) |
|||||||||
182
Table of Contents
| Name, Address, and Age |
Position(s) Held with Fund(s) |
Length of Time Served |
Principal Occupation(s) During Past 5 Years |
Number of Portfolios in Fund Complex1 Overseen by Trustee or Officer |
Other Directorships Held by Trustee or Officer | |||||
| INDEPENDENT TRUSTEES (continued) | ||||||||||
| Robert A. Rudell | Trustee | July 17, 2003 | Private Investor | 6 | Director and Independent | |||||
| 2005 Market Street | to present | (2002-Present) | Chairman — | |||||||
| Philadelphia, PA 19103 | Heartland Funds | |||||||||
| (3 mutual funds) | ||||||||||
| September 1948 | (2005-Present) | |||||||||
| Jon Edward | Trustee | July 17, 2003 | President — H&S | 6 | None | |||||
| Socolofsky | to present | Enterprises of Minocqua, LLC | ||||||||
| 2005 Market Street | (Commercial real estate developer) | |||||||||
| Philadelphia, PA 19103 | (2005-Present) | |||||||||
| March 1946 | Private Investor | |||||||||
| (2002-Present) | ||||||||||
| Susan M. Stalnecker | Trustee | Dec. 14, 2016 | Senior Advisor — Boston Consulting Group | 6 | Trustee — Duke University | |||||
| 2005 Market Street | to present | (2016-Present) | Health System, Audit | |||||||
| Philadelphia, PA 19103 | Committee member | |||||||||
| Vice President — Productivity & Shared | (2010–Present) | |||||||||
| January 1953 | Services — E.I. du Pont de Nemours and | |||||||||
| Company (2012-2016) | Director — Leidos | |||||||||
| (2016-Present) | ||||||||||
| Vice President and Treasurer — | ||||||||||
| E.I. du Pont de Nemours and | ||||||||||
| Company (2006-2012) | ||||||||||
| OFFICERS | ||||||||||
| David F. Connor | Senior Vice President, | Senior Vice President | David F. Connor has served in | 6 | None4 | |||||
| 2005 Market Street | General Counsel, | since May 2013; | various capacities at | |||||||
| Philadelphia, PA 19103 | and Secretary | General Counsel | different times at | |||||||
| since May 2015; | Macquarie Investment Management3. | |||||||||
| December 1963 | Secretary since | |||||||||
| Oct. 2005 | ||||||||||
| Daniel V. Geatens | Vice President | Sept. 20, 2007 | Daniel V. Geatens has served in | 6 | None4 | |||||
| 2005 Market Street | and Treasurer | to present | various capacities at | |||||||
| Philadelphia, PA 19103 | different times at | |||||||||
| Macquarie Investment Management3. | ||||||||||
| October 1972 | ||||||||||
| Richard Salus | Senior | Jan. 1, 2006 | Richard Salus has served in | 6 | None4 | |||||
| 2005 Market Street | Vice President | to present | various executive capacities | |||||||
| Philadelphia, PA 19103 | and | at different times at | ||||||||
| Chief Financial | Macquarie Investment Management3. | |||||||||
| October 1963 | Officer | |||||||||
| 1 | The term “Fund Complex” refers to the Funds in the Optimum Fund Trust. |
| 2 | “Interested persons” of the Funds by virtue of their executive and management positions or relationships with the Fund’s service providers or sub-service providers. |
| 3 | Macquarie Investment Management is the marketing name for Macquarie Management Holdings, Inc. and its subsidiaries, including the Fund’s(s’) investment advisor, principal underwriter, and its transfer agent. Mr. Geatens also serves as the Chief Financial Officer and Treasurer for Macquarie Global Infrastructure Total Return Fund Inc., which shares an affiliated investment manager. |
| 4 | Messrs, Lytle, Connor, Geatens, and Salus also serve in similar capacities for the Delaware Funds® by Macquarie, a fund complex that has the same manager, principal underwriter, and transfer agent as the Trust. |
The Statement of Additional Information for the Funds includes additional information about the Trustees and Officers and is available, without charge, upon request by calling your financial advisor or 800 914-0278.
| (continues) | 183 |
Table of Contents
This annual report is for the information of Optimum Fund Trust shareholders, but it may be used with prospective investors when preceded or accompanied by a current prospectus for Optimum Fund Trust and the fact sheet for the most recently completed calendar quarter. The prospectus sets forth details about charges, expenses, investment objectives, and operating policies of the investment company. You should read the prospectus carefully before you invest. The figures in this report represent past results that are not a guarantee of future results. The return and principal value of an investment in the investment company will fluctuate so that shares, when redeemed, may be worth more or less than their original cost.
| Board of trustees | Affiliated officers | Contact information | ||
| Matt Audette | David F. Connor | Investment manager | ||
| Chief Financial Officer and Managing Director — LPL Financial LLC |
Senior Vice President, General Counsel, and Secretary Optimum Fund Trust Philadelphia, PA |
Delaware Management Company, a series of Macquarie Investment Management Business Trust, Philadelphia, PA | ||
| Shawn K. Lytle | National distributor | |||
| Daniel V. Geatens | ||||
| President — Macquarie Investment | Delaware Distributors, L.P. | |||
| Management | Vice President and Treasurer | Philadelphia, PA | ||
| Philadelphia, PA | Optimum Fund Trust | |||
| Philadelphia, PA | Shareholder servicing, dividend | |||
| Robert J. Christian | disbursing, and transfer agent | |||
|
Private Investor
|
Richard Salus
|
|||
| Durant Adams Hunter
Managing Partner — Ridgeway Partners
|
Senior Vice President and Chief Financial Officer Optimum Fund Trust Philadelphia, PA
|
Delaware Investments Fund Services Company 2005 Market Street Philadelphia, PA 19103-7094 | ||
| Pamela J. Moret
|
For shareholders | |||
| Private Investor
|
800 914-0278 | |||
| Stephen Paul Mullin
President — Econsult Solutions, Inc. |
For securities dealers and financial institutions representatives only
| |||
| Robert A. Rudell
|
800 362-7500 | |||
| Private Investor
|
Website | |||
| Jon Edward Socolofsky
|
optimummutualfunds.com | |||
| Private Investor
|
||||
| Susan M. Stalnecker
|
||||
| Senior Advisor — Boston Consulting | ||||
| Group | ||||
|
Each Fund files its complete schedule of portfolio holdings with the Securities and Exchange Commission (SEC) for the first and third quarters of each fiscal year on Forms N-Q. Each Fund’s Forms N-Q, as well as a description of the policies and procedures that the Funds use to determine how to vote proxies (if any) relating to portfolio securities and the Schedules of Investments included in the Funds’ most recent Forms N-Q are available without charge (i) upon request, by calling 800 914-0278; (ii) on the Funds’ website at optimummutualfunds.com/literature; and (iii) on the SEC’s website at sec.gov. Each Fund’s Forms N-Q may be reviewed and copied at the SEC’s Public Reference Room in Washington, D.C.; information on the operation of the Public Reference Room may be obtained by calling 800 SEC-0330.
Information (if any) regarding how the Funds voted proxies relating to portfolio securities during the most recently disclosed 12-month period ended June 30 is available without charge (i) through the Funds’ website at optimummutualfunds.com/proxy; and (ii) on the SEC’s website at sec.gov. | ||||
184
Item 2. Code of Ethics
The registrant has adopted a code of ethics that applies to the registrant’s principal executive officer, principal financial officer, principal accounting officer or controller, or persons performing similar functions, regardless of whether these individuals are employed by the registrant or a third party. A copy of the registrant’s Code of Business Ethics has been posted on the Optimum Mutual Funds’ Internet Web site at www.optimummutualfunds.com. Any amendments to the Code of Business Ethics, and information on any waiver from its provisions granted by the registrant, will also be posted on this Web site within five business days of such amendment or waiver and will remain on the Web site for at least 12 months.
Item 3. Audit Committee Financial Expert
The registrant’s Board of Trustees/Directors has determined that certain members of the registrant’s Audit Committee are audit committee financial experts, as defined below. For purposes of this item, an “audit committee financial expert” is a person who has the following attributes:
a. An understanding of generally accepted accounting principles and financial statements;
b. The ability to assess the general application of such principles in connection with the accounting for estimates, accruals, and reserves;
c. Experience preparing, auditing, analyzing, or evaluating financial statements that present a breadth and level of complexity of accounting issues that are generally comparable to the breadth and complexity of issues that can reasonably be expected to be raised by the registrant’s financial statements, or experience actively supervising one or more persons engaged in such activities;
d. An understanding of internal controls and procedures for financial reporting; and
e. An understanding of audit committee functions.
An “audit committee financial expert” shall have acquired such attributes through:
a. Education and experience as a principal financial officer, principal accounting officer, controller, public accountant, or auditor or experience in one or more positions that involve the performance of similar functions;
b. Experience actively supervising a principal financial officer, principal accounting officer, controller, public accountant, auditor, or person performing similar functions;
c. Experience overseeing or assessing the performance of companies or public accountants with respect to the preparation, auditing, or evaluation of financial statements; or
d. Other relevant experience.
The registrant’s Board of Trustees/Directors has also determined that each member of the registrant’s Audit Committee is independent. In order to be “independent” for purposes of this item, the Audit Committee member may not: (i) other than in his or her capacity as a member of the Board of Trustees/Directors or any committee thereof, accept directly or indirectly any consulting, advisory or other compensatory fee from the issuer; or (ii) be an “interested person” of the registrant as defined in Section 2(a)(19) of the Investment Company Act of 1940.
The names of the audit committee financial experts on the registrant’s Audit Committee are set forth below:
Robert J. Christian
Robert A. Rudell
Jon E. Socolofsky
Susan M. Stalnecker
Item 4. Principal Accountant Fees and Services
(a) Audit fees.
The aggregate fees billed for services provided to the registrant by its independent auditors for the audit of the registrant’s annual financial statements and for services normally provided by the independent auditors in connection with statutory and regulatory filings or engagements were $153,000 for the fiscal year ended March 31, 2018.
The aggregate fees billed for services provided to the registrant by its independent auditors for the audit of the registrant’s annual financial statements and for services normally provided by the independent auditors in connection with statutory and regulatory filings or engagements were $153,000 for the fiscal year ended March 31, 2017.
(b) Audit-related fees.
The aggregate fees billed by the registrant’s independent auditors for services relating to the performance of the audit of the registrant’s financial statements and not reported under paragraph (a) of this Item were $0 for the fiscal year ended March 31, 2018.
The aggregate fees billed by the registrant’s independent auditors for services relating to the performance of the audit of the financial statements of the registrant’s investment adviser and other service providers under common control with the adviser and that relate directly to the operations or financial reporting of the registrant were $640,000 for the registrant’s fiscal year ended March 31, 2018. The percentage of these fees relating to services approved by the registrant’s Audit Committee pursuant to the de minimis exception from the pre-approval requirement in Rule 2-01(c)(7)(i)(C) of Regulation S-X was 0%. These audit-related services were as follows: year-end audit procedures; group reporting and subsidiary statutory audits.
The aggregate fees billed by the registrant’s independent auditors for services relating to the performance of the audit of the registrant’s financial statements and not reported under paragraph (a) of this Item were $0 for the fiscal year ended March 31, 2017.
The aggregate fees billed by the registrant’s independent auditors for services relating to the performance of the audit of the financial statements of the registrant’s investment adviser and other service providers under common control with the adviser and that relate directly to the operations or financial reporting of the registrant were $640,000 for the registrant’s fiscal year ended March 31, 2017. The percentage of these fees relating to services approved by the registrant’s Audit Committee pursuant to the de minimis exception from the pre-approval requirement in Rule 2-01(c)(7)(i)(C) of Regulation S-X was 0%. These audit-related services were as follows: year end audit procedures; group reporting and subsidiary statutory audits.
(c) Tax fees.
The aggregate fees billed by the registrant’s independent auditors for tax-related services provided to the registrant were $29,175 for the fiscal year ended March 31, 2018. The percentage of these fees relating to services approved by the registrant’s Audit Committee pursuant to the de minimis exception from the pre-approval requirement in Rule 2-01(c)(7)(i)(C) of Regulation S-X was 0%. These tax-related services were as follows: review of income tax returns and review of annual excise distribution calculations.
The aggregate fees billed by the registrant’s independent auditors for tax-related services provided to the registrant’s investment adviser and other service providers under common control with the adviser and that relate directly to the operations or financial reporting of the registrant were $0 for the registrant’s fiscal year ended March 31, 2018.
The aggregate fees billed by the registrant’s independent auditors for tax-related services provided to the registrant were $29,175 for the fiscal year ended March 31, 2017. The percentage of these fees relating to services approved by the registrant’s Audit Committee pursuant to the de minimis exception from the pre-approval requirement in Rule 2-01(c)(7)(i)(C) of Regulation S-X was 0%. These tax-related services were as follows: review of income tax returns and review of annual excise distribution calculations.
The aggregate fees billed by the registrant’s independent auditors for tax-related services provided to the registrant’s investment adviser and other service providers under common control with the adviser and that relate directly to the operations or financial reporting of the registrant were $0 for the registrant’s fiscal year ended March 31, 2017.
(d) All other fees.
The aggregate fees billed for all services provided by the independent auditors to the registrant other than those set forth in paragraphs (a), (b) and (c) of this Item were $0 for the fiscal year ended March 31, 2018.
The aggregate fees billed for all services other than those set forth in paragraphs (b) and (c) of this Item provided by the registrant’s independent auditors to the registrant’s adviser and other service providers under common control with the adviser and that relate directly to the operations or financial reporting of the registrant were $0 for the registrant’s fiscal year ended March 31, 2018. The percentage of these fees relating to services approved by the registrant’s Audit Committee pursuant to the de minimis exception from the pre-approval requirement in Rule 2-01(c)(7)(i)(C) of Regulation S-X was 0%.
The aggregate fees billed for all services provided by the independent auditors to the registrant other than those set forth in paragraphs (a), (b) and (c) of this Item were $0 for the fiscal year ended March 31, 2017.
The aggregate fees billed for all services other than those set forth in paragraphs (b) and (c) of this Item provided by the registrant’s independent auditors to the registrant’s adviser and other service providers under common control with the adviser and that relate directly to the operations or financial reporting of the registrant were $0 for the registrant’s fiscal year ended March 31, 2017. The percentage of these fees relating to services approved by the registrant’s Audit Committee pursuant to the de minimis exception from the pre-approval requirement in Rule 2-01(c)(7)(i)(C) of Regulation S-X was 0%.
(e) The registrant’s Audit Committee has established pre-approval policies and procedures as permitted by Rule 2-01(c)(7)(i)(B) of Regulation S-X (the “Pre-Approval Policy”) with respect to services provided by the registrant’s independent auditors. Pursuant to the Pre-Approval Policy, the Audit Committee has pre-approved the services set forth in the table below with respect to the registrant up to the specified fee limits. Certain fee limits are based on aggregate fees to the registrant and other registrants within the Optimum Fund Trust.
| Service | Range of Fees |
| Audit Services | |
| Statutory audits or financial audits for new Funds | up to $25,000 per Fund |
| Services associated with SEC registration statements (e.g., Form N-1A, Form N-14, etc.), periodic reports and other documents filed with the SEC or other documents issued in connection with securities offerings (e.g., comfort letters for closed-end Fund offerings, consents), and assistance in responding to SEC comment letters | up to $10,000 per Fund |
| Consultations by Fund management as to the accounting or disclosure treatment of transactions or events and/or the actual or potential impact of final or proposed rules, standards or interpretations by the SEC, FASB, or other regulatory or standard-setting bodies (Note: Under SEC rules, some consultations may be considered “audit-related services” rather than “audit services”) | up to $25,000 in the aggregate |
| Audit-Related Services | |
| Consultations by Fund management as to the accounting or disclosure treatment of transactions or events and /or the actual or potential impact of final or proposed rules, standards or interpretations by the SEC, FASB, or other regulatory or standard-setting bodies (Note: Under SEC rules, some consultations may be considered “audit services” rather than “audit-related services”) | up to $25,000 in the aggregate |
| Tax Services | |
| U.S. federal, state and local and international tax planning and advice (e.g., consulting on statutory, regulatory or administrative developments, evaluation of Funds’ tax compliance function, etc.) | up to $25,000 in the aggregate |
| U.S. federal, state and local tax compliance (e.g., excise distribution reviews, etc.) | up to $5,000 per Fund |
| Review of federal, state, local and international income, franchise and other tax returns | up to $5,000 per Fund |
Under the Pre-Approval Policy, the Audit Committee has also pre-approved the services set forth in the table below with respect to the registrant’s investment adviser and other entities controlling, controlled by or under common control with the investment adviser that provide ongoing services to the registrant (the “Control Affiliates”) up to the specified fee limit. This fee limit is based on aggregate fees to the investment adviser and its Control Affiliates.
| Service | Range of Fees |
| Non-Audit Services | |
| Services associated with periodic reports and other documents filed with the SEC and assistance in responding to SEC comment letters | up to $10,000 in the aggregate |
The Pre-Approval Policy requires the registrant’s independent auditors to report to the Audit Committee at each of its regular meetings regarding all services initiated since the last such report was rendered, including those services authorized by the Pre-Approval Policy.
(f) Not applicable.
(g) The aggregate non-audit fees billed by the registrant’s independent auditors for services rendered to the registrant and to its investment adviser and other service providers under common control with the adviser were $11,180,000 and $11,180,000 for the registrant’s fiscal years ended March 31, 2018 and March 31, 2017, respectively.
(h) In connection with its selection of the independent auditors, the registrant’s Audit Committee has considered the independent auditors’ provision of non-audit services to the registrant’s investment adviser and other service providers under common control with the adviser that were not required to be pre-approved pursuant to Rule 2-01(c)(7)(ii) of Regulation S-X. The Audit Committee has determined that the independent auditors’ provision of these services is compatible with maintaining the auditors’ independence.
Item 5. Audit Committee of Listed Registrants
Not applicable.
Item 6. Investments
(a) Included as part of report to shareholders filed under Item 1 of this Form N-CSR.
(b) Divestment of securities in accordance with Section 13(c) of the Investment Company Act of 1940.
Not applicable.
Item 7. Disclosure of Proxy Voting Policies and Procedures for Closed-End Management Investment Companies
Not applicable.
Item 8. Portfolio Managers of Closed-End Management Investment Companies
Not applicable.
Item 9. Purchases of Equity Securities by Closed-End Management Investment Company and Affiliated Purchasers
Not applicable.
Item 10. Submission of Matters to a Vote of Security Holders
Not applicable.
Item 11. Controls and Procedures
The registrant’s principal executive officer and principal financial officer have evaluated the registrant’s disclosure controls and procedures within 90 days of the filing of this report and have concluded that they are effective in providing reasonable assurance that the information required to be disclosed by the registrant in its reports or statements filed under the Securities Exchange Act of 1934 is recorded, processed, summarized and reported within the time periods specified in the rules and forms of the Securities and Exchange Commission.
There were no significant changes in the registrant’s internal control over financial reporting that occurred during the second fiscal quarter of the period covered by the report to stockholders included herein (i.e., the registrant’s fourth fiscal quarter) that have materially affected, or are reasonably likely to materially affect, the registrant’s internal control over financial reporting.
Item 12. Disclosure of Securities Lending Activities for Closed-End Management Investment Companies
Not applicable
Item 13. Exhibits
(a) (1) Code of Ethics
Not applicable.
(2) Certifications of Principal Executive Officer and Principal Financial Officer pursuant to Rule 30a-2 under the Investment Company Act of 1940 are attached hereto as Exhibit 99.CERT.
(3) Written solicitations to purchase securities pursuant to Rule 23c-1 under the Securities Exchange Act of 1934.
Not applicable.
(b) Certifications pursuant to Section 906 of the Sarbanes-Oxley Act of 2002 are furnished herewith as Exhibit 99.906CERT.
SIGNATURES
Pursuant to the requirements of the Securities Exchange Act of 1934 and the Investment Company Act of 1940, the registrant has duly caused this report to be signed on its behalf, by the undersigned, thereunto duly authorized.
OPTIMUM FUND TRUST
| /s/ SHAWN K. LYTLE | |
| By: | Shawn K. Lytle |
| Title: | President and Chief Executive Officer |
| Date: | June 6, 2018 |
Pursuant to the requirements of the Securities Exchange Act of 1934 and the Investment Company Act of 1940, this report has been signed below by the following persons on behalf of the registrant and in the capacities and on the dates indicated.
| /s/ SHAWN K. LYTLE | |
| By: | Shawn K. Lytle |
| Title: | President and Chief Executive Officer |
| Date: | June 6, 2018 |
| /s/ RICHARD SALUS | |
| By: | Richard Salus |
| Title: | Chief Financial Officer |
| Date: | June 6, 2018 |