UNITED STATES
SECURITIES AND EXCHANGE COMMISSION
Washington, D.C. 20549
Form 10-Q
þ | QUARTERLY REPORT PURSUANT TO SECTION 13 OR 15(d) OF THE SECURITIES EXCHANGE ACT OF 1934 |
For the quarterly period ended June 30, 2012
o | TRANSITION REPORT PURSUANT TO SECTION 13 OR 15(d) OF THE SECURITIES EXCHANGE ACT OF 1934 |
For the transition period from ___ to ___
Commission File Number 001-31792
CNO Financial Group, Inc.
Delaware | 75-3108137 | |
State of Incorporation | IRS Employer Identification No. | |
11825 N. Pennsylvania Street | ||
Carmel, Indiana 46032 | (317) 817-6100 | |
Address of principal executive offices | Telephone | |
Indicate by check mark whether the Registrant (1) has filed all reports required to be filed by Section 13 or 15(d) of the Securities Exchange Act of 1934 during the preceding 12 months (or for such shorter period that the registrant was required to file such reports) and (2) has been subject to such filing requirements for the past 90 days: Yes [ X ] No [ ]
Indicate by check mark whether the Registrant has submitted electronically and posted on its corporate Web site, if any, every Interactive Data File required to be submitted and posted pursuant to Rule 405 of Regulation S-T (§ 232.405 of this chapter) during the preceding 12 months (or for such shorter period that the registrant was required to submit and post such files). Yes [ X ] No [ ]
Indicate by check mark whether the Registrant is a large accelerated filer, an accelerated filer, a non-accelerated filer or a smaller reporting company. See the definitions of “large accelerated filer”, “accelerated filer” and “smaller reporting company” in Rule 12b-2 of the Exchange Act. Large accelerated filer [ X ] Accelerated filer [ ] Non-accelerated filer [ ] Smaller reporting company [ ]
Indicate by check mark whether the Registrant is a shell company (as defined in Rule 12b-2 of the Exchange Act): Yes [ ] No [ X ]
Shares of common stock outstanding as of July 18, 2012: 232,350,646
TABLE OF CONTENTS
PART I - FINANCIAL INFORMATION | Page | |
Item 1. | Financial Statements | |
Item 2. | ||
Item 3. | ||
Item 4. | ||
PART II - OTHER INFORMATION | ||
Item 1. | ||
Item 1A. | ||
Item 2. | ||
Item 5. | ||
Item 6. | ||
2
PART I - FINANCIAL INFORMATION
ITEM 1. | FINANCIAL STATEMENTS. |
CNO FINANCIAL GROUP, INC. AND SUBSIDIARIES
CONSOLIDATED BALANCE SHEET
(Dollars in millions)
(unaudited)
ASSETS
June 30, 2012 | December 31, 2011 | ||||||
Investments: | |||||||
Fixed maturities, available for sale, at fair value (amortized cost: June 30, 2012 - $22,033.0; December 31, 2011 - $21,779.1) | $ | 24,276.6 | $ | 23,516.0 | |||
Equity securities at fair value (cost: June 30, 2012 - $188.0; December 31, 2011 - $177.0) | 187.3 | 175.1 | |||||
Mortgage loans | 1,550.9 | 1,602.8 | |||||
Policy loans | 274.7 | 279.7 | |||||
Trading securities | 114.8 | 91.6 | |||||
Investments held by variable interest entities | 789.3 | 496.3 | |||||
Other invested assets | 257.1 | 202.8 | |||||
Total investments | 27,450.7 | 26,364.3 | |||||
Cash and cash equivalents - unrestricted | 190.2 | 436.0 | |||||
Cash and cash equivalents held by variable interest entities | 88.6 | 74.4 | |||||
Accrued investment income | 296.4 | 288.7 | |||||
Present value of future profits | 658.1 | 697.7 | |||||
Deferred acquisition costs | 591.4 | 797.1 | |||||
Reinsurance receivables | 3,013.8 | 3,091.1 | |||||
Income tax assets, net | 679.7 | 865.4 | |||||
Assets held in separate accounts | 15.6 | 15.0 | |||||
Other assets | 395.8 | 292.2 | |||||
Total assets | $ | 33,380.3 | $ | 32,921.9 | |||
(continued on next page)
The accompanying notes are an integral part of the
unaudited consolidated financial statements, which
include a summary of revisions to prior year balances in
connection with a change in accounting principle.
3
CNO FINANCIAL GROUP, INC. AND SUBSIDIARIES
CONSOLIDATED BALANCE SHEET, continued
(Dollars in millions)
(unaudited)
LIABILITIES AND SHAREHOLDERS' EQUITY
June 30, 2012 | December 31, 2011 | ||||||
Liabilities: | |||||||
Liabilities for insurance products: | |||||||
Interest-sensitive products | $ | 12,956.3 | $ | 13,165.5 | |||
Traditional products | 10,604.6 | 10,482.7 | |||||
Claims payable and other policyholder funds | 991.9 | 1,034.3 | |||||
Liabilities related to separate accounts | 15.6 | 15.0 | |||||
Other liabilities | 686.0 | 556.3 | |||||
Investment borrowings | 1,687.9 | 1,676.5 | |||||
Borrowings related to variable interest entities | 766.7 | 519.9 | |||||
Notes payable – direct corporate obligations | 778.2 | 857.9 | |||||
Total liabilities | 28,487.2 | 28,308.1 | |||||
Commitments and Contingencies | |||||||
Shareholders' equity: | |||||||
Common stock ($0.01 par value, 8,000,000,000 shares authorized, shares issued and outstanding: June 30, 2012 - 234,026,409; December 31, 2011 – 241,304,503) | 2.3 | 2.4 | |||||
Additional paid-in capital | 4,312.0 | 4,361.9 | |||||
Accumulated other comprehensive income | 990.8 | 781.6 | |||||
Accumulated deficit | (412.0 | ) | (532.1 | ) | |||
Total shareholders' equity | 4,893.1 | 4,613.8 | |||||
Total liabilities and shareholders' equity | $ | 33,380.3 | $ | 32,921.9 | |||
The accompanying notes are an integral part of the
unaudited consolidated financial statements, which
include a summary of revisions to prior year balances in
connection with a change in accounting principle.
4
CNO FINANCIAL GROUP, INC. AND SUBSIDIARIES
CONSOLIDATED STATEMENT OF OPERATIONS
(Dollars in millions, except per share data)
(unaudited)
Three months ended | Six months ended | ||||||||||||||
June 30, | June 30, | ||||||||||||||
2012 | 2011 | 2012 | 2011 | ||||||||||||
Revenues: | |||||||||||||||
Insurance policy income | $ | 694.8 | $ | 679.6 | $ | 1,381.1 | $ | 1,346.8 | |||||||
Net investment income (loss): | |||||||||||||||
General account assets | 351.1 | 342.2 | 696.3 | 678.3 | |||||||||||
Policyholder and reinsurer accounts and other special-purpose portfolios | (17.3 | ) | 3.1 | 48.3 | 40.5 | ||||||||||
Realized investment gains (losses): | |||||||||||||||
Net realized investment gains, excluding impairment losses | 35.4 | 13.0 | 66.2 | 31.4 | |||||||||||
Other-than-temporary impairment losses: | |||||||||||||||
Total other-than-temporary impairment losses | (3.5 | ) | (10.1 | ) | (11.4 | ) | (23.4 | ) | |||||||
Portion of other-than-temporary impairment losses recognized in accumulated other comprehensive income | — | — | — | — | |||||||||||
Net impairment losses recognized | (3.5 | ) | (10.1 | ) | (11.4 | ) | (23.4 | ) | |||||||
Total realized gains (losses) | 31.9 | 2.9 | 54.8 | 8.0 | |||||||||||
Fee revenue and other income | 4.5 | 4.2 | 8.4 | 7.6 | |||||||||||
Total revenues | 1,065.0 | 1,032.0 | 2,188.9 | 2,081.2 | |||||||||||
Benefits and expenses: | |||||||||||||||
Insurance policy benefits | 689.7 | 684.4 | 1,378.7 | 1,367.6 | |||||||||||
Interest expense | 28.7 | 28.9 | 57.5 | 58.1 | |||||||||||
Amortization | 68.3 | 70.6 | 154.9 | 165.5 | |||||||||||
Loss on extinguishment of debt | .5 | .6 | .7 | 2.0 | |||||||||||
Other operating costs and expenses | 173.3 | 175.7 | 400.3 | 345.8 | |||||||||||
Total benefits and expenses | 960.5 | 960.2 | 1,992.1 | 1,939.0 | |||||||||||
Income before income taxes | 104.5 | 71.8 | 196.8 | 142.2 | |||||||||||
Income tax expense on period income | 38.8 | 25.4 | 72.0 | 50.4 | |||||||||||
Net income | $ | 65.7 | $ | 46.4 | $ | 124.8 | $ | 91.8 | |||||||
Earnings per common share: | |||||||||||||||
Basic: | |||||||||||||||
Weighted average shares outstanding | 237,289,000 | 250,933,000 | 239,092,000 | 251,027,000 | |||||||||||
Net income | $ | .28 | $ | .18 | $ | .52 | $ | .37 | |||||||
Diluted: | |||||||||||||||
Weighted average shares outstanding | 293,475,000 | 308,048,000 | 295,409,000 | 307,773,000 | |||||||||||
Net income | $ | .24 | $ | .16 | $ | .45 | $ | .32 | |||||||
The accompanying notes are an integral part of the
unaudited consolidated financial statements, which
include a summary of revisions to prior year balances in
connection with a change in accounting principle.
5
CNO FINANCIAL GROUP, INC. AND SUBSIDIARIES
CONSOLIDATED STATEMENT OF COMPREHENSIVE INCOME
(Dollars in millions)
(unaudited)
Three months ended | Six months ended | ||||||||||||||
June 30, | June 30, | ||||||||||||||
2012 | 2011 | 2012 | 2011 | ||||||||||||
Net income | $ | 65.7 | $ | 46.4 | $ | 124.8 | $ | 91.8 | |||||||
Other comprehensive income, before tax: | |||||||||||||||
Unrealized gains for the period | 511.5 | 226.0 | 563.4 | 274.5 | |||||||||||
Amortization of present value of future profits and deferred acquisition costs for: | |||||||||||||||
Unrealized gains during the period | (56.2 | ) | (29.6 | ) | (76.2 | ) | (37.1 | ) | |||||||
Amount related to premium deficiencies assuming the net unrealized gains had been realized | (143.4 | ) | — | (113.1 | ) | — | |||||||||
Reclassification adjustments: | |||||||||||||||
For net realized investment gains included in net income | (31.0 | ) | (5.2 | ) | (52.6 | ) | (14.0 | ) | |||||||
For amortization of the present value of future profits and deferred acquisition costs related to net realized investment gains included in net income | 3.1 | (.6 | ) | 4.2 | (.2 | ) | |||||||||
Unrealized gains on investments | 284.0 | 190.6 | 325.7 | 223.2 | |||||||||||
Change related to deferred compensation plan | .8 | .1 | 1.6 | .4 | |||||||||||
Other comprehensive income before tax | 284.8 | 190.7 | 327.3 | 223.6 | |||||||||||
Income tax expense related to items of accumulated other comprehensive income | (102.0 | ) | (68.5 | ) | (118.1 | ) | (80.8 | ) | |||||||
Other comprehensive income, net of tax | 182.8 | 122.2 | 209.2 | 142.8 | |||||||||||
Comprehensive income | $ | 248.5 | $ | 168.6 | $ | 334.0 | $ | 234.6 | |||||||
The accompanying notes are an integral part of the
unaudited consolidated financial statements, which
include a summary of revisions to prior year balances in
connection with a change in accounting principle.
6
CNO FINANCIAL GROUP, INC. AND SUBSIDIARIES
CONSOLIDATED STATEMENT OF SHAREHOLDERS' EQUITY
(Dollars in millions)
(unaudited)
Common stock and additional paid-in capital | Accumulated other comprehensive income (loss) | Retained earnings (accumulated deficit) | Total | ||||||||||||
Balance, December 31, 2010 (as originally reported) | $ | 4,426.7 | $ | 238.3 | $ | (339.7 | ) | $ | 4,325.3 | ||||||
Cumulative effect of accounting change (adoption of ASU 2010-26) | — | 14.4 | (528.1 | ) | (513.7 | ) | |||||||||
Balance, December 31, 2010 (as adjusted) | 4,426.7 | 252.7 | (867.8 | ) | 3,811.6 | ||||||||||
Net income | — | — | 91.8 | 91.8 | |||||||||||
Change in unrealized appreciation (depreciation) of investments (net of applicable income tax expense of $79.2) | — | 139.9 | — | 139.9 | |||||||||||
Change in noncredit component of impairment losses on fixed maturities, available for sale (net of applicable income tax expense of $1.6) | — | 2.9 | — | 2.9 | |||||||||||
Cost of shares acquired | (16.2 | ) | — | — | (16.2 | ) | |||||||||
Stock option and restricted stock plans | 6.3 | — | — | 6.3 | |||||||||||
Balance, June 30, 2011 | $ | 4,416.8 | $ | 395.5 | $ | (776.0 | ) | $ | 4,036.3 | ||||||
Balance, December 31, 2011 (as originally reported) | $ | 4,364.3 | $ | 625.5 | $ | 42.8 | $ | 5,032.6 | |||||||
Cumulative effect of accounting change (adoption of ASU 2010-26) | — | 156.1 | (574.9 | ) | (418.8 | ) | |||||||||
Balance, December 31, 2011 (as adjusted) | 4,364.3 | 781.6 | (532.1 | ) | 4,613.8 | ||||||||||
Net income | — | — | 124.8 | 124.8 | |||||||||||
Change in unrealized appreciation (depreciation) of investments (net of applicable income tax expense of $115.9) | — | 205.2 | — | 205.2 | |||||||||||
Change in noncredit component of impairment losses on fixed maturities, available for sale (net of applicable income tax expense of $2.2) | — | 4.0 | — | 4.0 | |||||||||||
Cost of shares acquired | (58.2 | ) | — | — | (58.2 | ) | |||||||||
Dividends on common stock | — | — | (4.7 | ) | (4.7 | ) | |||||||||
Stock option and restricted stock plans | 8.2 | — | — | 8.2 | |||||||||||
Balance, June 30, 2012 | $ | 4,314.3 | $ | 990.8 | $ | (412.0 | ) | $ | 4,893.1 | ||||||
The accompanying notes are an integral part of the
unaudited consolidated financial statements, which
include a summary of revisions to prior year balances in
connection with a change in accounting principle.
7
CNO FINANCIAL GROUP, INC. AND SUBSIDIARIES
CONSOLIDATED STATEMENT OF CASH FLOWS
(Dollars in millions)
(unaudited)
Six months ended | |||||||
June 30, | |||||||
2012 | 2011 | ||||||
Cash flows from operating activities: | |||||||
Insurance policy income | $ | 1,216.6 | $ | 1,194.3 | |||
Net investment income | 660.0 | 687.1 | |||||
Fee revenue and other income | 8.4 | 7.6 | |||||
Insurance policy benefits | (1,108.8 | ) | (1,022.6 | ) | |||
Interest expense | (52.6 | ) | (42.2 | ) | |||
Deferrable policy acquisition costs | (94.7 | ) | (106.6 | ) | |||
Other operating costs | (385.6 | ) | (354.3 | ) | |||
Taxes | (4.3 | ) | (2.5 | ) | |||
Net cash provided by operating activities | 239.0 | 360.8 | |||||
Cash flows from investing activities: | |||||||
Sales of investments | 1,332.2 | 2,931.9 | |||||
Maturities and redemptions of investments | 824.5 | 538.1 | |||||
Purchases of investments | (2,614.5 | ) | (4,050.8 | ) | |||
Net sales of trading securities | 29.2 | 304.4 | |||||
Change in cash and cash equivalents held by variable interest entities | (14.2 | ) | 1.5 | ||||
Other | (16.7 | ) | (15.1 | ) | |||
Net cash used by investing activities | (459.5 | ) | (290.0 | ) | |||
Cash flows from financing activities: | |||||||
Payments on notes payable | (81.4 | ) | (66.2 | ) | |||
Issuance of common stock | 1.0 | .3 | |||||
Payments to repurchase common stock | (58.2 | ) | (16.2 | ) | |||
Common stock dividends paid | (4.7 | ) | — | ||||
Amounts received for deposit products | 674.4 | 837.7 | |||||
Withdrawals from deposit products | (814.6 | ) | (854.9 | ) | |||
Issuance of investment borrowings: | |||||||
Federal Home Loan Bank | — | 342.0 | |||||
Related to variable interest entities | 246.8 | 35.0 | |||||
Payments on investment borrowings: | |||||||
Federal Home Loan Bank | — | (267.0 | ) | ||||
Related to variable interest entities and other | (.6 | ) | (100.1 | ) | |||
Investment borrowings - repurchase agreements, net | 12.0 | 26.9 | |||||
Net cash used by financing activities | (25.3 | ) | (62.5 | ) | |||
Net increase (decrease) in cash and cash equivalents | (245.8 | ) | 8.3 | ||||
Cash and cash equivalents, beginning of period | 436.0 | 571.9 | |||||
Cash and cash equivalents, end of period | $ | 190.2 | $ | 580.2 | |||
The accompanying notes are an integral part of the
unaudited consolidated financial statements, which
include a summary of revisions to prior year balances in
connection with a change in accounting principle.
8
CNO FINANCIAL GROUP, INC. AND SUBSIDIARIES
Notes to Consolidated Financial Statements
(unaudited)
___________________
BUSINESS AND BASIS OF PRESENTATION
The following notes should be read together with the notes to the consolidated financial statements included in our 2011 Annual Report on Form 10-K.
CNO Financial Group, Inc., a Delaware corporation (“CNO”), is a holding company for a group of insurance companies operating throughout the United States that develop, market and administer health insurance, annuity, individual life insurance and other insurance products. CNO became the successor to Conseco, Inc., an Indiana corporation (our “Predecessor”), in connection with our bankruptcy reorganization which became effective on September 10, 2003. The terms “CNO Financial Group, Inc.”, the “Company”, “we”, “us”, and “our” as used in these financial statements refer to CNO and its subsidiaries or, when the context requires otherwise, our Predecessor and its subsidiaries. We focus on serving the senior and middle-income markets, which we believe are attractive, underserved, high growth markets. We sell our products through three distribution channels: career agents, independent producers (some of whom sell one or more of our product lines exclusively) and direct marketing.
Our unaudited consolidated financial statements reflect normal recurring adjustments that, in the opinion of management, are necessary for a fair statement of our financial position, results of operations and cash flows for the periods presented. As permitted by rules and regulations of the Securities and Exchange Commission (the “SEC”) applicable to quarterly reports on Form 10-Q, we have condensed or omitted certain information and disclosures normally included in financial statements prepared in accordance with accounting principles generally accepted in the United States of America (“GAAP”). We have reclassified certain amounts from the prior periods to conform to the 2012 presentation. These reclassifications have no effect on net income or shareholders’ equity. Results for interim periods are not necessarily indicative of the results that may be expected for a full year.
As discussed in the note to the consolidated financial statements entitled "Recently Issued Accounting Standards", we have adopted the provisions of Financial Accounting Standards Update No. 2010-26 (“ASU 2010-26”), effective January 1, 2012. Pursuant to the guidance, we elected to adopt the provisions on a retrospective basis. Accordingly, all prior periods presented have been retrospectively adjusted.
The balance sheet at December 31, 2011, presented herein, has been derived from the audited financial statements at that date but does not include all of the information and footnotes required by GAAP for complete financial statements.
When we prepare financial statements in conformity with GAAP, we are required to make estimates and assumptions that significantly affect reported amounts of various assets and liabilities and the disclosure of contingent assets and liabilities at the date of the financial statements and revenues and expenses during the reporting periods. For example, we use significant estimates and assumptions to calculate values for deferred acquisition costs, the present value of future profits, fair value measurements of certain investments (including derivatives), other-than-temporary impairments of investments, assets and liabilities related to income taxes, liabilities for insurance products, liabilities related to litigation and guaranty fund assessment accruals. If our future experience differs from these estimates and assumptions, our financial statements would be materially affected.
Our consolidated financial statements exclude the results of transactions between us and our consolidated affiliates, or among our consolidated affiliates.
9
CNO FINANCIAL GROUP, INC. AND SUBSIDIARIES
Notes to Consolidated Financial Statements
(unaudited)
___________________
INVESTMENTS
We classify our fixed maturity securities into one of three categories: (i) “available for sale” (which we carry at estimated fair value with any unrealized gain or loss, net of tax and related adjustments, recorded as a component of shareholders’ equity); (ii) “trading” (which we carry at estimated fair value with changes in such value recognized as net investment income (classified as investment income from policyholder and reinsurer accounts and other special-purpose portfolios)); or (iii) “held to maturity” (which we carry at amortized cost). We had no fixed maturity securities classified as held to maturity during the periods presented in these financial statements.
The trading account includes: (i) investments purchased with the intent of selling in the near term to generate income on price changes; and (ii) investments supporting insurance liabilities (including investments backing the market strategies of our multibucket annuity products) and certain reinsurance agreements. The change in fair value of these securities is recognized in income from policyholder and reinsurer accounts and other special-purpose portfolios (a component of net investment income). Investment income from trading securities backing insurance liabilities and certain reinsurance agreements is substantially offset by the change in insurance policy benefits related to certain products and agreements. Prior to June 30, 2011, certain of our trading securities were held to offset the income statement volatility caused by the effect of interest rate fluctuations on the value of embedded derivatives related to our fixed index annuity products. During the second quarter of 2011, we sold this trading portfolio and invested the proceeds in higher yielding investments which were classified as available for sale. See the note entitled “Accounting for Derivatives” for further discussion regarding these embedded derivatives. The trading account also includes certain fixed maturity securities containing embedded derivatives for which we have elected the fair value option. The change in value of these securities is recognized in realized investment gain (losses). Our trading securities totaled $114.8 million and $91.6 million at June 30, 2012 and December 31, 2011, respectively.
Accumulated other comprehensive income is primarily comprised of the net effect of unrealized appreciation (depreciation) on our investments. These amounts, included in shareholders’ equity as of June 30, 2012 and December 31, 2011, were as follows (dollars in millions):
June 30, 2012 | December 31, 2011 | ||||||
Net unrealized appreciation (depreciation) on fixed maturity securities, available for sale, on which an other-than-temporary impairment loss has been recognized | $ | 2.8 | $ | (4.4 | ) | ||
Net unrealized gains (losses) on all other investments | 2,236.8 | 1,733.2 | |||||
Adjustment to present value of future profits (a) | (201.4 | ) | (214.8 | ) | |||
Adjustment to deferred acquisition costs | (487.8 | ) | (289.3 | ) | |||
Unrecognized net loss related to deferred compensation plan | (6.7 | ) | (8.3 | ) | |||
Deferred income tax liabilities | (552.9 | ) | (434.8 | ) | |||
Accumulated other comprehensive income | $ | 990.8 | $ | 781.6 | |||
_________
(a) | The present value of future profits is the value assigned to the right to receive future cash flows from contracts existing at September 10, 2003 (the date our Predecessor emerged from bankruptcy). |
At June 30, 2012, adjustments to the present value of future profits, deferred acquisition costs and deferred income tax assets included $(170.9) million, $(213.2) million and $138.3 million, respectively, for premium deficiencies that would exist on certain long-term health products if unrealized gains on the assets backing such products had been realized and the proceeds from our sales of such assets were invested at then current yields.
10
CNO FINANCIAL GROUP, INC. AND SUBSIDIARIES
Notes to Consolidated Financial Statements
(unaudited)
___________________
At June 30, 2012, the amortized cost, gross unrealized gains and losses, estimated fair value, other-than-temporary impairments in accumulated other comprehensive income of fixed maturities, available for sale, were as follows (dollars in millions):
Amortized cost | Gross unrealized gains | Gross unrealized losses | Estimated fair value | Other-than- temporary impairments included in accumulated other comprehensive income | |||||||||||||||
Corporate securities | $ | 14,499.5 | $ | 1,810.3 | $ | (75.5 | ) | $ | 16,234.3 | $ | — | ||||||||
United States Treasury securities and obligations of United States government corporations and agencies | 216.3 | 7.4 | — | 223.7 | — | ||||||||||||||
States and political subdivisions | 1,790.4 | 250.0 | (5.9 | ) | 2,034.5 | — | |||||||||||||
Debt securities issued by foreign governments | .8 | — | — | .8 | — | ||||||||||||||
Asset-backed securities | 1,481.0 | 56.4 | (18.5 | ) | 1,518.9 | — | |||||||||||||
Collateralized debt obligations | 332.2 | 1.6 | (3.7 | ) | 330.1 | — | |||||||||||||
Commercial mortgage-backed securities | 1,478.2 | 110.9 | (3.0 | ) | 1,586.1 | — | |||||||||||||
Mortgage pass-through securities | 20.4 | 1.4 | — | 21.8 | — | ||||||||||||||
Collateralized mortgage obligations | 2,214.2 | 119.1 | (6.9 | ) | 2,326.4 | (8.2 | ) | ||||||||||||
Total fixed maturities, available for sale | $ | 22,033.0 | $ | 2,357.1 | $ | (113.5 | ) | $ | 24,276.6 | $ | (8.2 | ) | |||||||
The following table sets forth the amortized cost and estimated fair value of fixed maturities, available for sale, at June 30, 2012, by contractual maturity. Actual maturities will differ from contractual maturities because certain borrowers may have the right to call or prepay obligations with or without penalties. In addition, structured securities (such as asset-backed securities, collateralized debt obligations, commercial mortgage-backed securities, mortgage pass-through securities and collateralized mortgage obligations, collectively referred to as “structured securities”) frequently include provisions for periodic principal payments and permit periodic unscheduled payments.
Amortized cost | Estimated fair value | ||||||
(Dollars in millions) | |||||||
Due in one year or less | $ | 180.8 | $ | 183.2 | |||
Due after one year through five years | 1,563.1 | 1,676.9 | |||||
Due after five years through ten years | 4,511.6 | 4,939.1 | |||||
Due after ten years | 10,251.5 | 11,694.1 | |||||
Subtotal | 16,507.0 | 18,493.3 | |||||
Structured securities | 5,526.0 | 5,783.3 | |||||
Total fixed maturities, available for sale | $ | 22,033.0 | $ | 24,276.6 | |||
Net Realized Investment Gains (Losses)
During the first six months of 2012, we recognized net realized investment gains of $54.8 million, which were comprised of $61.2 million of net gains from the sales of investments (primarily fixed maturities) with proceeds of $1.3 billion, the increase in fair value of certain fixed maturity investments with embedded derivatives of $5.0 million, and $11.4 million of writedowns of investments for other than temporary declines in fair value recognized through net income.
11
CNO FINANCIAL GROUP, INC. AND SUBSIDIARIES
Notes to Consolidated Financial Statements
(unaudited)
___________________
During the first six months of 2011, we recognized net realized investment gains of $8.0 million, which were comprised of $31.4 million of net gains from the sales of investments (primarily fixed maturities) with proceeds of $2.9 billion and $23.4 million of writedowns of investments for other than temporary declines in fair value recognized through net income.
At June 30, 2012, fixed maturity securities in default or considered nonperforming had an aggregate amortized cost of $.4 million and a carrying value of $.5 million.
Our fixed maturity investments are generally purchased in the context of a long-term strategy to fund insurance liabilities, so we do not generally seek to generate short-term realized gains through the purchase and sale of such securities. In certain circumstances, including those in which securities are selling at prices which exceed our view of their underlying economic value, or when it is possible to reinvest the proceeds to better meet our long-term asset-liability objectives, we may sell certain securities.
During the six months ended June 30, 2012, we sold $266.8 million of fixed maturity investments which resulted in gross investment losses (before income taxes) of $7.8 million. We sell securities at a loss for a number of reasons including, but not limited to: (i) changes in the investment environment; (ii) expectation that the market value could deteriorate further; (iii) desire to reduce our exposure to an asset class, an issuer or an industry; (iv) prospective or actual changes in credit quality; or (v) changes in expected cash flows.
There were no investments sold at a loss during the first six months of 2012 that had been continuously in an unrealized loss position exceeding 20 percent of the amortized cost basis for more than 12 months prior to the sale of the investment.
We regularly evaluate all of our investments with unrealized losses for possible impairment. Our assessment of whether unrealized losses are “other than temporary” requires significant judgment. Factors considered include: (i) the extent to which fair value is less than the cost basis; (ii) the length of time that the fair value has been less than cost; (iii) whether the unrealized loss is event driven, credit-driven or a result of changes in market interest rates or risk premium; (iv) the near-term prospects for specific events, developments or circumstances likely to affect the value of the investment; (v) the investment’s rating and whether the investment is investment-grade and/or has been downgraded since its purchase; (vi) whether the issuer is current on all payments in accordance with the contractual terms of the investment and is expected to meet all of its obligations under the terms of the investment; (vii) whether we intend to sell the investment or it is more likely than not that circumstances will require us to sell the investment before recovery occurs; (viii) the underlying current and prospective asset and enterprise values of the issuer and the extent to which the recoverability of the carrying value of our investment may be affected by changes in such values; (ix) projections of, and unfavorable changes in, cash flows on structured securities including mortgage-backed and asset-backed securities; (x) our best estimate of the value of any collateral; and (xi) other objective and subjective factors.
Future events may occur, or additional information may become available, which may necessitate future realized losses in our portfolio. Significant losses could have a material adverse effect on our consolidated financial statements in future periods.
Impairment losses on equity securities are recognized in net income. The manner in which impairment losses on fixed maturity securities, available for sale, are recognized in the financial statements is dependent on the facts and circumstances related to the specific security. If we intend to sell a security or it is more likely than not that we would be required to sell a security before the recovery of its amortized cost, the security is other-than-temporarily impaired and the full amount of the impairment is recognized as a loss through earnings. If we do not expect to recover the amortized cost basis, we do not plan to sell the security, and if it is not more likely than not that we would be required to sell a security before the recovery of its amortized cost, less any current period credit loss, the recognition of the other-than-temporary impairment is bifurcated. We recognize the credit loss portion in net income and the noncredit loss portion in accumulated other comprehensive income.
We estimate the amount of the credit loss component of a fixed maturity security impairment as the difference between amortized cost and the present value of the expected cash flows of the security. The present value is determined using the best estimate of future cash flows discounted at the effective interest rate implicit to the security at the date of purchase or the current yield to accrete an asset-backed or floating rate security. The methodology and assumptions for establishing the best estimate of future cash flows vary depending on the type of security.
12
CNO FINANCIAL GROUP, INC. AND SUBSIDIARIES
Notes to Consolidated Financial Statements
(unaudited)
___________________
For most structured securities, cash flow estimates are based on bond specific facts and circumstances that may include collateral characteristics, expectations of delinquency and default rates, loss severity, prepayment speeds and structural support, including excess spread, subordination and guarantees. For corporate bonds, cash flow estimates are derived from scenario-based outcomes of expected corporate restructurings or the disposition of assets using bond specific facts and circumstances including timing, secured interest and loss severity. The previous amortized cost basis less the impairment recognized in net income becomes the security’s new cost basis. We accrete the new cost basis to the estimated future cash flows over the expected remaining life of the security, except when the security is in default or considered nonperforming.
The remaining noncredit impairment, which is recorded in accumulated other comprehensive income, is the difference between the security’s estimated fair value and our best estimate of future cash flows discounted at the effective interest rate prior to impairment. The remaining noncredit impairment typically represents changes in the market interest rates, current market liquidity and risk premiums. As of June 30, 2012, other-than-temporary impairments included in accumulated other comprehensive income of $8.2 million (before taxes and related amortization) related to structured securities.
The following table summarizes the amount of credit losses recognized in earnings on fixed maturity securities, available for sale, held at the beginning of the period, for which a portion of the other-than-temporary impairment was also recognized in accumulated other comprehensive income for the six months ended June 30, 2012 and 2011 (dollars in millions):
Three months ended | Six months ended | ||||||||||||||
June 30, | June 30, | ||||||||||||||
2012 | 2011 | 2012 | 2011 | ||||||||||||
Credit losses on fixed maturity securities, available for sale, beginning of period | $ | (1.9 | ) | $ | (1.8 | ) | $ | (2.0 | ) | $ | (6.1 | ) | |||
Add: credit losses on other-than-temporary impairments not previously recognized | — | — | — | — | |||||||||||
Less: credit losses on securities sold | .2 | .2 | .3 | 4.5 | |||||||||||
Less: credit losses on securities impaired due to intent to sell (a) | — | — | — | — | |||||||||||
Add: credit losses on previously impaired securities | — | — | — | — | |||||||||||
Less: increases in cash flows expected on previously impaired securities | — | — | — | — | |||||||||||
Credit losses on fixed maturity securities, available for sale, end of period | $ | (1.7 | ) | $ | (1.6 | ) | $ | (1.7 | ) | $ | (1.6 | ) | |||
__________
(a) | Represents securities for which the amount previously recognized in accumulated other comprehensive income was recognized in earnings because we intend to sell the security or we more likely than not will be required to sell the security before recovery of its amortized cost basis. |
Gross Unrealized Investment Losses
Our investment strategy is to maximize, over a sustained period and within acceptable parameters of quality and risk, investment income and total investment return through active investment management. Accordingly, we may sell securities at a gain or a loss to enhance the projected total return of the portfolio as market opportunities change, to reflect changing perceptions of risk, or to better match certain characteristics of our investment portfolio with the corresponding characteristics of our insurance liabilities.
13
CNO FINANCIAL GROUP, INC. AND SUBSIDIARIES
Notes to Consolidated Financial Statements
(unaudited)
___________________
The following table summarizes the gross unrealized losses and fair values of our investments with unrealized losses that are not deemed to be other-than-temporarily impaired, aggregated by investment category and length of time that such securities have been in a continuous unrealized loss position, at June 30, 2012 (dollars in millions):
Less than 12 months | 12 months or greater | Total | ||||||||||||||||||||||
Description of securities | Fair value | Unrealized losses | Fair value | Unrealized losses | Fair value | Unrealized losses | ||||||||||||||||||
United States Treasury securities and obligations of United States government corporations and agencies | $ | 19.0 | $ | — | $ | — | $ | — | $ | 19.0 | $ | — | ||||||||||||
States and political subdivisions | 21.3 | (.9 | ) | 83.9 | (5.0 | ) | 105.2 | (5.9 | ) | |||||||||||||||
Corporate securities | 790.6 | (25.9 | ) | 463.6 | (49.6 | ) | 1,254.2 | (75.5 | ) | |||||||||||||||
Asset-backed securities | 230.0 | (3.2 | ) | 243.3 | (15.3 | ) | 473.3 | (18.5 | ) | |||||||||||||||
Collateralized debt obligations | 178.1 | (2.5 | ) | 41.5 | (1.2 | ) | 219.6 | (3.7 | ) | |||||||||||||||
Commercial mortgage-backed securities | 75.8 | (.6 | ) | 38.6 | (2.4 | ) | 114.4 | (3.0 | ) | |||||||||||||||
Mortgage pass-through securities | — | — | 2.1 | — | 2.1 | — | ||||||||||||||||||
Collateralized mortgage obligations | 234.5 | (3.2 | ) | 137.5 | (3.7 | ) | 372.0 | (6.9 | ) | |||||||||||||||
Total fixed maturities, available for sale | $ | 1,549.3 | $ | (36.3 | ) | $ | 1,010.5 | $ | (77.2 | ) | $ | 2,559.8 | $ | (113.5 | ) | |||||||||
Equity securities | $ | 28.5 | $ | (3.6 | ) | $ | — | $ | — | $ | 28.5 | $ | (3.6 | ) | ||||||||||
The following table summarizes the gross unrealized losses and fair values of our investments with unrealized losses that are not deemed to be other-than-temporarily impaired, aggregated by investment category and length of time that such securities have been in a continuous unrealized loss position, at December 31, 2011 (dollars in millions):
Less than 12 months | 12 months or greater | Total | ||||||||||||||||||||||
Description of securities | Fair value | Unrealized losses | Fair value | Unrealized losses | Fair value | Unrealized losses | ||||||||||||||||||
United States Treasury securities and obligations of United States government corporations and agencies | $ | 9.1 | $ | — | $ | .2 | $ | — | $ | 9.3 | $ | — | ||||||||||||
States and political subdivisions | 6.9 | (.2 | ) | 155.4 | (13.4 | ) | 162.3 | (13.6 | ) | |||||||||||||||
Debt securities issued by foreign governments | .5 | — | — | — | .5 | — | ||||||||||||||||||
Corporate securities | 1,394.7 | (57.0 | ) | 466.2 | (79.9 | ) | 1,860.9 | (136.9 | ) | |||||||||||||||
Asset-backed securities | 437.6 | (14.5 | ) | 147.5 | (22.2 | ) | 585.1 | (36.7 | ) | |||||||||||||||
Collateralized debt obligations | 268.8 | (6.3 | ) | 1.7 | — | 270.5 | (6.3 | ) | ||||||||||||||||
Commercial mortgage-backed securities | 168.8 | (5.2 | ) | 33.0 | (2.7 | ) | 201.8 | (7.9 | ) | |||||||||||||||
Mortgage pass-through securities | 1.2 | — | 2.2 | (.1 | ) | 3.4 | (.1 | ) | ||||||||||||||||
Collateralized mortgage obligations | 645.0 | (20.8 | ) | 29.7 | (.6 | ) | 674.7 | (21.4 | ) | |||||||||||||||
Total fixed maturities, available for sale | $ | 2,932.6 | $ | (104.0 | ) | $ | 835.9 | $ | (118.9 | ) | $ | 3,768.5 | $ | (222.9 | ) | |||||||||
Equity securities | $ | 41.6 | $ | (3.0 | ) | $ | .4 | $ | — | $ | 42.0 | $ | (3.0 | ) | ||||||||||
Based on management’s current assessment of investments with unrealized losses at June 30, 2012, the Company believes the issuers of the securities will continue to meet their obligations (or with respect to equity-type securities, the
14
CNO FINANCIAL GROUP, INC. AND SUBSIDIARIES
Notes to Consolidated Financial Statements
(unaudited)
___________________
investment value will recover to its cost basis). While we do not have the intent to sell securities with unrealized losses and it is not more likely than not that we will be required to sell securities with unrealized losses prior to their anticipated recovery, our intent on an individual security may change, based upon market or other unforeseen developments. In such instances, if a loss is recognized from a sale subsequent to a balance sheet date due to these unexpected developments, the loss is recognized in the period in which we had the intent to sell the security before its anticipated recovery.
EARNINGS PER SHARE
A reconciliation of net income and shares used to calculate basic and diluted earnings per share is as follows (dollars in millions and shares in thousands):
Three months ended | Six months ended | ||||||||||||||
June 30, | June 30, | ||||||||||||||
2012 | 2011 | 2012 | 2011 | ||||||||||||
Net income for basic earnings per share | $ | 65.7 | $ | 46.4 | $ | 124.8 | $ | 91.8 | |||||||
Add: interest expense on 7.0% Convertible Senior Debentures due 2016 (the “7.0% Debentures”), net of income taxes | 3.7 | 3.7 | 7.4 | 7.4 | |||||||||||
Net income for diluted earnings per share | $ | 69.4 | $ | 50.1 | $ | 132.2 | $ | 99.2 | |||||||
Shares: | |||||||||||||||
Weighted average shares outstanding for basic earnings per share | 237,289 | 250,933 | 239,092 | 251,027 | |||||||||||
Effect of dilutive securities on weighted average shares: | |||||||||||||||
7% Debentures | 53,377 | 53,367 | 53,372 | 53,367 | |||||||||||
Stock option and restricted stock plans | 2,367 | 3,036 | 2,475 | 2,892 | |||||||||||
Warrants | 442 | 712 | 470 | 487 | |||||||||||
Dilutive potential common shares | 56,186 | 57,115 | 56,317 | 56,746 | |||||||||||
Weighted average shares outstanding for diluted earnings per share | 293,475 | 308,048 | 295,409 | 307,773 | |||||||||||
Basic earnings per common share is computed by dividing net income by the weighted average number of common shares outstanding for the period. Restricted shares (including our performance shares) are not included in basic earnings per share until vested. Diluted earnings per share reflect the potential dilution that could occur if outstanding stock options and warrants were exercised and restricted stock was vested. The dilution from options, warrants and restricted shares is calculated using the treasury stock method. Under this method, we assume the proceeds from the exercise of the options and warrants (or the unrecognized compensation expense with respect to restricted stock) will be used to purchase shares of our common stock at the average market price during the period, reducing the dilutive effect of the exercise of the options and warrants (or the vesting of the restricted stock). The dilution from our 7.0% Debentures is calculated using the "if converted" method. Initially, the 7.0% Debentures will be convertible into 182.1494 shares of our common stock for each $1,000 principal amount of 7.0% Debentures, which is equivalent to an initial conversion price of approximately $5.49 per share. The conversion rate is subject to adjustment following the occurrence of certain events in accordance with the terms of the 7.0% Debentures.
BUSINESS SEGMENTS
The Company manages its business through the following operating segments: Bankers Life, Washington National and Colonial Penn, which are defined on the basis of product distribution; Other CNO Business, comprised primarily of products we no longer sell actively; and corporate operations, comprised of holding company activities and certain noninsurance company businesses.
We measure segment performance by excluding realized investment gains (losses) and fair value changes in embedded derivative liabilities because we believe that this performance measure is a better indicator of the ongoing business and trends in our business. Our primary investment focus is on investment income to support our liabilities for insurance products as opposed to the generation of realized investment gains (losses), and a long-term focus is necessary to maintain profitability over the life of the business.
15
CNO FINANCIAL GROUP, INC. AND SUBSIDIARIES
Notes to Consolidated Financial Statements
(unaudited)
___________________
Realized investment gains (losses) and fair value changes in embedded derivative liabilities depend on market conditions and do not necessarily relate to the underlying business of our segments. Realized investment gains (losses) and fair value changes in embedded derivative liabilities may affect future earnings levels since our underlying business is long-term in nature and changes in our investment portfolio may impact our ability to earn the assumed interest rates needed to maintain the profitability of our business.
Operating information by segment was as follows (dollars in millions):
Three months ended | Six months ended | ||||||||||||||
June 30, | June 30, | ||||||||||||||
2012 | 2011 | 2012 | 2011 | ||||||||||||
Revenues: | |||||||||||||||
Bankers Life: | |||||||||||||||
Insurance policy income: | |||||||||||||||
Annuities | $ | 7.9 | $ | 8.7 | $ | 15.1 | $ | 17.1 | |||||||
Health | 341.4 | 343.3 | 675.5 | 683.1 | |||||||||||
Life | 69.7 | 57.6 | 134.9 | 109.4 | |||||||||||
Net investment income (a) | 185.6 | 196.9 | 420.5 | 406.5 | |||||||||||
Fee revenue and other income (a) | 3.3 | 3.3 | 6.2 | 5.6 | |||||||||||
Total Bankers Life revenues | 607.9 | 609.8 | 1,252.2 | 1,221.7 | |||||||||||
Washington National: | |||||||||||||||
Insurance policy income: | |||||||||||||||
Health | 143.2 | 141.7 | 285.6 | 281.9 | |||||||||||
Life | 3.7 | 3.8 | 8.0 | 7.9 | |||||||||||
Other | .7 | 1.1 | 1.4 | 2.2 | |||||||||||
Net investment income (a) | 51.0 | 46.7 | 101.0 | 93.0 | |||||||||||
Fee revenue and other income (a) | .3 | .2 | .5 | .5 | |||||||||||
Total Washington National revenues | 198.9 | 193.5 | 396.5 | 385.5 | |||||||||||
Colonial Penn: | |||||||||||||||
Insurance policy income: | |||||||||||||||
Health | 1.3 | 1.5 | 2.7 | 3.1 | |||||||||||
Life | 53.3 | 49.4 | 105.3 | 98.1 | |||||||||||
Net investment income (a) | 10.2 | 10.5 | 20.2 | 20.8 | |||||||||||
Fee revenue and other income (a) | .2 | .2 | .4 | .4 | |||||||||||
Total Colonial Penn revenues | 65.0 | 61.6 | 128.6 | 122.4 | |||||||||||
Other CNO Business: | |||||||||||||||
Insurance policy income: | |||||||||||||||
Annuities | 3.3 | 2.9 | 5.8 | 5.2 | |||||||||||
Health | 6.4 | 7.1 | 13.1 | 14.4 | |||||||||||
Life | 63.7 | 61.9 | 133.3 | 123.2 | |||||||||||
Other | .2 | .6 | .4 | 1.2 | |||||||||||
Net investment income (a) | 79.8 | 86.7 | 172.5 | 181.4 | |||||||||||
Total Other CNO Business revenues | 153.4 | 159.2 | 325.1 | 325.4 | |||||||||||
Corporate operations: | |||||||||||||||
Net investment income | 7.2 | 4.5 | 30.4 | 17.1 | |||||||||||
Fee and other income | .7 | .5 | 1.3 | 1.1 | |||||||||||
Total corporate revenues | 7.9 | 5.0 | 31.7 | 18.2 | |||||||||||
Total revenues | 1,033.1 | 1,029.1 | 2,134.1 | 2,073.2 | |||||||||||
(continued on next page)
16
CNO FINANCIAL GROUP, INC. AND SUBSIDIARIES
Notes to Consolidated Financial Statements
(unaudited)
___________________
(continued from previous page)
Three months ended | Six months ended | ||||||||||||||
June 30, | June 30, | ||||||||||||||
2012 | 2011 | 2012 | 2011 | ||||||||||||
Expenses: | |||||||||||||||
Bankers Life: | |||||||||||||||
Insurance policy benefits | $ | 396.7 | $ | 408.9 | $ | 817.6 | $ | 813.7 | |||||||
Amortization | 50.5 | 46.9 | 107.4 | 115.4 | |||||||||||
Interest expense on investment borrowings | 1.4 | 1.1 | 2.8 | 2.3 | |||||||||||
Other operating costs and expenses | 83.2 | 80.8 | 177.8 | 156.0 | |||||||||||
Total Bankers Life expenses | 531.8 | 537.7 | 1,105.6 | 1,087.4 | |||||||||||
Washington National: | |||||||||||||||
Insurance policy benefits | 113.7 | 118.3 | 229.4 | 230.5 | |||||||||||
Amortization | 10.8 | 11.4 | 23.5 | 24.8 | |||||||||||
Interest expense on investment borrowings | .8 | — | 1.5 | — | |||||||||||
Other operating costs and expenses | 39.7 | 42.0 | 83.5 | 84.1 | |||||||||||
Total Washington National expenses | 165.0 | 171.7 | 337.9 | 339.4 | |||||||||||
Colonial Penn: | |||||||||||||||
Insurance policy benefits | 39.6 | 38.0 | 81.7 | 76.7 | |||||||||||
Amortization | 3.9 | 3.5 | 7.6 | 7.5 | |||||||||||
Other operating costs and expenses | 20.9 | 19.6 | 48.5 | 43.4 | |||||||||||
Total Colonial Penn expenses | 64.4 | 61.1 | 137.8 | 127.6 | |||||||||||
Other CNO Business: | |||||||||||||||
Insurance policy benefits | 122.0 | 119.2 | 243.9 | 246.7 | |||||||||||
Amortization | 7.1 | 9.4 | 14.6 | 18.0 | |||||||||||
Interest expense on investment borrowings | 5.0 | 5.0 | 10.1 | 9.9 | |||||||||||
Other operating costs and expenses | 17.4 | 20.5 | 56.9 | 38.3 | |||||||||||
Total Other CNO Business expenses | 151.5 | 154.1 | 325.5 | 312.9 | |||||||||||
Corporate operations: | |||||||||||||||
Interest expense on corporate debt | 16.6 | 19.3 | 34.1 | 39.9 | |||||||||||
Interest expense on borrowings of variable interest entities | 4.7 | 3.5 | 8.7 | 6.0 | |||||||||||
Interest expense on investment borrowings | .2 | — | .3 | — | |||||||||||
Loss on extinguishment of debt | .5 | .6 | .7 | 2.0 | |||||||||||
Other operating costs and expenses | 12.1 | 12.8 | 33.6 | 24.0 | |||||||||||
Total corporate expenses | 34.1 | 36.2 | 77.4 | 71.9 | |||||||||||
Total expenses | 946.8 | 960.8 | 1,984.2 | 1,939.2 | |||||||||||
Income (loss) before net realized investment losses and fair value changes in embedded derivative liabilities (net of related amortization) and income taxes: | |||||||||||||||
Bankers Life | 76.1 | 72.1 | 146.6 | 134.3 | |||||||||||
Washington National | 33.9 | 21.8 | 58.6 | 46.1 | |||||||||||
Colonial Penn | .6 | .5 | (9.2 | ) | (5.2 | ) | |||||||||
Other CNO Business | 1.9 | 5.1 | (.4 | ) | 12.5 | ||||||||||
Corporate operations | (26.2 | ) | (31.2 | ) | (45.7 | ) | (53.7 | ) | |||||||
Income before net realized investment losses and fair value changes in embedded derivative liabilities (net of related amortization) and income taxes | $ | 86.3 | $ | 68.3 | $ | 149.9 | $ | 134.0 | |||||||
___________________
(a) | It is not practicable to provide additional components of revenue by product or services. |
17
CNO FINANCIAL GROUP, INC. AND SUBSIDIARIES
Notes to Consolidated Financial Statements
(unaudited)
___________________
A reconciliation of segment revenues and expenses to consolidated revenues and expenses is as follows (dollars in millions):
Three months ended | Six months ended | ||||||||||||||
June 30, | June 30, | ||||||||||||||
2012 | 2011 | 2012 | 2011 | ||||||||||||
Total segment revenues | $ | 1,033.1 | $ | 1,029.1 | $ | 2,134.1 | $ | 2,073.2 | |||||||
Net realized investment gains | 31.9 | 2.9 | 54.8 | 8.0 | |||||||||||
Consolidated revenues | $ | 1,065.0 | $ | 1,032.0 | $ | 2,188.9 | $ | 2,081.2 | |||||||
Total segment expenses | $ | 946.8 | $ | 960.8 | $ | 1,984.2 | $ | 1,939.2 | |||||||
Insurance policy benefits - fair value changes in embedded derivative liabilities | 17.7 | — | 6.1 | — | |||||||||||
Amortization related to fair value changes in embedded derivative liabilities | (7.1 | ) | — | (2.4 | ) | — | |||||||||
Amortization related to net realized investment gains | 3.1 | (.6 | ) | 4.2 | (.2 | ) | |||||||||
Consolidated expenses | $ | 960.5 | $ | 960.2 | $ | 1,992.1 | $ | 1,939.0 | |||||||
ACCOUNTING FOR DERIVATIVES
Our fixed index annuity products provide a guaranteed minimum rate of return and a higher potential return that is based on a percentage (the “participation rate”) of the amount of increase in the value of a particular index, such as the Standard & Poor’s 500 Index, over a specified period. Typically, on each policy anniversary date, a new index period begins. We are generally able to change the participation rate at the beginning of each index period during a policy year, subject to contractual minimums. We typically buy call options (including call spreads) referenced to the applicable indices in an effort to offset or hedge potential increases to policyholder benefits resulting from increases in the particular index to which the policy’s return is linked. We reflect changes in the estimated fair value of these options in net investment income (classified as investment income from policyholder and reinsurer accounts and other special-purpose portfolios). Net investment gains (losses) related to fixed index products were $18.0 million and $19.0 million in the six months ended June 30, 2012 and 2011, respectively. These amounts were substantially offset by a corresponding change to insurance policy benefits. The estimated fair value of these options was $76.8 million and $37.9 million at June 30, 2012 and December 31, 2011, respectively. We classify these instruments as other invested assets.
The Company accounts for the options attributed to the policyholder for the estimated life of the annuity contract as embedded derivatives. The expected future cost of options on fixed index annuity products is used to determine the value of embedded derivatives. The Company purchases options to hedge liabilities for the next policy year on each policy anniversary date and must estimate the fair value of the forward embedded options related to the policies. These accounting requirements often create volatility in the earnings from these products. We record the changes in the fair values of the embedded derivatives in current earnings as a component of insurance policy benefits. The fair value of these derivatives, which are classified as “liabilities for interest-sensitive products”, was $701.0 million at June 30, 2012 and $666.3 million at December 31, 2011. Prior to June 30, 2011, we maintained a specific block of investments in our trading securities account (which we carried at estimated fair value with changes in such value recognized as investment income from policyholder and reinsurer accounts and other special-purpose portfolios) to offset the income statement volatility caused by the effect of interest rate fluctuations on the value of embedded derivatives related to our fixed index annuity products. During the second quarter of 2011, we sold this trading portfolio, which will result in increased volatility in future earnings since the volatility caused by the accounting requirements to record embedded options at fair value will no longer be offset.
If the counterparties for the call options we hold fail to meet their obligations, we may have to recognize a loss. We limit our exposure to such a loss by diversifying among several counterparties believed to be strong and creditworthy. At June 30, 2012, substantially all of our counterparties were rated “BBB+” or higher by Standard & Poor’s Corporation (“S&P”).
18
CNO FINANCIAL GROUP, INC. AND SUBSIDIARIES
Notes to Consolidated Financial Statements
(unaudited)
___________________
Certain of our reinsurance payable balances contain embedded derivatives. Such derivatives had an estimated fair value of $4.9 million and $3.5 million at June 30, 2012 and December 31, 2011, respectively. We record the change in the fair value of these derivatives as a component of investment income (classified as investment income from policyholder and reinsurer accounts and other special-purpose portfolios). We maintain the investments related to these agreements in our trading securities account, which we carry at estimated fair value with changes in such value recognized as investment income (also classified as investment income from policyholder and reinsurer accounts and other special-purpose portfolios). The change in value of these trading securities offsets the change in value of the embedded derivatives.
We purchase certain fixed maturity securities that contain embedded derivatives that are required to be bifurcated from the instrument and held at fair value on the consolidated balance sheet. For certain of these securities, we have elected the fair value option to carry the entire security at fair value with changes in fair value reported in net income for operational ease.
REINSURANCE
The cost of reinsurance ceded totaled $59.3 million and $57.6 million in the second quarters of 2012 and 2011, respectively, and $116.5 million and $118.0 million in the first six months of 2012 and 2011, respectively. We deduct this cost from insurance policy income. Reinsurance recoveries netted against insurance policy benefits totaled $54.2 million and $52.3 million in the second quarters of 2012 and 2011, respectively, and $115.8 million and $114.8 million in the first six months of 2012 and 2011, respectively.
From time-to-time, we assume insurance from other companies. Any costs associated with the assumption of insurance are amortized consistent with the method used to amortize deferred acquisition costs. Reinsurance premiums assumed totaled $22.9 million and $26.1 million in the second quarters of 2012 and 2011, respectively, and $38.8 million and $46.5 million in the first six months of 2012 and 2011, respectively. Reinsurance premiums included amounts assumed pursuant to marketing and quota-share agreements with Coventry Health Care (“Coventry”) of $17.7 million and $20.4 million in the second quarters of 2012 and 2011, respectively, and $28.5 million and $34.8 million in the first six months of 2012 and 2011, respectively.
See the note entitled “Accounting for Derivatives” for a discussion of the derivative embedded in the payable related to certain modified coinsurance agreements.
INCOME TAXES
The components of income tax expense were as follows (dollars in millions):
Three months ended | Six months ended | ||||||||||||||
June 30, | June 30, | ||||||||||||||
2012 | 2011 | 2012 | 2011 | ||||||||||||
Current tax expense | $ | 3.4 | $ | 1.8 | $ | 6.7 | $ | 4.9 | |||||||
Deferred tax provision | 35.4 | 23.6 | 65.3 | 45.5 | |||||||||||
Total income tax expense | $ | 38.8 | $ | 25.4 | $ | 72.0 | $ | 50.4 | |||||||
19
CNO FINANCIAL GROUP, INC. AND SUBSIDIARIES
Notes to Consolidated Financial Statements
(unaudited)
___________________
A reconciliation of the U.S. statutory corporate tax rate to the effective rate reflected in the consolidated statement of operations is as follows:
Six months ended | |||||
June 30, | |||||
2012 | 2011 | ||||
U.S. statutory corporate rate | 35.0 | % | 35.0 | % | |
Other nondeductible benefits | 1.2 | (.4 | ) | ||
State taxes | .9 | .7 | |||
Provision for tax issues, tax credits and other | (.5 | ) | .1 | ||
Effective tax rate | 36.6 | % | 35.4 | % | |
The components of the Company’s income tax assets and liabilities were as follows (dollars in millions):
June 30, 2012 | December 31, 2011 | ||||||
Deferred tax assets: | |||||||
Net federal operating loss carryforwards | $ | 1,374.6 | $ | 1,445.2 | |||
Net state operating loss carryforwards | 16.4 | 16.8 | |||||
Tax credits | 36.7 | 32.6 | |||||
Capital loss carryforwards | 319.8 | 342.3 | |||||
Deductible temporary differences: | |||||||
Insurance liabilities | 763.3 | 744.4 | |||||
Other | 50.5 | 64.8 | |||||
Gross deferred tax assets | 2,561.3 | 2,646.1 | |||||
Deferred tax liabilities: | |||||||
Investments | (28.3 | ) | (24.2 | ) | |||
Present value of future profits and deferred acquisition costs | (339.7 | ) | (363.7 | ) | |||
Unrealized appreciation on investments | (552.9 | ) | (434.8 | ) | |||
Gross deferred tax liabilities | (920.9 | ) | (822.7 | ) | |||
Net deferred tax assets before valuation allowance | 1,640.4 | 1,823.4 | |||||
Valuation allowance | (938.4 | ) | (938.4 | ) | |||
Net deferred tax assets | 702.0 | 885.0 | |||||
Current income taxes accrued | (22.3 | ) | (19.6 | ) | |||
Income tax assets, net | $ | 679.7 | $ | 865.4 | |||
Our income tax expense includes deferred income taxes arising from temporary differences between the financial reporting and tax bases of assets and liabilities, capital loss carryforwards and net operating loss carryforwards (“NOLs”). Deferred tax assets and liabilities are measured using enacted tax rates expected to apply in the years in which temporary differences are expected to be recovered or paid. The effect of a change in tax rates on deferred tax assets and liabilities is recognized in earnings in the period when the changes are enacted.
A reduction of the net carrying amount of deferred tax assets by establishing a valuation allowance is required if, based on the available evidence, it is more likely than not that such assets will not be realized. In assessing the need for a valuation allowance, all available evidence, both positive and negative, shall be considered to determine whether, based on the weight of that evidence, a valuation allowance for deferred tax assets is needed. This assessment requires significant judgment and considers, among other matters, the nature, frequency and severity of current and cumulative losses, forecasts of future profitability, the duration of carryforward periods, our experience with operating loss and tax credit carryforwards expiring
20
CNO FINANCIAL GROUP, INC. AND SUBSIDIARIES
Notes to Consolidated Financial Statements
(unaudited)
___________________
unused, and tax planning strategies. We evaluate the need to establish a valuation allowance for our deferred income tax assets on an ongoing basis. The realization of our deferred income tax assets depends upon generating sufficient future taxable income during the periods in which our temporary differences become deductible and before our capital loss carryforwards and NOLs expire.
Recovery of our deferred tax assets is dependent on achieving the future taxable income used in our deferred tax valuation model and failure to do so would result in an increase in the valuation allowance in a future period. Any future increase in the valuation allowance may result in additional income tax expense and reduce shareholders’ equity, and such an increase could have a significant impact upon our earnings in the future. In addition, the use of the Company’s NOLs is dependent, in part, on whether the Internal Revenue Service (the “IRS”) ultimately agrees with the tax positions we have taken in our tax returns with respect to the allocation of cancellation of indebtedness income ("CODI") resulting from the bankruptcy of our Predecessor and the classification of the loss we recognized as a result of the transfer of the stock of Senior Health Insurance Company of Pennsylvania (“Senior Health”) to Senior Health Care Oversight Trust, an independent trust (the “Independent Trust”).
The Internal Revenue Code (the “Code”) limits the extent to which losses realized by a non-life entity (or entities) may offset income from a life insurance company (or companies) to the lesser of: (i) 35 percent of the income of the life insurance company; or (ii) 35 percent of the total loss of the non-life entities (including NOLs of the non-life entities). There is no similar limitation on the extent to which losses realized by a life insurance entity (or entities) may offset income from a non-life entity (or entities).
Section 382 of the Code imposes limitations on a corporation’s ability to use its NOLs when the company undergoes an ownership change. Future transactions and the timing of such transactions could cause an ownership change for Section 382 income tax purposes. Such transactions may include, but are not limited to, additional repurchases under our share repurchase program, issuances of common stock (including upon conversion of our outstanding 7.0% Debentures), and acquisitions or sales of shares of CNO stock by certain holders of our shares, including persons who have held, currently hold or may accumulate in the future five percent or more of our outstanding common stock for their own account. Many of these transactions are beyond our control. If an additional ownership change were to occur for purposes of Section 382, we would be required to calculate an annual restriction on the use of our NOLs to offset future taxable income. The annual restriction would be calculated based upon the value of CNO’s equity at the time of such ownership change, multiplied by a federal long-term tax exempt rate (3.26 percent at June 30, 2012), and the annual restriction could effectively eliminate our ability to use a substantial portion of our NOLs to offset future taxable income. We regularly monitor ownership change (as calculated for purposes of Section 382) and, as of June 30, 2012, we were below the 50 percent ownership change level that would trigger further impairment of our ability to utilize our NOLs.
21
CNO FINANCIAL GROUP, INC. AND SUBSIDIARIES
Notes to Consolidated Financial Statements
(unaudited)
___________________
As of June 30, 2012, we had $3.9 billion of federal NOLs and $.9 billion of capital loss carryforwards. The following table summarizes the expiration dates of our loss carryforwards assuming the IRS does not ultimately agree with the positions we have taken with respect to the allocation of CODI and the loss on our investment in Senior Health, both as further described below (dollars in millions):
Year of expiration | Net operating loss carryforwards (a) | Capital loss | Total loss | |||||||||||||||||||
Life | Non-life | carryforwards | carryforwards | |||||||||||||||||||
2013 | $ | — | $ | — | $ | 876.2 | (b) | $ | 876.2 | |||||||||||||
2014 | — | — | 28.7 | 28.7 | ||||||||||||||||||
2015 | — | — | 8.9 | 8.9 | ||||||||||||||||||
2018 | 613.9 | (a) | — | — | 613.9 | |||||||||||||||||
2021 | 29.6 | — | — | 29.6 | ||||||||||||||||||
2022 | 204.1 | — | — | 204.1 | ||||||||||||||||||
2023 | — | (b) | 2,591.7 | (a) | — | 2,591.7 | ||||||||||||||||
2024 | — | 3.2 | — | 3.2 | ||||||||||||||||||
2025 | — | 118.8 | — | 118.8 | ||||||||||||||||||
2027 | — | 216.8 | — | 216.8 | ||||||||||||||||||
2028 | — | .5 | — | .5 | ||||||||||||||||||
2029 | — | 148.8 | — | 148.8 | ||||||||||||||||||
Total | $ | 847.6 | $ | 3,079.8 | $ | 913.8 | $ | 4,841.2 | ||||||||||||||
_________________________
(a) | The life/non-life allocation summarized above assumes the IRS does not ultimately agree with the tax position we have taken in our tax returns with respect to the allocation of CODI. If the IRS ultimately agrees with our tax position, approximately $631 million of the non-life NOLs expiring in 2023 would be characterized as life NOLs expiring in 2018. |
(b) | The allocation of the capital loss carryforwards summarized above assumes the IRS does not ultimately agree with the tax position we have taken with respect to our investment in Senior Health, which was worthless when it was transferred to the Independent Trust in 2008. If the IRS ultimately agrees with our tax position of classifying this loss as ordinary, capital loss carryforwards expiring in 2013 would decrease and life NOLs expiring in 2023 would increase by $742 million. |
We had deferred tax assets related to NOLs for state income taxes of $16.4 million and $16.8 million at June 30, 2012 and December 31, 2011, respectively. The related state NOLs are available to offset future state taxable income in certain states through 2019.
In July 2006, the Joint Committee of Taxation accepted the audit and the settlement which characterized $2.1 billion of the tax losses on our Predecessor's investment in Conseco Finance Corp. as life company losses and the remaining $3.8 billion as non-life losses prior to the application of the CODI attribute reductions described below.
The Code provides that any income realized as a result of the CODI in bankruptcy must reduce NOLs. We realized $2.5 billion of CODI when we emerged from bankruptcy. Pursuant to the Company's interpretation of the tax law, the CODI reductions were all used to reduce non-life NOLs and this position has been taken in our tax returns. However, the IRS has recently issued a proposed adjustment which is not in agreement with our position. We have requested an appeal of the IRS proposed adjustment through their early appeals process. Due to uncertainties with respect to the position the IRS may take and limitations on our ability to utilize NOLs based on projected life and non-life income, we have consistently considered the $631 million of CODI to be a reduction to life NOLs when determining our valuation allowance, pending resolution. If the IRS ultimately agrees with our position that the $631 million of CODI is a reduction to non-life NOLs, our valuation allowance would be reduced by approximately $140 million based on the income projections used in determining our valuation allowance. The outcome of this uncertainty cannot be predicted.
We recognized a $742 million loss on our investment in Senior Health which was worthless when it was transferred to
22
CNO FINANCIAL GROUP, INC. AND SUBSIDIARIES
Notes to Consolidated Financial Statements
(unaudited)
___________________
the Independent Trust in 2008. We have treated the loss as a capital loss when determining the deferred tax benefit we may receive. We also established a full valuation allowance as we believe we will not generate capital gains to utilize the benefit. However, due to uncertainties in the Code, we have reflected this loss as an ordinary loss in our tax return, contrary to certain IRS rulings. If classifying this loss as ordinary is ultimately determined to be correct, our valuation allowance would be reduced by approximately $160 million based on the income projections used in determining our valuation allowance.
Tax years 2008 through 2010 are under examination by the IRS. This examination is expected to accelerate the resolution of the uncertainty related to the loss on our investment in Senior Health. The Company’s various state income tax returns are generally open for tax years 2008 through 2010 based on the individual state statutes of limitation. Generally, for tax years which generate net operating losses, capital losses or tax credit carryforwards, the statute of limitations does not close until the expiration of the statute of limitations for the tax year in which such carryforwards are utilized.
NOTES PAYABLE - DIRECT CORPORATE OBLIGATIONS
The following notes payable were direct corporate obligations of the Company as of June 30, 2012 and December 31, 2011 (dollars in millions):
June 30, 2012 | December 31, 2011 | ||||||
7.0% Debentures | $ | 293.0 | $ | 293.0 | |||
Senior Secured Credit Agreement (as defined below) | 223.8 | 255.2 | |||||
9.0% Senior Secured Notes due January 2018 (the “9.0% Senior Secured Notes”) | 275.0 | 275.0 | |||||
Senior Health Note due November 12, 2013 (the “Senior Health Note”) | — | 50.0 | |||||
Unamortized discount on 7.0% Debentures | (11.9 | ) | (12.9 | ) | |||
Unamortized discount on Senior Secured Credit Agreement | (1.7 | ) | (2.4 | ) | |||
Direct corporate obligations | $ | 778.2 | $ | 857.9 | |||
In March 2012, we amended our senior secured term loan facility maturing on September 30, 2016 (the "Senior Secured Credit Agreement"). The changes to the Senior Secured Credit Agreement included:
(i) | a change in the definition of “Total Capitalization” (used to calculate compliance with the Debt to Total Capitalization Ratio covenant) to provide that any change to the Company's shareholders' equity resulting from the adoption by the Company of ASU 2010-26, related to the accounting for deferred acquisition costs, shall be disregarded for the purpose of such covenant to the extent the Company going forward quantifies the impact of ASU 2010-26 for each fiscal quarter or fiscal year and the cumulative impact since its adoption; and |
(ii) | an increase in the cap on investments in “Capital Stock” (as defined in the amended credit agreement) from 1 percent to 3 percent. |
In the first six months of 2012, as required under the terms of the Senior Secured Credit Agreement, we made mandatory prepayments of $31.4 million due to our repurchase of $58.2 million of our common stock and a common stock dividend payment of $4.7 million made in June 2012. As a result of the prepayments, we recognized a loss on the extinguishment of debt totaling $.7 million representing the write-off of unamortized discount and issuance costs associated with the Senior Secured Credit Agreement.
In March 2012, we also paid in full the remaining $50.0 million principal balance on the Senior Health Note, which had been scheduled to mature in November 2013. The repayment in full of the Senior Health Note removed the previous restriction on our ability to pay cash dividends on our common stock.
23
CNO FINANCIAL GROUP, INC. AND SUBSIDIARIES
Notes to Consolidated Financial Statements
(unaudited)
___________________
The Senior Secured Credit Agreement requires the Company to maintain: (i) a debt to total capitalization ratio of not more than 30 percent (such ratio, calculated in accordance with the Senior Secured Credit Agreement, was 15.7 percent at June 30, 2012); (ii) an interest coverage ratio of not less than 2.00 to 1.00 for each rolling four quarters (such ratio was 5.24 to 1.00 for the rolling four quarters ended June 30, 2012); (iii) an aggregate ratio of total adjusted capital to company action level risk-based capital for the Company’s insurance subsidiaries of not less than 250 percent (such ratio was 369 percent at June 30, 2012); and (iv) a combined statutory capital and surplus for the Company’s insurance subsidiaries of at least $1,200.0 million (combined statutory capital and surplus at June 30, 2012, was $1,832.1 million). The Company is in compliance with all debt covenants as of June 30, 2012.
The scheduled repayment of our direct corporate obligations was as follows at June 30, 2012 (dollars in millions):
Year ending June 30, | |||
2013 | $ | 47.5 | |
2014 | 65.0 | ||
2015 | 80.0 | ||
2016 | 31.3 | ||
2017 | 293.0 | ||
Thereafter | 275.0 | ||
$ | 791.8 | ||
We may prepay, in whole or in part, the Senior Secured Credit Agreement, together with any accrued and unpaid interest, with prior notice but without premium or penalty in minimum amounts of $1.0 million or any multiple thereof.
Mandatory prepayments of the Senior Secured Credit Agreement will be required in an amount equal to: (i) 100 percent of the net cash proceeds from certain asset sales or casualty events; (ii) 100 percent of the net cash proceeds received by the Company or any of its subsidiaries from certain debt issuances; (iii) 50 percent of the net cash proceeds received from certain equity issuances; and (iv) 100 percent of the amount of certain restricted payments made (including any common stock dividends and share repurchases) as defined in the Senior Secured Credit Agreement provided that if, as of the end of the fiscal quarter immediately preceding such restricted payment, the debt to total capitalization ratio is: (i) equal to or less than 17.5 percent, but greater than 12.5 percent, the prepayment requirement shall be reduced by one-half; or (ii) equal to or less than 12.5 percent, the prepayment requirement shall not apply.
Notwithstanding the foregoing, no mandatory prepayments pursuant to items (i) or (iii) in the preceding paragraph shall be required if: (x) the debt to total capitalization ratio is equal or less than 20 percent; and (y) either (A) the financial strength rating of certain insurance subsidiaries is equal or better than A- (stable) from A.M. Best Company ("A.M. Best") or (B) the Senior Secured Credit Agreement is rated equal or better than BBB- (stable) from S&P and Baa3 (stable) by Moody's Investor Services, Inc. ("Moody's").
The 9.0% Senior Secured Notes were issued pursuant to an Indenture, dated as of December 21, 2010 (the “Indenture”), by and among the Company, the Subsidiary Guarantors and Wilmington Trust FSB, as trustee and collateral agent (“Wilmington”). The Indenture contains covenants that, among other things, limit (subject to certain exceptions) the Company's ability and the ability of the Company's Restricted Subsidiaries (as defined in the Indenture) to:
• | incur or guarantee additional indebtedness or issue preferred stock; |
• | pay dividends or make other distributions to shareholders; |
• | purchase or redeem capital stock or subordinated indebtedness; |
• | make certain investments; |
• | create liens; |
• | incur restrictions on the Company's ability and the ability of the Restricted Subsidiaries to pay dividends or make |
other payments to the Company;
• | sell assets, including capital stock of the Company's subsidiaries; |
• | consolidate or merge with or into other companies or transfer all or substantially all of the Company's assets; and |
• | engage in transactions with affiliates. |
24
CNO FINANCIAL GROUP, INC. AND SUBSIDIARIES
Notes to Consolidated Financial Statements
(unaudited)
___________________
Under the Indenture, the Company can make Restricted Payments (as such term is defined in the Indenture) up to a calculated limit, provided that the Company's pro forma risk-based capital ratio exceeds 225% after giving effect to the Restricted Payment and certain other conditions are met. Restricted Payments include, among other items, stock repurchases, common stock dividends and investments in excess of $75 million made at the holding company level that are other than cash and cash equivalents. The limit of Restricted Payments permitted under the Indenture is the sum of (x) 50% of the Company's “Consolidated Net Income” (as defined in the Indenture) for the period (taken as one accounting period) from January 1, 2011 to the end of the Company's most recently ended fiscal quarter for which financial statements are available at the time of such Restricted Payment and (y) certain other amounts. Based on the Company's Consolidated Net Income through June 30, 2012, the Company could make additional Restricted Payments under this Indenture covenant of approximately $122 million.
INVESTMENT BORROWINGS
Three of the Company’s insurance subsidiaries (Conseco Life Insurance Company (“Conseco Life”), Washington National Insurance Company and Bankers Life and Casualty Company ("Bankers Life")) are members of the Federal Home Loan Bank (“FHLB”). As members of the FHLB, Conseco Life, Washington National Insurance Company and Bankers Life have the ability to borrow on a collateralized basis from the FHLB. Conseco Life, Washington National Insurance Company and Bankers Life are required to hold certain minimum amounts of FHLB common stock as a condition of membership in the FHLB, and additional amounts based on the amount of the borrowings. At June 30, 2012, the carrying value of the FHLB common stock was $82.5 million. As of June 30, 2012, collateralized borrowings from the FHLB totaled $1.7 billion and the proceeds were used to purchase fixed maturity securities. The borrowings are classified as investment borrowings in the accompanying consolidated balance sheet. The borrowings are collateralized by investments with an estimated fair value of $2.1 billion at June 30, 2012, which are maintained in a custodial account for the benefit of the FHLB. Such investments are classified as fixed maturities, available for sale, in our consolidated balance sheet. Interest expense of $14.4 million and $12.2 million in the first six months of 2012 and 2011, respectively, was recognized related to the borrowings.
The following summarizes the terms of the borrowings (dollars in millions):
Amount | Maturity | Interest rate at | ||||
borrowed | date | June 30, 2012 | ||||
$ | 100.0 | October 2013 | Variable rate – 0.575% | |||
100.0 | November 2013 | Variable rate – 0.547% | ||||
67.0 | February 2014 | Fixed rate – 1.830% | ||||
50.0 | August 2014 | Variable rate – 0.597% | ||||
100.0 | September 2015 | Variable rate – 0.766% | ||||
150.0 | October 2015 | Variable rate – 0.592% | ||||
100.0 | (a) | November 2015 | Fixed rate – 4.890% | |||
146.0 | November 2015 | Fixed rate – 5.300% | ||||
100.0 | December 2015 | Fixed rate – 4.710% | ||||
100.0 | June 2016 | Variable rate – 0.685% | ||||
75.0 | June 2016 | Variable rate – 0.630% | ||||
75.0 | August 2016 | Variable rate – 0.677% | ||||
100.0 | October 2016 | Variable rate – 0.648% | ||||
50.0 | November 2016 | Variable rate – 0.738% | ||||
50.0 | November 2016 | Variable rate – 0.715% | ||||
100.0 | June 2017 | Variable rate – 0.760% | ||||
50.0 | August 2017 | Variable rate – 0.667% | ||||
100.0 | October 2017 | Variable rate – 0.897% | ||||
37.0 | November 2017 | Fixed rate – 3.750% | ||||
$ | 1,650.0 | |||||
25
CNO FINANCIAL GROUP, INC. AND SUBSIDIARIES
Notes to Consolidated Financial Statements
(unaudited)
___________________
_____________
(a) In July 2012, such borrowing was refinanced with a maturity date of July 2017 and a fixed interest rate of 3.90 percent.
The variable rate borrowings are pre-payable on each interest reset date without penalty. The fixed rate borrowings are pre-payable subject to payment of a yield maintenance fee based on current market interest rates. At June 30, 2012, the aggregate fee to prepay all fixed rate borrowings was $51.7 million.
As part of our investment strategy, we may enter into repurchase agreements to increase our investment return. We account for these transactions as collateralized borrowings, where the amount borrowed is equal to the sales price of the underlying securities. Repurchase agreements involve a sale of securities and an agreement to repurchase the same securities at a later date at an agreed-upon price. Such borrowings totaled $36.8 million at June 30, 2012. The borrowings mature as follows: $32.8 million - within 30 days; and $4.0 million - between 30 and 90 days. These borrowings were collateralized by investment securities (primarily collateralized mortgage obligations) with fair values approximately equal to the loan value. The primary risks associated with short-term collateralized borrowings are: (i) a substantial decline in the market value of the margined security; and (ii) that a counterparty may be unable to perform under the terms of the contract or be unwilling to extend such financing in future periods especially if the liquidity or value of the margined security has declined. Exposure is limited to any depreciation in value of the related securities.
At June 30, 2012, investment borrowings consisted of: (i) collateralized borrowings from the FHLB of $1.7 billion; (ii) repurchase agreements of $36.8 million; and (iii) other borrowings of $1.1 million.
At December 31, 2011, investment borrowings consisted of: (i) collateralized borrowings from the FHLB of $1.7 billion; (ii) repurchase agreements of $24.8 million; and (iii) other borrowings of $1.7 million.
26
CNO FINANCIAL GROUP, INC. AND SUBSIDIARIES
Notes to Consolidated Financial Statements
(unaudited)
___________________
CHANGES IN COMMON STOCK
Changes in the number of shares of common stock outstanding were as follows (shares in thousands):
Balance, December 31, 2011 | 241,305 | |||
Treasury stock purchased and retired | (8,090 | ) | ||
Stock options exercised | 415 | |||
Restricted stock vested | 396 | (a) | ||
Balance, June 30, 2012 | 234,026 | |||
________
(a) | Such amount was reduced by 142 thousand shares which were tendered to the Company for the payment of federal and state taxes owed on the vesting of restricted stock. |
In May 2011, the Company announced a common share repurchase program of up to $100.0 million of the Company's outstanding common stock. In February 2012 and June 2012, the Company's board of directors approved, in aggregate, an additional $200.0 million to repurchase the Company's outstanding common stock. In the first six months of 2012, we repurchased 8.1 million shares of common stock for $58.2 million pursuant to the program. The Company had remaining repurchase authority of $172.1 million as of June 30, 2012.
In May 2012, we initiated a common stock dividend program. In the second quarter of 2012, dividends declared and paid on common stock were $0.02 per common share totaling $4.7 million.
SALES INDUCEMENTS
Certain of our annuity products offer sales inducements to contract holders in the form of enhanced crediting rates or bonus payments in the initial period of the contract. Certain of our life insurance products offer persistency bonuses credited to the contract holders balance after the policy has been outstanding for a specified period of time. These enhanced rates and persistency bonuses are considered sales inducements in accordance with GAAP. Such amounts are deferred and amortized in the same manner as deferred acquisition costs. Sales inducements deferred totaled $2.3 million and $7.5 million during the six months ended June 30, 2012 and 2011, respectively. Amounts amortized totaled $14.3 million and $15.2 million during the six months ended June 30, 2012 and 2011, respectively. The unamortized balance of deferred sales inducements at June 30, 2012 and December 31, 2011 was $137.2 million and $149.2 million, respectively. The balance of insurance liabilities for persistency bonus benefits was $39.3 million and $50.0 million at June 30, 2012 and December 31, 2011, respectively.
RECENTLY ISSUED ACCOUNTING STANDARDS
Accounting Standard Adopted on a Retrospective Basis
In October 2010, the Financial Accounting Standards Board ("FASB") issued authoritative guidance that modified the definition of the types of costs incurred by insurance entities that could be capitalized in the acquisition of new and renewal contracts. The guidance impacts the timing of GAAP reported financial results, but has no impact on cash flows, statutory financial results or the ultimate profitability of the business.
The guidance specifies that an insurance entity shall only capitalize incremental direct costs related to the successful acquisition of new or renewal insurance contracts. The guidance also states that advertising costs should be included in deferred acquisition costs only if the capitalization criteria in the direct-response advertising guidance is met. The guidance was effective for fiscal years, and interim periods within those fiscal years, beginning after December 15, 2011. As permitted by the guidance, we elected to apply the provisions on a retrospective basis. The guidance reduced the balance of deferred acquisition costs, its amortization and the amount of costs capitalized. We are able to defer most commission payments, plus other costs directly related to the production of new business. The change did not impact the balance of the present value of future profits. Therefore, in contrast to the reduction in amortization of deferred acquisition costs, there was no change in the amortization of the present value of future profits.
27
CNO FINANCIAL GROUP, INC. AND SUBSIDIARIES
Notes to Consolidated Financial Statements
(unaudited)
___________________
The adoption of ASU 2010-26 had the following impact on our consolidated balance sheet and consolidated statement of operations as of and for the three and six months ended June 30, 2012 (dollars in millions, except per share amounts):
June 30, 2012 | |||||||||||
Amounts prior to adoption of ASU 2010-26 | Effect of adoption of ASU 2010-26 | As reported | |||||||||
Deferred acquisition costs | $ | 1,330.2 | $ | (738.8 | ) | $ | 591.4 | ||||
Income tax assets, net | 403.5 | 276.2 | 679.7 | ||||||||
Other assets | 418.9 | (23.1 | ) | 395.8 | |||||||
Total assets | 33,866.0 | (485.7 | ) | 33,380.3 | |||||||
Other liabilities | 678.5 | 7.5 | 686.0 | ||||||||
Total liabilities | 28,479.7 | 7.5 | 28,487.2 | ||||||||
Accumulated other comprehensive income | 886.6 | 104.2 | 990.8 | ||||||||
Retained earnings (accumulated deficit) | 185.4 | (597.4 | ) | (412.0 | ) | ||||||
Total shareholders' equity | 5,386.3 | (493.2 | ) | 4,893.1 | |||||||
Total liabilities and shareholders' equity | 33,866.0 | (485.7 | ) | 33,380.3 | |||||||
Three months ended | Six months ended | ||||||||||||||||||||||
June 30, 2012 | June 30, 2012 | ||||||||||||||||||||||
Amounts prior to adoption of ASU 2010-26 | Effect of adoption of ASU 2010-26 | As reported | Amounts prior to adoption of ASU 2010-26 | Effect of adoption of ASU 2010-26 | As reported | ||||||||||||||||||
Amortization | $ | 103.9 | $ | (35.6 | ) | $ | 68.3 | $ | 235.7 | $ | (80.8 | ) | $ | 154.9 | |||||||||
Other operating costs and expenses | 118.8 | 54.5 | 173.3 | 284.3 | 116.0 | 400.3 | |||||||||||||||||
Total benefits and expenses | 941.6 | 18.9 | 960.5 | 1,956.9 | 35.2 | 1,992.1 | |||||||||||||||||
Income before income taxes | 123.4 | (18.9 | ) | 104.5 | 232.0 | (35.2 | ) | 196.8 | |||||||||||||||
Tax expense on period income | 45.6 | (6.8 | ) | 38.8 | 84.7 | (12.7 | ) | 72.0 | |||||||||||||||
Net income | 77.8 | (12.1 | ) | 65.7 | 147.3 | (22.5 | ) | 124.8 | |||||||||||||||
Earnings per common share: | |||||||||||||||||||||||
Basic: | |||||||||||||||||||||||
Net income | $ | .33 | $ | (.05 | ) | $ | .28 | $ | .62 | $ | (.10 | ) | $ | .52 | |||||||||
Diluted: | |||||||||||||||||||||||
Net income | .28 | (.04 | ) | .24 | .52 | (.07 | ) | .45 | |||||||||||||||
28
CNO FINANCIAL GROUP, INC. AND SUBSIDIARIES
Notes to Consolidated Financial Statements
(unaudited)
___________________
The adoption of ASU 2010-26 affected prior period information as follows (dollars in millions, except per share amounts):
December 31, 2011 | |||||||||||
As originally reported | Effect of adoption of ASU 2010-26 | As adjusted | |||||||||
Deferred acquisition costs | $ | 1,418.1 | $ | (621.0 | ) | $ | 797.1 | ||||
Income tax assets, net | 630.5 | 234.9 | 865.4 | ||||||||
Other assets | 316.9 | (24.7 | ) | 292.2 | |||||||
Total assets | 33,332.7 | (410.8 | ) | 32,921.9 | |||||||
Other liabilities | 548.3 | 8.0 | 556.3 | ||||||||
Total liabilities | 28,300.1 | 8.0 | 28,308.1 | ||||||||
Accumulated other comprehensive income | 625.5 | 156.1 | 781.6 | ||||||||
Retained earnings (accumulated deficit) | 42.8 | (574.9 | ) | (532.1 | ) | ||||||
Total shareholders' equity | 5,032.6 | (418.8 | ) | 4,613.8 | |||||||
Total liabilities and shareholders' equity | 33,332.7 | (410.8 | ) | 32,921.9 | |||||||
Three months ended | Six months ended | ||||||||||||||||||||||
June 30, 2011 | June 30, 2011 | ||||||||||||||||||||||
As originally reported | Effect of adoption of ASU 2010-26 | As adjusted | As originally reported | Effect of adoption of ASU 2010-26 | As adjusted | ||||||||||||||||||
Amortization | $ | 101.5 | $ | (30.9 | ) | $ | 70.6 | $ | 238.2 | $ | (72.7 | ) | $ | 165.5 | |||||||||
Other operating costs and expenses | 124.4 | 51.3 | 175.7 | 239.5 | 106.3 | 345.8 | |||||||||||||||||
Total benefits and expenses | 939.8 | 20.4 | 960.2 | 1,905.4 | 33.6 | 1,939.0 | |||||||||||||||||
Income before income taxes | 92.2 | (20.4 | ) | 71.8 | 175.8 | (33.6 | ) | 142.2 | |||||||||||||||
Tax expense on period income | 32.7 | (7.3 | ) | 25.4 | 62.4 | (12.0 | ) | 50.4 | |||||||||||||||
Net income | 59.5 | (13.1 | ) | 46.4 | 113.4 | (21.6 | ) | 91.8 | |||||||||||||||
Earnings per common share: | |||||||||||||||||||||||
Basic: | |||||||||||||||||||||||
Net income | $ | .24 | $ | (.06 | ) | $ | .18 | $ | .45 | $ | (.08 | ) | $ | .37 | |||||||||
Diluted: | |||||||||||||||||||||||
Net income | .21 | (.05 | ) | .16 | .39 | (.07 | ) | .32 | |||||||||||||||
29
CNO FINANCIAL GROUP, INC. AND SUBSIDIARIES
Notes to Consolidated Financial Statements
(unaudited)
___________________
Six months ended | |||||||||||
June 30, 2011 | |||||||||||
As originally reported | Effect of adoption of ASU 2010-26 | As adjusted | |||||||||
Cash flows from operating activities: | |||||||||||
Deferrable policy acquisition costs | $ | (215.1 | ) | $ | 108.5 | $ | (106.6 | ) | |||
Other operating costs | (245.8 | ) | (108.5 | ) | (354.3 | ) | |||||
Net cash used by operating activities | 360.8 | — | 360.8 | ||||||||
Deferred acquisition costs represent incremental direct costs related to the successful acquisition of new or renewal insurance contracts. For universal life or investment products, we amortize these costs in relation to the estimated gross profits using the interest rate credited to the underlying policies. For other products, we amortize these costs in relation to future anticipated premium revenue using the projected investment earnings rate.
When we realize a gain or loss on investments backing our universal life or investment-type products, we adjust the amortization to reflect the change in estimated gross profits from the products due to the gain or loss realized and the effect on future investment yields. We also adjust deferred acquisition costs for the change in amortization that would have been recorded if our fixed maturity securities, available for sale, had been sold at their stated aggregate fair value and the proceeds reinvested at current yields. We limit the total adjustment related to the impact of unrealized losses to the total of costs capitalized plus interest related to insurance policies issued in a particular year. We include the impact of this adjustment in accumulated other comprehensive income (loss) within shareholders' equity.
We regularly evaluate the recoverability of the unamortized balance of the deferred acquisition costs. We consider estimated future gross profits or future premiums, expected mortality or morbidity, interest earned and credited rates, persistency and expenses in determining whether the balance is recoverable. If we determine a portion of the unamortized balance is not recoverable, it is charged to amortization expense. In certain cases, the unamortized balance of the deferred acquisition costs may not be deficient in the aggregate, but our estimates of future earnings indicate that profits would be recognized in early periods and losses in later periods. In this case, we increase the amortization of the deferred acquisition costs over the period of profits, by an amount necessary to offset losses that are expected to be recognized in the later years.
Changes in deferred acquisition costs were as follows (dollars in millions):
Three months ended | Six months ended | ||||||||||||||
June 30, | June 30, | ||||||||||||||
2012 | 2011 | 2012 | 2011 | ||||||||||||
Balance, beginning of period | $ | 790.4 | $ | 989.3 | $ | 797.1 | $ | 999.6 | |||||||
Additions | 48.5 | 53.4 | 94.7 | 106.6 | |||||||||||
Amortization | (45.1 | ) | (42.4 | ) | (101.9 | ) | (99.2 | ) | |||||||
Amounts related to fair value adjustment of fixed maturities, available for sale | (202.4 | ) | (24.8 | ) | (198.5 | ) | (31.5 | ) | |||||||
Balance, end of period | $ | 591.4 | $ | 975.5 | $ | 591.4 | $ | 975.5 | |||||||
Adopted Accounting Standards
In June 2011, the FASB issued authoritative guidance to increase the prominence of items reported in other comprehensive income by eliminating the option to present components of other comprehensive income as part of the statement of changes in shareholders' equity. Such guidance requires that all non-owner changes in shareholders' equity be presented either in a single continuous statement of comprehensive income or in two separate but consecutive statements. In the two-statement approach, the first statement should present total net income and its components followed consecutively by a
30
CNO FINANCIAL GROUP, INC. AND SUBSIDIARIES
Notes to Consolidated Financial Statements
(unaudited)
___________________
second statement that should present total other comprehensive income, the components of other comprehensive income and the total of comprehensive income. The guidance was applied retrospectively and is effective for fiscal years, and interim periods within those years, beginning after December 15, 2011. The adoption of this guidance resulted in a change in the presentation of our financial statements but did not have any impact on our financial condition, operating results or cash flows. In December 2011, the FASB issued authoritative guidance to defer the requirement to present reclassification adjustments out of accumulated other comprehensive income to net income on the face of the financial statements. All other aspects of the original guidance are still effective.
In May 2011, the FASB issued authoritative guidance which clarifies or updates requirements for measuring fair value and for disclosing information about fair value measurements. The guidance clarifies: (i) the application of the highest and best use and valuation premise concepts; (ii) measuring the fair value of an instrument classified in a reporting entity's shareholders' equity; and (iii) disclosure of quantitative information about the unobservable inputs used in a fair value measurement that is categorized within Level 3 of the fair value hierarchy. The guidance changes certain requirements for measuring fair value or disclosing information about fair value measurements including: (i) measuring the fair value of financial instruments that are managed within a portfolio; (ii) application of premiums and discounts in a fair value measurement; and (iii) additional disclosures about fair value measurements. Such additional disclosures include a description of the valuation process used for measuring Level 3 instruments and the sensitivity of the Level 3 fair value measurement to changes in unobservable inputs and the interrelationships between those unobservable inputs, if any. The guidance was effective prospectively for interim and annual periods beginning after December 15, 2011. Refer to the note to our consolidated financial statements entitled "Fair Value Measurements" for additional disclosures required by this guidance. The adoption of this guidance expanded our disclosures, but did not have a material impact on our financial condition, operating results or cash flows.
LITIGATION AND OTHER LEGAL PROCEEDINGS
Legal Proceedings
The Company and its subsidiaries are involved in various legal actions in the normal course of business, in which claims for compensatory and punitive damages are asserted, some for substantial amounts. We recognize an estimated loss from these loss contingencies when we believe it is probable that a loss has been incurred and the amount of the loss can be reasonably estimated. Some of the pending matters have been filed as purported class actions and some actions have been filed in certain jurisdictions that permit punitive damage awards that are disproportionate to the actual damages incurred. The amounts sought in certain of these actions are often large or indeterminate and the ultimate outcome of certain actions is difficult to predict. In the event of an adverse outcome in one or more of these matters, there is a possibility that the ultimate liability may be in excess of the liabilities we have established and could have a material adverse effect on our business, financial condition, results of operations and cash flows. In addition, the resolution of pending or future litigation may involve modifications to the terms of outstanding insurance policies or could impact the timing and amount of rate increases, which could adversely affect the future profitability of the related insurance policies. Based upon information presently available, and in light of legal, factual and other defenses available to the Company and its subsidiaries, the Company does not believe that it is probable that the ultimate liability from either pending or threatened legal actions, after consideration of existing loss provisions, will have a material adverse effect on the Company's consolidated financial condition, operating results or cash flows. However, given the inherent difficulty in predicting the outcome of legal proceedings, there exists the possibility such legal actions could have a material adverse effect on the Company's consolidated financial condition, operating results or cash flows.
In addition to the inherent difficulty of predicting litigation outcomes, particularly those that will be decided by a jury, many of the matters specifically identified below purport to seek substantial or an unspecified amount of damages for unsubstantiated conduct spanning several years based on complex legal theories and damages models. The alleged damages typically are indeterminate or not factually supported in the complaint, and, in any event, the Company's experience indicates that monetary demands for damages often bear little relation to the ultimate loss. In some cases, plaintiffs are seeking to certify classes in the litigation and class certification either has been denied or is pending and we have filed oppositions to class certification or sought to decertify a prior class certification. In addition, for many of these cases: (i) there is uncertainty as to the outcome of pending appeals or motions; (ii) there are significant factual issues to be resolved; and/or (iii) there are novel legal issues presented. Accordingly, the Company can not reasonably estimate the possible loss or range of loss in excess of amounts accrued, if any, or predict the timing of the eventual resolution of these matters. The Company reviews these matters on an ongoing basis. When assessing reasonably possible and probable outcomes, the Company bases its assessment on the expected ultimate outcome following all appeals.
31
CNO FINANCIAL GROUP, INC. AND SUBSIDIARIES
Notes to Consolidated Financial Statements
(unaudited)
___________________
Securities Litigation
On June 2, 2010, a purported shareholder derivative complaint was filed in the Marion County Circuit/Superior Court, Indiana, William T. Carter, derivatively on behalf of CNO Financial Group, Inc. v. R. Glenn Hilliard, Donna A. James, R. Keith Long, Debra J. Perry, C. James Prieur, Neal C. Schneider, Michael T. Tokarz, John G. Turner, William Kirsch, Eugene Bullis, Michael Dubes, James Hohmann, Edward Bonach, Ali Inanilan, and John Wells, and CNO Financial Group, Inc., Cause No. 49D10 10 06 PL 024523, on behalf of nominal defendant CNO Financial Group, Inc. against certain current and/or former members of its Board of Directors and executive officers seeking to remedy defendant's alleged breaches of fiduciary duties and unjust enrichment from August 2005 to the present. On November 1, 2010, the plaintiffs filed an amended complaint. The allegations in the complaint are similar to those in the purported class action complaint that had been filed in Plumbers and Pipefitters Local Union No. 719 Pension Trust Fund, on behalf of itself and all others similarly situated v. Conseco, Inc., et al., which was dismissed with prejudice in 2011 after the court granted our motion to dismiss. On December 17, 2010, we filed a motion to dismiss the amended complaint. On June 2, 2011, the court granted our motion to dismiss. The plaintiff appealed the court's decision and on June 22, 2012, the appellate court affirmed the trial court's granting of our motion to dismiss.
Cost of Insurance Litigation
On March 4, 2008, a complaint was filed in the United States District Court for the Central District of California, Celedonia X. Yue, M. D. on behalf of the class of all others similarly situated, and on behalf of the General Public v. Conseco Life Insurance Company, successor to Philadelphia Life Insurance Company and formerly known as Massachusetts General Life Insurance Company, Cause No. CV08-01506 CAS. Plaintiff in this putative class action owns a Valulife universal life policy insuring the life of Ruth S. Yue originally issued by Massachusetts General Life Insurance Company in 1995. Plaintiff is claiming breach of contract on behalf of the proposed national class and seeks injunctive and restitutionary relief pursuant to California Business & Professions Code Section 17200 and declaratory relief. The putative class consists of all owners of Valulife and Valuterm universal life insurance policies issued by either Massachusetts General or Philadelphia Life and that were later acquired and serviced by Conseco Life. Plaintiff alleges that members of the class will be damaged by increases in the cost of insurance (a non-guaranteed element ("NGE")) that are set to take place in the twenty first policy year of Valulife and Valuterm policies. No such increases have yet been applied to the subject policies. During 2010, Conseco Life voluntarily agreed not to implement the cost of insurance rate increase at issue in this litigation and is following a process with respect to any future cost of insurance rate increases as set forth in the regulatory settlement agreement described below under the caption entitled "Regulatory Examinations and Fines". Plaintiff filed a motion for certification of a nationwide class and a California state class. On December 7, 2009, the court granted that motion. On October 8, 2010, the court dismissed the causes of actions alleged in the California state class. On January 19, 2011, the court granted the plaintiff's motion for summary judgment as to the declaratory relief claim and on February 2, 2011, the court issued an advisory opinion, in the form of a declaratory judgment, as to what, in its view, Conseco Life could consider in implementing future cost of insurance rate increases related to its Valulife and Valuterm block of policies. Conseco Life is appealing the court's January 19, 2011 decision and the plaintiff is appealing the court's decision to dismiss the California causes of action. These appeals are pending. We believe this case is without merit, and intend to defend it vigorously.
On November 15, 2011, a second complaint was filed by Dr. Yue in the United States District Court for the Central District on California, Celedonia X. Yue, M. D. on behalf of the class of all others similarly situated, and on behalf of the General Public v. Conseco Life Insurance Company, Cause No. CV11-9506 AHM (SHx), involving the same Valulife universal life policy described in the preceding paragraph. Plaintiff, for herself and on behalf of proposed members of a national class and a California class is claiming breach of contract, injunctive and restitutionary relief pursuant to California Business & Professions Code Section 17200, breach of the covenant of good faith and fair dealing, declaratory relief, and temporary, preliminary, and permanent injunctive relief. The putative class consists of all owners and former owners of Valulife and Valuterm universal life insurance policies issued by either Massachusetts General or Philadelphia Life and that were later acquired and serviced by Conseco Life. Plaintiff alleges that members of the classes will be damaged by increases in the cost of insurance (a NGE) that took place on or about November 1, 2011. Plaintiff filed a motion for a preliminary injunction and a motion for certification of a California class. On April 2, 2012, the court granted the plaintiff's motions, which Conseco Life is appealing. Pending the outcome of that appeal, Conseco Life is preliminarily enjoined from imposing the 2011 increase in the cost of insurance on the members of the California class. Plaintiff also filed a motion on March 20, 2012 for certification of a nationwide class. The court stated that it will not issue a ruling prior to August 18, 2012 on plaintiff's motion for certification of a nationwide class, in order to allow the parties additional time to continue settlement discussions. We believe this case is without merit, and intend to defend it vigorously.
32
CNO FINANCIAL GROUP, INC. AND SUBSIDIARIES
Notes to Consolidated Financial Statements
(unaudited)
___________________
On February 6, 2012, a complaint was filed in the United States District Court for the Northern District of Illinois, Daniel B. Nicholas, on behalf of himself and all others similarly situated v. Conseco Life Insurance Company, Cause No. 12cv845. Plaintiff in this putative class action owns a Valulife universal life policy insuring Plaintiff's life originally issued by Massachusetts General Life Insurance Company (now Conseco Life Insurance Company) in 1991. Plaintiff is claiming breach of contract on behalf of the proposed national class and seeks declaratory, injunctive, and supplemental relief. The putative class consists of all persons who own or have owned one or more universal life policies issued by Conseco Life which provide that the cost of insurance rates will be determined based upon expectations as to future mortality experience and who have experienced an increase in the cost of insurance rates. Plaintiff alleges that members of the class will be damaged by cost of insurance charges that were increased due to general economic downturn, Conseco Life's diminished investment yields, and mounting policy losses.
On April 20, 2012, we announced that Conseco Life has reached a tentative settlement in the Nicholas case. The tentative settlement covers current and certain former holders of Valulife and Valuterm universal life policies in all states. Under the tentative settlement, the cost of insurance increase implemented by Conseco Life beginning in November 2011 will be reduced for those policyholders and they will receive certain policy benefit enhancements. Individuals whose Valulife or Valuterm policy terminated after the November 2011 increase will have the option to reinstate their policies with similar changes or elect a cash settlement option. In addition, the settlement provides that Conseco Life will not increase the cost of insurance or expense charges on this block of policies for five years. After a hearing held on April 19, 2012, the court took under advisement Conseco Life's requests for: (i) the designation of a nationwide class for the purpose of approving the tentative settlement; and (ii) an injunction to stay any other litigation involving the cost of insurance increase implemented by Conseco Life in November 2011 on the Valulife and Valuterm policies that are at issue in this litigation. On May 17, 2012, the court granted the motion to intervene which had been filed by the Plaintiff in the Yue litigation described above and venue has been transferred to the United States District Court for the Central District of California. The plaintiff in the Nicholas case has filed a motion for preliminary approval of the settlement in the United States District Court for the Central District of California. If the court grants final approval of the settlement, it would be subject to a court fairness hearing after notice to the inforce and former policyholders covered by the settlement and other conditions.
In connection with the tentative settlement, the Company recorded a pre-tax charge of approximately $20 million in its Other CNO Business segment for the quarter ended March 31, 2012. The liability the Company established related to the tentative settlement includes its best estimates of the costs of implementing the tentative settlement, if approved by the court. While the Company believes its estimates are adequate to cover these costs, the estimates are subject to significant judgment and it is possible that the estimates will prove insufficient to cover the actual costs.
On December 24, 2008, a purported class action was filed in the U.S. District Court for the Northern District of California, Cedric Brady, et. al. individually and on behalf of all other similarly situated v. Conseco, Inc. and Conseco Life Insurance Company Case No. 3:08-cv-05746. The plaintiffs allege that Conseco Life and Conseco, Inc. committed breach of contract and insurance bad faith and violated various consumer protection statutes in the administration of various interest sensitive whole life products sold primarily under the name “Lifetrend” by requiring the payment of additional cash amounts to maintain the policies in force and by making changes to certain NGEs in their policies. On April 23, 2009, the plaintiffs filed an amended complaint adding the additional counts of breach of fiduciary duty, fraud, negligent misrepresentation, conversion and declaratory relief. On May 29, 2009, Conseco, Inc. and Conseco Life filed a motion to dismiss the amended complaint. On July 29, 2009, the court granted in part and denied in part the motion to dismiss. The court dismissed the allegations that Conseco Life violated various consumer protection statutes, the breach of fiduciary duty count, and dismissed Conseco, Inc. for lack of personal jurisdiction.
On July 2, 2009, a purported class action was filed in the U.S. District Court for the Middle District of Florida, Bill W. McFarland, and all those similarly situated v. Conseco Life Insurance Company, Case No. 3:09-cv-598-J-32MCR. The plaintiff alleges that Conseco Life committed breach of contract and has been unjustly enriched in the administration, including changes to certain NGEs, of various interest sensitive whole life products sold primarily under the name “Lifetrend.” The plaintiff seeks declaratory and injunctive relief, compensatory damages, punitive damages and attorney fees.
Conseco Life filed a motion with the Judicial Panel on Multidistrict Litigation (“MDL”), seeking the establishment of an MDL proceeding consolidating the Brady case and the McFarland case into a single action. On February 3, 2010, the Judicial Panel on MDL ordered these cases be consolidated for pretrial proceedings in the Northern District of California Federal Court. On July 7, 2010, plaintiffs filed an amended motion for class certification of a nationwide class and a California state class. On October 6, 2010, the court granted the motion for certification of a nationwide class and denied the motion for certification of a
33
CNO FINANCIAL GROUP, INC. AND SUBSIDIARIES
Notes to Consolidated Financial Statements
(unaudited)
___________________
California state class. Conseco Life filed a motion to decertify the nationwide class on July 1, 2011. On December 20, 2011, the court issued an order denying Conseco Life's motion to decertify the class as to current policyholders, but granted the motion to decertify as to former policyholders. On March 5, 2012, the plaintiffs filed a motion for a preliminary injunction requesting that the court enjoin Conseco Life from imposing increased cost of insurance charges until trial with regard to 157 members of the class, and on July 17, 2012, the court granted a preliminary injunction as to 100 members of the class and denied the plaintiff's motion for a preliminary injunction as to the other 57 members. Trial in the MDL proceeding has been set for March 25, 2013. We believe these cases are without merit and intend to defend them vigorously.
Other Litigation
On December 8, 2008, a purported Florida state class action was filed in the U.S. District Court for the Southern District of Florida, Sydelle Ruderman individually and on behalf of all other similarly situated v. Washington National Insurance Company, Case No. 08-23401-CIV-Cohn/Selzer. The plaintiff alleges that the inflation escalation rider on her policy of long-term care insurance operates to increase the policy's lifetime maximum benefit, and that Washington National Insurance Company breached the contract by stopping her benefits when they reached the lifetime maximum. The Company takes the position that the inflation escalator only affects the per day maximum benefit. The Plaintiff filed a motion for class certification, and the motion has been fully briefed by both sides. The court has not yet ruled on the motion or set it for hearing. Additional parties have asked the court to allow them to intervene in the action, and on January 5, 2010, the court granted the motion to intervene and granted the plaintiff's motion for class certification. The court certified a (B) (3) Florida state class alleging damages and a (B) (2) Florida state class alleging injunctive relief. The parties reached a settlement of the (B) (3) class in 2010, which has been implemented. The amount recognized in 2010 related to the settlement in principle was not significant to the Company's consolidated financial condition, cash flows or results of operations. The plaintiff filed a motion for summary judgment as to the (B) (2) class which was granted by the court on September 8, 2010. The Company has appealed the court's decision and the appeal is pending. On February 17, 2012, the Eleventh Circuit Court of Appeals referred the case to the Florida Supreme Court, which accepted jurisdiction of the case. We believe this case is without merit, and intend to defend it vigorously.
On January 26, 2009, a purported class action complaint was filed in the United States District Court for the Northern District of Illinois, Samuel Rowe and Estella Rowe, individually and on behalf of themselves and all others similarly situated v. Bankers Life & Casualty Company and Bankers Life Insurance Company of Illinois, Case No. 09CV491. The plaintiffs are alleging violation of California Business and Professions Code Sections 17200 et seq. and 17500 et seq., breach of common law fiduciary duty, breach of implied covenant of good faith and fair dealing and violation of California Welfare and Institutions Code Section 15600 on behalf of the proposed national class and seek injunctive relief, compensatory damages, punitive damages and attorney fees. The plaintiff alleges that the defendants used an improper and misleading sales and marketing approach to seniors that fails to disclose all facts, misuses consumers' confidential financial information, uses misleading sales and marketing materials, promotes deferred annuities that are fundamentally inferior and less valuable than readily available alternative investment products and fails to adequately disclose other principal risks including maturity dates, surrender penalties and other restrictions which limit access to annuity proceeds to a date beyond the applicants actuarial life expectancy. Plaintiffs have amended their complaint attempting to convert this from a California only class action to a national class action. In addition, the amended complaint adds causes of action under the Racketeer Influenced and Corrupt Organization Act (“RICO”); aiding and abetting breach of fiduciary duty and for unjust enrichment. On September 13, 2010, the court dismissed the plaintiff's RICO claims. On October 25, 2010, the plaintiffs filed a second amended complaint re-alleging their RICO claims. On March 29, 2012, the court denied plaintiff's motion for certification of a nationwide class and denied plaintiff's motion for certification of a California class. The court allowed the plaintiff the opportunity to file a renewed motion for a California class, which the plaintiff did on May 21, 2012. We believe this case is without merit, and intend to defend it vigorously.
Regulatory Examinations and Fines
Insurance companies face significant risks related to regulatory investigations and actions. Regulatory investigations generally result from matters related to sales or underwriting practices, payment of contingent or other sales commissions, claim payments and procedures, product design, product disclosure, additional premium charges for premiums paid on a periodic basis, denial or delay of benefits, charging excessive or impermissible fees on products, changing the way cost of insurance charges are calculated for certain life insurance products or recommending unsuitable products to customers. We are, in the ordinary course of our business, subject to various examinations, inquiries and information requests from state, federal and other authorities. The ultimate outcome of these regulatory actions cannot be predicted with certainty. In the event of an
34
CNO FINANCIAL GROUP, INC. AND SUBSIDIARIES
Notes to Consolidated Financial Statements
(unaudited)
___________________
unfavorable outcome in one or more of these matters, the ultimate liability may be in excess of liabilities we have established and we could suffer significant reputational harm as a result of these matters, which could also have a material adverse effect on our business, financial condition, results of operations or cash flows.
The states of Pennsylvania, Illinois, Texas, Florida and Indiana led a multistate examination of the long-term care claims administration and complaint handling practices of Senior Health and Bankers Life, as well as the sales and marketing practices of Bankers Life. On May 7, 2008, we announced a settlement among the state insurance regulators and Senior Health and Bankers Life. This examination covered the years 2005, 2006 and 2007. More than 40 states are parties to the settlement, which included a Senior Health fine of up to $2.3 million, with up to an additional $10 million payable, on the part of either Senior Health and/or Bankers Life, in the event the process improvements and benchmarks are not met. The process improvement plan is being monitored by the lead states, and pursuant to the settlement agreement, the lead states are conducting a re-examination of Bankers Life to confirm compliance with the process improvements and benchmarks.
In October 2008, Conseco Life mailed notice to approximately 12,000 holders of its “Lifetrend” life insurance products to inform them of: (i) changes to certain NGEs of their policies; and (ii) the fact that certain policyholders who were not paying premiums may have failed to receive a notice that their policy was underfunded and that additional premiums were required in order for the policyholders to maintain their guaranteed cash values. In December 2008, Conseco Life mailed notice to approximately 16,000 holders of its CIUL3+ universal life policies to inform them of an increase in certain NGEs with respect to their policies. Prior to or around the time that the notices were sent, Conseco Life had informed the insurance regulators in a number of states, including among others Indiana, Iowa and Florida, of these matters and the planned communication with the impacted policyholders. Several states initiated regulatory actions and inquiries after the notices were sent by Conseco Life, and Conseco Life agreed to take no further actions with respect to those policies during the pendency of a market conduct examination.
After working with various state insurance regulators to review the terms of the Lifetrend and CIUL3+ policies, Conseco Life reached a settlement in principle with the regulators regarding issues involving these policies. During this regulatory review process, Conseco Life had been allowed to move forward with implementing the NGE changes in its CIUL3+ policies while the regulators continued their review. Conseco Life had also resumed the administration of its Lifetrend policies with administrative changes in place but did not implement the NGE changes pending execution of the final settlement agreement with the regulators. On June 30, 2010, we announced that Conseco Life had finalized a regulatory settlement agreement that requires the establishment of a $10 million fund for certain owners of its Lifetrend life insurance products and the payment of a $1 million assessment to participating jurisdictions. Forty-seven jurisdictions, representing almost 98% percent of the Lifetrend policyholders, have signed the settlement agreement. Conseco Life has notified consumers of the settlement and the increase in their NGEs. As previously disclosed, we accrued for the financial impact of the settlement in our consolidated financial statements for year-end 2009.
In August 2011, we were notified of an examination to be done on behalf of a number of states for the purpose of determining compliance with unclaimed property laws by the Company and its subsidiaries. We are continuing to provide information to the examiners in response to their requests. A total of 32 states and the District of Columbia are currently participating in this examination.
On April 5, 2012, we reported that our subsidiaries, Bankers Life and BLC Financial Services, Inc., a broker-dealer licensed in Illinois (“BLCFS”) (collectively “Bankers”), have reached a settlement with the State of Maine Office of Securities and three other state securities regulators regarding allegations that Bankers has acted as a broker-dealer and investment advisor without proper state licensing. Since 2005 Bankers Life and BLCFS have operated under arrangements with unaffiliated broker-dealers (licensed in all states in which Bankers Life operates) under which insurance agents with Bankers Life who became licensed as registered representatives and/or investment advisor representatives of the unaffiliated broker-dealer have provided brokerage and investment advisory services to customers under the exclusive control of the unaffiliated broker-dealer. Following this settlement, Bankers Life will continue its arrangement whereby registered representatives of the unaffiliated broker-dealer, who are financial advisors, will handle any securities transactions, and BLCFS will be eliminated. By putting this legacy issue behind it, Bankers Life believes that this settlement provides additional clarity between the roles of agents and financial advisors and allows the company to continue to focus on providing the products and services its customers need. The consent order issued by Maine in connection with this settlement includes an acknowledgement by the state that the conduct of Bankers Life and BLCFS has resulted in no known direct consumer harm and that licensed agents or representatives of licensed broker-dealers or investment advisors other than Bankers participated in all securities transactions and at locations that were
35
CNO FINANCIAL GROUP, INC. AND SUBSIDIARIES
Notes to Consolidated Financial Statements
(unaudited)
___________________
registered with the appropriate securities authorities as broker-dealer locations of broker-dealers other than Bankers. The settlement provides for the payment by Bankers of $9.9 million among the states where these dual agents were located for the period from 2005 - 2011. Bankers also agreed to pay certain costs of the investigation as well as past licensing and registration fees. CNO recorded a pre-tax charge of approximately $10 million in the first quarter of 2012 related to this settlement.
CONSOLIDATED STATEMENT OF CASH FLOWS
The following disclosures supplement our consolidated statement of cash flows.
The following reconciles net income to net cash provided by operating activities (dollars in millions):
Six months ended | |||||||
June 30, | |||||||
2012 | 2011 | ||||||
Cash flows from operating activities: | |||||||
Net income | $ | 124.8 | $ | 91.8 | |||
Adjustments to reconcile net income to net cash provided by operating activities: | |||||||
Amortization and depreciation | 167.7 | 178.6 | |||||
Income taxes | 67.7 | 47.9 | |||||
Insurance liabilities | 105.4 | 192.5 | |||||
Accrual and amortization of investment income | (84.6 | ) | (31.7 | ) | |||
Deferral of policy acquisition costs | (94.7 | ) | (106.6 | ) | |||
Net realized investment gains | (54.8 | ) | (8.0 | ) | |||
Loss on extinguishment of debt | .7 | 2.0 | |||||
Other | 6.8 | (5.7 | ) | ||||
Net cash provided by operating activities | $ | 239.0 | $ | 360.8 | |||
Non-cash items not reflected in the investing and financing activities sections of the consolidated statement of cash flows (dollars in millions):
Six months ended | |||||||
June 30, | |||||||
2012 | 2011 | ||||||
Stock option and restricted stock plans | $ | 7.2 | $ | 6.0 | |||
INVESTMENTS IN VARIABLE INTEREST ENTITIES
Based on our assessment, we have concluded that we are the primary beneficiary with respect to certain variable interest entities (“VIEs”), which are consolidated in our financial statements. The following is a description of our significant investments in VIEs:
All of the VIEs are collateralized loan trusts that were established to issue securities and use the proceeds to principally invest in corporate loans and other permitted investments (including a new VIE which was consolidated in the first quarter of 2012). The assets held by the trusts are legally isolated and not available to the Company. The liabilities of the VIEs are expected to be satisfied from the cash flows generated by the underlying loans held by the trusts, not from the assets of the Company. Repayment of the remaining principal balance of the borrowings of the VIEs is based on available cash flows from the assets. The Company has no further commitments to the VIEs.
Certain of our insurance subsidiaries are noteholders of the VIEs. Another subsidiary of the Company is the investment
36
CNO FINANCIAL GROUP, INC. AND SUBSIDIARIES
Notes to Consolidated Financial Statements
(unaudited)
___________________
manager for the VIEs. As such, it has the power to direct the most significant activities of the VIEs which materially impacts the economic performance of the VIEs.
The following table provides supplemental information about the assets and liabilities of the VIEs which have been consolidated in accordance with authoritative guidance (dollars in millions):
June 30, 2012 | |||||||||||
VIEs | Eliminations | Net effect on consolidated balance sheet | |||||||||
Assets: | |||||||||||
Investments held by variable interest entities | $ | 789.3 | $ | — | $ | 789.3 | |||||
Notes receivable of VIEs held by insurance subsidiaries | — | (78.5 | ) | (78.5 | ) | ||||||
Cash and cash equivalents held by variable interest entities | 88.6 | — | 88.6 | ||||||||
Accrued investment income | 3.1 | — | 3.1 | ||||||||
Income tax assets, net | 5.1 | (1.5 | ) | 3.6 | |||||||
Other assets | 14.2 | — | 14.2 | ||||||||
Total assets | $ | 900.3 | $ | (80.0 | ) | $ | 820.3 | ||||
Liabilities: | |||||||||||
Other liabilities | $ | 60.6 | $ | (.3 | ) | $ | 60.3 | ||||
Borrowings related to variable interest entities | 766.7 | — | 766.7 | ||||||||
Notes payable of VIEs held by insurance subsidiaries | 82.5 | (82.5 | ) | — | |||||||
Total liabilities | $ | 909.8 | $ | (82.8 | ) | $ | 827.0 | ||||
December 31, 2011 | |||||||||||
VIEs | Eliminations | Net effect on consolidated balance sheet | |||||||||
Assets: | |||||||||||
Investments held by variable interest entities | $ | 496.3 | $ | — | $ | 496.3 | |||||
Notes receivable of VIEs held by insurance subsidiaries | — | (45.3 | ) | (45.3 | ) | ||||||
Cash and cash equivalents held by variable interest entities | 74.4 | — | 74.4 | ||||||||
Accrued investment income | 1.7 | — | 1.7 | ||||||||
Income tax assets, net | 6.8 | (1.4 | ) | 5.4 | |||||||
Other assets | 7.7 | — | 7.7 | ||||||||
Total assets | $ | 586.9 | $ | (46.7 | ) | $ | 540.2 | ||||
Liabilities: | |||||||||||
Other liabilities | $ | 30.3 | $ | (.1 | ) | $ | 30.2 | ||||
Borrowings related to variable interest entities | 519.9 | — | 519.9 | ||||||||
Notes payable of VIEs held by insurance subsidiaries | 49.3 | (49.3 | ) | — | |||||||
Total liabilities | $ | 599.5 | $ | (49.4 | ) | $ | 550.1 | ||||
The investment portfolios held by the VIEs are primarily comprised of corporate fixed maturity securities which are almost entirely rated as below-investment grade securities. At June 30, 2012, such securities had an amortized cost of $792.5 million; gross unrealized gains of $2.3 million; gross unrealized losses of $5.5 million; and an estimated fair value of $789.3 million.
37
CNO FINANCIAL GROUP, INC. AND SUBSIDIARIES
Notes to Consolidated Financial Statements
(unaudited)
___________________
The following table sets forth the amortized cost and estimated fair value of the investments held by the VIEs at June 30, 2012, by contractual maturity. Actual maturities will differ from contractual maturities because borrowers may have the right to call or prepay obligations with or without penalties.
Amortized cost | Estimated fair value | ||||||
(Dollars in millions) | |||||||
Due in one year or less | $ | 3.6 | $ | 3.6 | |||
Due after one year through five years | 376.8 | 375.1 | |||||
Due after five years through ten years | 412.1 | 410.6 | |||||
Total | $ | 792.5 | $ | 789.3 | |||
During the first six months of 2012, we recognized net realized investment losses on the VIE investments of $.2 million, which were comprised of $.2 million of net gains from the sales of fixed maturities, and $.4 million of writedowns of investments for other than temporary declines in fair value recognized through net income. During the first six months of 2011, we recognized net realized investment gains on the VIE investments of $.4 million, which were comprised of $3.6 million of net gains from the sales of fixed maturities, and $3.2 million of writedowns of investments for other than temporary declines in fair value recognized through net income.
At June 30, 2012, there were no investments held by the VIEs that were in default.
During the first six months of 2012, $21.2 million of investments held by the VIEs were sold which resulted in gross investment losses (before income taxes) of $.2 million.
At June 30, 2012, the VIEs held: (i) investments with a fair value of $446.4 million and gross unrealized losses of $3.9 million that had been in an unrealized loss position for less than twelve months; and (ii) investments with a fair value of $79.3 million and gross unrealized losses of $1.6 million that had been in an unrealized loss position for greater than twelve months.
The investments held by the VIEs are evaluated for other-than-temporary declines in fair value in a manner that is consistent with the Company’s fixed maturities, available for sale.
In addition, the Company, in the normal course of business, makes passive investments in structured securities issued by VIEs for which the Company is not the investment manager. These structured securities include asset-backed securities, collateralized debt obligations, commercial mortgage-backed securities, residential mortgage-backed securities and collateralized mortgage obligations. Our maximum exposure to loss on these securities is limited to our cost basis in the investment. We have determined that we are not the primary beneficiary of these structured securities due to the relative size of our investment in comparison to the total principal amount of the individual structured securities and the level of credit subordination which reduces our obligation to absorb gains or losses.
At June 30, 2012, we hold investments in various limited partnerships, in which we are not the primary beneficiary, totaling $29.6 million (classified as other invested assets). At June 30, 2012, we had unfunded commitments to these partnerships of $18.9 million. Our maximum exposure to loss on these investments is limited to the amount of our investment.
38
CNO FINANCIAL GROUP, INC. AND SUBSIDIARIES
Notes to Consolidated Financial Statements
(unaudited)
___________________
FAIR VALUE MEASUREMENTS
Fair value is the price that would be received to sell an asset or paid to transfer a liability in an orderly transaction between market participants at the measurement date and, therefore, represents an exit price, not an entry price. We carry certain assets and liabilities at fair value on a recurring basis, including fixed maturities, equity securities, trading securities, investments held by VIEs, derivatives, cash and cash equivalents, separate account assets and embedded derivatives. We carry our company-owned life insurance policy, which is backed by a series of mutual funds, at its cash surrender value and our hedge fund investments at their net asset values; in both cases, we believe these values approximate their fair values. In addition, we disclose fair value for certain financial instruments, including mortgage loans and policy loans, insurance liabilities for interest-sensitive products, investment borrowings, notes payable and borrowings related to VIEs.
The degree of judgment utilized in measuring the fair value of financial instruments is largely dependent on the level to which pricing is based on observable inputs. Observable inputs reflect market data obtained from independent sources, while unobservable inputs reflect our view of market assumptions in the absence of observable market information. Financial instruments with readily available active quoted prices would be considered to have fair values based on the highest level of observable inputs, and little judgment would be utilized in measuring fair value. Financial instruments that rarely trade would often have fair value based on a lower level of observable inputs, and more judgment would be utilized in measuring fair value.
Valuation Hierarchy
There is a three-level hierarchy for valuing assets or liabilities at fair value based on whether inputs are observable or unobservable.
• | Level 1 – includes assets and liabilities valued using inputs that are unadjusted quoted prices in active markets for identical assets or liabilities. Our Level 1 assets primarily include cash and exchange traded securities. |
• | Level 2 – includes assets and liabilities valued using inputs that are quoted prices for similar assets in an active market, quoted prices for identical or similar assets in a market that is not active, observable inputs, or observable inputs that can be corroborated by market data. Level 2 assets and liabilities include those financial instruments that are valued by independent pricing services using models or other valuation methodologies. These models are primarily industry-standard models that consider various inputs such as interest rate, credit spread, reported trades, broker/dealer quotes, issuer spreads and other inputs that are observable or derived from observable information in the marketplace or are supported by observable levels at which transactions are executed in the marketplace. Financial assets in this category primarily include: certain public and privately placed corporate fixed maturity securities; certain government or agency securities; certain mortgage and asset-backed securities; certain equity securities; most investments held by our consolidated VIEs; certain mutual fund and hedge fund investments; and most short-term investments; and non-exchange-traded derivatives such as call options to hedge liabilities related to our fixed index annuity products. Financial liabilities in this category include investment borrowings, notes payable and borrowings related to VIEs. |
• | Level 3 – includes assets and liabilities valued using unobservable inputs that are used in model-based valuations that contain management assumptions. Level 3 assets and liabilities include those financial instruments whose fair value is estimated based on non-binding broker prices or internally developed models or methodologies utilizing significant inputs not based on, or corroborated by, readily available market information. Financial assets in this category include certain corporate securities (primarily certain below-investment grade privately placed securities), certain structured securities, mortgage loans, and other less liquid securities. Financial liabilities in this category include our insurance liabilities for interest-sensitive products, which includes embedded derivatives (including embedded derivatives related to our fixed index annuity products and to a modified coinsurance arrangement) since their values include significant unobservable inputs including actuarial assumptions. |
At each reporting date, we classify assets and liabilities into the three input levels based on the lowest level of input that is significant to the measurement of fair value for each asset and liability reported at fair value. This classification is impacted by a number of factors, including the type of financial instrument, whether the financial instrument is new to the market and not yet established, the characteristics specific to the transaction and overall market conditions. Our assessment of the significance of a particular input to the fair value measurement and the ultimate classification of each asset and liability requires judgment
39
CNO FINANCIAL GROUP, INC. AND SUBSIDIARIES
Notes to Consolidated Financial Statements
(unaudited)
___________________
and is subject to change from period to period based on the observability of the valuation inputs. Any transfers between levels are reported as having occurred at the beginning of the period. There were no significant transfers between Level 1 and Level 2 in the first six months of 2012.
The vast majority of our fixed maturity and equity securities, including those held in trading portfolios and those held by consolidated VIEs, short-term and separate account assets use Level 2 inputs for the determination of fair value. These fair values are obtained primarily from independent pricing services, which use Level 2 inputs for the determination of fair value. Substantially all of our Level 2 fixed maturity securities and separate account assets were valued from independent pricing services. Third party pricing services normally derive the security prices through recently reported trades for identical or similar securities making adjustments through the reporting date based upon available market observable information. If there are no recently reported trades, the third party pricing services may use matrix or model processes to develop a security price where future cash flow expectations are developed and discounted at an estimated risk-adjusted market rate. The number of prices obtained for a given security is dependent on the Company’s analysis of such prices as further described below.
For securities that are not priced by pricing services and may not be reliably priced using pricing models, we obtain broker quotes. These broker quotes are non-binding and represent an exit price, but assumptions used to establish the fair value may not be observable and therefore represent Level 3 inputs. Approximately 25 percent of our Level 3 fixed maturity securities were valued using unadjusted broker quotes or broker-provided valuation inputs. The remaining Level 3 fixed maturity investments do not have readily determinable market prices and/or observable inputs. For these securities, we use internally developed valuations. Key assumptions used to determine fair value for these securities may include risk-free rates, risk premiums, performance of underlying collateral and other factors involving significant assumptions which may not be reflective of an active market. For certain investments, we use a matrix or model process to develop a security price where future cash flow expectations are developed and discounted at an estimated market rate. The pricing matrix utilizes a spread level to determine the market price for a security. The credit spread generally incorporates the issuer’s credit rating and other factors relating to the issuer’s industry and the security’s maturity. In some instances issuer-specific spread adjustments, which can be positive or negative, are made based upon internal analysis of security specifics such as liquidity, deal size, and time to maturity.
As the Company is responsible for the determination of fair value, we have control processes designed to ensure that the fair values received from third-party pricing sources are reasonable and the valuation techniques and assumptions used appear reasonable and consistent with prevailing market conditions. As part of these controls, we perform monthly quantitative and qualitative analysis on the prices received from third parties to determine whether the prices are reasonable estimates of fair value. The Company’s analysis includes: (i) a review of the methodology used by third party pricing services; (ii) where available, a comparison of multiple pricing services’ valuations for the same security; (iii) a review of month to month price fluctuations; (iv) a review to ensure valuations are not unreasonably stale; and (v) back testing to compare actual purchase and sale transactions with valuations received from third parties. As a result of such procedures, the Company may conclude the prices received from third parties are not reflective of current market conditions. In those instances, we may request additional pricing quotes or apply internally developed valuations. However, the number of instances is insignificant and the aggregate change in value of such investments is not materially different from the original prices received.
The categorization of the fair value measurements of our investments priced by independent pricing services was based upon the Company’s judgment of the inputs or methodologies used by the independent pricing services to value different asset classes. Such inputs include: benchmark yields, reported trades, broker dealer quotes, issuer spreads, benchmark securities, bids, offers and reference data. The Company categorizes such fair value measurements based upon asset classes and the underlying observable or unobservable inputs used to value such investments.
Except for exchange traded derivatives which are classified as Level 1, the fair value measurements for derivative instruments, including embedded derivatives requiring bifurcation, are determined based on the consideration of several inputs including closing exchange or over-the-counter market price quotations; time value and volatility factors underlying options; market interest rates; and non-performance risk. For certain embedded derivatives, we may use actuarial assumptions in the determination of fair value.
The categorization of fair value measurements, by input level, for our financial instruments carried at fair value on a recurring basis at June 30, 2012 is as follows (dollars in millions):
40
CNO FINANCIAL GROUP, INC. AND SUBSIDIARIES
Notes to Consolidated Financial Statements
(unaudited)
___________________
Quoted prices in active markets for identical assets or liabilities (Level 1) | Significant other observable inputs (Level 2) | Significant unobservable inputs (Level 3) | Total | ||||||||||||
Assets: | |||||||||||||||
Fixed maturities, available for sale: | |||||||||||||||
Corporate securities | $ | — | $ | 15,913.3 | $ | 321.0 | $ | 16,234.3 | |||||||
United States Treasury securities and obligations of United States government corporations and agencies | — | 222.2 | 1.5 | 223.7 | |||||||||||
States and political subdivisions | — | 2,018.5 | 16.0 | 2,034.5 | |||||||||||
Debt securities issued by foreign governments | — | .8 | — | .8 | |||||||||||
Asset-backed securities | — | 1,495.9 | 23.0 | 1,518.9 | |||||||||||
Collateralized debt obligations | — | — | 330.1 | 330.1 | |||||||||||
Commercial mortgage-backed securities | — | 1,586.1 | — | 1,586.1 | |||||||||||
Mortgage pass-through securities | — | 19.7 | 2.1 | 21.8 | |||||||||||
Collateralized mortgage obligations | — | 2,321.9 | 4.5 | 2,326.4 | |||||||||||
Total fixed maturities, available for sale | — | 23,578.4 | 698.2 | 24,276.6 | |||||||||||
Equity securities: | |||||||||||||||
Corporate securities | 19.4 | 106.7 | 3.2 | 129.3 | |||||||||||
Venture capital investments | — | — | 58.0 | 58.0 | |||||||||||
Total equity securities | 19.4 | 106.7 | 61.2 | 187.3 | |||||||||||
Trading securities: | |||||||||||||||
Corporate securities | — | 47.9 | — | 47.9 | |||||||||||
United States Treasury securities and obligations of United States government corporations and agencies | — | 4.9 | — | 4.9 | |||||||||||
States and political subdivisions | — | 15.4 | .5 | 15.9 | |||||||||||
Asset-backed securities | — | 9.0 | — | 9.0 | |||||||||||
Collateralized debt obligations | — | — | 3.4 | 3.4 | |||||||||||
Commercial mortgage-backed securities | — | 14.5 | — | 14.5 | |||||||||||
Mortgage pass-through securities | — | .2 | — | .2 | |||||||||||
Collateralized mortgage obligations | — | 14.4 | — | 14.4 | |||||||||||
Equity securities | .8 | 3.8 | — | 4.6 | |||||||||||
Total trading securities | .8 | 110.1 | 3.9 | 114.8 | |||||||||||
Investments held by variable interest entities - corporate securities | — | 789.3 | — | 789.3 | |||||||||||
Other invested assets: | |||||||||||||||
Company-owned life insurance | — | 108.2 | — | 108.2 | |||||||||||
Hedge funds | — | 16.4 | — | 16.4 | |||||||||||
Derivatives | 1.1 | 75.7 | — | 76.8 | |||||||||||
Total other invested assets | 1.1 | 200.3 | — | 201.4 | |||||||||||
Cash and cash equivalents - unrestricted: | |||||||||||||||
Cash | 131.6 | — | — | 131.6 | |||||||||||
Cash equivalents and short-term investments | — | 58.6 | — | 58.6 | |||||||||||
Total cash and cash equivalents - unrestricted | 131.6 | 58.6 | — | 190.2 | |||||||||||
Cash and cash equivalents held by variable interest entities | 88.6 | — | — | 88.6 | |||||||||||
Assets held in separate accounts | — | 15.6 | — | 15.6 | |||||||||||
Total assets carried at fair value by category | $ | 241.5 | $ | 24,859 | $ | 763.3 | $ | 25,863.8 | |||||||
Liabilities: | |||||||||||||||
Liabilities for insurance products: | |||||||||||||||
Interest-sensitive products - embedded derivatives associated with fixed index annuity products | $ | — | $ | — | $ | 701.0 | $ | 701.0 | |||||||
Interest-sensitive products - embedded derivatives associated with modified coinsurance agreement | — | — | 4.9 | 4.9 | |||||||||||
Total liabilities for insurance products | — | — | 705.9 | 705.9 | |||||||||||
Total liabilities carried at fair value by category | $ | — | $ | — | $ | 705.9 | $ | 705.9 | |||||||
41
CNO FINANCIAL GROUP, INC. AND SUBSIDIARIES
Notes to Consolidated Financial Statements
(unaudited)
___________________
For those financial instruments disclosed at fair value, we use the following methods and assumptions to determine the estimated fair values:
Mortgage loans and policy loans. We discount future expected cash flows for loans included in our investment portfolio based on interest rates currently being offered for similar loans to borrowers with similar credit ratings. We aggregate loans with similar characteristics in our calculations. The fair value of policy loans approximates their carrying value.
Insurance liabilities for interest-sensitive products. We discount future expected cash flows based on interest rates currently being offered for similar contracts with similar maturities.
Investment borrowings, notes payable and borrowings related to variable interest entities. For publicly traded debt, we use current fair values. For other notes, we use discounted cash flow analyses based on our current incremental borrowing rates for similar types of borrowing arrangements.
The fair value measurements for our financial instruments disclosed at fair value on a recurring basis are as follows (dollars in millions):
June 30, 2012 | December 31, 2011 | ||||||||||||||||||||||||||
Quoted prices in active markets for identical assets or liabilities (Level 1) | Significant other observable inputs (Level 2) | Significant unobservable inputs (Level 3) | Total estimated fair value | Total carrying amount | Total estimated fair value | Total carrying amount | |||||||||||||||||||||
Assets: | |||||||||||||||||||||||||||
Mortgage loans | $ | — | $ | — | $ | 1,683.4 | $ | 1,683.4 | $ | 1,550.9 | $ | 1,735.4 | $ | 1,602.8 | |||||||||||||
Policy loans | — | 274.7 | — | 274.7 | 274.7 | 279.7 | 279.7 | ||||||||||||||||||||
Liabilities: | |||||||||||||||||||||||||||
Insurance liabilities for interest-sensitive products excluding embedded derivatives (a) | — | — | 12,250.4 | 12,250.4 | 12,250.4 | 13,165.5 | 13,165.5 | ||||||||||||||||||||
Investment borrowings | — | 1,739.6 | — | 1,739.6 | 1,687.9 | 1,735.7 | 1,676.5 | ||||||||||||||||||||
Borrowings related to variable interest entities | — | 745.8 | — | 745.8 | 766.7 | 485.1 | 519.9 | ||||||||||||||||||||
Notes payable – direct corporate obligations | — | 997.0 | — | 997.0 | 778.2 | 978.3 | 857.9 | ||||||||||||||||||||
____________________
(a) | The estimated fair value of insurance liabilities for interest-sensitive products was approximately equal to its carrying value at June 30, 2012. This was because interest rates credited on the vast majority of account balances approximate current rates paid on similar products and because these rates are not generally guaranteed beyond one year. |
42
CNO FINANCIAL GROUP, INC. AND SUBSIDIARIES
Notes to Consolidated Financial Statements
(unaudited)
___________________
The categorization of fair value measurements, by input level, for our fixed maturity securities, equity securities, trading securities, certain other invested assets, assets held in separate accounts and embedded derivative instruments included in liabilities for insurance products at December 31, 2011 is as follows (dollars in millions):
Quoted prices in active markets for identical assets or liabilities (Level 1) | Significant other observable inputs (Level 2) (a) | Significant unobservable inputs (Level 3) (a) | Total | ||||||||||||||||
Assets: | |||||||||||||||||||
Fixed maturities, available for sale: | |||||||||||||||||||
Corporate securities | $ | — | $ | 15,594.4 | $ | 278.1 | $ | 15,872.5 | |||||||||||
United States Treasury securities and obligations of United States government corporations and agencies | — | 303.8 | 1.6 | 305.4 | |||||||||||||||
States and political subdivisions | — | 1,952.3 | 2.1 | 1,954.4 | |||||||||||||||
Debt securities issued by foreign governments | — | 1.4 | — | 1.4 | |||||||||||||||
Asset-backed securities | — | 1,334.3 | 79.7 | 1,414.0 | |||||||||||||||
Collateralized debt obligations | — | — | 327.3 | 327.3 | |||||||||||||||
Commercial mortgage-backed securities | — | 1,415.7 | 17.3 | 1,433.0 | |||||||||||||||
Mortgage pass-through securities | — | 29.8 | 2.2 | 32.0 | |||||||||||||||
Collateralized mortgage obligations | — | 2,051.2 | 124.8 | 2,176.0 | |||||||||||||||
Total fixed maturities, available for sale | — | 22,682.9 | 833.1 | 23,516.0 | |||||||||||||||
Equity securities | 17.9 | 87.3 | 69.9 | 175.1 | |||||||||||||||
Trading securities: | |||||||||||||||||||
Corporate securities | — | 67.6 | — | 67.6 | |||||||||||||||
United States Treasury securities and obligations of United States government corporations and agencies | — | 4.9 | — | 4.9 | |||||||||||||||
States and political subdivisions | — | 15.6 | — | 15.6 | |||||||||||||||
Asset-backed securities | — | .1 | — | .1 | |||||||||||||||
Commercial mortgage-backed securities | — | — | .4 | .4 | |||||||||||||||
Mortgage pass-through securities | — | .2 | — | .2 | |||||||||||||||
Collateralized mortgage obligations | — | .7 | — | .7 | |||||||||||||||
Equity securities | .7 | 1.4 | — | 2.1 | |||||||||||||||
Total trading securities | .7 | 90.5 | .4 | 91.6 | |||||||||||||||
Investments held by variable interest entities | — | 496.3 | — | 496.3 | |||||||||||||||
Other invested assets | — | 159.9 | (b) | — | 159.9 | ||||||||||||||
Assets held in separate accounts | — | 15.0 | — | 15.0 | |||||||||||||||
Liabilities: | |||||||||||||||||||
Liabilities for insurance products: | |||||||||||||||||||
Interest-sensitive products | — | — | 669.8 | (c) | 669.8 | ||||||||||||||
_____________
(a) | We revised the hierarchy classification of certain fixed maturities, equity securities, trading securities and other invested assets as we believe the observability of the inputs more closely represent Level 2 valuations. |
(b) | Includes company-owned life insurance and derivatives. |
43
CNO FINANCIAL GROUP, INC. AND SUBSIDIARIES
Notes to Consolidated Financial Statements
(unaudited)
___________________
(c) | Includes $666.3 million of embedded derivatives associated with our fixed index annuity products and $3.5 million of embedded derivatives associated with a modified coinsurance agreement. |
The following table presents additional information about assets and liabilities measured at fair value on a recurring basis and for which we have utilized significant unobservable (Level 3) inputs to determine fair value for the three months ended June 30, 2012 (dollars in millions):
June 30, 2012 | |||||||||||||||||||||||||||||||
Beginning balance as of March 31, 2012 (a) | Purchases, sales, issuances and settlements, net (c) | Total realized and unrealized gains (losses) included in net income | Total realized and unrealized gains (losses) included in accumulated other comprehensive income (loss) | Transfers into Level 3 | Transfers out of Level 3 (b) | Ending balance as of June 30, 2012 | Amount of total gains (losses) for the three months ended June 30, 2012 included in our net income relating to assets and liabilities still held as of the reporting date | ||||||||||||||||||||||||
Assets: | |||||||||||||||||||||||||||||||
Fixed maturities, available for sale: | |||||||||||||||||||||||||||||||
Corporate securities | $ | 268.0 | $ | 18.3 | $ | — | $ | 2.0 | $ | 63.5 | $ | (30.8 | ) | $ | 321.0 | $ | — | ||||||||||||||
United States Treasury securities and obligations of United States government corporations and agencies | 1.6 | (.1 | ) | — | — | — | — | 1.5 | — | ||||||||||||||||||||||
States and political subdivisions | 9.6 | — | — | .8 | 10.6 | (5.0 | ) | 16.0 | — | ||||||||||||||||||||||
Asset-backed securities | 22.7 | — | — | 1.6 | 1.3 | (2.6 | ) | 23.0 | — | ||||||||||||||||||||||
Collateralized debt obligations | 332.4 | (3.9 | ) | — | 1.6 | — | — | 330.1 | — | ||||||||||||||||||||||
Mortgage pass-through securities | 2.2 | (.1 | ) | — | — | — | — | 2.1 | — | ||||||||||||||||||||||
Collateralized mortgage obligations | 14.7 | — | — | .1 | — | (10.3 | ) | 4.5 | — | ||||||||||||||||||||||
Total fixed maturities, available for sale | 651.2 | 14.2 | — | 6.1 | 75.4 | (48.7 | ) | 698.2 | — | ||||||||||||||||||||||
Equity securities: | |||||||||||||||||||||||||||||||
Corporate securities | 3.2 | — | — | — | — | — | 3.2 | — | |||||||||||||||||||||||
Venture capital investments | 65.2 | — | (3.0 | ) | (4.2 | ) | — | — | 58.0 | (3.0 | ) | ||||||||||||||||||||
Total equity securities | 68.4 | — | (3.0 | ) | (4.2 | ) | — | — | 61.2 | (3.0 | ) | ||||||||||||||||||||
Trading securities: | |||||||||||||||||||||||||||||||
States and political subdivisions | — | — | — | — | .5 | — | .5 | — | |||||||||||||||||||||||
Collateralized debt obligations | 3.6 | — | — | (.2 | ) | — | — | 3.4 | (.2 | ) | |||||||||||||||||||||
Total trading securities | 3.6 | — | — | (.2 | ) | .5 | — | 3.9 | (.2 | ) | |||||||||||||||||||||
Liabilities: | |||||||||||||||||||||||||||||||
Liabilities for insurance products: | |||||||||||||||||||||||||||||||
Interest-sensitive products | (707.7 | ) | 21.1 | (19.3 | ) | — | — | — | (705.9 | ) | (19.3 | ) | |||||||||||||||||||
44
CNO FINANCIAL GROUP, INC. AND SUBSIDIARIES
Notes to Consolidated Financial Statements
(unaudited)
___________________
____________
(a) | We revised the hierarchy classification of certain fixed maturities, equity securities, trading securities and other invested assets as we believe the observability of the inputs more closely represent Level 2 valuations. |
(b) | For our fixed maturity securities, the majority of our transfers out of Level 3 are the result of obtaining a valuation from an independent pricing service at the end of the period, whereas a broker quote was used as of the beginning of the period. |
(c) | Purchases, sales, issuances and settlements, net, represent the activity that occurred during the period that results in a change of the asset or liability but does not represent changes in fair value for the instruments held at the beginning of the period. Such activity primarily consists of purchases and sales of fixed maturity and equity securities and changes to embedded derivative instruments related to insurance products resulting from the issuance of new contracts, or changes to existing contracts. The following summarizes such activity for the three months ended June 30, 2012 (dollars in millions): |
Purchases | Sales | Issuances | Settlements | Purchases, sales, issuances and settlements, net | |||||||||||||||
Assets: | |||||||||||||||||||
Fixed maturities, available for sale: | |||||||||||||||||||
Corporate securities | $ | 18.3 | $ | — | $ | — | $ | — | $ | 18.3 | |||||||||
United States Treasury securities and obligations of United States government corporations and agencies | — | (.1 | ) | — | — | (.1 | ) | ||||||||||||
Collateralized debt obligations | 7.2 | (11.1 | ) | — | — | (3.9 | ) | ||||||||||||
Mortgage pass-through securities | — | (.1 | ) | — | — | (.1 | ) | ||||||||||||
Total fixed maturities, available for sale | 25.5 | (11.3 | ) | — | — | 14.2 | |||||||||||||
Liabilities: | |||||||||||||||||||
Liabilities for insurance products: | |||||||||||||||||||
Interest-sensitive products | (24.5 | ) | 36.7 | (1.5 | ) | 10.4 | 21.1 | ||||||||||||
45
CNO FINANCIAL GROUP, INC. AND SUBSIDIARIES
Notes to Consolidated Financial Statements
(unaudited)
___________________
The following table presents additional information about assets and liabilities measured at fair value on a recurring basis and for which we have utilized significant unobservable (Level 3) inputs to determine fair value for the six months ended June 30, 2012 (dollars in millions):
June 30, 2012 | |||||||||||||||||||||||||||||||
Beginning balance as of December 31, 2011 (a) | Purchases, sales, issuances and settlements, net (c) | Total realized and unrealized gains (losses) included in net income | Total realized and unrealized gains (losses) included in accumulated other comprehensive income (loss) | Transfers into Level 3 | Transfers out of Level 3 (b) | Ending balance as of June 30, 2012 | Amount of total gains (losses) for the six months ended June 30, 2012 included in our net income relating to assets and liabilities still held as of the reporting date | ||||||||||||||||||||||||
Assets: | |||||||||||||||||||||||||||||||
Fixed maturities, available for sale: | |||||||||||||||||||||||||||||||
Corporate securities | $ | 278.1 | $ | 16.0 | $ | — | $ | 3.5 | $ | 94.3 | $ | (70.9 | ) | $ | 321.0 | $ | — | ||||||||||||||
United States Treasury securities and obligations of United States government corporations and agencies | 1.6 | (.1 | ) | — | — | — | — | 1.5 | — | ||||||||||||||||||||||
States and political subdivisions | 2.1 | — | — | 1.7 | 14.3 | (2.1 | ) | 16.0 | — | ||||||||||||||||||||||
Asset-backed securities | 79.7 | (27.3 | ) | (.3 | ) | (2.7 | ) | .6 | (27.0 | ) | 23.0 | — | |||||||||||||||||||
Collateralized debt obligations | 327.3 | (5.7 | ) | — | 8.5 | — | — | 330.1 | — | ||||||||||||||||||||||
Commercial mortgage-backed securities | 17.3 | — | — | — | — | (17.3 | ) | — | — | ||||||||||||||||||||||
Mortgage pass-through securities | 2.2 | (.1 | ) | — | — | — | — | 2.1 | — | ||||||||||||||||||||||
Collateralized mortgage obligations | 124.8 | (22.5 | ) | — | (1.0 | ) | — | (96.8 | ) | 4.5 | — | ||||||||||||||||||||
Total fixed maturities, available for sale | 833.1 | (39.7 | ) | (.3 | ) | 10.0 | 109.2 | (214.1 | ) | 698.2 | — | ||||||||||||||||||||
Equity securities: | |||||||||||||||||||||||||||||||
Corporate securities | 6.4 | — | (3.8 | ) | .6 | — | — | 3.2 | (3.8 | ) | |||||||||||||||||||||
Venture capital investments | 63.5 | — | (3.0 | ) | (2.5 | ) | — | — | 58.0 | (3.0 | ) | ||||||||||||||||||||
Total equity securities | 69.9 | — | (6.8 | ) | (1.9 | ) | — | — | 61.2 | (6.8 | ) | ||||||||||||||||||||
Trading securities: | |||||||||||||||||||||||||||||||
States and political subdivisions | — | — | — | .1 | .4 | — | .5 | .1 | |||||||||||||||||||||||
Collateralized debt obligations | — | 4.2 | — | (.8 | ) | — | — | 3.4 | (.8 | ) | |||||||||||||||||||||
Commercial mortgage-backed securities | .4 | — | — | — | — | (.4 | ) | — | — | ||||||||||||||||||||||
Total trading securities | .4 | 4.2 | — | (.7 | ) | .4 | (.4 | ) | 3.9 | (.7 | ) | ||||||||||||||||||||
Liabilities: | |||||||||||||||||||||||||||||||
Liabilities for insurance products: | |||||||||||||||||||||||||||||||
Interest-sensitive products | (669.8 | ) | (29.4 | ) | (6.7 | ) | — | — | — | (705.9 | ) | (6.7 | ) | ||||||||||||||||||
46
CNO FINANCIAL GROUP, INC. AND SUBSIDIARIES
Notes to Consolidated Financial Statements
(unaudited)
___________________
____________
(a) | We revised the hierarchy classification of certain fixed maturities, equity securities, trading securities and other invested assets as we believe the observability of the inputs more closely represent Level 2 valuations. |
(b) | For our fixed maturity securities, the majority of our transfers out of Level 3 are the result of obtaining a valuation from an independent pricing service at the end of the period, whereas a broker quote was used as of the beginning of the period. |
(c) | Purchases, sales, issuances and settlements, net, represent the activity that occurred during the period that results in a change of the asset or liability but does not represent changes in fair value for the instruments held at the beginning of the period. Such activity primarily consists of purchases and sales of fixed maturity and equity securities and changes to embedded derivative instruments related to insurance products resulting from the issuance of new contracts, or changes to existing contracts. The following summarizes such activity for the six months ended June 30, 2012 (dollars in millions): |
Purchases | Sales | Issuances | Settlements | Purchases, sales, issuances and settlements, net | |||||||||||||||
Assets: | |||||||||||||||||||
Fixed maturities, available for sale: | |||||||||||||||||||
Corporate securities | $ | 43.3 | $ | (27.3 | ) | $ | — | $ | — | $ | 16.0 | ||||||||
United States Treasury securities and obligations of United States government corporations and agencies | — | (.1 | ) | — | — | (.1 | ) | ||||||||||||
Asset-backed securities | — | (27.3 | ) | — | — | (27.3 | ) | ||||||||||||
Collateralized debt obligations | 35.5 | (41.2 | ) | — | — | (5.7 | ) | ||||||||||||
Mortgage pass-through securities | — | (.1 | ) | — | — | (.1 | ) | ||||||||||||
Collateralized mortgage obligations | 4.1 | (26.6 | ) | — | — | (22.5 | ) | ||||||||||||
Total fixed maturities, available for sale | 82.9 | (122.6 | ) | — | — | (39.7 | ) | ||||||||||||
Trading securities - collateralized debt obligations | 4.2 | — | — | — | 4.2 | ||||||||||||||
Liabilities: | |||||||||||||||||||
Liabilities for insurance products: | |||||||||||||||||||
Interest-sensitive products | (51.8 | ) | 41.7 | (40.4 | ) | 21.1 | (29.4 | ) | |||||||||||
47
CNO FINANCIAL GROUP, INC. AND SUBSIDIARIES
Notes to Consolidated Financial Statements
(unaudited)
___________________
The following table presents additional information about assets and liabilities measured at fair value on a recurring basis and for which we have utilized significant unobservable (Level 3) inputs to determine fair value for the three months ended June 30, 2011 (dollars in millions):
June 30, 2011 | ||||||||||||||||||||||||||||||||
Beginning balance as of March 31, 2011 | Purchases, sales, issuances and settlements, net (a) | Total realized and unrealized gains (losses) included in net income | Total realized and unrealized gains (losses) included in other comprehensive income (loss) | Transfers into Level 3 | Transfers out of Level 3 | Ending balance as of June 30, 2011 | Amount of total gains (losses) for the three months ended June 30, 2011 included in our net income relating to assets and liabilities still held as of the reporting date | |||||||||||||||||||||||||
Assets: | ||||||||||||||||||||||||||||||||
Fixed maturities, available for sale: | ||||||||||||||||||||||||||||||||
Corporate securities | $ | 1,853.1 | $ | (59.0 | ) | $ | (10.0 | ) | $ | 5.0 | $ | 43.5 | $ | (1,470.8 | ) | $ | 361.8 | $ | (5.1 | ) | ||||||||||||
United States Treasury securities and obligations of United States government corporations and agencies | 1.7 | — | — | — | — | — | 1.7 | — | ||||||||||||||||||||||||
Asset-backed securities | 207.4 | (1.6 | ) | — | 2.6 | 4.4 | (42.1 | ) | 170.7 | — | ||||||||||||||||||||||
Collateralized debt obligations | 186.2 | 7.2 | — | .1 | — | — | 193.5 | — | ||||||||||||||||||||||||
Mortgage pass-through securities | 3.3 | (.1 | ) | — | — | — | — | 3.2 | — | |||||||||||||||||||||||
Collateralized mortgage obligations | 247.5 | 45.8 | (.9 | ) | (.1 | ) | 25.1 | (113.3 | ) | 204.1 | — | |||||||||||||||||||||
Total fixed maturities, available for sale | 2,499.2 | (7.7 | ) | (10.9 | ) | 7.6 | 73.0 | (1,626.2 | ) | 935.0 | (5.1 | ) | ||||||||||||||||||||
Equity securities | 44.3 | — | — | .3 | — | — | 44.6 | — | ||||||||||||||||||||||||
Trading securities: | ||||||||||||||||||||||||||||||||
Collateralized mortgage obligations | .5 | — | — | — | — | (.5 | ) | — | — | |||||||||||||||||||||||
Total trading securities | .5 | — | — | — | — | (.5 | ) | — | — | |||||||||||||||||||||||
Investments held by variable interest entities: | ||||||||||||||||||||||||||||||||
Corporate securities | — | — | — | — | — | — | — | — | ||||||||||||||||||||||||
Liabilities: | ||||||||||||||||||||||||||||||||
Liabilities for insurance products: | ||||||||||||||||||||||||||||||||
Interest-sensitive products | (587.5 | ) | (15.2 | ) | (10.7 | ) | — | — | — | (613.4 | ) | (10.7 | ) | |||||||||||||||||||
____________
(a) | Purchases, sales, issuances and settlements, net, represent the activity that occurred during the period that results in a change of the asset or liability but does not represent changes in fair value for the instruments held at the beginning of the period. Such activity primarily consists of purchases and sales of fixed maturity and equity securities and changes to embedded derivative instruments related to insurance products resulting from the issuance of new contracts, or changes to existing contracts. The following summarizes such activity for the three months ended June 30, 2011 (dollars in millions): |
48
CNO FINANCIAL GROUP, INC. AND SUBSIDIARIES
Notes to Consolidated Financial Statements
(unaudited)
___________________
Purchases | Sales | Issuances | Settlements | Purchases, sales, issuances and settlements, net | |||||||||||||||
Assets: | |||||||||||||||||||
Fixed maturities, available for sale: | |||||||||||||||||||
Corporate securities | $ | — | $ | (59.0 | ) | $ | — | $ | — | $ | (59.0 | ) | |||||||
Asset-backed securities | — | (1.6 | ) | — | — | (1.6 | ) | ||||||||||||
Collateralized debt obligations | 19.0 | (11.8 | ) | — | — | 7.2 | |||||||||||||
Mortgage pass-through securities | — | (.1 | ) | — | — | (.1 | ) | ||||||||||||
Collateralized mortgage obligations | 61.4 | (15.6 | ) | — | — | 45.8 | |||||||||||||
Total fixed maturities, available for sale | 80.4 | (88.1 | ) | — | — | (7.7 | ) | ||||||||||||
Liabilities: | |||||||||||||||||||
Liabilities for insurance products: | |||||||||||||||||||
Interest-sensitive products | (27.4 | ) | 7.5 | (6.8 | ) | 11.5 | (15.2 | ) | |||||||||||
49
CNO FINANCIAL GROUP, INC. AND SUBSIDIARIES
Notes to Consolidated Financial Statements
(unaudited)
___________________
The following table presents additional information about assets and liabilities measured at fair value on a recurring basis and for which we have utilized significant unobservable (Level 3) inputs to determine fair value for the six months ended June 30, 2011 (dollars in millions):
June 30, 2011 | ||||||||||||||||||||||||||||||||
Beginning balance as of December 31, 2010 | Purchases, sales, issuances and settlements, net (a) | Total realized and unrealized gains (losses) included in net income | Total realized and unrealized gains (losses) included in other comprehensive income (loss) | Transfers into Level 3 | Transfers out of Level 3 | Ending balance as of June 30, 2011 | Amount of total gains (losses) for the six months ended June 30, 2011 included in our net income relating to assets and liabilities still held as of the reporting date | |||||||||||||||||||||||||
Assets: | ||||||||||||||||||||||||||||||||
Fixed maturities, available for sale: | ||||||||||||||||||||||||||||||||
Corporate securities | $ | 1,907.8 | $ | (161.0 | ) | $ | (21.0 | ) | $ | 8.3 | $ | 56.5 | $ | (1,428.8 | ) | $ | 361.8 | $ | (11.5 | ) | ||||||||||||
United States Treasury securities and obligations of United States government corporations and agencies | 2.0 | (.1 | ) | — | (.2 | ) | — | — | 1.7 | — | ||||||||||||||||||||||
States and political subdivisions | 2.5 | — | — | — | — | (2.5 | ) | — | — | |||||||||||||||||||||||
Asset-backed securities | 182.3 | (2.7 | ) | — | 1.9 | 10.9 | (21.7 | ) | 170.7 | — | ||||||||||||||||||||||
Collateralized debt obligations | 256.5 | (69.5 | ) | 2.2 | 4.3 | — | — | 193.5 | — | |||||||||||||||||||||||
Mortgage pass-through securities | 3.5 | (.3 | ) | — | — | — | — | 3.2 | — | |||||||||||||||||||||||
Collateralized mortgage obligations | 197.1 | 54.4 | (.9 | ) | .7 | 38.7 | (85.9 | ) | 204.1 | — | ||||||||||||||||||||||
Total fixed maturities, available for sale | 2,551.7 | (179.2 | ) | (19.7 | ) | 15.0 | 106.1 | (1,538.9 | ) | 935.0 | (11.5 | ) | ||||||||||||||||||||
Equity securities | 6.9 | 36.7 | — | 1.0 | — | — | 44.6 | — | ||||||||||||||||||||||||
Trading securities: | ||||||||||||||||||||||||||||||||
Collateralized mortgage obligations | .4 | — | — | — | — | (.4 | ) | — | — | |||||||||||||||||||||||
Total trading securities | .4 | — | — | — | — | (.4 | ) | — | — | |||||||||||||||||||||||
Investments held by variable interest entities: | ||||||||||||||||||||||||||||||||
Corporate securities | 6.7 | (7.9 | ) | 1.5 | (.3 | ) | — | — | — | — | ||||||||||||||||||||||
Liabilities: | ||||||||||||||||||||||||||||||||
Liabilities for insurance products: | ||||||||||||||||||||||||||||||||
Interest-sensitive products | (553.2 | ) | (51.3 | ) | (8.9 | ) | — | — | — | (613.4 | ) | (8.9 | ) | |||||||||||||||||||
____________
(a) | Purchases, sales, issuances and settlements, net, represent the activity that occurred during the period that results in a change of the asset or liability but does not represent changes in fair value for the instruments held at the beginning of the period. Such activity primarily consists of purchases and sales of fixed maturity and equity securities and changes to embedded derivative instruments related to insurance products resulting from the issuance of new contracts, or changes to existing contracts. The following summarizes such activity for the six months ended June 30, 2011 (dollars in millions): |
50
CNO FINANCIAL GROUP, INC. AND SUBSIDIARIES
Notes to Consolidated Financial Statements
(unaudited)
___________________
Purchases | Sales | Issuances | Settlements | Purchases, sales, issuances and settlements, net | |||||||||||||||
Assets: | |||||||||||||||||||
Fixed maturities, available for sale: | |||||||||||||||||||
Corporate securities | $ | — | $ | (161.0 | ) | $ | — | $ | — | $ | (161.0 | ) | |||||||
United States Treasury securities and obligations of United States governement corporations and agencies | — | (.1 | ) | — | — | (.1 | ) | ||||||||||||
Asset-backed securities | — | (2.7 | ) | — | — | (2.7 | ) | ||||||||||||
Collateralized debt obligations | 20.7 | (90.2 | ) | — | — | (69.5 | ) | ||||||||||||
Mortgage pass-through securities | — | (.3 | ) | — | — | (.3 | ) | ||||||||||||
Collateralized mortgage obligations | 73.9 | (19.5 | ) | — | — | 54.4 | |||||||||||||
Total fixed maturities, available for sale | 94.6 | (273.8 | ) | — | — | (179.2 | ) | ||||||||||||
Equity securities | 36.7 | — | — | — | 36.7 | ||||||||||||||
Investments held by variable interest entities: | |||||||||||||||||||
Corporate securities | — | (7.9 | ) | — | — | (7.9 | ) | ||||||||||||
Liabilities: | |||||||||||||||||||
Liabilities for insurance products: | |||||||||||||||||||
Interest-sensitive products | (52.4 | ) | 10.1 | (25.8 | ) | 16.8 | (51.3 | ) | |||||||||||
At June 30, 2012, 90 percent of our Level 3 fixed maturities, available for sale, were investment grade and 47 percent and 46 percent of our Level 3 fixed maturities, available for sale, consisted of collateralized debt obligations and corporate securities, respectively.
Realized and unrealized investment gains and losses presented in the preceding tables represent gains and losses during the time the applicable financial instruments were classified as Level 3.
Realized and unrealized gains (losses) on Level 3 assets are primarily reported in either net investment income for policyholder and reinsurer accounts and other special-purpose portfolios, net realized investment gains (losses) or insurance policy benefits within the consolidated statement of operations or accumulated other comprehensive income within shareholders’ equity based on the appropriate accounting treatment for the instrument.
The amount presented for gains (losses) included in our net loss for assets and liabilities still held as of the reporting date primarily represents impairments for fixed maturities, available for sale, changes in fair value of trading securities and certain derivatives and changes in fair value of embedded derivative instruments included in liabilities for insurance products that exist as of the reporting date.
51
CNO FINANCIAL GROUP, INC. AND SUBSIDIARIES
Notes to Consolidated Financial Statements
(unaudited)
___________________
The following table provides additional information about the significant unobservable (Level 3) inputs developed internally by the Company to determine fair value for certain assets and liabilities carried at fair value at June 30, 2012 (dollars in millions):
Fair Value at June 30, 2012 | Valuation Technique(s) | Unobservable Inputs | Range (Weighted Average) | ||||||
Assets: | |||||||||
Corporate securities (a) | $ | 182.0 | Discounted cash flow analysis | Discount margins | 2.05% - 3.65% (2.94%) | ||||
Asset-backed securities (b) | 12.4 | Discounted cash flow analysis | Discount margins | 1.90% - 2.05% (2.05%) | |||||
Collateralized debt obligations (c) | 333.5 | Discounted cash flow analysis | Recoveries | 54% - 66% (ramp over 6 months) | |||||
Constant prepayment rate | 20% | ||||||||
Discount margins | .93% - 20.39% (3.30%) | ||||||||
Annual default rate | 1.36% - 5.90% (3.24%) | ||||||||
Portfolio CCC % | .72% - 21.83% (12.21%) | ||||||||
Equity securities (d) | 3.2 | Discounted cash flow analysis | Recoveries | .308 -.308 (.308) | |||||
Venture capital investments (e) | 58.0 | Market multiples | EBITDA multiple | 4.6 - 28.8 (11.69) | |||||
Revenue multiple | 0.7 - 7.1 (4.16) | ||||||||
Book equity multiple | 1.0 - 4.9 (1) | ||||||||
Other assets categorized as Level 3 (f) | 174.2 | Unadjusted third-party price source | Not applicable | Not applicable | |||||
Total | 763.3 | ||||||||
Liabilities: | |||||||||
Interest sensitive products (g) | 705.9 | Discounted projected embedded derivatives | Projected portfolio yields | 5.35% - 5.61% (5.55%) | |||||
Discount rates | 0.0 - 3.3% (1.3%) | ||||||||
Surrender rates | 4% - 43% (19%) | ||||||||
________________________________
(a) | Corporate securities - The significant unobservable input used in the fair value measurement of our corporate securities is discount margin added to a riskless market yield. Significant increases (decreases) in discount margin in isolation would result in a significantly lower (higher) fair value measurement. |
(b) | Asset-backed securities - The significant unobservable input used in the fair value measurement of our asset-backed securities is discount margin added to a riskless market yield. Significant increases (decreases) in discount margin in isolation would result in a significantly lower (higher) fair value measurement. |
(c) | Collateralized debt obligations - The significant unobservable inputs used in the fair value measurement of our collateralized debt obligations relate to collateral performance, including default rate, recoveries and constant prepayment rate, as well as discount margins of the underlying collateral. Significant increases (decreases) in default rate in isolation would result in a significantly lower (higher) fair value measurement. Generally, a significant increase (decrease) in the constant prepayment rate and recoveries in isolation would result in a significantly higher (lower) fair value measurement. Generally a significant increase (decrease) in discount margin in isolation would result in a significantly lower (higher) fair value measurement. Generally, a change in the assumption used for the annual default rate is accompanied by a directionally similar change in the assumption used for discount margins and portfolio CCC % and a directionally opposite change in the assumption used for constant prepayment rate and recoveries. A tranche's payment priority and investment cost basis could alter generalized fair value outcomes. |
(d) | Equity securities - The significant unobservable input used in the fair value measurement of our equity securities is the anticipated cash recovery. Significant increases (decreases) in the anticipated recovery would result in a significantly higher (lower) fair value measurement. |
(e) | Venture capital investments - The significant unobservable inputs used in the fair value measurement of our venture capital |
52
CNO FINANCIAL GROUP, INC. AND SUBSIDIARIES
Notes to Consolidated Financial Statements
(unaudited)
___________________
investments are the EBITDA multiple and revenue multiple. Generally, a significant increase (decrease) in the EBITDA or revenue multiples in isolation would result in a significantly higher (lower) fair value measurement.
(f) | Other assets categorized as Level 3 - For these assets, there were no adjustments to quoted market prices obtained from third-party pricing sources. |
(g) | Interest sensitive products - The significant unobservable inputs used in the fair value measurement of our interest sensitive products are projected portfolio yields, discount rates and surrender rates. Increases (decreases) in projected portfolio yields in isolation would lead to a higher (lower) fair value measurement. The discount rate is based on the Treasury rate adjusted by a margin. Increases (decreases) in the discount rates would lead to a lower (higher) fair value measurement. Assumed surrender rates are used to project how long the contracts remain in force. Generally, the longer the contracts are assumed to be in force the higher the fair value of the embedded derivative. |
53
CNO FINANCIAL GROUP, INC. AND SUBSIDIARIES
___________________
ITEM 2. | MANAGEMENT'S DISCUSSION AND ANALYSIS OF FINANCIAL CONDITION AND RESULTS OF OPERATIONS. |
In this section, we review the consolidated financial condition of CNO at June 30, 2012, and the consolidated results of operations for the three and six months ended June 30, 2012 and 2011, and, where appropriate, factors that may affect future financial performance. Please read this discussion in conjunction with the accompanying consolidated financial statements and notes.
CAUTIONARY STATEMENT REGARDING FORWARD-LOOKING STATEMENTS
Our statements, trend analyses and other information contained in this report and elsewhere (such as in filings by CNO with the SEC, press releases, presentations by CNO or its management or oral statements) relative to markets for CNO’s products and trends in CNO’s operations or financial results, as well as other statements, contain forward-looking statements within the meaning of the federal securities laws and the Private Securities Litigation Reform Act of 1995. Forward-looking statements typically are identified by the use of terms such as “anticipate,” “believe,” “plan,” “estimate,” “expect,” “project,” “intend,” “may,” “will,” “would,” “contemplate,” “possible,” “attempt,” “seek,” “should,” “could,” “goal,” “target,” “on track,” “comfortable with,” “optimistic” and similar words, although some forward-looking statements are expressed differently. You should consider statements that contain these words carefully because they describe our expectations, plans, strategies and goals and our beliefs concerning future business conditions, our results of operations, financial position, and our business outlook or they state other “forward-looking” information based on currently available information. The “Risk Factors” section of our 2011 Annual Report on Form 10-K provides examples of risks, uncertainties and events that could cause our actual results to differ materially from the expectations expressed in our forward-looking statements. Assumptions and other important factors that could cause our actual results to differ materially from those anticipated in our forward-looking statements include, among other things:
• | changes in or sustained low interest rates causing reductions in investment income, the margins of our fixed annuity and life insurance businesses, and sales of, and demand for, our products; |
• | expectations of lower future investment earnings may cause us to accelerate amortization, write down the balance of insurance acquisition costs or establish additional liabilities for insurance products; |
• | general economic, market and political conditions, including the performance and fluctuations of the financial markets which may affect the value of our investments as well as our ability to raise capital or refinance existing indebtedness and the cost of doing so; |
• | the ultimate outcome of lawsuits filed against us and other legal and regulatory proceedings to which we are subject; |
• | our ability to make anticipated changes to certain NGEs of our life insurance products; |
• | our ability to obtain adequate and timely rate increases on our health products, including our long-term care business; |
• | the receipt of any required regulatory approvals for dividend and surplus debenture interest payments from our insurance subsidiaries; |
• | mortality, morbidity, the increased cost and usage of health care services, persistency, the adequacy of our previous reserve estimates and other factors which may affect the profitability of our insurance products; |
• | changes in our assumptions related to deferred acquisition costs or the present value of future profits; |
• | the recoverability of our deferred tax assets and the effect of potential ownership changes and tax rate changes on their value; |
• | our assumption that the positions we take on our tax return filings, including our position that our 7.0% Debentures will not be treated as stock for purposes of Section 382 of the Code and will not trigger an ownership change, will not be successfully challenged by the IRS; |
• | changes in accounting principles and the interpretation thereof (including changes in principles related to accounting for deferred acquisition costs); |
54
CNO FINANCIAL GROUP, INC. AND SUBSIDIARIES
___________________
• | our ability to continue to satisfy the financial ratio and balance requirements and other covenants of our debt agreements; |
• | our ability to achieve anticipated expense reductions and levels of operational efficiencies including improvements in claims adjudication and continued automation and rationalization of operating systems; |
• | performance and valuation of our investments, including the impact of realized losses (including other-than-temporary impairment charges); |
• | our ability to identify products and markets in which we can compete effectively against competitors with greater market share, higher ratings, greater financial resources and stronger brand recognition; |
• | our ability to generate sufficient liquidity to meet our debt service obligations and other cash needs; |
• | our ability to maintain effective controls over financial reporting; |
• | our ability to continue to recruit and retain productive agents and distribution partners and customer response to new products, distribution channels and marketing initiatives; |
• | our ability to achieve eventual upgrades of the financial strength ratings of CNO and our insurance company subsidiaries as well as the impact of our ratings on our business, our ability to access capital, and the cost of capital; |
• | the risk factors or uncertainties listed from time to time in our filings with the SEC; |
• | regulatory changes or actions, including those relating to regulation of the financial affairs of our insurance companies, such as the payment of dividends and surplus debenture interest to us, regulation of the sale, underwriting and pricing of products, and health care regulation affecting health insurance products; and |
• | changes in the Federal income tax laws and regulations which may affect or eliminate the relative tax advantages of some of our products or affect the value of our deferred tax assets. |
Other factors and assumptions not identified above are also relevant to the forward-looking statements, and if they prove incorrect, could also cause actual results to differ materially from those projected.
All written or oral forward-looking statements attributable to us are expressly qualified in their entirety by the foregoing cautionary statement. Our forward-looking statements speak only as of the date made. We assume no obligation to update or to publicly announce the results of any revisions to any of the forward-looking statements to reflect actual results, future events or developments, changes in assumptions or changes in other factors affecting the forward-looking statements.
The reporting of risk-based capital ("RBC") measures is not intended for the purpose of ranking any insurance company or for use in connection with any marketing, advertising or promotional activities.
OVERVIEW
We are a holding company for a group of insurance companies operating throughout the United States that develop, market and administer health insurance, annuity, individual life insurance and other insurance products. We focus on serving the senior and middle-income markets, which we believe are attractive, underserved, high growth markets. We sell our products through three distribution channels: career agents, independent producers (some of whom sell one or more of our product lines exclusively) and direct marketing.
The Company manages its business through the following operating segments: Bankers Life, Washington National and Colonial Penn, which are defined on the basis of product distribution; Other CNO Business, comprised primarily of products we no longer sell actively; and corporate operations, comprised of holding company activities and certain noninsurance company businesses. The Company’s segments are described below:
• | Bankers Life, which markets and distributes Medicare supplement insurance, interest-sensitive life insurance, traditional life insurance, fixed annuities and long-term care insurance products to the middle-income senior market through a dedicated field force of career agents and sales managers supported by a network of community-based |
55
CNO FINANCIAL GROUP, INC. AND SUBSIDIARIES
___________________
branch offices. The Bankers Life segment includes primarily the business of Bankers Life and Casualty Company. Bankers Life also markets and distributes Medicare Advantage plans primarily through a distribution arrangement with Humana, Inc. and Medicare Part D prescription drug plans ("PDP") through a distribution and reinsurance arrangement with Coventry.
• | Washington National, which markets and distributes supplemental health (including specified disease, accident and hospital indemnity insurance products) and life insurance to middle-income consumers at home and at the worksite. These products are marketed through Performance Matters Associates, Inc. ("PMA"), a wholly owned subsidiary, and through independent marketing organizations and insurance agencies including worksite marketing. The products being marketed are underwritten by Washington National Insurance Company. |
• | Colonial Penn, which markets primarily graded benefit and simplified issue life insurance directly to customers through television advertising, direct mail, the internet and telemarketing. The Colonial Penn segment includes primarily the business of Colonial Penn Life Insurance Company. |
• | Other CNO Business, which consists of blocks of interest-sensitive life insurance, traditional life insurance, annuities, long-term care insurance and other supplemental health products. These blocks of business are not being actively marketed and were primarily issued or acquired by Conseco Life and Washington National Insurance Company. |
Potential continuation of a low interest rate environment for an extended period of time.
Some of our products, principally traditional whole life, universal life, fixed rate and fixed index annuity contracts, expose us to the risk that changes in interest rates will reduce our spread (the difference between the amounts that we are required to pay under the contracts and the investment income we are able to earn on the investments supporting our obligations under the contracts). Our spread is a key component of our net income. In addition, investment income is an important component of the profitability of our health products, especially long-term care and supplemental health policies.
If interest rates were to decrease further or remain at low levels for an extended period of time, we may have to invest new cash flows or reinvest proceeds from investments that have matured or have been prepaid or sold at lower yields, reducing the spread between interest earned on investments and interest credited to some of our products. In addition, borrowers may prepay or redeem fixed maturity investments or mortgage loans in our investment portfolio in order to borrow at lower market rates. This could increase the severity of this risk. We can lower crediting rates on certain products to offset the decrease in spread. However, our ability to lower these rates may be limited by: (i) contractually guaranteed minimum rates; or (ii) competition. In addition, a decrease in crediting rates may not match the timing or magnitude of changes in investment yields. Currently, the vast majority of our products, with contractually guaranteed minimum rates, have crediting rates set at the minimum rate. As a result, further decreases in investment yields would decrease the spread we earn and such spread could potentially become a loss.
The following table summarizes the distribution of annuity and universal life account values by guaranteed interest crediting rates as of June 30, 2012 (dollars in millions):
Guaranteed | Fixed rate and fixed | Universal | ||||||||||
rate | index annuities | life | Total | |||||||||
> 5.0% to 6.0% | $ | .3 | $ | 36.5 | $ | 36.8 | ||||||
> 4.0% to 5.0% | 92.1 | 931.1 | 1,023.2 | |||||||||
> 3.0% to 4.0% | 1,763.0 | 1,226.3 | 2,989.3 | |||||||||
> 2.0% to 3.0% | 3,821.3 | 369.6 | 4,190.9 | |||||||||
> 1.0% to 2.0% | 1,339.7 | 4.9 | 1,344.6 | |||||||||
1.0% and under | 899.1 | 33.0 | 932.1 | |||||||||
$ | 7,915.5 | $ | 2,601.4 | $ | 10,516.9 | |||||||
Weighted average | 2.52 | % | 4.00 | % | 2.88 | % | ||||||
In addition, during periods of declining or low interest rates, life and annuity products may be relatively more attractive to consumers, resulting in increased premium payments on products with flexible premium features, repayment of policy loans and increased persistency (a higher percentage of insurance policies remaining in force from year-to-year).
56
CNO FINANCIAL GROUP, INC. AND SUBSIDIARIES
___________________
Our expectation of future investment income is an important consideration in determining the amortization of insurance acquisition costs and analyzing the recovery of these assets as well as determining the adequacy of our liabilities for insurance products. Expectations of lower future investment earnings may cause us to accelerate amortization, write down the balance of insurance acquisition costs or establish additional liabilities for insurance products, thereby reducing net income in the future periods.
The blocks of business in our Other CNO Business segment are particularly sensitive to changes in our expectations of future interest rates. Since many of these blocks are not expected to generate future profits, the entire impact of adverse changes to our earlier estimate of future gross profits is recognized in earnings in the period such changes occur. For example, in both 2011 and 2010, we recognized a pre-tax reduction in earnings of approximately $13 million in the Other CNO Business segment primarily due to increases in future loss reserves resulting from decreased projected future investment yields related to investments backing our interest-sensitive insurance products.
The following summarizes hypothetical scenarios which assume immediate and permanent reductions to interest rates based on tests performed in December 2011. We estimate that the pre-tax charge resulting from a hypothetical immediate and permanent 10 basis point decrease to assumed spreads related to our universal life and investment-type products would be approximately $55 million. In addition, we estimate that the pre-tax charge resulting from a hypothetical immediate and permanent 50 basis point decrease to assumed investment earnings rates related to products other than universal life and investment-type products would be approximately $110 million.
The following summarizes a hypothetical stress scenario related to the effect of continued low new money rates on our portfolio yields based on a test performed in June 2012. The scenario assumed new money rates consistent with a 10 year treasury rate of 1.75 percent, which remain level for five years, and then grade from this level to a long-term yield assumption over time. We estimate that this scenario would result in a pre-tax charge of $75 million to $100 million primarily related to an increase in future loss reserves resulting from decreased projected future investment yields on investments backing our interest-sensitive and long-term care insurance products. In addition, we estimate that this scenario would result in an approximate unfavorable pre-tax investment income effect of $8 million to $15 million during 2013 and $23 million to $30 million during 2014. Under this hypothetical scenario, insurance liabilities reported under statutory accounting principles would increase by up to $50 million, which would result in a reduction to our consolidated RBC ratio of approximately 10 percentage points.
Although the hypothetical revisions described in the scenarios summarized in the previous two paragraphs are not currently required or anticipated, we believe similar changes could occur based on past variances in experience and our expectations of the ranges of future experience that could reasonably occur. We have assumed that revisions to assumptions resulting in such adjustments would occur equally among policy types, ages and durations within each product classification. Any actual adjustment would be dependent on the specific policies affected and, therefore, may differ from such estimates. In addition, the impact of actual adjustments would reflect the net effect of all changes in assumptions during the period.
57
CNO FINANCIAL GROUP, INC. AND SUBSIDIARIES
___________________
The following summarizes our earnings for the three and six months ending June 30, 2012 and 2011 (dollars in millions, except per share data):
Three months ended | Six months ended | ||||||||||||||
June 30, | June 30, | ||||||||||||||
2012 | 2011 | 2012 | 2011 | ||||||||||||
Earnings before net realized investment gains, fair value changes in embedded derivative liabilities, corporate interest expense, loss on extinguishment of debt and income taxes (“EBIT” a non-GAAP financial measure) (a): | |||||||||||||||
Bankers Life | $ | 76.1 | $ | 72.1 | $ | 146.6 | $ | 134.3 | |||||||
Washington National | 33.9 | 21.8 | 58.6 | 46.1 | |||||||||||
Colonial Penn | .6 | .5 | (9.2 | ) | (5.2 | ) | |||||||||
Other CNO Business | 1.9 | 5.1 | (.4 | ) | 12.5 | ||||||||||
EBIT from business segments | 112.5 | 99.5 | 195.6 | 187.7 | |||||||||||
Corporate Operations, excluding corporate interest expense | (9.1 | ) | (11.3 | ) | (10.9 | ) | (11.8 | ) | |||||||
EBIT | 103.4 | 88.2 | 184.7 | 175.9 | |||||||||||
Corporate interest expense | (16.6 | ) | (19.3 | ) | (34.1 | ) | (39.9 | ) | |||||||
Income before loss on extinguishment of debt, net realized investment gains, fair value changes in embedded derivative liabilities and taxes | 86.8 | 68.9 | 150.6 | 136.0 | |||||||||||
Tax expense on operating income | 32.6 | 24.4 | 55.8 | 48.3 | |||||||||||
Net operating income | 54.2 | 44.5 | 94.8 | 87.7 | |||||||||||
Net realized investment gains (net of related amortization and taxes) | 18.7 | 2.3 | 32.8 | 5.4 | |||||||||||
Fair value changes in embedded derivative liabilities (net of related amortization and taxes) | (6.9 | ) | — | (2.4 | ) | — | |||||||||
Loss on extinguishment of debt, net of income taxes | (.3 | ) | (.4 | ) | (.4 | ) | (1.3 | ) | |||||||
Net income | $ | 65.7 | $ | 46.4 | $ | 124.8 | $ | 91.8 | |||||||
Per diluted share: | |||||||||||||||
Net operating income | $ | .20 | $ | .15 | $ | .35 | $ | .31 | |||||||
Net realized investment gains, net of related amortization and taxes | .06 | .01 | .11 | .02 | |||||||||||
Fair value changes in embedded derivative liabilities, net of related amortization and taxes | (.02 | ) | — | (.01 | ) | — | |||||||||
Loss on extinguishment of debt, net of income taxes | — | — | — | (.01 | ) | ||||||||||
Net income | $ | .24 | $ | .16 | $ | .45 | $ | .32 | |||||||
____________
(a) | Management believes that an analysis of EBIT provides a clearer comparison of the operating results of the Company from period to period because it excludes: (i) corporate interest expense; (ii) loss on extinguishment of debt; (iii) net realized investment gains; and (iv) fair value changes in embedded derivative liabilities that are unrelated to the Company’s underlying fundamentals. Net realized investment gains or losses include: (i) gains or losses on the sales of investments; (ii) other-than-temporary impairments recognized through net income; and (iii) changes in fair value of certain fixed maturity investments with embedded derivatives. The table above reconciles the non-GAAP measure to the corresponding GAAP measure. |
CRITICAL ACCOUNTING POLICIES
Refer to “Critical Accounting Policies” in our 2011 Annual Report on Form 10-K for information on our other accounting policies that we consider critical in preparing our consolidated financial statements.
58
CNO FINANCIAL GROUP, INC. AND SUBSIDIARIES
___________________
RESULTS OF OPERATIONS
The following tables and narratives summarize the operating results of our segments for the periods presented (dollars in millions):
Three months ended | Six months ended | ||||||||||||||
June 30, | June 30, | ||||||||||||||
2012 | 2011 | 2012 | 2011 | ||||||||||||
Income (loss) before net realized investment gains (losses), fair value changes in embedded derivative liabilities, net of related amortization, loss on extinguishment of debt and income taxes (a non-GAAP measure) (a): | |||||||||||||||
Bankers Life | $ | 76.1 | $ | 72.1 | $ | 146.6 | $ | 134.3 | |||||||
Washington National | 33.9 | 21.8 | 58.6 | 46.1 | |||||||||||
Colonial Penn | .6 | .5 | (9.2 | ) | (5.2 | ) | |||||||||
Other CNO Business | 1.9 | 5.1 | (.4 | ) | 12.5 | ||||||||||
Corporate operations | (25.7 | ) | (30.6 | ) | (45.0 | ) | (51.7 | ) | |||||||
86.8 | 68.9 | 150.6 | 136.0 | ||||||||||||
Net realized investment gains (losses), net of related amortization: | |||||||||||||||
Bankers Life | 16.2 | (1.5 | ) | 25.9 | 4.3 | ||||||||||
Washington National | 3.5 | (.5 | ) | 6.6 | (1.0 | ) | |||||||||
Colonial Penn | 1.9 | .2 | 4.5 | 1.3 | |||||||||||
Other CNO Business | 6.1 | 1.4 | 12.6 | .8 | |||||||||||
Corporate operations | 1.1 | 3.9 | 1.0 | 2.8 | |||||||||||
28.8 | 3.5 | 50.6 | 8.2 | ||||||||||||
Fair value changes in embedded derivative liabilities, net of related amortization: | |||||||||||||||
Bankers Life | (10.4 | ) | — | (3.6 | ) | — | |||||||||
Other CNO Business | (.2 | ) | — | (.1 | ) | — | |||||||||
(10.6 | ) | — | (3.7 | ) | — | ||||||||||
Loss on extinguishment of debt: | |||||||||||||||
Corporate operations | (.5 | ) | (.6 | ) | (.7 | ) | (2.0 | ) | |||||||
Income (loss) before income taxes: | |||||||||||||||
Bankers Life | 81.9 | 70.6 | 168.9 | 138.6 | |||||||||||
Washington National | 37.4 | 21.3 | 65.2 | 45.1 | |||||||||||
Colonial Penn | 2.5 | .7 | (4.7 | ) | (3.9 | ) | |||||||||
Other CNO Business | 7.8 | 6.5 | 12.1 | 13.3 | |||||||||||
Corporate operations | (25.1 | ) | (27.3 | ) | (44.7 | ) | (50.9 | ) | |||||||
Income before income taxes | $ | 104.5 | $ | 71.8 | $ | 196.8 | $ | 142.2 | |||||||
____________________
(a) | These non-GAAP measures as presented in the above table and in the following segment financial data and discussions of segment results exclude net realized investment gains (losses), fair value changes in embedded derivative liabilities, net of related amortization, loss on extinguishment of debt and before income taxes. These are considered non-GAAP financial measures. A non-GAAP measure is a numerical measure of a company’s performance, financial position, or cash flows that excludes or includes amounts that are normally excluded or included in the most directly comparable measure calculated and presented in accordance with GAAP. |
These non-GAAP financial measures of “income (loss) before net realized investment gains (losses), fair value changes in embedded derivative liabilities, net of related amortization, loss on extinguishment of debt and before income taxes” differ from “income (loss) before income taxes” as presented in our consolidated statement of operations prepared in accordance with GAAP due to the exclusion of before tax realized investment gains (losses), fair value changes in
59
CNO FINANCIAL GROUP, INC. AND SUBSIDIARIES
___________________
embedded derivative liabilities, net of related amortization and loss on extinguishment of debt. We measure segment performance excluding these items because we believe that this performance measure is a better indicator of the ongoing businesses and trends in our business. Our primary investment focus is on investment income to support our liabilities for insurance products as opposed to the generation of realized investment gains (losses), and a long-term focus is necessary to maintain profitability over the life of the business. Realized investment gains (losses) and fair value changes in embedded derivative liabilities depend on market conditions and do not necessarily relate to decisions regarding the underlying business of our segments. However, “income (loss) before net realized investment gains (losses), fair value changes in embedded derivative liabilities, net of related amortization, loss on extinguishment of debt and before income taxes” does not replace “income (loss) before income taxes” as a measure of overall profitability. We may experience realized investment gains (losses), which will affect future earnings levels since our underlying business is long-term in nature and we need to earn the assumed interest rates on the investments backing our liabilities for insurance products to maintain the profitability of our business. In addition, management uses this non-GAAP financial measure in its budgeting process, financial analysis of segment performance and in assessing the allocation of resources. We believe these non-GAAP financial measures enhance an investor’s understanding of our financial performance and allows them to make more informed judgments about the Company as a whole. These measures also highlight operating trends that might not otherwise be transparent. The table above reconciles the non-GAAP measure to the corresponding GAAP measure.
General: CNO is the top tier holding company for a group of insurance companies operating throughout the United States that develop, market and administer health insurance, annuity, individual life insurance and other insurance products. We distribute these products through our Bankers Life segment, which utilizes a career agency force, through our Colonial Penn segment, which utilizes direct response marketing, and through our Washington National segment, which utilizes independent producers.
60
CNO FINANCIAL GROUP, INC. AND SUBSIDIARIES
___________________
Bankers Life (dollars in millions)
Three months ended | Six months ended | ||||||||||||||
June 30, | June 30, | ||||||||||||||
2012 | 2011 | 2012 | 2011 | ||||||||||||
Premium collections: | |||||||||||||||
Annuities | $ | 169.5 | $ | 259.1 | $ | 354.2 | $ | 481.3 | |||||||
Medicare supplement and other supplemental health | 331.3 | 329.1 | 660.8 | 666.7 | |||||||||||
Life | 75.4 | 62.0 | 145.5 | 118.4 | |||||||||||
Total collections | $ | 576.2 | $ | 650.2 | $ | 1,160.5 | $ | 1,266.4 | |||||||
Average liabilities for insurance products: | |||||||||||||||
Annuities: | |||||||||||||||
Mortality based | $ | 231.7 | $ | 243.1 | $ | 232.7 | $ | 244.5 | |||||||
Fixed index | 2,798.2 | 2,268.3 | 2,752.8 | 2,208.0 | |||||||||||
Deposit based | 4,577.8 | 4,793.2 | 4,611.4 | 4,812.8 | |||||||||||
Medicare supplement and other supplemental health | 4,653.2 | 4,529.9 | 4,643.9 | 4,509.8 | |||||||||||
Life: | |||||||||||||||
Interest sensitive | 444.7 | 425.2 | 443.0 | 422.8 | |||||||||||
Non-interest sensitive | 506.2 | 416.8 | 494.6 | 407.3 | |||||||||||
Total average liabilities for insurance products, net of reinsurance ceded | $ | 13,211.8 | $ | 12,676.5 | $ | 13,178.4 | $ | 12,605.2 | |||||||
Revenues: | |||||||||||||||
Insurance policy income | $ | 419.0 | $ | 409.6 | $ | 825.5 | $ | 809.6 | |||||||
Net investment income: | |||||||||||||||
General account invested assets | 204.9 | 196.5 | 405.2 | 387.8 | |||||||||||
Fixed index products | (19.3 | ) | .4 | 15.3 | 18.7 | ||||||||||
Fee revenue and other income | 3.3 | 3.3 | 6.2 | 5.6 | |||||||||||
Total revenues | 607.9 | 609.8 | 1,252.2 | 1,221.7 | |||||||||||
Expenses: | |||||||||||||||
Insurance policy benefits | 366.3 | 351.3 | 701.5 | 688.9 | |||||||||||
Amounts added to policyholder account balances: | |||||||||||||||
Annuity products and interest-sensitive life products other than fixed index products | 36.6 | 40.5 | 75.1 | 81.3 | |||||||||||
Fixed index products | (6.2 | ) | 17.1 | 41.0 | 43.5 | ||||||||||
Amortization related to operations | 50.5 | 46.9 | 107.4 | 115.4 | |||||||||||
Interest expense on investment borrowings | 1.4 | 1.1 | 2.8 | 2.3 | |||||||||||
Other operating costs and expenses | 83.2 | 80.8 | 177.8 | 156.0 | |||||||||||
Total benefits and expenses | 531.8 | 537.7 | 1,105.6 | 1,087.4 | |||||||||||
Income before net realized investment gains (losses) and fair value changes in embedded derivative liabilities, net of related amortization, and income taxes | 76.1 | 72.1 | 146.6 | 134.3 | |||||||||||
Net realized investment gains (losses) | 17.9 | (1.8 | ) | 28.5 | 4.8 | ||||||||||
Amortization related to net realized investment gains (losses) | (1.7 | ) | .3 | (2.6 | ) | (.5 | ) | ||||||||
Net realized investment gains (losses), net of related amortization | 16.2 | (1.5 | ) | 25.9 | 4.3 | ||||||||||
Insurance policy benefits - fair value changes in embedded derivative liabilities | (16.7 | ) | — | (5.7 | ) | — | |||||||||
Amortization related to fair value changes in embedded derivative liabilities | 6.3 | — | 2.1 | — | |||||||||||
Fair value changes in embedded derivative liabilities, net of related amortization | (10.4 | ) | — | (3.6 | ) | — | |||||||||
Income before income taxes | $ | 81.9 | $ | 70.6 | $ | 168.9 | $ | 138.6 | |||||||
61
CNO FINANCIAL GROUP, INC. AND SUBSIDIARIES
___________________
Three months ended | Six months ended | ||||||||||||||
June 30, | June 30, | ||||||||||||||
2012 | 2011 | 2012 | 2011 | ||||||||||||
Health benefit ratios: | |||||||||||||||
All health lines: | |||||||||||||||
Insurance policy benefits | $ | 313.7 | $ | 305.0 | $ | 596.5 | $ | 602.6 | |||||||
Benefit ratio (a) | 91.9 | % | 88.8 | % | 88.3 | % | 88.2 | % | |||||||
Medicare supplement: | |||||||||||||||
Insurance policy benefits | $ | 132.9 | $ | 125.3 | $ | 250.7 | $ | 247.0 | |||||||
Benefit ratio (a) | 72.2 | % | 69.8 | % | 68.3 | % | 68.5 | % | |||||||
PDP: | |||||||||||||||
Insurance policy benefits | $ | 11.4 | $ | 14.8 | $ | 20.6 | $ | 27.7 | |||||||
Benefit ratio (a) | 64.2 | % | 88.6 | % | 72.4 | % | 89.0 | % | |||||||
PFFS: | |||||||||||||||
Insurance policy benefits | $ | (.1 | ) | $ | (.1 | ) | $ | (.2 | ) | $ | (.8 | ) | |||
Benefit ratio (a) | N/A | N/A | N/A | N/A | |||||||||||
Long-term care: | |||||||||||||||
Insurance policy benefits | $ | 169.5 | $ | 165.0 | $ | 325.4 | $ | 328.7 | |||||||
Benefit ratio (a) | 121.4 | % | 115.0 | % | 116.1 | % | 114.2 | % | |||||||
Interest-adjusted benefit ratio (b) | 75.4 | % | 71.6 | % | 70.4 | % | 71.2 | % | |||||||
____________________
(a) | We calculate benefit ratios by dividing the related product’s insurance policy benefits by insurance policy income. |
(b) | We calculate the interest-adjusted benefit ratio (a non-GAAP measure) for Bankers Life’s long-term care products by dividing such product’s insurance policy benefits less the imputed interest income on the accumulated assets backing the insurance liabilities by policy income. These are considered non-GAAP financial measures. A non-GAAP measure is a numerical measure of a company’s performance, financial position, or cash flows that excludes or includes amounts that are normally excluded or included in the most directly comparable measure calculated and presented in accordance with GAAP. |
These non-GAAP financial measures of “interest-adjusted benefit ratios” differ from “benefit ratios” due to the deduction of imputed interest income on the accumulated assets backing the insurance liabilities from the product’s insurance policy benefits used to determine the ratio. Interest income is an important factor in measuring the performance of health products that are expected to be inforce for a longer duration of time, are not subject to unilateral changes in provisions (such as non-cancelable or guaranteed renewable contracts) and require the performance of various functions and services (including insurance protection) for an extended period of time. Actual interest income will vary from imputed interest income. The net cash flows from long-term care products generally cause an accumulation of amounts in the early years of a policy (accounted for as reserve increases) that will be paid out as benefits in later policy years (accounted for as reserve decreases). Accordingly, as the policies age, the benefit ratio will typically increase, but the increase in benefits will be partially offset by the imputed interest income earned on the accumulated assets. The interest-adjusted benefit ratio reflects the effects of such interest income offset. Since interest income is an important factor in measuring the performance of this product, management believes a benefit ratio that includes the effect of interest income is useful in analyzing product performance. We utilize the interest-adjusted benefit ratio in measuring segment performance because we believe that this performance measure is a better indicator of the ongoing businesses and trends in the business. However, the “interest-adjusted benefit ratio” does not replace the “benefit ratio” as a measure of current period benefits to current period insurance policy income. Accordingly, management reviews both “benefit ratios” and “interest-adjusted benefit ratios” when analyzing the financial results attributable to these products. The investment income earned on the accumulated assets backing Bankers Life’s long-term care reserves was $64.2 million and $62.3 million in the three months ended June 30, 2012 and 2011, respectively, and $128.0 million and $123.8 million in the six months ended June 30, 2012 and 2011, respectively.
Total premium collections were $576.2 million in the second quarter of 2012, down 11 percent from 2011, and were $1,160.5 million in the first six months of 2012, down 8.4 percent from 2011. See “Premium Collections” for further analysis of Bankers Life’s premium collections.
62
CNO FINANCIAL GROUP, INC. AND SUBSIDIARIES
___________________
Average liabilities for insurance products, net of reinsurance ceded were $13.2 billion in the second quarter of 2012, up 4.2 percent from 2011, and were $13.2 billion in the first six months of 2012, up 4.5 percent from 2011. The increase in such liabilities was primarily due to increases in annuity, health and life reserves resulting from new sales of these products.
Insurance policy income is comprised of premiums earned on policies which provide mortality or morbidity coverage and fees and other charges assessed on other policies.
Net investment income on general account invested assets (which excludes income on policyholder accounts and other special-purpose portfolios) was $204.9 million in the second quarter of 2012, up 4.3 percent from 2011, and was $405.2 million in the the first six months of 2012, up 4.5 percent from 2011. The average balance of general account invested assets was $14.2 billion and $13.4 billion in the second quarters of 2012 and 2011, respectively. The average yield on these assets was 5.79 percent and 5.85 percent in the second quarters of 2012 and 2011, respectively. The average balance of general account invested assets was $14.1 billion and $13.4 billion in the first six months of 2012 and 2011, respectively. The average yield on these assets was 5.73 percent and 5.80 percent in the first six months of 2012 and 2011, respectively. The increase in general account invested assets is primarily due to sales and increased persistency of our annuity and health products in recent periods. The increase in net investment income in the 2012 periods primarily reflects the growth in general account invested assets.
Net investment income related to fixed index products represents the change in the estimated fair value of options which are purchased in an effort to offset or hedge certain potential benefits accruing to the policyholders of our fixed index products. Our fixed index products are designed so that the investment income spread earned on the related insurance liabilities is expected to be more than adequate to cover the cost of the options and other costs related to these policies. Net investment income (loss) related to fixed index products was $(19.3) million and $(6.4) million in the second quarters of 2012 and 2011, respectively, and was $15.3 million and $14.7 million in the first six months of 2012 and 2011, respectively. Such amounts were mostly offset by the corresponding charge (credit) to amounts added to policyholder account balances for fixed index products. Such income and related charges fluctuate based on the value of options embedded in the segment’s fixed index annuity policyholder account balances subject to this benefit and to the performance of the index to which the returns on such products are linked. For periods prior to June 30, 2011, net investment income related to fixed index products also included income on trading securities which were held to offset the change in estimated fair values of the embedded derivatives related to our fixed index products caused by interest rate fluctuations. During the second quarter of 2011, we sold this trading portfolio and invested the proceeds in higher yielding investments. Such trading account income was $6.8 million and $4.0 million in the three and six months ended June 30, 2011, respectively.
Insurance policy benefits fluctuated as a result of the factors summarized below for benefit ratios. Benefit ratios are calculated by dividing the related insurance product’s insurance policy benefits by insurance policy income.
The Medicare supplement business consists of both individual and group policies. Government regulations generally require us to attain and maintain a ratio of total benefits incurred to total premiums earned (excluding changes in policy benefit reserves), after three years from the original issuance of the policy and over the lifetime of the policy, of not less than 65 percent on individual products and not less than 75 percent on group products, as determined in accordance with statutory accounting principles. Since the insurance product liabilities we establish for Medicare supplement business are subject to significant estimates, the ultimate claim liability we incur for a particular period is likely to be different than our initial estimate. Our insurance policy benefits reflected reserve redundancies from prior years of $13.9 million and $10.5 million in the first six months of 2012 and 2011, respectively. Excluding the effects of prior period claim reserve redundancies, our benefit ratios would have been 72.1 percent and 71.4 percent in the first six months of 2012 and 2011, respectively.
The insurance policy benefits on our PDP business result from our quota-share reinsurance agreement with Coventry. Insurance margins (insurance policy income less insurance policy benefits) on the PDP business were $6.4 million and $1.9 million in the second quarters of 2012 and 2011, respectively, and were $7.9 million and $3.4 million in the six months ended June 30, 2012 and 2011, respectively. In the first six months of 2012 and 2011, reserves related to the previously terminated Private-Fee-For-Service ("PFFS") business were released due to favorable claim developments resulting in insurance policy benefits of $(.2) million and $(.8) million, respectively.
The net cash flows from our long-term care products generally cause an accumulation of amounts in the early years of a policy (accounted for as reserve increases) which will be paid out as benefits in later policy years (accounted for as reserve decreases). Accordingly, as the policies age, the benefit ratio typically increases, but the increase in reserves is partially offset by investment income earned on the accumulated assets. The benefit ratio on our long-term care business in the Bankers Life segment was 121.4 percent and 115.0 percent in the second quarters of 2012 and 2011, respectively, and was 116.1 percent and 114.2 percent in the first six months of 2012 and 2011, respectively. The interest-adjusted benefit ratio on this business was
63
CNO FINANCIAL GROUP, INC. AND SUBSIDIARIES
___________________
75.4 percent and 71.6 percent in the second quarters of 2012 and 2011, respectively, and was 70.4 percent and 71.2 percent in the first six months of 2012 and 2011, respectively. Since the insurance product liabilities we establish for long-term care business are subject to significant estimates, the ultimate claim liability we incur for a particular period is likely to be different than our initial estimate. Our insurance policy benefits reflected reserve redundancies from prior years of $10.4 million and $15.0 million in the first six months of 2012 and 2011, respectively. Excluding the effects of prior year claim reserve redundancies, our benefit ratios would have been 119.8 percent and 119.4 percent in the first six months of 2012 and 2011, respectively.
Over the past several years, we have implemented rate increases in the long-term care block in the Bankers Life segment. In October 2010, we commenced additional rate increase filings on certain long-term care blocks. We expect to implement rate increases of approximately $35 million after approval from all states. Approximately $32 million of approvals had been received as of June 30, 2012. In the first six months of both 2012 and 2011, the income before income taxes in the Bankers Life segment reflected a reduction in insurance policy benefits partially offset by additional amortization of insurance acquisition costs due to the impacts of recent rate increases. These impacts netted to approximately $15 million and $11 million in the first six months of 2012 and 2011, respectively, and include: (i) the reduction in liabilities for policyholders choosing to lapse their policies rather than paying higher rates; (ii) the reduction in liabilities for policyholders choosing to reduce their coverages to achieve a lower cost; offset by (iii) the increase in the liabilities related to waiver of premium benefits to reflect higher premiums after the rate increases; and (iv) increased amortization of insurance acquisition costs resulting from the increase in lapses.
Amounts added to policyholder account balances for annuity products and interest-sensitive life products were $36.6 million in the second quarter of 2012, down 9.6 percent from 2011, and were $75.1 million in the first six months of 2012, down 7.6 percent from 2011. The weighted average crediting rate for these products was 2.9 percent and 3.1 percent in the second quarters of 2012 and 2011, respectively, and 3.0 percent and 3.1 percent in the first six months of 2012 and 2011, respectively. The average liabilities of the deposit-based annuity block were $4.6 billion and $4.8 billion in the first six months of 2012 and 2011, respectively.
Amounts added to fixed index products based on change in value of the indices will generally fluctuate with the corresponding related investment income accounts described above.
Amortization related to operations includes amortization of deferred acquisition costs and the present value of future profits. Deferred acquisition costs and the present value of future profits are collectively referred to as “insurance acquisition costs.” Insurance acquisition costs are generally amortized either: (i) in relation to the estimated gross profits for universal life and investment-type products; or (ii) in relation to actual and expected premium revenue for other products. In addition, for universal life and investment-type products, we are required to adjust the total amortization recorded to date through the statement of operations if actual experience or other evidence suggests that earlier estimates of future gross profits should be revised. Accordingly, amortization for universal life and investment-type products is dependent on the profits realized during the period and on our expectation of future profits. For other products, we amortize insurance acquisition costs in relation to actual and expected premium revenue, and amortization is only adjusted if expected premium revenue changes or if we determine the balance of these costs is not recoverable from future profits. Bankers Life’s amortization expense was $50.5 million and $46.9 million in the second quarters of 2012 and 2011, respectively, and was $107.4 million and $115.4 million in the six months ended June 30, 2012 and 2011, respectively. During the first quarter of 2011, we experienced higher policy lapses than we anticipated on our Medicare supplement products, including lapses where policyholders terminated their current policy and purchased a lower cost policy offered through this segment. These lapses reduced our estimates of future expected premium income and, accordingly, we recognized additional amortization expense of $6 million. Amortization expense related to our annuity block also decreased in 2012, as compared to 2011, due to higher persistency on this business.
Interest expense on investment borrowings represents interest expense on collateralized borrowings as further described in the note to the consolidated financial statements entitled “Investment Borrowings”.
64
CNO FINANCIAL GROUP, INC. AND SUBSIDIARIES
___________________
Other operating costs and expenses in our Bankers Life segment were $83.2 million in the second quarter of 2012, up 3.0 percent from 2011, and were $177.8 million in the first six months of 2012, up 14 percent from 2011. Other operating expenses in first six months of 2012 increased primarily due to higher legal and regulatory expenses, including a $10 million settlement with state securities regulators. Other operating costs and expenses include the following (dollars in millions):
Three months ended | Six months ended | ||||||||||||||
June 30, | June 30, | ||||||||||||||
2012 | 2011 | 2012 | 2011 | ||||||||||||
Expenses related to the marketing and quota-share agreements with Coventry | $ | 1.9 | $ | 2.6 | $ | 3.8 | $ | 4.6 | |||||||
Commission expense and agent manager benefits | 14.9 | 14.7 | 28.9 | 28.5 | |||||||||||
Other operating expenses | 66.4 | 63.5 | 145.1 | 122.9 | |||||||||||
Total | $ | 83.2 | $ | 80.8 | $ | 177.8 | $ | 156.0 | |||||||
Net realized investment gains (losses) fluctuate each period. During the first six months of 2012, net realized investment gains in this segment included $31.5 million of net gains from the sales of investments (primarily fixed maturities) and $3.0 million of writedowns of investments for other than temporary declines in fair value recognized through net income. During the first six months of 2011, net realized investment gains in this segment included $10.1 million of net gains from the sales of investments (primarily fixed maturities) and $5.3 million of writedowns of investments for other than temporary declines in fair value recognized through net income.
Amortization related to net realized investment losses is the increase or decrease in the amortization of insurance acquisition costs which results from realized investment gains or losses. When we sell securities which back our universal life and investment-type products at a gain (loss) and reinvest the proceeds at a different yield, we increase (reduce) the amortization of insurance acquisition costs in order to reflect the change in estimated gross profits due to the gains (losses) realized and the resulting effect on estimated future yields. Sales of fixed maturity investments resulted in an increase (decrease) in the amortization of insurance acquisition costs of $1.7 million and $(.3) million in the second quarters of 2012 and 2011, respectively, and $2.6 million and $.5 million in the six months ended June 30, 2012 and 2011, respectively.
Insurance policy benefits - fair value changes in embedded derivative liabilities represents fair value changes due to fluctuations in the interest rates used to discount embedded derivative liabilities related to our fixed index annuities. Prior to June 30, 2011, we held certain trading securities to offset the income statement volatility caused by the interest rate fluctuations. In the second quarter of 2011, we sold this trading portfolio.
Amortization related to fair value changes in embedded derivative liabilities is the increase or decrease in the amortization of insurance acquisition costs which results from changes in interest rates used to discount embedded derivative liabilities related to our fixed index annuities.
65
CNO FINANCIAL GROUP, INC. AND SUBSIDIARIES
___________________
Washington National (dollars in millions)
Three months ended | Six months ended | ||||||||||||||
June 30, | June 30, | ||||||||||||||
2012 | 2011 | 2012 | 2011 | ||||||||||||
Premium collections: | |||||||||||||||
Medicare supplement and other supplemental health | $ | 145.1 | $ | 142.8 | $ | 286.8 | $ | 286.0 | |||||||
Life | 3.8 | 3.9 | 7.8 | 8.2 | |||||||||||
Total collections | $ | 148.9 | $ | 146.7 | $ | 294.6 | $ | 294.2 | |||||||
Average liabilities for insurance products: | |||||||||||||||
Medicare supplement and other supplemental health | $ | 2,418.9 | $ | 2,437.1 | $ | 2,424.3 | $ | 2,435.8 | |||||||
Non-interest sensitive life | 199.1 | 202.2 | 199.7 | 203.7 | |||||||||||
Total average liabilities for insurance products, net of reinsurance ceded | $ | 2,618.0 | $ | 2,639.3 | $ | 2,624.0 | $ | 2,639.5 | |||||||
Revenues: | |||||||||||||||
Insurance policy income | $ | 147.6 | $ | 146.6 | $ | 295.0 | $ | 292.0 | |||||||
Net investment income: | |||||||||||||||
General account invested assets | 51.0 | 46.7 | 101.0 | 93.0 | |||||||||||
Trading account income related to reinsurer accounts | 1.4 | .7 | 1.5 | 1.0 | |||||||||||
Change in value of embedded derivatives related to modified coinsurance agreements | (1.4 | ) | (.7 | ) | (1.5 | ) | (1.0 | ) | |||||||
Fee revenue and other income | .3 | .2 | .5 | .5 | |||||||||||
Total revenues | 198.9 | 193.5 | 396.5 | 385.5 | |||||||||||
Expenses: | |||||||||||||||
Insurance policy benefits | 113.7 | 118.3 | 229.4 | 230.5 | |||||||||||
Amortization related to operations | 10.8 | 11.4 | 23.5 | 24.8 | |||||||||||
Interest expense on investment borrowings | .8 | — | 1.5 | — | |||||||||||
Other operating costs and expenses | 39.7 | 42.0 | 83.5 | 84.1 | |||||||||||
Total benefits and expenses | 165.0 | 171.7 | 337.9 | 339.4 | |||||||||||
Income before net realized investment gains (losses) and income taxes | 33.9 | 21.8 | 58.6 | 46.1 | |||||||||||
Net realized investment gains (losses) | 3.5 | (.5 | ) | 6.6 | (1.0 | ) | |||||||||
Income before income taxes | $ | 37.4 | $ | 21.3 | $ | 65.2 | $ | 45.1 | |||||||
Health benefit ratios: | |||||||||||||||
Medicare supplement: | |||||||||||||||
Insurance policy benefits | $ | 20.5 | $ | 24.8 | $ | 40.6 | $ | 48.3 | |||||||
Benefit ratio (a) | 67.7 | % | 71.1 | % | 66.6 | % | 68.7 | % | |||||||
Supplemental health: | |||||||||||||||
Insurance policy benefits | $ | 87.1 | $ | 88.4 | $ | 179.1 | $ | 170.8 | |||||||
Benefit ratio (a) | 77.0 | % | 82.7 | % | 79.7 | % | 80.7 | % | |||||||
Interest-adjusted benefit ratio (b) | 50.1 | % | 54.1 | % | 52.6 | % | 51.6 | % | |||||||
66
CNO FINANCIAL GROUP, INC. AND SUBSIDIARIES
___________________
_________________
(a) | We calculate benefit ratios by dividing the related product’s insurance policy benefits by insurance policy income. |
(b) | We calculate the interest-adjusted benefit ratio (a non-GAAP measure) for Washington National’s supplemental health products by dividing such product’s insurance policy benefits less the imputed interest income on the accumulated assets backing the insurance liabilities by policy income. These are considered non-GAAP financial measures. A non-GAAP measure is a numerical measure of a company’s performance, financial position, or cash flows that excludes or includes amounts that are normally excluded or included in the most directly comparable measure calculated and presented in accordance with GAAP. |
These non-GAAP financial measures of “interest-adjusted benefit ratios” differ from “benefit ratios” due to the deduction of imputed interest income on the accumulated assets backing the insurance liabilities from the product’s insurance policy benefits used to determine the ratio. Interest income is an important factor in measuring the performance of health products that are expected to be inforce for a longer duration of time, are not subject to unilateral changes in provisions (such as non-cancelable or guaranteed renewable contracts) and require the performance of various functions and services (including insurance protection) for an extended period of time. Actual interest income will vary from imputed interest income. The net cash flows from supplemental health products generally cause an accumulation of amounts in the early years of a policy (accounted for as reserve increases) that will be paid out as benefits in later policy years (accounted for as reserve decreases). Accordingly, as the policies age, the benefit ratio will typically increase, but the increase in benefits will be partially offset by the imputed interest income earned on the accumulated assets. The interest-adjusted benefit ratio reflects the effects of such interest income offset. Since interest income is an important factor in measuring the performance of these products, management believes a benefit ratio that includes the effect of interest income is useful in analyzing product performance. We utilize the interest-adjusted benefit ratio in measuring segment performance because we believe that this performance measure is a better indicator of the ongoing businesses and trends in the business. However, the “interest-adjusted benefit ratio” does not replace the “benefit ratio” as a measure of current period benefits to current period insurance policy income. Accordingly, management reviews both “benefit ratios” and “interest-adjusted benefit ratios” when analyzing the financial results attributable to these products. The investment income earned on the accumulated assets backing the supplemental health reserves was $30.5 million and $30.6 million in the three months ended June 30, 2012 and 2011, respectively, and $61.0 million and $61.6 million in the six months ended June 30, 2012 and 2011, respectively.
Total premium collections were $148.9 million in the second quarter of 2012, up 1.5 percent from 2011, and were $294.6 million in the first six months of 2012, up .1 percent from 2011. See “Premium Collections” for further analysis.
Average liabilities for insurance products, net of reinsurance ceded were $2.6 billion in the second quarter of 2012, down .8 percent from 2011, and were $2.6 billion in the first six months of 2012, down .6 percent from 2011. The decrease in such liabilities was primarily due to policyholder redemptions and lapses exceeding new sales.
Insurance policy income is comprised of premiums earned on traditional insurance policies which provide mortality or morbidity coverage and fees and other charges assessed on other policies. Such income increased slightly during the 2012 periods, as supplemental health premiums have increased and Medicare supplement premiums have decreased consistent with sales.
Net investment income on general account invested assets (which excludes income on policyholder and reinsurer accounts) was $51.0 million in the second quarter of 2012, up 9.2 percent from 2011, and was $101.0 million in the first six months of 2012, up 8.6 percent from 2011. The average balance of general account invested assets was $3.7 billion and $3.1 billion in the second quarters of 2012 and 2011, respectively. The average yield on these assets was 5.57 percent and 5.95 percent in the second quarters of 2012 and 2011. The average balance of general account invested assets was $3.7 billion and $3.1 billion in the first six months of 2012 and 2011, respectively. The average yield on these assets was 5.51 percent and 5.94 percent in the first six months of 2012 and 2011. The increase in general account invested assets is primarily due to the increase in invested assets purchased with the proceeds from collateralized borrowings from the FHLB pursuant to an investment borrowing program that commenced in this segment in June 2011. The decline in average yield is primarily due to lower yields related to the variable rate investments purchased with the proceeds from collateralized borrowings from the FHLB.
Trading account income related to reinsurer accounts primarily represents the income on trading securities which are held to act as hedges for embedded derivatives related to certain modified coinsurance agreements. The income on our trading account securities is designed to substantially offset the change in value of embedded derivatives related to modified coinsurance agreements described below.
67
CNO FINANCIAL GROUP, INC. AND SUBSIDIARIES
___________________
Change in value of embedded derivatives related to modified coinsurance agreements is described in the note to our consolidated financial statements entitled “Accounting for Derivatives.” We have transferred the specific block of investments related to these agreements to our trading securities account, which we carry at estimated fair value with changes in such value recognized as trading account income. The change in the value of the embedded derivatives has largely been offset by the change in value of the trading securities.
Insurance policy benefits fluctuated as a result of the factors summarized below for benefit ratios. Benefit ratios are calculated by dividing the related insurance product’s insurance policy benefits by insurance policy income.
The benefit ratios on Washington National’s Medicare supplement products have been impacted by increases in policyholder lapses following our premium rate increase actions. We establish active life reserves for these policies, which are in addition to amounts required for incurred claims. When policies lapse, active life reserves for such lapsed policies are released, resulting in decreased insurance policy benefits (although such decrease is substantially offset by additional amortization expense). In addition, the insurance product liabilities we establish for our Medicare supplement business are subject to significant estimates and the ultimate claim liability we incur for a particular period is likely to be different than our initial estimate. Our insurance policy benefits reflected claim reserve redundancies from prior years of $1.1 million and $.1 million in the first six months of 2012 and 2011, respectively. Excluding the effects of prior year claim reserve redundancies, our benefit ratios for the Medicare supplement block would have been 68.4 percent and 68.8 percent in the first six months of 2012 and 2011, respectively. Government regulations generally require us to attain and maintain a ratio of total benefits incurred to total premiums earned (excluding changes in policy benefit reserves), after three years from the original issuance of the policy and over the lifetime of the policy, of not less than 65 percent on these products, as determined in accordance with statutory accounting principles. Insurance margins (insurance policy income less insurance policy benefits) on these products were $9.7 million and $10.1 million in the second quarters of 2012 and 2011, respectively, and were $20.4 million and $22.1 million in the six months ended June 30, 2012 and 2011, respectively. Such decrease is primarily due to lower sales and to policyholder lapses; partially offset by favorable claim experience.
Washington National’s supplemental health products (including specified disease, accident and hospital indemnity products) generally provide fixed or limited benefits. For example, payments under cancer insurance policies are generally made directly to, or at the direction of, the policyholder following diagnosis of, or treatment for, a covered type of cancer. Approximately three-fourths of our supplemental health policies inforce (based on policy count) are sold with return of premium or cash value riders. The return of premium rider generally provides that after a policy has been inforce for a specified number of years or upon the policyholder reaching a specified age, we will pay to the policyholder, or a beneficiary under the policy, the aggregate amount of all premiums paid under the policy, without interest, less the aggregate amount of all claims incurred under the policy. The cash value rider is similar to the return of premium rider, but also provides for payment of a graded portion of the return of premium benefit if the policy terminates before the return of premium benefit is earned. Accordingly, the net cash flows from these products generally result in the accumulation of amounts in the early years of a policy (reflected in our earnings as reserve increases) which will be paid out as benefits in later policy years (reflected in our earnings as reserve decreases which offset the recording of benefit payments). As the policies age, the benefit ratio will typically increase, but the increase in benefits will be partially offset by investment income earned on the accumulated assets. The benefit ratio will fluctuate depending on the claim experience during the year. Insurance margins (insurance policy income less insurance policy benefits) on these products were $26.0 million and $18.5 million in the second quarters of 2012 and 2011, respectively, and were $45.6 million and $40.8 million in the six months ended June 30, 2012 and 2011, respectively. The increase in margin in the 2012 periods is primarily related to higher insurance policy income.
Amortization related to operations includes amortization of insurance acquisition costs. Insurance acquisition costs are generally amortized in relation to actual and expected premium revenue, and amortization is only adjusted if expected premium revenue changes or if we determine the balance of these costs is not recoverable from future profits. Such amounts were generally consistent with the related premium revenue. A revision to our current assumptions could result in increases or decreases to amortization expense in future periods.
Interest expense on investment borrowings represents $.8 million and $1.5 million of interest expense on collateralized borrowings in the three and six months ended June 30, 2012, respectively, as further described in the note to the consolidated financial statements entitled "Investment Borrowings".
Other operating costs and expenses were $39.7 million in the second quarter of 2012, down 5.5 percent from 2011, and were $83.5 million in the first six months of 2012, down .7 percent from 2011. Other operating costs and expenses include commission expense of $16.5 million and $16.6 million in the second quarters of 2012 and 2011, respectively, and $33.5
68
CNO FINANCIAL GROUP, INC. AND SUBSIDIARIES
___________________
million and $32.7 million in the six months ended June 30, 2012 and 2011, respectively.
Net realized investment gains (losses) fluctuate each period. During the first six months of 2012, net realized investment gains in this segment included $9.5 million of net gains from the sales of investments (primarily fixed maturities) and $2.9 million of writedowns of investments for other than temporary declines in fair value recognized through net income. During the first six months of 2011, net realized investment losses included $4.0 million of net gains from the sales of investments (primarily fixed maturities) and $5.0 million of writedowns of investments for other than temporary declines in fair value recognized through net income.
Colonial Penn (dollars in millions)
Three months ended | Six months ended | ||||||||||||||
June 30, | June 30, | ||||||||||||||
2012 | 2011 | 2012 | 2011 | ||||||||||||
Premium collections: | |||||||||||||||
Life | $ | 52.5 | $ | 48.5 | $ | 105.1 | $ | 97.9 | |||||||
Supplemental health | 1.2 | 1.5 | 2.5 | 3.0 | |||||||||||
Total collections | $ | 53.7 | $ | 50.0 | $ | 107.6 | $ | 100.9 | |||||||
Average liabilities for insurance products: | |||||||||||||||
Annuities-mortality based | $ | 76.8 | $ | 77.8 | $ | 76.9 | $ | 78.2 | |||||||
Supplemental health | 15.1 | 16.3 | 15.3 | 16.4 | |||||||||||
Life: | |||||||||||||||
Interest sensitive | 18.9 | 20.5 | 19.4 | 20.6 | |||||||||||
Non-interest sensitive | 601.8 | 588.7 | 600.1 | 587.7 | |||||||||||
Total average liabilities for insurance products, net of reinsurance ceded | $ | 712.6 | $ | 703.3 | $ | 711.7 | $ | 702.9 | |||||||
Revenues: | |||||||||||||||
Insurance policy income | $ | 54.6 | $ | 50.9 | $ | 108.0 | $ | 101.2 | |||||||
Net investment income: | |||||||||||||||
General account invested assets | 10.2 | 10.5 | 20.2 | 20.8 | |||||||||||
Fee revenue and other income | .2 | .2 | .4 | .4 | |||||||||||
Total revenues | 65.0 | 61.6 | 128.6 | 122.4 | |||||||||||
Expenses: | |||||||||||||||
Insurance policy benefits | 39.3 | 37.8 | 81.2 | 76.3 | |||||||||||
Amounts added to annuity and interest-sensitive life product account balances | .3 | .2 | .5 | .4 | |||||||||||
Amortization related to operations | 3.9 | 3.5 | 7.6 | 7.5 | |||||||||||
Other operating costs and expenses | 20.9 | 19.6 | 48.5 | 43.4 | |||||||||||
Total benefits and expenses | 64.4 | 61.1 | 137.8 | 127.6 | |||||||||||
Income (loss) before net realized investment gains and income taxes | .6 | .5 | (9.2 | ) | (5.2 | ) | |||||||||
Net realized investment gains | 1.9 | .2 | 4.5 | 1.3 | |||||||||||
Income (loss) before income taxes | $ | 2.5 | $ | .7 | $ | (4.7 | ) | $ | (3.9 | ) | |||||
This segment's results are significantly impacted by the adoption of the new accounting standard related to deferred acquisition costs. We are no longer able to defer most of Colonial Penn's direct response advertising costs although such costs generate predictable sales and future inforce profits. The amount of our investment in new business during a particular period will have a significant impact on this segment's results. Based on our current advertising plan, we expect to report approximately break-even results in this segment for the remainder of 2012.
Total premium collections increased by 7.4 percent, to $53.7 million, in the second quarter of 2012, as compared to the same period in 2011, and by 6.6 percent, to $107.6 million, in the first six months of 2012, as compared to the same period in 2011. See “Premium Collections” for further analysis of Colonial Penn’s premium collections.
69
CNO FINANCIAL GROUP, INC. AND SUBSIDIARIES
___________________
Insurance policy income is comprised of premiums earned on policies which provide mortality or morbidity coverage and fees and other charges assessed on other policies. The increase in such income reflects the growth in the block of business.
Net investment income on general account invested assets (which excludes income on policyholder and reinsurer accounts) was $10.2 million in the second quarter of 2012, down 2.9 percent from 2011, and was $20.2 million in the first six months of 2012, down 2.9 percent from 2011. The average balance of general account invested assets was $679.1 million and $681.0 million in the second quarters of 2012 and 2011, respectively. The average yield on these assets was 5.98 percent and 6.21 percent in the second quarters of 2012 and 2011, respectively. The average balance of general account invested assets was $681.5 million and $681.0 million in the first six months of 2012 and 2011, respectively. The average yield on these assets was 5.93 percent and 6.12 percent in the first six months of 2012 and 2011, respectively.
Insurance policy benefits increased in the 2012 periods due to growth in the segment.
Amortization related to operations includes amortization of insurance acquisition costs. Insurance acquisition costs in the Colonial Penn segment are amortized in relation to actual and expected premium revenue, and amortization is only adjusted if expected premium revenue changes or if we determine the balance of these costs is not recoverable from future profits. Such amounts were generally consistent with the related premium revenue and gross profits for such periods and the assumptions we made when we established the present value of future profits. A revision to our current assumptions could result in increases or decreases to amortization expense in future periods.
Other operating costs and expenses increased in the 2012 periods primarily due to higher marketing expenses.
Net realized investment gains fluctuate each period. During the first six months of 2012, net realized investment gains in this segment included $4.7 million of net gains from the sales of investments (primarily fixed maturities) and $.2 million of writedowns of investments for other than temporary declines in fair value recognized through net income. During the first six months of 2011, net realized investment gains in this segment included $1.6 million of net gains from the sales of investments (primarily fixed maturities) and $.3 million of writedowns of investments for other than temporary declines in fair value recognized through net income.
70
CNO FINANCIAL GROUP, INC. AND SUBSIDIARIES
___________________
Other CNO Business (dollars in millions)
Three months ended | Six months ended | ||||||||||||||
June 30, | June 30, | ||||||||||||||
2012 | 2011 | 2012 | 2011 | ||||||||||||
Premium collections: | |||||||||||||||
Annuities | $ | 1.2 | $ | 5.9 | $ | 2.1 | $ | 10.1 | |||||||
Other health | 6.5 | 7.2 | 13.4 | 14.8 | |||||||||||
Life | 40.9 | 48.9 | 86.2 | 95.3 | |||||||||||
Total collections | $ | 48.6 | $ | 62.0 | $ | 101.7 | $ | 120.2 | |||||||
Average liabilities for insurance products: | |||||||||||||||
Annuities: | |||||||||||||||
Mortality based | $ | 225.5 | $ | 237.2 | $ | 227.3 | $ | 238.7 | |||||||
Fixed index | 532.5 | 632.1 | 543.2 | 642.1 | |||||||||||
Deposit based | 633.1 | 656.1 | 635.7 | 657.9 | |||||||||||
Separate accounts | 15.8 | 17.7 | 15.6 | 17.8 | |||||||||||
Other health | 479.8 | 481.9 | 480.4 | 481.9 | |||||||||||
Life: | |||||||||||||||
Interest sensitive | 2,365.9 | 2,506.1 | 2,391.4 | 2,516.7 | |||||||||||
Non-interest sensitive | 763.3 | 790.9 | 764.9 | 798.2 | |||||||||||
Total average liabilities for insurance products, net of reinsurance ceded | $ | 5,015.9 | $ | 5,322.0 | $ | 5,058.5 | $ | 5,353.3 | |||||||
Revenues: | |||||||||||||||
Insurance policy income | $ | 73.6 | $ | 72.5 | $ | 152.6 | $ | 144.0 | |||||||
Net investment income: | |||||||||||||||
General account invested assets | 84.0 | 87.6 | 168.0 | 175.8 | |||||||||||
Fixed index products | (4.1 | ) | (.9 | ) | 2.7 | 4.1 | |||||||||
Trading account income related to policyholder accounts | (.1 | ) | — | 1.8 | 1.5 | ||||||||||
Total revenues | 153.4 | 159.2 | 325.1 | 325.4 | |||||||||||
Expenses: | |||||||||||||||
Insurance policy benefits | 93.8 | 85.9 | 176.8 | 174.7 | |||||||||||
Amounts added to policyholder account balances: | |||||||||||||||
Annuity products and interest-sensitive life products other than fixed index products | 27.5 | 30.3 | 57.2 | 61.9 | |||||||||||
Fixed index products | .7 | 3.0 | 9.9 | 10.1 | |||||||||||
Amortization related to operations | 7.1 | 9.4 | 14.6 | 18.0 | |||||||||||
Interest expense on investment borrowings | 5.0 | 5.0 | 10.1 | 9.9 | |||||||||||
Other operating costs and expenses | 17.4 | 20.5 | 56.9 | 38.3 | |||||||||||
Total benefits and expenses | 151.5 | 154.1 | 325.5 | 312.9 | |||||||||||
Income (loss) before net realized investment losses and fair value changes in embedded derivative liabilities, net of related amortization, and income taxes | 1.9 | 5.1 | (.4 | ) | 12.5 | ||||||||||
Net realized investment gains (losses) | 7.5 | 1.1 | 14.2 | .1 | |||||||||||
Amortization related to net realized investment gains (losses) | (1.4 | ) | .3 | (1.6 | ) | .7 | |||||||||
Net realized investment gains (losses), net of related amortization | 6.1 | 1.4 | 12.6 | .8 | |||||||||||
Insurance policy benefits - fair value changes in embedded derivative liabilities | (1.0 | ) | — | (.4 | ) | — | |||||||||
Amortization related to fair value changes in embedded derivative liabilities | .8 | — | .3 | — | |||||||||||
Fair value changes in embedded derivative liabilities, net of related amortization | (.2 | ) | — | (.1 | ) | — | |||||||||
Income (loss) before income taxes | $ | 7.8 | $ | 6.5 | $ | 12.1 | $ | 13.3 | |||||||
71
CNO FINANCIAL GROUP, INC. AND SUBSIDIARIES
___________________
Three months ended | Six months ended | ||||||||||||||
June 30, | June 30, | ||||||||||||||
2012 | 2011 | 2012 | 2011 | ||||||||||||
Health benefit ratios: | |||||||||||||||
Long-term care: | |||||||||||||||
Insurance policy benefits | $ | 14.9 | $ | 14.5 | $ | 30.0 | $ | 31.7 | |||||||
Benefit ratio (a) | 230.2 | % | 205.8 | % | 228.8 | % | 221.0 | % | |||||||
Interest-adjusted benefit ratio (b) | 121.3 | % | 106.4 | % | 121.7 | % | 127.6 | % | |||||||
____________________
(a) | We calculate benefit ratios by dividing the related product’s insurance policy benefits by insurance policy income. |
(b) | We calculate the interest-adjusted benefit ratio (a non-GAAP measure) for Other CNO Business long-term care products by dividing such product’s insurance policy benefits less the imputed interest income on the accumulated assets backing the insurance liabilities by policy income. These are considered non-GAAP financial measures. A non-GAAP measure is a numerical measure of a company’s performance, financial position, or cash flows that excludes or includes amounts that are normally excluded or included in the most directly comparable measure calculated and presented in accordance with GAAP. |
These non-GAAP financial measures of “interest-adjusted benefit ratios” differ from “benefit ratios” due to the deduction of imputed interest income on the accumulated assets backing the insurance liabilities from the product’s insurance policy benefits used to determine the ratio. Interest income is an important factor in measuring the performance of health products that are expected to be inforce for a longer duration of time, are not subject to unilateral changes in provisions (such as non-cancelable or guaranteed renewable contracts) and require the performance of various functions and services (including insurance protection) for an extended period of time. Actual interest income will vary from imputed interest income. The net cash flows from long-term care products generally cause an accumulation of amounts in the early years of a policy (accounted for as reserve increases) that will be paid out as benefits in later policy years (accounted for as reserve decreases). Accordingly, as the policies age, the benefit ratio will typically increase, but the increase in benefits will be partially offset by the imputed interest income earned on the accumulated assets. The interest-adjusted benefit ratio reflects the effects of such interest income offset. Since interest income is an important factor in measuring the performance of these products, management believes a benefit ratio that includes the effect of interest income is useful in analyzing product performance. We utilize the interest-adjusted benefit ratio in measuring segment performance because we believe that this performance measure is a better indicator of the ongoing businesses and trends in the business. However, the “interest-adjusted benefit ratio” does not replace the “benefit ratio” as a measure of current period benefits to current period insurance policy income. Accordingly, management reviews both “benefit ratios” and “interest-adjusted benefit ratios” when analyzing the financial results attributable to these products. The investment income earned on the accumulated assets backing the long-term care reserves was $7.0 million and $7.0 million in the three months ended June 30, 2012 and 2011, respectively, and $14.0 million and $13.4 million in the six months ended June 30, 2012 and 2011, respectively.
Total premium collections were $48.6 million in the second quarter of 2012, down 22 percent from 2011, and were $101.7 million in the first six months of 2012, down 15 percent from 2011. The decrease in collected premiums was primarily due to policyholder redemptions and lapses. See “Premium Collections” for further analysis.
Average liabilities for insurance products, net of reinsurance ceded were $5.0 billion in the second quarter of 2012, down 5.8 percent from 2011, and were $5.1 billion in the first six months of 2012, down 5.5 percent from 2011. The decrease in such liabilities was primarily due to policyholder redemptions and lapses.
Insurance policy income is comprised of policyholder charges on our interest-sensitive products and premiums earned on traditional insurance policies which provide mortality or morbidity coverage. The increase in insurance policy income is primarily due to increased policyholder charges from the implementation of changes to certain NGEs related to certain interest-sensitive life products.
Net investment income on general account invested assets (which excludes income on policyholder and reinsurer accounts) was $84.0 million in the second quarter of 2012, down 4.1 percent from 2011, and was $168.0 million in the first six months of 2012, down 4.4 percent from 2011. The average balance of general account invested assets was $5.6 billion and $5.9 billion in the second quarters of 2012 and 2011, respectively. The average yield on these assets was 5.97 percent in both the second quarters of 2012 and 2011. The average balance of general account invested assets was $5.7 billion and $5.9 billion in
72
CNO FINANCIAL GROUP, INC. AND SUBSIDIARIES
___________________
the first six months of 2012 and 2011, respectively. The average yield on these assets was 5.91 percent and 5.96 percent in the first six months of 2012 and 2011, respectively.
Net investment income related to fixed index products represents the change in the estimated fair value of options which are purchased in an effort to offset or hedge certain potential benefits accruing to the policyholders of our fixed index products. Our fixed index products are designed so that the investment income spread earned on the related insurance liabilities is expected to be more than adequate to cover the cost of the options and other costs related to these policies. Net investment income (loss) related to fixed index products was $(4.1) million and $(1.3) million in the second quarters of 2012 and 2011, respectively, and was $2.7 million and $4.3 million in the six months ended June 30, 2012 and 2011, respectively. Such amounts were mostly offset by the corresponding charge (credit) to amounts added to policyholder account balances for fixed index products. Such income and related charges fluctuate based on the value of options embedded in the segment’s fixed index annuity policyholder account balances subject to this benefit and to the performance of the index to which the returns on such products are linked. For periods prior to June 30, 2011, net investment income related to fixed index products also included income (loss) on trading securities which were held to offset the change in estimated fair values of embedded derivatives related to our fixed index products caused by interest rate fluctuations. During the second quarter of 2011, we sold this trading portfolio and invested the proceeds in higher yielding investments. Such trading account income (loss) was $.4 million and $(.2) million in the three and six months ended June 30, 2011, respectively.
Trading account income related to policyholder accounts represents the income on investments backing the market strategies of certain annuity products which provide for different rates of cash value growth based on the experience of a particular market strategy. The income on our trading account securities is designed to substantially offset certain amounts included in insurance policy benefits related to the aforementioned annuity products.
Insurance policy benefits reflected unfavorable mortality in the life block in the second quarter of 2012 as compared to the same period in 2011.
The long-term care policies in this segment generally provide for indemnity and non-indemnity benefits on a guaranteed renewable or non-cancellable basis. The benefit ratio on our long-term care policies was 230.2 percent and 205.8 percent in the second quarters of 2012 and 2011, respectively, and was 228.8 percent and 221.0 percent in the six months ended June 30, 2012 and 2011, respectively. Benefit ratios are calculated by dividing the product’s insurance policy benefits by insurance policy income. Since the insurance product liabilities we establish for long-term care business are subject to significant estimates, the ultimate claim liability we incur for a particular period is likely to be different than our initial estimate. Our insurance policy benefits reflected reserve deficiencies from prior years of $4.9 million and $3.3 million in the first six months of 2012 and 2011, respectively. Excluding the effects of prior year claim reserve deficiencies, our benefit ratios would have been 191.3 percent and 198.1 percent in the first six months of 2012 and 2011, respectively. These ratios reflect the level of incurred claims experienced in recent periods, adverse development on claims incurred in prior periods and lower policy income. The prior period deficiencies have primarily resulted from the impact of paid claim experience being different than prior estimates.
The net cash flows from long-term care products generally cause an accumulation of amounts in the early years of a policy (reflected in our earnings as reserve increases) which will be paid out as benefits in later policy years (reflected in our earnings as reserve decreases which offset the recording of benefit payments). Accordingly, as the policies age, the benefit ratio will typically increase, but the increase in benefits will be partially offset by investment income earned on the assets which have accumulated. The interest-adjusted benefit ratio for long-term care products is calculated by dividing the insurance product’s insurance policy benefits less interest income on the accumulated assets backing the insurance liabilities by insurance policy income. The interest-adjusted benefit ratio on this business was 121.7 percent and 127.6 percent in the first six months of 2012 and 2011, respectively. Excluding the effects of prior year claim reserve deficiencies, our interest-adjusted benefit ratios would have been 84.3 percent and 104.6 percent in the first six months of 2012 and 2011, respectively.
In each quarterly period, we calculate our best estimate of claim reserves based on all of the information available to us at that time, which necessarily takes into account new experience emerging during the period. Our actuaries estimate these claim reserves using various generally recognized actuarial methodologies which are based on informed estimates and judgments that are believed to be appropriate. As additional experience emerges and other data become available, these estimates and judgments are reviewed and may be revised. Significant assumptions made in estimating claim reserves for long-term care policies include expectations about the: (i) future duration of existing claims; (ii) cost of care and benefit utilization; (iii) interest rate utilized to discount claim reserves; (iv) claims that have been incurred but not yet reported; (v) claim status on the reporting date; (vi) claims that have been closed but are expected to reopen; and (vii) correspondence that has been received that will ultimately become claims that have payments associated with them.
73
CNO FINANCIAL GROUP, INC. AND SUBSIDIARIES
___________________
Amounts added to policyholder account balances for annuity products and interest-sensitive life products were $27.5 million in the second quarter of 2012, down 9.2 percent from 2011, and were $57.2 million in the first six months of 2012, down 7.6 percent from 2011. The decrease was primarily due to a smaller block of interest-sensitive life business in force due to lapses exceeding new sales in recent periods. The weighted average crediting rates for these products was 3.8 percent and 4.0 percent in the first six months of 2012 and 2011, respectively.
Amounts added to fixed index products generally fluctuate with the corresponding related investment income accounts described above.
Amortization related to operations includes amortization of insurance acquisition costs. Insurance acquisition costs are generally amortized either: (i) in relation to the estimated gross profits for universal life and investment-type products; or (ii) in relation to actual and expected premium revenue for other products. In addition, for universal life and investment-type products, we are required to adjust the total amortization recorded to date through the statement of operations if actual experience or other evidence suggests that earlier estimates of future gross profits should be revised. Accordingly, amortization for universal life and investment-type products is dependent on the profits realized during the period and on our expectation of future profits. For other products, we amortize insurance acquisition costs in relation to actual and expected premium revenue, and amortization is only adjusted if expected premium revenue changes. The assumptions we use to estimate our future gross profits and premiums involve significant judgment. A revision to our current assumptions could result in increases or decreases to amortization expense in future periods. Earnings on our universal life products, which comprise a significant part of this block, are subject to volatility since our insurance acquisition costs are equal to the value of future estimated gross profits. Accordingly, the impact of adverse changes in our earlier estimates of future gross profits is generally reflected in earnings in the period such differences occur.
Interest expense on investment borrowings includes $5.0 million and $5.0 million of interest expense on collateralized borrowings in the second quarters of 2012 and 2011, respectively, and $10.1 million and $9.9 million in the six months ended June 30, 2012 and 2011, respectively, as further described in the note to the consolidated financial statements entitled “Investment Borrowings”.
Other operating costs and expenses were $17.4 million in the second quarter of 2012, down 15 percent from 2011, and were $56.9 million in the first six months of 2012, up 49 percent from 2011. In the first quarter of 2012, we recognized a $20.5 million charge related to a tentative litigation settlement.
Net realized investment gains (losses) fluctuate each period. During the first six months of 2012, net realized investment gains in this segment included $19.1 million of net gains from the sales of investments (primarily fixed maturities) and $4.9 million of writedowns of investments for other than temporary declines in fair value recognized through net income. During the first six months of 2011, net realized investment gains included $9.7 million of net gains from the sales of investments (primarily fixed maturities) and $9.6 million of writedowns of investments for other than temporary declines in fair value recognized through net income.
Amortization related to net realized investment losses is the increase or decrease in the amortization of insurance acquisition costs which results from realized investment gains or losses. When we sell securities which back our universal life and investment-type products at a gain (loss) and reinvest the proceeds at a different yield (or when we have the intent to sell the impaired investments before an anticipated recovery in value occurs), we increase (reduce) the amortization of insurance acquisition costs in order to reflect the change in estimated gross profits due to the gains (losses) realized and the resulting effect on estimated future yields. Sales of fixed maturity investments resulted in an increase (decrease) in the amortization of insurance acquisition costs of $1.4 million and $(.3) million in the second quarters of 2012 and 2011, respectively, and $1.6 million and $(.7) million in the six months ended June 30, 2012 and 2011, respectively.
Insurance policy benefits - fair value changes in embedded derivative liabilities represents fair value changes due to fluctuations in the interest rates used to discount embedded derivative liabilities related to our fixed index annuities. Prior to June 30, 2011, we held certain trading securities to offset the income statement volatility caused by the interest rate fluctuations. In the second quarter of 2011, we sold this trading portfolio.
Amortization related to fair value changes in embedded derivative liabilities is the increase or decrease in the amortization of insurance acquisition costs which results from changes in interest rates used to discount embedded derivative liabilities related to our fixed index annuities.
74
CNO FINANCIAL GROUP, INC. AND SUBSIDIARIES
___________________
Corporate Operations (dollars in millions)
Three months ended | Six months ended | ||||||||||||||
June 30, | June 30, | ||||||||||||||
2012 | 2011 | 2012 | 2011 | ||||||||||||
Corporate operations: | |||||||||||||||
Interest expense on corporate debt | $ | (16.6 | ) | $ | (19.3 | ) | $ | (34.1 | ) | $ | (39.9 | ) | |||
Net investment income (loss): | |||||||||||||||
General account invested assets | 1.0 | .9 | 1.9 | .9 | |||||||||||
Other special-purpose portfolios: | |||||||||||||||
COLI | (4.0 | ) | (1.1 | ) | 2.3 | .9 | |||||||||
Investments held in a rabbi trust | — | — | 4.1 | 2.0 | |||||||||||
Investments in certain hedge funds | (1.6 | ) | — | (1.8 | ) | — | |||||||||
Other trading account activities | 4.5 | 1.0 | 10.5 | 5.2 | |||||||||||
Fee revenue and other income | .2 | .2 | .6 | .6 | |||||||||||
Net operating results of variable interest entities | 2.9 | .2 | 5.1 | 2.2 | |||||||||||
Interest expense on investment borrowings | (.2 | ) | — | (.3 | ) | — | |||||||||
Other operating costs and expenses | (11.9 | ) | (12.5 | ) | (33.3 | ) | (23.6 | ) | |||||||
Loss before net realized investment gains, loss on extinguishment of debt and income taxes | (25.7 | ) | (30.6 | ) | (45.0 | ) | (51.7 | ) | |||||||
Net realized investment gains (losses) | 1.1 | 3.9 | 1.0 | 2.8 | |||||||||||
Loss on extinguishment of debt | (.5 | ) | (.6 | ) | (.7 | ) | (2.0 | ) | |||||||
Loss before income taxes | $ | (25.1 | ) | $ | (27.3 | ) | $ | (44.7 | ) | $ | (50.9 | ) | |||
Interest expense on corporate debt has been impacted by: (i) prepayments of our Senior Secured Credit Agreement in 2011 and 2012 and the amendment in May 2011 which reduced the interest rate payable on the Senior Secured Credit Agreement; and (ii) repayments of the Senior Health Note. Such transactions are further discussed in the note to the consolidated financial statements entitled “Notes Payable - Direct Corporate Obligations”. Our average corporate debt outstanding was $842.8 million and $982.9 million during the first six months of 2012 and 2011, respectively. The average interest rate on our debt was 7.4 percent and 7.6 percent during the first six months of 2012 and 2011, respectively.
Net investment income on general account invested assets increased in 2012 due to the increase in invested assets in the corporate operations segment.
Net investment income on other special-purpose portfolios includes the income (loss) from: (i) investments related to deferred compensation plans held in a rabbi trust (which is offset by amounts included in other operating costs and expenses as the investment results are allocated to participants’ account balances); (ii) trading account activities which commenced in the first quarter of 2011; (iii) income from COLI exceeding the return on these investments equivalent to our overall portfolio yield; and (iv) investments in certain hedge funds which commenced in the third quarter of 2011. COLI is utilized as an investment vehicle to fund Bankers’ agent deferred compensation plan. For segment reporting, the Bankers Life segment is allocated a return on these investments equivalent to the yield on the Company’s overall portfolio, with any difference in the actual COLI return allocated to Corporate Operations.
Net operating results of variable interest entities represents the operating results of VIEs. The VIEs are consolidated in accordance with GAAP. These entities were established to issue securities and use the proceeds to invest in loans and other permitted assets. Refer to the note to the consolidated financial statements entitled “Investments in Variable Interest Entities” for more information on the VIEs.
Interest expense on investment borrowings represents interest expense on repurchase agreements as further discussed in the note to the consolidated financial statements entitled "Investment Borrowings".
Other operating costs and expenses include general corporate expenses, net of amounts charged to subsidiaries for services provided by the corporate operations. These amounts fluctuate as a result of expenses such as consulting and legal
75
CNO FINANCIAL GROUP, INC. AND SUBSIDIARIES
___________________
costs which often vary from period to period. In the first quarter of 2012, we recognized a $6.8 million charge related to the relocation of Bankers Life's primary office.
Net realized investment gains (losses) often fluctuate each period. During the first six months of 2012, net realized investment gains included $1.4 million of net gains from the sales of investments (of which, $.2 million were net gains recognized by VIEs) and $.4 million of writedowns of investments (all of which were recognized by VIEs) due to other than temporary declines in fair value recognized through net income. During the first six months of 2011, net realized investment gains included $6.0 million of net gains from the sales of investments (of which, $3.6 million were net gains recognized by VIEs) and $3.2 million of writedowns of investments (all of which were recognized by VIEs) due to other than temporary declines in fair value recognized through net income.
Loss on extinguishment of debt in the first six months of 2012 of $.7 million represents the write-off of unamortized discount and issuance costs associated with repayments of the Senior Secured Credit Agreement as further discussed in the note to the consolidated financial statements entitled “Notes Payable – Direct Corporate Obligations.” The loss on extinguishment of debt of $2.0 million in the first six months of 2011 represents the write-off of unamortized discount and issuance costs associated with the prepayment of $66.2 million outstanding principal balance under the Senior Secured Credit Agreement.
76
CNO FINANCIAL GROUP, INC. AND SUBSIDIARIES
___________________
EBIT from Business Segments Summarized by In-Force and New Business
Management believes that an analysis of EBIT, separated between in-force and new business provides increased clarity around the value drivers of our business, particularly since the new business results are significantly impacted by the rate of sales, mix of business and the distribution channel through which new sales are made. EBIT from new business includes pre-tax revenues and expenses associated with new sales of our insurance products during the first year after the sale is completed. EBIT from in-force business includes all pre-tax revenues and expenses associated with sales of insurance products that were completed more than one year before the end of the reporting period. The allocation of certain revenues and expenses between new and in-force business is based on estimates, which we believe are reasonable.
The following summarizes our earnings, separated between in-force and new business on a consolidated basis and for each of our operating segments for the three and six months ended June 30, 2012 and 2011:
Business segments - total (dollars in millions)
Three months ended | Six months ended | ||||||||||||||
June 30, | June 30, | ||||||||||||||
2012 | 2011 | 2012 | 2011 | ||||||||||||
EBIT from In-Force Business | |||||||||||||||
Revenues: | |||||||||||||||
Insurance policy income | $ | 601.7 | $ | 594.3 | $ | 1,198.7 | $ | 1,178.3 | |||||||
Net investment income and other | 324.7 | 334.1 | 702.5 | 685.8 | |||||||||||
Total revenues | 926.4 | 928.4 | 1,901.2 | 1,864.1 | |||||||||||
Benefits and expenses: | |||||||||||||||
Insurance policy benefits | 611.7 | 626.3 | 1,247.0 | 1,251.1 | |||||||||||
Amortization | 64.6 | 61.9 | 137.7 | 147.2 | |||||||||||
Other expenses | 100.2 | 101.6 | 237.7 | 197.8 | |||||||||||
Total benefits and expenses | 776.5 | 789.8 | 1,622.4 | 1,596.1 | |||||||||||
EBIT from In-Force Business | $ | 149.9 | $ | 138.6 | $ | 278.8 | $ | 268.0 | |||||||
EBIT from New Business | |||||||||||||||
Revenues: | |||||||||||||||
Insurance policy income | $ | 93.1 | $ | 85.3 | $ | 182.4 | $ | 168.5 | |||||||
Net investment income and other | 5.7 | 10.4 | 18.8 | 22.4 | |||||||||||
Total revenues | 98.8 | 95.7 | 201.2 | 190.9 | |||||||||||
Benefits and expenses: | |||||||||||||||
Insurance policy benefits | 60.3 | 58.1 | 125.6 | 116.5 | |||||||||||
Amortization | 7.7 | 9.3 | 15.4 | 18.5 | |||||||||||
Other expenses | 68.2 | 67.4 | 143.4 | 136.2 | |||||||||||
Total benefits and expenses | 136.2 | 134.8 | 284.4 | 271.2 | |||||||||||
EBIT from New Business | $ | (37.4 | ) | $ | (39.1 | ) | $ | (83.2 | ) | $ | (80.3 | ) | |||
EBIT from In-Force and New Business | |||||||||||||||
Revenues: | |||||||||||||||
Insurance policy income | $ | 694.8 | $ | 679.6 | $ | 1,381.1 | $ | 1,346.8 | |||||||
Net investment income and other | 330.4 | 344.5 | 721.3 | 708.2 | |||||||||||
Total revenues | 1,025.2 | 1,024.1 | 2,102.4 | 2,055.0 | |||||||||||
Benefits and expenses: | |||||||||||||||
Insurance policy benefits | 672.0 | 684.4 | 1,372.6 | 1,367.6 | |||||||||||
Amortization | 72.3 | 71.2 | 153.1 | 165.7 | |||||||||||
Other expenses | 168.4 | 169.0 | 381.1 | 334.0 | |||||||||||
Total benefits and expenses | 912.7 | 924.6 | 1,906.8 | 1,867.3 | |||||||||||
EBIT from In-Force and New Business | $ | 112.5 | $ | 99.5 | $ | 195.6 | $ | 187.7 | |||||||
77
CNO FINANCIAL GROUP, INC. AND SUBSIDIARIES
___________________
Bankers Life (dollars in millions)
Three months ended | Six months ended | ||||||||||||||
June 30, | June 30, | ||||||||||||||
2012 | 2011 | 2012 | 2011 | ||||||||||||
EBIT from In-Force Business | |||||||||||||||
Revenues: | |||||||||||||||
Insurance policy income | $ | 351.6 | $ | 346.3 | $ | 693.4 | $ | 685.1 | |||||||
Net investment income and other | 183.2 | 189.8 | 407.9 | 389.7 | |||||||||||
Total revenues | 534.8 | 536.1 | 1,101.3 | 1,074.8 | |||||||||||
Benefits and expenses: | |||||||||||||||
Insurance policy benefits | 348.7 | 361.3 | 716.1 | 718.2 | |||||||||||
Amortization | 43.7 | 38.5 | 93.7 | 98.6 | |||||||||||
Other expenses | 39.8 | 37.7 | 91.8 | 72.7 | |||||||||||
Total benefits and expenses | 432.2 | 437.5 | 901.6 | 889.5 | |||||||||||
EBIT from In-Force Business | $ | 102.6 | $ | 98.6 | $ | 199.7 | $ | 185.3 | |||||||
EBIT from New Business | |||||||||||||||
Revenues: | |||||||||||||||
Insurance policy income | $ | 67.4 | $ | 63.3 | $ | 132.1 | $ | 124.5 | |||||||
Net investment income and other | 5.7 | 10.4 | 18.8 | 22.4 | |||||||||||
Total revenues | 73.1 | 73.7 | 150.9 | 146.9 | |||||||||||
Benefits and expenses: | |||||||||||||||
Insurance policy benefits | 48.0 | 47.6 | 101.5 | 95.5 | |||||||||||
Amortization | 6.8 | 8.4 | 13.7 | 16.8 | |||||||||||
Other expenses | 44.8 | 44.2 | 88.8 | 85.6 | |||||||||||
Total benefits and expenses | 99.6 | 100.2 | 204.0 | 197.9 | |||||||||||
EBIT from New Business | $ | (26.5 | ) | $ | (26.5 | ) | $ | (53.1 | ) | $ | (51.0 | ) | |||
EBIT from In-Force and New Business | |||||||||||||||
Revenues: | |||||||||||||||
Insurance policy income | $ | 419.0 | $ | 409.6 | $ | 825.5 | $ | 809.6 | |||||||
Net investment income and other | 188.9 | 200.2 | 426.7 | 412.1 | |||||||||||
Total revenues | 607.9 | 609.8 | 1,252.2 | 1,221.7 | |||||||||||
Benefits and expenses: | |||||||||||||||
Insurance policy benefits | 396.7 | 408.9 | 817.6 | 813.7 | |||||||||||
Amortization | 50.5 | 46.9 | 107.4 | 115.4 | |||||||||||
Other expenses | 84.6 | 81.9 | 180.6 | 158.3 | |||||||||||
Total benefits and expenses | 531.8 | 537.7 | 1,105.6 | 1,087.4 | |||||||||||
EBIT from In-Force and New Business | $ | 76.1 | $ | 72.1 | $ | 146.6 | $ | 134.3 | |||||||
78
CNO FINANCIAL GROUP, INC. AND SUBSIDIARIES
___________________
Washington National (dollars in millions)
Three months ended | Six months ended | ||||||||||||||
June 30, | June 30, | ||||||||||||||
2012 | 2011 | 2012 | 2011 | ||||||||||||
EBIT from In-Force Business | |||||||||||||||
Revenues: | |||||||||||||||
Insurance policy income | $ | 132.8 | $ | 133.5 | $ | 265.8 | $ | 265.4 | |||||||
Net investment income and other | 51.3 | 46.9 | 101.5 | 93.5 | |||||||||||
Total revenues | 184.1 | 180.4 | 367.3 | 358.9 | |||||||||||
Benefits and expenses: | |||||||||||||||
Insurance policy benefits | 107.6 | 112.9 | 217.4 | 219.5 | |||||||||||
Amortization | 10.0 | 10.6 | 22.0 | 23.3 | |||||||||||
Other expenses | 32.3 | 32.1 | 66.3 | 64.0 | |||||||||||
Total benefits and expenses | 149.9 | 155.6 | 305.7 | 306.8 | |||||||||||
EBIT from In-Force Business | $ | 34.2 | $ | 24.8 | $ | 61.6 | $ | 52.1 | |||||||
EBIT from New Business | |||||||||||||||
Revenues: | |||||||||||||||
Insurance policy income | $ | 14.8 | $ | 13.1 | $ | 29.2 | $ | 26.6 | |||||||
Net investment income and other | — | — | — | — | |||||||||||
Total revenues | 14.8 | 13.1 | 29.2 | 26.6 | |||||||||||
Benefits and expenses: | |||||||||||||||
Insurance policy benefits | 6.1 | 5.4 | 12.0 | 11.0 | |||||||||||
Amortization | .8 | .8 | 1.5 | 1.5 | |||||||||||
Other expenses | 8.2 | 9.9 | 18.7 | 20.1 | |||||||||||
Total benefits and expenses | 15.1 | 16.1 | 32.2 | 32.6 | |||||||||||
EBIT from New Business | $ | (.3 | ) | $ | (3.0 | ) | $ | (3.0 | ) | $ | (6.0 | ) | |||
EBIT from In-Force and New Business | |||||||||||||||
Revenues: | |||||||||||||||
Insurance policy income | $ | 147.6 | $ | 146.6 | $ | 295.0 | $ | 292.0 | |||||||
Net investment income and other | 51.3 | 46.9 | 101.5 | 93.5 | |||||||||||
Total revenues | 198.9 | 193.5 | 396.5 | 385.5 | |||||||||||
Benefits and expenses: | |||||||||||||||
Insurance policy benefits | 113.7 | 118.3 | 229.4 | 230.5 | |||||||||||
Amortization | 10.8 | 11.4 | 23.5 | 24.8 | |||||||||||
Other expenses | 40.5 | 42.0 | 85.0 | 84.1 | |||||||||||
Total benefits and expenses | 165.0 | 171.7 | 337.9 | 339.4 | |||||||||||
EBIT from In-Force and New Business | $ | 33.9 | $ | 21.8 | $ | 58.6 | $ | 46.1 | |||||||
79
CNO FINANCIAL GROUP, INC. AND SUBSIDIARIES
___________________
Colonial Penn (dollars in millions)
Three months ended | Six months ended | ||||||||||||||
June 30, | June 30, | ||||||||||||||
2012 | 2011 | 2012 | 2011 | ||||||||||||
EBIT from In-Force Business | |||||||||||||||
Revenues: | |||||||||||||||
Insurance policy income | $ | 43.7 | $ | 42.0 | $ | 86.9 | $ | 83.8 | |||||||
Net investment income and other | 10.4 | 10.7 | 20.6 | 21.2 | |||||||||||
Total revenues | 54.1 | 52.7 | 107.5 | 105.0 | |||||||||||
Benefits and expenses: | |||||||||||||||
Insurance policy benefits | 33.4 | 32.9 | 69.6 | 66.7 | |||||||||||
Amortization | 3.8 | 3.4 | 7.4 | 7.3 | |||||||||||
Other expenses | 5.7 | 6.3 | 12.6 | 12.9 | |||||||||||
Total benefits and expenses | 42.9 | 42.6 | 89.6 | 86.9 | |||||||||||
EBIT from In-Force Business | $ | 11.2 | $ | 10.1 | $ | 17.9 | $ | 18.1 | |||||||
EBIT from New Business | |||||||||||||||
Revenues: | |||||||||||||||
Insurance policy income | $ | 10.9 | $ | 8.9 | $ | 21.1 | $ | 17.4 | |||||||
Net investment income and other | — | — | — | — | |||||||||||
Total revenues | 10.9 | 8.9 | 21.1 | 17.4 | |||||||||||
Benefits and expenses: | |||||||||||||||
Insurance policy benefits | 6.2 | 5.1 | 12.1 | 10.0 | |||||||||||
Amortization | .1 | .1 | .2 | .2 | |||||||||||
Other expenses | 15.2 | 13.3 | 35.9 | 30.5 | |||||||||||
Total benefits and expenses | 21.5 | 18.5 | 48.2 | 40.7 | |||||||||||
EBIT from New Business | $ | (10.6 | ) | $ | (9.6 | ) | $ | (27.1 | ) | $ | (23.3 | ) | |||
EBIT from In-Force and New Business | |||||||||||||||
Revenues: | |||||||||||||||
Insurance policy income | $ | 54.6 | $ | 50.9 | $ | 108.0 | $ | 101.2 | |||||||
Net investment income and other | 10.4 | 10.7 | 20.6 | 21.2 | |||||||||||
Total revenues | 65.0 | 61.6 | 128.6 | 122.4 | |||||||||||
Benefits and expenses: | |||||||||||||||
Insurance policy benefits | 39.6 | 38.0 | 81.7 | 76.7 | |||||||||||
Amortization | 3.9 | 3.5 | 7.6 | 7.5 | |||||||||||
Other expenses | 20.9 | 19.6 | 48.5 | 43.4 | |||||||||||
Total benefits and expenses | 64.4 | 61.1 | 137.8 | 127.6 | |||||||||||
EBIT from In-Force and New Business | $ | .6 | $ | .5 | $ | (9.2 | ) | $ | (5.2 | ) | |||||
80
CNO FINANCIAL GROUP, INC. AND SUBSIDIARIES
___________________
Other CNO Business (dollars in millions)
Three months ended | Six months ended | ||||||||||||||
June 30, | June 30, | ||||||||||||||
2012 | 2011 | 2012 | 2011 | ||||||||||||
EBIT from In-Force Business (a) | |||||||||||||||
Revenues: | |||||||||||||||
Insurance policy income | $ | 73.6 | $ | 72.5 | $ | 152.6 | $ | 144.0 | |||||||
Net investment income and other | 79.8 | 86.7 | 172.5 | 181.4 | |||||||||||
Total revenues | 153.4 | 159.2 | 325.1 | 325.4 | |||||||||||
Benefits and expenses: | |||||||||||||||
Insurance policy benefits | 122.0 | 119.2 | 243.9 | 246.7 | |||||||||||
Amortization | 7.1 | 9.4 | 14.6 | 18.0 | |||||||||||
Other expenses | 22.4 | 25.5 | 67.0 | 48.2 | |||||||||||
Total benefits and expenses | 151.5 | 154.1 | 325.5 | 312.9 | |||||||||||
EBIT from In-Force Business | $ | 1.9 | $ | 5.1 | $ | (.4 | ) | $ | 12.5 | ||||||
_________________________
(a) | All activity in the Other CNO Business segment relates to in-force business. |
The above analysis of EBIT, separated between in-force and new business, illustrates how our segments are impacted by the rate of sales, mix of business and distribution channel through which new sales are made. In addition, when the impacts from new business are separated, the value drivers of our in-force business are more apparent.
The EBIT from in-force business in the Bankers Life segment grew in the 2012 periods primarily due to the growth in this segment's in-force block reflecting prior period sales and improved persistency. Other expenses include a $10 million settlement with state regulators in the first quarter of 2012.
The EBIT from new business in the Bankers Life segment in the 2012 periods reflects slightly higher non-deferrable costs related to the generation of new business. Certain costs associated with Bankers career agency force are fully recognized in this segment's earnings when incurred.
The EBIT from in-force business in the Washington National segment grew in the 2012 periods primarily due to higher investment income on higher average balance of general account assets from the FHLB investment borrowing program that commenced in June 2011.
The EBIT from new business in the Washington National segment in the 2012 periods reflects slightly lower non-deferrable acquisition costs and increased new business. Costs associated with this segment's new business are largely comprised of commissions which are deferred and recognized over the life of the business.
The EBIT from new business in the Colonial Penn segment in the 2012 periods reflects additional marketing costs. The vast majority of the costs to generate new business in this segment are not deferrable and EBIT will fluctuate based on management's decisions on how much marketing costs to incur in each period.
We are not investing in new business in the Other CNO Business segment.
81
CNO FINANCIAL GROUP, INC. AND SUBSIDIARIES
___________________
PREMIUM COLLECTIONS
In accordance with GAAP, insurance policy income in our consolidated statement of operations consists of premiums earned for traditional insurance policies that have life contingencies or morbidity features. For annuity and universal life contracts, premiums collected are not reported as revenues, but as deposits to insurance liabilities. We recognize revenues for these products over time in the form of investment income and surrender or other charges.
Our insurance segments sell products through three primary distribution channels — career agents (our Bankers Life segment), direct marketing (our Colonial Penn segment) and independent producers (our Washington National segment). Our career agency force in the Bankers Life segment sells primarily Medicare supplement and long-term care insurance policies, PDP contracts, life insurance and annuities. These agents visit the customer’s home, which permits one-on-one contact with potential policyholders and promotes strong personal relationships with existing policyholders. Our direct marketing distribution channel in the Colonial Penn segment is engaged primarily in the sale of graded benefit life and simplified issue life insurance policies which are sold directly to the policyholder. Our Washington National segment sells primarily supplemental health and life insurance. These products are marketed through PMA, a subsidiary that specializes in marketing and distributing health products, and through independent marketing organizations and insurance agencies, including worksite marketing.
Agents, insurance brokers and marketing companies who market our products and prospective purchasers of our products use the financial strength ratings of our insurance subsidiaries as an important factor in determining whether to market or purchase. Ratings have the most impact on our annuity, interest-sensitive life insurance and long-term care products. The current financial strength ratings of our primary insurance subsidiaries from A.M. Best, S&P, Moody’s and Fitch Ratings (“Fitch”) are “B+ (Good)” (except Conseco Life), “BB+”, “Ba1” and “BBB” (except Conseco Life), respectively. The current financial strength ratings of Conseco Life from A.M. Best and Fitch are “B-” and “BB+”, respectively. For a description of these ratings and additional information on our ratings, see “Financial Strength Ratings of our Insurance Subsidiaries.”
We set premium rates on our health insurance policies based on facts and circumstances known at the time we issue the policies using assumptions about numerous variables, including the actuarial probability of a policyholder incurring a claim, the probable size of the claim, and the interest rate earned on our investment of premiums. We also consider historical claims information, industry statistics, the rates of our competitors and other factors. If our actual claims experience is less favorable than we anticipated and we are unable to raise our premium rates, our financial results may be adversely affected. We generally cannot raise our health insurance premiums in any state until we obtain the approval of the state insurance regulator. We review the adequacy of our premium rates regularly and file for rate increases on our products when we believe such rates are too low. It is likely that we will not be able to obtain approval for all requested premium rate increases. If such requests are denied in one or more states, our net income may decrease. If such requests are approved, increased premium rates may reduce the volume of our new sales and may cause existing policyholders to lapse their policies. If the healthier policyholders allow their policies to lapse, this would reduce our premium income and profitability in the future.
82
CNO FINANCIAL GROUP, INC. AND SUBSIDIARIES
___________________
Total premium collections by segment were as follows:
Bankers Life (dollars in millions)
Three months ended | Six months ended | ||||||||||||||
June 30, | June 30, | ||||||||||||||
2012 | 2011 | 2012 | 2011 | ||||||||||||
Premiums collected by product: | |||||||||||||||
Annuities: | |||||||||||||||
Fixed index (first-year) | $ | 120.2 | $ | 163.9 | $ | 255.1 | $ | 312.1 | |||||||
Other fixed rate (first-year) | 47.9 | 94.1 | 95.7 | 167.2 | |||||||||||
Other fixed rate (renewal) | 1.4 | 1.1 | 3.4 | 2.0 | |||||||||||
Subtotal - other fixed rate annuities | 49.3 | 95.2 | 99.1 | 169.2 | |||||||||||
Total annuities | 169.5 | 259.1 | 354.2 | 481.3 | |||||||||||
Health: | |||||||||||||||
Medicare supplement (first-year) | 25.1 | 24.7 | 48.9 | 49.8 | |||||||||||
Medicare supplement (renewal) | 149.8 | 144.3 | 300.9 | 298.0 | |||||||||||
Subtotal - Medicare supplement | 174.9 | 169.0 | 349.8 | 347.8 | |||||||||||
Long-term care (first-year) | 5.9 | 6.0 | 11.4 | 12.1 | |||||||||||
Long-term care (renewal) | 132.9 | 136.9 | 264.1 | 275.7 | |||||||||||
Subtotal - long-term care | 138.8 | 142.9 | 275.5 | 287.8 | |||||||||||
PDP and PFFS (first year) | .1 | .2 | .4 | .6 | |||||||||||
PDP and PFFS (renewal) | 14.6 | 14.4 | 29.6 | 25.0 | |||||||||||
Subtotal – PDP and PFFS | 14.7 | 14.6 | 30.0 | 25.6 | |||||||||||
Other health (first-year) | .6 | .3 | 1.0 | .7 | |||||||||||
Other health (renewal) | 2.3 | 2.3 | 4.5 | 4.8 | |||||||||||
Subtotal - other health | 2.9 | 2.6 | 5.5 | 5.5 | |||||||||||
Total health | 331.3 | 329.1 | 660.8 | 666.7 | |||||||||||
Life insurance: | |||||||||||||||
First-year | 35.7 | 29.4 | 68.5 | 54.1 | |||||||||||
Renewal | 39.7 | 32.6 | 77.0 | 64.3 | |||||||||||
Total life insurance | 75.4 | 62.0 | 145.5 | 118.4 | |||||||||||
Collections on insurance products: | |||||||||||||||
Total first-year premium collections on insurance products | 235.5 | 318.6 | 481.0 | 596.6 | |||||||||||
Total renewal premium collections on insurance products | 340.7 | 331.6 | 679.5 | 669.8 | |||||||||||
Total collections on insurance products | $ | 576.2 | $ | 650.2 | $ | 1,160.5 | $ | 1,266.4 | |||||||
Annuities in this segment include fixed index and other fixed rate annuities sold to the senior market. Annuity collections in this segment decreased 35 percent, to $169.5 million, in the second quarter of 2012, and 26 percent, to $354.2 million, in the first six months of 2012, as compared to the same periods in 2011. The change in mix of premium collections between our fixed index products and our fixed annuity products has fluctuated due to volatility in the financial markets in recent periods. In addition, premium collections from Bankers Life's fixed annuity products have decreased in recent periods as low new money interest rates negatively impacted our sales and the overall sales in the fixed annuity market.
Health products include Medicare supplement, PDP contracts, long-term care and other insurance products. Our profits on health policies depend on the overall level of sales, the length of time the business remains inforce, investment yields, claims experience and expense management.
83
CNO FINANCIAL GROUP, INC. AND SUBSIDIARIES
___________________
Collected premiums on Medicare supplement policies in the Bankers Life segment increased 3.5 percent, to $174.9 million, in the second quarter of 2012, and .6 percent, to $349.8 million, in the first six months of 2012, as compared to the same periods in the prior year.
Premiums collected on Bankers Life’s long-term care policies decreased 2.9 percent, to $138.8 million, in the second quarter of 2012, and 4.3 percent, to $275.5 million, in the first six months of 2012, as compared to the same periods in 2011. The decrease was primarily attributable to higher lapses following premium rate increases in recent periods.
Premiums collected on PDP and PFFS business relate to our quota-share reinsurance agreements with Coventry. Premiums collected on PFFS business were $3.7 million in the three and six months ended June 30, 2011. The PFFS premiums recognized in the 2011 periods relate to adjustments to prior year contracts based on audits conducted by the Centers for Medicare and Medicaid Services, an agency of the United States government which, among other things, administers the Medicare program. Such audits can result in positive or negative adjustments to premium revenue in the period the results of the audits are reported to us.
Life products in this segment are sold primarily to the senior market through our career agents. Life premiums collected in this segment increased 22 percent, to $75.4 million, in the second quarter of 2012, and 23 percent, to $145.5 million, in the first six months of 2012, as compared to the same periods in 2011, reflecting higher sales in this segment.
Washington National (dollars in millions)
Three months ended | Six months ended | ||||||||||||||
June 30, | June 30, | ||||||||||||||
2012 | 2011 | 2012 | 2011 | ||||||||||||
Premiums collected by product: | |||||||||||||||
Health: | |||||||||||||||
Medicare supplement (first-year) | $ | .3 | $ | .5 | $ | .6 | $ | 1.1 | |||||||
Medicare supplement (renewal) | 28.8 | 32.6 | 56.6 | 67.3 | |||||||||||
Subtotal - Medicare supplement | 29.1 | 33.1 | 57.2 | 68.4 | |||||||||||
Supplemental health (first-year) | 15.1 | 13.7 | 29.2 | 26.9 | |||||||||||
Supplemental health (renewal) | 100.3 | 95.2 | 199.1 | 188.9 | |||||||||||
Subtotal – supplemental health | 115.4 | 108.9 | 228.3 | 215.8 | |||||||||||
Other health (all renewal) | .6 | .8 | 1.3 | 1.8 | |||||||||||
Total health | 145.1 | 142.8 | 286.8 | 286.0 | |||||||||||
Life insurance: | |||||||||||||||
First-year | .3 | .3 | .5 | .7 | |||||||||||
Renewal | 3.5 | 3.6 | 7.3 | 7.5 | |||||||||||
Total life insurance | 3.8 | 3.9 | 7.8 | 8.2 | |||||||||||
Collections on insurance products: | |||||||||||||||
Total first-year premium collections on insurance products | 15.7 | 14.5 | 30.3 | 28.7 | |||||||||||
Total renewal premium collections on insurance products | 133.2 | 132.2 | 264.3 | 265.5 | |||||||||||
Total collections on insurance products | $ | 148.9 | $ | 146.7 | $ | 294.6 | $ | 294.2 | |||||||
Health products in the Washington National segment include Medicare supplement, supplemental health and other insurance products. Our profits on health policies depend on the overall level of sales, the length of time the business remains inforce, investment yields, claim experience and expense management.
Collected premiums on Medicare supplement policies in the Washington National segment decreased 12 percent, to $29.1 million, in the second quarter of 2012, and 16 percent, to $57.2 million, in the first six months of 2012, as compared to the same periods in 2011. We have experienced lower sales of these products as we have increased our focus on supplemental health products in recent periods.
Premiums collected on supplemental health products (including specified disease, accident and hospital indemnity insurance products) increased 6.0 percent, to $115.4 million, in the second quarter of 2012, and 5.8 percent, to $228.3 million,
84
CNO FINANCIAL GROUP, INC. AND SUBSIDIARIES
___________________
in the first six months of 2012, as compared to the same periods in 2011. Such increases are due to higher new sales and an improvement in persistency.
Life products in the Washington National segment are primarily traditional life products. Life premiums collected in the 2012 periods were down slightly compared to the same periods in 2011.
Colonial Penn (dollars in millions)
Three months ended | Six months ended | ||||||||||||||
June 30, | June 30, | ||||||||||||||
2012 | 2011 | 2012 | 2011 | ||||||||||||
Premiums collected by product: | |||||||||||||||
Life insurance: | |||||||||||||||
First-year | $ | 10.7 | $ | 8.6 | $ | 21.1 | $ | 17.3 | |||||||
Renewal | 41.8 | 39.9 | 84.0 | 80.6 | |||||||||||
Total life insurance | 52.5 | 48.5 | 105.1 | 97.9 | |||||||||||
Health (all renewal): | |||||||||||||||
Medicare supplement | 1.1 | 1.4 | 2.3 | 2.7 | |||||||||||
Other health | .1 | .1 | .2 | .3 | |||||||||||
Total health | 1.2 | 1.5 | 2.5 | 3.0 | |||||||||||
Collections on insurance products: | |||||||||||||||
Total first-year premium collections on insurance products | 10.7 | 8.6 | 21.1 | 17.3 | |||||||||||
Total renewal premium collections on insurance products | 43.0 | 41.4 | 86.5 | 83.6 | |||||||||||
Total collections on insurance products | $ | 53.7 | $ | 50.0 | $ | 107.6 | $ | 100.9 | |||||||
Life products in this segment are sold primarily to the senior market. Life premiums collected in this segment increased 8.2 percent, to $52.5 million, in the second quarter of 2012, and 7.4 percent, to $105.1 million, in the first six months of 2012, as compared to the same periods in 2011. Graded benefit life products sold through our direct response marketing channel accounted for $51.8 million and $47.8 million of our total collected premiums in the second quarters of 2012 and 2011, respectively, and $103.6 million and $96.2 million in the first six months of 2012 and 2011, respectively.
Health products include Medicare supplement and other insurance products. Our profits on health policies depend on the overall level of sales, the length of time the business remains inforce, investment yields, claims experience and expense management. Premiums collected on these products have decreased as we do not currently market these products through this segment.
85
CNO FINANCIAL GROUP, INC. AND SUBSIDIARIES
___________________
Other CNO Business (dollars in millions)
Three months ended | Six months ended | ||||||||||||||
June 30, | June 30, | ||||||||||||||
2012 | 2011 | 2012 | 2011 | ||||||||||||
Premiums collected by product: | |||||||||||||||
Annuities: | |||||||||||||||
Fixed index (first-year) | $ | .2 | $ | 2.7 | $ | .2 | $ | 5.4 | |||||||
Fixed index (renewal) | .8 | 1.4 | 1.5 | 2.3 | |||||||||||
Subtotal - fixed index annuities | 1.0 | 4.1 | 1.7 | 7.7 | |||||||||||
Other fixed rate (first-year) | — | 1.6 | — | 2.0 | |||||||||||
Other fixed rate (renewal) | .2 | .2 | .4 | .4 | |||||||||||
Subtotal - other fixed rate annuities | .2 | 1.8 | .4 | 2.4 | |||||||||||
Total annuities | 1.2 | 5.9 | 2.1 | 10.1 | |||||||||||
Health: | |||||||||||||||
Long-term care (all renewal) | 6.3 | 7.0 | 13.0 | 14.4 | |||||||||||
Other health (all renewal) | .2 | .2 | .4 | .4 | |||||||||||
Total health | 6.5 | 7.2 | 13.4 | 14.8 | |||||||||||
Life insurance: | |||||||||||||||
First-year | .8 | .9 | 1.4 | 1.3 | |||||||||||
Renewal | 40.1 | 48.0 | 84.8 | 94.0 | |||||||||||
Total life insurance | 40.9 | 48.9 | 86.2 | 95.3 | |||||||||||
Collections on insurance products: | |||||||||||||||
Total first-year premium collections on insurance products | 1.0 | 5.2 | 1.6 | 8.7 | |||||||||||
Total renewal premium collections on insurance products | 47.6 | 56.8 | 100.1 | 111.5 | |||||||||||
Total collections on insurance products | $ | 48.6 | $ | 62.0 | $ | 101.7 | $ | 120.2 | |||||||
Annuities in this segment include fixed index and other fixed annuities. We are no longer actively pursuing sales of annuity products in this segment.
Health products in the Other CNO Business segment include long-term care and other health insurance products. Our profits on health policies depend on the length of time the business remains inforce, investment yields, claim experience and expense management.
The long-term care premiums in this segment relate to blocks of business that we no longer market or underwrite. As a result, we expect this segment’s long-term care premiums to continue to decline, reflecting additional policy lapses in the future.
Life products in the Other CNO Business segment include primarily universal life products. Life premiums collected in this segment decreased 16 percent, to $40.9 million, in the second quarter of 2012, and 9.5 percent, to $86.2 million, in the first six months of 2012, as compared to the same periods in 2011. We are not actively marketing life products in this segment and expect premiums to continue to decline.
86
CNO FINANCIAL GROUP, INC. AND SUBSIDIARIES
___________________
LIQUIDITY AND CAPITAL RESOURCES
Our capital structure as of June 30, 2012, and December 31, 2011, was as follows (dollars in millions):
June 30, 2012 | December 31, 2011 | ||||||
Total capital: | |||||||
Corporate notes payable | $ | 778.2 | $ | 857.9 | |||
Shareholders’ equity: | |||||||
Common stock | 2.3 | 2.4 | |||||
Additional paid-in capital | 4,312.0 | 4,361.9 | |||||
Accumulated other comprehensive income | 990.8 | 781.6 | |||||
Accumulated deficit | (412.0 | ) | (532.1 | ) | |||
Total shareholders’ equity | 4,893.1 | 4,613.8 | |||||
Total capital | $ | 5,671.3 | $ | 5,471.7 | |||
The following table summarizes certain financial ratios as of and for the six months ended June 30, 2012, and as of and for the year ended December 31, 2011:
June 30, 2012 | December 31, 2011 | ||||||
Book value per common share | $ | 20.91 | $ | 19.12 | |||
Book value per common share, excluding accumulated other comprehensive income (a) | 16.67 | 15.88 | |||||
Ratio of earnings to fixed charges | 2.00X | 1.75X | |||||
Debt to total capital ratios: | |||||||
Corporate debt to total capital | 13.7 | % | 15.7 | % | |||
Corporate debt to total capital, excluding accumulated other comprehensive income (a) | 16.6 | % | 18.3 | % | |||
____________________
(a) | This non-GAAP measure differs from the corresponding GAAP measure presented immediately above, because accumulated other comprehensive income has been excluded from the value of capital used to determine this measure. Management believes this non-GAAP measure is useful because it removes the volatility that arises from changes in accumulated other comprehensive income. Such volatility is often caused by changes in the estimated fair value of our investment portfolio resulting from changes in general market interest rates rather than the business decisions made by management. However, this measure does not replace the corresponding GAAP measure. |
Liquidity for Insurance Operations
Our insurance companies generally receive adequate cash flows from premium collections and investment income to meet their obligations. Life insurance, long-term care insurance and annuity liabilities are generally long-term in nature. Life and annuity policyholders may, however, withdraw funds or surrender their policies, subject to any applicable penalty provisions; there are generally no withdrawal or surrender benefits for long-term care insurance. We seek to balance the duration of our invested assets with the estimated duration of benefit payments arising from contract liabilities.
Three of the Company’s insurance subsidiaries (Conseco Life, Washington National Insurance Company and Bankers Life) are members of the FHLB. As members of the FHLB, Conseco Life, Washington National Insurance Company and Bankers Life have the ability to borrow on a collateralized basis from the FHLB. Conseco Life, Washington National Insurance Company and Bankers Life are required to hold certain minimum amounts of FHLB common stock as a condition of membership in the FHLB, and additional amounts based on the amount of the borrowings. At June 30, 2012, the carrying value of the FHLB common stock was $82.5 million. As of June 30, 2012, collateralized borrowings from the FHLB totaled $1.7 billion and the proceeds were used to purchase fixed maturity securities. The borrowings are classified as investment
87
CNO FINANCIAL GROUP, INC. AND SUBSIDIARIES
___________________
borrowings in the accompanying consolidated balance sheet. The borrowings are collateralized by investments with an estimated fair value of $2.1 billion at June 30, 2012, which are maintained in a custodial account for the benefit of the FHLB. The following summarizes the terms of the borrowings (dollars in millions):
Amount | Maturity | Interest rate at | ||||
borrowed | date | June 30, 2012 | ||||
$ | 100.0 | October 2013 | Variable rate – 0.575% | |||
100.0 | November 2013 | Variable rate – 0.547% | ||||
67.0 | February 2014 | Fixed rate – 1.830% | ||||
50.0 | August 2014 | Variable rate – 0.597% | ||||
100.0 | September 2015 | Variable rate – 0.766% | ||||
150.0 | October 2015 | Variable rate – 0.592% | ||||
100.0 | (a) | November 2015 | Fixed rate – 4.890% | |||
146.0 | November 2015 | Fixed rate – 5.300% | ||||
100.0 | December 2015 | Fixed rate – 4.710% | ||||
100.0 | June 2016 | Variable rate – 0.685% | ||||
75.0 | June 2016 | Variable rate – 0.630% | ||||
75.0 | August 2016 | Variable rate – 0.677% | ||||
100.0 | October 2016 | Variable rate – 0.648% | ||||
50.0 | November 2016 | Variable rate – 0.738% | ||||
50.0 | November 2016 | Variable rate – 0.715% | ||||
100.0 | June 2017 | Variable rate – 0.760% | ||||
50.0 | August 2017 | Variable rate – 0.667% | ||||
100.0 | October 2017 | Variable rate – 0.897% | ||||
37.0 | November 2017 | Fixed rate – 3.750% | ||||
$ | 1,650.0 | |||||
______________
(a) In July 2012, such borrowing was refinanced with a maturity date of July 2017 and a fixed interest rate of 3.90 percent.
State laws generally give state insurance regulatory agencies broad authority to protect policyholders in their jurisdictions. Regulators have used this authority in the past to restrict the ability of our insurance subsidiaries to pay any dividends or other amounts without prior approval. We cannot be assured that the regulators will not seek to assert greater supervision and control over our insurance subsidiaries’ businesses and financial affairs.
Financial Strength Ratings of our Insurance Subsidiaries
Financial strength ratings provided by A.M. Best, S&P, Moody’s and Fitch are the rating agency’s opinions of the ability of our insurance subsidiaries to pay policyholder claims and obligations when due.
On December 22, 2010, A.M. Best upgraded the financial strength ratings of our primary insurance subsidiaries, except Conseco Life, to “B+” from “B”. A.M. Best also affirmed the financial strength rating of “B-” of Conseco Life and revised the outlook for the rating of Conseco Life to stable from negative. On November 4, 2011, A.M. Best affirmed the financial strength ratings of our primary insurance subsidiaries as well as the outlook for all ratings as stable. A “stable” designation means that there is a low likelihood of a rating change due to stable financial market trends. The “B+” rating is assigned to companies that have a good ability, in A.M. Best’s opinion, to meet their ongoing obligations to policyholders. A “B-” rating is assigned to companies that have a fair ability, in A.M. Best’s opinion, to meet their current obligations to policyholders, but are financially vulnerable to adverse changes in underwriting and economic conditions. A.M. Best ratings for the industry currently range from “A++ (Superior)” to “F (In Liquidation)” and some companies are not rated. An “A++” rating indicates a superior ability to meet ongoing obligations to policyholders. A.M. Best has sixteen possible ratings. There are five ratings above the “B+” rating of our primary insurance subsidiaries, other than Conseco Life, and ten ratings that are below that rating. There are seven ratings above the “B-” rating of Conseco Life and eight ratings that are below that rating.
88
CNO FINANCIAL GROUP, INC. AND SUBSIDIARIES
___________________
On August 4, 2011, S&P upgraded the financial strength ratings of our primary insurance subsidiaries to “BB+” from “BB” and the outlook for such ratings is stable. A “stable” designation means that a rating is not likely to change. S&P financial strength ratings range from “AAA” to “R” and some companies are not rated. An insurer rated “BB” or lower is regarded as having vulnerable characteristics that may outweigh its strengths. A “BB” rating indicates the least degree of vulnerability within the range; a “CC” rating indicates the highest degree of vulnerability. Pluses and minuses show the relative standing within a category. In S&P’s view, an insurer rated “BB” has marginal financial security characteristics and although positive attributes exist, adverse business conditions could lead to an insufficient ability to meet financial commitments. S&P has twenty-one possible ratings. There are ten ratings above our “BB+” rating and ten ratings that are below our rating.
On May 3, 2012, Moody's placed the financial strength ratings of "Ba1" of our primary insurance subsidiaries, except Conseco Life, on review for possible upgrade. Moody's also affirmed the financial strength rating of "Ba1" of Conseco Life with a stable outlook. A “stable” designation means that a rating is not likely to change. Moody’s financial strength ratings range from “Aaa” to “C”. These ratings may be supplemented with numbers “1”, “2”, or “3” to show relative standing within a category. In Moody’s view, an insurer rated “Ba1” offers questionable financial security and, often, the ability of these companies to meet policyholders’ obligations may be very moderate and thereby not well safeguarded in the future. Moody’s has twenty-one possible ratings. There are ten ratings above our “Ba1” rating and ten ratings that are below our rating.
On June 1, 2012, Fitch affirmed the financial strength ratings of "BBB" of our primary insurance subsidiaries as well as the "BB+" rating of Conseco Life and the outlook for all of these ratings is stable. On February 3, 2012, Fitch upgraded the financial strength ratings of our primary insurance subsidiaries, except Conseco Life, to “BBB” (from “BBB-” or “BB+” depending on the company). Fitch also affirmed the financial strength rating of “BB+” of Conseco Life. A “BBB” rating, in Fitch's opinion, indicates that there is currently a low expectation of ceased or interrupted payments. The capacity to meet policyholder and contract obligations on a timely basis is considered adequate, but adverse changes in circumstances and economic conditions are more likely to impact this capacity. A “BB” rating, in Fitch's opinion, indicates that there is an elevated vulnerability to ceased or interrupted payments, particularly as the result of adverse economic or market changes over time. However, business or financial alternatives may be available to allow for policyholder and contract obligations to be met in a timely manner. Fitch ratings for the industry range from “AAA Exceptionally Strong” to “C Distressed” and some companies are not rated. Pluses and minuses show the relative standing within a category. Fitch has nineteen possible ratings. There are eight ratings above the “BBB" rating of our primary insurance subsidiaries, other than Conseco Life, and ten ratings that are below that rating. There are ten ratings above the “BB+” rating of Conseco Life and eight ratings that are below that rating.
In light of the difficulties experienced recently by many financial institutions, including insurance companies, rating agencies have increased the frequency and scope of their credit reviews and requested additional information from the companies that they rate, including us. They may also adjust upward the capital and other requirements employed in the rating agency models for maintenance of certain ratings levels. We cannot predict what actions rating agencies may take, or what actions we may take in response. Accordingly, downgrades and outlook revisions related to us or the life insurance industry may occur in the future at any time and without notice by any rating agency. These could increase policy surrenders and withdrawals, adversely affect relationships with our distribution channels, reduce new sales, reduce our ability to borrow and increase our future borrowing costs.
Liquidity of the Holding Companies
Availability and Sources and Uses of Holding Company Liquidity; Limitations on Ability of Insurance Subsidiaries to Make Dividend and Surplus Debenture Interest Payments to the Holding Companies
At June 30, 2012, CNO, CDOC, Inc. (“CDOC”) (our wholly owned subsidiary and a guarantor under the Senior Secured Credit Agreement) and our other non-insurance subsidiaries held: (i) unrestricted cash and cash equivalents of $76.0 million; (ii) fixed income investments of $75.7 million; and (iii) equity securities and other invested assets totaling $46.0 million. CNO and CDOC are holding companies with no business operations of their own; they depend on their operating subsidiaries for cash to make principal and interest payments on debt, and to pay administrative expenses and income taxes. CNO and CDOC receive cash from insurance subsidiaries, consisting of dividends and distributions, interest payments on surplus debentures and tax-sharing payments, as well as cash from non-insurance subsidiaries consisting of dividends, distributions, loans and advances. The principal non-insurance subsidiaries that provide cash to CNO and CDOC are 40|86 Advisors, Inc. (“40|86 Advisors”), which receives fees from the insurance subsidiaries for investment services, and CNO Services, LLC which receives fees from the insurance subsidiaries for providing administrative services. The agreements between our insurance subsidiaries and CNO Services, LLC and 40|86 Advisors, respectively, were previously approved by the domestic insurance
89
CNO FINANCIAL GROUP, INC. AND SUBSIDIARIES
___________________
regulator for each insurance company, and any payments thereunder do not require further regulatory approval.
The following summarizes the current legal ownership structure of CNO’s primary subsidiaries:
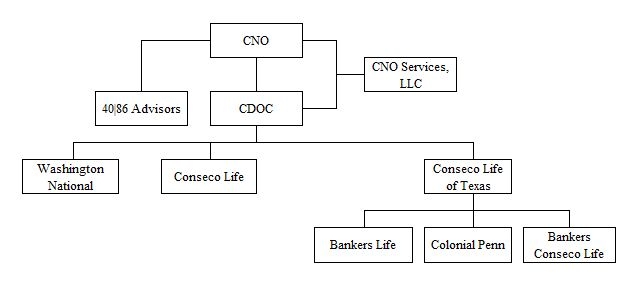
The ability of our insurance subsidiaries to pay dividends is subject to state insurance department regulations and is based on the financial statements of our insurance subsidiaries prepared in accordance with statutory accounting practices prescribed or permitted by regulatory authorities, which differ from GAAP. These regulations generally permit dividends to be paid from statutory earned surplus of the insurance company for any 12-month period in amounts equal to the greater of (or in a few states, the lesser of): (i) statutory net gain from operations or net income for the prior year; or (ii) 10 percent of statutory capital and surplus as of the end of the preceding year (excluded from this calculation would be the $80.4 million of additional surplus recognized related to certain deferred tax assets). This type of dividend is referred to as an “ordinary dividend”. Any dividend in excess of these levels or from an insurance company that has negative earned surplus requires the approval of the director or commissioner of the applicable state insurance department and is referred to as an “extraordinary dividend”. Each of the direct insurance subsidiaries of CDOC has significant negative earned surplus and any dividend payments from the subsidiaries of CDOC will therefore require the approval of the director or commissioner of the applicable state insurance department. In the first six months of 2012, our insurance subsidiaries paid extraordinary dividends to CDOC totaling $103.0 million. We generally maintain capital and surplus levels in our insurance subsidiaries in an amount that is sufficient to maintain a minimum consolidated RBC ratio of 350 percent and will typically cause our insurance subsidiaries to pay ordinary dividends or request regulatory approval for extraordinary dividends when the consolidated RBC ratio exceeds such level and we have concluded the capital level in each of our insurance subsidiaries is adequate to support their business and projected growth. The consolidated RBC ratio of our insurance subsidiaries was 369 percent at June 30, 2012. Based on our continued expectation to generate strong statutory earnings and excess capital, we anticipate total year dividend payments to the holding company in the range of $200 to $275 million during 2012 ($103.0 million of which have been paid through June 30, 2012). We expect to receive regulatory approval for future dividends from our subsidiaries, but there can be no assurance that such payments will be approved or that the financial condition of our insurance subsidiaries will not change, making future approvals less likely.
CDOC holds surplus debentures from Conseco Life Insurance Company of Texas (“Conseco Life of Texas”) with an aggregate principal amount of $749.6 million. Interest payments do not require additional approval provided the RBC ratio of Conseco Life of Texas exceeds 100 percent (but do require prior written notice to the Texas state insurance department). The RBC ratio of Conseco Life of Texas was 298 percent at June 30, 2012. CDOC also holds a surplus debenture from Colonial Penn Life Insurance Company with an outstanding principal balance of $160.0 million. Interest payments require prior approval by the Pennsylvania state insurance department. Dividends and other payments from our non-insurance subsidiaries, including 40|86 Advisors and CNO Services, LLC, to CNO or CDOC do not require approval by any regulatory authority or other third party. However, insurance regulators may prohibit payments by our insurance subsidiaries to parent companies if they determine that such payments could be adverse to our policyholders or contractholders.
The insurance subsidiaries of CDOC receive funds to pay dividends primarily from: (i) the earnings of their direct businesses; (ii) tax sharing payments received from subsidiaries (if applicable); and (iii) with respect to Conseco Life of Texas,
90
CNO FINANCIAL GROUP, INC. AND SUBSIDIARIES
___________________
dividends received from subsidiaries. At June 30, 2012, the subsidiaries of Conseco Life of Texas had earned surplus (deficit) as summarized below (dollars in millions):
Earned surplus | ||||||
Subsidiary of CDOC | (deficit) | Additional information | ||||
Subsidiaries of Conseco Life of Texas: | ||||||
Bankers Life | $ | 276.7 | (a) | |||
Colonial Penn Life Insurance Company | (235.7 | ) | (b) | |||
___________
(a) | Bankers Life paid ordinary dividends of $20.0 million to Conseco Life of Texas in the first six months of 2012. |
(b) | The deficit is primarily due to transactions which occurred several years ago, including a tax planning transaction and the fee paid to recapture a block of business previously ceded to an unaffiliated insurer. |
A significant deterioration in the financial condition, earnings or cash flow of the material subsidiaries of CNO or CDOC for any reason could hinder such subsidiaries’ ability to pay cash dividends or other disbursements to CNO and/or CDOC, which, in turn, could limit CNO’s ability to meet debt service requirements and satisfy other financial obligations. In addition, we may choose to retain capital in our insurance subsidiaries or to contribute additional capital to our insurance subsidiaries to strengthen their surplus, and these decisions could limit the amount available at our top tier insurance subsidiaries to pay dividends to the holding companies. In the past, we have made capital contributions to our insurance subsidiaries to meet debt covenants and minimum capital levels required by certain regulators and it is possible we will be required to do so in the future. We paid a capital contribution to our insurance subsidiaries of $26.0 million in the first six months of 2012, which had been accrued at December 31, 2011.
In March 2012, we amended our Senior Secured Credit Agreement. The changes to the Senior Secured Credit Agreement included:
(i) | a change in the definition of “Total Capitalization” (used to calculate compliance with the Debt to Total Capitalization Ratio covenant) to provide that any change to the Company's shareholders' equity resulting from the adoption by the Company of ASU 2010-26, related to the accounting for deferred acquisition costs, shall be disregarded for the purpose of such covenant to the extent the Company going forward quantifies the impact of ASU 2010-26 for each fiscal quarter or fiscal year and the cumulative impact since its adoption; and |
(ii) | an increase in the cap on investments in “Capital Stock” (as defined in the amended credit agreement) from 1 percent to 3 percent. |
In May 2011, the Company announced a common share repurchase program of up to $100.0 million of the Company's outstanding common stock. In February 2012 and June 2012, the Company's board of directors approved, in aggregate, an additional $200.0 million to repurchase the Company's outstanding common stock. The Company had remaining repurchase authority of $172.1 million as of June 30, 2012. We currently anticipate repurchasing a total of approximately $150 million to $170 million of common stock during 2012 ($58.2 million of which were repurchased in the first six months of 2012, representing 8.1 million shares).
In May 2012, we initiated a common stock dividend program. In the second quarter of 2012, dividends declared and paid on common stock were $0.02 per common share totaling $4.7 million.
In the first six months of 2012, as required under the terms of the Senior Secured Credit Agreement, we made mandatory prepayments of $31.4 million due to our repurchase of $58.2 million of our common stock and the aforementioned common stock dividend payment of $4.7 million made in June 2012.
In March 2012, we also paid in full the remaining $50.0 million principal balance on the Senior Health Note, which had been scheduled to mature in November 2013. The repayment in full of the Senior Health Note removed the previous restriction on our ability to pay cash dividends on our common stock.
The Senior Secured Credit Agreement requires the Company to maintain: (i) a debt to total capitalization ratio of not more than 30 percent (such ratio, calculated in accordance with the Senior Secured Credit Agreement, was 15.7 percent at
91
CNO FINANCIAL GROUP, INC. AND SUBSIDIARIES
___________________
June 30, 2012); (ii) an interest coverage ratio of not less than 2.00 to 1.00 for each rolling four quarters (such ratio was 5.24 to 1.00 for the rolling four quarters ended June 30, 2012); (iii) an aggregate ratio of total adjusted capital to company action level risk-based capital for the Company’s insurance subsidiaries of not less than 250 percent (such ratio was 369 percent at June 30, 2012); and (iv) a combined statutory capital and surplus for the Company’s insurance subsidiaries of at least $1,200.0 million (combined statutory capital and surplus at June 30, 2012, was $1,832.1 million).
The scheduled principal payments on our direct corporate obligations (including payments required under the Senior Secured Credit Agreement, the 9.0% Senior Secured Notes and the 7.0% Debentures) are as follows at June 30, 2012 (dollars in millions):
Year ending June 30, | Principal | ||
2013 | $ | 47.5 | |
2014 | 65.0 | ||
2015 | 80.0 | ||
2016 | 31.3 | ||
2017 | 293.0 | ||
Thereafter | 275.0 | ||
$ | 791.8 | ||
We may prepay, in whole or in part, the Senior Secured Credit Agreement, together with any accrued and unpaid interest, with prior notice but without premium or penalty in minimum amounts of $1.0 million or any multiple thereof.
Mandatory prepayments of the Senior Secured Credit Agreement will be required in an amount equal to: (i) 100 percent of the net cash proceeds from certain asset sales or casualty events; (ii) 100 percent of the net cash proceeds received by the Company or any of its subsidiaries from certain debt issuances; (iii) 50 percent of the net cash proceeds received from certain equity issuances; and (iv) 100 percent of the amount of certain restricted payments made (including any common stock dividends and share repurchases) as defined in the Senior Secured Credit Agreement provided that if, as of the end of the fiscal quarter immediately preceding such restricted payment, the debt to total capitalization ratio is: (i) equal to or less than 17.5 percent, but greater than 12.5 percent, the prepayment requirement shall be reduced by one-half; or (ii) equal to or less than 12.5 percent, the prepayment requirement shall not apply.
Notwithstanding the foregoing, no mandatory prepayments pursuant to items (i) or (iii) in the preceding paragraph shall be required if: (x) the debt to total capitalization ratio is equal or less than 20 percent; and (y) either (A) the financial strength rating of certain insurance subsidiaries is equal or better than A- (stable) from A.M. Best or (B) the Senior Secured Credit Agreement is rated equal or better than BBB- (stable) from S&P and Baa3 (stable) by Moody's.
The 9.0% Senior Secured Notes were issued pursuant to an Indenture, by and among the Company, the Subsidiary Guarantors and Wilmington. The Indenture contains covenants that, among other things, limit (subject to certain exceptions) the Company's ability and the ability of the Company's Restricted Subsidiaries (as defined in the Indenture) to:
• | incur or guarantee additional indebtedness or issue preferred stock; |
• | pay dividends or make other distributions to shareholders; |
• | purchase or redeem capital stock or subordinated indebtedness; |
• | make certain investments; |
• | create liens; |
• | incur restrictions on the Company's ability and the ability of the Restricted Subsidiaries to pay dividends or make other payments to the Company; |
• | sell assets, including capital stock of the Company's subsidiaries; |
• | consolidate or merge with or into other companies or transfer all or substantially all of the Company's assets; and |
• | engage in transactions with affiliates. |
Under the Indenture, the Company can make Restricted Payments (as such term is defined in the Indenture) up to a calculated limit, provided that the Company's pro forma risk-based capital ratio exceeds 225% after giving effect to the Restricted Payment and certain other conditions are met. Restricted Payments include, among other items, stock repurchases, common stock dividends and investments in excess of $75 million made at the holding company level that are other than cash and cash equivalents. The limit of Restricted Payments permitted under the Indenture is the sum of (x) 50% of the Company's
92
CNO FINANCIAL GROUP, INC. AND SUBSIDIARIES
___________________
“Consolidated Net Income” (as defined in the Indenture) for the period (taken as one accounting period) from January 1, 2011 to the end of the Company's most recently ended fiscal quarter for which financial statements are available at the time of such Restricted Payment and (y) certain other amounts. Based on the Company's Consolidated Net Income through June 30, 2012, the Company could make additional Restricted Payments under this Indenture covenant of approximately $122 million.
As part of our investment strategy for the holding company, we may enter into repurchase agreements to increase our investment return. We account for these transactions as collateralized borrowings, where the amount borrowed is equal to the sales price of the underlying securities. Repurchase agreements involve a sale of securities and an agreement to repurchase the same securities at a later date at an agreed-upon price. Such borrowings totaled $36.8 million at June 30, 2012. The borrowings mature as follows: $32.8 million - within 30 days; and $4.0 million - between 30 and 90 days. These borrowings were collateralized by investment securities (primarily collateralized mortgage obligations) with fair values approximately equal to the loan value. The primary risks associated with short-term collateralized borrowings are: (i) a substantial decline in the market value of the margined security; and (ii) that a counterparty will be unable to perform under the terms of the contract or be unwilling to extend such related financing in future periods especially if the liquidity or value of the margined security has declined. Exposure is limited to any depreciation in value of the related securities.
We believe that the existing cash available to the holding company, the cash flows to be generated from operations and other transactions will be sufficient to allow us to meet our debt service obligations, pay corporate expenses and satisfy other financial obligations. However, our cash flow is affected by a variety of factors, many of which are outside of our control, including insurance regulatory issues, competition, financial markets and other general business conditions. We cannot provide assurance that we will possess sufficient income and liquidity to meet all of our debt service requirements and other holding company obligations.
93
CNO FINANCIAL GROUP, INC. AND SUBSIDIARIES
___________________
INVESTMENTS
At June 30, 2012, the amortized cost, gross unrealized gains and losses and estimated fair value of fixed maturities, available for sale, and equity securities were as follows (dollars in millions):
Amortized cost | Gross unrealized gains | Gross unrealized losses | Estimated fair value | ||||||||||||
Investment grade (a): | |||||||||||||||
Corporate securities | $ | 13,291.6 | $ | 1,767.1 | $ | (47.6 | ) | $ | 15,011.1 | ||||||
United States Treasury securities and obligations of United States government corporations and agencies | 216.3 | 7.4 | — | 223.7 | |||||||||||
States and political subdivisions | 1,766.1 | 249.9 | (4.8 | ) | 2,011.2 | ||||||||||
Debt securities issued by foreign governments | .8 | — | — | .8 | |||||||||||
Asset-backed securities | 1,233.7 | 50.6 | (14.0 | ) | 1,270.3 | ||||||||||
Collateralized debt obligations | 326.8 | 1.6 | (2.8 | ) | 325.6 | ||||||||||
Commercial mortgage-backed securities | 1,478.2 | 110.9 | (3.0 | ) | 1,586.1 | ||||||||||
Mortgage pass-through securities | 20.4 | 1.4 | — | 21.8 | |||||||||||
Collateralized mortgage obligations | 1,270.9 | 97.2 | (2.5 | ) | 1,365.6 | ||||||||||
Total investment grade fixed maturities, available for sale | 19,604.8 | 2,286.1 | (74.7 | ) | 21,816.2 | ||||||||||
Below-investment grade (a): | |||||||||||||||
Corporate securities | 1,207.9 | 43.2 | (27.9 | ) | 1,223.2 | ||||||||||
States and political subdivisions | 24.3 | .1 | (1.1 | ) | 23.3 | ||||||||||
Asset-backed securities | 247.3 | 5.8 | (4.5 | ) | 248.6 | ||||||||||
Collateralized debt obligations | 5.4 | — | (.9 | ) | 4.5 | ||||||||||
Collateralized mortgage obligations | 943.3 | 21.9 | (4.4 | ) | 960.8 | ||||||||||
Total below-investment grade fixed maturities, available for sale | 2,428.2 | 71.0 | (38.8 | ) | 2,460.4 | ||||||||||
Total fixed maturities, available for sale | $ | 22,033.0 | $ | 2,357.1 | $ | (113.5 | ) | $ | 24,276.6 | ||||||
Equity securities | $ | 188.0 | $ | 2.9 | $ | (3.6 | ) | $ | 187.3 | ||||||
_______________
(a) | Investment ratings – Investment ratings are assigned the second lowest rating by Nationally Recognized Statistical Rating Organizations ("NRSROs") (Moody’s, S&P or Fitch), or if not rated by such firms, the rating assigned by the National Association of Insurance Commissioners (the "NAIC"). NAIC designations of “1” or “2” include fixed maturities generally rated investment grade (rated “Baa3” or higher by Moody’s or rated “BBB-” or higher by S&P and Fitch). NAIC designations of “3” through “6” are referred to as below-investment grade (which generally are rated “Ba1” or lower by Moody’s or rated “BB+” or lower by S&P and Fitch). References to investment grade or below-investment grade throughout our consolidated financial statements are determined as described above. |
94
CNO FINANCIAL GROUP, INC. AND SUBSIDIARIES
___________________
The NAIC evaluates the fixed maturity investments of insurers for regulatory and capital assessment purposes and assigns securities to one of six credit quality categories called NAIC designations, which are used by insurers when preparing their annual statements based on statutory accounting principles. The NAIC designations are generally similar to the credit quality designations of the NRSROs for marketable fixed maturity securities, except for certain structured securities as described below. The following summarizes the NAIC designations and NRSRO equivalent ratings:
NAIC Designation | NRSRO Equivalent Rating | |
1 | AAA/AA/A | |
2 | BBB | |
3 | BB | |
4 | B | |
5 | CCC and lower | |
6 | In or near default | |
The NAIC adopted revised rating methodologies for non-agency residential mortgage-backed securities that became effective December 31, 2009 and for commercial mortgage-backed traded securities and other asset-backed securities that became effective December 31, 2010. The NAIC's objective with the revised ratings was to increase the accuracy in assessing potential losses, and to use the improved assessment to determine a more appropriate capital requirement for such structured securities. Accordingly, certain structured securities rated below investment grade by the NRSROs could be assigned as NAIC 1 or NAIC 2 securities dependent on the cost basis of the holder relative to estimated recoverable amounts as determined by the NAIC.
A summary of our fixed maturity securities, available for sale, by NAIC designations (or for fixed maturity securities held by non-regulated entities, based on NRSRO ratings) as of June 30, 2012 is as follows (dollars in millions):
Percentage | |||||||||||
Estimated | of total | ||||||||||
NAIC | Amortized | fair | estimated | ||||||||
designation | cost | value | fair value | ||||||||
1 | $ | 10,656.0 | $ | 11,825.3 | 48.7 | % | |||||
2 | 10,017.4 | 11,074.6 | 45.6 | ||||||||
3 | 1,008.0 | 1,024.3 | 4.2 | ||||||||
4 | 309.8 | 315.9 | 1.3 | ||||||||
5 | 41.4 | 36.1 | .2 | ||||||||
6 | .4 | .4 | — | ||||||||
$ | 22,033.0 | $ | 24,276.6 | 100.0 | % | ||||||
95
CNO FINANCIAL GROUP, INC. AND SUBSIDIARIES
___________________
Concentration of Fixed Maturity Securities, Available for Sale
The following table summarizes the carrying values and gross unrealized losses of our fixed maturity securities, available for sale, by category as of June 30, 2012 (dollars in millions):
Carrying value | Percent of fixed maturities | Gross unrealized losses | Percent of gross unrealized losses | ||||||||||
Energy/pipelines | $ | 2,431.3 | 10.0 | % | $ | 4.5 | 3.9 | % | |||||
Collateralized mortgage obligations | 2,326.4 | 9.6 | 6.9 | 6.1 | |||||||||
Utilities | 2,089.6 | 8.6 | 2.2 | 1.9 | |||||||||
States and political subdivisions | 2,034.5 | 8.4 | 5.9 | 5.2 | |||||||||
Commercial mortgage-backed securities | 1,586.1 | 6.5 | 3.0 | 2.6 | |||||||||
Asset-backed securities | 1,518.9 | 6.3 | 18.5 | 16.3 | |||||||||
Insurance | 1,447.5 | 6.0 | 6.0 | 5.3 | |||||||||
Food/beverage | 1,191.8 | 4.9 | 4.7 | 4.2 | |||||||||
Healthcare/pharmaceuticals | 1,174.6 | 4.8 | .7 | .6 | |||||||||
Cable/media | 928.3 | 3.8 | 7.3 | 6.5 | |||||||||
Real estate/REITs | 890.9 | 3.7 | .2 | .2 | |||||||||
Banks | 771.6 | 3.2 | 14.6 | 12.9 | |||||||||
Capital goods | 723.1 | 3.0 | 1.6 | 1.4 | |||||||||
Transportation | 533.5 | 2.2 | — | — | |||||||||
Telecom | 505.0 | 2.1 | 20.0 | 17.6 | |||||||||
Aerospace/defense | 457.7 | 1.9 | — | — | |||||||||
Chemicals | 392.7 | 1.6 | — | — | |||||||||
Building materials | 377.2 | 1.6 | 7.9 | 7.0 | |||||||||
Metals and mining | 352.2 | 1.4 | .8 | .7 | |||||||||
Paper | 344.1 | 1.4 | 1.7 | 1.5 | |||||||||
Collateralized debt obligations | 330.1 | 1.4 | 3.7 | 3.2 | |||||||||
Consumer products | 328.4 | 1.3 | .3 | .3 | |||||||||
Brokerage | 263.8 | 1.1 | 2.5 | 2.2 | |||||||||
Technology | 255.0 | 1.0 | .2 | .2 | |||||||||
Other | 1,022.3 | 4.2 | .3 | .2 | |||||||||
Total fixed maturities, available for sale | $ | 24,276.6 | 100.0 | % | $ | 113.5 | 100.0 | % | |||||
Below-Investment Grade Securities
At June 30, 2012, the amortized cost of the Company’s below-investment grade fixed maturity securities was $2,428.2 million, or 11 percent of the Company’s fixed maturity portfolio. The estimated fair value of the below-investment grade portfolio was $2,460.4 million, or 101 percent of the amortized cost.
Below-investment grade corporate debt securities have different characteristics than investment grade corporate debt securities. Based on historical performance, probability of default by the borrower is significantly greater for below-investment grade corporate debt securities and in many cases severity of loss is relatively greater as such securities are generally unsecured and often subordinated to other indebtedness of the issuer. Also, issuers of below-investment grade corporate debt securities frequently have higher levels of debt relative to investment-grade issuers, hence, all other things being equal, are generally more sensitive to adverse economic conditions. The Company attempts to reduce the overall risk related to its investment in below-investment grade securities, as in all investments, through careful credit analysis, strict investment policy guidelines, and diversification by issuer and/or guarantor and by industry.
96
CNO FINANCIAL GROUP, INC. AND SUBSIDIARIES
___________________
Net Realized Investment Gains (Losses)
The following table sets forth the net realized investment gains (losses) for the periods indicated (dollars in millions):
Three months ended | Six months ended | ||||||||||||||
June 30, | June 30, | ||||||||||||||
2012 | 2011 | 2012 | 2011 | ||||||||||||
Fixed maturity securities, available for sale: | |||||||||||||||
Realized gains on sale | $ | 39.6 | $ | 25.7 | $ | 68.3 | $ | 66.9 | |||||||
Realized losses on sale | (5.5 | ) | (14.4 | ) | (7.8 | ) | (39.0 | ) | |||||||
Impairments: | |||||||||||||||
Total other-than-temporary impairment losses | (.5 | ) | (5.0 | ) | (.9 | ) | (11.5 | ) | |||||||
Other-than-temporary impairment losses recognized in accumulated other comprehensive income (loss) | — | — | — | — | |||||||||||
Net impairment losses recognized | (.5 | ) | (5.0 | ) | (.9 | ) | (11.5 | ) | |||||||
Net realized investment gains (losses) from fixed maturities | 33.6 | 6.3 | 59.6 | 16.4 | |||||||||||
Equity securities | .1 | .2 | .1 | .2 | |||||||||||
Commercial mortgage loans | (.6 | ) | (.3 | ) | (.1 | ) | (.7 | ) | |||||||
Impairments of mortgage loans and other investments | (3.0 | ) | (5.1 | ) | (10.5 | ) | (11.9 | ) | |||||||
Other | 1.8 | 1.8 | 5.7 | 4.0 | |||||||||||
Net realized investment gains | $ | 31.9 | $ | 2.9 | $ | 54.8 | $ | 8.0 | |||||||
During the first six months of 2012, we recognized net realized investment gains of $54.8 million, which were comprised of $61.2 million of net gains from the sales of investments (primarily fixed maturities) with proceeds of $1.3 billion, the increase in fair value of certain fixed maturity investments with embedded derivatives of $5.0 million, and $11.4 million of writedowns of investments for other than temporary declines in fair value recognized through net income.
During the first six months of 2011, we recognized net realized investment gains of $8.0 million, which were comprised of $31.4 million of net gains from the sales of investments (primarily fixed maturities) and $23.4 million of writedowns of investments for other than temporary declines in fair value recognized through net income.
At June 30, 2012, fixed maturity securities in default or considered nonperforming had an aggregate amortized cost of $.4 million and a carrying value of $.5 million.
During the first six months of 2012, the $11.4 million of other-than-temporary impairments we recorded in earnings included: (i) $3.2 million of losses related to certain commercial mortgage loans; (iii) $6.8 million of losses related to equity securities; and (iii) $1.4 million of additional losses following unforeseen issue-specific events or conditions.
During the first six months of 2012, the $7.8 million of realized losses on sales of $266.8 million of fixed maturity securities, available for sale, included: (i) $3.3 million of losses related to the sales of mortgage-backed securities and asset-backed securities; and (ii) $4.5 million of additional losses primarily related to various corporate securities. Securities are generally sold at a loss following unforeseen issue-specific events or conditions or shifts in perceived risks. These reasons include but are not limited to: (i) changes in the investment environment; (ii) expectation that the fair value could deteriorate further; (iii) desire to reduce our exposure to an asset class, an issuer or an industry; (iv) prospective or actual changes in credit quality; or (v) related to structured securities, changes in expected cash flows.
As disclosed in the notes to the consolidated financial statements included in our 2011 Annual Report on Form 10-K, we completed the commutation of an investment made by our Predecessor in a guaranteed investment contract issued by a Bermuda insurance company in exchange for interests in certain underlying assets held by the insurance company. During the first six months of 2011, we completed two partial commutations of this investment pursuant to which we received government agency securities as well as equity interests in certain corporate investments with an aggregate fair value of $88.5 million in exchange for a portion of our holdings with a book value of $97.4 million (resulting in a net realized loss of $8.9 million, of
97
CNO FINANCIAL GROUP, INC. AND SUBSIDIARIES
___________________
which, $4.5 million was recognized in the second quarter of 2011). During the first six months of 2011, we recognized impairment charges of $11.5 million (of which, $5.1 million was recognized in the second quarter of 2011).
During the first six months of 2011, the $23.4 million of other-than-temporary impairments we recorded in earnings included: (i) $11.5 million on an investment in a guaranteed investment contract as discussed above; (ii) $8.6 million of losses related to certain commercial mortgage loans reflecting our intent to sell such loans; (iii) $3.2 million related to investments held by a VIE as a result of our intent to sell such investments; and (iv) $.1 million of additional losses following unforeseen issue-specific events or conditions.
During the first six months of 2011, the $39.0 million of realized losses on sales of $.7 billion of fixed maturity securities, available for sale, included: (i) $11.3 million of losses related to the sales of mortgage-backed securities and asset-backed securities; (ii) $9.6 million related to sales of securities issued by states and political subdivisions; (iii) $8.9 million related to the partial commutation of the guaranteed investment contract as discussed above; and (iv) $9.2 million of additional losses primarily related to various corporate securities.
Our fixed maturity investments are generally purchased in the context of a long-term strategy to fund insurance liabilities, so we do not generally seek to generate short-term realized gains through the purchase and sale of such securities. In certain circumstances, including those in which securities are selling at prices which exceed our view of their underlying economic value, or when it is possible to reinvest the proceeds to better meet our long-term asset-liability objectives, we may sell certain securities.
There were no investments sold at a loss during the first six months of 2012 that had been continuously in an unrealized loss position exceeding 20 percent of the amortized cost basis for more than 12 months prior to the sale of the investment.
We regularly evaluate all of our investments with unrealized losses for possible impairment. Our assessment of whether unrealized losses are “other than temporary” requires significant judgment. Factors considered include: (i) the extent to which fair value is less than the cost basis; (ii) the length of time that the fair value has been less than cost; (iii) whether the unrealized loss is event driven, credit-driven or a result of changes in market interest rates or risk premium; (iv) the near-term prospects for specific events, developments or circumstances likely to affect the value of the investment; (v) the investment’s rating and whether the investment is investment-grade and/or has been downgraded since its purchase; (vi) whether the issuer is current on all payments in accordance with the contractual terms of the investment and is expected to meet all of its obligations under the terms of the investment; (vii) whether we intend to sell the investment or it is more likely than not that circumstances will require us to sell the investment before recovery occurs; (viii) the underlying current and prospective asset and enterprise values of the issuer and the extent to which the recoverability of the carrying value of our investment may be affected by changes in such values; (ix) projections of, and unfavorable changes in, cash flows on structured securities including mortgage-backed and asset-backed securities; (x) our best estimate of the value of any collateral; and (xi) other objective and subjective factors.
Future events may occur, or additional information may become available, which may necessitate future realized losses in our portfolio. Significant losses could have a material adverse effect on our consolidated financial statements in future periods.
98
CNO FINANCIAL GROUP, INC. AND SUBSIDIARIES
___________________
The following table sets forth the amortized cost and estimated fair value of those fixed maturities, available for sale, with unrealized losses at June 30, 2012, by contractual maturity. Actual maturities will differ from contractual maturities because borrowers may have the right to call or prepay obligations with or without penalties. Structured securities frequently include provisions for periodic principal payments and permit periodic unscheduled payments.
Amortized cost | Estimated fair value | ||||||
(Dollars in millions) | |||||||
Due in one year or less | $ | 32.3 | $ | 32.2 | |||
Due after one year through five years | 143.7 | 141.3 | |||||
Due after five years through ten years | 451.3 | 434.3 | |||||
Due after ten years | 832.5 | 770.6 | |||||
Subtotal | 1,459.8 | 1,378.4 | |||||
Structured securities | 1,213.5 | 1,181.4 | |||||
Total | $ | 2,673.3 | $ | 2,559.8 | |||
The following summarizes the investments in our portfolio rated below-investment grade which have been continuously in an unrealized loss position exceeding 20 percent of the cost basis for the period indicated as of June 30, 2012 (dollars in millions):
Number of issuers | Cost basis | Unrealized loss | Estimated fair value | ||||||||||
Less than 6 months | 1 | $ | 4.0 | $ | (.8 | ) | $ | 3.2 | |||||
Greater than or equal to 6 months and less than 12 months | 2 | 4.9 | (1.4 | ) | 3.5 | ||||||||
Greater than 12 months | 1 | 9.3 | (2.3 | ) | 7.0 | ||||||||
4 | $ | 18.2 | $ | (4.5 | ) | $ | 13.7 | ||||||
99
CNO FINANCIAL GROUP, INC. AND SUBSIDIARIES
___________________
The following table summarizes the gross unrealized losses of our fixed maturity securities, available for sale, by category and ratings category as of June 30, 2012 (dollars in millions):
Investment grade | Below investment grade | |||||||||||||||||||
AAA/AA/A | BBB | BB | B+ and below | Total gross unrealized losses | ||||||||||||||||
Telecom | $ | — | $ | 18.0 | $ | .8 | $ | 1.2 | $ | 20.0 | ||||||||||
Asset-backed securities | 5.1 | 8.9 | 3.0 | 1.5 | 18.5 | |||||||||||||||
Banks | 2.5 | 6.1 | 6.0 | — | 14.6 | |||||||||||||||
Building materials | — | .9 | 6.9 | .1 | 7.9 | |||||||||||||||
Cable/media | — | .1 | 4.6 | 2.7 | 7.4 | |||||||||||||||
Collateralized mortgage obligations | 2.3 | .2 | .2 | 4.2 | 6.9 | |||||||||||||||
Insurance | .1 | 4.8 | 1.1 | — | 6.0 | |||||||||||||||
States and political subdivisions | 1.6 | 3.2 | 1.1 | — | 5.9 | |||||||||||||||
Food/beverage | — | 4.7 | — | — | 4.7 | |||||||||||||||
Energy/pipelines | — | 3.1 | .9 | .5 | 4.5 | |||||||||||||||
Collateralized debt obligations | 2.8 | — | — | .9 | 3.7 | |||||||||||||||
Commercial mortgage-backed securities | 2.6 | .4 | — | — | 3.0 | |||||||||||||||
Brokerage | .7 | 1.8 | — | — | 2.5 | |||||||||||||||
Utilities | — | 2.2 | — | — | 2.2 | |||||||||||||||
Paper | — | — | 1.7 | — | 1.7 | |||||||||||||||
Capital goods | — | 1.4 | .1 | — | 1.5 | |||||||||||||||
Healthcare/pharmaceuticals | — | .2 | .2 | .4 | .8 | |||||||||||||||
Metals and mining | — | .6 | .1 | .1 | .8 | |||||||||||||||
Consumer products | — | .3 | — | — | .3 | |||||||||||||||
Gaming | — | — | — | .2 | .2 | |||||||||||||||
Real estate/REITs | — | .1 | .1 | — | .2 | |||||||||||||||
Technology | — | — | .1 | .1 | .2 | |||||||||||||||
Total fixed maturities, available for sale | $ | 17.7 | $ | 57.0 | $ | 26.9 | $ | 11.9 | $ | 113.5 | ||||||||||
Our investment strategy is to maximize, over a sustained period and within acceptable parameters of quality and risk, investment income and total investment return through active investment management. Accordingly, we may sell securities at a gain or a loss to enhance the projected total return of the portfolio as market opportunities change, to reflect changing perceptions of risk, or to better match certain characteristics of our investment portfolio with the corresponding characteristics of our insurance liabilities.
100
CNO FINANCIAL GROUP, INC. AND SUBSIDIARIES
___________________
The following table summarizes the gross unrealized losses and fair values of our investments with unrealized losses that are not deemed to be other-than-temporarily impaired, aggregated by investment category and length of time that such securities had been in a continuous unrealized loss position, at June 30, 2012 (dollars in millions):
Less than 12 months | 12 months or greater | Total | ||||||||||||||||||||||
Description of securities | Fair value | Unrealized losses | Fair value | Unrealized losses | Fair value | Unrealized losses | ||||||||||||||||||
United States Treasury securities and obligations of United States government corporations and agencies | $ | 19.0 | $ | — | $ | — | $ | — | $ | 19.0 | $ | — | ||||||||||||
States and political subdivisions | 21.3 | (.9 | ) | 83.9 | (5.0 | ) | 105.2 | (5.9 | ) | |||||||||||||||
Corporate securities | 790.6 | (25.9 | ) | 463.6 | (49.6 | ) | 1,254.2 | (75.5 | ) | |||||||||||||||
Asset-backed securities | 230.0 | (3.2 | ) | 243.3 | (15.3 | ) | 473.3 | (18.5 | ) | |||||||||||||||
Collateralized debt obligations | 178.1 | (2.5 | ) | 41.5 | (1.2 | ) | 219.6 | (3.7 | ) | |||||||||||||||
Commercial mortgage-backed securities | 75.8 | (.6 | ) | 38.6 | (2.4 | ) | 114.4 | (3.0 | ) | |||||||||||||||
Mortgage pass-through securities | — | — | 2.1 | — | 2.1 | — | ||||||||||||||||||
Collateralized mortgage obligations | 234.5 | (3.2 | ) | 137.5 | (3.7 | ) | 372.0 | (6.9 | ) | |||||||||||||||
Total fixed maturities, available for sale | $ | 1,549.3 | $ | (36.3 | ) | $ | 1,010.5 | $ | (77.2 | ) | $ | 2,559.8 | $ | (113.5 | ) | |||||||||
Equity securities | $ | 28.5 | $ | (3.6 | ) | $ | — | $ | — | $ | 28.5 | $ | (3.6 | ) | ||||||||||
Based on management’s current assessment of investments with unrealized losses at June 30, 2012, the Company believes the issuers of the securities will continue to meet their obligations (or with respect to equity-type securities, the investment value will recover to its cost basis). While we do not have the intent to sell securities with unrealized losses and it is not more likely than not that we will be required to sell securities with unrealized losses prior to their anticipated recovery, our intent on an individual security may change, based upon market or other unforeseen developments. In such instances, if a loss is recognized from a sale subsequent to a balance sheet date due to these unexpected developments, the loss is recognized in the period in which we had the intent to sell the security before its anticipated recovery.
Structured Securities
At June 30, 2012 fixed maturity investments included structured securities with an estimated fair value of $5.8 billion (or 24 percent of all fixed maturity securities). The yield characteristics of structured securities differ in some respects from those of traditional corporate fixed-income securities or government securities. For example, interest and principal payments on structured securities may occur more frequently, often monthly. In many instances, we are subject to the risk that the amount and timing of principal and interest payments may vary from expectations. For example, in many cases, partial prepayments may occur at the option of the issuer and prepayment rates are influenced by a number of factors that cannot be predicted with certainty, including: the relative sensitivity of the underlying assets backing the security to changes in interest rates; a variety of economic, geographic and other factors; the timing and pace of liquidations of defaulted collateral; and various security-specific structural considerations (for example, the repayment priority of a given security in a securitization structure). In addition, the total amount of payments for non-agency structured securities may be affected by changes to cumulative default rates or loss severities of the related collateral.
101
CNO FINANCIAL GROUP, INC. AND SUBSIDIARIES
___________________
The following table sets forth the par value, amortized cost and estimated fair value of structured securities, summarized by interest rates on the underlying collateral, at June 30, 2012 (dollars in millions):
Par value | Amortized cost | Estimated fair value | |||||||||
Below 4 percent | $ | 651.9 | $ | 598.9 | $ | 597.6 | |||||
4 percent – 5 percent | 694.8 | 681.0 | 744.6 | ||||||||
5 percent – 6 percent | 3,039.4 | 2,884.7 | 3,027.6 | ||||||||
6 percent – 7 percent | 1,044.0 | 993.2 | 1,033.1 | ||||||||
7 percent – 8 percent | 170.7 | 176.4 | 184.9 | ||||||||
8 percent and above | 187.0 | 191.8 | 195.5 | ||||||||
Total structured securities | $ | 5,787.8 | $ | 5,526.0 | $ | 5,783.3 | |||||
The amortized cost and estimated fair value of structured securities at June 30, 2012, summarized by type of security, were as follows (dollars in millions):
Estimated fair value | ||||||||||
Type | Amortized cost | Amount | Percent of fixed maturities | |||||||
Pass-throughs, sequential and equivalent securities | $ | 1,485.9 | $ | 1,553.3 | 6.4 | % | ||||
Planned amortization classes, target amortization classes and accretion-directed bonds | 719.4 | 764.7 | 3.1 | |||||||
Commercial mortgage-backed securities | 1,478.2 | 1,586.1 | 6.5 | |||||||
Asset-backed securities | 1,481.0 | 1,518.9 | 6.3 | |||||||
Collateralized debt obligations | 332.2 | 330.1 | 1.4 | |||||||
Other | 29.3 | 30.2 | .1 | |||||||
Total structured securities | $ | 5,526.0 | $ | 5,783.3 | 23.8 | % | ||||
Pass-throughs, sequentials and equivalent securities have unique prepayment variability characteristics. Pass-through securities typically return principal to the holders based on cash payments from the underlying mortgage obligations. Sequential securities return principal to tranche holders in a detailed hierarchy. Planned amortization classes, targeted amortization classes and accretion-directed bonds adhere to fixed schedules of principal payments as long as the underlying mortgage loans experience prepayments within certain estimated ranges. In most circumstances, changes in prepayment rates are first absorbed by support or companion classes insulating the timing of receipt of cash flows from the consequences of both faster prepayments (average life shortening) and slower prepayments (average life extension).
Commercial mortgage-backed securities are secured by commercial real estate mortgages, generally income producing properties that are managed for profit. Property types include multi-family dwellings including apartments, retail centers, hotels, restaurants, hospitals, nursing homes, warehouses, and office buildings. Most commercial mortgage-backed securities have call protection features whereby underlying borrowers may not prepay their mortgages for stated periods of time without incurring prepayment penalties.
102
CNO FINANCIAL GROUP, INC. AND SUBSIDIARIES
___________________
Commercial Mortgage Loans
The following table provides the carrying value and estimated fair value of our outstanding mortgage loans and the underlying collateral as of June 30, 2012, summarized by loan-to-value ratios (dollars in millions):
Estimated fair value | |||||||||||
Loan-to-value ratio (a) | Carrying value | Mortgage loans | Collateral | ||||||||
Less than 60% | $ | 770.5 | $ | 865.3 | $ | 2,125.8 | |||||
60% to 70% | 329.0 | 352.9 | 506.4 | ||||||||
Greater than 70% to 80% | 184.8 | 196.3 | 245.3 | ||||||||
Greater than 80% to 90% | 166.6 | 180.3 | 195.4 | ||||||||
Greater than 90% | 100.0 | 88.6 | 105.9 | ||||||||
Total | $ | 1,550.9 | $ | 1,683.4 | $ | 3,178.8 | |||||
________________
(a) | Loan-to-value ratios are calculated as the ratio of: (i) the carrying value of the commercial mortgage loans; to (ii) the estimated fair value of the underlying collateral. |
103
CNO FINANCIAL GROUP, INC. AND SUBSIDIARIES
___________________
INVESTMENT IN VARIABLE INTEREST ENTITIES
The following table provides supplemental information about the revenues and expenses of the VIEs which have been consolidated in accordance with authoritative guidance, after giving effect to the elimination of our investment in the VIEs and investment management fees earned by a subsidiary of the Company (dollars in millions):
Three months ended | Six months ended | ||||||||||||||
June 30, | June 30, | ||||||||||||||
2012 | 2011 | 2012 | 2011 | ||||||||||||
Revenues: | |||||||||||||||
Net investment income – policyholder and reinsurer accounts and other special-purpose portfolios | $ | 7.3 | $ | 3.7 | $ | 13.4 | $ | 8.1 | |||||||
Fee revenue and other income | .5 | .3 | .7 | .5 | |||||||||||
Total revenues | 7.8 | 4.0 | 14.1 | 8.6 | |||||||||||
Expenses: | |||||||||||||||
Interest expense | 4.7 | 3.5 | 8.7 | 6.0 | |||||||||||
Other operating expenses | .2 | .3 | .3 | .4 | |||||||||||
Total expenses | 4.9 | 3.8 | 9.0 | 6.4 | |||||||||||
Income before net realized investment losses and income taxes | 2.9 | .2 | 5.1 | 2.2 | |||||||||||
Net realized investment gains (losses) | .3 | 1.8 | (.2 | ) | .4 | ||||||||||
Income (loss) before income taxes | $ | 3.2 | $ | 2.0 | $ | 4.9 | $ | 2.6 | |||||||
During the first six months of 2012, net realized investment losses included: (i) $.2 million of net gains from the sales of investments; and (ii) $.4 million of writedowns of investments held by VIEs as a result of our intent not to hold such investments for a period of time that would be sufficient to allow for any anticipated recovery in value. During the first six months of 2011, net realized investment gains included: (i) $3.6 million of net gains from the sales of investments; and (ii) $3.2 million of writedowns of investments held by VIEs as a result of our intent to sell such investments.
104
CNO FINANCIAL GROUP, INC. AND SUBSIDIARIES
___________________
Supplemental Information on Investments Held by VIEs
The following table summarizes the carrying values of the investments held by the VIEs by category as of June 30, 2012 (dollars in millions):
Carrying value | Percent of fixed maturities | Gross unrealized losses | Percent of gross unrealized losses | ||||||||||
Healthcare/pharmaceuticals | $ | 89.8 | 11.4 | % | $ | 1.1 | 19.5 | % | |||||
Cable/media | 84.0 | 10.6 | .6 | 10.4 | |||||||||
Technology | 78.9 | 10.0 | .4 | 7.7 | |||||||||
Autos | 63.2 | 8.0 | .2 | 4.5 | |||||||||
Food/beverage | 57.6 | 7.3 | .3 | 4.7 | |||||||||
Brokerage | 45.7 | 5.8 | .5 | 9.2 | |||||||||
Gaming | 37.9 | 4.8 | .2 | 2.8 | |||||||||
Consumer products | 28.5 | 3.6 | .5 | 9.7 | |||||||||
Telecom | 26.0 | 3.3 | .3 | 5.0 | |||||||||
Insurance | 25.2 | 3.2 | .1 | 1.4 | |||||||||
Entertainment/hotels | 24.9 | 3.2 | .3 | 6.2 | |||||||||
Chemicals | 20.9 | 2.6 | — | .9 | |||||||||
Utilities | 19.3 | 2.4 | .1 | 1.5 | |||||||||
Building materials | 18.6 | 2.4 | .1 | 2.2 | |||||||||
Retail | 18.1 | 2.3 | — | .5 | |||||||||
Aerospace/defense | 15.9 | 2.0 | — | .8 | |||||||||
Metals and mining | 15.9 | 2.0 | .1 | 2.1 | |||||||||
Capital goods | 13.1 | 1.7 | — | .7 | |||||||||
Energy/pipelines | 12.8 | 1.6 | .1 | 1.1 | |||||||||
Real estate/REITs | 12.7 | 1.6 | .1 | 2.0 | |||||||||
Transportation | 12.5 | 1.6 | .1 | 1.4 | |||||||||
Paper | 5.2 | .7 | .1 | 1.0 | |||||||||
Other | 62.6 | 7.9 | .3 | 4.7 | |||||||||
Total | $ | 789.3 | 100.0 | % | $ | 5.5 | 100.0 | % | |||||
The following table sets forth the amortized cost and estimated fair value of those investments held by the VIEs with unrealized losses at June 30, 2012, by contractual maturity. Actual maturities will differ from contractual maturities because borrowers may have the right to call or prepay obligations with or without penalties.
Amortized cost | Estimated fair value | ||||||
(Dollars in millions) | |||||||
Due in one year or less | $ | 1.6 | $ | 1.6 | |||
Due after one year through five years | 240.2 | 237.1 | |||||
Due after five years through ten years | 289.4 | 287.0 | |||||
Total | $ | 531.2 | $ | 525.7 | |||
There were no investments held by the VIEs rated below-investment grade which had been continuously in an unrealized loss position exceeding 20 percent of the cost basis as of June 30, 2012.
105
CNO FINANCIAL GROUP, INC. AND SUBSIDIARIES
___________________
NEW ACCOUNTING STANDARDS
See “Recently Issued Accounting Standards” in the notes to consolidated financial statements for a discussion of recently issued accounting standards.
ITEM 3. QUANTITATIVE AND QUALITATIVE DISCLOSURES ABOUT MARKET RISK.
Our market risks, and the ways we manage them, are summarized in “Management’s Discussion and Analysis of Financial Condition and Results of Operations”, included in our Annual Report on Form 10-K for the year ended December 31, 2011. There have been no material changes in the first six months of 2012 to such risks or our management of such risks.
ITEM 4. CONTROLS AND PROCEDURES.
Evaluation of Disclosure Controls and Procedures. CNO’s management, under the supervision and with the participation of the Chief Executive Officer and the Chief Financial Officer, evaluated the effectiveness of CNO’s disclosure controls and procedures (as defined in Rules 13a-15(e) and 15d-15(e) under the Securities Exchange Act of 1934, as amended). Based on its evaluation, the Chief Executive Officer and Chief Financial Officer concluded that, as of June 30, 2012, CNO’s disclosure controls and procedures were effective to ensure that information required to be disclosed by CNO in reports that it files or submits under the Securities Exchange Act of 1934 is recorded, processed, summarized and reported within the time periods specified in the SEC’s rules and forms. Disclosure controls and procedures are also designed to reasonably assure that such information is accumulated and communicated to our management, including our Chief Executive Officer and Chief Financial Officer, as appropriate, to allow timely decisions regarding required disclosure.
Changes to Internal Control Over Financial Reporting. There were no changes in the Company’s internal control over financial reporting (as defined in Rule 13a-15(f) under the Securities Exchange Act of 1934) during the six months ended June 30, 2012, that have materially affected, or are reasonably likely to materially affect, our internal control over financial reporting.
PART II - OTHER INFORMATION
ITEM 1. LEGAL PROCEEDINGS.
Information required for Part II, Item 1 is incorporated by reference to the discussion under the heading “Litigation and Other Legal Proceedings” in the footnotes to our consolidated financial statements included in Part I, Item 1 of this Form 10-Q.
ITEM 1A. RISK FACTORS.
CNO and its businesses are subject to a number of risks including general business and financial risk factors. Any or all of such factors could have a material adverse effect on the business, financial condition or results of operations of CNO. Refer to “Risk Factors” in our Annual Report on Form 10-K for the year ended December 31, 2011, for further discussion of such risk factors. There have been no material changes from such previously disclosed risk factors.
106
CNO FINANCIAL GROUP, INC. AND SUBSIDIARIES
___________________
ITEM 2. UNREGISTERED SALES OF EQUITY SECURITIES AND USE OF PROCEEDS.
Issuer Purchases of Equity Securities
Period | Total number of shares (or units) | Average price paid per share (or unit) | Total number of shares (or units) purchased as part of publicly announced plans or programs | Maximum number (or approximate dollar value) of shares (or units) that may yet be purchased under the plans or programs(a) | ||||||||||
(dollars in millions) | ||||||||||||||
April 1 through April 30 | 539 | $ | 7.63 | — | $ | 111.3 | ||||||||
May 1 through May 31 | 3,174,465 | 6.86 | 3,174,394 | 89.5 | ||||||||||
June 1 through June 30 | 2,478,224 | 7.05 | 2,478,224 | 172.1 | ||||||||||
Total | 5,653,228 | 6.95 | 5,652,618 | 172.1 | ||||||||||
____________
(a) | In May 2011, the Company announced a common share repurchase program of up to $100.0 million. In both February 2012 and June 2012, the Company announced that its board of directors had approved an additional $100.0 million ($200.0 million in aggregate) to repurchase the Company's outstanding common stock. |
Under the Indenture, the Company can make Restricted Payments (as such term is defined in the Indenture) up to a calculated limit, provided that the Company's pro forma risk-based capital ratio exceeds 225% after giving effect to the Restricted Payment and certain other conditions are met. Restricted Payments include, among other items, stock repurchases, common stock dividends and investments in excess of $75 million made at the holding company level that are other than cash and cash equivalents. The limit of Restricted Payments permitted under the Indenture is the sum of (x) 50% of the Company's “Consolidated Net Income” (as defined in the Indenture) for the period (taken as one accounting period) from January 1, 2011 to the end of the Company's most recently ended fiscal quarter for which financial statements are available at the time of such Restricted Payment and (y) certain other amounts. Based on the Company's Consolidated Net Income through June 30, 2012, the Company could make additional Restricted Payments under this Indenture covenant of approximately $122 million.
ITEM 5. OTHER INFORMATION.
None.
107
CNO FINANCIAL GROUP, INC. AND SUBSIDIARIES
___________________
ITEM 6. EXHIBITS.
12.1 | Computation of Ratio of Earnings to Fixed Charges. |
31.1 | Certification Pursuant to the Securities Exchange Act Rule 13a-14(a)/15d-14(a), as Adopted Pursuant to Section 302 of the Sarbanes-Oxley Act of 2002. |
31.2 | Certification Pursuant to the Securities Exchange Act Rule 13a-14(a)/15d-14(a), as Adopted Pursuant to Section 302 of the Sarbanes-Oxley Act of 2002. |
32.1 | Certification Pursuant to 18 U.S.C. Section 1350, as Adopted Pursuant to Section 906 of the Sarbanes-Oxley Act of 2002. |
32.2 | Certification Pursuant to 18 U.S.C. Section 1350, as Adopted Pursuant to Section 906 of the Sarbanes-Oxley Act of 2002. |
101.INS | XBRL Instance Document. |
101.SCH | XBRL Taxonomy Extension Schema Document. |
101.CAL | XBRL Taxonomy Extension Calculation Linkbase Document. |
101.DEF | XBRL Taxonomy Extension Definition Linkbase Document. |
101.LAB | XBRL Taxonomy Extension Label Linkbase Document. |
101.PRE | XBRL Taxonomy Extension Presentation Linkbase Document. |
108
CNO FINANCIAL GROUP, INC. AND SUBSIDIARIES
___________________
SIGNATURE
Pursuant to the requirements of the Securities Exchange Act of 1934, the Registrant has duly caused this report to be signed on its behalf by the undersigned thereunto duly authorized.
CNO FINANCIAL GROUP, INC.
Dated: July 27, 2012
By: | /s/ Frederick J. Crawford | |
Frederick J. Crawford | ||
Executive Vice President and Chief Financial Officer | ||
(authorized officer and principal financial officer) | ||
109