Movements in the Price of Gold
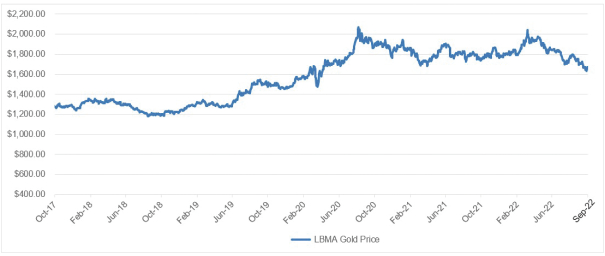
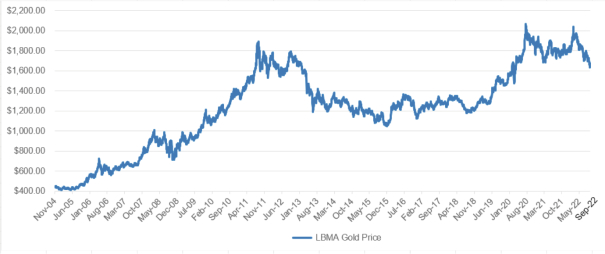
The following chart provides historical background on the price of gold. The chart illustrates movements in the price of gold in U.S. dollars per ounce over the period from the day the Shares began trading on the NYSE on November 18, 2004 to September 30, 2022, and is based on the LBMA Gold Price PM when available from March 20, 2015 and previously the London PM Fix.
Daily Gold Price – November 18, 2004 – September 30, 2022
LBMA Gold Price PM USD
Creation and Redemption of Shares
The Trust creates and redeems Shares from time to time, but only in one or more Baskets. The creation and redemption of Baskets is only made in exchange for the delivery to the Trust or the distribution by the Trust of the amount of gold and any cash represented by the Baskets being created or redeemed, the amount of which is based on the combined NAV of the number of Shares included in the Baskets being created or redeemed determined on the day the order to create or redeem Baskets is properly received. Creations of Baskets may only be settled after the requisite gold is deposited in the allocated account of the Trust.
Authorized Participants are the only persons that may place orders to create and redeem Baskets. To become an Authorized Participant, a person must enter into a Participant Agreement with the Sponsor and the Trustee. The Participant Agreement and the related procedures attached thereto may be amended by the Trustee and the Sponsor without the consent of any Shareholder or Authorized Participant. Authorized Participants who make deposits with the Trust in exchange for Baskets receive no fees, commissions or other form of compensation or inducement of any kind from either the Sponsor or the Trust, and no such person has any obligation or responsibility to the Sponsor or the Trust to effect any sale or resale of Shares.
Some of the activities of Authorized Participants will result in their being deemed participants in a distribution in a manner which would render them statutory underwriters and subject them to the prospectus-delivery and liability provisions of the Securities Act of 1933, as amended (the “Securities Act”). As of the date of this annual report, the Authorized Participants are Credit Suisse Securities (USA) LLC, Goldman, Sachs & Co., Goldman Sachs Execution & Clearing, L.P., HSBC Securities (USA) Inc., J.P. Morgan Securities LLC, Merrill Lynch Professional Clearing Corp., Morgan Stanley & Co. LLC, RBC Capital Markets LLC, UBS Securities LLC and Virtu Americas LLC. An updated list of Authorized Participants can be obtained from the Trustee or the Sponsor.
Prior to initiating any creation or redemption order, an Authorized Participant must have entered into an agreement with the Custodian to establish an Authorized Participant Unallocated Account in London, or a
7