Item 2. |
Management’s Discussion and Analysis of Financial Condition and Results of Operations |
This information should be read in conjunction with the financial statements and notes included in Item 1 of Part I of this Quarterly Report. The discussion and analysis which follows may contain trend analysis and other forward-looking statements within the meaning of Section 21E of the Securities Exchange Act of 1934, as amended, which reflect our current views with respect to future events and financial results. Words such as “anticipate,” “expect,” “intend,” “plan,” “believe,” “seek,” “outlook” and “estimate” as well as similar words and phrases signify forward-looking statements. SPDR
®
Gold Trust’s forward-looking statements are not guarantees of future results and conditions and important factors, risks and uncertainties may cause our actual results to differ materially from those expressed in our forward-looking statements. Trust Overview
SPDR
®
Gold Trust (the “Trust”) is an investment trust that was formed on November 12, 2004 (the “Date of Inception”). The Trust issues baskets of Shares (“Baskets”) in exchange for deposits of gold and distributes gold in connection with the redemption of Baskets. The investment objective of the Trust is for the Shares to reflect the performance of the price of gold bullion, less the expenses of the Trust’s operations. The Shares are designed to provide investors with a cost effective and convenient way to invest in gold. Gold is held by HSBC Bank plc (the “Custodian”) on behalf of the Trust.
As of the date of this quarterly report, Credit Suisse Securities (USA) LLC, Goldman, Sachs & Co., Goldman Sachs Execution & Clearing, L.P., HSBC Securities (USA) Inc., J.P. Morgan Securities LLC, Merrill Lynch Professional Clearing Corp., Morgan Stanley & Co. LLC, RBC Capital Markets LLC, UBS Securities LLC and Virtu Americas LLC are the only Authorized Participants. An updated list of Authorized Participants can be obtained from the Trustee or the Sponsor.
Investing in the Shares does not insulate the investor from certain risks, including price volatility. The following chart illustrates the movement in the price of the Shares and NAV of the Shares against the corresponding gold price (per 1/10 of an oz. of gold) since the day the Shares first began trading on the NYSE:
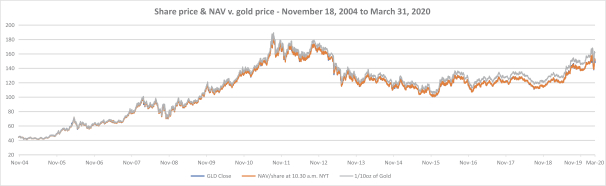
The divergence of the price of the Shares and NAV of the Shares from the gold price over time reflects the cumulative effect of the Trust expenses that arise if an investment had been held since inception.
Critical Accounting Policy
Valuation of Gold, Definition of NAV
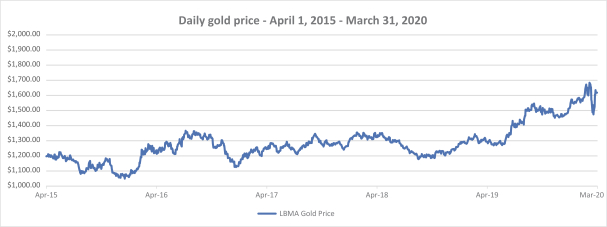
The Trustee values the gold held by the Trust and determines the NAV of the Trust as of the LBMA Gold Price PM on each day that the NYSE Arca is open for regular trading, at the earlier of the LBMA Gold Price PM for the day or 12:00 PM New York time. If no LBMA Gold Price PM is announced on a particular evaluation day or
12