Filed Pursuant To Rule 433
Registration No. 333-217785
June 27, 2017

Filed Pursuant To Rule 433 Registration No. 333-217785 June 27, 2017 SPDR® ETF Trading Report May 2017 Consolidated Consolidated Avg. Avg. Avg. Quote Short Spread ($) Avg. Daily Consolidated Daily Volume Avg. Quote Size Avg. Size ($) Avg. Daily Interest Spread Spread vs. 3 mo. Volume Avg. Daily (shares) vs. Quote Size (Shares) vs. Quote vs. 3 mo. Trade Volatility as of Ticker ETF Name ($) (%) trailing (shares) Volume ($) 3 mo. trailing (shares) 3 mo. trailing Size ($) trailing Size (%) 04/13/2017 US Core SPY SPDR S&P 500® ETF 0.01 0.00 0.01 67,945,478 16,246,918,076 77,591,578 16,650 15,153 3,981,348 3,590,958 272 0.30 175,515,778 MDY SPDR S&P MidCap 400® ETF 0.06 0.02 0.07 1,165,921 364,735,259 1,266,682 1,140 1,470 356,626 458,890 113 0.40 2,748,190 SLY SPDR S&P 600 Small Cap ETF 0.45 0.37 0.43 18,835 2,277,348 44,045 2,745 2,399 331,898 287,904 120 0.50 19,544 DIA SPDR Dow Jones Industrial Average ETF Trust 0.02 0.01 0.02 2,515,648 525,135,976 3,115,235 1,944 2,503 405,810 520,324 129 0.20 6,572,913 THRK SPDR Russell 3000 ETF 0.64 0.36 0.69 6,669 1,191,341 9,130 3,041 2,449 543,214 431,955 125 0.40 6,741 TWOK SPDR Russell 2000® ETF 0.22 0.27 0.25 12,304 1,001,907 18,790 6,351 5,824 517,162 470,404 131 0.50 3,667 ONEK SPDR Russell 1000 ETF 0.30 0.26 0.35 5,129 575,839 3,660 2,755 3,031 309,304 337,866 164 0.30 17,137 SMD SPDR S&P 1000 ETF 0.69 0.76 0.70 2,526 228,698 3,936 1,747 1,819 158,680 164,911 62 0.40 1,360 SPYX SPDR S&P 500 Fossil Fuel Reserves Free ETF 0.23 0.40 0.25 3,982 231,249 6,913 2,609 3,533 151,505 202,830 112 0.30 18,623 SHE SPDR SSGA Gender Diversity Index ETF 0.05 0.08 0.05 15,040 996,638 8,304 8,156 7,896 540,498 520,504 79 0.30 12,173 US Style SPYG SPDR S&P 500 Growth ETF 0.21 0.18 0.23 34,220 4,014,721 30,719 2,323 2,774 272,534 319,149 93 0.30 30,724 SPYV SPDR S&P 500 Value ETF 0.20 0.18 0.23 12,548 1,407,489 19,007 2,978 3,107 334,042 351,060 76 0.40 13,293 MDYG SPDR S&P 400 Mid Cap Growth ETF 0.34 0.24 0.37 18,796 2,660,493 17,343 3,582 3,125 507,032 437,813 136 0.50 15,848 MDYV SPDR S&P 400 Mid Cap Value ETF 0.26 0.27 0.28 18,830 1,789,839 28,942 7,599 6,183 722,285 591,095 100 0.50 6,238 SLYG SPDR S&P 600 Small Cap Growth ETF 0.59 0.28 0.60 31,204 6,641,296 31,594 2,583 2,535 549,740 534,961 83 0.50 38,992 SLYV SPDR S&P 600 Small Cap Value ETF 0.30 0.25 0.29 51,632 6,082,581 53,407 2,003 1,675 235,973 196,310 76 0.50 28,937 US Sector XLY Consumer Discretionary Select Sector SPDR Fund 0.01 0.01 0.01 4,274,872 384,253,665 4,120,104 9,806 9,400 881,461 829,832 167 0.40 11,080,736 XLP Consumer Staples Select Sector SPDR Fund 0.01 0.02 0.01 7,265,121 402,059,723 8,013,525 70,351 73,407 3,893,224 4,046,194 378 0.30 37,230,614 XLE Energy Select Sector SPDR Fund 0.01 0.02 0.01 15,295,347 1,029,065,088 15,638,997 16,994 14,276 1,143,356 984,473 188 0.70 35,703,716 XLF Financial Select Sector SPDR Fund 0.01 0.04 0.01 68,476,950 1,611,424,722 77,863,175 915,371 884,105 21,538,680 21,032,858 1,211 0.50 78,037,933 XLV Health Care Select Sector SPDR Fund 0.01 0.01 0.01 6,033,113 455,219,793 7,228,908 18,357 16,774 1,385,036 1,258,553 247 0.40 21,377,955 XLI Industrial Select Sector SPDR Fund 0.01 0.02 0.01 8,478,822 563,568,509 9,529,966 29,749 27,489 1,977,416 1,806,577 276 0.40 34,568,472 Source: ArcaVision. Data is as of May 31, 2017. Past performance is not a guarantee of future results.

SPDR® ETF Trading Report
Consolidated Consolidated Avg. Avg. Avg. Quote Short
Spread ($) Avg. Daily Consolidated
Daily Volume Avg. Quote Size Avg. Size ($) Avg. Daily Interest
Spread Spread vs. 3 mo. Volume Avg. Daily (shares) vs. Quote Size (Shares) vs. Quote vs.
3 mo. Trade Volatility as of
Ticker ETF Name ($) (%) trailing (shares) Volume ($) 3 mo. trailing (shares) 3 mo. trailing Size
($) trailing Size (%) 04/13/2017
US Sector (cont’d)
XLB
Materials Select Sector SPDR Fund 0.01 0.02 0.01 4,277,090 225,591,917 4,323,383 27,524 25,019 1,451,616 1,312,997 233 0.50 14,329,656 XLK Technology Select Sector SPDR Fund 0.01 0.02 0.01 10,144,943 563,878,949 8,947,527 81,789 82,745 4,545,833
4,470,712 392 0.50 30,940,854 XLU Utilities Select Sector SPDR Fund 0.01 0.02 0.01 10,249,976 534,244,613 12,746,825 29,402 27,393 1,532,432 1,414,848 278 0.40 48,743,080 XLRE Real Estate Select Sector SPDR Fund 0.01 0.03 0.01 1,718,503 54,396,569
2,005,836 35,287 46,800 1,116,834 1,479,816 338 0.40 5,210,472
US Industry
KBE SPDR S&P Bank ETF 0.01 0.03 0.01 2,010,561 84,879,794 2,657,445 4,796 5,923 202,487 254,097 160 0.70 7,030,245 KCE SPDR S&P Capital Markets ETF 0.13
0.29 0.13 4,412 205,258 9,250 6,577 8,097 305,962 382,745 87 0.50 3,606 KIE SPDR S&P Insurance ETF 0.04 0.05 0.04 227,178 19,481,607 162,247 1,449 1,538 124,252 132,191 125 0.40 531,363 KRE SPDR S&P Regional Banking ETF 0.01 0.02 0.01
6,961,472 370,710,494 8,188,801 4,693 4,791 249,902 260,055 177 0.80 25,352,559 XBI SPDR S&P Biotech ETF 0.03 0.04 0.03 3,734,853 259,193,816 4,037,685 1,290 1,222 89,526 84,892 162 1.10 26,962,951 MTK SPDR Morgan Stanley Technology ETF 0.09
0.12 0.18 27,597 1,996,606 24,330 1,798 2,383 130,085 166,381 128 0.50 15,295 XHB SPDR S&P Homebuilders ETF 0.01 0.03 0.01 1,092,704 41,164,851 1,402,621 13,252 12,162 499,203 452,183 173 0.50 7,662,460 XME SPDR S&P Metals & Mining
ETF 0.01 0.04 0.01 3,323,477 96,303,238 3,881,229 6,833 5,726 198,020 172,124 179 0.90 10,709,477 XES SPDR S&P Oil & Gas Equipment & Services ETF 0.02 0.13 0.02 557,138 9,524,592 739,834 7,110 6,608 121,581 124,759 232 1.80
868,498 XITK SPDR FactSet Innovative Technology ETF 0.15 0.21 0.15 5,230 357,971 5,401 428 531 29,335 34,611 245 0.80 2,585 XOP SPDR S&P Oil & Gas Exploration & Production ETF 0.01 0.03 0.01 17,007,633 588,597,828 17,365,005
11,970 12,277 414,282 440,253 224 1.30 55,258,357 XPH SPDR S&P Pharmaceuticals ETF 0.04 0.10 0.04 73,786 3,095,384 111,903 2,298 2,487 96,401 104,031 194 0.80 1,048,928 XRT SPDR S&P Retail ETF 0.01 0.03 0.01 4,128,474 173,004,033 5,092,852
6,632 6,090 277,947 256,389 181 0.80 17,819,511 XSD SPDR S&P Semiconductor ETF 0.04 0.07 0.04 110,810 6,771,712 87,138 1,829 1,819 111,770 109,558 161 1.10 458,138 XHE SPDR S&P Health Care Equipment ETF 0.20 0.34 0.20 27,548 1,587,000 23,965
2,858 2,727 164,649 153,966 128 0.60 40,762 XTL SPDR S&P Telecom ETF 0.30 0.00 0.24 16,787 1,185,375 15,063 3,781 4,366 266,976 307,410 265 0.80 1,489 XAR SPDR S&P Aerospace & Defense ETF 0.06 0.09 0.06 107,756 7,359,089 111,762
1,946 6,656 132,892 451,610 118 0.70 2,275,329 XHS SPDR S&P Health Care Services ETF 0.12 0.20 0.10 14,447 869,817 13,176 1,108 907 66,713 53,214 141 0.70 21,293 XSW SPDR S&P Software & Services ETF 0.13 0.21 0.13 6,431 392,142
6,032 2,316 2,204 141,207 130,874 325 0.60 7,231 XTH SPDR S&P Technology Hardware ETF 0.34 0.47 0.46 333 20,612 372 4,910 6,040 358,135 421,290 8 1.30 7,772 XTN SPDR S&P Transportation ETF 0.06 0.12 0.06 26,951 1,408,963 40,471 2,622 2,698
137,078 143,156 149 0.70 21,464 XWEB SPDR S&P Internet ETF 0.24 0.36 0.24 145 6,114 158 3,966 4,065 258,821 245,201 1 2.00 335
Source: ArcaVision. Data is as
of May 31, 2017. Past performance is not a guarantee of future results.
State Street Global Advisors 2
SPDR® ETF Trading Report
Consolidated Consolidated Avg. Avg. Avg. Quote Short
Spread ($) Avg. Daily Consolidated
Daily Volume Avg. Quote Size Avg. Size ($) Avg. Daily Interest
Spread Spread vs. 3 mo. Volume Avg. Daily (shares) vs. Quote Size (Shares) vs. Quote vs.
3 mo. Trade Volatility as of
Ticker ETF Name ($) (%) trailing (shares) Volume ($) 3 mo. trailing (shares) 3 mo. trailing Size
($) trailing Size (%) 04/13/2017
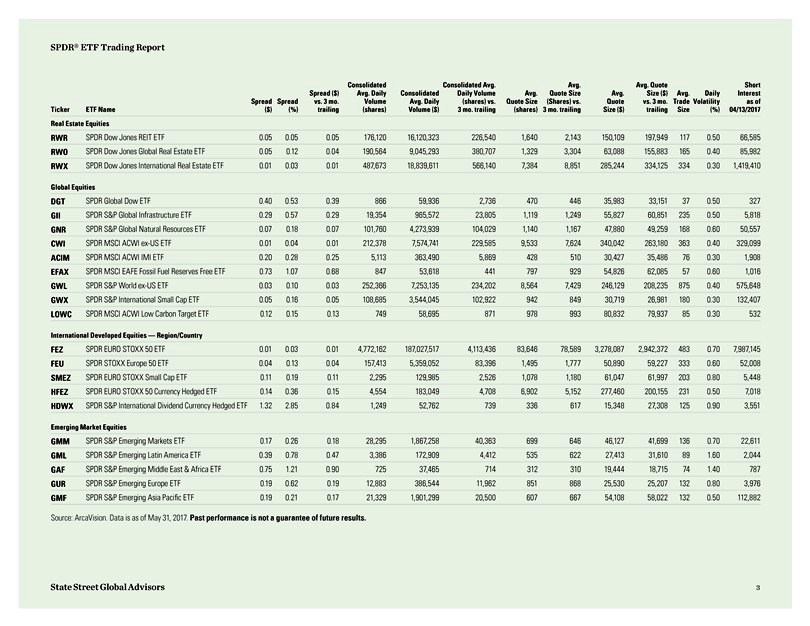
Real Estate Equities
RWR SPDR Dow
Jones REIT ETF 0.05 0.05 0.05 176,120 16,120,323 226,540 1,640 2,143 150,109 197,949 117 0.50 66,585 RWO SPDR Dow Jones Global Real Estate ETF 0.05 0.12 0.04 190,564 9,045,293 380,707 1,329 3,304 63,088 155,883 165 0.40 85,982 RWX SPDR Dow Jones
International Real Estate ETF 0.01 0.03 0.01 487,673 18,839,611 566,140 7,384 8,851 285,244 334,125 334 0.30 1,419,410
Global Equities
DGT SPDR Global Dow ETF 0.40 0.53 0.39 866 59,936 2,736 470 446 35,983 33,151 37 0.50 327 GII SPDR S&P Global Infrastructure ETF 0.29 0.57 0.29 19,354 965,572 23,805 1,119
1,249 55,827 60,851 235 0.50 5,818 GNR SPDR S&P Global Natural Resources ETF 0.07 0.18 0.07 101,760 4,273,939 104,029 1,140 1,167 47,880 49,259 168 0.60 50,557 CWI SPDR MSCI ACWI ex-US ETF 0.01 0.04 0.01 212,378 7,574,741 229,585 9,533 7,624
340,042 263,180 363 0.40 329,099 ACIM SPDR MSCI ACWI IMI ETF 0.20 0.28 0.25 5,113 363,490 5,869 428 510 30,427 35,486 76 0.30 1,908 EFAX SPDR MSCI EAFE Fossil Fuel Reserves Free ETF 0.73 1.07 0.68 847 53,618 441 797 929 54,826 62,085 57 0.60 1,016
GWL SPDR S&P World ex-US ETF 0.03 0.10 0.03 252,366 7,253,135 234,202 8,564 7,429 246,129 208,235 875 0.40 575,648 GWX SPDR S&P International Small Cap ETF 0.05 0.16 0.05 108,685 3,544,045 102,922 942 849 30,719 26,981 180 0.30 132,407 LOWC
SPDR MSCI ACWI Low Carbon Target ETF 0.12 0.15 0.13 749 58,695 871 978 993 80,832 79,937 85 0.30 532
International Developed Equities — Region/Country
FEZ SPDR EURO STOXX 50 ETF 0.01 0.03 0.01 4,772,162 187,027,517 4,113,436 83,646 78,589 3,278,087 2,942,372 483 0.70 7,987,145 FEU SPDR STOXX Europe 50 ETF 0.04
0.13 0.04 157,413 5,359,052 83,396 1,495 1,777 50,890 59,227 333 0.60 52,008 SMEZ SPDR EURO STOXX Small Cap ETF 0.11 0.19 0.11 2,295 129,985 2,526 1,078 1,180 61,047 61,997 203 0.80 5,448 HFEZ SPDR EURO STOXX 50 Currency Hedged ETF 0.14 0.36 0.15
4,554 183,049 4,708 6,902 5,152 277,460 200,155 231 0.50 7,018 HDWX SPDR S&P International Dividend Currency Hedged ETF 1.32 2.85 0.84 1,249 52,762 739 336 617 15,348 27,308 125 0.90 3,551
Emerging Market Equities
GMM SPDR S&P Emerging Markets ETF 0.17 0.26 0.18 28,295 1,867,258
40,363 699 646 46,127 41,699 136 0.70 22,611 GML SPDR S&P Emerging Latin America ETF 0.39 0.78 0.47 3,386 172,909 4,412 535 622 27,413 31,610 89 1.60 2,044 GAF SPDR S&P Emerging Middle East & Africa ETF 0.75 1.21 0.90 725 37,465 714
312 310 19,444 18,715 74 1.40 787 GUR SPDR S&P Emerging Europe ETF 0.19 0.62 0.19 12,883 386,544 11,962 851 868 25,530 25,207 132 0.80 3,976 GMF SPDR S&P Emerging Asia Pacific ETF 0.19 0.21 0.17 21,329 1,901,299 20,500 607 667 54,108 58,022
132 0.50 112,882
Source: ArcaVision. Data is as of May 31, 2017. Past performance is not a guarantee of future results.
State Street Global Advisors 3
SPDR® ETF Trading Report
Consolidated Consolidated Avg. Avg. Avg. Quote Short
Spread ($) Avg. Daily Consolidated
Daily Volume Avg. Quote Size Avg. Size ($) Avg. Daily Interest
Spread Spread vs. 3 mo. Volume Avg. Daily (shares) vs. Quote Size (Shares) vs. Quote vs.
3 mo. Trade Volatility as of
Ticker ETF Name ($) (%) trailing (shares) Volume ($) 3 mo. trailing (shares) 3 mo. trailing Size
($) trailing Size (%) 04/13/2017
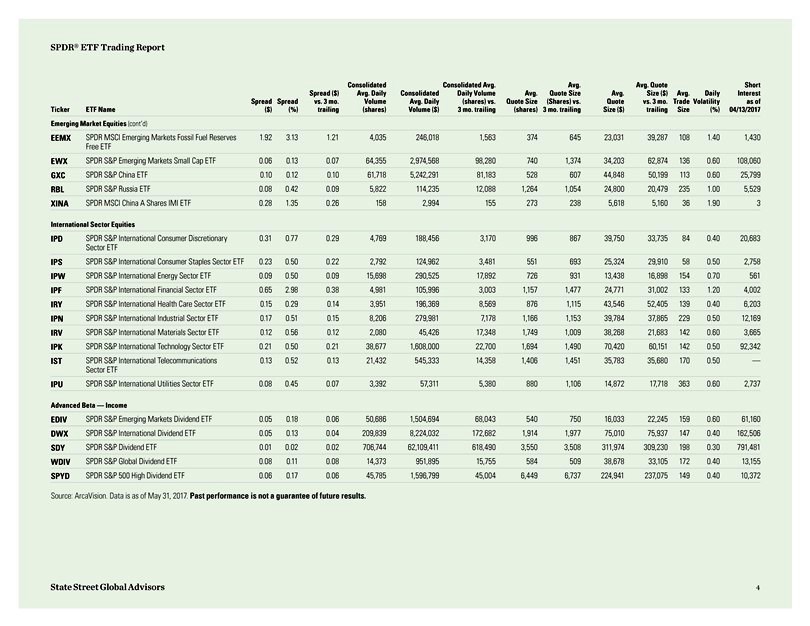
Emerging Market Equities (cont’d)
EEMX SPDR MSCI Emerging Markets Fossil Fuel Reserves 1.92 3.13 1.21 4,035 246,018 1,563 374 645 23,031 39,287 108 1.40 1,430 Free ETF
EWX SPDR S&P Emerging Markets Small Cap ETF 0.06 0.13 0.07 64,355 2,974,568 98,280 740 1,374 34,203 62,874 136 0.60 108,060 GXC SPDR S&P China ETF 0.10 0.12 0.10 61,718
5,242,291 81,183 528 607 44,848 50,199 113 0.60 25,799 RBL SPDR S&P Russia ETF 0.08 0.42 0.09 5,822 114,235 12,088 1,264 1,054 24,800 20,479 235 1.00 5,529 XINA SPDR MSCI China A Shares IMI ETF 0.28 1.35 0.26 158 2,994 155 273 238 5,618 5,160 36
1.90 3
International Sector Equities
IPD SPDR S&P International Consumer
Discretionary 0.31 0.77 0.29 4,769 188,456 3,170 996 867 39,750 33,735 84 0.40 20,683
Sector ETF
IPS SPDR S&P International Consumer Staples Sector ETF 0.23 0.50 0.22 2,792 124,962 3,481 551 693 25,324 29,910 58 0.50 2,758 IPW SPDR S&P International Energy Sector ETF
0.09 0.50 0.09 15,698 290,525 17,892 726 931 13,438 16,898 154 0.70 561 IPF SPDR S&P International Financial Sector ETF 0.65 2.98 0.38 4,981 105,996 3,003 1,157 1,477 24,771 31,002 133 1.20 4,002 IRY SPDR S&P International Health Care Sector
ETF 0.15 0.29 0.14 3,951 196,369 8,569 876 1,115 43,546 52,405 139 0.40 6,203 IPN SPDR S&P International Industrial Sector ETF 0.17 0.51 0.15 8,206 279,981 7,178 1,166 1,153 39,784 37,865 229 0.50 12,169 IRV SPDR S&P International Materials
Sector ETF 0.12 0.56 0.12 2,080 45,426 17,348 1,749 1,009 38,268 21,683 142 0.60 3,665 IPK SPDR S&P International Technology Sector ETF 0.21 0.50 0.21 38,677 1,608,000 22,700 1,694 1,490 70,420 60,151 142 0.50 92,342 IST SPDR S&P
International Telecommunications 0.13 0.52 0.13 21,432 545,333 14,358 1,406 1,451 35,783 35,680 170 0.50 —
Sector ETF
IPU SPDR S&P International Utilities Sector ETF 0.08 0.45 0.07 3,392 57,311 5,380 880 1,106 14,872 17,718 363 0.60 2,737
Advanced Beta — Income
EDIV SPDR S&P Emerging Markets Dividend ETF 0.05 0.18 0.06
50,686 1,504,694 68,043 540 750 16,033 22,245 159 0.60 61,160 DWX SPDR S&P International Dividend ETF 0.05 0.13 0.04 209,839 8,224,032 172,682 1,914 1,977 75,010 75,937 147 0.40 162,506 SDY SPDR S&P Dividend ETF 0.01 0.02 0.02 706,744
62,109,411 618,490 3,550 3,508 311,974 309,230 198 0.30 791,481 WDIV SPDR S&P Global Dividend ETF 0.08 0.11 0.08 14,373 951,895 15,755 584 509 38,678 33,105 172 0.40 13,155 SPYD SPDR S&P 500 High Dividend ETF 0.06 0.17 0.06 45,785 1,596,799
45,004 6,449 6,737 224,941 237,075 149 0.40 10,372
Source: ArcaVision. Data is as of May 31, 2017. Past performance is not a guarantee of future results.
State Street Global Advisors 4
SPDR® ETF Trading Report Consolidated Consolidated Avg. Avg. Avg. Quote Short Spread ($) Avg. Daily
Consolidated Daily Volume Avg. Quote Size Avg. Size ($) Avg. Daily Interest Spread Spread vs. 3 mo. Volume Avg. Daily (shares) vs. Quote Size (Shares) vs. Quote vs. 3 mo. Trade Volatility as of
Ticker ETF Name ($) (%) trailing (shares) Volume ($) 3 mo. trailing (shares) 3 mo. trailing Size ($) trailing Size (%) 04/13/2017
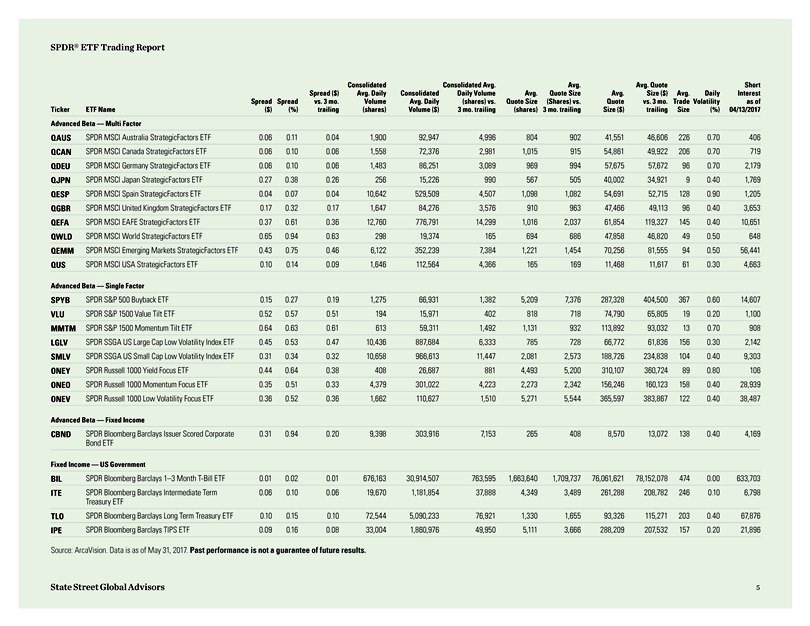
Advanced Beta — Multi Factor
QAUS SPDR MSCI Australia StrategicFactors ETF 0.06 0.11 0.04
1,900 92,947 4,996 804 902 41,551 46,606 226 0.70 406 QCAN SPDR MSCI Canada StrategicFactors ETF 0.06 0.10 0.06 1,558 72,376 2,981 1,015 915 54,861 49,922 206 0.70 719 QDEU SPDR MSCI Germany StrategicFactors ETF 0.06 0.10 0.06 1,483 86,251 3,089 969
994 57,675 57,672 96 0.70 2,179 QJPN SPDR MSCI Japan StrategicFactors ETF 0.27 0.38 0.26 256 15,226 990 567 505 40,002 34,921 9 0.40 1,769 QESP SPDR MSCI Spain StrategicFactors ETF 0.04 0.07 0.04 10,642 529,509 4,507 1,098 1,082 54,691 52,715 128
0.90 1,205 QGBR SPDR MSCI United Kingdom StrategicFactors ETF 0.17 0.32 0.17 1,647 84,276 3,576 910 963 47,466 49,113 96 0.40 3,653 QEFA SPDR MSCI EAFE StrategicFactors ETF 0.37 0.61 0.36 12,760 776,791 14,299 1,016 2,037 61,854 119,327 145 0.40
10,651 QWLD SPDR MSCI World StrategicFactors ETF 0.65 0.94 0.63 298 19,374 165 694 686 47,858 46,820 49 0.50 648 QEMM SPDR MSCI Emerging Markets StrategicFactors ETF 0.43 0.75 0.46 6,122 352,239 7,384 1,221 1,454 70,256 81,555 94 0.50 56,441 QUS
SPDR MSCI USA StrategicFactors ETF 0.10 0.14 0.09 1,646 112,564 4,366 165 169 11,468 11,617 61 0.30 4,663
Advanced Beta — Single Factor
SPYB SPDR S&P 500 Buyback ETF 0.15 0.27 0.19 1,275 66,931 1,382 5,209 7,376 287,328 404,500 367 0.60 14,607 VLU SPDR S&P 1500 Value Tilt ETF 0.52 0.57 0.51 194 15,971 402
818 718 74,790 65,805 19 0.20 1,100 MMTM SPDR S&P 1500 Momentum Tilt ETF 0.64 0.63 0.61 613 59,311 1,492 1,131 932 113,892 93,032 13 0.70 908 LGLV SPDR SSGA US Large Cap Low Volatility Index ETF 0.45 0.53 0.47 10,436 887,684 6,333 785 728 66,772
61,836 156 0.30 2,142 SMLV SPDR SSGA US Small Cap Low Volatility Index ETF 0.31 0.34 0.32 10,658 966,613 11,447 2,081 2,573 188,726 234,838 104 0.40 9,303 ONEY SPDR Russell 1000 Yield Focus ETF 0.44 0.64 0.38 408 26,687 881 4,493 5,200 310,107
360,724 89 0.80 106 ONEO SPDR Russell 1000 Momentum Focus ETF 0.35 0.51 0.33 4,379 301,022 4,223 2,273 2,342 156,246 160,123 158 0.40 28,939 ONEV SPDR Russell 1000 Low Volatility Focus ETF 0.36 0.52 0.36 1,662 110,627 1,510 5,271 5,544 365,597
383,867 122 0.40 38,487
Advanced Beta — Fixed Income
CBND SPDR Bloomberg
Barclays Issuer Scored Corporate 0.31 0.94 0.20 9,398 303,916 7,153 265 408 8,570 13,072 138 0.40 4,169 Bond ETF
Fixed Income — US Government
BIL SPDR Bloomberg Barclays 1–3 Month T-Bill ETF 0.01 0.02 0.01 676,163 30,914,507 763,595 1,663,640 1,709,737 76,061,621 78,152,078 474 0.00 633,703 ITE SPDR Bloomberg
Barclays Intermediate Term 0.06 0.10 0.06 19,670 1,181,854 37,888 4,349 3,489 261,288 208,782 246 0.10 6,798
Treasury ETF
TLO SPDR Bloomberg Barclays Long Term Treasury ETF 0.10 0.15 0.10 72,544 5,090,233 76,921 1,330 1,655 93,326 115,271 203 0.40 67,876 IPE SPDR Bloomberg Barclays TIPS ETF 0.09 0.16
0.08 33,004 1,860,976 49,950 5,111 3,666 288,209 207,532 157 0.20 21,896
Source: ArcaVision. Data is as of May 31, 2017. Past performance is not a guarantee
of future results.
State Street Global Advisors 5

SPDR® ETF Trading Report Consolidated Consolidated Avg. Avg. Avg. Quote Short
Spread ($) Avg. Daily Consolidated Daily Volume Avg. Quote Size Avg. Size ($) Avg. Daily Interest Spread Spread vs. 3 mo. Volume Avg. Daily (shares) vs. Quote Size
(Shares) vs. Quote vs. 3 mo. Trade Volatility as of
Ticker ETF Name ($) (%) trailing (shares) Volume ($) 3 mo. trailing (shares) 3 mo.
trailing Size ($) trailing Size (%) 04/13/2017
Fixed Income — US Government (cont’d)
SST SPDR Bloomberg Barclays Short Term Treasury ETF 0.06 0.19 0.05 47,599 1,435,161 51,688 5,051 5,373 152,288 161,727 519 0.10 28,806 SIPE SPDR Bloomberg Barclays 0–5 Year
TIPS ETF 0.22 1.12 0.22 1,356 24,915 1,944 996 861 19,581 17,056 11 0.50 2,001 TIPX SPDR Bloomberg Barclays 1–10 Year TIPS ETF 0.11 0.55 0.10 7,748 151,242 15,573 1,268 931 24,751 18,276 382 0.20 77,886
Fixed Income — US Investment Grade Corporates
SCPB SPDR Bloomberg Barclays Short Term
Corporate 0.01 0.04 0.01 315,328 9,651,021 322,377 25,505 30,928 780,708 945,778 330 0.00 120,767
Bond ETF
ITR SPDR Bloomberg Barclays Intermediate Term Corporate 0.02 0.06 0.02 283,726 9,731,998 381,819 8,275 10,488 283,833 358,270 331 0.10 100,409 Bond ETF
LWC SPDR Bloomberg Barclays Long Term Corporate 0.16 0.39 0.13 25,092 1,026,309 29,004 997 1,046 40,777 42,091 183 0.30 8,135
Bond ET
FLRN SPDR Bloomberg Barclays Investment Grade 0.02 0.05 0.02 200,321 6,152,610
319,232 14,081 11,825 432,428 363,146 352 0.00 145,548
Floating Rate ETF
Fixed Income — High Yield
JNK SPDR Bloomberg Barclays High Yield Bond
ETF 0.01 0.03 0.01 8,269,083 306,918,252 10,660,575 96,375 98,521 3,577,440 3,622,617 595 0.20 35,151,641 SJNK SPDR Bloomberg Barclays Short Term High Yield 0.01 0.04 0.01 1,685,970 47,226,385 2,052,769 51,896 44,214 1,453,607 1,233,128 400 0.10
640,483
Bond ETF
CJNK SPDR BofA Merrill Lynch Crossover Corporate Bond
ETF 0.25 0.95 0.24 3,692 97,918 7,362 669 657 17,742 17,227 126 0.40 9,476
Fixed Income — US Mortgage
MBG SPDR Bloomberg Barclays Mortgage Backed Bond ETF 0.06 0.22 0.07 24,293 640,401 48,295 4,221 2,310 111,266 60,638 258 0.20 26,657
Fixed Income — US Aggregate
BNDS SPDR Bloomberg Barclays Aggregate Bond ETF 0.07 0.12
0.07 63,534 3,639,468 70,904 6,672 4,984 382,172 284,586 558 0.10 2,826
Fixed Income — Hybrids
CWB SPDR Bloomberg Barclays Convertible Securities ETF 0.01 0.03 0.01 531,998 25,949,224 601,089 1,235 1,417 60,243 68,158 132 0.30 1,140,112 PSK SPDR Wells Fargo Preferred Stock
ETF 0.06 0.13 0.06 45,244 2,031,920 48,420 5,378 4,114 241,526 182,045 229 0.10 14,015
Fixed Income — Municipal
SHM SPDR Nuveen Bloomberg Barclays Short Term 0.01 0.03 0.01 274,297 13,337,810 349,116 10,059 11,454 489,169 555,175 256 0.00 259,016 Municipal Bond ETF
TFI SPDR Nuveen Bloomberg Barclays Municipal Bond ETF 0.02 0.04 0.02 322,110 15,604,416 331,800 4,185 3,903 202,721 187,500 195 0.10 429,096 HYMB SPDR Nuveen S&P High Yield
Municipal Bond ETF 0.11 0.20 0.11 54,869 3,120,328 78,840 737 560 41,913 31,741 151 0.10 63,577
Source: ArcaVision. Data is as of May 31, 2017. Past
performance is not a guarantee of future results.
State Street Global Advisors 6
SPDR® ETF Trading Report
Consolidated Consolidated Avg. Avg. Avg. Quote Short
Spread ($) Avg. Daily Consolidated
Daily Volume Avg. Quote Size Avg. Size ($) Avg. Daily Interest
Spread Spread vs. 3 mo. Volume Avg. Daily (shares) vs. Quote Size (Shares) vs. Quote vs.
3 mo. Trade Volatility as of
Ticker ETF Name ($) (%) trailing (shares) Volume ($) 3 mo. trailing (shares) 3 mo. trailing Size
($) trailing Size (%) 04/13/2017
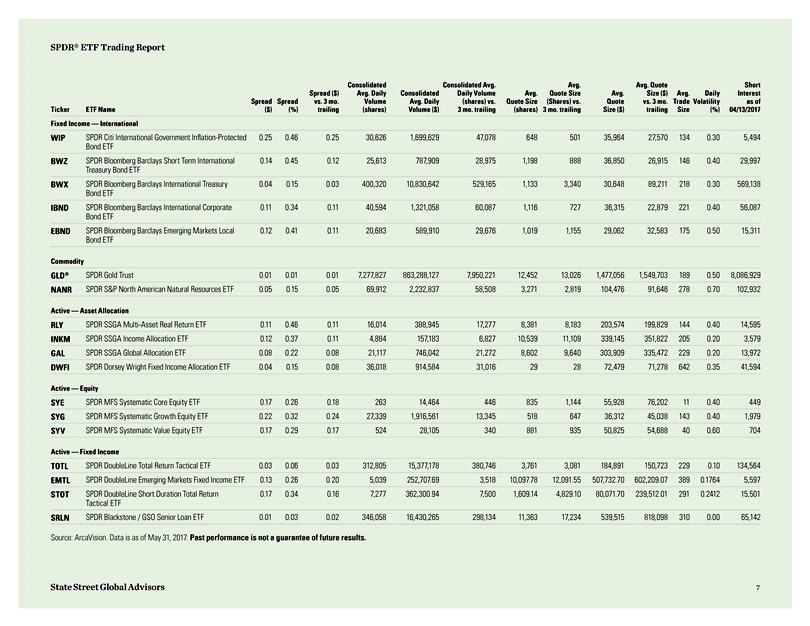
Fixed Income — International
WIP SPDR Citi International Government Inflation-Protected 0.25 0.46 0.25 30,626 1,699,629 47,078 648 501 35,964 27,570 134 0.30 5,494 Bond ETF
BWZ SPDR Bloomberg Barclays Short Term International 0.14 0.45 0.12 25,613 787,909 28,975 1,198 888 36,850 26,915 146 0.40 29,997 Treasury Bond ETF
BWX SPDR Bloomberg Barclays International Treasury 0.04 0.15 0.03 400,320 10,830,642 529,165 1,133 3,340 30,648 89,211 218 0.30 569,138
Bond ETF
IBND SPDR Bloomberg Barclays International Corporate 0.11 0.34 0.11 40,594
1,321,058 60,087 1,116 727 36,315 22,879 221 0.40 56,087
Bond ETF
EBND
SPDR Bloomberg Barclays Emerging Markets Local 0.12 0.41 0.11 20,683 589,910 29,676 1,019 1,155 29,062 32,583 175 0.50 15,311 Bond ETF
Commodity
GLD® SPDR Gold Trust 0.01 0.01 0.01 7,277,827 863,288,127 7,950,221 12,452 13,026 1,477,056 1,549,703 189 0.50 8,086,929 NANR SPDR S&P North American Natural Resources ETF
0.05 0.15 0.05 69,912 2,232,837 58,508 3,271 2,819 104,476 91,646 278 0.70 102,932
Active — Asset Allocation
RLY SPDR SSGA Multi-Asset Real Return ETF 0.11 0.46 0.11 16,014 388,945 17,277 8,381 8,183 203,574 199,829 144 0.40 14,595 INKM SPDR SSGA Income Allocation ETF 0.12 0.37 0.11 4,884
157,183 6,827 10,539 11,109 339,145 351,822 205 0.20 3,579 GAL SPDR SSGA Global Allocation ETF 0.08 0.22 0.08 21,117 746,042 21,272 8,602 9,640 303,909 335,472 229 0.20 13,972 DWFI SPDR Dorsey Wright Fixed Income Allocation ETF 0.04 0.15 0.08 36,018
914,584 31,016 29 28 72,479 71,278 642 0.35 41,594
Active — Equity
SYE
SPDR MFS Systematic Core Equity ETF 0.17 0.26 0.18 263 14,464 446 835 1,144 55,928 76,202 11 0.40 449 SYG SPDR MFS Systematic Growth Equity ETF 0.22 0.32 0.24 27,339 1,916,561 13,345 518 647 36,312 45,038 143 0.40 1,979 SYV SPDR MFS Systematic Value
Equity ETF 0.17 0.29 0.17 524 28,105 340 881 935 50,825 54,688 40 0.60 704
Active — Fixed Income
TOTL SPDR DoubleLine Total Return Tactical ETF 0.03 0.06 0.03 312,805 15,377,178 380,746 3,761 3,081 184,891 150,723 229 0.10 134,564 EMTL SPDR DoubleLine Emerging Markets Fixed
Income ETF 0.13 0.26 0.20 5,039 252,707.69 3,518 10,097.78 12,091.55 507,732.70 602,209.07 389 0.1764 5,597 STOT SPDR DoubleLine Short Duration Total Return 0.17 0.34 0.16 7,277 362,300.94 7,500 1,609.14 4,829.10 80,071.70 239,512.01 291 0.2412
15,501
Tactical ETF
SRLN SPDR Blackstone / GSO Senior Loan ETF 0.01 0.03
0.02 346,058 16,430,265 298,134 11,363 17,234 539,515 818,098 310 0.00 65,142
Source: ArcaVision. Data is as of May 31, 2017. Past performance is not a
guarantee of future results.
State Street Global Advisors 7
SPDR® ETF Trading Report
Consolidated Consolidated Avg. Avg. Avg. Quote Short
Spread ($) Avg. Daily Consolidated
Daily Volume Avg. Quote Size Avg. Size ($) Avg. Daily Interest
Spread Spread vs. 3 mo. Volume Avg. Daily (shares) vs. Quote Size (Shares) vs. Quote vs.
3 mo. Trade Volatility as of
Ticker ETF Name ($) (%) trailing (shares) Volume ($) 3 mo. trailing (shares) 3 mo. trailing Size
($) trailing Size (%) 04/13/2017
Active — Fixed Income (cont’d)
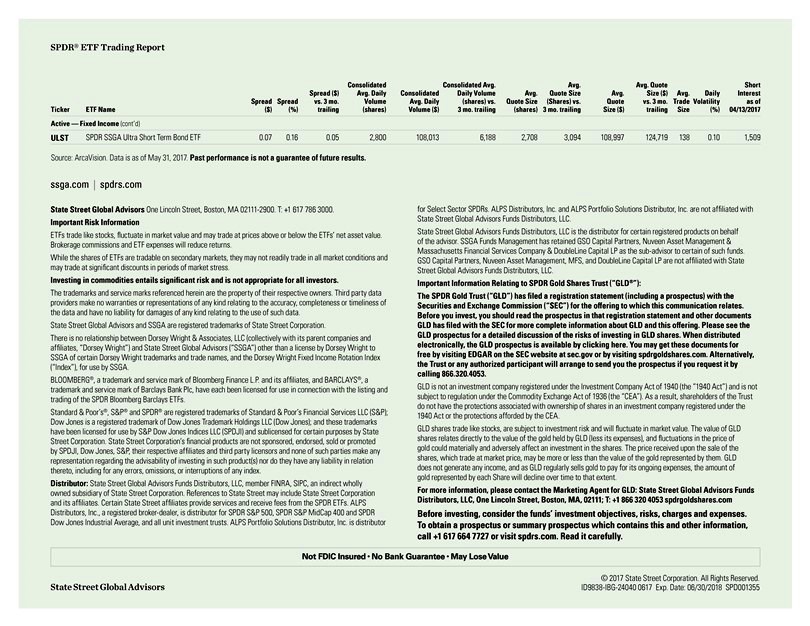
ULST SPDR SSGA Ultra Short Term Bond ETF 0.07 0.16 0.05 2,800 108,013 6,188 2,708 3,094 108,997 124,719 138 0.10 1,509
Source: ArcaVision. Data is as of May 31, 2017. Past performance is not a guarantee of future results.
ssga.com | spdrs.com
State Street Global Advisors One Lincoln Street, Boston, MA 02111-2900.
T: +1 617 786 3000. for Select Sector SPDRs. ALPS Distributors, Inc. and ALPS Portfolio Solutions Distributor, Inc. are not affiliated with
Important Risk
Information State Street Global Advisors Funds Distributors, LLC.
ETFs trade like stocks, fluctuate in market value and may trade at prices above or below the
ETFs’ net asset value. State Street Global Advisors Funds Distributors, LLC is the distributor for certain registered products on behalf Brokerage commissions and ETF expenses will reduce returns. of the advisor. SSGA Funds Management has
retained GSO Capital Partners, Nuveen Asset Management &
Massachusetts Financial Services Company & DoubleLine Capital LP as the sub-advisor to
certain of such funds. While the shares of ETFs are tradable on secondary markets, they may not readily trade in all market conditions and GSO Capital Partners, Nuveen Asset Management, MFS, and DoubleLine Capital LP are not affiliated with
State may trade at significant discounts in periods of market stress. Street Global Advisors Funds Distributors, LLC.
Investing in commodities entails
significant risk and is not appropriate for all investors. Important Information Relating to SPDR Gold Shares Trust (“GLD®”):
The trademarks and
service marks referenced herein are the property of their respective owners. Third party data The SPDR Gold Trust (“GLD”) has filed a registration statement (including a prospectus) with the providers make no warranties or representations
of any kind relating to the accuracy, completeness or timeliness of Securities and Exchange Commission (“SEC”) for the offering to which this communication relates. the data and have no liability for damages of any kind relating to
the use of such data. Before you invest, you should read the prospectus in that registration statement and other documents State Street Global Advisors and SSGA are registered trademarks of State Street Corporation. GLD has filed with the SEC for
more complete information about GLD and this offering. Please see the
There is no relationship between Dorsey Wright & Associates, LLC (collectively with
its parent companies and GLD prospectus for a detailed discussion of the risks of investing in GLD shares. When distributed affiliates, “Dorsey Wright”) and State Street Global Advisors (“SSGA”) other than a license by Dorsey
Wright to electronically, the GLD prospectus is available by clicking here. You may get these documents for
SSGA of certain Dorsey Wright trademarks and trade
names, and the Dorsey Wright Fixed Income Rotation Index free by visiting EDGAR on the SEC website at sec.gov or by visiting spdrgoldshares.com. Alternatively,
(“Index”), for use by SSGA. the Trust or any authorized participant will arrange to send you the prospectus if you request it by calling 866.320.4053.
BLOOMBERG®, a trademark and service mark of Bloomberg Finance L.P. and its affiliates, and BARCLAYS®, a trademark and service mark of Barclays Bank Plc,
have each been licensed for use in connection with the listing and GLD is not an investment company registered under the Investment Company Act of 1940 (the “1940 Act”) and is not trading of the SPDR Bloomberg Barclays ETFs. subject to
regulation under the Commodity Exchange Act of 1936 (the “CEA”). As a result, shareholders of the Trust do not have the protections associated with ownership of shares in an investment company registered under the Standard &
Poor’s®, S&P® and SPDR® are registered trademarks of Standard & Poor’s Financial Services LLC (S&P); 1940 Act or the protections afforded by the CEA.
Dow Jones is a registered trademark of Dow Jones Trademark Holdings LLC (Dow Jones); and these trademarks have been licensed for use by S&P Dow Jones Indices LLC (SPDJI) and
sublicensed for certain purposes by State GLD shares trade like stocks, are subject to investment risk and will fluctuate in market value. The value of GLD Street Corporation. State Street Corporation’s financial products are not sponsored,
endorsed, sold or promoted shares relates directly to the value of the gold held by GLD (less its expenses), and fluctuations in the price of by SPDJI, Dow Jones, S&P, their respective affiliates and third party licensors and none of such
parties make any gold could materially and adversely affect an investment in the shares. The price received upon the sale of the representation regarding the advisability of investing in such product(s) nor do they have any liability in relation
shares, which trade at market price, may be more or less than the value of the gold represented by them. GLD thereto, including for any errors, omissions, or interruptions of any index. does not generate any income, and as GLD regularly sells gold
to pay for its ongoing expenses, the amount of gold represented by each Share will decline over time to that extent.
Distributor: State Street Global
Advisors Funds Distributors, LLC, member FINRA, SIPC, an indirect wholly owned subsidiary of State Street Corporation. References to State Street may include State Street Corporation For more information, please contact the Marketing Agent for
GLD: State Street Global Advisors Funds and its affiliates. Certain State Street affiliates provide services and receive fees from the SPDR ETFs. ALPS Distributors, LLC, One Lincoln Street, Boston, MA, 02111; T: +1 866 320 4053
spdrgoldshares.com
Distributors, Inc., a registered broker-dealer, is distributor for SPDR S&P 500, SPDR S&P MidCap 400 and SPDR Before investing, consider
the funds’ investment objectives, risks, charges and expenses. Dow Jones Industrial Average, and all unit investment trusts. ALPS Portfolio Solutions Distributor, Inc. is distributor To obtain a prospectus or summary prospectus which contains
this and other information, call +1 617 664 7727 or visit spdrs.com. Read it carefully.
© 2017 State Street Corporation. All Rights Reserved.
State Street Global Advisors ID9838-IBG-24040 0617 Exp. Date: 06/30/2018 SPD001355
SPDR® GOLD TRUST has filed a registration statement (including a prospectus) with the SEC for the offering to which this communication relates. Before you invest, you should read the prospectus in that registration statement and other documents the issuer has filed with the SEC for more complete information about the Trust and this offering. You may get these documents for free by visiting EDGAR on the SEC Web site at www.sec.gov. Alternatively, the Trust or any Authorized Participant will arrange to send you the prospectus if you request it by calling toll free at 1-866-320-4053 or contacting State Street Global Markets, LLC, One Lincoln Street, Attn: SPDR® Gold Shares, 30th Floor, Boston, MA 02111.