UNITED STATES
SECURITIES AND EXCHANGE COMMISSION
Washington, D.C. 20549
SECURITIES AND EXCHANGE COMMISSION
Washington, D.C. 20549
FORM N-CSR
CERTIFIED SHAREHOLDER REPORT OF REGISTERED MANAGEMENT INVESTMENT COMPANIES
Investment Company Act file number 811-21309
Advent Convertible and Income Fund1
(Exact name of registrant as specified in charter)
(Exact name of registrant as specified in charter)
888 Seventh Ave, 31st Floor, New York, NY 10019
(Address of principal executive offices) (Zip code)
Robert White, Treasurer
888 Seventh Ave, 31st Floor, New York, NY 10019
(Name and address of agent for service)
(Name and address of agent for service)
Registrant’s telephone number, including area code: (212) 482-1600
Date of fiscal year end: October 31
Date of reporting period: November 1, 2018 - October 31, 2019
1 Effective July 1, 2019 the Registrant’s name changed from Advent Claymore Convertible Securities and Income Fund to Advent Convertible and Income Fund
Item 1. Reports to Stockholders.
The registrant’s annual report transmitted to shareholders pursuant to Rule 30e-1 under the Investment Company Act of 1940, as amended (the “Investment Company Act”), is as follows:
GUGGENHEIMINVESTMENTS.COM/AVK
...YOUR BRIDGE TO THE LATEST, MOST UP-TO-DATE INFORMATION ABOUT THE ADVENT
CONVERTIBLE AND INCOME FUND
The shareholder report you are reading right now is just the beginning of the story.
Online at guggenheiminvestments.com/avk, you will find:
|
•
|
Daily, weekly and monthly data on share prices, net asset values, dividends and more
|
|
•
|
Portfolio overviews and performance analyses
|
|
•
|
Announcements, press releases and special notices
|
|
•
|
Fund and adviser contact information
|
Advent Capital Management and Guggenheim Investments are continually updating and expanding shareholder information services on the Fund’s website in an ongoing effort to provide
you with the most current information about how your Fund’s assets are managed and the results of our efforts. It is just one more small way we are working to keep you better informed about your investment in the Fund.
|
(Unaudited)
|
October 31, 2019
|
DEAR SHAREHOLDER

Tracy V. Maitland
President and Chief Executive Officer
We thank you for your investment in the Advent Convertible and Income Fund (the “Fund” or “AVK”) (formerly known as Advent Claymore Convertible Securities and Income Fund). This report covers the Fund’s performance for the 12 months ended
October 31, 2019.President and Chief Executive Officer
Advent Capital Management, LLC (“Advent” or the “Investment Adviser”) serves as the Fund’s Investment Adviser. Based in New York, New York, with additional investment personnel
in London, England, Advent is a credit-oriented firm specializing in the management of global convertible, high-yield and equity securities across three lines of business—long-only strategies, hedge funds and closed-end funds. As of October 31,
2019, Advent managed approximately $9.4 billion in assets.
Guggenheim Funds Distributors, LLC (the “Servicing Agent”) serves as the servicing agent to the Fund. The Servicing Agent is an affiliate of Guggenheim Partners, LLC, a global
diversified financial services firm.
The Fund’s investment objective is to provide total return through a combination of capital appreciation and current income. Under normal market conditions, the Fund invests at
least 80% of its managed assets in a diversified portfolio of convertible securities and non-convertible income securities. Under normal market conditions, the Fund will invest at least 30% of its managed assets in convertible securities and may
invest up to 70% of its managed assets in non-convertible income securities. The Fund may invest without limitation in foreign securities. The Fund also uses a strategy of writing (selling) covered call options on up to 25% of the securities held
in the portfolio, thus generating option writing premiums.
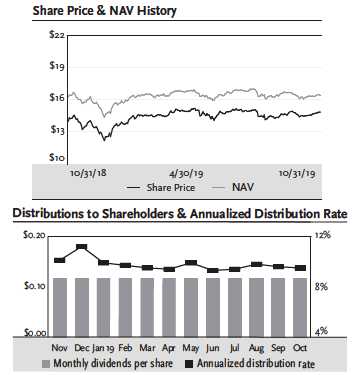
All AVK returns cited—whether based on net asset value (“NAV”) or market price—assume the reinvestment of all distributions. For the 12-month period ended October 31, 2019, the
Fund generated a total return based on market price of 17.01% and a total return of 9.94% based on NAV. As of October 31, 2019, the Fund’s market price of $14.79 represented a discount of 9.49% to NAV of $16.34.
Past performance is not a guarantee of future results. All NAV returns include the deduction of management fees, operating expenses, and all other Fund expenses. The market price
of the Fund’s shares fluctuates from time to time, and may be higher or lower than the Fund’s NAV.
AVK l ADVENT CONVERTIBLE AND INCOME FUND ANNUAL REPORT l 3
|
DEAR SHAREHOLDER (Unaudited) continued
|
October 31, 2019
|
The Fund paid a distribution each month of the annual period. The most recent monthly distribution, $0.1172, represents an annualized distribution rate of 9.51% based upon the
last closing market price of $14.79 on October 31, 2019.
There is no guarantee of any future distribution or that the current returns and distribution rate will be maintained. The Fund’s distribution rate is not constant and the amount
of distributions, when declared by the Fund’s Board of Trustees, is subject to change based on the performance of the Fund. Please see the Questions and Answers on page 5 for more information on distributions for the period.
We encourage shareholders to consider the opportunity to reinvest their distributions from the Fund through the Dividend Reinvestment Plan (“DRIP”), which is described in detail
on page 71 of this report. When shares trade at a discount to NAV, the DRIP takes advantage of the discount by reinvesting the monthly dividend distribution in common shares of the Fund purchased in the market at a price less than NAV. Conversely,
when the market price of the Fund’s common shares is at a premium above NAV, the DRIP reinvests participants’ dividends in newly issued common shares at the greater of NAV per share or 95% of the market price per share. The DRIP provides a
cost-effective means to accumulate additional shares and enjoy the benefits of compounding returns over time.
The Fund is managed by a team of experienced and seasoned professionals led by myself in my capacity as Chief Investment Officer (as well as President and Founder) of Advent
Capital Management, LLC. We encourage you to read the following Questions & Answers section, which provides additional information regarding the factors that influenced the Fund’s performance.
We thank you for your investment in the Fund and we are honored that you have chosen the Advent Convertible and Income Fund as part of your investment portfolio. For the most
up-to-date information regarding your investment, including related investment risks, please visit the Fund’s website at guggenheiminvestments.com/avk.
Sincerely,

Tracy V. Maitland
President and Chief Executive Officer of the
Advent Convertible and Income Fund
November 30, 2019
President and Chief Executive Officer of the
Advent Convertible and Income Fund
November 30, 2019
4 l AVK l ADVENT CONVERTIBLE AND INCOME FUND ANNUAL REPORT
|
QUESTIONS & ANSWERS (Unaudited)
|
October 31, 2019
|
The individuals who are primarily responsible for the day-to-day management of portfolio (the “Portfolio Managers”) of Advent Convertible and Income Fund (the
“Fund” or “AVK”) include Tracy Maitland (President and Chief Investment Officer of Advent), Paul Latronica (Managing Director of Advent) and Tony Huang (Director of Advent). Mr. Maitland and Mr. Latronica are portfolio managers and Mr. Huang is an
associate portfolio manager. The Portfolio Managers are supported by teams of investment professionals who make investment decisions for the Fund’s core portfolios of convertible bonds, the Fund’s high yield securities investments and the Fund’s
leverage allocation, respectively. In the following interview, the management team discusses the convertible securities and high yield markets and Fund performance for the 12-month period ended October 31, 2019.
Please describe the Fund’s objective and management strategies.
The Fund’s investment objective is to provide total return through a combination of capital appreciation and current income. Under normal market conditions, the Fund invests at
least 80% of its managed assets in a diversified portfolio of convertible securities and non-convertible income producing securities. Under normal market conditions, the Fund must invest at least 30% of its managed assets in convertible securities
and may invest up to 70% of its managed assets in nonconvertible income securities. The Fund may invest without limitation in foreign securities.
The Fund also uses a strategy of writing (selling) covered call options on up to 25% of the securities held in the portfolio. The objective of this strategy is to generate
current gains from option premiums to enhance distributions payable to the holders of common shares. In addition, the Fund may invest in other derivatives, such as put options, forward foreign currency exchange contracts, futures contracts, and
swaps.
The Fund uses financial leverage to finance the purchase of additional securities. Although financial leverage may create an opportunity for increased return for shareholders, it
also results in additional risks and can magnify the effect of any losses. There is no assurance that the strategy will be successful. If income and gains earned on securities purchased with the financial leverage proceeds are greater than the cost
of the financial leverage, shareholders’ return will be greater than if financial leverage had not been used. Conversely, if the income or gains from the securities purchased with the proceeds of financial leverage are less than the cost of the
financial leverage, shareholders’ return will be less than if financial leverage had not been used.
Discuss Advent’s investment approach.
Advent’s approach involves core portfolios of convertible bonds that are managed, subject to the Fund’s investment policies and restrictions, in a manner similar to that of
Advent’s Balanced Convertible Strategy and Global Balanced Convertible Strategy, which seek high total returns by investing in a portfolio of U.S.-dollar convertible securities and global convertible securities, respectively, that provide
equity-like returns while seeking to limit downside risk.
AVK l ADVENT CONVERTIBLE AND INCOME FUND ANNUAL REPORT l 5
|
QUESTIONS & ANSWERS (Unaudited) continued
|
October 31, 2019
|
These core portfolios are supplemented by investments in high yield securities selected in a manner similar to that of Advent’s High Yield Strategy, which seeks income and total
return by investing primarily in high yielding corporate credit using fundamental and relative value analysis to identify undervalued securities.
Advent uses a separate portion of the Fund’s portfolio to increase or decrease relative overall exposure to convertible securities, high yield securities, and equities. This
portion of the Fund’s portfolio incorporates leverage and operates as an asset-allocation tool reflecting Advent’s conservative management philosophy and its views on the relative value of these three asset classes under changing market conditions.
Please describe the economic and market environment over the last 12 months.
The end result of fiscal year 2019 was strong gains in the corporate bond and equity markets, but with significant periods of volatility, as in fiscal year 2018. Fiscal year 2019
began with a meaningful correction in the last two months of calendar year 2018, as fears of global demand slowdown began to take hold. Adding to this was the last U.S. Federal Reserve (the “Fed”) rate tightening in December, which markets began to
fear as a policy mistake. Equity markets corrected and corporate bond spreads widened as major economic data began decelerating. Yield curves continued a multi-quarter trend of flattening, as longer-maturity instruments reflected economic slowdown
more quickly than front-end bonds more sensitive to monetary policy.
However, reaction to the global slowing by the Fed was fairly swift, with a declaration early in the year that the target Federal Open Market Committee (“FOMC”) rate would not
rise throughout 2019. As economic data continued to fade in the spring, sentiment inside and outside the Fed moved toward adopting a series of rate reductions as a necessity to ensure economic expansion. Helped by falling inflation, the FOMC
instituted three reductions in the target rate to 1.50-1.75% as the fiscal year closed.
As 2019 progressed, rate reductions led to powerful rallies in the equity markets, falling spreads in the corporate bond markets, and major reductions in risk-free rates, with
the yield curves actually steepening as the fiscal year closed, after briefly inverting in the summer. While corporate profits stalled with slowing demand and difficult year-over-year comparisons after lapping the 2018 implementation of new
corporate tax law, equity market valuations rose with the monetary stimulus amidst optimism of a soft landing and possible reacceleration in 2020.
In certain months in the spring and summer, trade negotiations introduced volatility into the markets as U.S.-China talks resulted in the escalation and expansion of tariffs and
the goods to which they applied. As the fiscal year closed, trade diplomacy continued between the two nations, but with news reversing seemingly on a daily basis and uncertainty over extent of a first-phase agreement.
Optimism is plentiful about the next fiscal year as the lagged effect of both the Fed and European Central Bank monetary stimulus will be in full force. Corporate earnings could
be poised to reaccelerate with recovery in cyclical sectors. The 2020 U.S. elections promise to provide much
6 l AVK l ADVENT CONVERTIBLE AND INCOME FUND ANNUAL REPORT
|
QUESTIONS & ANSWERS (Unaudited) continued
|
October 31, 2019
|
uncertainty for investors to ponder, and populist protests and geopolitical strife around the world seem to be more common in recent months. However, the U.S. economy has proven
to be resilient, helped by the lower interest rates and liquidity injections and the willingness of consumers to spend as employment remains strong.
How did the Fund perform in this environment?
All AVK returns cited—whether based on net asset value (“NAV”) or market price—assume the reinvestment of all distributions. For the 12-month period ended October 31, 2019, the
Fund generated a total return based on market price of 17.01% and a total return of 9.94% based on NAV. As of October 31, 2019, the Fund’s market price of $14.79 represented a discount of 9.49% to NAV of $16.34. As of October 31, 2018, the Fund’s
market price of $13.93 represented a discount of 14.01% to NAV of $16.20.
Past performance is not a guarantee of future results. All NAV returns include the deduction of management fees, operating expenses, and all other Fund expenses. The market price
of the Fund’s shares fluctuates from time to time, and may be higher or lower than the Fund’s NAV.
How did other markets perform in this environment for the 12-month period ended October 31, 2019?
|
Index
|
Total Return
|
|
Bloomberg Barclays U.S. Aggregate Bond Index
|
11.51%
|
|
ICE Bank of America (“BofA”) Merrill Lynch U.S. Convertible Index
|
12.45%
|
|
ICE BofA Merrill Lynch U.S. High Yield Index
|
8.32%
|
|
Standard & Poor’s 500® (“S&P 500”) Index
|
14.32%
|
|
Thomson Reuters Convertible Global Focus USD Hedged Index
|
6.89%
|
|
MSCI World Index
|
12.69%
|
|
MSCI World 100% Hedged to USD Index
|
13.48%
|
What contributed to performance?
The ratio of returns between convertibles and equities at 87% is unusual given that the delta, or percent sensitivity of index securities to their underlying equities, is between
50-60%. However, the convertible market benefitted during the year from a higher exposure to the technology sector than the S&P 500, a favorable interest-rate environment that helped bond pricing, and higher volatility that enhanced pricing of
the embedded equity options.
Global convertibles to global equities (MSCI indices) had a reasonable 51% ratio.
In the U.S. high-yield corporate bond market, price gains from falling interest rates augmented the index’s strong coupon. This was a reversal from the previous fiscal year when
Fed rate hikes reduced bond prices and offset the universe’s coupon income.
AVK l ADVENT CONVERTIBLE AND INCOME FUND ANNUAL REPORT l 7
|
QUESTIONS & ANSWERS (Unaudited) continued
|
October 31, 2019
|
Please discuss the Fund’s distributions.
The Fund paid a distribution each month of the annual period. The most recent monthly distribution, $0.1172, represents an annualized distribution rate of 9.51% based upon the
last closing market price of $14.79 on October 31, 2019.
The Fund currently anticipates that some of the 2019 distributions will consist of income and some will be a return of capital. A final determination of the tax character of
distributions paid by the Fund in 2019 will be reported to shareholders in January 2020 on form 1099-DIV.
|
Payable Date
|
Amount
|
|
November 30, 2018
|
$0.1172
|
|
December 31, 2018
|
$0.1172
|
|
January 31, 2019
|
$0.1172
|
|
February 28, 2019
|
$0.1172
|
|
March 29, 2019
|
$0.1172
|
|
April 30, 2019
|
$0.1172
|
|
May 31, 2019
|
$0.1172
|
|
June 28, 2019
|
$0.1172
|
|
July 31, 2019
|
$0.1172
|
|
August 30, 2019
|
$0.1172
|
|
September 30, 2019
|
$0.1172
|
|
October 31, 2019
|
$0.1172
|
|
Total
|
$1.4064
|
There is no guarantee of any future distribution or that the current returns and distribution rate will be maintained. The Fund’s distribution rate is not constant and the amount
of distributions, when declared by the Fund’s Board of Trustees, is subject to change based on the performance of the Fund.
While the Fund generally seeks to pay distributions that will consist primarily of investment company taxable income and net capital gain, because of the nature of the Fund’s
investments and changes in market conditions from time to time, or in order to maintain a more stable distribution level over time, the distributions paid by the Fund for any particular period may be more or less than the amount of net investment
income from that period. If the Fund’s total distributions in any year exceed the amount of its investment company taxable income and net capital gain for the year, any such excess would generally be characterized as a return of capital for U.S.
federal income tax purposes.
A return of capital distribution is in effect a partial return of the amount a shareholder invested in the Fund. A return of capital does not necessarily reflect the Fund’s
investment performance and should not be confused with “yield” or “income.” A return of capital distribution decreases the Fund’s total assets and, therefore, could have the effect of increasing the Fund’s expense ratio. Please see Note 2(g) on
page 45 for more information on distributions for the period.
8 l AVK l ADVENT CONVERTIBLE AND INCOME FUND ANNUAL REPORT
|
QUESTIONS & ANSWERS (Unaudited) continued
|
October 31, 2019
|
How has the Fund’s leverage strategy affected performance?
As part of its investment strategy, the Fund utilizes leverage to finance the purchase of additional securities that provide increased income and potentially greater appreciation
potential to common shareholders than could be achieved from a portfolio that is not leveraged.
The Fund’s leverage outstanding as of October 31, 2019, consisted of $387 million in borrowings with a related average interest rate of 3.55% and was approximately 41% of the
Fund’s total managed assets. During the fiscal year, leverage stayed relatively constant as the market value of the Fund’s equity appreciated at a rate similar to the Fund’s distribution ratio.
The NAV return for the Fund was above the cost of leverage for the 12 months. Although Advent looks at funds deployed from borrowings differently than funds which use the
shareholder equity base, on this simple metric, the Fund’s leverage was beneficial to shareholders for the fiscal period.
Advent continues to seek attractive and relatively lower-risk opportunities to invest borrowings that have very low cost compared to history and plans to continue taking
advantage of the yield curve and interest rate environment for the benefit of shareholders.
What was the impact of the Fund’s covered call strategy?
Volatility during the fiscal year 2019 increased from the low levels that prevailed in the prior year. The CBOE VIX Volatility Index, or “VIX” for its ticker, averaged 16.8, up
from the average of 14.8 for fiscal 2018. The increase in volatility occurred almost entirely in the first quarter of the fiscal year as global economies slowed and the impact of the Fed’s rate increases weighed on equity sentiment. After the first
quarter, the VIX averaged 15.1, levels close to that of the prior fiscal year as Fed rate reductions helped stabilize the domestic economy and money flows. The Fund reduced its equity allocations as markets appreciated late in the fiscal period and
only made select call option sales given the calmer markets. When volatility is lower, the income generated from call option writing is less than at other times, making for a less favorable trade-off in deciding whether to cap upside participation
in equities held.
How were the Fund’s total investments allocated among asset classes during the 12 months ended October 31, 2019, and what did this mean for performance?
On October 31, 2019, the Fund’s total investments were invested approximately 47.6% in convertible bonds, convertible preferred securities, and mandatory convertibles; 42.8% in
corporate bonds; 5.2% in equities; 3.4% in cash and cash equivalents; and 1.0% in senior floating rate interests.
On October 31, 2018, the Fund’s total investments were invested approximately 48.8% in convertible bonds, convertible preferred securities, and mandatory convertibles; 37.9% in
corporate bonds; 9.1% in equities; 3.2% in cash and cash equivalents; and 1.0% in senior floating rate interests.
Asset class allocations were similar at the end of the prior fiscal year and the end of this fiscal year. The Fund did have a slightly higher allocation toward equities early in
the period, sourced primarily from high-yield, as strong economic growth in the U.S. coupled with higher corporate profit growth
AVK l ADVENT CONVERTIBLE AND INCOME FUND ANNUAL REPORT l 9
|
QUESTIONS & ANSWERS (Unaudited) continued
|
October 31, 2019
|
due partly to tax reform led to more opportunities for capital appreciation in the equity markets. Higher borrowing costs also led the asset allocation sleeve to invest more
capital in higher-dividend equities and less in convertibles and BB high-yield securities, where spreads had become less attractive. As the fiscal year reached a close, the effect of the Fed’s rate reductions had made a powerful impact on equity
valuations, all while corporate earnings growth had been roughly flat compared to 2018. As a result equity valuation multiples had risen and raised the downside risks. By fiscal year end, the Fund had reduced its equity position and boosted the
allocation to high-yield.
International investments were flat from 22.1% at October 2018 to 22.8% at October 2019. International economic growth struggled in 2019 as geopolitical events and trade tensions
hurt demand for many of the cyclical industries in foreign developed markets which are common issuers of convertible securities. Purchasing manager indices decelerated throughout the fiscal year, and while foreign developed equity indices advanced
in the fiscal year, it was not to the extent of the U.S. markets. Seeing more opportunities in U.S. issuers, especially as the Fed began reducing interest rates, the Fund did not increase its international securities allocation over the year.
Which investment decisions had the greatest effect on the Fund’s performance?
As discussed in the performance contributor section above, the Fund and convertible market continued to have strong performance thanks to exposure from technology sector issuers.
The semiconductor industry began the fiscal year in its first cyclical downturn in three years as global economies began to slow, but the downturn proved short-lived, and a recovery has been assisted by Fed rate reductions catalyzing investment
demand. Microchip Technology, a leading semiconductor maker and industry consolidator, benefitted from solid execution of its large Microsemi acquisition where synergies have resulted in over $1 billion of debt paydown since closure. Security
software provider Rapid7 is experiencing an acceleration of revenue growth in the 2019 calendar year to above 30% as it enters the large security information and event management market and adds new verticals such as the federal government.
Finally, within traditional convertible bonds, insulin device maker Insulet had a series of powerful quarterly earnings reports showing accelerated adoption of its DASH delivery system worldwide.
Although the convertible security universe tends to have lower maturities and duration than other fixed-income classes, two convertible preferred stocks issued by large banks
Wells Fargo and Bank of America had strong returns for the Fund during the fiscal year given the price gains experienced by similar securities of long-maturity fixed-income bonds. Yields for the 30-year U.S. Treasury fell from 3.39% to 2.18% during
the fiscal year, and these convertible preferred stocks are more sensitive to the rate environment than the equities. Lastly, high-yield bonds of office products retailer Staples had strong returns after the company chose to call the bonds as part
of a refinancing. That call involved a valuable make-whole payment to holders of the remaining coupons and led to a substantial price gain.
Among detractors, convertibles in cloud networking hardware vendor Nutanix declined after the company struggled to perform an encore to its 30% growth in calendar year 2018, and
experienced deceleration in its sales funnel. This, plus aggressive spending on new product initiatives, reversed
10 l AVK l ADVENT CONVERTIBLE AND INCOME FUND ANNUAL REPORT
|
QUESTIONS & ANSWERS (Unaudited) continued
|
October 31, 2019
|
cash flow momentum, hurting profitability and the stock valuation. While fundamentals rebounded somewhat closing the Fund’s fiscal year, the Fund reduced the position given the
cash flow direction and lack of delta participation in the bonds.
In energy, the Fund’s sleeves have generally been underweight versus benchmarks, but some individual holdings performed poorly in the context of an entire sector that depreciated
during the fiscal year. Oil and natural gas prices struggled in fiscal 2019, with global demand waning with the worldwide economic slowdown and oil supply from U.S. producers offsetting production cuts from the Organization of Petroleum Exporting
Countries. Convertibles and high-yield bonds held in Oasis Petroleum fell after the company experienced production shortfalls and was forced to raise capital spending, thereby pushing out reaching cash flow break-even. High-yield bonds of oil
services provider Superior Energy also suffered as customers reduced capital spending. As of the end of the fiscal year, the Fund’s energy exposure remains modest at approximately 5% of total assets and weighted heavily toward straight bond
holdings with little-to-no direct equity risk.
Stock holdings in retailer Macy’s declined as the company struggled with online competition and high inventories. The theory that Macy’s would benefit from the bankruptcy of
competitor Sears did not play out as Macy’s inexpensive share valuation worsened. Convertibles in Chinese media provider iQIYI fell amidst macro uncertainty in China and lower advertising revenues along with negative sentiment related to trade
uncertainty between China and the U.S. The company’s plans to monetize more users in mid-tier Chinese cities and to control content costs appear intact, and convertibles remain attractive from a yield and upside participation standpoint.
AVK l ADVENT CONVERTIBLE AND INCOME FUND ANNUAL REPORT l 11
|
QUESTIONS & ANSWERS (Unaudited) continued
|
October 31, 2019
|
Index Definitions
The following indices are referenced throughout this report. It is not possible to invest directly in an index. These indices are intended as measures of broad market returns.
The Fund’s mandate differs materially from each of the individual indices. The Fund also maintains leverage and incurs transaction costs, advisory fees, and other expenses, while these indices do not.
Bloomberg Barclays U.S. Aggregate Bond Index is a broad-based flagship benchmark that measures the
investment grade, U.S. dollar-denominated, fixed-rate taxable bond market, including U.S. Treasuries, government-related and corporate securities, mortgage-backed securities or “MBS” (agency fixed-rate and hybrid adjustable-rate mortgage, or
“ARM”, pass-throughs), asset-backed securities (“ABS”), and commercial mortgage-backed securities (“CMBS”) (agency and non-agency).
VIX is the ticker symbol for the Chicago Board Options Exchange Market Volatility Index, a popular measure of the implied volatility of
S&P 500 Index options. It is a weighted blend of prices for a range of options on the S&P 500 Index.
ICE BofA Merrill Lynch U.S. Convertible Index consists of convertible bonds traded in the U.S. dollar
denominated investment grade and noninvestment grade convertible securities sold into the U.S. market and publicly traded in the United States. The Index constituents are market-value weighted based on the convertible securities prices and
outstanding shares, and the underlying index is rebalanced daily.
ICE BofA Merrill Lynch U.S High Yield Index includes USD-denominated, high yield, fixed-rate corporate
securities. Securities are classified as high yield if the rating of Moody’s, Fitch, or S&P is Ba1/BB +/BB + or below.
S&P 500® Index is a
capitalization-weighted index of 500 stocks designed to measure the performance of the broad economy, representing all major industries and is considered a representation of U.S. stock market.
Thomson Reuters Convertible Global Focus USD Hedged Index is a market-weighted index with a minimum
size for inclusion of $500 million (US), €200 million (Europe), ¥22 billion (Japan), and $275 million (Other) of Convertible Bonds with an Equity Link.
AVK Risks and Other Considerations
The views expressed in this report reflect those of the Investment Adviser only through the report period as stated on the cover. These views are subject to change at any time,
based on market and other conditions and should not be construed as a recommendation of any kind. The material may also contain forward-looking statements that involve risk and uncertainty, and there is no guarantee they will come to pass. There
can be no assurance that the Fund will achieve its investment objectives or avoid losses. The value of the Fund will fluctuate with the value of the underlying securities.
12 l AVK l ADVENT CONVERTIBLE AND INCOME FUND ANNUAL REPORT
|
QUESTIONS & ANSWERS (Unaudited) continued
|
October 31, 2019
|
Historically, closed-end funds often trade at a discount to their net asset value. In the normal course of business, the Fund trades financial instruments and enters into
financial transactions where risk of potential loss exists due to, among other things, changes in the market (market risk) or the potential inability of a counterparty to meet the terms of an agreement (counterparty risk). The Fund is also exposed
to other risks such as, but not limited to, concentration, interest rate, credit and financial leverage risks.
Please see Note 2(i) beginning on page 46 for a discussion of certain Fund risks and considerations.
This material is not intended as a recommendation or as investment advice of any kind, including in connection with rollovers, transfers,
and distributions. Such material is not provided in a fiduciary capacity, may not be relied upon for or in connection with the making of investment decisions, and does not constitute a solicitation of an offer to buy or sell securities. All content
has been provided for informational or educational purposes only and is not intended to be and should not be construed as legal or tax advice and/or a legal opinion. Always consult a financial, tax and/or legal professional regarding your specific
situation.
AVK l ADVENT CONVERTIBLE AND INCOME FUND ANNUAL REPORT l 13
|
FUND SUMMARY (Unaudited)
|
|
|
October 31, 2019
|
|
|
|
||||
|
Fund Statistics
|
|
|
|
|
|
Share Price
|
|
|
|
$14.79
|
|
Net Asset Value
|
|
|
|
$16.34
|
|
Discount to NAV
|
|
|
|
-9.49%
|
|
Net Assets ($000)
|
|
|
|
$564,148
|
|
|
||||
|
AVERAGE ANNUAL TOTAL RETURNS
|
|
|
|
|
|
FOR THE PERIOD ENDED October 31, 2019
|
|
|
|
|
|
|
One
|
Three
|
Five
|
Ten
|
|
|
Year
|
Year
|
Year
|
Year
|
|
Advent Convertible and
|
|
|
|
|
|
Income Fund
|
|
|
|
|
|
NAV
|
9.94%
|
8.48%
|
4.50%
|
7.40%
|
|
Market
|
17.01%
|
11.26%
|
5.31%
|
8.57%
|
|
Portfolio Breakdown
|
|
|
% of Net Assets
|
|
|
Corporate Bonds
|
|
|
|
72.0%
|
|
Convertible Bonds
|
|
|
|
65.6%
|
|
Convertible Preferred Stocks
|
|
|
|
14.5%
|
|
Common Stocks
|
|
|
|
8.8%
|
|
Money Market Fund
|
|
|
|
5.8%
|
|
Senior Floating Rate Interests
|
|
|
|
1.7%
|
|
Options Written
|
|
|
|
-0.1%
|
|
Total Investments
|
|
|
|
168.3%
|
|
Other Assets & Liabilities, net
|
|
|
|
-68.3%
|
|
Net Assets
|
|
|
|
100.0%
|
Past performance does not guarantee future results and does not reflect the deductions of taxes that a shareholder would pay on fund distributions. All NAV returns include the
deduction of management fees, operating expenses and all other Fund expenses. All portfolio data is subject to change daily. For more information, please visit guggenheiminvestments.com/avk.
The above summaries are provided for informational purposes only and should not be viewed as recommendations.
14 l AVK l ADVENT CONVERTIBLE AND INCOME FUND ANNUAL REPORT
|
FUND SUMMARY (Unaudited) continued
|
October 31, 2019
|
All or a portion of the above distributions may be characterized as a return of capital. For the year ended October 31, 2019, 60% of the distributions were characterized as
return of capital. The final determination of the tax character of the distributions paid by the Fund in 2019 will be reported to shareholders in January 2020.
|
Country Diversification
|
|
|
|
|
|
Country
|
% of Long-Term Investments
|
|
United States
|
77.2%
|
|
Cayman Islands
|
4.3%
|
|
Canada
|
3.6%
|
|
Netherlands
|
3.1%
|
|
France
|
1.8%
|
|
Japan
|
1.6%
|
|
Bermuda
|
1.4%
|
|
Luxembourg
|
0.9%
|
|
China
|
0.8%
|
|
United Kingdom
|
0.7%
|
|
Panama
|
0.7%
|
|
Australia
|
0.5%
|
|
Germany
|
0.5%
|
|
Jersey
|
0.4%
|
|
Greece
|
0.3%
|
|
Finland
|
0.3%
|
|
Spain
|
0.3%
|
|
Switzerland
|
0.3%
|
|
Monaco
|
0.2%
|
|
Virgin Islands (UK)
|
0.2%
|
|
Austria
|
0.2%
|
|
Hong Kong
|
0.2%
|
|
Malaysia
|
0.2%
|
|
Taiwan, Province of China
|
0.1%
|
|
Belgium
|
0.1%
|
|
Denmark
|
0.1%
|
|
Total Long-Term Investments
|
100.0%
|
|
|
|
|
|
|
|
|
AVK l ADVENT CONVERTIBLE AND INCOME FUND ANNUAL REPORT l 15
|
|
PORTFOLIO OF INVESTMENTS
|
|
October 31, 2019
|
|
|
||
|
|
Shares
|
Value
|
|
|
||
|
COMMON STOCKS† – 8.8%
|
|
|
|
Consumer, Cyclical – 4.2%
|
|
|
|
Six Flags Entertainment Corp.1
|
163,000
|
$ 6,876,970
|
|
Carnival Corp.1
|
150,000
|
6,433,500
|
|
Delta Air Lines, Inc.1
|
100,000
|
5,508,000
|
|
Las Vegas Sands Corp.
|
75,000
|
4,638,000
|
|
Total Consumer, Cyclical
|
|
23,456,470
|
|
|
||
|
Industrial – 1.9%
|
|
|
|
Boeing Co.1
|
19,200
|
6,526,272
|
|
Eaton Corporation plc1
|
50,000
|
4,355,500
|
|
Total Industrial
|
|
10,881,772
|
|
|
||
|
Technology – 0.8%
|
|
|
|
Western Digital Corp.1
|
90,000
|
4,648,500
|
|
|
||
|
Financial – 0.7%
|
|
|
|
Citigroup, Inc.
|
50,000
|
3,593,000
|
|
|
||
|
Communications – 0.6%
|
|
|
|
Alibaba Group Holding Ltd. ADR*
|
20,000
|
3,533,400
|
|
|
||
|
Energy – 0.6%
|
|
|
|
Chevron Corp.1
|
30,000
|
3,484,200
|
|
Total Common Stocks
|
|
|
|
(Cost $51,049,683)
|
|
49,597,342
|
|
|
||
|
CONVERTIBLE PREFERRED STOCKS† – 14.5%
|
|
|
|
Financial – 3.6%
|
|
|
|
Wells Fargo & Co.
|
|
|
|
7.50% 1,4
|
6,000
|
9,067,975
|
|
Bank of America Corp.
|
|
|
|
7.25%1,4
|
4,000
|
6,066,360
|
|
Crown Castle International Corp.
|
|
|
|
6.88% due 08/01/201
|
1,996
|
2,486,397
|
|
QTS Realty Trust, Inc.
|
|
|
|
6.50%1,4
|
15,083
|
1,892,012
|
|
Assurant, Inc.
|
|
|
|
6.50% due 03/15/21
|
5,387
|
673,213
|
|
Total Financial
|
|
20,185,957
|
|
|
||
|
Consumer, Non-cyclical – 2.7%
|
|
|
|
Danaher Corp.
|
|
|
|
4.75% due 04/15/221
|
6,535
|
7,255,941
|
|
Bunge Ltd.
|
|
|
|
4.88%1,4
|
36,391
|
3,694,327
|
|
See notes to financial statements.
|
|
|
|
16 l AVK l ADVENT CONVERTIBLE AND INCOME FUND ANNUAL REPORT |
|
PORTFOLIO OF INVESTMENTS continued
|
|
October 31, 2019
|
|
|
Shares
|
Value
|
|
|
||
|
CONVERTIBLE PREFERRED STOCKS† – 14.5% (continued)
|
|
|
|
Consumer, Non-cyclical – 2.7% (continued)
|
|
|
|
Becton Dickinson and Co.
|
|
|
|
6.13% due 05/01/201
|
52,354
|
$ 3,229,195
|
|
Avantor, Inc.
|
|
|
|
6.25% due 05/15/221
|
25,867
|
1,345,343
|
|
Total Consumer, Non-cyclical
|
|
15,524,806
|
|
|
||
|
Technology – 2.7%
|
|
|
|
Broadcom, Inc.
|
|
|
|
8.00% due 09/30/221
|
13,158
|
14,250,377
|
|
Change Healthcare, Inc.
|
|
|
|
6.00% due 06/30/221
|
15,756
|
796,151
|
|
Total Technology
|
|
15,046,528
|
|
|
||
|
Industrial – 2.3%
|
|
|
|
Energizer Holdings, Inc.
|
|
|
|
7.50% due 01/15/221
|
97,842
|
9,085,608
|
|
Fortive Corp.
|
|
|
|
5.00% due 07/01/211
|
1,836
|
1,663,428
|
|
Stanley Black & Decker, Inc.
|
|
|
|
5.38% due 05/15/201
|
11,555
|
1,177,917
|
|
Colfax Corp.
|
|
|
|
5.75% due 01/15/221
|
5,343
|
783,337
|
|
Total Industrial
|
|
12,710,290
|
|
|
||
|
Utilities – 1.8%
|
|
|
|
Dominion Energy, Inc.
|
|
|
|
7.25% due 06/01/221
|
18,505
|
1,982,811
|
|
DTE Energy Co.
|
|
|
|
6.25% due 11/01/22*
|
38,565
|
1,958,330
|
|
Southern Co.
|
|
|
|
6.75% due 08/01/221
|
34,367
|
1,821,451
|
|
CenterPoint Energy, Inc.
|
|
|
|
7.00% due 09/01/211
|
25,266
|
1,288,566
|
|
Sempra Energy
|
|
|
|
6.75% due 07/15/211
|
10,450
|
1,214,238
|
|
American Electric Power Company, Inc.
|
|
|
|
6.13% due 03/15/221
|
18,997
|
1,044,645
|
|
NextEra Energy, Inc.
|
|
|
|
4.87% due 09/01/221
|
17,700
|
900,222
|
|
Total Utilities
|
|
10,210,263
|
See notes to financial statements.
AVK l ADVENT CONVERTIBLE AND INCOME FUND ANNUAL REPORT l 17
|
PORTFOLIO OF INVESTMENTS continued
|
|
October 31, 2019
|
|
|
Shares
|
Value
|
|
|
||
|
CONVERTIBLE PREFERRED STOCKS† – 14.5% (continued)
|
|
|
|
Basic Materials – 1.4%
|
|
|
|
International Flavors & Fragrances, Inc.
|
|
|
|
6.00% due 09/15/211
|
169,564
|
$ 7,930,508
|
|
Total Convertible Preferred Stocks
|
|
|
|
(Cost $75,653,061)
|
|
81,608,352
|
|
|
||
|
MONEY MARKET FUND† – 5.8%
|
|
|
|
Morgan Stanley Institutional Liquidity Government Portfolio –
|
|
|
|
Institutional Class 1.72%2
|
32,701,173
|
32,701,173
|
|
Total Money Market Fund
|
|
|
|
(Cost $32,701,173)
|
|
32,701,173
|
|
|
Face
|
|
|
|
Amount~
|
Value
|
|
|
||
|
CORPORATE BONDS†† – 72.0%
|
|
|
|
Consumer, Non-cyclical – 13.2%
|
|
|
|
Bausch Health Companies, Inc.
|
|
|
|
5.75% due 08/15/271,3
|
4,690,000
|
$ 5,104,772
|
|
7.00% due 03/15/241,3
|
2,587,000
|
2,712,922
|
|
HCA, Inc.
|
|
|
|
7.50% due 02/15/221
|
5,190,000
|
5,771,280
|
|
7.69% due 06/15/251
|
1,112,000
|
1,345,520
|
|
Tenet Healthcare Corp.
|
|
|
|
4.63% due 07/15/241
|
2,146,000
|
2,218,428
|
|
4.88% due 01/01/263
|
1,983,000
|
2,054,884
|
|
7.00% due 08/01/25
|
1,837,000
|
1,908,551
|
|
Encompass Health Corp.
|
|
|
|
5.75% due 09/15/251
|
3,782,000
|
3,966,372
|
|
5.75% due 11/01/241
|
1,834,000
|
1,858,071
|
|
Land O’Lakes Capital Trust I
|
|
|
|
7.45% due 03/15/281,3
|
3,750,000
|
4,237,500
|
|
United Rentals North America, Inc.
|
|
|
|
6.50% due 12/15/261
|
3,793,000
|
4,120,146
|
|
Molina Healthcare, Inc.
|
|
|
|
5.38% due 11/15/221
|
3,830,000
|
4,055,013
|
|
Capitol Investment Merger Sub 2 LLC
|
|
|
|
10.00% due 08/01/241,3
|
3,597,000
|
3,713,902
|
|
MEDNAX, Inc.
|
|
|
|
6.25% due 01/15/271,3
|
3,729,000
|
3,701,032
|
|
Nielsen Finance LLC / Nielsen Finance Co.
|
|
|
|
5.00% due 04/15/221,3
|
3,596,000
|
3,632,032
|
|
Magellan Health, Inc.
|
|
|
|
4.90% due 09/22/241
|
3,556,000
|
3,538,220
|
|
Centene Corp.
|
|
|
|
4.75% due 05/15/221
|
3,430,000
|
3,515,750
|
|
See notes to financial statements.
|
|
|
|
18 l AVK l ADVENT CONVERTIBLE AND INCOME FUND ANNUAL REPORT
|
|
|
|
PORTFOLIO OF INVESTMENTS continued
|
|
October 31, 2019
|
|
|
Face
|
|
|
|
Amount~
|
Value
|
|
|
||
|
CORPORATE BONDS†† – 72.0% (continued)
|
|
|
|
Consumer, Non-cyclical – 13.2% (continued)
|
|
|
|
Ritchie Bros Auctioneers, Inc.
|
|
|
|
5.38% due 01/15/251,3
|
3,249,000
|
$ 3,403,328
|
|
Constellation Brands, Inc.
|
|
|
|
3.15% due 08/01/291
|
3,253,000
|
3,319,397
|
|
Cardtronics Incorporated / Cardtronics USA Inc
|
|
|
|
5.50% due 05/01/251,3
|
2,569,000
|
2,665,338
|
|
Ortho-Clinical Diagnostics Incorporated / Ortho-Clinical Diagnostics S.A.
|
|
|
|
6.63% due 05/15/221,3
|
2,233,000
|
2,160,428
|
|
Spectrum Brands, Inc.
|
|
|
|
5.75% due 07/15/251
|
1,758,000
|
1,841,505
|
|
Central Garden & Pet Co.
|
|
|
|
6.13% due 11/15/231
|
1,419,000
|
1,473,986
|
|
Envision Healthcare Corp.
|
|
|
|
8.75% due 10/15/263
|
1,857,000
|
1,077,060
|
|
Dean Foods Co.
|
|
|
|
6.50% due 03/15/233
|
2,132,000
|
1,012,700
|
|
Service Corporation International
|
|
|
|
8.00% due 11/15/21
|
159,000
|
175,695
|
|
Land O’ Lakes, Inc.
|
|
|
|
6.00% due 11/15/221,3
|
45,000
|
47,981
|
|
Total Consumer, Non-cyclical
|
|
74,631,813
|
|
|
||
|
Consumer, Cyclical – 12.8%
|
|
|
|
Scientific Games International, Inc.
|
|
|
|
10.00% due 12/01/221
|
3,336,000
|
3,440,250
|
|
8.25% due 03/15/261,3
|
1,868,000
|
1,980,080
|
|
Navistar International Corp.
|
|
|
|
6.63% due 11/01/253
|
4,500,000
|
4,612,500
|
|
Eagle Intermediate Global Holding BV/Ruyi US Finance LLC
|
|
|
|
7.50% due 05/01/251,3
|
5,230,000
|
4,582,788
|
|
Staples, Inc.
|
|
|
|
10.75% due 04/15/271,3
|
2,595,000
|
2,705,288
|
|
7.50% due 04/15/261,3
|
1,770,000
|
1,845,579
|
|
Dana Financing Luxembourg Sarl
|
|
|
|
6.50% due 06/01/261,3
|
3,636,000
|
3,835,980
|
|
Enterprise Development Authority
|
|
|
|
12.00% due 07/15/241,3
|
3,432,000
|
3,775,200
|
|
Downstream Development Authority of the Quapaw Tribe of Oklahoma
|
|
|
|
10.50% due 02/15/231,3
|
3,546,000
|
3,749,895
|
|
Churchill Downs, Inc.
|
|
|
|
4.75% due 01/15/281,3
|
3,011,000
|
3,131,440
|
|
5.50% due 04/01/271,3
|
428,000
|
454,750
|
|
Michaels Stores, Inc.
|
|
|
|
8.00% due 07/15/271,3
|
3,371,000
|
3,340,492
|
See notes to financial statements.
AVK l ADVENT CONVERTIBLE AND INCOME FUND ANNUAL REPORT l 19
|
PORTFOLIO OF INVESTMENTS continued
|
|
October 31, 2019
|
|
|
Face
|
|
|
|
Amount~
|
Value
|
|
|
||
|
CORPORATE BONDS†† – 72.0% (continued)
|
|
|
|
Consumer, Cyclical – 12.8% (continued)
|
|
|
|
Wolverine World Wide, Inc.
|
|
|
|
5.00% due 09/01/261,3
|
3,201,000
|
$ 3,249,015
|
|
Truck Hero, Inc.
|
|
|
|
8.50% due 04/21/241,3
|
3,174,000
|
3,162,097
|
|
Mattamy Group Corp.
|
|
|
|
6.88% due 12/15/231,3
|
3,037,000
|
3,154,684
|
|
Wynn Macau Ltd.
|
|
|
|
5.50% due 10/01/273
|
2,754,000
|
2,840,923
|
|
American Greetings Corp.
|
|
|
|
8.75% due 04/15/251,3
|
3,040,000
|
2,796,800
|
|
Carlson Travel, Inc.
|
|
|
|
9.50% due 12/15/243
|
2,600,000
|
2,632,500
|
|
TRI Pointe Group, Inc.
|
|
|
|
4.88% due 07/01/211
|
2,484,000
|
2,564,730
|
|
Delphi Technologies plc
|
|
|
|
5.00% due 10/01/251,3
|
2,745,000
|
2,388,150
|
|
Goodyear Tire & Rubber Co.
|
|
|
|
8.75% due 08/15/201
|
2,130,000
|
2,233,838
|
|
AAG FH Limited Partnership / AAG FH Finco, Inc.
|
|
|
|
9.75% due 07/15/241,3
|
2,254,000
|
2,090,585
|
|
Six Flags Entertainment Corp.
|
|
|
|
4.88% due 07/31/241,3
|
2,000,000
|
2,070,000
|
|
Tempur Sealy International, Inc.
|
|
|
|
5.63% due 10/15/231
|
2,000,000
|
2,065,000
|
|
Scotts Miracle-Gro Co.
|
|
|
|
5.25% due 12/15/261
|
1,716,000
|
1,812,525
|
|
GameStop Corp.
|
|
|
|
6.75% due 03/15/211,3
|
1,250,000
|
1,256,250
|
|
William Carter Co.
|
|
|
|
5.63% due 03/15/271,3
|
703,000
|
754,846
|
|
Total Consumer, Cyclical
|
|
72,526,185
|
|
|
||
|
Communications – 11.7%
|
|
|
|
Sprint Corp.
|
|
|
|
7.88% due 09/15/231
|
6,900,000
|
7,633,125
|
|
7.25% due 09/15/21
|
1,731,000
|
1,851,408
|
|
Sirius XM Radio, Inc.
|
|
|
|
5.38% due 04/15/251,3
|
5,000,000
|
5,218,750
|
|
3.88% due 08/01/221,3
|
2,689,000
|
2,759,586
|
|
5.00% due 08/01/271,3
|
297,000
|
313,335
|
|
CenturyLink, Inc.
|
|
|
|
6.45% due 06/15/211
|
3,312,000
|
3,494,160
|
|
6.88% due 01/15/281
|
1,284,000
|
1,367,460
|
|
CommScope, Inc.
|
|
|
|
8.25% due 03/01/271,3
|
4,674,000
|
4,444,881
|
|
|
||
|
See notes to financial statements.
|
|
|
|
20 l AVK l ADVENT CONVERTIBLE AND INCOME FUND ANNUAL REPORT
|
|
|
|
PORTFOLIO OF INVESTMENTS continued
|
|
October 31, 2019
|
|
|
Face
|
|
|
|
Amount~
|
Value
|
|
|
||
|
CORPORATE BONDS†† – 72.0% (continued)
|
|
|
|
Communications – 11.7% (continued)
|
|
|
|
Altice Luxembourg S.A.
|
|
|
|
10.50% due 05/15/271,3
|
3,547,000
|
$ 4,021,411
|
|
Charter Communications Operating LLC / Charter Communications Operating Capital
|
|
|
|
3.58% due 07/23/201
|
3,900,000
|
3,933,793
|
|
Symantec Corp.
|
|
|
|
5.00% due 04/15/251,3
|
3,775,000
|
3,873,401
|
|
DISH DBS Corp.
|
|
|
|
6.75% due 06/01/211
|
2,015,000
|
2,120,788
|
|
5.13% due 05/01/201
|
1,716,000
|
1,737,450
|
|
Diamond Sports Group LLC / Diamond Sports Finance Co.
|
|
|
|
5.38% due 08/15/261,3
|
3,360,000
|
3,519,600
|
|
Cincinnati Bell, Inc.
|
|
|
|
8.00% due 10/15/251,3
|
3,534,000
|
3,171,765
|
|
MDC Partners, Inc.
|
|
|
|
6.50% due 05/01/241,3
|
3,293,000
|
3,165,396
|
|
Meredith Corp.
|
|
|
|
6.88% due 02/01/261
|
2,601,000
|
2,693,934
|
|
National CineMedia LLC
|
|
|
|
6.00% due 04/15/221
|
1,774,000
|
1,796,352
|
|
5.88% due 04/15/281,3
|
659,000
|
694,323
|
|
Photo Holdings Merger Sub, Inc.
|
|
|
|
8.50% due 10/01/261,3
|
2,808,000
|
2,478,425
|
|
Nokia Oyj
|
|
|
|
3.38% due 06/12/221
|
2,361,000
|
2,393,464
|
|
T-Mobile USA, Inc.
|
|
|
|
4.00% due 04/15/221
|
1,741,000
|
1,801,430
|
|
GrubHub Holdings, Inc.
|
|
|
|
5.50% due 07/01/271,3
|
1,741,000
|
1,636,540
|
|
Total Communications
|
|
66,120,777
|
|
|
||
|
Basic Materials – 8.6%
|
|
|
|
Alcoa Nederland Holding BV
|
|
|
|
6.75% due 09/30/241,3
|
4,000,000
|
4,225,000
|
|
6.13% due 05/15/281,3
|
3,495,000
|
3,757,125
|
|
Commercial Metals Co.
|
|
|
|
5.75% due 04/15/261
|
3,019,000
|
3,120,891
|
|
4.88% due 05/15/231
|
3,000,000
|
3,112,500
|
|
FMG Resources August 2006 Pty Ltd.
|
|
|
|
4.75% due 05/15/221,3
|
2,756,000
|
2,849,015
|
|
5.13% due 03/15/231,3
|
2,000,000
|
2,087,500
|
|
First Quantum Minerals Ltd.
|
|
|
|
6.88% due 03/01/263
|
3,924,000
|
3,860,235
|
|
7.50% due 04/01/253
|
800,000
|
805,000
|
|
New Gold, Inc.
|
|
|
|
6.38% due 05/15/251,3
|
3,850,000
|
3,677,135
|
See notes to financial statements.
AVK l ADVENT CONVERTIBLE AND INCOME FUND ANNUAL REPORT l 21
|
PORTFOLIO OF INVESTMENTS continued
|
|
October 31, 2019
|
|
|
Face
|
|
|
|
Amount~
|
Value
|
|
|
||
|
CORPORATE BONDS†† – 72.0% (continued)
|
|
|
|
Basic Materials – 8.6% (continued)
|
|
|
|
Valvoline, Inc.
|
|
|
|
5.50% due 07/15/241
|
2,406,000
|
$ 2,509,007
|
|
4.38% due 08/15/251
|
1,000,000
|
1,022,500
|
|
Compass Minerals International, Inc.
|
|
|
|
4.88% due 07/15/241,3
|
3,281,000
|
3,215,380
|
|
AK Steel Corp.
|
|
|
|
7.50% due 07/15/231
|
3,100,000
|
3,123,250
|
|
Steel Dynamics, Inc.
|
|
|
|
5.50% due 10/01/241
|
2,563,000
|
2,647,015
|
|
Freeport-McMoRan, Inc.
|
|
|
|
3.55% due 03/01/221
|
2,293,000
|
2,324,529
|
|
TPC Group, Inc.
|
|
|
|
10.50% due 08/01/241,3
|
2,016,000
|
2,147,040
|
|
Kaiser Aluminum Corp.
|
|
|
|
5.88% due 05/15/241
|
2,038,000
|
2,124,615
|
|
Tronox Finance plc
|
|
|
|
5.75% due 10/01/251,3
|
1,983,000
|
1,878,892
|
|
Total Basic Materials
|
|
48,486,629
|
|
|
||
|
Energy – 8.6%
|
|
|
|
PBF Holding Company LLC / PBF Finance Corp.
|
|
|
|
7.25% due 06/15/251
|
3,857,000
|
4,045,029
|
|
Parsley Energy LLC / Parsley Finance Corp.
|
|
|
|
5.63% due 10/15/271,3
|
2,158,000
|
2,238,925
|
|
5.38% due 01/15/251,3
|
1,703,000
|
1,761,719
|
|
Calumet Specialty Products Partners Limited Partnership / Calumet Finance Corp.
|
|
|
|
11.00% due 04/15/251,3
|
3,698,000
|
3,716,490
|
|
Parkland Fuel Corp.
|
|
|
|
5.88% due 07/15/271,3
|
3,178,000
|
3,371,286
|
|
PDC Energy, Inc.
|
|
|
|
5.75% due 05/15/261
|
3,433,000
|
3,218,438
|
|
Genesis Energy Limited Partnership / Genesis Energy Finance Corp.
|
|
|
|
6.25% due 05/15/261
|
3,431,000
|
3,190,830
|
|
Oasis Petroleum, Inc.
|
|
|
|
6.25% due 05/01/261,3
|
4,465,000
|
3,058,525
|
|
Ascent Resources Utica Holdings LLC / ARU Finance Corp.
|
|
|
|
7.00% due 11/01/261,3
|
2,100,000
|
1,617,000
|
|
10.00% due 04/01/221,3
|
1,438,000
|
1,367,969
|
|
Murphy Oil Corp.
|
|
|
|
6.88% due 08/15/241
|
2,688,000
|
2,848,850
|
|
Plains All American Pipeline, LP
|
|
|
|
6.13% 4,5
|
3,000,000
|
2,802,060
|
|
Continental Resources, Inc.
|
|
|
|
5.00% due 09/15/221
|
2,598,000
|
2,619,566
|
|
|
||
|
See notes to financial statements.
|
|
|
|
22 l AVK l ADVENT CONVERTIBLE AND INCOME FUND ANNUAL REPORT
|
|
|
|
PORTFOLIO OF INVESTMENTS continued
|
|
October 31, 2019
|
|
|
Face
|
|
|
|
Amount~
|
Value
|
|
|
||
|
CORPORATE BONDS†† – 72.0% (continued)
|
|
|
|
Energy – 8.6% (continued)
|
|
|
|
Alliance Resource Operating Partners Limited Partnership / Alliance Resource Finance Corp.
|
|
|
|
7.50% due 05/01/251,3
|
2,859,000
|
$ 2,430,150
|
|
Summit Midstream Holdings LLC / Summit Midstream Finance Corp.
|
|
|
|
5.75% due 04/15/251
|
2,768,000
|
2,159,040
|
|
5.50% due 08/15/221
|
125,000
|
112,500
|
|
Gulfport Energy Corp.
|
|
|
|
6.00% due 10/15/24
|
3,430,000
|
2,220,925
|
|
SM Energy Co.
|
|
|
|
6.75% due 09/15/261
|
2,356,000
|
2,032,050
|
|
Indigo Natural Resources LLC
|
|
|
|
6.88% due 02/15/261,3
|
2,082,000
|
1,905,030
|
|
PBF Logistics Limited Partnership / PBF Logistics Finance Corp.
|
|
|
|
6.88% due 05/15/231
|
1,565,000
|
1,611,950
|
|
Total Energy
|
|
48,328,332
|
|
|
||
|
Financial – 5.9%
|
|
|
|
GMAC, Inc.
|
|
|
|
8.00% due 11/01/31
|
3,306,000
|
4,616,003
|
|
SBA Communications Corp.
|
|
|
|
4.00% due 10/01/221
|
3,697,000
|
3,789,980
|
|
Credit Acceptance Corp.
|
|
|
|
6.63% due 03/15/261,3
|
2,920,000
|
3,109,800
|
|
7.38% due 03/15/231
|
655,000
|
678,744
|
|
Springleaf Finance Corp.
|
|
|
|
7.75% due 10/01/211
|
3,347,000
|
3,660,848
|
|
Fidelity & Guaranty Life Holdings, Inc.
|
|
|
|
5.50% due 05/01/251,3
|
3,168,000
|
3,397,680
|
|
CIT Group, Inc.
|
|
|
|
5.00% due 08/15/221
|
2,920,000
|
3,111,464
|
|
Navient Corp.
|
|
|
|
8.00% due 03/25/201
|
3,008,000
|
3,079,440
|
|
Ardonagh Midco 3 plc
|
|
|
|
8.63% due 07/15/231,3
|
2,836,000
|
2,687,110
|
|
CoreCivic, Inc.
|
|
|
|
4.63% due 05/01/231
|
2,665,000
|
2,508,431
|
|
AG Merger Sub II, Inc.
|
|
|
|
10.75% due 08/01/271,3
|
2,510,000
|
2,497,450
|
|
Newmark Group, Inc.
|
|
|
|
6.13% due 11/15/231
|
90,000
|
98,219
|
|
Total Financial
|
|
33,235,169
|
|
|
||
|
Technology – 5.7%
|
|
|
|
Amkor Technology, Inc.
|
|
|
|
6.63% due 09/15/271,3
|
6,249,000
|
6,873,900
|
See notes to financial statements.
AVK l ADVENT CONVERTIBLE AND INCOME FUND ANNUAL REPORT l 23
|
PORTFOLIO OF INVESTMENTS continued
|
|
October 31, 2019
|
|
|
Face
|
|
|
|
Amount~
|
Value
|
|
|
||
|
CORPORATE BONDS†† – 72.0% (continued)
|
|
|
|
Technology – 5.7% (continued)
|
|
|
|
NCR Corp.
|
|
|
|
5.00% due 07/15/221
|
5,000,000
|
$ 5,050,000
|
|
Qorvo, Inc.
|
|
|
|
5.50% due 07/15/261
|
4,000,000
|
4,279,920
|
|
Seagate HDD Cayman
|
|
|
|
4.25% due 03/01/221
|
4,058,000
|
4,203,242
|
|
Infor US, Inc.
|
|
|
|
6.50% due 05/15/221
|
4,000,000
|
4,070,000
|
|
Western Digital Corp.
|
|
|
|
4.75% due 02/15/261
|
3,906,000
|
3,998,865
|
|
Dell, Inc.
|
|
|
|
4.63% due 04/01/21
|
3,675,000
|
3,789,384
|
|
Total Technology
|
|
32,265,311
|
|
|
||
|
Industrial – 5.1%
|
|
|
|
MasTec, Inc.
|
|
|
|
4.88% due 03/15/231
|
4,715,000
|
4,797,512
|
|
Louisiana-Pacific Corp.
|
|
|
|
4.88% due 09/15/241
|
3,779,000
|
3,901,818
|
|
WESCO Distribution, Inc.
|
|
|
|
5.38% due 06/15/241
|
3,433,000
|
3,561,737
|
|
Ball Corp.
|
|
|
|
4.38% due 12/15/201
|
3,432,000
|
3,502,785
|
|
Energizer Holdings, Inc.
|
|
|
|
6.38% due 07/15/261,3
|
3,000,000
|
3,206,400
|
|
Navios Maritime Acquisition Corporation / Navios Acquisition Finance US, Inc.
|
|
|
|
8.13% due 11/15/211,3
|
3,695,000
|
3,029,900
|
|
TransDigm, Inc.
|
|
|
|
6.00% due 07/15/221
|
2,558,000
|
2,604,684
|
|
Navios Maritime Holdings, Inc. / Navios Maritime Finance II US, Inc.
|
|
|
|
7.38% due 01/15/223
|
3,512,000
|
2,054,520
|
|
Mueller Water Products, Inc.
|
|
|
|
5.50% due 06/15/261,3
|
1,899,000
|
1,996,324
|
|
Total Industrial
|
|
28,655,680
|
|
|
||
|
Utilities – 0.4%
|
|
|
|
Talen Energy Supply LLC
|
|
|
|
10.50% due 01/15/261,3
|
1,700,000
|
1,466,250
|
|
6.63% due 01/15/281,3
|
776,000
|
752,720
|
|
Total Utilities
|
|
2,218,970
|
|
Total Corporate Bonds
|
|
|
|
(Cost $402,880,189)
|
|
406,468,866
|
See notes to financial statements.
24 l AVK l ADVENT CONVERTIBLE AND INCOME FUND ANNUAL REPORT
|
PORTFOLIO OF INVESTMENTS continued
|
October 31, 2019
|
|
|
|
Face
|
|
|
|
Amount~
|
Value
|
|
|
||
|
CONVERTIBLE BONDS†† – 65.6%
|
|
|
|
Technology – 16.4%
|
|
|
|
Microchip Technology, Inc.
|
|
|
|
1.63% due 02/15/271
|
8,554,000
|
$ 11,219,287
|
|
Alteryx, Inc.
|
|
|
|
1.00% due 08/01/261,3
|
7,211,000
|
6,536,829
|
|
Splunk, Inc.
|
|
|
|
0.50% due 09/15/231
|
5,744,000
|
6,265,118
|
|
Nuance Communications, Inc.
|
|
|
|
1.00% due 12/15/351
|
5,000,000
|
4,885,630
|
|
1.25% due 04/01/251
|
1,171,000
|
1,236,869
|
|
Akamai Technologies, Inc.
|
|
|
|
0.13% due 05/01/251
|
3,676,000
|
4,135,500
|
|
0.38% due 09/01/271,3
|
1,321,000
|
1,320,716
|
|
Workiva, Inc.
|
|
|
|
1.13% due 08/15/263
|
4,721,000
|
4,259,883
|
|
STMicroelectronics N.V.
|
|
|
|
0.25% due 07/03/24
|
3,200,000
|
4,155,360
|
|
ON Semiconductor Corp.
|
|
|
|
1.63% due 10/15/231
|
3,315,000
|
4,136,961
|
|
Rapid7, Inc.
|
|
|
|
1.25% due 08/01/231
|
2,899,000
|
4,020,416
|
|
Synaptics, Inc.
|
|
|
|
0.50% due 06/15/221
|
4,000,000
|
3,785,000
|
|
Talend S.A.
|
|
|
|
1.75% due 09/01/243
|
EUR 3,180,000
|
3,443,358
|
|
Workday, Inc.
|
|
|
|
0.25% due 10/01/221
|
2,675,000
|
3,415,426
|
|
Pure Storage, Inc.
|
|
|
|
0.13% due 04/15/231
|
3,173,000
|
3,343,737
|
|
Insight Enterprises, Inc.
|
|
|
|
0.75% due 02/15/251,3
|
2,002,000
|
2,189,155
|
|
Coupa Software, Inc.
|
|
|
|
0.13% due 06/15/251,3
|
1,804,000
|
2,048,828
|
|
Five9, Inc.
|
|
|
|
0.13% due 05/01/231
|
1,365,000
|
2,025,319
|
|
New Relic, Inc.
|
|
|
|
0.50% due 05/01/231
|
2,080,000
|
2,004,288
|
|
Zynga, Inc.
|
|
|
|
0.25% due 06/01/241,3
|
1,789,000
|
1,833,475
|
|
Lumentum Holdings, Inc.
|
|
|
|
0.25% due 03/15/241
|
1,353,000
|
1,714,100
|
|
DocuSign, Inc.
|
|
|
|
0.50% due 09/15/231
|
1,250,000
|
1,474,153
|
|
Pluralsight, Inc.
|
|
|
|
0.38% due 03/01/241,3
|
1,668,000
|
1,467,723
|
|
See notes to financial statements.
|
|
|
|
AVK l ADVENT CONVERTIBLE AND INCOME FUND ANNUAL REPORT l 25
|
||
|
PORTFOLIO OF INVESTMENTS continued
|
|
October 31, 2019
|
|
|
Face
|
|
|
|
Amount~
|
Value
|
|
|
||
|
CONVERTIBLE BONDS†† – 65.6% (continued)
|
|
|
|
Technology – 16.4% (continued)
|
|
|
|
Lenovo Group Ltd.
|
|
|
|
3.38% due 01/24/241
|
1,350,000
|
$ 1,464,356
|
|
Envestnet, Inc.
|
|
|
|
1.75% due 06/01/231
|
1,288,000
|
1,459,809
|
|
ServiceNow, Inc.
|
|
|
|
due 06/01/221,6
|
711,000
|
1,333,677
|
|
LivePerson, Inc.
|
|
|
|
0.75% due 03/01/241,3
|
1,007,000
|
1,276,372
|
|
CSG Systems International, Inc.
|
|
|
|
4.25% due 03/15/361
|
999,000
|
1,173,924
|
|
Tabula Rasa HealthCare, Inc.
|
|
|
|
1.75% due 02/15/261,3
|
967,000
|
1,006,284
|
|
Altair Engineering, Inc.
|
|
|
|
0.25% due 06/01/241
|
953,000
|
990,119
|
|
Teradyne, Inc.
|
|
|
|
1.25% due 12/15/231
|
475,000
|
945,319
|
|
Twilio, Inc.
|
|
|
|
0.25% due 06/01/231
|
550,000
|
837,223
|
|
Verint Systems, Inc.
|
|
|
|
1.50% due 06/01/211
|
682,000
|
698,197
|
|
Cypress Semiconductor Corp.
|
|
|
|
4.50% due 01/15/221
|
330,000
|
573,053
|
|
Total Technology
|
|
92,675,464
|
|
|
||
|
Consumer, Non-cyclical – 15.7%
|
|
|
|
Exact Sciences Corp.
|
|
|
|
0.38% due 03/15/271
|
6,424,000
|
6,916,588
|
|
Herbalife Nutrition Ltd.
|
|
|
|
2.63% due 03/15/241
|
6,743,000
|
6,809,298
|
|
Wright Medical Group, Inc.
|
|
|
|
1.63% due 06/15/231
|
6,566,000
|
6,288,183
|
|
Jazz Investments I Ltd.
|
|
|
|
1.50% due 08/15/241
|
6,046,000
|
5,810,911
|
|
Heska Corp.
|
|
|
|
3.75% due 09/15/263
|
3,979,000
|
4,783,612
|
|
Square, Inc.
|
|
|
|
0.50% due 05/15/231
|
3,933,000
|
4,352,781
|
|
Lannett Company, Inc.
|
|
|
|
4.50% due 10/01/263
|
4,000,000
|
4,142,000
|
|
DexCom, Inc.
|
|
|
|
0.75% due 12/01/231,3
|
3,064,000
|
3,669,265
|
|
Illumina, Inc.
|
|
|
|
0.50% due 06/15/211
|
2,042,000
|
2,664,905
|
|
due 08/15/231,6
|
803,000
|
872,020
|
|
See notes to financial statements.
|
|
|
|
26 l AVK l ADVENT CONVERTIBLE AND INCOME FUND ANNUAL REPORT
|
|
|
|
PORTFOLIO OF INVESTMENTS continued
|
October 31, 2019
|
|
|
|
Face
|
|
|
|
Amount~
|
Value
|
|
|
||
|
CONVERTIBLE BONDS†† – 65.6% (continued)
|
|
|
|
Consumer, Non-cyclical – 15.7% (continued)
|
|
|
|
BioMarin Pharmaceutical, Inc.
|
|
|
|
1.50% due 10/15/201
|
3,307,000
|
$ 3,479,162
|
|
Intercept Pharmaceuticals, Inc.
|
|
|
|
3.25% due 07/01/231
|
3,548,000
|
3,125,887
|
|
Ionis Pharmaceuticals, Inc.
|
|
|
|
1.00% due 11/15/211
|
2,522,000
|
2,782,982
|
|
Insulet Corp.
|
|
|
|
0.38% due 09/01/261,3
|
2,791,000
|
2,681,104
|
|
Euronet Worldwide, Inc.
|
|
|
|
0.75% due 03/15/491,3
|
2,270,000
|
2,587,204
|
|
Chegg, Inc.
|
|
|
|
0.13% due 03/15/251,3
|
2,547,000
|
2,389,850
|
|
Wright Medical Group N.V.
|
|
|
|
2.25% due 11/15/211
|
1,942,000
|
2,291,124
|
|
NuVasive, Inc.
|
|
|
|
2.25% due 03/15/211
|
1,735,000
|
2,183,393
|
|
Teladoc Health, Inc.
|
|
|
|
1.38% due 05/15/251
|
1,150,000
|
1,869,441
|
|
Orpea
|
|
|
|
0.38% due 05/17/271
|
9,164**
|
1,641,512
|
|
QIAGEN N.V.
|
|
|
|
0.50% due 09/13/231
|
1,600,000
|
1,548,152
|
|
Horizon Pharma Investment Ltd.
|
|
|
|
2.50% due 03/15/221
|
1,257,000
|
1,511,143
|
|
Neurocrine Biosciences, Inc.
|
|
|
|
2.25% due 05/15/241
|
962,000
|
1,406,371
|
|
Yaoko Company Ltd.
|
|
|
|
due 06/20/246
|
JPY 120,000,000
|
1,152,379
|
|
Sarepta Therapeutics, Inc.
|
|
|
|
1.50% due 11/15/241
|
775,000
|
1,094,796
|
|
CONMED Corp.
|
|
|
|
2.63% due 02/01/241,3
|
729,000
|
1,004,035
|
|
Anthem, Inc.
|
|
|
|
2.75% due 10/15/421
|
264,000
|
999,064
|
|
WuXi AppTec Company Ltd.
|
|
|
|
due 09/17/241,6
|
900,000
|
986,782
|
|
Flexion Therapeutics, Inc.
|
|
|
|
3.38% due 05/01/241
|
1,019,000
|
983,614
|
|
Biocartis N.V.
|
|
|
|
4.00% due 05/09/24
|
EUR 1,100,000
|
926,548
|
|
Nipro Corp.
|
|
|
|
due 01/29/211,6
|
JPY 90,000,000
|
864,329
|
|
GMO Payment Gateway, Inc.
|
|
|
|
due 06/19/236
|
JPY 70,000,000
|
824,773
|
|
|
||
|
See notes to financial statements.
|
|
|
|
AVK l ADVENT CONVERTIBLE AND INCOME FUND ANNUAL REPORT l 27
|
||
|
PORTFOLIO OF INVESTMENTS continued
|
|
October 31, 2019
|
|
|
Face
|
|
|
|
Amount~
|
Value
|
|
|
||
|
CONVERTIBLE BONDS†† – 65.6% (continued)
|
|
|
|
Consumer, Non-cyclical – 15.7% (continued)
|
|
|
|
Insmed, Inc.
|
|
|
|
1.75% due 01/15/251
|
918,000
|
$ 788,290
|
|
GN Store Nord A/S
|
|
|
|
due 05/21/241,6
|
EUR 700,000
|
775,450
|
|
Carrefour S.A.
|
|
|
|
due 03/27/241,6
|
800,000
|
772,720
|
|
Top Glove Labuan Ltd.
|
|
|
|
2.00% due 03/01/24
|
675,000
|
666,632
|
|
J Sainsbury plc
|
|
|
|
2.88% due 12/29/495
|
GBP 500,000
|
653,088
|
|
PTC Therapeutics, Inc.
|
|
|
|
1.50% due 09/15/261,3
|
248,000
|
258,881
|
|
Total Consumer, Non-cyclical
|
|
88,558,269
|
|
|
||
|
Communications – 13.7%
|
|
|
|
Liberty Media Corp.
|
|
|
|
1.38% due 10/15/23
|
4,138,000
|
5,231,839
|
|
2.25% due 12/01/481,3
|
2,839,000
|
3,365,144
|
|
YY, Inc.
|
|
|
|
1.38% due 06/15/261,3
|
4,000,000
|
3,715,704
|
|
0.75% due 06/15/251,3
|
3,149,000
|
2,923,157
|
|
Palo Alto Networks, Inc.
|
|
|
|
0.75% due 07/01/231
|
5,815,000
|
6,425,359
|
|
DISH Network Corp.
|
|
|
|
3.38% due 08/15/261
|
4,946,000
|
4,637,178
|
|
Booking Holdings, Inc.
|
|
|
|
0.90% due 09/15/211
|
2,042,000
|
2,405,043
|
|
0.35% due 06/15/201
|
1,094,000
|
1,706,035
|
|
Twitter, Inc.
|
|
|
|
0.25% due 06/15/241
|
4,294,000
|
4,110,438
|
|
IAC Financeco 2, Inc.
|
|
|
|
0.88% due 06/15/261,3
|
3,802,000
|
4,108,924
|
|
Proofpoint, Inc.
|
|
|
|
0.25% due 08/15/241,3
|
3,738,000
|
3,878,175
|
|
Viavi Solutions, Inc.
|
|
|
|
1.00% due 03/01/241
|
2,625,000
|
3,527,344
|
|
Snap, Inc.
|
|
|
|
0.75% due 08/01/261,3
|
2,759,000
|
2,795,502
|
|
Ctrip.com International Ltd.
|
|
|
|
1.99% due 07/01/251
|
2,436,000
|
2,553,232
|
|
Zillow Group, Inc.
|
|
|
|
0.75% due 09/01/241,3
|
2,425,000
|
2,445,662
|
|
GCI Liberty, Inc.
|
|
|
|
1.75% due 09/30/461,3
|
1,810,000
|
2,442,685
|
|
See notes to financial statements.
|
|
|
|
28 l AVK l ADVENT CONVERTIBLE AND INCOME FUND ANNUAL REPORT
|
|
|
|
PORTFOLIO OF INVESTMENTS continued
|
October 31, 2019
|
|
|
|
Face
|
|
|
|
Amount~
|
Value
|
|
|
||
|
CONVERTIBLE BONDS†† – 65.6% (continued)
|
|
|
|
Communications – 13.7% (continued)
|
|
|
|
Vonage Holdings Corp.
|
|
|
|
1.75% due 06/01/241,3
|
2,507,000
|
$ 2,436,892
|
|
Q2 Holdings, Inc.
|
|
|
|
0.75% due 06/01/261,3
|
2,238,000
|
2,374,005
|
|
Okta, Inc.
|
|
|
|
0.13% due 09/01/251,3
|
2,347,000
|
2,232,711
|
|
Etsy, Inc.
|
|
|
|
0.13% due 10/01/261,3
|
2,454,000
|
2,228,639
|
|
Wayfair, Inc.
|
|
|
|
1.00% due 08/15/261,3
|
2,146,000
|
1,918,896
|
|
1.13% due 11/01/241,3
|
205,000
|
209,829
|
|
Liberty Latin America Ltd.
|
|
|
|
2.00% due 07/15/243
|
1,874,000
|
1,951,905
|
|
iQIYI, Inc.
|
|
|
|
2.00% due 04/01/251,3
|
2,050,000
|
1,856,609
|
|
Zendesk, Inc.
|
|
|
|
0.25% due 03/15/231
|
1,218,000
|
1,589,042
|
|
FireEye, Inc.
|
|
|
|
0.88% due 06/01/241
|
1,357,000
|
1,345,525
|
|
8x8, Inc.
|
|
|
|
0.50% due 02/01/241,3
|
1,229,000
|
1,257,517
|
|
InterDigital, Inc.
|
|
|
|
2.00% due 06/01/241,3
|
1,063,000
|
1,050,831
|
|
Pinduoduo, Inc.
|
|
|
|
due 10/01/241,3,6
|
395,000
|
460,478
|
|
Total Communications
|
|
77,184,300
|
|
|
||
|
Industrial – 5.4%
|
|
|
|
Airbus SE
|
|
|
|
due 07/01/221,6
|
EUR 1,600,000
|
2,350,292
|
|
due 06/14/211,6
|
EUR 1,700,000
|
2,072,478
|
|
KBR, Inc.
|
|
|
|
2.50% due 11/01/231,3
|
3,379,000
|
4,243,423
|
|
Fortive Corp.
|
|
|
|
0.88% due 02/15/221,3
|
2,452,000
|
2,425,217
|
|
Cellnex Telecom S.A.
|
|
|
|
1.50% due 01/16/261
|
EUR 1,600,000
|
2,382,780
|
|
Sika A.G.
|
|
|
|
0.15% due 06/05/25
|
CHF 1,980,000
|
2,284,098
|
|
China Railway Construction Corporation Ltd.
|
|
|
|
due 01/29/211,6
|
2,000,000
|
2,120,554
|
|
Asia Cement Corp.
|
|
|
|
due 09/21/236
|
1,627,000
|
1,868,740
|
|
OSI Systems, Inc.
|
|
|
|
1.25% due 09/01/221
|
1,430,000
|
1,581,938
|
|
|
||
|
See notes to financial statements.
|
|
|
|
|
||
|
AVK l ADVENT CONVERTIBLE AND INCOME FUND ANNUAL REPORT l 29
|
||
|
PORTFOLIO OF INVESTMENTS continued
|
|
October 31, 2019
|
|
|
Face
|
|
|
|
Amount~
|
Value
|
|
|
||
|
CONVERTIBLE BONDS†† – 65.6% (continued)
|
|
|
|
Industrial – 5.4% (continued)
|
|
|
|
Vinci S.A.
|
|
|
|
0.38% due 02/16/221
|
1,200,000
|
$ 1,483,380
|
|
MINEBEA MITSUMI, Inc.
|
|
|
|
due 08/03/226
|
JPY 120,000,000
|
1,320,301
|
|
Taiwan Cement Corp.
|
|
|
|
due 12/10/236
|
1,100,000
|
1,290,219
|
|
Chart Industries, Inc.
|
|
|
|
1.00% due 11/15/241,3
|
947,000
|
1,142,193
|
|
Vishay Intertechnology, Inc.
|
|
|
|
2.25% due 06/15/251
|
1,119,000
|
1,105,422
|
|
CRRC Corporation Ltd.
|
|
|
|
due 02/05/211,6
|
1,000,000
|
963,311
|
|
Mesa Laboratories, Inc.
|
|
|
|
1.38% due 08/15/25
|
781,000
|
820,538
|
|
Air Transport Services Group, Inc.
|
|
|
|
1.13% due 10/15/241
|
818,000
|
751,926
|
|
Total Industrial
|
|
30,206,810
|
|
|
||
|
Consumer, Cyclical – 4.7%
|
|
|
|
Huazhu Group Ltd.
|
|
|
|
0.38% due 11/01/221
|
5,025,000
|
5,511,797
|
|
Tesla, Inc.
|
|
|
|
2.00% due 05/15/241
|
2,175,000
|
2,667,252
|
|
1.25% due 03/01/211
|
909,000
|
990,441
|
|
Marriott Vacations Worldwide Corp.
|
|
|
|
1.50% due 09/15/221
|
2,542,000
|
2,601,515
|
|
Zhongsheng Group Holdings Ltd.
|
|
|
|
due 05/23/236
|
HKD 17,000,000
|
2,386,185
|
|
Harvest International Co.
|
|
|
|
due 11/21/226
|
HKD 16,000,000
|
2,069,036
|
|
Guess?, Inc.
|
|
|
|
2.00% due 04/15/241,3
|
1,982,000
|
1,899,004
|
|
Sony Corp.
|
|
|
|
due 09/30/226
|
JPY 147,000,000
|
1,898,064
|
|
Cie Generale des Etablissements Michelin SCA
|
|
|
|
due 01/10/221,6
|
1,800,000
|
1,825,884
|
|
Adidas AG
|
|
|
|
0.05% due 09/12/231
|
EUR 800,000
|
1,086,760
|
|
Meritor, Inc.
|
|
|
|
3.25% due 10/15/371
|
1,032,000
|
1,062,529
|
|
Suzuki Motor Corp.
|
|
|
|
due 03/31/236
|
JPY 70,000,000
|
823,749
|
|
EZCORP, Inc.
|
|
|
|
2.38% due 05/01/25
|
858,000
|
644,161
|
|
|
||
|
|
||
|
See notes to financial statements.
|
|
|
|
30 l AVK l ADVENT CONVERTIBLE AND INCOME FUND ANNUAL REPORT
|
|
|
|
PORTFOLIO OF INVESTMENTS continued
|
October 31, 2019
|
|
|
|
||
|
|
||
|
|
Face
|
|
|
|
Amount~
|
Value
|
|
|
||
|
CONVERTIBLE BONDS†† – 65.6% (continued)
|
|
|
|
Consumer, Cyclical – 4.7% (continued)
|
|
|
|
Kering S.A.
|
|
|
|
due 09/30/221,6
|
EUR 400,000
|
$ 478,846
|
|
LVMH Moet Hennessy Louis Vuitton SE
|
|
|
|
due 02/16/216
|
1,031**
|
471,949
|
|
Total Consumer, Cyclical
|
|
26,417,172
|
|
|
||
|
Financial – 4.6%
|
|
|
|
AXA S.A.
|
|
|
|
7.25% due 05/15/211,3
|
4,371,000
|
4,540,376
|
|
SBI Holdings, Inc.
|
|
|
|
due 09/13/236
|
JPY 300,000,000
|
2,930,675
|
|
Poseidon Finance 1 Ltd.
|
|
|
|
due 02/01/251,6
|
2,424,000
|
2,431,719
|
|
Deutsche Wohnen SE
|
|
|
|
0.33% due 07/26/241
|
EUR 1,800,000
|
2,104,764
|
|
PRA Group, Inc.
|
|
|
|
3.50% due 06/01/231
|
1,960,000
|
1,991,588
|
|
Colony Capital, Inc.
|
|
|
|
3.88% due 01/15/211
|
1,909,000
|
1,880,371
|
|
IMMOFINANZ AG
|
|
|
|
1.50% due 01/24/241
|
EUR 1,300,000
|
1,840,271
|
|
BofA Finance LLC
|
|
|
|
0.25% due 05/01/231
|
1,523,000
|
1,536,333
|
|
Blackstone Mortgage Trust, Inc.
|
|
|
|
4.75% due 03/15/231
|
1,263,000
|
1,336,362
|
|
Aurelius SE
|
|
|
|
1.00% due 12/01/20
|
EUR 1,200,000
|
1,312,609
|
|
IH Merger Sub LLC
|
|
|
|
3.50% due 01/15/221
|
835,000
|
1,151,227
|
|
PHP Finance Jersey NO 2 Ltd.
|
|
|
|
2.88% due 07/15/25
|
GBP 785,000
|
1,092,644
|
|
Cindai Capital Ltd.
|
|
|
|
due 02/08/236
|
800,000
|
775,773
|
|
LEG Immobilien AG
|
|
|
|
0.88% due 09/01/251
|
EUR 600,000
|
770,555
|
|
Total Financial
|
|
25,695,267
|
|
|
||
|
Basic Materials – 2.1%
|
|
|
|
Toray Industries, Inc.
|
|
|
|
due 08/31/211,6
|
JPY 370,000,000
|
3,759,866
|
|
Brenntag Finance BV
|
|
|
|
1.88% due 12/02/221
|
3,500,000
|
3,457,300
|
|
Mitsubishi Chemical Holdings Corp.
|
|
|
|
due 03/29/241,6
|
JPY 130,000,000
|
1,246,078
|
|
|
||
|
See notes to financial statements.
|
|
|
|
AVK l ADVENT CONVERTIBLE AND INCOME FUND ANNUAL REPORT l 31
|
||
|
PORTFOLIO OF INVESTMENTS continued
|
|
October 31, 2019
|
|
|
Face
|
|
|
|
Amount~
|
Value
|
|
|
||
|
CONVERTIBLE BONDS†† – 65.6% (continued)
|
|
|
|
Basic Materials – 2.1% (continued)
|
|
|
|
Cleveland-Cliffs, Inc.
|
|
|
|
1.50% due 01/15/251
|
930,000
|
$ 1,022,620
|
|
Osisko Gold Royalties Ltd.
|
|
|
|
4.00% due 12/31/22
|
CAD 1,300,000
|
1,006,490
|
|
Pretium Resources, Inc.
|
|
|
|
2.25% due 03/15/22
|
837,000
|
892,995
|
|
Glencore Funding LLC6
|
|
|
|
due 03/27/25
|
800,000
|
678,072
|
|
Total Basic Materials
|
|
12,063,421
|
|
|
||
|
Energy – 1.8%
|
|
|
|
TOTAL S.A.
|
|
|
|
0.50% due 12/02/221
|
2,000,000
|
2,109,360
|
|
Transocean, Inc.
|
|
|
|
0.50% due 01/30/231
|
2,326,000
|
1,916,429
|
|
RAG-Stiftung
|
|
|
|
due 02/18/211,6
|
EUR 800,000
|
893,806
|
|
due 10/02/241,6
|
EUR 700,000
|
781,799
|
|
BP Capital Markets plc
|
|
|
|
1.00% due 04/28/231
|
GBP 1,000,000
|
1,564,898
|
|
Whiting Petroleum Corp.
|
|
|
|
1.25% due 04/01/201
|
1,380,000
|
1,363,321
|
|
Eni SpA
|
|
|
|
due 04/13/221,6
|
EUR 900,000
|
1,038,525
|
|
Helix Energy Solutions Group, Inc.
|
|
|
|
4.13% due 09/15/23
|
632,000
|
765,905
|
|
Total Energy
|
|
10,434,043
|
|
|
||
|
Utilities – 1.2%
|
|
|
|
NRG Energy, Inc.
|
|
|
|
2.75% due 06/01/481
|
2,318,000
|
2,635,633
|
|
CenterPoint Energy, Inc.
|
|
|
|
4.52% due 09/15/29
|
40,717**
|
2,369,322
|
|
China Yangtze Power International BVI 1 Ltd.
|
|
|
|
due 11/09/211,6
|
1,775,000
|
1,857,551
|
|
Total Utilities
|
|
6,862,506
|
|
Total Convertible Bonds
|
|
|
|
(Cost $352,213,811)
|
|
370,097,252
|
See notes to financial statements.
32 l AVK l ADVENT CONVERTIBLE AND INCOME FUND ANNUAL REPORT
|
PORTFOLIO OF INVESTMENTS continued
|
|
October 31, 2019
|
|
|
Face
|
|
|
|
Amount~
|
Value
|
|
|
||
|
SENIOR FLOATING RATE INTERESTS††,7 – 1.7%
|
|
|
|
Consumer, Cyclical – 1.0%
|
|
|
|
PetSmart, Inc.
|
|
|
|
5.04% (3 Month USD LIBOR + 3.00%, Rate Floor: 1.00%) due 03/11/22
|
3,878,150
|
$ 3,790,099
|
|
Alterra Mountain Co.
|
|
|
|
4.80% (3 Month USD LIBOR + 3.00%, Rate Floor: 0.00%) due 07/31/24
|
1,864,785
|
1,869,447
|
|
Total Consumer, Cyclical
|
|
5,659,546
|
|
|
||
|
Communications – 0.5%
|
|
|
|
Sprint Communications, Inc.
|
|
|
|
4.56% (3 Month USD LIBOR + 2.50%, Rate Floor: 0.75%) due 02/03/24
|
2,925,000
|
2,896,978
|
|
|
||
|
Consumer, Non-cyclical – 0.2%
|
|
|
|
Refinitiv US Holdings, Inc.
|
|
|
|
5.79% (3 Month USD LIBOR + 3.75%, Rate Floor: 0.00%) due 10/01/25
|
992,500
|
998,644
|
|
Total Senior Floating Rate Interests
|
|
|
|
(Cost $9,669,440)
|
|
9,555,168
|
|
Total Investments – 168.4%
|
|
|
|
(Cost $924,167,357)
|
|
$ 950,028,153
|
|
|
||
|
|
Contracts
|
Value
|
|
|
||
|
LISTED OPTIONS WRITTEN† – (0.1)%
|
|
|
|
Call options on:
|
|
|
|
Citigroup, Inc.
|
|
|
|
Expiring November 2019 with strike price of $72.50 (Notional Value $3,625,000)
|
500
|
$ (50,000)
|
|
Alibaba Group Holdings, Ltd.
|
|
|
|
Expiring November 2019 with strike price of $180.00 (Notional Value $3,600,000)
|
200
|
(89,000)
|
|
Las Vegas Sands Corp.
|
|
|
|
Expiring November 2019 with strike price of $60.00 (Notional Value $4,500,000)
|
750
|
(201,000)
|
|
Total Call Options
|
|
(340,000)
|
|
Total Listed Options Written
|
|
|
|
(Premiums received $202,770)
|
|
(340,000)
|
|
Other Assets & Liabilities, net – (68.3)%
|
|
(385,539,893)
|
|
Total Net Assets – 100.0%
|
|
$ 564,148,260
|
See notes to financial statements.
AVK l ADVENT CONVERTIBLE AND INCOME FUND ANNUAL REPORT l 33
|
PORTFOLIO OF INVESTMENTS continued
|
|
|
October 31, 2019
|
||||
|
|
|||||||
|
|
|||||||
|
FORWARD FOREIGN CURRENCY EXCHANGE CONTRACTS††
|
|
|
|
|
|
|
|
|
|
|
|
Unrealized
|
|
|
|
|
|
Settlement
|
Settlement
|
Value at
|
Appreciation
|
|
Counterparty
|
Contracts to Sell
|
Currency
|
Date
|
Value
|
October 31, 2019
|
(Depreciation)
|
|
|
Bank of New York Mellon
|
1,649,306,300
|
JPY
|
12/13/19
|
$15,410,265
|
$ 15,300,648
|
$ 109,617
|
|
|
Bank of New York Mellon
|
34,500,000
|
HKD
|
12/13/19
|
4,402,431
|
4,400,918
|
1,513
|
|
|
Bank of New York Mellon
|
1,361,891
|
CAD
|
12/13/19
|
1,037,284
|
1,036,377
|
907
|
|
|
Bank of New York Mellon
|
2,204,393
|
CHF
|
12/13/19
|
2,236,126
|
2,241,882
|
(5,756)
|
|
|
Bank of New York Mellon
|
2,578,424
|
GBP
|
12/13/19
|
3,198,452
|
3,341,465
|
(143,013)
|
|
|
Bank of New York Mellon
|
22,436,676
|
EUR
|
12/13/19
|
24,868,586
|
25,108,540
|
(239,954)
|
|
|
|
|
|
|
|
|
|
$(276,686)
|
|
|
|
|
|
Settlement
|
Settlement
|
Value at
|
Unrealized
|
|
Counterparty
|
Contracts to Buy
|
Currency
|
Date
|
Value
|
October 31, 2019
|
Appreciation
|
|
|
Bank of New York Mellon
|
927,000
|
EUR
|
12/13/19
|
$1,019,084
|
$ 1,037,391
|
$ 18,307
|
|
|
Bank of New York Mellon
|
50,700,000
|
JPY
|
12/13/19
|
466,748
|
470,345
|
3,597
|
|
|
|
|
|
|
|
|
|
$ 21,904
|
~ The face amount is denominated in U.S. dollars unless otherwise indicated.
* Non-income producing security.
** Represents shares.
† Value determined based on Level 1 inputs — See Note 6.
†† Value determined based on Level 2 inputs — See Note 6.
1 All or a portion of these securities have been physically segregated in connection with the margin loan and
reverse repurchase agreements. As of October 31, 2019, the total value of securities segregated was $757,529,999.
2 Rate indicated is the 7-day yield as of October 31, 2019.
3 Security is a 144A or Section 4(a)(2) security. These securities have been determined to be liquid under
guidelines established by the Board of Trustees. The total market value of 144A or Section 4(a)(2) securities is $317,074,656 (cost $312,051,608), or 56.2% of total net assets.
4 Perpetual maturity.
5 Security has a fixed rate coupon which will convert to a floating or variable rate coupon on a future date.
6 Zero coupon rate security.
7 Variable rate security. Rate indicated is the rate effective at October 31, 2019. In some instances, the effective
rate is limited by a minimum rate floor or a maximum rate cap established by the issuer. The settlement status of a position may also impact the effective rate indicated. In some cases, a position may be unsettled at period end and may not have a
stated effective rate. In instances where multiple underlying reference rates and spread amounts are shown, the effective rate is based on a weighted average.
See notes to financial statements.
34 l AVK l ADVENT CONVERTIBLE AND INCOME FUND ANNUAL REPORT
|
PORTFOLIO OF INVESTMENTS continued
|
October 31, 2019
|
|
|
|
||
|
ADR
|
American Depositary Receipt
|
|
|
CAD
|
Canadian Dollar
|
|
|
CHF
|
Swiss Franc
|
|
|
EUR
|
Euro
|
|
|
GBP
|
British Pound
|
|
|
HKD
|
Hong Kong Dollar
|
|
|
JPY
|
Japanese Yen
|
|
|
LIBOR
|
London Interbank Offered Rate
|
|
|
plc
|
Public Limited Company
|
|
See Sector Classification in Other Information section.
The following table summarizes the inputs used to value the Fund’s investments at October 31, 2019 (See Note 6 in the Notes to Financial Statements):
|
|
Level 2
|
Level 3
|
||||||||||||||
|
|
Level 1
|
Significant
|
Significant
|
|||||||||||||
|
|
Quoted
|
Observable
|
Unobservable
|
|||||||||||||
|
Investments in Securities (Assets)
|
Prices
|
Inputs
|
Inputs
|
Total
|
||||||||||||
|
Common Stocks
|
$
|
49,597,342
|
$
|
—
|
$
|
—
|
$
|
49,597,342
|
||||||||
|
Convertible Preferred Stocks
|
81,608,352
|
—
|
—
|
81,608,352
|
||||||||||||
|
Money Market Fund
|
32,701,173
|
—
|
—
|
32,701,173
|
||||||||||||
|
Corporate Bonds
|
—
|
406,468,866
|
—
|
406,468,866
|
||||||||||||
|
Convertible Bonds
|
—
|
370,097,252
|
—
|
370,097,252
|
||||||||||||
|
Senior Floating Rate Interests
|
—
|
9,555,168
|
—
|
9,555,168
|
||||||||||||
|
Forward Foreign Currency
|
||||||||||||||||
|
Exchange Contracts*
|
—
|
133,941
|
—
|
133,941
|
||||||||||||
|
Total Assets
|
$
|
163,906,867
|
$
|
786,255,227
|
$
|
—
|
$
|
950,162,094
|
||||||||
|
|
Level 2
|
Level 3
|
||||||||||||||
|
|
Level 1
|
Significant
|
Significant
|
|||||||||||||
|
|
Quoted
|
Observable
|
Unobservable
|
|||||||||||||
|
Investments in Securities (Liabilities)
|
Prices
|
Inputs
|
Inputs
|
Total
|
||||||||||||
|
Options Written
|
$
|
340,000
|
$
|
—
|
$
|
—
|
$
|
340,000
|
||||||||
|
Forward Foreign Currency
|
||||||||||||||||
|
Exchange Contracts*
|
—
|
388,723
|
—
|
388,723
|
||||||||||||
|
Total Liabilities
|
$
|
340,000
|
$
|
388,723
|
$
|
—
|
$
|
728,723
|
||||||||
|
* This derivative is reported as unrealized appreciation/depreciation at period end.
|
||||||||||||||||
Please refer to the detailed portfolio for the breakdown of investment type by industry category.
The Fund may hold assets and/or liabilities in which the fair value approximates the carrying amount for financial statement purposes. As of the period end, reverse repurchase
agreements of $177,016,427 are categorized as Level 2 within the disclosure hierarchy – See note 7.
The fund did not hold any Level 3 securities during the year ended October 31, 2019.
See notes to financial statements.
AVK l ADVENT CONVERTIBLE AND INCOME FUND ANNUAL REPORT l 35
|
STATEMENT OF ASSETS AND LIABILITIES
|
October 31, 2019
|
|||
|
ASSETS:
|
||||
|
Investments, at value (cost $924,167,357)
|
$
|
950,028,153
|
||
|
Cash
|
656,000
|
|||
|
Unrealized appreciation on forward foreign currency exchange contracts
|
133,941
|
|||
|
Receivables:
|
||||
|
Investments sold
|
9,943,112
|
|||
|
Interest
|
7,916,314
|
|||
|
Dividends
|
213,854
|
|||
|
Tax reclaims
|
63,780
|
|||
|
Other assets
|
186,043
|
|||
|
Total assets
|
969,141,197
|
|||
|
LIABILITIES:
|
||||
|
Margin Loan
|
210,000,000
|
|||
|
Reverse repurchase agreements (Note 7)
|
177,016,427
|
|||
|
Options Written, at value (proceeds $202,770)
|
340,000
|
|||
|
Unrealized depreciation on forward foreign currency exchange contracts
|
388,723
|
|||
|
Interest payable on the margin loan
|
23,731
|
|||
|
Payable for:
|
||||
|
Investments purchased
|
16,057,139
|
|||
|
Investment advisory fees
|
434,500
|
|||
|
Professional fees
|
266,239
|
|||
|
Servicing fees
|
169,053
|
|||
|
Other liabilities
|
297,125
|
|||
|
Total liabilities
|
404,992,937
|
|||
|
NET ASSETS
|
$
|
564,148,260
|
||
|
NET ASSETS CONSIST OF:
|
||||
|
Common stock, $0.001 par value per share; unlimited number of shares authorized,
|
||||
|
34,525,222 shares issued and outstanding
|
$
|
34,525
|
||
|
Additional paid-in capital
|
574,932,410
|
|||
|
Total distributable earnings (loss)
|
(10,818,675
|
)
|
||
|
NET ASSETS
|
$
|
564,148,260
|
||
|
Shares outstanding ($0.001 par value with unlimited amount authorized)
|
34,525,222
|
|||
|
Net asset value
|
$
|
16.34
|
||
See notes to financial statements.
36 l AVK l ADVENT CONVERTIBLE AND INCOME FUND ANNUAL REPORT
|
STATEMENT OF OPERATIONS
|
October 31, 2019
|
|
For the Year Ended October 31, 2019
|
|
|
INVESTMENT INCOME:
|
||||
|
Interest (net of foreign taxes withholding $16,121)
|
$
|
33,363,974
|
||
|
Dividends (net of foreign taxes withholding $2,804)
|
5,974,976
|
|||
|
Total investment income
|
39,338,950
|
|||
|
EXPENSES:
|
||||
|
Interest expense
|
14,250,656
|
|||
|
Investment advisory fees
|
5,118,997
|
|||
|
Servicing fees
|
1,990,721
|
|||
|
Trustees’ fees and expenses*
|
463,609
|
|||
|
Professional fees
|
428,202
|
|||
|
Insurance
|
191,778
|
|||
|
Administration fees
|
182,194
|
|||
|
Fund accounting fees
|
172,587
|
|||
|
Printing fees
|
113,940
|
|||
|
Custodian fees
|
60,088
|
|||
|
Registration and filing fees
|
33,855
|
|||
|
Transfer agent fees
|
20,380
|
|||
|
Other expenses
|
30,341
|
|||
|
Total expenses
|
23,057,348
|
|||
|
Net investment income
|
16,281,602
|
|||
|
NET REALIZED AND UNREALIZED GAIN (LOSS):
|
||||
|
Net realized gain (loss) on:
|
||||
|
Investments
|
(6,130,747
|
)
|
||
|
Foreign currency transactions
|
(40,029
|
)
|
||
|
Forward foreign currency exchange contracts
|
2,083,374
|
|||
|
Options Written
|
66,968
|
|||
|
Net realized loss
|
(4,020,434
|
)
|
||
|
Net change in unrealized appreciation (depreciation) on:
|
||||
|
Investments
|
42,204,732
|
|||
|
Foreign currency translations
|
7,424
|
|||
|
Forward foreign currency exchange contracts
|
(1,151,928
|
)
|
||
|
Options Written
|
(56,885
|
)
|
||
|
Net change in unrealized appreciation (depreciation)
|
41,003,343
|
|||
|
Net realized and unrealized gain
|
36,982,909
|
|||
|
Net increase in net assets resulting from operations
|
$
|
53,264,511
|
||
* Relates to Trustees not deemed “interested persons” within the meaning of Section 2(a)(19) of the 1940 Act.
See notes to financial statements.
AVK l ADVENT CONVERTIBLE AND INCOME FUND ANNUAL REPORT l 37
|
STATEMENTS OF CHANGES IN NET ASSETS
|
October 31, 2019
|
|||||||
|
|
Year Ended
|
Year Ended
|
||||||
|
|
October 31, 2019
|
October 31, 2018
|
||||||
|
INCREASE (DECREASE) IN NET ASSETS FROM OPERATIONS:
|
||||||||
|
Net investment income
|
$
|
16,281,602
|
$
|
11,487,807
|
||||
|
Net realized gain (loss) on investments
|
(4,020,434
|
)
|
24,129,828
|
|||||
|
Net change in unrealized appreciation (depreciation)
|
||||||||
|
on investments
|
41,003,343
|
(51,825,603
|
)
|
|||||
|
Net increase (decrease) in net assets resulting from operations
|
53,264,511
|
(16,207,968
|
)
|
|||||
|
Distributions to shareholders
|
(19,250,159
|
)
|
(13,035,462
|
)
|
||||
|
Return of capital
|
(29,306,113
|
)
|
(18,468,343
|
)
|
||||
|
SHAREHOLDER TRANSACTIONS:
|
||||||||
|
Net proceeds from the issuance of shares due to merger
|
—
|
253,762,759
|
a
|
|||||
|
Net increase in net assets resulting from shareholder transactions
|
—
|
253,762,759
|
||||||
|
Net increase in net assets
|
4,708,239
|
206,050,986
|
||||||
|
NET ASSETS:
|
||||||||
|
Beginning of period
|
559,440,021
|
353,389,035
|
||||||
|
End of period
|
$
|
564,148,260
|
$
|
559,440,021
|
||||
|
a Fund merger – See note 11
|
||||||||
See notes to financial statements.
38 l AVK l ADVENT CONVERTIBLE AND INCOME FUND ANNUAL REPORT
|
STATEMENT OF CASH FLOWS
|
October 31, 2019
|
|||
|
For the Year Ended October 31, 2019
|
||||
|
Cash Flows from Operating Activities:
|
||||
|
Net increase in net assets resulting from operations
|
$
|
53,264,511
|
||
|
Adjustments to Reconcile Net Increase in Net Assets Resulting from Operations to
|
||||
|
Net Cash Provided by Operating and Investing Activities:
|
||||
|
Net change in unrealized (appreciation) depreciation on investments
|
(42,204,732
|
)
|
||
|
Net change in unrealized (appreciation) depreciation on forward foreign
|
||||
|
currency exchange contracts
|
1,151,928
|
|||
|
Net change in unrealized (appreciation) depreciation on options written
|
56,885
|
|||
|
Net realized loss on investments
|
6,130,747
|
|||
|
Net realized gain on options written
|
(66,968
|
)
|
||
|
Purchase of long-term investments
|
(1,132,278,062
|
)
|
||
|
Proceeds from sale of long-term investments
|
1,162,613,882
|
|||
|
Net purchases of short-term investments
|
(2,533,308
|
)
|
||
|
Return of capital distributions received from investments
|
103,050
|
|||
|
Net accretion of discount and amortization of premium
|
(1,165,039
|
)
|
||
|
Corporate actions and other payments
|
473,236
|
|||
|
Premiums received on options written
|
647,632
|
|||
|
Cost of closing options written
|
(785,689
|
)
|
||
|
Decrease investments sold receivable
|
9,972,044
|
|||
|
Decrease in dividend receivable
|
417,116
|
|||
|
Increase in interest receivable
|
(405,318
|
)
|
||
|
Decrease in tax reclaims receivable
|
219,675
|
|||
|
Decrease in other assets
|
71,458
|
|||
|
Decrease in investments purchased payable
|
(5,387,298
|
)
|
||
|
Decrease in interest payable on margin loan
|
(2,546
|
)
|
||
|
Decrease in professional fees payable
|
(105,748
|
)
|
||
|
Decrease in servicing fees payable
|
(2,913
|
)
|
||
|
Decrease in due to custodian
|
(858,165
|
)
|
||
|
Decrease in investment advisory fees payable
|
(7,490
|
)
|
||
|
Decrease in merger fees payable
|
(225,003
|
)
|
||
|
Increase in other liabilities
|
118,387
|
|||
|
Net Cash Provided by Operating and Investing Activities
|
$
|
49,212,272
|
||
|
Cash Flows From Financing Activities:
|
||||
|
Distributions to common shareholders
|
(48,556,272
|
)
|
||
|
Net Cash Used in Financing Activities
|
(48,556,272
|
)
|
||
|
Net increase in cash
|
656,000
|
|||
|
Cash at Beginning of Year
|
—
|
|||
|
Cash at End of Year
|
$
|
656,000
|
||
|
Supplemental Disclosure of Cash Flow Information:
|
||||
|
Cash paid during the year for interest
|
$
|
14,251,765
|
||
See notes to financial statements.
AVK l ADVENT CONVERTIBLE AND INCOME FUND ANNUAL REPORT l 39
|
FINANCIAL HIGHLIGHTS
|
|
|
|
|
October 31, 2019
|
|
|
Year Ended
|
Year Ended
|
Year Ended
|
Year Ended
|
Year Ended
|
|||||||||||||||
|
|
October 31,
|
October 31,
|
October 31,
|
October 31,
|
October 31,
|
|||||||||||||||
|
|
2019
|
2018
|
2017
|
2016
|
2015
|
|||||||||||||||
|
Per Share Data:
|
||||||||||||||||||||
|
Net asset value, beginning of period
|
$
|
16.20
|
$
|
17.63
|
$
|
16.26
|
$
|
17.11
|
$
|
19.00
|
||||||||||
|
Income from investment operations:
|
||||||||||||||||||||
|
Net investment income(a)
|
0.47
|
0.51
|
0.69
|
0.75
|
0.65
|
|||||||||||||||
|
Net gain (loss) on investments (realized and unrealized)
|
1.08
|
(0.54
|
)
|
1.86
|
(0.47
|
)
|
(1.41
|
)
|
||||||||||||
|
Total from investment operations
|
1.55
|
(0.03
|
)
|
2.55
|
0.28
|
(0.76
|
)
|
|||||||||||||
|
Less distributions from:
|
||||||||||||||||||||
|
Net investment income
|
(0.56
|
)
|
(0.58
|
)
|
(0.75
|
)
|
(0.74
|
)
|
(0.76
|
)
|
||||||||||
|
Return of capital
|
(0.85
|
)
|
(0.82
|
)
|
(0.49
|
)
|
(0.39
|
)
|
(0.37
|
)
|
||||||||||
|
Total distributions to shareholders
|
(1.41
|
)
|
(1.40
|
)
|
(1.24
|
)
|
(1.13
|
)
|
(1.13
|
)
|
||||||||||
|
Increase resulting from tender offer and repurchase of Common Shares
|
—
|
—
|
0.06
|
—
|
—
|
|||||||||||||||
|
Net asset value, end of period
|
$
|
16.34
|
$
|
16.20
|
$
|
17.63
|
$
|
16.26
|
$
|
17.11
|
||||||||||
|
Market value, end of period
|
$
|
14.79
|
$
|
13.93
|
$
|
16.09
|
$
|
14.01
|
$
|
14.13
|
||||||||||
|
Total Return(b)
|
||||||||||||||||||||
|
Net asset value
|
9.94
|
%
|
(0.34
|
%)
|
16.55
|
%
|
1.94
|
%
|
(4.20
|
%)
|
||||||||||
|
Market value
|
17.01
|
%
|
(5.22
|
%)
|
24.20
|
%
|
7.57
|
%
|
(12.57
|
%)
|
||||||||||
|
Ratios/Supplemental Data:
|
||||||||||||||||||||
|
Net assets, end of period (in thousands)
|
$
|
564,148
|
$
|
559,440
|
$
|
353,389
|
$
|
383,513
|
$
|
403,555
|
||||||||||
See notes to financial statements.
40 l AVK l ADVENT CONVERTIBLE AND INCOME FUND ANNUAL REPORT
|
FINANCIAL HIGHLIGHTS continued
|
|
|
|
|
|
|
|
October 31, 2019
|
||
|
|
||||||||||
|
|
||||||||||
|
|
Year Ended
|
Year Ended
|
Year Ended
|
Year Ended
|
Year Ended
|
|||||||||||||||
|
|
October 31,
|
October 31,
|
October 31,
|
October 31,
|
October 31,
|
|||||||||||||||
|
|
2019
|
2018
|
2017
|
2016
|
2015
|
|||||||||||||||
|
Ratio to average net assets of:
|
||||||||||||||||||||
|
Net investment income, including interest expense
|
2.90
|
%
|
2.93
|
%
|
4.04
|
%
|
4.66
|
%
|
3.56
|
%
|
||||||||||
|
Total expenses, including interest expense(c),(d)
|
4.11
|
%
|
3.87
|
%
|
2.72
|
%
|
2.92
|
%
|
2.48
|
%
|
||||||||||
|
Portfolio turnover rate
|
123
|
%
|
121
|
%
|
110
|
%
|
98
|
%
|
117
|
%
|
||||||||||
|
Senior Indebtedness:
|
||||||||||||||||||||
|
Margin loan outstanding (in thousands)(e)
|
$
|
210,000
|
$
|
235,000
|
$
|
227,000
|
$
|
262,000
|
$
|
262,000
|
||||||||||
|
Asset Coverage per $1,000 of indebtedness(f)
|
$
|
3,686
|
$
|
3,381
|
$
|
2,557
|
$
|
2,464
|
$
|
2,540
|
||||||||||
|
(a)
|
Based on average shares outstanding.
|
|
|
|
|
|
|
|
|
|
|
(b)
|
Total return is calculated assuming a purchase of a common share at the beginning of the period and a sale on the last day of the period reported either at the net asset
value (“NAV”)
|
|||||||||
|
|
or market price per share. Dividends and distributions are assumed to be reinvested at NAV for NAV returns or the prices obtained under the Fund’s Dividend Reinvestment Plan
for
|
|||||||||
|
|
market value returns. Total return does not reflect brokerage commissions.
|
|
|
|
|
|
|
|||
|
(c)
|
Expense ratio does not reflect the fees and expenses incurred directly by the Fund as a result of its investment in shares of business development companies. If these fees were included
|
|||||||||
|
|
in the expense ratio, the increase to the expense ratio would be approximately 0.00%, 0.00%, 0.00%, 0.01% and 0.01% for the years ended October 31, 2019, 2018, 2017, 2016 and
2015.
|
|||||||||
|
(d)
|
Excluding interest expense, the operating expense ratios for the years ended October 31 would be:
|
|
|
|
|
|
||||
|
|
2019
|
2018
|
2017
|
2016
|
2015
|
|
|
|
|
|
|
|
1.57%
|
1.62%
|
1.49%
|
1.52%
|
1.42%
|
|
|
|
|
|
|
(e)
|
Commencing on October 31, 2018, as a result of the Fund having earmarked or segregated cash to collateralize the reverse repurchase agreement transactions or otherwise having
|
|||||||||
|
|
covered the transactions, in accordance with releases and interpretive letters issued by the Securities and Exchange Commission (the “SEC”), the Fund does not treat its
obligations
|
|||||||||
|
|
under such transactions as senior securities representing indebtedness for purposes of the 1940 Act.
|
|
|
|
|
|||||
|
(f)
|
Calculated by subtracting the Fund’s total liabilities (not including the margin loan) from the Fund’s total assets and dividing by the margin loan.
|
|
|
|||||||
See notes to financial statements.
AVK l ADVENT CONVERTIBLE AND INCOME FUND ANNUAL REPORT l 41
|
NOTES TO FINANCIAL STATEMENTS
|
October 31, 2019
|
Note 1 – Organization
Advent Convertible and Income Fund (the “Fund”) (formerly known as Advent Claymore Convertible Securities and Income Fund) was organized as a Delaware statutory trust on February
19, 2003. The Fund is registered as a diversified, closed-end management investment company under the Investment Company Act of 1940, as amended (the “1940 Act”).
The Fund’s investment objective is to provide total return through a combination of capital appreciation and current income. The Fund pursues its investment objective by
investing at least 80% of its managed assets in a diversified portfolio of convertible securities and non-convertible income producing securities.
Note 2 – Significant Accounting Policies
The Fund operates as an investment company and accordingly follows the investment company accounting and reporting guidance of the Financial Accounting Standards Board (“FASB”)
Accounting Standards Codification Topic 946 Financial Services – Investment Companies.
The following significant accounting policies are in conformity with U.S. generally accepted accounting principles (“U.S. GAAP”) and are consistently followed by the Fund. This
requires management to make estimates and assumptions that affect the reported amount of assets and liabilities and disclosure of contingent assets and liabilities at the date of the financial statements and the reported amounts of revenues and
expenses during the reporting period. Actual results could differ from these estimates. All time references are based on Eastern Time.
(a) Valuation of Investments
The Board of Trustees of the Fund (the “Board”) has adopted policies and procedures for the valuation of the Fund’s investments (the “Valuation Procedures”). Pursuant to the
Valuation Procedures, the Board has delegated to a valuation committee, consisting of representatives from investment management, finance, legal and compliance departments (the “Valuation Committee”), the day-to-day responsibility for implementing
the Valuation Procedures, including, under most circumstances, the responsibility for determining the fair value of the Fund’s securities and/or other assets.
Valuations of the Fund’s securities are supplied primarily by pricing services appointed pursuant to the processes set forth in the Valuation Procedures. The Valuation Committee
convenes quarterly, or more frequently as needed, to review the valuation of all assets which have been fair valued for reasonableness. The Fund’s officers, through the Valuation Committee and consistent with the monitoring and review
responsibilities set forth in the Valuation Procedures, regularly review procedures used and valuations provided by the pricing services.
If the pricing service cannot or does not provide a valuation for a particular investment or such valuation is deemed unreliable, such investment is fair valued by the Valuation
Committee.
Securities listed on an exchange or on an over-the-counter market will be valued at the last reported sale price on the primary exchange or market on which they are traded;
provided, however, that securities listed on the National Association of Securities Dealers Automated Quotations (“NASDAQ”) National Market system will be valued at the NASDAQ Official Closing Price, which may not necessarily represent the last
sale price.
42 l AVK l ADVENT CONVERTIBLE AND INCOME FUND ANNUAL REPORT
|
NOTES TO FINANCIAL STATEMENTS continued
|
October 31, 2019
|
Equity securities that are traded on an exchange or on the over-the-counter market and for which there are no transactions on a given day are valued at the mean of the closing
bid and asked prices.
Open-end investment companies are valued at their net asset value (“NAV”) as of the close of business, on the valuation date. Exchange-traded funds and closed-end investment
companies are valued at the last quoted sale price.
Generally, trading in foreign securities markets is substantially completed each day at various times prior to the close of the New York Stock Exchange (“NYSE”). The values of
foreign securities are determined as of the close of such foreign markets or the close of the NYSE, if earlier. All investments quoted in foreign currencies are valued in U.S. dollars on the basis of the foreign currency exchange rates prevailing
at the close of U.S. business at 4:00 p.m. Investments in foreign securities may involve risks not present in domestic investments. The Valuation Committee will determine the current value of such foreign securities by taking into consideration
certain factors which may include those discussed above, as well as the following factors, among others: the value of the securities traded on other foreign markets, ADR trading, closed-end fund trading, foreign currency exchange activity, and the
trading prices of financial products that are tied to foreign securities. In addition, under the Valuation Procedures, the Valuation Committee is authorized to use prices and other information supplied by a third party pricing vendor in valuing
foreign securities.
Debt securities are valued based on prices provided by pricing services or, if not available or if Advent Capital Management, LLC (“Advent” or the “Investment Adviser”) considers
that price to not represent fair value, by dealers using the mean of the closing bid and asked prices for such securities or, if such prices are not available, at prices for securities of comparable maturity, quality and type. If sufficient market
activity is limited or does not exist, the pricing services or dealers may utilize proprietary valuation models which may, for example, consider market characteristics such as benchmark yield curves, option-adjusted spreads, credit spreads,
estimated default rates, coupon rates, anticipated timing of principal repayments, underlying collateral, or other unique security features in order to estimate relevant cash flows, which are then discounted to calculate a security’s fair value.
Short-term securities with remaining maturities of 60 days or less at the time of valuation are valued at amortized cost, which approximates market value. Short-term securities which have a term-to-maturity greater than 60 days from the date of
purchase are valued at their current market quotations until maturity or disposition. Convertible securities are valued in the same manner as debt securities. Repurchase agreements are valued at amortized cost, provided such amounts approximate
market value.
Typically, loans are valued using information provided by an independent third party pricing service which uses broker quotes. If the pricing service cannot or does not provide a
valuation for a particular investment or such valuation is deemed unreliable, such investment is fair valued by the Valuation Committee.
Listed options are valued at the Official Settlement Price listed in by the exchange, usually as of 4:00 p.m. Long options are valued using the bid price and short options are
valued using the ask price. In the event that a settlement price is not available, fair valuation is enacted. Over-the-counter (“OTC”) options are valued using the average bid price (for long options), or average ask price (for short options)
obtained from one or more security dealers.
AVK l ADVENT CONVERTIBLE AND INCOME FUND ANNUAL REPORT l 43
|
NOTES TO FINANCIAL STATEMENTS continued
|
October 31, 2019
|
Forward foreign currency exchange contracts are valued by pricing services or, if not available or if Advent considers that price to not represent fair value, by dealers using
the mid price. Futures contracts are valued using the settlement price established each day on the exchange on which they are traded.
Valuations in accordance with these methods are intended to reflect each security’s (or asset’s or liability’s) “fair value”. Each such determination is based on a consideration
of all relevant factors, which are likely to vary from one pricing context to another. Examples of such factors may include, but are not limited to market prices; sale prices; broker quotes; and models which derive prices based on inputs such as
prices of securities with comparable maturities and characteristics, or based on inputs such as anticipated cash flows or collateral, spread over U.S. Treasuries, and other information analysis.
(b) Investment Transactions and Investment Income
Investment transactions are accounted for on the trade date. Realized gains and losses on investments are determined on the identified cost basis. Dividend income is recorded net
of applicable withholding taxes on the ex-dividend date and interest income is recorded on an accrual basis. Discounts or premiums on debt securities purchased are accreted or amortized to interest income over the lives of the respective securities
using the effective interest method.
(c) Convertible Securities
The Fund invests in convertible securities, preferred stocks and fixed-income securities which are convertible into common stock. Convertible securities may be converted either
at a stated price or rate within a specified period of time into a specified number of shares of common stock. Most commonly, convertible securities have paid dividends or interest greater than on the related common stocks, but less than fixed
income non-convertible securities. By investing in a convertible security, the Fund may participate in any capital appreciation or depreciation of a company’s stock, but to a lesser degree than if it had invested in that company’s common stock.
Convertible securities rank senior to common stock in a corporation’s capital structure and, therefore, entail less risk than the corporation’s common stock.
(d) Senior Floating Rate Interests
Senior floating rate interests in which the Fund invests generally pay interest rates which are periodically adjusted by reference to a base short-term floating rate, plus a
premium. These base lending rates are generally (i) the lending rate offered by one or more major European banks, such as the one-month or three-month London Inter-Bank Offered Rate (“LIBOR”), (ii) the prime rate offered by one or more major United
States banks, or (iii) the bank’s certificate of deposit rate. Senior floating rate interests often require repayments from excess cash flows or permit the borrower to repay at its election. The rate at which the borrower repays cannot be predicted
with accuracy. As a result, the actual remaining maturity may be substantially less than the stated maturities shown on the Schedule of Investments.
(e) Currency Translation
The accounting records of the Fund are maintained in U.S. dollars. All assets and liabilities initially expressed in foreign currencies are converted into U.S. dollars at
prevailing exchange rates. Purchases and sales of investment securities, dividend and interest income, and certain expenses are translated at the rates of exchange prevailing on the respective dates of such transactions.
44 l AVK l ADVENT CONVERTIBLE AND INCOME FUND ANNUAL REPORT
|
NOTES TO FINANCIAL STATEMENTS continued
|
October 31, 2019
|
The Fund does not isolate that portion of the results of operations resulting from changes in foreign exchange rates on investments from the fluctuations arising from changes in
market prices of securities held. Such fluctuations are included with the net realized gain or loss and unrealized appreciation or depreciation on investments.
Foreign exchange realized gain or loss resulting from holding of a foreign currency, expiration of a currency exchange contract, difference in exchange rates between the trade
date and settlement date of an investment purchased or sold, and the difference between dividends or interest actually received compared to the amount shown in the Fund’s accounting records on the date of receipt, if any, is shown as net realized
gains or losses on foreign currency transactions on the Fund’s Statement of Operations.
Foreign exchange unrealized appreciation or depreciation on assets and liabilities, other than investments, if any, is shown as unrealized appreciation (depreciation) on foreign
currency translation on the Fund’s Statement of Operations.
(f) Forward Foreign Currency Exchange Contracts
Forward foreign currency exchange contracts are agreements between two parties to buy and sell currencies at a set price on a future date. Fluctuations in the value of open
forward foreign currency exchange contracts are recorded for financial reporting purposes as unrealized appreciation and depreciation by the Fund until the contracts are closed. When the contracts are closed, realized gains and losses are recorded,
and included on the Statement of Operations in forward foreign currency exchange contracts.
(g) Distributions to Shareholders
The Fund declares and pays monthly distributions to common shareholders. These distributions consist of investment company taxable income, which generally includes qualified
dividend income, ordinary income and short-term capital gains. Any net realized long-term capital gains are distributed annually to common shareholders. To the extent distributions exceed taxable income, the excess will be deemed a return of
capital.
Distributions to shareholders are recorded on the ex-dividend date. The amount and timing of distributions are determined in accordance with U.S. federal income tax regulations,
which may differ from U.S. GAAP.
(h) Covered Call Options and Put Options
When an option is written, the premium received is recorded as an asset with an equal liability and is subsequently marked to market to reflect the current market value of the
option written. These liabilities are reflected as options written on the Statement of Assets and Liabilities. Premiums received from writing options which expire unexercised are recorded on the expiration date as a realized gain. The difference
between the premium received and the amount paid on effecting a closing purchase transaction, including brokerage commissions, is also treated as a realized gain, or if the premium is less than the amount paid for the closing purchase transactions,
as a realized loss. If an option is exercised, the premium is added to the proceeds from the sale of the underlying security in determining whether there has been a realized gain or loss.
AVK l ADVENT CONVERTIBLE AND INCOME FUND ANNUAL REPORT l 45
|
NOTES TO FINANCIAL STATEMENTS continued
|
October 31, 2019
|
When a call option is purchased, the Fund obtains the right (but not the obligation) to buy the underlying instrument at the strike price at anytime during the option period.
When a put option is purchased, the Fund obtains the right (but not the obligation) to sell the option’s underlying instrument at the strike price at anytime during the option period. When the Fund purchases an option, an amount equal to the
premium paid by the Fund is reflected as an asset and subsequently marked-to-market to reflect the current market value of the option purchased. Purchased options are included with Investments on the Statement of Assets and Liabilities.
(i) Certain Risks and Other Considerations
In the normal course of business, the Fund trades financial instruments and enters into financial transactions where risk of potential loss exists due to, among other things,
changes in the market (market risk) or the potential inability of a counterparty to meet the terms of an agreement (counterparty risk). The Fund is also exposed to other risks such as, but not limited to, convertible securities, equity securities,
illiquid securities, leverage concentration, interest rate and credit risks.
Investment and Market Risk. An investment in the Fund’s common shares is subject to investment risk,
including the possible loss of the entire principal amount that you invest. An investment in the Fund’s common shares represents an indirect investment in the securities owned by the Fund. The value of the securities owned by the Fund may
fluctuate, sometimes rapidly and unpredictably, which will affect the NAV and may affect the market price of the common shares. The value of securities owned by the Fund may decline due to general market conditions that are not specifically
related to a particular issuer, such as real or perceived economic conditions, changes in interest or currency rates or changes in investor sentiment or market outlook generally. At any point in time, your common shares may be worth less than
your original investment, including the reinvestment of the Fund’s dividends and distributions.
Convertible Securities Risk. The market value of a convertible security is a function of its
“investment value” and its “conversion value.” A security’s “investment value” represents the value of the security without its conversion feature (i.e., a nonconvertible fixed income security). The investment value may be determined by reference
to its credit quality and the current value of its yield to maturity or probable call date. At any given time, investment value is dependent upon such factors as the general level of interest rates, the yield of similar nonconvertible securities,
the financial strength of the issuer, and the seniority of the security in the issuer’s capital structure. A security’s “conversion value” is determined by multiplying the number of shares the holder is entitled to receive upon conversion or
exchange by the current price of the underlying security. If the conversion value of a convertible security is significantly below its investment value, the convertible security will trade like nonconvertible debt or preferred stock and its
market value will not be influenced greatly by fluctuations in the market price of the underlying security. In that circumstance, the convertible security takes on the characteristics of a bond, and its price moves in the opposite direction from
interest rates. Conversely, if the conversion value of a convertible security is near or above its investment value, the market value of the convertible security will be more heavily influenced by fluctuations in the market price of the
underlying security. In that case, the convertible security’s price may be as volatile as that of common stock. Because both interest rates and market movements can influence its value, a convertible security generally is not as sensitive to
interest rates as a similar fixed income security, nor is it as sensitive to changes in share price as its underlying equity security. Convertible securities are often rated below investment grade or are not rated.
46 l AVK l ADVENT CONVERTIBLE AND INCOME FUND ANNUAL REPORT
|
NOTES TO FINANCIAL STATEMENTS continued
|
October 31, 2019
|
Although all markets are prone to change over time, the generally high rate at which convertible securities are retired (through mandatory or scheduled conversions by issuers or
through voluntary redemptions by holders) and replaced with newly issued convertibles may cause the convertible securities market to change more rapidly than other markets. For example, a concentration of available convertible securities in a few
economic sectors could elevate the sensitivity of the convertible securities market to the volatility of the equity markets and to the specific risks of those sectors. Moreover, convertible securities with innovative structures, such as
mandatory-conversion securities and equity-linked securities, have increased the sensitivity of the convertible securities market to the volatility of the equity markets and to the special risks of those innovations, which may include risks
different from, and possibly greater than, those associated with traditional convertible securities. A convertible security may be subject to redemption at the option of the issuer at a price set in the governing instrument of the convertible
security.
If a convertible security held by the Fund is subject to such redemption option and is called for redemption, the Fund must allow the issuer to redeem the security, convert it
into the underlying common stock, or sell the security to a third party.
As a result of the conversion feature, convertible securities typically offer lower interest rates than if the securities were not convertible. During periods of rising interest
rates, it is possible that the potential for capital gain on convertible securities may be less than that of a common stock equivalent if the yield on the convertible security is at a level that would cause it to sell at discount.
Also, in the absence of adequate anti-dilution provisions in a convertible security, dilution in the value of the Fund’s holding may occur in the event the underlying stock is
subdivided, additional securities are issued, a stock dividend is declared, or the issuer enters into another type of corporate transaction which increases its outstanding securities.
Equity Securities Risk. Equity securities risk is the risk that the value of the securities held by the
Fund will fall due to general market and economic conditions, perceptions regarding the industries in which the issuers of securities held by the Fund participate or factors relating to specific companies in which the Fund invests. Stock of an
issuer in the Fund’s portfolio may decline in price if the issuer fails to make anticipated dividend payments because, among other reasons, the issuer of the security experiences a decline in its financial condition. Common stock in which the
Fund may invest is structurally subordinated to preferred stock, bonds and other debt instruments in a company’s capital structure, in terms of priority to corporate income, and therefore will be subject to greater dividend risk than preferred
stock or debt instruments of such issuers. In addition, while common stock has historically generated higher average returns than fixed income securities, common stock has also experienced significantly more volatility in those returns. An
adverse event, such as an unfavorable earnings report, may depress the value of common stock of an issuer held by the Fund. Common stocks are susceptible to general stock market fluctuations and to volatile increases and decreases in value as
market confidence in and perceptions of their issuers change. These investor perceptions are based on various and unpredictable factors including expectations regarding: government, economic, monetary and fiscal policies; inflation and interest
rates; economic expansion or contraction; and global or regional political, economic and banking crises.
AVK l ADVENT CONVERTIBLE AND INCOME FUND ANNUAL REPORT l 47
|
NOTES TO FINANCIAL STATEMENTS continued
|
October 31, 2019
|
Illiquid Securities Risk. Illiquid securities may be difficult to dispose of at a fair price at the
times when the Fund believes it is desirable to do so. The market price of illiquid securities generally is more volatile than that of more liquid securities, which may adversely affect the price that the Fund pays for or recovers upon the sale
of illiquid securities. Illiquid securities are also more difficult to value and the manager’s judgment may play a greater role in the valuation process. Investment of the Fund’s assets in illiquid securities may restrict the Fund’s ability to
take advantage of market opportunities. The risks associated with illiquid securities may be particularly acute in situations in which the Fund’s operations require cash and could result in the Fund borrowing to meet its short-term needs or
incurring losses on the sale of illiquid securities. Although many of the Rule 144A Securities in which the Fund invests may be, in the view of the manager, liquid, if qualified institutional buyers are unwilling to purchase these Rule 144A
Securities, they may become illiquid.
Leverage Risk. The use of leverage may result in higher income to common shareholders over time;
however, there can be no assurance that these expectations will be realized or that a leveraging strategy will be successful in any particular time period. Use of leverage creates an opportunity for increased income and capital appreciation but,
at the same time, creates special risks. Leverage is a speculative technique that exposes the Fund to greater risk and increased costs than if it were not implemented. There can be no assurance that a leveraging strategy will be utilized or will
be successful.
The use of leverage by the Fund will cause the NAV, and possibly the market price, of the Fund’s common shares to fluctuate significantly in response to changes in interest rates
and other economic indicators. As a result, the NAV and market price and dividend rate of the common shares of the Fund is likely to be more volatile than those of a closed-end management investment company that is not exposed to leverage. In a
declining market the use of leverage may result in a greater decline in the NAV of the common shares than if the Fund were not leveraged.
Leverage will increase operating costs, which may reduce total return. The Fund will have to pay interest on its indebtedness, if any, which may reduce the Fund’s return. This
interest expense may be greater than the Fund’s return on the underlying investment, which would negatively affect the performance of the Fund. Increases in interest rates that the Fund must pay on its indebtedness will increase the cost of
leverage and may reduce the return to common shareholders. This risk may be greater in the current market environment because interest rates are near historically low levels.
Certain types of indebtedness subject the Fund to covenants in credit agreements relating to asset coverage and portfolio composition requirements. Certain indebtedness issued by
the Fund also may be subject to certain restrictions on investments imposed by guidelines of one or more rating agencies, which may issue ratings for such indebtedness. These guidelines may impose asset coverage or portfolio composition
requirements that are more stringent than those imposed by the 1940 Act.
Reverse repurchase agreements involve the risks that the interest income earned on the investment of the proceeds will be less than the interest expense and Fund expenses
associated with the repurchase agreement, that the market value of the securities sold by the Fund may decline below the price at which the Fund is obligated to repurchase such securities and that the securities may not be returned to the Fund.
There is no assurance that reverse repurchase agreements can be
48 l AVK l ADVENT CONVERTIBLE AND INCOME FUND ANNUAL REPORT
|
NOTES TO FINANCIAL STATEMENTS continued
|
October 31, 2019
|
successfully employed. In connection with reverse repurchase agreements, the Fund will also be subject to counterparty risk with respect to the purchaser of the securities. If
the broker/dealer to whom the Fund sells securities becomes insolvent, the Fund’s right to purchase or repurchase securities may be restricted.
The Fund may have leverage outstanding during a shorter-term period during which such leverage may not be beneficial to the Fund if it believes that the long-term benefits to
common shareholders of such leverage would outweigh the costs and portfolio disruptions associated with redeeming and reissuing such leverage. However, there can be no assurance that the Fund’s judgment in weighing such costs and benefits will be
correct.
During the time in which the Fund is utilizing leverage, the amount of the fees paid for investment advisory services will be higher than if the Fund did not utilize leverage
because the fees paid will be calculated based on the Fund’s managed assets, including proceeds of leverage. This may create a conflict of interest between the Adviser and the common shareholders, as common shareholders bear the portion of the
investment advisory fee attributable to the assets purchased with the proceeds of leverage, which means that common shareholders effectively bear the entire advisory fee.
In addition, the Fund may engage in certain derivatives transactions that have economic characteristics similar to leverage. The Fund intends to earmark or segregate cash or
liquid securities or otherwise cover such transactions in accordance with applicable interpretations of the staff of the SEC. Securities so segregated or designated as “cover” will be unavailable for sale (unless replaced by other securities
qualifying for segregation or cover requirements), which may adversely affect the ability of the Fund to pursue its investment objective.
The Fund may be required to pay a commitment fee on unused portions of its credit facility. In connection with the use of leverage, the Fund may enter into interest rate swap or
cap transactions, either separately or as a component of its credit facility in order to fix its borrowing costs. In the event the Fund elects or are required to de-lever, the Fund may be required to pay early termination payments and other
breakage costs associated with the termination of the interest rate swap or cap transaction. While such transactions are intended to reduce the risks associated with an increase in short-term interest rates, the use of interest rate swaps and caps
involves investment techniques and risks different from those associated with ordinary portfolio security transactions. Depending on the state of interest rates in general, the Fund’s use of interest rate instruments could enhance or harm the
overall performance of the Fund’s common shares.
Credit Risk. Credit risk is the risk that one or more income securities in the Fund’s portfolio will
decline in price, or fail to pay interest and principal when due, because the issuer of the security experiences a decline in its financial status. The Fund’s investments in income securities involve credit risk. However, in general, lower rated,
lower grade and non-investment grade securities carry a greater degree of risk that the issuer will lose its ability to make interest and principal payments, which could have a negative impact on the Fund’s NAV or dividends.
Interest Rate Risk. Convertible and nonconvertible income-producing securities including preferred
stock and debt securities (collectively, “income securities”) are subject to certain interest rate risks. If interest rates go up, the value of income securities in the Fund’s portfolio generally will decline. These risks may be greater in the
current market environment because interest rates are near
AVK l ADVENT CONVERTIBLE AND INCOME FUND ANNUAL REPORT l 49
|
NOTES TO FINANCIAL STATEMENTS continued
|
October 31, 2019
|
historically low levels. During periods of rising interest rates, the average life of certain types of income securities may be extended because of slower than expected principal
payments. This may lock in a below market interest rate, increase the security’s duration (the estimated period until the security is paid in full) and reduce the value of the security. This is known as extension risk. During periods of declining
interest rates, the issuer of a security may exercise its option to prepay principal earlier than scheduled, forcing the Fund to reinvest in lower yielding securities. This is known as call or prepayment risk. Lower grade securities have call
features that allow the issuer to repurchase the security prior to its stated maturity. An issuer may redeem a lower grade security if the issuer can refinance the security at a lower cost due to declining interest rates or an improvement in the
credit standing of the issuer.
Lower Grade Securities Risk. Investing in lower grade and non-investment grade securities involves
additional risks. Securities of below investment grade quality are commonly referred to as “junk bonds” or “high yield securities.” Investment in securities of below investment grade quality involves substantial risk of loss. Securities of below
investment grade quality are predominantly speculative with respect to the issuer’s capacity to pay interest and repay principal when due and therefore involve a greater risk of default or decline in market value due to adverse economic and
issuer specific developments. Issuers of below investment grade securities are not perceived to be as strong financially as those with higher credit ratings. Issuers of lower grade securities may be highly leveraged and may not have available to
them more traditional methods of financing. Therefore, the risks associated with acquiring the securities of such issuers generally are greater than is the case with higher rated securities. These issuers are more vulnerable to financial setbacks
and recession than more creditworthy issuers, which may impair their ability to make interest and principal payments. The issuer’s ability to service its debt obligations also may be adversely affected by specific issuer developments, the
issuer’s inability to meet specific projected business forecasts or the unavailability of additional financing. Therefore, there can be no assurance that in the future there will not exist a higher default rate relative to the rates currently
existing in the market for lower grade securities. The risk of loss due to default by the issuer is significantly greater for the holders of lower grade securities because such securities may be unsecured and may be subordinate to other creditors
of the issuer. Securities of below investment grade quality display increased price sensitivity to changing interest rates and to a deteriorating economic environment. The market values for securities of below investment grade quality tend to be
more volatile and such securities tend to be less liquid than investment grade debt securities. To the extent that a secondary market does exist for certain below investment grade securities, the market for them may be subject to irregular
trading activity, wide bid/ask spreads and extended trade settlement periods.
Foreign Securities and Emerging Markets Risk. Investing in non-U.S. issuers may involve unique risks,
such as currency, political, economic and market risk. In addition, investing in emerging markets entails additional risk including, but not limited to: news and events unique to a country or region; smaller market size, resulting in lack of
liquidity and price volatility; certain national policies which may restrict the Fund’s investment opportunities; less uniformity in accounting and reporting requirements; unreliable securities valuation; and custody risk.
Counterparty Risk. The Fund is subject to counterparty credit risk, which is the risk that the
counterparty fails to perform on agreements with the Fund such as swap and option contracts, and reverse repurchase agreements.
50 l AVK l ADVENT CONVERTIBLE AND INCOME FUND ANNUAL REPORT
|
NOTES TO FINANCIAL STATEMENTS continued
|
October 31, 2019
|
LIBOR Risk. The London Interbank Offered Rate (“LIBOR”) as a reference or benchmark interest rate in
the U.S. and globally for commercial and financial contracts. LIBOR is used as a benchmark rate for floating rate debt, bank loans, derivatives and other borrowings or debt securities. The Fund has leverage arrangements that require the Fund to
pay a floating rate of interest based on LIBOR. In addition, the Fund may invest in instruments that pay a floating rate of interest based on LIBOR. In July 2017, the head of the United Kingdom Financial Conduct Authority announced the desire to
phase out the use of LIBOR by the end of 2021. Abandonment of or modifications to LIBOR could have adverse impacts on newly issued financial instruments and existing financial instruments which reference LIBOR. It is expected that a number of
private-sector banks currently reporting information used to set LIBOR will stop doing so after 2021 when their current reporting commitment ends. The U.S. and other countries are currently working to replace LIBOR with alternative reference
rates. There is currently no definitive information regarding the future utilization of LIBOR and the nature of any replacement rate. The expected discontinuation of LIBOR, and the transition to an alternative benchmark rate, may require
renegotiation by the Fund of certain of its investment instruments and its leverage arrangements. Moreover, the discontinuation of LIBOR and the transition to an alternative benchmark rate may adversely impact the functioning, liquidity,
volatility, and value of floating rate income securities and could lead to significant short-term and long-term uncertainty and market instability. These risks will be exacerbated if the work necessary to effect an orderly transition to an
alternative reference rate is not completed in a timely manner. These events may also increase the difficulty of borrowing or refinancing and may diminish the effectiveness of hedging strategies. The precise impacts of a transition away from
LIBOR on the Fund, on floating rate income securities in which the Fund may invest, and on the financing market generally remain uncertain. Additionally, because the usefulness of LIBOR as a benchmark could deteriorate during the transition
period, these effects could occur prior to the end of 2021.
(j) Indemnifications
Under the Fund’s organizational documents, its Trustees and Officers are indemnified against certain liabilities arising out of the performance of their duties to the Fund. In
addition, throughout the normal course of business, the Fund enters into contracts that contain a variety of representations and warranties which provide general indemnifications. The Fund’s maximum exposure under these arrangements is unknown, as
this would involve future claims that may be made against the Fund and/or its affiliates that have not yet occurred. However, based on experience, the Fund expects the risk of loss to be remote.
Note 3 – Derivatives
As part of its investment strategy, the Fund utilizes derivative instruments. These investments involve, to varying degrees, elements of market risk and risks in excess of
amounts recognized in the Statement of Assets and Liabilities. Valuation and accounting treatment of these instruments can be found under Significant Accounting Policies in Note 2 of these Notes to Financial Statements.
Derivatives are instruments whose values depend on, or are derived from, in whole or in part, the value of one or more other assets, such as securities, currencies, commodities
or indices. Derivative instruments may be used to increase investment flexibility (including to maintain cash reserves while maintaining exposure to certain other assets), for risk management (hedging) purposes, to facilitate trading, to reduce
transaction costs and to pursue higher investment returns. Derivative
AVK l ADVENT CONVERTIBLE AND INCOME FUND ANNUAL REPORT l 51
|
NOTES TO FINANCIAL STATEMENTS continued
|
October 31, 2019
|
instruments may also be used to mitigate certain investment risks, such as foreign currency exchange rate risk, interest rate risk and credit risk. U.S. GAAP requires disclosures
to enable investors to better understand how and why a Fund uses derivative instruments, how these derivative instruments are accounted for and their effects on the Fund's financial position and results of operations.
The Fund utilized derivatives for the following purposes:
Hedge – an investment made in order to seek to reduce the risk of adverse price movements in a
security, by taking an offsetting position to protect against broad market moves.
Income – the use of any instrument that distributes cash flows typically based upon some rate of
interest.
Options Purchased and Written
A call option on a security gives the purchaser of the option the right to buy, and the writer of a call option the obligation to sell, the underlying security. The purchaser of
a put option has the right to sell, and the writer of the put option the obligation to buy, the underlying security at any time during the option period. The risk associated with purchasing options is limited to the premium originally paid.
The risk in writing a call option is that a Fund may incur a loss if the market price of the underlying security increases and the option is exercised. The risk in writing a put
option is that a Fund may incur a loss if the market price of the underlying security decreases and the option is exercised. In addition, there may be an imperfect correlation between the movement in prices of options and the underlying securities
where a Fund may not be able to enter into a closing transaction because of an illiquid secondary market; or, for OTC options, a Fund may be at risk because of the counterparty’s inability to perform.
The following table represents the Fund’s use and volume of call options written on a monthly basis:
|
|
Average Notional
|
|
Use
|
Amount
|
|
Income
|
$ 1,963,750
|
Forward Foreign Currency Exchange Contracts
A forward foreign currency exchange contract is an agreement between two parties to exchange two designated currencies at a specific time in the future. Certain types of
contracts may be cash settled, in an amount equal to the change in exchange rates during the term of the contract. The contracts can be used to hedge or manage exposure to foreign currency risks with portfolio investments or to gain exposure to
foreign currencies.
The market value of a forward foreign currency exchange contract changes with fluctuations in foreign currency exchange rates. Furthermore, the Fund may be exposed to risk if the
counterparties cannot meet the contract terms or if the currency value changes unfavorably as compared to the U.S. dollar.
52 l AVK l ADVENT CONVERTIBLE AND INCOME FUND ANNUAL REPORT
|
NOTES TO FINANCIAL STATEMENTS continued
|
October 31, 2019
|
The following table represents the Fund’s use, and volume of forward foreign currency exchange contracts on a monthly basis:
|
|
Average Value
|
|
|
Use
|
Purchased
|
Sold
|
|
Hedge
|
$ 3,804,052
|
$ 47,648,489
|
Derivative Investment Holdings Categorized by Risk Exposure
The following is a summary of the location of derivative investments on the Fund’s Statement of Assets and Liabilities as of October 31, 2019:
|
Derivative Investment Type
|
Asset Derivatives
|
Liability Derivatives
|
|
Currency contracts
|
Unrealized
|
Unrealized
|
|
|
appreciation
|
depreciation
|
|
|
on forward
|
on forward
|
|
|
foreign currency
|
foreign currency
|
|
|
exchange contracts
|
exchange contracts
|
|
Equity contracts
|
|
Options written,
|
|
|
|
at value
|
The following table sets forth the fair value of the Fund’s derivative investments categorized by primary risk exposure at October 31, 2019:
|
Asset Derivative Investments Value
|
||
|
Forward Foreign
|
|
|
|
Currency Exchange
|
|
|
|
Risk
|
|
|
|
$ 133,941
|
|
|
|
Liability Derivative Investments Value
|
||
|
|
Forward Foreign
|
Total Value
|
|
Options Written
|
Currency Exchange
|
at October 31,
|
|
Equity Risk
|
Risk
|
2019
|
|
$ 340,000
|
$ 388,723
|
$ 728,723
|
The following is a summary of the location of derivative investments on the Fund’s Statement of Operations for the year ended October 31, 2019:
|
|
Location of Gain (Loss)
|
|
Derivative Investment Type
|
on Derivatives
|
|
Currency contracts
|
Net realized gain (loss) on forward foreign currency exchange contracts
Net change in unrealized appreciation (depreciation) on forward foreign currency exchange contracts
|
|
Equity contracts
|
Net realized gain (loss) on options written
Net change in unrealized appreciation (depreciation) on options written
|
AVK l ADVENT CONVERTIBLE AND INCOME FUND ANNUAL REPORT l 53
|
NOTES TO FINANCIAL STATEMENTS continued
|
October 31, 2019
|
The following is a summary of the Fund’s realized gain (loss) and change in unrealized appreciation (depreciation) on derivative investments recognized on the Statement of
Operations categorized by primary risk exposure for the year ended October 31, 2019:
|
Realized Gain (Loss) on Derivative Investments Recognized on the Statement of Operations:
|
||
|
|
Forward
|
|
|
Options
|
Foreign
|
|
|
Written
|
Currency
|
|
|
Equity
|
Exchange
|
|
|
Risk
|
Risk
|
Total
|
|
$ 66,968
|
$ 2,083,374
|
$ 2,150,342
|
|
Change in Unrealized Appreciation (Depreciation) on Derivative Investments
|
||
|
Recognized on the Statement of Operations
|
||
|
|
Forward
|
|
|
Options
|
Foreign
|
|
|
Written
|
Currency
|
|
|
Equity
|
Exchange
|
|
|
Risk
|
Risk
|
Total
|
|
$ (56,885)
|
$ (1,151,928)
|
$ (1,208,813)
|
In conjunction with the use of derivative instruments, the Fund is required to maintain collateral in various forms. Depending on the financial instrument utilized and the broker
involved, the Fund uses margin deposits at the broker, cash and/or securities segregated at the custodian bank, discount notes or repurchase agreements allocated to the Fund as collateral.
The Fund has established counterparty credit guidelines and enters into transactions only with financial institutions of investment grade or better. The Fund monitors the
counterparty credit risk.
Note 4 – Offsetting
In the normal course of business, the Fund enters into transactions subject to enforceable master netting arrangements or other similar arrangements. Generally, the right to
offset in those agreements allows the Fund to counteract the exposure to a specific counterparty with collateral received or delivered to that counterparty based on the terms of the arrangements. These arrangements provide for the right to
liquidate upon the occurrence of an event of default, credit event upon merger or additional termination event.
In order to better define their contractual rights and to secure rights that will help the Fund mitigate its counterparty risk, the Fund may enter into an International Swaps and
Derivatives Association, Inc. Master Agreement (“ISDA Master Agreement”) or similar agreement with its derivative contract counterparties. An ISDA Master Agreement is a bilateral agreement between a fund and a counterparty that governs OTC
derivatives, including foreign exchange contracts, and typically contains, among other things, collateral posting terms and netting provisions in the event of a default and/or termination event. The provisions of the ISDA Master Agreement typically
permit a single net payment in the event of a default (close-out netting) or similar event, including the bankruptcy or insolvency of the counterparty.
For derivatives traded under an ISDA Master Agreement, the collateral requirements are typically calculated by netting the mark-to-market amount for each transaction under such
agreement and comparing that amount to the value of any collateral currently pledged by the Fund and the
54 l AVK l ADVENT CONVERTIBLE AND INCOME FUND ANNUAL REPORT
|
NOTES TO FINANCIAL STATEMENTS continued
|
October 31, 2019
|
counterparty. For financial reporting purposes, cash collateral that has been pledged to cover obligations of the Fund and cash collateral received from the counterparty, if any,
are reported separately on the Statement of Assets and Liabilities as segregated cash with broker/receivable for variation margin, or payable for swap settlement/variation margin. Cash and/or securities pledged or received as collateral by the Fund
in connection with an OTC derivative subject to an ISDA Master Agreement generally may not be invested, sold or rehypothecated by the counterparty or the Fund, as applicable, absent an event of default under such agreement, in which case such
collateral generally may be applied towards obligations due to and payable by such counterparty or the Fund, as applicable. Generally, the amount of collateral due from or to a counterparty must exceed a minimum transfer amount threshold (e.g.,
$300,000) before a transfer is required to be made. To the extent amounts due to the Fund from its counterparties are not fully collateralized, contractually or otherwise, the Fund bears the risk of loss from counterparty nonperformance. The Fund
attempts to mitigate counterparty risk by only entering into agreements with counterparties that it believes to be of good standing and by monitoring the financial stability of those counterparties.
For financial reporting purposes, the Fund does not offset derivative assets and derivative liabilities that are subject to netting arrangements in the Statement of Assets and
Liabilities.
The following tables present derivative financial instruments and secured financing transactions that are subject to enforceable netting arrangements and offset in the Statement
of Assets and Liabilities in conformity with U.S. GAAP.
|
|
|
|
Gross
|
Net Amounts
|
|
Gross Amounts Not Offset
|
|
|
|
|
|
|
Amounts
|
of Assets
|
|
in the Statement of
|
|
|
|
|
|
Gross
|
Offset in the
|
Presented in
|
|
Assets and Liabilities
|
|
|
|
|
|
Amounts of
|
Statement
|
the Statement |
Derivatives
|
|
|
|
|
|
Investment
|
Recognized
|
of Assets &
|
of Assets &
|
Available
|
Financial
|
Collateral
|
Net
|
|
Counterparty
|
Type
|
Assets
|
Liabilities
|
Liabilities
|
for Offset
|
Instruments
|
Received
|
Amount
|
|
Bank of New York
|
Forward
|
$133,941
|
$ —
|
$133,941
|
$(133,941)
|
$ —
|
$ —
|
$ —
|
|
Mellon
|
Foreign
|
|
|
|
|
|
|
|
|
|
Currency
|
|
|
|
|
|
|
|
|
|
Exchange
|
|
|
|
|
|
|
|
|
|
Contracts
|
|
|
|
|
|
|
|
|
|
|
|
Gross
|
Net Amounts
|
|
Gross Amounts Not Offset
|
|
|
|
|
|
|
Amounts
|
of Liabilities
|
|
in the Statement of
|
|
|
|
|
|
Gross
|
Offset in the
|
Presented in
|
|
Assets and Liabilities
|
|
|
|
|
|
Amounts of
|
Statement
|
the Statement |
Derivatives
|
|
|
|
|
|
Investment
|
Recognized
|
of Assets &
|
of Assets &
|
Available
|
Financial
|
Collateral
|
Net
|
|
Counterparty
|
Type
|
Liabilities
|
Liabilities
|
Liabilities
|
for Offset
|
Instruments
|
Pledged
|
Amount
|
|
Société
|
Reverse
|
$177,016,427
|
$ —
|
$177,016,427
|
$ —
|
$177,016,427
|
$ —
|
$ —
|
|
Générale
|
Repurchase
|
|
|
|
|
|
|
|
|
|
Agreements
|
|
|
|
|
|
|
|
|
Bank of New York
|
Forward
|
388,723
|
—
|
388,723
|
(133,941)
|
—
|
—
|
254,782
|
|
Mellon
|
Foreign
|
|
|
|
|
|
|
|
|
|
Currency
|
|
|
|
|
|
|
|
|
|
Exchange
|
|
|
|
|
|
|
|
|
|
Contracts
|
|
|
|
|
|
|
|
The table above does not include the additional collateral pledged to the counterparty for the reverse repurchase agreement. Total additional collateral pledged for the reverse
repurchase agreement was $90,983,662.
AVK l ADVENT CONVERTIBLE AND INCOME FUND ANNUAL REPORT l 55
|
NOTES TO FINANCIAL STATEMENTS continued
|
October 31, 2019
|
Note 5 – Fees and Other Transactions
Pursuant to an Investment Advisory Agreement between the Fund and Advent, the Investment Adviser is responsible for the daily management of the Fund’s portfolio of investments,
which includes buying and selling securities for the Fund, as well as investment research. The Investment Adviser will receive an annual fee from the Fund based on the average value of the Fund’s Managed Assets. In addition, subject to the approval
of the Fund’s Board, a pro rata portion of the salaries, bonuses, health insurance, retirement benefits and similar employment costs for the time spent on Fund operations (other than the provision of services required under the Investment Advisory
Agreement) of all personnel employed by the Investment Adviser who devote substantial time to Fund operations may be reimbursed by the Fund to the Investment Adviser. For the year ended October 31, 2019, the Investment Adviser was not reimbursed by
the Fund for these items. The annual fee will be determined as follows:
(a) If the average value of the Fund’s Managed Assets (calculated monthly) is greater than $250 million, the fee will be a maximum amount equal to 0.54% of the average value of
the Fund’s Managed Assets.
(b) If the average value of the Fund’s Managed Assets (calculated monthly) is $250 million or less, the fee will be a maximum amount equal to 0.55% of the average value of the
Fund’s Managed Assets.
Pursuant to a Servicing Agreement between the Fund and Guggenheim Funds Distributors, LLC (the “Servicing Agent”), the Servicing Agent will act as servicing agent to the Fund.
The Servicing Agent will receive an annual fee of 0.21% of the average value of the Fund’s Managed Assets.
For purposes of calculating the fees payable under the foregoing agreements, average daily managed assets means the average daily value of the Fund’s total assets minus the sum
of its accrued liabilities. Total assets means all of the Fund’s assets and is not limited to its investment securities. Accrued liabilities means all of the Fund’s liabilities other than borrowings for investment purposes.
Certain officers of the Fund may also be officers, directors and/or employees of the Investment Adviser or Servicing Agent. The Fund does not compensate its officers who are
officers, directors and/or employees of the aforementioned firms.
MUFG Investor Services (US), LLC (“MUIS”) acts as the Fund’s administrator. The Bank of New York Mellon Corp. (“BNY”) acts as the Fund’s custodian and accounting agent. As
custodian, BNY is responsible for the custody of the Fund’s assets. As accounting agent, BNY is responsible for maintaining the books and records of the Fund’s securities and cash. For providing the aforementioned services, MUIS and BNY are
entitled to receive a monthly fee equal to an annual percentage of the Fund’s average daily managed assets subject to certain minimum monthly fees and out of pocket expenses.
Note 6 – Fair Value Measurement
In accordance with U.S. GAAP, fair value is defined as the price that the Fund would receive to sell an investment or pay to transfer a liability in an orderly transaction with
an independent buyer in the principal market, or in the absence of a principal market, the most advantageous market for the investment or liability. U.S. GAAP establishes a three-tier fair value hierarchy based on the types of
56 l AVK l ADVENT CONVERTIBLE AND INCOME FUND ANNUAL REPORT
|
NOTES TO FINANCIAL STATEMENTS continued
|
October 31, 2019
|
inputs used to value assets and liabilities and requires corresponding disclosure. The hierarchy and the corresponding inputs are summarized below:
Level 1 — quoted prices in active markets for identical assets or liabilities.
Level 2 — significant other observable inputs (for example quoted prices for securities that are similar based on characteristics such as interest rates, prepayment speeds,
credit risk, etc.).
Level 3 — significant unobservable inputs based on the best information available under the circumstances, to the extent observable inputs are not available, which may include
assumptions.
The types of inputs available depend on a variety of factors, such as the type of security and the characteristics of the markets in which it trades, if any. Fair valuation
determinations that rely on fewer or no observable inputs require greater judgment. Accordingly, fair value determinations for Level 3 securities require the greatest amount of judgment.
Independent pricing services are used to value a majority of the Fund’s investments. When values are not available from a pricing service, they will be determined under the
valuation policies that have been reviewed and approved by the Board. In any event, values may be determined using a variety of sources and techniques, including: market prices; broker quotes; and models which derive prices based on inputs such as
prices of securities with comparable maturities and characteristics or based on inputs such as anticipated cash flows or collateral, spread over U.S. Treasury Securities, and other information and analysis.
The inputs or methodologies used for valuing securities are not necessarily an indication of the risk associated with investing in those securities. The suitability of the
techniques and sources employed to determine fair valuation are regularly monitored and subject to change.
Note 7 – Reverse Repurchase Agreements
The Fund may enter into reverse repurchase agreements as part of its financial leverage strategy. Under a reverse repurchase agreement, the Fund temporarily transfers possession
of a portfolio instrument to another party, such as a bank or broker-dealer, in return for cash. At the same time, the Fund agrees to repurchase the instrument at an agreed upon time and price, which reflects an interest payment. Such agreements
have the economic effect of borrowings. The Fund may enter into such agreements when it is able to invest the cash acquired at a rate higher than the cost of the agreement, which would increase earned income. When the Fund enters into a reverse
repurchase agreement, any fluctuations in the market value of either the instruments transferred to another party or the instruments in which the proceeds may be invested would affect the market value of the Fund’s assets. As a result, such
transactions may increase fluctuations in the market value of the Fund’s assets. For the year ended October 31, 2019, the average daily balance for which reverse repurchase agreements were outstanding amounted to $173,643,836. The average interest
rate was 3.53%. As of October 31, 2019 there were $177,016,427 reverse repurchase agreements outstanding.
|
Counterparty
|
Interest Rate(s)
|
Maturity Date(s)
|
Face Value
|
|
Société Générale
|
3.45%-3.83%
|
12/15/2020-12/15/2022
|
$ 123,012,298
|
|
Société Générale
|
2.75% (3 Month USD LIBOR+0.85%)*
|
11/21/2019
|
54,004,129
|
|
|
|
|
$ 177,016,427
|
|
* Variable rate security. Rate indicated is the rate effective at October 31, 2019.
|
|
||
|
|
|||
|
|
AVK l ADVENT CONVERTIBLE AND INCOME FUND ANNUAL REPORT l 57
|
|
NOTES TO FINANCIAL STATEMENTS continued
|
October 31, 2019
|
The following is a summary of the remaining contractual maturities of the reverse repurchase agreements outstanding as of October 31, 2019, aggregated by asset class of the
related collateral pledged by the Fund:
|
|
Overnight and
|
Up to
|
31 – 90
|
Greater than
|
|
|
|
Continuous
|
30 days
|
days
|
90 days
|
Total
|
|
Corporate Bonds
|
$ —
|
$ —
|
$ —
|
$ 177,016,427
|
$ 177,016,427
|
|
Total Reverse
|
|
|
|
|
|
|
Repurchase Agreements
|
$ —
|
$ —
|
$ —
|
$ 177,016,427
|
$ 177,016,427
|
|
Gross amount of
|
|
|
|
|
|
|
recognized liabilities
|
|
|
|
|
|
|
for reverse repurchase
|
|
|
|
|
|
|
agreements
|
$ —
|
$ —
|
$ —
|
$ 177,016,427
|
$ 177,016,427
|
Note 8 – Margin Loan
On November 9, 2012, the Fund entered into a five year margin loan agreement with an approved counterparty whereby the counterparty agreed to provide secured financing to the
Fund and the Fund provided pledged collateral to the lender. The interest rate on the amount borrowed was a fixed 1.74%. An unused commitment fee of 0.25% was charged on the difference between the $170,000,000 margin loan agreement and the amount
borrowed. If applicable, the unused commitment fee was included in Interest Expense on the Statement of Operations. On December 20, 2012, the Fund borrowed $170,000,000 under the margin loan agreement. On December 15, 2017, the Fund terminated its
existing margin loan agreement and transferred the $150,000,000 loan obligation to another approved counterparty.
Concurrent with the termination of the margin loan on December 15, 2017, the Fund entered into a new senior secured credit agreement with Société Générale. Under the terms of the
new credit agreement, the Fund’s credit facility is as follows:
|
3.43% fixed rate 3-year maturity
|
$ 65,000,000
|
|
3.83% fixed rate 5-year maturity
|
65,000,000
|
|
3 Month USD LIBOR+0.85% floating rate 175-day evergreen maturity
|
20,000,000
|
The Fund pays a commitment fee on the undrawn portion of the 175-day evergreen facility in the amount of 0.25% per annum. If applicable, the unused commitment fee is included in
Interest Expense on the Statement of Operations. On March 14, 2018 the Fund reallocated its leverage with Société Générale, terminating its 3 Month USD LIBOR+0.85% floating rate 175-day evergreen maturity of $20,000,000.
On August 27, 2018, with the completion of the mergers of Advent Claymore Convertible Securities and Income Fund II (“AGC”) and Advent Claymore Enhanced Growth and Income Fund
(“LCM”) (together the “Target Funds”) into Advent Convertible and Income Fund (“AVK” or the “Acquiring
58 l AVK l ADVENT CONVERTIBLE AND INCOME FUND ANNUAL REPORT
|
NOTES TO FINANCIAL STATEMENTS continued
|
October 31, 2019
|
Fund”), the Fund amended its leverage facilities with Société Générale in order to assume the leverage of the Target Funds. Under the terms of the amended credit agreement, the
Fund’s credit facility is as follows:
|
3.48% fixed rate 3-year maturity
|
$ 114,000,000
|
|
3.89% fixed rate 5-year maturity
|
114,000,000
|
|
3 Month USD LIBOR+0.85% floating rate
|
7,000,000
|
|
0.25% Undrawn Commitment Fee
|
30,000,000
|
On December 20, 2018, the Fund reallocated its leverage with Société Générale, decreasing its 3.48% fixed rate 3-year maturity margin loan by $25,000,000 and increasing its
reverse repurchase agreements by the same amount.
As of October 31, 2019, there was $210,000,000 outstanding in connection with the Fund’s margin loan agreement. The average daily amount of borrowings on the margin loan during
the year ended October 31, 2019 was $213,356,164, with a related average interest rate of 3.56%. The maximum amount outstanding during the year was $235,000,000. As of October 31, 2019, the total value of securities segregated as collateral in
connection with the margin loan was $489,529,910.
The margin loan agreement governing the loan facility includes usual and customary covenants. These covenants impose on the Fund asset coverage requirements, collateral
requirements, investment strategy requirements, and certain financial obligations. These covenants place limits or restrictions on the Fund’s ability to (i) enter into additional indebtedness with a party other than the counterparty, (ii) change
its fundamental investment policy, or (iii) pledge to any other party, other than to the counterparty, securities owned or held by the Fund over which the counterparty has a lien. In addition, the Fund is required to deliver financial information
to the counterparty within established deadlines, maintain an asset coverage ratio (as defined in Section 18(g) of the 1940 Act) greater than 300%, comply with the rules of the stock exchange on which its shares are listed, and maintain its
classification as a “closed-end management investment company” as defined in the 1940 Act.
There is no guarantee that the Fund’s leverage strategy will be successful. The Fund’s use of leverage may cause the Fund’s NAV and market price of common shares to be more
volatile and can magnify the effect of any losses.
Note 9 – Federal Income Taxes Information
The Fund intends to continue to comply with the requirements of Subchapter M of the Internal Revenue Code of 1986, as amended, applicable to regulated investment companies.
Accordingly, no provision for U.S. federal income taxes is required. In addition, by distributing substantially all of its ordinary income and long-term capital gains, if any, during each calendar year, the Fund avoids a 4% federal excise tax that
is assessed on the amount of the under distribution.
In order to present paid-in capital in excess of par and total distributable earnings or losses on the Statement of Assets and Liabilities that more closely represent their tax
character, certain adjustments have been made to total distributable earnings or losses and paid-in capital. For the year ended October 31, 2019, the adjustments were to decrease paid-in capital by $1,217,661 and increase total distributable
earnings (loss) by $1,217,661 due to the difference in the treatment for book and tax purposes of distributions to shareholders, real estate investment trusts, partnerships, contingent payment debt instruments and capital loss carryforward
expiration.
AVK l ADVENT CONVERTIBLE AND INCOME FUND ANNUAL REPORT l 59
|
NOTES TO FINANCIAL STATEMENTS continued
|
October 31, 2019
|
As of October 31, 2019, the cost of investments for U.S. federal income tax purposes, the aggregate gross unrealized appreciation for all investments for which there was an
excess of value over tax cost, and the aggregate gross unrealized depreciation for all investments for which there was an excess of tax cost over value, were as follows:
|
|
Tax
|
Tax
|
|
|
Tax
|
Unrealized
|
Unrealized
|
Net Unrealized
|
|
Cost
|
Appreciation
|
Depreciation
|
Appreciation
|
|
$ 926,250,099
|
$ 44,735,027
|
$ (21,092,690)
|
$ 23,642,337
|
The differences between book basis and tax basis unrealized appreciation/(depreciation) are primarily attributable to the tax deferral of losses on wash sales, the mark-to-market
of certain derivatives, and additional income adjustments for tax purposes on certain convertible securities.
As of October 31, 2019, tax components of distributable earnings (loss) were as follows:
|
Undistributed
|
Undistributed
|
|
|
Ordinary
|
Long-Term
|
|
|
Income/
|
Capital Gain/
|
Net Unrealized
|
|
(Accumulated
|
(Accumulated
|
Appreciation/
|
|
Ordinary Loss)
|
Capital Loss)
|
(Depreciation)
|
|
$ —
|
$ (33,454,459)
|
$ 22,635,784
|
The components of distributable earnings’ differences between book basis and tax basis are attributable to the tax deferral of losses on wash sales, straddle loss deferrals, and
additional income adjustments on certain convertible bonds.
At October 31, 2019, the Fund had a capital loss carryforward available as shown in the table below, to offset possible future capital gains. Under the RIC Modernization Act of
2010, the Fund is permitted to carry forward capital losses incurred in taxable years beginning after December 22, 2010 for an unlimited period and such capital loss carryforwards will retain their character as either short-term or long-term
capital losses.
|
|
|
Total
|
|
Unlimited
|
Unlimited
|
Capital Loss
|
|
Short-Term
|
Long-Term
|
Carryforward
|
|
$ (27,512,559)
|
$ (5,941,900)
|
$ (33,454,459)*
|
|
* In accordance with Sections 382-384 of the Internal Revenue Code, a portion of certain Fund losses are subject to an annual limitation. This annual
limitation is generally applicable to all of the capital loss carryforwards shown.
|
For the year ended October 31, 2019, the capital loss carryforward amounts expired and utilized were $1,291,643 and $0, respectively.
For the years ended October 31, 2019 and 2018, the tax character of distributions paid, as reflected on the Statements of Changes in Net Assets, of $19,250,159 and $13,035,462
was ordinary income and $29,306,113 and $18,468,343 was return of capital, respectively.
60 l AVK l ADVENT CONVERTIBLE AND INCOME FUND ANNUAL REPORT
|
NOTES TO FINANCIAL STATEMENTS continued
|
October 31, 2019
|
For all open tax years and all major jurisdictions, management of the Fund has concluded that there are no significant uncertain tax positions that would require recognition in
the financial statements. Uncertain tax positions are tax positions taken or expected to be taken in the course of preparing the Fund’s tax returns that would not meet a more-likely-than not threshold of being sustained by the applicable tax
authority and would be recorded as a tax expense in the current year. Open tax years are those that are open for examination by taxing authorities (i.e., generally the last four tax year ends and the interim tax period since then). Furthermore,
management of the Fund is also not aware of any tax positions for which it is reasonably possible that the total amounts of unrecognized tax benefits will significantly change in the next twelve months.
Note 10 – Security Transactions
For the year ended October 31, 2019, the cost of purchases and proceeds from sales of investment securities, excluding options written and short-term securities, were as follows:
|
Purchases
|
Sales
|
|
$ 1,132,278,062
|
$ 1,162,613,882
|
|
Note 11 – Mergers
|
|
|
On August 27, 2018 the mergers of AGC and LCM with and into AVK were completed.
|
|
In the mergers, common shareholders of AGC and LCM, respectively, received newly-issued AVK common shares in tax-free transactions having an aggregate net asset value equal to
the aggregate net asset value of their holdings of AGC and/or LCM common shares, as applicable, as determined at the close of business on August 24, 2018. Fractional AVK shares were not issued in the mergers and consequently cash was distributed
for any such fractional amounts. Relevant details pertaining to the mergers are as follows:
|
Fund
|
NAV/Share ($)
|
Conversion Ratio
|
||||||
|
Advent Claymore Convertible Securities and Income Fund (AVK)
|
$
|
17.52
|
N/A
|
|||||
|
Advent Claymore Convertible Securities and Income Fund II (AGC)
|
$
|
6.36
|
0.36302760
|
|||||
|
Advent/Claymore Enhanced Growth & Income Fund (LCM)
|
$
|
8.68
|
0.49513765
|
|||||
Investments
The cost, fair value and net unrealized appreciation (depreciation) of the investments of the Target Funds as of the date of the mergers, were as follows:
|
|
AGC
|
LCM
|
||||||
|
Cost of investments
|
$
|
291,324,660
|
$
|
111,470,689
|
||||
|
Fair value of investments
|
$
|
297,048,631
|
$
|
114,147,866
|
||||
|
Net unrealized appreciation (depreciation) on investments
|
$
|
5,723,971
|
$
|
2,677,177
|
||||
|
Net unrealized appreciation (depreciation) on forward foreign
|
||||||||
|
currency exchange contracts
|
$
|
503,058
|
$
|
235,863
|
||||
|
Net unrealized appreciation (depreciation) on foreign
|
||||||||
|
currency translations
|
$
|
85
|
$
|
(419
|
)
|
|||
AVK l ADVENT CONVERTIBLE AND INCOME FUND ANNUAL REPORT l 61
|
NOTES TO FINANCIAL STATEMENTS continued
|
October 31, 2019
|
Common Shares
The common shares outstanding, net assets applicable to common shares and NAV per common share outstanding immediately before and after the mergers were as follows:
|
Target Funds – Prior to Mergers
|
AGC
|
LCM
|
||||||
|
Common shares outstanding
|
27,367,344
|
9,182,041
|
||||||
|
Net assets applicable to common shares
|
$
|
174,095,431
|
$
|
79,667,328
|
||||
|
NAV per common share
|
$
|
6.36
|
$
|
8.68
|
||||
|
Acquiring Fund – Prior to Mergers
|
AVK
|
|||||||
|
Common shares outstanding
|
20,043,745
|
|||||||
|
Net assets applicable to common shares
|
$
|
351,231,894
|
||||||
|
NAV per common share
|
$
|
17.52
|
||||||
|
Acquiring Fund – Post Mergers
|
AVK
|
|||||||
|
Common shares outstanding
|
34,525,222
|
|||||||
|
Net assets applicable to common shares
|
$
|
604,994,653
|
||||||
|
NAV per common share
|
$
|
17.52
|
||||||
Cost and Expenses
In connection with the mergers, the Target Funds and the Acquiring Fund incurred certain associated costs and expenses. Such amounts incurred by the Acquiring Fund are shown on
the Statement of Assets and Liabilities and on the Statement of Operations as “Merger fees”. Costs specific to one or each of the funds were expensed to such fund as incurred. With respect to any expenses incurred in connection with the mergers
that were not attributable to a specific fund, such expenses were allocated in proportion to the projected expense savings to be realized by each fund as a result of the Mergers. Of the estimated total costs of the mergers, approximately $579,000
was borne by AGC, $260,000 was borne by LCM and $86,000 was borne by AVK.
Pro Forma Results of Operations
Assuming the acquisition had been completed on November 1, 2017, the beginning of the fiscal reporting period of AVK, the pro forma results of operations for the year ended
October 31, 2018, are as follows:
|
Acquiring Fund – Pro Forma Results from Operations (unaudited)
|
AVK
|
|||
|
Net investment income (loss)
|
$
|
17,253,226
|
||
|
Net realized and unrealized gains (losses)
|
$
|
(17,845,647
|
)
|
|
|
Change in net assets resulting from operations
|
$
|
(592,421
|
)
|
|
Because the combined investment portfolios have been managed as a single integrated portfolio since the acquisition was completed, it is not practicable to separate the amounts
of revenue and earnings of AGC and LCM that have been included in AVK’s Statement of Operations since August 27, 2018.
62 l AVK l ADVENT CONVERTIBLE AND INCOME FUND ANNUAL REPORT
|
NOTES TO FINANCIAL STATEMENTS continued
|
October 31, 2019
|
Note 12 – Capital
Common Shares
The Fund has an unlimited amount of common shares, $0.001 par value, authorized and 34,525,222 issued and outstanding. In connection with the Fund’s dividend reinvestment plan,
the Fund did not issue shares during the year ended October 31, 2019, or the year ended October 31, 2018. As of October 31, 2019, Advent Capital Management LLC, the Fund’s Investment Adviser, owned 152,662 shares of the Fund.
|
Transactions in common shares were as follows:
|
|
|
|
|
Year Ended
|
Year Ended
|
||||||
|
|
October 31, 2019
|
October 31, 2018
|
||||||
|
Beginning shares
|
34,525,222
|
20,043,745
|
||||||
|
Shares issued in fund merger
|
—
|
14,481,477
|
||||||
|
Ending shares
|
34,525,222
|
34,525,222
|
||||||
Note 13 – Recent Regulatory Reporting Updates
In August 2018, the Financial Accounting Standards Board issued an Accounting Standards Update, ASU 2018-13, Fair Value Measurement (Topic 820), Disclosure Framework - Changes to
the Disclosure Requirements for Fair Value Measurement (the “2018 ASU”) which adds, modifies and removes disclosure requirements related to certain aspects of fair value measurement. The 2018 ASU is effective for fiscal years, and interim periods
within those fiscal years, beginning after December 15, 2019. Early adoption is permitted. As of October 31, 2019, the Fund has fully adopted the provisions of the 2018 ASU, which did not have a material impact on the Fund’s financial statements
and related disclosures or impact the Fund’s net assets or results of operations.
Note 14 – Recent Accounting Pronouncements
In March 2017, the Financial Accounting Standards Board issued an Accounting Standards Update, ASU 2017-08, Receivables – Nonrefundable Fees and Other Costs (Subtopic 310-20),
Premium Amortization on Purchased Callable Debt Securities (the “ASU”) which amends the amortization period for certain purchased callable debt securities held at a premium, shortening such period to the earliest call date. The ASU does not require
any accounting change for debt securities held at a discount; the discount continues to be amortized to maturity. The ASU is effective for fiscal years, and interim periods within those fiscal years, beginning after December 15, 2018. Management
has evaluated the implications of these changes and has determined that the adoption of the ASU will have no impact on the Fund’s net assets or results of operations.
Note 15 – Subsequent Events:
On November 1, 2019, the Fund declared a monthly distribution to common shareholders of $0.1172 per common share. The distribution is payable on November 29, 2019 to shareholders
of record on November 15, 2019.
On December 2, 2019, the Fund declared a monthly distribution to common shareholders of $0.1172 per common share. The distribution is payable on December 31, 2019 to shareholders
of record on December 13, 2019.
AVK l ADVENT CONVERTIBLE AND INCOME FUND ANNUAL REPORT l 63
|
NOTES TO FINANCIAL STATEMENTS continued
|
October 31, 2019
|
The Fund has performed an evaluation of subsequent events through the date of issuance of this report and has determined that there are no material events that would require
disclosure other than the events disclosed above.
64 l AVK l ADVENT CONVERTIBLE AND INCOME FUND ANNUAL REPORT
|
REPORT OF INDEPENDENT REGISTERED PUBLIC ACCOUNTING FIRM
|
October 31, 2019
|
To the Board of Trustees and Shareholders of Advent Convertible and Income Fund
Opinion on the Financial Statements
We have audited the accompanying statement of assets and liabilities, including the portfolio of investments, of Advent Convertible and Income Fund (the “Fund”) as of October 31,
2019, the related statements of operations and cash flows for the year ended October 31, 2019, the statement of changes in net assets for each of the two years in the period ended October 31, 2019, including the related notes, and the financial
highlights for each of the five years in the period ended October 31, 2019 (collectively referred to as the “financial statements”). In our opinion, the financial statements present fairly, in all material respects, the financial position of the
Fund as of October 31, 2019, the results of its operations and its cash flows for the year then ended, the changes in its net assets for each of the two years in the period ended October 31, 2019 and the financial highlights for each of the five
years in the period ended October 31, 2019 in conformity with accounting principles generally accepted in the United States of America.
Basis for Opinion
These financial statements are the responsibility of the Fund’s management. Our responsibility is to express an opinion on the Fund’s financial statements based on our audits. We
are a public accounting firm registered with the Public Company Accounting Oversight Board (United States) (PCAOB) and are required to be independent with respect to the Fund in accordance with the U.S. federal securities laws and the applicable
rules and regulations of the Securities and Exchange Commission and the PCAOB.
We conducted our audits of these financial statements in accordance with the standards of the PCAOB. Those standards require that we plan and perform the audit to obtain
reasonable assurance about whether the financial statements are free of material misstatement, whether due to error or fraud.
Our audits included performing procedures to assess the risks of material misstatement of the financial statements, whether due to error or fraud, and performing procedures that
respond to those risks. Such procedures included examining, on a test basis, evidence regarding the amounts and disclosures in the financial statements. Our audits also included evaluating the accounting principles used and significant estimates
made by management, as well as evaluating the overall presentation of the financial statements. Our procedures included confirmation of securities owned as of October 31, 2019 by correspondence with the custodian, transfer agent and brokers; when
replies were not received from brokers, we performed alternative auditing procedures. We believe that our audits provide a reasonable basis for our opinion.
/s/ PricewaterhouseCoopers LLP
New York, New York
December 20, 2019
We have served as the auditor of one or more investment companies in the Advent complex since 2003.
AVK l ADVENT CONVERTIBLE AND INCOME FUND ANNUAL REPORT l 65
|
OTHER INFORMATION (Unaudited)
|
October 31, 2019
|
|
Federal Income Tax Information
Qualified dividend income of as much as $5,536,052 was received by the Fund through October 31, 2019. The Fund intends to designate the maximum amount of dividends that qualify
for the reduced tax rate pursuant to the Jobs and Growth Tax Relief Reconciliation Act of 2003.
For corporate shareholders $4,438,792 of investment income (dividend income plus short-term gains, if any), qualified for the dividends-received deduction.
Additionally, of the taxable ordinary income distributions paid during the fiscal year ending October 31, 2019, the Fund had the corresponding percentage qualify as interest
related dividends as permitted by IRC Section 871(k)(2).
|
% of Qualifying Interest Income
|
|
66.10%
|
In January 2020, you will be advised on IRS Form 1099 DIV or substitute 1099 DIV as to the federal status of the distributions received by you in calendar year 2019.
Sector Classification
Information in the “Portfolio of Investments” is categorized by sectors using sector-level Classifications used by Bloomberg Industry Classification System, a widely recognized
industry classifica -tion system provider. The Fund’s registration statement has investment policies relating to concentration in specific sectors/industries. For purposes of these investment policies, the Fund usually classifies industries based
on industry-level classifications used by widely recognized industry classification system providers such as Bloomberg Industry Classification System, Global Industry Classification Standards and Barclays Global Classification Scheme.
Results of Shareholder Votes
The Annual Meeting of Shareholders of the Fund was held on September 25, 2019. Shareholders voted on the election of Trustees. With regards to the election of the following Class
I Trustees by shareholders of the Fund:
|
|
# of Shares in Favor
|
# of Shares Against
|
# of Shares Abstain
|
|
Randall C. Barnes
|
24,403,646
|
6,260,164
|
328,911
|
|
Derek Medina
|
24,376,949
|
6,278,317
|
337,455
|
|
Gerald L. Seizert
|
24,392,993
|
6,251,924
|
347,804
|
The other Trustees of the Fund whose terms did not expire in 2019 are Daniel L. Black, Ronald A. Nyberg, Michael A. Smart and Tracy V. Maitland.
66 l AVK l ADVENT CONVERTIBLE AND INCOME FUND ANNUAL REPORT
|
OTHER INFORMATION (Unaudited) continued
|
October 31, 2019
|
|
Trustees
The Trustees of the Advent Convertible and Income Fund and their principal business occupations during the past five years:
| Term of |
Number of
|
||||
|
|
Position(s)
|
Office and
|
|
Portfolios in
|
|
|
Name, Address
|
Held
|
Length
|
|
Fund |
|
| and Year |
with
|
of Time
|
Principal Occupation(s)
|
Complex
|
Other Directorships
|
|
of Birth
|
Trust
|
Served*
|
During Past 5 Years
|
Overseen **
|
Held by Trustees
|
|
Independent Trustees:
|
|
|
|
|
|
|
|
|||||
|
Randall C.
|
Trustee and
|
Since 2005
|
Current: Private Investor (2001-present).
|
158
|
Current: Trustee, Purpose Investments
|
|
Barnes++
|
Chairman of
|
|
|
|
Funds (2013-present).
|
|
(1951)
|
the Audit
|
|
Former: Senior Vice President and Treasurer, PepsiCo, Inc. (1993-1997);
|
|
|
|
|
Committee
|
|
President, Pizza Hut International (1991-1993); Senior Vice President,
|
|
Former: Managed Duration Investment
|
|
|
|
|
Strategic Planning and New Business Development, PepsiCo, Inc. (1987-1990).
|
|
Grade Municipal Fund (2003-2016).
|
|
Daniel L. Black+
|
Trustee
|
Since 2005
|
Current: Managing Partner, the Wicks Group of Cos., LLC (2003-present).
|
1
|
Current: EZ Shield, Inc. (2016-present);
|
|
(1960)
|
|
|
|
|
Harlem Lacrosse & Leadership, Inc.
|
|
|
|
|
Former: Managing Director and Co-Head of the Merchant Banking Group at
|
|
(2014-present); Antenna International,
|
|
|
|
|
BNY Capital Markets, a division of BNY Mellon (1998-2003); and Co-Head of
|
|
Inc. (2010-present).
|
|
|
|
|
U.S. Corporate Banking at BNY Mellon (1995-1998).
|
|
|
|
|
|
|
|
|
Former: Little Sprouts, LLC (2015-2018);
|
|
|
|
|
|
|
Bendon Inc. (2012-2016); Bonded
|
|
|
|
|
|
|
Services, Ltd. (2011-2016).
|
|
Derek Medina+
|
Trustee and
|
Since 2003
|
Current: Senior Vice President, Business Affairs at ABC News (2008-present).
|
1
|
Current: Oliver Scholars (2011-present);
|
|
(1966 )
|
Chairman of
|
|
|
|
Young Scholar’s Institute (2005-present).
|
|
|
the Nominating
|
|
Former: Vice President, Business Affairs and News Planning at ABC News
|
|
|
|
|
and Governance
|
|
(2003-2008); Executive Director, Office of the President at ABC News (2000-2003);
|
|
|
|
|
Committee
|
|
Associate at Cleary Gottlieb Steen & Hamilton (law firm) (1995-1998); Associate in
|
|
|
|
|
|
|
Corporate Finance at J.P. Morgan/Morgan Guaranty (1988-1990).
|
|
|
AVK l ADVENT CONVERTIBLE AND INCOME FUND ANNUAL REPORT l 67
|
OTHER INFORMATION (Unaudited) continued
|
|
October 31, 2019
|
|||
| Term of |
Number of
|
||||
|
|
Position(s)
|
Office and
|
|
Portfolios in
|
|
|
Name, Address
|
Held
|
Length
|
|
Fund
|
|
|
and Year
|
with
|
of Time
|
Principal Occupation(s)
|
Complex
|
Other Directorships
|
|
of Birth
|
Trust
|
Served*
|
During Past Five Years
|
Overseen **
|
Held by Trustees
|
|
Independent Trustees continued:
|
|||||
|
Ronald A.
|
Trustee
|
Since 2004
|
Current: Partner, Momkus LLC (2016-present).
|
158
|
Current: PPM Funds (9)(2018-present);
|
|
Nyberg++
|
|
|
|
|
Edward-Elmhurst Healthcare System
|
|
(1953)
|
|
|
Former: Partner, Nyberg & Cassioppi, LLC (2000-2016); Executive Vice President,
|
|
(2012-present); Western Asset Inflation-
|
|
|
|
|
General Counsel, and Corporate Secretary, Van Kampen Investments (1982-1999).
|
Linked Opportunities & Income Fund
|
|
|
|
|
|
|
|
(2004-present); Western Asset Inflation-
|
|
|
|
|
|
|
Linked Income Fund (2003-present).
|
|
|
|||||
|
|
|
|
|
|
Former: Managed Duration Investment
|
|
|
|
|
|
|
Grade Municipal Fund (2003-2016).
|
|
Gerald L.
|
Trustee
|
Since 2003
|
Current: Chairman of Seizert Capital Partners, LLC.
|
1
|
Current: University of Toledo Foundation
|
|
Seizert, CFA, CIC+
|
|
|
|
|
(2013-present); Beaumont Hospital
|
|
(1952)
|
|
|
Former: Co-Chief Executive (1998-1999) and a Managing Partner and Chief
|
|
(2012-present).
|
|
Investment Officer – Equities of Munder Capital Management, LLC (1995-1999);
|
|||||
|
|
|
|
Vice President and Portfolio Manager of Loomis, Sayles & Co., L.P. (asset
|
|
|
|
|
|
|
manager) (1984-1995); Vice President and Portfolio Manager at First of
|
|
|
|
|
|
|
America Bank (1978-1984).
|
|
|
|
Michael A.
|
Trustee
|
Since 2003
|
Current: Managing Partner, CWS Private Equity (2014–present), Managing
|
1
|
Current: The Mead School (2014-
|
|
Smart+
|
|
|
Partner, Cordova, Smart & Williams, LLC (2003–present).
|
|
present); National Association of
|
|
(1960)
|
|
|
|
|
Investment Companies (“NAIC”) (2010-
|
|
|
|
|
Former: Principal , FirstAtlantic Capital Ltd. (2001-2003); Managing Director in
|
|
present); Sprint Industrial Holdings
|
|
|
|
|
Investment Banking – the Private Equity Group (1995-2001) and a Vice President
|
|
(2007-present).
|
|
|
|
|
in Investment Banking – Corporate Finance (1992-1995) at Merrill Lynch & Co;
|
|
|
|
|
|
|
Founding Partner of The Carpediem Group, a private placement firm (1991-1992);
|
Former: Berkshire Blanket, Holdings,
|
|
|
|
|
|
Associate at Dillon, Read and Co. (investment bank) (1988-1990).
|
|
Inc. (2006-2016); Sqwincher Holdings
|
|
|
|
|
|
|
(2006-2015).
|
68 l AVK l ADVENT CONVERTIBLE AND INCOME FUND ANNUAL REPORT
|
OTHER INFORMATION (Unaudited) continued
|
|
October 31, 2019
|
|||
|
|
|||||
|
|
|||||
|
Term of
|
Number of
|
||||
|
|
Position(s)
|
Office
|
|
Portfolios in
|
|
|
Name, Address
|
Held
|
and Length
|
|
Fund
|
|
|
and Year
|
with
|
of Time
|
Principal Occupation(s)
|
Complex
|
Other Directorships
|
|
of Birth
|
Trust
|
Served*
|
During Past Five Years
|
Overseen **
|
Held by Trustees
|
|
Interested Trustee:
|
|
|
|
|
|
|
Tracy V.
|
Trustee,
|
Since 2003
|
Current: Founder, President and Chief Investment Officer of Advent Capital
|
1
|
None.
|
|
Maitland+ø
|
Chairman,
|
|
Management, LLC (2001-present).
|
|
|
|
(1960)
|
President and
|
|
|
|
|
|
|
Chief Executive
|
|
|
|
|
|
|
Officer
|
|
|
|
|
+ Address of all Trustees noted: 888 Seventh Avenue, 31st Floor, New York, NY 10019.
++ Address of all Trustees noted: 227 West Monroe Street, Chicago, IL 60606.
* After a Trustee’s initial term, each Trustee is expected to serve a three-year term concurrent with the class of
Trustees for which he serves:
- Mr. Michael A. Smart and Mr. Daniel L. Black are the Class II Trustees. The term of the Class II Trustees will
continue until the 2020 annual meeting of shareholders or until successors shall have been elected and qualified.
- Mr. Tracy V. Maitland and Mr. Ronald A. Nyberg are the Class III Trustees. The term of the Class III Trustees
will continue until the 2021 annual meeting of shareholders or until successors shall have been elected and qualified.
- Mr. Gerald L. Seizert, Mr. Derek Medina and Mr. Randall C. Barnes are the Class I Trustees. The term of the Class
I Trustees will continue until the 2022 annual meeting of shareholders or until successors shall have been elected and qualified.
** As of period end. The Guggenheim Investments Fund Complex consists of U.S. registered investment companies advised or serviced by Guggenheim Funds
Investment Advisors, LLC and/or Guggenheim Funds Distributors, LLC and/or affiliates of such entities.
ø Mr. Maitland is an “interested person” (as defined in section 2(a)(19) of the 1940 Act) of the Fund because of his position as an officer of Advent
Capital Management, LLC, the Fund’s Investment Adviser.
AVK l ADVENT CONVERTIBLE AND INCOME FUND ANNUAL REPORT l 69
|
OTHER INFORMATION (Unaudited) continued
|
October 31, 2019
|
|||
|
|
||||
|
|
||||
|
Officers
|
|
|
|
|
|
The Officers of the Advent Convertible and Income Fund, who are not Trustees, and their principal occupations during the past five years:
|
|
|||
|
|
Position(s)
|
|
|
|
|
Name, Address*
|
held
|
Term of Office
|
|
|
| and Year |
with the
|
and Length of
|
|
|
|
of Birth
|
Trust
|
Time Served**
|
Principal Occupations During Past Five Years
|
|
|
|
||||
|
Officers:
|
|
|
|
|
|
Edward C. Delk
|
Secretary and
|
Since 2012
|
Current: General Counsel and Chief Compliance Officer, Advent Capital Management, LLC (2012-present).
|
|
|
(1968)
|
Chief
|
|
|
|
|
|
Compliance
|
|
Former: Assistant General Counsel and Chief Compliance Officer, Insight Venture Management, LLC (2009-2012); Associate General Counsel,
|
|
|
|
Officer
|
|
TIAA-CREF (2008-2009); Principal, Legal Department, The Vanguard Group, Inc. (2000-2008).
|
|
|
Tony Huang
|
Vice President
|
Since 2014
|
Current: Director and Associate Portfolio Manager, Advent Capital Management, LLC (2007-present).
|
|
|
(1976)
|
and Assistant
|
|
|
|
|
|
Secretary
|
|
Former: Senior Vice President, Portfolio Manager and Analyst, Essex Investment Management (2001-2006); Vice President, Analyst, Abacus
|
|
|
|
|
|
Investments (2001); Vice President, Portfolio Manager, M/C Venture Partners (2000-2001); Associate, Fidelity Investments (1996-2000).
|
|
|
Robert White
|
Treasurer and
|
Since 2005
|
Current: Chief Financial and Administrative Officer, Advent Capital Management, LLC (2005-present).
|
|
|
(1965)
|
Chief Financial
|
|
|
|
|
|
Officer
|
|
Former: Vice President, Client Service Manager, Goldman Sachs Prime Brokerage (1997-2005).
|
|
* Address for all Officers: 888 Seventh Avenue, 31st Floor, New York, NY 10019.
** Officers serve at the pleasure of the Board of Trustees and until his or her successor is appointed and qualified or until his or her earlier resignation
or removal.
70 l AVK l ADVENT CONVERTIBLE AND INCOME FUND ANNUAL REPORT
|
DIVIDEND REINVESTMENT PLAN (Unaudited)
|
October 31, 2019
|
Unless the registered owner of common shares elects to receive cash by contacting the Plan Administrator, all dividends declared on common shares of the Fund will be
automatically reinvested by Computershare Trust Company, N.A. (the “Plan Administrator”), Administrator for shareholders in the Fund’s Dividend Reinvestment Plan (the “Plan”), in additional common shares of the Fund. Participation in the Plan is
completely voluntary and may be terminated or resumed at any time without penalty by notice if received and processed by the Plan Administrator prior to the dividend record date; otherwise such termination or resumption will be effective with
respect to any subsequently declared dividend or other distribution. Some brokers may automatically elect to receive cash on your behalf and may re-invest that cash in additional common shares of the Fund for you. If you wish for all dividends
declared on your common shares of the Fund to be automatically reinvested pursuant to the Plan, please contact your broker.
The Plan Administrator will open an account for each common shareholder under the Plan in the same name in which such common shareholder’s common shares are registered. Whenever
the Fund declares a dividend or other distribution (together, a “Dividend”) payable in cash, nonparticipants in the Plan will receive cash and participants in the Plan will receive the equivalent in common shares. The common shares will be acquired
by the Plan Administrator for the participants’ accounts, depending upon the circumstances described below, either (i) through receipt of additional unissued but authorized common shares from the Fund (“Newly Issued Common Shares”) or (ii) by
purchase of outstanding common shares on the open market (“Open-Market Purchases”) on the New York Stock Exchange or elsewhere. If, on the payment date for any Dividend, the closing market price plus estimated brokerage commission per common share
is equal to or greater than the net asset value per common share, the Plan Administrator will invest the Dividend amount in Newly Issued Common Shares on behalf of the participants. The number of Newly Issued Common Shares to be credited to each
participant’s account will be determined by dividing the dollar amount of the Dividend by the net asset value per common share on the payment date; provided that, if the net asset value is less than or equal to 95% of the closing market value on
the payment date, the dollar amount of the Dividend will be divided by 95% of the closing market price per common share on the payment date. If, on the payment date for any Dividend, the net asset value per common share is greater than the closing
market value plus estimated brokerage commission, the Plan Administrator will invest the Dividend amount in common shares acquired on behalf of the participants in Open-Market Purchases.
If, before the Plan Administrator has completed its Open-Market Purchases, the market price per common share exceeds the net asset value per common share, the average per common
share purchase price paid by the Plan Administrator may exceed the net asset value of the common shares, resulting in the acquisition of fewer common shares than if the Dividend had been paid in Newly Issued Common Shares on the Dividend payment
date. Because of the foregoing difficulty with respect to Open-Market Purchases, the Plan provides that if the Plan Administrator is unable to invest the full Dividend amount in Open-Market Purchases during the purchase period or if the market
discount shifts to a market premium during the purchase period, the Plan Administrator may cease making Open-Market Purchases and may invest the uninvested portion of the Dividend amount in Newly Issued Common Shares at net asset value per common
share at the close of business on the Last Purchase Date provided that, if the net asset value is less than or equal to 95% of the then current market price per common share; the dollar amount of the Dividend will be divided by 95% of the market
price on the payment date.
AVK l ADVENT CONVERTIBLE AND INCOME FUND ANNUAL REPORT l 71
|
DIVIDEND REINVESTMENT PLAN (Unaudited) continued
|
October 31, 2019
|
The Plan Administrator maintains all shareholders’ accounts in the Plan and furnishes written confirmation of all transactions in the accounts, including information needed by
shareholders for tax records. Common shares in the account of each Plan participant will be held by the Plan Administrator on behalf of the Plan participant, and each shareholder proxy will include those shares purchased or received pursuant to the
Plan. The Plan Administrator will forward all proxy solicitation materials to participants and vote proxies for shares held under the Plan in accordance with the instruction of the participants.
There will be no brokerage charges with respect to common shares issued directly by the Fund. However, each participant will pay a pro rata share of brokerage commission incurred
in connection with Open-Market Purchases. The automatic reinvestment of Dividends will not relieve participants of any Federal, state or local income tax that may be payable (or required to be withheld) on such Dividends.
The Fund reserves the right to amend or terminate the Plan. There is no direct service charge to participants with regard to purchases in the Plan; however, the Fund reserves the
right to amend the Plan to include a service charge payable by the participants.
All correspondence or questions concerning the Plan should be directed to the Plan Administrator, Computershare Trust Company, N.A., P.O. Box 30170 College Station, TX
77842-3170; Attention: Shareholder Services Department, Phone Number: (866) 488-3559 or online at www.computershare.com/investor.
72 l AVK l ADVENT CONVERTIBLE AND INCOME FUND ANNUAL REPORT
|
CONSIDERATIONS REGARDING ANNUAL REVIEW OF THE
|
|
|
INVESTMENT MANAGEMENT AGREEMENT (Unaudited)
|
October 31, 2019
|
In discussing the factors and other considerations summarized below, the Board noted that it generally receives, reviews and evaluates information concerning the performance of
the Fund and the services and personnel of Advent and its affiliates at quarterly meetings of the Board. While emphasis might be placed on information concerning the investment performance of the Fund, its fees and expenses in comparison with other
funds’ fees and other matters at the meeting at which the renewal of the Investment Management Agreement is considered, the process of evaluating the Fund’s investment management arrangements is an ongoing one. The Board did not identify any one
particular factor that was controlling or of paramount importance in its deliberations and each individual Trustee may have weighed the information provided differently. The information below represents a summary of certain aspects of the more
detailed discussions held by the Board and does not necessarily include all information considered by the Trustees.
Nature, Extent and Quality of Services
The Independent Trustees received and considered various data and information regarding the nature, extent and quality of services provided to the Fund by Advent under the
Investment Management Agreement. The Independent Trustees reviewed and considered the information provided by Advent in response to a detailed series of requests submitted on behalf of the Independent Trustees by their independent legal counsel.
The Independent Trustees were provided with, among other things, information about the background, experience and expertise of the management and other personnel of Advent and the services provided by that organization to the Fund. The Independent
Trustees discussed the quality of the services provided. The compliance history of Advent was discussed, along with the ability of Advent to provide services to the Fund.
The Independent Trustees evaluated the capabilities of Advent, including information regarding its resources and ability to attract and retain highly qualified investment and
other professionals. The Independent Trustees also considered the commitment of Advent to the Fund. The Independent Trustees discussed the portfolio managers at Advent responsible for portfolio management for the Fund, including the involvement of
Mr. Maitland, and other personnel at Advent.
Based on the above factors, together with those referenced below, the Independent Trustees concluded that they were satisfied with the nature, extent and quality of the
investment management services provided to the Fund by Advent.
Fund Performance and Expenses
The Independent Trustees considered the Fund’s performance on a market price and net asset value basis over various time periods. They also considered the performance of the Fund
in comparison to the performance results of other closed-end funds that were determined to be similar to the Fund in terms of investment strategy (the “Peer Group”). The Independent Trustees recognized that the number of other funds in the Peer
Group was small and that, for a variety of reasons, including exposures to types of assets that significantly vary from those held by the Fund, the Peer Group comparison may have limited usefulness in evaluating Fund performance. The Board also was
aware that the performance benchmark indexes may not be fully probative in making comparisons due to the fact that the securities included in the benchmarks may include convertibles, high yield or other
AVK l ADVENT CONVERTIBLE AND INCOME FUND ANNUAL REPORT l 73
|
CONSIDERATIONS REGARDING ANNUAL REVIEW OF THE
|
|
|
INVESTMENT MANAGEMENT AGREEMENT (Unaudited) continued
|
October 31, 2019
|
securities with characteristics unlike those purchased by the Fund or in amounts that vary materially from the Fund’s typical holdings. The Board noted that the Fund ranked in
the middle of its Peer Group for the one-year period ended October 31, 2018. The Fund also trailed its benchmark indexes during the one-year period.
The Board noted that it had discussions with Advent about the performance of the Fund. The Board noted that the Fund is managed consistent with its stated policies and strategies
and that the Fund would tend to underperform in relation to funds with high common stock exposure in rising equity markets. The Independent Trustees considered the steps management has historically taken, and the activities it presently undertakes,
to seek to improve performance, and will continue to monitor performance on an on-going basis. The Board discussed the merger of two other affiliated closed-end funds into the Fund during the period. The Board also reviewed information about the
discount at which each Fund’s shares have traded as compared with its peers.
The Independent Trustees received and considered information regarding the Fund’s total expense ratio relative to its peers, noting that the Fund generally had a higher expense
ratio (based on common assets) than funds in the Peer Group. The Independent Trustees acknowledged that the expense ratio was often higher than the expense ratios of certain Peer Group funds for several reasons because of the Fund’s use of leverage
and longer-term borrowings and that certain funds in the Peer Group had no leverage or lower leverage and therefore reported lower expense ratios. The Board noted that in the most recent year, the Fund had incurred extraordinary expenses related
its merger with other funds. The costs of leverage were also considered and the potential benefits of the continued use of leverage were considered. The Independent Trustees also noted that expense ratio comparisons with Peer Groups were difficult
because the items included in other funds’ expenses may differ from those of the Fund.
Based on the above considerations, discussions and other factors, the Independent Trustees concluded that the overall performance results and expense comparisons supported the
re-approval of the Investment Management Agreement.
Investment Management and Advisory Fee Rates
The Independent Trustees reviewed and considered the contractual investment management fee rates for the Fund in comparison with those of the funds in the Peer Group. The
Independent Trustees also received and considered information about the nature, extent and quality of services and fee rates offered by Advent to its other clients. In particular, Advent confirmed that the Fund differs from certain other accounts
advised by Advent in that they are more complex to manage, require greater resources from Advent and differ in terms of investment strategy and use of leverage. The Independent Trustees also noted the differing services provided by Advent to the
Funds in relation to those typically provided to private funds and separate accounts. The Independent Trustees were also aware of the regulatory, reputational, compliance and operational risks faced by Advent in providing services to the Fund,
which are generally greater than presented in providing services to clients other than registered funds. Based on the totality of the information they reviewed, the Independent Trustees concluded that the fees were fair and reasonable.
74 l AVK l ADVENT CONVERTIBLE AND INCOME FUND ANNUAL REPORT
|
CONSIDERATIONS REGARDING ANNUAL REVIEW OF THE
|
|
|
INVESTMENT MANAGEMENT AGREEMENT (Unaudited) continued
|
October 31, 2019
|
Profitability
The Independent Trustees received and considered estimated profitability analyses of Advent. The Independent Trustees also discussed with representatives of Advent the
methodologies used to determine profitability. The Independent Trustees considered the nature of the services provided, their benefits to the Fund, and the extensive resources required to provide those services. In addition, the Independent
Trustees considered whether any direct or indirect collateral benefits inured to Advent as a result of its affiliation with the Fund. The Independent Trustees concluded that the profits and other ancillary benefits that Advent received with regard
to providing services to the Fund were not unreasonable.
Economies of Scale
The Independent Trustees received and considered information regarding whether there have been economies of scale with respect to the management of the Fund and whether it has
appropriately benefited from any economies of scale, and whether there is potential for realization of any further economies of scale. It was noted that, because the Fund is a closed-end fund, any increase in asset levels generally would have to
come from material appreciation through investment performance and the Independent Trustees concluded that the opportunity to benefit from economies of scale was diminished in the context of closed-end funds. The Independent Trustees took note of
the increased asset size of the Fund as a result of a recent merger and Advent’s belief that shareholders have benefited from the merger with the caveat that results are preliminary because a full fiscal year has not been completed since the merger
was consummated.
Conclusion
After consideration of the factors discussed above and other information considered by the Independent Trustees, the Board, including the Independent Trustees, unanimously voted
to approve the Investment Management Agreement for an additional one-year term.
AVK l ADVENT CONVERTIBLE AND INCOME FUND ANNUAL REPORT l 75
|
FUND INFORMATION
|
October 31, 2019
|
|
Board of Trustees
|
Investment Adviser
|
|
Randall C. Barnes
|
Advent Capital Management, LLC
|
|
|
New York, NY
|
|
Daniel L. Black
|
|
|
Servicing Agent
|
|
|
Tracy V. Maitland,*
|
Guggenheim Funds Distributors, LLC
|
|
Chairman
|
Chicago, IL
|
|
|
|
|
Derek Medina
|
Accounting Agent and Custodian
|
|
The Bank of New York Mellon
|
|
|
Ronald A. Nyberg
|
New York, NY
|
|
|
|
|
Gerald L. Seizert
|
Administrator |
|
MUFG Investor Services (US), LLC
|
|
|
Michael A. Smart
|
Rockville, MD
|
|
|
|
|
* Trustee is an “interested person” of the Fund
|
Transfer Agent
|
|
as defined in the Investment Company Act of
|
Computershare Trust Company, N.A.
|
|
1940, as amended.
|
Jersey City, NJ
|
|
|
|
| Officers | Legal Counsel |
|
Tracy V. Maitland
|
Skadden, Arps, Slate, Meagher
|
|
President and Chief Executive Officer
|
& Flom LLP
|
|
New York, NY
|
|
|
Robert White
|
|
|
Treasurer and Chief Financial Officer
|
Independent Registered Public
|
|
|
Accounting Firm
|
|
Edward C. Delk
|
PricewaterhouseCoopers LLP |
|
Secretary and Chief Compliance Officer
|
New York, NY
|
|
|
|
|
Tony Huang
|
|
|
Vice President and Assistant Secretary
|
|
76 l AVK l ADVENT CONVERTIBLE AND INCOME FUND ANNUAL REPORT
|
FUND INFORMATION continued
|
October 31, 2019
|
Portfolio Managers of the Fund
The individuals who are primarily responsible for the day-to-day management of the Fund’s portfolio include Tracy Maitland (President and Chief Investment Officer of Advent),
Paul Latronica (Managing Director of Advent) and Tony Huang (Director of Advent). Mr. Maitland and Mr. Latronica are portfolio managers and Mr. Huang is an associate portfolio manager.
Privacy Principles of the Fund
The Fund is committed to maintaining the privacy of its shareholders and to safeguarding their non-public personal information. The following information is provided to help you
understand what personal information the Fund collects, how the Fund protects that information and why, in certain cases, the Fund may share information with select other parties.
Generally, the Fund does not receive any non-public personal information relating to its shareholders, although certain non-public personal information of its shareholders may
become available to the Fund. The Fund does not disclose any non-public personal information about its shareholders or former shareholders to anyone, except as permitted by law or as is necessary in order to service shareholder accounts (for
example, to a transfer agent or third party administrator).
The Fund restricts access to non-public personal information about its shareholders to employees of the Fund’s Investment Adviser and its affiliates with a legitimate business
need for the information. The Fund maintains physical, electronic and procedural safeguards designed to protect the non-public personal information of its shareholders.
Questions concerning your shares of Advent Convertible and Income Fund?
|
•
|
If your shares are held in a Brokerage Account, contact your Broker.
|
|
•
|
If you have physical possession of your shares in certificate form, contact the Fund’s Transfer Agent: Computershare
Trust Company, N.A., P.O. Box 30170, College Station, TX 77842-3170; (866) 488-3559 or online at www.computershare.com/investor.
|
This report is sent to shareholders of Advent Convertible and Income Fund for their information. It is not a Prospectus, circular or representation intended for use in the
purchase or sale of shares of the Fund or of any securities mentioned in this report.
A description of the Fund’s proxy voting policies and procedures related to portfolio securities is available without charge, upon request, by calling the Fund at (866) 274-2227.
Information regarding how the Fund voted proxies for portfolio securities, if applicable, during the most recent 12-month period ended June 30, is also available, without charge and upon request by calling the Fund at (866) 274-2227, by visiting
the Fund’s website at guggenheiminvestments.com/avk or by accessing the Fund’s Form N-PX on the U.S. Securities & Exchange Commission’s (“SEC”) website at www.sec.gov.
The Fund files its complete schedule of portfolio holdings with the SEC for the first and third quarters of each fiscal year as an exhibit to its reports on Form N-PORT, and for
reporting periods ended prior to July 31, 2019, filed such information on Form N-Q. The Fund’s Forms N-PORT and N-Q are available on the SEC’s website at https://www.sec.gov. The Fund’s Forms N-PORT and N-Q may be reviewed and copied at the SEC’s
Public Reference Room in Washington, DC, and that information on the operation of the Public Reference Room may be obtained by calling 800-SEC-0330. Copies of the portfolio holdings are also available to shareholders, without charge and upon
request, by calling 800.820.0888.
Notice to Shareholders
Notice is hereby given in accordance with Section 23(c) of the Investment Company Act of 1940, as amended that the Fund from time to time may purchase shares of its common stock
in the open market or in private transactions.
AVK l ADVENT CONVERTIBLE AND INCOME FUND ANNUAL REPORT l 77
This Page Intentionally Left Blank
This Page Intentionally Left Blank
ABOUT THE FUND MANAGER
Advent Capital Management, LLC
Advent Capital Management, LLC (“Advent”) is a registered investment adviser, based in New York, which specializes in convertible and high-yield securities for institutional and
individual investors. The firm was established by Tracy V. Maitland, a former Director in the Convertible Securities sales and trading division of Merrill Lynch. Advent’s investment discipline emphasizes capital structure research, encompassing
equity fundamentals as well as credit research, with a focus on cash flow and asset values while seeking to maximize total return.
Investment Philosophy
Advent believes that superior returns can be achieved while reducing risk by investing in a diversified portfolio of global equity, convertible and high-yield securities. Advent
seeks securities with attractive risk/reward characteristics. Advent employs a bottom-up security selection process across all of the strategies it manages. Securities are chosen from those that Advent believes have stable-to-improving fundamentals
and attractive valuations.
Investment Process
Advent manages securities by using a strict four-step process:
|
1
|
Screen the convertible and high-yield markets for securities with attractive risk/reward characteristics and favorable cash flows;
|
|
|
2
|
Analyze the quality of issues to help manage downside risk;
|
|
|
3
|
Analyze fundamentals to identify catalysts for favorable performance; and
|
|
|
4
|
Continually monitor the portfolio for improving or deteriorating trends in the financials of each investment.
|
|
|
Advent Capital Management, LLC
|
Guggenheim Funds Distributors, LLC
|
|
|
888 Seventh Avenue, 31st Floor
|
227 West Monroe Street
|
|
|
New York, NY 10019
|
Chicago, IL 60606
|
|
|
|
Member FINRA/SIPC
|
|
|
|
(12/19)
|
NOT FDIC-INSURED l NOT BANK-GUARANTEED l MAY LOSE VALUE
CEF-AVK-AR-1019
Item 2. Code of Ethics.
a) The registrant has adopted a code of ethics that applies to its principal executive officer, principal financial officer, principal accounting officer or controller, or persons performing similar functions
(the “Code of Ethics”).
(b) No information need be disclosed pursuant to this paragraph.
(c) The registrant has not amended its Code of Ethics during the period covered by the report presented in Item 1 hereto.
(d) The registrant has not granted a waiver or an implicit waiver to its principal executive officer, principal financial officer, principal accounting officer or controller, or persons performing similar
functions from a provision of its Code of Ethics during the period covered by this report.
(e) Not applicable.
(f) (1) The registrant’s Code of Ethics is attached hereto as Exhibit (a)(1).
(2) Not applicable.
(3) Not applicable.
Item 3. Audit Committee Financial Expert.
The registrant’s Board of Trustees has determined that it has six audit committee financial experts serving on its audit committee (the “Audit Committee”), each of whom is an “independent” Trustee, as defined in Item 3
of Form N-CSR: Randall C. Barnes, Daniel L. Black, Derek M. Medina, Ronald A. Nyberg, Gerald L. Seizert and Michael A. Smart.
Mr. Barnes qualifies as an audit committee financial expert by virtue of his experience obtained as a former Senior Vice President, Treasurer of PepsiCo, Inc.
Mr. Black qualifies as an audit committee financial expert by virtue of his experience obtained as a partner of a private equity firm, which includes review and analysis of audited and unaudited financial statements
using generally accepted accounting principles (“GAAP”) to show accounting estimates, accruals and reserves.
Mr. Medina qualifies as an audit committee financial expert by virtue of his experience obtained as a Senior Vice President, Business Affairs of ABC News and as a former associate in Corporate Finance at J.P.
Morgan/Morgan Guaranty, which includes review and analysis of audited and unaudited financial statements using GAAP to show accounting estimates, accruals and reserves.
Mr. Nyberg qualifies as an audit committee financial expert by virtue of his experience obtained as a former Executive Vice President, General Counsel and Secretary of Van Kampen Investments, which included review and
analysis of offering documents and audited and unaudited financial statements using GAAP to show accounting estimates, accruals and reserves.
Mr. Seizert qualifies as an audit committee financial expert by virtue of his experience obtained as the chief executive officer and portfolio manager of an asset management company, which includes review and analysis
of audited and unaudited financial statements using GAAP to show accounting estimates, accruals and reserves.
Mr. Smart qualifies as an audit committee financial expert by virtue of his experience obtained as a managing partner of a private equity firm and a former Vice President at Merrill Lynch & Co, which includes
review and analysis of audited and unaudited financial statements using GAAP to show accounting estimates, accruals and reserves.
(Under applicable securities laws, a person who is determined to be an audit committee financial expert will not be deemed an “expert” for any purpose, including without limitation for the purposes of Section 11 of the
Securities Act of 1933, as amended, as a result of being designated or identified as an audit committee financial expert. The designation or identification of a person as an audit committee financial expert does not impose on such person any duties,
obligations, or liabilities that are greater than the duties, obligations, and liabilities imposed on such person as a member of the Audit Committee and Board of Trustees in the absence of such designation or identification. The designation or
identification of a person as an audit committee financial expert pursuant to this Item does not affect the duties, obligations, or liability of any other member of the Audit Committee or Board of Trustees.)
Item 4. Principal Accountant Fees and Services.
(a) Audit Fees: the aggregate fees billed for professional services rendered by the principal accountant for the audit of the registrant’s annual financial statements or services that are normally provided by the
accountant in connection with statutory and regulatory filings or engagements were $100,000 and $140,000 for the fiscal years ended October 31, 2019, and October 31, 2018, respectively.
(b) Audit-Related Fees: the aggregate fees billed for assurance and related services by the principal accountant that are reasonably related to the performance of the audit of the registrant’s financial statements, and
are not reported under paragraph 4(a) of this Item, were $0 and $0 for the fiscal years ended October 31, 2019, and October 31, 2018, respectively.
The registrant’s principal accountant did not bill fees for tax services not included in Items 4(a), (b) or (c) above that required approval by the Audit Committee pursuant to paragraph (c)(7)(ii) of Rule 2-01 of
Regulation S-X during the registrant’s last two fiscal years.
(c) Tax Fees: the aggregate fees billed for professional services rendered by the principal accountant for tax compliance, tax advice and tax planning, including federal, state and local income tax return preparation
and related advice and determination of taxable income and miscellaneous tax advice were $17,510 and $17,510 for the fiscal years ended October 31, 2019, and October 31, 2018, respectively.
The registrant’s principal accountant did not bill fees for non-audit services that required approval by the Audit Committee pursuant to paragraph (c)(7)(ii) of Rule 2-01 of Regulation S-X during the registrant’s last
two fiscal years.
(d) All Other Fees: the aggregate fees billed for products and services provided by the principal accountant, other than the services reported in paragraphs 4(a), 4(b) or 4(c) of this Item were $0 and $0 for the
fiscal years ended October 31, 2019, and October 31, 2018, respectively.
The registrant’s principal accountant did not bill fees for non-audit services that required approval by the Audit Committee pursuant to paragraph (c)(7)(ii) of Rule 2-01 of Regulation S-X during the registrant’s last
two fiscal years.
(e) Audit Committee Pre-Approval Policies and Procedures.
(1) In accordance with Rule 2-01(c)(7) of Regulation S-X, the Audit Committee pre-approves all of the Audit and Tax Fees of the registrant. All of the services described in paragraphs 4(b) through 4(d) above were
approved by the Audit Committee in accordance with paragraph (c)(7) of Rule 2-01 of Regulation S-X.
The Audit Committee has adopted written policies relating to the pre-approval of the audit and non-audit services performed by the registrant’s independent auditors. Unless a type of service to be provided by the
independent auditors has received general pre-approval, it requires specific pre-approval by the Audit Committee. Under the policies, on an annual basis, the Audit Committee reviews and pre-approves the services to be provided by the independent
auditors without having to obtain specific pre-approval from the Audit Committee. The Audit Committee has delegated pre-approval authority to the Audit Committee Chairperson. In addition, the Audit Committee pre-approves any permitted non-audit
services to be provided by the independent auditors to the registrant’s investment adviser or any entity controlling, controlled by, or under common control with the adviser if such services relate directly to the operations and financial reporting
of the registrant.
AUDIT COMMITTEE PRE-APPROVAL POLICY OF
ADVENT CONVERTIBLE AND INCOME FUND
Statement of Principles
The Audit Committee (the “Audit Committee”) of the Board of Trustees (the “Board”) of Advent Convertible and Income Fund (the “Trust,”) is required to pre-approve all Covered Services (as defined in the Audit
Committee Charter) in order to assure that the provision of the Covered Services does not impair the auditors’ independence. Unless a type of service to be provided by the Independent Auditor (as defined in the Audit Committee Charter) is
pre-approved in accordance with the terms of this Audit Committee Pre-Approval Policy (the “Policy”), it will require specific pre-approval by the Audit Committee or by any member of the Audit Committee to which pre-approval authority has been
delegated.
This Policy and the appendices to this Policy describe the Audit, Audit-Related, Tax and All Other services that are Covered Services and that have been pre-approved under this Policy. The appendices hereto sometimes
are referred to herein as the “Service Pre-Approval Documents”. The term of any such pre-approval is 12 months from the date of pre-approval, unless the Audit Committee specifically provides for a different period. At its June meeting of each
calendar year, the Audit Committee will review and re-approve this Policy and approve or re-approve the Service
Pre-Approval Documents for that year, together with any changes deemed necessary or desirable by the Audit Committee. The Audit Committee may, from time to time, modify the nature of the services pre-approved, the
aggregate level of fees pre-approved or both. The Audit Committee hereby directs that each version of this Policy and the Service Pre-Approval Documents approved, re-approved or amended from time to time be maintained with the books and records of
the Trust.
Delegation
In the intervals between the scheduled meetings of the Audit Committee, the Audit Committee delegates pre-approval authority under this Policy to the Chairman of the Audit Committee (the “Chairman”). The Chairman
shall report any pre-approval decisions under this Policy to the Audit Committee at its next scheduled meeting. At each scheduled meeting, the Audit Committee will review with the Independent Auditor the Covered Services pre-approved by the Chairman
pursuant to delegated authority, if any, and the fees related thereto. Based on these reviews, the Audit Committee can modify, at its discretion, the pre-approval originally granted by the Chairman pursuant to delegated authority. This modification
can be to the nature of services pre-approved, the aggregate level of fees approved, or both. The Audit Committee expects pre-approval of Covered Services by the Chairman pursuant to this delegated authority to be the exception rather than the rule
and may modify or withdraw this delegated authority at any time the Audit Committee determines that it is appropriate to do so.
Pre-Approved Fee Levels
Fee levels for all Covered Services to be provided by the Independent Auditor and pre-approved under this Policy will be established annually by the Audit Committee and set forth in the Service Pre-Approval Documents.
Any increase in pre-approved fee levels will require specific pre-approval by the Audit Committee (or the Chairman pursuant to delegated authority).
Audit Services
The terms and fees of the annual Audit services engagement for the Trust are subject to the specific pre-approval of the Audit Committee. The Audit Committee will approve, if necessary, any changes in terms, conditions
or fees resulting from changes in audit scope, Trust structure or other matters.
In addition to the annual Audit services engagement specifically approved by the Audit Committee, any other Audit services for the Trust not listed in the Service Pre-Approval Document for the respective period must be
specifically pre-approved by the Audit Committee (or the Chairman pursuant to delegated authority).
Audit-Related Services
Audit-Related services are assurance and related services that are not required for the audit, but are reasonably related to the performance of the audit or review of the financial statements of the Trust and, to the
extent they are Covered Services, the other Covered Entities (as defined in the Audit Committee Charter) or that are traditionally performed by the Independent Auditor. Audit-Related services that are Covered Services and are not listed in the
Service Pre-Approval Document for the respective period must be specifically pre-approved by the Audit Committee (or the Chairman pursuant to delegated authority).
Tax Services
The Audit Committee believes that the Independent Auditor can provide Tax services to the Covered Entities such as tax compliance, tax planning and tax advice without impairing the auditor’s independence. However, the
Audit Committee will not permit the retention of the Independent Auditor in connection with a transaction initially recommended by the Independent Auditor, the sole business purpose of which may be tax avoidance and the tax treatment of which may not
be supported in the Internal Revenue Code and related regulations. Tax services that are Covered Services and are not listed in the Service Pre-Approval Document for the respective period must be specifically pre-approved by the Audit Committee (or
the Chairman pursuant to delegated authority).
All Other Services
All Other services that are Covered Services and are not listed in the Service Pre-Approval Document for the respective period must be specifically pre-approved by the Audit Committee (or the Chairman pursuant to
delegated authority).
Procedures
Requests or applications to provide Covered Services that require approval by the Audit Committee (or the Chairman pursuant to delegated authority) must be submitted to the Audit Committee or the Chairman, as the case
may be, by both the Independent Auditor and the Chief Financial Officer of the respective Covered Entity, and must include a joint statement as to whether, in their view, (a) the request or application is consistent with the SEC’s rules on auditor
independence and (b) the requested service is or is not a non-audit service prohibited by the SEC. A request or application submitted to the Chairman between scheduled meetings of the Audit Committee should include a discussion as to why approval is
being sought prior to the next regularly scheduled meeting of the Audit Committee.
(2) None of the services described in each of Items 4 (b) through (d) were approved by the Audit Committee pursuant to paragraph (c)(7)(C) of Rule 2-01 of Regulation S-X.
(f) Not applicable.
(g) The aggregate non-audit fees billed by the registrant’s accountant for services rendered to the registrant, the registrant’s investment adviser (not including a sub-adviser whose role is primarily portfolio
management and is sub-contracted with or overseen by another investment adviser) and/or any entity controlling, controlled by, or under common control with the adviser that provides ongoing services to the registrant that directly related to the
operations and financial reporting of the registrant were $17,510 and $17,510 for the fiscal years ended October 31, 2019, and October 31, 2018, respectively.
(h) Not applicable.
Item 5. Audit Committee of Listed Registrants.
a) The Audit Committee was established as a separately designed standing audit committee in accordance with Section 3(a)(58)(A) of the Securities Exchange Act of 1934 as amended. The Audit Committee of the
registrant is composed of: Randall C. Barnes, Daniel L. Black, Derek M. Medina, Ronald A. Nyberg, Gerald L. Seizert and Michael A. Smart.
b) Not applicable.
Item 6. Schedule of Investments.
The Schedule of Investments is included as part of Item 1.
Item 7. Disclosure of Proxy Voting Policies and Procedures for Closed-End Management Investment Companies.
The registrant has delegated the voting of proxies relating to its voting securities to its investment manager, Advent Capital Management, LLC (the “Manager”). The Manager’s Proxy Voting Policies and Procedures are
included as Exhibit (c) attached hereto.
Item 8. Portfolio Managers of Closed-End Management Investment Companies.
a) (1) The individuals who are primarily responsible for the day-to-day management of the Fund’s portfolio (the “Portfolio Managers”) include Tracy Maitland (President and Chief Investment Officer of Advent), Paul
Latronica (Managing Director of Advent) and Tony Huang (Director of Advent). Mr. Maitland and Mr. Latronica are portfolio managers and Mr. Huang is an associate portfolio manager. The Portfolio Managers are supported by teams of investment
professionals who make investment decisions for the Fund’s core portfolio of convertible bonds, the Fund’s high yield securities investments and the Fund’s leverage allocation, respectively. The following provides information regarding the Portfolio
Managers as of October 31, 2019.
|
Name
|
Since
|
Professional Experience
|
|
Tracy Maitland
|
2003
(Inception)
|
Founder, President and Chief Investment Officer of Advent Capital Management, LLC.
|
|
Paul Latronica
|
2011
|
Managing Director of Advent Capital Management, LLC. He has been associated with Advent for more than 15 years.
|
|
Tony Huang
|
2019
|
Director of Advent Capital Management, LLC. He has been associated with Advent for more than 10 years.
|
(a) (2) (i-iii) Other accounts managed. The following summarizes information regarding each of the other accounts managed by them as of October 31, 2019:
Tracy Maitland
|
Type of Account
|
Number of Accounts
|
Total Assets in the Accounts
|
Number of Accounts In Which the Advisory Fee is Based on Performance
|
Total Assets in the Accounts In Which the Advisory Fee is Based on Performance
|
|
Registered investment companies
|
2
|
$1,045,940,326.63
|
0
|
$0
|
|
Other pooled investment vehicles
|
5
|
$277,073,891.35
|
5
|
$277,073,891.35
|
|
Other accounts
|
545
|
7,808,826,710.71
|
0
|
$0
|
Paul Latronica
|
Type of Account
|
Number of Accounts
|
Total Assets in the Accounts
|
Number of Accounts In Which the Advisory Fee is Based on Performance
|
Total Assets in the Accounts In Which the Advisory Fee is Based on Performance
|
|
Registered investment companies
|
1
|
$ 951,120,718.11
|
0
|
$0.00
|
|
Other pooled investment vehicles
|
1
|
$68,581,325.47
|
0
|
$0.00
|
|
Other accounts
|
501
|
$3,543,190,498.23
|
0
|
$0.00
|
Tony Huang
|
Type of Account
|
Number of Accounts
|
Total Assets in the Accounts
|
Number of Accounts In Which the Advisory Fee is Based on Performance
|
Total Assets in the Accounts In Which the Advisory Fee is Based on Performance
|
|
Registered investment companies
|
0
|
$ 0.00
|
0
|
$0.00
|
|
Other pooled investment vehicles
|
1
|
$68,581,325.47
|
0
|
$0.00
|
|
Other accounts
|
6
|
$ 1,852,340,297.72
|
0
|
$0.00
|
(a) (2) (iv) Conflicts of Interest. If another account of the Portfolio Managers has investment objectives and policies that are similar to those of the registrant, the Portfolio Managers will allocate orders pro-rata
among the registrant and such other accounts, or, if the Portfolio Managers deviate from this policy, the Portfolio Managers will allocate orders such that all accounts (including the registrant) receive fair and equitable treatment.
(a) (3) Compensation Structure. The salaries of the Portfolio Managers are fixed at an industry-appropriate amount and generally reviewed annually. In addition, a discretionary bonus may be awarded to the Portfolio
Managers, if appropriate. Bonuses are generally considered on an annual basis and based upon a variety of factors, including, but not limited to, the overall success of the firm, an individual’s responsibility and his/her performance versus
expectations. The bonus is determined by senior management at Advent Capital Management, LLC. Compensation is based on the entire employment relationship and not based solely on the performance of the registrant or any other single account or type
of account. In addition, all Advent Capital Management, LLC employees are also eligible to participate in a 401(k) plan.
(a) (4) Securities ownership. The following table discloses the dollar range of equity securities of the registrant beneficially owned by the Portfolio Managers as of October 31, 2018:
|
Name of Portfolio Manager
|
Dollar Range of Equity Securities in Fund
|
|
Tracy Maitland
|
More than $1,000,000
|
|
Tony Huang
|
$100,001 - $500,000.
|
|
Paul Latronica
|
$10,001- $50,000
|
(b) Not applicable.
Item 9. Purchases of Equity Securities by Closed-End Management Investment Company and Affiliated Purchasers.
None.
Item 10. Submission of Matters to a Vote of Security Holders.
The registrant has not made any material changes to the procedures by which shareholders may recommend nominees to the registrant’s Board of Trustees.
Item 11. Controls and Procedures.
(a) The registrant’s principal executive officer and principal financial officer have evaluated the registrant’s disclosure controls and procedures (as defined in Rule 30a-3(c) under the Investment Company Act) as of a
date within 90 days of this filing and have concluded based on such evaluation, as required by Rule 30a-3(b) under the Investment Company Act, that the registrant’s disclosure controls and procedures were effective, as of that date, in ensuring that
information required to be disclosed by the registrant in this Form N-CSR was recorded, processed, summarized, and reported within the time periods specified in the Securities and Exchange Commission’s rules and forms.
(b) There were no changes in the registrant’s internal control over financial reporting (as defined in Rule 30a-3(d) under the Investment Company Act) that occurred during the registrant’s period covered by this report
that have materially affected, or are reasonably likely to materially affect, the registrant’s internal control over financial reporting.
Item 12. Disclosure of Securities Lending Activities for Closed-End Management Investment Companies.
(a) The registrant has not participated in securities lending activities during the period covered by this report.
(b) Not applicable.
Item 13. Exhibits.
(a)(1) Code of Ethics for Chief Executive and Senior Financial Officers.
(a)(2) Certification of principal executive officer and principal financial officer pursuant to Rule 30a-2(a) of the Investment Company Act.
(a)(3) Not applicable.
(b) Certification of principal executive officer and principal financial officer pursuant to Rule 30a-2(b) of the Investment Company Act and Section 906 of the Sarbanes-Oxley Act of 2002.
(c) Proxy Voting Policies and Procedures.
SIGNATURES
Pursuant to the requirements of the Securities Exchange Act of 1934 and the Investment Company Act of 1940, the registrant has duly caused this report to be signed on its behalf by the undersigned,
thereunto duly authorized.
Advent Convertible and Income Fund
By: /s/ Tracy V. Maitland
Name: Tracy V. Maitland
Title: President and Chief Executive Officer
Date: January 2, 2020
Pursuant to the requirements of the Securities Exchange Act of 1934 and the Investment Company Act of 1940, this report has been signed by the following persons on behalf of the registrant and in the
capacities and on the dates indicated.
By: /s/ Tracy V. Maitland
Name: Tracy V. Maitland
Title: President and Chief Executive Officer
Date: January 2, 2020
By: /s/ Robert White
Name: Robert White
Title: Treasurer and Chief Financial Officer
Date: January 2, 2020