ACADEMY CLASS SHARES OF
J.P. MORGAN MONEY MARKET FUNDS
Prospectus
INSTITUTIONAL FUNDS
JPMorgan Prime Money Market Fund: JPAXX
GOVERNMENT FUNDS
JPMorgan 100% U.S. Treasury Securities Money Market Fund: JACXX
JPMorgan U.S. Government Money Market Fund: JGAXX
JPMorgan U.S. Treasury Plus Money Market Fund: JPCXX
The Securities and Exchange Commission and the Commodity Futures Trading Commission have not approved or disapproved of these securities or determined if this prospectus is truthful or complete. Any representation to the contrary is a criminal offense.

JPMorgan Prime Money Market Fund
| | |
| |
Academy |
| Management Fees |
|
| Other Expenses |
|
| Service Fees |
|
| Remainder of Other Expenses |
|
| Total Annual Fund Operating Expenses |
|
| | ||||
| |
1 Year |
3 Years |
5 Years |
10 Years |
| ACADEMY SHARES ($) |
|
|
|
|
The Fund is subject to management risk and the Fund may not achieve its objective if the adviser’s expectations regarding particular instruments or interest rates are not met.
June 21, 2024 | 1
JPMorgan Prime Money Market Fund (continued)
Any gain resulting from the sale or exchange of Fund shares will be taxable as long-term or short-term gain, depending upon how long you have held your shares.
The Fund is subject to the main risks noted below, any of which may adversely affect the Fund’s performance and ability to meet its investment objective.
2 | J.P. Morgan Money Market Funds
June 21, 2024 | 3
JPMorgan Prime Money Market Fund (continued)
| |

| |
|
|
| |
|
|
| |
|
|
|
|
|
4 | J.P. Morgan Money Market Funds
| | |||
| |
Past 1 Year |
Past 5 Years |
Past 10 Years |
| ACADEMY SHARES |
% |
% |
% |
Management
J.P. Morgan Investment Management Inc. (the adviser)
Purchase and Sale of Fund Shares
The Fund’s Academy Shares are offered to clients of Academy Securities, Inc. and its affiliates (collectively, Academy Clients). Academy Clients may purchase the Academy Shares through accounts maintained with Academy Securities, Inc. or its affiliates. Academy Shares may also be purchased through an electronic-trading platform sponsored by JPMorgan or its affiliates, or through platforms maintained by other financial intermediaries for which JPMIM has contracted with Academy Securities, Inc. to provide marketing support services.
Purchase minimums
| For Academy Shares |
|
| To establish a regular account |
$5,000,000 |
| To add to an account |
No minimum |
You may purchase or redeem shares on any business day that the Fund is open through your financial advisor or by calling 1-646-341-6869.
Tax Information
The Fund intends to make distributions that may be taxed as ordinary income or capital gains, except when your investment is in an IRA, 401(k) plan or other tax-advantaged investment plan, in which case you may be subject to federal income tax upon withdrawal from the tax-advantaged investment plan.
Payments to Broker-Dealers and Other Financial Intermediaries
If you purchase shares of the Fund through a broker-dealer or other financial intermediary, including Academy Securities, the Fund and its related companies may pay the financial intermediary for the sale of Fund shares and related services. These payments may create a conflict of interest by influencing the broker-dealer or financial intermediary and your salesperson to recommend the Fund over another investment. Ask your salesperson or visit your financial intermediary’s website for more information.
June 21, 2024 | 5
JPMorgan 100% U.S. Treasury Securities Money Market Fund
| | |
| |
Academy |
| Management Fees |
|
| Other Expenses |
|
| Service Fees |
|
| Remainder of Other Expenses |
|
| Total Annual Fund Operating Expenses |
|
| | ||||
| |
1 Year |
3 Years |
5 Years |
10 Years |
| ACADEMY SHARES ($) |
|
|
|
|
The Fund is subject to management risk and the Fund may not achieve its objective if the adviser’s expectations regarding particular instruments or interest rates are not met.
6 | J.P. Morgan Money Market Funds
An investment in this Fund or any other fund may not provide a complete investment program. The suitability of an investment in the Fund should be considered based on the investment objective, strategies and risks described in this prospectus, considered in light of all of the other investments in your portfolio, as well as your risk tolerance, financial goals and time horizons. You may want to consult with a financial advisor to determine if this Fund is suitable for you.
The Fund is subject to the main risks noted below, any of which may adversely affect the Fund’s performance and ability to meet its investment objective.
June 21, 2024 | 7
JPMorgan 100% U.S. Treasury Securities Money Market Fund (continued)
| |

| |
|
|
| |
|
|
| |
| |
| |
|
|
|
|
|
| | |||
| |
Past 1 Year |
Past 5 Years |
Past 10 Years |
| ACADEMY SHARES |
% |
% |
% |
Management
J.P. Morgan Investment Management Inc. (the adviser)
Purchase and Sale of Fund Shares
The Fund’s Academy Shares are offered to clients of Academy Securities, Inc. and its affiliates (collectively, Academy Clients). Academy Clients may purchase the Academy Shares through accounts maintained with Academy Securities, Inc. or its affiliates. Academy Shares may also be purchased through an electronic-trading platform sponsored by JPMorgan or its affiliates, or through platforms maintained by other financial intermediaries for which JPMIM has contracted with Academy Securities, Inc. to provide marketing support services.
Purchase minimums
| For Academy Shares |
|
| To establish a regular account |
$5,000,000 |
| To add to an account |
No minimum |
8 | J.P. Morgan Money Market Funds
You may purchase or redeem shares on any business day that the Fund is open through your financial advisor or by calling 1-646-341-6869.
Tax Information
The Fund intends to make distributions that may be taxed as ordinary income or capital gains, except when your investment is in an IRA, 401(k) plan or other tax-advantaged investment plan, in which case you may be subject to federal income tax upon withdrawal from the tax-advantaged investment plan.
Payments to Broker-Dealers and Other Financial Intermediaries
If you purchase shares of the Fund through a broker-dealer or other financial intermediary, including Academy Securities, the Fund and its related companies may pay the financial
intermediary for the sale of Fund shares and related services. These payments may create a conflict of interest by influencing the broker-dealer or financial intermediary and your salesperson to recommend the Fund over another investment. Ask your salesperson or visit your financial intermediary’s website for more information.
June 21, 2024 | 9
JPMorgan U.S. Government Money Market Fund
Ticker: Academy/JGAXX
The Fund’s Objective
The Fund seeks high current income with liquidity and stability of principal.
Fees and Expenses of the Fund
The following table describes the fees and expenses that you may pay if you buy, hold and sell shares of the Fund. You may pay other fees, such as brokerage commissions and other fees to financial intermediaries, which are not reflected in the table and examples below.
| ANNUAL FUND OPERATING EXPENSES (Expenses that you pay each year as a percentage of the value of your investment) | |
| |
Academy |
| Management Fees |
0.08% |
| Other Expenses |
0.10 |
| Service Fees |
0.05 |
| Remainder of Other Expenses |
0.05 |
| Total Annual Fund Operating Expenses |
0.18 |
Example
This Example is intended to help you compare the cost of investing in the Fund with the cost of investing in other mutual funds. The Example assumes that you invest $10,000 in the Fund for the time periods indicated. The Example also assumes that your investment has a 5% return each year and that the Fund’s operating expenses remain the same. Your actual costs may be higher or lower.
| WHETHER OR NOT YOU SELL YOUR SHARES, YOUR COST WOULD BE: | ||||
| |
1 Year |
3 Years |
5 Years |
10 Years |
| ACADEMY SHARES ($) |
18 |
58 |
101 |
230 |
The Fund’s Main Investment Strategy
Under normal conditions, the Fund invests its assets exclusively in:
●
debt securities issued or guaranteed by the U.S. government, or by U.S. government agencies or instrumentalities or Government-Sponsored Enterprises (“GSEs”), and
●
repurchase agreements fully collateralized by U.S. Treasury and U.S. government securities.
The Fund is a money market fund managed in the following manner:
●
The Fund seeks to maintain a net asset value (“NAV”) of $1.00 per share.
●
The dollar-weighted average maturity of the Fund will be 60 days or less and the dollar-weighted average life to maturity will be 120 days or less.
●
The Fund will only buy securities that have remaining maturities of 397 days or less or securities otherwise permitted to be purchased because of maturity shortening provisions under applicable regulation.
●
The Fund invests only in U.S. dollar-denominated securities.
●
The Fund seeks to invest in securities that present minimal credit risk.
The Fund may invest significantly in securities with floating or variable rates of interest. Their yields will vary as interest rates change. The Fund will generally hold a portion of its assets in cash, primarily to meet redemptions.
The Fund intends to continue to qualify as a “government money market fund,” as such term is defined in or interpreted under Rule 2a-7 under the Investment Company Act of 1940, as amended (“Investment Company Act”). “Government money market funds” are required to invest at least 99.5% of their assets in (i) cash, (ii) securities issued or guaranteed by the United States or certain U.S. government agencies or instrumentalities and/or (iii) repurchase agreements that are collateralized fully, and are exempt from requirements that permit money market funds to impose a liquidity fee. While the J.P. Morgan Funds’ Board of Trustees (the “Board”) may elect to subject the Fund to liquidity fee requirements in the future, the Board has not elected to do so at this time. A government money market fund may also include investments in other government money market funds as an eligible investment for purposes of the 99.5% requirement above.
The Fund may trade securities on a when-issued, delayed settlement or forward commitment basis. The Fund’s adviser seeks to develop an appropriate portfolio by considering the differences in yields among securities of different maturities, market sectors and issuers.
The Fund’s Main Investment Risks
The Fund is subject to management risk and the Fund may not achieve its objective if the adviser’s expectations regarding particular instruments or interest rates are not met.
You could lose money by investing in the Fund. Although the Fund seeks to preserve the value of your investment at $1.00 per share, it cannot guarantee it will do so. An investment in the Fund is not a bank account and is not insured or guaranteed by the Federal Deposit Insurance Corporation or any other government agency. The Fund’s sponsor is not required to reimburse the Fund for losses, and you should not expect that the sponsor will provide financial support to the Fund at any time, including during periods of market stress.
10 | J.P. Morgan Money Market Funds
An investment in this Fund or any other fund may not provide a complete investment program. The suitability of an investment in the Fund should be considered based on the investment objective, strategies and risks described in this prospectus, considered in light of all of the other investments in your portfolio, as well as your risk tolerance, financial goals and time horizons. You may want to consult with a financial advisor to determine if this Fund is suitable for you.
The Fund is subject to the main risks noted below, any of which may adversely affect the Fund’s performance and ability to meet its investment objective.
Interest Rate Risk. The Fund’s investments in bonds and other debt securities will change in value based on changes in interest rates. If rates increase, the value of these investments generally declines. Securities with greater interest rate sensitivity and longer maturities generally are subject to greater fluctuations in value. The Fund may invest in variable and floating rate securities. Although these instruments are generally less sensitive to interest rate changes than fixed rate instruments, the value of floating rate and variable securities may decline if their interest rates do not rise as quickly, or as much, as general interest rates. The Fund may face a heightened level of interest rate risk due to certain changes in monetary policy. It is difficult to predict the pace at which central banks or monetary authorities may change interest rates or the timing, frequency, or magnitude of such changes. Any such changes could be sudden and could expose debt markets to significant volatility and reduced liquidity for Fund investments.
Credit Risk. The Fund’s investments are subject to the risk that issuers and/or counterparties will fail to make payments when due or default completely. Prices of the Fund’s investments may be adversely affected if any of the issuers or counterparties it is invested in are subject to an actual or perceived deterioration in their credit quality. Credit spreads may increase, which may reduce the market values of the Fund’s securities. Credit spread risk is the risk that economic and market conditions or any actual or perceived credit deterioration may lead to an increase in the credit spreads (i.e., the difference in yield between two securities of similar maturity but different credit quality) and a decline in price of the issuer’s securities.
General Market Risk. Economies and financial markets throughout the world are becoming increasingly interconnected, which increases the likelihood that events or conditions in one country or region will adversely impact markets or issuers in other countries or regions. Securities in the Fund’s portfolio may underperform in comparison to securities in general financial markets, a particular financial market or other asset classes due to a number of factors, including inflation (or expectations for inflation), deflation (or expectations for deflation), interest rates, global demand for particular products or resources, market instability, financial system instability, debt crises and downgrades, embargoes, tariffs, sanctions and other trade barriers, regulatory events, other governmental trade or
market control programs and related geopolitical events. In addition, the value of the Fund’s investments may be negatively affected by the occurrence of global events such as war, terrorism, environmental disasters, natural disasters or events, country instability, and infectious disease epidemics or pandemics.
Asset-Backed, Mortgage-Related and Mortgage-Backed Securities Risk. Mortgage-related and asset-backed securities are subject to certain other risks, including prepayment and call risks. During periods of difficult or frozen credit markets, significant changes in interest rates, or deteriorating economic conditions, mortgage-related and asset-backed securities may decline in value, face valuation difficulties, become more volatile and/or become illiquid. When mortgages and other obligations are prepaid and when securities are called, the Fund may have to reinvest in securities with a lower yield or fail to recover additional amounts (i.e., premiums) paid for securities with higher interest rates, resulting in an unexpected capital loss and/or a decrease in the amount of dividends and yield. In periods of either rising or declining interest rates, the Fund may be subject to extension risk, and may receive principal later than expected. As a result, in periods of rising interest rates, the Fund may exhibit additional volatility. Additionally, asset-backed, mortgage-related and mortgage-backed securities are subject to risks associated with their structure and the nature of the assets underlying the securities and the servicing of those assets. Certain asset-backed, mortgage-related and mortgage-backed securities may face valuation difficulties and may be less liquid than other types of asset-backed, mortgage-related and mortgage-backed securities, or debt securities.
Government Securities Risk. U.S. government securities include securities issued or guaranteed by the U.S. government or its agencies and instrumentalities (such as securities issued by the Government National Mortgage Association (Ginnie Mae), the Federal National Mortgage Association (Fannie Mae), the Federal Home Loan Mortgage Corporation (Freddie Mac) or other Government-Sponsored Enterprises (GSEs)). U.S. government securities are subject to market risk, interest rate risk and credit risk. Securities, such as those issued or guaranteed by Ginnie Mae or the U.S. Treasury, that are backed by the full faith and credit of the United States are guaranteed only as to the timely payment of interest and principal when held to maturity and the market prices for such securities will fluctuate. Notwithstanding that these securities are backed by the full faith and credit of the United States, circumstances could arise that would prevent the payment of interest or principal. This would result in losses to the Fund. Securities issued or guaranteed by U.S. government related organizations, such as Fannie Mae and Freddie Mac, are not backed by the full faith and credit of the U.S. government and no assurance can be given that the U.S. government will provide financial support. Therefore, U.S. government related organizations may not have the funds to meet their payment obligations in the future. U.S.
June 20, 2024 | 11
JPMorgan U.S. Government Money Market Fund (continued)
government securities include zero coupon securities, which tend to be subject to greater market risk than interest-paying securities of similar maturities.
When-Issued, Delayed Settlement and Forward Commitment Transactions Risk. The Fund may purchase or sell securities which it is eligible to purchase or sell on a when-issued basis, may purchase and sell such securities for delayed delivery and may make contracts to purchase or sell such securities for a fixed price at a future date beyond normal settlement time (forward commitments). When-issued transactions, delayed delivery purchases and forward commitments involve the risk that the security the Fund buys will lose value prior to its delivery. There also is the risk that the security will not be issued or that the other party to the transaction will not meet its obligation. If this occurs, the Fund loses both the investment opportunity for the assets it set aside to pay for the security and any gain in the security’s price.
Risk of Regulation of Money Market Funds. The SEC has adopted amendments to the rules that govern money market funds. These amendments may affect the Fund's investment strategies, performance, yield, expenses, operations and continued viability.
Transactions Risk. The Fund could experience a loss and its liquidity may be negatively impacted when selling securities to meet redemption requests. The risk of loss increases if the redemption requests are unusually large or frequent or occur in times of overall market turmoil or declining prices. Similarly, large purchases of Fund shares may adversely affect the Fund’s performance to the extent that the Fund is delayed in investing new cash and is required to maintain a larger cash position than it ordinarily would.
Floating and Variable Rate Securities Risk. Floating and variable rate securities provide for a periodic adjustment in the interest rate paid on the securities. The rate adjustment intervals may be regular and range from daily up to annually, or may be based on an event, such as a change in the prime rate. Floating and variable rate securities may be subject to greater liquidity risk than other debt securities, meaning that there may be limitations on the Fund’s ability to sell the securities at any given time. Such securities also may lose value.
Net Asset Value Risk. There is no assurance that the Fund will meet its investment objective of maintaining a net asset value of $1.00 per share on a continuous basis. Furthermore, there can be no assurance that the Fund’s affiliates will purchase distressed assets from the Fund, make capital infusions, enter into capital support agreements or take other actions to ensure that the Fund maintains a net asset value of $1.00 per share. In the event any money market fund fails to maintain a stable net asset value, other money market funds, including the Fund, could face a universal risk of increased redemption pressures, potentially jeopardizing the stability of their net asset values. In general, certain other money market funds have in the past
failed to maintain stable net asset values and there can be no assurance that such failures and resulting redemption pressures will not occur in the future.
Repurchase Agreement Risk. There is a risk that the counterparty to a repurchase agreement will default or otherwise become unable to honor a financial obligation and the value of your investment could decline as a result.
Risk Associated with the Fund Holding Cash. The Fund will generally hold a portion of its assets in cash, primarily to meet redemptions. Cash positions may hurt performance and may subject the Fund to additional risks and costs, such as increased exposure to the custodian bank holding the assets and any fees imposed for large cash balances.
Interfund Lending Risk. A delay in repayment to the Fund from a borrowing fund could result in lost opportunity costs. Interfund loans are subject to the risk that the borrowing fund could be unable to repay the loan when due. In the case of a default by a borrowing fund and to the extent that the loan is collateralized, the Fund could take possession of collateral that the Fund is not permitted to hold and, therefore, would be required to dispose of such collateral as soon as possible, which could result in a loss to the Fund.
Prepayment Risk. The issuer of certain securities may repay principal in advance, especially when yields fall. Changes in the rate at which prepayments occur can affect the return on investment of these securities. When debt obligations are prepaid or when securities are called, the Fund may have to reinvest in securities with a lower yield. The Fund also may fail to recover additional amounts (i.e., premiums) paid for securities with higher coupons, resulting in an unexpected capital loss.
State and Local Taxation Risk. The Fund may invest in securities whose interest is subject to state and local income taxes. Consult your tax professional for more information.
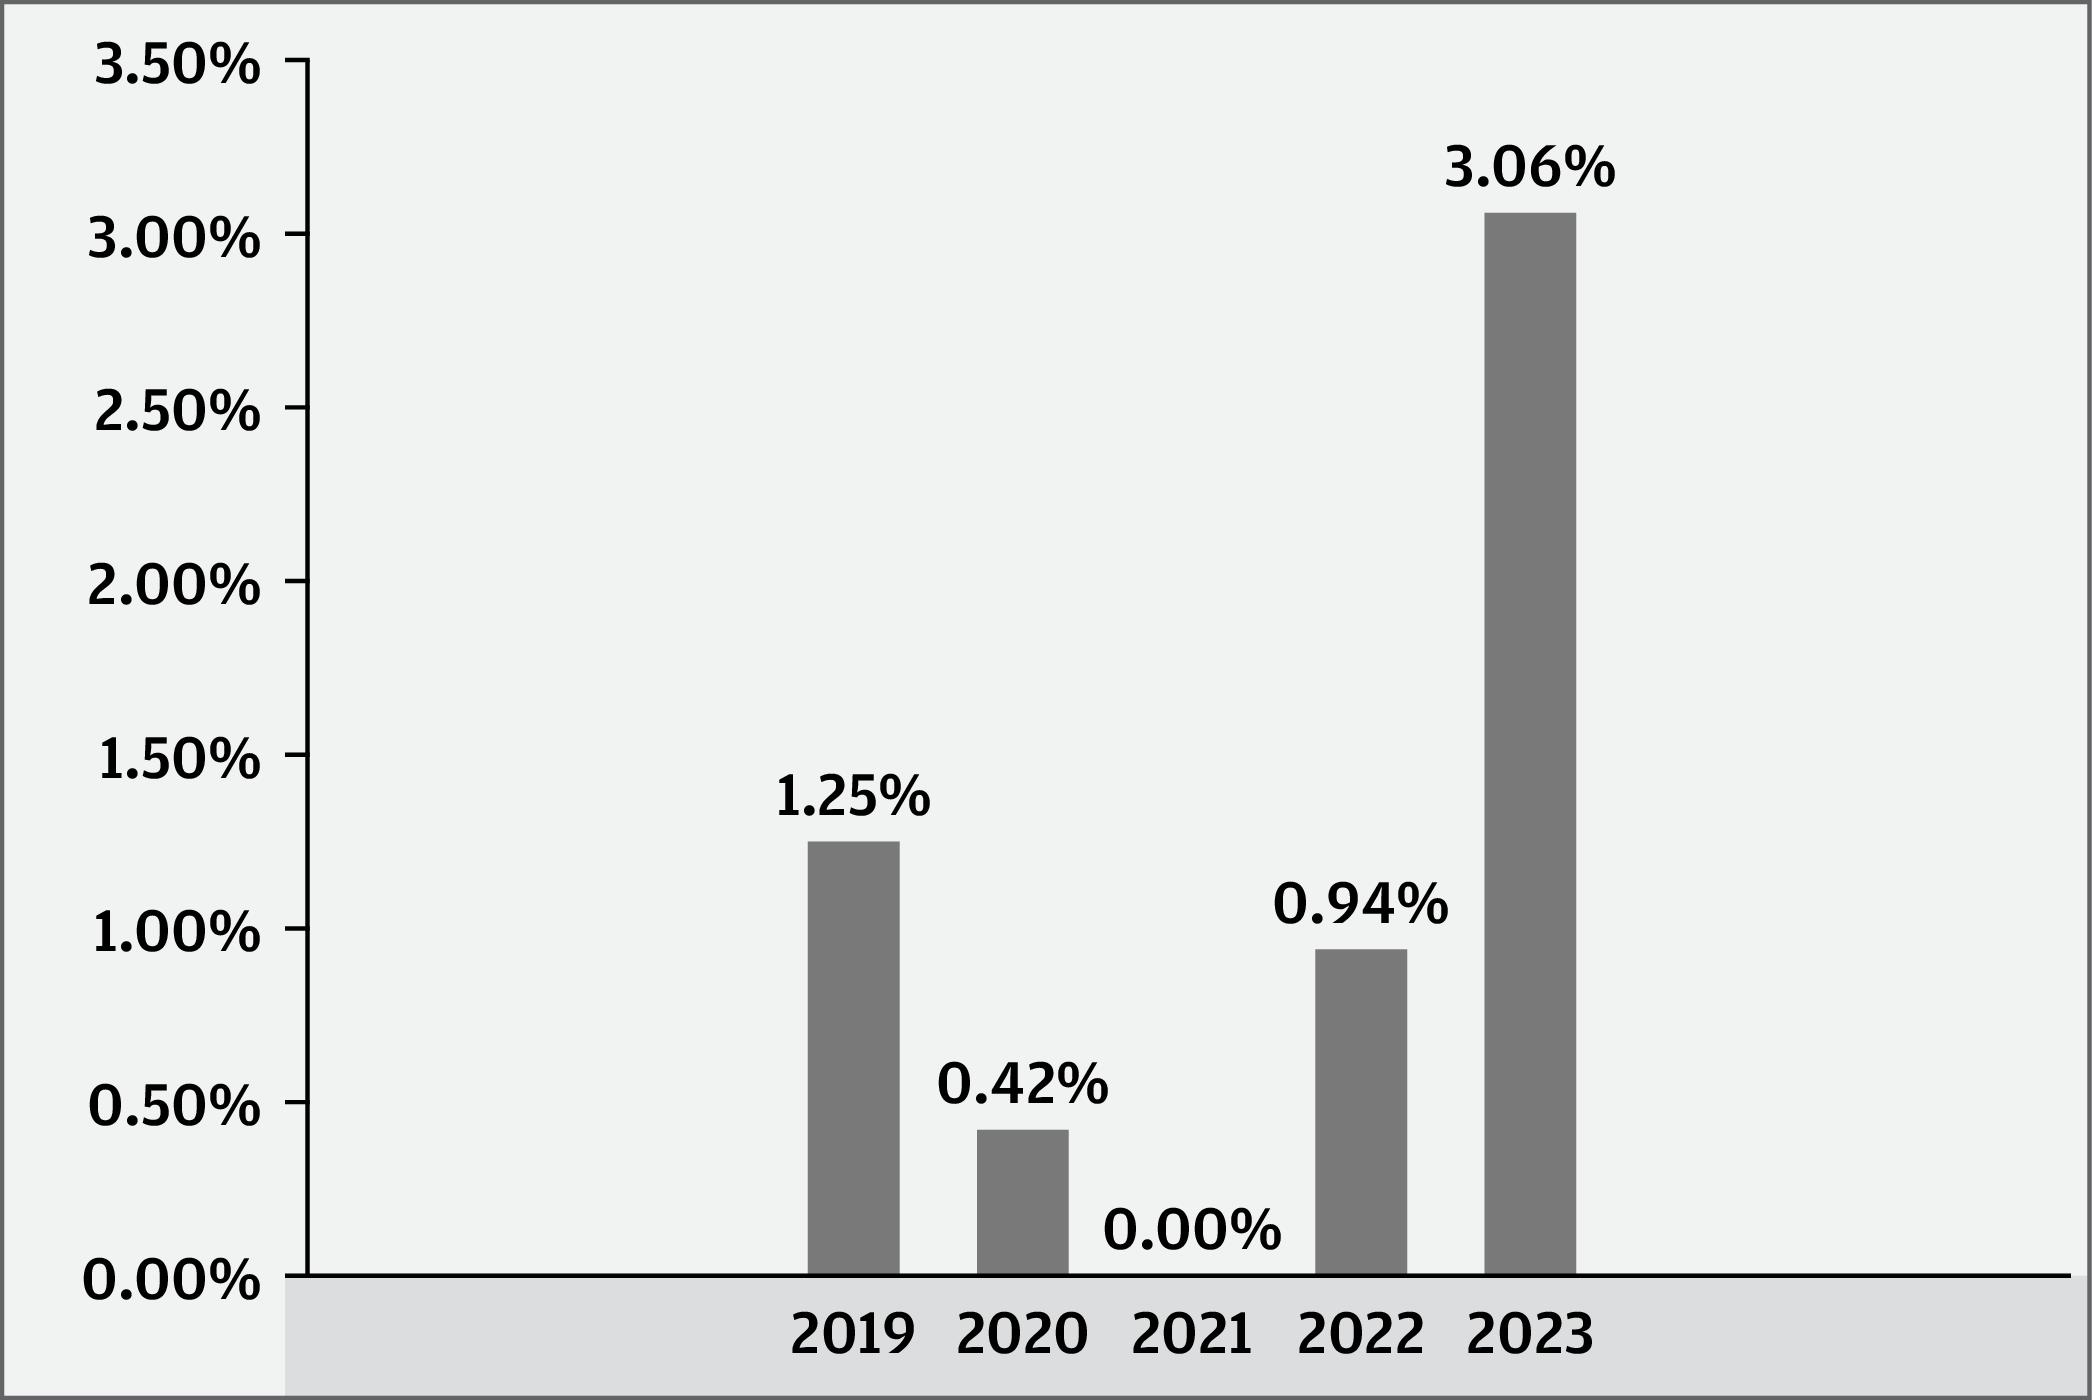
The Fund’s Past Performance
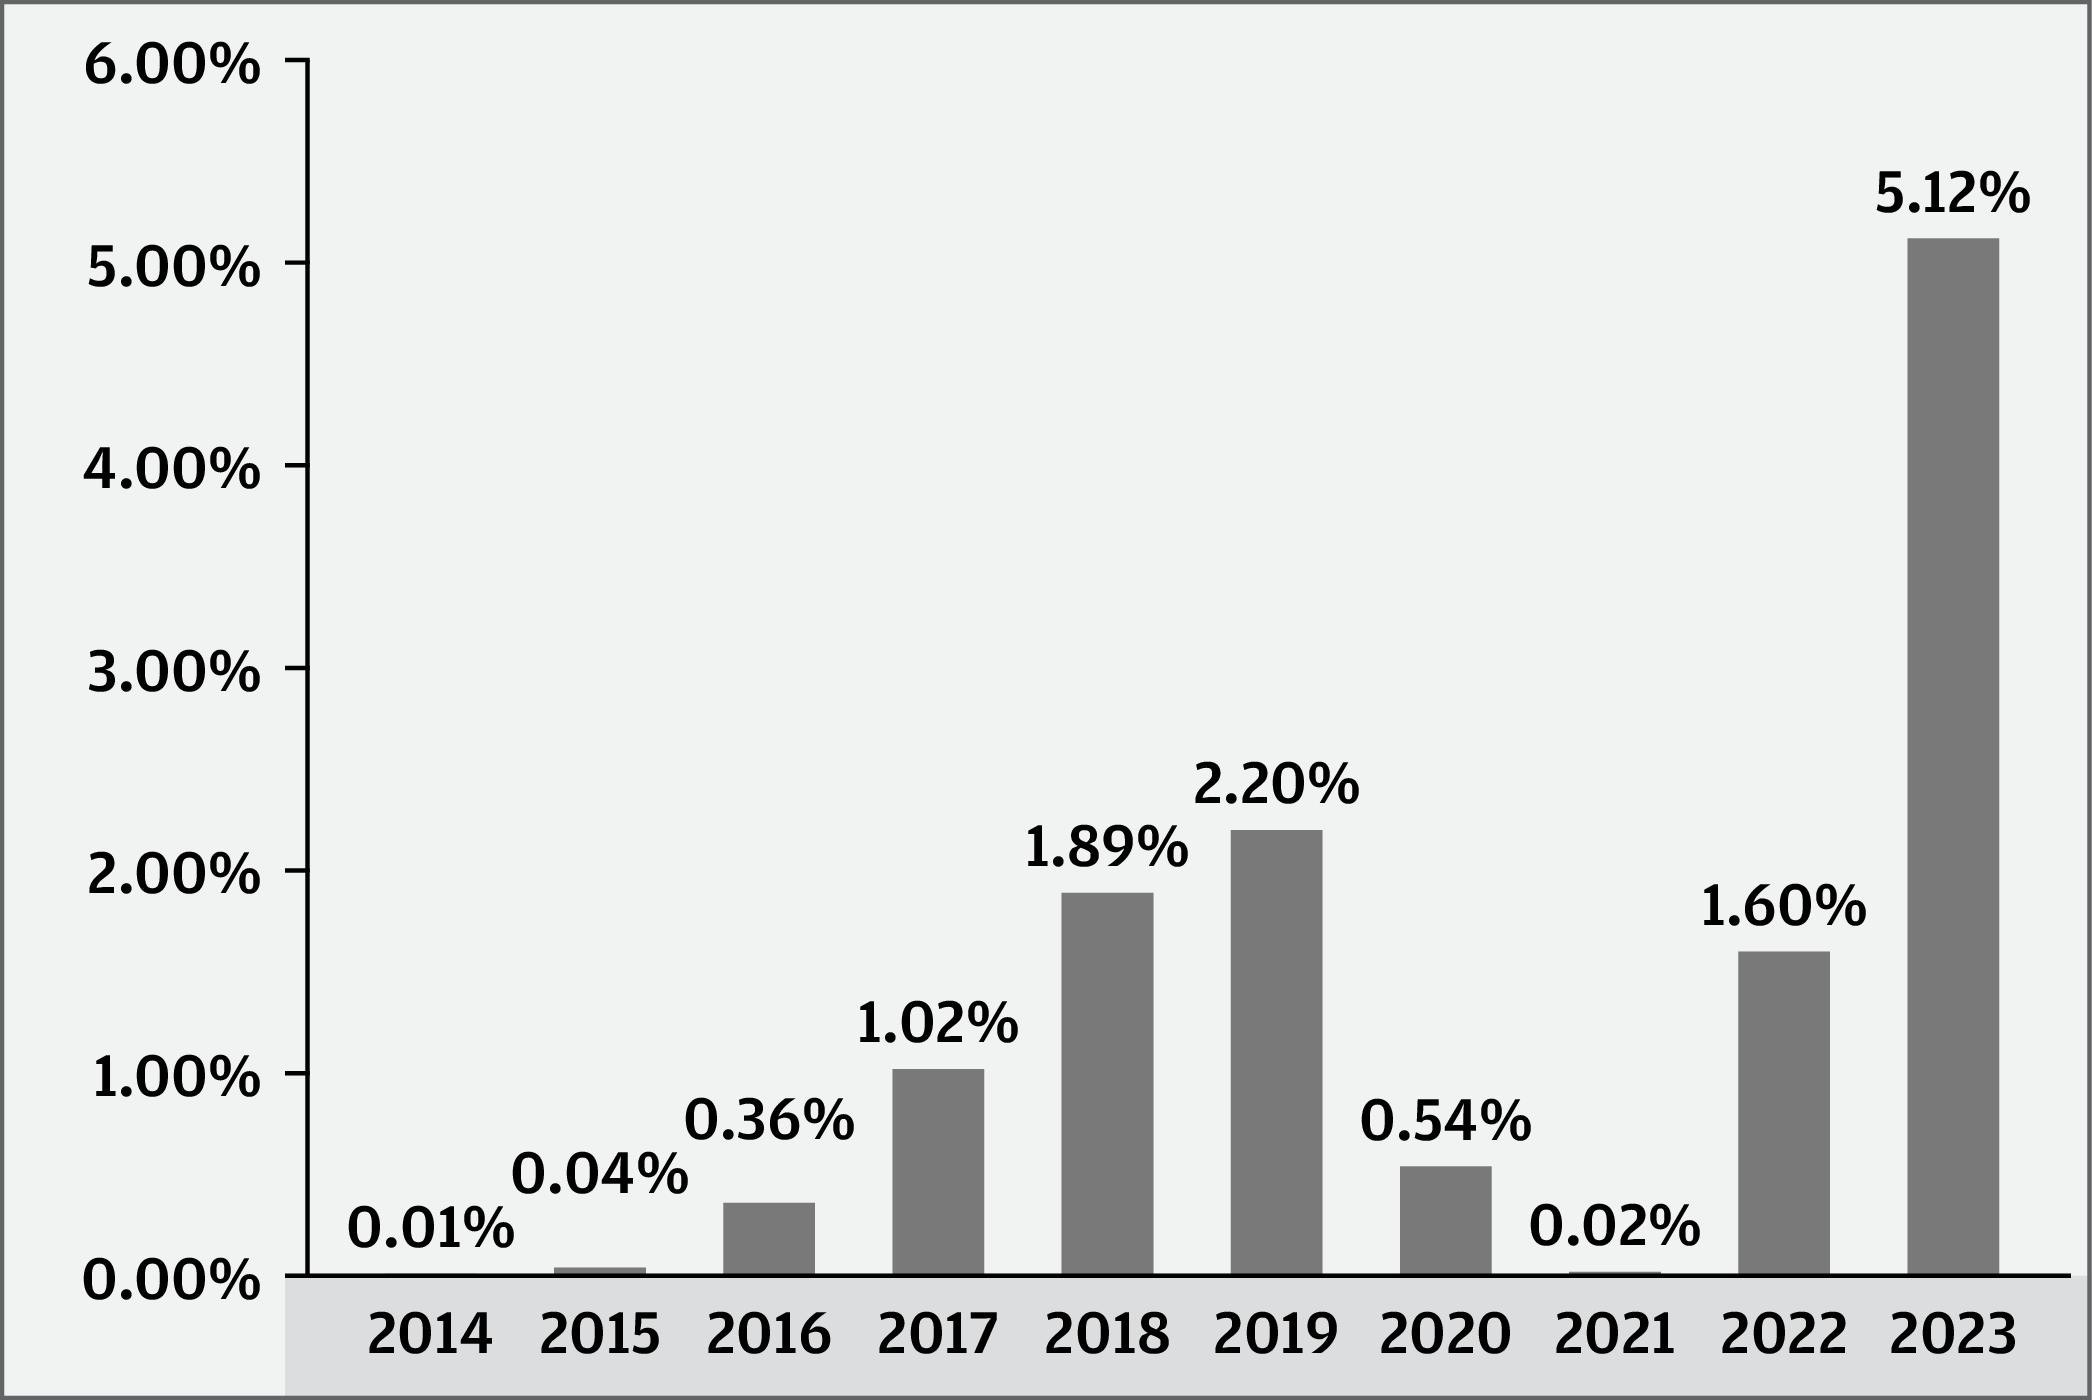
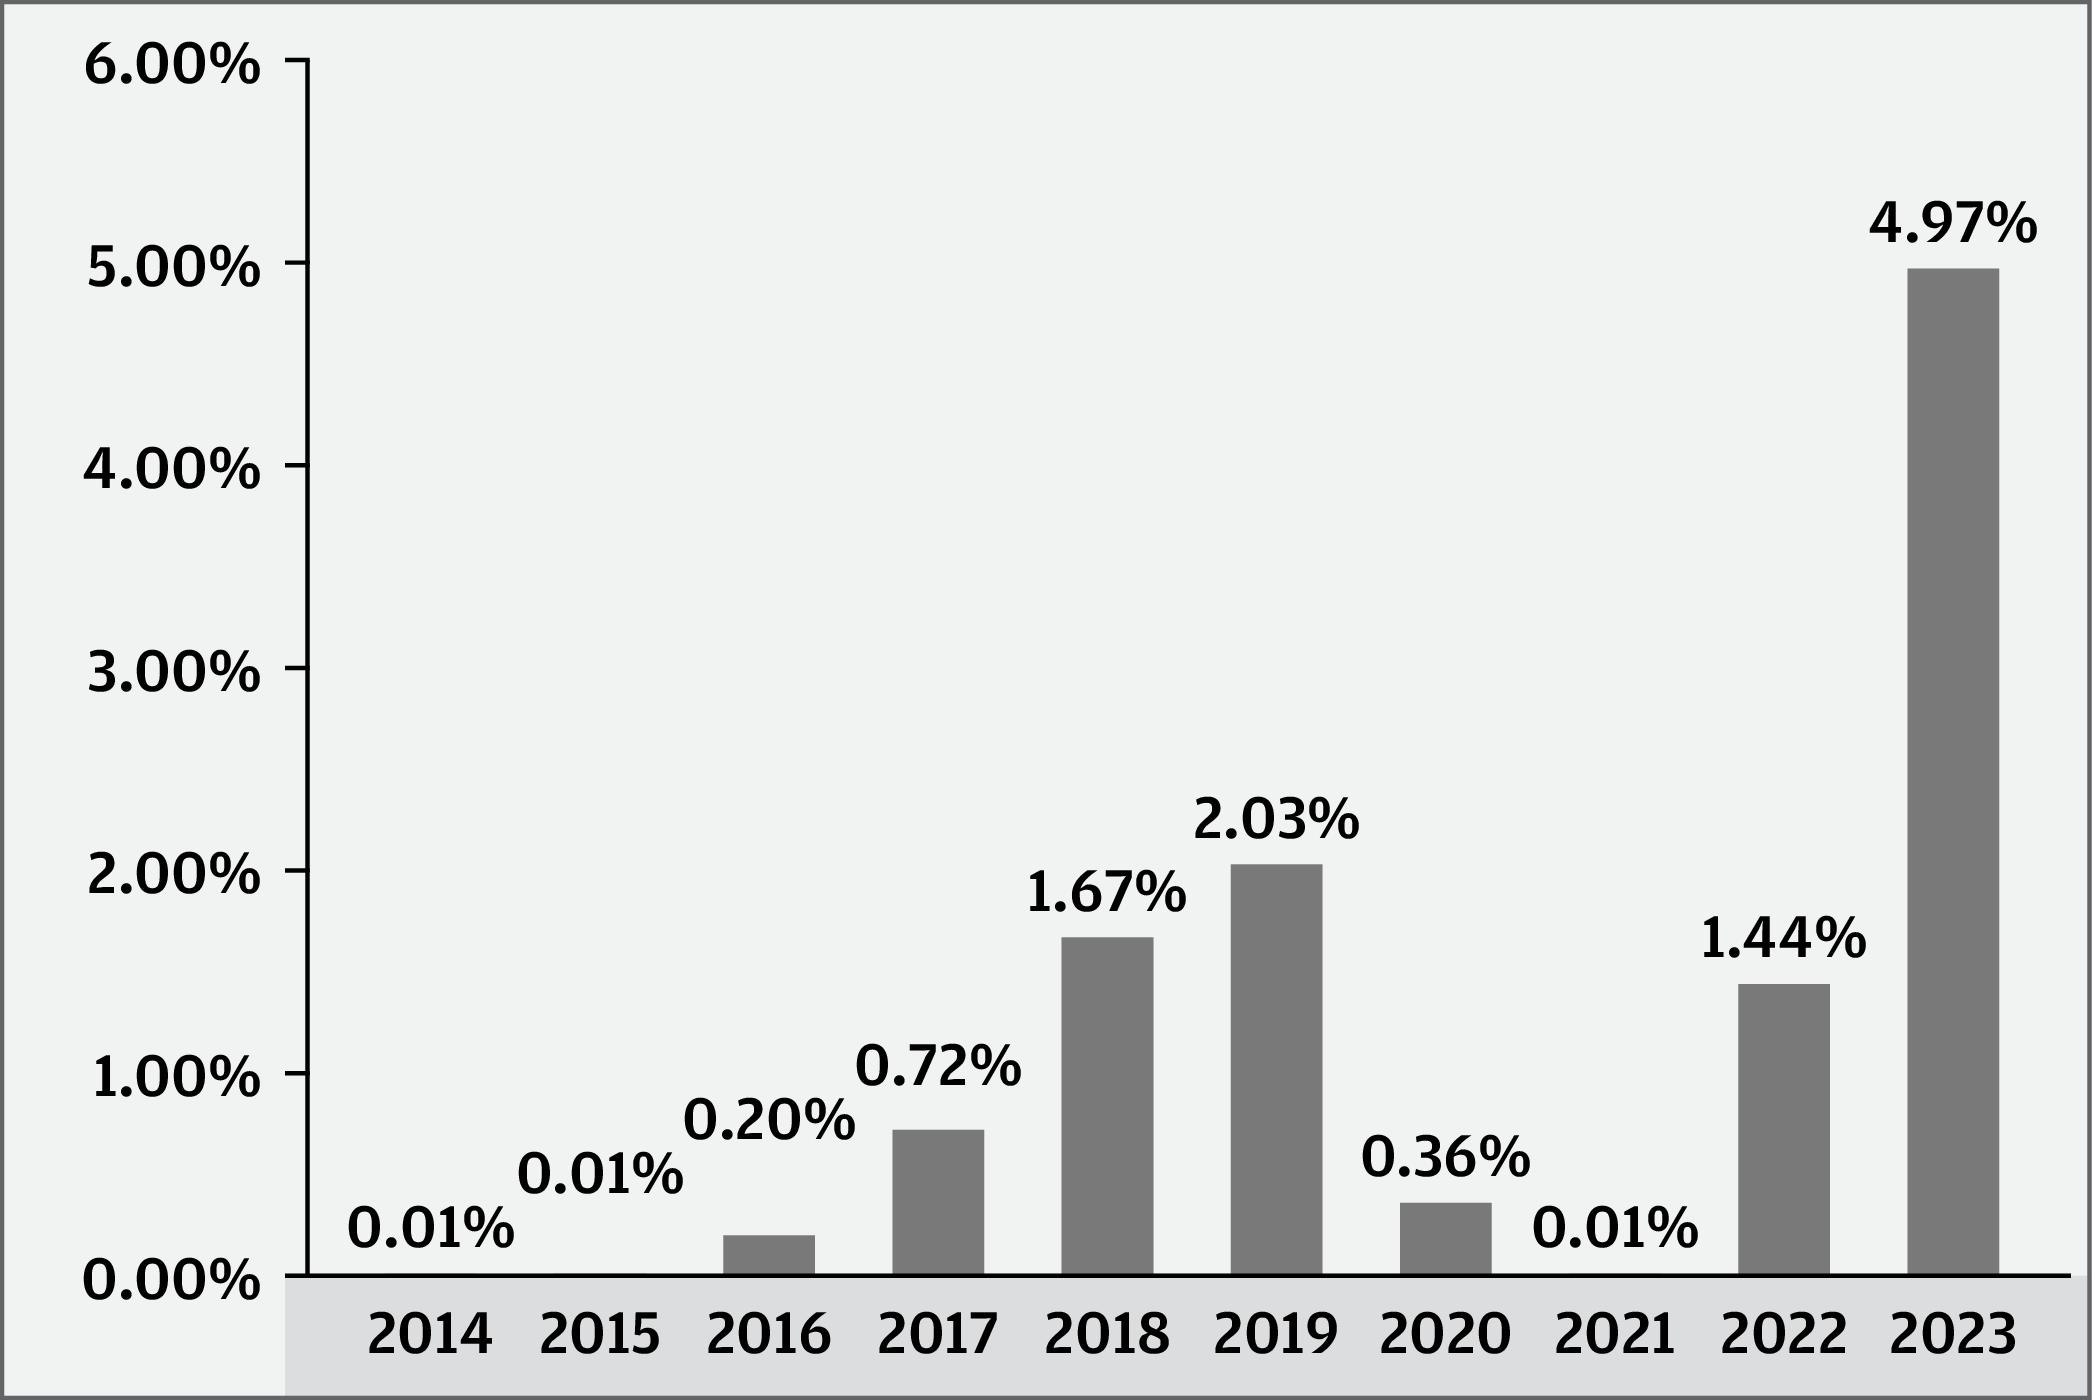
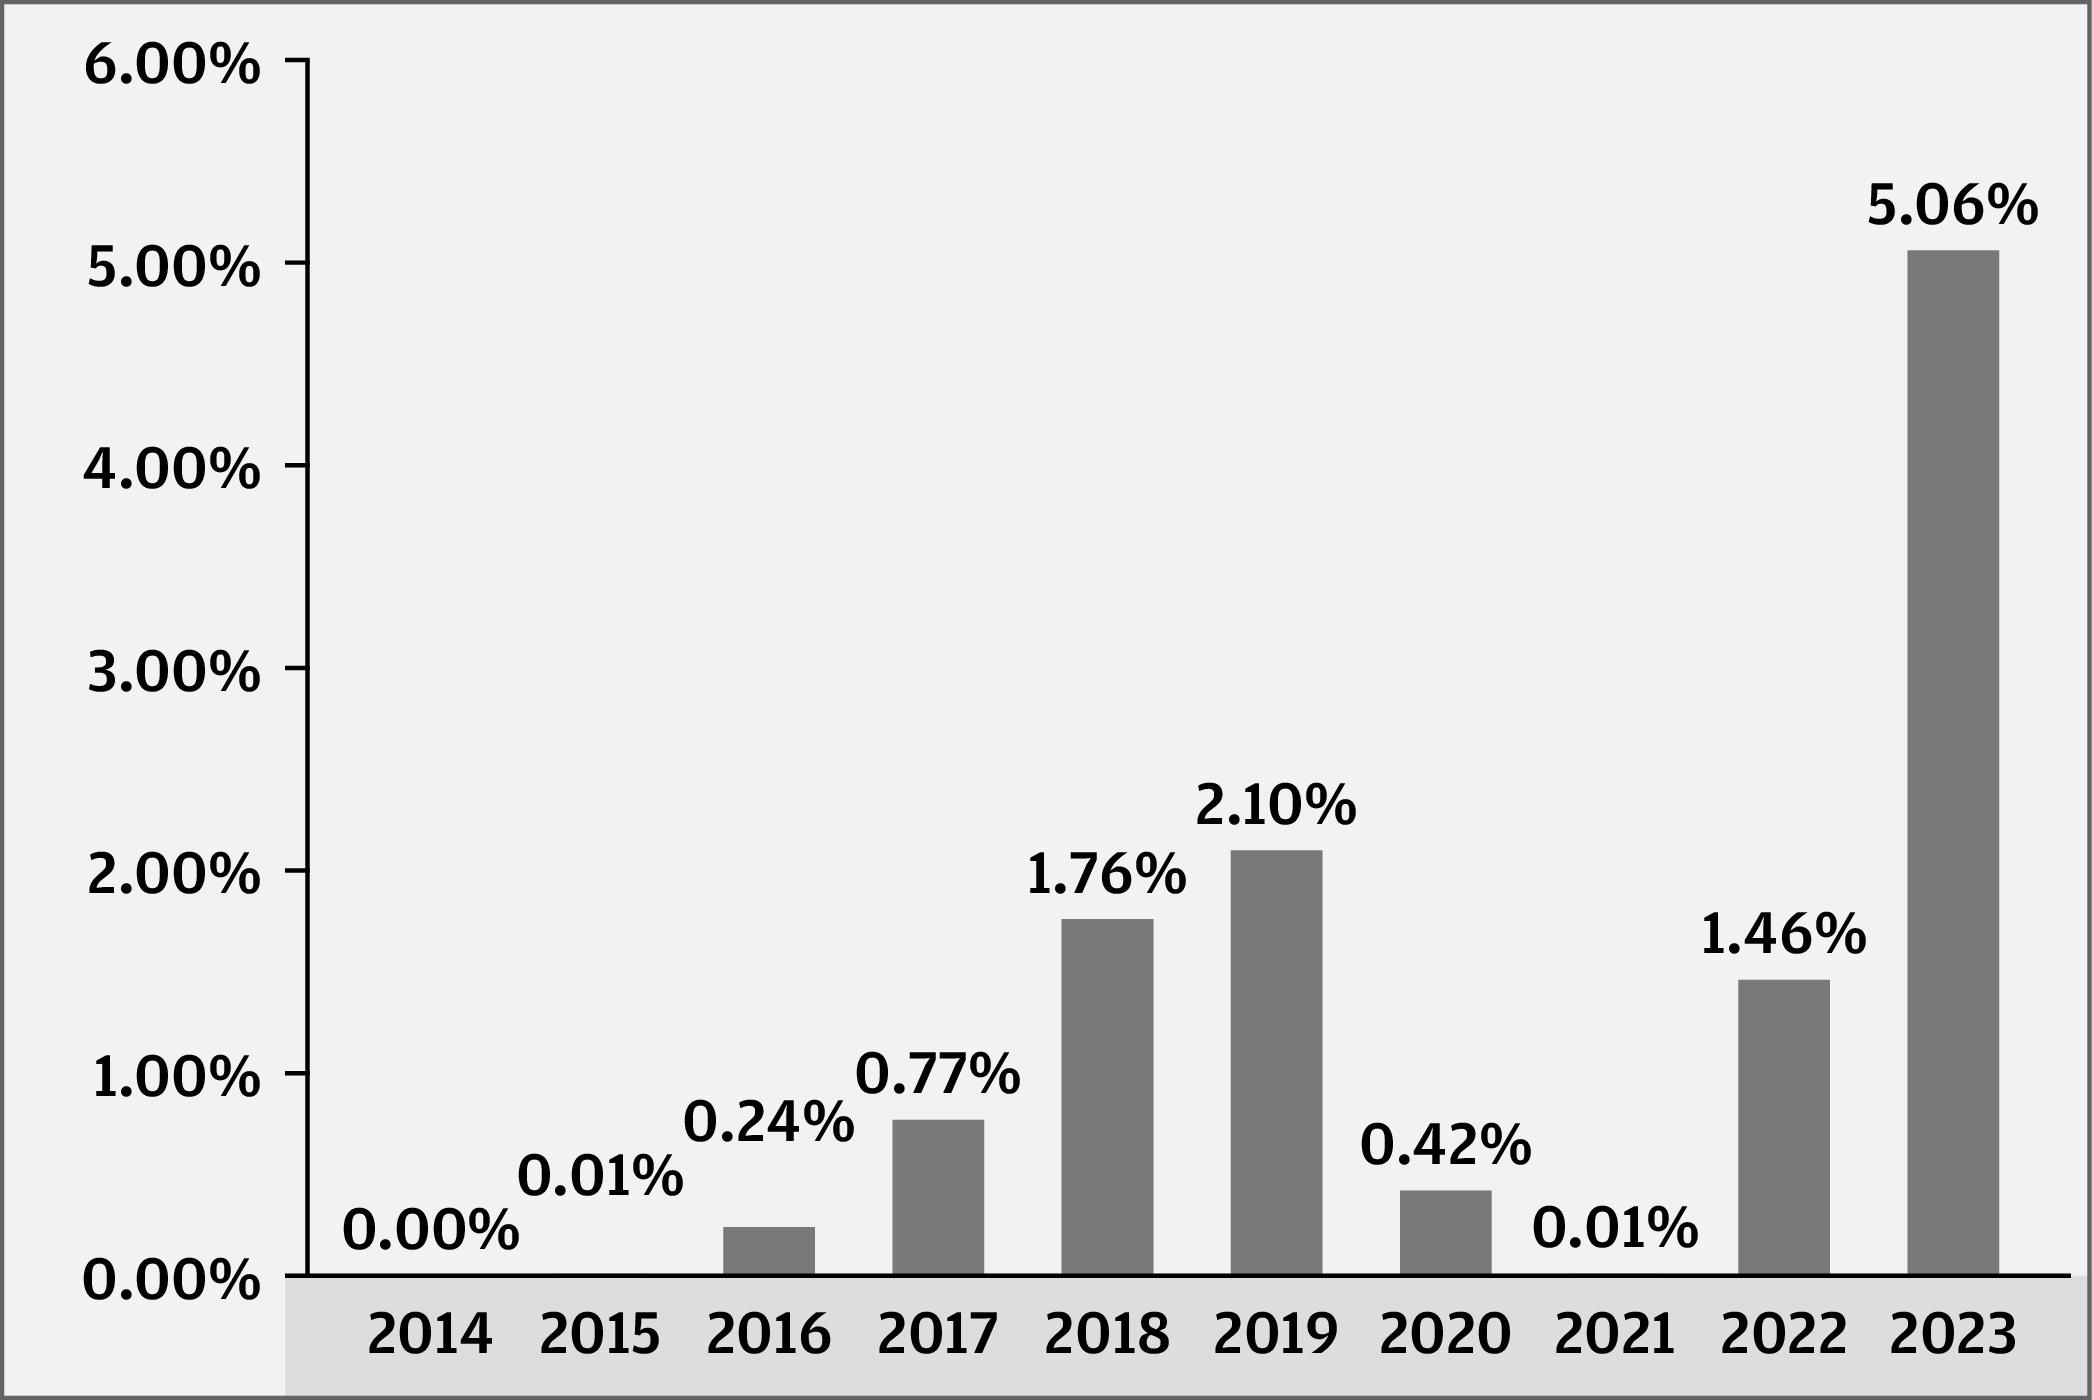
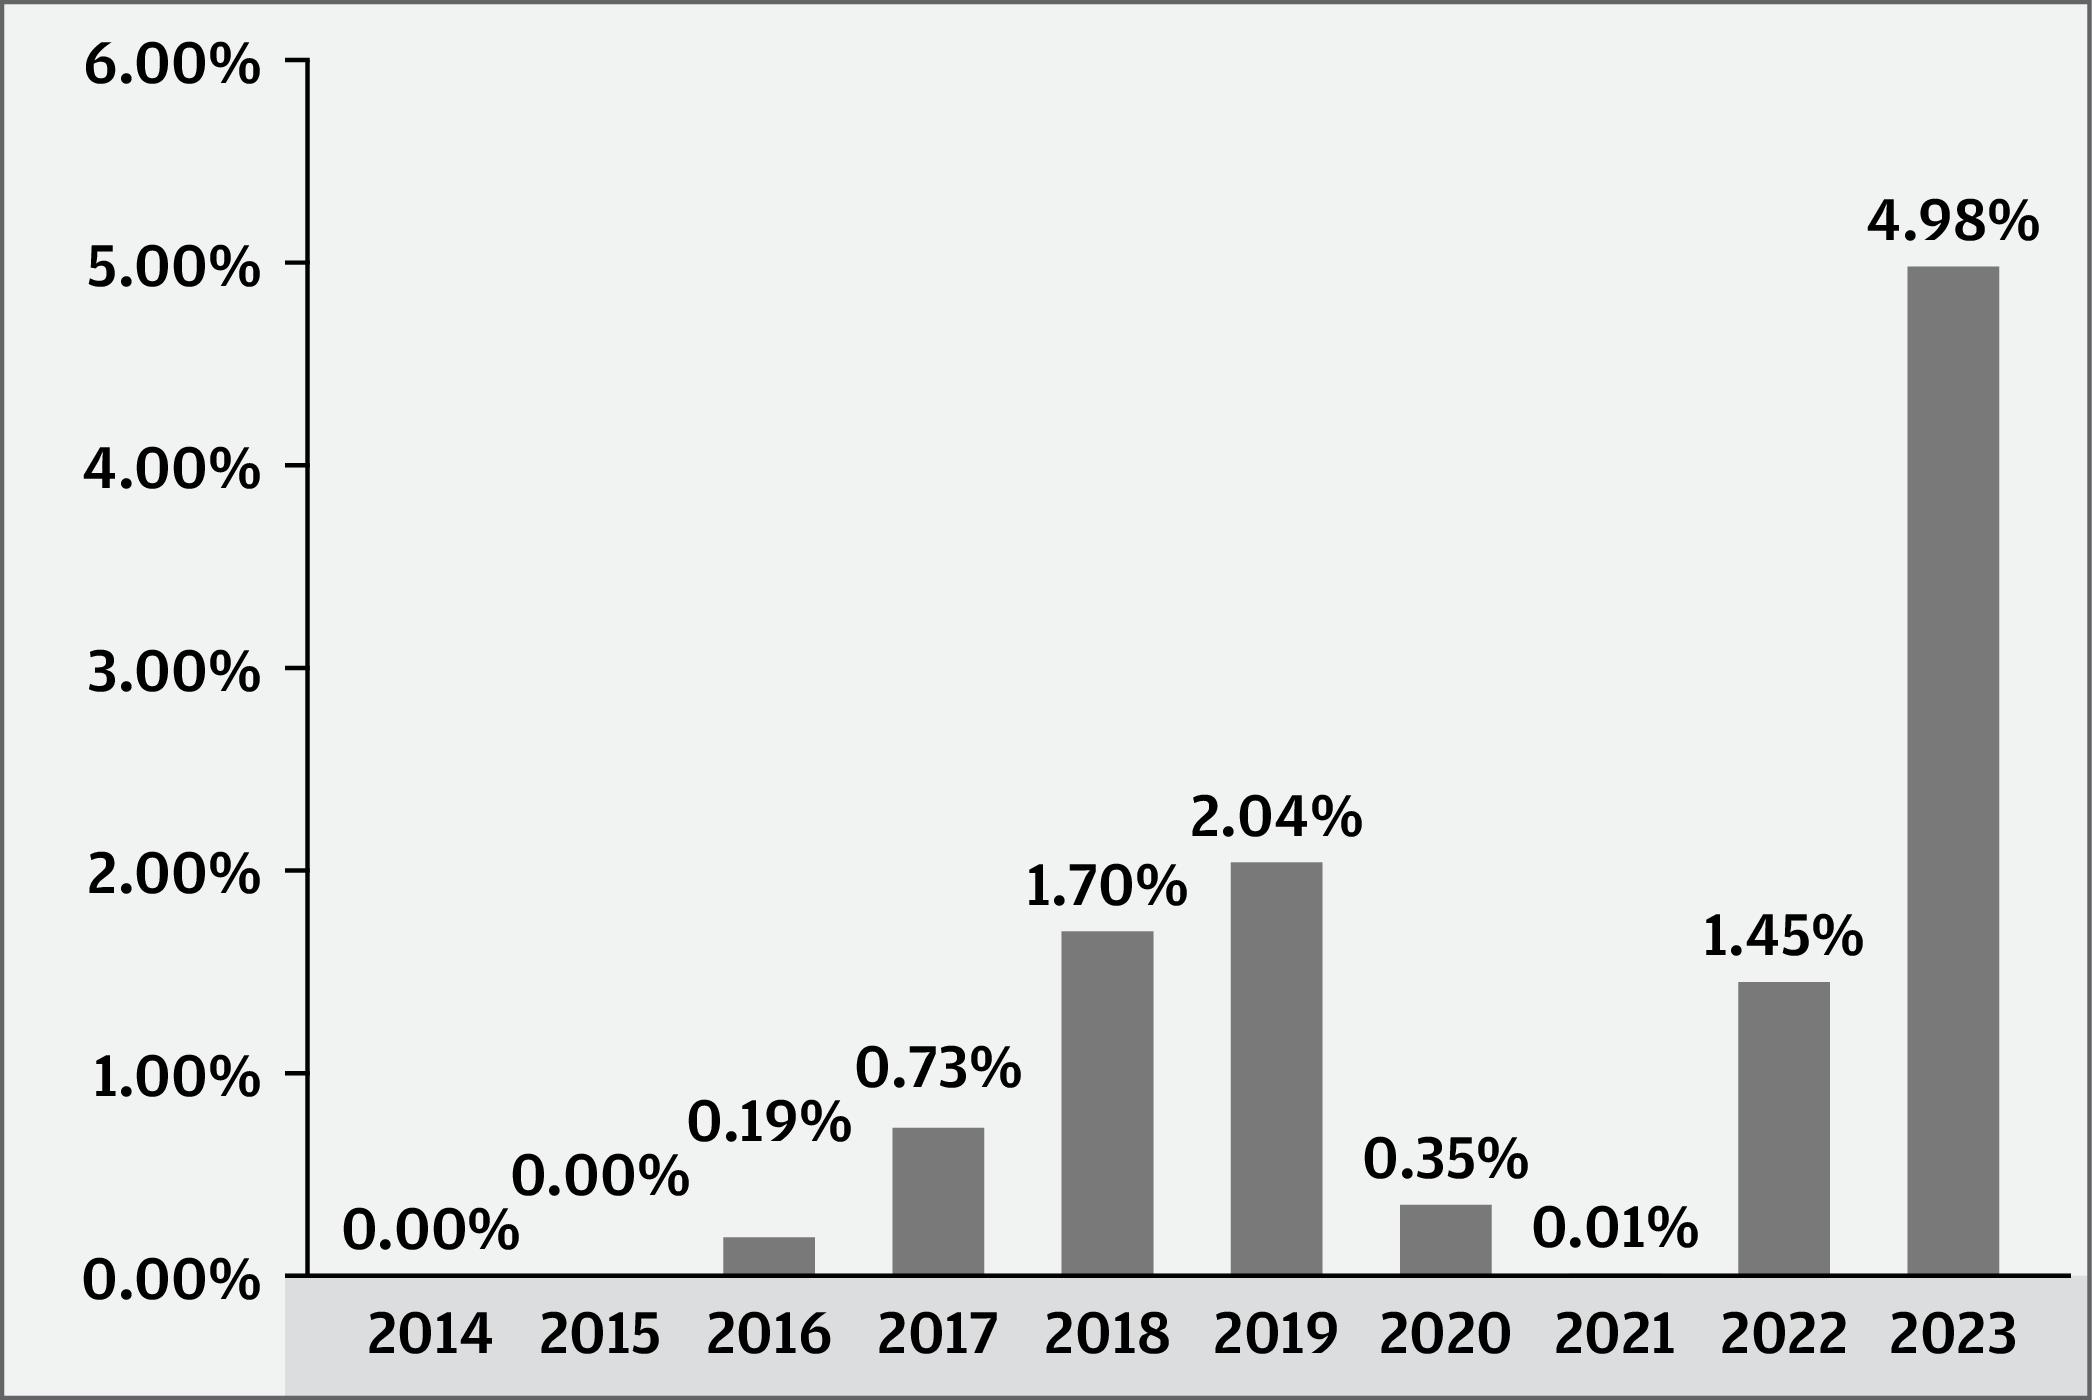
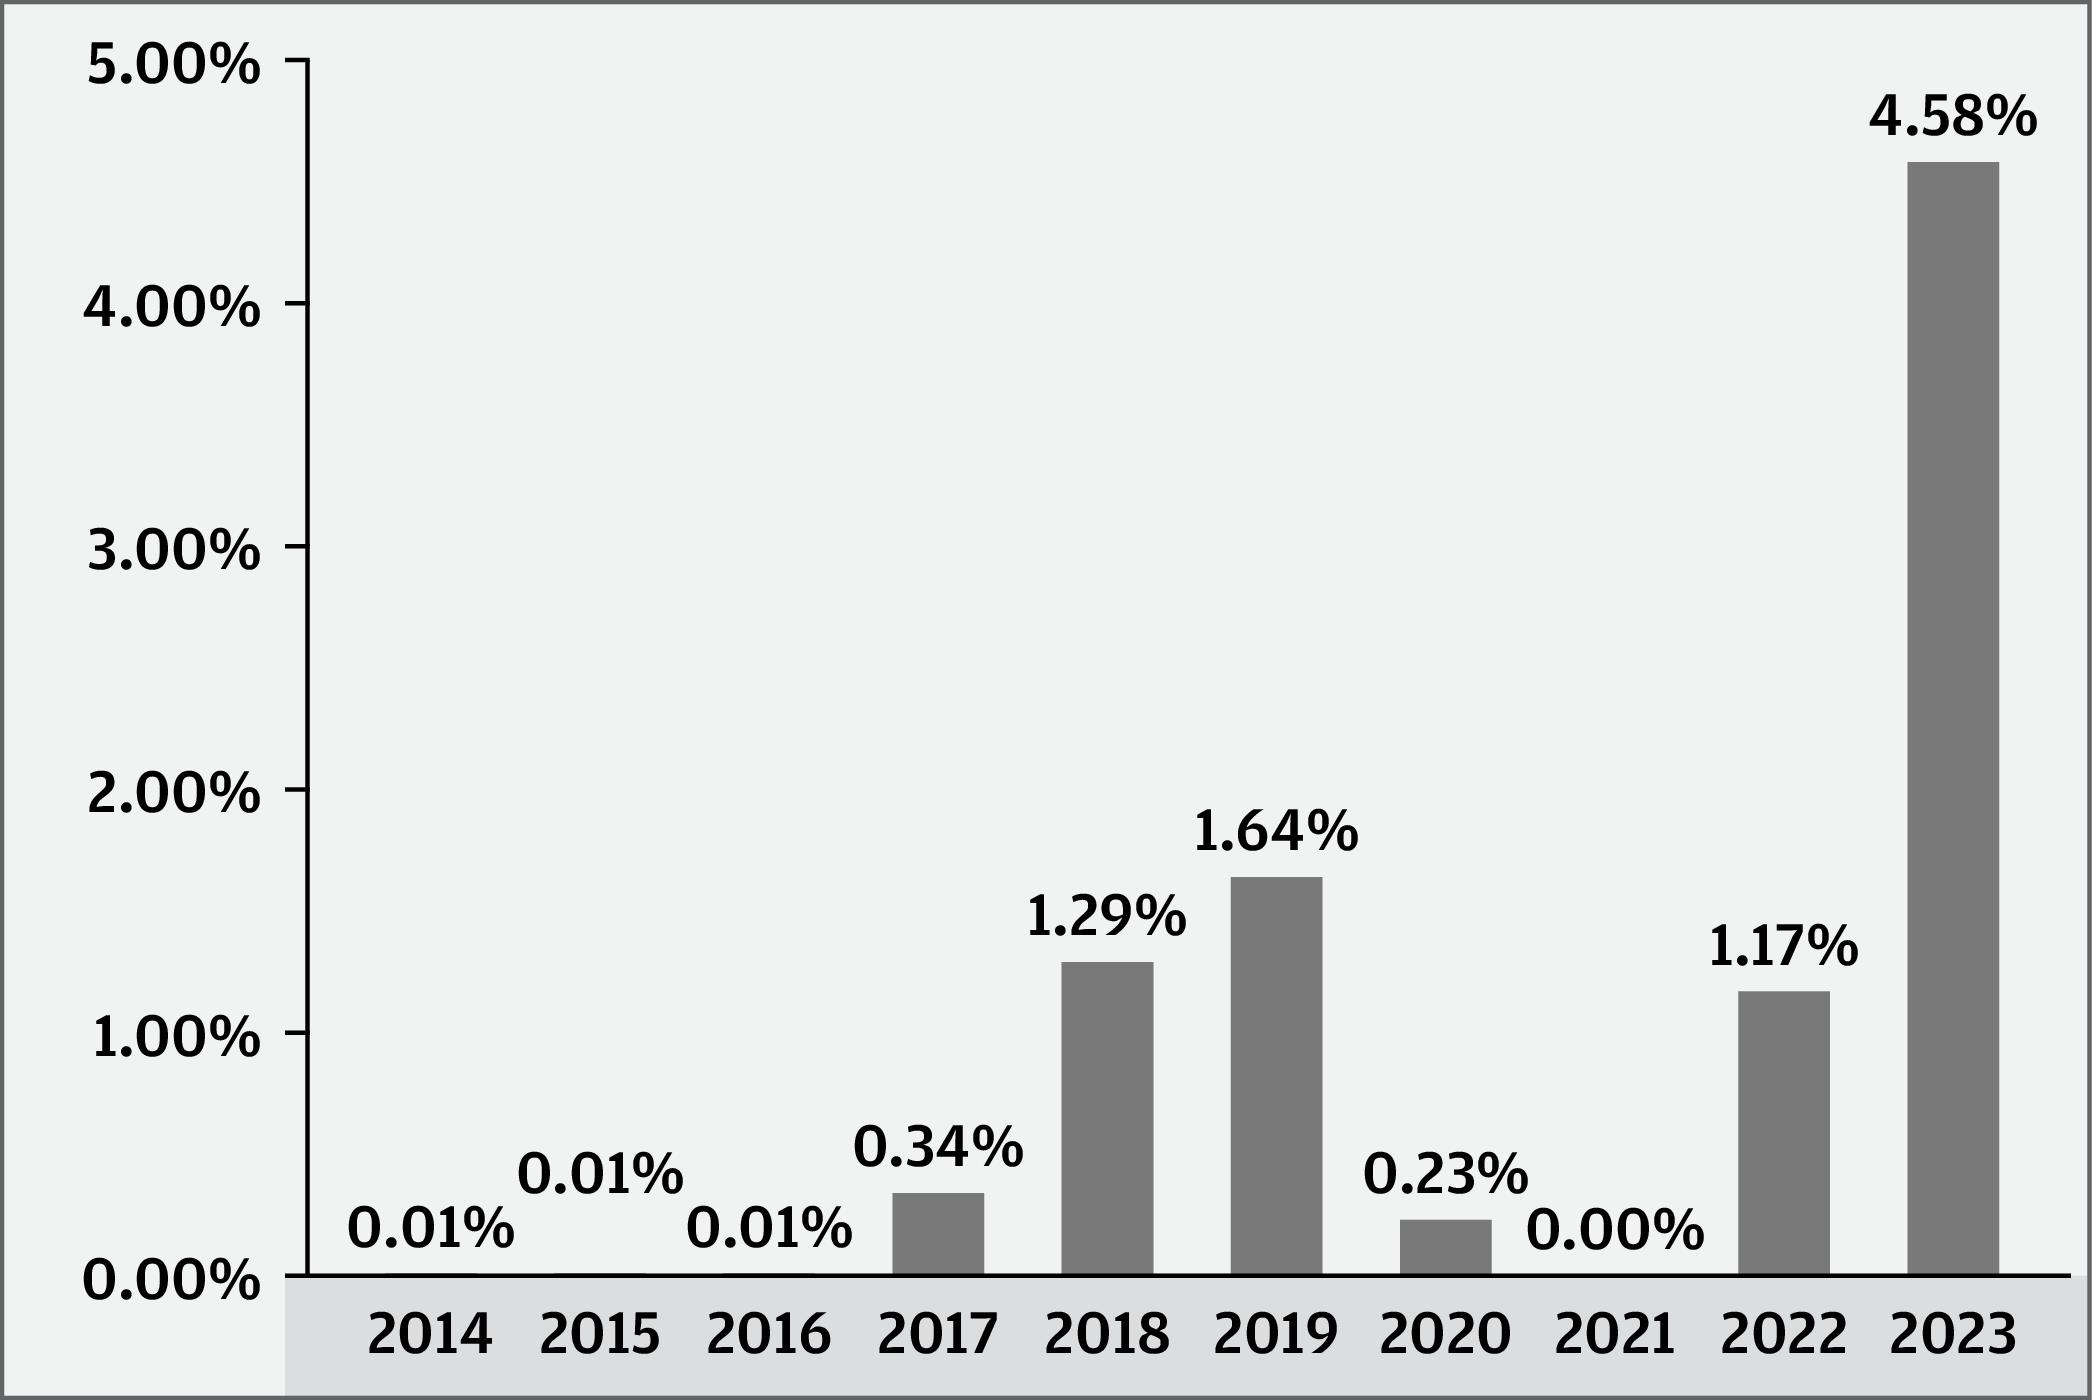
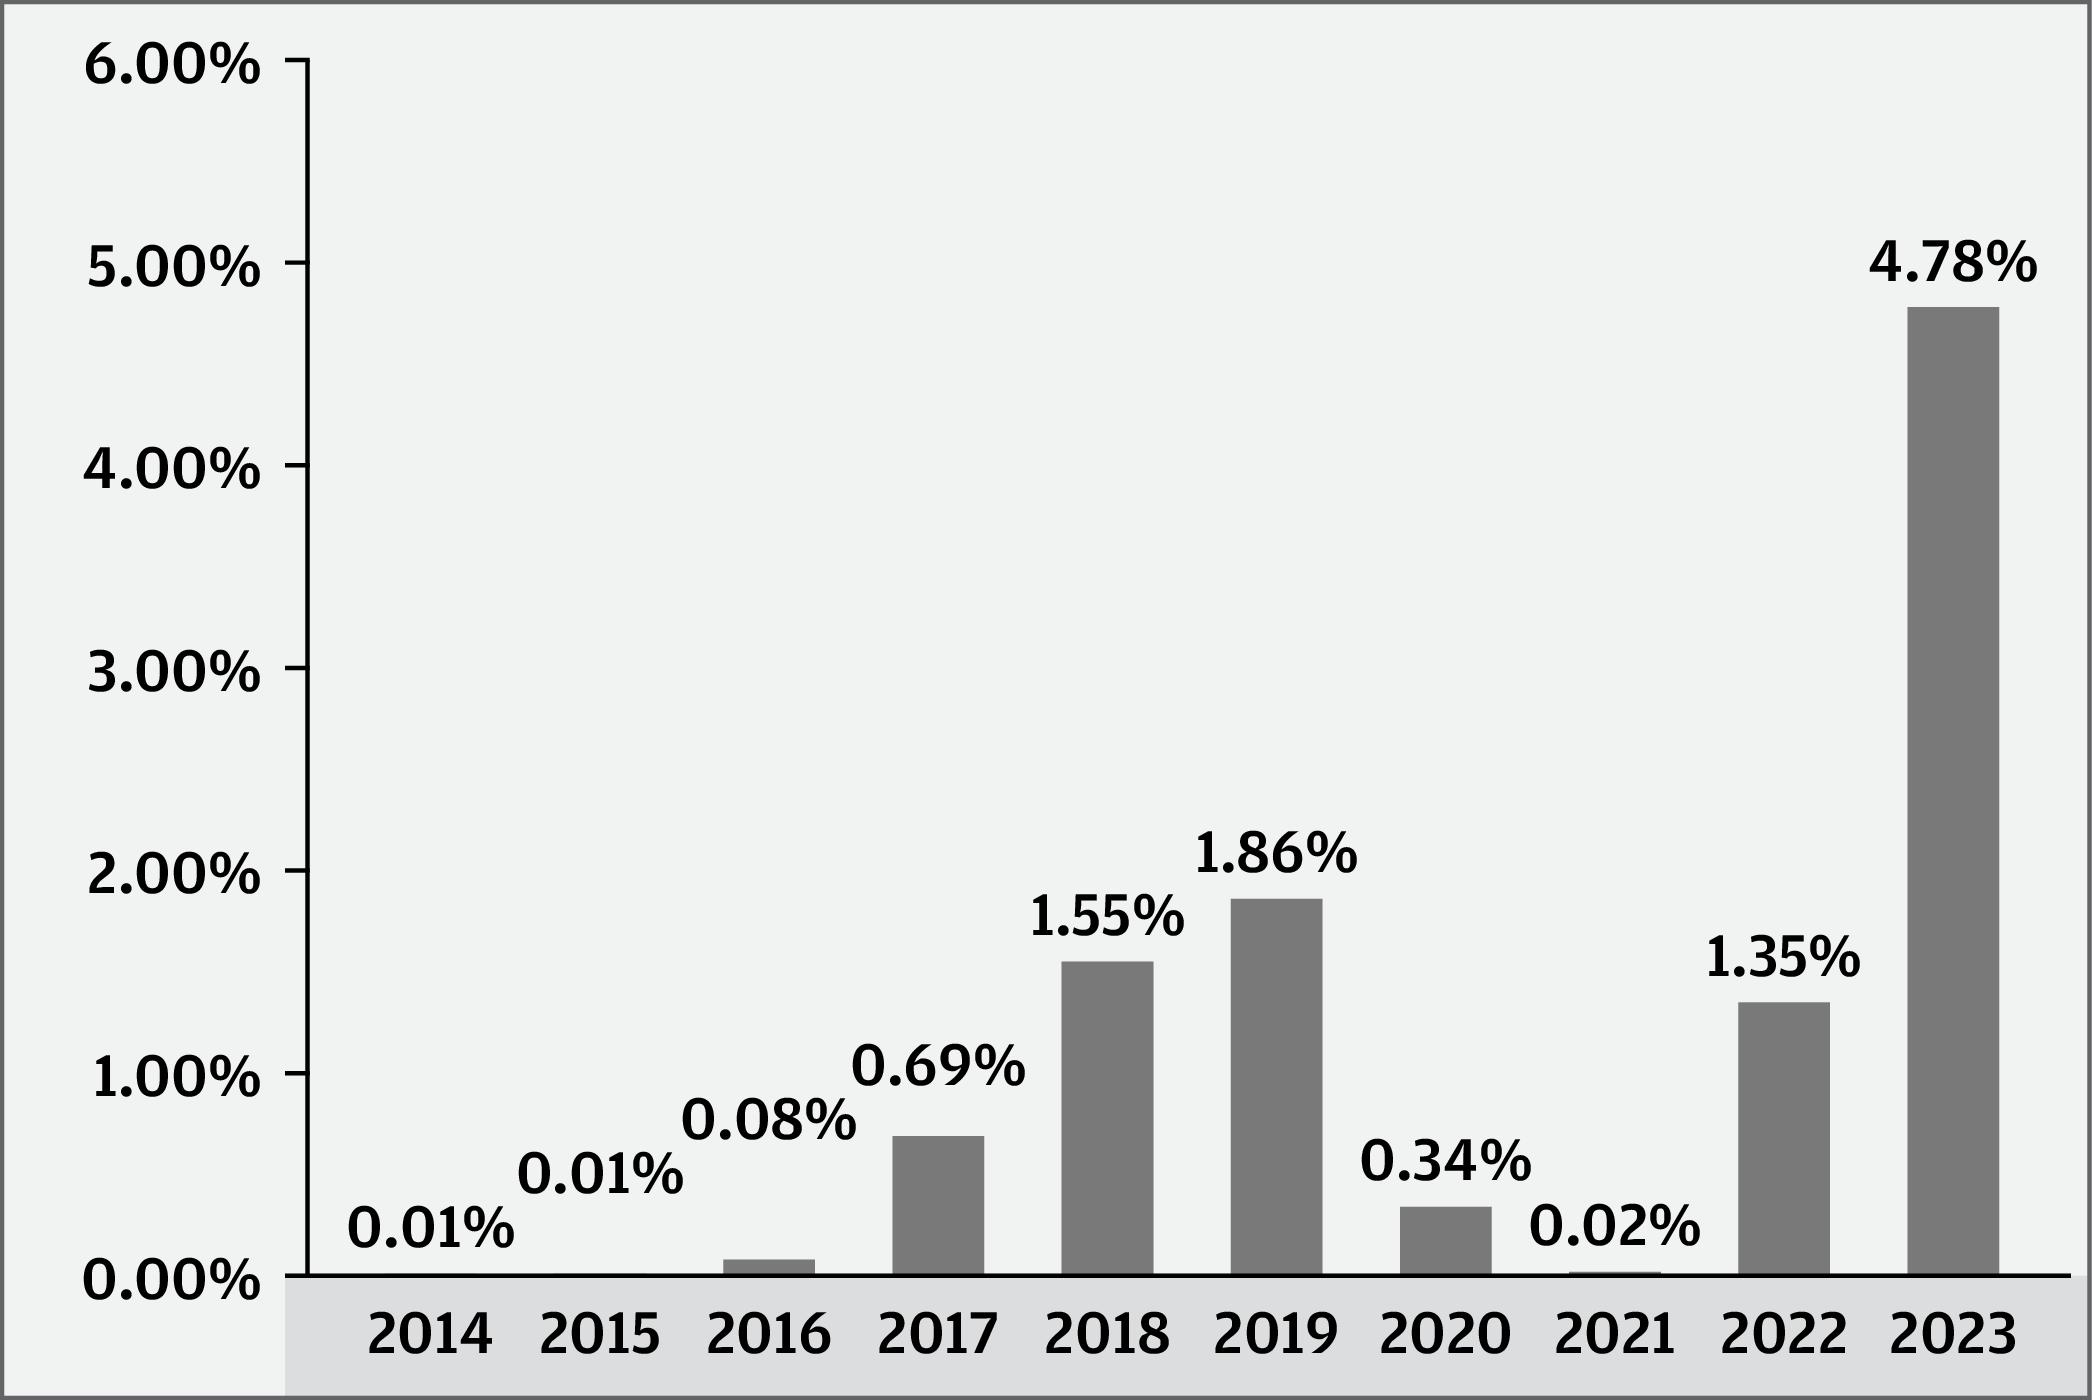
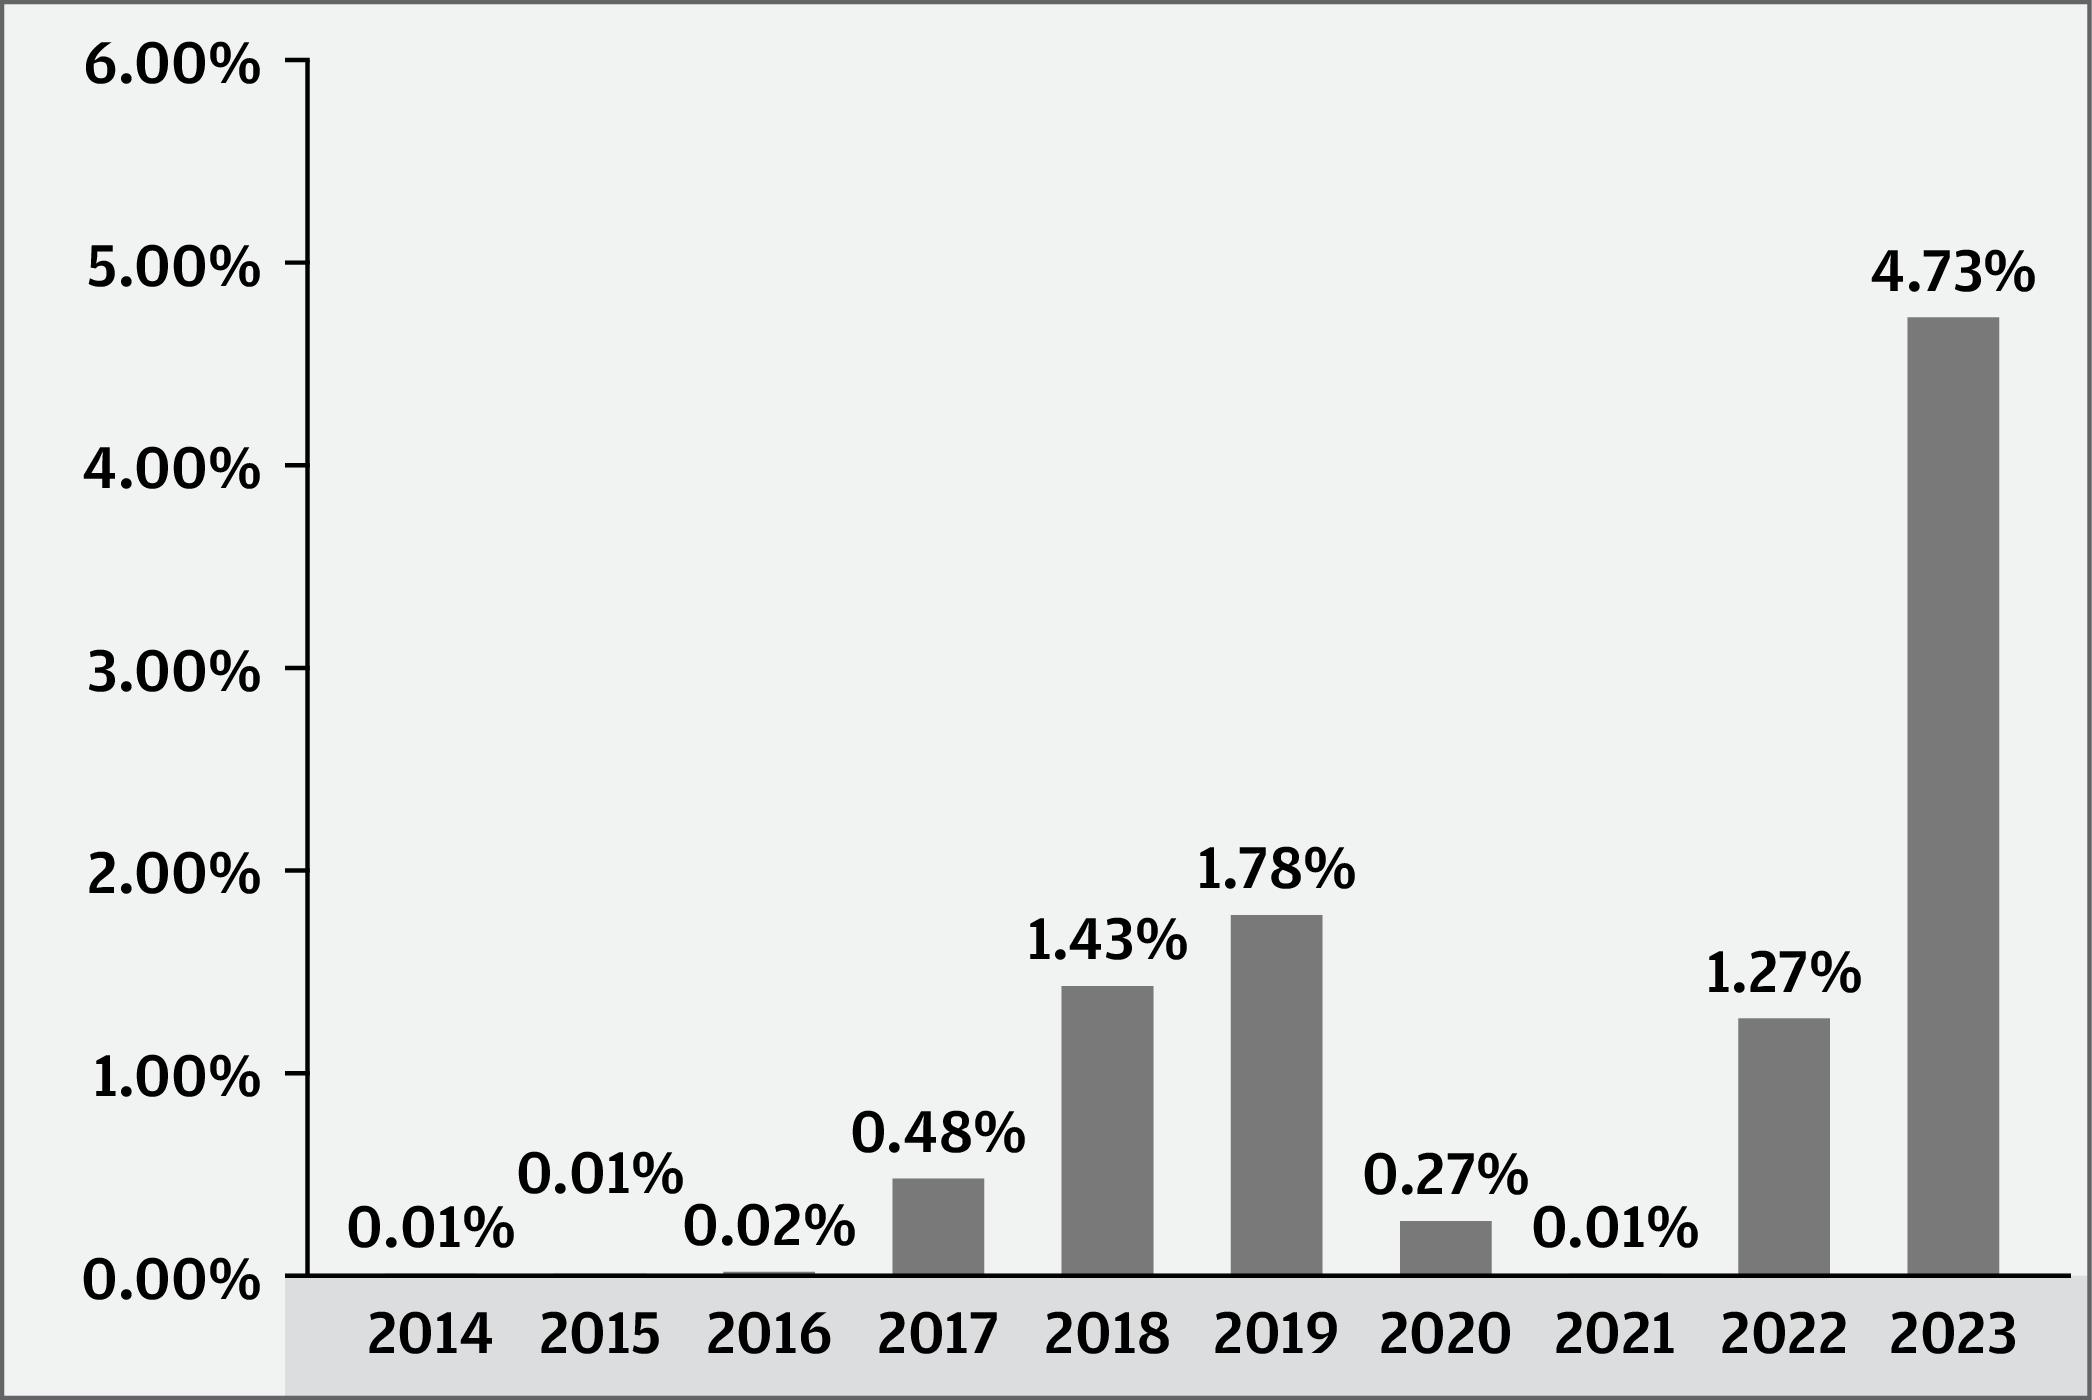
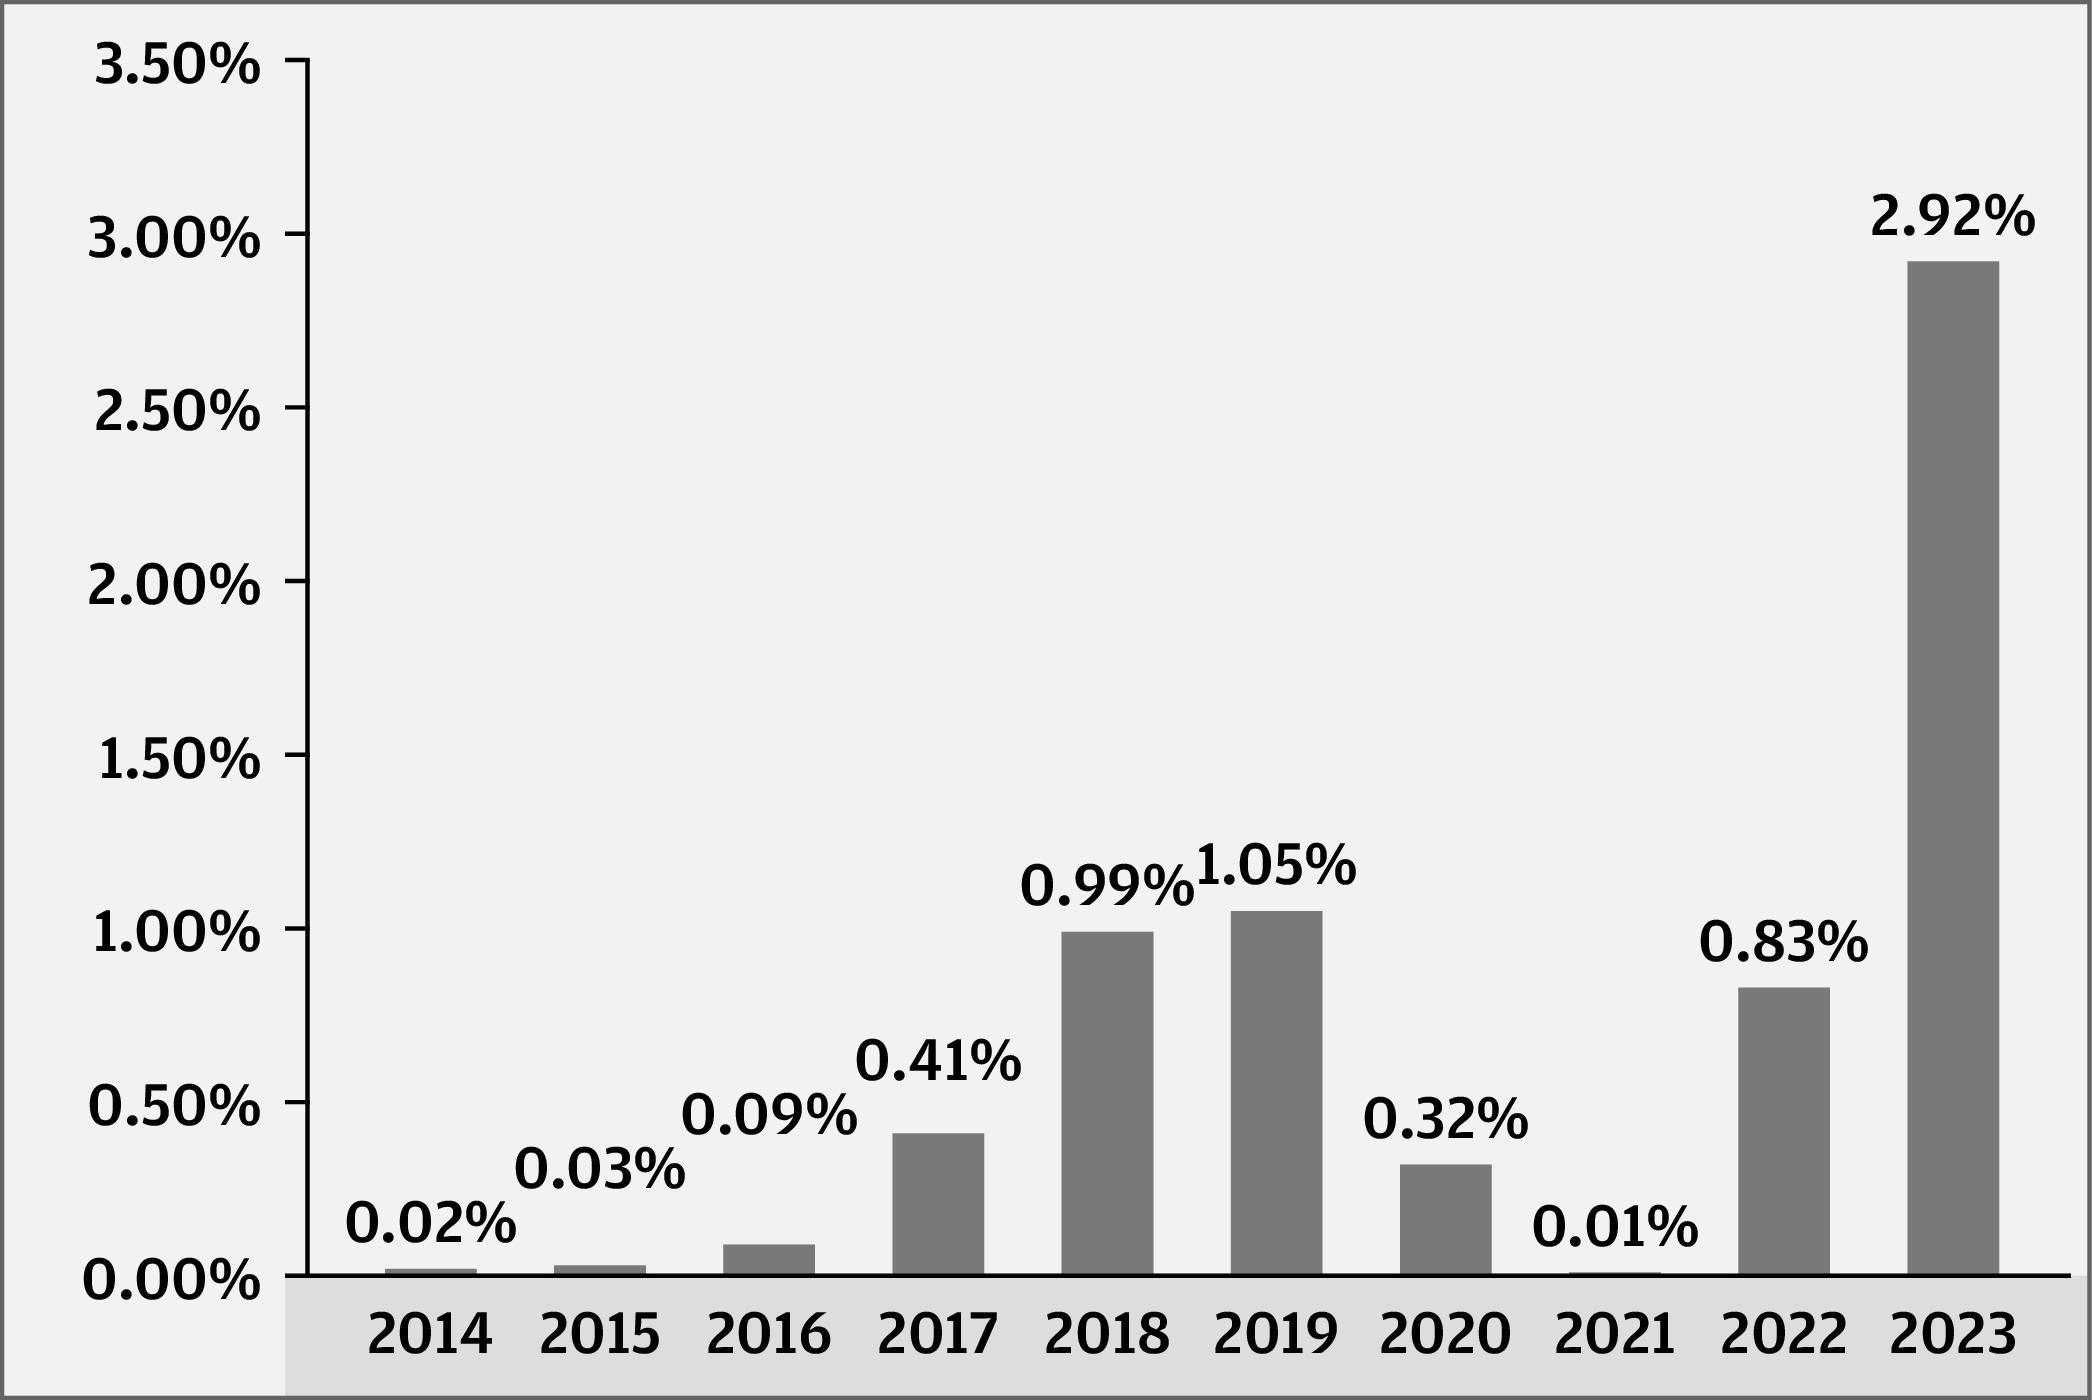
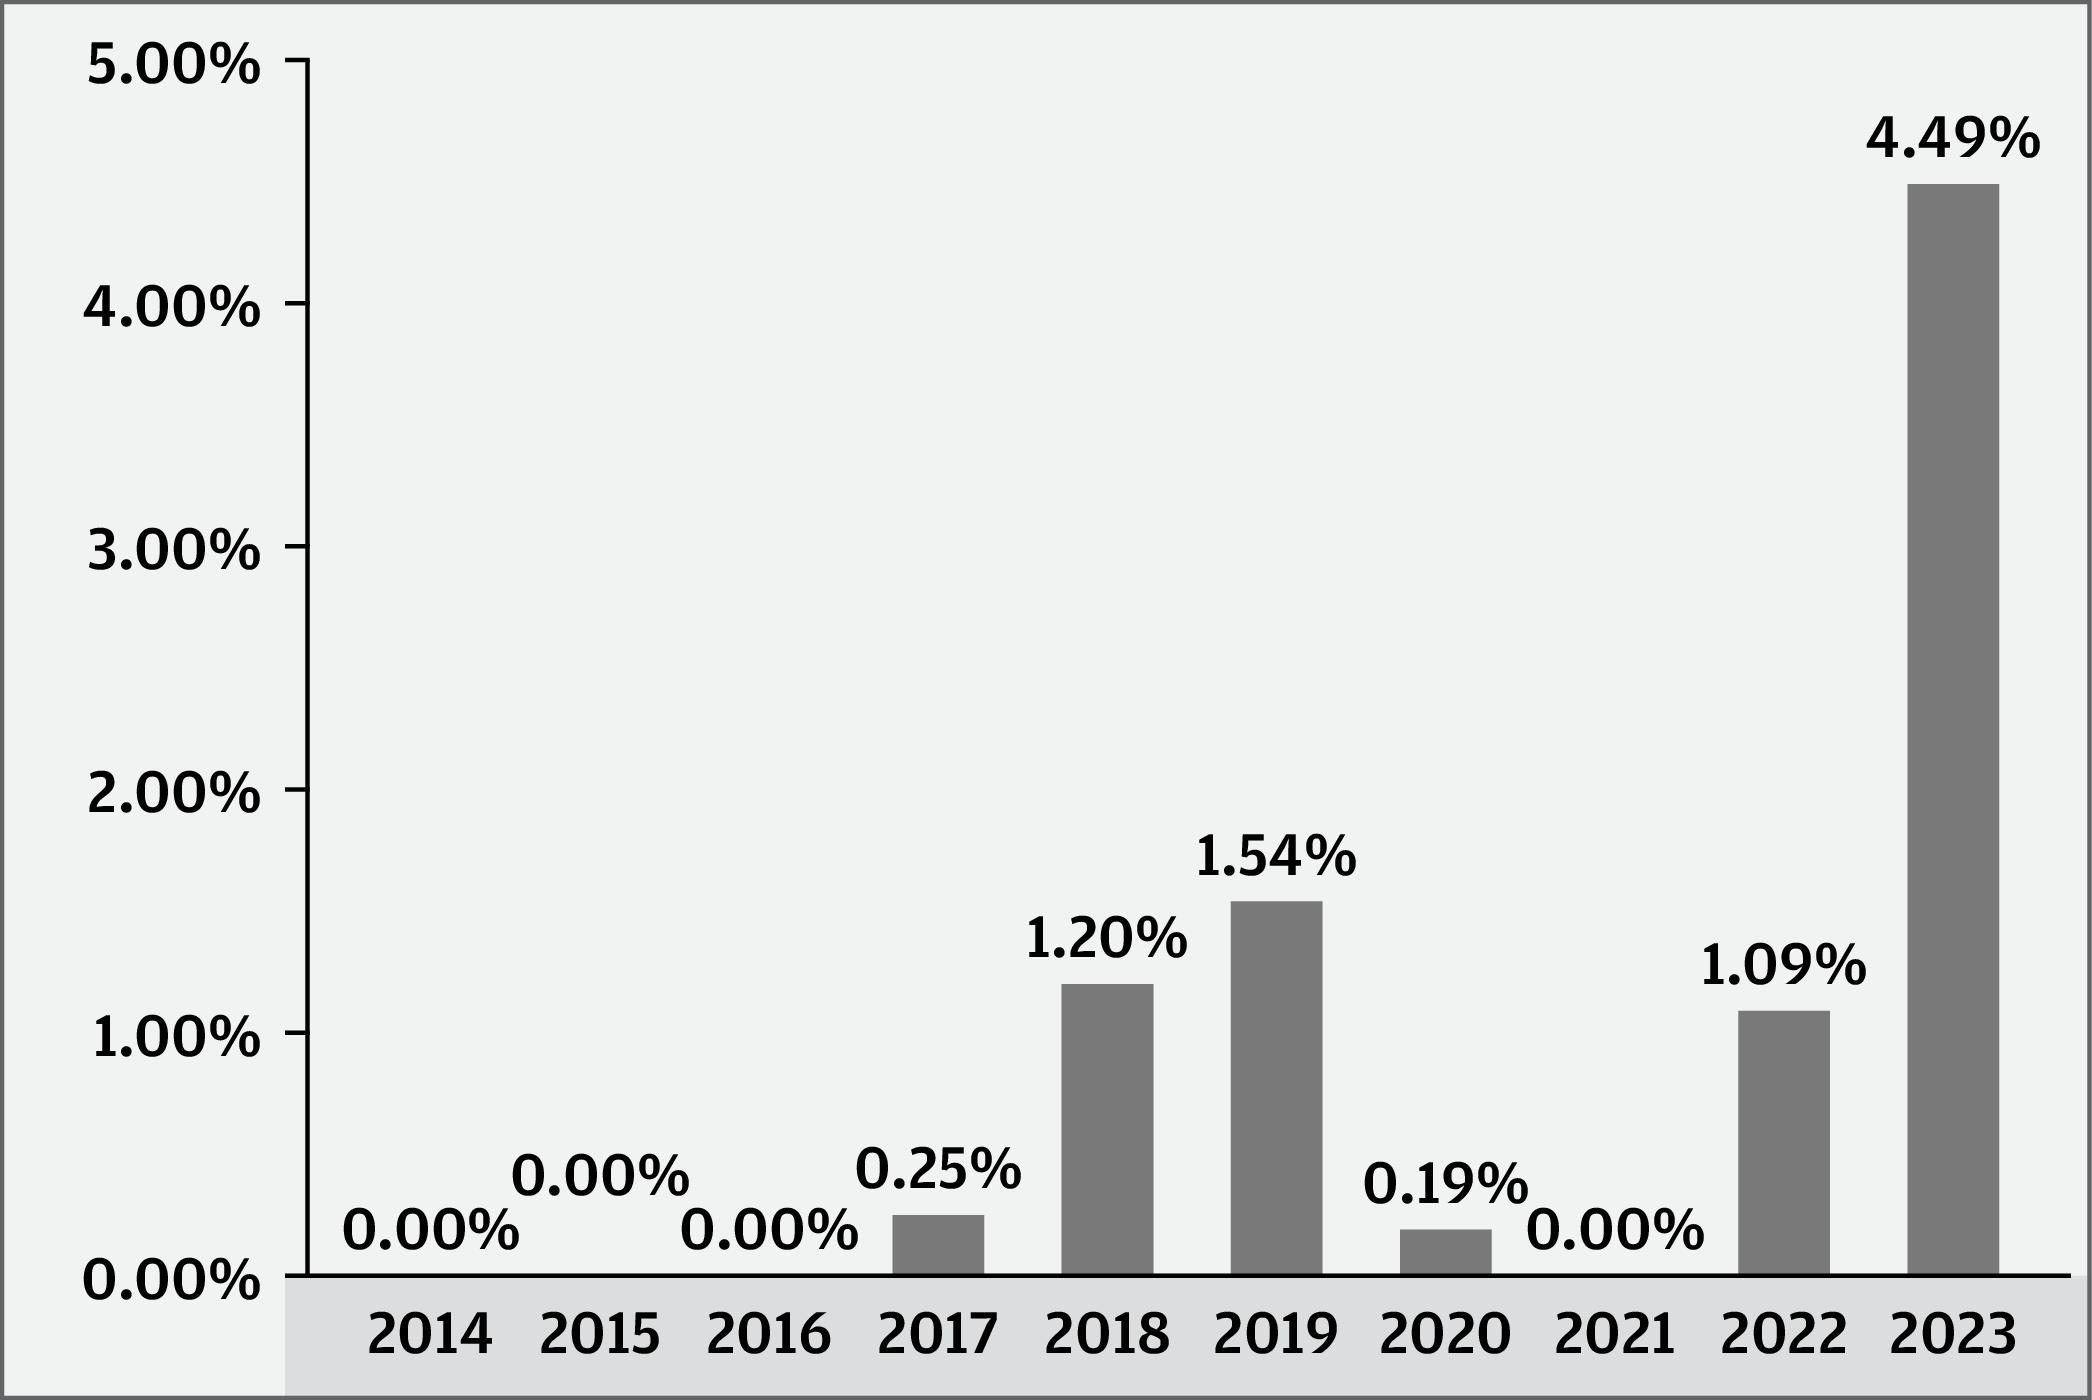
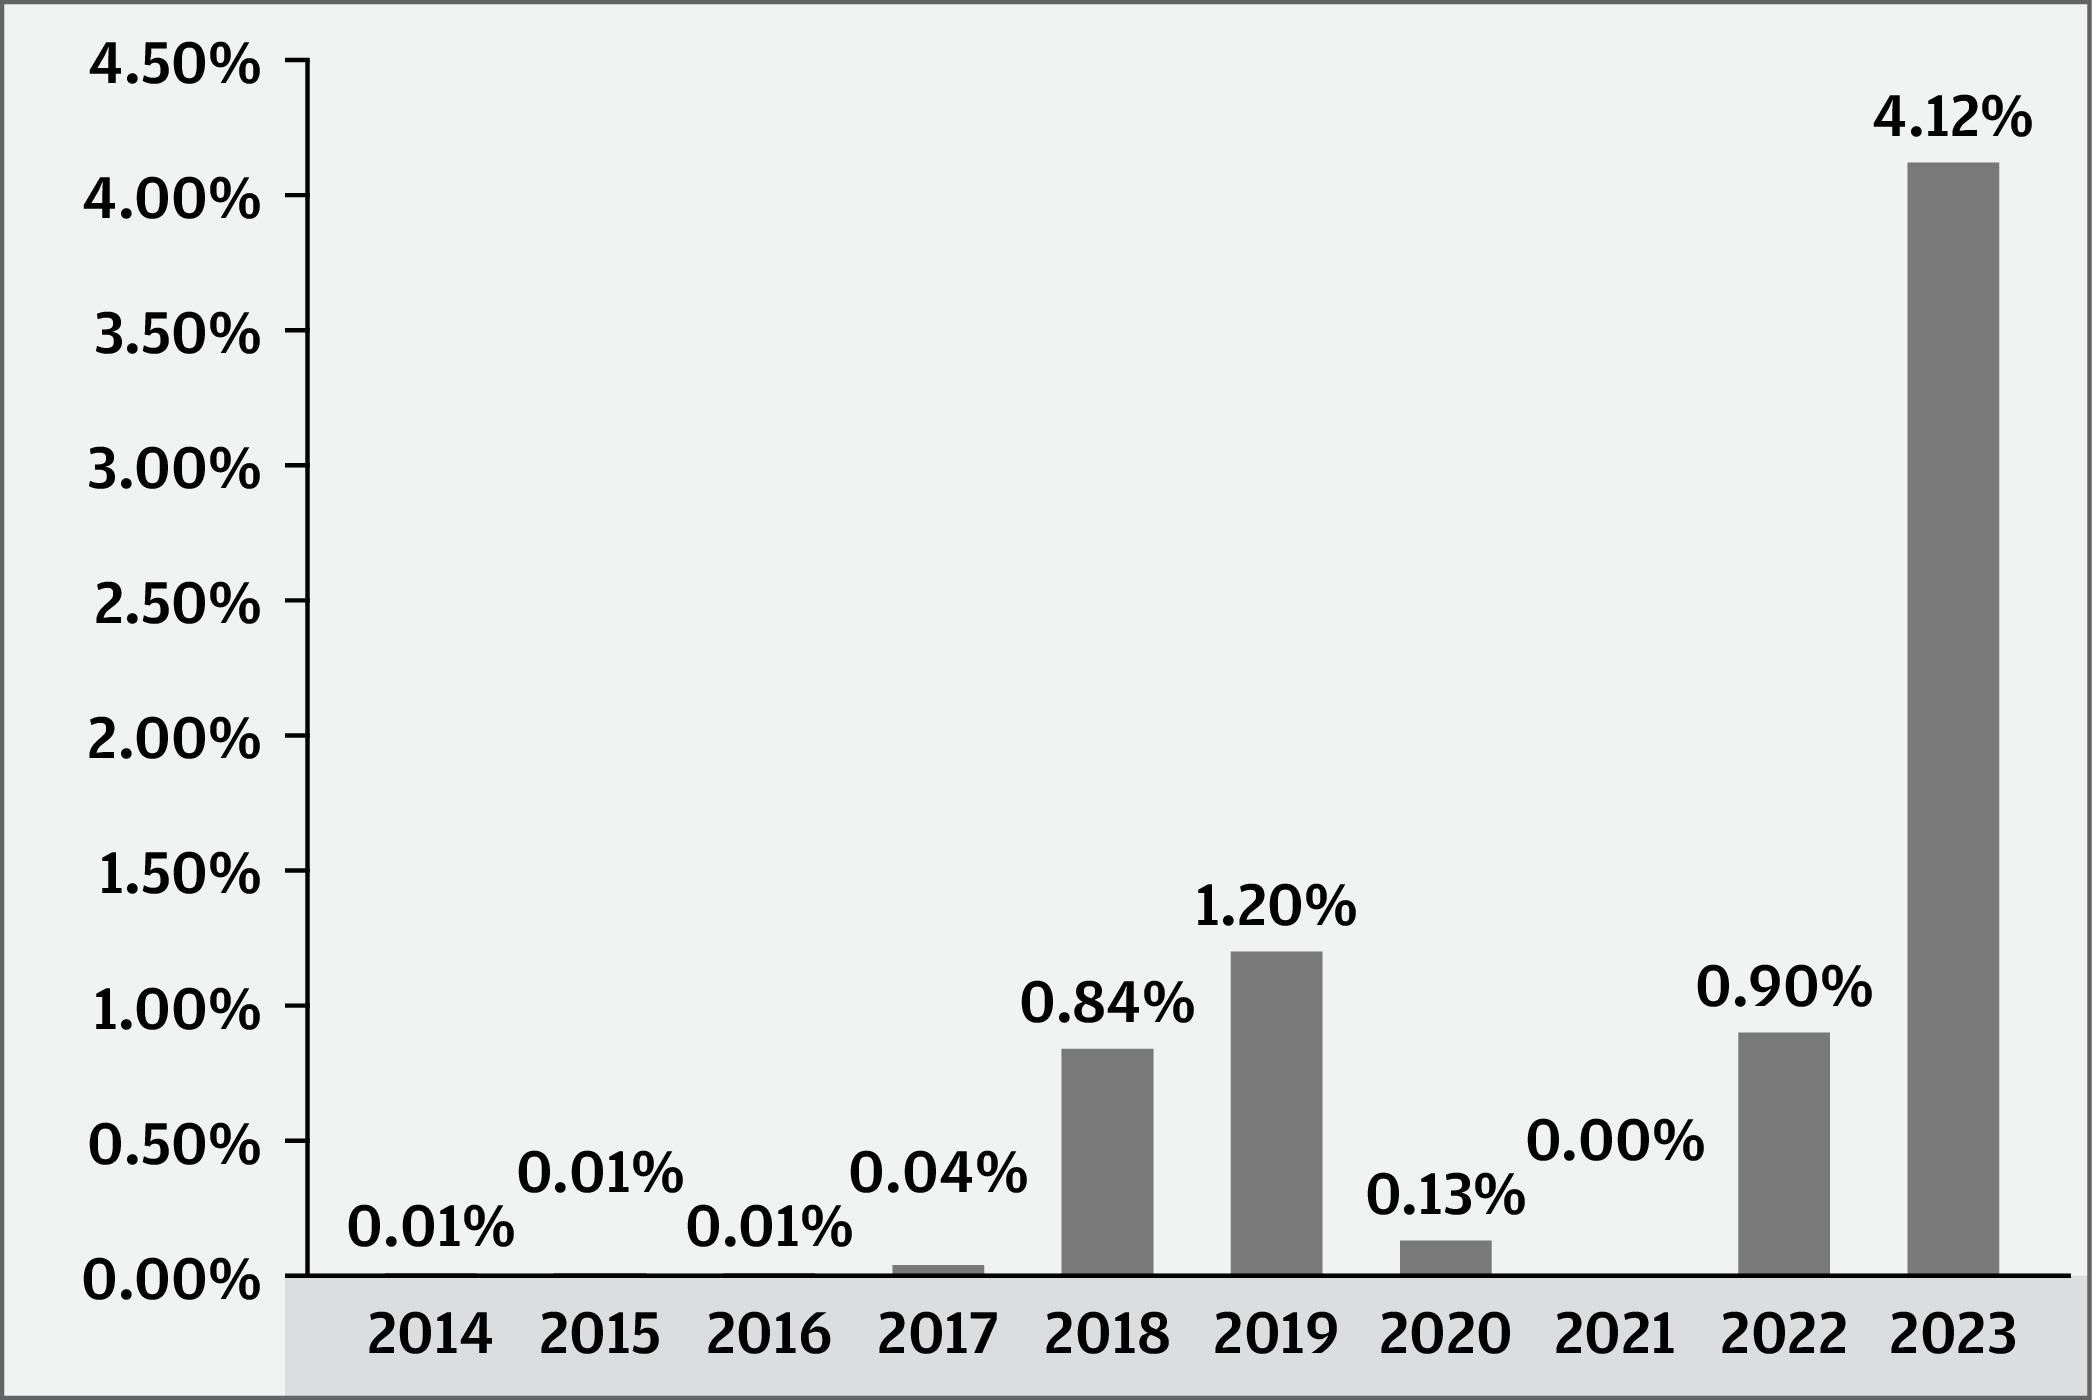
This section provides some indication of the risks of investing in the Fund. The bar chart shows how the performance of the Fund’s Academy Shares has varied from year to year for the past ten calendar years. The table shows the average annual total returns for the past one year, five years and ten years. The performance of Academy Shares is based on the performance of Capital Shares (which are not offered in this prospectus) prior to the inception of the Academy Shares.
12 | J.P. Morgan Money Market Funds
To obtain current yield information call 1-800-766-7722. Past performance is not necessarily an indication of how the Fund will perform in the future.
| YEAR-BY-YEAR RETURNS |
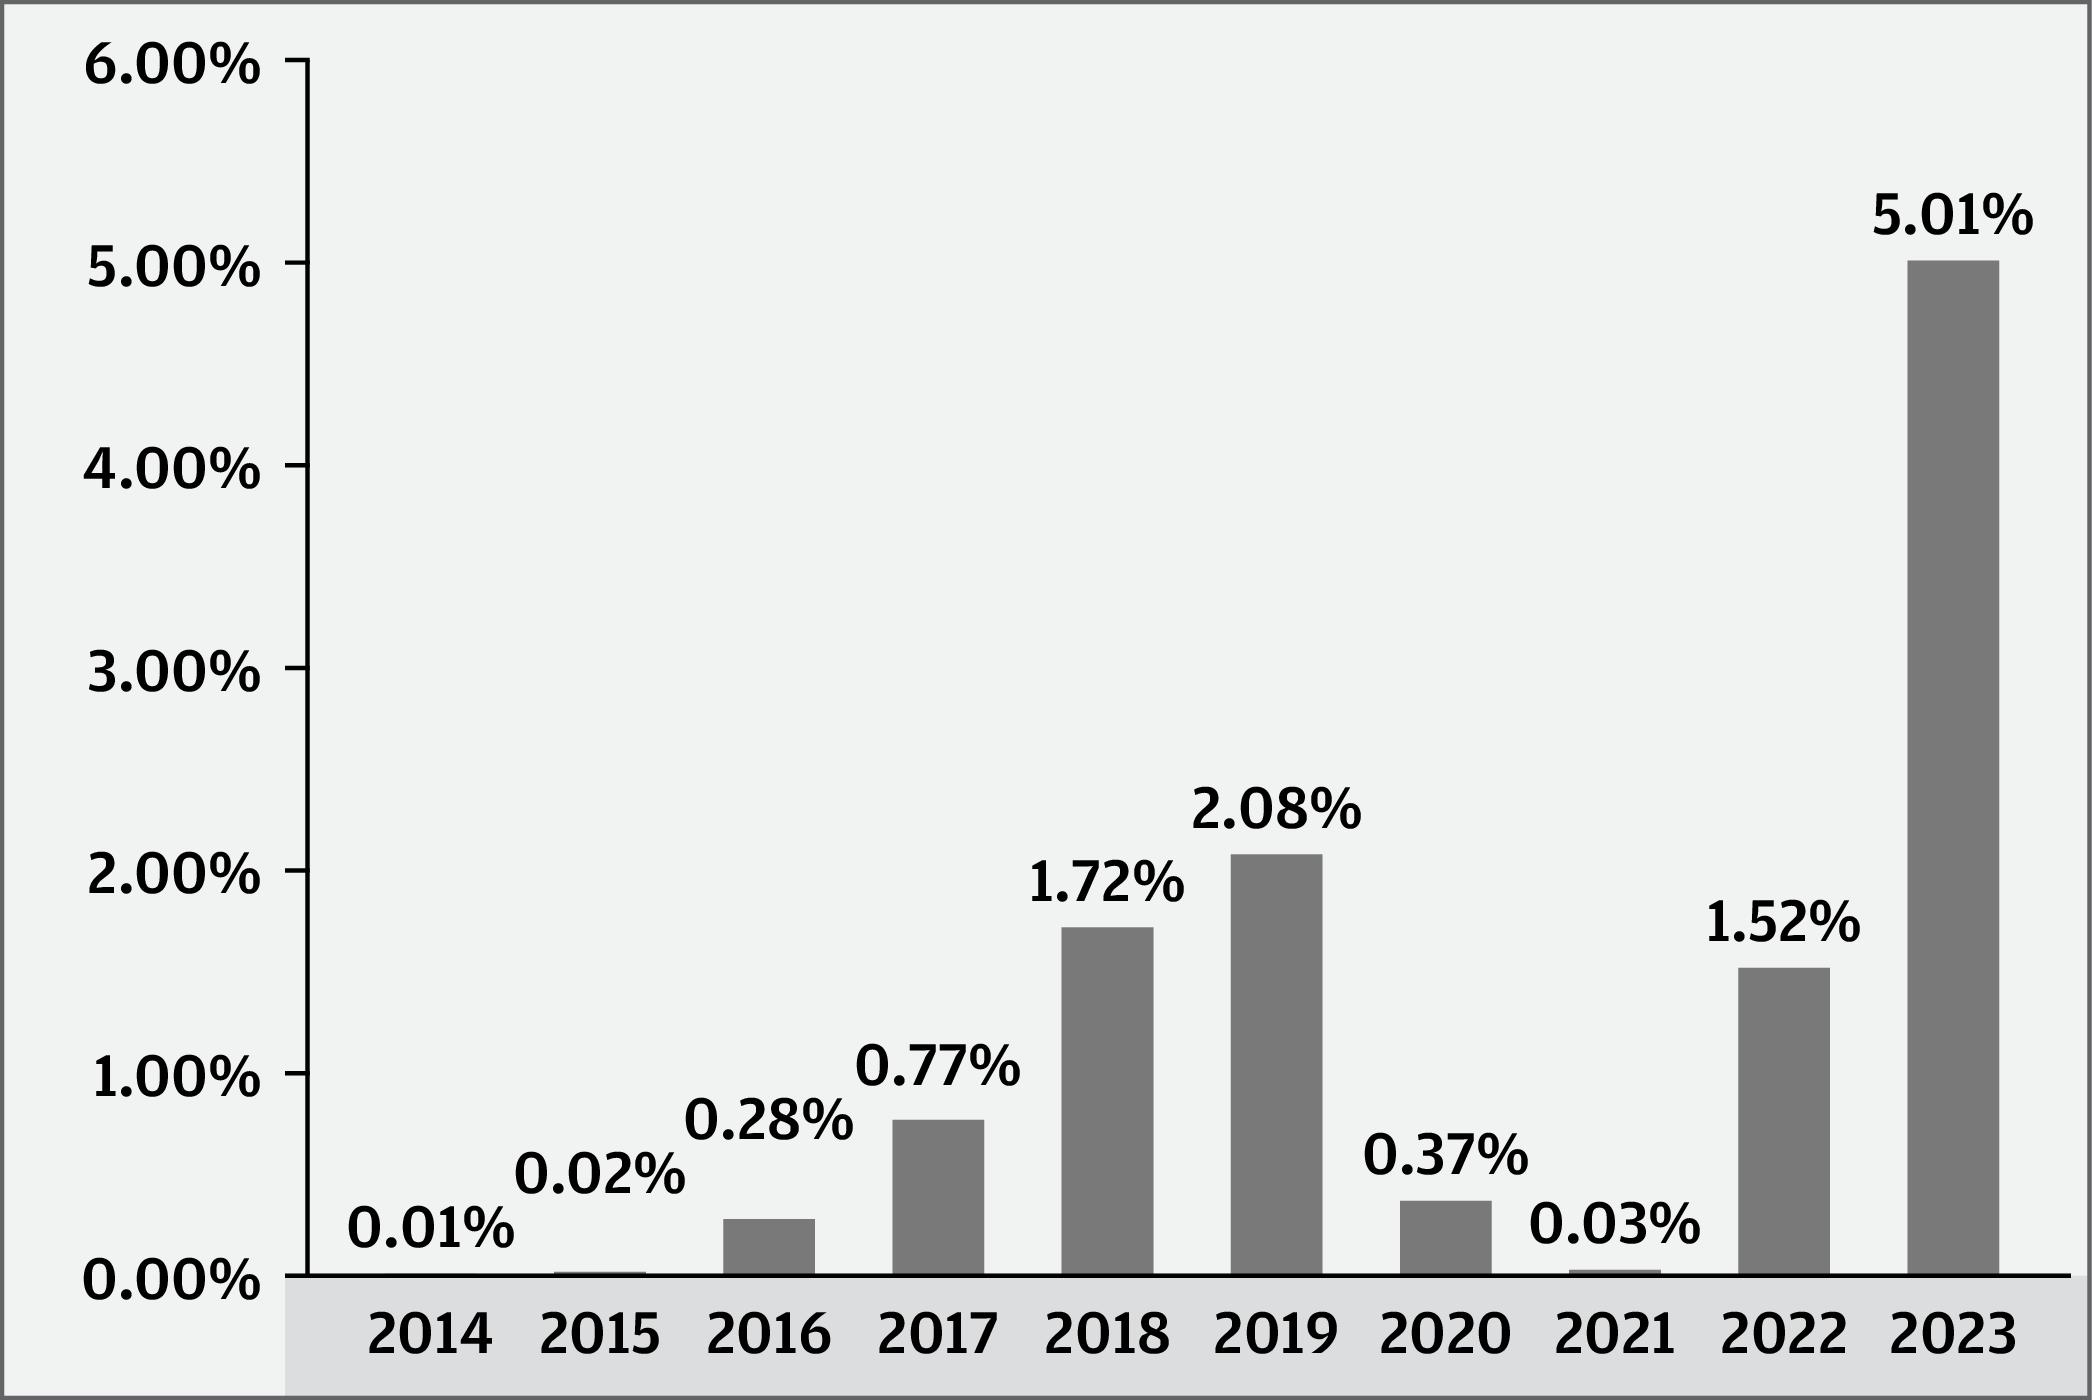
| Best Quarter |
4Q, 2023 |
1.32% |
| Worst Quarter |
1Q, 2Q, 3Q and 4Q 2014 1Q, 2Q and 3Q 2015 |
0.00% |
| |
4Q 2020 | |
| The Fund’s year-to-date total return |
through |
3/31/24 |
was |
1.30% |
. |
| AVERAGE ANNUAL TOTAL RETURNS (For periods ended December 31, 2023) | |||
| |
Past 1 Year |
Past 5 Years |
Past 10 Years |
| ACADEMY SHARES |
5.01 % |
1.79 % |
1.17 % |
Management
J.P. Morgan Investment Management Inc. (the adviser)
Purchase and Sale of Fund Shares
The Fund’s Academy Shares are offered to clients of Academy Securities, Inc. and its affiliates (collectively, Academy Clients). Academy Clients may purchase the Academy Shares through
accounts maintained with Academy Securities, Inc. or its affiliates. Academy Shares may also be purchased through an electronic-trading platform sponsored by JPMorgan or its affiliates, or through platforms maintained by other financial intermediaries for which JPMIM has contracted with Academy Securities, Inc. to provide marketing support services.
Purchase minimums
| For Academy Shares |
|
| To establish a regular account |
$5,000,000 |
| To add to an account |
No minimum |
You may purchase or redeem shares on any business day that the Fund is open through your financial advisor or by calling 1-646-341-6869.
Tax Information
The Fund intends to make distributions that may be taxed as ordinary income or capital gains, except when your investment is in an IRA, 401(k) plan or other tax-advantaged investment plan, in which case you may be subject to federal income tax upon withdrawal from the tax-advantaged investment plan.
Payments to Broker-Dealers and Other Financial Intermediaries
If you purchase shares of the Fund through a broker-dealer or other financial intermediary, including Academy Securities, the Fund and its related companies may pay the financial intermediary for the sale of Fund shares and related services. These payments may create a conflict of interest by influencing the broker-dealer or financial intermediary and your salesperson to recommend the Fund over another investment. Ask your salesperson or visit your financial intermediary’s website for more information.
June 20, 2024 | 13
JPMorgan U.S. Treasury Plus Money Market Fund
Class/Ticker: Academy/JPCXX
The Fund’s Objective
The Fund seeks current income with liquidity and stability of principal.
Fees and Expenses of the Fund
The following table describes the fees and expenses that you may pay if you buy, hold and sell shares of the Fund. You may pay other fees, such as brokerage commissions and other fees to financial intermediaries, which are not reflected in the table and examples below.
| ANNUAL FUND OPERATING EXPENSES (Expenses that you pay each year as a percentage of the value of your investment) | |
| |
Academy |
| Management Fees |
0.08% |
| Other Expenses |
0.10 |
| Service Fees |
0.05 |
| Remainder of Other Expenses |
0.05 |
| Total Annual Fund Operating Expenses |
0.18 |
Example
This Example is intended to help you compare the cost of investing in the Fund with the cost of investing in other mutual funds. The Example assumes that you invest $10,000 in the Fund for the time periods indicated. The Example also assumes that your investment has a 5% return each year and that the Fund’s operating expenses remain the same. Your actual costs may be higher or lower.
| WHETHER OR NOT YOU SELL YOUR SHARES, YOUR COST WOULD BE: | ||||
| |
1 Year |
3 Years |
5 Years |
10 Years |
| ACADEMY SHARES ($) |
18 |
58 |
101 |
230 |
The Fund’s Main Investment Strategy
Under normal conditions, the Fund invests its assets exclusively in:
●
obligations of the U.S. Treasury, including Treasury bills, bonds and notes and other obligations issued or guaranteed by the U.S. Treasury, and
●
repurchase agreements fully collateralized by U.S. Treasury securities.
The debt securities described above carry different interest rates, maturities and issue dates.
The Fund is a money market fund managed in the following manner:
●
The Fund seeks to maintain a net asset value (“NAV”) of $1.00 per share.
●
The dollar-weighted average maturity of the Fund will be 60 days or less and the dollar-weighted average life to maturity will be 120 days or less.
●
The Fund will only buy securities that have remaining maturities of 397 days or less or securities otherwise permitted to be purchased because of maturity shortening provisions under applicable regulation.
●
The Fund invests only in U.S. dollar-denominated securities.
●
The Fund seeks to invest in securities that present minimal credit risk.
The Fund will generally hold a portion of its assets in cash, primarily to meet redemptions.
The Fund intends to continue to qualify as a “government money market fund,” as such term is defined in or interpreted under Rule 2a-7 under the Investment Company Act of 1940, as amended (“Investment Company Act”).“Government money market funds” are required to invest at least 99.5% of their assets in (i) cash, (ii) securities issued or guaranteed by the United States or certain U.S. government agencies or instrumentalities and/or (iii) repurchase agreements that are collateralized fully, and are exempt from requirements that permit money market funds to impose a liquidity fee. While the J.P. Morgan Funds’ Board of Trustees (the “Board”) may elect to subject the Fund to liquidity fee requirements in the future, the Board has not elected to do so at this time. A government money market fund may also include investments in other government money market funds as an eligible investment for purposes of the 99.5% requirement above.
The Fund’s adviser seeks to develop an appropriate portfolio by considering the differences in yields among securities of different maturities and issue dates.
The Fund’s Main Investment Risks
The Fund is subject to management risk and the Fund may not achieve its objective if the adviser’s expectations regarding particular instruments or interest rates are not met.
You could lose money by investing in the Fund. Although the Fund seeks to preserve the value of your investment at $1.00 per share, it cannot guarantee it will do so. An investment in the Fund is not a bank account and is not insured or guaranteed by the Federal Deposit Insurance Corporation or any other government agency. The Fund’s sponsor is not required to reimburse the Fund for losses, and you should not expect that the sponsor will provide financial support to the Fund at any time, including during periods of market stress.
14 | J.P. Morgan Money Market Funds
An investment in this Fund or any other fund may not provide a complete investment program. The suitability of an investment in the Fund should be considered based on the investment objective, strategies and risks described in this prospectus, considered in light of all of the other investments in your portfolio, as well as your risk tolerance, financial goals and time horizons. You may want to consult with a financial advisor to determine if this Fund is suitable for you.
The Fund is subject to the main risks noted below, any of which may adversely affect the Fund’s performance and ability to meet its investment objective.
Interest Rate Risk. The Fund’s investments in bonds and other debt securities will change in value based on changes in interest rates. If rates increase, the value of these investments generally declines. Securities with greater interest rate sensitivity and longer maturities generally are subject to greater fluctuations in value. The Fund may invest in variable and floating rate securities. Although these instruments are generally less sensitive to interest rate changes than fixed rate instruments, the value of floating rate and variable securities may decline if their interest rates do not rise as quickly, or as much, as general interest rates. The Fund may face a heightened level of interest rate risk due to certain changes in monetary policy. It is difficult to predict the pace at which central banks or monetary authorities may change interest rates or the timing, frequency, or magnitude of such changes. Any such changes could be sudden and could expose debt markets to significant volatility and reduced liquidity for Fund investments.
Credit Risk. The Fund’s investments are subject to the risk that issuers and/or counterparties will fail to make payments when due or default completely. Prices of the Fund’s investments may be adversely affected if any of the issuers or counterparties it is invested in are subject to an actual or perceived deterioration in their credit quality. Credit spreads may increase, which may reduce the market values of the Fund’s securities. Credit spread risk is the risk that economic and market conditions or any actual or perceived credit deterioration may lead to an increase in the credit spreads (i.e., the difference in yield between two securities of similar maturity but different credit quality) and a decline in price of the issuer’s securities.
General Market Risk. Economies and financial markets throughout the world are becoming increasingly interconnected, which increases the likelihood that events or conditions in one country or region will adversely impact markets or issuers in other countries or regions. Securities in the Fund’s portfolio may underperform in comparison to securities in general financial markets, a particular financial market or other asset classes due to a number of factors, including inflation (or expectations for inflation), deflation (or expectations for deflation), interest rates, global demand for particular products or resources, market instability, financial system instability, debt crises and downgrades, embargoes, tariffs, sanctions and other trade barriers, regulatory events, other governmental trade or
market control programs and related geopolitical events. In addition, the value of the Fund’s investments may be negatively affected by the occurrence of global events such as war, terrorism, environmental disasters, natural disasters or events, country instability, and infectious disease epidemics or pandemics.
Government Securities Risk. U.S. government securities are subject to market risk, interest rate risk and credit risk. Securities, such as those issued or guaranteed by the U.S. Treasury, that are backed by the full faith and credit of the United States are guaranteed only as to the timely payment of interest and principal when held to maturity and the market prices for such securities will fluctuate. Notwithstanding that these securities are backed by the full faith and credit of the United States, circumstances could arise that would prevent the payment of interest or principal. This would result in losses to the Fund. U.S. government securities include zero coupon securities, which tend to be subject to greater market risk than interest-paying securities of similar maturities.
Risk of Regulation of Money Market Funds. The SEC has adopted amendments to the rules that govern money market funds. These amendments may affect the Fund's investment strategies, performance, yield, expenses, operations and continued viability.
Transactions Risk. The Fund could experience a loss and its liquidity may be negatively impacted when selling securities to meet redemption requests. The risk of loss increases if the redemption requests are unusually large or frequent or occur in times of overall market turmoil or declining prices. Similarly, large purchases of Fund shares may adversely affect the Fund’s performance to the extent that the Fund is delayed in investing new cash and is required to maintain a larger cash position than it ordinarily would.
Net Asset Value Risk. There is no assurance that the Fund will meet its investment objective of maintaining a net asset value of $1.00 per share on a continuous basis. Furthermore, there can be no assurance that the Fund’s affiliates will purchase distressed assets from the Fund, make capital infusions, enter into capital support agreements or take other actions to ensure that the Fund maintains a net asset value of $1.00 per share. In the event any money market fund fails to maintain a stable net asset value, other money market funds, including the Fund, could face a universal risk of increased redemption pressures, potentially jeopardizing the stability of their net asset values. In general, certain other money market funds have in the past failed to maintain stable net asset values and there can be no assurance that such failures and resulting redemption pressures will not occur in the future.
Repurchase Agreement Risk. There is a risk that the counterparty to a repurchase agreement will default or otherwise become unable to honor a financial obligation and the value of your investment could decline as a result.
June 21, 2024 | 15
JPMorgan U.S. Treasury Plus Money Market Fund (continued)
Risk Associated with the Fund Holding Cash. The Fund will generally hold a portion of its assets in cash, primarily to meet redemptions. Cash positions may hurt performance and may subject the Fund to additional risks and costs, such as increased exposure to the custodian bank holding the assets and any fees imposed for large cash balances.
Prepayment Risk. The issuer of certain securities may repay principal in advance, especially when yields fall. Changes in the rate at which prepayments occur can affect the return on investment of these securities. When debt obligations are prepaid or when securities are called, the Fund may have to reinvest in securities with a lower yield. The Fund also may fail to recover additional amounts (i.e., premiums) paid for securities with higher coupons, resulting in an unexpected capital loss.
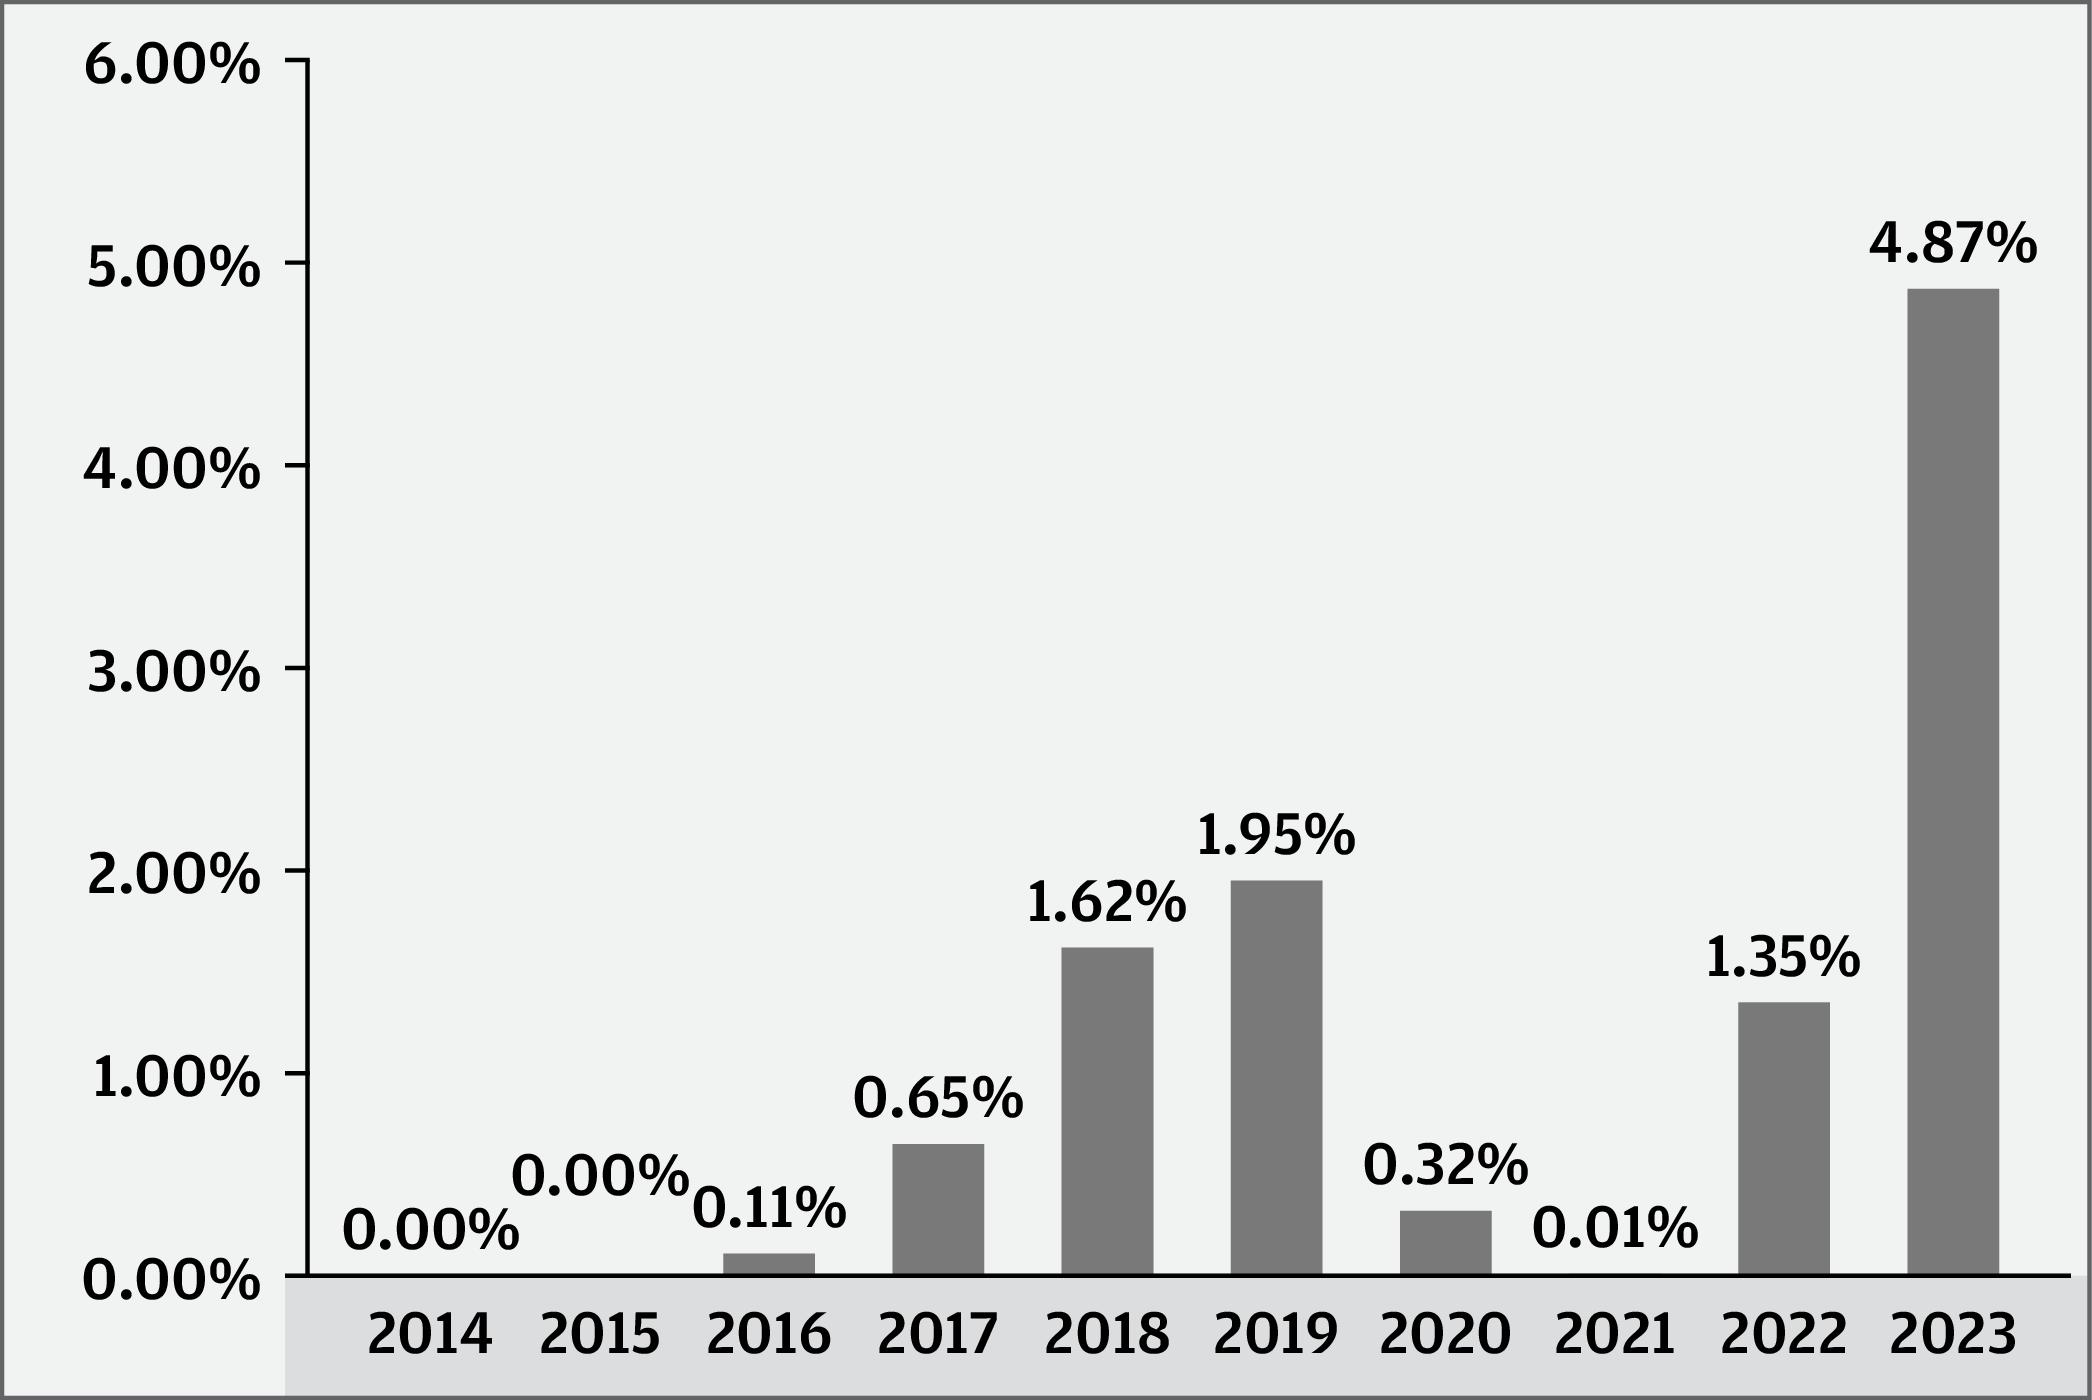
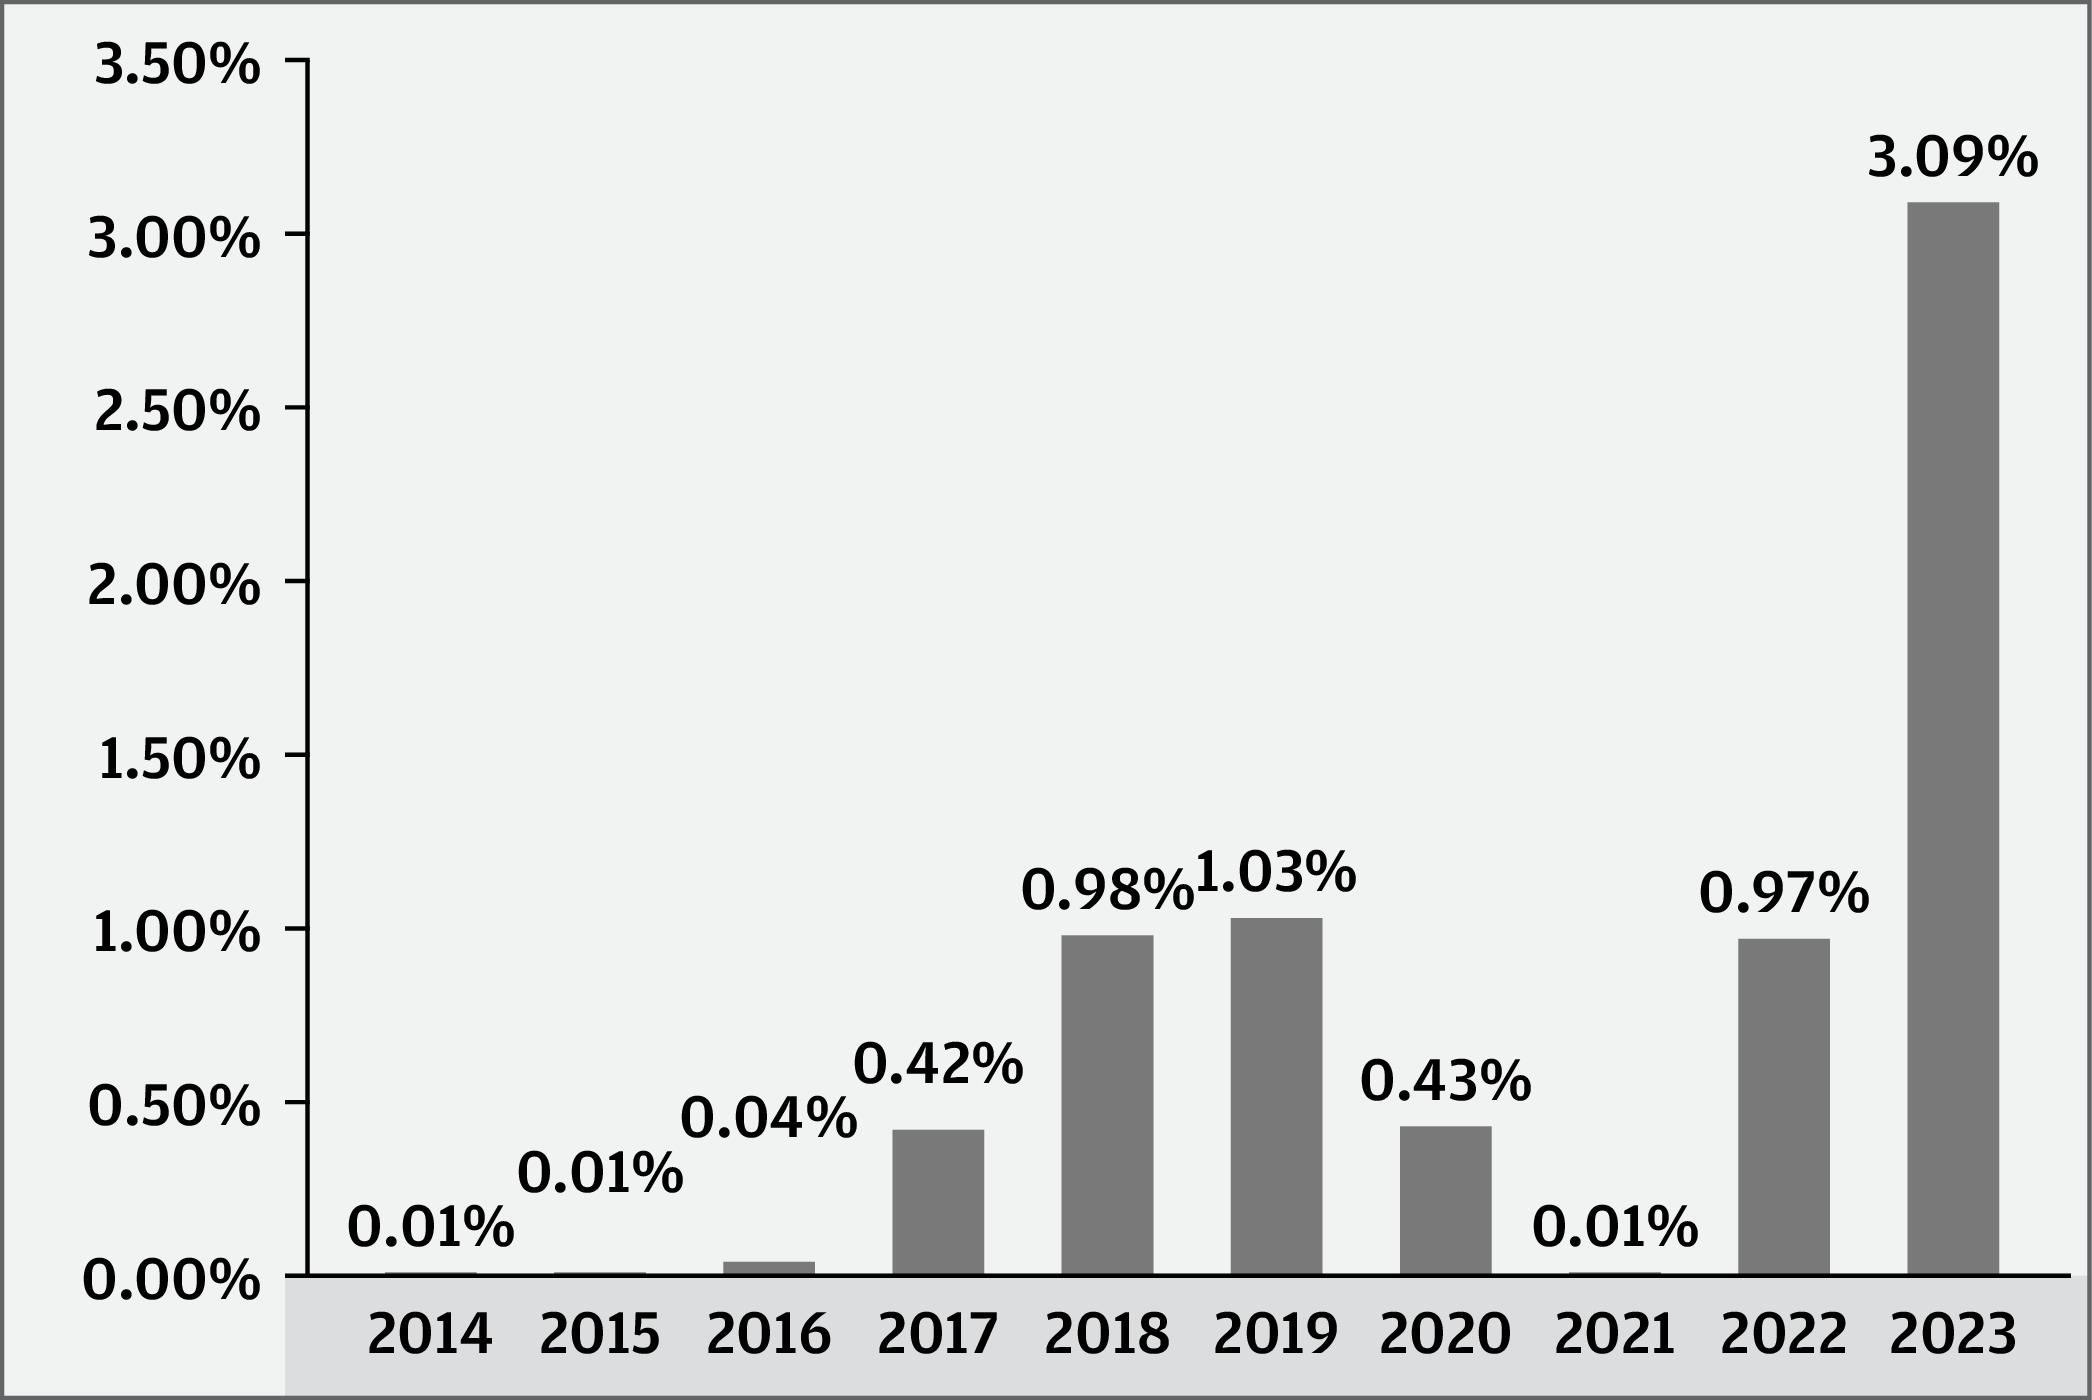
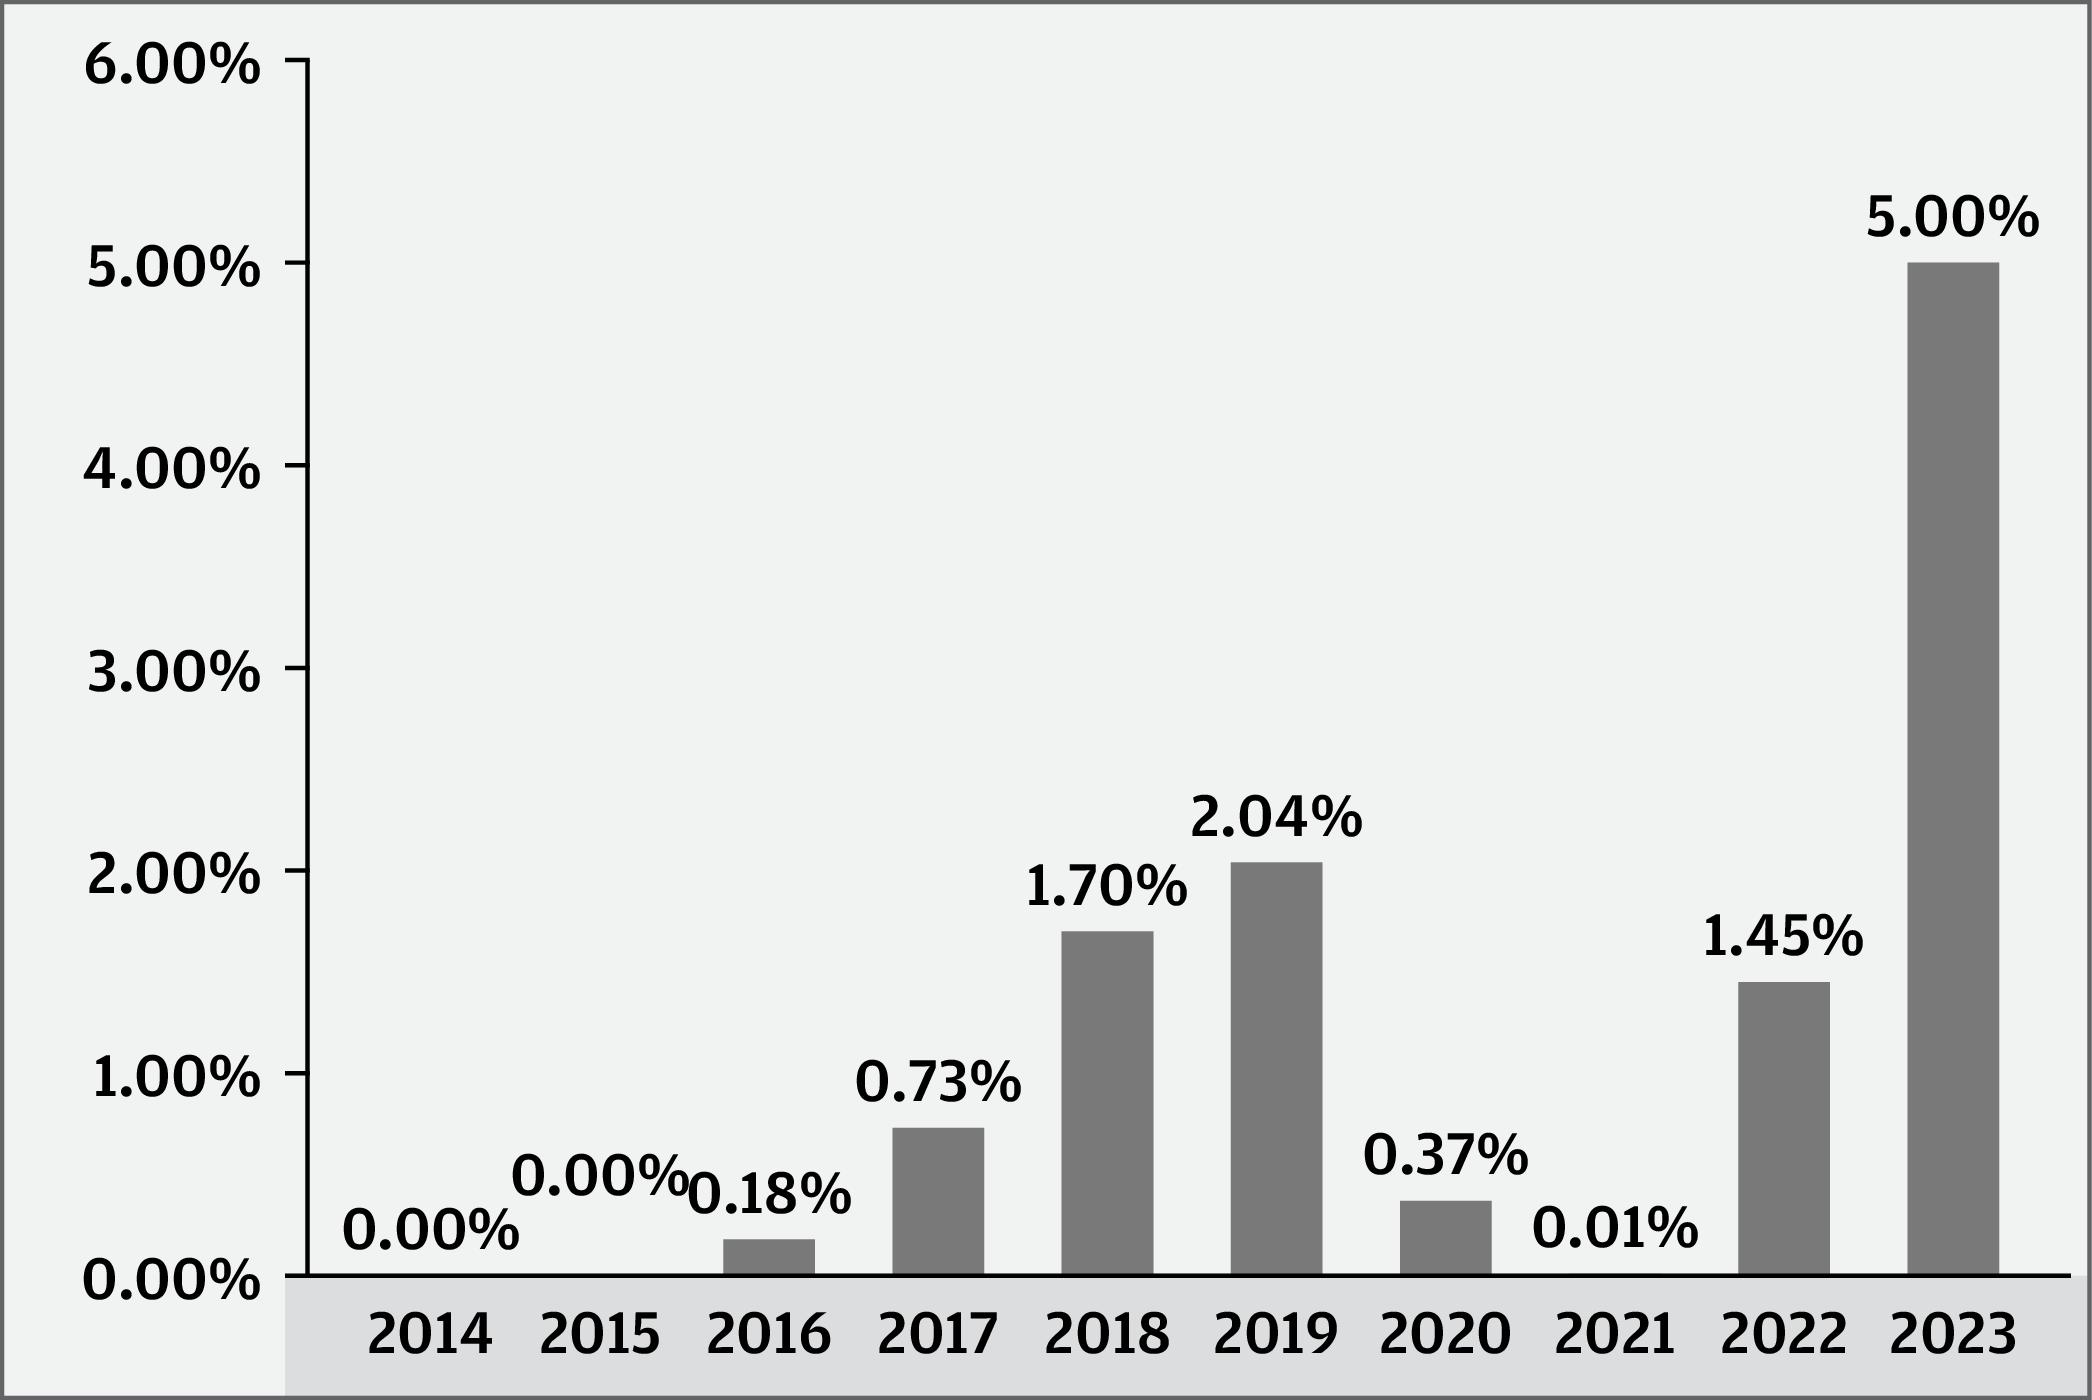
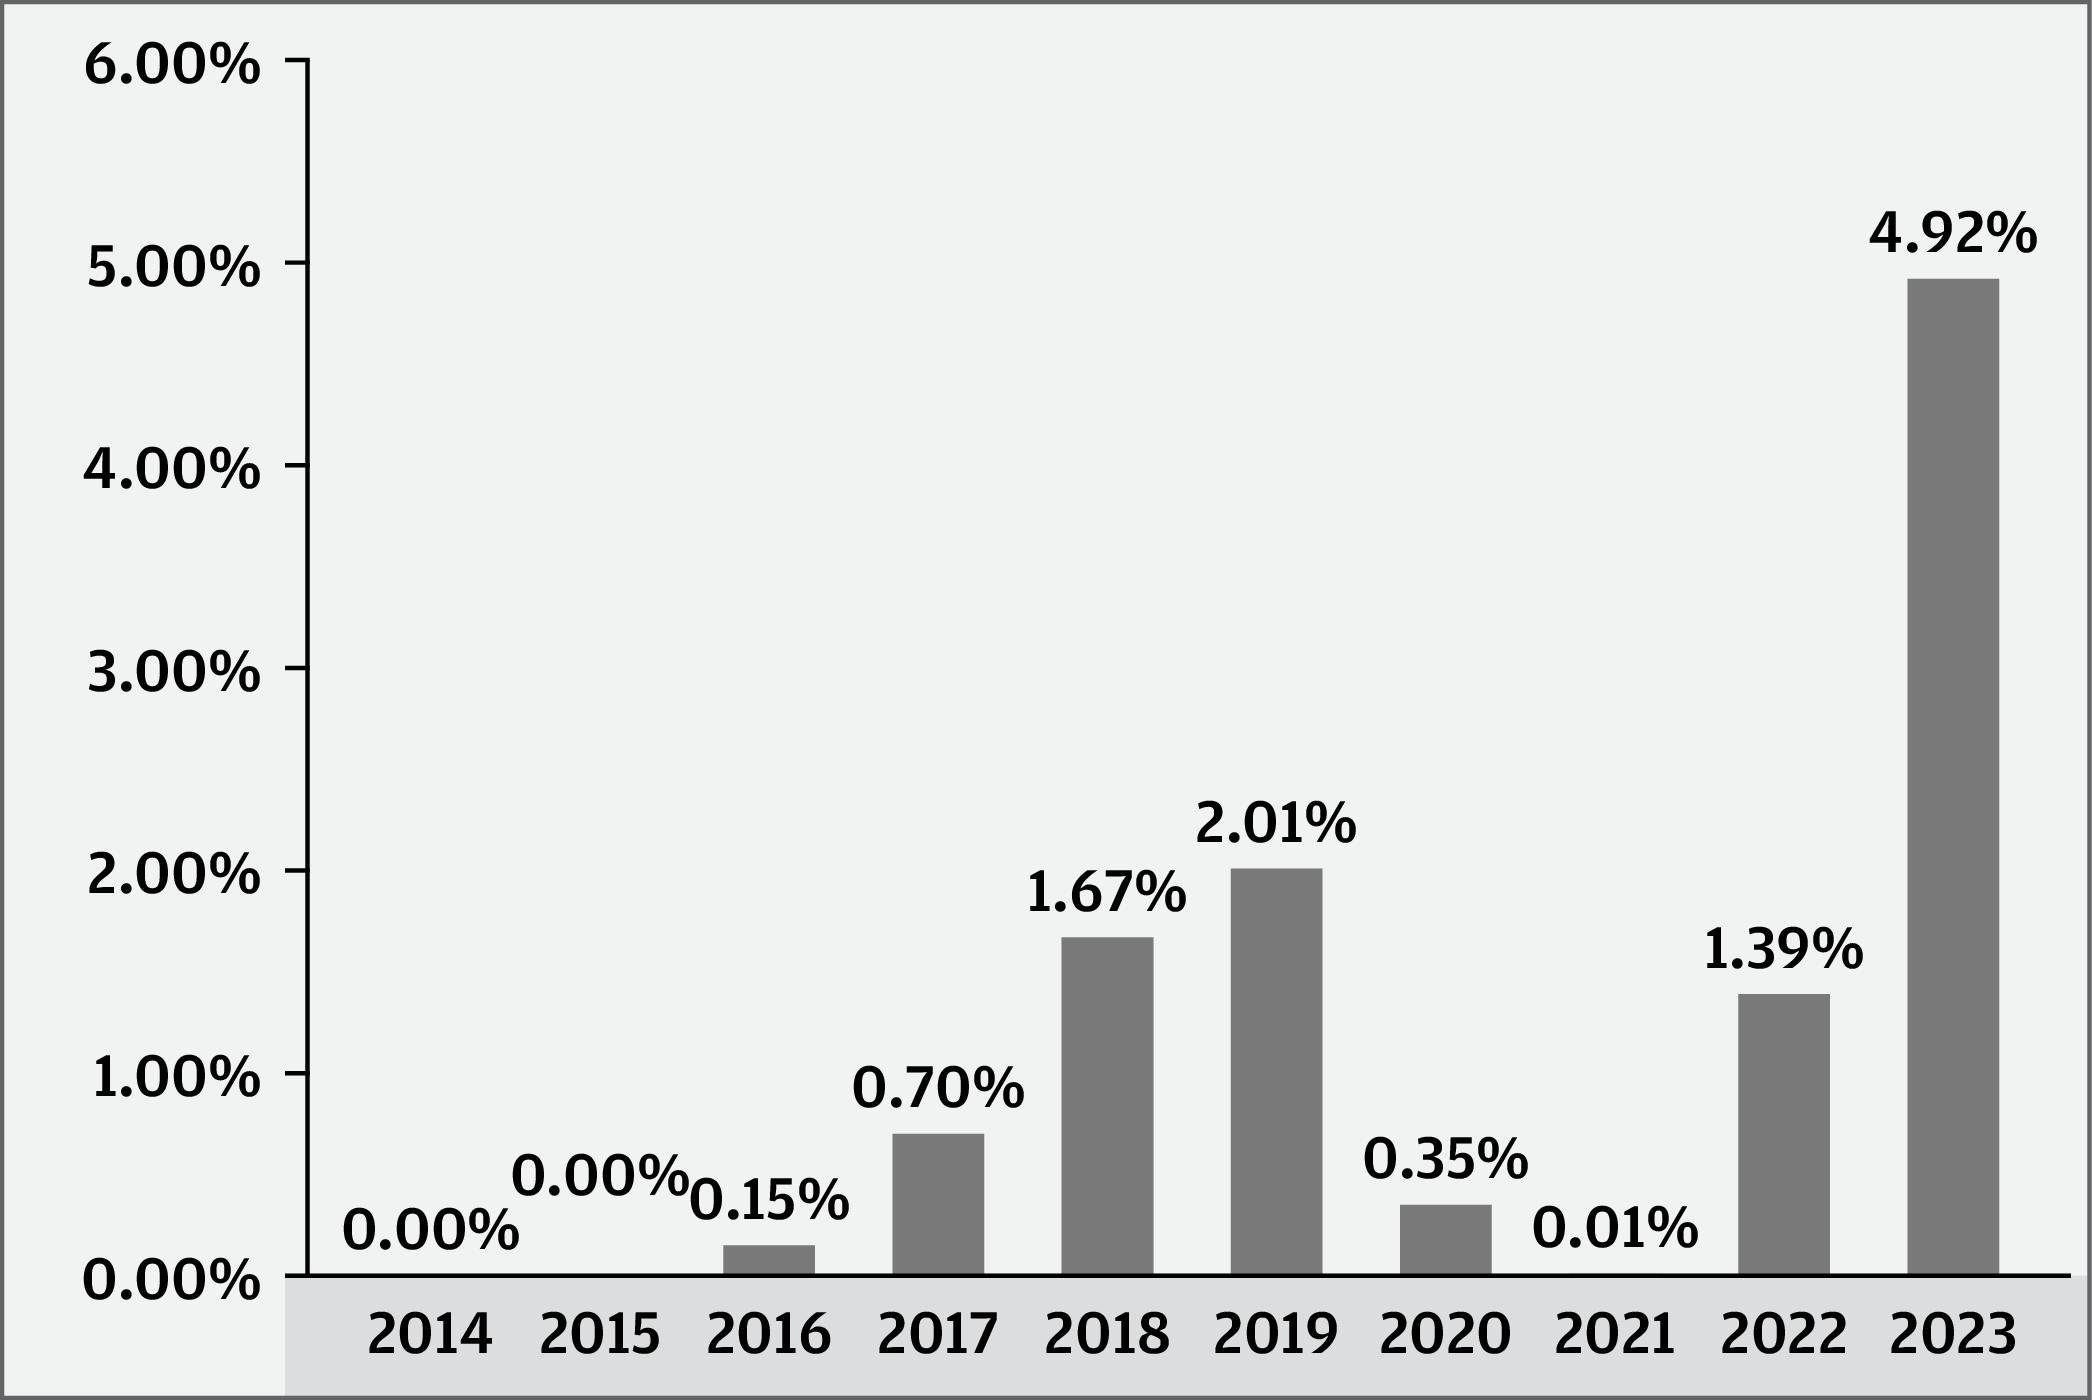
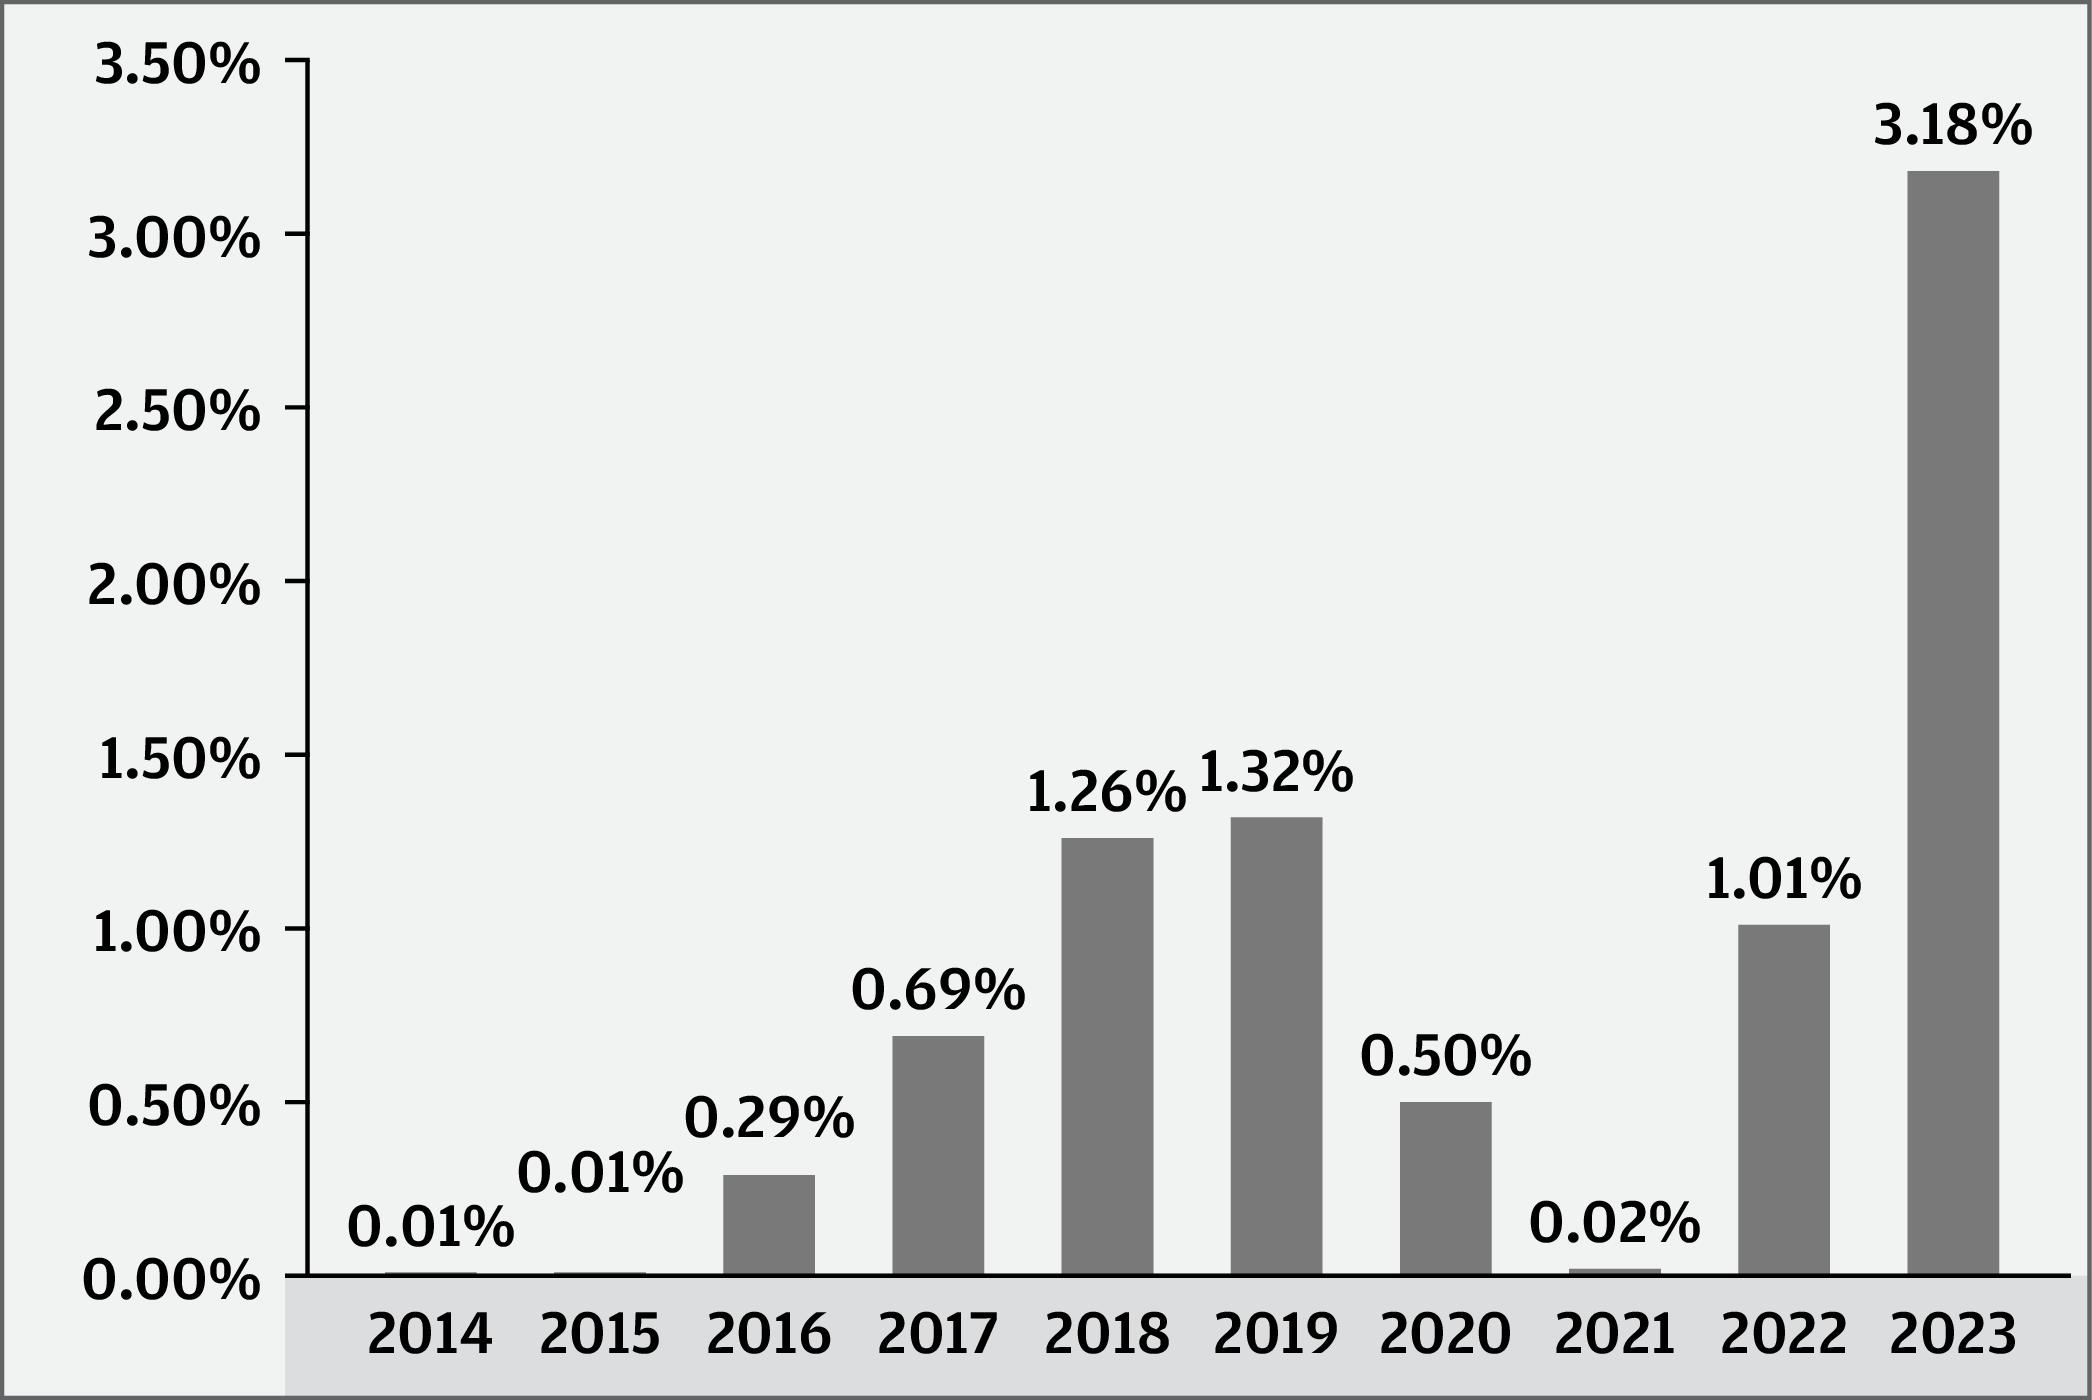
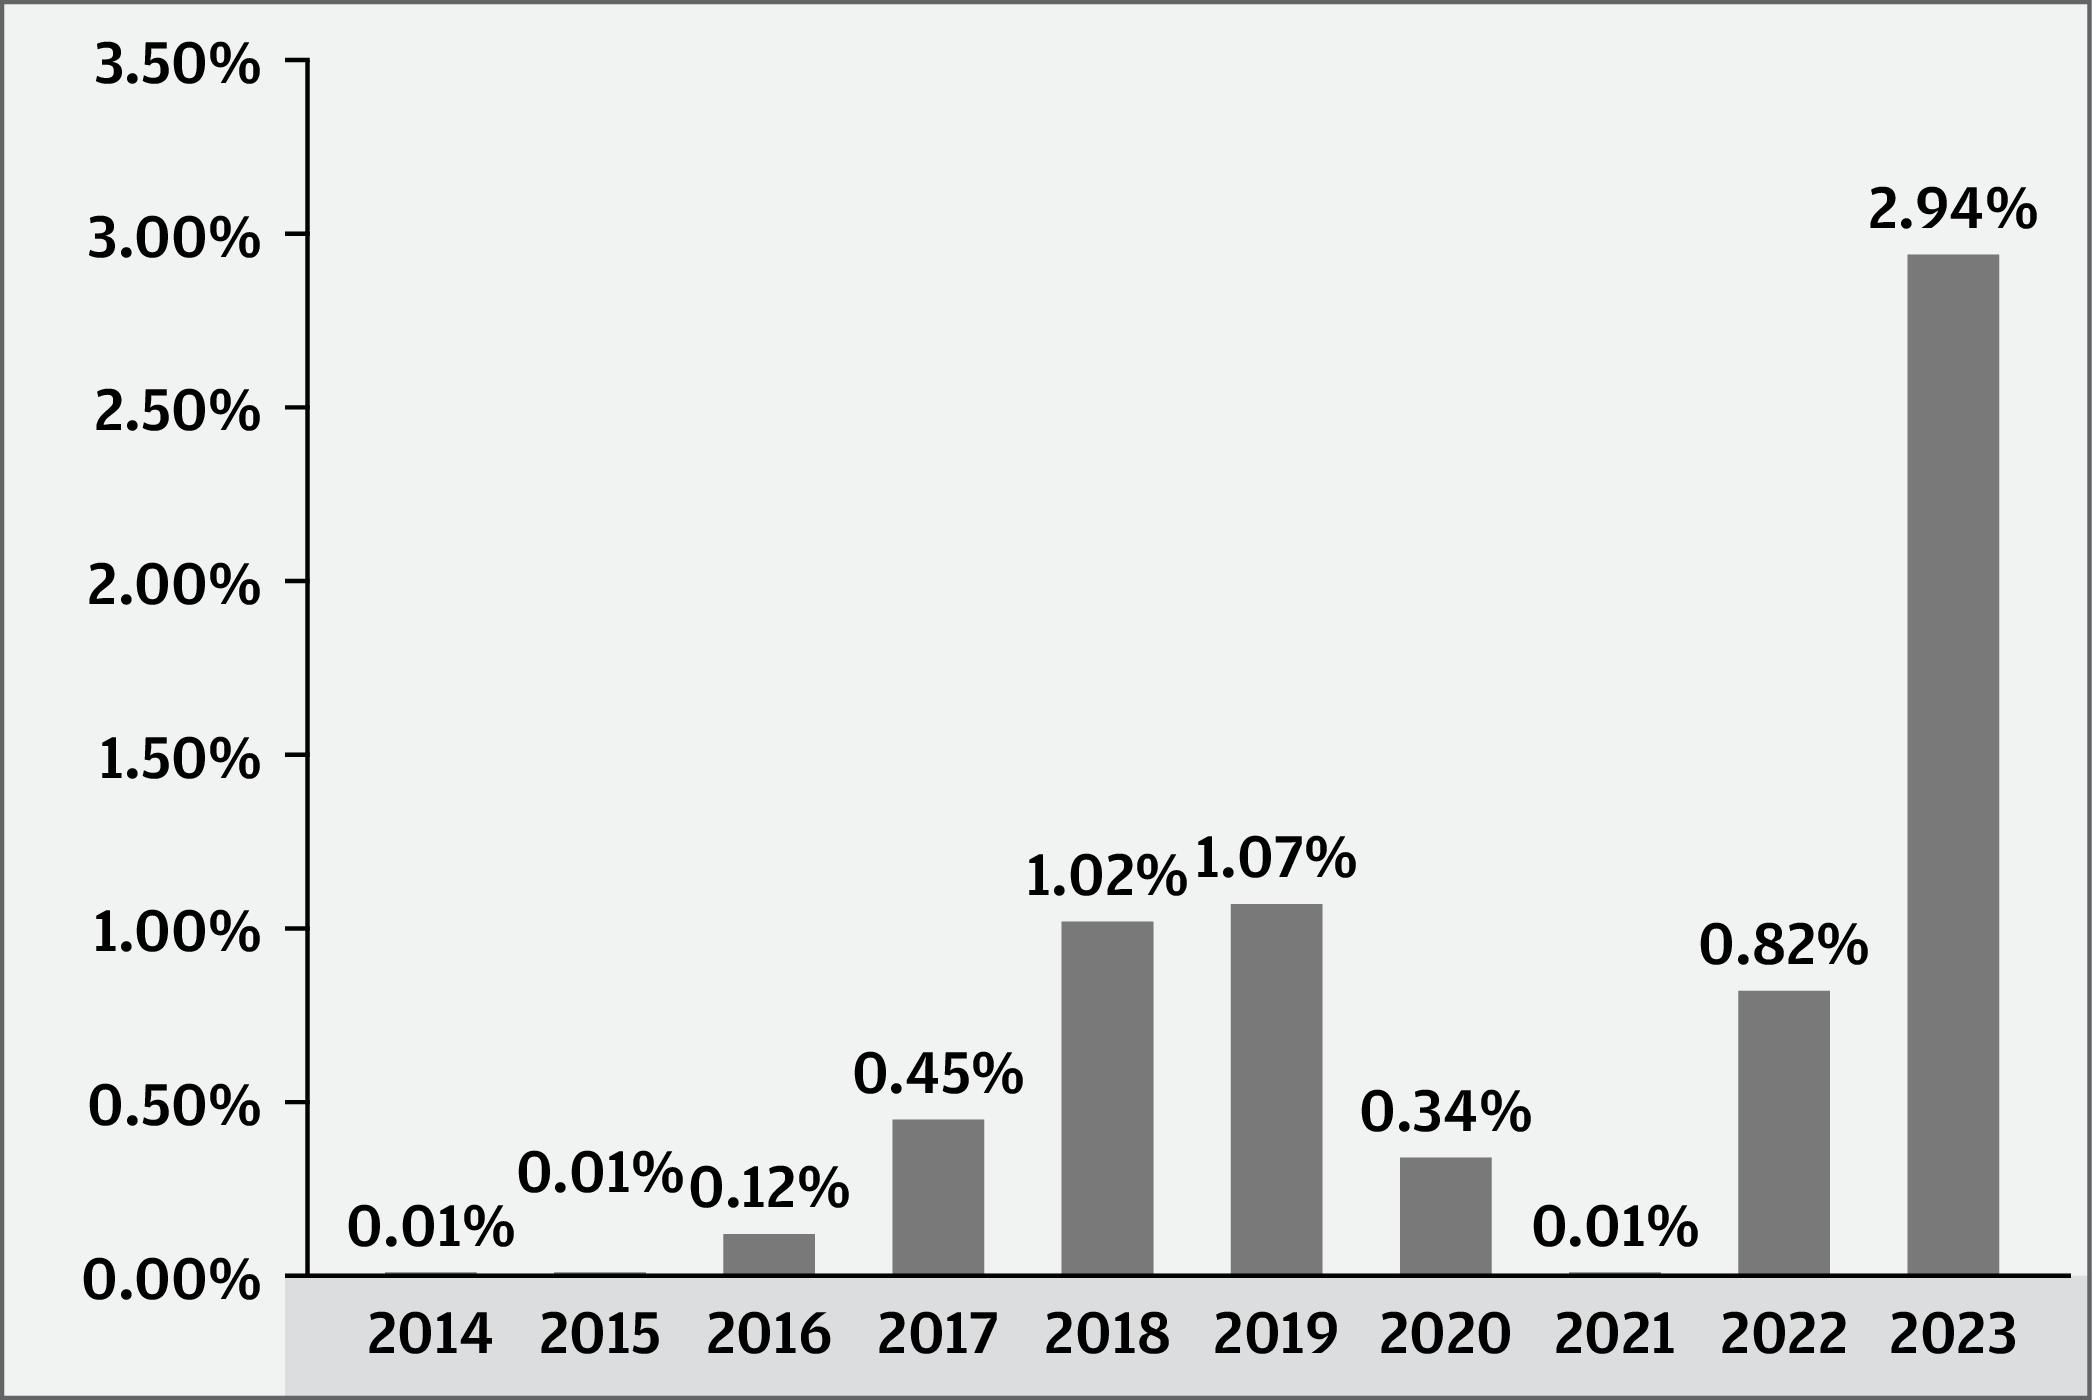
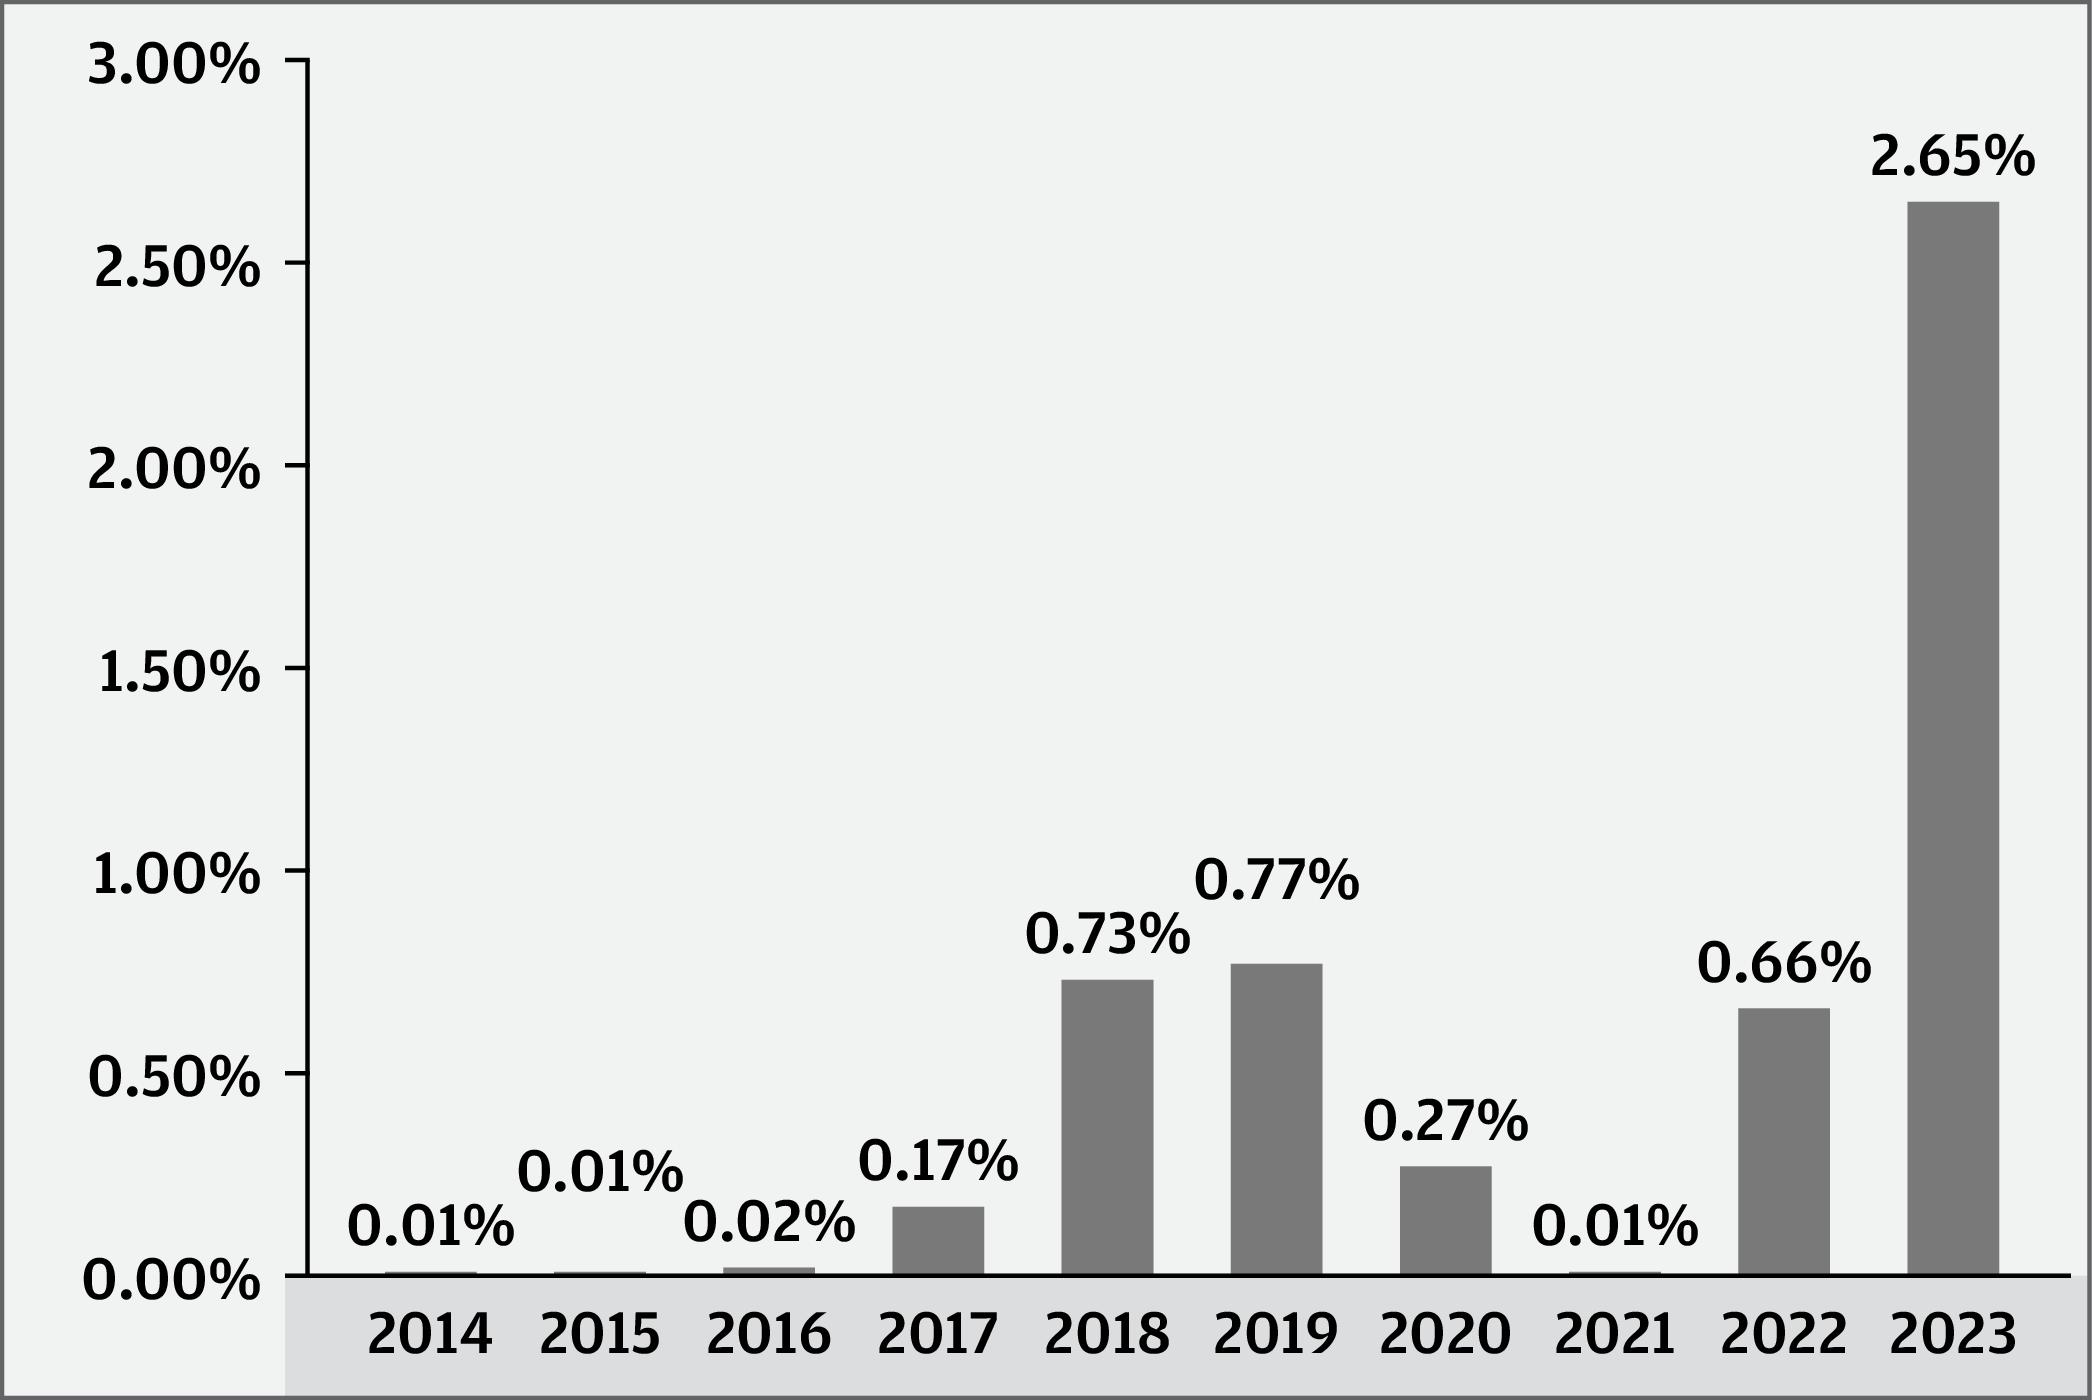
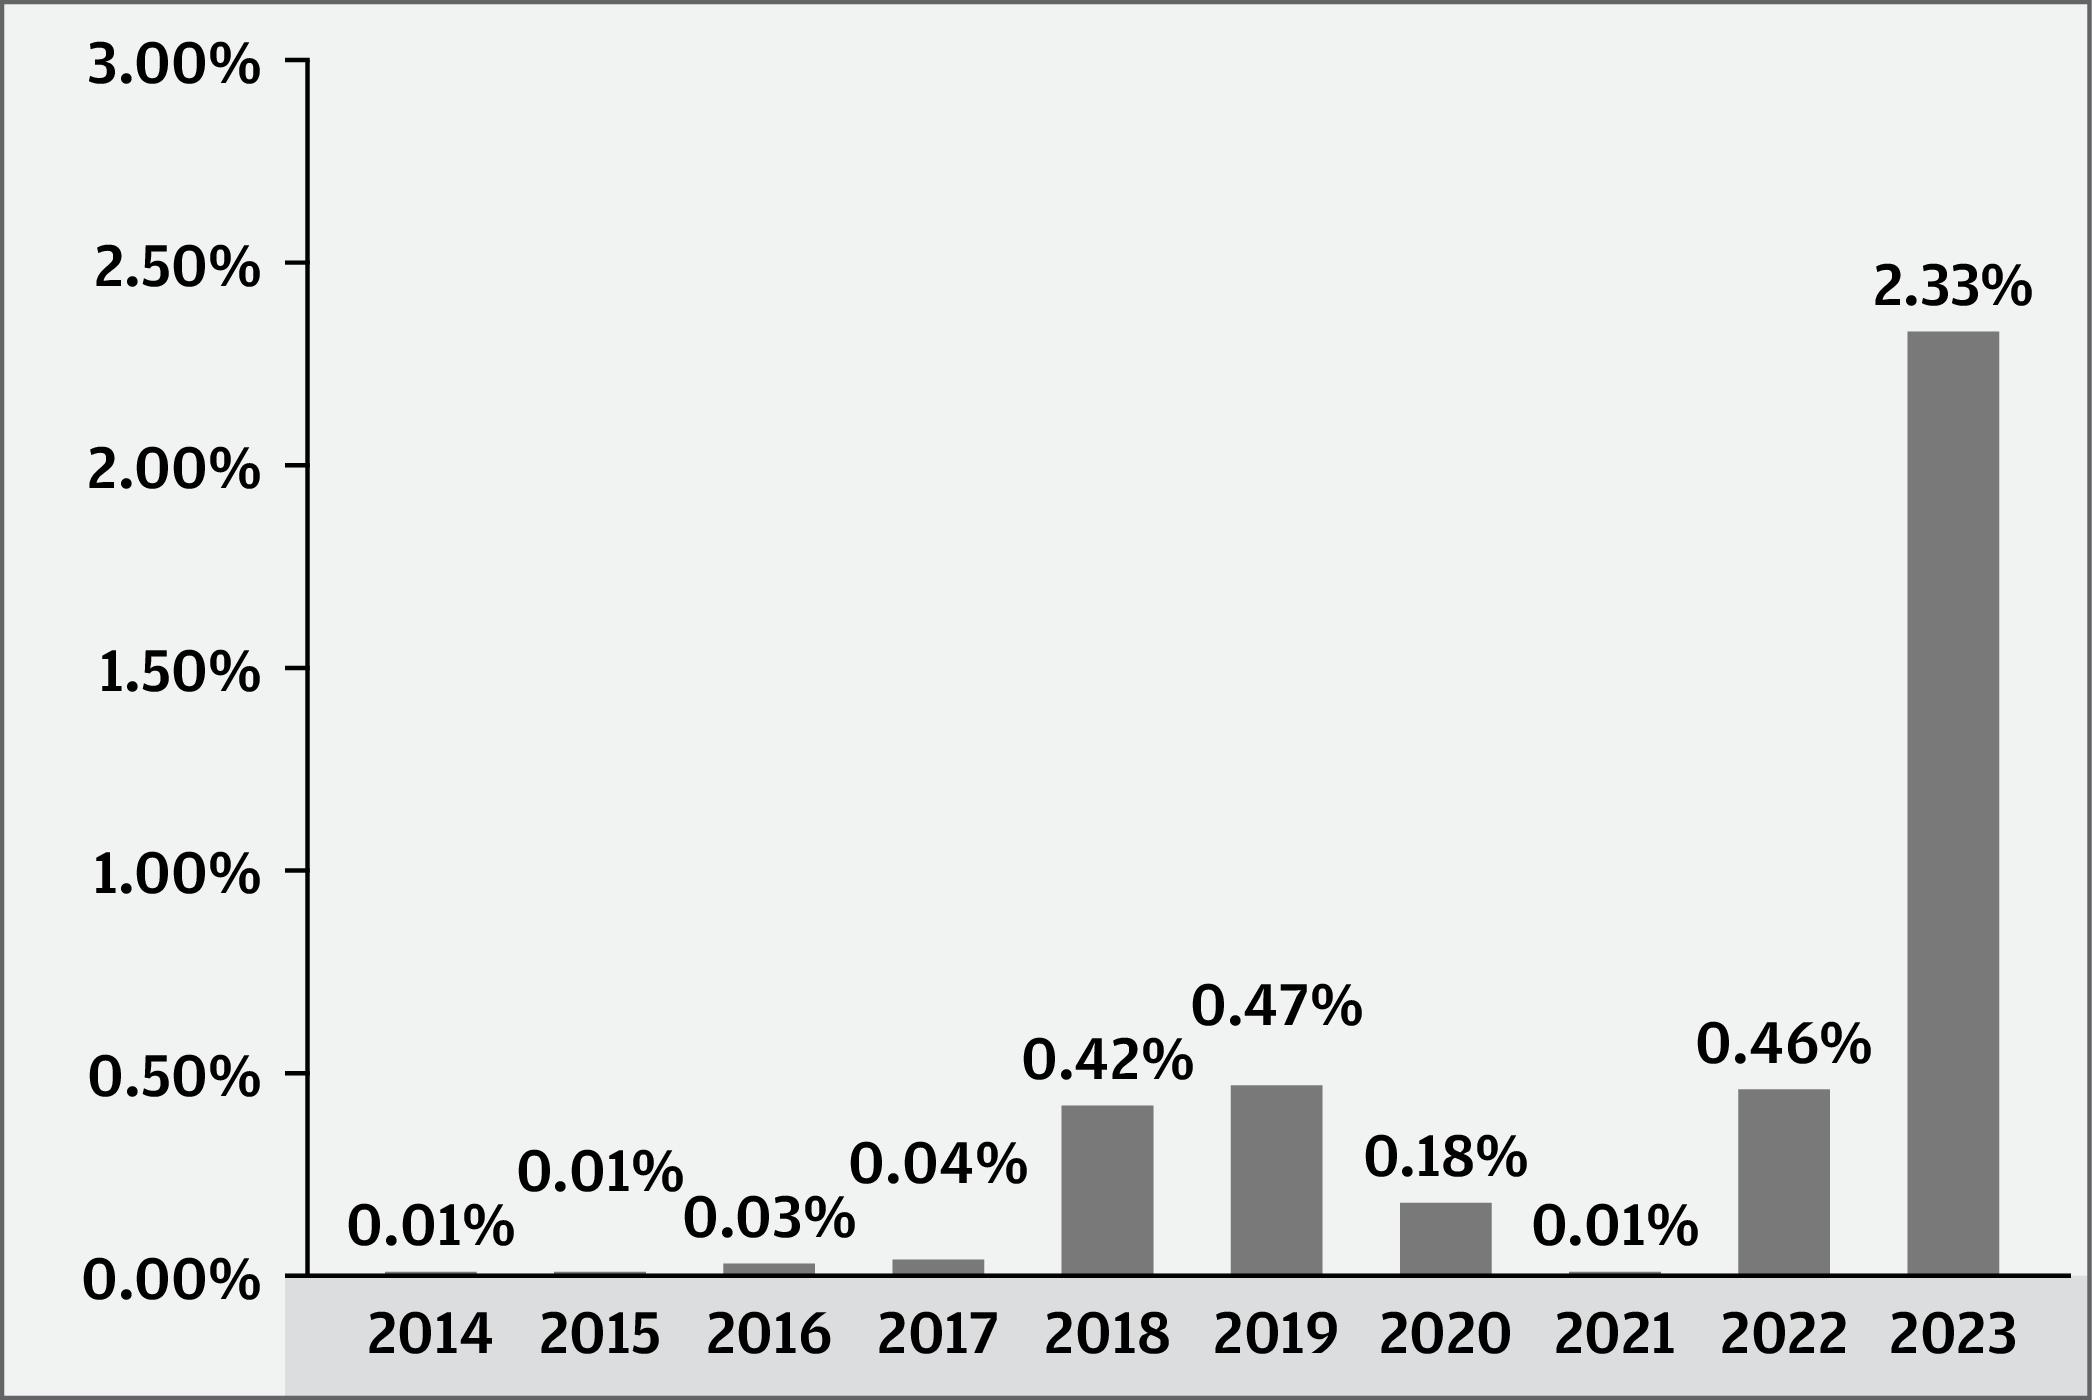
The Fund’s Past Performance
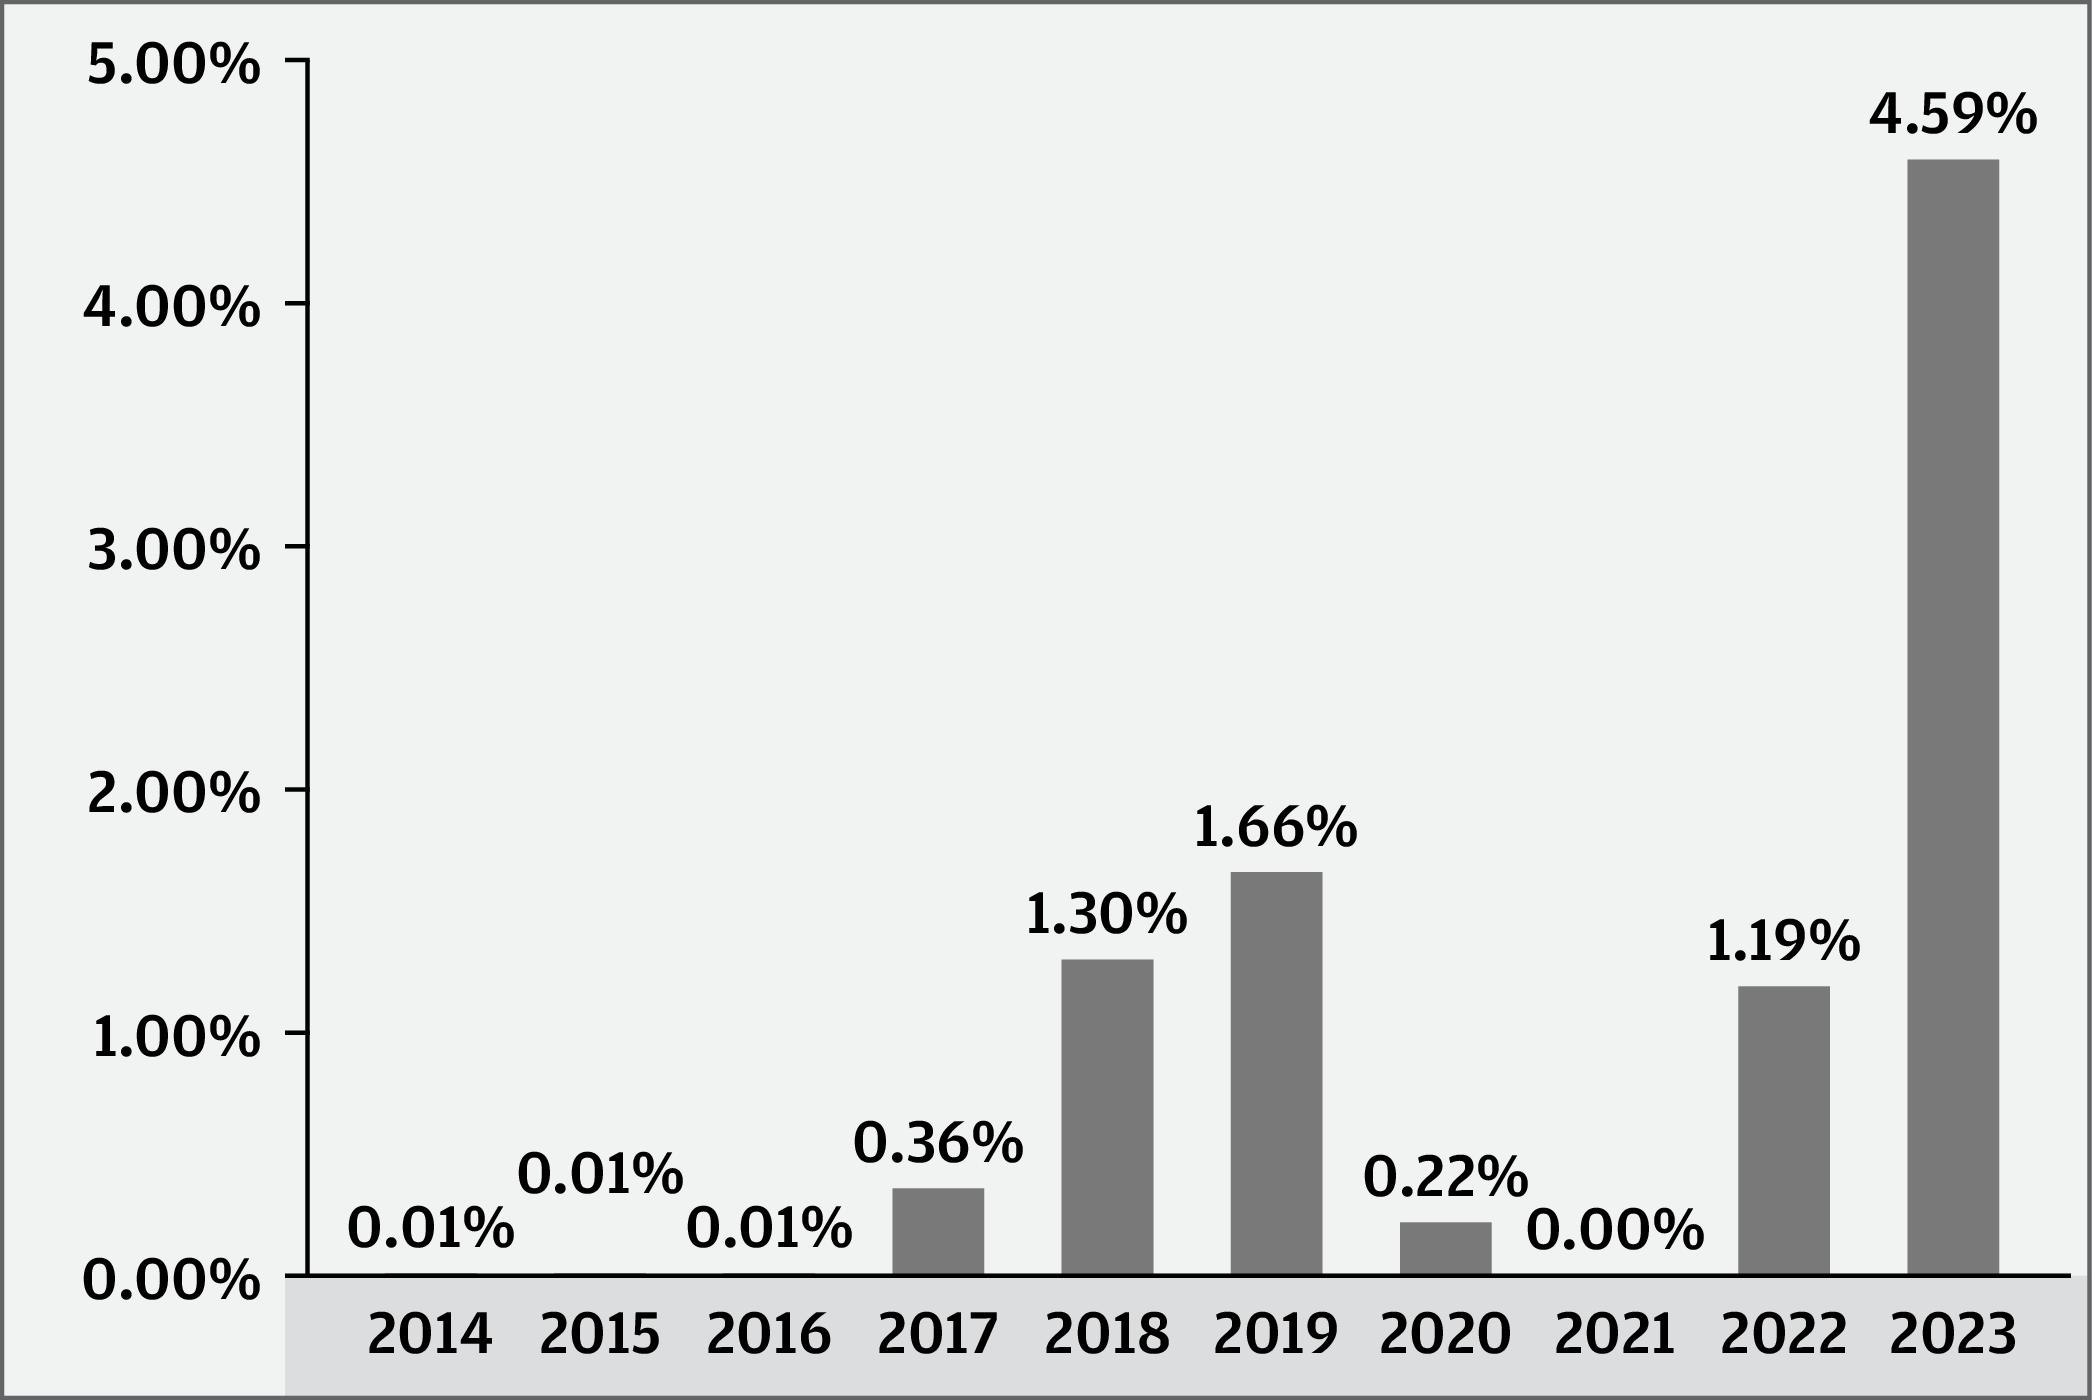
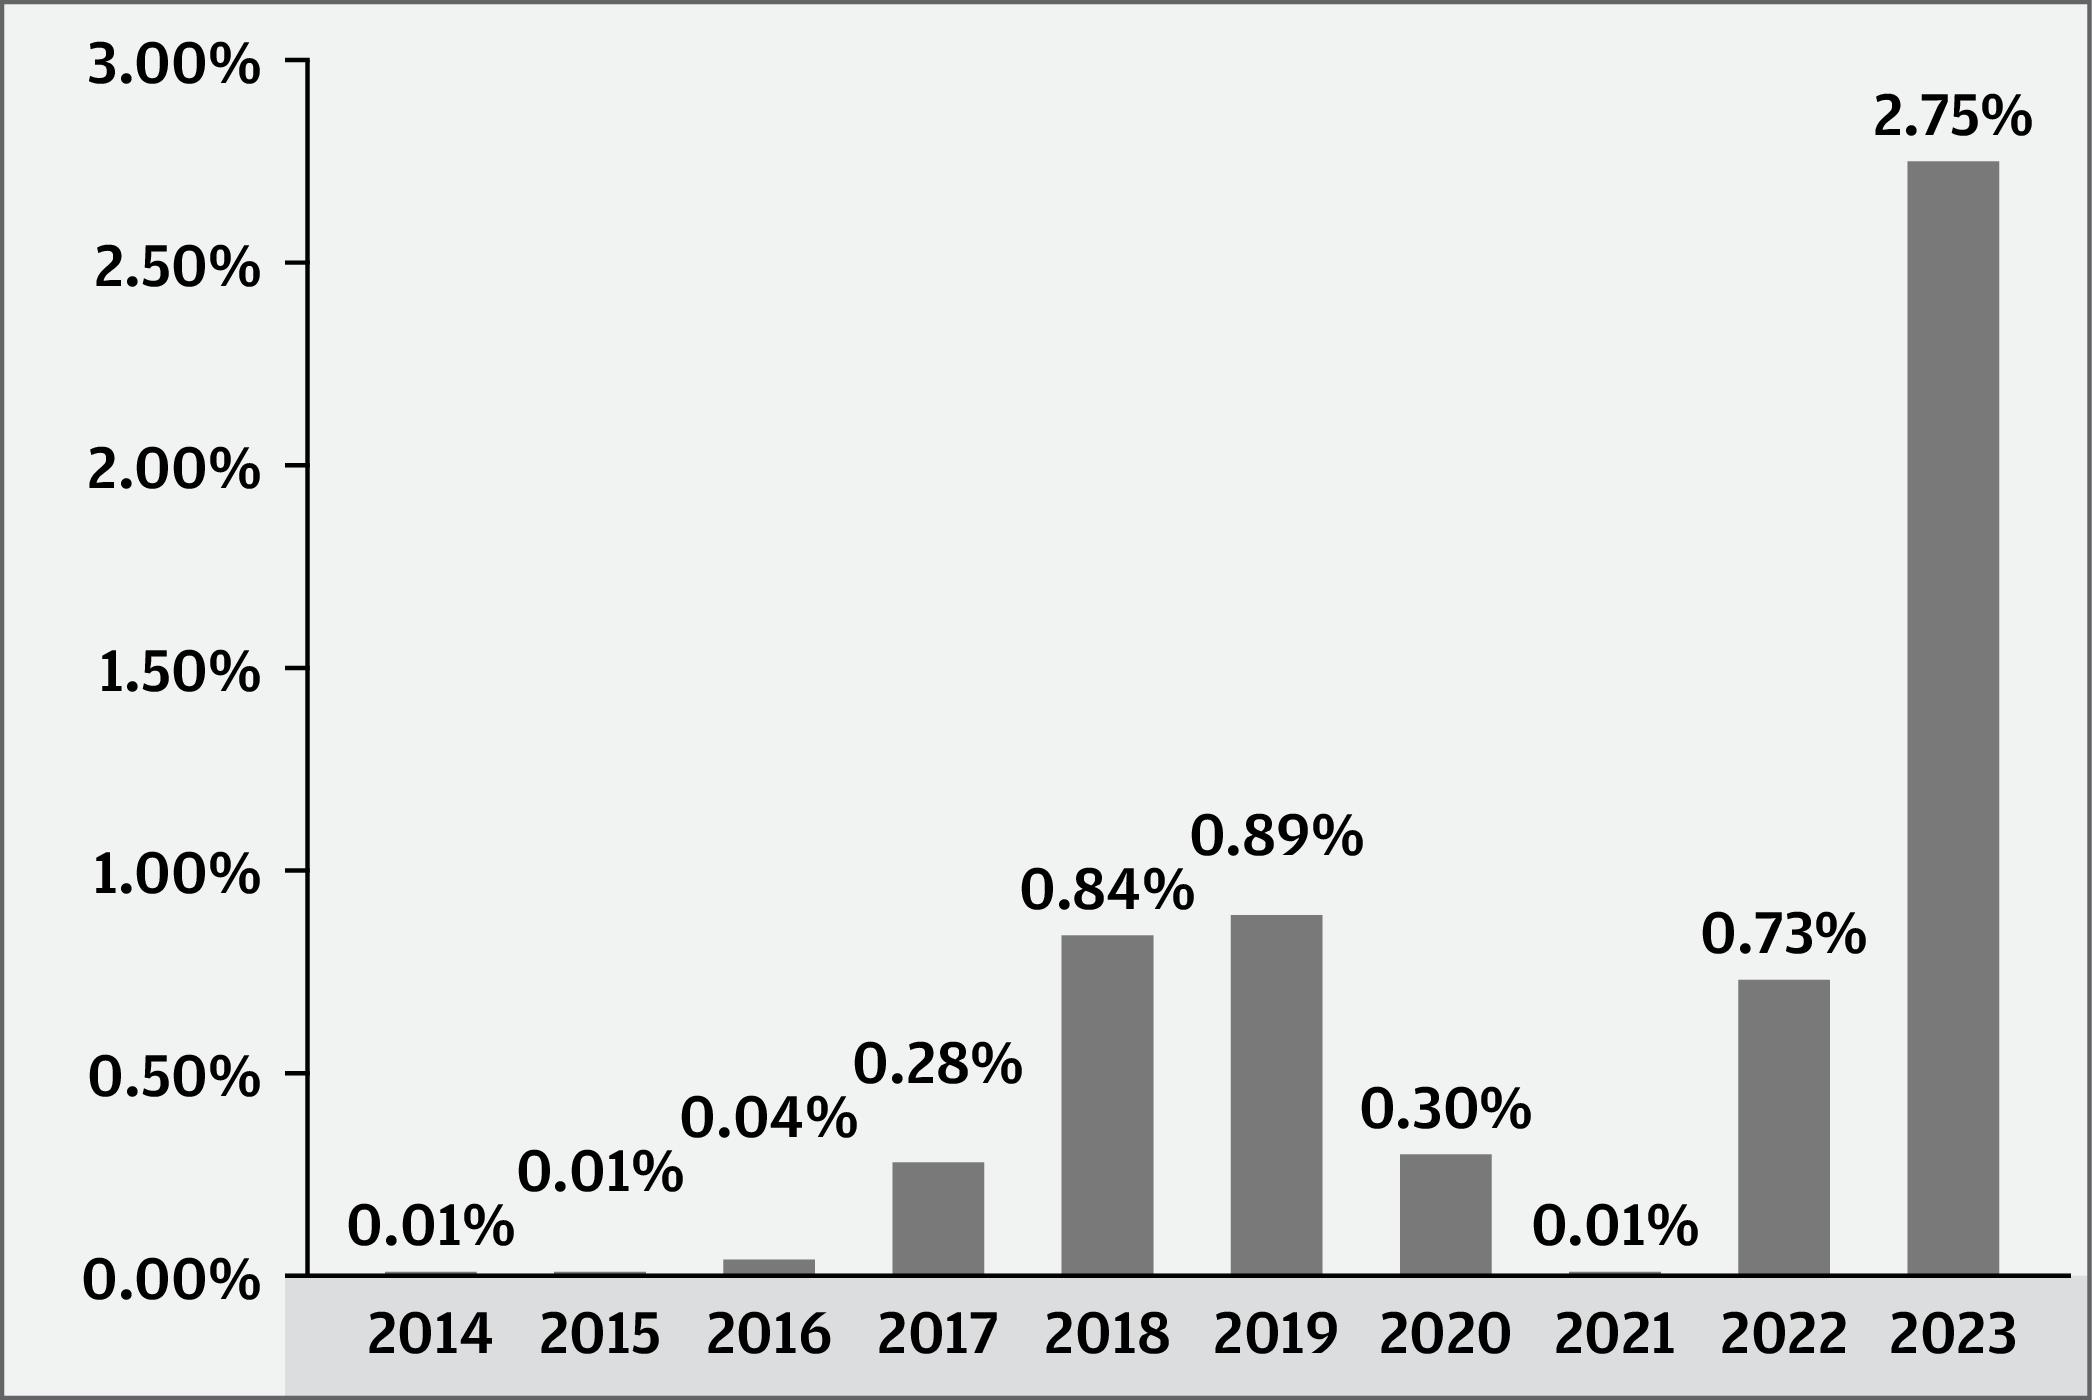
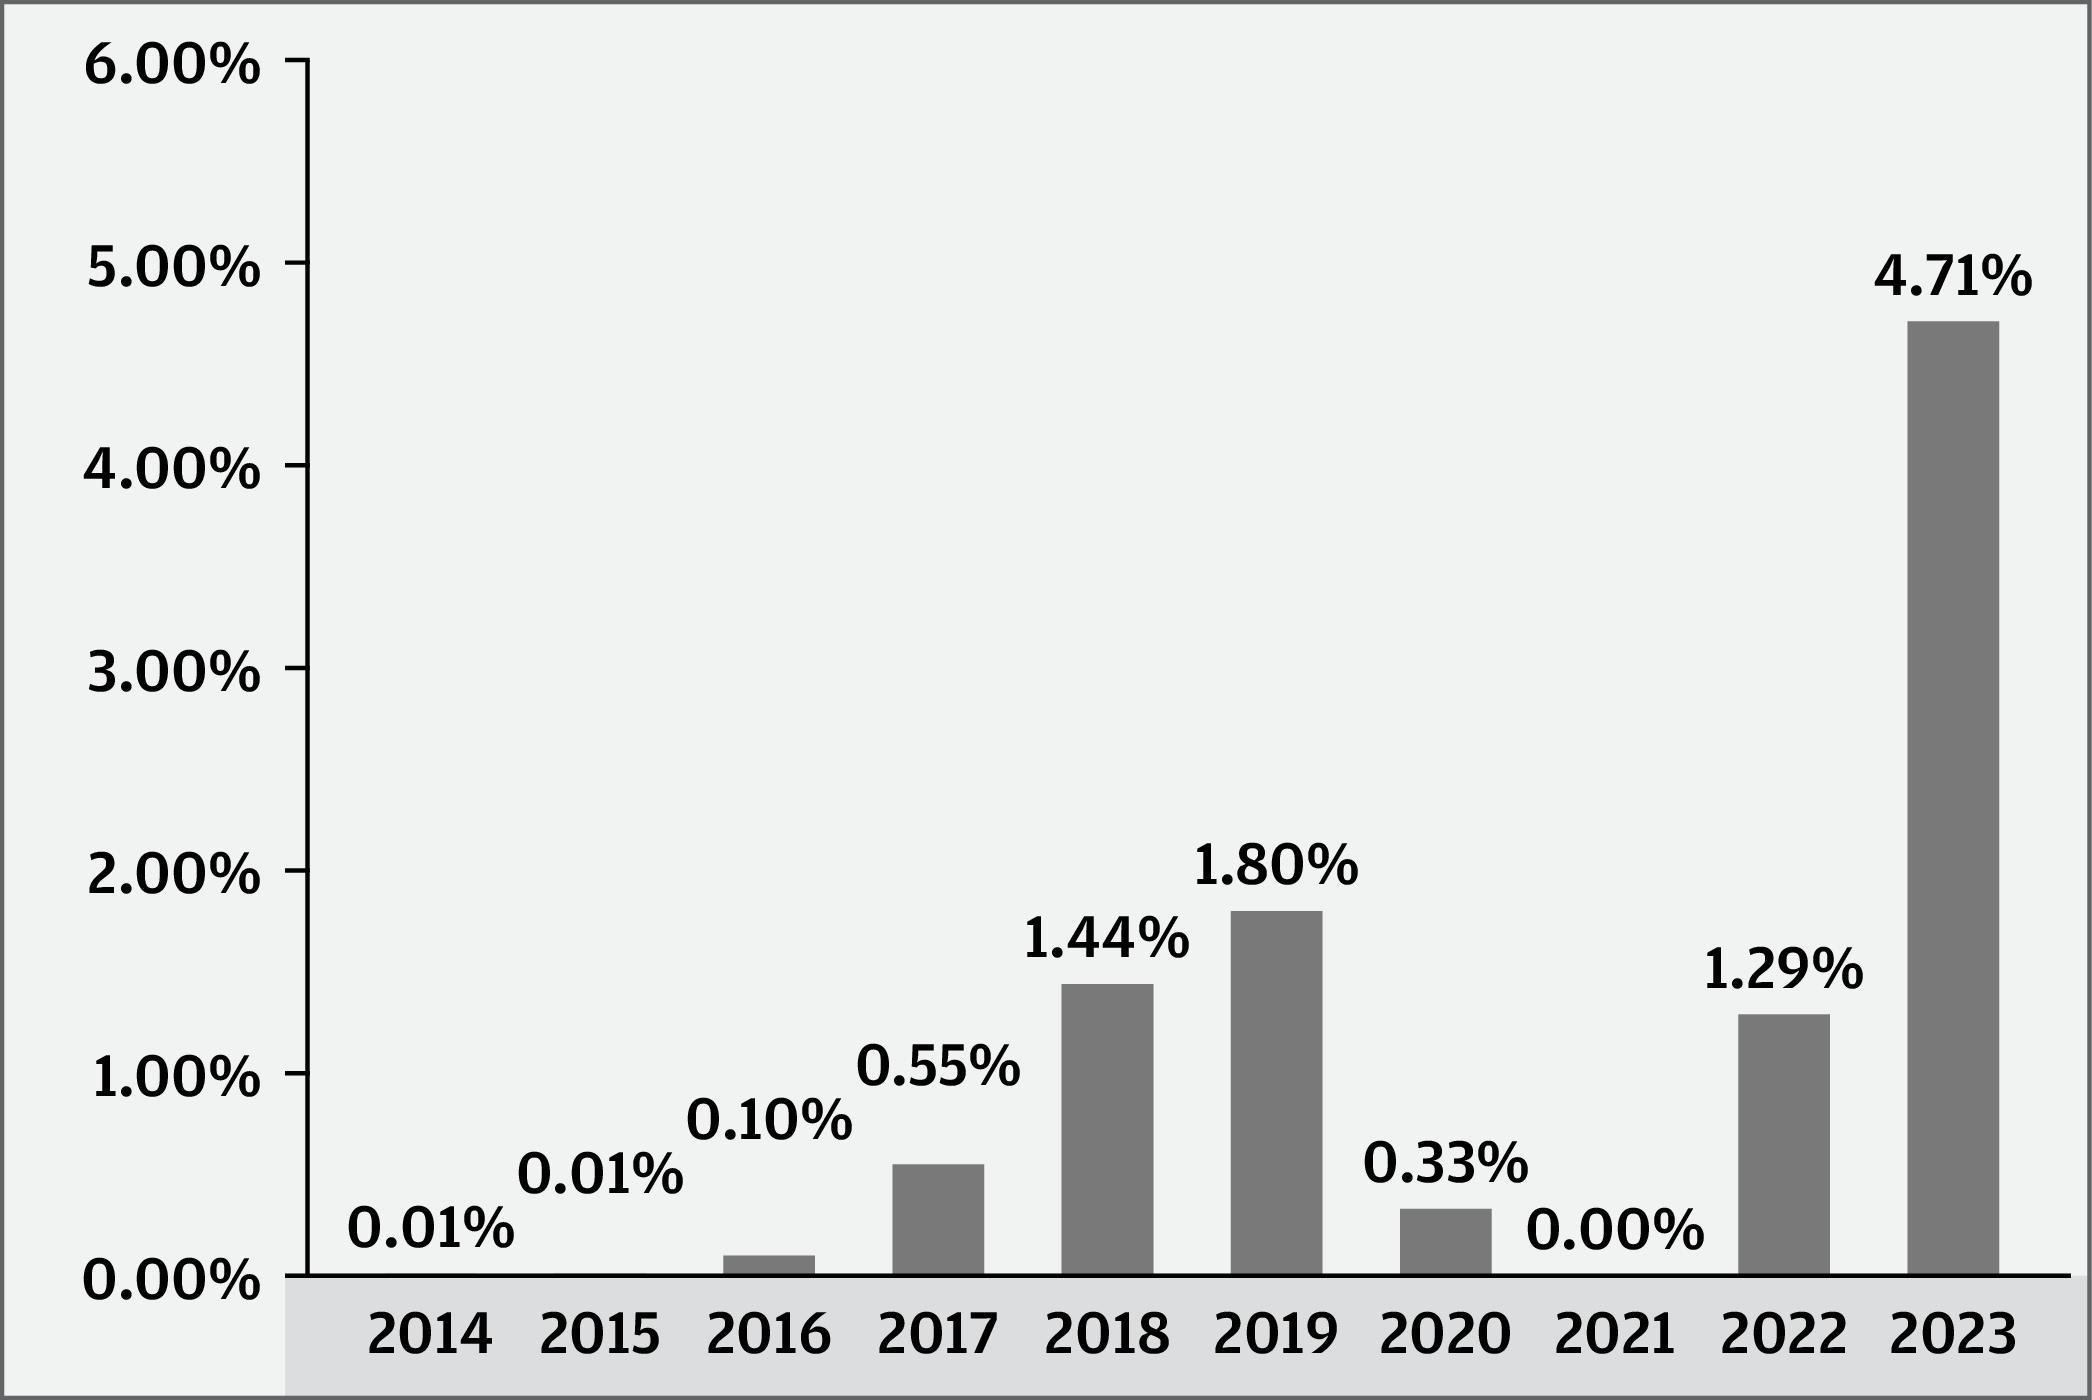
This section provides some indication of the risks of investing in the Fund. The bar chart shows how the performance of the Fund’s Academy Shares has varied from year to year for the past ten calendar years. The table shows the average annual total returns for the past one year, five years and ten years. The performance of Academy Shares is based on the performance of Institutional Shares (which are not offered in this prospectus) prior to the inception of the Academy Shares.
To obtain current yield information call 1-646-341-6869 or visit www.jpmorgan.com/academy. Past performance is not necessarily an indication of how the Fund will perform in the future.
| YEAR-BY-YEAR RETURNS |

| Best Quarter |
4Q, 2023 |
1.32% |
| Worst Quarter |
1Q, 2Q, 3Q and 4Q 2014 1Q, 2Q, 3Q and 4Q 2015 4Q 2020 2Q, 3Q and |
0.00% |
| |
4Q 2021 | |
| The Fund’s year-to-date total return |
through |
3/31/24 |
was |
1.30% |
. |
| AVERAGE ANNUAL TOTAL RETURNS (For periods ended December 31, 2023) | |||
| |
Past 1 Year |
Past 5 Years |
Past 10 Years |
| ACADEMY SHARES |
5.01 % |
1.76 % |
1.14 % |
Management
J.P. Morgan Investment Management Inc. (the adviser)
Purchase and Sale of Fund Shares
The Fund’s Academy Shares are offered to clients of Academy Securities, Inc. and its affiliates (collectively, Academy Clients). Academy Clients may purchase the Academy Shares through accounts maintained with Academy Securities, Inc. or its affiliates. Academy Shares may also be purchased through an electronic-trading platform sponsored by JPMorgan or its affiliates, or through platforms maintained by other financial intermediaries for which JPMIM has contracted with Academy Securities, Inc. to provide marketing support services.
Purchase minimums
| For Academy Shares |
|
| To establish a regular account |
$5,000,000 |
| To add to an account |
No minimum |
16 | J.P. Morgan Money Market Funds
You may purchase or redeem shares on any business day that the Fund is open through your financial advisor or by calling 1-646-341-6869.
Tax Information
The Fund intends to make distributions that may be taxed as ordinary income or capital gains, except when your investment is in an IRA, 401(k) plan or other tax-advantaged investment plan, in which case you may be subject to federal income tax upon withdrawal from the tax-advantaged investment plan.
Payments to Broker-Dealers and Other Financial Intermediaries
If you purchase shares of the Fund through a broker-dealer or other financial intermediary, including Academy Securities, the Fund and its related companies may pay the financial
intermediary for the sale of Fund shares and related services. These payments may create a conflict of interest by influencing the broker-dealer or financial intermediary and your salesperson to recommend the Fund over another investment. Ask your salesperson or visit your financial intermediary’s website for more information.
June 21, 2024 | 17
More About the Funds
Additional Information About the Funds’ Investment Strategies
Prime Money Market Fund
The Fund invests in high quality, short-term money market instruments which are issued and payable in U.S. dollars. The Fund principally invests in:
●
high quality commercial paper and other short-term debt securities, including floating and variable rate demand notes of U.S. and foreign corporations,
●
debt securities issued or guaranteed by qualified U.S. and foreign banks, including certificates of deposit, time deposits and other short-term securities,
●
securities issued or guaranteed by the U.S. government, its agencies or instrumentalities or Government-Sponsored Enterprises (“GSEs”),
●
asset-backed securities,
●
repurchase agreements, and
●
taxable municipal obligations.
The Fund is a money market fund managed in the following manner:
●
The Fund calculates its net asset value to four decimals (e.g., $1.0000) using market-based pricing and operates with a floating net asset value.
●
The dollar-weighted average maturity of the Fund will be 60 days or less and the dollar-weighted average life to maturity will be 120 days or less.
●
The Fund will only buy securities that have remaining maturities of 397 days or less or securities otherwise permitted to be purchased because of maturity shortening provisions under applicable regulation.
●
The Fund invests only in U.S. dollar-denominated securities.
●
The Fund seeks to invest in securities that present minimal credit risk.
The Fund may invest significantly in securities with floating or variable rates of interest. Their yields will vary as interest rates change. The securities in which the Fund may invest include privately placed securities. The Fund will generally hold a portion of its assets in cash, primarily to meet redemptions.
The Fund will concentrate its investments in the banking industry. Therefore, under normal conditions, the Fund will invest at least 25% of its total assets in securities issued by companies in the banking industry. The Fund may, however, invest less than 25% of its total assets in this industry as a temporary defensive measure.
The Fund may trade securities on a when-issued, delayed settlement or forward commitment basis. The Fund’s adviser seeks to develop an appropriate portfolio by considering the differences in yields among securities of different maturities, market sectors and issuers.
Liquidity Fees
The Fund’s policies and procedures permit the Fund to impose a discretionary liquidity fee on redemptions of up to 2% of the value of the shares redeemed if the adviser, as the delegate of the Board, determines it is in the best interests of the Fund.
100% U.S. Treasury Securities Money Market Fund
Under normal conditions, the Fund invests its assets exclusively in obligations of the U.S. Treasury, including Treasury bills, bonds and notes.
These investments carry different interest rates, maturities and issue dates. The interest on these securities is generally exempt from state and local income taxes. Ordinarily, the Fund does not buy securities issued or guaranteed by agencies of the U.S. government.
The Fund is a money market fund managed in the following manner:
●
The Fund seeks to maintain a net asset value (“NAV”) of $1.00 per share.
●
The dollar-weighted average maturity of the Fund will be 60 days or less and the dollar-weighted average life to maturity will be 120 days or less.
●
The Fund will only buy securities that have remaining maturities of 397 days or less or securities otherwise permitted to be purchased because of maturity shortening provisions under applicable regulation.
●
The Fund seeks to invest in securities that present minimal credit risk.
The Fund will generally hold a portion of its assets in cash, primarily to meet redemptions.
18 | J.P. Morgan Money Market Funds
The Fund intends to continue to qualify as a “government money market fund,” as such term is defined in or interpreted under Rule 2a-7 under the Investment Company Act of 1940, as amended (“Investment Company Act”). “Government money market funds” are required to invest at least 99.5% of their assets in (i) cash, (ii) securities issued or guaranteed by the United States or certain U.S. government agencies or instrumentalities and/or (iii) repurchase agreements that are collateralized fully, and are exempt from requirements that permit money market funds to impose a liquidity fee. While the J.P. Morgan Funds’ Board of Trustees (the “Board”) may elect to subject the Fund to liquidity fee requirements in the future, the Board has not elected to do so at this time. A government money market fund may also include investments in other government money market funds as an eligible investment for purposes of the 99.5% requirement above.
The Fund’s adviser seeks to develop an appropriate portfolio by considering the differences in yields among securities of different maturities and issue dates.
U.S. Government Money Market Fund
Under normal conditions, the Fund invests its assets exclusively in:
●
debt securities issued or guaranteed by the U.S. government, or by U.S. government agencies or instrumentalities or Government-Sponsored Enterprises (“GSEs”), and
●
repurchase agreements fully collateralized by U.S. Treasury and U.S. government securities.
The Fund is a money market fund managed in the following manner:
●
The Fund seeks to maintain a net asset value (“NAV”) of $1.00 per share.
●
The dollar-weighted average maturity of the Fund will be 60 days or less and the dollar-weighted average life to maturity will be 120 days or less.
●
The Fund will only buy securities that have remaining maturities of 397 days or less or securities otherwise permitted to be purchased because of maturity shortening provisions under applicable regulation.
●
The Fund invests only in U.S. dollar-denominated securities.
●
The Fund seeks to invest in securities that present minimal credit risk.
The Fund may invest significantly in securities with floating or variable rates of interest. Their yields will vary as interest rates change. The Fund will generally hold a portion of its assets in cash, primarily to meet redemptions.
The Fund intends to continue to qualify as a “government money market fund,” as such term is defined in or interpreted under Rule 2a-7 under the Investment Company Act of 1940, as amended (“Investment Company Act”). “Government money market funds” are required to invest at least 99.5% of their assets in (i) cash, (ii) securities issued or guaranteed by the United States or certain U.S. government agencies or instrumentalities and/or (iii) repurchase agreements that are collateralized fully, and are exempt from requirements that permit money market funds to impose a liquidity fee. While the J.P. Morgan Funds’ Board of Trustees (the “Board”) may elect to subject the Fund to liquidity fee requirements in the future, the Board has not elected to do so at this time. A government money market fund may also include investments in other government money market funds as an eligible investment for purposes of the 99.5% requirement above.
The Fund may trade securities on a when-issued, delayed settlement or forward commitment basis. The Fund’s adviser seeks to develop an appropriate portfolio by considering the differences in yields among securities of different maturities, market sectors and issuers.
U.S. Treasury Plus Money Market Fund
Under normal conditions, the Fund invests its assets exclusively in:
●
obligations of the U.S. Treasury, including Treasury bills, bonds and notes and other obligations issued or guaranteed by the U.S. Treasury, and
●
repurchase agreements fully collateralized by U.S. Treasury securities.
The debt securities described above carry different interest rates, maturities and issue dates.
The Fund is a money market fund managed in the following manner:
●
The Fund seeks to maintain a net asset value (“NAV”) of $1.00 per share.
●
The dollar-weighted average maturity of the Fund will be 60 days or less and the dollar-weighted average life to maturity will be 120 days or less.
●
The Fund will only buy securities that have remaining maturities of 397 days or less or securities otherwise permitted to be purchased because of maturity shortening provisions under applicable regulation.
June 21, 2024 | 19
More About the Funds (continued)
●
The Fund invests only in U.S. dollar-denominated securities.
●
The Fund seeks to invest in securities that present minimal credit risk.
The Fund will generally hold a portion of its assets in cash, primarily to meet redemptions.
The Fund intends to continue to qualify as a “government money market fund,” as such term is defined in or interpreted under Rule 2a-7 under the Investment Company Act of 1940, as amended (“Investment Company Act”).“Government money market funds” are required to invest at least 99.5% of their assets in (i) cash, (ii) securities issued or guaranteed by the United States or certain U.S. government agencies or instrumentalities and/or (iii) repurchase agreements that are collateralized fully, and are exempt from requirements that permit money market funds to impose a liquidity fee. While the J.P. Morgan Funds’ Board of Trustees (the “Board”) may elect to subject the Fund to liquidity fee requirements in the future, the Board has not elected to do so at this time. A government money market fund may also include investments in other government money market funds as an eligible investment for purposes of the 99.5% requirement above.
The Fund’s adviser seeks to develop an appropriate portfolio by considering the differences in yields among securities of different maturities and issue dates.
Each of the Funds
Each Fund may utilize these investment strategies to a greater or lesser degree.
Each Fund is a money market fund managed to meet the requirements of Rule 2a-7 under the Investment Company Act of 1940. Within these requirements, each Fund is managed in the following manner:
●
The dollar-weighted average maturity of each Fund will be 60 days or less, and the dollar-weighted average life to maturity will be 120 days or less. For a discussion of dollar weighted average maturity and dollar-weighted average life to maturity, please see page 42.
●
Each Fund will only buy securities that have remaining maturities of 397 days or less as determined under Rule 2a-7.
●
Each Fund invests only in U.S. dollar-denominated securities.
●
Each taxable Fund will not acquire any security other than a daily liquid asset unless, immediately following such purchase, at least 25% of its total assets would be invested in daily liquid assets and each Fund will not acquire any security other than a weekly liquid asset unless, immediately following such purchase, at least 50% of its total assets would be invested in weekly liquid assets. “Daily liquid assets” means (i) cash; (ii) direct obligations of the U.S. Government; (iii) securities that will mature or are subject to a demand feature that is exercisable and payable within one business day and (iv) amounts receivable and due unconditionally within one business day on pending sales of portfolio securities. “Weekly liquid assets” means (i) cash; (ii) direct obligations of the U.S. Government; (iii) Government securities issued by a person controlled or supervised by and acting as an instrumentality of the Government of the United States pursuant to authority granted by the Congress of the United States, that are issued at a discount to the principal amount to be repaid at maturity without the provision for the payment of interest and have a remaining maturity of 60 days or less; (iv) securities that will mature or are subject to a demand feature that is exercisable and payable within five business days and (v) amounts receivable and due unconditionally within five business days on pending sales of portfolio securities.
●
Each Fund seeks to invest in securities that present minimal credit risk. With regard to the Prime Money Market Fund, these securities will:
●
have one of the two highest short-term ratings from at least two of Standard & Poor’s Corporation, Moody’s Investors Service, Inc. and Fitch Ratings, or one such rating if only one of these rating organizations rates that security;
●
have an additional third party guarantee in order to meet the rating requirements; or
●
be considered of comparable quality by J.P. Morgan Investment Management Inc. (JPMIM), the Funds’ adviser, if the security is not rated by Standard & Poor’s Corporation, Moody’s Investors Service, Inc., or Fitch Ratings.
All of the Funds that are permitted to invest in repurchase agreements may engage in repurchase agreement transactions that are collateralized by cash or government securities. The repurchase agreements in which the Funds invest may be with counterparties with varying degrees of credit quality. The Prime Money Market Fund may, in addition, engage in repurchase agreement transactions that are collateralized by money market instruments, debt securities, loan participations or other securities, including equity securities and securities that are rated below investment grade by nationally recognized statistical rating organizations or unrated securities of comparable quality. High yield securities (known as junk bonds) are considered to be speculative and are subject to greater risk of loss, greater sensitivity to interest rate and economic changes, valuation difficulties and potential illiquidity.
The adviser also integrates financially material environmental, social and governance (ESG) factors as part of the Fund's investment process (ESG Integration). ESG Integration is the systematic inclusion of ESG issues in investment analysis and investment decisions. As part of its security selection strategy, for each Fund except the 100% U.S. Treasury Securities Money Market Fund, the adviser
20 | J.P. Morgan Money Market Funds
seeks to assess the impact of ESG factors on many issuers in the universe in which the Funds may invest. The adviser’s assessment is based on an analysis of key opportunities and risks across industries to seek to identify financially material issues with respect to the Funds’ investments in securities and ascertain key issues that merit engagement with issuers. These assessments may not be conclusive and securities of issuers that may be negatively impacted by such factors may be purchased and retained by the Funds while the Funds may divest or not invest in securities of issuers that may be positively impacted by such factors. In particular, ESG Integration does not change the Funds’ investment objective, exclude specific types of industries or companies or limit the Funds’ investable universe. The Funds are not designed for investors who wish to screen out particular types of companies or investments or are looking for Funds that meet specific ESG goals.
| FUNDAMENTAL INVESTMENT OBJECTIVES |
| An investment objective is fundamental if it cannot be changed without the consent of a majority of the outstanding shares of the Funds. The investment objective for the U.S. Government Money Market Fund is fundamental. The investment objective for the Prime Money Market Fund is not fundamental and may be changed without the consent of a majority of the outstanding shares of the Fund. |
Please note that the Funds also may use strategies that are not described in this section, but which are described in the Statement of Additional Information.
Investment Risks
There can be no assurance that each Fund will achieve its investment objective.
The main risks associated with investing in each Fund are summarized in the “Risk/Return Summaries” at the front of this prospectus. In addition to each Fund’s main risks, each Fund may be subject to additional risks in connection with investments and strategies used by each Fund from time to time. The table below identifies main risks and some of the additional risks for each Fund.
Please note that each Fund may also be subject to other risks that are described in the Statement of Additional Information.
The Funds are subject to the main risks designated as such in the table below, any of which may adversely affect a Fund’s net asset value (NAV), market price, performance and ability to meet its investment objective. Each Fund may also be subject to additional risks that are noted in the table below, as well as those that are not described herein but which are described in the Statement of Additional Information.
June 21, 2024 | 21
More About the Funds (continued)
| |
Prime Money Market Fund |
100% U.S. Treasury Securities Money Market Fund |
U.S. Government Money Market Fund |
U.S. Treasury Plus Money Market Fund |
| Asia Pacific Market Risk |
○ |
|
|
|
| Asset-Backed, Mortgage-Related and Mortgage-Backed Securities Risk |
• |
|
• |
|
| Concentration Risk |
• |
|
|
|
| Credit Risk |
• |
• |
• |
• |
| Cybersecurity Risk |
○ |
○ |
○ |
○ |
| European Market Risk |
○ |
|
|
|
| Floating and Variable Rate Securities Risk |
• |
○ |
• |
○ |
| Foreign Securities Risk |
• |
|
|
|
| General Market Risk |
• |
• |
• |
• |
| Geographic Focus Risk |
○ |
|
|
|
| Government Securities Risk |
• |
• |
• |
• |
| Industry and Sector Focus Risk |
• |
|
|
|
| Interest Rate Risk |
• |
• |
• |
• |
| Interfund Lending Risk |
|
|
• |
|
| Japan Risk |
○ |
|
|
|
| LIBOR Discontinuance or Unavailability Risk |
• |
|
|
|
| Municipal Obligations Risk |
• |
|
|
|
| Net Asset Value Risk |
|
• |
• |
• |
| Prepayment Risk |
• |
• |
• |
• |
| Privately Placed Securities Risk |
• |
|
|
|
| Regulatory and Legal Risk |
○ |
○ |
○ |
○ |
| Repurchase Agreement Risk |
• |
|
• |
• |
| Risk Associated with the Fund Holding Cash |
• |
• |
• |
• |
| Risk of Regulation of Money Market Funds |
• |
• |
• |
• |
| State and Local Taxation Risk |
|
|
• |
|
| Transactions and Liquidity Risk |
• |
• |
• |
• |
| Volcker Rule Risk |
○ |
○ |
○ |
○ |
| When-Issued, Delayed Settlement and Forward Commitment Transactions Risk |
• |
|
• |
|
●
Main Risks
○
Additional Risks
22 | J.P. Morgan Money Market Funds
Interest Rate Risk. The Funds invest in debt securities that increase or decrease in value based on changes in interest rates. If rates increase, the value of these investments generally declines. On the other hand, if rates fall, the value of these investments generally increases. Your investment will decline in value if the value of these investments decreases. Securities with greater interest rate sensitivity and longer maturities generally are subject to greater fluctuations in value. Each Fund may invest in variable and floating rate securities. Although these instruments are generally less sensitive to interest rate changes than fixed rate instruments, the value of variable and floating rate securities may decline if their interest rates do not rise as quickly, or as much, as general interest rates. Many factors can cause interest rates to rise. Some examples include central bank monetary policy, rising inflation rates and general economic conditions. The Funds may face a heightened level of interest rate risk due to certain changes or uncertainty in monetary policy.
Debt market conditions are highly unpredictable and some parts of the market are subject to dislocations. It is difficult to accurately predict the pace at which the Federal Reserve Board will change interest rates any further, or the timing, frequency or magnitude of any such changes, and the evaluation of macro-economic and other conditions could cause a change in approach in the future. Any such changes could be sudden and could expose debt markets to significant volatility and reduced liquidity for Fund investments.
Credit Risk. There is a risk that the issuer and/or a counterparty to a security, contract, repurchase agreement or other investment, will default or otherwise become unable to honor a financial obligation. The risk of defaults across issuers and/or counterparties increases in adverse market and economic conditions, including the conditions resulting from the COVID-19 pandemic. The price and liquidity of a security can also be adversely affected if either its credit status or the market environment generally deteriorates and the probability of default rises. The value of your investment could decline as a result of these events. Prices of a Fund’s investments may be adversely affected if any of the issuers or counterparties it is invested in are subject to an actual or perceived deterioration in their credit quality. Credit spreads may increase, which may reduce the market values of a Fund’s securities. Credit spread risk is the risk that economic and market conditions or any actual or perceived credit deterioration may lead to an increase in the credit spreads (i.e., the difference in yield between two securities of similar maturity but different credit quality) and a decline in price of the issuer’s securities.
General Market Risk. Economies and financial markets throughout the world are becoming increasingly interconnected, which increases the likelihood that events or conditions in one country or region will adversely impact markets or issuers in other countries or regions. Securities in the Fund’s portfolio may underperform in comparison to securities in general financial markets, a particular financial market or other asset classes due to a number of factors, including inflation (or expectations for inflation), deflation (or expectations for deflation), interest rates, global demand for particular products or resources, market instability, financial system instability, debt crises and downgrades, embargoes, tariffs, sanctions and other trade barriers, regulatory events, other governmental trade or market control programs and related geopolitical events. In addition, the value of the Fund’s investments may be negatively affected by the occurrence of global events such as war, terrorism, environmental disasters, natural disasters or events, country instability, and infectious disease epidemics or pandemics.
For example, the outbreak of COVID-19 negatively affected economies, markets and individual companies throughout the world, including those in which a Fund invests. The effects of any future pandemic or other global event to public health and business and market conditions, may have a significant negative impact on the performance of the Fund’s investments, increase the Fund’s volatility, exacerbate pre-existing political, social and economic risks to the Fund, and negatively impact broad segments of businesses and populations. In addition, governments, their regulatory agencies, or self-regulatory organizations have taken or may take actions in response to a pandemic or other global event that affect the instruments in which the Fund invests, or the issuers of such instruments, in ways that could have a significant negative impact on the Fund’s investment performance. The ultimate impact of any pandemic or other global event and the extent to which the associated conditions and governmental responses impact a Fund will also depend on future developments, which are highly uncertain, difficult to accurately predict and subject to frequent changes.
Asset-Backed, Mortgage-Related and Mortgage-Backed Securities Risk. Mortgage-related and asset-backed securities differ from conventional debt securities and are subject to certain additional risks because principal is paid back over the life of the security rather than at maturity. The value of these securities will be influenced by the factors affecting the housing market and the assets underlying such securities. As a result, during periods of difficult or frozen credit markets, significant changes in interest rates, or deteriorating economic conditions, mortgage-related and asset-backed securities may decline in value, face valuation difficulties, become more volatile and/or become illiquid. Additionally, during such periods and also under normal conditions, these securities are also subject to prepayment and call risk. Gains and losses associated with prepayments will increase/decrease the income available for distributions by a Fund and the Fund’s yield. When mortgages and other obligations are prepaid and when securities are called, a Fund may have to reinvest in securities with a lower yield or fail to recover additional amounts (i.e., premiums) paid for securities with higher interest rates, resulting in an unexpected capital loss and/or a decrease in the amount of dividends and yield. In periods of either rising or declining interest rates, a Fund may be subject to extension risk, and may receive principal later than expected. As a result, in periods of rising interest rates, a Fund may exhibit additional volatility. Some of these securities may receive little or no collateral protection from the underlying assets and are thus subject to the risk of default described under “Credit Risk.”
June 21, 2024 | 23
More About the Funds (continued)
Additionally, asset-backed, mortgage-related and mortgage-backed securities are subject to risks associated with their structure and the nature of the assets underlying the securities and the servicing of those assets. Certain asset-backed, mortgage-related and mortgage-backed securities may face valuation difficulties and may be less liquid than other types of asset-backed, mortgage-related and mortgage-backed securities, or debt securities.
The mortgage loans underlying privately issued mortgage-related securities may not be subject to the same underwriting requirements for the underlying mortgages that are applicable to those mortgage-related securities that have government or government-sponsored entity guarantees. As a result, the mortgage loans underlying privately issued mortgage-related securities may have less favorable collateral, credit risk or other underwriting characteristics than government or government-sponsored mortgage-related securities and have wider variances in a number of terms including interest rate, term, size, purpose and borrower characteristics. In addition, certain mortgage-related securities which may include loans that originally qualified under standards established by government-sponsored entities (for example, certain REMICs that include Fannie Mae mortgages) are not considered as government securities for purposes of a Fund’s investment strategies or policies. There is no government or government-sponsored guarantee for such privately issued investments.
Government Securities Risk. U.S. government securities include securities issued or guaranteed by the U.S. government or its agencies and instrumentalities (such as securities issued by the Government National Mortgage Association (Ginnie Mae), the Federal National Mortgage Association (Fannie Mae), the Federal Home Loan Mortgage Corporation (Freddie Mac) or other Government-Sponsored Enterprises (GSEs)). U.S. government securities are subject to market risk, interest rate risk and credit risk. Securities, such as those issued or guaranteed by Ginnie Mae or the U.S. Treasury, that are backed by the full faith and credit of the United States are guaranteed only as to the timely payment of interest and principal when held to maturity and the market prices for such securities will fluctuate. Notwithstanding that these securities are backed by the full faith and credit of the United States, circumstances could arise that would prevent the payment of interest or principal. This would result in losses to a Fund. Securities issued or guaranteed by U.S. government related organizations, such as Fannie Mae and Freddie Mac, are not backed by the full faith and credit of the U.S. government and no assurance can be given that the U.S. government will provide financial support. Therefore, U.S. government related organizations may not have the funds to meet their payment obligations in the future. U.S. government securities include zero coupon securities, which tend to be subject to greater market risk than interest-paying securities of similar maturities.
Risk of Regulation of Money Market Funds. The SEC has adopted amendments to the rules that govern money market funds. These amendments may affect a Fund’s investment strategies, performance, yield, expenses, operations and continued viability.
Transactions and Liquidity Risk. A Fund could experience a loss when selling securities to meet redemption requests, and its liquidity may be negatively impacted. The risk of loss increases if the redemption requests are large or frequent, occur in times of overall market turmoil or declining prices for the securities sold, or when the securities a Fund wishes to, or is required to, sell are illiquid. To the extent a large proportion of shares of a Fund are held by a small number of shareholders (or a single shareholder) including funds or accounts over which the adviser or its affiliates have investment discretion, a Fund is subject to the risk that these shareholders will purchase or redeem Fund shares in large amounts rapidly or unexpectedly, including as a result of an asset allocation decision made by the adviser or its affiliates. In addition to the other risks described in this section, these transactions could adversely affect the ability of a Fund to conduct its investment program. A Fund may be unable to sell illiquid securities at its desired time or price or the price at which the securities have been valued for purposes of the Fund’s net asset value (“NAV”). Illiquidity can be caused by a drop in overall market trading volume, an inability to find a ready buyer, or legal restrictions on the securities’ resale. Other market participants may be attempting to sell debt securities at the same time as a Fund, causing downward pricing pressure and contributing to illiquidity. The capacity for bond dealers to engage in trading or “make a market” in debt securities has not kept pace with the growth of bond markets. This could potentially lead to decreased liquidity and increased volatility in the debt markets. Liquidity and valuation risk may be magnified in a rising interest rate environment, when credit quality is deteriorating or in other circumstances where investor redemptions from fixed income mutual funds may be higher than normal. Certain securities that were liquid when purchased may later become illiquid, particularly in times of overall economic distress. Similarly, large purchases of Fund shares may adversely affect a Fund’s performance to the extent that the Fund is delayed in investing new cash and is required to maintain a larger cash position than it ordinarily would. Large redemptions also could accelerate the realization of capital gains, increase a Fund’s transaction costs and impact a Fund’s performance.
Repurchase Agreement Risk. There is a risk that the counterparty to a repurchase agreement will default or otherwise become unable to honor a financial obligation and the value of your investment could decline as a result.
A repurchase agreement is subject to the risk that the seller may fail to repurchase the security. In the event of default by the seller under a repurchase agreement construed to be a collateralized loan, the underlying securities would not be owned by a Fund, but would only constitute collateral for the seller’s obligation to pay the repurchase price. Therefore, a Fund may suffer time delays and incur costs in connection with the disposition of the collateral. For example, certain repurchase agreements a Fund may enter into may or may not be subject to an automatic stay in bankruptcy proceedings. As a result of the automatic stay, to the extent applicable,
24 | J.P. Morgan Money Market Funds
a Fund could be prohibited from selling the collateral in the event of a counterparty’s bankruptcy unless the Fund is able to obtain the approval of the bankruptcy court. In addition, to the extent that a repurchase agreement is secured by collateral other than cash and government securities (“Non-Traditional Collateral”), these risks may be magnified and the value of Non-Traditional Collateral may be more volatile or less liquid thereby increasing the risk that a Fund will be unable to recover fully in the event of a counterparty’s default. High yield securities (known as junk bonds) are considered to be speculative and are subject to greater risk of loss, greater sensitivity to interest rate and economic changes, valuation difficulties and potential illiquidity.
Concentration Risk. Because the Prime Money Market Fund will, under ordinary circumstances, invest a significant portion of its assets in securities of companies in the banking industry, developments affecting the banking industry may have a disproportionate impact on the Fund.
Foreign Securities Risk. Because the Funds may invest in foreign securities, they are subject to special risks in addition to those applicable to U.S. investments. These risks include political and economic risks, civil conflicts and war, greater volatility, expropriation and nationalization risks, sanctions or other measures by the United States or other governments, currency fluctuations, higher transaction costs, delayed settlement, possible foreign controls on investment, and less stringent investor protection and disclosure standards of foreign markets. The securities markets of many foreign countries are relatively small, with a limited number of companies representing a small number of industries. In certain markets where securities and other instruments are not traded “delivery versus payment,” a Fund may not receive timely payment for securities or other instruments it has delivered or receive delivery of securities paid for and may be subject to increased risk that the counterparty will fail to make payments or delivery when due or default completely. Securities registration, custody, and settlement may in some instances be subject to delays and legal and administrative uncertainties. Foreign investment in the securities markets of certain foreign countries is restricted or controlled to varying degrees. These restrictions or controls may at times limit or preclude investment in certain securities and may increase the costs and expenses of a Fund. In addition, the repatriation of investment income, capital or the proceeds of sales of securities from certain of the countries is controlled under regulations, including in some cases the need for certain advance government notification or authority, and if a deterioration occurs in a country’s balance of payments, the country could impose temporary restrictions on foreign capital remittances. A Fund also could be adversely affected by delays in, or a refusal to grant, any required governmental approval for repatriation, as well as by the application to it of other restrictions on investment. Events and evolving conditions in certain economies or markets may alter the risks associated with investments tied to countries or regions that historically were perceived as comparatively stable becoming riskier and more volatile.
Industry and Sector Focus Risk. At times, a Fund may increase the relative emphasis of its investments in a particular industry or sector. The prices of securities of issuers in a particular industry or sector may be more susceptible to fluctuations due to changes in economic or business conditions, government regulations, availability of basic resources or supplies, contagion risk within a particular industry or sector or to other industries or sectors, or other events that affect that industry or sector more than securities of issuers in other industries and sectors. To the extent that a Fund increases the relative emphasis of its investments in a particular industry or sector, the value of the Fund’s shares may fluctuate in response to events affecting that industry or sector.
Floating and Variable Rate Securities Risk. Floating and variable rate securities provide for a periodic adjustment in the interest rate paid on the securities. The rate adjustment intervals may be regular and range from daily up to annually, or may be based on an event, such as a change in the prime rate. Floating and variable rate securities may be subject to greater liquidity risk than other debt securities, meaning that there may be limitations on a Fund’s ability to sell the securities at any given time. Such securities also may lose value.
Net Asset Value Risk. There is no assurance that a Fund will maintain a stable net asset value of $1.00 per share on a continuous basis. Furthermore, there can be no assurance that a Fund’s affiliates will purchase distressed assets from a Fund, make capital infusions, enter into capital support agreements or take other actions to ensure that a Fund maintains a stable net asset value. In the event any money market fund fails to maintain a stable net asset value, other money market funds, including a Fund, could face a universal risk of increased redemption pressures, potentially jeopardizing the stability of their net asset values. In general, certain other money market funds have in the past failed to maintain stable net asset values and there can be no assurance that such failures and resulting redemption pressures will not occur in the future. The Prime Money Market Fund will not maintain a stable NAV per share. The value of the Fund’s shares is calculated to four decimal places and fluctuates with changes in the values of the Fund’s portfolio securities.
Municipal Obligations Risk. The risk of a municipal obligation generally depends on the financial and credit status of the issuer. Changes in a municipality’s financial health may make it difficult for the municipality to make interest and principal payments when due. A number of municipalities have had significant financial problems recently, and these and other municipalities could, potentially, continue to experience significant financial problems resulting from lower tax revenues and/or decreased aid from state and local governments in the event of an economic downturn. This could decrease a Fund’s income or hurt the ability to preserve capital and liquidity.
June 21, 2024 | 25
More About the Funds (continued)
Under some circumstances, municipal obligations might not pay interest unless the state legislature or municipality authorizes money for that purpose. Some obligations, including municipal lease obligations, carry additional risks. For example, they may be difficult to trade or interest payments may be tied only to a specific stream of revenue.
Municipal obligations may be more susceptible to downgrades or defaults during recessions or similar periods of economic stress. Factors contributing to the economic stress on municipalities may include lower property tax collections as a result of lower home values, lower sales tax revenue as a result of consumers cutting back spending, and lower income tax revenue as a result of a higher unemployment rate. In addition, since some municipal obligations may be secured or guaranteed by banks and other institutions, the risk to a Fund could increase if the banking or financial sector suffers an economic downturn and/or if the credit ratings of the institutions issuing the guarantee are downgraded or at risk of being downgraded by a national rating organization. If such events were to occur, the value of the security could decrease or the value could be lost entirely, and it may be difficult or impossible for a Fund to sell the security at the time and the price that normally prevails in the market. Such a downward revision or risk of being downgraded may have an adverse effect on the market prices of the obligations and thus the value of a Fund’s investments. To the extent that the financial institutions securing the municipal obligations are located outside the U.S., these obligations could be riskier than those backed by U.S. institutions because of possible political, social or economic instability, higher transaction costs, currency fluctuations, and possible delayed settlement.
In addition to being downgraded, an insolvent municipality may file for bankruptcy. For example, Chapter 9 of the Bankruptcy Code provides a financially distressed municipality protection from its creditors while it develops and negotiates a plan for reorganizing its debts. “Municipality” is defined broadly by the Bankruptcy Code as a “political subdivision or public agency or instrumentality of a state” and may include various issuers of obligations in which a Fund invests. The reorganization of a municipality’s debts may include extending debt maturities, reducing the amount of principal or interest, refinancing the debt or taking other measures, which may significantly affect the rights of creditors and the value of the obligations issued by the municipality and the value of a Fund’s investments.
For some Funds, there may be times that, in the opinion of the adviser, municipal money market securities of sufficient quality are not available for a Fund to be able to invest in accordance with its normal investment policies.
Interest on municipal obligations, while generally exempt from federal income tax, may not be exempt from federal alternative minimum tax.
Geographic Focus Risk. A Fund may focus its investments in one or more regions or small groups of countries. As a result, the Fund’s performance may be subject to greater volatility than a more geographically diversified fund and may be subject to the risks facing certain regions.
When-Issued, Delayed Settlement and Forward Commitment Transactions Risk. A Fund may purchase or sell securities which it is eligible to purchase or sell on a when-issued basis, may purchase and sell such securities for delayed delivery and may make contracts to purchase or sell such securities for a fixed price at a future date beyond normal settlement time (forward commitments). When-issued transactions, delayed delivery purchases and forward commitments involve the risk that the security a Fund buys will lose value prior to its delivery. There also is the risk that the security will not be issued or that the other party to the transaction will not meet its obligation. If this occurs, a Fund loses both the investment opportunity for the assets it set aside to pay for the security and any gain in the security’s price.
Risk Associated with the Fund Holding Cash. A Fund will generally hold a portion of its assets in cash, primarily to meet redemptions. Cash positions may hurt performance and may subject a Fund to additional risks and costs, such as increased exposure to the custodian bank holding the assets and any fees imposed for large cash balances.
Prepayment Risk. The issuer of certain securities may repay principal in advance, especially when yields fall. Changes in the rate at which prepayments occur can affect the return on investment of these securities. When debt obligations are prepaid or when securities are called, a Fund may have to reinvest in securities with a lower yield. A Fund also may fail to recover additional amounts (i.e., premiums) paid for securities with higher coupons, resulting in an unexpected capital loss.
LIBOR Discontinuance and Unavailability Risk. The London Interbank Offering Rate (LIBOR) was a leading floating rate benchmark used in loans, notes, derivatives and other instruments or investments. As a result of benchmark reforms, publication of most LIBOR settings has ceased. Some LIBOR settings continue to be published but only on a temporary, synthetic and non-representative basis. Regulated entities have generally ceased entering into new LIBOR contracts in connection with regulatory guidance or prohibitions. Public and private sector actors have worked to establish alternative reference rates to be used in place of LIBOR. There is no assurance that any such alternative reference rate will be similar to or produce the same value or economic equivalence as LIBOR or that it will have the same volume or liquidity as did LIBOR which may affect the value, volatility, liquidity or return on certain of the Fund’s loans, notes, derivatives and other instruments or investments comprising some or all of the Fund’s investments and result in costs incurred in connection with changing reference rates used for positions, closing out positions and entering into new trades. Certain of
26 | J.P. Morgan Money Market Funds
the Fund’s investments may have transitioned from LIBOR or will transition from LIBOR in the future. The transition from LIBOR to alternative reference rates may result in operational issues for the Fund or its investments. No assurances can be given as to the impact of the LIBOR transition (and the timing of any such impact) on the Fund and its investments.
Interfund Lending Risk. A delay in repayment to a Fund from a borrowing fund could result in lost opportunity costs. Interfund loans are subject to the risk that the borrowing fund could be unable to repay the loan when due. In the case of a default by a borrowing fund and to the extent that the loan is collateralized, a Fund could take possession of collateral that the Fund is not permitted to hold and, therefore, would be required to dispose of such collateral as soon as possible, which could result in a loss to the Fund. A Fund’s interfund lending arrangements are subject to certain conditions under an SEC exemptive order. Although the conditions of the SEC exemptive order are designed to minimize the risks associated with interfund lending, no lending activity is without risk.
Privately Placed Securities Risk. Privately placed securities generally are less liquid than publicly traded securities and a Fund may not always be able to sell such securities without experiencing delays in finding buyers or reducing the sale price for such securities. The disposition of some of the securities held by a Fund may be restricted under federal securities laws or by the relevant exchange or by a governmental or supervisory authority. As a result, a Fund may not be able to dispose of such investments at a time when, or at a price at which, it desires to do so and may have to bear expenses of registering these securities, if necessary. These securities may also be difficult to value.
State and Local Taxation Risk. A Fund may invest in securities whose interest is subject to state and local income taxes. Consult your tax professional for more information.
Asia Pacific Market Risk. The economies in the Asia Pacific region are in all stages of economic development and may be intertwined. The small size of securities markets and the low trading volume in some countries in the Asia Pacific region may lead to a lack of liquidity. The share prices of companies in the region tend to be volatile and there is a significant possibility of loss. Many of the countries in the region are developing, both politically and economically, and as a result companies in the region may be subject to risks like nationalization or other forms of government interference, and/or may be heavily reliant on only a few industries or commodities. Investments in the region may also be subject to currency risks, such as restrictions on the flow of money in and out of the country, extreme volatility relative to the U.S. dollar, and devaluation, all of which could decrease the value of a Fund. The imposition of tariffs or other trade barriers or a downturn in the economy of a significant trading partner could adversely impact Chinese companies.
European Market Risk. A Fund’s performance will be affected by political, social and economic conditions in the various countries in which it invests in Europe and in Europe more generally, such as growth of the economic output (the gross national product), the rate of inflation, the rate at which capital is reinvested into European economies, the success of governmental actions to reduce budget deficits, the resource self-sufficiency of European countries and interest and monetary exchange rates between European countries. European financial markets may experience volatility due to concerns about high government debt levels, credit rating downgrades, rising unemployment, the future of the euro as a common currency, possible restructuring of government debt and other government measures responding to those concerns, and fiscal and monetary controls imposed on member countries of the European Union. The risk of investing in Europe may be heightened due to steps taken by the United Kingdom to exit the European Union. On January 31, 2020, the United Kingdom officially withdrew from the European Union. As of May 1, 2021, the EU-UK Trade and Cooperation Agreement (“TCA”) governs certain aspects of the European Union’s and the United Kingdom’s relationship, many of which are still to be determined, including those related to financial services. Notwithstanding the TCA, significant uncertainty remains in the market regarding the ramifications of the United Kingdom’s withdrawal from the European Union. The impact on the United Kingdom and European economies and the broader global economy could be significant, resulting in increased volatility and illiquidity, currency fluctuations, impacts on arrangements for trading and on other existing cross-border cooperation arrangements (whether economic, tax, fiscal, legal, regulatory or otherwise), and in potentially lower growth for companies in the United Kingdom, Europe and globally, which could have an adverse effect on the value of a Fund’s investments. In addition, if one or more other countries were to exit the European Union or abandon the use of the euro as a currency, the value of investments tied to those countries or the euro could decline significantly and unpredictably.
Japan Risk. Japan may be subject to political, economic, nuclear and labor risks, among others. Any of these risks, individually or in the aggregate, can impact an investment made in Japan. The growth of Japan’s economy has recently lagged that of its Asian neighbors and other major developed economies. Since the year 2000, Japan’s economic growth rate has remained relatively low, and it may remain low in the future. Furthermore, the Japanese economic growth rate could be impacted by Bank of Japan monetary policies, rising interest rates, tax increases, budget deficits, consumer confidence and volatility in the Japanese yen. The Japanese economy is heavily dependent on international trade and has been adversely affected in the past by trade tariffs, other protectionist measures, competition from emerging economies and the economic conditions of its trading partners. Japan is also heavily dependent on oil imports, and higher commodity prices could therefore have a negative impact on the Japanese economy. Strained
June 21, 2024 | 27
More About the Funds (continued)
foreign relations with neighboring countries (China, South Korea, North Korea and Russia) may not only negatively impact the Japanese economy but also the geographic region as well as globally. In addition, Japan's economy has in the past and could in the future be significantly impacted by natural disasters.
Cyber Security Risk. As the use of technology has become more prevalent in the course of business, the Funds have become more susceptible to operational and financial risks associated with cyber security, including: theft, loss, misuse, improper release, corruption and destruction of, or unauthorized access to, confidential or highly restricted data relating to a Fund and its shareholders; and compromises or failures to systems, networks, devices and applications relating to the operations of a Fund and its service providers. Cyber security risks may result in financial losses to a Fund and its shareholders; the inability of a Fund to transact business with its shareholders; delays or mistakes in the calculation of a Fund’s NAV or other materials provided to shareholders; the inability to process transactions with shareholders or other parties; violations of privacy and other laws; regulatory fines, penalties and reputational damage; and compliance and remediation costs, legal fees and other expenses. A Fund’s service providers (including, but not limited to, the adviser, any sub-advisers, administrator, transfer agent, and custodian or their agents), financial intermediaries, companies in which a Fund invests and parties with which a Fund engages in portfolio or other transactions also may be adversely impacted by cyber security risks in their own businesses, which could result in losses to a Fund or its shareholders. While measures have been developed which are designed to reduce the risks associated with cyber security, there is no guarantee that those measures will be effective, particularly since the Funds do not directly control the cyber security defenses or plans of their service providers, financial intermediaries and companies in which they invest or with which they do business.
Regulatory and Legal Risk. U.S. and non-U.S. governmental agencies and other regulators regularly implement additional regulations and legislators pass new laws that affect the investments held by a Fund, the strategies used by a Fund or the level of regulation or taxation applying to a Fund (such as regulations related to investments in derivatives and other transactions). These regulations and laws may adversely impact the investment strategies, performance, costs and operations of a Fund or taxation of shareholders.
Volcker Rule Risk. Pursuant to section 619 of the Dodd-Frank Wall Street Reform and Consumer Protection Act and certain rules promulgated thereunder known as the Volcker Rule, if the adviser and/or its affiliates own 5% or more of the outstanding ownership interests of a Fund after the permitted seeding period from the implementation of a Fund’s investment strategy, a Fund could be subject to restrictions on trading that would adversely impact a Fund’s ability to execute its investment strategy. Generally, the permitted seeding period is three years from the implementation of a Fund’s investment strategy, with permissible extensions under certain circumstances. As a result, the adviser and/or its affiliates may be required to reduce their ownership interests in a Fund at a time that is sooner than would otherwise be desirable, which may result in a Fund’s liquidation or, if a Fund is able to continue operating, may result in losses, increased transaction costs and adverse tax consequences as a result of the sale of portfolio securities.
For more information about risks associated with the types of investments that the Funds purchase, please read the Statement of Additional Information.
Conflicts of Interest
An investment in a Fund is subject to a number of actual or potential conflicts of interest. For example, the Adviser and/or its affiliates provide a variety of different services to a Fund, for which the Fund compensates them. As a result, the Adviser and/or its affiliates have an incentive to enter into arrangements with a Fund, and face conflicts of interest when balancing that incentive against the best interests of a Fund. The Adviser and/or its affiliates also face conflicts of interest in their service as investment adviser to other clients, and, from time to time, make investment decisions that differ from and/or negatively impact those made by the Adviser on behalf of a Fund. In addition, affiliates of the Adviser provide a broad range of services and products to their clients and are major participants in the global currency, equity, commodity, fixed income and other markets in which a Fund invests or will invest. In certain circumstances by providing services and products to their clients, these affiliates’ activities will disadvantage or restrict the Funds and/or benefit these affiliates. The Adviser may also acquire material non-public information which would negatively affect the Adviser’s ability to transact in securities for a Fund. JPMorgan and the Funds have adopted policies and procedures reasonably designed to appropriately prevent, limit or mitigate conflicts of interest. In addition, many of the activities that create these conflicts of interest are limited and/or prohibited by law, unless an exception is available. For more information about conflicts of interest, see the Potential Conflicts of Interest section in the Statement of Additional Information.
Temporary Defensive Positions
For liquidity and to respond to unusual market conditions, the Funds may hold all or most of their total assets in cash for temporary defensive purposes. These investments may be inconsistent with a Fund’s main investment strategies. This may result in a lower yield.
28 | J.P. Morgan Money Market Funds
Temporary Defensive Position Risk
If a Fund departs from its investment policies during temporary defensive periods or to meet redemptions, it may not achieve its investment objective.
Additional Fee Waiver and/or Expense Reimbursement
Service providers to a Fund including the Fund’s adviser and/or its affiliates may, from time to time, voluntarily waive all or a portion of any fees to which they are entitled and/or reimburse certain expenses as they may determine from time to time. A Fund’s service providers may discontinue or modify these voluntary actions at any time without notice. Performance for the Funds reflects the voluntary waiver of fees and/or the reimbursement of expenses, if any. Without these voluntary waivers and/or expense reimbursements, performance would have been less favorable.
EXPENSE LIMITATIONS
Prime Money Market Fund
The JPMorgan Prime Money Market Fund’s adviser and/or its affiliates have contractually agreed to waive fees and/or reimburse expenses to the extent Total Annual Fund Operating Expenses (excluding acquired fund fees and expenses other than certain money market fund fees as described below, dividend and interest expenses related to short sales, interest, taxes, expenses related to litigation and potential litigation, expenses related to trustee elections and extraordinary expenses) exceed 0.18% of the average daily net assets of the Academy Shares. The Fund may invest in one or more money market funds advised by the adviser or its affiliates (affiliated money market funds). The Fund’s adviser, shareholder servicing agent and/or administrator have contractually agreed to waive fees and/or reimburse expenses in an amount sufficient to offset the respective net fees each collects from the affiliated money market funds on the Fund’s investment in such money market funds. These waivers are in effect through 6/30/25, at which time it will be determined whether such waivers will be renewed or revised. To the extent that the Fund engages in securities lending, affiliated money market fund fees and expenses resulting from the Fund’s investment of cash received from securities lending borrowers are not included in Total Annual Fund Operating Expenses and therefore, the above waivers do not apply to such investments.
100% U.S. Treasury Securities Money Market Fund
The JPMorgan 100% U.S. Treasury Securities Money Market Fund’s adviser and/or its affiliates have contractually agreed to waive fees and/or reimburse expenses to the extent Total Annual Fund Operating Expenses (excluding acquired fund fees and expenses other than certain money market fund fees as described below, dividend and interest expenses related to short sales, interest, taxes, expenses related to litigation and potential litigation, expenses related to trustee elections and extraordinary expenses) exceed 0.18% of the average daily net assets of the Academy Shares. The Fund may invest in one or more money market funds advised by the adviser or its affiliates (affiliated money market funds). The Fund’s adviser, shareholder servicing agent and/or administrator have contractually agreed to waive fees and/or reimburse expenses in an amount sufficient to offset the respective net fees each collects from the affiliated money market funds on the Fund’s investment in such money market funds. These waivers are in effect through 6/30/25, at which time it will be determined whether such waivers will be renewed or revised. To the extent that the Fund engages in securities lending, affiliated money market fund fees and expenses resulting from the Fund’s investment of cash received from securities lending borrowers are not included in Total Annual Fund Operating Expenses and therefore, the above waivers do not apply to such investments.
U.S. Government Money Market Fund
The JPMorgan U.S. Government Money Market Fund’s adviser and/or its affiliates have contractually agreed to waive fees and/or reimburse expenses to the extent Total Annual Fund Operating Expenses (excluding acquired fund fees and expenses other than certain money market fund fees as described below, dividend and interest expenses related to short sales, interest, taxes, expenses related to litigation and potential litigation, expenses related to trustee elections and extraordinary expenses) exceed 0.18% of the average daily net assets of the Academy Shares. The Fund may invest in one or more money market funds advised by the adviser or its affiliates (affiliated money market funds). The Fund’s adviser, shareholder servicing agent and/or administrator have contractually agreed to waive fees and/or reimburse expenses in an amount sufficient to offset the respective net fees each collects from the affiliated money market funds on the Fund’s investment in such money market funds. These waivers are in effect through 6/30/25, at which time it will be determined whether such waivers will be renewed or revised. To the extent that the Fund engages in securities lending, affiliated money market fund fees and expenses resulting from the Fund’s investment of cash received from securities lending borrowers are not included in Total Annual Fund Operating Expenses and therefore, the above waivers do not apply to such investments.
June 21, 2024 | 29
More About the Funds (continued)
U.S. Treasury Plus Money Market Fund
The JPMorgan U.S. Treasury Plus Money Market Fund’s adviser and/or its affiliates have contractually agreed to waive fees and/or reimburse expenses to the extent Total Annual Fund Operating Expenses (excluding acquired fund fees and expenses other than certain money market fund fees as described below, dividend and interest expenses related to short sales, interest, taxes, expenses related to litigation and potential litigation, expenses related to trustee elections and extraordinary expenses) exceed 0.18% of the average daily net assets of the Academy Shares. The Fund may invest in one or more money market funds advised by the adviser or its affiliates (affiliated money market funds). The Fund’s adviser, shareholder servicing agent and/or administrator have contractually agreed to waive fees and/or reimburse expenses in an amount sufficient to offset the respective net fees each collects from the affiliated money market funds on the Fund’s investment in such money market funds. These waivers are in effect through 6/30/25, at which time it will be determined whether such waivers will be renewed or revised. To the extent that the Fund engages in securities lending, affiliated money market fund fees and expenses resulting from the Fund’s investment of cash received from securities lending borrowers are not included in Total Annual Fund Operating Expenses and therefore, the above waivers do not apply to such investments.
Additional Historical Performance Information
Some of the companies that provide services to the Funds have in the past agreed not to collect some expenses and to reimburse others. Without these agreements, the performance figures would have been lower than those shown.
Each Fund is a money market fund managed to meet the requirements of Rule 2a-7 under the Investment Company Act of 1940. Effective May 28, 2010, Rule 2a-7 was amended to impose new liquidity, credit quality, and maturity requirements on all money market funds. Effective October 14, 2014, Rule 2a-7 was amended to reflect various other changes. Effective July 12, 2023, Rule 2a-7 was further amended to reflect various other changes. Fund performance shown prior to the effective date of such changes is based on SEC rules then in-effect and is not an indication of future returns.
Prime Money Market Fund
The historical performance for the Academy Shares in the bar chart and the performance table prior to their inception on 5/15/19 is based on the performance of the Fund’s Capital Shares, which invest in the same portfolio of securities, but are offered in a different prospectus. The actual return of Academy Shares would have been different than those shown because Academy Shares have different expenses than Capital Shares.
100% U.S. Treasury Securities Money Market Fund
The historical performance for the Academy Shares in the bar chart and the performance table prior to their inception on 9/30/20 is based on the performance of the Fund’s Capital Shares, which invest in the same portfolio of securities, but are offered in a different prospectus. The actual return of Academy Shares would have been different than those shown because Academy Shares have different expenses than Capital Shares.
U.S. Government Money Market Fund
The historical performance for the Academy Shares in the bar chart and the performance table prior to their inception on 5/15/19 is based on the performance of the Fund’s Capital Shares, which invest in the same portfolio of securities, but are offered in a different prospectus. The actual return of Academy Shares would have been different than those shown because Academy Shares have different expenses than Capital Shares.
U.S. Treasury Plus Money Market Fund
The historical performance for the Academy Shares in the bar chart and the performance table prior to their inception on 9/30/20 is based on the performance of the Fund’s Institutional Shares, which invest in the same portfolio of securities, but are offered in a different prospectus. The actual return of Academy Shares would have been different than those shown because Academy Shares have different expenses than Institutional Shares.
30 | J.P. Morgan Money Market Funds
The Funds’ Management and Administration
The Prime Money Market Fund and the 100% U.S. Treasury Securities Money Market Fund are each a series of JPMorgan Trust I (JPMT I), a Delaware statutory trust.
The U.S. Government Money Market Fund and the U.S. Treasury Plus Money Market Fund are each a series of JPMorgan Trust II (JPMT II), a Delaware statutory trust.
The Trusts are governed by the Board of Trustees which is responsible for overseeing all business activities of the Fund. In addition to the Funds, each Trust consists of other series representing separate investment funds (each, a “J.P. Morgan Fund”).
The Funds operate in a multiple class structure. A multiple class fund is an open-end investment company that issues two or more classes of shares representing interests in the same investment portfolio.
Each class in a multiple class fund can set its own transaction minimums and may vary with respect to expenses for distribution, administration and shareholder services. This means that one class could offer access to the Funds on different terms than another class. Certain classes may be more appropriate for a particular investor.
The Funds may issue other classes of shares that have different expense levels and performance and different requirements for who may invest. Call 1-800-766-7722 to obtain more information concerning each of the Fund’s other share classes. A Financial Intermediary (as described below) who receives compensation for selling Fund shares may receive a different amount of compensation for sales of different classes of shares.
The Funds' Investment Adviser
J.P. Morgan Investment Management Inc. (JPMIM) acts as investment adviser to the Funds and makes the day-to-day investment decisions for the Funds. In rendering investment advisory services to certain Funds, JPMIM uses the portfolio management, research and other resources of a foreign (non-U.S.) affiliate of JPMIM and may provide services to a Fund through a “participating affiliate” arrangement, as that term is used in relief granted by the staff of the SEC. Under this relief, U.S. registered investment advisers are allowed to use portfolio management or research resources of advisory affiliates subject to the regulatory supervision of the registered investment adviser.
JPMIM is a wholly-owned subsidiary of JPMorgan Asset Management Holdings Inc., which is a wholly-owned subsidiary of JPMorgan Chase & Co. (JPMorgan Chase), a bank holding company. JPMIM is located at 383 Madison Avenue, New York, NY 10179.
During the fiscal period ended 2/29/24, JPMIM was paid management fees (net of waivers, if any), as shown below, as a percentage of average daily net assets:
| Prime Money Market Fund |
0.08% |
| 100% U.S. Treasury Securities Money Market Fund |
0.08 |
| U.S. Government Money Market Fund |
0.08 |
| U.S. Treasury Plus Money Market Fund |
0.08 |
A discussion of the basis the Board of Trustees of the Trust used in reapproving the investment advisory agreements for the Funds is available in the semi-annual reports for the most recent fiscal year ended August 31.
The Funds' Administrator
JPMIM (the Administrator) provides administration services and oversees the other service providers of the Funds. The Administrator receives a pro-rata portion of the following annual fee on behalf of each Money Market Fund for administration services: 0.070% of the first $150 billion of average daily net assets of all money market funds in the J.P. Morgan Funds Complex, plus 0.050% of average daily net assets of such Money Market Funds between $150 billion and $300 billion, plus 0.030% of average daily net assets of such Money Market Funds between $300 billion and $400 billion, plus 0.010% of the average daily net assets of such Money Market Funds over $400 billion.
The Funds' Shareholder Servicing Agent
JPMT I and JPMT II, on behalf of the Funds, have entered into a shareholder servicing agreement with JPMorgan Distribution Services, Inc. (JPMDS) under which JPMDS has agreed to provide certain support services to the Funds’ shareholders. For performing these services, JPMDS, as shareholder servicing agent, receives an annual fee of 0.05% of the average daily net assets of Academy Shares of each Fund. JPMDS may enter into service agreements with Academy Securities, Inc., or its affiliates, under which it will pay all or a portion of the annual fee to Academy Securities, Inc., or its affiliates, for performing shareholder and administrative services. The amount payable for “service fees” (as defined by the Financial Industry Regulatory Authority (FINRA)) does not exceed 0.25% of the average annual net assets attributable to the Academy Shares of each Fund.
June 21, 2024 | 31
The Funds’ Management and Administration (continued)
The Funds' Distributor
JPMDS (the Distributor) is the distributor for the Funds. The Distributor is an affiliate of JPMIM.
Additional Compensation to Financial Intermediaries
JPMIM, JPMDS and, from time to time, other affiliates of JPMorgan Chase may also, at their own expense and out of their own legitimate profits, provide additional cash payments to Financial Intermediaries, including Academy Securites, whose customers invest in shares of the J.P. Morgan Funds. For this purpose, Financial Intermediaries include financial advisors, investment advisers, brokers, financial planners, banks, insurance companies, retirement or 401(k) plan administrators and others, including various affiliates of JPMorgan Chase, that have entered into agreements with JPMDS. These additional cash payments are payments over and above any sales charges (including Rule 12b-1 fees) and service fees (including sub-transfer agency and networking fees) that are paid to such Financial Intermediaries, as described elsewhere in this prospectus. These additional cash payments are generally made to Financial Intermediaries that provide shareholder, sub-transfer agency or administrative services or marketing support. Marketing support may include access to sales meetings, sales representatives and Financial Intermediary management representatives, inclusion of the J.P. Morgan Funds on a sales list, or other sales programs and/or for training and educating a Financial Intermediary’s employees. These additional cash payments also may be made as an expense reimbursement in cases where the Financial Intermediary provides shareholder services to J.P. Morgan Fund shareholders. JPMIM and JPMDS may also pay cash compensation in the form of finders’ fees that vary depending on the J.P. Morgan Fund and the dollar amount of shares sold. Such additional compensation may provide such Financial Intermediaries with an incentive to favor sales of shares of the J.P. Morgan Funds over other investment options they make available to their customers. See the Statement of Additional Information for more information.
In addition, JPMIM may, out of its expense and legitimate profits, make payments to Academy Securities, Inc. for marketing support in connection with Academy Shares that are offered through other Financial Intermediaries. Marketing support may include access to sales meetings, sales representatives and Financial Intermediary management representatives, inclusion of Academy Shares on a sales list, or other sales programs and/or for training and educating a Financial Intermediary’s employees on Academy Securities, Inc.
32 | J.P. Morgan Money Market Funds
How Your Account Works
The Fund’s Academy Shares are offered to clients of Academy Securities, Inc. and its affiliates (collectively, Academy Clients). Academy Clients may purchase the Academy Shares through accounts maintained with Academy Securities, Inc. or its affiliates. Academy Shares may also be purchased through an electronic-trading platform sponsored by JPMorgan or its affiliates, or through platforms maintained by other financial intermediaries for which JPMIM has contracted with Academy Securities, Inc. to provide marketing support services. Academy Securities, Inc. may impose policies, limitations and fees which are different than those described herein.
Buying Fund Shares
You do not pay any sales charge (sometimes called a load) when you buy Academy Class Shares of these Funds.
The net asset value (NAV) of each class of shares is generally calculated as of each cut-off time each day the Funds are accepting orders. You will pay the next NAV per share calculated after the J.P. Morgan Institutional Funds Service Center accepts your order.
Shares are available on any business day that the Federal Reserve Bank of New York (Federal Reserve) is open, except as noted below. The Funds are may also close on days when the Federal Reserve is open and the New York Stock Exchange (NYSE) is closed. On any business day when the Securities Industry and Financial Markets Association (SIFMA) recommends that the securities markets close trading early, the Funds may close early.
On occasion, the NYSE closes before 4:00 p.m. Eastern Time (ET). When the NYSE closes early, the Funds may also elect to close early and purchase orders accepted by the Funds after the early closing will be effective the following business day. The Funds are, however, may elect to remain open following an early close of the NYSE. If your purchase order is accepted by the Funds before the Funds' close on a day when the NYSE closes early but the Funds remain open, or on a day when the Funds are open but the NYSE is not, it will become effective following the Funds' next calculation of its NAV. Purchase orders accepted after the Funds' final calculation of NAV for the day will be effective the following business day.
The price you pay for your shares is the NAV per share of the class. NAV is the value of everything a class of a Fund owns, minus everything the class owes, divided by the number of shares of that class held by investors. Each Fund, other than the Prime Money Market Fund, seeks to maintain a stable NAV per share of $1.00 and each Fund uses the amortized cost method to value its portfolio of securities provided that certain conditions are met, including that the Board continues to believe that the amortized cost valuation fairly reflects the market-based NAV per share of the Fund. This method provides more stability in valuations. However, it may also result in periods during which the stated value of a security is different than the price the Fund would receive if it sold the investment.
The NAV of each class of shares of the JPMorgan U.S. Government Money Market Fund is generally calculated as of the following times each day the Fund is accepting purchase orders and redemption requests (each such time, including the final of such times each day, a cut-off time): 9:00 a.m., 10:00 a.m., 11:00 a.m., 12:00 p.m., 1:00 p.m., 2:00 p.m., 3:00 p.m., 4:00 p.m. and 5:00 p.m. ET.
Until August 1, 2024, the NAV of each class of shares of the JPMorgan Prime Money Market Fund is generally calculated as of the following times on each day the Fund accepts purchase orders and redemption requests: 8:00 a.m., 12:00 p.m. and 3:00 p.m. ET.
Effective August 1, 2024, the NAV of each class of shares of the JPMorgan Prime Money Market Fund is generally calculated as of 3:00 p.m. ET on each day the Fund accepts purchase orders and redemption requests.
The NAV of each class of shares of the JPMorgan Prime Money Market Fund is calculated using market-based values. The NAV per share of a class of the Fund is equal to the value of all the assets attributable to that class, minus the liabilities attributable to that class, divided by the number of outstanding shares of that class. The following is a summary of the valuation procedures generally used to value the J.P. Morgan Funds’ investments for market-based NAVs.
Securities for which market quotations are readily available are generally valued at their current market value. Other securities and assets, including securities for which market quotations are not readily available; market quotations are determined not to be reliable; or, their value has been materially affected by events occurring after the close of trading on the exchange or market on which the security is principally traded but before the Funds' NAV is calculated, may be valued at fair value in accordance with policies and procedures adopted by the Board. Fair value represents a good faith determination of the value of a security or other asset based upon specifically applied procedures. Fair valuation may require subjective determinations. There can be no assurance that the fair value of an asset is the price at which the asset could have been sold during the period in which the particular fair value was used in determining the Fund’s NAV.
Fixed income securities are valued using prices supplied by an approved independent third party or affiliated pricing services or broker/dealers. Those prices are determined using a variety of inputs and factors as more fully described in the Statement of Additional Information.
Shares of mutual funds are valued at their respective NAVs.
June 21, 2024 | 33
How Your Account Works (continued)
If the Funds accept your purchase order and receives payment the same day, as described below, your order will be processed at the price calculated at the next cut-off time and you will be entitled to all dividends declared on that day. If the Fund accepts your purchase order after the final cut-off time for a day, it will be processed at the next day’s first calculated price. If the Funds does not receive payment on the same day that your order is placed, as described below, you will not be entitled to any dividends declared on that day.
The Funds has the right to refuse any purchase order or to stop offering shares for sale at any time. In addition, in its discretion, the Board may elect to calculate the price of the Fund’s shares once per day. Under certain circumstances, the Board has delegated to management the ability to temporarily suspend one or more cut-off times for the Funds, other than the last cut-off time of the day.
Share ownership is electronically recorded; therefore, no certificate will be issued.
Academy Securities will be responsible for transmitting your purchase order and payment to the Funds by the applicable deadlines. Academy Securities may have an earlier cut-off time for purchase orders. In addition, Academy Securities may be closed at times when the Funds are open. Your purchase through Academy Securities will be processed at the NAV next calculated following receipt of the order from Academy Securities and acceptance by the Funds, which may not occur on the day that the order is submitted to Academy Securities.
Shares of the Funds have not been registered for sale outside of the United States. This prospectus is not intended for distribution to prospective investors outside of the United States. The Funds generally do not market or sell shares to investors domiciled outside of the United States, even, with regard to individuals, if they are citizens or lawful permanent residents of the United States.
In order to receive a dividend on the day that you submit your order, the Funds must receive “federal funds” or other immediately available funds by the close of the Federal Reserve wire transfer system (normally, 6:45 p.m. ET) on the same business day the purchase order is placed. In the event that an order is placed by a cut-off time specified above and payment through federal funds or other immediately available funds is not received by the Funds by the close of the Federal Reserve wire transfer system or other immediately available funds that same day, you will not accrue a dividend on that day and the Funds reserve the right to cancel your purchase order and you will be liable for any resulting losses or fees incurred by the Funds or the Funds' transfer agent. If you pay by other acceptable methods, before the final cut-off time on a day, we will process your order that day, but you will not receive any dividends declared on that day. Payments received electronically from Financial Intermediaries on your behalf for trades accepted by the Funds will begin to receive dividends the day payment is received by the Funds.
To open an account, buy or sell shares or get fund information, call:
Academy Securities 1-646-341-6869
The JPMorgan Prime Money Market Fund does not permit Financial Intermediaries to serve as its agent for the receipt of orders. All trades in the JPMorgan Prime Money Market Fund are priced at the NAV next calculated by the Fund following its receipt of the trade in proper form from the Financial Intermediary. Additionally, the Fund must receive “federal funds” or other immediately available funds by the close of the Federal Reserve wire transfer system (normally, 6:45 p.m. ET) on the same business day the purchase order is placed. In the event that payment is not received by the Fund by the close of the Federal Reserve wire transfer system or through other immediately available funds that same day, the Fund reserves the right to cancel your purchase order and you will be liable for any resulting losses or fees incurred by the Fund or the Fund’s transfer agent. A shareholder that redeems shares of the JPMorgan Prime Money Market Fund will not receive a dividend on the date of redemption, regardless of the form of payment requested.
How to Invest
Contact Academy Securities. You may invest in the Funds by contacting your financial advisor, who is affiliated with Academy Securities or its affiliates and authorized to sell Academy Shares. Academy Securities will transmit your request to the Funds and may charge you a fee for this service. The availability of certain services described below may be limited by Academy Securities who may set its own minimum purchase, balance, eligibility or other requirements. Please contact Academy Securities for more information.
Academy Securities may have established a sweep program for investors who maintain a brokerage account with a participating dealer. Under such sweep programs, free credit cash balances in a brokerage account arising from sales of securities for cash, redemptions of debt securities, dividend and interest payments and deposited funds may be invested automatically in the Funds. Fund purchases usually will be made on the next business day following the day that credit balances are generated in your account at Academy Securities. Likewise, brokerage account cash debit balances arising from the purchase of securities or other brokerage activity may trigger redemptions in the Funds. These sweep programs are subject to Academy Securities’ minimum purchase, balance, eligibility and other requirements. Please contact your financial adviser for more information.
The minimum investment for the Funds, which may be waived at Academy Securities’ discretion, is:
34 | J.P. Morgan Money Market Funds
| Type of account |
Initial investment |
Subsequent investment |
| Regular account |
$5,000,000 |
No minimum |
If your account balance falls below $5,000,000, Academy Securities reserves the right to request that you buy more shares or close your account. If your account balance is still below the minimum 30 calendar days after notification, Academy Securities reserves the right to close your account and send the proceeds to your address of record.
An order must be supported by all appropriate documentation and information in good order, including the name of the registered shareholder and your account number. Academy Securities may refuse to honor incomplete orders.
For more information:
●
Contact your financial advisor
●
Call 1-646-341-6869
●
Visit www.jpmorgan.com/academy
Shareholder Eligibility
For all MMFs, where a Financial Intermediary serves as each Fund’s agent for the purpose of receiving orders, trades that are not transmitted to the Funds by the Financial Intermediary before the time required by the Funds or the shareholder servicing agent may, in the Funds' discretion, be processed on an as-of basis, provided, however, that any cost or loss to the Funds or the shareholder servicing agent or their affiliates, from such transactions shall be borne exclusively by the Financial Intermediary.
General
The Funds are intended for short-term investment horizons, and does not monitor for market timers or prohibit short-term trading activity. Although the Funds are managed in a manner that is consistent with its investment objective, frequent trading by shareholders may disrupt their management and increase its expenses.
Federal law requires all financial institutions, including Academy Securities, to obtain, verify and record information that identifies each person who opens an account. When you open an account, you will be asked for certain information, including any information that the Funds or the Distributor, in its sole discretion, may require to confirm eligibility. Your account application is required by law to be rejected if the required identifying information is not provided. Once all required information is received, federal law requires that your identity be verified. After an account is opened, your ability to purchase additional shares may be restricted until your identity is verified. If your identity cannot be verified within a reasonable time, your account may be closed and your shares redeemed at the NAV per share next calculated after the account is closed.
Academy Securities is paid by JPMDS to assist you in executing Fund transactions and monitoring your investment. Academy Securities may provide the following services in connection with its customers’ investments in the Funds:
●
Acting directly or through an agent, as the sole shareholder of record.
●
Maintaining account records for customers.
●
Processing orders to purchase, redeem or exchange shares for customers.
●
Responding to inquiries from shareholders.
●
Assisting customers with investment procedures.
●
Providing, or causing to be provided, tax forms and account statements as necessary.
Shares of the Funds have not been registered for sale outside of the United States. This prospectus is not intended for distribution to prospective investors outside of the United States. The Funds generally do not market or sell shares to investors domiciled outside of the United States, even, with regard to individuals, if they are citizens or lawful permanent residents of the United States.
The Funds reserve the right to change the manner in which shares are offered at any time.
June 21, 2024 | 35
How Your Account Works (continued)
Selling Fund Shares
You can sell, or redeem, your shares on any day that the Funds are open for business, subject to certain restrictions. You will receive the NAV per share calculated at each Fund’s next cut-off time after the Fund receives your order from Academy Securities in good order (meaning that it includes the information required by, and complies with security requirements implemented by, the Funds’ transfer agent or the Funds). The Funds must receive your order from Academy Securities by the Funds’ final daily cut-off time in order for us to process your order at that day’s price. This may not occur on the day that an order is submitted to a Financial Intermediary.
Proceeds may be made available throughout the day following calculation of NAVs.
The length of time that the Funds typically expects to pay redemption proceeds depends on the method of payment and the agreement between the Financial Intermediary with whom you hold your shares and the Funds. For redemption proceeds that are paid directly to you by the Funds, the Funds typically expects to make payments by wire on the same business day or by mailing a check or paying redemption proceeds by ACH on the next business day if the Funds receive your order from the Financial Intermediary before the Funds’ final daily cut-off time. For payments that are made to your Financial Intermediary for transmittal to you, the Funds expect to pay redemption proceeds to the Financial Intermediary for transmittal to you on the same business day or up to three business days following the Funds’ receipt of the redemption order from the Financial Intermediary. If you sell shares that were recently purchased by check or ACH, payment will be delayed until we verify that those funds have cleared, which may take up to two weeks. Academy Securities may have an earlier cut-off time than the Funds’ final daily cut-off time for redemption orders. Shareholders that redeem shares and purchase additional shares on the same day will receive dividends as set forth above under ‘‘Buying Fund Shares’’. Dividends will not accrue on shares that are redeemed and paid on a same day basis. Other redeeming shareholders will accrue dividends on the redemption date. Except as set forth in the section “Suspension of Redemptions” below, payment of redemption proceeds may take longer than the time the Funds typically expects and may take up to one day after the Funds receive the redemption order as permitted by the Investment Company Act of 1940.
Contact Academy Securities. You may sell your shares by contacting your financial advisor or Academy Securities, either of whom can prepare the necessary documentation. Academy Securities will transmit your request to sell shares of your Fund and may charge you a fee for this service.
Academy Securities may have established a sweep program with the Funds for investors who maintain a brokerage account with a participating dealer. Brokerage cash debits arising from purchases of securities for cash or other brokerage activity will automatically sweep from the Funds for active program participants.
For more information:
●
Contact your financial advisor
●
Call 1-646-341-6869
●
Visit www.jpmorgan.com/academy
Additional Information Regarding Redemptions
Generally, all redemptions will be for cash. The J.P. Morgan Funds typically expect to satisfy redemption requests by selling portfolio assets or by using holdings of cash or cash equivalents. On a less regular basis, the Funds may also satisfy redemption requests by borrowing from another Fund, by drawing on a line of credit from a bank, or using other short-term borrowings from its custodian. These methods may be used during both normal and stressed market conditions. In addition to paying redemption proceeds in cash, if you redeem shares worth $250,000 or more, the J.P. Morgan Funds reserve the right to pay part or all of your redemption proceeds in readily marketable securities instead of cash. If payment is made in securities, the Fund will value the securities selected in the same manner in which it computes its NAV. This process minimizes the effect of large redemptions on the Funds and its remaining shareholders. If you receive a redemption in-kind, securities received by you may be subject to market risk and you could incur taxable gains and brokerage or other charges in converting the securities to cash. While the J.P. Morgan Funds do not routinely use redemptions in-kind, the Funds reserve the right to use redemptions in-kind to manage the impact of large redemptions on the Funds. Except as set forth in the section “Suspension of Redemptions” below, redemption in-kind proceeds will typically be made by delivering a pro-rata amount of the Funds' holdings that are readily marketable securities to the redeeming shareholder within one day for the Funds after the Funds' receipt of the redemption order.
The Funds reserve the right to change the manner in which shares are offered at any time.
36 | J.P. Morgan Money Market Funds
Liquidity Fees
A Fund that does not qualify as a Government MMF may impose a discretionary liquidity fee of up to 2% of the value of the shares redeemed if the adviser, as the delegate of the Board, determines it is in the best interests of the Fund. Discretionary liquidity fees are most likely to be imposed, if at all, during times of extraordinary market stress. The adviser generally expects that a discretionary liquidity fee would be implemented, if at all, after a Fund has notified Financial Intermediaries and shareholders that a liquidity fee will be imposed (generally, applied to all redemption requests processed at the first net asset value calculation on the next business day following the announcement that the Fund will impose a liquidity fee), although the adviser, in its discretion, may elect otherwise. In the event that a discretionary liquidity fee is imposed, the adviser expects that for the duration of its implementation and the day after which such is terminated, a Fund would strike only one NAV per day, at the Fund’s last scheduled NAV calculation time.
The imposition of a discretionary liquidity fee will be reported by a Fund to the SEC on Form N-MFP. Such information will also be available on the Fund’s website (www.jpmorganfunds.com). In addition, a Fund will communicate such action through a supplement to its registration statement and may further communicate such action through a press release or by other means. If a discretionary liquidity fee is applied, it will be charged on all redemption orders submitted after the effective time of the imposition of the fee. Discretionary liquidity fees would reduce the amount you receive upon redemption of your shares.
The adviser may, in its discretion, terminate a discretionary liquidity fee at any time if it believes such action to be in the best interest of a Fund. When a discretionary liquidity fee is in place, the Fund may elect not to permit the purchase of shares or to subject the purchase of shares to certain conditions, which may include affirmation of the purchaser’s knowledge that a discretionary liquidity fee is in effect. When a discretionary liquidity fee is in place, shareholders will not be permitted to exchange into or out of a Fund.
The Board may, in its discretion, permanently suspend redemptions and liquidate if, among other things, a Fund, at the end of a business day, has less than 10% of its total assets invested in weekly liquid assets. With regard to the Retail Funds and the Government Funds, the Board may suspend redemptions and liquidate the Fund if the Board determines that the deviation between its amortized cost price per share and its market-based NAV per share may result in material dilution or other unfair results to investors or existing shareholders. Prior to suspending redemptions, a Fund will notify the SEC of its decision to liquidate and suspend redemptions.
There is some degree of uncertainty with respect to the tax treatment of discretionary liquidity fees received by Funds, and such tax treatment may be the subject of future guidance issued by the Internal Revenue Service (“IRS”). If a Fund receives discretionary liquidity fees, it will consider the appropriate tax treatment of such fees to the Fund at such time.
Financial Intermediaries are required to promptly take the steps requested by a Fund or its designees to impose or help to implement a discretionary liquidity fee as requested from time to time, including the rejection of orders due to the imposition of a fee or the prompt re-confirmation of orders following a notification regarding the implementation of a fee. If a discretionary liquidity fee is imposed, these steps are expected to include the submission of trades on a gross, rather than net, basis from the time of the effectiveness of the liquidity fee and the submission of such order information to the Fund or its designee prior to the next calculation of a Fund’s NAV. Unless otherwise agreed to between a Fund and Financial Intermediary, the Fund will withhold discretionary liquidity fees on behalf of Financial Intermediaries. With regard to such orders, a redemption request that a Fund determines in its sole discretion has been received in good order by the Fund or its designated agent prior to the imposition of a discretionary liquidity fee may be paid by the Fund without the deduction of a liquidity fee.
Other Information Concerning the Funds
The Funds use reasonable procedures to confirm that instructions given by telephone are genuine. These procedures include recording telephone instructions and asking for personal identification. If these procedures are followed, Academy Securities and the Funds will not be responsible for any loss, liability, cost or expense of acting upon unauthorized or fraudulent instructions; you bear the risk of loss.
Due to the relatively high cost of maintaining small accounts, if your account value falls below the Funds’ minimum investment requirement, the Funds reserve the right to redeem all of the remaining shares in your account and close your account or charge an annual sub-minimum account fee of $10 per Fund. Before either of these actions is taken, you will be given 60 days’ advance written notice in order to provide you with time to increase your account balance to the required minimum, by purchasing sufficient shares, in accordance with the terms of this prospectus.
Due to the relatively high cost of maintaining small accounts, if your account value falls below the Funds’ minimum investment requirement, the Funds reserve the right to redeem all of the remaining shares in your account and close your account or charge an annual sub-minimum account fee of $10 per Fund. Before either of these actions is taken, you will be given 60 days’ advance written notice in order to provide you with time to increase your account balance to the required minimum, by purchasing sufficient shares, in accordance with the terms of this prospectus.
Shares of the JPMorgan U.S. Government Money Market Fund are intended to qualify as eligible investments for federally chartered credit unions pursuant to Sections 107(7), 107(8) and 107(15) of the Federal Credit Union Act, Part 703 of the National Credit Union Administration (NCUA) Rules and Regulations and NCUA Letter Number 155. A credit union should consult qualified legal counsel to determine whether the Fund is a permissible investment under the laws applicable to it.
June 21, 2024 | 37
How Your Account Works (continued)
The Funds and their service providers may temporarily hold redemption proceeds from accounts maintained directly with the Funds if there is a reasonable belief that financial exploitation of a Specified Adult has occurred, is occurring, has been attempted, or will be attempted. For purposes of this paragraph, the term “Specified Adult” refers to an individual who is (A) a natural person age 65 and older; or (B) a natural person age 18 and older who the member reasonably believes has a mental or physical impairment that renders the individual unable to protect his or her own interests.
Additional Information that Applies to All Accounts: If unable to verify your identity or that of any other person(s) authorized to act on your behalf, or if potentially criminal activity is identified, the Funds and the Distributor reserve the right to close your account or take such other action they deem reasonable or required by law.
Suspension of Redemptions
The Funds may suspend your ability to redeem or may postpone payment for more than one day for the Funds when:
1.
Trading on the NYSE is restricted;
2.
The NYSE is closed (other than weekend and holiday closings);
3.
Federal securities laws permit, upon the occurrence of any of the conditions set forth under Section 22(e) of the Investment Company Act of 1940;
4.
The SEC has permitted a suspension; or
5.
An emergency exists, as determined by the SEC.
See “Purchases, Redemptions and Exchanges” in the Statement of Additional Information for more details about this process.
38 | J.P. Morgan Money Market Funds
Shareholder Information
Distributions and Taxes
Each Fund has elected to be treated and intends to qualify each taxable year as a regulated investment company. A regulated investment company is not subject to tax at the corporate level on income and gains from investments that are distributed to shareholders. Each Fund’s failure to qualify as a regulated investment company would result in corporate-level taxation and, consequently, a reduction in income available for distribution to shareholders.
Each Fund can earn income and realize capital gain. Each Fund deducts any expenses and then pays out the earnings, if any, to shareholders as distributions.
Each Fund declares dividends of net investment income, if any, daily, and distributes net investment income, if any, at least monthly, so your shares can start earning dividends on the day you buy them. Each Fund distributes such dividends monthly in the form of additional Fund shares of the same class, unless you tell us that you want distributions in cash or as a deposit in a pre-assigned bank account. Such instruction must be received prior to the final calculation of the NAV on date of payment. Dividends on a dividend reinvestment begin to accrue on the date following the purchase date. In the event that a liquidity or redemption gate is in place at the time that dividends are distributed, all distributions will be made in form of cash. The taxation of dividends will not be affected by the form in which you receive them. For each taxable year, each Fund will distribute substantially all of its net investment income and short-term capital gain. Net short-term capital gains, if any, may be included in a Fund’s daily distribution. However, from time to time a Fund may not pay out all of the income and/or gains generated from its investments, including for the purpose of stabilizing its net asset value per share.
For federal income tax purposes, dividends of net investment income and any net short-term capital gain generally are taxable as ordinary income. It is unlikely that dividends from any of the Funds will qualify to any significant extent for the reduced tax rate applicable to qualified dividend income. The Funds may consider certain repurchase agreements to be U.S. Government Securities for purposes of Rule 2a-7; however, such repurchase agreements are generally not expected to be considered as obligations of the United States for purposes of any income tax exemption applicable to interest paid on obligations of the United States. Accordingly, income distributed by the Funds that is derived from repurchase agreements is expected to be subject to federal, state and local income tax.
An additional 3.8% Medicare tax is imposed on certain net investment income (including ordinary dividends and capital gain distributions received from a Fund and net gains from redemptions or other taxable dispositions of Fund shares, but excluding any exempt interest dividends from a Fund) of U.S. individuals, estates and trusts to the extent that such person’s “modified adjusted gross income” (in the case of an individual) or “adjusted gross income” (in the case of an estate or trust) exceed certain threshold amounts.
Dividends of interest earned on bonds issued by the U.S. government and its agencies may be exempt from some types of state and local taxes.
A Fund’s investments in certain debt obligations and asset backed securities may require the Fund to accrue and distribute income not yet received. In order to generate sufficient cash to make the requisite distributions, the Fund may be required to liquidate other investments in its portfolio that it otherwise would have continued to hold, including when it is not advantageous to do so.
If you receive distributions that are properly reported as capital gain dividends, the tax rate will be based on how long a Fund held a particular asset, not on how long you have owned your shares. Each Fund expects substantially all of its distributions of capital gain to be attributable to short-term capital gain which is taxed as ordinary income.
Regarding the Prime Money Market Fund, the Fund’s investment in foreign securities may be subject to foreign withholding or other taxes. In that case, the Fund’s yield would be decreased.
Any gain resulting from the sale or exchange of Fund shares will be taxable as long-term or short-term gain, depending upon how long you have held your shares. To avoid buying a dividend, please check a Fund’s Dividend and Capital Gain Schedule before you invest. There is some degree of uncertainty with respect to the tax treatment of liquidity fees received by a Fund, and such tax treatment may be the subject of future guidance issued by the IRS. If a Fund receives liquidity fees, it will consider the appropriate tax treatment of such fees to the Fund at such time.
Regarding the Prime Money Market Fund, because the Fund is not expected to maintain a stable share price, a sale or exchange of Fund shares may result in a capital gain or loss for you. Unless you choose to adopt a simplified “NAV method” of accounting (described below), such capital gain or loss generally will be treated either as short-term if you held your Fund shares for one year or less, or long-term if you held your Fund shares longer.
If you elect to adopt the NAV method of accounting, rather than computing gain or loss on every taxable disposition of Fund shares as described above, you would determine your gain or loss based on the change in the aggregate value of your Fund shares during a computation period (such as your taxable year), reduced by your net investment (purchases minus sales) in those shares during that period. Under the NAV method, any resulting net capital gain or loss would be treated as short-term capital gain or loss.
June 21, 2024 | 39
Shareholder Information (continued)
Please see the Statement of Additional Information for additional discussion of the tax consequences of the above-described and other investments to a Fund and its shareholders.
The dates on which net investment income and capital gain, if any, will be distributed are available online at www.jpmorganfunds.com.
Early in each calendar year, each Fund will send you a notice showing the amount of distributions you received during the preceding calendar year and the tax status of those distributions.
Gains, if any, resulting from the sale or exchange of your shares generally will be subject to tax.
Any investor for whom a Fund does not have a valid Taxpayer Identification Number may be subject to backup withholding.
The Funds are not intended for foreign shareholders. Any foreign shareholders would generally be subject to U.S. tax withholding on distributions by a Fund, as discussed in the Statement of Additional Information.
Distributions by the Fund to retirement plans and other entities that qualify for tax-exempt or tax-deferred treatment under federal income tax laws will generally not be taxable. Special tax rules apply to investments through such plans. The tax considerations described in this section do not apply to such tax-exempt or tax-deferred entities or accounts. You should consult your tax advisor to determine the suitability of the Fund as an investment and the tax treatment of distributions.
The above is a general summary of the tax implications of investing in the Funds. Because each investor’s tax consequences are unique, please consult your tax advisor to see how investing in the Funds will affect your own tax situation.
| IMPORTANT TAX REPORTING CONSIDERATIONS |
| Your Financial Intermediary or the Funds (if you hold your shares in a Fund direct account) is required to report gains and losses to the IRS in connection with redemptions of shares by S corporations purchased after January 1, 2012. If a shareholder is a corporation and has not instructed the Fund that it is a C corporation in its account application or by written instruction to J.P. Morgan Funds Services, P.O. Box 219143, Kansas City, MO 64121-9145, the Funds will treat the shareholder as an S corporation and file a Form 1099-B. |
Shareholder Statements and Reports
Academy Securities will send you transaction confirmation statements and account statements at least quarterly. You may receive your statements and confirmations from Academy Securities on a different schedule. Please review these statements carefully. The Funds will correct errors if notified within 10 days of the date printed on the transaction confirmation or account statement. Academy Securities may have a different cut-off time. Please retain all of your statements, as they could be needed for tax purposes.
After each fiscal half-year, you will receive a financial report from the Funds. In addition, the Funds will periodically send you proxy statements and other reports.
For more information, please call 1-646-341-6869.
Portfolio Holdings Disclosure
Each business day, the Funds will make available upon request an uncertified complete schedule of their portfolio holdings as of the prior business day.
Not later than 60 days after the end of each fiscal quarter, each Fund will make available, upon request, a complete schedule of its portfolio holdings as of the last day of that quarter. In addition to providing hard copies upon request, the Funds will post these quarterly schedules on the J.P. Morgan Funds’ website at www.jpmorgan.com/academy and on the SEC’s website at www.sec.gov.
Not later than five business days after the end of each calendar month, each Fund will post detailed information regarding its portfolio holdings, as well as its dollar-weighted average maturity and dollar-weighted average life, as of the last day of that month on the J.P. Morgan Funds’ website and provide a link to the SEC website where the most recent twelve months of publicly available information filed by the Fund may be obtained.
In addition, not later than five business days after the end of each calendar month, each Fund will file a schedule of detailed information regarding its portfolio holdings as of the last day of that month with the SEC. These filings will be publicly available on the J.P. Morgan Funds’ website at www.jpmorgan.com/academy and the SEC’s website upon filing.
Shareholders may request portfolio holdings schedules at no charge by calling 1-800-766-7722 or calling Academy Securities at 1-646-341-6869. A description of the Funds’ policies and procedures with respect to the disclosure of the Funds’ portfolio holdings is available in the Statement of Additional Information.
40 | J.P. Morgan Money Market Funds
In addition, each Fund may post portfolio holdings on the J.P. Morgan Funds’ website at www.jpmorganfunds.com or on the J.P. Morgan external websites.
On each business day, all Funds will post their levels of daily and weekly liquid assets as of the final time that the net asset value was calculated for the Fund on the previous business day and each business day during the preceding six months on the J.P. Morgan Funds’ website.
On each business day, all Funds will post information regarding their net inflows/outflows and as of the final time that the net asset value was calculated for the Fund on the previous business day and each business day during the preceding six months on the J.P. Morgan Funds’ website.
Disclosure of Market-Based Net Asset Value
On each business day, the Funds will post its market-based NAV per share (Market-Based NAV) to four decimal places shown as of the final time that the net asset value was calculated for each Fund on the previous business day and each business day for the Fund during the preceding six months on the J.P. Morgan Funds’ website.
The Market-Based NAV of the U.S. Government Money Market Fund will be provided for informational purposes only. For purposes of transactions in the shares of a Fund in accordance with Rule 2a-7, the price for shares will continue to be the NAV per share of the applicable share class, calculated using the amortized cost method to two decimals, as described under “How Your Account Works.”
June 21, 2024 | 41
What the Terms Mean
Asset-backed securities: Interests in a stream of payments from specific assets, such as auto or credit card receivables.
Commercial paper: Short-term securities with maturities of 1 to 270 days which are issued by banks, corporations and others.
Daily liquid assets: Means (i) cash; (ii) direct obligations of the U.S. Government; (iii) securities that will mature or are subject to a demand feature that is exercisable and payable within one business day and (iv) amounts receivable and due unconditionally within one business day on pending sales of portfolio securities.
Demand notes: Debt securities with no set maturity date. The investor can generally demand payment of the principal at any time.
Distribution fee: Covers the cost of the distribution system used to sell shares to the public.
Dollar-weighted average maturity: The average maturity of the Fund is the average amount of time until the organization(s) that issued the debt securities in the Fund’s portfolio must pay off the principal amount of the debt. This calculation may utilize maturity shortening provisions under applicable rules. “Dollar- weighted” means the larger the dollar value of debt security in the Fund, the more weight it gets in calculating this average. To calculate the dollar-weighted average maturity, the Fund may treat a variable or floating rate security as having a maturity equal to the time remaining to the security’s next interest rate reset date rather than the security’s actual maturity date.
Dollar-weighted average life: The dollar weighted average portfolio maturity without reference to the exceptions used for variable or floating rate securities regarding the use of the date of interest rate resets in lieu of the security’s actual maturity date.
Floating rate securities: Securities whose interest rates adjust automatically whenever a particular interest rate changes.
GSE: A financial services corporation created by the United States Congress, such as Federal National Mortgage Association, or Fannie Mae, and the Federal Home Loan Mortgage Corporation, or Freddie Mac. Certain securities issued by such corporations may be subject to mortgage-related securities risk.
Liquidity: The ability to easily convert investments into cash without losing a significant amount of money in the process.
Liquidity fees: Certain Funds’ policies and procedures permit the Fund to impose liquidity fees on redemptions of up to 2% of the value of the shares redeemed if the adviser, as the delegate of the Board, determines it is in the best interests of the Fund.
Management fee: A fee paid to the investment adviser to manage the Fund and make decisions about buying and selling the Fund’s investments.
Municipal lease obligations: These provide participation in municipal lease agreements and installment purchase contracts, but are not part of general obligations of the municipality.
Municipal obligations: Debt securities issued by or on behalf of states, territories and possessions or by their agencies or other groups with authority to act for them. Interest on certain municipal obligations, generally issued as general obligation and revenue bonds, is exempt from federal taxation and state and/or local taxes in the state where issued.
Other expenses: Miscellaneous items, including transfer agency, administration, custody and registration fees.
Qualified U.S. and foreign banks: These include (i) U.S. banks with more than $1 billion in total assets, and foreign branches of these banks; or (ii) foreign banks with the equivalent of more than $1 billion in total assets and which have branches or agencies in the U.S. or (iii) other U.S. or foreign commercial banks which the Fund’s adviser judges to have comparable credit standing.
Repurchase agreement: A special type of a short-term investment. A dealer sells securities to a Fund and agrees to buy them back later for a set price. This set price includes interest. In effect, the dealer is borrowing the Fund’s money for a short time, using the securities as collateral.
Reverse repurchase agreement: Contract whereby the Fund sells a security and agrees to repurchase it from the buyer on a particular date and at a specific price. Considered a form of borrowing.
Service fee: A fee to cover the cost of paying Financial Intermediaries to provide certain support services for your account.
U.S. government securities: Debt instruments (Treasury bills, notes, and bonds) guaranteed by the U.S. government or its agencies or instrumentalities for the timely payment of principal and interest.
Variable rate securities: Securities whose interest rates are periodically adjusted.
Weekly liquid assets: Means (i) cash; (ii) direct obligations of the U.S. Government; (iii) Government securities issued by a person controlled or supervised by and acting as an instrumentality of the Government of the United States pursuant to authority granted by the Congress of the United States, that are issued at a discount to the principal amount to be repaid at maturity without the provision for the payment of interest and have a remaining maturity of 60 days or less; (iv) securities that will mature or are subject to a demand feature that is exercisable and payable within five business days and (v) amounts receivable and due unconditionally within five business days on pending sales of portfolio securities.
42 | J.P. Morgan Money Market Funds
Financial Highlights
The financial highlights table is intended to help you understand each Fund’s financial performance for the past five fiscal years or the period of a Fund’s operations, as applicable. Certain information reflects financial results for a single Fund share. The total returns in the tables represent the rate that an investor would have earned (or lost) on an investment in a Fund (assuming reinvestment of all dividends and distributions). This information for each period presented has been audited by PricewaterhouseCoopers LLP, whose reports, along with each Fund’s financial statements, are included in the respective Fund’s annual report, which is available upon request.
To the extent a Fund invests in other funds, the Total Annual Operating Expenses included in the Fee Table will not correlate to the ratio of expenses to average net assets in the financial highlights below.
| |
Per share operating performance | ||||||
| |
|
Investment operations |
Distributions | ||||
| |
Net asset value, beginning of period |
Net investment income (loss) |
Net realized and unrealized gains (losses) on investments |
Total from investment operations |
Net investment income |
Net realized gain |
Total distributions |
| JPMorgan Prime Money Market Fund |
|
|
|
|
|
|
|
| Academy |
|
|
|
|
|
|
|
| Year Ended February 29, 2024 |
$1.0006 |
$0.0527 |
$(0.0001) |
$0.0526 |
$(0.0527) |
$— |
$(0.0527) |
| Year Ended February 28, 2023 |
1.0003 |
0.0240 |
0.0003 |
0.0243 |
(0.0240) |
— |
(0.0240) |
| Year Ended February 28, 2022 |
1.0006 |
0.0007 |
(0.0003) |
0.0004 |
(0.0007) |
— |
(0.0007) |
| Year Ended February 28, 2021 |
1.0006 |
0.0036 |
—(e) |
0.0036 |
(0.0036) |
—(e) |
(0.0036) |
| May 15, 2019 (f) through February 29, 2020 |
1.0003 |
0.0162 |
0.0003 |
0.0165 |
(0.0162) |
— |
(0.0162) |
(a)
Annualized for periods less than one year, unless otherwise noted.
(b)
Not annualized for periods less than one year.
(c)
Includes interest expense, if applicable, which is less than 0.005% unless otherwise noted.
(d)
| Voluntary waivers were as follows: |
February 29, 2024 |
February 28, 2023 |
February 28, 2022 |
February 28, 2021 |
February 29, 2020 |
| Academy |
— |
0.01% |
0.08% |
0.01% |
— |
(e)
Amount rounds to less than $0.00005.
(f)
Commencement of offering of class of shares.
44 | J.P. Morgan Money Market Funds
| |
Ratios/Supplemental data | ||||
| |
|
|
Ratios to average net assets(a) | ||
| Net asset value, end of period |
Total return(b) |
Net assets, end of period (000's) |
Net expenses(c) |
Net investment income (loss) |
Expenses without waivers and reimbursements |
| |
|
|
|
|
|
| |
|
|
|
|
|
| $1.0005 |
5.38% |
$786,157 |
0.18% |
5.23% |
0.18% |
| 1.0006 |
2.46 |
618,235 |
0.17(d) |
2.30 |
0.19 |
| 1.0003 |
0.04 |
918,415 |
0.10(d) |
0.07 |
0.19 |
| 1.0006 |
0.36 |
1,011,973 |
0.17(d) |
0.38 |
0.19 |
| 1.0006 |
1.66 |
150,519 |
0.18 |
1.69 |
0.26 |
June 21, 2024 | 45
Financial Highlights (continued)
| |
Per share operating performance | ||||||
| |
|
Investment operations |
Distributions | ||||
| |
Net asset value, beginning of period |
Net investment income (loss)(b) |
Net realized and unrealized gains (losses) on investments |
Total from investment operations |
Net investment income |
Net realized gain |
Total distributions |
| JPMorgan 100% U.S. Treasury Securities Money Market Fund |
|
|
|
|
|
|
|
| Academy |
|
|
|
|
|
|
|
| Year Ended February 29, 2024 |
$1.00 |
$0.05 |
$—(e) |
$0.05 |
$(0.05) |
$— |
$(0.05) |
| Year Ended February 28, 2023 |
1.00 |
0.02 |
—(e) |
0.02 |
(0.02) |
—(e) |
(0.02) |
| Year Ended February 28, 2022 |
1.00 |
—(e) |
—(e) |
—(e) |
—(e) |
—(e) |
—(e) |
| September 30, 2020 (g) through February 28, 2021 |
1.00 |
—(e) |
—(e) |
—(e) |
—(e) |
— |
—(e) |
(a)
Annualized for periods less than one year, unless otherwise noted.
(b)
Calculated based upon average shares outstanding.
(c)
Not annualized for periods less than one year.
(d)
Includes interest expense, if applicable, which is less than 0.005% unless otherwise noted.
(e)
Amount rounds to less than $0.005.
(f)
| Voluntary waivers were as follows: |
February 29, 2024 |
February 28, 2023 |
February 28, 2022 |
February 28, 2021 |
| Academy |
— |
—(a) |
0.12% |
0.08% |
(a)Amount rounds to less than 0.005%.
(g)
Commencement of offering of class of shares.
(h)
Amount rounds to less than 0.005%.
46 | J.P. Morgan Money Market Funds
| |
Ratios/Supplemental data | ||||
| |
|
|
Ratios to average net assets(a) | ||
| Net asset value, end of period |
Total return(c) |
Net assets, end of period (000's) |
Net expenses(d) |
Net investment income (loss) |
Expenses without waivers and reimbursements |
| |
|
|
|
|
|
| |
|
|
|
|
|
| $1.00 |
5.14% |
$149,126 |
0.17% |
5.06% |
0.18% |
| 1.00 |
2.10 |
100,272 |
0.18(f) |
2.20 |
0.19 |
| 1.00 |
0.01 |
131,020 |
0.05(f) |
0.01 |
0.18 |
| 1.00 |
0.00(h) |
17,600 |
0.10(f) |
0.01 |
0.21 |
June 21, 2024 | 47
Financial Highlights (continued)
| |
Per share operating performance | |||||
| |
|
Investment operations |
Distributions |
| ||
| |
Net asset value, beginning of period |
Net investment income (loss)(b) |
Net realized and unrealized gains (losses) on investments |
Total from investment operations |
Net investment income |
Net asset value, end of period |
| JPMorgan U.S. Government Money Market Fund |
|
|
|
|
|
|
| Academy |
|
|
|
|
|
|
| Year Ended February 29, 2024 |
$1.00 |
$0.05 |
$—(e) |
$0.05 |
$(0.05) |
$1.00 |
| Year Ended February 28, 2023 |
1.00 |
0.02 |
—(e) |
0.02 |
(0.02) |
1.00 |
| Year Ended February 28, 2022 |
1.00 |
—(e) |
—(e) |
—(e) |
—(e) |
1.00 |
| Year Ended February 28, 2021 |
1.00 |
—(e) |
—(e) |
—(e) |
—(e) |
1.00 |
| May 15, 2019 (g) through February 29, 2020 |
1.00 |
0.01 |
—(e) |
0.01 |
(0.01) |
1.00 |
(a)
Annualized for periods less than one year, unless otherwise noted.
(b)
Calculated based upon average shares outstanding.
(c)
Not annualized for periods less than one year.
(d)
Includes interest expense, if applicable, which is less than 0.005% unless otherwise noted.
(e)
Amount rounds to less than $0.005.
(f)
| Voluntary waivers were as follows: |
February 29, 2024 |
February 28, 2023 |
February 28, 2022 |
February 28, 2021 |
February 29, 2020 |
| Academy |
— |
0.03% |
0.13% |
0.04% |
— |
(g)
Commencement of offering of class of shares.
48 | J.P. Morgan Money Market Funds
| Ratios/Supplemental data | ||||
| |
|
Ratios to average net assets(a) | ||
| Total return(c) |
Net assets, end of period (000's) |
Net expenses(d) |
Net investment income (loss) |
Expenses without waivers and reimbursements |
| |
|
|
|
|
| |
|
|
|
|
| 5.19% |
$7,529,994 |
0.18% |
5.12% |
0.18% |
| 2.20 |
4,267,302 |
0.15(f) |
1.79 |
0.18 |
| 0.03 |
10,734,174 |
0.04(f) |
0.03 |
0.18 |
| 0.14 |
3,689,489 |
0.14(f) |
0.07 |
0.18 |
| 1.47 |
85,026 |
0.18 |
1.49 |
0.21 |
June 21, 2024 | 49
Financial Highlights (continued)
| |
Per share operating performance | |||||
| |
|
Investment operations |
Distributions |
| ||
| |
Net asset value, beginning of period |
Net investment income (loss)(b) |
Net realized and unrealized gains (losses) on investments |
Total from investment operations |
Net investment income |
Net asset value, end of period |
| JPMorgan U.S. Treasury Plus Money Market Fund |
|
|
|
|
|
|
| Academy |
|
|
|
|
|
|
| Year Ended February 29, 2024 |
$1.00 |
$0.05 |
$—(e) |
$0.05 |
$(0.05) |
$1.00 |
| Year Ended February 28, 2023 |
1.00 |
0.02 |
—(e) |
0.02 |
(0.02) |
1.00 |
| Year Ended February 28, 2022 |
1.00 |
—(e) |
—(e) |
—(e) |
—(e) |
1.00 |
| September 30, 2020 (g) through February 28, 2021 |
1.00 |
—(e) |
—(e) |
—(e) |
—(e) |
1.00 |
(a)
Annualized for periods less than one year, unless otherwise noted.
(b)
Calculated based upon average shares outstanding.
(c)
Not annualized for periods less than one year.
(d)
Includes interest expense, if applicable, which is less than 0.005% unless otherwise noted.
(e)
Amount rounds to less than $0.005.
(f)
| Voluntary waivers were as follows: |
February 29, 2024 |
February 28, 2023 |
February 28, 2022 |
February 28, 2021 |
| Academy |
— |
0.03% |
0.14% |
0.05% |
(g)
Commencement of offering of class of shares.
50 | J.P. Morgan Money Market Funds
| Ratios/Supplemental data | ||||
| |
|
Ratios to average net assets(a) | ||
| Total return(c) |
Net assets, end of period (000's) |
Net expenses(d) |
Net investment income (loss) |
Expenses without waivers and reimbursements |
| |
|
|
|
|
| |
|
|
|
|
| 5.18% |
$2,124,743 |
0.18% |
5.18% |
0.18% |
| 2.18 |
153,500 |
0.15(f) |
2.60 |
0.19 |
| 0.01 |
100 |
0.04(f) |
0.01 |
0.19 |
| 0.01 |
17,600 |
0.07(f) |
0.03 |
0.23 |
June 21, 2024 | 51
Additional Fee and Expense Information
ADDITIONAL FEE AND EXPENSE INFORMATION
FOR JPMT II FUNDS AND FORMER ONE GROUP MUTUAL FUNDS
FOR JPMT II FUNDS AND FORMER ONE GROUP MUTUAL FUNDS
In connection with the 2004 final settlement between Banc One Investment Advisors Corporation (BOIA), subsequently known as JPMorgan Investment Advisors Inc. (JPMIA), with the New York Attorney General arising out of market timing of certain mutual funds advised by BOIA, BOIA agreed, among other things, to disclose hypothetical information regarding investment and expense information to Fund shareholders. The hypothetical examples are provided for JPMT II Funds or those Funds that have acquired the assets and liabilities of a JPMT II Fund or a series of One Group Mutual Funds.
The “Gross Expense Ratio” includes the contractual expenses that make up the investment advisory, administration and service fees, Rule 12b-1 distribution fees, fees paid to vendors not affiliated with JPMIM that provide services to the Funds and other fees and expenses of the Funds. The “Net Expense Ratio” is Gross Expenses less any fee waivers or expense reimbursements memorialized in a written contract between the Funds and JPMIM and/or its affiliates, as applicable.
| |
|
|
|
| |
Class |
Net Expense Ratio |
Gross Expense Ratio |
| JPMorgan Prime Money Market Fund |
Academy |
0.18 % |
0.18 % |
| JPMorgan 100% U.S. Treasury Securities Money Market Fund |
Academy |
0.18 % |
0.18 % |
| JPMorgan U.S. Government Money Market Fund |
Academy |
0.18 % |
0.18 % |
| JPMorgan U.S. Treasury Plus Money Market Fund |
Academy |
0.18 % |
0.18 % |
A Fund’s annual return is reduced by its fees and expenses for that year. The examples below are intended to help you understand the annual and cumulative impact of the Fund’s fees and expenses on your investment through a hypothetical investment of $10,000 held for the next 10 years. The examples assume the following:
●
On June 21, 2024, you invest $10,000 in the Fund and you will hold the shares for the entire 10 year period;
●
Your investment has a 5% return each year;
●
The Fund’s operating expenses remain at the levels discussed below and are not affected by increases or decreases in Fund assets over time;
●
At the time of purchase, any applicable initial sales charges (loads) are deducted; and
●
There is no sales charge (load) on reinvested dividends.
●
The annual costs are calculated using the Net Expense Ratios for the period through the expiration of any fee waivers or expense reimbursements memorialized in a written contract between the Funds and JPMIM and/or its affiliates; and the Gross Expense Ratios thereafter.
“Gross Cumulative Return” shows what the cumulative return on your investment at the end of each 12-month period (year) ended June 30 would be if Fund expenses are not deducted. “Net Cumulative Return” shows what the cumulative return on your investment at the end of each year would be assuming Fund expenses are deducted each year in the amount shown under “Annual Costs.” “Net Annual Return” shows what effect the “Annual Costs” will have on the assumed 5% annual return for each year.
Your actual costs may be higher or lower than those shown.
52 | J.P. Morgan Money Market Funds
| JPMorgan Prime Money Market Fund | ||||
| |
Academy Shares | |||
| Period Ended |
Annual Costs |
Gross Cumulative Return |
Net Cumulative Return |
Net Annual Return |
| June 30, 2025 |
$18 |
5.00% |
4.82% |
4.82% |
| June 30, 2026 |
19 |
10.25 |
9.87 |
4.82 |
| June 30, 2027 |
20 |
15.76 |
15.17 |
4.82 |
| June 30, 2028 |
21 |
21.55 |
20.72 |
4.82 |
| June 30, 2029 |
22 |
27.63 |
26.54 |
4.82 |
| June 30, 2030 |
23 |
34.01 |
32.64 |
4.82 |
| June 30, 2031 |
24 |
40.71 |
39.03 |
4.82 |
| June 30, 2032 |
26 |
47.75 |
45.73 |
4.82 |
| June 30, 2033 |
27 |
55.13 |
52.76 |
4.82 |
| June 30, 2034 |
28 |
62.89 |
60.12 |
4.82 |
| JPMorgan 100% U.S. Treasury Securities Money Market Fund | ||||
| |
Academy Shares | |||
| Period Ended |
Annual Costs |
Gross Cumulative Return |
Net Cumulative Return |
Net Annual Return |
| June 30, 2025 |
$18 |
5.00% |
4.82% |
4.82% |
| June 30, 2026 |
19 |
10.25 |
9.87 |
4.82 |
| June 30, 2027 |
20 |
15.76 |
15.17 |
4.82 |
| June 30, 2028 |
21 |
21.55 |
20.72 |
4.82 |
| June 30, 2029 |
22 |
27.63 |
26.54 |
4.82 |
| June 30, 2030 |
23 |
34.01 |
32.64 |
4.82 |
| June 30, 2031 |
24 |
40.71 |
39.03 |
4.82 |
| June 30, 2032 |
26 |
47.75 |
45.73 |
4.82 |
| June 30, 2033 |
27 |
55.13 |
52.76 |
4.82 |
| June 30, 2034 |
28 |
62.89 |
60.12 |
4.82 |
| JPMorgan U.S. Government Money Market Fund | ||||
| |
Academy Shares | |||
| Period Ended |
Annual Costs |
Gross Cumulative Return |
Net Cumulative Return |
Net Annual Return |
| June 30, 2025 |
$18 |
5.00% |
4.82% |
4.82% |
| June 30, 2026 |
19 |
10.25 |
9.87 |
4.82 |
| June 30, 2027 |
20 |
15.76 |
15.17 |
4.82 |
| June 30, 2028 |
21 |
21.55 |
20.72 |
4.82 |
| June 30, 2029 |
22 |
27.63 |
26.54 |
4.82 |
| June 30, 2030 |
23 |
34.01 |
32.64 |
4.82 |
| June 30, 2031 |
24 |
40.71 |
39.03 |
4.82 |
| June 30, 2032 |
26 |
47.75 |
45.73 |
4.82 |
| June 30, 2033 |
27 |
55.13 |
52.76 |
4.82 |
| June 30, 2034 |
28 |
62.89 |
60.12 |
4.82 |
June 21, 2024 | 53
Additional Fee and Expense Information (continued)
| JPMorgan U.S. Treasury Plus Money Market Fund | ||||
| |
Academy Shares | |||
| Period Ended |
Annual Costs |
Gross Cumulative Return |
Net Cumulative Return |
Net Annual Return |
| June 30, 2025 |
$18 |
5.00% |
4.82% |
4.82% |
| June 30, 2026 |
19 |
10.25 |
9.87 |
4.82 |
| June 30, 2027 |
20 |
15.76 |
15.17 |
4.82 |
| June 30, 2028 |
21 |
21.55 |
20.72 |
4.82 |
| June 30, 2029 |
22 |
27.63 |
26.54 |
4.82 |
| June 30, 2030 |
23 |
34.01 |
32.64 |
4.82 |
| June 30, 2031 |
24 |
40.71 |
39.03 |
4.82 |
| June 30, 2032 |
26 |
47.75 |
45.73 |
4.82 |
| June 30, 2033 |
27 |
55.13 |
52.76 |
4.82 |
| June 30, 2034 |
28 |
62.89 |
60.12 |
4.82 |
54 | J.P. Morgan Money Market Funds
How to Reach Us
For Shareholder Inquiries:
By telephone
Call 1-646-341-6869
Call 1-646-341-6869
Online
www.jpmorgan.com/academy
www.jpmorgan.com/academy
MORE INFORMATION
For investors who want more information on these Funds the following documents are available free upon request:
ANNUAL AND SEMI-ANNUAL REPORTS
Our annual and semi-annual reports contain more information about each Fund’s investments and performance.
STATEMENT OF ADDITIONAL INFORMATION (SAI)
The SAI contains more detailed information about the Funds and their policies. It is incorporated by reference into this prospectus. This means, by law, it is considered to be part of this prospectus.
You can get a free copy of these documents and other information, or ask us any questions, by calling us at 1-800-766-7722 or writing to:
J.P. Morgan Institutional Funds Service Center
P.O. Box 219265
Kansas City, MO 64121-9265
P.O. Box 219265
Kansas City, MO 64121-9265
If you buy your shares through a Financial Intermediary, you should contact that Financial Intermediary directly for more information. You can also find information online at www.jpmorganfunds.com.
Reports, a copy of the SAI, and other information about the Funds are also available on the EDGAR Database on the Commission’s Internet site at http://www.sec.gov, and copies of this information may be obtained, after paying a duplicating fee, by electronic request at the following E-mail address: publicinfo@sec.gov.
Investment Company Act File Nos.
| JPMorgan Trust I |
811-21295 |
| JPMorgan Trust II |
811-4236 |
©JPMorgan Chase & Co. 2024. All rights reserved. June 2024.


PR-MMACAD-624