Prospectus
JPMorgan SmartRetirement Blend Funds
Class I Shares
November 1, 2023
JPMorgan SmartRetirement® Blend Income Fund
Class/Ticker: I/JIJSX
JPMorgan SmartRetirement® Blend 2020 Fund
Class/Ticker: I/JSSRX
JPMorgan SmartRetirement® Blend 2025 Fund
Class/Ticker: I/JBSSX
JPMorgan SmartRetirement® Blend 2030 Fund
Class/Ticker: I/JRBEX
JPMorgan SmartRetirement® Blend 2035 Fund
Class/Ticker: I/JPSRX
JPMorgan SmartRetirement® Blend 2040 Fund
Class/Ticker: I/JOBEX
JPMorgan SmartRetirement® Blend 2045 Fund
Class/Ticker: I/JMSSX
JPMorgan SmartRetirement® Blend 2050 Fund
Class/Ticker: I/JNEAX
JPMorgan SmartRetirement® Blend 2055 Fund
Class/Ticker: I/JPTBX
JPMorgan SmartRetirement® Blend 2060 Fund
Class/Ticker: I/JACSX
JPMorgan SmartRetirement® Blend 2065 Fund
Class/Ticker: I/JSBSX
The Securities and Exchange Commission and the Commodity Futures Trading Commission have not approved or disapproved of these securities or determined if this prospectus is truthful or complete. Any representation to the contrary is a criminal offense.

Contents
| | |
| 1 | |
| 9 | |
| 19 | |
| 29 | |
| 39 | |
| 49 | |
| 59 | |
| 69 | |
| 79 | |
| 89 | |
| 99 | |
| 108 | |
| 108 | |
| 113 | |
| 114 | |
| 125 | |
| 126 | |
| 126 | |
| 126 | |
| 126 |
| 129 | |
| 129 | |
| 131 | |
| 131 | |
| 134 | |
| 134 | |
| 137 | |
| 137 | |
| 138 | |
| 139 | |
| 142 | |
| 142 | |
| 142 | |
| 144 | |
| 145 | |
| 145 | |
| 145 | |
| 146 | |
| 146 | |
| 148 | |
| Back cover |
JPMorgan SmartRetirement® Blend Income Fund
| | |
| |
Class I |
| Management Fees |
|
| Distribution (Rule 12b-1) Fees |
|
| Other Expenses |
|
| Service Fees |
|
| Remainder of Other Expenses |
|
| Acquired Fund (Underlying Fund) Fees and Expenses |
|
| Total Annual Fund Operating Expenses |
|
| Fee Waivers and/or Expense Reimbursements1 |
- |
| Total Annual Fund Operating Expenses after Fee Waivers and/or Expense Reimbursements1 |
|
1
| | ||||
| |
1 Year |
3 Years |
5 Years |
10 Years |
| CLASS I SHARES ($) |
|
|
|
|
November 1, 2023 | 1
JPMorgan SmartRetirement® Blend Income Fund (continued)
| |
|
| |
% |
| |
% |
| |
% |
| |
% |
| |
% |
| |
% |
| |
% |
| |
% |
| |
% |
| |
% |
| |
% |
| |
% |
| |
% |
| |
% |
The Fund is subject to management risk and may not achieve its objective if the Adviser’s expectations regarding particular instruments or markets are not met. The Fund is exposed to the risks summarized below through both its direct investments and investments in underlying funds.
An investment in this Fund or any other fund may not provide a complete investment program. The suitability of an investment in the Fund should be considered based on the investment objective, strategies and risks described in this prospectus, considered in light of all of the other investments in your portfolio, as well as your risk tolerance, financial goals and time horizons. You may want to consult with a financial advisor to determine if this Fund is suitable for you.
The Fund is subject to the main risks noted below, through its investments in underlying funds and through its direct investments. Any of the risks noted below, whether through investments in underlying funds or direct investments, may adversely affect the Fund’s performance and ability to meet its investment objective.
2 | JPMorgan SmartRetirement Blend Funds
November 1, 2023 | 3
JPMorgan SmartRetirement® Blend Income Fund (continued)
4 | JPMorgan SmartRetirement Blend Funds
November 1, 2023 | 5
JPMorgan SmartRetirement® Blend Income Fund (continued)
6 | JPMorgan SmartRetirement Blend Funds
| |
| |
|
|
| |
|
|
| |
|
|
|
|
|
| | |||
| |
Past 1 Year |
Past 5 Years |
Past 10 Years |
| CLASS I SHARES |
|
|
|
| Return Before Taxes |
- % |
% |
% |
| Return After Taxes on Distributions |
- |
|
|
| Return After Taxes on Distributions and Sale of Fund Shares |
- |
|
|
| S&P TARGET DATE RETIREMENT INCOME INDEX (Reflects No Deduction for Fees, Expenses, or Taxes) |
- |
|
|
| JPM SMARTRETIREMENT BLEND INCOME COMPOSITE BENCHMARK (Reflects No Deduction for Fees, Expenses, or Taxes) |
- |
|
|
November 1, 2023 | 7
JPMorgan SmartRetirement® Blend Income Fund (continued)
Management
J.P. Morgan Investment Management Inc. (the adviser)
| Portfolio Manager |
Managed Fund Since |
Primary Title with Investment Adviser |
| Daniel Oldroyd |
2012 |
Managing Director |
| Silvia Trillo |
2019 |
Managing Director |
| Ove Fladberg |
2022 |
Managing Director |
| Anshul Mohan |
2023 |
Executive Director |
| Jeffrey A. Geller |
2012 |
Managing Director |
Purchase and Sale of Fund Shares
Purchase minimums
| For Class I Shares | |
| To establish an account |
$1,000,000 |
| To add to an account |
No minimum levels |
In general, you may purchase or redeem shares on any business day:
•
Through your Financial Intermediary
•
By writing to J.P. Morgan Funds Services, P.O. Box 219143, Kansas City, MO 64121-9143
•
After you open an account, by calling J.P. Morgan Funds Services at 1-800-480-4111
Tax Information
The Fund intends to make distributions that may be taxed as ordinary income or capital gains, except when your investment is in an IRA, 401(k) plan or other tax-advantaged investment plan, in which case you may be subject to federal income tax upon withdrawal from the tax-advantaged investment plan.
Payments to Broker-Dealers and Other Financial Intermediaries
If you purchase shares of the Fund through a broker-dealer or other financial intermediary (such as a bank), the Fund and its related companies may pay the financial intermediary for the sale of Fund shares and related services. These payments may create a conflict of interest by influencing the broker-dealer or financial intermediary and your salesperson to recommend the Fund over another investment. Ask your salesperson or visit your financial intermediary’s website for more information.
8 | JPMorgan SmartRetirement Blend Funds
JPMorgan SmartRetirement® Blend 2020 Fund
| | |
| |
Class I |
| Management Fees |
|
| Distribution (Rule 12b-1) Fees |
|
| Other Expenses |
|
| Service Fees |
|
| Remainder of Other Expenses |
|
| Acquired Fund (Underlying Fund) Fees and Expenses |
|
| Total Annual Fund Operating Expenses |
|
| Fee Waivers and/or Expense Reimbursements1 |
- |
| Total Annual Fund Operating Expenses after Fee Waivers and/or Expense Reimbursements1 |
|
1
| | ||||
| |
1 Year |
3 Years |
5 Years |
10 Years |
| CLASS I SHARES ($) |
|
|
|
|
November 1, 2023 | 9
JPMorgan SmartRetirement® Blend 2020 Fund (continued)
10 | JPMorgan SmartRetirement Blend Funds
| | |
| |
% |
| |
% |
| |
% |
| |
% |
| |
% |
| |
% |
| |
% |
| |
% |
| |
% |
| |
% |
| |
% |
| |
% |
| |
% |
| |
% |
November 1, 2023 | 11
JPMorgan SmartRetirement® Blend 2020 Fund (continued)
The Fund is subject to management risk and may not achieve its objective if the Adviser’s expectations regarding particular instruments or markets are not met. The Fund is exposed to the risks summarized below through both its direct investments and investments in underlying funds.
An investment in this Fund or any other fund may not provide a complete investment program. The suitability of an investment in the Fund should be considered based on the investment objective, strategies and risks described in this prospectus, considered in light of all of the other investments in your portfolio, as well as your risk tolerance, financial goals and time horizons. You may want to consult with a financial advisor to determine if this Fund is suitable for you.
The Fund is subject to the main risks noted below, through its investments in underlying funds and through its direct investments. Any of the risks noted below, whether through investments in underlying funds or direct investments, may adversely affect the Fund’s performance and ability to meet its investment objective.
12 | JPMorgan SmartRetirement Blend Funds
November 1, 2023 | 13
JPMorgan SmartRetirement® Blend 2020 Fund (continued)
14 | JPMorgan SmartRetirement Blend Funds
November 1, 2023 | 15
JPMorgan SmartRetirement® Blend 2020 Fund (continued)
16 | JPMorgan SmartRetirement Blend Funds
| |
| |
|
|
| |
|
|
| |
|
|
|
|
|
November 1, 2023 | 17
JPMorgan SmartRetirement® Blend 2020 Fund (continued)
| | |||
| |
Past 1 Year |
Past 5 Years |
Past 10 Years |
| CLASS I SHARES |
|
|
|
| Return Before Taxes |
- % |
% |
% |
| Return After Taxes on Distributions |
- |
|
|
| Return After Taxes on Distributions and Sale of Fund Shares |
- |
|
|
| S&P TARGET DATE 2020 INDEX (Reflects No Deduction for Fees, Expenses, or Taxes) |
- |
|
|
| JPM SMARTRETIREMENT BLEND 2020 COMPOSITE BENCHMARK (Reflects No Deduction for Fees, Expenses, or Taxes) |
- |
|
|
Management
J.P. Morgan Investment Management Inc. (the adviser)
| Portfolio Manager |
Managed Fund Since |
Primary Title with Investment Adviser |
| Daniel Oldroyd |
2012 |
Managing Director |
| Silvia Trillo |
2019 |
Managing Director |
| Ove Fladberg |
2022 |
Managing Director |
| Anshul Mohan |
2023 |
Executive Director |
| Jeffrey A. Geller |
2012 |
Managing Director |
Purchase and Sale of Fund Shares
Purchase minimums
| For Class I Shares | |
| To establish an account |
$1,000,000 |
| To add to an account |
No minimum levels |
In general, you may purchase or redeem shares on any business day:
•
Through your Financial Intermediary
•
By writing to J.P. Morgan Funds Services, P.O. Box 219143, Kansas City, MO 64121-9143
•
After you open an account, by calling J.P. Morgan Funds Services at 1-800-480-4111
Tax Information
The Fund intends to make distributions that may be taxed as ordinary income or capital gains, except when your investment is in an IRA, 401(k) plan or other tax-advantaged investment plan, in which case you may be subject to federal income tax upon withdrawal from the tax-advantaged investment plan.
Payments to Broker-Dealers and Other Financial Intermediaries
If you purchase shares of the Fund through a broker-dealer or other financial intermediary (such as a bank), the Fund and its related companies may pay the financial intermediary for the sale of Fund shares and related services. These payments may create a conflict of interest by influencing the broker-dealer or financial intermediary and your salesperson to recommend the Fund over another investment. Ask your salesperson or visit your financial intermediary’s website for more information.
18 | JPMorgan SmartRetirement Blend Funds
JPMorgan SmartRetirement® Blend 2025 Fund
| | |
| |
Class I |
| Management Fees |
|
| Distribution (Rule 12b-1) Fees |
|
| Other Expenses |
|
| Service Fees |
|
| Remainder of Other Expenses |
|
| Acquired Fund (Underlying Fund) Fees and Expenses |
|
| Total Annual Fund Operating Expenses |
|
| Fee Waivers and/or Expense Reimbursements1 |
- |
| Total Annual Fund Operating Expenses after Fee Waivers and/or Expense Reimbursements1 |
|
1
| | ||||
| |
1 Year |
3 Years |
5 Years |
10 Years |
| CLASS I SHARES ($) |
|
|
|
|
November 1, 2023 | 19
JPMorgan SmartRetirement® Blend 2025 Fund (continued)
20 | JPMorgan SmartRetirement Blend Funds
| | |
| |
% |
| |
% |
| |
% |
| |
% |
| |
% |
| |
% |
| |
% |
| |
% |
| |
% |
| |
% |
| |
|
| |
% |
| |
% |
| |
% |
November 1, 2023 | 21
JPMorgan SmartRetirement® Blend 2025 Fund (continued)
The Fund is subject to management risk and may not achieve its objective if the Adviser’s expectations regarding particular instruments or markets are not met. The Fund is exposed to the risks summarized below through both its direct investments and investments in underlying funds.
An investment in this Fund or any other fund may not provide a complete investment program. The suitability of an investment in the Fund should be considered based on the investment objective, strategies and risks described in this prospectus, considered in light of all of the other investments in your portfolio, as well as your risk tolerance, financial goals and time horizons. You may want to consult with a financial advisor to determine if this Fund is suitable for you.
The Fund is subject to the main risks noted below, through its investments in underlying funds and through its direct investments. Any of the risks noted below, whether through investments in underlying funds or direct investments, may adversely affect the Fund’s performance and ability to meet its investment objective.
22 | JPMorgan SmartRetirement Blend Funds
November 1, 2023 | 23
JPMorgan SmartRetirement® Blend 2025 Fund (continued)
24 | JPMorgan SmartRetirement Blend Funds
November 1, 2023 | 25
JPMorgan SmartRetirement® Blend 2025 Fund (continued)
26 | JPMorgan SmartRetirement Blend Funds
| |
| |
|
|
| |
|
|
| |
|
|
|
|
|
November 1, 2023 | 27
JPMorgan SmartRetirement® Blend 2025 Fund (continued)
| | |||
| |
Past 1 Year |
Past 5 Years |
Past 10 Years |
| CLASS I SHARES |
|
|
|
| Return Before Taxes |
- % |
% |
% |
| Return After Taxes on Distributions |
- |
|
|
| Return After Taxes on Distributions and Sale of Fund Shares |
- |
|
|
| S&P TARGET DATE 2025 INDEX (Reflects No Deduction for Fees, Expenses, or Taxes) |
- |
|
|
| JPM SMARTRETIREMENT BLEND 2025 COMPOSITE BENCHMARK (Reflects No Deduction for Fees, Expenses, or Taxes) |
- |
|
|
Management
J.P. Morgan Investment Management Inc. (the adviser)
| Portfolio Manager |
Managed Fund Since |
Primary Title with Investment Adviser |
| Daniel Oldroyd |
2012 |
Managing Director |
| Silvia Trillo |
2019 |
Managing Director |
| Ove Fladberg |
2022 |
Managing Director |
| Anshul Mohan |
2023 |
Executive Director |
| Jeffrey A. Geller |
2012 |
Managing Director |
Purchase and Sale of Fund Shares
Purchase minimums
| For Class I Shares | |
| To establish an account |
$1,000,000 |
| To add to an account |
No minimum levels |
In general, you may purchase or redeem shares on any business day:
•
Through your Financial Intermediary
•
By writing to J.P. Morgan Funds Services, P.O. Box 219143, Kansas City, MO 64121-9143
•
After you open an account, by calling J.P. Morgan Funds Services at 1-800-480-4111
Tax Information
The Fund intends to make distributions that may be taxed as ordinary income or capital gains, except when your investment is in an IRA, 401(k) plan or other tax-advantaged investment plan, in which case you may be subject to federal income tax upon withdrawal from the tax-advantaged investment plan.
Payments to Broker-Dealers and Other Financial Intermediaries
If you purchase shares of the Fund through a broker-dealer or other financial intermediary (such as a bank), the Fund and its related companies may pay the financial intermediary for the sale of Fund shares and related services. These payments may create a conflict of interest by influencing the broker-dealer or financial intermediary and your salesperson to recommend the Fund over another investment. Ask your salesperson or visit your financial intermediary’s website for more information.
28 | JPMorgan SmartRetirement Blend Funds
JPMorgan SmartRetirement® Blend 2030 Fund
| | |
| |
Class I |
| Management Fees |
|
| Distribution (Rule 12b-1) Fees |
|
| Other Expenses |
|
| Service Fees |
|
| Remainder of Other Expenses |
|
| Acquired Fund (Underlying Fund) Fees and Expenses |
|
| Total Annual Fund Operating Expenses |
|
| Fee Waivers and/or Expense Reimbursements1 |
- |
| Total Annual Fund Operating Expenses after Fee Waivers and/or Expense Reimbursements1 |
|
1
| | ||||
| |
1 Year |
3 Years |
5 Years |
10 Years |
| CLASS I SHARES ($) |
|
|
|
|
November 1, 2023 | 29
JPMorgan SmartRetirement® Blend 2030 Fund (continued)
30 | JPMorgan SmartRetirement Blend Funds
| | |
| |
% |
| |
% |
| |
% |
| |
% |
| |
% |
| |
% |
| |
% |
| |
% |
| |
% |
| |
% |
| |
% |
| |
% |
| |
% |
| |
% |
November 1, 2023 | 31
JPMorgan SmartRetirement® Blend 2030 Fund (continued)
The Fund is subject to management risk and may not achieve its objective if the Adviser’s expectations regarding particular instruments or markets are not met. The Fund is exposed to the risks summarized below through both its direct investments and investments in underlying funds.
An investment in this Fund or any other fund may not provide a complete investment program. The suitability of an investment in the Fund should be considered based on the investment objective, strategies and risks described in this prospectus, considered in light of all of the other investments in your portfolio, as well as your risk tolerance, financial goals and time horizons. You may want to consult with a financial advisor to determine if this Fund is suitable for you.
The Fund is subject to the main risks noted below, through its investments in underlying funds and through its direct investments. Any of the risks noted below, whether through investments in underlying funds or direct investments, may adversely affect the Fund’s performance and ability to meet its investment objective.
32 | JPMorgan SmartRetirement Blend Funds
November 1, 2023 | 33
JPMorgan SmartRetirement® Blend 2030 Fund (continued)
34 | JPMorgan SmartRetirement Blend Funds
November 1, 2023 | 35
JPMorgan SmartRetirement® Blend 2030 Fund (continued)
36 | JPMorgan SmartRetirement Blend Funds
| |
| |
|
|
| |
|
|
| |
|
|
|
|
|
November 1, 2023 | 37
JPMorgan SmartRetirement® Blend 2030 Fund (continued)
| | |||
| |
Past 1 Year |
Past 5 Years |
Past 10 Years |
| CLASS I SHARES |
|
|
|
| Return Before Taxes |
- % |
% |
% |
| Return After Taxes on Distributions |
- |
|
|
| Return After Taxes on Distributions and Sale of Fund Shares |
- |
|
|
| S&P TARGET DATE 2030 INDEX (Reflects No Deduction for Fees, Expenses, or Taxes) |
- |
|
|
| JPM SMARTRETIREMENT BLEND 2030 COMPOSITE BENCHMARK (Reflects No Deduction for Fees, Expenses, or Taxes) |
- |
|
|
Management
J.P. Morgan Investment Management Inc. (the adviser)
| Portfolio Manager |
Managed Fund Since |
Primary Title with Investment Adviser |
| Daniel Oldroyd |
2012 |
Managing Director |
| Silvia Trillo |
2019 |
Managing Director |
| Ove Fladberg |
2022 |
Managing Director |
| Anshul Mohan |
2023 |
Executive Director |
| Jeffrey A. Geller |
2012 |
Managing Director |
Purchase and Sale of Fund Shares
Purchase minimums
| For Class I Shares | |
| To establish an account |
$1,000,000 |
| To add to an account |
No minimum levels |
In general, you may purchase or redeem shares on any business day:
•
Through your Financial Intermediary
•
By writing to J.P. Morgan Funds Services, P.O. Box 219143, Kansas City, MO 64121-9143
•
After you open an account, by calling J.P. Morgan Funds Services at 1-800-480-4111
Tax Information
The Fund intends to make distributions that may be taxed as ordinary income or capital gains, except when your investment is in an IRA, 401(k) plan or other tax-advantaged investment plan, in which case you may be subject to federal income tax upon withdrawal from the tax-advantaged investment plan.
Payments to Broker-Dealers and Other Financial Intermediaries
If you purchase shares of the Fund through a broker-dealer or other financial intermediary (such as a bank), the Fund and its related companies may pay the financial intermediary for the sale of Fund shares and related services. These payments may create a conflict of interest by influencing the broker-dealer or financial intermediary and your salesperson to recommend the Fund over another investment. Ask your salesperson or visit your financial intermediary’s website for more information.
38 | JPMorgan SmartRetirement Blend Funds
JPMorgan SmartRetirement® Blend 2035 Fund
| | |
| |
Class I |
| Management Fees |
|
| Distribution (Rule 12b-1) Fees |
|
| Other Expenses |
|
| Service Fees |
|
| Remainder of Other Expenses |
|
| Acquired Fund (Underlying Fund) Fees and Expenses |
|
| Total Annual Fund Operating Expenses |
|
| Fee Waivers and/or Expense Reimbursements1 |
- |
| Total Annual Fund Operating Expenses after Fee Waivers and/or Expense Reimbursements1 |
|
1
| | ||||
| |
1 Year |
3 Years |
5 Years |
10 Years |
| CLASS I SHARES ($) |
|
|
|
|
November 1, 2023 | 39
JPMorgan SmartRetirement® Blend 2035 Fund (continued)
40 | JPMorgan SmartRetirement Blend Funds
| | |
| |
% |
| |
% |
| |
% |
| |
% |
| |
% |
| |
% |
| |
% |
| |
% |
| |
% |
| |
% |
| |
% |
| |
% |
| |
% |
| |
% |
November 1, 2023 | 41
JPMorgan SmartRetirement® Blend 2035 Fund (continued)
The Fund is subject to management risk and may not achieve its objective if the Adviser’s expectations regarding particular instruments or markets are not met. The Fund is exposed to the risks summarized below through both its direct investments and investments in underlying funds.
An investment in this Fund or any other fund may not provide a complete investment program. The suitability of an investment in the Fund should be considered based on the investment objective, strategies and risks described in this prospectus, considered in light of all of the other investments in your portfolio, as well as your risk tolerance, financial goals and time horizons. You may want to consult with a financial advisor to determine if this Fund is suitable for you.
The Fund is subject to the main risks noted below, through its investments in underlying funds and through its direct investments. Any of the risks noted below, whether through investments in underlying funds or direct investments, may adversely affect the Fund’s performance and ability to meet its investment objective.
42 | JPMorgan SmartRetirement Blend Funds
November 1, 2023 | 43
JPMorgan SmartRetirement® Blend 2035 Fund (continued)
44 | JPMorgan SmartRetirement Blend Funds
November 1, 2023 | 45
JPMorgan SmartRetirement® Blend 2035 Fund (continued)
46 | JPMorgan SmartRetirement Blend Funds
| |
| |
|
|
| |
|
|
| |
|
|
|
|
|
November 1, 2023 | 47
JPMorgan SmartRetirement® Blend 2035 Fund (continued)
| | |||
| |
Past 1 Year |
Past 5 Years |
Past 10 Years |
| CLASS I SHARES |
|
|
|
| Return Before Taxes |
- % |
% |
% |
| Return After Taxes on Distributions |
- |
|
|
| Return After Taxes on Distributions and Sale of Fund Shares |
- |
|
|
| S&P TARGET DATE 2035 INDEX (Reflects No Deduction for Fees, Expenses, or Taxes) |
- |
|
|
| JPM SMARTRETIREMENT BLEND 2035 COMPOSITE BENCHMARK (Reflects No Deduction for Fees, Expenses, or Taxes) |
- |
|
|
Management
J.P. Morgan Investment Management Inc. (the adviser)
| Portfolio Manager |
Managed Fund Since |
Primary Title with Investment Adviser |
| Daniel Oldroyd |
2012 |
Managing Director |
| Silvia Trillo |
2019 |
Managing Director |
| Ove Fladberg |
2022 |
Managing Director |
| Anshul Mohan |
2023 |
Executive Director |
| Jeffrey A. Geller |
2012 |
Managing Director |
Purchase and Sale of Fund Shares
Purchase minimums
| For Class I Shares | |
| To establish an account |
$1,000,000 |
| To add to an account |
No minimum levels |
In general, you may purchase or redeem shares on any business day:
•
Through your Financial Intermediary
•
By writing to J.P. Morgan Funds Services, P.O. Box 219143, Kansas City, MO 64121-9143
•
After you open an account, by calling J.P. Morgan Funds Services at 1-800-480-4111
Tax Information
The Fund intends to make distributions that may be taxed as ordinary income or capital gains, except when your investment is in an IRA, 401(k) plan or other tax-advantaged investment plan, in which case you may be subject to federal income tax upon withdrawal from the tax-advantaged investment plan.
Payments to Broker-Dealers and Other Financial Intermediaries
If you purchase shares of the Fund through a broker-dealer or other financial intermediary (such as a bank), the Fund and its related companies may pay the financial intermediary for the sale of Fund shares and related services. These payments may create a conflict of interest by influencing the broker-dealer or financial intermediary and your salesperson to recommend the Fund over another investment. Ask your salesperson or visit your financial intermediary’s website for more information.
48 | JPMorgan SmartRetirement Blend Funds
JPMorgan SmartRetirement® Blend 2040 Fund
| | |
| |
Class I |
| Management Fees |
|
| Distribution (Rule 12b-1) Fees |
|
| Other Expenses |
|
| Service Fees |
|
| Remainder of Other Expenses |
|
| Acquired Fund (Underlying Fund) Fees and Expenses |
|
| Total Annual Fund Operating Expenses |
|
| Fee Waivers and/or Expense Reimbursements1 |
- |
| Total Annual Fund Operating Expenses after Fee Waivers and/or Expense Reimbursements1 |
|
1
| | ||||
| |
1 Year |
3 Years |
5 Years |
10 Years |
| CLASS I SHARES ($) |
|
|
|
|
November 1, 2023 | 49
JPMorgan SmartRetirement® Blend 2040 Fund (continued)
50 | JPMorgan SmartRetirement Blend Funds
| | |
| |
% |
| |
% |
| |
% |
| |
% |
| |
% |
| |
% |
| |
% |
| |
% |
| |
% |
| |
% |
| |
% |
| |
% |
| |
% |
| |
% |
November 1, 2023 | 51
JPMorgan SmartRetirement® Blend 2040 Fund (continued)
The Fund is subject to management risk and may not achieve its objective if the Adviser’s expectations regarding particular instruments or markets are not met. The Fund is exposed to the risks summarized below through both its direct investments and investments in underlying funds.
An investment in this Fund or any other fund may not provide a complete investment program. The suitability of an investment in the Fund should be considered based on the investment objective, strategies and risks described in this prospectus, considered in light of all of the other investments in your portfolio, as well as your risk tolerance, financial goals and time horizons. You may want to consult with a financial advisor to determine if this Fund is suitable for you.
The Fund is subject to the main risks noted below, through its investments in underlying funds and through its direct investments. Any of the risks noted below, whether through investments in underlying funds or direct investments, may adversely affect the Fund’s performance and ability to meet its investment objective.
52 | JPMorgan SmartRetirement Blend Funds
November 1, 2023 | 53
JPMorgan SmartRetirement® Blend 2040 Fund (continued)
54 | JPMorgan SmartRetirement Blend Funds
November 1, 2023 | 55
JPMorgan SmartRetirement® Blend 2040 Fund (continued)
56 | JPMorgan SmartRetirement Blend Funds
| |

| |
|
|
| |
|
|
| |
|
|
|
|
|
November 1, 2023 | 57
JPMorgan SmartRetirement® Blend 2040 Fund (continued)
| | |||
| |
Past 1 Year |
Past 5 Years |
Past 10 Years |
| CLASS I SHARES |
|
|
|
| Return Before Taxes |
- % |
% |
% |
| Return After Taxes on Distributions |
- |
|
|
| Return After Taxes on Distributions and Sale of Fund Shares |
- |
|
|
| S&P TARGET DATE 2040 INDEX (Reflects No Deduction for Fees, Expenses, or Taxes) |
- |
|
|
| JPM SMARTRETIREMENT BLEND 2040 COMPOSITE BENCHMARK (Reflects No Deduction for Fees, Expenses, or Taxes) |
- |
|
|
Management
J.P. Morgan Investment Management Inc. (the adviser)
| Portfolio Manager |
Managed Fund Since |
Primary Title with Investment Adviser |
| Daniel Oldroyd |
2012 |
Managing Director |
| Silvia Trillo |
2019 |
Managing Director |
| Ove Fladberg |
2022 |
Managing Director |
| Anshul Mohan |
2023 |
Executive Director |
| Jeffrey A. Geller |
2012 |
Managing Director |
Purchase and Sale of Fund Shares
Purchase minimums
| For Class I Shares | |
| To establish an account |
$1,000,000 |
| To add to an account |
No minimum levels |
In general, you may purchase or redeem shares on any business day:
•
Through your Financial Intermediary
•
By writing to J.P. Morgan Funds Services, P.O. Box 219143, Kansas City, MO 64121-9143
•
After you open an account, by calling J.P. Morgan Funds Services at 1-800-480-4111
Tax Information
The Fund intends to make distributions that may be taxed as ordinary income or capital gains, except when your investment is in an IRA, 401(k) plan or other tax-advantaged investment plan, in which case you may be subject to federal income tax upon withdrawal from the tax-advantaged investment plan.
Payments to Broker-Dealers and Other Financial Intermediaries
If you purchase shares of the Fund through a broker-dealer or other financial intermediary (such as a bank), the Fund and its related companies may pay the financial intermediary for the sale of Fund shares and related services. These payments may create a conflict of interest by influencing the broker-dealer or financial intermediary and your salesperson to recommend the Fund over another investment. Ask your salesperson or visit your financial intermediary’s website for more information.
58 | JPMorgan SmartRetirement Blend Funds
JPMorgan SmartRetirement® Blend 2045 Fund
| | |
| |
Class I |
| Management Fees |
|
| Distribution (Rule 12b-1) Fees |
|
| Other Expenses |
|
| Service Fees |
|
| Remainder of Other Expenses |
|
| Acquired Fund (Underlying Fund) Fees and Expenses |
|
| Total Annual Fund Operating Expenses |
|
| Fee Waivers and/or Expense Reimbursements1 |
- |
| Total Annual Fund Operating Expenses after Fee Waivers and/or Expense Reimbursements1 |
|
1
| | ||||
| |
1 Year |
3 Years |
5 Years |
10 Years |
| CLASS I SHARES ($) |
|
|
|
|
November 1, 2023 | 59
JPMorgan SmartRetirement® Blend 2045 Fund (continued)
60 | JPMorgan SmartRetirement Blend Funds
| | |
| |
% |
| |
% |
| |
% |
| |
% |
| |
% |
| |
% |
| |
% |
| |
% |
| |
% |
| |
% |
| |
% |
| |
% |
| |
% |
| |
% |
November 1, 2023 | 61
JPMorgan SmartRetirement® Blend 2045 Fund (continued)
The Fund is subject to management risk and may not achieve its objective if the Adviser’s expectations regarding particular instruments or markets are not met. The Fund is exposed to the risks summarized below through both its direct investments and investments in underlying funds.
An investment in this Fund or any other fund may not provide a complete investment program. The suitability of an investment in the Fund should be considered based on the investment objective, strategies and risks described in this prospectus, considered in light of all of the other investments in your portfolio, as well as your risk tolerance, financial goals and time horizons. You may want to consult with a financial advisor to determine if this Fund is suitable for you.
The Fund is subject to the main risks noted below, through its investments in underlying funds and through its direct investments. Any of the risks noted below, whether through investments in underlying funds or direct investments, may adversely affect the Fund’s performance and ability to meet its investment objective.
62 | JPMorgan SmartRetirement Blend Funds
November 1, 2023 | 63
JPMorgan SmartRetirement® Blend 2045 Fund (continued)
64 | JPMorgan SmartRetirement Blend Funds
November 1, 2023 | 65
JPMorgan SmartRetirement® Blend 2045 Fund (continued)
66 | JPMorgan SmartRetirement Blend Funds
| |
| |
|
|
| |
|
|
| |
|
|
|
|
|
November 1, 2023 | 67
JPMorgan SmartRetirement® Blend 2045 Fund (continued)
| | |||
| |
Past 1 Year |
Past 5 Years |
Past 10 Years |
| CLASS I SHARES |
|
|
|
| Return Before Taxes |
- % |
% |
% |
| Return After Taxes on Distributions |
- |
|
|
| Return After Taxes on Distributions and Sale of Fund Shares |
- |
|
|
| S&P TARGET DATE 2045 INDEX (Reflects No Deduction for Fees, Expenses, or Taxes) |
- |
|
|
| JPM SMARTRETIREMENT BLEND 2045 COMPOSITE BENCHMARK (Reflects No Deduction for Fees, Expenses, or Taxes) |
- |
|
|
Management
J.P. Morgan Investment Management Inc. (the adviser)
| Portfolio Manager |
Managed Fund Since |
Primary Title with Investment Adviser |
| Daniel Oldroyd |
2012 |
Managing Director |
| Silvia Trillo |
2019 |
Managing Director |
| Ove Fladberg |
2022 |
Managing Director |
| Anshul Mohan |
2023 |
Executive Director |
| Jeffrey A. Geller |
2012 |
Managing Director |
Purchase and Sale of Fund Shares
Purchase minimums
| For Class I Shares | |
| To establish an account |
$1,000,000 |
| To add to an account |
No minimum levels |
In general, you may purchase or redeem shares on any business day:
•
Through your Financial Intermediary
•
By writing to J.P. Morgan Funds Services, P.O. Box 219143, Kansas City, MO 64121-9143
•
After you open an account, by calling J.P. Morgan Funds Services at 1-800-480-4111
Tax Information
The Fund intends to make distributions that may be taxed as ordinary income or capital gains, except when your investment is in an IRA, 401(k) plan or other tax-advantaged investment plan, in which case you may be subject to federal income tax upon withdrawal from the tax-advantaged investment plan.
Payments to Broker-Dealers and Other Financial Intermediaries
If you purchase shares of the Fund through a broker-dealer or other financial intermediary (such as a bank), the Fund and its related companies may pay the financial intermediary for the sale of Fund shares and related services. These payments may create a conflict of interest by influencing the broker-dealer or financial intermediary and your salesperson to recommend the Fund over another investment. Ask your salesperson or visit your financial intermediary’s website for more information.
68 | JPMorgan SmartRetirement Blend Funds
JPMorgan SmartRetirement® Blend 2050 Fund
| | |
| |
Class I |
| Management Fees |
|
| Distribution (Rule 12b-1) Fees |
|
| Other Expenses |
|
| Service Fees |
|
| Remainder of Other Expenses |
|
| Acquired Fund (Underlying Fund) Fees and Expenses |
|
| Total Annual Fund Operating Expenses |
|
| Fee Waivers and/or Expense Reimbursements1 |
- |
| Total Annual Fund Operating Expenses after Fee Waivers and/or Expense Reimbursements1 |
|
1
| | ||||
| |
1 Year |
3 Years |
5 Years |
10 Years |
| CLASS I SHARES ($) |
|
|
|
|
November 1, 2023 | 69
JPMorgan SmartRetirement® Blend 2050 Fund (continued)
70 | JPMorgan SmartRetirement Blend Funds
| | |
| |
% |
| |
% |
| |
% |
| |
% |
| |
% |
| |
% |
| |
% |
| |
% |
| |
% |
| |
% |
| |
% |
| |
% |
| |
% |
| |
% |
November 1, 2023 | 71
JPMorgan SmartRetirement® Blend 2050 Fund (continued)
The Fund is subject to management risk and may not achieve its objective if the Adviser’s expectations regarding particular instruments or markets are not met. The Fund is exposed to the risks summarized below through both its direct investments and investments in underlying funds.
An investment in this Fund or any other fund may not provide a complete investment program. The suitability of an investment in the Fund should be considered based on the investment objective, strategies and risks described in this prospectus, considered in light of all of the other investments in your portfolio, as well as your risk tolerance, financial goals and time horizons. You may want to consult with a financial advisor to determine if this Fund is suitable for you.
The Fund is subject to the main risks noted below, through its investments in underlying funds and through its direct investments. Any of the risks noted below, whether through investments in underlying funds or direct investments, may adversely affect the Fund’s performance and ability to meet its investment objective.
72 | JPMorgan SmartRetirement Blend Funds
November 1, 2023 | 73
JPMorgan SmartRetirement® Blend 2050 Fund (continued)
74 | JPMorgan SmartRetirement Blend Funds
November 1, 2023 | 75
JPMorgan SmartRetirement® Blend 2050 Fund (continued)
76 | JPMorgan SmartRetirement Blend Funds
| |
| |
|
|
| |
|
|
| |
|
|
|
|
|
November 1, 2023 | 77
JPMorgan SmartRetirement® Blend 2050 Fund (continued)
| | |||
| |
Past 1 Year |
Past 5 Years |
Past 10 Years |
| CLASS I SHARES |
|
|
|
| Return Before Taxes |
- % |
% |
% |
| Return After Taxes on Distributions |
- |
|
|
| Return After Taxes on Distributions and Sale of Fund Shares |
- |
|
|
| S&P TARGET DATE 2050 INDEX (Reflects No Deduction for Fees, Expenses, or Taxes) |
- |
|
|
| JPM SMARTRETIREMENT BLEND 2050 COMPOSITE BENCHMARK (Reflects No Deduction for Fees, Expenses, or Taxes) |
- |
|
|
Management
J.P. Morgan Investment Management Inc. (the adviser)
| Portfolio Manager |
Managed Fund Since |
Primary Title with Investment Adviser |
| Daniel Oldroyd |
2012 |
Managing Director |
| Silvia Trillo |
2019 |
Managing Director |
| Ove Fladberg |
2022 |
Managing Director |
| Anshul Mohan |
2023 |
Executive Director |
| Jeffrey A. Geller |
2012 |
Managing Director |
Purchase and Sale of Fund Shares
Purchase minimums
| For Class I Shares | |
| To establish an account |
$1,000,000 |
| To add to an account |
No minimum levels |
In general, you may purchase or redeem shares on any business day:
•
Through your Financial Intermediary
•
By writing to J.P. Morgan Funds Services, P.O. Box 219143, Kansas City, MO 64121-9143
•
After you open an account, by calling J.P. Morgan Funds Services at 1-800-480-4111
Tax Information
The Fund intends to make distributions that may be taxed as ordinary income or capital gains, except when your investment is in an IRA, 401(k) plan or other tax-advantaged investment plan, in which case you may be subject to federal income tax upon withdrawal from the tax-advantaged investment plan.
Payments to Broker-Dealers and Other Financial Intermediaries
If you purchase shares of the Fund through a broker-dealer or other financial intermediary (such as a bank), the Fund and its related companies may pay the financial intermediary for the sale of Fund shares and related services. These payments may create a conflict of interest by influencing the broker-dealer or financial intermediary and your salesperson to recommend the Fund over another investment. Ask your salesperson or visit your financial intermediary’s website for more information.
78 | JPMorgan SmartRetirement Blend Funds
JPMorgan SmartRetirement® Blend 2055 Fund
| | |
| |
Class I |
| Management Fees |
|
| Distribution (Rule 12b-1) Fees |
|
| Other Expenses |
|
| Service Fees |
|
| Remainder of Other Expenses |
|
| Acquired Fund (Underlying Fund) Fees and Expenses |
|
| Total Annual Fund Operating Expenses |
|
| Fee Waivers and/or Expense Reimbursements1 |
- |
| Total Annual Fund Operating Expenses after Fee Waivers and/or Expense Reimbursements1 |
|
1
| | ||||
| |
1 Year |
3 Years |
5 Years |
10 Years |
| CLASS I SHARES ($) |
|
|
|
|
November 1, 2023 | 79
JPMorgan SmartRetirement® Blend 2055 Fund (continued)
80 | JPMorgan SmartRetirement Blend Funds
| | |
| |
% |
| |
% |
| |
% |
| |
% |
| |
% |
| |
% |
| |
% |
| |
% |
| |
% |
| |
% |
| |
% |
| |
% |
| |
% |
| |
% |
November 1, 2023 | 81
JPMorgan SmartRetirement® Blend 2055 Fund (continued)
The Fund is subject to management risk and may not achieve its objective if the Adviser’s expectations regarding particular instruments or markets are not met. The Fund is exposed to the risks summarized below through both its direct investments and investments in underlying funds.
An investment in this Fund or any other fund may not provide a complete investment program. The suitability of an investment in the Fund should be considered based on the investment objective, strategies and risks described in this prospectus, considered in light of all of the other investments in your portfolio, as well as your risk tolerance, financial goals and time horizons. You may want to consult with a financial advisor to determine if this Fund is suitable for you.
The Fund is subject to the main risks noted below, through its investments in underlying funds and through its direct investments. Any of the risks noted below, whether through investments in underlying funds or direct investments, may adversely affect the Fund’s performance and ability to meet its investment objective.
82 | JPMorgan SmartRetirement Blend Funds
November 1, 2023 | 83
JPMorgan SmartRetirement® Blend 2055 Fund (continued)
84 | JPMorgan SmartRetirement Blend Funds
November 1, 2023 | 85
JPMorgan SmartRetirement® Blend 2055 Fund (continued)
86 | JPMorgan SmartRetirement Blend Funds
| |
| |
|
|
| |
|
|
| |
|
|
|
|
|
November 1, 2023 | 87
JPMorgan SmartRetirement® Blend 2055 Fund (continued)
| | |||
| |
Past 1 Year |
Past 5 Years |
Past 10 Years |
| CLASS I SHARES |
|
|
|
| Return Before Taxes |
- % |
% |
% |
| Return After Taxes on Distributions |
- |
|
|
| Return After Taxes on Distributions and Sale of Fund Shares |
- |
|
|
| S&P TARGET DATE 2055 INDEX (Reflects No Deduction for Fees, Expenses, or Taxes) |
- |
|
|
| JPM SMARTRETIREMENT BLEND 2055 COMPOSITE BENCHMARK (Reflects No Deduction for Fees, Expenses, or Taxes) |
- |
|
|
Management
J.P. Morgan Investment Management Inc. (the adviser)
| Portfolio Manager |
Managed Fund Since |
Primary Title with Investment Adviser |
| Daniel Oldroyd |
2012 |
Managing Director |
| Silvia Trillo |
2019 |
Managing Director |
| Ove Fladberg |
2022 |
Managing Director |
| Anshul Mohan |
2023 |
Executive Director |
| Jeffrey A. Geller |
2012 |
Managing Director |
Purchase and Sale of Fund Shares
Purchase minimums
| For Class I Shares | |
| To establish an account |
$1,000,000 |
| To add to an account |
No minimum levels |
In general, you may purchase or redeem shares on any business day:
•
Through your Financial Intermediary
•
By writing to J.P. Morgan Funds Services, P.O. Box 219143, Kansas City, MO 64121-9143
•
After you open an account, by calling J.P. Morgan Funds Services at 1-800-480-4111
Tax Information
The Fund intends to make distributions that may be taxed as ordinary income or capital gains, except when your investment is in an IRA, 401(k) plan or other tax-advantaged investment plan, in which case you may be subject to federal income tax upon withdrawal from the tax-advantaged investment plan.
Payments to Broker-Dealers and Other Financial Intermediaries
If you purchase shares of the Fund through a broker-dealer or other financial intermediary (such as a bank), the Fund and its related companies may pay the financial intermediary for the sale of Fund shares and related services. These payments may create a conflict of interest by influencing the broker-dealer or financial intermediary and your salesperson to recommend the Fund over another investment. Ask your salesperson or visit your financial intermediary’s website for more information.
88 | JPMorgan SmartRetirement Blend Funds
JPMorgan SmartRetirement® Blend 2060 Fund
| | |
| |
Class I |
| Management Fees |
|
| Distribution (Rule 12b-1) Fees |
|
| Other Expenses |
|
| Service Fees |
|
| Remainder of Other Expenses |
|
| Acquired Fund (Underlying Fund) Fees and Expenses |
|
| Total Annual Fund Operating Expenses |
|
| Fee Waivers and/or Expense Reimbursements1 |
- |
| Total Annual Fund Operating Expenses after Fee Waivers and/or Expense Reimbursements1 |
|
1
| | ||||
| |
1 Year |
3 Years |
5 Years |
10 Years |
| CLASS I SHARES ($) |
|
|
|
|
November 1, 2023 | 89
JPMorgan SmartRetirement® Blend 2060 Fund (continued)
90 | JPMorgan SmartRetirement Blend Funds
| | |
| |
% |
| |
% |
| |
% |
| |
% |
| |
% |
| |
% |
| |
% |
| |
% |
| |
% |
| |
% |
| |
% |
| |
% |
| |
% |
| |
% |
November 1, 2023 | 91
JPMorgan SmartRetirement® Blend 2060 Fund (continued)
The Fund is subject to management risk and may not achieve its objective if the Adviser’s expectations regarding particular instruments or markets are not met. The Fund is exposed to the risks summarized below through both its direct investments and investments in underlying funds.
An investment in this Fund or any other fund may not provide a complete investment program. The suitability of an investment in the Fund should be considered based on the investment objective, strategies and risks described in this prospectus, considered in light of all of the other investments in your portfolio, as well as your risk tolerance, financial goals and time horizons. You may want to consult with a financial advisor to determine if this Fund is suitable for you.
The Fund is subject to the main risks noted below, through its investments in underlying funds and through its direct investments. Any of the risks noted below, whether through investments in underlying funds or direct investments, may adversely affect the Fund’s performance and ability to meet its investment objective.
92 | JPMorgan SmartRetirement Blend Funds
November 1, 2023 | 93
JPMorgan SmartRetirement® Blend 2060 Fund (continued)
94 | JPMorgan SmartRetirement Blend Funds
November 1, 2023 | 95
JPMorgan SmartRetirement® Blend 2060 Fund (continued)
96 | JPMorgan SmartRetirement Blend Funds
| |

| |
|
|
| |
|
|
| |
|
|
|
|
|
November 1, 2023 | 97
JPMorgan SmartRetirement® Blend 2060 Fund (continued)
| | |||
| |
Past |
Past |
Life of Fund since |
| |
1 Year |
5 Years |
|
| CLASS I SHARES |
|
|
|
| Return Before Taxes |
- % |
% |
% |
| Return After Taxes on Distributions |
- |
|
|
| Return After Taxes on Distributions and Sale of Fund Shares |
- |
|
|
| S&P TARGET DATE 2060 INDEX (Reflects No Deduction for Fees, Expenses, or Taxes) |
- |
|
|
| JPM SMARTRETIREMENT BLEND 2060 COMPOSITE BENCHMARK (Reflects No Deduction for Fees, Expenses, or Taxes) |
- |
|
|
Management
J.P. Morgan Investment Management Inc. (the adviser)
| Portfolio Manager |
Managed Fund Since |
Primary Title with Investment Adviser |
| Daniel Oldroyd |
2016 |
Managing Director |
| Silvia Trillo |
2019 |
Managing Director |
| Ove Fladberg |
2022 |
Managing Director |
| Anshul Mohan |
2023 |
Executive Director |
| Jeffrey A. Geller |
2016 |
Managing Director |
Purchase and Sale of Fund Shares
Purchase minimums
| For Class I Shares | |
| To establish an account |
$1,000,000 |
| To add to an account |
No minimum levels |
In general, you may purchase or redeem shares on any business day:
•
Through your Financial Intermediary
•
By writing to J.P. Morgan Funds Services, P.O. Box 219143, Kansas City, MO 64121-9143
•
After you open an account, by calling J.P. Morgan Funds Services at 1-800-480-4111
Tax Information
The Fund intends to make distributions that may be taxed as ordinary income or capital gains, except when your investment is in an IRA, 401(k) plan or other tax-advantaged investment plan, in which case you may be subject to federal income tax upon withdrawal from the tax-advantaged investment plan.
Payments to Broker-Dealers and Other Financial Intermediaries
If you purchase shares of the Fund through a broker-dealer or other financial intermediary (such as a bank), the Fund and its related companies may pay the financial intermediary for the sale of Fund shares and related services. These payments may create a conflict of interest by influencing the broker-dealer or financial intermediary and your salesperson to recommend the Fund over another investment. Ask your salesperson or visit your financial intermediary’s website for more information.
98 | JPMorgan SmartRetirement Blend Funds
JPMorgan SmartRetirement® Blend 2065 Fund
Class/Ticker: JSBSX
What is the goal of the Fund?
The Fund seeks high total return with a shift to current income and some capital appreciation over time as the Fund approaches and passes the target retirement date.
Fees and Expenses of the Fund
The following table describes the fees and expenses that you may pay if you buy, hold and sell shares of the Fund. You may pay other fees, such as brokerage commissions and other fees to financial intermediaries, which are not reflected in the table and examples below.
“Acquired Fund (Underlying Fund) Fees and Expenses” are expenses incurred indirectly by the Fund through its ownership of shares in other investment companies, including affiliated money market funds, other mutual funds, exchange-traded funds and business development companies. The impact of Acquired Fund (Underlying Fund) Fees and Expenses is included in the total returns of the Fund. Acquired Fund (Underlying Fund) Fees and Expenses are not direct costs of the Fund, are not used by the Fund to calculate its net asset value per share and are not included in the calculation of the ratio of expenses to average net assets shown in the Financial Highlights section of the Fund’s prospectus.
| ANNUAL FUND OPERATING EXPENSES (Expenses that you pay each year as a percentage of the value of your investment) | |
| |
Class I |
| Management Fees |
0.15% |
| Distribution (Rule 12b-1) Fees |
NONE |
| Other Expenses |
16.74 |
| Service Fees |
0.25 |
| Remainder of Other Expenses1 |
16.49 |
| Acquired Fund (Underlying Fund) Fees and Expenses |
0.16 |
| Total Annual Fund Operating Expenses |
17.05 |
| Fee Waivers and/or Expense Reimbursements2 |
-16.61 |
| Total Annual Fund Operating Expenses after Fee Waivers and/or Expense Reimbursements2 |
0.44 |
1
“Remainder of Other Expenses” has been calculated based on the actual other expenses incurred in the most recent fiscal year.
2
The Fund’s adviser and/or its affiliates have contractually agreed to waive fees and/or reimburse expenses to the extent Total Annual Fund Operating Expenses (excluding (1) dividend and interest expenses related to short sales, interest, taxes, expenses related to litigation and potential litigation, expenses related to trustee elections, and extraordinary expenses incurred by the Fund or an underlying fund and (2) Acquired Fund (Underlying Fund) Fees and Expenses incurred by an underlying fund) exceed 0.44% of the average daily net assets of Class I Shares. These waivers are in effect through 10/31/24, at which time it will be determined whether such waivers will be renewed or revised. To the extent that the Fund engages in securities lending, affiliated money market fund fees and expenses resulting from the
Fund’s investment of cash received from securities lending borrowers are not included in Total Annual Fund Operating Expenses and therefore, the above waivers do not apply to such investments.
Example
This Example is intended to help you compare the cost of investing in the Fund with the cost of investing in other mutual funds. The Example assumes that you invest $10,000 in the Fund for the time periods indicated. The Example also assumes that your investment has a 5% return each year and that the Fund’s operating expenses are equal to the total annual fund operating expenses after fee waivers and expense reimbursements shown in the fee table through 10/31/24 and total annual fund operating expenses thereafter. Your actual costs may be higher or lower.
| WHETHER OR NOT YOU SELL YOUR SHARES, YOUR COST WOULD BE: | ||||
| |
1 Year |
3 Years |
5 Years |
10 Years |
| CLASS I SHARES ($) |
45 |
3,194 |
5,629 |
9,571 |
Portfolio Turnover
The Fund pays transaction costs, such as commissions, when it buys and sells securities (or “turns over” its portfolio). A higher portfolio turnover rate may indicate higher transaction costs and may result in higher taxes when Fund shares are held in a taxable account. These costs, which are not reflected in annual fund operating expenses or in the Example, affect the Fund’s performance. The Fund’s portfolio turnover rate from November 1, 2022 (the Fund’s inception date) to June 30, 2023 (the end of the Fund’s fiscal year) was 29% of the average value of its portfolio.
What are the Fund’s main investment strategies?
The JPMorgan SmartRetirement® Blend 2065 Fund is generally intended for investors who plan to retire around the year 2065 (the target retirement year) and then withdraw their investment in the Fund throughout retirement. The Fund seeks to help investors save for retirement and then, after reaching the target retirement year, withdraw a portion of their investment in the Fund each year until December 31, 2100 (target maturity year). The Fund assumes a person will be at or around age 65 at the target retirement year.
The Fund is designed to provide exposure to equity, fixed income and cash/cash equivalent asset classes by investing in mutual funds and exchange traded funds (ETFs) within the same group of investment companies (i.e., J.P. Morgan Funds), passive ETFs that are managed by unaffiliated investment advisers in certain limited instances (unaffiliated passive ETFs) (collectively with the J.P. Morgan Funds, the underlying funds) and/or direct investments in securities and other financial instruments. The Fund may also invest in derivatives. Derivatives are instruments that have a value based on another instrument, exchange rate or index. The Fund may use futures
November 1, 2023 | 99
JPMorgan SmartRetirement® Blend 2065 Fund (continued)
contracts to gain exposure to, or to overweight or underweight its investments among, various sectors or markets. The Fund may also use exchange traded futures for cash management and to gain market exposure pending investment in underlying funds. “Blend” in the Fund’s name means that the Fund’s adviser, J.P. Morgan Investment Management Inc. (JPMIM or the Adviser), uses passive underlying funds and strategies as well as actively-managed underlying funds and strategies.
In allocating the Fund’s assets between actively-managed underlying funds and passive underlying funds, the Adviser generally uses passive ETFs for asset classes where the price of the asset is assumed to be fair and accurate, reflecting all relevant information that is available about the value of the asset (efficient markets). Examples of efficient markets include U.S. Large Cap Equities, U.S. Small/Mid Cap Equities, and Developed International Equities. Generally, the amount of the Fund’s assets allocated to passive underlying funds will decrease the closer a Fund is to its target retirement year.
In selecting underlying funds, the Adviser expects to select J.P. Morgan Funds without considering or canvassing the universe of unaffiliated underlying funds available even though there may (or may not) be one or more unaffiliated underlying funds that investors might regard as more attractive for the Fund or that have superior returns. For actively-managed underlying
funds, the Adviser limits its selection to J.P. Morgan Funds. For efficient markets exposure, the Adviser expects to use J.P. Morgan passive ETFs unless the investment is not available. To the extent the Adviser determines in its sole discretion that an investment in a J.P. Morgan passive ETF is not available, only then will the Adviser consider an unaffiliated passive ETF.
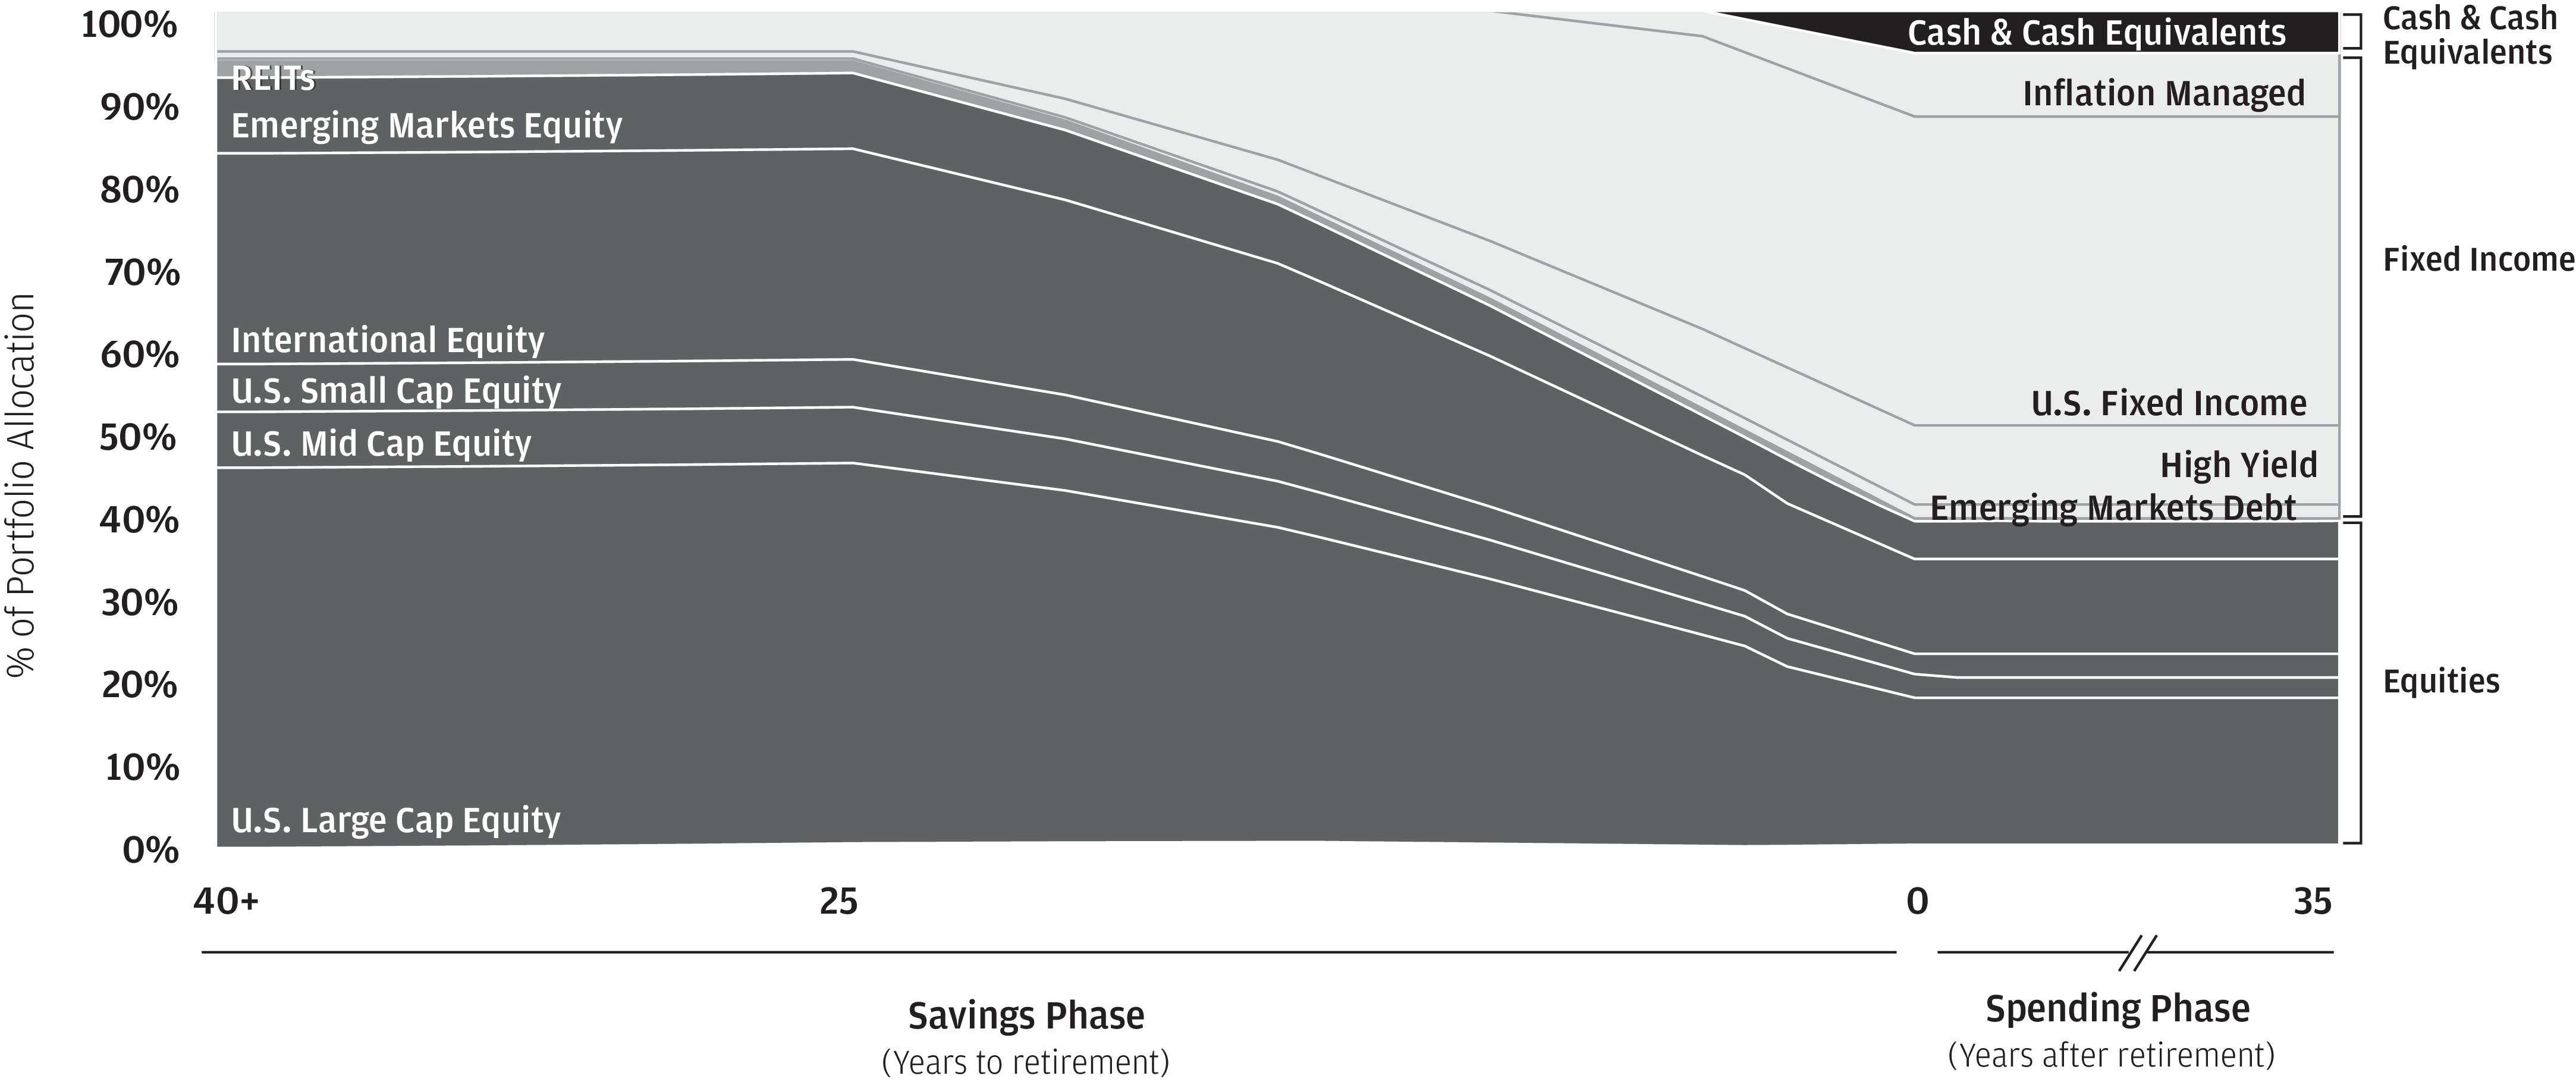
The Fund’s asset allocation strategy is designed with two main goals in mind: promoting asset accumulation prior to retirement, which is the Fund’s “Savings Phase”, and supporting investors withdrawing their investment in the Fund throughout retirement, which is the Fund’s “Spending Phase”. As a result, the Fund’s asset allocation strategy will change over time, generally becoming more conservative as it approaches the target retirement year and then remaining relatively stable afterwards. This means the asset allocation strategy during the Savings Phase will generally start with a greater emphasis on equity investments and gradually shift to more emphasis on fixed income investments. During the Spending Phase, the Fund will generally have a greater emphasis on fixed income investments. The anticipated target allocations between asset classes over the life of the Fund are displayed in the “glide path” below. In addition, the Fund's target allocations based on its position along the glide path as of the date of this prospectus are included in the table following the glide path.
100 | JPMorgan SmartRetirement Blend Funds
| Target Allocations1 | |
| Equity |
94.00 % |
| U.S. Large Cap Equity |
46.00 % |
| U.S. Mid Cap Equity |
6.60 % |
| U.S. Small Cap Equity |
5.65 % |
| REITs |
1.90 % |
| International Equity |
24.90 % |
| Emerging Markets Equity |
8.95 % |
| Fixed Income |
6.00 % |
| U.S. Fixed Income |
4.80 % |
| Inflation Managed |
0.00 % |
| High Yield Fixed Income |
0.85 % |
| Emerging Markets Debt |
0.35 % |
| Money Market Funds/Cash and Cash Equivalents |
0.00 % |
| Money Market Funds/Cash and Cash Equivalents |
0.00 % |
Note: Above allocations may not sum up to 100% due to rounding.
1
As of the date of this prospectus, the Fund utilizes both underlying funds and direct investments to implement its target allocations. The amount of the Fund’s assets allocated to underlying funds and direct investments will vary over time. The Fund also has flexibility to utilize derivatives to implement its target allocations.
The Adviser will periodically assess the target allocations shown above taking into account various factors, such as current market conditions, assumptions regarding future market performance, time horizon and data on the savings and spending behavior of investors, and may make adjustments. Based on the Adviser’s assessment, these adjustments may include modifying the existing allocations among asset classes or, among other things, adding or removing asset classes or maintaining asset allocations for longer or shorter periods of time. As a result of the Adviser’s ability to make these modifications, as well as a Fund moving along its glide path each year, the Fund’s actual allocations may differ from what is shown above by +/- 15%. In addition, as the Adviser monitors the risk profile of the Fund over various market environments, it may determine that conditions are not favorable and that deviations beyond +/- 15% are necessary to substantially reduce risk in order to preserve capital. Updated information concerning the Fund’s actual allocations to underlying funds and investments is avail- able in the Fund’s shareholder reports and on the Fund’s website from time to time.
During the Spending Phase, the Adviser will seek to achieve certain long-term risk and return targets that allow investors to withdraw a portion of their investment in the fund each year until the target maturity year. In connection with this, the Adviser will produce an annual “sample withdrawal amount”. The sample withdrawal amount is a generic hypothetical example that seeks to estimate a percentage of an investor’s investment in the Fund as of the beginning of the year that theoretically could be redeemed by an investor during that year while still allowing for redemptions in future years through the target maturity year. It attempts to balance income needs in the current year against the need for income in the future. Investors may use the sample withdrawal amount as a consideration
in determining how much of their investment to withdraw each year during the Spending Phase. The sample withdrawal amount will be made available in January of each year on the Fund’s website, www.jpmorganfunds.com, and by calling 1-800-480-4111.
Because it is assumed that investors will be withdrawing a portion of their investment in the Fund each year during the Spending Phase, the Fund’s assets are expected to decline over time and approach zero in the target maturity year. In addition, as assets decline and approach zero, there may be a point before the target maturity year where the Adviser can no longer manage the Fund in-line with its investment goal. Accordingly, it is expected that the Fund will be liquidated or merged into the SmartRetirement Blend Income Fund at the discretion of the Fund’s Board of Trustees at or prior to the target maturity year. The Adviser anticipates that the sample withdrawal amount will increase as a percentage of an investor’s investment in the several years immediately preceding the target maturity year and that the sample withdrawal amount will be 100% of an investor’s investment in the year 2100. As a result, the Fund and the sample withdrawal amount will be less useful for those who invest closer to the target maturity year.
The sample withdrawal amount is not expected to be level from year to year and instead will likely vary each year. If investors choose to follow the sample withdrawal amount, they will be redeeming shares and their investment in the Fund will be reduced. The sample withdrawal amount assumes the reinvestment of distributions in additional shares of the Fund. In addition, the sample withdrawal amount is not designed to comply with any required minimum distribution rules applicable to tax- deferred retirement accounts nor does it take into account any tax considerations to investors (including, for example, any early withdrawal penalties that may be imposed on investors in tax-deferred retirement accounts). Many of the assumptions and factors upon which the sample withdrawal amount will be based are the result of estimates and judgment calls by the Adviser. If those assumptions and factors are inaccurate or incomplete, the withdrawal amount may not accurately reflect the amount that an investor could redeem during the year while still allowing for redemptions in future years. Investors should not consider the Fund as a complete solution for his or her investment or retirement income needs or as a guarantee of income. In making a decision about their investment in the Fund in their individual situation, or in assessing the adequacy of estimated distributions that they may receive at any particular time, investors should consider all of their other assets, income and investments in addition to their investment in the Fund.
The provision of a sample withdrawal amount is for the purpose of outlining a possible theoretical course of action. The sample withdrawal amount is a generic hypothetical example as of a specific calculation date that does not consider, nor is it based upon, an investor’s specific circumstances including his or her
November 1, 2023 | 101
JPMorgan SmartRetirement® Blend 2065 Fund (continued)
age, financial needs, risk tolerance, required minimum distribution amount under the Internal Revenue Code with respect to any year, if any, other assets and overall investment objectives. No suggestion is offered herein that any particular redemption amount is advisable under the circumstances outlined in the sample withdrawal amount, and, more generally, there is no recommendation herein regarding any particular course of conduct in any particular situation or with respect to any particular investor. The sample withdrawal amount does not constitute and is not intended to constitute a suggestion, recommendation or impartial advice of any kind. Instead, it will be presented merely for educational purposes so as to give an indication as to the kinds of approaches that may be possible, and each should make an independent decision regarding how to proceed based on the own independent analysis, taking into account whatever independent advice from the investor’s professional adviser, tax adviser or other third parties that the investor may regard as necessary or appropriate to obtain.
JPMIM may hire affiliated and/or unaffiliated sub-advisers to manage any of the asset classes described under each Fund’s “What are the Fund’s main investment strategies?” section in the “Risk/Return Summary.” When using sub-advisers to man- age each Fund’s assets, the Adviser, subject to certain conditions and oversight by the Fund’s Board of Trustees, will have the right to hire, terminate, or replace sub-advisers without investor approval. Each Fund will notify investors of changes to sub-advisers. Please see “The Adviser, Sub-Advisers, Administrator and Distributor” on page 144 for more details.
The Fund’s Main Investment Risks
The Fund is subject to management risk and may not achieve its objective if the Adviser’s expectations regarding particular instruments or markets are not met. The Fund is exposed to the risks summarized below through both its direct investments and investments in underlying funds.
An investment in this Fund or any other fund may not provide a complete investment program. The suitability of an investment in the Fund should be considered based on the investment objective, strategies and risks described in this prospectus, considered in light of all of the other investments in your portfolio, as well as your risk tolerance, financial goals and time horizons. You may want to consult with a financial advisor to determine if this Fund is suitable for you.
The Fund is subject to the main risks noted below, through its investments in underlying funds and through its direct investments. Any of the risks noted below, whether through investments in underlying funds or direct investments, may adversely affect the Fund’s performance and ability to meet its investment objective.
Investment Risk. The Fund is not a complete retirement program and there is no guarantee that the Fund will provide sufficient retirement income to an investor. Meeting your retirement
goals is dependent upon many factors including the amount you save and the period over which you do so. You should consider your expected retirement date, individual retirement needs (i.e., how much money you expect to need), other expected income after retirement, inflation, other assets, and risk tolerance in choosing whether to invest in the Fund. Your risk tolerance may change over time and the Adviser may change the Fund’s strategic target allocation model. It is important that you re-evaluate your investment in the Fund periodically.
Investments in Mutual Funds and ETFs Risk. The Fund invests in other J.P. Morgan Funds and unaffiliated passive ETFs, so the Fund’s investment performance and risks are directly related to the performance and risks of the underlying funds. Shareholders will indirectly bear the expenses charged by the underlying funds. Because the Fund’s Adviser or its affiliates provide services to and receive fees from certain of the underlying funds, the Fund’s investments in the underlying funds benefit the Adviser and/or its affiliates. In addition, the Fund may hold a significant percentage of the shares of an underlying fund. As a result, the Fund’s investments in an underlying fund may create a conflict of interest. Certain ETFs and other underlying funds may not be actively managed. Securities may be purchased, held and sold by such funds when an actively managed fund would not do so. ETFs may trade at a price below their net asset value (also known as a discount). In addition, the Adviser’s authority to allocate investments among J.P. Morgan Funds and unaffiliated passive ETFs creates conflicts of interest. For example, investing in J.P. Morgan Funds could cause the Fund to incur higher fees and will cause the Adviser and/or its affiliates to receive greater compensation, increase assets under management or support particular investment strategies or J.P. Morgan Funds.
Active Asset Allocation Risk. The Adviser has discretion to make short to intermediate term allocations that increase or decrease the exposure to asset classes and investments shown in the glide path. The Fund’s allocation strategy may not be successful in adding value, may increase losses to the Fund and/or cause the Fund to have a risk profile different than that portrayed in the glide path from time to time.
Risk Associated with the Fund Holding Cash, Money Market Instruments and Other Short-Term Investments.The Fund will, at times, hold assets in cash, money market instruments and other short-term investments, which may hurt the Fund’s performance. These positions may also subject the Fund to additional risks and costs.
Index Strategy Risk. The Fund uses passive underlying funds and other strategies that are not actively managed and are designed to track the performance and holdings of a specified index. Securities may be purchased, held and sold by an index fund or as part of an indexing strategy at times when an actively managed fund would not do so. There is also the risk that the underlying fund’s or strategy’s performance may not correlate with the performance of the index.
102 | JPMorgan SmartRetirement Blend Funds
Equity Securities Risk. Investments in equity securities (such as stocks) are more volatile and carry more risks than some other forms of investment. The price of equity securities may rise or fall because of economic or political changes or changes in a company’s financial condition, sometimes rapidly or unpredictably. These price movements may result from factors affecting individual companies, sectors or industries selected for the Fund or the underlying fund’s portfolio or the securities market as a whole, such as changes in economic or political conditions. When the value of such securities goes down, the Fund’s investment in the underlying fund decreases in value.
Inflation-Managed Strategy Risk. The Fund may invest in underlying funds that utilize derivatives and debt securities to mimic a portfolio of inflation-protected bonds. There is no guarantee that this strategy will be effective. In addition, the Fund may be exposed to inflation-protected securities. Unlike conventional bonds, the principal and interest payments on inflation-protected securities such as Treasury Inflation Protected Securities (TIPS) are adjusted periodically to a specified rate of inflation (e.g., Non-Seasonally Adjusted Consumer Price Index for all Urban Consumers (CPI-U)). Exposure to TIPS and other inflation-linked debt securities are subject to the effects of changes in market interest rates caused by factors other than inflation (real interest rates). In general, the price of a TIPS tends to decline when real interest rates increase.
General Market Risk. Economies and financial markets throughout the world are becoming increasingly interconnected, which increases the likelihood that events or conditions in one country or region will adversely impact markets or issuers in other countries or regions. Securities in the Fund’s portfolio may underperform in comparison to securities in general financial markets, a particular financial market or other asset classes due to a number of factors, including inflation (or expectations for inflation), deflation (or expectations for deflation), interest rates, global demand for particular products or resources, market instability, financial system instability, debt crises and downgrades, embargoes, tariffs, sanctions and other trade barriers, regulatory events, other governmental trade or market control programs and related geopolitical events. In addition, the value of the Fund’s investments may be negatively affected by the occurrence of global events such as war, terrorism, environmental disasters, natural disasters or events, country instability, and infectious disease epidemics or pandemics.
Foreign Securities and Emerging Markets Risk. Investments in foreign currencies and foreign issuers are subject to additional risks, including political and economic risks, unstable governments, civil conflicts and war, greater volatility, decreased market liquidity, currency fluctuations, higher transaction costs, delayed settlement, possible foreign controls on investment, expropriation and nationalization risks, sanctions or other measures by the United States or other governments, liquidity risks and less stringent investor protection and disclosure standards of foreign markets. In certain markets where securi
ties and other instruments are not traded “delivery versus payment,” the Fund and/or an underlying fund may not receive timely payment for securities or other instruments it has delivered or receive delivery of securities paid for and may be subject to increased risk that the counterparty will fail to make payments or delivery when due or default completely. Foreign market trading hours, clearance and settlement procedures, and holiday schedules may limit the Fund's ability to buy and sell securities.
Events and evolving conditions in certain economies or markets may alter the risks associated with investments tied to countries or regions that historically were perceived as comparatively stable becoming riskier and more volatile.These risks are magnified in countries in “emerging markets.” Emerging market countries typically have less-established market economies than developed countries and may face greater social, economic, regulatory and political uncertainties. In addition, emerging markets typically present greater illiquidity and price volatility concerns due to smaller or limited local capital markets and greater difficulty in determining market valuations of securities due to limited public information on issuers. Certain emerging market countries may be subject to less stringent requirements regarding accounting, auditing, financial reporting and record keeping and therefore, material information related to an investment may not be available or reliable. Additionally, the Fund may have substantial difficulties exercising its legal rights or enforcing a counterparty’s legal obligations in certain jurisdictions outside of the United States, in particular, in emerging markets countries, which can increase the risk of loss.
Industry and Sector Focus Risk. At times, the Fund and/or an underlying fund may increase the relative emphasis of its investments in a particular industry or sector. The prices of securities of issuers in a particular industry or sector may be more susceptible to fluctuations due to changes in economic or business conditions, government regulations, availability of basic resources or supplies, contagion risk within a particular industry or sector or to other industries or sectors, or other events that affect that industry or sector more than securities of issuers in other industries and sectors. To the extent that the Fund increases the relative emphasis of its investments in a particular industry or sector, the value of the Fund’s Shares may fluctuate in response to events affecting that industry or sector.
Interest Rate Risk. Investments in bonds and other debt securities will change in value based on changes in interest rates. If rates increase, the value of these investments generally declines. Securities with greater interest rate sensitivity and longer maturities generally are subject to greater fluctuations in value. The Fund and/or an underlying fund may invest in variable and floating rate Loans and other variable and floating rate securities. Although these instruments are generally less sensitive to interest rate changes than fixed rate instruments, the value of variable and floating rate Loans and other securities may decline if their interest rates do not rise as quickly, or
November 1, 2023 | 103
JPMorgan SmartRetirement® Blend 2065 Fund (continued)
as much, as general interest rates. The Fund may face a heightened level of interest rate risk due to certain changes in monetary policy. It is difficult to predict the pace at which central banks or monetary authorities may increase interest rates or the timing, frequency, or magnitude of such increases. Any such changes could be sudden and could expose debt markets to significant volatility and reduced liquidity for Fund investments.
Credit Risk. The Fund’s and/or an underlying fund’s investments are subject to the risk that issuers and/or counterparties will fail to make payments when due or default completely. Prices of investments may be adversely affected if any of the issuers or counterparties it is invested in are subject to an actual or perceived deterioration in their credit quality. Credit spreads may increase, which may reduce the market values of the underlying fund’s securities. Credit spread risk is the risk that economic and market conditions or any actual or perceived credit deterioration may lead to an increase in the credit spreads (i.e., the difference in yield between two securities of similar maturity but different credit quality) and a decline in price of the issuer’s securities.
Mortgage-Related and Other Asset-Backed Securities Risk. Investments in mortgage-related and asset-backed securities including so-called “sub-prime” mortgages are subject to certain risks including prepayment and call risks. When mortgages and other obligations are prepaid and when securities are called, the Fund and/or an underlying fund may have to reinvest in securities with a lower yield or fail to recover additional amounts (i.e., premiums) paid for securities with higher interest rates, resulting in an unexpected capital loss and/or a decrease in the amount of dividends and yield. In periods of either rising or declining interest rates, the Fund and/or underlying fund may be subject to extension risk, and may receive principal later than expected. As a result, in periods of rising interest rates, the Fund and/or underlying fund may exhibit additional volatility. During periods of difficult or frozen credit markets, significant changes in interest rates, or deteriorating economic conditions, such securities may decline in value, face valuation difficulties, become more volatile and/or become illiquid. Additionally, asset-backed, mortgage-related and mortgage-backed securities are subject to risks associated with their structure and the nature of the assets underlying the securities and the servicing of those assets. Certain asset-backed, mortgage-related and mortgage-backed securities may face valuation difficulties and may be less liquid than other types of asset-backed, mortgage-related and mortgage-backed securities, or debt securities.
Government Securities Risk. Investments in securities issued or guaranteed by the U.S. government or its agencies and instrumentalities (such as securities issued by the Government National Mortgage Association (Ginnie Mae), the Federal National Mortgage Association (Fannie Mae), or the Federal Home Loan Mortgage Corporation (Freddie Mac)) are subject to risks. U.S. government securities are subject to market risk,
interest rate risk and credit risk. Securities, such as those issued or guaranteed by Ginnie Mae or the U.S. Treasury, that are backed by the full faith and credit of the United States are guaranteed only as to the timely payment of interest and principal when held to maturity and the market prices for such securities will fluctuate. Notwithstanding that these securities are backed by the full faith and credit of the United States, circumstances could arise that would prevent the payment of interest or principal. This would result in losses to the Fund and underlying fund. Securities issued or guaranteed by U.S. government-related organizations, such as Fannie Mae and Freddie Mac, are not backed by the full faith and credit of the U.S. government and no assurance can be given that the U.S. government will provide financial support. Therefore, U.S. government-related organizations may not have the funds to meet their payment obligations in the future.
Prepayment Risk. The issuer of certain securities may repay principal in advance, especially when yields fall. Changes in the rate at which prepayments occur can affect the return on investment of these securities. When debt obligations are prepaid or when securities are called, the Fund and/or an underlying fund may have to reinvest in securities with a lower yield. The Fund and/or an underlying fund also may fail to recover additional amounts (i.e., premiums) paid for securities with higher coupons, resulting in an unexpected capital loss.
High Yield Securities and Loan Risk. Investments in instruments, including junk bonds, Loans and instruments that are issued by companies that are highly leveraged, less creditworthy or financially distressed are subject to risks. These investments are considered to be speculative and may be subject to greater risk of loss, greater sensitivity to economic changes, valuation difficulties, and potential illiquidity. Such investments are subject to additional risks including subordination to other creditors, no collateral or limited rights in collateral, lack of a regular trading market, extended settlement periods, liquidity risks, prepayment risks, potentially less protection under the federal securities laws and lack of publicly available information.
In recent years, there has been a broad trend of weaker or less restrictive covenant protections in both the Loan and high yield markets. Among other things, under such weaker or less restrictive covenants, borrowers might be able to exercise more flexibility with respect to certain activities than borrowers who are subject to stronger or more protective covenants. For example, borrowers might be able to incur more debt, including secured debt, return more capital to shareholders, remove or reduce assets that are designated as collateral securing Loans or high yield securities, increase the claims against assets that are permitted against collateral securing Loans or high yield securities or otherwise manage their business in ways that could impact creditors negatively. In addition, certain privately held borrowers might be permitted to file less frequent, less detailed or less timely financial reporting or other information, which could negatively impact the value of the Loans or high
104 | JPMorgan SmartRetirement Blend Funds
yield securities issued by such borrowers. Each of these factors might negatively impact the Loans and high yield instruments held by the Fund.
High yield securities and Loans that are deemed to be liquid at the time of purchase may become illiquid. No active trading market may exist for some Loans and other instruments and certain investments may be subject to restrictions on resale. In addition, the settlement period for Loans is uncertain as there is no standardized settlement schedule applicable to such investments. Certain Loans may take more than seven days to settle. The inability to dispose of the Fund’s and/or underlying fund’s securities and other investments in a timely fashion could result in losses to the Fund and underlying fund. Instruments that have a more limited secondary market have more pronounced liquidity and valuation risk than other types of fixed income instruments or equity securities. When Loans and other instruments are prepaid, the Fund and/or an underlying fund may have to reinvest in instruments with a lower yield or fail to recover additional amounts (i.e., premiums) paid for these instruments, resulting in an unexpected capital loss and/or a decrease in the amount of dividends and yield. Certain Loans may not be considered securities under the federal securities laws and, therefore, investments in such Loans may not be subject to certain protections under those laws. In addition, the Adviser may not have access to material non-public information to which other investors may have access.
Real Estate Securities Risk. The Fund may be exposed through its direct investments or investments in underlying funds to real estate securities, including real estate investment trusts (REITs). These securities are subject to the same risks as direct investments in real estate and mortgages, which include, but are not limited to, sensitivity to changes in real estate values and property taxes, interest rate risk, tax and regulatory risk, fluctuations in rent schedules and operating expenses, adverse changes in local, regional or general economic conditions, deterioration of the real estate market and the financial circumstances of tenants and sellers, unfavorable changes in zoning, building, environmental and other laws, the need for unanticipated renovations, unexpected increases in the cost of energy and environmental factors. In addition, investments in REITS are subject to risks associated with management skill and creditworthiness of the issuer and underlying funds will indirectly bear their proportionate share of expenses, including management fees, paid by each REIT in which they invest in addition to the expenses of the underlying funds. Certain underlying funds are highly concentrated in real estate securities, including REITs.
Smaller Company Risk. Some of the underlying funds invest in securities of smaller companies (mid cap and small cap companies) which may be riskier, less liquid, more volatile and vulnerable to economic, market and industry changes than securities of larger, more established companies. The securities of small companies may trade less frequently and in smaller volumes than securities of larger companies. As a result,
changes in the price of debt or equity issued by such companies may be more sudden or erratic than the prices of other securities, especially over the short term. These risks are higher for small cap companies.
Derivatives Risk. The underlying funds and the Fund may use derivatives, including futures contracts and exchange traded futures. Derivatives may be riskier than other investments and may increase the volatility of the Fund and the underlying funds. Derivatives may be sensitive to changes in economic and market conditions and may create leverage, which could result in losses that significantly exceed the Fund’s or an underlying fund’s original investment. Certain derivatives expose the Fund and the underlying funds to counterparty risk, which is the risk that the derivative counterparty will not fulfill its contractual obligation (including credit risk associated with the counterparty). Certain derivatives are synthetic instruments that attempt to replicate the performance of certain reference assets. With regard to such derivatives, the Fund or the underlying fund do not have a claim on the reference assets and are subject to enhanced counterparty risk. Derivatives may not perform as expected, so the Fund and the underlying funds may not realize the intended benefits. When used for hedging, the change in value of a derivative may not correlate as expected with the security or other risk being hedged. In addition, given their complexity, derivatives expose the Fund and underlying funds to risks of mispricing or improper valuation. Derivatives also can expose the Fund to derivative liquidity risk relating to the payment obligations created thereunder and legal and operational risk.
Securities and Financial Instruments Risk. The Fund’s direct investments in securities and financial instruments are subject to additional risks specific to their structure, sector or market (e.g., futures and swaps on foreign securities are subject to foreign investment, emerging market and derivative risks; debt securities are subject to credit risk).
Sample Withdrawal Amount Risk. The Spending Phase of the Fund is designed for investors in retirement who intend to spend down their holdings in the Fund. There is no guarantee that the Fund will provide sufficient retirement income, the sample withdrawal amount for any given year may be zero in order to preserve capital and you may lose money invested in the Fund. You should not rely solely on the sample withdrawal amount in determining your retirement income needs. Prior to investing in the Fund, you should be aware of the following:
1.
The Spending Phase is not designed for the accumulation of assets prior to retirement. If you choose to redeem shares in accordance with the sample withdrawal amount and the Fund outperforms after you have redeemed shares, you will not participate in the appreciation of assets on the amount you redeemed. The long-term risk and return target of the Fund in any given year, including any income and gain from investments earned by the Fund, is not designed to be equal to or greater than the sample withdrawal amount for such
November 1, 2023 | 105
JPMorgan SmartRetirement® Blend 2065 Fund (continued)
year. This means that, if you choose to follow the sample withdrawal amount, you likely will be redeeming shares and your investment in the Fund will be reduced.
2.
The Adviser will seek to manage the overall volatility of the Fund during the Spending Phase, but it may not be successful in doing so and the Fund’s risk profile may be more or less aggressive from year to year. Your risk tolerance may change over time and the Adviser may change the Fund’s long-term risk and return target, including, but not limited to, in response to market events. For example, to the extent that market performance leads the Fund to underperform (outperform) the long-term risk and return target for a given year, it may lead to a decrease (increase) in the sample withdrawal amount or an increase (decrease) in the long-term risk and return target in subsequent years. It is important that you re-evaluate your investment in the Fund periodically.
3.
The sample withdrawal amount is calculated solely as of the applicable calculation date and does not take into account any subsequent changes to the basis upon which it is calculated, such as changes in the Adviser’s assumptions regarding future market performance. In this regard, once a sample withdrawal amount is set for a given year, the Adviser does not expect to modify it during the year. Rather, any changes to the sample withdrawal amount, including changes to account for unexpected factors, including market performance, will be made in the next annual calculation.
4.
The sample withdrawal amount calculation assumes the reinvestment of distributions in additional shares of the Fund. As a result, if distributions are not reinvested, following the sample withdrawal amount without adjusting for distributions not reinvested will increase the likelihood that a shareholder will (i) have insufficient shares for redemption in future years and (ii) exhaust his or her assets in the Fund prior to the maturity date.
Maturity Date and Redemption Risk. While assets invested in the Fund are expected to decline over time and equal zero on the maturity date, the Fund may be liquidated prior to the maturity date. For example, as assets decline and approach zero, there may be a point before the maturity date where the Adviser can no longer manage the Fund in-line with its investment goal and the Fund may be liquidated at the discretion of the Board of Trustees. In addition, as assets in the Fund decline, Fund expenses will be spread over a smaller asset base, potentially causing an increase in the Fund’s expense ratio. In order to accommodate investors redeeming shares, the Fund may sell securities at times when it would not otherwise do so, which may result in a loss to the Fund. These transactions may result in higher portfolio turnover, accelerate the realization of taxable income if sales of securities resulted in capital gains or other income and increase transaction costs, which may impact the Fund’s expense ratio. To the extent that such transactions result in short-term capital gains, such gains will generally be taxed at the ordinary income tax rate. It is possible for the Fund
to suffer substantial investment losses and simultaneously experience additional asset reductions as a result of shareholders redeeming shares. Moreover, even if the Fund’s capital grows over short, intermediate, or long periods of time, the Fund is not designed for such growth to enable the Fund to allow for redemptions without returning capital to shareholders. Rather, the Fund expects that substantially all capital will be returned to shareholders by the maturity date.
Transactions Risk. The Fund or an underlying fund could experience a loss and its liquidity may be negatively impacted when selling securities to meet redemption requests. The risk of loss increases if the redemption requests are unusually large or frequent or occur in times of overall market turmoil or declining prices. Similarly, for both the Fund and underlying funds large purchases of a fund's shares may adversely affect the Fund’s performance to the extent that the Fund is delayed in investing new cash and is required to maintain a larger cash position than it ordinarily would.
Investments in the Fund are not deposits or obligations of, or guaranteed or endorsed by, any bank and are not insured or guaranteed by the FDIC, the Federal Reserve Board or any other government agency.
You could lose money investing in the Fund.
The Fund’s Past Performance
The Fund commenced operations on November 1, 2022 and therefore, has no reportable performance history. Once the Fund has operated for at least one calendar year, a bar chart and performance table will be included in the prospectus to show the performance of the Fund. When such information is included, this section will provide some indication of the risks of investing in the Fund by showing changes in the Fund’s performance history from year to year and showing how the Fund’s average annual total returns compare with those of a broad measure of market performance. Although past performance of the Fund is no guarantee of how it will perform in the future, historical performance may give you some indication of the risks of investing in the Fund.
Management
J.P. Morgan Investment Management Inc. (the adviser)
| Portfolio Manager |
Managed Fund Since |
Primary Title with Investment Adviser |
| Daniel Oldroyd |
2022 |
Managing Director |
| Silvia Trillo |
2022 |
Managing Director |
| Ove Fladberg |
2022 |
Managing Director |
| Anshul Mohan |
2023 |
Executive Director |
| Jeffrey A. Geller |
2022 |
Managing Director |
106 | JPMorgan SmartRetirement Blend Funds
Purchase and Sale of Fund Shares
Purchase minimums
| For Class I Shares | |
| To establish an account |
$1,000,000 |
| To add to an account |
No minimum levels |
In general, you may purchase or redeem shares on any business day:
•
Through your Financial Intermediary
•
By writing to J.P. Morgan Funds Services, P.O. Box 219143, Kansas City, MO 64121-9143
•
After you open an account, by calling J.P. Morgan Funds Services at 1-800-480-4111
Tax Information
The Fund intends to make distributions that may be taxed as ordinary income or capital gains, except when your investment is in an IRA, 401(k) plan or other tax-advantaged investment plan, in which case you may be subject to federal income tax upon withdrawal from the tax-advantaged investment plan.
Payments to Broker-Dealers and Other Financial Intermediaries
If you purchase shares of the Fund through a broker-dealer or other financial intermediary (such as a bank), the Fund and its related companies may pay the financial intermediary for the sale of Fund shares and related services. These payments may create a conflict of interest by influencing the broker-dealer or financial intermediary and your salesperson to recommend the Fund over another investment. Ask your salesperson or visit your financial intermediary’s website for more information.
November 1, 2023 | 107
More About the Funds
Each of the Funds described in this prospectus (other than the JPMorgan SmartRetirement Blend 2065 Fund) is a series of JPMorgan Trust I (“JPMT I”) and is managed by J.P. Morgan Investment Management Inc. (JPMIM or the Adviser). The JPMorgan SmartRetirement Blend 2065 Fund is a series of JPMorgan Trust IV (“JPMT IV” and, collectively with JPMT I, the “Trusts”). The underlying funds that are J.P. Morgan Funds are managed by JPMIM. As a result, the Adviser is considered a control affiliate and the underlying J.P. Morgan Funds advised by JPMIM are in the same group of investment companies. In the future, certain underlying J.P. Morgan Funds may be advised or sub-advised by affiliates of JPMIM. For more information about the Funds and JPMIM, please read “Management of the Funds” and the Statement of Additional Information.
Principal Investment Strategies
SmartRetirement Blend Income Fund
The JPMorgan SmartRetirement Blend Income Fund is a “Fund of Funds” that invests in other mutual funds and exchange traded funds (ETFs) within the same group of investment companies (J.P. Morgan Funds) and, for the limited purposes described below, also invests in passive ETFs that are managed by unaffiliated investment advisers (unaffiliated passive ETFs) (collectively with the J.P. Morgan Funds, the underlying funds). A passive ETF is a registered investment company that seeks to track the performance of a particular market index. These indices include not only broad-based market indices but more specific indices as well, including those relating to particular sectors, markets, factors, regions or industries. The Fund also invests directly in securities and other financial instruments. The Fund is generally intended for investors who are retired or about to retire soon. The Fund is designed to provide exposure to a variety of asset classes through investments in underlying funds, securities and other financial instruments, with an emphasis on fixed income investments over equity investments and other investments. “Blend” in the Fund’s name means that the Fund’s adviser uses underlying funds and strategies that attempt to replicate performance of various indexes as well as actively-managed underlying funds and strategies.
The Fund’s target allocations among various asset classes and sub-asset classes as of the date of this prospectus are set forth below:
| Target Allocations1 |
|
| Fixed Income |
55.00 % |
| U.S. Fixed Income |
36.50 % |
| Inflation Managed |
7.50 % |
| High Yield Fixed Income |
9.35 % |
| Emerging Markets Debt |
1.65 % |
| Equity |
40.00 % |
| U.S. Large Cap Equity |
19.60 % |
| U.S. Mid Cap Equity |
2.80 % |
| U.S. Small Cap Equity |
2.40 % |
| REITs |
0.80 % |
| International Equity |
11.20 % |
| Emerging Markets Equity |
3.20 % |
| Money Market Funds/Cash and Cash Equivalents |
5.00 % |
| Money Market Funds/Cash and Cash Equivalents |
5.00 % |
Note: Above allocations may not sum up to 100% due to rounding.
1
As of the date of this prospectus, the Fund utilizes both underlying funds and direct investments to implement its target allocations. The amount of the Fund’s assets allocated to underlying funds and direct investments will vary over time. The Fund also has flexibility to utilize derivatives to implement its target allocations.
The Adviser will periodically assess the target allocations shown above taking into account various factors, such as current market conditions, assumptions regarding future market performance, time horizon and data on the savings and spending behavior of investors, and may make adjustments. The Adviser also integrates financially material environmental, social and governance (“ESG”) factors as part of each Fund’s investment process (“ESG Integration”). ESG Integration is the systematic inclusion of ESG issues in investment analysis and investment decisions. As part of this assessment, the Adviser will also consider the risks presented by certain ESG factors. Specifically, the Adviser will assess how ESG risks are considered within an active underlying fund’s/manager’s investment process and how the active underlying fund/manager defines and mitigates financially material ESG risks. Although these particular risks are considered, underlying funds and securities of issuers presenting such risks may be purchased and retained by the Fund while the Fund may divest or not invest in underlying funds and securities of issuers that do not present such risks. In particular, ESG Integration does not change a Fund’s investment objective, exclude specific types of industries or companies or limit the Fund’s investable universe. The Funds are not designed for investors who wish to screen out particular types of companies or investments or
108 | JPMorgan SmartRetirement Blend Funds
are looking for Funds that meet specific ESG goals. Based on the Adviser’s assessment, adjustments may be made that include modifying the existing allocations among asset classes or, among other things, adding or removing asset classes or maintaining asset allocations for longer or shorter periods of time. As a result of the Adviser’s ability to make these modifications, the Fund’s actual allocations may differ from what is shown above by +/- 15%. In addition, as the Adviser monitors the risk profile of the Fund over various market environments, it may determine that conditions are not favorable and that deviations beyond +/- 15% are necessary to substantially reduce risk in order to preserve capital. Updated information concerning the Fund’s actual allocations to underlying funds and investments is available in the Fund’s shareholder reports and on the Fund’s website from time to time.
The Fund may invest in one or more underlying funds in an asset class in an amount equal to the allocation ranges for the applicable asset class. For example, the JPMorgan SmartRetirement Blend Income Fund may invest up to 34.60% of its assets in a single underlying fund that is a U.S. Large Cap Equity Fund, or may invest up to 34.60% across multiple underlying funds that are U.S. Large Cap Equity Funds.
In allocating the Fund’s assets between actively-managed underlying funds and passive underlying funds, the Adviser generally uses passive ETFs for asset classes where the price of the asset is assumed to be fair and accurate, reflecting all relevant information that is available about the value of the asset (efficient markets). Examples of efficient markets include US Large Cap Equities, US Small/Mid Cap Equities, and Developed International Equities. For actively-managed underlying funds, the Adviser limits its selection to J.P. Morgan Funds. For efficient markets exposure, the Adviser expects to use J.P. Morgan passive ETFs unless the investment is not available.
In selecting underlying funds, the Adviser expects to select J.P. Morgan Funds without considering or canvassing the universe of unaffiliated underlying funds available even though there may (or may not) be one or more unaffiliated underlying funds that investors might regard as more attractive for the Fund or that have superior returns. For actively-managed underlying funds, the Adviser limits its selection to J.P. Morgan Funds. For efficient markets exposure, the Adviser expects to use J.P. Morgan passive ETFs unless the investment is not available. To the extent the Adviser determines in its sole discretion that an investment in a J.P. Morgan passive ETF is not available, only then will the Adviser consider an unaffiliated passive ETF.
In connection with its main investment strategies, the Fund may use futures including exchange traded futures. The Fund is also permitted to use other derivatives such as options, swaps and exchange traded notes (ETNs). Under certain market conditions, the use of derivatives could be significant. For example, the Adviser may increase the usage of derivatives to “equitize” inflows or outflows of cash received into or paid out of the Fund, to invest in eligible asset classes with greater efficiency than investments in underlying funds or securities, or under other conditions in which the Adviser determines that the increased use of derivatives maybe beneficial to the Fund, including interest rate risk management, managing duration or implementing overweights or underweights to particular markets or sectors based on, among other things, its current market outlook or specific market events. While not part of their principal investment strategies, the JPMorgan SmartRetirement Blend Funds may also use futures and other derivatives for interest rate risk management to adjust the duration position of a JPMorgan SmartRetirement Blend Fund. Futures and other derivatives used for this purpose are not subject to or included as part of a JPMorgan SmartRetirement Blend Fund’s stated global fixed income ranges. Generally, ETNs are structured as senior, unsecured notes in which an issuer such as a bank agrees to pay a return based on the target commodity index less any fees. ETNs are synthetic instruments that allow individual investors to have access to derivatives linked to commodities and assets such as oil, currencies and foreign stock indexes. ETNs combine certain aspects of bonds and ETFs. Similar to ETFs, ETNs are traded on a major exchange (e.g., the New York Stock Exchange) during normal trading hours. However, investors can also hold the ETN until maturity. At maturity, the issuer pays to the investor a cash amount equal to principal amount, subject to the day’s index factor. ETN returns are based upon the performance of a market index minus applicable fees. Please note that the Funds also may use strategies that are not described herein, but which are described in the Statement of Additional Information.
JPMIM may hire affiliated and/or unaffiliated sub-advisers to manage any of the asset classes described under each Fund’s “What are the Fund’s main investment strategies?” section in the “Risk/Return Summary.” When using sub-advisers to manage each Fund’s assets, the Adviser, subject to certain conditions and oversight by the Funds’ Board of Trustees, will have the right to hire, terminate, or replace sub-advisers without investor approval. Each Fund will notify investors of changes to sub-advisers. Please see “The Adviser, Sub-Advisers, Administrator and Distributor” on page 145 for more details.
November 1, 2023 | 109
More About the Funds (continued)
SmartRetirement Blend 2020 Fund, SmartRetirement Blend 2025 Fund, SmartRetirement Blend 2030 Fund, SmartRetirement Blend 2035 Fund, SmartRetirement Blend 2040 Fund, SmartRetirement Blend 2045 Fund, SmartRetirement Blend 2050 Fund, SmartRetirement Blend 2055 Fund, SmartRetirement Blend 2060 Fund and SmartRetirement Blend 2065 Fund
The JPMorgan SmartRetirement Blend 2020 Fund, JPMorgan SmartRetirement Blend 2025 Fund, JPMorgan SmartRetirement Blend 2030 Fund, JPMorgan SmartRetirement Blend 2035 Fund, JPMorgan SmartRetirement Blend 2040 Fund, JPMorgan SmartRetirement Blend 2045 Fund, JPMorgan SmartRetirement Blend 2050 Fund, JPMorgan SmartRetirement Blend 2055 Fund, JPMorgan SmartRetirement Blend 2060 Fund and JPMorgan SmartRetirement Blend 2065 Fund described in this prospectus are “Funds of Funds.” Each Fund is generally intended for investors who plan to retire around the year stated in the Fund’s name (the target retirement year) and then withdraw their investment in the Fund throughout retirement. The Funds seek to help investors save for retirement and then, after reaching the target retirement year, withdraw a portion of their investment in the Fund each year until 35 years after the target retirement year (target maturity year). The Funds assume a person will be at or around age 65 at the target retirement year. Each Fund is designed to provide exposure to equity, fixed income and cash/cash equivalent asset classes by investing in mutual funds and exchange traded funds (ETFs) within the same group of investment companies (i.e., J.P. Morgan Funds), passive ETFs that are managed by unaffiliated investment advisers in certain limited instances (unaffiliated passive ETFs) (collectively with the J.P. Morgan Funds, the underlying funds) and/or direct investments in securities and other financial instruments. The equity asset class investments include US Large Cap, US Mid Cap and US Small Cap underlying funds/investments, REIT underlying funds/investments, International underlying funds/investments and Emerging Market underlying funds/investments. The fixed income asset class investments include US Fixed Income underlying funds/investments, Inflation Managed underlying funds/investments, High Yield underlying funds/investments and Emerging Market Debt underlying funds/investments. The cash/cash equivalent asset class investments include money market underlying funds and cash/cash equivalents. Each Fund may also invest in derivatives. A passive ETF is a registered investment company that seeks to track the performance of a particular market index. These indices include not only broad-based market indices but more specific indices as well, including those relating to particular sectors, markets, factors, regions or industries. Derivatives are instruments that have a value based on another instrument, exchange rate or index such as futures. Each Fund may use futures contracts to gain exposure to, or to overweight or underweight its investments among, various sectors or markets. Each Fund may also use exchange traded futures for cash management and to gain market exposure pending investment in underlying funds. “Blend” in a Fund’s name means that each Fund’s adviser, J.P. Morgan Investment Management Inc. (JPMIM or the Adviser), uses passive underlying funds and strategies as well as actively-managed underlying funds and strategies. Generally, the amount of a Fund’s assets allocated to passive underlying funds will decrease the closer a Fund is to its target retirement year, with the JPMorgan SmartRetirement Blend 2025 Fund allocating approximately 45% of its assets to passive underlying funds and the JPMorgan SmartRetirement Blend 2060 Fund allocating approximately 83% of its assets to passive underlying funds. These percentages are estimates only and the Adviser may allocate more or less to passive underlying funds, actively-managed underlying funds, securities or other financial instruments in its discretion
In allocating the Fund’s assets between actively-managed underlying funds and passive underlying funds, the Adviser generally uses passive ETFs for asset classes where the price of the asset is assumed to be fair and accurate, reflecting all relevant information that is available about the value of the asset (efficient markets). Examples of efficient markets include US Large Cap Equities, US Small/Mid Cap Equities and Developed International Equities. In selecting underlying funds, the Adviser expects to select J.P. Morgan Funds without considering or canvassing the universe of unaffiliated underlying funds available even though there may (or may not) be one or more unaffiliated underlying funds that investors might regard as more attractive for the Fund or that have superior returns. For actively-managed underlying funds, the Adviser limits its selection to J.P. Morgan Funds. For efficient markets exposure, the Adviser expects to use J.P. Morgan passive ETFs unless the investment is not available. To the extent the Adviser determines in its sole discretion that an investment in a J.P. Morgan passive ETF is not available, only then will the Adviser consider an unaffiliated passive ETF.
Each Fund’s asset allocation strategy is designed with two main goals in mind: promoting asset accumulation prior to retirement, which is a Fund’s “Savings Phase”, and supporting investors withdrawing their investment in the Fund throughout retirement, which is a Fund’s “Spending Phase”. As a result, each Fund’s asset allocation strategy will change over time, generally becoming more conservative as it approaches the target retirement year and then remaining relatively stable afterwards. This means the asset allocation strategy during the Savings Phase will start with a greater emphasis on equity investments and gradually shift to more emphasis on fixed income investments. During the Spending Phase, the Funds will have a greater emphasis on fixed income investments.
The anticipated target allocations between asset classes over the life of a Fund are displayed in the “glide path” below. The table following the glide path is simply the glide path in tabular form.
110 | JPMorgan SmartRetirement Blend Funds
| Target Allocations1 | ||||||||||||
| Years to Target Date |
40+ |
35 |
30 |
25 |
20 |
15 |
10 |
5 |
0 |
-10 |
-20 |
-35 |
| Equity |
94.00 % |
94.00 % |
94.00 % |
94.00 % |
87.00 % |
78.00 % |
65.95 % |
53.00 % |
40.00 % |
40.00 % |
40.00 % |
40.00 % |
| U.S. Large Cap Equity |
46.00 % |
46.00 % |
46.00 % |
46.00 % |
42.65 % |
38.25 % |
32.35 % |
26.00 % |
19.60 % |
19.60 % |
19.60 % |
19.60 % |
| U.S. Mid Cap Equity |
6.60 % |
6.60 % |
6.60 % |
6.60 % |
6.10 % |
5.45 % |
4.60 % |
3.70 % |
2.80 % |
2.80 % |
2.80 % |
2.80 % |
| U.S. Small Cap Equity |
5.65 % |
5.65 % |
5.65 % |
5.65 % |
5.20 % |
4.70 % |
3.95 % |
3.20 % |
2.40 % |
2.40 % |
2.40 % |
2.40 % |
| REITs |
1.90 % |
1.90 % |
1.90 % |
1.90 % |
1.75 % |
1.55 % |
1.30 % |
1.05 % |
0.80 % |
0.80 % |
0.80 % |
0.80 % |
| International Equity |
24.90 % |
24.90 % |
24.90 % |
24.90 % |
23.05 % |
21.05 % |
17.80 % |
14.30 % |
11.20 % |
11.20 % |
11.20 % |
11.20 % |
| Emerging Markets Equity |
8.95 % |
8.95 % |
8.95 % |
8.95 % |
8.25 % |
7.00 % |
5.95 % |
4.75 % |
3.20 % |
3.20 % |
3.20 % |
3.20 % |
| Fixed Income |
6.00 % |
6.00 % |
6.00 % |
6.00 % |
13.00 % |
22.00 % |
34.05 % |
47.00 % |
55.00 % |
55.00 % |
55.00 % |
55.00 % |
| U.S. Fixed Income |
4.80 % |
4.80 % |
4.80 % |
4.80 % |
10.40 % |
17.60 % |
27.20 % |
34.60 % |
36.50 % |
36.50 % |
36.50 % |
36.50 % |
| Inflation Managed |
0.00 % |
0.00 % |
0.00 % |
0.00 % |
0.00 % |
0.00 % |
0.00 % |
3.00 % |
7.50 % |
7.50 % |
7.50 % |
7.50 % |
| High Yield Fixed Income |
0.85 % |
0.85 % |
0.85 % |
0.85 % |
2.20 % |
3.75 % |
5.80 % |
8.00 % |
9.35 % |
9.35 % |
9.35 % |
9.35 % |
| Emerging Markets Debt |
0.35 % |
0.35 % |
0.35 % |
0.35 % |
0.40 % |
0.65 % |
1.05 % |
1.40 % |
1.65 % |
1.65 % |
1.65 % |
1.65 % |
| Money Market Funds/Cash and Cash Equivalents |
0.00 % |
0.00 % |
0.00 % |
0.00 % |
0.00 % |
0.00 % |
0.00 % |
0.00 % |
5.00 % |
5.00 % |
5.00 % |
5.00 % |
| Money Market Funds/Cash and Cash Equivalents |
0.00 % |
0.00 % |
0.00 % |
0.00 % |
0.00 % |
0.00 % |
0.00 % |
0.00 % |
5.00 % |
5.00 % |
5.00 % |
5.00 % |
Note: Above allocations may not sum up to 100% due to rounding.
1
As of the date of this prospectus, the Fund utilizes both underlying funds and direct investments to implement its target allocations. The amount of the Fund’s assets allocated to underlying funds and direct investments will vary over time. The Fund also has flexibility to utilize derivatives to implement its target allocations.
The Adviser will periodically assess the target allocations shown above taking into account various factors, such as current market conditions, assumptions regarding future market performance, time horizon and data on the savings and spending behavior of investors, and may make adjustments. The Adviser also integrates financially material environmental, social and governance (“ESG”) factors as part of each Fund’s investment process (“ESG Integration”). ESG Integration is the systematic inclusion of ESG issues in investment analysis and investment decisions. As part of this assessment, the Adviser will also consider the risks presented by certain ESG factors. Specifically, the Adviser will assess how ESG risks are considered within an active underlying fund’s/manager’s investment process and how the active underlying fund/manager defines and mitigates financially material ESG risks. Although these particular risks are considered, underlying funds and securities of issuers presenting such risks may be purchased and retained by the Fund while the Fund may divest or not invest in underlying funds and securities of issuers that do not present such risks. In particular, ESG Integration does not change a Fund’s investment objective, exclude specific types of industries or companies or limit the Fund’s investable universe. The Funds are not designed for investors who wish to screen out particular types of companies or investments or
November 1, 2023 | 111
More About the Funds (continued)
are looking for Funds that meet specific ESG goals. Based on the Adviser’s assessment, adjustments may be made that include modifying the existing allocations among asset classes or, among other things, adding or removing asset classes or maintaining asset allocations for longer or shorter periods of time. As a result of the Adviser’s ability to make these modifications, as well as a Fund moving along its glide path each year, the Fund’s actual allocations may differ from what is shown above by +/- 15%. In addition, as the Adviser monitors the risk profile of the Fund over various market environments, it may determine that conditions are not favorable and that deviations beyond +/- 15% are necessary to substantially reduce risk in order to preserve capital. Updated information concerning a Fund’s actual allocations to underlying funds and investments is available in the Fund’s shareholder reports and on the Fund’s website from time to time.
Each of the Funds may invest in one or more underlying funds in an asset class in an amount equal to the allocation ranges for the applicable asset class. For example, the JPMorgan SmartRetirement 2060 Fund may invest up to 61.00% of its assets in a single underlying fund that is a U.S. Large Cap Equity Fund, or may invest up to 61.00% across multiple underlying funds that are U.S. Large Cap Equity Funds.
In connection with their main investment strategies, the Funds may use futures including exchange traded futures. The Funds are also permitted to use other derivatives such as options, swaps and exchange traded notes (ETNs). Under certain market conditions, the use of derivatives could be significant. For example, the Adviser may increase the usage of derivatives to “equitize” inflows or outflows of cash received into or paid out of the Fund, to invest in eligible asset classes with greater efficiency than investments in underlying funds or securities, or under other conditions in which the Adviser determines that the increased use of derivatives maybe beneficial to the Fund, including interest rate risk management, managing duration or implementing overweights or underweights to particular markets or sectors based on, among other things, its current market outlook or specific market events. While not part of their principal investment strategies, the JPMorgan SmartRetirement Blend Funds may also use futures and other derivatives for interest rate risk management to adjust the duration position of a JPMorgan SmartRetirement Blend Fund. Futures and other derivatives used for this purpose are not subject to or included as part of a JPMorgan SmartRetirement Blend Fund’s stated fixed income ranges. Generally, ETNs are structured as senior, unsecured notes in which an issuer such as a bank agrees to pay a return based on the target commodity index less any fees. ETNs are synthetic instruments that allow individual investors to have access to derivatives linked to commodities and assets such as oil, currencies and foreign stock indexes. ETNs combine certain aspects of bonds and ETFs. Similar to ETFs, ETNs are traded on a major exchange (e.g., the New York Stock Exchange) during normal trading hours. However, investors can also hold the ETN until maturity. At maturity, the issuer pays to the investor a cash amount equal to principal amount, subject to the day’s index factor. ETN returns are based upon the performance of a market index minus applicable fees. Please note that the Funds also may use strategies that are not described herein, but which are described in the Statement of Additional Information.
During the Spending Phase, the Adviser will seek to achieve certain long-term risk and return targets that allow investors to withdraw a portion of their investment in the fund each year until the target maturity year. In connection with this, the Adviser will produce an annual “sample withdrawal amount”. The sample withdrawal amount is a generic hypothetical example that seeks to estimate a percentage of an investor’s investment in the Fund as of the beginning of the year that theoretically could be redeemed by an investor during that year while still allowing for redemptions in future years through the target maturity year. It attempts to balance income needs in the current year against the need for income in the future. The related long-term risk and return targets represent the investment return the Adviser seeks to achieve over the long-term and the risk level (e.g., the balance between asset classes) the Adviser seeks to take to achieve that long-term return in light of the sample withdrawal amount. Investors may use the sample withdrawal amount as a consideration in determining how much of their investment to withdraw each year during the Spending Phase. The sample withdrawal amount will be made available in January of each year on the Fund’s website, www.jpmorganfunds.com, and by calling 1-800-480-4111.
Because it is assumed that investors will be withdrawing a portion of their investment in the Fund each year during the Spending Phase, the Fund’s assets are expected to decline over time and approach zero in the target maturity year. In addition, as assets decline and approach zero, there may be a point before the target maturity year where the Adviser can no longer manage the Fund in-line with its investment goal. Accordingly, it is expected that a Fund will be liquidated or merged into the SmartRetirement Blend Income Fund at the discretion of the Fund’s Board of Trustees at or prior to the target maturity year. The Adviser anticipates that the withdrawal amount will increase as a percentage of an investor’s investment in the several years immediately preceding the target maturity year and that the sample withdrawal amount will be 100% of an investor’s investment in the target maturity year. As a result, the Funds and the sample withdrawal amount will be less useful for those who invest closer to the target maturity year.
The sample withdrawal amount is not expected to be level from year to year and instead will likely vary each year. If investors choose to follow the sample withdrawal amount, they will be redeeming shares and their investment in the Fund will be reduced. The sample withdrawal amount assumes the reinvestment of distributions in additional shares of the Fund. As a result, if distributions are not reinvested, following the sample withdrawal amount without adjusting for distributions not reinvested will increase the likelihood that an investor will (i) have insufficient shares for redemption in future years and (ii) exhaust his or her assets in the Fund prior to the
112 | JPMorgan SmartRetirement Blend Funds
maturity year. The sample withdrawal amount is not designed to comply with any required minimum distribution rules applicable to tax-deferred retirement accounts nor does it take into account any tax considerations to investors (including, for example, any early withdrawal penal-ties that may be imposed on investors in tax-deferred retirement accounts). Investors investing through a tax-deferred retirement account subject to a required minimum distribution who redeem shares of the Fund from such account will need to include such redemption amount, as appropriate, in the computation of any annual required minimum distribution. Many of the assumptions and factors upon which the sample withdrawal amount will be based are the result of estimates and judgment calls by the Adviser. If those assumptions and factors are inaccurate or incomplete, the withdrawal amount may not accurately reflect the amount that an investor could redeem during the year while still allowing for redemptions in future years. Investors should not consider the Fund as a complete solution for his or her investment or retirement income needs or as a guarantee of income. In making a decision about their investment in the Fund in their individual situation, or in assessing the adequacy of estimated distributions that they may receive at any particular time, investors should consider all of their other assets, income and investments in addition to their investment in the Fund.
The provision of a sample withdrawal amount is for the purpose of outlining a possible theoretical course of action. The sample withdrawal amount is a generic hypothetical example as of a specific calculation date that does not consider, nor is it based upon, an investor’s specific circumstances including his or her age, financial needs, risk tolerance, required minimum distribution amount under the Internal Revenue Code with respect to any year, if any, other assets and overall investment objectives. No suggestion is offered herein that any particular redemption amount is advisable under the circumstances outlined in the sample withdrawal amount, and, more generally, there is no recommendation herein regarding any particular course of conduct in any particular situation or with respect to any particular investor. The sample withdrawal amount does not constitute and is not intended to constitute a suggestion, recommendation or impartial advice of any kind. Instead, it will be presented merely for educational purposes so as to give an indication as to the kinds of approaches that may be possible, and each should make an independent decision regarding how to proceed based on the own independent analysis, taking into account whatever independent advice from the investor’s professional adviser, tax adviser or other third parties that the investor may regard as necessary or appropriate to obtain.
JPMIM may hire affiliated and/or unaffiliated sub-advisers to manage any of the asset classes described under each Fund’s “What are the Fund’s main investment strategies?” section in the “Risk/Return Summary.” When using sub-advisers to manage each Fund’s assets, the Adviser, subject to certain conditions and oversight by the Funds’ Board of Trustees, will have the right to hire, terminate, or replace sub-advisers without investor approval. Each Fund will notify investors of changes to sub-advisers. Please see “The Adviser, Sub-Advisers, Administrator and Distributor” on page 145 for more details.
| FUNDAMENTAL POLICIES |
| A Fund’s investment strategy may involve “fundamental policies.” A policy is fundamental if it cannot be changed without the consent of a majority of the outstanding shares of the Fund. Each Fund’s investment objective is fundamental, although over time, each Target Date Fund’s investment objective migrates from seeking total return to seeking current income and some capital appreciation as the Target Date Fund approaches its target date. All other fundamental policies are specifically identified in the Statement of Additional Information. |
Additional Information About the Funds’ Investment Strategies
Securities Lending. Certain of the underlying funds (and, if and when approved by the Board, each Fund) may engage in securities lending to increase income. Securities lending involves the lending of securities owned by a fund (including, if and when approved by the Board, underlying Funds advised by JPMIM) to financial institutions such as certain broker-dealers in exchange for cash collateral. The Funds and underlying funds that engage in securities lending will invest cash collateral in one or more money market funds advised by the adviser or its affiliates and from which the adviser or its affiliates may receive fees. During the term of the loan, the Funds and underlying funds that engage in securities lending are entitled to receive amounts equivalent to distributions paid on the loaned securities as well as the return on the cash collateral investments. Upon termination of the loan, the Funds and underlying funds that engage in securities lending are required to return the cash collateral to the borrower plus any agreed upon rebate. Cash collateral investments will be subject to market depreciation or appreciation, and a Fund and a underlying funds that engage in securities lending will be responsible for any loss that might result from its investment of cash collateral. If the adviser determines to make securities loans, the value of the securities loaned may not exceed 33 1∕3% of the value of total assets of a Fund or underlying fund, as applicable. Loan collateral (including any investment of that collateral) is not subject to the percentage limitations regarding a Fund’s investments described elsewhere in this prospectus. This prospectus will not be updated to reflect any such Board approval. Securities Lending is not a principal strategy of the Funds.
November 1, 2023 | 113
More About the Funds (continued)
Investment Risks
The main risks associated with investing in the Funds are summarized in the “Risk/Return Summaries” at the front of this prospectus. The table below identifies main risks and some of the additional risks associated with Funds and the underlying funds. The degree to which these risks apply to a Fund will vary according to its point along the glide path and also whether the Fund is in the Spending Phase, and each may be considered a main risk of the Fund over the course of time. The Fund is exposed to the risks summarized below through both its direct investments and investments in underlying funds. Risks that are not expected to be main risks of the JPMorgan SmartRetirement Blend Funds are identified as “Additional Risks.”
An investment in a Fund or any other fund may not provide a complete investment program. The suitability of an investment in a Fund should be considered based on the investment objective, strategies and risks described in this prospectus, considered in light of all of the other investments in your portfolio, as well as your risk tolerance, financial goals and time horizons. You may want to consult with a financial advisor to determine if a Fund is suitable for you.
| |
JPMorgan SmartRetirement Blend Income Fund |
JPMorgan SmartRetirement Blend Funds |
| Active Asset Allocation Risk |
• |
• |
| Asset-Backed, Mortgage-Related and Other Mortgage-Backed Securities Risk |
• |
• |
| Commodity Risk |
○ |
○ |
| Credit Risk |
• |
• |
| Currency Risk |
○ |
○ |
| Cyber Security Risk |
○ |
○ |
| Derivatives Risk |
• |
• |
| Equity Securities Risk |
• |
• |
| Exchange Traded Notes Risk |
○ |
○ |
| Foreign Securities and Emerging Market Risk |
• |
• |
| General Market Risk |
• |
• |
| Geographic Focus Risk |
○ |
○ |
| Government Securities Risk |
• |
• |
| High Portfolio Turnover Risk |
○ |
○ |
| High Yield Securities Risk |
• |
• |
| Index Strategy Risk |
• |
• |
| Industry and Sector Focus Risk |
• |
• |
| Inflation-Managed Strategies Risk |
○ |
○ |
| Investment Risk |
• |
• |
| Investments in Mutual Funds and ETFs Risk |
• |
• |
| Interest Rate Risk |
• |
• |
| Loan Risk |
• |
• |
| Maturity Date and Redemption Risk |
• |
• |
| Newer Fund Risk* |
|
○ |
| Non-Diversified Risk |
○ |
○ |
| Prepayment Risk |
• |
• |
| Real Estate Securities Risk |
• |
• |
| Regulatory and Legal Risk |
○ |
○ |
•
Main Risks
○
Additional Risks
*
This risk applies only to the JPMorgan SmartRetirement Blend 2065 Fund
114 | JPMorgan SmartRetirement Blend Funds
| |
JPMorgan SmartRetirement Blend Income Fund |
JPMorgan SmartRetirement Blend Funds |
| Risk Associated with the Fund Holding Cash, Money Market Instruments and Other Short-Term Investments |
• |
• |
| Sample Withdrawal Amount Risk |
• |
• |
| Securities and Financial Instruments Risk |
• |
• |
| Securities Lending Risk |
○ |
○ |
| Smaller Company Risk |
• |
• |
| Sovereign Debt Risk |
• |
• |
| Strategy Risk |
○ |
○ |
| Transactions and Liquidity Risk |
• |
• |
| Volcker Rule Risk |
○ |
○ |
•
Main Risks
○
Additional Risks
Investment Risk. JPMorgan SmartRetirement Blend Funds are subject to investment risk, including stock and fixed income market risk. These markets may be volatile causing a Fund’s share price to drop and an investor to lose money. The Target Date Funds become more conservative over time meaning they allocate more of their assets to fixed income investments than equity investments as they near the target retirement date. Despite the more conservative allocation, the Target Date Funds and JPMorgan SmartRetirement Blend Income Fund will continue to be exposed to market risk, including stock market risk and the share price of a Fund may decline even after a Fund’s allocation is at its most conservative. In determining whether to invest in a JPMorgan SmartRetirement Blend Fund, investors should consider their estimated retirement date, retirement needs and expectations, and risk tolerance.
JPMorgan SmartRetirement Blend Funds are not a complete retirement program and there is no guarantee that the Funds will provide sufficient retirement income to an investor.
1.
Meeting your retirement goals is dependent upon many factors including the amount you save and the period over which you do so.
2.
You should consider your expected retirement date, individual retirement needs (i.e., how much money you expect to need), other expected income after retirement, inflation, other assets, and risk tolerance when choosing a Target Date Fund.
3.
Target Date Funds are not a complete retirement program and there is no guarantee that any of the Funds will provide sufficient retirement income, and you may lose money before or after retirement.
4.
Your risk tolerance may change over time and the Adviser may change the Fund’s strategic target allocation model. It is important that you re-evaluate your investment in a Target Date Fund periodically.
5.
If you need help making an investment decision, you should consult a financial advisor.
Investments in Mutual Funds and ETFs Risk. Each JPMorgan SmartRetirement Blend Fund invests in underlying J.P. Morgan Funds and unaffiliated passive ETFs, so each Fund’s performance is directly related to the performance of the underlying funds. Each Fund’s net asset value will change with the value of the underlying funds and changes in the markets where the underlying funds invest. Because the Funds’ Adviser or its affiliates provide services to and receive fees from certain of the underlying funds, investments in a Fund benefit the Adviser and/or its affiliates. In addition, a Fund may hold a significant percentage of the shares of an underlying fund. As a result, the Fund’s investments in an underlying fund may create a conflict of interest. In addition, the underlying funds may include equity index funds that replicate the holdings on an index that hold the common stock of JPMorgan Chase & Co., the indirect parent of the Adviser.
In addition to investing in underlying J.P. Morgan Funds, the Funds may also invest in unaffiliated passive ETFs. ETFs are pooled investment vehicles whose ownership interests are purchased and sold on a securities exchange. ETFs may be structured as investment companies, depositary receipts or other pooled investment vehicles and may be passively or actively managed. Passively managed ETFs generally seek to track the performance of a particular market index, including broad-based market indexes, as well as indexes relating to particular sectors, markets, regions or industries. Actively managed ETFs do not seek to track the performance of a particular market index. Ordinarily, a Fund must not hold more than 3% of the total assets of another ETF or other investment company and must limit its investments in a single ETF to 5% of its total assets and in all ETFs and other investment companies to
November 1, 2023 | 115
More About the Funds (continued)
10% of its total assets. The Securities and Exchange Commission adopted an exemptive rule that allows any fund to disregard these 3%, 5% and 10% limitations, subject to certain conditions. The price movement of an index-based ETF may not track the underlying index and may result in a loss. In addition, ETFs may trade at a price above (premium) or below (discount) their net asset value, especially during periods of significant market volatility or stress, causing investors to pay or receive significantly more or less than the value of the ETF’s underlying portfolio when they purchase or sell their ETF shares, respectively.
Active Asset Allocation Risk. The Adviser has discretion to make short to intermediate term allocations that increase or decrease the exposure to asset classes and investments. A Fund’s allocation strategy may not be successful in adding value, may increase losses to the Fund and/or cause the Fund to have a risk profile different than that portrayed in the glide path from time to time.
Derivatives Risk. The underlying funds and the Funds may use derivatives in connection with their investment strategies. Derivatives may be riskier than other types of investments because they may be more sensitive to changes in economic or market conditions than other types of investments and could result in losses that significantly exceed a Fund’s or underlying fund’s original investment. Derivatives are subject to the risk that changes in the value of a derivative may not correlate perfectly with the underlying asset, rate or index. The use of derivatives may not be successful, resulting in losses to the Fund or underlying fund, and the cost of such strategies may reduce the Fund’s or underlying fund’s returns. Certain derivatives also expose the Fund and underlying funds to counterparty risk (the risk that the derivative counterparty will not fulfill its contractual obligation), including credit risk of the derivative counterparty. Certain derivatives are synthetic instruments that attempt to replicate the performance of certain reference assets. With regard to such derivatives, the Fund or the underlying fund do not have a claim on the reference assets and is subject to enhanced counterparty risk. In addition, the Fund or underlying fund may use derivatives for non-hedging purposes, which increases the Fund’s or underlying fund’s potential for loss.
Investing in derivatives and, in the case of underlying funds engaging in short sales, will result in a form of leverage. Leverage involves special risks. A Fund or underlying fund may be more volatile than if the Fund or underlying fund had not been leveraged because the leverage tends to exaggerate any effect of the increase or decrease in the value of a Fund’s or underlying fund’s portfolio securities. Registered investment companies such as the underlying funds are limited in their ability to engage in derivative transactions.
The possible lack of a liquid secondary market for derivatives and the resulting inability of the Fund or underlying fund to sell or otherwise close a derivatives position could expose the Fund or underlying fund to losses and could make derivatives more difficult for the Fund or underlying fund to value accurately. Derivatives also can expose the Fund to derivative liquidity risk, which includes the risks involving the liquidity demands that derivatives can create to make payments of margin, collateral or settlement payments to counterparties, legal risk, which includes the risk of loss resulting from insufficient or unenforceable contractual documentation, insufficient capacity or authority of a Fund’s counterparty or operational risk, which includes documentation or settlement issues, system failures, inadequate controls and human error.
A Fund’s or underlying fund’s transactions in futures contracts, swaps and other derivatives could also affect the amount, timing and character of distributions to shareholders which may result in a Fund or underlying fund realizing more short-term capital gain and ordinary income subject to tax at ordinary income tax rates than it would if it did not engage in such transactions, which may adversely impact a Fund’s or underlying fund’s after-tax return.
| WHAT IS A DERIVATIVE? |
| Derivatives are securities or contracts (like futures and options) that derive their value from the performance of underlying assets or securities. |
Securities and Financial Instruments Risks. JPMorgan SmartRetirement Blend Funds may invest directly in securities and other financial instruments, such as derivatives. The intention of doing so is to gain exposure to, or to overweight or underweight their investments, among various sectors or markets and for interest rate management. There is no guarantee that the use of these securities and financial instruments will produce the intended result of effectively allocating a Fund’s investments to a specific market or sector or interest rate management. In addition, securities and financial instruments are subject to additional risks specific to their structure, sector or market (e.g., futures and swaps on foreign securities are subject to foreign investment, emerging market and derivative risks; debt securities are subject to credit risk). Depending on the type of security or instrument, the market value may move up and down, sometimes rapidly and unpredictably causing a security or instrument to be worth less than the price originally paid for it. To the extent that a security or instrument decreases in value, the value of your investment in a Fund will be affected. In certain circumstances, underlying funds may pay redemption proceeds in securities instead of cash. To the extent this occurs, the Funds will be subject to the risks of holding securities directly. While the Funds may seek to sell securities received in-kind and invest the proceeds in underlying funds, there is no guarantee they will be able to do so without incurring losses. In addition, the Funds could incur taxable gains, brokerage and other charges in converting such securities to cash.
116 | JPMorgan SmartRetirement Blend Funds
High Yield Securities Risk. The Fund and/or an underlying fund may invest in debt securities that are considered to be speculative (known as junk bonds). These securities are issued by companies which are highly leveraged, less creditworthy or financially distressed. Non-investment grade debt securities can be more sensitive to short-term corporate, economic and market developments. During periods of economic uncertainty and change, the market price of an underlying fund’s investments and a Fund’s or underlying fund’s net asset value may be volatile. Furthermore, though these investments generally provide a higher yield than higher-rated debt securities, the high degree of risk involved in the investments can result in substantial or total losses. These securities are subject to greater risk of loss, greater sensitivity to economic changes, valuation difficulties, and a potential lack of a secondary or public market for securities. The market price of these securities can change suddenly and unexpectedly.
In recent years, there has been a broad trend of weaker or less restrictive covenant protections in the high yield market. Among other things, under such weaker or less restrictive covenants, borrowers might be able to exercise more flexibility with respect to certain activities than borrowers who are subject to stronger or more protective covenants. For example, borrowers might be able to incur more debt, including secured debt, return more capital to shareholders, remove or reduce assets that are designated as collateral securing high yield securities, increase the claims against assets that are permitted against collateral securing high yield securities or otherwise manage their business in ways that could impact creditors negatively. In addition, certain privately held borrowers might be permitted to file less frequent, less detailed or less timely financial reporting or other information, which could negatively impact the value of the high yield securities issued by such borrowers. Each of these factors might negatively impact the high yield instruments held by a Fund.
Loan Risk. Some of the underlying funds may invest in loan assignments and participations and commitments to purchase loan assignments (Loans) including Loans that are rated below investment grade. Like other high yield, corporate debt instruments, such Loans are subject to an increased risk of default in the payment of principal and interest as well as the other risks described under “Interest Rate Risk,” “Credit Risk,” and “High Yield Securities Risk.” Although certain Loans are secured by collateral, an underlying fund could experience delays or limitations in realizing on such collateral or have its interest subordinated to other indebtedness of the obligor. Loans are vulnerable to market sentiment such that economic conditions or other events may reduce the demand for Loans and cause their value to decline rapidly and unpredictably. Although an underlying fund will limit its investments in illiquid securities to no more than 15% of an underlying fund’s net assets at the time of purchase, Loans that are deemed to be liquid at the time of purchase may become illiquid.
In recent years, there has been a broad trend of weaker or less restrictive covenant protections in the Loan market. Among other things, under such weaker or less restrictive covenants, borrowers might be able to exercise more flexibility with respect to certain activities than borrowers who are subject to stronger or more protective covenants. For example, borrowers might be able to incur more debt, including secured debt, return more capital to shareholders, remove or reduce assets that are designated as collateral securing Loans, increase the claims against assets that are permitted against collateral securing Loans or otherwise manage their business in ways that could impact creditors negatively. In addition, certain privately held borrowers might be permitted to file less frequent, less detailed or less timely financial reporting or other information, which could negatively impact the value of the Loans issued by such borrowers. Each of these factors might negatively impact the Loans held by a Fund.
No active trading market may exist for some of the Loans and certain Loans may be subject to restrictions on resale. The inability to dispose of Loans in a timely fashion could result in losses to an underlying fund. In addition, the settlement period for Loans is uncertain as there is no standardized settlement schedule applicable to such investments. Certain Loans may take more than seven days to settle. Because some Loans that an underlying fund invests in may have a more limited secondary market, liquidity and valuation risk is more pronounced for an underlying fund than for funds that invest primarily in other types of fixed income instruments or equity securities. Typically, Loans are not registered securities and are not listed on any national securities exchange. Consequently, there may be less public information available about an underlying fund’s investments and the market for certain Loans may be subject to irregular trading activity, wide bid/ask spreads and extended trade settlement periods. As a result, an underlying fund may be more dependent upon the analytical ability of its adviser.
Affiliates of the Adviser may participate in the primary and secondary market for Loans. Because of limitations imposed by applicable law, the presence of the Adviser’s affiliates in the Loan market may restrict an underlying fund’s ability to acquire some Loans, affect the timing of such acquisition or affect the price at which the Loan is acquired. Also, because the Adviser may wish to invest in the publicly traded securities of an obligor, it may not have access to material non-public information regarding the obligor to which other investors have access. In addition, certain Loans may not be considered securities under the federal securities laws and, therefore, investments in such Loans may not be subject to certain protections under those laws.
Interest Rate Risk. Investments in bonds and other debt securities will change in value based on changes in interest rates. If rates increase, the value of these underlying funds’ investments generally declines. On the other hand, if rates fall, the value of the investments generally increases. Your investment will decline in value if the value of the underlying funds’ investments decreases. Securities with greater interest rate sensitivity and longer maturities generally are subject to greater fluctuations in value.
November 1, 2023 | 117
More About the Funds (continued)
The Funds and/or an underlying fund may invest in variable and floating rate Loans and other variable and floating rate securities. Although these instruments are generally less sensitive to interest rate changes than other fixed rate instruments, the value of variable and floating rate Loans and other securities may decline if their interest rates do not rise as quickly or as much as general interest rates. Many factors can cause interest rates to rise. Some examples include central bank monetary policy, rising inflation rates and general economic conditions. The Funds may face a heightened level of interest rate risk due to certain changes or uncertainty in monetary policy, such as an interest rate increase by the Federal Reserve. It is difficult to predict the pace at which central banks or monetary authorities may increase interest rates or the timing, frequency, or magnitude of such increases. Any such changes could be sudden and could expose debt markets to significant volatility and reduced liquidity for Fund investments.
Debt market conditions are highly unpredictable and some parts of the market are subject to dislocations. Beginning in March 2022, the Federal Reserve Board began increasing interest rates and has signaled the possibility of further increases. It is difficult to accurately predict the pace at which the Federal Reserve Board will increase interest rates any further, or the timing, frequency or magnitude of any such increases, and the evaluation of macro-economic and other conditions could cause a change in approach in the future. Any such changes could be sudden and could expose debt markets to significant volatility and reduced liquidity for Fund investments.
Credit Risk. The Funds’ and/or an underlying fund’s investments are subject to the risk that issuers and/or counterparties will fail to make payments when due or default completely. The risk of defaults across issuers and/or counterparties increases in adverse market and economic conditions, including the conditions resulting from the COVID-19 pandemic. Such default could result in losses to the underlying funds and to the Funds. In addition, the credit quality of securities held by an underlying fund may be lowered if an issuer’s or a counterparty’s financial condition changes. Lower credit quality may lead to greater volatility in the price of a security and in shares of an underlying fund. Lower credit quality also may affect liquidity and make it difficult for the underlying fund to sell the security. Although U.S. government securities issued directly by the U.S. government are guaranteed by the U.S. Treasury, other U.S. government securities issued by an agency or instrumentality of the U.S. government may not be. No assurance can be given that the U.S. government will provide financial support.
Prices of an underlying fund’s investments may be adversely affected if any of the issuers or counterparties it is invested in are subject to an actual or perceived deterioration in their credit quality. Credit spreads may increase, which may reduce the market values of the underlying fund’s securities. Credit spread risk is the risk that economic and market conditions or any actual or perceived credit deterioration may lead to an increase in the credit spreads (i.e., the difference in yield between two securities of similar maturity but different credit quality) and a decline in price of the issuer’s securities.
Asset-Backed, Mortgage-Related and Mortgage-Backed Securities Risk. Some of the Funds invest in asset-backed, mortgage-related and mortgage-backed securities. These securities differ from conventional debt securities and are subject to certain additional risks because principal is paid back over the life of the security rather than at maturity. The value of these securities will be influenced by the factors affecting the property market and the assets underlying such securities. As a result, during periods of difficult or frozen credit markets, significant changes in interest rates, or deteriorating economic conditions, mortgage-related and asset-backed securities: may decline in value, face valuation difficulties, be more volatile and/or be illiquid. Additionally, during such periods and also under normal conditions, these securities are also subject to prepayment and call risk. Gains and losses associated with prepayments will increase or decrease the Funds and/or an underlying fund’s yield and the income available for distribution by the Funds and/or an underlying fund. When mortgages and other obligations are prepaid and when securities are called, the Funds and/or an underlying fund may have to reinvest in securities with a lower yield or fail to recover additional amounts (i.e., premiums) paid for securities with higher interest rates, resulting in an unexpected capital loss and/or a decrease in the amount of dividends and yield. In periods of rising interest rates, the Funds and/or an underlying fund may be subject to contraction risk which is the risk that borrowers will increase the rate at which they prepay the maturity value of mortgages and other obligations. In periods of either rising or declining interest rates, the Funds and/or an underlying fund may be subject to extension risk which is the risk that the expected maturity of an obligation will lengthen in duration due to a decrease in prepayments. As a result, in certain interest rate environments, the Funds and/or an underlying fund may exhibit additional volatility. Some of these securities may receive little or no collateral protection from the underlying assets and are thus subject to the risk of default described under “Credit Risk.” The risk of such defaults is generally higher in the case of asset backed, mortgage-backed and mortgage-related investments that include so-called “sub-prime” mortgages (which are loans made to borrowers with low credit ratings or other factors that increase the risk of default). The structure of some of these securities may be complex and there may be less available information than other types of debt securities. Additionally, asset-backed, mortgage-related and mortgage-backed securities are subject to risks associated with their structure and the nature of the assets underlying the securities and the servicing of those assets. Certain asset-backed, mortgage-related and mortgage-backed securities may face valuation difficulties and may be less liquid than other types of asset-backed, mortgage-related and mortgage-backed securities, or debt securities.
118 | JPMorgan SmartRetirement Blend Funds
The mortgage loans underlying privately issued mortgage-related securities may not be subject to the same underwriting requirements for the underlying mortgages that are applicable to those mortgage-related securities that have government or government-sponsored entity guarantees. As a result, the mortgage loans underlying privately issued mortgage-related securities may have less favorable collateral, credit risk or other underwriting characteristics than government or government-sponsored mortgage-related securities and have wider variances in a number of terms including interest rate, term, size, purpose and borrower characteristics. In addition, certain mortgage-related securities which may include loans that originally qualified under standards established by government-sponsored entities (for example, certain REMICs that include Fannie Mae mortgages) are not considered as government securities for purposes of a Fund’s investment strategies or policies. There is no government or government-sponsored guarantee for such privately issued investments.
Some of the underlying funds may invest in collateralized mortgage obligations (CMOs). CMOs are debt obligations collateralized by mortgage loans or mortgage pass-through securities. CMOs are issued in multiple classes, and each class may have its own interest rate and/or final payment date. A class with an earlier final payment date may have certain preferences in receiving principal payments or earning interest. As a result, the value of some classes in which the underlying fund invests may be particularly sensitive to changes in prevailing interest rates.
Some of the underlying funds may invest in interest-only (IO) and principal-only (PO) mortgage-related securities. The values of IO and PO mortgage-backed securities are more volatile than other types of mortgage-related securities. They are very sensitive to changes in interest rates and to the rate of prepayments. A rapid or unexpected increase in prepayments can significantly depress the price of interest-only securities, while a rapid or unexpected decrease could have the same effect on principal-only securities. In addition, because there may be a drop in trading volume, an inability to find a ready buyer, or the imposition of legal restrictions on the resale of securities, these instruments may be illiquid.
Equity Securities Risk. Investments in equity securities (such as stocks) are more volatile and carry more risks than some other forms of investment. The price of equity securities may rise or fall because of economic or political changes or changes in a company’s financial condition, sometimes rapidly or unpredictably. These price movements may result from factors affecting individual companies, sectors or industries selected for a Fund’s or an underlying fund’s portfolio or securities market as a whole, such as changes in economic or political conditions. When the value of such securities goes down, the Fund’s investment decreases in value.
General Market Risk. Economies and financial markets throughout the world are becoming increasingly interconnected, which increases the likelihood that events or conditions in one country or region will adversely impact markets or issuers in other countries or regions. Securities in the Fund’s portfolio may underperform in comparison to securities in general financial markets, a particular financial market or other asset classes due to a number of factors, including inflation (or expectations for inflation), deflation (or expectations for deflation), interest rates, global demand for particular products or resources, market instability, financial system instability, debt crises and downgrades, embargoes, tariffs, sanctions and other trade barriers, regulatory events, other governmental trade or market control programs and related geopolitical events. In addition, the value of the Fund’s investments may be negatively affected by the occurrence of global events such as war, terrorism, environmental disasters, natural disasters or events, country instability, and infectious disease epidemics or pandemics.
For example, the outbreak of COVID-19 negatively affected economies, markets and individual companies throughout the world, including those in which an underlying fund invests. The effects of any future pandemic or other global event to public health and business and market conditions may have a significant negative impact on the performance of underlying fund’s investments, increase the underlying fund’s volatility, exacerbate pre-existing political, social and economic risks to an underlying fund, and negatively impact broad segments of businesses and populations. In addition, governments, their regulatory agencies, or self-regulatory organizations have taken or may take actions in response to a pandemic or other global event that affect the instruments in which an underlying fund invests, or the issuers of such instruments, in ways that could have a significant negative impact on the underlying fund’s investment performance. The ultimate impact of any pandemic or other global event and the extent to which the associated conditions and governmental responses impact an underlying fund will also depend on future developments, which are highly uncertain, difficult to accurately predict and subject to frequent changes.
Foreign Securities and Emerging Market Risk. Because the Fund and/or an underlying fund may invest in foreign currencies or securities of foreign issuers, investments in such underlying funds are subject to special risks in addition to those of U.S. investments. These risks include political and economic risks, unstable governments, civil conflicts and war, greater volatility, decreased market liquidity, currency fluctuations, higher transaction costs, delayed settlement, possible foreign controls on investment, expropriation and nationalization risks, sanctions or other measures by the United States or other governments, liquidity risks and less stringent investor protection and disclosure standards of foreign markets. The securities markets of many foreign countries are relatively small, with a limited number of companies representing a small number of industries. If foreign securities are denominated and traded in a foreign currency, the value of the underlying fund’s foreign holdings can be affected by currency exchange rates and
November 1, 2023 | 119
More About the Funds (continued)
exchange control regulations. In certain markets where securities and other instruments are not traded “delivery versus payment,” the Fund and/or an underlying fund may not receive timely payment for securities or other instruments it has delivered or receive delivery of securities paid for and may be subject to increased risk that the counterparty will fail to make payments or delivery when due or default completely. Foreign market trading hours, clearance and settlement procedures, and holiday schedules may limit the Fund's ability to buy and sell securities. Investments in foreign markets may also be adversely affected by governmental actions such as the imposition of capital controls, nationalization of companies or industries, expropriation of assets or the imposition of punitive taxes. The governments of certain countries may prohibit or impose substantial restrictions on foreign investing in their capital markets or in certain sectors or industries. In addition, a foreign government may limit or cause delay in the convertibility or repatriation of its currency which would adversely affect the U.S. dollar value and/or liquidity of investments denominated in that currency. Certain foreign investments may become less liquid in response to market developments or adverse investor perceptions, or become illiquid after purchase by the Fund, particularly during periods of market turmoil. Moreover, the growing interconnectivity of global economies and financial markets has increased the probability that adverse developments and conditions in one country or region will affect the stability of economies and financial markets in other countries or regions. A reduction in trading in securities of issuers located in countries whose economies are heavily dependent upon trading with key partners may have an adverse impact on the Fund’s investments.
Securities registration, custody, and settlement may in some instances be subject to delays and legal and administrative uncertainties. Foreign investment in the securities markets of certain foreign countries is restricted or controlled to varying degrees. These restrictions or controls may at times limit or preclude investment in certain securities and may increase the costs and expenses of a Fund. In addition, the repatriation of investment income, capital or the proceeds of sales of securities from certain of the countries is controlled under regulations, including in some cases the need for certain advance government notification or authority, and if a deterioration occurs in a country’s balance of payments, the country could impose temporary restrictions on foreign capital remittances. A Fund also could be adversely affected by delays in, or a refusal to grant, any required governmental approval for repatriation, as well as by the application to it of other restrictions on investment.
Events and evolving conditions in certain economies or markets may alter the risks associated with investments tied to countries or regions that historically were perceived as comparatively stable becoming riskier and more volatile. The risks associated with foreign securities are magnified in countries in “emerging markets.” These countries may have relatively unstable governments and less-established market economies than developed countries and you may sustain sudden, and sometimes substantial, fluctuations in the value of your investments. The underlying fund’s investments in foreign and emerging market securities may also be subject to foreign withholding and/or other taxes, which would decrease an underlying fund’s yield on those securities. Certain emerging market countries may be subject to less stringent requirements regarding accounting, auditing, financial reporting and record keeping and therefore, material information related to an investment may not be available or reliable. Additionally, the Fund may have substantial difficulties exercising its legal rights or enforcing a counterparty’s legal obligations in certain jurisdictions outside of the United States, in particular in emerging markets countries, which can increase the risks of loss. The Fund’s investments in foreign and emerging market securities may also be subject to foreign withholding and/or other taxes, which would decrease the Fund’s yield on those securities. Emerging markets are more likely than developed markets to experience problems with the clearing and settling of trades, as well as the holding of securities by local banks, agents, and depositories.
Industry and Sector Focus Risk. At times, a Fund and/or an underlying fund may increase the relative emphasis of its investments in a particular industry or sector. The prices of securities of issuers in a particular industry or sector may be more susceptible to fluctuations due to changes in economic or business conditions, government regulations, availability of basic resources or supplies, contagion risk within a particular industry or sector or to other industries or sectors, or other events that affect that industry or sector more than securities of issuers in other industries and sectors. To the extent that the underlying fund increases the relative emphasis of its investments in a particular industry or sector, the value of the underlying funds or a Fund’s Shares may fluctuate in response to events affecting that industry or sector.
Sample Withdrawal Amount Risk. The Spending Phase of a Fund is designed for investors in retirement who intend to spend down their holdings in a Fund. There is no guarantee that a Fund will provide sufficient retirement income, the sample withdrawal amount for any given year may be zero in order to preserve capital and you may lose money invested in a Fund. You should not rely solely on the sample withdrawal amount in determining your retirement income needs. Prior to investing in the Fund, you should be aware of the following:
1.
The Spending Phase is not designed for the accumulation of assets prior to retirement. If you choose to redeem shares in accordance with the sample withdrawal amount and a Fund outperforms after you have redeemed shares, you will not participate in the appreciation of assets on the amount you redeemed. The long-term risk and return target of a Fund in any given year, including any income and gain from investments earned by a Fund, is not designed to be equal to or greater than the sample withdrawal amount for such year. This means that, if you choose to follow the sample withdrawal amount, you likely will be redeeming shares and your investment in a Fund will be reduced.
120 | JPMorgan SmartRetirement Blend Funds
2.
The Adviser will seek to manage the overall volatility of a Fund during the Spending Phase, but it may not be successful in doing so and a Fund’s risk profile may be more or less aggressive from year to year. Your risk tolerance may change over time and the Adviser may change a Fund’s long-term risk and return target, including, but not limited to, in response to market events. For example, to the extent that market performance leads a Fund to underperform (outperform) the long-term risk and return target for a given year, it may lead to a decrease (increase) in the sample withdrawal amount or an increase (decrease) in the long-term risk and return target in subsequent years. It is important that you re-evaluate your investment in a Fund periodically.
3.
The sample withdrawal amount is calculated solely as of the applicable calculation date and does not take into account any subsequent changes to the basis upon which it is calculated, such as changes in the Adviser’s assumptions regarding future market performance. In this regard, once a sample withdrawal amount is set for a given year, the Adviser does not expect to modify it during the year. Rather, any changes to the sample withdrawal amount, including changes to account for unexpected factors, including market performance, will be made in the next annual calculation.
4.
The sample withdrawal amount calculation assumes the reinvestment of distributions in additional shares of a Fund. As a result, if distributions are not reinvested, following the sample withdrawal amount without adjusting for distributions not reinvested will increase the likelihood that a shareholder will (i) have insufficient shares for redemption in future years and (ii) exhaust his or her assets in the Fund prior to the maturity date.
Maturity Date and Redemption Risk. While assets invested in the Funds are expected to decline over time and equal zero on the maturity date, a Fund may be liquidated prior to the maturity date. For example, as assets decline and approach zero, there may be a point before the maturity date where the Adviser can no longer manage a Fund in-line with its investment goal and a Fund may be liquidated at the discretion of the Board of Trustees. In addition, as assets in a Fund decline, Fund expenses will be spread over a smaller asset base, potentially causing an increase in a Fund’s expense ratio. In order to accommodate investors redeeming shares, a Fund may sell securities at times when it would not otherwise do so, which may result in a loss to a Fund. These transactions may result in higher portfolio turnover, accelerate the realization of taxable income if sales of securities resulted in capital gains or other income and increase transaction costs, which may impact a Fund’s expense ratio. To the extent that such transactions result in short-term capital gains, such gains will generally be taxed at the ordinary income tax rate. It is possible for a Fund to suffer substantial investment losses and simultaneously experience additional asset reductions as a result of shareholders redeeming shares. Moreover, even if a Fund’s capital grows over short, intermediate, or long periods of time, a Fund is not designed for such growth to enable a Fund to allow for redemptions without returning capital to shareholders. Rather, a Fund expects that substantially all capital will be returned to shareholders by the maturity date.
Smaller Company Risk. Investments in securities of smaller companies may be riskier, less liquid, more volatile and vulnerable to economic, market and industry changes than securities of larger, more established companies. The securities of small companies may trade less frequently and in smaller volumes than securities of larger companies. As a result, changes in the price of debt or equity issued by such companies may be more sudden or erratic than the prices of other securities, especially over the short term.
Sovereign Debt Risk. Certain of the underlying funds may invest in sovereign debt securities. Sovereign debt securities are issued or guaranteed by foreign governmental entities. These investments are subject to the risk that a governmental entity may delay or refuse to pay interest or repay principal on its sovereign debt, due, for example, to cash flow problems, insufficient foreign currency reserves, political considerations, the relative size of the governmental entity’s debt position in relation to the economy or other failure to put in place economic reforms required by the International Monetary Fund or other multi-lateral agencies. If a governmental entity defaults, it may ask for more time in which to pay or further loans. There is no legal process for collecting sovereign debts that a government does not pay nor are there bankruptcy proceedings through which all or part of the sovereign debt that a governmental entity has not repaid may be collected.
Real Estate Securities Risk. Investments by certain of the underlying funds will be highly concentrated in the securities of companies in the real estate sector. The value of real estate securities in general, and REITs in particular, are subject to the same risks as direct investments in real estate and mortgages, which include, but are not limited to, sensitivity to changes in real estate values and property taxes, interest rate risk, tax and regulatory risk, fluctuations in rent schedules and operating expenses, adverse changes in local, regional or general economic conditions, deterioration of the real estate market and the financial circumstances of tenants and sellers, unfavorable changes in zoning, building, environmental and other laws, the need for unanticipated renovations, unexpected increases in the cost of energy and environmental factors. Furthermore, a REIT could fail to qualify for tax free pass-through of its income under the Internal Revenue Code or fail to maintain its exemption from registration under the 1940 Act, which could produce adverse economic consequences for the REIT and its investors, including the Fund.
The underlying mortgage loans may be subject to the risks of default or of prepayments that occur earlier or later than expected, and such loans may also include so-called “subprime” mortgages. The value of REITs will also rise and fall in response to the management skill and creditworthiness of the issuer. In particular, the value of these securities may decline when interest rates rise and will
November 1, 2023 | 121
More About the Funds (continued)
also be affected by the real estate market and by the management of the underlying properties. REITs may be more volatile and/or more illiquid than other types of equity securities. The Fund will indirectly bear its proportionate share of expenses, including management fees, paid by each REIT in which it invests in addition to the expenses of the Fund.
In addition, certain companies in which an underlying fund invests may have developed or commenced development on properties and may develop additional properties in the future. Real estate development involves significant risks in addition to those involved in the ownership and operation of established properties, including the risks that financing, if needed, may not be available on favorable terms for development projects, that construction may not be completed on schedule (resulting in increased debt service expense and construction costs), that estimates of the costs of construction may prove to be inaccurate and that properties may not be leased, rented or operated on profitable terms and therefore will fail to perform in accordance with expectations. As a result, the value of the Fund’s investment may decrease in value. Real estate securities have limited diversification and are, therefore, subject to risks inherent in operating and financing a limited number of projects. Real estate securities are also subject to heavy cash flow dependency and defaults by borrowers or tenants.
Government Securities Risk. Investments in securities issued or guaranteed by the U.S. government or its agencies and instrumentalities (such as securities issued by Ginnie Mae, Fannie Mae or Freddie Mac). U.S. government securities are subject to risks. Securities, such as those issued or guaranteed by Ginnie Mae or the U.S. Treasury, that are backed by the full faith and credit of the United States are guaranteed only as to the timely payment of interest and principal when held to maturity and the market prices for such securities will fluctuate. Notwithstanding that these securities are backed by the full faith and credit of the United States, circumstances could arise that would prevent the payment of interest or principal. This would result in losses to the Fund and underlying fund. Securities issued or guaranteed by U.S. government-related organizations, such as Fannie Mae and Freddie Mac, are not backed by the full faith and credit of the U.S. government and no assurance can be given that the U.S. government will provide financial support. Therefore, U.S. government-related organizations such as Fannie Mae or Freddie Mac may not have the funds to meet their payment obligations in the future. U.S. government securities include zero-coupon securities, which tend to be subject to greater market risk than interest-paying securities of similar maturities.
Index Strategy Risk. The Funds use passive underlying funds and other strategies that are not actively managed and are designed to track the performance and holdings of a specified index. Securities may be purchased, held and sold by an index fund or as part of an indexing strategy at times when an actively managed fund would not do so. There is also the risk that the underlying fund’s or strategy’s performance may not correlate with the performance of the index. Certain index funds may hold securities of affiliates of the Funds’ adviser and sub-adviser if such securities are in the index.
Transactions and Liquidity Risk. A Fund or an underlying fund could experience a loss when selling securities to meet redemption requests and its liquidity may be negatively impacted. The risk of loss increases if the redemption requests are large or frequent, occur in times of overall market turmoil or declining prices for the securities sold, or when the securities an underlying fund wishes to, or is required to, sell are illiquid. To the extent a large proportion of shares of a Fund or an underlying fund are held by a small number of shareholders (or a single shareholder) including funds or accounts over which the Adviser or its affiliates have investment discretion, a Fund or an underlying fund is subject to the risk that these shareholders will purchase or redeem Fund shares in large amounts rapidly or unexpectedly, including as a result of an asset allocation decision made by the Adviser or its affiliates. In addition to the other risks described in this section, these transactions could adversely affect the ability of a Fund to conduct its investment program. An underlying fund may be unable to sell illiquid securities at its desired time or price or the price at which the securities have been valued for purposes of the Fund’s net asset value. Illiquidity can be caused by a drop in overall market trading volume, an inability to find a ready buyer, or legal restrictions on the securities’ resale. Other market participants may be attempting to sell debt securities at the same time as an underlying fund, causing downward pricing pressure and contributing to illiquidity. The capacity for bond dealers to engage in trading or “make a market” in debt securities has not kept pace with the growth of bond markets. This could potentially lead to decreased liquidity and increased volatility in the debt markets. Liquidity and valuation risk may be magnified in a rising interest rate environment, when credit quality is deteriorating or in other circumstances where investor redemptions from fixed income mutual funds may be higher than normal. Certain securities that were liquid when purchased may later become illiquid, particularly in times of overall economic distress.
Similarly, for both the Funds and underlying funds, large purchases of a fund’s shares may adversely affect the fund’s performance to the extent that the fund is delayed in investing new cash and is required to maintain a larger cash position than it ordinarily would. Large redemptions also could accelerate the realization of capital gains, increase a Fund’s or underlying fund’s transaction cost and impact a Fund’s or underlying fund’s performance.
Commodity Risk. Certain underlying funds will have a significant portion of their assets concentrated in commodity-linked securities and derivatives. Some of the underlying funds may have direct investments in commodities. Developments affecting commodities will have a disproportionate impact on such underlying funds. An underlying fund’s investment in commodities, commodity-linked securities and derivatives may subject the underlying fund to greater volatility than investments in traditional securities, particularly if the instruments involve leverage. The value of commodities, commodity-linked securities and derivatives may be affected by changes in
122 | JPMorgan SmartRetirement Blend Funds
overall market movements, commodity index volatility, changes in interest rates, or factors affecting a particular industry or commodity, such as drought, floods, weather, livestock disease, environmental incidents, embargoes, tariffs and international economic, political and regulatory developments. The natural resources and energy sector can be significantly affected by changes in the prices and supplies of oil, gas and other energy fuels, energy conservation, the success of exploration projects, and tax and other government regulations, policies of the Organization of Petroleum Exporting Countries (OPEC) and oil importing nations.
The metals sector can be affected by sharp price volatility over short periods caused by global economic, financial and political factors, resource availability, government regulation, economic cycles, changes in inflation or expectations about inflation in various countries, interest rates, currency fluctuations, metal sales by governments, central banks or international agencies, investment speculation and fluctuations in industrial and commercial supply and demand. Use of leveraged commodity-linked derivatives creates an opportunity for increased return but, at the same time, creates the possibility for greater loss (including the likelihood of greater volatility of the underlying fund’s net asset value), and there can be no assurance that the underlying fund’s use of leverage will be successful.
In addition, to the extent that an underlying fund gains exposure to an asset through synthetic replication by investing in commodity-linked investments rather than directly in the asset, it may not have a claim on the applicable underlying asset and will be subject to enhanced counterparty risk. Some of the underlying funds may concentrate in certain commodity sectors such as natural resources. When an underlying fund concentrates in a particular industry or group of industries, events impacting that sector will have a greater effect on an underlying fund than they would on a fund that is more widely diversified among a number of unrelated industries. In addition, certain commodity sub-sectors are subject to greater governmental regulation than are other industries, therefore, changes in tax and other government regulations may be more likely to adversely affect such underlying funds.
Currency Risk. Changes in foreign currency exchange rates will affect the value of an underlying fund’s securities and may affect the price of an underlying fund’s shares. Generally, when the value of the U.S. dollar rises in value relative to a foreign currency, an investment impacted by that currency loses value because that currency is worth less in U.S. dollars. Currency exchange rates may fluctuate significantly over short periods of time for a number of reasons, including changes in interest rates. Devaluation of a currency by a country’s government or banking authority also will have a significant impact on the value of any investments denominated in that currency. Currency markets generally are not as regulated as securities markets may be riskier than other types of investments and may increase the volatility of the underlying fund. Although the underlying fund may attempt to hedge its currency exposure into the U.S. dollar, it may not be successful in reducing the effects of currency fluctuations. The underlying fund may also hedge from one foreign currency to another. In addition, the underlying fund’s use of currency hedging may not be successful and the use of such strategies may lower the underlying fund’s potential returns. An underlying fund may engage in various strategies to hedge against currency risk. These strategies may consist of use of forward currency contracts including non-deliverable forward contracts and foreign currency futures contracts. To the extent an underlying fund enters into such transactions in markets other than in the United States, the underlying fund may be subject to certain currency, settlement, liquidity, trading and other risks similar to those described in this prospectus with respect to the underlying fund’s investments in foreign securities. In addition, an underlying fund may engage in such transactions as a substitute for securities in which the underlying fund invests, to increase exposure to a foreign currency, to shift exposure from one foreign currency to another or for risk management purposes or to increase income or gain to the underlying fund. While an underlying fund’s use of hedging strategies is intended to reduce the volatility of the NAV, the NAV of the underlying fund will fluctuate. There can be no assurance that the underlying fund’s hedging activities will be effective, and the underlying fund will incur costs in connection with the hedging. Currency hedging may limit an underlying fund’s return if the relative values of currencies change. Furthermore, an underlying fund may only engage in hedging activities from time to time and may not necessarily be engaging in hedging activities when movements in currency exchange rates occur.
Exchange Traded Notes Risk. Generally, ETNs are structured as senior, unsecured notes in which an issuer such as a bank agrees to pay a return based on the target commodity index less any fees. ETNs are synthetic instruments that allow individual investors to have access to derivatives linked to commodities and assets such as oil, currencies and foreign stock indexes. ETNs combine certain aspects of bonds and ETFs. Similar to ETFs, ETNs are traded on a major exchange (e.g., the New York Stock Exchange) during normal trading hours. However, investors can also hold the ETN until maturity. At maturity, the issuer pays to the investor a cash amount equal to principal amount, subject to the day’s index factor. ETN returns are based upon the performance of a market index minus applicable fees. The value of an ETN may be influenced by time to maturity, level of supply and demand for the ETN, volatility and lack of liquidity in underlying commodities markets, changes in the applicable interest rates, changes in the issuer’s credit rating and economic, legal, political or geographic events that affect the referenced commodity. The value of the ETN may drop due to a downgrade in the issuer’s credit rating, even if the underlying index remains unchanged. Investments in ETNs are subject to the risks facing income securities in general including the risk that a counterparty will fail to make payments when due or default. In addition, investors in ETNs generally have no right with respect to the instruments underlying the index or any right to receive delivery of the instruments underlying the index.
November 1, 2023 | 123
More About the Funds (continued)
Securities Lending Risk. To generate additional income, certain underlying funds (and, if and when approved by the Board, each Fund) may lend up to 33 1∕3% of such fund’s total assets pursuant to agreements requiring that the loan be continuously secured by collateral equal to at least 100% of the market value plus accrued interest on the securities lent. Securities lending involves counterparty risk, including the risk that the loaned securities may not be returned or returned in a timely manner and/or a loss of rights in the collateral if the borrower or the lending agent defaults or fails financially. This risk is increased when a Fund’s and/or an underlying fund’s loans are concentrated with a single or limited number of borrowers. The earnings on the collateral invested may not be sufficient to pay fees incurred in connection with the loan. Also, the principal value of the collateral invested may decline and may not be sufficient to pay back the borrower for the amount of collateral posted. There are no limits on the number of borrowers a Fund or an underlying fund may use and a Fund and/or an underlying fund may lend securities to only one or a small group of borrowers. Underlying funds participating in securities lending bear the risk of loss in connection with investments of the cash collateral received from the borrowers, which do not trigger additional collateral requirements from the borrower. To the extent that the value or return of a Fund’s and/or an underlying fund’s investments of the cash collateral declines below the amount owed to a borrower, the Fund and/or underlying fund, as applicable, may incur losses that exceed the amount it earned on lending the security. In situations where the Adviser does not believe that it is prudent to sell the cash collateral investments in the market, a Fund and/or an underlying fund, as applicable, may borrow money to repay the applicable borrower the amount of cash collateral owed to the borrower upon return of the loaned securities. This will result in financial leverage, which may cause the Fund and/or underlying fund, as applicable, to be more volatile because financial leverage tends to exaggerate the effect of any increase or decrease in the value of a fund’s portfolio securities. Securities lending is not a principal strategy of the Fund.
Non-Diversified Risk. Certain of the underlying funds are non-diversified and they may invest a greater percentage of their assets in a particular issuer or group of issuers than a diversified fund would. This increased investment in fewer issuers may result in the underlying fund’s shares being more sensitive to the economic results of those issuing the securities. The value of the Fund’s shares may also be more volatile than the value of a Fund which invests in more securities.
Strategy Risk. A main investment strategy of some of the underlying funds is to invest in common stocks considered to be attractive and to short sell stocks considered to be unattractive. This strategy may fail to produce the intended results. There is no guarantee that the use of long and short positions will succeed in limiting the underlying fund’s exposure to domestic stock market movements, capitalization, sector-swings or other factors. The strategy used by these underlying funds involves complex securities transactions, including short sales, that involve risks different than direct equity investments. Some of the other underlying funds also use short sales. The use of short sales may result in these underlying funds realizing more short-term capital gains and ordinary income subject to tax at ordinary income tax rates than they would if they did not engage in such short sales.
Inflation-Managed Strategies Risk. Certain underlying funds may use inflation-managed strategies including using swaps that are based on the Consumer Price Index for all Urban Consumers (CPI-U) in combination with a core portfolio of fixed income securities to create the equivalent of a portfolio of inflation-protected fixed income securities. There is no guarantee that the use of derivatives and debt securities will mimic a portfolio of inflation-protected bonds or reflect the actual rate of inflation. In addition, some of the underlying funds may make direct investments in inflation-protected securities. Inflation-linked securities are subject to the effects of changes in market interest rates caused by factors other than inflation (real interest rates). In general, the price of an inflation-linked security tends to decrease when real interest rates increase and can increase when real interest rates decrease. Interest payments on inflation-linked securities are unpredictable and will fluctuate as the principal and interest are adjusted for inflation. Any increase in the principal amount of an inflation-linked debt security will be considered taxable ordinary income, even though the underlying fund will not receive the principal until maturity. There can be no assurance that the inflation index used will accurately measure the real rate of inflation in the prices of goods and services. An underlying fund’s investments in inflation-linked securities may lose value in the event that the actual rate of inflation is different than the rate of the inflation index.
Geographic Focus Risk. An underlying fund may focus its investments in one or more regions or small groups of countries. As a result, the underlying fund’s performance may be subject to greater volatility than a more geographically diversified fund and may be subject to the risks facing certain regions.
High Portfolio Turnover Risk. The techniques and strategies contemplated by some of the underlying funds are expected to result in a high degree of portfolio turnover. Portfolio turnover rate may vary greatly from year to year as well as within a particular year. High portfolio turnover (e.g. over 100%) may involve correspondingly greater expenses to the underlying funds, including brokerage commissions or dealer mark-ups and other transaction costs on the sale of securities and reinvestments in other securities. Such sales may also result in realization of taxable capital gain, including short-term capital gain that will generally be taxable to shareholders as ordinary income, and may adversely impact the underlying fund’s after-tax returns. The trading costs or tax effects associated with portfolio turnover may adversely affect an underlying fund’s performance.
Risk Associated with a Fund Holding Cash, Money Market Instruments and Other Short-Term Investments. The Fund will, at times, hold assets in cash, money market instruments and other short-term investments, which may hurt the Fund’s performance. These positions may also subject a Fund to additional risks and costs.
124 | JPMorgan SmartRetirement Blend Funds
Cyber Security Risk. As the use of technology has become more prevalent in the course of business, the Fund has become more susceptible to operational and financial risks associated with cyber security, including: theft, loss, misuse, improper release, corruption and destruction of, or unauthorized access to, confidential or highly restricted data relating to the Fund and its shareholders; and compromises or failures to systems, networks, devices and applications relating to the operations of the Fund and its service providers. Cyber security risks may result in financial losses to the Fund and its shareholders; the inability of the Fund to transact business with its shareholders; delays or mistakes in the calculation of the Fund’s NAV or other materials provided to shareholders; the inability to process transactions with shareholders or other parties; violations of privacy and other laws; regulatory fines, penalties and reputational damage; and compliance and remediation costs, legal fees and other expenses. The Fund’s service providers (including, but not limited to, the adviser, any sub-advisers, administrator, transfer agent, and custodian or their agents), financial intermediaries, companies in which the Fund invests and parties with which the Fund engages in portfolio or other transactions also may be adversely impacted by cyber security risks in their own businesses, which could result in losses to the Fund or its shareholders. While measures have been developed which are designed to reduce the risks associated with cyber security, there is no guarantee that those measures will be effective, particularly since the Fund does not directly control the cyber security defenses or plans of their service providers, financial intermediaries and companies in which they invest or with which they do business.
Newer Fund Risk. (applicable to the SmartRetirement Blend 2065 Fund) The Fund is new with limited operating history. As a result, prospective investors have a limited track record or history on which to base their investment decisions. In addition, until the Fund achieves a certain size, the performance of certain of its investments may disproportionately impact the performance of the Fund, which may be subject to heightened volatility. In addition, there can be no assurance that the Fund will grow to or maintain an economically viable size.
Regulatory and Legal Risk. U.S. and non-U.S. governmental agencies and other regulators regularly implement additional regulations and legislators pass new laws that affect the investments held by a Fund, the strategies used by a Fund or the level of regulation or taxation applying to a Fund (such as regulations related to investments in derivatives and other transactions). These regulations and laws may adversely impact the investment strategies, performance, costs and operations of a Fund or taxation of shareholders.
Volcker Rule Risk. Pursuant to section 619 of the Dodd-Frank Wall Street Reform and Consumer Protection Act and certain rules promulgated thereunder known as the Volcker Rule, if the adviser and/or its affiliates own 5% or more of the outstanding ownership interests of a Fund after the permitted seeding period from the implementation of a Fund’s investment strategy, a Fund could be subject to restrictions on trading that would adversely impact a Fund’s ability to execute its investment strategy. Generally, the permitted seeding period is three years from the implementation of a Fund’s investment strategy, with permissible extensions under certain circumstances. As a result, the adviser and/or its affiliates may be required to reduce their ownership interests in a Fund at a time that is sooner than would otherwise be desirable, which may result in a Fund’s liquidation or, if a Fund is able to continue operating, may result in losses, increased transaction costs and adverse tax consequences as a result of the sale of portfolio securities.
Conflicts of Interest
An investment in a Fund is subject to a number of actual or potential conflicts of interest. For example, the Adviser and/or its affiliates provide a variety of different services to a Fund, for which a Fund compensates them. As a result, the Adviser and/or its affiliates have an incentive to enter into arrangements with a Fund, and face conflicts of interest when balancing that incentive against the best interests of a Fund. The Adviser and/or its affiliates also face conflicts of interest in their service as investment adviser to other clients, and, from time to time, make investment decisions that differ from and/or negatively impact those made by the Adviser on behalf of a Fund. In addition, affiliates of the Adviser provide a broad range of services and products to their clients and are major participants in the global currency, equity, commodity, fixed income and other markets in which a Fund invests or will invest. In certain circumstances by providing services and products to their clients, these affiliates’ activities will disadvantage or restrict a Fund and/or benefit these affiliates. In addition, the Adviser’s authority to allocate investments among J.P. Morgan Funds and unaffiliated ETFs creates conflicts of interest. For actively-managed underlying funds, the Adviser limits its selection to J.P. Morgan Funds. For efficient markets exposure, the Adviser expects to use J.P. Morgan passive ETFs unless the investment is not available. To the extent that an investment in an affiliated passive ETF is not available, only then will the Adviser consider an unaffiliated fund. Investing in J.P. Morgan Funds could cause the Fund to incur higher fees and will cause the Adviser and/or its affiliates to receive greater compensation, increase assets under management or support particular investment strategies or J.P. Morgan Funds (for example, by seeding a new Fund or allocating capital to a Fund that is small). Also, decreases in underlying fund fees, if any, may not fully benefit investors because a Fund's expense cap may change over time. These conflicts also could cause the Adviser to adjust its asset class target or actual allocation to provide for increased use of J.P. Morgan Funds. The Adviser may also acquire material non-public information which would negatively affect the Adviser’s ability to transact in securities for a Fund. JPMorgan and the Funds have
November 1, 2023 | 125
More About the Funds (continued)
adopted policies and procedures reasonably designed to appropriately prevent, limit or mitigate conflicts of interest. In addition, many of the activities that create these conflicts of interest are limited and/or prohibited by law, unless an exception is available. For more information about conflicts of interest, see the Potential Conflicts of Interest section in the Statement of Additional Information.
Temporary Defensive Positions
For liquidity and to respond to unusual market conditions, the Funds may invest all or most of their total assets in cash and cash equivalents for temporary defensive purposes. These investments may result in a lower yield than lower-quality or longer-term investments.
| WHAT IS A CASH EQUIVALENT? |
| Cash equivalents are highly liquid, high-quality instruments with maturities of three months or less on the date they are purchased. They include securities issued by the U.S. government, its agencies and instrumentalities, repurchase agreements, certificates of deposit, bankers’ acceptances, commercial paper, money market mutual funds and bank deposit accounts. |
While the Funds are engaged in a temporary defensive position, they may not meet their investment objectives. These investments may also be inconsistent with a Fund’s main investment strategies. Therefore, the Funds will pursue a temporary defensive position only when market conditions warrant.
Expenses of Underlying Funds
The percentage of each Fund’s assets that will be allocated to underlying funds may be changed from time to time. To the extent that allocations among the underlying funds are changed or new underlying funds are utilized, or to the extent that the expense ratios of the underlying funds change, the weighted average operating expenses borne by a Fund may increase or decrease.
The Funds will invest in Class R6 Shares of the underlying J.P. Morgan Funds to the extent they are available. If an underlying J.P. Morgan Fund does not offer Class R6 Shares, the Funds will invest in Class R5 Shares of the underlying J.P. Morgan Funds. To the extent that an underlying J.P. Morgan Fund does not offer Class R5 Shares, the Fund will invest in Class L Shares, if applicable and available. To the extent that an underlying J.P. Morgan Fund does not offer Class R6, Class R5 or Class L Shares, the Fund will invest in Class I Shares, if available. With respect to underlying funds that are money market funds, the Funds will invest in IM shares or Institutional Class shares. The shares of the underlying J.P. Morgan Funds in which the Funds invest may impose a separate service fee. To avoid charging a separate service fee at an effective rate above 0.25%, the shareholder servicing agent will waive service fees with respect to a Fund in an amount equal to the weighted average pro rata amount of service fees charged by the underlying J.P. Morgan Funds. This amount is shown as a waiver under “Fee Waivers and/or Expense Reimbursements” for Class I Shares in the Annual Fund Operating Expenses table.
Each Fund’s adviser and/or its affiliates have contractually agreed to waive fees and/or reimburse expenses to the extent Total Annual Fund Operating Expenses (excluding (1) dividend and interest expenses related to short sales, interest, taxes, expenses related to litigation and potential litigation, expenses related to trustee elections and extraordinary expenses incurred by the Fund or an underlying fund and (2) Acquired Fund Fees and Expenses incurred by an underlying fund) exceed 0.44% of the average daily net assets of Class I Shares. These waivers are in effect through 10/31/24, at which time it will be determined whether such waivers will be renewed or revised. To the extent that a Fund engages in securities lending, affiliated money market fund fees and expenses resulting from the Fund’s investment of cash received from securities lending borrowers are not included in Total Annual Fund Operating Expenses and therefore, the above waivers do not apply to such investments.
Additional Fee Waiver and/or Expense Reimbursement
Service providers to a Fund may, from time to time, voluntarily waive all or a portion of any fees to which they are entitled and/or reimburse certain expenses as they may determine from time to time. A Fund’s service providers may discontinue or modify these voluntary actions at any time without notice. Performance for the Funds will reflect the voluntary waiver of fees and/or the reimbursement of expenses, if any. Without these voluntary waivers and/or expense reimbursements, performance would have been less favorable.
More Information on the Composite Benchmarks
The composite benchmark for each Fund is a customized benchmark of unmanaged market indexes that represent the asset classes in which each Fund invests. Each index is weighted to reflect the strategic target allocations of the respective Fund and is adjusted over time to correspond to changes in the strategic target allocations of each Fund. When the composite benchmark weighting changes, its new allocation is utilized to calculate composite performance from and after such change. If a new asset class is added to
126 | JPMorgan SmartRetirement Blend Funds
the strategic target allocations, an index will be added to represent this asset class. Composite benchmark performance for periods prior to the change is not recalculated or restated based on the composite benchmark’s new allocation but rather reflects the composite benchmark’s actual allocation during that period.
The asset classes in which each Fund invests and the related benchmark indexes are as follows: U.S. Large Cap Equity (S&P 500 Index); U.S. Mid Cap Equity (S&P 400 Index); U.S. Small Cap Equity (Russell 2000 Index); REITs (MSCI USREIT Index); International Equity (MSCI EAFE Index (net total return)); Emerging Markets Equity (MSCI Emerging Markets Index (net total return)); U.S. Fixed Income (Bloomberg U.S. Aggregate Index); Inflation Managed (Bloomberg U.S. Treasury Inflation Notes: 1-10 Year Index); High Yield (Bloomberg U.S. High Yield – 2% Issuer Cap Index); Emerging Markets Debt (EMBI Global Diversified Index); and Money Market/Cash and Cash Equivalents (FTSE 3-Month Treasury Bill Index). For performance commencing February 1, 2020 to August 31, 2021, the IA SBBI US 30 Day TBill TR USD Index represented the Money Market/Cash and Cash Equivalents component of the benchmark. For historical performance prior to February 1, 2020, the composite benchmark was a weighted average of the benchmarks associated with the underlying funds in which the Funds invest.
S&P OPCO, LLC DISCLAIMER
The S&P Target Date Indices, S&P 500 Index and S&P 400 Index (“Indices”) are products of S&P Dow Jones Indices LLC and/or its affiliates and have been licensed for use by the adviser. Copyright © 2023. S&P Dow Jones Indices LLC, a subsidiary of S&P Global, Inc., and/or its affiliates. All rights reserved. Redistribution or reproduction in whole or in part are prohibited without written permission of S&P Dow Jones Indices LLC. For more information on any of S&P Dow Jones Indices LLC’s indices please visit www.spdji.com. S&P® is a registered trademark of Standard & Poor’s Financial Services LLC and Dow Jones® is a registered trademark of Dow Jones Trademark Holdings LLC. Neither S&P Dow Jones Indices LLC, Dow Jones Trademark Holdings LLC, their affiliates nor their third party licensors make any representation or warranty, express or implied, as to the ability of any index to accurately represent the asset class or market sector that it purports to represent and neither S&P Dow Jones Indices LLC, Dow Jones Trademark Holdings LLC, their affiliates nor their third party licensors shall have any liability for any errors, omissions, or interruptions of any index or the data included therein.
FRANK RUSSELL COMPANY DISCLAIMER
Frank Russell Company is the source and owner of the Russell Index data contained or reflected in this material and all trademarks and copyrights related thereto. Frank Russell Company is not responsible for the formatting or configuration of this material or for any inaccuracy in the adviser's presentation thereof.
MSCI INC. DISCLAIMER
Source: MSCI. The MSCI information may only be used for your internal use, may not be reproduced or redisseminated in any form and may not be used as a basis for or a component of any financial instruments or products or indices. None of the MSCI information is intended to constitute investment advice or a recommendation to make (or refrain from making) any kind of investment decision and may not be relied on as such. Historical data and analysis should not be taken as an indication or guarantee of any future performance analysis, forecast, or prediction. The MSCI information is provided on an "as is" basis and the user of this information assumes the entire risk of any use made of this information. MSCI, each of its affiliates and each other person involved in or related to compiling, computing or creating any MSCI information (collectively, the "MSCI Parties") expressly disclaims all warranties (including, without limitation, any warranties of originality, accuracy, completeness, timeliness, non-infringement, merchantability and fitness for a particular purpose) with respect to this information. Without limiting any of the foregoing, in no event shall any MSCI Party have any liability for any direct, indirect, special, incidental, punitive, consequential (including, without limitation, lost profits) or any other damages. (www.msci.com)
BLOOMBERG DISCLAIMER
Source: Bloomberg Index Services Limited. BLOOMBERG® is a trademark and service mark of Bloomberg Finance L.P. and its affiliates (collectively “Bloomberg”). Bloomberg or Bloomberg’s licensors own all proprietary rights in the Bloomberg Indices. Bloomberg does not approve or endorse this material, or guarantee the accuracy or completeness of any information herein, or make any warranty, express or implied, as to the results to be obtained therefrom and, to the maximum extent allowed by law, shall have any liability or responsibility for injury or damages arising in connection therewith.
J.P. MORGAN SECURITIES LLC DISCLAIMER
Information has been obtained from sources believed to be reliable but J.P. Morgan does not warrant its completeness or accuracy. The Index is used with permission. The Index may not be copied, used, or distributed without J.P. Morgan's prior written approval. Copyright 2016, J.P. Morgan Chase & Co. All rights reserved.
FTSE DISCLAIMER
November 1, 2023 | 127
More About the Funds (continued)
The JPMorgan SmartRetirement Blend Funds have been developed solely by JPMIM. The JPMorgan SmartRetirement Blend Funds are not in any way connected to or sponsored, endorsed, sold or promoted by FTSE International Limited ("FTSE") or the London Stock Exchange Group plc and its group undertakings (collectively, the “LSE Group”) or Nareit. All rights in the FTSE 3-Month Treasury Bill Index (the “Index”) vest in FTSE and Nareit. "FTSE®" is a trade mark of the LSE Group and is used by FTSE International Limited ("FTSE") under licence. "NAREIT®" is a trade mark of the Nareit. The Index is calculated by FTSE. Neither FTSE, nor the LSE Group, nor Nareit accept any liability whatsoever to any person arising out of (a) the use of, reliance on or any error in the Index or (b) investment in or operation of the JPMorgan SmartRetirement Blend Funds. FTSE, the LSE Group, and Nareit make no claim, prediction, warranty or representation either as to the results to be obtained from the JPMorgan SmartRetirement Blend Funds or the suitability of the Index for the purpose to which it is being put by JPMIM.
128 | JPMorgan SmartRetirement Blend Funds
Investing with J.P. Morgan Funds
Choosing A Share Class
Each share class represents an investment in the same portfolio of securities, but each has different availability and eligibility criteria, sales charges, expenses, dividends and distributions. These arrangements allow you to choose the available class that best meets your needs. You should read this section carefully to determine which share class is best for you. Factors you should consider in choosing a share class include:
•
The amount you plan to invest;
•
The length of time you expect to hold your investment;
•
The total costs associated with your investment, including any sales charges that you pay when you buy or sell your Fund shares and expenses that are paid out of Fund assets over time;
•
Whether you qualify for any reduction or waiver of sales charges;
•
Whether you plan to take any distributions in the near future;
•
The availability of the share class;
•
The services that will be available to you;
•
The amount of compensation that your Financial Intermediary will receive; and
•
The advantages and disadvantages of each share class.
Please read this prospectus carefully, and then select the Fund and share class most appropriate for you and decide how much you want to invest. Each Fund may offer other classes of shares not included in this prospectus that have different expense levels, performance and eligibility requirements from the share classes offered in this prospectus. In addition, each Fund may have a similar name, investment objective and policies as other funds and ETFs advised by the adviser or its affiliates that may have different expense levels, performance and eligibility requirements from the share classes offered in this prospectus. Please visit www.jpmorganfunds.com/funddocuments to obtain more information concerning these or other share classes, funds or ETFs. A Financial Intermediary may receive different compensation based on the share class sold.
Additional Information that Applies to All Accounts: If your identity or the identity of any other person(s) authorized to act on your behalf cannot be verified, or if potentially criminal activity is identified, the J.P. Morgan Funds and the Distributor reserve the right to reject opening an account for you, close your account, or take such other action they deem reasonable or required by law.
Shares of the Funds have not been registered for sale outside of the United States. This prospectus is not intended for distribution to prospective investors outside of the United States. The Funds generally do not market or sell shares to investors domiciled outside of the United States, even, with regard to individuals, if they are citizens or lawful permanent residents of the United States.
| |
Class I |
| Eligibility1,2,3 |
May be purchased by: •Institutional Investors who meet the minimum investment requirements; •Individuals purchasing directly from the Fund through JPMorgan Distribution Services, Inc. (the “Distributor”) and meeting the investment minimum requirements; •Financial Intermediaries or any other organization, including affiliates of JPMorgan Chase & Co. (JPMorgan Chase), authorized to act in a fiduciary, advisory or custodial capacity for its clients or customers; •Brokerage program of a Financial Intermediary that has entered into a written agreement with the Distributor to offer such shares (“Eligible Brokerage Program”); and •Employees of JPMorgan Chase and its affiliates and officers or trustees of the J.P. Morgan Funds. |
November 1, 2023 | 129
Investing with J.P. Morgan Funds (continued)
| |
Class I |
| Minimum Investment1,4,5 |
$1,000,000 — An investor can combine purchases of Class I Shares of other J.P. Morgan Funds in order to meet the minimum. $1,000 for each Fund or $50, if establishing a monthly $50 Systematic Investment Plan for investments through an Eligible Brokerage Program. $1,000 for each Fund or $50, if establishing a monthly $50 Systematic Investment Plan6 for investments by employees of JPMorgan Chase and its affiliates and officers or trustees of the J.P. Morgan Funds.3 |
| Minimum Subsequent Investments1 |
No minimum except $50 for investments by employees of JPMorgan Chase and its affiliates and officers or trustees of the J.P. Morgan Funds and investments through an Eligible Brokerage Program. |
| Systematic Investment Plan |
No, except for investments by employees of JPMorgan Chase and its affiliates and officers or trustees of the J.P. Morgan Funds and investments through an Eligible Brokerage Program. |
| Systematic Redemption Plan |
No, except for investments by employees of JPMorgan Chase and its affiliates and officers or trustees of the J.P. Morgan Funds. |
| Contingent Deferred Sales Charge (CDSC) (refer to Financial Intermediary Compensation Section for more details) |
None |
| Distribution (12b-1) Fee |
None |
| Service Fee |
0.25% of the average daily net assets. |
| Redemption Fee |
None |
| Advantages |
No front-end sales charge or CDSC is assessed so you own more shares initially. In addition, Class I Shares have lower fees than Class A and Class C Shares. |
| Disadvantages |
Limited availability and higher minimum initial investment than Class A and Class C Shares. |
1
Financial Intermediaries or other organizations making the Funds available to their clients or customers may impose minimums which may be different from the requirements for investors purchasing directly from the Funds.
2
Certain Retirement Plans may purchase Shares. For more information, see “ELIGIBLE RETIREMENT PLANS” below.
3
Must be purchased directly from the Funds or on approved JPMorgan Chase & Co. affiliated platforms. Employees for this purpose include officers, directors, trustees, retirees and employees and their immediate family members (i.e., spouses, domestic partners, children, grandchildren, parents, grandparents and any dependent of the person, as defined in section 152 of the Internal Revenue Code) of J.P. Morgan Funds or JPMorgan Chase and its subsidiaries and affiliates. Approved affiliated platforms may impose minimums which may be different from the requirements for investors purchasing directly from the Funds.
4
Investment minimums may be waived for certain types of Group Retirement Plans, as well as for certain fee-based programs. The Funds and/or the Distributor reserve the right to waive any initial or subsequent investment minimum.
5
Please see “MINIMUM ACCOUNT BALANCE” for more information about minimum balance requirements.
6
You are eligible for the lower $50 initial investment amount as long as you agree to make regular monthly investments of at least $50 until you reach the required $1,000 investment amount per fund. Once the required amount is reached, you must maintain the minimum $1,000 investment in the Fund.
Eligible Retirement Plans
The only retirement plans that are eligible to purchase Class I Shares are the following:
•
Employer sponsored retirement, deferred compensation, employee benefit plans (including health savings accounts) and trusts used to fund those plans held directly at a broker dealer or financial intermediary (that is outside of retirement plan record keeping or third party administrator platform). Employer sponsored plans include 401(k) plans, 457 plans, 403(b) plans, profit-sharing and money purchase pension plans, defined benefit plans, retiree health benefit plans, group annuity separate accounts offered to retirement plans, and non-qualified deferred compensation plans. Purchases may be subject to applicable sales charges as described in this prospectus.
130 | JPMorgan SmartRetirement Blend Funds
•
Group Retirement Plans (and their successor, related, and affiliated plans) that made these share classes of any of the SmartRetirement Funds or the SmartRetirement Blend Funds, respectively, available to participants on or before 4/3/17, may continue to open accounts for new participants in such share classes of any of the JPMorgan SmartRetirement Funds or the JPMorgan SmartRetirement Blend Funds, respectively, and purchase additional shares in existing participant accounts.
•
Group Retirement Plans (or financial intermediary platforms available to Group Retirement Plans) that were approved by any of the SmartRetirement Funds or the SmartRetirement Blend Funds and the Distributor after 4/3/17 and before 12/31/18 because the particular Group Retirement Plan had operational difficulties in implementing the eligibility restrictions may continue to purchase Class A, Class C, or Class I Shares (as available) of any of the JPMorgan SmartRetirement Funds or the JPMorgan SmartRetirement Blend Funds, respectively.
All other new Group Retirement Plans are no longer eligible to purchase these share classes.
Sales Charges and Financial Intermediary Compensation
The following section describes the various sales charges and other fees that you will pay if you purchase shares of the Funds. In addition, it describes the types of compensation paid to Financial Intermediaries for the sale of Fund shares and related services. The Funds and/or the Distributor reserve the right to change sales charges, commissions and finder’s fees at any time.
To obtain information, see below, visit www.jpmorganfunds.com or call 1-800-480-4111. You may contact your Financial Intermediary about the reduction, elimination or waiver of sales charges. You may also contact your Financial Intermediary about any commissions charged by them on your purchase of Class I Shares.
Service Fees
The Distributor, as shareholder servicing agent, receives an annual fee of up to the following fee (based on the average daily net assets of each class of a Fund).
| Class |
Service Fee |
| Class I |
0.25% |
The Distributor may enter into service agreements with Financial Intermediaries under which it will pay all or a portion of that fee to such Financial Intermediaries for performing shareholder and administrative services.
Networking and Sub-Transfer Agency Fees
JPMDS, as shareholder servicing agent, has entered into agreements with Financial Intermediaries pursuant to which the Financial Intermediary is paid for services such as networking or sub-transfer agency (collectively, the “Sub-TA Agreements”). Sub-TA Agreement payments are generally based on either (1) a percentage of the average daily net assets of clients serviced by such Financial Intermediary up to a set maximum dollar amount per shareholder account serviced, or (2) a per account fee based on the number of accounts serviced by such Financial Intermediary. Sub-TA Agreement payments are in addition to, rather than in lieu of, Rule 12b-1 fees the Financial Intermediary may also be receiving pursuant to agreements with the Distributor for classes with Rule 12b-1 fees. Payments to Financial Intermediaries for sub-transfer agency services will be made by JPMDS, as shareholder servicing agent, from the service fee. From time to time, JPMIM or its affiliates may pay a portion of the sub-transfer agency fees at its or their own expense and out of its or their legitimate profits.
Purchasing Fund Shares
You may purchase shares directly from the J.P. Morgan Funds through the Distributor or through your Financial Intermediary.
Purchase and redemption orders will be accepted only on days that J.P. Morgan Funds are open for business. The J.P. Morgan Funds are open for business on each day the NYSE is open for trading. A purchase or redemption order received by the J.P. Morgan Funds prior to the close of regular trading on the NYSE (normally 4:00 p.m. ET) (“Funds Close”), on a day the J.P. Morgan Funds are open for business, will be effected at that day’s NAV. The J.P. Morgan Funds will not treat an intraday unscheduled disruption or closure in NYSE trading as a closure of the NYSE and will calculate NAV as of 4:00 p.m. ET, if the particular disruption or closure directly affects only the NYSE. An order received after the Funds Close will generally be effected at the NAV determined on the next business day. However, orders received by Financial Intermediaries on a business day prior to the Funds Close and communicated to the J.P. Morgan Funds prior to such time as agreed upon by the J.P. Morgan Funds and the Financial Intermediary will be effected at the NAV determined on the business day the order was received by the Financial Intermediary.
A purchase order must be supported by all appropriate documentation and information in the proper form. The J.P. Morgan Funds may refuse to honor incomplete purchase orders.
November 1, 2023 | 131
Investing with J.P. Morgan Funds (continued)
Share ownership is electronically recorded; therefore, no certificate will be issued. A shareholder who purchases shares of a Fund that accrues dividends daily will not accrue a dividend on the day of the purchase.
If you purchase shares through your Financial Intermediary, contact your investment representative for its requirements and procedures. If a Financial Intermediary holds your shares, it is the responsibility of the Financial Intermediary to send your purchase order to the J.P. Morgan Funds. Your Financial Intermediary may have an earlier cut-off time for purchase orders.
If you purchase shares directly with the Funds, see the information below.
| HOW TO PURCHASE DIRECTLY WITH THE J.P. MORGAN FUNDS | ||
| |
Opening a New Account |
Purchasing into an Existing Account |
| By Phone or Online 1-800-480-4111 Shareholder Services representatives are available Monday through Friday from 8:00 am to 6:00 pm ET. www.jpmorganfunds.com Note: Certain account types are not available for online account access. Please call for additional information. |
A new account generally may not be opened by phone or online. Employees of JPMorgan Chase & Co. may open a new account online. A new fund position can be added to an existing account by phone or online if you have bank information on file. The minimum initial investment requirement must be met. |
You must already have bank information on file. If we do not have bank information on file, you must submit written instructions. Please call for instructions on how to add bank information to your account. |
| By Mail Regular mailing address: J.P. Morgan Funds Services P.O. Box 219143 Kansas City, MO 64121-9143 Overnight mailing address: J.P. Morgan Funds Services 430 W 7th Street, Suite 219143 Kansas City, MO 64105-1407 |
Mail the completed and signed application with a check to our Regular or Overnight mailing address. Refer to the Additional Information Regarding Purchases section. |
Please mail your check and include your name, the Fund name, and your fund account number. |
| All checks must be made payable to one of the following: •J.P. Morgan Funds; or •The specific Fund in which you are investing. Please include your existing account number, if applicable. All checks must be in U.S. dollars. The J.P. Morgan Funds do not accept credit cards, cash, starter checks, money orders or credit card checks. The Funds and/or the Distributor reserve the right to refuse “third-party” checks and checks drawn on non- U.S. financial institutions even if payment may be effected through a U.S. financial institution. Checks made payable to any individual or company and endorsed to J.P. Morgan Funds or a Fund are considered third-party checks. | ||
| By ACH or Wire1 1-800-480-4111 Wire Instructions: DST Asset Manager Solutions, Inc. 2000 Crown Colony Drive Quincy, MA 02169 Attn: J.P. Morgan Funds Services ABA: 021 000 021 DDA: 323 125 832 FBO: Fund Name Fund: Fund # Account: Your Account # and Your Account Registration |
You may include bank information on your application for your initial purchase to be processed via Automated Clearing House (ACH) rather than sending a check. New accounts cannot be opened by wire purchase. |
Purchase by ACH: To process a purchase via ACH using bank information on file you may call us or process the purchase online. Purchase by Wire: If you choose to pay by wire, please call to notify the Fund of your purchase. You must also initiate the wire with your financial institution. |
132 | JPMorgan SmartRetirement Blend Funds
| HOW TO PURCHASE DIRECTLY WITH THE J.P. MORGAN FUNDS | ||
| |
Opening a New Account |
Purchasing into an Existing Account |
| Systematic Investment Plan1 |
You may include instructions to set up a Systematic Investment Plan on your application. Bank Information must be included. Refer to Choosing A Share Class for fund minimums. |
If bank information is on file, you may call, go online or mail written instructions to start, edit or delete a Systematic Investment Plan. You cannot have a Systematic Investment Plan and a Systematic Redemption Plan or Systematic Exchange Plan on the same fund account. If bank information is not on file, you will be required to submit a completed form with your bank information and Systematic Investment Plan details. |
1
The Funds currently do not charge for these services, but may impose a charge in the future. However, your bank may impose a charge for debiting your bank account.
Transactions by phone, fax or the Internet
You may access your account and conduct certain transactions using phone, fax or the J.P. Morgan Funds website. Phone conversations are recorded. The J.P. Morgan Funds and their agents use reasonable procedures to verify the identity of the shareholder. If these procedures are followed, the J.P. Morgan Funds and their agents are not liable for any losses, liability, cost or expenses (including attorney fees) that may occur from acting on unauthorized or fraudulent instructions. Therefore please take precautions to protect your account information and immediately review account statements or other information provided to you. In addition, a confirmation is sent promptly after a transaction. Please review it carefully and contact J.P. Morgan Funds Services or your Financial Intermediary immediately about any transaction you believe to be unauthorized. If you purchase shares directly with the J.P. Morgan Funds, you may revoke your right to make purchases over the phone, fax or internet by mailing written instructions to us. If you purchase shares through your Financial Intermediary, contact your investment representative regarding your ability to revoke or modify your purchase rights.
You may not always reach J.P. Morgan Funds Services by phone or online. This may be true at times of unusual market changes and shareholder activity. You can mail us your instructions or contact your Financial Intermediary. We may modify or cancel the ability to purchase or redeem shares online or by phone without notice.
Additional Information Regarding Purchases
Federal law requires all financial institutions to obtain, verify and record information that identifies each person who opens an account. When you open an account, we will ask for your name, residential or business street address, date of birth (for an individual), and other information that will allow us to identify you, including your social security number, tax identification number or other identifying number. The J.P. Morgan Funds cannot waive these requirements. The Fund is required by law to reject your Account Application if the required identifying information is not provided.
We will attempt to collect any missing information required on the Account Application by contacting either you or your Financial Intermediary. If we cannot obtain this information within the established time frame, your Account Application will be rejected. Amounts received prior to receipt of the required information will be held uninvested and will be returned to you without interest if your Account Application is rejected. If the required information is obtained, your investment will be accepted and you will pay the NAV per share next calculated after all of the required information is received.
Once we have received all of the required information, federal law requires us to verify your identity. After an account is opened, we may restrict your ability to purchase additional shares until your identity is verified. If we are unable to verify your identity within a reasonable time, the Funds and/or the Distributor reserve the right to close your account at the current day’s NAV per share. If your account is closed for this reason, your shares will be redeemed at the NAV per share next calculated after the account is closed, less any applicable fees.
Purchases by wire may be canceled if J.P. Morgan Funds Services does not receive payment by 4:00 p.m. ET on the settlement date. You will be responsible for any expenses and/or losses to the Funds.
November 1, 2023 | 133
Investing with J.P. Morgan Funds (continued)
Exchanging Fund Shares
An exchange is selling shares of one J.P. Morgan Fund and taking the proceeds to simultaneously purchase shares of another J.P. Morgan Fund. Before making an exchange request, you should read the prospectus of the J.P. Morgan Fund whose shares you would like to purchase by exchange. You can obtain a prospectus for any J.P. Morgan Fund by contacting your Financial Intermediary, by visiting www.jpmorganfunds.com, or by calling 1-800-480-4111.
| EXCHANGE PRIVILEGES |
| Class I Shares of a Fund may be exchanged for: |
| •Class I Shares of another J.P. Morgan Fund, |
| •Morgan Shares of a J.P. Morgan money market fund (except for JPMorgan Prime Money Market Fund), or |
| •Another share class of the same Fund if you are eligible to purchase that class. |
In general, the same rules and procedures that apply to redemptions and purchases apply to exchanges:
•
All exchanges are subject to meeting any investment minimum or eligibility requirements of the new Fund and class.
•
The J.P. Morgan Funds will provide 60 days’ written notice of any termination of or material change to your exchange privilege.
•
All exchanges are based upon the net asset value that is next calculated after the Fund receives your order, provided the exchange out of one Fund must occur before the exchange into the other Fund.
•
In order for an exchange to take place on the date that the order is submitted, the order must be received prior to the close of both the Fund that you wish to exchange into and the Fund that you wish to exchange out of, otherwise, the exchange will occur on the following business day on which both Funds are open.
•
A shareholder that exchanges into shares of a Fund that accrues dividends daily, including a money market fund, will not accrue a dividend on the day of the exchange. A shareholder that exchanges out of shares of a Fund that accrues a daily dividend will accrue a dividend on the day of the exchange.
•
The exchange privilege is not intended as a way for you to speculate on short-term movements in the market. Therefore, to prevent disruptions in the management of J.P. Morgan Funds, certain J.P. Morgan Funds limit excessive exchange activity as described in the “Frequent Trading Policy” section. Your exchange privilege will be limited or revoked if the exchange activity is considered excessive. In addition, any J.P. Morgan Fund may reject any exchange request for any reason, including if it is not in the best interests of the Fund and/or its shareholders to accept the exchange.
Tax Consequences on Exchanges
Generally, an exchange between J.P. Morgan Funds is considered a sale and generally results in a capital gain or loss for federal income tax purposes. An exchange between classes of shares of the same Fund is generally not taxable for federal income tax purposes. You should talk to your tax advisor before making an exchange.
Redeeming Fund Shares
If you sell shares through your Financial Intermediary, contact your investment representative for its requirements and procedures. If a Financial Intermediary holds your shares, it is the responsibility of the Financial Intermediary to send your redemption order to the J.P. Morgan Funds. Your Financial Intermediary may have an earlier cut-off time for redemption orders.
If you sell shares directly with a Fund, see the information below.
Your redemption proceeds may be mailed to you at your address of record1, wired, or sent by ACH to a pre-existing bank account on file.
134 | JPMorgan SmartRetirement Blend Funds
| HOW TO REDEEM | |
| By Phone or Online Note: certain account types are not available for online account access. |
Call us at 1-800-480-4111 Shareholder Services representatives are available Monday through Friday from 8:00 am to 7:00 pm ET. www.jpmorganfunds.com |
| By Mail |
Regular mailing address: J.P. Morgan Funds Services P.O. Box 219143 Kansas City, MO 64121-9143 Overnight mailing address: J.P. Morgan Funds Services 430 W 7th Street, Suite 219143 Kansas City, MO 64105-1407 |
| Systematic Redemption Plan2, 3 |
You may include instructions to set up a Systematic Redemption Plan on your application. Payment instructions must be included. You may call, or mail written instructions to start, edit or delete a Systematic Redemption Plan. You may send a written redemption request to your Financial Intermediary, if applicable, or to the Fund at the following address: J.P. Morgan Funds Services P.O. Box 219143 Kansas City, MO 64121-9143 You may redeem over the phone. Please see “Can I redeem by phone?” for more information. |
1
You cannot request a redemption by check to be sent to an address updated within 15 days.
2
If the amount of the systematic payment exceeds the income earned by your account since the previous payment under the Systematic Redemption Plan, payments will be made by redeeming some of your shares. This will reduce the amount of your investment, up to possibly closing your account.
3
The Funds currently do not charge for these services, but may impose a charge in the future. However, your bank may impose a charge for crediting your bank account.
You may redeem some or all of your shares on any day that the Funds are open for business. You will not be permitted to enter a redemption order for shares purchased directly through J.P. Morgan Funds Services by check or through an ACH transaction for five business days following the acceptance of a purchase order unless you provide satisfactory proof that your purchase check or ACH transaction has cleared (sometimes referred to as uncollected shares).
If a Fund or Financial Intermediary receives your redemption order before the close of the NYSE (normally 4 p.m. ET or before 4:00 p.m. ET, if the NYSE closes before 4:00 p.m. ET), you will receive the NAV per share calculated after your redemption order is received in good order (meaning that it includes the information required by, and complies with security requirements implemented by, the Fund’s transfer agent or the Fund), minus the amount of any applicable fees. Your Financial Intermediary may have an earlier cut-off time for redemption orders and may charge a fee to process redemption of shares. A shareholder that redeems out of shares of a Fund that accrues a daily dividend will accrue a dividend on the day of the redemption.
All redemption requests must be supported by valid identity authentication, the appropriate documentation (if applicable) and any necessary information in good order. Additional information may be required depending on the situation.
For accounts held directly with the Funds, the length of time that the Funds typically expect to pay redemption proceeds depends on whether payment is made by ACH, wire or check. The Funds typically expect to make payments of redemption proceeds by wire or ACH on the next business day following receipt of the redemption order by the Funds. For payment by check, the Funds typically expect to mail the check on the next business day following receipt of the redemption order by the Funds.
For accounts held through Financial Intermediaries, the length of time that the Funds typically expect to pay redemption proceeds depends on the method of payment and the agreement between the Financial Intermediary and the Funds. For redemption proceeds that are paid directly to you by the Fund, the Fund typically expects to make payments by wire or ACH
November 1, 2023 | 135
Investing with J.P. Morgan Funds (continued)
or by mailing a check on the next business day following the Fund’s receipt of a redemption order from the Financial Intermediary. For payments that are made to your Financial Intermediary for transmittal to you, the Funds expect to pay redemption proceeds to the Financial Intermediary within 1 to 3 business days following the Fund’s receipt of the redemption order from the Financial Intermediary.
Payment of redemption proceeds may take longer than the time a Fund typically expects and may take up to seven days as permitted by the Investment Company Act of 1940.
Transactions by phone, fax or the Internet
You may access your account and conduct certain transactions using phone, fax or the J.P. Morgan Funds website. Phone conversations are recorded. The J.P. Morgan Funds and their agents use reasonable procedures to verify the identity of the shareholder. If these procedures are followed, the J.P. Morgan Funds and their agents are not liable for any losses, liability, cost or expenses (including attorney fees) that may occur from acting on unauthorized or fraudulent instructions. Therefore please take precautions to protect your account information and immediately review account statements or other information provided to you. In addition, a confirmation is sent promptly after a transaction. Please review it carefully and contact J.P. Morgan Funds Services or your Financial Intermediary immediately about any transaction you believe to be unauthorized. You may revoke your right to make redemptions over the phone or by mailing written instructions to us.
You may not always reach J.P. Morgan Funds Services by phone or online. This may be true at times of unusual market changes and shareholder activity. You can mail us your instructions or contact your Financial Intermediary. We may modify or cancel the ability to purchase or redeem shares online or by phone without notice.
Additional Information Regarding Redemptions
Medallion signature guarantees may be required if:
•
You want to redeem shares with a value of $50,000 or more and you want to receive your proceeds in the form of a check; or
•
You want your payment sent to an address, bank account or payee other than the one currently designated on your Fund account.
The J.P. Morgan Funds may refuse to honor incomplete redemption orders.
The J.P. Morgan Funds may suspend your ability to redeem when:
1.
Trading on the NYSE is restricted;
2.
The NYSE is closed (other than weekend and holiday closings);
3.
Federal securities laws permit;
4.
The SEC has permitted a suspension; or
5.
An emergency exists, as determined by the SEC.
You generally will recognize a gain or loss on a redemption for federal income tax purposes. You should talk to your tax advisor before making a redemption.
Generally, all redemptions will be for cash. The J.P. Morgan Funds typically expect to satisfy redemption requests by selling portfolio assets or by using holdings of cash or cash equivalents. On a less regular basis, the Funds may also satisfy redemption requests by borrowing from another Fund, by drawing on a line of credit from a bank, or using other short-term borrowings from its custodian. These methods may be used during both normal and stressed market conditions. In addition to paying redemption proceeds in cash, if you redeem shares worth $250,000 or more, the J.P. Morgan Funds reserve the right to pay part or all of your redemption proceeds in readily marketable securities instead of cash. If payment is made in securities, the Fund will value the securities selected in the same manner in which it computes its NAV. This process minimizes the effect of large redemptions on the Fund and its remaining shareholders. If you receive a redemption in-kind, securities received by you may be subject to market risk and you could incur taxable gains and brokerage or other charges in converting the securities to cash. While the J.P. Morgan Funds do not routinely use redemptions in-kind, the Funds reserve the right to use redemptions in-kind to manage the impact of large redemptions on the Funds. Redemption in-kind proceeds will typically be made by delivering a pro-rata amount of a Fund’s holdings that are readily marketable securities to the redeeming shareholder within seven days after the Fund’s receipt of the redemption order.
136 | JPMorgan SmartRetirement Blend Funds
The Funds and their service providers may temporarily hold redemption proceeds from accounts maintained directly with the Funds if there is a reasonable belief that financial exploitation of a Specified Adult has occurred, is occurring, has been attempted, or will be attempted. For purposes of this paragraph, the term “Specified Adult” refers to an individual who is (A) a natural person age 65 and older; or (B) a natural person age 18 and older who the member reasonably believes has a mental or physical impairment that renders the individual unable to protect his or her own interests.
Minimum Account Balance
Due to the relatively high cost associated with maintaining small accounts J.P. Morgan Funds has established minimum balance requirements for each Fund held in your accounts. Minimum investment amounts per Fund are described earlier within the Investing with J.P. Morgan Funds section of this prospectus. If a shareholder does not maintain the required minimum balance in each Fund, J.P. Morgan Funds may either 1) redeem all remaining shares in that Fund or 2) charge a $10 below minimum balance fee per Fund. To collect the fee, the Fund will redeem $10 worth of shares from your account. The Funds and/or the Distributor reserve the right to determine whether we redeem all remaining shares and close your account or charge the annual below minimum account fee. You will not be charged a CDSC, if applicable, for these actions. Shareholders will receive written notice and be given 60 days to bring Fund balances above minimum requirements before action is taken on your account.
If your account is below the minimum balance, you are participating in a systematic investment plan, and you are not actively selling shares, it will be excluded from the minimum balance requirements as long as the systematic payments will increase your Fund value above the required minimum balance within 18 months of the date that the account was established. Once the required minimum account balance is reached, you must maintain the minimum investment amount in that Fund.
Investors in Class A or Class C Shares, employees investing in Class I Shares, as well as investors in the Premier and Morgan share classes of the J.P. Morgan Money Market Funds cannot combine investments for purposes of meeting the minimum.
Certain Financial Intermediaries or other organizations making the J.P. Morgan Funds available to their clients or customers impose minimum account balances that may be different than the requirements for investors purchasing directly from the Funds. If a shareholder purchases shares through such an intermediary and does not maintain the required minimum balance imposed by that intermediary, the intermediary may redeem the investor’s shares or impose a fee consistent with the terms of the investment arrangement with the investor. Please contact your intermediary for more information.
Closings, Reorganizations and Liquidations
To the extent authorized by law, each Fund reserves the right to discontinue offering shares at any time, to merge or reorganize itself or a share class, or to cease operations and liquidate at any time.
Frequent Trading Policy
J.P. Morgan Funds do not authorize market timing and, except for the Funds identified below, use reasonable methods to identify market timers and to prevent such activity. However, there can be no assurance that these methods will prevent market timing or other trading that may be deemed abusive. Market timing is an investment strategy using frequent purchases, redemptions and/or exchanges in an attempt to profit from short-term market movements. Market timing may result in dilution of the value of Fund shares held by long-term shareholders, disrupt portfolio management and increase Fund expenses for all shareholders. Although market timing may affect any Fund, these risks may be higher for Funds that invest significantly in non-U.S. securities or thinly traded securities (e.g., certain small cap securities), such as international, global or emerging market funds or small cap funds. For example, when a Fund invests in securities trading principally in non-U.S. markets that close prior to the close of the NYSE, market timers may seek to take advantage of the difference between the prices of these securities at the close of their non-U.S. markets and the value of such securities when the Fund calculates its net asset value.
J.P. Morgan Funds or the Distributor will prohibit any purchase order (including exchanges) with respect to one investor, a related group of investors or their agent(s) where they detect a pattern of either purchases and sales of one of the J.P. Morgan Funds, or exchanges between or among J.P. Morgan Funds, that indicates market timing or trading that they determine is abusive.
Although J.P. Morgan Funds use a variety of methods to detect and deter market timing, there is no assurance that the Funds’ own operational systems and procedures will identify and eliminate all market timing strategies. For example, certain accounts, which are known as omnibus accounts, include multiple investors and such accounts typically provide the Funds with a net purchase or redemption order on any given day where purchasers of Fund shares and redeemers of Fund shares are netted against one another and the identity of individual purchasers and redeemers are not known by the Funds. While the Funds seek to monitor for market timing activities in omnibus accounts, the netting effect limits the Funds’ ability to locate and eliminate individual market timers. As a result, the Funds are often dependent upon Financial Intermediaries who utilize their own policies and procedures to identify market timers. These policies and procedures may be different than those utilized by the Funds.
November 1, 2023 | 137
Investing with J.P. Morgan Funds (continued)
The Boards of J.P. Morgan Funds have adopted various policies and procedures to identify market timers, including reviewing “round trips” in and out of J.P. Morgan Funds by investors. A “round trip” includes a purchase or exchange into a Fund followed or preceded by a redemption or exchange out of the same Fund. If the Distributor detects that you have completed two round trips within 60 days in the same Fund, the Distributor will reject your purchase and exchange orders for a period of at least 90 days. For subsequent violations, the Distributor may, in its sole discretion, reject your purchase and exchange orders temporarily or permanently. In identifying market timers, the Distributor may also consider activity of accounts that it believes to be under common ownership or control.
J.P. Morgan Funds have attempted to put safeguards in place to assure that Financial Intermediaries have implemented procedures designed to deter market timing and abusive trading. Despite these safeguards, there is no assurance that the Funds will be able to effectively identify and eliminate market timing and abusive trading in the Funds particularly with respect to omnibus accounts.
J.P. Morgan Funds will seek to apply the Funds’ market timing policies and restrictions as uniformly as practicable to accounts with the Funds, except with respect to the following:
1.
Trades that occur through omnibus accounts at Financial Intermediaries as described above;
2.
Purchases, redemptions and exchanges made on a systematic basis;
3.
Automatic reinvestments of dividends and distributions;
4.
Purchases, redemptions or exchanges that are part of a rebalancing program, such as a wrap, advisory or bona fide asset allocation program, which includes investment models developed and maintained by a financial intermediary;
5.
Redemptions of shares to pay fund or account fees;
6.
Transactions initiated by the trustee or adviser to a donor-advised charitable gift fund;
7.
Transactions in Section 529 college savings plans;
8.
Transactions in Fund of Fund Products; and
9.
Transactions within a Retirement account such as:
•
Shares redeemed to return an excess contribution;
•
Transactions initiated by sponsors of group employee benefit plans or other related accounts;
•
Retirement plan contributions, loans, distributions, and hardship withdrawals;
•
IRA re-characterizations and conversions; and
•
IRA purchases of shares by asset transfer or direct rollover.
In addition to rejecting purchases in connection with suspected market timing activities, the Distributor can reject a purchase (including purchases for the Funds listed below) for any reason, including purchases that it does not think are in the best interests of a Fund and/or its shareholders or if it determines the trading to be abusive. Your Financial Intermediary may also have additional procedures for identifying market timers and rejecting or otherwise restricting purchases and/or exchanges.
Certain J.P. Morgan Funds are intended for short-term investment horizons and do not monitor for market timers or prohibit such short-term trading activity. Those Funds are the JPMorgan Short Duration Bond Fund, JPMorgan Short Duration Core Plus Fund, JPMorgan Short-Intermediate Municipal Bond Fund, JPMorgan Limited Duration Bond Fund, JPMorgan Managed Income Fund, JPMorgan Ultra-Short Municipal Fund and the J.P. Morgan Money Market Funds. Although these Funds are managed in a manner that is consistent with their investment objectives, frequent trading by shareholders may disrupt their management and increase their expenses.
Valuation
Shares are purchased at NAV per share. This is also known as the offering price. Shares are also redeemed at NAV. The NAV of each class within a Fund varies, primarily because each class has different class-specific expenses such as distribution and service fees.
The NAV per share of a class of a Fund is equal to the value of all the assets attributable to that class, minus the liabilities attributable to that class, divided by the number of outstanding shares of that class. The following is a summary of the procedures generally used to value J.P. Morgan Funds’ investments.
Securities for which market quotations are readily available are generally valued at their current market value. Other securities and assets, including securities for which market quotations are not readily available; market quotations are determined not to be reliable; or, their value has been materially affected by events occurring after the close of trading on the exchange or market on which
138 | JPMorgan SmartRetirement Blend Funds
the security is principally traded but before a Fund’s NAV is calculated, may be valued at fair value in accordance with policies and procedures adopted by the J.P. Morgan Funds’ Board of Trustees. Fair value represents a good faith determination of the value of a security or other asset based upon specifically applied procedures. Fair valuation may require subjective determinations. There can be no assurance that the fair value of an asset is the price at which the asset could have been sold during the period in which the particular fair value was used in determining a Fund’s NAV.
Equity securities listed on a North American, Central American, South American or Caribbean securities exchange are generally valued at the last sale price on the exchange on which the security is principally traded. Other foreign equity securities are fair valued using quotations from an independent pricing service, as applicable. The value of securities listed on the NASDAQ Stock Market, Inc. is generally the NASDAQ official closing price.
Fixed income securities are valued using prices supplied by an approved independent third party or affiliated pricing services or broker/dealers. Those prices are determined using a variety of inputs and factors as more fully described in the Statement of Additional Information.
Assets and liabilities initially expressed in foreign currencies are converted into U.S. dollars at the prevailing market rates from an approved independent pricing service as of 4:00 p.m. ET.
Shares of ETFs are generally valued at the last sale price on the exchange on which the ETF is principally traded. Shares of open-end investment companies are valued at their respective NAVs.
Options traded on U.S. securities exchanges are valued at the composite mean price, using the National Best Bid and Offer quotes.
Options traded on foreign exchanges are valued at the settled price, or if no settled price is available, at the last sale price available prior to the calculation of a Fund’s NAV and will be fair valued by applying fair value factors provided by independent pricing services, as applicable, for any options involving equity reference obligations listed on exchanges other than North American, Central American, South American or Caribbean securities exchanges.
Exchange traded futures are valued at the last sale price available prior to the calculation of a Fund’s NAV. Any futures involving equity reference obligations listed on exchanges other than North American, Central American, South American or Caribbean securities exchanges will be fair valued by applying fair value factors provided by independent pricing services, as applicable.
Non-listed over-the-counter options and futures are valued utilizing market quotations provided by approved pricing services.
Swaps and structured notes are priced generally by an approved independent third party or affiliated pricing service or at an evaluated price provided by a counterparty or broker/dealer.
Any derivatives involving equity reference obligations listed on exchanges other than North American, Central American, South American or Caribbean securities exchanges will be fair valued by applying fair value factors provided by independent pricing services, as applicable.
NAV is calculated each business day as of the close of the NYSE, which is typically 4:00 p.m. ET. On occasion, the NYSE will close before 4:00 p.m. ET. When that happens, NAV will be calculated as of the time the NYSE closes. The Funds will not treat an intraday unscheduled disruption or closure in NYSE trading as a closure of the NYSE and will calculate NAV as of 4:00 p.m. ET, if the particular disruption or closure directly affects only the NYSE. The price at which a purchase is effected is based on the next calculation of NAV after the order is received in proper form in accordance with this prospectus. To the extent a Fund invests in securities that are primarily listed on foreign exchanges or other markets that trade on weekends or other days when a Fund does not price its shares, the value of a Fund’s shares may change on days when you will not be able to purchase or redeem your shares.
Distributions and Taxes
Each Fund has elected to be treated and intends to qualify each taxable year as a regulated investment company. A regulated investment company is not subject to tax at the corporate level on income and gains from investments that are distributed to shareholders. Each Fund’s failure to qualify as a regulated investment company would result in corporate-level taxation and, consequently, a reduction in income available for distribution to shareholders.
Each Fund can earn income and realize capital gain. Each Fund deducts any expenses and then pays out the earnings, if any, to shareholders as distributions.
Prior to January 1, 2022, dividends from net investment income were generally declared and paid at least quarterly for each Fund. Beginning January 1, 2022, dividends from net investment income will generally be declared and paid at least annually for each Fund. Each Fund will distribute its net realized capital gains, if any, at least annually. For each taxable year, each Fund will distribute substantially all of its net investment income and net realized capital gains.
You have the following options for your distributions. You may:
November 1, 2023 | 139
Investing with J.P. Morgan Funds (continued)
•
Reinvest all distributions in additional Fund shares;
•
Take distributions of net investment income in cash and reinvest distributions of net capital gain in additional shares;
•
Take distributions of net capital gain in cash and reinvest distributions of net investment income; or
•
Take all distributions in cash.
If you do not select an option when you open your account, we will reinvest all distributions. If your distributions are reinvested, they will be in the form of shares of the same class without a sales charge. If you take your distributions in cash, you can choose to have a check mailed to your address of record or you can have them deposited into a pre-assigned bank account. The taxation of the dividends will not be affected whether you have them deposited into a bank account or sent by check.
Dividends of net investment income paid to a non-corporate U.S. shareholder that are properly reported as qualified dividend income generally will be taxable to such shareholder at preferential rates. The maximum individual federal income tax rate applicable to “qualified dividend income” is either 15% or 20%, depending on whether the individual’s income exceeds certain threshold amounts. The amount of dividend income that may be so reported by a Fund generally will be limited to the aggregate of the eligible dividends received by each Fund. In addition, a Fund must meet certain holding period and other requirements with respect to the shares on which the Fund received the eligible dividends, and the non-corporate U.S. shareholder must meet certain holding period and other requirements with respect to the Fund. The amount of a Fund’s distributions that would otherwise qualify for this favorable tax treatment may be reduced as a result of the Fund’s securities lending activities or high portfolio turnover rate. Dividends of net investment income that are not reported as qualified dividend income and dividends of net short-term capital gain will be taxable to a U.S. shareholder as ordinary income.
Distributions of net capital gain (that is, the excess of the net gains from the sale of investments that a Fund owned for more than one year over the net losses from investments that the Fund owned for one year or less) that are properly reported by a Fund as capital gain dividends will be taxable as long-term capital gain, regardless of how long you have held your shares in the Fund. The maximum individual federal income tax rate applicable to long-term capital gains is generally either 15% or 20%, depending on whether the individual’s income exceeds certain threshold amounts. Distributions of net short-term capital gain (that is, the excess of any net short-term capital gain over net long-term capital loss), if any, will be taxable to U.S. shareholders as ordinary income. Capital gain of a corporate shareholder is taxed at the same rate as ordinary income.
An additional 3.8% Medicare tax is imposed on certain net investment income (including ordinary dividends and capital gain distributions received from a Fund and net gains from redemptions or other taxable dispositions of Fund shares) of U.S. individuals, estates and trusts to the extent that such person’s “modified adjusted gross income” (in the case of an individual) or “adjusted gross income” (in the case of an estate or trust) exceeds certain threshold amounts.
Except when your investment is in an IRA, 401(k) plan or other tax-advantaged investment plan, or you are a tax-exempt investor, if you buy shares of a Fund before a distribution, you will be subject to tax on the entire amount of the taxable distribution you receive. This is known as “buying a dividend”. Distributions are taxable to you even if they are paid from income or gains earned by a Fund before your investment (and thus were included in the price you paid for your Fund shares). Any gain resulting from the sale or exchange of Fund shares generally will be taxable as long-term or short-term gain, depending upon how long you have held your shares. To avoid buying a dividend, please check a Fund’s Dividend and Capital Gain Schedule before you invest.
A Fund or an underlying fund’s investment in foreign securities may be subject to foreign withholding or other taxes. In that case, the Fund’s yield on those securities would be decreased. If at least 50% of the value of a Fund’s total assets at the close of each quarter of its taxable year is represented by interests in other regulated investment companies (as is expected to be the case for each Fund), that Fund may elect to “pass through” to its shareholders the amount of foreign taxes deemed paid by that Fund. If that Fund so elects, each of its shareholders would be required to include in gross income, even though not actually received, its pro rata share of the foreign taxes deemed paid by that Fund, but would be treated as having paid its pro rata share of such foreign taxes and would therefore be allowed to either deduct such amounts in computing taxable income or use such amounts (subject to various limitations) as a foreign tax credit against federal income tax (but not both). In addition, a Fund or an underlying fund’s investment in certain foreign securities or foreign currencies may increase or accelerate the Fund’s recognition of ordinary income and may affect the timing or amount of Fund distributions.
A Fund or an underlying fund’s investments in certain debt obligations, mortgage-backed securities, asset-backed securities and derivative instruments may require the Fund to accrue and distribute income not yet received. In order to generate sufficient cash to make the requisite distributions, a Fund may be required to liquidate other investments in its portfolio that it otherwise would have continued to hold, including when it is not advantageous to do so. A Fund or an underlying fund’s investment in REIT securities also may result in the Fund’s receipt of cash in excess of the REIT’s earnings; if the Fund distributes such amounts, such distributions could constitute a return of capital to Fund shareholders for federal income tax purposes.
A Fund or an underlying fund’s transactions in futures contracts, short sales, swaps and other derivatives will be subject to special tax
140 | JPMorgan SmartRetirement Blend Funds
rules, the effect of which may be to accelerate income to the Fund, defer losses to the Fund, cause adjustments in the holding periods of the Fund’s securities, and convert short-term capital losses into long-term capital losses. These rules could therefore affect the amount, timing and character of distributions to shareholders. A Fund or an underlying fund’s use of these types of transactions may result in the Fund realizing more short-term capital gain and ordinary income subject to tax at ordinary income tax rates than it would if it did not engage in such transactions.
An increase in the principal amount of an inflation-linked security will be original issue discount which is taxable as ordinary income and is required to be distributed, even though the Fund will not receive the principal, including any increases thereto, until maturity. A Fund’s use of a Fund-of-Funds structure could affect the amount, timing and character of distributions from the Fund, and therefore, may increase the amount of taxes payable by shareholders. See “Distributions and Tax Matters — Investments in Other Funds” in the Statement of Additional Information.
The Funds are not managed to maximize after-tax return. As the Funds invest in shares of other funds, their distributable income and gains will normally consist, in part, of distributions from the underlying funds and gains and losses on the disposition of shares of the underlying funds. To the extent that an underlying fund realizes net losses on its investments for a given taxable year, a Fund will not be able to recognize its share of those losses (so as to offset distributions of net income or capital gains from other underlying funds) until it disposes of shares of the underlying fund. Moreover, even when a Fund does make such a disposition, a portion of its loss may be recognized as a long-term capital loss, which will not be treated as favorably for federal income tax purposes as a short-term capital loss or an ordinary deduction. In particular, a Fund will not be able to offset any capital losses from its dispositions of underlying fund shares against its ordinary income (including distributions of any net short-term capital gain realized by an underlying fund). A Fund’s realized losses on sales of shares of underlying funds may potentially be deferred indefinitely as “wash sales.” Each of these effects is caused by the Fund’s investment in the underlying funds and may result in distributions to Fund shareholders being of higher magnitudes and less likely to qualify for lower capital gain tax rates.
Please see the Statement of Additional Information for additional discussion of the tax consequences of the above-described and other investments to each Fund and its shareholders.
The dates on which net investment income and capital gain dividends, if any, will be distributed are available online at www.jpmorganfunds.com.
Early in each calendar year, each Fund will send you a notice showing the amount of distributions you received during the preceding calendar year and the tax status of those distributions.
The Funds are not intended for foreign shareholders. Any foreign shareholders would generally be subject to U.S. tax-withholding on distributions by the Funds, as discussed in the Statement of Additional Information.
Distributions by a Fund to retirement plans and other entities that qualify for tax-exempt or tax-deferred treatment under federal income tax laws will generally not be taxable. Special tax rules apply to investments through such plans. The tax considerations described in this section do not apply to such tax-exempt or tax-deferred entities or accounts. You should consult your tax advisor to determine the suitability of a Fund as an investment and the tax treatment of distributions.
Any investor for whom a Fund does not have a valid Taxpayer Identification Number may be subject to backup withholding.
The above is a general summary of tax implications of investing in the Funds. Because each investor’s tax consequences are unique, please consult your tax advisor to see how investing in a Fund and, for individuals and S corporations, selection of a particular cost method of accounting will affect your own tax situation.
November 1, 2023 | 141
Investing with J.P. Morgan Funds (continued)
IMPORTANT TAX REPORTING CONSIDERATIONS
Your Financial Intermediary or the Fund (if you hold your shares in the Fund direct account) will report gains and losses realized on redemptions of shares for shareholders who are individuals and S corporations purchased after January 1, 2012 to the Internal Revenue Service (IRS). This information will also be reported to you on Form 1099-B and the IRS each year. In calculating the gain or loss on redemptions of shares, the average cost method will be used to determine the cost basis of Fund shares purchased after January 1, 2012 unless you instruct the Fund in writing at J.P. Morgan Funds Services, P.O. Box 219143, Kansas City, MO 64121-9143 that you want to use another available method for cost basis reporting (for example, First In, First Out (FIFO), Last In, First Out (LIFO), Specific Lot Identification (SLID) or High Cost, First Out (HIFO)). If you designate SLID as your cost basis method, you will also need to designate a secondary cost basis method (Secondary Method). If a Secondary Method is not provided, the Fund will designate FIFO as the Secondary Method and will use the Secondary Method with respect to systematic redemptions.
Not all cost basis methods are available. Please contact the Fund at J.P. Morgan Funds Services, P.O. Box 219143, Kansas City, MO 64121-9143 for more information on the available methods for cost basis reporting. To determine which available cost basis method is best for you, you should consult with your tax advisor. Please note that you will be responsible for calculating and reporting gains and losses on redemptions of shares purchased prior to January 1, 2012 to the IRS as such information will not be reported by the Fund and may not be maintained by your Financial Intermediary.
Your Financial Intermediary or the Fund (if you hold your shares in the Fund direct account) is also required to report gains and losses to the IRS in connection with redemptions of shares by S corporations. If a shareholder is a corporation and has not instructed the Fund that it is a C corporation in its account application or by written instruction to J.P. Morgan Funds Services, P.O. Box 219143, Kansas City, MO 64121-9143, the Fund will treat the shareholder as an S corporation and file a Form 1099-B.
Shareholder Statements and Reports
The J.P. Morgan Funds or your Financial Intermediary will send you transaction confirmation statements and quarterly account statements. Please review these statements carefully. The Funds will correct errors if notified within one year of the date printed on the transaction confirmation or account statement, except that, with respect to unfulfilled Letters of Intent, the Funds may process corrections up to 15 months after the date printed on the transaction confirmation or account statement. Your Financial Intermediary may have a different cut-off time. J.P. Morgan Funds will charge a fee for requests for statements that are older than two years. Please retain all of your statements, as they could be needed for tax purposes.
To reduce expenses and conserve natural resources, the J.P. Morgan Funds will deliver a single copy of prospectuses and financial reports to individual investors who share a residential address, provided they have the same last name or the J.P. Morgan Funds reasonably believe they are members of the same family. If you would like to receive separate mailings, please call 1-800-480-4111 and the Fund will begin individual delivery within 30 days. If you would like to receive these documents by e-mail, please visit www.jpmorganfunds.com and sign up for electronic delivery.
If you hold your Fund shares directly, you may access your account statements at www.jpmorganfunds.com.
After each fiscal half year you will receive a financial report from the Funds. In addition, the Funds will periodically send you proxy statements and other reports.
If you have any questions or need additional information, please write to J.P. Morgan Funds Services at P.O. Box 219143, Kansas City, MO 64121-9143, call 1-800-480-4111 or visit www.jpmorganfunds.com.
Availability of Proxy Voting Record
The Trustees for each Fund have delegated the authority to vote proxies for securities owned by the Funds to the Funds' adviser. A copy of each Fund’s voting record for the most recent 12-month period ended June 30 is available on the SEC’s website at www.sec.gov or on J.P. Morgan Funds’ website at www.jpmorganfunds.com no later than August 31 of each year. Each Fund’s proxy voting record will include, among other things, a brief description of the matter voted on for each portfolio security, and will state how each vote was cast, for example, for or against the proposal.
Portfolio Holdings Disclosure
Not later than 60 days after the end of each fiscal quarter, each Fund will make available a complete schedule of its portfolio holdings as of the last day of that quarter. In addition to providing hard copies upon request, the Funds will post these quarterly schedules on the J.P. Morgan Funds’ website at www.jpmorganfunds.com and on the SEC’s website at www.sec.gov. In addition, from time to time, each Fund may post portfolio holdings on the J.P. Morgan Funds’ website on a more timely basis.
142 | JPMorgan SmartRetirement Blend Funds
Each of the Funds may disclose the complete uncertified holdings list and the percentage allocations to each of the underlying funds, allocation to each JPMIM sub-portfolio and allocations to each unaffiliated sub-adviser and the percentage that each represents of the respective Fund’s portfolio as of the most recent month end online at www.jpmorganfunds.com, no sooner than ten calendar days after month end.
Shareholders may request portfolio holdings schedules at no charge by calling 1-800-480-4111. A description of each Fund’s policies and procedures with respect to the disclosure of a Fund’s portfolio holdings is available in the Statement of Additional Information.
November 1, 2023 | 143
Glossary of Common Investment Terminology
For the purpose of the “INVESTING WITH J.P. MORGAN FUNDS” section, references to “account” and “Fund” are not interchangeable. Fund refers to an individual mutual fund position. An account may be invested in a single Fund or multiple Funds.
Capital Gains Distribution — Payment to mutual fund shareholders of gains realized on securities that a Fund has sold at a profit, minus any realized losses.
Dividend Distribution — Payment to mutual fund shareholders of income from interest or dividends generated by a Fund’s investments.
Financial Intermediaries — Include financial advisors, investment advisers, brokers, financial planners, banks, insurance companies, retirement or 401(k) plan administrators and others, including various affiliates of JPMorgan Chase, that have entered into agreements with the Distributor and/or shareholder servicing agent. Shares purchased this way will typically be held for you by the Financial Intermediary.
Group Retirement Plans — Refers to employer-sponsored retirement, deferred compensation and employee benefit plans (including health savings accounts) and trusts used to fund those plans. To satisfy eligibility requirements, the plan must be a group plan (more than one participant), the shares cannot be held in a commission-based brokerage account and
•
Shares must be held at a plan level or
•
Shares must be held at the Fund level through an omnibus account of a retirement plan recordkeeper.
Group Retirement Plans include group employer-sponsored 401(k) plans, 457 plans, employer-sponsored 403(b) plans, profit-sharing and money purchase pension plans, defined benefit plans, retiree health benefit plans, group annuity separate accounts offered to retirement plans and non-qualified deferred compensation plans. Group Retirement Plans do not include traditional IRAs, Roth IRAs, Coverdell Education Savings Accounts, SEPs, SARSEPs, SIMPLE IRAs, KEOGHs, individual 401(k) or individual 403(b) plans.
Institutional Investors — Include fee-based “wrap” account sponsors (provided they have an agreement covering the arrangement with the Distributor), corporations, qualified nonprofit organizations, charitable trusts, foundations and endowments, state, county, city or any instrumentality, department, authority or agency thereof, and banks, trust companies or other depository institutions investing for their own account or on behalf of their clients.
Medallion Signature Guarantee — A special stamp used to verify the authenticity of certain documents. It is a guarantee by a financial institution that the signature is genuine and the financial institution accepts liability for any forgery. Medallion signature guarantees protect shareholders by preventing unauthorized transfer of assets that could result in monetary losses to the investor due to fraud. Medallion guarantee stamps can be obtained at many bank branches or brokerage firms.
Uncollected Shares — Shares purchased directly through J.P. Morgan Funds Services by check or through an ACH transaction are not available for redemption for up to five business days following the acceptance of a purchase order unless you provide satisfactory proof that your purchase check or ACH transaction has cleared.
Wire or ACH — Refers to the method used for payment or redemptions. Movement of money by wire is typically faster than money sent by ACH (Automated Clearing House). While J.P. Morgan Funds does not charge for either method, your bank may charge a fee for these services.
144 | JPMorgan SmartRetirement Blend Funds
Management of the Funds
The Adviser, Sub-Advisers, Administrator and Distributor
JPMIM acts as the investment adviser to the Funds and makes the day-to-day investment decisions for the Funds. In rendering investment advisory services to certain Funds, JPMIM uses the portfolio management, research and other resources of a foreign (non-U.S.) affiliate of JPMIM and may provide services to a Fund through a “participating affiliate” arrangement, as that term is used in relief granted by the staff of the SEC. Under this relief, U.S. registered investment advisers are allowed to use portfolio management or research resources of advisory affiliates subject to the regulatory supervision of the registered investment adviser.
JPMIM is a wholly-owned subsidiary of JPMorgan Asset Management Holdings Inc., which is a wholly-owned subsidiary of JPMorgan Chase & Co, (JPMorgan Chase), a bank holding company. JPMIM is located at 383 Madison Avenue, New York, NY 10179.
JPMIM may serve as the “manager of managers” for the Funds and will have responsibility for monitoring and coordinating the overall management of the Funds. In this capacity, JPMIM: (i) evaluates, selects, and recommends to the Trustees affiliated and unaffiliated sub-advisers needed to manage all or part of the assets of the Funds; (ii) reviews the Funds’ portfolio holdings and monitors concentration in a particular security or industry; (iii) monitors and evaluates the sub-advisers’ investment programs and results as well as the performance of sub-advisers relative to the applicable benchmark indexes; and (iv) reviews the Funds’ compliance with its investment objectives, strategies, policies and restrictions. JPMIM may also directly manage certain portions of the Funds. The sub-adviser(s), and JPMIM, to the extent it directly manages certain portions of the Funds, are responsible for deciding which securities to purchase and sell for their respective portions of the Funds and for placing orders for each Fund’s transactions. JPMIM has obtained an exemptive order of the SEC granting exemptions from certain provisions of the 1940 Act (the Exemptive Order), pursuant to which JPMIM is permitted, subject to supervision and approval of the Trust’s Trustees, to enter into and materially amend sub-advisory agreements with unaffiliated sub-advisers without such agreements being approved by the shareholders of each Fund. JPMIM may not enter into any sub-advisory agreement with an affiliated sub-adviser without such agreement being approved by shareholders of each Fund. Accordingly, each Fund and JPMIM may hire, terminate, or replace unaffiliated sub-advisers without shareholder approval (except as noted above), including, without limitation, the replacement or reinstatement of any sub-advisers with respect to which a sub-advisory agreement has automatically terminated as a result of an assignment. JPMIM will continue to have the ultimate responsibility to oversee the sub-advisers and recommend their hiring, termination and replacement. Shareholders will be notified of any changes in sub-advisers. Shareholders of each Fund have the right to terminate a sub-advisory agreement for each Fund at any time by a vote of the majority of the outstanding voting securities of the Fund. The Exemptive Order also permits each Fund to disclose to shareholders the management fees only in the aggregate.
JPMIM (the Administrator) (1111 Polaris Parkway, Columbus, Ohio 43240) provides administration services and oversees the Funds’ other service providers. The Administrator receives a the following annual fee on behalf of each Fund for administration services: 0.075% of the first $10 billion of average daily net assets of the Fund, plus 0.050% of average daily net assets of the Fund between $10 billion and $20 billion, plus 0.025% of average daily net assets of the Fund between $20 billion and $25 billion, plus 0.010% of the average daily net assets of the Fund over $25 billion.
JPMorgan Distribution Services, Inc. (the Distributor or JPMDS) (1111 Polaris Parkway, Columbus, Ohio 43240) is the distributor for the Funds. The Distributor is an affiliate of JPMIM. The Distributor is a direct, wholly-owned subsidiary of JPMorgan Chase.
Advisory Fees
A discussion of the basis the Board of Trustees of the Trust used in reapproving the investment advisory agreement for each Fund is available in the semi-annual report for the most recent fiscal period ended December 31.
During the most recent fiscal year ended 6/30/23, JPMIM was paid management fees (net of waivers), as shown below, as a percentage of average daily net assets:
| JPMorgan SmartRetirement Blend Income Fund |
0.00% |
| JPMorgan SmartRetirement Blend 2020 Fund |
0.00 |
| JPMorgan SmartRetirement Blend 2025 Fund |
0.00 |
| JPMorgan SmartRetirement Blend 2030 Fund |
0.00 |
| JPMorgan SmartRetirement Blend 2035 Fund |
0.00 |
| JPMorgan SmartRetirement Blend 2040 Fund |
0.00 |
| JPMorgan SmartRetirement Blend 2045 Fund |
0.01 |
| JPMorgan SmartRetirement Blend 2050 Fund |
0.01 |
| JPMorgan SmartRetirement Blend 2055 Fund |
0.00 |
| JPMorgan SmartRetirement Blend 2060 Fund |
0.00 |
| JPMorgan SmartRetirement Blend 2065 Fund |
0.00 |
November 1, 2023 | 145
Management of the Funds (continued)
Additional Compensation to Financial Intermediaries
JPMIM, JPMDS, and from time to time, other affiliates of JPMorgan Chase, may also, at their own expense and out of their own legitimate profits, provide additional cash payments to Financial Intermediaries who sell shares of the J.P. Morgan Funds. For this purpose, Financial Intermediaries include investment advisers, financial advisors, brokers, financial planners, banks, insurance companies, retirement or 401(k) plan administrators and others, including various affiliates of JPMorgan Chase that have entered into an agreement with JPMDS. These additional cash payments are payments over and above any sales charges (including Rule 12b-1 fees), share service (including sub-transfer agency and/or networking fees) that are paid to such Financial Intermediaries, as described elsewhere in this prospectus. These additional cash payments are generally made to Financial Intermediaries, that provide service fees, sub-transfer agency or administrative services, or marketing support. Marketing support may include access to sales meetings, sales representatives and Financial Intermediary management representatives, inclusion of the J.P. Morgan Funds on a sales list, including a preferred or select sales list, or other sales programs and/or for training and educating a Financial Intermediary’s employees. These additional cash payments also may be made as an expense reimbursement in cases where the Financial Intermediary provides shareholder services to J.P. Morgan Fund shareholders. JPMIM and JPMDS may also pay cash compensation in the form of finders’ fees that vary depending on the J.P. Morgan Fund and the dollar amount of shares sold. Such additional compensation may provide such Financial Intermediaries with an incentive to favor sales of shares of the J.P. Morgan Funds over other investment options they make available to their customers. See the Statement of Additional Information for more information.
The Fund Managers
The Funds are managed by JPMIM’s Multi-Asset Solutions Team. The members of the Multi-Asset Solutions Team responsible for management and oversight of the Funds are Daniel Oldroyd, Silvia Trillo, Ove Fladberg, Anshul Mohan and Jeffrey A. Geller. In their capacity as portfolio managers, Mr. Oldroyd, Ms. Trillo, Mr. Fladberg, Mr. Mohan, Mr. Geller and the team of investment professionals manage the portfolio construction, investment strategy selection and asset allocation processes for each Fund. Mr. Oldroyd, Managing Director, is the Head of Target Date Strategies for JPMIM and is a CFA and CAIA charterholder. An employee of JPMIM since 2000, Mr. Oldroyd has been a portfolio manager of the Firm’s target date strategies since 2010. Ms. Trillo, Managing Director, has been an employee of JPMIM or one of its affiliates since 2003 and a member of Multi-Asset Solutions since 2011 and a portfolio manager of the Firm’s target date strategies since 2019. Mr. Fladberg, Managing Director, has been an employee of JPMIM or one of its affiliates since 2003 and a portfolio manager of the Firm’s target date strategies since 2022. Mr. Mohan, Executive Director, has been an employee of JPMIM or one of its affiliates since 2010 and a portfolio manager of the Firm’s target date series since 2023. As CIO for the Americas of Multi-Asset Solutions and an employee of JPMIM since 2006, Mr. Geller, Managing Director, has had investment oversight responsibility for the Funds since 2008.
JPMIM serves as the Adviser and certain affiliates serve as sub-advisers to the underlying funds, for which they receive a fee.
The Statement of Additional Information provides additional information about the portfolio managers’ compensation, the other accounts managed by the portfolio managers, and the portfolio managers’ ownership of securities in the Funds.
146 | JPMorgan SmartRetirement Blend Funds
Financial Highlights
The Financial Highlights tables are intended to help you understand a Fund’s financial performance for each share class for the past five fiscal years or the periods of a Fund’s operations, as applicable. Certain information reflects financial results for a single Fund share. The total returns in the tables represent the rate that an investor would have earned (or lost) on an investment in a Fund (assuming reinvestment of all dividends and distributions). The information for the other periods has been audited by PricewaterhouseCoopers LLP, whose report, along with each Fund’s financial statements, are included in the respective Fund’s annual report, which is available upon request.
Because each Fund invests in other funds, the Total Annual Operating Expenses included in the Fee Table will not correlate to the ratio of expenses to average net assets in the financial highlights below.
| |
|
Per share operating performance | |||||
| |
|
Investment operations |
Distributions | ||||
| |
Net asset value, beginning of period |
Net investment income (loss)(a)(b) |
Net realized and unrealized gains (losses) on investments |
Total from investment operations |
Net investment income |
Net realized gain |
Total distributions |
| JPMorgan SmartRetirement® Blend Income Fund |
|
|
|
|
|
|
|
| Class I |
|
|
|
|
|
|
|
| Year Ended June 30, 2023 |
$16.42 |
$0.42 |
$0.61 |
$1.03 |
$(0.40) |
$— |
$(0.40) |
| Year Ended June 30, 2022 |
19.48 |
0.38 |
(2.66) |
(2.28) |
(0.23) |
(0.55) |
(0.78) |
| Year Ended June 30, 2021 |
17.65 |
0.33 |
2.28 |
2.61 |
(0.34) |
(0.44) |
(0.78) |
| Year Ended June 30, 2020 |
17.52 |
0.42 |
0.13 |
0.55 |
(0.42) |
— |
(0.42) |
| Year Ended June 30, 2019 |
17.53 |
0.45 |
0.49 |
0.94 |
(0.45) |
(0.50) |
(0.95) |
(a)
Net investment income (loss) is affected by the timing of distributions from Underlying Funds.
(b)
Calculated based upon average shares outstanding.
(c)
Includes adjustments in accordance with accounting principles generally accepted in the United States of America and as such, the net asset values for financial reporting purposes and the returns based upon those net asset values may differ from the net asset values and returns for shareholder transactions.
(d)
Includes interest expense, if applicable, each of which is less than 0.005% unless otherwise noted.
(e)
Does not include expenses of Underlying Funds.
148 | JPMorgan SmartRetirement Blend Funds
| |
Ratios/Supplemental data | |||||
| |
|
|
Ratios to average net assets |
| ||
| Net asset value, end of period |
Total return(c) |
Net assets, end of period (000’s) |
Net expenses(d)(e) |
Net investment income (loss)(a) |
Expenses without waivers and reimbursements(e) |
Portfolio turnover rate |
| |
|
|
|
|
|
|
| |
|
|
|
|
|
|
| $17.05 |
6.42% |
$1,581 |
0.31% |
2.55% |
0.52% |
37% |
| 16.42 |
(12.25) |
3,519 |
0.27 |
2.05 |
0.50 |
54 |
| 19.48 |
14.98 |
6,243 |
0.27 |
1.75 |
0.56 |
116 |
| 17.65 |
3.19 |
5,745 |
0.28 |
2.41 |
0.66 |
66 |
| 17.52 |
5.67 |
7,450 |
0.27 |
2.62 |
0.65 |
57 |
November 1, 2023 | 149
Financial Highlights (continued)
| |
|
Per share operating performance | |||||
| |
|
Investment operations |
Distributions | ||||
| |
Net asset value, beginning of period |
Net investment income (loss)(a)(b) |
Net realized and unrealized gains (losses) on investments |
Total from investment operations |
Net investment income |
Net realized gain |
Total distributions |
| JPMorgan SmartRetirement® Blend 2020 Fund |
|
|
|
|
|
|
|
| Class I |
|
|
|
|
|
|
|
| Year Ended June 30, 2023 |
$18.32 |
$0.46 |
$0.70 |
$1.16 |
$(0.44) |
$— |
$(0.44) |
| Year Ended June 30, 2022 |
21.93 |
0.43 |
(2.98) |
(2.55) |
(0.26) |
(0.80) |
(1.06) |
| Year Ended June 30, 2021 |
19.70 |
0.37 |
2.71 |
3.08 |
(0.38) |
(0.47) |
(0.85) |
| Year Ended June 30, 2020 |
19.53 |
0.47 |
0.19 |
0.66 |
(0.47) |
(0.02) |
(0.49) |
| Year Ended June 30, 2019 |
19.63 |
0.50 |
0.53 |
1.03 |
(0.51) |
(0.62) |
(1.13) |
(a)
Net investment income (loss) is affected by the timing of distributions from Underlying Funds.
(b)
Calculated based upon average shares outstanding.
(c)
Includes adjustments in accordance with accounting principles generally accepted in the United States of America and as such, the net asset values for financial reporting purposes and the returns based upon those net asset values may differ from the net asset values and returns for shareholder transactions.
(d)
Includes interest expense, if applicable, each of which is less than 0.005% unless otherwise noted.
(e)
Does not include expenses of Underlying Funds.
150 | JPMorgan SmartRetirement Blend Funds
| |
Ratios/Supplemental data | |||||
| |
|
|
Ratios to average net assets |
| ||
| Net asset value, end of period |
Total return(c) |
Net assets, end of period (000’s) |
Net expenses (d)(e) |
Net investment income (loss)(a) |
Expenses without waivers and reimbursements(e) |
Portfolio turnover rate |
| |
|
|
|
|
|
|
| |
|
|
|
|
|
|
| $19.04 |
6.52% |
$1,803 |
0.31% |
2.52% |
0.51% |
26% |
| 18.32 |
(12.31) |
5,098 |
0.28 |
2.04 |
0.50 |
56 |
| 21.93 |
15.85 |
10,270 |
0.27 |
1.73 |
0.53 |
127 |
| 19.70 |
3.43 |
12,068 |
0.27 |
2.38 |
0.61 |
58 |
| 19.53 |
5.66 |
17,098 |
0.28 |
2.61 |
0.62 |
33 |
November 1, 2023 | 151
Financial Highlights (continued)
| |
|
Per share operating performance | |||||
| |
|
Investment operations |
Distributions | ||||
| |
Net asset value, beginning of period |
Net investment income (loss)(a)(b) |
Net realized and unrealized gains (losses) on investments |
Total from investment operations |
Net investment income |
Net realized gain |
Total distributions |
| JPMorgan SmartRetirement® Blend 2025 Fund |
|
|
|
|
|
|
|
| Class I |
|
|
|
|
|
|
|
| Year Ended June 30, 2023 |
$20.26 |
$0.49 |
$1.08 |
$1.57 |
$(0.41) |
$— |
$(0.41) |
| Year Ended June 30, 2022 |
24.44 |
0.47 |
(3.61) |
(3.14) |
(0.30) |
(0.74) |
(1.04) |
| Year Ended June 30, 2021 |
20.88 |
0.39 |
3.98 |
4.37 |
(0.40) |
(0.41) |
(0.81) |
| Year Ended June 30, 2020 |
20.85 |
0.45 |
0.10 |
0.55 |
(0.44) |
(0.08) |
(0.52) |
| Year Ended June 30, 2019 |
20.77 |
0.51 |
0.63 |
1.14 |
(0.51) |
(0.55) |
(1.06) |
(a)
Net investment income (loss) is affected by the timing of distributions from Underlying Funds.
(b)
Calculated based upon average shares outstanding.
(c)
Includes adjustments in accordance with accounting principles generally accepted in the United States of America and as such, the net asset values for financial reporting purposes and the returns based upon those net asset values may differ from the net asset values and returns for shareholder transactions.
(d)
Includes interest expense, if applicable, each of which is less than 0.005% unless otherwise noted.
(e)
Does not include expenses of Underlying Funds.
152 | JPMorgan SmartRetirement Blend Funds
| |
Ratios/Supplemental data | |||||
| |
|
|
Ratios to average net assets |
| ||
| Net asset value, end of period |
Total return(c) |
Net assets, end of period (000’s) |
Net expenses(d)(e) |
Net investment income (loss)(a) |
Expenses without waivers and reimbursements(e) |
Portfolio turnover rate |
| |
|
|
|
|
|
|
| |
|
|
|
|
|
|
| $21.42 |
7.89% |
$4,455 |
0.31% |
2.40% |
0.50% |
35% |
| 20.26 |
(13.48) |
12,346 |
0.30 |
2.01 |
0.50 |
50 |
| 24.44 |
21.19 |
22,423 |
0.29 |
1.67 |
0.53 |
107 |
| 20.88 |
2.67 |
19,084 |
0.30 |
2.15 |
0.61 |
61 |
| 20.85 |
5.89 |
18,384 |
0.29 |
2.52 |
0.62 |
25 |
November 1, 2023 | 153
Financial Highlights (continued)
| |
|
Per share operating performance | |||||
| |
|
Investment operations |
Distributions | ||||
| |
Net asset value, beginning of period |
Net investment income (loss)(a)(b) |
Net realized and unrealized gains (losses) on investments |
Total from investment operations |
Net investment income |
Net realized gain |
Total distributions |
| JPMorgan SmartRetirement® Blend 2030 Fund |
|
|
|
|
|
|
|
| Class I |
|
|
|
|
|
|
|
| Year Ended June 30, 2023 |
$21.86 |
$0.48 |
$1.64 |
$2.12 |
$(0.42) |
$— |
$(0.42) |
| Year Ended June 30, 2022 |
26.66 |
0.50 |
(4.14) |
(3.64) |
(0.34) |
(0.82) |
(1.16) |
| Year Ended June 30, 2021 |
21.81 |
0.40 |
5.12 |
5.52 |
(0.41) |
(0.26) |
(0.67) |
| Year Ended June 30, 2020 |
21.85 |
0.42 |
0.06 |
0.48 |
(0.41) |
(0.11) |
(0.52) |
| Year Ended June 30, 2019 |
21.89 |
0.50 |
0.66 |
1.16 |
(0.51) |
(0.69) |
(1.20) |
(a)
Net investment income (loss) is affected by the timing of distributions from Underlying Funds.
(b)
Calculated based upon average shares outstanding.
(c)
Includes adjustments in accordance with accounting principles generally accepted in the United States of America and as such, the net asset values for financial reporting purposes and the returns based upon those net asset values may differ from the net asset values and returns for shareholder transactions.
(d)
Includes interest expense, if applicable, each of which is less than 0.005% unless otherwise noted.
(e)
Does not include expenses of Underlying Funds.
154 | JPMorgan SmartRetirement Blend Funds
| |
Ratios/Supplemental data | |||||
| |
|
|
Ratios to average net assets |
| ||
| Net asset value, end of period |
Total return(c) |
Net assets, end of period (000’s) |
Net expenses(d)(e) |
Net investment income (loss)(a) |
Expenses without waivers and reimbursements(e) |
Portfolio turnover rate |
| |
|
|
|
|
|
|
| |
|
|
|
|
|
|
| $23.56 |
9.86% |
$6,269 |
0.32% |
2.15% |
0.50% |
31% |
| 21.86 |
(14.35) |
13,080 |
0.32 |
1.95 |
0.49 |
49 |
| 26.66 |
25.56 |
24,992 |
0.32 |
1.62 |
0.52 |
94 |
| 21.81 |
2.19 |
16,640 |
0.34 |
1.92 |
0.60 |
51 |
| 21.85 |
5.76 |
28,932 |
0.32 |
2.35 |
0.62 |
17 |
November 1, 2023 | 155
Financial Highlights (continued)
| |
|
Per share operating performance | |||||
| |
|
Investment operations |
Distributions | ||||
| |
Net asset value, beginning of period |
Net investment income (loss)(a)(b) |
Net realized and unrealized gains (losses) on investments |
Total from investment operations |
Net investment income |
Net realized gain |
Total distributions |
| JPMorgan SmartRetirement® Blend 2035 Fund |
|
|
|
|
|
|
|
| Class I |
|
|
|
|
|
|
|
| Year Ended June 30, 2023 |
$23.50 |
$0.49 |
$2.24 |
$2.73 |
$(0.42) |
$— |
$(0.42) |
| Year Ended June 30, 2022 |
28.89 |
0.60 |
(4.64) |
(4.04) |
(0.42) |
(0.93) |
(1.35) |
| Year Ended June 30, 2021 |
22.56 |
0.45 |
6.37 |
6.82 |
(0.47) |
(0.02) |
(0.49) |
| Year Ended June 30, 2020 |
22.80 |
0.40 |
(0.13) |
0.27 |
(0.41) |
(0.10) |
(0.51) |
| Year Ended June 30, 2019 |
22.78 |
0.48 |
0.72 |
1.20 |
(0.50) |
(0.68) |
(1.18) |
(a)
Net investment income (loss) is affected by the timing of distributions from Underlying Funds.
(b)
Calculated based upon average shares outstanding.
(c)
Includes adjustments in accordance with accounting principles generally accepted in the United States of America and as such, the net asset values for financial reporting purposes and the returns based upon those net asset values may differ from the net asset values and returns for shareholder transactions.
(d)
Includes interest expense, if applicable, each of which is less than 0.005% unless otherwise noted.
(e)
Does not include expenses of Underlying Funds.
156 | JPMorgan SmartRetirement Blend Funds
| |
Ratios/Supplemental data | |||||
| |
|
|
Ratios to average net assets |
| ||
| Net asset value, end of period |
Total return(c) |
Net assets, end of period (000’s) |
Net expenses(d)(e) |
Net investment income (loss)(a) |
Expenses without waivers and reimbursements(e) |
Portfolio turnover rate |
| |
|
|
|
|
|
|
| |
|
|
|
|
|
|
| $25.81 |
11.78% |
$2,765 |
0.31% |
2.01% |
0.51% |
25% |
| 23.50 |
(14.78) |
6,629 |
0.29 |
2.12 |
0.50 |
32 |
| 28.89 |
30.42 |
13,615 |
0.30 |
1.74 |
0.53 |
50 |
| 22.56 |
1.14 |
11,645 |
0.36 |
1.77 |
0.62 |
55 |
| 22.80 |
5.73 |
12,979 |
0.35 |
2.16 |
0.63 |
16 |
November 1, 2023 | 157
Financial Highlights (continued)
| |
|
Per share operating performance | |||||
| |
|
Investment operations |
Distributions | ||||
| |
Net asset value, beginning of period |
Net investment income (loss)(a)(b) |
Net realized and unrealized gains (losses) on investments |
Total from investment operations |
Net investment income |
Net realized gain |
Total distributions |
| JPMorgan SmartRetirement® Blend 2040 Fund |
|
|
|
|
|
|
|
| Class I |
|
|
|
|
|
|
|
| Year Ended June 30, 2023 |
$24.42 |
$0.48 |
$2.70 |
$3.18 |
$(0.44) |
$— |
$(0.44) |
| Year Ended June 30, 2022 |
30.22 |
0.60 |
(4.96) |
(4.36) |
(0.44) |
(1.00) |
(1.44) |
| Year Ended June 30, 2021 |
22.92 |
0.46 |
7.29 |
7.75 |
(0.45) |
— |
(0.45) |
| Year Ended June 30, 2020 |
23.27 |
0.38 |
(0.25) |
0.13 |
(0.37) |
(0.11) |
(0.48) |
| Year Ended June 30, 2019 |
23.43 |
0.47 |
0.72 |
1.19 |
(0.49) |
(0.86) |
(1.35) |
(a)
Net investment income (loss) is affected by the timing of distributions from Underlying Funds.
(b)
Calculated based upon average shares outstanding.
(c)
Includes adjustments in accordance with accounting principles generally accepted in the United States of America and as such, the net asset values for financial reporting purposes and the returns based upon those net asset values may differ from the net asset values and returns for shareholder transactions.
(d)
Includes interest expense, if applicable, each of which is less than 0.005% unless otherwise noted.
(e)
Does not include expenses of Underlying Funds.
158 | JPMorgan SmartRetirement Blend Funds
| |
Ratios/Supplemental data | |||||
| |
|
|
Ratios to average net assets |
| ||
| Net asset value, end of period |
Total return(c) |
Net assets, end of period (000’s) |
Net expenses(d)(e) |
Net investment income (loss)(a) |
Expenses without waivers and reimbursements(e) |
Portfolio turnover rate |
| |
|
|
|
|
|
|
| |
|
|
|
|
|
|
| $27.16 |
13.22% |
$3,010 |
0.31% |
1.90% |
0.51% |
22% |
| 24.42 |
(15.25) |
5,656 |
0.30 |
2.07 |
0.50 |
30 |
| 30.22 |
34.02 |
8,625 |
0.32 |
1.69 |
0.53 |
41 |
| 22.92 |
0.48 |
6,039 |
0.39 |
1.62 |
0.62 |
45 |
| 23.27 |
5.62 |
16,102 |
0.37 |
2.04 |
0.63 |
18 |
November 1, 2023 | 159
Financial Highlights (continued)
| |
|
Per share operating performance | |||||
| |
|
Investment operations |
Distributions | ||||
| |
Net asset value, beginning of period |
Net investment income (loss)(a)(b) |
Net realized and unrealized gains (losses) on investments |
Total from investment operations |
Net investment income |
Net realized gain |
Total distributions |
| JPMorgan SmartRetirement® Blend 2045 Fund |
|
|
|
|
|
|
|
| Class I |
|
|
|
|
|
|
|
| Year Ended June 30, 2023 |
$25.07 |
$0.49 |
$3.06 |
$3.55 |
$(0.43) |
$— |
$(0.43) |
| Year Ended June 30, 2022 |
31.00 |
0.61 |
(5.18) |
(4.57) |
(0.47) |
(0.89) |
(1.36) |
| Year Ended June 30, 2021 |
22.97 |
0.45 |
8.02 |
8.47 |
(0.44) |
— |
(0.44) |
| Year Ended June 30, 2020 |
23.43 |
0.36 |
(0.41) |
(0.05) |
(0.36) |
(0.05) |
(0.41) |
| Year Ended June 30, 2019 |
23.39 |
0.41 |
0.79 |
1.20 |
(0.48) |
(0.68) |
(1.16) |
(a)
Net investment income (loss) is affected by the timing of distributions from Underlying Funds.
(b)
Calculated based upon average shares outstanding.
(c)
Includes adjustments in accordance with accounting principles generally accepted in the United States of America and as such, the net asset values for financial reporting purposes and the returns based upon those net asset values may differ from the
net asset values and returns for shareholder transactions.
net asset values and returns for shareholder transactions.
(d)
Includes interest expense, if applicable, each of which is less than 0.005% unless otherwise noted.
(e)
Does not include expenses of Underlying Funds.
160 | JPMorgan SmartRetirement Blend Funds
| |
Ratios/Supplemental data | |||||
| |
|
|
Ratios to average net assets |
| ||
| Net asset value, end of period |
Total return(c) |
Net assets, end of period (000’s) |
Net expenses(d)(e) |
Net investment income (loss)(a) |
Expenses without waivers and reimbursements(e) |
Portfolio turnover rate |
| |
|
|
|
|
|
|
| |
|
|
|
|
|
|
| $28.19 |
14.38% |
$5,768 |
0.33% |
1.87% |
0.50% |
22% |
| 25.07 |
(15.55) |
7,763 |
0.32 |
2.05 |
0.50 |
26 |
| 31.00 |
37.07 |
10,992 |
0.34 |
1.63 |
0.53 |
36 |
| 22.97 |
(0.24) |
6,487 |
0.41 |
1.56 |
0.62 |
56 |
| 23.43 |
5.58 |
7,330 |
0.38 |
1.80 |
0.64 |
21 |
November 1, 2023 | 161
Financial Highlights (continued)
| |
|
Per share operating performance | |||||
| |
|
Investment operations |
Distributions | ||||
| |
Net asset value, beginning of period |
Net investment income (loss)(a)(b) |
Net realized and unrealized gains (losses) on investments |
Total from investment operations |
Net investment income |
Net realized gain |
Total distributions |
| JPMorgan SmartRetirement® Blend 2050 Fund |
|
|
|
|
|
|
|
| Class I |
|
|
|
|
|
|
|
| Year Ended June 30, 2023 |
$25.03 |
$0.40 |
$3.22 |
$3.62 |
$(0.35) |
$— |
$(0.35) |
| Year Ended June 30, 2022 |
31.00 |
0.61 |
(5.19) |
(4.58) |
(0.47) |
(0.92) |
(1.39) |
| Year Ended June 30, 2021 |
22.96 |
0.44 |
8.04 |
8.48 |
(0.44) |
— |
(0.44) |
| Year Ended June 30, 2020 |
23.37 |
0.36 |
(0.36) |
— |
(0.34) |
(0.07) |
(0.41) |
| Year Ended June 30, 2019 |
23.40 |
0.40 |
0.79 |
1.19 |
(0.47) |
(0.75) |
(1.22) |
(a)
Net investment income (loss) is affected by the timing of distributions from Underlying Funds.
(b)
Calculated based upon average shares outstanding.
(c)
Includes adjustments in accordance with accounting principles generally accepted in the United States of America and as such, the net asset values for financial reporting purposes and the returns based upon those net asset values may differ from the net asset values and returns for shareholder transactions.
(d)
Includes interest expense, if applicable, each of which is less than 0.005% unless otherwise noted.
(e)
Does not include expenses of Underlying Funds.
162 | JPMorgan SmartRetirement Blend Funds
| |
Ratios/Supplemental data | |||||
| |
|
|
Ratios to average net assets |
| ||
| Net asset value, end of period |
Total return(c) |
Net assets, end of period (000’s) |
Net expenses(d)(e) |
Net investment income (loss)(a) |
Expenses without waivers and reimbursements(e) |
Portfolio turnover rate |
| |
|
|
|
|
|
|
| |
|
|
|
|
|
|
| $28.30 |
14.63% |
$804 |
0.34% |
1.54% |
0.51% |
21% |
| 25.03 |
(15.62) |
2,505 |
0.33 |
2.03 |
0.50 |
30 |
| 31.00 |
37.14 |
4,604 |
0.34 |
1.61 |
0.55 |
35 |
| 22.96 |
(0.03) |
3,183 |
0.41 |
1.51 |
0.64 |
46 |
| 23.37 |
5.60 |
7,583 |
0.37 |
1.72 |
0.66 |
21 |
November 1, 2023 | 163
Financial Highlights (continued)
| |
|
Per share operating performance | |||||
| |
|
Investment operations |
Distributions | ||||
| |
Net asset value, beginning of period |
Net investment income (loss)(a)(b) |
Net realized and unrealized gains (losses) on investments |
Total from investment operations |
Net investment income |
Net realized gain |
Total distributions |
| JPMorgan SmartRetirement® Blend 2055 Fund |
|
|
|
|
|
|
|
| Class I |
|
|
|
|
|
|
|
| Year Ended June 30, 2023 |
$24.84 |
$0.45 |
$3.13 |
$3.58 |
$(0.40) |
$— |
$(0.40) |
| Year Ended June 30, 2022 |
30.75 |
0.60 |
(5.12) |
(4.52) |
(0.46) |
(0.93) |
(1.39) |
| Year Ended June 30, 2021 |
22.77 |
0.46 |
7.95 |
8.41 |
(0.43) |
— |
(0.43) |
| Year Ended June 30, 2020 |
23.18 |
0.36 |
(0.39) |
(0.03) |
(0.34) |
(0.04) |
(0.38) |
| Year Ended June 30, 2019 |
23.01 |
0.39 |
0.80 |
1.19 |
(0.47) |
(0.55) |
(1.02) |
(a)
Net investment income (loss) is affected by the timing of distributions from Underlying Funds.
(b)
Calculated based upon average shares outstanding.
(c)
Includes adjustments in accordance with accounting principles generally accepted in the United States of America and as such, the net asset values for financial reporting purposes and the returns based upon those net asset values may differ from the net asset values and returns for shareholder transactions.
(d)
Includes interest expense, if applicable, each of which is less than 0.005% unless otherwise noted.
(e)
Does not include expenses of Underlying Funds.
164 | JPMorgan SmartRetirement Blend Funds
| |
Ratios/Supplemental data | |||||
| |
|
|
Ratios to average net assets |
| ||
| Net asset value, end of period |
Total return(c) |
Net assets, end of period (000’s) |
Net expenses(d)(e) |
Net investment income (loss)(a) |
Expenses without waivers and reimbursements(e) |
Portfolio turnover rate |
| |
|
|
|
|
|
|
| |
|
|
|
|
|
|
| $28.02 |
14.62% |
$1,361 |
0.34% |
1.73% |
0.55% |
19% |
| 24.84 |
(15.52) |
2,092 |
0.33 |
2.03 |
0.52 |
30 |
| 30.75 |
37.13 |
3,117 |
0.34 |
1.66 |
0.56 |
38 |
| 22.77 |
(0.15) |
1,803 |
0.41 |
1.55 |
0.72 |
54 |
| 23.18 |
5.57 |
2,906 |
0.38 |
1.72 |
0.73 |
21 |
November 1, 2023 | 165
Financial Highlights (continued)
| |
|
Per share operating performance | |||||
| |
|
Investment operations |
Distributions | ||||
| |
Net asset value, beginning of period |
Net investment income (loss)(a)(b) |
Net realized and unrealized gains (losses) on investments |
Total from investment operations |
Net investment income |
Net realized gain |
Total distributions |
| JPMorgan SmartRetirement® Blend 2060 Fund |
|
|
|
|
|
|
|
| Class I |
|
|
|
|
|
|
|
| Year Ended June 30, 2023 |
$19.37 |
$0.38 |
$2.42 |
$2.80 |
$(0.34) |
$— |
$(0.34) |
| Year Ended June 30, 2022 |
23.77 |
0.86 |
(4.36) |
(3.50) |
(0.36) |
(0.54) |
(0.90) |
| Year Ended June 30, 2021 |
17.63 |
0.35 |
6.12 |
6.47 |
(0.33) |
— |
(0.33) |
| Year Ended June 30, 2020 |
17.96 |
0.23 |
(0.26) |
(0.03) |
(0.26) |
(0.04) |
(0.30) |
| Year Ended June 30, 2019 |
17.49 |
0.32 |
0.66 |
0.98 |
(0.35) |
(0.16) |
(0.51) |
(a)
Net investment income (loss) is affected by the timing of distributions from Underlying Funds.
(b)
Calculated based upon average shares outstanding.
(c)
Includes adjustments in accordance with accounting principles generally accepted in the United States of America and as such, the net asset values for financial reporting purposes and the returns based upon those net asset values may differ from the net asset values and returns for shareholder transactions.
(d)
Includes interest expense, if applicable, each of which is less than 0.005% unless otherwise noted.
(e)
Does not include expenses of Underlying Funds.
166 | JPMorgan SmartRetirement Blend Funds
| |
Ratios/Supplemental data | |||||
| |
|
|
Ratios to average net assets |
| ||
| Net asset value, end of period |
Total return(c) |
Net assets, end of period (000’s) |
Net expenses(d)(e) |
Net investment income (loss)(a) |
Expenses without waivers and reimbursements(e) |
Portfolio turnover rate |
| |
|
|
|
|
|
|
| |
|
|
|
|
|
|
| $21.83 |
14.65% |
$10,506 |
0.34% |
1.87% |
0.55% |
18% |
| 19.37 |
(15.42) |
9,233 |
0.33 |
4.00 |
0.62 |
21 |
| 23.77 |
36.93 |
540 |
0.34 |
1.63 |
0.66 |
34 |
| 17.63 |
(0.19) |
250 |
0.41 |
1.27 |
1.77 |
53 |
| 17.96 |
5.83 |
534 |
0.38 |
1.87 |
1.53 |
34 |
November 1, 2023 | 167
Financial Highlights (continued)
| |
Per share operating performance | |||||
| |
|
Investment operations |
Distributions |
| ||
| |
Net asset value, beginning of period |
Net investment income (loss)(b)(c) |
Net realized and unrealized gains (losses) on investments |
Total from investment operations |
Net investment income |
Net asset value, end of period |
| JPMorgan SmartRetirement® Blend 2065 Fund |
|
|
|
|
|
|
| Class I |
|
|
|
|
|
|
| November 1, 2022 (i) through June 30, 2023 |
$15.00 |
$0.24 |
$2.04 |
$2.28 |
$(0.09) |
$17.19 |
(a)
Annualized for periods less than one year, unless otherwise noted.
(b)
Net investment income (loss) is affected by the timing of distributions from Underlying Funds.
(c)
Calculated based upon average shares outstanding.
(d)
Not annualized for periods less than one year.
(e)
Includes adjustments in accordance with accounting principles generally accepted in the United States of America and as such, the net asset values for financial reporting purposes and the returns based upon those net asset values may differ from the net asset values and returns for shareholder transactions.
(f)
Does not include expenses of underlying Funds.
(g)
Includes interest expense, if applicable, each of which is less than 0.005% unless otherwise noted.
(h)
Certain non-recurring expenses incurred by the Fund were not annualized for the period indicated.
(i)
Commencement of operations.
168 | JPMorgan SmartRetirement Blend Funds
| Ratios/Supplemental data | |||||
| |
|
Ratios to average net assets(a) |
| ||
| Total return(d)(e) |
Net assets, end of period (000’s) |
Net expenses(f)(g)(h) |
Net investment income (loss)(b)(h) |
Expenses without waivers and reimbursements(f)(h) |
Portfolio turnover rate(d) |
| |
|
|
|
|
|
| |
|
|
|
|
|
| 15.25% |
$23 |
0.33% |
2.29% |
16.89% |
29% |
November 1, 2023 | 169
How to Reach Us
MORE INFORMATION
For investors who want more information on these Funds the following documents are available free upon request:
ANNUAL AND SEMI-ANNUAL REPORTS
Our annual and semi-annual reports contain more information about each Fund’s investments and performance. The annual report also includes details about the market conditions and investment strategies that had a significant effect on each Fund’s performance during the last fiscal year.
STATEMENT OF ADDITIONAL INFORMATION (SAI)
The SAI contains more detailed information about the Funds and their policies. It is incorporated by reference into this prospectus. That means, by law, it is considered to be part of this prospectus.
You can get a free copy of these documents and other information, or ask us any questions, by calling us at 1-800-480-4111 or writing to:
J.P. Morgan Funds Services
P.O. Box 219143
Kansas City, MO 64121-9143
P.O. Box 219143
Kansas City, MO 64121-9143
If you buy your shares through a Financial Intermediary, you should contact that Financial Intermediary directly for more information. You can also find information online at www.jpmorganfunds.com.
Reports, a copy of the SAI and other information about the Funds are also available on the EDGAR Database on the Commission’s Internet site at http://www.sec.gov, and copies of this information may be obtained, after paying a duplicating fee, by electronic request at the following E-mail address: publicinfo@sec.gov.
Investment Company Act File No. for each of the Funds is 811-21295.
©JPMorgan Chase & Co., 2023. All rights reserved. November 2023.


PR-SRBI-1123