Prospectus
J.P. Morgan International Equity Funds
Class A, Class C, Class I, & Class L* Shares
March 1, 2023
JPMorgan Emerging Markets Equity Fund*
Class/Ticker: A/JFAMX; C/JEMCX; I/JEMSX; L/JMIEX
JPMorgan Emerging Markets Research Enhanced Equity Fund
Class/Ticker: I/EMREX
JPMorgan Europe Dynamic Fund
Class/Ticker: A/VEUAX; C/VEUCX; I/JFESX; L/JFEIX
JPMorgan International Equity Fund
Class/Ticker: A/JSEAX; C/JIECX; I/VSIEX
JPMorgan International Focus Fund
Class/Ticker: A/IUAEX; C/IUCEX; I/IUESX
JPMorgan International Hedged Equity Fund
Class/Ticker: A/JIHAX; C/JIHCX; I/JIHIX
JPMorgan International Value Fund
Class/Ticker: A/JFEAX; C/JIUCX; I/JIESX; L/JNUSX
* Closed to new investors.
The Securities and Exchange Commission and the Commodity Futures Trading Commission have not approved or disapproved of these securities or determined if this prospectus is truthful or complete. Any representation to the contrary is a criminal offense.

Contents
| | |
| 1 | |
| 7 | |
| 13 | |
| 19 | |
| 25 | |
| 30 | |
| 36 | |
| 42 | |
| 49 | |
| 55 | |
| 61 | |
| 61 | |
| 68 | |
| 81 | |
| 81 | |
| 81 | |
| 82 | |
| 82 |
| 82 | |
| 83 | |
| 86 | |
| 86 | |
| 91 | |
| 97 | |
| 100 | |
| 101 | |
| 104 | |
| 104 | |
| 106 | |
| 107 | |
| 108 | |
| 110 | |
| 111 | |
| 111 | |
| 112 | |
| 114 | |
| 128 | |
| 136 | |
| Back cover |
JPMorgan Emerging Markets Equity Fund
| | |||
| |
Class A |
Class C |
Class I |
| Maximum Sales Charge (Load) Imposed on Purchases as % of the Offering Price |
|
|
|
| Maximum Deferred Sales Charge (Load) as % of Original Cost of the Shares |
1 |
|
|
1
| | |||
| |
Class A |
Class C |
Class I |
| Management Fees |
|
|
|
| Distribution (Rule 12b-1) Fees |
|
|
|
| Other Expenses |
|
|
|
| Service Fees |
|
|
|
| Remainder of Other Expenses |
|
|
|
| Total Annual Fund Operating Expenses |
|
|
|
| Fee Waivers and/or Expense Reimbursements1 |
- |
- |
- |
| Total Annual Fund Operating Expenses after Fee Waivers and/or Expense Reimburse- ments1 |
|
|
|
1
March 1, 2023 | 1
JPMorgan Emerging Markets Equity Fund (continued)
| | ||||
| |
1 Year |
3 Years |
5 Years |
10 Years |
| CLASS A SHARES ($) |
|
|
|
|
| CLASS C SHARES ($) |
|
|
|
|
| CLASS I SHARES ($) |
|
|
|
|
| | ||||
| |
1 Year |
3 Years |
5 Years |
10 Years |
| CLASS A SHARES ($) |
|
|
|
|
| CLASS C SHARES ($) |
|
|
|
|
| CLASS I SHARES ($) |
|
|
|
|
2 | J.P. Morgan International Equity Funds
March 1, 2023 | 3
JPMorgan Emerging Markets Equity Fund (continued)
4 | J.P. Morgan International Equity Funds
March 1, 2023 | 5
JPMorgan Emerging Markets Equity Fund (continued)
| |

| |
|
|
| |
|
|
| | |||
| |
Past 1 Year |
Past 5 Years |
Past 10 Years |
| CLASS I SHARES |
|
|
|
| Return Before Taxes |
- |
- |
|
| Return After Taxes on Distributions |
- |
- |
|
| Return After Taxes on Distributions and Sale of Fund Shares |
- |
|
|
| CLASS A SHARES |
|
|
|
| Return Before Taxes |
- |
- |
|
| CLASS C SHARES |
|
|
|
| Return Before Taxes |
- |
- |
|
| MSCI EMERGING MARKETS INDEX (Net Total Return) (Reflects No Deduction for Fees, Expenses, or Taxes, Except Foreign Withholding Taxes) |
- |
- |
|
Management
J.P. Morgan Investment Management Inc. (the adviser)
| Portfolio Manager |
Managed the Fund Since |
Primary Title with Investment Adviser |
| Leon Eidelman |
2013 |
Managing Director |
| Austin Forey |
2005 |
Managing Director |
| Amit Mehta |
2013 |
Managing Director |
Purchase and Sale of Fund Shares
Purchase minimums
| For Class A and Class C Shares |
|
| To establish an account |
$1,000 |
| To add to an account |
$50 |
| For Class I Shares |
|
| To establish an account |
$1,000,000 |
| To add to an account |
No minimum levels |
In general, you may purchase or redeem shares on any business day:
•
Through your Financial Intermediary
•
By writing to J.P. Morgan Funds Services, P.O. Box 219143, Kansas City, MO 64121-9143
•
After you open an account, by calling J.P. Morgan Funds Services at 1-800-480-4111
Tax Information
The Fund intends to make distributions that may be taxed as ordinary income or capital gains, except when your investment is in an IRA, 401(k) plan or other tax-advantaged investment plan, in which case you may be subject to federal income tax upon withdrawal from the tax-advantaged investment plan.
Payments to Broker-Dealers and Other Financial Intermediaries
If you purchase shares of the Fund through a broker-dealer or other financial intermediary (such as a bank), the Fund and its related companies may pay the financial intermediary for the sale of Fund shares and related services. These payments may create a conflict of interest by influencing the broker-dealer or financial intermediary and your salesperson to recommend the Fund over another investment. Ask your salesperson or visit your financial intermediary’s website for more information.
6 | J.P. Morgan International Equity Funds
JPMorgan Emerging Markets Equity Fund
| | |
| |
Class L |
| Management Fees |
|
| Distribution (Rule 12b-1) Fees |
|
| Other Expenses |
|
| Service Fees |
|
| Remainder of Other Expenses |
|
| Total Annual Fund Operating Expenses |
|
| | ||||
| |
1 Year |
3 Years |
5 Years |
10 Years |
| CLASS L SHARES ($) |
|
|
|
|
March 1, 2023 | 7
JPMorgan Emerging Markets Equity Fund (continued)
8 | J.P. Morgan International Equity Funds
March 1, 2023 | 9
JPMorgan Emerging Markets Equity Fund (continued)
10 | J.P. Morgan International Equity Funds
| |

| |
|
|
| |
|
|
| | |||
| |
Past 1 Year |
Past 5 Years |
Past 10 Years |
| CLASS L SHARES |
|
|
|
| Return Before Taxes |
- |
- |
|
| Return After Taxes on Distributions |
- |
- |
|
| Return After Taxes on Distributions and Sale of Fund Shares |
- |
|
|
| MSCI EMERGING MARKETS INDEX (Net Total Return) (Reflects No Deduction for Fees, Expenses, or Taxes, Except Foreign Withholding Taxes) |
- |
- |
|
Management
J.P. Morgan Investment Management Inc. (the adviser)
| Portfolio Manager |
Managed the Fund Since |
Primary Title with Investment Adviser |
| Leon Eidelman |
2013 |
Managing Director |
| Austin Forey |
2005 |
Managing Director |
| Amit Mehta |
2013 |
Managing Director |
March 1, 2023 | 11
JPMorgan Emerging Markets Equity Fund (continued)
Purchase and Sale of Fund Shares
Class L Shares of the Fund are no longer generally available to new purchasers. Existing Class L shareholders can still purchase additional shares, reinvest their dividends and exchange into the Fund from other J.P. Morgan Funds. In addition, certain group employer benefits plans, certain discretionary fee-based advisory programs, college savings plans and other J.P. Morgan Funds can continue to purchase shares as described in “Investing with J.P. Morgan Funds — LIMITED OFFERING OF THE CLASS L SHARES” in the prospectus.
Purchase minimums
| For Class L Shares | |
| To establish an account |
$3,000,000 |
| To add to an account |
No minimum levels |
In general, you may purchase or redeem shares on any business day:
•
Through your Financial Intermediary
•
By writing to J.P. Morgan Funds Services, P.O. Box 219143, Kansas City, MO 64121-9143
•
After you open an account, by calling J.P. Morgan Funds Services at 1-800-480-4111
Tax Information
The Fund intends to make distributions that may be taxed as ordinary income or capital gains, except when your investment is in an IRA, 401(k) plan or other tax-advantaged investment plan, in which case you may be subject to federal income tax upon withdrawal from the tax-advantaged investment plan.
Payments to Broker-Dealers and Other Financial Intermediaries
If you purchase shares of the Fund through a broker-dealer or other financial intermediary (such as a bank), the Fund and its related companies may pay the financial intermediary for the sale of Fund shares and related services. These payments may create a conflict of interest by influencing the broker-dealer or financial intermediary and your salesperson to recommend the Fund over another investment. Ask your salesperson or visit your financial intermediary’s website for more information.
12 | J.P. Morgan International Equity Funds
JPMorgan Emerging Markets Research Enhanced Equity Fund
Class/Ticker: I/EMREX
What is the goal of the Fund?
The Fund seeks to provide long-term capital appreciation.
Fees and Expenses of the Fund
The following tables describe the fees and expenses that you may pay if you buy, hold and sell shares of the Fund. You may pay other fees, such as brokerage commissions and other fees to financial intermediaries, which are not reflected in the table and examples below.
| ANNUAL FUND OPERATING EXPENSES (Expenses that you pay each year as a percentage of the value of your investment) | |
| |
Class I |
| Management Fees |
0.25% |
| Distribution (Rule 12b-1) Fees |
NONE |
| Other Expenses |
0.43 |
| Service Fees |
0.25 |
| Remainder of Other Expenses |
0.18 |
| Total Annual Fund Operating Expenses |
0.68 |
| Fee Waivers and/or Expense Reimbursements1 |
-0.23 |
| Total Annual Fund Operating Expenses after Fee Waivers and/or Expense Reimbursements1 |
0.45 |
1
The Fund’s adviser and/or its affiliates have contractually agreed to waive fees and/or reimburse expenses to the extent Total Annual Fund Operating Expenses (excluding acquired fund fees and expenses other than certain money market fund fees as described below, dividend and interest expenses related to short sales, interest, taxes, expenses related to litigation and potential litigation, expenses related to trustee elections, and extraordinary expenses) exceed 0.45% of the average daily net assets of Class I Shares. The Fund may invest in one or more money market funds advised by the adviser or its affiliates (affiliated money market funds). The Fund’s adviser, shareholder servicing agent and/or administrator have contractually agreed to waive fees and/or reimburse expenses in an amount sufficient to offset the respective net fees each collects from the affiliated money market funds on the Fund’s investment in such money market funds. These waivers are in effect through 2/29/24, at which time it will be determined whether such waivers will be renewed or revised. To the extent that the Fund engages in securities lending, affiliated money market fund fees and expenses resulting from the Fund’s investment of cash received from securities lending borrowers are not included in Total Annual Fund Operating Expenses and therefore, the above waivers do not apply to such investments.
Example
This Example is intended to help you compare the cost of investing in the Fund with the cost of investing in other mutual funds. The Example assumes that you invest $10,000 in the Fund for the time periods indicated. The Example also assumes that your investment has a 5% return each year and that the Fund’s operating expenses are equal to the total annual fund operating expenses after fee waivers and expense reimburse
ments shown in the fee table through 2/29/24 and total annual fund operating expenses thereafter. Your actual costs may be higher or lower.
| WHETHER OR NOT YOU SELL YOUR SHARES, YOUR COST WOULD BE: | ||||
| |
1 Year |
3 Years |
5 Years |
10 Years |
| CLASS I SHARES ($) |
46 |
194 |
356 |
825 |
Portfolio Turnover
The Fund pays transaction costs, such as commissions, when it buys and sells securities (or “turns over” its portfolio). A higher portfolio turnover rate may indicate higher transaction costs and may result in higher taxes when Fund shares are held in a taxable account. These costs, which are not reflected in annual fund operating expenses or in the Example, affect the Fund’s performance. During the Fund’s most recent fiscal year, the Fund’s portfolio turnover rate was 34% of the average value of its portfolio.
What are the Fund’s main investment strategies?
Under normal circumstances, the Fund invests at least 80% of its Assets in equity securities and equity-related instruments that are tied economically to emerging markets. “Assets” means net assets, plus the amount of borrowings for investment purposes. Emerging markets include most countries in the world except Australia, Canada, Japan, New Zealand, the United Kingdom, the United States, most of the countries of Western Europe and Hong Kong.
The equity securities and equity-related instruments in which the Fund may invest include, but are not limited to, common stock, preferred stock, convertible securities, trust or partner-ship interests, depositary receipts, real estate investment trusts (REITS), privately placed securities, warrants and rights, participation notes or other structured notes, and other instruments that provide economic exposure to one or more equity securities. Certain of the equity securities in which the Fund invests are expected to be issued by companies that rely on variable interest entity (“VIE”) structures. In implementing its strategy, the Fund seeks to construct a portfolio of long holdings that will outperform the Morgan Stanley Capital International (MSCI) Emerging Markets Index (net total return)1 (the Index) over time while maintaining similar risk characteristics, including sector and geographic risks. The Fund primarily invests in securities included within the universe of the Index, however, the Fund may also invest in securities not included within the Index or securities or instruments with similar economic characteristics.
March 1, 2023 | 13
JPMorgan Emerging Markets Research Enhanced Equity Fund (continued)
The Fund may invest in securities across all market capitalizations, although the Fund may invest a significant portion of its assets in companies of any one particular market capitalization category.
Within each sector, the Fund may modestly overweight equity securities that it considers undervalued while modestly under-weighting or not holding equity securities that appear over-valued. By emphasizing investment in equity securities that appear undervalued or fairly valued, the Fund seeks returns that modestly exceed those of the Index over the long term with a modest level of volatility.
The Fund may use exchange-traded funds and exchange-traded futures to gain exposure to particular foreign securities or markets and for the efficient management of cash flows. The Fund may invest in securities denominated in any currency and may from time to time hedge a portion of its foreign currency exposure using currency forwards.
Securities and equity-related instruments tied economically to an emerging market include: (i) securities of issuers that are organized under the laws of an emerging markets country or that maintain their principal place of business in an emerging markets country; (ii) securities that are traded principally in an emerging market country; (iii) securities of issuers that, during their most recent fiscal year, derived at least 50% of their revenues or profits from goods produced or sold, investments made, or services performed in an emerging markets country or that have at least 50% of their assets in an emerging market country; or (iv) securities or other instruments that expose the Fund to the economic fortunes and risks of one or more emerging market countries.
Investment Process: In managing the Fund, the adviser combines fundamental research with a disciplined portfolio construction process. The adviser utilizes proprietary research, risk management techniques and individual security selection in constructing the Fund’s portfolio. In-depth, fundamental research into individual securities is conducted by research analysts who emphasize each issuer’s long-term prospects. This research allows the adviser to rank issuers within each sector group according to what it believes to be their relative value.
The adviser will ordinarily overweight securities which it deems to be attractive and underweight or not hold those securities which it believes are unattractive. The adviser may sell a security as its valuations or rankings change or if more attractive investments become available.
As part of its investment process, the adviser seeks to assess the impact of environmental, social and governance (ESG) factors on many issuers in the universe in which the Fund invests. The adviser’s assessment is based on an analysis of key opportunities and risks across industries to seek to identify financially material issues with respect to the Fund’s invest
ments in securities and ascertain key issues that merit engagement with issuers. These assessments may not be conclusive and securities of issuers may be purchased and retained by the Fund for reasons other than material ESG factors while the Fund may divest or not invest in securities of issuers that may be positively impacted by such factors.
The Fund’s Main Investment Risks
The Fund is subject to management risk and may not achieve its objective if the adviser’s expectations regarding particular instruments or markets are not met.
An investment in this Fund or any other fund may not provide a complete investment program. The suitability of an investment in the Fund should be considered based on the investment objective, strategies and risks described in this prospectus, considered in light of all of the other investments in your portfolio, as well as your risk tolerance, financial goals and time horizons. You may want to consult with a financial advisor to determine if this Fund is suitable for you.
The Fund is subject to the main risks noted below, any of which may adversely affect the Fund’s performance and ability to meet its investment objective.
Foreign Securities and Emerging Markets Risk. Investments in foreign issuers and foreign securities (including depositary receipts) are subject to additional risks, including political and economic risks, unstable governments, civil conflicts and war, greater volatility, decreased market liquidity, expropriation and nationalization risks, sanctions or other measures by the United States or other governments, currency fluctuations, higher transaction costs, delayed settlement, possible foreign controls on investment, and less stringent investor protection and disclosure standards of foreign markets. In certain markets where securities and other instruments are not traded “delivery versus payment,” the Fund may not receive timely payment for securities or other instruments it has delivered or receive delivery of securities paid for and may be subject to increased risk that the counterparty will fail to make payments or delivery when due or default completely. Foreign market trading hours, clearance and settlement procedures, and holiday schedules may limit the Fund’s ability to buy and sell securities.
Events and evolving conditions in certain economies or markets may alter the risks associated with investments tied to countries or regions that historically were perceived as comparatively stable becoming riskier and more volatile. These risks are magnified in “emerging markets.” Emerging market countries typically have less established market economies than developed countries and may face greater social, economic, regulatory and political uncertainties. In addition, emerging markets typically present greater illiquidity and price volatility concerns due to smaller or limited local capital markets and greater difficulty in determining market valuations of securities due to limited public information on issuers. Certain emerging
1The index is a registered service mark of Morgan Stanley Capital International, which does not sponsor and is in no way affiliated with the Fund.
14 | J.P. Morgan International Equity Funds
market countries may be subject to less stringent requirements regarding accounting, auditing, financial reporting and record keeping and therefore, material information related to an investment may not be available or reliable. Additionally, the Fund may have substantial difficulties exercising its legal rights or enforcing a counterparty’s legal obligations in certain jurisdictions outside of the United States, in particular in emerging markets countries, which can increase the risks of loss.
Geographic Focus Risk. The Fund may focus its investments in one or more regions or small groups of countries. As a result, the Fund’s performance may be subject to greater volatility than a more geographically diversified fund.
Depositary Receipts Risk. The Fund’s investments may take the form of depositary receipts, including unsponsored depositary receipts. Unsponsored depositary receipts may not provide as much information about the underlying issuer and may not carry the same voting privileges as sponsored depositary receipts. Unsponsored depositary receipts are issued by one or more depositaries in response to market demand, but without a formal agreement with the company that issues the underlying securities.
Equity Market Risk. The price of equity securities may rise or fall because of changes in the broad market or changes in a company’s financial condition, sometimes rapidly or unpredictably. These price movements may result from factors affecting individual companies, sectors or industries selected for the Fund’s portfolio or the securities market as a whole, such as changes in economic or political conditions. When the value of the Fund’s securities goes down, your investment in the Fund decreases in value.
General Market Risk. Economies and financial markets throughout the world are becoming increasingly interconnected, which increases the likelihood that events or conditions in one country or region will adversely impact markets or issuers in other countries or regions. Securities in the Fund’s portfolio may underperform in comparison to securities in general financial markets, a particular financial market or other asset classes due to a number of factors, including inflation (or expectations for inflation), deflation (or expectations for deflation), interest rates, global demand for particular products or resources, market instability, debt crises and downgrades, embargoes, tariffs, sanctions and other trade barriers, regulatory events, other governmental trade or market control programs and related geopolitical events. In addition, the value of the Fund’s investments may be negatively affected by the occurrence of global events such as war, terrorism, environmental disasters, natural disasters or events, country instability, and infectious disease epidemics or pandemics.
For example, the outbreak of COVID-19 has negatively affected economies, markets and individual companies throughout the world, including those in which the Fund invests. The effects of this pandemic to public health and business and market conditions, including, among other things, reduced consumer
demand and economic output, supply chain disruptions and increased government spending, may continue to have a significant negative impact on the performance of the Fund’s investments, increase the Fund’s volatility, exacerbate pre-existing political, social and economic risks to the Fund, and negatively impact broad segments of businesses and populations. In addition, governments, their regulatory agencies, or self-regulatory organizations have taken or may take actions in response to the pandemic that affect the instruments in which the Fund invests, or the issuers of such instruments, in ways that could have a significant negative impact on the Fund’s investment performance. The duration and extent of COVID-19 and associated economic and market conditions and uncertainty over the long-term cannot be reasonably estimated at this time. The ultimate impact of COVID-19 and the extent to which the associated conditions impact the Fund will also depend on future developments, which are highly uncertain, difficult to accurately predict and subject to frequent changes.
Smaller Company Risk. Investments in securities of smaller companies (mid cap and small cap companies) may be riskier, less liquid, more volatile and more vulnerable to economic, market and industry changes than securities of larger, more established companies. The securities of smaller companies may trade less frequently and in smaller volumes than securities of larger companies. As a result, changes in the price of securities issued by such companies may be more sudden or erratic than the prices of securities of large capitalization companies, especially over the short term. These risks are higher for small cap companies.
Real Estate Securities Risk. The Fund’s investments in real estate securities, including REITs, are subject to the same risks as direct investments in real estate and mortgages, and their value will depend on the value of the underlying real estate interests. These risks include default, prepayments, changes in value resulting from changes in interest rates and demand for real and rental property, and the management skill and credit-worthiness of REIT issuers. The Fund will indirectly bear its proportionate share of expenses, including management fees, paid by each REIT in which it invests in addition to the expenses of the Fund.
Greater China Region Risk. In addition to the risks listed under “Foreign Securities and Emerging Markets Risk,” investments in Mainland China, Hong Kong and Taiwan are subject to significant legal, regulatory, monetary and economic risks, as well as the potential for regional and global conflicts, including actions that are contrary to the interests of the U.S.
Investments in Mainland China involve political and legal uncertainties, currency fluctuations and aggressive currency controls, the risk of confiscatory taxation, and nationalization or expropriation of assets, which could adversely affect and significantly diminish the values of the Mainland Chinese companies in which the Fund invests. The Mainland Chinese securities markets are emerging markets characterized by
March 1, 2023 | 15
JPMorgan Emerging Markets Research Enhanced Equity Fund (continued)
greater price volatility. Mainland China is dominated by the one-party rule of the Communist Party, and the Mainland Chinese government exercises significant control over Mainland China’s economic growth. There is the potential of increased tariffs and restrictions on trade between the United States and Mainland China. An increase in tariffs or trade restrictions, or even the threat of such developments, could lead to a significant reduction in international trade, which could have a negative impact on Mainland Chinese companies and a commensurately negative impact on the Fund.
The political reunification of Mainland China and Taiwan, over which Mainland China continues to claim sovereignty, is a highly complex issue. There is the potential for future political, military or economic disturbances that may have an adverse impact on the values of the Fund’s investments in Mainland China and elsewhere, or make certain Fund investments impractical or impossible. Any escalation of hostility between Mainland China and Taiwan would likely have a significant adverse impact on the value and liquidity of the Fund’s investments in both Mainland China and elsewhere, causing substantial investment losses for the Fund.
Hong Kong is a Special Administrative Region of the People's Republic of China. Since Hong Kong reverted to Chinese sovereignty in 1997, it has been governed by the Basic Law. Under the Basic Law, Hong Kong was guaranteed a high degree of autonomy in certain matters, including economic matters, until 2047. Attempts by the government of Mainland China to exert greater control over Hong Kong’s economic, political or legal structures or its existing social policy could negatively affect investor confidence in Hong Kong (as has been the case previously during certain periods), which in turn could negatively affect markets and business performance.
Chinese operating companies sometimes rely on VIE structures to raise capital from non-Chinese investors, even though such arrangements are not formally recognized under Chinese law. In a VIE structure, a Mainland China-based operating company establishes an entity (typically offshore) that enters into service and other contracts with the Mainland Chinese company designed to provide economic exposure to the company. The offshore entity then issues exchange-traded shares that are sold to the public, including non-Chinese investors (such as the Fund). Shares of the offshore entity are not equity ownership interests in the Mainland Chinese operating company and therefore the ability of the offshore entity to control the activities at the Mainland Chinese company are limited and the Mainland Chinese company may engage in activities that negatively impact investment value. Under a VIE structure, the Fund will typically have little or no ability to influence the Mainland China-based operating company through proxy voting or other means because it is not a Mainland Chinese company owner/shareholder. The VIE structure is designed to provide the offshore entity (and in turn, investors in the entity) with economic exposure to the Mainland Chinese company that replicates equity ownership, without actual equity ownership of
the Mainland Chinese operating company. VIE structures are used due to Mainland Chinese government prohibitions on foreign ownership of companies in certain industries and it is not clear that the contracts are enforceable or that the structures will otherwise work as intended. Intervention by the Mainland Chinese government with respect to VIE structures could adversely affect the Mainland Chinese operating company’s performance, the enforceability of the offshore entity’s contractual arrangements with the Mainland Chinese company and the value of the offshore entity’s shares. If this were to occur, the market value of the Fund’s associated portfolio holdings would likely fall, causing substantial investment losses for the Fund.
Derivatives Risk. Derivatives, including futures and participation notes, may be riskier than other types of investments because they may be more sensitive to changes in economic or market conditions than other types of investments and could result in losses that significantly exceed the Fund’s original investment. Many derivatives create leverage thereby causing the Fund to be more volatile than it would be if it had not used derivatives. Certain derivatives also expose the Fund to counterparty risk (the risk that the derivative counterparty will not fulfill its contractual obligations), including credit risk of the derivative counterparty. Certain derivatives are synthetic instruments that attempt to replicate the performance of certain reference assets. With regard to such derivatives, the Fund does not have a claim on the reference assets and is subject to enhanced counterparty risk.
Convertible Securities Risk. The value of convertible securities tends to decline as interest rates rise and, because of the conversion feature, tends to vary with fluctuations in the market value of the underlying securities.
Privately Placed Securities Risk. Privately placed securities generally are less liquid than publicly traded securities and the Fund may not always be able to sell such securities without experiencing delays in finding buyers or reducing the sale price for such securities. The disposition of some of the securities held by the Fund may be restricted under federal securities laws. As a result, the Fund may not be able to dispose of such investments at a time when, or at a price at which, it desires to do so and may have to bear expenses of registering these securities, if necessary. These securities may also be difficult to value.
Structured Instrument Risk. Instruments that have similar economic characteristics to equity securities, such as participation notes or other structured instruments (“structured instruments”), are structured, synthetic instruments that generally attempt to replicate the performance of a particular equity or market (“reference assets”). There can be no assurance that structured instruments will trade at the same price or have the same value as the reference assets. In addition, structured instruments may be subject to transfer restrictions and may be illiquid or thinly traded and less liquid than other types of
16 | J.P. Morgan International Equity Funds
securities, which may also expose the Fund to risks of mispricing or improper valuation. Structured instruments typically are not secured by the reference assets and are therefore dependent solely upon the counterparty for repayment. Structured instruments also have the same risks associated with a direct investment in the reference assets.
Currency Risk. Changes in foreign currency exchange rates will affect the value of the Fund’s securities and the price of the Fund’s shares. Generally, when the value of the U.S. dollar rises in value relative to a foreign currency, an investment impacted by that currency loses value because that currency is worth less in U.S. dollars. Currency exchange rates may fluctuate significantly over short periods of time for a number of reasons, including changes in interest rates. Devaluation of a currency by a country’s government or banking authority also will have a significant impact on the value of any investments denominated in that currency. Currency markets generally are not as regulated as securities markets, may be riskier than other types of investments and may increase the volatility of the Fund. Although the Fund may attempt to hedge its currency exposure into the U.S. dollar, it may not be successful in reducing the effects of currency fluctuations. The Fund may also hedge from one foreign currency to another. In addition, the Fund’s use of currency hedging may not be successful and the use of such strategies may lower the Fund’s potential returns.
Industry and Sector Focus Risk. At times, the Fund may increase the relative emphasis of its investments in a particular industry or sector. The prices of securities of issuers in a particular industry or sector may be more susceptible to fluctuations due to changes in economic or business conditions, government regulations, availability of basic resources or supplies, or other events that affect that industry or sector more than securities of issuers in other industries and sectors. To the extent that the Fund increases the relative emphasis of its investments in a particular industry or sector, the value of the Fund’s shares may fluctuate in response to events affecting that industry or sector.
Exchange-Traded Fund (ETF) and Other Investment Company Risk. The Fund may invest in shares of other investment companies and ETFs. Shareholders bear both their proportionate share of the Fund’s expenses and similar expenses of the underlying investment company or ETF when the Fund invests in shares of another investment company or ETF. The Fund is subject to the risks associated with the ETF or investment company’s investments. The price and movement of an ETF designed to track an index may not track the index and may result in a loss. In addition, ETFs and investment companies may trade at a price above (premium) or below (discount) their net asset value, especially during periods of significant market volatility or stress, causing investors to pay significantly more or less than the value of the ETF’s underlying portfolio. Certain ETFs traded on exchanges may be thinly traded and experience large spreads between the “ask” price quoted by a seller and the “bid” price offered by a buyer.
Transactions Risk. The Fund could experience a loss and its liquidity may be negatively impacted when selling securities to meet redemption requests. The risk of loss increases if the redemption requests are unusually large or frequent or occur in times of overall market turmoil or declining prices. Similarly, large purchases of Fund shares may adversely affect the Fund’s performance to the extent that the Fund is delayed in investing new cash and is required to maintain a larger cash position than it ordinarily would.
Investments in the Fund are not deposits or obligations of, or guaranteed or endorsed by, any bank and are not insured or guaranteed by the FDIC, the Federal Reserve Board or any other government agency.
You could lose money investing in the Fund.
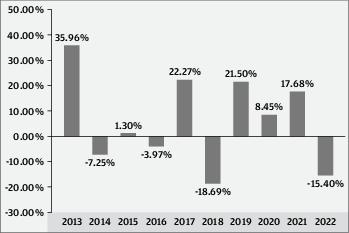
The Fund’s Past Performance
This section provides some indication of the risks of investing in the Fund. The bar chart shows how the performance of the Fund’s Class I Shares has varied from year to year for the past four calendar years. The table shows the average annual total returns for the past one year and life of the Fund. Performance shown for Class I Shares prior to its inception are based on Class R6 Shares (which are not offered in this prospectus). The actual returns for Class I Shares would have been lower than those shown because Class I Shares have higher expenses than Class R6 Shares. The table compares the Fund’s performance to the performance of the MSCI Emerging Markets Index (net total return). The MSCI Emerging Markets Index does not include the fees and expenses of the mutual funds in the index. Past performance (before and after taxes) is not necessarily an indication of how the Fund will perform in the future. Updated performance information is available by visiting www.jpmorganfunds.com or by calling 1-800-480-4111.
Source: MSCI. The MSCI information may only be used for your internal use, may not be reproduced or redisseminated in any form and may not be used as a basis for or a component of any financial instruments or products or indices. None of the MSCI information is intended to constitute investment advice or a recommendation to make (or refrain from making) any kind of investment decision and may not be relied on as such. Historical data and analysis should not be taken as an indication or guarantee of any future performance analysis, forecast, or prediction. The MSCI information is provided on an “as is” basis and the user of this information assumes the entire risk of any use made of this information. MSCI, each of its affiliates and each other person involved in or related to compiling, computing or creating any MSCI information (collectively, the “MSCI Parties”) expressly disclaims all warranties (including, without limitation, any warranties of originality, accuracy, completeness, timeliness, non-infringement, merchantability and fitness for a particular purpose) with respect to this information. Without limiting any of the foregoing, in no event shall any MSCI Party have any liability
March 1, 2023 | 17
JPMorgan Emerging Markets Research Enhanced Equity Fund (continued)
for any direct, indirect, special, incidental, punitive, consequential (including, without limitation, lost profits) or any other damages. (www.msci.com)
| YEAR-BY-YEAR RETURNS — CLASS I SHARES |

| Best Quarter |
4th quarter, 2020 |
21.17% |
| Worst Quarter |
1st quarter, 2020 |
-24.22% |
| AVERAGE ANNUAL TOTAL RETURNS (For periods ended December 31, 2022) | ||
| |
Past |
Life of Fund since |
| |
1 Year |
01/30/2019 |
| CLASS I SHARES |
|
|
| Return Before Taxes |
-21.47% |
2.12% |
| Return After Taxes on Distributions |
-21.80 |
1.54 |
| Return After Taxes on Distributions and Sale of Fund Shares |
-12.29 |
1.72 |
| MSCI EMERGING MARKETS INDEX (Net Total Return) (Reflects No Deduction for Fees, Expenses, or Taxes, Except Foreign Withholding Taxes) |
-20.09 |
2.26 |
Management
J.P. Morgan Investment Management Inc. (the adviser)
| Portfolio Manager |
Managed the Fund Since |
Primary Title with Investment Adviser |
| Lina Nassar |
2018 |
Vice President |
| Sonal Tanna |
2022 |
Managing Director |
Purchase and Sale of Fund Shares
Purchase minimums
| For Class I Shares |
|
| To establish an account |
$1,000,000 |
| To add to an account |
No minimum levels |
In general, you may purchase or redeem shares on any business day:
•
Through your Financial Intermediary
•
By writing to J.P. Morgan Funds Services, P.O. Box 219143, Kansas City, MO 64121-9143
•
After you open an account, by calling J.P. Morgan Funds Services at 1-800-480-4111
Tax Information
The Fund intends to make distributions that may be taxed as ordinary income or capital gains, except when your investment is in an IRA, 401(k) plan or other tax-advantaged investment plan, in which case you may be subject to federal income tax upon withdrawal from the tax-advantaged investment plan.
Payments to Broker-Dealers and Other Financial Intermediaries
If you purchase shares of the Fund through a broker-dealer or other financial intermediary (such as a bank), the Fund and its related companies may pay the financial intermediary for the sale of Fund shares and related services. These payments may create a conflict of interest by influencing the broker-dealer or financial intermediary and your salesperson to recommend the Fund over another investment. Ask your salesperson or visit your financial intermediary’s website for more information.
18 | J.P. Morgan International Equity Funds
JPMorgan Europe Dynamic Fund
| | |||
| |
Class A |
Class C |
Class I |
| Maximum Sales Charge (Load) Imposed on Purchases as % of the Offering Price |
|
|
|
| Maximum Deferred Sales Charge (Load) as % of Original Cost of the Shares |
1 |
|
|
1
| | |||
| |
Class A |
Class C |
Class I |
| Management Fees |
|
|
|
| Distribution (Rule 12b-1) Fees |
|
|
|
| Other Expenses |
|
|
|
| Service Fees |
|
|
|
| Remainder of Other Expenses |
|
|
|
| Acquired Fund Fees and Expenses |
|
|
|
| Total Annual Fund Operating Expenses |
|
|
|
| Fee Waivers and/or Expense Reimbursements1 |
- |
- |
- |
| Total Annual Fund Operating Expenses after Fee Waivers and/or Expense Reimburse- ments1 |
|
|
|
1
March 1, 2023 | 19
JPMorgan Europe Dynamic Fund (continued)
| | ||||
| |
1 Year |
3 Years |
5 Years |
10 Years |
| CLASS A SHARES ($) |
|
|
|
|
| CLASS C SHARES ($) |
|
|
|
|
| CLASS I SHARES ($) |
|
|
|
|
| | ||||
| |
1 Year |
3 Years |
5 Years |
10 Years |
| CLASS A SHARES ($) |
|
|
|
|
| CLASS C SHARES ($) |
|
|
|
|
| CLASS I SHARES ($) |
|
|
|
|
20 | J.P. Morgan International Equity Funds
March 1, 2023 | 21
JPMorgan Europe Dynamic Fund (continued)
22 | J.P. Morgan International Equity Funds
| |
| |
|
|
| |
|
|
| | |||
| |
Past 1 Year |
Past 5 Years |
Past 10 Years |
| CLASS A SHARES |
|
|
|
| Return Before Taxes |
- |
|
|
| Return After Taxes on Distributions |
- |
- |
|
| Return After Taxes on Distributions and Sale of Fund Shares |
- |
|
|
| CLASS C SHARES |
|
|
|
| Return Before Taxes |
- |
|
|
| CLASS I SHARES |
|
|
|
| Return Before Taxes |
- |
|
|
| MSCI EUROPE INDEX (Net Total Return) (Reflects No Deduction for Fees, Expenses, or Taxes, Except Foreign Withholding Taxes) |
- |
|
|
Management
J.P. Morgan Investment Management Inc. (the adviser)
March 1, 2023 | 23
JPMorgan Europe Dynamic Fund (continued)
| Portfolio Manager |
Managed the Fund Since |
Primary Title with Investment Adviser |
| Jonathan Ingram |
2007 |
Managing Director |
| John Baker |
2005 |
Managing Director |
| Blake Crawford |
2019 |
Executive Director |
Purchase and Sale of Fund Shares
Purchase minimums
| For Class A and Class C Shares |
|
| To establish an account |
$1,000 |
| To add to an account |
$50 |
| For Class I Shares |
|
| To establish an account |
$1,000,000 |
| To add to an account |
No minimum levels |
In general, you may purchase or redeem shares on any business day:
•
Through your Financial Intermediary
•
By writing to J.P. Morgan Funds Services, P.O. Box 219143, Kansas City, MO 64121-9143
•
After you open an account, by calling J.P. Morgan Funds Services at 1-800-480-4111
Tax Information
The Fund intends to make distributions that may be taxed as ordinary income or capital gains, except when your investment is in an IRA, 401(k) plan or other tax-advantaged investment plan, in which case you may be subject to federal income tax upon withdrawal from the tax-advantaged investment plan.
Payments to Broker-Dealers and Other Financial Intermediaries
If you purchase shares of the Fund through a broker-dealer or other financial intermediary (such as a bank), the Fund and its related companies may pay the financial intermediary for the sale of Fund shares and related services. These payments may create a conflict of interest by influencing the broker-dealer or financial intermediary and your salesperson to recommend the Fund over another investment. Ask your salesperson or visit your financial intermediary’s website for more information.
24 | J.P. Morgan International Equity Funds
JPMorgan Europe Dynamic Fund
| | |
| |
Class L |
| Management Fees |
|
| Distribution (Rule 12b-1) Fees |
|
| Other Expenses |
|
| Service Fees |
|
| Remainder of Other Expenses |
|
| Acquired Fund Fees and Expenses |
|
| Total Annual Fund Operating Expenses |
|
| Fee Waivers and/or Expense Reimbursements1 |
- |
| Total Annual Fund Operating Expenses after Fee Waivers and/or Expense Reimbursements1 |
|
1
| | ||||
| |
1 Year |
3 Years |
5 Years |
10 Years |
| CLASS L SHARES ($) |
|
|
|
|
March 1, 2023 | 25
JPMorgan Europe Dynamic Fund (continued)
26 | J.P. Morgan International Equity Funds
March 1, 2023 | 27
JPMorgan Europe Dynamic Fund (continued)
28 | J.P. Morgan International Equity Funds
| |

| |
|
|
| |
|
|
| | |||
| |
Past 1 Year |
Past 5 Years |
Past 10 Years |
| CLASS L SHARES |
|
|
|
| Return Before Taxes |
- |
|
|
| Return After Taxes on Distributions |
- |
|
|
| Return After Taxes on Distributions and Sale of Fund Shares |
- |
|
|
| MSCI EUROPE INDEX (Net Total Return) (Reflects No Deduction for Fees, Expenses, or Taxes, Except Foreign Withholding Taxes) |
- |
|
|
Management
J.P. Morgan Investment Management Inc. (the adviser)
| Portfolio Manager |
Managed the Fund Since |
Primary Title with Investment Adviser |
| Jonathan Ingram |
2007 |
Managing Director |
| John Baker |
2005 |
Managing Director |
| Blake Crawford |
2019 |
Executive Director |
Purchase and Sale of Fund Shares
Class L Shares of the Fund are no longer generally available to new purchasers. Existing Class L shareholders can still purchase additional shares, reinvest their dividends and exchange into the Fund from other J.P. Morgan Funds. In addition, certain group employer benefits plans, certain discretionary fee-based advisory programs, college savings plans and other J.P. Morgan Funds can continue to purchase shares as described in “Investing with J.P. Morgan Funds — LIMITED OFFERING OF THE CLASS L SHARES” in the prospectus.
Purchase minimums
| For Class L Shares | |
| To establish an account |
$3,000,000 |
| To add to an account |
No minimum levels |
In general, you may purchase or redeem shares on any business day:
•
Through your Financial Intermediary
•
By writing to J.P. Morgan Funds Services, P.O. Box 219143, Kansas City, MO 64121-9143
•
After you open an account, by calling J.P. Morgan Funds Services at 1-800-480-4111
Tax Information
The Fund intends to make distributions that may be taxed as ordinary income or capital gains, except when your investment is in an IRA, 401(k) plan or other tax-advantaged investment plan, in which case you may be subject to federal income tax upon withdrawal from the tax-advantaged investment plan.
Payments to Broker-Dealers and Other Financial Intermediaries
If you purchase shares of the Fund through a broker-dealer or other financial intermediary (such as a bank), the Fund and its related companies may pay the financial intermediary for the sale of Fund shares and related services. These payments may create a conflict of interest by influencing the broker-dealer or financial intermediary and your salesperson to recommend the Fund over another investment. Ask your salesperson or visit your financial intermediary’s website for more information.
March 1, 2023 | 29
JPMorgan International Equity Fund
| | |||
| |
Class A |
Class C |
Class I |
| Maximum Sales Charge (Load) Imposed on Purchases as % of the Offering Price |
|
|
|
| Maximum Deferred Sales Charge (Load) as % of Original Cost of the Shares |
1 |
|
|
1
| | |||
| |
Class A |
Class C |
Class I |
| Management Fees |
|
|
|
| Distribution (Rule 12b-1) Fees |
|
|
|
| Other Expenses |
|
|
|
| Service Fees |
|
|
|
| Remainder of Other Expenses |
|
|
|
| Total Annual Fund Operating Expenses |
|
|
|
| Fee Waivers and/or Expense Reimbursements1 |
- |
- |
- |
| Total Annual Fund Operating Expenses after Fee Waivers and/or Expense Reimburse- ments1 |
|
|
|
1
| | ||||
| |
1 Year |
3 Years |
5 Years |
10 Years |
| CLASS A SHARES ($) |
|
|
|
|
| CLASS C SHARES ($) |
|
|
|
|
| CLASS I SHARES ($) |
|
|
|
|
| | ||||
| |
1 Year |
3 Years |
5 Years |
10 Years |
| CLASS A SHARES ($) |
|
|
|
|
| CLASS C SHARES ($) |
|
|
|
|
| CLASS I SHARES ($) |
|
|
|
|
30 | J.P. Morgan International Equity Funds
1MSCI EAFE Index is a registered service mark of MSCI, Inc., which does not sponsor and is in no way affiliated with the Fund.
March 1, 2023 | 31
JPMorgan International Equity Fund (continued)
32 | J.P. Morgan International Equity Funds
March 1, 2023 | 33
JPMorgan International Equity Fund (continued)
| |

| |
|
|
| |
|
|
| | |||
| |
Past 1 Year |
Past 5 Years |
Past 10 Years |
| CLASS I SHARES |
|
|
|
| Return Before Taxes |
- |
|
|
| Return After Taxes on Distributions |
- |
|
|
| Return After Taxes on Distributions and Sale of Fund Shares |
- |
|
|
| CLASS A SHARES |
|
|
|
| Return Before Taxes |
- |
- |
|
| CLASS C SHARES |
|
|
|
| Return Before Taxes |
- |
|
|
| MSCI EAFE INDEX (Net Total Return) (Reflects No Deduction for Fees, Expenses, or Taxes, Except Foreign Withholding Taxes) |
- |
|
|
Management
J.P. Morgan Investment Management Inc. (the adviser)
| Portfolio Manager |
Managed the Fund Since |
Primary Title with Investment Adviser |
| Thomas Murray |
2004 |
Managing Director |
| Shane Duffy |
2013 |
Managing Director |
| James Sutton |
2020 |
Executive Director |
| Zenah Shuhaiber |
2022 |
Executive Director |
Purchase and Sale of Fund Shares
Purchase minimums
| For Class A and Class C Shares |
|
| To establish an account |
$1,000 |
| To add to an account |
$50 |
| For Class I Shares |
|
| To establish an account |
$1,000,000 |
| To add to an account |
No minimum levels |
In general, you may purchase or redeem shares on any business day:
34 | J.P. Morgan International Equity Funds
•
Through your Financial Intermediary
•
By writing to J.P. Morgan Funds Services, P.O. Box 219143, Kansas City, MO 64121-9143
•
After you open an account, by calling J.P. Morgan Funds Services at 1-800-480-4111
Tax Information
The Fund intends to make distributions that may be taxed as ordinary income or capital gains, except when your investment is in an IRA, 401(k) plan or other tax-advantaged investment plan, in which case you may be subject to federal income tax upon withdrawal from the tax-advantaged investment plan.
Payments to Broker-Dealers and Other Financial Intermediaries
If you purchase shares of the Fund through a broker-dealer or other financial intermediary (such as a bank), the Fund and its related companies may pay the financial intermediary for the sale of Fund shares and related services. These payments may create a conflict of interest by influencing the broker-dealer or financial intermediary and your salesperson to recommend the Fund over another investment. Ask your salesperson or visit your financial intermediary’s website for more information.
March 1, 2023 | 35
JPMorgan International Focus Fund
| | |||
| |
Class A |
Class C |
Class I |
| Maximum Sales Charge (Load) Imposed on Purchases as % of the Offering Price |
|
|
|
| Maximum Deferred Sales Charge (Load) as % of Original Cost of the Shares |
1 |
|
|
1
| | |||
| |
Class A |
Class C |
Class I |
| Management Fees |
|
|
|
| Distribution (Rule 12b-1) Fees |
|
|
|
| Other Expenses |
|
|
|
| Service Fees |
|
|
|
| Remainder of Other Expenses |
|
|
|
| Total Annual Fund Operating Expenses |
|
|
|
| Fee Waivers and/or Expense Reimbursements1 |
- |
- |
- |
| Total Annual Fund Operating Expenses after Fee Waivers and/or Expense Reimburse- ments1 |
|
|
|
1
| | ||||
| |
1 Year |
3 Years |
5 Years |
10 Years |
| CLASS A SHARES ($) |
|
|
|
|
| CLASS C SHARES ($) |
|
|
|
|
| CLASS I SHARES ($) |
|
|
|
|
| | ||||
| |
1 Year |
3 Years |
5 Years |
10 Years |
| CLASS A SHARES ($) |
|
|
|
|
| CLASS C SHARES ($) |
|
|
|
|
| CLASS I SHARES ($) |
|
|
|
|
36 | J.P. Morgan International Equity Funds
March 1, 2023 | 37
JPMorgan International Focus Fund (continued)
38 | J.P. Morgan International Equity Funds
March 1, 2023 | 39
JPMorgan International Focus Fund (continued)
| |

| |
|
|
| |
|
|
| | |||
| |
Past 1 Year |
Past 5 Years |
Past 10 Years |
| CLASS I SHARES |
|
|
|
| Return Before Taxes |
- |
|
|
| Return After Taxes on Distributions |
- |
|
|
| Return After Taxes on Distributions and Sale of Fund Shares |
- |
|
|
| CLASS A SHARES |
|
|
|
| Return Before Taxes |
- |
|
|
| CLASS C SHARES |
|
|
|
| Return Before Taxes |
- |
|
|
| MSCI ACWI EX USA INDEX (Net Total Return) (Reflects No Deduction for Fees, Expenses, or Taxes, Except Foreign Withholding Taxes) |
- |
|
|
Management
J.P. Morgan Investment Management Inc. (the adviser)
| Portfolio Manager |
Managed the Fund Since |
Primary Title with Investment Adviser |
| Shane Duffy |
2011 |
Managing Director |
| Thomas Murray |
2011 |
Managing Director |
Purchase and Sale of Fund Shares
Purchase minimums
| For Class A and Class C Shares |
|
| To establish an account |
$1,000 |
| To add to an account |
$50 |
| For Class I Shares |
|
| To establish an account |
$1,000,000 |
| To add to an account |
No minimum levels |
In general, you may purchase or redeem shares on any business day:
•
Through your Financial Intermediary
40 | J.P. Morgan International Equity Funds
•
By writing to J.P. Morgan Funds Services, P.O. Box 219143, Kansas City, MO 64121-9143
•
After you open an account, by calling J.P. Morgan Funds Services at 1-800-480-4111
Tax Information
The Fund intends to make distributions that may be taxed as ordinary income or capital gains, except when your investment is in an IRA, 401(k) plan or other tax-advantaged investment plan, in which case you may be subject to federal income tax upon withdrawal from the tax-advantaged investment plan.
Payments to Broker-Dealers and Other Financial Intermediaries
If you purchase shares of the Fund through a broker-dealer or other financial intermediary (such as a bank), the Fund and its related companies may pay the financial intermediary for the sale of Fund shares and related services. These payments may create a conflict of interest by influencing the broker-dealer or financial intermediary and your salesperson to recommend the Fund over another investment. Ask your salesperson or visit your financial intermediary’s website for more information.
March 1, 2023 | 41
JPMorgan International Hedged Equity Fund
Class/Ticker: A/JIHAX; C/JIHCX; I/JIHIX
What is the goal of the Fund?
The Fund seeks to provide capital appreciation.
Fees and Expenses of the Fund
The following tables describe the fees and expenses that you may pay if you buy, hold and sell shares of the Fund. You may pay other fees, such as brokerage commissions and other fees to financial intermediaries, which are not reflected in the table and examples below. You may pay other fees, such as brokerage commissions and other fees to financial intermediaries, which are not reflected in the table and examples below. You may qualify for sales charge discounts on purchases of Class A Shares if you and your family invest, or agree to invest in the future, at least $50,000 in the J.P. Morgan Funds. More information about these and other discounts is available from your financial intermediary and in “Investing with J.P. Morgan Funds — SALES CHARGES AND FINANCIAL INTERMEDIARY COMPENSATION” on page 91 and in “Financial Intermediary-Specific Sales Charge Waivers” in Appendix A of the prospectus and in “PURCHASES, REDEMPTIONS AND EXCHANGES” in Appendix A to Part II of the Statement of Additional Information.
| SHAREHOLDER FEES (Fees paid directly from your investment) | |||
| |
Class A |
Class C |
Class I |
| Maximum Sales Charge (Load) Imposed on Purchases as a % of the Offering Price of Shares |
5.25% |
NONE |
NONE |
| Maximum Deferred Sales Charge (Load) as a % of the Original Cost of Shares |
NONE1 |
1.00% |
NONE |
1
For purchases under $1 million.
“Acquired Fund Fees and Expenses” are expenses incurred indirectly by the Fund through its ownership of shares in other investment companies, including affiliated money market funds, other mutual funds, exchange traded funds and business development companies. The impact of Acquired Fund Fees and Expenses is included in the total returns of the Fund. Acquired Fund Fees and Expenses are not direct costs of the Fund, are not used by the Fund to calculate its net asset value per share and are not included in the calculation of the ratio of expenses to average net assets shown in the Financial Highlights section of the Fund’s prospectus.
| ANNUAL FUND OPERATING EXPENSES (Expenses that you pay each year as a percentage of the value of your investment) | |||
| |
Class A |
Class C |
Class I |
| Management Fees |
0.25% |
0.25% |
0.25% |
| Distribution (Rule 12b-1) Fees |
0.25 |
0.75 |
NONE |
| Other Expenses |
0.57 |
0.58 |
0.56 |
| Service Fees |
0.25 |
0.25 |
0.25 |
| Remainder of Other Expenses |
0.32 |
0.33 |
0.31 |
| Acquired Fund Fees and Expenses |
0.01 |
0.01 |
0.01 |
| Total Annual Fund Operating Expenses |
1.08 |
1.59 |
0.82 |
| Fee Waivers and/or Expense Reimbursements1 |
-0.23 |
-0.24 |
-0.22 |
| Total Annual Fund Operating Expenses after Fee Waivers and/or Expense Reimburse- ments1 |
0.85 |
1.35 |
0.60 |
1
The Fund’s adviser and/or its affiliates have contractually agreed to waive fees and/or reimburse expenses to the extent Total Annual Fund Operating Expenses (excluding Acquired Fund Fees and Expenses, other than certain money market fund fees as described below, dividend and interest expenses related to short sales, interest, taxes, expenses related to litigation and potential litigation, expenses related to trustee elections, and extraordinary expenses) exceed 0.85%, 1.35% and 0.60% of the average daily net assets of Class A, Class C and Class I Shares, respectively. The Fund may invest in one or more money market funds advised by the adviser or its affiliates (affiliated money market funds). The Fund’s adviser, shareholder servicing agent and/or administrator have contractually agreed to waive fees and/or reimburse expenses in an amount sufficient to offset the respective net fees each collects from the affiliated money market funds on the Fund’s investment in such money market funds. These waivers are in effect through 2/29/24, at which time it will be determined whether such waivers will be renewed or revised. To the extent that the Fund engages in securities lending, affiliated money market fund fees and expenses resulting from the Fund’s investment of cash received from securities lending borrowers are not included in Total Annual Fund Operating Expenses and therefore, the above waivers do not apply to such investments.
Example
This Example is intended to help you compare the cost of investing in the Fund with the cost of investing in other mutual funds. The Example assumes that you invest $10,000 in the Fund for the time periods indicated. The Example also assumes that your investment has a 5% return each year and that the Fund’s operating expenses are equal to the total annual fund operating expenses after fee waivers and expense reimbursements shown in the fee table through 2/29/24 and total annual fund operating expenses thereafter. Your actual costs may be higher or lower.
42 | J.P. Morgan International Equity Funds
| IF YOU SELL YOUR SHARES, YOUR COST WOULD BE: | ||||
| |
1 Year |
3 Years |
5 Years |
10 Years |
| CLASS A SHARES ($) |
607 |
829 |
1,068 |
1,753 |
| CLASS C SHARES ($) |
237 |
478 |
843 |
1,732 |
| CLASS I SHARES ($) |
61 |
240 |
433 |
993 |
| IF YOU DO NOT SELL YOUR SHARES, YOUR COST WOULD BE: | ||||
| |
1 Year |
3 Years |
5 Years |
10 Years |
| CLASS A SHARES ($) |
607 |
829 |
1,068 |
1,753 |
| CLASS C SHARES ($) |
137 |
478 |
843 |
1,732 |
| CLASS I SHARES ($) |
61 |
240 |
433 |
993 |
Portfolio Turnover
The Fund pays transaction costs, such as commissions, when it buys and sells securities (or “turns over” its portfolio). A higher portfolio turnover rate may indicate higher transaction costs and may result in higher taxes when Fund shares are held in a taxable account. These costs, which are not reflected in annual fund operating expenses or in the Example, affect the Fund’s performance. During the Fund’s most recent fiscal year, the Fund’s portfolio turnover rate was 17% of the average value of its portfolio.
What are the Fund’s main investment strategies?
The Fund seeks to provide capital appreciation through participation in international equity markets while hedging overall market exposure relative to traditional long-only equity strategies.
Under normal circumstances, the Fund invests at least 80% of its Assets in equity securities. “Assets” means net assets plus the amount of borrowings for investment purposes. The Fund primarily invests in equity securities of foreign companies across all market capitalizations, including foreign subsidiaries of U.S. companies. The equity securities in which the Fund may invest include, but are not limited to, common stock, preferred stock, depositary receipts, privately placed securities and real estate investment trusts. In implementing its strategy, the Fund constructs a portfolio of long holdings that seeks to outperform the Morgan Stanley Capital International (MSCI) Europe, Australasia, Far East (EAFE) Index1 (net total return) (the Index) over time while maintaining similar risk characteristics, including sector and geographic risk. The Fund primarily invests in securities included within the universe of the Index, however, the Fund may also invest in securities not included within the Index.
Within each sector, the Fund may modestly overweight equity securities that it considers undervalued while modestly underweighting or not holding equity securities that appear overvalued. By emphasizing investment in equity securities that
appear undervalued or fairly valued, the Fund seeks to constitute a portfolio of long holdings with returns that modestly exceed those of the Index over the long term with a modest level of volatility.
The Fund’s options overlay strategy is intended to provide the Fund with downside protection, while foregoing some upside potential. The Fund will also systematically purchase and sell exchange traded put options and sell exchange traded call options, employing an option overlay known as a “Put/Spread Collar” strategy. A call option gives the buyer the right to buy, and obligates the seller of the option to sell, a security at a specified price at a future date. A put option gives the buyer the right to sell, and obligates the seller of the option to buy, a security at a specified price at a future date. The options may be based on the Index or on exchange-traded funds (ETFs) that seek to provide investment returns linked to the performance of the Index. The combination of the diversified portfolio of equity securities, the downside protection from put options and the income from the index call options is intended to provide the Fund with a portion of the returns associated with its long investments while exposing investors to less risk than traditional long-only equity strategies. Specifically, the Fund seeks to provide a competitive risk adjusted return over a full market cycle (defined as three to five years) relative to the Index with lower volatility than traditional long-only equity strategies.
The Fund may invest in securities denominated in any currency and may from time to time hedge a portion of its foreign currency exposure using currency forwards. An issuer of a security will be deemed to be located in a particular country if: (i) the principal trading market for the security is in such country, (ii) the issuer is organized under the laws of such country or (iii) the issuer derives at least 50% of its revenues or profits from such country or has at least 50% of its total assets situated in such country.
The Fund constructs a Put/Spread Collar by buying a put option on the Index or an ETF at a higher strike price and writing (or selling) a put option on the same instrument at a relatively lower strike price, resulting in what is known as a put option spread, while simultaneously selling an Index or ETF call option. The Fund may elect to construct additional Put/Spread Collars if the size of the Fund increases, either through purchases or appreciation. A put option spread seeks to protect the Fund against a decline in price, but only to the extent of the difference between the strike prices of the put option purchased and the put option sold. Entering into put option spreads is typically less expensive than a strategy of only purchasing put options and may benefit the Fund in a flat to upwardly moving market by reducing the cost of the downside protection; the downside protection of the put option spread, however, is limited as compared to just owning a put option. The premiums received
1MSCI EAFE Index is a registered service mark of Morgan Stanley Capital International, which does not sponsor and is in no way affiliated with the Fund.
March 1, 2023 | 43
JPMorgan International Hedged Equity Fund (continued)
from writing call options are intended to provide income which substantially offsets the cost of the put option spread, but writing the call options also reduces the Fund’s ability to profit from increases in the value of its equity portfolio because in rising markets the call option will be exercised once the market price rises to the option’s strike price.
In addition to the use of the Put/Spread Collar strategy described above, the Fund may use exchange-traded futures, primarily futures on indexes, to more effectively gain targeted equity exposure from its cash positions and to hedge the Fund’s portfolio if it is unable to purchase or write the necessary options for its overlay strategy and efficient management of cash flows.
Investment Process — Long Portfolio: In constructing its long portfolio, the adviser combines fundamental research with a disciplined portfolio construction process. The adviser utilizes proprietary research, risk management techniques and individual security selection in constructing the Fund’s portfolio. In-depth, fundamental research into individual securities is conducted by research analysts who emphasize each issuer’s long-term prospects. This research allows the adviser to rank issuers within each sector group according to what it believes to be their relative value. As part of its investment process, the adviser seeks to assess the impact of environmental, social and governance (ESG) factors on many issuers in the universe in which the Fund invests. The adviser’s assessment is based on an analysis of key opportunities and risks across industries to seek to identify financially material issues with respect to the Fund’s investments in securities and ascertain key issues that merit engagement with issuers. These assessments may not be conclusive and securities of issuers may be purchased and retained by the Fund for reasons other than material ESG factors while the Fund may divest or not invest in securities of issuers that may be positively impacted by such factors.
The adviser will ordinarily overweight securities which it deems to be attractive and underweight or not hold those securities which it believes are unattractive. The adviser may sell a security as its valuations or rankings change or if more attractive investments become available.
In managing the Fund, the adviser will seek to help manage risk in the Fund’s portfolio by investing in issuers in at least three foreign countries. However, the Fund may invest a substantial part of its assets in just one country.
Investment Process — Options Overlay Strategy: To implement the Put/Spread Collar strategy, the adviser utilizes exchange traded equity options based either on the Index or on ETFs that seek to provide investment returns linked to the performance of the Index. The Put/Spread Collar is constructed by buying a put option at a higher strike price while writing a put option at a relatively lower strike price and simultaneously selling a call option that substantially offsets the cost of the put option spread. The Put/Spread Collar strategy is an actively managed process and is designed to provide a continuous market hedge for the portfolio. The put option spread is generally maintained
at a level whereby the Fund is protected from a decrease in the market of five to twenty percent. The options are reset on at least a quarterly basis to seek to better capitalize on current market conditions and opportunities while seeking to provide predictable returns in all market cycles.
The Fund’s Main Investment Risks
The Fund is subject to management risk and may not achieve its objective if the adviser’s expectations regarding particular instruments or markets are not met.
An investment in this Fund or any other fund may not provide a complete investment program. The suitability of an investment in the Fund should be considered based on the investment objective, strategies and risks described in this prospectus, considered in light of all of the other investments in your portfolio, as well as your risk tolerance, financial goals and time horizons. You may want to consult with a financial advisor to determine if this Fund is suitable for you.
The Fund is subject to the main risks noted below, any of which may adversely affect the Fund’s performance and ability to meet its investment objective.
General Market Risk. Economies and financial markets throughout the world are becoming increasingly interconnected, which increases the likelihood that events or conditions in one country or region will adversely impact markets or issuers in other countries or regions. Securities in the Fund’s portfolio may underperform in comparison to securities in general financial markets, a particular financial market or other asset classes due to a number of factors, including inflation (or expectations for inflation), deflation (or expectations for deflation), interest rates, global demand for particular products or resources, market instability, debt crises and downgrades, embargoes, tariffs, sanctions and other trade barriers, regulatory events, other governmental trade or market control programs and related geopolitical events. In addition, the value of the Fund’s investments may be negatively affected by the occurrence of global events such as war, terrorism, environmental disasters, natural disasters or events, country instability, and infectious disease epidemics or pandemics.
For example, the outbreak of COVID-19 has negatively affected economies, markets and individual companies throughout the world, including those in which the Fund invests. The effects of this pandemic to public health and business and market conditions, including, among other things, reduced consumer demand and economic output, supply chain disruptions and increased government spending, may continue to have a significant negative impact on the performance of the Fund’s investments, increase the Fund’s volatility, exacerbate pre-existing political, social and economic risks to the Fund, and negatively impact broad segments of businesses and populations. In addition, governments, their regulatory agencies, or self-regulatory organizations have taken or may take actions in
44 | J.P. Morgan International Equity Funds
response to the pandemic that affect the instruments in which the Fund invests, or the issuers of such instruments, in ways that could have a significant negative impact on the Fund’s investment performance. The duration and extent of COVID-19 and associated economic and market conditions and uncertainty over the long-term cannot be reasonably estimated at this time. The ultimate impact of COVID-19 and the extent to which the associated conditions impact the Fund will also depend on future developments, which are highly uncertain, difficult to accurately predict and subject to frequent changes.
Equity Market Risk. The price of equity securities may rise or fall because of changes in the broad market or changes in a company’s financial condition, sometimes rapidly or unpredictably. These price movements may result from factors affecting individual companies, sectors or industries selected for the Fund’s portfolio or the securities market as a whole, such as changes in economic or political conditions. When the value of the Fund’s securities goes down, your investment in the Fund decreases in value.
Foreign Securities and Emerging Markets Risk. Investments in foreign issuers and foreign securities (including depositary receipts) are subject to additional risks, including political and economic risks, unstable governments, civil conflicts and war, greater volatility, decreased market liquidity, expropriation and nationalization risks, sanctions or other measures by the United States or other governments, currency fluctuations, higher transaction costs, delayed settlement, possible foreign controls on investment, and less stringent investor protection and disclosure standards of foreign markets. In certain markets where securities and other instruments are not traded “delivery versus payment,” the Fund may not receive timely payment for securities or other instruments it has delivered or receive delivery of securities paid for and may be subject to increased risk that the counterparty will fail to make payments or delivery when due or default completely. Foreign market trading hours, clearance and settlement procedures, and holiday schedules may limit the Fund’s ability to buy and sell securities.
Events and evolving conditions in certain economies or markets may alter the risks associated with investments tied to countries or regions that historically were perceived as comparatively stable becoming riskier and more volatile. These risks are magnified in “emerging markets.” Emerging market countries typically have less established market economies than developed countries and may face greater social, economic, regulatory and political uncertainties. In addition, emerging markets typically present greater illiquidity and price volatility concerns due to smaller or limited local capital markets and greater difficulty in determining market valuations of securities due to limited public information on issuers. Certain emerging market countries may be subject to less stringent requirements regarding accounting, auditing, financial reporting and record keeping and therefore, material information related to an investment may not be available or reliable. Additionally, the Fund may have substantial difficulties exercising its legal rights
or enforcing a counterparty’s legal obligations in certain jurisdictions outside of the United States, in particular in emerging markets countries, which can increase the risks of loss.
Strategy Risk. The Fund’s investment strategies may not always provide greater market protection than other equity instruments particularly in rising equity markets when the Fund is expected to underperform traditional long-only equity strategies. In addition, as a result of the structure of the options overlay strategy, the Fund is not expected to provide market protection during times of low market volatility; during such periods, the Fund is expected to perform in line with broad equity markets.
Options Risk. The value of the Fund’s positions in Index options or options on ETFs will fluctuate in response to changes in the value of the underlying index. Writing index call options or options on ETFs can reduce equity market risk, but it limits the opportunity to profit from an increase in the market value of stocks in exchange for upfront cash at the time of selling the call option. The Fund also risks losing all or part of the cash paid for purchasing put options. Unusual market conditions or the lack of a ready market for any particular option at a specific time may reduce the effectiveness of the Fund’s option strategies, and for these and other reasons, the Fund’s option strategies may not reduce the Fund’s volatility to the extent desired and could result in losses.
Derivatives Risk. Derivatives, including options and futures, may be riskier than other types of investments and may increase the volatility of the Fund. Derivatives may be sensitive to changes in economic and market conditions and may create leverage, which could result in losses that significantly exceed the Fund’s original investment. Certain derivatives also expose the Fund to counterparty risk, which is the risk that the derivative counterparty will not fulfill its contractual obligations (and includes credit risk associated with the counterparty). Certain derivatives are synthetic instruments that attempt to replicate the performance of certain reference assets. With regard to such derivatives, the Fund does not have a claim on the reference assets and is subject to enhanced counterparty risk. Derivatives may not perform as expected, so the Fund may not realize the intended benefits. When used for hedging, the change in value of a derivative may not correlate as expected with the security or other risk being hedged. In addition, given their complexity, derivatives expose the Fund to risks of mispricing or improper valuation.
Geographic Focus Risk. The Fund may focus its investments in one or more regions or small groups of countries. As a result, the Fund’s performance may be subject to greater volatility than a more geographically diversified fund.
European Market Risk. The Fund’s performance will be affected by political, social and economic conditions in Europe, such as growth of the economic output (the gross national product), the rate of inflation, the rate at which capital is reinvested into European economies, the success of governmental actions to
March 1, 2023 | 45
JPMorgan International Hedged Equity Fund (continued)
reduce budget deficits, the resource self-sufficiency of European countries and interest and monetary exchange rates between European countries. European financial markets may experience volatility due to concerns about high government debt levels, credit rating downgrades, rising unemployment, the future of the euro as a common currency, possible restructuring of government debt and other government measures responding to those concerns, and fiscal and monetary controls imposed on member countries of the European Union. The risk of investing in Europe may be heightened due to steps taken by the United Kingdom to exit the European Union. On January 31, 2020, the United Kingdom officially withdrew from the European Union. On December 30, 2020, the European Union and the United Kingdom signed the EU-UK Trade and Cooperation Agreement (“TCA”), an agreement on the terms governing certain aspects of the European Union’s and the United Kingdom’s relationship, many of which are still to be determined, including those related to financial services. Notwithstanding the TCA, significant uncertainty remains in the market regarding the ramifications of the United Kingdom’s withdrawal from the European Union. The impact on the United Kingdom and European economies and the broader global economy could be significant, resulting in increased volatility and illiquidity, currency fluctuations, impacts on arrangements for trading and on other existing cross-border cooperation arrangements (whether economic, tax, fiscal, legal, regulatory or otherwise), and in potentially lower growth for companies in the United Kingdom, Europe and globally, which could have an adverse effect on the value of the Fund’s investments. In addition, if one or more other countries were to exit the European Union or abandon the use of the euro as a currency, the value of investments tied to those countries or the euro could decline significantly and unpredictably.
Japan Risk. The Japanese economy may be subject to economic, political and social instability, which could have a negative impact on Japanese securities. In the past, Japan’s economic growth rate has remained relatively low, and it may remain low in the future. Furthermore, the Japanese economic growth rate could be impacted by Bank of Japan’s monetary policies, rising interest rates, tax increases, budget deficits, consumer confidence and volatility in the Japanese yen. At times, the Japanese economy has been adversely impacted by government intervention and protectionism, changes in its labor market, and an unstable financial services sector. International trade, government support of the financial services sector and other troubled sectors, government policy, natural disasters, an aging demographic and declining population and/or geopolitical developments associated with actual or potential conflicts with one or more countries in Asia could significantly affect the Japanese economy. Strained foreign relations with neighboring countries (China, South Korea, North Korea and Russia) may not only negatively impact the Japanese economy, but also the geographic region as well as globally. A significant portion of Japan’s trade is conducted with developing nations and can be affected by conditions in these nations or by currency fluctua
tions. Japan is an island state with few natural resources and limited land area and is reliant on imports for its commodity needs. Any fluctuations or shortages in the commodity markets could have a negative impact on the Japanese economy. In addition, Japan's economy has in the past and could in the future be significantly impacted by natural disasters.
Smaller Company Risk. Investments in securities of smaller companies (mid cap and small cap companies) may be riskier, less liquid, more volatile and more vulnerable to economic, market and industry changes than securities of larger, more established companies. The securities of smaller companies may trade less frequently and in smaller volumes than securities of larger companies. As a result, changes in the price of securities issued by such companies may be more sudden or erratic than the prices of securities of large capitalization companies, especially over the short term. These risks are higher for small cap companies.
Privately Placed Securities Risk. Privately placed securities generally are less liquid than publicly traded securities and the Fund may not always be able to sell such securities without experiencing delays in finding buyers or reducing the sale price for such securities. The disposition of some of the securities held by the Fund may be restricted under federal securities laws. As a result, the Fund may not be able to dispose of such investments at a time when, or at a price at which, it desires to do so and may have to bear expenses of registering these securities, if necessary. These securities may also be difficult to value.
Currency Risk. Changes in foreign currency exchange rates will affect the value of the Fund’s securities and the price of the Fund’s shares. Generally, when the value of the U.S. dollar rises in value relative to a foreign currency, an investment impacted by that currency loses value because that currency is worth less in U.S. dollars. Currency exchange rates may fluctuate significantly over short periods of time for a number of reasons, including changes in interest rates. Devaluation of a currency by a country’s government or banking authority also will have a significant impact on the value of any investments denominated in that currency. Currency markets generally are not as regulated as securities markets, may be riskier than other types of investments and may increase the volatility of the Fund. Although the Fund may attempt to hedge its currency exposure into the U.S. dollar, it may not be successful in reducing the effects of currency fluctuations. The Fund may also hedge from one foreign currency to another. In addition, the Fund’s use of currency hedging may not be successful and the use of such strategies may lower the Fund’s potential returns.
Industry and Sector Focus Risk. At times, the Fund may increase the relative emphasis of its investments in a particular industry or sector. The prices of securities of issuers in a particular industry or sector may be more susceptible to fluctuations due to changes in economic or business conditions, government regulations, availability of basic resources or supplies, or other events that affect that industry or sector more than securities
46 | J.P. Morgan International Equity Funds
of issuers in other industries and sectors. To the extent that the Fund increases the relative emphasis of its investments in a particular industry or sector, the value of the Fund’s shares may fluctuate in response to events affecting that industry or sector.
Transactions Risk. The Fund could experience a loss and its liquidity may be negatively impacted when selling securities to meet redemption requests. The risk of loss increases if the redemption requests are unusually large or frequent or occur in times of overall market turmoil or declining prices. Similarly, large purchases of Fund shares may adversely affect the Fund’s performance to the extent that the Fund is delayed in investing new cash and is required to maintain a larger cash position than it ordinarily would.
Investments in the Fund are not deposits or obligations of, or guaranteed or endorsed by, any bank and are not insured or guaranteed by the FDIC, the Federal Reserve Board or any other government agency.
You could lose money investing in the Fund.
The Fund’s Past Performance
This section provides some indication of the risks of investing in the Fund. The bar chart shows the performance of the Fund’s Class I Shares has varied from year to year for the past three years. The table shows the average annual total returns for the past one year and life of the Fund. The table compares the Fund’s performance to the performance of the MSCI EAFE Index (net total return), and ICE BofAML 3-Month US Treasury Bill Index. The MSCI EAFE Index (net total return), and ICE BofAML 3-Month US Treasury Bill Index does not include the fees and expenses of the mutual funds in the index. Past performance (before and after taxes) is not necessarily an indication of how the Fund will perform in the future. Updated performance information is available by visiting www.jpmorganfunds.com or by calling 1-800-480-4111.
Source: MSCI. The MSCI information may only be used for your internal use, may not be reproduced or redisseminated in any form and may not be used as a basis for or a component of any financial instruments or products or indices. None of the MSCI information is intended to constitute investment advice or a recommendation to make (or refrain from making) any kind of investment decision and may not be relied on as such. Historical data and analysis should not be taken as an indication or guarantee of any future performance analysis, forecast, or prediction. The MSCI information is provided on an “as is” basis and the user of this information assumes the entire risk of any use made of this information. MSCI, each of its affiliates and each other person involved in or related to compiling, computing or creating any MSCI information (collectively, the “MSCI Parties”) expressly disclaims all warranties (including, without limitation, any warranties of originality, accuracy, completeness, timeliness, non-infringement, merchantability and fitness for a particular purpose) with respect to this information. Without limiting any of
the foregoing, in no event shall any MSCI Party have any liability for any direct, indirect, special, incidental, punitive, consequential (including, without limitation, lost profits) or any other damages. (www.msci.com)
SOURCE ICE DATA INDICES, LLC (“ICE DATA”), IS USED WITH PERMISSION. ICE® IS A REGISTERED TRADEMARK OF ICE DATA OR ITS AFFILIATES AND BOFA® IS A REGISTERED TRADEMARK OF BANK OF AMERICA CORPORATION LICENSED BY BANK OF AMERICA CORPORATION AND ITS AFFILIATES (“BOFA”) AND MAY NOT BE USED WITHOUT BOFA’S PRIOR WRITTEN APPROVAL. ICE DATA, ITS AFFILIATES AND THEIR RESPECTIVE THIRD PARTY SUPPLIERS DISCLAIM ANY AND ALL WARRANTIES AND REPRESENTATIONS, EXPRESS AND/OR IMPLIED, INCLUDING ANY WARRANTIES OF MERCHANTABILITY OR FITNESS FOR A PARTICULAR PURPOSE OR USE, INCLUDING THE INDICES, INDEX DATA AND ANY DATA INCLUDED IN, RELATED TO, OR DERIVED THEREFROM. NEITHER ICE DATA, ITS AFFILIATES NOR THEIR RESPECTIVE THIRD PARTY SUPPLIERS SHALL BE SUBJECT TO ANY DAMAGES OR LIABILITY WITH RESPECT TO THE ADEQUACY, ACCURACY, TIMELINESS OR COMPLETENESS OF THE INDICES OR THE INDEX DATA OR ANY COMPONENT THEREOF, AND THE INDICES AND INDEX DATA AND ALL COMPONENTS THEREOF ARE PROVIDED ON AN “AS IS” BASIS AND YOUR USE IS AT YOUR OWN RISK. ICE DATA, ITS AFFILIATES AND THEIR RESPECTIVE THIRD PARTY SUPPLIERS DO NOT SPONSOR, ENDORSE, OR RECOMMEND THE ADVISER, OR ANY OF ITS PRODUCTS OR SERVICES.
| YEAR-BY-YEAR RETURNS - CLASS I SHARES |

| Best Quarter |
4th quarter, 2022 |
7.88% |
| Worst Quarter |
1st quarter, 2020 |
-13.44% |
March 1, 2023 | 47
JPMorgan International Hedged Equity Fund (continued)
| AVERAGE ANNUAL TOTAL RETURNS (For periods ended December 31, 2022) | ||
| |
Past |
Life of Fund since |
| |
1 Year |
03/15/2019 |
| CLASS I SHARES |
|
|
| Return Before Taxes |
-9.52% |
1.13% |
| Return After Taxes on Distributions |
-9.78 |
0.77 |
| Return After Taxes on Distributions and Sale of Fund Shares |
-5.07 |
1.03 |
| CLASS A SHARES |
|
|
| Return Before Taxes |
-14.49 |
-0.55 |
| CLASS C SHARES |
|
|
| Return Before Taxes |
-11.23 |
0.36 |
| MSCI EAFE INDEX (Net Total Return) (Reflects No Deduction for Fees, Expenses, or Taxes, Except Foreign Withholding Taxes) |
-14.45 |
3.36 |
| ICE BOFAML 3-MONTH US TREASURY BILL INDEX (Reflects No Deduction for Fees, Expenses, or Taxes) |
1.47 |
1.04 |
After-tax returns are calculated using the historical highest individual federal marginal income tax rates and do not reflect the impact of state and local taxes.Actual after-tax returns depend on the investor’s tax situation and may differ from those shown. The after-tax returns shown are not relevant to investors who hold their shares through tax-deferred arrangements such as 401(k) plans or individual retirement accounts.
Management
J.P. Morgan Investment Management Inc. (the adviser)
| Portfolio Manager |
Managed the Fund Since |
Primary Title with Investment Adviser |
| Hamilton Reiner |
2018 |
Managing Director |
| Piera Elisa Grassi |
2020 |
Managing Director |
| Nicholas Farserotu |
2020 |
Vice President |
| Winnie Cheung |
2020 |
Vice President |
Purchase and Sale of Fund Shares
Purchase minimums
| For Class A and Class C Shares |
|
| To establish an account |
$1,000 |
| To add to an account |
$50 |
| For Class I Shares |
|
| To establish an account |
$1,000,000 |
| To add to an account |
No minimum levels |
In general, you may purchase or redeem shares on any business day:
•
Through your Financial Intermediary
•
By writing to J.P. Morgan Funds Services, P.O. Box 219143, Kansas City, MO 64121-9143
•
After you open an account, by calling J.P. Morgan Funds Services at 1-800-480-4111
Tax Information
The Fund intends to make distributions that may be taxed as ordinary income or capital gains, except when your investment is in an IRA, 401(k) plan or other tax-advantaged investment plan, in which case you may be subject to federal income tax upon withdrawal from the tax-advantaged investment plan.
Payments to Broker-Dealers and Other Financial Intermediaries
If you purchase shares of the Fund through a broker-dealer or other financial intermediary (such as a bank), the Fund and its related companies may pay the financial intermediary for the sale of Fund shares and related services. These payments may create a conflict of interest by influencing the broker-dealer or financial intermediary and your salesperson to recommend the Fund over another investment. Ask your salesperson or visit your financial intermediary’s website for more information.
48 | J.P. Morgan International Equity Funds
JPMorgan International Value Fund
| | |||
| |
Class A |
Class C |
Class I |
| Maximum Sales Charge (Load) Imposed on Purchases as % of the Offering Price |
|
|
|
| Maximum Deferred Sales Charge (Load) as % of Original Cost of the Shares |
1 |
|
|
1
| | |||
| |
Class A |
Class C |
Class I |
| Management Fees |
|
|
|
| Distribution (Rule 12b-1) Fees |
|
|
|
| Other Expenses |
|
|
|
| Service Fees |
|
|
|
| Remainder of Other Expenses |
|
|
|
| Acquired Fund Fees and Expenses |
|
|
|
| Total Annual Fund Operating Expenses |
|
|
|
| Fee Waivers and/or Expense Reimbursements1 |
- |
- |
- |
| Total Annual Fund Operating Expenses after Fee Waivers and/or Expense Reimburse- ments1 |
|
|
|
1
March 1, 2023 | 49
JPMorgan International Value Fund (continued)
| | ||||
| |
1 Year |
3 Years |
5 Years |
10 Years |
| CLASS A SHARES ($) |
|
|
|
|
| CLASS C SHARES ($) |
|
|
|
|
| CLASS I SHARES ($) |
|
|
|
|
| | ||||
| |
1 Year |
3 Years |
5 Years |
10 Years |
| CLASS A SHARES ($) |
|
|
|
|
| CLASS C SHARES ($) |
|
|
|
|
| CLASS I SHARES ($) |
|
|
|
|
50 | J.P. Morgan International Equity Funds
March 1, 2023 | 51
JPMorgan International Value Fund (continued)
52 | J.P. Morgan International Equity Funds
| |

| |
|
|
| |
|
|
March 1, 2023 | 53
JPMorgan International Value Fund (continued)
| | |||
| |
Past 1 Year |
Past 5 Years |
Past 10 Years |
| CLASS I SHARES |
|
|
|
| Return Before Taxes |
- |
- |
|
| Return After Taxes on Distributions |
- |
- |
|
| Return After Taxes on Distributions and Sale of Fund Shares |
- |
- |
|
| CLASS A SHARES |
|
|
|
| Return Before Taxes |
- |
- |
|
| CLASS C SHARES |
|
|
|
| Return Before Taxes |
- |
- |
|
| MSCI EAFE VALUE INDEX (Net Total Return) (Reflects No Deduction for Fees, Expenses, or Taxes, Except Foreign Withholding Taxes) |
- |
|
|
Management
J.P. Morgan Investment Management Inc. (the adviser)
| Portfolio Manager |
Managed the Fund Since |
Primary Title with Investment Adviser |
| Ian Butler |
2018 |
Executive Director |
| Thomas Buckingham |
2018 |
Executive Director |
| Kyle Williams |
2018 |
Executive Director |
| Michael Barakos |
2018 |
Managing Director |
Purchase and Sale of Fund Shares
Purchase minimums
| For Class A and Class C Shares |
|
| To establish an account |
$1,000 |
| To add to an account |
$50 |
| For Class I Shares |
|
| To establish an account |
$1,000,000 |
| To add to an account |
No minimum levels |
In general, you may purchase or redeem shares on any business day:
•
Through your Financial Intermediary
•
By writing to J.P. Morgan Funds Services, P.O. Box 219143, Kansas City, MO 64121-9143
•
After you open an account, by calling J.P. Morgan Funds Services at 1-800-480-4111
Tax Information
The Fund intends to make distributions that may be taxed as ordinary income or capital gains, except when your investment is in an IRA, 401(k) plan or other tax-advantaged investment plan, in which case you may be subject to federal income tax upon withdrawal from the tax-advantaged investment plan.
Payments to Broker-Dealers and Other Financial Intermediaries
If you purchase shares of the Fund through a broker-dealer or other financial intermediary (such as a bank), the Fund and its related companies may pay the financial intermediary for the sale of Fund shares and related services. These payments may create a conflict of interest by influencing the broker-dealer or financial intermediary and your salesperson to recommend the Fund over another investment. Ask your salesperson or visit your financial intermediary’s website for more information.
54 | J.P. Morgan International Equity Funds
JPMorgan International Value Fund
| | |
| |
Class L |
| Management Fees |
|
| Distribution (Rule 12b-1) Fees |
|
| Other Expenses |
|
| Service Fees |
|
| Remainder of Other Expenses |
|
| Acquired Fund Fees and Expenses |
|
| Total Annual Fund Operating Expenses |
|
| Fee Waivers and/or Expense Reimbursements1 |
- |
| Total Annual Fund Operating Expenses after Fee Waivers and/or Expense Reimbursements1 |
|
1
| | ||||
| |
1 Year |
3 Years |
5 Years |
10 Years |
| CLASS L SHARES ($) |
|
|
|
|
March 1, 2023 | 55
JPMorgan International Value Fund (continued)
56 | J.P. Morgan International Equity Funds
March 1, 2023 | 57
JPMorgan International Value Fund (continued)
58 | J.P. Morgan International Equity Funds
| |

| |
|
|
| |
|
|
| | |||
| |
Past 1 Year |
Past 5 Years |
Past 10 Years |
| CLASS L SHARES |
|
|
|
| Return Before Taxes |
- |
- |
|
| Return After Taxes on Distributions |
- |
- |
|
| Return After Taxes on Distributions and Sale of Fund Shares |
- |
|
|
| MSCI EAFE VALUE INDEX (Net Total Return) (Reflects No Deduction for Fees, Expenses, or Taxes, Except Foreign With- holding Taxes) |
- |
|
|
Management
J.P. Morgan Investment Management Inc. (the adviser)
| Portfolio Manager |
Managed the Fund Since |
Primary Title with Investment Adviser |
| Ian Butler |
2018 |
Executive Director |
| Thomas Buckingham |
2018 |
Executive Director |
| Kyle Williams |
2018 |
Executive Director |
| Michael Barakos |
2018 |
Managing Director |
Purchase and Sale of Fund Shares
Class L Shares of the Fund are no longer generally available to new purchasers. Existing Class L shareholders can still purchase additional shares, reinvest their dividends and exchange into the Fund from other J.P. Morgan Funds. In addition, certain group employer benefits plans, certain discretionary fee-based advisory programs, college savings plans and other J.P. Morgan Funds can continue to purchase shares as described in “Investing with J.P. Morgan Funds — LIMITED OFFERING OF THE CLASS L SHARES” in the prospectus.
Purchase minimums
| For Class L Shares | |
| To establish an account |
$3,000,000 |
| To add to an account |
No minimum levels |
In general, you may purchase or redeem shares on any business day:
•
Through your Financial Intermediary
•
By writing to J.P. Morgan Funds Services, P.O. Box 219143, Kansas City, MO 64121-9143
•
After you open an account, by calling J.P. Morgan Funds Services at 1-800-480-4111
Tax Information
The Fund intends to make distributions that may be taxed as ordinary income or capital gains, except when your investment is in an IRA, 401(k) plan or other tax-advantaged investment plan, in which case you may be subject to federal income tax upon withdrawal from the tax-advantaged investment plan.
Payments to Broker-Dealers and Other Financial Intermediaries
If you purchase shares of the Fund through a broker-dealer or other financial intermediary (such as a bank), the Fund and its related companies may pay the financial intermediary for the sale of Fund shares and related services. These payments may
March 1, 2023 | 59
JPMorgan International Value Fund (continued)
create a conflict of interest by influencing the broker-dealer or financial intermediary and your salesperson to recommend the Fund over another investment. Ask your salesperson or visit your financial intermediary’s website for more information.
60 | J.P. Morgan International Equity Funds
More About the Funds
Additional Information About the Funds’ Investment Strategies
Emerging Markets Equity Fund
Under normal circumstances, the Fund invests at least 80% of the value of its Assets in equity securities and equity-related instruments that are tied economically to emerging markets. Emerging markets include most countries in the world except Australia, Canada, Japan, New Zealand, the United Kingdom, the United States, most of the countries of Western Europe and Hong Kong. Securities and instruments tied economically to an emerging market include: (i) securities of issuers that are organized under the laws of an emerging markets country or that maintain their principal place of business in an emerging markets country; (ii) securities that are traded principally in an emerging market country; (iii) securities of issuers that, during their most recent fiscal year, derived at least 50% of their revenues or profits from goods produced or sold, investments made, or services performed in an emerging markets country or that have at least 50% of their assets in emerging market countries; or (iv) securities or other instruments that expose the Fund to the economic fortunes and risks of one or more emerging market countries. “Assets” means net assets, plus the amount of borrowings for investment purposes.
The equity securities and equity-related instruments in which the Fund may invest include, but are not limited to, common stock, preferred stock, convertible securities, trust or partnership interests, depositary receipts, warrants and rights, participation notes or other structured notes, and other instruments that provide economic exposure to one or more equity securities. Certain of the equity securities in which the Fund invests are expected to be issued by companies that rely on variable interest entity (“VIE”) structures.
The Fund may overweight or underweight countries relative to its benchmark, the MSCI Emerging Markets (EM) Index (net total return). The adviser attempts to emphasize securities that it believes are undervalued, while underweighting or avoiding securities that appear to the adviser to be overvalued.
The Fund may invest in securities denominated in U.S. dollars, other major reserve currencies, such as the euro, yen and pound sterling, and currencies of other countries in which it can invest. The Fund typically maintains full currency exposure to those markets in which it invests. However, the Fund may from time to time hedge a portion of its foreign currency exposure into the U.S. dollar.
The Fund may invest in securities across all market capitalizations, although the Fund may invest a significant portion of its assets in companies of any one particular market capitalization category.
The Fund may utilize currency forwards to reduce currency deviations, where practical, for the purpose of risk management. The Fund may also use exchange-traded futures for the efficient management of cash flows.
Investment Process: The adviser seeks to add value primarily through security selection decisions. Thus, decisions about country weightings are secondary to those about the individual securities, which make up the portfolio. The portfolio managers are primarily responsible for implementing the recommendations of the research analysts, who make their recommendations based on the security ranking system described below.
Research analysts use their local expertise to identify, research, and rank companies according to their expected performance. Securities are assessed using a two part analysis which considers (1) expected share price returns on a medium term forward basis (five year expected returns) and (2) longer-term business growth characteristics and qualitative factors (strategic classifications). The adviser also integrates financially material ESG factors as part of the Fund’s investment process (ESG Integration). ESG Integration is the systematic inclusion of ESG issues in investment analysis and investment decisions. As a part of this analysis, research analysts seek to assess the impact of environmental, social and governance factors on many issuers in the universe in which the Fund invests. The adviser’s assessment is based on an analysis of key opportunities and risks across industries to seek to identify financially material issues with respect to the Fund’s investments in securities and ascertain key issues that merit engagement with issuers. These assessments may not be conclusive and securities of issuers that may be negatively impacted by such factors may be purchased and retained by the Fund while the Fund may divest or not invest in securities of issuers that may be positively impacted by such factors. In particular, ESG Integration does not change a Fund’s investment objective, exclude specific types of industries or companies or limit the Fund’s investable universe. The Fund is not designed for investors who wish to screen out particular types of companies or investments or are looking for Funds that meet specific ESG goals. In order to encourage creativity, considerable autonomy is given to research analysts at the stock idea generation stage of the process.
The Fund has access to the adviser’s currency specialists in determining the extent and nature of the Fund’s exposure to various foreign currencies.
March 1, 2023 | 61
More About the Funds (continued)
Emerging Markets Research Enhanced Equity Fund
Under normal circumstances, the Fund invests at least 80% of its Assets in equity securities and equity-related instruments that are tied economically to emerging markets. “Assets” means net assets, plus the amount of borrowings for investment purposes. Emerging markets include most countries in the world except Australia, Canada, Japan, New Zealand, the United Kingdom, the United States, most of the countries of Western Europe and Hong Kong.
The equity securities and equity-related instruments in which the Fund may invest include, but are not limited to, common stock, preferred stock, convertible securities, trust or partner-ship interests, depositary receipts, real estate investment trust (REITS), privately placed securities, warrants and rights, participation notes or other structured notes, and other instruments that provide economic exposure to one or more equity securities. Certain of the equity securities in which the Fund invests are expected to be issued by companies that rely on variable interest entity (“VIE”) structures. In implementing its strategy, the Fund seeks to construct a portfolio of long holdings that will outperform the Morgan Stanley Capital International (MSCI) Emerging Markets Index(net total return) (the Index) over time while maintaining similar risk characteristics, including sector and geographic risks. The Fund primarily invests in securities included within the universe of the Index, however, the Fund may also invest in securities not included within the Index or securities or instruments with similar economic characteristics.
The Fund may invest in securities across all market capitalizations, although the Fund may invest a significant portion of its assets in companies of any one particular market capitalization category.
Within each sector, the Fund may modestly overweight equity securities that it considers undervalued while modestly under-weighting or not holding equity securities that appear over-valued. By emphasizing investment in equity securities that appear undervalued or fairly valued, the Fund seeks returns that modestly exceed those of the Index over the long term with a modest level of volatility.
The Fund may use exchange-traded funds and exchange-traded futures to gain exposure to particular foreign securities or markets and for the efficient management of cash flows. The Fund may invest in securities denominated in any currency and may from time to time hedge a portion of its foreign currency exposure using currency forwards.
Securities and equity-related instruments tied economically to an emerging market include: (i) securities of issuers that are organized under the laws of an emerging markets country or that maintain their principal place of business in an emerging markets country; (ii) securities that are traded principally in an emerging market country; (iii) securities of issuers that, during their most recent fiscal year, derived at least 50% of their revenues or profits from goods produced or sold, investments made, or services performed in an emerging markets country or that have at least 50% of their assets in an emerging market country; or (iv) securities or other instruments that expose the Fund to the economic fortunes and risks of one or more emerging market countries.
Investment Process: In managing the Fund, the adviser combines fundamental research with a disciplined portfolio construction process. The adviser utilizes proprietary research, risk management techniques and individual security selection in constructing the Fund’s portfolio. In-depth, fundamental research into individual securities is conducted by research analysts who emphasize each issuer’s long-term prospects. This research allows the adviser to rank issuers within each sector group according to what it believes to be their relative value.
The adviser will ordinarily overweight securities which it deems to be attractive and underweight or not hold those securities which it believes are unattractive. The adviser may sell a security as its valuations or rankings change or if more attractive investments become available. The adviser also integrates financially material ESG factors as part of the Fund’s investment process (ESG Integration). ESG Integration is the systematic inclusion of ESG issues in investment analysis and investment decisions. As part of its investment process, the adviser seeks to assess the impact of environmental, social and governance factors on many issuers in the universe in which the Fund invests. The adviser’s assessment is based on an analysis of key opportunities and risks across industries to seek to identify financially material issues with respect to the Fund’s investments in securities and ascertain key issues that merit engagement with issuers. These assessments may not be conclusive and securities of issuers that may be negatively impacted by such factors may be purchased and retained by the Fund while the Fund may divest or not invest in securities of issuers that may be positively impacted by such factors. In particular, ESG Integration does not change a Fund’s investment objective, exclude specific types of industries or companies or limit the Fund’s investable universe. The Fund is not designed for investors who wish to screen out particular types of companies or investments or are looking for Funds that meet specific ESG goals.
Europe Dynamic Fund
The Fund invests primarily in equity securities issued by companies with principal business activities in Western Europe. Under normal market conditions, the Fund invests at least 80% of the value of its Assets in equity securities of European issuers. “Assets” means net assets, plus the amount of borrowings for investment purposes.
62 | J.P. Morgan International Equity Funds
The equity securities in which the Fund may invest include, but are not limited to, common stock, preferred stock, convertible securities, trust or partnership interests, depositary receipts and warrants and rights.
The Fund may utilize exchange-traded futures for the efficient management of cash flows.
The Fund may invest in Austria, Belgium, Denmark, Germany, Finland, France, Greece, Ireland, Italy, Luxembourg, the Netherlands, Norway, Portugal, Spain, Sweden, Switzerland, and the United Kingdom, as well as other Western European countries which the adviser believes are appropriate. In addition, the Fund may invest up to 8% of its Assets in equity securities of emerging market European issuers. These countries may include Poland, the Czech Republic, Hungary and other countries with similar economic profiles which the adviser believes are appropriate.
The Fund may invest in securities denominated in U.S. dollars, other major reserve currencies, such as the euro, yen and pound sterling, and currencies of other countries in which it can invest. The adviser may adjust the Fund’s exposure to each currency based on its view of the markets and issuers. It may increase or decrease the emphasis on a type of security, sector, country or currency, based on its analysis of a variety of economic factors, including fundamental economic strength, earnings growth, quality of management, sector growth, credit quality and interest rate trends. The Fund may purchase securities where the issuer is located in one country but the security is denominated in the currency of another.
While the Fund’s assets will usually be invested in a number of different Western European countries, the Fund may at times invest most or all of the assets in a limited number of these countries. The Fund will, however, try to choose a wide range of industries and companies of varying sizes.
While the Fund invests primarily in equities, it may also invest in debt securities rated as investment grade by Moody’s Investors Service Inc. (Moody’s), Standard & Poor’s Corporation (S&P) or Fitch Ratings (Fitch) or the equivalent by another national rating organization, meaning that such securities will carry a minimum rating of Baa3, BBB–, or BBB–, respectively, or in securities that are unrated but are deemed by the adviser to be of comparable quality. No more than 20% of the Fund’s assets will be invested in debt securities denominated in a currency other than the U.S. dollar. No more than 20% of the Fund’s assets will be invested in debt securities issued by a single foreign government or international organization, such as the World Bank.
The Fund may also invest in corporate bonds, municipal bonds, inflation-linked debt securities and debt securities issued by governmental entities and private issuers.
Investment Process: In managing the Fund, the adviser uses a bottom-up stock selection process that focuses on the value, quality and momentum characteristics to decide which securities to buy and sell. The adviser also integrates financially material ESG factors as part of the Fund’s investment process (ESG Integration). ESG Integration is the systematic inclusion of ESG issues in investment analysis and investment decisions. As part of its investment process, the adviser seeks to assess the impact of environmental, social and governance factors on many issuers in the universe in which the Fund invests. The adviser’s assessment is based on an analysis of key opportunities and risks across industries to seek to identify financially material issues with respect to the Fund’s investments in securities and ascertain key issues that merit engagement with issuers. These assessments may not be conclusive and securities of issuers that may be negatively impacted by such factors may be purchased and retained by the Fund while the Fund may divest or not invest in securities of issuers that may be positively impacted by such factors. In particular, ESG Integration does not change a Fund’s investment objective, exclude specific types of industries or companies or limit the Fund’s investable universe. The Fund is not designed for investors who wish to screen out particular types of companies or investments or are looking for Funds that meet specific ESG goals.
International Equity Fund
Under normal conditions, the Fund will invest at least 80% of the value of its Assets in equity investments. “Assets” means net assets, plus the amount of borrowings for investment purposes. The Fund will primarily invest in foreign companies of various market capitalizations, including foreign subsidiaries of U.S. companies.
The equity securities in which the Fund may invest include, but are not limited to, common stock, preferred stock, convertible securities, trust or partnership interests, depositary receipts and warrants and rights. Certain of the equity securities in which the Fund invests are expected to be issued by companies that rely on variable interest entity (“VIE”) structures.
The Fund may invest in securities denominated in U.S. dollars, other major reserve currencies, such as the euro, yen and pound sterling, and currencies of other countries in which it can invest.
The Fund may invest in securities across all market capitalizations, although the Fund may invest a significant portion of its assets in companies of any one particular market capitalization category.
The Fund may utilize currency forwards to manage currency exposure of its foreign investments relative to its benchmark. The Fund may also use exchange-traded futures for the efficient management of cash flows.
March 1, 2023 | 63
More About the Funds (continued)
Investment Process: In managing the Fund, the adviser will seek to help manage risk in the Fund’s portfolio by investing in issuers in at least three different countries other than the United States. However, the Fund may invest a substantial part of its assets in just one region or country.
The Fund intends to invest in companies (or governments) in the following countries or regions: the Far East (including Japan, Hong Kong, Singapore and Malaysia), Western Europe (including the United Kingdom, Germany, the Netherlands, France, Switzerland, Italy, Scandinavia and Spain), Australia, Canada and other countries or areas that the adviser may select from time to time. A substantial part of the Fund’s assets may be invested in U.S. companies based in countries that are represented in the MSCI, Europe, Australasia and Far East (EAFE) Index. However, the Fund may also invest in companies or governments in emerging markets.
The adviser may adjust the Fund’s exposure to each currency based on its view of the markets and issuers. The adviser will decide how much to invest in the securities of a particular country or currency by evaluating the yield and potential growth of an investment, as well as the relationship between the currency and the U.S. dollar. The adviser may increase or decrease the emphasis on a type of security, sector, country or currency, based on its analysis of a variety of economic factors, including fundamental economic strength, earnings growth, quality of management, sector growth, credit quality and interest rate trends. The adviser also integrates financially material ESG factors as part of the Fund’s investment process (ESG Integration). ESG Integration is the systematic inclusion of ESG issues in investment analysis and investment decisions. As part of its investment process, the adviser seeks to assess the impact of environmental, social and governance factors on many issuers in the universe in which the Fund invests. The adviser’s assessment is based on an analysis of key opportunities and risks across industries to seek to identify financially material issues with respect to the Fund’s investments in securities and ascertain key issues that merit engagement with issuers. These assessments may not be conclusive and securities of issuers that may be negatively impacted by such factors may be purchased and retained by the Fund while the Fund may divest or not invest in securities of issuers that may be positively impacted by such factors. In particular, ESG Integration does not change a Fund’s investment objective, exclude specific types of industries or companies or limit the Fund’s investable universe. The Fund is not designed for investors who wish to screen out particular types of companies or investments or are looking for Funds that meet specific ESG goals.
International Focus Fund
The Fund primarily invests in the equity securities of foreign companies, including those in emerging markets, and is generally not limited by any particular capitalization, style or sector, and may invest in any foreign country. While the Fund is generally not limited within its equity universe, it currently intends to focus on investing in mid to large capitalization companies in a diversified group of sectors and foreign countries. The Fund may deviate from its current intention, including by focusing on particular capitalization sizes, styles, sectors and/or foreign countries.
Under normal circumstances, the Fund will invest at least 80% of its Assets in equity securities. “Assets” means net assets plus borrowings for investment purposes. The equity securities in which the Fund may invest include, but are not limited to, common stocks, preferred stocks and depositary receipts, including American Depositary Receipts (ADRs), European Depositary Receipts (EDRs) and Global Depositary Receipts (GDRs). Certain of the equity securities in which the Fund invests are expected to be issued by companies that rely on variable interest entity (“VIE”) structures. Under normal market conditions, the Fund will typically hold between 40 and 50 securities.
The adviser will generally seek to diversify the Fund’s portfolio by investing in issuers located in at least three foreign countries. However, the Fund may invest a substantial portion of its assets in just one foreign country. An issuer of a security will be deemed to be located in a particular country if: (i) the principal trading market for the security is in such country, (ii) the issuer is organized under the laws of such country or (iii) the issuer derives at least 50% of its revenues or profits from such country or has at least 50% of its total assets situated in such country.
The Fund may invest in securities denominated in any currency and will invest substantially in securities denominated in foreign currencies
The Fund may utilize currency forwards (including non-deliverable forwards) to manage currency exposures, where practical, for the purpose of risk management, including hedging non-dollar currency exposure back to the U.S. dollar. The Fund may also use exchanged-traded futures for the efficient management of cash flows.
Investment Process: The adviser, utilizing the insights of its global sector specialists, seeks to identify companies that it believes are attractively valued relative to the long-term growth they can achieve. The adviser identifies these companies through internal research and by subjecting them to a disciplined set of growth, valuation and quality criteria. Companies that display attractive growth and valuation characteristics and for which the growth is believed to be sustainable will be considered candidates for purchase. Conversely, companies become candidates for sale if the expected growth is believed to be at risk or when valuations are no longer attractive. The adviser also integrates financially material ESG factors as part of the Fund’s investment process (ESG Integration). ESG Integration is the systematic inclusion of ESG issues in investment analysis and investment decisions. As part of its
64 | J.P. Morgan International Equity Funds
investment process, the adviser seeks to assess the impact of environmental, social and governance factors on many issuers in the universe in which the Fund invests. The adviser’s assessment is based on an analysis of key opportunities and risks across industries to seek to identify financially material issues with respect to the Fund’s investments in securities and ascertain key issues that merit engagement with issuers. These assessments may not be conclusive and securities of issuers that may be negatively impacted by such factors may be purchased and retained by the Fund while the Fund may divest or not invest in securities of issuers that may be positively impacted by such factors. In particular, ESG Integration does not change a Fund’s investment objective, exclude specific types of industries or companies or limit the Fund’s investable universe. The Fund is not designed for investors who wish to screen out particular types of companies or investments or are looking for Funds that meet specific ESG goals.
International Hedged Equity Fund
The Fund seeks to provide capital appreciation through participation in international equity markets while hedging overall market exposure relative to traditional long-only equity strategies.
Under normal circumstances, the Fund invests at least 80% of its Assets in equity securities. “Assets” means net assets plus the amount of borrowings for investment purposes. The Fund primarily invests in equity securities of foreign companies across all market capitalizations, including foreign subsidiaries of U.S. companies. The equity securities in which the Fund may invest include, but are not limited to, common stock, preferred stock, depositary receipts, privately placed securities and real estate investment trusts (REITs). In implementing its strategy, the Fund constructs a portfolio of long holdings that seeks to outperform the Morgan Stanley Capital International (MSCI) Europe, Australasia, Far East (EAFE) Index1 (net total return) (the Index) over time while maintaining similar risk characteristics, including sector and geographic risk. The Fund primarily invests in securities included within the universe of the Index, however, the Fund may also invest in securities not included within the Index.
Within each sector, the Fund may modestly overweight equity securities that it considers undervalued while modestly underweighting or not holding equity securities that appear overvalued. By emphasizing investment in equity securities that appear undervalued or fairly valued, the Fund seeks to constitute a portfolio of long holdings with returns that modestly exceed those of the Index over the long term with a modest level of volatility.
The Fund’s options overlay strategy is intended to provide the Fund with downside protection, while foregoing some upside potential. The Fund will also systematically purchase and sell exchange traded put options and sell exchange traded call options, employing an option overlay known as a “Put/Spread Collar” strategy. A call option gives the buyer the right to buy, and obligates the seller of the option to sell, a security at a specified price at a future date. A put option gives the buyer the right to sell, and obligates the seller of the option to buy, a security at a specified price at a future date. The options may be based on the Index or on exchange-traded funds (ETFs) that seek to provide investment returns linked to the performance of the Index. The combination of the diversified portfolio of equity securities, the downside protection from put options and the income from the index call options is intended to provide the Fund with a portion of the returns associated with its long investments while exposing investors to less risk than traditional long-only equity strategies. Specifically, the Fund seeks to provide a competitive risk adjusted return over a full market cycle (defined as three to five years) relative to the Index with lower volatility than traditional long-only equity strategies.
The Fund may invest in securities denominated in any currency and may from time to time hedge a portion of its foreign currency exposure using currency forwards. An issuer of a security will be deemed to be located in a particular country if: (i) the principal trading market for the security is in such country, (ii) the issuer is organized under the laws of such country or (iii) the issuer derives at least 50% of its revenues or profits from such country or has at least 50% of its total assets situated in such country.
The Fund constructs a Put/Spread Collar by buying a put option on the Index or an ETF at a higher strike price and writing (or selling) a put option on the same instrument at a relatively lower strike price, resulting in what is known as a put option spread, while simultaneously selling an Index or ETF call option. The Fund may elect to construct additional Put/Spread Collars if the size of the Fund increases, either through purchases or appreciation. A put option spread seeks to protect the Fund against a decline in price, but only to the extent of the difference between the strike prices of the put option purchased and the put option sold. Entering into put option spreads is typically less expensive than a strategy of only purchasing put options and may benefit the Fund in a flat to upwardly moving market by reducing the cost of the downside protection; the downside protection of the put option spread, however, is limited as compared to just owning a put option. The premiums received from writing call options are intended to provide income which substantially offsets the cost of the put option spread, but writing the call options also reduces the Fund’s ability to profit from increases in the value of its equity portfolio because in rising markets the call option will be exercised once the market price rises to the option’s strike price.
1MSCI EAFE Index is a registered service mark of Morgan Stanley Capital International, which does not sponsor and is in no way affiliated with the Fund.
March 1, 2023 | 65
More About the Funds (continued)
In addition to the use of the Put/Spread Collar strategy described above, the Fund may use exchange-traded futures, primarily futures on indexes, to more effectively gain targeted equity exposure from its cash positions and to hedge the Fund’s portfolio if it is unable to purchase or write the necessary options for its overlay strategy and efficient management of cash flows.
Investment Process — Long Portfolio: In constructing its long portfolio, the adviser combines fundamental research with a disciplined portfolio construction process. The adviser utilizes proprietary research, risk management techniques and individual security selection in constructing the Fund’s portfolio. In-depth, fundamental research into individual securities is conducted by research analysts who emphasize each issuer’s long-term prospects. This research allows the adviser to rank issuers within each sector group according to what it believes to be their relative value. The adviser also integrates financially material ESG factors as part of the Fund’s investment process (ESG Integration). ESG Integration is the systematic inclusion of ESG issues in investment analysis and investment decisions. As part of its investment process, the adviser seeks to assess the impact of environmental, social and governance factors on many issuers in the universe in which the Fund invests. The adviser’s assessment is based on an analysis of key opportunities and risks across industries to seek to identify financially material issues with respect to the Fund’s investments in securities and ascertain key issues that merit engagement with issuers. These assessments may not be conclusive and securities of issuers that may be negatively impacted by such factors may be purchased and retained by the Fund while the Fund may divest or not invest in securities of issuers that may be positively impacted by such factors. In particular, ESG Integration does not change a Fund’s investment objective, exclude specific types of industries or companies or limit the Fund’s investable universe. The Fund is not designed for investors who wish to screen out particular types of companies or investments or are looking for Funds that meet specific ESG goals.
The adviser will ordinarily overweight securities which it deems to be attractive and underweight or not hold those securities which it believes are unattractive. The adviser may sell a security as its valuations or rankings change or if more attractive investments become available.
In managing the Fund, the adviser will seek to help manage risk in the Fund’s portfolio by investing in issuers in at least three foreign countries. However, the Fund may invest a substantial part of its assets in just one country.
Investment Process — Options Overlay Strategy: To implement the Put/Spread Collar strategy, the adviser utilizes exchange traded equity options based either on the Index or on ETFs that seek to provide investment returns linked to the performance of the Index. The Put/Spread Collar is constructed by buying a put option at a higher strike price while writing a put option at a relatively lower strike price and simultaneously selling a call option that substantially offsets the cost of the put option spread. The Put/Spread Collar strategy is an actively managed process and is designed to provide a continuous market hedge for the portfolio. The put option spread is generally maintained at a level whereby the Fund is protected from a decrease in the market of five to twenty percent. The options are reset on at least a quarterly basis to seek to better capitalize on current market conditions and opportunities while seeking to provide predictable returns in all market cycles.
International Value Fund
The Fund invests primarily in securities of issuers in foreign developed countries, including foreign subsidiaries of U.S. issuers. An issuer of a security will be deemed to be located in a particular country if: (i) the principal trading market for the security is in such country, (ii) the issuer is organized under the laws of such country or (iii) the issuer derives at least 50% of its revenues or profits from such country or has at least 50% of its total assets situated in such country. The Fund typically does not invest in U.S. issuers that do not qualify as foreign issuers.
Securities in which the Fund invests include common stocks and depositary receipts. Certain of the equity securities in which the Fund invests are expected to be issued by companies that rely on variable interest entity (“VIE”) structures. Generally, the Fund expects to maintain regional geographic exposures similar to those of its benchmark over time, although the Fund may deviate from these exposures in the adviser’s discretion.
The Fund may invest in securities denominated in U.S. dollars, other major reserve currencies, such as the euro, yen and pound sterling, and currencies of other countries in which it can invest. The Fund may invest in securities across all market capitalizations and may invest a significant portion of its assets in companies of any one particular market capitalization category. The Fund may also use exchange-traded futures for the efficient management of cash flows. From time to time, the Fund may hedge a portion of its foreign currency exposure using currency forwards.
Investment Process: In managing the Fund, the adviser seeks to identify securities that it believes present attractive valuations using behavioral based and quantitative screens, such as price to earnings ratios, and conducting fundamental analysis. Behavioral finance theorizes that investors behave irrationally in systematic and predictable ways because human psychology affects investment decision-making. This investor behavior results in market inefficiencies that persist over time. These securities are then subjected to further analysis, including consideration of their momentum and quality characteristics, to seek to identify securities with values that the adviser believes will increase. The adviser also integrates financially material ESG factors as part of the Fund’s investment process (ESG Integration). ESG Integration is the systematic inclusion of ESG issues in investment analysis and investment decisions.
66 | J.P. Morgan International Equity Funds
As part of its investment process, the adviser seeks to assess the impact of environmental, social and governance factors on many issuers in the universe in which the Fund invests. The adviser’s assessment is based on an analysis of key opportunities and risks across industries to seek to identify financially material issues with respect to the Fund’s investments in securities and ascertain key issues that merit engagement with issuers. These assessments may not be conclusive and securities of issuers that may be negatively impacted by such factors may be purchased and retained by the Fund while the Fund may divest or not invest in securities of issuers that may be positively impacted by such factors. In particular, ESG Integration does not change a Fund’s investment objective, exclude specific types of industries or companies or limit the Fund’s investable universe. The Fund is not designed for investors who wish to screen out particular types of companies or investments or are looking for Funds that meet specific ESG goals.
The Fund may sell securities if the adviser’s conviction in a security changes, if the issuer’s fundamentals change, or if the adviser believes the security is no longer attractively valued. Investments may also be sold if certain adverse political and economic events occur or if the adviser identifies a security that it believes offers a better investment opportunity.
The Fund may invest a substantial part of its assets in just one region or country.
Each of the Funds
The main investment strategies for a particular Fund are summarized above. Each Fund will invest primarily in equity and equity-related securities as described above. These equity securities may include:
•
common stock
•
preferred stock
•
convertible securities
•
trust or partnership interests
•
warrants and rights to buy common stock
•
privately placed securities
The main investment strategies for each Fund may also include the following, some of which may be equity securities:
•
real estate investment trusts (REITs), which are pooled vehicles that invest primarily in income-producing real estate or loans related to real estate
•
foreign securities, which may be in the form of depositary receipts
•
securities denominated in U.S. dollars, other major reserve currencies, such as the euro, yen and pound sterling and currencies of other countries in which a Fund may invest
•
derivatives, including participation notes and certain forwards and futures
Although not main strategies, the Funds may also utilize the following which may be equity securities:
•
high yield securities which are below investment grade (junk bonds) and securities in the lowest investment grade category.
•
sovereign debt
•
corporate debt
•
securities lending
•
derivatives, including certain futures, forwards, options and swaps
•
other investment companies
•
exchange-traded funds (ETFs)
•
affiliated money market funds
•
closed-end investment companies
Derivatives, which are instruments that have a value based on another instrument, exchange rate or index, may also be used as substitutes for securities in which the Fund can invest.
The Funds may use futures contracts, options, swaps, participation notes, forwards and other instruments to more effectively gain targeted equity exposure from its cash positions, to hedge various investments, for risk management and to increase the Fund’s gain. The Funds may use exchange-traded futures to manage cash flows.
ETFs, which are pooled investment vehicles whose ownership interests are purchased and sold on a securities exchange, may be passively or actively managed. Passively managed ETFs generally seek to track the performance of a particular market index, including broad-based market indexes, as well as indexes relating to particular sectors, markets, regions or industries. Actively managed ETFs do not seek to track the performance of a particular market index. Ordinarily, a Fund must limit its investments in a single ETF to 5% of its total assets and in all ETFs and other investment companies to 10% of its total assets. The Securities and Exchange Commission
March 1, 2023 | 67
More About the Funds (continued)
has adopted an exemptive rule that allows any fund to disregard these 5% and 10% limitations, subject to certain conditions. ETFs that are not structured as investment companies as defined in the Investment Company Act of 1940 are not subject to these percentage limitations. The price movement of an index-based ETF may not track the underlying index and may result in a loss. In addition, ETFs may trade at a price above (premium) or below (discount) their net asset value, especially during periods of significant market volatility or stress, causing investors to pay or receive significantly more or less than the value of the ETF’s underlying portfolio when they purchase or sell their ETF shares, respectively.
Each Fund may utilize the investment strategies listed herein, including the use of derivatives, to a greater or lesser degree.
The Funds (except for the International Value Fund) will provide shareholders with at least 60 days’ prior notice of any change in their 80% investment policy above.
The frequency with which each Fund buys and sells securities will vary from year to year, depending on market conditions.
Securities Lending. Each Fund may engage in securities lending to increase its income. Securities lending involves the lending of securities owned by a Fund to financial institutions such as certain broker-dealers in exchange for cash collateral. The Funds will invest cash collateral in one or more money market funds advised by the adviser or its affiliates. The adviser or its affiliates will receive additional compensation from the affiliated money market funds on a Fund’s investment in such money market funds. During the term of the loan, the Fund is entitled to receive amounts equivalent to distributions paid on the loaned securities as well as the return on the cash collateral investments. Upon termination of the loan, the Fund is required to return the cash collateral to the borrower plus any agreed upon rebate. Cash collateral investments will be subject to market depreciation or appreciation, and a Fund will be responsible for any loss that might result from its investment of cash collateral. If the adviser determines to make securities loans, the value of the securities loaned may not exceed 33⅓% of the value of total assets of a Fund. Loan collateral (including any investment of that collateral) is not subject to the percentage limitations regarding a Fund’s investments described elsewhere in this Prospectus. Securities lending is not a principal strategy of the Funds.
| NON-FUNDAMENTAL INVESTMENT OBJECTIVES |
| An investment objective is fundamental if it cannot be changed without the consent of a majority of the outstanding shares of the Fund. The investment objective for each of the Funds is non-fundamental and may be changed without the consent of a majority of the outstanding shares of that Fund. |
Please note that the Funds also may use strategies that are not described herein, but which are described in the prospectus and in the Statement of Additional Information.
Investment Risks
There can be no assurance that each Fund will achieve its investment objective.
The main risks associated with investing in each Fund are summarized in the “Risk/Return Summaries” at the front of this prospectus. In addition to each Fund’s main risks, each Fund may be subject to additional risks in connection with investments and strategies used by each Fund from time to time. The table below identifies main risks and some of the additional risks for each Fund.
An investment in a Fund or any other fund may not provide a complete investment program. The suitability of an investment in a Fund should be considered based on the investment objective, strategies and risks described in this prospectus, considered in light of all of the other investments in your portfolio, as well as your risk tolerance, financial goals and time horizons. You may want to consult with a financial advisor to determine if a Fund is suitable for you.
The Funds are subject to the main risks designated as such in the table below, any of which may adversely affect a Fund’s net asset value (NAV), market price, performance and ability to meet its investment objective. Each Fund may also be subject to additional risks that are noted in the table below, as well as those that are not described herein but which are described in the Statement of Additional Information.
68 | J.P. Morgan International Equity Funds
| |
Emerging Markets Equity Fund |
Emerging Markets Research Enhanced Equity |
Europe Dynamic Fund |
International Equity Fund |
International Focus Fund |
International Hedged Equity Fund |
International Value Fund |
| Asia Pacific Market Risk |
○ |
○ |
|
○ |
○ |
○ |
○ |
| China Stock Connect Programs Risk |
○ |
○ |
|
○ |
○ |
|
○ |
| Convertible Securities Risk |
○ |
• |
○ |
○ |
○ |
○ |
○ |
| Credit Risk |
○ |
|
○ |
○ |
|
|
|
| Currency Risk |
• |
• |
• |
• |
• |
• |
• |
| Cyber Security Risk |
○ |
○ |
○ |
○ |
○ |
○ |
○ |
| Depositary Receipts Risk |
• |
• |
○ |
○ |
○ |
○ |
• |
| Derivatives Risk |
• |
• |
• |
• |
• |
• |
• |
| Equity Market Risk |
• |
• |
• |
• |
• |
• |
• |
| European Market Risk |
○ |
○ |
• |
• |
• |
• |
• |
| Exchange-Traded Fund (ETF) and Other Investment Company Risk |
○ |
• |
○ |
○ |
○ |
○ |
○ |
| Extension Risk |
|
○ |
|
|
|
○ |
|
| Foreign Securities and Emerging Markets Risk |
• |
• |
• |
• |
• |
• |
• |
| General Market Risk |
• |
• |
• |
• |
• |
• |
• |
| Geographic Focus Risk |
• |
• |
• |
• |
• |
• |
• |
| Greater China Region Risk |
• |
• |
|
○ |
○ |
|
○ |
| High Portfolio Turnover Risk |
|
|
• |
|
|
|
○ |
| High Yield Securities Risk |
|
|
○ |
○ |
|
|
|
| India Risk |
○ |
○ |
|
○ |
○ |
|
○ |
| Industry and Sector Focus Risk |
• |
• |
• |
• |
• |
• |
• |
| Inflation-Linked Securities Risk |
|
|
○ |
|
|
|
|
| Initial Public Offerings (IPO) Risk |
○ |
○ |
○ |
○ |
○ |
○ |
○ |
| Interest Rate Risk |
○ |
○ |
○ |
○ |
○ |
○ |
○ |
| Japan Risk |
○ |
○ |
|
• |
• |
• |
• |
| Middle East and Africa Risk |
○ |
○ |
○ |
○ |
○ |
○ |
○ |
| Options Risk |
|
|
○ |
○ |
○ |
• |
○ |
| Preferred Securities Risk |
○ |
○ |
○ |
○ |
○ |
○ |
○ |
| Prepayment Risk |
|
○ |
|
|
|
○ |
|
| Privately Placed Securities Risk |
○ |
• |
○ |
○ |
○ |
• |
○ |
| Real Estate Securities Risk |
○ |
• |
○ |
○ |
○ |
○ |
○ |
•
Main Risks
○
Additional Risks
March 1, 2023 | 69
More About the Funds (continued)
| |
Emerging Markets Equity Fund |
Emerging Markets Research Enhanced Equity |
Europe Dynamic Fund |
International Equity Fund |
International Focus Fund |
International Hedged Equity Fund |
International Value Fund |
| Regulatory and Legal Risk |
○ |
○ |
○ |
○ |
○ |
○ |
○ |
| Securities Lending Risk |
○ |
○ |
○ |
○ |
○ |
○ |
○ |
| Smaller Company Risk |
• |
• |
• |
• |
• |
• |
• |
| Sovereign Debt Risk |
○ |
|
○ |
○ |
|
|
|
| Strategy Risk |
○ |
○ |
○ |
○ |
○ |
• |
○ |
| Structured Instrument Risk |
• |
• |
○ |
○ |
○ |
○ |
○ |
| Transactions and Liquidity Risk |
• |
• |
• |
• |
• |
• |
• |
| Value Investing Risk |
|
|
|
|
|
|
• |
| Variable Interest Entities Risk |
○ |
○ |
|
○ |
○ |
|
○ |
| Volcker Rule Risk |
○ |
○ |
○ |
○ |
○ |
○ |
○ |
•
Main Risks
○
Additional Risks
Equity Market Risk. The price of equity securities may rise or fall because of changes in the broad market or changes in a company’s financial condition, sometimes rapidly or unpredictably. These price movements may result from factors affecting individual companies, sectors or industries selected for a Fund’s portfolio or the securities market as a whole, such as changes in economic or political conditions. Equity securities are subject to “stock market risk” meaning that stock prices in general (or in particular, the prices of the types of securities in which a Fund invests) may decline over short or extended periods of time. When the value of a Fund’s securities goes down, your investment in a Fund decreases in value.
General Market Risk. Economies and financial markets throughout the world are becoming increasingly interconnected, which increases the likelihood that events or conditions in one country or region will adversely impact markets or issuers in other countries or regions. Securities in a Fund’s portfolio may underperform in comparison to securities in general financial markets, a particular financial market or other asset classes due to a number of factors, including inflation (or expectations for inflation), deflation (or expectations for deflation), interest rates, global demand for particular products or resources, market instability, debt crises and downgrades, embargoes, tariffs, sanctions and other trade barriers, regulatory events, other governmental trade or market control programs and related geopolitical events. In addition, the value of a Fund’s investments may be negatively affected by the occurrence of global events such as war, terrorism, environmental disasters, natural disasters or events, country instability, and infectious disease epidemics or pandemics.
For example, the outbreak of COVID-19 has negatively affected economies, markets and individual companies throughout the world, including those in which a Fund invests. The effects of this pandemic to public health and business and market conditions, including, among other things, reduced consumer demand and economic output, supply chain disruptions and increased government spending, may continue to have a significant negative impact on the performance of a Fund’s investments, increase a Fund’s volatility, exacerbate pre-existing political, social and economic risks to a Fund, and negatively impact broad segments of businesses and populations. In addition, governments, their regulatory agencies, or self-regulatory organizations have taken or may take actions in response to the pandemic that affect the instruments in which a Fund invests, or the issuers of such instruments, in ways that could
70 | J.P. Morgan International Equity Funds
have a significant negative impact on a Fund’s investment performance. The duration and extent of COVID-19 and associated economic and market conditions and uncertainty over the long-term cannot be reasonably estimated at this time. The ultimate impact of COVID-19 and the extent to which the associated conditions impact a Fund will also depend on future developments, which are highly uncertain, difficult to accurately predict and subject to frequent changes.
Foreign Securities and Emerging Markets Risk. Investments in foreign securities (including depositary receipts) are subject to special risks in addition to those of U.S. investments. These risks include political and economic risks, unstable governments, civil conflicts and war, greater volatility, decreased market liquidity, expropriation and nationalization risks, sanctions or other measures by the United States or other governments, currency fluctuations, higher transaction costs, delayed settlement, possible foreign controls on investment, and less stringent investor protection and disclosure standards of foreign markets. The securities markets of many foreign countries are relatively small, with a limited number of companies representing a small number of industries. If foreign securities are denominated and traded in a foreign currency, the value of a Fund’s foreign holdings can be affected by currency exchange rates and exchange control regulations. In certain markets where securities and other instruments are not traded “delivery versus payment,” a Fund may not receive timely payment for securities or other instruments it has delivered or receive delivery of securities paid for and may be subject to increased risk that the counterparty will fail to make payments or delivery when due or default completely.
Foreign market trading hours, clearance and settlement procedures, and holiday schedules may limit a Fund’s ability to buy and sell securities. Investments in foreign markets may also be adversely affected by governmental actions such as the imposition of capital controls, nationalization of companies or industries, expropriation of assets or the imposition of punitive taxes. The governments of certain countries may prohibit or impose substantial restrictions on foreign investing in their capital markets or in certain sectors or industries. In addition, a foreign government may limit or cause delay in the convertibility or repatriation of its currency which would adversely affect the U.S. dollar value and/or liquidity of investments denominated in that currency. Certain foreign investments may become less liquid in response to market developments or adverse investor perceptions, or become illiquid after purchase by a Fund, particularly during periods of market turmoil. Moreover, the growing interconnectivity of global economies and financial markets has increased the probability that adverse developments and conditions in one country or region will affect the stability of economies and financial markets in other countries or regions. A reduction in trading in securities of issuers located in countries whose economies are heavily dependent upon trading with key partners may have an adverse impact on a Fund’s investments.
Securities registration, custody and settlement may in some instances be subject to delays and legal and administrative uncertainties. Foreign investment in the securities markets of certain foreign countries is restricted or controlled to varying degrees. These restrictions or controls may at times limit or preclude investment in certain securities and may increase the costs and expenses of a Fund. In addition, the repatriation of investment income, capital or the proceeds of sales of securities from certain of the countries is controlled under regulations, including in some cases the need for certain advance government notification or authority, and if a deterioration occurs in a country’s balance of payments, the country could impose temporary restrictions on foreign capital remittances. A Fund also could be adversely affected by delays in, or a refusal to grant, any required governmental approval for repatriation, as well as by the application to it of other restrictions on investment.
Events and evolving conditions in certain economies or markets may alter the risks associated with investments tied to countries or regions that historically were perceived as comparatively stable becoming riskier and more volatile. The risks associated with foreign securities are magnified in “emerging markets.” These countries may have relatively unstable governments and less established market economies than developed countries. Emerging markets may face greater social, economic, regulatory and political uncertainties. These risks make emerging market securities more volatile and less liquid than securities issued in more developed countries and you may sustain sudden, and sometimes substantial, fluctuations in the value of your investments. Certain emerging market countries may be subject to less stringent requirements regarding accounting, auditing, financial reporting and record keeping and therefore, material information related to an investment may not be available or reliable. Additionally, a Fund may have substantial difficulties exercising its legal rights or enforcing a counterparty’s legal obligations in certain jurisdictions outside of the United States, in particular in emerging markets countries, which can increase the risks of loss. A Fund’s investments in foreign and emerging market securities may also be subject to foreign withholding and/or other taxes, which would decrease a Fund’s yield on those securities. Emerging markets are more likely than developed markets to experience problems with the clearing and settling of trades, as well as the holding of securities by local banks, agents and depositories.
Strategy Risk. The Fund’s investment strategies may not always provide greater market protection than other equity instruments particularly in rising equity markets when the Fund is expected to underperform traditional long-only equity strategies. In addition, as a result of the structure of the options overlay strategy, the Fund is not expected to provide market protection during times of low market volatility; during such periods, the Fund is expected to perform in line with broad equity markets.
March 1, 2023 | 71
More About the Funds (continued)
Options Risk. The value of the Fund’s positions in Index options or options on ETFs will fluctuate in response to changes in the value of the underlying index. Writing index call options or options on ETFs can reduce equity market risk, but it limits the opportunity to profit from an increase in the market value of stocks in exchange for upfront cash at the time of selling the call option. The Fund also risks losing all or part of the cash paid for purchasing put options. Unusual market conditions or the lack of a ready market for any particular option at a specific time may reduce the effectiveness of the Fund’s option strategies, and for these and other reasons, the Fund’s option strategies may not reduce the Fund’s volatility to the extent desired and could result in losses.
Geographic Focus Risk. In addition to the more general Foreign Securities and Emerging Markets Risk above, certain of the Funds may focus their investments in one or more foreign regions or small groups of countries. As a result, such Fund’s performance may be subject to greater volatility than a more geographically diversified fund and may be subject to the risks facing certain regions.
Greater China Region Risk. In addition to the risks listed under “Foreign Securities and Emerging Markets Risk,” investments in Mainland China, Hong Kong and Taiwan are subject to significant legal, regulatory, monetary and economic risks, as well as the potential for regional and global conflicts, including actions that are contrary to the interests of the U.S. Investments in Mainland China involve political and legal uncertainties, currency fluctuations and aggressive currency controls, the risk of confiscatory taxation, and nationalization or expropriation of assets, which could adversely affect and significantly diminish the values of the Mainland Chinese companies in which the Fund invests. The Mainland Chinese securities markets are emerging markets characterized by greater price volatility. Mainland China is dominated by the one-party rule of the Communist Party, and the Mainland Chinese government exercises significant control over Mainland China’s economic growth. There is the potential of increased tariffs and restrictions on trade between the United States and Mainland China. An increase in tariffs or trade restrictions, or even the threat of such developments, could lead to a significant reduction in international trade, which could have a negative impact on Mainland Chinese companies and a commensurately negative impact on the Fund. The political reunification of Mainland China and Taiwan, over which Mainland China continues to claim sovereignty, is a highly complex issue. There is the potential for future political, military or economic disturbances that may have an adverse impact on the values of the Fund’s investments in Mainland China and elsewhere, or make certain Fund investments impractical or impossible. Any escalation of hostility between Mainland China and Taiwan would likely have a significant adverse impact on the value and liquidity of the Fund’s investments in both Mainland China and elsewhere, causing substantial investment losses for the Fund.
Hong Kong is a Special Administrative Region of the People’s Republic of China. Since Hong Kong reverted to Chinese sovereignty in 1997, it has been governed by the Basic Law. Under the Basic Law, Hong Kong was guaranteed a high degree of autonomy in certain matters, including economic matters, until 2047. Attempts by the government of Mainland China to exert greater control over Hong Kong’s economic, political or legal structures or its existing social policy, could negatively affect investor confidence in Hong Kong (as has been the case previously during certain periods), which in turn could negatively affect markets and business performance.
The growing interconnectivity of global economies and financial markets has increased the possibility that conditions in one country or region might adversely impact the issuers of securities in a different country or region. In particular, the adoption or continuation of protectionist trade policies by one or more countries, or a slowdown in the U.S. economy, could lead to a decrease in demand for products in Greater China and reduced flows of private capital to these economies.
Brokerage commissions and other fees may be higher for securities traded in Mainland Chinese and Taiwanese markets than more developed markets.
At times, there is a high correlation among the markets in the Greater China region. Political, social or economic disruptions in the region, including conflicts and currency devaluations, even in countries in which the Fund is not invested, may adversely affect security values in other countries in the region and thus the Fund’s holdings.
Variable Interest Entities Risk. Chinese operating companies sometimes rely on VIE structures to raise capital from non-Chinese investors, even though such arrangements are not formally recognized under Chinese law. In a VIE structure, a Mainland China-based operating company establishes an entity (typically offshore) that enters into service and other contracts with the Mainland Chinese company designed to provide economic exposure to the company. The offshore entity then issues exchange-traded shares that are sold to the public, including non-Chinese investors (such as a Fund). Shares of the offshore entity are not equity ownership interests in the Mainland Chinese operating company and therefore the ability of the offshore entity to control the activities at the Mainland Chinese company are limited and the Mainland Chinese company may engage in activities that negatively impact investment value. Under a VIE structure, a Fund will typically have little or no ability to influence the Mainland China-based operating company through proxy voting or other means because it is not a Mainland Chinese company owner/shareholder. The VIE structure is designed to provide the offshore entity (and in turn, investors in the entity) with economic exposure to the Mainland Chinese company that replicates equity ownership, without actual equity ownership of the Mainland Chinese operating company. VIE structures are used due to Mainland Chinese government prohibitions on foreign ownership of companies in certain industries and it is not clear that the contracts are enforceable or that the structures will otherwise work as intended. There may also be conflicts of interest between the legal owners of the Mainland Chinese company and non-Chinese investors (such as a Fund).
72 | J.P. Morgan International Equity Funds
Although the China Securities Regulatory Commission published that they do not object to the use of VIE structures for Mainland Chinese Companies to raise capital from non-Chinese investors, there is no guarantee that the Mainland Chinese government or a Mainland Chinese regulator will not otherwise interfere with the operation of VIE structures. Intervention by the Mainland Chinese government with respect to VIE structures could adversely affect the Mainland Chinese operating company’s performance, the enforceability of the offshore entity’s contractual arrangements with the Mainland Chinese company and the value of the offshore entity’s shares. Under extreme circumstances, China might prohibit the use of VIE structures, or sever their ability to transmit economic and governance rights to non-Chinese investors. It remains unclear whether the Mainland China government will withdraw its implicit acceptance of the VIE structure, or whether any new laws, rules or regulations relating to VIE structures will be adopted or, if adopted, what impact they would have on the interests of non-Chinese investors (such as a Fund). Further, if the Mainland Chinese government determines that the agreements establishing the VIE structure do not comply with Mainland Chinese law and regulations, including those related to prohibitions on foreign ownership, the Mainland Chinese government could subject the Mainland Chinese company to penalties, revocation of business and operating licenses or forfeiture of ownership interests. The offshore entity’s control over the Mainland Chinese company may also be jeopardized if certain legal formalities are not observed in connection with the agreements, if the agreements are breached or if the agreements are otherwise determined not to be enforceable. If any of the foregoing were to occur, a non-Chinese investor may have little or no legal recourse and the market value of a Fund’s associated portfolio holdings would likely fall, causing substantial investment losses for the Fund.
In addition, Mainland Chinese companies listed on U.S. exchanges, including American Depositary Receipts and companies that rely on VIE structures, may be delisted if they do not meet U.S. accounting standards and auditor oversight requirements. Delisting could significantly decrease the liquidity and value of the securities of these companies, decrease the ability of a Fund to invest in such securities and increase the cost of a Fund if it is required to seek alternative markets in which to invest in such securities.
China Stock Connect Programs Risk.. The universe of A-share issues currently available via the Shanghai-Hong Kong Stock Connect program or the Shenzhen-Hong Kong Stock Connect Program (the Programs) in Mainland China to a Fund may be limited as compared with the universe of equity securities available in other markets. There are significant risks inherent in investing in China A-Shares through the Programs. There may be a lower level of liquidity in the China A-share markets accessed through the Programs, which are relatively smaller in terms of both combined total market value and the number of A-shares which are available for investments compared to other markets. This could potentially lead to severe price volatility in China A-shares. Investments in China A-shares are heavily regulated and the recoupment and repatriation of assets invested in China A-shares is subject to restrictions by the Mainland Chinese government. In addition, investments in China A-Shares through the Programs are subject to trading, clearance and settlement procedures that could increase the risk of loss to a Fund and/or affect a Fund’s ability to effectively pursue its investment strategy, such as the prohibition on same day (turnaround) trading through the Programs. China A-Shares currently eligible for trading under a Program may also lose such designation. Further, all China A-Shares trades must be settled in renminbi (RMB), which requires a Fund to have timely access to a reliable supply of RMB in Hong Kong, which cannot be assured.
Asia Pacific Market Risk. The economies in the Asia Pacific region are in all stages of economic development and may be intertwined. The small size of securities markets and the low trading volume in some countries in the Asia Pacific Region may lead to a lack of liquidity. Also, some Asia Pacific economies and financial markets have been extremely volatile in recent years. Many of the countries in the region are developing, both politically and economically. They may have relatively unstable governments and economies based on only a few commodities or industries. The share prices of companies in the region tend to be volatile and there is a significant possibility of loss. Also, some companies in the region may have less established product markets or a small management group and they may be more vulnerable to political or economic conditions, like nationalization. In addition, some countries have restricted the flow of money in and out of the country.
Certain of the currencies in the Asia Pacific region have experienced extreme volatility relative to the U.S. dollar. For example, Thailand, Indonesia, the Philippines and South Korea have had currency crises and have sought help from the International Monetary Fund. Holding securities in currencies that are devalued (or in companies whose revenues are substantially in currencies that are devalued) will likely decrease the value of a Fund’s holdings.
The trading volume on some Asia Pacific region stock exchanges is much lower than in the United States, and Asia Pacific region securities of some companies are less liquid and more volatile than similar U.S. securities. In addition, brokerage commissions on regional stock exchanges are fixed and are generally higher than the negotiated commissions in the United States. The imposition of tariffs or other trade barriers, or a downturn in the economy of a significant trading partner could adversely impact Asia Pacific companies. If a Fund concentrates in the Asia Pacific region, the Fund’s performance may be more volatile than that of a fund that invests globally. If Asia Pacific securities fall out of favor, it may cause a Fund to underperform funds that do not concentrate in the Asia Pacific region.
March 1, 2023 | 73
More About the Funds (continued)
European Market Risk. A Fund’s performance will be affected by political, social and economic conditions in Europe, such as growth of the economic output (the gross national product), the rate of inflation, the rate at which capital is reinvested into European economies, the success of governmental actions to reduce budget deficits, the resource self-sufficiency of European countries and interest and monetary exchange rates between European countries. European financial markets may experience volatility due to concerns about high government debt levels, credit rating downgrades, rising unemployment, the future of the euro as a common currency, possible restructuring of government debt and other government measures responding to those concerns, and fiscal and monetary controls imposed on member countries of the European Union. The risk of investing in Europe may be heightened due to steps taken by the United Kingdom to exit the European Union. On January 31, 2020, the United Kingdom officially withdrew from the European Union. On December 30, 2020, the European Union and the United Kingdom signed the EU-UK Trade and Cooperation Agreement (TCA), an agreement on the terms governing certain aspects of the European Union’s and the United Kingdom’s relationship, many of which are still to be determined, including those related to financial services. Notwithstanding the TCA, significant uncertainty remains in the market regarding the ramifications of the United Kingdom’s withdrawal from the European Union. The impact on the United Kingdom and European economies and the broader global economy could be significant, resulting in increased volatility and illiquidity, currency fluctuations, impacts on arrangements for trading and on other existing cross-border cooperation arrangements (whether economic, tax, fiscal, legal, regulatory or otherwise), and in potentially lower growth for companies in the United Kingdom, Europe and globally, which could have an adverse effect on the value of a Fund’s investments. In addition, if one or more other countries were to exit the European Union or abandon the use of the euro as a currency, the value of investments tied to those countries or the euro could decline significantly and unpredictably.
India Risk. Government actions, bureaucratic obstacles and inconsistent economic reform within the Indian government have had a significant effect on the economy and could adversely affect market conditions, economic growth and the profitability of private enterprises. Global economic developments may inhibit the flow of foreign capital on which India is dependent to sustain its growth. Large portions of many Indian companies remain in the hands of individuals and corporate governance standards of Indian companies may be weaker and less transparent, which may increase the risk of loss and unequal treatment of investors. Investments in Indian securities may be limited or prevented, at times, due to the limits on foreign ownership imposed by the Reserve Bank of India. Investments in India are subject to risks presented by investments in an emerging market country, including liquidity risk, which may result in extreme volatility in the prices of Indian securities. Religious, cultural and military disputes persist in India, and between India and Pakistan (as well as between sectarian groups within each country). In addition, the Indian economy could be adversely impacted by natural disasters and acts of terrorism. Both India and Pakistan have tested nuclear arms, and the threat of deployment of such weapons could hinder development of the Indian economy, and escalating tensions could impact the broader region.
Japan Risk. The Japanese economy may be subject to economic, political and social instability, which could have a negative impact on Japanese securities. In the past, Japan’s economic growth rate has remained relatively low, and it may remain low in the future. Furthermore, the Japanese economic growth rate could be impacted by Bank of Japan’s monetary policies, rising interest rates, tax increases, budget deficits, consumer confidence and volatility in the Japanese yen. At times, the Japanese economy has been adversely impacted by government intervention and protectionism, changes in its labor market, and an unstable financial services sector. International trade, government support of the financial services sector and other troubled sectors, government policy, natural disasters, an aging demographic and declining population and/or geopolitical developments associated with actual or potential conflicts with one or more countries in Asia could significantly affect the Japanese economy. Strained foreign relations with neighboring countries (China, South Korea, North Korea and Russia) may not only negatively impact the Japanese economy, but also the geographic region as well as globally. A significant portion of Japan’s trade is conducted with developing nations and can be affected by conditions in these nations or by currency fluctuations. Japan is an island state with few natural resources and limited land area and is reliant on imports for its commodity needs. Any fluctuations or shortages in the commodity markets could have a negative impact on the Japanese economy. In addition, Japan's economy has in the past and could in the future be significantly impacted by natural disasters.
Middle East and Africa Risk. Certain countries in the region are in early stages of development. As a result, there may be a high concentration of market capitalization and trading volume in a small number of issuers representing a limited number of industries, as well as a high concentration of investors and financial intermediaries. Brokers may be fewer in number and less well capitalized than brokers in more developed regions. Certain economies in the region depend to a significant degree upon exports of commodities and are vulnerable to changes in commodity prices, which in turn may be affected by a variety of factors. In addition, certain governments in the region have exercised substantial influence over the private sector, including ownership or control of companies. Governmental actions in the future could have a significant economic impact. In particular, changes in investment policies or shifts in the prevailing political climate could result in the introduction of changes to Government regulations with respect to price controls, export and import controls, income and other taxes, foreign ownership restrictions, foreign exchange and currency controls and labor and welfare benefit policies. Unexpected changes in these policies or regulations could lead to increased investment, operating or compliance expenses. Any such changes could have a material adverse effect on the Fund and the Fund Manager’s business,
74 | J.P. Morgan International Equity Funds
financial condition and results of operations. Certain countries in the region may be affected by political instability, armed conflict, territorial disputes, historical animosities, regional instability, terrorist activities and religious, ethnic and/or socio-economic unrest. Such developments could have a negative effect on economic growth and could result in significant disruptions in the securities markets, including securities held by a Fund. Specific country risks that may have a material adverse effect on the Fund’s business, financial condition and results of operations are: potential political instability, riots or other forms of civil disturbance or violence; war, terrorism, invasion, rebellion or revolution; Government interventions, including expropriation or nationalization of assets, increased protectionism and the introduction of tariffs or subsidies; changing fiscal and regulatory regimes; arbitrary or inconsistent Government action; inflation in local economies; cancellation, nullification or unenforceability of contractual rights; and underdeveloped industrial and economic infrastructure. In particular, since late 2010, there have been significant civil disturbances and events resulting from political turmoil affecting several countries in the Middle East and Africa (MENA) Region, which to date have led to the collapse, or near collapse, of the political regimes of Syria, Tunisia, Egypt and Libya. There are on-going protests in other countries in the MENA Region, including strikes, demonstrations, marches and rallies. In addition, since late 2011 tensions between western nations and Iran in respect of Iran’s nuclear program have escalated, with Iran threatening to block the Strait of Hormuz and western nations implementing more severe economic sanctions against Iran. Such continuing instability and unrest in the MENA Region may significantly impact economies in the region. Such impacts could occur through a lower flow of foreign direct investment into the region, the outflow of expatriate residents or capital, or increased volatility in the global and regional financial markets. Certain Middle Eastern and African countries have currencies pegged to the U.S. dollar, which, if abandoned, could cause sudden and significant currency adjustments, which could impact the Fund’s investment returns in those countries. The legal systems, and the unpredictability thereof, in certain countries in the region also may have an adverse impact on the Fund and may expose the Fund to significant or unlimited liabilities. Investment in certain countries in the region by the Fund may be restricted or prohibited under applicable regulation, and the Fund, as a foreign investor, may be required to obtain approvals and may have to invest on less advantageous terms (including price) than nationals. A Fund’s investments in securities of a country in the region may be subject to economic sanctions or other government restrictions, which may negatively impact the value or liquidity of the Fund’s investments. Investments in the region may adversely impact the operations of the Fund through the delay of the Fund’s ability to exercise its rights as a security holder. Substantial limitations may exist in the region with respect to the Fund’s ability to repatriate investment income, capital gains or its investment. Securities which are subject to material legal restrictions on repatriation of assets will be considered illiquid securities by the Fund and subject to the limitations on illiquid investments.
Depositary Receipts Risk. A Fund’s investments may take the form of depositary receipts, including unsponsored depositary receipts. Unsponsored depositary receipts may not provide as much information about the underlying issuer and may not carry the same voting privileges as sponsored depositary receipts. Unsponsored depositary receipts are issued by one or more depositaries in response to market demand, but without a formal agreement with the company that issues the underlying securities.
Currency Risk. Changes in foreign currency exchange rates will affect the value of a Fund’s securities and the price of a Fund’s shares. Generally, when the value of the U.S. dollar rises in value relative to a foreign currency, an investment impacted by that currency loses value because that currency is worth less in U.S. dollars. Currency exchange rates may fluctuate significantly over short periods of time for a number of reasons, including changes in interest rates. Devaluation of a currency by a country’s government or banking authority also will have a significant impact on the value of any investments denominated in that currency. Currency markets generally are not as regulated as securities markets, may be riskier than other types of investments and may increase the volatility of a Fund. Some of the Funds may engage in various strategies to hedge against currency risk. These strategies may consist of use of forward currency contracts including non-deliverable forward contracts and foreign currency futures contracts. To the extent a Fund enters into such transactions in markets other than in the United States, a Fund may be subject to certain currency, settlement, liquidity, trading and other risks similar to those described in this prospectus with respect to a Fund’s investments in foreign securities. There can be no assurance that a Fund’s hedging activities will be effective, and a Fund will incur costs in connection with the hedging. Currency hedging may limit a Fund’s return if the relative values of currencies change. Furthermore, a Fund may only engage in hedging activities from time to time and may not necessarily be engaging in hedging activities when movements in currency exchange rates occur.
Smaller Company Risk. Investments in smaller, newer companies may be riskier, less liquid, more volatile and more vulnerable to economic, market and industry changes than investments in larger, more established companies. The securities of smaller companies may trade less frequently and in smaller volumes than securities of larger companies. As a result, changes in the price of debt or equity issued by such companies may be more sudden or erratic than the prices of large capitalization companies, especially over the short term. Because smaller companies may have limited product lines, markets or financial resources or may depend on a few key employees, they may be more susceptible to particular economic events or competitive factors than large capitalization companies. This may cause unexpected and frequent decreases in the value of a Fund’s investments.
March 1, 2023 | 75
More About the Funds (continued)
Value Investing Risk. Value investing attempts to identify companies that, according to the adviser’s estimate of their true worth, are undervalued. The adviser selects stocks at prices that it believes are temporarily low relative to factors such as the company’s earnings, cash flow or dividends. A value stock may decrease in price or may not increase in price as anticipated by the adviser if other investors fail to recognize the company’s value or the factors that the adviser believes will cause the stock price to increase do not occur. The Fund’s performance may be better or worse than the performance of equity funds that focus on growth stocks or that have a broader investment style.
High Portfolio Turnover Risk. A Fund may engage in active and frequent trading leading to increased portfolio turnover, higher transaction costs, and the possibility that the recognition of capital gains will be accelerated, including short-term capital gains that will generally be taxable to shareholders as ordinary income.
Industry and Sector Focus Risk. At times, a Fund may increase the relative emphasis of its investments in a particular industry or sector. The prices of securities of issuers in a particular industry or sector may be more susceptible to fluctuations due to changes in economic or business conditions, government regulations, availability of basic resources or supplies, or other events that affect that industry or sector more than securities of issuers in other industries and sectors. To the extent that a Fund increases the relative emphasis of its investments in a particular industry or sector, the value of a Fund’s shares may fluctuate in response to events affecting that industry or sector.
Transactions and Liquidity Risk. A Fund could experience a loss when selling securities to meet redemption requests and its liquidity may be negatively impacted. The risk of loss increases if the redemption requests are large or frequent, occur in times of overall market turmoil or declining prices for the securities sold, or when the securities a Fund wishes to, or is required to, sell are illiquid. To the extent a large proportion of shares of a Fund are held by a small number of shareholders (or a single shareholder) including funds or accounts over which the adviser or its affiliates have investment discretion, the Fund is subject to the risk that these shareholders will purchase or redeem Fund shares in large amounts rapidly or unexpectedly, including as a result of an asset allocation decision made by the adviser or its affiliates. In addition to the other risks described in this section, these transactions could adversely affect the ability of a Fund to conduct its investment program. A Fund may be unable to sell illiquid securities at its desired time or price or the price at which the securities have been valued for purposes of the Fund’s net asset value. Illiquidity can be caused by a drop in overall market trading volume, an inability to find a ready buyer, or legal restrictions on the securities’ resale. Other market participants may be attempting to sell debt securities at the same time as a Fund, causing downward pricing pressure and contributing to illiquidity. The capacity for bond dealers to engage in trading or “make a market” in debt securities has not kept pace with the growth of bond markets. This could potentially lead to decreased liquidity and increased volatility in the debt markets. Liquidity and valuation risk may be magnified in a rising interest rate environment, when credit quality is deteriorating or in other circumstances where investor redemptions from fixed income mutual funds may be higher than normal. Certain securities that were liquid when purchased may later become illiquid, particularly in times of overall economic distress. Similarly, large purchases of Fund shares may adversely affect a Fund’s performance to the extent that the Fund is delayed in investing new cash and is required to maintain a larger cash position than it ordinarily would. Large redemptions also could accelerate the realization of capital gains, increase the Fund’s transaction costs and impact the Fund’s performance.
Exchange-Traded Fund (ETF) and Other Investment Company Risk. A Fund may invest in shares of other investment companies and ETFs. Shareholders bear both their proportionate share of a Fund’s expenses and similar expenses of the underlying investment company or ETF when the Fund invests in shares of another investment company or ETF. A Fund is subject to the risks associated with the ETF or investment company’s investments. The price and movement of an ETF or closed-end fund designed to track an index may not track the index and may result in a loss. In addition, ETFs and closed-end investment companies may trade at a price above (premium) or below (discount) their net asset value, especially during periods of significant market volatility or stress, causing investors to pay significantly more or less than the value of the ETF’s underlying portfolio. Certain ETFs or closed-end funds traded on exchanges may be thinly traded and experience large spreads between the “ask” price quoted by a seller and the “bid” price offered by a buyer.
Derivatives Risk. The Funds may use derivatives in connection with its investment strategies. Derivatives may be riskier than other types of investments because they may be more sensitive to changes in economic or market conditions than other types of investments and could result in losses that significantly exceed a Fund’s original investment. Derivatives are subject to the risk that changes in the value of a derivative may not correlate perfectly with the underlying asset, rate or index. The use of derivatives may not be successful, resulting in losses to the Fund, and the cost of such strategies may reduce the Fund’s returns. Certain derivatives also expose the Fund to counterparty risk (the risk that the derivative counterparty will not fulfill its contractual obligations), including credit risk of the derivative counterparty. In addition, the Fund may use derivatives for non-hedging purposes, which increases the Fund’s potential for loss. Certain derivatives are synthetic instruments that attempt to replicate the performance of certain reference assets. With regard to such derivatives, the Fund does not have a claim on the reference assets and is subject to enhanced counterparty risk.
76 | J.P. Morgan International Equity Funds
Investing in derivatives and engaging in short sales will result in a form of leverage. Leverage involves special risks. A Fund may be more volatile than if the Fund had not been leveraged because the leverage tends to exaggerate any effect on the value of a Fund’s portfolio securities. Registered investment companies are limited in their ability to engage in derivative transactions and required to identify and earmark assets to provide asset coverage for derivative transactions.
The possible lack of a liquid secondary market for derivatives and the resulting inability of the Fund to sell or otherwise close a derivatives position could expose the Fund to losses and could make derivatives more difficult for the Fund to value accurately.
A Fund’s transactions in futures contracts, swaps and other derivatives could also affect the amount, timing and character of distributions to shareholders which may result in a Fund realizing more short-term capital gain and ordinary income subject to tax at ordinary income tax rates than it would if it did not engage in such transactions, which may adversely impact the Fund’s after-tax return.
| WHAT IS A DERIVATIVE? |
| Derivatives are securities or contracts (for example, futures and options) that derive their value from the performance of underlying assets or securities. |
Sovereign Debt Risk. Sovereign debt securities are issued or guaranteed by foreign governmental entities. These investments are subject to the risk that a governmental entity may delay or refuse to pay interest or repay principal on its sovereign debt, due, for example, to cash flow problems, insufficient foreign currency reserves, political considerations, the relative size of the governmental entity’s debt position in relation to the economy or the failure to put in place economic reforms required by the International Monetary Fund or other multilateral agencies. If a governmental entity defaults, it may ask for more time in which to pay or for further loans. There is no legal process for collecting sovereign debts that a government does not pay nor are there bankruptcy proceedings through which all or part of the sovereign debt that a governmental entity has not repaid may be collected.
Inflation-Linked Securities Risk. Inflation-linked debt securities are subject to the effects of changes in market interest rates caused by factors other than inflation (such as real interest rates). In general, the price of an inflation-linked security tends to decrease when real interest rates increase and can increase when real interest rates decrease. Interest payments on inflation-linked securities are unpredictable and will fluctuate as the principal and interest are adjusted for inflation. Any increase in the principal amount of an inflation-linked debt security will be considered taxable ordinary income, even though the Fund will not receive the principal until maturity.
There can also be no assurance that the inflation index used will accurately measure the real rate of inflation in the prices of goods and services. The Fund’s investments in inflation-linked securities may lose value in the event that the actual rate of inflation is different than the rate of inflation calculated by the index. In addition, inflation-linked securities are subject to the risk that the CPI or other relevant index may be discontinued, fundamentally altered in a manner materially adverse to the interests of an investor in the securities, altered by legislation or Executive Order in a materially adverse manner to the interests of an investor in the securities or substituted with an alternative index.
Credit Risk. A Fund’s investments are subject to the risk that an issuer and/or the counterparty to a security, contract, repurchase agreement or other investment held by the Fund will fail to make payments when due or default completely on securities, repurchase agreements or other investments held by a Fund. The risk of defaults across issuers and/or counterparties increases in adverse market and economic conditions, including the conditions resulting from the COVID-19 pandemic. Such defaults could result in losses to a Fund. In addition, the credit quality of securities held by a Fund may be lowered if an issuer’s or counterparty’s financial condition changes. Lower credit quality may lead to greater volatility in the price of a security and in shares of a Fund. Lower credit quality also may affect liquidity and make it difficult for a Fund to sell the security. A Fund may invest in securities that are rated in the lowest investment grade category. Such securities also are considered to have speculative characteristics similar to high yield securities, and issuers of such securities are more vulnerable to changes in economic conditions than issuers of higher grade securities. Although U.S. government securities issued directly by the U.S. government are guaranteed by the U.S. Treasury, other U.S. government securities issued by an agency or instrumentality of the U.S. government may not be. No assurance can be given that the U.S. government would provide financial support to its agencies or instrumentalities if not required to do so by law.
Prices of a Fund’s investments may be adversely affected if any of the issuers or counterparties it is invested in are subject to an actual or perceived deterioration in their credit quality. Credit spreads may increase, which may reduce the market values of a Fund’s securities. Credit spread risk is the risk that economic and market conditions or any actual or perceived credit deterioration may lead to an increase in the credit spreads (i.e., the difference in yield between two securities of similar maturity but different credit quality) and a decline in price of the issuer’s securities.
March 1, 2023 | 77
More About the Funds (continued)
Preferred Securities Risk. Preferred securities generally have a preference as to dividends and liquidation over an issuer’s common stock but ranks junior to debt securities in an issuer’s capital structure. Unlike interest payments on debt securities, dividends on preferred securities are payable only if declared by the issuer’s board of directors. As a consequence, if the board of directors of an issuer does not declare dividends or distributions for the relevant dividend or distribution periods, the issuer will not be obligated to pay dividends or distributions on the relevant payment date, and such dividends and distributions may be forfeited. Holders of preferred securities typically do not have voting rights except in certain circumstances where they may be given only limited voting rights. Preferred securities also may be subject to optional or mandatory redemption provisions. Preferred shares may carry different rights or obligations in jurisdictions outside of the United States.
Privately Placed Securities Risk. Privately placed securities generally are less liquid than publicly traded securities and a Fund may not always be able to sell such securities without experiencing delays in finding buyers or reducing the sale price for such securities. The disposition of some of the securities held by the Fund may be restricted under federal securities laws or by the relevant exchange by a governmental or supervisory authority. As a result, the Fund may not be able to dispose of such investments at a time when, or at a price at which, it desires to do so and may have to bear expenses of registering these securities, if necessary. These securities may also be difficult to value.
High Yield Securities Risk. A Fund may invest in debt securities that are considered to be speculative (also known as junk bonds). These investments may be issued by companies which may be highly leveraged, less creditworthy or financially distressed. Non-investment grade debt securities can be more sensitive to short-term corporate, economic and market developments. During periods of economic uncertainty and change, the market price of a Fund’s investments and a Fund’s net asset value may be volatile. Furthermore, though these investments generally provide a higher yield than higher-rated debt securities, the high degree of risk involved in these investments can result in substantial or total losses. These securities are subject to greater risk of loss, greater sensitivity to economic changes, valuation difficulties, and a potential lack of a secondary or public market for securities. The market price of these securities can change suddenly and unexpectedly. As a result, certain Funds are intended for investors who are able and willing to assume a high degree of risk.
In recent years, there has been a broad trend of weaker or less restrictive covenant protections in the high yield market. Among other things, under such weaker or less restrictive covenants, borrowers might be able to exercise more flexibility with respect to certain activities than borrowers who are subject to stronger or more protective covenants. For example, borrowers might be able to incur more debt, including secured debt, return more capital to shareholders, remove or reduce assets that are designated as collateral securing high yield securities, increase the claims against assets that are permitted against collateral securing high yield securities or otherwise manage their business in ways that could impact creditors negatively. In addition, certain privately held borrowers might be permitted to file less frequent, less detailed or less timely financial reporting or other information, which could negatively impact the value of the high yield securities issued by such borrowers. Each of these factors might negatively impact the high yield instruments held by a Fund.
As part of its high yield strategy, a Fund may invest in debt securities of smaller, newer companies. A Fund’s risks increase as it invests more heavily in smaller companies (mid cap and small cap companies). The securities of smaller companies may trade less frequently and in smaller volumes than securities of larger companies. In addition, smaller companies may be more vulnerable to economic, market and industry changes. As a result, the changes in value of their debt securities may be more sudden or erratic than in large capitalization companies, especially over the short term. Because smaller companies may have limited product lines, markets or financial resources or may depend on a few key employees, they may be more susceptible to particular economic events or competitive factors than large capitalization companies. This may cause unexpected and frequent decreases in the value of a Fund’s investments.
Structured Instrument Risk. A Fund may invest in instruments that have similar economic characteristics to equity securities, such as participation notes or other structured instruments that may be developed from time to time (structured instruments). Structured instruments are notes that are issued by banks, broker-dealers or their affiliates and are designed to offer a return linked to a particular underlying equity or market.
If the structured instrument were held to maturity, the issuer would pay to the purchaser the underlying instrument’s value at maturity with any necessary adjustments. The holder of a structured instrument that is linked to a particular underlying security or instrument may be entitled to receive dividends paid in connection with that underlying security or instrument, but typically does not receive voting rights as it would if it directly owned the underlying security or instrument. Structured instruments have transaction costs. In addition, there can be no assurance that there will be a trading market for a structured instrument or that the trading price of a structured instrument will equal the underlying value of the security, instrument or market that it seeks to replicate. Unlike a direct investment in equity securities, structured instruments typically involve a term or expiration date, potentially increasing a Fund’s turnover rate, transaction costs and tax liability.
78 | J.P. Morgan International Equity Funds
Due to transfer restrictions, the secondary markets on which a structured instrument is traded may be less liquid than the market for other securities, or may be completely illiquid, which may expose a Fund to risks of mispricing or improper valuation. Structured instruments typically constitute general unsecured contractual obligations of the banks, broker-dealers or their relevant affiliates that issue them, which subjects a Fund to counterparty risk (and this risk may be amplified if the Fund purchases structured instruments from only a small number of issuers). Structured instruments also have the same risks associated with a direct investment in the underlying securities, instruments or markets that they seek to replicate.
Real Estate Securities Risk. The value of real estate securities in general, and REITs in particular, are subject to the same risks as direct investments in real estate and mortgages which include, but are not limited to, sensitivity to changes in real estate values and property taxes, interest rate risk, tax and regulatory risk, fluctuations in rent schedules and operating expenses, adverse changes in local, regional or general economic conditions, deterioration of the real estate market and the financial circumstances of tenants and sellers, unfavorable changes in zoning, building, environmental and other laws, the need for unanticipated renovations, unexpected increases in the cost of energy and environmental factors. Furthermore, a REIT could fail to qualify for tax free pass-through of its income under the Internal Revenue Code or fail to maintain its exemption from registration under the 1940 Act, which could produce adverse economic consequences for the REIT and its investors, including the Fund.
The underlying mortgage loans may be subject to the risks of default or of prepayments that occur earlier or later than expected, and such loans may also include so-called “sub-prime” mortgages. The value of REITs will also rise and fall in response to the management skill and creditworthiness of the issuer. In particular, the value of these securities may decline when interest rates rise and will also be affected by the real estate market and by the management of the underlying properties. REITs may be more volatile and/or more illiquid than other types of equity securities. A Fund will indirectly bear its proportionate share of expenses, including management fees, paid by each REIT in which it invests in addition to the expenses of the Fund.
In addition, certain of the companies in which the Fund intends to invest may have developed or commenced development on properties and may develop additional properties in the future. Real estate development involves significant risks in addition to those involved in the ownership and operation of established properties, including the risks that financing, if needed, may not be available on favorable terms for development projects, that construction may not be completed on schedule (resulting in increased debt service expense and construction costs), that estimates of the costs of construction may prove to be inaccurate and that properties may not be leased, rented or operated on profitable terms and therefore will fail to perform in accordance with expectations. As a result, the value of the Fund’s investment may decrease in value. Real estate securities have limited diversification and are, therefore, subject to risks inherent in operating and financing a limited number of projects. Real estate securities are also subject to heavy cash flow dependency and defaults by borrowers or tenants.
Convertible Securities Risk. A convertible security generally entitles the holder to receive interest paid or accrued on debt securities or the dividend paid on preferred stock until the convertible security matures or is redeemed, converted or exchanged. Before conversion, convertible securities generally have characteristics similar to both debt and equity securities. The value of convertible securities tends to decline as interest rates rise and, because of the conversion feature, tends to vary with fluctuations in the market value of the underlying securities. Convertible securities ordinarily provide a stream of income with generally higher yields than those of common stock of the same or similar issuers. Convertible securities generally rank senior to common stock in a corporation’s capital structure but are usually subordinated to comparable non-convertible securities. Convertible securities generally do not participate directly in any dividend increases or decreases of the underlying securities, although the market prices of convertible securities may be affected by any dividend changes or other changes in the underlying securities. Contingent convertible securities are subject to additional risk factors. A contingent convertible security is a hybrid debt security typically issued by a non-U.S. bank that may be convertible into equity or may be written down if a pre-specified trigger event such as a decline in capital ratio below a prescribed threshold occurs. If such a trigger event occurs, a Fund may lose the principal amount invested on a permanent or temporary basis or the contingent convertible security may be converted to equity. In addition to being subject to a possible write-down upon the occurrence of a trigger event, contingent convertible securities may also be subject to a permanent write-down or conversion into equity (in whole or in part), if the applicable bank regulator or other public administrative authority having responsibility for managing the orderly dissolution of an institution (the “resolution authority”) has determined that the issuer is not viable. Coupon payments on contingent convertible securities may be discretionary and may be cancelled by the issuer. Holders of contingent convertible securities may suffer a loss of capital when comparable equity holders do not. As contingent convertible securities may be perpetual or have long-dated maturities, they may face greater interest rate sensitivity and may be subject to greater fluctuations in value than securities with shorter maturity dates. Such securities also may be subject to prepayment risk due to optional or mandatory redemption provisions.
Initial Public Offerings (IPO) Risk. IPO securities have no trading history, and information about the companies may be available for very limited periods. The prices of securities sold in IPOs may be highly volatile and their purchase may involve high transaction costs. At any particular time or from time to time, the Fund may not be able to invest in securities issued in IPOs, or invest to the extent desired, because, for example, only a small portion (if any) of the securities being offered in an IPO may be made available to
March 1, 2023 | 79
More About the Funds (continued)
the Fund. In addition, under certain market conditions, a relatively small number of companies may issue securities in IPOs. Similarly, as the number of purchasers to which IPO securities are allocated increases, the number of securities issued to the Fund may decrease. The performance of the Fund during periods when it is unable to invest significantly or at all in IPOs may be lower than during periods when the Fund is able to do so. In addition, as the Fund increases in size, the impact of IPOs on the Fund’s performance will generally decrease.
Interest Rate Risk. A Fund’s debt securities will increase or decrease in value based on changes in interest rates. If rates increase, the value of a Fund’s investments generally declines. On the other hand, if rates fall, the value of investments generally increases. Securities with greater interest rate sensitivity and longer maturities tend to produce higher yields, but generally are subject to greater fluctuations in value. The Funds may invest in variable and floating rate securities. Although these instruments are generally less sensitive to interest rate changes than fixed rate instruments, the value of variable and floating rate securities may decline if their interest rates do not rise as quickly or as much as general interest rates. Many factors can cause interest rates to rise. Some examples include central bank monetary policy, rising inflation rates and general economic conditions. The Funds may face a heightened level of interest rate risk due to certain changes or uncertainty in monetary policy, such as an interest rate increase by the Federal Reserve.
Debt market conditions are highly unpredictable and some parts of the market are subject to dislocations. Beginning in March 2022, the Federal Reserve Board began increasing interest rates and has signaled the possibility of further increases. It is difficult to accurately predict the pace at which the Federal Reserve Board will increase interest rates any further, or the timing, frequency or magnitude of any such increases, and the evaluation of macro-economic and other conditions could cause a change in approach in the future. Any such changes could be sudden and could expose debt markets to significant volatility and reduced liquidity for Fund investments.
Securities Lending Risk. Each Fund may engage in securities lending. Securities lending involves counterparty risk, including the risk that the loaned securities may not be returned or returned in a timely manner and/or a loss of rights in the collateral if the borrower or the lending agent defaults. This risk is increased when a Fund’s loans are concentrated with a single or limited number of borrowers. In addition, each Fund bears the risk of loss in connection with its investments of the cash collateral it receives from the borrower. To the extent that the value or return of a Fund’s investments of the cash collateral declines below the amount owed to a borrower, the Fund may incur losses that exceed the amount it earned on lending the security. In situations where the adviser does not believe that it is prudent to sell the cash collateral investments in the market, a Fund may borrow money to repay the borrower the amount of cash collateral owed to the borrower upon return of the loaned securities. This will result in financial leverage, which may cause a Fund to be more volatile because financial leverage tends to exaggerate the effect of any increase or decrease in the value of the Fund’s portfolio securities.
Extension Risk.The Fund invests in securities that may be subject to the risk that a rise in interest rates or credit spreads will extend the life of a security to a date later than the anticipated repayment date, causing the value of the investment to decrease.
Prepayment Risk. The issuer of certain securities may repay principal in advance, especially when yields fall. Changes in the rate at which prepayments or redemptions occur can affect the return on investment of these securities. When debt obligations are prepaid or when securities are redeemed, a Fund may have to reinvest in securities with a lower yield. A Fund also may fail to recover additional amounts (i.e., premiums) paid for securities with higher coupons, resulting in an unexpected capital loss.
Cyber Security Risk. As the use of technology has become more prevalent in the course of business, the Fund has become more susceptible to operational and financial risks associated with cyber security, including: theft, loss, misuse, improper release, corruption and destruction of, or unauthorized access to, confidential or highly restricted data relating to the Fund and its shareholders; and compromises or failures to systems, networks, devices and applications relating to the operations of the Fund and its service providers. Cyber security risks may result in financial losses to the Fund and its shareholders; the inability of the Fund to transact business with its shareholders; delays or mistakes in the calculation of the Fund’s NAV or other materials provided to shareholders; the inability to process transactions with shareholders or other parties; violations of privacy and other laws; regulatory fines, penalties and reputational damage; and compliance and remediation costs, legal fees and other expenses. The Fund’s service providers (including, but not limited to, the adviser, any sub-advisers, administrator, transfer agent, and custodian or their agents), financial intermediaries, companies in which the Fund invests and parties with which the Fund engages in portfolio or other transactions also may be adversely impacted by cyber security risks in their own businesses, which could result in losses to the Fund or its shareholders. While measures have been developed which are designed to reduce the risks associated with cyber security, there is no guarantee that those measures will be effective, particularly since the Fund does not directly control the cyber security defenses or plans of their service providers, financial intermediaries and companies in which they invest or with which they do business.
80 | J.P. Morgan International Equity Funds
Regulatory and Legal Risk. U.S. and non-U.S. governmental agencies and other regulators regularly implement additional regulations and legislators pass new laws that affect the investments held by a Fund, the strategies used by a Fund or the level of regulation or taxation applying to a Fund (such as regulations related to investments in derivatives and other transactions). These regulations and laws may adversely impact the investment strategies, performance, costs and operations of a Fund or taxation of shareholders.
Volcker Rule Risk. Pursuant to section 619 of the Dodd-Frank Wall Street Reform and Consumer Protection Act and certain rules promulgated thereunder known as the Volcker Rule, if the adviser and/or its affiliates own 25% or more of the outstanding ownership interests of a Fund after the permitted seeding period from the implementation of a Fund’s investment strategy, a Fund could be subject to restrictions on trading that would adversely impact a Fund’s ability to execute its investment strategy. Generally, the permitted seeding period is three years from the implementation of a Fund’s investment strategy. As a result, the adviser and/or its affiliates may be required to reduce their ownership interests in the Fund at a time that is sooner than would otherwise be desirable, which may result in a Fund’s liquidation or, if a Fund is able to continue operating, may result in losses, increased transaction costs and adverse tax consequences as a result of the sale of portfolio securities.
For more information about risks associated with the types of investments that a Fund purchases, please read the “Risk/Return Summary” at the front of this prospectus and the Statement of Additional Information.
Conflicts of Interest
An investment in a Fund is subject to a number of actual or potential conflicts of interest. For example, the Adviser and/or its affiliates provide a variety of different services to a Fund, for which the Fund compensates them. As a result, the Adviser and/or its affiliates have an incentive to enter into arrangements with a Fund, and face conflicts of interest when balancing that incentive against the best interests of a Fund. The Adviser and/or its affiliates also face conflicts of interest in their service as investment adviser to other clients, and, from time to time, make investment decisions that differ from and/ or negatively impact those made by the Adviser on behalf of a Fund. In addition, affiliates of the Adviser provide a broad range of services and products to their clients and are major participants in the global currency, equity, commodity, fixed income and other markets in which a Fund invests or will invest. In certain circumstances by providing services and products to their clients, these affiliates’ activities will disadvantage or restrict the Funds and/or benefit these affiliates. The Adviser may also acquire material non-public information which would negatively affect the Adviser’s ability to transact in securities for a Fund. JPMorgan and the Funds have adopted policies and procedures reasonably designed to appropriately prevent, limit or mitigate conflicts of interest. In addition, many of the activities that create these conflicts of interest are limited and/or prohibited by law, unless an exception is available. For more information about conflicts of interest, see the Potential Conflicts of Interest section in the Statement of Additional Information.
Temporary Defensive Positions
For liquidity and to respond to unusual market conditions, the Funds may invest all or most of their total assets in cash and cash equivalents for temporary defensive purposes. These investments may result in a lower yield than lower-quality or longer-term investments.
| WHAT IS A CASH EQUIVALENT? |
| Cash equivalents are highly liquid, high-quality instruments with maturities of three months or less on the date they are purchased. They include securities issued by the U.S. government, its agencies and instrumentalities, repurchase agreements, certificates of deposit, bankers’ acceptances, commercial paper, money market mutual funds and bank deposit accounts. |
While the Funds are engaged in a temporary defensive position, they may not meet their investment objectives. These investments may also be inconsistent with a Fund’s main investment strategies. Therefore, the Funds will pursue a temporary defensive position only when market conditions warrant.
MSCI Disclaimer
Source: MSCI. The MSCI information may only be used for your internal use, may not be reproduced or redisseminated in any form and may not be used as a basis for or a component of any financial instruments or products or indices. None of the MSCI information is intended to constitute investment advice or a recommendation to make (or refrain from making) any kind of investment decision and may not be relied on as such. Historical data and analysis should not be taken as an indication or guarantee of any future performance analysis, forecast, or prediction. The MSCI information is provided on an “as is” basis and the user of this information assumes the entire risk of any use made of this information. MSCI, each of its affiliates and each other person involved in or related to compiling, computing or creating any MSCI information (collectively, the “MSCI Parties”) expressly disclaims all warranties (including, without limitation, any
March 1, 2023 | 81
More About the Funds (continued)
warranties of originality, accuracy, completeness, timeliness, non-infringement, merchantability and fitness for a particular purpose) with respect to this information. Without limiting any of the foregoing, in no event shall any MSCI Party have any liability for any direct, indirect, special, incidental, punitive, consequential (including, without limitation, lost profits) or any other damages. (www.msci.com)
ICE Data Indices, LLC Disclaimer
SOURCE ICE DATA INDICES, LLC (“ICE DATA”), IS USED WITH PERMISSION. ICE® IS A REGISTERED TRADEMARK OF ICE DATA OR ITS AFFILIATES AND BOFA® IS A REGISTERED TRADEMARK OF BANK OF AMERICA CORPORATION LICENSED BY BANK OF AMERICA CORPORATION AND ITS AFFILIATES (“BOFA”) AND MAY NOT BE USED WITHOUT BOFA’S PRIOR WRITTEN APPROVAL. ICE DATA, ITS AFFILIATES AND THEIR RESPECTIVE THIRD PARTY SUPPLIERS DISCLAIM ANY AND ALL WARRANTIES AND REPRESENTATIONS, EXPRESS AND/OR IMPLIED, INCLUDING ANY WARRANTIES OF MERCHANTABILITY OR FITNESS FOR A PARTICULAR PURPOSE OR USE, INCLUDING THE INDICES, INDEX DATA AND ANY DATA INCLUDED IN, RELATED TO, OR DERIVED THEREFROM. NEITHER ICE DATA, ITS AFFILIATES NOR THEIR RESPECTIVE THIRD PARTY SUPPLIERS SHALL BE SUBJECT TO ANY DAMAGES OR LIABILITY WITH RESPECT TO THE ADEQUACY, ACCURACY, TIMELINESS OR COMPLETENESS OF THE INDICES OR THE INDEX DATA OR ANY COMPONENT THEREOF, AND THE INDICES AND INDEX DATA AND ALL COMPONENTS THEREOF ARE PROVIDED ON AN “AS IS” BASIS AND YOUR USE IS AT YOUR OWN RISK. ICE DATA, ITS AFFILIATES AND THEIR RESPECTIVE THIRD PARTY SUPPLIERS DO NOT SPONSOR, ENDORSE, OR RECOMMEND THE ADVISER, OR ANY OF ITS PRODUCTS OR SERVICES.
Additional Fee Waiver and/or Expense Reimbursement
Service providers to a Fund, including the Fund’s adviser and/or its affiliates, may, from time to time, voluntarily waive all or a portion of any fees to which they are entitled and/or reimburse certain expenses as they may determine from time to time. A Fund’s service providers may discontinue or modify these voluntary actions at any time without notice. Performance for the Funds reflects the voluntary waiver of fees and/or the reimbursement of expenses, if any. Without these voluntary waivers and/or expense reimbursements, performance would have been less favorable.
Additional Historical Performance Information
Emerging Markets Research Enhanced Equity Fund
Historical performance shown for Class I Shares prior to their inception on 1/30/19 is based on Class R6 Shares of the Fund (which are not offered in this prospectus), which invest in the same portfolio of securities. The actual returns of Class I Shares would have been lower than those shown because Class I Shares have higher expenses than Class R6 Shares.
International Value Fund
As of 5/17/18, the Fund changed its investment objective and investment strategies. In view of these changes, the Fund’s performance record prior to 5/17/18 might be less pertinent for investors considering whether to purchase shares of the Fund.
82 | J.P. Morgan International Equity Funds
The Funds' Management and Administration
Each Fund, with the exception of the Emerging Markets Research Enhanced Equity Fund and the International Hedged Equity Fund, is a series of JPMorgan Trust I, a Delaware statutory trust. The Emerging Market Research Enhanced Equity Fund and the International Hedged Equity Fund are a series of JPMorgan Trust IV, a Delaware statutory trust (each a “Trust” and together the “Trusts”). Each Trust is governed by the Board of Trustees which is responsible for overseeing all business activities of the Funds.
Each of the Funds operates in a multiple class structure. A multiple class fund is an open-end investment company that issues two or more classes of shares representing interests in the same investment portfolio.
Each class in a multiple class fund can set its own transaction minimums and may vary with respect to expenses for distribution, administration and shareholder services. This means that one class could offer access to a Fund on different terms than another class. Certain classes may be more appropriate for a particular investor.
Each Fund may issue other classes of shares that have different expense levels and performance and different requirements for who may invest. Call 1-800-480-4111 to obtain more information concerning all of the Funds’ other share classes. A Financial Intermediary who receives compensation for selling Fund shares may receive a different amount of compensation for sales of different classes of shares.
The Funds’ Investment Advisers
J.P. Morgan Investment Management Inc. (JPMIM) is the investment adviser to the Funds and makes the day-today investment decisions for the Funds. In rendering investment advisory services to certain Funds, JPMIM uses the portfolio management, research and other resources of a foreign (non-U.S.) affiliate of JPMIM and may provide services to a Fund through a “participating affiliate” arrangement, as that term is used in relief granted by the staff of the SEC. Under this relief, U.S. registered investment advisers are allowed to use portfolio management or research resources of advisory affiliates subject to the regulatory supervision of the registered investment adviser.
JPMIM is a wholly-owned subsidiary of JPMorgan Asset Management Holdings Inc., which is a wholly-owned subsidiary of JPMorgan Chase & Co. (JPMorgan Chase), a bank holding company. JPMIM is located at 383 Madison Ave., New York, New York, NY 10179.
During the most recent fiscal year ended 10/31/22, JPMIM was paid management fees (net of waivers), as shown below, as a percentage of average daily net assets:
| JPMorgan Emerging Markets Equity Fund |
0.67% |
| JPMorgan Emerging Markets Research Enhanced Equity Fund |
0.22 |
| JPMorgan Europe Dynamic Fund |
0.60 |
| JPMorgan International Equity Fund |
0.44 |
| JPMorgan International Focus Fund |
0.49 |
| JPMorgan International Hedged Equity Fund |
0.11 |
| JPMorgan International Value Fund |
0.43 |
A discussion of the basis the trustees of each Trust used in reapproving the investment advisory and sub-advisory agreements for the Funds is available in the annual report for the most recent fiscal period ended October 31.
The Portfolio Managers
Emerging Markets Equity Fund
The portfolio management team for the Fund utilizes a team based approach and is comprised of Leon Eidelman, Austin Forey and Amit Mehta. Mr. Eidelman is the lead portfolio manager for the Fund and is primarily responsible for security selection, portfolio construction and managing daily cash flows and has been a portfolio manager of the Fund since February 2013. Mr. Eidelman utilizes the research and insights of Mr. Forey and Mr. Mehta, as well as those of JPMIM’s research analysts. Mr. Forey is the head of the Global Emerging Markets Fundamental team, oversees the portfolio management team and has been a portfolio manager of the Fund since September 2005. Mr. Mehta is a Managing Director, CFA charterholder, and an employee of JPMIM since 2011. He has been a portfolio manager of the Fund since February 2013.
March 1, 2023 | 83
The Funds' Management and Administration (continued)
Emerging Markets Research Enhanced Equity Fund
The portfolio management team for the Fund utilizes a team based approach and is comprised of Lina Nassar and Sonal Tanna. Dr. Nassar, an Executive Director and CFA Charterholder and employee since 2011 is the lead portfolio manager for the Fund and is primarily responsible for portfolio construction, and has been a portfolio manager of the Fund since inception. Ms. Tanna, a Managing Director and CFA Charterholder and employee since 1999, assists in the day-to-day management of the Fund and has been a portfolio manager of the Fund since March 2022.
Europe Dynamic Fund
The portfolio management team utilizes a team based approach and is comprised of Jonathan Ingram, John Baker and Blake Crawford. Mr. Ingram, a Managing Director and CFA charterholder, Mr. Baker, a Managing Director and Blake Crawford, an Executive Director and CFA charterholder, share authority in management of the Fund.
Mr. Ingram is Head of the Unconstrained portfolios sub-team within the J.P. Morgan Asset Management International Equity Group — Behavioural Finance Team. Mr. Ingram has been employed by JPMIM or its affiliates (or one of their predecessors) since 2000, and has been a portfolio manager of the Fund since April 2007. Mr. Baker is a portfolio manager within the Unconstrained portfolios sub-team of the J.P. Morgan Asset Management International Equity Group — Behavioural Finance Team. Mr. Baker has been employed by JPMIM or its affiliates (or one of their predecessors) since 1994, and has been a portfolio manager of the Fund since July 2005. Mr. Crawford is a portfolio manager within the Unconstrained portfolios sub-team of the J.P. Morgan Asset Management International Equity Group — Behavioural Finance Team. Mr. Crawford has been employed by JPMIM or its affiliates (or one of their predecessors) since 2008, and has been a portfolio manager of the Fund since April 2019.
International Equity Fund
The portfolio management team is led by Thomas Murray, a Managing Director and CFA charterholder. Shane Duffy, a Managing Director and CFA charterholder, James Sutton, an Executive Director and CFA charterholder, and Zenah Shuhaiber, an Executive Director and CFA charterholder, assist Mr. Murray in the day-to-day management of the Fund. Mr. Murray has worked at JPMIM or its affiliates (or one of their predecessors) since 1996 and has been a portfolio manager of the Fund since March 2004. Mr. Duffy has worked at JPMIM or its affiliates (or one of their predecessors) since 1999 and has been a portfolio manager of the Fund since July 2013. Mr. Sutton has worked at JPMIM or its affiliates (or one of their predecessors) since 2010 and has been a portfolio manager of the Fund since December 2020. Ms. Shuhaiber has worked at JPMIM or its affiliates (or one of their predecessors) since 2005 and has been a portfolio manager of the Fund since December 2022.
International Focus Fund
The portfolio management team is led by Shane Duffy and Tom Murray. Mr. Duffy and Mr. Murray share authority in the day-to-day management of the Fund.
Mr. Duffy, a Managing Director and CFA charterholder, has been an employee of JPMIM or its affiliates (or one of their predecessors) since 1999. Mr. Murray has worked at JPMIM or its affiliates (or one of their predecessors) since 1996. Mr. Duffy and Mr. Murray have been portfolio managers of the Fund since inception.
International Hedged Equity Fund
The Fund utilizes a team-based portfolio management approach. Piera Elisa Grassi, a Managing Director of JPMIM, is responsible for managing the Fund’s long portfolio investment process by utilizing proprietary research, risk management techniques and individual security selection to construct the Fund’s portfolio. Ms. Grassi is the lead portfolio manager for the International Research Enhanced strategies within the International Equity Group, based in London. An employee since 2004, Ms. Grassi was previously a portfolio manager and quantitative analyst. Prior to joining JPMIM or its affiliates (or one of their predecessors),Ms. Grassi was a bond quantitative analyst and risk analyst at Foreign and Colonial Asset Management. Before this, she worked for BARRA in London, focusing on equity risk management and portfolio construction. Ms. Grassi obtained a Laurea from Bocconi University in Milan. Hamilton Reiner, a Managing Director of JPMIM, is responsible for implementing the Fund’s overlay options strategy and for providing insight with respect to the impact to the options strategy of purchasing certain securities. Mr. Reiner has been the head of Equity Derivatives at JPMIM since 2012. He joined JPMorgan Chase in 2009 and from 2009 to 2012, he was a portfolio manager and head of Equity Derivatives at JPMorgan Chase. Prior to joining the firm, Mr. Reiner was head of the Equity Long/Short Prime Brokerage platform at Barclays Capital. Mr. Reiner has been a portfolio manager of the Fund since 2018. Nicholas Farserotu, a Vice President, is a portfolio manager within the Inter-national Equity Group focusing on the International Research Enhanced strategies. An employee since 2015,Mr. Farserotu was previously an investment analyst at SphereInvest Group in Geneva. Mr. Farserotu obtained an MSc. in Financial Engineering from Imperial College London (with Distinction) and also holds an MSc. and a BSc. in Economics from the
84 | J.P. Morgan International Equity Funds
University of Geneva. He is a CFA charterholder. Winnie Cheung, a Vice President, is a portfolio manager in the International Equity Group focusing on the International Research Enhanced strategies. An employee since 2012, Ms. Cheung was previously a performance analyst. Ms. Cheung obtained a MSc in Finance from Cass Business School in London.
International Value Fund
The portfolio management team utilizes a team based approach and is comprised of Ian Butler, Thomas Buckingham, Kyle Williams and Michael Barakos. Mr. Butler, an Executive Director and CFA charterholder, Mr. Buckingham, an Executive Director and CFA charterholder, Mr. Williams, an Executive Director and CFA charterholder, and Mr. Barakos, a Managing Director and CFA charterholder, share authority in the management of the Fund.
Mr. Butler has been employed by JPMIM or its affiliates (or one of their predecessors) since 2005, Mr. Buckingham has been employed by JPMIM or its affiliates (or one of their predecessors) since 2007, Mr. Williams has been employed by JPMIM or its affiliates (or one of their predecessors) since 2011, and Mr. Barakos has been employed by JPMIM or its affiliates (or one of their predecessors) since 1999. All work as portfolio managers within the JPMorgan International Equity Group, specifically managing style based strategies, and have been portfolio managers of the Fund since May 2018.
The Statement of Additional Information provides additional information about the portfolio managers’ compensation, other accounts managed by the portfolio managers and the portfolio managers’ ownership of securities in the Fund.
The Funds' Administrator
JPMIM (the Administrator) provides administration services and oversees the other service providers of each Fund. The Administrator receives the following annual fee from each Fund for administration services: 0.075% of the first $10 billion of average daily net assets of the Fund, plus 0.050% of average daily net assets of the Fund between $10 billion and $20 billion, plus 0.025% of average daily net assets of the Fund between $20 billion and $25 billion, plus 0.010% of the average daily net assets of the Fund over $25 billion.
The Funds' Shareholder Servicing Agent
The Trusts, on behalf of the Funds, have entered into shareholder servicing agreements with JPMorgan Distribution Services, Inc. (JPMDS) under which JPMDS has agreed to provide certain support services to the Funds’ shareholders. For performing these services, JPMDS, as shareholder servicing agent, receives an annual fee of up to 0.25% of the average daily net assets of the Class A, Class C and Class I Shares of each Fund and an annual fee of up to 0.10% of the average daily net assets of the Class L Shares of the each applicable Fund. JPMDS may enter into service agreements with Financial Intermediaries under which it will pay all or a portion of the annual fee to such Financial Intermediaries for performing shareholder and administrative services.
The Funds' Distributor
JPMDS (the Distributor) is the distributor for the Funds. The Distributor is an affiliate of JPMIM.
Additional Compensation to Financial Intermediaries
JPMIM, JPMDS and, from time to time, other affiliates of JPMorgan Chase may also, at their own expense and out of their own legitimate profits, provide additional cash payments to Financial Intermediaries whose customers invest in shares of the J.P. Morgan Funds. For this purpose, Financial Intermediaries include financial advisors, investment advisers, brokers, financial planners, banks, insurance companies, retirement or 401(k) plan administrators and others, including various affiliates of JPMorgan Chase, that have entered into agreements with JPMDS. These additional cash payments are payments over and above any sales charges (including Rule 12b-1 fees) and service fees (including sub-transfer agency and/or networking fees) that are paid to such Financial Intermediaries, as described elsewhere in this prospectus. These additional cash payments are generally made to Financial Intermediaries that provide shareholder, sub-transfer agency or administrative services or marketing support. Marketing support may include access to sales meetings, sales representatives and Financial Intermediary management representatives, inclusion of the J.P. Morgan Funds on a sales list, including a preferred or select sales list, or other sales programs and/or for training and educating a Financial Intermediary’s employees. These additional cash payments also may be made as an expense reimbursement in cases where the Financial Intermediary provides shareholder services to J.P. Morgan Fund shareholders. JPMIM, and JPMDS may also pay cash compensation in the form of finders’ fees that vary depending on the J.P. Morgan Fund and the dollar amount of shares sold. Such additional compensation may provide such Financial Intermediaries with an incentive to favor sales of shares of the J.P. Morgan Funds over other investment options they make available to their customers. See the Statement of Additional Information for more information.
March 1, 2023 | 85
Investing with J.P. Morgan Funds
Choosing A Share Class
Each share class represents an investment in the same portfolio of securities, but each has different availability and eligibility criteria, sales charges, expenses, dividends and distributions. These arrangements allow you to choose the available class that best meets your needs. You should read this section carefully to determine which share class is best for you. Factors you should consider in choosing a share class include:
•
The amount you plan to invest;
•
The length of time you expect to hold your investment;
•
The total costs associated with your investment, including any sales charges that you pay when you buy or sell your Fund shares and expenses that are paid out of Fund assets over time;
•
Whether you qualify for any reduction or waiver of sales charges;
•
Whether you plan to take any distributions in the near future;
•
The availability of the share class;
•
The services that will be available to you;
•
The amount of compensation that your Financial Intermediary will receive; and
•
The advantages and disadvantages of each share class.
Please read this prospectus carefully, and then select the Fund and share class most appropriate for you and decide how much you want to invest. Each Fund may offer other classes of shares not included in this prospectus that have different expense levels, performance and eligibility requirements from the share classes offered in this prospectus. In addition, each Fund may have a similar name, investment objective and policies as other funds and ETFs advised by the adviser or its affiliates that may have different expense levels, performance and eligibility requirements from the share classes offered in this prospectus. Please visit www.jpmorganfunds.com to obtain more information concerning these or other share classes, funds or ETFs. A Financial Intermediary may receive different compensation based on the share class sold.
Additional Information that Applies to All Accounts: If your identity or the identity of any other person(s) authorized to act on your behalf cannot be verified, or if potentially criminal activity is identified, the J.P. Morgan Funds and the Distributor reserve the right to reject opening an account for you, close your account, or take such other action they deem reasonable or required by law.
Shares of the Funds have not been registered for sale outside of the United States. This prospectus is not intended for distribution to prospective investors outside of the United States. The Funds generally do not market or sell shares to investors domiciled outside of the United States, even, with regard to individuals, if they are citizens or lawful permanent residents of the United States.
86 | J.P. Morgan International Equity Funds
| |
Class A |
Class C |
Class I |
Class L |
| Eligibility1,2,3 |
May be purchased by the general public4 |
May be purchased by the general public5 |
May be purchased by: •Institutional Investors who meet the minimum investment requirements; •Individuals purchasing directly from the Fund through JPMorgan Distribution Services, Inc. (the “Distributor”) and meeting the investment minimum requirements; •Financial Intermediaries or any other organization, including affiliates of JPMorgan Chase & Co. (JPMorgan Chase), authorized to act in a fiduciary, advisory or custodial capacity for its clients or customers; •Brokerage program of a Financial Intermediary that has entered into a written agreement with the Distributor to offer such shares (“Eligible Brokerage Program”); and •Employees of JPMorgan Chase and its affiliates and officers or trustees of the J.P. Morgan Funds.6 |
Limited to certain investors, including:11 •Purchases directly from the Fund through the Distributor by institutional investors such as corporations, pension and profit sharing plans and foundations that meet the minimum investment requirements; and •Purchases through your Financial Intermediary or any other organization, including affiliates of JPMorgan Chase authorized to act in a fiduciary, advisory or custodial capacity for its clients or customers. |
March 1, 2023 | 87
Investing with J.P. Morgan Funds (continued)
| |
Class A |
Class C |
Class I |
Class L |
| Minimum Investment1, 7, 8 |
$1,000 for each Fund or $50, if establishing a monthly $50 Systematic Investment Plan9 |
$1,000 for each Fund or $50, if establishing a monthly $50 Systematic Investment Plan9 |
$1,000,000 – An investor can combine purchases of Class I Shares of other J.P. Morgan Funds in order to meet the minimum. $1,000 for each Fund or $50, if establishing a monthly $50 Systematic Investment Plan for investments through an Eligible Brokerage Program. $1,000 for each Fund or $50 if establishing a monthly $50 Systematic Investment Plan9 for investments by employees of JPMorgan Chase and its affiliates and officers or trustees of the J.P. Morgan Funds.6 |
$3,000,000 – An investor can combine purchases of Class L Shares of other J.P. Morgan Funds in order to meet the minimum. |
| Minimum Subsequent Investments1 |
$5010 |
$5010 |
No minimum except $50 for investments by employees of JPMorgan Chase and its affiliates and officers or trustees of the J.P. Morgan Funds and investments through an Eligible Brokerage Program. |
No minimum |
| Systematic Investment Plan |
Yes |
Yes |
No, except for investments by employees of JPMorgan Chase and its affiliates and officers or trustees of the J.P. Morgan Funds and investments through an Eligible Brokerage Program. |
No |
| Systematic Redemption Plan |
Yes |
Yes |
No, except for investments by employees of JPMorgan Chase and its affiliates and officers or trustees of the J.P. Morgan Funds. |
No |
88 | J.P. Morgan International Equity Funds
| |
Class A |
Class C |
Class I |
Class L |
| Front-End Sales Charge (refer to Sales Charges and Financial Intermediary Compensation Section for more details) |
Up to 5.25% reduced or waived for large purchases and certain investors, eliminated for purchases of $1 million or more. |
None |
None |
None |
| Contingent Deferred Sales Charge (CDSC) (refer to Sales Charges and Financial Intermediary Compensation Section for more details) |
On purchases of $1 million or more: •1.00% on redemptions made within 12 months after purchase. •0.50% on redemptions made between 12 and 18 months after purchase. Waived under certain circumstances. |
•1.00% on redemptions made within 12 months after purchase. Waived under certain circumstances. |
None |
None |
| Distribution (12b-1) Fee |
0.25% of the average daily net assets. |
0.75% of the average daily net assets. |
None |
None |
| Service Fee |
0.25% of the average daily net assets. |
0.25% of the average daily net assets. |
0.25% of the average daily net assets. |
0.10% of the average daily net assets. |
| Redemption Fee |
None |
None |
None |
None |
| Conversion Feature12 |
None |
Class C Shares will be converted to Class A Shares in the following instances: •If an investor is eligible to purchase Class A Shares, then their Class C Share positions will convert to Class A Shares after 8 years, calculated from the first day of the month of purchase and processed on the tenth business day of the anniversary month. •If Class C Shares held in an account with a third party broker of record are transferred to an account with the Distributor, those Class C Shares will be converted to Class A Shares on the tenth business day of the month following the transfer. |
None |
None |
March 1, 2023 | 89
Investing with J.P. Morgan Funds (continued)
| |
Class A |
Class C |
Class I |
Class L |
| Advantages |
If you are eligible to have the sales charge reduced or eliminated or you have a long-term investment horizon, these shares have lower distribution fees over a longer term investment horizon than Class C Shares. |
No front-end sales charge is assessed so you own more shares initially. These shares may make sense for investors who have a shorter investment horizon relative to Class A Shares. |
No front-end sales charge or CDSC is assessed so you own more shares initially. In addition, Class I Shares have lower fees than Class A and Class C Shares. |
No front-end sales charge or CDSC is assessed so you own more shares initially. In addition, Class L Shares have the lowest fee structure of the shares offered in this prospectus. |
| Disadvantages |
A front-end sales charge is generally assessed, diminishing the number of shares owned. If you are eligible to have the sales charge reduced or eliminated, you may be subject to a CDSC. Class A Shares may not make sense for investors who have a shorter investment horizon relative to Class C Shares. |
Shares are subject to CDSC and have higher ongoing distribution fees. This means that over the long term Class C Shares accrue higher fees than Class A Shares. |
Limited availability and higher minimum initial investment than Class A and Class C Shares. |
Limited availability and higher minimum initial investment than Class A, Class C and Class I Shares. Not all Funds have Class L Shares. |
1
Financial Intermediaries or other organizations making the Funds available to their clients or customers may impose minimums which may be different from the requirements for investors purchasing directly from the Fund.
2
Certain Retirement Plans may purchase Shares. For more information, see “ELIGIBLE RETIREMENT PLANS” below.
3
Certain Funds and/or classes are subject to limited offering. Please see the FUNDS SUBJECT TO A LIMITED OFFERING section for more information about applicable limited offerings.
4
Effective November 2, 2020, employees of JPMorgan Chase and its affiliates and officers or trustees of the J.P. Morgan Funds are no longer eligible to purchase Class A Shares in accounts where the Distributor is broker of record. Employees for this purpose include officers, directors, trustees, retirees and employees and their immediate family members (i.e., spouses, domestic partners, children, grandchildren, parents, grandparents and any dependent of the person, as defined in section 152 of the Internal Revenue Code) of J.P. Morgan Funds or JPMorgan Chase and its subsidiaries and affiliates.
5
Investors who hold shares in accounts where the Distributor is broker of record are no longer eligible to purchase Class C Shares. In addition, shareholders are ineligible to hold Class C Shares if they are eligible for conversion to Class A Shares.
6
Must be purchased directly from the Funds or on approved JPMorgan Chase & Co. affiliated platforms. Employees for this purpose include officers, directors, trustees, retirees and employees and their immediate family members (i.e., spouses, domestic partners, children, grandchildren, parents, grandparents and any dependent of the person, as defined in section 152 of the Internal Revenue Code) of J.P. Morgan Funds or JPMorgan Chase and its subsidiaries and affiliates. Approved affiliated platforms may impose minimums which may be different from the requirements for investors purchasing directly from the Fund.
7
Investment minimums may be waived for certain types of Group Retirement Plans, as well as for certain fee-based programs. The Funds and/or the Distributor reserve the right to waive any initial or subsequent investment minimum.
8
Please see “MINIMUM ACCOUNT BALANCE” for more information about minimum balance requirements.
9
You are eligible for the lower $50 initial investment amount as long as you agree to make regular monthly investments of at least $50 until you reach the required $1,000 investment amount per fund. Once the required amount is reached, you must maintain the minimum $1,000 investment in the Fund.
10
Minimum subsequent investment amount for Systematic Investment Plans established before 3/1/15 is $25.
11
The Class L Shares are publicly offered on a limited basis. Please see “Limited Offering of the Class L Shares” for more information.
12
Please see “Class C Shares Conversion Feature” for more information about the conversion feature.
ELIGIBLE RETIREMENT PLANS
The only retirement plans that are eligible to purchase Class A, Class C, Class I and Class L Shares are the following:
•
Employer sponsored retirement, deferred compensation, employee benefit plans (including health savings accounts) and trusts used to fund those plans held directly at a broker dealer or financial intermediary (that is outside of retirement plan record
90 | J.P. Morgan International Equity Funds
keeping or third party administrator platform). Employer sponsored plans include 401(k) plans, 457 plans, 403(b) plans, profit-sharing and money purchase pension plans, defined benefit plans, retiree health benefit plans, group annuity separate accounts offered to retirement plans, and non-qualified deferred compensation plans. Purchases may be subject to applicable sales charges as described in this prospectus.
•
Group Retirement Plans (and their successor, related, and affiliated plans) which have these share classes available to participants on or before 4/3/2017, may continue to open accounts for new participants in such share classes of the Fund and purchase additional shares in existing participant accounts.
•
Group Retirement Plans (or financial intermediary platforms available to Group Retirement Plans) that were approved by a Fund and the Distributor after 4/3/2017 and before 12/31/18 because the particular Group Retirement Plan had operational difficulties in implementing the eligibility restrictions may continue to purchase Class A, Class C, Class I or Class L Shares of the Funds.
•
Select Financial Intermediaries, which have received written approval from a Fund on behalf of existing Group Retirement Plan Participants that hold Class C shares, may purchase Class A shares.
All other new Group Retirement Plans are no longer eligible to purchase these share classes.
Sales Charges and Financial Intermediary Compensation
The following section describes the various sales charges and other fees that you will pay if you purchase shares of the Funds. In addition, it describes the types of compensation paid to Financial Intermediaries for the sale of Fund shares and related services. The Funds and/or the Distributor reserve the right to change sales charges, commissions and finder’s fees at any time.
To obtain information regarding sales charges and the reduction, and elimination or waiver of sales charges on Class A and Class C Shares of the J.P. Morgan Funds, see below, visit www.jpmorganfunds.com or call 1-800-480-4111. You may contact your Financial Intermediary about the reduction, elimination or waiver of sales charges. You may also contact your Financial Intermediary about any commissions charged by them on your purchase of Class I Shares.
Class A Shares
The public offering price of Class A Shares of each Fund is the net asset value (NAV) per share plus the applicable sales charge, unless you qualify for a waiver of the sales charge. The sales charge is allocated between your Financial Intermediary and the Distributor as shown in the tables below, except if the Distributor, in its discretion, re-allows the entire amount to your Financial Intermediary. In those instances in which the entire amount is re-allowed, such Financial Intermediaries may be deemed to be underwriters under the Securities Act of 1933.
The table below shows the front-end sales charge you would pay at different levels of investment, the commission paid to Financial Intermediaries, any finder’s fees paid to Financial Intermediaries and any applicable CDSC. Purchases at certain dollar levels, known as “breakpoints,” allow for a reduction in the front-end sales charge.
| Class A Shares Amount of Investment |
Sales Charge as a % of Offering Price |
Sales Charge as a % of your Investment1 |
Commission as a % of Offering Price2 |
CDSC |
| Less than $50,000 |
5.25 |
5.54 |
4.75 |
0.00 |
| $50,000 to $99,999 |
4.50 |
4.71 |
4.05 |
0.00 |
| $100,000 to $249,999 |
3.50 |
3.63 |
3.05 |
0.00 |
| $250,000 to $499,999 |
2.50 |
2.56 |
2.05 |
0.00 |
| $500,000 to $999,999 |
2.00 |
2.04 |
1.60 |
0.00 |
| Amount of Investment |
Sales Charge as a % of Offering Price |
Sales Charge as a % of your Investment |
Finder’s Fee as a % of your Investment3 |
CDSC as a % of your Redemption3,4 |
| $1,000,000 to $3,999,999 |
0.00 |
0.00 |
1.00 |
0-12 months – 1.00% 12-18 months – 0.50% |
| $4,000,000 to $9,999,999 |
0.00 |
0.00 |
0.75 | |
| $10,000,000 to $49,999,999 |
0.00 |
0.00 |
0.50 | |
| $50,000,000 or more |
0.00 |
0.00 |
0.25 |
1
The actual sales charge you pay may differ slightly from the rates disclosed above due to rounding calculations.
March 1, 2023 | 91
Investing with J.P. Morgan Funds (continued)
2
The sales charge is allocated between your Financial Intermediary and the Distributor. The Distributor, at its discretion, may re-allow the entire sales charge to your Financial Intermediary; in those instances such Financial Intermediaries may be deemed to be underwriters under the Securities Act of 1933.
3
The Distributor or its affiliates pays any finder’s fee to your Financial Intermediary. The Distributor or its affiliates may withhold finder’s fees with respect to short-term investments.
4
Please see the “Exchanging Fund Shares” section for details regarding CDSC and exchanges.
The Distributor may also pay Financial Intermediaries a finder’s fee on sales to defined contribution plans with no minimum investment amount.
Finder’s Fee Schedule for Defined Contribution Plans
| Class A Shares Amount of Investment |
Sales Charge as a % of Offering Price |
Sales Charge as a % of your Investment |
Finder’s Fee as a % of your Investment |
CDSC as a % of your Redemption1 |
| $0 to $3,999,999 |
0.00 |
0.00 |
1.00 |
0.00 |
| $4,000,000 to $9,999,999 |
0.00 |
0.00 |
0.75 |
0.00 |
| $10,000,000 to $49,999,999 |
0.00 |
0.00 |
0.50 |
0.00 |
| $50,000,000 or more |
0.00 |
0.00 |
0.25 |
0.00 |
If a plan redeems the shares of certain funds for which a finder’s fee has been paid within 18 months of the purchase date, no CDSC is charged; however, the Distributor reserves the right to reclaim the finder’s fee paid to the Financial Intermediary.
Class C Shares
The table below shows the amount of sales charge, commission paid and any CDSC that may be charged.
| Class C Shares Amount of Investment |
Sales Charge as a % of Offering Price |
Sales Charge as a % of your Investment |
Commission as a % of Offering Price |
CDSC as a % of your Redemption |
| All Investments |
0.00 |
0.00 |
1.00 |
0-12 months — 1.00% |
Class I and Class L Shares
There is no sales charge, commission or CDSC associated with Class I or Class L Shares.
Reducing Your Class A Sales Charges
Each Fund permits you to reduce the front-end sales charge you pay on Class A Shares by exercising your Rights of Accumulation or Letter of Intent privileges. Both of these are described below.
Rights of Accumulation: For Class A Shares, a front-end sales charge can be reduced by breakpoint discounts based on the amount of a single purchase or through Rights of Accumulation. By using Rights of Accumulation, you may combine the current market value of any existing qualifying holdings and account types (as described below) with the amount of the current purchase to qualify for a breakpoint and reduced sales charge on the current purchase.
The amount of the sales charge will be calculated based on the higher of (a) the market value of your qualified holdings as of the last calculated NAV prior to your investment or (b) if you purchased shares after July 3, 2017, the initial value of total share purchases, or if you already held shares on July 3, 2017, the market value of the shares on that date, provided that, in either case, the value will be reduced by the market value on the applicable redemption date of any shares you have redeemed. Depending on their operational capabilities, Financial Intermediaries may utilize one or both of the methods described above so your holdings could be valued differently depending on where you hold your shares.
Letter of Intent: By signing a Letter of Intent, you may combine the current market value of any existing qualifying holdings and account types with the value that you intend to buy over a 13 month period to calculate the front-end sales charge and any breakpoint discounts. Each purchase that you make during that 13 month period will receive the sales charge and breakpoint discount that applies to the total amount. The 13 month Letter of Intent period commences on the day that the Letter of Intent is received by the J.P. Morgan Funds or your Financial Intermediary, and you must inform your Financial Intermediary or the J.P. Morgan Funds that you have a Letter of Intent each time you make an investment. Purchases submitted prior to the date on which the Letter of Intent is received by the J.P. Morgan Funds or your Financial Intermediary are considered only in determining the level of sales charge that will be paid. The Letter of Intent will not result in a reduction in the amount of any previously paid sales charges.
92 | J.P. Morgan International Equity Funds
A percentage of your investment will be held in escrow until the full amount covered by the Letter of Intent has been invested. If the terms of the Letter of Intent are not fulfilled by the end of the 13th month, you must pay the Distributor the difference between the sales charges applicable to the purchases at the time they were made and the reduced sales charges previously paid or the Distributor will liquidate sufficient escrowed shares to obtain the difference and/or adjust the shareholder’s account to reflect the correct number of shares that would be held after deduction of the sales charge. The Letter of Intent will be considered completed if the shareholder dies within the 13 month period covered by the Letter of Intent. Commissions to dealers will not be adjusted or paid on the difference between the Letter of Intent amount and the amount actually invested before the shareholder’s death. Calculations made to determine whether a Letter of Intent commitment has been fulfilled will be made on the basis of the amount invested prior to the deduction of any applicable sales charge.
Below are the qualifying holdings and account types that may be aggregated in order to exercise your Rights of Accumulation and Letter of Intent privileges to qualify for a reduced front-end sales charge on Class A Shares.
Qualifying Holdings: Class A, Class C, Class I, Class L Shares and Class R6 Shares (only when used in advisory programs) of the J.P. Morgan Funds and Class A, Class C and the Advisor Class units in New York’s 529 Advisor-Guided College Savings Program (NY 529 Advisor-Guided Plan). Investments in the JPMorgan 529 Stable Asset Income Portfolio are not included.
Qualifying Accounts:
1.
Your account(s);
2.
Account(s) of your spouse or domestic partner;
3.
Account(s) of children under the age of 21 who share your residential address;
4.
Trust accounts established by any of the individuals in items (1) through (3) above. If the person(s) who established the trust is deceased, the trust account may be aggregated with the account(s) of the primary beneficiary of the trust;
5.
Solely controlled business accounts; and
6.
Single-participant retirement plans of any of the individuals in items (1) through (3) above.
You may use your qualifying holdings and account types even if they are held at different Financial Intermediaries. In order to obtain any reduction in the sales charge by utilizing either the Rights of Accumulation or Letter of Intent privileges, you must, before each purchase of Class A Shares, inform your Financial Intermediary or the J.P. Morgan Funds if you have any existing holdings that may be aggregated with your current purchase in order to qualify for a reduced front-end sales charge.
In order to verify your eligibility for a reduced sales charge, you may be required to provide appropriate documentation, such as an account statement or the social security or tax identification number on an account, so that J.P. Morgan Funds may confirm (1) the value of each of your accounts invested in J.P. Morgan Funds or in the NY 529 Advisor-Guided Plan and (2) the value of the accounts owned by your spouse or domestic partner and by children under the age of 21 who share your residential address.
Certain Financial Intermediaries may not participate in extending the Rights of Accumulation or Letter of Intent privileges to your holdings in the NY 529 Advisor-Guided Plan. Please check with your Financial Intermediary to determine whether the Financial Intermediary makes these privileges available with respect to NY 529 Advisor-Guided Plan investments.
Additional information regarding the reduction of Class A sales charges is available in each Fund's Statement of Additional Information. To determine if you are eligible for Rights of Accumulation or Letter of Intent privileges or to request a copy of the Statement of Additional Information, call 1-800-480-4111. These programs may be terminated or amended at any time.
Sales Charge Waivers
The availability of certain sales charge waivers and discounts will depend on whether you purchase your shares directly from a Fund or on a Financial Intermediary platform. Financial Intermediaries may have different policies and procedures regarding the availability of front-end sales load waivers or contingent deferred (back-end) sales load (“CDSC”) waivers, which are discussed in Appendix A. Except as described in Appendix A, purchases will be subject to the waivers or discounts discussed below.
Waiver of the Class A Sales Charge
No sales charge is imposed on Class A Shares of the Funds if the shares were:
1.
Bought with the reinvestment of dividends and capital gains distributions.
2.
Acquired in exchange for shares of another J.P. Morgan Fund if a comparable sales charge has been paid for the exchanged shares.
March 1, 2023 | 93
Investing with J.P. Morgan Funds (continued)
3.
Bought through a Financial Intermediary and not directly from the Funds by officers, directors, trustees, retirees and employees, and their immediate family members (i.e., spouses, domestic partners, children, grandchildren, parents, grandparents and any dependent of the person, as defined in Section 152 of the Internal Revenue Code) of:
•
J.P. Morgan Funds.
•
JPMorgan Chase and its subsidiaries and affiliates.
Former employees and their immediate family members can make subsequent purchases in accounts established during the employees’ employment. Officers, directors, trustees, retirees and employees, and their immediate family members of J.P. Morgan Funds and JPMorgan Chase and its subsidiaries and affiliates may open new Class I Share accounts subject to a $1,000 minimum investment requirement provided such accounts are opened directly from the Funds and not through a Financial Intermediary. Class I Shares have lower expenses than Class A Shares. Please call 1-800-480-4111 for more information concerning all of the Funds’ other share classes.
4.
Bought by employees of:
•
DST Asset Manager Solutions, Inc. and its subsidiaries and affiliates.
•
Financial Intermediaries or financial institutions that have entered into dealer agreements with the Funds or the Distributor and their subsidiaries and affiliates (or otherwise have an arrangement with a Financial Intermediary or financial institution with respect to sales of Fund shares). This waiver includes the employees’ immediate family members (i.e., spouses, domestic partners, children, grandchildren, parents, grandparents and any dependent of the employee, as defined in Section 152 of the Internal Revenue Code).
5.
Bought by:
•
Employer sponsored retirement, deferred compensation, employee benefit plans (including health savings accounts) and trusts used to fund those plans. Employer sponsored plans include 401(k) plans, 457 plans, 403(b) plans, profit-sharing and money purchase pension plans, defined benefit plans, retiree health benefit plans and non-qualified deferred compensation plans. Traditional IRAs, Roth IRAs, Coverdell Education Savings Accounts, SEPs, SARSEPs, SIMPLE IRAs and KEOGHs plans do not qualify under this waiver.
•
Financial Intermediaries, including affiliates of JPMorgan Chase, who have a dealer arrangement with the Distributor, act in a custodial capacity, or who place trades for their own accounts or for the accounts of their clients and who charge a management, asset allocation, consulting, or other fee for their services.
•
Financial Intermediaries who have entered into an agreement with the Distributor and have been approved by the Distributor to offer Fund shares to investment brokerage programs in which the end shareholder makes investment decisions independent of a financial advisor; these programs may or may not charge a transaction fee.
•
Tuition programs that qualify under Section 529 of the Internal Revenue Code.
•
A bank, trust company or thrift institution which is acting as a fiduciary exercising investment discretion, provided that appropriate notification of such fiduciary relationship is reported at the time of the investment to the Fund or the Fund’s Distributor.
6.
Bought in connection with plans of reorganization of a J.P. Morgan Fund, such as mergers, asset acquisitions and exchange offers to which the Fund is a party. However, you may pay a CDSC when you redeem the Fund shares you received in connection with the plan of reorganization.
7.
Purchased in Individual Retirement Accounts (IRAs) established prior to September 2, 2014:
i.
That were established through a rollover from a qualified retirement plan for which J.P. Morgan Retirement Plan Services LLC had a contractual relationship to provide recordkeeping for the plan (an “RPS Rollover IRA”) or an IRA that was subsequently established in connection with the RPS Rollover IRA;
ii.
Where JPMorgan Institutional Investments Inc. continues to be the broker of record for the IRA; and
iii.
Where UMB Bank, n.a. continues to serve as custodian for the IRA.
8. Purchased in an account where the Distributor is the broker of record as of April 10, 2017.
To determine if you qualify for a sales charge waiver, call 1-800-480-4111 or contact your Financial Intermediary. These waivers may not continue indefinitely and may be discontinued at any time without notice.
94 | J.P. Morgan International Equity Funds
Contingent Deferred Sales Charge (CDSC)
Certain redemptions of Class A and Class C Shares are subject to a CDSC. Please see “SALES CHARGES AND FINANCIAL INTERMEDIARY COMPENSATION” for the amount of the applicable CDSC. The CDSC is calculated by multiplying the original cost of the shares by the CDSC rate. For Class A Shares, the CDSC is calculated from the date of the purchase of the applicable shares. For Class C Shares, the Funds assume that all purchases made in a given month were made on the first day of the month.
No CDSC is imposed on share appreciation, nor is a CDSC imposed on shares acquired through reinvestment of dividends or capital gains distributions.
To keep your CDSC as low as possible, the Funds will first redeem any shares that are not subject to a CDSC (i.e., shares that have been held for longer than the CDSC period or shares acquired through reinvestment of dividends or capital gains distributions), followed by the shares held for the longest time. You should retain any records necessary to substantiate historical costs because the Distributor, the Funds, the transfer agent and your Financial Intermediary may not maintain such information.
If you received Fund shares in connection with a fund reorganization, the CDSC applicable to your original shares (including the period of time you have held those shares) will be applied to the shares received in the reorganization.
Waiver of the Class A and Class C CDSC
No CDSC is imposed on redemptions of shares:
1.
If you participate in a Systematic Redemption Plan and withdraw no more than the amount permitted to be withdrawn without a CDSC. Please refer to Systematic Redemption Plan in the “HOW TO REDEEM” table below.
2.
Made due to the death or disability of a shareholder. For shareholders that become disabled, the redemption must be made within one year of initial qualification for Social Security disability payments or within one year of becoming disabled as defined in section 72(m)(7) of the Internal Revenue Code. This waiver is only available for accounts opened prior to the shareholder’s disability. In order to qualify for the waiver, the Distributor must be notified of the death or disability at the time of the redemption order and be provided with satisfactory evidence of such death or disability.
3.
That represent a Required Minimum Distribution from your IRA Account or other qualifying retirement plan. The waiver only applies to the pro rata required minimum distribution amount from the assets invested in one or more of the J.P. Morgan Funds.
4.
That are part of a J.P. Morgan Fund-initiated event, such as mergers, liquidations, asset acquisitions, and exchange offers to which the Fund is a party, or result from a failure to maintain the required minimum balance in an account. However, you may pay a sales charge when you redeem the Fund shares you received in connection with the Fund-initiated event.
5.
Exchanged into the same share class of other J.P. Morgan Funds. Your new Fund will be subject to the CDSC of the Fund from which you exchanged and the current holding period is carried over to your new shares. Please read “Exchanging Fund Shares” for more information.
6.
For Class C Shares only, if your Financial Intermediary has notified the Distributor before you invest that it is waiving its commission.
7.
Sold as a return of excess contributions from an IRA Account.
8.
Sold to pay the Distributor or a Financial Intermediary account-related fees (only if the transaction is initiated by the Distributor or the Financial Intermediary).
To see if you qualify for a CDSC waiver, call 1-800-480-4111 or contact your Financial Intermediary. These waivers may not continue indefinitely and may be discontinued at any time without notice.
Repurchase Rights
If you redeem shares in a mutual fund, Repurchase Rights may allow you to reinvest all or a portion of the redemption proceeds or repurchase shares at NAV if the purchase is made within 90 days of the sale or distribution. In order to take advantage of Repurchase Rights, you must inform your Financial Intermediary or J.P. Morgan Funds you wish to do so at the time of purchase. This policy does not apply to systematic purchases.
There is no sales charge on:
•
Class A Shares if they are bought with proceeds from the sale of Class A Shares of a J.P. Morgan Fund
•
Class A Shares if they are bought with proceeds from the sale of Class I Shares or Class L Shares of a J.P. Morgan Fund
March 1, 2023 | 95
Investing with J.P. Morgan Funds (continued)
•
Class A Shares if they are bought with proceeds from the sale of Class R6 Shares of a J.P. Morgan Fund held in a fee-based advisory account
•
Class A Shares if they are bought with proceeds from the sale of Morgan Shares of a J.P. Morgan Money Market Fund, provided that the Morgan Shares were acquired from Class A Shares where a sales charge was paid or waived
In addition, if you repurchase Class C Shares within 90 days of a redemption, there will be no CDSC on the new Class C Shares.
Rule 12b–1 Fees
Each Fund described in this prospectus has adopted a Distribution Plan under Rule 12b-1 with respect to Class A and Class C Shares that allows it to pay distribution fees for the sale and distribution of these shares of the Funds. These fees are called “Rule 12b-1 fees.” Rule 12b-1 fees are paid by the Funds to the Distributor as compensation for its services and expenses in connection with the sale and distribution of Fund shares. The Distributor in turn pays all or part of these Rule 12b-1 fees to Financial Intermediaries that have agreements with the Distributor to sell shares of the Funds. The Distributor may pay Rule 12b-1 fees to its affiliates. Payments are not tied to actual expenses incurred.
The Rule 12b-1 fees (based on average daily net assets of the share class) vary by share class as follows:
| Class |
Rule 12b-1 Fee |
| Class A |
0.25% |
| Class C |
0.75% |
| Class I |
None |
| Class L |
None |
Rule 12b-1 fees, together with the CDSC, help the Distributor sell Class C Shares without an upfront sales charge by defraying the costs of advancing brokerage commissions and other expenses paid to Financial Intermediaries.
Because Rule 12b-1 fees are paid out of Fund assets on an ongoing basis, over time these fees will increase the cost of your investment and may cost you more than paying other types of sales charges.
With respect to Class A Shares transactions, for purchases at NAV where the Distributor paid a finder’s fee at the time of the purchase, the selling Financial Intermediary will start to receive the applicable Rule 12b-1 fee in the 13th month after the sale and the Distributor will retain the Rule 12b-1 fees during such period.
Networking and Sub-Transfer Agency Fees
JPMDS, as shareholder servicing agent, has entered into agreements with Financial Intermediaries pursuant to which the Financial Intermediary is paid for services such as networking or sub-transfer agency (collectively, the “Sub-TA Agreements”). Sub-TA Agreement payments are generally based on either (1) a percentage of the average daily net assets of clients serviced by such Financial Intermediary up to a set maximum dollar amount per shareholder account serviced, or (2) a per account fee based on the number of accounts serviced by such Financial Intermediary. Sub-TA Agreement payments are in addition to, rather than in lieu of, Rule 12b-1 fees the Financial Intermediary may also be receiving pursuant to agreements with the Distributor for classes with Rule 12b-1 fees. Payments to Financial Intermediaries for sub-transfer agency services will be made by JPMDS, as shareholder servicing agent, from the service fee. From time to time, JPMIM or its affiliates may pay a portion of the sub-transfer agency fees at its or their own expense and out of its or their legitimate profits.
Service Fees
JPMDS, as shareholder servicing agent, receives an annual fee of up to the following fee (based on the average daily net assets of the applicable class of a Fund).
| Class |
Service Fee |
| Class A |
0.25% |
| Class C |
0.25% |
| Class I |
0.25% |
| Class L |
0.10% |
JPMDS may enter into service agreements with Financial Intermediaries under which it will pay all or a portion of that fee to such Financial Intermediaries for performing shareholder and administrative services.
96 | J.P. Morgan International Equity Funds
Conversion Feature for Certain Class A Shares Held by Employees
Employees will no longer be eligible to hold Class A Shares directly with the Funds. Therefore, Class A Shares held by employees purchased directly from the Funds were converted to Class I Shares beginning on November 6, 2020. Employees include officers, directors, trustees, retirees and employees, and their immediate family members (i.e., spouses, domestic partners, children, grandchildren, parents, grandparents and any dependent of the person, as defined in Section 152 of the Internal Revenue Code) of J.P. Morgan Funds and JPMorgan Chase and its subsidiaries and affiliates.
Because the share price of the Class I Shares may be higher than that of the Class A Shares at the time of conversion, you may receive fewer Class I Shares; however, the dollar value will be the same. After conversion, your new shares will no longer be subject to Rule 12b-1 fees charged on Class A Shares. You will not be assessed any sales charges, fees or other charges for the conversion of the shares, nor will you be subject to any federal income tax as a result of the conversion.
Class C Shares Conversion Feature
Class C Shares will be converted to Class A Shares in the following instances:
•
If an investor is eligible to purchase Class A Shares, then their Class C Share positions will convert to Class A Shares after 8 years, calculated from the first day of the month of purchase and processed on the tenth business day of the anniversary month.
•
If Class C Shares held in an account with a third party broker of record are transferred to an account with the Distributor, those Class C Shares will be converted to Class A Shares on the tenth business day of the month following the transfer.
Because the share price of the Class A Shares may be higher than that of the Class C Shares at the time of conversion, you may receive fewer Class A Shares; however, the dollar value will be the same.
After conversion, your new shares will be subject to the lower Rule 12b-1 fees charged on Class A Shares. You will not be assessed any sales charges, fees or other charges for the conversion of shares, nor will you be subject to any federal income tax as a result of the conversion. You will not pay any CDSC when you sell Class A Shares that have converted from Class C Shares.
Purchasing Fund Shares
You may purchase shares directly from the J.P. Morgan Funds through the Distributor or through your Financial Intermediary.
This prospectus offers multiple share classes. Each share class has different sales charges and/or expenses. When deciding what share class to buy, you should consider the amount of your investment, the length of time you intend to hold the shares, the sales charges and expenses applicable to each share class and whether you qualify for any sales charge discounts. Please refer to “Choosing a Share Class” for investment minimums for initial and subsequent purchases and to help you determine which share class would be best for you.
Purchase and redemption orders will be accepted only on days that J.P. Morgan Funds are open for business. The Funds are open for business on each day the NYSE is open for trading. A purchase or redemption order received by the Funds prior to the close of regular trading on the NYSE (normally 4:00 p.m. ET) (“Fund Close”), on a day the Funds are open for business, will be effected at that day’s NAV. The Funds will not treat an intraday unscheduled disruption or closure in NYSE trading as a closure of the NYSE and will calculate NAV as of 4:00 p.m. ET, if the particular disruption or closure directly affects only the NYSE. An order received after the Fund Close will generally be effected at the NAV determined on the next business day. However, orders received by Financial Intermediaries on a business day prior to the Fund Close and communicated to the Funds prior to such time as agreed upon by the Funds and the Financial Intermediary will be effected at the NAV determined on the business day the order was received by the Financial Intermediary.
A purchase order must be supported by all appropriate documentation and information in the proper form. The Funds may refuse to honor incomplete purchase orders.
Share ownership is electronically recorded; therefore, no certificate will be issued. A shareholder who purchases shares of a Fund that accrues dividends daily will not accrue a dividend on the day of the purchase.
If you purchase shares through your Financial Intermediary, contact your investment representative for its requirements and procedures. If a Financial Intermediary holds your shares, it is the responsibility of the Financial Intermediary to send your purchase order to the Fund. Your Financial Intermediary may have an earlier cut-off time for purchase orders.
If you purchase shares directly with the Funds, see the information below.
March 1, 2023 | 97
Investing with J.P. Morgan Funds (continued)
| HOW TO PURCHASE DIRECTLY WITH THE J.P. MORGAN FUNDS | ||
| |
Opening a New Account |
Purchasing into an Existing Account |
| By Phone or Online 1-800-480-4111 Shareholder Services representatives are available Monday through Friday from 8:00 am to 6:00 pm ET. www.jpmorganfunds.com Note: Certain account types are not available for online account access. Please call for additional information. |
A new account generally may not be opened by phone or online. Employees of JPMorgan Chase & Co. may open a new account online. A new fund position can be added to an existing account by phone or online if you have bank information on file. The minimum initial investment requirement must be met. |
You must already have bank information on file. If we do not have bank information on file, you must submit written instructions. Please call for instructions on how to add bank information to your account. |
| By Mail Regular mailing address: J.P. Morgan Funds Services P.O. Box 219143 Kansas City, MO 64121-9143 Overnight mailing address: J.P. Morgan Funds Services 430 W 7th Street, Suite 219143 Kansas City, MO 64105-1407 |
Mail the completed and signed application with a check to our Regular or Overnight mailing address. Refer to the Additional Information Regarding Purchases section. |
Please mail your check and include your name, the Fund name, and your fund account number. |
| All checks must be made payable to one of the following: •J.P. Morgan Funds; or •The specific Fund in which you are investing. Please include your existing account number, if applicable. All checks must be in U.S. dollars. The J.P. Morgan Funds do not accept credit cards, cash, starter checks, money orders or credit card checks. The Funds and/or the Distributor reserve the right to refuse “third-party” checks and checks drawn on non- U.S. financial institutions even if payment may be effected through a U.S. financial institution. Checks made payable to any individual or company and endorsed to J.P. Morgan Funds or a Fund are considered third-party checks. | ||
| By ACH or Wire1 1-800-480-4111 Wire Instructions: DST Asset Manager Solutions, Inc. 2000 Crown Colony Drive Quincy, MA 02169 Attn: J.P. Morgan Funds Services ABA: 021 000 021 DDA: 323 125 832 FBO: Fund Name Fund: Fund # Account: Your Account # and Your Account Registration |
You may include bank information on your application for your initial purchase to be processed via Automated Clearing House (ACH) rather than sending a check. New accounts cannot be opened by wire purchase. |
Purchase by ACH: To process a purchase via ACH using bank information on file you may call us or process the purchase online. Purchase by Wire: If you choose to pay by wire, please call to notify the Fund of your purchase. You must also initiate the wire with your financial institution. |
98 | J.P. Morgan International Equity Funds
| HOW TO PURCHASE DIRECTLY WITH THE J.P. MORGAN FUNDS | ||
| |
Opening a New Account |
Purchasing into an Existing Account |
| Systematic Investment Plan1 |
You may include instructions to set up a Systematic Investment Plan on your application. Bank Information must be included. Refer to Choosing A Share Class for fund minimums. |
If bank information is on file, you may call, go online or mail written instructions to start, edit or delete a Systematic Investment Plan. You cannot have a Systematic Investment Plan and a Systematic Redemption Plan or Systematic Exchange Plan on the same fund account. If bank information is not on file, you will be required to submit a completed form with your bank information and Systematic Investment Plan details. |
1
The Funds currently do not charge for these services, but may impose a charge in the future. However, your bank may impose a charge for debiting your bank account.
Transactions by phone, fax or the Internet
You may access your account and conduct certain transactions using phone, fax or the J.P. Morgan Funds website. Phone conversations are recorded. The J.P. Morgan Funds and their agents use reasonable procedures to verify the identity of the shareholder. If these procedures are followed, the J.P. Morgan Funds and their agents are not liable for any losses, liability, cost or expenses (including attorney fees) that may occur from acting on unauthorized or fraudulent instructions. Therefore please take precautions to protect your account information and immediately review account statements or other information provided to you. In addition, a confirmation is sent promptly after a transaction. Please review it carefully and contact J.P. Morgan Funds Services or your Financial Intermediary immediately about any transaction you believe to be unauthorized. You may revoke your right to make purchases over the phone or by mailing written instructions to us.
You may not always reach J.P. Morgan Funds Services by phone or online. This may be true at times of unusual market changes and shareholder activity. You can mail us your instructions or contact your Financial Intermediary. We may modify or cancel the ability to purchase or redeem shares online or by phone without notice.
Additional Information Regarding Purchases
Federal law requires all financial institutions to obtain, verify and record information that identifies each person who opens an account. When you open an account, we will ask for your name, residential or business street address, date of birth (for an individual), and other information that will allow us to identify you, including your social security number, tax identification number or other identifying number. The J.P. Morgan Funds cannot waive these requirements. A Fund is required by law to reject your Account Application if the required identifying information is not provided.
We will attempt to collect any missing information required on the Account Application by contacting either you or your Financial Intermediary. If we cannot obtain this information within the established time frame, your Account Application will be rejected. Amounts received prior to receipt of the required information will be held uninvested and will be returned to you without interest if your Account Application is rejected. If the required information is obtained, your investment will be accepted and you will pay the NAV per share next calculated after all of the required information is received, plus any applicable sales charge.
Once we have received all of the required information, federal law requires us to verify your identity. After an account is opened, we may restrict your ability to purchase additional shares until your identity is verified. If we are unable to verify your identity within a reasonable time, the Funds and/or the Distributor reserve the right to close your account at the current day’s NAV per share. If your account is closed for this reason, your shares will be redeemed at the NAV per share next calculated after the account is closed, less any applicable CDSC or fees. In addition, you will not be entitled to recoup any sales charges paid to a Fund in connection with your purchase of Fund shares.
Purchases by wire may be canceled if J.P. Morgan Funds Services does not receive payment by 4:00 p.m. ET on the settlement date. You will be responsible for any expenses and/or losses to the Funds.
March 1, 2023 | 99
Investing with J.P. Morgan Funds (continued)
Exchanging Fund Shares
An exchange is selling shares of one J.P. Morgan Fund and taking the proceeds to simultaneously purchase shares of another J.P. Morgan Fund. Before making an exchange request, you should read the prospectus of the J.P. Morgan Fund whose shares you would like to purchase by exchange. You can obtain a prospectus for any J.P. Morgan Fund by contacting your Financial Intermediary, by visiting www.jpmorganfunds.com, or by calling 1-800-480-4111.
| EXCHANGE PRIVILEGES |
| Class A Shares of a Fund may be exchanged for: |
| •Class A Shares of another J.P. Morgan Fund, |
| •Morgan Shares of a J.P. Morgan money market fund (except for JPMorgan Prime Money Market Fund), or |
| •Another share class of the same Fund if you are eligible to purchase that class. |
| Class C Shares of a Fund may be exchanged for: |
| •Class C Shares of another J.P. Morgan Fund (except for JPMorgan Prime Money Market Fund). Your new Class C Shares will be subject to the CDSC of the Fund from which you exchanged, and the current holding period for your exchanged Class C Shares is carried over to your new shares. |
| •Class I, Class L or Class R6 Shares, if available, of the same Fund, provided you meet the eligibility requirements for the class you are exchanging into. In addition, the Class C Shares that you wish to exchange must not currently be subject to any CDSC. |
| •Reserve Shares of a J.P. Morgan money market fund (except for the JPMorgan Prime Money Market Fund).Reserve Shares are not subject to an initial sales charge or CDSC. If you exchange Class C Shares that are subject to a CDSC to Reserve Shares, you will not pay a CDSC at the time of the exchange. However, your new Reserve Class Shares will be subject to the CDSC of the Fund from which you exchanged, and the current holding period for your exchanged Class C Shares will be carried over to your new Reserve Shares. Reserve Shares investment minimums may be waived for Class C shareholders that convert or exchange their Class C Shares into Reserve Shares of a J.P. Morgan money market fund (except for the JPMorgan Prime Money Market Fund). |
| Class I Shares of a Fund may be exchanged for: |
| •Class I Shares of another J.P. Morgan Fund, |
| •Morgan Shares of a J.P. Morgan money market fund (except for JPMorgan Prime Money Market Fund), or |
| •Another share class of the same Fund if you are eligible to purchase that class. |
| Class L Shares of a Fund may be exchanged for: |
| •Class L Shares of another J.P. Morgan Fund, or |
| •Another share class of the same Fund if you are eligible to purchase that class. |
The following rules and procedures apply to exchanges:
•
All exchanges are subject to meeting any investment minimum or eligibility requirements of the new Fund and class.
•
The J.P. Morgan Funds will provide 60 days’ written notice of any termination of or material change to your exchange privilege.
•
All exchanges are based upon the net asset value that is next calculated after the Fund receives your order, provided the exchange out of one Fund must occur before the exchange into the other Fund.
•
In order for an exchange to take place on the date that the order is submitted, the order must be received prior to the close of both the Fund that you wish to exchange into and the Fund that you wish to exchange out of, otherwise, the exchange will occur on the following business day on which both Funds are open.
•
A shareholder that exchanges into shares of a Fund that accrues dividends daily, including a money market fund, will not accrue a dividend on the day of the exchange. A shareholder that exchanges out of shares of a Fund that accrues a daily dividend will accrue a dividend on the day of the exchange.
•
The exchange privilege is not intended as a way for you to speculate on short-term movements in the market. Therefore, to prevent disruptions in the management of J.P. Morgan Funds, certain J.P. Morgan Funds limit excessive exchange activity as described in the “Frequent Trading Policy” section. Your exchange privilege will be limited or revoked if the exchange activity is considered excessive. In addition, any J.P. Morgan Fund may reject any exchange request for any reason, including if it is not in the best interests of the Fund and/or its shareholders to accept the exchange.
•
For Class A and Class C Shares only, you can set up a systematic exchange program to automatically exchange shares on a regular basis. However, you cannot have simultaneous systematic investment plans for the same Fund. You may call 1-800-480-4111 for complete instructions.
Generally, you will not pay a sales charge on an exchange except as specified below.
100 | J.P. Morgan International Equity Funds
If you exchange Class A or Class C Shares of a Fund that are subject to a CDSC for Class A (Morgan Shares of a J.P. Morgan money market fund) or Class C Shares, respectively, of another Fund, you will not pay a CDSC at the time of the exchange, however:
1.
Your new Class A (Morgan Shares of a J.P. Morgan money market fund) or Class C Shares will be subject to the CDSC of the Fund from which you exchanged, and
2.
The current holding period for your exchanged Class A (Morgan Shares of a J.P. Morgan money market fund) or Class C Shares, is carried over to your new shares.
Following an exchange, the fees and expenses of the new share class may be higher than those of the class you previously held. You should carefully review the prospectus for the new share class, including information on the fees, expenses and exchange features of the new share class, or contact your Financial Intermediary for more information.
Tax Consequences on Exchanges
Generally, an exchange between J.P. Morgan Funds is considered a sale and generally results in a capital gain or loss for federal income tax purposes. An exchange between classes of shares of the same Fund is generally not taxable for federal income tax purposes. You should talk to your tax advisor before making an exchange.
Redeeming Fund Shares
If you sell shares through your Financial Intermediary, contact your investment representative for its requirements and procedures. If a Financial Intermediary holds your shares, it is the responsibility of the Financial Intermediary to send your redemption order to the Fund. Your Financial Intermediary may have an earlier cut-off time for redemption orders.
If you sell shares directly with a Fund, see the information below.
Your redemption proceeds may be mailed to you at your address of record1, wired, or sent by ACH to a pre-existing bank account on file.
March 1, 2023 | 101
Investing with J.P. Morgan Funds (continued)
| HOW TO REDEEM | |
| By Phone or Online Note: Certain account types are not available for online account access. |
Call us at 1-800-480-4111 Shareholder Services representatives are available Monday through Friday from 8:00 am to 6:00 pm ET. www.jpmorganfunds.com |
| By Mail |
Regular mailing address: J.P. Morgan Funds Services P.O. Box 219143 Kansas City, MO 64121-9143 Overnight mailing address: J.P. Morgan Funds Services 430 W 7th Street, Suite 219143 Kansas City, MO 64105-1407 |
| Systematic Redemption Plan2, 3 Note:The Funds currently do not charge for this service, but may impose a charge in the future. |
You may include instructions to set up a Systematic Redemption Plan on your application. Payment instructions must be included. You may call, or mail written instructions to start, edit or delete a Systematic Redemption Plan. You may send a written redemption request to your Financial Intermediary, if applicable, or to the Fund at the following address: J.P. Morgan Funds Services P.O. Box 219143 Kansas City, MO 64121-9143 You may redeem over the phone. Please see “Can I redeem by phone?” for more information. If you own Class A or Class C Shares, the applicable CDSC will be deducted from those payments unless such payments are made: 4 •Monthly and constitute no more than 1/12 of 10% of your then-current balance in the Fund each month; or •Quarterly and constitute no more than ¼ of 10% of your then-current balance in the Fund each quarter. It may not be in your best interest to buy additional Class A Shares while participating in a Systematic Redemption Plan. This is because Class A Shares have an upfront sales charge. |
1
You cannot request a redemption by check to be sent to an address updated within 15 days.
2
If the amount of the systematic payment exceeds the income earned by your account since the previous payment under the Systematic Redemption Plan, payments will be made by redeeming some of your shares. This will reduce the amount of your investment, up to possibly closing your account.
3
The Funds currently do not charge for these services, but may impose a charge in the future. However, your bank may impose a charge for crediting your bank account.
4
Your current balance in the Fund for purposes of these calculations will be determined by multiplying the number of shares held by the last calculated NAV per share of the applicable class.
You may redeem some or all of your shares on any day that the Funds are open for business. You will not be permitted to enter a redemption order for shares purchased directly through J.P. Morgan Funds Services by check or through an ACH transaction for five business days following the acceptance of a purchase order unless you provide satisfactory proof that your purchase check or ACH transaction has cleared (sometimes referred to as uncollected shares).
If a Fund or Financial Intermediary receives your redemption order before the close of the NYSE (normally 4 p.m. ET or before 4:00 p.m. ET, if the NYSE closes before 4:00 p.m. ET), you will receive the NAV per share calculated after your redemption order is received in good order (meaning that it includes the information required by, and complies with security requirements implemented by, the Fund’s transfer agent or the Fund), minus the amount of any applicable CDSC or fees. Your Financial Intermediary may have an earlier cut-off time for redemption orders and may charge a fee to process redemption of shares. A shareholder that redeems out of shares of a Fund that accrues a daily dividend will accrue a dividend on the day of the redemption.
102 | J.P. Morgan International Equity Funds
All redemption requests must be supported by valid identity authentication, the appropriate documentation (if applicable) and any necessary information in good order. Additional information may be required depending on the situation.
For accounts held directly with the Funds, the length of time that the Funds typically expect to pay redemption proceeds depends on whether payment is made by ACH, wire or check. The Funds typically expect to make payments of redemption proceeds by wire or ACH on the next business day following receipt of the redemption order by the Funds. For payment by check, the Funds typically expect to mail the check on the next business day following receipt of the redemption order by the Funds.
For accounts held through Financial Intermediaries, the length of time that the Funds typically expect to pay redemption proceeds depends on the method of payment and the agreement between the Financial Intermediary and the Funds. For redemption proceeds that are paid directly to you by the Fund, the Fund typically expects to make payments by wire or ACH or by mailing a check on the next business day following the Fund’s receipt of a redemption order from the Financial Intermediary. For payments that are made to your Financial Intermediary for transmittal to you, the Funds expect to pay redemption proceeds to the Financial Intermediary within 1 to 3 business days following the Fund’s receipt of the redemption order from the Financial Intermediary.
Payment of redemption proceeds may take longer than the time a Fund typically expects and may take up to seven days as permitted by the Investment Company Act of 1940.
Transactions by phone, fax or the Internet
You may access your account and conduct certain transactions using phone, fax or the J.P. Morgan Funds website. Phone conversations are recorded. The J.P. Morgan Funds and their agents use reasonable procedures to verify the identity of the shareholder. If these procedures are followed, the J.P. Morgan Funds and their agents are not liable for any losses, liability, cost or expenses (including attorney fees) that may occur from acting on unauthorized or fraudulent instructions. Therefore please take precautions to protect your account information and immediately review account statements or other information provided to you. In addition, a confirmation is sent promptly after a transaction. Please review it carefully and contact J.P. Morgan Funds Services or your Financial Intermediary immediately about any transaction you believe to be unauthorized. You may revoke your right to make redemptions over the phone or by mailing written instructions to us.
You may not always reach J.P. Morgan Funds Services by phone or online. This may be true at times of unusual market changes and shareholder activity. You can mail us your instructions or contact your Financial Intermediary. We may modify or cancel the ability to purchase or redeem shares online or by phone without notice.
Additional Information Regarding Redemptions
Medallion signature guarantees may be required if:
•
You want to redeem shares with a value of $50,000 or more and you want to receive your proceeds in the form of a check; or
•
You want your payment sent to an address, bank account or payee other than the one currently designated on your Fund account.
The Fund may refuse to honor incomplete redemption orders.
The Fund may suspend your ability to redeem when:
1.
Trading on the NYSE is restricted;
2.
The NYSE is closed (other than weekend and holiday closings);
3.
Federal securities laws permit;
4.
The SEC has permitted a suspension; or
5.
An emergency exists, as determined by the SEC.
You generally will recognize a gain or loss on a redemption for federal income tax purposes. You should talk to your tax advisor before making a redemption.
Generally, all redemptions will be for cash. The J.P. Morgan Funds typically expect to satisfy redemption requests by selling portfolio assets or by using holdings of cash or cash equivalents. On a less regular basis, the Funds may also satisfy redemption requests by borrowing from another Fund, by drawing on a line of credit from a bank, or using other short-term borrowings from its custodian. These methods may be used during both normal and stressed market conditions. In addition to paying redemption proceeds in cash, if you redeem shares worth $250,000 or more, the J.P. Morgan Funds reserve the right to pay part or all of your redemption proceeds in readily marketable securities instead of cash. If payment is made in securities, the Fund will value the securities selected
March 1, 2023 | 103
Investing with J.P. Morgan Funds (continued)
in the same manner in which it computes its NAV. This process minimizes the effect of large redemptions on the Fund and its remaining shareholders. If you receive a redemption in-kind, securities received by you may be subject to market risk and you could incur taxable gains and brokerage or other charges in converting the securities to cash. While the J.P. Morgan Funds do not routinely use redemptions in-kind, the Funds reserve the right to use redemptions in-kind to manage the impact of large redemptions on the Funds. Redemption in-kind proceeds will typically be made by delivering a pro-rata amount of a Fund’s holdings that are readily marketable securities to the redeeming shareholder within seven days after the Fund’s receipt of the redemption order.
The Funds and their service providers may temporarily hold redemption proceeds from accounts maintained directly with the Funds if there is a reasonable belief that financial exploitation of a Specified Adult has occurred, is occurring, has been attempted, or will be attempted. For purposes of this paragraph, the term “Specified Adult” refers to an individual who is (A) a natural person age 65 and older; or (B) a natural person age 18 and older who the member reasonably believes has a mental or physical impairment that renders the individual unable to protect his or her own interests.
Minimum Account Balance
Due to the relatively high cost associated with maintaining small accounts J.P. Morgan Funds has established minimum balance requirements for each Fund held in your accounts. Minimum investment amounts per Fund are described earlier within the Investing with J.P. Morgan Funds section of this prospectus. If a shareholder does not maintain the required minimum balance in each Fund, J.P. Morgan Funds may either 1) redeem all remaining shares in that Fund or 2) charge a $10 below minimum balance fee per Fund. To collect the fee, the Fund will redeem $10 worth of shares from your account. The Funds and/or the Distributor reserve the right to determine whether we redeem all remaining shares and close your account or charge the annual below minimum account fee. You will not be charged a CDSC, if applicable, for these actions. Shareholders will receive written notice and be given 60 days to bring Fund balances above minimum requirements before action is taken on your account.
If your account is below the minimum balance, you are participating in a systematic investment plan, and you are not actively selling shares, it will be excluded from the minimum balance requirements as long as the systematic payments will increase your Fund value above the required minimum balance within 18 months of the date that the account was established. Once the required minimum account balance is reached, you must maintain the minimum investment amount in that Fund.
Investors in Class A or Class C Shares, employees investing in Class I Shares, as well as investors in the Premier and Morgan share classes of the J.P. Morgan Money Market Funds cannot combine investments for purposes of meeting the minimum.
Certain Financial Intermediaries or other organizations making the J.P. Morgan Funds available to their clients or customers impose minimum account balances that may be different than the requirements for investors purchasing directly from the Funds. If a shareholder purchases shares through such an intermediary and does not maintain the required minimum balance imposed by that intermediary, the intermediary may redeem the investor’s shares or impose a fee consistent with the terms of the investment arrangement with the investor. Please contact your intermediary for more information.
Closings, Reorganizations and Liquidations
To the extent authorized by law, each Fund reserves the right to discontinue offering shares at any time, to merge or reorganize itself or a share class, or to cease operations and liquidate at any time.
Limited Offering
Funds Subject to a Limited Offering
Certain Funds are offered on a limited basis as described below. Except as otherwise described below, shareholders permitted to continue to purchase include shareholders of record and if the shareholder of record is an omnibus account, beneficial owners in that account as of the effective date of the limited offering.
JPMorgan Emerging Markets Equity Fund
Effective as of the close of business on December 31, 2020 (the “Closing Date”), the JPMorgan Emerging Markets Equity Fund (the “Fund”) offered on a limited basis and investors are not eligible to purchase shares of the Fund, except as described below. In addition, both before and after the Closing Date, the Fund may from time to time, in its sole discretion based on the Fund’s net asset levels and other factors, limit new purchases into the Fund or otherwise modify the closure policy at any time on a case-by-case basis.
The following groups will be permitted to continue to purchase Fund shares. Except as otherwise described below, shareholders of record are permitted to continue to purchase shares; if the shareholder of record is an omnibus account, beneficial owners in that account as of the applicable closing date are permitted to continue to purchase:
104 | J.P. Morgan International Equity Funds
•
Shareholders of record of the Fund as of the Closing Date are able to continue to purchase additional shares in their existing Fund accounts and may continue to reinvest dividends or capital gains distributions from shares owned in the Fund;
•
Shareholders of the Fund as of the Closing Date are able to add to their existing Fund accounts through exchanges from other J.P. Morgan Funds;
•
Group Retirement Plans (as defined in the glossary) (and their successor, related and affiliated plans), which have the Fund available to participants on or before the Closing Date may continue to open accounts for new participants and can purchase additional shares in existing participant accounts. A new Group Retirement Plan may establish a new account with the Fund only if the Group Retirement Plan has been accepted for investment by the Fund and its distributor by March 31, 2021, and the plan’s account with the Fund must be either funded by the plan or available to participant directed investments by May 31, 2021;
•
Institutional investors (including successor, related, or affiliated accounts) may establish a new account with the Fund only if the account has been accepted for investment by the Fund and its distributor by the Closing Date, and the account with the Fund is funded by May 31, 2021 (Institutional investors include, but are not limited to, corporations, qualified non-profit organizations, charitable trusts, foundations and endowments, governmental entities, municipalities, and hospitals investing for their own account. These accounts may not be held for the benefit of multiple underlying, unrelated investors.);
•
Fully discretionary fee-based advisory programs, where investment discretion (fund and investment allocations) solely reside with the Financial Intermediary’s home office and where the Financial Intermediary’s home office has full authority to make investment changes without approval from the shareholder, may continue to utilize the Fund for new and existing program accounts. These programs must be accepted for continued investment by the Fund and its distributor by the Closing Date. Additionally, after the Closing Date, new fully discretionary fee-based advisory programs may utilize the Fund for program accounts only with the approval by the Fund and its distributor;
•
Registered Investment Advisory firms who have included the Fund in their discretionary models by the closing date and utilize an approved clearing platform may continue to make Fund shares available to new and existing accounts. These particular firms must be accepted for continued investment by the Fund and its distributor on or before the Closing Date;
•
Other fee-based advisory programs (including Rep as Advisor and Portfolio Manager programs) may continue to utilize the Fund for existing program accounts, but will not be able to open new program accounts after the Closing Date; and
•
Named investment professionals listed in the Fund’s prospectus may utilize the Fund for both new accounts and existing Fund accounts.
Limited Offering of the Class L Shares
The Funds' Class L Shares are publicly offered only on a limited basis. Investors are not eligible to purchase Class L Shares of the Funds except as described below. In addition, a Fund may from time to time, in its sole discretion based on a Fund’s net asset levels and other factors, limit new purchases into a Fund or otherwise modify the closure policy at any time on a case-by-case basis.
Except as otherwise described below, shareholders of record are permitted to continue to purchase Class L Shares; if the shareholder of record is an omnibus account, beneficial owners in that account as of December 1, 2016 (“the Transition Date”) are permitted to continue to purchase Class L Shares.
•
Existing shareholders of Class L Shares of a Fund are able to continue to purchase additional Class L Shares of that Fund in their existing Fund accounts either through J.P. Morgan Funds Services or a Financial Intermediary and may continue to reinvest dividends or capital gains distributions from shares owned in the Fund;
•
Existing shareholders of Class L Shares of a Fund are able to add to their existing Fund accounts through exchanges from Class L Shares of other Funds;
•
Group Retirement Plans (as defined in the Glossary) may continue to use the Class L Shares of a Fund under certain circumstances. Effective April 3, 2017, new Group Retirement Plans are not eligible to purchase Class L Shares. Group Retirement Plans (and their successor, related and affiliated plans) which have Class L Shares of a Fund available to participants on or before April 3, 2017, may continue to open accounts for new participants in Class L Shares of a Fund and purchase additional shares in existing participant accounts. In addition, new Group Retirement Plans may purchase Class L Shares of a Fund until December 31, 2018, if it is determined that the particular Group Retirement Plan is having operational difficulties in implementing the new eligibility restrictions and receives the approval of the particular Fund and its Distributor;
•
Current and future J.P. Morgan Funds that are permitted to invest in other J.P. Morgan Funds may purchase Class L Shares of a Fund;
March 1, 2023 | 105
Investing with J.P. Morgan Funds (continued)
•
New York’s 529 Advisor-Guided College Savings Program may continue to utilize Class L Shares for new and existing program accounts;
•
Registered investment advisors using an approved custodial platform may utilize Class L Shares of any Fund in fee-based advisory programs for both new and existing program accounts;
•
Banks and trust companies acting as a fiduciary and using an approved custodial platform may continue to utilize Class L Shares of any Fund for new and existing customer accounts. New banks or trust companies may utilize a Fund only with the approval of that Fund and its Distributor; and
•
Other fee-based advisory programs currently utilizing a Fund may continue to utilize the Class L Shares of that particular Fund for new and existing program accounts and any new affiliated program.
Additional information that applies to all limited offerings:
If all shares of a Fund (or a Class subject to a limited offering) in an existing shareholder’s account are voluntarily redeemed or involuntarily redeemed (due to instances when a shareholder does not meet aggregate account balance minimums or when participants in Systematic Investment Plans do not meet minimum investment requirements), then the shareholder’s account will be closed. Such former Fund shareholders will not be able to buy additional Fund shares or reopen their accounts in the Fund unless a former shareholder makes his or her repurchase within 90 days of the redemption. Repurchases during this 90 day period will not be subject to any applicable sales charges if such sales charges are normally waived for repurchases within 90 days of the redemption as described in the “Repurchase Rights” section above. However, these repurchase restrictions do not apply to Group Retirement Plans that are eligible to continue to invest under the limited offerings as described above. If shares are purchased through a Financial Intermediary, contact your investment representative for their requirements and procedures.
If a Fund receives a purchase order directly from an investor who is not eligible to purchase shares of the Fund, after the limited offering dates outlined above, J.P. Morgan Funds Services will attempt to contact the investor to determine whether he or she would like to purchase shares of another Fund or would prefer that the investment be refunded. If J.P. Morgan Funds Services cannot contact the investor within 30 days, the entire investment will be refunded.
The J.P. Morgan Funds reserves the right to change these policies at any time.
Frequent Trading Policy
J.P. Morgan Funds do not authorize market timing and, except for the Funds identified below, use reasonable methods to identify market timers and to prevent such activity. However, there can be no assurance that these methods will prevent market timing or other trading that may be deemed abusive. Market timing is an investment strategy using frequent purchases, redemptions and/or exchanges in an attempt to profit from short-term market movements. Market timing may result in dilution of the value of Fund shares held by long-term shareholders, disrupt portfolio management and increase Fund expenses for all shareholders. Although market timing may affect any Fund, these risks may be higher for Funds that invest significantly in non-U.S. securities or thinly traded securities (e.g., certain small cap securities), such as international, global or emerging market funds or small cap funds. For example, when a Fund invests in securities trading principally in non-U.S. markets that close prior to the close of the NYSE, market timers may seek to take advantage of the difference between the prices of these securities at the close of their non-U.S. markets and the value of such securities when the Fund calculates its net asset value.
J.P. Morgan Funds or the Distributor will prohibit any purchase order (including exchanges) with respect to one investor, a related group of investors or their agent(s) where they detect a pattern of either purchases and sales of one of the J.P. Morgan Funds, or exchanges between or among J.P. Morgan Funds, that indicates market timing or trading that they determine is abusive.
Although J.P. Morgan Funds use a variety of methods to detect and deter market timing, there is no assurance that the Funds’ own operational systems and procedures will identify and eliminate all market timing strategies. For example, certain accounts, which are known as omnibus accounts, include multiple investors and such accounts typically provide the Funds with a net purchase or redemption order on any given day where purchasers of Fund shares and redeemers of Fund shares are netted against one another and the identity of individual purchasers and redeemers are not known by the Funds. While the Funds seek to monitor for market timing activities in omnibus accounts, the netting effect limits the Funds’ ability to locate and eliminate individual market timers. As a result, the Funds are often dependent upon Financial Intermediaries who utilize their own policies and procedures to identify market timers. These policies and procedures may be different than those utilized by the Funds.
The Boards of J.P. Morgan Funds have adopted various policies and procedures to identify market timers, including reviewing “round trips” in and out of J.P. Morgan Funds by investors. A “round trip” includes a purchase or exchange into a Fund followed or preceded by a redemption or exchange out of the same Fund. If the Distributor detects that you have completed two round trips within 60 days
106 | J.P. Morgan International Equity Funds
in the same Fund, the Distributor will reject your purchase and exchange orders for a period of at least 90 days. For subsequent violations, the Distributor may, in its sole discretion, reject your purchase and exchange orders temporarily or permanently. In identifying market timers, the Distributor may also consider activity of accounts that it believes to be under common ownership or control.
J.P. Morgan Funds have attempted to put safeguards in place to assure that Financial Intermediaries have implemented procedures designed to deter market timing and abusive trading. Despite these safeguards, there is no assurance that the Funds will be able to effectively identify and eliminate market timing and abusive trading in the Funds particularly with respect to omnibus accounts.
J.P. Morgan Funds will seek to apply the Funds’ market timing policies and restrictions as uniformly as practicable to accounts with the Funds, except with respect to the following:
1.
Trades that occur through omnibus accounts at Financial Intermediaries as described above;
2.
Purchases, redemptions and exchanges made on a systematic basis;
3.
Automatic reinvestments of dividends and distributions;
4.
Purchases, redemptions or exchanges that are part of a rebalancing program, such as a wrap, advisory or bona fide asset allocation program, which includes investment models developed and maintained by a financial intermediary;
5.
Redemptions of shares to pay fund or account fees;
6.
Transactions initiated by the trustee or adviser to a donor-advised charitable gift fund;
7.
Transactions in Section 529 college savings plans;
8.
Transactions in Fund of Fund Products; and
9.
Transactions within a Retirement account such as:
•
Shares redeemed to return an excess contribution;
•
Transactions initiated by sponsors of group employee benefit plans or other related accounts;
•
Retirement plan contributions, loans, distributions, and hardship withdrawals;
•
IRA re-characterizations and conversions; and
•
IRA purchases of shares by asset transfer or direct rollover.
In addition to rejecting purchases in connection with suspected market timing activities, the Distributor can reject a purchase (including purchases for the Funds listed below) for any reason, including purchases that it does not think are in the best interests of a Fund and/or its shareholders or if it determines the trading to be abusive. Your Financial Intermediary may also have additional procedures for identifying market timers and rejecting or otherwise restricting purchases and/or exchanges.
Certain J.P. Morgan Funds are intended for short-term investment horizons and do not monitor for market timers or prohibit such short-term trading activity. Those Funds are the JPMorgan Short Duration Bond Fund, JPMorgan Short Duration Core Plus Fund, JPMorgan Short-Intermediate Municipal Bond Fund, JPMorgan Limited Duration Bond Fund, JPMorgan Managed Income Fund, JPMorgan Ultra-Short Municipal Fund and the J.P. Morgan Money Market Funds. Although these Funds are managed in a manner that is consistent with their investment objectives, frequent trading by shareholders may disrupt their management and increase their expenses.
Valuation
Shares are purchased at NAV per share, plus a sales charge, if any. This is also known as the offering price. Shares are also redeemed at NAV, minus any applicable CDSC. The NAV of each class within a Fund varies, primarily because each class has different class-specific expenses such as distribution and service fees.
The NAV per share of a class of a Fund is equal to the value of all the assets attributable to that class, minus the liabilities attributable to that class, divided by the number of outstanding shares of that class. The following is a summary of the procedures generally used to value J.P. Morgan Funds’ investments.
Securities for which market quotations are readily available are generally valued at their current market value. Other securities and assets, including securities for which market quotations are not readily available; market quotations are determined not to be reliable; or, their value has been materially affected by events occurring after the close of trading on the exchange or market on which the security is principally traded but before a Fund’s NAV is calculated, may be valued at fair value in accordance with policies and procedures adopted by the J.P. Morgan Funds’ Board of Trustees. Fair value represents a good faith determination of the value of a
March 1, 2023 | 107
Investing with J.P. Morgan Funds (continued)
security or other asset based upon specifically applied procedures. Fair valuation may require subjective determinations. There can be no assurance that the fair value of an asset is the price at which the asset could have been sold during the period in which the particular fair value was used in determining a Fund’s NAV.
Equity securities listed on a North American, Central American, South American or Caribbean securities exchange are generally valued at the last sale price on the exchange on which the security is principally traded. Other foreign equity securities are fair valued using quotations from an independent pricing service, as applicable. The value of securities listed on the NASDAQ Stock Market, Inc. is generally the NASDAQ official closing price.
Fixed income securities are valued using prices supplied by an approved independent third party or affiliated pricing services or broker/dealers. Those prices are determined using a variety of inputs and factors as more fully described in the Statement of Additional Information.
Assets and liabilities initially expressed in foreign currencies are converted into U.S. dollars at the prevailing market rates from an approved independent pricing service as of 4:00 p.m. ET.
Shares of ETFs are generally valued at the last sale price on the exchange on which the ETF is principally traded. Shares of open-end investment companies are valued at their respective NAVs.
Options traded on U.S. securities exchanges are valued at the composite mean price, using the National Best Bid and Offer quotes.
Options traded on foreign exchanges are valued at the settled price, or if no settled price is available, at the last sale price available prior to the calculation of a Fund’s NAV and will be fair valued by applying fair value factors provided by independent pricing services, as applicable, for any options involving equity reference obligations listed on exchanges other than North American, Central American, South American or Caribbean securities exchanges.
Exchange traded futures are valued at the last sale price available prior to the calculation of a Fund’s NAV. Any futures involving equity reference obligations listed on exchanges other than North American, Central American, South American or Caribbean securities exchanges will be fair valued by applying fair value factors provided by independent pricing services, as applicable.
Non-listed over-the-counter options and futures are valued utilizing market quotations provided by approved pricing services.
Swaps and structured notes are priced generally by an approved independent third party or affiliated pricing service or at an evaluated price provided by a counterparty or broker/dealer.
Any derivatives involving equity reference obligations listed on exchanges other than North American, Central American, South American or Caribbean securities exchanges will be fair valued by applying fair value factors provided by independent pricing services, as applicable.
NAV is calculated each business day as of the close of the NYSE, which is typically 4:00 p.m. ET. On occasion, the NYSE will close before 4:00 p.m. ET. When that happens, NAV will be calculated as of the time the NYSE closes. The Funds will not treat an intraday unscheduled disruption or closure in NYSE trading as a closure of the NYSE and will calculate NAV as of 4:00 p.m. ET, if the particular disruption or closure directly affects only the NYSE. The price at which a purchase is effected is based on the next calculation of NAV after the order is received in proper form in accordance with this prospectus. To the extent a Fund invests in securities that are primarily listed on foreign exchanges or other markets that trade on weekends or other days when a Fund does not price its shares, the value of a Fund’s shares may change on days when you will not be able to purchase or redeem your shares.
Distributions and Taxes
Each Fund has elected to be treated and intends to qualify each taxable year as a regulated investment company. A regulated investment company is not subject to tax at the corporate level on income and gains from investments that are distributed to shareholders. Each Fund’s failure to qualify as a regulated investment company would result in corporate-level taxation and, consequently, a reduction in income available for distribution to shareholders.
Each Fund can earn income and realize capital gain. Each Fund deducts any expenses and then pays out the earnings, if any, to shareholders as distributions.
Each Fund generally distributes net investment income, if any, at least annually. The Funds will distribute net realized capital gains, if any, at least annually. For each taxable year, each Fund will distribute substantially all of its net investment income and net realized capital gains.
You have the following options for your distributions. You may:
•
Reinvest all distributions in additional Fund shares;
•
Take distributions of net investment income in cash and reinvest distributions of net capital gain in additional shares;
•
Take distributions of net capital gain in cash and reinvest distributions of net investment income; or
108 | J.P. Morgan International Equity Funds
•
Take all distributions in cash.
If you do not select an option when you open your account, we will reinvest all distributions. If your distributions are reinvested, they will be in the form of shares of the same class without a sales charge. If you take your distributions in cash, you can choose to have a check mailed to your address of record or you can have them deposited into a pre-assigned bank account. The taxation of the dividends will not be affected whether you have them deposited into a bank account or sent by check.
Distributions of net investment income generally are taxable as ordinary income. Dividends of net investment income paid to a non-corporate U.S. shareholder that are properly reported as qualified dividend income generally will be taxable to such shareholder at preferential rates. The maximum individual federal income tax rate applicable to “qualified dividend income” is either 15% or 20%, depending on whether the individual’s income exceeds certain threshold amounts. The amount of dividend income that may be so reported by a Fund generally will be limited to the aggregate of the eligible dividends received by each Fund. In addition, a Fund must meet certain holding period and other requirements with respect to the shares on which the Fund received the eligible dividends, and the non-corporate U.S. shareholder must meet certain holding period and other requirements with respect to the Fund. The amount of a Fund’s distributions that would otherwise qualify for this favorable tax treatment may be reduced as a result of the Fund’s securities lending activities or high portfolio turnover rate. Dividends of net investment income that are not reported as qualified dividend income and dividends of net short-term capital gain will be taxable to a U.S. shareholder as ordinary income.
Distributions of net capital gain (that is, the excess of the net gains from the sale of investments that a Fund owned for more than one year over the net losses from investments that the Fund owned for one year or less) that are properly reported by a Fund as capital gain dividends will be taxable as long-term capital gain, regardless of how long you have held your shares in the Fund. The maximum individual federal income tax rate applicable to long-term capital gains is generally either 15% or 20%, depending on whether the individual’s income exceeds certain threshold amounts. Distributions of net short-term capital gain (that is, the excess of any net short-term capital gain over net long-term capital loss), if any, will be taxable to U.S. shareholders as ordinary income. Capital gain of a corporate shareholder is taxed at the same rate as ordinary income.
An additional 3.8% Medicare tax is imposed on certain net investment income (including ordinary dividends and capital gain distributions received from a Fund and net gains from redemptions or other taxable dispositions of Fund shares) of U.S. individuals, estates and trusts to the extent that such person’s “modified adjusted gross income” (in the case of an individual) or “adjusted gross income” (in the case of an estate or trust) exceeds certain threshold amounts.
If you buy shares of a Fund just before a distribution, you will be subject to tax on the entire amount of the taxable distribution you receive. Distributions are taxable to you even if they are paid from income or gains earned by a Fund before your investment (and thus were included in the price you paid for your Fund shares). Any gain resulting from the sale or exchange of Fund shares generally will be taxable as long-term or short-term gain, depending upon how long you have held your shares.
Each Fund is generally subject to foreign withholding or other foreign taxes, which in some cases can be significant on any income or gain from investments in foreign stocks or securities. In that case, the Fund’s total return on those securities would be decreased.
Each Fund may generally deduct these taxes in computing its taxable income. Rather than deducting these foreign taxes, a Fund that invests more than 50% of its assets in the stock or securities of foreign corporations or foreign governments at the end of its taxable year may make an election to treat a proportionate amount of eligible foreign taxes as constituting a taxable distribution to each shareholder, which would, subject to certain limitations, generally allow the shareholder to either (i) credit that proportionate amount of taxes against U.S. Federal income tax liability as a foreign tax credit or (ii) take that amount as an itemized deduction. Any foreign tax withheld on payments made “in lieu of” dividends or interest with respect to loaned securities will not qualify for the pass-through of foreign tax credits to shareholders. Although in some cases the Fund may be able to apply for a refund of a portion of such taxes, the ability to successfully obtain such a refund may be uncertain. A Fund’s investments in certain debt obligations, derivative instruments and so-called “passive foreign investment companies” may require such Fund to accrue and distribute income not yet received. In order to generate sufficient cash to make the requisite distributions, a Fund may be required to liquidate other investments in its portfolio that it otherwise would have continued to hold, including when it is not advantageous to do so.
A Fund’s transactions in futures contracts, short sales, swaps and other derivatives will be subject to special tax rules, the effect of which may be to accelerate income to the Fund, defer losses to the Fund, cause adjustments in the holding periods of the Fund’s securities, and convert short-term capital losses into long-term capital losses. These rules could therefore affect the amount, timing and character of distributions to shareholders. A Fund’s use of these types of transactions may result in the Fund realizing more short-term capital gain and ordinary income subject to tax at ordinary income tax rates than it would if it did not engage in such transactions.
An increase in the principal amount of an inflation-linked security will be original issue discount which is taxable as ordinary income and is required to be distributed, even though the Fund will not receive the principal, including any increases thereto, until maturity. The extent to which a Fund can invest in master limited partnerships is limited by the Fund's intention to qualify as a regulated
March 1, 2023 | 109
Investing with J.P. Morgan Funds (continued)
investment company under the Internal Revenue Code.
Please see the Statement of Additional Information for additional discussion of the tax consequences of the above-described and other investments to each Fund and its shareholders.
The dates on which net investment income and capital gain dividends, if any, will be distributed are available online at www.jpmorganfunds.com.
Early in each calendar year, each Fund will send you a notice showing the amount of distributions you received during the preceding calendar year and the tax status of those distributions.
The Funds are not intended for foreign shareholders. Any foreign shareholders would generally be subject to U.S. tax-withholding on distributions by the Funds, as discussed in the Statement of Additional Information.
Distributions by a Fund to retirement plans and other entities that qualify for tax-exempt or tax-deferred treatment under federal income tax laws will generally not be taxable. Special tax rules apply to investments through such plans. The tax considerations described in this section do not apply to such tax-exempt or tax-deferred entities or accounts. You should consult your tax advisor to determine the suitability of a Fund as an investment and the tax treatment of distributions.
Any investor for whom a Fund does not have a valid Taxpayer Identification Number may be subject to backup withholding.
The above is a general summary of tax implications of investing in the Funds. Because each investor’s tax consequences are unique, please consult your tax advisor to see how investing in a Fund and, for individuals and S corporations, selection of a particular cost method of accounting will affect your own tax situation.
IMPORTANT TAX REPORTING CONSIDERATIONS
Your Financial Intermediary or the Fund (if you hold your shares in the Fund direct account) will report gains and losses realized on redemptions of shares for shareholders who are individuals and S corporations purchased after January 1, 2012 to the Internal Revenue Service (IRS). This information will also be reported to you on Form 1099-B and the IRS each year. In calculating the gain or loss on redemptions of shares, the average cost method will be used to determine the cost basis of Fund shares purchased after January 1, 2012 unless you instruct the Fund in writing at J.P. Morgan Funds Services, P.O. Box 219143, Kansas City, MO 64121-9143 that you want to use another available method for cost basis reporting (for example, First In, First Out (FIFO), Last In, First Out (LIFO), Specific Lot Identification (SLID) or High Cost, First Out (HIFO)). If you designate SLID as your cost basis method, you will also need to designate a secondary cost basis method (Secondary Method). If a Secondary Method is not provided, the Fund will designate FIFO as the Secondary Method and will use the Secondary Method with respect to systematic redemptions.
Not all cost basis methods are available. Please contact the Fund at J.P. Morgan Funds Services, P.O. Box 219143, Kansas City, MO 64121-9143 for more information on the available methods for cost basis reporting. To determine which available cost basis method is best for you, you should consult with your tax advisor. Please note that you will be responsible for calculating and reporting gains and losses on redemptions of shares purchased prior to January 1, 2012 to the IRS as such information will not be reported by the Fund and may not be maintained by your Financial Intermediary.
Your Financial Intermediary or the Fund (if you hold your shares in the Fund direct account) is also required to report gains and losses to the IRS in connection with redemptions of shares by S corporations. If a shareholder is a corporation and has not instructed the Fund that it is a C corporation in its account application or by written instruction to J.P. Morgan Funds Services, P.O. Box 219143, Kansas City, MO 64121-9143, the Fund will treat the shareholder as an S corporation and file a Form 1099-B.
Shareholder Statements and Reports
The J.P. Morgan Funds or your Financial Intermediary will send you transaction confirmation statements and quarterly account statements. Please review these statements carefully. The Funds will correct errors if notified within one year of the date printed on the transaction confirmation or account statement, except that, with respect to unfulfilled Letters of Intent, the Funds may process corrections up to 15 months after the date printed on the transaction confirmation or account statement. Your Financial Intermediary may have a different cut-off time. J.P. Morgan Funds will charge a fee for requests for statements that are older than two years. Please retain all of your statements, as they could be needed for tax purposes.
To reduce expenses and conserve natural resources, the J.P. Morgan Funds will deliver a single copy of prospectuses and financial reports to individual investors who share a residential address, provided they have the same last name or the J.P. Morgan Funds reasonably believe they are members of the same family. If you would like to receive separate mailings, please call 1-800-480-4111 and the Fund will begin individual delivery within 30 days. If you would like to receive these documents by e-mail, please visit www.jpmorganfunds.com and sign up for electronic delivery.
110 | J.P. Morgan International Equity Funds
If you hold your Fund shares directly, you may access your account statements at www.jpmorganfunds.com.
After each fiscal half year you will receive a financial report from the Funds. In addition, the Funds will periodically send you proxy statements and other reports.
If you have any questions or need additional information, please write to J.P. Morgan Funds Services at P.O. Box 219143, Kansas City, MO 64121-9143, call 1-800-480-4111 or visit www.jpmorganfunds.com.
Availability of Proxy Voting Record
The Trustees for each Fund have delegated the authority to vote proxies for securities owned by the Funds to the Funds' adviser. A copy of each Fund’s voting record for the most recent 12-month period ended June 30 is available on the SEC’s website at www.sec.gov or on J.P. Morgan Funds’ website at www.jpmorganfunds.com no later than August 31 of each year. Each Fund’s proxy voting record will include, among other things, a brief description of the matter voted on for each portfolio security, and will state how each vote was cast, for example, for or against the proposal.
Portfolio Holdings Disclosure
No sooner than 15 days after the end of each month, each of the following Funds will make available upon request the uncertified, complete schedule of its portfolio holdings as of the last day of that month:
JPMorgan Emerging Markets Equity Fund
JPMorgan Emerging Markets Research Enhanced Equity Fund
JPMorgan Europe Dynamic Fund
JPMorgan International Hedged Equity Fund
JPMorgan Emerging Markets Research Enhanced Equity Fund
JPMorgan Europe Dynamic Fund
JPMorgan International Hedged Equity Fund
No sooner than 10 days after the end of each month, each of the following Funds will post the uncertified, complete schedule of its portfolio holdings as of the last day of that month on J.P. Morgan Funds’ website at www.jpmorganfunds.com:
JPMorgan International Equity Fund
JPMorgan International Focus Fund
JPMorgan International Value Fund
JPMorgan International Focus Fund
JPMorgan International Value Fund
Not later than 60 days after the end of each fiscal quarter, each Fund will make available upon request a complete schedule of its portfolio holdings as of the last day of that quarter. In addition to providing hard copies upon request, each Fund will post these quarterly schedules on J.P. Morgan Funds' website at www.jpmorganfunds.com and on the SEC’s website at www.sec.gov.
In addition, from time to time, a Fund may post portfolio holdings on J.P. Morgan Funds’ website on a more frequent basis.
Each Fund may disclose the Fund’s 10 largest portfolio holdings and the percentage that each of these 10 holdings represent of the Fund’s portfolio as of the most recent month’s end, online at www.jpmorganfunds.com, no sooner than 5 calendar days after month’s end.
Shareholders may request portfolio holdings schedules at no charge by calling 1-800-480-4111. A description of each Fund’s policies and procedures with respect to the disclosure of a Fund’s portfolio holdings is available in the Statement of Additional Information.
March 1, 2023 | 111
Glossary of Common Investment Terminology
For the purpose of the “INVESTING WITH J.P. MORGAN FUNDS” section, references to “account” and “Fund” are not interchangeable. Fund refers to an individual mutual fund position. An account may be invested in a single Fund or multiple Funds.
Breakpoints — Differences in sales charges that are assessed based on the amount of purchases. The larger the investment, the lower the sales charge.
Capital Gains Distribution — Payment to mutual fund shareholders of gains realized on securities that a Fund has sold at a profit, minus any realized losses.
Contingent Deferred Sales Charge (CDSC) — A back-end sales charge imposed when shares are redeemed from a Fund. This fee usually declines over time.
Dividend Distribution — Payment to mutual fund shareholders of income from interest or dividends generated by a Fund’s investments.
Financial Intermediaries — Include financial advisors, investment advisers, brokers, financial planners, banks, insurance companies, retirement or 401(k) plan administrators and others, including various affiliates of JPMorgan Chase, that have entered into agreements with the Distributor and/or shareholder servicing agent. Shares purchased this way will typically be held for you by the Financial Intermediary.
Group Retirement Plans — Refers to employer-sponsored retirement, deferred compensation and employee benefit plans (including health savings accounts) and trusts used to fund those plans. To satisfy eligibility requirements, the plan must be a group plan (more than one participant), the shares cannot be held in a commission-based brokerage account and
•
Shares must be held at a plan level or
•
Shares must be held at the Fund level through an omnibus account of a retirement plan recordkeeper.
Group Retirement Plans include group employer-sponsored 401(k) plans, 457 plans, employer-sponsored 403(b) plans, profit-sharing and money purchase pension plans, defined benefit plans, retiree health benefit plans, group annuity separate accounts offered to retirement plans and non-qualified deferred compensation plans. Group Retirement Plans do not include traditional IRAs, Roth IRAs, Coverdell Education Savings Accounts, SEPs, SARSEPs, SIMPLE IRAs, KEOGHs, individual 401(k) or individual 403(b) plans.
Institutional Investors — Include fee-based “wrap” account sponsors (provided they have an agreement covering the arrangement with the Distributor), corporations, qualified nonprofit organizations, charitable trusts, foundations and endowments, state, county, city or any instrumentality, department, authority or agency thereof, and banks, trust companies or other depository institutions investing for their own account or on behalf of their clients.
Letter of Intent (LOI) — A Letter of Intent is signed by an investor stating the investor’s intention to buy a specified amount over a period of 13 months in order to receive a reduced front-end sales charge. Each purchase the investor makes during the 13 month period will receive the sales charge and breakpoint discount that applies to the total amount specified in the Letter of Intent. If the amount is not met within the 13 month period, the investor must pay the Distributor the difference between the sales charges applicable to the purchases at the time they were made and the reduced sales charges previously paid. A Letter of Intent shall be based on the sales charge and breakpoint schedules in effect when the initial shares were purchased.
Medallion Signature Guarantee — A special stamp used to verify the authenticity of certain documents. It is a guarantee by a financial institution that the signature is genuine and the financial institution accepts liability for any forgery. Medallion signature guarantees protect shareholders by preventing unauthorized transfer of assets that could result in monetary losses to the investor due to fraud. Medallion guarantee stamps can be obtained at many bank branches or brokerage firms.
Required Minimum Distribution (RMD) — Refers to the annual amounts that must be withdrawn from pre-tax retirement accounts (such as Traditional, SEP, and SIMPLE IRAs) in or after the year the shareholder reaches the qualified age based on applicable IRS regulations.
Rights of Accumulation (ROA) — When utilizing “rights of accumulation,” the investor can combine the current market value of any existing qualifying holdings and account types with the amount of the current purchase to qualify for a breakpoint and reduced front-end sales charge on the current purchase. Rights of Accumulation shall be based on the sales charge and breakpoint schedules in effect when the initial shares were purchased.
Uncollected Shares — Shares purchased directly through J.P. Morgan Funds Services by check or through an ACH transaction are not available for redemption for up to five business days following the acceptance of a purchase order unless you provide satisfactory proof that your purchase check or ACH transaction has cleared.
Wire or ACH — Refers to the method used for payment or redemptions. Movement of money by wire is typically faster than money sent by ACH (Automated Clearing House). While J.P. Morgan Funds does not charge for either method, your bank may charge a fee for these services.
112 | J.P. Morgan International Equity Funds
Financial Highlights
The financial highlights tables are intended to help you understand each Fund’s financial performance for each share class for the past five fiscal years or the period of a Fund’s operations, as applicable. Certain information reflects financial results for a single Fund share. The total returns in the tables represent the rate that an investor would have earned (or lost) on an investment in a Fund (assuming reinvestment of all dividends and distributions). This information for each period presented has been audited by PricewaterhouseCoopers LLP, whose reports, along with each Fund’s financial statements, are included in the respective Fund’s annual report, which is available upon request.
To the extent a Fund invests in other funds, the Total Annual Operating Expenses included in the Fee Table will not correlate to the ratio of expenses to average net assets in the financial highlights below.
| |
Per share operating performance | ||||||
| |
|
Investment operations |
Distributions | ||||
| |
Net asset value, beginning of period |
Net investment income (loss)(a) |
Net realized and unrealized gains (losses) on investments |
Total from investment operations |
Net investment income |
Net realized gain |
Total distributions |
| JPMorgan Emerging Markets Equity Fund |
|
|
|
|
|
|
|
| Class A |
|
|
|
|
|
|
|
| Year Ended October 31, 2022 |
$40.54 |
$0.06 |
$(15.42) |
$(15.36) |
$(0.07) |
$(1.26) |
$(1.33) |
| Year Ended October 31, 2021 |
36.44 |
(0.14) |
4.24 |
4.10 |
— |
— |
— |
| Year Ended October 31, 2020 |
30.07 |
(0.02) |
6.56 |
6.54 |
(0.17) |
— |
(0.17) |
| Year Ended October 31, 2019 |
23.84 |
0.19 |
6.16 |
6.35 |
(0.12) |
— |
(0.12) |
| Year Ended October 31, 2018 |
27.58 |
0.14 |
(3.84) |
(3.70) |
(0.04) |
— |
(0.04) |
| Class C |
|
|
|
|
|
|
|
| Year Ended October 31, 2022 |
38.96 |
(0.10) |
(14.78) |
(14.88) |
— |
(1.26) |
(1.26) |
| Year Ended October 31, 2021 |
35.20 |
(0.34) |
4.10 |
3.76 |
— |
— |
— |
| Year Ended October 31, 2020 |
29.07 |
(0.18) |
6.35 |
6.17 |
(0.04) |
— |
(0.04) |
| Year Ended October 31, 2019 |
23.08 |
0.04 |
5.98 |
6.02 |
(0.03) |
— |
(0.03) |
| Year Ended October 31, 2018 |
26.80 |
0.02 |
(3.74) |
(3.72) |
—(d) |
— |
—(d) |
| Class I |
|
|
|
|
|
|
|
| Year Ended October 31, 2022 |
41.60 |
0.12 |
(15.81) |
(15.69) |
(0.17) |
(1.26) |
(1.43) |
| Year Ended October 31, 2021 |
37.34 |
(0.04) |
4.34 |
4.30 |
(0.04) |
— |
(0.04) |
| Year Ended October 31, 2020 |
30.79 |
0.05 |
6.75 |
6.80 |
(0.25) |
— |
(0.25) |
| Year Ended October 31, 2019 |
24.45 |
0.27 |
6.29 |
6.56 |
(0.22) |
— |
(0.22) |
| Year Ended October 31, 2018 |
28.29 |
0.24 |
(3.96) |
(3.72) |
(0.12) |
— |
(0.12) |
| Class L |
|
|
|
|
|
|
|
| Year Ended October 31, 2022 |
41.96 |
0.17 |
(15.95) |
(15.78) |
(0.22) |
(1.26) |
(1.48) |
| Year Ended October 31, 2021 |
37.64 |
0.01 |
4.37 |
4.38 |
(0.06) |
— |
(0.06) |
| Year Ended October 31, 2020 |
31.03 |
0.08 |
6.80 |
6.88 |
(0.27) |
— |
(0.27) |
| Year Ended October 31, 2019 |
24.63 |
0.29 |
6.35 |
6.64 |
(0.24) |
— |
(0.24) |
| Year Ended October 31, 2018 |
28.49 |
0.26 |
(3.99) |
(3.73) |
(0.13) |
— |
(0.13) |
| | |
| (a) |
Calculated based upon average shares outstanding. |
| (b) |
Includes adjustments in accordance with accounting principles generally accepted in the United States of America and as such, the net asset values for financial reporting purposes and the returns based upon those net asset values may differ from the net asset values and returns for shareholder transactions. |
| (c) |
Includes interest expense, if applicable, which is less than 0.0005% unless otherwise noted. |
| (d) |
Amount rounds to less than $0.005. |
114 | J.P. Morgan International Equity Funds
| |
Ratios/Supplemental data | |||||
| |
|
|
Ratios to average net assets | |||
| Net asset value, end of period |
Total return (excludes sales charge)(b) |
Net assets, end of period (000's) |
Net expenses(c) |
Net investment income (loss) |
Expenses without waivers and reimbursements |
Portfolio turnover rate |
| |
|
|
|
|
|
|
| |
|
|
|
|
|
|
| $23.85 |
(39.06)% |
$358,077 |
1.25% |
0.19% |
1.33% |
18% |
| 40.54 |
11.25 |
702,288 |
1.24 |
(0.33) |
1.30 |
25 |
| 36.44 |
21.84 |
578,112 |
1.24 |
(0.06) |
1.33 |
15 |
| 30.07 |
26.77 |
524,357 |
1.24 |
0.69 |
1.47 |
34 |
| 23.84 |
(13.44) |
369,490 |
1.24 |
0.51 |
1.52 |
13 |
| |
|
|
|
|
|
|
| 22.82 |
(39.36) |
35,997 |
1.75 |
(0.35) |
1.83 |
18 |
| 38.96 |
10.68 |
82,409 |
1.74 |
(0.83) |
1.80 |
25 |
| 35.20 |
21.24 |
72,364 |
1.74 |
(0.58) |
1.83 |
15 |
| 29.07 |
26.12 |
56,830 |
1.74 |
0.15 |
1.98 |
34 |
| 23.08 |
(13.87) |
43,612 |
1.74 |
0.06 |
2.02 |
13 |
| |
|
|
|
|
|
|
| 24.48 |
(38.92) |
1,871,401 |
1.00 |
0.37 |
1.07 |
18 |
| 41.60 |
11.51 |
4,753,438 |
0.99 |
(0.09) |
1.05 |
25 |
| 37.34 |
22.19 |
4,016,180 |
0.99 |
0.15 |
1.07 |
15 |
| 30.79 |
27.04 |
1,725,882 |
0.99 |
0.94 |
1.21 |
34 |
| 24.45 |
(13.23) |
773,142 |
0.99 |
0.84 |
1.26 |
13 |
| |
|
|
|
|
|
|
| 24.70 |
(38.84) |
1,282,832 |
0.90 |
0.53 |
0.92 |
18 |
| 41.96 |
11.63 |
2,598,326 |
0.89 |
0.02 |
0.90 |
25 |
| 37.64 |
22.29 |
1,877,489 |
0.89 |
0.25 |
0.92 |
15 |
| 31.03 |
27.20 |
926,781 |
0.89 |
1.00 |
1.06 |
34 |
| 24.63 |
(13.16) |
475,997 |
0.89 |
0.91 |
1.11 |
13 |
March 1, 2023 | 115
Financial Highlights (continued)
| |
Per share operating performance | ||||||
| |
|
Investment operations |
Distributions | ||||
| |
Net asset value, beginning of period |
Net investment income (loss)(b) |
Net realized and unrealized gains (losses) on investments |
Total from investment operations |
Net investment income |
Net realized gain |
Total distributions |
| JPMorgan Emerging Markets Research Enhanced Equity Fund |
|
|
|
|
|
|
|
| Class I |
|
|
|
|
|
|
|
| Year Ended October 31, 2022 |
$20.87 |
$0.48 |
$(6.96) |
$(6.48) |
$(0.52) |
$(0.53) |
$(1.05) |
| Year Ended October 31, 2021 |
18.11 |
0.51 |
2.56 |
3.07 |
(0.31) |
— |
(0.31) |
| Year Ended October 31, 2020 |
16.78 |
0.33 |
1.04 |
1.37 |
— |
(0.04) |
(0.04) |
| January 30, 2019 (g) through October 31, 2019 |
16.22 |
0.31 |
0.25 |
0.56 |
— |
— |
— |
| | |
| (a) |
Annualized for periods less than one year, unless otherwise noted. |
| (b) |
Calculated based upon average shares outstanding. |
| (c) |
Not annualized for periods less than one year. |
| (d) |
Includes adjustments in accordance with accounting principles generally accepted in the United States of America and as such, the net asset values for financial reporting purposes and the returns based upon those net asset values may differ from the net asset values and returns for shareholder transactions. |
| (e) |
Includes interest expense, if applicable, which is less than 0.005% unless otherwise noted. |
| (f) |
Certain non-recurring expenses incurred by the Fund were not annualized for the period indicated. |
| (g) |
Commencement of offering of class of shares. |
116 | J.P. Morgan International Equity Funds
| |
Ratios/Supplemental data | |||||
| |
|
|
Ratios to average net assets (a) | |||
| Net asset value, end of period |
Total return (c)(d) |
Net assets, end of period (000's) |
Net expenses (e) |
Net investment income (loss) |
Expenses without waivers and reimbursements |
Portfolio turnover rate (c) |
| |
|
|
|
|
|
|
| |
|
|
|
|
|
|
| $13.34 |
(32.53)% |
$171,538 |
0.45% |
3.00% |
0.68% |
34% |
| 20.87 |
16.95 |
5,435 |
0.45 |
2.36 |
0.69 |
53 |
| 18.11 |
8.15 |
33 |
0.45 |
1.98 |
1.39 |
47 |
| 16.78 |
3.45 |
5 |
0.44(f) |
2.52(f) |
0.70(f) |
28 |
March 1, 2023 | 117
Financial Highlights (continued)
| |
Per share operating performance | ||||
| |
|
Investment operations |
Distributions | ||
| |
Net asset value, beginning of period |
Net investment income (loss)(b) |
Net realized and unrealized gains (losses) on investments |
Total from investment operations |
Net investment income |
| JPMorgan Europe Dynamic Fund |
|
|
|
|
|
| Class A |
|
|
|
|
|
| Year Ended October 31, 2022 |
$30.91 |
$0.36 |
$(6.95) |
$(6.59) |
$(0.62) |
| Year Ended October 31, 2021 |
21.64 |
0.40(e) |
9.14 |
9.54 |
(0.27) |
| Year Ended October 31, 2020 |
24.25 |
0.25 |
(2.16) |
(1.91) |
(0.70) |
| Year Ended October 31, 2019 |
23.01 |
0.61 |
1.18 |
1.79 |
(0.55) |
| Year Ended October 31, 2018 |
27.04 |
0.42 |
(4.08) |
(3.66) |
(0.37) |
| Class C |
|
|
|
|
|
| Year Ended October 31, 2022 |
27.25 |
0.20 |
(6.13) |
(5.93) |
(0.47) |
| Year Ended October 31, 2021 |
19.10 |
0.22(e) |
8.08 |
8.30 |
(0.15) |
| Year Ended October 31, 2020 |
21.47 |
0.12 |
(1.91) |
(1.79) |
(0.58) |
| Year Ended October 31, 2019 |
20.39 |
0.44 |
1.06 |
1.50 |
(0.42) |
| Year Ended October 31, 2018 |
24.00 |
0.25 |
(3.62) |
(3.37) |
(0.24) |
| Class I |
|
|
|
|
|
| Year Ended October 31, 2022 |
31.57 |
0.24 |
(6.88) |
(6.64) |
(0.73) |
| Year Ended October 31, 2021 |
22.10 |
0.47(e) |
9.33 |
9.80 |
(0.33) |
| Year Ended October 31, 2020 |
24.75 |
0.31 |
(2.19) |
(1.88) |
(0.77) |
| Year Ended October 31, 2019 |
23.48 |
0.67 |
1.21 |
1.88 |
(0.61) |
| Year Ended October 31, 2018 |
27.60 |
0.49 |
(4.17) |
(3.68) |
(0.44) |
| Class L |
|
|
|
|
|
| Year Ended October 31, 2022 |
31.99 |
0.52 |
(7.22) |
(6.70) |
(0.75) |
| Year Ended October 31, 2021 |
22.38 |
0.54(e) |
9.44 |
9.98 |
(0.37) |
| Year Ended October 31, 2020 |
25.05 |
0.35 |
(2.23) |
(1.88) |
(0.79) |
| Year Ended October 31, 2019 |
23.70 |
0.65 |
1.27 |
1.92 |
(0.57) |
| Year Ended October 31, 2018 |
27.85 |
0.51 |
(4.18) |
(3.67) |
(0.48) |
| | |
| (a) |
Annualized for periods less than one year, unless otherwise noted. |
| (b) |
Calculated based upon average shares outstanding. |
| (c) |
Not annualized for periods less than one year. |
| (d) |
Includes adjustments in accordance with accounting principles generally accepted in the United States of America and as such, the net asset values for financial reporting purposes and the returns based upon those net asset values may differ from the net asset values and returns for shareholder transactions. |
| (e) |
Reflects income from foreign withholding tax claims, including related interest income. Had the Fund not received these proceeds, the net investment income (loss) per share would have been $0.38, $0.20, $0.45, $0.52 and $0.53 for Class A, Class C, Class I, Class L and Class R6, respectively, and the net investment income (loss) ratios would have been 1.29%, 0.78%, 1.44%, 1.70% and 1.75% for Class A, Class C, Class I, Class L and Class R6, respectively. |
118 | J.P. Morgan International Equity Funds
| |
Ratios/Supplemental data | |||||
| |
|
|
Ratios to average net assets (a) | |||
| Net asset value, end of period |
Total return (excludes sales charge)(c)(d) |
Net assets, end of period (000's) |
Net expenses |
Net investment income (loss) |
Expenses without waivers and reimbursements |
Portfolio turnover rate (c) |
| |
|
|
|
|
|
|
| |
|
|
|
|
|
|
| $23.70 |
(21.70)% |
$64,573 |
1.25% |
1.37% |
1.28% |
75% |
| 30.91 |
44.30 |
88,315 |
1.24 |
1.37(e) |
1.26 |
92 |
| 21.64 |
(8.21) |
68,882 |
1.24 |
1.09 |
1.28 |
159 |
| 24.25 |
8.14 |
98,294 |
1.24 |
2.67 |
1.31 |
83 |
| 23.01 |
(13.72) |
124,681 |
1.24 |
1.58 |
1.29 |
149 |
| |
|
|
|
|
|
|
| 20.85 |
(22.09) |
5,096 |
1.75 |
0.82 |
1.78 |
75 |
| 27.25 |
43.56 |
11,313 |
1.74 |
0.86(e) |
1.77 |
92 |
| 19.10 |
(8.68) |
11,082 |
1.74 |
0.59 |
1.77 |
159 |
| 21.47 |
7.64 |
19,798 |
1.74 |
2.15 |
1.80 |
83 |
| 20.39 |
(14.18) |
31,125 |
1.74 |
1.08 |
1.79 |
149 |
| |
|
|
|
|
|
|
| 24.20 |
(21.48) |
83,608 |
0.98 |
0.81 |
1.00 |
75 |
| 31.57 |
44.61 |
443,053 |
0.98 |
1.52(e) |
0.99 |
92 |
| 22.10 |
(7.98) |
52,841 |
0.99 |
1.33 |
1.01 |
159 |
| 24.75 |
8.44 |
86,582 |
0.99 |
2.86 |
1.05 |
83 |
| 23.48 |
(13.53) |
139,858 |
0.99 |
1.84 |
1.04 |
149 |
| |
|
|
|
|
|
|
| 24.54 |
(21.39) |
15,568 |
0.85 |
1.87 |
0.86 |
75 |
| 31.99 |
44.88 |
86,054 |
0.84 |
1.78(e) |
0.85 |
92 |
| 22.38 |
(7.86) |
55,597 |
0.85 |
1.49 |
0.86 |
159 |
| 25.05 |
8.49 |
65,686 |
0.89 |
2.77 |
0.90 |
83 |
| 23.70 |
(13.41) |
389,665 |
0.88 |
1.88 |
0.89 |
149 |
March 1, 2023 | 119
Financial Highlights (continued)
| |
Per share operating performance | ||||||
| |
|
Investment operations |
Distributions | ||||
| |
Net asset value, beginning of period |
Net investment income (loss)(a) |
Net realized and unrealized gains (losses) on investments |
Total from investment operations |
Net investment income |
Net realized gain |
Total distributions |
| JPMorgan International Equity Fund |
|
|
|
|
|
|
|
| Class A |
|
|
|
|
|
|
|
| Year Ended October 31, 2022 |
$21.63 |
$0.31 |
$(5.83) |
$(5.52) |
$(0.37) |
$(0.99) |
$(1.36) |
| Year Ended October 31, 2021 |
16.47 |
0.30(d) |
5.04 |
5.34 |
(0.18) |
— |
(0.18) |
| Year Ended October 31, 2020 |
17.27 |
0.19 |
(0.49) |
(0.30) |
(0.50) |
— |
(0.50) |
| Year Ended October 31, 2019 |
15.56 |
0.33 |
1.89 |
2.22 |
(0.33) |
(0.18) |
(0.51) |
| Year Ended October 31, 2018 |
17.81 |
0.33 |
(2.33) |
(2.00) |
(0.25) |
— |
(0.25) |
| Class C |
|
|
|
|
|
|
|
| Year Ended October 31, 2022 |
20.41 |
0.20 |
(5.48) |
(5.28) |
(0.27) |
(0.99) |
(1.26) |
| Year Ended October 31, 2021 |
15.53 |
0.18(d) |
4.77 |
4.95 |
(0.07) |
— |
(0.07) |
| Year Ended October 31, 2020 |
16.29 |
0.09 |
(0.45) |
(0.36) |
(0.40) |
— |
(0.40) |
| Year Ended October 31, 2019 |
14.68 |
0.23 |
1.80 |
2.03 |
(0.24) |
(0.18) |
(0.42) |
| Year Ended October 31, 2018 |
16.83 |
0.25 |
(2.23) |
(1.98) |
(0.17) |
— |
(0.17) |
| Class I |
|
|
|
|
|
|
|
| Year Ended October 31, 2022 |
22.02 |
0.38 |
(5.95) |
(5.57) |
(0.42) |
(0.99) |
(1.41) |
| Year Ended October 31, 2021 |
16.76 |
0.36(d) |
5.13 |
5.49 |
(0.23) |
— |
(0.23) |
| Year Ended October 31, 2020 |
17.56 |
0.21 |
(0.47) |
(0.26) |
(0.54) |
— |
(0.54) |
| Year Ended October 31, 2019 |
15.82 |
0.36 |
1.93 |
2.29 |
(0.37) |
(0.18) |
(0.55) |
| Year Ended October 31, 2018 |
18.09 |
0.41 |
(2.40) |
(1.99) |
(0.28) |
— |
(0.28) |
| | |
| (a) |
Calculated based upon average shares outstanding. |
| (b) |
Includes adjustments in accordance with accounting principles generally accepted in the United States of America and as such, the net asset values for financial reporting purposes and the returns based upon those net asset values may differ from the net asset values and returns for shareholder transactions. |
| (c) |
Includes interest expense, if applicable, which is less than 0.005% unless otherwise noted. |
| (d) |
Reflects income from foreign withholding tax claims. Had the Fund not received these proceeds, the net investment income (loss) per share and the net investment income (loss) ratios for each share class would have remained the same. |
120 | J.P. Morgan International Equity Funds
| |
Ratios/Supplemental data | |||||
| |
|
|
Ratios to average net assets | |||
| Net asset value, end of period |
Total return (excludes sales charge)(b) |
Net assets, end of period (000's) |
Net expenses (c) |
Net investment income (loss) |
Expenses without waivers and reimbursements |
Portfolio turnover rate |
| |
|
|
|
|
|
|
| |
|
|
|
|
|
|
| $14.75 |
(27.15)% |
$304,284 |
0.95% |
1.76% |
1.11% |
31% |
| 21.63 |
32.56 |
433,033 |
0.95 |
1.47(d) |
1.11 |
35 |
| 16.47 |
(1.88) |
263,791 |
0.95 |
1.17 |
1.12 |
28 |
| 17.27 |
14.93 |
328,312 |
0.95 |
2.03 |
1.22 |
25 |
| 15.56 |
(11.42) |
240,394 |
0.95 |
1.88 |
1.32 |
33 |
| |
|
|
|
|
|
|
| 13.87 |
(27.51) |
6,191 |
1.45 |
1.23 |
1.64 |
31 |
| 20.41 |
31.94 |
10,899 |
1.45 |
0.91(d) |
1.62 |
35 |
| 15.53 |
(2.38) |
9,358 |
1.45 |
0.61 |
1.62 |
28 |
| 16.29 |
14.39 |
14,549 |
1.45 |
1.51 |
1.74 |
25 |
| 14.68 |
(11.89) |
18,899 |
1.45 |
1.48 |
1.83 |
33 |
| |
|
|
|
|
|
|
| 15.04 |
(26.95) |
513,812 |
0.70 |
2.16 |
0.86 |
31 |
| 22.02 |
32.94 |
584,191 |
0.70 |
1.71(d) |
0.86 |
35 |
| 16.76 |
(1.64) |
339,416 |
0.70 |
1.26 |
0.86 |
28 |
| 17.56 |
15.20 |
190,885 |
0.70 |
2.22 |
0.96 |
25 |
| 15.82 |
(11.20) |
179,831 |
0.70 |
2.30 |
1.06 |
33 |
March 1, 2023 | 121
Financial Highlights (continued)
| |
Per share operating performance | ||||
| |
|
Investment operations |
Distributions | ||
| |
Net asset value, beginning of period |
Net investment income (loss)(a) |
Net realized and unrealized gains (losses) on investments |
Total from investment operations |
Net investment income |
| JPMorgan International Focus Fund |
|
|
|
|
|
| Class A |
|
|
|
|
|
| Year Ended October 31, 2022 |
$27.55 |
$0.41 |
$(7.95) |
$(7.54) |
$(0.43) |
| Year Ended October 31, 2021 |
22.07 |
0.35(d) |
5.32 |
5.67 |
(0.19) |
| Year Ended October 31, 2020 |
21.15 |
0.18 |
0.75 |
0.93 |
(0.01) |
| Year Ended October 31, 2019 |
18.24 |
0.26 |
3.02 |
3.28 |
(0.37) |
| Year Ended October 31, 2018 |
21.14 |
0.36 |
(3.13) |
(2.77) |
(0.13) |
| Class C |
|
|
|
|
|
| Year Ended October 31, 2022 |
27.06 |
0.29 |
(7.83) |
(7.54) |
(0.29) |
| Year Ended October 31, 2021 |
21.68 |
0.20(d) |
5.24 |
5.44 |
(0.06) |
| Year Ended October 31, 2020 |
20.86 |
0.07 |
0.75 |
0.82 |
— |
| Year Ended October 31, 2019 |
17.98 |
0.16 |
2.97 |
3.13 |
(0.25) |
| Year Ended October 31, 2018 |
20.90 |
0.26 |
(3.09) |
(2.83) |
(0.09) |
| Class I |
|
|
|
|
|
| Year Ended October 31, 2022 |
27.95 |
0.47 |
(8.06) |
(7.59) |
(0.48) |
| Year Ended October 31, 2021 |
22.39 |
0.42(d) |
5.39 |
5.81 |
(0.25) |
| Year Ended October 31, 2020 |
21.43 |
0.23 |
0.78 |
1.01 |
(0.05) |
| Year Ended October 31, 2019 |
18.49 |
0.31 |
3.04 |
3.35 |
(0.41) |
| Year Ended October 31, 2018 |
21.41 |
0.44 |
(3.19) |
(2.75) |
(0.17) |
| | |
| (a) |
Calculated based upon average shares outstanding. |
| (b) |
Includes adjustments in accordance with accounting principles generally accepted in the United States of America and as such, the net asset values for financial reporting purposes and the returns based upon those net asset values may differ from the net asset values and returns for shareholder transactions. |
| (c) |
Includes interest expense, if applicable, which is less than 0.005% unless otherwise noted. |
| (d) |
Reflects income from foreign withholding tax claims. Had the Fund not received these proceeds, the net investment income (loss) per share and the net investment income (loss) ratios for each share class would have remained the same. |
122 | J.P. Morgan International Equity Funds
| |
Ratios/Supplemental data | |||||
| |
|
|
Ratios to average net assets | |||
| Net asset value, end of period |
Total return (excludes sales charge)(b) |
Net assets, end of period (000's) |
Net expenses (c) |
Net investment income (loss) |
Expenses without waivers and reimbursements |
Portfolio turnover rate |
| |
|
|
|
|
|
|
| |
|
|
|
|
|
|
| $19.58 |
(27.75)% |
$237,262 |
1.00% |
1.75% |
1.24% |
30% |
| 27.55 |
25.74 |
337,503 |
1.00 |
1.31(d) |
1.21 |
32 |
| 22.07 |
4.39 |
135,527 |
1.00 |
0.86 |
1.22 |
38 |
| 21.15 |
18.41 |
114,629 |
1.00 |
1.33 |
1.32 |
34 |
| 18.24 |
(13.20) |
84,325 |
1.00 |
1.75 |
1.38 |
63 |
| |
|
|
|
|
|
|
| 19.23 |
(28.13) |
14,034 |
1.50 |
1.26 |
1.76 |
30 |
| 27.06 |
25.11 |
24,272 |
1.50 |
0.77(d) |
1.72 |
32 |
| 21.68 |
3.93 |
15,463 |
1.50 |
0.32 |
1.73 |
38 |
| 20.86 |
17.73 |
18,447 |
1.50 |
0.83 |
1.84 |
34 |
| 17.98 |
(13.60) |
22,532 |
1.50 |
1.29 |
1.89 |
63 |
| |
|
|
|
|
|
|
| 19.88 |
(27.56) |
433,591 |
0.75 |
1.99 |
0.99 |
30 |
| 27.95 |
26.04 |
832,039 |
0.75 |
1.54(d) |
0.96 |
32 |
| 22.39 |
4.71 |
372,068 |
0.75 |
1.05 |
0.96 |
38 |
| 21.43 |
18.62 |
177,764 |
0.75 |
1.57 |
1.08 |
34 |
| 18.49 |
(12.96) |
189,061 |
0.75 |
2.09 |
1.13 |
63 |
March 1, 2023 | 123
Financial Highlights (continued)
| |
Per share operating performance | ||||
| |
|
Investment operations |
Distributions | ||
| |
Net asset value, beginning of period |
Net investment income (loss)(b) |
Net realized and unrealized gains (losses) on investments |
Total from investment operations |
Net investment income |
| JPMorgan International Hedged Equity Fund |
|
|
|
|
|
| Class A |
|
|
|
|
|
| Year Ended October 31, 2022 |
$16.73 |
$0.32 |
$(2.60) |
$(2.28) |
$(0.38) |
| Year Ended October 31, 2021 |
14.12 |
0.30 |
2.58 |
2.88 |
(0.27) |
| Year Ended October 31, 2020 |
15.58 |
0.27 |
(1.49) |
(1.22) |
(0.24) |
| March 15, 2019 (f) through October 31, 2019 |
15.00 |
0.19 |
0.39 |
0.58 |
— |
| Class C |
|
|
|
|
|
| Year Ended October 31, 2022 |
16.68 |
0.20 |
(2.56) |
(2.36) |
(0.32) |
| Year Ended October 31, 2021 |
14.06 |
0.22 |
2.57 |
2.79 |
(0.17) |
| Year Ended October 31, 2020 |
15.53 |
0.20 |
(1.50) |
(1.30) |
(0.17) |
| March 15, 2019 (f) through October 31, 2019 |
15.00 |
0.16 |
0.37 |
0.53 |
— |
| Class I |
|
|
|
|
|
| Year Ended October 31, 2022 |
16.83 |
0.33 |
(2.59) |
(2.26) |
(0.41) |
| Year Ended October 31, 2021 |
14.18 |
0.32 |
2.61 |
2.93 |
(0.28) |
| Year Ended October 31, 2020 |
15.61 |
0.31 |
(1.50) |
(1.19) |
(0.24) |
| March 15, 2019 (f) through October 31, 2019 |
15.00 |
0.32 |
0.29 |
0.61 |
— |
| | |
| (a) |
Annualized for periods less than one year, unless otherwise noted. |
| (b) |
Calculated based upon average shares outstanding. |
| (c) |
Not annualized for periods less than one year. |
| (d) |
Includes adjustments in accordance with accounting principles generally accepted in the United States of America and as such, the net asset values for financial reporting purposes and the returns based upon those net asset values may differ from the net asset values and returns for shareholder transactions. |
| (e) |
Includes interest expense, if applicable, which is less than 0.005% unless otherwise noted. |
| (f) |
Commencement of operations. |
| (g) |
Certain non-recurring expenses incurred by the Fund were not annualized for the period indicated. |
124 | J.P. Morgan International Equity Funds
| |
Ratios/Supplemental data | |||||
| |
|
|
Ratios to average net assets (a) | |||
| Net asset value, end of period |
Total return (excludes sales charge)(c)(d) |
Net assets, end of period (000's) |
Net expenses (e) |
Net investment income (loss) |
Expenses without waivers and reimbursements |
Portfolio turnover rate (c) |
| |
|
|
|
|
|
|
| |
|
|
|
|
|
|
| $14.07 |
(13.89)% |
$4,032 |
0.85% |
2.13% |
1.07% |
17% |
| 16.73 |
20.60 |
3,561 |
0.85 |
1.85 |
1.05 |
50 |
| 14.12 |
(8.02) |
1,573 |
0.85 |
1.84 |
1.30 |
85 |
| 15.58 |
3.87 |
330 |
0.85(f) |
1.95(f) |
1.31(f) |
9 |
| |
|
|
|
|
|
|
| 14.00 |
(14.36) |
235 |
1.35 |
1.35 |
1.58 |
17 |
| 16.68 |
19.97 |
320 |
1.35 |
1.35 |
1.55 |
50 |
| 14.06 |
(8.47) |
115 |
1.35 |
1.34 |
1.81 |
85 |
| 15.53 |
3.53 |
119 |
1.35(f) |
1.73(f) |
1.92(f) |
9 |
| |
|
|
|
|
|
|
| 14.16 |
(13.68) |
156,582 |
0.60 |
2.21 |
0.81 |
17 |
| 16.83 |
20.90 |
148,703 |
0.60 |
2.02 |
0.79 |
50 |
| 14.18 |
(7.78) |
135,542 |
0.60 |
2.12 |
1.03 |
85 |
| 15.61 |
4.07 |
59,751 |
0.60(f) |
3.38(f) |
1.19(f) |
9 |
March 1, 2023 | 125
Financial Highlights (continued)
| |
Per share operating performance | ||||
| |
|
Investment operations |
Distributions | ||
| |
Net asset value, beginning of period |
Net investment income (loss)(a) |
Net realized and unrealized gains (losses) on investments |
Total from investment operations |
Net investment income |
| JPMorgan International Value Fund |
|
|
|
|
|
| Class A |
|
|
|
|
|
| Year Ended October 31, 2022 |
$13.46 |
$0.44 |
$(2.72) |
$(2.28) |
$(0.61) |
| Year Ended October 31, 2021 |
9.46 |
0.43(c) |
3.89 |
4.32 |
(0.32) |
| Year Ended October 31, 2020 |
12.22 |
0.28 |
(2.55) |
(2.27) |
(0.49) |
| Year Ended October 31, 2019 |
12.44 |
0.44 |
(0.20) |
0.24 |
(0.46) |
| Year Ended October 31, 2018 |
14.26 |
0.36 |
(1.87) |
(1.51) |
(0.31) |
| Class C |
|
|
|
|
|
| Year Ended October 31, 2022 |
13.02 |
0.35 |
(2.62) |
(2.27) |
(0.52) |
| Year Ended October 31, 2021 |
9.14 |
0.33(c) |
3.79 |
4.12 |
(0.24) |
| Year Ended October 31, 2020 |
11.81 |
0.21 |
(2.47) |
(2.26) |
(0.41) |
| Year Ended October 31, 2019 |
12.02 |
0.36 |
(0.18) |
0.18 |
(0.39) |
| Year Ended October 31, 2018 |
13.78 |
0.28 |
(1.82) |
(1.54) |
(0.22) |
| Class I |
|
|
|
|
|
| Year Ended October 31, 2022 |
13.84 |
0.49 |
(2.81) |
(2.32) |
(0.64) |
| Year Ended October 31, 2021 |
9.72 |
0.47(c) |
3.99 |
4.46 |
(0.34) |
| Year Ended October 31, 2020 |
12.54 |
0.31 |
(2.61) |
(2.30) |
(0.52) |
| Year Ended October 31, 2019 |
12.76 |
0.48 |
(0.20) |
0.28 |
(0.50) |
| Year Ended October 31, 2018 |
14.62 |
0.41 |
(1.92) |
(1.51) |
(0.35) |
| Class L |
|
|
|
|
|
| Year Ended October 31, 2022 |
13.78 |
0.49 |
(2.79) |
(2.30) |
(0.65) |
| Year Ended October 31, 2021 |
9.66 |
0.47(c) |
3.99 |
4.46 |
(0.34) |
| Year Ended October 31, 2020 |
12.47 |
0.30 |
(2.58) |
(2.28) |
(0.53) |
| Year Ended October 31, 2019 |
12.70 |
0.46 |
(0.17) |
0.29 |
(0.52) |
| Year Ended October 31, 2018 |
14.55 |
0.41 |
(1.90) |
(1.49) |
(0.36) |
| | |
| (a) |
Calculated based upon average shares outstanding. |
| (b) |
Includes adjustments in accordance with accounting principles generally accepted in the United States of America and as such, the net asset values for financial reporting purposes and the returns based upon those net asset values may differ from the net asset values and returns for shareholder transactions. |
| (c) |
Reflects income from foreign withholding tax claims, including related interest income, less IRS compliance fees. Without these proceeds, the net investment income (loss) per share would have been $0.38, $0.28, $0.42, $0.41, $0.34, $0.35 and $0.44 for Class A, Class C, Class I, Class L, Class R2, Class R5, and Class R6,respectively, and the net investment income (loss) ratios would have been 3.00%, 2.26%, 3.19%, 3.23%, 2.72%, 2.80% and 3.44% for Class A, Class C, Class I, Class L, Class R2, Class R5, and Class R6, respectively. |
126 | J.P. Morgan International Equity Funds
| |
Ratios/Supplemental data | |||||
| |
|
|
Ratios to average net assets | |||
| Net asset value, end of period |
Total return (excludes sales charge)(b) |
Net assets, end of period (000's) |
Net expenses |
Net investment income (loss) |
Expenses without waivers and reimbursements |
Portfolio turnover rate |
| |
|
|
|
|
|
|
| |
|
|
|
|
|
|
| $10.57 |
(17.56)% |
$160,039 |
0.98% |
3.71% |
1.23% |
26% |
| 13.46 |
46.20 |
187,774 |
1.00 |
3.39(c) |
1.24 |
33 |
| 9.46 |
(19.51) |
125,744 |
1.00 |
2.66 |
1.26 |
59 |
| 12.22 |
2.30 |
181,458 |
1.00 |
3.69 |
1.28 |
61 |
| 12.44 |
(10.88) |
242,231 |
1.00 |
2.59 |
1.27 |
90 |
| |
|
|
|
|
|
|
| 10.23 |
(18.04) |
1,791 |
1.49 |
3.01 |
1.76 |
26 |
| 13.02 |
45.54 |
3,923 |
1.50 |
2.70(c) |
1.77 |
33 |
| 9.14 |
(19.94) |
4,202 |
1.50 |
2.07 |
1.78 |
59 |
| 11.81 |
1.82 |
9,358 |
1.50 |
3.15 |
1.80 |
61 |
| 12.02 |
(11.37) |
14,055 |
1.50 |
2.06 |
1.78 |
90 |
| |
|
|
|
|
|
|
| 10.88 |
(17.38) |
29,816 |
0.73 |
4.00 |
0.98 |
26 |
| 13.84 |
46.51 |
39,188 |
0.75 |
3.58(c) |
0.99 |
33 |
| 9.72 |
(19.31) |
26,805 |
0.75 |
2.88 |
1.02 |
59 |
| 12.54 |
2.56 |
45,503 |
0.75 |
3.91 |
1.03 |
61 |
| 12.76 |
(10.62) |
66,291 |
0.75 |
2.84 |
1.02 |
90 |
| |
|
|
|
|
|
|
| 10.83 |
(17.31) |
5,451 |
0.63 |
4.04 |
0.83 |
26 |
| 13.78 |
46.77 |
7,042 |
0.66 |
3.66(c) |
0.84 |
33 |
| 9.66 |
(19.25) |
5,585 |
0.65 |
2.72 |
0.85 |
59 |
| 12.47 |
2.69 |
30,256 |
0.65 |
3.81 |
0.87 |
61 |
| 12.70 |
(10.57) |
73,651 |
0.65 |
2.84 |
0.87 |
90 |
March 1, 2023 | 127
Appendix A – Financial Intermediary-Specific Sales Charge Waivers
Each Financial Intermediary below is responsible for the implementation or administration of the applicable waivers, discounts, and/or other platform or account features on its platform or for its accounts, as described below.
WAIVERS APPLICABLE TO PURCHASES THROUGH AMERIPRISE FINANCIAL
Front-end Sales Charge Waivers on Class A Shares available at Ameriprise Financial
The following information applies to Class A shares purchases if you have an account with or otherwise purchase Fund shares through Ameriprise Financial:
Shareholders purchasing Fund shares through an Ameriprise Financial retail brokerage account are eligible for the following front-end sales charge waivers, which may differ from those disclosed elsewhere in this Fund’s prospectus or Statement of Additional Information (“SAI”):
•
Employer-sponsored retirement plans (e.g., 401(k) plans, 457 plans, employer-sponsored 403(b) plans, profit sharing and money purchase pension plans and defined benefit plans). For purposes of this provision, employer-sponsored retirement plans do not include SEP IRAs, Simple IRAs or SAR-SEPs.
•
Shares purchased through reinvestment of capital gains distributions and dividend reinvestment when purchasing shares of the same Fund (but not any other fund within the same fund family).
•
Shares exchanged by Ameriprise Financial from Class C Shares of the same Fund in the month of or following the 7-year anniversary of the purchase date. To the extent that this prospectus elsewhere provides for a waiver with respect to exchanges of Class C Shares or conversion of Class C Shares following a shorter holding period, that waiver will apply.
•
Employees and registered representatives of Ameriprise Financial or its affiliates and their immediate family members.
•
Shares purchased by or through qualified accounts (including IRAs, Coverdell Education Savings Accounts, 401(k)s, 403(b) TSCAs subject to ERISA and defined benefit plans) that are held by a covered family member, defined as an Ameriprise financial advisor and/or the advisor’s spouse, advisor’s lineal ascendant (mother, father, grandmother, grandfather, great grandmother, great grandfather), advisor’s lineal descendant (son, step-son, daughter, step-daughter, grandson, granddaughter, great grandson, great granddaughter) or any spouse of a covered family member who is a lineal descendant.
•
Shares purchased from the proceeds of redemptions within the same fund family, provided (1) the repurchase occurs within 90 days following the redemption, (2) the redemption and purchase occur in the same account, and (3) redeemed shares were subject to a front-end or deferred sales load (i.e. Rights of Reinstatement.)
WAIVERS APPLICABLE TO PURCHASES THROUGH U.S. BANCORP INVESTMENTS
Shareholders purchasing Fund shares through a U.S. Bancorp Investments (USBI) platform or account or who own shares for which USBI is the broker-dealer of record and where the shares are held in an omnibus account at the Fund are eligible for the following additional sales charge waiver.
Front-end Sales Load Waiver on Class A Shares available at U.S. Bancorp Investments
Class C Shares that are no longer subject to a contingent deferred sales charge and that are exchanged by USBI to the Class A Shares of the same Fund pursuant to USBI’s share class exchange policy.
All other sales charge waivers and reductions described elsewhere in a Fund’s Prospectus or Statement of Additional Information still apply.
WAIVERS APPLICABLE TO PURCHASES THROUGH D.A. DAVIDSON
Shareholders purchasing Fund shares including existing Fund shareholders through a D.A. Davidson &. Co. (“D.A. Davidson”) platform or account, or through an introducing broker-dealer or independent registered investment advisor for which D.A. Davidson provides trade execution, clearance, and/or custody services, where the account is held omnibus at the Fund, are eligible for the following sales charge waivers (front-end sales charge waivers and contingent deferred, or back-end, sales charge waivers)and discounts, which may differ from those disclosed elsewhere in this prospectus or Statement of Additional Information.
Front-end sales charge waivers on Class A Shares available at D.A. Davidson
•
Shares purchased within the same fund family through a systematic reinvestment of capital gains and dividend distributions.
•
Employees and registered representatives of D.A. Davidson or its affiliates and their family members as designated by D.A. Davidson.
128 | J.P. Morgan International Equity Funds
•
Shares purchased from the proceeds of redemptions within the same fund family, provided (1) the repurchase occurs within 90 days following the redemption, (2) the redemption and purchase occur in the same account, and (3) redeemed shares were subject to a front-end or deferred sales charge (known as Rights of Reinstatement).
•
A shareholder in a Fund’s Class C Shares will have their shares exchanged at net asset value to Class A Shares (or the appropriate share class) of the Fund if the shares are no longer subject to a CDSC and the exchange is consistent with D.A. Davidson’s policies and procedures.
CDSC Waivers on Class A and C Shares available at D.A. Davidson
•
Death or disability of the shareholder.
•
Shares sold as part of a systematic withdrawal plan as described in the Fund’s prospectus.
•
Return of excess contributions from an IRA Account.
•
Shares sold as part of a required minimum distribution for IRA or other qualifying retirement accounts as described in the Fund’s prospectus.
•
Shares acquired through a right of reinstatement.
Front-end sales charge discounts available at D.A. Davidson: breakpoints, rights of accumulation and/or letters of intent
•
Breakpoints as described in this prospectus.
•
Rights of accumulation which entitle shareholders to breakpoint discounts will be automatically calculated based on the aggregated holding of fund family assets held by accounts within the purchaser’s household at D.A. Davidson. Eligible fund family assets not held at D.A. Davidson may be included in the calculation of rights of accumulation only if the shareholder notifies his or her financial advisor about such assets.
•
Letters of intent which allow for breakpoint discounts based on anticipated purchases within a fund family, over a 13-month time period. Eligible fund family assets not held at D.A. Davidson may be included in the calculation of letters of intent only if the shareholder notifies his or her financial advisor about such assets.
POLICIES REGARDING TRANSACTIONS THROUGH EDWARD JONES
Effective on or after January 15, 2021, the following information supersedes prior information with respect to transactions and positions held in fund shares through an Edward Jones system. Clients of Edward Jones (also referred to as “shareholders”) purchasing fund shares on the Edward Jones commission and fee-based platforms are eligible only for the following sales charge discounts (also referred to as “breakpoints”) and waivers, which can differ from discounts and waivers described elsewhere in this Fund prospectus or SAI or through another broker-dealer. In all instances, it is the shareholder’s responsibility to inform Edward Jones at the time of purchase of any relationship, holdings of J.P. Morgan Funds, or other facts qualifying the purchaser for discounts or waivers. Edward Jones can ask for documentation of such circumstance. Shareholders should contact Edward Jones if they have questions regarding their eligibility for these discounts and waivers.
Breakpoints
•
Breakpoint pricing, otherwise known as volume pricing, at dollar thresholds as described in the prospectus.
Rights of Accumulation (“ROA”)
•
The applicable sales charge on a purchase of Class A Shares is determined by taking into account all share classes (except certain money market funds and any assets held in group retirement plans) of the J.P. Morgan Funds held by the shareholder or in an account grouped by Edward Jones with other accounts for the purpose of providing certain pricing considerations (“pricing groups”). If grouping assets as a shareholder, this includes all share classes held on the Edward Jones platform and/or held on another platform. The inclusion of eligible fund family assets in the ROA calculation is dependent on the shareholder notifying Edward Jones of such assets at the time of calculation. Money market funds are included only if such shares were sold with a sales charge at the time of purchase or acquired in exchange for shares purchased with a sales charge.
•
The employer maintaining a SEP IRA plan and/or SIMPLE IRA plan may elect to establish or change ROA for the IRA accounts associated with the plan to a plan-level grouping as opposed to including all share classes at a shareholder or pricing group level.
•
ROA is determined by calculating the higher of cost minus redemptions or market value (current shares x NAV).
Letter of Intent (“LOI”)
•
Through a LOI, shareholders can receive the sales charge and breakpoint discounts for purchases shareholders intend to make over a 13-month period from the date Edward Jones receives the LOI. The LOI is determined by calculating the higher of cost or
March 1, 2023 | 129
Appendix A – Financial Intermediary-Specific Sales Charge Waivers (continued)
market value of qualifying holdings at LOI initiation in combination with the value that the shareholder intends to buy over a 13-month period to calculate the front-end sales charge and any breakpoint discounts. Each purchase the shareholder makes during that 13-month period will receive the sales charge and breakpoint discount that applies to the total amount. The inclusion of eligible fund family assets in the LOI calculation is dependent on the shareholder notifying Edward Jones of such assets at the time of calculation. Purchases made before the LOI is received by Edward Jones are not adjusted under the LOI and will not reduce the sales charge previously paid. Sales charges will be adjusted if LOI is not met.
•
If the employer maintaining a SEP IRA plan and/or SIMPLE IRA plan has elected to establish or change ROA for the IRA accounts associated with the plan to a plan-level grouping, LOIs will also be at the plan-level and may only be established by the employer.
Front-End Sales Charge Waivers
Sales charges are waived for the following shareholders and in the following situations:
•
Associates of Edward Jones and its affiliates and their family members who are in the same pricing group (as determined by Edward Jones under its policies and procedures) as the associate. This waiver will continue for the remainder of the associate’s life if the associate retires from Edward Jones in good-standing and remains in good standing pursuant to Edward Jones’ policies and procedures.
•
Shares purchased in an Edward Jones fee-based program.
•
Shares purchased through reinvestment of capital gains distributions and dividend reinvestment.
•
Shares purchased from the proceeds of redeemed shares of the same fund family so long as the following conditions are met: 1) the proceeds are from the sale of shares within 60 days of the purchase, and 2) the sale and purchase are made in the same share class and the same account or the purchase is made in an individual retirement account with proceeds from liquidations in a non-retirement account.
•
Shares exchanged into Class A Shares from another share class so long as the exchange is into the same Fund and was initiated at the discretion of Edward Jones. Edward Jones is responsible for any remaining CDSC due to the fund company, if applicable. Any future purchases are subject to the applicable sales charge as disclosed in a Fund’s prospectus.
•
Exchanges from Class C Shares to Class A Shares of the same Fund, generally, in the 84th month following the anniversary of the purchase date or earlier at the discretion of Edward Jones.
Contingent Deferred Sales Charge (“CDSC”) Waivers
If the shareholder purchases shares that are subject to a CDSC and those shares are redeemed before the CDSC is expired, the shareholder is responsible to pay the CDSC except in the following conditions:
•
The death or disability of the shareholder.
•
Systematic withdrawals with up to 10% per year of the account value.
•
Return of excess contributions from an Individual Retirement Account (IRA).
•
Shares sold as part of a required minimum distribution for IRA and retirement accounts if the redemption is taken in or after the year the shareholder reaches qualified age based on applicable IRS regulations.
•
Shares sold to pay Edward Jones fees or costs in such cases where the transaction is initiated by Edward Jones.
•
Shares exchanged in an Edward Jones fee-based program. Edward Jones is responsible for any remaining CDSC due to the fund company, if applicable.
•
Shares acquired through NAV reinstatement.
•
Shares redeemed at the discretion of Edward Jones for Minimum Balances, as described below.
Other Important Information Regarding Transactions Through Edward Jones
Minimum Purchase Amounts
•
Initial purchase minimum: $250
•
Subsequent purchase minimum: none
Minimum Balances
Edward Jones has the right to redeem at its discretion fund holdings with a balance of $250 or less. The following are examples of accounts that are not included in this policy:
•
A fee-based account held on an Edward Jones platform
•
A 529 account held on an Edward Jones platform
•
An account with an active systematic investment plan or LOI
130 | J.P. Morgan International Equity Funds
Exchanging Share Classes
•
At any time it deems necessary, Edward Jones has the authority to exchange at NAV a shareholder’s holdings in a Fund to Class A Shares of the same Fund
WAIVERS APPLICABLE TO PURCHASES THROUGH JANNEY MONTGOMERY SCOTT LLC
If you purchase Fund shares through a Janney Montgomery Scott LLC (“Janney”) brokerage account where the shares are held in an omnibus account at the Fund, you are eligible for the following load waivers (front-end sales charge waivers and contingent deferred sales charge (“CDSC”), or back-end sales charge, waivers) and discounts, which may differ from those disclosed elsewhere in the Funds’ prospectus or Statement of Additional Information.
Front-end sales charge waivers on Class A Shares available at Janney
•
Shares purchased through reinvestment of capital gains distributions and dividend reinvestment when purchasing shares of the same Fund (but not any other Fund within the fund family).
•
Shares purchased by employees and registered representatives of Janney or its affiliates and their family members as designated by Janney.
•
Shares purchased from the proceeds of redemptions within the same fund family, provided (1) the repurchase occurs within ninety (90) days following the redemption, (2) the redemption and purchase occur in the same account, and (3) redeemed shares were subject to a front-end or deferred sales load (i.e., right of reinstatement).
•
Shares purchased through Employer-sponsored retirement plans (e.g., 401(k) plans, 457 plans, employer-sponsored 403(b) plans, profit sharing and money purchase pension plans and defined benefit plans). For purposes of this provision, employer-sponsored retirement plans do not include SEP IRAs, Simple IRAs, SAR-SEPs or Keogh plans.
•
Shares acquired through a right of reinstatement.
•
Class C Shares that are no longer subject to a contingent deferred sales charge and are exchanged into Class A Shares of the same Fund pursuant to Janney’s policies and procedures.
CDSC waivers on Class A and C Shares available at Janney
•
Shares sold upon the death or disability of the shareholder.
•
Shares sold as part of a systematic withdrawal plan as described in a Fund’s Prospectus.
•
Shares purchased in connection with a return of excess contributions from an IRA account.
•
Shares sold as part of a required minimum distribution for IRA and other retirement accounts as described in a Fund’s Prospectus.
•
Shares sold to pay Janney fees but only if the transaction is initiated by Janney.
•
Shares acquired through a right of reinstatement.
•
Shares exchanged into the same share class of a different Fund within the fund family.
Front-end sales charge discounts available at Janney: breakpoints, rights of accumulation, and/or letters of intent
•
Breakpoints as described in a Fund’s Prospectus.
•
Rights of accumulation (“ROA”), which entitle shareholders to breakpoint discounts, will be automatically calculated based on the aggregated holding of fund family assets held by accounts within the purchaser’s household at Janney. Eligible fund family assets not held at Janney may be included in the ROA calculation only if the shareholder notifies his or her financial advisor about such assets.
•
Letters of intent which allow for breakpoint discounts based on anticipated purchases within a fund family, over a 13-month time period. Eligible fund family assets not held at Janney may be included in the calculation of letters of intent only if the shareholder notifies his or her financial advisor about such assets.
WAIVERS APPLICABLE TO PURCHASES THROUGH LPL FINANCIAL
Shareholders purchasing Fund shares through LPL Financial’s Mutual Fund Only Platform are eligible only for the following front-end sales charge waivers for Class A Shares, which differ from those disclosed elsewhere in this Fund’s prospectus or Statement of Additional Information:
Sales charges will be waived for Class A Shares bought by clients of LPL Financial who are accessing the J.P. Morgan Funds through LPL Financial’s mutual fund only platform.
For accounts where LPL Financial is listed as the broker dealer, the following waiver replaces the first bullet point under item five in “Waiver of the Class A Sales Charge” under the “Sales Charges and Financial Intermediary Compensation” section of each prospectus:
March 1, 2023 | 131
Appendix A – Financial Intermediary-Specific Sales Charge Waivers (continued)
Class A Shares may be purchased without a sales charge by Group Retirement Plans (as defined in the Glossary) which are employer sponsored retirement, deferred compensation, employee benefit plans (including health savings accounts) and trusts used to fund those plans. Please note that no new Group Retirement Plans will be permitted to invest in Class A Shares after April 3, 2017.
WAIVERS APPLICABLE TO PURCHASES THROUGH MERRILL LYNCH
Shareholders purchasing Fund shares through a Merrill Lynch platform or account are eligible only for the following load waivers (front-end sales charge waivers and contingent deferred, or back-end, sales charge waivers) and discounts, which may differ from those disclosed elsewhere in this Fund’s prospectus or Statement of Additional Information. In all instances, it is the purchaser’s responsibility to notify Merrill Lynch at the time of purchase of any relationship or other facts qualifying the purchaser for sales charge waivers or discounts. With regard to these waivers and discounts, Merrill Lynch is responsible for the implementation on the Merrill Lynch platform or accounts.
Front-end Sales Load Waivers on Class A Shares available at Merrill Lynch
Employer-sponsored retirement, deferred compensation and employee benefit plans (including health savings accounts) and trusts used to fund those plans, provided that the shares are not held in a commission-based brokerage account and shares are held for the benefit of the plan.
Shares purchased by a 529 Plan (does not include 529 Plan units or 529-specific share classes or equivalents).
Exchanges as described in this prospectus.
Shares purchased through a Merrill Lynch affiliated investment advisory program.
Shares exchanged due to the holdings moving from a Merrill Lynch affiliated investment advisory program to a Merrill Lynch brokerage (non-advisory) account pursuant to Merrill Lynch’s policies relating to sales load discounts and waivers.
Shares purchased by third party investment advisors on behalf of their advisory clients through Merrill Lynch’s platform.
Shares of funds purchased through the Merrill Edge Self-Directed platform.
Shares purchased through reinvestment of capital gains distributions and dividend reinvestment when purchasing shares of the same Fund (but not any other Fund within the fund family).
Shares exchanged from Class C (i.e. level-load) shares of the same Fund pursuant to Merrill Lynch’s policies relating to sales load discounts and waivers.
Employees and registered representatives of Merrill Lynch or its affiliates and their family members as defined by Merrill Lynch.
Directors or Trustees of the Fund, and employees of the Fund’s investment adviser or any of its affiliates, as described in this prospectus.
Eligible shares purchased from the proceeds of redemptions within the same fund family, provided (1) the repurchase occurs within 90 days following the redemption, (2) the redemption and purchase occur in the same account, and (3) redeemed shares were subject to a front-end or deferred sales load (known as Rights of Reinstatement). Automated transactions (i.e. systematic purchases and withdrawals) and purchases made after shares are automatically sold to pay Merrill Lynch’s account maintenance fees are not eligible for reinstatement.
CDSC Waivers on Class A and Class C Shares available at Merrill Lynch
Death or disability of the shareholder.
Shares sold as part of a systematic withdrawal plan as described in the Fund’s prospectus.
Return of excess contributions from an IRA Account.
Shares sold as part of a required minimum distribution for IRA and retirement accounts pursuant to the Internal Revenue Code.
Shares sold to pay Merrill Lynch fees but only if the transaction is initiated by Merrill Lynch.
Shares acquired through a right of reinstatement.
Shares held in retirement brokerage accounts, that are exchanged for a lower cost share class due to transfer to certain fee based accounts or platforms.
Shares received through an exchange due to the holdings moving from a Merrill Lynch affiliated investment advisory program to a Merrill Lynch brokerage (non-advisory) account pursuant to Merrill Lynch’s policies relating to sales load discounts and waivers.
132 | J.P. Morgan International Equity Funds
Front-end Load Discounts available at Merrill Lynch: Breakpoints, Rights of Accumulation and Letters of Intent
Breakpoints as described in this prospectus.
Rights of Accumulation (ROA) which entitle shareholders to breakpoint discounts as described in the Fund’s prospectus will be automatically calculated based on the aggregated holding of fund family assets held by accounts (including 529 program holdings, where applicable) within the purchaser’s household at Merrill Lynch. Eligible fund family assets not held at Merrill Lynch may be included in the ROA calculation only if the shareholder notifies his or her financial advisor about such assets.
Letters of Intent (LOI) which allow for breakpoint discounts based on anticipated purchases within a fund family, through Merrill Lynch, over a 13-month period of time.
WAIVERS APPLICABLE TO PURCHASES THROUGH TRANSACTIONAL BROKERAGE ACCOUNTS AT MORGAN STANLEY WEALTH MANAGEMENT
Front-end Sales Charge Waivers on Class A Shares available at Morgan Stanley Wealth Management
Shareholders purchasing Fund shares through a Morgan Stanley Wealth Management transactional brokerage account are eligible only for the following front-end sales charge waivers with respect to Class A Shares, which may differ from and may be more limited than those disclosed elsewhere in a Fund’s Prospectus or Statement of Additional Information.
•
Employer-sponsored retirement plans (e.g., 401(k) plans, 457 plans, employer-sponsored 403(b) plans, profit sharing and money purchase pension plans and defined benefit plans). For purposes of this provision, employer-sponsored retirement plans do not include SEPs, Simple IRAs, SARSEPs or Keogh plans.
•
Morgan Stanley employees and employee-related accounts according to Morgan Stanley’s account linking rules.
•
Shares purchased through reinvestment of dividends and capital gains distributions when purchasing shares of the same fund.
•
Shares purchased through a Morgan Stanley self-directed brokerage account.
•
Class C (i.e., level-load) shares that are no longer subject to a contingent deferred sales charge and are exchanged into Class A Shares of the same fund pursuant to Morgan Stanley Wealth Management’s share class conversion program.
•
Shares purchased from the proceeds of redemptions within the same fund family, provided (i) the repurchase occurs within 90 days following the redemption, (ii) the redemption and purchase occur in the same account, and (iii) redeemed shares were subject to a front-end or deferred sales charge.
WAIVERS APPLICABLE TO PURCHASES THROUGH OPPENHEIMER & CO. INC.
Shareholders purchasing Fund shares through an Oppenheimer & Co. Inc. (“OPCO”)platform or account are eligible only for the following load waivers (front-end sales charge waivers and contingent deferred, or back-end, sales charge waivers) and discounts, which may differ from those disclosed elsewhere in this Fund’s prospectus or Statement of Additional Information.
Front-end Sales Load Waivers on Class A Shares available at OPCO
•
Employer-sponsored retirement, deferred compensation and employee benefit plans (including health savings accounts) and trusts used to fund those plans, provided that the shares are not held in a commission-based brokerage account and shares are held for the benefit of the plan.
•
Shares purchased through a OPCO affiliated investment advisory program.
•
Shares purchased through reinvestment of capital gains distributions and dividend reinvestment when purchasing shares of the same fund (but not any other fund within the fund family).
•
Shares purchased from the proceeds of redemptions within the same fund family, provided (1) the repurchase occurs within 90 days following the redemption, (2) the redemption and purchase occur in the same account, and (3) redeemed shares were subject to a front-end or deferred sales load (known as Rights of Restatement).
•
A shareholder in the Fund’s Class C shares will have their shares exchanged at net asset value to Class A shares (or the appropriate share class) of the Fund if the shares are no longer subject to a CDSC and the exchange is in line with the policies and procedures of OPCO.
•
Employees and registered representatives of OPCO or its affiliates and their family members.
•
Directors or Trustees of the Fund, and employees of the Fund’s investment adviser or any of its affiliates, as described in this prospectus.
CDSC Waivers on A and C Shares available at OPCO
•
Death or disability of the shareholder.
March 1, 2023 | 133
Appendix A – Financial Intermediary-Specific Sales Charge Waivers (continued)
•
Shares sold as part of a systematic withdrawal plan as described in the Fund’s prospectus.
•
Return of excess contributions from an IRA Account.
•
Shares sold as part of a required minimum distribution for IRA or other qualifying retirement accounts as described in the Fund’s prospectus.
•
Shares sold to pay OPCO fees but only if the transaction is initiated by OPCO.
•
Shares acquired through a right of reinstatement.
Front-end load Discounts Available at OPCO: Breakpoints, Rights of Accumulation & Letters of Intent
•
Breakpoints as described in this prospectus.
•
Rights of Accumulation (“ROA”) and Letters of Intent (“LOI”), which entitle shareholders to breakpoint discounts, will be automatically calculated based on the aggregated holding of fund family assets held by accounts within the purchaser’s household at OPCO. Eligible fund family assets not held at OPCO may be included in the ROA or LOI calculation only if the shareholder notifies his or her financial advisor about such assets.
WAIVERS APPLICABLE TO PURCHASES THROUGH RAYMOND JAMES
Raymond James & Associates, Inc., Raymond James Financial Services, Inc. and each entity’s affiliates are defined as Raymond James.
Shareholders purchasing fund shares through a Raymond James platform or account, or through an introducing broker-dealer or independent registered investment adviser for which Raymond James provides trade execution, clearance, and/or custody services, are eligible only for the following load waivers (front-end sales charge waivers and contingent deferred, or back-end, sales charge waivers) and discounts, which may differ from those disclosed elsewhere in the Funds’ prospectus or Statement of Additional Information.
Front-end Sales Load Waivers on Class A Shares available at Raymond James
•
Shares purchased in an investment advisory program.
•
Shares purchased within the same fund family through a systematic reinvestment of capital gains and dividend distributions.
•
Employees and registered representatives of Raymond James or its affiliates and their family members as designated by Raymond James.
•
Shares purchased from the proceeds of redemptions within the same fund family, provided (1) the repurchase occurs within 90 days following the redemption, (2) the redemption and purchase occur in the same account, and (3) redeemed shares were subject to a front-end or deferred sales load (known as Rights of Reinstatement).
•
A shareholder in a Fund’s Class C Shares will have their shares converted at net asset value to Class A Shares (or the appropriate share class) of the Fund if the shares are no longer subject to a CDSC and the conversion is in line with the policies and procedures of Raymond James.
CDSC Waivers on Class A and Class C Shares available at Raymond James
•
Death or disability of the shareholder.
•
Shares sold as part of a systematic withdrawal plan as described in the Funds’ prospectus.
•
Return of excess contributions from an IRA Account.
•
Shares sold as part of a required minimum distribution for IRA and retirement accounts due to the shareholder reaching the qualified age based on applicable IRS regulations as described in the Funds’ prospectus.
•
Shares sold to pay Raymond James fees but only if the transaction is initiated by Raymond James.
•
Shares acquired through a right of reinstatement.
Front-end Load Discounts available at Raymond James: Breakpoints, Rights of Accumulation, and/or Letters of Intent
•
Breakpoints as described in this prospectus.
•
Rights of accumulation which entitle shareholders to breakpoint discounts will be automatically calculated based on the aggregated holding of fund family assets held by accounts within the purchaser’s household at Raymond James. Eligible fund family assets not held at Raymond James may be included in the calculation of rights of accumulation only if the shareholder notifies his or her financial advisor about such assets.
•
Letters of intent which allow for breakpoint discounts based on anticipated purchases within a fund family, over a 13-month time period. Eligible fund family assets not held at Raymond James may be included in the calculation of letters of intent only if the shareholder notifies his or her financial advisor about such assets.
134 | J.P. Morgan International Equity Funds
WAIVERS APPLICABLE TO PURCHASES THROUGH ROBERT W. BAIRD & CO. INC.
Shareholders purchasing fund shares through a Robert W. Baird & Co. Inc. (“Baird”)platform or account are only eligible for the following sales charge waivers (front-end sales charge waiversand CDSC waivers) and discounts, which may differ from those disclosed elsewhere in this prospectus or theStatement of Additional Information.
Front-End Sales Charge Waivers on Class A Shares Available at Baird
•
Shares purchased through reinvestment of capital gains distributions and dividend reinvestment when purchasing shares of the same fund.
•
Shares purchased by employees and registers representatives of Baird or its affiliate and their family members as designated by Baird.
•
Shares purchased from the proceeds of redemptions within the same fund family, provided (1) the repurchase occurs within 90 days following the redemption, (2) the redemption and purchase occur in the same account, and (3) redeemed shares were subject to a front-end or deferred sales charge (known as rights of reinstatement).
•
A shareholder in the Fund’s Class C Shares will have their shares exchanged at net asset value to Class A Shares of the Fund if the shares are no longer subject to CDSC and the exchange is in line with the policies and procedures of Baird.
•
Employer-sponsored retirement plans or charitable accounts in a transactional brokerage account at Baird, including 401(k) plans, 457 plans, employer-sponsored 403(b) plans, profit sharing and money purchase pension plans and defined benefit plans. For purposes of this provision, employer-sponsored retirement plans do not include SEP IRAs, Simple IRAs or SAR-SEPs.
CDSC Waivers on Class A and Class C Shares Available at Baird
•
Shares sold due to death or disability of the shareholder.
•
Shares sold as part of a systematic withdrawal plan as described in the Fund’s Prospectus.
•
Shares bought due to returns of excess contributions from an IRA Account.
•
Shares sold as part of a required minimum distribution for IRA or other qualifying retirement accounts as described in the Fund’s prospectus.
•
Shares sold to pay Baird fees but only if the transaction is initiated by Baird.
•
Shares acquired through a right of reinstatement.
Front-End Sales Charge Discounts Available at Baird: Breakpoints and/or Rights of Accumulations
•
Breakpoints as described in this prospectus.
•
Rights of accumulations which entitle shareholders to breakpoint discounts will be automatically calculated based on the aggregated holding of fund family assets held by accounts within the purchaser’s household at Baird. Eligible fund family assets not held at Baird may be included in the rights of accumulations calculation only if the shareholder notifies his or her financial advisor about such assets.
•
Letters of Intent (LOI) allow for breakpoint discounts based on anticipated purchases within a fund family, through Baird, over a 13-month period of time.
WAIVERS APPLICABLE TO PURCHASES THROUGH STIFEL, NICOLAUS & COMPANY, INC.
Shareholders purchasing Fund Shares through a Stifel, Nicolaus & Company(“Stifel”) platform or account or who own shares for which Stifel or an affiliate is the broker-dealer of record are eligible for the following additional sales charge waiver.
Front-End Sales Load Waiver on Class A Shares Available at Stifel
Class C Shares that are no longer subject to a contingent deferred sales charge and that are exchanged to Class A Shares of the same Fund pursuant to Stifel’s policies and procedures.
All other sales charge waivers and reductions described elsewhere in a Fund’s prospectus or Statement of Additional Information still apply.
March 1, 2023 | 135
Additional Fee and Expense Information
ADDITIONAL FEE AND EXPENSE INFORMATION
FOR THE JPMT II FUNDS AND FORMER ONE GROUP MUTUAL FUNDS
FOR THE JPMT II FUNDS AND FORMER ONE GROUP MUTUAL FUNDS
In connection with the 2004 final settlement between Banc One Investment Advisors Corporation (BOIA), subsequently known as JPMorgan Investment Advisors Inc. (JPMIA), with the New York Attorney General arising out of market timing of certain mutual funds advised by BOIA, BOIA agreed, among other things, to disclose hypothetical information regarding investment and expense information to Fund shareholders. The hypothetical examples are provided for JPMT II Funds or those Funds that have acquired the assets and liabilities of a JPMT II Fund or a series of One Group Mutual Funds.
The “Gross Expense Ratio” includes the contractual expenses that make up the investment advisory, administration and servicing fees, Rule 12b-1 distribution fees, fees paid to vendors not affiliated with JPMIM that provide services to the Funds and other fees and expenses of the Funds. The “Net Expense Ratio” is Gross Expenses less any fee waivers or expense reimbursements memorialized in a written contract between the Funds and JPMIM and/or its affiliates, as applicable.
The table below shows the ratios for Class A, Class C and Class I Shares of the affected Funds offered in this prospectus.
| |
|
|
|
| |
Class |
Net Expense Ratio |
Gross Expense Ratio |
| JPMorgan International Equity Fund |
A |
0.95% |
1.11% |
| |
C |
1.45% |
1.64% |
| |
I |
0.70% |
0.86% |
A Fund’s annual return is reduced by its fees and expenses for that year. The examples below are intended to help you understand the annual and cumulative impact of the Fund’s fees and expenses on your investment through a hypothetical investment of $10,000 held for the next 10 years. The examples assume the following:
•
On February 28, 2023, you invest $10,000 in the Fund and you will hold the shares for the entire 10 year period;
•
Your investment has a 5% return each year;
•
The Fund’s operating expenses remain at the levels discussed below and are not affected by increases or decreases in Fund assets over time;
•
At the time of purchase, any applicable initial sales charges (loads) are deducted; and
•
There is no sales charge (load) on reinvested dividends.
•
The annual costs are calculated using the Net Expense Ratios for the period through the expiration of any fee waivers or expense reimbursements memorialized in a written contract between the Fund and JPMIM and/or its affiliates; and the Gross Expense Ratios thereafter.
“Annual Net Return” shows what effect the “Annual Costs” will have on the assumed 5% annual return for each year. “Gross Cumulative Return” shows what the cumulative return on your investment at the end of each 12 month period (year) ended October 31 would be if Fund expenses are not deducted. “Net Cumulative Return” shows what the cumulative return on your investment at the end of each year would be assuming Fund expenses are deducted each year in the amount shown under “Annual Costs.”
Your actual costs may be higher or lower than those shown.
136 | J.P. Morgan International Equity Funds
| JPMorgan International Equity Fund | ||||||||
| |
Class A |
Class C1 | ||||||
| Period Ended |
Annual Costs |
Gross Cumulative Return |
Net Cumulative Return |
Net Annual Return |
Annual Costs |
Gross Cumulative Return |
Net Cumulative Return |
Net Annual Return |
| February 29, 2024 |
$617 |
-0.51% |
-1.41% |
-1.41% |
$148 |
5.00% |
3.55% |
3.55% |
| February 28, 2025 |
112 |
4.46 |
2.42 |
3.89 |
173 |
10.25 |
7.03 |
3.36 |
| February 28, 2026 |
116 |
9.68 |
6.41 |
3.89 |
178 |
15.76 |
10.63 |
3.36 |
| February 28, 2027 |
120 |
15.17 |
10.55 |
3.89 |
184 |
21.55 |
14.34 |
3.36 |
| February 29, 2028 |
125 |
20.93 |
14.85 |
3.89 |
191 |
27.63 |
18.18 |
3.36 |
| February 28, 2029 |
130 |
26.97 |
19.31 |
3.89 |
197 |
34.01 |
22.16 |
3.36 |
| February 28, 2030 |
135 |
33.32 |
23.95 |
3.89 |
204 |
40.71 |
26.26 |
3.36 |
| February 28, 2031 |
140 |
39.99 |
28.78 |
3.89 |
211 |
47.75 |
30.50 |
3.36 |
| February 29, 2032 |
146 |
46.99 |
33.79 |
3.89 |
148 |
55.13 |
35.58 |
3.89 |
| February 28, 2033 |
151 |
54.34 |
38.99 |
3.89 |
153 |
62.89 |
40.85 |
3.89 |
1
The disclosure and numbers for Class C Shares shown above assume that the shareholder did not redeem the shares.With redemption, the numbers for Class C Shares for the first year (period ended February 29, 2024) would be as follows:
| |
Annual Costs |
Gross Cumulative Return |
Net Cumulative Return |
Net Annual Return |
|
| |
$248 |
4.00% |
2.55% |
2.55% |
|
| | ||||
| |
Class I | |||
| Period Ended |
Annual Costs |
Gross Cumulative Return |
Net Cumulative Return |
Net Annual Return |
| February 29, 2024 |
$72 |
5.00% |
4.30% |
4.30% |
| February 28, 2025 |
92 |
10.25 |
8.62 |
4.14 |
| February 28, 2026 |
95 |
15.76 |
13.11 |
4.14 |
| February 28, 2027 |
99 |
21.55 |
17.80 |
4.14 |
| February 29, 2028 |
103 |
27.63 |
22.67 |
4.14 |
| February 28, 2029 |
108 |
34.01 |
27.75 |
4.14 |
| February 28, 2030 |
112 |
40.71 |
33.04 |
4.14 |
| February 28, 2031 |
117 |
47.75 |
38.55 |
4.14 |
| February 29, 2032 |
122 |
55.13 |
44.29 |
4.14 |
| February 28, 2033 |
127 |
62.89 |
50.26 |
4.14 |
March 1, 2023 | 137
How to Reach Us
MORE INFORMATION
For investors who want more information on these Funds the following documents are available free upon request:
ANNUAL AND SEMI-ANNUAL REPORTS
Our annual and semi-annual reports contain more information about each Fund’s investments and performance. The annual report also includes details about the market conditions and investment strategies that had a significant effect on each Fund’s performance during the last fiscal year.
STATEMENT OF ADDITIONAL INFORMATION (SAI)
The SAIs contain more detailed information about the Funds and their policies. They are incorporated by reference into this prospectus. This means, by law, they are considered to be part of this prospectus.
You can get a free copy of these documents and other information, or ask us any questions, by calling us at 1-800-480-4111 or writing to:
J.P. Morgan Funds Services
P.O. Box 219143
Kansas City, MO 64121-9143
P.O. Box 219143
Kansas City, MO 64121-9143
If you buy your shares through a Financial Intermediary, you should contact that Financial Intermediary directly for this information. You can also find information online at www.jpmorganfunds.com.
Reports, a copy of the SAI, and other information about the Funds are also available on the EDGAR Database on the Commission’s Internet site at http://www.sec.gov, and copies of this information may be obtained, after paying a duplicating fee, by electronic request at the following E-mail address: publicinfo@sec.gov.
Investment Company Act File No. for each of the Funds except the Emerging Markets Research Enhanced Equity Fund and International Hedged Equity Fund is 811-21295.
Investment Company Act File No. for the Emerging Markets Research Enhanced Equity Fund and International Hedged Equity Fund is 811-23117.
©JPMorgan Chase & Co. 2022. All rights reserved. March 2023.


PR-INTEQACIL-323


