UNITED STATES
SECURITIES AND EXCHANGE COMMISSION
Washington, D.C. 20549
FORM 10-K
ANNUAL REPORT PURSUANT TO SECTION 13 OR 15(d)
OF THE SECURITIES EXCHANGE ACT OF 1934
For the fiscal year ended December 31, 2016
Commission file number: 001-32550
WESTERN ALLIANCE BANCORPORATION
(Exact name of registrant as specified in its charter)
Delaware | 88-0365922 | |
(State or other jurisdiction of incorporation or organization) | (I.R.S. Employer Identification No.) | |
One E. Washington Street Suite 1400, Phoenix, AZ | 85004 | |
(Address of principal executive offices) | (Zip Code) | |
(602) 389-3500
(Registrant’s telephone number, including area code)
Securities registered pursuant to Section 12(b) of the Act:
Title of each class | Name of each exchange on which registered | |
Common Stock, $0.0001 Par Value | New York Stock Exchange | |
Securities registered pursuant to Section 12(g) of the Act: None
Indicate by check mark if the registrant is a well-known seasoned issuer, as defined in Rule 405 of the Securities Act. Yes ý No ¨
Indicate by check mark if the registrant is not required to file reports pursuant to Section 13 or Section 15(d) of the Act. Yes ¨ No ý
Indicate by check mark whether the registrant (1) has filed all reports required to be filed by Section 13 or 15(d) of the Securities Exchange Act of 1934 during the preceding 12 months (or for such shorter period that the registrant was required to file such reports), and (2) has been subject to such filing requirements for the past 90 days. Yes ý No ¨
Indicate by check mark whether the registrant has submitted electronically and posted on its corporate Web site, if any, every Interactive Data File required to be submitted and posted pursuant to Rule 405 of Regulation S-T (§232.405 of this chapter) during the preceding 12 months (or for such shorter period that the registrant was required to submit and post such files). Yes ý No ¨
Indicate by check mark if disclosure of delinquent filers pursuant to Item 405 of Regulation S-K (§229.405 of this chapter) is not contained herein, and will not be contained, to the best of registrant’s knowledge, in definitive proxy or information statements incorporated by reference in Part III of this Form 10-K or any amendment to this Form 10-K. ¨
Indicate by check mark whether the registrant is a large accelerated filer, an accelerated filer, a non-accelerated filer, or a smaller reporting company. See the definitions of “large accelerated filer,” "accelerated filer" and "smaller reporting company" in Rule 12b-2 of the Exchange Act.
Large accelerated filer | ý | Accelerated filer | ¨ | |||
Non-accelerated filer | ¨ | Smaller reporting company | ¨ | |||
Indicate by check mark whether the registrant is a shell company (as defined in Rule 12b-2 of the Exchange Act). Yes ¨ No ý
The aggregate market value of the registrant’s voting stock held by non-affiliates was approximately $2.47 billion based on the June 30, 2016 closing price of said stock on the New York Stock Exchange ($32.65 per share).
As of February 21, 2017, Western Alliance Bancorporation had 105,330,934 shares of common stock outstanding.
Portions of the registrant’s definitive proxy statement for its 2017 Annual Meeting of Stockholders are incorporated by reference into Part III of this report.
INDEX
Page | ||
Item 1. | ||
Item 1A. | ||
Item 1B. | ||
Item 2. | ||
Item 3. | ||
Item 4. | ||
Item 5. | ||
Item 6. | ||
Item 7. | ||
Item 7A. | ||
Item 8. | ||
Item 9. | ||
Item 9A. | ||
Item 9B. | ||
Item 10. | ||
Item 11. | ||
Item 12. | ||
Item 13. | ||
Item 14. | ||
Item 15. | ||
Item 16. | ||
2
PART I
Forward-Looking Statements
Certain statements contained in this Annual Report on Form 10-K for the fiscal year ended December 31, 2016 (this “Form 10-K”) are “forward-looking statements” within the meaning of the Private Securities Litigation Reform Act of 1995 (the “Reform Act”). Statements that constitute forward-looking statements within the meaning of the Reform Act are generally identified through the inclusion of words such as “aim,” “anticipate,” “believe,” “drive,” “estimate,” “expect,” “expressed confidence,” “forecast,” “future,” “goals,” “guidance,” “intend,” “may,” “opportunity,” “plan,” “position,” “potential,” “project,” “ seek,” “should,” “strategy,” “target,” “will,” “would” or similar statements or variations of such words and other similar expressions. All statements other than historical fact are “forward-looking statements” within the meaning of the Reform Act, including statements that are related to or are dependent on estimates or assumptions relating to expectations, beliefs, projections, future plans and strategies, anticipated events or trends and similar expressions that are not historical facts. These forward-looking statements reflect the Company's current views about future events and financial performance and involve certain risks, uncertainties, assumptions, and changes in circumstances that may cause the Company's actual results to differ significantly from historical results and those expressed in any forward-looking statement. Factors that may cause actual results to differ materially from those contemplated by such forward-looking statements include, but are not limited to, those described in “Risk Factors” in Item 1A of this Form 10-K. Forward-looking statements speak only as of the date they are made and the Company undertakes no obligation to publicly update or revise any forward-looking statements included in this Form 10-K or to update the reasons why actual results could differ from those contained in such statements, whether as a result of new information, future events or otherwise, except to the extent required by federal securities laws. In light of these risks, uncertainties and assumptions, the forward-looking events discussed in this Form 10-K might not occur, and you should not put undue reliance on any forward-looking statements.
3
GLOSSARY OF ENTITIES AND TERMS
The acronyms and abbreviations identified below are used in various sections of this Form 10-K, including "Management's Discussion and Analysis of Financial Condition and Results of Operations," in Item 7 and the Consolidated Financial Statements and the Notes to Consolidated Financial Statements in Item 8 of this Form 10-K.
ENTITIES / DIVISIONS: | |||
AAB | Alliance Association Bank | HFF | Hotel Franchise Finance |
ABA | Alliance Bank of Arizona | LVSP | Las Vegas Sunset Properties |
BON | Bank of Nevada | TPB | Torrey Pines Bank |
Bridge | Bridge Bank | WA PWI, LLC | Western Alliance Public Welfare Investments, LLC |
Company | Western Alliance Bancorporation and subsidiaries | WAB or Bank | Western Alliance Bank |
FIB | First Independent Bank | WAL or Parent | Western Alliance Bancorporation |
TERMS: | |||
AFS | Available-for-Sale | GLBA | Gramm-Leach-Bliley Act |
ALCO | Asset and Liability Management Committee | GSE | Government-Sponsored Enterprise |
AOCI | Accumulated Other Comprehensive Income | HFI | Held for Investment |
ASC | Accounting Standards Codification | HFS | Held for Sale |
ASU | Accounting Standards Update | HTM | Held-to-Maturity |
ATM | At-the-Market | ICS | Insured Cash Sweep Service |
BHCA | Bank Holding Company Act of 1956 | IRC | Internal Revenue Code |
BOD | Board of Directors | ISDA | International Swaps and Derivatives Association |
BOLI | Bank Owned Life Insurance | LIBOR | London Interbank Offered Rate |
CAMELS | Capital Adequacy, Assets, Management Capability, Earnings, Liquidity, Sensitivity | LIHTC | Low-Income Housing Tax Credit |
CCO | Chief Credit Officer | LTD | Long-Term Debt |
CDARS | Certificate Deposit Account Registry Service | MBS | Mortgage-Backed Securities |
CDO | Collateralized Debt Obligation | MLC | Management Loan Committee |
CEO | Chief Executive Officer | MOU | Memorandum of Understanding |
CET1 | Common Equity Tier 1 | NBL | National Business Lines |
CFO | Chief Financial Officer | NOL | Net Operating Loss |
CFPB | Consumer Financial Protection Bureau | NPV | Net Present Value |
CLO | Collateralized Loan Obligation | NUBILs | Net Unrealized Built In Losses |
CMO | Collateralized Debt Obligation | NYSE | New York Stock Exchange |
COSO | Committee of Sponsoring Organizations of the Treadway Commission | OCC | Office of the Comptroller of the Currency |
CRA | Community Reinvestment Act | OCI | Other Comprehensive Income |
CRE | Commercial Real Estate | OFAC | Office of Foreign Asset Control |
DIF | FDIC's Deposit Insurance Fund | OREO | Other Real Estate Owned |
EPS | Earnings per share | OTTI | Other-than-Temporary Impairment |
EVE | Economic Value of Equity | PCI | Purchased Credit Impaired |
Exchange Act | Securities Exchange Act of 1934, as amended | SBA | Small Business Administration |
FASB | Financial Accounting Standards Board | SBIC | Small Business Investment Company |
FCRA | Fair Credit Reporting Act of 1971 | SBLF | Small Business Lending Fund |
FDIA | Federal Deposit Insurance Act | SEC | Securities and Exchange Commission |
FDIC | Federal Deposit Insurance Corporation | SERP | Supplemental Executive Retirement Plan |
FHLB | Federal Home Loan Bank | SLC | Senior Loan Committee |
FICO | The Financing Corporation | SSAE | Statement on Standards for Attestation Engagements |
FRA | Federal Reserve Act | TDR | Troubled Debt Restructuring |
FRB | Federal Reserve Bank | TEB | Tax Equivalent Basis |
FVO | Fair Value Option | XBRL | eXtensible Business Reporting Language |
GAAP | U.S. Generally Accepted Accounting Principles | ||
4
Item 1. | Business. |
Organization Structure and Description of Services
WAL is a bank holding company headquartered in Phoenix, Arizona, incorporated under the laws of the state of Delaware. WAL provides a full spectrum of deposit, lending, treasury management, international banking, and online banking products and services through its wholly-owned banking subsidiary, WAB.
WAB operates the following full-service banking divisions: ABA, BON, Bridge, FIB, and TPB. The Company also serves business customers through a national platform of specialized financial services including AAB, Corporate Finance, Equity Fund Resources, HFF, Life Sciences Group, Mortgage Warehouse Lending, Public and Nonprofit Finance, Renewable Resource Group, Resort Finance, and Technology Finance. In addition, the Company has one non-bank subsidiary, LVSP, which holds and manages certain non-performing loans and OREO.
WAL also has eight unconsolidated subsidiaries used as business trusts in connection with issuance of trust-preferred securities as described in "Note 10. Qualifying Debt" in Item 8 of this Form 10-K.
Bank Subsidiary
At December 31, 2016, WAL has the following bank subsidiary:
Bank Name | Headquarters | Number of Locations | Location Cities | Total Assets | Net Loans | Deposits | ||||||||||||
(in millions) | ||||||||||||||||||
Western Alliance Bank | Phoenix, Arizona | 48 | Arizona: Chandler, Flagstaff, Mesa, Phoenix, Scottsdale, and Tucson | $ | 17,095.1 | $ | 13,067.2 | $ | 14,563.9 | |||||||||
Nevada: Carson City, Fallon, Reno, Sparks, Henderson, Las Vegas, Mesquite, and North Las Vegas | ||||||||||||||||||
California: Beverly Hills, Carlsbad, Costa Mesa, La Mesa, Los Angeles, Menlo Park, Oakland, Palo Alto, Pleasanton, San Diego, San Francisco, and San Jose | ||||||||||||||||||
Other: Atlanta, Georgia; Boston, Massachusetts; Reston, Virginia | ||||||||||||||||||
WAB also has the following significant wholly-owned subsidiaries:
• | WAB Investments, Inc., BON Investments, Inc., and TPB Investments, Inc. - each hold certain investment securities, municipal and non-profit loans, and leases. After the close of business on December 31, 2016, these subsidiaries were merged into a newly created entity called Western Alliance Business Trust. |
• | WA PWI, LLC holds certain limited partnerships invested primarily in low income housing tax credits and small business investment corporations. |
• | BW Real Estate, Inc. - operates as a real estate investment trust and holds certain real estate loans and related securities. |
Market Segments
The Company’s reportable segments are aggregated primarily based on geographic location, services offered, and markets served. The Company's regional segments, which include Arizona, Nevada, Southern California, and Northern California, provide full service banking and related services to their respective markets. The Company's NBL segments provide specialized banking services to niche markets. These NBLs are managed centrally and are broader in geographic scope, though still predominately within the Company's core market areas. The Corporate & Other segment primarily relates to the Company's Treasury division and also includes other corporate-related items, income and expense items not allocated to other reportable segments, and inter-segment eliminations.
The accounting policies of the reported segments are the same as those of the Company as described in "Note 1. Summary of Significant Accounting Policies" in Item 8. All intercompany transactions are eliminated for reporting consolidated results of operations. Loan and deposit accounts are assigned directly to the segments where these products are originated and/or serviced. Equity capital is assigned to each segment based on the risk profile of their assets and liabilities with a funds credit
5
provided for the use of this equity as a funding source. Any excess equity not allocated to segments based on risk is assigned to the Corporate & Other segment.
Net interest income, provision for credit losses, and non-interest expense amounts are recorded in their respective segment to the extent that the amounts are directly attributable to those segments. Net interest income of a reportable segment includes a funds transfer pricing process that matches assets and liabilities with similar interest rate sensitivity and maturity characteristics. Using this funds transfer pricing methodology, liquidity is transferred between users and providers. Net income amounts for each reportable segment are further derived by the use of expense allocations. Certain expenses not directly attributable to a specific segment are allocated across all segments based on key metrics, such as number of employees, average loan balances, and average deposit balances. Income taxes are applied to each segment based on the effective tax rate for the geographic location of the segment. Any difference in the corporate tax rate and the aggregate effective tax rates in the segments are adjusted in the Corporate & Other segment.
Lending Activities
General
Through WAB and its banking divisions and operating subsidiaries, the Company provides a variety of financial services to customers, including CRE loans, construction and land development loans, commercial loans, and consumer loans. The Company’s lending has focused primarily on meeting the needs of business customers.
Commercial and Industrial: Commercial and industrial loans include working capital lines of credit, inventory and accounts receivable lines, mortgage warehouse lines, equipment loans and leases, and other commercial loans. Loans to technology companies, tax-exempt municipalities, and not-for-profit organizations are categorized as commercial and industrial loans.
CRE: Loans to finance the purchase or refinancing of CRE for investors (non-owner occupied) or owner-occupants make up the majority of the Company's loan portfolio. These CRE loans are secured by multi-family residential properties, professional offices, industrial facilities, retail centers, hotels, and other commercial properties. As of December 31, 2016 and 2015, 36% and 48%, respectively, of the Company's CRE loans were owner-occupied. The decrease in the percentage of these loans from the prior year is due to the acquired HFF loans, which were primarily CRE, non-owner occupied loans. Owner-occupied CRE loans are loans secured by owner-occupied non-farm nonresidential properties for which the primary source of repayment (more than 50%) is the cash flow from the ongoing operations and activities conducted by the borrower who owns the property. Non-owner occupied CRE loans are CRE loans for which the primary source of repayment is nonaffiliated rental income associated with the collateral property.
Construction and Land Development: Construction and land development loans include single family and multi-family residential projects, industrial/warehouse properties, office buildings, retail centers, medical office facilities, and residential lot developments. These loans are primarily originated to experienced local developers with whom the Company has a satisfactory lending history. An analysis of each construction project is performed as part of the underwriting process to determine whether the type of property, location, construction costs, and contingency funds are appropriate and adequate. Loans to finance commercial raw land are primarily to borrowers who plan to initiate active development of the property within two years.
Consumer: Limited types of consumer loans are offered to meet customer demand and to respond to community needs. Examples of these consumer loans include: home equity loans and lines of credit, home improvement loans, personal lines of credit, and loans to individuals for investment purposes.
6
At December 31, 2016, the Company's loan portfolio totaled $13.21 billion, including HFS loans, or approximately 77% of total assets. The following table sets forth the composition of the Company's HFI loan portfolio as of the periods presented:
December 31, | ||||||||||||||
2016 | 2015 | |||||||||||||
Amount | Percent | Amount | Percent | |||||||||||
(in thousands) | ||||||||||||||
Commercial and industrial | $ | 5,755,021 | 43.6 | % | $ | 5,114,257 | 46.1 | % | ||||||
Commercial real estate - non-owner occupied | 3,543,956 | 26.9 | 2,283,536 | 20.6 | ||||||||||
Commercial real estate - owner occupied | 2,013,276 | 15.2 | 2,083,285 | 18.7 | ||||||||||
Construction and land development | 1,478,114 | 11.2 | 1,133,439 | 10.2 | ||||||||||
Residential real estate | 259,432 | 2.0 | 322,939 | 2.9 | ||||||||||
Commercial leases | 100,765 | 0.8 | 148,493 | 1.3 | ||||||||||
Consumer | 38,963 | 0.3 | 26,905 | 0.2 | ||||||||||
Loans, net of deferred loan fees and costs | 13,189,527 | 100.0 | % | 11,112,854 | 100.0 | % | ||||||||
Allowance for credit losses | (124,704 | ) | (119,068 | ) | ||||||||||
Total loans HFI | $ | 13,064,823 | $ | 10,993,786 | ||||||||||
As of December 31, 2016 and 2015, the Company also has $18.9 million and $23.8 million, respectively, of HFS loans. For additional information concerning loans, see "Note 4. Loans, Leases and Allowance for Credit Losses" of the Consolidated Financial Statements contained herein or "Management Discussion and Analysis of Financial Condition and Results of Operations—Financial Condition – Loans discussions" in Item 7 of this Form 10-K.
The Company adheres to a specific set of credit standards within its banking subsidiary that are intended to ensure the proper management of credit risk. Furthermore, the Bank's senior management team plays an active role in monitoring compliance with such standards.
Loan originations are subject to a process that includes the credit evaluation of borrowers, utilizing established lending limits, analysis of collateral, and procedures for continual monitoring and identification of credit deterioration. Loan officers actively monitor their individual credit relationships in order to report suspected risks and potential downgrades as early as possible. The WAB BOD approves all changes to loan policy, as well as lending limit authorities. The Bank's lending policies generally incorporate consistent underwriting standards across all geographic regions that the Bank operates in, customized as necessary to conform to state law and local market conditions. The Bank's credit culture has enabled management to identify troubled credits early, allowing management to take corrective action when necessary.
Loan Approval Procedures and Authority
The Company's loan approval procedures are executed through a tiered loan limit authorization process, which is structured as follows:
• | Individual Authorities. The authorization levels for individual loan officers are established on a case-by-case basis. Generally, the more experienced a loan officer, the higher the authorization level. The maximum approval authority for any loan officer is $1.0 million. Certain members of executive management or credit administration may have higher approval authority. |
• | Management Loan Committees. Credits in excess of individual loan limits are submitted to the appropriate region’s MLC. The MLCs consist of members of the senior management team of each region. The MLCs have approval authority up to $7.0 million. |
• | Credit Administration. Credits in excess of the MLC authority are submitted to the WAB SLC. The SLC has approval authority up to established house concentration limits, which range from $15.0 million to $50.0 million, depending on risk grade. SLC approval is also required for new relationships of $12.5 million or greater to borrowers within market footprint, and $5.0 million or greater outside market footprint. The SLC reviews all other loan approvals to any one new borrower of $5.0 million or greater. The SLC is chaired by the WAB CCO and includes the Company’s CEO. Current policy states that over house limit exceptions require unanimous approval of the SLC. |
Loans to One Borrower. In addition to the limits set forth above, subject to certain exceptions, state banking laws generally limit the amount of funds that a bank may lend to a single borrower. Under Arizona law, the obligations of one borrower to a
7
bank generally may not exceed 20% of the bank’s capital, plus an additional 10% of its capital if the additional amounts are fully secured by readily marketable collateral.
Concentrations of Credit Risk. The Company's lending policies also establish customer and product concentration limits to control single customer and product exposures. The Company's lending policies have several different measures to limit concentration exposures. Set forth below are the primary segmentation limits and actual measures as of December 31, 2016:
Percent of Total Capital | ||||||
Policy Limit | Actual | |||||
CRE | 435 | % | 264 | % | ||
Commercial and industrial | 400 | 278 | ||||
Construction and land development | 85 | 70 | ||||
Residential real estate | 20 | 12 | ||||
Consumer | 5 | 2 | ||||
Asset Quality
General
To measure asset quality, the Company has instituted a loan grading system consisting of ten different categories. The first six are considered “satisfactory.” The other four grades range from a “special mention” category to a “loss” category and are consistent with the grading systems used by federal banking regulators. All loans are assigned a credit risk grade at the time they are made, and each assigned loan officer reviews the credit with his or her immediate supervisor on a quarterly basis to determine whether a change in the credit risk grade is warranted. In addition, the grading of the Company's loan portfolio is reviewed on a regular basis by its internal Loan Review Department.
Collection Procedure
If a borrower fails to make a scheduled payment on a loan, Bank personnel attempt to remedy the deficiency by contacting the borrower and seeking payment. Contacts generally are made within 15 business days after the payment becomes past due. The Bank maintains regional Special Assets Departments, which generally services and collects loans rated substandard or worse. Each division is responsible for monitoring activity that may indicate an increased risk rating, including, but not limited to, past-dues, overdrafts and loan agreement covenant defaults. Loans deemed uncollectible are proposed for charge-off.
Nonperforming Assets
Nonperforming assets include loans past due 90 days or more and still accruing interest, non-accrual loans, TDR loans, and repossessed assets, including OREO. In general, loans are placed on non-accrual status when the Company determines that ultimate collection of principal and interest is in doubt due to the borrower’s financial condition, collateral value, and collection efforts. A TDR loan is a loan on which the Company, for reasons related to a borrower’s financial difficulties, grants a concession to the borrower that the Company would not otherwise consider. Other repossessed assets resulted from loans where the Company has received title or physical possession of the borrower’s assets. The Company generally re-appraises OREO and collateral dependent impaired loans every twelve months. The net gain on sales / valuations of repossessed and other assets was $0.1 million, $2.1 million, and $5.4 million for the years ended December 31, 2016, 2015, and 2014, respectively. Losses may be experienced in future periods.
Criticized Assets
Federal bank regulators require banks to classify its assets on a regular basis. In addition, in connection with their examinations of the Bank, examiners have authority to identify problem assets and, if appropriate, re-classify them. A loan grade of seven from the Company's internal loan grading system is utilized to identify potential problem assets and loans grades eight through ten are utilized to identify actual problem assets.
The following describes the potential and actual problem assets using the Company's internal loan grading system definitions:
• | "Special Mention" (Grade 7): Generally these are assets that possess weaknesses that warrant management's close attention. These loans may involve borrowers with adverse financial trends, higher debt to equity ratios, or weaker liquidity positions, but not to the degree of being considered a “problem loan” where risk of loss may be apparent. Loans in this category are usually performing as agreed, although there may be non-compliance with financial covenants. |
8
• | “Substandard” (Grade 8): These assets are characterized by well-defined credit weaknesses and carry the distinct possibility that the Company will sustain some loss if such weakness or deficiency is not corrected. The Company believes that these loans generally are adequately secured and in the event of a foreclosure action or liquidation, the Company should be protected from loss. All loans 90 days or more past due and all loans on non-accrual are considered at least “substandard,” unless extraordinary circumstances would suggest otherwise. |
• | “Doubtful” (Grade 9): These assets have all the weaknesses inherent in those classified as "substandard" with the added characteristic that the weaknesses present make collection or liquidation in full, on the basis of currently existing facts, conditions and values, highly questionable and improbable, but because of certain known factors which may work to the advantage and strengthening of the asset (for example, capital injection, perfecting liens on additional collateral and refinancing plans), classification as an estimated loss is deferred until a more precise status may be determined. |
• | “Loss” (Grade 10): These assets are considered uncollectible and having such little recoverable value that it is not practical to defer writing off the asset. This classification does not mean that the loan has absolutely no recovery or salvage value, but rather that it is not practicable or desirable to defer writing off the asset, even though partial recovery may be achieved in the future. |
Allowance for Credit Losses
The Company must maintain an adequate allowance for credit losses. The allowance for credit losses is established through a provision for credit losses and is reflected as a reduction in earnings. Loans are charged against the allowance for credit losses when management believes that collectability of the contractual principal or interest is unlikely. Subsequent recoveries, if any, are credited to the allowance. The allowance is reported at an amount believed adequate to absorb probable losses on existing loans that may become uncollectable, based on evaluation of the collectability of loans and prior credit loss experience, together with other factors. For a detailed discussion of the Company’s methodology see “Management’s Discussion and Analysis and Financial Condition – Critical Accounting Policies – Allowance for Credit Losses” in Item 7 of this Form 10-K.
Investment Activities
WAB and WAL have an investment policy, which was approved by their respective BODs. This policy dictates that investment decisions be made based on the safety of the investment, liquidity requirements of the Bank and holding company, potential returns, cash flow targets, and consistency with the Company's interest rate risk management. The Bank’s ALCO is responsible for making securities portfolio decisions in accordance with established policies. The CFO and Treasurer have the authority to purchase and sell securities within specified guidelines. All transactions for the Bank and for the holding company were reviewed by the ALCO and BOD.
Generally, the Company's investment policy limits new securities investments to the following: securities backed by the full faith and credit of the U.S. government, including U.S. treasury bills, notes, and bonds, direct obligations of Ginnie Mae, USDA and SBA loans; MBS or CMO issued by a GSE, such as Fannie Mae or Freddie Mac; debt securities issued by a GSE, such as Fannie Mae, Freddie Mac, and the FHLB; tax-exempt securities with a rating of “Single-A” or higher; preferred stock where the issuing company is rated “BBB” or higher; corporate debt with a rating of “Single-A” or better; investment grade corporate bond mutual funds; private label collateralized mortgage obligations with a single rating of “AA” or higher; commercial mortgage-backed securities with a rating of “AAA;” and mandatory purchases of equity securities of the FRB and FHLB. Preferred stock holdings are limited to no more than 10% of the Bank’s Common Equity Tier 1; tax-exempt securities are limited to no more than 5% of the Bank's assets; investment grade corporate bond mutual funds are limited to no more than 5% of the Bank's Tier 1 capital; corporate debt holdings are limited to no more than 2.5% of the Bank’s assets; and commercial mortgage-backed securities are limited to an aggregate purchase limit of $50 million.
The Company no longer purchases (although it may continue to hold previously acquired) CDOs. The Company's policies also govern the use of derivatives, and provide that the Company prudently use derivatives in accordance with applicable regulations as a risk management tool to reduce the overall exposure to interest rate risk, and not for speculative purposes.
As of December 31, 2016, the majority of the Company's investment securities are classified as AFS or measured at fair value (“trading”) pursuant to ASC Topic 320, Investments and ASC Topic 825, Financial Instruments. AFS securities are reported at fair value in accordance with Topic 820, Fair Value Measurements and Disclosures.
As of December 31, 2016, the Company's investment securities portfolio totals $2.70 billion, representing approximately 15.7% of the Company's total assets, with the majority of the portfolio invested in AAA/AA+ rated securities. The average duration of the Company's investment securities is 4.2 years as of December 31, 2016.
9
The following table summarizes the investment securities portfolio as of December 31, 2016 and 2015:
December 31, | ||||||||||||||
2016 | 2015 | |||||||||||||
Amount | Percent | Amount | Percent | |||||||||||
(dollars in thousands) | ||||||||||||||
Collateralized debt obligations | $ | 13,490 | 0.5 | % | $ | 10,060 | 0.5 | % | ||||||
Commercial MBS issued by GSEs | 117,792 | 4.4 | 19,114 | 1.0 | ||||||||||
Corporate debt securities | 64,144 | 2.4 | 13,251 | 0.7 | ||||||||||
CRA investments | 37,113 | 1.4 | 34,685 | 1.7 | ||||||||||
Preferred stock | 94,662 | 3.5 | 111,236 | 5.6 | ||||||||||
Private label commercial MBS | — | — | 4,691 | 0.2 | ||||||||||
Private label residential MBS | 433,685 | 16.0 | 257,128 | 13.0 | ||||||||||
Residential MBS issued by GSEs | 1,356,258 | 50.1 | 1,171,702 | 59.0 | ||||||||||
Tax-exempt | 500,312 | 18.5 | 334,830 | 16.9 | ||||||||||
Trust preferred securities | 26,532 | 1.0 | 24,314 | 1.2 | ||||||||||
U.S. government sponsored agency securities | 56,022 | 2.1 | — | — | ||||||||||
U.S. treasury securities | 2,502 | 0.1 | 2,993 | 0.2 | ||||||||||
Total investment securities | $ | 2,702,512 | 100.0 | % | $ | 1,984,004 | 100.0 | % | ||||||
As of December 31, 2016 and 2015, the Company has an investment in BOLI of $164.5 million and $162.5 million, respectively. The BOLI is used to help offset employee benefit costs. For additional information concerning investments, see “Management’s Discussion and Analysis of Financial Condition and Results of Operations – Financial Condition – Investments” in Item 7 of this Form 10-K.
Deposit Products
The Company offers a variety of deposit products, including checking accounts, savings accounts, money market accounts, and other types of deposit accounts, including fixed-rate, fixed maturity certificates of deposit. The Company has historically focused on growing its lower cost core customer deposits. As of December 31, 2016, the deposit portfolio was comprised of 39% non-interest bearing deposits and 61% interest-bearing deposits.
The competition for deposits in the Company's markets is strong. The Company has historically been successful in attracting and retaining deposits due to several factors, including its: 1) knowledgeable and empowered bankers committed to providing personalized and responsive service that translates into long-lasting relationships; 2) broad selection of cash management services offered; and 3) incentives to employees for business development and retention. The Company intends to continue its focus on attracting deposits from its business lending relationships in order to maintain its low cost of funds and improve its net interest margin. The loss of low-cost deposits could negatively impact future profitability.
Deposit balances are generally influenced by national and local economic conditions, changes in prevailing interest rates, internal pricing decisions, perceived stability of financial institutions and competition. The Company’s deposits are primarily obtained from communities surrounding its offices. In order to attract and retain deposits, the Company relies on providing quality service and introducing new products and services that meet the needs of its customers.
In 2016, the Bank's deposit rates were determined through an internal oversight process under the direction of its ALCO. The Bank considers a number of factors when determining deposit rates, including:
• | current and projected national and local economic conditions and the outlook for interest rates; |
• | local competition; |
• | loan and deposit positions and forecasts, including any concentrations in either; and |
• | FHLB advance rates and rates charged on other funding sources. |
The following table shows the Company's deposit composition:
10
December 31, | ||||||||||||||
2016 | 2015 | |||||||||||||
Amount | Percent | Amount | Percent | |||||||||||
(in thousands) | ||||||||||||||
Non-interest-bearing demand deposits | $ | 5,632,926 | 38.7 | % | $ | 4,093,976 | 34.0 | % | ||||||
Interest-bearing transaction accounts | 1,346,718 | 9.3 | 1,028,073 | 8.5 | ||||||||||
Savings and money market accounts | 6,120,877 | 42.0 | 5,296,921 | 44.1 | ||||||||||
Certificate of deposit ($250,000 or more) | 609,678 | 4.2 | 626,718 | 5.2 | ||||||||||
Other time deposits | 839,664 | 5.8 | 984,936 | 8.2 | ||||||||||
Total deposits | $ | 14,549,863 | 100.0 | % | $ | 12,030,624 | 100.0 | % | ||||||
The Company does not pay interest to depositors of non-interest bearing accounts. However, earnings credits are awarded to some account holders, which offset charges incurred by account holders for deposit services that are utilized.
In addition to the Company's deposit base, it has access to other sources of funding, including FHLB and FRB advances, repurchase agreements, and unsecured lines of credit with other financial institutions. Previously, the Company has also accessed the capital markets through trust preferred, subordinated debt, and Senior Note offerings. For additional information concerning the Company's deposits, see “Management’s Discussion and Analysis of Financial Condition and Results of Operations – Balance Sheet Analysis – Deposits” in Item 7 of this Form 10-K.
Other Financial Products and Services
In addition to traditional commercial banking activities, the Company offers other financial services to its customers, including: internet banking, wire transfers, electronic bill payment, lock box services, courier, and cash management services.
Customer, Product, and Geographic Concentrations
Approximately 53% and 49% of the Company's loan portfolio at December 31, 2016 and 2015, respectively, consisted of CRE-secured loans, including CRE loans, and construction and land development loans. The Company’s business is concentrated primarily in the Los Angeles, Phoenix, Las Vegas, Reno, San Francisco, San Jose, San Diego and Tucson metropolitan areas. Consequently, the Company is dependent on the trends of these regional economies. The Company is not dependent upon any single or limited number of customers, the loss of which would have a material adverse effect on the Company. Neither the Company nor any of its reportable segments have customer relationships that individually account for 10% or more of consolidated or segment revenues. No material portion of the Company’s business is seasonal.
Foreign Operations
The Company does not have significant foreign operations. The Company provides loans, letters of credit, foreign exchange, and other trade-related services to commercial enterprises that conduct business outside the U.S.
Competition
The financial services industry is highly competitive. Many of the Company's competitors are much larger in total assets and capitalization, have greater access to capital markets, and offer a broader range of financial services than the Company can offer, and may have lower cost structures.
This increasingly competitive environment is primarily a result of long-term changes in regulation that made mergers and geographic expansion easier; changes in technology and product delivery systems and web-based tools; and the accelerating pace of consolidation among financial services providers. The Company competes for loans, deposits, and customers with other banks, credit unions, brokerage companies, mortgage companies, insurance companies, finance companies, and other non-bank financial services providers. This strong competition for deposit and loan products directly affects the interest rates on those products and the terms on which they are offered to consumers.
Technological innovation continues to contribute to greater competition in domestic and international financial services markets.
Mergers between financial institutions have placed additional pressure on banks to consolidate their operations, reduce expenses, and increase revenues to remain competitive. The competitive environment is also significantly impacted by federal and state legislation that makes it easier for non-bank financial institutions to compete with the Company.
11
Employees
As of December 31, 2016, the Company has 1,557 full-time equivalent employees. The Company’s employees are not represented by a union or covered by a collective bargaining agreement. Management believes that its employee relations are good.
Supervision and Regulation
The Company and its subsidiaries are extensively regulated and supervised under both federal and state laws. A summary description of the laws and regulations which relate to the Company’s operations are discussed in Item 7 of this Form 10-K.
Additional Available Information
The Company maintains an internet website at http://www.westernalliancebancorporation.com. The Company makes available its annual reports on Form 10-K, quarterly reports on Form 10-Q, current reports on Form 8-K and amendments to such reports filed or furnished pursuant to Sections 13(a) and 15(d) of the Exchange Act and other information related to the Company free of charge, through this site as soon as reasonably practicable after it electronically files those documents with, or otherwise furnishes them to the SEC. The SEC maintains an internet site, http://www.sec.gov, in which all forms filed electronically may be accessed. The Company’s internet website and the information contained therein are not incorporated in this Form 10-K.
In addition, copies of the Company’s annual report will be made available, free of charge, upon written request.
12
Item 1A. | Risk Factors. |
Investing in the Company’s common stock involves various risks, many of which are specific to the Company’s business. The discussion below addresses the material risks and uncertainties, of which the Company is currently aware, that could have a material adverse effect on the Company’s business, results of operations, and financial condition. Other risks that the Company does not know about now, or that the Company does not currently believe are significant, could negatively impact the Company’s business or the trading price of the Company’s securities. See additional discussions about credit, interest rate, market, and litigation risks in "Item 7. Management’s Discussion and Analysis of Financial Condition and Results of Operations."
Risks Relating to the Company's Business
The Company’s financial performance may be adversely affected by conditions in the financial markets and economic conditions generally.
The Company’s financial performance is highly dependent upon the business environment in the markets where the Company operates and in the U.S. as a whole. Unfavorable or uncertain economic and market conditions can be caused by declines in economic growth, business activity, or investor or business confidence, limitations on the availability or increases in the cost of credit and capital, increases in inflation or interest rates, natural disasters, terrorist attacks, acts of war, or a combination of these or other factors. A worsening of business and economic conditions generally or specifically in the principal markets in which the Company conducts business could have adverse effects, including the following:
• | a decrease in deposit balances or the demand for loans and other products and services the Company offers; |
• | an increase in the number of borrowers who become delinquent, file for protection under bankruptcy laws or default on their loans or other obligations to the Company, which could lead to higher levels of nonperforming assets, net charge-offs and provisions for credit losses; |
• | a decrease in the value of loans and other assets secured by real estate; |
• | a decrease in net interest income from the Company’s lending and deposit gathering activities; |
• | an impairment of certain intangible assets such as goodwill; and |
• | an increase in competition resulting from the increasing consolidation of financial services companies. |
In the U.S. financial services industry, the commercial soundness of financial institutions is closely interrelated as a result of credit, trading, clearing or other relationships between the institutions. As a result, concerns about, or a default or threatened default by, one institution could lead to significant market-wide liquidity and credit problems, losses or defaults by other institutions. This is sometimes referred to as “systemic risk” and may adversely affect financial intermediaries, such as clearing agencies, clearing houses, banks, securities firms, and exchanges, with which the Company interacts on a daily basis, and therefore could adversely affect the Company.
It is possible that the business environment in the U.S. will experience volatility in the future. There can be no assurance that these conditions will improve in the near term or that conditions will not worsen. Such conditions could adversely affect the Company’s business, results of operations, and financial condition.
The Company is highly dependent on real estate and events that negatively impact the real estate market will hurt the Company’s business and earnings.
The Company is located in areas in which economic growth is largely dependent on the real estate market, and a majority of the Company’s loan portfolio is secured by or otherwise dependent on real estate. A decline in real estate activity, even if less severe than occurred in 2009 and 2008, would likely cause a decline in asset and deposit growth and negatively impact the Company’s earnings and financial condition.
The Company’s loan portfolio consists primarily of CRE and commercial and industrial loans, which contain concentrations in specialty business lines that have unique risk characteristics and may expose the Company to increased lending risks.
The Company’s loan portfolio consists primarily of CRE and commercial and industrial loans, which contain concentrations in specialty business lines, such as mortgage warehouse, corporate finance, municipal and nonprofit loans, as well as loans in other business sectors such as technology and innovation. These loan concentrations present unique risks and involve specialized underwriting and management as these loans typically involve large loan balances to single borrowers or groups of
13
related borrowers. Consequently, an adverse development with respect to one commercial loan or one credit relationship may adversely affect the Company. In addition, based on the nature of lending to these specialty markets, repayment of loans may be dependent upon borrowers receiving additional equity financing, or in some cases, a successful sale to a third party, public offering, or other form of liquidity event. Although each specialty business has dedicated teams in place with specialized skills, tools, and resources available to monitor and evaluate risk specific to the industry, unforeseen adverse events, changes in regulatory policy, or a general decline in the borrower's industry may have a material adverse effect on the Company’s financial condition and results of operations.
Due to the inherent risk associated with financial estimates, the Company’s allowance for loan losses may be insufficient, which could require the Company to raise additional capital or otherwise adversely affect the Company’s financial condition and results of operations.
Credit losses are inherent in the business of making loans. Management makes various assumptions and judgments about the collectability of the Company’s consolidated loan portfolio and maintains an allowance for estimated credit losses based on a number of factors, including the size of the portfolio, asset classifications, economic trends, industry experience and trends, industry and geographic concentrations, estimated collateral values, management’s assessment of the credit risk inherent in the portfolio, historical loan loss experience, and loan underwriting policies. In addition, the Company evaluates all loans identified as problem loans and augments the allowance based upon its estimation of the potential loss associated with those problem loans. Additions to the allowance for credit losses recorded through the Company’s provision for credit losses decreases the Company’s net income. If such assumptions and judgments are incorrect, the Company’s actual credit losses may exceed the Company’s allowance for credit losses.
At December 31, 2016, the Company's allowance for credit losses is $124.7 million. Deterioration in the real estate market and/or general economic conditions could affect the ability of the Company’s loan customers to service their debt, which could result in additional loan provisions and increases in the Company’s allowance for credit losses. In addition, the Company may be required to record additional loan provisions or increase the Company’s allowance for credit losses based on new information regarding existing loans, input from regulators in connection with their review of the Company’s allowance, changes in regulatory guidance, regulations or accounting standards, identification of additional problem loans, and other factors, both within and outside of the Company’s management’s control. Moreover, because future events are uncertain and because the Company may not successfully identify all deteriorating loans in a timely manner, there may be loans that deteriorate in an accelerated time frame.
Any increases in the provision or allowance for credit losses will result in a decrease in the Company’s net income and, potentially, capital, and may have a material adverse effect on the Company’s financial condition and results of operations. If actual credit losses materially exceed the Company’s allowance for credit losses, the Company may be required to raise additional capital, which may not be available to the Company on acceptable terms or at all. The Company’s inability to raise additional capital on acceptable terms when needed could materially and adversely affect the Company’s financial condition, results of operations, and capital.
Because of the geographic concentration of the Company’s assets, changes in local economic conditions could adversely affect the Company’s business and results of operations.
The Company’s business is primarily concentrated in selected markets in Arizona, California, and Nevada. As a result of this geographic concentration, the Company’s financial condition and results of operations depend largely upon economic conditions in these market areas. Deterioration in economic conditions in these markets could result in one or more of the following: an increase in loan delinquencies and charge-offs; an increase in problem assets and foreclosures; a decrease in the demand for the Company’s products and services; or a decrease in the value of collateral for loans, especially real estate.
The Company’s financial instruments expose the Company to certain market risks and may increase the volatility of AOCI.
The Company holds certain financial instruments measured at fair value. For those financial instruments measured at fair value, the Company is required to recognize the changes in the fair value of such instruments in AOCI each quarter. Therefore, any increases or decreases in the fair value of these financial instruments have a corresponding impact on reported AOCI. Fair value can be affected by a variety of factors, many of which are beyond the Company’s control, including the Company’s credit position, interest rate volatility, capital markets volatility, and other economic factors. Accordingly, the Company is subject to mark-to-market risk and the application of fair value accounting may cause the Company’s AOCI to be more volatile than would be suggested by the Company’s underlying performance.
14
If the Company loses a significant portion of its core deposits or its cost of funding deposits increases significantly, the Company's liquidity and/or profitability would be adversely impacted.
The Company’s profitability depends in part on successfully attracting and retaining a stable base of relatively low-cost deposits. The competition for these deposits in the Company's markets is strong and customers may demand higher interest rates on their deposits or seek other investments offering higher rates of return. The Company is a participant in the Promontory Interfinancial Network, and offers its reciprocal deposit products, such as CDARS and ICS, to customers seeking federal insurance for deposit amounts that exceed the applicable deposit insurance limit at a single institution. The Company also from time to time offers other credit enhancements to depositors, such as FHLB letters of credit and, for certain deposits of public monies, pledges of collateral in the form of readily marketable securities. Any event or circumstance that interferes with or limits the Company's ability to offer these products to customers that require greater security for their deposits, such as a significant regulatory enforcement action or a significant decline in capital levels at the Company's bank subsidiary, could negatively impact the Company's ability to attract and retain deposits. For further discussion of CDARS and ICS, see "Note 8. Deposits" to the Consolidated Financial Statements included in this Form 10-K. If the Company were to lose a significant portion of its low-cost deposits, the Company would be required to borrow from other sources at higher rates and the Company's liquidity and profitability would be adversely impacted.
From time to time, the Company has been dependent on borrowings from the FHLB and the FRB, and there can be no assurance these programs will be available as needed.
As of December 31, 2016, the Company has borrowings from the FHLB of San Francisco of $80.0 million and none from the FRB. In the past, the Company has been reliant on borrowings from the FHLB of San Francisco and the FRB to satisfy its short-term liquidity needs. The Company’s borrowing capacity is generally dependent on the value of its collateral pledged to these entities. These lenders could reduce the Company’s borrowing capacity or eliminate certain types of collateral and could otherwise modify or even terminate their loan programs. Any change or termination could have an adverse effect on the Company’s liquidity and profitability.
The business may be adversely affected by fraud.
As a financial institution, the Company is inherently exposed to operational risk in the form of theft and other fraudulent activity by employees, customers, and other third parties targeting the Company and/or the Company’s customers or data. Such activity may take many forms, including check fraud, electronic fraud, wire fraud, phishing, social engineering and other dishonest acts.
Although the Company devotes substantial resources to maintaining effective policies and internal controls to identify and prevent such incidents, given the increasing sophistication of possible perpetrators, the Company may experience financial losses or reputational harm as a result of fraud.
A failure in or breach of the Company’s operational or security systems or infrastructure, or those of the Company’s third party vendors and other service providers, including as a result of cyber-attacks, could disrupt the Company’s businesses, result in the disclosure or misuse of confidential or proprietary information, damage the Company’s reputation, increase the Company’s costs, and cause losses.
The Company’s operations rely on the secure processing, storage, and transmission of confidential and other information. Although the Company takes numerous protective measures to maintain the confidentiality, integrity, and availability of the Company’s and its customers’ information across all geographies and product lines, and endeavors to modify these protective measures as circumstances warrant, the nature of the threats continues to evolve. As a result, the Company’s computer systems, software, and networks and those of the Company’s customers and third party vendors may be vulnerable to unauthorized access, loss, or destruction of data (including confidential client information), account takeovers, unavailability of service, computer viruses, or other malicious code, cyber-attacks, and other events that could have an adverse security impact and result in significant losses to the Company and/or its customers. These threats may originate externally from third parties, including foreign governments, organized criminal groups, and other hackers, and outsourced or infrastructure-support providers and application developers, or the threats may originate from within the Company’s organization.
The Company also faces the risk of operational disruption, failure, termination, or capacity constraints of any of the third parties that facilitate the Company’s business activities, including vendors, exchanges, clearing agents, clearing houses, or other financial intermediaries. Such parties could also be the source or cause of an attack on, or breach of, the Company’s operational systems, data or infrastructure. In addition, the Company may be at risk of an operational failure with respect to its customers’ systems. The Company’s risk and exposure to these matters remains heightened because of, among other things, the evolving nature of these threats, the outsourcing of some of the Company’s business operations, and the continued uncertain global economic environment. As cyber threats continue to evolve, the Company may be required to expend significant additional
15
resources to continue to modify or enhance its protective measures or to investigate and remediate any information security vulnerabilities.
The Company maintains insurance policies that it believes provide reasonable coverage at a manageable expense for an institution of the Company’s size and scope with similar technological systems. However, the Company cannot assure that these policies will afford coverage for all possible losses or would be sufficient to cover all financial losses, damages, penalties, including lost revenues, should the Company experience any one or more of the its or a third party’s systems failing or experiencing an attack.
The Company relies on third parties to provide key components of its business infrastructure.
The Company relies on third parties to provide key components for its business operations, such as data processing and storage, recording and monitoring transactions, online banking interfaces and services, internet connections, and network access. While the Company selects these third-party vendors carefully, it does not control their actions. Any problems caused by these third parties, including those resulting from breakdowns or other disruptions in communication services provided by a vendor, failure of a vendor to handle current or higher volumes, cyber-attacks and security breaches at a vendor, failure of a vendor to provide services for any reason, or poor performance by a vendor, could adversely affect the Company’s ability to deliver products and services to its customers and otherwise conduct its business. Financial or operational difficulties of a third-party vendor could also hurt the Company’s operations if those difficulties interfere with the vendor's ability to serve the Company. Replacing these third party vendors also could create significant delays and expense that adversely affect the Company’s business and performance.
A change in the Company’s creditworthiness could increase the Company’s cost of funding or adversely affect its liquidity.
Market participants regularly evaluate the Company’s creditworthiness and the creditworthiness of the Company’s long-term debt based on a number of factors, some of which are not entirely within the Company’s control, including the Company’s financial strength and the financial services industry generally. There can be no assurance that the Company's perceived creditworthiness will remain the same. Changes could adversely affect the cost and other terms upon which the Company is able to obtain funding and its access to the capital markets, and could increase the Company’s cost of capital. Likewise, any loss of or decline in the credit rating assigned to WAB could impair its ability to attract deposits or to obtain other funding sources, or increase its cost of funding.
The Company may not be able to keep pace with its growth by improving its controls and processes, and its reporting systems and procedures, which could cause it to experience compliance and operational problems or lose customers, or incur additional expenditures beyond current projections, any one of which could adversely affect the Company’s financial results.
The Company’s future success will depend on the ability of officers and other key employees to continue to implement and improve operational, credit, financial, management and other internal risk controls and processes, and improve reporting systems and procedures, while at the same time maintaining and growing existing businesses and client relationships. The Company may not successfully implement such changes or improvements in an efficient or timely manner, or it may discover deficiencies in its existing systems and controls that adversely affect the Company’s ability to grow its existing businesses and client relationships and could require the Company to incur additional expenditures to expand its administrative and operational infrastructure. If the Company is unable to maintain and implement improvements to its controls, processes, and reporting systems and procedures, the Company may lose customers, experience compliance and operational problems or incur additional expenditures beyond current projections, any one of which could adversely affect the Company’s financial results.
The Company’s expansion strategy may not prove to be successful and its market value and profitability may suffer.
The Company continually evaluates expansion through acquisitions of banks and other financial businesses, and the expansion of its existing banking divisions through establishment of new branches. In recent years, the Company completed the acquisition of Bridge Capital Holdings and GE’s domestic select-service hotel franchise finance loan business. These acquisitions were, and any future acquisitions will be, accompanied by the risks commonly encountered in such transactions. These risks include, among other things:
• | difficulty of integrating the operations and personnel; |
• | potential disruption of the Company’s ongoing business; |
• | failure to retain key personnel at the acquired business; |
16
• | inability of the Company’s management to maximize its financial and strategic position by the successful implementation of uniform product offerings and the incorporation of uniform technology into the Company’s product offerings and control systems; and |
• | failure to realize any expected revenue increases, cost savings, and other projected benefits from an acquisition. |
The Company expects that competition for suitable acquisition candidates may be significant. The Company may compete with other banks or financial service companies with similar acquisition strategies, many of which are larger and have greater financial and other resources. The Company cannot assure that it will be able to successfully identify and acquire suitable acquisition targets on acceptable terms and conditions, or that it will be able to obtain the regulatory approvals needed to complete any such transactions.
The Company cannot provide any assurance that it will be successful in overcoming these risks or any other problems encountered in connection with acquisitions. Potential regulatory enforcement actions, like a MOU, also may adversely affect the Company's ability to engage in certain expansionary activities. The Company’s inability to overcome the risks inherent in the successful completion and integration of acquisitions could have an adverse effect on the achievement of the Company's business strategy.
The Company’s future success depends on its ability to compete effectively in a highly competitive market.
The Company faces substantial competition in all phases of its operations from a variety of different competitors. The Company’s competitors, including large commercial banks, community banks, thrift institutions, mutual savings banks, credit unions, finance companies, insurance companies, securities dealers, brokers, mortgage bankers, investment advisors, money market mutual funds, and other financial institutions, compete with lending and deposit-gathering services offered by the Company. Increased competition in the Company’s markets may result in reduced loans and deposits or less favorable pricing.
There is competition for financial services in the markets in which the Company conduct its businesses, including from many local commercial banks, as well as numerous national and regionally based commercial banks. In particular, the Company has experienced intense price and terms competition in some of the lending lines of business in recent years. Many of these competing institutions have much greater financial and marketing resources than the Company has. Due to their size, larger competitors can achieve economies of scale and may offer a broader range of products and services or more attractive pricing than the Company. In addition, some of the financial services organizations with which the Company competes are not subject to the same degree of regulation as is imposed on bank holding companies and federally insured depository institutions. As a result, these non-bank competitors have certain advantages over the Company in accessing funding and in providing various services.
The banking business in the Company’s primary market areas is very competitive, and the level of competition facing the Company may increase further, which may limit its asset growth and financial results. In particular, the Company's predominate source of revenue is net interest income from its loan portfolio. Therefore, if the Company is unable to compete effectively, including sustaining loan growth at its historical levels, its business and results of operations may be adversely affected.
The Company’s success is dependent upon its ability to recruit and retain qualified employees.
The Company’s business plan includes and is dependent upon hiring and retaining highly qualified and motivated executives and employees at every level. In particular, the Company’s relative success to date has been partly the result of its management’s ability to identify and retain highly qualified employees in both administrative support roles, as well as those with expertise in certain specialty areas, or that have long-standing relationships in their communities. These professionals bring with them valuable knowledge and customer relationships and have been an integral part of the Company’s ability to attract deposits and to expand its market share. If the Company is unable to hire or retain qualified employees, it may not be able to successfully execute its business strategy or may incur additional costs to achieve its objectives.
The Company could be harmed if its succession planning is inadequate to mitigate the loss of key members of its senior management team.
The Company believes that its success to date has been substantially dependent on its senior management team, including, but not limited to, Robert Sarver, Chairman and CEO; Dale Gibbons, CFO; Robert R. McAuslan, CCO; John Guedry, Executive Vice President-Southern Nevada Administration; Don Garner, Executive Vice President-Arizona Administration; Daniel Myers, Executive Vice President-Northern California Administration; and Gerald Cady, Executive Vice President-Southern California Administration. The Company also believes that its prospects for success in the future are dependent on retaining its senior management team. In addition to their skills and experience as bankers, these persons provide the Company with strong relationships in the investment community, as well as extensive ties within local markets upon which the Company’s
17
competitive strategy is based. The Company’s ability to retain these persons may be hindered by the fact that it has not entered into employment agreements with any of them. The loss of the services of any of these persons, particularly Mr. Sarver, could have an adverse effect on the Company’s business if the Company does not have an effective succession plan in place and cannot replace them with equally qualified persons who are also familiar with its market areas.
Mr. Sarver’s involvement in outside business interests requires substantial time and attention and may adversely affect the Company’s ability to achieve its strategic plan.
Mr. Sarver joined the Company in December 2002 and is an integral part of the Company’s business. He has substantial business interests that are unrelated to the Company, including his position as managing partner of the Phoenix Suns National Basketball Association franchise and his recent purchase of a Spanish soccer team, RCD Mallorca Football Club. Mr. Sarver’s other business interests demand significant time commitments, the intensity of which may vary throughout the year. Mr. Sarver’s other commitments may reduce the amount of time he has available to devote to the Company’s business. The Company believes that Mr. Sarver spends the substantial majority of his business time on matters related to the Company. However, a significant reduction in the amount of time Mr. Sarver devotes to the Company’s business may adversely affect its ability to achieve the Company’s strategic plan.
The Company's risk management practices may prove to be inadequate or not fully effective.
The Company's risk management framework seeks to mitigate risk and appropriately balance risk and return. The Company has established policies and procedures intended to identify, monitor, and manage the types of risk to which it is subject, including credit risk, market risk, liquidity risk, operational risk, compliance risk, and reputational risk. A BOD level risk committee approves and reviews the Company's risk management policies and oversees operation of the Company's risk management framework. Although the Company has devoted significant resources to developing its risk management policies and procedures and expects to continue to do so in the future, these policies and procedures, as well as the Company's risk management techniques, may not be fully effective. In addition, as regulations and the markets in which the Company operates continue to evolve, the Company's risk management framework may not always keep sufficient pace with those changes. If the Company's risk management framework does not effectively identify or mitigate its risks, the Company could suffer unexpected losses and could be materially adversely affected. Management of the Company's risks in some cases depends upon the use of analytical and/or forecasting models. If the models the Company uses to mitigate these risks are inadequate, or are subject to ineffective governance policies, the Company may incur increased losses. In addition, there may be risks that exist, or that develop in the future, that the Company has not appropriately anticipated, identified, or mitigated.
The Company's internal controls and procedures may fail or be circumvented and the accuracy of the Company's judgments and estimates about financial and accounting matters may impact operating results and financial condition.
The Company's management regularly reviews and updates its internal control over financial reporting, disclosure controls and procedures, and corporate governance policies and procedures. Any system of controls and procedures, however well designed and operated, is based in part on certain assumptions and can provide only reasonable, not absolute, assurances that the objectives of the system are met. Any failure or circumvention of the Company's controls and procedures or failure to comply with regulations related to controls and procedures could result in materially inaccurate reported financial statements and/or have a material adverse effect on the Company's business, results of operations, and financial condition. Similarly, the Company's management makes certain estimates and judgments in preparing the Company's financial statements. The quality and accuracy of those estimates and judgments will impact the Company's operating results and financial condition.
There are substantial risks and uncertainties associated with the introduction or expansion of lines of business or new products and services within existing lines of business.
From time to time, the Company may implement new lines of business or offer new products and services within existing lines of business. There are substantial risks and uncertainties associated with these efforts, particularly in instances where the markets are not fully developed. In developing and marketing new lines of business and/or new products and services, the Company may invest significant time and resources. Initial timetables for the introduction and development of new lines of business and/or new products or services may not be achieved and price and profitability targets may not prove attainable. External factors, such as compliance with regulations, competitive alternatives, and shifting market preferences, may also impact the successful implementation of a new line of business or a new product or service. Furthermore, any new line of business and/or new product or service could have a significant impact on the effectiveness of the Company’s system of internal controls. Failure to successfully manage these risks in the development and implementation of new lines of business or new products or services could have a material adverse effect on the Company’s business, results of operations, and financial condition.
18
If the Company is unable to understand and adapt to technological change, the Company’s business could be adversely affected.
The financial services industry is continually undergoing rapid technological change with frequent introductions of new technology-driven products and services. The effective use of technology can increase efficiency and enable financial institutions to better serve customers and to reduce costs. However, some new technologies needed to compete effectively result in incremental operating costs. The Company’s future success depends, in part, upon its ability to address the needs of its customers by using technology to provide products and services that will satisfy customer demands, as well as to create additional efficiencies in operations. Many of the Company’s competitors, because of their larger size and available capital, have substantially greater resources to invest in technological improvements. The Company may not be able to effectively implement new technology-driven products and services or be successful in marketing these products and services to its customers. Failure to successfully keep pace with technological change affecting the financial services industry could have a material adverse impact on the Company’s business and, in turn, its financial condition and results of operations.
The markets in which the Company operates are subject to the risk of earthquakes and other natural disasters.
The Company's acquisition of Bridge Capital Holdings in 2015 substantially increased the Company's presence in the State of California, and many of the real and personal properties securing the Company's loans are located in California. California is experiencing a long-term drought and is prone to earthquakes, brush fires, flooding, and other natural disasters. In addition to possibly sustaining damage to the Company's own properties, if there is a major earthquake, flood, or other natural disaster in California or any of its other markets, the Company faces the risk that many of its borrowers may experience uninsured property losses, or sustained job interruption and/or loss, which may materially impair their ability to meet the terms of their loan obligations. Therefore, the continuing drought in California, or an earthquake, flood, pandemic, or other natural disaster or catastrophic event, or a combination of these or other factors, in any of the Company's markets could have a material adverse effect on the Company's business, financial condition, results of operations, and cash flows.
Risks Related to the Banking Industry
The Company operates in a highly regulated environment and the laws and regulations that govern the Company’s operations, corporate governance, executive compensation, and accounting principles, or changes in them, or the Company’s failure to comply with them, may adversely affect the Company.
The Company is subject to extensive regulation, supervision, and legislation that govern almost all aspects of its operations. Intended to protect customers, depositors, and the DIF, these laws and regulations, among other matters, prescribe minimum capital requirements, impose limitations on the business activities in which the Company can engage, limit the dividends or distributions that WAB can pay to the Company or that the Company can pay to its stockholders, restrict the ability of affiliates to guarantee the Company’s debt, impose certain specific accounting requirements on the Company that may be more restrictive and may result in greater or earlier charges to earnings or reductions in the Company’s capital than GAAP, among other things. Compliance with laws and regulations can be difficult and costly, and changes to laws and regulations often impose significant additional compliance costs. To the extent the Company continues to grow larger and become more complex, regulatory oversight and risk and the cost of compliance will likely increase, which may adversely affect the Company. See “Management’s Discussion and Analysis of Financial Condition and Results of Operations - Supervision and Regulation” included in this Form 10-K for a more detailed summary of the regulations and supervision to which the Company are subject.
Since the recent financial crisis, financial institutions generally have been subjected to increased scrutiny from regulatory authorities. Recent changes to the legal and regulatory framework governing the Company’s operations, including the passage and continued implementation of the Dodd-Frank Act, have drastically revised the laws and regulations under which the Company operates. These changes may result in increased costs of doing business, and decreased revenues and net income, and may reduce the Company’s ability to effectively compete in attracting and retaining customers. In general, bank regulators have increased their focus on risk management and regulatory compliance, and the Company expects this focus to continue. Additional compliance requirements are likely and can be costly to implement, may require additional compliance personnel, and may limit the Company’s ability to offer competitive products to its customers.
The Company is also subject to changes in federal and state law, as well as regulations and governmental policies, income tax laws, and accounting principles. Regulations affecting banks and other financial institutions are undergoing continuous review and frequently change, and the ultimate effect of such changes cannot be predicted. Regulations and laws may be modified at any time, and new legislation may be enacted that will affect the Company, WAB, and the Company’s other subsidiaries. Any changes in any federal and state law, as well as regulations and governmental policies, income tax laws, and accounting principles, could affect the Company in substantial and unpredictable ways, including ways that may adversely affect the Company’s business, financial condition, or results of operations. Failure to appropriately comply with any such laws,
19
regulations or principles or an alleged failure to comply, even if the Company acted in good faith or the alleged failure reflects a difference in interpretation, could result in sanctions by regulatory agencies, civil money penalties or damage to the Company’s reputation, all of which could adversely affect the Company’s business, financial condition, or results of operations.
State and federal banking agencies periodically conduct examinations of the Company’s business, including for compliance with laws and regulations, and the Company’s failure to comply with any supervisory actions to which the Company is or becomes subject as a result of such examinations may adversely affect the Company.
State and federal banking agencies periodically conduct examinations of the Company’s business, including for compliance with laws and regulations. If, as a result of an examination, an agency were to determine that the financial condition, capital resources, asset quality, earnings prospects, management, liquidity, or other aspects of any of the Company’s operations had become unsatisfactory, or that any of the Company’s banks or their management was in violation of any law or regulation, federal banking agencies may take a number of different remedial or enforcement actions it deems appropriate to remedy such a deficiency. These actions include the power to enjoin “unsafe or unsound” practices, to require affirmative actions to correct any conditions resulting from any violation or practice, to issue an administrative order that can be judicially enforced, to direct an increase in the bank’s capital, to restrict the bank’s growth, to assess civil monetary penalties against the bank’s officers or directors, to remove officers and directors and, if the FDIC concludes that such conditions cannot be corrected or there is an imminent risk of loss to depositors, to terminate the bank’s deposit insurance. Under Arizona law, the state banking supervisory authority has many of the same enforcement powers with respect to its state-chartered banks. Finally, the CFPB has the authority to examine the Company and has authority to take enforcement actions, including the issuance of cease-and-desist orders or civil monetary penalties against the Company if it finds that the Company offers consumer financial products and services in violation of federal consumer financial protection laws or in an unfair, deceptive, or abusive manner.
If the Company were unable to comply with regulatory directives in the future, or if the Company were unable to comply with the terms of any future supervisory requirements to which the Company may become subject, then it could become subject to a variety of supervisory actions and orders, including cease and desist orders, prompt corrective actions, MOUs, and/or other regulatory enforcement actions. If the Company’s regulators were to take such supervisory actions, then the Company could, among other things, become subject to greater restrictions on its ability to make acquisition and develop any new business, as well as restrictions on its existing business, and the Company could be required to raise additional capital, dispose of certain assets and liabilities within a prescribed period of time, or both. Failure to implement the measures in the time frames provided, or at all, could result in additional orders or penalties from federal and state regulators, which could result in one or more of the remedial actions described above. In the event WAB was ultimately unable to comply with the terms of a regulatory enforcement action, it could ultimately fail and be placed into receivership by the chartering agency. The terms of any such supervisory action and the consequences associated with any failure to comply therewith could have a material negative effect on the Company’s business, operating flexibility, and financial condition.
Changes in interest rates and increased rate competition could adversely affect the Company’s profitability, business, and prospects.
Most of the Company’s assets and liabilities are monetary in nature, which subjects the Company to significant risks from changes in interest rates and can impact the Company’s net income and the valuation of its assets and liabilities. Increases or decreases in prevailing interest rates could have an adverse effect on the Company’s business, asset quality, and prospects. The Company’s operating income and net income depend to a great extent on its net interest margin. Net interest margin is the difference between the interest yields the Company receives on loans, securities, and other earning assets and the interest rates the Company pays on interest bearing deposits, borrowings, and other liabilities. These rates are highly sensitive to many factors beyond the Company’s control, including competition, general economic conditions, and monetary and fiscal policies of various governmental and regulatory authorities, including the FRB. If the rate of interest the Company pays on its interest bearing deposits, borrowings, and other liabilities increases more than the rate of interest the Company receives on loans, securities, and other earning assets increases, the Company’s net interest income, and therefore its earnings, would be adversely affected. The Company’s earnings also could be adversely affected if the rates on the Company’s loans and other investments fall more quickly than those on its deposits and other liabilities. The Company has recently experienced increased competition for loans on the basis of interest rates.
In addition, loan volumes are affected by market interest rates on loans. Rising interest rates generally are associated with a lower volume of loan originations, while lower interest rates are usually associated with higher loan originations. Conversely, in rising interest rate environments, loan repayment rates will decline and in falling interest rate environments, loan repayment rates will increase. The Company cannot guarantee that it will be able to minimize interest rate risk. In addition, an increase in the general level of interest rates may adversely affect the ability of certain borrowers to pay the interest on and principal of their obligations.
20
Interest rates also affect how much money the Company can lend. When interest rates rise, the cost of borrowing increases. Accordingly, changes in market interest rates could materially and adversely affect the Company’s net interest spread, asset quality, loan origination volume, business, financial condition, results of operations, and cash flows.
The Company is exposed to risk of environmental liabilities with respect to properties to which the Company obtains title.
Approximately 55% of the Company’s loan portfolio at December 31, 2016 was secured by real estate. In the course of the Company’s business, the Company may foreclose on and take title to real estate, and could be subject to environmental liabilities with respect to these properties. The Company may be held liable to a governmental entity or to third parties for property damage, personal injury, investigation, and clean-up costs incurred by these parties in connection with environmental contamination, or may be required to investigate or clean up hazardous or toxic substances, or chemical releases at a property. The costs associated with investigation or remediation activities could be substantial. In addition, if the Company is the owner or former owner of a contaminated site, the Company may be subject to common law claims by third parties based on damages and costs resulting from environmental contamination emanating from the property. These costs and claims could be substantial and adversely affect the Company’s business and prospects.
Risks Related to the Company's Common Stock
The price of the Company’s common stock has increased substantially since the U.S. Presidential Election in November 2016 and may fluctuate significantly in the future.
The price of the Company’s common stock on New York Stock Exchange constantly changes, and has increased substantially since the U.S. Presidential Election in November 2016 based on assumptions related to increased interest rates, tax policy, and deregulation in the financial services industry. The Company expects that the market price of its common stock will continue to fluctuate and there can be no assurances about the market price for its common stock.
The Company’s stock price may fluctuate as a result of a variety of factors, many of which are beyond the Company’s control. These factors include:
• | changes in the political climate; |
• | sales of the Company’s equity securities; |
• | the Company’s financial condition, performance, creditworthiness, and prospects; |
• | quarterly variations in the Company’s operating results or the quality of its assets; |
• | operating results that vary from the expectations of management, securities analysts, and investors; |
• | changes in expectations as to the Company’s future financial performance; |
• | announcements of strategic developments, acquisitions, and other material events by the Company or its competitors; |
• | the operating and securities price performance of other companies that investors believe are comparable to the Company; |
• | the credit, mortgage, and housing markets, the markets for securities relating to mortgages or housing, and developments with respect to financial institutions generally; |
• | changes in global financial markets and global economies and general market conditions, such as interest or foreign exchange rates, stock, commodity or real estate valuations or volatility and other geopolitical, regulatory or judicial events; and |
• | the Company’s past and future dividend practices. |
There may be future sales or other dilution of the Company’s equity, which may adversely affect the market price of the Company’s common stock.
The Company is not restricted from issuing additional common stock, including any securities that are convertible into or exchangeable for, or that represent the right to receive, common stock. The Company also grants a significant number of shares of common stock to employees and directors under the Company’s Incentive Plan each year. The issuance of any additional shares of the Company’s common stock or preferred stock or securities convertible into, exchangeable for or that represent the right to receive common stock, or the exercise of such securities could be substantially dilutive to stockholders of the
21
Company’s common stock. Holders of the Company’s common stock have no preemptive rights that entitle such holders to purchase their pro rata share of any offering of shares of any class or series. Because the Company’s decision to issue securities in any future offering will depend on market conditions, its acquisition activity, and other factors, the Company cannot predict or estimate the amount, timing, or nature of its future offerings. Thus, the Company’s stockholders bear the risk of the Company’s future offerings reducing the market price of the Company’s common stock and diluting their stock holdings in the Company.
Offerings of debt, which would be senior to the Company’s common stock upon liquidation, and/or preferred equity securities which may be senior to the Company’s common stock for purposes of dividend distributions or upon liquidation, may adversely affect the market price of the Company’s common stock.
The Company may from time to time issue debt securities, borrow money through other means, or issue preferred stock. From time to time the Company borrows money from the FRB, the FHLB, other financial institutions, and other lenders. In June 2016, the Company issued $175,000,000 of subordinated debentures with a maturity date of July 1, 2056, at an interest rate of 6.25%. In June 2015, WAB issued $150,000,000 aggregate principal amount of 5.00% Fixed-to-Floating Rate Subordinated Notes due July 15, 2025. All of these securities or borrowings have priority over the common stock in a liquidation, which could affect the market price of the Company’s stock.
The Company’s BOD is authorized to issue one or more classes or series of preferred stock from time to time without any action on the part of the stockholders. The Company’s BOD also has the power, without stockholder approval, to set the terms of any such classes or series of preferred stock that may be issued, including voting rights, dividend rights, and preferences over the Company’s common stock with respect to dividends or upon the Company’s dissolution, winding-up, and liquidation and other terms. If the Company issues preferred stock in the future that has a preference over its common stock, with respect to the payment of dividends or upon the Company’s liquidation, dissolution, or winding up, or if the Company issues preferred stock with voting rights that dilute the voting power of its common stock, the rights of holders of its common stock, the market price of its common stock could be adversely affected.
Anti-takeover provisions could negatively impact the Company’s stockholders.
Provisions of Delaware law and provisions of the Company’s Certificate of Incorporation, as amended, and its Amended and Restated Bylaws could make it more difficult for a third party to acquire control of the Company or have the effect of discouraging a third party from attempting to acquire control of the Company. Additionally, the Company’s Certificate of Incorporation, as amended, authorizes the Company’s BOD to issue additional series of preferred stock and such preferred stock could be issued as a defensive measure in response to a takeover proposal. These provisions could make it more difficult for a third party to acquire the Company even if an acquisition might be in the best interest of the Company’s stockholders.
Item 1B. | Unresolved Staff Comments |
None.
22
Item 2. | Properties |
At December 31, 2016, the Company and WAB are headquartered at One E. Washington Street in Phoenix, Arizona. WAB operates 40 domestic branch locations, which includes 6 executive and administrative offices, 18 of these locations are owned and 22 are leased. The Company also has 8 loan production offices and 6 other leased locations. In addition, WAB owns and occupies a 36,000 square foot operations facility in Las Vegas, Nevada and has 2 locations under construction. See "Item 1. Business” for location cities. For information regarding rental payments, see "Note 5. Premises and Equipment" of the Consolidated Financial Statements included in this Form 10-K.
Item 3. | Legal Proceedings |
There are no material pending legal proceedings to which the Company is a party or to which any of its properties are subject. There are no material proceedings known to the Company to be contemplated by any governmental authority. See the “Supervision and Regulation” section of "Item 7. Management's Discussion and Analysis of Financial Condition and Results of Operations" of this Form 10-K for additional information. From time to time, the Company is involved in a variety of litigation matters in the ordinary course of its business and anticipates that it will become involved in new litigation matters in the future.
Item 4. | Mine Safety Disclosures |
Not applicable.
23
PART II
Item 5. | Market for Registrant's Common Equity, Related Stockholder Matters and Issuer Purchases of Equity Securities. |
Market Information
The Company’s common stock began trading on the New York Stock Exchange under the symbol “WAL” on June 30, 2005. The Company has filed, without qualifications, its 2016 Domestic Company Section 303A CEO Certification regarding its compliance with the NYSE’s corporate governance listing standards. The following table presents the high and low sales prices of the Company’s common stock for each quarterly period for the last two years as reported by The NASDAQ Global Select Market:
2016 Quarters | 2015 Quarters | |||||||||||||||||||||||||||||||
Fourth | Third | Second | First | Fourth | Third | Second | First | |||||||||||||||||||||||||
Range of stock prices: | ||||||||||||||||||||||||||||||||
High | $ | 50.72 | $ | 38.55 | $ | 38.36 | $ | 35.42 | $ | 39.11 | $ | 35.17 | $ | 34.95 | $ | 30.41 | ||||||||||||||||
Low | 35.56 | 30.69 | 29.72 | 26.60 | 29.12 | 28.42 | 28.91 | 24.52 | ||||||||||||||||||||||||
Holders
At December 31, 2016, there were approximately 1,511 stockholders of record. This number does not include stockholders who hold shares in the name of brokerage firms or other financial institutions. The Company is not provided the exact number of or identities of these stockholders. There are no other classes of common equity outstanding.
Dividends
WAL is a legal entity separate and distinct from WAB and LVSP. As a holding company with limited significant assets other than the capital stock of its subsidiaries, WAL's ability to pay dividends depends primarily upon the receipt of dividends or other capital distributions from its subsidiaries. The Company's subsidiaries ability to pay dividends to WAL is subject to, among other things, their individual earnings, financial condition, and need for funds, as well as federal and state governmental policies and regulations applicable to WAL and each of those subsidiaries, which limit the amount that may be paid as dividends without prior approval. See the additional discussion in the “Supervision and Regulation” section of this report for information regarding restrictions on the ability to pay cash dividends. In addition, the terms and conditions of other securities the Company issues may restrict its ability to pay dividends to holders of the Company's common stock. For example, if any required payments on outstanding trust preferred securities are not made, WAL would be prohibited from paying cash dividends on its common stock. WAL has never paid a cash dividend on its common stock and does not anticipate paying any cash dividends in the foreseeable future.
Sale of Unregistered Securities
None.
Share Repurchases
There were no shares repurchased during 2016 or 2015.
24
Performance Graph
The following graph summarizes a five year comparison of the cumulative total returns for the Company’s common stock, the Standard & Poor’s 500 stock index and the KBW Regional Banking Total Return Index, each of which assumes an initial value of $100.00 on December 31, 2011 and reinvestment of dividends.
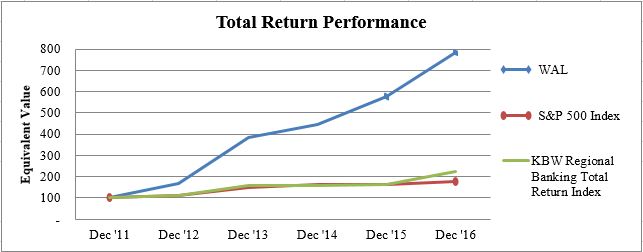
25
Item 6. | Selected Financial Data. |
The following selected financial data have been derived from the Company’s consolidated financial condition and results of operations, as of and for the years ended December 31, 2016, 2015, 2014, 2013, and 2012, and should be read in conjunction with the Consolidated Financial Statements and the related notes included elsewhere in this report:
Year Ended December 31, | ||||||||||||||||||||
2016 | 2015 | 2014 | 2013 | 2012 | ||||||||||||||||
(in thousands) | ||||||||||||||||||||
Results of Operations: | ||||||||||||||||||||
Interest income | $ | 700,506 | $ | 525,144 | $ | 416,379 | $ | 362,655 | $ | 318,295 | ||||||||||
Interest expense | 43,293 | 32,568 | 31,486 | 29,760 | 28,032 | |||||||||||||||
Net interest income | 657,213 | 492,576 | 384,893 | 332,895 | 290,263 | |||||||||||||||
Provision for credit losses | 8,000 | 3,200 | 4,726 | 13,220 | 46,844 | |||||||||||||||
Net interest income after provision for credit losses | 649,213 | 489,376 | 380,167 | 319,675 | 243,419 | |||||||||||||||
Non-interest income | 42,915 | 29,768 | 24,651 | 22,197 | 46,505 | |||||||||||||||
Non-interest expense | 330,949 | 260,606 | 207,319 | 196,216 | 188,860 | |||||||||||||||
Income from continuing operations before provision for income taxes | 361,179 | 258,538 | 197,499 | 145,656 | 101,064 | |||||||||||||||
Income tax expense | 101,381 | 64,294 | 48,390 | 29,830 | 25,935 | |||||||||||||||
Income from continuing operations | 259,798 | 194,244 | 149,109 | 115,826 | 75,129 | |||||||||||||||
Loss from discontinued operations, net of tax | — | — | (1,158 | ) | (861 | ) | (2,490 | ) | ||||||||||||
Net income | $ | 259,798 | $ | 194,244 | $ | 147,951 | $ | 114,965 | $ | 72,639 | ||||||||||
On April 20, 2016, the Company completed its acquisition of GE Capital US Holdings, Inc.'s domestic select-service HFF loan portfolio. As a result, the results of operations from the HFF segment are included in the Company's results beginning on this date. See "Note 2. Mergers, Acquisitions and Dispositions" for further discussion of the impact of the acquisition on the Company's Consolidated Financial Statements.
26
Year Ended December 31, | ||||||||||||||||||||
2016 | 2015 | 2014 | 2013 | 2012 | ||||||||||||||||
(in thousands, except per share data) | ||||||||||||||||||||
Per Share Data: | ||||||||||||||||||||
Earnings per share available to common stockholders - basic | $ | 2.52 | $ | 2.05 | $ | 1.69 | $ | 1.33 | $ | 0.84 | ||||||||||
Earnings per share available to common stockholders - diluted | 2.50 | 2.03 | 1.67 | 1.31 | 0.83 | |||||||||||||||
Earnings per share from continuing operations - basic | 2.52 | 2.05 | 1.70 | 1.34 | 0.87 | |||||||||||||||
Earnings per share from continuing operations - diluted | 2.50 | 2.03 | 1.69 | 1.32 | 0.86 | |||||||||||||||
Book value per common share | 18.00 | 15.44 | 10.49 | 8.20 | 7.15 | |||||||||||||||
Shares outstanding at period end | 105,071 | 103,087 | 88,691 | 87,186 | 86,465 | |||||||||||||||
Weighted average shares outstanding - basic | 103,042 | 94,570 | 86,693 | 85,682 | 82,285 | |||||||||||||||
Weighted average shares outstanding - diluted | 103,843 | 95,219 | 87,506 | 86,541 | 82,912 | |||||||||||||||
Selected Balance Sheet Data: | ||||||||||||||||||||
Cash and cash equivalents | $ | 284,491 | $ | 224,640 | $ | 164,396 | $ | 305,514 | $ | 204,625 | ||||||||||
Investment securities and money market investments | 2,702,512 | 1,984,126 | 1,522,546 | 1,659,370 | 1,236,648 | |||||||||||||||
Loans, net of deferred loan fees and costs | 13,208,436 | 11,136,663 | 8,398,265 | 6,801,415 | 5,709,318 | |||||||||||||||
Allowance for credit losses | 124,704 | 119,068 | 110,216 | 100,050 | 95,427 | |||||||||||||||
Total assets | 17,200,842 | 14,275,089 | 10,600,498 | 9,307,342 | 7,622,442 | |||||||||||||||
Total deposits | 14,549,863 | 12,030,624 | 8,931,043 | 7,838,205 | 6,455,177 | |||||||||||||||
Other borrowings | 80,000 | 150,000 | 390,263 | 341,096 | 193,717 | |||||||||||||||
Qualifying debt | 367,937 | 210,328 | 40,437 | 41,858 | 36,218 | |||||||||||||||
Total stockholders' equity | 1,891,529 | 1,591,502 | 1,000,928 | 855,498 | 759,421 | |||||||||||||||
Selected Other Balance Sheet Data: | ||||||||||||||||||||
Average assets | $ | 16,134,263 | $ | 12,420,803 | $ | 9,891,109 | $ | 8,500,324 | $ | 7,193,425 | ||||||||||
Average earning assets | 15,117,364 | 11,621,977 | 9,270,465 | 7,887,584 | 6,685,107 | |||||||||||||||
Average stockholders' equity | 1,770,914 | 1,323,952 | 964,131 | 798,497 | 691,004 | |||||||||||||||
Selected Financial and Liquidity Ratios: | ||||||||||||||||||||
Return on average assets | 1.61 | % | 1.56 | % | 1.50 | % | 1.35 | % | 1.01 | % | ||||||||||
Return on average tangible common equity | 17.71 | 17.83 | 18.52 | 18.28 | 13.97 | |||||||||||||||
Net interest margin | 4.58 | 4.51 | 4.42 | 4.39 | 4.49 | |||||||||||||||
Loan to deposit ratio | 90.78 | 92.57 | 94.03 | 86.77 | 88.45 | |||||||||||||||
Capital Ratios: | ||||||||||||||||||||
Tier 1 leverage ratio | 9.9 | % | 9.8 | % | 9.7 | % | 9.8 | % | 10.1 | % | ||||||||||
Tier 1 capital ratio | 10.5 | 10.2 | 10.5 | 11.1 | 11.3 | |||||||||||||||
Total capital ratio | 13.2 | 12.2 | 11.7 | 12.4 | 12.6 | |||||||||||||||
Average equity to average assets | 11.0 | 10.7 | 9.7 | 9.4 | 9.6 | |||||||||||||||
Selected Asset Quality Ratios: | ||||||||||||||||||||
Non-accrual loans to gross loans | 0.31 | % | 0.44 | % | 0.81 | % | 1.11 | % | 1.83 | % | ||||||||||
Non-accrual loans and repossessed assets to total assets | 0.51 | 0.65 | 1.18 | 1.53 | 2.39 | |||||||||||||||
Loans past due 90 days or more and still accruing to total loans | 0.01 | 0.03 | 0.06 | 0.02 | 0.02 | |||||||||||||||
Allowance for credit losses to total loans | 0.95 | 1.07 | 1.31 | 1.47 | 1.67 | |||||||||||||||
Allowance for credit losses to non-accrual loans | 309.65 | 246.10 | 162.90 | 132.20 | 91.13 | |||||||||||||||
Net charge-offs (recoveries) to average loans | 0.02 | (0.06 | ) | (0.07 | ) | 0.14 | 0.99 | |||||||||||||
27
Item 7. | Management's Discussions and Analysis of Financial Condition and Results of Operations. |
The following discussion and analysis is designed to provide insight on the financial condition and results of operations of Western Alliance Bancorporation and its subsidiaries and should be read in conjunction with “Item 8. Financial Statements and Supplementary Data.” This discussion and analysis contains forward-looking statements that involve risk, uncertainties, and assumptions. Certain risks, uncertainties, and other factors, including, but not limited to, those set forth under “Forward-Looking Statements” at the beginning of Part I of this Form 10-K and those discussed in Part I, Item 1A of this Form 10-K under the heading "Risk Factors," may cause actual results to differ materially from those projected in the forward-looking statements.
Financial Overview and Highlights
WAL is a bank holding company headquartered in Phoenix, Arizona, incorporated under the laws of the state of Delaware. WAL provides a full spectrum of deposit, lending, treasury management, international banking, and online banking products and services through its wholly-owned banking subsidiary, WAB.
WAB operates the following full-service banking divisions: ABA, BON, Bridge, FIB, and TPB. The Company also serves business customers through a national platform of specialized financial services including AAB, Corporate Finance, Equity Fund Resources, HFF, Life Sciences Group, Mortgage Warehouse Lending, Public and Nonprofit Finance, Renewable Resource Group, Resort Finance, and Technology Finance.
Financial Result Highlights of 2016
• | Net income available to common stockholders of $259.8 million for 2016, compared to $193.5 million for 2015 |
• | Diluted earnings per share of $2.50 for 2016, and $2.03 per share for 2015 |
• | Operating PPNR increased $112.5 million to $380.4 million, compared to $267.9 million in 20151 |
• | Net operating revenue of $699.1 million, constituting year-over-year growth of 34.0%, or $177.3 million, compared to an increase in operating non-interest expenses of 25.5%, or $64.8 million1 |
• | Net interest margin of 4.58% in 2016, compared to 4.51% in 2015 |
• | Efficiency ratio of 45.0% in 2016, compared to 47.0% in 2015 |
• | Operating efficiency ratio of 43.4% in 2016, compared to 45.8% in 20151 |
• | Total loans of $13.21 billion, up $2.07 billion from December 31, 2015 |
• | Total deposits of $14.55 billion, up $2.52 billion from December 31, 2015 |
• | Nonperforming assets (nonaccrual loans and repossessed assets) decreased to 0.51% of total assets, from 0.65% at December 31, 2015 |
• | Net loan charge-offs (recoveries) to average loans outstanding of 0.02%, compared to (0.06)% at December 31, 2015 |
• | Tangible common equity ratio of 9.4%, compared to 9.2% at December 31, 20151 |
• | Stockholders' equity of $1.89 billion, an increase of $300.0 million from December 31, 2015 |
• | Book value per common share of $18.00, an increase of 16.6% from $15.44 at December 31, 2015 |
• | Tangible book value per share, net of tax, of $15.17, an increase of 21.0% from $12.54 at December 31, 20151 |
The impact to the Company from these items, and others of both a positive and negative nature, are discussed in more detail below as they pertain to the Company’s overall comparative performance for the year ended December 31, 2016.
1 See Non-GAAP Financial Measures section beginning on page 33.
28
Acquisition of GE Capital US Holdings, Inc. Loan Portfolio
On April 20, 2016, WAB completed its acquisition of GE Capital US Holdings, Inc.'s domestic select-service hotel franchise finance loan portfolio, paying cash of $1.27 billion. The acquisition was undertaken, in part, because it expands the Company's national reach and diversifies the Company's loan portfolio.
Effective April 20, 2016, the results of the acquired loan portfolio are reflected in the Company's newly created HFF NBL operating segment. Acquisition / restructure expenses related to the purchase total $4.3 million for the year ended December 31, 2016, of which approximately $0.6 million are acquisition related costs as defined by ASC 805. The transaction was accounted for under the acquisition method of accounting in accordance with ASC 805. Assets purchased and liabilities assumed were recorded at their respective acquisition date estimated fair values. The fair values of assets acquired and liabilities assumed are subject to adjustment during the first twelve months after the acquisition date if additional information becomes available to indicate a more accurate or appropriate value for an asset or liability. Although there have been no measurement period adjustments identified to date and any future adjustments are not expected to be significant, the fair values of loans is still preliminary as of December 31, 2016.
The recognized amounts of identifiable assets acquired and liabilities assumed are as follows:
April 20, 2016 | |||
(in thousands) | |||
Assets: | |||
Loans | $ | 1,280,997 | |
Other assets | 3,560 | ||
Total assets | $ | 1,284,557 | |
Liabilities: | |||
Other liabilities | $ | 12,559 | |
Total liabilities | 12,559 | ||
Net assets acquired | $ | 1,271,998 | |
Consideration paid | |||
Cash | $ | 1,272,187 | |
Goodwill | $ | 189 | |
Loans acquired consist of loans that are not considered impaired (non-PCI loans) and loans that have shown evidence of credit deterioration since origination (PCI loans) as of the acquisition date. All loans were recorded net of fair value adjustments (interest rate and credit marks), which were determined using discounted contractual cash flow models. The fair value of non-PCI loans acquired totals $1.19 billion, which is net of interest and credit marks of $43.3 million. The fair value of PCI loans totals $93.3 million, which is net of interest and credit marks of $17.0 million. See "Note 4. Loans, Leases and Allowance for Credit Losses" of the Notes to Consolidated Financial Statements for additional detail of the acquired loans.
Acquisition of Bridge Capital Holdings
On June 30, 2015, the Company completed its acquisition of Bridge Capital Holdings and its wholly-owned subsidiary, Bridge Bank, headquartered in San Jose, California. Under the terms of the acquisition, each outstanding share of Bridge common stock was exchanged for 0.8145 shares of WAL's common stock plus $2.39 in cash. The Company paid $36.5 million in cash and issued 12.5 million common shares for all equity interests in Bridge. The merger was undertaken, in part, because Bridge strengthens the Company's Northern California presence and provides new avenues for growth in technology and international services.
Bridge’s results of operations have been included in the Company’s results beginning July 1, 2015. Acquisition / restructure expenses related to the Bridge acquisition of $8.8 million for the year ended December 31, 2015, have been included in non-interest expense, of which approximately $0.9 million are acquisition related costs as defined by ASC 805. The acquisition was accounted for under the acquisition method of accounting in accordance with ASC 805. Assets purchased and liabilities assumed were recorded at their respective acquisition date estimated fair values.
The fair values of assets acquired and liabilities assumed are subject to adjustment during the first twelve months after the acquisition date if additional information becomes available to indicate a more accurate or appropriate value for an asset or liability. Due to early adoption of the amended guidance within ASU 2015-16, Simplifying the Accounting for Measurement-Period Adjustments, as discussed in "Note 1. Summary of Significant Accounting Policies," these adjustments to provisional amounts identified during the measurement period are recognized in the reporting period in which the adjustment amounts are
29
determined, rather than retrospectively adjusting the provisional amounts at the acquisition date. The Company identified net measurement period adjustments totaling $6.9 million since July 1, 2015, which have been reflected as an adjustment to increase goodwill. The significant measurement period adjustments relate to loans, net deferred tax assets, and other liabilities. The measurement period for the Bridge acquisition ended on June 30, 2016. Therefore, the fair value of these assets acquired and liabilities assumed were considered final effective June 30, 2016.
The following table shows the recognized amounts of identifiable assets acquired and liabilities assumed at their as adjusted acquisition date fair values, which include all measurement period adjustments identified and recognized since July 1, 2015:
As Adjusted | |||
(in thousands) | |||
Assets: | |||
Cash and cash equivalents (1) | $ | 378,966 | |
Investment securities - AFS | 61,476 | ||
Investments in restricted stock | 7,015 | ||
Loans | 1,439,660 | ||
Premises and equipment | 1,519 | ||
Other assets acquired through foreclosure | 1,407 | ||
Bank owned life insurance | 17,385 | ||
Investment in LIHTC | 5,354 | ||
Intangible assets | 14,997 | ||
Deferred tax assets, net | 18,287 | ||
Other assets | 19,178 | ||
Total assets | $ | 1,965,244 | |
Liabilities: | |||
Deposits | $ | 1,742,031 | |
Qualifying debt | 11,287 | ||
Other liabilities | 10,910 | ||
Total liabilities | 1,764,228 | ||
Net assets acquired | $ | 201,016 | |
Consideration paid | |||
Common stock (12,451,240 shares at $33.76 per share) | $ | 420,354 | |
Fair value of equity awards related to pre-combination vesting | 10,676 | ||
Cash | 36,539 | ||
Fair value of total consideration | 467,569 | ||
Goodwill | $ | 266,553 | |
(1) | Cash and cash equivalents are net of a $6.2 million payment made by Bridge related to the cash out of vested, unexercised stock options at the date of closing. Cash acquired, less cash consideration paid of $36.5 million, resulted in net cash and cash equivalents increasing by $342.4 million |
Loans acquired in the Bridge acquisition consist of loans that are not considered impaired (non-PCI loans) and loans that have shown evidence of credit deterioration since origination (PCI loans) as of the acquisition date. All loans were recorded net of fair value adjustments (interest rate and credit marks), which were determined using discounted contractual cash flow models. The fair value of non-PCI loans acquired totals $1.43 billion, which is net of interest and credit marks of $26.0 million. The fair value of PCI loans totals $10.6 million, which is net of interest and credit marks of $6.0 million. See "Note 4. Loans, Leases and Allowance for Credit Losses" of these Notes to Consolidated Financial Statements for additional detail of the acquired loans.
In connection with the Bridge acquisition, the Company acquired intangible assets of $15.0 million, consisting primarily of core deposit intangibles. The core deposit intangible asset balance has been allocated to the Northern California and Technology & Innovation segments based on their respective core deposit balances at June 30, 2015, and is being amortized over its estimated useful life of 10 years.
Goodwill related to the acquisition totaled $266.6 million, which includes net measurement period adjustments totaling $6.9 million, identified and recognized since July 1, 2015. Goodwill has been allocated to the Northern California and Technology & Innovation segments based on their proportionate loan and deposit balances as of June 30, 2015. Management believes this methodology allocates goodwill to the reporting units in a manner consistent with the expected synergies of the combination. None of the goodwill recognized as part of the acquisition is expected to be deductible for income tax purposes.
30
Qualifying debt assumed from Bridge is comprised of junior subordinated debt with a contractual balance of $17.5 million and is recorded net of a $6.2 million fair value mark that is being amortized over the remaining life of the trusts. See "Note 10. Qualifying Debt" of these Notes to Consolidated Financial Statements for further detail and discussion of the debt.
In connection with the acquisition, the Company assumed Bridge's SERP, an unfunded noncontributory defined benefit pension plan. The SERP provides retirement benefits to certain Bridge officers based on years of service and final average salary. Pursuant to the terms of the SERP agreements, if the officer's service is terminated by Bridge or by the officer for "good reason" (as defined in the SERP agreements) within 24 months following a change in control, such as the Bridge acquisition, the officer is entitled to full vesting of the normal benefit under the SERP agreement, and such SERP benefits will be made in installment payments commencing on the first business day of January of the year following the officer's attainment of age 55 or, if the officer is already age 55 as of such termination of employment, on the first business day of January of the year following the officer's termination of employment. As of June 30, 2015, a $7.1 million liability included in other liabilities was recorded in the Company's Consolidated Balance Sheet related to the SERP. A discount rate of 5.75% and an employee compensation rate increase of 4.00% were used in determining the SERP liability as of June 30, 2015. See "Note 19. Employee Benefit Plans" of these Notes to the Consolidated Financial Statements for further detail and discussion of the SERP.
31
As a bank holding company, management focuses on key ratios in evaluating the Company's financial condition and results of operations.
Results of Operations and Financial Condition
A summary of the Company's results of operations, financial condition, and selected metrics are included in the following tables:
Year Ended December 31, | ||||||||||||
2016 | 2015 | 2014 | ||||||||||
(in thousands, except per share amounts) | ||||||||||||
Net income available to common stockholders | $ | 259,798 | $ | 193,494 | $ | 146,564 | ||||||
Earnings per share applicable to common stockholders - basic | 2.52 | 2.05 | 1.69 | |||||||||
Earnings per share applicable to common stockholders - diluted | 2.50 | 2.03 | 1.67 | |||||||||
Net interest margin | 4.58 | % | 4.51 | % | 4.42 | % | ||||||
Return on average assets | 1.61 | 1.56 | 1.50 | |||||||||
Return on average tangible common equity | 17.71 | 17.83 | 18.52 | |||||||||
December 31, | ||||||||
2016 | 2015 | |||||||
(in thousands) | ||||||||
Total assets | $ | 17,200,842 | $ | 14,275,089 | ||||
Loans, net of deferred loan fees and costs | 13,208,436 | 11,136,663 | ||||||
Total deposits | 14,549,863 | 12,030,624 | ||||||
Asset Quality
For all banks and bank holding companies, asset quality plays a significant role in the overall financial condition of the institution and results of operations. The Company measures asset quality in terms of non-accrual loans as a percentage of gross loans and net charge-offs as a percentage of average loans. Net charge-offs are calculated as the difference between charged-off loans and recovery payments received on previously charged-off loans. The following table summarizes the Company's key asset quality metrics:
At or for the Year Ended December 31, | ||||||||||||
2016 | 2015 | 2014 | ||||||||||
(in thousands) | ||||||||||||
Non-accrual loans | $ | 40,272 | $ | 48,381 | $ | 67,659 | ||||||
Non-performing assets | 142,791 | 166,058 | 214,661 | |||||||||
Non-accrual loans to gross loans | 0.31 | % | 0.44 | % | 0.81 | % | ||||||
Net charge-offs (recoveries) to average loans | 0.02 | % | (0.06 | )% | (0.07 | )% | ||||||
Asset and Deposit Growth
The Company’s assets and liabilities are comprised primarily of loans and deposits. Therefore, the ability to originate new loans and attract new deposits is fundamental to the Company’s growth. Total assets increased to $17.20 billion at December 31, 2016 from $14.28 billion at December 31, 2015. The increase in total assets of $2.92 billion, or 20.5% relates primarily to the $1.28 billion in loans acquired from the HFF purchase on April 20, 2016, organic loan growth, and an increase in investment securities resulting from increased deposits. Total loans, including HFS loans, increased by $2.07 billion, or 18.6%, to $13.21 billion as of December 31, 2016, compared to $11.14 billion as of December 31, 2015. Total deposits increased $2.52 billion, or 20.9%, to $14.55 billion as of December 31, 2016 from $12.03 billion as of December 31, 2015.
32
RESULTS OF OPERATIONS
The following table sets forth a summary financial overview for the comparable periods:
Year Ended December 31, | Increase | Year Ended December 31, | Increase | |||||||||||||||||||||
2016 | 2015 | (Decrease) | 2015 | 2014 | (Decrease) | |||||||||||||||||||
(in thousands, except per share amounts) | ||||||||||||||||||||||||
Consolidated Income Statement Data: | ||||||||||||||||||||||||
Interest income | $ | 700,506 | $ | 525,144 | $ | 175,362 | $ | 525,144 | $ | 416,379 | $ | 108,765 | ||||||||||||
Interest expense | 43,293 | 32,568 | 10,725 | 32,568 | 31,486 | 1,082 | ||||||||||||||||||
Net interest income | 657,213 | 492,576 | 164,637 | 492,576 | 384,893 | 107,683 | ||||||||||||||||||
Provision for credit losses | 8,000 | 3,200 | 4,800 | 3,200 | 4,726 | (1,526 | ) | |||||||||||||||||
Net interest income after provision for credit losses | 649,213 | 489,376 | 159,837 | 489,376 | 380,167 | 109,209 | ||||||||||||||||||
Non-interest income | 42,915 | 29,768 | 13,147 | 29,768 | 24,651 | 5,117 | ||||||||||||||||||
Non-interest expense | 330,949 | 260,606 | 70,343 | 260,606 | 207,319 | 53,287 | ||||||||||||||||||
Income from continuing operations before income taxes | 361,179 | 258,538 | 102,641 | 258,538 | 197,499 | 61,039 | ||||||||||||||||||
Income tax expense | 101,381 | 64,294 | 37,087 | 64,294 | 48,390 | 15,904 | ||||||||||||||||||
Income from continuing operations | 259,798 | 194,244 | 65,554 | 194,244 | 149,109 | 45,135 | ||||||||||||||||||
Loss from discontinued operations, net of tax | — | — | — | — | (1,158 | ) | 1,158 | |||||||||||||||||
Net income | $ | 259,798 | $ | 194,244 | $ | 65,554 | $ | 194,244 | $ | 147,951 | $ | 46,293 | ||||||||||||
Net income available to common stockholders | $ | 259,798 | $ | 193,494 | $ | 66,304 | $ | 193,494 | $ | 146,564 | $ | 46,930 | ||||||||||||
Earnings per share applicable to common stockholders - basic | $ | 2.52 | $ | 2.05 | $ | 0.47 | $ | 2.05 | $ | 1.69 | $ | 0.36 | ||||||||||||
Earnings per share applicable to common stockholders - diluted | $ | 2.50 | $ | 2.03 | $ | 0.47 | $ | 2.03 | $ | 1.67 | $ | 0.36 | ||||||||||||
Non-GAAP Financial Measures
The following discussion and analysis contains financial information determined by methods other than those prescribed by GAAP. The Company's management uses these non-GAAP financial measures in their analysis of the Company's performance. These measurements typically adjust GAAP performance measures to exclude the effects of certain significant activities or transactions that, in management's opinion, do not reflect recurring period-to-period comparisons of the Company's performance. Management believes presentation of these non-GAAP financial measures provides useful supplemental information that is essential to a complete understanding of the operating results of the Company's core businesses. Since the presentation of these non-GAAP performance measures and their impact differ between companies, these non-GAAP disclosures should not be viewed as a substitute for operating results determined in accordance with GAAP, nor are they necessarily comparable to non-GAAP performance measures that may be presented by other companies.
Operating Pre-Provision Net Revenue
Operating PPNR is defined by the Federal Reserve in SR 14-3, which requires companies subject to the rule to project PPNR over the planning horizon for each of the economic scenarios defined annually by the regulators. Banking regulations define PPNR as net interest income plus non-interest income less non-interest expense. Management has further adjusted this metric to exclude any non-recurring or non-operational elements of non-interest income or non-interest expense, which are outlined in the table below. Management feels that this is an important metric as it illustrates the underlying performance of the Company, it enables investors and others to assess the Company's ability to generate capital to cover credit losses through the credit cycle, and provides consistent reporting with a key metric used by bank regulatory agencies.
33
The following table shows the components of operating PPNR for the years ended December 31, 2016, 2015, and 2014:
Year Ended December 31, | |||||||||||
2016 | 2015 | 2014 | |||||||||
(in thousands) | |||||||||||
Total non-interest income | $ | 42,915 | $ | 29,768 | $ | 24,651 | |||||
Less: | |||||||||||
Gain (loss) on sales of investment securities, net (1) | 1,059 | 615 | 757 | ||||||||
Unrealized gains (losses) on assets and liabilities measured at fair value, net (1) | 8 | 47 | 1,212 | ||||||||
(Loss) on extinguishment of debt (1) | — | (81 | ) | (502 | ) | ||||||
Total operating non-interest income | 41,848 | 29,187 | 23,184 | ||||||||
Plus: net interest income | 657,213 | 492,576 | 384,893 | ||||||||
Net operating revenue | $ | 699,061 | $ | 521,763 | $ | 408,077 | |||||
Total non-interest expense | $ | 330,949 | $ | 260,606 | $ | 207,319 | |||||
Less: | |||||||||||
Net (gain) loss on sales / valuations of repossessed and other assets | (125 | ) | (2,070 | ) | (5,350 | ) | |||||
Acquisition / restructure expense | 12,412 | 8,836 | 198 | ||||||||
Total operating non-interest expense | $ | 318,662 | $ | 253,840 | $ | 212,471 | |||||
Operating pre-provision net revenue (2) | $ | 380,399 | $ | 267,923 | $ | 195,606 | |||||
Plus: | |||||||||||
Non-operating revenue adjustments | 1,067 | 581 | 1,467 | ||||||||
Less: | |||||||||||
Provision for credit losses | 8,000 | 3,200 | 4,726 | ||||||||
Non-operating expense adjustments | 12,287 | 6,766 | (5,152 | ) | |||||||
Income from continuing operations before provision for income taxes | 361,179 | 258,538 | 197,499 | ||||||||
Income tax expense | 101,381 | 64,294 | 48,390 | ||||||||
Income from continuing operations | 259,798 | 194,244 | 149,109 | ||||||||
(Loss) from discontinued operations, net of tax | — | — | (1,158 | ) | |||||||
Net income | $ | 259,798 | $ | 194,244 | $ | 147,951 | |||||
(1) The operating PPNR non-GAAP performance metric is adjusted to exclude the effects of this non-operational item. | |||||||||||
(2) There were no adjustments made for non-recurring items during the years ended December 31, 2016, 2015, and 2014. | |||||||||||
34
Tangible Common Equity
The following table presents financial measures related to tangible common equity. Tangible common equity represents total stockholders' equity, less identifiable intangible assets and goodwill. Management believes that tangible common equity financial measures are useful in evaluating the Company's capital strength, financial condition, and ability to manage potential losses. In addition, management believes that these measures improve comparability to other institutions that have not engaged in acquisitions that resulted in recorded goodwill and other intangible assets.
December 31, | |||||||
2016 | 2015 | ||||||
(dollars and shares in thousands) | |||||||
Total stockholders' equity | $ | 1,891,529 | $ | 1,591,502 | |||
Less: goodwill and intangible assets | 302,894 | 305,354 | |||||
Total tangible stockholders' equity | 1,588,635 | 1,286,148 | |||||
Plus: deferred tax - attributed to intangible assets | 4,949 | 6,093 | |||||
Total tangible common equity, net of tax | $ | 1,593,584 | $ | 1,292,241 | |||
Total assets | $ | 17,200,842 | $ | 14,275,089 | |||
Less: goodwill and intangible assets, net | 302,894 | 305,354 | |||||
Tangible assets | 16,897,948 | 13,969,735 | |||||
Plus: deferred tax - attributed to intangible assets | 4,949 | 6,093 | |||||
Total tangible assets, net of tax | $ | 16,902,897 | $ | 13,975,828 | |||
Tangible equity ratio | 9.4 | % | 9.2 | % | |||
Tangible common equity ratio | 9.4 | 9.2 | |||||
Common shares outstanding | 105,071 | 103,087 | |||||
Tangible book value per share, net of tax | $ | 15.17 | $ | 12.54 | |||
35
Operating Efficiency Ratio
The following table shows the components used in the calculation of the operating efficiency ratio, which management uses as a metric for assessing cost efficiency:
Year Ended December 31, | |||||||||||
2016 | 2015 | 2014 | |||||||||
(dollars in thousands) | |||||||||||
Total operating non-interest expense | $ | 318,662 | $ | 253,840 | $ | 212,471 | |||||
Divided by: | |||||||||||
Total net interest income | $ | 657,213 | $ | 492,576 | $ | 384,893 | |||||
Plus: | |||||||||||
Tax equivalent interest adjustment | 34,902 | 31,883 | 24,571 | ||||||||
Operating non-interest income | 41,848 | 29,187 | 23,184 | ||||||||
Net operating revenue - TEB | $ | 733,963 | $ | 553,646 | $ | 432,648 | |||||
Operating efficiency ratio - TEB | 43.4 | % | 45.8 | % | 49.1 | % | |||||
Adjusted Allowance for Credit Losses
The adjusted allowance for credit losses to gross loans ratio includes an adjustment for the remaining credit marks on acquired performing and PCI loans. Under GAAP, the allowance for credit losses on acquired loans is not carried over in an acquisition as acquired loans are recorded at fair value, net of related interest rate and credit marks, which discounts the loans based on expected future cash flows. The credit marks on acquired loans represent the allowance for credit losses carried over to the Company. Therefore, by adding back the remaining credit marks on acquired loans, management believes this is more indicative of the allowance available for inherent losses in the loan portfolio.
December 31, | |||||||
2016 | 2015 | ||||||
(dollars in thousands) | |||||||
Allowance for credit losses | $ | 124,704 | $ | 119,068 | |||
Plus: remaining credit marks | |||||||
Acquired performing loans | 34,070 | 12,154 | |||||
Purchased credit impaired loans | 13,194 | 8,491 | |||||
Adjusted allowance for credit losses | $ | 171,968 | $ | 139,713 | |||
Gross loans held for investment and deferred fees, net | $ | 13,189,527 | $ | 11,112,854 | |||
Plus: remaining credit marks | |||||||
Acquired performing loans | 34,070 | 12,154 | |||||
Purchased credit impaired loans | 13,194 | 8,491 | |||||
Adjusted loans, net of deferred fees and costs | $ | 13,236,791 | $ | 11,133,499 | |||
Allowance for credit losses to gross loans | 0.95 | % | 1.07 | % | |||
Allowance for credit losses to gross loans, adjusted for acquisition accounting | 1.30 | 1.25 | |||||
36
Regulatory Capital
The following table presents certain financial measures related to regulatory capital under Basel III, which includes Common Equity Tier 1 and total capital. The FRB and other banking regulators use Common Equity Tier 1 and total capital as a basis for assessing a bank's capital adequacy; therefore, management believes it is useful to assess financial condition and capital adequacy using this same basis. Specifically, the total capital ratio takes into consideration the risk levels of assets and off-balance sheet financial instruments. In addition, management believes that the classified assets to Common Equity Tier 1 plus allowance measure is an important regulatory metric for assessing asset quality.
December 31, | |||||||
2016 | 2015 | ||||||
(dollars in thousands) | |||||||
Common Equity Tier 1: | |||||||
Common Equity | $ | 1,891,529 | $ | 1,591,502 | |||
Less: | |||||||
Non-qualifying goodwill and intangibles | 294,754 | 293,487 | |||||
Disallowed deferred tax asset | 1,400 | 5,001 | |||||
AOCI related adjustments | (13,460 | ) | 10,228 | ||||
Unrealized gain on changes in fair value liabilities | 8,118 | 6,309 | |||||
Common Equity Tier 1 (regulatory) | $ | 1,600,717 | $ | 1,276,477 | |||
Divided by: Risk-weighted assets (regulatory) | $ | 15,980,092 | $ | 13,193,563 | |||
Common Equity Tier 1 ratio | 10.0 | % | 9.7 | % | |||
Common Equity Tier 1 (regulatory) | $ | 1,600,717 | $ | 1,276,477 | |||
Plus: | |||||||
Trust preferred securities | 81,500 | 81,500 | |||||
Less: | |||||||
Disallowed deferred tax asset | 934 | 7,502 | |||||
Unrealized gain on changes in fair value liabilities | 5,412 | 9,464 | |||||
Tier 1 capital | $ | 1,675,871 | $ | 1,341,011 | |||
Divided by: Tangible average assets | $ | 16,868,674 | $ | 13,683,148 | |||
Tier 1 leverage ratio | 9.9 | % | 9.8 | % | |||
Total Capital: | |||||||
Tier 1 capital (regulatory) | $ | 1,675,871 | $ | 1,341,011 | |||
Plus: | |||||||
Subordinated debt | 299,927 | 140,097 | |||||
Qualifying allowance for credit losses | 124,704 | 119,068 | |||||
Other | 6,978 | 3,296 | |||||
Less: Tier 2 qualifying capital deductions | — | — | |||||
Tier 2 capital | $ | 431,609 | $ | 262,461 | |||
Total capital | $ | 2,107,480 | $ | 1,603,472 | |||
Total capital ratio | 13.2 | % | 12.2 | % | |||
Classified assets to Tier 1 capital plus allowance for credit losses: | |||||||
Classified assets | $ | 211,782 | $ | 221,126 | |||
Divided by: | |||||||
Tier 1 capital | 1,675,871 | 1,341,011 | |||||
Plus: Allowance for credit losses | 124,704 | 119,068 | |||||
Total Tier 1 capital plus allowance for credit losses | $ | 1,800,575 | $ | 1,460,079 | |||
Classified assets to Tier 1 capital plus allowance | 11.8 | % | 15.1 | % | |||
37
Net Interest Margin
The net interest margin is reported on a TEB. A tax equivalent adjustment is added to reflect interest earned on certain securities and loans that are exempt from federal and state income tax. The following tables set forth the average balances, interest income, interest expense, and average yield (on a fully TEB) for the periods indicated:
Year Ended December 31, | ||||||||||||||||||||||
2016 | 2015 | |||||||||||||||||||||
Average Balance | Interest | Average Yield / Cost | Average Balance | Interest | Average Yield / Cost | |||||||||||||||||
(dollars in thousands) | ||||||||||||||||||||||
Interest earning assets | ||||||||||||||||||||||
Loans: | ||||||||||||||||||||||
Commercial and industrial | $ | 5,422,129 | $ | 252,017 | 5.14 | % | $ | 4,246,882 | $ | 186,067 | 4.97 | % | ||||||||||
Commercial real estate | 5,210,612 | 285,096 | 5.47 | 4,115,920 | 217,386 | 5.28 | ||||||||||||||||
Construction and land development | 1,307,895 | 83,206 | 6.36 | 961,910 | 55,909 | 5.81 | ||||||||||||||||
Residential real estate | 289,181 | 13,374 | 4.62 | 306,948 | 15,077 | 4.91 | ||||||||||||||||
Consumer | 35,821 | 1,658 | 4.63 | 26,482 | 1,442 | 5.45 | ||||||||||||||||
Loans held for sale | 22,256 | 1,245 | 5.59 | 16,092 | 536 | 3.33 | ||||||||||||||||
Total loans (1), (2), (3) | 12,287,894 | 636,596 | 5.40 | 9,674,234 | 476,417 | 5.18 | ||||||||||||||||
Securities: | ||||||||||||||||||||||
Securities - taxable | 1,789,806 | 39,772 | 2.22 | 1,268,755 | 28,525 | 2.25 | ||||||||||||||||
Securities - tax-exempt | 507,103 | 18,768 | 5.34 | 407,012 | 15,032 | 5.41 | ||||||||||||||||
Total securities (1) | 2,296,909 | 58,540 | 2.91 | 1,675,767 | 43,557 | 3.02 | ||||||||||||||||
Other | 532,561 | 5,370 | 1.01 | 271,976 | 5,170 | 1.90 | ||||||||||||||||
Total interest earning assets | 15,117,364 | 700,506 | 4.86 | 11,621,977 | 525,144 | 4.79 | ||||||||||||||||
Non-interest earning assets | ||||||||||||||||||||||
Cash and due from banks | 141,789 | 137,923 | ||||||||||||||||||||
Allowance for credit losses | (122,048 | ) | (115,033 | ) | ||||||||||||||||||
Bank owned life insurance | 163,596 | 152,288 | ||||||||||||||||||||
Other assets | 833,562 | 623,648 | ||||||||||||||||||||
Total assets | $ | 16,134,263 | $ | 12,420,803 | ||||||||||||||||||
Interest-bearing liabilities | ||||||||||||||||||||||
Interest-bearing deposits: | ||||||||||||||||||||||
Interest-bearing transaction accounts | $ | 1,217,344 | $ | 2,231 | 0.18 | % | $ | 983,889 | $ | 1,736 | 0.18 | % | ||||||||||
Savings and money market accounts | 5,827,549 | 19,368 | 0.33 | 4,470,189 | 12,544 | 0.28 | ||||||||||||||||
Time certificates of deposit | 1,615,502 | 8,123 | 0.50 | 1,808,120 | 7,515 | 0.42 | ||||||||||||||||
Total interest-bearing deposits | 8,660,395 | 29,722 | 0.34 | 7,262,198 | 21,795 | 0.30 | ||||||||||||||||
Short-term borrowings | 80,727 | 573 | 0.71 | 185,173 | 4,965 | 2.68 | ||||||||||||||||
Long-term debt | — | — | — | 76,655 | 801 | 1.04 | ||||||||||||||||
Qualifying debt | 290,779 | 12,998 | 4.47 | 120,191 | 5,007 | 4.17 | ||||||||||||||||
Total interest-bearing liabilities | 9,031,901 | 43,293 | 0.48 | 7,644,217 | 32,568 | 0.43 | ||||||||||||||||
Non-interest-bearing liabilities | ||||||||||||||||||||||
Non-interest-bearing demand deposits | 5,062,319 | 3,273,138 | ||||||||||||||||||||
Other liabilities | 269,129 | 179,496 | ||||||||||||||||||||
Stockholders’ equity | 1,770,914 | 1,323,952 | ||||||||||||||||||||
Total liabilities and stockholders' equity | $ | 16,134,263 | $ | 12,420,803 | ||||||||||||||||||
Net interest income and margin (4) | $ | 657,213 | 4.58 | % | $ | 492,576 | 4.51 | % | ||||||||||||||
Net interest spread (5) | 4.38 | % | 4.36 | % | ||||||||||||||||||
(1) | Yields on loans and securities have been adjusted to a TEB. The taxable-equivalent adjustment was $34.9 million and $31.9 million for 2016 and 2015, respectively. |
(2) | Included in the yield computation are net loan fees of $28.5 million and accretion on acquired loans of $29.2 million for 2016, compared to $16.9 million and $17.1 million for 2015, respectively. |
(3) | Includes non-accrual loans. |
(4) | Net interest margin is computed by dividing net interest income by total average earning assets. |
(5) | Net interest spread represents average yield earned on interest-earning assets less the average rate paid on interest bearing liabilities. |
38
Year Ended December 31, | ||||||||||||||||||||||
2015 | 2014 | |||||||||||||||||||||
Average Balance | Interest | Average Yield / Cost | Average Balance | Interest | Average Yield / Cost | |||||||||||||||||
(dollars in thousands) | ||||||||||||||||||||||
Interest earning assets | ||||||||||||||||||||||
Loans: | ||||||||||||||||||||||
Commercial and industrial | $ | 4,246,882 | $ | 186,067 | 4.97 | % | $ | 2,930,860 | $ | 119,518 | 4.69 | % | ||||||||||
Commercial real estate | 4,115,920 | 217,386 | 5.28 | 3,520,505 | 196,282 | 5.58 | ||||||||||||||||
Construction and land development | 961,910 | 55,909 | 5.81 | 615,994 | 37,349 | 6.06 | ||||||||||||||||
Residential real estate | 306,948 | 15,077 | 4.91 | 328,297 | 15,832 | 4.82 | ||||||||||||||||
Consumer | 26,482 | 1,442 | 5.45 | 36,431 | 1,941 | 5.33 | ||||||||||||||||
Loans held for sale | 16,092 | 536 | 3.33 | — | — | — | ||||||||||||||||
Total loans (1), (2), (3) | 9,674,234 | 476,417 | 5.18 | 7,432,087 | 370,922 | 5.23 | ||||||||||||||||
Securities: | ||||||||||||||||||||||
Securities - taxable | 1,268,755 | 28,525 | 2.25 | 1,191,305 | 27,903 | 2.34 | ||||||||||||||||
Securities - tax-exempt | 407,012 | 15,032 | 5.41 | 416,404 | 15,306 | 5.28 | ||||||||||||||||
Total securities (1) | 1,675,767 | 43,557 | 3.02 | 1,607,709 | 43,209 | 3.10 | ||||||||||||||||
Other | 271,976 | 5,170 | 1.90 | 230,669 | 2,248 | 0.97 | ||||||||||||||||
Total interest earning assets | 11,621,977 | 525,144 | 4.79 | 9,270,465 | 416,379 | 4.76 | ||||||||||||||||
Non-interest earning assets | ||||||||||||||||||||||
Cash and due from banks | 137,923 | 133,739 | ||||||||||||||||||||
Allowance for credit losses | (115,033 | ) | (106,100 | ) | ||||||||||||||||||
Bank owned life insurance | 152,288 | 141,885 | ||||||||||||||||||||
Other assets | 623,648 | 451,120 | ||||||||||||||||||||
Total assets | $ | 12,420,803 | $ | 9,891,109 | ||||||||||||||||||
Interest-bearing liabilities | ||||||||||||||||||||||
Interest-bearing deposits: | ||||||||||||||||||||||
Interest-bearing transaction accounts | $ | 983,889 | $ | 1,736 | 0.18 | % | $ | 793,118 | $ | 1,522 | 0.19 | % | ||||||||||
Savings and money market accounts | 4,470,189 | 12,544 | 0.28 | 3,616,829 | 10,852 | 0.30 | ||||||||||||||||
Time certificates of deposit | 1,808,120 | 7,515 | 0.42 | 1,758,342 | 7,638 | 0.43 | ||||||||||||||||
Total interest-bearing deposits | 7,262,198 | 21,795 | 0.30 | 6,168,289 | 20,012 | 0.32 | ||||||||||||||||
Short-term borrowings | 185,173 | 4,965 | 2.68 | 173,228 | 2,336 | 1.35 | ||||||||||||||||
Long-term debt | 76,655 | 801 | 1.04 | 265,828 | 7,384 | 2.78 | ||||||||||||||||
Qualifying debt | 120,191 | 5,007 | 4.17 | 42,297 | 1,754 | 4.15 | ||||||||||||||||
Total interest-bearing liabilities | 7,644,217 | 32,568 | 0.43 | 6,649,642 | 31,486 | 0.47 | ||||||||||||||||
Non-interest-bearing liabilities | ||||||||||||||||||||||
Non-interest-bearing demand deposits | 3,273,138 | 2,153,686 | ||||||||||||||||||||
Other liabilities | 179,496 | 123,650 | ||||||||||||||||||||
Stockholders’ equity | 1,323,952 | 964,131 | ||||||||||||||||||||
Total liabilities and stockholders' equity | $ | 12,420,803 | $ | 9,891,109 | ||||||||||||||||||
Net interest income and margin (4) | $ | 492,576 | 4.51 | % | $ | 384,893 | 4.42 | % | ||||||||||||||
Net interest spread (5) | 4.36 | % | 4.29 | % | ||||||||||||||||||
(1) | Yields on loans and securities have been adjusted to a TEB. The taxable-equivalent adjustment was $31.9 million and $24.6 million for 2015 and 2014, respectively. |
(2) | Included in the yield computation are net loan fees of $16.9 million and accretion on acquired loans of $17.1 million for 2015, compared to $8.8 million and $17.0 million for 2014, respectively. |
(3) | Includes non-accrual loans. |
(4) | Net interest margin is computed by dividing net interest income by total average earning assets. |
(5) | Net interest spread represents average yield earned on interest-earning assets less the average rate paid on interest bearing liabilities. |
39
Year Ended December 31, | Year Ended December 31, | |||||||||||||||||||||||
2016 versus 2015 | 2015 versus 2014 | |||||||||||||||||||||||
Increase (Decrease) Due to Changes in (1) | Increase (Decrease) Due to Changes in (1) | |||||||||||||||||||||||
Volume | Rate | Total | Volume | Rate | Total | |||||||||||||||||||
(in thousands) | ||||||||||||||||||||||||
Interest income: | ||||||||||||||||||||||||
Loans: | ||||||||||||||||||||||||
Commercial and industrial | $ | 54,625 | $ | 11,325 | $ | 65,950 | $ | 57,658 | $ | 8,891 | $ | 66,549 | ||||||||||||
Commercial real estate | 59,896 | 7,814 | 67,710 | 31,447 | (10,343 | ) | 21,104 | |||||||||||||||||
Construction and land development | 22,011 | 5,286 | 27,297 | 20,106 | (1,546 | ) | 18,560 | |||||||||||||||||
Residential real estate | (822 | ) | (881 | ) | (1,703 | ) | (1,049 | ) | 294 | (755 | ) | |||||||||||||
Consumer | 432 | (216 | ) | 216 | (542 | ) | 43 | (499 | ) | |||||||||||||||
Loans held for sale | 345 | 364 | 709 | 536 | — | 536 | ||||||||||||||||||
Total loans | 136,487 | 23,692 | 160,179 | 108,156 | (2,661 | ) | 105,495 | |||||||||||||||||
Securities: | ||||||||||||||||||||||||
Securities - taxable | 11,579 | (332 | ) | 11,247 | 1,741 | (1,119 | ) | 622 | ||||||||||||||||
Securities - tax-exempt | 3,704 | 32 | 3,736 | (347 | ) | 73 | (274 | ) | ||||||||||||||||
Total securities | 15,283 | (300 | ) | 14,983 | 1,394 | (1,046 | ) | 348 | ||||||||||||||||
Other | 2,628 | (2,428 | ) | 200 | 785 | 2,137 | 2,922 | |||||||||||||||||
Total interest income | 154,398 | 20,964 | 175,362 | 110,335 | (1,570 | ) | 108,765 | |||||||||||||||||
Interest expense: | ||||||||||||||||||||||||
Interest bearing transaction accounts | $ | 428 | $ | 67 | $ | 495 | $ | 337 | $ | (123 | ) | $ | 214 | |||||||||||
Savings and money market | 4,511 | 2,313 | 6,824 | 2,395 | (703 | ) | 1,692 | |||||||||||||||||
Time certificates of deposit | (969 | ) | 1,577 | 608 | 207 | (330 | ) | (123 | ) | |||||||||||||||
Short-term borrowings | (741 | ) | (3,651 | ) | (4,392 | ) | 320 | 2,309 | 2,629 | |||||||||||||||
Long-term debt | — | (801 | ) | (801 | ) | (1,978 | ) | (4,605 | ) | (6,583 | ) | |||||||||||||
Qualifying debt | 7,625 | 366 | 7,991 | 3,245 | 8 | 3,253 | ||||||||||||||||||
Total interest expense | 10,854 | (129 | ) | 10,725 | 4,526 | (3,444 | ) | 1,082 | ||||||||||||||||
Net increase | $ | 143,544 | $ | 21,093 | $ | 164,637 | $ | 105,809 | $ | 1,874 | $ | 107,683 | ||||||||||||
(1) | Changes due to both volume and rate have been allocated to volume changes. |
Comparison of interest income, interest expense and net interest margin
The Company's primary source of revenue is interest income. For the year ended December 31, 2016, interest income was $700.5 million, an increase of 33.4%, compared to $525.1 million for the year ended December 31, 2015. This increase was primarily the result of a $2.61 billion increase in the average loan balance which drove a $160.2 million increase in loan interest income for the year ended December 31, 2016. The acquisition of the HFF loan portfolio increased the 2016 average loan balance by $904.8 million. The remaining increase in the average loan balance from the prior year is attributable to organic loan growth and inclusion of a full year of Bridge loans in the average loan balances, compared to only six months in 2015. Interest income from investment securities increased by $15.0 million for the comparable period primarily due to an increase in the average investment balance of $621.1 million from December 31, 2015. Average yield on interest earning assets increased to 4.86% for the year ended December 31, 2016, compared to 4.79% for the same period in 2015, which was primarily the result of increased yields on loans, primarily as a result of the HFF portfolio.
For the year ended December 31, 2016, interest expense was $43.3 million, compared to $32.6 million for the year ended December 31, 2015. Interest expense on deposits increased $7.9 million for the same period as average interest bearing deposits increased $1.40 billion, which is a 4 basis point increase in average cost of interest bearing deposits. Interest expense on short-term and long-term borrowing decreased by $5.2 million as a result of a $181.1 million decrease in average short-term and long-term borrowings for the year ended December 31, 2016 compared to the same period in 2015. The decrease in average short-term borrowings relates primarily to the payoff of the Company's 10% Senior Notes during 2015, as well as a decrease in average FHLB overnight advances. Average long-term borrowings decreased from the prior year as the Company paid off $200.0 million of FHLB advances classified as long-term during 2015.
40
For the year ended December 31, 2016, net interest income was $657.2 million, compared to $492.6 million for the year ended December 31, 2015. The increase in net interest income reflects a $3.50 billion increase in average interest earning assets, offset by a $1.4 billion increase in average interest-bearing liabilities. The increase in net interest margin of 7 basis points is the result of an increase in the average loan balance and average yield on loans compared to the same period in 2015, slightly offset by higher deposit costs.
Interest income for the year ended December 31, 2015 was $525.1 million, an increase of 26.1%, compared to $416.4 million for the year ended December 31, 2014. This increase was primarily the result of a $2.24 billion increase in the average loan balance, which drove a $105.5 million increase in loan interest income for the year ended December 31, 2015 compared to 2014. The acquisition of Bridge increased the 2015 average loan balance by $786.7 million. Other interest income increased by $2.9 million for the comparable period primarily due to FRB dividends in 2015 of $1.7 million, compared to zero in 2014. Average yield on interest earning assets increased to 4.79% for the year ended December 31, 2015, compared to 4.76% for the same period in 2014, which was primarily the result of increased yields on other interest earning assets.
Interest expense for the year ended December 31, 2015 was $32.6 million, compared to $31.5 million for the year ended December 31, 2014, an increase of $1.1 million, or 3.4%. Interest expense on deposits increased $1.8 million for the same period as average interest bearing deposits increased $1.09 billion, offset by a 2 basis point decrease in average cost of interest-bearing deposits. Interest expense on short-term and long-term borrowings decreased by $4.0 million as a result of a $177.2 million decrease in average short-term and long-term borrowings for the year ended December 31, 2015, compared to the same period in 2014.
Net interest income was $492.6 million for the year ended December 31, 2015, compared to $384.9 million for the year ended December 31, 2014, an increase of $107.7 million, or 28.0%. The increase in net interest income reflects a $2.35 billion increase in average interest earning assets, offset by a $994.6 million increase in average interest-bearing liabilities. The acquisition of Bridge increased the 2015 average interest earning assets by $826.7 million and average interest-bearing liabilities by $314.9 million. The increase in net interest margin of 9 basis points was mostly due to collection of fees associated with early loan payoffs and the payoff of the Company's 10% Senior Notes.
Provision for Credit Losses
The provision for credit losses in each period is reflected as a reduction in earnings in that period. The provision is equal to the amount required to maintain the allowance for credit losses at a level that is adequate to absorb probable credit losses inherent in the loan portfolio. For the year ended December 31, 2016, the provision for credit losses was $8.0 million, compared to $3.2 million for the year ended December 31, 2015. The provision increase was primarily due to an increase in total organic loans, as well as increased net charge-offs for 2016, compared to net recoveries for 2015. For the year ended December 31, 2015, the provision for credit losses was $3.2 million, compared to $4.7 million for the year ended December 31, 2014. The provision decrease was primarily due to an improvement in underlying asset quality and sustained loan recoveries during 2015. The Company may establish an additional allowance for credit losses for PCI loans through provision for credit losses when impairment is determined as a result of lower than expected cash flows. As of December 31, 2016 and 2015, the allowance for credit losses on PCI loans was $1.8 million and less than $0.1 million, respectively.
41
Non-interest Income
The following table presents a summary of non-interest income for the periods presented:
Year Ended December 31, | ||||||||||||||||||||||||
2016 | 2015 | Increase (Decrease) | 2015 | 2014 | Increase (Decrease) | |||||||||||||||||||
(in thousands) | ||||||||||||||||||||||||
Service charges and fees | $ | 18,824 | $ | 14,782 | $ | 4,042 | $ | 14,782 | $ | 10,567 | $ | 4,215 | ||||||||||||
Card income | 4,438 | 3,679 | 759 | 3,679 | 3,310 | 369 | ||||||||||||||||||
SBA / warrant income | 4,181 | 1,579 | 2,602 | 1,579 | — | 1,579 | ||||||||||||||||||
Lending related income and gains (losses) on sale of loans, net | 3,770 | 369 | 3,401 | 369 | 71 | 298 | ||||||||||||||||||
Income from bank owned life insurance | 3,762 | 3,899 | (137 | ) | 3,899 | 4,508 | (609 | ) | ||||||||||||||||
Gain (loss) on sales of investment securities, net | 1,059 | 615 | 444 | 615 | 757 | (142 | ) | |||||||||||||||||
(Loss) on extinguishment of debt | — | (81 | ) | 81 | (81 | ) | (502 | ) | 421 | |||||||||||||||
Unrealized gains (losses) on assets and liabilities measured at fair value, net | 45 | 47 | (2 | ) | 47 | 1,212 | (1,165 | ) | ||||||||||||||||
Other income | 6,836 | 4,879 | 1,957 | 4,879 | 4,728 | 151 | ||||||||||||||||||
Total non-interest income | $ | 42,915 | $ | 29,768 | $ | 13,147 | $ | 29,768 | $ | 24,651 | $ | 5,117 | ||||||||||||
Total non-interest income for the year ended December 31, 2016 compared to 2015, increased by $13.1 million, or 44.2%. The increase is primarily due to service charges and fees, lending related income and net gains on sale of loans, and SBA / warrant income. The increase in service charges and fees is due to growth in the Company's deposit base, which increased $2.52 billion from December 31, 2015, as well as inclusion of a full year of Bridge's results, compared to only six months of income in 2015. The increase in lending related income and net gains on sale of loans relates to increases in total gains on sale of loans and letters of credit fees. The SBA / warrant income increased largely as a result of warrant income.
Total non-interest income for the year ended December 31, 2015 compared to 2014, increased by $5.1 million, or 20.8%. The increase is primarily due to service charges and fees and SBA/warrant income, which were partially offset by the decrease in net unrealized gains on assets and liabilities measured at fair value. The increase in service charges and fees is due to the growth of the Company's deposit base, both organically and from the acquisition of Bridge, as well as the Company's continued focus on collection of service charges on customer accounts. Bridge contributed $2.6 million to total service charges and fees. The increase in SBA / warrant income is solely due to income from Bridge operations. The $1.2 million decrease in non-interest income from net unrealized gains on assets and liabilities measured at fair value primarily relates to the fair value adjustment on junior subordinated debt, which is recognized as a gain of $1.4 million in 2014 non-interest income and is no longer recurring subsequent to 2014 due to the early adoption of an element in ASU 2016-01, which requires presentation of the fair value change in OCI rather than earnings.
42
Non-interest Expense
The following table presents a summary of non-interest expense for the periods presented:
Year Ended December 31, | |||||||||||||||||||||||
2016 | 2015 | Increase (Decrease) | 2015 | 2014 | Increase (Decrease) | ||||||||||||||||||
(in thousands) | |||||||||||||||||||||||
Salaries and employee benefits | $ | 188,810 | $ | 149,828 | $ | 38,982 | $ | 149,828 | $ | 126,630 | $ | 23,198 | |||||||||||
Occupancy | 27,303 | 22,180 | 5,123 | 22,180 | 18,155 | 4,025 | |||||||||||||||||
Legal, professional, and directors' fees | 24,610 | 18,548 | 6,062 | 18,548 | 14,278 | 4,270 | |||||||||||||||||
Data processing | 18,660 | 13,200 | 5,460 | 13,200 | 10,057 | 3,143 | |||||||||||||||||
Insurance | 12,898 | 11,003 | 1,895 | 11,003 | 8,862 | 2,141 | |||||||||||||||||
Marketing | 3,596 | 2,885 | 711 | 2,885 | 2,300 | 585 | |||||||||||||||||
Loan and repossessed asset expenses | 2,999 | 4,377 | (1,378 | ) | 4,377 | 4,423 | (46 | ) | |||||||||||||||
Card expense | 2,936 | 2,764 | 172 | 2,764 | 2,417 | 347 | |||||||||||||||||
Intangible amortization | 2,788 | 1,970 | 818 | 1,970 | 1,461 | 509 | |||||||||||||||||
Net (gain) loss on sales / valuations of repossessed and other assets | (125 | ) | (2,070 | ) | 1,945 | (2,070 | ) | (5,350 | ) | 3,280 | |||||||||||||
Acquisition / restructure expense | 12,412 | 8,836 | 3,576 | 8,836 | 198 | 8,638 | |||||||||||||||||
Other expense | 34,062 | 27,085 | 6,977 | 27,085 | 23,888 | 3,197 | |||||||||||||||||
Total non-interest expense | $ | 330,949 | $ | 260,606 | $ | 70,343 | $ | 260,606 | $ | 207,319 | $ | 53,287 | |||||||||||
Total non-interest expense for the year ended December 31, 2016, compared to 2015, increased $70.3 million, or 27.0%. This increase primarily relates to salaries and employee benefits, legal, professional, and directors' fees, data processing, occupancy, acquisition / restructure expense, and other non-interest expense. The rise in salaries and employee benefits, legal, professional, and directors' fees, data processing, occupancy, and other non-interest expense is primarily attributable to the addition of Bridge as 2016 includes a full year of Bridge's expenses, compared to only six months of expenses in 2015. These expenses also increased as a result of the acquisition of the HFF loan portfolio in April 2016. The increase in acquisition / restructure expense in 2016 was driven by the core system conversion that occurred in the last quarter of 2016, as well as costs associated with the acquisition of the HFF loan portfolio.
Total non-interest expense for the year ended December 31, 2015, compared to 2014, increased $53.3 million, or 25.7%. This increase primarily relates to salaries and employee benefits, acquisition / restructure expense, data processing, legal, professional, and directors' fees, and occupancy. The rise in salaries and employee benefits was primarily attributable to the addition of Bridge employees, as well as growth in staffing to support continued asset growth. The increase in acquisition /restructure expense was driven by the acquisition of Bridge in June 2015. Data processing increased due to the addition of Bridge and technology enhancement initiatives. Legal and professional fees also increased due to the addition of Bridge. The increase in occupancy related to the addition of Bridge offices, which increased rent expense, office utilities, and depreciation on premises and equipment.
43
Income Taxes
The effective tax rate for the year ended December 31, 2016 was 28.07%, compared to 24.87% for the year ended December 31, 2015, and 24.50% for the year ended December 31, 2014. The increase in the effective tax rate from 2015 compared to 2016 is due primarily to the increase in pre-tax book income without proportional increases to favorable tax rate items for the year ended December 31, 2016 compared to 2015. There was not a significant change in the effective tax rate from 2014 compared to 2015.
Business Segment Results
The Company's reportable segments are aggregated primarily based on geographic location, services offered, and markets served. The Company's regional segments, which include Arizona, Nevada, Southern California, and Northern California, provide full service banking and related services to their respective markets. The Company's NBL segments, which include HOA services, HFF, Public & Nonprofit Finance, Technology & Innovation, and Other NBLs, provide specialized banking services to niche markets. These NBLs are managed centrally and are broader in geographic scope than the Company's other segments, though still predominately located within the Company's core market areas. The Corporate & Other segment consists of corporate-related items, income and expense items not allocated to the Company's other reportable segments, and inter-segment eliminations.
The following tables present selected operating segment information for the periods presented:
Regional Segments | ||||||||||||||||||||
Consolidated Company | Arizona | Nevada | Southern California | Northern California | ||||||||||||||||
At December 31, 2016 | (in millions) | |||||||||||||||||||
Loans, net of deferred loan fees and costs | $ | 13,208.5 | $ | 2,955.9 | $ | 1,725.5 | $ | 1,766.8 | $ | 1,095.4 | ||||||||||
Deposits | 14,549.8 | 3,843.4 | 3,731.5 | 2,382.6 | 1,543.6 | |||||||||||||||
At December 31, 2015 | ||||||||||||||||||||
Loans, net of deferred loan fees and costs | $ | 11,136.7 | $ | 2,811.7 | $ | 1,737.2 | $ | 1,761.9 | $ | 1,188.4 | ||||||||||
Deposits | 12,030.6 | 2,880.7 | 3,382.8 | 1,902.5 | 1,541.1 | |||||||||||||||
Year Ended December 31, 2016: | (in thousands) | |||||||||||||||||||
Income (loss) before income taxes | $ | 361,179 | $ | 104,082 | $ | 88,896 | $ | 61,029 | $ | 42,924 | ||||||||||
Year Ended December 31, 2015: | ||||||||||||||||||||
Income (loss) before income taxes | $ | 258,538 | $ | 71,102 | $ | 78,618 | $ | 49,581 | $ | 28,660 | ||||||||||
National Business Lines | ||||||||||||||||||||||||
HOA Services | HFF | Public & Nonprofit Finance | Technology & Innovation | Other NBL | Corporate & Other | |||||||||||||||||||
At December 31, 2016 | (in millions) | |||||||||||||||||||||||
Loans, net of deferred loan fees and costs | $ | 116.8 | $ | 1,292.1 | $ | 1,454.3 | $ | 1,011.4 | $ | 1,776.9 | $ | 13.4 | ||||||||||||
Deposits | 1,890.3 | — | — | 1,038.2 | — | 120.2 | ||||||||||||||||||
At December 31, 2015 | ||||||||||||||||||||||||
Loans, net of deferred loan fees and costs | $ | 88.4 | $ | — | $ | 1,458.9 | $ | 770.3 | $ | 1,280.3 | $ | 39.6 | ||||||||||||
Deposits | 1,291.9 | — | — | 842.5 | — | 189.1 | ||||||||||||||||||
Year Ended December 31, 2016: | (in thousands) | |||||||||||||||||||||||
Income (loss) before income taxes | $ | 17,724 | $ | 30,039 | $ | 13,206 | $ | 46,226 | $ | 32,804 | $ | (75,751 | ) | |||||||||||
Year Ended December 31, 2015: | ||||||||||||||||||||||||
Income (loss) before income taxes | $ | 7,603 | $ | — | $ | 12,345 | $ | 22,529 | $ | 36,107 | $ | (48,007 | ) | |||||||||||
44
BALANCE SHEET ANALYSIS
Total assets increased $2.92 billion, or 20.5%, to $17.20 billion at December 31, 2016, compared to $14.28 billion at December 31, 2015. The increase in total assets relates primarily to the $1.28 billion in loans acquired from the HFF purchase on April 20, 2016, organic loan growth, and an increase in investment securities resulting from increased deposits. Loans increased $2.07 billion, or 18.6%, to $13.21 billion at December 31, 2016, compared to $11.14 billion at December 31, 2015.
Total liabilities increased $2.63 billion, or 20.7%, to $15.31 billion at December 31, 2016, compared to $12.68 billion at December 31, 2015. The increase in liabilities is due primarily to an increase in total deposits of $2.52 billion, or 20.9%, to $14.55 billion, all of which is attributable to organic deposit growth.
Total stockholders’ equity increased by $300.0 million, or 18.9%, to $1.89 billion at December 31, 2016, compared to $1.59 billion at December 31, 2015. The increase in stockholders' equity relates to net income for the year ended December 31, 2016, issuances of common stock under the Company's ATM program, and a decrease in the fair value of the Company's AFS portfolio, which is recognized as part of AOCI.
Investment securities
Investment securities are classified at the time of acquisition as either HTM, AFS, or measured at fair value based upon various factors, including asset/liability management strategies, liquidity and profitability objectives, and regulatory requirements. HTM securities are carried at amortized cost, adjusted for amortization of premiums or accretion of discounts. AFS securities are securities that may be sold prior to maturity based upon asset/liability management decisions. Investment securities classified as AFS are carried at fair value. Unrealized gains or losses on AFS securities are recorded as part of AOCI in stockholders’ equity. Amortization of premiums or accretion of discounts on MBS is periodically adjusted for estimated prepayments. Investment securities measured at fair value are reported at fair value, with unrealized gains and losses included in current period earnings.
The Company's investment securities portfolio is utilized as collateral for borrowings, required collateral for public deposits and customer repurchase agreements, and to manage liquidity, capital, and interest rate risk. The following table summarizes the carrying value of the investment securities portfolio for each of the periods below:
At December 31, | ||||||||||||||||||||
2016 | 2015 | 2014 | 2013 | 2012 | ||||||||||||||||
(in thousands) | ||||||||||||||||||||
Collateralized debt obligations | $ | 13,490 | $ | 10,060 | $ | 11,445 | $ | 50 | $ | 50 | ||||||||||
Commercial MBS issued by GSEs | 117,792 | 19,114 | 2,147 | — | — | |||||||||||||||
Corporate debt securities | 64,144 | 13,251 | 52,489 | 97,777 | 97,781 | |||||||||||||||
CRA investments | 37,113 | 34,685 | 24,332 | 24,882 | 25,816 | |||||||||||||||
Mutual funds | — | — | 37,702 | 36,532 | 37,961 | |||||||||||||||
Preferred stock | 94,662 | 111,236 | 82,612 | 61,484 | 75,555 | |||||||||||||||
Private label commercial MBS | — | 4,691 | 5,149 | 5,433 | 5,741 | |||||||||||||||
Private label residential MBS | 433,685 | 257,128 | 70,243 | 36,099 | 35,607 | |||||||||||||||
Residential MBS issued by GSEs | 1,356,258 | 1,171,702 | 893,047 | 1,024,457 | 668,265 | |||||||||||||||
Tax-exempt | 500,312 | 334,830 | 299,037 | 299,244 | 265,073 | |||||||||||||||
Trust preferred securities | 26,532 | 24,314 | 25,546 | 23,805 | 24,135 | |||||||||||||||
U.S. government sponsored agency securities | 56,022 | — | 18,346 | 46,975 | — | |||||||||||||||
U.S. treasury securities | 2,502 | 2,993 | — | — | — | |||||||||||||||
Total investment securities | $ | 2,702,512 | $ | 1,984,004 | $ | 1,522,095 | $ | 1,656,738 | $ | 1,235,984 | ||||||||||
45
Weighted average yield on investment securities is calculated by dividing income within each maturity range by the outstanding amount of the related investment and has not been tax-effected on tax-exempt obligations. For purposes of calculating the weighted average yield, AFS and securities measured at fair value are carried at amortized cost in the table below. The maturity distribution and weighted average yield of the Company's investment security portfolios at December 31, 2016 are summarized in the table below:
December 31, 2016 | |||||||||||||||||||||||||||||||||||
Due Under 1 Year | Due 1-5 Years | Due 5-10 Years | Due Over 10 Years | Total | |||||||||||||||||||||||||||||||
Amount | Yield | Amount | Yield | Amount | Yield | Amount | Yield | Amount | Yield | ||||||||||||||||||||||||||
(dollars in thousands) | |||||||||||||||||||||||||||||||||||
Held-to-maturity | |||||||||||||||||||||||||||||||||||
Tax-exempt | $ | — | — | % | $ | — | — | % | $ | — | — | % | $ | 92,079 | 4.89 | % | $ | 92,079 | 4.89 | % | |||||||||||||||
Available-for-sale | |||||||||||||||||||||||||||||||||||
Collateralized debt obligations | $ | — | — | % | $ | — | — | % | $ | — | — | % | $ | 50 | 4.34 | % | $ | 50 | 4.34 | % | |||||||||||||||
Commercial MBS issued by GSEs (1) | — | — | — | — | — | — | 121,742 | 2.19 | 121,742 | 2.19 | |||||||||||||||||||||||||
Corporate debt securities | — | — | 5,058 | 4.27 | 60,000 | 3.75 | — | — | 65,058 | 3.79 | |||||||||||||||||||||||||
CRA investments | 30,824 | 2.01 | 6,803 | 2.93 | — | — | — | — | 37,627 | 2.18 | |||||||||||||||||||||||||
Preferred stock | — | — | — | — | — | — | 96,071 | 6.93 | 96,071 | 6.93 | |||||||||||||||||||||||||
Private label residential MBS (1) | — | — | — | — | — | — | 440,272 | 3.05 | 440,272 | 3.05 | |||||||||||||||||||||||||
Residential MBS issued by GSEs (1) | — | — | — | — | — | — | 1,369,289 | 2.49 | 1,369,289 | 2.48 | |||||||||||||||||||||||||
Tax-exempt | — | — | 11,537 | 3.25 | 90,457 | 3.93 | 307,699 | 3.36 | 409,693 | 3.48 | |||||||||||||||||||||||||
Trust preferred securities | — | — | — | — | — | — | 32,000 | 1.91 | 32,000 | 1.91 | |||||||||||||||||||||||||
U.S. government sponsored agency securities | — | — | — | — | 44,000 | 2.48 | 15,000 | 2.20 | 59,000 | 2.41 | |||||||||||||||||||||||||
U.S. treasury securities | — | — | 2,496 | 1.45 | — | — | — | — | 2,496 | 1.45 | |||||||||||||||||||||||||
Total AFS securities | $ | 30,824 | 2.01 | % | $ | 25,894 | 3.19 | % | $ | 194,457 | 3.55 | % | $ | 2,382,123 | 2.86 | % | $ | 2,633,298 | 2.90 | % | |||||||||||||||
Securities measured at fair value | |||||||||||||||||||||||||||||||||||
Residential MBS issued by GSEs (1) | $ | — | — | % | $ | — | — | % | $ | — | — | % | $ | 1,053 | 2.05 | % | $ | 1,053 | 2.05 | % | |||||||||||||||
Total securities measured at fair value | $ | — | — | % | $ | — | — | % | $ | — | — | % | $ | 1,053 | 2.05 | % | $ | 1,053 | 2.05 | % | |||||||||||||||
(1) | MBS are comprised of pools of loans with varying maturities, the majority of which are due after 10 years. |
The Company does not own any subprime MBS in its investment portfolio. The majority of its MBS are GSE issued. The remaining MBS not GSE issued consist of $399.0 million rated AAA, $29.9 million rated AA, $2.1 million rated A, $2.6 million rated BBB, and none are non-investment grade.
Gross unrealized losses at December 31, 2016 are primarily caused by interest rate fluctuations and credit spread widening in applicable markets. The Company has reviewed securities on which there is an unrealized loss in accordance with its accounting policy for OTTI securities described in "Note 3. Investment Securities" to the Consolidated Financial Statements contained herein. There were no impairment charges recorded during the years ended December 31, 2016, 2015, and 2014.
The Company does not consider any securities to be other-than-temporarily impaired as of December 31, 2016, 2015, and 2014. However, the Company cannot guarantee that OTTI will not occur in future periods. At December 31, 2016, the Company had the intent and ability to retain its investments for a period of time sufficient to allow for any anticipated recovery in fair value.
46
Loans
The table below summarizes the distribution of the Company’s held for investment loan portfolio at the end of each of the periods indicated:
December 31, | ||||||||||||||||||||
2016 | 2015 | 2014 | 2013 | 2012 | ||||||||||||||||
(in thousands) | ||||||||||||||||||||
Loans, held for investment | ||||||||||||||||||||
Commercial and industrial | $ | 5,759,090 | $ | 5,117,223 | $ | 3,327,629 | $ | 2,236,740 | $ | 1,659,003 | ||||||||||
Commercial real estate - non-owner occupied | 3,549,876 | 2,289,480 | 2,058,620 | 1,843,415 | 1,505,600 | |||||||||||||||
Commercial real estate - owner occupied | 2,015,671 | 2,085,738 | 1,734,617 | 1,561,862 | 1,396,797 | |||||||||||||||
Construction and land development | 1,489,488 | 1,143,228 | 754,154 | 537,231 | 394,319 | |||||||||||||||
Residential real estate | 258,734 | 322,265 | 298,872 | 350,312 | 407,937 | |||||||||||||||
Commercial leases | 100,356 | 147,633 | 204,270 | 235,968 | 288,747 | |||||||||||||||
Consumer | 38,572 | 26,474 | 32,633 | 45,153 | 31,836 | |||||||||||||||
Deferred loan fees and costs | (22,260 | ) | (19,187 | ) | (12,530 | ) | (9,266 | ) | (6,045 | ) | ||||||||||
Loans, net of deferred loan fees and costs | 13,189,527 | 11,112,854 | 8,398,265 | 6,801,415 | 5,678,194 | |||||||||||||||
Allowance for credit losses | (124,704 | ) | (119,068 | ) | (110,216 | ) | (100,050 | ) | (95,427 | ) | ||||||||||
Total loans HFI | $ | 13,064,823 | $ | 10,993,786 | $ | 8,288,049 | $ | 6,701,365 | $ | 5,582,767 | ||||||||||
As of December 31, 2016, 2015, and 2012, the Company also has $18.9 million, $23.8 million, and $31.1 million of HFS loans. The Company did not have HFS loans as of December 31, 2014 and 2013.
The following table sets forth the amount of loans outstanding by type of loan as of December 31, 2016 that were contractually due in one year or less, more than one year and less than five years, and more than five years based on remaining scheduled repayments of principal. Lines of credit or other loans having no stated final maturity and no stated schedule of repayments are reported as due in one year or less. The table also presents an analysis of the rate structure for loans within the same maturity time periods. Actual cash flows from these loans may differ materially from contractual maturities due to prepayment, refinancing, or other factors.
47
Due in one year or less | Due after one year to five years | Due after five years | Total | |||||||||||||
(in thousands) | ||||||||||||||||
Commercial and industrial | ||||||||||||||||
Floating rate | $ | 1,430,312 | $ | 1,786,486 | $ | 730,735 | $ | 3,947,533 | ||||||||
Fixed rate | 52,722 | 371,980 | 1,383,603 | 1,808,305 | ||||||||||||
Commercial real estate — non-owner occupied | ||||||||||||||||
Floating rate | 229,400 | 1,330,428 | 581,586 | 2,141,414 | ||||||||||||
Fixed rate | 168,684 | 1,022,211 | 211,835 | 1,402,730 | ||||||||||||
Commercial real estate — owner occupied | ||||||||||||||||
Floating rate | 58,295 | 161,234 | 871,370 | 1,090,899 | ||||||||||||
Fixed rate | 66,629 | 306,334 | 565,326 | 938,289 | ||||||||||||
Construction and land development | ||||||||||||||||
Floating rate | 514,901 | 730,721 | 120,468 | 1,366,090 | ||||||||||||
Fixed rate | 54,059 | 46,790 | 12,335 | 113,184 | ||||||||||||
Residential real estate | ||||||||||||||||
Floating rate | 15,412 | 49,687 | 144,653 | 209,752 | ||||||||||||
Fixed rate | 6,944 | 16,190 | 26,919 | 50,053 | ||||||||||||
Leases | ||||||||||||||||
Floating rate | 594 | 2,509 | — | 3,103 | ||||||||||||
Fixed rate | 7,445 | 58,006 | 32,189 | 97,640 | ||||||||||||
Consumer | ||||||||||||||||
Floating rate | 24,794 | 3,490 | 3,804 | 32,088 | ||||||||||||
Fixed rate | 3,211 | 2,501 | 1,644 | 7,356 | ||||||||||||
Total | $ | 2,633,402 | $ | 5,888,567 | $ | 4,686,467 | $ | 13,208,436 | ||||||||
As of December 31, 2016, approximately $6.32 billion, or 71.9%, of total variable rate loans were subject to rate floors with a weighted average interest rate of 4.7%. At December 31, 2015, approximately $5.14 billion, or 71.9% of total variable rate loans were subject to rate floors with a weighted average interest rate of 3.4%. At December 31, 2016, total loans consisted of 66.6% with floating rates and 33.4% with fixed rates, compared to 64.2% with floating rates and 35.8% with fixed rates at December 31, 2015.
48
Concentrations of Lending Activities
The Company’s lending activities, including those within its NBLs, are driven in large part by the customers served in the market areas where the Company has offices in the states of Arizona, Nevada and California. The following table presents a breakout of the in-footprint and out of footprint distribution of loans:
December 31, 2016 | December 31, 2015 | ||||||||||||||||
In-Footprint | Out-of-Footprint | Total | In-Footprint | Out-of-Footprint | Total | ||||||||||||
Arizona | 20.7 | % | 1.7 | % | 22.4 | % | 22.3 | % | 2.9 | % | 25.2 | % | |||||
Nevada | 13.0 | % | 0.1 | % | 13.1 | % | 15.4 | % | 0.2 | % | 15.6 | % | |||||
Southern California | 13.0 | % | 0.4 | % | 13.4 | % | 14.0 | % | 1.8 | % | 15.8 | % | |||||
Northern California | 7.9 | % | 0.4 | % | 8.3 | % | 10.0 | % | 0.7 | % | 10.7 | % | |||||
HOA Services | 0.2 | % | 0.7 | % | 0.9 | % | 0.1 | % | 0.7 | % | 0.8 | % | |||||
Hotel Franchise Finance | 1.0 | % | 8.8 | % | 9.8 | % | — | % | — | % | — | % | |||||
Public & Nonprofit Finance | 9.8 | % | 1.2 | % | 11.0 | % | 11.3 | % | 1.8 | % | 13.1 | % | |||||
Technology & Innovation | 2.8 | % | 4.8 | % | 7.6 | % | 2.6 | % | 4.3 | % | 6.9 | % | |||||
Other NBLs | 6.0 | % | 7.5 | % | 13.5 | % | 5.1 | % | 6.8 | % | 11.9 | % | |||||
Total | 74.4 | % | 25.6 | % | 100.0 | % | 80.8 | % | 19.2 | % | 100.0 | % | |||||
The Company monitors concentrations within four broad categories: product, collateral, geography, and industry. The Company’s loan portfolio includes significant credit exposure to the CRE market. At December 31, 2016 and 2015, CRE related loans accounted for approximately 53% and 49% of total loans, respectively. Substantially all of these loans are secured by first liens with an initial loan to value ratio of generally not more than 75%. Approximately 36% and 48% of these CRE loans, excluding construction and land loans, were owner-occupied at December 31, 2016 and 2015, respectively.
Interest Reserves
Interest reserves are generally established at the time of the loan origination for construction and land development loans. The Company’s practice is to monitor the construction, sales and/or leasing progress to determine the feasibility of ongoing construction and development projects. The Company discontinues the use of the interest reserve when a project is determined not to be viable and may take appropriate action to protect its collateral position via renegotiation and/or legal action as deemed appropriate. At December 31, 2016, the Company had 31 loans with an outstanding balance of $118.6 million with available interest reserves of $3.6 million. At December 31, 2015, the Company had 21 loans with an outstanding principal balance of $117.3 million and available interest reserve amounts of $3.6 million.
Impaired loans
A loan is identified as impaired when it is no longer probable that interest and principal will be collected according to the contractual terms of the original loan agreement. Generally, impaired loans are classified as non-accrual. However, in certain instances, impaired loans may continue on an accrual basis if full repayment of all principal and interest is expected and the loan is both well-secured and in the process of collection. Impaired loans are measured for reserve requirements in accordance with ASC 310 based on the present value of expected future cash flows discounted at the loan's effective interest rate or, as a practical expedient, at the loan's observable market price or the fair value of the collateral less applicable disposition costs if the loan is collateral dependent. The amount of an impairment reserve, if any, and any subsequent changes are charged against the allowance for credit losses.
In addition to the Company's own internal loan review process, regulators may from time to time direct the Company to modify loan grades, loan impairment calculations, or loan impairment methodology.
49
Total non-performing loans decreased by $27.1 million, or 22.2%, at December 31, 2016 to $95.0 million from $122.1 million at December 31, 2015.
December 31, | ||||||||||||||||||||
2016 | 2015 | 2014 | 2013 | 2012 | ||||||||||||||||
(dollars in thousands) | ||||||||||||||||||||
Total non-accrual loans (1) | $ | 40,272 | $ | 48,381 | $ | 67,659 | $ | 75,680 | $ | 104,716 | ||||||||||
Loans past due 90 days or more on accrual status (2) | 1,067 | 3,028 | 5,132 | 1,534 | 1,388 | |||||||||||||||
Accruing troubled debt restructured loans | 53,637 | 70,707 | 84,720 | 89,576 | 84,609 | |||||||||||||||
Total nonperforming loans, excluding loans acquired with deteriorated credit quality | 94,976 | 122,116 | 157,511 | 166,790 | 190,713 | |||||||||||||||
Other impaired loans | 4,233 | 6,758 | 9,239 | 11,587 | 7,442 | |||||||||||||||
Total impaired loans | $ | 99,209 | $ | 128,874 | $ | 166,750 | $ | 178,377 | $ | 198,155 | ||||||||||
Other assets acquired through foreclosure, net | $ | 47,815 | $ | 43,942 | $ | 57,150 | $ | 66,719 | $ | 77,247 | ||||||||||
Non-accrual loans to gross loans held for investment | 0.31 | % | 0.44 | % | 0.81 | % | 1.11 | % | 1.84 | % | ||||||||||
Loans past due 90 days or more on accrual status to gross loans held for investment | 0.01 | 0.03 | 0.06 | 0.02 | 0.02 | |||||||||||||||
Interest income received on non-accrual loans | $ | 1,254 | $ | 1,634 | $ | 2,536 | $ | 1,916 | $ | 191 | ||||||||||
Interest income that would have been recorded under the original terms of non-accrual loans | 2,045 | 2,549 | 3,758 | 5,405 | 5,469 | |||||||||||||||
(1) | Includes non-accrual TDR loans of $7.1 million and $18.2 million at December 31, 2016 and 2015, respectively. |
(2) | Includes $0.1 million from loans acquired with deteriorated credit quality at December 31, 2016. |
The composition of non-accrual loans by loan type and by segment were as follows:
December 31, 2016 | December 31, 2015 | |||||||||||||||||||
Non-accrual Balance | Percent of Non-Accrual Balance | Percent of Total HFI Loans | Non-accrual Balance | Percent of Non-Accrual Balance | Percent of Total HFI Loans | |||||||||||||||
(dollars in thousands) | ||||||||||||||||||||
Commercial and industrial | $ | 16,967 | 42.13 | % | 0.13 | % | $ | 20,877 | 43.15 | % | 0.19 | % | ||||||||
Commercial real estate | 16,666 | 41.39 | 0.13 | 18,675 | 38.60 | 0.17 | ||||||||||||||
Construction and land development | 1,284 | 3.19 | 0.01 | 2,309 | 4.77 | 0.02 | ||||||||||||||
Residential real estate | 5,192 | 12.89 | 0.04 | 6,324 | 13.07 | 0.06 | ||||||||||||||
Consumer | 163 | 0.40 | — | 196 | 0.41 | — | ||||||||||||||
Total non-accrual loans | $ | 40,272 | 100.00 | % | 0.31 | % | $ | 48,381 | 100.00 | % | 0.44 | % | ||||||||
December 31, 2016 | December 31, 2015 | |||||||||||||
Nonaccrual Loans | Percent of Segment's Total HFI Loans | Nonaccrual Loans | Percent of Segment's Total HFI Loans | |||||||||||
(dollars in thousands) | ||||||||||||||
Arizona | $ | 10,424 | 0.35 | % | $ | 10,596 | 0.38 | % | ||||||
Nevada | 10,407 | 0.60 | 8,010 | 0.46 | ||||||||||
Southern California | 2,891 | 0.16 | 2,844 | 0.16 | ||||||||||
Northern California | 4,408 | 0.41 | 1,590 | 0.14 | ||||||||||
National Business Lines | 8,979 | 0.16 | 10,218 | 0.28 | ||||||||||
Corporate & Other | 3,163 | 23.22 | 15,123 | 38.18 | ||||||||||
Total non-accrual loans | $ | 40,272 | 0.31 | % | $ | 48,381 | 0.44 | % | ||||||
50
Troubled Debt Restructured Loans
A TDR loan is a loan that is granted a concession, for reasons related to a borrower’s financial difficulties, that the lender would not otherwise consider. The loan terms that have been modified or restructured due to a borrower’s financial situation include, but are not limited to, a reduction in the stated interest rate, an extension of the maturity or renewal of the loan at an interest rate below current market, a reduction in the face amount of the debt, a reduction in accrued interest, extensions, deferrals, renewals, and rewrites. A TDR loan is also considered impaired. Generally, a loan that is modified at an effective market rate of interest is no longer disclosed as a TDR in years subsequent to the restructuring if it is performing based on the terms specified by the restructuring agreement. However, such loans continue to be considered impaired.
As of December 31, 2016 and 2015, the aggregate amount of loans classified as impaired was $99.2 million and $128.9 million, respectively, a net decrease of 23.0%. The total specific allowance for credit losses related to these loans was $4.2 million and $4.7 million at December 31, 2016 and 2015, respectively. The Company had $53.6 million and $70.7 million in loans classified as accruing restructured loan at December 31, 2016 and 2015, respectively.
Impaired loans by segment at December 31, 2016 and 2015 were as follows:
December 31, | ||||||||
2016 | 2015 | |||||||
(in thousands) | ||||||||
Arizona | $ | 19,180 | $ | 22,400 | ||||
Nevada | 48,348 | 56,843 | ||||||
Southern California | 2,888 | 3,181 | ||||||
Northern California | 4,024 | — | ||||||
National Business Lines | 8,624 | 10,218 | ||||||
Corporate & Other | 16,145 | 36,232 | ||||||
Total impaired loans | $ | 99,209 | $ | 128,874 | ||||
The following tables present a breakdown of total impaired loans and the related specific reserves for the periods indicated:
December 31, 2016 | ||||||||||||||||||||
Impaired Balance | Percent of Impaired Balance | Percent of Total HFI Loans | Reserve Balance | Percent of Reserve Balance | Percent of Total Allowance | |||||||||||||||
(dollars in thousands) | ||||||||||||||||||||
Commercial and industrial | $ | 21,462 | 21.63 | % | 0.16 | % | $ | 3,301 | 77.88 | % | 2.65 | % | ||||||||
Commercial real estate | 46,272 | 46.64 | 0.36 | 937 | 22.10 | 0.75 | ||||||||||||||
Construction and land development | 14,838 | 14.96 | 0.11 | — | — | — | ||||||||||||||
Residential real estate | 16,391 | 16.52 | 0.12 | — | — | — | ||||||||||||||
Consumer | 246 | 0.25 | — | 1 | 0.02 | — | ||||||||||||||
Total impaired loans | $ | 99,209 | 100.00 | % | 0.75 | % | $ | 4,239 | 100.00 | % | 3.40 | % | ||||||||
December 31, 2015 | ||||||||||||||||||||
Impaired Balance | Percent of Impaired Balance | Percent of Total HFI Loans | Reserve Balance | Percent of Reserve Balance | Percent of Total Allowance | |||||||||||||||
(dollars in thousands) | ||||||||||||||||||||
Commercial and industrial | $ | 29,409 | 22.82 | % | 0.26 | % | $ | 3,518 | 75.52 | % | 2.95 | % | ||||||||
Commercial real estate | 64,234 | 49.84 | 0.58 | 869 | 18.66 | 0.73 | ||||||||||||||
Construction and land development | 18,322 | 14.22 | 0.17 | — | — | — | ||||||||||||||
Residential real estate | 16,575 | 12.86 | 0.15 | 270 | 5.80 | 0.23 | ||||||||||||||
Consumer | 334 | 0.26 | — | 1 | 0.02 | — | ||||||||||||||
Total impaired loans | $ | 128,874 | 100.00 | % | 1.16 | % | $ | 4,658 | 100.00 | % | 3.91 | % | ||||||||
The amount of interest income recognized on impaired loans for the years ended December 31, 2016, 2015, and 2014 was approximately $4.2 million, $4.8 million, and $5.5 million, respectively.
51
Allowance for Credit Losses
The following table summarizes the activity in the Company's allowance for credit losses for the period indicated:
Year Ended December 31, | ||||||||||||||||||||
2016 | 2015 | 2014 | 2013 | 2012 | ||||||||||||||||
(dollars in thousands) | ||||||||||||||||||||
Allowance for credit losses: | ||||||||||||||||||||
Balance at beginning of period | $ | 119,068 | $ | 110,216 | $ | 100,050 | $ | 95,427 | $ | 99,170 | ||||||||||
Provision charged to operating expense: | ||||||||||||||||||||
Commercial and industrial | 10,638 | 18,411 | 14,551 | 5,760 | 21,599 | |||||||||||||||
Commercial real estate | (2,449 | ) | (9,762 | ) | (6,176 | ) | 2,972 | 15,823 | ||||||||||||
Construction and land development | 1,732 | (1,454 | ) | 1,966 | 3,443 | 4,448 | ||||||||||||||
Residential real estate | (2,137 | ) | (3,539 | ) | (4,352 | ) | 228 | 2,088 | ||||||||||||
Consumer | 216 | (456 | ) | (1,263 | ) | 817 | 2,886 | |||||||||||||
Total Provision | 8,000 | 3,200 | 4,726 | 13,220 | 46,844 | |||||||||||||||
Recoveries of loans previously charged-off: | ||||||||||||||||||||
Commercial and industrial | (3,991 | ) | (3,754 | ) | (4,728 | ) | (5,037 | ) | (3,067 | ) | ||||||||||
Commercial real estate | (5,690 | ) | (4,139 | ) | (3,859 | ) | (2,758 | ) | (3,294 | ) | ||||||||||
Construction and land development | (485 | ) | (1,872 | ) | (2,160 | ) | (2,060 | ) | (2,903 | ) | ||||||||||
Residential real estate | (875 | ) | (2,181 | ) | (1,896 | ) | (2,097 | ) | (1,078 | ) | ||||||||||
Consumer | (144 | ) | (203 | ) | (459 | ) | (930 | ) | (357 | ) | ||||||||||
Total recoveries | (11,185 | ) | (12,149 | ) | (13,102 | ) | (12,882 | ) | (10,699 | ) | ||||||||||
Loans charged-off: | ||||||||||||||||||||
Commercial and industrial | 12,477 | 5,550 | 4,370 | 4,000 | 17,341 | |||||||||||||||
Commercial real estate | 728 | — | 964 | 8,648 | 19,166 | |||||||||||||||
Construction and land development | 18 | — | 87 | 1,538 | 10,992 | |||||||||||||||
Residential real estate | 165 | 820 | 1,728 | 5,922 | 7,063 | |||||||||||||||
Consumer | 161 | 127 | 513 | 1,371 | 6,724 | |||||||||||||||
Total charged-off | 13,549 | 6,497 | 7,662 | 21,479 | 61,286 | |||||||||||||||
Net charge-offs (recoveries) | 2,364 | (5,652 | ) | (5,440 | ) | 8,597 | 50,587 | |||||||||||||
Balance at end of period | $ | 124,704 | $ | 119,068 | $ | 110,216 | $ | 100,050 | $ | 95,427 | ||||||||||
Net charge-offs (recoveries) to average loans outstanding - annualized | 0.02 | % | (0.06 | )% | (0.07 | )% | 0.14 | % | 0.99 | % | ||||||||||
Allowance for credit losses to gross loans | 0.95 | 1.07 | 1.31 | 1.47 | 1.67 | |||||||||||||||
52
The following table summarizes the allocation of the allowance for credit losses by loan type. However, the allocation of a portion of the allowance to one category of loans does not preclude its availability to absorb losses in other categories.
Commercial and Industrial | Commercial Real Estate | Construction and Land Development | Residential Real Estate | Consumer | Total | |||||||||||||||||||
(dollars in thousands) | ||||||||||||||||||||||||
December 31, 2016 | ||||||||||||||||||||||||
Allowance for Credit Losses | $ | 73,333 | $ | 25,673 | $ | 21,175 | $ | 3,851 | $ | 672 | $ | 124,704 | ||||||||||||
Percent of Total Allowance for Credit Losses | 58.8 | % | 20.6 | % | 17.0 | % | 3.1 | % | 0.5 | % | 100.0 | % | ||||||||||||
Percent of Gross Loans to Total Gross HFI Loans | 44.3 | 42.1 | 11.3 | 2.0 | 0.3 | 100.0 | ||||||||||||||||||
December 31, 2015 | ||||||||||||||||||||||||
Allowance for Credit Losses | $ | 71,181 | $ | 23,160 | $ | 18,976 | $ | 5,278 | $ | 473 | $ | 119,068 | ||||||||||||
Percent of Total Allowance for Credit Losses | 59.8 | % | 19.5 | % | 15.9 | % | 4.4 | % | 0.4 | % | 100.0 | % | ||||||||||||
Percent of Gross Loans to Total Gross HFI Loans | 47.4 | 39.3 | 10.2 | 2.9 | 0.2 | 100.0 | ||||||||||||||||||
December 31, 2014 | ||||||||||||||||||||||||
Allowance for Credit Losses | $ | 54,566 | $ | 28,783 | $ | 18,558 | $ | 7,456 | $ | 853 | $ | 110,216 | ||||||||||||
Percent of Total Allowance for Credit Losses | 49.5 | % | 26.1 | % | 16.8 | % | 6.8 | % | 0.8 | % | 100.0 | % | ||||||||||||
Percent of Gross Loans to Total Gross HFI Loans | 42.0 | 45.0 | 9.0 | 3.6 | 0.4 | 100.0 | ||||||||||||||||||
December 31, 2013 | ||||||||||||||||||||||||
Allowance for Credit Losses | $ | 39,657 | $ | 32,064 | $ | 14,519 | $ | 11,640 | $ | 2,170 | $ | 100,050 | ||||||||||||
Percent of Total Allowance for Credit Losses | 39.7 | % | 32.0 | % | 14.5 | % | 11.6 | % | 2.2 | % | 100.0 | % | ||||||||||||
Percent of Gross Loans to Total Gross HFI Loans | 36.3 | 50.0 | 7.9 | 5.1 | 0.7 | 100.0 | ||||||||||||||||||
December 31, 2012 | ||||||||||||||||||||||||
Allowance for Credit Losses | $ | 32,860 | $ | 34,982 | $ | 10,554 | $ | 15,237 | $ | 1,794 | $ | 95,427 | ||||||||||||
Percent of Total Allowance for Credit Losses | 34.4 | % | 36.7 | % | 11.0 | % | 16.0 | % | 1.9 | % | 100.0 | % | ||||||||||||
Percent of Gross Loans to Total Gross HFI Loans | 34.3 | 51.1 | 6.9 | 7.2 | 0.5 | 100.0 | ||||||||||||||||||
The allowance for credit losses as a percentage of total loans decreased to 0.95% at December 31, 2016 from 1.07% at December 31, 2015. The total balance of the allowance for credit losses has increased due to the increase in the size of the loan portfolio. However, the increase in the allowance is not proportional to the increase in the portfolio as the loans acquired in the HFF acquisition were recorded at fair value and no previous allowance for credit losses was carried over therefore reducing the allowance for credit losses to total loans ratio. See "Non-GAAP Financial Measures" in "Item 7. Management's Discussion and Analysis of Financial Condition and Results of Operations" for an allowance for credit losses to gross loans ratio that has been adjusted for acquisition accounting.
53
Problem Loans
The Company classifies loans consistent with federal banking regulations using a nine category grading system. These loan grades are described in further detail in "Item 1. Business” of this Form 10-K. The following table presents information regarding potential and actual problem loans, consisting of loans graded Special Mention, Substandard, Doubtful, and Loss, but still performing, and excluding acquired loans:
December 31, 2016 | |||||||||||||
Number of Loans | Loan Balance | Percent of Loan Balance | Percent of Total HFI Loan Balance | ||||||||||
(dollars in thousands) | |||||||||||||
Commercial and industrial | 96 | $ | 92,019 | 51.65 | % | 0.70 | % | ||||||
Commercial real estate | 41 | 71,900 | 40.36 | 0.55 | |||||||||
Construction and land development | 7 | 12,297 | 6.90 | 0.09 | |||||||||
Residential real estate | 9 | 1,831 | 1.03 | 0.01 | |||||||||
Consumer | 9 | 103 | 0.06 | — | |||||||||
Total | 162 | $ | 178,150 | 100.00 | % | 1.35 | % | ||||||
December 31, 2015 | |||||||||||||
Number of Loans | Loan Balance | Percent of Loan Balance | Percent of Total HFI Loan Balance | ||||||||||
(dollars in thousands) | |||||||||||||
Commercial and industrial | 90 | $ | 80,011 | 55.69 | % | 0.72 | % | ||||||
Commercial real estate | 50 | 40,345 | 28.08 | 0.36 | |||||||||
Construction and land development | 3 | 17,734 | 12.34 | 0.16 | |||||||||
Residential real estate | 12 | 5,309 | 3.70 | 0.05 | |||||||||
Consumer | 8 | 271 | 0.19 | — | |||||||||
Total | 163 | $ | 143,670 | 100.00 | % | 1.29 | % | ||||||
54
Other Assets Acquired Through Foreclosure
The following table represents the changes in other assets acquired through foreclosure:
Year Ended December 31, | ||||||||||||
2016 | ||||||||||||
Gross Balance | Valuation Allowance | Net Balance | ||||||||||
(in thousands) | ||||||||||||
Balance, beginning of period | $ | 52,984 | $ | (9,042 | ) | $ | 43,942 | |||||
Transfers to other assets acquired through foreclosure, net | 13,110 | — | 13,110 | |||||||||
Proceeds from sale of other real estate owned and repossessed assets, net | (11,584 | ) | 2,451 | (9,133 | ) | |||||||
Valuation adjustments, net | — | 268 | 268 | |||||||||
(Losses) gains, net (1) | (372 | ) | — | (372 | ) | |||||||
Balance, end of period | $ | 54,138 | $ | (6,323 | ) | $ | 47,815 | |||||
2015 | ||||||||||||
Balance, beginning of period | $ | 71,421 | $ | (14,271 | ) | $ | 57,150 | |||||
Additions from acquisition | 1,407 | — | 1,407 | |||||||||
Transfers to other assets acquired through foreclosure, net | 28,566 | — | 28,566 | |||||||||
Proceeds from sale of other real estate owned and repossessed assets, net | (51,038 | ) | 5,411 | (45,627 | ) | |||||||
Valuation adjustments, net | — | (182 | ) | (182 | ) | |||||||
Gains (losses), net (1) | 2,628 | — | 2,628 | |||||||||
Balance, end of period | $ | 52,984 | $ | (9,042 | ) | $ | 43,942 | |||||
2014 | ||||||||||||
Balance, beginning of period | $ | 88,421 | $ | (21,702 | ) | $ | 66,719 | |||||
Transfers to other assets acquired through foreclosure, net | 13,777 | — | 13,777 | |||||||||
Proceeds from sale of other real estate owned and repossessed assets, net | (33,643 | ) | 7,725 | (25,918 | ) | |||||||
Valuation adjustments, net | — | (294 | ) | (294 | ) | |||||||
Gains (losses), net (1) | 2,866 | — | 2,866 | |||||||||
Balance, end of period | $ | 71,421 | $ | (14,271 | ) | $ | 57,150 | |||||
(1) | Includes net gains related to initial transfers to other assets of $0.4 million, $0.9 million, and $0.1 million during the years ended December 31, 2016, 2015, and 2014, respectively, pursuant to accounting guidance. |
Other assets acquired through foreclosure consist primarily of properties acquired as a result of, or in-lieu-of, foreclosure. OREO and other repossessed property are reported at the lower of carrying value or fair value less estimated costs to sell the property. Costs relating to the development or improvement of the assets are capitalized and costs relating to holding the assets are charged to expense. The Company has $47.8 million, $43.9 million, and $57.2 million of such assets at December 31, 2016, 2015, and 2014 respectively.
At December 31, 2016, the Company held 31 OREO properties, compared to 39 at December 31, 2015.
Goodwill and Other Intangible Assets
Goodwill represents the excess consideration paid for net assets acquired in a business combination over their fair value. Goodwill and other intangible assets acquired in a business combination and determined to have an indefinite useful life are not subject to amortization, but are subsequently evaluated for impairment at least annually. The Company has goodwill of $290.0 million, which includes $266.6 million acquired in the Bridge acquisition in 2015 and $0.2 million related to the HFF loan portfolio acquisition in 2016. Intangible assets total $12.9 million at December 31, 2016. The goodwill and intangible balances at December 31, 2016 are allocated to the Nevada, Northern California, Technology & Innovation, and HFF operating segments. See "Note 2. Mergers, Acquisitions and Dispositions" to the Consolidated Financial Statements for further discussion of the HFF and Bridge acquisitions and the allocation of goodwill and intangible assets acquired.
The Company performs its annual goodwill and intangibles impairment tests as of October 1 each year, or more often if events or circumstances indicate that the carrying value may not be recoverable. During the years ended December 31, 2016, 2015, and 2014, there were no events or circumstances that indicated an interim impairment test of goodwill or other intangible assets
55
was necessary, and based on the Company's annual goodwill and intangibles impairment tests as of October 1 of each of these years, it was determined that goodwill and intangible assets are not impaired.
The fair values of assets acquired and liabilities assumed are subject to adjustment during the first twelve months after the acquisition date if additional information becomes available to indicate a more accurate or appropriate value for an asset or liability. The measurement period for the Bridge acquisition ended on June 30, 2016. Therefore, the fair values of these assets acquired and liabilities assumed were considered final effective June 30, 2016. The Company recognized initial goodwill of $0.2 million related to the HFF loan portfolio purchase, which closed on April 20, 2016. Although there have been no measurement period adjustments related to the HFF acquisition identified to date and any future adjustments are not expected to be significant, the fair values of loans is still preliminary as of December 31, 2016.
The following is a summary of acquired intangible assets:
December 31, 2016 | December 31, 2015 | |||||||||||||||||||||||
Gross Carrying Amount | Accumulated Amortization | Net Carrying Amount | Gross Carrying Amount | Accumulated Amortization | Net Carrying Amount | |||||||||||||||||||
(in thousands) | ||||||||||||||||||||||||
Subject to amortization: | ||||||||||||||||||||||||
Core deposit intangibles | $ | 40,804 | $ | 28,227 | $ | 12,577 | $ | 40,804 | $ | 25,438 | $ | 15,366 | ||||||||||||
December 31, 2016 | December 31, 2015 | |||||||||||||||||||||||
Gross Carrying Amount | Impairment | Net Carrying Amount | Gross Carrying Amount | Impairment | Net Carrying Amount | |||||||||||||||||||
Not subject to amortization | ||||||||||||||||||||||||
Trade name | $ | 350 | $ | — | $ | 350 | $ | 350 | $ | — | $ | 350 | ||||||||||||
Deferred Tax Assets
For the year ended December 31, 2016, the net deferred tax asset increased $8.8 million to $95.2 million. This overall increase in the net deferred tax asset was primarily the result of decreases in the fair market value of AFS securities.
At each of the periods ended December 31, 2016 and 2015, the Company had no deferred tax valuation allowance.
Deposits
Deposits are the primary source for funding the Company's asset growth. Total deposits increased to $14.55 billion at December 31, 2016, from $12.03 billion at December 31, 2015, an increase of $2.52 billion, or 20.9%. The increase in deposits is attributable to organic deposit growth. Non-interest-bearing demand deposits increased by $1.54 billion from December 31, 2015. Savings and money market deposits increased $824.0 million from December 31, 2015.
WAB is a participant in the Promontory Interfinancial Network, a network that offers deposit placement services such as CDARS and ICS, which offer products that qualify large deposits for FDIC insurance. At December 31, 2016, the Company has $413.9 million of CDARS deposits and $607.5 million of ICS deposits, compared to $517.5 million of CDARS deposits and $714.4 million of ICS deposits at December 31, 2015. At December 31, 2016 and 2015, the Company also has $136.2 million and $178.8 million, respectively, of wholesale brokered deposits. There are also $571.9 million and $365.6 million of additional deposits as of December 31, 2016 and 2015, respectively, that the Company considers core deposits because of their origin from AAB clients, but which are classified as brokered deposits for regulatory reporting purposes.
56
The average balances and weighted average rates paid on deposits are presented below:
Year Ended December 31, | |||||||||||||||||||||
2016 | 2015 | 2014 | |||||||||||||||||||
Average Balance | Rate | Average Balance | Rate | Average Balance | Rate | ||||||||||||||||
(dollars in thousands) | |||||||||||||||||||||
Interest-bearing transaction accounts | $ | 1,217,344 | 0.18 | % | $ | 983,889 | 0.18 | % | $ | 793,118 | 0.19 | % | |||||||||
Savings and money market accounts | 5,827,549 | 0.33 | 4,470,189 | 0.28 | 3,616,829 | 0.30 | |||||||||||||||
Time certificates of deposit | 1,615,502 | 0.50 | 1,808,120 | 0.42 | 1,758,342 | 0.43 | |||||||||||||||
Total interest-bearing deposits | 8,660,395 | 0.34 | 7,262,198 | 0.30 | 6,168,289 | 0.32 | |||||||||||||||
Non-interest-bearing demand deposits | 5,062,319 | — | 3,273,138 | — | 2,153,686 | — | |||||||||||||||
Total deposits | $ | 13,722,714 | 0.22 | % | $ | 10,535,336 | 0.21 | % | $ | 8,321,975 | 0.24 | % | |||||||||
The Company does not pay interest to depositors of non-interest bearing accounts. However, earnings credits are awarded to some account holders, which offset charges incurred by account holders for deposit services that are utilized.
Certificates of Deposit of $100,000 or More
The table below discloses the remaining maturity for certificates of deposit of $100,000 or more:
December 31, | ||||||||
2016 | 2015 | |||||||
(in thousands) | ||||||||
3 months or less | $ | 453,260 | $ | 757,102 | ||||
3 to 6 months | 465,089 | 248,000 | ||||||
6 to 12 months | 274,323 | 348,349 | ||||||
Over 12 months | 99,258 | 89,238 | ||||||
Total | $ | 1,291,930 | $ | 1,442,689 | ||||
Other Borrowings
The Company from time to time utilizes short-term borrowed funds to support short-term liquidity needs generally created by increased loan demand. The majority of these short-term borrowed funds consist of advances from the FHLB and customer repurchase agreements. The Company’s borrowing capacity with the FHLB is determined based on collateral pledged, generally consisting of securities and loans. In addition, the Company has borrowing capacity from other sources, collateralized by securities, including securities sold under agreements to repurchase, which are reflected at the amount of cash received in connection with the transaction, and may require additional collateral based on the fair value of the underlying securities. At December 31, 2016, total short-term borrowed funds consist of customer repurchase agreements of $41.7 million and FHLB overnight advances of $80.0 million. At December 31, 2015, total short-term borrowed funds consisted of customer repurchase agreements of $38.2 million and FHLB advances of $150.0 million.
At December 31, 2016 and 2015, the Company does not have any borrowings classified as long-term.
57
Qualifying Debt
At December 31, 2016 and 2015, qualifying debt consists of subordinated debt and junior subordinated debt, inclusive of issuance costs and fair market value adjustments. At December 31, 2016, the carrying value of subordinated debt was $305.8 million, compared to $152.0 million at December 31, 2015, an increase of $153.8 million, resulting from issuance of $175.0 million of subordinated debentures in June 2016.
The junior subordinated debt has contractual balances and maturity dates as follows:
December 31, | ||||||||||
Name of Trust | Maturity | 2016 | 2015 | |||||||
At fair value | (in thousands) | |||||||||
BankWest Nevada Capital Trust II | 2033 | $ | 15,464 | $ | 15,464 | |||||
Intermountain First Statutory Trust I | 2034 | 10,310 | 10,310 | |||||||
First Independent Statutory Trust I | 2035 | 7,217 | 7,217 | |||||||
WAL Trust No. 1 | 2036 | 20,619 | 20,619 | |||||||
WAL Statutory Trust No. 2 | 2037 | 5,155 | 5,155 | |||||||
WAL Statutory Trust No. 3 | 2037 | 7,732 | 7,732 | |||||||
Total contractual balance | 66,497 | 66,497 | ||||||||
FVO on junior subordinated debt | (16,087 | ) | (19,569 | ) | ||||||
Junior subordinated debt, at fair value | $ | 50,410 | $ | 46,928 | ||||||
At amortized cost | ||||||||||
Bridge Capital Holdings Trust I | 2035 | $ | 12,372 | $ | 12,372 | |||||
Bridge Capital Holdings Trust II | 2036 | 5,155 | 5,155 | |||||||
Total contractual balance | 17,527 | 17,527 | ||||||||
Purchase accounting adjustment, net of accretion (1) | (5,776 | ) | (6,085 | ) | ||||||
Junior subordinated debt, at amortized cost | $ | 11,751 | $ | 11,442 | ||||||
Total junior subordinated debt | $ | 62,161 | $ | 58,370 | ||||||
(1) | The purchase accounting adjustment is being amortized over the remaining life of the trusts, pursuant to accounting guidance. |
The weighted average interest rate of all junior subordinated debt as of December 31, 2016 was 3.34%, which is three-month LIBOR plus the contractual spread of 2.34%, compared to a weighted average interest rate of 2.95% at December 31, 2015.
58
Capital Resources
The Company and the Bank are subject to various regulatory capital requirements administered by the federal banking agencies. Failure to meet minimum capital requirements could trigger certain mandatory or discretionary actions that, if undertaken, could have a direct material effect on the Company’s business and financial statements. Under capital adequacy guidelines and the regulatory framework for prompt corrective action, the Company and the Bank must meet specific capital guidelines that involve quantitative measures of their assets, liabilities, and certain off-balance sheet items (discussed in "Note 16. Commitments and Contingencies" to the Consolidated Financial Statements) as calculated under regulatory accounting practices. The capital amounts and classification are also subject to qualitative judgments by the regulators about components, risk weightings, and other factors.
The capital framework under Basel III became effective for the Company on January 1, 2015. Under the Basel III final rules, minimum requirements have increased for both the quantity and quality of capital held by the Company. A new capital conservation buffer, comprised of Common Equity Tier 1 capital, is also established above the regulatory minimum capital requirements. This capital conservation buffer began being phased in on January 1, 2016 at 0.625% of risk-weighted assets and will increase each subsequent year by an additional 0.625% until reaching its final level of 2.5% on January 1, 2019. Strict eligibility requirements for regulatory capital instruments have been implemented under the final rules and the final rules also revise the definitions and calculations of Tier 1 capital, total capital, and risk-weighted assets.
As of December 31, 2016 and 2015, the Company and the Bank exceeded the capital levels necessary to be classified as well-capitalized, as defined by the banking agencies. The actual capital amounts and ratios for the Company and the Bank are presented in the following tables as of the periods indicated:
Total Capital | Tier 1 Capital | Risk-Weighted Assets | Tangible Average Assets | Total Capital Ratio | Tier 1 Capital Ratio | Tier 1 Leverage Ratio | Common Equity Tier 1 | |||||||||||||||||||||
(dollars in thousands) | ||||||||||||||||||||||||||||
December 31, 2016 | ||||||||||||||||||||||||||||
WAL | $ | 2,107,480 | $ | 1,675,871 | $ | 15,980,092 | $ | 16,868,674 | 13.2 | % | 10.5 | % | 9.9 | % | 10.0 | % | ||||||||||||
WAB | 2,001,081 | 1,720,072 | 15,888,346 | 16,764,327 | 12.6 | 10.8 | 10.3 | 10.8 | ||||||||||||||||||||
Well-capitalized ratios | 10.0 | 8.0 | 5.0 | 6.5 | ||||||||||||||||||||||||
Minimum capital ratios | 8.0 | 6.0 | 4.0 | 4.5 | ||||||||||||||||||||||||
December 31, 2015 | ||||||||||||||||||||||||||||
WAL | $ | 1,603,472 | $ | 1,341,011 | $ | 13,193,563 | $ | 13,683,148 | 12.2 | % | 10.2 | % | 9.8 | % | 9.7 | % | ||||||||||||
WAB | 1,485,070 | 1,213,304 | 13,073,394 | 13,561,251 | 11.4 | 9.3 | 9.0 | 9.3 | ||||||||||||||||||||
Well-capitalized ratios | 10.0 | 8.0 | 5.0 | 6.5 | ||||||||||||||||||||||||
Minimum capital ratios | 8.0 | 6.0 | 4.0 | 4.5 | ||||||||||||||||||||||||
Contractual Obligations and Off-Balance Sheet Arrangements
The Company enters into contracts for services in the ordinary course of business that may require payment for services to be provided in the future and may contain penalty clauses for early termination of the contracts. To meet the financing needs of customers, the Company has financial instruments with off-balance sheet risk, including commitments to extend credit and standby letters of credit. The Company has also committed to irrevocably and unconditionally guarantee the payments or distributions with respect to the holders of preferred securities of the Company's eight statutory business trusts to the extent that the trusts have not made such payments or distributions: 1) accrued and unpaid distributions; 2) the redemption price; and 3) upon a dissolution or termination of the trust, the lesser of the liquidation amount and all accrued and unpaid distributions and the amount of assets of the trust remaining available for distribution. The Company does not believe that these off-balance sheet arrangements have or are reasonably likely to have a material effect on its financial condition, changes in financial condition, revenues or expenses, results of operations, liquidity, capital expenditures, or capital resources. However, there can be no assurance that such arrangements will not have a future effect.
59
The following table sets forth the Company's significant contractual obligations as of December 31, 2016:
Payments Due by Period | ||||||||||||||||||||
Total | Less Than 1 Year | 1-3 Years | 3-5 Years | After 5 Years | ||||||||||||||||
(in thousands) | ||||||||||||||||||||
Time deposit maturities | $ | 1,449,342 | $ | 1,331,419 | $ | 110,597 | $ | 7,326 | $ | — | ||||||||||
Qualifying debt | 409,024 | — | — | — | 409,024 | |||||||||||||||
Other borrowings | 80,000 | 80,000 | — | — | — | |||||||||||||||
Operating lease obligations | 49,587 | 11,024 | 19,581 | 11,976 | 7,006 | |||||||||||||||
Purchase obligations | 42,963 | 17,284 | 9,671 | 8,352 | 7,656 | |||||||||||||||
Total | $ | 2,030,916 | $ | 1,439,727 | $ | 139,849 | $ | 27,654 | $ | 423,686 | ||||||||||
Purchase obligations primarily relate to contracts for software licensing and maintenance and outsourced service providers.
Off-balance sheet commitments associated with outstanding letters of credit, commitments to extend credit, and credit card guarantees as of December 31, 2016 are summarized below. Since commitments associated with letters of credit and commitments to extend credit may expire unused, the amounts shown do not necessarily reflect the actual future cash funding requirements.
Amount of Commitment Expiration per Period | ||||||||||||||||||||
Total Amounts Committed | Less Than 1 Year | 1-3 Years | 3-5 Years | After 5 Years | ||||||||||||||||
(in thousands) | ||||||||||||||||||||
Commitments to extend credit | $ | 4,428,495 | $ | 2,121,720 | $ | 1,575,416 | $ | 320,886 | $ | 410,473 | ||||||||||
Credit card commitments and financial guarantees | 115,536 | 115,536 | — | — | — | |||||||||||||||
Standby letters of credit | 78,576 | 67,192 | 11,017 | 367 | — | |||||||||||||||
Total | $ | 4,622,607 | $ | 2,304,448 | $ | 1,586,433 | $ | 321,253 | $ | 410,473 | ||||||||||
The following table sets forth certain information regarding short-term borrowings as of December 31, 2016 and the respective prior year end balances for customer repurchase agreements, lines of credit, and FHLB advances:
December 31, | ||||||||||||
2016 | 2015 | 2014 | ||||||||||
Customer Repurchase Accounts: | ||||||||||||
Maximum month-end balance | $ | 50,332 | $ | 53,709 | $ | 63,388 | ||||||
Balance at end of year | 41,728 | 38,155 | 54,899 | |||||||||
Average balance | 41,623 | 49,924 | 57,855 | |||||||||
Lines of Credit: | ||||||||||||
Maximum month-end balance | 5,000 | — | 25,000 | |||||||||
Balance at end of year | — | — | 25,000 | |||||||||
Average balance | 562 | 1,740 | 1,499 | |||||||||
FHLB Advances: | ||||||||||||
Maximum month-end balance | 490,000 | 330,000 | 135,300 | |||||||||
Balance at end of year (1) | 80,000 | 150,000 | 96,850 | |||||||||
Average balance | 58,750 | 66,493 | 61,459 | |||||||||
Total Short-Term Borrowed Funds | $ | 121,728 | $ | 188,155 | $ | 176,749 | ||||||
Weighted average interest rate at end of year | 0.42 | % | 1.75 | % | 3.16 | % | ||||||
Weighted average interest rate during year | 0.44 | 2.26 | 4.15 | |||||||||
(1) | Excludes premium of $0.1 million as of December 31, 2014. |
60
Critical Accounting Policies
The Notes to the Consolidated Financial Statements contain a discussion of the Company's significant accounting policies, including information regarding recently issued accounting pronouncements, adoption of such policies, and the related impact of their adoption. The Company believes that certain of these policies, along with various estimates that it is required to make in recording its financial transactions, are important to have a complete understanding of the Company's financial position. In addition, these estimates require management to make complex and subjective judgments, many of which include matters with a high degree of uncertainty. The following is a summary of these critical accounting policies and significant estimates.
Allowance for credit losses
Credit risk is inherent in the business of extending loans and leases to borrowers, for which the Company must maintain an adequate allowance for credit losses. The allowance for credit losses is established through a provision for credit losses recorded to expense. Loans are charged against the allowance for credit losses when management believes that the contractual principal or interest will not be collected. Subsequent recoveries, if any, are credited to the allowance. The allowance is an amount believed adequate to absorb estimated probable losses on existing loans that may become uncollectable, based on evaluation of the collectability of loans and prior credit loss experience, together with other factors. The Company formally re-evaluates and establishes the appropriate level of the allowance for credit losses on a quarterly basis.
The allowance consists of specific and general components. The specific allowance relates to impaired loans. For impaired collateral dependent loans, the reserve is calculated based on collateral value, net of estimated disposition costs. Generally, the Company obtains independent collateral valuation analysis for each loan every twelve months. Loans not collateral dependent are evaluated based on the expected future cash flows discounted at the original contractual interest rate. The Company's impairment analysis also incorporates various valuation considerations, including loan type, loss experience, and geographic criteria.
The general allowance covers all non-impaired loans and incorporates several quantitative and qualitative factors. Quantitative factors include company-specific, ten-year historical net charge-offs stratified by loans with similar characteristics. Qualitative factors include: 1) levels of and trends in delinquencies and impaired loans; 2) levels of and trends in charge-offs and recoveries; 3) trends in volume and terms of loans; 4) changes in underwriting standards or lending policies; 5) experience, ability, depth of lending staff; 6) national and local economic trends and conditions; 7) changes in credit concentrations; 8) out-of-market exposures; 9) changes in quality of loan review system; and 10) changes in the value of underlying collateral.
Due to the credit concentration of the Company's loan portfolio in real estate secured loans, the value of collateral is heavily dependent on real estate values in Nevada, Arizona, and California. While management uses the best information available to make its evaluation, future adjustments to the allowance may be necessary if there are significant changes in economic or other conditions. In addition, regulators, as an integral part of their examination processes, periodically review the Bank's allowances for credit losses, and may require the Bank to make additions to the allowance based on their judgment about information available to them at the time of their examination. Management regularly reviews the assumptions and formulae used in determining the allowance and makes adjustments if required to reflect the current risk profile of the portfolio.
Loans acquired with deteriorated credit quality
ASC 310-30, Accounting for Certain Loans or Debt Securities Acquired in a Transfer, applies to a loan with evidence of deterioration of credit quality since its origination, and for which it is probable, at acquisition, that the investor will be unable to collect all contractually required payments receivable. For these loans accounted for under ASC 310-30, management determines the value of the loan portfolio based, in part, on work provided by an appraiser. Factors considered in the valuation are projected cash flows for the loans, type of loan and related collateral, loan grade, delinquency, and loan to value. Loans are grouped together according to similar characteristics and are treated in the aggregate when applying various valuation techniques. Loans are first evaluated individually to determine if there has been credit deterioration since origination. Once acquired loans are determined to have deteriorated credit quality, the Company evaluates such loans for common risk characteristics and aggregation into one or more pools. Common risk characteristics for pooling acquired loans may include credit ratings, loan type, collateral type, delinquency status, geographic location, loan to value, or combinations thereof. Management also estimates the amount of credit losses that are expected to be realized for individual loans by estimating the probability of default and the loss given default. These estimates are subjective. The accretion of the fair value adjustments attributable to interest rates on loans acquired with deteriorated credit quality is recorded in interest income in the Consolidated Income Statements over the estimated life of the pool. The fair value adjustment attributable to credit losses on these loans is non-accretable. When a loan is sold, paid off or transferred to OREO and liquidated, any remaining non-accretable yield is recorded in interest income.
61
Adjustments to these loan values in future periods may occur based on management's expectation of future cash flows to be collected over the lives of the loans. Estimating cash flows is performed at a pool level and incorporates analysis of historical cash flows, delinquencies, and charge-offs, as well as assumptions about future cash flows. Performance can vary from period to period, causing changes in estimates of the expected cash flows. If, based on the review of a pool of loans, it is probable that a significant increase or improvement in cash flows previously expected to be collected, any valuation allowance established for the pool of loans is first reduced for the increase in the present value of cash flows expected to be collected, and any remaining increase in estimated cash flows increases the accretable yield and is recognized over the remaining estimated life of the loan pool. If based on the review of a pool of loans, it is probable that a decrease or impairment in cash flows previously expected to be collected or if actual cash flows are less than cash flows previously expected, the allowance for credit losses is increased for the decrease in the present value of the cash flows expected to be collected.
Business Combinations
Business combinations are accounted for under the acquisition method of accounting in accordance with ASC 805, Business Combinations. Under the acquisition method, the acquiring entity in a business combination recognizes all of the acquired assets and assumed liabilities at their estimated fair values as of the date of acquisition. Any excess of the purchase price over the fair value of net assets and other identifiable intangible assets acquired is recorded as goodwill. To the extent the fair value of net assets acquired, including identified intangible assets, exceeds the purchase price, a bargain purchase gain is recognized. Assets acquired and liabilities assumed from contingencies are also recognized at fair value if the fair value can be determined during the measurement period. Results of operations of an acquired business are included in the Consolidated Income Statement from the date of acquisition. Acquisition-related costs, including conversion and restructuring charges, are expensed as incurred.
Income taxes
The Company’s income tax expense, deferred tax assets and liabilities, and liabilities for unrecognized tax benefits reflect management’s best estimate of current and future taxes to be paid. The Company is subject to federal and state income taxes in the United States. Significant judgments and estimates are required in the determination of the consolidated income tax expense.
Deferred income taxes arise from temporary differences between the tax basis of assets and liabilities and their reported amounts in the financial statements, which will result in taxable or deductible amounts in the future. In evaluating the Company's ability to recover its deferred tax assets in the jurisdictions from which they arise, all available positive and negative evidence is considered, including scheduled reversals of deferred tax liabilities, tax planning strategies, projected future taxable income, and recent operating results. The assumptions about future taxable income require the use of significant judgment and are consistent with the plans and estimates used to manage the underlying business.
Liquidity
Liquidity is the ongoing ability to accommodate liability maturities and deposit withdrawals, fund asset growth and business operations, and meet contractual obligations through unconstrained access to funding at reasonable market rates. Liquidity management involves forecasting funding requirements and maintaining sufficient capacity to meet the needs and accommodate fluctuations in asset and liability levels due to changes in the Company's business operations or unanticipated events.
The ability to have readily available funds sufficient to repay fully maturing liabilities is of primary importance to depositors, creditors, and regulators. The Company's liquidity, represented by cash and amounts due from banks, federal funds sold, and non-pledged marketable securities, is a result of the Company's operating, investing, and financing activities and related cash flows. In order to ensure funds are available when necessary, on at least a quarterly basis, the Company projects the amount of funds that will be required over a twelve month period and it also strives to maintain relationships with a diversified customer base. Liquidity requirements can also be met through short-term borrowings or the disposition of short-term assets.
62
The following table presents the available and outstanding balances of the Company's lines of credit:
December 31, 2016 | ||||||||
Available Balance | Outstanding Balance | |||||||
(in millions) | ||||||||
Unsecured fed funds credit lines at correspondent banks | $ | 100.0 | $ | — | ||||
Other lines with correspondent banks: | ||||||||
Secured other lines with correspondent banks | 22.5 | — | ||||||
Unsecured other lines with correspondent banks | 45.0 | — | ||||||
Total other lines with correspondent banks | $ | 167.5 | $ | — | ||||
In addition to lines of credit, the Company has borrowing capacity with the FHLB and FRB from pledged loans and securities. The borrowing capacity, outstanding borrowings, and available credit as of December 31, 2016 are presented in the following table:
December 31, 2016 | ||||
(in millions) | ||||
FHLB: | ||||
Borrowing capacity | $ | 2,669.6 | ||
Outstanding borrowings | 80.0 | |||
Letters of credit | 443.3 | |||
Total available credit | $ | 2,146.3 | ||
FRB: | ||||
Borrowing capacity | $ | 997.0 | ||
Outstanding borrowings | — | |||
Total available credit | $ | 997.0 | ||
The Company has a formal liquidity policy and, in the opinion of management, its liquid assets are considered adequate to meet cash flow needs for loan funding and deposit cash withdrawals for the next 90-120 days. At December 31, 2016, there is $2.00 billion in liquid assets, comprised of $284.5 million in cash, cash equivalents, and money market investments and $1.72 billion in unpledged marketable securities. At December 31, 2015, the Company maintained $1.26 billion in liquid assets, comprised of $224.8 million of cash, cash equivalents, and money market investments, and $1.04 billion of unpledged marketable securities.
The Parent maintains liquidity that would be sufficient to fund its operations and certain non-bank affiliate operations for an extended period should funding from normal sources be disrupted. Since deposits are taken by WAB and not by the Parent, Parent liquidity is not dependent on the bank's deposit balances. In the Company's analysis of Parent liquidity, it is assumed that the Parent is unable to generate funds from additional debt or equity issuances, receives no dividend income from subsidiaries and does not pay dividends to stockholders, while continuing to make nondiscretionary payments needed to maintain operations and repayment of contractual principal and interest payments owed by the Parent and affiliated companies. Under this scenario, the amount of time the Parent and its non-bank subsidiary can operate and meet all obligations before the current liquid assets are exhausted is considered as part of the Parent liquidity analysis. Management believes the Parent maintains adequate liquidity capacity to operate without additional funding from new sources for over twelve months.
WAB maintains sufficient funding capacity to address large increases in funding requirements, such as deposit outflows. This capacity is comprised of liquidity derived from a reduction in asset levels and various secured funding sources. On a long-term basis, the Company’s liquidity will be met by changing the relative distribution of its asset portfolios (for example, by reducing investment or loan volumes, or selling or encumbering assets). Further, the Company can increase liquidity by soliciting higher levels of deposit accounts through promotional activities and/or borrowing from correspondent banks, the FHLB of San Francisco, and the FRB. At December 31, 2016, the Company's long-term liquidity needs primarily relate to funds required to support loan originations, commitments, and deposit withdrawals, which can be met by cash flows from investment payments and maturities, and investment sales, if necessary.
The Company’s liquidity is comprised of three primary classifications: 1) cash flows provided by operating activities; 2) cash flows used in investing activities; and 3) cash flows provided by financing activities. Net cash provided by or used in operating
63
activities consists primarily of net income, adjusted for changes in certain other asset and liability accounts and certain non-cash income and expense items, such as the provision for credit losses, investment and other amortization and depreciation. For the years ended December 31, 2016, 2015, and 2014, net cash provided by operating activities was $280.6 million, $220.4 million, and $167.4 million, respectively.
The Company's primary investing activities are the origination of real estate and commercial loans, the collection of repayments of these loans, and the purchase and sale of securities. The Company's net cash provided by and used in investing activities has been primarily influenced by its loan and securities activities. The net increase in loans for the years ended December 31, 2016, 2015, and 2014, was $810.5 million, $1.27 billion, and $1.56 billion, respectively. There was a net increase in investment securities for the year ended December 31, 2016 of $771.9 million, compared to a net increase of $420.2 million for the year ended December 31, 2015, and net decrease of $187.0 million for the year ended December 31, 2014.
Net cash provided by financing activities has been impacted significantly by increased deposit levels. During the years ended December 31, 2016, 2015, and 2014, net deposits increased $2.52 billion, $1.36 billion, and $1.09 billion, respectively. Also, during the year ended December 31, 2016, WAB issued $175.0 million of subordinated debt, receiving proceeds of $169.3 million.
Fluctuations in core deposit levels may increase the Company's need for liquidity as certificates of deposit mature or are withdrawn before maturity, and as non-maturity deposits, such as checking and savings account balances, are withdrawn. Additionally, the Company is exposed to the risk that customers with large deposit balances will withdraw all or a portion of such deposits, due in part to the FDIC limitations on the amount of insurance coverage provided to depositors. To mitigate the uninsured deposit risk, the Company participates in the CDARS and ICS programs, which allow an individual customer to invest up to $50.0 million and $110.0 million, respectively, through one participating financial institution or, a combined total of $150.0 million per individual customer, with the entire amount being covered by FDIC insurance. As of December 31, 2016, the Company has $413.9 million of CDARS and $607.5 million of ICS deposits.
As of December 31, 2016, the Company has $136.2 million of wholesale brokered deposits outstanding. Brokered deposits are generally considered to be deposits that have been received from a third party who is engaged in the business of placing deposits on behalf of others. A traditional deposit broker will direct deposits to the banking institution offering the highest interest rate available. Federal banking laws and regulations place restrictions on depository institutions regarding brokered deposits because of the general concern that these deposits are not relationship based and are at a greater risk of being withdrawn and placed on deposit at another institution offering a higher interest rate, thus posing liquidity risk for institutions that gather brokered deposits in significant amounts. There was also $571.9 million and $365.6 million of additional deposits as of December 31, 2016 and 2015, respectively, that the Company considers core deposits, but which are classified as brokered deposits for regulatory reporting purposes.
Federal and state banking regulations place certain restrictions on dividends paid. The total amount of dividends which may be paid at any date is generally limited to the retained earnings of the bank. Dividends paid by WAB to the Parent would be prohibited if the effect thereof would cause the bank’s capital to be reduced below applicable minimum capital requirements. During the year ended December 31, 2016, the Parent contributed $230.7 million to WAB and $50.8 million to LVSP and LVSP paid dividends to the Parent of $12.8 million.
Recent accounting pronouncements
See "Note 1. Summary of Significant Accounting Policies," of the Notes to Consolidated Financial Statements contained in Item 8. Financial Statements and Supplementary Data for information on recent and recently adopted accounting pronouncements and their expected impact, if any, on the Company's consolidated financial statements.
64
SUPERVISION AND REGULATION
WAL, WAB, and certain of its non-banking subsidiaries are subject to comprehensive regulation under federal and state laws. The regulatory framework applicable to bank holding companies and their subsidiary banks is intended to protect depositors, the FDIC’s DIF, and the U.S. banking system as a whole. This system is not designed to protect equity investors in bank holding companies such as WAL.
Set forth below is a summary of the significant laws and regulations applicable to WAL and its subsidiaries. The description that follows is qualified in its entirety by reference to the full text of the statutes, regulations, and policies that are described. Such statutes, regulations, and policies are subject to ongoing review by Congress and state legislatures and federal and state regulatory agencies. A change in any of the statutes, regulations, or regulatory policies applicable to WAL and its subsidiaries could have a material effect on the results of the Company.
Overview
WAL is a separate and distinct legal entity from WAB and its other subsidiaries. As a registered bank holding company, WAL is subject to inspection, examination, and supervision by the FRB, and is regulated under the BHCA. WAL is also under the jurisdiction of the SEC and is subject to the disclosure and other regulatory requirements of the Securities Act of 1933, as amended, and the Exchange Act, as administered by the SEC. The Company’s common stock is listed on the NYSE under the trading symbol “WAL” and the Company is subject to the rules of the NYSE for listed companies. The Company is a financial institution holding company within the meaning of Arizona law. WAL provides a full spectrum of deposit, lending, treasury management, and online banking products and services through its wholly-owned banking subsidiary, WAB. WAB is an Arizona chartered bank and a member of the Federal Reserve System. WAB operates the following full-service banking divisions: ABA , BON, Bridge, FIB, and TPB. WAB is subject to the supervision of, and to regular examination by, the Arizona Department of Financial Institutions, the FRB as its primary federal supervisory agency, as well as by the FDIC as its deposit insurer. WAB's deposits are insured by the FDIC up to the applicable deposit insurance limits in accordance with FDIC laws and regulations. The Company also serves business customers through a national platform of specialized financial services providers including AAB, Corporate Finance, Equity Fund Resources, HFF, Life Sciences Group, Mortgage Warehouse Lending, Public and Nonprofit Finance, Renewable Resource Group, Resort Finance, and Technology Finance.
WAL and WAB are also supervised by the CFPB for compliance with federal consumer financial protection laws. The Company’s non-bank subsidiaries are subject to federal and state laws and regulations, including regulations of the FRB.
The Dodd-Frank Wall Street Reform and Consumer Protection Act of 2010 (the “Dodd-Frank Act”) significantly changed the financial regulatory regime in the United States. Since the enactment of the Dodd-Frank Act, U.S. banks and financial services firms have been subject to enhanced regulation and oversight. Several provisions of the Dodd-Frank Act are subject to further rulemaking, guidance, and interpretation by the federal banking agencies. Considering the recent changes in administration and controlling party in the United States, Congress, state legislatures, and financial regulatory agencies may introduce various legislative and regulatory initiatives that are likely to impact the financial services industry, generally. However it is not clear whether such changes will be enacted or, if enacted, what their effect on the Company will be.
Bank Holding Company Regulation
WAL is a bank holding company as defined under the BHCA. The BHCA generally limits the business of bank holding companies to banking, managing or controlling banks, and other activities that the FRB has determined to be so closely related to banking as to be a proper incident thereto. Business activities that have been determined to be related to banking, and therefore appropriate for bank holding companies and their affiliates to engage in, include securities brokerage services, investment advisory services, fiduciary services, and certain management advisory and data processing services, among others. Bank holding companies that have elected to become financial holding companies may engage in any activity, or acquire and retain the shares of a company engaged in any activity that is either (i) financial in nature or incidental to such financial activity (as determined by the FRB in consultation with the Secretary of the Treasury) or (ii) complementary to a financial activity, and that does not pose a substantial risk to the safety and soundness of depository institutions or the financial system generally (as solely determined by the FRB). Activities that are financial in nature include securities underwriting and dealing, insurance underwriting, and making merchant banking investments.
65
Mergers and Acquisitions
The BHCA, the Bank Merger Act, and other federal and state statutes regulate acquisitions of commercial banks. The BHCA requires the prior FRB approval for a bank holding company to acquire, directly or indirectly, 5% or more of any class of voting securities of a commercial bank or its parent holding company and for a company, other than a bank holding company, to acquire 25% or more of any class of voting securities of a bank or bank holding company. Under the Change in Bank Control Act, any person, including a company, may not acquire, directly or indirectly, control of a bank without providing 60 days’ prior notice and receiving a non-objection from the appropriate federal banking agency.
Under the Bank Merger Act, the prior approval of the appropriate federal banking agency is required for insured depository institutions to merge or enter into purchase and assumption transactions. In reviewing applications seeking approval of merger and purchase and assumption transactions, the federal banking agencies will consider, among other things, the competitive effect and public benefits of the transactions, the capital position of the combined banking organization, the applicant's performance record under the CRA, and the effectiveness of the subject organizations in combating money laundering activities. For further information relating to the CRA, see the Section titled “Community Reinvestment Act and Fair Lending Laws.”
Under Section 6-142 of the Arizona Revised Statutes, no person may acquire control of a company that controls an Arizona bank without the prior approval of the Arizona Superintendent of Financial Institutions, or Arizona Superintendent. A person who has the power to vote 15% or more of the voting stock of a controlling company is presumed to control the company.
Enhanced Prudential Standards
Section 165 of the Dodd-Frank Act imposes enhanced prudential standards on larger banking organizations, with certain of these standards applicable to banking organizations over $10 billion, including WAL and WAB, as of the quarter ending June 30, 2014. In October 2012, the FDIC, the OCC, and the FRB issued separate but similar rules requiring covered banks and bank holding companies with $10 billion to $50 billion in total consolidated assets to conduct an annual company-run stress test. WAL and WAB conducted its first company-run capital stress test as required by the Dodd-Frank Act in the first quarter of 2016 and provided the results to the FRB. WAL found the Company would have sufficient capital to maintain regulatory capital levels throughout an economic downturn.
In February 2014, the FRB issued a rule further implementing the enhanced prudential standards required by the Dodd-Frank Act. Although most of the standards apply only to bank holding companies with more than $50 billion in assets, as directed by the Dodd-Frank Act, the rule contains certain standards that apply to bank holding companies with more than $10 billion in assets, including a requirement to establish a risk committee of the Company's BOD to manage enterprise-wide risk. The Company meets these requirements.
Debit Card Interchange Fees
The Dodd-Frank Act requires that any interchange transaction fee charged for a debit transaction be “reasonable” and proportional to the cost incurred by the issuer for the transaction, with new regulations that establish such fee standards, eliminate exclusivity arrangements between issuers and networks for debit card transactions, and limit restrictions on merchant discounting for use of certain payment forms and minimum or maximum amount thresholds as a condition for acceptance of credit cards. The FRB’s implementing debit card interchange rule caps an issuer's base fee at 21 cents per transaction and allows an additional amount equal to 5 basis points of the transaction's value. The rule also permits a fraud-prevention adjustment of 1 cent per transaction conditioned upon an issuer developing, implementing, and updating reasonably designed fraud-prevention policies and procedures. WAB began complying with the restrictions on debit card interchange fees on July 1, 2015. Losing the exemption from the Durbin Amendment’s requirements negatively affected the amount of revenue the Company receives from debit card interchange fees. In 2016, the Company earned $0.5 million from debit card interchange fees, compared to $1.4 million in 2015.
Volcker Rule
Section 619 of the Dodd-Frank Act, commonly known as the Volcker Rule, restricts the ability of banking entities, such as the Company and WAB, from: (i) engaging in “proprietary trading” and (ii) investing in or sponsoring certain covered funds, subject to certain limited exceptions. Under the Volcker Rule, the term "covered funds" is defined as any issuer that would be an investment company under the Investment Company Act but for the exemption in Section 3(c)(1) or 3(c)(7) of that Act, which includes CLO and CDO securities. There are also several exemptions from the definition of covered fund, including, among other things, loan securitizations, joint ventures, certain types of foreign funds, entities issuing asset-backed commercial paper, and registered investment companies. Further, the final rules permit banking entities, subject to certain conditions and limitations, to invest in or sponsor a covered fund in connection with 1) organizing and offering the covered fund; 2) certain risk-mitigating hedging activities; and 3) de minimis investments in covered funds. Compliance with the Volcker Rule is generally required by July 21, 2017. Management believes the Company will be fully compliant with the Volcker Rule by this date.
66
Dividends
The Company has never declared or paid cash dividends on its common stock. The Company currently intends to retain any future earnings for future growth and does not anticipate paying any cash dividends in the foreseeable future. Any determination in the future to pay dividends will be at the discretion of WAL's BOD and will depend on the Company’s earnings, financial condition, results of operations, business prospects, capital requirements, regulatory restrictions, contractual restrictions, and other factors that the BOD may deem relevant.
The Company’s ability to pay dividends is subject to the regulatory authority of the FRB. The supervisory concern of the FRB focuses on a bank holding company’s capital position, its ability to meet its financial obligations as they come due, and its capacity to act as a source of financial strength to its insured depository institution subsidiaries. In addition, FRB policy discourages the payment of dividends by a bank holding company that is not supported by current operating earnings.
As a Delaware corporation, the Company is also subject to limitations under Delaware law on the payment of dividends. Under the Delaware General Corporation Law, dividends may only be paid out of surplus or out of net profits for the year in which the dividend is declared or the preceding year, and no dividends may be paid on common stock at any time during which the capital of outstanding preferred stock or preference stock exceeds the Company's net assets.
From time to time, the Company may become a party to financing agreements and other contractual obligations that have the effect of limiting or prohibiting the declaration or payment of dividends such as the Series B Preferred Stock it issued pursuant to the SBLF (which has subsequently been redeemed). Holding company expenses and obligations with respect to its outstanding trust preferred securities and corresponding subordinated debt also may limit or impair the Company’s ability to declare and pay dividends.
Since the Company has no significant assets other than the voting stock of its subsidiaries, it currently depends on dividends from WAB and, to a lesser extent, its non-bank subsidiaries, for a substantial portion of its revenue and as the primary sources of its cash flow. The ability of a state member bank, such as WAB, to pay cash dividends is restricted by the FRB and the state of Arizona. The FRB’s Regulation H states that a member bank may not declare or pay a dividend if the total of all dividends declared during that calendar year exceed the bank’s net income during that calendar year and the retained net income of the prior two years. Further, without receiving prior approval from the FRB and two thirds of its shareholders, a bank cannot declare or pay a dividend that would exceed its undivided profits or withdraw any portion of its permanent capital.
Under Section 6-187 of the Arizona Revised Statutes, WAB may pay dividends on the same basis as any other Arizona corporation, except that cash dividends paid out of capital surplus require the prior approval of the Arizona Superintendent. Under Section 10-640 of the Arizona Revised Statutes, a corporation may not make a distribution to stockholders if to do so would render the corporation insolvent or unable to pay its debts as they become due. However, an Arizona bank may not declare a non-stock dividend out of capital surplus without the approval of the Arizona Superintendent.
Federal Reserve System
As a member of the Federal Reserve System, WAB is required by law to maintain reserves against its transaction deposits. The reserves must be held in cash or with the FRB. Banks are permitted to meet this requirement by maintaining the specified amount as an average balance over a two-week period. The total of reserve balances was approximately $43.7 million and $37.9 million, as of December 31, 2016 and 2015, respectively.
Source of Strength Doctrine
FRB policy requires bank holding companies to act as a source of financial and managerial strength to their subsidiary banks. Section 616 of the Dodd-Frank Act codified the requirement that bank holding companies act as a source of financial strength. As a result, the Company is expected to commit resources to support WAB, including at times when the Company may not be in a financial position to provide such resources. Any capital loans by a bank holding company to any of its subsidiary banks are subordinate in right of payment to deposits and to certain other indebtedness of such subsidiary banks. The U.S. Bankruptcy Code provides that, in the event of a bank holding company's bankruptcy, any commitment by the bank holding company to a federal bank regulatory agency to maintain the capital of a subsidiary bank will be assumed by the bankruptcy trustee and entitled to priority of payment.
Capital Adequacy and Prompt Corrective Action
In July 2013, the FRB, the OCC, and the FDIC approved final rules (the “Capital Rules”) establishing a new comprehensive capital framework for U.S. banking organizations. The Capital Rules generally implement the Basel Committee on Banking Supervision’s (the “Basel Committee”) December 2010 final capital framework referred to as “Basel III” for strengthening international capital standards. The Capital Rules revise the definitions and the components of regulatory capital, as well as address other issues affecting
67
the numerator in banking institutions’ regulatory capital ratios. The Capital Rules also address asset risk weights and other matters affecting the denominator in banking institutions’ regulatory capital ratios and replace the existing general risk-weighting approach with a more risk-sensitive approach.
The Capital Rules: (i) include CET1 and the related regulatory capital ratio of CET1 to risk-weighted assets; (ii) specify that Tier 1 capital consists of CET1 and “Additional Tier 1 capital” instruments meeting certain revised requirements; (iii) mandate that most deductions/adjustments to regulatory capital measures be made to CET1 and not to the other components of capital; and (iv) expand the scope of the deductions from and adjustments to capital as compared to existing regulations. Under the Capital Rules, for most banking organizations, including the Company, the most common form of Additional Tier 1 capital is non-cumulative perpetual preferred stock, and the most common forms of Tier 2 capital are subordinated notes and a portion of the allocation for loan and lease losses, in each case, subject to the Capital Rules’ specific requirements.
Pursuant to the Capital Rules, the minimum capital ratios effective January 1, 2015, are as follows:
• | 4.5% CET1 to risk-weighted assets; |
• | 6.0% Tier 1 capital (that is, CET1 plus Additional Tier 1 capital) to risk-weighted assets; |
• | 8.0% Total capital (that is, Tier 1 capital plus Tier 2 capital) to risk-weighted assets; and |
• | 4.0% Tier 1 capital to average consolidated assets as reported on consolidated financial statements (called “leverage ratio”). |
The Capital Rules also include a “capital conservation buffer,” composed entirely of CET1, in addition to these minimum risk-weighted asset ratios. The capital conservation buffer is designed to absorb losses during periods of economic stress. Banking institutions with a ratio of CET1 to risk-weighted assets above the minimum but below the capital conservation buffer will face constraints on dividends, equity, and other capital instrument repurchases and compensation based on the amount of the shortfall. Thus, when fully phased-in on January 1, 2019, the capital standards applicable to the Company will include an additional capital conservation buffer of 2.5% of CET1, effectively resulting in minimum ratios inclusive of the capital conservation buffer of (i) CET1 to risk-weighted assets of at least 7%, (ii) Tier 1 capital to risk-weighted assets of at least 8.5%, and (iii) Total capital to risk-weighted assets of at least 10.5%.
The Capital Rules provide for a number of deductions from and adjustments to CET1. These include, for example, the requirement that mortgage servicing assets, deferred tax assets arising from temporary differences that could not be realized through net operating loss carrybacks, and significant investments in non-consolidated financial entities be deducted from CET1 to the extent that any one such category exceeds 10% of CET1 or all such items, in the aggregate, exceed 15% of CET1. The deductions and adjustments will be incrementally phased in between January 1, 2015 and January 1, 2019.
In addition, under the current general risk-based capital rules, the effects of accumulated other comprehensive income or loss items included in shareholders’ equity (for example, mark-to-market of securities held in the available-for-sale portfolio) under U.S. generally accepted accounting principles are reversed for the purposes of determining regulatory capital ratios. Pursuant to the Capital Rules, the effects of certain of these items are not excluded; however, non-advanced approaches banking organizations, may make a one-time permanent election to continue to exclude these items. The Company has made this one-time election to exclude these items from its regulatory capital ratios.
The Capital Rules also preclude certain hybrid securities, such as trust preferred securities, issued on or after May 19, 2010 from inclusion in bank holding companies’ Tier 1 capital. The Company has used trust preferred securities in the past as a tool for raising additional Tier 1 capital and otherwise improving its regulatory capital ratios. Although the Company may continue to include its existing trust preferred securities as Tier 1 capital, the prohibition on the use of these securities as Tier 1 capital going forward may limit the Company’s ability to raise capital in the future.
Implementation of the deductions and other adjustments to CET1 began on January 1, 2015 and will be phased in over a 4-year period (beginning at 40% on January 1, 2015 and an additional 20% per year thereafter). The implementation of the capital conservation buffer began on January 1, 2016 at the 0.625% level and increases by 0.625% on each subsequent January 1, until it reaches 2.5% on January 1, 2019. The risk-weighting categories in the Capital Rules are standardized and include a risk-sensitive number of categories, depending on the nature of the assets, generally ranging from 0% for U.S. government and agency securities, to 600% for certain equity exposures, and resulting in higher risk weights for a variety of asset classes.
Management believes the Company is in compliance, and will continue to be in compliance, with the targeted capital ratios as such requirements are phased in.
68
Prompt Corrective Action and Safety and Soundness
Pursuant to Section 38 of the FDIA, federal banking agencies are required to take “prompt corrective action” should a depository institution fail to meet certain capital adequacy standards. At each successive lower capital category, an insured depository institution is subject to more restrictions and prohibitions, including restrictions on growth, restrictions on interest rates paid on deposits, restrictions or prohibitions on payment of dividends and restrictions on the acceptance of brokered deposits. Furthermore, if an insured depository institution is classified in one of the undercapitalized categories, it is required to submit a capital restoration plan to the appropriate federal banking agency, and the holding company must guarantee the performance of that plan. Based upon its capital levels, a bank that is classified as well-capitalized, adequately capitalized, or undercapitalized may be treated as though it were in the next lower capital category if the appropriate federal banking agency, after notice and opportunity for hearing, determines that an unsafe or unsound condition, or an unsafe or unsound practice, warrants such treatment.
For purposes of prompt corrective action, to be: (i) well-capitalized, a bank must have a total risk based capital ratio of at least 10%, a Tier 1 risk based capital ratio of at least 8%, a CET1 risk based capital ratio of at least 6.5%, and a Tier 1 leverage ratio of at least 5%; (ii) adequately capitalized, a bank must have a total risk based capital ratio of at least 8%, a Tier 1 risk based capital ratio of at least 6%, a CET1 risk based capital ratio of at least 4.5%, and a Tier 1 leverage ratio of at least 4%; (iii) undercapitalized, a bank would have a total risk based capital ratio of less than 8%, a Tier 1 risk based capital ratio of less than 6%, a CET1 risk based capital ratio of less than 4.5%, and a Tier 1 leverage ratio of less than 4%; (iv) significantly undercapitalized, a bank would have a total risk based capital ratio of less than 6%, a Tier 1 risk based capital ratio of less than 4%, a CET1 risk based capital ratio of less than 3%, and a Tier 1 leverage ratio of less than 3%; (v) critically undercapitalized, a bank would have a ratio of tangible equity to total assets that is less than or equal to 2%.
Bank holding companies and insured banks also may be subject to potential enforcement actions of varying levels of severity by the federal regulators for unsafe or unsound practices in conducting their business, or for violation of any law, rule, regulation, condition imposed in writing by the agency or term of a written agreement with the agency. In more serious cases, enforcement actions may include the issuance of directives to increase capital; the issuance of formal and informal agreements; the imposition of civil monetary penalties; the issuance of a cease and desist order that can be judicially enforced; the issuance of removal and prohibition orders against officers, directors, and other institution−affiliated parties; the termination of the bank’s deposit insurance; the appointment of a conservator or receiver for the bank; and the enforcement of such actions through injunctions or restraining orders based upon a judicial determination that the agency would be harmed if such equitable relief was not granted.
Transactions with Affiliates and Insiders
Under federal law, transactions between insured depository institutions and their affiliates are governed by Sections 23A and 23B of the FRA and its implementing Regulation W. In a bank holding company context, at a minimum, the parent holding company of a bank, and any companies which are controlled by such parent holding company, are affiliates of the bank. Generally, Sections 23A and 23B of the FRA are intended to protect insured depository institutions from losses arising from transactions with non-insured affiliates by limiting the extent to which a bank or its subsidiaries may engage in covered transactions with any one affiliate and with all affiliates of the bank in the aggregate, and requiring that such transactions be on terms consistent with safe and sound banking practices.
Further, Section 22(h) of the FRA and its implementing Regulation O restricts loans to directors, executive officers, and principal stockholders (“insiders”). Under Section 22(h), loans to insiders and their related interests may not exceed, together with all other outstanding loans to such persons and affiliated entities, the institution's total capital and surplus. Loans to insiders above specified amounts must receive the prior approval of the BOD. Further, under Section 22(h) of the FRA, loans to directors, executive officers, and principal stockholders must be made on terms substantially the same as offered in comparable transactions to other persons, except that such insiders may receive preferential loans made under a benefit or compensation program that is widely available to the bank's employees and does not give preference to the insider over the employees. Section 22(g) of the FRA places additional limitations on loans to executive officers.
Lending Limits
In addition to the requirements set forth above, state banking law generally limits the amount of funds that a state-chartered bank may lend to a single borrower. Under Section 6-352 of the Arizona Revised Statutes, the obligations of one borrower to a bank may not exceed 20% of the bank’s capital, plus an additional 10% of its capital if the additional amounts are fully secured by readily marketable collateral.
69
Consumer Protection and CFPB Supervision
The Dodd-Frank Act centralized responsibility for consumer financial protection by creating the CFPB, an independent agency charged with responsibility for implementing, enforcing, and examining compliance with federal consumer financial laws. The Company is subject to a number of federal and state laws designed to protect borrowers and promote lending to various sectors of the economy and population. These laws include the Equal Credit Opportunity Act, the Fair Credit Reporting Act, the Fair Debt Collection Procedures Act, the Truth in Lending Act, the Home Mortgage Disclosure Act, the Real Estate Settlement Practices Act, various state law counterparts, and the Consumer Financial Protection Act of 2010, which is part of the Dodd-Frank Act. The Dodd-Frank Act does not prevent states from adopting stricter consumer protection standards. State regulation of financial products and potential enforcement actions could also adversely affect the Company’s business, financial condition, or operations.
Depositor Preference
The FDIA provides that, in the event of the “liquidation or other resolution” of an insured depository institution, the claims of depositors of the institution, including the claims of the FDIC as subrogee of insured depositors, and certain claims for administrative expenses of the FDIC as a receiver, will have priority over other general unsecured claims against the institution. If an insured depository institution fails, insured and uninsured depositors, along with the FDIC, will have priority in payment ahead of unsecured, non-deposit creditors, including the parent bank holding company, with respect to any extensions of credit they have made to such insured depository institution.
Federal Deposit Insurance
Substantially all of the deposits of WAB are insured up to applicable limits by the FDIC’s DIF and WAB is subject to deposit insurance assessments to maintain the DIF.
The FDIC uses a risk-based assessment system that imposes insurance premiums based upon a risk matrix that takes into account a bank's CAMELS rating. The risk matrix utilizes different risk categories distinguished by capital levels and supervisory ratings. As a result of the Dodd-Frank Act, the base for insurance assessments is now consolidated average assets less average tangible equity. Assessment rates are calculated using formulas that take into account the risk of the institution being assessed. As of September 30, 2015, WAB is classified as, and subject to the scorecard for, a large and highly complex institution to determine its total base assessment rate.
The Dodd-Frank Act requires that the FDIC raise the minimum reserve ratio of the DIF from 1.15% to 1.35%, and that the FDIC offset the effect of this increase on insured depository institutions with total consolidated assets of less than $10 billion. In March 2016, the FDIC finalized a rule to impose a surcharge of 4.5 cents per $100 of their assessment base on deposit insurance assessment rates paid by insured depository institutions with total consolidated assets of more than $10 billion. If the reserve ratio does not reach 1.35% by December 31, 2018 through use of the surcharge, the FDIC will impose an additional, one-time shortfall assessment on banks with more than $10 billion in assets on March 31, 2019, to be paid by June 30, 2019. As of June 30, 2016, the minimum reserve ratio reached 1.17% and as such, WAB was subject to the surcharge beginning July 1, 2016. The FDIC also has authority to further increase deposit insurance assessments. FDIC deposit insurance expense also includes FICO assessments related to outstanding FICO bonds.
Under the FDIA, the FDIC may terminate deposit insurance upon a finding that the institution has engaged in unsafe and unsound practices, is in an unsafe or unsound condition to continue operations, or has violated any applicable law, regulation, rule, order or condition imposed by the FDIC. The Company’s management is not aware of any practice, condition, or violation that might lead to the termination of its deposit insurance.
Financial Privacy and Data Security
The Company is subject to federal laws, including the GLBA, and certain state laws containing consumer privacy protection provisions. These provisions limit the ability of banks and other financial institutions to disclose non-public information about consumers to affiliated and non-affiliated third parties and limit the reuse of certain consumer information received from non-affiliated institutions. These provision require notice of privacy policies to clients and, in some circumstances, allow consumers to prevent disclosure of certain personal information to affiliates or non-affiliated third parties by means of “opt out” or “opt in” authorizations.
The GLBA requires that financial institutions implement comprehensive written information security programs that include administrative, technical, and physical safeguards to protect consumer information. Further, pursuant to interpretive guidance issued under the GLBA and certain state laws, financial institutions are required to notify clients of security breaches resulting in unauthorized access to their personal information.
70
For example, under California law, every business that owns or licenses personal information about a California resident must maintain reasonable security procedures and policies to protect that information and comply with specific requirements relating to the destruction of records containing personal information and disclosure of breaches to customers, and restrictions on the use of customer information unless the customer "opts in." Other states, including Arizona and Nevada where WAB has branches, may also have applicable laws requiring businesses that retain consumer personal information to develop reasonable security policies and procedures, notify consumers of a security breach, or provide disclosures about the use and sharing of consumer personal information.
Community Reinvestment Act and Fair Lending Laws
WAB has a responsibility under the CRA to help meet the credit needs of its communities, including low and moderate-income neighborhoods. The CRA does not establish specific lending requirements or programs for financial institutions nor does it limit an institution's discretion to develop the types of products and services that it believes are best suited to its particular community, consistent with the CRA. In addition, the Equal Credit Opportunity Act and the Fair Housing Act prohibit discrimination in lending practices on the basis of characteristics specified in those statutes. WAB’s failure to comply with the provisions of the CRA could, at a minimum, result in regulatory restrictions on its activities and the activities of the Company. WAB’s failure to comply with the Equal Credit Opportunity Act and the Fair Housing Act could result in enforcement actions. Based upon its most recent CRA examination as of November 2015, WAB received a rating of “satisfactory.”
Incentive Compensation
The Dodd-Frank Act requires the federal banking agencies and the SEC to establish joint regulations or guidelines prohibiting incentive-based payment arrangements at specified regulated entities, including the Company and WAB, with at least $1 billion in total consolidated assets that encourage inappropriate risks by providing an executive officer, employee, director, or principal shareholder with excessive compensation, fees, or benefits that could lead to material financial loss to the entity. The federal banking agencies and the SEC most recently proposed such regulations in 2016, but the regulations have not yet been finalized. If the regulations are adopted in the form initially proposed, they will restrict the manner in which executive compensation is structured.
The Dodd-Frank Act also requires publicly traded companies to give stockholders a non-binding vote on executive compensation at least every three years and on so-called “golden parachute” payments in connection with approvals of mergers and acquisitions. WAL gives stockholders a non-binding vote on executive compensation annually.
Preventing Suspicious Activity
Under Title III of the USA PATRIOT Act, all financial institutions are required to take certain measures to identify their customers, prevent money laundering, monitor customer transactions, and report suspicious activity to U.S. law enforcement agencies. Financial institutions also are required to respond to requests for information from federal banking regulatory authorities and law enforcement agencies. Information sharing among financial institutions for the above purposes is encouraged by an exemption granted to complying financial institutions from the privacy provisions of the GLBA and other privacy laws. Financial institutions that hold correspondent accounts for foreign banks or provide private banking services to foreign individuals are required to take measures to avoid dealing with certain foreign individuals or entities, including foreign banks with profiles that raise money laundering concerns, and are prohibited from dealing with foreign “shell banks” and persons from jurisdictions of particular concern. The primary federal banking regulators and the Secretary of the Treasury have adopted regulations to implement several of these provisions. All financial institutions also are required to establish internal anti-money laundering programs. The effectiveness of a financial institution in combating money laundering activities is a factor to be considered in any application submitted by the financial institution under the Bank Merger Act. The Company has in place a Bank Secrecy Act and USA PATRIOT Act compliance program and engages in relatively few transactions with foreign financial institutions or foreign persons.
The FCRA’s Red Flags Rule requires financial institutions with covered accounts (e.g., consumer bank accounts and loans) to develop, implement, and administer an identity theft prevention program. This program must include reasonable policies and procedures to detect suspicious patterns or practices that indicate the possibility of identity theft, such as inconsistencies in personal information or changes in account activity.
71
Office of Foreign Assets Control Regulation
The United States has imposed economic sanctions that affect transactions with designated foreign countries, nationals, and others. These are typically known as the “OFAC” rules based on their administration by the OFAC. The OFAC-administered sanctions targeting countries take many different forms. Generally, they contain one or more of the following elements: (i) restrictions on trade with or investment in a sanctioned country, including prohibitions against direct or indirect imports from and exports to a sanctioned country and prohibitions on “U.S. persons” engaging in financial transactions relating to making investments in, or providing investment-related advice or assistance to, a sanctioned country; and (ii) a blocking of assets in which the government or specially designated nationals of the sanctioned country have an interest, by prohibiting transfers of property subject to U.S. jurisdiction (including property in the possession or control of U.S. persons). Blocked assets (property and bank deposits) cannot be paid out, withdrawn, set off, or transferred in any manner without a license from OFAC. Failure to comply with these sanctions could have serious legal and reputational consequences.
Future Legislative Initiatives
Considering the recent changes in administration and controlling party in the United States, Congress, state legislatures, and financial regulatory agencies may introduce various legislative and regulatory initiatives that are likely to impact the financial services industry, generally. However it is not clear whether such changes will be enacted or, if enacted, what their effect on the Company will be. Such legislation could change banking statutes and the operating environment of the Company in substantial and unpredictable ways. If enacted, such legislation could increase or decrease the cost of doing business, limit or expand permissible activities, or affect the competitive balance among banks, savings associations, credit unions, and other financial institutions. The Company cannot predict whether any such legislation will be enacted, and, if enacted, the effect that it or any implementing regulations would have on the financial condition or results of operations of the Company. A change in statutes, regulations, or regulatory policies applicable to WAL or any of its subsidiaries could have a material effect on the business of the Company.
Item 7A. | Quantitative and Qualitative Disclosures about Market Risk. |
Market risk is the risk of loss in a financial instrument arising from adverse changes in market prices and rates, foreign currency exchange rates, commodity prices, and equity prices. The Company's market risk arises primarily from interest rate risk inherent in its lending, investing, and deposit taking activities. To that end, management actively monitors and manages the Company's interest rate risk exposure. The Company generally manages its interest rate sensitivity by evaluating re-pricing opportunities on its earning assets to those on its funding liabilities.
Management uses various asset/liability strategies to manage the re-pricing characteristics of the Company's assets and liabilities, all of which are designed to ensure that exposure to interest rate fluctuations is limited to within the Company's guidelines of acceptable levels of risk-taking. Hedging strategies, including the terms and pricing of loans and deposits and management of the deployment of its securities, are used to reduce mismatches in interest rate re-pricing opportunities of portfolio assets and their funding sources.
Interest rate risk is addressed by the ALCO, which includes members of executive management, finance, and operations. ALCO monitors interest rate risk by analyzing the potential impact on the net EVE and net interest income from potential changes in interest rates and considers the impact of alternative strategies or changes in balance sheet structure. The Company manages its balance sheet in part to maintain the potential impact on EVE and net interest income within acceptable ranges despite changes in interest rates.
The Company's exposure to interest rate risk is reviewed at least quarterly by the ALCO. Interest rate risk exposure is measured using interest rate sensitivity analysis to determine its change in both EVE and net interest income in the event of hypothetical changes in interest rates. If potential changes to EVE and net interest income resulting from hypothetical interest rate changes are not within the limits established by the Bank’s BOD, the BOD may direct management to adjust the asset and liability mix to bring interest rate risk within Board-approved limits.
Net Interest Income Simulation. In order to measure interest rate risk at December 31, 2016, the Company uses a simulation model to project changes in net interest income that result from forecasted changes in interest rates. This analysis calculates the difference between a baseline net interest income forecast using current yield curves that do not take into consideration any future anticipated rate hikes, compared to forecasted net income resulting from an immediate parallel shift in rates upward or downward, along with other scenarios directed by ALCO. The income simulation model includes various assumptions regarding the re-pricing relationships for each of the Company's products. Many of the Company's assets are floating rate loans, which are assumed to re-price immediately and, proportional to the change in market rates, depending on their contracted index, including the impact of caps or floors. Some loans and investments contain contractual prepayment features (embedded options) and, accordingly, the simulation model incorporates prepayment assumptions. The Company's non-term deposit products re-price more slowly, usually changing less than the change in market rates and at the Company's discretion.
72
This analysis indicates the impact of changes in net interest income for the given set of rate changes and assumptions. It assumes the balance sheet remains static and that its structure does not change over the course of the year. It does not account for all factors that could impact the Company's results, including changes by management to mitigate interest rate changes or secondary factors, such as changes to the Company's credit risk profile as interest rates change.
Furthermore, loan prepayment rate estimates and spread relationships change regularly. Interest rate changes create changes in actual loan prepayment speeds that will differ from the market estimates incorporated in this analysis. Changes that vary significantly from the modeled assumptions may have significant effects on the Company's actual net interest income.
This simulation model assesses the changes in net interest income that would occur in response to an instantaneous and sustained increase or decrease (shock) in market interest rates over a twelve-month period. At December 31, 2016, the Company's net interest income exposure for the next twelve months related to these hypothetical changes in market interest rates was within the Company's current guidelines.
Sensitivity of Net Interest Income
Interest Rate Scenario (change in basis points from Base) | ||||||||||||||||||||||||
Down 100 | Base | Up 100 | Up 200 | Up 300 | Up 400 | |||||||||||||||||||
(in thousands) | ||||||||||||||||||||||||
Interest Income | $ | 693,361 | $ | 747,612 | $ | 829,894 | $ | 913,371 | $ | 997,877 | $ | 1,082,588 | ||||||||||||
Interest Expense | 24,657 | 48,894 | 87,237 | 125,585 | 163,938 | 202,296 | ||||||||||||||||||
Net Interest Income | 668,704 | 698,718 | 742,657 | 787,786 | 833,939 | 880,292 | ||||||||||||||||||
% Change | (4.3 | )% | 6.3 | % | 12.7 | % | 19.4 | % | 26.0 | % | ||||||||||||||
Economic Value of Equity. The Company measures the impact of market interest rate changes on the NPV of estimated cash flows from its assets, liabilities, and off-balance sheet items, defined as EVE, using a simulation model. This simulation model assesses the changes in the market value of interest rate sensitive financial instruments that would occur in response to an instantaneous and sustained increase or decrease (shock) in market interest rates.
At December 31, 2016, the Company's EVE exposure related to these hypothetical changes in market interest rates was within the Company's current guidelines. The following table shows the Company's projected change in EVE for this set of rate shocks at December 31, 2016:
Economic Value of Equity
Interest Rate Scenario (change in basis points from Base) | ||||||||||||||||||||||||
Down 100 | Base | Up 100 | Up 200 | Up 300 | Up 400 | |||||||||||||||||||
(in thousands) | ||||||||||||||||||||||||
Assets | $ | 17,582,768 | $ | 17,269,700 | $ | 16,936,777 | $ | 16,602,285 | $ | 16,284,287 | $ | 15,966,573 | ||||||||||||
Liabilities | 14,604,340 | 14,154,503 | 13,786,246 | 13,455,692 | 13,151,225 | 12,870,144 | ||||||||||||||||||
Net Present Value | 2,978,428 | 3,115,197 | 3,150,531 | 3,146,593 | 3,133,062 | 3,096,429 | ||||||||||||||||||
% Change | (4.4 | )% | 1.1 | % | 1.0 | % | 0.6 | % | (0.6 | )% | ||||||||||||||
The computation of prospective effects of hypothetical interest rate changes are based on numerous assumptions, including relative levels of market interest rates, asset prepayments, and deposit decay, and should not be relied upon as indicative of actual results. Further, the computations do not contemplate any actions the Company may undertake in response to changes in interest rates. Actual amounts may differ from the projections set forth above should market conditions vary from the underlying assumptions.
73
Derivative Contracts. In the normal course of business, the Company uses derivative instruments to meet the needs of its customers and manage exposure to fluctuations in interest rates. The following table summarizes the aggregate notional amounts, market values, and terms of the Company’s derivative positions as of December 31, 2016 and 2015:
Outstanding Derivatives Positions
December 31, 2016 | December 31, 2015 | |||||||||||||||||||
Notional | Net Value | Weighted Average Term (Years) | Notional | Net Value | Weighted Average Term (Years) | |||||||||||||||
(dollars in thousands) | ||||||||||||||||||||
$ | 993,485 | $ | (61,529 | ) | 18.2 | $ | 800,478 | $ | (61,216 | ) | 14.5 | |||||||||
74
Item 8. | Financial Statements and Supplementary Data |
The Company's Consolidated Financial Statements and Supplementary Data included in this Annual Report is immediately following the Index to Consolidated Financial Statements page to this Annual Report.
INDEX TO CONSOLIDATED FINANCIAL STATEMENTS
PAGE | |
75
RSM US LLP
Report of Independent Registered Public Accounting Firm
To the Board of Directors and Stockholders
Western Alliance Bancorporation
We have audited the accompanying Consolidated Balance Sheets of Western Alliance Bancorporation and Subsidiaries (collectively referred to herein as the Company) as of December 31, 2016 and 2015, and the related Consolidated Statements of Income, Comprehensive Income, Stockholders' Equity, and Cash Flows for each of the three years in the period ended December 31, 2016. These financial statements are the responsibility of the Company's management. Our responsibility is to express an opinion on these financial statements based on our audits.
We conducted our audits in accordance with the standards of the Public Company Accounting Oversight Board (United States). Those standards require that we plan and perform the audit to obtain reasonable assurance about whether the financial statements are free of material misstatement. An audit includes examining, on a test basis, evidence supporting the amounts and disclosures in the financial statements. An audit also includes assessing the accounting principles used and significant estimates made by management, as well as evaluating the overall financial statement presentation. We believe that our audits provide a reasonable basis for our opinion.
In our opinion, the Consolidated Financial Statements referred to above present fairly, in all material respects, the financial position of the Company as of December 31, 2016 and 2015, and the results of their operations and their cash flows for each of the three years in the period ended December 31, 2016, in conformity with U.S. generally accepted accounting principles.
We have also audited, in accordance with the standards of the Public Company Accounting Oversight Board (United States), the Company’s internal control over financial reporting as of December 31, 2016, based on criteria established in Internal Control — Integrated Framework issued by the Committee of Sponsoring Organizations of the Treadway Commission in 2013, and our report dated February 28, 2017 expressed an unqualified opinion on the effectiveness of the Company’s internal control over financial reporting.
/s/ RSM US LLP
Phoenix, Arizona
February 28, 2017
76
WESTERN ALLIANCE BANCORPORATION AND SUBSIDIARIES
CONSOLIDATED BALANCE SHEETS
December 31, | ||||||||
2016 | 2015 | |||||||
(in thousands, except shares and per share amounts) | ||||||||
Assets: | ||||||||
Cash and due from banks | $ | 168,066 | $ | 133,709 | ||||
Interest-bearing deposits in other financial institutions | 116,425 | 90,931 | ||||||
Cash and cash equivalents | 284,491 | 224,640 | ||||||
Money market investments | — | 122 | ||||||
Investment securities - measured at fair value; amortized cost of $1,055 at December 31, 2016 and $1,389 at December 31, 2015 | 1,053 | 1,481 | ||||||
Investment securities - AFS, at fair value; amortized cost of $2,633,298 at December 31, 2016 and $1,966,034 at December 31, 2015 | 2,609,380 | 1,982,523 | ||||||
Investment securities - HTM, at amortized cost; fair value of $91,966 at December 31, 2016 and $0 at December 31, 2015 | 92,079 | — | ||||||
Investments in restricted stock, at cost | 65,249 | 58,111 | ||||||
Loans - HFS | 18,909 | 23,809 | ||||||
Loans - HFI, net of deferred loan fees and costs | 13,189,527 | 11,112,854 | ||||||
Less: allowance for credit losses | (124,704 | ) | (119,068 | ) | ||||
Net loans held for investment | 13,064,823 | 10,993,786 | ||||||
Premises and equipment, net | 119,833 | 118,535 | ||||||
Other assets acquired through foreclosure, net | 47,815 | 43,942 | ||||||
Bank owned life insurance | 164,510 | 162,458 | ||||||
Goodwill | 289,967 | 289,638 | ||||||
Other intangible assets, net | 12,927 | 15,716 | ||||||
Deferred tax assets, net | 95,194 | 86,352 | ||||||
Other assets | 334,612 | 273,976 | ||||||
Total assets | $ | 17,200,842 | $ | 14,275,089 | ||||
Liabilities: | ||||||||
Deposits: | ||||||||
Non-interest-bearing demand | $ | 5,632,926 | $ | 4,093,976 | ||||
Interest-bearing | 8,916,937 | 7,936,648 | ||||||
Total deposits | 14,549,863 | 12,030,624 | ||||||
Customer repurchase agreements | 41,728 | 38,155 | ||||||
Other borrowings | 80,000 | 150,000 | ||||||
Qualifying debt | 367,937 | 210,328 | ||||||
Other liabilities | 269,785 | 254,480 | ||||||
Total liabilities | 15,309,313 | 12,683,587 | ||||||
Commitments and contingencies (Note 16) | ||||||||
Stockholders’ equity: | ||||||||
Common stock - par value $0.0001; 200,000,000 authorized; 106,371,093 shares issued at December 31, 2016 and 104,082,230 at December 31, 2015 | 10 | 10 | ||||||
Treasury stock, at cost (1,300,232 shares at December 31, 2016 and 995,186 shares at December 31, 2015) | (26,362 | ) | (16,879 | ) | ||||
Additional paid in capital | 1,400,140 | 1,323,473 | ||||||
Accumulated other comprehensive (loss) income | (4,695 | ) | 22,260 | |||||
Retained earnings | 522,436 | 262,638 | ||||||
Total stockholders’ equity | 1,891,529 | 1,591,502 | ||||||
Total liabilities and stockholders’ equity | $ | 17,200,842 | $ | 14,275,089 | ||||
See accompanying Notes to Consolidated Financial Statements.
77
WESTERN ALLIANCE BANCORPORATION AND SUBSIDIARIES
CONSOLIDATED INCOME STATEMENTS
Year Ended December 31, | ||||||||||||
2016 | 2015 | 2014 | ||||||||||
(in thousands, except per share amounts) | ||||||||||||
Interest income: | ||||||||||||
Loans, including fees | $ | 636,596 | $ | 476,417 | $ | 370,922 | ||||||
Investment securities | 52,570 | 37,888 | 38,603 | |||||||||
Dividends | 9,002 | 10,317 | 6,562 | |||||||||
Other | 2,338 | 522 | 292 | |||||||||
Total interest income | 700,506 | 525,144 | 416,379 | |||||||||
Interest expense: | ||||||||||||
Deposits | 29,722 | 21,795 | 20,012 | |||||||||
Other borrowings | 508 | 5,678 | 9,639 | |||||||||
Qualifying debt | 12,998 | 5,007 | 1,754 | |||||||||
Other | 65 | 88 | 81 | |||||||||
Total interest expense | 43,293 | 32,568 | 31,486 | |||||||||
Net interest income | 657,213 | 492,576 | 384,893 | |||||||||
Provision for credit losses | 8,000 | 3,200 | 4,726 | |||||||||
Net interest income after provision for credit losses | 649,213 | 489,376 | 380,167 | |||||||||
Non-interest income: | ||||||||||||
Service charges and fees | 18,824 | 14,782 | 10,567 | |||||||||
Card income | 4,438 | 3,679 | 3,310 | |||||||||
SBA / warrant income | 4,181 | 1,579 | — | |||||||||
Lending related income and gains (losses) on sale of loans, net | 3,770 | 369 | 71 | |||||||||
Income from bank owned life insurance | 3,762 | 3,899 | 4,508 | |||||||||
Gain (loss) on sales of investment securities, net | 1,059 | 615 | 757 | |||||||||
(Loss) on extinguishment of debt | — | (81 | ) | (502 | ) | |||||||
Unrealized gains (losses) on assets and liabilities measured at fair value, net | 45 | 47 | 1,212 | |||||||||
Other income | 6,836 | 4,879 | 4,728 | |||||||||
Total non-interest income | 42,915 | 29,768 | 24,651 | |||||||||
Non-interest expense: | ||||||||||||
Salaries and employee benefits | 188,810 | 149,828 | 126,630 | |||||||||
Occupancy | 27,303 | 22,180 | 18,155 | |||||||||
Legal, professional, and directors' fees | 24,610 | 18,548 | 14,278 | |||||||||
Data processing | 18,660 | 13,200 | 10,057 | |||||||||
Insurance | 12,898 | 11,003 | 8,862 | |||||||||
Marketing | 3,596 | 2,885 | 2,300 | |||||||||
Loan and repossessed asset expenses | 2,999 | 4,377 | 4,423 | |||||||||
Card expense | 2,936 | 2,764 | 2,417 | |||||||||
Intangible amortization | 2,788 | 1,970 | 1,461 | |||||||||
Net (gain) loss on sales / valuations of repossessed and other assets | (125 | ) | (2,070 | ) | (5,350 | ) | ||||||
Acquisition / restructure expense | 12,412 | 8,836 | 198 | |||||||||
Other expense | 34,062 | 27,085 | 23,888 | |||||||||
Total non-interest expense | 330,949 | 260,606 | 207,319 | |||||||||
Income from continuing operations before provision for income taxes | 361,179 | 258,538 | 197,499 | |||||||||
Income tax expense | 101,381 | 64,294 | 48,390 | |||||||||
Income from continuing operations | 259,798 | 194,244 | 149,109 | |||||||||
(Loss) from discontinued operations, net of tax | — | — | (1,158 | ) | ||||||||
Net income | 259,798 | 194,244 | 147,951 | |||||||||
Dividends on preferred stock | — | 750 | 1,387 | |||||||||
Net income available to common stockholders | $ | 259,798 | $ | 193,494 | $ | 146,564 | ||||||
78
Year Ended December 31, | ||||||||||||
2016 | 2015 | 2014 | ||||||||||
(in thousands, except per share amounts) | ||||||||||||
Earnings per share from continuing operations: | ||||||||||||
Basic | $ | 2.52 | $ | 2.05 | $ | 1.70 | ||||||
Diluted | 2.50 | 2.03 | 1.69 | |||||||||
Loss per share from discontinued operations: | ||||||||||||
Basic | — | — | (0.01 | ) | ||||||||
Diluted | — | — | (0.02 | ) | ||||||||
Earnings per share available to common stockholders: | ||||||||||||
Basic | 2.52 | 2.05 | 1.69 | |||||||||
Diluted | 2.50 | 2.03 | 1.67 | |||||||||
Weighted average number of common shares outstanding: | ||||||||||||
Basic | 103,042 | 94,570 | 86,693 | |||||||||
Diluted | 103,843 | 95,219 | 87,506 | |||||||||
Dividends declared per common share | $ | — | $ | — | $ | — | ||||||
See accompanying Notes to Consolidated Financial Statements.
79
WESTERN ALLIANCE BANCORPORATION AND SUBSIDIARIES
CONSOLIDATED STATEMENTS OF COMPREHENSIVE INCOME
Year Ended December 31, | ||||||||||||
2016 | 2015 | 2014 | ||||||||||
(in thousands) | ||||||||||||
Net income | $ | 259,798 | $ | 194,244 | $ | 147,951 | ||||||
Other comprehensive (loss) income, net: | ||||||||||||
Unrealized gain on transfer of HTM securities to AFS, net of tax effect of $(5,367) for the respective period presented | — | — | 8,976 | |||||||||
Unrealized (loss) gain on AFS securities, net of tax effect of $15,099, $3,922, and $(17,749), respectively | (24,254 | ) | (6,117 | ) | 29,683 | |||||||
Unrealized gain on SERP, net of tax effect of $(18) and $(52) for the respective periods presented | 31 | 90 | — | |||||||||
Unrealized (loss) gain on junior subordinated debt, net of tax effect of $1,405 and $2,679 for the respective periods presented | (2,077 | ) | (4,276 | ) | — | |||||||
Realized (gain) loss on sale of AFS securities included in income, net of tax effect of $404, $230, and $283, respectively | (655 | ) | (385 | ) | (474 | ) | ||||||
Net other comprehensive (loss) income | (26,955 | ) | (10,688 | ) | 38,185 | |||||||
Comprehensive income | $ | 232,843 | $ | 183,556 | $ | 186,136 | ||||||
See accompanying Notes to Consolidated Financial Statements.
80
WESTERN ALLIANCE BANCORPORATION AND SUBSIDIARIES
CONSOLIDATED STATEMENTS OF STOCKHOLDERS’ EQUITY
Preferred Stock | Common Stock | Additional Paid in Capital | Treasury Stock | Accumulated Other Comprehensive Income (Loss) | Retained Earnings (Accumulated Deficit) | Total Stockholders’ Equity | |||||||||||||||||||||||||||
Shares | Amount | Shares | Amount | ||||||||||||||||||||||||||||||
(in thousands) | |||||||||||||||||||||||||||||||||
Balance, Dec 31, 2013 | 141 | $ | 141,000 | 87,186 | $ | 9 | $ | 802,310 | $ | (5,164 | ) | $ | (21,546 | ) | $ | (61,111 | ) | $ | 855,498 | ||||||||||||||
Net income | — | — | — | — | — | — | — | 147,951 | 147,951 | ||||||||||||||||||||||||
Exercise of stock options | — | — | 625 | — | 8,294 | — | — | — | 8,294 | ||||||||||||||||||||||||
Restricted stock, performance stock units, and other grants, net | — | — | 510 | — | 13,253 | — | — | — | 13,253 | ||||||||||||||||||||||||
Restricted Stock surrendered | — | — | (178 | ) | — | — | (4,112 | ) | — | — | (4,112 | ) | |||||||||||||||||||||
ATM common stock issuance, net | — | — | 548 | — | 13,746 | — | — | — | 13,746 | ||||||||||||||||||||||||
Preferred stock redemption | (70 | ) | (70,500 | ) | — | — | — | — | — | — | (70,500 | ) | |||||||||||||||||||||
Dividends on preferred stock | — | — | — | — | — | — | — | (1,387 | ) | (1,387 | ) | ||||||||||||||||||||||
Other comprehensive income, net | — | — | — | — | — | — | 38,185 | — | 38,185 | ||||||||||||||||||||||||
Balance, Dec 31, 2014 | 71 | $ | 70,500 | 88,691 | $ | 9 | $ | 837,603 | $ | (9,276 | ) | $ | 16,639 | $ | 85,453 | $ | 1,000,928 | ||||||||||||||||
Balance, Jan 1, 2015 (1) | 71 | 70,500 | 88,691 | 9 | 837,603 | (9,276 | ) | 32,948 | 69,144 | 1,000,928 | |||||||||||||||||||||||
Net income | — | — | — | — | — | — | — | 194,244 | 194,244 | ||||||||||||||||||||||||
Exercise of stock options | — | — | 182 | — | 1,935 | — | — | — | 1,935 | ||||||||||||||||||||||||
Restricted stock, performance stock units, and other grants, net | — | — | 732 | — | 24,617 | — | — | — | 24,617 | ||||||||||||||||||||||||
Restricted Stock surrendered | — | — | (275 | ) | — | — | (7,603 | ) | — | — | (7,603 | ) | |||||||||||||||||||||
Issuance of common stock in acquisition of Bridge (2) | — | — | 12,997 | 1 | 431,030 | — | 431,031 | ||||||||||||||||||||||||||
ATM common stock issuance, net | — | — | 760 | — | 28,288 | — | — | — | 28,288 | ||||||||||||||||||||||||
Preferred stock redemption | (71 | ) | (70,500 | ) | — | — | — | — | — | — | (70,500 | ) | |||||||||||||||||||||
Dividends on preferred stock | — | — | — | — | — | — | — | (750 | ) | (750 | ) | ||||||||||||||||||||||
Other comprehensive loss, net | — | — | — | — | — | — | (10,688 | ) | — | (10,688 | ) | ||||||||||||||||||||||
Balance, Dec 31, 2015 | — | $ | — | 103,087 | $ | 10 | $ | 1,323,473 | $ | (16,879 | ) | $ | 22,260 | $ | 262,638 | $ | 1,591,502 | ||||||||||||||||
Net income | — | — | — | — | — | — | — | 259,798 | 259,798 | ||||||||||||||||||||||||
Exercise of stock options | — | — | 77 | — | 1,070 | — | — | — | 1,070 | ||||||||||||||||||||||||
Restricted stock, performance stock unit, and other grants, net | — | — | 662 | — | 19,812 | — | — | — | 19,812 | ||||||||||||||||||||||||
Restricted Stock surrendered | — | — | (305 | ) | — | — | (9,483 | ) | — | — | (9,483 | ) | |||||||||||||||||||||
ATM common stock issuance, net | — | — | 1,550 | — | 55,785 | — | — | — | 55,785 | ||||||||||||||||||||||||
Other comprehensive loss, net | — | — | — | — | — | — | (26,955 | ) | — | (26,955 | ) | ||||||||||||||||||||||
Balance, Dec 31, 2016 | — | $ | — | 105,071 | $ | 10 | $ | 1,400,140 | $ | (26,362 | ) | $ | (4,695 | ) | $ | 522,436 | $ | 1,891,529 | |||||||||||||||
(1) | As adjusted, due to the Company's election to early adopt an element of ASU 2016-01 issued by the FASB in January 2016. The cumulative effect of adoption of this guidance at January 1, 2015 resulted in a decrease to retained earnings of $16.3 million and a corresponding increase to accumulated other comprehensive income. |
(2) | Includes value of certain share-based awards replaced in connection with the acquisition. |
See accompanying Notes to Consolidated Financial Statements.
81
WESTERN ALLIANCE BANCORPORATION AND SUBSIDIARIES
CONSOLIDATED STATEMENTS OF CASH FLOWS
Year Ended December 31, | ||||||||||||
2016 | 2015 | 2014 | ||||||||||
(in thousands) | ||||||||||||
Cash flows from operating activities: | ||||||||||||
Net income | $ | 259,798 | $ | 194,244 | $ | 147,951 | ||||||
Adjustments to reconcile net income to cash provided by operating activities: | ||||||||||||
Provision for credit losses | 8,000 | 3,200 | 4,726 | |||||||||
Depreciation and amortization | 12,494 | 8,466 | 6,166 | |||||||||
Stock-based compensation | 20,338 | 25,533 | 16,577 | |||||||||
Excess tax benefit of stock-based compensation | (4,075 | ) | (5,874 | ) | (4,194 | ) | ||||||
Deferred income taxes | 7,644 | 3,254 | (7,182 | ) | ||||||||
Amortization of net premiums for investment securities | 13,790 | 9,775 | 8,035 | |||||||||
Accretion of fair market value adjustments on loans acquired from business combinations | (29,209 | ) | (17,144 | ) | (17,014 | ) | ||||||
Accretion and amortization of fair market value adjustments on other assets and liabilities acquired from business combinations | 3,098 | 1,279 | (552 | ) | ||||||||
Income from bank owned life insurance | (3,762 | ) | (3,899 | ) | (4,508 | ) | ||||||
Unrealized losses on assets and liabilities measured at fair value, net | (45 | ) | (47 | ) | (1,212 | ) | ||||||
(Gains) / Losses on: | ||||||||||||
Sales of investment securities | (1,059 | ) | (615 | ) | (757 | ) | ||||||
Sale of loans | (2,492 | ) | (517 | ) | (71 | ) | ||||||
Extinguishment of debt | — | 81 | 502 | |||||||||
Other assets acquired through foreclosure, net | 372 | (2,628 | ) | (2,866 | ) | |||||||
Valuation adjustments of other repossessed assets, net | (268 | ) | 182 | 294 | ||||||||
Sale of premises, equipment, and other assets, net | 21 | 376 | (2,778 | ) | ||||||||
Changes in, net of acquisitions: | ||||||||||||
Other assets | (1,666 | ) | (9,482 | ) | 9,313 | |||||||
Other liabilities | (2,334 | ) | 14,231 | 14,971 | ||||||||
Net cash provided by operating activities | 280,645 | 220,415 | 167,401 | |||||||||
Cash flows from investing activities: | ||||||||||||
Investment securities - measured at fair value | ||||||||||||
Principal pay downs and maturities | 395 | 347 | 1,144 | |||||||||
Investment securities - AFS | ||||||||||||
Purchases | (1,205,057 | ) | (827,002 | ) | (143,052 | ) | ||||||
Principal pay downs and maturities | 499,541 | 273,950 | 226,455 | |||||||||
Proceeds from sales | 25,504 | 132,546 | 95,826 | |||||||||
Investment securities - HTM | ||||||||||||
Purchases | (92,384 | ) | — | — | ||||||||
Principal pay downs and maturities | 94 | — | 6,600 | |||||||||
Purchase of investment tax credits | (28,847 | ) | (29,437 | ) | (32,484 | ) | ||||||
Sale (purchase) of money market investments, net | 121 | 330 | 2,181 | |||||||||
Proceeds from bank owned life insurance | 1,710 | 797 | 1,046 | |||||||||
(Purchase) liquidation of restricted stock | (7,139 | ) | (25,821 | ) | 4,911 | |||||||
Loan fundings and principal collections, net | (810,543 | ) | (1,269,351 | ) | (1,560,633 | ) | ||||||
Purchase of premises, equipment, and other assets, net | (10,574 | ) | (10,856 | ) | (13,925 | ) | ||||||
Proceeds from sale of other real estate owned and repossessed assets, net | 9,133 | 45,627 | 25,918 | |||||||||
Cash and cash equivalents (used) acquired in acquisitions, net | (1,272,187 | ) | 342,427 | — | ||||||||
Net cash used in investing activities | (2,890,233 | ) | (1,366,443 | ) | (1,386,013 | ) | ||||||
82
Year Ended December 31, | ||||||||||||
2016 | 2015 | 2014 | ||||||||||
(in thousands) | ||||||||||||
Cash flows from financing activities: | ||||||||||||
Net increase (decrease) in deposits | $ | 2,519,239 | $ | 1,357,855 | $ | 1,093,353 | ||||||
Proceeds from issuance of subordinated debt | 169,256 | 148,211 | — | |||||||||
Net (decrease) increase in borrowings | (66,428 | ) | (257,038 | ) | 40,407 | |||||||
Early extinguishment of debt | — | — | (6,501 | ) | ||||||||
Proceeds from exercise of common stock options | 1,070 | 1,935 | 8,294 | |||||||||
Cash paid for tax withholding on vested restricted stock | (9,483 | ) | (7,603 | ) | (4,112 | ) | ||||||
Redemption of preferred stock | — | (70,500 | ) | (70,500 | ) | |||||||
Excess tax benefit of stock-based compensation | — | 5,874 | 4,194 | |||||||||
Cash dividends paid on preferred stock | — | (750 | ) | (1,387 | ) | |||||||
Proceeds from issuance of stock in offerings, net | 55,785 | 28,288 | 13,746 | |||||||||
Net cash provided by financing activities | 2,669,439 | 1,206,272 | 1,077,494 | |||||||||
Net increase (decrease) in cash and cash equivalents | 59,851 | 60,244 | (141,118 | ) | ||||||||
Cash and cash equivalents at beginning of period | 224,640 | 164,396 | 305,514 | |||||||||
Cash and cash equivalents at end of period | $ | 284,491 | $ | 224,640 | $ | 164,396 | ||||||
Supplemental disclosure: | ||||||||||||
Cash paid during the period for: | ||||||||||||
Interest | $ | 41,565 | $ | 28,831 | $ | 26,516 | ||||||
Income taxes | 61,281 | 54,590 | 35,556 | |||||||||
Non-cash investing and financing activity: | ||||||||||||
Transfers to other assets acquired through foreclosure, net | 13,110 | 28,566 | 13,777 | |||||||||
Change in unfunded LIHTC and SBIC commitments | 56,479 | 39,617 | 9,798 | |||||||||
Non-cash assets acquired in acquisition | 1,284,557 | 1,587,186 | — | |||||||||
Non-cash liabilities acquired in acquisition | 12,559 | 1,764,996 | — | |||||||||
Change in unrealized gain (loss) on AFS securities, net of tax | (24,254 | ) | (6,117 | ) | 29,683 | |||||||
Change in unrealized (loss) gain on junior subordinated debt, net of tax | (2,077 | ) | (4,276 | ) | — | |||||||
Change in unfunded obligations | 21,225 | (27,325 | ) | (28,522 | ) | |||||||
Transfer of HTM securities to AFS, amortized cost | — | — | 275,292 | |||||||||
Unrealized gain on transfer of HTM securities to AFS, net of tax | — | — | 8,976 | |||||||||
See accompanying Notes to Consolidated Financial Statements.
83
WESTERN ALLIANCE BANCORPORATION AND SUBSIDIARIES
NOTES TO CONSOLIDATED FINANCIAL STATEMENTS
1. SUMMARY OF SIGNIFICANT ACCOUNTING POLICIES
Nature of operation
WAL is a bank holding company headquartered in Phoenix, Arizona, incorporated under the laws of the state of Delaware. WAL provides a full spectrum of deposit, lending, treasury management, international banking, and online banking products and services through its wholly-owned banking subsidiary, WAB.
WAB operates the following full-service banking divisions: ABA, BON, FIB, Bridge, and TPB. The Company also serves business customers through a national platform of specialized financial services including AAB, Corporate Finance, Equity Fund Resources, HFF, Life Sciences Group, Mortgage Warehouse Lending, Public and Nonprofit Finance, Renewable Resource Group, Resort Finance, and Technology Finance. In addition, the Company has one non-bank subsidiary, LVSP, which holds and manages certain non-performing loans and OREO.
Basis of presentation
The accounting and reporting policies of the Company are in accordance with GAAP and conform to practices within the financial services industry. The accounts of the Company and its consolidated subsidiaries are included in the Consolidated Financial Statements.
Use of estimates
The preparation of financial statements in conformity with GAAP requires management to make estimates and assumptions that affect the reported amounts of assets and liabilities and disclosures of contingent assets and liabilities at the date of the financial statements and the reported amounts of revenues and expenses during the reporting period. Management's estimates and judgments are ongoing and are based on experience, current and expected future conditions, third-party evaluations and various other assumptions that management believes are reasonable under the circumstances. The results of these estimates form the basis for making judgments about the carrying values of assets and liabilities, as well as identifying and assessing the accounting treatment with respect to commitments and contingencies. Actual results may differ from those estimates and assumptions used in the Consolidated Financial Statements and related notes. Material estimates that are particularly susceptible to significant changes in the near term relate to the determination of the allowance for credit losses; estimated cash flows related to PCI loans; fair value determinations related to acquisitions and certain assets and liabilities carried at fair value; and accounting for income taxes.
Principles of consolidation
As of December 31, 2016, WAL has ten wholly-owned subsidiaries: WAB, LVSP, and eight unconsolidated subsidiaries used as business trusts in connection with the issuance of trust-preferred securities.
The Bank has the following significant wholly-owned subsidiaries: WAB Investments, Inc., BON Investments, Inc., and TPB Investments, Inc., which hold certain investment securities, municipal and nonprofit loans, and leases; WA PWI, LLC, which holds certain limited partnerships invested primarily in low income housing tax credits and small business investment corporations; and BW Real Estate, Inc., which operates as a real estate investment trust and holds certain of WAB's real estate loans and related securities. After the close of business on December 31, 2016, WAB Investments, Inc., BON Investments, Inc., and TPB Investments, Inc. were merged into a newly created entity called Western Alliance Business Trust.
The Company does not have any other significant entities that should be considered for consolidation. All significant intercompany balances and transactions have been eliminated in consolidation.
Reclassifications
Certain amounts in the Consolidated Financial Statements as of and for the years ended December 31, 2016, 2015, and 2014 may have been reclassified to conform to the current presentation. The reclassifications have no effect on net income or stockholders’ equity as previously reported.
Business combinations
Business combinations are accounted for under the acquisition method of accounting in accordance with ASC 805, Business Combinations. Under the acquisition method, the acquiring entity in a business combination recognizes all of the acquired
84
assets and assumed liabilities at their estimated fair values as of the date of acquisition. Any excess of the purchase price over the fair value of net assets and other identifiable intangible assets acquired is recorded as goodwill. To the extent the fair value of net assets acquired, including identified intangible assets, exceeds the purchase price, a bargain purchase gain is recognized. Changes to estimated fair values from a business combination are recognized as an adjustment to goodwill during the measurement period and are recognized in the proper reporting period in which the adjustment amounts are determined. Results of operations of an acquired business are included in the Consolidated Income Statement from the date of acquisition. Acquisition-related costs, including conversion and restructuring charges, are expensed as incurred.
Cash and cash equivalents
For purposes of reporting cash flows, cash and cash equivalents include cash on hand, amounts due from banks (including cash items in process of clearing), and federal funds sold. Cash flows from loans originated by the Company and customer deposit accounts are reported net.
The Company maintains amounts due from banks, which at times may exceed federally insured limits. The Company has not experienced any losses in such accounts.
Cash reserve requirements
Depository institutions are required by law to maintain reserves against their transaction deposits. The reserves must be held in cash or with the FRB. Banks are permitted to meet this requirement by maintaining the specified amount as an average balance over a two-week period. The total of reserve balances was approximately $43.7 million and $37.9 million as of December 31, 2016 and 2015, respectively.
Investment securities
Investment securities may be classified as HTM, AFS, or measured at fair value. The appropriate classification is initially decided at the time of purchase. Securities classified as HTM are those debt securities that the Company has both the intent and ability to hold to maturity regardless of changes in market conditions, liquidity needs, or general economic conditions. These securities are carried at amortized cost. The sale of a security within three months of its maturity date or after the majority of the principal outstanding has been collected is considered a maturity for purposes of classification and disclosure.
In May 2014, management reassessed its intent to hold certain CDOs classified as HTM, which necessitated a reclassification of all of the Company's HTM securities to AFS at the date of the transfer. As an extended period of time has passed since this reclassification was made, beginning in 2016, management believes that the Company is again able to assert that it has both the intent and ability to hold certain securities classified as HTM to maturity. See "Note 3. Investment Securities" of these Notes to Consolidated Financial Statements for additional detail related to HTM securities.
Securities classified as AFS or trading securities measured at fair value are reported as an asset in the Consolidated Balance Sheet at their estimated fair value. As the fair value of AFS securities changes, the changes are reported net of income tax as an element of OCI, except for other-than-temporarily-impaired securities. When AFS securities are sold, the unrealized gain or loss is reclassified from OCI to non-interest income. The changes in the fair values of trading securities are reported in non-interest income. Securities classified as AFS are both equity and debt securities that the Company intends to hold for an indefinite period of time, but not necessarily to maturity. Any decision to sell a security classified as AFS would be based on various factors, including significant movements in interest rates, changes in the maturity mix of the Company’s assets and liabilities, liquidity needs, decline in credit quality, and regulatory capital considerations.
Interest income is recognized based on the coupon rate and increased by accretion of discounts earned or decreased by the amortization of premiums paid over the contractual life of the security, adjusted for prepayment estimates, using the interest method.
In estimating whether there are any OTTI losses, management considers the 1) length of time and the extent to which the fair value has been less than amortized cost; 2) financial condition and near term prospects of the issuer; 3) impact of changes in market interest rates; and 4) intent and ability of the Company to retain its investment for a period of time sufficient to allow for any anticipated recovery in fair value and whether it is not more likely than not the Company would be required to sell the security.
Declines in the fair value of individual AFS debt securities that are deemed to be other-than-temporary are reflected in earnings when identified. The fair value of the debt security then becomes the new cost basis. For individual debt securities where the Company does not intend to sell the security and it is not more likely than not that the Company will be required to sell the security before recovery of its amortized cost basis, the other-than-temporary decline in fair value of the debt security related to
85
1) credit loss is recognized in earnings; and 2) interest rate, market, or other factors is recognized in other comprehensive income or loss.
For individual debt securities where the Company either intends to sell the security or more likely than not will not recover all of its amortized cost, the OTTI is recognized in earnings equal to the entire difference between the security's cost basis and its fair value at the balance sheet date. For individual debt securities for which a credit loss has been recognized in earnings, interest accruals and amortization and accretion of premiums and discounts are suspended when the credit loss is recognized. Interest received after accruals have been suspended is recognized on a cash basis.
Restricted stock
On January 30, 2015, WAB became a member of the Federal Reserve System and, as part of its membership, is required to maintain stock in the FRB in a specified ratio to its capital. In addition, WAB is a member of the FHLB system and, accordingly, maintains an investment in capital stock of the FHLB based on the borrowing capacity used. The Bank also maintains an investment in its primary correspondent bank. All of these investments are considered equity securities with no actively traded market. Therefore, the shares are considered restricted investment securities. These investments are carried at cost, which is equal to the value at which they may be redeemed. The dividend income received from the stock is reported in interest income. The Company conducts a periodic review and evaluation of its restricted stock to determine if any impairment exists. No impairment has been recorded to date.
Loans, held for sale
Loans, held for sale consist of SBA loans that the Company originates (or acquires) and intends to sell. These loans are carried at the lower of aggregate cost or fair value. Fair value is determined based on available market data for similar assets, expected cash flows, and appraisals of underlying collateral or the credit quality of the borrower. Gains and losses on the sale of loans are recognized pursuant to ASC 860, Transfers and Servicing. Interest income of these loans is accrued daily and loan origination fees and costs are deferred and included in the cost basis of the loan. The Company issues various representations and warranties associated with these loan sales. The Company has not experienced any losses as a result of these representations and warranties.
Loans, held for investment
The Company generally holds loans for investment and has the intent and ability to hold loans until their maturity. Therefore, they are reported at book value. Net loans are stated at the amount of unpaid principal, adjusted for net deferred fees and costs, purchase accounting fair value adjustments, and an allowance for credit losses. In addition, the book value of loans that are subject to a fair value hedge is adjusted for changes in value attributable to the effective portion of the hedged benchmark interest rate risk.
The Company may also acquire loans through a business combination. These acquired loans are recorded at estimated fair value on the date of purchase, which is comprised of unpaid principal adjusted for estimated credit losses and interest rate fair value adjustments. Loans are evaluated individually to determine if there has been credit deterioration since origination. Such loans may then be aggregated and accounted for as a pool of loans based on common characteristics. When the Company acquires such loans, the yield that may be accreted (accretable yield) is limited to the excess of the Company’s estimate of undiscounted cash flows expected to be collected over the Company’s initial investment in the loan. The excess of contractual cash flows over the cash flows expected to be collected may not be recognized as an adjustment to yield, loss, or a valuation allowance. Subsequent increases in cash flows expected to be collected generally are recognized prospectively through adjustment of the loan’s yield over the remaining life. Subsequent decreases to cash flows expected to be collected are recognized as impairment. The Company may not carry over or create a valuation allowance in the initial accounting for loans acquired under these circumstances. For purchased loans that are not deemed impaired, fair value adjustments attributable to both credit and interest rates are accreted (or amortized) over the contractual life of the individual loan. For additional information, see "Note 4. Loans, Leases and Allowance for Credit Losses" of these Notes to Consolidated Financial Statements.
Loan fees collected for the origination of loans less direct loan origination costs (net deferred loan fees) are amortized over the contractual life of the loan through interest income. If the loan has scheduled payments, the amortization of the net deferred loan fee is calculated using the interest method over the contractual life of the loan. If the loan does not have scheduled payments, such as a line of credit, the net deferred loan fee is recognized as interest income on a straight-line basis over the contractual life of the loan commitment. Commitment fees based on a percentage of a customer’s unused line of credit and fees related to standby letters of credit are recognized over the commitment period. When loans are repaid, any remaining unamortized balances of premiums, discounts, or net deferred fees are recognized as interest income.
86
Non-accrual loans: For all loan types except credit cards, when a borrower discontinues making payments as contractually required by the note, the Company must determine whether it is appropriate to continue to accrue interest. The Company ceases accruing interest income when the loan has become delinquent by more than 90 days or when management determines that the full repayment of principal and collection of interest according to contractual terms is no longer likely. The Company may decide to continue to accrue interest on certain loans more than 90 days delinquent if the loans are well secured by collateral and in the process of collection. Credit card loans and other personal loans are typically charged off no later than 180 days delinquent.
For all loan types, when a loan is placed on non-accrual status, all interest accrued but uncollected is reversed against interest income in the period in which the status is changed and, the Company makes a loan-level decision to apply either the cash basis or cost recovery method. The Company recognizes income on a cash basis only for those non-accrual loans for which the collection of the remaining principal balance is not in doubt. Under the cost recovery method, subsequent payments received from the customer are applied to principal and generally no further interest income is recognized until the principal has been paid in full or until circumstances have changed such that payments are again consistently received as contractually required.
Impaired loans: A loan is identified as impaired when it is no longer probable that interest and principal will be collected according to the contractual terms of the original loan agreement. Generally, impaired loans are classified as non-accrual. However, in certain instances, impaired loans may continue on an accrual basis, if full repayment of all principal and interest is expected and the loan is both well secured and in the process of collection. Impaired loans are measured for reserve requirements in accordance with ASC 310, Receivables, based on the present value of expected future cash flows discounted at the loan's effective interest rate or, as a practical expedient, at the loan's observable market price or the fair value of the collateral less applicable disposition costs if the loan is collateral dependent. The amount of an impairment reserve, if any, and any subsequent changes are recorded as a provision for credit losses. Losses are recorded as a charge-off when losses are confirmed. In addition to management's internal loan review process, regulators may from time to time direct the Company to modify loan grades, loan impairment calculations, or loan impairment methodology.
Troubled Debt Restructured Loans: A TDR loan is a loan on which the Company, for reasons related to a borrower’s financial difficulties, grants a concession to the borrower that the Company would not otherwise consider. The loan terms that have been modified or restructured due to a borrower’s financial situation include, but are not limited to, a reduction in the stated interest rate, an extension of the maturity or renewal of the loan at an interest rate below current market, a reduction in the face amount of the debt, a reduction in the accrued interest, or deferral of interest payments. A TDR loan is also considered impaired. A TDR loan may be returned to accrual status when the loan is brought current, has performed in accordance with the contractual restructured terms for a reasonable period of time (generally six months) and the ultimate collectability of the total contractual restructured principal and interest is no longer in doubt. However, such loans continue to be considered impaired. Consistent with regulatory guidance, a TDR loan that is subsequently modified in another restructuring agreement but has shown sustained performance and classification as a TDR, will be removed from TDR status provided that the modified terms were market-based at the time of modification.
Allowance for credit losses
Credit risk is inherent in the business of extending loans and leases to borrowers, for which the Company must maintain an adequate allowance for credit losses. The allowance for credit losses is established through a provision for credit losses recorded to expense. Loans are charged against the allowance for credit losses when management believes that the contractual principal or interest will not be collected. Subsequent recoveries, if any, are credited to the allowance. The allowance is an amount believed adequate to absorb estimated probable losses on existing loans that may become uncollectable, based on evaluation of the collectability of loans and prior credit loss experience, together with other factors. The Company formally re-evaluates and establishes the appropriate level of the allowance for credit losses on a quarterly basis.
The allowance consists of specific and general components. The specific allowance applies to impaired loans. For impaired collateral dependent loans, the reserve is calculated based on the collateral value, net of estimated disposition costs. Generally, the Company obtains independent collateral valuation analysis for each loan every twelve months. Loans not collateral dependent are evaluated based on the expected future cash flows discounted at the original contractual interest rate.
The general allowance covers all non-impaired loans and incorporates several quantitative and qualitative factors. Quantitative factors include company-specific, ten-year historical net charge-offs stratified by loans with similar characteristics. Qualitative factors include: 1) levels of and trends in delinquencies and impaired loans; 2) levels of and trends in charge-offs and recoveries; 3) trends in volume and terms of loans; 4) changes in underwriting standards or lending policies; 5) experience, ability, depth of lending staff; 6) national and local economic trends and conditions; 7) changes in credit concentrations; 8) out-of-market exposures; 9) changes in quality of loan review system; and 10) changes in the value of underlying collateral.
87
Due to the credit concentration of the Company's loan portfolio in real estate secured loans, the value of collateral is heavily dependent on real estate values in Nevada, Arizona, and California. While management uses the best information available to make its evaluation, future adjustments to the allowance may be necessary if there are significant changes in economic or other conditions. In addition, regulators, as an integral part of their examination processes, periodically review the Bank's allowance for credit losses, and may require the Bank to make additions to the allowance based on their judgment about information available to them at the time of their examination. Management regularly reviews the assumptions and formulae used in determining the allowance and makes adjustments if required to reflect the current risk profile of the portfolio.
Transfers of financial assets
Transfers of financial assets are accounted for as sales when control over the assets has been surrendered. Control over transferred assets is deemed surrendered when the 1) assets have been isolated from the Company; 2) transferee obtains the right to pledge or exchange the transferred assets; and 3) Company no longer maintains effective control over the transferred assets through an agreement to repurchase the transferred assets before maturity.
Premises and equipment
Premises and equipment are stated at cost less accumulated depreciation and amortization. Depreciation is computed principally by the straight-line method over the estimated useful lives of the assets. Leasehold improvements are amortized over the term of the lease or the estimated life of the improvement, whichever is shorter. Depreciation and amortization is computed using the following estimated lives:
Years | ||
Bank premises | 31 | |
Furniture, fixtures, and equipment | 3 - 10 | |
Leasehold improvements (1) | 3 - 10 | |
(1) | Depreciation is recorded over the lesser of 3 to 10 years or the term of the lease. |
Management periodically reviews premises and equipment in order to determine if facts and circumstances suggest that the value of an asset is not recoverable.
Goodwill and other intangible assets
The Company records as goodwill the excess of the purchase price over the fair value of the identifiable net assets acquired in accordance with applicable guidance. The Company performs its annual goodwill and intangibles impairment tests as of October 1 each year, or more often if events or circumstances indicate that the carrying value may not be recoverable. The Company can first elect to assess, through qualitative factors, whether it is more likely than not that goodwill is impaired. Pursuant to this guidance, if the qualitative assessment indicates potential impairment, the Company will proceed with the two-step process. The first step tests for impairment, while the second step, if necessary, measures the impairment. The resulting impairment amount, if any, is charged to current period earnings as non-interest expense.
The Company’s intangible assets consist primarily of core deposit intangible assets that are amortized over periods ranging from 5 to 10 years. The Company considers the remaining useful lives of its core deposit intangible assets each reporting period, as required by ASC 350, Intangibles—Goodwill and Other, to determine whether events and circumstances warrant a revision to the remaining period of amortization. If the estimate of an intangible asset’s remaining useful life has changed, the remaining carrying amount of the intangible asset is amortized prospectively over the revised remaining useful life. The Company has not revised its estimates of the useful lives of its core deposit intangibles during the years ended December 31, 2016, 2015, or 2014.
Other assets acquired through foreclosure
Other assets acquired through foreclosure consist primarily of properties acquired as a result of, or in-lieu-of, foreclosure. Properties or other assets (primarily repossessed assets formerly leased) are classified as OREO and other repossessed property and are initially reported at fair value of the asset less estimated selling costs. Subsequent adjustments are based on the lower of carrying value or fair value less estimated costs to sell the property. Costs related to the development or improvement of the assets are capitalized and costs related to holding the assets are charged to non-interest expense. Property is evaluated regularly to ensure the recorded amount is supported by its current fair value and valuation allowances.
88
Investments in low income housing credits
The Company invests in Limited Partnerships formed for the purpose of investing in low income housing projects, which qualify for federal LIHTC. These investments are expected to generate tax credits over a ten-year period. The Company adopted the amended guidance in ASU 2014-01, Accounting for Investments in Qualified Affordable Housing Projects, beginning on January 1, 2014 and accounts for these investments using the proportional amortization method. See "Note 15. Income Taxes" for the additional disclosures required under these amendments.
Bank owned life insurance
BOLI is carried at its cash surrender value with changes recorded in other non-interest income in the Consolidated Income Statements. The face amount of the underlying policies including death benefits was $360.3 million and $361.7 million as of December 31, 2016 and 2015, respectively. There are no loans offset against cash surrender values, and there are no restrictions as to the use of proceeds.
Customer repurchase agreements
The Company enters into repurchase agreements with customers, whereby it pledges securities against overnight investments made from the customer’s excess collected funds. The Company records these at the amount of cash received in connection with the transaction.
Stock compensation plans
The Company has the Incentive Plan, as amended, which is described more fully in "Note 11. Stockholders' Equity" of these Notes to Consolidated Financial Statements. Compensation expense for stock options and non-vested restricted stock awards is based on the fair value of the award on the measurement date which, for the Company, is the date of the grant and is recognized ratably over the service period of the award. The Company utilizes the Black-Scholes option-pricing model to calculate the fair value of stock options. The fair value of non-vested restricted stock awards is the market price of the Company’s stock on the date of grant.
See "Note 11. Stockholders' Equity" of these Notes to Consolidated Financial Statements for further discussion of stock options and restricted stock awards.
Treasury Shares
Effective January 1, 2016, the Company separately presents treasury shares, which represent shares surrendered to the Company equal in value to the statutory payroll tax withholding obligations arising from the vesting of employee restricted stock awards. Prior period amounts have been adjusted to reflect this new presentation, with no change to total stockholders' equity. Treasury shares are carried at cost.
Derivative financial instruments
The Company uses interest-rate swaps to mitigate interest-rate risk associated with changes to 1) the fair value of certain fixed-rate financial instruments (fair value hedges) and 2) certain cash flows related to future interest payments on variable rate financial instruments (cash flow hedges).
The Company recognizes derivatives as assets or liabilities in the Consolidated Balance Sheet at their fair value in accordance with ASC 815, Derivatives and Hedging. The accounting for changes in the fair value of a derivative instrument depends on whether it has been designated and qualifies as part of a hedging relationship and further, on the type of hedging relationship. On the date the derivative contract is entered into, the Company designates the derivative as a fair value hedge or cash flow hedge. Derivative instruments designated in a hedge relationship to mitigate exposure to changes in the fair value of an asset or liability attributable to a particular risk, such as interest rate risk, are considered fair value hedges. Derivative instruments designated in a hedge relationship to mitigate exposure to variability in expected future cash flows, or other types of forecasted transactions, are considered cash flow hedges.
Changes in the fair value of a derivative that is designated and qualifies as a fair value hedge, along with changes in the fair value of the hedged asset or liability that are attributable to the hedged risk are recorded in current-period earnings. For a cash flow hedge, the effective portion of the change in the fair value of the derivative is recorded in AOCI and reclassified into earnings in the same period or periods during which the hedged transaction affects earnings. Any ineffective portion of the change in fair value of a cash flow hedge is recognized immediately in non-interest income in the Consolidated Income Statement. Under both the fair value and cash flow hedge scenarios, changes in the fair value of derivatives not considered to
89
be highly effective in hedging the change in fair value or the expected cash flows of the hedged item are recognized in earnings as non-interest income during the period of the change.
The Company documents its hedge relationships, including identification of the hedging instruments and the hedged items, as well as its risk management objectives and strategies for undertaking the hedge transaction at the time the derivative contract is executed. Both at inception and at least quarterly thereafter, the Company assesses whether the derivatives used in hedging transactions are highly effective (as defined in the guidance) in offsetting changes in either the fair value or cash flows of the hedged item. Retroactive effectiveness is assessed, as well as the continued expectation that the hedge will remain effective prospectively. The Company discontinues hedge accounting prospectively when it is determined that a hedge is no longer highly effective. When hedge accounting is discontinued on a fair value hedge that no longer qualifies as an effective hedge, the derivative continues to be reported at fair value in the Consolidated Balance Sheet, but the carrying amount of the hedged item is no longer adjusted for future changes in fair value. The adjustment to the carrying amount of the hedged item that existed at the date hedge accounting is discontinued is amortized over the remaining life of the hedged item into earnings.
Derivative instruments that are not designated as hedges, so called free-standing derivatives, are reported in the Consolidated Balance Sheet at fair value and the changes in fair value are recognized in earnings as non-interest income during the period of change.
The Company may in the normal course of business purchase a financial instrument or originate a loan that contains an embedded derivative instrument. Upon purchasing the instrument or originating the loan, the Company assesses whether the economic characteristics of the embedded derivative are clearly and closely related to the economic characteristics of the remaining component of the financial instrument (i.e., the host contract) and whether a separate instrument with the same terms as the embedded instrument would meet the definition of a derivative instrument. When it is determined that the embedded derivative possesses economic characteristics that are not clearly and closely related to the economic characteristics of the host contract and a separate instrument with the same terms would qualify as a derivative instrument, the embedded derivative is separated from the host contract and carried at fair value. However, in cases where the host contract is measured at fair value, with changes in fair value reported in current earnings, or the Company is unable to reliably identify and measure an embedded derivative for separation from its host contract, the entire contract is carried in the Consolidated Balance Sheet at fair value and is not designated as a hedging instrument.
Income taxes
The Company is subject to income taxes in the United States and files a consolidated federal income tax return with all of its subsidiaries, with the exception of BW Real Estate, Inc. Deferred income taxes are recorded to reflect the effects of temporary differences between the financial reporting carrying amounts of assets and liabilities and their income tax bases using enacted tax rates that are expected to be in effect when the taxes are actually paid or recovered. As changes in tax laws or rates are enacted, deferred tax assets and liabilities are adjusted through the provision for income taxes.
Net deferred tax assets are recorded to the extent that these assets will more-likely-than-not be realized. In making these determinations, all available positive and negative evidence is considered, including scheduled reversals of deferred tax liabilities, tax planning strategies, projected future taxable income, and recent operating results. If it is determined that deferred income tax assets to be realized in the future are in excess of their net recorded amount, an adjustment to the valuation allowance will be recorded, which will reduce the Company's provision for income taxes.
A tax benefit from an unrecognized tax benefit may be recognized when it is more-likely-than-not that the position will be sustained upon examination, including related appeals or litigation, based on technical merits. Income tax benefits must meet a more-likely-than-not recognition threshold at the effective date to be recognized.
Interest and penalties related to unrecognized tax benefits are recognized as part of the provision for income taxes in the Consolidated Income Statement. Accrued interest and penalties are included in the related tax liability line with other liabilities in the Consolidated Balance Sheet. See "Note 15. Income Taxes" of these Notes to Consolidated Financial Statements for further discussion on income taxes.
Off-balance sheet instruments
In the ordinary course of business, the Company has entered into off-balance sheet financial instrument arrangements consisting of commitments to extend credit and standby letters of credit. Such financial instruments are recorded in the Consolidated Financial Statements when they are funded. They involve, to varying degrees, elements of credit risk in excess of amounts recognized in the Consolidated Balance Sheet. Losses would be experienced when the Company is contractually obligated to make a payment under these instruments and must seek repayment from the borrower, which may not be as financially sound in the current period as they were when the commitment was originally made. Commitments to extend credit
90
are agreements to lend to a customer as long as there is no violation of any condition established in the contract. Commitments generally have fixed expiration dates or other termination clauses and may require payment of a fee. The Company enters into credit arrangements that generally provide for the termination of advances in the event of a covenant violation or other event of default. Since many of the commitments are expected to expire without being drawn upon, the total commitment amounts do not necessarily represent future cash requirements. The Company evaluates each customer’s creditworthiness on a case-by-case basis. The amount of collateral obtained, if deemed necessary by the Company upon extension of credit, is based on management’s credit evaluation of the party. The commitments are collateralized by the same types of assets used as loan collateral.
As with outstanding loans, the Company applies qualitative factors and utilization rates to its off-balance sheet obligations in determining an estimate of losses inherent in these contractual obligations. The estimate for credit losses on off-balance sheet instruments is included in other liabilities and the charge to income that establishes this liability is included in non-interest expense.
The Company also has off-balance sheet arrangements related to its derivative instruments. Derivative instruments are recognized in the Consolidated Financial Statements at fair value and their notional values are carried off-balance sheet. See "Note 13. Derivatives and Hedging Activities" of these Notes to Consolidated Finance Statements for further discussion.
Fair values of financial instruments
The Company uses fair value measurements to record fair value adjustments to certain assets and liabilities. ASC 820, Fair Value Measurement, establishes a framework for measuring fair value and a three-level valuation hierarchy for disclosure of fair value measurement, as well as enhances disclosure requirements for fair value measurements. The valuation hierarchy is based upon the transparency of inputs to the valuation of an asset or liability as of the measurement date. The Company uses various valuation approaches, including market, income, and/or cost approaches. ASC 820 establishes a hierarchy for inputs used in measuring fair value that maximizes the use of observable inputs and minimizes the use of unobservable inputs by requiring that observable inputs be used when available. Observable inputs are inputs that market participants would use in pricing the asset or liability developed based on market data obtained from sources independent of the Company. Unobservable inputs are inputs that reflect the Company’s assumptions about the factors market participants would consider in pricing the asset or liability developed based on the best information available in the circumstances. The hierarchy is broken down into three levels based on the reliability of inputs, as follows:
• | Level 1 - Unadjusted quoted prices in active markets that are accessible at the measurement date for identical, unrestricted assets or liabilities. |
• | Level 2 - Inputs other than quoted prices included in Level 1 that are observable for the asset or liability, either directly or indirectly. These might include quoted prices for similar instruments in active markets, quoted prices for identical or similar instruments in markets that are not active, inputs other than quoted prices that are observable for the asset or liability (such as interest rates, prepayment speeds, volatilities, etc.) or model-based valuation techniques where all significant assumptions are observable, either directly or indirectly, in the market. |
• | Level 3 - Valuation is generated from model-based techniques where one or more significant inputs are not observable, either directly or indirectly, in the market. These unobservable assumptions reflect the Company’s own estimates of assumptions that market participants would use in pricing the asset or liability. Valuation techniques may include use of matrix pricing, discounted cash flow models, and similar techniques. |
The availability of observable inputs varies based on the nature of the specific financial instrument. To the extent that valuation is based on models or inputs that are less observable or unobservable in the market, the determination of fair value requires more judgment. Accordingly, the degree of judgment exercised by the Company in determining fair value is greatest for instruments categorized in Level 3. In certain cases, the inputs used to measure fair value may fall into different levels of the fair value hierarchy. In such cases, for disclosure purposes, the level in the fair value hierarchy within which the fair value measurement in its entirety falls is determined based on the lowest level input that is significant to the fair value measurement in its entirety.
Fair value is a market-based measure considered from the perspective of a market participant who may purchase the asset or assume the liability rather than an entity-specific measure. When market assumptions are available, ASC 820 requires the Company to make assumptions regarding the assumptions that market participants would use to estimate the fair value of the financial instrument at the measurement date.
ASC 825, Financial Instruments, requires disclosure of fair value information about financial instruments, whether or not recognized in the balance sheet, for which it is practicable to estimate that value.
91
Management uses its best judgment in estimating the fair value of the Company’s financial instruments; however, there are inherent limitations in any estimation technique. Therefore, for substantially all financial instruments, the fair value estimates presented herein are not necessarily indicative of the amounts the Company could have realized in a sales transaction at December 31, 2016 and 2015. The estimated fair value amounts for December 31, 2016 and 2015 have been measured as of period-end, and have not been re-evaluated or updated for purposes of these Consolidated Financial Statements subsequent to those dates. As such, the estimated fair values of these financial instruments subsequent to the reporting date may be different than the amounts reported at period-end.
The information in "Note 17. Fair Value Accounting" in these Notes to Consolidated Financial Statements should not be interpreted as an estimate of the fair value of the entire Company since a fair value calculation is only required for a limited portion of the Company’s assets and liabilities.
Due to the wide range of valuation techniques and the degree of subjectivity used in making the estimate, comparisons between the Company’s disclosures and those of other companies or banks may not be meaningful.
The following methods and assumptions were used by the Company in estimating the fair value of its financial instruments:
Cash and cash equivalents
The carrying amounts reported in the Consolidated Balance Sheets for cash and due from banks approximate their fair value.
Money market investments
The carrying amounts reported in the Consolidated Balance Sheets for money market investments approximate their fair value.
Investment securities
The fair values of CRA investments, exchange-listed preferred stock, and certain corporate debt securities are based on quoted market prices and are categorized as Level 1 in the fair value hierarchy.
The fair values of other investment securities were determined based on matrix pricing. Matrix pricing is a mathematical technique that utilizes observable market inputs including, for example, yield curves, credit ratings, and prepayment speeds. Fair values determined using matrix pricing are generally categorized as Level 2 in the fair value hierarchy.
During the year ended December 31, 2016, the Company's CDO securities were transferred from Level 3 to Level 2 as a result of an increase in the availability and reliability of the observable inputs utilized in the securities' fair value measurement. Previously, quoted prices and quoted prices for similar assets were not available. Therefore, the Company would engage a third party to estimate the future cash flows and discount rate using third party quotes adjusted based on assumptions a market participant would assume necessary for each specific security, which resulted in fair values for these securities being categorized as Level 3 in the fair value hierarchy.
Restricted stock
WAB is a member of the Federal Reserve System and the FHLB and, accordingly, maintains investments in the capital stock of the FRB and the FHLB. WAB also maintains an investment in its primary correspondent bank. These investments are carried at cost since no ready market exists for them, and they have no quoted market value. The Company conducts a periodic review and evaluation of its restricted stock to determine if any impairment exists. The fair values of these investments have been categorized as Level 2 in the fair value hierarchy.
Loans
The fair value of loans is estimated based on discounted cash flows using interest rates currently being offered for loans with similar terms to borrowers with similar credit quality and adjustments that the Company believes a market participant would consider in determining fair value based on a third party independent valuation. As a result, the fair value for loans is categorized as Level 2 in the fair value hierarchy, excluding impaired loans which are categorized as Level 3.
92
Accrued interest receivable and payable
The carrying amounts reported in the Consolidated Balance Sheets for accrued interest receivable and payable approximate their fair value.
Derivative financial instruments
All derivatives are recognized in the Consolidated Balance Sheets at their fair value. The fair value for derivatives is determined based on market prices, broker-dealer quotations on similar products, or other related input parameters. As a result, the fair values have been categorized as Level 2 in the fair value hierarchy.
Deposits
The fair value disclosed for demand and savings deposits is by definition equal to the amount payable on demand at their reporting date (that is, their carrying amount), which the Company believes a market participant would consider in determining fair value. The carrying amount for variable-rate deposit accounts approximates their fair value. Fair values for fixed-rate certificates of deposit are estimated using a discounted cash flow calculation that applies interest rates currently being offered on certificates to a schedule of aggregated expected monthly maturities on these deposits. The fair value measurement of the deposit liabilities is categorized as Level 2 in the fair value hierarchy.
FHLB advances and customer repurchase agreements
The fair values of the Company’s borrowings are estimated using discounted cash flow analyses, based on the market rates for similar types of borrowing arrangements. The FHLB advances and customer repurchase agreements have been categorized as Level 2 in the fair value hierarchy due to their short durations.
Subordinated debt
The fair value of subordinated debt is based on the market rate for the respective subordinated debt security. Subordinated debt has been categorized as Level 3 in the fair value hierarchy.
Junior subordinated debt
Junior subordinated debt is valued based on a discounted cash flow model which uses as inputs Treasury Bond rates and the 'BB' rated financial index. Junior subordinated debt has been categorized as Level 3 in the fair value hierarchy.
Off-balance sheet instruments
The fair value of the Company’s off-balance sheet instruments (lending commitments and standby letters of credit) is based on quoted fees currently charged to enter into similar agreements, taking into account the remaining terms of the agreements, and the counterparties’ credit standing.
Recent accounting pronouncements
In May 2014, the FASB issued guidance within ASU 2014-09, Revenue from Contracts with Customers. The amendments in ASU 2014-09 to Topic 606, Revenue from Contracts with Customers, creates a common revenue standard and clarifies the principles for recognizing revenue that can be applied consistently across various transactions, industries, and capital markets. The amendments in the ASU clarify that an entity should recognize revenue to depict the transfer of promised goods or services to customers in an amount that reflects the consideration to which the entity expects to be entitled in exchange for those goods or services. As part of that principle, the entity should identify the contract(s) with the customer, identify the performance obligation(s) of the contract, determine the transaction price, allocate that transaction price to the performance obligation(s) of the contract, and then recognize revenue when or as the entity satisfies the performance obligation(s).
In August 2015, the FASB issued ASU 2015-14, Revenue from Contracts with Customers - Deferral of the Effective Date, which deferred the original effective date of ASU No. 2014-09 by one year. Accordingly, the amendments in ASU No. 2014-09 will be effective for annual reporting periods beginning after December 15, 2017, including interim reporting periods within that reporting period. Earlier application is permitted only as of annual reporting periods beginning after December 15, 2016, including interim reporting periods within that annual reporting period. The amendments will be applied through the election of one of two retrospective methods. The Company is currently assessing the effect, but does not expect the adoption will have a significant impact on the Company’s Consolidated Financial Statements.
93
In November 2015, the FASB issued guidance within ASU 2015-17, Income Taxes. The amendments in ASU 2015-17 to Topic 740, Income Taxes, changes the presentation of deferred income tax liabilities and assets, from previously bifurcated current and noncurrent, to a single noncurrent amount on the classified statement of financial position. The amendment is effective for the annual period ending after December 15, 2016, and for and interim periods within those annual periods. Early application is permitted. The adoption of this guidance is not expected to have a material impact on the Company's Consolidated Financial Statements.
In January 2016, the FASB issued guidance within ASU 2016-01, Recognition and Measurement of Financial Assets and Financial Liabilities. The amendments in ASU 2016-01 to Subtopic 825-10, Financial Instruments, contain the following elements: 1) requires equity investments to be measured at fair value with changes in fair value recognized in net income; 2) simplifies the impairment assessment of equity investments without readily determinable fair values by requiring a qualitative assessment to identify impairment; 3) eliminates the requirement for public entities to disclose the methods and significant assumptions used to estimate the fair value that is required to be disclosed for financial instruments measured at amortized cost on the balance sheet; 4) requires public business entities to use the exit price notion when measuring the fair value of financial instruments for disclosure purposes; 5) requires an entity to present separately in OCI the portion of the total change in the fair value of a liability resulting from a change in the instrument-specific credit risk when the entity has elected to measure the liability at fair value in accordance with the fair value option for financial instruments; 6) requires separate presentation of financial assets and financial liabilities by measurement category and form of financial asset on the balance sheet or accompanying notes to the financial statements; 7) clarifies that the entity should evaluate the need for a valuation allowance on a deferred tax asset related to AFS securities in combination with the entity's other deferred tax assets. The amendments are effective for fiscal years beginning after December 15, 2017, and for interim periods within those fiscal years. Except for the early application of the amendment noted in item 5) above, which the Company elected to early adopt effective January 1, 2015 as discussed in the Company's Annual Report on Form 10-K for the year ended December 31, 2015, early adoption of the amendments in this Update is not permitted. The adoption of the other amendments in this guidance is not expected to have a material impact on the Company's Consolidated Financial Statements.
In February 2016, the FASB issued guidance within ASU 2016-02, Leases. The amendments in ASU 2016-02 to Topic 842, Leases, require lessees to recognize the lease assets and lease liabilities arising from operating leases in the statement of financial position. The accounting applied by a lessor is largely unchanged from that applied under previous GAAP. The amendments in this Update are effective for fiscal years beginning after December 15, 2018, including interim periods within those fiscal years. Early adoption is permitted. Management is in the process of evaluating the effects that the standard is expected to have on the Company's Consolidated Financial Statements and related disclosures.
In March 2016, the FASB issued guidance within ASU 2016-05, Effect of Derivative Contract Novations on Existing Hedge Accounting Relationships. The amendments in ASU 2016-05 to Topic 815, Derivatives and Hedging, clarify that a change in the counterparty to a derivative instrument that has been designated as the hedging instrument under Topic 815 does not, in and of itself, require dedesignation of that hedging relationship provided that all other hedge accounting criteria continue to be met. An entity has the option to apply the amendments in this Update on either a prospective basis or a modified retrospective basis. The amendments in this Update are effective for financial statements issued for fiscal years beginning after December 15, 2016, and interim periods within those fiscal years. The adoption of this guidance is not expected to have a material impact on the Company's Consolidated Financial Statements.
In June 2016, the FASB issued guidance within ASU 2016-13, Measurement of Credit Losses on Financial Instruments. The amendments in ASU 2016-13 to Topic 326, Financial Instruments - Credit Losses, require that an organization measure all expected credit losses for financial assets held at the reporting date based on historical experience, current conditions, and reasonable and supportable forecasts. The ASU also requires enhanced disclosures, including qualitative and quantitative disclosures that provide additional information about the amounts recorded in the financial statements. Additionally, the ASU amends the accounting for credit losses on AFS debt securities and purchased financial assets with credit deterioration. The amendments in this Update are effective for fiscal years beginning after December 15, 2019, and interim periods within those fiscal years. Early adoption is permitted for fiscal years beginning after December 15, 2018, and interim periods within those fiscal years. Management is in the process of evaluating the effects that the standard is expected to have on the Company's Consolidated Financial Statements and related disclosures.
In August 2016, the FASB issued guidance within ASU 2016-15, Classification of Certain Cash Receipts and Cash Payments. The amendments in ASU 2016-15 to Topic 230, Statement of Cash Flows, provide guidance on eight specific cash flow classification issues: 1) debt prepayment or debt extinguishment costs; 2) settlement of zero-coupon debt instruments; 3) contingent consideration payments made after a business combination; 4) proceeds from the settlement of insurance claims; 5) proceeds from the settlement of corporate-owned life insurance policies, including bank-owned life insurance policies; 6) distributions received from equity method investments; 7) beneficial interest in securitization transactions; and 8) separately identifiable cash flows and the application of the predominance principle. The amendments in this Update are effective for
94
fiscal years beginning after December 15, 2017, and interim periods within those fiscal years. Early adoption is permitted, including adoption in an interim period, however, an entity is required to adopt all of the amendments in the same period. The amendments in this Update should be applied using a retrospective transition method to each period presented. Management is in the process of evaluating the effects that the standard is expected to have on the Company's Consolidated Statement of Cash Flows.
In January 2017, the FASB issued guidance within ASU 2017-01, Clarifying the Definition of a Business. The amendments in ASU 2017-01 to Topic 805, Business Combinations, clarify the definition of a business with the objective of adding guidance to assist entities with evaluating whether transactions should be accounted for as acquisitions (or disposals) of assets or businesses. The amendments in this Update should be applied prospectively and are effective for annual periods beginning after December 31, 2017, including interim periods within those periods. The adoption of this guidance is not expected to have a material impact on the Company's Consolidated Financial Statements.
In January 2017, the FASB issued guidance within ASU 2017-04, Simplifying the Test for Goodwill Impairment. The amendments in ASU 2017-04 to Topic 350, Intangibles - Goodwill and Other, modify the concept of impairment from the condition that exists when the carrying amount of goodwill exceeds its implied fair value to the condition that exists when the carrying amount of a reporting unit exceeds its fair value. Accordingly, the amendments eliminate Step 2 from the goodwill impairment test as an entity will no longer determine goodwill impairment by calculating the implied fair value of goodwill by assigning the fair value of a reporting unit to all of its assets and liabilities as if that reporting unit had been acquired in a business combination. An entity still has the option to perform the qualitative assessment for a reporting unit to determine if the quantitative impairment test is necessary. The amendments in this Update should be applied on a prospective basis and are effective for annual or interim goodwill impairment tests in fiscal years beginning after December 15, 2019. Early adoption is permitted for interim or annual goodwill impairment tests performed after January 1, 2017. The adoption of this guidance is not expected to have a material impact on the Company's Consolidated Financial Statements.
Recently adopted accounting guidance
In June 2014, the FASB issued guidance within ASU 2014-12, Accounting for Share-Based Payments When the Terms of an Award Provide That a Performance Target Could Be Achieved after the Requisite Service Period. The amendments in ASU 2014-12 to Topic 718, Compensation - Stock Compensation, provide explicit guidance on whether to treat a performance target that could be achieved after the requisite service period as a performance condition that affects vesting or as a nonvesting condition that affects the grant-date fair value of an award. The amendments are effective for annual periods and interim periods within those annual periods beginning after December 15, 2015. An entity may elect to apply the amendments either prospectively to all awards granted or modified after the effective date or retrospectively to all awards with performance targets that are outstanding as of the beginning of the earliest annual period presented in the financial statements and to all new or modified awards thereafter. The adoption of this guidance did not have a material impact on the Company's Consolidated Financial Statements.
In August 2014, the FASB issued guidance within ASU 2014-15, Presentation of Financial Statements - Going Concern. The amendments in ASU 2014-15 to Subtopic 205-40, Going Concern, provide guidance about management's responsibility to evaluate whether there is substantial doubt about an entity's ability to continue as a going concern. The amendments require management to assess an entity's ability to continue as a going concern by incorporating and expanding upon certain principles that are currently in U.S. auditing standards. The amendments are effective for the annual period ending after December 15, 2016, and for annual periods and interim periods thereafter. Early application is permitted. The adoption of this guidance did not have a material impact on the Company’s Consolidated Financial Statements.
In February 2015, the FASB issued guidance within ASU 2015-02, Amendments to the Consolidation Analysis. The amendments in ASU 2015-02 to Topic 810, Consolidation, change the analysis that a reporting entity must perform to determine whether it should consolidate certain types of legal entities. Specifically, the amendments modify the evaluation of whether limited partnerships and similar legal entities are variable interest entities or voting interest entities, eliminate the presumption that a general partner should consolidate a limited partnership, affect the consolidation analysis of reporting entities that are involved with variable interest entities, particularly those that have fee arrangements and related party relationships, and provide a scope exception from consolidation guidance for reporting entities with interests in legal entities that are required to comply with or operate in accordance with requirements that are similar to those in Rule 2a-7 of the Investment Company Act of 1940 for registered money market funds. The amendments are effective for fiscal years, and for interim periods within those fiscal years, beginning after December 15, 2015. An entity may apply the amendments in this Update using a modified retrospective approach by recording a cumulative-effect adjustment to equity as of the beginning of the fiscal year of adoption or, may apply the amendments retrospectively. The adoption of this guidance did not have a material impact on the Company's Consolidated Financial Statements.
95
In March 2016, the FASB issued guidance within ASU 2016-09, Improvements to Employee Share-Based Payment Accounting. The amendments in ASU 2016-09 to Topic 718, Compensation - Stock Compensation, require recognition of all excess tax benefits and tax deficiencies through income tax expense or benefit in the income statement. Other amendments in this ASU include guidance on the classification of share-based payment transactions in the statement of cash flows and an option to account for forfeitures of share-based awards as they occur rather than estimating the compensation cost based on the number of awards that are expected to vest. The amendments in this Update are effective for annual periods beginning after December 15, 2016, and interim periods within those annual periods. Early adoption is permitted in any interim or annual period. Effective January 1, 2016, the Company elected early adoption of ASU 2016-09, Improvements to Employee Share-Based Payment Accounting. As a result of adoption, the Company recognized a $3.9 million tax benefit as a reduction of income tax expense during the three months ended March 31, 2016. During the year ended December 31, 2016, the Company recognized a $4.1 million tax benefit related to adoption of this new guidance. The Company has elected to continue to estimate compensation cost based on the number of awards that are expected to vest. The adoption of this guidance did not have a significant impact on the Company's Consolidated Statement of Cash Flows.
96
2. MERGERS, ACQUISITIONS AND DISPOSITIONS
Acquisition of GE Capital US Holdings, Inc. Loan Portfolio
On April 20, 2016, WAB completed its acquisition of GE Capital US Holdings, Inc.'s domestic select-service hotel franchise finance loan portfolio, paying cash of $1.27 billion. The acquisition was undertaken, in part, because it expands the Company's national reach and diversifies the Company's loan portfolio.
Effective April 20, 2016, the results of the acquired loan portfolio are reflected in the Company's newly created HFF NBL operating segment. Acquisition / restructure expenses related to the purchase total $4.3 million for the year ended December 31, 2016, of which approximately $0.6 million are acquisition related costs as defined by ASC 805. The transaction was accounted for under the acquisition method of accounting in accordance with ASC 805. Assets purchased and liabilities assumed were recorded at their respective acquisition date estimated fair values. The fair values of assets acquired and liabilities assumed are subject to adjustment during the first twelve months after the acquisition date if additional information becomes available to indicate a more accurate or appropriate value for an asset or liability. Although there have been no measurement period adjustments identified to date and any future adjustments are not expected to be significant, the fair values of loans is still preliminary as of December 31, 2016.
The recognized amounts of identifiable assets acquired and liabilities assumed are as follows:
April 20, 2016 | |||
(in thousands) | |||
Assets: | |||
Loans | $ | 1,280,997 | |
Other assets | 3,560 | ||
Total assets | $ | 1,284,557 | |
Liabilities: | |||
Other liabilities | $ | 12,559 | |
Total liabilities | 12,559 | ||
Net assets acquired | $ | 1,271,998 | |
Consideration paid | |||
Cash | $ | 1,272,187 | |
Goodwill | $ | 189 | |
Loans acquired consist of loans that are not considered impaired (non-PCI loans) and loans that have shown evidence of credit deterioration since origination (PCI loans) as of the acquisition date. All loans were recorded net of fair value adjustments (interest rate and credit marks), which were determined using discounted contractual cash flow models. The fair value of non-PCI loans acquired totals $1.19 billion, which is net of interest and credit marks of $43.3 million. The fair value of PCI loans totals $93.3 million, which is net of interest and credit marks of $17.0 million. See "Note 4. Loans, Leases and Allowance for Credit Losses" of these Notes to Consolidated Financial Statements for additional detail of the acquired loans.
The following table presents pro forma information as if the acquisition was completed on January 1, 2015. The pro forma information includes adjustments for interest income on loans acquired and excludes acquisition / restructure expense. The pro forma information is not necessarily indicative of the results of operations as they would have been had the transactions been effected on the assumed dates.
Year Ended December 31, | ||||||||
2016 | 2015 | |||||||
Interest income | $ | 707,620 | $ | 593,057 | ||||
Non-interest income | 42,915 | 29,768 | ||||||
Net income available to common stockholders | 265,731 | 231,528 | ||||||
Earnings per share - basic | 2.59 | 2.51 | ||||||
Earnings per share - diluted | 2.57 | 2.49 | ||||||
97
Acquisition of Bridge Capital Holdings
On June 30, 2015, the Company completed its acquisition of Bridge Capital Holdings and its wholly-owned subsidiary, Bridge Bank, headquartered in San Jose, California. Under the terms of the acquisition, each outstanding share of Bridge common stock was exchanged for 0.8145 shares of WAL's common stock plus $2.39 in cash. The Company paid $36.5 million in cash and issued 12.5 million common shares for all equity interests in Bridge. The merger was undertaken, in part, because Bridge strengthens the Company's Northern California presence and provides new avenues for growth in technology and international services.
Bridge’s results of operations have been included in the Company’s results beginning July 1, 2015. Acquisition / restructure expenses related to the Bridge acquisition of $8.8 million for the year ended December 31, 2015, have been included in non-interest expense, of which approximately $0.9 million are acquisition related costs as defined by ASC 805. During the year ended December 31, 2016, there were no acquisition / restructure expenses related to the Bridge acquisition. The acquisition was accounted for under the acquisition method of accounting in accordance with ASC 805. Assets purchased and liabilities assumed were recorded at their respective acquisition date estimated fair values.
The fair values of assets acquired and liabilities assumed are subject to adjustment during the first twelve months after the acquisition date if additional information becomes available to indicate a more accurate or appropriate value for an asset or liability. Due to early adoption of the amended guidance within ASU 2015-16, Simplifying the Accounting for Measurement-Period Adjustments, as discussed in "Note 1. Summary of Significant Accounting Policies," these adjustments to provisional amounts identified during the measurement period are recognized in the reporting period in which the adjustment amounts are determined, rather than retrospectively adjusting the provisional amounts at the acquisition date. The Company identified net measurement period adjustments totaling $6.9 million since July 1, 2015, which have been reflected as an adjustment to increase goodwill. Measurement period adjustments for the year ended December 31, 2016 and 2015 total $0.1 million and $6.8 million, respectively. The significant measurement period adjustments relate to loans, net deferred tax assets, and other liabilities. The measurement period for the Bridge acquisition ended on June 30, 2016. Therefore, the fair value of these assets acquired and liabilities assumed were considered final effective June 30, 2016.
98
The following table shows the recognized amounts of identifiable assets acquired and liabilities assumed at their as adjusted acquisition date fair values, which include all measurement period adjustments identified and recognized since July 1, 2015:
As Adjusted | |||
(in thousands) | |||
Assets: | |||
Cash and cash equivalents (1) | $ | 378,966 | |
Investment securities - AFS | 61,476 | ||
Investments in restricted stock | 7,015 | ||
Loans | 1,439,660 | ||
Premises and equipment | 1,519 | ||
Other assets acquired through foreclosure | 1,407 | ||
Bank owned life insurance | 17,385 | ||
Investment in LIHTC | 5,354 | ||
Intangible assets | 14,997 | ||
Deferred tax assets, net | 18,287 | ||
Other assets | 19,178 | ||
Total assets | $ | 1,965,244 | |
Liabilities: | |||
Deposits | $ | 1,742,031 | |
Qualifying debt | 11,287 | ||
Other liabilities | 10,910 | ||
Total liabilities | 1,764,228 | ||
Net assets acquired | $ | 201,016 | |
Consideration paid | |||
Common stock (12,451,240 shares at $33.76 per share) | $ | 420,354 | |
Fair value of equity awards related to pre-combination vesting | 10,676 | ||
Cash | 36,539 | ||
Fair value of total consideration | 467,569 | ||
Goodwill | $ | 266,553 | |
(1) | Cash and cash equivalents are net of a $6.2 million payment made by Bridge related to the cash out of vested, unexercised stock options at the date of closing. Cash acquired, less cash consideration paid of $36.5 million, resulted in net cash and cash equivalents increasing by $342.4 million |
Loans acquired in the Bridge acquisition consist of loans that are not considered impaired (non-PCI loans) and loans that have shown evidence of credit deterioration since origination (PCI loans) as of the acquisition date. All loans were recorded net of fair value adjustments (interest rate and credit marks), which were determined using discounted contractual cash flow models. The fair value of non-PCI loans acquired totals $1.43 billion, which is net of interest and credit marks of $26.0 million. The fair value of PCI loans totals $10.6 million, which is net of interest and credit marks of $6.0 million. See "Note 4. Loans, Leases and Allowance for Credit Losses" of these Notes to Consolidated Financial Statements for additional detail of the acquired loans.
In connection with the Bridge acquisition, the Company acquired intangible assets of $15.0 million, consisting primarily of core deposit intangibles. The core deposit intangible asset balance has been allocated to the Northern California and Technology & Innovation segments based on their respective core deposit balances at June 30, 2015, and is being amortized over its estimated useful life of 10 years.
Goodwill related to the acquisition totaled $266.6 million, which includes net measurement period adjustments totaling $6.9 million, identified and recognized since July 1, 2015. Goodwill has been allocated to the Northern California and Technology & Innovation segments based on their proportionate loan and deposit balances as of June 30, 2015. Management believes this methodology allocates goodwill to the reporting units in a manner consistent with the expected synergies of the combination. None of the goodwill recognized as part of the acquisition is expected to be deductible for income tax purposes.
Qualifying debt assumed from Bridge is comprised of junior subordinated debt with a contractual balance of $17.5 million and is recorded net of a $6.2 million fair value mark that is being amortized over the remaining life of the trusts. See "Note 10. Qualifying Debt" of these Notes to Consolidated Financial Statements for further detail and discussion of the debt.
99
In connection with the acquisition, the Company assumed Bridge's SERP, an unfunded noncontributory defined benefit pension plan. The SERP provides retirement benefits to certain Bridge officers based on years of service and final average salary. Pursuant to the terms of the SERP agreements, if the officer's service is terminated by Bridge or by the officer for "good reason" (as defined in the SERP agreements) within 24 months following a change in control, such as the Bridge acquisition, the officer is entitled to full vesting of the normal benefit under the SERP agreement, and such SERP benefits will be made in installment payments commencing on the first business day of January of the year following the officer's attainment of age 55 or, if the officer is already age 55 as of such termination of employment, on the first business day of January of the year following the officer's termination of employment. As of June 30, 2015, a $7.1 million liability included in other liabilities was recorded in the Company's Consolidated Balance Sheet related to the SERP. A discount rate of 5.75% and an employee compensation rate increase of 4.00% were used in determining the SERP liability as of June 30, 2015. See "Note 19. Employee Benefit Plans" of these Notes to the Consolidated Financial Statements for further detail and discussion of the SERP.
The following table presents pro forma information as if the Bridge acquisition was completed on January 1, 2014. The pro forma information includes adjustments for interest income on loans and securities acquired, amortization of intangibles arising from the transaction and interest expense on deposits acquired. The pro forma information is not necessarily indicative of the results of operations as they would have been had the transactions been effected on the assumed dates.
Year Ended December 31, | ||||||||
2015 | 2014 | |||||||
Interest income | $ | 560,292 | $ | 495,235 | ||||
Non-interest income | 37,073 | 38,768 | ||||||
Net income available to common stockholders (1) | 205,099 | 164,165 | ||||||
Earnings per share - basic | 1.90 | 1.64 | ||||||
Earnings per share - diluted | 1.87 | 1.62 | ||||||
(1) | Excludes acquisition / restructure related costs incurred by the Company of $8.8 million for the year ended December 31, 2015 and acquisition / restructure related costs incurred by Bridge of $6.8 million for the year ended December 31, 2015 and related tax effects. |
PartnersFirst Discontinued Operations
The Company discontinued its affinity credit card business and presented these activities as discontinued operations. During the second quarter 2014, the Company shut down its remaining affinity credit card operations. Therefore, no additional discontinued operations have been reported.
The following table summarizes the operating results of the discontinued operations for the year ended December 31, 2014:
Year Ended December 31, 2014 | ||||
(in thousands) | ||||
Operating revenue | $ | (358 | ) | |
Non-interest expenses | (1,369 | ) | ||
Loss before income taxes | (1,727 | ) | ||
Income tax benefit | (569 | ) | ||
Net loss | $ | (1,158 | ) | |
100
3. INVESTMENT SECURITIES
The carrying amounts and fair values of investment securities at December 31, 2016 and 2015 are summarized as follows:
December 31, 2016 | ||||||||||||||||
Amortized Cost | Gross Unrealized Gains | Gross Unrealized (Losses) | Fair Value | |||||||||||||
(in thousands) | ||||||||||||||||
Held-to-maturity | ||||||||||||||||
Tax-exempt | $ | 92,079 | $ | 433 | $ | (546 | ) | $ | 91,966 | |||||||
Available-for-sale | ||||||||||||||||
Collateralized debt obligations | $ | 50 | $ | 13,440 | $ | — | $ | 13,490 | ||||||||
Commercial MBS issued by GSEs | 121,742 | — | (3,950 | ) | 117,792 | |||||||||||
Corporate debt securities | 65,058 | 371 | (1,285 | ) | 64,144 | |||||||||||
CRA investments | 37,627 | — | (514 | ) | 37,113 | |||||||||||
Preferred stock | 96,071 | 833 | (2,242 | ) | 94,662 | |||||||||||
Private label residential MBS | 440,272 | 182 | (6,769 | ) | 433,685 | |||||||||||
Residential MBS issued by GSEs | 1,369,289 | 3,046 | (17,130 | ) | 1,355,205 | |||||||||||
Tax-exempt | 409,693 | 8,477 | (9,937 | ) | 408,233 | |||||||||||
Trust preferred securities | 32,000 | — | (5,468 | ) | 26,532 | |||||||||||
U.S. government sponsored agency securities | 59,000 | — | (2,978 | ) | 56,022 | |||||||||||
U.S. treasury securities | 2,496 | 6 | — | 2,502 | ||||||||||||
Total AFS securities | $ | 2,633,298 | $ | 26,355 | $ | (50,273 | ) | $ | 2,609,380 | |||||||
Securities measured at fair value | ||||||||||||||||
Residential MBS issued by GSEs | $ | 1,053 | ||||||||||||||
December 31, 2015 | ||||||||||||||||
Amortized Cost | Gross Unrealized Gains | Gross Unrealized (Losses) | Fair Value | |||||||||||||
(in thousands) | ||||||||||||||||
Available-for-sale | ||||||||||||||||
Collateralized debt obligations | $ | 50 | $ | 10,059 | $ | (49 | ) | $ | 10,060 | |||||||
Commercial MBS issued by GSEs | 19,147 | 72 | (105 | ) | 19,114 | |||||||||||
Corporate debt securities | 12,769 | 482 | — | 13,251 | ||||||||||||
CRA investments | 34,722 | — | (37 | ) | 34,685 | |||||||||||
Preferred stock | 108,417 | 4,286 | (1,467 | ) | 111,236 | |||||||||||
Private label commercial MBS | 4,685 | 6 | — | 4,691 | ||||||||||||
Private label residential MBS | 261,530 | 5 | (4,407 | ) | 257,128 | |||||||||||
Residential MBS issued by GSEs | 1,169,631 | 5,254 | (4,664 | ) | 1,170,221 | |||||||||||
Tax-exempt | 320,087 | 14,743 | — | 334,830 | ||||||||||||
Trust preferred securities | 32,000 | — | (7,686 | ) | 24,314 | |||||||||||
U.S. treasury securities | 2,996 | — | (3 | ) | 2,993 | |||||||||||
Total AFS securities | $ | 1,966,034 | $ | 34,907 | $ | (18,418 | ) | $ | 1,982,523 | |||||||
Securities measured at fair value | ||||||||||||||||
Residential MBS issued by GSEs | $ | 1,481 | ||||||||||||||
For additional information on the fair value changes of securities measured at fair value, see the trading securities table in "Note 17. Fair Value Accounting" of these Notes to Consolidated Financial Statements.
The Company conducts an OTTI analysis on a quarterly basis. The initial indication of OTTI for both debt and equity securities is a decline in the market value below the amount recorded for an investment, and taking into account the severity and duration of the decline. Another potential indication of OTTI is a downgrade below investment grade. In determining whether an
101
impairment is OTTI, the Company considers the length of time and the extent to which the market value has been below cost, recent events specific to the issuer, including investment downgrades by rating agencies and economic conditions of its industry, and the Company’s ability and intent to hold the investment for a period of time sufficient to allow for any anticipated recovery. For marketable equity securities, the Company also considers the issuer’s financial condition, capital strength, and near-term prospects.
For debt securities, for the purpose of an OTTI analysis, the Company also considers the cause of the price decline (general level of interest rates, credit spreads, and industry and issuer-specific factors), the issuer’s financial condition, near-term prospects, and current ability to make future payments in a timely manner, as well as the issuer’s ability to service debt, and any change in agencies’ ratings at the evaluation date from the acquisition date and any likely imminent action.
The Company has reviewed securities for which there is an unrealized loss in accordance with its accounting policy for OTTI described above and determined that there are no impairment charges for the years ended December 31, 2016, 2015, and 2014. The Company does not consider any securities to be other-than-temporarily impaired as of December 31, 2016 and 2015. No assurance can be made that OTTI will not occur in future periods.
Information pertaining to securities with gross unrealized losses at December 31, 2016 and 2015, aggregated by investment category and length of time that individual securities have been in a continuous loss position follows:
December 31, 2016 | |||||||||||||||||||||||
Less Than Twelve Months | More Than Twelve Months | Total | |||||||||||||||||||||
Gross Unrealized Losses | Fair Value | Gross Unrealized Losses | Fair Value | Gross Unrealized Losses | Fair Value | ||||||||||||||||||
(in thousands) | |||||||||||||||||||||||
Held-to-maturity | |||||||||||||||||||||||
Tax-exempt | $ | 546 | $ | 30,364 | $ | — | $ | — | $ | 546 | $ | 30,364 | |||||||||||
Available-for-sale | |||||||||||||||||||||||
Commercial MBS issued by GSEs | $ | 3,950 | $ | 117,792 | $ | — | $ | — | $ | 3,950 | $ | 117,792 | |||||||||||
Corporate debt securities | 1,285 | 38,716 | — | — | 1,285 | 38,716 | |||||||||||||||||
CRA investments | 514 | 37,113 | — | — | 514 | 37,113 | |||||||||||||||||
Preferred stock | 2,188 | 63,151 | 54 | 1,471 | 2,242 | 64,622 | |||||||||||||||||
Private label residential MBS | 6,170 | 377,638 | 599 | 16,969 | 6,769 | 394,607 | |||||||||||||||||
Residential MBS issued by GSEs | 16,990 | 950,480 | 140 | 5,326 | 17,130 | 955,806 | |||||||||||||||||
Tax-exempt | 9,937 | 148,780 | — | — | 9,937 | 148,780 | |||||||||||||||||
Trust preferred securities | — | — | 5,468 | 26,532 | 5,468 | 26,532 | |||||||||||||||||
U.S. government sponsored agency securities | 2,978 | 56,022 | — | — | 2,978 | 56,022 | |||||||||||||||||
Total AFS securities | $ | 44,012 | $ | 1,789,692 | $ | 6,261 | $ | 50,298 | $ | 50,273 | $ | 1,839,990 | |||||||||||
December 31, 2015 | |||||||||||||||||||||||
Less Than Twelve Months | More Than Twelve Months | Total | |||||||||||||||||||||
Gross Unrealized Losses | Fair Value | Gross Unrealized Losses | Fair Value | Gross Unrealized Losses | Fair Value | ||||||||||||||||||
(in thousands) | |||||||||||||||||||||||
Available-for-sale | |||||||||||||||||||||||
Collateralized debt obligations | $ | 49 | $ | 1 | $ | — | $ | — | $ | 49 | $ | 1 | |||||||||||
Commercial MBS issued by GSEs | 105 | 17,051 | — | — | 105 | 17,051 | |||||||||||||||||
CRA investments | 37 | 24,729 | — | — | 37 | 24,729 | |||||||||||||||||
Preferred stock | 377 | 10,542 | 1,090 | 14,761 | 1,467 | 25,303 | |||||||||||||||||
Private label residential MBS | 3,733 | 226,720 | 674 | 30,372 | 4,407 | 257,092 | |||||||||||||||||
Residential MBS issued by GSEs | 3,566 | 536,515 | 1,098 | 38,338 | 4,664 | 574,853 | |||||||||||||||||
Trust preferred securities | — | — | 7,686 | 24,314 | 7,686 | 24,314 | |||||||||||||||||
U.S. treasury securities | 3 | 2,006 | — | — | 3 | 2,006 | |||||||||||||||||
Total AFS securities | $ | 7,870 | $ | 817,564 | $ | 10,548 | $ | 107,785 | $ | 18,418 | $ | 925,349 | |||||||||||
102
At December 31, 2016 and 2015, the Company’s unrealized losses relate primarily to interest rate fluctuations and credit spread widening in applicable markets. The total number of securities in an unrealized loss position at December 31, 2016 is 244, compared to 146 at December 31, 2015. In analyzing an issuer’s financial condition, management considers whether the securities are issued by the federal government or its agencies, whether downgrades by bond rating agencies have occurred, and industry analysis reports. Since material downgrades have not occurred and management does not intend to sell the debt securities in an unrealized loss position in the foreseeable future, none of the securities described in the above table or in this paragraph are deemed to be OTTI.
The trust preferred securities have yields based on floating rate LIBOR, which are highly correlated to the federal funds rate and have been negatively affected by the low rate environment. This has resulted in unrealized losses for these securities.
The amortized cost and fair value of securities as of December 31, 2016, by contractual maturities, are shown below. MBS are shown separately as individual MBS are comprised of pools of loans with varying maturities. Therefore, these securities are listed separately in the maturity summary.
December 31, 2016 | ||||||||
Amortized Cost | Estimated Fair Value | |||||||
(in thousands) | ||||||||
Held-to-maturity | ||||||||
After ten years | $ | 92,079 | $ | 91,966 | ||||
Available-for-sale | ||||||||
Due in one year or less | $ | 39,908 | $ | 39,412 | ||||
After one year through five years | 41,893 | 41,611 | ||||||
After five years through ten years | 194,458 | 194,719 | ||||||
After ten years | 425,736 | 426,956 | ||||||
Mortgage-backed securities | 1,931,303 | 1,906,682 | ||||||
Total AFS securities | $ | 2,633,298 | $ | 2,609,380 | ||||
103
The following tables summarize the carrying amount of the Company’s investment ratings position as of December 31, 2016 and 2015:
December 31, 2016 | ||||||||||||||||||||||||||||||||
AAA | Split-rated AAA/AA+ | AA+ to AA- | A+ to A- | BBB+ to BBB- | BB+ and below | Unrated | Totals | |||||||||||||||||||||||||
(in thousands) | ||||||||||||||||||||||||||||||||
Held-to-maturity | ||||||||||||||||||||||||||||||||
Tax-exempt | $ | — | $ | — | $ | — | $ | — | $ | — | $ | — | $ | 92,079 | $ | 92,079 | ||||||||||||||||
Available-for-sale | ||||||||||||||||||||||||||||||||
Collateralized debt obligations | $ | — | $ | — | $ | — | $ | — | $ | — | $ | 13,490 | $ | — | $ | 13,490 | ||||||||||||||||
Commercial MBS issued by GSEs | — | 117,792 | — | — | — | — | — | 117,792 | ||||||||||||||||||||||||
Corporate debt securities | — | — | 5,429 | 38,715 | 20,000 | — | — | 64,144 | ||||||||||||||||||||||||
CRA investments | — | — | — | — | — | — | 37,113 | 37,113 | ||||||||||||||||||||||||
Preferred stock | — | — | — | — | 64,486 | 14,658 | 15,518 | 94,662 | ||||||||||||||||||||||||
Private label residential MBS | 399,013 | — | 29,921 | 2,117 | 2,634 | — | — | 433,685 | ||||||||||||||||||||||||
Residential MBS issued by GSEs | — | 1,355,205 | — | — | — | — | — | 1,355,205 | ||||||||||||||||||||||||
Tax-exempt | 80,862 | — | 268,249 | 59,122 | — | — | — | 408,233 | ||||||||||||||||||||||||
Trust preferred securities | — | — | — | — | 26,532 | — | — | 26,532 | ||||||||||||||||||||||||
U.S. government sponsored agency securities | — | 56,022 | — | — | — | — | — | 56,022 | ||||||||||||||||||||||||
U.S. treasury securities | — | 2,502 | — | — | — | — | — | 2,502 | ||||||||||||||||||||||||
Total AFS securities (1) | $ | 479,875 | $ | 1,531,521 | $ | 303,599 | $ | 99,954 | $ | 113,652 | $ | 28,148 | $ | 52,631 | $ | 2,609,380 | ||||||||||||||||
Securities measured at fair value | ||||||||||||||||||||||||||||||||
Residential MBS issued by GSEs | $ | — | $ | 1,053 | $ | — | $ | — | $ | — | $ | — | $ | — | $ | 1,053 | ||||||||||||||||
(1) | Where ratings differ, the Company uses an average of the ratings by S&P, Moody’s, and/or Fitch. |
December 31, 2015 | ||||||||||||||||||||||||||||||||
AAA | Split-rated AAA/AA+ | AA+ to AA- | A+ to A- | BBB+ to BBB- | BB+ and below | Unrated | Totals | |||||||||||||||||||||||||
(in thousands) | ||||||||||||||||||||||||||||||||
Available-for-sale | ||||||||||||||||||||||||||||||||
Collateralized debt obligations | $ | — | $ | — | $ | — | $ | — | $ | — | $ | 10,060 | $ | — | $ | 10,060 | ||||||||||||||||
Commercial MBS issued by GSEs | — | 19,114 | — | — | — | — | — | 19,114 | ||||||||||||||||||||||||
Corporate debt securities | — | — | 2,721 | 5,489 | 5,041 | — | — | 13,251 | ||||||||||||||||||||||||
CRA investments | — | — | — | — | — | — | 34,685 | 34,685 | ||||||||||||||||||||||||
Preferred stock | — | — | — | — | 79,955 | 23,655 | 7,626 | 111,236 | ||||||||||||||||||||||||
Private label commercial MBS | 4,691 | — | — | — | — | — | — | 4,691 | ||||||||||||||||||||||||
Private label residential MBS | 235,605 | — | 40 | 3,186 | 1,750 | 2,705 | 13,842 | 257,128 | ||||||||||||||||||||||||
Residential MBS issued by GSEs | — | 1,170,221 | — | — | — | — | — | 1,170,221 | ||||||||||||||||||||||||
Tax-exempt | 7,949 | — | 180,460 | 131,110 | 6,243 | 180 | 8,888 | 334,830 | ||||||||||||||||||||||||
Trust preferred securities | — | — | — | — | 24,314 | — | — | 24,314 | ||||||||||||||||||||||||
U.S. treasury securities | — | 2,993 | — | — | — | — | — | 2,993 | ||||||||||||||||||||||||
Total AFS securities (1) | $ | 248,245 | $ | 1,192,328 | $ | 183,221 | $ | 139,785 | $ | 117,303 | $ | 36,600 | $ | 65,041 | $ | 1,982,523 | ||||||||||||||||
Securities measured at fair value | ||||||||||||||||||||||||||||||||
Residential MBS issued by GSEs | $ | — | $ | 1,481 | $ | — | $ | — | $ | — | $ | — | $ | — | $ | 1,481 | ||||||||||||||||
(1) | Where ratings differ, the Company uses an average of the ratings by S&P, Moody’s, and/or Fitch. |
104
Securities with carrying amounts of approximately $763.0 million and $830.7 million at December 31, 2016 and 2015, respectively, were pledged for various purposes as required or permitted by law.
The following table presents gross gains and losses on sales of investment securities:
Year Ended December 31, | ||||||||||||
2016 | 2015 | 2014 | ||||||||||
(in thousands) | ||||||||||||
Gross gains | $ | 2,115 | $ | 1,144 | $ | 1,118 | ||||||
Gross losses | (1,056 | ) | (529 | ) | (361 | ) | ||||||
Net gains on sales of investment securities | $ | 1,059 | $ | 615 | $ | 757 | ||||||
105
4. LOANS, LEASES AND ALLOWANCE FOR CREDIT LOSSES
The composition of the Company’s held for investment loan portfolio is as follows:
December 31, | ||||||||
2016 | 2015 | |||||||
(in thousands) | ||||||||
Commercial and industrial | $ | 5,755,021 | $ | 5,114,257 | ||||
Commercial real estate - non-owner occupied | 3,543,956 | 2,283,536 | ||||||
Commercial real estate - owner occupied | 2,013,276 | 2,083,285 | ||||||
Construction and land development | 1,478,114 | 1,133,439 | ||||||
Residential real estate | 259,432 | 322,939 | ||||||
Commercial leases | 100,765 | 148,493 | ||||||
Consumer | 38,963 | 26,905 | ||||||
Loans, net of deferred loan fees and costs | 13,189,527 | 11,112,854 | ||||||
Allowance for credit losses | (124,704 | ) | (119,068 | ) | ||||
Total loans HFI | $ | 13,064,823 | $ | 10,993,786 | ||||
Net deferred loan fees and costs as of December 31, 2016 and 2015 total $22.3 million and $19.2 million, respectively, which is a reduction in the carrying value of loans. Net unamortized discounts on loans total $5.2 million and $8.2 million as of December 31, 2016 and 2015, respectively. Total loans held for investment are also net of interest rate and credit marks on acquired loans totaling $69.5 million and $40.5 million as of December 31, 2016 and 2015, respectively, which is a reduction in the carrying value of loans.
As of December 31, 2016 and 2015, the Company also has $18.9 million and $23.8 million of HFS loans, respectively.
The following table presents the contractual aging of the recorded investment in past due loans held for investment by class of loans:
December 31, 2016 | ||||||||||||||||||||||||
Current | 30-59 Days Past Due | 60-89 Days Past Due | Over 90 days Past Due | Total Past Due | Total | |||||||||||||||||||
(in thousands) | ||||||||||||||||||||||||
Commercial real estate | ||||||||||||||||||||||||
Owner occupied | $ | 2,009,728 | $ | 71 | $ | — | $ | 3,477 | $ | 3,548 | $ | 2,013,276 | ||||||||||||
Non-owner occupied | 3,339,121 | 672 | 2 | — | 674 | 3,339,795 | ||||||||||||||||||
Multi-family | 204,161 | — | — | — | — | 204,161 | ||||||||||||||||||
Commercial and industrial | ||||||||||||||||||||||||
Commercial | 5,747,368 | 549 | 584 | 6,520 | 7,653 | 5,755,021 | ||||||||||||||||||
Leases | 100,761 | — | — | 4 | 4 | 100,765 | ||||||||||||||||||
Construction and land development | ||||||||||||||||||||||||
Construction | 973,242 | — | — | — | — | 973,242 | ||||||||||||||||||
Land | 503,588 | — | — | 1,284 | 1,284 | 504,872 | ||||||||||||||||||
Residential real estate | 249,726 | 4,333 | 281 | 5,092 | 9,706 | 259,432 | ||||||||||||||||||
Consumer | 38,765 | 26 | 2 | 170 | 198 | 38,963 | ||||||||||||||||||
Total loans | $ | 13,166,460 | $ | 5,651 | $ | 869 | $ | 16,547 | $ | 23,067 | $ | 13,189,527 | ||||||||||||
106
December 31, 2015 | ||||||||||||||||||||||||
Current | 30-59 Days Past Due | 60-89 Days Past Due | Over 90 days Past Due | Total Past Due | Total | |||||||||||||||||||
(in thousands) | ||||||||||||||||||||||||
Commercial real estate | ||||||||||||||||||||||||
Owner occupied | $ | 2,078,968 | $ | 445 | $ | 362 | $ | 3,510 | $ | 4,317 | $ | 2,083,285 | ||||||||||||
Non-owner occupied | 2,099,274 | 2,481 | — | 2,822 | 5,303 | 2,104,577 | ||||||||||||||||||
Multi-family | 178,959 | — | — | — | — | 178,959 | ||||||||||||||||||
Commercial and industrial | ||||||||||||||||||||||||
Commercial | 5,066,197 | 26,358 | 14,124 | 7,578 | 48,060 | 5,114,257 | ||||||||||||||||||
Leases | 145,905 | — | — | 2,588 | 2,588 | 148,493 | ||||||||||||||||||
Construction and land development | ||||||||||||||||||||||||
Construction | 694,527 | — | — | — | — | 694,527 | ||||||||||||||||||
Land | 438,495 | — | — | 417 | 417 | 438,912 | ||||||||||||||||||
Residential real estate | 317,677 | 888 | 159 | 4,215 | 5,262 | 322,939 | ||||||||||||||||||
Consumer | 26,587 | 12 | 91 | 215 | 318 | 26,905 | ||||||||||||||||||
Total loans | $ | 11,046,589 | $ | 30,184 | $ | 14,736 | $ | 21,345 | $ | 66,265 | $ | 11,112,854 | ||||||||||||
The following table presents the recorded investment in non-accrual loans and loans past due ninety days or more and still accruing interest by class of loans:
December 31, 2016 | December 31, 2015 | |||||||||||||||||||||||||||||||
Non-accrual loans | Loans past due 90 days or more and still accruing | Non-accrual loans | Loans past due 90 days or more and still accruing | |||||||||||||||||||||||||||||
Current | Past Due/ Delinquent | Total Non-accrual | Current | Past Due/ Delinquent | Total Non-accrual | |||||||||||||||||||||||||||
(in thousands) | ||||||||||||||||||||||||||||||||
Commercial real estate | ||||||||||||||||||||||||||||||||
Owner occupied | $ | 5,084 | $ | 3,264 | $ | 8,348 | $ | 285 | $ | 749 | $ | 3,253 | $ | 4,002 | $ | 339 | ||||||||||||||||
Non-owner occupied | 8,317 | 1 | 8,318 | — | 11,851 | 2,822 | 14,673 | — | ||||||||||||||||||||||||
Multi-family | — | — | — | — | — | — | — | — | ||||||||||||||||||||||||
Commercial and industrial | ||||||||||||||||||||||||||||||||
Commercial | 10,893 | 6,043 | 16,936 | 775 | 3,263 | 15,026 | 18,289 | 2,671 | ||||||||||||||||||||||||
Leases | 28 | 3 | 31 | — | — | 2,588 | 2,588 | — | ||||||||||||||||||||||||
Construction and land development | ||||||||||||||||||||||||||||||||
Construction | — | — | — | — | — | — | — | — | ||||||||||||||||||||||||
Land | — | 1,284 | 1,284 | — | 1,892 | 417 | 2,309 | — | ||||||||||||||||||||||||
Residential real estate | 99 | 5,093 | 5,192 | — | 1,835 | 4,489 | 6,324 | — | ||||||||||||||||||||||||
Consumer | — | 163 | 163 | 7 | — | 196 | 196 | 18 | ||||||||||||||||||||||||
Total | $ | 24,421 | $ | 15,851 | $ | 40,272 | $ | 1,067 | $ | 19,590 | $ | 28,791 | $ | 48,381 | $ | 3,028 | ||||||||||||||||
The reduction in interest income associated with loans on non-accrual status was approximately $2.0 million, $2.5 million, and $3.8 million for the years ended December 31, 2016, 2015, and 2014, respectively.
The Company utilizes an internal asset classification system as a means of reporting problem and potential problem loans. Under the Company’s risk rating system, the Company classifies problem and potential problem loans as Special Mention, Substandard, Doubtful, and Loss. Substandard loans include those characterized by well-defined weaknesses and carry the distinct possibility that the Company will sustain some loss if the deficiencies are not corrected. Loans classified as Doubtful, or risk rated nine, have all the weaknesses inherent in those classified as Substandard with the added characteristic that the weaknesses present make collection or liquidation in full, on the basis of currently existing facts, conditions and values, highly questionable and improbable. The final rating of Loss covers loans considered uncollectible and having such little recoverable value that it is not practical to defer writing off the asset. Loans that do not currently expose the Company to sufficient risk to warrant classification in one of the aforementioned categories, but possess weaknesses that warrant management’s close attention, are deemed to be Special Mention. Risk ratings are updated, at a minimum, quarterly.
107
The following tables present gross loans by risk rating:
December 31, 2016 | ||||||||||||||||||||||||
Pass | Special Mention | Substandard | Doubtful | Loss | Total | |||||||||||||||||||
(in thousands) | ||||||||||||||||||||||||
Commercial real estate | ||||||||||||||||||||||||
Owner occupied | $ | 1,935,322 | $ | 53,634 | $ | 22,090 | $ | 2,230 | $ | — | $ | 2,013,276 | ||||||||||||
Non-owner occupied | 3,278,090 | 22,972 | 38,733 | — | — | 3,339,795 | ||||||||||||||||||
Multi-family | 203,964 | 197 | — | — | — | 204,161 | ||||||||||||||||||
Commercial and industrial | ||||||||||||||||||||||||
Commercial | 5,621,448 | 70,011 | 58,562 | 5,000 | — | 5,755,021 | ||||||||||||||||||
Leases | 100,737 | — | 28 | — | — | 100,765 | ||||||||||||||||||
Construction and land development | ||||||||||||||||||||||||
Construction | 961,290 | — | 11,952 | — | — | 973,242 | ||||||||||||||||||
Land | 501,569 | 337 | 2,966 | — | — | 504,872 | ||||||||||||||||||
Residential real estate | 252,304 | 929 | 6,199 | — | — | 259,432 | ||||||||||||||||||
Consumer | 38,698 | 64 | 201 | — | — | 38,963 | ||||||||||||||||||
Total | $ | 12,893,422 | $ | 148,144 | $ | 140,731 | $ | 7,230 | $ | — | $ | 13,189,527 | ||||||||||||
December 31, 2016 | ||||||||||||||||||||||||
Pass | Special Mention | Substandard | Doubtful | Loss | Total | |||||||||||||||||||
(in thousands) | ||||||||||||||||||||||||
Current (up to 29 days past due) | $ | 12,887,308 | $ | 147,838 | $ | 124,084 | $ | 7,230 | $ | — | $ | 13,166,460 | ||||||||||||
Past due 30 - 59 days | 5,433 | 96 | 122 | — | — | 5,651 | ||||||||||||||||||
Past due 60 - 89 days | 410 | 210 | 249 | — | — | 869 | ||||||||||||||||||
Past due 90 days or more | 271 | — | 16,276 | — | — | 16,547 | ||||||||||||||||||
Total | $ | 12,893,422 | $ | 148,144 | $ | 140,731 | $ | 7,230 | $ | — | $ | 13,189,527 | ||||||||||||
December 31, 2015 | ||||||||||||||||||||||||
Pass | Special Mention | Substandard | Doubtful | Loss | Total | |||||||||||||||||||
(in thousands) | ||||||||||||||||||||||||
Commercial real estate | ||||||||||||||||||||||||
Owner occupied | $ | 2,032,932 | $ | 28,422 | $ | 20,814 | $ | 1,117 | $ | — | $ | 2,083,285 | ||||||||||||
Non-owner occupied | 2,054,428 | 14,867 | 35,282 | — | — | 2,104,577 | ||||||||||||||||||
Multi-family | 178,959 | — | — | — | — | 178,959 | ||||||||||||||||||
Commercial and industrial | ||||||||||||||||||||||||
Commercial | 4,962,930 | 76,283 | 74,294 | 750 | — | 5,114,257 | ||||||||||||||||||
Leases | 140,531 | 4,580 | 794 | 2,588 | — | 148,493 | ||||||||||||||||||
Construction and land development | ||||||||||||||||||||||||
Construction | 678,438 | 16,089 | — | — | — | 694,527 | ||||||||||||||||||
Land | 420,819 | 362 | 17,731 | — | — | 438,912 | ||||||||||||||||||
Residential real estate | 310,067 | 776 | 12,096 | — | — | 322,939 | ||||||||||||||||||
Consumer | 26,438 | 209 | 258 | — | — | 26,905 | ||||||||||||||||||
Total | $ | 10,805,542 | $ | 141,588 | $ | 161,269 | $ | 4,455 | $ | — | $ | 11,112,854 | ||||||||||||
108
December 31, 2015 | ||||||||||||||||||||||||
Pass | Special Mention | Substandard | Doubtful | Loss | Total | |||||||||||||||||||
(in thousands) | ||||||||||||||||||||||||
Current (up to 29 days past due) | $ | 10,799,558 | $ | 140,932 | $ | 104,232 | $ | 1,867 | $ | — | $ | 11,046,589 | ||||||||||||
Past due 30 - 59 days | 1,907 | 271 | 28,006 | — | — | 30,184 | ||||||||||||||||||
Past due 60 - 89 days | 4,077 | 385 | 10,274 | — | — | 14,736 | ||||||||||||||||||
Past due 90 days or more | — | — | 18,757 | 2,588 | — | 21,345 | ||||||||||||||||||
Total | $ | 10,805,542 | $ | 141,588 | $ | 161,269 | $ | 4,455 | $ | — | $ | 11,112,854 | ||||||||||||
The table below reflects the recorded investment in loans classified as impaired:
December 31, | ||||||||
2016 | 2015 | |||||||
(in thousands) | ||||||||
Impaired loans with a specific valuation allowance under ASC 310 (1) | $ | 10,909 | $ | 24,287 | ||||
Impaired loans without a specific valuation allowance under ASC 310 (2) | 88,300 | 104,587 | ||||||
Total impaired loans | $ | 99,209 | $ | 128,874 | ||||
Valuation allowance related to impaired loans (3) | $ | (4,239 | ) | $ | (4,658 | ) | ||
(1) | Includes TDR loans of $2.5 million and $3.0 million at December 31, 2016 and 2015, respectively. |
(2) | Includes TDR loans of $58.3 million and $85.9 million at December 31, 2016 and 2015, respectively. |
(3) | Includes valuation allowance related to TDR loans of $0.6 million and $0.3 million at December 31, 2016 and 2015, respectively. |
The following table presents impaired loans by class:
December 31, | ||||||||
2016 | 2015 | |||||||
(in thousands) | ||||||||
Commercial real estate | ||||||||
Owner occupied | $ | 20,748 | $ | 23,153 | ||||
Non-owner occupied | 25,524 | 41,081 | ||||||
Multi-family | — | — | ||||||
Commercial and industrial | ||||||||
Commercial | 21,107 | 26,513 | ||||||
Leases | 355 | 2,896 | ||||||
Construction and land development | ||||||||
Construction | — | — | ||||||
Land | 14,838 | 18,322 | ||||||
Residential real estate | 16,391 | 16,575 | ||||||
Consumer | 246 | 334 | ||||||
Total | $ | 99,209 | $ | 128,874 | ||||
A valuation allowance is established for an impaired loan when the fair value of the loan is less than the recorded investment. In certain cases, portions of impaired loans are charged-off to realizable value instead of establishing a valuation allowance and are included, when applicable, in the table above as “Impaired loans without a specific valuation allowance under ASC 310.” However, before concluding that an impaired loan needs no associated valuation allowance, an assessment is made to consider all available and relevant information for the method used to evaluate impairment and the type of loan being assessed. The valuation allowance disclosed above is included in the allowance for credit losses reported in the Consolidated Balance Sheets as of December 31, 2016 and 2015.
109
The following table presents the average investment in impaired loans and income recognized on impaired loans:
Year Ended December 31, | ||||||||||||
2016 | 2015 | 2014 | ||||||||||
(in thousands) | ||||||||||||
Average balance on impaired loans | $ | 109,461 | $ | 150,151 | $ | 169,758 | ||||||
Interest income recognized on impaired loans | 4,167 | 4,794 | 5,494 | |||||||||
Interest recognized on non-accrual loans, cash basis | 1,254 | 1,634 | 2,536 | |||||||||
The following table presents average investment in impaired loans by loan class:
Year Ended December 31, | ||||||||||||
2016 | 2015 | 2014 | ||||||||||
(in thousands) | ||||||||||||
Commercial real estate | ||||||||||||
Owner occupied | $ | 18,865 | $ | 34,912 | $ | 37,048 | ||||||
Non-owner occupied | 30,633 | 56,360 | 68,821 | |||||||||
Multi-family | — | — | — | |||||||||
Commercial and industrial | ||||||||||||
Commercial | 25,815 | 17,534 | 16,168 | |||||||||
Leases | 762 | 2,948 | 410 | |||||||||
Construction and land development | ||||||||||||
Construction | — | — | — | |||||||||
Land | 17,006 | 19,561 | 21,580 | |||||||||
Residential real estate | 16,096 | 18,453 | 25,223 | |||||||||
Consumer | 284 | 383 | 508 | |||||||||
Total | $ | 109,461 | $ | 150,151 | $ | 169,758 | ||||||
The average investment in TDR loans included in the average investment in impaired loans table above for the years ended December 31, 2016, 2015, and 2014 was $68.8 million, $113.9 million, and $126.6 million, respectively.
The following table presents interest income on impaired loans by class:
Year Ended December 31, | ||||||||||||
2016 | 2015 | 2014 | ||||||||||
(in thousands) | ||||||||||||
Commercial real estate | ||||||||||||
Owner occupied | $ | 849 | $ | 1,575 | $ | 1,550 | ||||||
Non-owner occupied | 1,196 | 1,560 | 1,484 | |||||||||
Multi-family | — | — | 1 | |||||||||
Commercial and industrial | ||||||||||||
Commercial | 683 | 288 | 745 | |||||||||
Leases | 44 | — | — | |||||||||
Construction and land development | ||||||||||||
Construction | — | — | — | |||||||||
Land | 830 | 785 | 1,021 | |||||||||
Residential real estate | 560 | 579 | 646 | |||||||||
Consumer | 5 | 7 | 47 | |||||||||
Total | $ | 4,167 | $ | 4,794 | $ | 5,494 | ||||||
The Company is not committed to lend significant additional funds on these impaired loans.
110
The following table summarizes nonperforming assets:
December 31, | ||||||||
2016 | 2015 | |||||||
(in thousands) | ||||||||
Non-accrual loans (1) | $ | 40,272 | $ | 48,381 | ||||
Loans past due 90 days or more on accrual status (2) | 1,067 | 3,028 | ||||||
Accruing troubled debt restructured loans | 53,637 | 70,707 | ||||||
Total nonperforming loans | 94,976 | 122,116 | ||||||
Other assets acquired through foreclosure, net | 47,815 | 43,942 | ||||||
Total nonperforming assets | $ | 142,791 | $ | 166,058 | ||||
(1) | Includes non-accrual TDR loans of $7.1 million and $18.2 million at December 31, 2016 and 2015, respectively. |
(2) | Includes $0.1 million and zero from loans acquired with deteriorated credit quality at December 31, 2016 and 2015, respectively. |
Loans Acquired in HFF Acquisition
The following table presents information regarding the contractually required principal payments receivable, cash flows expected to be collected, and the preliminary estimated fair value of loans acquired in the HFF asset purchase as of April 20, 2016, the closing date of the transaction. See "Note 2. Mergers, Acquisitions and Dispositions" of these Notes to Consolidated Financial Statements for additional details related to the purchase.
April 20, 2016 | ||||||||||||
Commercial Real Estate | Construction and Land Development | Total | ||||||||||
(in thousands) | ||||||||||||
Contractually required principal and interest payments: | ||||||||||||
PCI | $ | 122,279 | $ | 12,742 | $ | 135,021 | ||||||
Non-PCI | 1,370,323 | 86,697 | 1,457,020 | |||||||||
Total loans acquired | 1,492,602 | 99,439 | 1,592,041 | |||||||||
Cash flows expected to be collected: | ||||||||||||
PCI | 107,865 | 11,754 | 119,619 | |||||||||
Non-PCI | 1,315,523 | 80,955 | 1,396,478 | |||||||||
Total loans acquired | 1,423,388 | 92,709 | 1,516,097 | |||||||||
Fair value of loans acquired: | ||||||||||||
PCI | 85,329 | 7,938 | 93,267 | |||||||||
Non-PCI | 1,122,419 | 65,311 | 1,187,730 | |||||||||
Total loans acquired | $ | 1,207,748 | $ | 73,249 | $ | 1,280,997 | ||||||
111
Loans Acquired in Bridge Acquisition
The following table presents information regarding the contractually required principal and interest payments receivable, cash flows expected to be collected, and the estimated fair value of loans acquired in the Bridge acquisition, as of June 30, 2015, the closing date of the transaction, including measurement period adjustments.
As Adjusted | ||||||||||||||||||||||||
Commercial and Industrial | Commercial Real Estate | Construction and Land Development | Residential Real Estate | Consumer | Total | |||||||||||||||||||
(in thousands) | ||||||||||||||||||||||||
Contractually required principal and interest payments: | ||||||||||||||||||||||||
PCI | $ | 17,899 | $ | 3,127 | $ | — | $ | 2,509 | $ | — | $ | 23,535 | ||||||||||||
Non-PCI | 1,225,837 | 340,762 | 106,851 | 26,999 | 987 | 1,701,436 | ||||||||||||||||||
Total loans acquired | 1,243,736 | 343,889 | 106,851 | 29,508 | 987 | 1,724,971 | ||||||||||||||||||
Cash flows expected to be collected: | ||||||||||||||||||||||||
PCI | 10,066 | 1,570 | — | 2,088 | — | 13,724 | ||||||||||||||||||
Non-PCI | 1,186,076 | 304,944 | 102,240 | 26,629 | 989 | 1,620,878 | ||||||||||||||||||
Total loans acquired | 1,196,142 | 306,514 | 102,240 | 28,717 | 989 | 1,634,602 | ||||||||||||||||||
Fair value of loans acquired: | ||||||||||||||||||||||||
PCI | 7,092 | 1,417 | — | 2,075 | — | 10,584 | ||||||||||||||||||
Non-PCI | 1,076,742 | 229,306 | 99,080 | 23,023 | 925 | 1,429,076 | ||||||||||||||||||
Total loans acquired | $ | 1,083,834 | $ | 230,723 | $ | 99,080 | $ | 25,098 | $ | 925 | $ | 1,439,660 | ||||||||||||
Loans Acquired with Deteriorated Credit Quality
Changes in the accretable yield for loans acquired with deteriorated credit quality are as follows:
Year Ended December 31, | ||||||||||||
2016 | 2015 | 2014 | ||||||||||
(in thousands) | ||||||||||||
Balance, at beginning of period | $ | 15,925 | $ | 19,156 | $ | 28,164 | ||||||
Additions due to acquisition | 4,301 | 857 | — | |||||||||
Measurement period adjustments | — | 38 | — | |||||||||
Reclassifications from non-accretable to accretable yield (1) | 1,892 | 1,747 | 6,052 | |||||||||
Accretion to interest income | (3,439 | ) | (3,996 | ) | (7,185 | ) | ||||||
Reversal of fair value adjustments upon disposition of loans | (3,502 | ) | (1,877 | ) | (7,875 | ) | ||||||
Balance, at end of period | $ | 15,177 | $ | 15,925 | $ | 19,156 | ||||||
(1) | The primary drivers of reclassification from non-accretable to accretable yield resulted from changes in estimated cash flows. |
112
Allowance for Credit Losses
The following table summarizes the changes in the allowance for credit losses by portfolio type:
Year Ended December 31, | ||||||||||||||||||||||||
Construction and Land Development | Commercial Real Estate | Residential Real Estate | Commercial and Industrial | Consumer | Total | |||||||||||||||||||
(in thousands) | ||||||||||||||||||||||||
2016 | ||||||||||||||||||||||||
Beginning Balance | $ | 18,976 | $ | 23,160 | $ | 5,278 | $ | 71,181 | $ | 473 | $ | 119,068 | ||||||||||||
Charge-offs | 18 | 728 | 165 | 12,477 | 161 | 13,549 | ||||||||||||||||||
Recoveries | (485 | ) | (5,690 | ) | (875 | ) | (3,991 | ) | (144 | ) | (11,185 | ) | ||||||||||||
Provision | 1,732 | (2,449 | ) | (2,137 | ) | 10,638 | 216 | 8,000 | ||||||||||||||||
Ending balance | $ | 21,175 | $ | 25,673 | $ | 3,851 | $ | 73,333 | $ | 672 | $ | 124,704 | ||||||||||||
2015 | ||||||||||||||||||||||||
Beginning Balance | $ | 18,558 | $ | 28,783 | $ | 7,456 | $ | 54,566 | $ | 853 | $ | 110,216 | ||||||||||||
Charge-offs | — | — | 820 | 5,550 | 127 | 6,497 | ||||||||||||||||||
Recoveries | (1,872 | ) | (4,139 | ) | (2,181 | ) | (3,754 | ) | (203 | ) | (12,149 | ) | ||||||||||||
Provision | (1,454 | ) | (9,762 | ) | (3,539 | ) | 18,411 | (456 | ) | 3,200 | ||||||||||||||
Ending balance | $ | 18,976 | $ | 23,160 | $ | 5,278 | $ | 71,181 | $ | 473 | $ | 119,068 | ||||||||||||
2014 | ||||||||||||||||||||||||
Beginning Balance | $ | 14,519 | $ | 32,064 | $ | 11,640 | $ | 39,657 | $ | 2,170 | $ | 100,050 | ||||||||||||
Charge-offs | 87 | 964 | 1,728 | 4,370 | 513 | 7,662 | ||||||||||||||||||
Recoveries | (2,160 | ) | (3,859 | ) | (1,896 | ) | (4,728 | ) | (459 | ) | (13,102 | ) | ||||||||||||
Provision | 1,966 | (6,176 | ) | (4,352 | ) | 14,551 | (1,263 | ) | 4,726 | |||||||||||||||
Ending balance | $ | 18,558 | $ | 28,783 | $ | 7,456 | $ | 54,566 | $ | 853 | $ | 110,216 | ||||||||||||
113
The following table presents impairment method information related to loans and allowance for credit losses by loan portfolio segment:
Commercial Real Estate-Owner Occupied | Commercial Real Estate-Non-Owner Occupied | Commercial and Industrial | Residential Real Estate | Construction and Land Development | Commercial Leases | Consumer | Total Loans | |||||||||||||||||||||||||
(in thousands) | ||||||||||||||||||||||||||||||||
Loans as of December 31, 2016: | ||||||||||||||||||||||||||||||||
Recorded Investment: | ||||||||||||||||||||||||||||||||
Impaired loans with an allowance recorded | $ | 3,125 | $ | — | $ | 7,766 | $ | — | $ | — | $ | — | $ | 18 | $ | 10,909 | ||||||||||||||||
Impaired loans with no allowance recorded | 17,624 | 25,524 | 13,340 | 16,391 | 14,838 | 355 | 228 | 88,300 | ||||||||||||||||||||||||
Total loans individually evaluated for impairment | 20,749 | 25,524 | 21,106 | 16,391 | 14,838 | 355 | 246 | 99,209 | ||||||||||||||||||||||||
Loans collectively evaluated for impairment | 1,981,176 | 3,383,585 | 5,733,915 | 242,409 | 1,443,952 | 100,410 | 38,717 | 12,924,164 | ||||||||||||||||||||||||
Loans acquired with deteriorated credit quality | 11,351 | 134,847 | — | 632 | 19,324 | — | — | 166,154 | ||||||||||||||||||||||||
Total recorded investment | $ | 2,013,276 | $ | 3,543,956 | $ | 5,755,021 | $ | 259,432 | $ | 1,478,114 | $ | 100,765 | $ | 38,963 | $ | 13,189,527 | ||||||||||||||||
Unpaid Principal Balance | ||||||||||||||||||||||||||||||||
Impaired loans with an allowance recorded | $ | 3,125 | $ | — | $ | 8,019 | $ | — | $ | — | $ | — | $ | 18 | $ | 11,162 | ||||||||||||||||
Impaired loans with no allowance recorded | 26,336 | 33,632 | 43,176 | 26,225 | 33,487 | 507 | 1,358 | 164,721 | ||||||||||||||||||||||||
Total loans individually evaluated for impairment | 29,461 | 33,632 | 51,195 | 26,225 | 33,487 | 507 | 1,376 | 175,883 | ||||||||||||||||||||||||
Loans collectively evaluated for impairment | 1,981,176 | 3,383,585 | 5,733,915 | 242,409 | 1,443,952 | 100,410 | 38,717 | 12,924,164 | ||||||||||||||||||||||||
Loans acquired with deteriorated credit quality | 14,878 | 165,275 | 925 | 738 | 19,858 | — | — | 201,674 | ||||||||||||||||||||||||
Total unpaid principal balance | $ | 2,025,515 | $ | 3,582,492 | $ | 5,786,035 | $ | 269,372 | $ | 1,497,297 | $ | 100,917 | $ | 40,093 | $ | 13,301,721 | ||||||||||||||||
Related Allowance for Credit Losses | ||||||||||||||||||||||||||||||||
Impaired loans with an allowance recorded | $ | 937 | $ | — | $ | 3,301 | $ | — | $ | — | $ | — | $ | 1 | $ | 4,239 | ||||||||||||||||
Impaired loans with no allowance recorded | — | — | — | — | — | — | — | — | ||||||||||||||||||||||||
Total loans individually evaluated for impairment | 937 | — | 3,301 | — | — | — | 1 | 4,239 | ||||||||||||||||||||||||
Loans collectively evaluated for impairment | 11,403 | 12,646 | 69,673 | 3,851 | 20,398 | — | 671 | 118,642 | ||||||||||||||||||||||||
Loans acquired with deteriorated credit quality | — | 687 | 359 | — | 777 | — | — | 1,823 | ||||||||||||||||||||||||
Total allowance for credit losses | $ | 12,340 | $ | 13,333 | $ | 73,333 | $ | 3,851 | $ | 21,175 | $ | — | $ | 672 | $ | 124,704 | ||||||||||||||||
114
Commercial Real Estate-Owner Occupied | Commercial Real Estate-Non-Owner Occupied | Commercial and Industrial | Residential Real Estate | Construction and Land Development | Commercial Leases | Consumer | Total Loans | |||||||||||||||||||||||||
(in thousands) | ||||||||||||||||||||||||||||||||
Loans as of December 31, 2015: | ||||||||||||||||||||||||||||||||
Recorded Investment: | ||||||||||||||||||||||||||||||||
Impaired loans with an allowance recorded | $ | 2,778 | $ | 2,344 | $ | 18,230 | $ | 914 | $ | — | $ | — | $ | 21 | $ | 24,287 | ||||||||||||||||
Impaired loans with no allowance recorded | 20,375 | 38,737 | 8,283 | 15,661 | 18,322 | 2,896 | 313 | 104,587 | ||||||||||||||||||||||||
Total loans individually evaluated for impairment | 23,153 | 41,081 | 26,513 | 16,575 | 18,322 | 2,896 | 334 | 128,874 | ||||||||||||||||||||||||
Loans collectively evaluated for impairment | 2,044,934 | 2,180,250 | 5,085,299 | 303,372 | 1,115,117 | 145,597 | 26,571 | 10,901,140 | ||||||||||||||||||||||||
Loans acquired with deteriorated credit quality | 15,198 | 62,205 | 2,445 | 2,992 | — | — | — | 82,840 | ||||||||||||||||||||||||
Total recorded investment | $ | 2,083,285 | $ | 2,283,536 | $ | 5,114,257 | $ | 322,939 | $ | 1,133,439 | $ | 148,493 | $ | 26,905 | $ | 11,112,854 | ||||||||||||||||
Unpaid Principal Balance | ||||||||||||||||||||||||||||||||
Impaired loans with an allowance recorded | $ | 2,778 | $ | 2,344 | $ | 19,233 | $ | 969 | $ | — | $ | — | $ | 21 | $ | 25,345 | ||||||||||||||||
Impaired loans with no allowance recorded | 63,709 | 61,692 | 71,773 | 44,142 | 82,800 | 5,229 | 3,923 | 333,268 | ||||||||||||||||||||||||
Total loans individually evaluated for impairment | 66,487 | 64,036 | 91,006 | 45,111 | 82,800 | 5,229 | 3,944 | 358,613 | ||||||||||||||||||||||||
Loans collectively evaluated for impairment | 2,044,934 | 2,180,250 | 5,085,299 | 303,372 | 1,115,117 | 145,597 | 26,571 | 10,901,140 | ||||||||||||||||||||||||
Loans acquired with deteriorated credit quality | 20,227 | 88,181 | 7,820 | 3,536 | — | — | — | 119,764 | ||||||||||||||||||||||||
Total unpaid principal balance | $ | 2,131,648 | $ | 2,332,467 | $ | 5,184,125 | $ | 352,019 | $ | 1,197,917 | $ | 150,826 | $ | 30,515 | $ | 11,379,517 | ||||||||||||||||
Related Allowance for Credit Losses | ||||||||||||||||||||||||||||||||
Impaired loans with an allowance recorded | $ | 858 | $ | 11 | $ | 3,518 | $ | 270 | $ | — | $ | — | $ | 1 | $ | 4,658 | ||||||||||||||||
Impaired loans with no allowance recorded | — | — | — | — | — | — | — | — | ||||||||||||||||||||||||
Total loans individually evaluated for impairment | 858 | 11 | 3,518 | 270 | — | — | 1 | 4,658 | ||||||||||||||||||||||||
Loans collectively evaluated for impairment | 10,953 | 11,302 | 65,806 | 5,008 | 18,976 | 1,857 | 472 | 114,374 | ||||||||||||||||||||||||
Loans acquired with deteriorated credit quality | — | 36 | — | — | — | — | — | 36 | ||||||||||||||||||||||||
Total allowance for credit losses | $ | 11,811 | $ | 11,349 | $ | 69,324 | $ | 5,278 | $ | 18,976 | $ | 1,857 | $ | 473 | $ | 119,068 | ||||||||||||||||
Troubled Debt Restructurings
A TDR loan is a loan on which the Company, for reasons related to a borrower’s financial difficulties, grants a concession to the borrower that the Company would not otherwise consider. The loan terms that have been modified or restructured due to a borrower’s financial situation include, but are not limited to, a reduction in the stated interest rate, an extension of the maturity or renewal of the loan at an interest rate below current market, a reduction in the face amount of the debt, a reduction in the accrued interest, or deferral of interest payments. The majority of the Company's modifications are extensions in terms or deferral of payments which result in no lost principal or interest followed by reductions in interest rates or accrued interest. A TDR loan is also considered impaired. Consistent with regulatory guidance, a TDR loan that is subsequently modified in another restructuring agreement but has shown sustained performance and classification as a TDR, will be removed from TDR status provided that the modified terms were market-based at the time of modification.
115
The following table presents information on the financial effects of TDR loans by class for the periods presented:
Year Ended December 31, 2016 | |||||||||||||||||||||||
Number of Loans | Pre-Modification Outstanding Recorded Investment | Forgiven Principal Balance | Lost Interest Income | Post-Modification Outstanding Recorded Investment | Waived Fees and Other Expenses | ||||||||||||||||||
(dollars in thousands) | |||||||||||||||||||||||
Commercial real estate | |||||||||||||||||||||||
Owner occupied | — | $ | — | $ | — | $ | — | $ | — | $ | — | ||||||||||||
Non-owner occupied | — | — | — | — | — | — | |||||||||||||||||
Multi-family | — | — | — | — | — | — | |||||||||||||||||
Commercial and industrial | |||||||||||||||||||||||
Commercial | 2 | 2,405 | — | — | 2,405 | — | |||||||||||||||||
Leases | — | — | — | — | — | — | |||||||||||||||||
Construction and land development | |||||||||||||||||||||||
Construction | — | — | — | — | — | — | |||||||||||||||||
Land | — | — | — | — | — | — | |||||||||||||||||
Residential real estate | — | — | — | — | — | — | |||||||||||||||||
Consumer | — | — | — | — | — | — | |||||||||||||||||
Total | 2 | $ | 2,405 | $ | — | $ | — | $ | 2,405 | $ | — | ||||||||||||
Year Ended December 31, 2015 | |||||||||||||||||||||||
Number of Loans | Pre-Modification Outstanding Recorded Investment | Forgiven Principal Balance | Lost Interest Income | Post-Modification Outstanding Recorded Investment | Waived Fees and Other Expenses | ||||||||||||||||||
(dollars in thousands) | |||||||||||||||||||||||
Commercial real estate | |||||||||||||||||||||||
Owner occupied | — | $ | — | $ | — | $ | — | $ | — | $ | — | ||||||||||||
Non-owner occupied | 1 | 193 | — | — | 193 | — | |||||||||||||||||
Multi-family | — | — | — | — | — | — | |||||||||||||||||
Commercial and industrial | |||||||||||||||||||||||
Commercial | 1 | 256 | — | — | 256 | — | |||||||||||||||||
Leases | — | — | — | — | — | — | |||||||||||||||||
Construction and land development | |||||||||||||||||||||||
Construction | — | — | — | — | — | — | |||||||||||||||||
Land | — | — | — | — | — | — | |||||||||||||||||
Residential real estate | 1 | 81 | — | 3 | 78 | 4 | |||||||||||||||||
Consumer | — | — | — | — | — | — | |||||||||||||||||
Total | 3 | $ | 530 | $ | — | $ | 3 | $ | 527 | $ | 4 | ||||||||||||
116
Year Ended December 31, 2014 | |||||||||||||||||||||||
Number of Loans | Pre-Modification Outstanding Recorded Investment | Forgiven Principal Balance | Lost Interest Income | Post-Modification Outstanding Recorded Investment | Waived Fees and Other Expenses | ||||||||||||||||||
(dollars in thousands) | |||||||||||||||||||||||
Commercial real estate | |||||||||||||||||||||||
Owner occupied | 6 | $ | 14,646 | $ | 378 | $ | 257 | $ | 14,011 | $ | 33 | ||||||||||||
Non-owner occupied | 5 | 16,976 | — | 60 | 16,916 | 15 | |||||||||||||||||
Multi-family | — | — | — | — | — | — | |||||||||||||||||
Commercial and industrial | |||||||||||||||||||||||
Commercial | 6 | 2,655 | — | — | 2,655 | 4 | |||||||||||||||||
Leases | — | — | — | — | — | — | |||||||||||||||||
Construction and land development | |||||||||||||||||||||||
Construction | — | — | — | — | — | — | |||||||||||||||||
Land | 2 | 2,687 | — | 47 | 2,640 | — | |||||||||||||||||
Residential real estate | 5 | 1,966 | 447 | 70 | 1,449 | 15 | |||||||||||||||||
Consumer | — | — | — | — | — | — | |||||||||||||||||
Total | 24 | $ | 38,930 | $ | 825 | $ | 434 | $ | 37,671 | $ | 67 | ||||||||||||
The following table presents TDR loans by class for which there was a payment default during the period:
Year Ended December 31, | |||||||||||||||||||||
2016 | 2015 | 2014 | |||||||||||||||||||
Number of Loans | Recorded Investment | Number of Loans | Recorded Investment | Number of Loans | Recorded Investment | ||||||||||||||||
(dollars in thousands) | |||||||||||||||||||||
Commercial real estate | |||||||||||||||||||||
Owner occupied | — | $ | — | — | $ | — | 2 | $ | 395 | ||||||||||||
Non-owner occupied | 1 | 5,381 | — | — | 2 | 984 | |||||||||||||||
Multi-family | — | — | — | — | — | — | |||||||||||||||
Commercial and industrial | |||||||||||||||||||||
Commercial | — | — | — | — | 3 | 369 | |||||||||||||||
Leases | — | — | — | — | — | — | |||||||||||||||
Construction and land development | |||||||||||||||||||||
Construction | — | — | 1 | 137 | — | — | |||||||||||||||
Land | — | — | — | — | — | — | |||||||||||||||
Residential real estate | 2 | 408 | 3 | 1,047 | 1 | 202 | |||||||||||||||
Consumer | — | — | — | — | — | — | |||||||||||||||
Total | 3 | $ | 5,789 | 4 | $ | 1,184 | 8 | $ | 1,950 | ||||||||||||
A TDR loan is deemed to have a payment default when it becomes past due 90 days, goes on non-accrual, or is restructured again. Payment defaults, along with other qualitative indicators, are considered by management in the determination of the allowance for credit losses.
At December 31, 2016 and 2015, there was zero and $0.1 million, respectively, in loan commitments outstanding on TDR loans.
Loan Purchases and Sales
For the years ended December 31, 2016 and 2015, secondary market loan purchases totaled $340.6 million and $137.2 million, respectively. For 2016, these purchased loans consisted of $339.8 million of commercial and industrial loans, $0.6 million of commercial real estate loans, and $0.1 million in commercial leases. For 2015, these purchased loans consisted of $117.1 million of commercial and industrial loans, $13.2 million of commercial real estate loans, $6.8 million in commercial leases, and $0.1 million of construction and land development loans.
117
During the year ended December 31, 2016, the Company sold loans, which consisted primarily of CRE and SBA loans with a carrying value of $39.3 million and recognized a gain of $2.5 million on the sales. During the year ended December 31, 2015, the Company sold loans, which consisted primarily of commercial and industrial and CRE loans, with a carrying value of $102.2 million and recognized a gain of $0.5 million on the sales.
5. PREMISES AND EQUIPMENT
The following is a summary of the major categories of premises and equipment:
December 31, | ||||||||
2016 | 2015 | |||||||
(in thousands) | ||||||||
Bank premises | $ | 83,285 | $ | 83,431 | ||||
Land and improvements | 33,309 | 33,971 | ||||||
Furniture, fixtures, and equipment | 45,676 | 40,025 | ||||||
Leasehold improvements | 22,709 | 18,958 | ||||||
Construction in progress | 4,840 | 1,999 | ||||||
Total | 189,819 | 178,384 | ||||||
Accumulated depreciation and amortization | (69,986 | ) | (59,849 | ) | ||||
Premises and equipment, net | $ | 119,833 | $ | 118,535 | ||||
Lease Obligations
The Company leases certain premises and equipment under non-cancelable operating leases expiring through 2026. The following is a schedule of future minimum rental payments under these leases at December 31, 2016:
(in thousands) | ||||
2017 | $ | 11,024 | ||
2018 | 10,271 | |||
2019 | 9,310 | |||
2020 | 7,537 | |||
2021 | 4,439 | |||
Thereafter | 7,006 | |||
Total future minimum rental payments | $ | 49,587 | ||
The Company leases certain office locations and many of these leases contain multiple renewal options and provisions for increased rents. Total rent expense of $11.0 million, $8.1 million, and $6.2 million is included in occupancy expense for the years ended December 31, 2016, 2015, and 2014, respectively. Total depreciation expense of $9.2 million, $7.7 million, and $6.0 million is included in occupancy expense for the years ended December 31, 2016, 2015, and 2014, respectively.
118
6. OTHER ASSETS ACQUIRED THROUGH FORECLOSURE
The following table represents the changes in other assets acquired through foreclosure:
Year Ended December 31, | ||||||||||||
2016 | ||||||||||||
Gross Balance | Valuation Allowance | Net Balance | ||||||||||
(in thousands) | ||||||||||||
Balance, beginning of period | $ | 52,984 | $ | (9,042 | ) | $ | 43,942 | |||||
Transfers to other assets acquired through foreclosure, net | 13,110 | — | 13,110 | |||||||||
Proceeds from sale of other real estate owned and repossessed assets, net | (11,584 | ) | 2,451 | (9,133 | ) | |||||||
Valuation adjustments, net | — | 268 | 268 | |||||||||
(Losses) gains, net (1) | (372 | ) | — | (372 | ) | |||||||
Balance, end of period | $ | 54,138 | $ | (6,323 | ) | $ | 47,815 | |||||
2015 | ||||||||||||
Balance, beginning of period | $ | 71,421 | $ | (14,271 | ) | $ | 57,150 | |||||
Additions from acquisition | 1,407 | — | 1,407 | |||||||||
Transfers to other assets acquired through foreclosure, net | 28,566 | — | 28,566 | |||||||||
Proceeds from sale of other real estate owned and repossessed assets, net | (51,038 | ) | 5,411 | (45,627 | ) | |||||||
Valuation adjustments, net | — | (182 | ) | (182 | ) | |||||||
Gains (losses), net (1) | 2,628 | — | 2,628 | |||||||||
Balance, end of period | $ | 52,984 | $ | (9,042 | ) | $ | 43,942 | |||||
2014 | ||||||||||||
Balance, beginning of period | $ | 88,421 | $ | (21,702 | ) | $ | 66,719 | |||||
Transfers to other assets acquired through foreclosure, net | 13,777 | — | 13,777 | |||||||||
Proceeds from sale of other real estate owned and repossessed assets, net | (33,643 | ) | 7,725 | (25,918 | ) | |||||||
Valuation adjustments, net | — | (294 | ) | (294 | ) | |||||||
Gains (losses), net (1) | 2,866 | — | 2,866 | |||||||||
Balance, end of period | $ | 71,421 | $ | (14,271 | ) | $ | 57,150 | |||||
(1) | Includes net gains related to initial transfers to other assets of $0.4 million, $0.9 million, and $0.1 million during the years ended December 31, 2016, 2015, and 2014, respectively, pursuant to accounting guidance. |
At December 31, 2016, 2015, and 2014, the majority of the Company’s repossessed assets consisted of properties located in Nevada. The Company held 31 properties at December 31, 2016, compared to 39 at December 31, 2015.
119
7. GOODWILL AND OTHER INTANGIBLE ASSETS
Goodwill represents the excess consideration paid for net assets acquired in a business combination over their fair value. Goodwill and other intangible assets acquired in a business combination and determined to have an indefinite useful life are not subject to amortization, but are subsequently evaluated for impairment at least annually. The Company's goodwill totals $290.0 million as of December 31, 2016, of which $23.2 million relates to the Nevada operating segment, $149.7 million relates to the Northern California segment, $116.9 million relates to the Technology & Innovation segment, and $0.2 million relates to the Hotel Franchise Finance segment.
During the years ended December 31, 2016, 2015, and 2014, there were no events or circumstances that indicated an interim impairment test of goodwill or other intangible assets was necessary and, based on the Company's annual goodwill and intangibles impairment tests as of October 1 of each of these years, it was determined that goodwill and intangible assets are not impaired.
The following is a summary of the Company's acquired intangible assets:
December 31, 2016 | December 31, 2015 | |||||||||||||||||||||||
Gross Carrying Amount | Accumulated Amortization | Net Carrying Amount | Gross Carrying Amount | Accumulated Amortization | Net Carrying Amount | |||||||||||||||||||
(in thousands) | ||||||||||||||||||||||||
Subject to amortization: | ||||||||||||||||||||||||
Core deposit intangibles | $ | 40,804 | $ | 28,227 | $ | 12,577 | $ | 40,804 | $ | 25,438 | $ | 15,366 | ||||||||||||
December 31, 2016 | December 31, 2015 | |||||||||||||||||||||||
Gross Carrying Amount | Impairment | Net Carrying Amount | Gross Carrying Amount | Impairment | Net Carrying Amount | |||||||||||||||||||
Not subject to amortization | ||||||||||||||||||||||||
Trade name | $ | 350 | $ | — | $ | 350 | $ | 350 | $ | — | $ | 350 | ||||||||||||
As of December 31, 2016, the Company's core deposit intangible assets had a weighted average estimated useful life of 8.2 years. The Company's core deposit intangibles assets related to FIB and BON are amortized on a straight-line basis. The core deposit intangible assets acquired in the acquisition of Bridge are being amortized using an accelerated amortization method over a period of 10 years. Amortization expense recognized on all amortizable intangibles totaled $2.8 million, $2.0 million, and $1.5 million for the years ended December 31, 2016, 2015, and 2014, respectively.
Below is a summary of future estimated aggregate amortization expense:
Year Ended December 31, | ||||
(in thousands) | ||||
2017 | $ | 2,073 | ||
2018 | 1,594 | |||
2019 | 1,547 | |||
2020 | 1,494 | |||
2021 | 1,433 | |||
Thereafter | 4,436 | |||
Total | $ | 12,577 | ||
120
8. DEPOSITS
The table below summarizes deposits by type:
December 31, | ||||||||
2016 | 2015 | |||||||
(in thousands) | ||||||||
Non-interest-bearing demand | $ | 5,632,926 | $ | 4,093,976 | ||||
Interest-bearing demand | 1,346,718 | 1,028,073 | ||||||
Savings and money market | 6,120,877 | 5,296,921 | ||||||
Certificates of deposit ($250,000 or more) | 609,678 | 626,718 | ||||||
Other time deposits | 839,664 | 984,936 | ||||||
Total deposits | $ | 14,549,863 | $ | 12,030,624 | ||||
The summary of the contractual maturities for all time deposits as of December 31, 2016 is as follows:
December 31, | ||||
(in thousands) | ||||
2017 | $ | 1,331,419 | ||
2018 | 91,089 | |||
2019 | 19,508 | |||
2020 | 3,886 | |||
2021 | 3,440 | |||
Total | $ | 1,449,342 | ||
WAB is a participant in the Promontory Interfinancial Network, a network that offers deposit placement services such as CDARS and ICS, which offer products that qualify large deposits for FDIC insurance. Federal banking law and regulation places restrictions on depository institutions regarding brokered deposits because of the general concern that these deposits are not relationship-based and are at a greater risk of being withdrawn, thus posing liquidity risk for institutions that gather brokered deposits in significant amounts. At December 31, 2016 and 2015, the Company had $413.9 million and $517.5 million, respectively, of reciprocal CDARS deposits and $607.5 million and $714.4 million, respectively, of ICS deposits. At December 31, 2016 and 2015, the Company had $136.2 million and $178.8 million, respectively, of wholesale brokered deposits. There are also $571.9 million and $365.6 million of additional deposits as of December 31, 2016 and 2015, respectively, that the Company considers core deposits because of their origin from AAB clients, but which are classified as brokered deposits for regulatory reporting purposes.
121
9. OTHER BORROWINGS
The following table summarizes the Company’s borrowings as of December 31, 2016 and 2015:
December 31, | ||||||||
2016 | 2015 | |||||||
(in thousands) | ||||||||
Short-Term: | ||||||||
FHLB advances | 80,000 | 150,000 | ||||||
Total short-term borrowings | $ | 80,000 | $ | 150,000 | ||||
The Company maintains other lines of credit with correspondent banks totaling $167.5 million, of which $22.5 million is secured by pledged securities and has a floating interest rate of one-month or three-month LIBOR plus 1.50%. The remaining $145.0 million is unsecured and has a floating interest rate of one-month LIBOR plus 3.25%. As of December 31, 2016 and 2015, there are no outstanding balances on the Company's lines of credit.
The Company maintains lines of credit with the FHLB and the FRB. The Company’s borrowing capacity is determined based on collateral pledged, generally consisting of investment securities and loans, at the time of the borrowing. At December 31, 2016, there are $80.0 million in short-term FHLB overnight advances, with a weighted average interest rate of 0.55%. At December 31, 2015, short-term FHLB advances of $150.0 million had a weighted average interest rate of 0.36%.
As of December 31, 2016 and 2015, the Company had additional available credit with the FHLB of approximately $2.15 billion and $1.54 billion, respectively, and with the FRB of approximately $997.0 million and $1.21 billion, respectively.
10. QUALIFYING DEBT
Subordinated Debt
On June 16, 2016, the Company issued $175.0 million of subordinated debentures with a maturity date of July 1, 2056. Beginning on or after July 1, 2021, the Company may redeem the debentures, in whole or in part, at their principal amount plus any accrued and unpaid interest. The subordinated debt was recorded net of issuance costs of $5.5 million. The debentures have a fixed interest rate of 6.25% per annum. To hedge the interest rate risk, WAL entered into a fair value interest rate hedge with a pay variable/receive fixed swap.
On June 29, 2015, the Company issued $150.0 million of subordinated debt, which was recorded net of debt issuance costs of $1.8 million, and matures July 15, 2025. The subordinated debt has a fixed interest rate of 5.00% through June 30, 2020 and then converts to a variable rate of 3.20% plus three-month LIBOR through maturity.
The carrying value of all subordinated debt, which includes the effective portion of related hedges, totals $305.8 million and $152.0 million at December 31, 2016 and 2015, respectively.
122
Junior Subordinated Debt
The Company has formed or acquired through acquisition eight statutory business trusts, which exist for the exclusive purpose of issuing Cumulative Trust Preferred Securities.
The Company's junior subordinated debt has contractual balances and maturity dates as follows:
December 31, | ||||||||||
Name of Trust | Maturity | 2016 | 2015 | |||||||
At fair value | (in thousands) | |||||||||
BankWest Nevada Capital Trust II | 2033 | $ | 15,464 | $ | 15,464 | |||||
Intermountain First Statutory Trust I | 2034 | 10,310 | 10,310 | |||||||
First Independent Statutory Trust I | 2035 | 7,217 | 7,217 | |||||||
WAL Trust No. 1 | 2036 | 20,619 | 20,619 | |||||||
WAL Statutory Trust No. 2 | 2037 | 5,155 | 5,155 | |||||||
WAL Statutory Trust No. 3 | 2037 | 7,732 | 7,732 | |||||||
Total contractual balance | 66,497 | 66,497 | ||||||||
FVO on junior subordinated debt | (16,087 | ) | (19,569 | ) | ||||||
Junior subordinated debt, at fair value | $ | 50,410 | $ | 46,928 | ||||||
At amortized cost | ||||||||||
Bridge Capital Holdings Trust I | 2035 | $ | 12,372 | $ | 12,372 | |||||
Bridge Capital Holdings Trust II | 2036 | 5,155 | 5,155 | |||||||
Total contractual balance | 17,527 | 17,527 | ||||||||
Purchase accounting adjustment, net of accretion (1) | (5,776 | ) | (6,085 | ) | ||||||
Junior subordinated debt, at amortized cost | $ | 11,751 | $ | 11,442 | ||||||
Total junior subordinated debt | $ | 62,161 | $ | 58,370 | ||||||
(1) | The purchase accounting adjustment will be accreted over the remaining life of the trusts, pursuant to accounting guidance. |
With the exception of debt issued by Bridge Capital Trust I and Bridge Capital Trust II, junior subordinated debt is recorded at fair value at each reporting date due to the FVO election made by the Company under ASC 825. The Company did not make the FVO election for the junior subordinated debt acquired as part of the Bridge acquisition. Accordingly, the carrying value of these trusts does not reflect the current fair value of the debt and includes a fair market value adjustment established at acquisition that is being accreted over the remaining life of the trusts.
The weighted average interest rate of all junior subordinated debt as of December 31, 2016 was 3.34%, which is three-month LIBOR plus the contractual spread of 2.34%, compared to a weighted average interest rate of 2.95% at December 31, 2015.
In the event of certain changes or amendments to regulatory requirements or federal tax rules, the debt is redeemable in whole. The obligations under these instruments are fully and unconditionally guaranteed by the Company and rank subordinate and junior in right of payment to all other liabilities of the Company. Based on guidance issued by the FRB, the Company's securities continue to qualify as Tier 1 Capital.
123
11. STOCKHOLDERS' EQUITY
Stock-Based Compensation
Stock Awards and Stock Options
The Incentive Plan, as amended, gives the BOD the authority to grant up to 10.5 million stock awards consisting of unrestricted stock, stock units, dividend equivalent rights, stock options (incentive and non-qualified), stock appreciation rights, restricted stock, and performance and annual incentive awards. The Incentive Plan limits the maximum number of shares of common stock that may be awarded to any person eligible for an award to 300,000 per calendar year. Stock awards available for grant at December 31, 2016 were 3.7 million.
Restricted stock awards granted to employees in 2016 and 2015 generally vest over a three-year period. Stock grants made to non-employee WAL directors during 2016 became fully vested at June 30, 2016. The Company estimates the compensation cost for stock grants based upon the grant date fair value. Stock compensation cost is recognized on a straight-line basis over the requisite service period for the entire award. For the year ended December 31, 2016, the Company recognized $10.7 million in stock-based compensation expense related to these stock grants, compared to $9.3 million in 2015.
In addition, in 2015, the Company began granting shares of restricted stock to certain members of executive management that have both performance and service conditions that affect vesting. During the year ended December 31, 2016, the Company granted 54,329 shares of these restricted stock awards. The performance condition is based on achieving an EPS target for fiscal year 2016. This EPS target has been met as of December 31, 2016 and therefore the restricted stock awards will vest over a remaining two-year service period. The grant date fair value of the awards was $1.5 million. For the year ended December 31, 2016, the Company recognized $1.1 million in stock-based compensation expense related to these performance-based restricted stock grants, compared to $0.5 million in 2015. There were no such awards granted during the year ended December 31, 2014.
A summary of the status of the Company’s unvested shares of restricted stock, including those issued in connection with the Bridge acquisition, and changes during the years then ended is presented below:
December 31, | ||||||||||||||
2016 | 2015 | |||||||||||||
Shares | Weighted Average Grant Date Fair Value | Shares | Weighted Average Grant Date Fair Value | |||||||||||
(in thousands, except per share amounts) | ||||||||||||||
Balance, beginning of period | 1,492 | $ | 20.46 | 1,050 | $ | 16.19 | ||||||||
Granted | 478 | 32.00 | 509 | 27.55 | ||||||||||
Issued in acquisition | — | — | 546 | 14.70 | ||||||||||
Vested | (571 | ) | 16.95 | (528 | ) | 13.02 | ||||||||
Forfeited | (121 | ) | 23.65 | (85 | ) | 21.63 | ||||||||
Balance, end of period | 1,278 | $ | 26.02 | 1,492 | $ | 20.46 | ||||||||
The weighted average grant date fair value of stock awards granted during the years ended December 31, 2016, 2015, and 2014 was $13.6 million, $12.6 million, and $12.2 million, respectively. The total fair value of restricted stock that vested during the years ended December 31, 2016, 2015, and 2014 was $18.3 million, $14.6 million, and $13.3 million, respectively.
As of December 31, 2016, there was $15.7 million of total unrecognized compensation cost related to unvested share-based compensation arrangements granted under the Incentive Plan. That cost is expected to be recognized over a weighted average period of 1.82 years.
124
As of December 31, 2016, the Company has stock option awards outstanding related to stock option awards converted in connection with the Bridge acquisition. A summary of option activity during the year ended December 31, 2016 is presented below:
December 31, 2016 | |||||||||||||
Shares | Weighted Average Exercise Price (per share) | Weighted Average Remaining Contractual Term (in years) | Aggregate Intrinsic Value | ||||||||||
(in thousands, except exercise price and contractual terms) | |||||||||||||
Outstanding options, beginning of period | 224 | $ | 19.15 | ||||||||||
Granted | — | — | |||||||||||
Exercised | (77 | ) | 13.93 | ||||||||||
Forfeited or expired | (10 | ) | 24.48 | ||||||||||
Options outstanding, end of period | 137 | $ | 21.70 | 6.76 | $ | 3,704 | |||||||
Options exercisable, end of period | 64 | $ | 17.30 | 5.86 | $ | 2,020 | |||||||
Options expected to vest, end of period | 56 | $ | 25.56 | 7.56 | $ | 2,316 | |||||||
The total intrinsic value of options exercised during the years ended December 31, 2016, 2015, and 2014 was $1.7 million, $3.6 million, and $7.1 million, respectively.
Performance Stock Units
The Company grants members of its executive management committee performance stock units that do not vest unless the Company achieves a specified cumulative EPS target over a three-year performance period. The number of shares issued will vary based on the cumulative EPS target that is achieved. The Company estimates the cost of performance stock units based upon the grant date fair value and expected vesting percentage over the three-year performance period. For the year ended December 31, 2016, the Company recognized $5.7 million in stock-based compensation expense related to these performance stock units, compared to $4.8 million and $3.6 million in stock-based compensation expense for such units in 2015 and 2014, respectively.
The three-year performance period for the 2012 grant ended on December 31, 2014, and the Company's cumulative EPS for the performance period exceeded the level required for a maximum award under the terms of the grant. As a result, on February 18, 2015, executive management committee members were granted 285,000 of fully vested common shares.
The three-year performance period for the 2013 grant ended on December 31, 2015, and the Company's cumulative EPS for the performance period exceeded the level required for a maximum award under the terms of the grant. As a result, on February 17, 2016, executive management committee members were granted 308,400 of fully vested common shares.
The three-year performance period for the 2014 grant ended on December 31, 2016, and the Company's cumulative EPS for the performance period exceeded the level required for a maximum award under the terms of the grant. As a result, 206,050 shares will become fully vested and be paid out to executive management committee members in the first quarter of 2017.
As of December 31, 2016, outstanding performance stock unit grants made in 2015 and 2016 are expected to pay out at the maximum award amount, or 204,585 and 211,000 common shares, in 2018 and 2019, respectively.
Common Stock Issuance
Under ATM Distribution Agreement
On June 4, 2014, the Company entered into a distribution agency agreement with Credit Suisse Securities (USA) LLC, under which the Company could sell shares of its common stock up to an aggregate offering price of $100.0 million in an offering registered with the SEC. The parties executed an Amended and Restated Distribution Agency Agreement on October 30, 2014. The Company pays Credit Suisse Securities (USA) LLC a mutually agreed rate, not to exceed 2% of the gross offering proceeds of the shares. The common stock would be sold at prevailing market prices at the time of the sale or at negotiated prices and, as a result, prices will vary.
As the Company completed $100.0 million in aggregate sales under the ATM offering, the Company's ATM offering expired and the Amended and Restated Distribution Agency Agreement was terminated as of June 30, 2016. During the year ended December 31, 2016, the Company sold 1.6 million shares under the ATM offering at a weighted-average selling price of $36.63 per share for gross proceeds of $56.8 million. Total related offering costs were $1.0 million, of which $0.9 million relates to
125
compensation costs paid to Credit Suisse Securities (USA) LLC. During the year ended December 31, 2015, the Company sold 760,376 shares under the ATM offering at a weighted-average selling price of $38.13 per share for gross proceeds of $29.0 million. Total related offering costs were $0.7 million, of which $0.5 million relates to compensation costs paid to Credit Suisse Securities (USA) LLC. During the year ended December 31, 2014, the Company sold 548,122 shares under the ATM offering at a weighted-average selling price of $25.96 per share for gross proceeds of $14.2 million. Total related offering costs were $0.5 million, of which $0.2 million relates to compensation costs paid to Credit Suisse Securities (USA) LLC.
In Connection with Bridge Acquisition
Under the terms of the Bridge merger agreement, each share of Bridge common stock issued and outstanding as of June 30, 2015, the acquisition date, was exchanged for 0.8145 shares of WAL common stock and $2.39 in cash. This resulted in the issuance of 12,451,240 shares, or $420.4 million, of the Company's common stock and payment of $36.5 million in cash.
Equity Awards Assumed in Bridge Acquisition
In connection with the Bridge acquisition, the Company assumed unvested restricted stock awards and stock options originally granted by Bridge and converted them into WAL restricted stock awards and stock options. Bridge equity awards were converted into WAL equity awards at a conversion ratio of 0.905, resulting in the issuance of 546,151 shares of WAL restricted stock and 213,091 of WAL options. The portion of the fair value of these equity awards associated with prior service of Bridge employees represents a component of the total consideration for the Bridge acquisition, which totaled $10.7 million.
Bridge's restricted stock awards generally had an original vesting period of five years. The remaining vesting period of these awards remained unchanged upon conversion. The value of restricted stock replacement awards were based on WAL's stock price as of the acquisition date and totaled $17.0 million as of June 30, 2015, of which $9.0 million is considered purchase price consideration for pre-combination service and $8.0 million is post-combination compensation service expense that is being recognized over the remaining vesting period of the awards. During the year ended December 31, 2016, the Company recognized $2.2 million in compensation expense related to these awards, compared to $1.7 million for the year ended December 31, 2015.
Bridge's stock options had an original vesting period of four years and a contractual term of ten years. Stock option replacement awards were valued using the Black-Scholes option valuation model, using the following weighted average assumptions.
June 30, 2015 | |||
Dividend yield | — | % | |
Volatility | 33.96 | % | |
Risk-free interest rate | 2.11 | % | |
Expected life in years | 7.66 | ||
Weighted average fair value of assumed options | $ | 19.06 | |
The value of assumed stock options as of June 30, 2015 totaled $4.1 million, of which $1.7 million is considered purchase price consideration for pre-combination service and $2.4 million is post-combination compensation service expense that is being recognized over the remaining vesting period of the options. During the year ended December 31, 2016, the Company recognized $0.6 million in compensation expense related to these awards, compared to $0.5 million in compensation expense for the year ended December 31, 2015.
Preferred Stock
On September 27, 2011, the Company received $141.0 million from the issuance of 141,000 shares of non-cumulative perpetual preferred stock, Series B, par value of $0.0001 per share and a liquidation preference of $1,000 per share, to the U.S. Treasury Department under the SBLF. On December 31, 2014, the Company redeemed 70,500 of its 141,000 shares of non-cumulative perpetual preferred stock, Series B. The shares were redeemed at their liquidation value of $1,000 per share plus accrued dividends for a total redemption price of $70.7 million. On December 18, 2015, the Company redeemed its remaining 70,500 shares of non-cumulative perpetual preferred stock, Series B. The shares were redeemed at their liquidation value of $1,000 per share plus accrued dividends for a total redemption price of $70.7 million.
126
12. ACCUMULATED OTHER COMPREHENSIVE INCOME
The following table summarizes the changes in accumulated other comprehensive income (loss) by component, net of tax, for the periods indicated:
Unrealized holding gains (losses) on AFS | Unrealized holding gains (losses) on SERP | Unrealized holding gains (losses) on junior subordinated debt | Impairment loss on securities | Total | ||||||||||||||||
(in thousands) | ||||||||||||||||||||
Balance, December 31, 2013 | $ | (21,690 | ) | $ | — | $ | — | $ | 144 | $ | (21,546 | ) | ||||||||
Transfer of HTM securities to AFS | 8,976 | — | — | — | 8,976 | |||||||||||||||
Other comprehensive income (loss) before reclassifications | 29,683 | — | — | — | 29,683 | |||||||||||||||
Amounts reclassified from accumulated other comprehensive income | (474 | ) | — | — | — | (474 | ) | |||||||||||||
Net current-period other comprehensive income (loss) | 38,185 | — | — | — | 38,185 | |||||||||||||||
Balance, December 31, 2014 | $ | 16,495 | $ | — | $ | — | $ | 144 | $ | 16,639 | ||||||||||
Balance, January 1, 2015 (1) | 16,495 | — | 16,309 | 144 | 32,948 | |||||||||||||||
Other comprehensive (loss) income before reclassifications | (6,117 | ) | 90 | (4,276 | ) | — | (10,303 | ) | ||||||||||||
Amounts reclassified from accumulated other comprehensive income | (385 | ) | — | — | — | (385 | ) | |||||||||||||
Net current-period other comprehensive (loss) income | (6,502 | ) | 90 | (4,276 | ) | — | (10,688 | ) | ||||||||||||
Balance, December 31, 2015 | $ | 9,993 | $ | 90 | $ | 12,033 | $ | 144 | $ | 22,260 | ||||||||||
Other comprehensive (loss) income before reclassifications | (24,163 | ) | 31 | (2,077 | ) | — | (26,209 | ) | ||||||||||||
Amounts reclassified from accumulated other comprehensive income | (746 | ) | — | — | — | (746 | ) | |||||||||||||
Net current-period other comprehensive (loss) income | (24,909 | ) | 31 | (2,077 | ) | — | (26,955 | ) | ||||||||||||
Balance, December 31, 2016 | $ | (14,916 | ) | $ | 121 | $ | 9,956 | $ | 144 | $ | (4,695 | ) | ||||||||
(1) | As adjusted, due to the Company's election to early adopt an element of ASU 2016-01 issued by the FASB in January 2016. The cumulative effect of adoption of this guidance at January 1, 2015 resulted in a decrease to retained earnings of $16.3 million and a corresponding increase to accumulated other comprehensive income. |
The following table presents reclassifications out of accumulated other comprehensive income:
Year Ended December 31, | ||||||||||||
Income Statement Classification | 2016 | 2015 | 2014 | |||||||||
(in thousands) | ||||||||||||
Gain (loss) on sales of investment securities, net | $ | 1,059 | $ | 615 | $ | 757 | ||||||
Income tax (expense) benefit | (404 | ) | (230 | ) | (283 | ) | ||||||
Net of tax | $ | 655 | $ | 385 | $ | 474 | ||||||
13. DERIVATIVES AND HEDGING ACTIVITIES
The Company is a party to various derivative instruments. Derivative instruments are contracts between two or more parties that have a notional amount and an underlying variable, require a small or no initial investment, and allow for the net settlement of positions. A derivative’s notional amount serves as the basis for the payment provision of the contract and takes the form of units, such as shares or dollars. A derivative’s underlying variable is a specified interest rate, security price, commodity price, foreign exchange rate, index, or other variable. The interaction between the notional amount and the underlying variable determines the number of units to be exchanged between the parties and influences the fair value of the derivative contract.
The primary type of derivatives that the Company uses are interest rate swaps. Generally, these instruments are used to help manage the Company's exposure to interest rate risk and meet client financing and hedging needs.
127
Derivatives are recorded at fair value in the Consolidated Balance Sheets, after taking into account the effects of bilateral collateral and master netting agreements. These agreements allow the Company to settle all derivative contracts held with the same counterparty on a net basis, and to offset net derivative positions with related cash collateral, where applicable.
As of December 31, 2016, 2015, and 2014, the Company does not have any significant outstanding cash flow hedges or free-standing derivatives.
Derivatives Designated in Hedge Relationships
The Company utilizes derivatives that have been designated as part of a hedge relationship in accordance with the applicable accounting guidance to minimize the exposure to changes in benchmark interest rates and volatility of net interest income and EVE to interest rate fluctuations. The primary derivative instruments used to manage interest rate risk are interest rate swaps, which convert the contractual interest rate index of agreed-upon amounts of assets and liabilities (i.e., notional amounts) to another interest rate index.
The Company has entered into pay fixed/receive variable interest rate swaps designated as fair value hedges of certain fixed rate loans. As a result, the Company receives variable-rate interest payments in exchange for making fixed-rate payments over the lives of the contracts without exchanging the notional amounts.
The Company has also entered into pay variable/receive fixed interest rate swaps, designated as fair value hedges on its fixed rate subordinated debt offerings. As a result, the Company is paying a floating rate of three month LIBOR plus 3.16% and is receiving semi-annual fixed payments of 5.00% to match the payments on the $150.0 million subordinated debt. For the fair value hedge on the Company's $175.0 million subordinated debentures issued on June 16, 2016, the Company is paying a floating rate of three month LIBOR plus 3.25% and is receiving quarterly fixed payments of 6.25% to match the payments on the debt.
Fair Values, Volume of Activity, and Gain/Loss Information Related to Derivative Instruments
The following table summarizes the fair values of the Company's derivative instruments on a gross and net basis as of December 31, 2016, 2015, and 2014. The change in the notional amounts of these derivatives from December 31, 2014 to December 31, 2016 indicates the volume of the Company's derivative transaction activity during these periods. The derivative asset and liability balances are presented on a gross basis, prior to the application of bilateral collateral and master netting agreements. Total derivative assets and liabilities are adjusted to take into account the impact of legally enforceable master netting agreements that allow the Company to settle all derivative contracts with the same counterparty on a net basis and to offset the net derivative position with the related collateral. Where master netting agreements are not in effect or are not enforceable under bankruptcy laws, the Company does not adjust those derivative amounts with counterparties. The fair value of derivative contracts, after taking into account the effects of master netting agreements, is included in other assets or other liabilities in the Consolidated Balance Sheets, as indicated in the following table:
December 31, 2016 | December 31, 2015 | December 31, 2014 | |||||||||||||||||||||||||||||||||
Fair Value | Fair Value | Fair Value | |||||||||||||||||||||||||||||||||
Notional Amount | Derivative Assets | Derivative Liabilities | Notional Amount | Derivative Assets | Derivative Liabilities | Notional Amount | Derivative Assets | Derivative Liabilities | |||||||||||||||||||||||||||
(in thousands) | |||||||||||||||||||||||||||||||||||
Derivatives designated as hedging instruments: | |||||||||||||||||||||||||||||||||||
Fair value hedges | |||||||||||||||||||||||||||||||||||
Interest rate swaps | $ | 993,485 | $ | 4,220 | $ | 65,749 | $ | 800,478 | $ | 3,569 | $ | 64,785 | $ | 647,703 | $ | 7 | $ | 57,820 | |||||||||||||||||
Total | 993,485 | 4,220 | 65,749 | 800,478 | 3,569 | 64,785 | 647,703 | 7 | 57,820 | ||||||||||||||||||||||||||
Netting adjustments (1) | — | 1,869 | 1,869 | — | — | — | — | — | — | ||||||||||||||||||||||||||
Net derivatives in the balance sheet | $ | 993,485 | $ | 2,351 | $ | 63,880 | $ | 800,478 | $ | 3,569 | $ | 64,785 | $ | 647,703 | $ | 7 | $ | 57,820 | |||||||||||||||||
(1) | Netting adjustments represent the amounts recorded to convert the Company's derivative balances from a gross basis to a net basis in accordance with the applicable accounting guidance. |
128
Fair value hedges
An assessment of effectiveness is performed at initiation of a hedge and on a quarterly basis thereafter. All of the Company's fair value hedges remained “highly effective” as of December 31, 2016, 2015, and 2014.
The following table summarizes the gains (losses) on fair value hedges for the years ended December 31, 2016, 2015, and 2014 all of which are recorded in non-interest income.
Year Ended December 31, | |||||||||||
2016 | 2015 | 2014 | |||||||||
(in thousands) | |||||||||||
Hedge of Fixed Rate Loans (1) | |||||||||||
Gain (loss) on "pay fixed" swap | $ | 15,582 | $ | (6,965 | ) | $ | (60,377 | ) | |||
Gain (loss) on receive fixed rate loans | (15,519 | ) | 7,044 | 60,208 | |||||||
Net ineffectiveness | $ | 63 | $ | 79 | $ | (169 | ) | ||||
Hedge of Fixed Rate Subordinated Debt Issuances (1) | |||||||||||
Gain (loss) on "receive fixed" swap | $ | (15,894 | ) | $ | 3,569 | $ | — | ||||
Gain (loss) on subordinated debt | 15,894 | (3,569 | ) | — | |||||||
Net ineffectiveness | $ | — | $ | — | $ | — | |||||
(1) | The fair value of derivatives contracts are carried as other assets and other liabilities in the Consolidated Balance Sheets. The effective portion of hedging gains (losses) is recorded as basis adjustments to the underlying hedged asset or liability. Gains and losses on both the hedging derivative and hedged item are recorded through non-interest income with a resulting net income impact for the amount of ineffectiveness. |
Counterparty Credit Risk
Like other financial instruments, derivatives contain an element of credit risk. This risk is measured as the expected positive replacement value of the contracts. Management generally enters into bilateral collateral and master netting agreements that provide for the net settlement of all contracts with the same counterparty. Additionally, management monitors counterparty credit risk exposure on each contract to determine appropriate limits on the Company's total credit exposure across all product types. In general, the Company has a zero credit threshold with regard to derivative exposure with counterparties. Management reviews the Company's collateral positions on a daily basis and exchanges collateral with counterparties in accordance with standard ISDA documentation and other related agreements. The Company generally holds collateral in the form of highly rated securities issued by the U.S. Treasury or government-sponsored enterprises, such as GNMA, FNMA, and FHLMC. The total collateral netted against net derivative liabilities totaled $65.7 million at December 31, 2016, $61.7 million at December 31, 2015, and $57.8 million at December 31, 2014.
The following table summarizes the Company's largest exposure to an individual counterparty at the dates indicated:
December 31, | ||||||||||||
2016 | 2015 | 2014 | ||||||||||
(in thousands) | ||||||||||||
Largest gross exposure (derivative asset) to an individual counterparty | $ | 2,351 | $ | 3,569 | $ | 7 | ||||||
Collateral posted by this counterparty | 1,691 | 4,680 | — | |||||||||
Derivative liability with this counterparty | — | — | — | |||||||||
Collateral pledged to this counterparty | — | 1,340 | — | |||||||||
Net exposure after netting adjustments and collateral | $ | 660 | $ | 229 | $ | 7 | ||||||
Credit Risk Contingent Features
Management has entered into certain derivative contracts that require the Company to post collateral to the counterparties when these contracts are in a net liability position. Conversely, the counterparties may be required to post collateral when these contracts are in a net asset position. The amount of collateral to be posted is based on the amount of the net liability and exposure thresholds. As of December 31, 2016, 2015, and 2014 the aggregate fair value of all derivative contracts with credit risk contingent features (i.e., those containing collateral posting provisions) held by the Company that were in a net liability position totaled $63.9 million, $64.8 million, and $57.8 million, respectively. As of December 31, 2016, the Company was in an over-collateralized net position of $24.3 million after considering $70.7 million of collateral held in the form of cash and securities. As of December 31, 2015 and 2014, the Company was in an over-collateralized position of $15.5 million and $14.2 million, respectively.
129
14. EARNINGS PER SHARE
Diluted EPS is based on the weighted average outstanding common shares during each period, including common stock equivalents. Basic EPS is based on the weighted average outstanding common shares during the period.
The following table presents the calculation of basic and diluted EPS:
Year Ended December 31, | ||||||||||||
2016 | 2015 | 2014 | ||||||||||
(in thousands, except per share amounts) | ||||||||||||
Weighted average shares - basic | 103,042 | 94,570 | 86,693 | |||||||||
Dilutive effect of stock awards | 801 | 649 | 813 | |||||||||
Weighted average shares - diluted | 103,843 | 95,219 | 87,506 | |||||||||
Net income available to common stockholders | $ | 259,798 | $ | 193,494 | $ | 146,564 | ||||||
Earnings per share - basic | 2.52 | 2.05 | 1.69 | |||||||||
Earnings per share - diluted | 2.50 | 2.03 | 1.67 | |||||||||
The Company has no anti-dilutive stock options outstanding as of December 31, 2016 and 2015. As of December 31, 2014, the Company has 1,500 stock options outstanding, which are not included in the computation of diluted earnings per common share because their effect would be anti-dilutive.
130
15. INCOME TAXES
The provision for income taxes charged to operations consists of the following:
Year Ended December 31, | ||||||||||||
2016 | 2015 | 2014 | ||||||||||
(in thousands) | ||||||||||||
Current | $ | 93,737 | $ | 61,040 | $ | 55,572 | ||||||
Deferred | 7,644 | 3,254 | (7,182 | ) | ||||||||
Total tax provision | $ | 101,381 | $ | 64,294 | $ | 48,390 | ||||||
The reconciliation between the statutory federal income tax rate and the Company’s effective tax rate are summarized as follows:
Year Ended December 31, | ||||||||||||
2016 | 2015 | 2014 | ||||||||||
(in thousands) | ||||||||||||
Income tax at statutory rate | $ | 126,413 | $ | 90,489 | $ | 69,125 | ||||||
Increase (decrease) resulting from: | ||||||||||||
State income taxes, net of federal benefits | 8,046 | 5,783 | 4,904 | |||||||||
Bank owned life insurance | (1,317 | ) | (1,365 | ) | (1,578 | ) | ||||||
Tax-exempt income | (22,425 | ) | (20,226 | ) | (15,006 | ) | ||||||
Deferred tax asset valuation allowance | — | (2,290 | ) | (2,104 | ) | |||||||
Low income housing tax credits | (6,153 | ) | (5,223 | ) | (3,872 | ) | ||||||
Other, net | (3,183 | ) | (2,874 | ) | (3,079 | ) | ||||||
Total tax provision | $ | 101,381 | $ | 64,294 | $ | 48,390 | ||||||
The effective tax rate for the year ended December 31, 2016 was 28.07%, compared to 24.87% for the year ended December 31, 2015, and 24.50% for the year ended December 31, 2014. The increase in the effective tax rate from 2015 compared to 2016 is due primarily to the increase in pre-tax book income without proportional increases to favorable tax rate items for the year ended December 31, 2016 compared to 2015. There was not a significant change in the effective tax rate from 2014 compared to 2015.
131
The cumulative tax effects of the primary temporary differences are shown in the following table:
December 31, | ||||||||
2016 | 2015 | |||||||
(in thousands) | ||||||||
Deferred tax assets: | ||||||||
Allowance for credit losses | $ | 50,860 | $ | 47,431 | ||||
Fair market value adjustment related to acquired loans | 7,941 | 13,930 | ||||||
Stock-based compensation | 12,302 | 12,069 | ||||||
Net operating loss carryovers | 9,024 | 9,255 | ||||||
Tax credit carryovers | — | 9,052 | ||||||
Startup costs and other amortization | 4,216 | 4,771 | ||||||
Allowance for other assets acquired through foreclosure, net | 3,230 | 4,280 | ||||||
Section 382 limited NUBILs | 3,251 | 3,284 | ||||||
Unrealized loss on AFS securities | 9,149 | — | ||||||
Other | 13,679 | 13,686 | ||||||
Total gross deferred tax assets | 113,652 | 117,758 | ||||||
Deferred tax liabilities: | ||||||||
Unrealized gain on debt instruments measured at fair value | (6,132 | ) | (7,537 | ) | ||||
Deferred loan costs | (3,212 | ) | (7,400 | ) | ||||
Unrealized gain on AFS securities | — | (6,353 | ) | |||||
Core deposit intangible | (4,949 | ) | (6,093 | ) | ||||
Premises and equipment | (449 | ) | (2,039 | ) | ||||
Unrealized gains on financial instruments measured at fair value | (2,200 | ) | (1,000 | ) | ||||
Other | (1,516 | ) | (984 | ) | ||||
Total deferred tax liabilities | (18,458 | ) | (31,406 | ) | ||||
Deferred tax assets, net | $ | 95,194 | $ | 86,352 | ||||
Deferred tax assets and liabilities are included in the Consolidated Financial Statements at currently enacted income tax rates applicable to the period in which the deferred tax assets or liabilities are expected to be reversed. As changes in tax laws or rates are enacted, deferred tax assets and liabilities are adjusted through the provision for income taxes.
For the year ended December 31, 2016, the net deferred tax assets increased $8.8 million to $95.2 million. This overall increase in the net deferred tax asset was primarily the result of decreases in the fair market value of AFS securities.
Although realization is not assured, the Company believes that the realization of the recognized deferred tax asset of $95.2 million at December 31, 2016 is more-likely-than-not based on expectations as to future taxable income and based on available tax planning strategies within the meaning of ASC 740, Income Taxes, that could be implemented if necessary to prevent a carryover from expiring.
At each of the periods ended December 31, 2016 and 2015, the Company had no deferred tax valuation allowance.
The deferred tax asset related to federal and state NOL carryovers outstanding at December 31, 2016 and 2015 available to reduce the tax liability in future years totaled $9.0 million and $9.3 million, respectively. The respective $9.0 million and $9.3 million of tax benefits relate entirely to federal NOL carryovers (subject to an annual limitation imposed by IRC Section 382). The Company’s ability to use federal NOL carryovers, as well as its ability to use certain future tax deductions called NUBILs associated with the Company's acquisitions is subject to annual limitations. In management’s opinion, it is more-likely-than-not that the results of future operations will generate sufficient taxable income to realize all of the deferred tax benefits related to these NOL carryovers and NUBILs.
The Company files income tax returns in the U.S. federal jurisdiction and in various states. With few exceptions, the Company is no longer subject to U.S. federal, state, or local income tax examinations by tax authorities for years before 2012.
When tax returns are filed, it is highly certain that some positions taken would be sustained upon examination by the taxing authorities, while others are subject to uncertainty about the merits of the position taken or the amount of the position that would be ultimately sustained. The benefit of a tax position is recognized in the Consolidated Financial Statements in the period in which, based on all available evidence, management believes it is more-likely-than-not that the position will be sustained upon examination, including the resolution of appeals or litigation processes, if any. Tax positions taken are not offset
132
or aggregated with other positions. Tax positions that meet the more-likely-than-not recognition threshold are measured as the largest amount of tax benefit that is more than 50% likely of being realized upon settlement with the applicable taxing authority. The portion of the benefits associated with tax positions taken that exceeds the amount measured as described above would be reflected as a liability for unrecognized tax benefits in the accompanying Consolidated Balance Sheet along with any associated interest and penalties that would be payable to the taxing authorities upon examination.
The total gross activity of unrecognized tax benefits related to uncertain tax positions are shown in the following table:
December 31, | |||||||
2016 | 2015 | ||||||
(in thousands) | |||||||
Beginning balance | $ | 1,038 | $ | — | |||
Gross Increases | |||||||
Tax positions in prior periods | — | 1,038 | |||||
Current period tax positions | — | — | |||||
Gross decreases | |||||||
Tax positions in prior periods | — | — | |||||
Settlements | — | — | |||||
Lapse of statute of limitations | — | — | |||||
Ending balance | $ | 1,038 | $ | 1,038 | |||
As of December 31, 2016 and 2015, the total amount of unrecognized tax benefits, net of associated deferred tax benefit, that would impact the effective tax rate, if recognized, is $0.7 million.
Interest and penalties related to unrecognized tax benefits are recognized in the provision for income taxes. During the years ended December 31, 2016 and 2014, the Company recognized no amounts for interest and penalties. During the year ended December 31, 2015, the Company recognized $0.1 million in penalties and no amounts for interest.
As of December 31, 2016 and 2015, the Company has accrued a total liability of $0.1 million for penalties and $0.1 million for interest.
Investments in LIHTC
The Company invests in LIHTC funds that are designed to generate a return primarily through the realization of federal tax credits.
Investments in LIHTC and unfunded LIHTC obligations are included as part of other assets and other liabilities, respectively, in the Consolidated Balance Sheets and total $187.4 million and $84.4 million, respectively, as of December 31, 2016, compared to $152.7 million and $61.2 million as of December 31, 2015. For the years ended December 31, 2016, 2015, and 2014, $17.3 million, $14.4 million, and $10.6 million of amortization related to LIHTC investments was recognized as a component of income tax expense, respectively.
133
16. COMMITMENTS AND CONTINGENCIES
Unfunded Commitments and Letters of Credit
The Company is party to financial instruments with off-balance sheet risk in the normal course of business to meet the financing needs of its customers. These financial instruments include commitments to extend credit and standby letters of credit. They involve, to varying degrees, elements of credit risk in excess of amounts recognized in the Consolidated Balance Sheets.
Lines of credit are obligations to lend money to a borrower. Credit risk arises when the borrower's current financial condition may indicate less ability to pay than when the commitment was originally made. In the case of standby letters of credit, the risk arises from the potential failure of the customer to perform according to the terms of a contract. In such a situation, the third party might draw on the standby letter of credit to pay for completion of the contract and the Company would look to its customer to repay these funds with interest. To minimize the risk, the Company uses the same credit policies in making commitments and conditional obligations as it would for a loan to that customer.
Standby letters of credit and financial guarantees are commitments issued by the Company to guarantee the performance of a customer to a third party in borrowing arrangements. The Company generally has recourse to recover from the customer any amounts paid under the guarantees. Typically, letters of credit issued have expiration dates within one year.
A summary of the contractual amounts for unfunded commitments and letters of credit are as follows:
December 31, | ||||||||
2016 | 2015 | |||||||
(in thousands) | ||||||||
Commitments to extend credit, including unsecured loan commitments of $360,840 at December 31, 2016 and $341,374 at December 31, 2015 | $ | 4,428,495 | $ | 3,624,578 | ||||
Credit card commitments and financial guarantees | 115,536 | 57,966 | ||||||
Standby letters of credit, including unsecured letters of credit of $6,431 at December 31, 2016 and $4,257 at December 31, 2015 | 78,576 | 50,659 | ||||||
Total | $ | 4,622,607 | $ | 3,733,203 | ||||
The following table represents the contractual commitments for lines and letters of credit by maturity at December 31, 2016:
Amount of Commitment Expiration per Period | ||||||||||||||||||||
Total Amounts Committed | Less Than 1 Year | 1-3 Years | 3-5 Years | After 5 Years | ||||||||||||||||
(in thousands) | ||||||||||||||||||||
Commitments to extend credit | $ | 4,428,495 | $ | 2,121,720 | $ | 1,575,416 | $ | 320,886 | $ | 410,473 | ||||||||||
Credit card commitments and financial guarantees | 115,536 | 115,536 | — | — | — | |||||||||||||||
Standby letters of credit | 78,576 | 67,192 | 11,017 | 367 | — | |||||||||||||||
Total | $ | 4,622,607 | $ | 2,304,448 | $ | 1,586,433 | $ | 321,253 | $ | 410,473 | ||||||||||
Commitments to extend credit are agreements to lend to a customer provided that there is no violation of any condition established in the contract. Commitments generally have fixed expiration dates or other termination clauses and may require payment of a fee. The Company enters into credit arrangements that generally provide for the termination of advances in the event of a covenant violation or other event of default. Since many of the commitments are expected to expire without being drawn upon, the total commitment amounts do not necessarily represent future cash requirements. The Company evaluates each customer’s creditworthiness on a case-by-case basis. The amount of collateral obtained, if deemed necessary by the Company upon extension of credit, is based on management’s credit evaluation of the party. The commitments are collateralized by the same types of assets used as loan collateral.
The Company has exposure to credit losses from unfunded commitments and letters of credit. As funds have not been disbursed on these commitments, they are not reported as loans outstanding. Credit losses related to these commitments are included in other liabilities as a separate loss contingency and are not included in the allowance for credit losses reported in "Note 4. Loans, Leases and Allowance for Credit Losses" of these Consolidated Financial Statements. This loss contingency for unfunded loan commitments and letters of credit was $7.0 million and $3.3 million as of December 31, 2016 and 2015, respectively. Changes to this liability are adjusted through non-interest expense.
134
Concentrations of Lending Activities
The Company’s lending activities are driven in large part by the customers served in the market areas where the Company has branch offices in the states of Arizona, Nevada, and California. Despite the geographic concentration of lending activities, the Company does not have a single external customer from which it derives 10% or more of its revenues. The Company monitors concentrations within four broad categories: geography, industry, product, and collateral. The Company's loan portfolio includes significant credit exposure to the CRE market. As of December 31, 2016 and 2015, CRE related loans accounted for approximately 53% and 49% of total loans, respectively. Substantially all of these loans are secured by first liens with an initial loan to value ratio of generally not more than 75%. Approximately 36% and 48% of these CRE loans, excluding construction and land loans, were owner-occupied at December 31, 2016 and 2015, respectively.
Contingencies
The Company is involved in various lawsuits of a routine nature that are being handled and defended in the ordinary course of the Company’s business. Expenses are being incurred in connection with these lawsuits, but in the opinion of management, based in part on consultation with outside legal counsel, the resolution of these lawsuits and associated defense costs will not have a material impact on the Company’s financial position, results of operations, or cash flows.
Other
The Company has entered into change in control agreements with certain named executives and other employees designated as executives by the BOD. Under these agreements, in the event of a qualifying termination, each executive is entitled to receive 1) accrued benefits, payable in accordance with the Company’s normal payroll practice; 2) a lump sum cash severance payment in an amount equal to the sum of a) two times the executive’s annual base salary plus b) two times the executive's annual bonus; 3) any unpaid bonus that was earned by the executive in the prior year; and 4) reimbursement of paid group health premiums up to 24 months.
17. FAIR VALUE ACCOUNTING
The fair value of an asset or liability is the price that would be received to sell that asset or paid to transfer that liability in an orderly transaction occurring in the principal market (or most advantageous market in the absence of a principal market) for such asset or liability. In estimating fair value, the Company utilizes valuation techniques that are consistent with the market approach, the income approach, and/or the cost approach. Such valuation techniques are consistently applied. Inputs to valuation techniques include the assumptions that market participants would use in pricing an asset or liability. ASC 825 establishes a fair value hierarchy that prioritizes the inputs to valuation techniques used to measure fair value. The hierarchy gives the highest priority to unadjusted quoted prices in active markets for identical assets or liabilities (Level 1 measurements) and the lowest priority to unobservable inputs (Level 3 measurements). The three levels of the fair value hierarchy under ASC 825 are described in "Note 1. Summary of Significant Accounting Policies" of these Notes to Consolidated Financial Statements.
In general, fair value is based upon quoted market prices, where available. If such quoted market prices are not available, fair value is based upon internally developed models that primarily use, as inputs, observable market-based parameters. Valuation adjustments may be made to ensure that financial instruments are recorded at fair value. These adjustments may include amounts to reflect counterparty credit quality and the Company’s creditworthiness, among other things, as well as unobservable parameters. Any such valuation adjustments are applied consistently over time. The Company’s valuation methodologies may produce a fair value calculation that may not be indicative of net realizable value or reflective of future fair values. While management believes the Company’s valuation methodologies are appropriate and consistent with other market participants, the use of different methodologies or assumptions to determine the fair value of certain financial instruments could result in a different estimate of fair value at the reporting date. Furthermore, the reported fair value amounts have not been comprehensively revalued since the presentation dates, and therefore, estimates of fair value after the balance sheet date may differ significantly from the amounts presented herein. A more detailed description of the valuation methodologies used for assets and liabilities measured at fair value is set forth below. Transfers between levels in the fair value hierarchy are recognized as of the end of the month following the event or change in circumstances that caused the transfer.
Under ASC 825, the Company elected the FVO treatment for junior subordinated debt issued by WAL. This election is irrevocable and results in the recognition of unrealized gains and losses on these items in earnings at each reporting date. The Company did not elect FVO treatment for assumed Bridge junior subordinated debt.
All securities for which the fair value measurement option had been elected are included in a separate line item in the Consolidated Balance Sheets as securities measured at fair value.
135
For the years ended December 31, 2016, 2015, and 2014 securities gains and losses from fair value changes were as follows:
Changes in Fair Values for Items Measured at Fair Value Pursuant to Election of the Fair Value Option | ||||||||||||||||||||
Unrealized Gain/(Loss) on Assets and Liabilities Measured at Fair Value, Net | Interest Income on Securities | Interest Expense on Junior Subordinated Debt | Total Changes Included in Current-Period Earnings | Total Changes Included in OCI (1) | ||||||||||||||||
(in thousands) | ||||||||||||||||||||
Year Ended December 31, 2016 | ||||||||||||||||||||
Securities measured at fair value | $ | (18 | ) | $ | 41 | $ | — | $ | 23 | $ | — | |||||||||
Junior subordinated debt | (3,482 | ) | — | (2,828 | ) | (2,828 | ) | (2,077 | ) | |||||||||||
Total | $ | (3,500 | ) | $ | 41 | $ | (2,828 | ) | $ | (2,805 | ) | $ | (2,077 | ) | ||||||
Year Ended December 31, 2015 | ||||||||||||||||||||
Securities measured at fair value | $ | (32 | ) | $ | 54 | $ | — | $ | 22 | $ | — | |||||||||
Junior subordinated debt | (6,491 | ) | — | (2,151 | ) | (2,151 | ) | (4,276 | ) | |||||||||||
Total | $ | (6,523 | ) | $ | 54 | $ | (2,151 | ) | $ | (2,129 | ) | $ | (4,276 | ) | ||||||
Year Ended December 31, 2014 | ||||||||||||||||||||
Securities measured at fair value | $ | (41 | ) | $ | 90 | $ | — | $ | 49 | $ | — | |||||||||
Junior subordinated debt | 1,421 | — | (1,754 | ) | (333 | ) | — | |||||||||||||
Total | $ | 1,380 | $ | 90 | $ | (1,754 | ) | $ | (284 | ) | $ | — | ||||||||
(1) | Due to the Company's election to early adopt an element of ASU 2016-01, changes in the fair value of junior subordinated debt are presented as part of OCI, net of tax, rather than included in earnings, effective January 1, 2015. |
There were no net gains or losses recognized during the years ended December 31, 2016, 2015, and 2014 on trading securities sold during the period.
Interest income on securities measured at fair value is accounted for similarly to those classified as AFS. Any premiums or discounts are recognized in interest income over the term of the securities. For MBS, estimates of prepayments are considered in the constant yield calculations. Interest expense on junior subordinated debt is also determined under a constant yield calculation.
Fair value on a recurring basis
Financial assets and financial liabilities measured at fair value on a recurring basis include the following:
Securities measured at fair value: All of the Company’s securities measured at fair value, which consist of MBS, are reported at fair value utilizing Level 2 inputs in the same manner as described below for AFS securities.
AFS securities: Preferred stock, CRA investments, and certain corporate debt securities are reported at fair value utilizing Level 1 inputs. Other securities classified as AFS are reported at fair value utilizing Level 2 inputs. For these securities, the Company obtains fair value measurements from an independent pricing service. The fair value measurements consider observable data that may include dealer quotes, market spreads, cash flows, the U.S. Treasury yield curve, live trading levels, trade execution data, market consensus prepayment speeds, credit information, and the bond’s terms and conditions, among other things.
Historically, the Company has estimated the fair value of its CDO securities utilizing Level 3 inputs, which include pricing indications from comparable securities. During the year ended December 31, 2016, these securities were transferred from Level 3 to Level 2 as a result of an increase in the availability and reliability of the observable inputs utilized in the securities' fair value measurement.
Independent pricing service: The Company's independent pricing service provides pricing information on the majority of the Company's Level 1 and 2 securities. Management independently evaluates the fair value measurements received from the Company's third party pricing service through multiple review steps. First, management reviews what has transpired in the marketplace with respect to interest rates, credit spreads, volatility, and mortgage rates, among other things, and develops an expectation of changes to the securities' valuations from the previous quarter. Then, management obtains market values from additional sources. The pricing service provides management with observable market data including interest rate curves and mortgage prepayment speed grids, as well as dealer quote sheets, new bond offering sheets, and historical trade documentation. Management reviews the assumptions and decides whether they are reasonable. Management may compare interest rates, credit spreads, and prepayments speeds used as part of the assumptions to those that management believes are reasonable.
136
Management may price securities using the provided assumptions to determine whether they can develop similar prices on like securities. Any discrepancies between management’s review and the prices provided by the vendor are discussed with the vendor and the Company’s other valuation advisors. Lastly, management selects a sample of investment securities and compares the values provided by its primary third party pricing service to the market values obtained from secondary sources and evaluates those with notable variances.
Annually, the Company receives an SSAE 16 report from its independent pricing service attesting to the controls placed on the operations of the service from its auditor.
Interest rate swaps: Interest rate swaps are reported at fair value utilizing Level 2 inputs. The Company obtains dealer quotations to value its interest rate swaps.
Junior subordinated debt: The Company estimates the fair value of its junior subordinated debt using a discounted cash flow model which incorporates the effect of the Company’s own credit risk in the fair value of the liabilities (Level 3). The Company’s cash flow assumptions are based on contractual cash flows as the Company anticipates that it will pay the debt according to its contractual terms.
As of December 31, 2016, the Company estimates the discount rate at 5.66%, which represents an implied credit spread of 4.66% plus three-month LIBOR (1.00%). As of December 31, 2015, the Company estimated the discount rate at 5.67%, which was a 5.06% credit spread plus three-month LIBOR (0.61%).
The fair value of assets and liabilities measured at fair value on a recurring basis was determined using the following inputs as of the periods presented:
Fair Value Measurements at the End of the Reporting Period Using: | ||||||||||||||||
Quoted Prices in Active Markets for Identical Assets (Level 1) | Significant Other Observable Inputs (Level 2) | Significant Unobservable Inputs (Level 3) | Fair Value | |||||||||||||
(in thousands) | ||||||||||||||||
December 31, 2016 | ||||||||||||||||
Assets: | ||||||||||||||||
Measured at fair value | ||||||||||||||||
Residential MBS issued by GSEs | $ | — | $ | 1,053 | $ | — | $ | 1,053 | ||||||||
Available-for-sale | ||||||||||||||||
Collateralized debt obligations | $ | — | $ | 13,490 | $ | — | $ | 13,490 | ||||||||
Commercial MBS issued by GSEs | — | 117,792 | — | 117,792 | ||||||||||||
Corporate debt securities | 20,000 | 44,144 | — | 64,144 | ||||||||||||
CRA investments | 37,113 | — | — | 37,113 | ||||||||||||
Preferred stock | 94,662 | — | — | 94,662 | ||||||||||||
Private label residential MBS | — | 433,685 | — | 433,685 | ||||||||||||
Residential MBS issued by GSEs | — | 1,355,205 | — | 1,355,205 | ||||||||||||
Tax-exempt | — | 408,233 | — | 408,233 | ||||||||||||
Trust preferred securities | — | 26,532 | — | 26,532 | ||||||||||||
U.S. government sponsored agency securities | — | 56,022 | — | 56,022 | ||||||||||||
U.S. treasury securities | — | 2,502 | — | 2,502 | ||||||||||||
Total AFS securities | $ | 151,775 | $ | 2,457,605 | $ | — | $ | 2,609,380 | ||||||||
Loans - HFS | $ | — | $ | 18,909 | $ | — | $ | 18,909 | ||||||||
Derivative assets (1) | — | 4,220 | — | 4,220 | ||||||||||||
Liabilities: | ||||||||||||||||
Junior subordinated debt (2) | $ | — | $ | — | $ | 50,410 | $ | 50,410 | ||||||||
Derivative liabilities (1) | — | 65,749 | — | 65,749 | ||||||||||||
(1) | Derivative assets and liabilities relate to interest rate swaps, see "Note 13. Derivatives and Hedging Activities." In addition, the carrying value of loans includes a net positive value of $48,161 and the net carrying value of subordinated debt includes a net negative value of $12,325 as of December 31, 2016, which relates to the effective portion of the hedges put in place to mitigate against fluctuations in interest rates. |
(2) | Includes only the portion of junior subordinated debt that is recorded at fair value at each reporting period pursuant to the election of FVO treatment. |
137
Fair Value Measurements at the End of the Reporting Period Using: | ||||||||||||||||
Quoted Prices in Active Markets for Identical Assets (Level 1) | Significant Other Observable Inputs (Level 2) | Significant Unobservable Inputs (Level 3) | Fair Value | |||||||||||||
(in thousands) | ||||||||||||||||
December 31, 2015 | ||||||||||||||||
Assets: | ||||||||||||||||
Measured at fair value | ||||||||||||||||
Residential MBS issued by GSEs | $ | — | $ | 1,481 | $ | — | $ | 1,481 | ||||||||
Available-for-sale | ||||||||||||||||
Collateralized debt obligations | $ | — | $ | — | $ | 10,060 | $ | 10,060 | ||||||||
Commercial MBS issued by GSEs | — | 19,114 | — | 19,114 | ||||||||||||
Corporate debt securities | — | 13,251 | — | 13,251 | ||||||||||||
CRA investments | 34,685 | — | — | 34,685 | ||||||||||||
Preferred stock | 111,236 | — | — | 111,236 | ||||||||||||
Private label commercial MBS | — | 4,691 | — | 4,691 | ||||||||||||
Private label residential MBS | — | 257,128 | — | 257,128 | ||||||||||||
Residential MBS issued by GSEs | — | 1,170,221 | — | 1,170,221 | ||||||||||||
Tax-exempt | — | 334,830 | — | 334,830 | ||||||||||||
Trust preferred securities | — | 24,314 | — | 24,314 | ||||||||||||
U.S. government sponsored agency securities | 2,993 | — | — | 2,993 | ||||||||||||
Total AFS securities | $ | 148,914 | $ | 1,823,549 | $ | 10,060 | $ | 1,982,523 | ||||||||
Loans - HFS | $ | — | $ | 23,809 | $ | — | $ | 23,809 | ||||||||
Derivative assets (1) | — | 3,569 | — | 3,569 | ||||||||||||
Liabilities: | ||||||||||||||||
Junior subordinated debt | $ | — | $ | — | $ | 46,928 | $ | 46,928 | ||||||||
Derivative liabilities (1) | — | 64,785 | — | 64,785 | ||||||||||||
(1) | Derivative assets and liabilities relate to interest rate swaps, see "Note 13. Derivatives and Hedging Activities." In addition, the carrying value of loans includes a net positive value of $64,184 and the net carrying value of subordinated debt includes a net negative value of $3,569 as of December 31, 2015, which relates to the effective portion of the hedges put in place to mitigate against fluctuations in interest rates. |
For the years ended December 31, 2016, 2015, and 2014, the change in Level 3 assets and liabilities measured at fair value on a recurring basis was as follows:
Junior Subordinated Debt | ||||||||||||
Year Ended December 31, | ||||||||||||
2016 | 2015 | 2014 | ||||||||||
(in thousands) | ||||||||||||
Beginning balance | $ | (46,928 | ) | $ | (40,437 | ) | $ | (41,858 | ) | |||
Transfers into Level 3 | — | — | — | |||||||||
Total gains (losses) for the period | ||||||||||||
Included in earnings | — | — | 1,421 | |||||||||
Included in other comprehensive income (1) | (3,482 | ) | (6,491 | ) | — | |||||||
Ending balance | $ | (50,410 | ) | $ | (46,928 | ) | $ | (40,437 | ) | |||
(1) | Due to the Company's election to early adopt an element of ASU 2016-01, changes in the fair value of junior subordinated debt are presented as part of OCI rather than earnings effective January 1, 2015. Accordingly, total losses for 2015 are included in the other comprehensive income line, Unrealized gain (loss) on junior subordinated debt, which is net of tax. The above amount represents the gross loss from changes in fair value of junior subordinated debt. |
138
CDO Securities | ||||||||||||
Year Ended December 31, | ||||||||||||
2016 | 2015 | 2014 | ||||||||||
(in thousands) | ||||||||||||
Beginning balance | $ | 10,060 | $ | 11,445 | $ | — | ||||||
Transfers into Level 3 | — | — | 6,243 | |||||||||
Transfers out of Level 3 | (11,274 | ) | — | — | ||||||||
Total gains (losses) for the period | ||||||||||||
Included in other comprehensive income (1) | 1,214 | (1,385 | ) | 5,202 | ||||||||
Ending balance | $ | — | $ | 10,060 | $ | 11,445 | ||||||
(1) | Total gains (losses) for the period are included in the other comprehensive income line, Unrealized gain (loss) on AFS securities. |
The transfer of CDO securities from Level 3 to Level 2 during the year ended December 31, 2016 is the result of an increase in the availability and reliability of the observable inputs utilized in the securities' fair value measurement. The Company recognized this transfer between levels on October 31, 2016, in accordance with its policy to recognize transfers between levels in the fair value hierarchy as of the end of the month following the event or change in circumstance that caused the transfer.
For Level 3 assets and liabilities measured at fair value on a recurring basis as of December 31, 2016 and 2015, the significant unobservable inputs used in the fair value measurements were as follows:
December 31, 2016 | Valuation Technique | Significant Unobservable Inputs | Input Value | ||||||||
(in thousands) | |||||||||||
Junior subordinated debt | $ | 50,410 | Discounted cash flow | Implied credit rating of the Company | 5.66 | % | |||||
December 31, 2015 | Valuation Technique | Significant Unobservable Inputs | Input Value | ||||||||
(in thousands) | |||||||||||
Junior subordinated debt | $ | 46,928 | Discounted cash flow | Adjusted Corporate Bond over Treasury Index with comparable credit spread | 5.67 | % | |||||
CDO securities | 10,060 | S&P Model | Pricing indications from comparable securities | ||||||||
The significant unobservable inputs used in the fair value measurement of the Company’s junior subordinated debt as of December 31, 2016 was the implied credit risk for the Company, calculated as the difference between the 20-year 'BB' rated financial index over the corresponding swap index.
The significant unobservable inputs used in the fair value measurement of the Company's CDO securities in 2015 include securities terms, conditions, and underlying collateral type, as well as trustee and servicer reports, trade data on comparable securities, and market quotes that are converted into spreads to benchmark LIBOR curves. Significant increases or decreases in these inputs could result in significantly different fair value measurements.
139
Fair value on a nonrecurring basis
Certain assets are measured at fair value on a nonrecurring basis. That is, the assets are not measured at fair value on an ongoing basis, but are subject to fair value adjustments in certain circumstances (for example, when there is evidence of impairment). The following table presents such assets carried on the balance sheet by caption and by level within the ASC 825 hierarchy:
Fair Value Measurements at the End of the Reporting Period Using | ||||||||||||||||
Total | Quoted Prices in Active Markets for Identical Assets (Level 1) | Active Markets for Similar Assets (Level 2) | Unobservable Inputs (Level 3) | |||||||||||||
(in thousands) | ||||||||||||||||
As of December 31, 2016: | ||||||||||||||||
Impaired loans with specific valuation allowance | $ | 6,670 | $ | — | $ | — | $ | 6,670 | ||||||||
Impaired loans without specific valuation allowance (1) | 60,738 | — | — | 60,738 | ||||||||||||
Other assets acquired through foreclosure | 47,815 | — | — | 47,815 | ||||||||||||
As of December 31, 2015: | ||||||||||||||||
Impaired loans with specific valuation allowance | $ | 19,629 | $ | — | $ | — | $ | 19,629 | ||||||||
Impaired loans without specific valuation allowance (1) | 66,754 | — | — | 66,754 | ||||||||||||
Other assets acquired through foreclosure | 43,942 | — | — | 43,942 | ||||||||||||
(1) | Excludes loan balances with charge-offs of $27.6 million and $37.8 million as of December 31, 2016 and 2015, respectively. |
For Level 3 assets measured at fair value on a nonrecurring basis as of December 31, 2016 and 2015, the significant unobservable inputs used in the fair value measurements were as follows:
December 31, 2016 | Valuation Technique(s) | Significant Unobservable Inputs | Range | ||||||||
(in thousands) | |||||||||||
Impaired loans | $ | 67,408 | Collateral method | Third party appraisal | Costs to sell | 4.0% to 10.0% | |||||
Discounted cash flow method | Discount rate | Contractual loan rate | 4.0% to 7.0% | ||||||||
Scheduled cash collections | Loss given default | 0% to 20.0% | |||||||||
Proceeds from non-real estate collateral | Loss given default | 0% to 70.0% | |||||||||
Other assets acquired through foreclosure | 47,815 | Collateral method | Third party appraisal | Costs to sell | 4.0% to 10.0% | ||||||
December 31, 2015 | Valuation Technique(s) | Significant Unobservable Inputs | Range | ||||||||
(in thousands) | |||||||||||
Impaired loans | $ | 86,383 | Collateral method | Third party appraisal | Costs to sell | 4.0% to 10.0% | |||||
Discounted cash flow method | Discount rate | Contractual loan rate | 4.0% to 7.0% | ||||||||
Scheduled cash collections | Loss given default | 0% to 20.0% | |||||||||
Proceeds from non-real estate collateral | Loss given default | 0% to 70.0% | |||||||||
Other assets acquired through foreclosure | 43,942 | Collateral method | Third party appraisal | Costs to sell | 4.0% to 10.0% | ||||||
140
Impaired loans: The specific reserves for collateral dependent impaired loans are based on collateral value, net of estimated disposition costs and other identified quantitative inputs. Collateral value is determined based on independent third-party appraisals or internally-developed discounted cash flow analyses. Appraisals may utilize a single valuation approach or a combination of approaches, including comparable sales and the income approach. Fair value is determined, where possible, using market prices derived from an appraisal or evaluation, which are considered to be Level 2. However, certain assumptions and unobservable inputs are often used by the appraiser, therefore qualifying the assets as Level 3 in the fair value hierarchy. In addition, when adjustments are made to an appraised value to reflect various factors such as the age of the appraisal or known changes in the market or the collateral, such valuation inputs are considered unobservable and the fair value measurement is categorized as a Level 3 measurement. Internal discounted cash flow analyses are also utilized to estimate the fair value of impaired loans, which considers internally-developed, unobservable inputs such as discount rates, default rates, and loss severity.
Total Level 3 impaired loans had an estimated fair value of $67.4 million and $86.4 million at December 31, 2016 and 2015, respectively. Impaired loans with a specific valuation allowance had a gross estimated fair value of $10.9 million and $24.3 million at December 31, 2016 and 2015, respectively, which was reduced by a specific valuation allowance of $4.2 million and $4.7 million, respectively.
Other assets acquired through foreclosure: Other assets acquired through foreclosure consist of properties acquired as a result of, or in-lieu-of, foreclosure. These assets are initially reported at the fair value determined by independent appraisals using appraised value less estimated cost to sell. Such properties are generally re-appraised every twelve months. There is risk for subsequent volatility. Costs relating to the development or improvement of the assets are capitalized and costs relating to holding the assets are charged to expense.
Fair value is determined, where possible, using market prices derived from an appraisal or evaluation, which are considered to be Level 2. However, certain assumptions and unobservable inputs are often used by the appraiser, therefore qualifying the assets as Level 3 in the fair value hierarchy. When significant adjustments are based on unobservable inputs, such as when a current appraised value is not available or management determines the fair value of the collateral is further impaired below the appraised value and there is no observable market price, the resulting fair value measurement has been categorized as a Level 3 measurement. The Company had $47.8 million and $43.9 million of such assets at December 31, 2016 and 2015, respectively.
Credit vs. non-credit losses
Under the provisions of ASC 320, Investments-Debt and Equity Securities, OTTI is separated into the amount of total impairment related to the credit loss and the amount of the total impairment related to all other factors. The amount of the total OTTI related to the credit loss is recognized in earnings. The amount of the total impairment related to all other factors is recognized in OCI.
For the years ended December 31, 2016, 2015, and 2014, the Company determined that no securities experienced credit losses.
There is no OTTI balance recognized in comprehensive income as of December 31, 2016 and 2015.
141
FAIR VALUE OF FINANCIAL INSTRUMENTS
The estimated fair value of the Company’s financial instruments is as follows:
December 31, 2016 | ||||||||||||||||||||
Carrying Amount | Fair Value | |||||||||||||||||||
Level 1 | Level 2 | Level 3 | Total | |||||||||||||||||
(in thousands) | ||||||||||||||||||||
Financial assets: | ||||||||||||||||||||
Investment securities: | ||||||||||||||||||||
HTM | $ | 92,079 | $ | — | $ | 91,966 | $ | — | $ | 91,966 | ||||||||||
AFS | 2,609,380 | 151,775 | 2,457,605 | — | 2,609,380 | |||||||||||||||
Trading | 1,053 | — | 1,053 | — | 1,053 | |||||||||||||||
Derivative assets | 4,220 | — | 4,220 | — | 4,220 | |||||||||||||||
Loans, net | 13,083,732 | — | 12,736,336 | 67,408 | 12,803,744 | |||||||||||||||
Accrued interest receivable | 70,320 | — | 70,320 | — | 70,320 | |||||||||||||||
Financial liabilities: | ||||||||||||||||||||
Deposits | $ | 14,549,863 | $ | — | $ | 14,553,931 | $ | — | $ | 14,553,931 | ||||||||||
Customer repurchase agreements | 41,728 | — | 41,728 | — | 41,728 | |||||||||||||||
FHLB advances | 80,000 | — | 80,000 | — | 80,000 | |||||||||||||||
Qualifying debt | 367,937 | — | — | 375,626 | 375,626 | |||||||||||||||
Derivative liabilities | 65,749 | — | 65,749 | — | 65,749 | |||||||||||||||
Accrued interest payable | 15,354 | — | 15,354 | — | 15,354 | |||||||||||||||
December 31, 2015 | ||||||||||||||||||||
Carrying Amount | Fair Value | |||||||||||||||||||
Level 1 | Level 2 | Level 3 | Total | |||||||||||||||||
(in thousands) | ||||||||||||||||||||
Financial assets: | ||||||||||||||||||||
Investment securities: | ||||||||||||||||||||
AFS | $ | 1,982,523 | $ | 148,914 | $ | 1,823,549 | $ | 10,060 | $ | 1,982,523 | ||||||||||
Trading | 1,481 | — | 1,481 | — | 1,481 | |||||||||||||||
Derivative assets | 3,569 | — | 3,569 | — | 3,569 | |||||||||||||||
Loans, net | 11,017,595 | — | 10,766,826 | 86,383 | 10,853,209 | |||||||||||||||
Accrued interest receivable | 54,445 | — | 54,445 | — | 54,445 | |||||||||||||||
Financial liabilities: | ||||||||||||||||||||
Deposits | $ | 12,030,624 | $ | — | $ | 12,034,199 | $ | — | $ | 12,034,199 | ||||||||||
Customer repurchase agreements | 38,155 | — | 38,155 | — | 38,155 | |||||||||||||||
FHLB advances | 150,000 | — | 150,000 | — | 150,000 | |||||||||||||||
Qualifying debt | 210,238 | — | — | 207,437 | 207,437 | |||||||||||||||
Derivative liabilities | 64,785 | — | 64,785 | — | 64,785 | |||||||||||||||
Accrued interest payable | 13,626 | — | 13,626 | — | 13,626 | |||||||||||||||
Interest rate risk
The Company assumes interest rate risk (the risk to the Company’s earnings and capital from changes in interest rate levels) as a result of its normal operations. As a result, the fair values of the Company’s financial instruments, as well as its future net interest income will change when interest rate levels change and that change may be either favorable or unfavorable to the Company.
Interest rate risk exposure is measured using interest rate sensitivity analysis to determine the Company's change in EVE and net interest income resulting from hypothetical changes in interest rates. If potential changes to EVE and net interest income resulting from hypothetical interest rate changes are not within the limits established by the BOD, the BOD may direct management to adjust the asset and liability mix to bring interest rate risk within BOD-approved limits. As of December 31, 2016, the Company’s interest rate risk profile was within BOD-approved limits.
142
WAB has an ALCO charged with managing interest rate risk within the BOD-approved limits. Limits are structured to prohibit an interest rate risk profile that does not conform to both management and BOD risk tolerances. There is also ALCO reporting at the Parent company level for reviewing interest rate risk for the Company, which gets reported to the BOD and its Finance and Investment Committee.
Fair value of commitments
The estimated fair value of standby letters of credit outstanding at December 31, 2016 and 2015 is insignificant. Loan commitments on which the committed interest rates are less than the current market rate are also insignificant at December 31, 2016 and 2015.
18. REGULATORY CAPITAL REQUIREMENTS
The Company and the Bank are subject to various regulatory capital requirements administered by the federal banking agencies. Failure to meet minimum capital requirements could trigger certain mandatory or discretionary actions that, if undertaken, could have a direct material effect on the Company’s business and financial statements. Under capital adequacy guidelines and the regulatory framework for prompt corrective action, the Company and the Bank must meet specific capital guidelines that involve quantitative measures of their assets, liabilities, and certain off-balance sheet items as calculated under regulatory accounting practices. The capital amounts and classification are also subject to qualitative judgments by the regulators about components, risk weightings, and other factors.
The capital framework under Basel III became effective for the Company on January 1, 2015. Under the Basel III final rules, minimum requirements have increased for both the quantity and quality of capital held by the Company. A new capital conservation buffer, comprised of Common Equity Tier 1 capital, is also established above the regulatory minimum capital requirements. This capital conservation buffer began being phased in on January 1, 2016 at 0.625% of risk-weighted assets and will increase each subsequent year by an additional 0.625% until reaching its final level of 2.5% on January 1, 2019. Strict eligibility requirements for regulatory capital instruments have been implemented under the final rules and the final rules also revise the definitions and calculations of Tier 1 capital, total capital, and risk-weighted assets.
As of December 31, 2016 and 2015, the Company and the Bank exceeded the capital levels necessary to be classified as well-capitalized, as defined by the federal banking agencies. The actual capital amounts and ratios for the Company and the Bank are presented in the following tables as of the periods indicated:
Total Capital | Tier 1 Capital | Risk-Weighted Assets | Tangible Average Assets | Total Capital Ratio | Tier 1 Capital Ratio | Tier 1 Leverage Ratio | Common Equity Tier 1 | |||||||||||||||||||||
(dollars in thousands) | ||||||||||||||||||||||||||||
December 31, 2016 | ||||||||||||||||||||||||||||
WAL | $ | 2,107,480 | $ | 1,675,871 | $ | 15,980,092 | $ | 16,868,674 | 13.2 | % | 10.5 | % | 9.9 | % | 10.0 | % | ||||||||||||
WAB | 2,001,081 | 1,720,072 | 15,888,346 | 16,764,327 | 12.6 | 10.8 | 10.3 | 10.8 | ||||||||||||||||||||
Well-capitalized ratios | 10.0 | 8.0 | 5.0 | 6.5 | ||||||||||||||||||||||||
Minimum capital ratios | 8.0 | 6.0 | 4.0 | 4.5 | ||||||||||||||||||||||||
December 31, 2015 | ||||||||||||||||||||||||||||
WAL | $ | 1,603,472 | $ | 1,341,011 | $ | 13,193,563 | $ | 13,683,148 | 12.2 | % | 10.2 | % | 9.8 | % | 9.7 | % | ||||||||||||
WAB | 1,485,070 | 1,213,304 | 13,073,394 | 13,561,251 | 11.4 | 9.3 | 9.0 | 9.3 | ||||||||||||||||||||
Well-capitalized ratios | 10.0 | 8.0 | 5.0 | 6.5 | ||||||||||||||||||||||||
Minimum capital ratios | 8.0 | 6.0 | 4.0 | 4.5 | ||||||||||||||||||||||||
19. EMPLOYEE BENEFIT PLANS
The Company has a qualified 401(k) employee benefit plan for all eligible employees. Participants are able to defer between 1% and 100% (up to a maximum of $18,000 for those under 50 years of age and up to a maximum of $24,000 for those over 50 years of age in 2016) of their annual compensation. The Company may elect to match a discretionary amount each year, which is 50% of the first 6% of the participant’s compensation deferred into the plan. The Company’s contributions to this plan total $2.7 million, $2.2 million, and $1.7 million for the years ended December 31, 2016, 2015, and 2014, respectively.
In addition, the Company maintains a non-qualified 401(k) restoration plan for the benefit of executives of the Company and certain affiliates. Participants are able to defer a portion of their annual salary and receive a matching contribution based
143
primarily on the contribution structure in effect under the Company’s 401(k) plan, but without regard to certain statutory limitations applicable under the 401(k) plan. The Company’s total contribution to the restoration plan was $117,000, $68,000, and $77,000 for the years ended December 31, 2016, 2015, and 2014, respectively.
In connection with the Bridge acquisition, the Company assumed Bridge's SERP, an unfunded noncontributory defined benefit pension plan. The SERP provides retirement benefits to certain Bridge officers based on years of service and final average salary. The Company uses a December 31st measurement date for this plan.
The following table reflects the accumulated benefit obligation and funded status of the SERP:
December 31, 2016 | Six Months Ended December 31, 2015 | |||||||
(in thousands) | ||||||||
Change in benefit obligation | ||||||||
Benefit obligation at beginning of period | $ | 7,444 | $ | 7,122 | ||||
Service cost | 680 | 334 | ||||||
Interest cost | 425 | 202 | ||||||
Actuarial (gains)/losses | (88 | ) | (147 | ) | ||||
Expected benefits paid | (67 | ) | (67 | ) | ||||
Projected benefit obligation at end of year | $ | 8,394 | $ | 7,444 | ||||
Unfunded projected/accumulated benefit obligation | (8,394 | ) | (7,444 | ) | ||||
Additional liability | $ | — | $ | — | ||||
Weighted average assumptions to determine benefit obligation | ||||||||
Discount rate | 5.75 | % | 5.75 | % | ||||
Rate of compensation increase | 4.00 | % | 4.00 | % | ||||
The components of net periodic benefit cost recognized through December 31, 2016 and the amounts in accumulated other comprehensive income expected to be recognized as components of net periodic benefit cost during 2017 are as follows:
Year Ended | Six Months Ended December 31, 2015 | |||||||||||
2017 | 2016 | |||||||||||
(in thousands) | ||||||||||||
Components of net periodic benefit cost | ||||||||||||
Service cost | $ | 602 | $ | 614 | $ | 334 | ||||||
Interest cost | 480 | 425 | 202 | |||||||||
Amortization of prior service cost | 103 | 101 | 60 | |||||||||
Amortization of actuarial (gains)/losses | (109 | ) | (100 | ) | (18 | ) | ||||||
Net periodic benefit cost | $ | 1,076 | $ | 1,040 | $ | 578 | ||||||
Other comprehensive income (cost) | $ | (6 | ) | $ | 1 | $ | 42 | |||||
144
20. RELATED PARTY TRANSACTIONS
Principal stockholders, directors, and executive officers of the Company, together with the companies they control, are considered to be related parties. In the ordinary course of business, the Company engages in various related party transactions, including extending credit, accepting deposits, and service transactions.
Federal banking regulations require that any extensions of credit to insiders and their related interests not be offered on terms more favorable than would be offered to non-related borrowers of similar creditworthiness. The following table summarizes the aggregate activity in such loans for the periods indicated:
Year Ended December 31, | ||||||||
2016 | 2015 | |||||||
(in thousands) | ||||||||
Balance, beginning | $ | 74,381 | $ | 70,570 | ||||
New loans | 637 | 10,678 | ||||||
Advances | 1,980 | 18,614 | ||||||
Repayments and other | (60,124 | ) | (25,481 | ) | ||||
Balance, ending | $ | 16,874 | $ | 74,381 | ||||
None of these loans are past due, on non-accrual status or have been restructured to provide a reduction or deferral of interest or principal because of deterioration in the financial position of the borrower. There were no loans to a related party that were considered classified loans at December 31, 2016 or 2015. The interest income associated with these loans was approximately $0.6 million, $2.7 million and $1.9 million for the years ended December 31, 2016, 2015, and 2014, respectively.
Loan commitments outstanding with related parties totaled approximately $46.6 million and $164.5 million at December 31, 2016 and 2015, respectively.
The Company also accepts deposits from related parties which totaled $97.3 million and $76.0 million at December 31, 2016 and 2015, respectively, with related interest expense totaling less than $0.2 million during each of the years ended December 31, 2016, 2015, and 2014. In addition, the Company engages in certain activities with related parties for sponsorships, donations, and other services during the normal course of business. Those expenses totaled less than $1.0 million during each of the years ended December 31, 2016 and 2015 and less than $2.0 million for the year ended December 31, 2014.
145
21. PARENT COMPANY FINANCIAL INFORMATION
The condensed financial statements of the holding company are presented in the following tables:
WESTERN ALLIANCE BANCORPORATION
Condensed Balance Sheets
December 31, | ||||||||
2016 | 2015 | |||||||
(in thousands) | ||||||||
ASSETS: | ||||||||
Cash and cash equivalents | $ | 11,409 | $ | 7,627 | ||||
Money market investments | — | 122 | ||||||
Investment securities - AFS | 34,562 | 50,507 | ||||||
Investment in bank subsidiaries | 2,003,550 | 1,522,245 | ||||||
Investment in non-bank subsidiaries | 46,140 | 4,948 | ||||||
Loans, net of deferred loan fees and costs and allowance for credit losses (1) | — | 35,635 | ||||||
Other assets acquired through foreclosure, net (1) | — | 14,471 | ||||||
Other assets | 29,400 | 16,854 | ||||||
Total assets | $ | 2,125,061 | $ | 1,652,409 | ||||
LIABILITIES AND STOCKHOLDERS' EQUITY: | ||||||||
Qualifying debt | $ | 216,838 | $ | 58,370 | ||||
Accrued interest and other liabilities | 16,694 | 2,537 | ||||||
Total liabilities | 233,532 | 60,907 | ||||||
Total stockholders’ equity | 1,891,529 | 1,591,502 | ||||||
Total liabilities and stockholders’ equity | $ | 2,125,061 | $ | 1,652,409 | ||||
(1) | During the year ended December 31, 2016, the Parent Company contributed these assets to its non-banking subsidiary, LVSP. |
WESTERN ALLIANCE BANCORPORATION
Condensed Income Statements
Year Ended December 31, | ||||||||||||
2016 | 2015 | 2014 | ||||||||||
(in thousands) | ||||||||||||
Income: | ||||||||||||
Dividends from subsidiaries | $ | 12,795 | $ | 140,900 | $ | 67,515 | ||||||
Interest income | 3,327 | 4,593 | 4,381 | |||||||||
Non-interest income | 2,445 | 586 | 1,235 | |||||||||
Total income | 18,567 | 146,079 | 73,131 | |||||||||
Expense: | ||||||||||||
Interest expense | 6,975 | 6,671 | 8,776 | |||||||||
Non-interest expense | 9,221 | 11,397 | 10,348 | |||||||||
Total expense | 16,196 | 18,068 | 19,124 | |||||||||
Income before income taxes and equity in undistributed earnings of subsidiaries | 2,371 | 128,011 | 54,007 | |||||||||
Income tax benefit | 4,399 | 5,876 | 5,388 | |||||||||
Income before equity in undistributed earnings of subsidiaries | 6,770 | 133,887 | 59,395 | |||||||||
Equity in undistributed earnings of subsidiaries | 253,028 | 60,357 | 88,556 | |||||||||
Net income | 259,798 | 194,244 | 147,951 | |||||||||
Dividends on preferred stock | — | 750 | 1,387 | |||||||||
Net income available to common stockholders | $ | 259,798 | $ | 193,494 | $ | 146,564 | ||||||
146
Western Alliance Bancorporation
Condensed Statements of Cash Flows
Year Ended December 31, | |||||||||||
2016 | 2015 | 2014 | |||||||||
(in thousands) | |||||||||||
Cash flows from operating activities: | |||||||||||
Net income | $ | 259,798 | $ | 194,244 | $ | 147,951 | |||||
Adjustments to reconcile net income to net cash (used in) provided by operating activities: | |||||||||||
Equity in net undistributed earnings of subsidiaries | (253,028 | ) | (60,357 | ) | (88,556 | ) | |||||
Excess tax benefit of stock-based compensation | (359 | ) | (1,945 | ) | (4,194 | ) | |||||
Junior subordinated debt change in fair value | — | — | (1,421 | ) | |||||||
Loss on extinguishment of debt | — | — | 502 | ||||||||
Other operating activities, net | (9,521 | ) | 2,869 | (15,928 | ) | ||||||
Net cash (used in) provided by operating activities | (3,110 | ) | 134,811 | 38,354 | |||||||
Cash flows from investing activities: | |||||||||||
Purchases of securities | (20,148 | ) | — | (23,431 | ) | ||||||
Principal pay downs, calls, maturities, and sales proceeds of securities, net | 34,390 | 2,358 | 8,376 | ||||||||
Proceeds from sale of other repossessed assets, net | — | 4,138 | 9,610 | ||||||||
Capital contributions to subsidiaries | (226,869 | ) | — | — | |||||||
Loans purchases, fundings, and principal collections, net | 2,770 | 3,704 | 3,286 | ||||||||
Sale (purchase) of money market investments, net | 121 | 330 | 2,181 | ||||||||
Sale (purchase) of premises, equipment, and other assets, net | — | — | 617 | ||||||||
Net cash and cash equivalents (used) in acquisition (1) | — | (19,440 | ) | — | |||||||
Net cash (used in) provided by investing activities | (209,736 | ) | (8,910 | ) | 639 | ||||||
Cash flows from financing activities: | |||||||||||
Proceeds from issuance of subordinated debt | 169,256 | — | — | ||||||||
Cash paid for tax withholding on vested restricted stock | (9,483 | ) | (7,603 | ) | (4,112 | ) | |||||
Proceeds from other borrowings, net | — | — | 22,000 | ||||||||
Excess tax benefit of stock-based compensation | — | 1,945 | 4,194 | ||||||||
Repayments on other borrowings | — | (83,444 | ) | (6,501 | ) | ||||||
Proceeds from issuance of common stock | 55,785 | 28,288 | 13,746 | ||||||||
Proceeds from exercise of stock options | 1,070 | 1,935 | 8,294 | ||||||||
Redemption of preferred stock | — | (70,500 | ) | (70,500 | ) | ||||||
Cash dividends paid on preferred stock | — | (750 | ) | (1,387 | ) | ||||||
Net cash provided by (used) in financing activities | 216,628 | (130,129 | ) | (34,266 | ) | ||||||
Net increase (decrease) in cash and cash equivalents | 3,782 | (4,228 | ) | 4,727 | |||||||
Cash and cash equivalents at beginning of year | 7,627 | 11,855 | 7,128 | ||||||||
Cash and cash equivalents at end of year | $ | 11,409 | $ | 7,627 | $ | 11,855 | |||||
Supplemental disclosure: | |||||||||||
Cash paid during the year for: | |||||||||||
Interest | $ | 5,165 | $ | 4,235 | $ | 9,067 | |||||
Income taxes | 189 | 54,590 | 32,238 | ||||||||
Non-cash investing and financing activity: | |||||||||||
Change in unrealized (loss) gain on AFS securities, net of tax | (1,984 | ) | 1,199 | 2,031 | |||||||
Change in unrealized (loss) gain on junior subordinated debt, net of tax | (2,077 | ) | (4,276 | ) | — | ||||||
Loan and OREO contributions to subsidiaries | 50,773 | 183 | 2,663 | ||||||||
(1) | Cash acquired, less cash consideration paid of $36.5 million, resulted in a net $19.4 million use of cash and cash equivalents in the acquisition. |
147
22. SEGMENTS
The Company's reportable segments are aggregated based primarily on geographic location, services offered, and markets served. The Company's regional segments, which include Arizona, Nevada, Southern California, and Northern California, provide full service banking and related services to their respective markets. The operations from the regional segments correspond to the following banking divisions: ABA in Arizona, BON and FIB in Nevada, TPB in Southern California, and Bridge in Northern California.
The Company's NBL segments provide specialized banking services to niche markets. With the purchase of GE's domestic select-service hotel franchise loan portfolio on April 20, 2016, management has created a new operating segment called HFF, which is now included as one of the Company's NBL reportable segments. The Company's other NBL reportable segments include HOA Services, Public & Nonprofit Finance, Technology & Innovation, and Other NBLs. These NBLs are managed centrally and are broader in geographic scope than the Company's other segments, though still predominately located within the Company's core market areas. The HOA Services NBL corresponds to the AAB division. The newly created HFF NBL includes the hotel franchise loan portfolio purchased from GE. The operations of Public and Nonprofit Finance are combined into one reportable segment. The Technology & Innovation NBL includes the operations of Equity Fund Resources, Life Sciences Group, Renewable Resource Group, and Technology Finance. The Other NBLs segment consists of Corporate Finance, Mortgage Warehouse Lending, and Resort Finance.
The Corporate & Other segment consists of corporate-related items, income and expense items not allocated to the Company's other reportable segments, and inter-segment eliminations.
The Company's segment reporting process begins with the assignment of all loan and deposit accounts directly to the segments where these products are originated and/or serviced. Equity capital is assigned to each segment based on the risk profile of their assets and liabilities. With the exception of goodwill, which is assigned a 100% weighting, equity capital allocations ranged from 0% to 12% during the year, with a funds credit provided for the use of this equity as a funding source. Any excess or deficient equity not allocated to segments based on risk is assigned to the Corporate & Other segment.
Net interest income, provision for credit losses, and non-interest expense amounts are recorded in their respective segment to the extent that the amounts are directly attributable to those segments. Net interest income is recorded in each segment on a TEB with a corresponding increase in income tax expense, which is eliminated in the Corporate & Other segment.
Further, net interest income of a reportable segment includes a funds transfer pricing process that matches assets and liabilities with similar interest rate sensitivity and maturity characteristics. Using this funds transfer pricing methodology, liquidity is transferred between users and providers. A net user of funds has lending/investing in excess of deposits/borrowings and a net provider of funds has deposits/borrowings in excess of lending/investing. A segment that is a user of funds is charged for the use of funds, while a provider of funds is credited through funds transfer pricing, which is determined based on the average life of the assets or liabilities in the portfolio.
Net income amounts for each reportable segment is further derived by the use of expense allocations. Certain expenses not directly attributable to a specific segment are allocated across all segments based on key metrics, such as number of employees, average loan balances, and average deposit balances. These types of expenses include information technology, operations, human resources, finance, risk management, credit administration, legal, and marketing.
Income taxes are applied to each segment based on the effective tax rate for the geographic location of the segment. Any difference in the corporate tax rate and the aggregate effective tax rates in the segments are adjusted in the Corporate & Other segment.
148
The following is a summary of operating segment balance sheet information for the periods indicated:
Regional Segments | ||||||||||||||||||||
Consolidated Company | Arizona | Nevada | Southern California | Northern California | ||||||||||||||||
At December 31, 2016 | (in millions) | |||||||||||||||||||
Assets: | ||||||||||||||||||||
Cash, cash equivalents, and investment securities | $ | 3,052.3 | $ | 1.9 | $ | 10.1 | $ | 2.1 | $ | 1.9 | ||||||||||
Loans, net of deferred loan fees and costs | 13,208.5 | 2,955.9 | 1,725.5 | 1,766.8 | 1,095.4 | |||||||||||||||
Less: allowance for credit losses | (124.7 | ) | (30.1 | ) | (18.5 | ) | (19.4 | ) | (8.8 | ) | ||||||||||
Total loans | 13,083.8 | 2,925.8 | 1,707.0 | 1,747.4 | 1,086.6 | |||||||||||||||
Other assets acquired through foreclosure, net | 47.8 | 6.2 | 18.0 | — | 0.3 | |||||||||||||||
Goodwill and other intangible assets, net | 302.9 | — | 23.7 | — | 157.5 | |||||||||||||||
Other assets | 714.0 | 42.9 | 58.8 | 14.5 | 14.3 | |||||||||||||||
Total assets | $ | 17,200.8 | $ | 2,976.8 | $ | 1,817.6 | $ | 1,764.0 | $ | 1,260.6 | ||||||||||
Liabilities: | ||||||||||||||||||||
Deposits | $ | 14,549.8 | $ | 3,843.4 | $ | 3,731.5 | $ | 2,382.6 | $ | 1,543.6 | ||||||||||
Borrowings and qualifying debt | 447.9 | — | — | — | — | |||||||||||||||
Other liabilities | 311.6 | 12.8 | 28.3 | 12.9 | 12.4 | |||||||||||||||
Total liabilities | 15,309.3 | 3,856.2 | 3,759.8 | 2,395.5 | 1,556.0 | |||||||||||||||
Allocated equity: | 1,891.5 | 346.6 | 250.7 | 201.6 | 283.7 | |||||||||||||||
Total liabilities and stockholders' equity | $ | 17,200.8 | $ | 4,202.8 | $ | 4,010.5 | $ | 2,597.1 | $ | 1,839.7 | ||||||||||
Excess funds provided (used) | — | 1,226.0 | 2,192.9 | 833.1 | 579.1 | |||||||||||||||
National Business Lines | ||||||||||||||||||||||||
HOA Services | Hotel Franchise Finance | Public & Nonprofit Finance | Technology & Innovation | Other NBL | Corporate & Other | |||||||||||||||||||
Assets: | (in millions) | |||||||||||||||||||||||
Cash, cash equivalents, and investment securities | $ | — | $ | — | $ | — | $ | — | $ | — | $ | 3,036.3 | ||||||||||||
Loans, net of deferred loan fees and costs | 116.8 | 1,292.1 | 1,454.3 | 1,011.4 | 1,776.9 | 13.4 | ||||||||||||||||||
Less: allowance for credit losses | (1.3 | ) | (0.8 | ) | (15.6 | ) | (10.6 | ) | (19.0 | ) | (0.6 | ) | ||||||||||||
Total loans | 115.5 | 1,291.3 | 1,438.7 | 1,000.8 | 1,757.9 | 12.8 | ||||||||||||||||||
Other assets acquired through foreclosure, net | — | — | — | — | — | 23.3 | ||||||||||||||||||
Goodwill and other intangible assets, net | — | 0.2 | — | 121.5 | — | — | ||||||||||||||||||
Other assets | 0.3 | 5.3 | 15.6 | 7.2 | 11.1 | 544.0 | ||||||||||||||||||
Total assets | $ | 115.8 | $ | 1,296.8 | $ | 1,454.3 | $ | 1,129.5 | $ | 1,769.0 | $ | 3,616.4 | ||||||||||||
Liabilities: | ||||||||||||||||||||||||
Deposits | $ | 1,890.3 | $ | — | $ | — | $ | 1,038.2 | $ | — | $ | 120.2 | ||||||||||||
Borrowings and qualifying debt | — | — | — | — | — | 447.9 | ||||||||||||||||||
Other liabilities | 0.7 | 1.4 | 50.5 | 2.0 | 17.5 | 173.1 | ||||||||||||||||||
Total liabilities | 1,891.0 | 1.4 | 50.5 | 1,040.2 | 17.5 | 741.2 | ||||||||||||||||||
Allocated equity: | 65.6 | 107.1 | 117.1 | 224.1 | 145.5 | 149.5 | ||||||||||||||||||
Total liabilities and stockholders' equity | $ | 1,956.6 | $ | 108.5 | $ | 167.6 | $ | 1,264.3 | $ | 163.0 | $ | 890.7 | ||||||||||||
Excess funds provided (used) | 1,840.8 | (1,188.3 | ) | (1,286.7 | ) | 134.8 | (1,606.0 | ) | (2,725.7 | ) | ||||||||||||||
149
Regional Segments | ||||||||||||||||||||
Consolidated Company | Arizona | Nevada | Southern California | Northern California | ||||||||||||||||
At December 31, 2015 | (in millions) | |||||||||||||||||||
Assets: | ||||||||||||||||||||
Cash, cash equivalents, and investment securities | $ | 2,266.8 | $ | 2.3 | $ | 9.5 | $ | 2.4 | $ | 2.4 | ||||||||||
Loans, net of deferred loan fees and costs | 11,136.7 | 2,811.7 | 1,737.2 | 1,761.9 | 1,188.4 | |||||||||||||||
Less: allowance for credit losses | (119.1 | ) | (30.1 | ) | (18.6 | ) | (18.8 | ) | (12.7 | ) | ||||||||||
Total loans | 11,017.6 | 2,781.6 | 1,718.6 | 1,743.1 | 1,175.7 | |||||||||||||||
Other assets acquired through foreclosure, net | 43.9 | 8.4 | 20.8 | — | 0.3 | |||||||||||||||
Goodwill and other intangible assets, net | 305.4 | — | 24.8 | — | 158.2 | |||||||||||||||
Other assets | 641.4 | 43.9 | 62.3 | 15.7 | 16.1 | |||||||||||||||
Total assets | $ | 14,275.1 | $ | 2,836.2 | $ | 1,836.0 | $ | 1,761.2 | $ | 1,352.7 | ||||||||||
Liabilities: | ||||||||||||||||||||
Deposits | $ | 12,030.6 | $ | 2,880.7 | $ | 3,382.8 | $ | 1,902.5 | $ | 1,541.1 | ||||||||||
Borrowings and qualifying debt | 360.3 | — | — | — | — | |||||||||||||||
Other liabilities | 292.7 | 12.2 | 29.0 | 7.8 | 11.2 | |||||||||||||||
Total liabilities | 12,683.6 | 2,892.9 | 3,411.8 | 1,910.3 | 1,552.3 | |||||||||||||||
Allocated equity: | 1,591.5 | 309.2 | 244.4 | 191.3 | 293.2 | |||||||||||||||
Total liabilities and stockholders' equity | $ | 14,275.1 | $ | 3,202.1 | $ | 3,656.2 | $ | 2,101.6 | $ | 1,845.5 | ||||||||||
Excess funds provided (used) | — | 365.9 | 1,820.2 | 340.4 | 492.8 | |||||||||||||||
National Business Lines | ||||||||||||||||||||
HOA Services | Public & Nonprofit Finance | Technology & Innovation | Other NBLs | Corporate & Other | ||||||||||||||||
Assets: | (in millions) | |||||||||||||||||||
Cash, cash equivalents, and investment securities | $ | — | $ | — | $ | — | $ | — | $ | 2,250.2 | ||||||||||
Loans, net of deferred loan fees and costs | 88.4 | 1,458.9 | 770.3 | 1,280.3 | 39.6 | |||||||||||||||
Less: allowance for credit losses | (0.9 | ) | (15.6 | ) | (8.2 | ) | (13.8 | ) | (0.4 | ) | ||||||||||
Total loans | 87.5 | 1,443.3 | 762.1 | 1,266.5 | 39.2 | |||||||||||||||
Other assets acquired through foreclosure, net | — | — | — | — | 14.4 | |||||||||||||||
Goodwill and other intangible assets, net | — | — | 122.4 | — | — | |||||||||||||||
Other assets | 0.2 | 14.0 | 2.7 | 11.5 | 475.0 | |||||||||||||||
Total assets | $ | 87.7 | $ | 1,457.3 | $ | 887.2 | $ | 1,278.0 | $ | 2,778.8 | ||||||||||
Liabilities: | ||||||||||||||||||||
Deposits | $ | 1,291.9 | $ | — | $ | 842.5 | $ | — | $ | 189.1 | ||||||||||
Borrowings and qualifying debt | — | — | — | — | 360.3 | |||||||||||||||
Other liabilities | 0.5 | 63.8 | — | 40.8 | 127.4 | |||||||||||||||
Total liabilities | 1,292.4 | 63.8 | 842.5 | 40.8 | 676.8 | |||||||||||||||
Allocated equity: | 34.2 | 87.8 | 200.9 | 105.7 | 124.8 | |||||||||||||||
Total liabilities and stockholders' equity | $ | 1,326.6 | $ | 151.6 | $ | 1,043.4 | $ | 146.5 | $ | 801.6 | ||||||||||
Excess funds provided (used) | 1,238.9 | (1,305.7 | ) | 156.2 | (1,131.5 | ) | (1,977.2 | ) | ||||||||||||
150
The following is a summary of operating segment income statement information for the periods indicated:
Regional Segments | ||||||||||||||||||||
Consolidated Company | Arizona | Nevada | Southern California | Northern California | ||||||||||||||||
Year Ended December 31, 2016: | (in thousands) | |||||||||||||||||||
Net interest income (expense) | $ | 657,213 | $ | 170,513 | $ | 137,507 | $ | 103,542 | $ | 88,162 | ||||||||||
Provision for (recovery of) credit losses | 8,000 | 9,912 | (3,337 | ) | (580 | ) | 2,587 | |||||||||||||
Net interest income (expense) after provision for credit losses | 649,213 | 160,601 | 140,844 | 104,122 | 85,575 | |||||||||||||||
Non-interest income | 42,915 | 6,887 | 8,622 | 2,550 | 10,422 | |||||||||||||||
Non-interest expense | (330,949 | ) | (63,406 | ) | (60,570 | ) | (45,643 | ) | (53,073 | ) | ||||||||||
Income (loss) before income taxes | 361,179 | 104,082 | 88,896 | 61,029 | 42,924 | |||||||||||||||
Income tax expense (benefit) | 101,381 | 40,832 | 31,113 | 25,663 | 18,049 | |||||||||||||||
Net income (loss) | $ | 259,798 | $ | 63,250 | $ | 57,783 | $ | 35,366 | $ | 24,875 | ||||||||||
National Business Lines | ||||||||||||||||||||||||
HOA Services | Hotel Franchise Finance | Public & Nonprofit Finance | Technology & Innovation | Other NBLs | Corporate & Other | |||||||||||||||||||
(in thousands) | ||||||||||||||||||||||||
Net interest income (expense) | $ | 41,539 | $ | 38,583 | $ | 20,900 | $ | 69,143 | $ | 49,893 | $ | (62,569 | ) | |||||||||||
Provision for (recovery of) credit losses | 256 | — | (183 | ) | (1,626 | ) | 4,200 | (3,229 | ) | |||||||||||||||
Net interest income (expense) after provision for credit losses | 41,283 | 38,583 | 21,083 | 70,769 | 45,693 | (59,340 | ) | |||||||||||||||||
Non-interest income | 460 | — | 59 | 6,728 | 2,315 | 4,872 | ||||||||||||||||||
Non-interest expense | (24,019 | ) | (8,544 | ) | (7,936 | ) | (31,271 | ) | (15,204 | ) | (21,283 | ) | ||||||||||||
Income (loss) before income taxes | 17,724 | 30,039 | 13,206 | 46,226 | 32,804 | (75,751 | ) | |||||||||||||||||
Income tax expense (benefit) | 6,647 | 11,265 | 4,952 | 17,335 | 12,302 | (66,777 | ) | |||||||||||||||||
Net income (loss) | $ | 11,077 | $ | 18,774 | $ | 8,254 | $ | 28,891 | $ | 20,502 | $ | (8,974 | ) | |||||||||||
151
Regional Segments | ||||||||||||||||||||
Consolidated Company | Arizona | Nevada | Southern California | Northern California (1) | ||||||||||||||||
Year Ended December 31, 2015: | (in thousands) | |||||||||||||||||||
Net interest income (expense) | $ | 492,576 | $ | 129,914 | $ | 122,082 | $ | 94,585 | $ | 56,698 | ||||||||||
Provision for (recovery of) credit losses | 3,200 | 3,099 | (6,887 | ) | 152 | 3,038 | ||||||||||||||
Net interest income (expense) after provision for credit losses | 489,376 | 126,815 | 128,969 | 94,433 | 53,660 | |||||||||||||||
Non-interest income | 29,768 | 4,204 | 9,202 | 2,697 | 5,161 | |||||||||||||||
Non-interest expense | (260,606 | ) | (59,917 | ) | (59,553 | ) | (47,549 | ) | (30,161 | ) | ||||||||||
Income (loss) before income taxes | 258,538 | 71,102 | 78,618 | 49,581 | 28,660 | |||||||||||||||
Income tax expense (benefit) | 64,294 | 27,893 | 27,516 | 20,849 | 12,051 | |||||||||||||||
Net income (loss) | $ | 194,244 | $ | 43,209 | $ | 51,102 | $ | 28,732 | $ | 16,609 | ||||||||||
National Business Lines | ||||||||||||||||||||
HOA Services | Public & Nonprofit Finance | Technology & Innovation (1) | Other NBLs | Corporate & Other | ||||||||||||||||
(in thousands) | ||||||||||||||||||||
Net interest income (expense) | $ | 25,572 | $ | 19,988 | $ | 30,137 | $ | 48,525 | $ | (34,925 | ) | |||||||||
Provision for (recovery of) credit losses | 232 | 2,655 | 2,264 | (1,234 | ) | (119 | ) | |||||||||||||
Net interest income (expense) after provision for credit losses | 25,340 | 17,333 | 27,873 | 49,759 | (34,806 | ) | ||||||||||||||
Non-interest income | 322 | 687 | 2,252 | 849 | 4,394 | |||||||||||||||
Non-interest expense | (18,059 | ) | (5,675 | ) | (7,596 | ) | (14,501 | ) | (17,595 | ) | ||||||||||
Income (loss) before income taxes | 7,603 | 12,345 | 22,529 | 36,107 | (48,007 | ) | ||||||||||||||
Income tax expense (benefit) | 2,851 | 4,630 | 8,448 | 13,540 | (53,484 | ) | ||||||||||||||
Net income (loss) | $ | 4,752 | $ | 7,715 | $ | 14,081 | $ | 22,567 | $ | 5,477 | ||||||||||
(1) | As the Bridge acquisition was completed on June 30, 2015, the results of operations of Bridge are included in the Company's Consolidated Income Statements beginning on July 1, 2015. |
152
Regional Segments | ||||||||||||||||||||
Consolidated Company | Arizona | Nevada | Southern California | Northern California | ||||||||||||||||
Year Ended December 31, 2014: | (in thousands) | |||||||||||||||||||
Net interest income (expense) | $ | 384,893 | $ | 112,128 | $ | 117,508 | $ | 91,090 | $ | 9,133 | ||||||||||
Provision for (recovery of) credit losses | 4,726 | 2,083 | (7,542 | ) | (1,638 | ) | — | |||||||||||||
Net interest income (expense) after provision for credit losses | 380,167 | 110,045 | 125,050 | 92,728 | 9,133 | |||||||||||||||
Non-interest income | 24,651 | 3,586 | 8,944 | 3,917 | 184 | |||||||||||||||
Non-interest expense | (207,319 | ) | (54,859 | ) | (59,683 | ) | (49,764 | ) | (3,857 | ) | ||||||||||
Income (loss) from continuing operations before income taxes | 197,499 | 58,772 | 74,311 | 46,881 | 5,460 | |||||||||||||||
Income tax expense (benefit) | 48,390 | 23,053 | 26,009 | 19,711 | 2,296 | |||||||||||||||
Income from continuing operations | 149,109 | 35,719 | 48,302 | 27,170 | 3,164 | |||||||||||||||
(Loss) from discontinued operations, net of tax | (1,158 | ) | — | — | — | — | ||||||||||||||
Net income | $ | 147,951 | $ | 35,719 | $ | 48,302 | $ | 27,170 | $ | 3,164 | ||||||||||
National Business Lines | ||||||||||||||||
HOA Services | Public & Nonprofit Finance | Other NBLs | Corporate & Other | |||||||||||||
(in thousands) | ||||||||||||||||
Net interest income (expense) | $ | 19,621 | $ | 15,215 | $ | 36,174 | $ | (15,976 | ) | |||||||
Provision for (recovery of) credit losses | 156 | 4,129 | 7,080 | 458 | ||||||||||||
Net interest income (expense) after provision for credit losses | 19,465 | 11,086 | 29,094 | (16,434 | ) | |||||||||||
Non-interest income | 214 | (68 | ) | 1,596 | 6,278 | |||||||||||
Non-interest expense | (13,757 | ) | (3,702 | ) | (10,345 | ) | (11,352 | ) | ||||||||
Income (loss) from continuing operations before income taxes | 5,922 | 7,316 | 20,345 | (21,508 | ) | |||||||||||
Income tax expense (benefit) | 2,221 | 2,744 | 7,629 | (35,273 | ) | |||||||||||
Income from continuing operations | 3,701 | 4,572 | 12,716 | 13,765 | ||||||||||||
(Loss) from discontinued operations, net of tax | — | — | — | (1,158 | ) | |||||||||||
Net income | $ | 3,701 | $ | 4,572 | $ | 12,716 | $ | 12,607 | ||||||||
153
23. QUARTERLY FINANCIAL DATA (UNAUDITED)
Year Ended December 31, 2016 | ||||||||||||||||
Fourth Quarter | Third Quarter | Second Quarter | First Quarter | |||||||||||||
(in thousands, except per share amounts) | ||||||||||||||||
Interest income | $ | 187,411 | $ | 184,750 | $ | 174,089 | $ | 154,256 | ||||||||
Interest expense | 12,142 | 12,203 | 10,403 | 8,545 | ||||||||||||
Net interest income | 175,269 | 172,547 | 163,686 | 145,711 | ||||||||||||
Provision for credit losses | 1,000 | 2,000 | 2,500 | 2,500 | ||||||||||||
Net interest income after provision for credit losses | 174,269 | 170,547 | 161,186 | 143,211 | ||||||||||||
Non-interest income | 10,540 | 10,683 | 8,559 | 13,133 | ||||||||||||
Non-interest expense | (88,645 | ) | (85,007 | ) | (81,804 | ) | (75,493 | ) | ||||||||
Income before provision for income taxes | 96,164 | 96,223 | 87,941 | 80,851 | ||||||||||||
Income tax expense | 26,364 | 29,171 | 26,327 | 19,519 | ||||||||||||
Net income available to common stockholders | $ | 69,800 | $ | 67,052 | $ | 61,614 | $ | 61,332 | ||||||||
Earnings per share: | ||||||||||||||||
Basic | $ | 0.67 | $ | 0.65 | $ | 0.60 | $ | 0.60 | ||||||||
Diluted | $ | 0.67 | $ | 0.64 | $ | 0.60 | $ | 0.60 | ||||||||
Year Ended December 31, 2015 | ||||||||||||||||
Fourth Quarter | Third Quarter (1) | Second Quarter (1) | First Quarter (1) | |||||||||||||
(in thousands, except per share amounts) | ||||||||||||||||
Interest income | $ | 151,331 | $ | 146,233 | $ | 116,618 | $ | 110,962 | ||||||||
Interest expense | 7,988 | 8,826 | 7,900 | 7,854 | ||||||||||||
Net interest income | 143,343 | 137,407 | 108,718 | 103,108 | ||||||||||||
Provision for credit losses | 2,500 | — | — | 700 | ||||||||||||
Net interest income after provision for credit losses | 140,843 | 137,407 | 108,718 | 102,408 | ||||||||||||
Non-interest income | 9,479 | 8,502 | 5,545 | 6,242 | ||||||||||||
Non-interest expense | (72,448 | ) | (72,916 | ) | (61,209 | ) | (54,033 | ) | ||||||||
Income before provision for income taxes | 77,874 | 72,993 | 53,054 | 54,617 | ||||||||||||
Income tax expense | 19,348 | 17,133 | 13,579 | 14,234 | ||||||||||||
Net income | 58,526 | 55,860 | 39,475 | 40,383 | ||||||||||||
Dividends on preferred stock | 151 | 176 | 247 | 176 | ||||||||||||
Net income available to common stockholders | $ | 58,375 | $ | 55,684 | $ | 39,228 | $ | 40,207 | ||||||||
Earnings per share: | ||||||||||||||||
Basic | $ | 0.58 | $ | 0.55 | $ | 0.44 | $ | 0.46 | ||||||||
Diluted | $ | 0.57 | $ | 0.55 | $ | 0.44 | $ | 0.45 | ||||||||
(1) | Due to the Company's election to early adopt an element of ASU 2016-01, changes in the fair value of junior subordinated debt are presented as part of OCI rather than earnings effective January 1, 2015. Accordingly, prior period 2015 amounts have been adjusted. |
154
Item 9. | Changes in and Disagreements with Accountants on Accounting and Financial Disclosure |
None.
Item 9A. | Controls and Procedures. |
As of the end of the period covered by this Annual Report on Form 10-K, an evaluation was carried out by the Company’s management, with the participation of its CEO and CFO, of the effectiveness of the Company’s disclosure controls and procedures (as defined in Rule 13a-15(e), under the Exchange Act. Based upon that evaluation, the Company’s Chief Executive Officer and Chief Financial Officer concluded that the disclosure controls and procedures were effective as of the end of the period covered by this report. No changes were made to the Company’s internal control over financial reporting (as defined in Rule 13a-15(f) under the Exchange Act) during the last fiscal quarter that materially affected, or are reasonably likely to materially affect, the Company’s internal control over financial reporting.
MANAGEMENTS REPORT ON INTERNAL CONTROL OVER FINANCIAL REPORTING
The management of WAL is responsible for establishing and maintaining adequate internal control over financial reporting. The Company’s internal control over financial reporting is a process designed under the supervision of the Company’s CEO and CFO to provide reasonable assurance regarding the reliability of financial reporting and the preparation of the Company’s financial statements for external purposes in accordance with U.S. generally accepted accounting principles.
As of December 31, 2016, management assessed the effectiveness of the Company’s internal control over financial reporting based on the criteria for effective internal control over financial reporting established in “Internal Control-Integrated Framework” issued by the COSO in 2013. Based on this assessment, management determined that the Company maintained effective internal control over financial reporting as of December 31, 2016, based on those criteria.
RSM US LLP, the independent registered public accounting firm that audited the Consolidated Financial Statements of the Company included in this Annual Report on Form 10-K has audited the effectiveness of the Company’s internal control over financial reporting as of December 31, 2016. Their report, which expresses an unqualified opinion on the effectiveness of the Company’s internal control over financial reporting as of December 31, 2016, is included herein.
155
REPORT OF INDEPENDENT REGISTERED PUBLIC ACCOUNTING FIRM
To the Board of Directors and Stockholders
Western Alliance Bancorporation
We have audited Western Alliance Bancorporation’s (the Company) internal control over financial reporting as of December 31, 2016, based on criteria established in Internal Control — Integrated Framework issued by the Committee of Sponsoring Organizations of the Treadway Commission in 2013. Western Alliance Bancorporation’s management is responsible for maintaining effective internal control over financial reporting and for its assessment of the effectiveness of internal control over financial reporting included in the accompanying Management’s Report on Internal Control Over Financial Reporting. Our responsibility is to express an opinion on the Company's internal control over financial reporting based on our audit.
We conducted our audit in accordance with the standards of the Public Company Accounting Oversight Board (United States). Those standards require that we plan and perform the audit to obtain reasonable assurance about whether effective internal control over financial reporting was maintained in all material respects. Our audit included obtaining an understanding of internal control over financial reporting, assessing the risk that a material weakness exists, and testing and evaluating the design and operating effectiveness of internal control based on the assessed risk. Our audit also included performing such other procedures as we considered necessary in the circumstances. We believe that our audit provides a reasonable basis for our opinion.
A company's internal control over financial reporting is a process designed to provide reasonable assurance regarding the reliability of financial reporting and the preparation of financial statements for external purposes in accordance with generally accepted accounting principles. A company's internal control over financial reporting includes those policies and procedures that (a) pertain to the maintenance of records that, in reasonable detail, accurately and fairly reflect the transactions and dispositions of the assets of the company; (b) provide reasonable assurance that transactions are recorded as necessary to permit preparation of financial statements in accordance with generally accepted accounting principles, and that receipts and expenditures of the company are being made only in accordance with authorizations of management and directors of the company; and (c) provide reasonable assurance regarding prevention or timely detection of unauthorized acquisition, use, or disposition of the company's assets that could have a material effect on the financial statements.
Because of its inherent limitations, internal control over financial reporting may not prevent or detect misstatements. Also, projections of any evaluation of effectiveness to future periods are subject to the risk that controls may become inadequate because of changes in conditions, or that the degree of compliance with the policies or procedures may deteriorate.
In our opinion, Western Alliance Bancorporation maintained, in all material respects, effective internal control over financial reporting as of December 31, 2016, based on criteria established in Internal Control — Integrated Framework issued by the Committee of Sponsoring Organizations of the Treadway Commission in 2013.
We have also audited, in accordance with the standards of the Public Company Accounting Oversight Board (United States), the Consolidated Financial Statements of Western Alliance Bancorporation and our report dated February 28, 2017 expressed an unqualified opinion.
/s/ RSM US LLP
Phoenix, Arizona
February 28, 2017
156
Item 9B. | Other Information |
On February 28, 2017, the Company entered into an indemnification agreement with each of the Company’s directors and officers (each, an “Indemnitee”), to be effective immediately upon execution, in the form approved by the BOD of the Company (the “Indemnification Agreement”).
The Indemnification Agreement clarifies and supplements the indemnification rights and obligations of the Indemnitee and Company already included in the Company’s Certificate of Incorporation and Bylaws and, for any directors or officers of the Company who were party to a prior indemnification agreement with the Company, supersedes such prior agreement. Under the terms of the Indemnification Agreement, subject to certain exceptions specified in the Indemnification Agreement, the Company will indemnify the Indemnitee to the fullest extent permitted by applicable law in the event the Indemnitee becomes subject to or a participant in certain claims or proceedings as a result of the Indemnitee’s service as a director or officer. The Company will also, subject to certain exceptions and repayment conditions, advance to the Indemnitee specified indemnifiable expenses incurred in connection with such claims or proceedings.
The foregoing description of the Indemnification Agreement does not purport to be complete and is qualified in its entirety by reference to the full and complete terms of the Indemnification Agreement, which is filed as Exhibit 10.10 to this Annual Report on Form 10-K and is incorporated herein by reference.
157
PART III
Item 10. | Directors, Executive Officers and Corporate Governance |
The information required by this item is incorporated by reference from the Company’s Definitive Proxy Statement for the 2017 Annual Meeting of Stockholders to be held on June 6, 2017.
The Company has adopted a Code of Business Conduct and Ethics applicable to all of its directors and employees, including the principal executive officer, principal financial officer and principal accounting officer. A copy of the Code of Business Conduct and Ethics is available on the Company’s website at www.westernalliancebancorporation.com.
Item 11. | Executive Compensation |
The information required by this item is incorporated by reference from the Company’s Definitive Proxy Statement for the 2017 Annual Meeting of Stockholders to be held on June 6, 2017.
Item 12. | Security Ownership of Certain Beneficial Owners and Management and Related Stockholder Matters |
The information required by this item is incorporated by reference from the Company’s Definitive Proxy Statement for the 2017 Annual Meeting of Stockholders to be held on June 6, 2017.
Item 13. | Certain Relationships and Related Transactions, and Director Independence |
The information required by this item is incorporated by reference from the Company’s Definitive Proxy Statement for the 2017 Annual Meeting of Stockholders to be held on June 6, 2017.
Item 14. | Principal Accountant Fees and Services |
The information required by this item is incorporated by reference from the Company’s Definitive Proxy Statement for the 2017 Annual Meeting of Stockholders to be held on June 6, 2017.
PART IV
Item 15. | EXHIBITS AND FINANCIAL STATEMENT SCHEDULES |
(1) | The following financial statements are incorporated by reference from Item 8 hereto: |
(2) | Financial Statement Schedules |
Not applicable.
On the Exhibit Index, a “±” identifies each management contract or compensatory plan or arrangement required to be filed as an exhibit to this Annual Report.
158
EXHIBITS
3.1 | Articles of Conversion, as filed with the Nevada Secretary of State on May 29, 2014 (incorporated by reference to Exhibit 3.1 of Western Alliance’s Form 8-K filed with the SEC on June 3, 2014). | |
3.2 | Certificate of Conversion, as filed with the Delaware Secretary of State on May 29, 2014 (incorporated by reference to Exhibit 3.2 of Western Alliance’s Form 8-K filed with the SEC on June 3, 2014). | |
3.3 | Certificate of Incorporation, as filed with the Delaware Secretary of State on May 29, 2014 (incorporated by reference to Exhibit 3.3 of Western Alliance’s Form 8-K filed with the SEC on June 3, 2014). | |
3.4 | Amended and Restated Bylaws of Western Alliance, effective as of May 19, 2015 (incorporated by reference to Exhibit 3.2 of Western Alliance's Form 8-K filed with the SEC on May 22, 2015). | |
3.5 | Certificate of Designation of Non-Cumulative Perpetual Preferred Stock, Series B, as filed with the Delaware Secretary of State on May 29, 2014 (incorporated by reference to Exhibit 3.4 of Western Alliance’s Form 8-K filed with the SEC on June 3, 2014). | |
3.6 | Certificate of Amendment of Certificate of Incorporation of Western Alliance, effective as of May 19, 2015 (incorporated by reference to Exhibit 3.1 of Western Alliance's Form 8-K filed with the SEC on May 22, 2015). | |
4.1 | Form of Common Stock Certificate (incorporated by reference to Exhibit 4.1 of Western Alliance’s Form 8-K filed with the SEC on June 3, 2014). | |
4.2 | Senior Debt Indenture, dated August 25, 2010, between Western Alliance and Wells Fargo Bank, National Association, as trustee. (incorporated by reference to Exhibit 4.1 of Western Alliance’s Form 8-K filed with the SEC on August 25, 2010). | |
4.3 | Form of Senior Debt Indenture (incorporated by reference to Exhibit 4.2 of Western Alliance's Form S-3 filed with the SEC on May 7, 2015). | |
4.4 | Form of Subordinated Debt Indenture (incorporated by reference to Exhibit 4.3 of Western Alliance's Form S-3 filed with the SEC on May 7, 2015). | |
4.5 | Form of 5.00% Fixed to Floating Rate Subordinated Bank Note due July 15, 2025 (incorporated by reference to Exhibit 4.1 of Western Alliance's Form 8-K filed with the SEC on July 2, 2015). | |
4.6 | Subordinated Debt Indenture, dated June 16, 2016, between Western Alliance and The Bank of New York Mellon Trust Company, N.A., as trustee (incorporated by reference to Exhibit 4.1 of Western Alliance's Form 8-K filed with the SEC on June 16, 2016). | |
4.7 | First Supplemental Indenture (including Form of Debenture) dated June 16, 2016 between Western Alliance and The Bank of New York Mellon Trust Company, N.A., as trustee (incorporated by reference to Exhibit 4.2 of Western Alliance's Form 8-K filed with the SEC on June 16, 2016). | |
4.8 | Form of Global Debenture dated June 16, 2016 (incorporated by reference to Exhibit 4.3 of Western Alliance's Form 8-K filed with the SEC on June 16, 2016). | |
10.1 | Western Alliance 2005 Stock Incentive Plan, as amended (incorporated by reference to Appendix G of the Registrant's definitive Proxy Statement on Schedule 14A filed with the Commission on April 2, 2014). ± | |
10.2 | Bridge Capital Holdings 2006 Equity Incentive Plan (incorporated by reference to Exhibit 4.11 of Western Alliance's Form S-8 filed with the SEC on July 2, 2015). ± | |
10.3 | Form of BankWest Nevada Corporation Incentive Stock Option Plan Agreement (incorporated by reference to Exhibit 10.3 of Western Alliance’s Registration Statement on Form S-1 filed with the SEC on April 28, 2005). ± | |
10.4 | Form of Western Alliance Incentive Stock Option Plan Agreement (incorporated by reference to Exhibit 10.4 of Western Alliance’s Registration Statement on Form S-1 filed with the SEC on April 28, 2005). ± | |
10.5 | Form of Western Alliance 2002 Stock Option Plan Agreement (incorporated by reference to Exhibit 10.5 of Western Alliance’s Registration Statement on Form S-1 filed with the SEC on April 28, 2005). ± | |
10.6 | Form of Western Alliance 2002 Stock Option Plan Agreement (with double trigger acceleration clause) (incorporated by reference to Exhibit 10.6 of Western Alliance’s Registration Statement on Form S-1 filed with the SEC on April 28, 2005). ± | |
10.7 | Form of Non-Competition Agreement (incorporated by reference to Exhibit 10.8 of Western Alliance’s Registration Statement on Form S-1 filed with the SEC on April 28, 2005). ± | |
10.8* | Western Alliance 2017 Annual Bonus Plan. ± | |
10.9 | Western Alliance Change in Control Severance Plan (incorporated by reference to Exhibit 10.1 of Western Alliance’s Form 8-K filed with the SEC on September 25, 2012). ± | |
10.10* | Form of Indemnification Agreement, dated February 24, 2017, by and between Western Alliance and each of Western Alliance's directors and executive officers. ± | |
159
21.1* | List of Subsidiaries of Western Alliance. | |
23.1* | Consent of RSM US LLP. | |
24.1* | Power of Attorney (see signature page). | |
31.1* | CEO Certification Pursuant Rule 13a-14(a)/15d-14(a). | |
31.2* | CFO Certification Pursuant Rule 13a-14(a)/15d-14(a). | |
32** | CEO and CFO Certification Pursuant to 18 U.S.C. Section 1350, as adopted pursuant to section 906 of the Sarbanes Oxley Act of 2002. | |
101.INS* | XBRL Instance Document. | |
101.SCH* | XBRL Taxonomy Extension Schema Document. | |
101.DEF* | XBRL Taxonomy Extension Definition Linkbase Document. | |
101.CAL* | XBRL Taxonomy Extension Calculation Linkbase Document. | |
101.LAB* | XBRL Taxonomy Extension Label Linkbase Document. | |
101.PRE* | XBRL Taxonomy Extension Presentation Linkbase Document. | |
* Filed herewith.
** Furnished herewith.
± Management contract or compensatory arrangement.
Stockholders may obtain copies of exhibits by writing to: Dale Gibbons, Western Alliance Bancorporation, One East Washington Street Suite 1400, Phoenix, AZ 85004.
Item 16. | EXHIBITS AND FINANCIAL STATEMENT SCHEDULES |
None.
160
SIGNATURES
Pursuant to the requirements of Section 13 or 15(d) of the Securities Exchange Act of 1934, the registrant has duly caused this report to be signed on its behalf by the undersigned, thereunto duly authorized.
WESTERN ALLIANCE BANCORPORATION | ||||
February 28, 2017 | By: | /s/ Robert Sarver | ||
Robert Sarver | ||||
Chairman of the Board and | ||||
Chief Executive Officer | ||||
KNOW ALL MEN BY THESE PRESENTS, that each person whose signature appears below constitutes and appoints Robert Sarver and Dale Gibbons, and each of them, his or her true and lawful attorneys-in-fact and agents, with full power of substitution and resubstitution, for him or her and in his or her name, place and stead, in any and all capacities, to sign any and all amendments to this Annual Report on Form 10-K, and to file the same, with all exhibits thereto and other documents in connection therewith the Securities and Exchange Commission, granting unto said attorneys-in-fact and agents, and each of them, full power and authority to do and perform each and every act and thing requisite and necessary to be done in and about the premises, as fully and to all intents and purposes as he or she might or could do in person hereby ratifying and confirming all that said attorneys-in-fact and agents, or his or her substitute or substitutes, may lawfully do or cause to be done by virtue hereof.
Pursuant to the requirements of the Securities Exchange Act of 1934, this report has been signed by the following persons on behalf of the registrant in their listed capacities on February 28, 2017.
161
Name | Title | |
/s/ Robert Sarver | Chairman of the Board and Chief Executive Officer | |
Robert Sarver | (Principal Executive Officer) | |
/s/ Dale Gibbons | Executive Vice President and Chief Financial | |
Dale Gibbons | Officer (Principal Financial Officer) | |
/s/ J. Kelly Ardrey Jr. | Senior Vice President and Chief Accounting Officer | |
J. Kelly Ardrey Jr. | (Principal Accounting Officer) | |
/s/ Bruce D. Beach | Director | |
Bruce D. Beach | ||
/s/ William S. Boyd | Director | |
William S. Boyd | ||
/s/ Howard Gould | Director | |
Howard Gould | ||
/s/ Steven J. Hilton | Director | |
Steven J. Hilton | ||
/s/ Robert Latta | Director | |
Robert Latta | ||
/s/ Marianne Boyd Johnson | Director | |
Marianne Boyd Johnson | ||
/s/ Cary Mack | Director | |
Cary Mack | ||
/s/ Todd Marshall | Director | |
Todd Marshall | ||
/s/ M. Nafees Nagy | Director | |
M. Nafees Nagy | ||
/s/ James Nave | Director | |
James Nave | ||
/s/ Michael Patriarca | Director | |
Michael Patriarca | ||
/s/ John Peter Sande III | Director | |
John Peter Sande III | ||
/s/ Donald D. Snyder | Director | |
Donald D. Snyder | ||
/s/ Sung Won Sohn | Director | |
Sung Won Sohn | ||
/s/ Kenneth A. Vecchione | Director | |
Kenneth A. Vecchione | ||
162