Exhibit 99.1
Western
Alliance Reports Second Quarter 2013 Net Income of $34.0 Million, or
$0.39 Per Share
PHOENIX--(BUSINESS WIRE)--July 18, 2013--Western Alliance Bancorporation
(NYSE:WAL) announced today its financial results for the second quarter
2013.
Second Quarter 2013 Highlights:
-
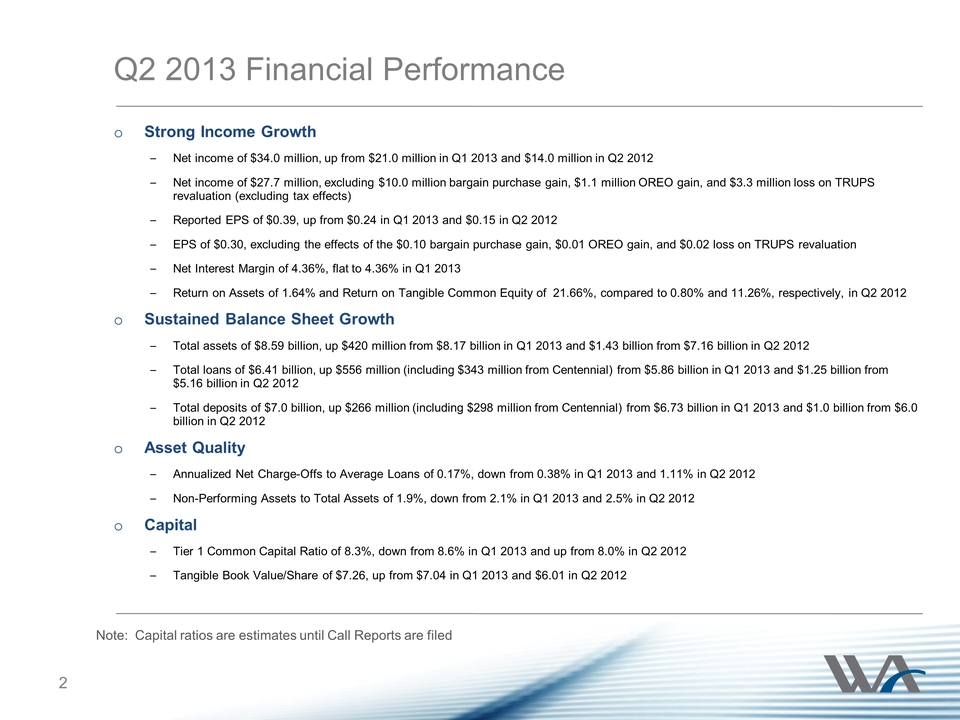
Net income of $34.0 million, compared to $21.0 million for the first
quarter 2013 and $14.0 million for the second quarter 2012
-
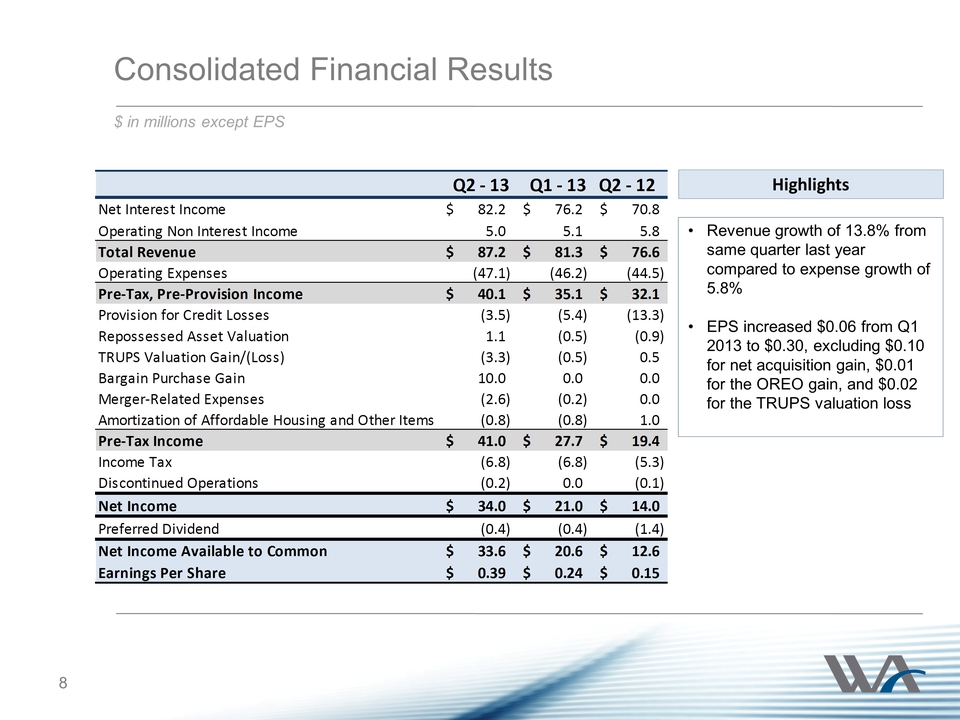
Net income of $27.7 million for the second quarter 2013, excluding a
$10.0 million bargain purchase gain from the acquisition of Centennial
Bank, a $3.3 million trust preferred fair value revaluation charge,
and a $1.1 million gain on OREO valuation (excluding tax effects)
-
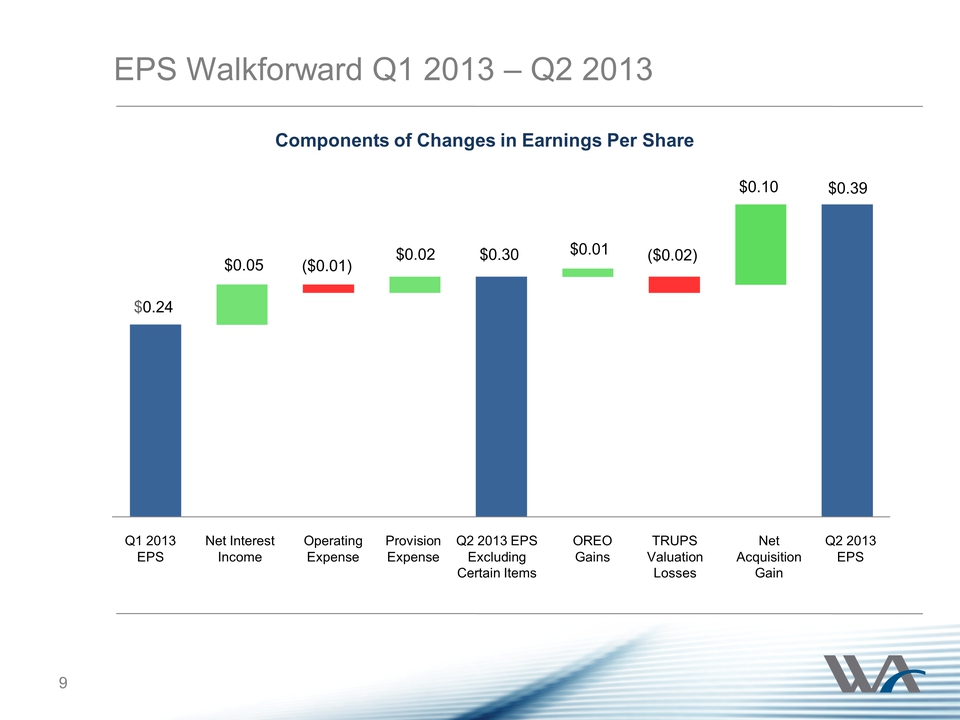
Earnings per share of $0.39, compared to $0.24 per share in the first
quarter 2013 and $0.15 per share in the second quarter 2012
-
Earnings per share of $0.30 for the second quarter 2013, excluding
$0.10 per share bargain purchase gain from the acquisition of
Centennial Bank, $0.02 trust preferred valuation charge, and $0.01
OREO valuation gain
-
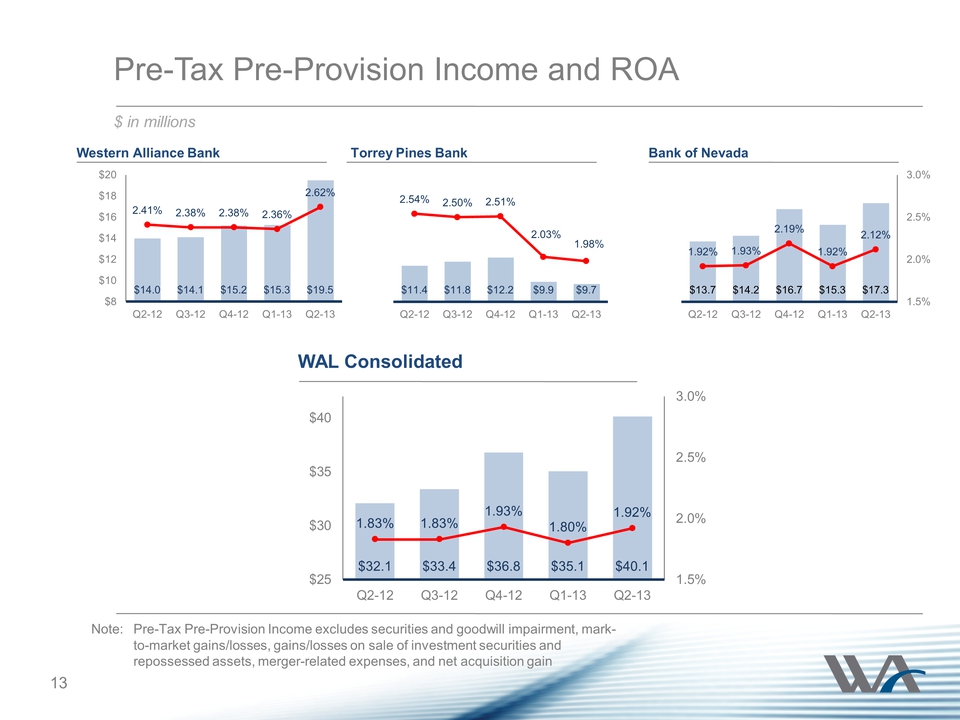
Pre-tax, pre-provision operating earnings of $40.1 million, up 14.4%
from $35.1 million in first quarter 2013 and from $32.1 million in
second quarter 20121
-
Net interest margin of 4.36%, compared to 4.36% in the first quarter
2013 and 4.46% in the second quarter 2012
-
Total loans of $6.41 billion, up $556 million from March 31, 2013, and
up $1.25 billion from June 30, 2012, including $343 million increase
from the acquisition of Centennial Bank, which closed on April 30, 2013
-
Total deposits of $7.00 billion, up $266 million from March 31, 2013
and up $1.00 billion from June 30, 2012, including $298 million
increase from the acquisition of Centennial Bank, which closed on
April 30, 2013
-
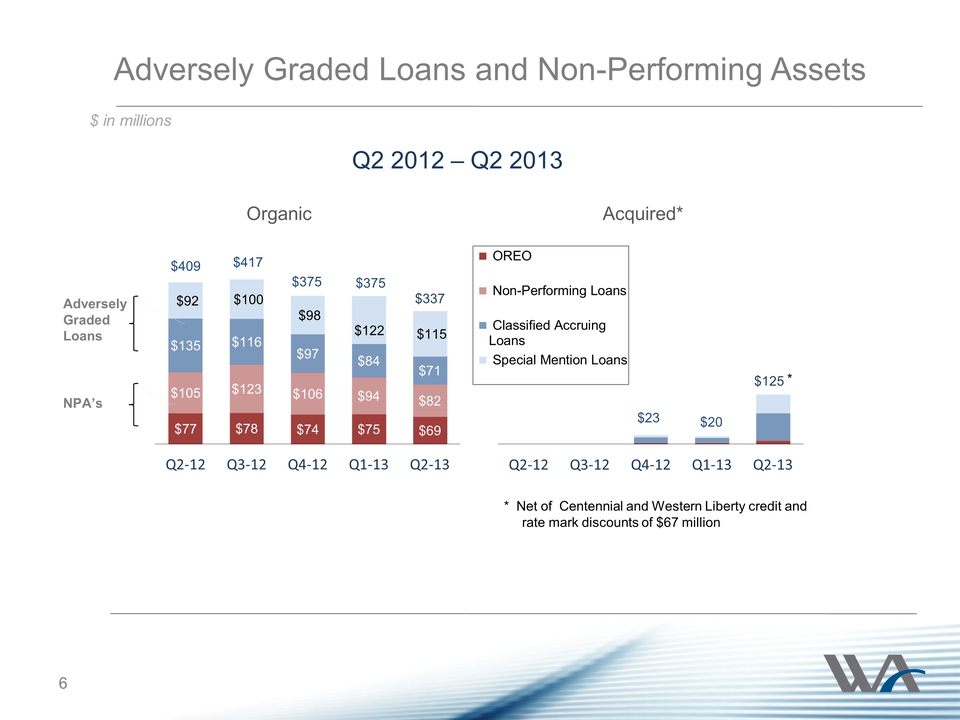
Nonperforming assets (nonaccrual loans and repossessed assets)
decreased to 1.9% of total assets from 2.1% in first quarter 2013 and
from 2.5% in second quarter 2012
-
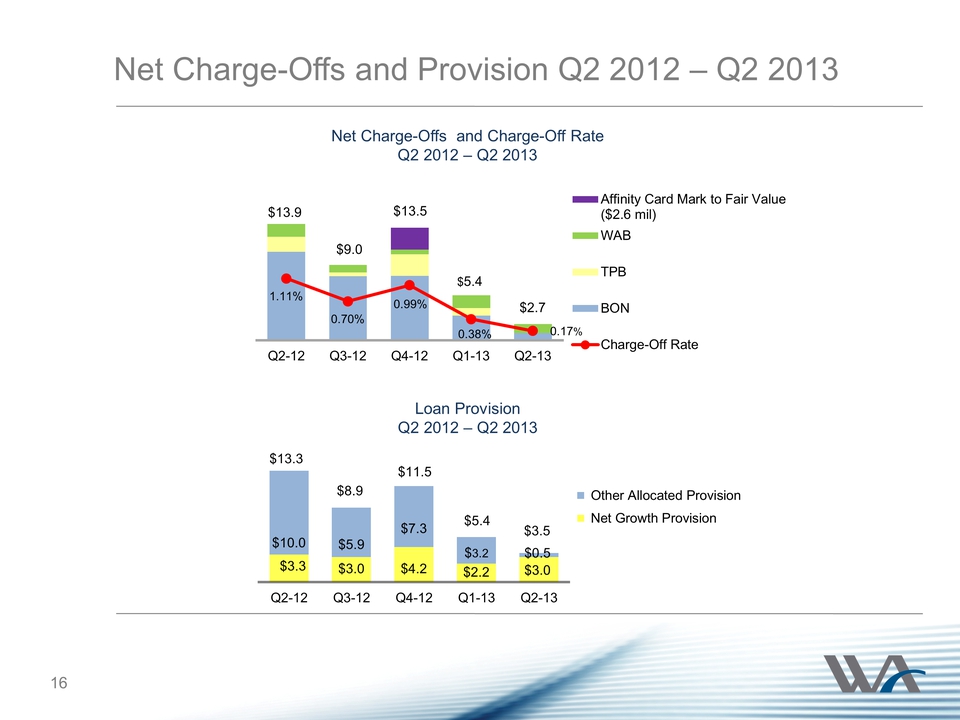
Net loan charge-offs (annualized) to average loans outstanding
decreased to 0.17% from 0.38% in the first quarter 2013 and 1.11% in
the second quarter 2012
-
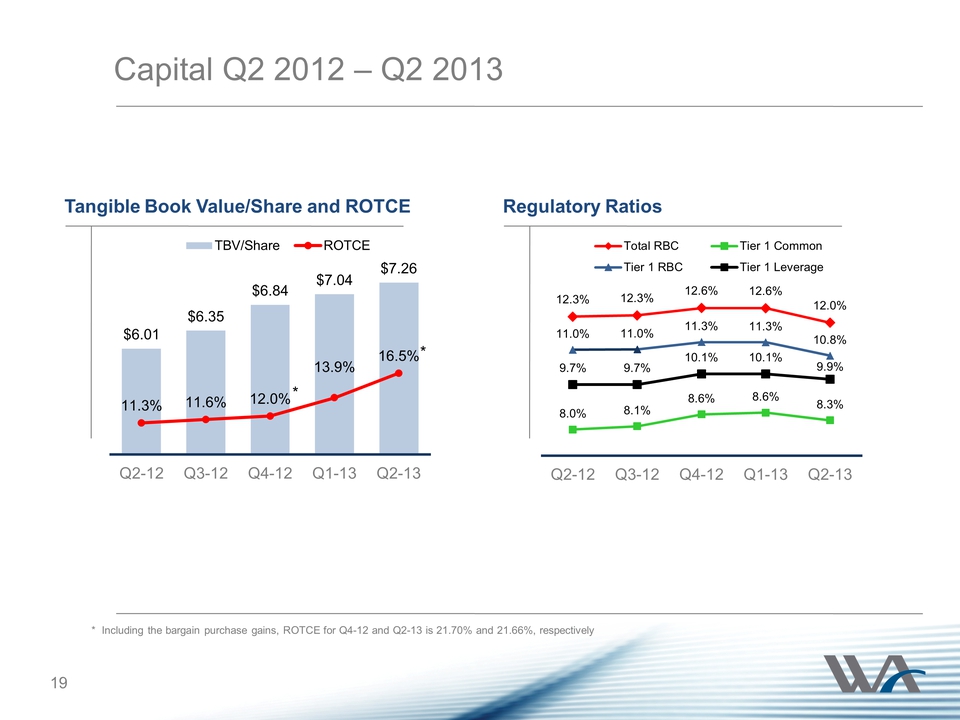
Tier I Leverage capital of 9.9% and Total Risk-Based Capital ratio of
12.0%, compared to 9.7% and 12.3% a year ago
-
Total equity of $800 million, up $128 million from June 30, 2012
Financial Performance
“Our proven business model of exceptional client service, strong credit
underwriting, and striving for continued performance improvement has
driven our record earnings for the second quarter,” said Robert Sarver,
Chairman and Chief Executive Officer of Western Alliance Bancorporation.
“On the revenue side, strong loan growth and disciplined pricing led to
record net interest income. Meanwhile, effective cost control and
leveraging our infrastructure resulted in improved operating efficiency,
as deposits per branch rose over 10% during the past year to $171
million. The acquisition of Centennial Bank augmented our results with a
bargain purchase gain and higher earning assets. Continued collection
activities and economic recovery resulted in a gain on sale of real
estate owned and a lower credit provision as non-performing loans and
repossessed assets fell to under 2%. We also invested in our future by
recruiting new members to our team and, on July 1st, opened
our 42nd office to more effectively serve the vibrant
Scottsdale Airpark market.”
Western Alliance Bancorporation reported net income of $34.0 million, or
$0.39 per share, in the second quarter 2013 (includes an $8.5 million
gain from the acquisition of Centennial Bank, net of merger related
expenses and tax), more than double the $14.0 million, or $0.15 per
share, earned one year ago. Key performance improvement drivers include
sustained organic balance sheet growth, prudent expense management, and
reduced legacy asset costs against the backdrop of improved economic
conditions.
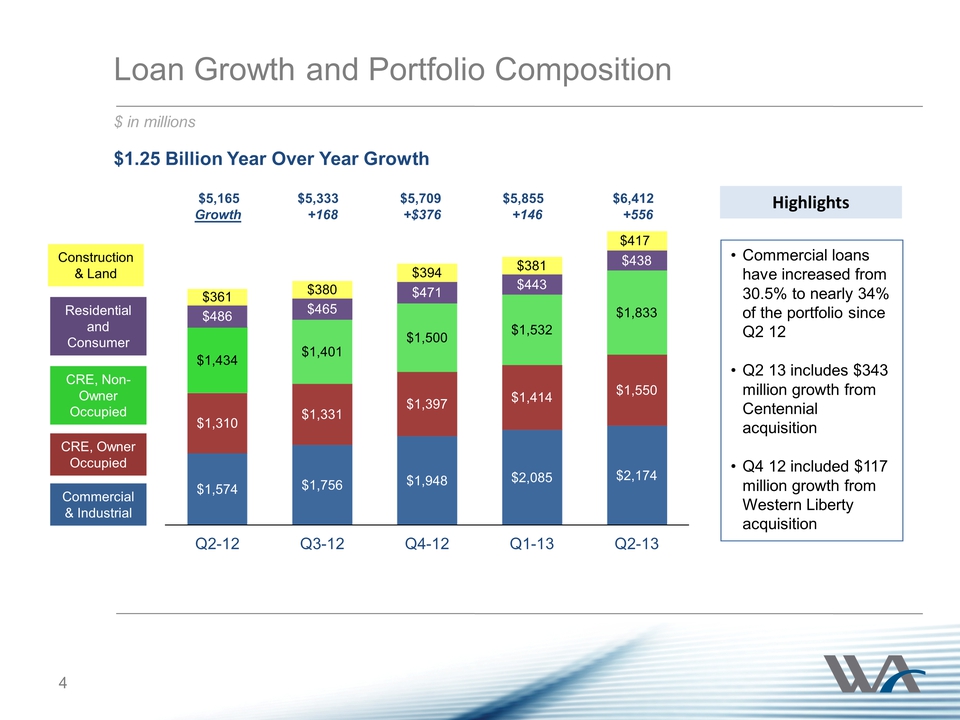
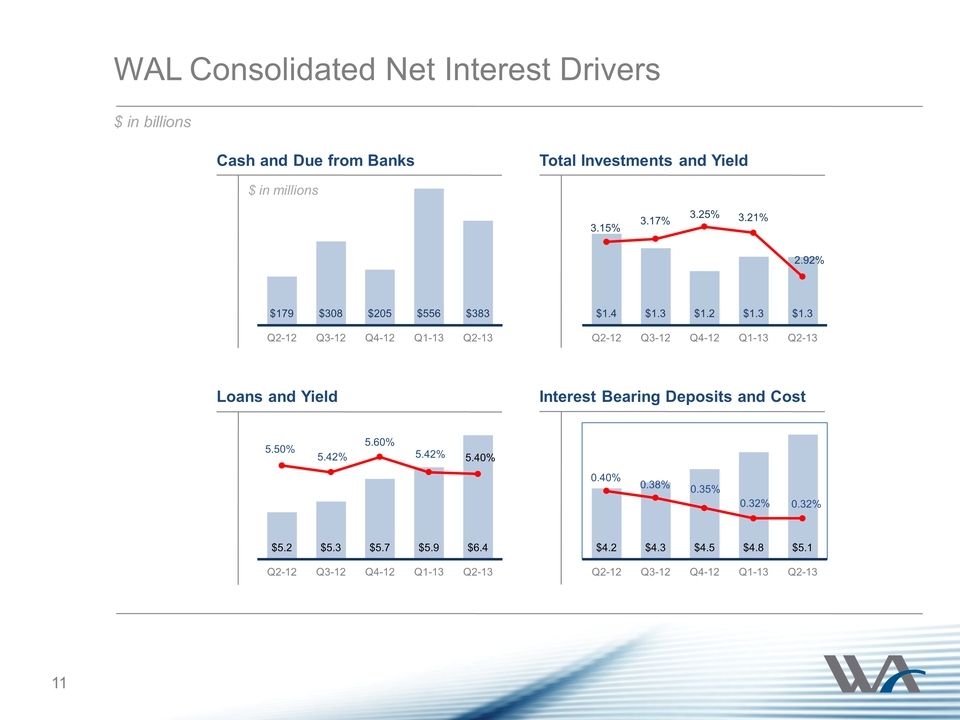
Total loans increased $556 million to $6.41 billion at June 30, 2013
from $5.86 billion on March 31, 2013. Loans increased $1.25 billion, or
24.1%, from June 30, 2012. The increases in each of these periods were
primarily driven by growth in commercial and industrial loans and
commercial real estate loans.
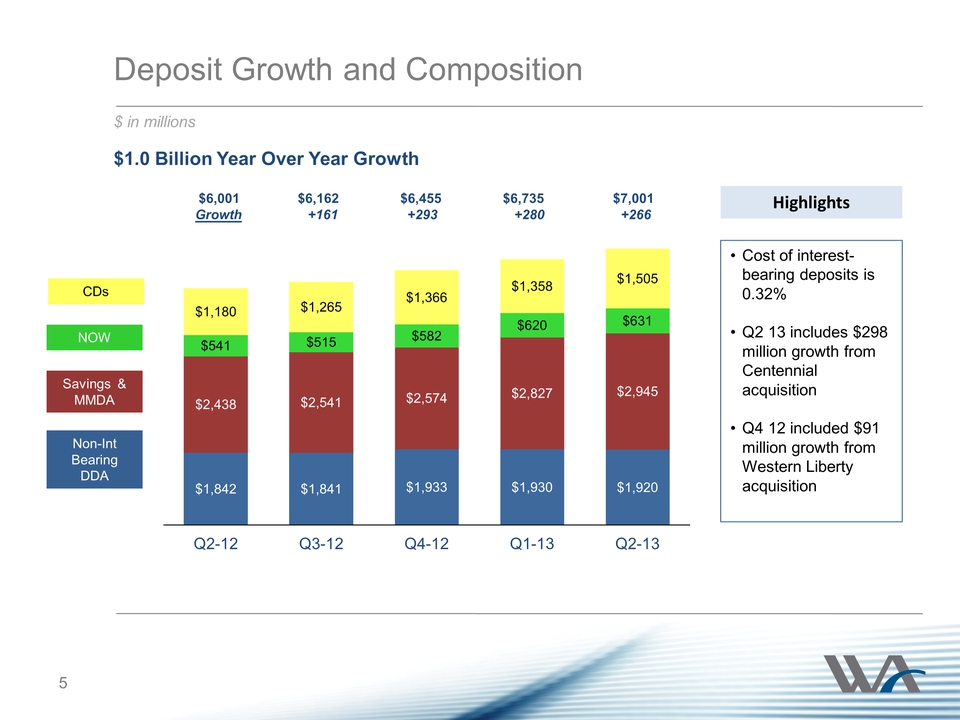
Total deposits increased $266 million to $7.00 billion at June 30, 2013
from $6.73 billion at March 31, 2013. Deposits increased $1.00 billion
from June 30, 2012. The increases in each of these periods were
primarily due to growth in certificates of deposits and savings and
money market deposits.
Income Statement
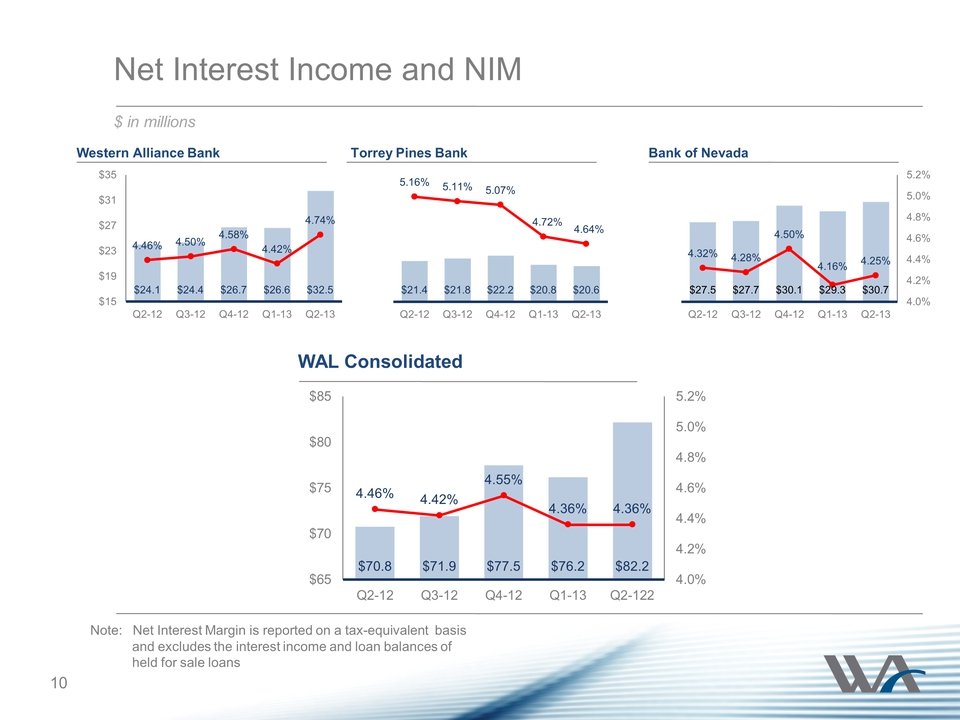
Net interest income was $82.2 million in the second quarter 2013, an
increase of $6.0 million, or 7.8%, from $76.2 million in the first
quarter of 2013 and an increase of $11.3 million, or 16.0%, compared to
the second quarter 2012. The Company’s net interest margin remained flat
in the second quarter 2013 at 4.36% compared to the first quarter 2013
and decreased from 4.46% in the second quarter 2012.
Operating non-interest income was $5.0 million for the second quarter
2013, down from $5.1 million in the first quarter of 2013 and down from
$5.8 million for the second quarter of 2012.1
Net revenue was $87.2 million for the second quarter 2013, up from $81.3
million for the first quarter of 2013 and an increase of 13.8% from
$76.6 million for the second quarter 2012.1
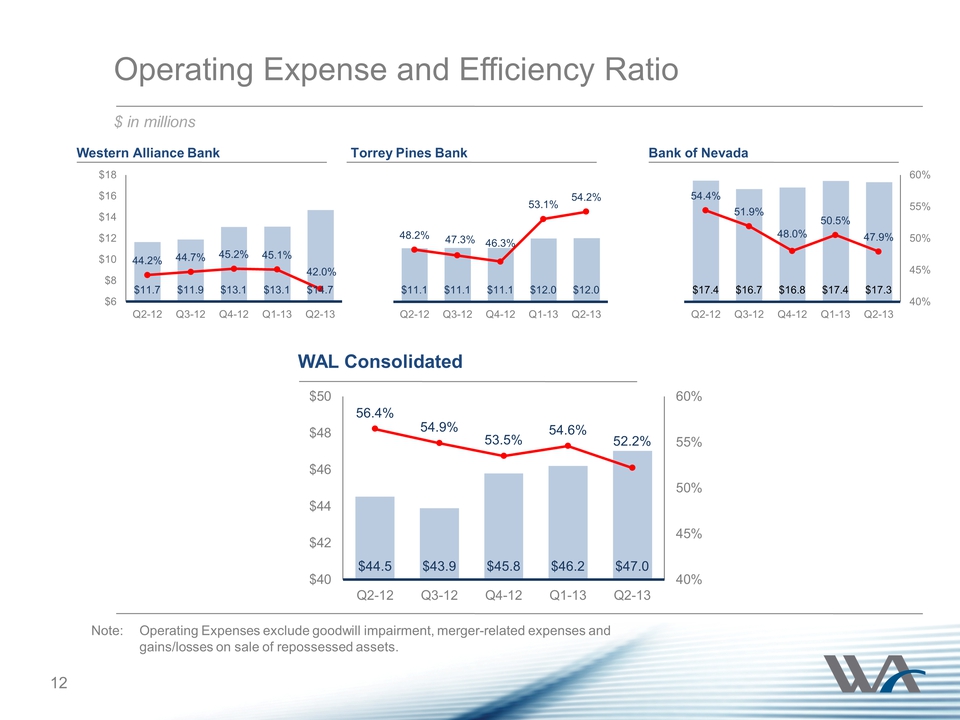
Operating non-interest expense was $47.0 million for the second quarter
2013, compared to $46.2 million for the first quarter of 2013 and $44.5
million for the second quarter of 2012.1 The Company’s
operating efficiency ratio1 on a tax equivalent basis was
52.2% for the second quarter 2013, an improvement from 54.6% for the
first quarter 2013 and 56.4% for the second quarter 2012 as the growth
rate in revenue continued to outpace that of expense.
The Company had 1,015 full-time equivalent employees and 41 offices at
June 30, 2013, compared to 953 employees and 39 offices one year ago.
The Company views its pre-tax, pre-provision operating earnings as a key
metric for assessing the Company’s earning power, which it defines as
net operating revenue less operating non-interest expense. For the
second quarter 2013, the Company’s performance was $40.1 million, up
from $35.1 million in the first quarter 2013 and up 25.2% from $32.1
million in the second quarter 2012.
The provision for credit losses was $3.5 million for the second quarter
2013, compared to $5.4 million for the first quarter 2013. The provision
for the second quarter of 2012 was $13.3 million. Net loan charge-offs
in the second quarter 2013 were $2.7 million, or 0.17% of average loans
(annualized), down from 0.38% of average loans (annualized) for the
first quarter 2013. Net charge-offs for the second quarter 2012 were
$13.9 million or 1.11% of average loans (annualized).
Nonaccrual loans decreased $11 million to $83 million during the
quarter. Loans past due 90 days and still accruing interest totaled $793
thousand at June 30, 2013, compared to $2 million at March 31, 2013 and
$795 thousand at June 30, 2012. Loans past due 30-89 days, still
accruing interest totaled $7 million at quarter end, down from $15
million at March 31, 2013 and down from $14 million at June 30, 2012.
As the Company’s asset quality improved and its capital increased, the
ratio of classified assets to Tier I capital plus the allowance for
credit losses, a common regulatory measure of asset quality, improved to
32% at June 30, 2013 from 42% at June 30, 2012.1
Net gain on sales and valuation of repossessed assets (primarily other
real estate) was $1.1 million for the second quarter 2013 compared to a
$0.5 million loss from the first quarter 2013 and a $0.9 million loss in
the second quarter 2012. At June 30, 2013, other repossessed assets
totaled $76.5 million compared to $77.9 million at March 31, 2013 and
$77.0 million one year ago. During the second quarter 2013, the
Company’s net sales proceeds received from other repossessed real estate
dispositions was 116.9% of carrying value.
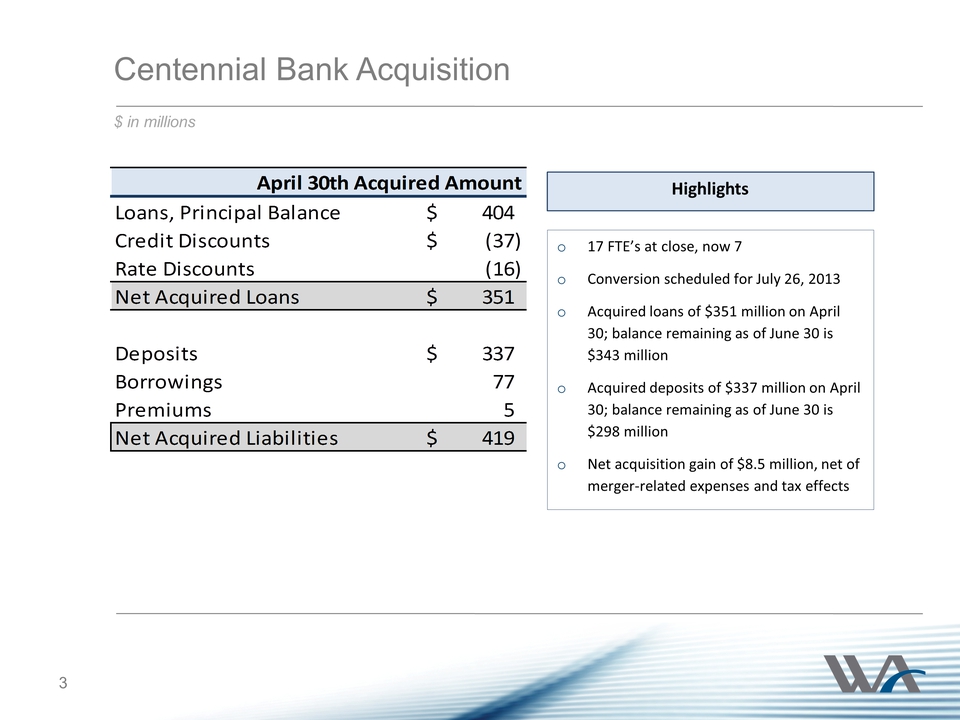
During the quarter, the Company completed its acquisition of Centennial
Bank, which increased assets, loans and deposits at June 30, 2013 by
$403 million, $343 million and $298 million, respectively, and recorded
a net acquisition gain of $8.5 million. Pursuant to the accounting
guidance, acquired net assets are recorded at estimated fair value. The
estimated fair value of certain net assets are preliminary and subject
to measurement period adjustments.
Balance Sheet
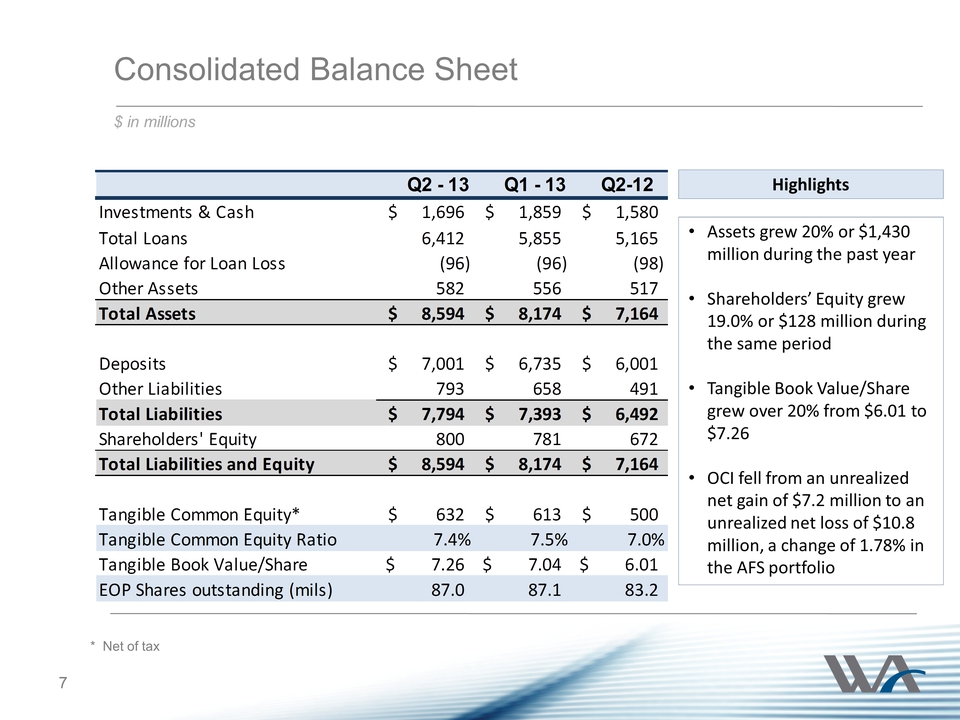
Gross loans totaled $6.41 billion at June 30, 2013, an increase of $556
million from March 31, 2013 and an increase of $1.25 billion from $5.16
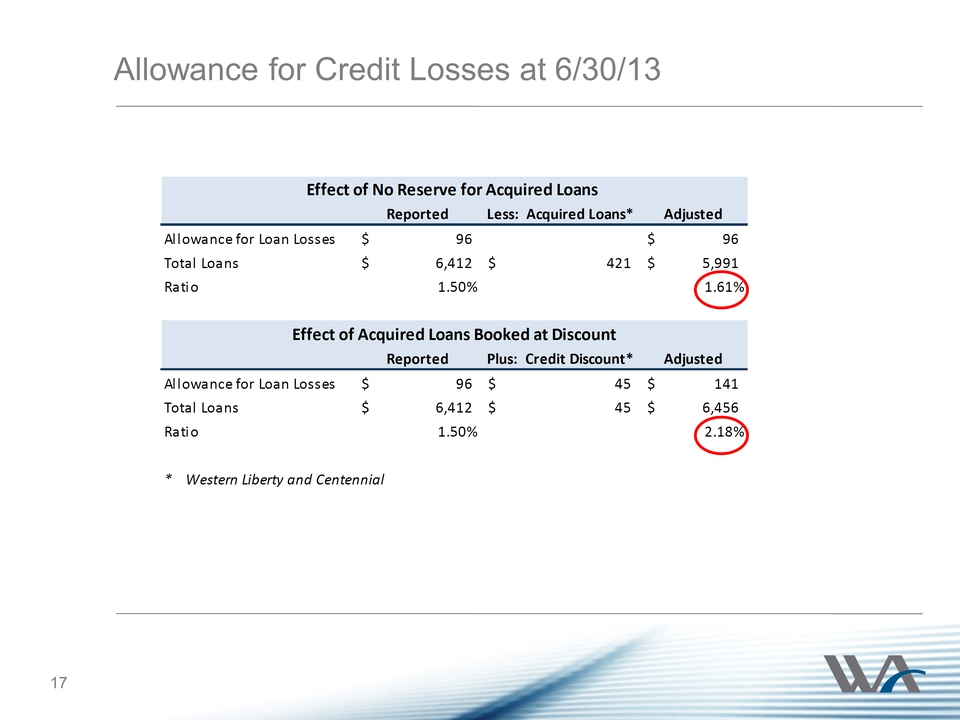
billion at June 30, 2012. At June 30, 2013, the allowance for credit
losses was 1.50% of total loans, which has declined from 1.63% at March
31, 2013 and 1.89% at June 30, 2012, as the Company’s asset quality has
improved.
Deposits totaled $7.00 billion at June 30, 2013, an increase of $266
million from $6.73 billion at March 31, 2013 and an increase of $1.00
billion from $6.00 billion at June 30, 2012. Non-interest bearing
deposits were flat at $1.92 billion at June 30, 2013 compared to March
31, 2013 and increased $77 million from $1.84 billion at June 30, 2012.
Non-interest bearing deposits comprised 27.4% of total deposits at June
30, 2013, compared to 30.7% a year ago, while the proportion from
savings and money market increased to 42.1% from 40.6% during the same
period. Certificates of deposit as a percent of total deposits were
21.5% at June 30, 2013. The Company’s ratio of loans to deposits was
91.2% at June 30, 2013 compared to 86.9% at March 31, 2013 and 86.1% at
June 30, 2012.
Stockholders’ equity at June 30, 2013 increased to $800 million from
$781 million at March 31, 2013. At June 30, 2013, tangible common equity
was 7.4% of tangible assets1 and total risk-based capital was
12.0% of risk-weighted assets. The Company’s tangible book value per
share1 was $7.26 at June 30, 2013, up 20.8% during the past
year.
Total assets increased to $8.59 billion at June 30, 2013 from $8.17
billion at March 31, 2013 and increased 20.0% from $7.16 billion at June
30, 2012.
Operating Unit Highlights
Western Alliance Bank (doing business as Alliance Bank of Arizona and
First Independent Bank) reported loan growth of $339 million during the
second quarter 2013 and $671 million during the last 12 months to $2.45
billion. Second quarter loan growth came primarily from the acquisition
of Centennial Bank (which was merged into Western Alliance Bank).
Deposits increased $208 million in the second quarter and $651 million
during the last 12 months to $2.65 billion. Net income for Western
Alliance Bank was $20.5 million during the second quarter 2013 compared
with net income of $8.5 million during the first quarter of 2013 and net
income of $7.8 million during the second quarter 2012.
Bank of Nevada, which was the recipient of net affiliate loan sales and
participations, reported that loans increased by $115 million during the
second quarter of 2013 and increased $414 million during the last 12
months to $2.42 billion at June 30, 2013. Second quarter loan growth
came primarily from a rise in commercial real estate and construction
and land development loans. Deposits increased by $13 million in the
second quarter of 2013 and $189 million over the last twelve months to
$2.62 billion. Net income for Bank of Nevada was $12.7 million for the
second quarter 2013, compared with net income of $10.7 million for the
first quarter of 2013 and net income of $3.8 million during the second
quarter 2012.
The Torrey Pines Bank segment, which excludes the discontinued
operations of PartnersFirst, reported that loans increased $92 million
during the second quarter 2013 and increased $100 million during the
last 12 months to $1.52 billion. Second quarter increases in loan
balances were primarily attributable to an increase in commercial and
industrial loans. Deposits increased $51 million in the second quarter
2013 and $157 million over the last 12 months to $1.75 billion. Net
income for Torrey Pines Bank was $5.8 million during the second quarter
2013 compared with net income of $6.3 million for the first quarter of
2013 and net income of $5.3 million during the second quarter 2012.
Attached to this press release is summarized financial information for
the quarter ended June 30, 2013.
Conference Call and Webcast
Western Alliance Bancorporation will host a conference call and live
webcast to discuss its second quarter 2013 financial results at 12:00
p.m. ET on Friday, July 19, 2013. Participants may access the call by
dialing 1-888-317-6003 and using passcode: 2074791 or via live audio
webcast using the website link: https://services.choruscall.com/links/wal130719.html.
The webcast is also available via the Company’s website at www.westernalliancebancorp.com.
Participants should log in at least 15 minutes early to receive
instructions. The call will be recorded and made available for replay
after 2:00 p.m. ET July 19th through August 2nd at
9:00 a.m. ET by dialing 1-877-344-7529 using the conference number
10031032.
About Western Alliance Bancorporation
Western Alliance Bancorporation is the parent company of Bank of Nevada,
Western Alliance Bank doing business as Alliance Bank of Arizona and
First Independent Bank, and Torrey Pines Bank. These dynamic
organizations provide a broad array of deposit and credit services to
clients in Nevada, Arizona and California. Staffed with experienced
financial professionals, these organizations deliver a broader product
array and larger credit capacity than community banks, yet are empowered
to be more responsive to customers' needs than larger institutions.
Additional investor information can be accessed on the Investor
Relations page of the Company's website, www.westernalliancebancorp.com.
Cautionary Note Regarding Forward-Looking Statements
This release contains forward-looking statements that relate to
expectations, beliefs, projections, future plans and strategies,
anticipated events or trends and similar expressions concerning matters
that are not historical facts. The forward-looking statements contained
herein reflect our current views about future events and financial
performance and are subject to risks, uncertainties, assumptions and
changes in circumstances that may cause our actual results to differ
significantly from historical results and those expressed in any
forward-looking statement. Some factors that could cause actual results
to differ materially from historical or expected results include:
factors discussed in our Annual Report on Form 10-K for the year ended
December 31, 2012 as filed with the Securities and Exchange Commission;
changes in general economic conditions, either nationally or locally in
the areas in which we conduct or will conduct our business; inflation,
interest rate, market and monetary fluctuations; increases in
competitive pressures among financial institutions and businesses
offering similar products and services; higher defaults on our loan
portfolio than we expect; changes in management’s estimate of the
adequacy of the allowance for credit losses; legislative or regulatory
changes or changes in accounting principles, policies or guidelines;
supervisory actions by regulatory agencies which may limit our ability
to pursue certain growth opportunities; management’s estimates and
projections of interest rates and interest rate policy; the execution of
our business plan; and other factors affecting the financial services
industry generally or the banking industry in particular.
We do not intend and disclaim any duty or obligation to update or revise
any industry information or forward-looking statements set forth in this
press release to reflect new information, future events or otherwise.
This press release contains both financial measures based on accounting
principles generally accepted in the United States (“GAAP”) and non-GAAP
based financial measures, which are used where management believes it to
be helpful in understanding Western Alliance Bancorporation’s results of
operations or financial position. Where non-GAAP financial measures are
used, the comparable GAAP financial measure, as well as the
reconcilement to the comparable GAAP financial measure, can be found in
this press release. These disclosures should not be viewed as a
substitute for operating results determined in accordance with GAAP, nor
are they necessarily comparable to non-GAAP performance measures that
may be presented by other companies.
1 See Reconciliation of Non-GAAP Financial Measures beginning
on page 16
|
|
|
|
|
|
|
|
|
|
|
|
|
|
|
|
|
|
|
|
|
|
|
|
Western Alliance Bancorporation and Subsidiaries
|
|
Summary Consolidated Financial Data
|
|
Unaudited
|
|
|
|
|
|
At or for the Three Months
|
|
|
|
|
For the Six Months
|
|
|
|
|
|
|
Ended June 30,
|
|
|
|
|
Ended June 30,
|
|
|
|
|
|
|
2013
|
|
|
2012
|
|
|
Change %
|
|
|
|
|
2013
|
|
|
2012
|
|
|
Change %
|
|
|
|
|
|
|
|
|
|
|
|
|
|
|
|
|
|
|
|
|
|
|
|
|
|
|
Selected Balance Sheet Data:
|
|
|
|
|
|
|
|
|
|
|
|
|
|
|
|
|
|
|
|
|
|
|
|
(dollars in millions)
|
|
|
|
|
|
|
|
|
|
|
|
|
|
|
|
|
|
|
|
|
|
|
|
Total assets
|
|
|
|
$
|
8,593.7
|
|
|
|
$
|
7,163.6
|
|
|
|
20.0
|
|
%
|
|
|
|
|
|
|
|
|
|
|
|
|
Loans, net of deferred fees
|
|
|
|
|
6,411.5
|
|
|
|
|
5,164.8
|
|
|
|
24.1
|
|
|
|
|
|
|
|
|
|
|
|
|
|
|
Securities and money market investments
|
|
|
|
|
1,313.1
|
|
|
|
|
1,401.5
|
|
|
|
(6.3
|
)
|
|
|
|
|
|
|
|
|
|
|
|
|
|
Securities purchased under agreement to resell
|
|
|
|
|
134.0
|
|
|
|
|
-
|
|
|
|
-
|
|
|
|
|
|
|
|
|
|
|
|
|
|
|
Total deposits
|
|
|
|
|
7,001.3
|
|
|
|
|
6,001.4
|
|
|
|
16.7
|
|
|
|
|
|
|
|
|
|
|
|
|
|
|
Borrowings
|
|
|
|
|
470.5
|
|
|
|
|
390.4
|
|
|
|
20.5
|
|
|
|
|
|
|
|
|
|
|
|
|
|
|
Junior subordinated debt
|
|
|
|
|
39.9
|
|
|
|
|
36.7
|
|
|
|
8.7
|
|
|
|
|
|
|
|
|
|
|
|
|
|
|
Stockholders' equity
|
|
|
|
|
799.5
|
|
|
|
|
672.1
|
|
|
|
19.0
|
|
|
|
|
|
|
|
|
|
|
|
|
|
|
|
|
|
|
|
|
|
|
|
|
|
|
|
|
|
|
|
|
|
|
|
|
|
|
Selected Income Statement Data:
|
|
|
|
|
|
|
|
|
|
|
|
|
|
|
|
|
|
|
|
|
|
|
|
(dollars in thousands)
|
|
|
|
|
|
|
|
|
|
|
|
|
|
|
|
|
|
|
|
|
|
|
|
Interest income
|
|
|
|
$
|
89,285
|
|
|
|
$
|
77,846
|
|
|
|
14.7
|
|
%
|
|
|
|
$
|
172,393
|
|
|
|
$
|
155,283
|
|
|
|
11.0
|
|
%
|
|
Interest expense
|
|
|
|
|
7,133
|
|
|
|
|
7,041
|
|
|
|
1.3
|
|
|
|
|
|
|
14,038
|
|
|
|
|
14,421
|
|
|
|
(2.7
|
)
|
|
|
Net interest income
|
|
|
|
|
82,152
|
|
|
|
|
70,805
|
|
|
|
16.0
|
|
|
|
|
|
|
158,355
|
|
|
|
|
140,862
|
|
|
|
12.4
|
|
|
|
Provision for loan losses
|
|
|
|
|
3,481
|
|
|
|
|
13,330
|
|
|
|
(73.9
|
)
|
|
|
|
|
|
8,920
|
|
|
|
|
26,411
|
|
|
|
(66.2
|
)
|
|
|
Net interest income after provision for credit losses
|
|
|
|
|
78,671
|
|
|
|
|
57,475
|
|
|
|
36.9
|
|
|
|
|
|
|
149,435
|
|
|
|
|
114,451
|
|
|
|
30.6
|
|
|
|
Non-interest income
|
|
|
|
|
10,862
|
|
|
|
|
7,397
|
|
|
|
46.8
|
|
|
|
|
|
|
14,761
|
|
|
|
|
13,281
|
|
|
|
11.1
|
|
|
|
Non-interest expense
|
|
|
|
|
48,531
|
|
|
|
|
45,431
|
|
|
|
6.8
|
|
|
|
|
|
|
95,460
|
|
|
|
|
92,328
|
|
|
|
3.4
|
|
|
|
Income from continuing operations, before income tax expense
|
|
|
|
|
41,002
|
|
|
|
|
19,441
|
|
|
|
110.9
|
|
|
|
|
|
|
68,736
|
|
|
|
|
35,404
|
|
|
|
94.1
|
|
|
|
Income tax expense
|
|
|
|
|
6,817
|
|
|
|
|
5,259
|
|
|
|
29.6
|
|
|
|
|
|
|
13,625
|
|
|
|
|
9,700
|
|
|
|
40.5
|
|
|
|
Income from continuing operations
|
|
|
|
|
34,185
|
|
|
|
|
14,182
|
|
|
|
141.0
|
|
|
|
|
|
|
55,111
|
|
|
|
|
25,704
|
|
|
|
114.4
|
|
%
|
|
Loss on discontinued operations, net
|
|
|
|
|
(169
|
)
|
|
|
|
(221
|
)
|
|
|
23.5
|
|
|
|
|
|
|
(131
|
)
|
|
|
|
(443
|
)
|
|
|
|
|
|
Net income
|
|
|
|
$
|
34,016
|
|
|
|
$
|
13,961
|
|
|
|
143.7
|
|
%
|
|
|
|
$
|
54,980
|
|
|
|
$
|
25,261
|
|
|
|
|
|
|
Diluted net income per common share from continuing operations
|
|
|
|
$
|
0.39
|
|
|
|
$
|
0.16
|
|
|
|
|
|
|
|
|
$
|
0.63
|
|
|
|
$
|
0.28
|
|
|
|
|
|
|
Diluted net loss per common share from discontinued operations,
net of tax
|
|
|
|
$
|
(0.00
|
)
|
|
|
$
|
(0.00
|
)
|
|
|
|
|
|
|
|
$
|
(0.00
|
)
|
|
|
$
|
(0.01
|
)
|
|
|
|
|
|
Diluted net income per common share
|
|
|
|
$
|
0.39
|
|
|
|
$
|
0.15
|
|
|
|
160.0
|
|
%
|
|
|
|
$
|
0.63
|
|
|
|
$
|
0.27
|
|
|
|
133.0
|
|
%
|
|
|
|
|
|
|
|
|
|
|
|
|
|
|
|
|
|
|
|
|
|
|
|
|
|
Common Share Data:
|
|
|
|
|
|
|
|
|
|
|
|
|
|
|
|
|
|
|
|
|
|
|
|
Diluted net income per common share
|
|
|
|
$
|
0.39
|
|
|
|
$
|
0.15
|
|
|
|
160.0
|
|
%
|
|
|
|
$
|
0.63
|
|
|
|
$
|
0.27
|
|
|
|
133.0
|
|
%
|
|
Book value per common share
|
|
|
|
$
|
7.57
|
|
|
|
$
|
6.39
|
|
|
|
18.5
|
|
%
|
|
|
|
|
|
|
|
|
|
|
|
|
Tangible book value per share, net of tax (1)
|
|
|
|
$
|
7.26
|
|
|
|
$
|
6.01
|
|
|
|
20.8
|
|
%
|
|
|
|
|
|
|
|
|
|
|
|
|
Average shares outstanding (in thousands):
|
|
|
|
|
|
|
|
|
|
|
|
|
|
|
|
|
|
|
|
|
|
|
|
Basic
|
|
|
|
|
85,659
|
|
|
|
|
81,590
|
|
|
|
5.0
|
|
|
|
|
|
|
85,493
|
|
|
|
|
81,475
|
|
|
|
4.9
|
|
|
|
Diluted
|
|
|
|
|
86,524
|
|
|
|
|
81,955
|
|
|
|
5.6
|
|
|
|
|
|
|
86,254
|
|
|
|
|
82,091
|
|
|
|
5.1
|
|
|
|
Common shares outstanding
|
|
|
|
|
86,997
|
|
|
|
|
83,157
|
|
|
|
4.6
|
|
|
|
|
|
|
|
|
|
|
|
|
|
|
|
|
|
|
|
|
|
|
|
|
|
|
|
|
|
|
|
|
|
|
|
|
|
|
(1) See Reconciliation of Non-GAAP Financial Measures
|
|
|
|
|
|
|
|
|
|
|
|
|
|
|
|
|
|
|
|
|
|
|
|
|
|
|
|
|
|
|
|
|
|
|
|
|
Western Alliance Bancorporation and Subsidiaries
|
|
Summary Consolidated Financial Data (continued)
|
|
Unaudited
|
|
|
|
|
|
At or for the Three Months
|
|
|
|
|
For the Six Months
|
|
|
|
|
|
|
Ended June 30,
|
|
|
|
|
Ended June 30,
|
|
|
|
|
|
|
2013
|
|
|
|
2012
|
|
|
|
Change %
|
|
|
|
|
2013
|
|
|
|
2012
|
|
|
|
Change %
|
|
|
|
|
|
|
(in thousands, except per share data)
|
|
Selected Performance Ratios:
|
|
|
|
|
|
|
|
|
|
|
|
|
|
|
|
|
|
|
|
|
|
|
|
|
|
|
|
Return on average assets (1)
|
|
|
|
1.64
|
%
|
|
|
0.80
|
%
|
|
|
105.0
|
|
%
|
|
|
|
1.37
|
%
|
|
|
0.74
|
%
|
|
|
85.1
|
|
%
|
|
Return on tangible common equity (2)
|
|
|
|
21.66
|
|
|
|
11.26
|
|
|
|
92.4
|
|
|
|
|
|
17.60
|
|
|
|
10.25
|
|
|
|
71.7
|
|
|
|
Net interest margin (1)
|
|
|
|
4.36
|
|
|
|
4.46
|
|
|
|
(2.2
|
)
|
|
|
|
|
4.36
|
|
|
|
4.49
|
|
|
|
(2.9
|
)
|
|
|
Net interest spread
|
|
|
|
4.22
|
|
|
|
4.27
|
|
|
|
(1.2
|
)
|
|
|
|
|
4.21
|
|
|
|
4.31
|
|
|
|
(2.3
|
)
|
|
|
Efficiency ratio - tax equivalent basis (2)
|
|
|
|
52.21
|
|
|
|
56.44
|
|
|
|
(7.5
|
)
|
|
|
|
|
|
|
|
|
|
|
|
|
|
|
|
Loan to deposit ratio
|
|
|
|
91.58
|
|
|
|
86.06
|
|
|
|
6.4
|
|
|
|
|
|
|
|
|
|
|
|
|
|
|
|
|
|
|
|
|
|
|
|
|
|
|
|
|
|
|
|
|
|
|
|
|
|
|
|
|
|
|
|
|
Capital Ratios:
|
|
|
|
|
|
|
|
|
|
|
|
|
|
|
|
|
|
|
|
|
|
|
|
|
|
|
|
Tangible equity (2)
|
|
|
|
9.0
|
%
|
|
|
8.9
|
%
|
|
|
0.6
|
|
%
|
|
|
|
|
|
|
|
|
|
|
|
|
|
|
Tangible common equity (2)
|
|
|
|
7.4
|
|
|
|
7.0
|
|
|
|
5.5
|
|
|
|
|
|
|
|
|
|
|
|
|
|
|
|
|
Tier 1 common equity (2)
|
|
|
|
8.3
|
|
|
|
8.0
|
|
|
|
4.3
|
|
|
|
|
|
|
|
|
|
|
|
|
|
|
|
|
Tier 1 Leverage ratio (3)
|
|
|
|
9.9
|
|
|
|
9.7
|
|
|
|
2.1
|
|
|
|
|
|
|
|
|
|
|
|
|
|
|
|
|
Tier 1 Risk Based Capital (3)
|
|
|
|
10.8
|
|
|
|
11.0
|
|
|
|
(1.8
|
)
|
|
|
|
|
|
|
|
|
|
|
|
|
|
|
|
Total Risk Based Capital (3)
|
|
|
|
12.0
|
|
|
|
12.3
|
|
|
|
(2.4
|
)
|
|
|
|
|
|
|
|
|
|
|
|
|
|
|
|
|
|
|
|
|
|
|
|
|
|
|
|
|
|
|
|
|
|
|
|
|
|
|
|
|
|
|
|
Asset Quality Ratios:
|
|
|
|
|
|
|
|
|
|
|
|
|
|
|
|
|
|
|
|
|
|
|
|
|
|
|
|
Net charge-offs to average loans outstanding (1)
|
|
|
|
0.17
|
%
|
|
|
1.11
|
%
|
|
|
(84.7
|
)
|
%
|
|
|
|
0.71
|
%
|
|
|
1.15
|
%
|
|
|
(38.3
|
)
|
%
|
|
Nonaccrual loans to gross loans
|
|
|
|
1.42
|
|
|
|
2.02
|
|
|
|
(29.7
|
)
|
|
|
|
|
|
|
|
|
|
|
|
|
|
|
|
Nonaccrual loans and repossessed assets to total assets
|
|
|
|
1.85
|
|
|
|
2.53
|
|
|
|
(26.9
|
)
|
|
|
|
|
|
|
|
|
|
|
|
|
|
|
|
Loans past due 90 days and still accruing to total loans
|
|
|
|
0.01
|
|
|
|
0.02
|
|
|
|
(50.0
|
)
|
|
|
|
|
|
|
|
|
|
|
|
|
|
|
|
Allowance for credit losses to loans
|
|
|
|
1.50
|
|
|
|
1.89
|
|
|
|
(20.6
|
)
|
|
|
|
|
|
|
|
|
|
|
|
|
|
|
|
Allowance for credit losses to nonaccrual loans
|
|
|
|
116.19
|
|
|
|
93.47
|
|
|
|
24.3
|
|
|
|
|
|
|
|
|
|
|
|
|
|
|
|
|
|
|
|
|
|
|
|
|
|
|
|
|
|
|
|
|
|
|
|
|
|
|
|
|
|
|
|
|
(1) Annualized for the three and six month periods ended June 30,
2013 and 2012.
|
|
(2) See Reconciliation of Non-GAAP Financial Measures.
|
|
(3) Capital ratios are preliminary until Call Reports are filed.
|
|
|
|
|
|
|
|
|
|
|
|
|
|
|
|
|
|
|
|
|
|
|
|
|
|
|
|
Western Alliance Bancorporation and Subsidiaries
|
|
Condensed Consolidated Income Statements
|
|
Unaudited
|
|
|
|
Three Months Ended
|
|
|
|
Six Months Ended
|
|
|
|
|
|
June 30,
|
|
|
|
June 30,
|
|
|
|
|
|
2013
|
|
|
2012
|
|
|
|
2013
|
|
|
2012
|
|
Interest income:
|
|
|
|
(dollars in thousands)
|
|
Loans
|
|
|
|
$
|
81,093
|
|
|
|
$
|
68,342
|
|
|
|
|
$
|
155,818
|
|
|
|
$
|
136,102
|
|
|
Investment securities
|
|
|
|
|
7,822
|
|
|
|
|
9,389
|
|
|
|
|
|
15,980
|
|
|
|
|
18,974
|
|
|
Federal funds sold and other
|
|
|
|
|
370
|
|
|
|
|
115
|
|
|
|
|
|
595
|
|
|
|
|
207
|
|
|
Total interest income
|
|
|
|
|
89,285
|
|
|
|
|
77,846
|
|
|
|
|
|
172,393
|
|
|
|
|
155,283
|
|
|
Interest expense:
|
|
|
|
|
|
|
|
|
|
|
|
|
|
|
|
Deposits
|
|
|
|
|
3,929
|
|
|
|
|
4,168
|
|
|
|
|
|
7,661
|
|
|
|
|
8,930
|
|
|
Borrowings
|
|
|
|
|
2,749
|
|
|
|
|
2,386
|
|
|
|
|
|
5,456
|
|
|
|
|
4,520
|
|
|
Junior subordinated debt
|
|
|
|
|
455
|
|
|
|
|
487
|
|
|
|
|
|
921
|
|
|
|
|
971
|
|
|
Total interest expense
|
|
|
|
|
7,133
|
|
|
|
|
7,041
|
|
|
|
|
|
14,038
|
|
|
|
|
14,421
|
|
|
Net interest income
|
|
|
|
|
82,152
|
|
|
|
|
70,805
|
|
|
|
|
|
158,355
|
|
|
|
|
140,862
|
|
|
Provision for credit losses
|
|
|
|
|
3,481
|
|
|
|
|
13,330
|
|
|
|
|
|
8,920
|
|
|
|
|
26,411
|
|
|
Net interest income after provision for credit losses
|
|
|
|
|
78,671
|
|
|
|
|
57,475
|
|
|
|
|
|
149,435
|
|
|
|
|
114,451
|
|
|
Non-interest income
|
|
|
|
|
|
|
|
|
|
|
|
|
|
|
|
Service charges
|
|
|
|
|
2,449
|
|
|
|
|
2,317
|
|
|
|
|
|
4,983
|
|
|
|
|
4,602
|
|
|
Bank owned life insurance
|
|
|
|
|
1,036
|
|
|
|
|
1,120
|
|
|
|
|
|
2,072
|
|
|
|
|
2,243
|
|
|
Amortization of affordable housing investments
|
|
|
|
|
(900
|
)
|
|
|
|
(59
|
)
|
|
|
|
|
(1,800
|
)
|
|
|
|
(59
|
)
|
|
(Losses) Gains on sales of investment securities, net
|
|
|
|
|
(5
|
)
|
|
|
|
1,110
|
|
|
|
|
|
142
|
|
|
|
|
1,471
|
|
|
Unrealized (losses) gains on assets/liabilities measured at fair
value, net
|
|
|
|
|
(3,290
|
)
|
|
|
|
564
|
|
|
|
|
|
(3,761
|
)
|
|
|
|
232
|
|
|
Bargain purchase gain from acquisition
|
|
|
|
|
10,044
|
|
|
|
|
-
|
|
|
|
|
|
10,044
|
|
|
|
|
-
|
|
|
Other
|
|
|
|
|
1,528
|
|
|
|
|
2,345
|
|
|
|
|
|
3,081
|
|
|
|
|
4,792
|
|
|
Total non-interest income
|
|
|
|
|
10,862
|
|
|
|
|
7,397
|
|
|
|
|
|
14,761
|
|
|
|
|
13,281
|
|
|
Non-interest expenses:
|
|
|
|
|
|
|
|
|
|
|
|
|
|
|
|
Salaries and employee benefits
|
|
|
|
|
28,100
|
|
|
|
|
25,995
|
|
|
|
|
|
54,674
|
|
|
|
|
52,659
|
|
|
Occupancy
|
|
|
|
|
4,753
|
|
|
|
|
4,669
|
|
|
|
|
|
9,599
|
|
|
|
|
9,391
|
|
|
Legal, professional and director's fees
|
|
|
|
|
2,227
|
|
|
|
|
2,517
|
|
|
|
|
|
5,011
|
|
|
|
|
4,089
|
|
|
Insurance
|
|
|
|
|
2,096
|
|
|
|
|
2,152
|
|
|
|
|
|
4,466
|
|
|
|
|
4,202
|
|
|
Data Processing
|
|
|
|
|
2,175
|
|
|
|
|
1,293
|
|
|
|
|
|
4,040
|
|
|
|
|
2,288
|
|
|
Marketing
|
|
|
|
|
1,607
|
|
|
|
|
1,459
|
|
|
|
|
|
3,371
|
|
|
|
|
2,830
|
|
|
Loan and repossessed asset expenses
|
|
|
|
|
721
|
|
|
|
|
1,653
|
|
|
|
|
|
2,317
|
|
|
|
|
3,337
|
|
|
Customer service
|
|
|
|
|
717
|
|
|
|
|
682
|
|
|
|
|
|
1,360
|
|
|
|
|
1,274
|
|
|
Net (gain) loss on sales and valuations of repossessed assets
|
|
|
|
|
(1,124
|
)
|
|
|
|
901
|
|
|
|
|
|
(605
|
)
|
|
|
|
3,552
|
|
|
Intangible amortization
|
|
|
|
|
597
|
|
|
|
|
890
|
|
|
|
|
|
1,194
|
|
|
|
|
1,779
|
|
|
Merger/restructure expense
|
|
|
|
|
2,620
|
|
|
|
|
-
|
|
|
|
|
|
2,815
|
|
|
|
|
-
|
|
|
Other
|
|
|
|
|
4,042
|
|
|
|
|
3,220
|
|
|
|
|
|
7,218
|
|
|
|
|
6,927
|
|
|
Total non-interest expense
|
|
|
|
|
48,531
|
|
|
|
|
45,431
|
|
|
|
|
|
95,460
|
|
|
|
|
92,328
|
|
|
Income from continuing operations before income taxes
|
|
|
|
|
41,002
|
|
|
|
|
19,441
|
|
|
|
|
|
68,736
|
|
|
|
|
35,404
|
|
|
Income tax expense
|
|
|
|
|
6,817
|
|
|
|
|
5,259
|
|
|
|
|
|
13,625
|
|
|
|
|
9,700
|
|
|
Income from continuing operations
|
|
|
|
|
34,185
|
|
|
|
|
14,182
|
|
|
|
|
|
55,111
|
|
|
|
|
25,704
|
|
|
Loss from discontinued operations net of tax benefit
|
|
|
|
|
(169
|
)
|
|
|
|
(221
|
)
|
|
|
|
|
(131
|
)
|
|
|
|
(443
|
)
|
|
Net income
|
|
|
|
|
34,016
|
|
|
|
|
13,961
|
|
|
|
|
|
54,980
|
|
|
|
|
25,261
|
|
|
Preferred stock dividends
|
|
|
|
|
353
|
|
|
|
|
1,325
|
|
|
|
|
|
706
|
|
|
|
|
3,088
|
|
|
Net income available to common stockholders
|
|
|
|
$
|
33,663
|
|
|
|
$
|
12,636
|
|
|
|
|
$
|
54,274
|
|
|
|
$
|
22,173
|
|
|
Diluted net income per share
|
|
|
|
$
|
0.39
|
|
|
|
$
|
0.15
|
|
|
|
|
$
|
0.63
|
|
|
|
$
|
0.27
|
|
|
|
|
|
|
|
|
|
|
|
|
|
|
|
|
|
|
|
|
|
|
|
|
|
|
|
|
|
|
|
|
|
|
|
|
|
|
|
|
|
|
|
|
|
|
|
|
Western Alliance Bancorporation and Subsidiaries
|
|
Five Quarter Condensed Consolidated Income Statements
|
|
Unaudited
|
|
|
|
Three Months Ended
|
|
|
|
|
|
June 30,
|
|
|
March 31,
|
|
|
December 31,
|
|
|
September 30,
|
|
|
June 30,
|
|
|
|
|
|
2013
|
|
|
2013
|
|
|
2012
|
|
|
2012
|
|
|
2012
|
|
Interest income:
|
|
|
|
(in thousands, except per share data)
|
|
Loans
|
|
|
|
$
|
81,093
|
|
|
|
$
|
74,725
|
|
|
|
$
|
75,303
|
|
|
|
$
|
69,580
|
|
|
|
$
|
68,342
|
|
|
Investment securities
|
|
|
|
|
7,822
|
|
|
|
|
8,158
|
|
|
|
|
8,794
|
|
|
|
|
9,034
|
|
|
|
|
9,389
|
|
|
Federal funds sold and other
|
|
|
|
|
370
|
|
|
|
|
225
|
|
|
|
|
246
|
|
|
|
|
55
|
|
|
|
|
115
|
|
|
Total interest income
|
|
|
|
|
89,285
|
|
|
|
|
83,108
|
|
|
|
|
84,343
|
|
|
|
|
78,669
|
|
|
|
|
77,846
|
|
|
Interest expense:
|
|
|
|
|
|
|
|
|
|
|
|
|
|
|
|
|
|
Deposits
|
|
|
|
|
3,929
|
|
|
|
|
3,732
|
|
|
|
|
3,890
|
|
|
|
|
3,974
|
|
|
|
|
4,168
|
|
|
Borrowings
|
|
|
|
|
2,749
|
|
|
|
|
2,707
|
|
|
|
|
2,528
|
|
|
|
|
2,262
|
|
|
|
|
2,386
|
|
|
Junior subordinated debt
|
|
|
|
|
455
|
|
|
|
|
466
|
|
|
|
|
470
|
|
|
|
|
487
|
|
|
|
|
487
|
|
|
Total interest expense
|
|
|
|
|
7,133
|
|
|
|
|
6,905
|
|
|
|
|
6,888
|
|
|
|
|
6,723
|
|
|
|
|
7,041
|
|
|
Net interest income
|
|
|
|
|
82,152
|
|
|
|
|
76,203
|
|
|
|
|
77,455
|
|
|
|
|
71,946
|
|
|
|
|
70,805
|
|
|
Provision for credit losses
|
|
|
|
|
3,481
|
|
|
|
|
5,439
|
|
|
|
|
11,501
|
|
|
|
|
8,932
|
|
|
|
|
13,330
|
|
|
Net interest income after provision for credit losses
|
|
|
|
|
78,671
|
|
|
|
|
70,764
|
|
|
|
|
65,954
|
|
|
|
|
63,014
|
|
|
|
|
57,475
|
|
|
Non-interest income
|
|
|
|
|
|
|
|
|
|
|
|
|
|
|
|
|
|
Service charges
|
|
|
|
|
2,449
|
|
|
|
|
2,534
|
|
|
|
|
2,438
|
|
|
|
|
2,412
|
|
|
|
|
2,317
|
|
|
Bank owned life insurance
|
|
|
|
|
1,036
|
|
|
|
|
1,036
|
|
|
|
|
1,080
|
|
|
|
|
1,116
|
|
|
|
|
1,120
|
|
|
Amortization of affordable housing investments
|
|
|
|
|
(900
|
)
|
|
|
|
(900
|
)
|
|
|
|
(1,069
|
)
|
|
|
|
(651
|
)
|
|
|
|
(59
|
)
|
|
(Losses) Gains on sales of investment securities, net
|
|
|
|
|
(5
|
)
|
|
|
|
147
|
|
|
|
|
1,447
|
|
|
|
|
1,031
|
|
|
|
|
1,110
|
|
|
Unrealized (losses) gains on assets/liabilities measured at fair
value, net
|
|
|
|
|
(3,290
|
)
|
|
|
|
(471
|
)
|
|
|
|
(48
|
)
|
|
|
|
470
|
|
|
|
|
564
|
|
|
Bargain purchase gain from acquisition
|
|
|
|
|
10,044
|
|
|
|
|
-
|
|
|
|
|
17,562
|
|
|
|
|
-
|
|
|
|
|
-
|
|
|
Other
|
|
|
|
|
1,528
|
|
|
|
|
1,553
|
|
|
|
|
3,053
|
|
|
|
|
2,604
|
|
|
|
|
2,345
|
|
|
Total non-interest income
|
|
|
|
|
10,862
|
|
|
|
|
3,899
|
|
|
|
|
24,463
|
|
|
|
|
6,982
|
|
|
|
|
7,397
|
|
|
Non-interest expenses:
|
|
|
|
|
|
|
|
|
|
|
|
|
|
|
|
|
|
Salaries and employee benefits
|
|
|
|
|
28,100
|
|
|
|
|
26,574
|
|
|
|
|
26,885
|
|
|
|
|
25,500
|
|
|
|
|
25,995
|
|
|
Occupancy
|
|
|
|
|
4,753
|
|
|
|
|
4,846
|
|
|
|
|
4,769
|
|
|
|
|
4,655
|
|
|
|
|
4,669
|
|
|
Legal, professional and director's fees
|
|
|
|
|
2,227
|
|
|
|
|
2,784
|
|
|
|
|
1,849
|
|
|
|
|
2,291
|
|
|
|
|
2,517
|
|
|
Data Processing
|
|
|
|
|
2,175
|
|
|
|
|
1,865
|
|
|
|
|
2,071
|
|
|
|
|
1,390
|
|
|
|
|
1,293
|
|
|
Insurance
|
|
|
|
|
2,096
|
|
|
|
|
2,370
|
|
|
|
|
2,188
|
|
|
|
|
2,121
|
|
|
|
|
2,152
|
|
|
Marketing
|
|
|
|
|
1,607
|
|
|
|
|
1,764
|
|
|
|
|
1,546
|
|
|
|
|
1,231
|
|
|
|
|
1,459
|
|
|
Loan and repossessed asset expenses
|
|
|
|
|
721
|
|
|
|
|
1,596
|
|
|
|
|
2,102
|
|
|
|
|
1,236
|
|
|
|
|
1,653
|
|
|
Customer service
|
|
|
|
|
717
|
|
|
|
|
643
|
|
|
|
|
678
|
|
|
|
|
653
|
|
|
|
|
682
|
|
|
Net (gain) loss on sales and valuations of repossessed assets
|
|
|
|
|
(1,124
|
)
|
|
|
|
519
|
|
|
|
|
529
|
|
|
|
|
126
|
|
|
|
|
901
|
|
|
Intangible amortization
|
|
|
|
|
597
|
|
|
|
|
597
|
|
|
|
|
596
|
|
|
|
|
880
|
|
|
|
|
890
|
|
|
Merger/restructure expense
|
|
|
|
|
2,620
|
|
|
|
|
195
|
|
|
|
|
2,706
|
|
|
|
|
113
|
|
|
|
|
-
|
|
|
Goodwill and intangible impairment
|
|
|
|
|
-
|
|
|
|
|
-
|
|
|
|
|
-
|
|
|
|
|
3,435
|
|
|
|
|
-
|
|
|
Other
|
|
|
|
|
4,042
|
|
|
|
|
3,176
|
|
|
|
|
3,070
|
|
|
|
|
3,912
|
|
|
|
|
3,220
|
|
|
Total non-interest expense
|
|
|
|
|
48,531
|
|
|
|
|
46,929
|
|
|
|
|
48,989
|
|
|
|
|
47,543
|
|
|
|
|
45,431
|
|
|
Income from continuing operations before income taxes
|
|
|
|
|
41,002
|
|
|
|
|
27,734
|
|
|
|
|
41,428
|
|
|
|
|
22,453
|
|
|
|
|
19,441
|
|
|
Income tax expense
|
|
|
|
|
6,817
|
|
|
|
|
6,808
|
|
|
|
|
7,509
|
|
|
|
|
6,752
|
|
|
|
|
5,259
|
|
|
Income from continuing operations
|
|
|
|
$
|
34,185
|
|
|
|
$
|
20,926
|
|
|
|
$
|
33,919
|
|
|
|
$
|
15,701
|
|
|
|
$
|
14,182
|
|
|
(Loss) Income from discontinued operations, net of tax
|
|
|
|
|
(169
|
)
|
|
|
|
38
|
|
|
|
|
(1,804
|
)
|
|
|
|
(243
|
)
|
|
|
|
(221
|
)
|
|
Net income
|
|
|
|
$
|
34,016
|
|
|
|
$
|
20,964
|
|
|
|
$
|
32,115
|
|
|
|
$
|
15,458
|
|
|
|
$
|
13,961
|
|
|
Preferred stock dividends
|
|
|
|
|
353
|
|
|
|
|
353
|
|
|
|
|
353
|
|
|
|
|
352
|
|
|
|
|
1,325
|
|
|
Net Income available to common stockholders
|
|
|
|
$
|
33,663
|
|
|
|
$
|
20,611
|
|
|
|
$
|
31,762
|
|
|
|
$
|
15,106
|
|
|
|
$
|
12,636
|
|
|
Diluted net income per share
|
|
|
|
$
|
0.39
|
|
|
|
$
|
0.24
|
|
|
|
$
|
0.37
|
|
|
|
$
|
0.18
|
|
|
|
$
|
0.15
|
|
|
|
|
|
|
|
|
|
|
|
|
|
|
|
|
|
|
|
|
|
|
|
|
|
|
|
|
|
|
|
|
|
|
|
|
|
|
|
|
|
|
|
|
|
|
|
|
|
|
|
|
Western Alliance Bancorporation and Subsidiaries
|
|
Five Quarter Condensed Consolidated Balance Sheets
|
|
Unaudited
|
|
|
|
|
|
June 30,
|
|
|
March 31,
|
|
|
December 31,
|
|
|
September 30,
|
|
|
June 30,
|
|
|
|
|
|
2013
|
|
|
2013
|
|
|
2012
|
|
|
2012
|
|
|
2012
|
|
Assets:
|
|
|
|
(in millions)
|
|
Cash and due from banks
|
|
|
|
$
|
248.9
|
|
|
|
$
|
422.3
|
|
|
|
$
|
204.6
|
|
|
|
$
|
168.1
|
|
|
|
$
|
178.9
|
|
|
Securities purchased under agreement to resell
|
|
|
|
|
134.0
|
|
|
|
|
134.0
|
|
|
|
|
-
|
|
|
|
|
139.8
|
|
|
|
|
-
|
|
|
Cash and cash equivalents
|
|
|
|
|
382.9
|
|
|
|
|
556.3
|
|
|
|
|
204.6
|
|
|
|
|
307.9
|
|
|
|
|
178.9
|
|
|
|
|
|
|
|
|
|
|
|
|
|
|
|
|
|
|
|
|
Securities and money market investments
|
|
|
|
|
1,313.1
|
|
|
|
|
1,302.4
|
|
|
|
|
1,236.6
|
|
|
|
|
1,338.9
|
|
|
|
|
1,401.5
|
|
|
Loans held for sale
|
|
|
|
|
27.6
|
|
|
|
|
27.9
|
|
|
|
|
31.1
|
|
|
|
|
-
|
|
|
|
|
-
|
|
|
Loans held for investment
|
|
|
|
|
|
|
|
|
|
|
|
|
|
|
|
|
|
Commercial
|
|
|
|
|
2,174.1
|
|
|
|
|
2,084.9
|
|
|
|
|
1,947.8
|
|
|
|
|
1,756.0
|
|
|
|
|
1,573.6
|
|
|
Commercial real estate - non-owner occupied
|
|
|
|
|
1,839.7
|
|
|
|
|
1,538.4
|
|
|
|
|
1,505.6
|
|
|
|
|
1,407.1
|
|
|
|
|
1,440.4
|
|
|
Commercial real estate - owner occupied
|
|
|
|
|
1,550.0
|
|
|
|
|
1,414.3
|
|
|
|
|
1,396.8
|
|
|
|
|
1,331.3
|
|
|
|
|
1,310.3
|
|
|
Construction and land development
|
|
|
|
|
416.7
|
|
|
|
|
381.1
|
|
|
|
|
394.3
|
|
|
|
|
379.8
|
|
|
|
|
360.6
|
|
|
Residential real estate
|
|
|
|
|
381.7
|
|
|
|
|
388.7
|
|
|
|
|
407.9
|
|
|
|
|
408.4
|
|
|
|
|
430.4
|
|
|
Consumer
|
|
|
|
|
28.5
|
|
|
|
|
26.0
|
|
|
|
|
31.8
|
|
|
|
|
56.6
|
|
|
|
|
55.8
|
|
|
Deferred fees, net
|
|
|
|
|
(6.8
|
)
|
|
|
|
(6.0
|
)
|
|
|
|
(6.0
|
)
|
|
|
|
(6.3
|
)
|
|
|
|
(6.3
|
)
|
|
Gross loans and deferred fees, net
|
|
|
|
|
6,383.9
|
|
|
|
|
5,827.4
|
|
|
|
|
5,678.2
|
|
|
|
|
5,332.9
|
|
|
|
|
5,164.8
|
|
|
Allowance for credit losses
|
|
|
|
|
(96.3
|
)
|
|
|
|
(95.5
|
)
|
|
|
|
(95.4
|
)
|
|
|
|
(97.4
|
)
|
|
|
|
(97.5
|
)
|
|
Loans, net
|
|
|
|
|
6,287.6
|
|
|
|
|
5,731.9
|
|
|
|
|
5,582.8
|
|
|
|
|
5,235.5
|
|
|
|
|
5,067.3
|
|
|
|
|
|
|
|
|
|
|
|
|
|
|
|
|
|
|
|
|
Premises and equipment, net
|
|
|
|
|
106.1
|
|
|
|
|
107.1
|
|
|
|
|
107.9
|
|
|
|
|
106.9
|
|
|
|
|
106.9
|
|
|
Other repossessed assets
|
|
|
|
|
76.5
|
|
|
|
|
77.9
|
|
|
|
|
77.2
|
|
|
|
|
78.2
|
|
|
|
|
77.0
|
|
|
Bank owned life insurance
|
|
|
|
|
140.4
|
|
|
|
|
139.4
|
|
|
|
|
138.3
|
|
|
|
|
137.3
|
|
|
|
|
136.1
|
|
|
Goodwill and other intangibles
|
|
|
|
|
28.5
|
|
|
|
|
29.2
|
|
|
|
|
29.8
|
|
|
|
|
29.0
|
|
|
|
|
34.0
|
|
|
Other assets
|
|
|
|
|
231.0
|
|
|
|
|
202.0
|
|
|
|
|
214.3
|
|
|
|
|
169.9
|
|
|
|
|
161.9
|
|
|
Total assets
|
|
|
|
$
|
8,593.7
|
|
|
|
$
|
8,174.1
|
|
|
|
$
|
7,622.6
|
|
|
|
$
|
7,403.6
|
|
|
|
$
|
7,163.6
|
|
|
Liabilities and Stockholders' Equity:
|
|
|
|
|
|
|
|
|
|
|
|
|
|
|
|
|
|
Liabilities:
|
|
|
|
|
|
|
|
|
|
|
|
|
|
|
|
|
|
Deposits:
|
|
|
|
|
|
|
|
|
|
|
|
|
|
|
|
|
|
Non-interest bearing demand deposits
|
|
|
|
$
|
1,919.6
|
|
|
|
$
|
1,930.4
|
|
|
|
$
|
1,933.2
|
|
|
|
$
|
1,840.8
|
|
|
|
$
|
1,842.1
|
|
|
Interest bearing
|
|
|
|
|
|
|
|
|
|
|
|
|
|
|
|
|
|
Demand
|
|
|
|
|
631.3
|
|
|
|
|
619.7
|
|
|
|
|
582.3
|
|
|
|
|
514.7
|
|
|
|
|
540.6
|
|
|
Savings and money market
|
|
|
|
|
2,945.1
|
|
|
|
|
2,826.7
|
|
|
|
|
2,573.5
|
|
|
|
|
2,541.2
|
|
|
|
|
2,438.4
|
|
|
Time certificates
|
|
|
|
|
1,505.3
|
|
|
|
|
1,358.1
|
|
|
|
|
1,366.2
|
|
|
|
|
1,265.3
|
|
|
|
|
1,180.3
|
|
|
Total deposits
|
|
|
|
|
7,001.3
|
|
|
|
|
6,734.9
|
|
|
|
|
6,455.2
|
|
|
|
|
6,162.0
|
|
|
|
|
6,001.4
|
|
|
Customer repurchase agreements
|
|
|
|
|
51.9
|
|
|
|
|
64.7
|
|
|
|
|
79.0
|
|
|
|
|
73.1
|
|
|
|
|
86.9
|
|
|
Total customer funds
|
|
|
|
|
7,053.2
|
|
|
|
|
6,799.6
|
|
|
|
|
6,534.2
|
|
|
|
|
6,235.1
|
|
|
|
|
6,088.3
|
|
|
Securities sold short
|
|
|
|
|
129.5
|
|
|
|
|
132.6
|
|
|
|
|
-
|
|
|
|
|
138.3
|
|
|
|
|
-
|
|
|
Borrowings
|
|
|
|
|
418.6
|
|
|
|
|
293.8
|
|
|
|
|
193.7
|
|
|
|
|
223.6
|
|
|
|
|
303.5
|
|
|
Junior subordinated debt
|
|
|
|
|
39.9
|
|
|
|
|
36.7
|
|
|
|
|
36.2
|
|
|
|
|
36.2
|
|
|
|
|
36.7
|
|
|
Accrued interest payable and other liabilities
|
|
|
|
|
153.0
|
|
|
|
|
130.1
|
|
|
|
|
98.9
|
|
|
|
|
72.4
|
|
|
|
|
63.0
|
|
|
Total liabilities
|
|
|
|
|
7,794.2
|
|
|
|
|
7,392.8
|
|
|
|
|
6,863.0
|
|
|
|
|
6,705.6
|
|
|
|
|
6,491.5
|
|
|
Stockholders' Equity
|
|
|
|
|
|
|
|
|
|
|
|
|
|
|
|
|
|
Common stock and additional paid-in capital
|
|
|
|
|
789.5
|
|
|
|
|
786.9
|
|
|
|
|
784.9
|
|
|
|
|
751.1
|
|
|
|
|
748.1
|
|
|
Preferred Stock
|
|
|
|
|
141.0
|
|
|
|
|
141.0
|
|
|
|
|
141.0
|
|
|
|
|
141.0
|
|
|
|
|
141.0
|
|
|
Accumulated deficit
|
|
|
|
|
(120.2
|
)
|
|
|
|
(153.8
|
)
|
|
|
|
(174.5
|
)
|
|
|
|
(206.2
|
)
|
|
|
|
(221.3
|
)
|
|
Accumulated other comprehensive (loss) income
|
|
|
|
|
(10.8
|
)
|
|
|
|
7.2
|
|
|
|
|
8.2
|
|
|
|
|
12.1
|
|
|
|
|
4.3
|
|
|
Total stockholders' equity
|
|
|
|
|
799.5
|
|
|
|
|
781.3
|
|
|
|
|
759.6
|
|
|
|
|
698.0
|
|
|
|
|
672.1
|
|
|
Total liabilities and stockholders' equity
|
|
|
|
$
|
8,593.7
|
|
|
|
$
|
8,174.1
|
|
|
|
$
|
7,622.6
|
|
|
|
$
|
7,403.6
|
|
|
|
$
|
7,163.6
|
|
|
|
|
|
|
|
|
|
|
|
|
|
|
|
|
|
|
|
|
|
|
|
|
|
|
|
|
|
|
|
|
|
|
|
|
|
|
|
|
|
|
|
|
|
|
|
|
|
|
|
|
|
|
|
Western Alliance Bancorporation and Subsidiaries
|
|
Changes in the Allowance For Credit Losses
|
|
Unaudited
|
|
|
|
|
|
Three Months Ended
|
|
|
|
|
|
June 30,
|
|
|
March 31,
|
|
|
December 31,
|
|
|
September 30,
|
|
|
June 30,
|
|
|
|
|
|
2013
|
|
|
2013
|
|
|
2012
|
|
|
2012
|
|
|
2012
|
|
|
|
|
|
|
|
|
|
|
|
|
|
|
|
|
|
|
|
|
|
|
|
(in thousands)
|
|
Balance, beginning of period
|
|
|
|
$
|
95,494
|
|
|
|
$
|
95,427
|
|
|
|
$
|
97,410
|
|
|
|
$
|
97,512
|
|
|
|
$
|
98,122
|
|
|
Provision for credit losses
|
|
|
|
|
3,481
|
|
|
|
|
5,439
|
|
|
|
|
11,501
|
|
|
|
|
8,932
|
|
|
|
|
13,330
|
|
|
Recoveries of loans previously charged-off:
|
|
|
|
|
|
|
|
|
|
|
|
|
|
|
|
|
|
Commercial and industrial
|
|
|
|
|
1,757
|
|
|
|
|
441
|
|
|
|
|
372
|
|
|
|
|
501
|
|
|
|
|
1,417
|
|
|
Commercial real estate - non-owner occupied
|
|
|
|
|
154
|
|
|
|
|
440
|
|
|
|
|
288
|
|
|
|
|
27
|
|
|
|
|
368
|
|
|
Commercial real estate - owner occupied
|
|
|
|
|
479
|
|
|
|
|
502
|
|
|
|
|
109
|
|
|
|
|
606
|
|
|
|
|
193
|
|
|
Construction and land development
|
|
|
|
|
120
|
|
|
|
|
701
|
|
|
|
|
2,033
|
|
|
|
|
567
|
|
|
|
|
217
|
|
|
Residential real estate
|
|
|
|
|
549
|
|
|
|
|
569
|
|
|
|
|
313
|
|
|
|
|
153
|
|
|
|
|
274
|
|
|
Consumer
|
|
|
|
|
11
|
|
|
|
|
14
|
|
|
|
|
63
|
|
|
|
|
38
|
|
|
|
|
214
|
|
|
Total recoveries
|
|
|
|
|
3,070
|
|
|
|
|
2,667
|
|
|
|
|
3,178
|
|
|
|
|
1,892
|
|
|
|
|
2,683
|
|
|
Loans charged-off:
|
|
|
|
|
|
|
|
|
|
|
|
|
|
|
|
|
|
Commercial and industrial
|
|
|
|
|
1,065
|
|
|
|
|
1,770
|
|
|
|
|
4,654
|
|
|
|
|
4,100
|
|
|
|
|
4,933
|
|
|
Commercial real estate - non-owner occupied
|
|
|
|
|
1,000
|
|
|
|
|
1,908
|
|
|
|
|
2,673
|
|
|
|
|
998
|
|
|
|
|
2,463
|
|
|
Commercial real estate - owner occupied
|
|
|
|
|
1,391
|
|
|
|
|
979
|
|
|
|
|
4,470
|
|
|
|
|
472
|
|
|
|
|
3,178
|
|
|
Construction and land development
|
|
|
|
|
238
|
|
|
|
|
614
|
|
|
|
|
405
|
|
|
|
|
2,315
|
|
|
|
|
3,185
|
|
|
Residential real estate
|
|
|
|
|
2,010
|
|
|
|
|
2,493
|
|
|
|
|
1,307
|
|
|
|
|
2,242
|
|
|
|
|
2,094
|
|
|
Consumer
|
|
|
|
|
18
|
|
|
|
|
275
|
|
|
|
|
3,153
|
|
|
|
|
799
|
|
|
|
|
770
|
|
|
Total loans charged-off
|
|
|
|
|
5,722
|
|
|
|
|
8,039
|
|
|
|
|
16,662
|
|
|
|
|
10,926
|
|
|
|
|
16,623
|
|
|
Net loans charged-off
|
|
|
|
|
2,652
|
|
|
|
|
5,372
|
|
|
|
|
13,484
|
|
|
|
|
9,034
|
|
|
|
|
13,940
|
|
|
Balance, end of period
|
|
|
|
$
|
96,323
|
|
|
|
$
|
95,494
|
|
|
|
$
|
95,427
|
|
|
|
$
|
97,410
|
|
|
|
$
|
97,512
|
|
|
|
|
|
|
|
|
|
|
|
|
|
|
|
|
|
|
|
|
Net charge-offs (annualized) to average loans outstanding
|
|
|
|
|
0.17
|
%
|
|
|
|
0.38
|
%
|
|
|
|
0.99
|
%
|
|
|
|
0.70
|
%
|
|
|
|
1.11
|
%
|
|
Allowance for credit losses to gross loans
|
|
|
|
|
1.50
|
|
|
|
|
1.63
|
|
|
|
|
1.67
|
|
|
|
|
1.83
|
|
|
|
|
1.89
|
|
|
Nonaccrual loans
|
|
|
|
$
|
82,899
|
|
|
|
$
|
93,748
|
|
|
|
$
|
104,716
|
|
|
|
$
|
121,238
|
|
|
|
$
|
104,324
|
|
|
Repossessed assets
|
|
|
|
|
76,499
|
|
|
|
|
77,921
|
|
|
|
|
77,247
|
|
|
|
|
78,234
|
|
|
|
|
76,994
|
|
|
Loans past due 90 days, still accruing
|
|
|
|
|
793
|
|
|
|
|
1,640
|
|
|
|
|
1,388
|
|
|
|
|
1,710
|
|
|
|
|
795
|
|
|
Loans past due 30 to 89 days, still accruing
|
|
|
|
|
7,341
|
|
|
|
|
14,795
|
|
|
|
|
16,565
|
|
|
|
|
10,181
|
|
|
|
|
13,848
|
|
|
Classified loans on accrual
|
|
|
|
|
140,192
|
|
|
|
|
97,351
|
|
|
|
|
112,637
|
|
|
|
|
116,841
|
|
|
|
|
135,913
|
|
|
Special mention loans
|
|
|
|
|
115,135
|
|
|
|
|
125,660
|
|
|
|
|
103,550
|
|
|
|
|
97,681
|
|
|
|
|
91,924
|
|
|
|
|
|
|
|
|
|
|
|
|
|
|
|
|
|
|
|
|
|
|
|
|
|
|
|
|
|
|
|
|
|
|
|
|
|
|
|
|
|
|
|
|
|
|
|
|
|
|
|
|
|
|
|
|
Western Alliance Bancorporation and Subsidiaries
|
|
Analysis of Average Balances, Yields and Rates
|
|
Unaudited
|
|
|
|
|
|
Three Months Ended June 30,
|
|
|
|
|
|
2013
|
|
|
|
2012
|
|
|
|
|
|
Average
Balance
|
|
|
Interest
|
|
|
Average
Yield/
Cost
|
|
|
|
Average
Balance
|
|
|
Interest
|
|
|
Average
Yield/
Cost
|
|
Interest earning assets
|
|
|
|
($ in
millions)
|
|
|
($ in
thousands)
|
|
|
|
|
|
|
($ in
millions)
|
|
|
($ in
thousands)
|
|
|
|
|
Loans (1)
|
|
|
|
$
|
6,100.8
|
|
|
|
$
|
81,093
|
|
|
5.40
|
%
|
|
|
|
$
|
5,014.1
|
|
|
|
$
|
68,342
|
|
|
5.50
|
%
|
|
Investment securities (1)
|
|
|
|
|
1,295.9
|
|
|
|
|
7,822
|
|
|
2.92
|
%
|
|
|
|
|
1,417.1
|
|
|
|
|
9,389
|
|
|
3.15
|
%
|
|
Federal funds sold and other
|
|
|
|
|
407.6
|
|
|
|
|
370
|
|
|
0.36
|
%
|
|
|
|
|
133.1
|
|
|
|
|
115
|
|
|
0.35
|
%
|
|
Total interest earning assets
|
|
|
|
|
7,804.4
|
|
|
|
|
89,285
|
|
|
4.73
|
%
|
|
|
|
|
6,564.3
|
|
|
|
|
77,846
|
|
|
4.88
|
%
|
|
Non-interest earning assets
|
|
|
|
|
|
|
|
|
|
|
|
|
|
|
|
|
|
|
|
|
|
Cash and due from banks
|
|
|
|
|
119.2
|
|
|
|
|
|
|
|
|
|
|
|
113.1
|
|
|
|
|
|
|
|
|
Allowance for credit losses
|
|
|
|
|
(96.6
|
)
|
|
|
|
|
|
|
|
|
|
|
(97.5
|
)
|
|
|
|
|
|
|
|
Bank owned life insurance
|
|
|
|
|
139.7
|
|
|
|
|
|
|
|
|
|
|
|
135.4
|
|
|
|
|
|
|
|
|
Other assets
|
|
|
|
|
432.7
|
|
|
|
|
|
|
|
|
|
|
|
346.9
|
|
|
|
|
|
|
|
|
Total assets
|
|
|
|
$
|
8,399.4
|
|
|
|
|
|
|
|
|
|
|
$
|
7,062.2
|
|
|
|
|
|
|
|
|
Interest-bearing liabilities
|
|
|
|
|
|
|
|
|
|
|
|
|
|
|
|
|
|
|
|
|
|
Interest-bearing deposits:
|
|
|
|
|
|
|
|
|
|
|
|
|
|
|
|
|
|
|
|
|
|
Interest-bearing transaction accounts
|
|
|
|
$
|
626.8
|
|
|
|
$
|
370
|
|
|
0.24
|
%
|
|
|
|
$
|
518.4
|
|
|
|
$
|
310
|
|
|
0.24
|
%
|
|
Savings and money market
|
|
|
|
|
2,768.7
|
|
|
|
|
2,007
|
|
|
0.29
|
%
|
|
|
|
|
2,296.0
|
|
|
|
|
1,956
|
|
|
0.34
|
%
|
|
Time certificates of deposit
|
|
|
|
|
1,584.0
|
|
|
|
|
1,552
|
|
|
0.39
|
%
|
|
|
|
|
1,320.7
|
|
|
|
|
1,902
|
|
|
0.58
|
%
|
|
Total interest-bearing deposits
|
|
|
|
|
4,979.5
|
|
|
|
|
3,929
|
|
|
0.32
|
%
|
|
|
|
|
4,135.1
|
|
|
|
|
4,168
|
|
|
0.40
|
%
|
|
Borrowings
|
|
|
|
|
554.0
|
|
|
|
|
2,749
|
|
|
1.98
|
%
|
|
|
|
|
425.7
|
|
|
|
|
2,386
|
|
|
2.24
|
%
|
|
Junior subordinated debt
|
|
|
|
|
36.7
|
|
|
|
|
455
|
|
|
4.96
|
%
|
|
|
|
|
37.3
|
|
|
|
|
487
|
|
|
5.22
|
%
|
|
Total interest-bearing liabilities
|
|
|
|
|
5,570.1
|
|
|
|
|
7,133
|
|
|
0.51
|
%
|
|
|
|
|
4,598.1
|
|
|
|
|
7,041
|
|
|
0.61
|
%
|
|
Noninterest-bearing liabilities
|
|
|
|
|
|
|
|
|
|
|
|
|
|
|
|
|
|
|
|
|
|
Noninterest-bearing demand deposits
|
|
|
|
|
1,898.2
|
|
|
|
|
|
|
|
|
|
|
|
1,744.1
|
|
|
|
|
|
|
|
|
Other liabilities
|
|
|
|
|
124.6
|
|
|
|
|
|
|
|
|
|
|
|
52.1
|
|
|
|
|
|
|
|
|
Stockholders’ equity
|
|
|
|
|
806.4
|
|
|
|
|
|
|
|
|
|
|
|
667.9
|
|
|
|
|
|
|
|
|
Total liabilities and stockholders' equity
|
|
|
|
$
|
8,399.4
|
|
|
|
|
|
|
|
|
|
|
$
|
7,062.2
|
|
|
|
|
|
|
|
|
Net interest income and margin
|
|
|
|
|
|
|
$
|
82,152
|
|
|
4.36
|
%
|
|
|
|
|
|
|
$
|
70,805
|
|
|
4.46
|
%
|
|
Net interest spread
|
|
|
|
|
|
|
|
|
|
4.22
|
%
|
|
|
|
|
|
|
|
|
|
4.27
|
%
|
|
|
|
|
|
|
|
|
|
|
|
|
|
|
|
|
|
|
|
|
|
|
|
(1) Yields on loans and securities have been adjusted to a tax
equivalent basis. The taxable-equivalent adjustment was $2,929 and
$2,310 for the second quarter ended 2013 and 2012, respectively.
|
|
|
|
|
|
|
|
|
|
|
|
|
|
|
|
|
|
|
|
|
|
|
|
Western Alliance Bancorporation and Subsidiaries
|
|
Analysis of Average Balances, Yields and Rates
|
|
Unaudited
|
|
|
|
|
|
|
|
|
|
|
|
|
|
|
|
|
|
|
|
|
|
|
|
|
|
|
|
Six Months Ended June 30,
|
|
|
|
|
|
2013
|
|
|
|
2012
|
|
|
|
|
|
|
|
|
|
|
|
|
|
|
|
|
|
|
|
|
|
|
|
|
|
|
|
Average
Balance
|
|
|
Interest
|
|
|
Average
Yield/
Cost
|
|
|
|
Average
Balance
|
|
|
Interest
|
|
|
Average
Yield/
Cost
|
|
Interest earning Assets
|
|
|
|
($ in
millions)
|
|
|
($ in
thousands)
|
|
|
|
|
|
|
($ in
millions)
|
|
|
($ in
thousands)
|
|
|
|
|
Loans (1)
|
|
|
|
$
|
5,857.0
|
|
|
|
$
|
155,818
|
|
|
5.41
|
%
|
|
|
|
$
|
4,898.5
|
|
|
|
$
|
136,102
|
|
|
5.59
|
%
|
|
Investment securities (1)
|
|
|
|
|
1,289.7
|
|
|
|
|
15,980
|
|
|
3.06
|
%
|
|
|
|
|
1,420.2
|
|
|
|
|
18,974
|
|
|
3.14
|
%
|
|
Federal funds sold & other
|
|
|
|
|
406.2
|
|
|
|
|
595
|
|
|
0.29
|
%
|
|
|
|
|
132.2
|
|
|
|
|
207
|
|
|
0.31
|
%
|
|
Total interest earnings assets
|
|
|
|
|
7,552.9
|
|
|
|
|
172,393
|
|
|
4.73
|
%
|
|
|
|
|
6,450.9
|
|
|
|
|
155,283
|
|
|
4.94
|
%
|
|
Non-interest earning assets
|
|
|
|
|
|
|
|
|
|
|
|
|
|
|
|
|
|
|
|
|
|
Cash and due from banks
|
|
|
|
|
122.9
|
|
|
|
|
|
|
|
|
|
|
|
113.3
|
|
|
|
|
|
|
|
|
Allowance for credit losses
|
|
|
|
|
(96.8
|
)
|
|
|
|
|
|
|
|
|
|
|
(99.1
|
)
|
|
|
|
|
|
|
|
Bank owned life insurance
|
|
|
|
|
139.2
|
|
|
|
|
|
|
|
|
|
|
|
134.8
|
|
|
|
|
|
|
|
|
Other assets
|
|
|
|
|
427.3
|
|
|
|
|
|
|
|
|
|
|
|
352.5
|
|
|
|
|
|
|
|
|
Total assets
|
|
|
|
$
|
8,145.5
|
|
|
|
|
|
|
|
|
|
|
$
|
6,952.4
|
|
|
|
|
|
|
|
|
Interest-bearing liabilities
|
|
|
|
|
|
|
|
|
|
|
|
|
|
|
|
|
|
|
|
|
|
Interest-bearing deposits:
|
|
|
|
|
|
|
|
|
|
|
|
|
|
|
|
|
|
|
|
|
|
Interest bearing transaction accounts
|
|
|
|
$
|
617.8
|
|
|
|
$
|
671
|
|
|
0.22
|
%
|
|
|
|
$
|
511.3
|
|
|
|
$
|
624
|
|
|
0.24
|
%
|
|
Savings and money market
|
|
|
|
|
2,695.2
|
|
|
|
|
3,918
|
|
|
0.29
|
%
|
|
|
|
|
2,264.8
|
|
|
|
|
4,124
|
|
|
0.36
|
%
|
|
Time certificates of deposits
|
|
|
|
|
1,517.2
|
|
|
|
|
3,072
|
|
|
0.40
|
%
|
|
|
|
|
1,372.5
|
|
|
|
|
4,182
|
|
|
0.61
|
%
|
|
Total interest-bearing deposits
|
|
|
|
|
4,830.2
|
|
|
|
|
7,661
|
|
|
0.32
|
%
|
|
|
|
|
4,148.6
|
|
|
|
|
8,930
|
|
|
0.44
|
%
|
|
Borrowings
|
|
|
|
|
501.3
|
|
|
|
|
5,456
|
|
|
2.18
|
%
|
|
|
|
|
360.3
|
|
|
|
|
4,520
|
|
|
2.51
|
%
|
|
Junior subordinated debt
|
|
|
|
|
36.5
|
|
|
|
|
921
|
|
|
5.05
|
%
|
|
|
|
|
37.1
|
|
|
|
|
971
|
|
|
5.23
|
%
|
|
Total interest-bearing liabilities
|
|
|
|
$
|
5,368.0
|
|
|
|
|
14,038
|
|
|
0.52
|
%
|
|
|
|
$
|
4,546.0
|
|
|
|
|
14,421
|
|
|
0.63
|
%
|
|
Noninterest-bearing liabilities
|
|
|
|
|
|
|
|
|
|
|
|
|
|
|
|
|
|
|
|
|
|
Noninterest-bearing demand deposits
|
|
|
|
|
1,876.8
|
|
|
|
|
|
|
|
|
|
|
|
1,694.9
|
|
|
|
|
|
|
|
|
Other liabilities
|
|
|
|
|
108.2
|
|
|
|
|
|
|
|
|
|
|
|
48.7
|
|
|
|
|
|
|
|
|
Stockholders’ equity
|
|
|
|
|
792.5
|
|
|
|
|
|
|
|
|
|
|
|
662.8
|
|
|
|
|
|
|
|
|
Total liabilities and stockholders' equity
|
|
|
|
$
|
8,145.5
|
|
|
|
|
|
|
|
|
|
|
$
|
6,952.4
|
|
|
|
|
|
|
|
|
Net interest income and margin
|
|
|
|
|
|
|
$
|
158,355
|
|
|
4.36
|
%
|
|
|
|
|
|
|
$
|
140,862
|
|
|
4.49
|
%
|
|
Net interest spread
|
|
|
|
|
|
|
|
|
|
4.21
|
%
|
|
|
|
|
|
|
|
|
|
4.31
|
%
|
|
|
|
|
|
|
|
|
|
|
|
|
|
|
|
|
|
|
|
|
|
|
|
(1) Yields on loans and securities have been adjusted to a tax
equivalent basis. The taxable-equivalent adjustment was $6,311 and
$4,017 for the six months June 30, 2013 and 2012, respectively.
|
|
|
|
|
|
|
|
|
|
|
|
|
|
|
|
|
Western Alliance Bancorporation and Subsidiaries
|
|
Operating Segment Results
|
|
Unaudited
|
|
|
|
|
|
|
|
|
|
|
|
|
|
|
|
Inter-
|
|
|
|
|
|
|
|
|
|
|
|
|
|
|
|
|
|
|
|
|
segment
|
|
|
Consoli-
|
|
|
|
|
|
Western
|
|
|
Bank
|
|
|
Torrey
|
|
|
|
|
|
elimi-
|
|
|
dated
|
|
|
|
|
|
Alliance Bank
|
|
|
of Nevada
|
|
|
Pines Bank*
|
|
|
Other
|
|
|
nations
|
|
|
Company
|
|
At June 30, 2013
|
|
|
|
(dollars in millions)
|
|
Assets
|
|
|
|
$
|
3,053.0
|
|
|
|
$
|
3,319.2
|
|
|
|
$
|
2,030.7
|
|
|
|
$
|
1,124.8
|
|
|
|
$
|
(934.0
|
)
|
|
|
$
|
8,593.7
|
|
|
Held for sale loans
|
|
|
|
|
-
|
|
|
|
|
-
|
|
|
|
|
27.6
|
|
|
|
|
-
|
|
|
|
|
-
|
|
|
|
|
27.6
|
|
|
Gross loans and deferred fees, net
|
|
|
|
|
2,454.4
|
|
|
|
|
2,416.3
|
|
|
|
|
1,494.0
|
|
|
|
|
62.1
|
|
|
|
|
(43.0
|
)
|
|
|
|
6,383.9
|
|
|
Less: Allowance for credit losses
|
|
|
|
|
(22.3
|
)
|
|
|
|
(55.8
|
)
|
|
|
|
(15.6
|
)
|
|
|
|
(2.6
|
)
|
|
|
|
-
|
|
|
|
|
(96.3
|
)
|
|
Loans, net
|
|
|
|
|
2,432.1
|
|
|
|
|
2,360.5
|
|
|
|
|
1,478.5
|
|
|
|
|
59.5
|
|
|
|
|
(43.0
|
)
|
|
|
|
6,287.6
|
|
|
Goodwill and intangible assets
|
|
|
|
|
3.0
|
|
|
|
|
25.6
|
|
|
|
|
-
|
|
|
|
|
-
|
|
|
|
|
-
|
|
|
|
|
28.6
|
|
|
Deposits
|
|
|
|
|
2,648.9
|
|
|
|
|
2,619.9
|
|
|
|
|
1,749.4
|
|
|
|
|
-
|
|
|
|
|
(16.9
|
)
|
|
|
|
7,001.3
|
|
|
Borrowings
|
|
|
|
|
74.7
|
|
|
|
|
200.0
|
|
|
|
|
45.0
|
|
|
|
|
123.9
|
|
|
|
|
(25.0
|
)
|
|
|
|
418.6
|
|
|
Stockholders' equity
|
|
|
|
|
262.4
|
|
|
|
|
393.1
|
|
|
|
|
170.1
|
|
|
|
|
817.8
|
|
|
|
|
(843.9
|
)
|
|
|
|
799.5
|
|
|
|
|
|
|
|
|
|
|
|
|
|
|
|
|
|
|
|
|
|
|
|
No. of branches
|
|
|
|
|
17
|
|
|
|
|
12
|
|
|
|
|
12
|
|
|
|
|
-
|
|
|
|
|
-
|
|
|
|
|
41
|
|
|
No. of FTE
|
|
|
|
|
293
|
|
|
|
|
388
|
|
|
|
|
229
|
|
|
|
|
105
|
|
|
|
|
-
|
|
|
|
|
1,015
|
|
|
|
|
|
|
|
|
|
|
|
|
|
|
|
|
|
|
|
|
|
|
|
Three Months Ended June 30, 2013:
|
|
|
|
(in thousands)
|
|
Net interest income
|
|
|
|
$
|
32,530
|
|
|
|
$
|
30,679
|
|
|
|
$
|
20,603
|
|
|
|
|
(1,660
|
)
|
|
|
$
|
-
|
|
|
|
$
|
82,152
|
|
|
Provision for credit losses
|
|
|
|
|
1,009
|
|
|
|
|
999
|
|
|
|
|
740
|
|
|
|
|
733
|
|
|
|
|
-
|
|
|
|
|
3,481
|
|
|
Net interest income (loss) after provision for credit losses
|
|
|
|
|
31,521
|
|
|
|
|
29,680
|
|
|
|
|
19,863
|
|
|
|
|
(2,393
|
)
|
|
|
|
-
|
|
|
|
|
78,671
|
|
|
Non-interest income
|
|
|
|
|
11,300
|
|
|
|
|
3,732
|
|
|
|
|
606
|
|
|
|
|
(294
|
)
|
|
|
|
(4,482
|
)
|
|
|
|
10,862
|
|
|
Non-interest expense
|
|
|
|
|
(17,100
|
)
|
|
|
|
(16,034
|
)
|
|
|
|
(11,958
|
)
|
|
|
|
(7,921
|
)
|
|
|
|
4,482
|
|
|
|
|
(48,531
|
)
|
|
Income (loss) from continuing operations before income taxes
|
|
|
|
|
25,721
|
|
|
|
|
17,378
|
|
|
|
|
8,511
|
|
|
|
|
(10,608
|
)
|
|
|
|
-
|
|
|
|
|
41,002
|
|
|
Income tax expense (benefit)
|
|
|
|
|
5,247
|
|
|
|
|
4,672
|
|
|
|
|
2,669
|
|
|
|
|
(5,771
|
)
|
|
|
|
-
|
|
|
|
|
6,817
|
|
|
Income (loss) from continuing operations
|
|
|
|
|
20,474
|
|
|
|
|
12,706
|
|
|
|
|
5,842
|
|
|
|
|
(4,837
|
)
|
|
|
|
-
|
|
|
|
|
34,185
|
|
|
Loss from discontinued operations, net
|
|
|
|
|
-
|
|
|
|
|
|
|
|
-
|
|
|
|
|
(169
|
)
|
|
|
|
-
|
|
|
|
|
(169
|
)
|
|
Net income (loss)
|
|
|
|
$
|
20,474
|
|
|
|
$
|
12,706
|
|
|
|
$
|
5,842
|
|
|
|
$
|
(5,006
|
)
|
|
|
$
|
-
|
|
|
|
$
|
34,016
|
|
|
|
|
|
|
|
|
|
|
|
|
|
|
|
|
|
|
|
|
|
|
|
Six Months Ended June 30, 2013:
|
|
|
|
(in thousands)
|
|
Net interest income
|
|
|
|
$
|
59,165
|
|
|
|
$
|
59,933
|
|
|
|
$
|
41,380
|
|
|
|
$
|
(2,123
|
)
|
|
|
$
|
-
|
|
|
|
$
|
158,355
|
|
|
Provision for credit losses
|
|
|
|
|
3,644
|
|
|
|
|
1,404
|
|
|
|
|
832
|
|
|
|
|
3,040
|
|
|
|
|
-
|
|
|
|
|
8,920
|
|
|
Net interest income (loss) after provision for credit losses
|
|
|
|
|
55,521
|
|
|
|
|
58,529
|
|
|
|
|
40,548
|
|
|
|
|
(5,163
|
)
|
|
|
|
-
|
|
|
|
|
149,435
|
|
|
Non-interest income
|
|
|
|
|
12,704
|
|
|
|
|
7,069
|
|
|
|
|
1,204
|
|
|
|
|
1,411
|
|
|
|
|
(7,627
|
)
|
|
|
|
14,761
|
|
|
Non-interest expense
|
|
|
|
|
(30,168
|
)
|
|
|
|
(33,925
|
)
|
|
|
|
(23,927
|
)
|
|
|
|
(15,067
|
)
|
|
|
|
7,627
|
|
|
|
|
(95,460
|
)
|
|
Income (loss) from continuing operations before income taxes
|
|
|
|
|
38,057
|
|
|
|
|
31,673
|
|
|
|
|
17,825
|
|
|
|
|
(18,819
|
)
|
|
|
|
-
|
|
|
|
|
68,736
|
|
|
Income tax expense (benefit)
|
|
|
|
|
9,089
|
|
|
|
|
8,265
|
|
|
|
|
5,668
|
|
|
|
|
(9,397
|
)
|
|
|
|
-
|
|
|
|
|
13,625
|
|
|
Income (loss) from continuing operations
|
|
|
|
|
28,968
|
|
|
|
|
23,408
|
|
|
|
|
12,157
|
|
|
|
|
(9,422
|
)
|
|
|
|
-
|
|
|
|
|
55,111
|
|
|
Loss from discontinued operations, net
|
|
|
|
|
-
|
|
|
|
|
-
|
|
|
|
|
-
|
|
|
|
|
(131
|
)
|
|
|
|
-
|
|
|
|
|
(131
|
)
|
|
Net income (loss)
|
|
|
|
$
|
28,968
|
|
|
|
$
|
23,408
|
|
|
|
$
|
12,157
|
|
|
|
$
|
(9,553
|
)
|
|
|
$
|
-
|
|
|
|
$
|
54,980
|
|
|
|
|
|
|
|
|
|
|
|
|
|
|
|
|
|
|
|
|
|
|
|
* Excludes discontinued operations
|
|
|
|
|
|
|
|
|
|
|
|
|
|
|
|
|
|
|
|
|
|
|
|
|
|
|
|
|
|
|
|
|
|
|
|
|
|
|
|
|
|
|
|
|
|
|
|
|
|
|
|
|
|
|
Western Alliance Bancorporation and Subsidiaries
|
|
Operating Segment Results
|
|
Unaudited
|
|
|
|
|
|
|
|
|
|
|
|
|
|
|
|
Inter-
|
|
|
|
|
|
|
|
|
|
|
|
|
|
|
|
|
|
|
|
|
segment
|
|
|
Consoli-
|
|
|
|
|
|
Western
|
|
|
Bank
|
|
|
Torrey
|
|
|
|
|
|
elimi-
|
|
|
dated
|
|
|
|
|
|
Alliance Bank
|
|
|
of Nevada
|
|
|
Pines Bank*
|
|
|
Other
|
|
|
nations
|
|
|
Company
|
|
At June 30, 2012
|
|
|
|
(dollars in millions)
|
|
Assets
|
|
|
|
$
|
2,349.6
|
|
|
|
$
|
2,920.2
|
|
|
|
$
|
1,895.9
|
|
|
|
$
|
800.7
|
|
|
|
$
|
(802.8
|
)
|
|
|
$
|
7,163.6
|
|
|
Gross loans and deferred fees, net
|
|
|
|
|
1,783.6
|
|
|
|
|
2,002.1
|
|
|
|
|
1,422.0
|
|
|
|
|
-
|
|
|
|
|
(42.9
|
)
|
|
|
|
5,164.8
|
|
|
Less: Allowance for credit losses
|
|
|
|
|
(20.3
|
)
|
|
|
|
(60.5
|
)
|
|
|
|
(16.7
|
)
|
|
|
|
-
|
|
|
|
|
-
|
|
|
|
|
(97.5
|
)
|
|
Loans, net
|
|
|
|
|
1,763.3
|
|
|
|
|
1,941.6
|
|
|
|
|
1,405.3
|
|
|
|
|
-
|
|
|
|
|
(42.9
|
)
|
|
|
|
5,067.3
|
|
|
Goodwill and intangible assets
|
|
|
|
|
3.8
|
|
|
|
|
25.8
|
|
|
|
|
0.2
|
|
|
|
|
4.1
|
|
|
|
|
-
|
|
|
|
|
33.9
|
|
|
Deposits
|
|
|
|
|
1,998.2
|
|
|
|
|
2,430.9
|
|
|
|
|
1,592.5
|
|
|
|
|
-
|
|
|
|
|
(20.2
|
)
|
|
|
|
6,001.4
|
|
|
Borrowings
|
|
|
|
|
70.0
|
|
|
|
|
100.0
|
|
|
|
|
72.0
|
|
|
|
|
74
|
|
|
|
|
(12.0
|
)
|
|
|
|
303.5
|
|
|
Stockholders' equity
|
|
|
|
|
208.7
|
|
|
|
|
329.5
|
|
|
|
|
161.6
|
|
|
|
|
680.4
|
|
|
|
|
(708.1
|
)
|
|
|
|
672.1
|
|
|
|
|
|
|
|
|
|
|
|
|
|
|
|
|
|
|
|
|
|
|
|
No. of branches
|
|
|
|
|
16
|
|
|
|
|
11
|
|
|
|
|
12
|
|
|
|
|
-
|
|
|
|
|
-
|
|
|
|
|
39
|
|
|
No. of FTE
|
|
|
|
|
239
|
|
|
|
|
386
|
|
|
|
|
228
|
|
|
|
|
100
|
|
|
|
|
-
|
|
|
|
|
953
|
|
|
|
|
|
|
|
|
|
|
|
|
|
|
|
|
|
|
|
|
|
|
|
Three Months Ended June 30, 2012:
|
|
|
|
(in thousands)
|
|
Net interest income
|
|
|
|
$
|
24,060
|
|
|
|
$
|
27,498
|
|
|
|
$
|
21,374
|
|
|
|
$
|
(2,127
|
)
|
|
|
$
|
-
|
|
|
|
$
|
70,805
|
|
|
Provision for credit losses
|
|
|
|
|
2,100
|
|
|
|
|
8,747
|
|
|
|
|
2,483
|
|
|
|
|
-
|
|
|
|
|
-
|
|
|
|
|
13,330
|
|
|
Net interest income (loss) after provision for credit losses
|
|
|
|
|
21,960
|
|
|
|
|
18,751
|
|
|
|
|
18,891
|
|
|
|
|
(2,127
|
)
|
|
|
|
-
|
|
|
|
|
57,475
|
|
|
Non-interest income
|
|
|
|
|
1,994
|
|
|
|
|
4,291
|
|
|
|
|
1,079
|
|
|
|
|
1,929
|
|
|
|
|
(1,896
|
)
|
|
|
|
7,397
|
|
|
Non-interest expense
|
|
|
|
|
(12,086
|
)
|
|
|
|
(18,140
|
)
|
|
|
|
(11,338
|
)
|
|
|
|
(5,763
|
)
|
|
|
|
1,896
|
|
|
|
|
(45,431
|
)
|
|
Income (loss) from continuing operations before income taxes
|
|
|
|
|
11,868
|
|
|
|
|
4,902
|
|
|
|
|
8,632
|
|
|
|
|
(5,961
|
)
|
|
|
|
-
|
|
|
|
|
19,441
|
|
|
Income tax expense (benefit)
|
|
|
|
|
4,091
|
|
|
|
|
1,137
|
|
|
|
|
3,340
|
|
|
|
|
(3,309
|
)
|
|
|
|
-
|
|
|
|
|
5,259
|
|
|
Income (loss) from continuing operations
|
|
|
|
|
7,777
|
|
|
|
|
3,765
|
|
|
|
|
5,292
|
|
|
|
|
(2,652
|
)
|
|
|
|
-
|
|
|
|
|
14,182
|
|
|
Loss from discontinued operations, net
|
|
|
|
|
-
|
|
|
|
|
-
|
|
|
|
|
-
|
|
|
|
|
(221
|
)
|
|
|
|
-
|
|
|
|
|
(221
|
)
|
|
Net income (loss)
|
|
|
|
$
|
7,777
|
|
|
|
$
|
3,765
|
|
|
|
$
|
5,292
|
|
|
|
$
|
(2,873
|
)
|
|
|
$
|
-
|
|
|
|
$
|
13,961
|
|
|
|
|
|
|
|
|
|
|
|
|
|
|
|
|
|
|
|
|
|
|
|
Six Months Ended June 30, 2012:
|
|
|
|
|
|
|
|
|
|
|
|
|
|
|
|
|
|
|
|
|
Net interest income
|
|
|
|
$
|
47,116
|
|
|
|
$
|
55,337
|
|
|
|
$
|
42,610
|
|
|
|
$
|
(4,201
|
)
|
|
|
$
|
-
|
|
|
|
$
|
140,862
|
|
|
Provision for credit losses
|
|
|
|
|
103
|
|
|
|
|
22,229
|
|
|
|
|
4,079
|
|
|
|
|
-
|
|
|
|
|
-
|
|
|
|
|
26,411
|
|
|
Net interest income (loss) after provision for credit losses
|
|
|
|
|
47,013
|
|
|
|
|
33,108
|
|
|
|
|
38,531
|
|
|
|
|
(4,201
|
)
|
|
|
|
-
|
|
|
|
|
114,451
|
|
|
Non-interest income
|
|
|
|
|
3,847
|
|
|
|
|
7,874
|
|
|
|
|
2,256
|
|
|
|
|
3,893
|
|
|
|
|
(4,589
|
)
|
|
|
|
13,281
|
|
|
Noninterest expense
|
|
|
|
|
(24,005
|
)
|
|
|
|
(36,970
|
)
|
|
|
|
(22,410
|
)
|
|
|
|
(13,532
|
)
|
|
|
|
4,589
|
|
|
|
|
(92,328
|
)
|
|
Income (loss) from continuing operations before income taxes
|
|
|
|
|
26,855
|
|
|
|
|
4,012
|
|
|
|
|
18,377
|
|
|
|
|
(13,840
|
)
|
|
|
|
-
|
|
|
|
|
35,404
|
|
|
Income tax expense (benefit)
|
|
|
|
|
9,263
|
|
|
|
|
(714
|
)
|
|
|
|
7,297
|
|
|
|
|
(6,146
|
)
|
|
|
|
-
|
|
|
|
|
9,700
|
|
|
Income (loss) from continuing operations
|
|
|
|
|
17,592
|
|
|
|
|
4,726
|
|
|
|
|
11,080
|
|
|
|
|
(7,694
|
)
|
|
|
|
-
|
|
|
|
|
25,704
|
|
|
Loss from discontinued operations, net
|
|
|
|
|
-
|
|
|
|
|
-
|
|
|
|
|
-
|
|
|
|
|
(443
|
)
|
|
|
|
-
|
|
|
|
|
(443
|
)
|
|
Net income (loss)
|
|
|
|
$
|
17,592
|
|
|
|
$
|
4,726
|
|
|
|
$
|
11,080
|
|
|
|
$
|
(8,137
|
)
|
|
|
$
|
-
|
|
|
|
$
|
25,261
|
|
|
|
|
|
|
|
|
|
|
|
|
|
|
|
|
|
|
|
|
|
|
|
* Excludes discontinued operations
|
|
|
|
|
|
|
|
|
|
|
|
|
|
|
|
|
|
|
|
|
|
|
|
|
|
|
|
|
|
|
|
|
|
|
|
|
|
|
|
|
|
|
|
|
|
|
|
|
|
|
|
|
|
|
|
|
|
|
|
|
|
Western Alliance Bancorporation and Subsidiaries
|
|
Reconciliation of Non-GAAP Financial Measures (Unaudited)
|
|
|
|
|
|
June 30,
|
|
|
March 31,
|
|
|
December 31,
|
|
|
September 30,
|
|
|
June 30,
|
|
|
|
|
|
2013
|
|
|
2013
|
|
|
2012
|
|
|
2012
|
|
|
2012
|
|
|
|
|
|
(dollars in thousands)
|
|
Total stockholders' equity
|
|
|
|
$
|
799,524
|
|
|
|
$
|
781,294
|
|
|
|
$
|
759,616
|
|
|
|
$
|
698,011
|
|
|
|
$
|
672,120
|
|
|
Less:
|
|
|
|
|
|
|
|
|
|
|
|
|
|
|
|
|
|
Goodwill and intangible assets
|
|
|
|
|
28,568
|
|
|
|
|
29,166
|
|
|
|
|
29,763
|
|
|
|
|
28,989
|
|
|
|
|
33,953
|
|
|
Total tangible stockholders' equity
|
|
|
|
|
770,956
|
|
|
|
|
752,128
|
|
|
|
|
729,853
|
|
|
|
|
669,022
|
|
|
|
|
638,167
|
|
|
Less:
|
|
|
|
|
|
|
|
|
|
|
|
|
|
|
|
|
|
Preferred stock
|
|
|
|
|
141,000
|
|
|
|
|
141,000
|
|
|
|
|
141,000
|
|
|
|
|
141,000
|
|
|
|
|
141,000
|
|
|
Total tangible common equity
|
|
|
|
|
629,956
|
|
|
|
|
611,128
|
|
|
|
|
588,853
|
|
|
|
|
528,022
|
|
|
|
|
497,167
|
|
|
Add:
|
|
|
|
|
|
|
|
|
|
|
|
|
|
|
|
|
|
Deferred tax
|
|
|
|
|
1,870
|
|
|
|
|
2,080
|
|
|
|
|
2,289
|
|
|
|
|
2,033
|
|
|
|
|
2,896
|
|
|
Total tangible common equity, net of tax
|
|
|
|
$
|
631,826
|
|
|
|
$
|
613,208
|
|
|
|
$
|
591,142
|
|
|
|
$
|
530,055
|
|
|
|
$
|
500,063
|
|
|
Total assets
|
|
|
|
$
|
8,593,684
|
|
|
|
$
|
8,174,103
|
|
|
|
$
|
7,622,637
|
|
|
|
$
|
7,403,603
|
|
|
|
$
|
7,163,572
|
|
|
Less:
|
|
|
|
|
|
|
|
|
|
|
|
|
|
|
|
|
|
Goodwill and intangible assets
|
|
|
|
|
28,568
|
|
|
|
|
29,166
|
|
|
|
|
29,763
|
|
|
|
|
28,989
|
|
|
|
|
33,953
|
|
|
Tangible assets
|
|
|
|
|
8,565,116
|
|
|
|
|
8,144,937
|
|
|
|
|
7,592,874
|
|
|
|
|
7,374,614
|
|
|
|
|
7,129,619
|
|
|
Add:
|
|
|
|
|
|
|
|
|
|
|
|
|
|
|
|
|
|
Deferred tax
|
|
|
|
|
1,870
|
|
|
|
|
2,080
|
|
|
|
|
2,289
|
|
|
|
|
2,033
|
|
|
|
|
2,896
|
|
|
Total tangible assets, net of tax
|
|
|
|
$
|
8,566,986
|
|
|
|
$
|
8,147,017
|
|
|
|
$
|
7,595,163
|
|
|
|
$
|
7,376,647
|
|
|
|
$
|
7,132,515
|
|
|
Tangible equity ratio (1)
|
|
|
|
|
9.0
|
%
|
|
|
|
9.2
|
%
|
|
|
|
9.6
|
%
|
|
|
|
9.1
|
%
|
|
|
|
8.9
|
%
|
|
Tangible common equity ratio (2)
|
|
|
|
|
7.4
|
%
|
|
|
|
7.5
|
%
|
|
|
|
7.8
|
%
|
|
|
|
7.2
|
%
|
|
|
|
7.0
|
%
|
|
Common shares outstanding
|
|
|
|
|
86,997
|
|
|
|
|
87,079
|
|
|
|
|
86,465
|
|
|
|
|
83,455
|
|
|
|
|
83,157
|
|
|
Tangible book value per share, net of tax (3)
|
|
|
|
$
|
7.26
|
|
|
|
$
|
7.04
|
|
|
|
$
|
6.84
|
|
|
|
$
|
6.35
|
|
|
|
$
|
6.01
|
|
|
|
|
|
|
|
|
|
|
|
|
|
|
|
|
|
|
|
|
|
|
|
|
Three Months Ended
|
|
|
|
|
|
June 30,
|
|
|
March 31,
|
|
|
December 31,
|
|
|
September 30,
|
|
|
June 30,
|
|
|
|
|
|
2013
|
|
|
2013
|
|
|
2012
|
|
|
2012
|
|
|
2012
|
|
|
|
|
|
(in thousands)
|
|
Total non-interest income
|
|
|
|
$
|
10,862
|
|
|
|
$
|
3,899
|
|
|
|
$
|
24,463
|
|
|
|
$
|
6,982
|
|
|
|
$
|
7,397
|
|
|
Less:
|
|
|
|
|
|
|
|
|
|
|
|
|
|
|
|
|
|
Unrealized (losses) gains on assets/liabilities measured at fair
value, net
|
|
|
|
|
(3,290
|
)
|
|
|
|
(471
|
)
|
|
|
|
(48
|
)
|
|
|
|
470
|
|
|
|
|
564
|
|
|
Gain on sale of subsidiary/non-controlling interest
|
|
|
|
|
-
|
|
|
|
|
-
|
|
|
|
|
116
|
|
|
|
|
776
|
|
|
|
|
-
|
|
|
Bargain purchase gain from acquisition
|
|
|
|
|
10,044
|
|
|
|
|
-
|
|
|
|
|
17,562
|
|
|
|
|
-
|
|
|
|
|
-
|
|
|
Legal settlements
|
|
|
|
|
-
|
|
|
|
|
38
|
|
|
|
|
879
|
|
|
|
|
-
|
|
|
|
|
-
|
|
|
Mutual fund gains
|
|
|
|
|
-
|
|
|
|
|
-
|
|
|
|
|
483
|
|
|
|
|
-
|
|
|
|
|
-
|
|
|
Amortization of affordable housing investments
|
|
|
|
|
(900
|
)
|
|
|
|
(900
|
)
|
|
|
|
(1,069
|
)
|
|
|
|
(651
|
)
|
|
|
|
(59
|
)
|
|
(Losses) Gains on sales of investment securities, net
|
|
|
|
|
(5
|
)
|
|
|
|
147
|
|
|
|
|
1,447
|
|
|
|
|
1,031
|
|
|
|
|
1,110
|
|
|
Total operating non-interest income
|
|
|
|
|
5,013
|
|
|
|
|
5,085
|
|
|
|
|
5,093
|
|
|
|
|
5,356
|
|
|
|
|
5,782
|
|
|
Add: net interest income
|
|
|
|
|
82,152
|
|
|
|
|
76,203
|
|
|
|
|
77,455
|
|
|
|
|
71,946
|
|
|
|
|
70,805
|
|
|
Net operating revenue (4)
|
|
|
|
$
|
87,165
|
|
|
|
$
|
81,288
|
|
|
|
$
|
82,548
|
|
|
|
$
|
77,302
|
|
|
|
$
|
76,587
|
|
|
|
|
|
|
|
|
|
|
|
|
|
|
|
|
|
|
|
|
Total non-interest expense
|
|
|
|
$
|
48,531
|
|
|
|
$
|
46,929
|
|
|
|
$
|
48,989
|
|
|
|
$
|
47,543
|
|
|
|
$
|
45,431
|
|
|
Less:
|
|
|
|
|
|
|
|
|
|
|
|
|
|
|
|
|
|
Net (gain) loss on sales and valuations of repossessed assets
|
|
|
|
|
(1,124
|
)
|
|
|
|
519
|
|
|
|
|
529
|
|
|
|
|
126
|
|
|
|
|
901
|
|
|
Merger/restructure expense
|
|
|
|
|
2,620
|
|
|
|
|
195
|
|
|
|
|
2,706
|
|
|
|
|
113
|
|
|
|
|
-
|
|
|
Goodwill impairment
|
|
|
|
|
-
|
|
|
|
|
-
|
|
|
|
|
-
|
|
|
|
|
3,435
|
|
|
|
|
-
|
|
|
Total operating non-interest expense (4)
|
|
|
|
$
|
47,035
|
|
|
|
$
|
46,215
|
|
|
|
$
|
45,754
|
|
|
|
$
|
43,869
|
|
|
|
$
|
44,530
|
|
|
|
|
|
|
|
|
|
|
|
|
|
|
|
|
|
|
|
|
Net operating revenue
|
|
|
|
$
|
87,165
|
|
|
|
$
|
81,288
|
|
|
|
$
|
82,548
|
|
|
|
$
|
77,302
|
|
|
|
$
|
76,587
|
|
|
Less:
|
|
|
|
|
|
|
|
|
|
|
|
|
|
|
|
|
|
Operating non-interest expense
|
|
|
|
|
47,035
|
|
|
|
|
46,215
|
|
|
|
|
45,754
|
|
|
|
|
43,869
|
|
|
|
|
44,530
|
|
|
Pre-tax, pre-provision operating earnings (5)
|
|
|
|
$
|
40,130
|
|
|
|
$
|
35,073
|
|
|
|
$
|
36,794
|
|
|
|
$
|
33,433
|
|
|
|
$
|
32,057
|
|
|
|
|
|
|
|
|
|
|
|
|
|
|
|
|
|
|
|
|
|
|
|
|
|
|
|
|
|
|
|
|
|
|
|
|
|
|
|
|
|
|
|
|
|
|
|
|
|
|
|
|
|
|
|
|
Western Alliance Bancorporation and Subsidiaries
|
|
Reconciliation of Non-GAAP Financial Measures (Unaudited)
|
|
|
|
|
|
|
|
|
|
|
|
|
|
|
|
|
|
|
|
|
|
|
|
Three Months Ended
|
|
|
|
|
|
June 30,
|
|
|
March 31,
|
|
|
December 31,
|
|
|
September 30,
|
|
|
June 30,
|
|
|
|
|
|
2013
|
|
|
2013
|
|
|
2012
|
|
|
2012
|
|
|
2012
|
|
|
|
|
|
(in thousands)
|
|
Total operating non-interest expense
|
|
|
|
$
|
47,035
|
|
|
|
$
|
46,215
|
|
|
|
$
|
45,754
|
|
|
|
$
|
43,869
|
|
|
|
$
|
44,530
|
|
|
Divided by:
|
|
|
|
|
|
|
|
|
|
|
|
|
|
|
|
|
|
Total net interest income
|
|
|
|
$
|
82,152
|
|
|
|
$
|
76,203
|
|
|
|
$
|
77,455
|
|
|
|
$
|
71,946
|
|
|
|
$
|
70,805
|
|
|
Add:
|
|
|
|
|
|
|
|
|
|
|
|
|
|
|
|
|
|
Tax equivalent interest adjustment
|
|
|
|
|
2,929
|
|
|
|
|
3,382
|
|
|
|
|
3,012
|
|
|
|
|
2,655
|
|
|
|
|
2,310
|
|
|
Operating non-interest income
|
|
|
|
|
5,013
|
|
|
|
|
5,085
|
|
|
|
|
5,093
|
|
|
|
|
5,356
|
|
|
|
|
5,782
|
|
|
|
|
|
|
$
|
90,094
|
|
|
|
$
|
84,670
|
|
|
|
$
|
85,560
|
|
|
|
$
|
79,957
|
|
|
|
$
|
78,897
|
|
|
Efficiency ratio - tax equivalent basis (6)
|
|
|
|
|
52.2
|
%
|
|
|
|
54.6
|
%
|
|
|
|
53.5
|
%
|
|
|
|
54.9
|
%
|
|
|
|
56.4
|
%
|
|
|
|
|
|
|
|
|
|
|
|
|
|
|
|
|
|
|
|
|
|
|
|
Three Months Ended
|
|
|
|
|
|
|
|
|
|
|
|
|
|
|
June 30,
|
|
|
June 30,
|
|
|
|
|
|
|
|
|
|
|
|
|
|
|
2013
|
|
|
2012
|
|
|
|
|
|
|
|
|
|
|
|
|
|
|
(in thousands)
|
|
|
|
|
|
|
|
|
|
|
Stockholders' equity
|
|
|
|
$
|
799,524
|
|
|
|
$
|
672,120
|
|
|
|
|
|
|
|
|
|
|
|
Less:
|
|
|
|
|
|
|
|
|
|
|
|
|
|
|
|
|
|
Accumulated other comprehensive (loss) income
|
|
|
|
|
(10,646
|
)
|
|
|
|
4,291
|
|
|
|
|
|
|
|
|
|
|
|
Non-qualifying goodwill and intangibles
|
|
|
|
|
26,756
|
|
|
|
|
31,748
|
|
|
|
|
|
|
|
|
|
|
|
Other non-qualifying assets
|
|
|
|
|
2
|
|
|
|
|
3
|
|
|
|
|
|
|
|
|
|
|
|
Disallowed unrealized losses on equity securities
|
|
|
|
|
103
|
|
|
|
|
-
|
|
|
|
|
|
|
|
|
|
|
|
Add:
|
|
|
|
|
|
|
|
|
|
|
|
|
|
|
|
|
|
Qualifying trust preferred securities
|
|
|
|
|
47,228
|
|
|
|
|
45,123
|
|
|
|
|
|
|
|
|
|
|
|
Tier 1 capital (regulatory) (7) (10)
|
|
|
|
|
830,537
|
|
|
|
|
681,201
|
|
|
|
|
|
|
|
|
|
|
|
Less:
|
|
|
|
|
|
|
|
|
|
|
|
|
|
|
|
|
|
Qualifying non-controlling interests
|
|
|
|
|
-
|
|
|
|
|
423
|
|
|
|
|
|
|
|
|
|
|
|
Qualifying trust preferred securities
|
|
|
|
|
47,228
|
|
|
|
|
45,123
|
|
|
|
|
|
|
|
|
|
|
|
Preferred stock
|
|
|
|
|
141,000
|
|
|
|
|
141,000
|
|
|
|
|
|
|
|
|
|
|
|
Estimated Tier 1 common equity (8) (10)
|
|
|
|
$
|
642,309
|
|
|
|
$
|
494,655
|
|
|
|
|
|
|
|
|
|
|
|
Divided by:
|
|
|
|
|
|
|
|
|
|
|
|
|
|
|
|
|
|
Estimated risk-weighted assets (regulatory) (8) (10)
|
|
|
|
$
|
7,698,091
|
|
|
|
$
|
6,181,246
|
|
|
|
|
|
|
|
|
|
|
|
Tier 1 common equity ratio (8) (10)
|
|
|
|
|
8.3
|
%
|
|
|
|
8.0
|
%
|
|
|
|
|
|
|
|
|
|
|
|
|
|
|
|
|
|
|
|
|
|
|
|
|
|
|
|
|
|
|
|
|
June 30,
|
|
|
June 30,
|
|
|
|
|
|
|
|
|
|
|
|
|
|
|
2013
|
|
|
2012
|
|
|
|
|
|
|
|
|
|
|
|
|
|
|
(in thousands)
|
|
|
|
|
|
|
|
|
|
|
Classified assets
|
|
|
|
$
|
298,887
|
|
|
|
$
|
325,165
|
|
|
|
|
|
|
|
|
|
|
|
Divide:
|
|
|
|
|
|
|
|
|
|
|
|
|
|
|
|
|
|
Tier 1 capital (regulatory) (7) (10)
|
|
|
|
|
830,537
|
|
|
|
|
681,201
|
|
|
|
|
|
|
|
|
|
|
|
Plus: Allowance for credit losses
|
|
|
|
|
96,323
|
|
|
|
|
97,512
|
|
|
|
|
|
|
|
|
|
|
|
Total Tier 1 capital plus allowance for credit losses
|
|
|
|
$
|
926,860
|
|
|
|
$
|
778,713
|
|
|
|
|
|
|
|
|
|
|
|
Classified assets to Tier 1 capital plus allowance (9) (10)
|
|
|
|
|
32
|
%
|
|
|
|
42
|
%
|
|
|
|
|
|
|
|
|
|
|
|
|
|
|
|
|
|
|
|
|
|
|
|
|
|
|
|
|
(1)
|
|
We believe this non-GAAP ratio provides a critical metric with
which to analyze and evaluate financial condition and capital
strength.
|
|
(2)
|
|
We believe this non-GAAP ratio provides a critical metric with
which to analyze and evaluate financial condition and capital
strength.
|
|
(3)
|
|
We believe this non-GAAP ratio improves the comparability to other
institutions that have not engaged in acquisitions that resulted
in recorded goodwill and other intangibles.
|
|
(4)
|
|
We believe these non-GAAP measurements provide a useful indication
of the cash generating capacity of the Company.
|
|
(5)
|
|
We believe this non-GAAP measurement is a key indicator of the
earnings power of the Company, which is otherwise obscured by the
asset quality issues.
|
|
(6)
|
|
We believe this non-GAAP ratio provides a useful metric to measure
the operating efficiency of the Company.
|
|
(7)
|
|
Under the guidelines of the Federal Reserve and the FDIC in
effect, Tier 1 capital consisted of common stock, retained
earnings, non-cumulative perpetual preferred stock, trust
preferred securities up to a certain limit, and minority interests
in certain subsidiaries, less most other intangible assets.
|
|
(8)
|
|
Tier 1 common equity is often expressed as a percentage of
risk-weighted assets. Under the risk-based capital framework, a
bank's balance sheet assets and credit equivalent amounts of
off-balance sheet items, are assigned to one of four broad risk
categories. The aggregated dollar amount in each category is then
multiplied by the risk weighting assigned to that category. The
resulting weighted values from each of the four categories are
added together and this sum is the risk-weighted assets total
that, as adjusted, comprises the denominator (risk-weighted
assets) to determine the Tier 1 capital ratio. Adjustments are
made to Tier 1 capital to arrive at Tier 1 common equity. Tier 1
common equity is divided by the risk-weighted assets to determine
the Tier 1 common equity ratio. We believe this non-GAAP ratio
with which to analyze and evaluate financial condition and capital
strength.
|
|
(9)
|
|
We believe this non-GAAP ratio provides a critical regulatory
metric in which to analyze asset quality.
|
|
(10)
|
|
Preliminary until Call Reports are filed.
|
CONTACT:
Western Alliance Bancorporation
Dale Gibbons, 602-952-5476