Exhibit 99.1
Western
Alliance Reports Profit of $5.2 million for the First Quarter 2011
PHOENIX--(BUSINESS WIRE)--April 25, 2011--Western Alliance
Bancorporation (NYSE:WAL) announced today its financial results for the
first quarter 2011.
First Quarter 2011 Highlights:
-
Net income of $0.03 per common share, compared to net loss of $0.17
for the fourth quarter 2010 and $0.03 net loss for the first quarter
of 2010
-
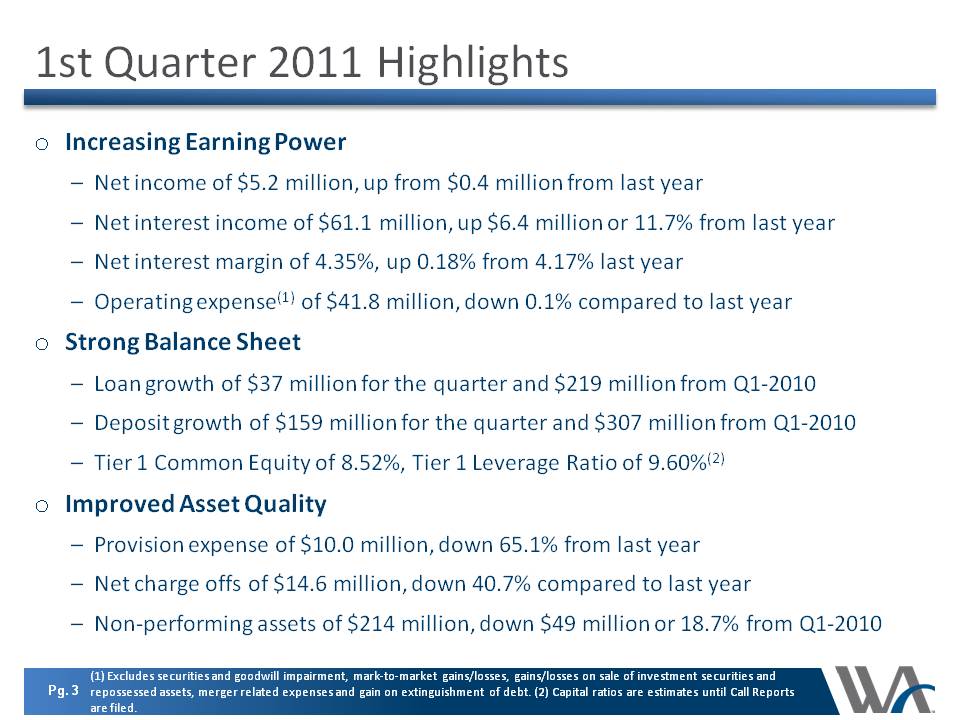
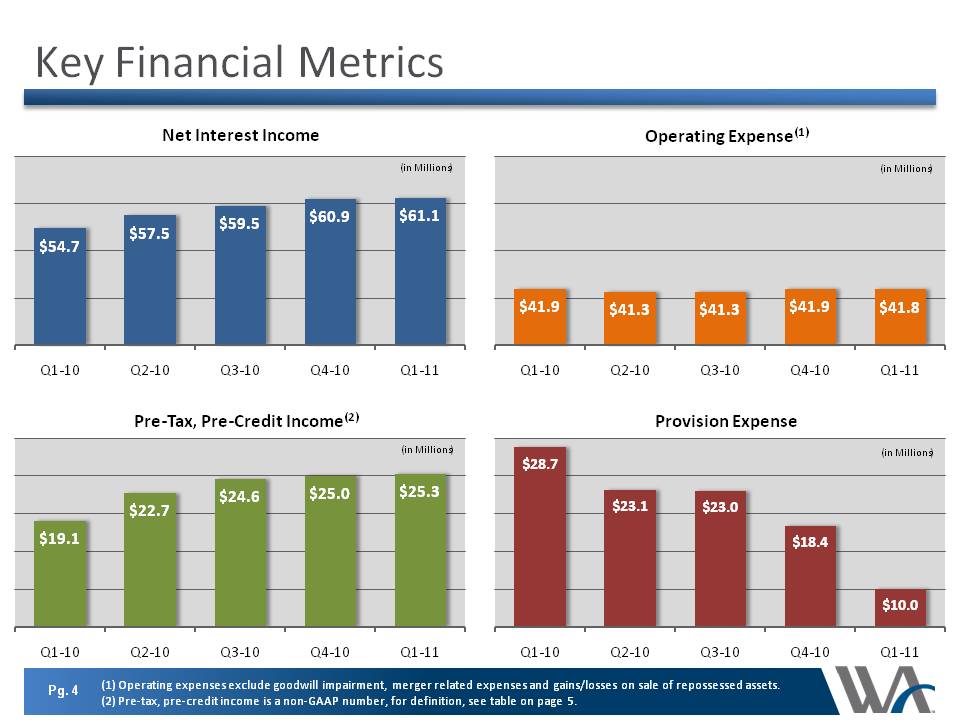
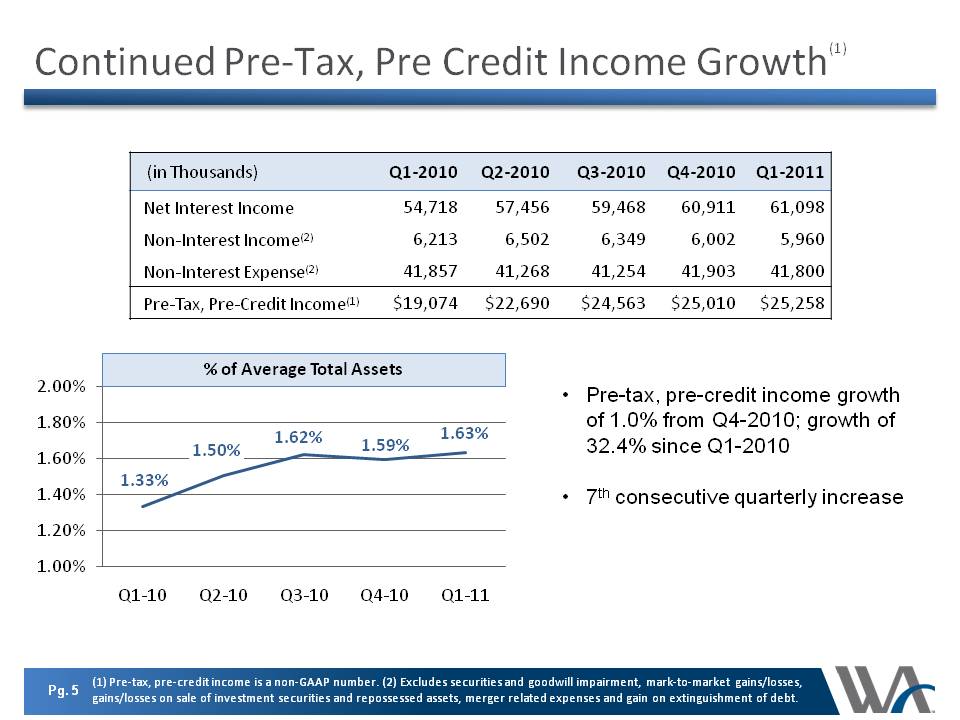
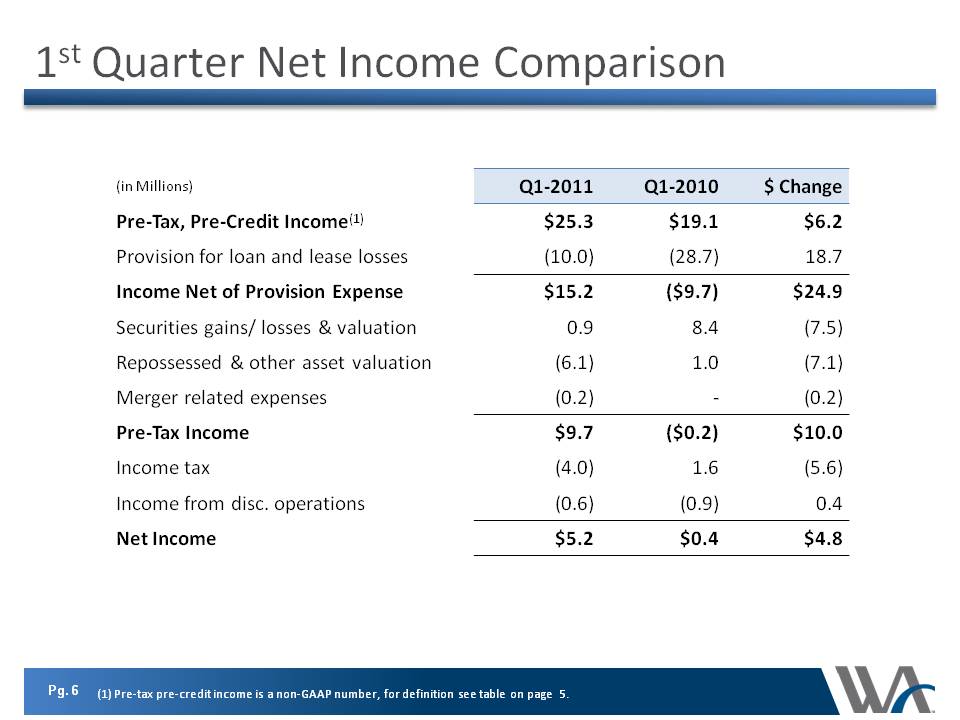
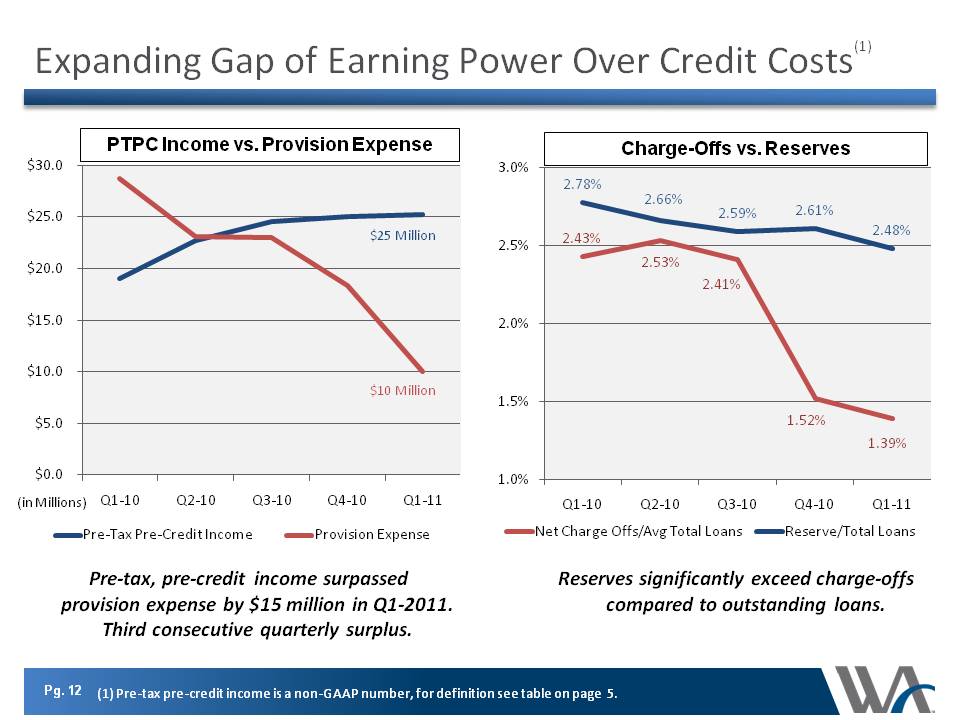
Pre-tax, pre-provision operating earnings of $25.3 million, up from
$25.0 million in fourth quarter 2010 and up 32.4% from $19.1 million
in first quarter 20101
-
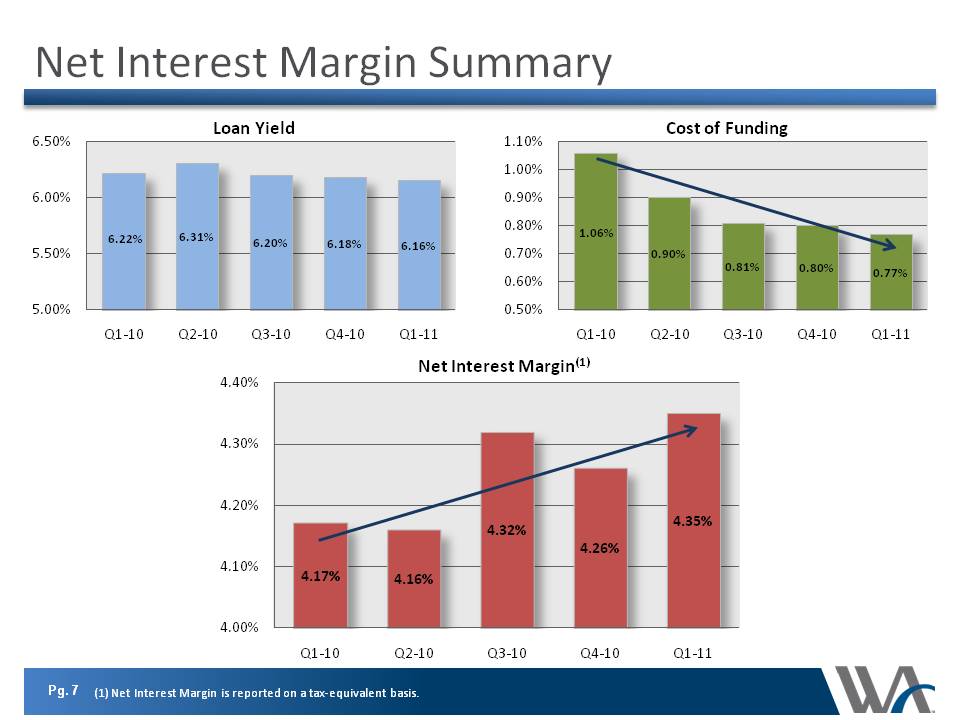
Record net interest income of $61.1 million, compared to $60.9 million
in prior quarter and $54.7 million in same quarter last year
-
Net interest margin of 4.35%, compared to 4.26% in fourth quarter of
2010 and 4.17% in first quarter last year
-
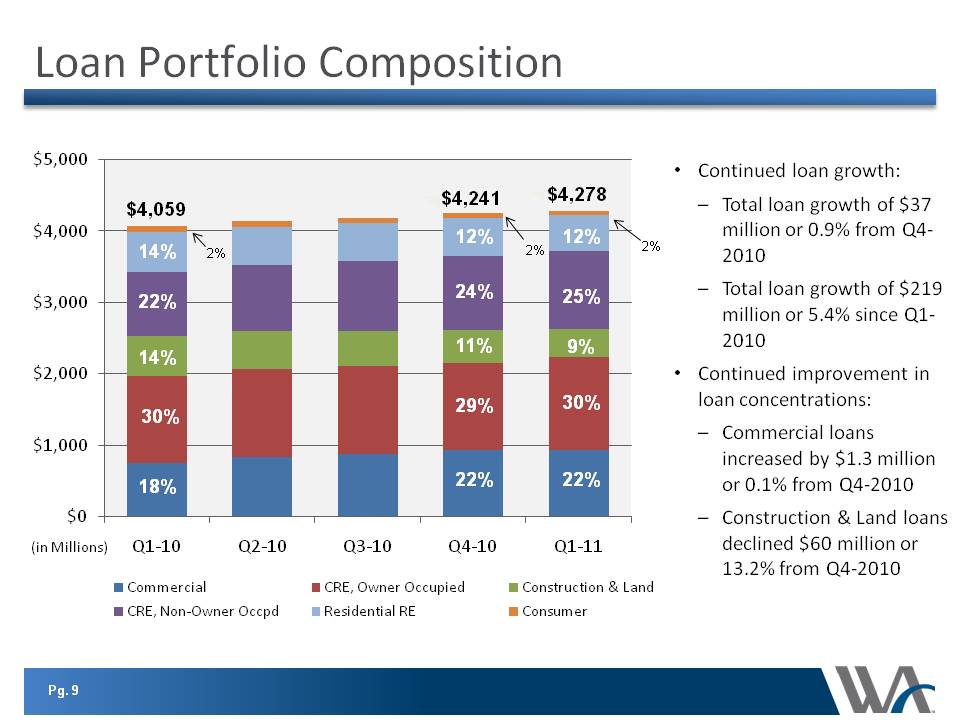
Total loans of $4.28 billion, up $37 million from December 31, 2010
and up $219 million from March 31, 2010
-
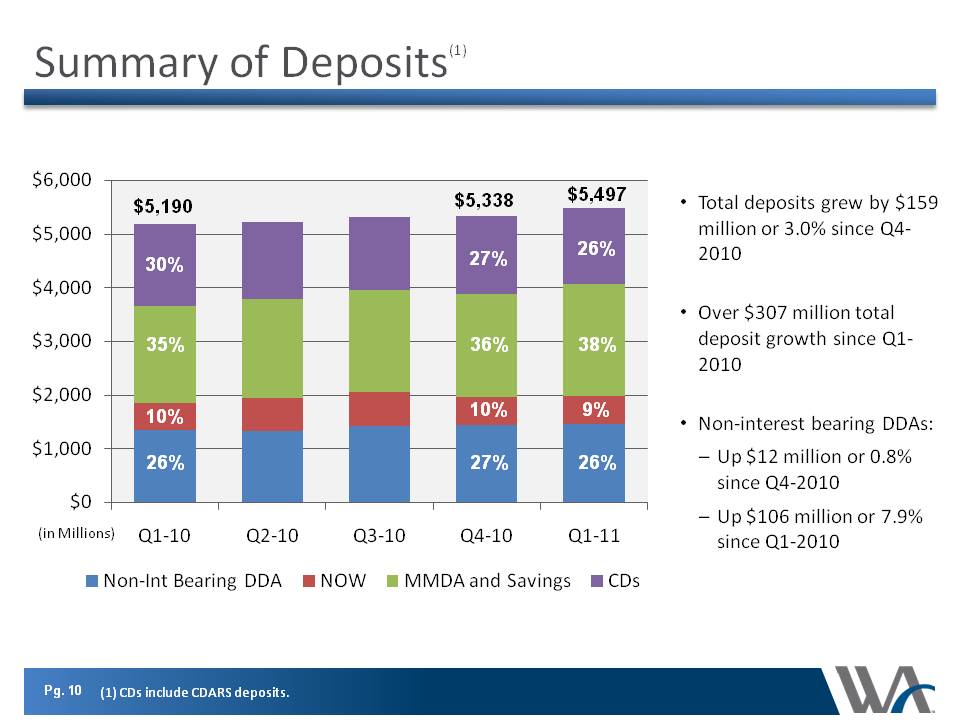
Total deposits of $5.50 billion, up $159 million from December 31,
2010 and up $307 million from March 31, 2010
-
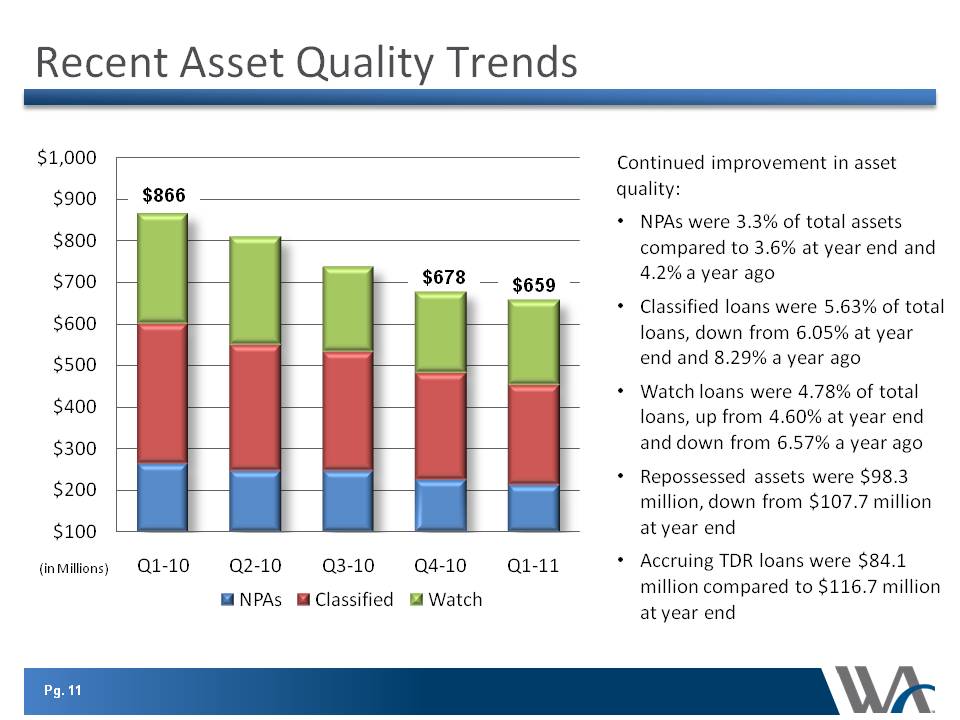
Nonperforming assets (nonaccrual loans and repossessed assets) of 3.3%
of total assets, compared to 3.6% in fourth quarter 2010 and 4.2% in
first quarter 2010
-
Total watch and classified loans (including nonaccrual) of $445
million at March 31, 2011, compared to $452 million at December 31,
2010 and $603 million at March 31, 2010
-
Provision for credit losses of $10.0 million, compared to $18.4
million in the fourth quarter 2010 and $28.7 million in first quarter
last year
-
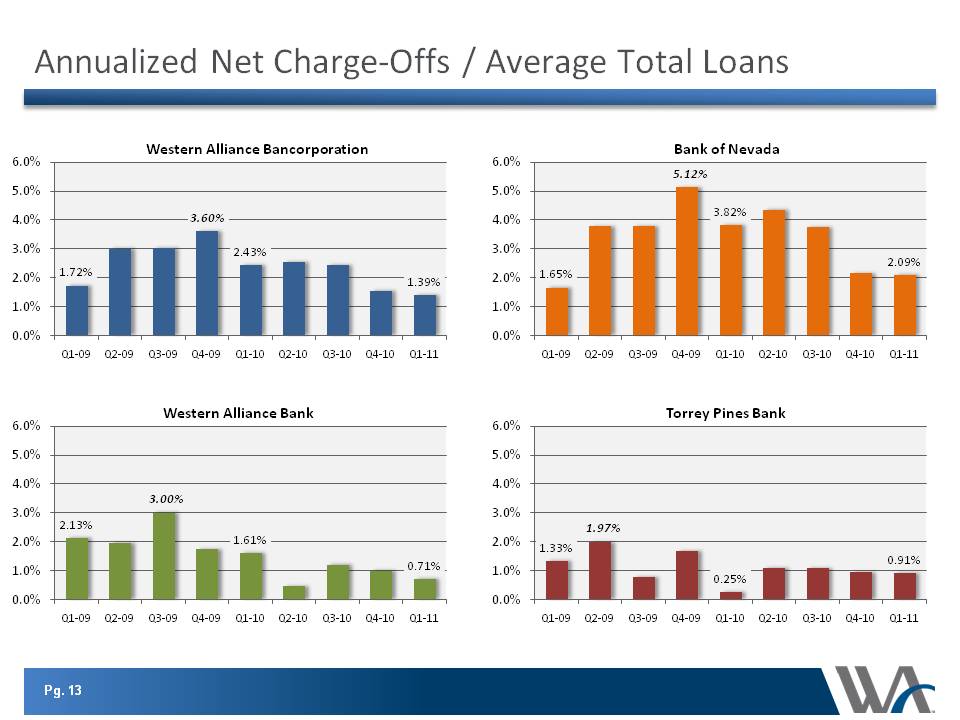
Net loan charge-offs of $14.6 million, down from $15.9 million for the
fourth quarter 2010 and $24.6 million in first quarter last year
-
Net income of $5.2 million, including pre-tax loss on repossessed
asset valuations/sales of $6.1 million
-
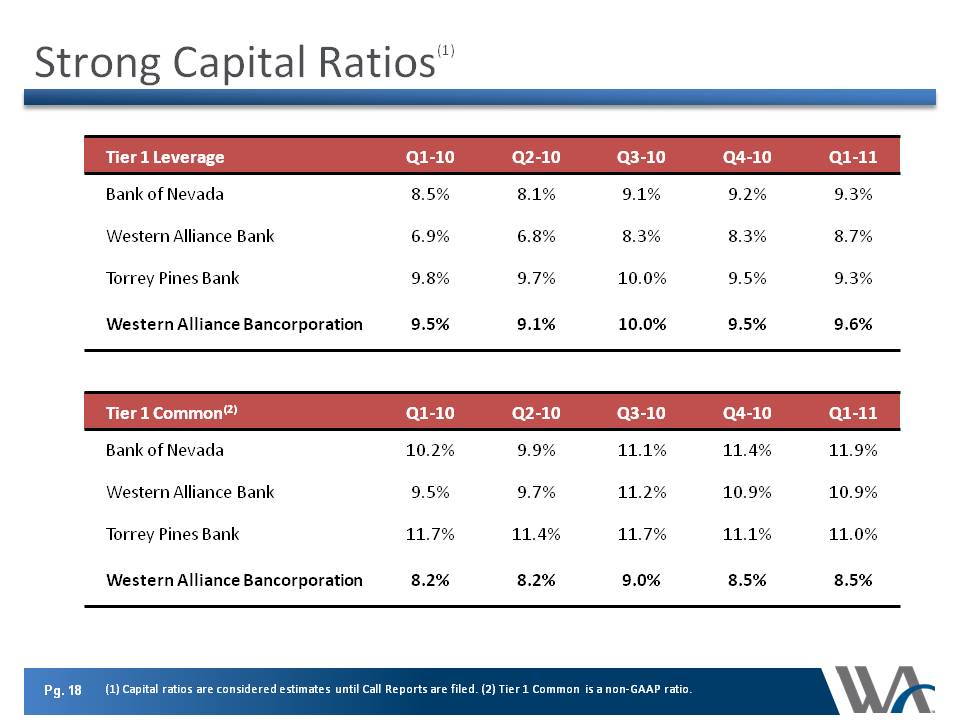
Tier I Leverage capital of 9.6% and Total Risk-Based Capital ratio of
13.2%, compared to 9.5% and 14.6% a year ago
Financial Performance
“I’m pleased with our strong start in 2011 with an increase in our top
line performance, driven by loan and deposit growth and an expanding
margin, and our bottom line performance through increased efficiency and
improved asset quality,” said Robert Sarver, Chairman and Chief
Executive Officer of Western Alliance Bancorporation. “For the first
time in three years, each of our operating units was profitable. We
continue to make important strides on multiple fronts simultaneously as
we achieve total loan growth while reducing higher risk construction and
land exposure, and growing our deposits while reducing our funding
costs. These successes demonstrate our continued progress toward
achieving our full operating potential.”
Ken Vecchione, President and Chief Operating Officer, added, “Western
Alliance continues to demonstrate predictability along with improving
credit metrics. Over the last several quarters our Company has shown
consistent loan growth, improving quarter-to-quarter net interest
income, expense discipline, increasing operating leverage, and strong
core profitability dynamics. Focus on our long-term objectives, adhering
to our straight-forward business model, and the improving backdrop of
credit quality help produce our best quarterly financial results since
2007.”
Western Alliance Bancorporation reported net income of $5.2 million in
the first quarter 2011, including a net loss from sales/valuation of
repossessed assets of $6.1 million and a loss on discontinued operations
net of tax of $0.6 million.
The Company reported net income per common share of $0.03 in the first
quarter 2011. The income included $0.05 loss from sales/valuations of
repossessed assets after tax and a net loss from discontinued affinity
credit card operations held for sale net of tax of $0.01.
Total loans increased $37 million to $4.28 billion at March 31, 2011
from $4.24 billion on December 31, 2010. This increase was driven by
growth in commercial real estate loans and commercial leases; partially
offset by reductions in all other loan types. Geographically, loans
outstanding at our Las Vegas, Nevada affiliate decreased by $42 million
and increased by $79 million at our other affiliates. Loans increased
$219 million from March 31, 2010.
Total deposits increased $159 million to $5.50 billion at March 31, 2011
from $5.34 billion at December 31, 2010, with significant growth in
money market/savings accounts and, non-interest bearing demand deposits
offset by a decline in certificates of deposits and interest bearing
demand deposits. Deposits increased $307 million from March 31, 2010.
Income Statement
Net interest income increased slightly to $61.1 million in the first
quarter 2011 from $60.9 million in the fourth quarter 2010 and 11.7
percent compared to the first quarter 2010, propelled by reductions in
cost of funds. The net interest margin in the first quarter 2011 was
4.35 percent compared to 4.26 percent in the fourth quarter 2010 and
4.17 percent in the first quarter of 2010.
Operating non-interest income was $6.0 million for the first quarter
2011.1 This performance was a decrease from $6.2 million for
the same period in 2010 and the same as fourth quarter of 2010,
resulting from the disposition of the majority of our asset management
businesses.1
Net revenue was $67.1 million for the first quarter 2011, a slight
increase from $66.9 million for the fourth quarter of 2010 and 10.2
percent from net revenue of $60.9 million for the first quarter 2010.1
Operating non-interest expense was $41.8 million for the first quarter
2011, compared to $41.9 million for the fourth quarter of 2010 and the
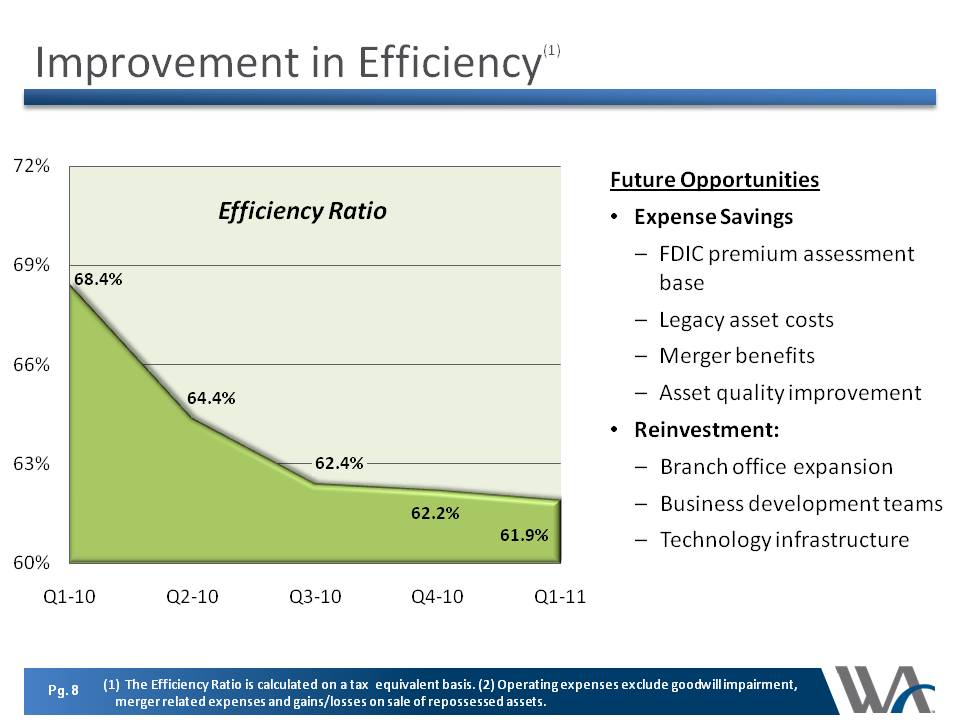
same period in 2010.1 The operating efficiency ratio was 62
percent for the first quarter 2011, compared to 68 percent for the first
quarter 2010.1 The Company had 894 full-time equivalent
employees at March 31, 2011, compared to 948 one year ago.
A key performance metric for the Company is its pre-tax, pre-provision
operating earnings, which it defines as net revenue less its operating
non-interest expense.1 For the first quarter 2011, the
Company’s performance was $25.3 million, compared to $25.0 million in
the fourth quarter 2010 and $19.1 million in the first quarter 2010.1
The provision for credit losses was $10.0 million for the first quarter
2011 compared to $18.4 million for the fourth quarter 2010 and $28.7
million for the first quarter 2010. Nonaccrual loans and repossessed
assets were $213 million or 3.3 percent of total assets at March 31,
2011, down from $225 million or 3.6 percent of total assets at December
31, 2010 and $254 million or 4.2 percent of total assets at March 31,
2010. Net loan charge-offs in the first quarter 2011 were $14.6 million
or 1.39 percent of average loans (annualized), down from $15.9 million
or 1.52 percent of average loans (annualized) for the fourth quarter
2010 and $24.6 million or 2.43% of average loans (annualized) for the
first quarter 2010. Loans past due 90 days and still accruing totaled
$1.1 million at March 31, 2011, down from $1.5 million at December 31,
2010 and down from $8.4 million at March 31, 2010. Loans past due 30-89
days totaled $30.7 million at quarter end, up from $18.2 million at
December 31, 2010 and down from $38.6 million at March 31, 2010.
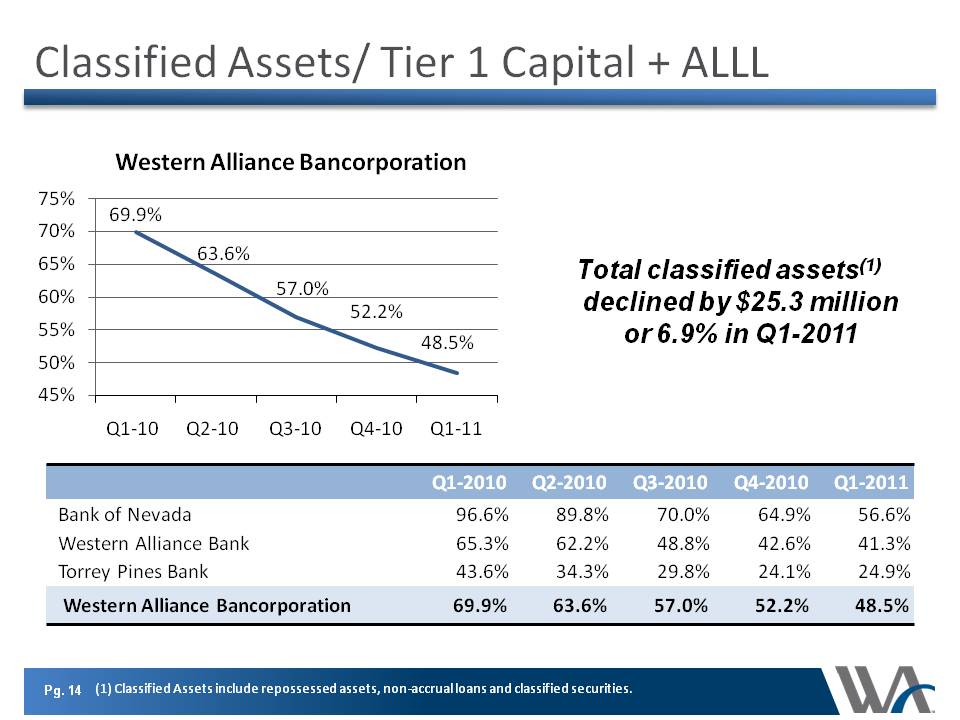
Classified assets to Tier I capital plus allowance for credit losses, a
common regulatory measure of asset quality, improved to 48 percent at
March 31, 2011 from 70 percent one year ago.1
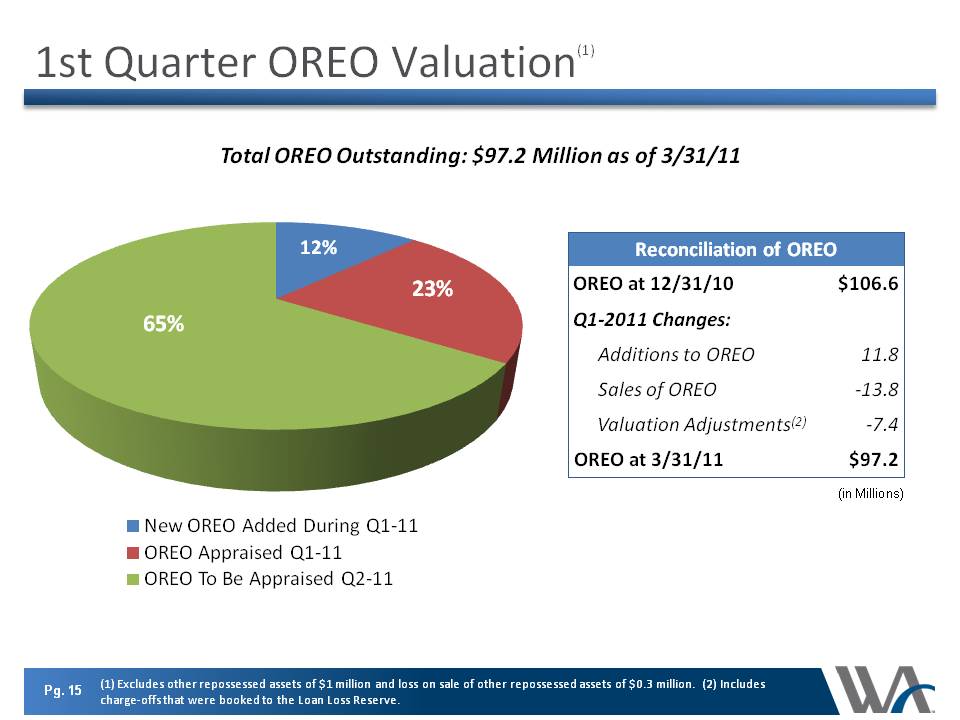
Net loss on sales and valuation of repossessed assets (primarily other
real estate) was $6.1 million for the first quarter 2011 compared to
$13.0 million in the prior quarter. At March 31, 2011, other repossessed
assets were valued at $98 million compared to $108 million at December
31, 2010.
During the first quarter 2011, the Company completed its consolidations
of its Alta Alliance Bank subsidiary into Torrey Pines Bank and its
First Independent Bank of Nevada subsidiary into Alliance Bank of
Arizona doing business as Western Alliance Bank and incurred $0.2
million in merger charges related to these transactions.
Balance Sheet
Gross loans totaled $4.28 billion at March 31, 2011, an increase of $37
million from December 31, 2010 and an increase of $219 million from
$4.06 billion at March 31, 2010. At March 31, 2011 the allowance for
credit losses was 2.48 percent of total loans down from 2.61 percent at
December 31, 2010 and 2.78 percent at March 31, 2010.
Deposits totaled $5.50 billion at March 31, 2011, an increase of $159
million from $5.34 billion at December 31, 2010 and an increase of $307
million from $5.19 billion at March 31, 2010.
Non-interest bearing deposits increased by $11.8 million to $1.46
billion at March 31, 2011 from December 31, 2010 and increased $106.3
million from $1.35 billion at March 31, 2010. Non-interest bearing
deposits comprised 26.5 percent of total deposits at March 31, 2011,
compared to 26 percent a year ago.
At March 31, 2011 the Company’s loans were 77.8 percent of deposits,
compared to 78.2 percent one year earlier and 79.4 percent at December
31, 2010.
Stockholders’ equity at March 31, 2011 was essentially flat at $601.6
million from $602.2 million at December 31, 2010. At March 31, 2011,
tangible common equity was 6.8 percent of tangible assets1
and total risk-based capital was 13.2 percent of risk-weighted assets.
Total assets increased 5 percent to $6.40 billion at March 31, 2011 from
$6.10 billion at March 31, 2010 and increased 3.4 percent from $6.19
billion at December 31, 2010.
Operating Unit Highlights
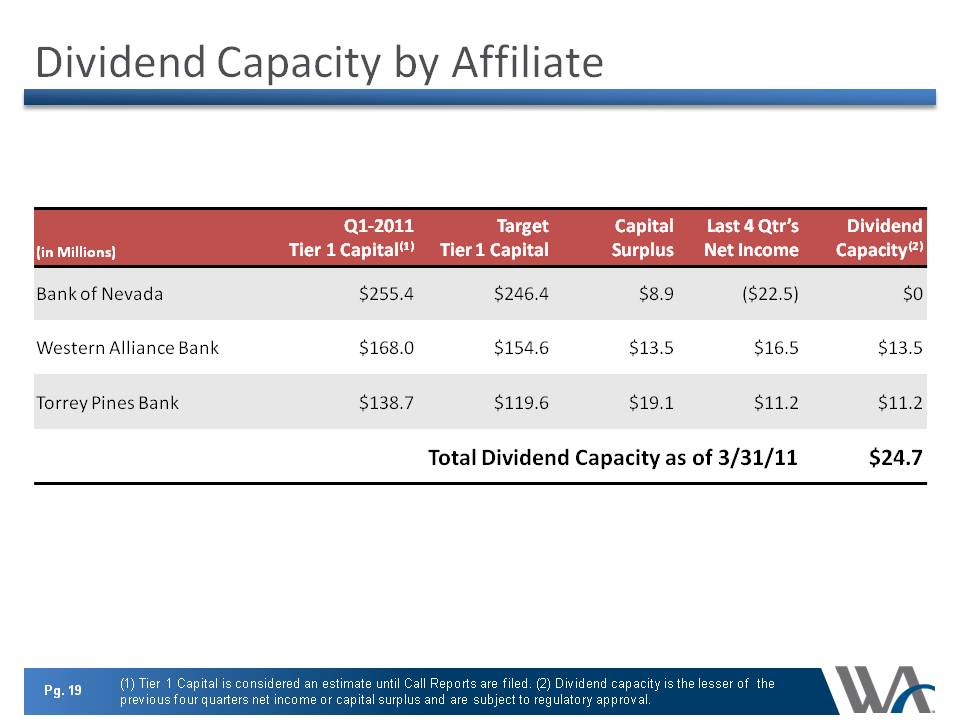
Bank of Nevada reported that loans declined $42 million during the first
quarter of 2011 and declined $141 million during the last 12 months to
$1.87 billion at March 31, 2011. Deposits increased slightly since
December 31, 2010 and increased $123 million over the last twelve months
to $2.39 billion. Net income for Bank of Nevada was $0.9 million during
the first quarter 2011, compared with net losses of $5.8 million for the
fourth quarter of 2010 and $3.0 million during the first quarter 2010.
Western Alliance Bank reported loan growth of $39 million during the
first quarter 2011 and an increase of $190 million during the last 12
months to $1.34 billion. Deposits increased $22 million in the first
quarter and decreased $18 million during the last 12 months to $1.69
billion. Net income for Western Alliance Bank was $4.9 million during
the first quarter 2011 compared with net income of $3.6 million during
the fourth quarter of 2010 and a net income of $1.1 million during the
first quarter 2010.
Torrey Pines Bank segment, which excludes discontinued operations,
reported that loans increased $40 million during the first quarter 2011
and increased $169 million during the last 12 months to $1.10 billion.
Deposits increased $135 million and $201 million to $1.42 billion during
the same periods, respectively. Net income for Torrey Pines Bank was
$4.0 million during the first quarter 2011 compared with net income of
$3.2 million for the fourth quarter of 2010 and net income of $0.5
million during the first quarter 2010.
Attached to this press release is summarized financial information for
the quarter ended March 31, 2011.
Conference Call and Webcast
Western Alliance Bancorporation will host a conference call and live
audio webcast to discuss its first quarter 2011 financial results at
12:00 p.m. ET on Monday, April 25, 2011. Participants may access the
call by dialing 1-866-843-0890 and using passcode: 1293839 or via live
audio webcast using the website link: http://www.talkpoint.com/viewer/starthere.asp?Pres=135049.
The webcast is also available via our website at www.westernalliancebancorp.com.
Participants should log in at least 15 minutes early to receive
instructions. The call will be recorded and made available for replay
after 2:00 p.m. ET, April 25, until 9 a.m. ET, May 9, by dialing
1-877-344-7529 and using the passcode: 449879.
About Western Alliance Bancorporation
Western Alliance Bancorporation is the parent company of Bank of Nevada,
Western Alliance Bank doing business as Alliance Bank of Arizona and
First Independent Bank, Torrey Pines Bank, and Shine Investment Advisory
Services. These dynamic organizations provide a broad array of deposit
and credit services to clients in Nevada, Arizona and California, and
investment services in Colorado. Staffed with experienced financial
professionals, these organizations deliver a broader product array and
larger credit capacity than community banks, yet are empowered to be
more responsive to customers' needs than larger institutions. Additional
investor information can be accessed on the Investor Relations page of
the company's website, www.westernalliancebancorp.com.
Cautionary Note Regarding Forward-Looking Statements
This release contains forward-looking statements that relate to
expectations, beliefs, projections, future plans and strategies,
anticipated events or trends and similar expressions concerning matters
that are not historical facts. The forward-looking statements contained
herein reflect our current views about future events and financial
performance and are subject to risks, uncertainties, assumptions and
changes in circumstances that may cause our actual results to differ
significantly from historical results and those expressed in any
forward-looking statement. Some factors that could cause actual results
to differ materially from historical or expected results include:
factors listed in the Form 10-K as filed with the Securities and
Exchange Commission; changes in general economic conditions, either
nationally or locally in the areas in which we conduct or will conduct
our business; inflation, interest rate, market and monetary
fluctuations; increases in competitive pressures among financial
institutions and businesses offering similar products and services;
higher defaults on our loan portfolio than we expect; changes in
management’s estimate of the adequacy of the allowance for credit
losses; legislative or regulatory changes or changes in accounting
principles, policies or guidelines; management’s estimates and
projections of interest rates and interest rate policy; the execution of
our business plan; and other factors affecting the financial services
industry generally or the banking industry in particular.
We do not intend and disclaim any duty or obligation to update or revise
any industry information or forward-looking statements set forth in this
press release to reflect new information, future events or otherwise.
This press release contains both financial measures based on accounting
principles generally accepted in the United States (“GAAP”) and non-GAAP
based financial measures, which are used where management believes it to
be helpful in understanding Western Alliance Bancorporation’s results of
operations or financial position. Where non-GAAP financial measures are
used, the comparable GAAP financial measure, as well as the
reconcilement to the comparable GAAP financial measure, can be found in
this press release. These disclosures should not be viewed as a
substitute for operating results determined in accordance with GAAP, nor
are they necessarily comparable to non-GAAP performance measures that
may be presented by other companies.
1 See Reconciliation of Non-GAAP Financial Measures beginning
on page 15
|
|
|
|
|
|
|
|
|
|
|
|
|
|
|
|
|
|
Western Alliance Bancorporation and Subsidiaries
|
|
Summary Consolidated Financial Data
|
|
Unaudited
|
|
|
|
|
|
|
|
|
|
|
|
|
|
|
|
|
|
|
|
|
|
|
|
|
At or for the Three Months
|
|
|
|
|
|
|
|
|
Ended March 31,
|
|
|
|
|
|
|
|
|
2011
|
|
|
|
2010
|
|
|
|
Change %
|
|
|
|
|
|
|
|
|
(in thousands, except per share data)
|
|
|
Selected Balance Sheet Data:
|
|
|
|
|
|
|
|
|
|
|
|
|
|
|
|
|
(dollars in millions)
|
|
|
|
|
|
|
|
|
|
|
|
|
|
|
|
|
Total assets
|
|
|
|
|
|
$
|
6,404.8
|
|
|
|
|
$
|
6,096.2
|
|
|
|
|
5.1
|
|
%
|
|
Loans, net of deferred fees
|
|
|
|
|
|
|
4,278.0
|
|
|
|
|
|
4,059.1
|
|
|
|
|
5.4
|
|
|
|
Securities and money market investments
|
|
|
|
|
|
|
1,319.6
|
|
|
|
|
|
781.1
|
|
|
|
|
68.9
|
|
|
|
Federal funds sold
|
|
|
|
|
|
|
-
|
|
|
|
|
|
2.4
|
|
|
|
|
(100.0
|
)
|
|
|
Total deposits
|
|
|
|
|
|
|
5,497.5
|
|
|
|
|
|
5,190.1
|
|
|
|
|
5.9
|
|
|
|
Borrowings
|
|
|
|
|
|
|
73.0
|
|
|
|
|
|
20.0
|
|
|
|
|
265.0
|
|
|
|
Junior subordinated and subordinated debt
|
|
|
|
|
|
|
43.0
|
|
|
|
|
|
102.3
|
|
|
|
|
(58.0
|
)
|
|
|
Stockholders' equity
|
|
|
|
|
|
|
601.6
|
|
|
|
|
|
575.7
|
|
|
|
|
4.5
|
|
|
|
|
|
|
|
|
|
|
|
|
|
|
|
|
|
|
|
|
Selected Income Statement Data:
|
|
|
|
|
|
|
|
|
|
|
|
|
|
|
|
|
(dollars in thousands)
|
|
|
|
|
|
|
|
|
|
|
|
|
|
|
|
|
Interest income
|
|
|
|
|
|
$
|
71,966
|
|
|
|
|
$
|
68,734
|
|
|
|
|
4.7
|
|
%
|
|
Interest expense
|
|
|
|
|
|
|
10,868
|
|
|
|
|
|
14,016
|
|
|
|
|
(22.5
|
)
|
|
|
Net interest income
|
|
|
|
|
|
|
61,098
|
|
|
|
|
|
54,718
|
|
|
|
|
11.7
|
|
|
|
Provision for loan losses
|
|
|
|
|
|
|
10,041
|
|
|
|
|
|
28,747
|
|
|
|
|
(65.1
|
)
|
|
|
Net interest income after provision for credit losses
|
|
|
|
|
|
|
51,057
|
|
|
|
|
|
25,971
|
|
|
|
|
96.6
|
|
|
|
Non-interest income
|
|
|
|
|
|
|
6,830
|
|
|
|
|
|
14,629
|
|
|
|
|
(53.3
|
)
|
|
|
Non-interest expense
|
|
|
|
|
|
|
48,146
|
|
|
|
|
|
40,843
|
|
|
|
|
17.9
|
|
|
|
Income (loss) from continuing operations before income taxes
|
|
|
|
|
|
|
9,741
|
|
|
|
|
|
(243
|
)
|
|
|
|
(4,108.6
|
)
|
|
|
Income tax expense (benefit)
|
|
|
|
|
|
|
4,029
|
|
|
|
|
|
(1,562
|
)
|
|
|
|
(357.9
|
)
|
|
|
Income from continuing operations
|
|
|
|
|
|
|
5,712
|
|
|
|
|
|
1,319
|
|
|
|
|
333.1
|
|
|
|
Loss on discontinued operations, net
|
|
|
|
|
|
|
(559
|
)
|
|
|
|
|
(935
|
)
|
|
|
|
(40.2
|
)
|
|
|
Net income
|
|
|
|
|
|
$
|
5,153
|
|
|
|
|
$
|
384
|
|
|
|
|
1,241.9
|
|
%
|
|
Diluted net income (loss) from continuing operations
|
|
|
|
|
|
$
|
0.04
|
|
|
|
|
$
|
(0.02
|
)
|
|
|
|
|
|
|
Diluted net loss from discontinued operations, net of tax
|
|
|
|
|
|
$
|
(0.01
|
)
|
|
|
|
$
|
(0.01
|
)
|
|
|
|
|
|
|
Diluted net income (loss) per common share
|
|
|
|
|
|
$
|
0.03
|
|
|
|
|
$
|
(0.03
|
)
|
|
|
|
(200.0
|
)
|
%
|
|
|
|
|
|
|
|
|
|
|
|
|
|
|
|
|
|
|
Common Share Data:
|
|
|
|
|
|
|
|
|
|
|
|
|
|
|
|
|
Diluted net income (loss) per common share
|
|
|
|
|
|
$
|
0.03
|
|
|
|
|
$
|
(0.03
|
)
|
|
|
|
(200.0
|
)
|
%
|
|
Book value per common share
|
|
|
|
|
|
$
|
5.72
|
|
|
|
|
$
|
6.12
|
|
|
|
|
(6.5
|
)
|
%
|
|
Tangible book value per share, net of tax (1)
|
|
|
|
|
|
$
|
5.30
|
|
|
|
|
$
|
5.62
|
|
|
|
|
(5.7
|
)
|
%
|
|
Average shares outstanding (in thousands):
|
|
|
|
|
|
|
|
|
|
|
|
|
|
|
|
|
Basic
|
|
|
|
|
|
|
80,794
|
|
|
|
|
|
71,965
|
|
|
|
|
12.3
|
|
|
|
Diluted
|
|
|
|
|
|
|
81,103
|
|
|
|
|
|
71,965
|
|
|
|
|
12.7
|
|
|
|
Common shares outstanding
|
|
|
|
|
|
|
82,237
|
|
|
|
|
|
73,031
|
|
|
|
|
12.6
|
|
|
|
|
|
|
|
|
|
|
|
|
|
|
|
|
|
|
|
|
(1) See Reconciliation of Non-GAAP Financial Measures
|
|
|
|
|
|
|
|
|
|
|
|
|
|
|
|
|
|
|
|
|
|
|
|
|
|
|
|
|
|
|
|
|
|
|
|
|
|
|
|
|
|
|
|
|
|
|
|
|
|
|
|
|
Western Alliance Bancorporation and Subsidiaries
|
|
Summary Consolidated Financial Data (continued)
|
|
Unaudited
|
|
|
|
|
|
|
|
|
|
At or for the Three Months
|
|
|
|
|
|
|
|
|
Ended March 31,
|
|
|
|
|
|
|
|
|
2011
|
|
|
|
2010
|
|
|
|
Change %
|
|
|
|
|
|
|
|
|
(in thousands, except per share data)
|
|
|
Selected Performance Ratios:
|
|
|
|
|
|
|
|
|
|
|
|
|
|
|
|
|
Return on average assets (1)
|
|
|
|
|
|
0.33
|
%
|
|
|
0.03
|
%
|
|
|
1,000.0
|
|
%
|
|
Return on average stockholders' equity (1)
|
|
|
|
|
|
3.41
|
|
|
|
0.27
|
|
|
|
1,163.0
|
|
|
|
Net interest margin (1)
|
|
|
|
|
|
4.35
|
|
|
|
4.17
|
|
|
|
4.3
|
|
|
|
Net interest spread
|
|
|
|
|
|
4.06
|
|
|
|
3.84
|
|
|
|
5.7
|
|
|
|
Efficiency ratio - tax equivalent basis (2)
|
|
|
|
|
|
61.89
|
|
|
|
68.42
|
|
|
|
(9.5
|
)
|
|
|
Loan to deposit ratio
|
|
|
|
|
|
77.82
|
|
|
|
78.21
|
|
|
|
(0.5
|
)
|
|
|
|
|
|
|
|
|
|
|
|
|
|
|
|
|
|
|
|
Capital Ratios:
|
|
|
|
|
|
|
|
|
|
|
|
|
|
|
|
|
Tangible equity (2)
|
|
|
|
|
|
8.8
|
%
|
|
|
8.8
|
%
|
|
|
0.4
|
|
%
|
|
Tangible common equity (2)
|
|
|
|
|
|
6.8
|
|
|
|
6.7
|
|
|
|
1.4
|
|
|
|
Tier one common equity (2)
|
|
|
|
|
|
8.5
|
|
|
|
8.2
|
|
|
|
3.5
|
|
|
|
Tier 1 Leverage ratio (3)
|
|
|
|
|
|
9.6
|
|
|
|
9.5
|
|
|
|
1.1
|
|
|
|
Tier 1 Risk Based Capital (3)
|
|
|
|
|
|
12.0
|
|
|
|
12.0
|
|
|
|
0.0
|
|
|
|
Total Risk Based Capital (3)
|
|
|
|
|
|
13.2
|
|
|
|
14.6
|
|
|
|
(9.6
|
)
|
|
|
|
|
|
|
|
|
|
|
|
|
|
|
|
|
|
|
|
Asset Quality Ratios:
|
|
|
|
|
|
|
|
|
|
|
|
|
|
|
|
|
Net charge-offs to average loans outstanding (1)
|
|
|
|
|
|
1.39
|
%
|
|
|
2.43
|
%
|
|
|
(42.8
|
)
|
%
|
|
Nonaccrual loans to gross loans
|
|
|
|
|
|
2.67
|
|
|
|
3.66
|
|
|
|
(27.0
|
)
|
|
|
Nonaccrual loans and repossessed assets to total assets
|
|
|
|
|
|
3.32
|
|
|
|
4.17
|
|
|
|
(20.4
|
)
|
|
|
Loans past due 90 days and still accruing to total loans
|
|
|
|
|
|
0.03
|
|
|
|
0.21
|
|
|
|
(85.7
|
)
|
|
|
Allowance for credit losses to loans
|
|
|
|
|
|
2.48
|
|
|
|
2.78
|
|
|
|
(10.8
|
)
|
|
|
Allowance for credit losses to nonaccrual loans
|
|
|
|
|
|
92.90
|
|
|
|
75.78
|
|
|
|
22.6
|
|
|
|
|
|
|
|
|
|
|
|
|
|
|
|
|
|
|
|
|
(1) Annualized for the three month periods ended March 31, 2011 and
2010.
|
|
(2) See Reconciliation of Non-GAAP Financial Measures.
|
|
(3) Capital ratios are preliminary until Call Reports are filed.
|
|
|
|
|
|
|
|
|
|
|
|
|
|
|
|
|
|
|
|
|
|
|
|
|
|
|
|
|
|
|
|
|
|
|
|
|
|
|
|
|
|
|
|
|
|
|
|
|
|
Western Alliance Bancorporation and Subsidiaries
|
|
Condensed Consolidated Statements of Operations
|
|
Unaudited
|
|
|
|
|
|
Three Months Ended
|
|
|
|
|
|
|
|
March 31,
|
|
|
|
|
|
|
|
2011
|
|
|
|
|
|
2010
|
|
Interest income:
|
|
|
|
|
|
(dollars in thousands)
|
|
Loans
|
|
|
|
|
|
$
|
63,882
|
|
|
|
|
|
|
$
|
62,350
|
|
|
Investment securities
|
|
|
|
|
|
|
7,930
|
|
|
|
|
|
|
|
6,121
|
|
|
Federal funds sold and other
|
|
|
|
|
|
|
154
|
|
|
|
|
|
|
|
263
|
|
|
Total interest income
|
|
|
|
|
|
|
71,966
|
|
|
|
|
|
|
|
68,734
|
|
|
Interest expense:
|
|
|
|
|
|
|
|
|
|
|
|
|
|
Deposits
|
|
|
|
|
|
|
7,898
|
|
|
|
|
|
|
|
12,079
|
|
|
Customer repurchase agreements
|
|
|
|
|
|
|
86
|
|
|
|
|
|
|
|
284
|
|
|
Borrowings
|
|
|
|
|
|
|
2,182
|
|
|
|
|
|
|
|
449
|
|
|
Junior subordinated and subordinated debt
|
|
|
|
|
|
|
702
|
|
|
|
|
|
|
|
1,204
|
|
|
Total interest expense
|
|
|
|
|
|
|
10,868
|
|
|
|
|
|
|
|
14,016
|
|
|
Net interest income
|
|
|
|
|
|
|
61,098
|
|
|
|
|
|
|
|
54,718
|
|
|
Provision for credit losses
|
|
|
|
|
|
|
10,041
|
|
|
|
|
|
|
|
28,747
|
|
|
Net interest income after provision for credit losses
|
|
|
|
|
|
|
51,057
|
|
|
|
|
|
|
|
25,971
|
|
|
Non-interest income
|
|
|
|
|
|
|
|
|
|
|
|
|
|
Unrealized (losses) gains on assets/liabilities measured at fair
value,net
|
|
|
|
|
|
|
(509
|
)
|
|
|
|
|
|
|
301
|
|
|
Securities impairment charges
|
|
|
|
|
|
|
-
|
|
|
|
|
|
|
|
(103
|
)
|
|
Gains on sales of investment securities, net
|
|
|
|
|
|
|
1,379
|
|
|
|
|
|
|
|
8,218
|
|
|
Trust and investment advisory services
|
|
|
|
|
|
|
636
|
|
|
|
|
|
|
|
1,213
|
|
|
Service charges
|
|
|
|
|
|
|
2,284
|
|
|
|
|
|
|
|
2,197
|
|
|
Operating lease income
|
|
|
|
|
|
|
671
|
|
|
|
|
|
|
|
964
|
|
|
Bank owned life insurance
|
|
|
|
|
|
|
1,184
|
|
|
|
|
|
|
|
719
|
|
|
Other
|
|
|
|
|
|
|
1,185
|
|
|
|
|
|
|
|
1,120
|
|
|
|
|
|
|
|
|
|
6,830
|
|
|
|
|
|
|
|
14,629
|
|
|
Non-interest expenses:
|
|
|
|
|
|
|
|
|
|
|
|
|
|
Salaries and employee benefits
|
|
|
|
|
|
|
22,840
|
|
|
|
|
|
|
|
21,440
|
|
|
Occupancy
|
|
|
|
|
|
|
4,854
|
|
|
|
|
|
|
|
4,787
|
|
|
Insurance
|
|
|
|
|
|
|
3,863
|
|
|
|
|
|
|
|
3,492
|
|
|
Net loss on sales and valuations of repossessed assets
|
|
|
|
|
|
|
6,129
|
|
|
|
|
|
|
|
(1,014
|
)
|
|
Repossessed asset and loan expenses
|
|
|
|
|
|
|
2,122
|
|
|
|
|
|
|
|
2,364
|
|
|
Legal, professional and director's fees
|
|
|
|
|
|
|
1,366
|
|
|
|
|
|
|
|
1,868
|
|
|
Merger related expenses
|
|
|
|
|
|
|
217
|
|
|
|
|
|
|
|
-
|
|
|
Customer service
|
|
|
|
|
|
|
892
|
|
|
|
|
|
|
|
1,065
|
|
|
Intangible amortization
|
|
|
|
|
|
|
890
|
|
|
|
|
|
|
|
907
|
|
|
Marketing
|
|
|
|
|
|
|
1,157
|
|
|
|
|
|
|
|
1,156
|
|
|
Data Processing
|
|
|
|
|
|
|
848
|
|
|
|
|
|
|
|
791
|
|
|
Operating lease depreciation
|
|
|
|
|
|
|
421
|
|
|
|
|
|
|
|
689
|
|
|
Other
|
|
|
|
|
|
|
2,547
|
|
|
|
|
|
|
|
3,298
|
|
|
|
|
|
|
|
|
|
48,146
|
|
|
|
|
|
|
|
40,843
|
|
|
Income (loss) from continuing operations before income taxes
|
|
|
|
|
|
|
9,741
|
|
|
|
|
|
|
|
(243
|
)
|
|
Income tax expense (benefit)
|
|
|
|
|
|
|
4,029
|
|
|
|
|
|
|
|
(1,562
|
)
|
|
Income from continuing operations
|
|
|
|
|
|
|
5,712
|
|
|
|
|
|
|
|
1,319
|
|
|
Loss from discontinued operations net of tax benefit
|
|
|
|
|
|
|
(559
|
)
|
|
|
|
|
|
|
(935
|
)
|
|
Net income
|
|
|
|
|
|
|
5,153
|
|
|
|
|
|
|
|
384
|
|
|
Preferred stock dividends
|
|
|
|
|
|
|
1,750
|
|
|
|
|
|
|
|
1,750
|
|
|
Accretion on preferred stock discount
|
|
|
|
|
|
|
753
|
|
|
|
|
|
|
|
716
|
|
|
Net income (loss) available to common stockholders
|
|
|
|
|
|
$
|
2,650
|
|
|
|
|
|
|
$
|
(2,082
|
)
|
|
Diluted net income (loss) per share
|
|
|
|
|
|
$
|
0.03
|
|
|
|
|
|
|
$
|
(0.03
|
)
|
|
|
|
|
|
|
|
|
|
|
|
|
|
|
|
|
|
|
|
|
|
|
|
|
|
|
|
|
|
|
|
|
|
|
|
|
|
|
|
|
|
|
|
|
|
|
|
|
|
|
|
Western Alliance Bancorporation and Subsidiaries
|
|
Five Quarter Condensed Consolidated Statements of Operations
|
|
Unaudited
|
|
|
|
Three Months Ended
|
|
|
|
|
|
March 31,
|
|
|
|
Dec. 31,
|
|
|
|
Sept. 30,
|
|
|
|
June 30,
|
|
|
|
March 31,
|
|
|
|
|
|
2011
|
|
|
|
2010
|
|
|
|
2010
|
|
|
|
2010
|
|
|
|
2010
|
|
Interest income:
|
|
|
|
(in thousands, except per share data)
|
|
Loans
|
|
|
|
$
|
63,882
|
|
|
|
|
$
|
64,985
|
|
|
|
|
$
|
64,273
|
|
|
|
|
$
|
64,201
|
|
|
|
|
$
|
62,350
|
|
|
Investment securities
|
|
|
|
|
7,930
|
|
|
|
|
|
7,054
|
|
|
|
|
|
6,047
|
|
|
|
|
|
5,327
|
|
|
|
|
|
6,121
|
|
|
Federal funds sold and other
|
|
|
|
|
154
|
|
|
|
|
|
335
|
|
|
|
|
|
385
|
|
|
|
|
|
472
|
|
|
|
|
|
263
|
|
|
Total interest income
|
|
|
|
|
71,966
|
|
|
|
|
|
72,374
|
|
|
|
|
|
70,705
|
|
|
|
|
|
70,000
|
|
|
|
|
|
68,734
|
|
|
Interest expense:
|
|
|
|
|
|
|
|
|
|
|
|
|
|
|
|
|
|
|
|
|
|
Deposits
|
|
|
|
|
7,898
|
|
|
|
|
|
8,652
|
|
|
|
|
|
9,531
|
|
|
|
|
|
11,067
|
|
|
|
|
|
12,079
|
|
|
Borrowings and customer repurchase agreements
|
|
|
|
|
2,268
|
|
|
|
|
|
2,097
|
|
|
|
|
|
970
|
|
|
|
|
|
483
|
|
|
|
|
|
733
|
|
|
Junior subordinated and subordinated debt
|
|
|
|
|
702
|
|
|
|
|
|
714
|
|
|
|
|
|
736
|
|
|
|
|
|
994
|
|
|
|
|
|
1,204
|
|
|
Total interest expense
|
|
|
|
|
10,868
|
|
|
|
|
|
11,463
|
|
|
|
|
|
11,237
|
|
|
|
|
|
12,544
|
|
|
|
|
|
14,016
|
|
|
Net interest income
|
|
|
|
|
61,098
|
|
|
|
|
|
60,911
|
|
|
|
|
|
59,468
|
|
|
|
|
|
57,456
|
|
|
|
|
|
54,718
|
|
|
Provision for credit losses
|
|
|
|
|
10,041
|
|
|
|
|
|
18,384
|
|
|
|
|
|
22,965
|
|
|
|
|
|
23,115
|
|
|
|
|
|
28,747
|
|
|
Net interest income after provision for credit losses
|
|
|
|
|
51,057
|
|
|
|
|
|
42,527
|
|
|
|
|
|
36,503
|
|
|
|
|
|
34,341
|
|
|
|
|
|
25,971
|
|
|
Non-interest income
|
|
|
|
|
|
|
|
|
|
|
|
|
|
|
|
|
|
|
|
|
|
Mark-to-market (losses) gains, net
|
|
|
|
|
(509
|
)
|
|
|
|
|
(6,710
|
)
|
|
|
|
|
(210
|
)
|
|
|
|
|
6,250
|
|
|
|
|
|
301
|
|
|
Gains on sales of investment securities, net
|
|
|
|
|
1,379
|
|
|
|
|
|
-
|
|
|
|
|
|
5,460
|
|
|
|
|
|
6,079
|
|
|
|
|
|
8,218
|
|
|
Gain on extinguishment of debt
|
|
|
|
|
-
|
|
|
|
|
|
-
|
|
|
|
|
|
-
|
|
|
|
|
|
3,000
|
|
|
|
|
|
-
|
|
|
Securities impairment charges
|
|
|
|
|
-
|
|
|
|
|
|
(12
|
)
|
|
|
|
|
-
|
|
|
|
|
|
(1,071
|
)
|
|
|
|
|
(103
|
)
|
|
Trust and investment advisory services
|
|
|
|
|
636
|
|
|
|
|
|
608
|
|
|
|
|
|
1,001
|
|
|
|
|
|
1,181
|
|
|
|
|
|
1,213
|
|
|
Service charges
|
|
|
|
|
2,284
|
|
|
|
|
|
2,177
|
|
|
|
|
|
2,276
|
|
|
|
|
|
2,319
|
|
|
|
|
|
2,197
|
|
|
Operating lease income
|
|
|
|
|
671
|
|
|
|
|
|
864
|
|
|
|
|
|
998
|
|
|
|
|
|
967
|
|
|
|
|
|
964
|
|
|
Bank owned life insurance
|
|
|
|
|
1,184
|
|
|
|
|
|
1,027
|
|
|
|
|
|
773
|
|
|
|
|
|
780
|
|
|
|
|
|
719
|
|
|
Other
|
|
|
|
|
1,185
|
|
|
|
|
|
1,326
|
|
|
|
|
|
1,869
|
|
|
|
|
|
1,255
|
|
|
|
|
|
1,120
|
|
|
|
|
|
|
|
6,830
|
|
|
|
|
|
(720
|
)
|
|
|
|
|
12,167
|
|
|
|
|
|
20,760
|
|
|
|
|
|
14,629
|
|
|
Non-interest expenses:
|
|
|
|
|
|
|
|
|
|
|
|
|
|
|
|
|
|
|
|
|
|
Salaries and employee benefits
|
|
|
|
|
22,840
|
|
|
|
|
|
21,125
|
|
|
|
|
|
21,860
|
|
|
|
|
|
22,161
|
|
|
|
|
|
21,440
|
|
|
Occupancy
|
|
|
|
|
4,854
|
|
|
|
|
|
5,075
|
|
|
|
|
|
4,890
|
|
|
|
|
|
4,828
|
|
|
|
|
|
4,787
|
|
|
Insurance
|
|
|
|
|
3,863
|
|
|
|
|
|
4,109
|
|
|
|
|
|
4,115
|
|
|
|
|
|
3,759
|
|
|
|
|
|
3,492
|
|
|
Repossessed asset and loan expenses
|
|
|
|
|
2,122
|
|
|
|
|
|
2,230
|
|
|
|
|
|
1,918
|
|
|
|
|
|
1,564
|
|
|
|
|
|
2,364
|
|
|
Net (gain) loss on sales and valuations of repossessed assets
|
|
|
|
|
6,129
|
|
|
|
|
|
12,991
|
|
|
|
|
|
4,855
|
|
|
|
|
|
11,994
|
|
|
|
|
|
(1,014
|
)
|
|
Legal, professional and director's fees
|
|
|
|
|
1,366
|
|
|
|
|
|
2,038
|
|
|
|
|
|
1,546
|
|
|
|
|
|
2,139
|
|
|
|
|
|
1,868
|
|
|
Marketing
|
|
|
|
|
1,157
|
|
|
|
|
|
982
|
|
|
|
|
|
878
|
|
|
|
|
|
1,045
|
|
|
|
|
|
1,156
|
|
|
Intangible amortization
|
|
|
|
|
890
|
|
|
|
|
|
889
|
|
|
|
|
|
901
|
|
|
|
|
|
907
|
|
|
|
|
|
907
|
|
|
Customer service
|
|
|
|
|
892
|
|
|
|
|
|
1,050
|
|
|
|
|
|
987
|
|
|
|
|
|
1,154
|
|
|
|
|
|
1,065
|
|
|
Data Processing
|
|
|
|
|
848
|
|
|
|
|
|
948
|
|
|
|
|
|
842
|
|
|
|
|
|
793
|
|
|
|
|
|
791
|
|
|
Operating lease depreciation
|
|
|
|
|
421
|
|
|
|
|
|
542
|
|
|
|
|
|
627
|
|
|
|
|
|
647
|
|
|
|
|
|
689
|
|
|
Merger related expense
|
|
|
|
|
217
|
|
|
|
|
|
1,651
|
|
|
|
|
|
-
|
|
|
|
|
|
-
|
|
|
|
|
|
-
|
|
|
Other
|
|
|
|
|
2,547
|
|
|
|
|
|
2,915
|
|
|
|
|
|
2,690
|
|
|
|
|
|
2,271
|
|
|
|
|
|
3,298
|
|
|
|
|
|
|
|
48,146
|
|
|
|
|
|
56,545
|
|
|
|
|
|
46,109
|
|
|
|
|
|
53,262
|
|
|
|
|
|
40,843
|
|
|
Income (loss) from continuing operations before income taxes
|
|
|
|
|
9,741
|
|
|
|
|
|
(14,738
|
)
|
|
|
|
|
2,561
|
|
|
|
|
|
1,839
|
|
|
|
|
|
(243
|
)
|
|
Income tax expense (benefit)
|
|
|
|
|
4,029
|
|
|
|
|
|
(4,580
|
)
|
|
|
|
|
(79
|
)
|
|
|
|
|
(190
|
)
|
|
|
|
|
(1,562
|
)
|
|
Income (loss) from continuing operations
|
|
|
|
$
|
5,712
|
|
|
|
|
$
|
(10,158
|
)
|
|
|
|
$
|
2,640
|
|
|
|
|
$
|
2,029
|
|
|
|
|
$
|
1,319
|
|
|
Loss from discontinued operations, net of tax
|
|
|
|
|
(559
|
)
|
|
|
|
|
(657
|
)
|
|
|
|
|
(631
|
)
|
|
|
|
|
(802
|
)
|
|
|
|
|
(935
|
)
|
|
Net income (loss)
|
|
|
|
$
|
5,153
|
|
|
|
|
$
|
(10,815
|
)
|
|
|
|
$
|
2,009
|
|
|
|
|
$
|
1,227
|
|
|
|
|
$
|
384
|
|
|
Preferred stock dividends
|
|
|
|
|
1,750
|
|
|
|
|
|
1,750
|
|
|
|
|
|
1,750
|
|
|
|
|
|
1,750
|
|
|
|
|
|
1,750
|
|
|
Accretion on preferred stock
|
|
|
|
|
753
|
|
|
|
|
|
734
|
|
|
|
|
|
716
|
|
|
|
|
|
716
|
|
|
|
|
|
716
|
|
|
Net Income (loss) available to common stockholders
|
|
|
|
$
|
2,650
|
|
|
|
|
$
|
(13,299
|
)
|
|
|
|
$
|
(457
|
)
|
|
|
|
$
|
(1,239
|
)
|
|
|
|
$
|
(2,082
|
)
|
|
Diluted net income (loss) per share
|
|
|
|
$
|
0.03
|
|
|
|
|
$
|
(0.17
|
)
|
|
|
|
$
|
(0.01
|
)
|
|
|
|
$
|
(0.02
|
)
|
|
|
|
$
|
(0.03
|
)
|
|
|
|
|
|
|
|
|
|
|
|
|
|
|
|
|
|
|
|
|
|
|
|
|
|
|
|
|
|
|
|
|
|
|
|
|
|
|
|
|
|
|
|
|
|
|
|
|
|
|
|
|
|
|
|
|
|
|
|
|
|
|
|
Western Alliance Bancorporation and Subsidiaries
|
|
Five Quarter Condensed Consolidated Balance Sheets
|
|
Unaudited
|
|
|
|
|
|
|
|
|
|
|
|
|
|
|
|
|
|
|
|
|
|
|
|
|
|
March 31,
|
|
|
|
Dec. 31,
|
|
|
|
Sept. 30,
|
|
|
|
June 30,
|
|
|
|
March 31,
|
|
|
|
|
|
2011
|
|
|
|
2010
|
|
|
|
2010
|
|
|
|
2010
|
|
|
|
2010
|
|
Assets:
|
|
|
|
(in millions)
|
|
Cash and due from banks
|
|
|
|
$
|
363.3
|
|
|
|
|
$
|
215.8
|
|
|
|
|
$
|
615.0
|
|
|
|
|
$
|
560.6
|
|
|
|
|
$
|
827.6
|
|
|
Federal funds sold
|
|
|
|
|
-
|
|
|
|
|
|
0.9
|
|
|
|
|
|
1.0
|
|
|
|
|
|
-
|
|
|
|
|
|
2.4
|
|
|
Cash and cash equivalents
|
|
|
|
|
363.3
|
|
|
|
|
|
616.0
|
|
|
|
|
|
616.0
|
|
|
|
|
|
560.6
|
|
|
|
|
|
830.0
|
|
|
|
|
|
|
|
|
|
|
|
|
|
|
|
|
|
|
|
|
|
|
|
|
Securities and money market investments
|
|
|
|
|
1,319.6
|
|
|
|
|
|
1,273.1
|
|
|
|
|
|
929.7
|
|
|
|
|
|
848.6
|
|
|
|
|
|
781.1
|
|
|
Loans:
|
|
|
|
|
|
|
|
|
|
|
|
|
|
|
|
|
|
|
|
|
|
Commercial
|
|
|
|
|
935.9
|
|
|
|
|
|
934.6
|
|
|
|
|
|
876.8
|
|
|
|
|
|
832.8
|
|
|
|
|
|
757.9
|
|
|
Commercial real estate - owner occupied
|
|
|
|
|
1,299.5
|
|
|
|
|
|
1,223.1
|
|
|
|
|
|
1,227.7
|
|
|
|
|
|
1,234.1
|
|
|
|
|
|
1,209.3
|
|
|
Construction and land development
|
|
|
|
|
391.7
|
|
|
|
|
|
451.5
|
|
|
|
|
|
488.3
|
|
|
|
|
|
532.4
|
|
|
|
|
|
556.9
|
|
|
Commercial real estate - non-owner occupied
|
|
|
|
|
1,086.9
|
|
|
|
|
|
1,038.5
|
|
|
|
|
|
981.4
|
|
|
|
|
|
926.0
|
|
|
|
|
|
902.9
|
|
|
Residential real estate
|
|
|
|
|
504.5
|
|
|
|
|
|
527.3
|
|
|
|
|
|
533.6
|
|
|
|
|
|
536.1
|
|
|
|
|
|
560.2
|
|
|
Consumer
|
|
|
|
|
65.7
|
|
|
|
|
|
71.5
|
|
|
|
|
|
71.4
|
|
|
|
|
|
74.6
|
|
|
|
|
|
77.6
|
|
|
Deferred fees, net
|
|
|
|
|
(6.2
|
)
|
|
|
|
|
(6.0
|
)
|
|
|
|
|
(5.7
|
)
|
|
|
|
|
(6.0
|
)
|
|
|
|
|
(5.7
|
)
|
|
|
|
|
|
|
4,278.0
|
|
|
|
|
|
4,240.5
|
|
|
|
|
|
4,173.5
|
|
|
|
|
|
4,130.0
|
|
|
|
|
|
4,059.1
|
|
|
Allowance for credit losses
|
|
|
|
|
(106.1
|
)
|
|
|
|
|
(110.7
|
)
|
|
|
|
|
(108.2
|
)
|
|
|
|
|
(110.0
|
)
|
|
|
|
|
(112.7
|
)
|
|
Loans, net
|
|
|
|
|
4,171.9
|
|
|
|
|
|
4,129.8
|
|
|
|
|
|
4,065.3
|
|
|
|
|
|
4,020.0
|
|
|
|
|
|
3,946.4
|
|
|
|
|
|
|
|
|
|
|
|
|
|
|
|
|
|
|
|
|
|
|
|
|
Premises and equipment, net
|
|
|
|
|
112.0
|
|
|
|
|
|
114.4
|
|
|
|
|
|
116.5
|
|
|
|
|
|
118.7
|
|
|
|
|
|
121.2
|
|
|
Other repossessed assets
|
|
|
|
|
98.3
|
|
|
|
|
|
107.7
|
|
|
|
|
|
110.1
|
|
|
|
|
|
104.4
|
|
|
|
|
|
105.6
|
|
|
Bank owned life insurance
|
|
|
|
|
131.0
|
|
|
|
|
|
129.8
|
|
|
|
|
|
94.8
|
|
|
|
|
|
94.0
|
|
|
|
|
|
93.2
|
|
|
Goodwill and other intangibles
|
|
|
|
|
38.4
|
|
|
|
|
|
39.3
|
|
|
|
|
|
40.2
|
|
|
|
|
|
41.3
|
|
|
|
|
|
42.2
|
|
|
Other assets
|
|
|
|
|
170.3
|
|
|
|
|
|
183.1
|
|
|
|
|
|
206.5
|
|
|
|
|
|
171.9
|
|
|
|
|
|
176.5
|
|
|
Total assets
|
|
|
|
$
|
6,404.8
|
|
|
|
|
$
|
6,193.9
|
|
|
|
|
$
|
6,179.1
|
|
|
|
|
$
|
5,959.5
|
|
|
|
|
$
|
6,096.2
|
|
|
Liabilities and Stockholders' Equity:
|
|
|
|
|
|
|
|
|
|
|
|
|
|
|
|
|
|
|
|
|
|
Liabilities:
|
|
|
|
|
|
|
|
|
|
|
|
|
|
|
|
|
|
|
|
|
|
Deposits:
|
|
|
|
|
|
|
|
|
|
|
|
|
|
|
|
|
|
|
|
|
|
Non-interest bearing demand deposits
|
|
|
|
$
|
1,455.1
|
|
|
|
|
$
|
1,443.3
|
|
|
|
|
$
|
1,421.7
|
|
|
|
|
$
|
1,330.4
|
|
|
|
|
$
|
1,348.7
|
|
|
Interest bearing
|
|
|
|
|
|
|
|
|
|
|
|
|
|
|
|
|
|
|
|
|
|
Demand
|
|
|
|
|
521.2
|
|
|
|
|
|
523.8
|
|
|
|
|
|
645.4
|
|
|
|
|
|
611.4
|
|
|
|
|
|
510.2
|
|
|
Savings and money market
|
|
|
|
|
2,100.6
|
|
|
|
|
|
1,926.1
|
|
|
|
|
|
1,892.2
|
|
|
|
|
|
1,845.9
|
|
|
|
|
|
1,798.5
|
|
|
Time certificates
|
|
|
|
|
1,420.6
|
|
|
|
|
|
1,445.2
|
|
|
|
|
|
1,369.2
|
|
|
|
|
|
1,442.5
|
|
|
|
|
|
1,532.7
|
|
|
Total deposits
|
|
|
|
|
5,497.5
|
|
|
|
|
|
5,338.4
|
|
|
|
|
|
5,328.5
|
|
|
|
|
|
5,230.2
|
|
|
|
|
|
5,190.1
|
|
|
Customer repurchase agreements
|
|
|
|
|
163.4
|
|
|
|
|
|
109.4
|
|
|
|
|
|
86.8
|
|
|
|
|
|
87.1
|
|
|
|
|
|
169.1
|
|
|
Total customer funds
|
|
|
|
|
5,660.9
|
|
|
|
|
|
5,447.8
|
|
|
|
|
|
5,415.3
|
|
|
|
|
|
5,317.3
|
|
|
|
|
|
5,359.2
|
|
|
Borrowings
|
|
|
|
|
73.0
|
|
|
|
|
|
73.0
|
|
|
|
|
|
72.9
|
|
|
|
|
|
-
|
|
|
|
|
|
20.0
|
|
|
Junior subordinated and subordinated debt
|
|
|
|
|
43.0
|
|
|
|
|
|
43.0
|
|
|
|
|
|
36.3
|
|
|
|
|
|
36.3
|
|
|
|
|
|
102.3
|
|
|
Accrued interest payable and other liabilities
|
|
|
|
|
26.3
|
|
|
|
|
|
27.9
|
|
|
|
|
|
34.8
|
|
|
|
|
|
30.0
|
|
|
|
|
|
39.0
|
|
|
Total liabilities
|
|
|
|
|
5,803.2
|
|
|
|
|
|
5,591.7
|
|
|
|
|
|
5,559.3
|
|
|
|
|
|
5,383.6
|
|
|
|
|
|
5,520.5
|
|
|
Stockholders' Equity
|
|
|
|
|
|
|
|
|
|
|
|
|
|
|
|
|
|
|
|
|
|
Common stock and additional paid-in capital
|
|
|
|
|
740.9
|
|
|
|
|
|
739.6
|
|
|
|
|
|
737.8
|
|
|
|
|
|
688.2
|
|
|
|
|
|
686.0
|
|
|
Preferred Stock
|
|
|
|
|
131.6
|
|
|
|
|
|
130.8
|
|
|
|
|
|
130.1
|
|
|
|
|
|
129.4
|
|
|
|
|
|
128.7
|
|
|
Retained earnings (deficit)
|
|
|
|
|
(256.2
|
)
|
|
|
|
|
(258.8
|
)
|
|
|
|
|
(245.5
|
)
|
|
|
|
|
(245.0
|
)
|
|
|
|
|
(243.7
|
)
|
|
Accumulated other comprehensive income (loss)
|
|
|
|
|
(14.7
|
)
|
|
|
|
|
(9.4
|
)
|
|
|
|
|
(2.6
|
)
|
|
|
|
|
3.3
|
|
|
|
|
|
4.7
|
|
|
Total stockholders' equity
|
|
|
|
|
601.6
|
|
|
|
|
|
602.2
|
|
|
|
|
|
619.8
|
|
|
|
|
|
575.9
|
|
|
|
|
|
575.7
|
|
|
Total liabilities and stockholders' equity
|
|
|
|
$
|
6,404.8
|
|
|
|
|
$
|
6,193.9
|
|
|
|
|
$
|
6,179.1
|
|
|
|
|
$
|
5,959.5
|
|
|
|
|
$
|
6,096.2
|
|
|
|
|
|
|
|
|
|
|
|
|
|
|
|
|
|
|
|
|
|
|
|
|
|
|
|
|
|
|
|
|
|
|
|
|
|
|
|
|
|
|
|
|
|
|
|
|
|
|
|
|
|
|
|
|
|
|
|
|
|
|
|
|
Western Alliance Bancorporation and Subsidiaries
|
|
Changes in the Allowance For Credit Losses
|
|
Unaudited
|
|
|
|
|
|
|
|
|
|
|
|
|
|
|
|
|
|
|
|
|
|
|
|
|
|
|
|
Three Months Ended
|
|
|
|
|
|
March 31,
|
|
|
|
Dec. 31,
|
|
|
|
Sept. 30,
|
|
|
|
June 30,
|
|
|
|
March 31,
|
|
|
|
|
|
2011
|
|
|
|
2010
|
|
|
|
2010
|
|
|
|
2010
|
|
|
|
2010
|
|
|
|
|
|
(in thousands)
|
|
|
|
|
|
|
|
Balance, beginning of period
|
|
|
|
$
|
110,699
|
|
|
|
|
$
|
108,170
|
|
|
|
|
$
|
110,013
|
|
|
|
|
$
|
112,724
|
|
|
|
|
$
|
108,623
|
|
|
Provision for credit losses
|
|
|
|
|
10,041
|
|
|
|
|
|
18,384
|
|
|
|
|
|
22,965
|
|
|
|
|
|
23,115
|
|
|
|
|
|
28,747
|
|
|
Recoveries of loans previously charged-off:
|
|
|
|
|
|
|
|
|
|
|
|
|
|
|
|
|
|
|
|
|
|
Construction and land development
|
|
|
|
|
416
|
|
|
|
|
|
773
|
|
|
|
|
|
214
|
|
|
|
|
|
1,801
|
|
|
|
|
|
409
|
|
|
Commercial real estate
|
|
|
|
|
471
|
|
|
|
|
|
13
|
|
|
|
|
|
160
|
|
|
|
|
|
808
|
|
|
|
|
|
22
|
|
|
Residential real estate
|
|
|
|
|
269
|
|
|
|
|
|
304
|
|
|
|
|
|
1,209
|
|
|
|
|
|
295
|
|
|
|
|
|
231
|
|
|
Commercial and industrial
|
|
|
|
|
829
|
|
|
|
|
|
800
|
|
|
|
|
|
389
|
|
|
|
|
|
573
|
|
|
|
|
|
1,238
|
|
|
Consumer
|
|
|
|
|
25
|
|
|
|
|
|
36
|
|
|
|
|
|
47
|
|
|
|
|
|
14
|
|
|
|
|
|
67
|
|
|
Total recoveries
|
|
|
|
|
2,010
|
|
|
|
|
|
1,926
|
|
|
|
|
|
2,019
|
|
|
|
|
|
3,491
|
|
|
|
|
|
1,967
|
|
|
Loans charged-off:
|
|
|
|
|
|
|
|
|
|
|
|
|
|
|
|
|
|
|
|
|
|
Construction and land development
|
|
|
|
|
4,198
|
|
|
|
|
|
3,221
|
|
|
|
|
|
3,843
|
|
|
|
|
|
7,921
|
|
|
|
|
|
8,638
|
|
|
Commercial real estate
|
|
|
|
|
6,114
|
|
|
|
|
|
7,297
|
|
|
|
|
|
12,813
|
|
|
|
|
|
7,827
|
|
|
|
|
|
5,884
|
|
|
Residential real estate
|
|
|
|
|
3,282
|
|
|
|
|
|
3,278
|
|
|
|
|
|
3,695
|
|
|
|
|
|
7,835
|
|
|
|
|
|
5,855
|
|
|
Commercial and industrial
|
|
|
|
|
1,407
|
|
|
|
|
|
2,823
|
|
|
|
|
|
5,036
|
|
|
|
|
|
4,602
|
|
|
|
|
|
4,757
|
|
|
Consumer
|
|
|
|
|
1,616
|
|
|
|
|
|
1,162
|
|
|
|
|
|
1,440
|
|
|
|
|
|
1,132
|
|
|
|
|
|
1,479
|
|
|
Total loans charged-off
|
|
|
|
|
16,617
|
|
|
|
|
|
17,781
|
|
|
|
|
|
26,827
|
|
|
|
|
|
29,317
|
|
|
|
|
|
26,613
|
|
|
Net loans charged-off
|
|
|
|
|
14,607
|
|
|
|
|
|
15,855
|
|
|
|
|
|
24,808
|
|
|
|
|
|
25,826
|
|
|
|
|
|
24,646
|
|
|
Balance, end of period
|
|
|
|
$
|
106,133
|
|
|
|
|
$
|
110,699
|
|
|
|
|
$
|
108,170
|
|
|
|
|
$
|
110,013
|
|
|
|
|
$
|
112,724
|
|
|
|
|
|
|
|
|
|
|
|
|
|
|
|
|
|
|
|
|
|
|
|
|
Net charge-offs (annualized) to average loans outstanding
|
|
1.39
|
%
|
|
|
|
|
1.52
|
%
|
|
|
|
|
2.41
|
%
|
|
|
|
|
2.53
|
%
|
|
|
|
|
2.43
|
%
|
|
Allowance for credit losses to gross loans
|
|
|
|
|
2.48
|
|
|
|
|
|
2.61
|
|
|
|
|
|
2.59
|
|
|
|
|
|
2.66
|
|
|
|
|
|
2.78
|
|
|
Nonaccrual loans
|
|
|
|
$
|
114,246
|
|
|
|
|
$
|
116,999
|
|
|
|
|
$
|
130,905
|
|
|
|
|
$
|
134,264
|
|
|
|
|
$
|
148,760
|
|
|
Repossessed assets
|
|
|
|
|
98,312
|
|
|
|
|
|
107,655
|
|
|
|
|
|
110,096
|
|
|
|
|
|
104,365
|
|
|
|
|
|
105,637
|
|
|
Loans past due 90 days, still accruing
|
|
|
|
|
1,087
|
|
|
|
|
|
1,458
|
|
|
|
|
|
5,667
|
|
|
|
|
|
8,233
|
|
|
|
|
|
8,437
|
|
|
Loans past due 30 to 89 days, still accruing
|
|
|
|
|
30,689
|
|
|
|
|
|
18,164
|
|
|
|
|
|
20,432
|
|
|
|
|
|
20,343
|
|
|
|
|
|
38,611
|
|
|
Classified loans (including nonaccrual)
|
|
|
|
|
240,737
|
|
|
|
|
|
256,657
|
|
|
|
|
|
285,972
|
|
|
|
|
|
304,270
|
|
|
|
|
|
336,624
|
|
|
Watch loans
|
|
|
|
|
204,470
|
|
|
|
|
|
194,905
|
|
|
|
|
|
205,114
|
|
|
|
|
|
257,715
|
|
|
|
|
|
266,734
|
|
|
|
|
|
|
|
|
|
|
|
|
|
|
|
|
|
|
|
|
|
|
|
|
|
|
|
|
|
|
|
|
|
|
|
|
|
|
|
|
|
|
|
|
|
|
|
|
|
|
|
|
|
|
|
|
|
|
|
|
|
|
|
|
Western Alliance Bancorporation and Subsidiaries
|
|
Analysis of Average Balances, Yields and Rates
|
|
Unaudited
|
|
|
|
|
|
|
|
Three Months Ended March 31,
|
|
|
|
|
|
2011
|
|
|
|
2010
|
|
|
|
|
|
Average
Balance
|
|
|
Interest
|
|
|
Average
Yield/Cost
|
|
|
|
Average
Balance
|
|
|
Interest
|
|
|
Average
Yield/Cost
|
|
Interest earning assets
|
|
|
|
($ in
millions)
|
|
|
($ in
thousands)
|
|
|
|
|
|
|
($ in
millions)
|
|
|
($ in
thousands)
|
|
|
|
|
Investment securities (1)
|
|
|
|
$
|
1,277.2
|
|
|
|
$
|
7,930
|
|
|
2.67
|
%
|
|
|
|
$
|
823.5
|
|
|
|
$
|
6,304
|
|
|
3.22
|
%
|
|
Federal funds sold and other
|
|
|
|
|
0.2
|
|
|
|
|
1
|
|
|
2.03
|
%
|
|
|
|
|
32.6
|
|
|
|
|
53
|
|
|
0.66
|
%
|
|
Loans (1)
|
|
|
|
|
4,203.2
|
|
|
|
|
63,882
|
|
|
6.16
|
%
|
|
|
|
|
4,053.5
|
|
|
|
|
62,167
|
|
|
6.22
|
%
|
|
Short term investments
|
|
|
|
|
228.1
|
|
|
|
|
131
|
|
|
0.23
|
%
|
|
|
|
|
389.8
|
|
|
|
|
183
|
|
|
0.19
|
%
|
|
Investment in restricted stock
|
|
|
|
|
36.8
|
|
|
|
|
22
|
|
|
0.24
|
%
|
|
|
|
|
41.4
|
|
|
|
|
27
|
|
|
0.26
|
%
|
|
Total interest earning assets
|
|
|
|
|
5,745.5
|
|
|
|
|
71,966
|
|
|
5.11
|
%
|
|
|
|
|
5,340.8
|
|
|
|
|
68,734
|
|
|
5.24
|
%
|
|
Non-interest earning assets
|
|
|
|
|
|
|
|
|
|
|
|
|
|
|
|
|
|
|
|
|
|
Cash and due from banks
|
|
|
|
|
121.6
|
|
|
|
|
|
|
|
|
|
|
|
98.2
|
|
|
|
|
|
|
|
|
Allowance for credit losses
|
|
|
|
|
(110.5
|
)
|
|
|
|
|
|
|
|
|
|
|
(117.7
|
)
|
|
|
|
|
|
|
|
Bank owned life insurance
|
|
|
|
|
130.2
|
|
|
|
|
|
|
|
|
|
|
|
92.8
|
|
|
|
|
|
|
|
|
Other assets
|
|
|
|
|
408.9
|
|
|
|
|
|
|
|
|
|
|
|
400.5
|
|
|
|
|
|
|
|
|
Total assets
|
|
|
|
$
|
6,295.7
|
|
|
|
|
|
|
|
|
|
|
$
|
5,814.6
|
|
|
|
|
|
|
|
|
Interest-bearing liabilities
|
|
|
|
|
|
|
|
|
|
|
|
|
|
|
|
|
|
|
|
|
|
Interest-bearing deposits:
|
|
|
|
|
|
|
|
|
|
|
|
|
|
|
|
|
|
|
|
|
|
Interest-bearing transaction accounts
|
|
|
|
$
|
501.5
|
|
|
|
$
|
533
|
|
|
0.43
|
%
|
|
|
|
$
|
450.0
|
|
|
|
$
|
783
|
|
|
0.71
|
%
|
|
Savings and money market
|
|
|
|
|
2,007.4
|
|
|
|
|
3,566
|
|
|
0.72
|
%
|
|
|
|
|
1,784.2
|
|
|
|
|
4,676
|
|
|
1.06
|
%
|
|
Time certificates of deposit
|
|
|
|
|
1,438.9
|
|
|
|
|
3,799
|
|
|
1.07
|
%
|
|
|
|
|
1,482.6
|
|
|
|
|
6,620
|
|
|
1.81
|
%
|
|
Total interest-bearing deposits
|
|
|
|
|
3,947.8
|
|
|
|
|
7,898
|
|
|
0.81
|
%
|
|
|
|
|
3,716.8
|
|
|
|
|
12,079
|
|
|
1.32
|
%
|
|
Borrowings
|
|
|
|
|
220.8
|
|
|
|
|
2,268
|
|
|
4.17
|
%
|
|
|
|
|
229.5
|
|
|
|
|
733
|
|
|
1.30
|
%
|
|
Junior subordinated and subordinated debt
|
|
|
|
|
43.0
|
|
|
|
|
702
|
|
|
6.62
|
%
|
|
|
|
|
102.4
|
|
|
|
|
1,204
|
|
|
4.77
|
%
|
|
Total interest-bearing liabilities
|
|
|
|
|
4,211.6
|
|
|
|
|
10,868
|
|
|
1.05
|
%
|
|
|
|
|
4,048.7
|
|
|
|
|
14,016
|
|
|
1.40
|
%
|
|
Noninterest-bearing liabilities
|
|
|
|
|
|
|
|
|
|
|
|
|
|
|
|
|
|
|
|
|
|
Noninterest-bearing demand deposits
|
|
|
|
|
1,441.4
|
|
|
|
|
|
|
|
|
|
|
|
1,150.2
|
|
|
|
|
|
|
|
|
Other liabilities
|
|
|
|
|
29.6
|
|
|
|
|
|
|
|
|
|
|
|
28.8
|
|
|
|
|
|
|
|
|
Stockholders’ equity
|
|
|
|
|
613.1
|
|
|
|
|
|
|
|
|
|
|
|
586.9
|
|
|
|
|
|
|
|
|
Total liabilities and stockholders' equity
|
|
|
|
$
|
6,295.7
|
|
|
|
|
|
|
|
|
|
|
$
|
5,814.6
|
|
|
|
|
|
|
|
|
Net interest income and margin
|
|
|
|
|
|
|
$
|
61,098
|
|
|
4.35
|
%
|
|
|
|
|
|
|
$
|
54,718
|
|
|
4.17
|
%
|
|
Net interest spread
|
|
|
|
|
|
|
|
|
|
4.06
|
%
|
|
|
|
|
|
|
|
|
|
3.84
|
%
|
|
|
|
|
|
|
|
|
|
|
|
|
|
|
|
|
|
|
|
|
|
|
|
(1) Yields on loans and securities have been adjusted to a tax
equivalent basis. The taxable-equivalent adjustment was $481 and
$244 for the first quarter ended 2011 and 2010, respectively.
|
|
|
|
|
|
|
|
|
|
|
|
|
|
|
|
|
|
|
|
|
|
|
|
|
|
|
|
|
|
|
|
|
|
|
|
|
|
|
|
|
|
|
|
|
|
|
|
|
|
|
|
|
|
Western Alliance Bancorporation and Subsidiaries
|
|
Operating Segment Results
|
|
Unaudited
|
|
|
|
|
|
|
|
|
|
|
|
|
|
|
|
|
|
|
|
Inter-
|
|
|
|
|
|
|
|
|
|
|
|
|
|
|
|
|
|
|
|
|
|
|
|
|
|
segment
|
|
|
|
Consoli-
|
|
|
|
|
|
Bank
|
|
|
|
Western
|
|
|
|
Torrey
|
|
|
|
|
|
|
|
elimi-
|
|
|
|
dated
|
|
|
|
|
|
of Nevada
|
|
|
|
Alliance Bank
|
|
|
|
Pines Bank*
|
|
|
|
Other
|
|
|
|
nations
|
|
|
|
Company
|
|
At March 31, 2011
|
|
|
|
(in millions)
|
|
Assets
|
|
|
|
$
|
2,778.3
|
|
|
|
|
$
|
1,979.8
|
|
|
|
|
$
|
1,590.7
|
|
|
|
|
$
|
728.4
|
|
|
|
|
$
|
(672.4
|
)
|
|
|
|
$
|
6,404.8
|
|
|
Gross loans and deferred fees, net
|
|
|
|
|
1,872.1
|
|
|
|
|
|
1,344.6
|
|
|
|
|
|
1,104.1
|
|
|
|
|
|
-
|
|
|
|
|
|
(42.8
|
)
|
|
|
|
|
4,278.0
|
|
|
Less: Allowance for credit losses
|
|
|
|
|
(70.6
|
)
|
|
|
|
|
(19.7
|
)
|
|
|
|
|
(15.8
|
)
|
|
|
|
|
-
|
|
|
|
|
|
-
|
|
|
|
|
|
(106.1
|
)
|
|
Net loans
|
|
|
|
|
1,801.5
|
|
|
|
|
|
1,324.9
|
|
|
|
|
|
1,088.3
|
|
|
|
|
|
-
|
|
|
|
|
|
(42.8
|
)
|
|
|
|
|
4,171.9
|
|
|
Goodwill
|
|
|
|
|
23.2
|
|
|
|
|
|
-
|
|
|
|
|
|
-
|
|
|
|
|
|
2.7
|
|
|
|
|
|
-
|
|
|
|
|
|
25.9
|
|
|
Deposits
|
|
|
|
|
2,390.2
|
|
|
|
|
|
1,693.1
|
|
|
|
|
|
1,416.7
|
|
|
|
|
|
-
|
|
|
|
|
|
(2.5
|
)
|
|
|
|
|
5,497.5
|
|
|
Stockholders' equity
|
|
|
|
|
310.4
|
|
|
|
|
|
165.8
|
|
|
|
|
|
137.0
|
|
|
|
|
|
608.7
|
|
|
|
|
|
(620.3
|
)
|
|
|
|
|
601.6
|
|
|
|
|
|
|
|
|
|
|
|
|
|
|
|
|
|
|
|
|
|
|
|
|
|
|
|
|
No. of branches
|
|
|
|
|
12
|
|
|
|
|
|
16
|
|
|
|
|
|
11
|
|
|
|
|
|
-
|
|
|
|
|
|
-
|
|
|
|
|
|
39
|
|
|
No. of FTE
|
|
|
|
|
407
|
|
|
|
|
|
210
|
|
|
|
|
|
193
|
|
|
|
|
|
84
|
|
|
|
|
|
-
|
|
|
|
|
|
894
|
|
|
|
|
|
|
|
|
|
|
|
|
|
|
|
|
|
|
|
|
|
|
|
|
|
|
|
|
Three Months Ended March 31, 2011:
|
|
|
|
|
|
|
|
|
|
|
|
|
|
|
|
|
|
|
|
|
|
|
|
|
|
|
|
|
|
(in thousands)
|
|
Net interest income
|
|
|
|
$
|
26,428
|
|
|
|
|
$
|
19,656
|
|
|
|
|
$
|
17,317
|
|
|
|
|
|
(2,303
|
)
|
|
|
|
$
|
-
|
|
|
|
|
$
|
61,098
|
|
|
Provision for credit losses
|
|
|
|
|
7,003
|
|
|
|
|
|
1,600
|
|
|
|
|
|
1,437
|
|
|
|
|
|
-
|
|
|
|
|
|
-
|
|
|
|
|
|
10,041
|
|
|
Net interest income (loss) after provision for credit losses
|
|
|
|
|
19,425
|
|
|
|
|
|
18,056
|
|
|
|
|
|
15,880
|
|
|
|
|
|
(2,303
|
)
|
|
|
|
|
-
|
|
|
|
|
|
51,057
|
|
|
Non-interest income
|
|
|
|
|
3,392
|
|
|
|
|
|
2,031
|
|
|
|
|
|
1,739
|
|
|
|
|
|
(332
|
)
|
|
|
|
|
-
|
|
|
|
|
|
6,830
|
|
|
Non-interest expense
|
|
|
|
|
(21,672
|
)
|
|
|
|
|
(12,383
|
)
|
|
|
|
|
(10,491
|
)
|
|
|
|
|
(3,600
|
)
|
|
|
|
|
-
|
|
|
|
|
|
(48,146
|
)
|
|
Income (loss) from continuing operations before income taxes
|
|
|
|
|
1,145
|
|
|
|
|
|
7,704
|
|
|
|
|
|
7,128
|
|
|
|
|
|
(6,235
|
)
|
|
|
|
|
-
|
|
|
|
|
|
9,741
|
|
|
Income tax expense (benefit)
|
|
|
|
|
251
|
|
|
|
|
|
2,849
|
|
|
|
|
|
3,106
|
|
|
|
|
|
(2,177
|
)
|
|
|
|
|
-
|
|
|
|
|
|
4,029
|
|
|
Income (loss) from continuing operations
|
|
|
|
|
894
|
|
|
|
|
|
4,855
|
|
|
|
|
|
4,022
|
|
|
|
|
|
(4,058
|
)
|
|
|
|
|
-
|
|
|
|
|
|
5,712
|
|
|
Loss from discontinued operations, net
|
|
|
|
|
-
|
|
|
|
|
|
-
|
|
|
|
|
|
-
|
|
|
|
|
|
(559
|
)
|
|
|
|
|
-
|
|
|
|
|
|
(559
|
)
|
|
Net income (loss)
|
|
|
|
$
|
894
|
|
|
|
|
$
|
4,855
|
|
|
|
|
$
|
4,022
|
|
|
|
|
$
|
(4,617
|
)
|
|
|
|
$
|
-
|
|
|
|
|
$
|
5,153
|
|
|
|
|
|
|
|
|
|
|
|
|
|
|
|
|
|
|
|
|
|
|
|
|
|
|
|
|
|
|
|
|
|
|
|
|
|
|
|
|
* Excludes discontinued operations
|
|
|
|
|
|
|
|
|
|
|
|
|
|
|
|
|
|
|
|
|
|
|
|
|
|
|
|
|
|
|
|
|
|
|
|
|
|
|
|
|
|
|
|
|
|
|
|
|
|
|
|
|
|
|
|
|
|
|
|
|
|
|
|
|
|
|
|
|
|
|
|
|
|
|
|
|
|
|
|
|
|
|
|
|
|
|
|
|
|
|
|
|
|
|
|
|
|
|
|
Western Alliance Bancorporation and Subsidiaries
|
|
Operating Segment Results
|
|
Unaudited
|
|
|
|
|
|
|
|
|
|
|
|
|
|
|
|
|
|
|
|
Inter-
|
|
|
|
|
|
|
|
|
|
|
|
|
|
|
|
|
|
|
|
|
|
|
|
|
|
segment
|
|
|
|
Consoli-
|
|
|
|
|
|
Bank
|
|
|
|
Western
|
|
|
|
Torrey
|
|
|
|
|
|
|
|
elimi-
|
|
|
|
dated
|
|
|
|
|
|
of Nevada
|
|
|
|
Alliance Bank
|
|
|
|
Pines Bank*
|
|
|
|
Other
|
|
|
|
nations
|
|
|
|
Company
|
|
At March 31, 2010:
|
|
|
|
(in millions)
|
|
Assets
|
|
|
|
$
|
2,775.7
|
|
|
|
|
$
|
1,911.4
|
|
|
|
|
$
|
1,393.5
|
|
|
|
|
$
|
621.5
|
|
|
|
|
$
|
(605.9
|
)
|
|
|
|
$
|
6,096.2
|
|
|
Gross loans and deferred fees, net
|
|
|
|
|
2,013.1
|
|
|
|
|
|
1,154.3
|
|
|
|
|
|
934.7
|
|
|
|
|
|
-
|
|
|
|
|
|
(43.0
|
)
|
|
|
|
|
4,059.1
|
|
|
Less: Allowance for credit losses
|
|
|
|
|
(70.2
|
)
|
|
|
|
|
(25.8
|
)
|
|
|
|
|
(16.7
|
)
|
|
|
|
|
-
|
|
|
|
|
|
-
|
|
|
|
|
|
(112.7
|
)
|
|
Net loans
|
|
|
|
|
1,942.9
|
|
|
|
|
|
1,128.5
|
|
|
|
|
|
918.0
|
|
|
|
|
|
-
|
|
|
|
|
|
(43.0
|
)
|
|
|
|
|
3,946.4
|
|
|
Goodwill
|
|
|
|
|
23.2
|
|
|
|
|
|
-
|
|
|
|
|
|
-
|
|
|
|
|
|
2.7
|
|
|
|
|
|
-
|
|
|
|
|
|
25.9
|
|
|
Deposits
|
|
|
|
|
2,267.1
|
|
|
|
|
|
1,710.7
|
|
|
|
|
|
1,215.7
|
|
|
|
|
|
-
|
|
|
|
|
|
(3.4
|
)
|
|
|
|
|
5,190.1
|
|
|
Stockholders' equity
|
|
|
|
|
295.9
|
|
|
|
|
|
130.5
|
|
|
|
|
|
127.7
|
|
|
|
|
|
580.9
|
|
|
|
|
|
(559.2
|
)
|
|
|
|
|
575.8
|
|
|
|
|
|
|
|
|
|
|
|
|
|
|
|
|
|
|
|
|
|
|
|
|
|
|
|
|
No. of branches
|
|
|
|
|
12
|
|
|
|
|
|
17
|
|
|
|
|
|
9
|
|
|
|
|
|
-
|
|
|
|
|
|
-
|
|
|
|
|
|
38
|
|
|
No. of FTE
|
|
|
|
|
441
|
|
|
|
|
|
238
|
|
|
|
|
|
206
|
|
|
|
|
|
63
|
|
|
|
|
|
-
|
|
|
|
|
|
948
|
|
|
|
|
|
|
|
|
|
|
|
|
|
|
|
|
|
|
|
|
|
|
|
|
|
|
|
|
Three Months Ended March 31, 2010:
|
|
|
|
(in thousands)
|
|
Net interest income
|
|
|
|
$
|
25,657
|
|
|
|
|
$
|
14,886
|
|
|
|
|
$
|
14,314
|
|
|
|
|
$
|
(139
|
)
|
|
|
|
$
|
-
|
|
|
|
|
$
|
54,718
|
|
|
Provision for credit losses
|
|
|
|
|
22,034
|
|
|
|
|
|
3,988
|
|
|
|
|
|
2,725
|
|
|
|
|
|
0
|
|
|
|
|
|
-
|
|
|
|
|
|
28,747
|
|
|
Net interest income after provision for credit losses
|
|
|
|
|
3,623
|
|
|
|
|
|
10,898
|
|
|
|
|
|
11,589
|
|
|
|
|
|
(139
|
)
|
|
|
|
|
-
|
|
|
|
|
|
25,971
|
|
|
Non-interest income
|
|
|
|
|
7,964
|
|
|
|
|
|
1,866
|
|
|
|
|
|
896
|
|
|
|
|
|
3,446
|
|
|
|
|
|
457
|
|
|
|
|
|
14,629
|
|
|
Noninterest expense
|
|
|
|
|
(16,170
|
)
|
|
|
|
|
(10,761
|
)
|
|
|
|
|
(11,368
|
)
|
|
|
|
|
(4,248
|
)
|
|
|
|
|
1,704
|
|
|
|
|
|
(40,843
|
)
|
|
Income (loss) from continuing operations before income taxes
|
|
|
|
|
(4,583
|
)
|
|
|
|
|
2,003
|
|
|
|
|
|
1,117
|
|
|
|
|
|
(941
|
)
|
|
|
|
|
2,161
|
|
|
|
|
|
(243
|
)
|
|
Income tax expense (benefit)
|
|
|
|
|
(1,583
|
)
|
|
|
|
|
861
|
|
|
|
|
|
628
|
|
|
|
|
|
(1,468
|
)
|
|
|
|
|
-
|
|
|
|
|
|
(1,562
|
)
|
|
Income (loss) from continuing operations
|
|
|
|
|
(3,000
|
)
|
|
|
|
|
1,142
|
|
|
|
|
|
489
|
|
|
|
|
|
527
|
|
|
|
|
|
2,161
|
|
|
|
|
|
1,319
|
|
|
Loss from discontinued operations, net
|
|
|
|
|
-
|
|
|
|
|
|
-
|
|
|
|
|
|
-
|
|
|
|
|
|
(935
|
)
|
|
|
|
|
-
|
|
|
|
|
|
(935
|
)
|
|
Net income (loss)
|
|
|
|
$
|
(3,000
|
)
|
|
|
|
$
|
1,142
|
|
|
|
|
$
|
489
|
|
|
|
|
$
|
(408
|
)
|
|
|
|
$
|
2,161
|
|
|
|
|
$
|
384
|
|
|
|
|
|
|
|
|
|
|
|
|
|
|
|
|
|
|
|
|
|
|
|
|
|
|
|
|
* Excludes discontinued operations
|
|
|
|
|
|
|
|
|
|
|
|
|
|
|
|
|
|
|
|
|
|
|
|
|
|
|
|
|
|
|
|
|
|
|
|
|
|
|
|
|
|
|
|
|
|
|
|
|
|
|
|
|
|
|
|
|
|
|
|
|
|
|
|
|
|
|
|
|
|
|
|
Western Alliance Bancorporation and Subsidiaries
|
|
Reconciliation of Non-GAAP Financial Measures (Unaudited)
|
|
|
|
|
|
|
|
|
|
|
|
|
|
|
|
|
|
|
|
|
|
|
|
March 31,
|
|
|
|
Dec. 31,
|
|
|
|
Sept. 30,
|
|
|
|
June 30,
|
|
|
|
March 31,
|
|
|
|
|
|
2011
|
|
|
|
2010
|
|
|
|
2010
|
|
|
|
2010
|
|
|
|
2010
|
|
|
|
|
|
(dollars in thousands)
|
|
|
|
|
|
|
|
|
|
|
|
|
|
|
|
|
|
|
|
Total stockholder's equity
|
|
|
|
$
|
601,576
|
|
|
|
|
$
|
602,174
|
|
|
|
|
$
|
619,764
|
|
|
|
|
$
|
575,858
|
|
|
|
|
$
|
575,779
|
|
|
Less:
|
|
|
|
|
|
|
|
|
|
|
|
|
|
|
|
|
|
|
|
|
|
Goodwill and intangible assets
|
|
|
|
|
38,401
|
|
|
|
|
|
39,291
|
|
|
|
|
|
40,180
|
|
|
|
|
|
41,307
|
|
|
|
|
|
42,214
|
|
|
Total tangible stockholders' equity
|
|
|
|
|
563,175
|
|
|
|
|
|
562,883
|
|
|
|
|
|
579,584
|
|
|
|
|
|
534,551
|
|
|
|
|
|
533,565
|
|
|
Less:
|
|
|
|
|
|
|
|
|
|
|
|
|
|
|
|
|
|
|
|
|
|
Preferred stock
|
|
|
|
|
131,580
|
|
|
|
|
|
130,827
|
|
|
|
|
|
130,094
|
|
|
|
|
|
129,378
|
|
|
|
|
|
128,661
|
|
|
Total tangible common equity
|
|
|
|
|
431,595
|
|
|
|
|
|
432,056
|
|
|
|
|
|
449,490
|
|
|
|
|
|
405,173
|
|
|
|
|
|
404,904
|
|
|
Add:
|
|
|
|
|
|
|
|
|
|
|
|
|
|
|
|
|
|
|
|
|
|
Deferred tax
|
|
|
|
|
4,461
|
|
|
|
|
|
4,774
|
|
|
|
|
|
5,087
|
|
|
|
|
|
5,400
|
|
|
|
|
|
5,713
|
|
|
Total tangible common equity, net of tax
|
|
|
|
$
|
436,056
|
|
|
|
|
$
|
436,830
|
|
|
|
|
$
|
454,577
|
|
|
|
|
$
|
410,573
|
|
|
|
|
$
|
410,617
|
|
|
Total assets
|
|
|
|
$
|
6,404,838
|
|
|
|
|
$
|
6,193,883
|
|
|
|
|
$
|
6,179,146
|
|
|
|
|
$
|
5,959,479
|
|
|
|
|
$
|
6,096,238
|
|
|
Less:
|
|
|
|
|
|
|
|
|
|
|
|
|
|
|
|
|
|
|
|
|
|
Goodwill and intangible assets
|
|
|
|
|
38,401
|
|
|
|
|
|
39,291
|
|
|
|
|
|
40,180
|
|
|
|
|
|
41,307
|
|
|
|
|
|
42,214
|
|
|
Tangible assets
|
|
|
|
|
6,366,437
|
|
|
|
|
|
6,154,592
|
|
|
|
|
|
6,138,966
|
|
|
|
|
|
5,918,172
|
|
|
|
|
|
6,054,024
|
|
|
Add:
|
|
|
|
|
|
|
|
|
|
|
|
|
|
|
|
|
|
|
|
|
|
Deferred tax
|
|
|
|
|
4,461
|
|
|
|
|
|
4,774
|
|
|
|
|
|
5,087
|
|
|
|
|
|
5,400
|
|
|
|
|
|
5,713
|
|
|
Total tangible assets, net of tax
|
|
|
|
$
|
6,370,898
|
|
|
|
|
$
|
6,159,366
|
|
|
|
|
$
|
6,144,053
|
|
|
|
|
$
|
5,923,572
|
|
|
|
|
$
|
6,059,737
|
|
|
Tangible equity ratio (1)
|
|
|
|
|
8.8
|
%
|
|
|
|
|
9.1
|
%
|
|
|
|
|
9.4
|
%
|
|
|
|
|
9.0
|
%
|
|
|
|
|
8.8
|
%
|
|
Tangible common equity ratio (2)
|
|
|
|
|
6.8
|
%
|
|
|
|
|
7.0
|
%
|
|
|
|
|
7.3
|
%
|
|
|
|
|
6.8
|
%
|
|
|
|
|
6.7
|
%
|
|
Common shares outstanding
|
|
|
|
|
82,237
|
|
|
|
|
|
81,669
|
|
|
|
|
|
81,503
|
|
|
|
|
|
73,344
|
|
|
|
|
|
73,031
|
|
|
Tangible book value per share, net of tax (3)
|
|
|
|
$
|
5.30
|
|
|
|
|
$
|
5.35
|
|
|
|
|
$
|
5.58
|
|
|
|
|
$
|
5.60
|
|
|
|
|
$
|
5.62
|
|
|
|
|
|
|
|
|
|
|
|
|
|
|
|
|
|
|
|
|
|
|
|
|
|
|
|
|
|
|
|
|
|
|
|
|
|
|
|
|
|
|
|
|
|
|
|
|
|
|
Three Months Ended
|
|
|
|
|
|
March 31,
|
|
|
|
Dec. 31,
|
|
|
|
Sept. 30,
|
|
|
|
June 30,
|
|
|
|
March 31,
|
|
|
|
|
|
2011
|
|
|
|
2010
|
|
|
|
2010
|
|
|
|
2010
|
|
|
|
2010
|
|
|
|
|
|
(in thousands)
|
|
|
|
|
|
|
|
|
|
|
|
|
|
|
|
|
|
|
|
|
|
|
|
Total non-interest income
|
|
|
|
$
|
6,830
|
|
|
|
|
$
|
(720
|
)
|
|
|
|
$
|
12,167
|
|
|
|
|
$
|
20,760
|
|
|
|
|
$
|
14,629
|
|
|
Less:
|
|
|
|
|
|
|
|
|
|
|
|
|
|
|
|
|
|
|
|
|
|
Mark-to-market (losses) gains, net
|
|
|
|
|
(509
|
)
|
|
|
|
|
(6,710
|
)
|
|
|
|
|
(210
|
)
|
|
|
|
|
6,250
|
|
|
|
|
|
301
|
|
|
Securities impairment charges
|
|
|
|
|
-
|
|
|
|
|
|
(12
|
)
|
|
|
|
|
-
|
|
|
|
|
|
(1,071
|
)
|
|
|
|
|
(103
|
)
|
|
Gains on sales of investment securities, net
|
|
|
|
|
1,379
|
|
|
|
|
|
-
|
|
|
|
|
|
5,460
|
|
|
|
|
|
6,079
|
|
|
|
|
|
8,218
|
|
|
Gain on extinguishment of debt
|
|
|
|
|
-
|
|
|
|
|
|
-
|
|
|
|
|
|
-
|
|
|
|
|
|
3,000
|
|
|
|
|
|
-
|
|
|
Gain on sale of subsidiary
|
|
|
|
|
-
|
|
|
|
|
|
-
|
|
|
|
|
|
568
|
|
|
|
|
|
-
|
|
|
|
|
|
-
|
|
|
Total operating non-interest income
|
|
|
|
|
5,960
|
|
|
|
|
|
6,002
|
|
|
|
|
|
6,349
|
|
|
|
|
|
6,502
|
|
|
|
|
|
6,213
|
|
|
Add: net interest income
|
|
|
|
|
61,098
|
|
|
|
|
|
60,911
|
|
|
|
|
|
59,468
|
|
|
|
|
|
57,456
|
|
|
|
|
|
54,718
|
|
|
Net revenue (4)
|
|
|
|
$
|
67,058
|
|
|
|
|
$
|
66,913
|
|
|
|
|
$
|
65,817
|
|
|
|
|
$
|
63,958
|
|
|
|
|
$
|
60,931
|
|
|
|
|
|
|
|
|
|
|
|
|
|
|
|
|
|
|
|
|
|
|
|
|
Total non-interest expense
|
|
|
|
$
|
48,146
|
|
|
|
|
$
|
56,545
|
|
|
|
|
$
|
46,109
|
|
|
|
|
$
|
53,262
|
|
|
|
|
$
|
40,843
|
|
|
Less:
|
|
|
|
|
|
|
|
|
|
|
|
|
|
|
|
|
|
|
|
|
|
Net loss (gain) on sales/valuations of repossessed assets
|
|
|
|
|
6,129
|
|
|
|
|
|
12,991
|
|
|
|
|
|
4,855
|
|
|
|
|
|
11,994
|
|
|
|
|
|
(1,014
|
)
|
|
Merger related
|
|
|
|
|
217
|
|
|
|
|
|
1,651
|
|
|
|
|
|
-
|
|
|
|
|
|
-
|
|
|
|
|
|
-
|
|
|
Goodwill impairment
|
|
|
|
|
-
|
|
|
|
|
|
-
|
|
|
|
|
|
-
|
|
|
|
|
|
-
|
|
|
|
|
|
-
|
|
|
Total operating non-interest expense (4)
|
|
|
|
$
|
41,800
|
|
|
|
|
$
|
41,903
|
|
|
|
|
$
|
41,254
|
|
|
|
|
$
|
41,268
|
|
|
|
|
$
|
41,857
|
|
|
|
|
|
|
|
|
|
|
|
|
|
|
|
|
|
|
|
|
|
|
|
|
Net revenue
|
|
|
|
$
|
67,058
|
|
|
|
|
$
|
66,913
|
|
|
|
|
$
|
65,817
|
|
|
|
|
$
|
63,958
|
|
|
|
|
$
|
60,931
|
|
|
Less:
|
|
|
|
|
|
|
|
|
|
|
|
|
|
|
|
|
|
|
|
|
|
Operating non-interest expense
|
|
|
|
|
41,800
|
|
|
|
|
|
41,903
|
|
|
|
|
|
41,254
|
|
|
|
|
|
41,268
|
|
|
|
|
|
41,857
|
|
|
Pre-tax, pre-provision operating earnings (5)
|
|
|
|
$
|
25,258
|
|
|
|
|
$
|
25,010
|
|
|
|
|
$
|
24,563
|
|
|
|
|
$
|
22,690
|
|
|
|
|
$
|
19,074
|
|
|
|
|
|
|
|
|
|
|
|
|
|
|
|
|
|
|
|
|
|
|
|
|
|
|
|
|
|
|
|
|
|
|
|
|
|
|
|
|
|
|
|
|
|
|
|
|
|
|
|
|
|
|
|
|
|
|
|
|
|
|
|
|
Western Alliance Bancorporation and Subsidiaries
|
|
Reconciliation of Non-GAAP Financial Measures (Unaudited)
|
|
|
|
|
|
|
|
|
|
|
|
|
|
|
|
|
|
|
|
|
|
|
|
|
|
|
|
Three Months Ended
|
|
|
|
|
|
March 31,
|
|
|
|
Dec. 31,
|
|
|
|
Sept. 30,
|
|
|
|
June 30,
|
|
|
|
March 31,
|
|
|
|
|
|
2011
|
|
|
|
2010
|
|
|
|
2010
|
|
|
|
2010
|
|
|
|
2010
|
|
|
|
|
|
(in thousands)
|
|
|
|
|
|
|
|
Total operating non-interest expense
|
|
|
|
$
|
41,800
|
|
|
|
|
$
|
41,903
|
|
|
|
|
$
|
41,254
|
|
|
|
|
$
|
41,268
|
|
|
|
|
$
|
41,857
|
|
|
Divided by:
|
|
|
|
|
|
|
|
|
|
|
|
|
|
|
|
|
|
|
|
|
|
Total net interest income
|
|
|
|
$
|
61,098
|
|
|
|
|
$
|
60,911
|
|
|
|
|
$
|
59,468
|
|
|
|
|
$
|
57,456
|
|
|
|
|
$
|
54,718
|
|
|
Add:
|
|
|
|
|
|
|
|
|
|
|
|
|
|
|
|
|
|
|
|
|
|
Tax equivalent interest adjustment
|
|
|
|
|
481
|
|
|
|
|
|
464
|
|
|
|
|
|
307
|
|
|
|
|
|
149
|
|
|
|
|
|
244
|
|
|
Operating non-interest income
|
|
|
|
|
5,960
|
|
|
|
|
|
6,002
|
|
|
|
|
|
6,349
|
|
|
|
|
|
6,502
|
|
|
|
|
|
6,213
|
|
|
|
|
|
|
$
|
67,539
|
|
|
|
|
$
|
67,377
|
|
|
|
|
$
|
66,124
|
|
|
|
|
$
|
64,107
|
|
|
|
|
$
|
61,175
|
|
|
Efficiency ratio - tax equivalent basis (6)
|
|
|
|
|
61.9
|
%
|
|
|
|
|
62.2
|
%
|
|
|
|
|
62.4
|
%
|
|
|
|
|
64.4
|
%
|
|
|
|
|
68.4
|
%
|
|
|
|
|
|
|
|
|
|
|
|
|
|
|
|
|
|
|
|
|
|
|
|
|
|
|
|
|
|
|
|
|
|
|
|
|
|
|
|
|
|
|
|
|
|
|
|
|
|
|
|
|
|
|
|
|
|
|
|
|
|
|
|
|
|
Three Months Ended
|
|
|
|
|
|
|
|
|
|
|
March 31,
|
|
|
|
|
|
|
|
|
March 31,
|
|
|
|
|
|
|
|
|
|
|
2011
|
|
|
|
|
|
|
|
|
2010
|
|
|
|
|
|
|
|
|
|
|
(in thousands)
|
|
|
|
|
|
|
|
|
|
|
|
|
Stockholder's equity
|
|
|
|
|
|
|
|
|
$
|
601,576
|
|
|
|
|
|
|
|
|
|
$
|
575,779
|
|
|
Less:
|
|
|
|
|
|
|
|
|
|
|
|
|
|
|
|
|
|
|
|
Accumulated other comprehensive (loss) income
|
|
|
|
|
|
|
|
|
|
(14,741
|
)
|
|
|
|
|
|
|
|
|
|
4,683
|
|
|
Non-qualifying goodwill and intangibles
|
|
|
|
|
|
|
|
|
|
34,663
|
|
|
|
|
|
|
|
|
|
|
37,269
|
|
|
Other non-qualifying assets
|
|
|
|
|
|
|
|
|
|
24,057
|
|
|
|
|
|
|
|
|
|
|
28,240
|
|
|
Disallowed unrealized losses on equity securities
|
|
|
|
|
|
|
|
|
|
19
|
|
|
|
|
|
|
|
|
|
|
-
|
|
|
Add:
|
|
|
|
|
|
|
|
|
|
|
|
|
|
|
|
|
|
|
|
Qualifying trust preferred securities
|
|
|
|
|
|
|
|
|
|
43,034
|
|
|
|
|
|
|
|
|
|
|
42,320
|
|
|
Tier 1 capital (regulatory) (7)
|
|
|
|
|
|
|
|
|
|
600,612
|
|
|
|
|
|
|
|
|
|
|
547,907
|
|
|
Less:
|
|
|
|
|
|
|
|
|
|
|
|
|
|
|
|
|
|
|
|
Qualifying non-controlling interests
|
|
|
|
|
|
|
|
|
|
122
|
|
|
|
|
|
|
|
|
|
|
178
|
|
|
Qualifying trust preferred securities
|
|
|
|
|
|
|
|
|
|
43,034
|
|
|
|
|
|
|
|
|
|
|
42,320
|
|
|
Preferred stock
|
|
|
|
|
|
|
|
|
|
131,580
|
|
|
|
|
|
|
|
|
|
|
128,661
|
|
|
Estimated Tier 1 common equity (8)
|
|
|
|
|
|
|
|
|
$
|
425,876
|
|
|
|
|
|
|
|
|
|
$
|
376,748
|
|
|
Divided by:
|
|
|
|
|
|
|
|
|
|
|
|
|
|
|
|
|
|
|
|
Estimated risk-weighted assets (regulatory (8)
|
|
|
|
|
|
|
|
|
$
|
4,996,916
|
|
|
|
|
|
|
|
|
|
$
|
4,575,838
|
|
|
Tier 1 common equity ratio (8)
|
|
|
|
|
|
|
|
|
|
8.5
|
%
|
|
|
|
|
|
|
|
|
|
8.2
|
%
|
|
|
|
|
|
|
|
|
|
|
|
|
|
|
|
|
|
|
|
|
|
|
|
|
|
|
|
|
|
|
|
|
|
|
|
|
|
|
|
|
|
|
|
|
|
|
|
|
|
|
March 31,
|
|
|
|
|
|
|
|
|
March 31,
|
|
|
|
|
|
|
|
|
|
|
2011
|
|
|
|
|
|
|
|
|
2010
|
|
|
|
|
|
|
|
|
|
|
(in thousands)
|
|
|
|
|
|
|
|
|
|
|
|
|
Classified assets
|
|
|
|
|
|
|
|
|
$
|
341,618
|
|
|
|
|
|
|
|
|
|
$
|
461,823
|
|
|
Divide:
|
|
|
|
|
|
|
|
|
|
|
|
|
|
|
|
|
|
|
|
Tier 1 capital (regulatory) (7)
|
|
|
|
|
|
|
|
|
|
600,612
|
|
|
|
|
|
|
|
|
|
|
547,907
|
|
|
Plus: Allowance for credit losses
|
|
|
|
|
|
|
|
|
|
106,133
|
|
|
|
|
|
|
|
|
|
|
112,724
|
|
|
Total Tier 1 capital plus allowance for credit losses
|
|
|
|
|
|
|
|
|
$
|
706,745
|
|
|
|
|
|
|
|
|
|
$
|
660,631
|
|
|
Classified assets to Tier 1 capital plus allowance (9)
|
|
|
|
|
|
|
|
|
|
48
|
%
|
|
|
|
|
|
|
|
|
|
70
|
%
|
|
|
|
|
|
|
|
|
|
|
|
|
|
|
|
|
|
|
|
|
|
|
|
|
|
|
|
|
|
|
|
|
|
|
|
|
|
|
|
|
|
|
|
(1) We believe this non-GAAP ratio provides a critical metric with
which to analyze and evaluate financial condition and capital
strength.
|
|
(2) We believe this non-GAAP ratio provides critical metrics with
which to analyze and evaluate financial condition and capital
strength.
|
|
(3) We believe this non-GAAP ratio improves the comparability to
other institutions that have not engaged in acquisitions that
resulted in recorded goodwill and other intangibles.
|
|
(4) We believe this non-GAAP measurement is better indicative of the
cash generating capacity of the Company.
|
|
(5) We believe this non-GAAP measurement is a key indicator of the
earnings power of the Company which is otherwise obscured by the
asset quality issues.
|
|
(6) We believe this non-GAAP ratio provides understanding of the
operating efficiency of the Company.
|
|
(7) Under the guidelines of the Federal Reserve and the FDIC in
effect at December 31, 2010, Tier 1 capital consisted of common
stock, retained earnings, non-cumulative perpetual preferred
stock, trust preferred securities up to a certain limit, and
minority interests in certain subsidiaries, less most other
intangible assets.
|
|
(8) Tier 1 common equity is often expressed as a percentage of
risk-weighted assets. Under the risk-based capital framework, a
bank's balance sheet assets and credit equivalent amounts of
off-balance sheet items, are assigned to one of four broad risk
categories. The aggregated dollar amount in each category is then
multiplied by the risk weighting assigned to that category. The
resulting weighted values from each of the four categories are
added together and this sum is the risk-weighted assets total
that, as adjusted, comprises the denominator (risk-weighted
assets) to determine the Tier 1 capital ratio. Adjustments are
made to Tier 1 capital to arrive at Tier 1 common equity. Tier 1
common equity is also divided by the risk-weighted assets to
determine the Tier 1 common equity ratio. We believe this non-GAAP
ratio provides a critical metric with which to analyze and
evaluate financial condition and capital strength.
|
|
(9) We believe this non-GAAP ratio provides a critical regulatory
metric in which to analyze asset quality.
|