| UNITED STATES SECURITIES AND EXCHANGE COMMISSION WASHINGTON, D.C. 20549 |
FORM N-CSR
CERTIFIED SHAREHOLDER REPORT OF REGISTERED MANAGEMENT INVESTMENT COMPANIES
Investment Company Act file number 811-21233
PARADIGM FUNDS
(Exact name of registrant as specified in charter)
| Nine Elk Street, Albany, NY | 12207-1002 |
| (Address of principal executive offices) | (Zip code) |
Robert A. Benton
Nine Elk Street, Albany, NY 12207-1002
(Name and address of agent for service)
Registrant's telephone number, including area code: (518) 431-3500
Date of fiscal year end: December 31
Date of reporting period: June 30, 2020
Form N-CSR is to be used by management investment companies to file reports with the Commission not later than 10 days after the transmission to stockholders of any report that is required to be transmitted to stockholders under Rule 30e-1 under the Investment Company Act of 1940 (17 CFR 270.30e -1). The Commission may use the information provided on Form N-CSR in its regulatory, disclosure review, inspection and policymaking roles.
A registrant is required to disclose the information specified by Form N-CSR, and the Commission will make this information public. A registrant is not required to respond to the collection of information contained in Form N-CSR unless the Form displays a currently valid Office of Management and Budget ("OMB") control number.
Item 1. Report to Stockholders.
| Paradigm Funds |
| Paradigm Value Fund Paradigm Select Fund Paradigm Micro-Cap Fund For Investors Seeking Long-Term Capital Appreciation |
|
SEMI-ANNUAL REPORT
|
| IMPORTANT NOTE: Beginning on January 1, 2021, as permitted by regulations adopted by the Securities and Exchange Commission, paper copies of the Funds’ shareholder reports will no longer be sent by mail, unless you specifically request paper copies of the reports from the Funds or from your financial intermedi- ary, such as a broker-dealer or bank. Instead, the reports will be made available on a website, and you will be notified by mail each time a report is posted and provided with a website link to access the report. If you already elected to receive shareholder reports electronically, you will not be affected by this change and you need not take any action. You may elect to receive shareholder reports and other communications from the Funds or your financial intermediary electronically by calling or sending an email request. You may elect to receive all future reports in paper free of charge. You can inform the Funds or your financial intermediary that you wish to continue receiving paper copies of your shareholder reports by calling or send- ing an email request. Your election to receive reports in paper will apply to all funds held with the fund com- plex/your financial intermediary. |
| Table of Contents | |
| PARADIGM FUNDS | |
| Letter to Shareholders | 2 |
| Sector Allocation | 4 |
| Performance Information | 6 |
| Schedules of Investments | 9 |
| Statements of Assets and Liabilities | 18 |
| Statements of Operations | 18 |
| Statements of Changes in Net Assets | 20 |
| Financial Highlights | 22 |
| NOTES TO FINANCIAL STATEMENTS | 24 |
| DISCLOSURE OF EXPENSES | 30 |
| ADDITIONAL INFORMATION | 32 |
2020 Semi-Annual Report 1
Letter to Shareholders
Dear Fellow Shareholders:
From our present reality, it seems difficult to believe that the equity markets in 2019 appeared volatile to us at the time. After the eventful first half of 2020, that period now feels like a distant memory as well as a comparative non-event. The market concerns of 2019 revolved around trade and tariff tensions with China, which today, seem a tertiary set of problems to have amidst a global pandemic. Despite the many uncertainties we currently face, the one constant from 2019 to 2020 is the outperformance of large-cap over small-cap and Growth over Value. This recurring trend appears to be becoming the one thing we can predictably expect. With our value bent and smaller-cap focus, this dynamic has been a persistent headwind for much of the past several years. The fact that we have been able to deliver relative outperformance despite these trends gives us comfort in our longer-term investment discipline and process.
At this time a year ago, the US economy appeared relatively sanguine and stable, despite the US-China trade tensions and attendant supply chain worries. Midway through last year, Institute for Supply Management (ISM) data remained expansionary and unemployment was a very healthy 3.7% . Through June, unemployment was 11.1%, much improved from the April record-high of 14.7% (the highest since 1948), but still an alarming number that equates to nearly 33 million people on some form of unemployment assistance in the US. Put another way, one in five American workers is currently in need of unemployment benefits. The most recent June employment data showed a reassuring improvement of 4.8 million people coming off of unemployment. However, 30% of those new hirings were driven by bars and restaurants reopening-a trend that is likely to reverse with the recent resurgence of COVID-19 cases across the US. On a slightly more positive note, both the ISM manufacturing and non-manufacturing indices expanded much faster than had been expected in June, and housing numbers have also been resilient. While it is reassuring to see these signs of stabilization after two months of severe economic contraction, we are not convinced we are out of the woods yet, from a macroeconomic perspective.
It is clearly impossible to opine on what the next 6 or 12 months might bring amidst a still evolving and reaccelerating pandemic. Current near-term questions include whether the US government will extend the CARES Act (which includes the weekly $600 federal unemployment benefit), set to end on July 31 in its current incarnation. If not extended, that begs the question of what possible "air-pocket" impact its cessation could have on the US consumer and thus the larger economy. The near-term future of commercial air travel remains uncertain as tourism remains largely on hold, with United Airlines recently announcing plans to furlough nearly half of its entire US workforce. Brooks Brothers (among others) has filed for bankruptcy amidst a new remote-working reality and a world in which weddings, graduations, and other occasions and celebrations are largely on hold. Last and far from least, we are also in a US presidential election year, one that appears especially fraught. The only potential offset to the unknowns enumerated above is the possibility of a COVID-19 vaccine being widely available sooner rather than later.
Having had myriad company management conversations in recent months, it is evident that companies are focusing on what is within their control. Companies are intent on maintaining financial flexibility, given this backdrop of extreme uncertainty. In 2020, COVID-19 provides a new reason for a capex pause: we have seen corporations slowing or pausing some of their spending as they reevaluate and re-strategize their capital allocation plans and employee, office space, and geographic footprints. We are hearing our company management teams say they are focusing on their "must do" capital expenditures, versus the "nice to do". Moreover companies are working to bolster their balance sheets in the event of unforeseen events, by returning to the equity markets, as well as extending and expanding their bank lines and revolvers.
We have reiterated that the quality of company management is one of our key investment criteria and considerations. This precept matters more than ever today, as we hear our companies' managements describe their process of navigating utter uncertainty, while keeping their employees and customers safe, ensuring the robustness of supply chains, and still protecting and growing their businesses.
It is impossible to know whether downward earnings revisions or business outlooks fully factor in the array of possible outcomes to 2020, let alone beyond. What we do know is that we have and will continue to adhere to our core investment discipline that has sustained our long-term outperformance across market cycles. Superior management teams, leading market share and competitive positions, true product differentiation and barriers to entry-those are the attributes that allow a company to prevail in a challenging environment, regardless of its industry. We have always maintained a multi-year investment horizon, and while 2020 has not thus far reflected what we had modeled, we think that our portfolio is well positioned to withstand the uncertainty of these times.
Paradigm Value Fund
The Paradigm Value Fund declined 16.47% in the first half of 2020, compared to a 23.50% decline for its benchmark, the Russell 2000 Value Index. Since inception (January 1, 2003) on an annualized basis, the Fund has returned 11.11%, compared to 7.81% for the benchmark.
2020 Semi-Annual Report 2
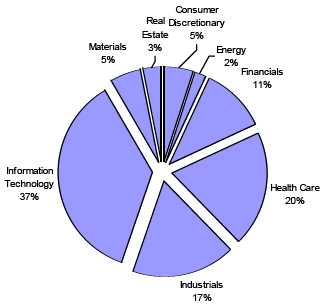
Strong stock selection made the Information Technology sector the top contributor in the first half. Increased internet traffic and demand for IT equipment to support work-from-home transitions drove incremental demand for IT products and services in the first half.
The Financials sector proved one of the most challenging in the first half due to emerging concerns over potential losses on loans to businesses impacted by COVID-19. Lower interest rates and the resulting negative pressure on bank profitability also weighed on the sector.
Paradigm Select Fund
The Paradigm Select Fund declined 7.22% in the first half of 2020, compared to a decline of 11.05% for its benchmark, the Russell 2500 Index. Since inception (January 1, 2005) on an annualized basis, the Fund has returned 8.73% compared to 7.68% for the benchmark.
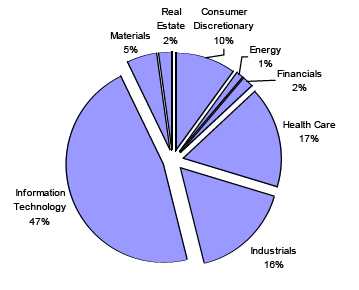
Strong stock selection made the Information Technology and Health Care sectors the top contributors to performance in the first half. Increased internet traffic and demand for IT equipment to support work-from-home transitions drove incremental demand for IT products and services in the first half. Following a steep decline in patient procedure volumes at the end of the first quarter, Health Care companies benefited from renewed optimism about a return of elective procedure volumes and increased adoption and utilization of COVID-19 related solutions in the second quarter.
The Industrials sector proved one of the most challenging in the first half, reflecting investor recognition of a weakened macroeconomic outlook. Pressure on cash flows due to pandemic-related facility closures and reduced demand created an additional burden for industrial firms with levered balance sheets.
Paradigm Micro-Cap Fund
The Paradigm Micro-Cap Fund declined 4.27% in the first half of 2020, compared a decline of 11.21% for its benchmark, the Russell Microcap Index. Since inception (January 1, 2008) on an annualized basis, the Fund has returned 7.07%, compared to 5.62% for the benchmark.
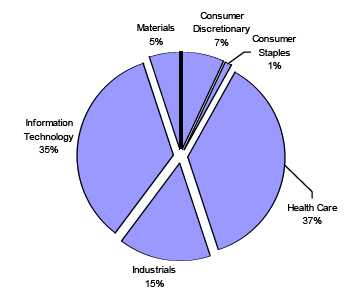
Strong stock selection made the Information Technology and Health Care sectors the top contributors to performance in the first half. Increased internet traffic and demand for IT equipment to support work-from-home transitions drove incremental demand for IT products and services in the first half. Following a steep decline in patient procedure volumes at the end of the first quarter, Health Care companies benefited from renewed optimism about a return of elective procedure volumes and increased adoption and utilization of COVID-19 related solutions in the second quarter.
The Consumer Discretionary sector proved one of the most challenging in the first half, as COVID-19 precipitated widespread non-essential retail store closures, combined with reduced customer traffic amidst shelter-in-place orders in many states. Moreover, record-high unemployment created uncertainty around consumer spending, combined with reduced demand for certain categories of work and dress apparel and footwear in a remote-work environment.
Sincerely,
|
Candace King Weir |
Amelia F. Weir |
Past performance does not guarantee future results. Investment return and principal value will fluctuate so that shares, when redeemed, may be worth more or less than their original cost. Returns assume that all dividends and distributions were reinvested and do not reflect the deduction of taxes that a shareholder would pay on fund distributions or the redemption of fund shares. Current performance may be lower or higher that the performance data quoted. Statements concerning financial market trends are based on current market conditions, which will fluctuate. Any statements of opinion constitute only current opinions of Paradigm Funds Advisor LLC which are subject to change. Investment in the Fund involves a risk of loss. The Russell 2000 Value Index, Russell 2500 Index and Russell Microcap Index are U.S. equity indices. These indices are included for informational purposes only and may not be representative of the type of investments made by the Funds. References made to these indices are for comparative purposes only. To obtain performance data current to the most recent month end, please call 1-800-239-0732 or visit our website at www.paradigm-funds.com. The prospectus should be read carefully before investing.
2020 Semi-Annual Report 3
Paradigm Funds (Unaudited)
PARADIGM VALUE FUND
Sector Allocation as of June 30, 2020
(As a Percentage of Equity Securities Held)
PARADIGM SELECT FUND
Sector Allocation as of June 30, 2020
(As a Percentage of Equity Securities Held)
2020 Semi-Annual Report 4
Paradigm Funds (Unaudited)
| PARADIGM MICRO-CAP FUND Sector Allocation as of June 30, 2020 (As a Percentage of Equity Securities Held) |
2020 Semi-Annual Report 5
Paradigm Value Fund (Unaudited)
PERFORMANCE INFORMATION
Average Annual Rate of Return (%) for the Periods Ended June 30, 2020.
June 30, 2020 NAV $40.79
| 1 Year(A) | 3 Year(A) | 5 Year(A) | 10 Year(A) | |||||
| Paradigm Value Fund | (8.93)% | 2.86% | 5.19% | 8.70% | ||||
| Russell 2000® Value Index(B) | (17.48)% | (4.35)% | 1.26% | 7.82% |
(A) 1 Year, 3 Year, 5 Year and 10 Year returns include change in share prices and in each case includes reinvestment of any dividends and capital gain distributions. The inception date of the Paradigm Value Fund was January 1, 2003.
(B) The Russell 2000® Value Index (whose composition is different from the Fund) is an unmanaged index of small-capitalization stocks with lower price-to-book ratios and lower forecasted growth values than the total population of small-capitalization stocks. Investors cannot invest directly in an index.
For purposes of the accompanying table, it is assumed that all dividends and distributions were reinvested.
Per the Fund’s most recent prospectus, the Fund’s Total Annual Operating Expense Ratio is 1.51% . The Total Annual Operating Expense Ratio may not correlate to the expense ratio in the Fund’s financial highlights because the financial highlights only include the direct operating expenses incurred by the Fund, not the indirect costs of investing in acquired funds. Shares redeemed within 90 days of purchase are subject to a 2.00% redemption fee.
PAST PERFORMANCE DOES NOT GUARANTEE FUTURE RESULTS. INVESTMENT RETURN AND PRINCIPAL VALUE WILL FLUCTUATE SO THAT SHARES, WHEN REDEEMED, MAY BE WORTH MORE OR LESS THAN THEIR ORIGINAL COST. RETURNS DO NOT REFLECT THE DEDUCTION OF TAXES THAT A SHAREHOLDER WOULD PAY ON FUND DISTRIBUTIONS OR THE REDEMPTION OF FUND SHARES. CURRENT PERFORMANCE MAY BE LOWER OR HIGHER THAN THE PERFORMANCE DATA QUOTED. TO OBTAIN PERFORMANCE DATA CURRENT TO THE MOST RECENT MONTH END, PLEASE CALL 1-800-239-0732 OR VISIT OUR WEBSITE AT www.paradigm-funds.com.
2020 Semi-Annual Report 6
Paradigm Select Fund (Unaudited)
PERFORMANCE INFORMATION
Average Annual Rate of Return (%) for the Periods Ended June 30, 2020.
June 30, 2020 NAV $41.79
| 1 Year(A) | 3 Year(A) | 5 Year(A) | 10 Year(A) | |||||
| Paradigm Select Fund | 7.58% | 8.22% | 7.77% | 11.78% | ||||
| Russell 2500® Index(B) | (4.70)% | 4.08% | 5.41% | 11.46% |
(A) 1 Year, 3 Year, 5 Year and 10 Year returns include change in share prices and in each case includes reinvestment of any dividends and capital gain distributions. The inception date of the Paradigm Select Fund was January 1, 2005.
(B) The Russell 2500® Index (whose composition is different from the Fund) measures the performance of the small to mid-cap segment of the U.S. equity universe, commonly referred to as “mid” cap. The Russell 2500 Index is a subset of the Russell 3000® Index. It includes approximately 2,500 of the smallest securities based on a combination of their market cap and current index membership. Investors cannot invest directly in an index.
For purposes of the accompanying table, it is assumed that all dividends and distributions were reinvested.
Per the Fund’s most recent prospectus, the Fund’s Total Annual Operating Expense Ratio (before any fee waiver) is 1.52%, and 1.17% post waiver. The Advisor has contractually agreed to waive management fees and reimburse expenses to the extent necessary to maintain total annual operating expenses of the Fund (excluding brokerage fees and commissions, interest and other borrowing expenses, taxes, extraordinary expenses and the indirect costs of investing in Acquired Funds) at 1.15% of its average daily net assets through April 30, 2021. The Total Annual Operating Expense Ratio may not correlate to the expense ratio in the Fund’s financial highlights because the financial highlights only include the direct operating expenses incurred by the Fund, not the indirect costs of investing in acquired funds. Shares redeemed within 90 days of purchase are subject to a 2.00% redemption fee.
PAST PERFORMANCE DOES NOT GUARANTEE FUTURE RESULTS. INVESTMENT RETURN AND PRINCIPAL VALUE WILL FLUCTUATE SO THAT SHARES, WHEN REDEEMED, MAY BE WORTH MORE OR LESS THAN THEIR ORIGINAL COST. RETURNS DO NOT REFLECT THE DEDUCTION OF TAXES THAT A SHAREHOLDER WOULD PAY ON FUND DISTRIBUTIONS OR THE REDEMPTION OF FUND SHARES. CURRENT PERFORMANCE MAY BE LOWER OR HIGHER THAN THE PERFORMANCE DATA QUOTED. TO OBTAIN PERFORMANCE DATA CURRENT TO THE MOST RECENT MONTH END, PLEASE CALL 1-800-239-0732 OR VISIT OUR WEBSITE AT www.paradigm-funds.com.
2020 Semi-Annual Report 7
Paradigm Micro-Cap Fund (Unaudited)
PERFORMANCE INFORMATION
Average Annual Rate of Return (%) for the Period Ended June 30, 2020.
June 30, 2020 NAV $29.59
| 1 Year(A) | 3 Year(A) | 5 Year(A) | 10 Year(A) | |||||
| Paradigm Micro-Cap Fund | 7.26% | 1.60% | 6.54% | 10.63% | ||||
| Russell Microcap® Index(B) | (4.77)% | 0.85% | 2.86% | 9.93% |
(A) 1 Year, 3 Year, 5 Year and 10 Year returns include change in share prices and in each case includes reinvestment of any dividends and capital gain distributions. The inception date of the Paradigm Micro-Cap Fund was January 1, 2008.
(B) The Russell Microcap® Index measures the performance of the microcap segment of the U.S. equity market. Microcap stocks make up less than 3% of the U.S. equity market (by market cap) and consist of the smallest 1,000 securities in the small-cap Russell 2000® Index, plus the next smallest eligible securities by market cap. The Russell Microcap Index is completely reconstituted annually to ensure larger stocks do not distort performance and characteristics of the true microcap opportunity set. Investors cannot invest directly in an index. Effective December 27, 2011 the Fund changed its investment strategy. Under normal circumstances, the Micro-Cap Fund invests at least 80% of its net assets in common stocks of U.S. micro-cap companies.
For purposes of the accompanying table, it is assumed that all dividends and distributions were reinvested.
Per the Fund’s most recent prospectus, the Fund’s Total Annual Operating Expense Ratio is 1.26% . The Total Annual Operating Expense Ratio may not correlate to the expense ratio in the Fund’s financial highlights because the financial highlights only include the direct operating expenses incurred by the Fund, not the indirect costs of investing in acquired funds. Shares redeemed within 90 days of purchase are subject to a 2.00% redemption fee.
PAST PERFORMANCE DOES NOT GUARANTEE FUTURE RESULTS. INVESTMENT RETURN AND PRINCIPAL VALUE WILL FLUCTUATE SO THAT SHARES, WHEN REDEEMED, MAY BE WORTH MORE OR LESS THAN THEIR ORIGINAL COST. RETURNS DO NOT REFLECT THE DEDUCTION OF TAXES THAT A SHAREHOLDER WOULD PAY ON FUND DISTRIBUTIONS OR THE REDEMPTION OF FUND SHARES. CURRENT PERFORMANCE MAY BE LOWER OR HIGHER THAN THE PERFORMANCE DATA QUOTED. TO OBTAIN PERFORMANCE DATA CURRENT TO THE MOST RECENT MONTH END, PLEASE CALL 1-800-239-0732 OR VISIT OUR WEBSITE AT www.paradigm-funds.com.
2020 Semi-Annual Report 8
| Paradigm Value Fund | |||||
| Schedule of Investments | |||||
| June 30, 2020 (Unaudited) | |||||
| Shares | Fair Value | % of Net Assets | |||
| COMMON STOCKS | |||||
| Air Courier Services | |||||
| 61,000 | Air Transport Services Group, Inc. * | $ | 1,358,470 | 3.17 | % |
| Aircraft Parts & Auxiliary Equipment, NEC | |||||
| 10,000 | Ducommun Incorporated * | 348,700 | 0.81 | % | |
| Communications Equipment, NEC | |||||
| 6,000 | Lumentum Holdings Inc. * | 488,580 | |||
| 25,000 | Vocera Communications, Inc. * | 530,000 | |||
| 1,018,580 | 2.38 | % | |||
| Communications Services, NEC | |||||
| 60,000 | Calix, Inc. * | 894,000 | 2.09 | % | |
| Computer Communications Equipment | |||||
| 124,300 | A10 Networks, Inc. * | 846,483 | |||
| 110,000 | Extreme Networks, Inc. * | 477,400 | |||
| 1,323,883 | 3.09 | % | |||
| Construction - Special Trade Contractors | |||||
| 76,800 | Matrix Service Co. * | 746,496 | 1.74 | % | |
| Electrical Work | |||||
| 19,700 | EMCOR Group Inc. | 1,302,958 | 3.04 | % | |
| Electronic Computers | |||||
| 6,000 | Omnicell, Inc. * | 423,720 | 0.99 | % | |
| Footwear, (No Rubber) | |||||
| 20,000 | Caleres, Inc. | 166,800 | 0.39 | % | |
| Heavy Construction Other Than Building Construction - Contractors | |||||
| 4,000 | Granite Construction Incorporated | 76,560 | 0.18 | % | |
| Industrial Organic Chemicals | |||||
| 21,700 | Sensient Technologies Corporation | 1,131,872 | 2.64 | % | |
| Laboratory Analytical Instruments | |||||
| 16,300 | PerkinElmer Inc. | 1,598,867 | 3.73 | % | |
| Millwood, Veneer, Plywood, & Structural Wood Members | |||||
| 5,000 | American Woodmark Corporation * | 378,250 | |||
| 29,000 | JELD-WEN Holding, Inc. * | 467,190 | |||
| 845,440 | 1.97 | % | |||
| Mining & Quarrying of Nonmetallic Minerals (No Fuels) | |||||
| 53,000 | Summit Materials, Inc. - Class A * | 852,240 | 1.99 | % | |
| National Commercial Banks | |||||
| 34,000 | First Merchants Corporation | 937,380 | |||
| 14,936 | National Bank Holdings Corporation - Class A | 403,272 | |||
| 1,340,652 | 3.13 | % | |||
| Office Machines, NEC | |||||
| 80,000 | Pitney Bowes Inc. | 208,000 | 0.49 | % | |
| Optical Instruments & Lenses | |||||
| 16,000 | II-VI Incorporated * | 755,520 | 1.76 | % | |
| Orthopedic, Prosthetic & Surgical Appliances & Supplies | |||||
| 120,000 | RTI Surgical, Inc. * | 381,600 | 0.89 | % | |
| Printed Circuit Boards | |||||
| 15,000 | Jabil Circuit, Inc. | 481,200 | 1.12 | % | |
| Retail - Apparel & Accessory Stores | |||||
| 170,800 | Express Inc. * | 263,032 | |||
| 40,000 | Tailored Brands, Inc. | 226,800 | |||
| 489,832 | 1.14 | % | |||
| Retail - Catalog & Mail-Order Houses | |||||
| 7,000 | Insight Enterprises, Inc. * | 344,400 | 0.80 | % | |
| * Non-Income Producing Securities. The accompanying notes are an integral part of these financial statements. |
2020 Semi-Annual Report 9
| Paradigm Value Fund | |||||
| Schedule of Investments | |||||
| June 30, 2020 (Unaudited) | |||||
| Shares | Fair Value | % of Net Assets | |||
| COMMON STOCKS | |||||
| Retail - Family Clothing Stores | |||||
| 67,600 | American Eagle Outfitters, Inc. | $ | 736,840 | 1.72 | % |
| Retail - Retail Stores, NEC | |||||
| 6,000 | IAC/InterActiveCorp. * | 1,940,400 | 4.53 | % | |
| Retail - Shoe Stores | |||||
| 19,500 | Designer Brands Inc. - Class A | 132,015 | |||
| 24,800 | Foot Locker, Inc. | 723,168 | |||
| 855,183 | 2.00 | % | |||
| Semiconductors & Related Devices | |||||
| 61,600 | Kulicke & Soffa Industries Inc. (Singapore) | 1,283,128 | |||
| 7,588 | Marvell Technology Group Ltd. (Bermuda) | 266,035 | |||
| 40,000 | NeoPhotonics Corporation * | 355,200 | |||
| 14,600 | Qorvo, Inc. * | 1,613,738 | |||
| 3,518,101 | 8.21 | % | |||
| Services - Business Services, NEC | |||||
| 21,400 | Tabula Rasa HealthCare, Inc. * | 1,171,222 | 2.73 | % | |
| Services - Computer Integrated Systems Design | |||||
| 20,000 | Allscripts Healthcare Solutions, Inc. * | 135,400 | |||
| 100,000 | Ribbon Communications Inc. * | 393,000 | |||
| 528,400 | 1.23 | % | |||
| Services - Help Supply Services | |||||
| 44,400 | Kforce Inc. | 1,298,700 | 3.03 | % | |
| Services - Home Health Care Services | |||||
| 18,500 | Addus HomeCare Corporation * | 1,712,360 | 4.00 | % | |
| Services - Hospitals | |||||
| 13,100 | Magellan Health Services Inc. * | 956,038 | 2.23 | % | |
| Services - Management Services | |||||
| 60,000 | R1 RCM Inc. * | 669,000 | 1.56 | % | |
| Services - Skilled Nursing Care Facilities | |||||
| 10,000 | The Ensign Group, Inc. | 418,500 | 0.98 | % | |
| Special Industry Machinery (No Metalworking Machinery) | |||||
| 3,500 | Kadant Inc. | 348,810 | 0.81 | % | |
| Special Industry Machinery, NEC | |||||
| 39,600 | Brooks Automation, Inc. | 1,751,904 | |||
| 20,000 | Veeco Instruments Inc. * | 269,800 | |||
| 2,021,704 | 4.72 | % | |||
| State Commercial Banks | |||||
| 21,000 | Banner Corporation | 798,000 | |||
| 8,448 | Prosperity Bancshares, Inc. | 501,642 | |||
| 36,000 | Renasant Corporation | 896,400 | |||
| 2,196,042 | 5.13 | % | |||
| Telegraph & Other Message Communications | |||||
| 18,400 | j2 Global, Inc. | 1,163,064 | 2.72 | % | |
| Telephone & Telegraph Apparatus | |||||
| 6,000 | Fabrinet (Thailand) * | 374,520 | 0.88 | % | |
| Transportation Services | |||||
| 15,400 | GATX Corp. | 939,092 | 2.19 | % | |
| Water, Sewer, Pipeline, Comm & Power Line Construction | |||||
| 25,000 | Primoris Services Corporation | 444,000 | 1.04 | % | |
| Wholesale - Computers & Peripheral Equipment & Software | |||||
| 10,832 | SYNNEX Corporation | 1,297,349 | 3.03 | % | |
| Total for Common Stocks (Cost $24,141,739) | 38,679,115 | 90.28 | % | ||
| * Non-Income Producing Securities. The accompanying notes are an integral part of these financial statements. |
2020 Semi-Annual Report 10
| Paradigm Value Fund | ||||||
| Schedule of Investments | ||||||
| June 30, 2020 (Unaudited) | ||||||
| Shares | Fair Value | % of Net Assets | ||||
| REAL ESTATE INVESTMENT TRUSTS | ||||||
| 19,000 | Blackstone Mortgage Trust, Inc. - Class A | $ | 457,710 | |||
| 11,650 | Mid-America Apartment Communities Inc. | 1,335,906 | ||||
| 38,000 | TPG RE Finance Trust, Inc. | 326,800 | ||||
| Total for Real Estate Investment Trusts (Cost $1,592,016) | 2,120,416 | 4.95 | % | |||
| MONEY MARKET FUNDS | ||||||
| 2,036,213 | SEI Daily Income Trust Government Fund CL F 0.03% ** | 2,036,213 | 4.75 | % | ||
| Total for Money Market Funds (Cost $2,036,213) | ||||||
| Total Investment Securities | 42,835,744 | 99.98 | % | |||
| (Cost $27,769,968) | ||||||
| Other Assets in Excess of Liabilities | 9,737 | 0.02 | % | |||
| Net Assets | $ | 42,845,481 | 100.00 | % | ||
| ** The Yield Rate shown represents the 7-day yield at June 30, 2020. The accompanying notes are an integral part of these financial statements. |
2020 Semi-Annual Report 11
| Paradigm Select Fund | ||||||
| Schedule of Investments | ||||||
| June 30, 2020 (Unaudited) | ||||||
| Shares | Fair Value | % of Net Assets | ||||
| COMMON STOCKS | ||||||
| Chemical & Allied Products | ||||||
| 1,775 | Innospec Inc. | $ | 137,119 | 0.38 | % | |
| Communications Equipment, NEC | ||||||
| 3,500 | Lumentum Holdings Inc. * | 285,005 | 0.79 | % | ||
| Construction - Special Trade Contractors | ||||||
| 41,700 | Matrix Service Co. * | 405,324 | 1.13 | % | ||
| Electrical Work | ||||||
| 11,900 | EMCOR Group Inc. | 787,066 | 2.19 | % | ||
| Electromedical & Electrotherapeutic Apparatus | ||||||
| 9,200 | Masimo Corporation * | 2,097,508 | 5.83 | % | ||
| Fire, Marine & Casualty Insurance | ||||||
| 3,950 | American Financial Group Inc. | 250,667 | 0.70 | % | ||
| Footwear (No Rubber) | ||||||
| 25,000 | Caleres, Inc. | 208,500 | 0.58 | % | ||
| General Industrial Machinery & Equipment | ||||||
| 23,400 | Rexnord Corporation * | 682,110 | 1.90 | % | ||
| Industrial Instruments For Measurement, Display, and Control | ||||||
| 9,200 | MKS Instruments, Inc. | 1,041,808 | 2.89 | % | ||
| Industrial Organic Chemicals | ||||||
| 5,800 | Sensient Technologies Corporation | 302,528 | ||||
| 4,350 | Westlake Chemical Corp. | 233,378 | ||||
| 535,906 | 1.49 | % | ||||
| Instruments For Measurement & Testing of Electricity & Electric Signals | ||||||
| 18,675 | Teradyne, Inc. | 1,578,224 | 4.39 | % | ||
| Laboratory Analytical Instruments | ||||||
| 9,700 | PerkinElmer Inc. | 951,473 | 2.64 | % | ||
| Mining & Quarrying of Nonmetallic Minerals (No Fuels) | ||||||
| 21,200 | Summit Materials, Inc. - Class A * | 340,896 | 0.95 | % | ||
| Miscellaneous Manufacturing Industries | ||||||
| 35,200 | Hillenbrand, Inc. | 952,864 | 2.65 | % | ||
| Optical Instruments & Lenses | ||||||
| 15,000 | II-VI Incorporated * | 708,300 | 1.97 | % | ||
| Plastics Products | ||||||
| 10,000 | Entegris, Inc. | 590,500 | 1.64 | % | ||
| Printed Circuit Boards | ||||||
| 34,900 | Jabil Circuit, Inc. | 1,119,592 | ||||
| 22,500 | TTM Technologies, Inc. * | 266,850 | ||||
| 1,386,442 | 3.85 | % | ||||
| Radio & TV Broadcasting & Communications Equipment | ||||||
| 10,000 | CommScope Holding Company, Inc. * | 83,300 | 0.23 | % | ||
| Retail - Catalog & Mail-Order Houses | ||||||
| 7,000 | Insight Enterprises, Inc. * | 344,400 | 0.96 | % | ||
| Retail - Eating & Drinking Places | ||||||
| 6,700 | Cannae Holdings, Inc. * | 275,370 | 0.76 | % | ||
| Retail - Family Clothing Stores | ||||||
| 49,600 | American Eagle Outfitters, Inc. | 540,640 | 1.50 | % | ||
| Retail - Lumber & Other Building Materials Dealers | ||||||
| 33,600 | BMC Stock Holdings, Inc. * | 844,704 | 2.35 | % | ||
| Retail - Radio, TV & Consumer Electronics Stores | ||||||
| 12,400 | Best Buy Co., Inc. | 1,082,148 | 3.01 | % | ||
| * Non-Income Producing Securities. The accompanying notes are an integral part of these financial statements. |
2020 Semi-Annual Report 12
| Paradigm Select Fund | |||||
| Schedule of Investments | |||||
| June 30, 2020 (Unaudited) | |||||
| Shares | Fair Value | % of Net Assets | |||
| COMMON STOCKS | |||||
| Retail - Retail Stores, NEC | |||||
| 6,200 | IAC/InterActiveCorp. * | $ | 2,005,080 | 5.57 | % |
| Retail - Shoe Stores | |||||
| 24,800 | Foot Locker, Inc. | 723,168 | 2.01 | % | |
| Savings Institution, Federally Chartered | |||||
| 7,800 | Capitol Federal Financial, Inc. | 85,878 | 0.24 | % | |
| Search, Detection, Navigation, Guidance, Aeronautical Systems | |||||
| 6,800 | Garmin Ltd. (Switzerland) | 663,000 | 1.84 | % | |
| Semiconductors & Related Devices | |||||
| 34,300 | Kulicke & Soffa Industries Inc. (Singapore) | 714,469 | |||
| 52,725 | Marvell Technology Group Ltd. (Bermuda) | 1,848,538 | |||
| 11,200 | Qorvo, Inc. * | 1,237,936 | |||
| 7,200 | Skyworks Solutions, Inc. | 920,592 | |||
| 4,721,535 | 13.12 | % | |||
| Services - Computer Integrated Systems Design | |||||
| 52,500 | Allscripts Healthcare Solutions, Inc. * | 355,425 | 0.99 | % | |
| Services - Help Supply Services | |||||
| 52,625 | Kelly Services, Inc. - Class A | 832,264 | |||
| 21,750 | Kforce Inc. | 636,188 | |||
| 1,468,452 | 4.08 | % | |||
| Services - Hospitals | |||||
| 9,000 | Magellan Health Services Inc. * | 656,820 | 1.82 | % | |
| Services - Prepackaged Software | |||||
| 1,809 | Black Knight, Inc. * | 131,261 | |||
| 8,300 | Progress Software Corporation | 321,625 | |||
| 452,886 | 1.26 | % | |||
| Steel Pipe & Tubes | |||||
| 15,750 | Allegheny Technologies Incorporated * | 160,493 | 0.45 | % | |
| Steel Works, Blast Furnaces & Rolling Mills (Coke Ovens) | |||||
| 6,200 | Carpenter Technology Corporation | 150,535 | 0.42 | % | |
| Surgical & Medical Instruments & Apparatus | |||||
| 29,400 | Globus Medical, Inc. - Class A * | 1,402,674 | 3.90 | % | |
| Telegraph & Other Message Communications | |||||
| 10,700 | j2 Global, Inc. | 676,347 | 1.88 | % | |
| Telephone & Telegraph Apparatus | |||||
| 10,000 | Ciena Corporation * | 541,600 | |||
| 5,000 | Fabrinet * (Thailand) | 312,100 | |||
| 853,700 | 2.37 | % | |||
| Title Insurance | |||||
| 5,900 | Fidelity National Financial, Inc. | 180,894 | 0.50 | % | |
| Wholesale - Computers & Peripheral Equipment & Software | |||||
| 8,700 | SYNNEX Corporation | 1,041,999 | 2.90 | % | |
| Wholesale - Electrical Apparatus & Equipment, Wiring Supplies | |||||
| 8,000 | EnerSys | 515,040 | 1.43 | % | |
| Wholesale - Lumber & Other Construction Materials | |||||
| 8,400 | Boise Cascade Company | 315,924 | 0.88 | % | |
| Total for Common Stocks (Cost $24,335,616) | $ | 32,540,124 | 90.44 | % | |
| REAL ESTATE INVESTMENT TRUSTS | |||||
| 5,900 | Mid-America Apartment Communities Inc. | 676,553 | 1.88 | % | |
| Total for Real Estate Investment Trusts (Cost $500,280) | |||||
| * Non-Income Producing Securities. The accompanying notes are an integral part of these financial statements. |
2020 Semi-Annual Report 13
| Paradigm Select Fund | ||||||
| Schedule of Investments | ||||||
| June 30, 2020 (Unaudited) | ||||||
| Shares | Fair Value | % of Net Assets | ||||
| MONEY MARKET FUNDS | ||||||
| 2,784,571 SEI Daily Income Trust Government Fund CL F 0.03% ** | 2,784,571 | 7.74 | % | |||
| Total for Money Market Funds (Cost $2,784,571) | ||||||
| Total Investment Securities | 36,001,248 | 100.06 | % | |||
| (Cost $27,620,467) | ||||||
| Liabilities in Excess of Other Assets | (19,947 | ) | -0.06 | % | ||
| Net Assets | $ | 35,981,301 | 100.00 | % | ||
| ** The Yield Rate shown represents the 7-day yield at June 30, 2020. The accompanying notes are an integral part of these financial statements. |
2020 Semi-Annual Report 14
| Paradigm Micro-Cap Fund | ||||||
| Schedule of Investments | ||||||
| June 30, 2020 (Unaudited) | ||||||
| Shares | Fair Value | % of Net Assets | ||||
| COMMON STOCKS | ||||||
| Aircraft Parts & Auxiliary Equipment, NEC | ||||||
| 40,000 | Ducommun Incorporated * | $ | 1,394,800 | 2.32 | % | |
| Ball & Roller Bearings | ||||||
| 300,000 | NN, Inc. | 1,422,000 | 2.36 | % | ||
| Communications Equipment, NEC | ||||||
| 40,000 | Vocera Communications, Inc. * | 848,000 | 1.41 | % | ||
| Communications Services, NEC | ||||||
| 100,000 | Calix, Inc. * | 1,490,000 | 2.48 | % | ||
| Computer Communications Equipment | ||||||
| 280,000 | Extreme Networks, Inc. * | 1,215,200 | 2.02 | % | ||
| Concrete Products, Except Block & Brick | ||||||
| 140,000 | Forterra, Inc. * | 1,562,400 | 2.60 | % | ||
| Construction - Special Trade Contractors | ||||||
| 17,500 | Matrix Service Co. * | 170,100 | 0.28 | % | ||
| Electronic Computers | ||||||
| 20,000 | Omnicell, Inc. * | 1,412,400 | 2.35 | % | ||
| Engines & Turbines | ||||||
| 319,600 | Westport Fuel Systems Inc. * | 396,304 | 0.66 | % | ||
| Footwear (No Rubber) | ||||||
| 60,000 | Caleres, Inc. | 500,400 | 0.83 | % | ||
| Guided Missiles & Space Vehicles & Parts | ||||||
| 80,000 | Kratos Defense & Security Solutions, Inc. * | 1,250,400 | 2.08 | % | ||
| Industrial Organic Chemicals | ||||||
| 5,950 | Sensient Technologies Corporation | 310,352 | 0.52 | % | ||
| Instruments For Measurement & Testing of Electricity & Electric Signals | ||||||
| 13,365 | Cohu, Inc. | 231,749 | 0.39 | % | ||
| Laboratory Analytical Instruments | ||||||
| 400,000 | Fluidigm Corporation * | 1,604,000 | 2.66 | % | ||
| Measuring & Controlling Devices, NEC | ||||||
| 60,000 | Onto Innovation Inc. * | 2,042,400 | 3.39 | % | ||
| Mining & Quarrying of Nonmetallic Minerals (No Fuels) | ||||||
| 60,000 | Summit Materials, Inc. - Class A * | 964,800 | 1.60 | % | ||
| Miscellaneous Manufacturing Industries | ||||||
| 5,200 | Hillenbrand, Inc. | 140,764 | 0.23 | % | ||
| Office Machines, NEC | ||||||
| 800,000 | Pitney Bowes Inc. | 2,080,000 | 3.46 | % | ||
| Orthopedic, Prosthetic & Surgical Appliances & Supplies | ||||||
| 173,600 | Invacare Corporation | 1,105,832 | ||||
| 244,900 | RTI Surgical, Inc. * | 778,782 | ||||
| 1,884,614 | 3.13 | % | ||||
| Pharmaceutical Preparations | ||||||
| 50,000 | Flexion Therapeutics, Inc. * | 657,500 | ||||
| 80,000 | Nature's Sunshine Products, Inc. * | 720,800 | ||||
| 160,000 | OptiNose, Inc. * | 1,190,400 | ||||
| 2,568,700 | 4.27 | % | ||||
| Retail - Apparel & Accessory Stores | ||||||
| 111,900 | Express Inc. * | 172,326 | ||||
| 310,000 | Tilly's, Inc. - Class A | 1,757,700 | ||||
| 19,200 | Zumiez Inc. * | 525,696 | ||||
| 2,455,722 | 4.08 | % | ||||
| * Non-Income Producing Securities. The accompanying notes are an integral part of these financial statements. |
2020 Semi-Annual Report 15
| Paradigm Micro-Cap Fund | |||||
| Schedule of Investments | |||||
| June 30, 2020 (Unaudited) | |||||
| Shares | Fair Value | % of Net Assets | |||
| COMMON STOCKS | |||||
| Retail - Catalog & Mail-Order Houses | |||||
| 30,000 | Insight Enterprises, Inc. * | $ | 1,476,000 | 2.45 | % |
| Retail - Family Clothing Stores | |||||
| 13,300 | American Eagle Outfitters, Inc. | 144,970 | 0.24 | % | |
| Retail - Shoe Stores | |||||
| 6,700 | Foot Locker, Inc. | 195,372 | 0.32 | % | |
| Semiconductors & Related Devices | |||||
| 33,700 | Kulicke & Soffa Industries Inc. (Singapore) | 701,971 | |||
| 250,000 | NeoPhotonics Corporation * | 2,220,000 | |||
| 80,000 | Ultra Clean Holdings, Inc. * | 1,810,400 | |||
| 4,732,371 | 7.86 | % | |||
| Services - Business Services, NEC | |||||
| 8,400 | Tabula Rasa HealthCare, Inc. * | 459,732 | 0.76 | % | |
| Services - Computer Integrated Systems Design | |||||
| 180,000 | Allscripts Healthcare Solutions, Inc. * | 1,218,600 | |||
| 504,000 | Ribbon Communications Inc. * | 1,980,720 | |||
| 3,199,320 | 5.32 | % | |||
| Services - Computer Processing & Data Preparation | |||||
| 17,900 | Inovalon Holdings, Inc. * | 344,754 | 0.57 | % | |
| Services - Help Supply Services | |||||
| 34,500 | Kelly Services, Inc. - Class A | 545,618 | 0.91 | % | |
| Services - Home Health Care Services | |||||
| 4,700 | Addus HomeCare Corporation * | 435,032 | 0.72 | % | |
| Services - Hospitals | |||||
| 5,900 | Magellan Health Services Inc. * | 430,582 | 0.72 | % | |
| Services - Prepackaged Software | |||||
| 50,000 | Cerence Inc. * | 2,042,000 | |||
| 10,900 | Progress Software Corporation | 422,375 | |||
| 2,464,375 | 4.09 | % | |||
| Services - Management Services | |||||
| 60,000 | Evolent Health, Inc. * | 427,200 | |||
| 200,000 | R1 RCM Inc. * | 2,230,000 | |||
| 2,657,200 | 4.41 | % | |||
| Services - Skilled Nursing Care Facilities | |||||
| 40,000 | The Ensign Group, Inc. | 1,674,000 | 2.78 | % | |
| Special Industry Machinery (No Metalworking Machinery) | |||||
| 15,100 | Kadant Inc. | 1,504,866 | 2.50 | % | |
| Special Industry Machinery, NEC | |||||
| 9,800 | Brooks Automation, Inc. | 433,552 | |||
| 160,000 | Veeco Instruments Inc. * | 2,158,400 | |||
| 2,591,952 | 4.31 | % | |||
| Surgical & Medical Instruments & Apparatus | |||||
| 53,700 | AtriCure, Inc. * | 2,413,815 | |||
| 300,000 | Cerus Corporation * | 1,980,000 | |||
| 113,200 | GenMark Diagnostics, Inc. * | 1,665,172 | |||
| 6,600 | OrthoPediatrics Corp. * | 288,816 | |||
| 6,347,803 | 10.55 | % | |||
| Telephone & Telegraph Apparatus | |||||
| 220,000 | Infinera Corporation * | 1,302,400 | 2.16 | % | |
| Total for Common Stocks (Cost $48,144,005) | 56,451,452 | 93.79 | % | ||
| * Non-Income Producing Securities. The accompanying notes are an integral part of these financial statements. |
2020 Semi-Annual Report 16
| Paradigm Micro-Cap Fund | |||||
| Schedule of Investments | |||||
| June 30, 2020 (Unaudited) | |||||
| Shares | Fair Value | % of Net Assets | |||
| MONEY MARKET FUNDS | |||||
| 3,098,001 SEI Daily Income Trust Government Fund CL F 0.03% ** | 3,098,001 | 5.15 | % | ||
| Total for Money Market Funds (Cost $3,098,001) | |||||
| Total Investment Securities | 59,549,453 | 98.94 | % | ||
| (Cost $51,242,006) | |||||
| Other Assets in Excess of Liabilities | 640,885 | 1.06 | % | ||
| Net Assets | $ | 60,190,338 | 100.00 | % | |
| ** The Yield Rate shown represents the 7-day yield at June 30, 2020. The accompanying notes are an integral part of these financial statements. |
2020 Semi-Annual Report 17
| Paradigm Funds | |||||||
| Statements of Assets and Liabilities (Unaudited) | Value | Select | |||||
| June 30, 2020 | Fund | Fund | |||||
| Assets: | |||||||
| Investment Securities at Fair Value* | $ | 42,835,744 | $ | 36,001,248 | |||
| Receivable for Fund Shares Sold | 12,010 | 25 | |||||
| Dividends Receivable | 51,007 | 12,778 | |||||
| Total Assets | 42,898,761 | 36,014,051 | |||||
| Liabilities: | |||||||
| Payable for Fund Shares Redeemed | 78 | - | |||||
| Payable to Advisor | 53,202 | 32,750 | |||||
| Total Liabilities | 53,280 | 32,750 | |||||
| Net Assets | $ | 42,845,481 | $ | 35,981,301 | |||
| Net Assets Consist of: | |||||||
| Paid In Capital | $ | 26,794,903 | $ | 27,663,994 | |||
| Total Distributable Earnings | 16,050,578 | 8,317,307 | |||||
| Net Assets | $ | 42,845,481 | $ | 35,981,301 | |||
| Net Asset Value, Offering and Redemption Price (Note 2) | $ | 40.79 | $ | 41.79 | |||
| * Investments at Identified Cost | $ | 27,769,968 | $ | 27,620,467 | |||
| Shares Outstanding (Unlimited number of shares | 1,050,279 | 861,047 | |||||
| authorized without par value) | |||||||
| Statements of Operations (Unaudited) | |||||||
| For the six month period ended June 30, 2020 | |||||||
| Investment Income: | |||||||
| Dividends | $ | 327,350 | $ | 159,746 | |||
| Total Investment Income | 327,350 | 159,746 | |||||
| Expenses: | |||||||
| Investment Advisor Fees | 329,594 | 239,035 | |||||
| Total Expenses | 329,594 | 239,035 | |||||
| Less: Expenses Waived | - | (55,775 | ) | ||||
| Net Expenses | 329,594 | 183,260 | |||||
| Net Investment Loss | (2,244 | ) | (23,514 | ) | |||
| Realized and Unrealized Gain (Loss) on Investments: | |||||||
| Net Realized Gain on Investments | 983,598 | 4,982 | |||||
| Net Change in Net Unrealized Appreciation on Investments | (10,187,615 | ) | (2,840,085 | ) | |||
| Net Realized and Unrealized Loss on Investments | (9,204,017 | ) | (2,835,103 | ) | |||
| Net Decrease in Net Assets from Operations | $ | (9,206,261 | ) | $ | (2,858,617 | ) | |
| The accompanying notes are an integral part of these financial statements. |
2020 Semi-Annual Report 18
| Paradigm Funds | |||
| Statements of Assets and Liabilities (Unaudited) | Micro-Cap | ||
| June 30, 2020 | Fund | ||
| Assets: | |||
| Investment Securities at Fair Value* | $ | 59,549,453 | |
| Receivable for Fund Shares Sold | 132 | ||
| Receivable for Securities Sold | 1,202,589 | ||
| Dividends Receivable | 14,579 | ||
| Total Assets | 60,766,753 | ||
| Liabilities: | |||
| Payable for Securities Purchased | 515,520 | ||
| Payable to Advisor | 60,895 | ||
| Total Liabilities | 576,415 | ||
| Net Assets | $ | 60,190,338 | |
| Net Assets Consist of: | |||
| Paid In Capital | $ | 47,845,520 | |
| Total Distributable Earnings | 12,344,818 | ||
| Net Assets | $ | 60,190,338 | |
| Net Asset Value, Offering and Redemption Price (Note 2) | $ | 29.59 | |
| * Investments at Identified Cost | $ | 51,242,006 | |
| Shares Outstanding (Unlimited number of shares | 2,034,035 | ||
| authorized without par value) | |||
| Statements of Operations (Unaudited) | |||
| For the six month period ended June 30, 2020 | |||
| Investment Income: | |||
| Dividends | $ | 405,715 | |
| Total Investment Income | 405,715 | ||
| Expenses: | |||
| Investment Advisor Fees | 347,489 | ||
| Total Expenses | 347,489 | ||
| Less: Expenses Waived | - | ||
| Net Expenses | 347,489 | ||
| Net Investment Income | 58,226 | ||
| Realized and Unrealized Gain (Loss) on Investments: | |||
| Net Realized Gain on Investments | 4,373,863 | ||
| Net Change in Net Unrealized Appreciation on Investments | (7,209,579 | ) | |
| Net Realized and Unrealized Loss on Investments | (2,835,716 | ) | |
| Net Decrease in Net Assets from Operations | $ | (2,777,490 | ) |
| The accompanying notes are an integral part of these financial statements. |
2020 Semi-Annual Report 19
| Paradigm Funds | ||||||||||||||||
| Statements of Changes in Net Assets | Value Fund | Select Fund | ||||||||||||||
| (Unaudited) | (Unaudited) | |||||||||||||||
| 1/1/2020 | 1/1/2019 | 1/1/2020 | 1/1/2019 | |||||||||||||
| to | to | to | to | |||||||||||||
| 6/30/2020 | 12/31/2019 | 6/30/2020 | 12/31/2019 | |||||||||||||
| From Operations: | ||||||||||||||||
| Net Investment Income (Loss) | $ | (2,244 | ) | $ | 62,034 | $ | (23,514 | ) | $ | 7,403 | ||||||
| Net Realized Gain on Investments | 983,598 | 2,720,157 | 4,982 | 176,985 | ||||||||||||
| Net Change in Unrealized Appreciation on Investments | (10,187,615 | ) | 7,968,653 | (2,840,085 | ) | 8,912,762 | ||||||||||
| Net Increase (Decrease) in Net Assets from Operations | (9,206,261 | ) | 10,750,844 | (2,858,617 | ) | 9,097,150 | ||||||||||
| From Distributions to Shareholders: | - | (2,630,133 | ) | - | (210,205 | ) | ||||||||||
| From Capital Share Transactions: | ||||||||||||||||
| Proceeds From Sale of Shares | 1,626,170 | 3,419,053 | 5,689,334 | 5,919,404 | ||||||||||||
| Proceeds from Redemption Fees (Note 2) | 7,814 | 662 | 10,770 | 1,324 | ||||||||||||
| Shares Issued on Reinvestment of Dividends | - | 2,591,031 | - | 204,471 | ||||||||||||
| Cost of Shares Redeemed | (4,471,254 | ) | (10,673,835 | ) | (3,603,744 | ) | (1,591,296 | ) | ||||||||
| Net Increase (Decrease) from Shareholder Activity | (2,837,270 | ) | (4,663,089 | ) | 2,096,360 | 4,533,903 | ||||||||||
| Net Increase (Decrease) in Net Assets | (12,043,531 | ) | 3,457,622 | (762,257 | ) | 13,420,848 | ||||||||||
| Net Assets at Beginning of Period | 54,889,012 | 51,431,390 | 36,743,558 | 23,322,710 | ||||||||||||
| Net Assets at End of Period | $ | 42,845,481 | $ | 54,889,012 | $ | 35,981,301 | $ | 36,743,558 | ||||||||
| Share Transactions: | ||||||||||||||||
| Issued | 42,162 | 72,697 | 136,563 | 140,889 | ||||||||||||
| Reinvested | - | 53,138 | - | 4,539 | ||||||||||||
| Redeemed | (115,863 | ) | (228,156 | ) | (91,403 | ) | (41,678 | ) | ||||||||
| Net Increase (Decrease) in Shares | (73,701 | ) | (102,321 | ) | 45,160 | 103,750 | ||||||||||
| Shares Outstanding Beginning of Period | 1,123,980 | 1,226,301 | 815,887 | 712,137 | ||||||||||||
| Shares Outstanding End of Period | 1,050,279 | 1,123,980 | 861,047 | 815,887 | ||||||||||||
| The accompanying notes are an integral part of these financial statements. |
2020 Semi-Annual Report 20
| Paradigm Funds | ||||||||
| Statements of Changes in Net Assets | Micro-Cap Fund | |||||||
| (Unaudited) | ||||||||
| 1/1/2020 | 1/1/2019 | |||||||
| to | to | |||||||
| 6/30/2020 | 12/31/2019 | |||||||
| From Operations: | ||||||||
| Net Investment Income (Loss) | $ | 58,226 | $ | (27,699 | ) | |||
| Net Realized Gain (Loss) on Investments | 4,373,863 | (176,959 | ) | |||||
| Net Change in Unrealized Appreciation on Investments | (7,209,579 | ) | 10,842,621 | |||||
| Net Increase (Decrease) in Net Assets from Operations | (2,777,490 | ) | 10,637,963 | |||||
| From Distributions to Shareholders: | - | (5,884 | ) | |||||
| From Capital Share Transactions: | ||||||||
| Proceeds From Sale of Shares | 80,067 | 740,498 | ||||||
| Proceeds From Merger | - | 9,389,723 | (a) | |||||
| Proceeds from Redemption Fees (Note 2) | - | - | ||||||
| Shares Issued on Reinvestment of Dividends | - | 5,836 | ||||||
| Cost of Shares Redeemed | (617,955 | ) | (1,608,168 | ) | ||||
| Net Increase (Decrease) from Shareholder Activity | (537,888 | ) | 8,527,889 | |||||
| Net Increase (Decrease) in Net Assets | (3,315,378 | ) | 19,159,968 | |||||
| Net Assets at Beginning of Period | 63,505,716 | 44,345,748 | ||||||
| Net Assets at End of Period | $ | 60,190,338 | $ | 63,505,716 | ||||
| Share Transactions: | ||||||||
| Issued | 2,984 | 25,965 | ||||||
| From Merger | - | 329,811 | (a) | |||||
| Reinvested | - | 189 | ||||||
| Redeemed | (23,626 | ) | (57,004 | ) | ||||
| Net Increase (Decrease) in Shares | (20,642 | ) | 298,961 | |||||
| Shares Outstanding Beginning of Period | 2,054,677 | 1,755,716 | ||||||
| Shares Outstanding End of Period | 2,034,035 | 2,054,677 | ||||||
| (a) See Note 8. The accompanying notes are an integral part of these financial statements. |
2020 Semi-Annual Report 21
| Paradigm Value Fund | ||||||||||||||||||||||||
| Financial Highlights - Paradigm Value Fund | ||||||||||||||||||||||||
| (Unaudited) | ||||||||||||||||||||||||
| Selected data for a share outstanding | 1/1/2020 | 1/1/2019 | 1/1/2018 | 1/1/2017 | 1/1/2016 | 1/1/2015 | ||||||||||||||||||
| throughout the period: | to | to | to | to | to | to | ||||||||||||||||||
| 6/30/2020 | 12/31/2019 | 12/31/2018 | 12/31/2017 | 12/31/2016 | 12/31/2015 | |||||||||||||||||||
| Net Asset Value - Beginning of Period | $ | 48.83 | $ | 41.94 | $ | 48.96 | $ | 48.10 | $ | 43.02 | $ | 48.33 | ||||||||||||
| Net Investment Income (Loss) (a) | 0.00 | + | 0.05 | (0.10 | ) | (0.08 | ) | (0.02 | ) | (0.02 | ) | |||||||||||||
| Net Gain (Loss) on Investments (Realized and Unrealized) | (8.05 | ) | 9.29 | (0.98 | ) | 6.89 | 7.46 | 0.74 | ||||||||||||||||
| Total from Investment Operations | (8.05 | ) | 9.34 | (1.08 | ) | 6.81 | 7.44 | 0.72 | ||||||||||||||||
| Distributions (From Net Investment Income) | - | (0.02 | ) | - | - | - | - | |||||||||||||||||
| Distributions (From Capital Gains) | - | (2.43 | ) | (5.95 | ) | (5.96 | ) | (2.36 | ) | (6.03 | ) | |||||||||||||
| Total Distributions | - | (2.45 | ) | (5.95 | ) | (5.96 | ) | (2.36 | ) | (6.03 | ) | |||||||||||||
| Proceeds from Redemption Fee (Note 2) | 0.01 | - | + | 0.01 | 0.01 | - | + | - | + | |||||||||||||||
| Net Asset Value - End of Period | $ | 40.79 | $ | 48.83 | $ | 41.94 | $ | 48.96 | $ | 48.10 | $ | 43.02 | ||||||||||||
| Total Return (b) | (16.47 | )% | * | 22.27 | % | (2.07 | )% | 14.06 | % | 17.29 | % | 1.35 | % | |||||||||||
| Ratios/Supplemental Data | ||||||||||||||||||||||||
| Net Assets - End of Period (Thousands) | $ | 42,845 | $ | 54,889 | $ | 51,431 | $ | 59,173 | $ | 62,096 | $ | 66,931 | ||||||||||||
| Before Reimbursement | ||||||||||||||||||||||||
| Ratio of Expenses to Average Net Assets | 1.50 | % | ** | 1.50 | % | 1.50 | % | 1.66 | % | 2.00 | % | 2.00 | % | |||||||||||
| After Reimbursement | ||||||||||||||||||||||||
| Ratio of Expenses to Average Net Assets (c) | 1.50 | % | ** | 1.50 | % | 1.50 | % | 1.50 | % | 1.50 | % | 1.50 | % | |||||||||||
| Ratio of Net Investment Income (Loss) to Average | ||||||||||||||||||||||||
| Net Assets (c) | (0.01 | )% | ** | 0.12 | % | (0.18 | )% | (0.15 | )% | (0.06 | )% | (0.05 | )% | |||||||||||
| Portfolio Turnover Rate | 3.16 | % | * | 12.31 | % | 20.54 | % | 24.12 | % | 12.68 | % | 14.35 | % | |||||||||||
| Paradigm Select Fund | ||||||||||||||||||||||||
| Financial Highlights - Paradigm Select Fund | ||||||||||||||||||||||||
| (Unaudited) | ||||||||||||||||||||||||
| Selected data for a share outstanding throughout the period: | 1/1/2020 | 1/1/2019 | 1/1/2018 | 1/1/2017 | 1/1/2016 | 1/1/2015 | ||||||||||||||||||
| to | to | to | to | to | to | |||||||||||||||||||
| 6/30/2020 | 12/31/2019 | 12/31/2018 | 12/31/2017 | 12/31/2016 | 12/31/2015 | |||||||||||||||||||
| Net Asset Value - Beginning of Period | $ | 45.04 | $ | 32.75 | $ | 37.44 | $ | 33.49 | $ | 29.09 | $ | 32.20 | ||||||||||||
| Net Investment Income (Loss) (a) | (0.03 | ) | 0.01 | 0.01 | (0.05 | ) | (0.04 | ) | 0.07 | |||||||||||||||
| Net Gain (Loss) on Investments (Realized and Unrealized) | (3.23 | ) | 12.54 | (3.74 | ) | 5.42 | 4.69 | (0.45 | ) | |||||||||||||||
| Total from Investment Operations | (3.26 | ) | 12.55 | (3.73 | ) | 5.37 | 4.65 | (0.38 | ) | |||||||||||||||
| Distributions (From Net Investment Income) | - | (0.01 | ) | - | - | (0.01 | ) | (0.05 | ) | |||||||||||||||
| Distributions (From Capital Gains) | - | (0.25 | ) | (0.96 | ) | (1.46 | ) | (0.24 | ) | (2.68 | ) | |||||||||||||
| Total Distributions | - | (0.26 | ) | (0.96 | ) | (1.46 | ) | (0.25 | ) | (2.73 | ) | |||||||||||||
| Proceeds from Redemption Fee (Note 2) | 0.01 | - | + | - | 0.04 | - | + | - | + | |||||||||||||||
| Net Asset Value - End of Period | $ | 41.79 | $ | 45.04 | $ | 32.75 | $ | 37.44 | $ | 33.49 | $ | 29.09 | ||||||||||||
| Total Return (b) | (7.22 | )% | * | 38.32 | % | (9.93 | )% | 16.12 | % | 15.98 | % | (1.26 | )% | |||||||||||
| Ratios/Supplemental Data | ||||||||||||||||||||||||
| Net Assets - End of Period (Thousands) | $ | 35,981 | $ | 36,744 | $ | 23,323 | $ | 25,262 | $ | 22,869 | $ | 5,399 | ||||||||||||
| Before Reimbursement | ||||||||||||||||||||||||
| Ratio of Expenses to Average Net Assets | 1.50 | % | ** | 1.50 | % | 1.50 | % | 1.50 | % | 1.50 | % | 1.50 | % | |||||||||||
| After Reimbursement | ||||||||||||||||||||||||
| Ratio of Expenses to Average Net Assets (c) | 1.15 | % | ** | 1.15 | % | 1.15 | % | 1.15 | % | 1.15 | % | 1.15 | % | |||||||||||
| Ratio of Net Investment Income (Loss) to Average | ||||||||||||||||||||||||
| Net Assets (c) | (0.15 | )% | ** | 0.03 | % | 0.03 | % | (0.13 | )% | (0.14 | )% | 0.21 | % | |||||||||||
| Portfolio Turnover Rate | 3.99 | % | * | 15.27 | % | 20.28 | % | 21.49 | % | 31.47 | % | 19.57 | % | |||||||||||
| * Not Annualized. ** Annualized. (a) Per share amount calculated using the average shares method. (b) Total return represents the rate that the investor would have earned or lost on an investment in the Fund assuming reinvestment of dividends. Returns do not reflect the deduction of taxes a shareholder would pay on Fund distributions or redemption of Fund shares. (c) Such percentages reflect an expense waiver by the Advisor. See Note 4. + Amount calculated is less than $0.005/0.005% . |
| The accompanying notes are an integral part of these financial statements. |
2020 Semi-Annual Report 22
| Paradigm Micro-Cap Fund | |||||||||||||||||||||||||
| Financial Highlights - Paradigm Micro-Cap Fund | |||||||||||||||||||||||||
| (Unaudited) | |||||||||||||||||||||||||
| Selected data for a share outstanding throughout the period: | 1/1/2020 | 1/1/2019 | 1/1/2018 | 1/1/2017 | 1/1/2016 | 1/1/2015 | |||||||||||||||||||
| to | to | to | to | to | to | ||||||||||||||||||||
| 6/30/2020 | 12/31/2019 | 12/31/2018 | 12/31/2017 | 12/31/2016 | 12/31/2015 | ||||||||||||||||||||
| Net Asset Value - Beginning of Period | $ | 30.91 | $ | 25.26 | $ | 32.40 | $ | 29.89 | $ | 24.32 | $ | 27.39 | |||||||||||||
| Net Investment Income (Loss) (a) | 0.03 | (0.02 | ) | (0.23 | ) | (0.31 | ) | (0.18 | ) | (0.11 | ) | ||||||||||||||
| Net Gain (Loss) on Investments (Realized and Unrealized) | (1.35 | ) | 5.67 | (3.35 | ) | 5.05 | 6.83 | (2.64 | ) | ||||||||||||||||
| Total from Investment Operations | (1.32 | ) | 5.65 | (3.58 | ) | 4.74 | 6.65 | (2.75 | ) | ||||||||||||||||
| Distributions (From Net Investment Income) | - | - | - | - | - | - | |||||||||||||||||||
| Distributions (From Capital Gains) | - | - | + | (3.56 | ) | (2.23 | ) | (1.08 | ) | (0.32 | ) | ||||||||||||||
| Total Distributions | - | - | (3.56 | ) | (2.23 | ) | (1.08 | ) | (0.32 | ) | |||||||||||||||
| Proceeds from Redemption Fee (Note 2) | - | - | - | + | - | + | - | + | - | ||||||||||||||||
| Net Asset Value - End of Period | $ | 29.59 | $ | 30.91 | $ | 25.26 | $ | 32.40 | $ | 29.89 | $ | 24.32 | |||||||||||||
| Total Return (b) | (4.27 | )% | * | 22.38 | % | (10.96 | )% | 15.79 | % | 27.33 | % | (10.05 | )% | ||||||||||||
| Ratios/Supplemental Data | |||||||||||||||||||||||||
| Net Assets - End of Period (Thousands) | $ | 60,190 | $ | 63,506 | $ | 44,346 | $ | 49,424 | $ | 51,670 | $ | 42,395 | |||||||||||||
| Ratio of Expenses to Average Net Assets | 1.25 | % | ** | 1.25 | % | 1.25 | % | 1.25 | % | 1.25 | % | 1.25 | % | ||||||||||||
| Ratio of Net Investment Income (Loss) to Average | |||||||||||||||||||||||||
| Net Assets | 0.21 | % | ** | (0.06 | )% | (0.67 | )% | (0.96 | )% | (0.67 | )% | (0.41 | )% | ||||||||||||
| Portfolio Turnover Rate | 38.05 | % | * | 86.09 | % | 111.47 | % | 125.90 | % | 88.88 | % | 70.95 | % | ||||||||||||
| * Not Annualized. ** Annualized. (a) Per share amount calculated using the average shares method. (b) Total return represents the rate that the investor would have earned or lost on an investment in the Fund assuming reinvestment of dividends. Returns do not reflect the deduction of taxes a shareholder would pay on Fund distributions or redemption of Fund shares. + Amount calculated is less than $0.005. |
| The accompanying notes are an integral part of these financial statements. |
2020 Semi-Annual Report 23
| NOTES TO FINANCIAL STATEMENTS PARADIGM FUNDS June 30, 2020 (Unaudited) |
1.) ORGANIZATION
Paradigm Funds (the “Trust”) is an open-end management investment company that was organized in Ohio as a business trust on September 13, 2002 that offers shares of beneficial interest in a number of separate series, each series representing a distinct fund with its own investment objectives and policies. The Paradigm Value Fund (“Value”) commenced operations on January 1, 2003. Value’s investment objective is long-term capital appreciation. The Paradigm Select Fund (“Select”) commenced operations on January 1, 2005. Select’s investment objective is long-term capital appreciation. The Paradigm Micro-Cap Fund (“Micro-Cap”) commenced operations on January 1, 2008. Micro-Cap’s investment objective is long-term capital appreciation. Under normal circumstances, Micro-Cap invests at least 80% of its net assets in the common stocks of U.S. micro-cap companies. Prior to December 27, 2011, the principal investment strategy of Micro-Cap was to invest primarily in the common stocks of small, mid or large capitalization companies that the Advisor (defined below) believed had the potential for capital appreciation. Value, Select and Micro-Cap are all diversified funds. The advisor to Value, Select and Micro-Cap (each a “Fund” and collectively the “Funds”) is Paradigm Funds Advisor LLC (the “Advisor”).
2.) SIGNIFICANT ACCOUNTING POLICIES
The Funds are investment companies and accordingly follow the investment company accounting and reporting guidance of the Financial Accounting Standards Board (“FASB”) Accounting Standards Codification Topic 946 Financial Services - Investment Companies. The financial statements are prepared in conformity with accounting principles generally accepted in the United States of America (“GAAP”). The Funds follows the significant accounting policies described in this section.
SECURITY VALUATION: All investments in securities are recorded at their estimated fair value, as described in Note 3.
SECURITY TRANSACTIONS AND OTHER: Security transactions are recorded based on the trade date for financial statement reporting purposes. Dividend income is recognized on the ex-dividend date. Interest income, if any, is recognized on an accrual basis. The Funds use specific identification in computing gain or loss on sale of investment securities. Withholding taxes on foreign dividends have been provided for in accordance with the Funds’ understanding of the applicable country’s tax rules and rates. The Funds may invest in real estate investment trusts (“REITs”) that pay distributions to their shareholders based on available funds from operations. It is common for these distributions to exceed the REITs’ taxable earnings and profits resulting in the excess portion of such distribution to be designated as return of capital. Distributions received from REITs are generally recorded as dividend income and, if necessary, are reclassified annually in accordance with tax information provided by the underlying REITs.
SHARE VALUATION: Each Fund’s net asset value (the “NAV”) is calculated as of the close of trading on the New York Stock Exchange (the “Exchange”) (normally 4:00 p.m. Eastern time) every day the Exchange is open. The NAV for each Fund is calculated by taking the total value of the Fund’s assets, subtracting its liabilities, and then dividing by the total number of shares outstanding, rounded to the nearest cent. The offering price and redemption price per share is equal to the net asset value per share, except that shares of each Fund are subject to a redemption fee of 2% if redeemed within 90 days or less of purchase. During the six month period ended June 30, 2020 proceeds from redemption fees were $7,814, $10,770 and $0 for Value, Select and Micro-Cap, respectively.
INCOME TAXES: The Funds’ policy is to comply with the requirements of the Internal Revenue Code that are applicable to regulated investment companies and to distribute all of their taxable income to shareholders. Therefore, no federal income tax provision is required. It is the Funds’ policy to distribute annually, prior to the end of the calendar year, dividends sufficient to satisfy excise tax requirements of the Internal Revenue Code. This Internal Revenue Code requirement may cause an excess of distributions over the book year-end accumulated income. In addition, it is the Funds’ policy to distribute annually, after the end of the fiscal year, any remaining net investment income and net realized capital gains.
The Funds recognize the tax benefits of certain tax positions only where the position is “more likely than not” to be sustained assuming examination by tax authorities. Management has analyzed the Funds’ tax posi-
2020 Semi-Annual Report 24
Notes to Financial Statements (Unaudited) - continued
tions, and has concluded that no liability for unrecognized tax benefits should be recorded related to uncertain tax positions taken on returns filed for open tax years. The Funds identify their major tax jurisdictions as U.S. Federal and New York State tax authorities; the Funds are not aware of any tax positions for which it is reasonably possible that the total amounts of unrecognized tax benefits will change materially in the next twelve months. The Funds recognize interest and penalties, if any, related to unrecognized tax benefits as income tax expense in the Statements of Operations. During the six month period ended June 30, 2020, the Funds did not incur any interest or penalties.
ESTIMATES: The financial statements are prepared in accordance with GAAP, which requires management to make estimates and assumptions that affect the reported amounts of assets and liabilities and disclosure of contingent assets and liabilities at the date of the financial statements and the reported amounts of increases and decreases in net assets from operations during the reporting period. Actual results could differ from those estimates.
DISTRIBUTIONS TO SHAREHOLDERS: Distributions to shareholders, which are determined in accordance with income tax regulations, are recorded on the ex-dividend date. The Funds may utilize earnings and profits distributed to shareholders on redemptions of shares as part of the dividends paid deduction. The treatment for financial reporting purposes of distributions made to shareholders during the year from net investment income or net realized capital gains may differ from their ultimate treatment for federal income tax purposes. These differences are caused primarily by differences in the timing of recognition of certain components of income, expense or realized capital gain for federal income tax purposes. Where such differences are permanent in nature, they are reclassified in the components of the net assets based on their ultimate characterization for federal income tax purposes. Any such reclassification will have no effect on net assets, results of operations or net asset values per share of any Fund.
3.) SECURITIES VALUATIONS
The Funds utilize various methods to measure the fair value of their investments on a recurring basis. GAAP establishes a hierarchy that prioritizes inputs to valuation methods. The three levels of inputs are:
Level 1 - Unadjusted quoted prices in active markets for identical assets or liabilities.
Level 2 - Observable inputs other than quoted prices included in level 1 that are observable for the asset or liability, either directly or indirectly. These inputs may include quoted prices for the identical instrument on an inactive market, prices for similar instruments, interest rates, prepayment speeds, credit risk, yield curves, default rates and similar data.
Level 3 - Unobservable inputs for the asset or liability, to the extent relevant observable inputs are not available, representing the Funds’ best information about the assumptions a market participant would use in valuing the assets or liabilities.
The availability of inputs can vary from security to security and is affected by a wide variety of factors, including, for example, the type of security, whether the security is new and not yet established in the marketplace, the liquidity of markets, and other characteristics particular to the security. To the extent that valuation is based on models or inputs that are less observable or unobservable in the market, the determination of fair value requires more judgment. Accordingly, the degree of judgment exercised in determining fair value is greatest for instruments categorized in level 3.
The inputs used to measure fair value may fall into different levels of the fair value hierarchy. In such cases, for disclosure purposes, the level in the fair value hierarchy within which the fair value measurement falls in its entirety, is determined based on the lowest level input that is significant to the fair value measurement in its entirety.
FAIR VALUE MEASUREMENTS
A description of the valuation techniques applied to the Funds’ major categories of assets measured at fair value on a recurring basis follows.
Equity securities (common stocks and real estate investment trusts) Equity securities that are traded on any exchange or on the NASDAQ over-the-counter market are valued at the last quoted sale price. Lacking a last sale price, a long security is valued at its last bid price except when, in the Advisor’s opinion, the last bid price does not accurately reflect the fair value of the long security. To the extent these securities are actively traded and valuation adjustments are not applied, they are classified in level 1 of the fair value hierarchy, and
2020 Semi-Annual Report 25
Notes to Financial Statements (Unaudited) - continued
if an equity security is valued by the pricing service at its last bid, it is generally categorized in level 2 of the fair value hierarchy. When market quotations are not readily available, when the Advisor determines the last bid price does not accurately reflect the fair value or when restricted securities are being valued, such securities are valued as determined in good faith by the Advisor, in conformity with guidelines adopted by and subject to review of the Trust’s Board of Trustees (the “Trustees” or the “Board”) and are categorized in level 2 or level 3, when appropriate.
Money market funds. Money market funds are valued at net asset value provided by the funds and are classified in level 1 of the fair value hierarchy.
In accordance with the Trust’s good faith pricing guidelines, the Advisor is required to consider all appropriate factors relevant to the value of securities for which it has determined other pricing sources are not available or reliable as described above. There is no single standard for determining fair value, since fair value depends upon the circumstances of each individual case. As a general principle, the current fair value of an issue of securities being valued by the Advisor would appear to be the amount which the owner might reasonably expect to receive for them upon their current sale. Methods which are in accordance with this principle may, for example, be based on (i) a multiple of earnings; (ii) a discount from market of a similar freely traded security (including a derivative security or a basket of securities traded on other markets, exchanges or among dealers); or (iii) yield to maturity with respect to debt issues, or a combination of these and other methods.
The following tables summarize the inputs used to value each Fund’s assets measured at fair value as of June 30, 2020:
| Value: | ||||||
| Valuation Inputs of Assets | Level 1 | Level 2 | Level 3 | Total | ||
| Common Stocks | $38,679,115 | $ - | $ - | $38,679,115 | ||
| Real Estate Investment Trusts | 2,120,416 | - | - | 2,120,416 | ||
| Money Market Funds | 2,036,213 | - | - | 2,036,213 | ||
| Total | $42,835,744 | $ - | $ - | $42,835,744 | ||
| Select: | ||||||
| Valuation Inputs of Assets | Level 1 | Level 2 | Level 3 | Total | ||
| Common Stocks | $32,540,124 | $ - | $ - | $32,540,124 | ||
| Real Estate Investment Trusts | 676,553 | - | - | 676,553 | ||
| Money Market Funds | 2,784,571 | - | - | 2,784,571 | ||
| Total | $36,001,248 | $ - | $ - | $36,001,248 | ||
| Micro-Cap: | ||||||
| Valuation Inputs of Assets | Level 1 | Level 2 | Level 3 | Total | ||
| Common Stocks | $ 56,451,452 | $ - | $ - | $56,451,452 | ||
| Money Market Funds | 3,098,001 | - | - | 3,098,001 | ||
| Total | $59,549,453 | $ - | $ - | $59,549,453 | ||
The Funds did not hold any level 3 assets during the six month period ended June 30, 2020.
The Funds did not invest in derivative instruments during the six month period ended June 30, 2020.
4.) INVESTMENT ADVISORY AGREEMENTS
The Trust, with respect to each of the Funds, has an investment advisory agreement (collectively, the “Management Agreements”) with the Advisor. Under the terms of the Management Agreements, the Advisor manages the investment portfolios of the Funds, subject to policies adopted by the Trustees. Under the Management Agreements, the Advisor, at its own expense and without reimbursement from the Trust, furnishes office space and all necessary office facilities, equipment and executive personnel necessary for managing the assets of the Funds. The Advisor pays all operating expenses of the Funds with the exception of taxes, brokerage fees and commissions, borrowing costs (such as interest and dividend expenses on securities sold short) and such extraordinary or non-recurring expenses as may arise, including litigation to which the Fund may be a party and indemnification of the Trustees and Trust officers with respect thereto. The Funds will also pay expenses that they are authorized to pay pursuant to Rule 12b-1 under the Investment Company Act of 1940, as amended (none are currently authorized). The Advisor also pays the salaries and fees of all of its officers and employees that serve as Trustees and Trust Officers. For its ser-
2020 Semi-Annual Report 26
Notes to Financial Statements (Unaudited) - continued
vices and payment of certain Fund expenses as described below, the Advisor receives an annual investment management fee of 1.50%, 1.50% and 1.25% of the average daily net assets from Value, Select and Micro-Cap, respectively. The Advisor’s investment management fee is accrued daily and is typically paid monthly. As a result of the above calculations, for the six month period ended June 30, 2020, the Advisor earned management fees (before the waivers described below) totaling $329,594, $239,035 and $347,489 for Value, Select and Micro-Cap, respectively. At June 30, 2020, $53,202, $32,750 and $60,895 was due to the Advisor from Value, Select and Micro-Cap, respectively. The Advisor has contractually agreed to waive management fees and/or reimburse the expenses of Select to the extent necessary to maintain total annual operating expenses of the Fund (excluding brokerage fees and commissions, interest and other borrowing expenses, taxes, extraordinary expenses and indirect costs of investing in acquired funds) at 1.15% of daily net assets through April 30, 2021. The Advisor waived $55,775 for the six month period ended June 30, 2020 for Select pursuant to its contractual agreement. There is no recapture provision to this waiver.
5.) RELATED PARTY TRANSACTIONS
Certain officers and shareholders of the Advisor are also officers and/or a Trustee of the Trust. These individuals may receive benefits from the Advisor resulting from management fees paid to the Advisor from the Funds.
The Trustees who are not interested persons of the Funds were each paid $4,000, for a total of $16,000, in Trustees fees for the six month period ended June 30, 2020 for the Trust. Under the Management Agreements, the Advisor pays these fees.
6.) INVESTMENTS
For the six month period ended June 30, 2020, purchases and sales of investment securities other than U.S. Government obligations and short-term investments were as follows:
| Value | Select | Micro-Cap | ||||
| Purchases | $1,351,835 | $3,571,537 | $20,502,849 | |||
| Sales | $3,755,921 | $1,221,994 | $23,487,857 |
There were no purchases or sales of U.S. Government obligations.
7.) CONTROL OWNERSHIP
The beneficial ownership, either directly or indirectly, of more than 25% of the voting shares of a fund creates a presumption of control of the fund, under section 2(a)(9) of the Investment Company Act of 1940, as amended. At June 30, 2020, National Financial Services, LLC, located at 200 Liberty Street, New York, New York, for the benefit of its customers, held, in aggregate, 30.64% of Value, and therefore also may be deemed to control Value. Candace King Weir, beneficial owner located at 9 Elk Street, Albany, New York 12207, held, in aggregate, 67.89%, of Select, and therefore may be deemed to control Select. Candace King Weir, beneficial owner located at 9 Elk Street, Albany, New York 12207, held, in aggregate, 89.10% of Micro-Cap, and therefore may be deemed to control Micro-Cap.
8.) MERGER OF PARADIGM OPPORTUNITY FUND WITH PARADIGM MICRO-CAP FUND
Effective as of the close of business December 4, 2019, pursuant to a Plan of Reorganization, Micro-Cap received all the assets and liabilities (the “Reorganization”) of the Paradigm Opportunity Fund (the “Target Fund”). Shares of the Target Fund were exchanged for shares of Micro-Cap. 210,241 shares of the Target Fund, valued at $44.66 per share, were exchanged for 329,811 shares of Micro-Cap valued at $28.47 per share. Each share of the Target Fund was exchanged for 1.569 shares of Micro-Cap. The Target Fund’s net assets on the date of the Reorganization of $9,389,723, including $4,017,053 of unrealized appreciation, were combined with those of Micro-Cap. The combined net assets immediately after the Reorganization amounted to $58,672,090 with 2,060,617 shares outstanding. The Reorganization was treated as a tax-free transaction for federal income tax purposes and, accordingly, the basis of the assets of Micro-Cap reflected the historical basis of the assets of the Target Fund as of the date of the Reorganization. After the Reorganization was completed, Micro-Cap was the accounting survivor and obtained and held the entire portfolio holdings previously held by the Target Fund.
Assuming the Reorganization had been completed on January 1, 2019, the beginning of the reporting period, the pro forma results of operations for the year ended December 31, 2019 would have been as follows:
2020 Semi-Annual Report 27
Notes to Financial Statements (Unaudited) - continued
| Net Investment Loss | $(47,869 | ) | |
| Net Realized Loss on Investments | (193,107 | ) | |
| Change in Net Unrealized Appreciation on Investments | 12,626,082 | ||
| Net Increase in Net Assets Resulting from Operations | $12,385,106 |
Because Micro-Cap has been managed as a single integrated portfolio since the Reorganization was completed, it is not practicable to separate the amounts of revenue and earnings of the Target Fund and Micro-Cap that have been included in Micro-Cap’s Statement of Operations since December 4, 2019.
9.) TAX MATTERS
For federal income tax purposes, at June 30, 2020 the cost of securities on a tax basis and the composition of gross unrealized appreciation (the excess of value over tax cost) and depreciation (the excess of tax cost over value) were as follows:
| Value | Select | Micro-Cap | |||||||
| Cost of Investments | $27,769,968 | $27,620,467 | $51,242,006 | ||||||
| Gross Unrealized Appreciation | $18,846,929 | $11,690,468 | $14,962,399 | ||||||
| Gross Unrealized Depreciation | ($3,781,153 | ) | ($3,309,687 | ) | ($6,654,952 | ) | |||
| Net Unrealized Appreciation | |||||||||
| (Depreciation) on Investments | $15,065,776 | $8,380,781 | $8,307,447 | ||||||
The tax character of distributions paid during the six month period ended June 30, 2020 and the fiscal year ended December 31, 2019 were as follows:
| Six Months Ended | Fiscal Year Ended | ||
| June 30, 2020 | December 31, 2019 | ||
| PARADIGM VALUE FUND | |||
| Ordinary Income | $ – | $ 605,925 | |
| Long-term Capital Gain | – | 2,024,208 | |
| $ – | $2,630,133 | ||
| PARADIGM SELECT FUND | |||
| Ordinary Income | $ – | $ 91,999 | |
| Long-term Capital Gain | – | 118,206 | |
| $ – | $ 210,205 | ||
| PARADIGM MICRO-CAP FUND | |||
| Ordinary Income | $ – | $ – | |
| Long-term Capital Gain | – | 5,884 | |
| $ – | $ 5,884 | ||
10.) CONCENTRATION OF SECTOR RISK
If a Fund has significant investments in the securities of issuers in industries within a particular sector, any development affecting that sector will have a greater impact on the value of the net assets of the Fund than would be the case if the Fund did not have significant investments in that sector. In addition, this may increase the risk of loss of an investment in the Fund and increase the volatility of the Fund’s NAV per share. From time to time, circumstances may affect a particular sector and the companies within such sector. For instance, economic or market factors, regulation or deregulation, and technological or other developments may negatively impact all companies in a particular sector and therefore the value of a Fund’s portfolio will be adversely affected. As of June 30, 2020, Value had 37% of the value of its net assets invested in stocks within the Information Technology sector; Select had 47% of the value of its net assets invested in stocks within the Information Technology sector; and Micro-Cap had 35% and 37% of the value of its net assets invested in stocks within the Information Technology sector and the Health Care sector, respectively.
11.) COVID-19 RISKS
Unexpected local, regional or global events, such as war; acts of terrorism; financial, political or social disruptions; natural, environmental or man-made disasters; the spread of infectious illnesses or other public health issues; and recessions and depressions could have a significant impact on the Fund and its investments and may impair market liquidity. Such events can cause investor fear, which can adversely affect the
2020 Semi-Annual Report 28
Notes to Financial Statements (Unaudited) - continued
economies of nations, regions and the market in general, in ways that cannot necessarily be foreseen. An outbreak of infectious respiratory illness known as COVID-19, which is caused by a novel coronavirus (SARS-CoV-2), was first detected in China in December 2019 and subsequently spread globally. This coron-avirus has resulted in, among other things, travel restrictions, closed international borders, enhanced health screenings at ports of entry and elsewhere, disruption of and delays in healthcare service preparation and delivery, prolonged quarantines, significant disruptions to business operations, market closures, cancellations and restrictions, supply chain disruptions, lower consumer demand, and significant volatility and declines in global financial markets, as well as general concern and uncertainty. The impact of COVID-19 has adversely affected, and other infectious illness outbreaks that may arise in the future could adversely affect, the economies of many nations and the entire global economy, individual issuers and capital markets in ways that cannot necessarily be foreseen. Public health crises caused by the COVID-19 outbreak may exacerbate other pre-existing political, social and economic risks in certain countries or globally. The duration of the COVID-19 outbreak and its effects cannot be determined with certainty.
12.) SUBSEQUENT EVENTS
Subsequent events after the date of the Statements of Assets and Liabilities have been evaluated through the date the financial statements were issued. Management has concluded that there is no impact requiring adjustment to or disclosure in the financial statements.
2020 Semi-Annual Report 29
| DISCLOSURE OF EXPENSES (Unaudited) |
The ongoing costs to shareholders associated with each Fund consist solely of management fees. Although the Funds charge no sales loads or transaction fees, you will be assessed fees for outgoing wire transfers, returned checks and stop payment orders at prevailing rates charged by Mutual Shareholder Services, LLC, the Funds’ transfer agent. IRA accounts will be charged an $8.00 annual maintenance fee. If shares are redeemed within 90 days of purchase from the Funds, the shares are subject to a 2% redemption fee. The following example is intended to help you understand your ongoing costs of investing in the Funds and to compare these costs with similar costs of investing in other mutual funds. The example is based on an investment of $1,000 invested in the Funds on January 1, 2020 and held through June 30, 2020.
The first line of each table below provides information about actual account values and actual expenses. In order to estimate the expenses a shareholder paid during the period covered by this report, shareholders can divide their account value by $1,000 (for example, an $8,600 account value divided by $1,000 = 8.6) and then multiply the result by the number in the first line under the heading entitled “Expenses Paid During the Period.”
The second line of each table below provides information about hypothetical account values and hypothetical expenses based on the Funds’ actual expense ratios and an assumed rate of return of 5% per year before expenses, which is not the Funds’ actual return. The hypothetical account values and expenses may not be used to estimate the actual ending account balance or expenses paid by a shareholder for the period. Shareholders may use this information to compare the ongoing costs of investing in the Funds and other funds. In order to do so, compare these 5% hypothetical examples with the 5% hypothetical examples that appear in other funds’ shareholder reports.
Please note that the expenses shown in the table are meant to highlight your ongoing costs only and do not reflect any transactional costs, such as the annual maintenance fee charged to IRA accounts, redemption fees, or exchange fees. Therefore, the second line of the table is useful in comparing ongoing costs only, and will not help you determine the relative total costs of owning different funds. In addition, if these transactional costs were included, your costs would have been higher.
| PARADIGM VALUE FUND | ||||||
| Expenses Paid | ||||||
| Beginning | Ending | During the Period* | ||||
| Account Value | Account Value | January 1, 2020 | ||||
| January 1, 2020 | June 30, 2020 | to June 30, 2020 | ||||
| Actual | $1,000.00 | $835.35 | $ 6.84 | |||
| Hypothetical | $1,000.00 | $1,017.40 | $7.52 | |||
| (5% annual return | ||||||
| before expenses) | ||||||
* Expenses are equal to the Fund’s annualized expense ratio of 1.50%, multiplied by the average
account value over the period, multiplied by 182/366 (to reflect the one-half year period).
| PARADIGM SELECT FUND | ||||||
| Expenses Paid | ||||||
| Beginning | Ending | During the Period* | ||||
| Account Value | Account Value | January 1, 2020 | ||||
| January 1, 2020 | June 30, 2020 | to June 30, 2020 | ||||
| Actual | $1,000.00 | $927.84 | $5.51 | |||
| Hypothetical | $1,000.00 | $1,019.14 | $5.77 | |||
| (5% annual return | ||||||
| before expenses) | ||||||
* Expenses are equal to the Fund’s annualized expense ratio of 1.15%, multiplied by the average
account value over the period, multiplied by 182/366 (to reflect the one-half year period).
2020 Semi-Annual Report 30
| Disclosure of Expenses (Unaudited) - continued | ||||||
| PARADIGM MICRO-CAP FUND | ||||||
| Expenses Paid | ||||||
| Beginning | Ending | During the Period* | ||||
| Account Value | Account Value | January 1, 2020 | ||||
| January 1, 2020 | June 30, 2020 | to June 30, 2020 | ||||
| Actual | $1,000.00 | $957.30 | $6.08 | |||
| Hypothetical | $1,000.00 | $1,018.65 | $6.27 | |||
| (5% annual return | ||||||
| before expenses) | ||||||
* Expenses are equal to the Fund’s annualized expense ratio of 1.25%, multiplied by the average
account value over the period, multiplied by 182/366 (to reflect the one-half year period).
2020 Semi-Annual Report 31
| ADDITIONAL INFORMATION June 30, 2020 |
APPROVAL AND RENEWAL OF INVESTMENT ADVISORY AGREEMENTS
At a meeting of the Board of Trustees held on February 12, 2020 (the “Meeting”) the Board of Trustees (the “Trustees” or the “Board”) considered the continuance of the Management Agreements (the “Agreements” or “Management Agreements”) with Paradigm Funds Advisor LLC (the “Advisor”) for the Paradigm Value Fund (“Value Fund”), the Paradigm Select Fund (“Select Fund”), and the Paradigm Micro-Cap Fund (“Micro-Cap Fund”) (each a “Fund”, or collectively, the “Funds”). Legal counsel reviewed the memorandum provided by Thompson Hine LLP outlining the duties of mutual fund trustees with respect to the renewal of investment advisory contracts, and explained that, in consideration of the continuance of the management agreements, the Board should review information reasonably necessary to evaluate the terms of the contracts and determine whether each was fair to each Fund and its shareholders. He also explained that the Advisor had provided information to the Trustees for evaluation of the continuance of the Agreements.
In renewing the Agreements, the Board of Trustees received materials from the Advisor (the “Report”) addressing the following factors: (i) the investment performance of the Funds and the Advisor; (ii) the nature, extent and quality of the services provided by the Advisor to the Funds; (iii) the cost of the services to be provided and the profits to be realized by the Advisor and its affiliates from the relationship with the Funds; (iv) the extent to which economies of scale will be realized as the Funds grow; and (v) whether the fee levels reflect these economies of scale for the benefit of shareholders.
As to the performance of the Funds, the Report included information regarding the performance of each Fund compared to a group of funds of similar size, style and objective (the “Peer Group”). All performance data was through the period ended December 31, 2019. The Report also included comparative performance information for comparable major indexes, each Fund’s Morningstar category average, and other accounts managed by the Advisor.
The Trustees discussed the outperformance and underperformance in relation to the Peer Group average, the Morningstar category average and the comparative index for certain periods for each Fund, as detailed in the Report. The Trustees discussed with representatives of the Advisor the factors underlying the performance of the Funds over various time periods, noting that the relative performance of each Fund over the various time periods was generally in line or exceeded that of its benchmark index. The Trustees further noted that when considering the performance of the Funds, they took into account the importance of the Advisor’s sector allocations. The Trustees stated that they are confident with the Advisor’s investment management process. The Trustees noted the Advisor’s explanations for the performance of the Funds and concluded, after careful review of the investment process and further discussion with the portfolio managers, that each Fund’s performance was either consistent with performance expectations. The Trustees indicated that they would continue to monitor performance on a going forward basis.
As to the nature, extent and quality of the services provided by the Advisor, the Trustees analyzed the Advisor’s experience and capabilities. They discussed the information provided regarding operational matters such as the Advisor’s research and investment personnel. They also discussed the portfolio managers’ backgrounds and investment management experience. They reviewed the Advisor’s financial information and discussed the firm’s ability to meet its obligations under the Agreements. The Board concluded that the nature and extent of the services provided by the Advisor were consistent with the Board’s expectations, and that the quality of services, particularly those provided by the portfolio managers, was satisfactory. The Trustees also concluded that the Advisor has the resources to provide quality advisory services to the Funds.
As to the costs of the services provided, the Board reviewed the fees received by the Advisor under the Agreements compared to the applicable Peer Group and category average. The Trustees noted that each Fund pays a unitary management fee under which the Advisor provides advisory services and certain administrative and governance functions and pays Fund expenses. The unitary management fee is 1.50% of average daily net assets for the Value Fund and Select Fund, and 1.25% of average daily net assets for the Micro-Cap Fund. As a result, in addition to reviewing the management fees, the Trustees agreed that comparison of each Fund’s expense ratio to the expense ratios of comparable funds was most relevant to the Board deliberations. The Report noted that the Value Fund’s audited expense ratio of 1.50% was found to be higher than the category average of 1.12% and its Peer Group’s average expense ratio of 1.18% but within the range of its Peer Group. The Report indicated that the Select Fund’s audited expense ratio of 1.15% was lower than its Morningstar category average of 1.12% and its Peer Group’s average expense ratio of 1.22% . The Report indicated that the Micro-Cap Fund’s audited expense ratio of 1.25% was lower than its Peer Group’s average expense ratio of 1.41% and higher than
2020 Semi-Annual Report 32
Additional Information (Unaudited) - continued
its Morningstar category average of 1.12% . The Trustees noted that, while the fees may be higher, in some cases, than the peer group averages and/or the Morningstar category averages in each case, they appeared reasonable when compared to the benchmarks’ range of fees. The Board noted that while the Advisor does not manage any other accounts, Paradigm Capital Management, Inc., an affiliate of the Advisor, provides services to hedge funds for which it receives an annual fee of between 0.75% and 1.00% plus a performance fee; institutional accounts for which it receives fees ranging from 0.55% to 1.00%; and separately managed accounts for high net-worth clients for which it receives fees ranging from 0.50% to 1.50% . After a discussion, the Trustees concluded that the management fees paid with respect to the Funds were reasonable. The Board noted that the Advisor has contractually agreed to waive management fees and reimburse expenses to the extent necessary to maintain total annual operating expenses of the Select Fund (excluding brokerage fees and commissions, interest and other borrowing expenses, taxes, extraordinary expenses and the indirect costs of investing in acquired funds) at 1.15% of its average daily net assets through April 30, 2021, thereby benefiting shareholders.
As for the profits realized by the Advisor, the Trustees reviewed a profit and loss analysis prepared by the Advisor that disclosed the direct and indirect expenses paid by the Advisor on behalf of each Fund, the total revenue derived by the Advisor from each Fund and the pre-tax operating margin of each Fund for the calendar year ended December 31, 2019. The Trustees also reviewed a broad industry analysis of mutual fund profitability prepared by an independent third party, which showed the operating margins realized by the Advisor were well within the range reported in the analysis. The Funds’ chief compliance officer noted no Fund securities were traded through the Advisor’s affiliated broker-dealer and that all trades were made on the basis of best price and execution. The Trustees concluded that the Advisor was not excessively profitable from its relationship with any of the Funds.
As for economies of scale, the Trustees discussed and considered information regarding whether economies of scale have been realized with respect to the management of the Funds, whether the Funds have appropriately benefited from any economies of scale, and whether there is potential for realization of any further economies of scale. The Board considered that the Funds’ shareholders had experienced benefits from the fact that the Advisor was obligated to pay certain of the Funds’ operating expenses, which had the effect of limiting the overall fees paid by the Funds. The Board also noted that the Advisor had contractually agreed to waive management fees and reimburse expenses for the Select Fund, thereby benefiting shareholders. The Trustees agreed that, at current asset levels, further fee concessions were not justified.
In considering the continuance of the Management Agreements between the Trust and the Advisor, the disinterested Trustees did not identify any factor as all-important or all-controlling and instead considered these factors collectively in light of each Fund’s surrounding circumstances. Additionally, as part of its deliberations, the Trustees also considered and relied upon the information about the Funds that had been provided to them throughout the year in connection with their regular Board meetings at which they engage in the ongoing oversight of the Funds and their operations. Next, the disinterested Trustees met in executive session to discuss the continuation of the Agreements. The officers of the Trust were excused during this discussion.
Upon the return of the other Meeting participants, the Trustees conveyed their consensus, including the independent Trustees, that renewal of the Management Agreements was in the best interests of each Fund and its shareholders.
AVAILABILITY OF QUARTERLY SCHEDULE OF INVESTMENTS
(Unaudited)
The Funds file their complete schedules of portfolio holdings with the Securities and Exchange Commission (“SEC”) for the first and third quarters of each fiscal year on Form N-PORT. The Funds’ Forms N-PORT are available on the SEC’s website at http://www.sec.gov.
PROXY VOTING GUIDELINES
(Unaudited)
Paradigm Funds Advisor LLC, the Funds’ Advisor, is responsible for exercising the voting rights associated with the securities held by the Funds. A description of the policies and procedures used by the Advisor in fulfilling this responsibility is available without charge on the Funds’ website at www.paradigm-funds.com. It is also included in the Funds’ Statement of Additional Information, which is available on the SEC’s website at http://www.sec.gov.
Information regarding how the Funds voted proxies, Form N-PX, relating to portfolio securities during the
2020 Semi-Annual Report 33
Additional Information (Unaudited) - continued
most recent 12-month period ended June 30 is available without charge, upon request, by calling our toll free number(1-800-239-0732). This information is also available on the SEC’s website at http://www.sec.gov.
ADDITIONAL INFORMATION
You will find more information about the Funds at www.paradigm-funds.com. For shareholder inquiries, please call toll-free in the U.S. at 1-800-239-0732.
2020 Semi-Annual Report 34
|
Board of Trustees
|
|
This report is provided for the general information of the shareholders of the Paradigm
|
Item 2. Code of Ethics. Not applicable.
Item 3. Audit Committee Financial Expert. Not applicable.
Item 4. Principal Accountant Fees and Services. Not applicable.
Item 5. Audit Committee of Listed Companies. Not applicable.
Item 6. Investments.
(a) Not applicable. Schedule filed with Item 1.
(b) Not applicable.
Item 7. Disclosure of Proxy Voting Policies and Procedures for Closed-End Management Investment Companies. Not applicable.
Item 8. Portfolio Managers of Closed End Management Investment Companies. Not applicable.
Item 9. Purchases of Equity Securities by Closed-End Management Investment Companies and Affiliated Purchasers. Not applicable.
Item 10. Submission of Matters to a Vote of Security Holders.
The registrant has not adopted procedures by which shareholders may recommend nominees to the registrant’s board of trustees.
Item 11. Controls and Procedures.
(a) The Registrant’s president and chief financial officer concluded that the disclosure controls and procedures (as defined in Rule 30a-3(c) under the Act (17 CFR 270.30a -3(c))) as of a date within 90 days of the filing date of the report that includes the disclosure required by this paragraph, based on the evaluation of these controls and procedures required by Rule 30a-3(b) under the Act (17 CFR 270.30a -3(b)) and Rules 13a-15(b) or 15d-15(b) under the Exchange Act (17 CFR 240.13a -15(b) or 240.15d -15(b)).
(b) There were no changes in the registrant’s internal control over financial reporting (as defined in Rule 30a-3(d) under the Act (17 CFR 270.30a -3(d)) that occurred during the period covered by this report that has materially affected, or is reasonably likely to materially affect, the registrant’s internal control over financial reporting.
Item 12. Disclosure of Securities Lending Activities for Closed-End Management Investment Companies.
Not applicable.
Item 13. Exhibits.
(a)(1) Code of Ethics. Not applicable.
(a)(2) Certifications pursuant to Section 302 of the Sarbanes-Oxley Act of 2002. Filed herewith.
(a)(3) Not applicable.
(a)(4) Not applicable.
(b) Certification pursuant to Section 906 of the Sarbanes-Oxley Act of 2002. Filed herewith.
| SIGNATURES |
Pursuant to the requirements of the Securities Exchange Act of 1934 and the Investment Company Act of 1940, the registrant has duly caused this report to be signed on its behalf by the undersigned, thereunto duly authorized.
| Paradigm Funds |
| By: /s/ Candace King Weir Candace King Weir President |
| Date: 8-19-2020 |
Pursuant to the requirements of the Securities Exchange Act of 1934 and the Investment Company Act of 1940, this report has been signed below by the following persons on behalf of the registrant and in the capacities and on the dates indicated.
| By: /s/ Candace King Weir Candace King Weir President |
| Date: 8-19-2020 |
|
By: /s/ Robert A. Benton |
| Date: 8/19/2020 |