PIMCO CLOSED-END FUNDS
Semiannual Report
June 30, 2024
PIMCO California Municipal Income Fund | PCQ | NYSE
PIMCO California Municipal Income Fund II | PCK | NYSE
PIMCO California Municipal Income Fund III | PZC | NYSE
PIMCO New York Municipal Income Fund | PNF | NYSE
PIMCO New York Municipal Income Fund II | PNI | NYSE
PIMCO New York Municipal Income Fund III | PYN | NYSE
PIMCO Municipal Income Fund | PMF | NYSE
PIMCO Municipal Income Fund II | PML | NYSE
PIMCO Municipal Income Fund III | PMX | NYSE
Table of Contents
| Page | ||||||||
| 2 | ||||||||
| 15 | ||||||||
| 16 | ||||||||
| 22 | ||||||||
| 23 | ||||||||
| 24 | ||||||||
| 25 | ||||||||
| 26 | ||||||||
| 28 | ||||||||
| 29 | ||||||||
| 30 | ||||||||
| 71 | ||||||||
| 96 | ||||||||
| 97 | ||||||||
| 99 | ||||||||
| 100 | ||||||||
| Fund | Fund Summary |
Schedule of Investments |
||||||
| 6 | 31 | |||||||
| 7 | 35 | |||||||
| 8 | 39 | |||||||
| 9 | 43 | |||||||
| 10 | 46 | |||||||
| 11 | 49 | |||||||
| 12 | 52 | |||||||
| 13 | 58 | |||||||
| 14 | 65 | |||||||
(1) |
Consolidated Schedule of Investments |
Important Information About the Funds |
We believe that bond funds have an important role to play in a well-diversified investment portfolio. It is important to note, however, that in an environment where interest rates may trend upward, rising rates would negatively impact the performance of most bond funds, and fixed-income securities and other instruments held by a Fund are likely to decrease in value. A wide variety of factors can cause interest rates or yields of U.S. Treasury securities (or yields of other types of bonds) to rise (e.g., central bank monetary policies, inflation rates, general economic conditions, etc.). In addition, changes in interest rates can be sudden and unpredictable, and there is no guarantee that Fund management will anticipate such movement accurately. A Fund may lose money as a result of movements in interest rates.
As of the date of this report, interest rates in the United States and many parts of the world, including certain European countries, remain elevated from historical levels and, for certain countries, remain high. In efforts to combat inflation, the U.S. Federal Reserve (the “Fed”) raised interest rates multiple times in 2022 and 2023. In the second half of 2023 and the beginning of 2024, however, the Fed paused the rate hikes, keeping interest rates steady. It is uncertain whether rates will remain steady, increase or decrease in the future. As such, the Funds may face a heightened level of risk associated with rising interest rates and/or bond yields. This could be driven by a variety of factors, including but not limited to central bank monetary policies, changing inflation or real growth rates, general economic conditions, increasing bond issuances or reduced market demand for low yielding investments. Further, while bond markets have steadily grown over the past three decades, dealer inventories of corporate bonds are near historic lows in relation to market size. As a result, there has been a significant reduction in the ability of dealers to “make markets.”
Bond funds and individual bonds with a longer duration (a measure used to determine the sensitivity of a security’s price to changes in interest rates) tend to be more sensitive to changes in interest rates, usually making them more volatile than securities or funds with shorter durations. All of the factors mentioned above, individually or collectively, could lead to increased volatility and/or lower liquidity in the fixed income markets, or negatively impact a Fund’s performance or cause a Fund to incur losses.
Investing in the municipal bond market involves the risks of investing in debt securities generally and certain other risks. The amount of public information available about the municipal bonds in which a Fund may invest is generally less than that for corporate equities or bonds, and the investment performance of a Fund’s investment in municipal bonds may therefore be more dependent on the analytical abilities of Pacific Investment Management Company LLC (“PIMCO”) than its investments in taxable bonds. The secondary market for municipal bonds also tends to be less well-developed or liquid than many other securities markets, which may adversely affect a Fund’s ability to sell its bonds at attractive prices.
The ability of municipal issuers to make timely payments of interest and principal may be diminished during general economic downturns, by litigation, legislation or political events, or by the bankruptcy of the issuer. Issuers of municipal securities also might seek protection under the bankruptcy laws. In the event of bankruptcy of such an issuer, a Fund could experience delays in collecting principal and interest and the Fund may not, in all circumstances, be able to collect all principal and interest to which it is entitled.
A Fund that has substantial exposures to California municipal bonds may be affected significantly by economic, regulatory or political developments affecting the ability of California issuers to pay interest or repay principal. Certain issuers of California municipal bonds have experienced serious financial difficulties in the past and reoccurrence of these difficulties may impair the ability of certain California issuers to pay principal or interest on their obligations. Provisions of the California Constitution and State statutes that limit the taxing and spending authority of California governmental entities may impair the ability of California issuers to pay principal and/or interest on their obligations. While California’s economy is broad, it does have major concentrations in advanced technology, aerospace and defense-related manufacturing, trade, entertainment, real estate and financial services, and may be sensitive to economic problems affecting those industries. Future California political and economic developments, constitutional amendments, legislative measures, executive orders, administrative regulations, litigation and voter initiatives could have an adverse effect on the debt obligations of California issuers.
A Fund that has substantial exposures to New York municipal bonds may be affected significantly by economic, regulatory or political developments affecting the ability of New York issuers to pay interest or repay principal. While New York’s economy is broad, it does have concentrations in the financial services industry, and may be sensitive to economic problems affecting that industry. Certain issuers of New York municipal bonds have experienced serious financial difficulties in the past and reoccurrence of these difficulties may impair the ability of certain New York issuers to pay principal or interest on their obligations. The financial health of New York City affects that of the State, and when New York City experiences financial difficulty, it may have an adverse effect on New York municipal bonds held by a Fund. The growth rate of New York has at times been somewhat slower than the nation overall. The economic and financial condition of New York also may be affected by various financial, social, economic and political factors.
Classifications of the Funds’ portfolio holdings in this report are made according to financial reporting standards. The classification of a particular portfolio holding as shown in the Allocation Breakdown and Schedule of Investments or Consolidated Schedule of Investments, as applicable, and other sections of this report may differ from the classification used for the Funds’ compliance calculations, including those used in the Funds’ then-current prospectus, investment
2 |
PIMCO CLOSED-END FUNDS |
objectives, regulatory, and other investment limitations and policies, which may be based on different asset class, sector or geographical classifications. Each Fund is separately monitored for compliance with respect to investment parameters and regulatory requirements.
The geographical classification of foreign (non-U.S.) securities in this report, if any, are classified by the country of incorporation of a holding. In certain instances, a security’s country of incorporation may be different from its country of economic exposure.
In February 2022, Russia launched an invasion of Ukraine. As a result, Russia and other countries, persons and entities that provided material aid to Russia’s aggression against Ukraine, have been the subject of economic sanctions and import and export controls imposed by countries throughout the world, including the United States. Such measures have had and may continue to have an adverse effect on the Russian, Belarusian and other securities and economies, which may, in turn, negatively impact a Fund. The extent, duration and impact of Russia’s military action in Ukraine, related sanctions and retaliatory actions are difficult to ascertain, but could be significant and have severe adverse effects on the region, including significant adverse effects on the regional, European and global economies and the markets for certain securities and commodities, such as oil and natural gas, as well as other sectors. Further, a Fund may have investments in securities and instruments that are economically tied to the region and may have been negatively impacted by the sanctions and counter-sanctions by Russia, including declines in value and reductions in liquidity. The sanctions may cause a Fund to sell portfolio holdings at a disadvantageous time or price or to continue to hold investments that a Fund may no longer seek to hold. PIMCO will continue to actively manage these positions in the best interests of a Fund and its shareholders.
The Funds may invest in certain instruments that rely in some fashion upon the London Interbank Offered Rate (“LIBOR”). LIBOR was traditionally an average interest rate, determined by the ICE Benchmark Administration, that banks charge one another for the use of short-term money. The United Kingdom’s Financial Conduct Authority, which regulates LIBOR, has announced plans to ultimately phase out the use of LIBOR. Although the transition process away from LIBOR for many instruments has been completed, some LIBOR use is continuing and there are potential effects related to the transition away from LIBOR or continued use of LIBOR on a Fund, or on certain instruments in which a Fund invests, which can be difficult to ascertain, and may vary depending on factors that include, but are not limited to: (i) existing fallback or termination provisions in individual contracts and (ii) whether, how, and when industry participants adopt new reference rates for affected instruments. The transition of investments from LIBOR to a replacement rate as a result of amendment, application of existing fallbacks, statutory requirements or otherwise may also result in a reduction in the value of certain instruments held by a Fund or a reduction in the effectiveness of related Fund transactions such as hedges. In addition, an instrument’s transition to a replacement rate
could result in variations in the reported yields of a Fund that holds such instrument. Any such effects of the transition away from LIBOR, as well as other unforeseen effects, could result in losses to a Fund.
The common shares of the Funds trade on the New York Stock Exchange. As with any stock, the price of a Fund’s common shares will fluctuate with market conditions and other factors. If you sell your common shares of a Fund, the price received may be more or less than your original investment.
Shares of closed-end investment management companies, such as the Funds, frequently trade at a discount from their net asset value (“NAV”) and may trade at a price that is less than the initial offering price and/or the NAV of such shares. Further, if a Fund’s shares trade at a price that is more than the initial offering price and/or the NAV of such shares, including at a substantial premium and/or for an extended period of time, there is no assurance that any such premium will be sustained for any period of time and will not decrease, or that the shares will not trade at a discount to NAV thereafter.
U.S. and global markets have experienced ongoing volatility, including as a result of the failures in March and April 2023 of certain U.S. and non-U.S. banks in 2023, which could be harmful to the Funds and issuers in which they invest. For example, if a bank at which a Fund or issuer has an account fails, any cash or other assets in bank or custody accounts, which may be substantial in size, could be temporarily inaccessible or permanently lost by the Fund or issuer. If a bank that provides a subscription line credit facility, asset-based facility, other credit facility and/or other services to an issuer or a fund fails, the issuer or fund could be unable to draw funds under its credit facilities or obtain replacement credit facilities or other services from other lending institutions with similar terms.
Issuers in which a Fund may invest can be affected by volatility in the banking sector. Even if banks used by issuers in which the Funds invest remain solvent, volatility in the banking sector could contribute to, cause or intensify an economic recession, increase the costs of capital and banking services or result in the issuers being unable to obtain or refinance indebtedness at all or on as favorable terms as could otherwise have been obtained. Potential impacts to funds and issuers resulting from changes in the banking sector, market conditions and potential legislative or regulatory responses are uncertain. Such conditions and responses, as well as a changing interest rate environment, can contribute to decreased market liquidity and erode the value of certain holdings, including those of U.S. and non-U.S. banks. Continued market volatility and uncertainty and/or a downturn in market and economic and financial conditions, as a result of developments in the banking sector or otherwise (including as a result of delayed access to cash or credit facilities), could have an adverse impact on the Funds and issuers in which they invest.
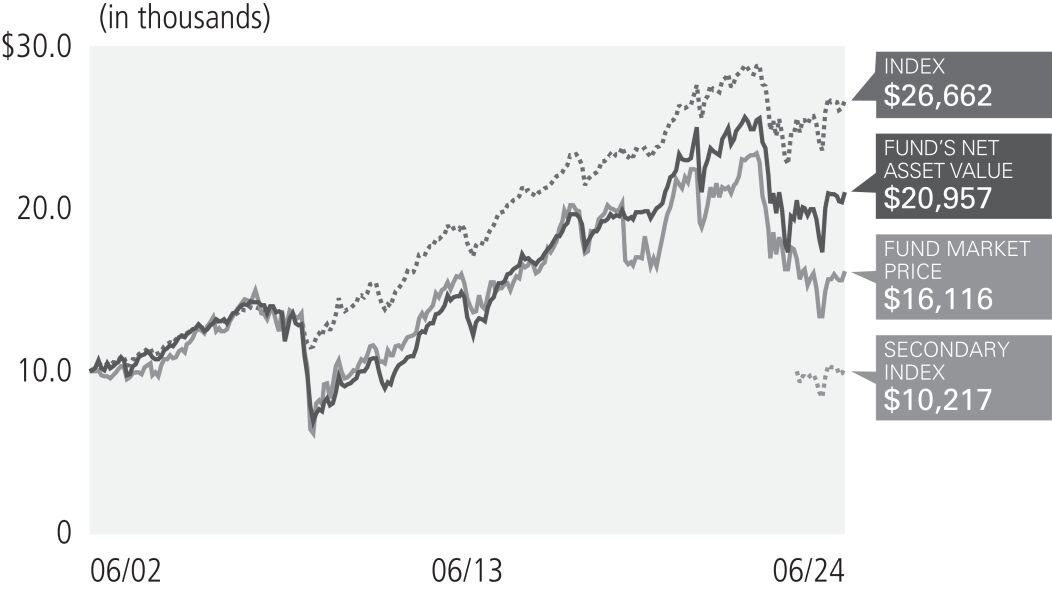
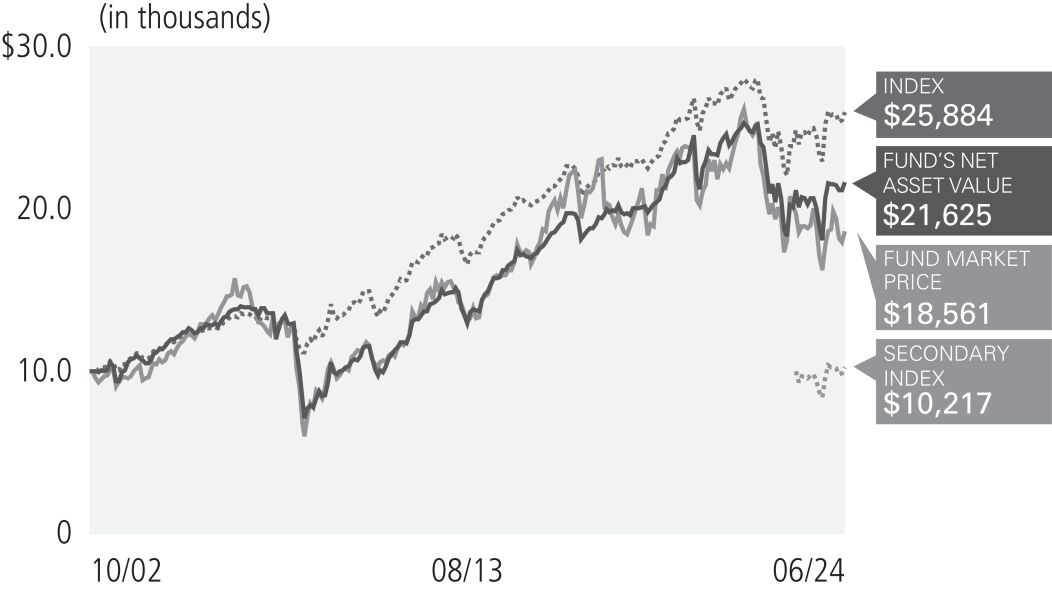
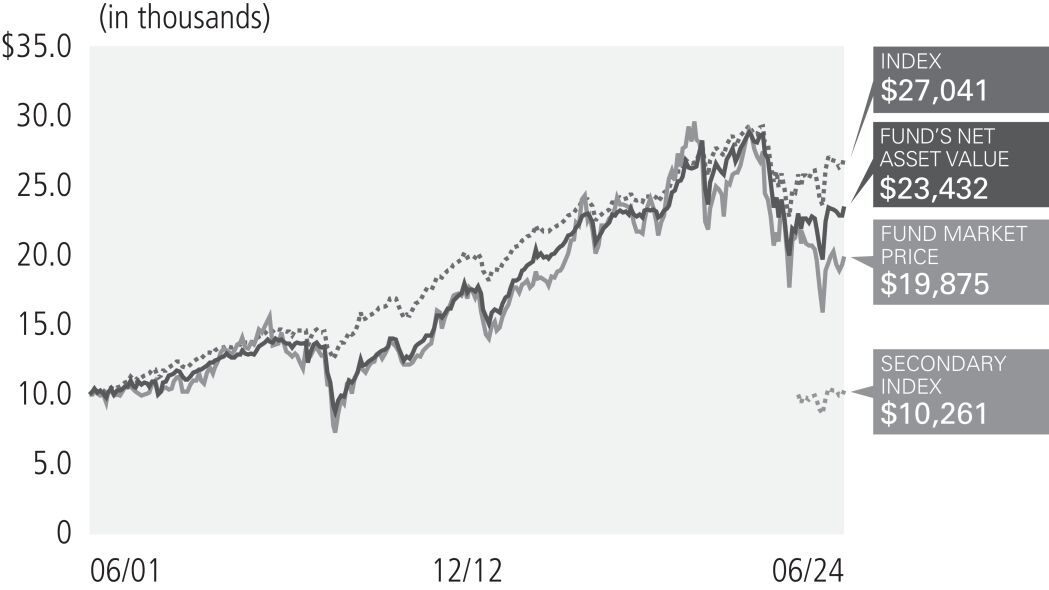
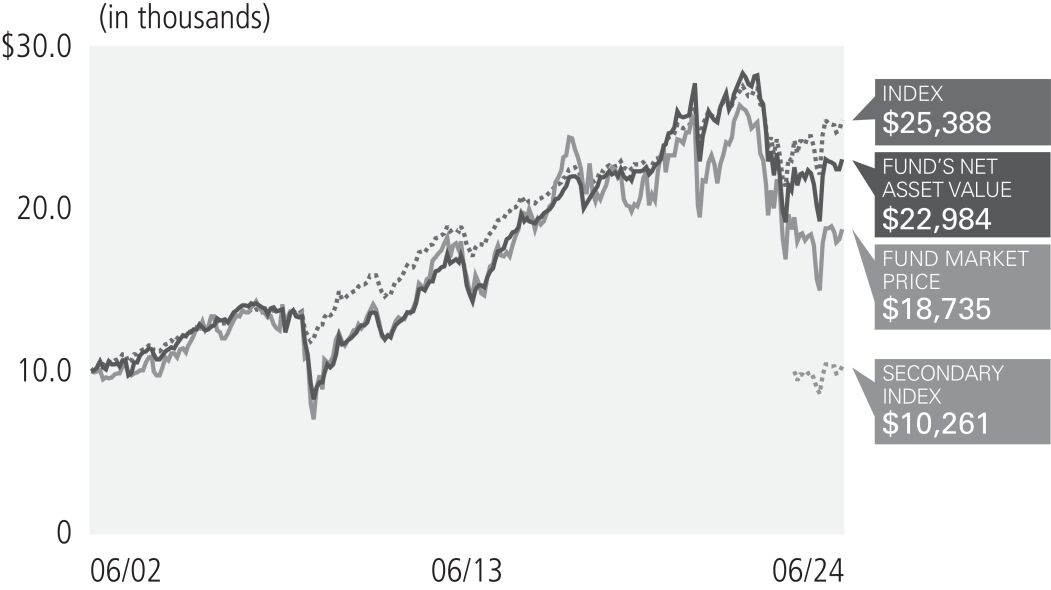
On each Fund Summary page in this Shareholder Report, the Average Annual Total Return table and Cumulative Returns chart measure performance assuming that any dividend and capital gain distributions
SEMIANNUAL REPORT |
| | JUNE 30, 2024 | 3 |
Important Information About the Funds |
(Cont.) |
were reinvested. Total return is calculated by determining the percentage change in NAV or market price (as applicable) in the specified period. Returns do not reflect the deduction of taxes that a shareholder would pay on Fund distributions. Total return for a period of more than one year represents the average annual total return. Performance at market price will differ from results at NAV. Although market price returns tend to reflect investment results over time, during shorter periods returns at market price can also be influenced by factors such as changing views about a Fund, market conditions, supply and demand for the Fund’s shares, or changes in the Fund’s dividends. Performance shown is net of fees and expenses. Historical NAV performance for a Fund may have been positively impacted by fee waivers or expense limitations in place during some or all of the periods shown, if applicable. Future performance (including total return or yield) and distributions may be negatively impacted by the expiration or reduction of any such fee waivers or expense limitations.
The dividend rate that a Fund pays on its common shares may vary as portfolio and market conditions change, and will depend on a number of factors, including without limit the amount of a Fund’s undistributed net investment income and net short- and long-term capital gains, as well as the costs of any leverage obtained by a Fund. As portfolio and market conditions change, the rate of distributions on the common shares and a Fund’s dividend policy could change. There can be no assurance that a change in market conditions or other factors will not result in a change in a Fund’s distribution rate or that the rate will be sustainable in the future.
The following table discloses the inception date and diversification status of each Fund:
Fund Name |
Inception Date |
Diversification Status | ||||||||
PIMCO Municipal Income Fund |
06/29/01 |
Diversified | ||||||||
PIMCO Municipal Income Fund II |
06/28/02 |
Diversified | ||||||||
PIMCO Municipal Income Fund III |
10/31/02 |
Diversified | ||||||||
PIMCO California Municipal Income Fund |
06/29/01 |
Diversified | ||||||||
PIMCO California Municipal Income Fund II |
06/28/02 |
Diversified | ||||||||
PIMCO California Municipal Income Fund III |
10/31/02 |
Diversified | ||||||||
PIMCO New York Municipal Income Fund |
06/29/01 |
Non-diversified | ||||||||
PIMCO New York Municipal Income Fund II |
06/28/02 |
Diversified | ||||||||
PIMCO New York Municipal Income Fund III |
10/31/02 |
Non-diversified | ||||||||
An investment in a Fund is not a bank deposit and is not guaranteed or insured by the Federal Deposit Insurance Corporation or any other government agency. It is possible to lose money on investments in a Fund.
The Trustees are responsible generally for overseeing the management of the Funds. The Trustees authorize the Funds to enter into service agreements with PIMCO and other service providers in order to provide, and in some cases authorize service providers to procure through other parties, necessary or desirable services on behalf of the
Funds. Shareholders are not parties to or third-party beneficiaries of such service agreements. Neither a Fund’s prospectus or Statement of Additional Information (“SAI”), any press release or shareholder report, any contracts filed as exhibits to a Fund’s registration statement, nor any other communications, disclosure documents or regulatory filings (including this report) from or on behalf of a Fund creates a contract between or among any shareholders of a Fund, on the one hand, and the Fund, a service provider to the Fund, and/or the Trustees or officers of the Fund, on the other hand. The Trustees (or the Funds and their officers, service providers or other delegates acting under authority of the Trustees) may amend its most recent prospectus or use a new prospectus or SAI with respect to a Fund, adopt and disclose new or amended policies and other changes in press releases and shareholder reports and/or amend, file and/or issue any other communications, disclosure documents or regulatory filings, and may amend or enter into any contracts to which a Fund is a party, and interpret the investment objective(s), policies, restrictions and contractual provisions applicable to any Fund, without shareholder input or approval, except in circumstances in which shareholder approval is specifically required by law (such as changes to fundamental investment policies) or where a shareholder approval requirement was specifically disclosed in a Fund’s then-current prospectus, SAI or shareholder report and is otherwise still in effect.
PIMCO has adopted written proxy voting policies and procedures (“Proxy Policy”) as required by Rule
206(4)-6
under the Investment Advisers Act of 1940, as amended. The Proxy Policy has been adopted by the Funds as the policies and procedures that PIMCO will use when voting proxies on behalf of the Funds. A description of the policies and procedures that PIMCO uses to vote proxies relating to portfolio securities of each Fund, and information about how each Fund voted proxies relating to portfolio securities held during the most recent twelve-month period ended June 30, are available without charge, upon request, by calling the Funds at (844) 33-PIMCO, on the Funds’ website at www.pimco.com, and on the Securities and Exchange Commission’s (“SEC”) website at www.sec.gov. The Funds file their complete schedules of portfolio holdings with the SEC for the first and third quarters of each fiscal year as an exhibit to their reports on Form N-PORT. The Funds’ Form N-PORT reports are available to the public on the SEC’s website at www.sec.gov and on PIMCO’s website at www.pimco.com, and upon request by calling PIMCO at (844) 33-PIMCO.
SEC rules allow the Funds to fulfill their obligation to deliver shareholder reports to investors by providing access to such reports online free of charge and by mailing a notice that the report is electronically available. Investors may elect to receive all future reports in paper free of charge by contacting their financial intermediary or, if invested directly with a Fund, investors can inform the Fund by calling (844) 33-PIMCO. Any election to receive reports in paper will apply to all funds held with the fund complex if invested directly with a Fund or to all funds held in the investor’s account if invested through a financial intermediary.
4 |
PIMCO CLOSED-END FUNDS |
In October 2022, the SEC adopted changes to the mutual fund and exchange-traded fund (“ETF”) shareholder report and registration statement disclosure requirements and the registered fund advertising rules, which impact the disclosures provided to shareholders. The rule amendments addressing fee and expense information in advertisements that might be materially misleading, which impact the Funds, were effective January 24, 2023.
In September 2023, the SEC adopted amendments to a current rule governing fund naming conventions. In general, the current rule requires funds with certain types of names to adopt a policy to invest at least 80% of their assets in the type of investment suggested by the name. The amendments expand the scope of the current rule in a number of ways that are expected to result in an increase in the types of fund names that would require the fund to adopt an 80% investment policy under the rule. Additionally, the amendments address deviations from a fund’s 80% investment policy and the use and valuation of derivatives instruments for purposes of the rule. The amendments were effective as of December 11, 2023, but the SEC is providing a 24-month compliance period following the effective date for fund groups with net assets of $1 billion or more (and a 30-month compliance period for fund groups with net assets of less than $1 billion).
SEMIANNUAL REPORT |
| | JUNE 30, 2024 | 5 |
PIMCO California Municipal Income Fund
Symbol on NYSE - PCQ |
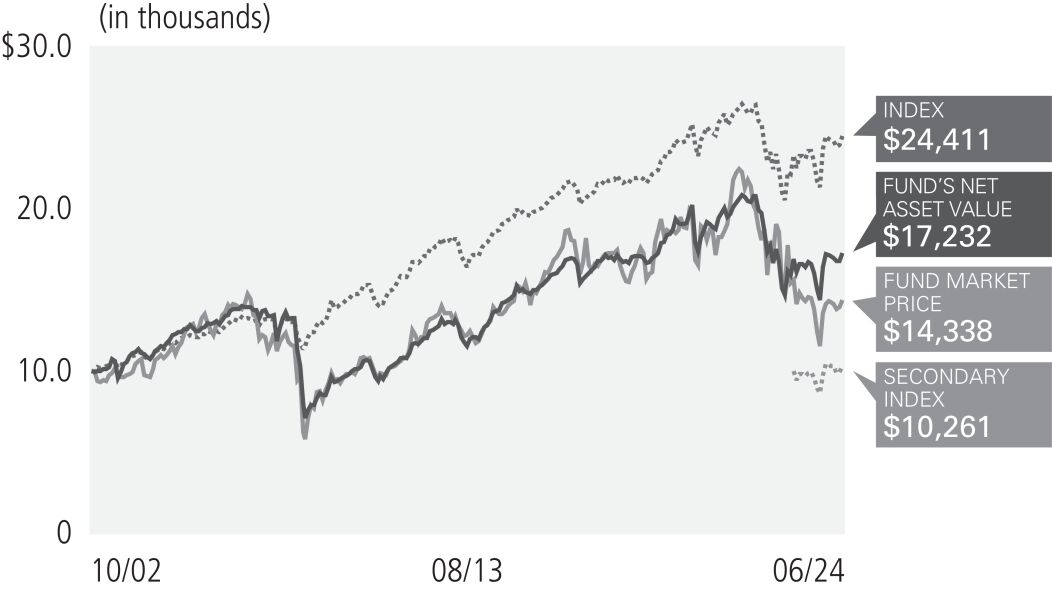
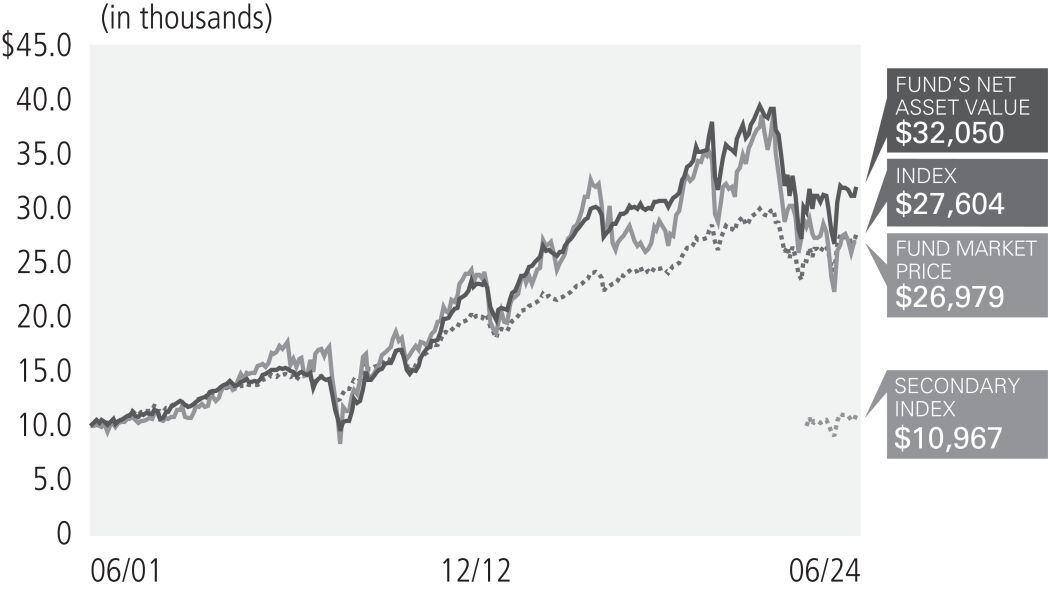
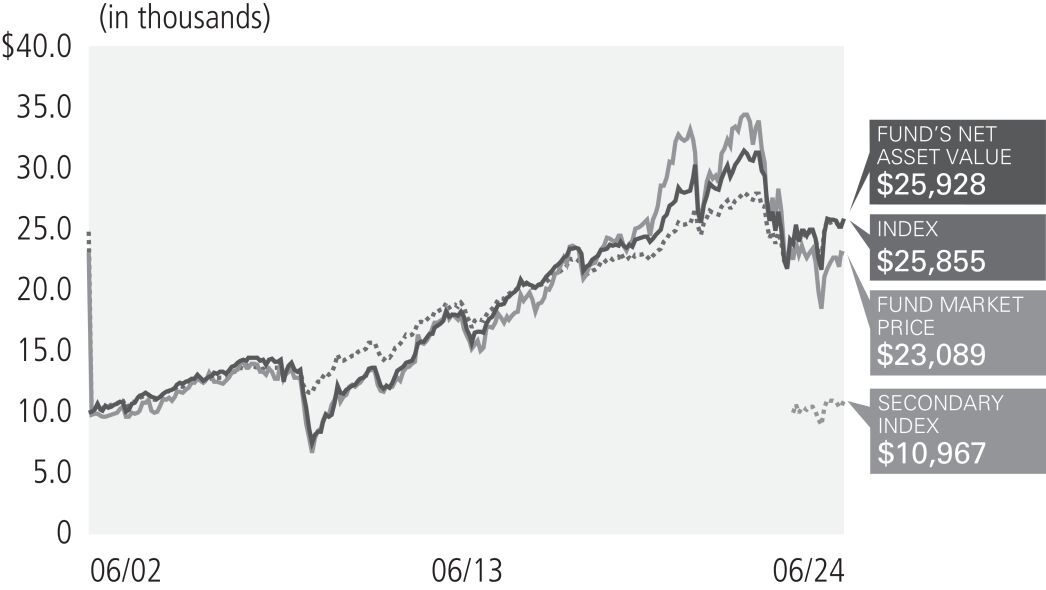
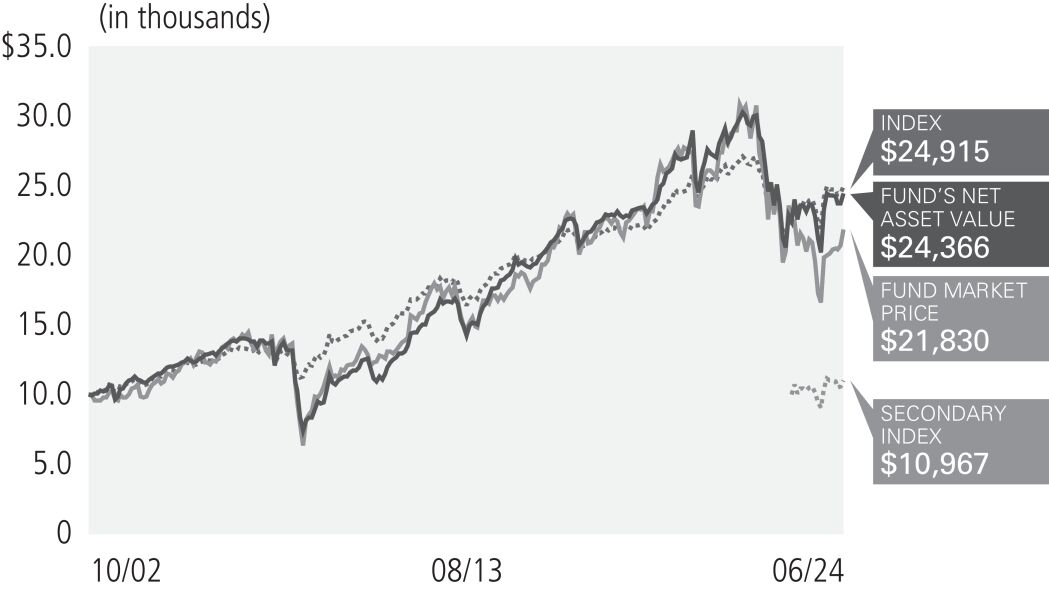
Cumulative Returns Through June 30, 2024
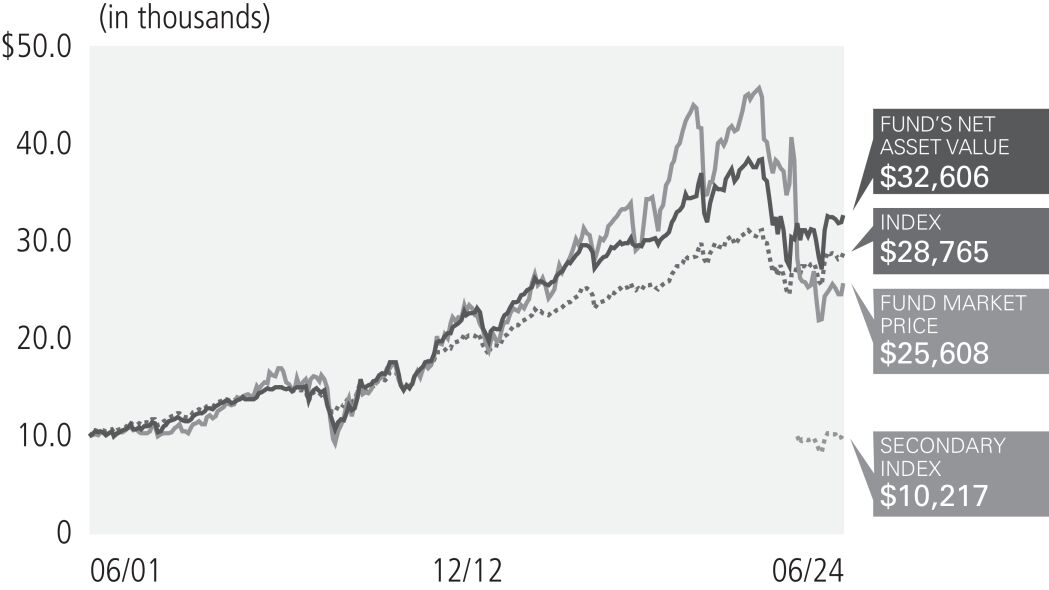
$10,000 invested at the end of the month when the Fund commenced operations.
Allocation Breakdown
as of June 30, 2024
†
§ Municipal Bonds & Notes |
||||
Ad Valorem Property Tax |
29.0% |
|||
Health, Hospital & Nursing Home Revenue |
12.2% |
|||
Local or Guaranteed Housing |
9.4% |
|||
College & University Revenue |
7.5% |
|||
Lease (Abatement) |
5.4% |
|||
Port, Airport & Marina Revenue |
4.9% |
|||
General Fund |
4.4% |
|||
Tobacco Settlement Funded |
4.3% |
|||
Natural Gas Revenue |
4.2% |
|||
Sales Tax Revenue |
3.8% |
|||
Special Tax |
2.3% |
|||
Electric Power & Light Revenue |
2.3% |
|||
Highway Revenue Tolls |
2.2% |
|||
Sewer Revenue |
2.1% |
|||
Water Revenue |
1.4% |
|||
Lease (Non-Terminable) |
1.2% |
|||
Other |
2.3% |
|||
U.S. Government Agencies |
1.1% |
|||
† |
% of Investments, at value. |
§ |
Allocation Breakdown and % of investments exclude securities sold short and financial derivative instruments, if any. |
Fund Information
as of June 30, 2024
(1)
Market Price |
$9.42 |
|||
NAV |
$10.48 |
|||
Premium/(Discount) to NAV |
(10.11)% |
|||
Market Price Distribution Rate (2) |
4.59% |
|||
NAV Distribution Rate (2) |
4.12% |
|||
Total Effective Leverage (3) |
40.79% |
|||