
UNITED STATES
SECURITIES AND EXCHANGE COMMISSION
Washington, D.C. 20549
FORM
(Mark One)
|
|
ANNUAL REPORT PURSUANT TO SECTION 13 OR 15(d) OF THE SECURITIES EXCHANGE ACT OF 1934 |
For the fiscal year ended
OR
|
|
TRANSITION REPORT PURSUANT TO SECTION 13 OR 15(d) OF THE SECURITIES EXCHANGE ACT OF 1934 |
For the transition period from to
Commission File Number:
(Exact name of registrant as specified in its charter)
|
|
|
|
|
(State or other jurisdiction of incorporation or organization) |
|
(IRS Employer Identification No.) |
|
|
|
|
|
|
|
|
|
(Address of principal executive offices) |
|
(Zip Code) |
(
(Registrant’s telephone number, including area code)
Securities registered pursuant to Section 12(b) of the Act:
|
Title of each class |
Trading Symbol(s) |
Name of each exchange on which registered |
|
|
|
|
Securities registered pursuant to Section 12(g) of the Act: None
Indicate by check mark if the registrant is a well-known seasoned issuer, as defined in Rule 405 of the Securities Act.
Indicate by check mark if the registrant is not required to file reports pursuant to Section 13 or Section 15(d) of the Act. Yes ☐
Indicate by check mark whether the registrant (1) has filed all reports required to be filed by Section 13 or 15(d) of the Securities Exchange Act of 1934 during the preceding 12 months (or for such shorter period that the registrant was required to file such reports), and (2) has been subject to such filing requirements for the past 90 days.
Indicate by check mark whether the registrant has submitted electronically every Interactive Data File required to be submitted pursuant to Rule 405 of Regulation S-T (§232.405 of this chapter) during the preceding 12 months (or for such shorter period that the registrant was required to submit such files).
Indicate by check mark whether the registrant is a large accelerated filer, an accelerated filer, a non-accelerated filer, a smaller reporting company, or an emerging growth company. See the definitions of “large accelerated filer,” “accelerated filer,” “smaller reporting company” and "emerging growth company" in Rule 12b-2 of the Exchange Act.
|
|
Accelerated filer ☐ |
Non-accelerated filer ☐ |
Smaller reporting company |
Emerging growth company |
If an emerging growth company, indicate by check mark if the registrant has elected not to use the extended transition period for complying with any new or revised financial accounting standards provided pursuant to Section 13(a) of the Exchange Act. ☐
Indicate by check mark whether the registrant has filed a report on and attestation to its management’s assessment of the effectiveness of its internal control over financial reporting under Section 404(b) of the Sarbanes-Oxley Act (15 U.S.C. 7262(b)) by the registered public accounting firm that prepared or issued its audit report.
Indicate by check mark whether the registrant is a shell company (as defined in Rule 12b-2 of the Exchange Act). Yes
The aggregate market value of Common Stock held by non-affiliates of the registrant (based upon the closing sale price on the New York Stock Exchange as of May 31, 2021, the last business day of the registrant’s most recently completed second fiscal quarter) was $
As of January 21, 2022, there were
DOCUMENTS INCORPORATED BY REFERENCE
TD SYNNEX CORPORATION
TABLE OF CONTENTS
2021 FORM 10-K
|
|
|
|
|
Page |
|
|
|
|
3 |
|
|
Item 1. |
|
|
4 |
|
|
Item 1A. |
|
|
10 |
|
|
Item 1B. |
|
|
24 |
|
|
Item 2. |
|
|
24 |
|
|
Item 3. |
|
|
24 |
|
|
Item 4. |
|
|
25 |
|
|
|
|
|
|
|
|
|
|
|
27 |
|
|
Item 5. |
|
|
27 |
|
|
Item 6. |
|
|
29 |
|
|
Item 7. |
|
Management’s Discussion and Analysis of Financial Condition and Results of Operations |
|
30 |
|
Item 7A. |
|
|
46 |
|
|
Item 8. |
|
|
47 |
|
|
Item 9. |
|
Changes in and Disagreements with Accountants on Accounting and Financial Disclosure |
|
89 |
|
Item 9A. |
|
|
89 |
|
|
Item 9B. |
|
|
89 |
|
|
Item 9C. |
|
Disclosure Regarding Foreign Jurisdictions that Prevent Inspections |
|
89 |
|
|
|
|
|
|
|
|
|
|
90 |
|
|
Item 10. |
|
|
90 |
|
|
Item 11. |
|
|
90 |
|
|
Item 12. |
|
Security Ownership of Certain Beneficial Owners and Management and Related Stockholder Matters |
|
90 |
|
Item 13. |
|
Certain Relationships and Related Transactions, and Director Independence |
|
91 |
|
Item 14. |
|
|
91 |
|
|
|
|
|
|
|
|
|
|
|
92 |
|
|
Item 15. |
|
|
92 |
|
|
Item 16. |
|
|
96 |
2
PART I
When used in this Annual Report on Form 10-K (this “Report”), the words “anticipates,” “believes,” “estimates,” “expects,” “intends,” “allows,” “can,” “may,” “could,’’ “designed,” “will,” and similar expressions are intended to identify forward-looking statements. These are statements that relate to future periods and include statements about market trends, our business model and our services, our business and market strategy, future growth, including expansion of our product and service lines, our infrastructure, our investment in our information technology, or IT, systems, our employee hiring and retention, the ownership interest of MiTAC Holdings Corporation, or MiTAC Holdings, in us and its impact, the ownership interest of Apollo Global Management, Inc., or Apollo, in us and its impact, the impact of the Merger, our integration plans, our revenue, sources of revenue, our gross margins, our operating costs and results, timing of payment, the value of our inventory, our competition, including with Synnex Technology International Corp., our future needs for additional financing, the likely sources for such funding and the impact of such funding, concentration of customers and suppliers, customer and supplier contract terms, customer forecasts and its impact on us, relationships with our suppliers, adequacy of our facilities, ability to obtain comparable leases, ability to manage and communicate with international resources, ability to meet demand, managing inventory and our shipping costs, our legal proceedings, our operations and trends related thereto, our international operations, foreign currency exchange rates and hedging activities, expansion of our operations and related effects, our strategic acquisitions including anticipated cost savings and other benefits, divestitures of businesses and assets, revenue, cost of revenue and gross margin, our goodwill, seasonality of sales, changes in share price, adequacy of our cash resources to meet our capital needs, our debt and financing arrangements, including the impact of any change to our credit rating, interest rate risk and impact thereof, cash held by our international subsidiaries and repatriation, changes in fair value of derivative instruments, our tax liabilities, adequacy of our disclosure controls and procedures, dependency on personnel, pricing pressures, cybersecurity and compliance with related rules and regulations, impact of rules and regulations affecting public companies, the replacement of LIBOR, impact of our pricing policies, impact of economic and industry trends, changes to the markets in which we compete, impact of our accounting policies and recently issued accounting pronouncements, our estimates and assumptions, impact of inventory repurchase obligations and commitments and contingencies, our effective tax rates, impact of any impairment of our goodwill and intangible assets, our share repurchase and dividend program, our securitization programs, term loans and revolving credit lines, our investments in working capital, personnel, our succession planning and various environmental, social and governance initiatives and attention. Forward-looking statements are subject to risks and uncertainties that could cause actual results to differ materially from those projected. These risks and uncertainties include, but are not limited to, those risks discussed herein and risks related to the risk that the legacy SYNNEX and legacy Tech Data businesses will not be integrated successfully or realize the anticipated benefits of the combined company, the COVID-19 global pandemic, the ability to retain key personnel, the seasonality of the buying patterns of our customers, concentration of sales to large customers, the loss or consolidation of one or more of our significant original equipment manufacturer, or OEM, suppliers or customers, market acceptance and product life of the products we assemble and distribute, competitive conditions in our industry and their impact on our margins, pricing and other terms with our OEM suppliers, our ability to gain market share, variations in supplier-sponsored programs, changes in our costs and operating expenses, dependence upon and trends in capital spending budgets in the IT industry, fluctuations in general economic conditions, change in market for our customers' products, employee turnover, changes in tax laws, risks associated with our international operations, uncertainties and variability in demand by our reseller and integration customers, supply shortages or delays, any termination or reduction in our floor plan financing arrangements, changes in value of foreign currencies and interest rates and other risk factors contained below under Part I, Item 1A, “Risk Factors.” These forward-looking statements speak only as of the date hereof. We expressly disclaim any obligation or undertaking to release publicly any updates or revisions to any forward-looking statements contained herein to reflect any change in our expectations with regard thereto or any change in events, conditions or circumstances on which any such statement is based.
In the sections of this Report entitled “Business” and “Management’s Discussion and Analysis of Financial Condition and Results of Operations,” all references to “TD SYNNEX,” “we,” “us,” “our” or the “Company” mean TD SYNNEX Corporation and its subsidiaries for periods after the acquisition of Tech Data, except where it is made clear that the term means only the parent company or one of its segments while all references to “SYNNEX,” “we,” “us,” “our” or the “Company” mean SYNNEX Corporation and its subsidiaries for periods prior to the acquisition of Tech Data, except where it is made clear that the term means only the parent company or one of its segments.
TD SYNNEX, the TD SYNNEX Logo, and all other TD SYNNEX company, product and services names and slogans are trademarks or registered trademarks of TD SYNNEX Corporation. Other names and marks are the property of their respective owners.
3
Item 1.Business
We are a Fortune 200 corporation and a leading global provider of a comprehensive range of distribution, systems design and integration solutions for the technology industry.
On December 1, 2020, we completed the previously announced separation of our customer experience services business (the “Separation”), which was accomplished by the distribution of one hundred percent of the outstanding common stock of Concentrix Corporation (“Concentrix”). Our stockholders received one share of Concentrix common stock for every share of our common stock held at the close of business on the record date. Concentrix is now an independent public company trading under the symbol “CNXC” on the Nasdaq Stock Market. After the Separation, we do not beneficially own any shares of Concentrix’ common stock and beginning December 1, 2020, we no longer consolidate Concentrix within our financial results or reflect the financial results of Concentrix within our continuing results of operations. We distributed a total of approximately 51.6 million shares of Concentrix common stock to our stockholders. In connection with the Separation, we entered into a separation and distribution agreement, as well as various other agreements with Concentrix that provide a framework for the relationships between the parties going forward, including among others an employee matters agreement, a tax matters agreement, and a commercial agreement, pursuant to which Concentrix has continued to provide services to us following the Separation. The historical results of operations and financial positions of Concentrix are reported as discontinued operations in our Consolidated Financial Statements. For further information on discontinued operations, see Note 5 - Discontinued Operations, to the Consolidated Financial Statements in Item 8.
On March 22, 2021, we entered into an agreement and plan of merger (the “Merger Agreement”) which provided that legacy SYNNEX Corporation would acquire legacy Tech Data Corporation, a Florida corporation (“Tech Data”) through a series of mergers, which would result in Tech Data becoming an indirect subsidiary of TD SYNNEX Corporation (collectively, the "Merger"). On September 1, 2021, pursuant to the terms of the Merger Agreement, we acquired all the outstanding shares of common stock of Tiger Parent (AP) Corporation, the parent corporation of Tech Data, for consideration of $1.61 billion in cash ($1.11 billion in cash after giving effect to a $500 million equity contribution by Tiger Parent Holdings, L.P., Tiger Parent (AP) Corporation’s sole stockholder and an affiliate of Apollo Global Management, Inc., to Tiger Parent (AP) Corporation prior to the effective time of the Merger) and 44 million shares of common stock of SYNNEX valued at approximately $5.61 billion.
We previously had two reportable segments as of November 30, 2020: Technology Solutions and Concentrix. After giving effect to the Separation on December 1, 2020, we operated in a single reportable segment. After completion of the Merger, we reviewed our reportable segments as there was a change in our chief executive officer, who is also our chief operating decision maker. Our chief operating decision maker has a leadership structure aligned with the geographic locations of the Americas, Europe and Asia-Pacific and Japan (“APJ”) and reviews and allocates resources based on these geographic locations. As a result, as of September 1, 2021 we began operating in three reportable segments based on our geographic locations: the Americas, Europe and APJ. Segment results for all prior periods have been restated for comparability to the Company’s current reportable segments. For financial information by segment, refer to Note 13 – Segment Information, to the Consolidated Financial Statements in Item 8.
We distribute PC systems, mobile phones and accessories, printers, peripherals, information technology (“IT”) systems including data center server and storage solutions, system components, software, networking, communications and security equipment, consumer electronics and complementary products. We also provide systems design and integration solutions.
We distribute more than 200,000 technology products (as measured by active SKUs) from more than 1,500 original equipment manufacturers (“OEM”), as well as suppliers of next-generation technologies and delivery models such as converged and hyper-converged infrastructure, the cloud, security, big data/analytics/Internet of things (“IoT”) and services. Our products are marketed globally to an active reseller base of more than 150,000 resellers, system integrators, and retailers. We purchase peripherals, IT systems, system components, software, networking, communications and security equipment, consumer electronics and complementary products from our suppliers and sell them to our reseller and retail customers. We perform a similar function for our distribution of licensed software products. Our reseller customers include value-added resellers (“VARs”), corporate resellers, government resellers, system integrators, direct marketers, retailers and managed service providers (“MSPs”). We provide our vendors with access to large and highly fragmented markets such as small- and medium-sized businesses (“SMB”) and serve as a variable, cost effective route to market for our vendors by providing them with access to resellers and end-users. We combine our core strengths in distribution with demand generation, supply chain management and design and integration solutions to help our customers achieve greater efficiencies in time to market, cost minimization, real-time linkages in the supply chain and aftermarket product support. We also provide comprehensive IT solutions in key vertical markets such as government and healthcare and we provide specialized service offerings that increase efficiencies in the areas of global computing components, logistics services and supply chain management. Additionally, we provide our customers with systems design and integration solutions for data center servers and networking solutions built specific to our customers’ workloads and data center environments.
Our business is characterized by low gross profit as a percentage of revenue, or gross margin, and low income from operations as a percentage of revenue, or operating margin. The market for IT products is generally characterized by declining unit prices and short product life cycles. We set our sales price based on the market supply and demand characteristics for each particular product or bundle of products we distribute and services we provide.
4
We are highly dependent on the end-market demand for IT products, and on our partners’ strategic initiatives and business models. This end-market demand is influenced by many factors including the introduction of new IT products and software by OEMs, replacement cycles for existing IT products, trends toward cloud computing, overall economic growth and general business activity. A difficult and challenging economic environment may also lead to consolidation or decline in the IT industries and increased price-based competition.
We have been in business since 1980 and have headquarters in both Clearwater, Florida and Fremont, California. We were originally incorporated in the State of California as COMPAC Microelectronics, Inc. in November 1980, and we changed our name to SYNNEX Information Technologies, Inc. in February 1994. We later reincorporated in the State of Delaware under the name of SYNNEX Corporation in October 2003. As a result of the Merger, on October 22, 2021, we filed with the Secretary of State of the State of Delaware a Certificate of Amendment to the Company’s Restated Certificate of Incorporation to change our corporate name from SYNNEX Corporation to TD SYNNEX Corporation, effective November 3, 2021. As of November 30, 2021, we had approximately 22,000 full-time co-workers worldwide.
Our Products and Suppliers
We distribute a comprehensive catalog of IT products from more than 1,500 OEM suppliers, enabling us to offer comprehensive solutions to our reseller and retail customers. We group the majority of our offerings into two primary solutions portfolios, Endpoint Solutions and Advanced Solutions which are comprised of the following:
Endpoint Solutions Portfolio:
|
|
• |
Our Endpoint Solutions portfolio primarily includes PC systems, mobile phones and accessories, printers, peripherals, supplies, endpoint technology software and consumer electronics. |
Advanced Solutions Portfolio:
|
|
• |
Our Advanced Solutions portfolio primarily includes data center technologies such as storage, networking, servers, advanced technology software and converged and hyper-converged infrastructure. Our Advanced Solutions portfolio also includes our specialized solution businesses. |
Our next-generation technology solutions, along with our services offerings, span our Endpoint and Advanced Solutions portfolios.
Our suppliers include leading peripherals, IT systems, system components, software, security, networking equipment, UCC and consumer electronics manufacturers. Our primary OEM suppliers are Alphabet Inc. (Google), Apple, Inc., ASUSTeK Computer Inc., Cisco Systems, Inc., HP Inc., Hewlett-Packard Enterprise Company, Intel Corporation, Lenovo Group Ltd, Microsoft Corporation, and Samsung Electronics Co., Ltd. Our largest OEM supplier is HP Inc. Revenue from the sale of products and services provided by HP Inc. represented approximately 12%, 15% and 14% of our total revenue for fiscal years 2021, 2020 and 2019, respectively.
We have distribution agreements with most of our suppliers, including HP Inc. These agreements usually provide for nonexclusive distribution rights and pertain to specific geographic territories. The agreements are also generally short-term, subject to periodic renewal, and often contain provisions permitting termination by either our supplier or us without cause upon relatively short notice. Conversely, our vendor agreements generally do not restrict us from selling similar products manufactured by competitors, nor do they require us to sell a specified quantity of product. As a result, we have the flexibility to terminate or curtail sales of one product line in favor of another due to technological change, pricing considerations, product availability, and customer demand or vendor distribution policies. An OEM supplier that elects to terminate a distribution agreement will generally repurchase its products carried in our inventory.
Our business subjects us to the risk that the value of our inventory will be affected adversely by suppliers’ price reductions or by technological changes affecting the usefulness or desirability of the products comprising our inventory. Many of our OEM suppliers offer us limited protection from the loss in value of our inventory due to technological change or a supplier’s price reduction. Under many of these agreements, we have a limited period of time to return or exchange products or claim price protection credits. Historically, price protection and stock rotation privileges, as well as our inventory management procedures, have helped reduce the risk of loss of inventory value. We monitor our inventory levels and attempt to time our purchases to maximize our protection under supplier programs.
Our Customers
We distribute IT products to more than 150,000 resellers, system integrators and retailers. Resellers are classified primarily by their end-user customers. End-users include large corporations or enterprises, federal, state and local governments, small/medium sized businesses, or SMBs, and individual consumers. In addition, resellers vary greatly in size and geographic reach. Our reseller customers buy from us and other distributors. Our larger reseller customers also buy certain products directly from OEM suppliers. System integrators offer services in addition to product resale, primarily in systems customization, integration, and deployment.
5
Retailers serve mostly individual end-users and to a small degree, small office/home office customers. We also provide systems design and integration solutions for data center servers built for our customers’ data center environments.
One customer accounted for 17%, 23% and 24% of our total revenue in fiscal years 2021, 2020 and 2019, respectively. We do not believe that the loss of any single customer would have a material adverse effect on us.
Our Services and Solutions
We offer a variety of business process services to our customers. These services can be purchased individually or they can be purchased in combination with others in the form of supply chain solutions and aftermarket product support.
We have sophisticated pick, pack and ship operations, which allows us to efficiently receive shipments from our OEM suppliers and quickly fill orders for our reseller and retail customers. We generally stock or otherwise have access to the inventory of our OEM suppliers to satisfy the demands of our reseller and retail customers. In addition, we design and integrate energy efficient and cost-effective data center servers which are built specific to the data center environments and actual workloads of our large-scale data center customers.
The above services are complemented by the following:
Systems Design and Integration Solutions. We provide our customers with systems design and full rack integration solutions, build-to-order, and configure-to-order assembly capabilities. In both of these cases, we offer design, integration, test and other production value-added solutions such as thermal testing, power-draw efficiency testing, burn-in, quality and logistics support.
Logistics Services. We provide logistics support to our reseller customers such as outsourced fulfillment, virtual distribution and direct ship to end-users. Other logistics support activities we provide include generation of customized shipping documents, multi-level serial number tracking for customized, configured products and online order and shipment tracking. We also offer full turn-key logistics solutions designed to address the needs of large volume or specialty logistics services. Our full turn-key service offering is modular in nature and is designed to cover all aspects of the logistics life cycle including, transportation management, inventory optimization, complementary product matching, reverse logistics, asset refurbishment and disposal and strategic procurement.
Cloud Services. We provide cloud-based solutions and services to our reseller customers to enable sales of and migration to technologies in a hosted environment to small and medium businesses. Our proprietary cloud platform offers a complete package of cloud-based solutions on a user-friendly platform and allows our reseller customers and OEM vendors to own the complete customer lifecycle through direct billing, provisioning, management, and support. Our solutions cover all end-user customer needs, including, pure public cloud solutions in productivity and collaboration, IaaS, or Infrastructure as a Service, PaaS, or Platform as a Service, SaaS, or Software as a Service, Security, Mobility, IoT and other hybrid solutions. Our dedicated cloud team comprising developers, sales engineers and solutions specialists, supports our reseller customers in the sales of these solutions.
Online Services. We maintain electronic data interchange (“EDI”), extensible markup language (“XML”), web-based communication links and mobile applications with many of our reseller and retail customers. These links improve the speed and efficiency of our transactions with our customers by enabling them to search for products, check inventory availability and prices, configure systems, place and track orders, receive invoices, review account status and process returns. We also have web-based application software that allows our customers or their end-user customers to order software and take delivery online.
Financial Services. We offer our reseller customers various financing options, including net terms, third party leasing, floor plan financing and letters-of-credit backed financing and arrangements where we collect payments directly from the end-user. We also lease products to our reseller customers and their end-users and provide device-as-a-service to end-users. The availability and terms of our financing services are subject to our credit policies or those of third-party financing providers to our customers.
Marketing Services. We offer our OEM suppliers a full range of marketing activities targeting resellers, system integrators and retailers including direct mail, external media advertising, reseller product training, targeted telemarketing campaigns, national and regional trade shows, trade groups, database analysis, print on demand services and web-based marketing.
Sales and Marketing
We serve our large commercial, government reseller, and retail customers through dedicated sales professionals. We market to smaller resellers and OEMs through dedicated regional sales teams. In addition, we have dedicated product management and business development specialists that focus on the sale and promotion of products and services of selected suppliers or for specific end-market verticals. These specialists are also directly involved in establishing new relationships with leading OEMs to create demand for their products and services and with resellers for their customers’ needs. We also have a direct sales approach for our design and integration solutions business. Our sales and marketing professionals are complemented by members of our executive management team who are integral in identifying potential new customer opportunities, promoting sales growth and ensuring customer satisfaction. We have sales and marketing professionals in close geographic proximity to our reseller, retail and OEM customers.
6
Our Operations
We operate 181 distribution and administrative facilities globally. Our distribution processes are highly automated to reduce errors, ensure timely order fulfillment and enhance the efficiency of our warehouse operations and back office administration. Our distribution facilities are geographically dispersed to be near reseller customers and their end-users. This decentralized, regional strategy enables us to benefit from lower shipping costs and shorter delivery lead times to our customers. Furthermore, we track several performance measurements to continuously improve the efficiency and accuracy of our distribution operations. Our regional locations also enable us to make local deliveries and provide will-call fulfillment to more customers than if our distribution operations were more centralized, resulting in better service to our customers. Our workforce is comprised of permanent and temporary employees, enabling us to respond to short-term changes in order activity.
Our proprietary IT systems and processes enable us to automate many of our distribution operations. We use radio frequency and bar code scanning technologies in our warehouse operations to maintain real-time inventory records, facilitate frequent cycle counts and improve the accuracy of order fulfillment.
To enhance the accuracy of our distribution order fulfillment and protect our inventory from shrinkage, our distribution systems also incorporate numerous controls. These controls include order weight checks, bar code scanning, and serial number profile verification. We also use digital video imaging to record our small package shipping activities by order. These images and other warehouse and shipping data are available online to our customer service representatives, enabling us to quickly respond to order inquiries by our customers.
We operate our principal systems design and integration solutions facilities in the United States with additional locations in the United Kingdom and China. We generally design and integrate IT systems, data center servers and networking solutions and IT appliances, by incorporating system components purchased directly from vendors or obtained from our distribution inventory. Additionally, we perform other production value-added services, including thermal testing, power-draw efficiency testing, burn-in, quality and logistics support. Some of our design and integration solutions facilities are ISO 9001:2015 and ISO 14001:2015 certified.
International Operations
Approximately 37% of our consolidated revenue for fiscal year 2021 was generated by our international operations. As a result of the Merger, we have expanded both our domestic and international operations. Our end market strategy is to continue expanding internationally on a selective basis in order to provide our distribution capabilities to OEMs in locations that meet their regional requirements.
Sales and cost concentrations in foreign jurisdictions subject us to various risks, including the impact of changes in the value of these foreign currencies relative to the United States Dollar, which in turn can impact reported sales.
See Note 13 – Segment Information to the Consolidated Financial Statements included in Item 8 of this Report for additional financial information related to international and domestic operations.
Seasonality
Our operating results are affected by the seasonality of the IT products industry. We have historically experienced higher sales in our fourth fiscal quarter due to patterns in capital budgeting, federal government spending and purchasing cycles of our customers and end-users. These historical patterns may not be repeated in subsequent periods and may be impacted by the Merger.
Purchasing
Product cost represents our single largest expense and IT product inventory is one of our largest working capital investments. Furthermore, product procurement from our OEM suppliers is a highly complex process that involves incentive programs, rebate programs, price protection, volume and early payment discounts and other arrangements. Consequently, efficient and effective purchasing operations are critical to our success.
Our purchasing group works closely with many areas of our organization, especially our product managers who work closely with our OEM suppliers and our sales force, to understand the volume and mix of IT products that should be purchased. In addition, in certain locations the purchasing group utilizes an internally developed, proprietary information systems application that further aids in forecasting future product demand based on several factors, including historical sales levels, expected product life cycle and current and projected economic conditions. We may also rely on our receipt of good-faith, non-binding, customer forecasts. We maintain EDI connections with our OEM suppliers to send purchase orders, receive purchase order status and receive notification once the product has shipped from our supplier. Our information system also tracks warehouse and channel inventory levels and open purchase orders on a real-time basis enabling us to stock inventory at a regional level closer to the customer as well as to actively manage our working capital resources. This level of automation promotes greater efficiencies of inventory management by replenishing and turning inventory, as well as placing purchase orders on a more frequent basis. Furthermore, our system tool also allows for automated checks and controls to prevent the generation of inaccurate orders.
7
Managing our OEM supplier incentive programs is another critical function of our purchasing and product management teams. We also attempt to maximize the benefits of incentives, rebates and volume and early payment discounts that our OEM suppliers offer us. We carefully evaluate these supplier incentive benefits relative to our product handling and carrying costs so that we do not over-invest in our inventory. We also closely monitor inventory levels on a product-by-product basis and plan purchases to take advantage of OEM supplier provided price protection. By managing inventory levels and monitoring customer purchase patterns at each of our regional distribution facilities, we believe we can minimize our shipping costs by stocking products near our resellers and retailers, and their end-user customers.
Financial Services
We offer various financing options to our customers as well as prepayment, credit card and cash on delivery terms. In providing credit terms to our reseller and retail customers, we closely and regularly monitor their creditworthiness through our information systems, their credit ratings information and periodic detailed credit file reviews by our financial services staff. We have also purchased credit insurance in most geographies to further control customer credit risks. Finally, we establish reserves for estimated credit losses in the normal course of business based on the overall quality and aging of our accounts receivable portfolio, the existence of credit insurance and specifically identified customer risks.
We also sell to certain reseller customers pursuant to third party floor plan financing. The expenses charged by these financing companies are subsidized either by our OEM suppliers or paid by us. We generally receive payment from these financing companies within 15 to 30 days from the date of sale, depending on the specific arrangement.
Information Technology
Our IT systems manage the entire order cycle, including processing customer orders, customer billing and payment tracking. These IT systems make our operations more efficient and provide visibility into our operations. We believe our IT infrastructure is scalable to support further growth. We continue to enhance and invest in our IT systems to improve product and inventory management, streamline order and fulfillment processes, and increase operational flexibility, including as part of the integration process related to the Merger.
To allow our customers and suppliers to communicate and transact business with us in an efficient and consistent manner, we have implemented a mix of proprietary and off-the-shelf software programs that integrate our IT systems with those of our customers and suppliers. In particular, we maintain EDI, XML, web-based communication links and mobile platform applications with many of our reseller and retail customers to enable them to search for products, check real-time pricing, inventory availability and specifications, place and track orders, receive invoices and process returns.
Competition
We operate in a highly competitive global environment. The IT product industry is characterized by intense competition, based primarily on product availability, credit terms and availability, price, speed and accuracy of delivery, effectiveness of sales and marketing programs, ability to tailor specific solutions to customer needs, quality and depth of product lines and training, pre- and post-sale technical support, flexibility and timely response to design changes, technological capabilities and product quality, service and support. We compete with a variety of regional, national and international IT product distributors and manufacturers.
We compete against several distributors in the Americas market, including Arrow Electronics, Inc. (“Arrow”), Ingram Micro, Inc. and ScanSource, Inc. and, to a lesser extent, regional distributors. The competitive environment in Europe is more fragmented with market share spread among several regional and local competitors such as ALSO Holding and Esprinet, as well as international distributors such as Ingram Micro, Inc., Westcon-Comstor and Arrow. We also face competition from our OEM suppliers that sell directly to resellers, retailers and end-users. The distribution industry has historically undergone, and continues to undergo, consolidation. Over the years, a number of providers within the IT distribution industry exited or merged with other providers. For example, during fiscal year 2017, we acquired the Westcon-Comstor Americas distribution business and Tech Data acquired the Technology Solutions operating group of Avnet Inc. (“Avnet”), and in fiscal year 2021 we acquired Tech Data. We have participated in this consolidation and expect to continue to assess opportunities.
As we enter new business areas, we may encounter increased competition from our current competitors and/or new competitors. Some of our competitors may have greater financial, operating, manufacturing and marketing resources than us. Some of our competitors may have broader geographic breadth and range of services than us. Some may have more developed relationships with their existing customers.
We constantly seek to expand our business into areas primarily related to our core distribution as well as other support, logistics and related value-added services, both organically and through strategic acquisitions.
8
Human Capital Resources
As of November 30, 2021, we had approximately 22,000 full-time co-workers. Given the variability in our business and the quick response time required by customers, it is critical that we are able to rapidly ramp-up and ramp-down our operational capabilities to maximize efficiency. As a result, we use temporary or contract workers, who totaled approximately 5,000 as of November 30, 2021, on a full-time equivalent basis. Certain of our employees in various countries outside of the United States are subject to laws providing representation rights to employees through workers' councils.
We are committed to fostering a diverse and inclusive workplace that attracts and retains exceptional talent. Through ongoing employee development, comprehensive compensation and benefits, and a focus on health, safety and employee wellbeing, we strive to help our employees in all aspects of their lives so they can do their best work.
Diversity, Equity and Inclusion
We are committed to being unconditionally inclusive to capture the ideas and perspectives that fuel innovation and enable our workforce, customers, and communities to succeed in the digital age. We strive to create an inclusive workplace where people can bring their authentic selves to work. Our commitment to diversity and inclusion starts at the top with a highly skilled and diverse board of directors. Women represent 27% of our board of directors and 42% of our co-worker base, and 55% of our board of directors is ethnically diverse and/or gender diverse. We strive to remain a diverse company. Both Robert Huang, founder of our company, and Steve Raymund, founder of Tech Data, wanted to ensure we had the best co-workers regardless of their age, ethnicity, or gender. Their legacy and our primary focus is to work hard, do well, and treat others with respect.
Pay Equity or Total Rewards
We believe people should be paid for what they do and how they do it, regardless of their gender, race, or other personal characteristics. To deliver on that commitment, we benchmark and set pay ranges based on market data and consider factors such as an employee’s role and experience, the location of their job, and their performance. We also review our compensation practices, both in terms of our overall workforce and individual employees, to ensure our pay is fair and equitable. Our practice of reviewing the compensation of employees to ensure consistent pay practices by conducting a pay equity analysis annually comparing employees in the same role within a country or location will extend to include employees added from the Merger, during the integration phase.
We require a talented workforce and are committed to providing total rewards that are market-competitive and performance-based, driving innovation and operational excellence. Our compensation programs, practices, and policies reflect our commitment to reward short- and long-term performance that aligns with, and drives, stockholder value. Total direct compensation is generally positioned within a competitive range of the market median, with differentiation based on tenure, skills, proficiency, and performance to attract and retain key talent.
Employee Engagement
We regularly collect feedback to better understand and improve the co-worker experience and identify opportunities to continually strengthen our culture. We want to know what is working well, what we can do better and how well our co-workers understand and are practicing our cultural values.
Training and Development
Human capital development underpins our efforts to execute our strategy and continue to distribute, design, integrate and market innovative products and services. We continually invest in our employees’ career growth and provide employees with a wide range of development opportunities, including face-to-face, virtual, social and self-directed learning, mentoring, coaching, and external development.
9
Health, Safety and Wellness
The physical health, financial wellbeing, life balance and mental health of our employees is vital to our success. Our environmental, health, and safety leadership team uses our global injury and illness reporting system to assess trends regionally and worldwide as a part of quarterly reviews. Our warehouse and integration facilities continue to represent our most significant health and safety risks. Managing and reducing risks at these facilities remains a focus, and injury rates continue to be low. We also sponsor a wellness program designed to enhance physical, financial, and mental wellbeing for all our employees. Throughout the year, we encourage healthy behaviors through regular communications, educational sessions, voluntary progress tracking, wellness challenges, and other incentives. Since the onset of the COVID-19 pandemic, we have taken an integrated approach to helping our co-workers manage their work and personal responsibilities, with a strong focus on employee wellbeing, health and safety. We have successfully transitioned most of our workforce to a remote working environment and implemented a number of safety and social distancing measures within our premises to protect the health and safety of co-workers who are required to be on-premise to support our business.
Environmental
We remain focused on protecting our planet and reducing our global carbon footprint. In support of this, TD SYNNEX has committed to the Science Based Targets Initiative (SBTi) Business Ambition Pledge. We are committed to embedding a culture of sustainability across our organization and increasing our sustainability initiatives and supporting our customers and vendors. We engage in and continue to explore a range of sustainability projects such as renewable energy, use of light emitting diode (LED) technologies, waste minimization projects and ISO 14001 at several of our facilities. We also offer trade-in, recycling and refurbishment services on a range of IT equipment to end-users through agreements with our resellers and retail partners.
Available Information
Our website is http://www.tdsynnex.com. We make available free of charge, on or through our website, our Annual Report on Form 10-K, quarterly reports on Form 10-Q, current reports on Form 8-K and amendments to those reports, if any, or other filings filed or furnished pursuant to Section 13(a) or 15(d) of the Exchange Act as soon as reasonably practicable after electronically filing or furnishing these reports with the Securities and Exchange Commission, or SEC. Information contained on our website is not a part of this Report. We have adopted a code of ethics applicable to our employees including our principal executive, financial and accounting officers, and it is available free of charge, on our website’s investor relations page.
The SEC maintains an Internet site at http://www.sec.gov that contains our Annual Report on Form 10-K, quarterly reports on Form 10-Q, current reports on Form 8-K and amendments to those reports, if any, or other filings filed or furnished pursuant to Section 13(a) or 15(d) of the Exchange Act, and our proxy and information statements.
Item 1A. Risk Factors
The following discussion is divided into several sections. The first section, which begins immediately following this paragraph, discusses some of the risks that may affect our business, results of operations and financial condition. The second section, captioned “Risks Related to Our Indebtedness” discusses our debt-related risks. The third section, captioned “Risks Related to Our Relationships with Apollo Global Management Inc. and MiTAC Holdings Corporation,” discusses risks relating to Apollo Global Management’s influence over us and our relationship with MiTAC Holdings Corporation. The fourth section, captioned “Risks Related to our Industry,” discusses risks impacting businesses operating in our industry. The fifth section, captioned “Risks Related to the Acquisition of Tech Data” relates to risks associated with the Merger. The sixth section, captioned “Risks Related to the Macro-Economic and Regulatory Environment,” relates to risks which broadly affect companies operating in regions in which we operate. You should carefully review all of these sections, as well as our consolidated financial statements and notes thereto and the other information appearing in this report, for important information regarding risks that affect us. These risk factors should be considered in connection with evaluating the forward-looking statements contained in this Report because these factors could cause the actual results and conditions to differ materially from those projected in the forward-looking statements. Before you invest in our Company, you should know that making such an investment involves some risks, including the risks described below. The risks that have been highlighted here are not the only ones that we face. If any of the risks actually occur, our business, financial condition and results of operations could be negatively affected. In that case, the trading price of our common stock could decline, and you may lose all or part of your investment.
Risks Related to Our Business and Operations
We anticipate that our revenue and operating results will fluctuate, which could adversely affect the enterprise value of our Company and our securities.
Our operating results have fluctuated and will fluctuate in the future as a result of many factors, including:
|
|
• |
the impact of the business acquisitions and dispositions we make; |
10
|
|
• |
general economic conditions and level of IT spending; |
|
|
• |
the loss or consolidation of one or more of our significant OEM suppliers or customers; |
|
|
• |
market acceptance, quality, pricing, availability and useful life of our products and services, as well as the mix of our products and services sold; |
|
|
• |
competitive conditions in our industry; |
|
|
• |
trends towards cloud based infrastructure and “as-a-Service” type product offerings; |
|
|
• |
pricing, margin and other terms with our OEM suppliers; |
|
|
• |
decline in inventory value as a result of product obsolescence and market acceptance; |
|
|
• |
variations in our levels of excess inventory, vendor reserves and doubtful accounts; |
|
|
• |
fluctuations in rates in the currencies in which we transact; |
|
|
• |
changes in the terms of OEM supplier-inventory protections, such as price protection and return rights; and |
|
|
• |
the expansion of our design and integration solutions sales and operations, globally. |
Although we attempt to control our expense levels, these levels are based, in part, on anticipated revenue. Therefore, we may not be able to control spending in a timely manner to compensate for any unexpected revenue shortfall.
Our operating results are affected by the seasonality of the IT products and services industry. We have historically experienced higher sales in our fourth fiscal quarter due to patterns in the capital budgeting, federal government spending and purchasing cycles of end-users. These historical patterns may not be repeated in subsequent periods and may be impacted by the Merger. You should not rely on period-to-period comparisons of our operating results as an indication of future performance. In future years, our operating results may be below our expectations or those of our public market analysts or investors, which would likely cause our share price to decline.
We are subject to uncertainties and variability in demand by our customers, which could decrease revenue and adversely affect our operating results, and we have customer contracts with provisions that could cause fluctuations in our revenue.
We sell to our customers on a purchase order basis, rather than pursuant to long-term contracts or contracts with minimum purchase requirements. Consequently, our sales are subject to demand variability by our customers. The level and timing of orders placed by our customers vary for a variety of reasons, including seasonal buying by end-users, the introduction of new hardware and software technologies and general economic conditions. Customers submitting a purchase order may cancel, reduce or delay their orders. If we are unable to anticipate and respond to the demands of our reseller, retail and design and integration solutions customers, we may lose customers because we have an inadequate supply of products, or we may have excess inventory, either of which could harm our business, financial position and operating results.
With regard to our design and integration solutions customers, unique parts are purchased based both on customer purchase orders and forecasted demand. We have limited protection against excess inventory should anticipated demand not materialize.
We depend on a limited number of OEMs to supply the IT products and services that we sell and the loss of, or a material change in, our business relationship with a major OEM supplier could adversely affect our business, financial position and operating results.
Our future success is highly dependent on our relationships with a small number of OEM suppliers. For example, sales of HP Inc. products and services comprised approximately 12%, 15% and 14% of our total revenue for fiscal years 2021, 2020 and 2019, respectively. Our OEM supplier agreements typically are short-term and may be terminated without cause upon short notice. OEM supplier agreements are often established at a regional or country level and these relationships may change in some countries or regions and not others. The loss or deterioration of our relationship with HP Inc. or any other major OEM supplier, the authorization by OEM suppliers of additional distributors, the sale of products by OEM suppliers directly to our reseller and retail customers and end-users, or our failure to establish relationships with new OEM suppliers or to expand the distribution and supply chain services that we provide OEM suppliers could adversely affect our business, financial position and operating results. In addition, OEM suppliers may face liquidity or solvency issues that in turn could negatively affect our business and operating results.
Our business is also highly dependent on the terms provided by our OEM suppliers. Generally, each OEM supplier has the ability to change the terms and conditions of its distribution agreements, such as reducing the amount of price protection and return rights or reducing the level of purchase discounts, incentive rebates, scope of the geographic area in which we can sell and marketing programs available to us.
11
From time to time we may conduct business with a supplier without a formal agreement because the agreement has expired or was otherwise terminated. In such case, we are subject to additional risk with respect to products, warranties and returns, and other terms and conditions. If we are unable to pass the impact of these changes through to our reseller and retail customers, our business, financial position and operating results could be adversely affected.
Our gross margins are low, which magnifies the impact of variations in gross margin, operating costs and our operating results.
As a result of significant price competition in the IT products and services industry, our gross margins are low, and we expect them to continue to be low in the future. Increased competition arising from industry consolidation and low demand for certain IT products and services may hinder our ability to maintain or improve our gross margins. These low gross margins magnify the impact of variations in revenue and operating costs on our operating results. A portion of our operating expense is relatively fixed, and planned expenditures are based in part on anticipated orders that are forecasted with limited visibility of future demand. As a result, we may not be able to reduce our operating expense to sufficiently mitigate any further reductions in gross profit or margin in the future. If we cannot proportionately decrease our cost structure in response to competitive price pressures, our business and operating results could suffer.
We also receive purchase discounts and rebates from OEM suppliers based on various factors, including sales or purchase volume and breadth of customers. A decrease in net sales could negatively affect the level of volume rebates received from our OEM suppliers and thus, our gross margin. Because some rebates from OEM suppliers are based on percentage increases in sales of products, it may become more difficult for us to achieve the percentage growth in sales required for larger discounts due to the current size of our revenue base. A decrease or elimination of purchase discounts and rebates from our OEM suppliers would adversely affect our business and operating results.
We are subject to the risk that our inventory value may decline, and protective terms under our OEM supplier agreements may not adequately cover the decline in value, which in turn may harm our business, financial position and operating results.
The IT products industry is subject to rapid technological change, new and enhanced product specification requirements, and evolving industry standards. These changes may cause inventory on hand to decline substantially in value or to rapidly become obsolete. Most of our OEM suppliers offer limited protection from the loss in value of inventory. For example, we can receive a credit from many OEM suppliers for products held in inventory in the event of a supplier price reduction. In addition, we have a limited right to return a certain percentage of purchases to most OEM suppliers. These policies are often subject to time restrictions and do not protect us in all cases from declines in inventory value. In addition, our OEM suppliers may become unable or unwilling to fulfill their protection obligations to us. The decrease or elimination of price protection, or the inability of our OEM suppliers to fulfill their protection obligations, could lower our gross margins and cause us to record inventory write-downs. If we are unable to manage our inventory with our OEM suppliers with a high degree of precision, we may have insufficient product supplies or we may have excess inventory, resulting in inventory write-downs, either of which could harm our business, financial position and operating results.
We depend on OEM suppliers to maintain an adequate supply of products to fulfill customer orders on a timely basis, and any supply shortages or delays could cause us to be unable to timely fulfill orders, which in turn could harm our business, financial position and operating results.
Our ability to obtain particular products in the required quantities and to fulfill reseller and retail customer orders on a timely basis is critical to our success. In most cases, we have no guaranteed price or delivery agreements with our OEM suppliers. We have experienced a supply shortage of certain products as a result of strong demand or problems experienced by our OEM suppliers, including during fiscal year 2020 and 2021 due to global supply chain constraints resulting from the impacts of the COVID-19 pandemic. If shortages or delays persist, the price of those products may increase, or the products may not be available at all. Such delays could also impact our ability to procure critical components required to complete customer orders. In addition, our OEM suppliers may decide to distribute, or to substantially increase their existing distribution business, through other distributors, their own dealer networks, or directly to resellers, retailers or end-users. Accordingly, if we are not able to secure and maintain an adequate supply of products to fulfill our customer orders on a timely basis, our business, financial position and operating results could be adversely affected.
We experience customer concentration and intense competition which could adversely impact our revenue.
Our business experiences customer concentration from time to time. One customer accounted for 17%, 23% and 24% of our total revenue in fiscal years 2021, 2020 and 2019. While we do not believe that the loss of any single customer would have a material adverse effect on us, such loss could result in an adverse impact on certain of our businesses. For example, our systems design and integration solutions product line has significant customer concentration, requires investments in working capital and infrastructure, and has customer contracts that often offer limited or no volume guarantees or protection for end-of-life investments. The loss of a customer or reduction in order volumes could adversely impact our revenue, provision for inventory losses, the absorption of fixed overhead costs and our future expansion plans. The systems design and integration solutions business operates in a competitive environment. Volumes can fluctuate based on customer demand, delivery quality and the competitive landscape. Our ability to deliver customized solutions on a timely basis is critical to our success. Any delay could impact our competitive position and result in loss of customer orders, which could impact our financial position and operating results.
12
We have pursued and intend to continue to pursue strategic acquisitions or investments in new markets and may encounter risks associated with these activities, which could harm our business and operating results.
We have in the past pursued, and in the future expect to pursue, acquisitions of, or investments in, businesses and assets in new markets, either within or outside the IT products and services industry, that complement or expand our existing business. For example, in September 2021, we completed the acquisition of Tech Data. Our acquisition strategy involves a number of risks, including:
|
|
• |
difficulty in successfully integrating acquired operations, IT systems, customers, OEM supplier relationships, products, services and businesses with our operations; |
|
|
• |
risk that the acquired businesses will fail to maintain the quality of services that we have historically provided; |
|
|
• |
loss of key employees of acquired operations or inability to hire key employees necessary for our expansion; |
|
|
• |
diversion of our capital and management attention away from other business issues; |
|
|
• |
increase in our expenses and working capital requirements; |
|
|
• |
in the case of acquisitions that we may make outside of the United States, difficulty in operating in foreign countries and over significant geographical distances; |
|
|
• |
other financial risks, such as potential liabilities of the businesses we acquire; and |
|
|
• |
our due diligence process may fail to identify significant issues with the acquired company’s product and service quality, financial disclosures, accounting practices or internal control deficiencies. |
We may incur additional costs and certain redundant expenses in connection with our acquisitions and investments, which may have an adverse impact on our operating margins. Future acquisitions may result in dilutive issuances of equity securities, the incurrence of additional debt, large write-offs, a decrease in future profitability, or future losses. The incurrence of debt in connection with any future acquisitions could restrict our ability to obtain working capital or other financing necessary to operate our business. Our recent and future acquisitions or investments may not be successful, and if we fail to realize the anticipated benefits of these acquisitions or investments, our business and operating results could be harmed.
Our goodwill and identifiable intangible assets could become impaired, which could have a material non-cash adverse effect on our results of operations.
We recorded substantial goodwill and both definite and indefinite-lived intangible assets as a result of our previous acquisitions, including the Merger. We review our goodwill and intangible assets for impairment when events or changes in circumstances indicate the carrying value may not be recoverable. We assess whether there has been an impairment in the value of goodwill and indefinite-lived intangible assets at least annually. Factors that may be considered a change in circumstances indicating that the carrying value of our goodwill or intangible assets may not be recoverable include declines in stock price, market capitalization or cash flows and slower growth rates in our industry. We could be required to record a significant charge to earnings in our financial statements during the period in which any impairment of our goodwill or intangible assets is determined, negatively impacting our results of operations.
Because of the capital-intensive nature of our business, we need continued access to capital, which if not available to us or if not available on favorable terms, could harm our ability to operate or expand our business.
Our business requires significant levels of capital to finance accounts receivable and product inventory that is not financed by trade creditors. If cash from available sources is insufficient, proceeds from our accounts receivable securitization and revolving credit programs are limited or cash is used for unanticipated needs, we may require additional capital sooner than anticipated.
In the event we are required, or elect, to raise additional funds, we may be unable to do so on favorable terms, or at all, and may incur expenses in raising the additional funds. Our current and future indebtedness could adversely affect our operating results and severely limit our ability to plan for, or react to, changes in our business or industry. We could also be limited by financial and other restrictive covenants in our securitization or credit arrangements, including limitations on our borrowing of additional funds and issuing dividends. Furthermore, the cost of securitization or debt financing could significantly increase in the future, making it cost prohibitive to securitize our accounts receivable or borrow, which could force us to issue new equity securities. If we issue new equity securities, existing stockholders may experience dilution, or the new equity securities may have rights, preferences or privileges senior to those of existing holders of common stock. If we cannot raise funds on acceptable terms, we may not be able to take advantage of future opportunities or respond to competitive pressures or unanticipated requirements. Any inability to raise additional capital when required could have an adverse effect on our business and operating results.
13
We have significant credit exposure to our customers, and negative trends in their businesses could cause us significant credit loss and negatively impact our cash flow and liquidity position.
We extend credit to our customers for a significant portion of our sales to them and they have a period of time, generally 30 days after the date of invoice, to make payment. However, in certain cases, for some of our larger customers, we offer longer terms of payment. As a result, we are subject to the risk that our customers will not pay on time or at all. Our credit exposure risk may increase due to financial difficulties or liquidity or solvency issues experienced by our customers, resulting in their inability to repay us. The liquidity or solvency issues may increase as a result of an economic downturn or a decrease in IT spending by end-users. If we are unable to collect payments in a timely manner from our customers due to changes in financial or economic conditions, or for other reasons, and we are unable to collect under our credit insurance policies, we may write-off the amount due from the customers. These write-offs may result in credit insurance being more expensive and on terms that are less favorable to us and may negatively impact our ability to utilize accounts receivable-based financing. In addition, the failure of customers to pay within a specified time period after the date of an invoice could result in defaults under our accounts receivable securitization program. These circumstances could negatively impact our cash flow and liquidity position, or result in the cross-default to our other indebtedness and acceleration of the repayment of our indebtedness. Further, we are exposed to higher collection risk as we continue to expand internationally, where the payment cycles are generally longer and the credit rating process may not be as robust as in the United States, and where our access to accounts receivable financing is more limited.
We are dependent on a variety of IT and telecommunications systems and the Internet, and any failure of these systems could adversely impact our business and operating results.
We depend on IT and telecommunications systems and the Internet for our operations. These systems support a variety of functions including inventory management, order processing, shipping, shipment tracking, and billing.
Failures or significant downtime of our IT or telecommunications systems has, in the past, and could, in the future, prevent us from taking customer orders, printing product pick-lists, shipping products, billing customers and handling call volume. Sales also may be affected if our reseller and retail customers are unable to access our pricing and product availability information. We also rely on the Internet, and in particular EDI and XML, for a large portion of our orders and information exchanges with our OEM suppliers and reseller and retail customers. The Internet and individual websites have experienced a number of disruptions, slowdowns and security breakdowns, some of which were caused by organized attacks. If we were to experience a future security breakdown, disruption or breach that compromised sensitive information, it could harm our relationship with our OEM suppliers and reseller and retail customers. Disruption of our website or the Internet in general could impair our order processing or more generally prevent our OEM suppliers and reseller and retail customers from accessing information. A significant increase in our IT costs or a temporary or permanent loss of our IT systems could harm our relationships with our customers. The occurrence of any of these events could have an adverse effect on our operations and financial results.
Because of the experience of our key personnel in the IT industry and their technological and industry expertise, if we were to lose any of our key personnel, it could inhibit our ability to operate and grow our business successfully.
We are dependent in large part on our ability to retain the services of our key senior executives and other technological and industry experts and personnel. Except for certain of our key executives, we generally do not have employment agreements with our employees. We also do not carry “key person” insurance coverage for any of our key executives. We compete for qualified senior management and technical personnel. The loss of, or inability to hire, key executives or qualified employees could inhibit our ability to operate and grow our business successfully.
We may experience theft of product from our warehouses, water damage to our properties and other casualty events which could harm our operating results.
From time to time, we have experienced incidents of theft at various facilities, water damages to our properties and other casualty events. These types of incidents may make it more difficult or expensive for us to obtain insurance coverage in the future. Also, the same or similar incidents may occur in the future for which we may not have sufficient insurance coverage or policy limits to be fully compensated for the loss, which may have an adverse effect on our business and financial results.
We may become involved in intellectual property or other disputes that could cause us to incur substantial costs, divert the efforts of our management, and require us to pay substantial damages or require us to obtain a license, which may not be available on commercially reasonable terms, if at all.
From time to time, we receive notifications alleging infringements of intellectual property rights allegedly held by others relating to our business or the products we sell or integrate for our OEM suppliers and others. Litigation with respect to patents or other intellectual property matters could result in substantial costs and diversion of management and other resources and could have an adverse effect on our business. Although we generally have various levels of indemnification protection from our OEM suppliers and design and integration solutions customers, in many cases any indemnification to which we may be entitled is subject to maximum limits or other restrictions.
14
In addition, we have developed proprietary IT systems, mobile applications, and cloud-based technology and acquired technologies that play an important role in our business. If any infringement claim is successful against us and if indemnification is not available or sufficient, we may be required to pay substantial damages or we may need to seek and obtain a license of the other party’s intellectual property rights. We may be unable to obtain such a license on commercially reasonable terms, if at all.
We are from time to time involved in other litigation in the ordinary course of business which have and may include claims with respect to antitrust, mergers and acquisitions and other matters. For example, four lawsuits were brought against the Company and its Board in connection with the Merger, each of which was later voluntarily dismissed. In the ordinary course of business, we also receive inquiries from and have discussions with government entities regarding the compliance of our contracting and sales practices with laws and regulations. We may not be successful in defending these or other claims. Regardless of the outcome, litigation could result in substantial expense and could divert the efforts of our management. Allegations made in the course of regulatory or legal proceedings may also harm our reputation, regardless of whether there is merit to such claims. Furthermore, because litigation and the outcome of regulatory proceedings are inherently unpredictable, our business, financial condition or operating results could be materially affected by an unfavorable resolution of one or more of these proceedings, claims, demands or investigations. We do not expect that the ultimate resolution of these matters will have a material adverse effect on our consolidated financial position. However, the resolution of certain of these matters could be material to our operating results for any particular period. For further information regarding our current litigation matters, refer to Note 18 – Commitments and Contingencies, to the Consolidated Financial Statements in Item 8.
We have significant operations globally and any disruption in the operations of our facilities could harm our business and operating results.
Our worldwide operations could be subject to natural disasters, adverse weather conditions, global pandemics and other business disruptions, which could seriously harm our revenue and financial condition and increase our costs and expenses. We have significant operations in our facilities located in the Americas, Europe and APJ. Certain of our facilities, including one of our corporate headquarters locations in Clearwater, Florida, are located in geographic areas that heighten our exposure to hurricanes, tropical storms and other severe weather events. Any prolonged disruption in the operations of our facilities, whether due to technical difficulties, power failures, break-ins, destruction, damage to, or prolonged closure of, the facilities as a result of a natural disaster, fire, pandemic or any other reason, could harm our operating results. If there are related disruptions in local or international supply chains, we may experience supply shortages or delays in receiving products from our OEM suppliers or experience other delays in shipping to our customers. If we are unable to fulfill customer requirements in a timely manner, this could harm our operating results. We currently have a disaster recovery plan and carry property damage and business interruption insurance; however, they may not be sufficient to compensate for losses that may occur.
A portion of our revenue is financed by floor plan financing companies and any termination or reduction in these financing arrangements could increase our financing costs and harm our business and operating results.
A portion of our product distribution revenue is financed by floor plan financing companies. Floor plan financing companies are engaged by our customers to finance, or floor, the purchase of products from us. In exchange for a fee, we transfer the risk of loss on the sale of our products to the floor plan companies. We currently receive payment from these financing companies within approximately 15 to 30 days from the date of the sale, which allows our business to operate at much lower relative working capital levels than if such programs were not available. If these floor plan arrangements are terminated or substantially reduced, the need for more working capital and the increased financing cost could harm our business and operating results.
Risks Related to our Indebtedness
The terms of our debt arrangements impose restrictions on our ability to operate which in turn could negatively affect our ability to respond to business and market conditions and therefore could have an adverse effect on our business and operating results.
As of November 30, 2021, we had $4.1 billion in outstanding short and long-term borrowings under term loans, our Senior Notes (as defined below), lines of credit, accounts receivable securitization programs and capital leases, excluding trade payables. The terms of one or more of the agreements under which this indebtedness was incurred may limit or restrict, among other things, our ability to:
|
|
• |
incur additional indebtedness; |
|
|
• |
enter into certain transactions with affiliates; and |
|
|
• |
merge, consolidate or sell, assign, transfer, lease, convey or otherwise dispose of all or substantially all of our assets. |
We are also required to maintain specified financial ratios and satisfy certain financial condition tests under certain of our debt facilities. Our inability to meet these ratios and tests could result in the acceleration of the repayment of the related debt, termination of the applicable facility, an increase in our effective cost of funds or the cross-default of other debt facilities and securitization
15
arrangements. As a result, our ability to operate may be restricted and our ability to respond to business and market conditions may be limited, which could have an adverse effect on our business and operating results.
We may not be able to generate sufficient cash to service all of our indebtedness and may be forced to take other actions to satisfy our obligations, which could adversely affect our business.
Our ability to make scheduled debt payments or to refinance our debt obligations depends on our financial and operating performance, which is subject to prevailing economic and competitive conditions and to certain financial, business and other factors beyond our control. We cannot be certain that we will maintain a level of cash flows from operating activities sufficient to permit us to pay the principal and interest on our indebtedness.
If our cash flows and capital resources are insufficient to fund our debt service obligations we may be forced to reduce or delay capital expenditures, sell assets or operations, seek additional capital or restructure or refinance our indebtedness. We cannot be certain that we would be able to take any of these actions, that these actions would be successful and permit us to meet our scheduled debt service obligations or that these actions would be permitted under the terms of our existing or future debt agreements. In the absence of such operating results and resources, we could face substantial liquidity problems and might be required to dispose of material assets or operations to meet our debt service and other obligations. Some of our indebtedness restricts our ability to dispose of certain assets. As such, we may not be able to consummate those dispositions or use any resulting proceeds and, in addition, such proceeds may not be adequate to meet any debt service obligations then due.
If we cannot make scheduled payments on our debt, we will be in default and, as a result:
|
|
• |
our lenders could declare all outstanding principal and interest to be due and payable; |
|
|
• |
the lenders under our credit agreements could terminate their commitments to loan us money and, in the case of any secured credit arrangements, foreclose against the assets securing their borrowings; |
|
|
• |
we could be forced to raise additional capital through the issuance of additional, potentially dilutive securities; and |
|
|
• |
we could be forced into bankruptcy or liquidation, which is likely to result in delays in the payment of our indebtedness and in the exercise of enforcement remedies related to our indebtedness. |
Despite our current level of indebtedness, we and our subsidiaries may still be able to incur substantially more debt. This could further exacerbate the risks to our financial condition.
We and our subsidiaries may be able to incur significant additional indebtedness in the future. For example, as of November 30, 2021, we had access to $3.5 billion in unused commitments under the TD SYNNEX revolving credit facility (as defined below). If new debt is added to our current debt levels, the related risks that we now face could intensify. Although the TD SYNNEX credit facilities (as defined below) contain restrictions on the incurrence of additional indebtedness by our subsidiaries, these restrictions are subject to a number of qualifications and exceptions, and the additional indebtedness incurred in compliance with these restrictions could be substantial.
Changes in our credit rating may increase our interest expense or other costs of capital.
Certain of our financing instruments involve variable rate debt, thus exposing us to the risk of fluctuations in interest rates. In addition, the interest rate payable on our Senior Notes (as defined below), our revolving and term loan credit agreement and certain other debt instruments is subject to adjustment from time to time if our credit rating is downgraded.
The expected replacement of the LIBOR benchmark interest rate and other interbank offered rates with new benchmark rate indices may have an impact on our financing costs.
As of November 30, 2021, we had approximately $1.5 billion of debt outstanding under facilities with interest rates based on LIBOR. Some of our credit facilities include fallback language that seeks to facilitate an agreement with our lenders on a replacement rate for LIBOR in the event of its discontinuance or that automatically replaces LIBOR with benchmark rates based on the Secured Overnight Financing Rate or other benchmark replacement rates upon certain triggering events. We cannot predict what the impact of any such replacement rate would be to our interest expense, however, the discontinuation, reform, or replacement of LIBOR or any other benchmark rates may result in fluctuating interest rates that may have a negative impact on our interest expense and our profitability. Potential changes to the underlying floating-rate indices and reference rates may have an adverse impact on our liabilities indexed to LIBOR and could have a negative impact on our profitability and cash flows. Furthermore, we cannot predict or quantify the time, effort and cost required to transition to the use of new benchmark rates, including with respect to negotiating and implementing any necessary changes to existing contractual agreements, and implementing changes to our systems and processes. We continue to evaluate the operational and other effects of such changes, including possible impacts on our accounting for interest rate hedging agreements.
16
Our variable rate indebtedness subjects us to interest rate risk, which could cause our indebtedness service obligations to increase significantly.
Interest rates may increase in the future. As a result, interest rates on the obligations under certain of our credit facilities, our and our subsidiaries’ respective accounts receivable securitization programs and debt facilities, or other variable rate debt incurrences or offerings could be higher or lower than current levels. As of November 30, 2021, we had approximately $1.5 billion of outstanding term loan debt subject to variable interest rates and our subsidiaries had approximately $178.5 million in the aggregate outstanding under debt facilities subject to variable interest rates. If interest rates increase, debt service obligations and our interest expense will increase even though the amount borrowed remains the same. Our net income and cash flows, including cash available for servicing indebtedness, will correspondingly decrease.
Certain of our borrowings and securitization arrangements are variable-rate obligations and expose us to interest rate risks. If interest rates increase, debt service obligations and our interest expense will increase even though the amount borrowed remains the same. Our net income and cash flows, including cash available for servicing indebtedness, will correspondingly decrease.
An increase in interest rates may increase our future borrowing costs and restrict our access to capital. Additionally, current market conditions, the recovering global economy, and overall credit conditions could limit our availability of capital, which could cause increases in interest margin spreads over underlying indices, effectively increasing the cost of our borrowing. While some of our debt arrangements have contractually negotiated spreads, any changes to these spreads in connection with renegotiations of our credit facilities could adversely affect our results of operations.
We have entered into interest rate swaps with financial institutions to effectively convert a portion of our floating rate debt to a fixed interest rate to manage our exposure to fluctuations in interest rates. While we have entered into interest rate hedging agreements with respect to our borrowings under certain of our credit facilities, such agreements are not expected to fully mitigate against interest rate risk. In the event of the nonperformance by the counterparties, we are exposed to credit losses.
Risks Related to Our Relationships with Apollo Global Management, Inc. and MiTAC Holdings Corporation
The concentration of ownership of our common stock among our executive officers, directors and principal stockholders could allow them to influence all matters requiring stockholder approval and could delay or prevent a change in control of TD SYNNEX.
As of November 30, 2021, our executive officers, directors and principal stockholders owned approximately 56% of our outstanding common stock. In particular, Apollo Global Management, Inc. (“Apollo”) and its affiliates owned approximately 45.0% of our common stock.
Apollo is the private equity company that owned Tech Data prior to the Merger. As part of the Merger, 44 million shares of TD SYNNEX common stock were issued to Apollo. Additionally, the Company entered into an Investor Rights Agreement at the closing of the Merger, which provides that the board of directors be comprised of eleven directors, and that affiliates of Apollo have the right to nominate (i) up to four directors, if Apollo and its affiliates own 30% or more of the outstanding shares of TD SYNNEX common stock; (ii) up to three directors if Apollo and its affiliates own between 20% and 30% of the outstanding shares of TD SYNNEX common stock; (iii) up to two directors, if Apollo and its affiliates own between 10% and 20% of the outstanding shares of TD SYNNEX common stock; or (iv) up to one director, if Apollo and its affiliates own between 5% and 10% of the outstanding shares of TD SYNNEX common stock. As a result, Apollo is in a position to influence (subject to organizational documents and Delaware law) the composition of the Company’s board of directors and the outcome of corporate actions requiring stockholder approval, such as mergers, business combinations and dispositions of assets, among other corporate transactions. This concentration of investment and voting power could discourage others from initiating a potential merger, takeover or other change of control transaction that may otherwise be beneficial to TD SYNNEX and its stockholders, which could adversely affect the market price of TD SYNNEX common stock.
There could be potential conflicts of interest between us and MiTAC Holdings Corporation and its affiliates, which could affect our business and operating results.
As of November 30, 2021, MiTAC Holdings Corporation (“MiTAC Holdings”) and its affiliates owned approximately 9.5% of our common stock. MiTAC Holdings’ and its affiliates’ continuing beneficial ownership of our common stock could create conflicts of interest with respect to a variety of business matters. For example, we currently purchase inventories from MiTAC Holdings. Similar risks could exist as a result of Matthew Miau’s positions as our Chairman Emeritus, a member of our Board of Directors, the Chairman of MiTAC Holdings and as a director or officer of MiTAC Holdings’ affiliates. For fiscal year 2021, Mr. Miau received the same compensation as our independent directors. Mr. Miau’s compensation as one of our directors is based upon the approval of the Nominating and Corporate Governance Committee, which is solely composed of independent members of the Board of Directors. We
17
also have adopted a policy requiring material transactions in which any of our directors has a potential conflict of interest to be approved by our Audit Committee, which is also composed of independent members of the Board of Directors.
Synnex Technology International Corp., or Synnex Technology International, a publicly-traded company based in Taiwan and affiliated with MiTAC Holdings, currently provides distribution and fulfillment services to various markets in Asia and Australia, and is also a competitor of ours. As of November 30, 2021, MiTAC Incorporated, a privately-held company based in Taiwan and a separate entity from MiTAC Holdings, directly and indirectly owned approximately 15.7% of Synnex Technology International and approximately 9.0% of MiTAC Holdings. As of November 30, 2021, MiTAC Holdings directly and indirectly owned 1.0% of Synnex Technology International. In addition, MiTAC Holdings directly and indirectly owned approximately 14.1% of MiTAC Incorporated and Synnex Technology International directly and indirectly owned approximately 18.4% of MiTAC Incorporated as of November 30, 2021. Synnex Technology International indirectly through its ownership of Peer Developments Limited owned approximately 4.0% of our outstanding common stock as of November 30, 2021. Neither MiTAC Holdings, nor Synnex Technology International is restricted from competing with us. In the future, we may increasingly compete with Synnex Technology International, particularly if our business in Asia expands or Synnex Technology International expands its business into geographies or customers we serve.
The future sale of a large number of shares by Apollo or MiTAC Holdings, including as the result of the exercise of registration rights, may adversely affect the market price of the Company’s common stock.
We have granted registration rights to Apollo pursuant to an Investors Rights Agreement dated September 1, 2021, and to MiTAC Holdings pursuant to a Letter Agreement dated September 3, 2021, that require us to register their shares for resale in certain circumstances. Sales of a substantial number of shares of the Company’s common stock in the public market, or the perception that these sales may occur, could cause the market price of our common stock to decline. These sales, or the possibility of these sales, also may make it more difficult for us to sell equity securities in the future.
Risks Related to Our Industry
Volatility in the IT industry could have a material adverse effect on our business and operating results.
We have, in the past, experienced decreases in demand and we anticipate that the industries we operate in will be subject to a high degree of cyclicality in the future. Softening demand for our products and services caused by an ongoing economic downturn and over-capacity may impact our revenue, as well the salability of inventory and collection of reseller and retail customer accounts receivable. In addition, if we are not able to adequately adapt to the emergence of new technology or customer demand, such as cloud-based IT infrastructure and software-as-a-service, our future operating results could be adversely affected.
We are subject to intense competition, both in the United States and internationally, and if we fail to compete successfully, we will be unable to gain or retain market share.
We operate in a highly competitive environment, both in the United States and internationally. This competition is based primarily on product and service availability, credit availability, price, effectiveness of information systems and e-commerce tools, speed of delivery, ability to tailor specific solutions to customer needs, quality and depth of product and service lines, pre-sales and post-sales technical support, flexibility and timely response to design changes, and technological capabilities, service and support. We compete with a variety of regional, national and international IT product and service providers and contract manufacturers and assemblers. In some instances, we also compete with our own customers, our own OEM suppliers and MiTAC Holdings and its affiliates.
Some of our competitors may have a broader range of services than us and may have more developed relationships with their existing customers. We may lose market share in the United States or in international markets, or may be forced in the future to reduce our prices in response to the actions of our competitors and thereby experience a reduction in our gross margins.
We may initiate other business activities, including the broadening of our supply chain capabilities, and may face competition from companies with more experience in those new areas. In addition, as we enter new areas of business, we may also encounter increased competition from current competitors or from new competitors, including some that may once have been our OEM suppliers or reseller and retail customers. Increased competition and negative reaction from our OEM suppliers or reseller and retail customers resulting from our expansion into new business areas could harm our business and operating results.
Our business may be adversely affected by some OEM suppliers’ strategies to consolidate business or increase their direct sales, which in turn could cause our business and operating results to suffer.
A determination by any of our primary OEMs to consolidate their business with other distributors or integration service providers could negatively affect our business and operating results. Consolidation of OEM suppliers has resulted in fewer sources for some of the products and services that we distribute. This consolidation has also resulted in larger OEM suppliers that have significant operating and financial resources. Other suppliers may reduce or eliminate promotional activities to reduce their expenses, which could, in turn, result in declined demand from our reseller or retailer customers and end-users.
18
Some OEM suppliers, including some of the leading OEM suppliers that we service, have been selling products and services directly to reseller and retail customers and end-users, thereby limiting our business opportunities. If large OEM suppliers increasingly sell directly to end-users or our resellers and retailers, or select a competitor rather than use us as the distributor of their products and services, our business and operating results will suffer.
The IT industry is subject to rapidly changing technologies and process developments, and we may not be able to adequately adjust our business to these changes, which in turn would harm our business and operating results.
Dynamic changes in the IT industry, including the consolidation of OEM suppliers and reductions in the number of authorized distributors used by OEM suppliers, have resulted in new and increased responsibilities for management personnel and have placed, and continue to place, a significant strain upon our management, operating and financial systems and other resources. We may be unable to successfully respond to and manage our business in light of industry developments and trends. As end-users migrate to cloud-based IT infrastructure and software-as-a-service, sales of hardware products may be reduced, thereby negatively impacting our operating results. Also crucial to our success in managing our operations is our ability to achieve additional economies of scale. Our failure to achieve these additional economies of scale or to respond to changes in the IT industry could adversely affect our business and operating results.
Risks Related to the Acquisition of Tech Data
We may fail to realize the anticipated benefits of the Merger, which could adversely affect the value of our common stock.
SYNNEX and Tech Data operated independently prior to the Merger, and there can be no assurances that the businesses will be integrated successfully. It is possible that the integration process could result in the loss of key employees, the disruption of ongoing business, higher than expected integration costs and an overall post-completion integration process that takes longer than originally anticipated. Specifically, issues that must be addressed to realize the anticipated benefits of the Merger so the combined business performs as expected include, among other things:
|
|
• |
integrating the companies’ IT systems and other technologies, products and services; |
|
|
• |
identifying and eliminating redundant and underperforming operations and assets; |
|
|
• |
harmonizing the companies’ operating practices, employee development and compensation programs, internal controls and other policies, procedures and processes; |
|
|
• |
attracting, motivating and retaining executives and other key personnel; |
|
|
• |
addressing possible differences in business backgrounds, corporate cultures and management philosophies; |
|
|
• |
consolidating the companies’ corporate, administrative and information technology infrastructure; |
|
|
• |
managing the movement of certain businesses and positions to different locations; |
|
|
• |
maintaining existing agreements with customers and vendors and avoiding delays in entering into new agreements with prospective customers and vendors; and |
|
|
• |
consolidating offices that are currently in or near the same location. |
In addition, at times, the attention of certain members of management and resources may be focused on the integration of the business and diverted from day-to-day business operations, which may disrupt the business of the combined company.
If we fail to properly mitigate these risks or address the issues set forth above, the anticipated cost savings and other benefits of the Merger may not be realized fully or at all, or may take longer to realize than expected, which in turn could adversely affect our business operations and value of our common stock.
We have incurred and will continue to incur significant transaction and integration-related costs in connection with the Merger.
We have incurred a number of non-recurring costs associated with the Merger and combining the operations of Tech Data and SYNNEX and we expect to continue to incur significant transaction costs related to the Merger. We also will incur significant integration-related fees and costs related to formulating and implementing integration plans, including facilities and systems consolidation costs and employment-related costs. We continue to assess the magnitude of these costs, and additional unanticipated costs may be incurred related to the Merger and the integration of Tech Data and SYNNEX. Although we expect that the elimination of duplicative costs, as well as the realization of other efficiencies related to the integration of the businesses, should allow us to offset integration-related costs over time, this net benefit may not be achieved in the near term, or at all.
19
Risks Related to the Macro-Economic and Regulatory Environment
The widespread outbreak of an illness or any other communicable disease, or any other public health crisis, could adversely affect our business, results of operations and financial condition.
We could be negatively impacted by the widespread outbreak of an illness or any other communicable disease, or any other public health crisis that results in economic and trade disruptions, including the disruption of global supply chains. In December 2019, there was an outbreak of a new strain of coronavirus, COVID-19. On March 11, 2020, the World Health Organization characterized COVID-19 as a pandemic. The COVID-19 pandemic has negatively impacted the global economy, disrupted global supply chains and workforce participation due to “shelter-in-place” restrictions by various governments worldwide and created significant volatility and disruption of financial markets. More recently, the Delta and Omicron variants of the virus have contributed to a surge in COVID-19 cases globally and the full impact of the newly emerged Omicron variant has yet to be determined. The extent of the impact of the COVID-19 pandemic on our future operational and financial performance, including our ability to execute our business strategies and initiatives in the expected time frame, will depend on future developments, including the duration and spread of the pandemic and related restrictions on travel and transportation, the effect on our customers and demand for our products and services; our ability to sell and provide our products and services, including as a result of travel restrictions and people working remotely; the ability of our customers to pay for our solutions; any closures of our or our customers’ or partners’ offices and facilities; and the impact of governmental actions or mandates imposed in response to COVID-19, all of which are uncertain and cannot be predicted. An extended period of global supply chain and economic disruption could materially affect our business, our results of operations, our access to sources of liquidity, the carrying value of our goodwill and intangible assets, our financial condition and our stock price.
Changes in foreign currency exchange rates and limitations on the convertibility of foreign currencies could adversely affect our business and operating results.
Approximately 37%, 24% and 23% of our revenues in fiscal years 2021, 2020 and 2019, respectively, were generated outside the United States. Most of our international revenue, cost of revenue and operating expenses are denominated in foreign currencies. We presently have currency exposure arising from both sales and purchases denominated in foreign currencies. Changes in exchange rates between foreign currencies and the U.S. dollar may adversely affect our operating margins. For example, if these foreign currencies appreciate against the U.S. dollar, it will be more expensive in terms of U.S. dollars to purchase inventory or pay expenses with foreign currencies. This could have a negative impact on us if revenue related to these purchases is transacted in U.S. dollars. In addition, currency devaluation can result in products that we purchase in U.S. dollars being relatively more expensive to procure than products manufactured locally. Furthermore, our local competitors in certain markets may have different purchasing models that provide them reduced foreign currency exposure compared to us. This may result in market pricing that we cannot meet without significantly lower profit on sales.
We conduct hedging activities, which involve the use of currency forward or option contracts. Hedging foreign currencies can be risky. Certain of these hedge positions are undesignated hedges of balance sheet exposures, such as intercompany loans, and typically have maturities of less than one year. While we maintain policies to protect against fluctuations in currency exchange rates, extreme fluctuations may result in our incurring losses in some countries.
There is also additional risk if the currency is not freely or actively traded. Some currencies, such as the Chinese Renminbi are subject to limitations on conversion into other currencies, which can limit our ability to hedge or to otherwise react to rapid foreign currency devaluations. We cannot predict the impact of future exchange rate fluctuations on our business and operating results.
We do not use derivative financial instruments for speculative trading purposes, nor do we hedge our foreign currency exposure in a manner that entirely offsets the effects of changes in foreign exchange rates.
As a general rule, we do not use financial instruments to hedge local currency denominated operating expenses in countries where a natural hedge exists. For example, in many countries, revenue from the local currency services substantially offsets the local currency denominated operating expenses.
The translation of the financial statements of foreign operations into U.S. dollars is also impacted by fluctuations in foreign currency exchange rates, which may positively or negatively impact our results of operations. In addition, the value of our equity investment in foreign countries may fluctuate based upon changes in foreign currency exchange rates. These fluctuations, which are recorded in a cumulative translation adjustment account, may result in losses in the event a foreign subsidiary is sold or closed at a time when the foreign currency is weaker than when we made investments in the country. The realization of any or all of these risks could have a significant adverse effect on our financial results.
We rely on independent shipping companies for delivery of products, and price increases or service interruptions from these carriers could adversely affect our business and operating results.
We rely almost entirely on arrangements with independent shipping companies, such as FedEx and UPS, for the delivery of our products from OEM suppliers and delivery of products to reseller and retail customers. Freight and shipping charges can have a significant impact on our gross margin. As a result, an increase in freight surcharges due to rising fuel cost or general price increases
20
will have an immediate adverse effect on our margins, unless we are able to pass the increased charges to our reseller and retail customers or renegotiate terms with our OEM suppliers. In addition, in the past, carriers have experienced work stoppages due to labor negotiations with management. An increase in freight or shipping charges, the termination of our arrangements with one or more of these independent shipping companies, the failure or inability of one or more of these independent shipping companies to deliver products, or the unavailability of their shipping services, even temporarily, could have an adverse effect on our business and operating results.
Because we conduct substantial operations in China, risks associated with economic, political and social events in China could negatively affect our business and operating results.
A substantial portion of our IT systems operations, including a substantial portion of our IT systems support and software development operations, are located in China. In addition, we also conduct general and administrative activities from our facilities in China. Our operations in China are subject to a number of risks relating to China’s economic and political systems, including:
|
|
• |
a government controlled foreign exchange rate and limitations on the convertibility of the Chinese Renminbi; |
|
|
• |
extensive government regulation; |
|
|
• |
changing governmental policies relating to tax benefits available to foreign-owned businesses; |
|
|
• |
the telecommunications infrastructure; |
|
|
• |
a relatively uncertain legal system; and |
|
|
• |
uncertainties related to continued economic and social reform. |
Our IT systems are an important part of our global operations. Any significant interruption in service, whether resulting from any of the above uncertainties, natural disasters or otherwise, could result in delays in our inventory purchasing, errors in order fulfillment, reduced levels of customer service and other disruptions in operations, any of which could cause our business and operating results to suffer.
We may have higher than anticipated tax liabilities.
We conduct business globally and file income tax returns in various tax jurisdictions. Our effective tax rate could be adversely affected by several factors, many of which are outside of our control, including:
|
|
• |
changes in income before taxes in various jurisdictions in which we operate that have differing statutory tax rates; |
|
|
• |
changing tax laws, regulations, and/or interpretations of such tax laws in multiple jurisdictions; |
|
|
• |
effect of tax rate on accounting for acquisitions and dispositions; |
|
|
• |
issues arising from tax audit or examinations and any related interest or penalties; and |
|
|
• |
uncertainty in obtaining tax holiday extensions or expiration or loss of tax holidays in various jurisdictions. |
The Organization for Economic Cooperation and Development has been working on the Base Erosion and Profit Sharing Project, and has issued and will continue to issue, guidelines and proposals that may change various aspects of the existing framework under which our tax obligations are determined in many of the countries in which we do business. Certain countries are evaluating their tax policies and regulations, which could affect international business and may have an adverse effect on our overall tax rate, along with increasing the complexity, burden and cost of tax compliance. For example, on December 22, 2017, the U.S. federal government enacted the U.S. Tax Cuts and Jobs Act (“U.S. Tax Reform”) which significantly revised U.S. corporate income tax law by, among other things, reducing the U.S. federal corporate income tax rate from 35% to 21% and implementing a modified territorial tax system that included a one-time transition tax on deemed repatriated earnings of foreign subsidiaries. Additional changes in the U.S. tax regime or in how U.S. multinational corporations are taxed on foreign earnings, including changes in how existing tax laws are interpreted or enforced, could adversely affect our business, financial condition or results of operations.
We report our results of operations based on our determination of the amount of taxes owed in various tax jurisdictions in which we operate. The determination of our worldwide provision for income taxes and other tax liabilities requires estimation, judgment and calculations where the ultimate tax determination may not be certain. Our determination of tax liability is always subject to review or examination by tax authorities in various tax jurisdictions. Any adverse outcome of such review or examination could have a negative impact on our operating results and financial condition. The results from various tax examinations and audits may differ from the liabilities recorded in our financial statements and could adversely affect our financial results and cash flows.
21
Cyberattacks or the improper disclosure or control of personal information could result in liability and harm our reputation, which could adversely affect our business.
Our business is heavily dependent upon information technology networks and systems. Internal or external attacks on those networks and systems could disrupt our normal operations centers and impede our ability to provide critical products and services to our customers, subjecting us to liability under our contracts and damaging our reputation. Additionally, such attacks could compromise our intellectual property or result in fraud if our business emails are improperly accessed. For example, in the third quarter of 2021, the Company became aware that certain outside actors gained access to a limited portion of the Company’s networks and systems. After conducting a thorough review of the attack with a leading third-party cybersecurity firm, the Company determined that the attack did not access any material data.
Our business also involves the use, storage and transmission of information about our employees, and customers. If any person, including any of our employees, negligently disregards or intentionally breaches our established controls with respect to such data or otherwise mismanages or misappropriates that data, we could be subject to monetary damages, fines or criminal prosecution.
We have security controls for our systems and other security practices in place to protect the security of, and prevent unauthorized access to, our systems and personal and proprietary information, such as firewalls and anti-virus software, and we also provide information to our employees about the need to deploy security measures and the impact of doing so; however there can be no assurance that such security measures, will prevent improper access to our networks and systems, such as that which occurred earlier in 2021, or access to or disclosure of, personally identifiable or proprietary information.
We could also face legal, reputational and financial risks if we fail to protect customer and internal data from security breaches or cyberattacks.
Furthermore, data privacy is subject to frequently changing rules and regulations, which sometimes conflict among the various jurisdictions and countries in which we provide services. The General Data Protection Regulation (“GDPR”) in Europe, the California Consumer Privacy Act and other similar laws have resulted, and will continue to result, in increased compliance costs. Our failure to adhere to or successfully implement processes in response to these and other changing regulatory requirements in this area could result in legal liability or impairment to our reputation in the marketplace, which could have a material adverse effect on our business, financial condition and results of operations.
Global health and economic, political and social conditions may harm our ability to do business, increase our costs and negatively affect our stock price.
Worldwide economic conditions remain uncertain due to adverse consequences concerning the United States and China trade negotiations, market volatility as a result of political leadership in certain countries and other disruptions to global and regional economies and markets, including increases in inflation. External factors, such as potential terrorist attacks, acts of war, geopolitical and social turmoil or epidemics and other similar outbreaks in many parts of the world, could prevent or hinder our ability to do business, increase our costs and negatively affect our stock price. More generally, these geopolitical, social and economic conditions could result in increased volatility in the United States and worldwide financial markets and economy. For example, increased instability may enhance volatility in currency exchange rates, cause our customers or potential customers to delay or reduce spending on our products or services, and limit our suppliers’ access to credit. It could also adversely impact our ability to obtain adequate insurance at reasonable rates and may require us to incur increased costs for security measures for our domestic and international operations. We are predominantly uninsured for losses and interruptions caused by terrorism, acts of war and similar events. These uncertainties make it difficult for us and our suppliers and customers to accurately plan future business activities.
Part of our business is conducted outside of the United States, exposing us to additional risks that may not exist in the United States, which in turn could cause our business and operating results to suffer.
We have significant international operations and presence which subjects us to risks, including:
|
|
• |
political or economic instability; |
|
|
• |
extensive governmental regulation; |
|
|
• |
changes in import/export duties; |
|
|
• |
fluctuation in foreign currency exchange rates; |
|
|
• |
trade restrictions; |
|
|
• |
compliance with the Foreign Corrupt Practices Act, U.K. bribery laws and similar laws; |
|
|
• |
difficulties and costs of staffing and managing operations in certain foreign countries; |
22
|
|
• |
work stoppages or other changes in labor conditions; |
|
|
• |
minimum wage increases; |
|
|
• |
difficulties in collecting accounts receivable on a timely basis or at all; |
|
|
• |
taxes; and |
|
|
• |
seasonal reductions in business activity in some parts of the world. |
We may continue to expand internationally to respond to competitive pressure and customer and market requirements. Establishing operations in any foreign country or region presents risks such as those described above as well as risks specific to the particular country or region. In addition, until a payment history is established over time with customers in a new geography or region, the likelihood of collecting accounts receivable generated by such operations could be less than our expectations. As a result, there is a greater risk that reserves set with respect to the collection of such accounts receivable may be inadequate. Furthermore, if our international expansion efforts in any foreign country are unsuccessful, we may decide to cease operations, which would likely cause us to incur additional expense and loss.
In addition, changes in policies or laws of the United States or foreign governments resulting in, among other things, higher taxation, currency conversion limitations, restrictions on fund transfers or the expropriation of private enterprises, could reduce the anticipated benefits of our international expansion. Any actions by countries in which we conduct business to reverse policies that encourage foreign trade or investment could adversely affect our business. If we fail to realize the anticipated growth of our future international operations, our business and operating results could suffer.
Increasing attention on environmental, social and governance (ESG) matters may have a negative impact on our business, impose additional costs on us, and expose us to additional risks.
Companies are facing increasing attention from investors, customers, partners, consumers and other stakeholders relating to ESG matters, including environmental stewardship, social responsibility, diversity and inclusion, racial justice and workplace conduct. In addition, organizations that provide information to investors on corporate governance and related matters have developed ratings processes for evaluating companies on their approach to ESG matters. Such ratings are used by some investors to inform their investment and voting decisions. Unfavorable ESG ratings may lead to negative investor sentiment toward the Company, which could have a negative impact on our stock price and our access to and costs of capital.
We have established corporate social responsibility programs aligned with sound environmental, social and governance principles. These programs reflect our current initiatives and are not guarantees that we will be able to achieve them. Our ability to successfully execute these initiatives and accurately report our progress presents numerous operational, financial, legal, reputational and other risks, many of which are outside our control, and all of which could have a material negative impact on our business. Additionally, the implementation of these initiatives imposes additional costs on us. If our ESG initiatives fail to satisfy investors, customers, partners and our other stakeholders, our reputation, our ability to sell products and services to customers, our ability to attract or retain employees, and our attractiveness as an investment, business partner or acquirer could be negatively impacted. Similarly, our failure or perceived failure to pursue or fulfill our goals, targets and objectives or to satisfy various reporting standards within the timelines we announce, or at all, could also have similar negative impacts and expose us to government enforcement actions and private litigation.
If we are unable to maintain effective internal control over financial reporting, our ability to report our financial results on a timely and accurate basis may be adversely affected, which in turn could cause the market price of our common stock to decline.
Section 404 of the Sarbanes-Oxley Act of 2002 requires our management to report on, and our independent registered public accounting firm to attest to, the effectiveness of our internal control structure and procedures for financial reporting. We completed an evaluation of the effectiveness of our internal control over financial reporting for fiscal year 2021, and we have an ongoing program to perform the system and process evaluation and testing necessary to continue to comply with these requirements. However, internal control over financial reporting has inherent limitations, including human error, the possibility that controls could be circumvented or become inadequate because of changed conditions, and fraud. Because of the inherent limitations, misstatements due to error or fraud may occur and may not always be prevented or timely detected. We expect to continue to incur significant expenses and to devote management resources to Section 404 compliance, including impacts resulting from the Merger. In the event that our management or independent registered public accounting firm determines that there is a material weakness in our internal control over financial reporting, investor perceptions and our reputation may be adversely affected, and the market price of our stock could decline.
Changes to financial accounting standards may affect our results of operations and cause us to change our business practices.
We prepare our financial statements to conform to generally accepted accounting principles in the United States (“GAAP”). These accounting principles are subject to interpretation by the Financial Accounting Standards Board, American Institute of Certified
23
Public Accountants, the SEC and various bodies formed to interpret and create appropriate accounting policies. A change in those policies can have a significant effect on our reported results and may affect our reporting of transactions completed before a change is announced. Changes to those rules or the questioning of current practices may adversely affect our reported financial results or the way we conduct our business.
Item 1B. Unresolved Staff Comments
None.
Item 2. Properties
Our principal executive offices are located in Fremont, California and Clearwater, Florida. Our Fremont property is owned by us, while the Clearwater location is currently leased. We operate distribution, integration, contact center and administrative facilities in different countries.
We occupy 181 facilities covering approximately 14.7 million square feet, including warehouse, logistics and administrative facilities. We own approximately 2.7 million square feet of property and lease the remainder. Our facilities are located in the following principal markets: the Americas – 80, Europe – 68 and APJ – 33.
We have sublet unused portions of some of our facilities. We believe our facilities are well maintained and adequate for current and near future operating needs. Upon the expiration or termination of any of our leased facilities, we believe we could obtain comparable office space.
Item 3. Legal Proceedings
We are from time to time involved in legal proceedings in the ordinary course of business. We do not believe that these proceedings will have a material adverse effect on the results of our operations, our financial position or the cash flows of our business.
In addition, we have been involved in various bankruptcy preference actions where we were a supplier to the companies now in bankruptcy. These preference actions are filed by the bankruptcy trustee on behalf of the bankrupt estate and generally seek to have payments made by the debtor within 90 days prior to the bankruptcy returned to the bankruptcy estate for allocation among all of the bankruptcy estate’s creditors. We are not currently involved in any material preference proceedings.
The French Autorité de la Concurrence (“Competition Authority”) began in 2013 an investigation into the French market for certain products of Apple, Inc., (“Apple”) for which we are a distributor. In March 2020, the Competition Authority imposed fines on Tech Data, on another distributor, and on Apple, finding that Tech Data entered into an anticompetitive agreement with Apple regarding volume allocations of Apple products. The fine imposed on Tech Data was €76 million (approximately $86 million as of November 30, 2021). We have vigorously contested the arguments of the Competition Authority, and we have appealed its determination to the French courts, seeking to set aside or reduce the fine. Although we believe we have strong arguments on appeal, we have determined that the best estimate of probable loss related to this matter as of November 30, 2021 is €36 million (approximately $41 million as of November 30, 2021). Under French law, the pendency of our appeal does not suspend the obligation to pay the fine. Tech Data has agreed with French authorities to make eight equal installment payments in relation to the fine assessed for a total amount of €22.8 million on a quarterly basis from January 2021 through October 2022. As of November 30, 2021, we have an accrual established for this matter of €24.6 million ($27.7 million as of November 30, 2021) that represents the total estimate of probable loss less installment payments made to date. If the appeal process is not completed prior to the end of December 2022, we may be required to pay further amounts towards the full fine assessed by the Competition Authority before our appeal is finally determined. However, any additional amounts that may need to be paid have not yet been determined. Additionally, we have provided a third-party surety bond to the Competition Authority to guarantee the payment of the amount of the fine and interest, if applicable. A civil lawsuit related to this matter, alleging anticompetitive actions in association with the established distribution networks for Apple, Tech Data and another distributor was filed by eBizcuss. We are currently evaluating this matter and cannot currently estimate the probability or amount of any potential loss.
24
Item 4. Mine Safety Disclosures
Not applicable.
Information About our Executive Officers
The following table sets forth information regarding our executive officers as of November 30, 2021:
|
Name |
|
Age |
|
Position |
|
|
|
Richard Hume |
|
62 |
|
Chief Executive Officer |
||
|
Dennis Polk |
|
55 |
|
Head of Global Businesses & Integration Lead |
||
|
Michael Urban |
|
57 |
|
President, Americas |
||
|
Marshall Witt |
|
56 |
|
Chief Financial Officer |
||
|
Patrick Zammit |
|
55 |
|
President, Europe & APJ |
||
|
David Vetter |
|
62 |
|
Chief Legal Officer |
||
|
Simon Leung |
|
56 |
|
Chief Business Officer |
||
Richard Hume is our Chief Executive Officer. Mr. Hume joined Tech Data in March 2016 as Executive Vice President, Chief Operating Officer. In June 2018, Mr. Hume was appointed as Chief Executive Officer of Tech Data and in September 2021 in conjunction with the Merger he was appointed as Chief Executive Officer of TD SYNNEX. Prior to joining Tech Data, Mr. Hume was employed for more than thirty years at IBM. Most recently, from January 2015 to February 2016, Mr. Hume served as General Manager and Chief Operating Officer of Infrastructure and Outsourcing. Prior to that position, from January 2012 to January 2015, Mr. Hume served as General Manager, Europe where he led IBM’s multi-brand European organization. From 2008 to 2011, Mr. Hume served as General Manager, Global Business Partners, directing the growth and channel development initiatives for IBM’s Business Partner Channel. Mr. Hume holds a Bachelor of Science degree in Accounting from Pennsylvania State University.
Dennis Polk is our Executive Chair of the Board of Directors, Integration Lead, and Head of Global Businesses. Mr. Polk joined TD SYNNEX in 2002 and served as President and Chief Executive Officer of TD SYNNEX from March 2018 to August 2021. Prior to that position, he served as Chief Operating Officer, Chief Financial Officer and Senior Vice President of Corporate Finance of TD SYNNEX. In conjunction with the Merger in September 2021, Mr. Polk was appointed as Executive Chair of the Board of Directors.
Michael Urban is our President of the Americas. Mr. Urban joined TD SYNNEX in February 2019 and served as President, Worldwide Technology Solutions Distribution until the Merger. Prior to joining TD SYNNEX, Mr. Urban was Corporate Vice President of Strategy, Transformation, and Global Vendor Management of Tech Data from September 2012 until January 2019. Prior to Tech Data, Mr. Urban served in progressive leadership roles including Chairman and Chief Executive Officer at Actebis. Mr. Urban received a Bachelor of Science degree in Engineering from Paderborn University in Germany.
Marshall Witt is our Chief Financial Officer and has served in this capacity since April 2013. Prior to joining TD SYNNEX, Mr. Witt was Senior Vice President of Finance and Controller with FedEx Freight. During his fifteen year tenure with FedEx Corporation, Mr. Witt held progressive financial and operational roles. Prior to FedEx Corporation, he held accounting and finance leadership positions including five years with KPMG LLP as an audit manager for banking and transportation clients. Mr. Witt holds a Bachelor of Business Administration in Finance from Pacific Lutheran University and a Masters in Accounting from Seattle University and is a Certified Public Accountant.
Patrick Zammit is our President, Europe and APJ. Mr. Zammit joined Tech Data in February 2017 as President, Europe through Tech Data’s acquisition of Avnet’s Technology Solutions business and served in this capacity until the Merger in September 2021 when he also assumed the role of President, APJ. Prior to this role, Mr. Zammit was employed for more than twenty years at Avnet, Inc. From January 2015 to January 2017, Mr. Zammit served as Global President of Avnet Technology Solutions. Prior to that position, from October 2006 until January 2015, Mr. Zammit served as President of Avnet Electronics Marketing EMEA. From 1993 to 2006, Mr. Zammit served in management positions of increasing responsibilities. Prior to joining Avnet, Mr. Zammit was employed by Arthur Andersen from 1989 to 1993. Mr. Zammit holds a Masters in Business Administration equivalent from Paris Business School ESLSCA.
David Vetter is our Chief Legal Officer. Mr. Vetter joined Tech Data in June 1993 as Vice President, General Counsel and was promoted to Corporate Vice President, General Counsel in April 2000. In March 2003, he was promoted to Senior Vice President, and effective July 2003, was appointed Secretary. In January 2017, Mr. Vetter was promoted to Executive Vice President, Chief Legal Officer and in conjunction with the Merger in September 2021 he assumed this role for TD SYNNEX. Prior to joining Tech Data, Mr. Vetter was employed by the law firm of Robbins, Gaynor & Bronstein, P.A. from 1984 to 1993, most recently as a partner. Mr. Vetter is a member of the Florida Bar Association and holds Bachelor of Arts degrees in English and Economics from Bucknell University and a Juris Doctorate Degree from the University of Florida.
25
Simon Leung is our Chief Business Officer. Prior to this role, Mr. Leung serviced as Senior Vice President, General Counsel and Corporate Secretary for TD SYNNEX from May 2001 until the Merger in September 2021. Mr. Leung joined TD SYNNEX in November 2000 as Corporate Counsel. Prior to TD SYNNEX, Mr. Leung was an attorney at the law firm of Paul, Hastings, Janofsky & Walker LLP. Mr. Leung received a Bachelor of Arts degree from the University of California, Davis in International Relations and his Juris Doctor degree from the University of Minnesota Law School.
26
PART II
Item 5. Market for Registrant’s Common Equity, Related Stockholder Matters and Issuer Purchases of Equity Securities
Our common stock, par value $0.001, is traded on the New York Stock Exchange, or NYSE, under the symbol “SNX.”
As of January 21, 2022, our common stock was held by approximately 4,500 stockholders of record. Because many of the shares of our common stock are held by brokers and other institutions on behalf of stockholders, we are unable to estimate the total number of beneficial owners represented by these stockholders of record.
Stock Price Performance Graph
The stock price performance graph below, which assumes a $100 investment on November 30, 2016, compares our cumulative total stockholder return, the NYSE Composite Index, S&P Midcap 400 Index and Computer and Peripheral Equipment index for the period beginning November 30, 2016 through November 30, 2021. The Computer and Peripheral Equipment index is based on the Standard Industrial Classification Code 5045—Wholesale Computer and Computer Peripheral Equipment and Software. The closing price per share of our common stock was $103.46 on November 30, 2021. The comparisons in the table are required by the SEC and are not intended to forecast or be indicative of possible future performance of our common stock.
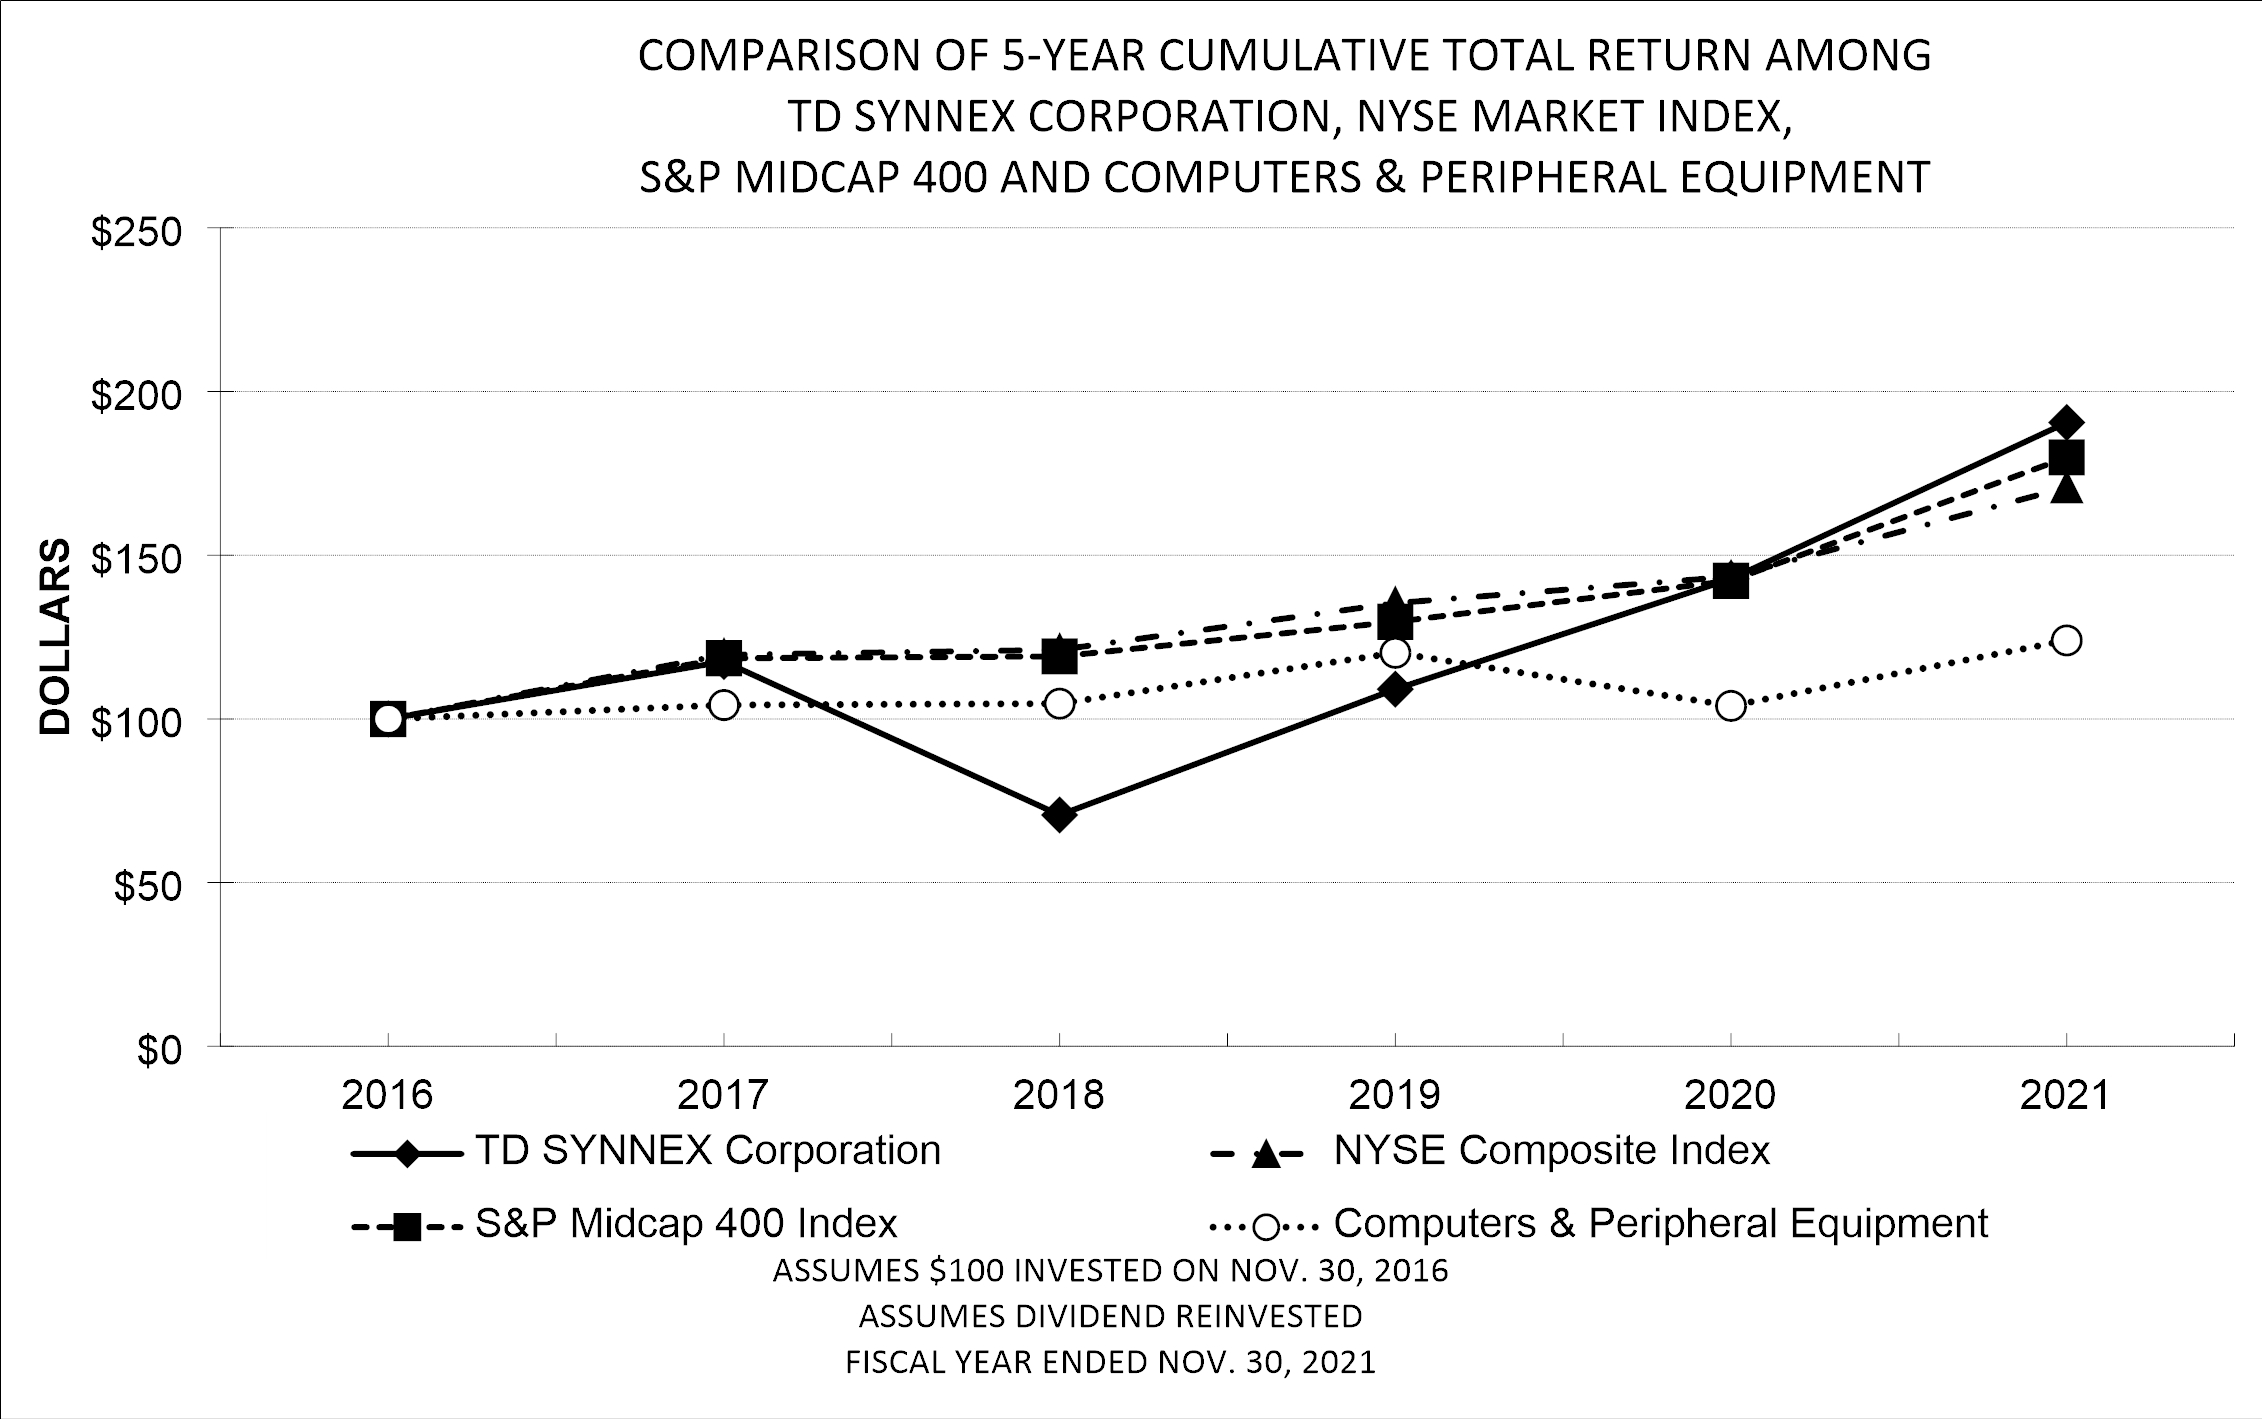
|
|
|
Fiscal Years Ended |
|
|||||||||||||||||||||
|
|
|
11/30/2016 |
|
|
11/30/2017 |
|
|
11/30/2018 |
|
|
11/30/2019 |
|
|
11/30/2020 |
|
|
11/30/2021 |
|
||||||
|
TD SYNNEX Corporation |
|
$ |
100.00 |
|
|
$ |
117.52 |
|
|
$ |
70.65 |
|
|
$ |
109.08 |
|
|
$ |
142.79 |
|
|
$ |
190.54 |
|
|
NYSE Composite Index |
|
$ |
100.00 |
|
|
$ |
119.59 |
|
|
$ |
121.11 |
|
|
$ |
135.38 |
|
|
$ |
143.45 |
|
|
$ |
170.70 |
|
|
S&P Midcap 400 Index |
|
$ |
100.00 |
|
|
$ |
118.53 |
|
|
$ |
119.10 |
|
|
$ |
129.65 |
|
|
$ |
142.23 |
|
|
$ |
179.88 |
|
|
Computers and Peripheral Equipment |
|
$ |
100.00 |
|
|
$ |
104.24 |
|
|
$ |
104.67 |
|
|
$ |
120.20 |
|
|
$ |
103.99 |
|
|
$ |
123.98 |
|
Securities Authorized for Issuance under Equity Compensation Plans
Information regarding the Securities Authorized for Issuance under Equity Compensation Plans can be found under Item 12 of this Report.
27
Dividends
On September 29, 2014, we announced the initiation of a quarterly cash dividend. Since then, dividends have been declared in January, March, June and September and paid at the end of January, April, July and October. On March 24, 2020, as a result of the unpredictable economic environment due to the impact of the COVID-19 pandemic, we announced the suspension of our quarterly dividend; however, on January 11, 2021, we announced the reinstatement of a quarterly cash dividend of $0.20 per share to stockholders of record as of January 22, 2021. Dividends declared per share by fiscal quarter in 2021 and 2020 were as follows:
|
|
|
Fiscal Years Ended November 30, |
|
|||||
|
|
|
2021 |
|
|
2020 |
|
||
|
First Quarter |
|
$ |
0.200 |
|
|
$ |
0.400 |
|
|
Second Quarter |
|
$ |
0.200 |
|
|
$ |
— |
|
|
Third Quarter |
|
$ |
0.200 |
|
|
$ |
— |
|
|
Fourth Quarter |
|
$ |
0.200 |
|
|
$ |
— |
|
On January 11, 2022, the Company announced a cash dividend of $0.30 per share to stockholders of record as of January 21, 2022, payable on January 28, 2022. Dividends are subject to continued capital availability and the declaration by our Board of Directors in the best interest of our stockholders.
Repurchases of Equity Securities
In June 2020, our Board of Directors authorized a three-year $400 million share repurchase program, effective July 1, 2020, pursuant to which we may repurchase our outstanding common stock from time to time in the open market or through privately negotiated transactions. As of November 30, 2021, we had not repurchased any shares under this program.
28
Item 6. [Reserved]
29
Item 7. Management’s Discussion and Analysis of Financial Condition and Results of Operations
For an understanding of TD SYNNEX and the significant factors that influenced our performance during the past three fiscal years, the following discussion and analysis of our financial condition and results of operations should be read in conjunction with the description of the business appearing in Item 1 of this Report and Item 8 Financial Statements and Supplementary Data included elsewhere in this Report. Amounts in certain tables appearing in this Report may not add or compute due to rounding.
In addition to historical information, the MD&A contains forward-looking statements that involve risks and uncertainties. These forward-looking statements include, but are not limited to, those matters discussed under the heading “Note Regarding Forward-looking Statements.” Our actual results could differ materially from those anticipated by these forward‑looking statements due to various factors, including, but not limited to, those set forth under Item 1A. Risk Factors of this Form 10-K and elsewhere in this document.
Overview
On December 1, 2020, we completed the previously announced separation of our customer experience services business (the “Separation”), which was accomplished by the distribution of one hundred percent of the outstanding common stock of Concentrix Corporation (“Concentrix”). Our stockholders received one share of Concentrix common stock for every share of our common stock held at the close of business on the record date. Concentrix is now an independent public company trading under the symbol “CNXC” on the Nasdaq Stock Market. After the Separation, we do not beneficially own any shares of Concentrix’ common stock and beginning December 1, 2020, we no longer consolidate Concentrix within our financial results or reflect the financial results of Concentrix within our continuing results of operations. We distributed a total of approximately 51.6 million shares of Concentrix common stock to our stockholders. In connection with the Separation, we entered into a separation and distribution agreement, as well as various other agreements with Concentrix that provide a framework for the relationships between the parties going forward, including among others an employee matters agreement, a tax matters agreement, and a commercial agreement, pursuant to which Concentrix has continued to provide services to us following the Separation.
The historical results of operations and financial position of Concentrix are reported as discontinued operations in our Consolidated Financial Statements. For further information on discontinued operations, see Note 5 - Discontinued Operations, to the Consolidated Financial Statements in Item 8.
On March 22, 2021, SYNNEX entered into an agreement and plan of merger (the “Merger Agreement”) which provided that legacy SYNNEX Corporation would acquire legacy Tech Data Corporation, a Florida corporation (“Tech Data”) through a series of mergers, which would result in Tech Data becoming an indirect subsidiary of TD SYNNEX Corporation. (collectively, the "Merger"). On September 1, 2021, pursuant to the terms of the Merger Agreement, we acquired all the outstanding shares of common stock of Tiger Parent (AP) Corporation, the parent corporation of Tech Data, for consideration of $1.61 billion in cash ($1.11 billion in cash after giving effect to a $500 million equity contribution by Tiger Parent Holdings, L.P., Tiger Parent (AP) Corporation’s sole stockholder and an affiliate of Apollo Global Management, Inc., to Tiger Parent (AP) Corporation prior to the effective time of the Merger) and 44 million shares of common stock of SYNNEX, valued at approximately $5.61 billion. See Note 3 – Acquisitions to the Consolidated Financial Statements for further information.
We previously had two reportable segments as of November 30, 2020: Technology Solutions and Concentrix. After giving effect to the Separation on December 1, 2020, we operated in a single reportable segment. After completion of the Merger, we reviewed our reportable segments as there was a change in our chief executive officer, who is also our chief operating decision maker. Our chief operating decision maker has a leadership structure aligned with the geographic locations of the Americas, Europe and Asia-Pacific and Japan (“APJ”) and reviews and allocates resources based on these geographic locations. As a result, as of September 1, 2021 we began operating in three reportable segments based on our geographic locations: the Americas, Europe and APJ. Our three reportable segments each generate revenues from products and services across our Endpoint Solutions and Advanced Solutions portfolios. Segment results for all prior periods have been restated for comparability to our current reportable segments. For financial information by segment, refer to Note 13 – Segment Information, to the Consolidated Financial Statements in Item 8. We have not presented information by reportable segment within the Management’s Discussion and Analysis of Financial Condition and Results of Operations due to the lack of comparability between periods resulting from the Merger on September 1, 2021.
Revenue and Cost of Revenue
We distribute peripherals, information technology (“IT”) systems including data center server and storage solutions, system components, software, networking, communications and security equipment, consumer electronics and complementary products. We also provide systems design and integration solutions.
In fiscal years 2021, 2020 and 2019 approximately 37%, 24% and 23% of our revenue, respectively, was generated from our international operations. As a result, our revenue growth has been impacted by fluctuations in foreign currency exchange rates.
The market for IT products is generally characterized by declining unit prices and short product life cycles. Our overall business is also highly competitive on the basis of price. We set our sales price based on the market supply and demand characteristics for each particular product or bundle of products we distribute and solutions we provide. We also participate in the incentive and rebate
30
programs of our OEM suppliers. These programs are important determinants of the final sales price we charge to our reseller customers. To mitigate the risk of declining prices and obsolescence of our distribution inventory, our OEM suppliers generally offer us limited price protection and return rights for products that are marked down or discontinued by them. We carefully manage our inventory to maximize the benefit to us of these supplier-provided protections.
A significant portion of our cost of revenue is the purchase price we pay our OEM suppliers for the products we sell, net of any incentives, rebates, price protection and purchase discounts received from our OEM suppliers. Cost of revenue also consists of provisions for inventory losses and write-downs, freight expenses associated with the receipt in and shipment out of our inventory, and royalties due to OEM vendors. In addition, cost of revenue includes the cost of material, labor and overhead for our systems design and integration solutions.
Margins
The IT distribution industry in which we operate is characterized by low gross profit as a percentage of revenue, or gross margin, and low income from operations as a percentage of revenue, or operating margin. Our gross margin has fluctuated annually due to changes in the mix of products we offer, customers we sell to, incentives and rebates received from our OEM suppliers, competition, seasonality, replacement of lower margin business, inventory obsolescence, and lower costs associated with increased efficiencies. Generally, when our revenue becomes more concentrated on limited products or customers, our gross margin tends to decrease due to increased pricing pressure from OEM suppliers or reseller customers. Our operating margin has also fluctuated in the past, based primarily on our ability to achieve economies of scale, the management of our operating expenses, changes in the relative mix of our revenue, and the timing of our acquisitions and investments.
Economic and Industry Trends
Our revenue is highly dependent on the end-market demand for IT products. This end-market demand is influenced by many factors including the introduction of new IT products and software by OEMs, replacement cycles for existing IT products, seasonality and overall economic growth and general business activity. A difficult and challenging economic environment may also lead to consolidation or decline in the IT distribution industry and increased price-based competition. Business in our system design and solutions is highly dependent on the demand for cloud infrastructure, and the number of key customers and suppliers in the market. Our business includes operations in the Americas, Europe and APJ, so we are affected by demand for our products in those regions and the strengthening or weakening of local currencies relative to the U.S. Dollar.
In December 2019, there was an outbreak of a new strain of coronavirus (“COVID-19”). In March 2020, the World Health Organization characterized COVID-19 as a pandemic. The COVID-19 pandemic has negatively impacted the global economy, disrupted global supply chains and workforce participation, including our own, and created significant volatility and disruption of financial markets. The disruptions due to COVID-19 have impacted our business including logistics operations in our business particularly during the second quarter of fiscal year 2020. We have successfully transitioned a significant portion of our workforce to a remote working environment and implemented a number of safety and social distancing measures within our premises to protect the health and safety of co-workers who are required to be on-premise to support our business. During the fiscal year ended November 30, 2020, we incurred net incremental costs associated with COVID-19 of approximately $45 million. Net incremental costs associated with COVID-19 were not material during the fiscal year ended November 30, 2021. We are unable to predict how long these conditions will persist, what additional measures may be introduced by governments, vendors or customers and the effect of any such additional measures on our business. As a result, many of the estimates and assumptions involved in the preparation of the financial statements included in this report on Form 10-K, required increased judgment and carry a higher degree of variability and volatility. As events continue to evolve with respect to the pandemic, our estimates may materially change in future periods.
Critical Accounting Policies and Estimates
The discussions and analysis of our consolidated financial condition and results of operations are based on our Consolidated Financial Statements, which have been prepared in conformity with GAAP. The preparation of these financial statements requires us to make estimates and assumptions that affect the reported amounts of assets and liabilities, disclosure of any contingent assets and liabilities at the financial statement date and reported amounts of revenue and expenses during the reporting period. On an ongoing basis, we review and evaluate our estimates and assumptions. Our estimates are based on our historical experience and a variety of other assumptions that we believe to be reasonable under the circumstances, the results of which form the basis for making our judgment about the carrying values of assets and liabilities that are not readily available from other sources. Actual results could differ from these estimates under different assumptions or conditions.
We believe the following critical accounting policies involve the more significant judgments, estimates and/or assumptions used in the preparation of our Consolidated Financial Statements.
Revenue Recognition.
We generate revenue primarily from the sale of various IT products.
31
We recognize revenues from the sale of IT hardware and software as control is transferred to customers, which is at the point in time when the product is shipped or delivered. We account for a contract with a customer when it has written approval, the contract is committed, the rights of the parties, including payment terms, are identified, the contract has commercial substance and consideration is probable of collection. Binding purchase orders from customers together with agreement to our terms and conditions of sale by way of an executed agreement or other signed documents are considered to be the contract with a customer. Products sold by us are delivered via shipment from our facilities, drop-shipment directly from the vendor, or by electronic delivery of software products. In situations where arrangements include customer acceptance provisions, revenue is recognized when we can objectively verify the products comply with specifications underlying acceptance and the customer has control of the products. Revenue is presented net of taxes collected from customers and remitted to government authorities. We generally invoice a customer upon shipment, or in accordance with specific contractual provisions. Payments are due as per contract terms and do not contain a significant financing component. Service revenues represents less than 10% of the total revenue for the periods presented.
Provisions for sales returns and allowances are estimated based on historical data and are recorded concurrently with the recognition of revenue. A liability is recorded at the time of sale for estimated product returns based upon historical experience and an asset is recognized for the amount expected to be recorded in inventory upon product return. These provisions are reviewed and adjusted periodically. Revenue is reduced for early payment discounts and volume incentive rebates offered to customers, which are considered variable consideration, at the time of sale based on an evaluation of the contract terms and historical experience.
We recognize revenue on a net basis on certain contracts, where our performance obligation is to arrange for the products or services to be provided by another party or the rendering of logistics services for the delivery of inventory for which we do not assume the risks and rewards of ownership, by recognizing the margins earned in revenue with no associated cost of revenue. Such arrangements include supplier service contracts, post-contract software support services and extended warranty contracts.
We consider shipping and handling activities as costs to fulfill the sale of products. Shipping revenue is included in revenue when control of the product is transferred to the customer, and the related shipping and handling costs are included in cost of revenue.
Business Combinations.
We allocate the fair value of purchase consideration to the assets acquired, liabilities assumed, and noncontrolling interests in the acquiree generally based on their fair values at the acquisition date. The excess of the fair value of purchase consideration over the fair value of these assets acquired, liabilities assumed and noncontrolling interests in the acquiree is recorded as goodwill and may involve engaging independent third-parties to perform an appraisal. When determining the fair values of assets acquired, liabilities assumed, and noncontrolling interests in the acquiree, we make significant estimates and assumptions, especially with respect to intangible assets. Critical estimates in valuing intangible assets include, but are not limited to, expected future cash flows, which includes consideration of future growth rates and margins, attrition rates, and discount rates. Fair value estimates are based on the assumptions we believe a market participant would use in pricing the asset or liability. Amounts recorded in a business combination may change during the measurement period, which is a period not to exceed one year from the date of acquisition, as additional information about conditions existing at the acquisition date becomes available.
Goodwill, intangible assets and long-lived assets
The values assigned to intangible assets include estimates and judgment regarding expectations for the length of customer relationships acquired in a business combination. Included within intangible assets is an indefinite lived trade names intangible asset. Indefinite lived intangible assets are tested for impairment annually and more frequently if events or changes in circumstances indicate that it is more likely than not that the asset is impaired. Other purchased intangible assets are amortized over the useful lives based on estimates of the use of the economic benefit of the asset or on the straight-line amortization method.
We allocate goodwill to reporting units based on the reporting unit expected to benefit from the business combination and test for impairment annually in the fourth quarter or more frequently if events or changes in circumstances indicate that it may be impaired. Goodwill is tested for impairment at the reporting unit level by first performing a qualitative assessment to determine whether it is more likely than not that the fair value of the reporting unit is less than its carrying value. The factors that are considered in the qualitative analysis include macroeconomic conditions, industry and market considerations, cost factors such as increases in product cost, labor, or other costs that would have a negative effect on earnings and cash flows; and other relevant entity-specific events and information.
If the reporting unit does not pass the qualitative assessment, then the reporting unit’s carrying value is compared to its fair value. The fair values of the reporting units are estimated using market and discounted cash flow approaches. The assumptions used in the market approach are based on the value of a business through an analysis of sales and other multiples of guideline companies and recent sales or offerings of a comparable entity. The assumptions used in the discounted cash flow approach are based on historical and forecasted revenue, operating costs, future economic conditions, and other relevant factors. Goodwill is considered impaired if the carrying value of the reporting unit exceeds its fair value and the excess is recognized as an impairment loss. No goodwill impairment has been identified for any of the years presented.
32
We review the recoverability of our long-lived assets, such as definite-lived intangible assets, property and equipment and certain other assets, when events or changes in circumstances occur that indicate the carrying value of the asset or asset group may not be recoverable. The assessment of possible impairment is based on our ability to recover the carrying value of the asset or asset group from the expected future pre-tax cash flows, undiscounted and without interest charges, of the related operations. If these cash flows are less than the carrying value of such assets, an impairment loss is recognized for the difference between estimated fair value and carrying value.
Income taxes
The asset and liability method is used in accounting for income taxes. Under this method, deferred tax assets and liabilities are recognized for the expected tax consequences of temporary differences between the tax bases of assets and liabilities and their reported amounts in the financial statements using enacted tax rates and laws that will be in effect when the difference is expected to reverse. Tax on global low-taxed intangible income is accounted for as a current expense in the period in which the income is includable in a tax return using the “period cost” method. Valuation allowances are provided against deferred tax assets that are not likely to be realized.
We recognize tax benefits from uncertain tax positions only if that tax position is more likely than not to be sustained on examination by the taxing authorities, based on the technical merits of the position. The tax benefits recognized in the financial statements from such positions are then measured based on the largest benefit that has a greater than 50% likelihood of being realized upon settlement. We recognize interest and penalties related to unrecognized tax benefits in the provision for income taxes.
Acquisitions
We continually seek to augment organic growth in our business with strategic acquisitions of businesses and assets that complement and expand our existing capabilities. We also divest businesses that we deem no longer strategic to our ongoing operations. In our business we seek to acquire new OEM relationships, enhance our supply chain and integration capabilities, the services we provide to our customers and OEM suppliers, and expand our geographic footprint.
Results of Operations
The following table sets forth, for the indicated periods, Consolidated Statement of Operations data as a percentage of revenue:
|
|
|
Fiscal Years Ended November 30, |
|
|||||||||
|
Statements of Operations Data: |
|
2021 |
|
|
2020 |
|
|
2019 |
|
|||
|
Revenue |
|
|
100.00 |
% |
|
|
100.00 |
% |
|
|
100.00 |
% |
|
Cost of revenue |
|
|
(94.02 |
)% |
|
|
(94.02 |
)% |
|
|
(93.93 |
)% |
|
Gross profit |
|
|
5.98 |
% |
|
|
5.98 |
% |
|
|
6.07 |
% |
|
Acquisition, integration and restructuring costs |
|
|
(0.35 |
)% |
|
|
(0.04 |
)% |
|
|
(0.01 |
)% |
|
Selling, general and administrative expenses |
|
|
(3.65 |
)% |
|
|
(3.33 |
)% |
|
|
(3.34 |
)% |
|
Operating income |
|
|
1.97 |
% |
|
|
2.61 |
% |
|
|
2.72 |
% |
|
Interest expense and finance charges, net |
|
|
(0.50 |
)% |
|
|
(0.40 |
)% |
|
|
(0.39 |
)% |
|
Other income (expense), net |
|
|
0.00 |
% |
|
|
(0.03 |
)% |
|
|
0.15 |
% |
|
Income from continuing operations before income taxes |
|
|
1.48 |
% |
|
|
2.18 |
% |
|
|
2.48 |
% |
|
Provision for income taxes |
|
|
(0.23 |
)% |
|
|
(0.51 |
)% |
|
|
(0.58 |
)% |
|
Income from continuing operations |
|
|
1.25 |
% |
|
|
1.67 |
% |
|
|
1.90 |
% |
|
Income from discontinued operations, net of taxes |
|
|
0.00 |
% |
|
|
0.97 |
% |
|
|
0.73 |
% |
|
Net income |
|
|
1.25 |
% |
|
|
2.65 |
% |
|
|
2.63 |
% |
The financial results of the former Concentrix business are presented as income from discontinued operations, net of taxes in the Consolidated Statement of Operations data.
Due to the ongoing impact of the COVID-19 pandemic, current results and financial condition discussed herein may not be indicative of future operating results and trends.
Certain non-GAAP financial information
In addition to disclosing financial results that are determined in accordance with GAAP, we also disclose certain non-GAAP financial information, including:
|
|
• |
Non-GAAP operating income, which is operating income, adjusted to exclude acquisition, integration and restructuring costs, amortization of intangible assets, share-based compensation expense and purchase accounting adjustments. |
33
|
|
• |
Non-GAAP operating margin, which is non-GAAP operating income, as defined above, divided by revenue. |
|
|
• |
Adjusted earnings before interest, taxes, depreciation and amortization (“Adjusted EBITDA”) which is net income before interest, taxes, depreciation and amortization, adjusted to exclude other income (expense), net, acquisition, integration and restructuring costs, share-based compensation expense, purchase accounting adjustments and income from discontinued operations, net of taxes. |
|
|
• |
Non-GAAP income from continuing operations, which is income from continuing operations, adjusted to exclude acquisition, integration and restructuring costs, amortization of intangible assets, share-based compensation expense, purchase accounting adjustments, contingent consideration, an acquisition-related contingent gain, income taxes related to the aforementioned items, as well as a capital loss carryback benefit. |
|
|
• |
Non-GAAP diluted earnings per common share (“EPS”) from continuing operations, which is diluted EPS from continuing operations excluding the per share impact of acquisition, integration and restructuring costs, amortization of intangible assets, share-based compensation expense, purchase accounting adjustments, contingent consideration, an acquisition-related contingent gain, income taxes related to the aforementioned items, as well as a capital loss carryback benefit. |
Acquisition, integration and restructuring costs typically consist of acquisition, integration, restructuring and divestiture related costs and are expensed as incurred. These expenses primarily represent professional services costs for legal, banking, consulting and advisory services, severance and other personnel related costs and debt extinguishment fees. From time to time, this category may also include transaction-related gains/losses on divestitures/spin-off of businesses, as well as various other costs associated with the acquisition or divestiture.
Our acquisition activities have resulted in the recognition of definite-lived intangible assets which consist primarily of customer relationships and lists and vendor lists. Definite-lived intangible assets are amortized over their estimated useful lives and are tested for impairment when events indicate that the carrying value may not be recoverable. The amortization of intangible assets is reflected in our statements of operations. Although intangible assets contribute to our revenue generation, the amortization of intangible assets does not directly relate to the sale of our products. Additionally, intangible asset amortization expense typically fluctuates based on the size and timing of our acquisition activity. Accordingly, we believe excluding the amortization of intangible assets, along with the other non-GAAP adjustments which neither relate to the ordinary course of our business nor reflect our underlying business performance, enhances our and our investors’ ability to compare our past financial performance with its current performance and to analyze underlying business performance and trends. Intangible asset amortization excluded from the related non-GAAP financial measure represents the entire amount recorded within our GAAP financial statements, and the revenue generated by the associated intangible assets has not been excluded from the related non-GAAP financial measure. Intangible asset amortization is excluded from the related non-GAAP financial measure because the amortization, unlike the related revenue, is not affected by operations of any particular period unless an intangible asset becomes impaired or the estimated useful life of an intangible asset is revised.
Share-based compensation expense is a non-cash expense arising from the grant of equity awards to employees based on the estimated fair value of those awards. Although share-based compensation is an important aspect of the compensation of our employees, the fair value of the share-based awards may bear little resemblance to the actual value realized upon the vesting or future exercise of the related share-based awards and the expense can vary significantly between periods as a result of the timing of grants of new stock-based awards, including grants in connection with acquisitions. Given the variety and timing of awards and the subjective assumptions that are necessary when calculating share-based compensation expense, we believe this additional information allows investors to make additional comparisons between our operating results from period to period.
Purchase accounting adjustments are primarily related to the impact of purchase accounting on the recognition of certain consideration received from vendors related to the Merger.
We believe that providing this additional information is useful to the reader to better assess and understand our base operating performance, especially when comparing results with previous periods and for planning and forecasting in future periods, primarily because management typically monitors the business adjusted for these items in addition to GAAP results. Management also uses these non-GAAP measures to establish operational goals and, in some cases, for measuring performance for compensation purposes. As these non-GAAP financial measures are not calculated in accordance with GAAP, they may not necessarily be comparable to similarly titled measures employed by other companies. These non-GAAP financial measures should not be considered in isolation or as a substitute for the comparable GAAP measures and should be used as a complement to, and in conjunction with, data presented in accordance with GAAP.
34
Non-GAAP Financial Information:
|
|
|
Fiscal Years Ended November 30, |
|
|||||||||
|
|
|
2021 |
|
|
2020 |
|
|
2019 |
|
|||
|
|
|
(in thousands, except per share amounts) |
|
|||||||||
|
Consolidated |
|
|
|
|
|
|
|
|
|
|
|
|
|
|
|
|
|
|
|
|
|
|
|
|
|
|
|
Operating income |
|
$ |
623,218 |
|
|
$ |
521,341 |
|
|
$ |
519,429 |
|
|
Acquisition, integration and restructuring costs |
|
|
112,150 |
|
|
|
7,414 |
|
|
|
981 |
|
|
Amortization of intangibles |
|
|
105,332 |
|
|
|
40,148 |
|
|
|
43,875 |
|
|
Share-based compensation |
|
|
33,078 |
|
|
|
17,631 |
|
|
|
17,608 |
|
|
Purchase accounting adjustments |
|
|
28,353 |
|
|
|
- |
|
|
|
- |
|
|
Non-GAAP operating income |
|
$ |
902,131 |
|
|
$ |
586,534 |
|
|
$ |
581,893 |
|
|
|
|
|
|
|
|
|
|
|
|
|
|
|
|
Operating margin |
|
|
1.97 |
% |
|
|
2.61 |
% |
|
|
2.72 |
% |
|
Non-GAAP operating margin |
|
|
2.85 |
% |
|
|
2.94 |
% |
|
|
3.05 |
% |
|
|
|
|
|
|
|
|
|
|
|
|
|
|
|
Net income |
|
$ |
395,069 |
|
|
$ |
529,160 |
|
|
$ |
500,712 |
|
|
Interest expense and finance charges, net |
|
|
157,835 |
|
|
|
79,023 |
|
|
|
74,225 |
|
|
Provision for income taxes |
|
|
71,416 |
|
|
|
101,609 |
|
|
|
111,113 |
|
|
Depreciation |
|
|
44,232 |
|
|
|
24,923 |
|
|
|
22,454 |
|
|
Amortization of intangibles |
|
|
105,332 |
|
|
|
40,148 |
|
|
|
43,875 |
|
|
EBITDA |
|
$ |
773,884 |
|
|
$ |
774,863 |
|
|
$ |
752,379 |
|
|
Other (income) expense, net |
|
|
(1,102 |
) |
|
|
6,172 |
|
|
|
(28,083 |
) |
|
Acquisition, integration and restructuring costs |
|
|
112,150 |
|
|
|
9,667 |
|
|
|
981 |
|
|
Share-based compensation |
|
|
33,078 |
|
|
|
17,631 |
|
|
|
17,608 |
|
|
Purchase accounting adjustments |
|
|
28,353 |
|
|
|
- |
|
|
|
- |
|
|
Income from discontinued operations, net of taxes |
|
|
- |
|
|
|
(194,622 |
) |
|
|
(138,538 |
) |
|
Adjusted EBITDA |
|
$ |
946,363 |
|
|
$ |
613,711 |
|
|
$ |
604,347 |
|
|
|
|
|
|
|
|
|
|
|
|
|
|
|
|
Income from continuing operations |
|
$ |
395,069 |
|
|
$ |
334,538 |
|
|
$ |
362,174 |
|
|
Acquisition, integration and restructuring costs |
|
|
159,194 |
|
|
|
9,667 |
|
|
|
981 |
|
|
Amortization of intangibles |
|
|
105,332 |
|
|
|
40,148 |
|
|
|
43,875 |
|
|
Share-based compensation |
|
|
33,078 |
|
|
|
17,631 |
|
|
|
17,608 |
|
|
Purchase accounting adjustments |
|
|
28,353 |
|
|
|
- |
|
|
|
- |
|
|
Contingent consideration |
|
|
- |
|
|
|
- |
|
|
|
(19,034 |
) |
|
Acquisition-related contingent gain |
|
|
- |
|
|
|
- |
|
|
|
(11,112 |
) |
|
Income taxes related to the above |
|
|
(80,375 |
) |
|
|
(19,557 |
) |
|
|
(11,284 |
) |
|
Income tax capital loss carryback benefit |
|
|
(44,968 |
) |
|
|
- |
|
|
|
- |
|
|
Non-GAAP income from continuing operations |
|
$ |
595,683 |
|
|
$ |
382,427 |
|
|
$ |
383,208 |
|
|
|
|
|
|
|
|
|
|
|
|
|
|
|
|
Diluted EPS from continuing operations |
|
$ |
6.24 |
|
|
$ |
6.46 |
|
|
$ |
7.05 |
|
|
Acquisition, integration and restructuring costs |
|
|
2.51 |
|
|
|
0.19 |
|
|
|
0.02 |
|
|
Amortization of intangibles |
|
|
1.66 |
|
|
|
0.78 |
|
|
|
0.85 |
|
|
Share-based compensation |
|
|
0.52 |
|
|
|
0.34 |
|
|
|
0.34 |
|
|
Purchase accounting adjustments |
|
|
0.45 |
|
|
|
— |
|
|
|
— |
|
|
Contingent consideration |
|
|
— |
|
|
|
— |
|
|
|
(0.37 |
) |
|
Acquisition-related contingent gain |
|
|
— |
|
|
|
— |
|
|
|
(0.22 |
) |
|
Income taxes related to the above |
|
|
(1.27 |
) |
|
|
(0.38 |
) |
|
|
(0.22 |
) |
|
Income tax capital loss carryback benefit |
|
|
(0.71 |
) |
|
|
- |
|
|
|
- |
|
|
Non-GAAP diluted EPS from continuing operations |
|
$ |
9.40 |
|
|
$ |
7.38 |
|
|
$ |
7.45 |
|
Fiscal Years Ended November 30, 2021, 2020 and 2019
Revenue
|
|
|
Fiscal Years Ended November 30, |
|
|
Percent Change |
|
||||||||||||||
|
|
|
2021 |
|
|
2020 |
|
|
2019 |
|
|
2021 to 2020 |
|
|
2020 to 2019 |
|
|||||
|
|
|
(in thousands) |
|
|
|
|
|
|
|
|||||||||||
|
Revenue |
|
$ |
31,614,169 |
|
|
$ |
19,977,150 |
|
|
$ |
19,069,970 |
|
|
|
58.3 |
% |
|
|
4.8 |
% |
35
We distribute a comprehensive range of products for the technology industry and design and integrate data center equipment. The prices of our products are highly dependent on the volumes purchased within a product category. The products we sell from one period to the next are often not comparable due to changes in product models, features and customer demand requirements.
Revenue increased in fiscal year 2021 compared to fiscal year 2020 primarily due to an increase in sales resulting from the Merger of approximately $10 billion as well as broad-based demand for technology equipment.
Revenue increased in fiscal year 2020 compared to fiscal year 2019 primarily due to a demand for technology equipment as COVID-19 related government mandated shelter-in-place restrictions during the second, third and fourth quarters of fiscal year 2020 led to increased needs for remote work, learn and consume related solutions. On a constant currency basis, revenue in our business increased by 4.8% during fiscal year 2020, compared to fiscal year 2019.
Gross Profit
|
|
|
Fiscal Years Ended November 30, |
|
|
Percent Change |
|
||||||||||||||
|
|
|
2021 |
|
|
2020 |
|
|
2019 |
|
|
2021 to 2020 |
|
|
2020 to 2019 |
|
|||||
|
|
|
(in thousands) |
|
|
|
|
|
|
|
|
|
|||||||||
|
Gross profit |
|
$ |
1,889,534 |
|
|
$ |
1,193,858 |
|
|
$ |
1,157,258 |
|
|
|
58.3 |
% |
|
|
3.2 |
% |
|
Gross margin |
|
|
5.98 |
% |
|
|
5.98 |
% |
|
|
6.07 |
% |
|
|
|
|
|
|
|
|
Our gross margin is affected by a variety of factors, including competition, selling prices, mix of products, product costs along with rebate and discount programs from our suppliers, reserves or settlement adjustments, freight costs, inventory losses and fluctuations in revenue.
Our gross profit increased in fiscal year 2021, as compared to the prior fiscal year, primarily driven by an increase in sales as a result of the Merger.
Our gross profit increased in fiscal year 2020, as compared to the prior fiscal year, primarily driven by strong demand for technology products as COVID-19 related government mandated shelter-in-place restrictions during the second, third and fourth quarters of fiscal year 2020 led to a greater need for remote work, learn and consume related solutions. This increase was partially offset by lower margins driven by product mix from our projects and integration-based server solutions.
Acquisition, Integration and Restructuring Costs
Acquisition, integration and restructuring costs are primarily comprised of costs related to the Merger, costs related to the Global Business Optimization 2 Program initiated by Tech Data prior to the Merger (the “GBO 2 Program”) and costs related to the Separation.
The Merger
We incurred acquisition, integration and restructuring costs related to the completion of the Merger, including professional services costs, personnel and other costs, an impairment of long-lived assets and stock-based compensation expense. Professional services costs are primarily comprised of legal expenses and tax and other consulting services. Personnel and other costs are primarily comprised of costs related to the settlement of certain outstanding long-term cash incentive awards for Tech Data upon closing of the Merger, retention and other bonuses, as well as severance costs. Impairment of long-lived assets relates to a charge of $22.2 million recorded for the write-off of capitalized costs associated with Tech Data’s tdONE program in conjunction with the decision to consolidate certain IT systems. Stock-based compensation expense primarily relates to costs associated with the conversion of certain Tech Data performance-based equity awards issued prior to the Merger into restricted stock units of TD SYNNEX (refer to Note 6 – Share-Based Compensation to the Consolidated Financial Statements for further information) and expenses for certain restricted stock awards issued in conjunction with the Merger.
To date, acquisition and integration expenses related to the Merger were composed of the following:
|
|
|
Year Ended November 30, |
|
|
|
|
|
2021 |
|
|
|
|
|
|
(in thousands) |
|
|
Professional services costs |
|
$ |
22,288 |
|
|
Personnel and other costs |
|
|
33,716 |
|
|
Impairment of long-lived assets |
|
|
22,166 |
|
|
Stock-based compensation |
|
|
20,113 |
|
|
Total |
|
$ |
98,283 |
|
|
|
|
|
|
|
36
GBO 2 Program
Prior to the Merger, Tech Data implemented its GBO 2 Program, that includes investments to optimize and standardize processes and apply data and analytics to be more agile in a rapidly evolving environment, increasing productivity, profitability and optimizing net-working capital. TD SYNNEX plans to continue this program in conjunction with the Company’s integration activities. Acquisition, integration and restructuring expenses related to the GBO 2 Program are primarily comprised of restructuring costs and other professional services costs. Restructuring costs are comprised of severance costs and other associated exit costs, including certain consulting costs. Other professional services costs are primarily comprised of professional services fees not related to restructuring activities, including costs related to improving profitability and optimizing net-working capital.
Acquisition, integration and restructuring costs under the GBO 2 Program for fiscal 2021 included the following:
|
|
|
Year Ended November 30, |
|
|
|
|
|
2021 |
|
|
|
|
|
|
(in thousands) |
|
|
Restructuring costs |
|
$ |
8,709 |
|
|
Other professional services costs |
|
|
5,158 |
|
|
Total |
|
$ |
13,867 |
|
|
|
|
|
|
|
Restructuring costs under the GBO 2 Program for fiscal 2021 were composed of the following:
|
|
|
Year Ended November 30, |
|
|
|
|
|
2021 |
|
|
|
|
|
|
(in thousands) |
|
|
Severance |
|
$ |
2,893 |
|
|
Other exit costs |
|
|
5,816 |
|
|
Total |
|
$ |
8,709 |
|
|
|
|
|
|
|
During fiscal 2021, we recorded restructuring costs related to GBO 2 of $2.7 million, $5.7 million and $0.3 million, for the Americas, Europe and APJ regions, respectively.
The Separation
During the fiscal year ended November 30, 2020, we incurred $7.4 million in transaction costs related to the Separation of Concentrix.
Selling, General and Administrative Expenses
|
|
|
Fiscal Years Ended November 30, |
|
|
Percent Change |
|
||||||||||||||
|
|
|
2021 |
|
|
2020 |
|
|
2019 |
|
|
2021 to 2020 |
|
|
2020 to 2019 |
|
|||||
|
|
|
(in thousands) |
|
|
|
|
|
|
|
|
|
|||||||||
|
Selling, general and administrative expenses |
|
$ |
1,154,166 |
|
|
$ |
665,102 |
|
|
$ |
636,849 |
|
|
|
73.5 |
% |
|
|
4.4 |
% |
|
Percentage of revenue |
|
|
3.65 |
% |
|
|
3.33 |
% |
|
|
3.34 |
% |
|
|
|
|
|
|
|
|
Our selling, general and administrative expenses consist primarily of personnel costs such as salaries, commissions, bonuses, share-based compensation and temporary personnel costs. Selling, general and administrative expenses also include cost of warehouses, delivery centers and other non-integration facilities, utility expenses, legal and professional fees, depreciation on certain of our capital equipment, bad debt expense, amortization of our intangible assets, and marketing expenses, offset in part by reimbursements from our OEM suppliers.
Selling, general and administrative expenses increased in fiscal year 2021, compared to fiscal year 2020, primarily due to an increase in employee related expenses resulting from the Merger and an increase in amortization of intangible assets acquired in connection with the Merger. Selling, general and administrative expenses increased as a percentage of revenue, compared to the prior year period, primarily due to the impact of the Merger.
Selling, general and administrative expenses increased in fiscal year 2020, compared to fiscal year 2019, primarily due to an increase in allowance for doubtful accounts and higher salaries and employee related expenses due to COVID-19. Incremental costs related to COVID-19 were approximately $33 million for fiscal year 2020. This increase was partially offset by a $3.7 million decrease in amortization of intangible assets. Our selling, general and administrative expenses as a percentage of revenue in fiscal year 2020, was consistent with the prior fiscal year.
37
Operating Income
|
|
|
Fiscal Years Ended November 30, |
|
|
Percent Change |
|
||||||||||||||
|
|
|
2021 |
|
|
2020 |
|
|
2019 |
|
|
2021 to 2020 |
|
|
2020 to 2019 |
|
|||||
|
|
|
(in thousands) |
|
|
|
|
|
|
|
|
|
|||||||||
|
Operating income |
|
$ |
623,218 |
|
|
$ |
521,341 |
|
|
$ |
519,429 |
|
|
|
19.5 |
% |
|
|
0.4 |
% |
|
Operating margin |
|
|
1.97 |
% |
|
|
2.61 |
% |
|
|
2.72 |
% |
|
|
|
|
|
|
|
|
Operating income increased during fiscal year 2021, compared to the prior year, primarily due to increased sales as a result of the Merger, partially offset by an increase in employee related expenses resulting from the Merger, an increase in acquisition, integration and restructuring costs and an increase in amortization of intangible assets acquired in connection with the Merger. Operating margin decreased due to an increase in employee related expenses resulting from the Merger, an increase in acquisition, integration and restructuring costs and an increase in amortization of intangible assets acquired in connection with the Merger.
Operating income increased during fiscal year 2020, compared to the prior year, primarily due to broad based growth, decreases in the amortization of intangible assets and transaction-related expenses. These increases were offset by the impact of COVID-19 related incremental costs associated with allowances for doubtful accounts and higher salary and employee related costs. Operating margin in our business decreased due to product mix.
Interest Expense and Finance Charges, Net
|
|
|
Fiscal Years Ended November 30, |
|
|
Percent Change |
|
||||||||||||||
|
|
|
2021 |
|
|
2020 |
|
|
2019 |
|
|
2021 to 2020 |
|
|
2020 to 2019 |
|
|||||
|
|
|
(in thousands) |
|
|
|
|
|
|
|
|
|
|||||||||
|
Interest expense and finance charges, net |
|
$ |
157,835 |
|
|
$ |
79,023 |
|
|
$ |
74,225 |
|
|
|
99.7 |
% |
|
|
6.5 |
% |
|
Percentage of revenue |
|
|
0.50 |
% |
|
|
0.40 |
% |
|
|
0.39 |
% |
|
|
|
|
|
|
|
|
Amounts recorded in interest expense and finance charges, net, consist primarily of interest expense paid on our Senior Notes (as defined below), our lines of credit and term loans and fees associated with the sale or pledge of accounts receivable through our securitization facilities, offset by income earned on our cash investments.
The increase in our interest expense and finance charges net, during the fiscal year 2021, compared to the prior year, was due to approximately $47 million of acquisition and integration related financing costs primarily related to a commitment for a bridge loan facility obtained in March 2021 which was terminated in conjunction with the Merger and an increase in interest expense related to the issuance of our Senior Notes and higher average outstanding borrowings.
The increase in our interest expense and finance charges net, during the fiscal year 2020, compared to the prior year, was primarily due to increased financing activities related to growth in the business and the planned Separation of Concentrix.
Other Income (Expense), Net
|
|
|
Fiscal Years Ended November 30, |
|
|
Percent Change |
|
||||||||||||||
|
|
|
2021 |
|
|
2020 |
|
|
2019 |
|
|
2021 to 2020 |
|
|
2020 to 2019 |
|
|||||
|
|
|
(in thousands) |
|
|
|
|
|
|
|
|
|
|||||||||
|
Other income (expense), net |
|
$ |
1,102 |
|
|
$ |
(6,172 |
) |
|
$ |
28,083 |
|
|
|
117.9 |
% |
|
|
-122.0 |
% |
|
Percentage of revenue |
|
|
0.00 |
% |
|
|
(0.03 |
)% |
|
|
0.15 |
% |
|
|
|
|
|
|
|
|
Amounts recorded as other income (expense), net include certain foreign currency transaction gains and losses, investment gains and losses, debt extinguishment gains and losses, and other non-operating gains and losses, such as settlements received from class actions lawsuits and realization of contingent assets.
Other income (expense), net increased during the fiscal year ended November 30, 2021, compared to the prior year, primarily due to a gain on sale of investment.
38
Other income (expense), net decreased during the fiscal year ended November 30, 2020, compared to the prior year, primarily due to a gain of $19.0 million upon the settlement of contingent consideration related to our acquisition of Westcon-Comstor Americas in an earlier year and a gain of $11.1 million recorded upon realization of contingent sales-tax assets related to the Westcon-Comstor Americas acquisition recorded in fiscal year 2019. In addition, other income (expense), net in fiscal year 2020 decreased compared to the prior year due to the write-off of $2.2 million of deferred financing costs associated with the $1.2 billion partial prepayment of our term loans on November 30, 2020 in preparation of the Separation on December 1, 2020.
Provision for Income Taxes
|
|
|
Fiscal Years Ended November 30, |
|
|
Percent Change |
|
||||||||||||||
|
|
|
2021 |
|
|
2020 |
|
|
2019 |
|
|
2021 to 2020 |
|
|
2020 to 2019 |
|
|||||
|
|
|
(in thousands) |
|
|
|
|
|
|
|
|
|
|||||||||
|
Provision for income taxes |
|
$ |
71,416 |
|
|
$ |
101,609 |
|
|
$ |
111,113 |
|
|
|
-29.7 |
% |
|
|
-8.6 |
% |
|
Percentage of income before income taxes |
|
|
15.31 |
% |
|
|
23.30 |
% |
|
|
23.48 |
% |
|
|
|
|
|
|
|
|
Income taxes consist of our current and deferred tax expense resulting from our income earned in domestic and foreign jurisdictions.
In connection with the Merger, the Company restructured its foreign financing structure, as well as select legal entities in anticipation of legally integrating legacy Tech Data and SYNNEX foreign operations. In addition to the treasury efficiencies, these restructurings resulted in a one-time domestic capital loss which would offset certain domestic capital gains when carried back under United States tax law to tax year 2020, resulting in a tax benefit of approximately $45 million. Our income tax expense decreased during the fiscal year ended November 30, 2021, as compared to the prior year, due to the capital loss carryback benefit, partially offset by an increase in income from continuing operations before income taxes. The effective tax rate for fiscal year 2021 was lower when compared to the prior year due to the capital loss carryback benefit.
Our income tax expense decreased during the fiscal year ended November 30, 2020, as compared to the prior year, due to the decrease in our effective tax rate. The effective tax rate for fiscal year 2020 was lower compared to the prior year, due to the benefit from the exercise of employee stock options and the reversal of a reserve for uncertain tax positions. The comparative decrease in the effective tax rate for fiscal year 2020 was partially offset by the favorable impact of a nontaxable contingent consideration gain recorded in the prior year period related to the fiscal year 2017 Westcon-Comstor Americas acquisition.
Discontinued Operations
|
|
|
Fiscal Years Ended November 30, |
|
|
Percent Change |
|
||||||||||||||
|
|
|
2021 |
|
|
2020 |
|
|
2019 |
|
|
2021 to 2020 |
|
|
2020 to 2019 |
|
|||||
|
|
|
(in thousands) |
|
|
|
|
|
|
|
|
|
|||||||||
|
Income from discontinued operations, net of taxes |
|
$ |
- |
|
|
$ |
194,622 |
|
|
$ |
138,538 |
|
|
|
-100.0 |
% |
|
|
40.5 |
% |
|
Percentage of revenue |
|
|
0.00 |
% |
|
|
0.97 |
% |
|
|
0.73 |
% |
|
|
|
|
|
|
|
|
Income from discontinued operations includes net income from Concentrix during the fiscal years ended November 30, 2020 and 2019, prior to the Separation on December 1, 2020.
See Note 5 - Discontinued Operations of the Consolidated Financial Statements included in Part II, Item 8 of this Annual Report for further details.
39
Liquidity and Capital Resources
Cash Conversion Cycle
|
|
|
|
|
Three Months Ended |
|
|||||||||
|
|
|
|
|
November 30, 2021 |
|
|
November 30, 2020 |
|
|
November 30, 2019 |
|
|||
|
|
|
|
|
(Amounts in thousands) |
|
|||||||||
|
Days sales outstanding ("DSO") |
|
|
|
|
|
|
|
|
|
|
|
|
|
|
|
Revenue |
|
(a) |
|
$ |
15,611,266 |
|
|
$ |
6,118,836 |
|
|
$ |
5,374,241 |
|
|
Accounts receivable, net |
|
(b) |
|
|
8,310,032 |
|
|
|
2,791,703 |
|
|
|
2,995,610 |
|
|
Days sales outstanding |
|
(c) = ((b)/(a))*the number of days during the period |
|
|
48 |
|
|
|
42 |
|
|
|
51 |
|
|
|
|
|
|
|
|
|
|
|
|
|
|
|
|
|
|
Days inventory outstanding ("DIO") |
|
|
|
|
|
|
|
|
|
|
|
|
|
|
|
Cost of revenue |
|
(d) |
|
$ |
14,668,096 |
|
|
$ |
5,752,179 |
|
|
$ |
5,036,301 |
|
|
Inventories |
|
(e) |
|
|
6,642,915 |
|
|
|
2,684,076 |
|
|
|
2,546,115 |
|
|
Days inventory outstanding |
|
(f) = ((e)/(d))*the number of days during the period |
|
|
41 |
|
|
|
42 |
|
|
|
46 |
|
|
|
|
|
|
|
|
|
|
|
|
|
|
|
|
|
|
Days payable outstanding ("DPO") |
|
|
|
|
|
|
|
|
|
|
|
|
|
|
|
Cost of revenue |
|
(g) |
|
$ |
14,668,096 |
|
|
$ |
5,752,179 |
|
|
$ |
5,036,301 |
|
|
Accounts payable |
|
(h) |
|
|
12,034,946 |
|
|
|
3,751,240 |
|
|
|
3,104,886 |
|
|
Days payable outstanding |
|
(i) = ((h)/(g))*the number of days during the period |
|
|
75 |
|
|
|
59 |
|
|
|
56 |
|
|
|
|
|
|
|
|
|
|
|
|
|
|
|
|
|
|
Cash conversion cycle ("CCC") |
|
(j) = (c)+(f)-(i) |
|
|
14 |
|
|
|
25 |
|
|
|
41 |
|
Cash Flows
Our business is working capital intensive. Our working capital needs are primarily to finance accounts receivable and inventory. We rely heavily on term loans, accounts receivable arrangements, our securitization programs, our revolver programs and trade credit from vendors for our working capital needs. We have financed our growth and cash needs to date primarily through cash generated from operations and financing activities. As a general rule, when sales volumes are increasing, our net investment in working capital dollars typically increases, which generally results in decreased cash flow generated from operating activities. Conversely, when sales volumes decrease, our net investment in working capital dollars typically decreases, which generally results in increases in cash flows generated from operating activities. We calculate CCC as days of the last fiscal quarter’s revenue outstanding in accounts receivable plus days of supply on hand in inventory, less days of the last fiscal quarter’s cost of revenue outstanding in accounts payable. Our CCC was 14 days, 25 days and 41 days at the end of fiscal years 2021, 2020 and 2019, respectively. The decrease in fiscal year 2021, compared to fiscal year 2020, was primarily due to our DPO, which was impacted by the timing of payments of accounts payable in our business including the impact of the Merger. The decrease in fiscal year 2020, compared to fiscal year 2019, was primarily due to efficient collections of accounts receivable and faster turnover of our inventories in the Company and the timing of payments of accounts payable in our business.
To increase our market share and better serve our customers, we may further expand our operations through investments or acquisitions. We expect that such expansion would require an initial investment in working capital, personnel, facilities and operations. These investments or acquisitions would likely be funded primarily by our existing cash and cash equivalents, additional borrowings, or the issuance of securities.
Our Consolidated Statements of Cash Flows include both continuing and discontinued operations. See Note 5 – Discontinued Operations of the Consolidated Financial Statements for further details.
Operating Activities
Net cash provided by operating activities was $810 million during fiscal year 2021, primarily due to net income and an increase in accounts payable due to the timing of payments, including the impact of the Merger. These cash inflows were partially offset by an increase in inventory and accounts receivable driven by growth in our business, including the impact of the Merger.
Net cash provided by operating activities was $1.834 billion during fiscal year 2020, primarily due to net income and cash inflows from an increase in accounts payable and changes in other operating assets and liabilities primarily reflecting efficient
40
working capital management in our business, and a decrease in DSO in our business of approximately 9 days from the end of fiscal year 2019 largely due to the impact of COVID-19. These items were partially offset by an increase in inventories driven by growth in our larger projects and integration-based server solutions.
Net cash provided by operating activities was $550 million during fiscal year 2019, primarily due to net income, an increase in accounts payable and a net change in other operating assets and liabilities. These cash inflows were partially offset by an increase in accounts receivable and receivables from vendors, and an increase in inventories. The increase in accounts receivable, including receivables from vendors, inventories and accounts payable was driven by growth in our business.
The significant components of our investing and financing cash flow activities are listed below.
Investing Activities
2021
|
|
• |
$907.1 million in net cash paid related to the Merger. |
|
|
• |
$54.9 million related to infrastructure investments. |
2020
|
|
• |
$198.0 million related to infrastructure investments. |
|
|
• |
$5.6 million of cash paid related to the settlement of employee stock-based awards assumed under the Convergys acquisition, being paid in accordance with the original vesting schedule. |
2019
|
|
• |
$137.4 million related to infrastructure investments. |
|
|
• |
$9.4 million of cash paid related to the settlement of employee stock-based awards assumed under the Convergys acquisition. |
Financing Activities
2021
|
|
• |
Proceeds of $2.5 billion for issuance of Senior Notes to finance the Merger. |
|
|
• |
Repayment of approximately $2.6 billion of debt of Tech Data paid off substantially concurrent with the closing of the Merger. |
|
|
• |
$149.9 million net transfer of cash and cash equivalents to Concentrix in connection with the Separation. |
|
|
• |
Dividends of $50.3 million paid. |
|
|
• |
Debt issuance costs of $42.3 million paid. |
2020
|
|
• |
Net repayments of $262.6 million under our borrowing arrangements. |
|
|
• |
Dividends of $20.8 million paid. |
2019
|
|
• |
Net repayments of $521.4 million under our borrowing arrangements. |
|
|
• |
$76.6 million of dividend payments. |
|
|
• |
$15.2 million of repurchases of our common stock. |
|
|
• |
$14.0 million in cash was used to pay contingent consideration related to our Westcon-Comstor Americas acquisition. |
41
We believe our current cash balances, cash flows from operations and credit availability are sufficient to support our operating activities for at least the next twelve months.
Capital Resources
Our cash and cash equivalents totaled $994.0 million and $1.4 billion as of November 30, 2021 and 2020, respectively. Our cash and cash equivalents held by international subsidiaries are no longer subject to U.S. federal tax on repatriation into the United States. Repatriation of some foreign balances is restricted by local laws. Historically, we have fully utilized and reinvested all foreign cash to fund our foreign operations and expansion. If in the future our intentions change, and we repatriate the cash back to the United States, we will report in our consolidated financial statements the impact of state and withholding taxes depending upon the planned timing and manner of such repatriation. Presently, we believe we have sufficient resources, cash flow and liquidity within the United States to fund current and expected future working capital, investment and other general corporate funding requirements.
We believe that our available cash and cash equivalents balances, the cash flows expected to be generated from operations and our existing sources of liquidity, will be sufficient to satisfy our current and planned working capital and investment needs, for the next twelve months in all geographies. We also believe that our longer-term working capital, planned capital expenditures, anticipated stock repurchases, dividend payments and other general corporate funding requirements will be satisfied through cash flows from operations and, to the extent necessary, from our borrowing facilities and future financial market activities.
Historically, we have renewed our accounts receivable securitization program and our parent company credit facilities on, or prior to, their respective expiration dates. We have no reason to believe that these and other arrangements will not be renewed or replaced as we continue to be in good credit standing with the participating financial institutions. We have had similar borrowing arrangements with various financial institutions throughout our years as a public company.
On-Balance Sheet Arrangements
TD SYNNEX United States accounts receivable securitization agreement
In the United States, we have an accounts receivable securitization program to provide additional capital for our operations (the “U.S. AR Arrangement”). Under the terms of the U.S. AR Arrangement, that, prior to the December 2021 amendment described below, was scheduled to expire in May 2022, our subsidiary that is the borrower under this facility could borrow up to a maximum of $650 million based upon eligible trade accounts receivable. The effective borrowing cost under the U.S. AR Arrangement was a blended rate based upon the composition of the lenders, that included prevailing dealer commercial paper rates and a rate based upon LIBOR. In addition, a program fee payable on the used portion of the lenders’ commitment, accrued at 1.25% per annum in the case of lender groups who funded their advances based on prevailing commercial paper rates, and 1.30% per annum in the case of lender groups who funded their advances based on LIBOR (subject to a 0.50% per annum floor). A facility fee was payable on the adjusted commitment of the lenders, to accrue at different tiers ranging between 0.35% per annum and 0.45% per annum depending on the amount of outstanding advances from time to time.
Under the terms of the U.S. AR Arrangement, we and certain of our U.S. subsidiaries sell, on a revolving basis, our receivables to a wholly-owned, bankruptcy-remote subsidiary. The borrowings are funded by pledging all of the rights, title and interest in the receivables acquired by our bankruptcy-remote subsidiary as security. Any amounts received under the U.S. AR Arrangement are recorded as debt on our Consolidated Balance Sheets.
On December 22, 2021, we and our subsidiaries that are party to the U.S. AR Arrangement amended the U.S. AR Arrangement to extend the maturity date to December 2024 and increase the lending commitment to $1.5 billion. Further, the effective borrowing cost under the U.S. AR Arrangement was also modified through adjustments to the (i) program fee payable on the used portion of the lenders’ commitment, which now accrues at 0.75% per annum and (ii) facility fee payable on the adjusted commitment of the lenders, which now accrues at different tiers ranging between 0.30% per annum and 0.40% per annum depending on the amount of outstanding advances from time to time.
42
SYNNEX United States credit agreement
Prior to the Merger, in the United States, we had a senior secured credit agreement (as amended, the "U.S. Credit Agreement") with a group of financial institutions. The U.S. Credit Agreement included a $600 million commitment for a revolving credit facility and a term loan in the original principal amount of $1.2 billion. Interest on borrowings under the U.S. Credit Agreement was based on LIBOR or a base rate at our option, plus a margin. The margin for LIBOR loans ranged from 1.25% to 2.00% and the margin for base rate loans ranged from 0.25% to 1.00%, provided that LIBOR was not less than zero. The base rate was a variable rate which was the highest of (a) the Federal Funds Rate, plus a margin of 0.5%, (b) the rate of interest announced, from time to time, by the agent, Bank of America, N.A., as its “prime rate,” and (c) the Eurodollar Rate, plus 1.0%. The unused revolving credit facility commitment fee ranged from 0.175% to 0.30% per annum. The margins above the applicable interest rates and the revolving commitment fee for revolving loans were based on our consolidated leverage ratio, as calculated under the U.S. Credit Agreement. Our obligations under the U.S. Credit Agreement were secured by substantially all of the parent company’s and our United States domestic subsidiaries’ assets on a pari passu basis with the interests of the lenders under the U.S. Term Loan Credit Agreement (defined below) pursuant to an intercreditor agreement and were guaranteed by certain of our United States domestic subsidiaries. The U.S. Credit Agreement was originally scheduled to mature in September 2022, however the U.S. Credit Agreement was terminated on September 1, 2021 and all outstanding balances were repaid in full as part of the Merger (see Note 3 – Acquisitions for further discussion).
SYNNEX United States term loan credit agreement
Prior to the Merger, in the United States we had a senior secured term loan credit agreement (the “U.S. Term Loan Credit Agreement”) with a group of financial institutions in the original principal amount of $1.8 billion. The remaining outstanding principal was payable on maturity. Interest on borrowings under the U.S. Term Loan Credit Agreement were based on LIBOR or a base rate at our option, plus a margin. The margin for LIBOR loans ranged from 1.25% to 1.75% and the margin for base rate loans ranged from 0.25% to 0.75%, provided that LIBOR was not less than zero. The base rate was a variable rate which was the highest of (a) 0.5% plus the greater of (x) the Federal Funds Rate in effect on such day and (y) the overnight bank funding rate in effect on such day, (b) the Eurodollar Rate plus 1.0% per annum, and (c) the rate of interest last quoted by The Wall Street Journal as the “Prime Rate” in the U.S. During the period in which the term loans were available to be drawn, we paid term loan commitment fees. The margins above our applicable interest rates and the term loan commitment fee were based on our consolidated leverage ratio as calculated under the U.S. Term Loan Credit Agreement. Our obligations under the U.S. Term Loan Credit Agreement were secured by substantially all of our and certain of our domestic subsidiaries’ assets on a pari passu basis with the interests of the lenders under the U.S. Credit Agreement pursuant to an intercreditor agreement, and were guaranteed by certain of our domestic subsidiaries. The U.S. Term Loan Credit Agreement was originally scheduled to mature in October 2023, however the U.S. Term Loan Credit Agreement was terminated on September 1, 2021 and all outstanding balances were repaid in full as part of the Merger (see Note 3 – Acquisitions for further discussion).
TD SYNNEX credit agreement
In connection with the Merger Agreement, we entered into a credit agreement, dated as of April 16, 2021 (the “TD SYNNEX Credit Agreement”) with the lenders party thereto and Citibank, N.A., as agent, pursuant to which we received commitments for the extension of a senior unsecured revolving credit facility not to exceed an aggregate principal amount of $3.5 billion, which revolving credit facility (the “TD SYNNEX revolving credit facility”) may, at our request but subject to the lenders’ discretion, potentially be increased by up to an aggregate amount of $500 million. The TD SYNNEX Credit Agreement also includes a senior unsecured term loan (the “TD SYNNEX term loan” and, together with the TD SYNNEX revolving credit facility, the “TD SYNNEX credit facilities”) in an aggregate principal amount of $1.5 billion, that was fully funded in connection with the closing of the Merger. The borrower under the TD SYNNEX credit facilities is the Company. There are no guarantors of the TD SYNNEX credit facilities. The maturity of the TD SYNNEX credit facilities is on the fifth anniversary of the September 2021 closing date, to occur in September 2026, subject in the case of the revolving credit facility, to two one-year extensions upon our prior notice to the lenders and the agreement of the lenders to extend such maturity date.
The outstanding principal amount of the TD SYNNEX term loan is payable in quarterly installments in an amount equal to 1.25% of the original $1.5 billion principal balance commencing on the last day of the first full fiscal quarter after the closing date of the TD SYNNEX credit facilities, with the outstanding principal amount of the term loans due in full on the maturity date. Loans borrowed under the TD SYNNEX Credit Agreement bear interest, in the case of LIBOR (or successor) rate loans, at a per annum rate equal to the applicable LIBOR (or successor) rate, plus the applicable margin, which may range from 1.125% to 1.75%, based on our public debt rating (as defined in the TD SYNNEX Credit Agreement). The applicable margin on base rate loans is 1.00% less than the corresponding margin on LIBOR (or successor rate) based loans. In addition to these borrowing rates, there is a commitment fee that ranges from 0.125% to 0.300% on any unused commitment under the TD SYNNEX revolving credit facility based on our public debt rating. As of November 30, 2021, the effective interest rate for the term loan was 1.49%.
The TD SYNNEX Credit Agreement contains various loan covenants that are customary for similar facilities for similarly rated borrowers that restrict our ability to take certain actions. The TD SYNNEX Credit Agreement also contains financial covenants that require compliance with a maximum debt to EBITDA ratio and a minimum interest coverage ratio, in each case tested on the last day of each fiscal quarter commencing with the first full fiscal quarter to occur after the closing date of the TD SYNNEX credit facilities.
43
The TD SYNNEX Credit Agreement also contains various customary events of default, including with respect to a change of control of the Company.
On March 22, 2021, we had entered into a debt commitment letter (the “Commitment Letter”), under which Citigroup Global Markets Inc. and certain other financing institutions joining thereto pursuant to the terms thereof committed to provide (i) a $1.5 billion senior unsecured term bridge facility (the "Term Loan A Bridge Facility"), (ii) a $2.5 billion senior unsecured term bridge facility (the “Bridge Facility”) and (iii) a $3.5 billion senior unsecured revolving bridge facility (the "Bridge Revolving Facility"), subject to the satisfaction of certain customary closing conditions. On April 16, 2021, (i) the $1.5 billion commitment with respect to the Term Loan A Bridge Facility under the Commitment Letter and (ii) the $3.5 billion commitment with respect to the Bridge Revolving Facility under the Commitment Letter were reduced to zero, in each case, as a result of us entering into the TD SYNNEX Credit Agreement; and on August 9, 2021 the Bridge Facility was reduced to zero as a result of the issuance of the TD SYNNEX Senior Notes described below.
TD SYNNEX Senior Notes
On August 9, 2021, we completed our offering of $2.5 billion aggregate principal amount of senior unsecured notes, consisting of $700.0 million of 1.25% senior notes due 2024, $700.0 million of 1.75% senior notes due 2026, $600.0 million of 2.375% senior notes due 2028, and $500.0 million of 2.65% senior notes due 2031 (collectively, the “Senior Notes,” and such offering, the “Senior Notes Offering”). We incurred $19.6 million towards issuance costs for the Senior Notes. We will pay interest semi-annually on the notes on each of February 9 and August 9, beginning February 9, 2022. The net proceeds from this offering were used to fund a portion of the aggregate cash consideration payable in connection with the Merger, refinance certain of our existing indebtedness and pay related fees and expenses and for general corporate purposes.
The interest rate payable on each series of the Senior Notes will be subject to adjustment from time to time if the credit rating assigned to such series of Senior Notes is downgraded (or downgraded and subsequently upgraded). We may redeem the Senior Notes, at any time in whole or from time to time in part, prior to (i) August 9, 2022 (the “2024 Par Call Date”) in the case of the 2024 Senior Notes, (ii) July 9, 2026 (the “2026 Par Call Date”) in the case of the 2026 Senior Notes, (iii) June 9, 2028 (the “2028 Par Call Date”) in the case of the 2028 Senior Notes, and (iv) May 9, 2031 in the case of the 2031 Senior Notes (the “2031 Par Call Date” and, together with the 2024 Par Call Date, the 2026 Par Call Date and the 2028 Par Call Date, each, a “Par Call Date” and together, the “Par Call Dates”), at a redemption price equal to the greater of (x) 100% of the aggregate principal amount of the applicable Senior Notes to be redeemed and (y) the sum of the present values of the remaining scheduled payments of the principal and interest on the Senior Notes, discounted to the date of redemption on a semi-annual basis at a rate equal to the sum of the applicable treasury rate plus 15 basis points for the 2024 Senior Notes, 20 basis points for the 2026 Senior Notes and 25 basis points for the 2028 Senior Notes and 2031 Senior Notes, plus in each case, accrued and unpaid interest thereon to, but excluding, the redemption date. We may also redeem the Senior Notes of any series at our option, at any time in whole or from time to time in part, on or after the applicable Par Call Date, at a redemption price equal to 100% of the principal amount of the Senior Notes to be redeemed.
Other borrowings and term debt
We have various other committed and uncommitted lines of credit with financial institutions at certain locations outside the United States, accounts receivable securitization arrangements, factoring of accounts receivable with recourse provisions, capital leases, a building mortgage, short-term loans, term loans, credit facilities, and book overdraft facilities, totaling approximately $635.5 million in borrowing capacity as of November 30, 2021. Most of these facilities are provided on an unsecured, short-term basis and are reviewed periodically for renewal. Interest rates and other terms of borrowing under these lines of credit vary by country, depending on local market conditions. There was $106.3 million outstanding on these facilities at November 30, 2021, at a weighted average interest rate of 4.59%, and there was $57.9 million outstanding at November 30, 2020, at a weighted average interest rate of 1.03%. Borrowings under these lines of credit facilities are guaranteed by the Company or secured by eligible accounts receivable.
At November 30, 2021, we were also contingently liable for reimbursement obligations with respect to issued standby letters of credit in the aggregate outstanding amount of $104.7 million. These letters of credit typically act as a guarantee of payment to certain third parties in accordance with specified terms and conditions.
The maximum commitment amounts for local currency credit facilities have been translated into United States Dollars at November 30, 2021 exchange rates.
Off-Balance Sheet Arrangements
We have financing programs under which trade accounts receivable owed by certain customers may be sold to financial institutions. Available capacity under these programs is dependent upon the level of our trade accounts receivable eligible to be sold into these programs and the financial institutions’ willingness to purchase such receivables. In addition, certain of these programs also require that we continue to service, administer and collect the sold accounts receivable. At November 30, 2021 and 2020, we had a total of $759.9 million and $21.4 million, respectively, of trade accounts receivable sold to and held by the financial institutions under
44
these programs. Discount fees for these programs in the years ended November 30, 2021, 2020 and 2019 totaled $4.7 million, $3.2 million and $2.3 million, respectively.
Covenant Compliance
Our credit facilities have a number of covenants and restrictions that require us to maintain specified financial ratios. They also limit our ability to incur additional debt, create liens, enter into agreements with affiliates, modify the nature of our business, and merge or consolidate. As of November 30, 2021, we were in compliance with all current and material covenants for the above arrangements.
Contractual Obligations
We are contingently liable under agreements, without expiration dates, to repurchase repossessed inventory acquired by flooring companies as a result of default on floor plan financing arrangements by our customers. There have been no material repurchases through November 30, 2021 under these agreements and we are not aware of any pending customer defaults or repossession obligations. As we do not have access to information regarding the amount of inventory purchased from us still on hand with the customer at any point in time, our repurchase obligations relating to inventory cannot be reasonably estimated. For more information on our third-party revolving short-term financing arrangements, see Note 2 – Summary of Significant Accounting Policies to the Consolidated Financial Statements included in Part II, Item 8 of this Report.
Related Party Transactions
We have a business relationship with MiTAC Holdings, a publicly-traded company in Taiwan, which began in 1992 when MiTAC Holdings became our primary investor through its affiliates. As of November 30, 2021 and 2020, MiTAC Holdings and its affiliates beneficially owned approximately 9.5% and 18% of our outstanding common stock, respectively. Mr. Matthew Miau, the Chairman Emeritus of our Board of Directors and a director, is the Chairman of MiTAC Holdings’ and a director or officer of MiTAC Holdings’ affiliates.
The shares owned by MiTAC Holdings are held by the following entities:
|
|
|
As of November 30, 2021 |
|
|
|
|
|
(shares in thousands) |
|
|
|
MiTAC Holdings(1) |
|
|
5,300 |
|
|
Synnex Technology International Corp.(2) |
|
|
3,860 |
|
|
Total |
|
|
9,160 |
|
|
|
(1) |
Shares are held via Silver Star Developments Ltd., a wholly-owned subsidiary of MiTAC Holdings. Excludes 192 shares held directly by Mr. Miau, 217 shares indirectly held by Mr. Miau through a charitable remainder trust, and 190 shares held by his spouse. |
|
|
(2) |
Synnex Technology International Corp. (“Synnex Technology International”) is a separate entity from us and is a publicly-traded corporation in Taiwan. Shares are held via Peer Development Ltd., a wholly-owned subsidiary of Synnex Technology International. MiTAC Holdings owns a noncontrolling interest of 14.1% in MiTAC Incorporated, a privately-held Taiwanese company, which in turn holds a noncontrolling interest of 15.7% in Synnex Technology International. Neither MiTAC Holdings nor Mr. Miau is affiliated with any person(s), entity, or entities that hold a majority interest in MiTAC Incorporated. |
We purchased inventories and services from MiTAC Holdings and its affiliates totaling $199.7 million, $211.9 million and $173.4 million during fiscal years 2021, 2020 and 2019, respectively. Our sales to MiTAC Holdings and its affiliates during fiscal years 2021, 2020 and 2019 totaled $0.6 million, $0.8 million and $0.8 million, respectively. In addition, we made payments of $0.2 million, $0.1 million and $41 thousand to MiTAC Holdings and its affiliates for reimbursement of rent and overhead costs for facilities used by us during the fiscal years ended November 30, 2021, 2020 and 2019, respectively.
Our business relationship with MiTAC Holdings and its affiliates has been informal and is generally not governed by long-term commitments or arrangements with respect to pricing terms, revenue or capacity commitments. We negotiate pricing and other material terms on a case-by-case basis with MiTAC Holdings. We have adopted a policy requiring that material transactions with MiTAC Holdings or its related parties be approved by our Audit Committee, which is composed solely of independent directors. In addition, Mr. Miau’s compensation is approved by the Nominating and Corporate Governance Committee, which is also composed solely of independent directors.
Synnex Technology International is a publicly-traded corporation in Taiwan that currently provides distribution and fulfillment services to various markets in Asia and Australia, and is also our competitor. MiTAC Holdings and its affiliates are not restricted from competing with us.
Recently Issued Accounting Pronouncements
For a summary of recent accounting pronouncements and the anticipated effects on our consolidated financial statements see Note 2 - Summary of Significant Accounting Policies to the Consolidated Financial Statements, which can be found under Item 8 of this Report.
45
Item 7A. Quantitative and Qualitative Disclosures about Market Risk
Foreign Currency Risk
We are exposed to foreign currency risk in the ordinary course of business. We manage cash flow exposures for our major countries and the foreign currency impact of assets and liabilities denominated in non-functional currencies using a combination of forward contracts. Principal currencies hedged are the Australian dollar, Brazilian real, British pound, Canadian dollar, Chinese yuan, Czech koruna, Danish krone, Euro, Indian rupee, Indonesian rupiah, Japanese yen, Mexican peso, Norwegian krone, Philippine peso, Polish zloty, Singapore dollar, Swedish krona and Swiss franc. We do not hold or issue derivative financial instruments for trading purposes.
In order to provide an assessment of our foreign currency exchange rate risk, we performed an analysis using a value-at-risk (“VaR”) model. The VaR model uses a Monte Carlo simulation to generate 1,000 random market price paths. The VaR model determines the potential impact of the fluctuation in foreign exchange rates assuming a one-day holding period, normal market conditions and a 95% confidence level. The model is not intended to represent actual losses but is used as a risk estimation and management tool. Firm commitments, assets and liabilities denominated in foreign currencies were excluded from the model. The estimated maximum potential one-day loss in fair value, calculated using the VaR model, would be approximately $3.8 million and $1.9 million at November 30, 2021 and 2020, respectively. We believe that the hypothetical loss in fair value of our foreign exchange derivatives would be offset by the gains in the value of the underlying transactions being hedged. Actual future gains and losses associated with our derivative positions may differ materially from the analyses performed as of November 30, 2021, due to the inherent limitations associated with predicting the changes in foreign currency exchange rates and our actual exposures and positions.
Interest Rate Risk
Our exposure to changes in interest rates relates primarily to our outstanding debt obligations which have floated relative to major interest rate benchmarks. We are most sensitive to fluctuations in U.S. interest rates, changes which affect the costs associated with hedging and interest paid on our debt.
To manage interest rate risk on the U.S. dollar-denominated floating-rate debt, we have entered into interest rate swaps with aggregate notional amounts of $1.5 billion and $1.6 billion as of November 30, 2021 and 2020 respectively, which effectively converted a portion of the floating rate debt to a fixed interest rate. All of our interest rate swaps as of November 30, 2021 are accounted for as cash flow hedges. A 15% variation in our interest rates would not have a material impact on the fair value of our swaps.
The following tables present hypothetical interest expense (after considering the impact of the above mentioned swaps) for the years ended November 30, 2021 and 2020, arising from hypothetical parallel shifts in the respective countries’ yield curves, of plus or minus 5%, 10% and 15% related to our outstanding borrowings with variable interest rates.
|
|
|
Interest Expense Given an Interest Rate Decrease by X Percent |
|
|
Actual Interest Expense Assuming No Change in Interest Rate |
|
|
Interest Expense Given an Interest Rate Increase by X Percent |
|
|||||||||||||||||||
|
(amounts in thousands) |
|
15% |
|
|
10% |
|
|
5% |
|
|
|
|
|
|
5% |
|
|
10% |
|
|
15% |
|
||||||
|
Total for the year ended November 30, 2021 |
|
$ |
145,711 |
|
|
$ |
146,064 |
|
|
$ |
146,415 |
|
|
$ |
146,768 |
|
|
$ |
147,121 |
|
|
$ |
147,472 |
|
|
$ |
147,825 |
|
|
Total for the year ended November 30, 2020 |
|
|
114,785 |
|
|
|
115,253 |
|
|
|
115,720 |
|
|
|
116,188 |
|
|
|
116,655 |
|
|
|
117,123 |
|
|
|
117,591 |
|
Equity Price Risk
The equity price risk associated with our marketable equity securities as of November 30, 2021 and 2020 is not material in relation to our consolidated financial position, results of operations or cash flows. Marketable equity securities include shares of common stock and are recorded at fair market value based on quoted market prices. Gains and losses on marketable equity securities are included in earnings.
46
Item 8.Financial Statements and Supplementary Data
INDEX
|
|
|
Page |
|
Consolidated Financial Statements of TD SYNNEX Corporation |
|
|
|
Management’s Report on Internal Control over Financial Reporting |
|
48 |
|
|
49 |
|
|
Consolidated Balance Sheets as of November 30, 2021 and 2020 |
|
52 |
|
Consolidated Statements of Operations for Fiscal Years Ended November 30, 2021, 2020 and 2019 |
|
53 |
|
|
54 |
|
|
|
55 |
|
|
Consolidated Statements of Cash Flows for Fiscal Years Ended November 30, 2021, 2020 and 2019 |
|
56 |
|
|
57 |
|
|
|
|
|
|
Financial Statement Schedule |
|
|
|
|
88 |
Financial statement schedules not listed above are either omitted because they are not applicable or the required information is shown in the Consolidated Financial Statements or in the Notes thereto.
47
Management’s Report on Internal Control over Financial Reporting
Our management is responsible for establishing and maintaining adequate internal control over financial reporting, as such term is defined in Exchange Act Rule 13a-15(f). Our internal control over financial reporting is designed to provide reasonable assurance regarding the reliability of financial reporting and the preparation of financial statements for external purposes in accordance with generally accepted accounting principles. Our internal control over financial reporting includes those policies and procedures that (i) pertain to the maintenance of records that, in reasonable detail, accurately and fairly reflect the transactions and dispositions of our assets; (ii) provide reasonable assurance that transactions are recorded as necessary to permit preparation of financial statements in accordance with generally accepted accounting principles, and that receipts and expenditures of ours are being made only in accordance with authorizations of management and directors; and (iii) provide reasonable assurance regarding prevention or timely detection of unauthorized acquisition, use or disposition of our assets that could have a material effect on the financial statements.
Because of its inherent limitations, internal control over financial reporting may not prevent or detect misstatements. Also, projections of any evaluation of effectiveness to future periods are subject to the risk that controls may become inadequate because of changes in conditions, or that the degree of compliance with the policies or procedures may deteriorate.
Our evaluation did not include the internal control over financial reporting of Tiger Parent (AP) Corporation, the parent company of Tech Data Corporation (“Tech Data”), which was acquired on September 1, 2021. Total assets and total revenue related to Tech Data excluded from our evaluation represented approximately 40% and 32%, respectively, of the related consolidated financial statement amounts as of and for the fiscal year ended November 30, 2021.
Under the supervision and with the participation of our management, including our principal executive officer and principal financial officer, we conducted an evaluation of the effectiveness of our internal control over financial reporting based on criteria established in Internal Control - Integrated Framework issued by the Committee of Sponsoring Organizations of the Treadway Commission (2013 framework). Based on this assessment, our management concludes that, as of November 30, 2021, our internal control over financial reporting was effective at the reasonable assurance level based on those criteria.
The effectiveness of our internal control over financial reporting as of November 30, 2021 has been audited by KPMG LLP, an independent registered public accounting firm, as stated in their report which appears on page 49 of this Report.
48
Report of Independent Registered Public Accounting Firm
To the Stockholders and Board of Directors
TD SYNNEX Corporation:
Opinions on the Consolidated Financial Statements and Internal Control Over Financial Reporting
We have audited the accompanying consolidated balance sheets of TD SYNNEX Corporation and subsidiaries (the Company) as of November 30, 2021 and 2020, the related consolidated statements of operations, comprehensive income, stockholders’ equity, and cash flows for each of the years in the three-year period ended November 30, 2021, and the related notes and financial statement Schedule II - Valuation and Qualifying Accounts (collectively, the consolidated financial statements). We also have audited the Company’s internal control over financial reporting as of November 30, 2021, based on criteria established in Internal Control – Integrated Framework issued by the Committee of Sponsoring Organizations of the Treadway Commission (2013 framework).
In our opinion, the consolidated financial statements referred to above present fairly, in all material respects, the financial position of the Company as of November 30, 2021 and 2020, and the results of its operations and its cash flows for each of the years in the three-year period ended November 30, 2021, in conformity with U.S. generally accepted accounting principles. Also in our opinion, the Company maintained, in all material respects, effective internal control over financial reporting as of November 30, 2021 based on criteria established in Internal Control – Integrated Framework issued by the Committee of Sponsoring Organizations of the Treadway Commission (2013 framework).
The Company acquired Tiger Parent (AP) Corporation during 2021, and management excluded from its assessment of the effectiveness of the Company’s internal control over financial reporting as of November 30, 2021, Tiger Parent (AP) Corporation’s internal control over financial reporting associated with 40% of total assets and 32% of total revenue included in the consolidated financial statements of the Company as of and for the year ended November 30, 2021. Our audit of internal control over financial reporting of the Company also excluded an evaluation of the internal control over financial reporting of Tiger Parent (AP) Corporation.
Change in Accounting Principle
As discussed in Note 2 to the consolidated financial statements, the Company changed its method of accounting for leases as of December 1, 2019 due to the adoption of Financial Accounting Standards Board’s Accounting Standards Codification Topic 842, Leases.
Basis for Opinions
The Company’s management is responsible for these consolidated financial statements, for maintaining effective internal control over financial reporting, and for its assessment of the effectiveness of internal control over financial reporting, included in the accompanying Management’s Report on Internal Control over Financial Reporting. Our responsibility is to express an opinion on the Company’s consolidated financial statements and an opinion on the Company’s internal control over financial reporting based on our audits. We are a public accounting firm registered with the Public Company Accounting Oversight Board (United States) (PCAOB) and are required to be independent with respect to the Company in accordance with the U.S. federal securities laws and the applicable rules and regulations of the Securities and Exchange Commission and the PCAOB.
We conducted our audits in accordance with the standards of the PCAOB. Those standards require that we plan and perform the audits to obtain reasonable assurance about whether the consolidated financial statements are free of material misstatement, whether due to error or fraud, and whether effective internal control over financial reporting was maintained in all material respects.
Our audits of the consolidated financial statements included performing procedures to assess the risks of material misstatement of the consolidated financial statements, whether due to error or fraud, and performing procedures that respond to those risks. Such procedures included examining, on a test basis, evidence regarding the amounts and disclosures in the consolidated financial statements. Our audits also included evaluating the accounting principles used and significant estimates made by management, as well as evaluating the overall presentation of the consolidated financial statements. Our audit of internal control over financial reporting included obtaining an understanding of internal control over financial reporting, assessing the risk that a material weakness exists, and testing and evaluating the design and operating effectiveness of internal control based on the assessed risk. Our audits also included performing such other procedures as we considered necessary in the circumstances. We believe that our audits provide a reasonable basis for our opinions.
Definition and Limitations of Internal Control Over Financial Reporting
A company’s internal control over financial reporting is a process designed to provide reasonable assurance regarding the reliability of financial reporting and the preparation of financial statements for external purposes in accordance with generally accepted accounting principles. A company’s internal control over financial reporting includes those policies and procedures that (1) pertain to the
49
maintenance of records that, in reasonable detail, accurately and fairly reflect the transactions and dispositions of the assets of the company; (2) provide reasonable assurance that transactions are recorded as necessary to permit preparation of financial statements in accordance with generally accepted accounting principles, and that receipts and expenditures of the company are being made only in accordance with authorizations of management and directors of the company; and (3) provide reasonable assurance regarding prevention or timely detection of unauthorized acquisition, use, or disposition of the company’s assets that could have a material effect on the financial statements.
Because of its inherent limitations, internal control over financial reporting may not prevent or detect misstatements. Also, projections of any evaluation of effectiveness to future periods are subject to the risk that controls may become inadequate because of changes in conditions, or that the degree of compliance with the policies or procedures may deteriorate.
Critical Audit Matters
The critical audit matters communicated below are matters arising from the current period audit of the consolidated financial statements that were communicated or required to be communicated to the audit committee and that: (1) relate to accounts or disclosures that are material to the consolidated financial statements and (2) involved our especially challenging, subjective, or complex judgments. The communication of critical audit matters does not alter in any way our opinion on the consolidated financial statements, taken as a whole, and we are not, by communicating the critical audit matters below, providing separate opinions on the critical audit matters or on the accounts or disclosures to which they relate.
Sufficiency of audit evidence over revenue
As discussed in Note 13 to the consolidated financial statements, and presented in the consolidated statements of operations, the Company reported revenue of $31,614,170 thousand for the fiscal year ended November 30, 2021.
We identified the evaluation of the sufficiency of audit evidence over revenue as a critical audit matter. The geographical dispersion of distribution and administrative facilities and employees providing revenue generating services required especially subjective auditor judgment in determining the nature and extent of procedures to perform and in evaluating those procedures.
The following are the primary procedures we performed to address this critical audit matter. We applied auditor judgment to determine the nature and extent of procedures to be performed over revenue, including the determination of the locations at which those procedures were to be performed. For certain locations we evaluated the design and tested the operating effectiveness of certain internal controls related to the recognition of revenue. For these locations, we then tested samples of revenue transactions during the year by comparing the amounts recognized by the Company to relevant underlying documentation such as contracts, shipping documents, or other third-party evidence. For other locations we performed a software-assisted analysis to test the relationships among revenues, trade receivables and cash. For these locations we also examined a sample of executed agreements, inspected cash receipts, and re-calculated revenue recognized. We investigated a selection of journal entries that were made by the Company to adjust revenue. We evaluated the sufficiency of the audit evidence obtained over revenue by assessing the results of the procedures performed, including the appropriateness of the determination of locations to perform procedures.
Fair value of acquired intangible assets
As discussed in Note 3 to the consolidated financial statements, on September 1, 2021, the Company acquired Tiger Parent (AP) Corporation (referenced herein as Tech Data) in a business combination. As a result of the transaction, the Company acquired a customer relationships intangible asset associated with the generation of future income from Tech Data’s existing customers and a trade name intangible asset associated with the value of the Tech Data brand name. The acquisition-date fair value of the customer relationships intangible asset and the trade name intangible asset was $3,860,200 thousand and $1,073,700 thousand, respectively, which included amounts related to the Americas and Europe reportable segments.
We identified the evaluation of the acquisition-date fair value measurement of the aforementioned intangible assets, specifically within the Americas and Europe reportable segments, as a critical audit matter. A high degree of subjective auditor judgment was required to evaluate certain assumptions within the discounted cash flow models used to estimate the acquisition-date fair value of these customer relationships and trade name intangible assets. The discounted cash flow models included the following assumptions for which there was limited observable market information, and the estimated fair value of the related intangible assets was sensitive to possible changes to these assumptions:
|
|
• |
revenue growth rates |
|
|
• |
customer attrition rates |
|
|
• |
discount rates. |
50
The following are the primary procedures we performed to address this critical audit matter. We evaluated the design and tested the operating effectiveness of certain internal controls related to the Company’s acquisition-date valuation process, including a control related to the development of market participant assumptions. We evaluated the Company’s forecasted revenue growth rates from existing Tech Data customers by comparing forecasted revenue growth assumptions to those of the Company’s peers and industry reports. We compared the Company’s estimates of forecasted revenue growth to Tech Data’s actual results to assess the Company’s ability to accurately forecast. We evaluated the relevance and reliability of the historical customer attrition rate through inquiries with Company management, reconciliation of revenue to audited financial statements and trend analysis. We compared the assumptions related to revenue growth rates and customer attrition rates to those of a market participant, including consideration of recent similar market transactions. In addition, we involved valuation professionals with specialized skills and knowledge, who assisted in:
|
|
• |
evaluating the customer attrition rates by comparing them to Tech Data’s historical customer attrition data |
|
|
• |
evaluating the discount rates by (i) comparing the inputs of the weighted average cost of capital to available market data for comparable entities and (ii) evaluating the reasonableness of the inputs and assumptions associated with the weighted average return on assets by assessing the methodology used by the Company and performing an independent analysis |
|
|
• |
testing the acquisition-date fair value of the customer relationships and the trade name intangible assets using the Company’s cash flow forecast and discount rate and comparing the results to the Company’s fair value estimate. |
/s/ KPMG LLP
We have served as the Company’s auditor since 2012.
Santa Clara, California
January 28, 2022
51
TD SYNNEX CORPORATION
CONSOLIDATED BALANCE SHEETS
(currency and share amounts in thousands, except par value)
|
|
|
November 30, 2021 |
|
|
November 30, 2020 |
|
||
|
ASSETS |
|
|
|
|
|
|
|
|
|
Current assets: |
|
|
|
|
|
|
|
|
|
Cash and cash equivalents |
|
$ |
|
|
|
$ |
|
|
|
Accounts receivable, net |
|
|
|
|
|
|
|
|
|
Receivables from vendors, net |
|
|
|
|
|
|
|
|
|
Inventories |
|
|
|
|
|
|
|
|
|
Other current assets |
|
|
|
|
|
|
|
|
|
Current assets of discontinued operations |
|
|
|
|
|
|
|
|
|
Total current assets |
|
|
|
|
|
|
|
|
|
Property and equipment, net |
|
|
|
|
|
|
|
|
|
Goodwill |
|
|
|
|
|
|
|
|
|
Intangible assets, net |
|
|
|
|
|
|
|
|
|
Other assets, net |
|
|
|
|
|
|
|
|
|
Noncurrent assets of discontinued operations |
|
|
|
|
|
|
|
|
|
Total assets |
|
$ |
|
|
|
$ |
|
|
|
|
|
|
|
|
|
|
|
|
|
LIABILITIES AND EQUITY |
|
|
|
|
|
|
|
|
|
Current liabilities: |
|
|
|
|
|
|
|
|
|
Borrowings, current |
|
$ |
|
|
|
$ |
|
|
|
Accounts payable |
|
|
|
|
|
|
|
|
|
Other accrued liabilities |
|
|
|
|
|
|
|
|
|
Current liabilities of discontinued operations |
|
|
|
|
|
|
|
|
|
Total current liabilities |
|
|
|
|
|
|
|
|
|
Long-term borrowings |
|
|
|
|
|
|
|
|
|
Other long-term liabilities |
|
|
|
|
|
|
|
|
|
Deferred tax liabilities |
|
|
|
|
|
|
|
|
|
Noncurrent liabilities of discontinued operations |
|
|
|
|
|
|
|
|
|
Total liabilities |
|
|
|
|
|
|
|
|
|
Commitments and contingencies (Note 18) |
|
|
|
|
|
|
|
|
|
Stockholders’ equity: |
|
|
|
|
|
|
|
|
|
Preferred stock, $ |
|
|
|
|
|
|
|
|
|
Common stock, $ |
|
|
|
|
|
|
|
|
|
Additional paid-in capital |
|
|
|
|
|
|
|
|
|
Treasury stock, |
|
|
( |
) |
|
|
( |
) |
|
Accumulated other comprehensive loss |
|
|
( |
) |
|
|
( |
) |
|
Retained earnings |
|
|
|
|
|
|
|
|
|
Total stockholders' equity |
|
|
|
|
|
|
|
|
|
Total liabilities and equity |
|
$ |
|
|
|
$ |
|
|
(Amounts may not add due to rounding)
The accompanying Notes are an integral part of these Consolidated Financial Statements.
52
TD SYNNEX CORPORATION
CONSOLIDATED STATEMENTS OF OPERATIONS
(currency and share amounts in thousands, except per share amounts)
|
|
|
Fiscal Years Ended November 30, |
|
|||||||||
|
|
|
2021 |
|
|
2020 |
|
|
2019 |
|
|||
|
Revenue |
|
$ |
|
|
|
$ |
|
|
|
$ |
|
|
|
Cost of revenue |
|
|
( |
) |
|
|
( |
) |
|
|
( |
) |
|
Gross profit |
|
|
|
|
|
|
|
|
|
|
|
|
|
Acquisition, integration and restructuring costs |
|
|
( |
) |
|
|
( |
) |
|
|
( |
) |
|
Selling, general and administrative expenses |
|
|
( |
) |
|
|
( |
) |
|
|
( |
) |
|
Operating income |
|
|
|
|
|
|
|
|
|
|
|
|
|
Interest expense and finance charges, net |
|
|
( |
) |
|
|
( |
) |
|
|
( |
) |
|
Other income (expense), net |
|
|
|
|
|
|
( |
) |
|
|
|
|
|
Income from continuing operations before income taxes |
|
|
|
|
|
|
|
|
|
|
|
|
|
Provision for income taxes |
|
|
( |
) |
|
|
( |
) |
|
|
( |
) |
|
Income from continuing operations |
|
|
|
|
|
|
|
|
|
|
|
|
|
Income from discontinued operations, net of taxes |
|
|
|
|
|
|
|
|
|
|
|
|
|
Net income |
|
$ |
|
|
|
$ |
|
|
|
$ |
|
|
|
Earnings per common share: |
|
|
|
|
|
|
|
|
|
|
|
|
|
Basic |
|
|
|
|
|
|
|
|
|
|
|
|
|
Continuing operations |
|
$ |
|
|
|
$ |
|
|
|
$ |
|
|
|
Discontinued operations |
|
|
|
|
|
|
|
|
|
|
|
|
|
Net income |
|
$ |
|
|
|
$ |
|
|
|
$ |
|
|
|
Diluted |
|
|
|
|
|
|
|
|
|
|
|
|
|
Continuing operations |
|
$ |
|
|
|
$ |
|
|
|
$ |
|
|
|
Discontinued operations |
|
|
|
|
|
|
|
|
|
|
|
|
|
Net income |
|
$ |
|
|
|
$ |
|
|
|
$ |
|
|
|
Weighted-average common shares outstanding: |
|
|
|
|
|
|
|
|
|
|
|
|
|
Basic |
|
|
|
|
|
|
|
|
|
|
|
|
|
Diluted |
|
|
|
|
|
|
|
|
|
|
|
|
(Amounts may not add due to rounding)
The accompanying Notes are an integral part of these Consolidated Financial Statements.
53
TD SYNNEX CORPORATION
CONSOLIDATED STATEMENTS OF COMPREHENSIVE INCOME
(currency in thousands)
|
|
|
Fiscal Years Ended November 30, |
|
|||||||||
|
|
|
2021 |
|
|
2020 |
|
|
2019 |
|
|||
|
Net income |
|
$ |
|
|
|
$ |
|
|
|
$ |
|
|
|
Other comprehensive income (loss): |
|
|
|
|
|
|
|
|
|
|
|
|
|
Change in unrealized losses of defined benefit plans, net of taxes of $ |
|
|
|
|
|
|
( |
) |
|
|
( |
) |
|
Reclassification of net (gains) losses to net income, net of tax of $ |
|
|
|
|
|
|
( |
) |
|
|
|
|
|
Total change in unrealized losses of defined benefit plans, net of taxes |
|
|
|
|
|
|
( |
) |
|
|
( |
) |
|
Unrealized gains (losses) on cash flow hedges during the period, net of tax (expense) benefit of ($ |
|
|
|
|
|
|
( |
) |
|
|
( |
) |
|
Reclassification of net (gains) losses on cash flow hedges to net income, net of tax (benefit) expense of ($ |
|
|
|
|
|
|
|
|
|
|
( |
) |
|
Total change in unrealized gains (losses) on cash flow hedges, net of taxes |
|
|
|
|
|
|
( |
) |
|
|
( |
) |
|
Foreign currency translation adjustments, net of tax (expense) benefit of ($ |
|
|
( |
) |
|
|
|
|
|
|
|
|
|
Other comprehensive income (loss) |
|
|
( |
) |
|
|
|
|
|
|
( |
) |
|
Comprehensive income |
|
$ |
|
|
|
$ |
|
|
|
$ |
|
|
(Amounts may not add due to rounding)
The accompanying Notes are an integral part of these Consolidated Financial Statements.
54
TD SYNNEX CORPORATION
CONSOLIDATED STATEMENTS OF STOCKHOLDERS’ EQUITY
(currency and share amounts in thousands)
|
|
|
Common stock |
|
|
|
|
|
|
Treasury stock |
|
|
|
|
|
|
|
|
|
|
|
|
|
||||||||||
|
|
|
Shares |
|
|
Amount |
|
|
Additional paid-in capital |
|
|
Shares |
|
|
Amount |
|
|
Accumulated other comprehensive income (loss) |
|
|
Retained earnings |
|
|
Total stockholders' equity |
|
||||||||
|
Balances, November 30, 2018 |
|
|
|
|
|
$ |
|
|
|
$ |
|
|
|
|
|
|
|
$ |
( |
) |
|
$ |
( |
) |
|
$ |
|
|
|
$ |
|
|
|
Share-based compensation |
|
|
— |
|
|
|
— |
|
|
|
|
|
|
|
— |
|
|
|
— |
|
|
|
— |
|
|
|
— |
|
|
|
|
|
|
Issuance of common stock on exercise of options, for employee stock purchase plan and vesting of restricted stock, net of shares withheld for employee taxes |
|
|
|
|
|
|
— |
|
|
|
|
|
|
|
|
|
|
|
( |
) |
|
|
— |
|
|
|
— |
|
|
|
( |
) |
|
Repurchases of common stock |
|
|
— |
|
|
|
— |
|
|
|
— |
|
|
|
|
|
|
|
( |
) |
|
|
— |
|
|
|
— |
|
|
|
( |
) |
|
Cash dividends declared |
|
|
— |
|
|
|
— |
|
|
|
— |
|
|
|
— |
|
|
|
— |
|
|
|
— |
|
|
|
( |
) |
|
|
( |
) |
|
Other comprehensive income (loss) |
|
|
— |
|
|
|
— |
|
|
|
— |
|
|
|
— |
|
|
|
— |
|
|
|
( |
) |
|
|
— |
|
|
|
( |
) |
|
Cumulative effect of changes in accounting principles |
|
|
— |
|
|
|
— |
|
|
|
— |
|
|
|
— |
|
|
|
— |
|
|
|
( |
) |
|
|
|
|
|
|
— |
|
|
Stock issuance costs (related to the Convergys acquisition in fiscal year 2018) |
|
|
— |
|
|
|
— |
|
|
|
( |
) |
|
|
— |
|
|
|
— |
|
|
|
— |
|
|
|
— |
|
|
|
( |
) |
|
Net income |
|
|
— |
|
|
|
— |
|
|
|
— |
|
|
|
— |
|
|
|
— |
|
|
|
— |
|
|
|
|
|
|
|
|
|
|
Balances, November 30, 2019 |
|
|
|
|
|
|
|
|
|
|
|
|
|
|
|
|
|
|
( |
) |
|
|
( |
) |
|
|
|
|
|
|
|
|
|
Share-based compensation |
|
|
— |
|
|
|
— |
|
|
|
|
|
|
|
— |
|
|
|
— |
|
|
|
— |
|
|
|
— |
|
|
|
|
|
|
Issuance of common stock on exercise of options, for employee stock purchase plan and vesting of restricted stock, net of shares withheld for employee taxes |
|
|
|
|
|
|
|
|
|
|
|
|
|
|
|
|
|
|
( |
) |
|
|
— |
|
|
|
— |
|
|
|
( |
) |
|
Repurchases of common stock |
|
|
— |
|
|
|
— |
|
|
|
— |
|
|
|
|
|
|
|
( |
) |
|
|
— |
|
|
|
— |
|
|
|
( |
) |
|
Cash dividends declared |
|
|
— |
|
|
|
— |
|
|
|
— |
|
|
|
— |
|
|
|
— |
|
|
|
— |
|
|
|
( |
) |
|
|
( |
) |
|
Other comprehensive income (loss) |
|
|
— |
|
|
|
— |
|
|
|
— |
|
|
|
— |
|
|
|
— |
|
|
|
|
|
|
|
— |
|
|
|
|
|
|
Net income |
|
|
— |
|
|
|
— |
|
|
|
— |
|
|
|
— |
|
|
|
— |
|
|
|
— |
|
|
|
|
|
|
|
|
|
|
Balances, November 30, 2020 |
|
|
|
|
|
|
|
|
|
|
|
|
|
|
|
|
|
|
( |
) |
|
|
( |
) |
|
|
|
|
|
|
|
|
|
Separation of Concentrix |
|
|
— |
|
|
|
— |
|
|
|
— |
|
|
|
— |
|
|
|
— |
|
|
|
|
|
|
|
( |
) |
|
|
( |
) |
|
Share-based compensation |
|
|
— |
|
|
|
— |
|
|
|
|
|
|
|
— |
|
|
|
— |
|
|
|
— |
|
|
|
— |
|
|
|
|
|
|
Issuance of common stock on exercise of options, for employee stock purchase plan and vesting of restricted stock, net of shares withheld for employee taxes |
|
|
|
|
|
|
— |
|
|
|
|
|
|
|
|
|
|
|
( |
) |
|
|
— |
|
|
|
— |
|
|
|
|
|
|
Cash dividends declared |
|
|
— |
|
|
|
— |
|
|
|
— |
|
|
|
— |
|
|
|
— |
|
|
|
— |
|
|
|
( |
) |
|
|
( |
) |
|
Other comprehensive income (loss) |
|
|
— |
|
|
|
— |
|
|
|
— |
|
|
|
— |
|
|
|
— |
|
|
|
( |
) |
|
|
— |
|
|
|
( |
) |
|
Issuance of common stock on Tech Data merger, net of issuance costs |
|
|
|
|
|
|
|
|
|
|
|
|
|
|
— |
|
|
|
— |
|
|
|
— |
|
|
|
— |
|
|
|
|
|
|
Net income |
|
|
— |
|
|
|
— |
|
|
|
— |
|
|
|
— |
|
|
|
— |
|
|
|
— |
|
|
|
|
|
|
|
|
|
|
Balances, November 30, 2021 |
|
|
|
|
|
$ |
|
|
|
$ |
|
|
|
|
|
|
|
$ |
( |
) |
|
$ |
( |
) |
|
$ |
|
|
|
$ |
|
|
(Amounts may not add due to rounding)
The accompanying Notes are an integral part of these Consolidated Financial Statements.
55
TD SYNNEX CORPORATION
CONSOLIDATED STATEMENTS OF CASH FLOWS
(currency in thousands)
|
|
|
Fiscal Years Ended November 30, |
|
|||||||||
|
|
|
2021 |
|
|
2020 |
|
|
2019 |
|
|||
|
Cash flows from operating activities: |
|
|
|
|
|
|
|
|
|
|
|
|
|
Net income |
|
$ |
|
|
|
$ |
|
|
|
$ |
|
|
|
Adjustments to reconcile net income to net cash provided by operating activities: |
|
|
|
|
|
|
|
|
|
|
|
|
|
Depreciation and amortization |
|
|
|
|
|
|
|
|
|
|
|
|
|
Share-based compensation |
|
|
|
|
|
|
|
|
|
|
|
|
|
Provision for doubtful accounts |
|
|
( |
) |
|
|
|
|
|
|
|
|
|
Deferred income taxes |
|
|
( |
) |
|
|
( |
) |
|
|
( |
) |
|
Contingent consideration |
|
|
|
|
|
|
|
|
|
|
( |
) |
|
Unrealized foreign exchange losses |
|
|
|
|
|
|
|
|
|
|
|
|
|
Impairment of long-lived assets |
|
|
|
|
|
|
|
|
|
|
|
|
|
Convertible debt conversion option fair value and extinguishment losses |
|
|
|
|
|
|
|
|
|
|
|
|
|
Other |
|
|
|
|
|
|
|
|
|
|
|
|
|
Changes in operating assets and liabilities, net of the impact of Concentrix separation and acquisition of businesses: |
|
|
|
|
|
|
|
|
|
|
|
|
|
Accounts receivable, net |
|
|
( |
) |
|
|
|
|
|
|
( |
) |
|
Receivables from vendors, net |
|
|
( |
) |
|
|
|
|
|
|
( |
) |
|
Inventories |
|
|
( |
) |
|
|
( |
) |
|
|
( |
) |
|
Accounts payable |
|
|
|
|
|
|
|
|
|
|
|
|
|
Other operating assets and liabilities |
|
|
( |
) |
|
|
|
|
|
|
|
|
|
Net cash provided by operating activities |
|
|
|
|
|
|
|
|
|
|
|
|
|
Cash flows from investing activities: |
|
|
|
|
|
|
|
|
|
|
|
|
|
Purchases of property and equipment |
|
|
( |
) |
|
|
( |
) |
|
|
( |
) |
|
Acquisition of businesses, net of cash acquired |
|
|
( |
) |
|
|
( |
) |
|
|
( |
) |
|
Other |
|
|
|
|
|
|
( |
) |
|
|
|
|
|
Net cash used in investing activities |
|
|
( |
) |
|
|
( |
) |
|
|
( |
) |
|
Cash flows from financing activities: |
|
|
|
|
|
|
|
|
|
|
|
|
|
Proceeds from borrowings |
|
|
|
|
|
|
|
|
|
|
|
|
|
Repayments of borrowings |
|
|
( |
) |
|
|
( |
) |
|
|
( |
) |
|
Dividends paid |
|
|
( |
) |
|
|
( |
) |
|
|
( |
) |
|
Increase (decrease) in book overdraft |
|
|
|
|
|
|
( |
) |
|
|
( |
) |
|
Repurchases of common stock |
|
|
|
|
|
|
( |
) |
|
|
( |
) |
|
Proceeds from issuance of common stock |
|
|
|
|
|
|
|
|
|
|
|
|
|
Repurchases of common stock for tax withholdings on equity awards |
|
|
( |
) |
|
|
( |
) |
|
|
( |
) |
|
Net transfer of cash and cash equivalents to Concentrix |
|
|
( |
) |
|
|
|
|
|
|
|
|
|
Settlement of contingent consideration |
|
|
|
|
|
|
|
|
|
|
( |
) |
|
Proceeds from issuance of Bonds |
|
|
|
|
|
|
|
|
|
|
|
|
|
Cash paid for debt issuance costs |
|
|
( |
) |
|
|
( |
) |
|
|
( |
) |
|
Other |
|
|
( |
) |
|
|
|
|
|
|
( |
) |
|
Net cash used in financing activities |
|
|
( |
) |
|
|
( |
) |
|
|
( |
) |
|
Effect of exchange rate changes on cash, cash equivalents and restricted cash |
|
|
( |
) |
|
|
|
|
|
|
( |
) |
|
Net (decrease) increase in cash, cash equivalents and restricted cash |
|
|
( |
) |
|
|
|
|
|
|
( |
) |
|
Cash, cash equivalents and restricted cash at beginning of year |
|
|
|
|
|
|
|
|
|
|
|
|
|
Cash, cash equivalents and restricted cash at end of year |
|
$ |
|
|
|
$ |
|
|
|
$ |
|
|
|
Supplemental disclosures of cash flow information: |
|
|
|
|
|
|
|
|
|
|
|
|
|
Interest paid on borrowings |
|
$ |
|
|
|
$ |
|
|
|
$ |
|
|
|
Income taxes paid |
|
$ |
|
|
|
$ |
|
|
|
$ |
|
|
|
Supplemental disclosure of non-cash investing and financing activities: |
|
|
|
|
|
|
|
|
|
|
|
|
|
Issuance of stock to acquire business |
|
$ |
|
|
|
|
|
|
|
|
|
|
|
Net assets transferred to Concentrix |
|
$ |
|
|
|
|
|
|
|
|
|
|
(Amounts may not add due to rounding)
The accompanying Notes are an integral part of these Consolidated Financial Statements.
56
TD SYNNEX CORPORATION
NOTES TO CONSOLIDATED FINANCIAL STATEMENTS
(currency and share amounts in thousands unless otherwise noted, except per share amounts)
NOTE 1—ORGANIZATION AND BASIS OF PRESENTATION:
TD SYNNEX Corporation (together with its subsidiaries, herein referred to as “SYNNEX”, “TD SYNNEX” or the “Company”) is a leading global provider of a comprehensive range of distribution, systems design and integration solutions for the technology industry, headquartered in Fremont, California and Clearwater, Florida and has operations in North and South America, Europe and Asia-Pacific and Japan.
On
The financial results of Concentrix for the years ended November 30, 2020 and 2019 are presented as income from discontinued operations, net of taxes on the Consolidated Statements of Operations and its assets and liabilities as of November 30, 2020 are presented as discontinued operations in the Consolidated Balance Sheets. The historical statements of comprehensive income, cash flows and the balances in stockholders' equity have not been revised to reflect the effect of the Separation. For further information on discontinued operations, see Note 5 – Discontinued Operations. Unless noted otherwise, discussion in the Notes to the Consolidated Financial Statements pertain to continuing operations.
In connection with the Separation, the Company and Concentrix have entered into a separation and distribution agreement as well as various other agreements that provide a framework for the relationships between the parties going forward, including among others an employee matters agreement, a tax matters agreement, and a commercial agreement, pursuant to which Concentrix will continue to provide services to SYNNEX following the Separation.
On March 22, 2021, SYNNEX entered into an agreement and plan of merger (the “Merger Agreement”) which provided that legacy SYNNEX Corporation would acquire legacy Tech Data Corporation, a Florida corporation (“Tech Data”) through a series of mergers, which would result in Tech Data becoming an indirect subsidiary of TD SYNNEX Corporation. (collectively, the "Merger"). On September 1, 2021, pursuant to the terms of the Merger Agreement, the Company acquired all the outstanding shares of common stock of Tiger Parent (AP) Corporation, the parent corporation of Tech Data, for consideration of $
Certain columns and rows may not add due to the use of rounded numbers.
NOTE 2—SUMMARY OF SIGNIFICANT ACCOUNTING POLICIES:
Use of estimates
The preparation of financial statements in conformity with generally accepted accounting principles (“GAAP”) in the United States requires management to make estimates and assumptions that affect the reported amounts of assets and liabilities, the disclosure of contingent assets and liabilities at the date of the financial statements, and the reported amounts of revenue and expense during the reporting period. The Company evaluates these estimates on a regular basis and bases them on historical experience and on various assumptions that the Company believes are reasonable. The COVID-19 pandemic has negatively impacted the global economy, disrupted global supply chains and work force participation and created volatility and disruption of financial markets, the impact of which was most acute during the second quarter of fiscal year 2020. Despite improvements in the global economy since the onset of the pandemic, the emergence of the Delta and Omicron variants and other mutations bring uncertainty to continued economic recovery. As a result, the Company cannot at this time accurately predict what effects these conditions will have on its operations and financial condition, including due to the uncertainties relating to the severity and duration of the pandemic, the effect on its customers and customer demand and the length of the restrictions and closures imposed by various governments. Consequently, many of the estimates and assumptions required increased judgment and carry a higher degree of variability and volatility. As events continue to
57
evolve and additional information becomes available, these estimates may change in future periods. Actual results could differ from the estimates.
Principles of consolidation
The Consolidated Financial Statements include the accounts of the Company, its wholly-owned subsidiaries, majority-owned subsidiaries in which no substantive participating rights are held by minority stockholders and variable interest entities if the Company is the primary beneficiary. All intercompany accounts and transactions have been eliminated.
The Consolidated Financial Statements include
Segment reporting
Operating segments are based on components of the Company that engage in business activity that earn revenue and incur expenses and (a) whose operating results are regularly reviewed by the Company’s chief operating decision maker to make decisions about resource allocation and performance and (b) for which discrete financial information is available.
Prior to the Separation, the Company had
Cash and cash equivalents
The Company considers all highly liquid debt instruments purchased with an original maturity or remaining maturity at the date of purchase of
Accounts receivable
The Company maintains an allowance for doubtful accounts as an estimate to cover the future expected credit losses resulting from uncertainty regarding collections from customers or original equipment manufacturer (“OEM”) vendors to make payments for outstanding balances. In estimating the required allowance, the Company takes into consideration historical credit losses, current conditions and reasonable and supportable forecasts. Adjustments to historical loss information are made for differences in current conditions as well as changes in forecasted macroeconomic conditions, such as changes in unemployment rates or gross domestic product growth. Expected credit losses are estimated on a pool basis when similar risk characteristics exist using an age-based reserve model. Receivables that do not share risk characteristics are evaluated on an individual basis.
The Company has uncommitted supply-chain financing programs with global financial institutions under which trade accounts receivable of certain customers and their affiliates may be acquired, without recourse, by the financial institutions. Available capacity under these programs is dependent on the level of the Company’s trade accounts receivable with these customers and the financial institutions’ willingness to purchase such receivables. In addition, certain of these programs also require that the Company continue to service, administer and collect the sold accounts receivable. As of November 30, 2021, and 2020, accounts receivable sold to and held by the financial institutions under these programs were $
Inventories
Inventories are stated at the lower of cost and net realizable value. Cost is computed based on the weighted-average method. Inventories are comprised of finished goods and work-in-process. Finished goods include products purchased for resale, system components purchased for both resale and for use in the Company’s systems design and integration business and completed systems. Work-in-process inventories are not material to the Consolidated Financial Statements.
58
Derivative Financial Instruments
The Company accounts for its derivative instruments as either assets or liabilities and carries them at fair value.
For derivative instruments that hedge the exposure to variability in expected future cash flows that are designated as cash flow hedges, the gain or loss on the derivative instrument is reported as a component of “Accumulated other comprehensive income (loss)” in stockholders’ equity and reclassified into earnings in the same line associated with the hedged transactions, in the same period or periods during which the hedged transaction affects earnings. To receive hedge accounting treatment, cash flow hedges must be highly effective in offsetting changes to expected future cash flows on hedged transactions.
For derivative instruments that are not designated as hedges, gains and losses resulting from changes in fair value on derivative instruments are reported in the Consolidated Statements of Operations in the current period.
Property and equipment
Property and equipment are stated at cost, less accumulated depreciation and amortization. Depreciation and amortization are computed using the straight-line method based upon the shorter of the estimated useful lives of the assets, or the lease term of the respective assets, if applicable. Maintenance and repairs are charged to expense as incurred, and improvements are capitalized. When assets are retired or otherwise disposed of, the cost and accumulated depreciation and amortization are removed from the accounts and any resulting gain or loss is reflected in operations in the period realized.
The Company’s capitalized software has been obtained or developed for internal use only. Development and acquisition costs are capitalized for computer software only when management authorizes and commits to funding a computer software project through the approval of a capital expenditure requisition, and the software project is either for the development of new software, to increase the life of existing software or to add significantly to the functionality of existing software. Once these requirements have been met, capitalization would begin at the point that conceptual formulation, evaluation, design and testing of possible software project alternatives have been completed. Capitalization ceases when the software project is substantially complete and ready for its intended use.
|
Equipment and Furniture |
|
|
|
Software |
|
|
|
Leasehold improvements |
|
|
|
Buildings and building improvements |
|
|
Business Combinations
The purchase price is allocated to the assets acquired, liabilities assumed, and noncontrolling interests in the acquired entity generally based on their fair values at the acquisition date. The excess of the fair value of purchase consideration over the fair value of these assets acquired, liabilities assumed and noncontrolling interests in the acquired entity is recorded as goodwill. The primary items that generate goodwill include the value of the synergies between the acquired entity and the Company and the value of the acquired assembled workforce, neither of which qualify for recognition as an intangible asset. Amounts recorded in a business combination may change during the measurement period, which is a period not to exceed one year from the date of acquisition, as additional information about conditions existing at the acquisition date becomes available. The Company includes the results of operations of the acquired business in the Consolidated Financial Statements prospectively from the date of acquisition. Acquisition-related charges are recognized separately from the business combination and are expensed as incurred. These charges primarily include direct third-party professional and legal fees, and integration-related costs.
Goodwill and intangible assets
The values assigned to intangible assets include estimates and judgment regarding expectations for the length of customer relationships acquired in a business combination. Included within intangible assets is an indefinite lived trade names intangible asset. Indefinite lived intangible assets are tested for impairment annually and more frequently if events or changes in circumstances indicate that it is more likely than not that the asset is impaired. Other purchased intangible assets are amortized over the useful lives based on estimates of the use of the economic benefit of the asset or on the straight-line amortization method.
The Company allocates goodwill to reporting units based on the reporting unit expected to benefit from the business combination and tests for impairment annually in the fourth quarter or more frequently if events or changes in circumstances indicate that it may be impaired. Goodwill is tested for impairment at the reporting unit level by first performing a qualitative assessment to determine whether it is more likely than not that the fair value of the reporting unit is less than its carrying value. The factors that are considered in the qualitative analysis include macroeconomic conditions, industry and market considerations, cost factors such as
59
increases in product cost, labor, or other costs that would have a negative effect on earnings and cash flows; and other relevant entity-specific events and information.
If the reporting unit does not pass the qualitative assessment, then the reporting unit’s carrying value is compared to its fair value. The fair values of the reporting units are estimated using market and discounted cash flow approaches. The assumptions used in the market approach are based on the value of a business through an analysis of sales and other multiples of guideline companies and recent sales or offerings of a comparable entity. The assumptions used in the discounted cash flow approach are based on historical and forecasted revenue, operating costs, future economic conditions, and other relevant factors. Goodwill is considered impaired if the carrying value of the reporting unit exceeds its fair value and the excess is recognized as an impairment loss.
Definite-lived intangible assets consist primarily of customer relationships and lists, vendor lists and other intangible assets. Amortization is based on the pattern in which the economic benefits of the intangible assets will be consumed or on a straight-line basis when the consumption pattern is not apparent over the following useful lives:
|
Customer relationships and lists |
|
|
|
Vendor lists |
|
|
|
Other intangible assets |
|
|
Impairment of long-lived assets
The Company reviews the recoverability of its long-lived assets, such as definite-lived intangible assets, property and equipment and certain other assets, when events or changes in circumstances occur that indicate the carrying value of the asset or asset group may not be recoverable. The assessment of possible impairment is based on the Company’s ability to recover the carrying value of the asset or asset group from the expected future pre-tax cash flows, undiscounted and without interest charges, of the related operations. If these cash flows are less than the carrying value of such assets, an impairment loss is recognized for the difference between estimated fair value and carrying value.
Leases
The Company enters into leases as a lessee for property and equipment in the ordinary course of business. When procuring goods or services, or upon entering into a contract with its customers, the Company determines whether an arrangement contains a lease at its inception. As part of that evaluation, the Company considers whether there is an implicitly or explicitly identified asset in the arrangement and whether the Company, as the lessee, or the customer, if the Company is the lessor, has the right to control the use of that asset. Effective December 1, 2019, when the Company is the lessee, all leases with a term of more than 12 months are recognized as right-of-use (“ROU”) assets and associated lease liabilities in the Consolidated Balance Sheet. Lease liabilities are recorded at the lease commencement date and determined using the present value of the lease payments not yet paid, at the Company’s incremental borrowing rate, which approximates the rate at which the Company would borrow on a secured basis in the country where the lease was executed. The interest rate implicit in the lease is generally not determinable in transactions where the Company is the lessee. The ROU asset equals the lease liability adjusted for any initial direct costs, prepaid rent and lease incentives. The Company’s variable lease payments generally relate to payments tied to various indexes, non-lease components and payments above a contractual minimum fixed amount.
Operating leases are included in other assets, net, other accrued liabilities and other long-term liabilities in the Consolidated Balance Sheet. Substantially all of the Company's leases are classified as operating leases and the Company’s finance leases are not material.
Concentration of credit risk
Financial instruments that potentially subject the Company to significant concentration of credit risk consist principally of cash and cash equivalents, accounts receivable, receivables from vendors and derivative instruments.
The Company’s cash and cash equivalents and derivative instruments are transacted and maintained with financial institutions with high credit standing, and their compositions and maturities are regularly monitored by management. Through November 30, 2021, the Company has not experienced any material credit losses on such deposits and derivative instruments.
Accounts receivable include amounts due from customers, including related party customers. Receivables from vendors, net, includes amounts due from OEM vendors primarily in the technology industry. The Company performs ongoing credit evaluations of its customers’ financial condition and limits the amount of credit extended when deemed necessary, but generally requires no collateral. The Company also maintains allowances for potential credit losses. In estimating the required allowances, the Company
60
takes into consideration the overall quality and aging of its receivable portfolio, the existence of credit insurance and specifically identified customer and vendor risks. The Company also considers risks attributed to COVID-19 in establishing the required allowances.
As of November 30, 2021, no single customer comprised more than 10% of the consolidated accounts receivable balance. As of November 30, 2020,
Book overdrafts
Book overdrafts, representing checks issued in excess of balances on deposit in the applicable bank accounts and which have not been paid by the applicable bank at the balance sheet date are classified as “Borrowings, current” in the Company’s Consolidated Balance Sheets. Under the terms of the Company’s banking arrangements, the respective financial institutions are not legally obligated to honor the book overdraft balances. The Company’s policy is to report the change in book overdrafts as a financing activity in the Consolidated Statements of Cash Flows.
Revenue recognition
The Company generates revenue primarily from the sale of various IT products.
The Company recognizes revenues from the sale of IT hardware and software as control is transferred to customers, which is at the point in time when the product is shipped or delivered. The Company accounts for a contract with a customer when it has written approval, the contract is committed, the rights of the parties, including payment terms, are identified, the contract has commercial substance and consideration is probable of collection. Binding purchase orders from customers together with agreement to the Company's terms and conditions of sale by way of an executed agreement or other signed documents are considered to be the contract with a customer. Products sold by the Company are delivered via shipment from the Company’s facilities, drop-shipment directly from the vendor, or by electronic delivery of software products. In situations where arrangements include customer acceptance provisions, revenue is recognized when the Company can objectively verify the products comply with specifications underlying acceptance and the customer has control of the products. Revenue is presented net of taxes collected from customers and remitted to government authorities. The Company generally invoices a customer upon shipment, or in accordance with specific contractual provisions. Payments are due as per contract terms and do not contain a significant financing component. Service revenues represents less than 10% of the total revenue for the periods presented.
Provisions for sales returns and allowances are estimated based on historical data and are recorded concurrently with the recognition of revenue. A liability is recorded at the time of sale for estimated product returns based upon historical experience and an asset is recognized for the amount expected to be recorded in inventory upon product return. These provisions are reviewed and adjusted periodically by the Company. Revenue is reduced for early payment discounts and volume incentive rebates offered to customers, which are considered variable consideration, at the time of sale based on an evaluation of the contract terms and historical experience.
The Company recognizes revenue on a net basis on certain contracts, where the Company’s performance obligation is to arrange for the products or services to be provided by another party or the rendering of logistics services for the delivery of inventory for which the Company does not assume the risks and rewards of ownership, by recognizing the margins earned in revenue with no associated cost of revenue. Such arrangements include supplier service contracts, post-contract software support services and extended warranty contracts.
The Company considers shipping and handling activities as costs to fulfill the sale of products. Shipping revenue is included in revenue when control of the product is transferred to the customer, and the related shipping and handling costs are included in cost of revenue.
The Company disaggregates its operating segment revenue by geography, which the Company believes provides a meaningful depiction of the nature of its revenue. Disaggregated revenue disclosure is presented in Note 13 – Segment Information.
Cost of Revenue
Cost of revenue includes the product price paid to OEM suppliers, net of any incentives, rebates, price protection and purchase discounts received from the OEM suppliers. Cost of revenue also consists of provisions for inventory losses and write-downs, shipping and handling costs and royalties due to OEM vendors. In addition, cost of revenue includes the cost of materials, labor and overhead and warranty for design and integration activities.
61
Selling, General and Administrative expenses
Selling, general and administrative expenses are charged to income as incurred. Expenses of promoting and selling products and services are classified as selling expense and include such items as compensation, sales commissions and travel. General and administrative expenses include such items as compensation, cost of warehouse, delivery centers and other non-integration facilities, legal and professional costs, office supplies, non-income taxes, insurance and utility expenses. In addition, selling, general and administrative expenses include other operating items such as allowances for credit losses, depreciation and amortization of intangible assets.
OEM supplier programs
Funds received from OEM suppliers for volume promotion programs, price protection and product rebates are recorded as adjustments to cost of revenue and/or the carrying value of inventories, as appropriate. Where there is a binding agreement, the Company tracks vendor promotional programs for volume discounts on a program-by-program basis and records them as a reduction to cost of revenue based on a systematic and rational allocation. The Company monitors the balances of vendor receivables on a quarterly basis and adjusts the balances due for differences between expected and actual sales volume. Vendor receivables are generally collected through reductions authorized by the vendor to accounts payable. Funds received for specific marketing and infrastructure reimbursements, net of related costs, are recorded as adjustments to “Selling, general and administrative expenses,” and any excess reimbursement amount is recorded as an adjustment to cost of revenue.
Royalties
The Company’s software product purchases include products licensed from OEM vendors, which are subsequently distributed to resellers. Royalties to OEM vendors are accrued and recorded in cost of revenue when software products are shipped and revenue is recognized.
Warranties
The Company’s OEM suppliers generally warrant the products distributed by the Company and allow returns of defective products. The Company generally does not independently warrant the products it distributes; however, the Company does warrant the following: (1) products that it builds to order from components purchased from other sources, (2) services with regard to products integrated for its customers; and (3) products sold in countries where the Company is responsible for defective product as a matter of law. The time period required by law in certain countries exceeds the warranty period provided by the manufacturer. The Company is obligated to provide warranty protection for sales of certain IT products within the European Union (“EU”) for up to two years as required under the EU directive where vendors have not affirmatively agreed to provide pass-through protection. Warranty expense and the accrual for warranty costs were not material to the Company’s Consolidated Financial Statements for any of the periods presented.
Advertising
Costs related to advertising and product promotion expenditures are charged to “Selling, general and administrative expenses” as incurred and are primarily offset by OEM marketing reimbursements. Net costs related to advertising and promotion expenditures were not material to the Company’s Consolidated Financial Statements for any of the periods presented.
Income taxes
The asset and liability method is used in accounting for income taxes. Under this method, deferred tax assets and liabilities are recognized for the expected tax consequences of temporary differences between the tax bases of assets and liabilities and their reported amounts in the financial statements using enacted tax rates and laws that will be in effect when the difference is expected to reverse. Tax on global low-taxed intangible income is accounted for as a current expense in the period in which the income is includable in a tax return using the “period cost” method. Valuation allowances are provided against deferred tax assets that are not likely to be realized.
The Company recognizes tax benefits from uncertain tax positions only if that tax position is more likely than not to be sustained on examination by the taxing authorities, based on the technical merits of the position. The tax benefits recognized in the financial statements from such positions are then measured based on the largest benefit that has a greater than 50% likelihood of being realized upon settlement. The Company recognizes interest and penalties related to unrecognized tax benefits in the provision for income taxes.
Foreign currency translations
The financial statements of the Company’s international subsidiaries whose functional currencies are the local currencies are translated into U.S. dollars for consolidation as follows: assets and liabilities at the exchange rate as of the balance sheet date, stockholders’ equity at the historical rates of exchange, and income and expense amounts at the average exchange rate for the month. Translation adjustments resulting from the translation of the subsidiaries’ accounts are included in “Accumulated other comprehensive
62
income (loss)” in stockholders’ equity. Transactions denominated in currencies other than the applicable functional currency are converted to the functional currency at the exchange rate on the transaction date. At period end, monetary assets and liabilities are remeasured to the functional currency using exchange rates in effect at the balance sheet date. Non-monetary assets and liabilities are remeasured at historical exchange rates. Gains and losses resulting from foreign currency transactions are included in earnings within “Cost of revenue” and “Other income (expense), net.”
Comprehensive income
Comprehensive income is defined as the change in equity of a business enterprise during a period from transactions and other events and circumstances from non-owner sources. The primary components of comprehensive income for the Company include net income, foreign currency translation adjustments arising from the consolidation of the Company’s international subsidiaries and unrealized gains and losses on cash flow hedges.
Share-based compensation
The Company accounts for share-based payment transactions in which the Company receives services in exchange for equity instruments of the Company. Share-based compensation cost for stock options, restricted stock awards and units, performance-based restricted stock units and employee stock purchase plans is determined based on the fair value at the measurement date. The Company recognizes share-based compensation cost as expense for awards other than its performance-based restricted stock units ratably on a straight-line basis over the requisite service period. The Company recognizes share-based compensation cost associated with its performance-based restricted stock units over the requisite service period if it is probable that the performance conditions will be satisfied. The Company accounts for expense reductions that result from the forfeiture of unvested awards in the period that the forfeitures occur.
Earnings per common share
Earnings per share is calculated using the two-class method. The two-class method is an earnings allocation proportional to the respective ownership among holders of common stock and participating securities. Basic earnings per common share is computed by dividing net income attributable to the Company’s common stockholders by the weighted-average of common shares outstanding during the period. Diluted earnings per common share also considers the dilutive effect of in-the-money stock options and restricted stock units, calculated using the treasury stock method.
Treasury Stock
Repurchases of shares of common stock are accounted for at cost, which includes brokerage fees, and are included as a component of stockholders’ equity in the Consolidated Balance Sheets.
Reclassifications
Certain reclassifications have been made to prior period amounts in the Consolidated Financial Statements to conform to the current period presentation. These reclassifications did not have a material impact on previously reported amounts.
Recently adopted accounting pronouncements
In August 2018, the Financial Accounting Standard Board (“FASB”) issued new guidance to add, remove, and clarify disclosure requirements related to defined benefit pension and other postretirement plans. The amendment requires the Company to disclose the weighted-average interest crediting rates used in cash balance pension plans. It also requires the Company to disclose the reasons for significant changes in the benefit obligation or plan assets including significant gains and losses affecting the benefit obligation for the period. The adoption of this new guidance did not have a material impact on the Company's Consolidated Financial Statements.
In August 2018, the FASB issued guidance to improve the effectiveness of fair value measurement disclosures by removing or modifying certain disclosure requirements and adding other requirements. Certain amendments should be applied prospectively, while all other amendments should be applied retrospectively to all periods presented. This guidance was applicable to the Company at the beginning of fiscal year 2021 and its adoption did not have a material impact on the Company's Consolidated Financial Statements.
In June 2016, the FASB issued a new credit loss standard to replace the incurred loss impairment methodology. The new impairment model requires immediate recognition of estimated credit losses expected to occur for most financial assets and certain other instruments. This new standard is to be adopted by way of a cumulative-effect adjustment to retained earnings as of the beginning of the first effective reporting period. This guidance was applicable to the Company at the beginning of fiscal year 2021 and its adoption did not have a material impact on the Company's Consolidated Financial Statements.
Recently issued accounting pronouncements
In October 2021, the FASB issued new guidance which requires contract assets and contract liabilities acquired in a business combination to be recognized and measured by the acquirer on the acquisition date in accordance with ASC 606, “Revenue from
63
Contracts with Customers.” Generally, this new guidance will result in the acquirer recognizing contract assets and contract liabilities at the same amounts recorded by the acquiree. Historically, such amounts were recognized by the acquirer at fair value in acquisition accounting. The guidance is effective for fiscal years beginning after December 15, 2022, including interim periods within those fiscal years (the fiscal quarter ending February 28, 2023 for the Company), and should be applied prospectively to acquisitions occurring on or after the effective date. Early adoption is permitted. The Company has not yet adopted this standard and will evaluate the impact of the new standard on future acquisitions.
In March 2020, the FASB issued optional guidance for a limited time to ease the potential burden in accounting for or recognizing the effects of reference rate reform, particularly, the risk of cessation of the London Interbank Offered Rate (“LIBOR”) on financial reporting. The guidance provides optional expedients and exceptions for applying GAAP to contracts, hedging relationships, and other transactions affected by reference rate reform if certain criteria are met. The amendments are elective and are effective upon issuance for all entities through December 31, 2022. The Company does not currently expect any material impacts from the adoption of this new guidance.
In December 2019, the FASB issued new guidance that simplifies the accounting for income taxes. The guidance is effective for annual reporting periods beginning after December 15, 2020, and interim periods within those reporting periods. Certain amendments should be applied prospectively, while other amendments should be applied retrospectively to all periods presented. The Company does not currently expect any material impacts from the adoption of this new guidance.
NOTE 3—ACQUISITIONS:
Tech Data Merger
On September 1, 2021, pursuant to the terms of the Merger Agreement, the Company acquired all the outstanding shares of common stock of Tiger Parent (AP) Corporation, the parent corporation of Tech Data, for an aggregate purchase price of $
The Company has accounted for the Merger as a business combination and allocated the purchase price to the estimated fair values of Tiger Parent (AP) Corporation’s assets acquired and liabilities assumed. As the Merger occurred during the fourth quarter of the Company’s fiscal year, the Company has not yet completed its evaluation and determination of certain assets acquired and liabilities assumed, primarily (i) the final assessment and valuation of certain assets acquired and liabilities assumed, including accounts receivable, receivables from vendors, inventory, accrued expenses and other liabilities and (ii) the final assessment and valuation of certain income tax amounts. Therefore, the final fair values of the assets and liabilities may vary from the Company's preliminary estimates.
The preliminary allocation of the purchase price is as follows:
64
|
Purchase price allocation: |
|
Fair Value |
|
|
|
Cash and cash equivalents |
|
$ |
|
|
|
Accounts receivable, net |
|
|
|
|
|
Receivables from vendors, net |
|
|
|
|
|
Inventories |
|
|
|
|
|
Other current assets |
|
|
|
|
|
Property and equipment |
|
|
|
|
|
Goodwill |
|
|
|
|
|
Intangible assets |
|
|
|
|
|
Other assets |
|
|
|
|
|
Total assets |
|
|
|
|
|
|
|
|
|
|
|
Borrowings, current |
|
|
|
|
|
Accounts payable |
|
|
|
|
|
Other accrued liabilities |
|
|
|
|
|
Long-term borrowings |
|
|
|
|
|
Other long-term liabilities |
|
|
|
|
|
Deferred tax liabilities |
|
|
|
|
|
Total liabilities |
|
|
|
|
|
|
|
|
|
|
|
Purchase consideration |
|
$ |
|
|
The allocation of the value of identifiable intangible assets is as follows:
|
|
|
Fair value |
|
|
Weighted average useful life |
|
|
Customer relationships |
|
$ |
|
|
|
|
|
Trade name |
|
|
|
|
|
|
|
Total intangibles acquired |
|
$ |
|
|
|
|
Goodwill is the excess of the consideration transferred over the net assets recognized and primarily represents future economic benefits arising from assets acquired that are not individually identified and separately recognized, including synergies inherent in the acquired business, of which approximately $
Included within the Company’s Consolidated Statement of Operations are estimated revenues for the year ended November 30, 2021, of approximately $
The following table presents unaudited supplemental pro forma information as if the Merger had occurred at the beginning of fiscal 2020, after giving effect to certain adjustments related to the transaction. The pro forma results exclude any benefits that may result from potential cost savings and certain non-recurring costs. As a result, the pro forma information below does not purport to present what actual results would have been had the Merger been consummated on the date indicated and it is not necessarily indicative of the results of operations that may result in the future.
|
|
|
(Unaudited) |
|
|||||
|
|
|
Years Ended November 30, |
|
|||||
|
|
|
2021 |
|
|
2020 |
|
||
|
Revenue |
|
$ |
|
|
|
$ |
|
|
|
Income from continuing operations attributable to TD SYNNEX Corporation |
|
|
|
|
|
|
|
|
Adjustments reflected in the pro forma results include the following:
|
|
• |
Amortization of acquired intangible assets |
|
|
• |
Interest costs associated with the Merger |
|
|
• |
Removal of certain non-recurring transaction costs of $ |
|
|
• |
Tax effects of adjustments based on an estimated statutory tax rate |
65
NOTE 4—ACQUISTION, INTEGRATION AND RESTRUCTURING EXPENSES:
Acquisition, integration and restructuring costs are primarily comprised of costs related to the Merger, costs related to the Global Business Optimization 2 Program initiated by Tech Data prior to the Merger (the “GBO 2 Program”) and costs related to the Separation.
The Merger
The Company incurred acquisition, integration and restructuring costs related to the completion of the Merger, including professional services costs, personnel and other costs, an impairment of long-lived assets and stock-based compensation expense. Professional services costs are primarily comprised of legal expenses and tax and other consulting services. Personnel and other costs are primarily comprised of costs related to the settlement of certain outstanding long-term cash incentive awards for Tech Data upon closing of the Merger, retention and other bonuses, as well as severance costs. Impairment of long-lived assets relates to a charge of $
To date, acquisition and integration expenses related to the Merger were composed of the following:
|
|
|
Year Ended November 30, |
|
|
|
|
|
2021 |
|
|
|
Professional services costs |
|
$ |
|
|
|
Personnel and other costs |
|
|
|
|
|
Impairment of long-lived assets |
|
|
|
|
|
Stock-based compensation |
|
|
|
|
|
Total |
|
$ |
|
|
|
|
|
|
|
|
GBO 2 Program
Prior to the Merger, Tech Data implemented its GBO 2 Program that includes investments to optimize and standardize processes and apply data and analytics to be more agile in a rapidly evolving environment, increasing productivity, profitability and optimizing net-working capital. TD SYNNEX plans to continue this program in conjunction with the Company’s integration activities. Acquisition, integration and restructuring expenses related to the GBO 2 Program are primarily comprised of restructuring costs and other professional services costs. Restructuring costs are comprised of severance costs and other associated exit costs, including certain consulting costs. Other professional services costs are primarily comprised of professional services fees not related to restructuring activities, including costs related to improving profitability and optimizing net-working capital.
Acquisition, integration and restructuring costs under the GBO2 Program for fiscal 2021 included the following:
|
|
|
Year Ended November 30, |
|
|
|
|
|
2021 |
|
|
|
Restructuring costs |
|
$ |
|
|
|
Other professional services costs |
|
|
|
|
|
Total |
|
$ |
|
|
|
|
|
|
|
|
Restructuring costs under the GBO 2 Program for fiscal 2021 were composed of the following:
|
|
|
Year Ended November 30, |
|
|
|
|
|
2021 |
|
|
|
Severance |
|
$ |
|
|
|
Other exit costs |
|
|
|
|
|
Total |
|
$ |
|
|
During fiscal 2021, the Company recorded restructuring costs related to GBO 2 of $
66
Restructuring activity during fiscal 2021 related to the GBO 2 Program is as follows:
|
|
|
|
|
|||||||||
|
Restructuring costs |
|
Severance and Benefits |
|
|
Other Exit Costs |
|
|
Total |
|
|||
|
Accrued Balance as of November 30, 2020 |
|
$ |
- |
|
|
$ |
- |
|
|
$ |
- |
|
|
Balance acquired related to the Merger |
|
|
|
|
|
|
|
|
|
|
|
|
|
Expenses during fiscal 2021 |
|
|
|
|
|
|
|
|
|
|
|
|
|
Cash payments |
|
|
( |
) |
|
|
( |
) |
|
|
( |
) |
|
Foreign currency translation |
|
|
( |
) |
|
|
( |
) |
|
|
( |
) |
|
Accrued Balance as of November 30, 2021 |
|
$ |
|
|
|
$ |
|
|
|
$ |
|
|
The Separation
During the fiscal year ended November 30, 2020, the Company incurred $
NOTE 5—DISCONTINUED OPERATIONS:
The following table summarizes the financial results from discontinued operations of Concentrix included in the Consolidated Statement of Operations:
|
|
|
Fiscal Years Ended November 30 |
|
|||||
|
|
|
2020 |
|
|
2019 |
|
||
|
Revenue |
|
$ |
|
|
|
$ |
|
|
|
Costs and expenses |
|
|
( |
) |
|
|
( |
) |
|
Interest expense and finance charges and others, net |
|
|
( |
) |
|
|
( |
) |
|
Income from discontinued operations before taxes |
|
|
|
|
|
|
|
|
|
Provision for income taxes |
|
|
( |
) |
|
|
( |
) |
|
Income from discontinued operations, net of taxes |
|
$ |
|
|
|
$ |
|
|
There were
|
|
|
Fiscal Years Ended November 30 |
|
|||||
|
|
|
2020 |
|
|
2019 |
|
||
|
Operating activities: |
|
|
|
|
|
|
|
|
|
Depreciation and amortization |
|
$ |
|
|
|
$ |
|
|
|
Share-based compensation |
|
|
|
|
|
|
|
|
|
Provision for doubtful accounts |
|
|
|
|
|
|
|
|
|
Deferred income taxes |
|
|
( |
) |
|
|
( |
) |
|
Unrealized foreign exchange losses |
|
|
|
|
|
|
|
|
|
Investing activities: |
|
|
|
|
|
|
|
|
|
Purchases of property and equipment |
|
$ |
|
|
|
$ |
|
|
The following table presents assets and liabilities that were transferred to Concentrix as of December 1, 2020 and presented as discontinued operations in the Consolidated Balance Sheet as of November 30, 2020:
67
|
|
|
November 30, 2020 |
|
|
|
Cash and cash equivalents |
|
$ |
|
|
|
Accounts receivable, net |
|
|
|
|
|
Other current assets |
|
|
|
|
|
Current assets of discontinued operations |
|
$ |
|
|
|
|
|
|
|
|
|
Property and equipment, net |
|
$ |
|
|
|
Goodwill |
|
|
|
|
|
Intangible assets, net |
|
|
|
|
|
Deferred tax assets |
|
|
|
|
|
Other assets |
|
|
|
|
|
Noncurrent assets of discontinued operations |
|
$ |
|
|
|
|
|
|
|
|
|
Borrowings, current |
|
$ |
|
|
|
Accounts payable |
|
|
|
|
|
Accrued compensation and benefits |
|
|
|
|
|
Other accrued liabilities |
|
|
|
|
|
Income taxes payable |
|
|
|
|
|
Current liabilities of discontinued operations |
|
$ |
|
|
|
|
|
|
|
|
|
Long-term borrowings |
|
$ |
|
|
|
Other long-term liabilities |
|
|
|
|
|
Deferred tax liabilities |
|
|
|
|
|
Noncurrent liabilities of discontinued operations |
|
$ |
|
|
In connection with the Separation, $
NOTE 6—SHARE-BASED COMPENSATION:
Overview of stock incentive plans
The Company’s stock incentive plans include plans adopted in 2020, 2013 and 2003 (the “TD SYNNEX Plan(s)”). The TD SYNNEX Plans, as amended, provide for the direct award or sale of shares of common stock, restricted stock awards, and restricted stock units, the grant of options to purchase shares of common stock and the award of stock appreciation rights to employees and non-employee directors and consultants.
The number of authorized shares under the 2020 TD SYNNEX Plan will not exceed the sum of
Under the Plans, qualified employees are eligible for the grant of incentive stock options to purchase shares of common stock. Qualified employees and outside directors and consultants are eligible for the grant of non-qualified stock options, stock appreciation rights, restricted stock grants and restricted stock units. The outstanding restricted stock awards and units generally vest ratably over a period, with certain awards subject to other vesting periods as defined per the grant agreement. Certain restricted stock units vest subject to the achievement of individual, divisional or company-wide performance goals. The majority of the performance-based restricted stock units vest at the end of requisite service periods, subject to the achievement of company-wide financial performance goals approved by the Compensation Committee. The exercise price for incentive stock options will not be less than
Unless terminated sooner, the 2020 TD SYNNEX Plan will terminate on March 17, 2030.
68
The Company recognizes share-based compensation expense for all share-based awards made to employees and directors, including employee stock options, restricted stock awards, restricted stock units, performance-based restricted stock units and employee stock purchase rights, based on estimated fair values.
The Company recorded share-based compensation expense in the Consolidated Statements of Operations for fiscal years 2021, 2020 and 2019 as follows:
|
|
|
Fiscal Years Ended November 30, |
|
|||||||||
|
|
|
2021 |
|
|
2020 |
|
|
2019 |
|
|||
|
Total share-based compensation |
|
$ |
|
|
|
$ |
|
|
|
$ |
|
|
|
Tax benefit recorded in the provision for income taxes |
|
|
( |
) |
|
|
( |
) |
|
|
( |
) |
|
Effect on net income |
|
$ |
|
|
|
$ |
|
|
|
$ |
|
|
Substantially all of the share-based compensation expense was recorded in “Selling, general and administrative expenses” and “Acquisition, integration and restructuring costs” in the Consolidated Statements of Operations.
Valuation Assumptions
The Company estimates the fair value of share-based payment awards on the measurement date and recognizes as expense over the requisite service period in the Company’s Consolidated Financial Statements.
The Company uses the Black-Scholes valuation model to estimate the fair value of stock options. The Black-Scholes option-pricing model was developed for use in estimating the fair value of short-lived exchange traded options that have no vesting restrictions and are fully transferable. In addition, option-pricing models require the input of highly subjective assumptions, including the option’s expected life and the price volatility of the underlying stock. The expected stock price volatility assumption was determined using historical volatility of the Company’s common stock.
The fair value of stock awards is determined based on the stock price at the date of grant. For grants that do not accrue dividends or dividend equivalents, the fair value is the stock price reduced by the present value of estimated dividends over the vesting period. For performance-based restricted stock units, the grant-date fair value assumes that the targeted performance goals will be achieved. Over the performance period, the number of awards will be adjusted higher or lower based on the probability of achievement of performance goals.
The Company accounts for expense reductions that result from the forfeiture of unvested awards in the period that the forfeitures occur.
Employee Stock Options
A summary of the changes in the Company’s stock options is set forth below:
|
|
|
Options Outstanding |
|
|||||
|
|
|
Number of shares |
|
|
Weighted- average exercise price per share |
|
||
|
Balances, November 30, 2020 |
|
|
|
|
|
$ |
|
|
|
Options granted |
|
|
|
|
|
|
|
|
|
Options exercised |
|
|
( |
) |
|
|
|
|
|
Balances, November 30, 2021 |
|
|
|
|
|
$ |
|
|
The Company did
|
|
|
Fiscal Years Ended November 30, |
|||
|
|
|
2021 |
|
2019 |
|
|
Expected life (years) |
|
|
|
|
|
|
Risk free interest rate |
|
|
|
|
|
|
Expected volatility |
|
|
|
|
|
|
Dividend yield |
|
|
|
|
|
The weighted-average grant-date fair values of the stock options granted during fiscal years 2021 and 2019 were $
69
options were vested and exercisable with a weighted-average life of
The cash received from the exercise of options and the intrinsic values of options exercised during fiscal years 2021, 2020 and 2019 were as follows:
|
|
|
Fiscal Years Ended November 30, |
|
|||||||||
|
|
|
2021 |
|
|
2020 |
|
|
2019 |
|
|||
|
Intrinsic value of options exercised |
|
$ |
|
|
|
$ |
|
|
|
$ |
|
|
|
Cash received from exercise of options |
|
$ |
|
|
|
$ |
|
|
|
$ |
|
|
The Company settles employee stock option exercises with newly issued common shares.
As of November 30, 2021, the unamortized share-based compensation expense related to unvested stock options under the TD SYNNEX Plans was $
Restricted Stock Awards and Restricted Stock Units
A summary of the changes in the Company’s non-vested restricted stock awards and stock units during fiscal year 2021 is presented below:
|
|
|
Number of shares |
|
|
Weighted-average, grant-date fair value per share |
|
||
|
Non-vested as of November 30, 2020 |
|
|
|
|
|
$ |
|
|
|
Awards granted |
|
|
|
|
|
|
|
|
|
Units granted |
|
|
|
|
|
|
|
|
|
Awards and units vested |
|
|
( |
) |
|
|
|
|
|
Awards and units cancelled/forfeited(1) |
|
|
( |
) |
|
|
|
|
|
Non-vested as of November 30, 2021 |
|
|
|
|
|
$ |
|
|
|
(1) |
As of November 30, 2021, there was $
In connection with the Separation, as required by the TD SYNNEX stock incentive plans, the Company made certain adjustments to outstanding employee equity awards with the intention of preserving the intrinsic value of the awards prior to the Separation. In accordance with the employee matters agreement, each exercisable and non-exercisable stock option and unvested restricted stock award was modified into similar awards of both SYNNEX and Concentrix and the exercise price of outstanding stock options was adjusted to preserve the intrinsic value of the awards. Certain restricted stock units and performance-contingent awards were modified to provide the holders restricted stock units and performance contingent awards in the company that employs such employee following the Separation. When settled wholly in the employer’s shares, the ratio was based on the closing stock price of SYNNEX at November 30, 2020 compared to the opening stock price of the respective entity on December 1, 2020. The options strike prices were adjusted in the same manner. The modification of these awards did not result in material incremental compensation cost.
Tech Data Equity Awards
Prior to the Merger, certain of Tech Data’s employees were granted performance-based equity awards in Tiger Parent Holdings L.P., a partnership entity that was the parent company of Tiger Parent (AP) Corporation and Tech Data, that were unvested at the time of the closing of the Merger. Upon closing of the Merger, the unvested performance-based equity awards were converted into
2014 Employee Stock Purchase Plan
On January 6, 2014, the Board of Directors approved the adoption of the 2014 Employee Stock Purchase Plan (“2014 ESPP”) to succeed the Company's 2003 Employee Stock Purchase Plan. The 2014 ESPP, as amended, commenced on January 1, 2015 with
70
Share-based compensation expense related to the 2014 ESPP was immaterial during fiscal years 2021, 2020 and 2019.
NOTE 7—STOCKHOLDERS’ EQUITY:
Share Repurchase Programs
In June 2020, the Board of Directors authorized a $
Dividends
The Company declared cumulative cash dividends of $
NOTE 8—BALANCE SHEET COMPONENTS:
Cash, cash equivalents and restricted cash:
The following table provides a reconciliation of cash, cash equivalents and restricted cash reported within the Consolidated Balance Sheets that sum to the total of the same amounts shown in the Consolidated Statements of Cash Flows:
|
|
|
As of November 30, |
|
|||||
|
|
|
2021 |
|
|
2020 |
|
||
|
Cash and cash equivalents |
|
$ |
|
|
|
$ |
|
|
|
Restricted cash included in other current assets |
|
|
|
|
|
|
|
|
|
Cash, cash equivalents and restricted cash |
|
$ |
|
|
|
$ |
|
|
|
Accounts receivable, net: |
|
As of November 30, |
|
|||||
|
|
|
2021 |
|
|
2020 |
|
||
|
Accounts receivable |
|
$ |
|
|
|
$ |
|
|
|
Less: Allowance for doubtful accounts |
|
|
( |
) |
|
|
( |
) |
|
Accounts receivable, net |
|
$ |
|
|
|
$ |
|
|
|
Receivables from vendors, net: |
|
As of November 30, |
|
|||||
|
|
|
2021 |
|
|
2020 |
|
||
|
Receivables from vendors |
|
$ |
|
|
|
$ |
|
|
|
Less: Allowance for doubtful accounts |
|
|
( |
) |
|
|
( |
) |
|
Receivables from vendors, net |
|
$ |
|
|
|
$ |
|
|
71
|
Allowance for doubtful trade receivables: |
|
|
|
|
|
|
|
|
|
Balance at November 30, 2018 |
$ |
|
|
|
Additions |
|
|
|
|
Write-offs, reclassifications and foreign exchange translation |
|
( |
) |
|
Balance at November 30, 2019 |
|
|
|
|
Additions |
|
|
|
|
Write-offs, reclassifications and foreign exchange translation |
|
|
|
|
Balance at November 30, 2020 |
|
|
|
|
Acquisitions |
|
|
|
|
Additions (deductions) |
|
( |
) |
|
Write-offs, reclassifications and foreign exchange translation |
|
( |
) |
|
Balance at November 30, 2021 |
$ |
|
|
|
|
|
|
|
|
Allowance for receivables from vendors: |
|
|
|
|
|
|
|
|
|
Balance at November 30, 2018 |
$ |
|
|
|
Additions |
|
|
|
|
Write-offs, reclassifications and foreign exchange translation |
|
( |
) |
|
Balance at November 30, 2019 |
|
|
|
|
Additions |
|
— |
|
|
Write-offs, reclassifications and foreign exchange translation |
|
( |
) |
|
Balance at November 30, 2020 |
|
|
|
|
Acquisitions |
|
|
|
|
Additions |
|
|
|
|
Write-offs, reclassifications and foreign exchange translation |
|
( |
) |
|
Balance at November 30, 2021 |
$ |
|
|
|
Property and equipment, net: |
|
As of November 30, |
|
|||||
|
|
|
2021 |
|
|
2020 |
|
||
|
Land |
|
$ |
|
|
|
$ |
|
|
|
Equipment, computers and software |
|
|
|
|
|
|
|
|
|
Furniture and fixtures |
|
|
|
|
|
|
|
|
|
Buildings, building improvements and leasehold improvements |
|
|
|
|
|
|
|
|
|
Construction-in-progress |
|
|
|
|
|
|
|
|
|
Total property and equipment, gross |
|
$ |
|
|
|
|
|
|
|
Less: Accumulated depreciation and amortization |
|
|
( |
) |
|
|
( |
) |
|
Property and equipment, net |
|
$ |
|
|
|
$ |
|
|
Depreciation and amortization expense for fiscal years 2021, 2020 and 2019, was $
|
Goodwill: |
|
Fiscal Year Ended November 30, 2021 |
|
|||||||||||||
|
|
|
Americas |
|
|
Europe |
|
|
APJ |
|
|
Total |
|
||||
|
Balance, beginning of year |
|
$ |
|
|
|
$ |
— |
|
|
$ |
|
|
|
$ |
|
|
|
Additions from acquisitions |
|
|
|
|
|
|
|
|
|
|
|
|
|
|
|
|
|
Foreign exchange translation |
|
|
( |
) |
|
|
( |
) |
|
|
|
|
|
|
( |
) |
|
Balance, end of year |
|
$ |
|
|
|
$ |
|
|
|
$ |
|
|
|
$ |
|
|
72
|
Intangible assets, net: |
|
As of November 30, 2021 |
|
|
As of November 30, 2020 |
|
||||||||||||||||||
|
|
|
Gross Amounts |
|
|
Accumulated Amortization |
|
|
Net Amounts |
|
|
Gross Amounts |
|
|
Accumulated Amortization |
|
|
Net Amounts |
|
||||||
|
Intangible assets with indefinite lives: |
|
|
|
|
|
|
|
|
|
|
|
|
|
|
|
|
|
|
|
|
|
|
|
|
|
Trade names |
|
$ |
|
|
|
$ |
- |
|
|
$ |
|
|
|
$ |
- |
|
|
$ |
- |
|
|
$ |
- |
|
|
Intangible assets with finite lives: |
|
|
|
|
|
|
|
|
|
|
|
|
|
|
|
|
|
|
|
|
|
|
|
|
|
Customer relationships and lists |
|
$ |
|
|
|
$ |
( |
) |
|
$ |
|
|
|
$ |
|
|
|
$ |
( |
) |
|
$ |
|
|
|
Vendor lists |
|
|
|
|
|
|
( |
) |
|
|
|
|
|
|
|
|
|
|
( |
) |
|
|
|
|
|
Other intangible assets |
|
|
|
|
|
|
( |
) |
|
|
|
|
|
|
|
|
|
|
( |
) |
|
|
|
|
|
|
|
$ |
|
|
|
$ |
( |
) |
|
$ |
|
|
|
$ |
|
|
|
$ |
( |
) |
|
$ |
|
|
Amortization expense for fiscal years 2021, 2020 and 2019, was $
Estimated future amortization expense of the Company’s intangible assets is as follows:
|
Fiscal years ending November 30, |
|
|
|
|
|
2022 |
|
$ |
|
|
|
2023 |
|
|
|
|
|
2024 |
|
|
|
|
|
2025 |
|
|
|
|
|
2026 |
|
|
|
|
|
Thereafter |
|
|
|
|
|
Total |
|
$ |
|
|
Accumulated other comprehensive income (loss)
The components of accumulated other comprehensive income (loss) ("AOCI"), net of taxes, were as follows:
|
|
|
Unrecognized gains (losses) on defined benefit plan, net of taxes |
|
|
Unrealized gains (losses) on cash flow hedges, net of taxes |
|
|
Foreign currency translation adjustment and other, net of taxes |
|
|
Total |
|
||||
|
Balance, beginning of year |
|
$ |
( |
) |
|
$ |
( |
) |
|
$ |
( |
) |
|
$ |
( |
) |
|
Transferred to Concentrix |
|
|
|
|
|
|
( |
) |
|
|
( |
) |
|
|
|
|
|
Other comprehensive income (loss) before reclassification |
|
|
— |
|
|
|
|
|
|
|
( |
) |
|
|
( |
) |
|
Reclassification of (gains) losses from other comprehensive income (loss) |
|
|
— |
|
|
|
|
|
|
|
— |
|
|
|
|
|
|
Balance, end of year |
|
$ |
|
|
|
$ |
( |
) |
|
$ |
( |
) |
|
$ |
( |
) |
Refer to Note 9 – Derivative Instruments for the location of gains and losses reclassified from accumulated other comprehensive income (loss) to the Consolidated Statements of Operations. Reclassifications of amortization of actuarial (gains) losses of defined benefits plans is recorded in "Other income (expense), net" in the combined statement of operations.
Foreign currency translation adjustment and other, net of taxes, is comprised of foreign currency translation adjustments and unrealized gains and losses on Concentrix’ available-for-sale debt securities prior to the Separation.
73
NOTE 9—DERIVATIVE INSTRUMENTS:
In the ordinary course of business, the Company is exposed to foreign currency risk, interest rate risk, equity risk, commodity price changes and credit risk. The Company enters into transactions, and owns monetary assets and liabilities, that are denominated in currencies other than the legal entity’s functional currency. The Company may enter into forward contracts, option contracts, swaps, or other derivative instruments to offset a portion of the risk on expected future cash flows, earnings, net investments in certain international subsidiaries and certain existing assets and liabilities. However, the Company may choose not to hedge certain exposures for a variety of reasons including, but not limited to, accounting considerations and the prohibitive economic cost of hedging particular exposures. There can be no assurance the hedges will offset more than a portion of the financial impact resulting from movements in foreign currency exchange or interest rates. Generally, the Company does not use derivative instruments to cover equity risk and credit risk. The Company’s hedging program is not used for trading or speculative purposes.
All derivatives are recognized on the balance sheet at their fair value. Changes in the fair value of derivatives are recorded in the Consolidated Statements of Operations, or as a component of AOCI in the Consolidated Balance Sheets, as discussed below.
Cash Flow Hedges
The Company uses interest rate swap derivative contracts to economically convert a portion of its variable-rate debt to fixed-rate debt. The swaps have maturities at various dates through
Non-Designated Derivatives
The Company uses short-term forward contracts to offset the foreign exchange risk of assets and liabilities denominated in currencies other than the functional currency of the respective entities. These contracts, which are not designated as hedging instruments, mature or settle within
Fair Values of Derivative Instruments in the Consolidated Balance Sheets
The fair values of the Company’s derivative instruments are disclosed in Note 10 - Fair Value Measurements and summarized in the table below:
|
|
|
Value as of |
|
|||||
|
Balance Sheet Line Item |
|
November 30, 2021 |
|
|
November 30, 2020 |
|
||
|
Derivative instruments not designated as hedging instruments: |
|
|
|
|
|
|
|
|
|
Foreign exchange forward contracts (notional value) |
|
$ |
|
|
|
$ |
|
|
|
Other current assets |
|
|
|
|
|
|
|
|
|
Other accrued liabilities |
|
|
|
|
|
|
|
|
|
Interest rate swap (notional value) |
|
$ |
|
|
|
$ |
|
|
|
Other assets, net |
|
|
|
|
|
|
|
|
|
Other accrued liabilities |
|
|
|
|
|
|
|
|
|
Derivative instruments designated as cash flow hedges: |
|
|
|
|
|
|
|
|
|
Interest rate swaps (notional value) |
|
$ |
|
|
|
$ |
|
|
|
Other accrued liabilities |
|
|
|
|
|
|
|
|
|
Other long-term liabilities |
|
|
|
|
|
|
|
|
Volume of activity
The notional amounts of foreign exchange forward contracts represent the gross amounts of foreign currency, including, principally, the Australian dollar, Brazilian real, British pound, Canadian dollar, Chinese yuan, Czech koruna, Danish krone, Euro, Indian rupee, Indonesian rupiah, Japanese yen, Mexican peso, Norwegian krone, Philippine peso, Polish zloty, Singapore dollar, Swedish krona and Swiss franc that will be bought or sold at maturity. The notional amounts for outstanding derivative instruments provide one measure of the transaction volume outstanding and do not represent the amount of the Company’s exposure to credit or market loss. The Company’s exposure to credit loss and market risk will vary over time as currency and interest rates change.
74
The Effect of Derivative Instruments on AOCI and the Consolidated Statements of Operations
The following table shows the gains and losses, before taxes, of the Company's derivative instruments designated as cash flow hedges in Other Comprehensive Income (“OCI”), and not designated as hedging instruments in the Consolidated Statements of Operations for the periods presented:
|
|
|
Location of Gains (losses) |
|
For the fiscal years ended November 30, |
|
|||||||||
|
|
|
in Income |
|
2021 |
|
|
2020 |
|
|
2019 |
|
|||
|
|
|
|
|
|
|
|
|
|
|
|
|
|
|
|
|
Derivative instruments designated as cash flow hedges: |
|
|
|
|
|
|
|
|
|
|
|
|
|
|
|
Gains (losses) recognized in OCI on interest rate swaps |
|
|
|
$ |
|
|
|
$ |
( |
) |
|
$ |
( |
) |
|
Gains (losses) on interest rate swaps reclassified from AOCI into income |
|
Interest expense and finance charges, net |
|
$ |
( |
) |
|
$ |
( |
) |
|
$ |
( |
) |
|
|
|
|
|
|
|
|
|
|
|
|
|
|
|
|
|
Derivative instruments not designated as hedging instruments: |
|
|
|
|
|
|
|
|
|
|
|
|
|
|
|
Gains (losses) recognized from foreign exchange forward contracts, net(1) |
|
Cost of products sold |
|
$ |
|
|
|
$ |
|
|
|
$ |
|
|
|
Gains (losses) recognized from foreign exchange forward contracts, net(1) |
|
Other income (expense), net |
|
|
( |
) |
|
|
|
|
|
|
( |
) |
|
Gains (losses) recognized from interest rate swaps, net |
|
Interest expense and finance charges, net |
|
|
|
|
|
|
( |
) |
|
|
( |
) |
|
Total |
|
|
|
$ |
|
|
|
$ |
|
|
|
$ |
( |
) |
|
|
(1) |
|
There were no material gain or loss amounts excluded from the assessment of effectiveness. Existing net losses in AOCI that are expected to be reclassified into earnings in the normal course of business within the next twelve months are $
Credit exposure for derivative financial instruments is limited to the amounts, if any, by which the counterparties’ obligations under the contracts exceed the Company’s obligations to the counterparties. The Company manages the potential risk of credit losses through careful evaluation of counterparty credit standing and selection of counterparties from a limited group of financial institutions.
NOTE 10—FAIR VALUE MEASUREMENTS:
The Company’s fair value measurements are classified and disclosed in one of the following three categories:
Level 1: Unadjusted quoted prices in active markets that are accessible at the measurement date for identical, unrestricted assets or liabilities;
Level 2: Quoted prices in markets that are not active, or inputs which are observable, either directly or indirectly, for substantially the full term of the asset or liability; and
Level 3: Prices or valuation techniques that require inputs that are both significant to the fair value measurement and unobservable (i.e., supported by little or no market activity).
75
The following table summarizes the valuation of the Company’s investments and financial instruments that are measured at fair value on a recurring basis:
|
|
|
As of November 30, 2021 |
|
|
As of November 30, 2020 |
|
||||||||||||||||||||||||||
|
|
|
|
|
|
|
Fair value measurement category |
|
|
|
|
|
|
Fair value measurement category |
|
||||||||||||||||||
|
|
|
Total |
|
|
Level 1 |
|
|
Level 2 |
|
|
Level 3 |
|
|
Total |
|
|
Level 1 |
|
|
Level 2 |
|
|
Level 3 |
|
||||||||
|
Assets: |
|
|
|
|
|
|
|
|
|
|
|
|
|
|
|
|
|
|
|
|
|
|
|
|
|
|
|
|
|
|
|
|
|
Cash equivalents |
|
$ |
|
|
|
$ |
|
|
|
$ |
|
|
|
$ |
|
|
|
$ |
|
|
|
$ |
|
|
|
$ |
|
|
|
$ |
|
|
|
Marketable equity securities |
|
|
|
|
|
|
|
|
|
|
|
|
|
|
|
|
|
|
|
|
|
|
|
|
|
|
|
|
|
|
|
|
|
Forward foreign currency exchange contracts |
|
|
|
|
|
|
|
|
|
|
|
|
|
|
|
|
|
|
|
|
|
|
|
|
|
|
|
|
|
|
|
|
|
Interest rate swaps |
|
|
|
|
|
|
|
|
|
|
|
|
|
|
|
|
|
|
|
|
|
|
|
|
|
|
|
|
|
|
|
|
|
Liabilities: |
|
|
|
|
|
|
|
|
|
|
|
|
|
|
|
|
|
|
|
|
|
|
|
|
|
|
|
|
|
|
|
|
|
Forward foreign currency exchange contracts |
|
$ |
|
|
|
$ |
|
|
|
$ |
|
|
|
$ |
|
|
|
$ |
|
|
|
$ |
|
|
|
$ |
|
|
|
$ |
|
|
|
Interest rate swaps |
|
|
|
|
|
|
|
|
|
|
|
|
|
|
|
|
|
|
|
|
|
|
|
|
|
|
|
|
|
|
|
|
The Company’s cash equivalents consist primarily of highly liquid investments in money market funds and term deposits with maturity periods of
The carrying values of accounts receivable, accounts payable and short-term debt approximate fair value due to their short maturities and interest rates which are variable in nature. The carrying value of the Company’s term loans approximate their fair value since they bear interest rates that are similar to existing market rates. The estimated fair value of the Senior Notes was approximately $
During the fiscal years ended November 30, 2021, 2020 and 2019, there were
NOTE 11—BORROWINGS:
Borrowings consist of the following:
|
|
|
As of November 30, |
|
|||||
|
|
|
2021 |
|
|
2020 |
|
||
|
Committed and uncommitted revolving credit facilities and borrowings |
|
$ |
|
|
|
$ |
|
|
|
Current portion of TD SYNNEX credit agreement |
|
|
|
|
|
|
|
|
|
Current portion of other long-term debt |
|
|
|
|
|
|
|
|
|
Borrowings, current |
|
$ |
|
|
|
$ |
|
|
|
TD SYNNEX credit agreement |
|
$ |
|
|
|
$ |
|
|
|
TD SYNNEX Senior Notes |
|
|
|
|
|
|
|
|
|
SYNNEX United States credit agreement - term loan component |
|
|
|
|
|
|
|
|
|
SYNNEX United States term loan credit agreement |
|
|
|
|
|
|
|
|
|
Other credit agreements and long-term debt |
|
|
|
|
|
|
|
|
|
Long-term borrowings, before unamortized debt discount and issuance costs |
|
$ |
|
|
|
$ |
|
|
|
Less: unamortized debt discount and issuance costs |
|
|
( |
) |
|
|
( |
) |
|
Long-term borrowings |
|
$ |
|
|
|
$ |
|
|
76
TD SYNNEX United States accounts receivable securitization arrangement
In the United States, the Company has an accounts receivable securitization program to provide additional capital for its operations (the “U.S. AR Arrangement”). Under the terms of the U.S. AR Arrangement, that, prior to the December 2021 amendment described below, was scheduled to expire in
Under the terms of the U.S. AR Arrangement, the Company and certain of its U.S. subsidiaries sell, on a revolving basis, their receivables to a wholly-owned, bankruptcy-remote subsidiary. The borrowings are funded by pledging all of the rights, title and interest in the receivables acquired by the Company's bankruptcy-remote subsidiary as security. Any amounts received under the U.S. AR Arrangement are recorded as debt on the Company's Consolidated Balance Sheets.
On December 22, 2021, the Company and its subsidiaries that are party to the U.S. AR Arrangement amended the U.S. AR Arrangement to extend the maturity date to
SYNNEX United States credit agreement
Prior to the Merger, in the United States, the Company had a senior secured credit agreement (as amended, the "U.S. Credit Agreement") with a group of financial institutions. The U.S. Credit Agreement included a $
SYNNEX United States term loan credit agreement
Prior to the Merger, in the United States the Company had a senior secured term loan credit agreement (the “U.S. Term Loan Credit Agreement”) with a group of financial institutions in the original principal amount of $
77
TD SYNNEX credit agreement
In connection with the Merger Agreement, the Company entered into a credit agreement, dated as of April 16, 2021 (the “TD SYNNEX Credit Agreement”) with the lenders party thereto and Citibank, N.A., as agent, pursuant to which the Company received commitments for the extension of a senior unsecured revolving credit facility not to exceed an aggregate principal amount of $
The TD SYNNEX Credit Agreement contains various loan covenants that are customary for similar facilities for similarly rated borrowers that restricts the ability of the Company and its subsidiaries to take certain actions. The TD SYNNEX Credit Agreement also contains financial covenants that require compliance with a maximum debt to EBITDA ratio and a minimum interest coverage ratio, in each case tested on the last day of each fiscal quarter commencing with the first full fiscal quarter to occur after the closing date of the TD SYNNEX credit facilities. The TD SYNNEX Credit Agreement also contains various customary events of default, including with respect to a change of control of the Company.
On March 22, 2021, the Company had entered into a debt commitment letter (the “Commitment Letter”), under which Citigroup Global Markets Inc. and certain other financing institutions joining thereto pursuant to the terms thereof committed to provide (i) a $
TD SYNNEX Senior Notes
On August 9, 2021, the Company completed its offering of $
The interest rate payable on each series of the Senior Notes will be subject to adjustment from time to time if the credit rating assigned to such series of Senior Notes is downgraded (or downgraded and subsequently upgraded).
78
Other borrowings and term debt
The Company has various other committed and uncommitted lines of credit with financial institutions at certain locations outside the United States, accounts receivable securitization arrangements, factoring of accounts receivable with recourse provisions, capital leases, a building mortgage, short-term loans, term loans, credit facilities, and book overdraft facilities, totaling approximately $
At November 30, 2021, the Company was also contingently liable for reimbursement obligations with respect to issued standby letters of credit in the aggregate outstanding amount of $
The maximum commitment amounts for local currency credit facilities have been translated into United States Dollars at November 30, 2021 exchange rates.
Future principal payments
As of November 30, 2021, future principal payments under the above loans are as follows:
|
Fiscal Years Ending November 30, |
|
|
|
|
|
2022 |
|
$ |
|
|
|
2023 |
|
|
|
|
|
2024 |
|
|
|
|
|
2025 |
|
|
|
|
|
2026 |
|
|
|
|
|
Thereafter |
|
|
|
|
|
Total |
|
$ |
|
|
Covenant compliance
The Company's credit facilities have a number of covenants and restrictions that require the Company to maintain specified financial ratios. The covenants also limit the Company’s ability to incur additional debt, create liens, enter into agreements with affiliates, modify the nature of the Company’s business, and merge or consolidate. As of November 30, 2021, the Company was in compliance with all current and material financial covenant requirements for the above arrangements.
79
NOTE 12—EARNINGS PER COMMON SHARE:
The following table sets forth the computation of basic and diluted earnings per common share for the periods indicated:
|
|
|
Fiscal Years Ended November 30, |
|
|||||||||
|
|
|
2021 |
|
|
2020 |
|
|
2019 |
|
|||
|
Basic earnings per common share: |
|
|
|
|
|
|
|
|
|
|
|
|
|
Income from continuing operations attributable to common stockholders(1) |
|
$ |
|
|
|
$ |
|
|
|
$ |
|
|
|
Income from discontinued operations attributable to common stockholders(1) |
|
|
|
|
|
|
|
|
|
|
|
|
|
Net income attributable to common stockholders(1) |
|
$ |
|
|
|
$ |
|
|
|
$ |
|
|
|
|
|
|
|
|
|
|
|
|
|
|
|
|
|
Weighted-average number of common shares - basic |
|
|
|
|
|
|
|
|
|
|
|
|
|
|
|
|
|
|
|
|
|
|
|
|
|
|
|
Basic earnings per common share |
|
|
|
|
|
|
|
|
|
|
|
|
|
Continuing operations |
|
$ |
|
|
|
$ |
|
|
|
$ |
|
|
|
Discontinued operations |
|
|
|
|
|
|
|
|
|
|
|
|
|
Total basic net earnings per share |
|
$ |
|
|
|
$ |
|
|
|
$ |
|
|
|
|
|
|
|
|
|
|
|
|
|
|
|
|
|
Diluted earnings per common share: |
|
|
|
|
|
|
|
|
|
|
|
|
|
Income from continuing operations attributable to common stockholders(1) |
|
$ |
|
|
|
$ |
|
|
|
$ |
|
|
|
Income from discontinued operations attributable to common stockholders(1) |
|
|
|
|
|
|
|
|
|
|
|
|
|
Net income attributable to common stockholders(1) |
|
$ |
|
|
|
$ |
|
|
|
$ |
|
|
|
|
|
|
|
|
|
|
|
|
|
|
|
|
|
Weighted-average number of common shares - basic |
|
|
|
|
|
|
|
|
|
|
|
|
|
Effect of dilutive securities: |
|
|
|
|
|
|
|
|
|
|
|
|
|
Stock options and restricted stock units |
|
|
|
|
|
|
|
|
|
|
|
|
|
Weighted-average number of common shares - diluted |
|
|
|
|
|
|
|
|
|
|
|
|
|
|
|
|
|
|
|
|
|
|
|
|
|
|
|
Diluted earnings per common share |
|
|
|
|
|
|
|
|
|
|
|
|
|
Continuing operations |
|
$ |
|
|
|
$ |
|
|
|
$ |
|
|
|
Discontinued operations |
|
|
|
|
|
|
|
|
|
|
|
|
|
Total basic net earnings per share |
|
$ |
|
|
|
$ |
|
|
|
$ |
|
|
|
|
|
|
|
|
|
|
|
|
|
|
|
|
|
Anti-dilutive shares excluded from diluted earnings per share calculation |
|
|
|
|
|
|
|
|
|
|||
|
|
(1) |
Restricted stock awards granted by the Company are considered participating securities. Income available to participating securities was immaterial in all periods presented. |
NOTE 13—SEGMENT INFORMATION:
Segment results for all prior periods have been restated for comparability to the Company’s current reportable segments (see Note 1 – Organization and Basis of Presentation for further discussion).
|
|
|
Americas |
|
|
Europe |
|
|
APJ |
|
|
Consolidated |
|
||||
|
Fiscal Year ended November 30, 2021 |
|
|
|
|
|
|
|
|
|
|
|
|
|
|
|
|
|
Revenue |
|
$ |
|
|
|
$ |
|
|
|
$ |
|
|
|
$ |
|
|
|
Operating income |
|
|
|
|
|
|
|
|
|
|
|
|
|
|
|
|
|
Depreciation and amortization expense |
|
|
( |
) |
|
|
( |
) |
|
|
( |
) |
|
|
( |
) |
|
Total assets |
|
|
|
|
|
|
|
|
|
|
|
|
|
|
|
|
|
Fiscal Year ended November 30, 2020 |
|
. |
|
|
|
|
|
|
|
|
|
|
|
|
|
|
|
Revenue |
|
$ |
|
|
|
$ |
|
|
|
$ |
|
|
|
$ |
|
|
|
Operating income |
|
|
|
|
|
|
|
|
|
|
|
|
|
|
|
|
|
Depreciation and amortization expense |
|
|
( |
) |
|
|
( |
) |
|
|
( |
) |
|
|
( |
) |
|
Total assets |
|
|
|
|
|
|
|
|
|
|
|
|
|
|
|
|
|
Fiscal Year ended November 30, 2019 |
|
|
|
|
|
|
|
|
|
|
|
|
|
|
|
|
|
Revenue |
|
$ |
|
|
|
$ |
|
|
|
$ |
|
|
|
$ |
|
|
|
Operating income |
|
|
|
|
|
|
|
|
|
|
|
|
|
|
|
|
|
Depreciation and amortization expense |
|
|
( |
) |
|
|
( |
) |
|
|
( |
) |
|
|
( |
) |
80
The Company attributes revenues from external customers to the country from where products are delivered. Except for the United States, no other country accounted for 10% or more of the Company’s revenue for the periods presented. Except for the United States, no other country accounted for 10% or more of the Company’s property and equipment, net, less capitalized software and application software, for the periods presented:
|
|
|
Fiscal Years Ended November 30, |
|
|||||||||
|
|
|
2021 |
|
|
2020 |
|
|
2019 |
|
|||
|
Revenue: |
|
|
|
|
|
|
|
|
|
|
|
|
|
United States |
|
$ |
|
|
|
$ |
|
|
|
$ |
|
|
|
Others |
|
|
|
|
|
|
|
|
|
|
|
|
|
Total |
|
$ |
|
|
|
$ |
|
|
|
$ |
|
|
|
|
|
As of November 30, |
|
|||||
|
|
|
2021 |
|
|
2020 |
|
||
|
Property and equipment, net: |
|
|
|
|
|
|
|
|
|
United States |
|
$ |
|
|
|
$ |
|
|
|
Others |
|
|
|
|
|
|
|
|
|
Total |
|
$ |
|
|
|
$ |
|
|
NOTE 14—RELATED PARTY TRANSACTIONS:
The Company has a business relationship with MiTAC Holdings Corporation (“MiTAC Holdings”), a publicly-traded company in Taiwan, which began in 1992 when MiTAC Holdings became one of the Company’s primary investors through its affiliates. As of November 30, 2021 and 2020, MiTAC Holdings and its affiliates beneficially owned approximately
Beneficial ownership of the Company’s common stock by MiTAC Holdings
As noted above, MiTAC Holdings and its affiliates in the aggregate beneficially owned approximately 9.5% of the Company’s outstanding common stock as of November 30, 2021. These shares are owned by the following entities:
|
|
|
|
|
As of November 30, 2021 |
|
|
|
MiTAC Holdings(1) |
|
|
|
|||
|
Synnex Technology International Corp.(2) |
|
|
|
|||
|
Total |
|
|
|
|||
|
|
1. |
|
|
|
2. |
|
The following table presents the Company's transactions with MiTAC Holdings and its affiliates for the periods indicated:
|
|
|
Fiscal Years Ended November 30, |
|
|||||||||
|
|
|
2021 |
|
|
2020 |
|
|
2019 |
|
|||
|
Purchases of inventories and services |
|
$ |
|
|
|
$ |
|
|
|
$ |
|
|
|
Sale of products to MiTAC Holdings and affiliates |
|
|
|
|
|
|
|
|
|
|
|
|
|
Payments made for rent and overhead costs for use of facilities of MiTAC Holdings and affiliates, net |
|
|
|
|
|
|
|
|
|
|
|
|
The following table presents the Company’s receivable from and payable to MiTAC Holdings and its affiliates for the periods presented:
|
|
|
As of November 30, |
|
|||||
|
|
|
2021 |
|
|
2020 |
|
||
|
Receivable from related parties (included in Accounts receivable, net) |
|
$ |
|
|
|
$ |
|
|
|
Payable to related parties (included in Accounts payable) |
|
|
|
|
|
|
|
|
81
The Company’s business relationship with MiTAC Holdings and its affiliates has been informal and is generally not governed by long-term commitments or arrangements with respect to pricing terms, revenue or capacity commitments. The Company negotiates pricing and other material terms on a case-by-case basis with MiTAC Holdings and affiliates. The Company has adopted a policy requiring that material transactions with MiTAC Holdings or its related parties be approved by its Audit Committee, which is composed solely of independent directors. In addition, Mr. Miau’s compensation is approved by the Nominating and Corporate Governance Committee, which is also composed solely of independent directors.
Synnex Technology International is a publicly-traded corporation in Taiwan that currently provides distribution and fulfillment services to various markets in Asia and Australia, and is also a potential competitor of the Company. Neither MiTAC Holdings nor Synnex Technology International is restricted from competing with the Company.
NOTE 15—EMPLOYEE BENEFITS PLANS:
The Company has 401(k) plans in the United States under which eligible employees may contribute up to the maximum amount as provided by law. Employees generally become eligible to participate in these plans on the first day of the month after their employment date. The Company may make discretionary contributions under the plans. Employees in certain of the Company's international subsidiaries are covered by government mandated defined contribution plans. During fiscal years 2021, 2020 and 2019, the Company contributed $
Defined Benefit Plans
The Company’s defined benefit plans sponsored by certain international subsidiaries are not material to operations.
NOTE 16—LEASES:
The Company leases certain of its facilities and equipment under operating lease agreements, which expire in various periods through
The following table presents the various components of lease costs.
|
|
|
Fiscal Years Ended November 30, |
|
|||||
|
|
|
2021 |
|
|
2020 |
|
||
|
Operating lease cost |
|
$ |
|
|
|
$ |
|
|
|
Short-term and variable lease cost |
|
|
|
|
|
|
|
|
|
Sublease income |
|
|
( |
) |
|
|
( |
) |
|
Total operating lease cost |
|
$ |
|
|
|
$ |
|
|
The following table presents a maturity analysis of expected undiscounted cash flows for operating leases on an annual basis for the next five years and thereafter as of November 30, 2021:
|
Fiscal Years Ending November 30, |
|
|
|
|
|
2022 |
|
$ |
|
|
|
2023 |
|
|
|
|
|
2024 |
|
|
|
|
|
2025 |
|
|
|
|
|
2026 |
|
|
|
|
|
Thereafter |
|
|
|
|
|
Total payments |
|
$ |
|
|
|
Less: imputed interest* |
|
|
( |
) |
|
Total present value of lease payments |
|
$ |
|
|
*
During the fiscal year ended November 30, 2019, rent expense was $
The following amounts were recorded in the Company's Consolidated Balance Sheet as of November 30, 2021 and 2020:
|
Operating leases |
|
Balance sheet location |
|
November 30, 2021 |
|
|
November 30, 2020 |
|
||
|
Operating lease ROU assets |
|
Other assets, net |
|
$ |
|
|
|
$ |
|
|
|
Current operating lease liabilities |
|
Other accrued liabilities |
|
|
|
|
|
|
|
|
|
Non-current operating lease liabilities |
|
Other long-term liabilities |
|
|
|
|
|
|
|
|
82
The following table presents supplemental cash flow information related to the Company's operating leases for the fiscal years ended November 30, 2021 and 2020. Cash payments related to variable lease costs and short-term leases are not included in the measurement of operating lease liabilities, and, as such, are excluded from the amounts below:
|
|
|
|
|
Fiscal Years Ended November 30, |
|
|||||
|
Cash flow information |
|
|
|
2021 |
|
|
2020 |
|
||
|
Cash paid for amounts included in the measurement of lease liabilities |
|
|
|
$ |
|
|
|
$ |
|
|
|
Non-cash ROU assets obtained in exchange for lease liabilities (subsequent to initial adoption) |
|
|
|
|
|
|
|
|
|
|
The weighted-average remaining lease term and discount rate as of November 30, 2021 and 2020 were as follows:
|
Operating lease term and discount rate |
|
|
|
2021 |
|
|
2020 |
|
||
|
Weighted-average remaining lease term (years) |
|
|
|
|
|
|
|
|
|
|
|
Weighted-average discount rate |
|
|
|
|
|
% |
|
|
|
% |
NOTE 17—INCOME TAXES:
The components of pretax income from continuing operations are as follows:
|
|
|
Fiscal Years Ended November 30, |
|
|||||||||
|
|
|
2021 |
|
|
2020 |
|
|
2019 |
|
|||
|
United States |
|
$ |
|
|
|
$ |
|
|
|
$ |
|
|
|
Foreign |
|
|
|
|
|
|
|
|
|
|
|
|
|
|
|
$ |
|
|
|
$ |
|
|
|
$ |
|
|
Significant components of the provision for income taxes are as follows:
|
|
|
Fiscal Years Ended November 30, |
|
|||||||||
|
|
|
2021 |
|
|
2020 |
|
|
2019 |
|
|||
|
Current tax provision: |
|
|
|
|
|
|
|
|
|
|
|
|
|
Federal |
|
$ |
( |
) |
|
$ |
|
|
|
$ |
|
|
|
State |
|
|
|
|
|
|
|
|
|
|
|
|
|
Foreign |
|
|
|
|
|
|
|
|
|
|
|
|
|
|
|
$ |
|
|
|
$ |
|
|
|
$ |
|
|
|
Deferred tax provision (benefit): |
|
|
|
|
|
|
|
|
|
|
|
|
|
Federal |
|
$ |
|
|
|
$ |
( |
) |
|
$ |
( |
) |
|
State |
|
|
( |
) |
|
|
( |
) |
|
|
( |
) |
|
Foreign |
|
|
( |
) |
|
|
|
|
|
|
|
|
|
|
|
$ |
( |
) |
|
$ |
( |
) |
|
$ |
( |
) |
|
Total tax provision |
|
$ |
|
|
|
$ |
|
|
|
$ |
|
|
The breakdown of net deferred tax assets and liabilities are as follows:
|
|
|
As of November 30, |
|
|||||
|
|
|
2021 |
|
|
2020 |
|
||
|
Deferred tax assets |
|
$ |
|
|
|
$ |
|
|
|
Deferred tax liabilities |
|
|
( |
) |
|
|
( |
) |
|
Total net deferred tax assets (liabilities) |
|
$ |
( |
) |
|
$ |
|
|
83
The significant components of the Company’s deferred tax assets and liabilities are as follows:
|
|
|
As of November 30, |
|
|||||
|
|
|
2021 |
|
|
2020 |
|
||
|
Assets: |
|
|
|
|
|
|
|
|
|
Loss carryforwards |
|
$ |
|
|
|
$ |
|
|
|
Lease liabilities |
|
|
|
|
|
|
|
|
|
Accrued liabilities |
|
|
|
|
|
|
|
|
|
Foreign tax credit carryforwards |
|
|
|
|
|
|
|
|
|
Disallowed interest expense |
|
|
|
|
|
|
- |
|
|
Allowance for doubtful accounts and sales return reserves |
|
|
|
|
|
|
|
|
|
Capitalized inventory costs |
|
|
|
|
|
|
|
|
|
Unrealized losses on cash flow hedges |
|
|
|
|
|
|
|
|
|
Acquisition and transaction related costs |
|
|
|
|
|
|
- |
|
|
Share-based compensation expense |
|
|
|
|
|
|
|
|
|
Deferred revenue |
|
|
|
|
|
|
|
|
|
Long-lived assets |
|
|
|
|
|
|
( |
) |
|
Other, net |
|
|
|
|
|
|
|
|
|
|
|
|
|
|
|
|
|
|
|
Less: valuation allowance |
|
|
( |
) |
|
|
( |
) |
|
Total deferred tax assets |
|
$ |
|
|
|
$ |
|
|
|
Liabilities: |
|
|
|
|
|
|
|
|
|
Long-lived assets |
|
$ |
( |
) |
|
$ |
( |
) |
|
Lease right-of-use assets |
|
|
( |
) |
|
|
( |
) |
|
Deferred costs |
|
|
( |
) |
|
|
— |
|
|
Capitalized marketing program costs |
|
|
( |
) |
|
|
— |
|
|
Other, net |
|
|
( |
) |
|
|
( |
) |
|
Total deferred tax liabilities |
|
$ |
( |
) |
|
$ |
( |
) |
|
Net deferred tax (liability) asset |
|
$ |
( |
) |
|
$ |
|
|
The increase in the Company's overall deferred tax liability position is primarily due to the increase in the Company's identified intangible assets recorded as a result of the Merger. The net change in the deferred tax valuation allowances in fiscal 2021was an increase of $
The valuation allowance at November 30, 2021 primarily relates to carryforwards for foreign net operating losses and foreign tax credits in the United States. The valuation allowance at November 30, 2020 relates primarily to certain state and foreign net operating loss carryforwards and state credits. The Company considers all positive and negative evidence available in determining the potential of realizing deferred tax assets. To the extent that the Company generates consistent taxable income within those operations with valuation allowances, the Company may reduce the valuation allowances, thereby reducing income tax expense and increasing net income in the period the determination is made.
The Company’s net operating loss carryforwards totaled $
84
The reconciliation of the statutory United States federal income tax rate to the Company’s effective income tax rate is as follows:
|
|
|
Fiscal Years Ended November 30, |
|
|||||||||
|
|
|
2021 |
|
|
2020 |
|
|
2019 |
|
|||
|
United States federal statutory income tax rate |
|
|
|
% |
|
|
|
% |
|
|
|
% |
|
State income taxes, net of federal income tax benefit |
|
|
|
|
|
|
|
|
|
|
|
|
|
Global intangible low taxed income |
|
|
|
|
|
|
|
|
|
|
|
|
|
Tax on foreign earnings different than US federal rate |
|
|
|
|
|
|
|
|
|
|
|
|
|
Net changes in deferred tax valuation allowances |
|
|
( |
) |
|
|
— |
|
|
|
— |
|
|
Adjustments related to the Tax Cuts and Jobs Act |
|
— |
|
|
|
— |
|
|
|
( |
) |
|
|
Interest not subject to tax, net |
|
|
|
|
|
|
( |
) |
|
|
|
|
|
Capital loss carryback |
|
|
( |
) |
|
|
— |
|
|
|
— |
|
|
Net changes in reserves for uncertain tax positions |
|
|
( |
) |
|
|
— |
|
|
|
— |
|
|
Other, net |
|
|
|
|
|
|
( |
) |
|
|
( |
) |
|
Effective income tax rate |
|
|
|
% |
|
|
|
% |
|
|
|
% |
In connection with the Merger, the Company restructured its foreign financing structure, as well as select legal entities in anticipation of legally integrating legacy Tech Data and SYNNEX foreign operations. In addition to the treasury efficiencies, these restructurings resulted in a one-time domestic capital loss which would offset certain domestic capital gains when carried back under United States tax law to tax year 2020, resulting in a tax benefit of approximately $
The Company’s United States business has sufficient cash flow and liquidity to fund its operating requirements and the Company expects and intends that profits earned outside the United States will be fully utilized and reinvested outside of the United States.
As of November 30, 2021, the Company had approximately $
The Company has been granted tax holidays in certain jurisdictions, primarily, China. The tax holidays provide for lower rates of taxation and require various thresholds of investment and business activities in those jurisdictions. Certain tax holidays begin to expire in fiscal year
The estimates and assumptions used by the Company in computing the income taxes reflected in the Company’s consolidated financial statements could differ from the actual results reflected in the income tax returns filed during the subsequent year. Adjustments are recorded based on filed returns when such returns are finalized or the related adjustments are identified.
The aggregate changes in the balances of gross unrecognized tax benefits, excluding accrued interest and penalties, during fiscal years 2021, 2020 and 2019 were as follows:
|
For the year ended November 30: |
|
2021 |
|
|
2020 |
|
|
2019 |
|
|||
|
Gross unrecognized tax benefits at beginning of period |
|
$ |
|
|
|
$ |
|
|
|
$ |
|
|
|
Increases (decreases) in tax positions for prior years and acquisitions |
|
|
|
|
|
|
( |
) |
|
|
|
|
|
Decreases in tax positions for prior years |
|
|
- |
|
|
|
( |
) |
|
- |
|
|
|
Increases in tax positions for current year |
|
|
|
|
|
|
|
|
|
|
|
|
|
Expiration of statutes of limitation |
|
|
( |
) |
|
|
( |
) |
|
|
( |
) |
|
Changes due to translation of foreign currencies |
|
|
( |
) |
|
|
( |
) |
|
|
( |
) |
|
Gross unrecognized tax benefits at end of period |
|
$ |
|
|
|
$ |
|
|
|
$ |
|
|
As of November 30, 2021, the amount of unrecognized tax benefits that, if recognized, would impact the effective tax rate was $
85
2021, 2020 and 2019, includes the current year end accrual, an interest benefit resulting from the expiration of statutes of limitation, and the translation adjustments on foreign currencies.
The Company conducts business primarily in the Americas, Europe and APJ, and as a result, one or more of its subsidiaries files income tax returns in the U.S. federal, various state, local and foreign tax jurisdictions. In the normal course of business, the Company is subject to examination by taxing authorities. The Company is no longer subject to examinations by the Internal Revenue Service for years before fiscal 2018. The Company is no longer subject to foreign or state income tax audits for returns covering years through 2003, and fiscal year 2010, respectively.
In preparation of the Separation, SYNNEX entered into a Tax Matters Agreement with Concentrix effective on December 1, 2020 that governs the rights and obligations of SYNNEX and Concentrix for certain pre-Separation tax liabilities. The Tax Matters Agreement provides that SYNNEX and Concentrix will share certain pre-Separation income tax liabilities that arise from adjustments made by tax authorities to SYNNEX and Concentrix’ U.S. and certain non-U.S. income tax returns. In certain jurisdictions SYNNEX and Concentrix have joint and several liability for past income tax liabilities and accordingly, SYNNEX could be legally liable under applicable tax law for such liabilities and required to make additional tax payments.
In addition, if the distribution of Concentrix' common shares to the SYNNEX stockholders is determined to be taxable, Concentrix and SYNNEX would share the tax liability equally, unless the taxability of the distribution is the direct result of action taken by either Concentrix or SYNNEX subsequent to the distribution in which case the party causing the distribution to be taxable would be responsible for any taxes imposed on the distribution.
NOTE 18—COMMITMENTS AND CONTINGENCIES:
As is customary in the technology industry, to encourage certain customers to purchase products from us, the Company also has other financing agreements with financial institutions to provide inventory financing facilities to the Company’s customers and allow certain customers of the Company to finance their purchases directly with the financial institutions. The Company is contingently liable to repurchase inventory sold under these agreements in the event of any default by its customers under the agreement and such inventory being repossessed by the financial institutions. As the Company does not have access to information regarding the amount of inventory purchased from the Company, still on hand with the customer at any point in time, the Company’s repurchase obligations relating to inventory cannot be reasonably estimated. Losses, if any, would be the difference between the repossession cost and the resale value of the inventory. Repurchases under these arrangements have been insignificant to date and the Company is not aware of any pending customer defaults or repossession obligations. The Company believes that, based on historical experience, the likelihood of a material loss pursuant to these inventory repurchase obligations is remote.
The French Autorité de la Concurrence (“Competition Authority”) began in 2013 an investigation into the French market for certain products of Apple, Inc., (“Apple”) for which the Company is a distributor. In March 2020, the Competition Authority imposed fines on Tech Data, on another distributor, and on Apple, finding that Tech Data entered into an anticompetitive agreement with Apple regarding volume allocations of Apple products. The fine imposed on Tech Data was €
From time to time, the Company receives notices from third parties, including customers and suppliers, seeking indemnification, payment of money or other actions in connection with claims made against them. Also, from time to time, the Company has been involved in various bankruptcy preference actions where the Company was a supplier to the companies now in bankruptcy. In addition, the Company is subject to various other claims, both asserted and unasserted, that arise in the ordinary course of business. The Company evaluates these claims and records the related liabilities. It is possible that the ultimate liabilities could differ from the amounts recorded.
Under the Separation and Distribution agreement, SYNNEX agreed to indemnify Concentrix, each of its subsidiaries and each of their respective directors, officers and employees from and against all liabilities relating to, arising out of or resulting from, among other matters, the liabilities allocated to SYNNEX as part of the Separation. Similarly, Concentrix agreed to indemnify SYNNEX, each of its subsidiaries and each of their respective directors, officers and employees from and against all liabilities relating to, arising out of or resulting from, among
86
other matters, the liabilities allocated to Concentrix as part of the Separation. SYNNEX expects Concentrix to fully perform under the terms of the Separation and Distribution agreement.
Under the Separation and Distribution agreement, SYNNEX and Concentrix agreed to cooperate with each other in managing litigation related to both companies' businesses. The Separation and Distribution agreement also included provisions that assign to each company responsibility for managing pending and future litigation related to the general corporate matters of SYNNEX arising prior to the Separation.
The Company does not believe that the above commitments and contingencies will have a material adverse effect on the Company’s results of operations, financial position or cash flows.
87
TD SYNNEX CORPORATION
SCHEDULE II—VALUATION AND QUALIFYING ACCOUNTS
For the Fiscal Years Ended November 30, 2021, 2020 and 2019
(in thousands)
(Amounts may not add due to rounding)
|
|
|
|
|
|
|
Additions/Deductions |
|
|
|
|
|
|
|
|
|
|
|
|
|
|
|
|
|
Balances at Beginning of Fiscal Year |
|
|
Charged to Revenue and Expense, net |
|
|
Additions from Acquisitions |
|
|
Reclassifications and Write-offs |
|
|
Balances at End of Fiscal Year |
|
|||||
|
Fiscal Year Ended November 30, 2019 |
|
|
|
|
|
|
|
|
|
|
|
|
|
|
|
|
|
|
|
|
|
Allowance for sales returns-gross |
|
$ |
|
|
|
$ |
|
|
|
$ |
— |
|
|
$ |
( |
) |
|
$ |
|
|
|
Allowance for deferred tax assets |
|
|
|
|
|
|
|
|
|
|
— |
|
|
|
— |
|
|
|
|
|
|
Fiscal Year Ended November 30, 2020 |
|
|
|
|
|
|
|
|
|
|
|
|
|
|
|
|
|
|
|
|
|
Allowance for sales returns-gross |
|
$ |
|
|
|
$ |
|
|
|
|
— |
|
|
$ |
|
|
|
$ |
|
|
|
Allowance for deferred tax assets |
|
|
|
|
|
|
( |
) |
|
|
— |
|
|
|
— |
|
|
|
|
|
|
Fiscal Year Ended November 30, 2021 |
|
|
|
|
|
|
|
|
|
|
|
|
|
|
|
|
|
|
|
|
|
Allowance for sales returns-gross |
|
$ |
|
|
|
$ |
( |
) |
|
$ |
|
|
|
$ |
|
|
|
$ |
|
|
|
Allowance for deferred tax assets |
|
|
|
|
|
|
- |
|
|
|
|
|
|
|
( |
) |
|
|
|
|
88
Item 9. Changes in and Disagreements with Accountants on Accounting and Financial Disclosure
None.
Item 9A. Controls and Procedures
Evaluation of disclosure controls and procedures
We maintain “disclosure controls and procedures,” as such term is defined in Rule 13a-15(e) under the Securities Exchange Act of 1934 (the “Exchange Act”), that are designed to ensure that information required to be disclosed by us in reports that we file or submit under the Exchange Act is recorded, processed, summarized, and reported within the time periods specified in Securities and Exchange Commission rules and forms, and that such information is accumulated and communicated to our management, including our Chief Executive Officer and Chief Financial Officer, as appropriate, to allow timely decisions regarding required disclosures. In designing and evaluating our disclosure controls and procedures, management recognized that disclosure controls and procedures, no matter how well conceived and operated, can provide only reasonable, not absolute, assurance that the objectives of the disclosure controls and procedures are met. Our disclosure controls and procedures have been designed to meet reasonable assurance standards. Additionally, in designing disclosure controls and procedures, our management necessarily was required to apply its judgment in evaluating the cost-benefit relationship of possible disclosure controls and procedures. The design of any disclosure controls and procedures is also based in part upon certain assumptions about the likelihood of future events, and there can be no assurance that any design will succeed in achieving its stated goals under all potential future conditions.
Based on their evaluation as of the end of the period covered by this Report, our Chief Executive Officer (our principal executive officer) and Chief Financial Officer (our principal financial officer) have concluded that, as of such date, our disclosure controls and procedures were effective at the reasonable assurance level.
Management’s Report on internal control over financial reporting
Management’s Report on internal control over financial reporting on page 48, and the attestation report of KPMG LLP, an independent registered public accounting firm on page 49, is incorporated herein by reference.
Changes in internal control over financial reporting
There were no changes in our internal control over financial reporting (as defined in Rule 13a-15(f) under the Exchange Act) identified in connection with management’s evaluation during our last quarter of fiscal 2021 that have materially affected, or are reasonably likely to materially affect, our internal control over financial reporting.
Item 9B. Other Information
None.
Item 9C. Disclosure Regarding Foreign Jurisdictions that Prevent Inspections
Not Applicable.
89
PART III
Item 10. Directors, Executive Officers and Corporate Governance
The information required by this item (with respect to Directors) is incorporated by reference from the information under the caption “Election of Directors” “Corporate Governance -- Organization of the Board of Directors” contained in our Proxy Statement to be filed with the Securities and Exchange Commission in connection with the solicitation of proxies for our 2022 Annual Meeting of Stockholders to be held on March 15, 2022 (the “Proxy Statement”). Certain information required by this item concerning executive officers is set forth in Part I of this Report under the caption “Information About Our Executive Officers.”
Item 405 of Regulation S-K calls for disclosure of any known late filing or failure by an insider to file a report required by Section 16(a) of the Exchange Act. To the extent disclosure for delinquent reports is being made, it can be found under the caption “Delinquent Section 16(a) Reports” in the Proxy Statement and is incorporated herein by reference.
We have adopted a code of ethics that applies to all of our employees, including our principal executive officer, our principal financial and accounting officer, our controllers and persons performing similar functions. This code of ethics, called a Code of Ethical Business Conduct, is available free of charge on our public website (www.tdsynnex.com) on the investor relations webpage. Future amendments or waivers relating to the code of ethics will be disclosed on the webpage referenced in this paragraph within five (5) business days following the date of such amendment or waiver.
Item 11. Executive Compensation
The information required by this item is incorporated by reference from the information under the captions “Corporate Governance -- 2021 Directors’ Compensation Table,” “Corporate Governance -- Narrative to Directors’ Compensation Table,” “Executive Compensation,” and “Corporate Governance -- Compensation Committee Interlocks and Insider Participation” contained in the Proxy Statement.
Item 12. Security Ownership of Certain Beneficial Owners and Management and Related Stockholder Matters
The information required by this item with respect to security ownership of certain beneficial owners and management is incorporated by reference from the information under the caption “Security Ownership of Certain Beneficial Owners and Management” contained in the Proxy Statement.
Equity Compensation Plan Information
The following table sets forth certain information regarding our equity compensation plans as of November 30, 2021:
|
Plan Category |
|
Number of securities to be issued upon exercise of outstanding options (a) |
|
|
Weighted-average exercise price of outstanding options (b) |
|
|
Number of securities remaining available for future issuance under equity compensation plans (excluding securities reflected in column (a)) (c) |
|
|
|||
|
Equity compensation plan approved by security holders |
|
|
688,752 |
|
(1) |
$ |
66.29 |
|
|
|
5,629,065 |
|
(2)(3) |
|
Equity compensation plan not approved by security holders |
|
|
- |
|
|
|
- |
|
|
|
- |
|
|
|
Total |
|
|
688,752 |
|
(1) |
$ |
66.29 |
|
|
|
5,629,065 |
|
(2)(3) |
|
|
(1) |
Includes the number of shares to be issued under our 2003, 2013 and 2020 Plans. Please see Note 6 - Share-Based Compensation of the Notes to the Consolidated Financial Statements for further information regarding the plans. |
|
|
(2) |
Includes the number of shares reserved for issuance under our 2020 Plan. The number of shares initially authorized for issuance under our 2020 Plan will not exceed the sum of (i) 2,493,196 shares of common stock plus (ii) any shares under the 2013 Plan that that are subject to outstanding awards to the extent those awards expire, terminate or are canceled for any reason prior to exercise without the issuance or delivery of such shares, any shares subject to vesting restrictions that are subsequently forfeited, and any reserved shares not issued or subject to outstanding awards and (iii) any shares that are subject to outstanding options under the 2003 Plan to the extent those options expire, terminate, or are canceled for any reason prior to exercise without the issuance or delivery of such shares, up to a maximum of 1,443,193 shares. Due to antidilution provisions in the 2020 TD SYNNEX Plan the number of authorized shares was increased by 2,620,859 shares following the Separation. Please see Note 6 - Share-Based Compensation of the Notes to the Consolidated Financial Statements for further information regarding the TD SYNNEX Plans. |
|
|
(3) |
Includes 1,074,095 shares available-for-sale pursuant to our 2014 Employee Stock Purchase Plan. Shares of common stock will be purchased at a price equal to 95% of the fair market value per share of common stock on either the first trading day of the offering period or on the last trading day of the accumulation period, whichever is lower. See Note 6 - Share-Based Compensation of the Notes to the Consolidated Financial Statements for further information regarding the 2014 Employee Stock Purchase Plan. |
90
Item 13. Certain Relationships and Related Transactions, and Director Independence
The information required by this item is incorporated by reference from the information contained under the caption “Certain Relationships and Related Party Transactions” and “Election of Directors” contained in the Proxy Statement.
Item 14. Principal Accounting Fees and Services
The information required by this item is incorporated by reference from the information contained under the caption “Ratification of the Appointment of Independent Registered Public Accountants” contained in the Proxy Statement.
91
PART IV
Item 15. Exhibits and Financial Statement Schedules
(a) Documents filed as part of this report:
|
|
(1) |
Financial Statements |
See Index under Item 8.
|
|
(2) |
Financial Statements Schedule |
See Index under Item 8.
|
|
(3) |
Exhibits |
See Item 15(b) below. Each compensatory plan required to be filed has been identified.
(b) Exhibits.
|
Exhibit Number |
|
Description of Document |
|
|
|
|
|
2.1+ |
|
|
|
|
|
|
|
3(i).1 |
|
|
|
|
|
|
|
3(ii).1 |
|
|
|
|
|
|
|
4.1 |
|
Description of securities registered pursuant to Section 12 of the Securities Exchange Act of 1934. |
|
|
|
|
|
4.2 |
|
|
|
|
|
|
|
4.3 |
|
|
|
|
|
|
|
4.4 |
|
|
|
|
|
|
|
4.5 |
|
|
|
|
|
|
|
4.6 |
|
|
|
|
|
|
|
4.7 |
|
|
|
|
|
|
|
4.8 |
|
|
|
|
|
|
|
4.9 |
|
|
|
|
|
|
|
4.10 |
|
|
|
|
|
|
92
|
4.11 |
|
|
|
|
|
|
|
4.12 |
|
|
|
|
|
|
|
10.1# |
|
|
|
|
|
|
|
10.2# |
|
|
|
|
|
|
|
10.3# |
|
|
|
|
|
|
|
|
|
|
|
10.4# |
|
|
|
|
|
|
|
10.5# |
|
|
|
|
|
|
|
10.6# |
|
|
|
|
|
|
|
10.7# |
|
|
|
|
|
|
|
10.8# |
|
|
|
|
|
|
|
10.9# |
|
|
|
|
|
|
|
10.10# |
|
|
|
|
|
|
|
10.11# |
|
|
|
|
|
|
|
10.12# |
|
|
|
|
|
|
|
10.13# |
|
|
|
|
|
|
|
10.14# |
|
|
|
|
|
|
|
10.15# |
|
|
|
|
|
|
|
10.16# |
|
|
|
|
|
|
|
10.17# |
|
|
|
|
|
|
93
|
10.18# |
|
|
|
|
|
|
|
10.19# |
|
|
|
|
|
|
|
10.20# |
|
TD SYNNEX Corporation 2014 Employee Stock Purchase Plan, as amended. |
|
|
|
|
|
10.21# |
|
|
|
|
|
|
|
10.22# |
|
|
|
|
|
|
|
10.23# |
|
|
|
|
|
|
|
10.24# |
|
|
|
|
|
|
|
10.25# |
|
|
|
|
|
|
|
10.26# |
|
|
|
|
|
|
|
10.27# |
|
|
|
10.28# |
|
|
|
|
|
|
|
10.29# |
|
|
|
|
|
|
|
10.30# |
|
|
|
|
|
|
|
10.31# |
|
|
|
|
|
|
|
10.32# |
|
|
|
|
|
|
|
10.33# |
|
|
|
|
|
|
|
10.34# |
|
|
|
|
|
|
|
10.35 |
|
|
|
|
|
|
94
|
10.36 |
|
|
|
|
|
|
|
10.37 |
|
|
|
|
|
|
|
10.38 |
|
|
|
|
|
|
|
10.39 |
|
|
|
|
|
|
|
10.40 |
|
|
|
|
|
|
|
10.41 |
|
|
|
|
|
|
|
10.42 |
|
|
|
|
|
|
|
10.43 |
|
|
|
|
|
|
|
10.44 |
|
|
|
|
|
|
|
21.1 |
|
|
|
|
|
|
|
23.1 |
|
Consent of KPMG LLP, Independent Registered Public Accounting Firm. |
|
|
|
|
|
24.1 |
|
|
|
|
|
|
|
31.1 |
|
|
|
|
|
|
|
31.2 |
|
|
|
|
|
|
|
32.1* |
|
|
|
|
|
|
|
101.INS |
|
Inline XBRL Instance Document – the instance document does not appear in the Interactive Data File because its XBRL tags are embedded within the Inline XBRL document. |
|
|
|
|
|
101.SCH |
|
Inline XBRL Taxonomy Extension Schema Document. |
|
|
|
|
|
101.CAL |
|
Inline XBRL Taxonomy Extension Calculation Linkbase Document. |
|
|
|
|
|
101.DEF |
|
Inline XBRL Taxonomy Extension Definition Linkbase Document. |
|
|
|
|
|
101.LAB |
|
Inline XBRL Taxonomy Extension Label Linkbase Document. |
|
|
|
|
|
101.PRE |
|
Inline XBRL Taxonomy Extension Presentation Linkbase Document. |
|
|
|
|
|
104 |
|
Cover Page Interactive Data File (formatted as inline XBRL and contained in Exhibit 101) |
|
|
|
|
|
# |
Indicates management contract or compensatory plan or arrangement. |
|
* |
In accordance with Item 601(b)(32)(ii) of Regulation S-K and SEC Release Nos. 33-8238 and 34-47986, Final Rule: Management’s Reports on Internal Control Over Financial Reporting and Certification of Disclosure in Exchange Act Periodic Reports, the certifications furnished in Exhibit 32.1 hereto are deemed to accompany this Form 10-K and will not be deemed “filed” for purpose of Section 18 of the Exchange Act. Such certifications will not be deemed to be incorporated by reference into any filing under the Securities Act or the Exchange Act, except to the extent that the registrant specifically incorporates it by reference. |
|
+ |
The schedules and exhibits to this agreement have been omitted pursuant to Item 601(b)(2) of Regulation S-K. A copy of any omitted schedule and/or exhibit will be furnished to the Securities and Exchange Commission upon request. |
(c) Financial Statement Schedules.
See Index under Item 8.
Item 16. Form 10-K Summary
None.
95
SIGNATURES
Pursuant to the requirements of Section 13 or 15(d) of the Securities Exchange Act of 1934, the registrant has duly caused this report to be signed on its behalf by the undersigned, thereunto duly authorized.
Date: January 28, 2022
TD SYNNEX CORPORATION
|
By: |
|
/s/ Richard T. Hume |
|
|
|
Richard T. Hume Chief Executive Officer |
POWER OF ATTORNEY
KNOW ALL MEN BY THESE PRESENTS, that each person whose signature appears below constitutes and appoints Richard T. Hume and Marshall W. Witt, and each of them, his true and lawful attorneys-in-fact, each with full power of substitution, for him or her in any and all capacities, to sign any amendments to this report on Form 10-K and to file the same, with exhibits thereto and other documents in connection therewith, with the Securities and Exchange Commission, hereby ratifying and confirming all that each of said attorneys-in-fact or their substitute or substitutes may do or cause to be done by virtue hereof.
Pursuant to the requirements of the Securities Exchange Act of 1934, this report has been signed below by the following persons on behalf of the registrant and in the capacities and on the dates indicated.
|
Name |
|
Title |
|
Date |
||
|
/s/ Richard T. Hume |
|
Chief Executive Officer (Principal Executive Officer) and Director |
|
January 28, 2022 |
||
|
Richard T. Hume |
|
|
|
|
||
|
|
|
|
|
|
||
|
/s/ Marshall W. Witt |
|
Chief Financial Officer (Principal Financial and Principal Accounting Officer) |
|
January 28, 2022 |
||
|
Marshall W. Witt |
|
|
|
|
||
|
|
|
|
|
|
||
|
/s/ Dennis Polk |
|
Chair of the Board |
January 28, 2022 |
|||
|
Dennis Polk |
|
|
|
|
||
|
|
|
|
|
|
||
|
/s/ Robert Kalsow-Ramos |
|
Vice Chair of the Board |
January 28, 2022 |
|||
|
Robert Kalsow-Ramos |
|
|
|
|
||
|
|
|
|
|
|
||
|
/s/ Matthew F.C. Miau |
|
Chairman Emeritus of the Board |
January 28, 2022 |
|||
|
Matthew F.C. Miau |
|
|
|
|
||
|
|
|
|
|
|
||
|
/s/ Ann F. Vezina |
|
Lead Independent Director |
January 28, 2022 |
|||
|
Ann F. Vezina |
|
|
|
|
||
|
|
|
|
|
|
||
|
/s/ Merline Saintil |
|
Director |
January 28, 2022 |
|||
|
Merline Saintil |
|
|
|
|
||
|
|
|
|
|
|
||
|
/s/ Nayaki Nayyar |
|
Director |
January 28, 2022 |
|||
|
Nayaki Nayyar |
|
|
|
|
||
|
|
|
|
||||
|
/s/ Fred A. Breidenbach |
|
Director |
January 28, 2022 |
|||
|
Fred A. Breidenbach |
|
|
|
|
||
|
|
|
|
||||
|
/s/ Matthew Nord |
|
Director |
January 28, 2022 |
|||
|
Matthew Nord |
|
|
|
|
||
|
|
|
|
|
|
||
|
/s/ Hau Lee |
|
Director |
January 28, 2022 |
|||
|
Hau Lee |
|
|
|
|
||
|
/s/ Duane E. Zitzner |
|
Director |
January 28, 2022 |
|||
|
Duane E. Zitzner |
|
|
|
|
||
|
|
|
|
|
|
||
96